analysis of economic determinants of fertility in iran: a multilevel approach
TRANSCRIPT
Analysis of economic determinants of fertility in Iran: a multilevel approachMaryam Moeeni1, Abolghasem Pourreza1,*, Fatemeh Torabi2, Hassan Heydari3, Mahmood Mahmoudi4
AbstractBackground: During the last three decades, the Total Fertility Rate (TFR) in Iran has fallen considerably; from 6.5 per woman in 1983 to 1.89 in 2010. This paper analyzes the extent to which economic determinants at the micro and macro levels are associated with the number of children in Iranian households.Methods: Household data from the 2010 Household Expenditure and Income Survey (HEIS) is linked to provincial data from the 2010 Iran Multiple-Indicator Demographic and Health Survey (IrMIDHS), the National Census of Population and Housing conducted in 1986, 1996, 2006 and 2011, and the 1985–2010 Iran statistical year books. Fertility is measured as the number of children in each household. A random intercept multilevel Poisson regression function is specified based on a collective model of intra-household bargaining power to investigate potential determinants of the number of children in Iranian households. Results: Ceteris paribus (other things being equal), probability of having more children drops significantly as either real per capita educational expenditure or real total expenditure of each household increase. Both the low- and the high-income households show probabilities of having more children compared to the middle-income households. Living in provinces with either higher average amount of value added of manufacturing establishments or lower average rate of house rent is associated to higher probability of having larger number of children. Higher levels of gender gap indices, resulting in household’s wife’s limited power over household decision-making, positively affect the probability of having more children.Conclusion: Economic determinants at the micro and macro levels, distribution of intra-household bargaining power between spouses and demographic covariates determined fertility behavior of Iranian households.Keywords: Fertility, Multilevel Analysis, Intra-Household Bargaining Power, Economic Determinants, IranCopyright: © 2014 by Kerman University of Medical SciencesCitation: Moeeni M, Pourreza A, Torabi F, Heydari H, Mahmoudi M. Analysis of economic determinants of fertility in Iran: a multilevel approach. Int J Health Policy Manag 2014; 3: 135–144. doi: 10.15171/ijhpm.2014.78
*Correspondence to:Abolghasem PourrezaEmail: [email protected]
Article History:Received: 19 April 2014Accepted: 22 August 2014ePublished: 26 August 2014
Original Article
Full list of authors’ affiliations is available at the end of the article.
http://ijhpm.comInt J Health Policy Manag 2014, 3(3), 135–144 doi 10.15171/ijhpm.2014.78
IntroductionThe number of children ever born per woman has important implications for public health, economic climate, and population structure. It can influence infant, child and maternal mortality, obstetric and child health services, economic growth (or decline), independency burden, labor force participation, and age structure of populations (1).According to the Population Reference Bureau (PRB), Iran is amongst the twenty most populated countries of the world. Nevertheless, during the last three decades, the Total Fertility Rate (TFR) in this country has fallen considerably from 6.5 per woman in 1983 to 1.89 in 2010 which is below the replacement fertility rate (2). It is interesting to note that Iran now has the lowest fertility rate in the Middle East (2).There is a rich literature about the demographic feature of fertility in Iran including fertility transition and how expansion in education, reduction in child mortality, urbanization, wide access to family planning services and religion have contributed to the recent fertility decline in this country (3–11). However, to our knowledge, the impact of economic factors on Iranian fertility behavior has not sufficiently been elaborated.
The objective of the paper is to provide an economic explanation for the dramatic change in fertility among Iranian households. The paper applies the intra-household bargaining model framework to investigate the extent to which economic determinants at the household and provincial levels are associated with fertility behavior. We link the household data from the 2010 Household Expenditure and Income Survey (HEIS) to the provincial data from the 2010 Iran Multiple-Indicator Demographic and Health Survey (IrMIDHS), the National Census of Population and Housing and the Iran statistical year books. Then, a random intercept multilevel Poisson regression function is specified based on a collective model of intra-household bargaining power in which spouses’ bargaining power is measured through extra-household indices of gender gap including indices of gender gap determined outside of household.The paper proceeds as follows. First, we provide theoretical background of intra-household bargaining models. In the Following section, different data sources are introduced. After that, we explain the multilevel method and count data model and define the explanatory variables included in the multilevel Poisson model. The subsequent section
Moeeni et al.
International Journal of Health Policy and Management, 2014, 3(3), 135–144136
focuses on the relationship between the household and provincial characteristics and the number of children in households (as a measure for fertility). Next, the findings are discussed extensively and in the final secession, we draw a brief conclusion.
Theoretical backgroundIn an economic view, children fall into several main categories such as public goods, investment goods and consumer durable goods. When children are described as consumer durable goods, they are considered to provide a flow of utility to their parents (12,13).Some economists have tried to explore fertility behavior of individuals and households based on microeconomic theories. Malthus’s classic essay is one of the primary economic studies of fertility behavior. The essay points to the conclusion that fertility rate change in direct proportion to the total income (14). Nonetheless, the Malthusian approach cannot describe fertility of developed economies for the reason that it neglects two features of these economies, including opportunity cost of parenthood and importance of educated and healthy children, which both persuade parents to have smaller families (15–17). Becker’ theory of fertility behavior, specially the notion of the “quality and quantity of children”, which is a substantial contribution to family and household economics, suggests those parents who give higher quality to their children usually choose a smaller family size (18–21). Becker et al. and Becker and Lewis emphasize the role of economic determinants such as household income, female labor force participation and childbearing cost in household fertility (15,18–20,22). A main conclusion of Becker’ theory is that unlike Malthusian theory, the effect of income on fertility is ambiguous depending on the extent of offsetting income influence versus substitution influence (19,21,23). According to Becker’s unitary model, spouses maximize one single utility function reflecting their same preferences about quality or quantity of children (21,23–25). Samuelson also develops a household social welfare function with one joint utility function (26). In contrast, intra-household bargaining decision-making models developed by Manser and Brown (27), and McElroy and Horney (28) advocate different utility functions for spouses. Intra-household bargaining refers to negotiations that occur between members of a household in order to arrive at decisions regarding the household unit (29) and intra-household bargaining power is the relative capacity of the household members especially spouses to dominate the other in a negotiation over decisions such as quantity of children. If all household members are on same position in a negotiation, they will have equal bargaining power, and conversely, if one has a dominant position in the negotiation, they have unequal bargaining power (29,30). Non-cooperative and cooperative bargaining settings are two categories of intra-household models which are based on the game-theoretic framework. In non-cooperative games, household members maximize their utility, taking the other members’ behaviors as given (27–29,31,32). One weakness of this approach is that a non-cooperative game does not essentially have a Pareto efficient intra-household allocation of welfare (23,24,33). In
cooperative games, household members’ aim is to reach an agreement on how to divide the gains from living together. In a cooperative game, a Pareto efficacy of intra-household allocation of welfare is achieved. Still, both cooperative and non-cooperative games depend on a particular bargaining concept which is a limitation (21,27,28). The collective model developed by Chiappori (30,34) and Apps and Rees (35) has only one assumption that all intra-household decisions are Pareto efficient; thus, it has the least limitation. In this model, household allocation problem can be defined as a unique solution to the following maximization problem:
(1 )A BW U Uµ µ= + − (1)
UA and UB are utility function of two household members A and B. μ and (1-μ) refer to the welfare weights. These welfare weights are interpreted as bargaining power of household members (24,25,30,34,35).A number of studies have recognized, at the macro level, the relationship between fertility and economic determinants such as per capita income, employment rate, inflation rate, economic uncertainty, and economic growth (36–43). The other works have noted the association between fertility and economic status of households or individuals at the micro level (32,38,44–47). Moreover, fertility behavior has been investigated, at the micro level, in the framework of household bargaining power. In this approach, the intra-household bargain power is derived from individual determinants such as spouses’ income, wage rate, assets, age, education and woman empowerment (32,48–51), or from household determinants such as age, educational and wage differences between spouses (29,52,53). Other studies have pointed at the key role of contextual factors, specifically gendered institutions reflecting asymmetric social norms, cultural beliefs and laws in bargaining power of household members (54–57). A few dimensions of gender gap (meaning the differences between female and male in social, political, intellectual, cultural, or economic attainments or attitudes) such as wage gender gap, polygamy, political participation etc. have also been used at higher levels as proxies for intra-household bargaining power (29,58,59). We therefore conclude that bargaining power in a single household is partly resulted from extra-household indices of gender gap driving us to accept the negative relationship between extra-household indices of gender gap and bargaining power of wives.In this paper, the spouses’ bargaining power is explained in terms of extra-household indices of gender gap which are based on benchmarking tools introduced by World Economic Forum (WEF). These benchmarking tools include economic participation and opportunity, educational attainment, political empowerment and health and survival (60,61). Based on the evidence mentioned in the previous paragraph, we assume a negative relationship between extra-household indices of gender gap and intra-household woman’s bargaining power. An expert panel consists of economists, sociologists-demographist, statisticians and health economists developed for determining content validity in this study. Selected
Moeeni et al.
International Journal of Health Policy and Management, 2014, 3(3), 135–144 137
measures of gender gap as indicators for “intra-household bargaining power” were evaluated by the panel. They reached an agreement that selected variables could represent all aspects of gender gap which have introduced by WEF and recognized those variables as appropriate proxies for intra-household bargaining power. To test reliability, the final sample of households was split into two subsets in which 90% of households in sample provide first subset and remaining households provide the second one. The result of the test confirmed the overall consistency of our measures.
Materials and methodsData sources and sample selectionThe first level of observations consists of households and the second level contains the Iranian provinces in the year of 2010.We apply different data sources: 1) the 2010 HEIS, 2) the 2010 IrMIDHS, 3) the National Census of Population and Housing, and 4) the Iran statistical year books provided by Statistical Center of Iran. We link the micro-data provided by the HEIS to the published provincial data from the three other data sources. The HEIS, operated by Statistical Center of Iran and Iranian central bank, is a nationally representative survey administered to two samples of urban and rural households in all provinces. The 2010 HEIS is the main data set in this study. A valid and reliable questionnaire, which was designed and employed by this centre, was used for data collection. The household-level variables consisting of number of children in each household, household educational expenditure in real price, total household expenditure in real price, income deciles, household’s wife’s employment status and gender composition of children have been constructed by extracting data from this survey. The total sample includes 38950 households. The present study emphasizes on the normal type of families, indicated by the monogamous married couples living together and having their own children. Hence, we exclude the following households from the sample: households with single parent because they could not exhibit distribution of bargaining power between parents and polygamous households since this study is based on the assumption that each household has one married woman as the wife. Households including wives aged less than fifteen years when the first child had been borne are dropped because they were under the childbearing age. We drop households including wives aged more than forty at the time of interview because the number of children in these households may be fewer than total number of children, which has not been recorded by the HEIS. Hence, limiting the sample to younger wives lowers the risk of underestimating the total number of children. We also eliminate childless households because we do not have any information about the length of marriage among them, and those with a multiple births because they may have unwanted children. Therefore, the final sample consists of 13952 households containing monogamous married couples living within thirty provinces.The 2010 IrMIDHS, which was carried out by the Iran ministry of health, includes a representative sample of 31350
households in all provinces. In this paper, we use a number of provincial-level variables from this survey, including unmet needs for contraception and polygamy rate.The National Census of Population and Housing, which was conducted by the Statistical Center of Iran, was started in 1956 and conducted every ten years until 2006 and every five years after that time. We make use of the surveys conducted in 1986, 1996, 2006 and 2011 to compile a number of provincial variables by calculating the average amount of each variable during stated period. The variables are the population of each province, the average percentage of urban population and the average household size in each province. Moreover, the provinces with sizable minorities of Sunnite population were selected from this data source. Other variables, at the provincial level, were obtained from the “International Statistics”, “Price Indices” and “Political Statistics” were parts of the 1985–2010 Iran statistical year books. We use an average of selected variables such as the average rate of house rent, the average value added in manufacturing establishments, the average amount of Consumer Price Index (CPI), the average employment rate, the average male to female wage ratio in manufacturing establishments, the average ratio of highly educated male to female employees in manufacturing establishments, the average female employment rate, the average ratio of male to female election onto City and Village Councils, in addition to the average percentage of urban population in each province over this period. The logic behind using an average value of data for multiple years is the fact that fertility is determined, developed, and changed during a long period of time. As a result, all economic and demographic conditions during those years could impact the Iranian fertility behavior.
Method and measuresIn this paper, the data has a two-level hierarchal structure in which 13952 households are nested within thirty provinces. It should be noticed that the Alborz province was formed by dividing the Tehran province into two provinces (Tehran and Alborz) in the year of 2010. But there was no comprehensive separate data and information about Alborz province in 2010. Therefore, Alborz province is regarded as part of Tehran province. Clustering the observations within higher-level units can result in a hierarchically structured data set in which observations are not independent. The Ordinary Least Square (OLS) method is not suitable for observations of this type because it can give inefficient estimates of parameters and downwardly biased estimates of standard errors (62–64). Besides, the dependent variable is counts of children in each household. The count data are constrained to be non-negative. Fitting a normal model to these data can cause negative predictions (65–67). Therefore, we apply a multilevel count model based on the extra Poisson distribution with random intercept to account for hierarchal structure of the observations and to avoid any bias resulted from fitting a linear model to count data. According to evidence (66,67), the probability mass function of yi conditional on xi in Poisson distribution is:
Moeeni et al.
International Journal of Health Policy and Management, 2014, 3(3), 135–144138
{ } { }
{ }
1exp|
!exp
yi
i i
i i
P y y xy
x
π π
π β
−= =
′≡
(2)
Therefore, the regression function based on a collective household model is specified as:
13950 30 30
0 1 1 2 21 1 1
0 0 0
~ ( )
log( )
ij ij
ij j ij ij ji j j
j j ij
Childnum Poisson
Lfpoure X X
π
π β β β
β β υ ε= = =
= + + +
= + +
∑ ∑ ∑
(3)
Following similar studies (32,44,58), Childnum, the number of children in household (i.e. those children still living with their parents), is proxied for total children ever born in each household. We use this variable as a measure of fertility in the sample. Lfpoure is the offset variable to control for the “exposure time” (i.e. the years that a household’s wife is at risk of childbearing). It is defined as the natural logarithm of the “age of the oldest child in the household plus one” as a proxy for marriage span because the HEIS does not record any information about the length of marriage. X1ij and X2j are the individual-level explanatory variables and the provincial-level ones respectively. υ0j explains the province random effects and ɛij is the individual-level error.The main Independent variables, measured either at the household or provincial levels, are economic determinants. Education can enhance the quality of children. Hence, to test the quantity-quality hypothesis of childbearing, we enter the per capita household educational expenditure in real price based on CPI of the provinces in 2010 which express parents’ preference for the educated children as an indicator for the quality of children. More, we add the total household expenditure in real price based on CPI of the provinces in 2010, as a proxy for household income. Another independent variable is a categorical variable which divide households into three categories: households in the first to third income deciles (the low-income households), households in the fourth to seventh income deciles (the middle-income households), and those in the eighth to tenth income deciles (the high-income households). One dummy variable, indicating whether or not a household’s wife has a job is included to measure the opportunity cost of childbearing and childrearing. All above covariates were measured at the household level. A number of provincial level covariates are incorporated into the model to determine the economic status, at the macro level. These independent variables are the average rate of house rent, measuring the cost of living in each province, the average value added in manufacturing establishments which is indicative for industrial and economic development, the average amount of CPI representing inflation rate of each province, and the average employment rate.Gender gap indices are derived from a number of variables at the provincial level to capture benchmarking tools introduced
by WEF. The main variables consist of the average male to female wage ratio in manufacturing establishments, the average ratio of highly educated male to female employees (i.e. employees with master or doctorial degree) in manufacturing establishments, the average female employment rate, in addition to the average ratio of male to female election onto City and Village Councils of Iran during its first, second and third periods. Two other variables, selected to measure gender gap based on the existing literature, are percentage of unmet needs for contraception (68,69) and polygamy rate. Polygamy is known as an indicator of discriminatory family code which reflects gender gap (29,58,59). Unmet needs for contraception is the other key indicator reflecting inequality in reproductive health as one of the indices of gender gap developed by WEF (68,69). In order to control for demographic factors, we add household-level characteristics in addition to provincial level covariates; the model contains a categorical variable classified as “having only boys”, “having only girls” and “having mixed-gender children” to specify gender composition of children. Two different dummies, indicating whether or not either wife or husband is literate, are used as independent variables, explaining variation in the fertility behavior of literate and illiterate spouses. The average percentage of urban population in each province is incorporated as a demographic covariate at the second level. Further, a binary variable, defined as living in the provinces with sizable minorities of Sunnite population, is included in the model. These two demographic dummy covariates are used to control for the regional, religious and developmental differences which can impact fertility in Iran. We also incorporate the average provincial household size to measure the effect of social norms related to reproductive choice on fertility behavior of households, as suggested by previous studies (70,71).Data analyses are performed using MLwiN version 2.20 (Bristol University, Bristol) and Stata version 9 (Stata Corporation, College Station, Texas). We use Iterated Generalized Least Square (IGLS) estimation and the 2nd order Predictive Quasi Likelihood (PQL) method.
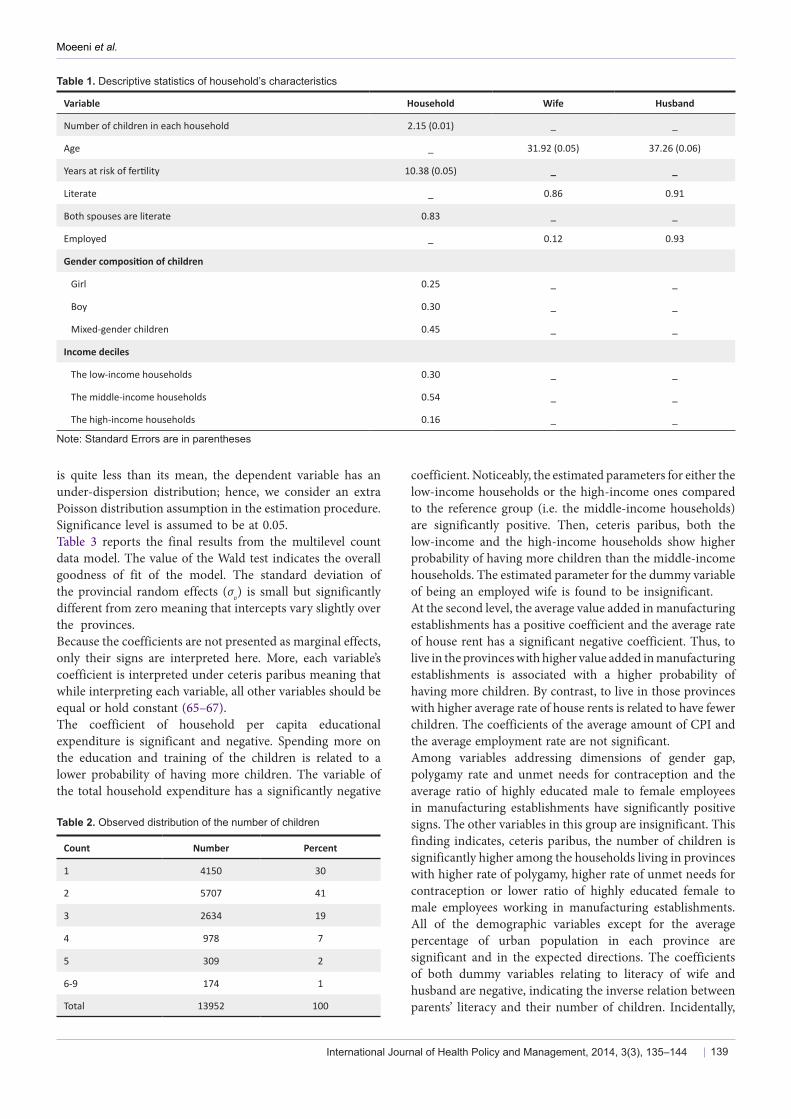
ResultsTable 1 reports the means and the standard deviations of continuous variables, and the percentage of the categorical variables and Table 2 reports the distribution of the number of children in the Iranian households.The average number of children per household is 2.15 and both the median and the mode are two children. The provinces of Gilan and Sistan and Baluchistan, with the average numbers of children equal to 1.69 and 2.92, display the lowest and the highest numbers of children per household, respectively. While 88% of households in Gilan and Mazandaran provinces have a maximum of two children, nearly 52% in Sistan and Baluchistan and 51% in Kohkloye and Boyerahmad have at least three children. This suggests a considerable difference in the average numbers of children per household across the Iranian provinces.Since, the variance of the number of children is 1.19, which
Moeeni et al.
International Journal of Health Policy and Management, 2014, 3(3), 135–144 139
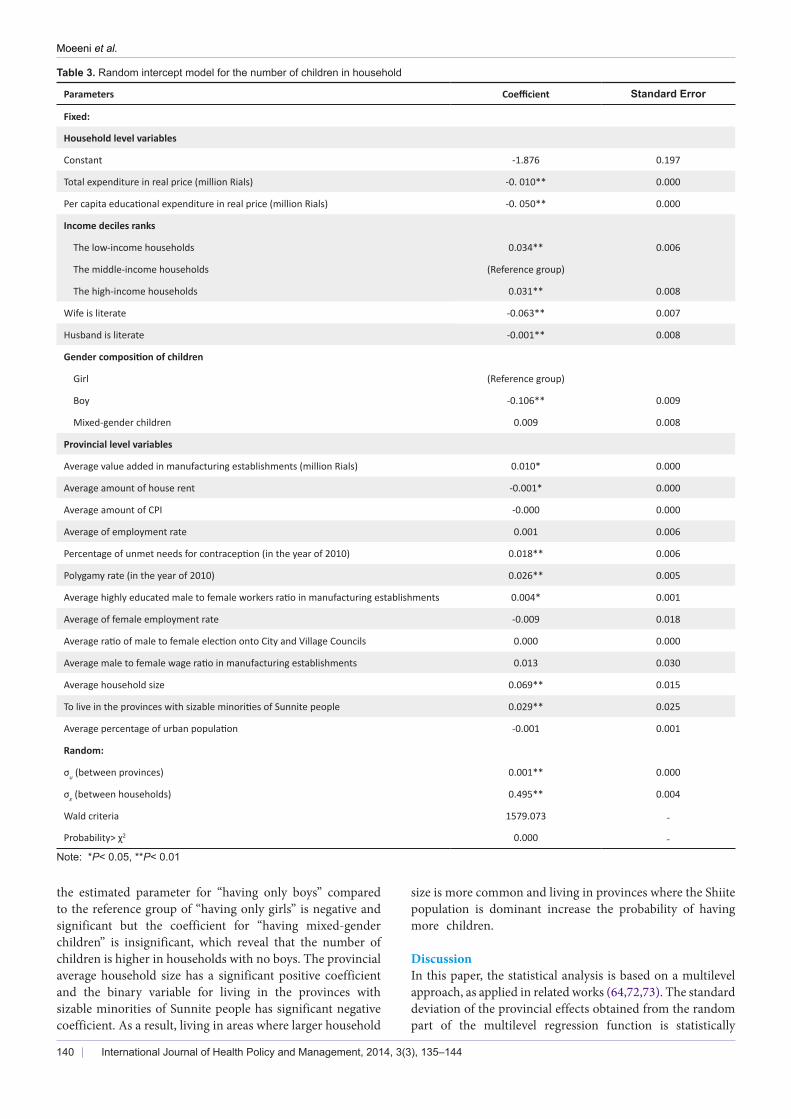
is quite less than its mean, the dependent variable has an under-dispersion distribution; hence, we consider an extra Poisson distribution assumption in the estimation procedure. Significance level is assumed to be at 0.05.Table 3 reports the final results from the multilevel count data model. The value of the Wald test indicates the overall goodness of fit of the model. The standard deviation of the provincial random effects (συ) is small but significantly different from zero meaning that intercepts vary slightly over the provinces. Because the coefficients are not presented as marginal effects, only their signs are interpreted here. More, each variable’s coefficient is interpreted under ceteris paribus meaning that while interpreting each variable, all other variables should be equal or hold constant (65–67). The coefficient of household per capita educational expenditure is significant and negative. Spending more on the education and training of the children is related to a lower probability of having more children. The variable of the total household expenditure has a significantly negative
Table 1. Descriptive statistics of household’s characteristics
Variable Household Wife Husband
Number of children in each household 2.15 (0.01) _ _
Age _ 31.92 (0.05) 37.26 (0.06)
Years at risk of fertility 10.38 (0.05) _ _
Literate _ 0.86 0.91
Both spouses are literate 0.83 _ _
Employed _ 0.12 0.93
Gender composition of children
Girl 0.25 _ _
Boy 0.30 _ _
Mixed-gender children 0.45 _ _
Income deciles
The low-income households 0.30 _ _
The middle-income households 0.54 _ _
The high-income households 0.16 _ _
Note: Standard Errors are in parentheses
Table 2. Observed distribution of the number of children
Count Number Percent
1 4150 30
2 5707 41
3 2634 19
4 978 7
5 309 2
6-9 174 1
Total 13952 100
coefficient. Noticeably, the estimated parameters for either the low-income households or the high-income ones compared to the reference group (i.e. the middle-income households) are significantly positive. Then, ceteris paribus, both the low-income and the high-income households show higher probability of having more children than the middle-income households. The estimated parameter for the dummy variable of being an employed wife is found to be insignificant.At the second level, the average value added in manufacturing establishments has a positive coefficient and the average rate of house rent has a significant negative coefficient. Thus, to live in the provinces with higher value added in manufacturing establishments is associated with a higher probability of having more children. By contrast, to live in those provinces with higher average rate of house rents is related to have fewer children. The coefficients of the average amount of CPI and the average employment rate are not significant.Among variables addressing dimensions of gender gap, polygamy rate and unmet needs for contraception and the average ratio of highly educated male to female employees in manufacturing establishments have significantly positive signs. The other variables in this group are insignificant. This finding indicates, ceteris paribus, the number of children is significantly higher among the households living in provinces with higher rate of polygamy, higher rate of unmet needs for contraception or lower ratio of highly educated female to male employees working in manufacturing establishments.All of the demographic variables except for the average percentage of urban population in each province are significant and in the expected directions. The coefficients of both dummy variables relating to literacy of wife and husband are negative, indicating the inverse relation between parents’ literacy and their number of children. Incidentally,
Moeeni et al.
International Journal of Health Policy and Management, 2014, 3(3), 135–144140
the estimated parameter for “having only boys” compared to the reference group of “having only girls” is negative and significant but the coefficient for “having mixed-gender children” is insignificant, which reveal that the number of children is higher in households with no boys. The provincial average household size has a significant positive coefficient and the binary variable for living in the provinces with sizable minorities of Sunnite people has significant negative coefficient. As a result, living in areas where larger household
size is more common and living in provinces where the Shiite population is dominant increase the probability of having more children.
DiscussionIn this paper, the statistical analysis is based on a multilevel approach, as applied in related works (64,72,73). The standard deviation of the provincial effects obtained from the random part of the multilevel regression function is statistically
Table 3. Random intercept model for the number of children in household
Parameters Coefficient Standard Error
Fixed:
Household level variables
Constant -1.876 0.197
Total expenditure in real price (million Rials) -0. 010** 0.000
Per capita educational expenditure in real price (million Rials) -0. 050** 0.000
Income deciles ranks
The low-income households 0.034** 0.006
The middle-income households (Reference group)
The high-income households 0.031** 0.008
Wife is literate -0.063** 0.007
Husband is literate -0.001** 0.008
Gender composition of children
Girl (Reference group)
Boy -0.106** 0.009
Mixed-gender children 0.009 0.008
Provincial level variables
Average value added in manufacturing establishments (million Rials) 0.010* 0.000
Average amount of house rent -0.001* 0.000
Average amount of CPI -0.000 0.000
Average of employment rate 0.001 0.006
Percentage of unmet needs for contraception (in the year of 2010) 0.018** 0.006
Polygamy rate (in the year of 2010) 0.026** 0.005
Average highly educated male to female workers ratio in manufacturing establishments 0.004* 0.001
Average of female employment rate -0.009 0.018
Average ratio of male to female election onto City and Village Councils 0.000 0.000
Average male to female wage ratio in manufacturing establishments 0.013 0.030
Average household size 0.069** 0.015
To live in the provinces with sizable minorities of Sunnite people 0.029** 0.025
Average percentage of urban population -0.001 0.001
Random:
συ (between provinces) 0.001** 0.000
σɛ (between households) 0.495** 0.004
Wald criteria 1579.073 -
Probability> χ2 0.000 -Note: *P< 0.05, **P< 0.01
Moeeni et al.
International Journal of Health Policy and Management, 2014, 3(3), 135–144 141
significant, providing evidence that the differences in the number of children among Iranian households could in part be explained by provincial effects.The empirical results obtained from the fixed part of the regression function appear to indicate that economic determinants at both household and provincial levels are the key factors associated to fertility of Iranian households. First, the higher the educational expenditure a household spends for each member, the smaller is the number of its children. Second, the probability of having a larger number of children drops significantly as the real total household expenditure, a proxy for household income, rises. These results are supported by previous studies (18,22,44,74,75). This suggests that, in total, the impact of substitution income on fertility is greater than its offsetting effect. These two findings can confirm the Becker’s theory of “quality and quantity of children”. In general, the preferences of Iranian households have shifted towards fewer but higher educated children. Third, the probability of having more children is significantly higher among both the low-income and the high-income households than those of middle-income households. This result is in line with some earlier research (38). We can conclude that while the high-income households can afford more children with good quality, households in the middle-income group decide to substitute the quantity with the quality of their children. Thus, the high-income households do not lower the number of their children as many as those of the middle-income ones. However, it should be noted that as the middle-income group constitute a sizeable portion of our sample, the negative effect of the real expenditure on the number of children can be related to the fertility behavior of this specific group. Still, some studies have found the reverse (16,38).We found no significant association between household’s wife’s employment status and the number of children (45). However, there is broad evidence on the negative association between women’s or wives’ employment and fertility at the micro level (45). This finding can be explained by the fact that only 13% of wives in our sample are employed. Then, the opportunity cost of childbearing and childrearing for wives in our sample is not as much important as those in samples with high percentage of women in the labor market.Living in provinces with higher average rate of house rent and less average amount of the value added in manufacturing establishments is inversely associated with the number of children, suggesting the direct relation between the macro-level economic difficulties and the smaller size of households in our sample. The results are parallel to the finding of related research showing that economic crisis is associated with lower fertility and childbearing postponement (36–38,40,42,50,76,77). However, there are other studies supporting the reverse (76,78).As discussed earlier, we utilize gender gap dimensions measured at the provincial level as indicators of intra-household bargaining power. Three of the variables referring to gender gap indices are significant with the anticipated effects. Higher rates of polygamy and unmet needs for contraception and a lower rate of scholar female to male employees working in the manufacturing establishments as
indicators for higher level of gender gap cause wives to lose their bargaining power over household decision-making especially the quantity of children. The lower the household’s wife’s gains bargaining power, the more is the number of her children. It confirms a negative relation between wives’ bargaining power and the number of their children which is well established in the literature (29,58,59). We can imply that the preference of Iranian women for fewer children but of better quality is stronger than their husbands. However, only wives with higher bargaining power can express this preference and reduce their number of children.As expected, almost all of the demographic variables are statistically significant meaning that, as evidenced by the previous research, demographic determinants including gender composition of children (9,38,79–82), education (9,10,32,73,83), and social norms about household size (70,71,84) exert prominent influences over fertility behavior.According to our results, urbanization has no significant influence on the number of children (72,85), meaning that variation in household sizes between urban and rural areas has been diminished in Iran. Still, it is in contrast with some other studies (32,38,83,86,87). However, the probability of having more children is higher in provinces with sizable religious minorities (10,88–91). It may be rooted in religious belief of minorities or more importantly in severe deprivations in those provinces. This study faced some limitations. First, some of the provincial level covariates were derived from individual-level data especially those coming from 2010 IrMIDHS. Second, we did not access some important information at the first level. As a result, cautions should be exercised in interpreting results and making conclusions. Third, gender gap as indicator for intra-household bargaining power was measured based on several separate and simple variables which could make concerns about developing these two complex concepts. The study also had several strengths. One of the strongest merits of this study was that we combined several appropriate data sources. Additionally, we applied multilevel models to analyze determinants of fertility in household and provincial level which was the other merit of this study.
ConclusionThis investigation of the determinants influencing the number of children among a sample of 13952 Iranian monogamous married couples is relied on a collective model of household decision-makings and uses a multilevel extra Poisson regression function.The empirical results of the analysis derive us to conclude that three groups of determinants influence fertility behavior of Iranian households. The first group consists of economic factors either at the micro or at the macro levels. Especially the findings reveal that: 1) preferences of parents has shifted towards fewer but more qualified children, which confirms the Becker’s theory of “quality and quantity of children”, and 2) economic conditions at the macro level such as house rent prices and value added in manufacturing establishments are related to the number of children. Second, distribution of intra-household bargaining power has a strong influence
Moeeni et al.
International Journal of Health Policy and Management, 2014, 3(3), 135–144142
on fertility in Iran. Spouses exercise their power, measured through extra-household indices of gender gap to achieve their desired number of children. As gender gap indices at provincial level increase, wives’ power in household decision-making falls, resulting in larger number of children which implies that Iranian women have stronger preference for fewer children than their husbands. Finally, although there is no difference between the number of children among urban and rural households, the findings yield a support for the effective role of the other demographic determinants such as literacy, social norms of household size, and religion in fertility behavior of Iranian households.
Acknowledgements This study was supported by Statistical Center of Iran in adittion to Statistical Research and Training Center. The authors are very grateful to all the staff of this center.
Ethical issues The study has been approved by ethical committee of Tehran University of Medical Science. All respondents participating to the surveys applied in this paper have been asked to sign an informed consent form before filling in the questioners.
Competing interests The authors declare that they have no competing interests.
Authors’ contributions MM, AP, FT, and HH made substantial contributions to conception and design of study in addition to analysis and interpretation of data. MM, AP, and FT also participated to drafting of manuscript and revising it critically. MM contributed to critical revision of manuscript.
Authors’ affiliations1Department of Management and Health Economics, School of Public Health, Tehran University of Medical Sciences, Tehran, Iran. 2Department of Demography, Faculty of Social Sciences, University of Tehran, Tehran, Iran. 3Faculty of Management and Economics, Tarbiat Modares University, Tehran, Iran. 4Department of Epidemiology and Biostatistics, School of Public Health, Tehran University of Medical Sciences, Tehran, Iran.
References1. Cleland JG. Trends in Human Fertility. In Heggenhougen HK,
editor. International Encyclopedia of Public Health. Oxford: Academic Press; 2008. p. 364-71.
2. Haub C, Yanagishita M. World population data sheet. Washington DC: Population Reference Bureau; 2011.
3. Abbasi-Shavazi MJ, McDonald P, Hosseini-Chavoshi M. National and Provincial Level Fertility Trends in Iran, 1972–2006. In: Abbasi-Shavazi MJ, McDonald P, Hosseini-Chavoshi M, editors. The Fertility Transition in Iran: Revolution and Reproduction. Netherlands: Springer; 2009. doi: 10.1007/978-90-481-3198-3
4. Abbasi-Shavazi MJ, McDonald PF, Hosseini-Chavoshi M. The fertility transition in Iran: Revolution and reproduction. Netherlands: Springer; 2009. doi: 10.1007/978-90-481-3198-3
5. Abbasi-Shavazi MJ, Torabi F. Women’s Education and Fertility in Islamic Countries. In: Groth H, Sousa-Poza A, editors. Population Dynamics in Muslim Countries. Berlin: Springer; 2012.
6. Aghajanian A. A new direction in population policy and family planning in the Islamic Republic of Iran. Asia Pac Popul J 1995; 10: 3.
7. Aghajanian A, Mehryar AH. Fertility transition in the Islamic Republic of Iran: 1976-1996. Asia Pac Popul J 1999; 14: 21.
8. Aghajanian A, Merhyar AH. Fertility, contraceptive use and family planning program activity in the Islamic Republic of Iran. Int Fam Plan Perspect 1999; 25: 98-102. doi: 10.2307/2991948
9. Erfani A, McQuillan K. The Changing Timing of Births in Iran: An Explanation of the Rise and Fall in Fertility After the 1979 Islamic Revolution. Biodemography Soc Biol 2014; 60: 67-86. doi: 10.1080/19485565.2014.899428
10. Salehi-Isfahani D, Abbasi-Shavazi MJ, Hosseini-Chavoshi M. Family planning and fertility decline in rural Iran: the impact of rural health clinics. Health Econ 2010; 19: 159-80. doi: 10.1002/hec.1613
11. Torabi F. Marriage postponement and fertility decline in Iran. London: London School of Hygiene and Tropical Medicine, University of London; 2011.
12. Cochrane SH. Children as by-products, investment goods and consumer goods: a review of some micro-economic models of fertility. Popul Stud 1975; 29: 373-90. doi: 10.1080/00324728.1975.10412706
13. Folbre N. Children as public goods. Am Econ Rev 1994; 84: 86-90.
14. Malthus TR, Hollingsworth T. An essay on the principle of population. London: Dent; 1973.
15. Becker GS. Nobel lecture: The economic way of looking at behavior. J Polit Econ 1993; 101: 385-409.
16. Galor O, Weil DN. Population, technology, and growth: From Malthusian stagnation to the demographic transition and beyond. Am Econ Rev 2000; 90: 806-28. doi: 10.1257/aer.90.4.806
17. Robinson WC. The economic theory of fertility over three decades. Popul Stud 1997; 51: 63-74.
18. Becker GS. A Treatise on the Family. Harvard: Harvard University Press; 2009.
19. Becker GS, Duesenberry JS, Okun B. An economic analysis of fertility. In: Becker GS, editor. Demographic and economic change in developed countries. New York: Columbia University Press; 1960. p. 209-40.
20. Becker GS, Murphy KM, Tamura R. Human capital, fertility, and economic growth. In: Becker GS, editor. Human Capital: A Theoretical and Empirical Analysis with Special Reference to Education. 3rd Edition. Chicago: The University of Chicago Press; 1994. p. 323-50.
21. Pollak RA. Gary Becker’s contributions to family and household economics. Rev Econ Househ 2003; 1: 111-41. doi: 10.3386/w9232
22. Becker GS, Lewis HG. Interaction between quantity and quality of children. In: Becker GS, editor. Economics of the family: Marriage, children, and human capital. Cambridge: UMI; 1974. p. 81-90.
23. Vermeulen F. Collective household models: principles and main results. J Econ Surv 2002; 16: 533-64. doi: 10.1111/1467-6419.00177
24. Bourguignon F, Chiappori PA. Collective models of household behavior. Eur Econ Rev 1992; 36: 355-364. doi: 10.1016/0014-2921(92)90091-a
25. Brhaving M, Chiappori PA, Lechene V. Collective and unitary models: A clarification. Rev Econ Househ 2006; 4: 5-14. doi: 10.1007/s11150-005-6694-2
26. Samuelson PA. Social indifference curves. Q J Econ 1956; 70: 1-22. doi: 10.2307/1884510
27. Manser M, Brown M. Marriage and household decision-making: A bargaining analysis. Int Econ Rev 1980; 21: 31-44. doi: 10.2307/2526238
28. McElroy MB, Horney MJ. Nash-bargained household decisions: Toward a generalization of the theory of demand. Int Econ Rev 1981; 22: 333-49. doi: 10.2307/2526280
29. Iyigun M, Walsh RP. Endogenous gender power, household
Moeeni et al.
International Journal of Health Policy and Management, 2014, 3(3), 135–144 143
labor supply and the demographic transition. J Dev Econ 2007; 82: 138-55. doi: 10.1016/j.jdeveco.2005.09.004
30. Chiappori PA. Rational household labor supply. Econometrica: Journal of the Econometric Society 1988; 56: 63-90. doi: 10.2307/1911842
31. Brhaving M, Chiappori PA. Efficient intra-household allocations: A general characterization and empirical tests. Econometrica 1998; 66: 1241-78. doi: 10.2307/2999616
32. Klawon E, Tiefenthaler J. Bargaining over family size: the determinants of fertility in Brazil. Popul Res Policy Rev 2001; 20: 423-40.
33. Dosman D, Adamowicz W. Combining stated and revealed preference data to construct an empirical examination of intrahousehold bargaining. Rev Econ Househ 2006; 4: 15-34.
34. Chiappori PA. Collective labor supply and welfare. J Polit Econ 1992; 100: 437-67.
35. Apps PF, Rees R. Collective labor supply and household production. J Polit Econ 1997; 105: 178-90.
36. Agadjanian V, Dommaraju P, Glick J. Reproduction in upheaval: ethnicity fertility and societal transformations in Kazakhstan. Population Studies: A Journal of Demography 2006; 62: 211-33. doi: 10.1080/02615470802045433
37. Billingsley S. The post-communist fertility puzzle. Popul Res Policy Rev 2010; 29: 193-231.
38. Billingsley S. Second and third births in Armenia and Moldova: An economic perspective of recent behaviour and current preferences. European Journal of Population/Revue européenne de Démographie 2011; 27: 125-55. doi: 10.1007/s10680-011-9229-y
39. Eun KS. Understanding recent fertility decline in Korea. Journal of Population and Social Security (Population) 2003; 1: 574-95.
40. Goldstein JR, Sobotka T, Jasilioniene A. The End of “Lowest-Low” Fertility? Popul Dev Rev 2009; 35: 663-99. doi: 10.1111/j.1728-4457.2009.00304.x
41. Hashimoto Y, Kondo A. Long-term effects of labor market conditions on family formation for Japanese youth. Osaka: Institute of Social and Economic Research, Osaka University; 2010.
42. Kohler HP, Kohler I. Fertility decline in Russia in the early and mid 1990s: The role of economic uncertainty and labour market crises. European Journal of Population/Revue européenne de Démographie 2002; 18: 233-62.
43. Sobotka T, Skirbekk V, Philipov D. Economic recession and fertility in the developed world. Popul Dev Rev 2011; 37: 267-306. doi: 10.1111/j.1728-4457.2011.00411.x
44. Hondroyiannis G. Modeling household fertility decisions in Greece. Soc Scie J 2004; 41: 477-83. doi: 10.1016/j.soscij.2004.04.003
45. Matysiak A, Vignoli D. Fertility and women’s employment: A meta-analysis. European Journal of Population/Revue européenne de Démographie 2008; 24: 363-84. doi: 10.1007/s10680-007-9146-2
46. Melkersson M, Rooth DO. Modeling female fertility using inflated count data models. J Popul Econ 2000; 13: 189-203. doi: 10.1007/s001480050133
47. Schultz TP. Eroding the economic foundations of marriage and fertility in the United States. Structural Change and Economic Dynamics 1998; 9: 391-413. doi: 10.1016/s0954-349x(98)00039-3
48. Eswaran M. The empowerment of women, fertility, and child mortality: Towards a theoretical analysis. J Popul Econ 2002; 15: 433-54. doi: 10.1007/s001480100070
49. Jejeebhoy SJ. Women’s education, autonomy, and reproductive behaviour: Experience from developing countries. Oxford; Clarendon Press; 1995.
50. Kodzi IA, Johnson DR, Casterline JB. To have or not to have another child: Life cycle, health and cost considerations of Ghanaian women. Soc Sci Med 2012; 74: 966-72. doi: 10.1016/j.socscimed.2011.12.035
51. Sanderson SK, Dubrow J. Fertility decline in the modern world and in the original demographic transition: Testing three theories with cross-national data. Popul Environ 2000; 21: 511-37. doi: 10.1007/bf02436770
52. MacPhail F, Dong XY. Women’s market work and household status in rural China: Evidence from Jiangsu and Shandong in the late 1990s. Fem Econ 2007; 13: 93-124.
53. Rasul I. Household bargaining over fertility: Theory and evidence from Malaysia. J Dev Econ 2008; 86: 215-41. doi: 10.1016/j.jdeveco.2007.02.005
54. Mabsout R, Van Staveren I. Disentangling bargaining power from individual and household level to institutions: Evidence on women’s position in Ethiopia. World Development 2010; 38: 783-96. doi: 10.1016/j.worlddev.2009.11.011
55. McDonald P. Gender equity, social institutions and the future of fertility. J Popul Res 2000; 17: 1-16. doi: 10.1007/BF03029445
56. Oláh LS. Gendering fertility: Second births in Sweden and Hungary. Popul Res Policy Rev 2003; 22: 171-200.
57. Van Staveren I, Odebode O. Gender norms as asymmetric institutions: A case study of Yoruba women in Nigeria. J Econ Issues 2007; 41: 903-25.
58. Adsera A. Vanishing children: From high unemployment to low fertility in developed countries. Am Econ Rev 2005; 95: 189-93. doi: 10.1257/000282805774669763
59. Erosa A, Fuster L, Restuccia D. Fertility decisions and gender differences in labor turnover, employment, and wages. Rev Econ Dyn 2002; 5: 856-91. doi: 10.1006/redy.2002.0195
60. Hausmann R, Tyson L, ahidi S. Global gender gap report. Geneva: World Economic Forum; 2011.
61. Hausmann R, Tyson LD, Zahidi S. The Global Gender Gap Report. Geneva: World Economic Forum; 2009.
62. Gelman A. Data analysis using regression and multilevel/hierarchical models. Cambridge: Cambridge University Press; 2007.
63. Goldstein H. Multilevel statistical models (Vol. 922). Chichester: Wiley; 2011. doi: 10.1002/9780470973394
64. Hank K, Kreyenfeld M. A multilevel analysis of child care and women’s fertility decisions in Western Germany. J Marriage Fam 2003; 65: 584-96. doi: 10.1111/j.1741-3737.2003.00584.x
65. Greene WH, Zhang C. Econometric analysis (Vol. 5). Upper Saddle River, NJ: Prentice Hall; 2009.
66. Verbeek M. A guide to modern econometrics. New York: Wiley; 2004.
67. Wooldridge JM. Econometric analysis of cross section and panel data. Cambridge: The MIT press; 2002.
68. Corroon M, Speizer IS, Fotso JC, Akiode A, Saad A, Calhoun L, et al. The Role of Gender Empowerment on Reproductive Health Outcomes in Urban Nigeria. Matern Child Health J 2014; 18: 307-15. doi: 10.1007/s10995-013-1266-1
69. Woldemicael G. Women’s autonomy and reproductive preferences in Eritrea. J Biosoc Sci 2009; 41: 161. doi: 10.1017/s0021932008003040
70. Quesnel-Vallée A, Morgan SP. Missing the target? Correspondence of fertility intentions and behavior in the US. Popul Res Policy Rev 2003; 22: 497-525. doi: 10.1023/B:POPU.0000021074.33415.c1
71. Voas D. Conflicting preferences: a reason fertility tends to be too high or too low. Popul Deve Rev 2003; 29: 627-46. doi: 10.1111/j.1728-4457.2003.00627.x
72. Hank K. Regional social contexts and individual fertility decisions: A multilevel analysis of first and second births in western
Moeeni et al.
International Journal of Health Policy and Management, 2014, 3(3), 135–144144
Germany. European Journal of Population/Revue européenne de Démographie 2002; 18: 281-99.
73. Van Bavel J. Choice of study discipline and the postponement of motherhood in Europe: The impact of expected earnings, gender composition, and family attitudes. Demography 2010; 47: 439-58. doi: 10.1353/dem.0.0108
74. Docquier F. Income Distribution, Non-convexities and the Fertility–Income Relationship. Economica 2004; 71: 261-73. doi: 10.1111/j.0013-0427.2004.00369.x
75. Jones LE, Tertilt M. An Economic History of Fertility in the United States: 1826–1960. In: Rupert P, editor. Frontiers of Family Economics (Frontiers of Family Economics, Volume 1). Emerald Group Publishing Limited; 2008. p.165-230.
76. Hondroyiannis G, Papapetrou E. Fertility and output in Europe: new evidence from panel cointegration analysis. Journal of Policy Modeling 2005; 27: 143-56. doi: 10.1016/j.jpolmod.2004.12.001
77. Simon CJ, Tamura R. Do higher rents discourage fertility? Evidence from US cities, 1940–2000. Reg Sci Urban Econ 2009; 39: 33-42. doi: 10.1016/j.regsciurbeco.2008.08.002
78. Gertler PJ, Molyneaux JW. How economic development and family planning programs combined to reduce Indonesian fertility. Demography 1994; 31: 33-63. doi: 10.2307/2061907
79. Arokiasamy P. Gender preference, contraceptive use and fertility in India: regional and development influences. Int J Popul Geogr 2002; 8: 49-67. doi: 10.1002/ijpg.236
80. Poston DL Jr. Son preference and fertility in China. J Biosoc Sci 2002; 34: 333-47. doi: 10.1017/s0021932002003334
81. Yamaguchi K, Ferguson LR. The stopping and spacing of childbirths and their birth-history predictors: rational-choice theory and event-history analysis. Am Sociol Rev 1995; 60: 272-
98. doi: 10.2307/209638782. Yount KM, Langsten R, Hill K. The effect of gender preference
on contraceptive use and fertility in rural Egypt. Stud Fam Plann 2000; 31: 290-300. doi: 10.1111/j.1728-4465.2000.00290.x
83. Bhargava A. Desired family size, family planning and fertility in Ethiopia. J Biosoc Sci 2007; 39: 367-81. doi: 10.1017/s0021932006001593
84. Kalwij A. The impact of family policy expenditure on fertility in western Europe. Demography 2010; 47: 503-19. doi: 10.1353/dem.0.0104
85. Abadian S. Women’s autonomy and its impact on fertility. World Development 1996; 24: 1793-809.
86. White MJ, Muhidin S, Andrzejewski C, Tagoe E, Knight R, Reed H. Urbanization and fertility: An event-history analysis of coastal Ghana. Demography 2008; 45: 803-16. doi: 10.1353/dem.0.0035
87. White MJ, Tagoe E, Stiff C, Adazu K, Smith DJ. Urbanization and the fertility transition in Ghana. Popul Resh Policy Rev 2005; 24: 59-83. doi: 10.1007/s11113-005-0367-y
88. Frejka T, Westoff CF. Religion, religiousness and fertility in the US and in Europe. European Journal of Population/Revue européenne de Démographie 2008; 24: 5-31.
89. McQuillan K. When does religion influence fertility? Popul Deve Rev 2004; 30: 25-56. doi: 10.1111/j.1728-4457.2004.00002.x
90. Voas D. Does religion belong in population studies? Environ Plan A 2007; 39: 1166. doi: 10.1068/a38154
91. Westoff CF, Frejka T. Religiousness and fertility among European Muslims. Popul Deve Rev 2007; 33: 785-809. doi: 10.1111/j.1728-4457.2007.00197.x
Implications for policy makers• The result of this paper can help policy-makers to find the
roots of the dramatic change in fertility rate in Iran during the last two recent decades.
• The findings give policy-makers an opportunity to adopt the most influential policies if they wanted to affect Iranian fertility.
• Policy-makers should adopt suitable policies among Iranian provinces due to the economic, social and demographic differences of these provinces.
Implications for publicThis paper tries to study fertility behavior of Iranian household focusing on differences related to economic, cultural and demographic background. Iranian parents play a key role in the existing fertility trends. More importantly, wives have profound impact on fertility behavior of Iranian families.
Key Messages