an investigation on sensitivity of ignition delay and activation energy in diesel combustion
TRANSCRIPT

Umashankar JoshiMechanical Engineering Department,
Wayne State University,
5050 Anthony Wayne Drive,
Suite 2100,
Detroit, MI 48202
e-mail: [email protected]
Ziliang ZhengMechanical Engineering Department,
Wayne State University,
5050 Anthony Wayne Drive,
Suite 2100,
Detroit, MI 48202
e-mail: [email protected]
Amit ShresthaMechanical Engineering Department,
Wayne State University,
5050 Anthony Wayne Drive,
Suite 2100,
Detroit, MI 48202
e-mail: [email protected]
Naeim HeneinMechanical Engineering Department,
Wayne State University,
5050 Anthony Wayne Drive,
Suite 2100,
Detroit, MI 48202
e-mail: [email protected]
Eric SattlerU.S. Army RDECOM-TARDEC,
6501 E 11 Mile Road,
Warren, MI 48092
An Investigation on Sensitivityof Ignition Delay and ActivationEnergy in Diesel CombustionThe auto-ignition process plays a major role in the combustion, performance, fuel econ-omy, and emission in diesel engines. The auto-ignition quality of different fuels has beenrated by its cetane number (CN) determined in the cooperative fuel research engine,according to ASTM D613. More recently, the ignition quality tester (IQT), a constant vol-ume vessel, has been used to determine the derived cetane number (DCN) to avoid theelaborate, time consuming, and costly engine tests, according to ASTM D6890. The igni-tion delay (ID) period in these two standard tests and many investigations has been con-sidered to be the time period between start of injection (SOI) and start of combustion(SOC). The ID values determined in different investigations can vary due to differencesin instrumentation and definitions. This paper examines the different definitions and theparameters that effect ID period. In addition, the activation energy dependence on the IDdefinition is investigated. Furthermore, results of an experimental investigation in asingle-cylinder research diesel engine will be presented, while the charge density is keptconstant during the ID period. The global activation energy is determined and its sensi-tivity to the charge temperature is examined. [DOI: 10.1115/1.4029777]
Introduction
In heterogeneous combustion, the following events occurimmediately after injection, leading to auto-ignition: spray break-down, droplet formation and evaporation, fuel air mixing, andendothermic and exothermic reactions. These events occur simul-taneously, so it is very difficult to separate between the events.Accordingly, the term ID represents the collective effect of allthese events on the auto-ignition process. Most previous investiga-tors agree that the ID begins at the SOI and is usually measuredby the needle lift (NL) of the injector [1]. Apart from NL, someresearchers considered ID to start at the energizing of the injector[2], while others considered the drop in fuel pressure (FP)upstream the injector [3] as the SOI. The major differences amongresearchers have been in the definition of the end of ID.
In optical engines and other optically accessible combustionequipment, the ID is termed as illumination delay [4,5]. In suchcases, the SOC is determined by directly capturing the first visibleradiation using photo sensors. In metal engines, on the other hand, itis difficult to determine the start of auto-ignition directly and achange in the slope of the pressure trace due to combustion has beenconsidered to be the end of ID [1]. Some investigations determinethe end of ID at certain points on the heat release rate (HRR) trace.
The ID in diesel engines account for the physical and chemicalprocesses in the fuel sprays before the start of active exothermicreactions. This is not the case of other equipment, such as shocktubes, and some rapid compression machines where the charge ishomogeneous [6,7]. In these cases, the ID period essentiallyaccount for the chemical reactions. From the above, it is clear thatthe activation energy determined from the Arrhenius plots wouldbe different in diesel engines and in homogeneous combustionsystems. The general format of the ID is given by [8]
ID ¼ APn1
m ;n2 Tn3
m eEa=RuTm (1)
where ID¼ ID time (ms), A¼ pre-exponential factor, Pm¼meanpressure during ID (kpa), A¼ equivalence ratio, Ru¼ universalgas constant (J K�1 mol�1), Ea¼ apparent activation energy(J mol�1), Tm¼mean temperature during ID (K), and n1, n2,n3¼ constants
The differences between the activation energy calculated forthe same fuel can be related to the differences in the definitions ofthe ID as explained above, and the equipment used in the experi-ments. In constant volume experiments, the charge density (whichdepends on both pressure and temperature) before start of fuelinjection is constant and well defined. Also, the variations in pres-sure and temperature during the ID period are fairly small as theyare related to the energy transferred to the fuel for evaporationand endothermic reactions. This is not the case in diesel engineswhere the charge density (pressure and temperature) depends onthe injection timing [9] in addition to other engine parameterssuch as intake pressure and temperature [10].
Contributed by the Combustion and Fuels Committee of ASME for publication inthe JOURNAL OF ENGINEERING FOR GAS TURBINES AND POWER. Manuscript receivedNovember 25, 2014; final manuscript received February 6, 2015; published onlineFebruary 25, 2015. Editor: David Wisler.
This material is declared a work of the U.S. Government and is not subject tocopyright protection in the United States. Approved for public release; distribution isunlimited.
Journal of Engineering for Gas Turbines and Power SEPTEMBER 2015, Vol. 137 / 091506-1
Downloaded From: http://gasturbinespower.asmedigitalcollection.asme.org/ on 03/16/2015 Terms of Use: http://asme.org/terms

In this investigation, the experiments were conducted, keepinga constant charge density at the SOI while the charge temperaturewas variable. In addition, the experiments covered differentinjection timings. The activation energy is calculated from IDsusing different definitions of the SOC.
Methodology
Experimental Setup
IQT Setup. IQT is a constant volume instrument (Fig. 1) usedto determine the DCN for fuels, under the ASTM D6890 standard[11]. The instrument specifications and test conditions are thesame as mentioned in the standard. A detailed description of theexperimental setup and specifications is given in Ref. [12].
Engine Setup. The test engine is a four stroke, single cylinder,high speed direct injection (HSDI) engine with a reentrant typecombustion bowl chamber. The cylinder head is fitted with aKistler, water cooled pressure transducer, and a Bosch secondgeneration, solenoid operated injector, equipped with a NL sensor.The fuel injection system is an open electronic control unit, com-mon rail system with a maximum pressure of 1350 bar. Theengine is supplied with compressed air from a temperature con-trolled, independent compressed air system. The intake manifoldis fitted with gate valves to control the air flow of the tangentialand helical ports to control swirl ratio. The rest of the engine spec-ifications is mentioned in Tables 1 and 2.
Fuel Properties. The fuels tested include ultra-low sulfur diesel(ULSD) which is a regular compression ignition fuel and Sasolisoparaffinic kerosene (IPK) which is an alternate jet fuel. Theproperties of both the fuels are listed in Table 3.
ID Definitions. The basic phenomenon that signifies the SOC inmetallic engines is a sudden rise in pressure trace; this simple ideahas been used to define the end of the ID period [1]. With theadvent of computers and rapid computing speed, it becomesconvenient to use a formula to define and locate such a point,especially when there is a large amount of data to be processed.However, researchers have been unable to formulate the pressurerise delay as there is no standard method that defines the point inthe trace that defines the sudden rise in pressure; hence, there aredifferent approaches to locate the SOC.
Zaidi et al. [13] defined SOC as the point where the pressurerate curve reaches its minimum value after SOI, whereas Assaniset al. [14] stated that SOC is at a point where the second derivativeof pressure curve reaches its first maximum after SOI. They chosethese points as they coincided with the start of sudden pressurerise. However, these points coincide only in those cases where thefuel injection happens quite early in the compression stroke, butin cases where the fuel injection is close to top dead center (TDC)and combustion happens near TDC or late in the expansion strokethere is an offset between the two points.
Figure 2 shows a test point in which ULSD was injected at�7.2 crank angle degree (CAD) at 1.2 bar intake pressure and90 �C intake temperature. It is noticed that the start of pressurerise is at around �2.2 CAD; while the minimum of pressure ratecurve and first maximum of second derivative of pressure trace isat around �3.6 CAD and �1.1 CAD, respectively. If the currentdefinitions of SOC are used, the error in ID value would be1.4 CAD and 1.1 CAD, respectively.
In another definition, Jayakumar et al. [15] defined SOC as thelowest point on the pressure trace before it reaches peak combus-tion pressure (Fig. 3). However, this definition can only be applied
Fig. 1 Schematic diagram of the IQT setup [9]
Table 1 Engine specifications
Displaced volume 422 ccStroke 85 mmBore 79.5 mmConnecting rod 179 mmGeometric compression ratio 20:1Number of valves 4Exhaust valve open 35 deg BBDCExhaust valve close 6 deg BTDCInlet valve open 2 deg BTDCIntake valve close 140 deg BTDCNozzle type 6 hole, 320 mini sacNozzle included angle 145 degCooling water temperature 180 �F
Table 2 Test conditions
Engine speed 1500 rpmSwirl ratio 3.77Injection pressure 800 barIntake temperature 30–110 �C (increment of 10)Intake pressure 1.2 bar @ 30 �CSOI �7 to þ3 CAD (change of 2 CAD)
091506-2 / Vol. 137, SEPTEMBER 2015 Transactions of the ASME
Downloaded From: http://gasturbinespower.asmedigitalcollection.asme.org/ on 03/16/2015 Terms of Use: http://asme.org/terms

in those cases where the pressure trace shows a considerable dipafter injection, which happens mostly in such instances where thecombustion takes place in the expansion stroke. As a result, thismethod cannot be applied to experiments where the combustiontakes place before TDC.
The problem to locate the start of pressure rise using a formula,applicable at all conditions, leads researchers to use other phe-nomenon to define SOC. Many researchers defined ID using theHRR curve. The most common definition being used nowadays isthe duration between the SOI and the point where the HRR curvecrosses zero and changes from negative to positive [16–21].Although this definition is applicable at all SOI conditions, it stillhas a drawback. This method fails to include the two stagecombustion shown by fuels with low CN, like Sasol IPK, and byregular fuels in advanced combustion modes like homogeneouscharge compression ignition (HCCI), premixed charge compres-sion ignition (PCCI), and low temperature combustion (LTC), etc.The location of the cool flame and negative temperature coeffi-cient temperature (NTC) regimes, seen in two stage combustion,on the HRR curve is always after it has crossed zero; as a result,the ID value in such cases is reduced considerably.
More recently, researchers have come up with new ID defini-tions to include NTC and cool flame regimes. In one suchapproach, SOC is determined as the point where 10% mass burnfraction occurs that lies at 10% (CA10) of the cumulative HRR(CuHRR) curve [9,22–24]. Similarly, in another approach, SOC islocated at the 5% (CA5) of the CuHRR curve [25]. These methodshave a wide applicability and can be used to define ID for HCCI,PCCI, and LTC combustion modes as well.
In addition to the ID definitions discussed above, we have com-pared one more definition in this study. As defined in the ASTMD6890 standard, the ID for the IQT is the time delay between theSOI and the pressure recovery point [9,10]. In addition, when theCuHRR curve and the pressure curve are compared they showidentical resemblance, and the pressure recovery point overlapswith CuHRR recovery point. As shown in Fig. 4, a single testpoint was run in the IQT under the ASTM standard conditions,and the pressure and CuHRR curve are compared. From the fig-ure, it is clear that the two points, viz., pressure recovery pointand CUHRR recovery point coincide. Thus, it can be said that theID for the IQT is the time delay between the SOI and the CuHRRrecovery point. While it is hard to always get a pressure recoverypoint in engines, a CuHRR recovery point will be more realistic todetect in engines. The main purpose behind using this definitionwould be that it gives a common yardstick to compare data trendsin two different environments, constant volume chamber, andengines.
Results and Discussions
Comparison Between ID Definitions. A comparison betweendifferent ID definitions has been made to see the closeness of eachdefinition to an approximate pressure rise delay. The data used inthis comparison were obtained from the single cylinder HSDIengine. The ID definitions compared are as follows:
(1) IDR¼ delay between SOI and HRR curve crossing zero(2) IDRP¼ delay between SOI and CuHRR curve crossing zero(3) IDCA5¼ delay between SOI and 5% of CuHRR curve(4) IDCA10¼ delay between SOI and 10% of CuHRR curve(5) IDP¼ delay between SOI and a detectable start of pressure
rise
In the first case, ULSD, a high CN fuel is injected early in thecompression stroke so that the pressure rise takes place beforeTDC (Fig. 5). As a result, ID is very short and there is absence ofobservable pressure dip before the peak of pressure. A comparisonbetween the various ID definitions reveals that IDR gives thesmallest value of the ID period and has the biggest offset to thestart of pressure rise. On the other hand, IDCA10 has the longestdelay period compared to other definitions; also, it ends very closeto the peak of HRR curve which signifies that combustion hasbeen already started and is reaching its highest rate. IDCA5 andIDRP give ID value close to the IDP.
In the next case, Sasol IPK, a high volatility, low ignition qual-ity fuel of 25 CN; which exhibits two-stage combustion, isinjected at the same SOI as the previous case (Fig. 6). In this case,except for IDR, the rest of the definitions include the cool flamein the ID period. Again, we see that the SOC for IDCA10 occurscloser to the peak of HRR curve, compared to the other defini-tions. Even in this case, IDCA5 and IDRP give ID values closer tothe IDP.
Fig. 3 SOC location defined as the lowest point on pressuretrace before pressure rise [15]
Fig. 4 ID method used for IQT based on recovery pointFig. 2 Comparison between SOC definitions based on pres-sure, dp/dh, and d2p/dh2 curves
Journal of Engineering for Gas Turbines and Power SEPTEMBER 2015, Vol. 137 / 091506-3
Downloaded From: http://gasturbinespower.asmedigitalcollection.asme.org/ on 03/16/2015 Terms of Use: http://asme.org/terms
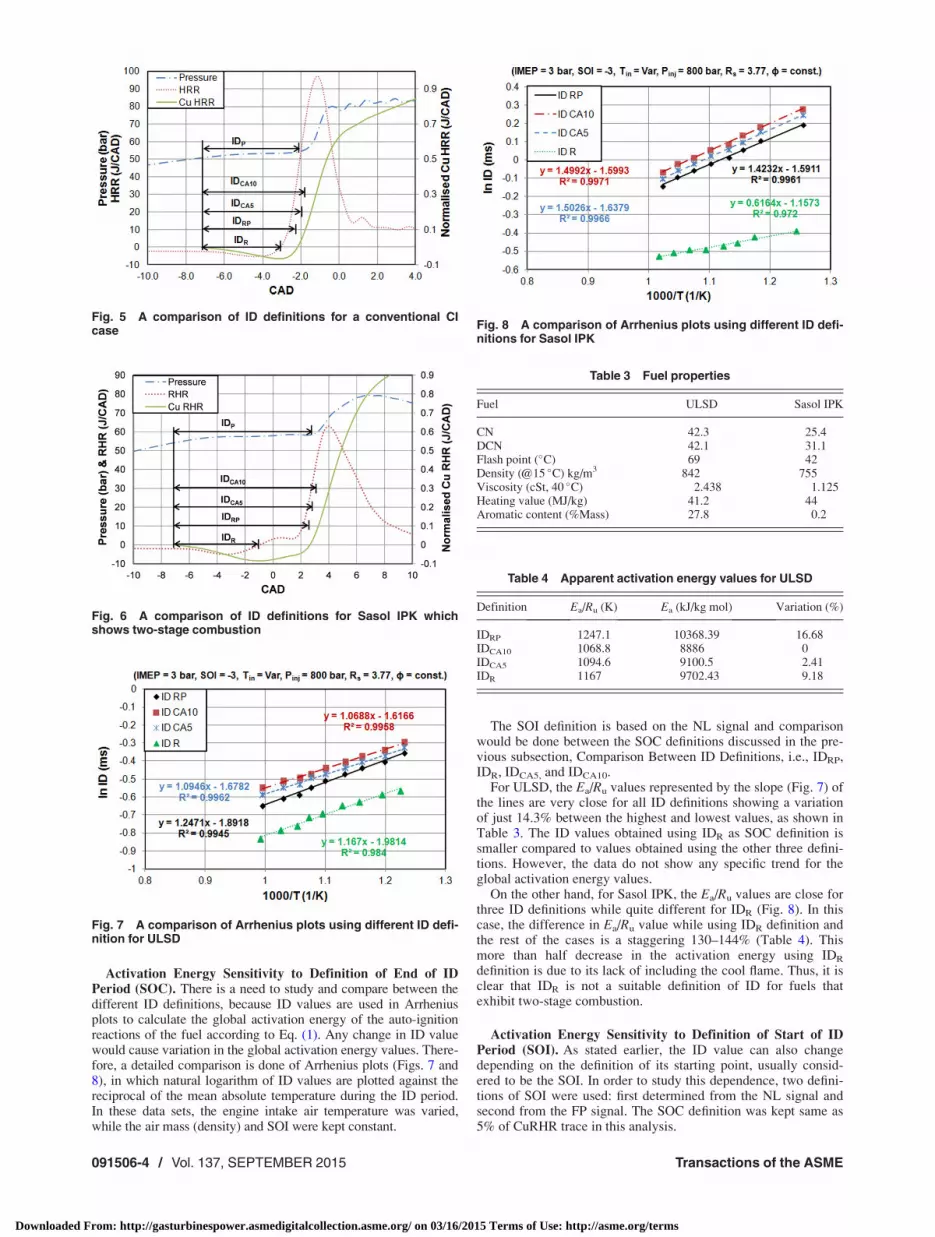
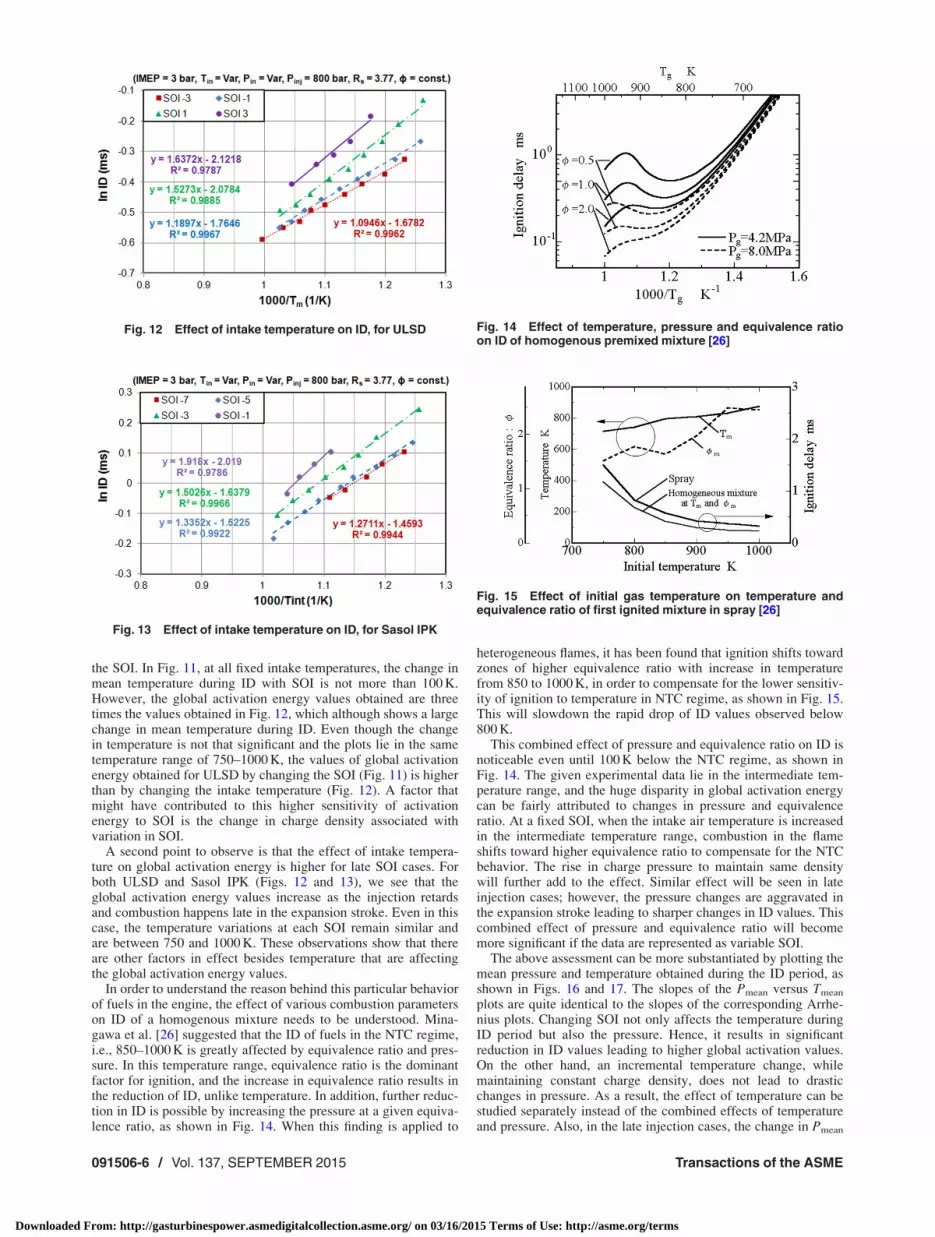
Activation Energy Sensitivity to Definition of End of IDPeriod (SOC). There is a need to study and compare between thedifferent ID definitions, because ID values are used in Arrheniusplots to calculate the global activation energy of the auto-ignitionreactions of the fuel according to Eq. (1). Any change in ID valuewould cause variation in the global activation energy values. There-fore, a detailed comparison is done of Arrhenius plots (Figs. 7 and8), in which natural logarithm of ID values are plotted against thereciprocal of the mean absolute temperature during the ID period.In these data sets, the engine intake air temperature was varied,while the air mass (density) and SOI were kept constant.
The SOI definition is based on the NL signal and comparisonwould be done between the SOC definitions discussed in the pre-vious subsection, Comparison Between ID Definitions, i.e., IDRP,IDR, IDCA5, and IDCA10.
For ULSD, the Ea/Ru values represented by the slope (Fig. 7) ofthe lines are very close for all ID definitions showing a variationof just 14.3% between the highest and lowest values, as shown inTable 3. The ID values obtained using IDR as SOC definition issmaller compared to values obtained using the other three defini-tions. However, the data do not show any specific trend for theglobal activation energy values.
On the other hand, for Sasol IPK, the Ea/Ru values are close forthree ID definitions while quite different for IDR (Fig. 8). In thiscase, the difference in Ea/Ru value while using IDR definition andthe rest of the cases is a staggering 130–144% (Table 4). Thismore than half decrease in the activation energy using IDR
definition is due to its lack of including the cool flame. Thus, it isclear that IDR is not a suitable definition of ID for fuels thatexhibit two-stage combustion.
Activation Energy Sensitivity to Definition of Start of IDPeriod (SOI). As stated earlier, the ID value can also changedepending on the definition of its starting point, usually consid-ered to be the SOI. In order to study this dependence, two defini-tions of SOI were used: first determined from the NL signal andsecond from the FP signal. The SOC definition was kept same as5% of CuRHR trace in this analysis.
Fig. 6 A comparison of ID definitions for Sasol IPK whichshows two-stage combustion
Fig. 7 A comparison of Arrhenius plots using different ID defi-nition for ULSD
Fig. 8 A comparison of Arrhenius plots using different ID defi-nitions for Sasol IPK
Table 3 Fuel properties
Fuel ULSD Sasol IPK
CN 42.3 25.4DCN 42.1 31.1Flash point (�C) 69 42Density (@15 �C) kg/m3 842 755Viscosity (cSt, 40 �C) 2.438 1.125Heating value (MJ/kg) 41.2 44Aromatic content (%Mass) 27.8 0.2
Table 4 Apparent activation energy values for ULSD
Definition Ea/Ru (K) Ea (kJ/kg mol) Variation (%)
IDRP 1247.1 10368.39 16.68IDCA10 1068.8 8886 0IDCA5 1094.6 9100.5 2.41IDR 1167 9702.43 9.18
Fig. 5 A comparison of ID definitions for a conventional CIcase
091506-4 / Vol. 137, SEPTEMBER 2015 Transactions of the ASME
Downloaded From: http://gasturbinespower.asmedigitalcollection.asme.org/ on 03/16/2015 Terms of Use: http://asme.org/terms

The SOI from the FP trace is taken as the point after injectionwhere it shows a considerable drop in the pressure trace, which isaround �0.8 CAD, as shown in Fig. 9. However, the FP transduceris upstream of the injector and there is a small delay in the pres-sure wave reaching the transducer. This delay has been measuredduring instrumentation and calibration, which was found to be1.7 CAD, thus shifting the actual SOI to �2.5 CAD. The NL sensordoes not have a lag and gives instantaneous values. The SOI isdetermined as the point where the NL signal crosses value of 2.This value is determined by the bounce back obtained during thedownward movement of the needle signifying that the needle hasreached its seat. Thus, the needle’s minimum lift is 2, the lowervalues being noise in the signal, based on this fact the SOI valueusing NL signal is at �3 CAD. Thus, the difference between thetwo SOI definitions is a constant value of 0.5 CAD.
Figure 10 shows Arrhenius plots based on the ID valuesobtained using the above mentioned SOI definitions, for bothULSD and Sasol IPK. The results show that Ea/Ru values arefairly close with a variation of 8.15% and 5.14% (Table 5) forULSD and Sasol IPK, respectively. Although there is a constantchange of 0.5 CAD between SOI location using NL and FP, thelines in Arrhenius plot are not parallel due to the logarithmic func-tion. Since SOI definition does not affects global activation energysignificantly, NL signal is used to define SOI and location of 5%of CuHRR being the closest to the pressure rise delay point,IDCA5 is used as the ID definition for the following discussion.
Activation Energy Sensitivity to Engine Conditions. Themean temperature during the ID period changes with variations inSOI and/or the engine intake air temperature. Therefore, a seriesof experiments were conducted to determine the sensitivity of
activation energy to these changes. In these experiments, theengine intake temperature was varied from 30 �C to 110 �C insteps of 10 �C at a given SOI, while maintaining the intake airdensity constant. This is achieved by increasing the intake airpressure at the higher intake temperatures. This whole process isthen repeated at different SOI timings. It should be noted that theair density, pressure, and temperature are different at differentinjection timings. These three parameters increase during the igni-tion period if it occurs in the compression stroke and decrease if itoccurs during the expansion stroke. These changes are reducedif the ID period is centered on TDC. The experiments were con-ducted on ULSD and Sasol IPK which have different physical andchemical properties as shown in Table 6. The data are plotted inFigs. 11–13.
Figure 11 shows data in such a form that each color representsa fixed intake temperature and pressure condition with a variationin SOI; therefore, we will see an effect of SOI on global activationat different intake conditions. On the other hand, in Fig. 12, eachcolor represents a fixed SOI at which the intake temperature isincreased maintaining same charged density thus giving us effectof intake temperature on global activation energy at different SOI.For Sasol IPK, we could just show the effect of intake temperature(Fig. 13) at different SOIs, as at a fixed intake temperature, wecould not get more than three SOIs where combustion could hap-pen without reaching high engine noise or very low combustionpressures. It was made sure that to calculate global activationenergy values there should be at least four data points in order toreduce errors.
It is interesting to notice that the global activation energy ismore sensitive to the change in temperature caused by changing
Fig. 10 A comparison of Arrhenius plots for ULSD and SasolIPK using two different SOI definitions
Table 5 Apparent activation energy values for Sasol IPK
Definition Ea/Ru (K) Ea (kJ/kg mol) Variation (%)
IDRP 1423.2 11832.48 130.88IDCA10 1499.2 12464.35 143.22IDCA5 1502.6 12492.62 143.77IDR 616.4 5125.75 0
Table 6 Apparent activation energy values for ULSD and SasolIPK
Definition Ea/Ru (K) Ea (kJ/kg mol) Variation (%)
ULSD NL 1094.6 9100.50 0ULSD FP 1183.9 9842.94 8.15Sasol NL 1506.2 12522.55 0Sasol IPK 1583.7 13166.88 5.14
Fig. 11 Effect of SOI on ID, for ULSD
Fig. 9 Start of ignition defined by NL and FP drop
Journal of Engineering for Gas Turbines and Power SEPTEMBER 2015, Vol. 137 / 091506-5
Downloaded From: http://gasturbinespower.asmedigitalcollection.asme.org/ on 03/16/2015 Terms of Use: http://asme.org/terms
the SOI. In Fig. 11, at all fixed intake temperatures, the change inmean temperature during ID with SOI is not more than 100 K.However, the global activation energy values obtained are threetimes the values obtained in Fig. 12, which although shows a largechange in mean temperature during ID. Even though the changein temperature is not that significant and the plots lie in the sametemperature range of 750–1000 K, the values of global activationenergy obtained for ULSD by changing the SOI (Fig. 11) is higherthan by changing the intake temperature (Fig. 12). A factor thatmight have contributed to this higher sensitivity of activationenergy to SOI is the change in charge density associated withvariation in SOI.
A second point to observe is that the effect of intake tempera-ture on global activation energy is higher for late SOI cases. Forboth ULSD and Sasol IPK (Figs. 12 and 13), we see that theglobal activation energy values increase as the injection retardsand combustion happens late in the expansion stroke. Even in thiscase, the temperature variations at each SOI remain similar andare between 750 and 1000 K. These observations show that thereare other factors in effect besides temperature that are affectingthe global activation energy values.
In order to understand the reason behind this particular behaviorof fuels in the engine, the effect of various combustion parameterson ID of a homogenous mixture needs to be understood. Mina-gawa et al. [26] suggested that the ID of fuels in the NTC regime,i.e., 850–1000 K is greatly affected by equivalence ratio and pres-sure. In this temperature range, equivalence ratio is the dominantfactor for ignition, and the increase in equivalence ratio results inthe reduction of ID, unlike temperature. In addition, further reduc-tion in ID is possible by increasing the pressure at a given equiva-lence ratio, as shown in Fig. 14. When this finding is applied to
heterogeneous flames, it has been found that ignition shifts towardzones of higher equivalence ratio with increase in temperaturefrom 850 to 1000 K, in order to compensate for the lower sensitiv-ity of ignition to temperature in NTC regime, as shown in Fig. 15.This will slowdown the rapid drop of ID values observed below800 K.
This combined effect of pressure and equivalence ratio on ID isnoticeable even until 100 K below the NTC regime, as shown inFig. 14. The given experimental data lie in the intermediate tem-perature range, and the huge disparity in global activation energycan be fairly attributed to changes in pressure and equivalenceratio. At a fixed SOI, when the intake air temperature is increasedin the intermediate temperature range, combustion in the flameshifts toward higher equivalence ratio to compensate for the NTCbehavior. The rise in charge pressure to maintain same densitywill further add to the effect. Similar effect will be seen in lateinjection cases; however, the pressure changes are aggravated inthe expansion stroke leading to sharper changes in ID values. Thiscombined effect of pressure and equivalence ratio will becomemore significant if the data are represented as variable SOI.
The above assessment can be more substantiated by plotting themean pressure and temperature obtained during the ID period, asshown in Figs. 16 and 17. The slopes of the Pmean versus Tmean
plots are quite identical to the slopes of the corresponding Arrhe-nius plots. Changing SOI not only affects the temperature duringID period but also the pressure. Hence, it results in significantreduction in ID values leading to higher global activation values.On the other hand, an incremental temperature change, whilemaintaining constant charge density, does not lead to drasticchanges in pressure. As a result, the effect of temperature can bestudied separately instead of the combined effects of temperatureand pressure. Also, in the late injection cases, the change in Pmean
Fig. 13 Effect of intake temperature on ID, for Sasol IPK
Fig. 14 Effect of temperature, pressure and equivalence ratioon ID of homogenous premixed mixture [26]
Fig. 15 Effect of initial gas temperature on temperature andequivalence ratio of first ignited mixture in spray [26]
Fig. 12 Effect of intake temperature on ID, for ULSD
091506-6 / Vol. 137, SEPTEMBER 2015 Transactions of the ASME
Downloaded From: http://gasturbinespower.asmedigitalcollection.asme.org/ on 03/16/2015 Terms of Use: http://asme.org/terms
with respect to Tmean is more drastic compared to the early injec-tion cases which would again cause the global activation energyto increase. Thus, the huge deviation in activation energy in thegiven data set is due to combined effect of pressure and equiva-lence ratio dominant in the intermediate temperature range.
The next question now arises, which is a more accurate repre-sentation of global activation energy–keeping constant SOI andvarying intake air temperature or doing vice versa. In order to geta more accurate value of global activation energy, it would be bet-ter to reduce as many control variables as possible. In diesel com-bustion, the effect of equivalence ratio cannot be avoided, andtherefore the pressure fluctuations should be avoided as much aspossible. The Pmean versus Tmean plots indicate that the variableintake temperature as a control parameter, compared to variableSOI, has lower pressure affects. Hence, the results would be morereliable in variable intake temperature than the variable SOI case.Also, it would be beneficial to obtain ID values near TDC andavoiding delay of SOC into expansion stroke. A comparisonbetween the SOI-3 and SOI-1 cases for ULSD shows that the acti-vation energy values obtained are close with a deviation of 8%which increases to 28.34% and 32.15% for SOI of 1 and 3aTDC,
respectively. With Sasol IPK, due to its longer ID, this reliabilityshifts to early injection case of SOI of 7 and 5aTDC, in whichcase the deviation is 4.81% (Fig. 13). At SOI of 3 and 1aTDC,this variability increases to 15.41% and 33.73%, respectively. Itreveals that global activation energy values are more reliable inthe cases in which combustion happens near TDC.
The results of this investigation suggest that the ID data used todetermine the activation energy could be obtained with SOIbefore the TDC, while the ID period is around TDC. Under suchconditions, the apparent activation energy for ULSD and SasolIPK are shown in Table 7. It is to be noted that these values aresmaller compared to the ones obtained by previous researchers[9,13]. The reasoning for the discrepancy with Kook et al. [9] isdifferences in the charge density and the average temperatureððTSOI þ TSOCÞ=2Þ used in Arrhenius plot. The reasoning for thediscrepancy with Zheng et al. [12] is the different combustionregimes that occur at the temperature used in the two investiga-tions. In their work, the mean temperature during ID periodranged from 730 to 820 K, while in this investigation the meantemperature ranged from 790 to 1000 K. Referring to Fig. 18 [27],the slope (which is a measure of the activation energy) in theArrhenius plot shows large variation in the temperature rangesused in the two investigations.
Sasol IPK has higher activation energy than ULSD as it has alow CN.
Conclusion
(1) The sensitivity of the ID and activation energy in dieselcombustion is related to the differences in the definition ofthe end of ID, the charge conditions, and the instrumenta-tion used in the different investigations.
(2) Investigations conducted at different temperature rangesexperienced different auto-ignition regimes. In generalinvestigations, low temperatures less than 800 havedepicted higher activation energy than experiments at rela-tively higher temperatures.
(3) In diesel engine experiments, tests with injection and IDaround TDC produced apparent activation energies that donot depend on injection timing.
(4) Since the variations in gas density are negligible near TDC,the global activation values obtained are repeatable.
(5) To investigate the sensitivity of ID to changes in gas tem-perature, it is advisable to vary the intake temperaturerather than to vary the SOI.
Fig. 16 Mean pressure and temperature for variable SOI case
Fig. 17 Mean pressure and temperature for variable intaketemperature case
Table 7 Apparent activation energy values for ULSD and SasolIPK
Fuel Ea/Ru (K) Ea (kJ/kg mol)
ULSD 1094.6 9100.50Sasol IPK 1271.1 10567.92
Fig. 18 ID data on an Arrhenius-type plot for different fuelsand pure compounds [27]
Journal of Engineering for Gas Turbines and Power SEPTEMBER 2015, Vol. 137 / 091506-7
Downloaded From: http://gasturbinespower.asmedigitalcollection.asme.org/ on 03/16/2015 Terms of Use: http://asme.org/terms

(6) IDCA5 was found to be the most appropriate definition, ofthe end of ID period. This is particularly relevant for fuelsthat exhibit the two-stage combustion regime.
(7) Sasol IPK showed higher apparent activation energy thanULSD and is more sensitive to changes in temperature.
Acknowledgment
The authors are grateful to the sponsors of the project, U.S.Army TARDEC and Automotive Research Center (ARC): A U.S.Army Center of Excellence for Modeling and Simulation ofGround Vehicles, led by University of Michigan.
Nomenclature
ATDC ¼ after top dead centerBTDC ¼ before top dead center
CAD ¼ crank angle degreeCN ¼ cetane number
CuHRR ¼ cumulative heat release rateDCN ¼ derived cetane numberECU ¼ electronic control unit
FP ¼ fuel pressureHRR ¼ heat release rate
HSDI ¼ high speed direct injectionID ¼ ignition delay
IQT ¼ ignition quality testerNL ¼ needle lift
Sasol IPK ¼ sasol isoparaffinic keroseneSOC ¼ start of combustionSOE ¼ start of energizingSOI ¼ start of injection
TDC ¼ top dead center
References[1] Heywood, J. B., 1988, Internal Combustion Engine Fundamentals, McGraw-
Hill, New York.[2] Park, S. H., Cha, J., and Lee, C. H., 2012, “Impact of Biodiesel in Bioethanol
Blended Diesel on the Engine Performance and Emissions Characteristics inCompression Ignition Engine,” Appl. Energy, 99, pp. 334–343.
[3] Donkerbroek, A. J., Boot, M. D., Luijten, C. C. M., Dam, N. J., and ter Meulen,J. J., 2011, “Flame Lift-Off Length and Soot Production of Oxygenated Fuels inRelation With Ignition Delay in a DI Heavy-Duty Diesel Engine,” Combust.Flame, 158(3), pp. 525–538.
[4] Henein, N., and Bolt, J., 1967, “Ignition Delay in Diesel Engines,” SAE Techni-cal Paper No. 670007.
[5] Kwon, S. I., Arai, M., and Hiroyasu, H., 1990, “Effects of Cylinder Tempera-ture and Pressure on Ignition Delay in Direct Injection Diesel Engine,” Bull.MESJ, 18(1), pp. 3–16.
[6] Vasu, S. S., Davidson, D. F., and Hanson, R. K., 2008, “Jet Fuel Ignition DelayTimes: Shock Tube Experiments Over Wide Conditions and Surrogate ModelPredictions,” Combust. Flame, 152(1–2), pp. 125–143.
[7] Sung, C. S., and Curran, H. J., 2014, “Using Rapid Compression Machines forChemical Kinetics Studies,” Prog. Energy Combust. Sci., 44, pp. 1–18.
[8] Henein, N. A., and Bolt, J. A., 1969, “The Effect of Some Engine Variables onIgnition Delay and Other Combustion Phenomena in a Diesel Engine,” Proc.Inst. Mech. Eng., 184(10), pp. 130–136.
[9] Kook, S., Bae, C., Miles, P., Choi, D., and Pickett, L. M., 2005, “The Influenceof Charge Dilution and Injection Timing on Low-Temperature Diesel Combus-tion and Emissions,” SAE Technical Paper No. 2005-01-3837.
[10] Jayakumar, C., Zheng, Z., Joshi, U. M., Henein, N., Bryzik, W., and Sattler, E.,2011, “Effect of Inlet Air Temperature on Auto-Ignition of Fuels With Differ-ent Cetane Number and Volatility,” ASME Paper No. ICEF2011-60141.
[11] ASTM, 2008, “Standard Test Method for Determination of Ignition Delay andDerived Cetane Number (DCN) of Diesel Fuel Oils by Combustion in a Con-stant Volume Chamber,” ASTM International, West Conshohocken, PA,ASTM Standard No. D6890-08.
[12] Zheng, Z., Badawy, T., Henein, N. A., and Sattler, E., 2013, “Investigation ofPhysical and Chemical Delay Periods of Different Fuels in the Ignition QualityTester,” ASME J. Eng. Gas Turbines Power, 135(6), p. 061501.
[13] Zaidi, K., Andrews, G., and Greenhough, J., 1998, “Diesel Fumigation PartialPremixing for Reducing Ignition Delay and Amplitude of PressureFluctuations,” SAE Technical Paper No. 980535.
[14] Assanis, D. N., Filipi, Z. S., Fiveland, S. B., and Syrimis, M., 2003, “A Predic-tive Ignition Delay Correlation Under Steady-State and Transient Operation ofa Direct Injection Diesel Engine,” ASME J. Eng. Gas Turbines Power, 125(2),pp. 450–457.
[15] Jayakumar, C., Zheng, Z., Joshi, U., Bryzik, W., Henein, N., and Sattler, E.,2012, “Effect of Intake Pressure and Temperature on the Auto-Ignition of FuelsWith Different Cetane Number and Volatility,” SAE Technical Paper No.2012-01-1317.
[16] Rodriguez, R. P., Sierens, R., and Verhelst, S., 2011, “Ignition Delay in a PalmOil and Rapeseed Oil Biodiesel Fuelled Engine and Predictive Correlations forthe Ignition Delay Period,” Fuel, 90(2), pp. 766–772.
[17] Colban, W., Miles, P., and Oh, S., 2007, “Effect of Intake Pressure on Perform-ance and Emissions in an Automotive Diesel Engine Operating in Low Temper-ature Combustion Regimes,” SAE Technical Paper No. 2007-01-4063.
[18] Dahodwala, M., Nagaraju, V., Acharya, K., Bryzik, W., and Henein, N. A.,2011, “Effect of Using Biodiesel (B-20) and Combustion Phasing onCombustion and Emissions in a HSDI Diesel Engine,” SAE Technical PaperNo. 2011-01-1203.
[19] Schihl, P., Hoogterp-Decker, L., and Gingrich, E., 2012, “The Ignition Behaviorof a Coal to Liquid Fischer-Tropsch Jet Fuel in a Military Relevant Single Cyl-inder Diesel Engine,” SAE Int. J. Fuels Lubr., 5(2), pp. 785–802.
[20] Aghav, Y., Thatte, V., Kumar, M., Lakshminarayanan, P., and Babu, M. K. G.,2008, “Predicting Ignition Delay and HC Emission for DI Diesel EngineEncompassing EGR and Oxygenated Fuels,” SAE Technical Paper No. 2008-28-0050.
[21] Lata, D. B., and Misra, A., 2011, “Analysis of Ignition Delay Period of a DualFuel Diesel Engine With Hydrogen and LPG as Secondary Fuel,” Int. J. Hydro-gen Energy, 36(5), pp. 3746–3756.
[22] Murphy, L., and Rothamer, D., 2011, “Effects of Cetane Number on Jet FuelCombustion in a Heavy-Duty Compression Ignition Engine at High Load,”SAE Technical Paper No. 2011-01-0335.
[23] Cowart, J., Carr, M., Caton, P., Stoulig, L., Luning-Prak, D., Moore, A., andHamilton, L., 2011, “High Cetane Fuel Combustion Performance in a Conven-tional Military Diesel Engine,” SAE Int. J. Fuels Lubr., 4(1), pp. 34–47.
[24] Han, D., Ickes, A. M., Bohac, S. V., Huang, Z., and Assanis, D. N., 2011,“Premixed Low-Temperature Combustion of Blends of Diesel and Gasoline ina High Speed Compression Ignition Engine,” Proc. Combust. Inst., 33(2),pp. 3039–3046.
[25] Janssen, A., Pischinger, S., and Muether, M., 2010, “Potential of Cellulose-Derived Biofuels for Soot Free Diesel Combustion,” SAE Int. J. Fuels Lubr.,3(1), pp. 70–84.
[26] Minagawa, T., Kosaka, H., and Kamimoto, T., 2000, “A Study on IgnitionDelay of Diesel Fuel Spray Via Numerical Simulation,” SAE Technical PaperNo. 2000-01-1892.
[27] Taylor, J., McCormick, R., and Clark, W., 2004, “Report on the RelationshipBetween Molecular Structure and Compression Ignition Fuels, BothConventional and HCCI,” National Renewable Energy Laboratory, Golden,CO, Report No. NREL/MP-540-36726.
091506-8 / Vol. 137, SEPTEMBER 2015 Transactions of the ASME
Downloaded From: http://gasturbinespower.asmedigitalcollection.asme.org/ on 03/16/2015 Terms of Use: http://asme.org/terms