an investigation of torque limiting mechanisms for
TRANSCRIPT
AN INVESTIGATION OF TORQUE LIMITING MECHANISMS FOR AN OUTBOARD BOAT MOTOR
by
Brad Maljaars
Michael Siklosi
A report presented to the
British Columbia Institute of Technology
in partial fulfillment of the requirement for the degree of
Bachelor of Engineering (Mechanical)
Faculty Advisor: Taco Niet Program Head: Mehrzhad Tabatabaian Burnaby, British Columbia, Canada, 2019
©Brad Maljaars, Michal Siklosi, 2019

ii

iii
We#hereby#declare#that#we#are#the#sole#author(s)#of#this#report.#
#
#
_______________________# # # ________________________
Signature# # # # Signature#
#
#
#
#
#
We#further#authorize#the#British#Columbia#Institute#of#Technology#to#distribute#digitally,#or#printed#paper,#copies#of#this#report,#in#total#or#in#part,#at#the#request#of#other#institutions#or#individuals#for#the#purpose#of#scholarly#activity.#
##_______________________# # # ________________________
Signature# # # # Signature#
#
iv
Abstract The Honda BF8A motor uses a shear pin as the torque limiting mechanism by
which the engine is protected in the event that the propeller is prevented from rotating due to the surrounding environment. An investigation of four novel mechanisms is conducted as an alternative to the shear pin. A friction clutch requiring magnet forces to produce the normal forces pushing together a friction material face and bronze face together is the first concept studied. Theoretical calculations and experiments were conducted verifying the concept could not be implemented. The second concept is metal-metal mating surfaces to transfer torque. An experiment was designed to test the feasibility of the concept but the idea was abandoned after manufacturing of the metal faces proved impractical. The third concept is rubber-rubber mating surfaces. A relation was derived relating the release torque to the force holding the faces together. A test apparatus was designed and manufactured producing results that showed the general theory was inadequate to describe the mechanism. The fourth concept used centrifugal forces of a spinning mechanism to engage the propeller. A theoretical analysis was conducted. However, a variety of considerations showed the idea to be impractical.

v
vi
Acknowledgements Various persons provided valuable guidance and assistance during the project. Taco Niet was kind enough to supervise the project and provide guidance on issues of
difficulty throughout the course of the project. Johan Fourie provided valuable suggestions in regards to the direction of the project. Chris Townsend provided invaluable advice and assistance in manufacturing test
apparatus, going above and beyond by providing assistance in the shop sometimes for more than 12 hours at a time even on weekends. Additionally, he assisted in purchasing items needed on short notice. His assistance is wholly appreciated.
vii
Table of Contents Abstract .............................................................................................................................. iv!Acknowledgements ............................................................................................................ vi!Table of Contents .............................................................................................................. vii!List of Tables ...................................................................................................................... x!List of Figures .................................................................................................................... xi!1.! Introduction ................................................................................................................ 13!2.! Theoretical Background ............................................................................................. 14!3.! Design #1: Magnetic and Friction Force Torque Limiter .......................................... 16!
3.1.! Description .......................................................................................................... 16!3.2.! Tests .................................................................................................................... 16!
3.2.1.! Test 1: Combined Magnetic Force ............................................................... 17!3.2.2.! Test 2: Friction Force ................................................................................... 18!
4.3.! Test Results and Analysis ................................................................................... 20!4.3.1.! Test 1: Combined Magnetic Force ............................................................... 20!4.3.2.! Test 2: Friction Force ................................................................................... 21!4.3.2.! Test 3: Qualitative Wear Test ...................................................................... 22!4.3.3.! Test 4: Saltwater Compatibility ................................................................... 22!
5.! Design #2: Mating Metal-Metal Face Torque Limiter .............................................. 24!5.1.! Description .......................................................................................................... 24!5.2.! Analysis............................................................................................................... 25!
6.! Design #3: Mating Rubber-Rubber Clutch ................................................................ 25!6.1.! Description .......................................................................................................... 25!
7.2.Test Results ................................................................................................................. 26!7.! Design #4: Centrifugal and Friction Force Torque Limiter ....................................... 28!
7.1.! Description .......................................................................................................... 28!7.2.! Analysis............................................................................................................... 29!
Conclusion ........................................................................................................................ 32!Appendix A.! Original Request for Proposal .................................................................. 33!Appendix B.! Project Management ................................................................................. 35!
B.1.! Milestone Schedule ............................................................................................ 35!B.2.! Work Breakdown Structure ................................................................................ 35!B.3.! Responsibility Assignment Matrix ..................................................................... 36!
viii
Appendix C.! Propeller Torque and Thrust Calculations ................................................ 36!C.1.! Forward Torque and Thrust ................................................................................ 36!C.2.! Reverse Torque and Thrust ................................................................................ 38!
Appendix D.! Magnets .................................................................................................... 39!D.1.! Minimum Magnetic Force Required to Achieve Required Release Torque ...... 39!
Appendix E.! Design Review Package ........................................................................... 44!Design Review Purpose ................................................................................................ 44!Objective and Background ............................................................................................ 44!Requirements and Limits .............................................................................................. 45!Design Analysis ............................................................................................................ 45!
Calculations and Estimates ............................................................................................... 47!Release Torque Estimate ............................................................................................... 47!Maximum Torque and Thrust ....................................................................................... 48!Magnetic Force ............................................................................................................. 50!Torque Capacity ............................................................................................................ 51!
Tests .................................................................................................................................. 51!Test 1: Combined Magnetic Force ................................................................................ 51!Test 2: Friction Force .................................................................................................... 52!Test 3: Relative Wear Rate ........................................................................................... 53!Test 4: Saltwater Compatibility .................................................................................... 53!
Project Risk Analysis ........................................................................................................ 54!Unusual Requirements ...................................................................................................... 54!Appendix F.! Design #1 Original Test Plan .................................................................... 54!
F.1.! Test #1: Magnetic Force Produced by Magnet Arrangement ............................. 56!F.2.! Test #2: Static Friction Force Generated by Magnets ........................................ 58!F.3.! Test #3: Wear Characteristics of Friction Material and Bronze ......................... 60!F.4. Test #4:Compatibility of Friction Material with Saltwater .................................. 61!F.5. Test Modifications ................................................................................................. 61!
Appendix G.! Design #1 Test Photos and Data .............................................................. 63!G.1.! Test 1 Data ......................................................................................................... 63!G.2.! Test 1 Photos ...................................................................................................... 64!G.3.! Test 2 Data ......................................................................................................... 65!G.4.! Test 2 Photos ...................................................................................................... 67!
Appendix H.! Design #2 Test Plan .................................................................................. 68!
ix
H.1.! Clutch Release Force / Rubber Expansion and Deflection Test ........................ 68!H.2.! Clutch Disc Wear Test ....................................................................................... 73!
Appendix I.! Design #4 Calculations and Data ............................................................... 74!Appendix J.! Rubber-Rubber Torque Limiter Design Theory and Test ......................... 76!
J.1.! Relation Between Release Torque and Rubber Surface Geometry ..................... 76!J.2.! Shaping of Rubber Face ...................................................................................... 79!J.3.! Manufacture of Test Apparatus ........................................................................... 81!J.4.! Torque Test .......................................................................................................... 82!J.5.! Results of Rubber Torque Test ............................................................................ 83!
Appendix K. Bibliography ................................................................................................ 84!
x
List of Tables Table C.1.1 Max propeller forward torque and thrust range ............................................ 38!Table C.2.1 Max propeller reverse torque and thrust range ............................................. 39!Table D.D.1.1 Torque capacity variables ......................................................................... 40!Table D.D.1.2 Supplier pull force values ......................................................................... 40!Table D.D.1.3 Variables in contact force equation ........................................................... 42!Table D.D.1.4 Contact forces ........................................................................................... 43!Table D.D.1.5 Additional variables .................................................................................. 43!Table G.1.1: Mass of moveable block .............................................................................. 63!Table G.1.2: Test 1 data .................................................................................................... 63!Table G.3.1: Test 2 data - dry ........................................................................................... 65!Table G.3.2: Test 2 data - wet ........................................................................................... 65!Table G.3.3: Test 2 release characteristics ........................................................................ 66!Table H.2.1: Arm mass (lbs) needed vs propeller RPM ................................................... 75!Table H.2.2 Tangential shear force of water ..................................................................... 76!Table J.5.1 Calculated and measured torque .................................................................... 83!
xi
List of Figures Figure 2.3.2.1.1 Estimated BH8A horsepower curve ....................................................... 15!Figure 3.2.1.1 Magnetic friction torque limiter design ..................................................... 16!Figure 3.2.1.1 Tests 1 and 2 apparatus .............................................................................. 17!Figure 3.2.1.2 Test 1 apparatus orientation with fishing line shown in red (cross section)
....................................................................................................................................................... 17!Figure 3.2.1.3 Friction surface in contact ......................................................................... 18!Figure 3.2.1.4 Friction surface separated .......................................................................... 18!Figure 3.2.2.1Test 2 apparatus orientation with fishing line shown in red (cross-section)
....................................................................................................................................................... 19!Figure 4.3.1.1 Test 1 data .................................................................................................. 20!Figure 4.3.2.1 Test 2 data, both wet and dry ..................................................................... 21!Figure 4.3.2.1 Bronze surface prior to test ........................................................................ 22!Figure 4.3.2.2 Bronze surface after test completion ......................................................... 22!Figure 4.3.3.1 Surface of magnet prior to immersion in saltwater ................................... 23!Figure 4.3.3.2 Surface of magnet after immersion in saltwater ........................................ 23!Figure 4.3.3.3 Bronze surface prior to immersion in saltwater ........................................ 23!Figure 4.3.3.4 Bronze surface after immersion in saltwater ............................................. 23!Figure 4.3.3.5 Bronze edge prior to immersion in saltwater ............................................ 23!Figure 4.3.3.6 Rust on bronze edge after immersion in saltwater .................................... 24!Figure 4.3.3.1 Face with wave-shaped contour ................................................................ 24!Figure 4.3.3.2 Wave spring [13] ....................................................................................... 25!Figure 4.3.3.1 Rubber-Rubber clutch concept .................................................................. 26!Figure 7.4.3.3.2 Rubber face produced using straight cuts ............................................... 26!Figure 4.3.3.1 Comparison of calculated and measured torque values ............................ 27!Figure 4.3.3.1Arm and disc arrangement .......................................................................... 28!Figure 4.3.3.2 Arm with forces ......................................................................................... 28!Figure 4.3.3.3 Cut-away view of a torque converter [14] ................................................. 29!Figure 4.3.3.1 Mass of arm needed vs. propeller RPM .................................................... 30!Figure 4.3.3.2 Tangential shear force of water vs water layer thickness .......................... 31!Figure 4.3.3.1 Milestone Schedule ................................................................................... 35!Figure 4.3.3.1 Work breakdown structure ........................................................................ 35!Figure 4.3.3.1 Responsibility assignment matrix .............................................................. 36!Figure 4.3.3.1 Magnetic force test apparatus .................................................................... 56!Figure 4.3.3.2 Magnetic force test apparatus .................................................................... 56!Figure 4.3.3.1 Static friction test apparatus ...................................................................... 58!Figure 4.3.3.2 Static friction test apparatus ...................................................................... 58!Figure 4.3.3.1 Wear test apparatus .................................................................................... 60!Figure 4.3.3.1 Typical Test 1 configurations .................................................................... 64!Figure 4.3.3.1 Typical Test 2 configurations .................................................................... 67!Figure 4.3.3.1 Test 1 apparatus ......................................................................................... 69!Figure 4.3.3.2 Test 1 apparatus cross-section ................................................................... 69!Figure 4.3.3.3 Test 1 apparatus exploded view ................................................................ 70!Figure 4.3.3.4 Components to be placed on scale ............................................................. 70!
xii
Figure 4.3.3.5 Bar with attached disc ............................................................................... 71!Figure 4.3.3.6 Rotating components ................................................................................. 71!Figure 4.3.3.7 Fixed components ...................................................................................... 72!Figure 4.3.3.1 Test 2 apparatus ......................................................................................... 73!Figure 4.3.3.2 Test 2 apparatus cross-section ................................................................... 73!Figure 4.3.3.3 Clutch disc contact surface ........................................................................ 74!Figure 4.3.3.1 Initial mating surface design ..................................................................... 79!Figure 4.3.3.2 Band saw set up ......................................................................................... 80!Figure 4.3.3.3 Cut rubber face .......................................................................................... 80!Figure 4.3.3.1 At left is bottom container in the guiding container, right is top container.
....................................................................................................................................................... 81!Figure 4.3.3.1 Test apparatus ............................................................................................ 82!
13
1. Introduction The project addressed the need for a torque protection system to allow the propeller of an
outboard Honda BF8A motor to disengage from the motor shaft in the event that the propeller was prevented from rotating due to obstructions from the surrounding environment. A shear pin is the standard mechanism used which requires work done by the boat user. However, when mistakenly replaced by a drive pin, the rubber present inside the propeller ended up shearing. The goal of the project was to find a mechanism that could protect the motor from torque overloads but also be automatically reset without the assistance of the boat user.

14
2. Theoretical Background This section explains the necessary parameters for the design of a torque limiter for the
Honda BF8A and the steps taken to determine those parameters. Many of these steps are quite ambiguous, requiring educated estimates, producing a range of values for most parameters. The design process relies on these ranges, some of which produce larger ranges of values in subsequent steps. These estimates and the resulting ambiguity are explained below, and all calculations are shown in Appendix C.
In order to create any design for a torque limiter to release before damaging the drivetrain components, a suitable maximum release torque had to be determined. It was also necessary to determine what the minimum release torque should be, to prevent slippage too soon. Yet before a suitable range for release torque could be determined, it was necessary to determine the horsepower, torque, RPM, and thrust that the Honda BF8A and its propeller are capable of, both in forward and reverse. However, the only published values are the engine horsepower and maximum RPM in the forward direction, and the gear ratio. These values are 8 HP, 5500 RPM, and 2.33:1, respectively [1] [2].
For the forward direction, engine torque and propeller maximum RPM were simple calculations providing a single value for each. However, using two methods of calculating the propeller shaft horsepower produced a range of possible values. One method was to simply take a percentage of the engine horsepower. The second method considered the power lost due to the number of bearings between the engine and the propeller [3]. Some ambiguity was introduced since it was not possible to determine exactly the number of bearings. After studying shop manual diagrams and parts lists it seemed that there were five bearings, although this number was not confirmed with one hundred percent certainty [2].
The range of propeller shaft horsepower was used in the simple torque formula to calculate the shaft torque, also now a range [4]. An online propeller calculator was also used in which various engine parameters were entered [5]. The formulas used were not shown, but it generated a torque value within this range.
There are no direct calculations for thrust, as many factors affect it, including water temperature and salinity; propeller design and wear; and hull resistance and speed, to name a few [6]. Many resources state that the only way to determine thrust is to perform a direct measurement in the exact conditions that the boat would be operating [7] [8]. It is beyond the scope of this project to perform a direct measurement.
A common method used to estimate thrust uses a generalized “rule of thumb” called the Bollard Pull [9]. This method considers the worst-case scenario when the most thrust is produced, occurring when the boat is stationary relative to the water. It is a common method for rating tug boats [10]. This produced a range of estimated maximum Bollard Pull Thrust.
A great deal more ambiguity was introduced in the calculations for when the propeller is rotating in reverse. When this happens, the engine speed is limited by a mechanical stop in the throttle, creating a much lower maximum torque and thrust. However, there is no published specification for the RPM in reverse. From personal experience and logical reasoning, it was estimated to be 1800 RPM.
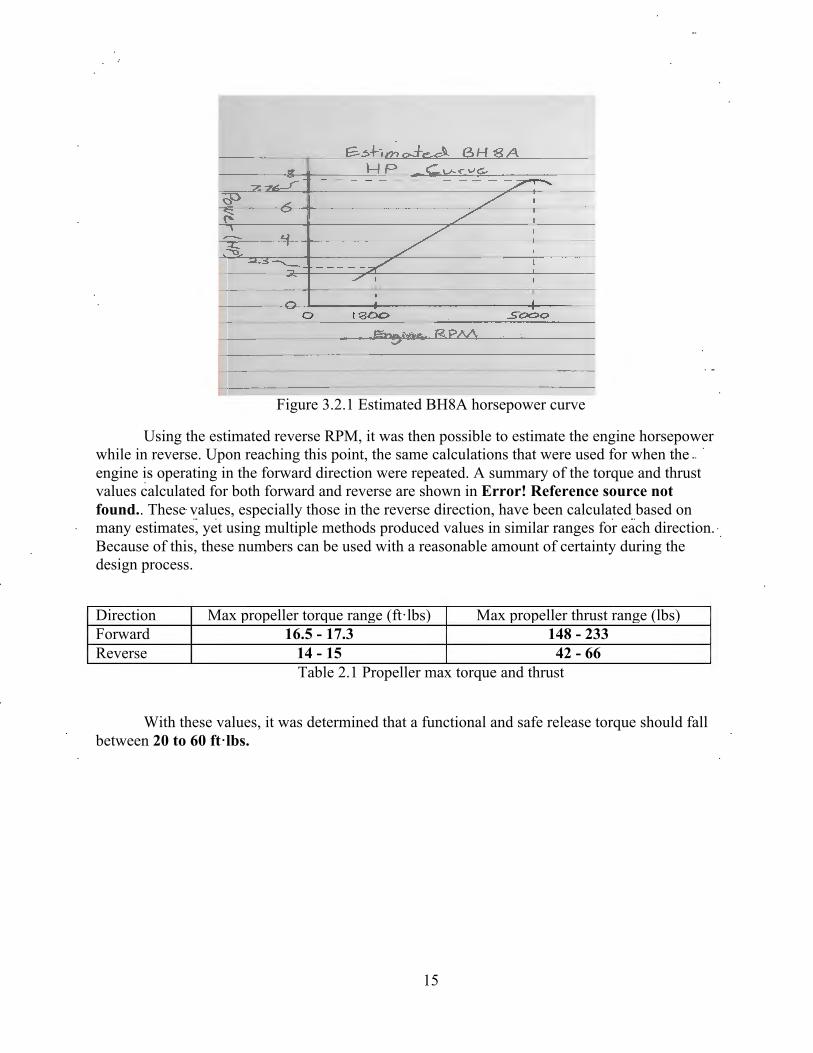
To add to the ambiguity, there is no published horsepower curve for this engine, so an estimated curve was drawn using similar curves from other outboard motors and the maximum RPM [8] [11] [12].
15
Figure 3.2.1 Estimated BH8A horsepower curve
Using the estimated reverse RPM, it was then possible to estimate the engine horsepower while in reverse. Upon reaching this point, the same calculations that were used for when the engine is operating in the forward direction were repeated. A summary of the torque and thrust values calculated for both forward and reverse are shown in Error! Reference source not found.. These values, especially those in the reverse direction, have been calculated based on many estimates, yet using multiple methods produced values in similar ranges for each direction. Because of this, these numbers can be used with a reasonable amount of certainty during the design process.
Direction Max propeller torque range (ft·lbs) Max propeller thrust range (lbs) Forward 16.5 - 17.3 148 - 233 Reverse 14 - 15 42 - 66
Table 2.1 Propeller max torque and thrust
With these values, it was determined that a functional and safe release torque should fall
between 20 to 60 ft·lbs.
~5,-t,rn0--+ec~ GI-I 8A __ HP Cv--,vc..
0-------t-----------t----0 sooo
16
3. Design #1: Magnetic and Friction Force Torque Limiter
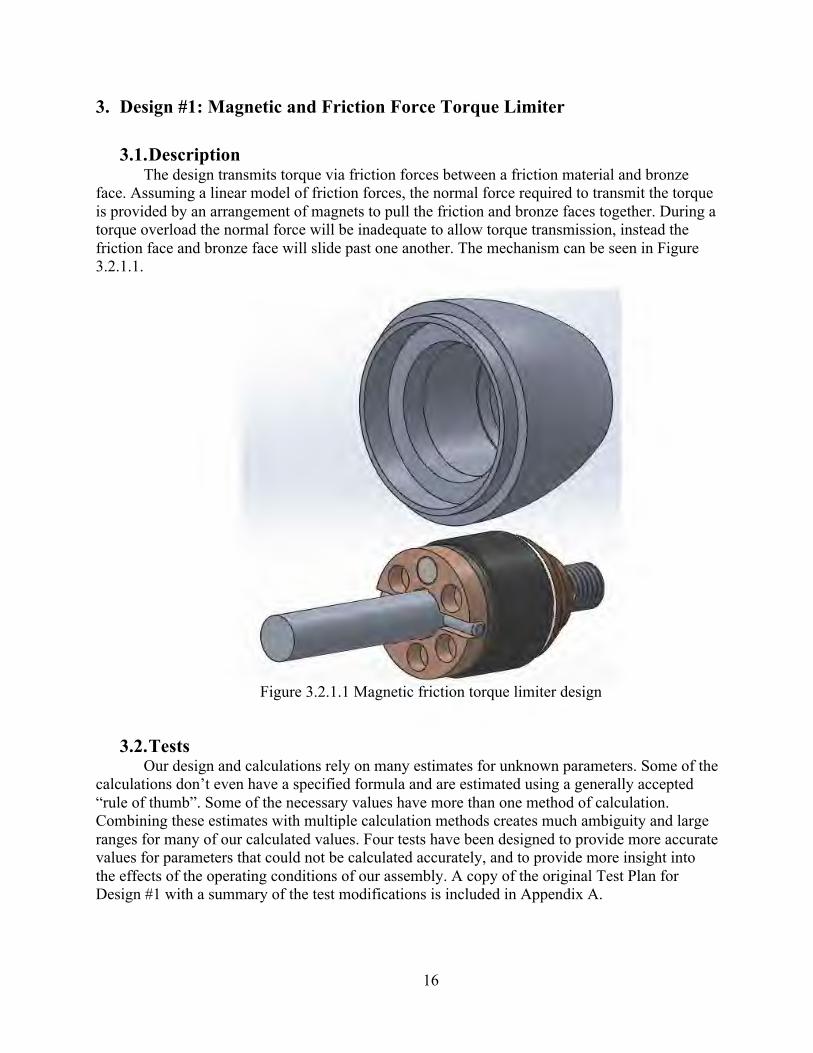
3.1. Description The design transmits torque via friction forces between a friction material and bronze
face. Assuming a linear model of friction forces, the normal force required to transmit the torque is provided by an arrangement of magnets to pull the friction and bronze faces together. During a torque overload the normal force will be inadequate to allow torque transmission, instead the friction face and bronze face will slide past one another. The mechanism can be seen in Figure 3.2.1.1.
Figure 3.2.1.1 Magnetic friction torque limiter design
3.2. Tests
Our design and calculations rely on many estimates for unknown parameters. Some of the calculations don’t even have a specified formula and are estimated using a generally accepted “rule of thumb”. Some of the necessary values have more than one method of calculation. Combining these estimates with multiple calculation methods creates much ambiguity and large ranges for many of our calculated values. Four tests have been designed to provide more accurate values for parameters that could not be calculated accurately, and to provide more insight into the effects of the operating conditions of our assembly. A copy of the original Test Plan for Design #1 with a summary of the test modifications is included in Appendix A.

17
3.2.1. Test 1: Combined Magnetic Force Test 1 used the apparatus shown in to obtain a direct value for the maximum mass
supported by one set of three magnets, to be translated into the magnetic force. The magnets are mounted in brass and wood in the same configuration as a single set in the design. The distances between the magnets are the same as those in the design, as well as the materials between the magnets. Wood is a substitute for rubber in the test, as neither have any significant effect on the magnetic fields.
Figure 3.2.1.1 Tests 1 and 2 apparatus
The apparatus was supported as shown in. Known mass was added in 10g increments to fishing line strung through the three holes and attached to the moveable center block, until it broke free. A single piece of fishing line was used to create two loops, which were able to self-adjust so that both loops supported the same amount of mass. Pulling from three points on the center block ensured the downward force remained centered. See Appendix G for images of various configurations of Test 1 in progress.
Figure 3.2.1.2 Test 1 apparatus orientation with fishing line shown in red (cross section)
There is a repulsive force between the center and bottom magnet in the test, and when they were brought close together, the center block had a tendency to move off-centre. To combat this, smooth round pencils were placed on opposite sides to help support the center block. Light finger pressure was occasionally needed for support in the other direction. Care was taken not to add or subtract force in the downward direction. The block remained centered while there was
18
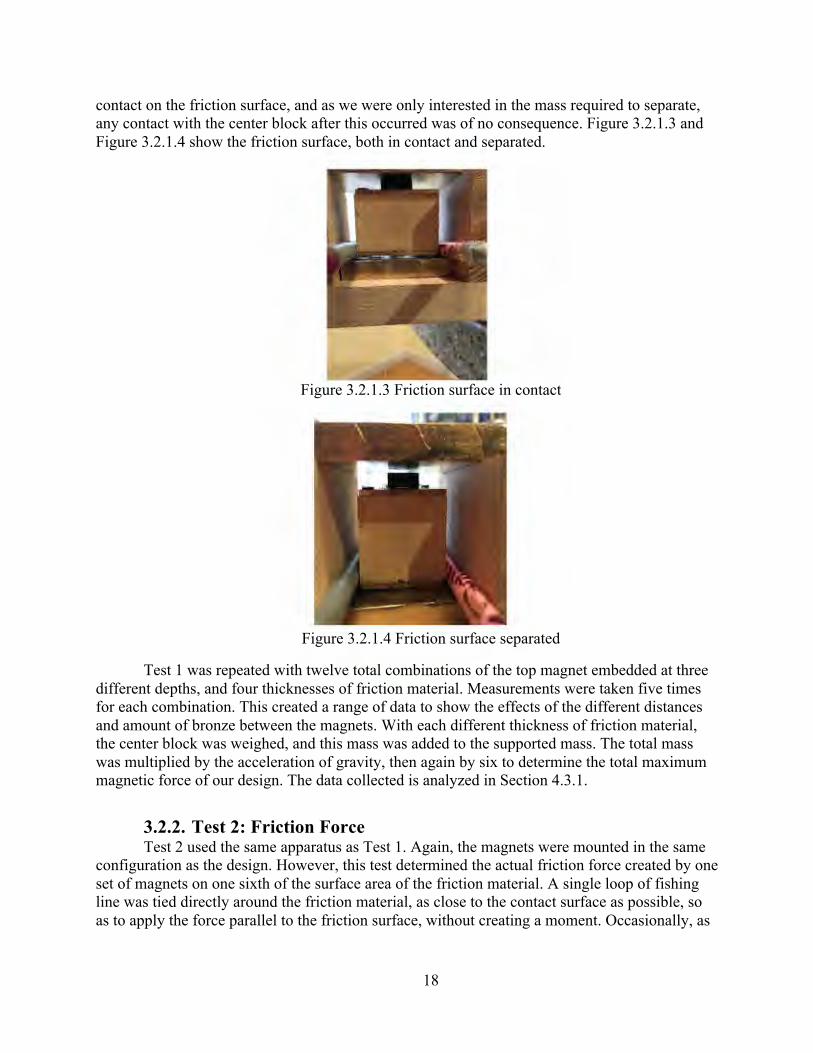
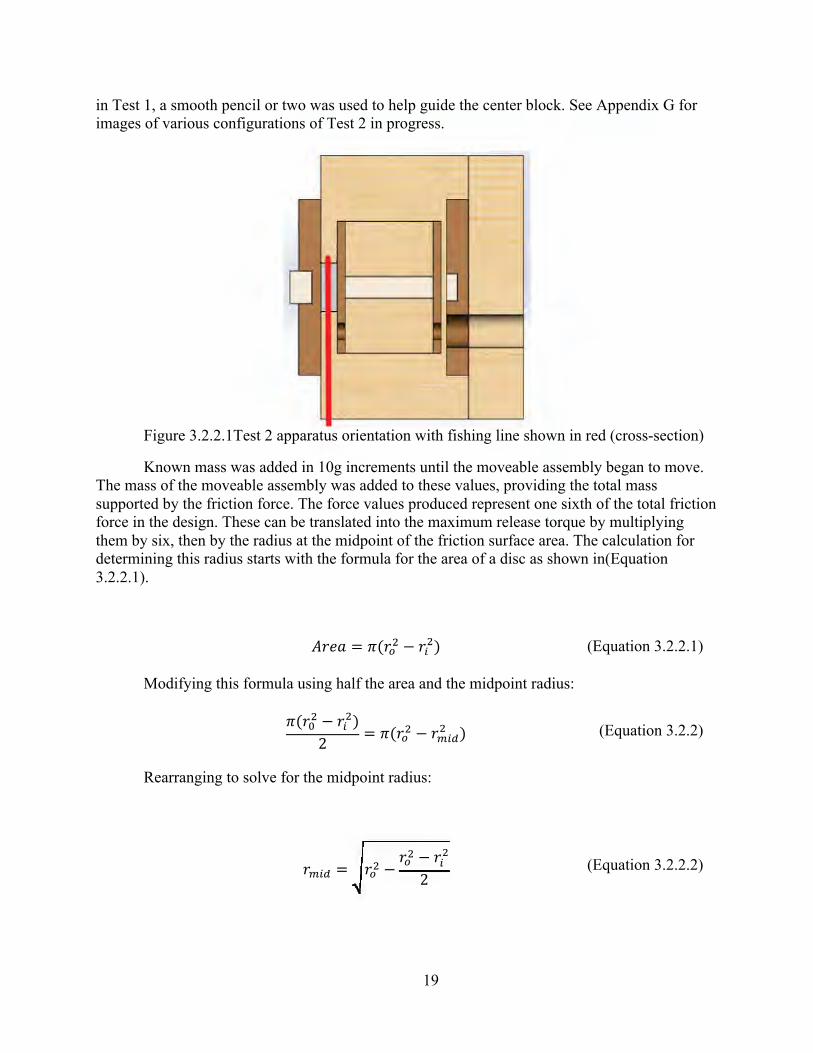
contact on the friction surface, and as we were only interested in the mass required to separate, any contact with the center block after this occurred was of no consequence. Figure 3.2.1.3 and Figure 3.2.1.4 show the friction surface, both in contact and separated.
Figure 3.2.1.3 Friction surface in contact
Figure 3.2.1.4 Friction surface separated
Test 1 was repeated with twelve total combinations of the top magnet embedded at three different depths, and four thicknesses of friction material. Measurements were taken five times for each combination. This created a range of data to show the effects of the different distances and amount of bronze between the magnets. With each different thickness of friction material, the center block was weighed, and this mass was added to the supported mass. The total mass was multiplied by the acceleration of gravity, then again by six to determine the total maximum magnetic force of our design. The data collected is analyzed in Section 4.3.1.
3.2.2. Test 2: Friction Force Test 2 used the same apparatus as Test 1. Again, the magnets were mounted in the same
configuration as the design. However, this test determined the actual friction force created by one set of magnets on one sixth of the surface area of the friction material. A single loop of fishing line was tied directly around the friction material, as close to the contact surface as possible, so as to apply the force parallel to the friction surface, without creating a moment. Occasionally, as
19
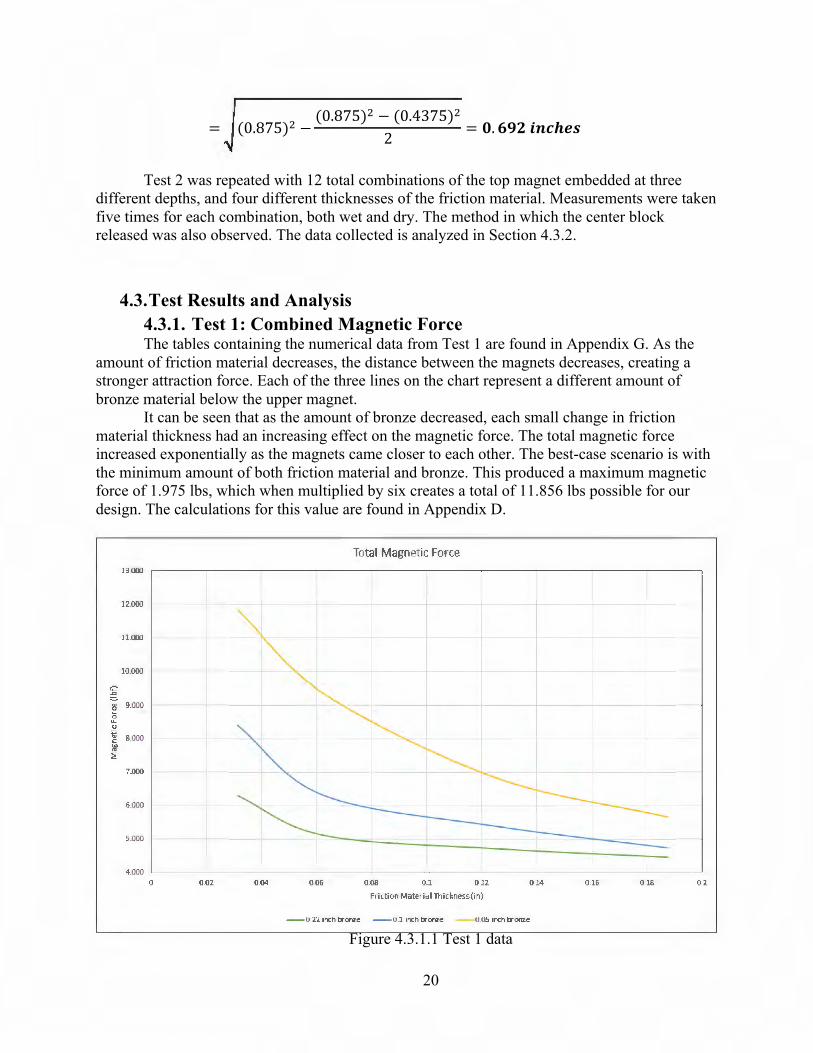
in Test 1, a smooth pencil or two was used to help guide the center block. See Appendix G for images of various configurations of Test 2 in progress.
Figure 3.2.2.1Test 2 apparatus orientation with fishing line shown in red (cross-section)
Known mass was added in 10g increments until the moveable assembly began to move. The mass of the moveable assembly was added to these values, providing the total mass supported by the friction force. The force values produced represent one sixth of the total friction force in the design. These can be translated into the maximum release torque by multiplying them by six, then by the radius at the midpoint of the friction surface area. The calculation for determining this radius starts with the formula for the area of a disc as shown in(Equation 3.2.2.1).
!"#$ = !(!!! − !!!) (Equation 3.2.2.1)
Modifying this formula using half the area and the midpoint radius:
!(!!! − !!!)2 = !(!!! − !!"#! ) (Equation 3.2.2)
Rearranging to solve for the midpoint radius:
!!"# = !!! −!!! − !!!2 (Equation 3.2.2.2)
r=
20
= (0.875)! − (0.875)! − (0.4375)!2 = !.!"#!!"#$%&!!!!!!!
Test 2 was repeated with 12 total combinations of the top magnet embedded at three
different depths, and four different thicknesses of the friction material. Measurements were taken five times for each combination, both wet and dry. The method in which the center block released was also observed. The data collected is analyzed in Section 4.3.2.
4.3. Test Results and Analysis 4.3.1. Test 1: Combined Magnetic Force The tables containing the numerical data from Test 1 are found in Appendix G. As the
amount of friction material decreases, the distance between the magnets decreases, creating a stronger attraction force. Each of the three lines on the chart represent a different amount of bronze material below the upper magnet.
It can be seen that as the amount of bronze decreased, each small change in friction material thickness had an increasing effect on the magnetic force. The total magnetic force increased exponentially as the magnets came closer to each other. The best-case scenario is with the minimum amount of both friction material and bronze. This produced a maximum magnetic force of 1.975 lbs, which when multiplied by six creates a total of 11.856 lbs possible for our design. The calculations for this value are found in Appendix D.
Figure 4.3.1.1 Test 1 data
j
13 GGO
12.000
11.GCO
10.000
.0
" ~.c-co
" 8JJCO
"' :e 7.000
6.C-CO
5.0C-O
4(){0 --0 002 004 006
Total Magnetic Force
0.08 0 .12
Friction Material Thickness (in)
014
--0 22 inch bronze - - 01 inch bronze --0.05 inch brorae
0 .16 016 0 .2
21
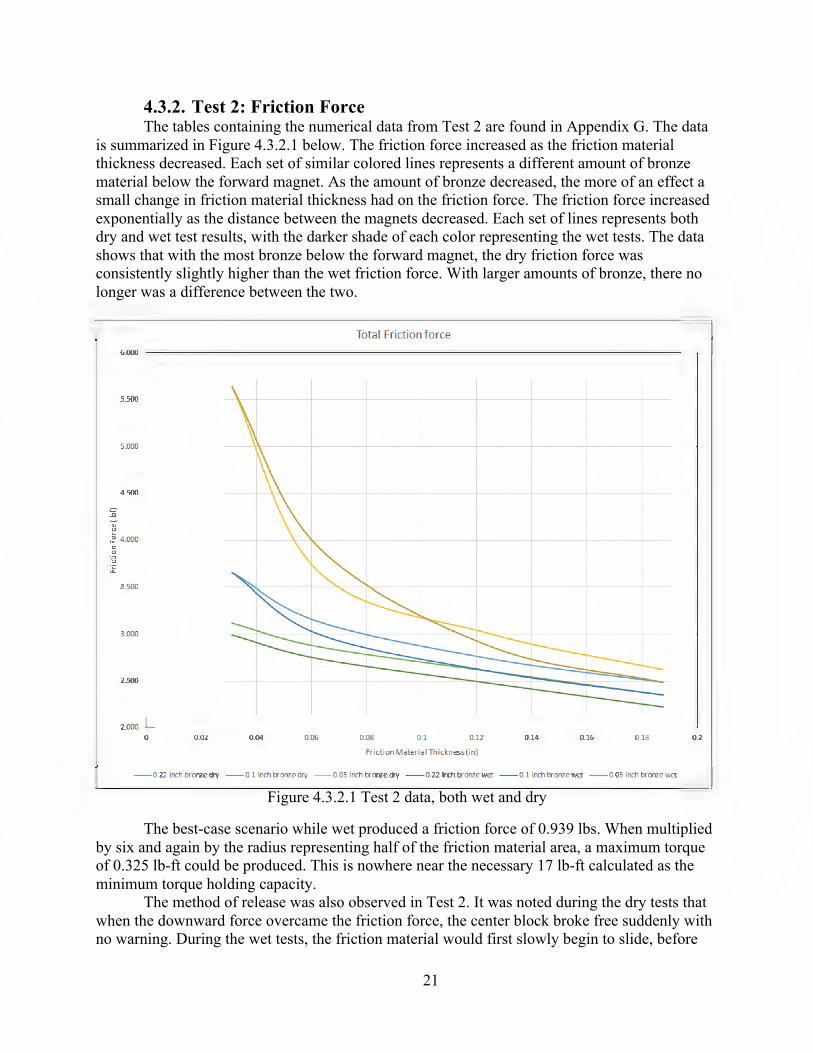
4.3.2. Test 2: Friction Force The tables containing the numerical data from Test 2 are found in Appendix G. The data
is summarized in Figure 4.3.2.1 below. The friction force increased as the friction material thickness decreased. Each set of similar colored lines represents a different amount of bronze material below the forward magnet. As the amount of bronze decreased, the more of an effect a small change in friction material thickness had on the friction force. The friction force increased exponentially as the distance between the magnets decreased. Each set of lines represents both dry and wet test results, with the darker shade of each color representing the wet tests. The data shows that with the most bronze below the forward magnet, the dry friction force was consistently slightly higher than the wet friction force. With larger amounts of bronze, there no longer was a difference between the two.
Figure 4.3.2.1 Test 2 data, both wet and dry
The best-case scenario while wet produced a friction force of 0.939 lbs. When multiplied by six and again by the radius representing half of the friction material area, a maximum torque of 0.325 lb-ft could be produced. This is nowhere near the necessary 17 lb-ft calculated as the minimum torque holding capacity.
The method of release was also observed in Test 2. It was noted during the dry tests that when the downward force overcame the friction force, the center block broke free suddenly with no warning. During the wet tests, the friction material would first slowly begin to slide, before
u
6.000
S.500
S.000
4.500
4.000 C 0
tl
3.500
3.000
2.500
2.000 L 0 0.02 0.04 0.06
Tot al Frict ion fo rce
0.08 0.1 0.12 0.14 0.16 0.18
Friction MaterialThickness( in)
--0.22 inch bronze dry --0.1 inch bronze dry --0.05 inch bronze dry --0.22 inch bronze wet --0.1 inch bronzev.ret --0.05 inch b"onzewet
0.2
22
breaking free. However, this was not the case at higher magnetic forces. During the dry tests, the center block would slide slowly before breaking free, rather than with no warning. During the wet tests, it would creep extremely slowly, before picking up speed and then breaking free. A table of the release characteristics for all the combinations of Test 2 is found in Appendix G.
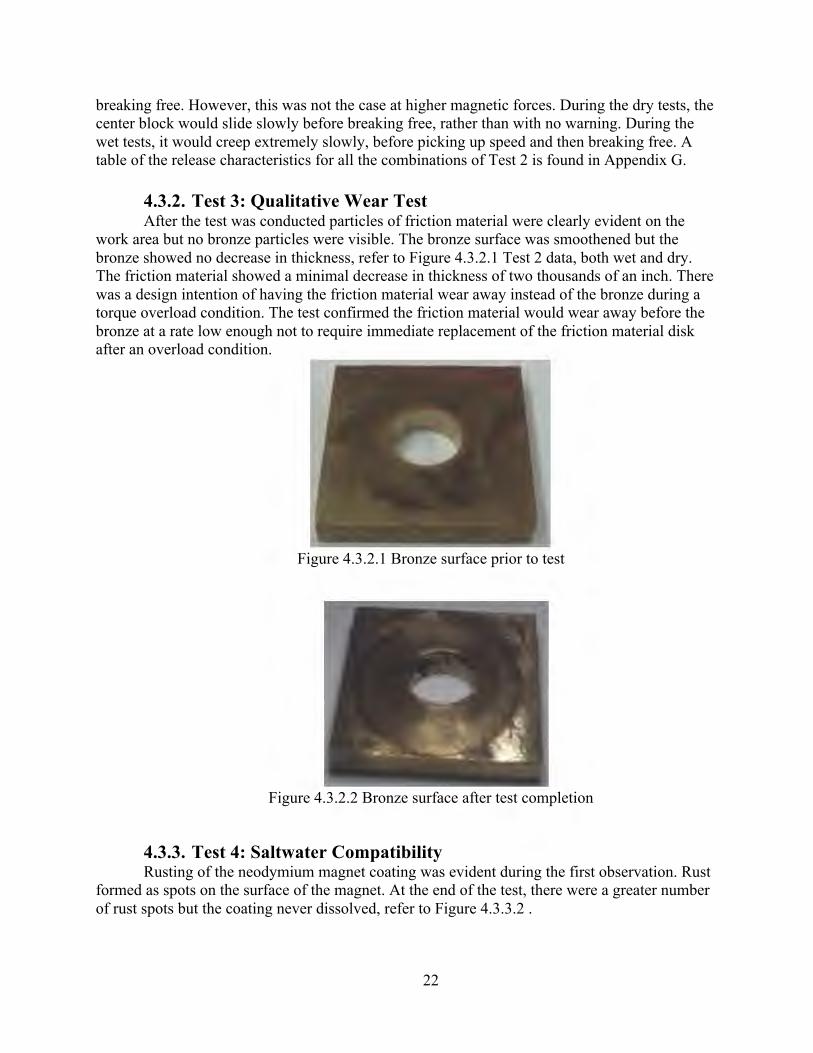
4.3.2. Test 3: Qualitative Wear Test After the test was conducted particles of friction material were clearly evident on the
work area but no bronze particles were visible. The bronze surface was smoothened but the bronze showed no decrease in thickness, refer to Figure 4.3.2.1 Test 2 data, both wet and dry. The friction material showed a minimal decrease in thickness of two thousands of an inch. There was a design intention of having the friction material wear away instead of the bronze during a torque overload condition. The test confirmed the friction material would wear away before the bronze at a rate low enough not to require immediate replacement of the friction material disk after an overload condition.
Figure 4.3.2.1 Bronze surface prior to test
Figure 4.3.2.2 Bronze surface after test completion
4.3.3. Test 4: Saltwater Compatibility Rusting of the neodymium magnet coating was evident during the first observation. Rust
formed as spots on the surface of the magnet. At the end of the test, there were a greater number of rust spots but the coating never dissolved, refer to Figure 4.3.3.2 .
23
Figure 4.3.3.1 Surface of magnet prior to immersion in saltwater
Figure 4.3.3.2 Surface of magnet after immersion in saltwater
The bronze became darker in colour during the test, Figure 4.3.3.4. This was noticeable during the first observation. At the end of the test the darker colour became evident on all surfaces and the original shiny colour was no longer present.
Figure 4.3.3.3 Bronze surface prior to immersion in saltwater
Figure 4.3.3.4 Bronze surface after immersion in saltwater
Oddly, rust formed locally on one edge of the bronze piece Figure 4.3.3.6 Rust on bronze edge after immersion in saltwater. The rust was noticed on the third observation of the bronze. However, the rust is attributed to steel residue present on the saw used to cut the bronze piece.
Figure 4.3.3.5 Bronze edge prior to immersion in saltwater
i
' '

24
Figure 4.3.3.6 Rust on bronze edge after immersion in saltwater
The epoxy showed no sign of degradation only a change of colour from white to blue. The friction material showed no changes in colour nor texture. The test confirmed the aluminum bronze is salt water compatible. Also, it was confirmed the neodymium magnet coating is not saltwater compatible but it dissolves much slower than suggested; it does not dissolve within 24 to 48 hours. The friction material and epoxy is saltwater compatible.
5. Design #2: Mating Metal-Metal Face Torque Limiter
5.1. Description Design #2 uses two mating metal faces to transmit the torque from the propeller shaft to
the propeller. A component with one of the faces would always be rotating with the shaft while the other face would be a part of a component rotating with the propeller. These faces would both have exactly the same contours and mate perfectly. A model of a single face with a rounded wave-shaped profile is shown in Figure 4.3.3.1 .
Figure 4.3.3.1 Face with wave-shaped contour
Other profiles for the mating faces could be used, such as triangular peaks and valleys, again mating perfectly. These profiles could have different heights or number of peaks. The tests outlined in Appendix H provide a method of comparing different profiles.
When excessive resistance is encountered by the propeller, the two faces would be able to slip past each other. They would need to be pressed together with enough force to allow the maximum safe torque produced by the engine to be transmitted, yet still allow slippage to avoid damage to drivetrain components.
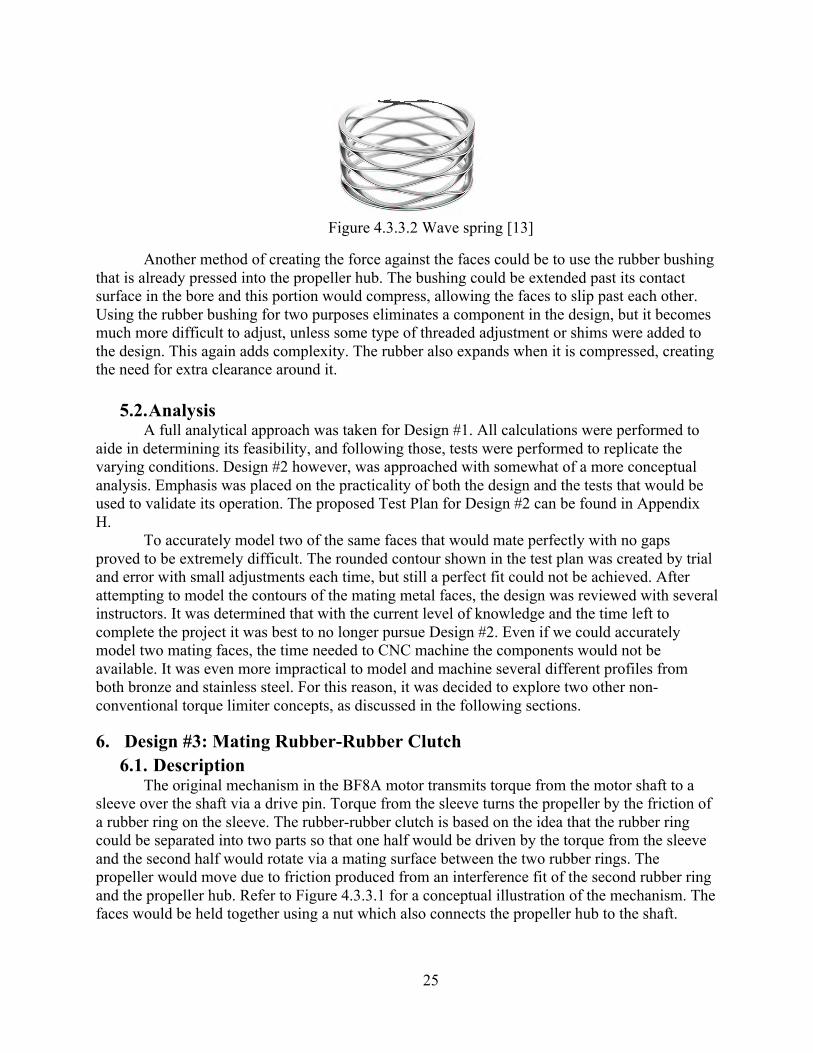
To produce the force against these faces a short wave spring similar to the one shown in Figure 4.3.3.2 could be used. This would create a constant force that could be changed by replacing the spring or shims. When the maximum allowable torque is reached, the peaks of the faces would ride up one another compressing the spring until they slipped past.
25
Figure 4.3.3.2 Wave spring [13]
Another method of creating the force against the faces could be to use the rubber bushing that is already pressed into the propeller hub. The bushing could be extended past its contact surface in the bore and this portion would compress, allowing the faces to slip past each other. Using the rubber bushing for two purposes eliminates a component in the design, but it becomes much more difficult to adjust, unless some type of threaded adjustment or shims were added to the design. This again adds complexity. The rubber also expands when it is compressed, creating the need for extra clearance around it.
5.2. Analysis
A full analytical approach was taken for Design #1. All calculations were performed to aide in determining its feasibility, and following those, tests were performed to replicate the varying conditions. Design #2 however, was approached with somewhat of a more conceptual analysis. Emphasis was placed on the practicality of both the design and the tests that would be used to validate its operation. The proposed Test Plan for Design #2 can be found in Appendix H.
To accurately model two of the same faces that would mate perfectly with no gaps proved to be extremely difficult. The rounded contour shown in the test plan was created by trial and error with small adjustments each time, but still a perfect fit could not be achieved. After attempting to model the contours of the mating metal faces, the design was reviewed with several instructors. It was determined that with the current level of knowledge and the time left to complete the project it was best to no longer pursue Design #2. Even if we could accurately model two mating faces, the time needed to CNC machine the components would not be available. It was even more impractical to model and machine several different profiles from both bronze and stainless steel. For this reason, it was decided to explore two other non-conventional torque limiter concepts, as discussed in the following sections.
6. Design #3: Mating Rubber-Rubber Clutch 6.1. Description
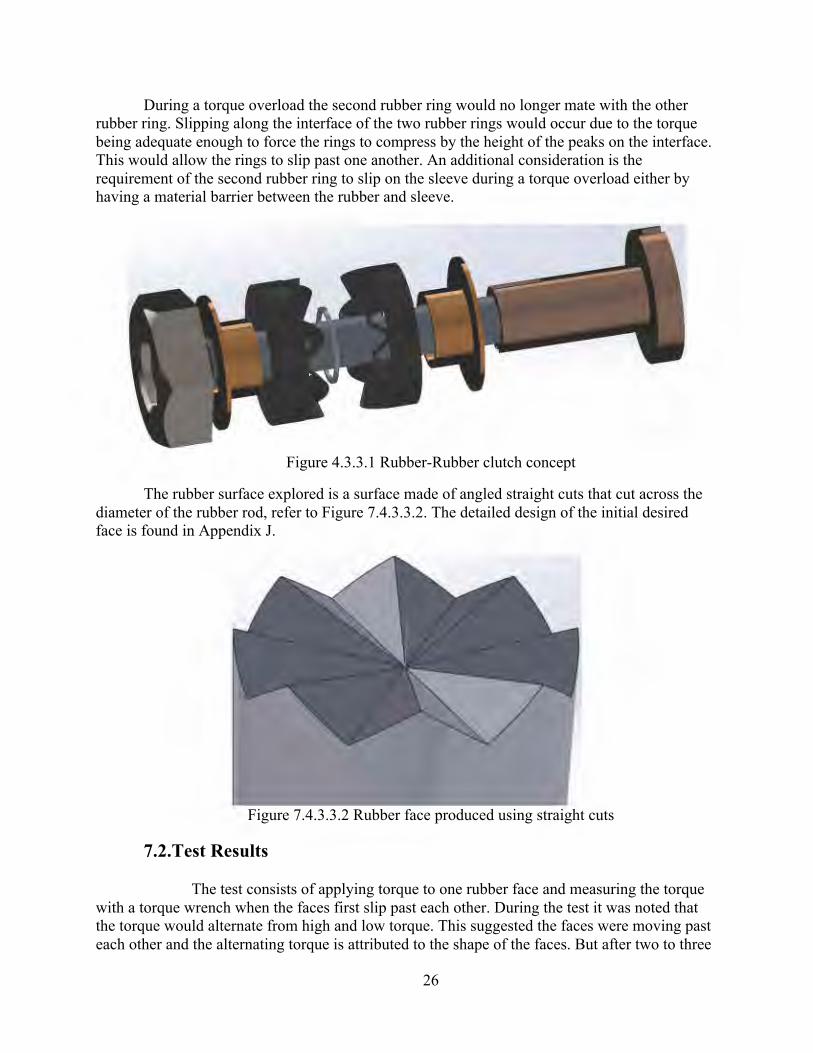
The original mechanism in the BF8A motor transmits torque from the motor shaft to a sleeve over the shaft via a drive pin. Torque from the sleeve turns the propeller by the friction of a rubber ring on the sleeve. The rubber-rubber clutch is based on the idea that the rubber ring could be separated into two parts so that one half would be driven by the torque from the sleeve and the second half would rotate via a mating surface between the two rubber rings. The propeller would move due to friction produced from an interference fit of the second rubber ring and the propeller hub. Refer to Figure 4.3.3.1 for a conceptual illustration of the mechanism. The faces would be held together using a nut which also connects the propeller hub to the shaft.
26
During a torque overload the second rubber ring would no longer mate with the other rubber ring. Slipping along the interface of the two rubber rings would occur due to the torque being adequate enough to force the rings to compress by the height of the peaks on the interface. This would allow the rings to slip past one another. An additional consideration is the requirement of the second rubber ring to slip on the sleeve during a torque overload either by having a material barrier between the rubber and sleeve.
Figure 4.3.3.1 Rubber-Rubber clutch concept
The rubber surface explored is a surface made of angled straight cuts that cut across the diameter of the rubber rod, refer to Figure 7.4.3.3.2. The detailed design of the initial desired face is found in Appendix J.
Figure 7.4.3.3.2 Rubber face produced using straight cuts
7.2.Test Results The test consists of applying torque to one rubber face and measuring the torque
with a torque wrench when the faces first slip past each other. During the test it was noted that the torque would alternate from high and low torque. This suggested the faces were moving past each other and the alternating torque is attributed to the shape of the faces. But after two to three
27
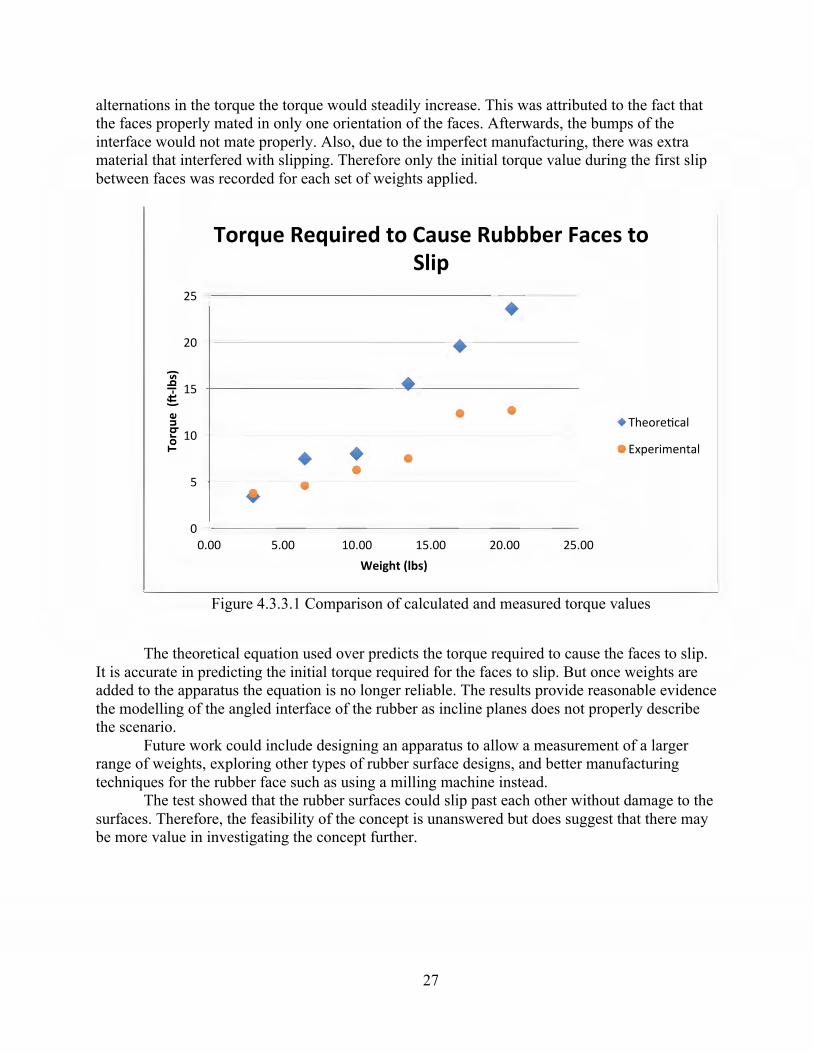
alternations in the torque the torque would steadily increase. This was attributed to the fact that the faces properly mated in only one orientation of the faces. Afterwards, the bumps of the interface would not mate properly. Also, due to the imperfect manufacturing, there was extra material that interfered with slipping. Therefore only the initial torque value during the first slip between faces was recorded for each set of weights applied.
Figure 4.3.3.1 Comparison of calculated and measured torque values
The theoretical equation used over predicts the torque required to cause the faces to slip.
It is accurate in predicting the initial torque required for the faces to slip. But once weights are added to the apparatus the equation is no longer reliable. The results provide reasonable evidence the modelling of the angled interface of the rubber as incline planes does not properly describe the scenario.
Future work could include designing an apparatus to allow a measurement of a larger range of weights, exploring other types of rubber surface designs, and better manufacturing techniques for the rubber face such as using a milling machine instead.
The test showed that the rubber surfaces could slip past each other without damage to the surfaces. Therefore, the feasibility of the concept is unanswered but does suggest that there may be more value in investigating the concept further.
0!
5!
10!
15!
20!
25!
0.00! 5.00! 10.00! 15.00! 20.00! 25.00!
Torque
''()*lbs)'
Weight'(lbs)'
Torque'Required'to'Cause'Rubbber'Faces'to'Slip'
Theore,cal!
Experimental!
• • • •
• •
28
7. Design #4: Centrifugal and Friction Force Torque Limiter
7.1. Description The idea behind Design #4 stems from the principle of having the propeller immediately
spin completely free the moment it encounters excessive resistance. The first 3 designs that were analyzed would release as well, but there is always some amount of contact force while the propeller is slipping. Design #4 all but eliminates this contact force during slippage.
It is beyond the scope of this project to create a full design and the tests required to validate the concept. This design was approached from an entirely conceptual point of view. Any modelling that is shown was created using rough dimensions and geometry, with the sole intent to give the reader a better understanding of the working principles of this design.
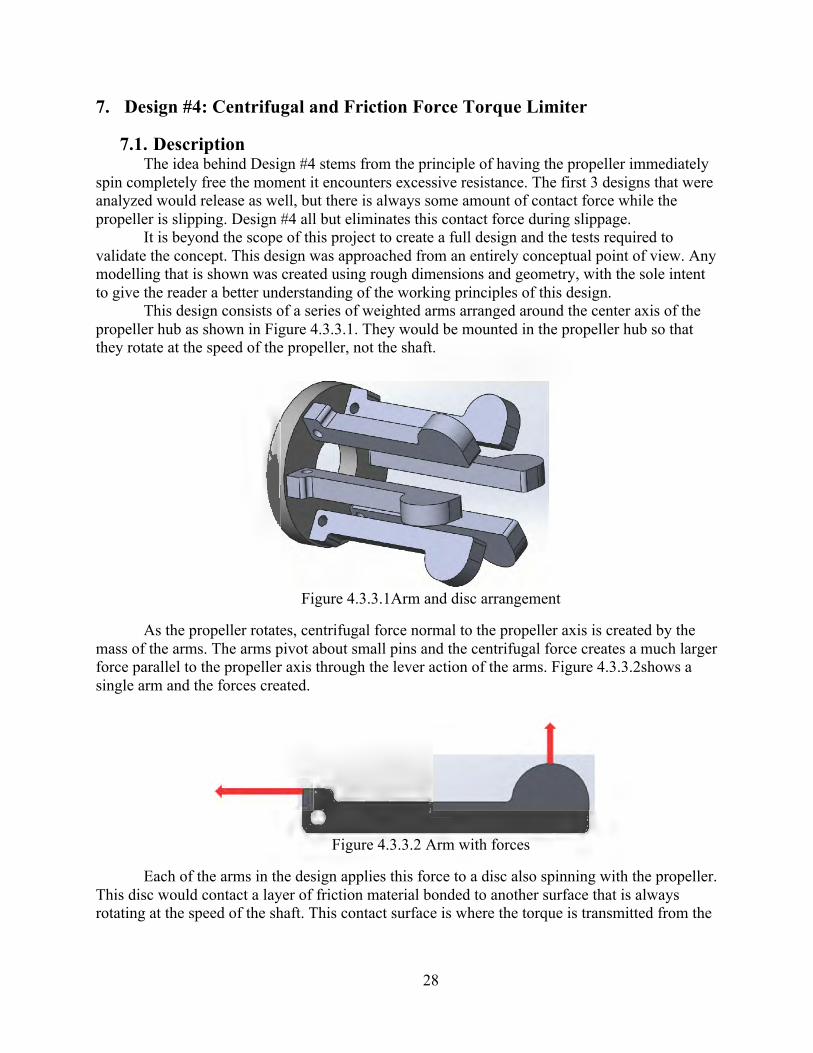
This design consists of a series of weighted arms arranged around the center axis of the propeller hub as shown in Figure 4.3.3.1. They would be mounted in the propeller hub so that they rotate at the speed of the propeller, not the shaft.
Figure 4.3.3.1Arm and disc arrangement
As the propeller rotates, centrifugal force normal to the propeller axis is created by the mass of the arms. The arms pivot about small pins and the centrifugal force creates a much larger force parallel to the propeller axis through the lever action of the arms. Figure 4.3.3.2shows a single arm and the forces created.
Figure 4.3.3.2 Arm with forces
Each of the arms in the design applies this force to a disc also spinning with the propeller. This disc would contact a layer of friction material bonded to another surface that is always rotating at the speed of the shaft. This contact surface is where the torque is transmitted from the
29
components rotating with the shaft to those rotating with the propeller. It is here where slippage occurs, should the propeller encounter excessive resistance.
Initially, the arms would be making slight contact with the disc without having moved at all, and as centrifugal force is generated, they would still not need to move. However, the hub modifications would need to include space for the arms to move outwards as the friction material wears. Due to the lever ratio of the arms, a small decrease in the friction material would create a larger movement of the arms.
To help with the minimal amount of force applied to the friction material at low speeds, three additions to the design were proposed, to be used together or separately. The simplest addition would be the use of a spring under each arm to create some force on the friction material even when there is no centrifugal force.
A more complex addition proposed would be to use the tangential shear force of the water to transfer a small amount of torque to the propeller when there is a large relative difference in rotational speed between the shaft and the propeller. This small amount of force would allow slippage if necessary yet help to get the propeller rotating once an obstruction is cleared. As the propeller speed increases, more centrifugal force is generated, and more force is applied to the friction material. A cycle is created increasing the force and thereby the propeller speed, if there is still slippage occurring.
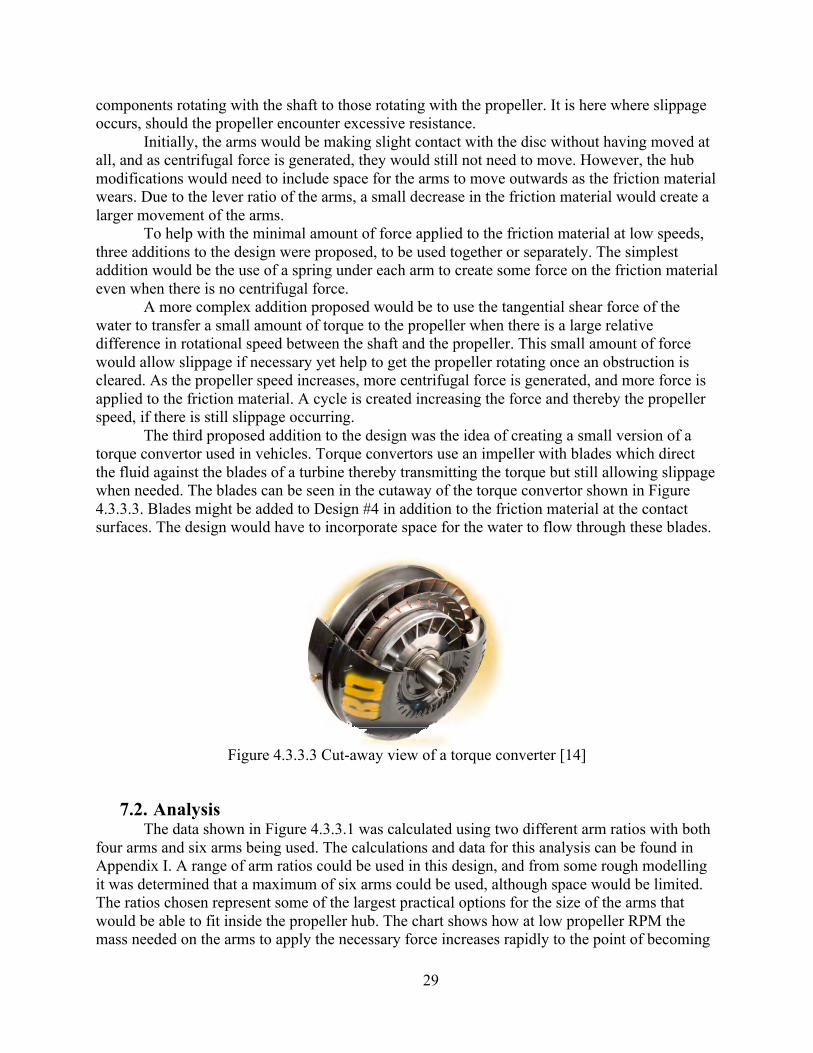
The third proposed addition to the design was the idea of creating a small version of a torque convertor used in vehicles. Torque convertors use an impeller with blades which direct the fluid against the blades of a turbine thereby transmitting the torque but still allowing slippage when needed. The blades can be seen in the cutaway of the torque convertor shown in Figure 4.3.3.3. Blades might be added to Design #4 in addition to the friction material at the contact surfaces. The design would have to incorporate space for the water to flow through these blades.
Figure 4.3.3.3 Cut-away view of a torque converter [14]
7.2. Analysis
The data shown in Figure 4.3.3.1 was calculated using two different arm ratios with both four arms and six arms being used. The calculations and data for this analysis can be found in Appendix I. A range of arm ratios could be used in this design, and from some rough modelling it was determined that a maximum of six arms could be used, although space would be limited. The ratios chosen represent some of the largest practical options for the size of the arms that would be able to fit inside the propeller hub. The chart shows how at low propeller RPM the mass needed on the arms to apply the necessary force increases rapidly to the point of becoming
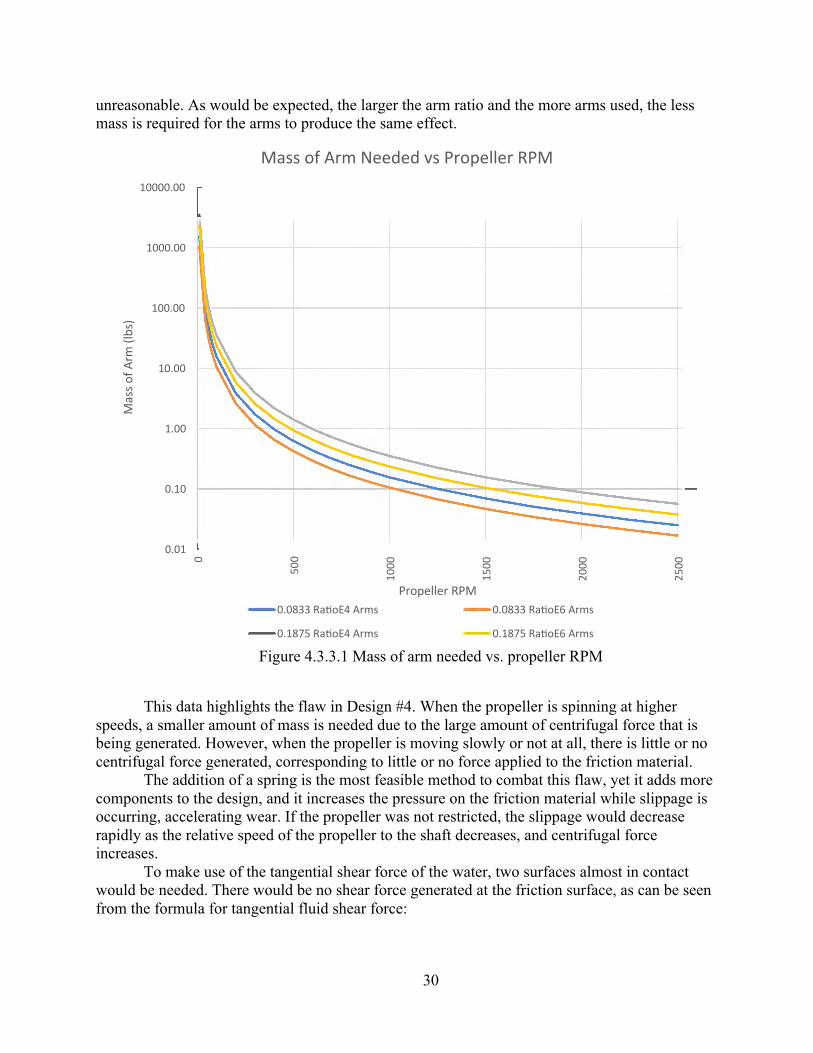
30
unreasonable. As would be expected, the larger the arm ratio and the more arms used, the less mass is required for the arms to produce the same effect.
Figure 4.3.3.1 Mass of arm needed vs. propeller RPM
This data highlights the flaw in Design #4. When the propeller is spinning at higher
speeds, a smaller amount of mass is needed due to the large amount of centrifugal force that is being generated. However, when the propeller is moving slowly or not at all, there is little or no centrifugal force generated, corresponding to little or no force applied to the friction material.
The addition of a spring is the most feasible method to combat this flaw, yet it adds more components to the design, and it increases the pressure on the friction material while slippage is occurring, accelerating wear. If the propeller was not restricted, the slippage would decrease rapidly as the relative speed of the propeller to the shaft decreases, and centrifugal force increases.
To make use of the tangential shear force of the water, two surfaces almost in contact would be needed. There would be no shear force generated at the friction surface, as can be seen from the formula for tangential fluid shear force:
0.01!
0.10!
1.00!
10.00!
100.00!
1000.00!
10000.00!0!
500!
1000
!
1500
!
2000
!
2500
!
Mass!of!Arm
!(lbs)!
Propeller!RPM!
Mass!of!Arm!Needed!vs!Propeller!RPM!
0.0833!Ra,o,!4!Arms! 0.0833!Ra,o,!6!Arms!
0.1875!Ra,o,!4!Arms! 0.1875!Ra,o,!6!Arms!
31
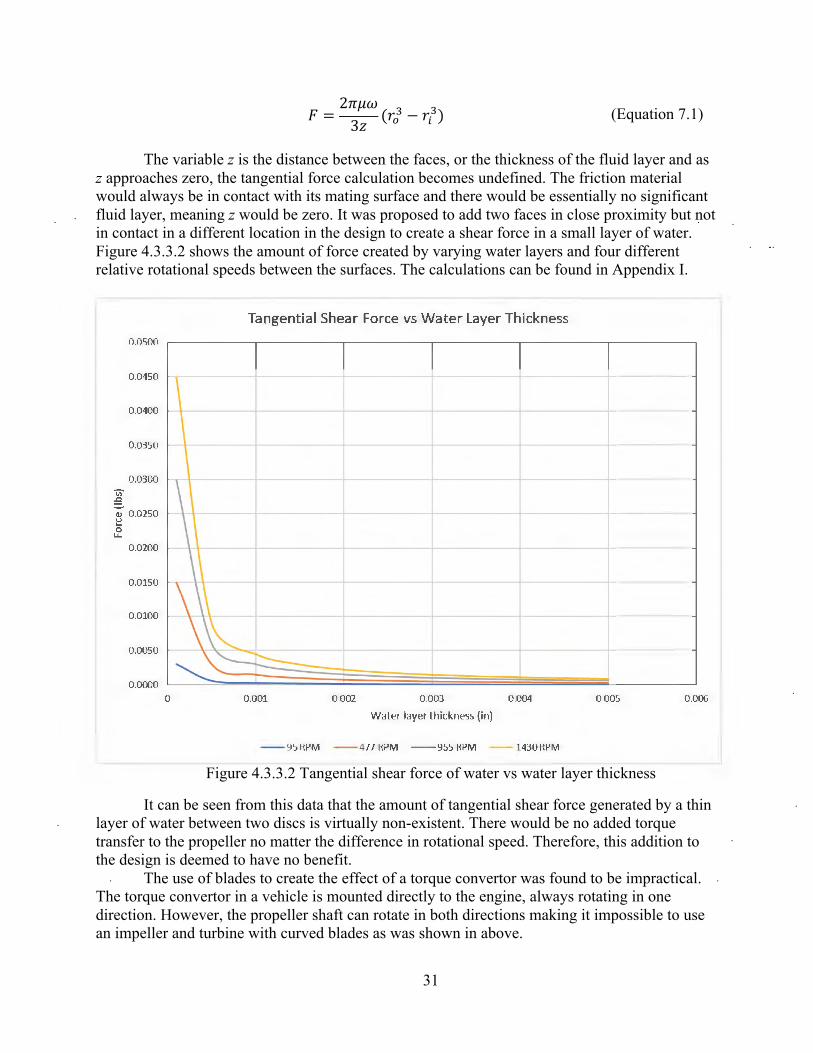
! = 2!"#3! (!!! − !!!) (Equation 7.1)
The variable z is the distance between the faces, or the thickness of the fluid layer and as
z approaches zero, the tangential force calculation becomes undefined. The friction material would always be in contact with its mating surface and there would be essentially no significant fluid layer, meaning z would be zero. It was proposed to add two faces in close proximity but not in contact in a different location in the design to create a shear force in a small layer of water. Figure 4.3.3.2 shows the amount of force created by varying water layers and four different relative rotational speeds between the surfaces. The calculations can be found in Appendix I.
Figure 4.3.3.2 Tangential shear force of water vs water layer thickness
It can be seen from this data that the amount of tangential shear force generated by a thin layer of water between two discs is virtually non-existent. There would be no added torque transfer to the propeller no matter the difference in rotational speed. Therefore, this addition to the design is deemed to have no benefit.
The use of blades to create the effect of a torque convertor was found to be impractical. The torque convertor in a vehicle is mounted directly to the engine, always rotating in one direction. However, the propeller shaft can rotate in both directions making it impossible to use an impeller and turbine with curved blades as was shown in above.
Tangential Shear Force vs Water Layer Thickness 0.0500
0.0450
0.0400
0.0350
0.0300 vi' _i::,_
Q) 0.0250 ::: 0
L.L.
0.0200
0.0150
0.0100
0.0050
0.0000 0 0.001 0.002 0.003 0.004 0.005 0.006
Water layer thickness (in)
--95 RPM --477 RPM --955 RPM -- 1430 RPM
32
Overall, Design #4 may be feasible, but much more extensive design work would be needed. In principle, while the propeller was rotating, enough force on the friction material could be generated, but there may be a problem with rapid acceleration creating unnecessary slippage for an extended length of time. The fact that it must operate in both directions, that acceleration limitations are impractical, and that the size constraints imposed create much added complexity to this design, would render it most likely not a cost-effective option.
Conclusion A total of four concepts were explored. Unfortunately, no implementable design was
discovered. The friction concept with magnets proved infeasible due to the inadequate magnetic forces. The steel-steel mating surfaces presented great difficulty in the manufacture of the design. The rubber-rubber mating surfaces did not agree with predicted theory but ended up becoming inconclusive and requires further investigation. The centrifugal mechanism provided great theoretical analysis but was found to be impractical. Of the four novel mechanisms explored only one mechanism could benefit from further investigation that being the rubber-rubber mating rings.
33
Appendix A. Original Request for Proposal
Introduction Honda Power Equipment is issuing this request for proposal to address a common complaint from its valued customers. Common boat propellers are equipped with a rubber shear bushing which protects the gearbox, by shearing under an excessive amount of torque. Once this happens, the operator can only move at a low speed, inhibiting mobility and possibly becoming a safety concern. The current measure is not easily field-serviceable and requires replacement of the entire propeller hub. The company wishes to upgrade this design as described below for the Honda BF8A outboard motor only. Project proposals must be submitted before 5:30 PM on November 15, 2018.
Objectives Whenever a boat propeller is fouled by submerged objects such as rope, netting or seaweed, or strikes a solid object, such as a log or a rock, a sudden torque overload is imposed on the propeller drivetrain. To avoid internal damage, the propeller hub utilizes a rubber bushing which shears between the propeller and driveshaft. However, after this event occurs and the propeller is cleared, the rubber bushing used currently allows only minimal transmission of torque to the propeller, permitting low speeds only, and is not easily field serviceable. The proposed design must still release in the event of torque overload, but it must be easily field serviceable or resettable. A replaceable design must be able to be replaced anywhere, with minimal tools or effort. A resettable design must easily reset, either manually or automatically.
A secondary function of the rubber shear bushing is vibration isolation between the propeller and drivetrain. These vibrations can cause unnecessary noise and premature wear, so it is imperative that the proposed design still include this function.
Parts and assemblies that are submerged for long periods of time, especially in saltwater, are at a high risk of corrosion. The proposed design must not corrode, risking breakdown, malfunction or hinderance of service due to seized components.
This shear system will allow Honda Power Equipment to provide an alternative for its customers who would rather not replace the entire propeller hub assembly. Its high quality will equal that of the rest of Honda Power Equipment’s products, for which they are renowned. The proposed design will be a replacement for the shear bushing and/or the sleeve to which it is vulcanized. A new propeller design may be included in the proposal, as long as the shear system can be easily removed from and reinstalled in it. No changes are to be made to the driveshaft itself. This proposed change will be made an option on the Honda BF8A outboard motor only, and if successful, may be expanded to other models.
Requirements At a minimum, proposals must include an overview of the proposing organization, the proposed design and justification for it, key technical specifications, and any limitations to the Project Scope. A proposed schedule with important milestones and a budget should also be included. All project proposals will be submitted by Thursday, November 15, 2018 at 5:30 PM as a bound hard copy. Any late submissions will not be reviewed. Bids will be reviewed for completeness before their content is considered.
Selection Criteria

34
A panel of representatives of Honda Power Equipment will first review the hard copies of the proposal, then select five finalists by individually ranking each on a scale of one to ten. These five organizations will be asked to present a functional, full-scale prototype with a method of testing, as well as a fifteen minute presentation of their proposed design. PowerPoint slides must be printed and distributed to all panel members before the presentation. They will again be ranked on a scale of one to ten, and the organization with the highest score will be awarded the contract.
Questions Concerning the RFP. Any questions or inquiries about the RFP must be received in writing prior to November 9, 2018. They may be directed to Michael Siklosi, Honda Power Equipment, at the address listed below. Any questions that are received will be responded to in writing, and copies will be provided to all potential bidders.
Timeline
Activity Date
Release of RFP October 16, 2018
Scheduling of current product demonstrations October 19, 2018
Submission of proposals November 15, 2018
Notification of finalists November 30, 2018
Finalist interviews and presentations December 5, 2018
Notification of final selection December 14, 2018
Confidentiality All information presented in this RFP, including any information that is subsequently disclosed by Honda Power Equipment during the proposal process, should be considered strictly confidential. Proposal contents will also be held strictly confidential.
Brad Maljaars Honda Power Equipment Michael Siklosi 12345 Progress Way
City, Province A1B 2C3
35
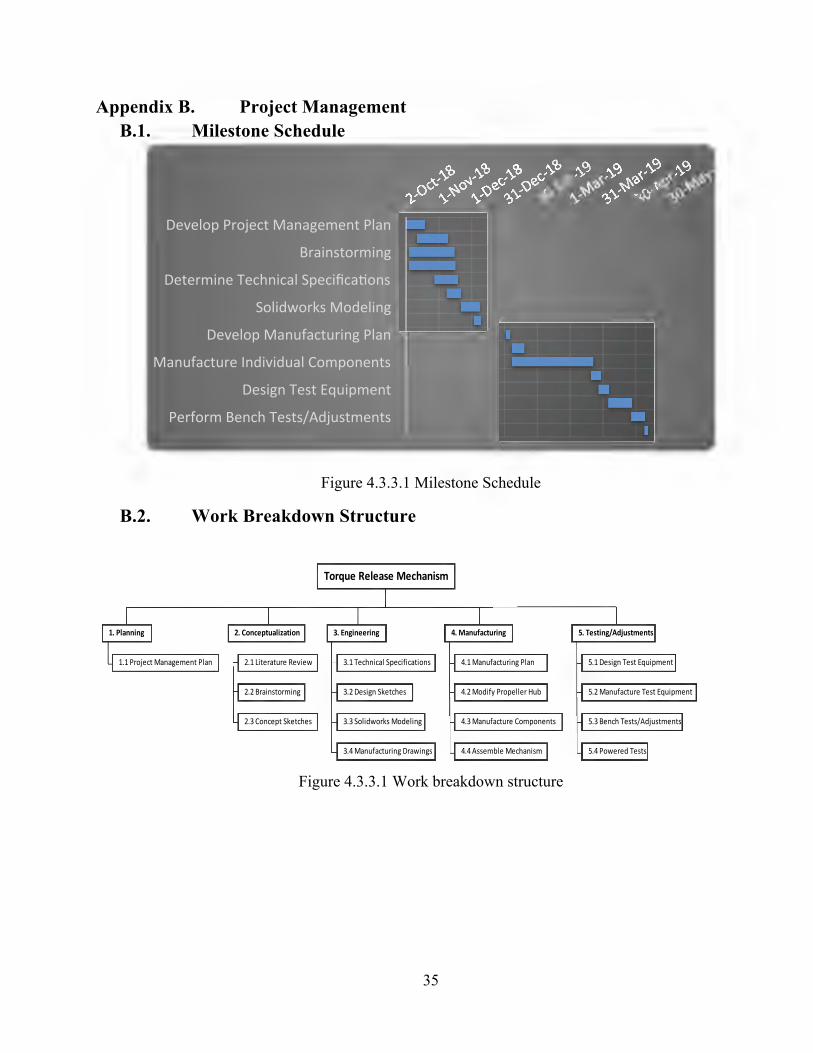
Appendix B. Project Management B.1. Milestone Schedule
Figure 4.3.3.1 Milestone Schedule
B.2. Work Breakdown Structure
Figure 4.3.3.1 Work breakdown structure
Develop!Project!Management!Plan!
Brainstorming!
Determine!Technical!Specifica,ons!
Solidworks!Modeling!
Develop!Manufacturing!Plan!
Manufacture!Individual!Components!
Design!Test!Equipment!
Perform!Bench!Tests/Adjustments!
2.2#Brainstorming
2.3#Concept#Sketches
3.#Engineering
3.2#Design#Sketches
5.1#Design#Test#Equipment
5.2#Manufacture#Test#Equipment
1.#Planning
1.1#Project#Management#Plan
2.#Conceptualization
2.1#Literature#Review 3.1#Technical#Specifications
Torque#Release#Mechanism
3.4#Manufacturing#Drawings
5.#Testing/Adjustments4.#Manufacturing
3.3#Solidworks#Modeling
4.1#Manufacturing#Plan
4.2#Modify#Propeller#Hub
4.4#Assemble#Mechanism
4.3#Manufacture#Components
5.4#Powered#Tests
5.3#Bench#Tests/Adjustments
36
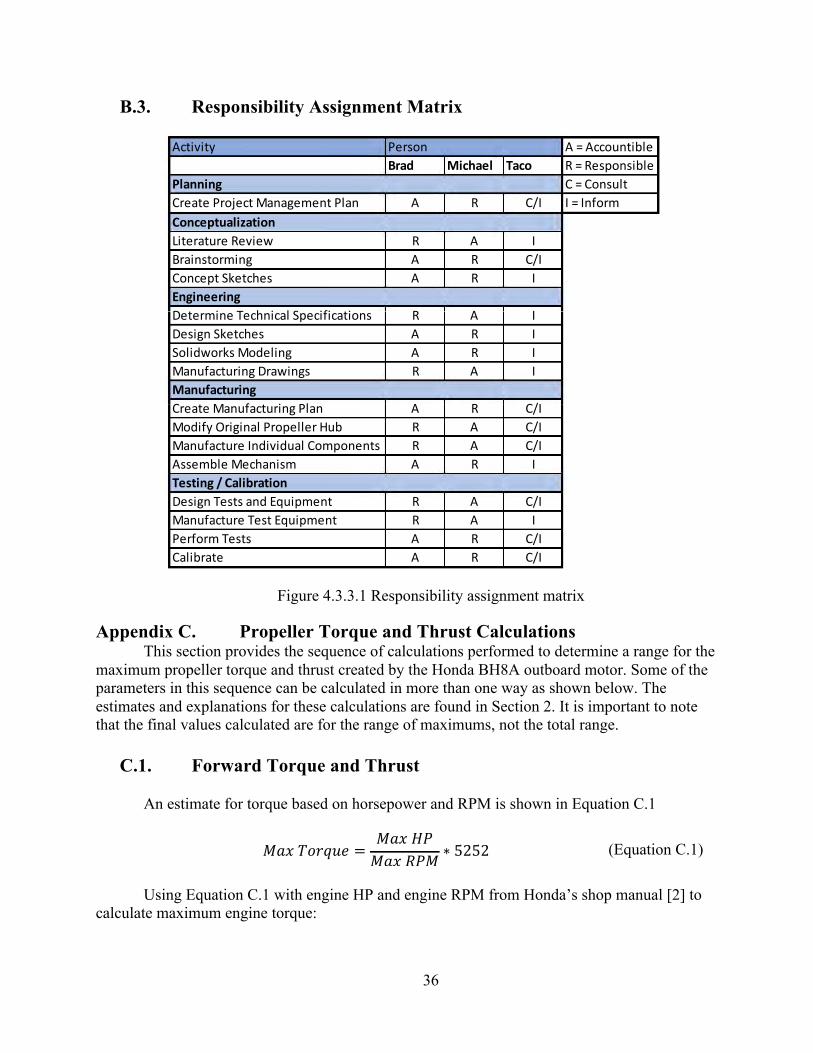
B.3. Responsibility Assignment Matrix
Figure 4.3.3.1 Responsibility assignment matrix
Appendix C. Propeller Torque and Thrust Calculations This section provides the sequence of calculations performed to determine a range for the
maximum propeller torque and thrust created by the Honda BH8A outboard motor. Some of the parameters in this sequence can be calculated in more than one way as shown below. The estimates and explanations for these calculations are found in Section 2. It is important to note that the final values calculated are for the range of maximums, not the total range.
C.1. Forward Torque and Thrust
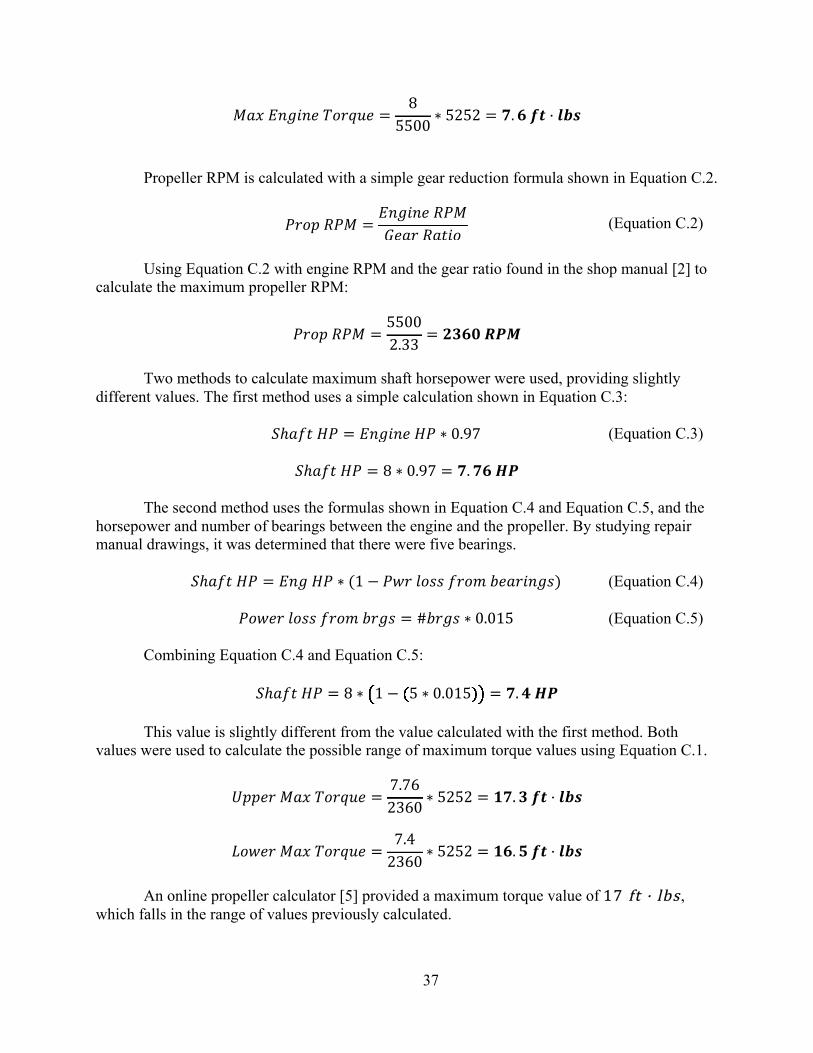
An estimate for torque based on horsepower and RPM is shown in Equation C.1
!"#!!"#$%& = !"#!!"!"#!!"# ∗ 5252 (Equation C.1)
Using Equation C.1 with engine HP and engine RPM from Honda’s shop manual [2] to
calculate maximum engine torque:
ActivityBrad% Michael Taco
PlanningCreate+Project+Management+Plan A R C/IConceptualizationLiterature+Review R A IBrainstorming A R C/IConcept+Sketches A R IEngineeringDetermine+Technical+Specifications R A IDesign+Sketches A R ISolidworks+Modeling A R IManufacturing+Drawings R A IManufacturingCreate+Manufacturing+Plan A R C/IModify+Original+Propeller+Hub R A C/IManufacture+Individual+Components R A C/IAssemble+Mechanism A R ITesting%/%CalibrationDesign+Tests+and+Equipment R A C/IManufacture+Test+Equipment R A IPerform+Tests A R C/ICalibrate A R C/I
Person A+=+AccountibleR+=+ResponsibleC+=+ConsultI+=+Inform
37
!"#!!"#$"%!!"#$%& = 85500 ∗ 5252 = !.!!!" · !"#
Propeller RPM is calculated with a simple gear reduction formula shown in Equation C.2.
!"#$!!"# = !"#$"%!!"#!"#$!!"#$% (Equation C.2)
Using Equation C.2 with engine RPM and the gear ratio found in the shop manual [2] to
calculate the maximum propeller RPM:
!"#$!!"# = 55002.33 = !"#$!!"#
Two methods to calculate maximum shaft horsepower were used, providing slightly
different values. The first method uses a simple calculation shown in Equation C.3:
!ℎ!"#!!! = !"#$"%!!" ∗ 0.97 (Equation C.3)
!ℎ!"#!!" = 8 ∗ 0.97 = !.!"!!"
The second method uses the formulas shown in Equation C.4 and Equation C.5, and the horsepower and number of bearings between the engine and the propeller. By studying repair manual drawings, it was determined that there were five bearings.
!ℎ!"#!!" = !"#!!" ∗ (1− !"#!!"##!!"#$!!"#$%&'() (Equation C.4)
!"#$%!!"##!!"#$!!"#$ = #!"#$ ∗ 0.015 (Equation C.5) Combining Equation C.4 and Equation C.5:
!ℎ!"#!!" = 8 ∗ 1− 5 ∗ 0.015 = !.!!!"
This value is slightly different from the value calculated with the first method. Both
values were used to calculate the possible range of maximum torque values using Equation C.1.
!""#$!!"#!!"#$%& = 7.762360 ∗ 5252 = !".!!!" · !"#
!"#$%!!"#!!"#$%& = 7.42360 ∗ 5252 = !".!!!" · !"#
An online propeller calculator [5] provided a maximum torque value of 17#ft # · # lbs ,
which falls in the range of values previously calculated.
( ( ))

38
A general ‘rule of thumb’ was used to calculate the propeller thrust. It uses the worst-case scenario called the Bollard Pull, which occurs when the boat is stationary relative to the water. The Bollard Pull formula is shown in Equation C.6.
!"##$%&!!"##!!ℎ!"#$ = 20!!"!30!!"# ∗ !ℎ!"#!!" (Equation C.6)
!""#$!!"#!!"!!ℎ!"#$ = 20!!"!30!!"# ∗ 7.76 = !""!!"!!""!!"#
!"#$%!!"#!!"!!ℎ!"#$ = 20!!"!30!!"# ∗ 7.4 = !"#!!"!!!!!!"#
Table C.1 Max propeller forward torque and thrust range
Max propeller torque range (forward) 16.5 - 17.3 ft # · # lbs Max propeller thrust range (forward) 148 - 233 lbs
C.2. Reverse Torque and Thrust
There are no specifications for the limited reverse operation of the BH8A. The engine
speed and horsepower were estimated to be about 1800 RPM and 2.3 HP, as outlined in Section 2. The calculations were repeated using these estimated values to determine a range for the maximum propeller torque and thrust in reverse.
Using Equation C.1:
!"#!!"#$"%!!"#$%& = 2.31800 ∗ 5252 = !.!!!" · !"#
Using Equation C.2:
!"#$!!"# = 18002.33 = !!"!!"#
Using Equation C.3: !ℎ!"#!!" = 2.3 ∗ 0.97 = !.!!!"
Combining Equation C.4 and Equation C.5:
!ℎ!"#!!" = 2.3 ∗ 1− 5 ∗ 0.015 = !.!!!"
Using Equation C.6 with the upper and lower maximum horsepower values:
( ( ))

39
!""#$!!"#!!"#$%& = 2.2773 ∗ 5252 = !"!!" · !"#
!""#$!!"#!!"#$%& = 2.1773 ∗ 5252 = !".!!!" · !"#
The online propeller calculator [5] provided a maximum torque value of 14#ft # · # lbs ,
very close to the manually calculated values. The same “Rule of Thumb” using the Bollard Pull (Equation C.6) and the range of
maximum horsepower was used to calculate the range of maximum propeller thrust in reverse.
!""#$!!"#!!"!!ℎ!"#$ = 20!!"!30!!"# ∗ 2.2 = !!!!"!!!!!"#
!"#!"!!"#!!"!!ℎ!"#$ = 20!!"!30!!"# ∗ 2.1 = !"!!"!!"!!"#
Max propeller torque range (reverse) 14 - 15 ft # · # lbs Max propeller thrust range (reverse) 42 - 66 lbs
Table C.2 Max propeller reverse torque and thrust range
Appendix D. Magnets Throughout the calculations of the magnetic force there is an assumption made: the
repulsive force of a permanent magnet is equal in magnitude to the attractive force for a given distance.
D.1. Minimum Magnetic Force Required to Achieve Required Release Torque
Estimated previously, the minimum release torque is 17 ft-lbs and the maximum
release torque is 60 ft-lbs. The size of the magnets is small therefore inadequate magnetic strength is of concern not excessive magnetic strength. It follows, the criteria of concept feasibility is the amount of magnetic force required to reach the minimum 17 ft-lbs release torque. If the magnetic forces produced cannot reach the 17 ft-lbs release torque the propeller will release too soon and be unable to propel the boat.
The two friction faces at the front of the mechanism consist of an annular ring of bronze
against an annular ring of friction material. The amount of torque that can be transmitted between the two surfaces can be described by an equation used to calculate torque capacity of a single disc friction clutch Equation D.1 [15].
! = ! !! !
!!!!!!!!!!!!!!
!! (Equation D.1)
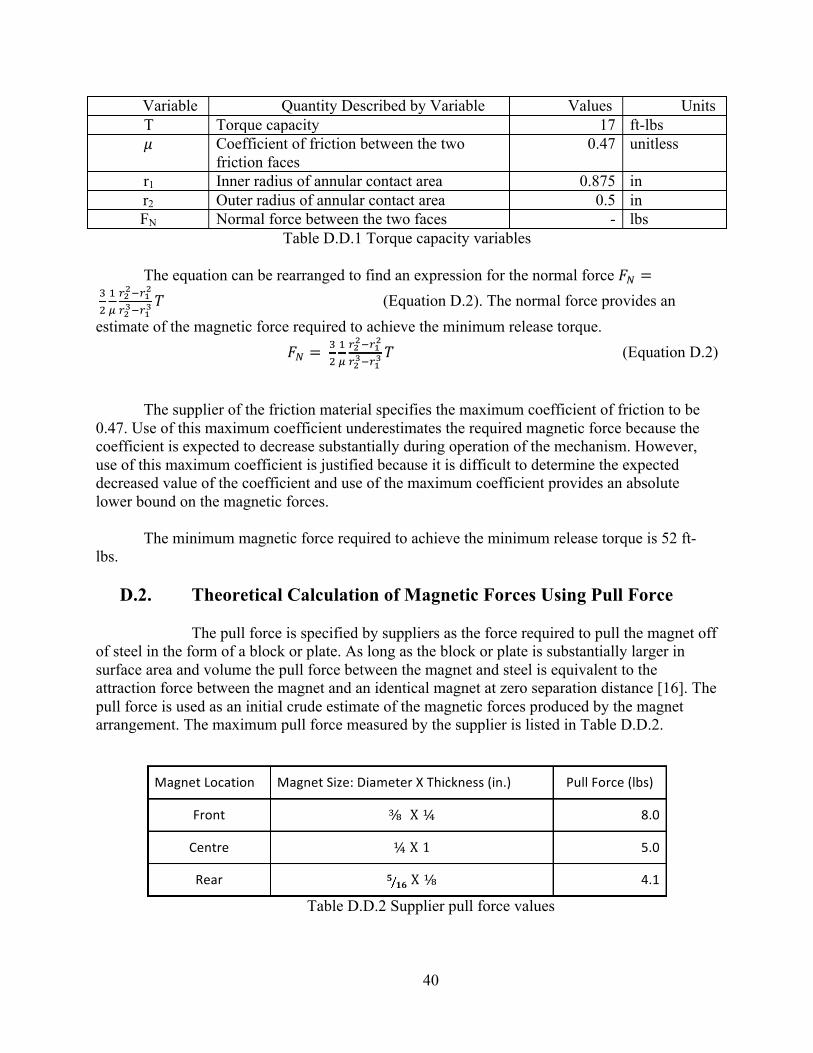
40
Variable Quantity Described by Variable Values Units T Torque capacity 17 ft-lbs ! Coefficient of friction between the two
friction faces 0.47 unitless
r1 Inner radius of annular contact area 0.875 in r2 Outer radius of annular contact area 0.5 in FN Normal force between the two faces - lbs
Table D.D.1 Torque capacity variables
The equation can be rearranged to find an expression for the normal force !! =!!!!!!!!!!!!!!!!!!!
! (Equation D.2). The normal force provides an estimate of the magnetic force required to achieve the minimum release torque.
!! = ! !!!!!!!!!!!!!!!!!!
! (Equation D.2)
The supplier of the friction material specifies the maximum coefficient of friction to be
0.47. Use of this maximum coefficient underestimates the required magnetic force because the coefficient is expected to decrease substantially during operation of the mechanism. However, use of this maximum coefficient is justified because it is difficult to determine the expected decreased value of the coefficient and use of the maximum coefficient provides an absolute lower bound on the magnetic forces.
The minimum magnetic force required to achieve the minimum release torque is 52 ft-
lbs.
D.2. Theoretical Calculation of Magnetic Forces Using Pull Force The pull force is specified by suppliers as the force required to pull the magnet off
of steel in the form of a block or plate. As long as the block or plate is substantially larger in surface area and volume the pull force between the magnet and steel is equivalent to the attraction force between the magnet and an identical magnet at zero separation distance [16]. The pull force is used as an initial crude estimate of the magnetic forces produced by the magnet arrangement. The maximum pull force measured by the supplier is listed in Table D.D.2.
Magnet!Location! Magnet!Size:!Diameter!X!Thickness!(in.)! Pull!Force!(lbs)!
Front! ⅜ X ¼ 8.0!
Centre! ¼ X 1 5.0!
Rear! ! !" X ⅛ 4.1!
Table D.D.2 Supplier pull force values
I

41
The magnet location will now be used to refer to the magnet sizes. Since the pull force is the same the force between two identical magnets, the pull force can be used to provide a lower and upper bound for the force between magnets of differing sizes.
The magnetic force between two front magnets is 8 lbs. The magnetic force between a
front magnet and a centre magnet will be less than 8 lbs because a centre magnet provides less force than a middle magnet. The magnetic force between two centre magnets is 5 lbs. The magnetic force between a front magnet and a centre will be greater than 5 lbs because the front magnet provides greater force than a middle magnet. Therefore, the force between a front and centre magnet is between 5 and 8 lbs. An initial approximation can be obtained by assuming the force will be at the middle of the range, 6.5 lbs.
!!""#!$" = 6!!"#$%&'!×!6.5!!"# = 39!!"# (Equation D.3)#
#Similarly,# the#magnetic# force#between#a#centre#and#a#rear#magnet#will#be#between#
4.1#and#5#lbs;#an#intial#approximation#being#4.6#lbs.###
!!"#$%&" = 6!!"#$%&'!×! 4.6 !!"# = 27.6!!"# (Equation D.4)#
!!"!#$ = !!""#!$" + !!"#$%&" #=#77#lbs## # (Equation D.5)#
#The#total#force#of#the#magnet#arrangement#is#77#lbs.#The#value#overestimates#the#force#that#can#be#produced#in#the#mechanism#because#the#pull#force#assumes#zero#separation#distance.#However,#the#estimate#is#well#above#the#minimum#magnetic#force#required,#25#lbs#greater.#The#concept#is#infeasible#if#separation#of#the#magnets#causes#a##reduction#in#strength#greater#than#25#lbs.#The#use#of#pull#forces#substantiates#further#investigation#into#the#magnetic#forces.#
D.3. Theoretical Calculation of Magnetic Forces Using Contact Forces The contact force between two magnets is the force required to separate two magnets at
zero separation distance. A theoretical power series formula is published in a paper titled “Magnetostatic interactions and forces between cylindrical permanent magnets” by Vokoun, Beleggia, Heller, and Sittner [17]. The equation is valid for two cylindrical magnets of the same radius.
!! = !−4! !!!!
! !!! !!!!!!
!!!! ‼(!!)‼
!!!! !!!!!! − !!!!!! (Equation D.6)
( )
42
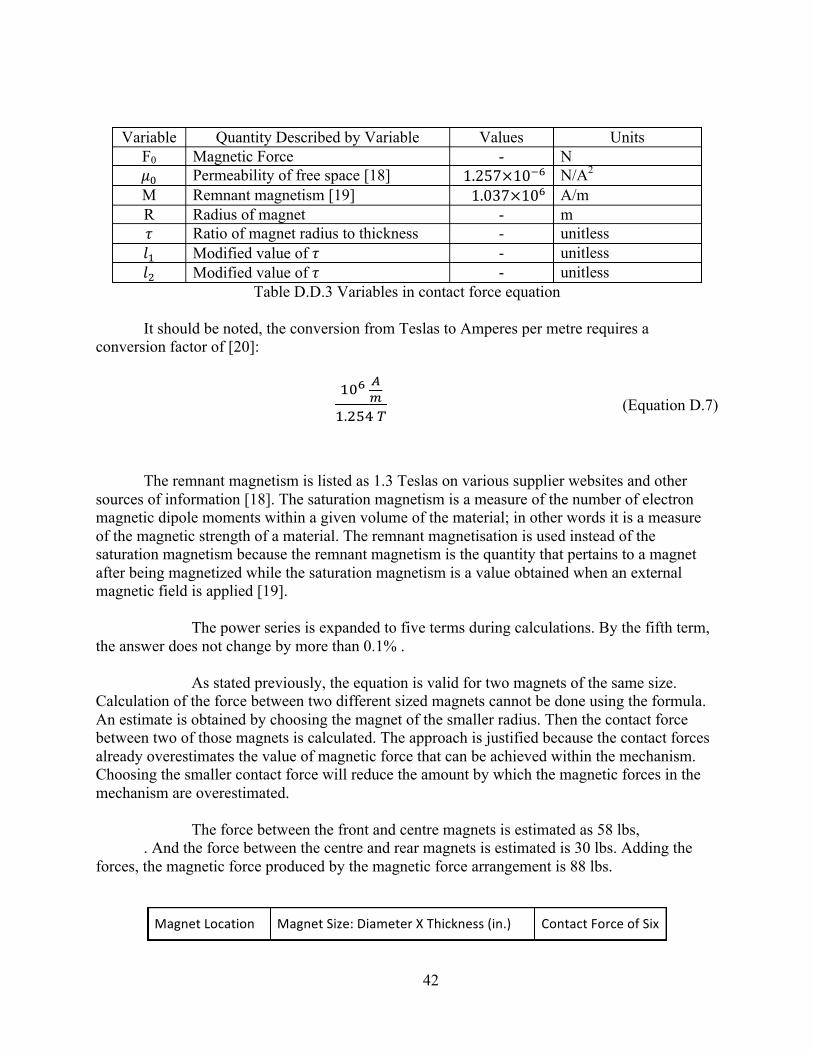
Variable Quantity Described by Variable Values Units F0 Magnetic Force - N !! Permeability of free space [18] 1.257×10!! N/A2
M Remnant magnetism [19] 1.037×10! A/m R Radius of magnet - m ! Ratio of magnet radius to thickness - unitless !! Modified value of ! - unitless !! Modified value of ! - unitless
Table D.D.3 Variables in contact force equation
It should be noted, the conversion from Teslas to Amperes per metre requires a conversion factor of [20]:
!"!!!!!.!"#!! (Equation D.7)
The remnant magnetism is listed as 1.3 Teslas on various supplier websites and other sources of information [18]. The saturation magnetism is a measure of the number of electron magnetic dipole moments within a given volume of the material; in other words it is a measure of the magnetic strength of a material. The remnant magnetisation is used instead of the saturation magnetism because the remnant magnetism is the quantity that pertains to a magnet after being magnetized while the saturation magnetism is a value obtained when an external magnetic field is applied [19].
The power series is expanded to five terms during calculations. By the fifth term, the answer does not change by more than 0.1% .
As stated previously, the equation is valid for two magnets of the same size.
Calculation of the force between two different sized magnets cannot be done using the formula. An estimate is obtained by choosing the magnet of the smaller radius. Then the contact force between two of those magnets is calculated. The approach is justified because the contact forces already overestimates the value of magnetic force that can be achieved within the mechanism. Choosing the smaller contact force will reduce the amount by which the magnetic forces in the mechanism are overestimated.
The force between the front and centre magnets is estimated as 58 lbs, . And the force between the centre and rear magnets is estimated is 30 lbs. Adding the
forces, the magnetic force produced by the magnetic force arrangement is 88 lbs.
Magnet!Location! Magnet!Size:!Diameter!X!Thickness!(in.)! Contact!Force!of!Six!
43
Magnets!(lbs)!
Front! ⅜ X ¼ 84!
Centre! ¼ X 1 58!
Rear! ! !" X ⅛ 30!
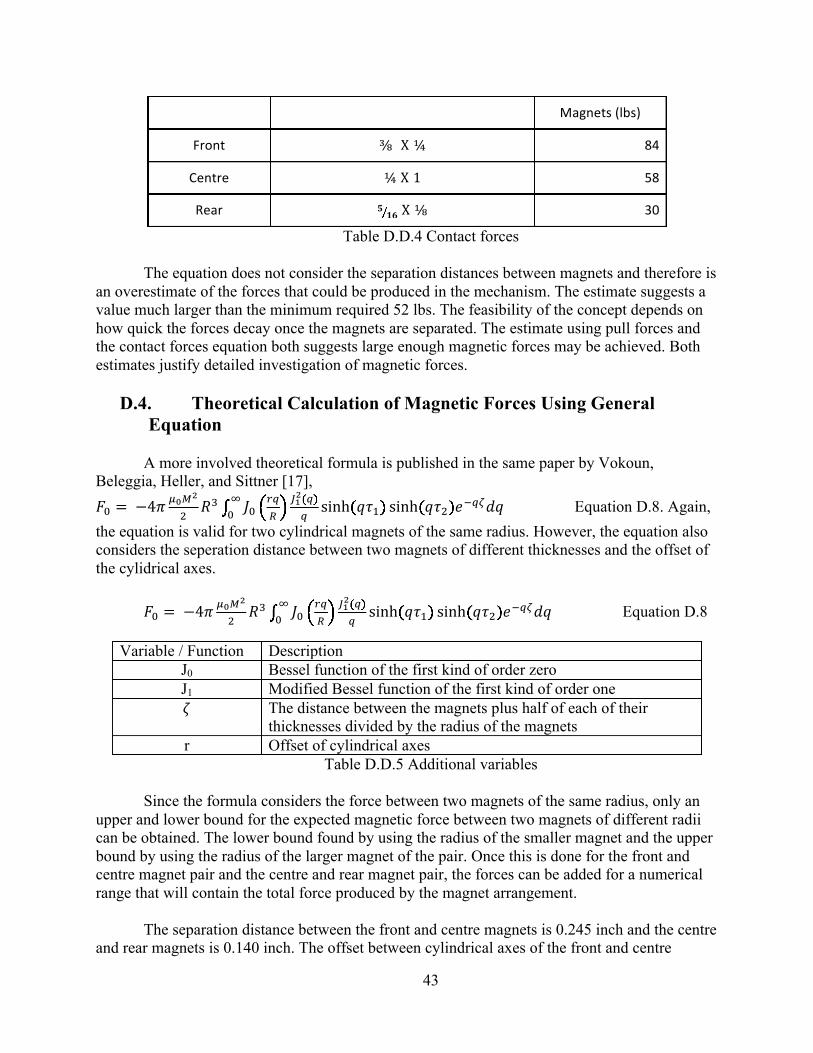
Table D.D.4 Contact forces The equation does not consider the separation distances between magnets and therefore is
an overestimate of the forces that could be produced in the mechanism. The estimate suggests a value much larger than the minimum required 52 lbs. The feasibility of the concept depends on how quick the forces decay once the magnets are separated. The estimate using pull forces and the contact forces equation both suggests large enough magnetic forces may be achieved. Both estimates justify detailed investigation of magnetic forces.
D.4. Theoretical Calculation of Magnetic Forces Using General
Equation
A more involved theoretical formula is published in the same paper by Vokoun, Beleggia, Heller, and Sittner [17], !! = !−4! !!!!
! !! !! !"!
!!! !! sinh !!!!
! sinh !!! !!!"!" Equation D.8. Again, the equation is valid for two cylindrical magnets of the same radius. However, the equation also considers the seperation distance between two magnets of different thicknesses and the offset of the cylidrical axes.
!! = !−4! !!!!
! !! !! !"!
!!! !! sinh !!!!
! sinh !!! !!!"!" Equation D.8
Variable / Function Description J0 Bessel function of the first kind of order zero J1 Modified Bessel function of the first kind of order one ! The distance between the magnets plus half of each of their
thicknesses divided by the radius of the magnets r Offset of cylindrical axes
Table D.D.5 Additional variables
Since the formula considers the force between two magnets of the same radius, only an upper and lower bound for the expected magnetic force between two magnets of different radii can be obtained. The lower bound found by using the radius of the smaller magnet and the upper bound by using the radius of the larger magnet of the pair. Once this is done for the front and centre magnet pair and the centre and rear magnet pair, the forces can be added for a numerical range that will contain the total force produced by the magnet arrangement.
The separation distance between the front and centre magnets is 0.245 inch and the centre
and rear magnets is 0.140 inch. The offset between cylindrical axes of the front and centre
I
- I (-)_u c ) c )
- I (-)_u c ) c )
44
magnets is 0.1 inch and between the centre and rear magnets is 0.06 inch. When the magnets are aligned, the offset between axes is considered to be zero.
Test 1, refer to Appendix F , was conducted to determine the magnetic force produced by
the magnetic arrangement used in the mechanism. However, the test was conducted with the magnets aligned. Theoretically, the force produced should be between 3.8 lbs and 14.6 lbs. The magnetic force measured adds to 11.8 lbs which verifies the validity of the general equation used.
Given that the general equation with zero offset has been experimentally verified during
testing, the equation is considered to be a better approximation than the use of pull forces and contact forces. Repeating the calculation of magnetic forces while considering offset of the axes predicts a range between 2.5 lbs and 12.8 lbs. The force is congruent with the expectation of a reduction in magnitude when the magnets become misaligned instead of being aligned. This estimates predicts the magnitude of force in the actual mechanism. The range of values predicts a force lower than the required 52 lbs. Therefore, the concept design is theoretically infeasible due to insufficient magnetic forces.
Appendix E. Design Review Package Note where values differ from the final report the final report is correct; differing values
are due to miscommunication between team members during the early stages of the first concept.
Project Overview Design Review Purpose The design review serves two purposes: ● Review of test readiness to examine test plans that are to be conducted ● Review of final design to receive feedback and suggestions of necessary changes
Objective and Background The objective of this project is to design and manufacture an improved torque overload protection system for a
Honda B8HA outboard boat motor.
To protect the engine and drivetrain, these propellers are rubber mounted and driven by a shear pin through the propeller shaft. The rubber absorbs shock and vibrations, and the shear pin is intended to shear before the torque created in the shaft becomes damaging. Excess torque can be created by large impacts, or by entanglement with objects like ropes, nets or seaweed. When the shear pin breaks, the motor is no longer operational. The operator must always keep at least one shear pin, one cotter pin, and the necessary tools on board.
Our design allows the operator to continue using the motor after a torque overload condition, without having to
perform any repairs. Currently we are performing tests to determine the feasibility of a magnet / friction design with no moving parts.
45
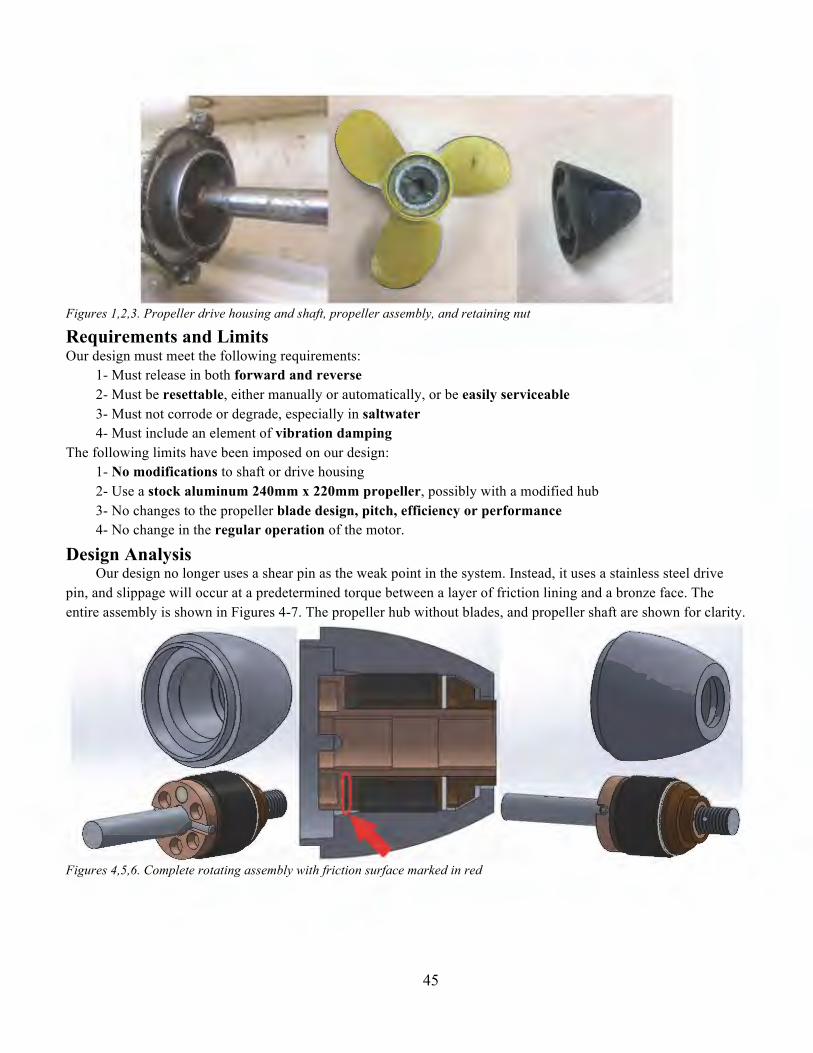
Figures 1,2,3. Propeller drive housing and shaft, propeller assembly, and retaining nut
Requirements and Limits Our design must meet the following requirements: 1- Must release in both forward and reverse 2- Must be resettable, either manually or automatically, or be easily serviceable 3- Must not corrode or degrade, especially in saltwater 4- Must include an element of vibration damping The following limits have been imposed on our design: 1- No modifications to shaft or drive housing
2- Use a stock aluminum 240mm x 220mm propeller, possibly with a modified hub 3- No changes to the propeller blade design, pitch, efficiency or performance 4- No change in the regular operation of the motor.
Design Analysis Our design no longer uses a shear pin as the weak point in the system. Instead, it uses a stainless steel drive
pin, and slippage will occur at a predetermined torque between a layer of friction lining and a bronze face. The entire assembly is shown in Figures 4-7. The propeller hub without blades, and propeller shaft are shown for clarity.
Figures 4,5,6. Complete rotating assembly with friction surface marked in red
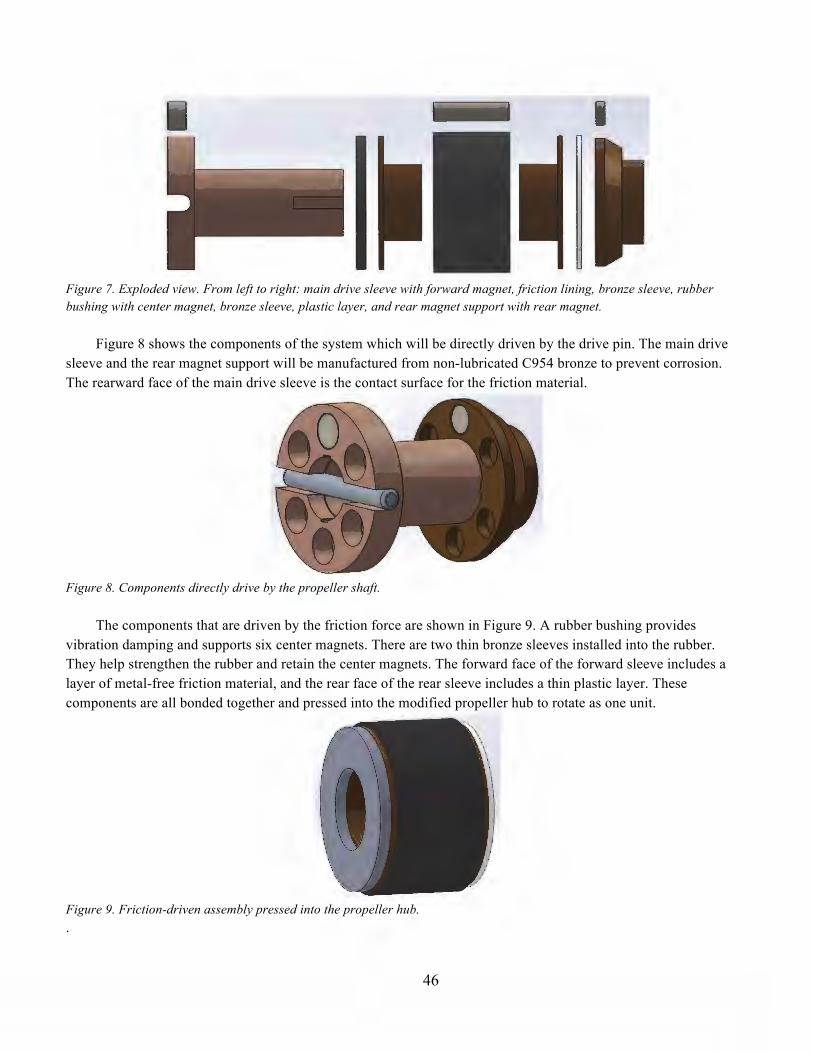
46
Figure 7. Exploded view. From left to right: main drive sleeve with forward magnet, friction lining, bronze sleeve, rubber bushing with center magnet, bronze sleeve, plastic layer, and rear magnet support with rear magnet.
Figure 8 shows the components of the system which will be directly driven by the drive pin. The main drive sleeve and the rear magnet support will be manufactured from non-lubricated C954 bronze to prevent corrosion. The rearward face of the main drive sleeve is the contact surface for the friction material.
Figure 8. Components directly drive by the propeller shaft.
The components that are driven by the friction force are shown in Figure 9. A rubber bushing provides vibration damping and supports six center magnets. There are two thin bronze sleeves installed into the rubber. They help strengthen the rubber and retain the center magnets. The forward face of the forward sleeve includes a layer of metal-free friction material, and the rear face of the rear sleeve includes a thin plastic layer. These components are all bonded together and pressed into the modified propeller hub to rotate as one unit.
Figure 9. Friction-driven assembly pressed into the propeller hub. .
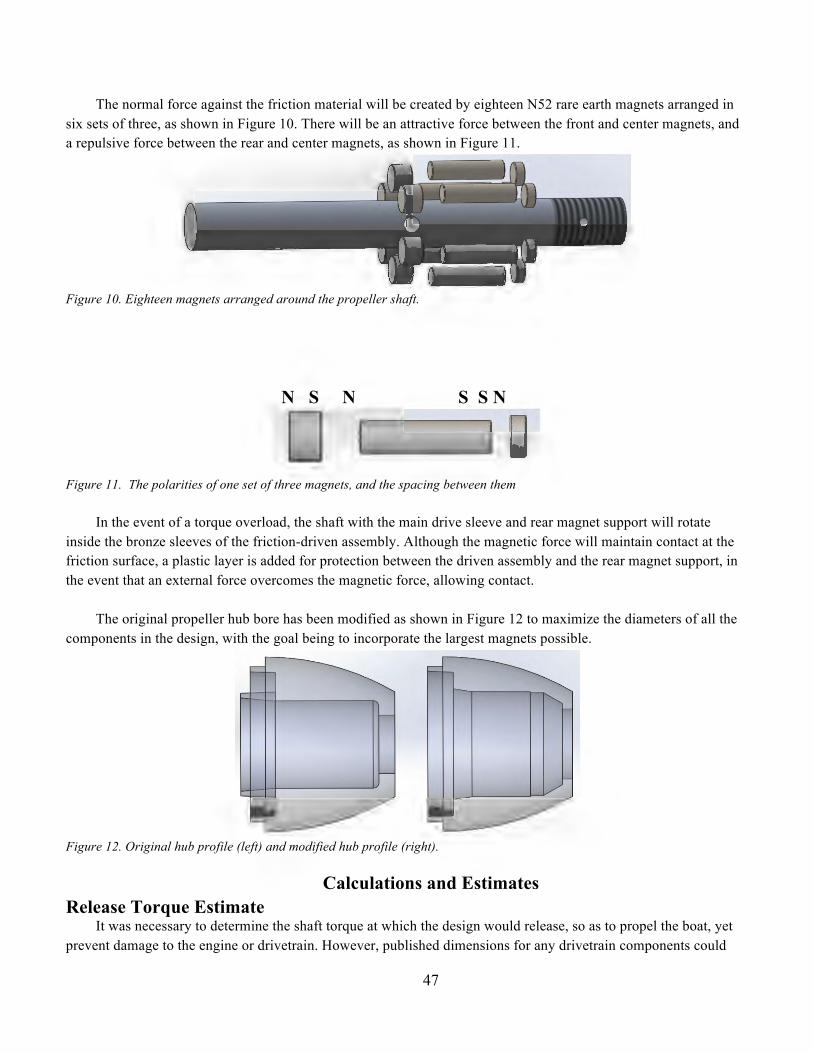
47
The normal force against the friction material will be created by eighteen N52 rare earth magnets arranged in six sets of three, as shown in Figure 10. There will be an attractive force between the front and center magnets, and a repulsive force between the rear and center magnets, as shown in Figure 11.
Figure 10. Eighteen magnets arranged around the propeller shaft. N S N S S N
Figure 11. The polarities of one set of three magnets, and the spacing between them
In the event of a torque overload, the shaft with the main drive sleeve and rear magnet support will rotate inside the bronze sleeves of the friction-driven assembly. Although the magnetic force will maintain contact at the friction surface, a plastic layer is added for protection between the driven assembly and the rear magnet support, in the event that an external force overcomes the magnetic force, allowing contact.
The original propeller hub bore has been modified as shown in Figure 12 to maximize the diameters of all the components in the design, with the goal being to incorporate the largest magnets possible.
Figure 12. Original hub profile (left) and modified hub profile (right).
Calculations and Estimates Release Torque Estimate
It was necessary to determine the shaft torque at which the design would release, so as to propel the boat, yet prevent damage to the engine or drivetrain. However, published dimensions for any drivetrain components could
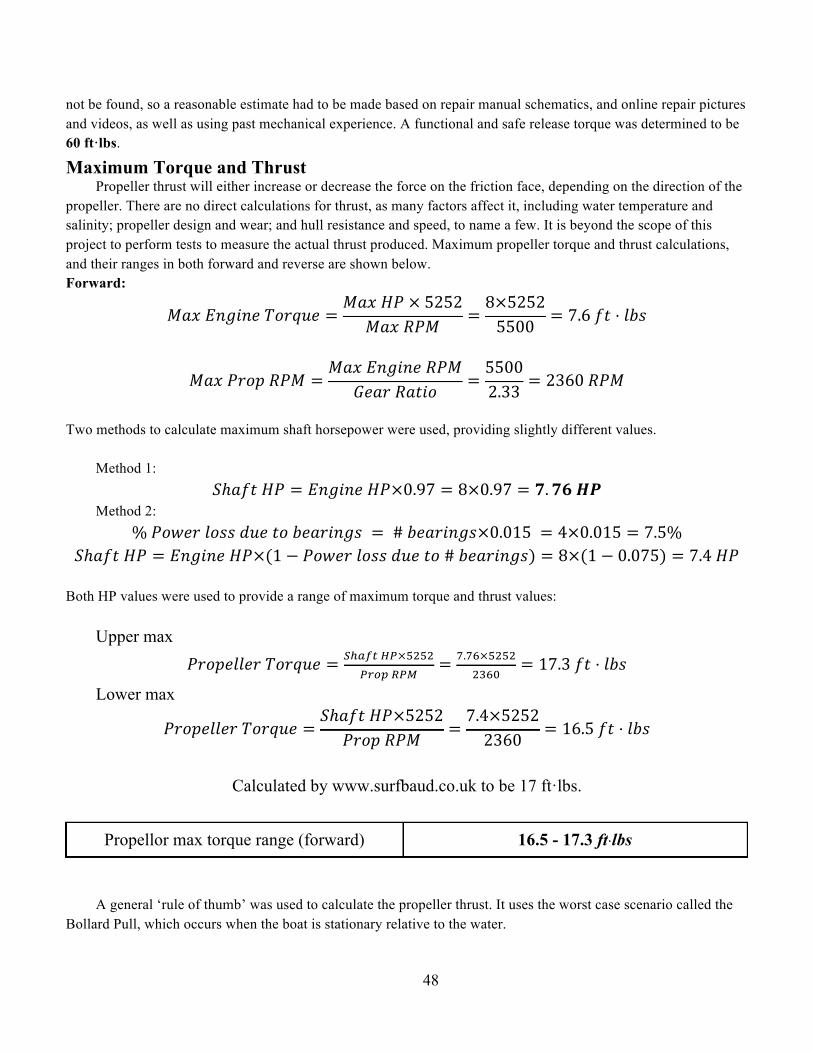
48
not be found, so a reasonable estimate had to be made based on repair manual schematics, and online repair pictures and videos, as well as using past mechanical experience. A functional and safe release torque was determined to be 60 ft·lbs.
Maximum Torque and Thrust Propeller thrust will either increase or decrease the force on the friction face, depending on the direction of the
propeller. There are no direct calculations for thrust, as many factors affect it, including water temperature and salinity; propeller design and wear; and hull resistance and speed, to name a few. It is beyond the scope of this project to perform tests to measure the actual thrust produced. Maximum propeller torque and thrust calculations, and their ranges in both forward and reverse are shown below. Forward:
!"#!!"#$"%!!"#$%& = !"#!!"!×!5252!"#!!"# = 8×5252
5500 = 7.6!!" ⋅ !"#
!"#!!"#$!!"# = !"#!!"#$"%!!"#!"#$!!"#$% = 5500
2.33 = 2360!!"#
Two methods to calculate maximum shaft horsepower were used, providing slightly different values.
Method 1: !ℎ!"#!!" = !"#$"%!!"×0.97 = 8×0.97 = !.!"!!"
Method 2: %!!"#$%!!"##!!"#!!"!!"#$%&'(! = !#!!"#$%&'(×0.015! = 4×0.015 = 7.5%
!ℎ!"#!!" = !"#$"%!!"×(1 − !"#$%!!"##!!"#!!"!#!!"#$%&'() = 8×(1 − 0.075) = 7.4!!" Both HP values were used to provide a range of maximum torque and thrust values:
Upper max !"#$%&&%"!!"#$%& = !!!"#!!"×!"!"
!"#$!!"# = !.!"×!"!"!"#$ = 17.3!!" ⋅ !"#
Lower max
!"#$%&&%"!!"#$%& = !ℎ!"#!!"×5252!"#$!!"# = 7.4×5252
2360 = 16.5!!" ⋅ !"#
Calculated by www.surfbaud.co.uk to be 17 ft·lbs.
Propellor max torque range (forward) 16.5 - 17.3 ft⋅lbs
A general ‘rule of thumb’ was used to calculate the propeller thrust. It uses the worst case scenario called the Bollard Pull, which occurs when the boat is stationary relative to the water.
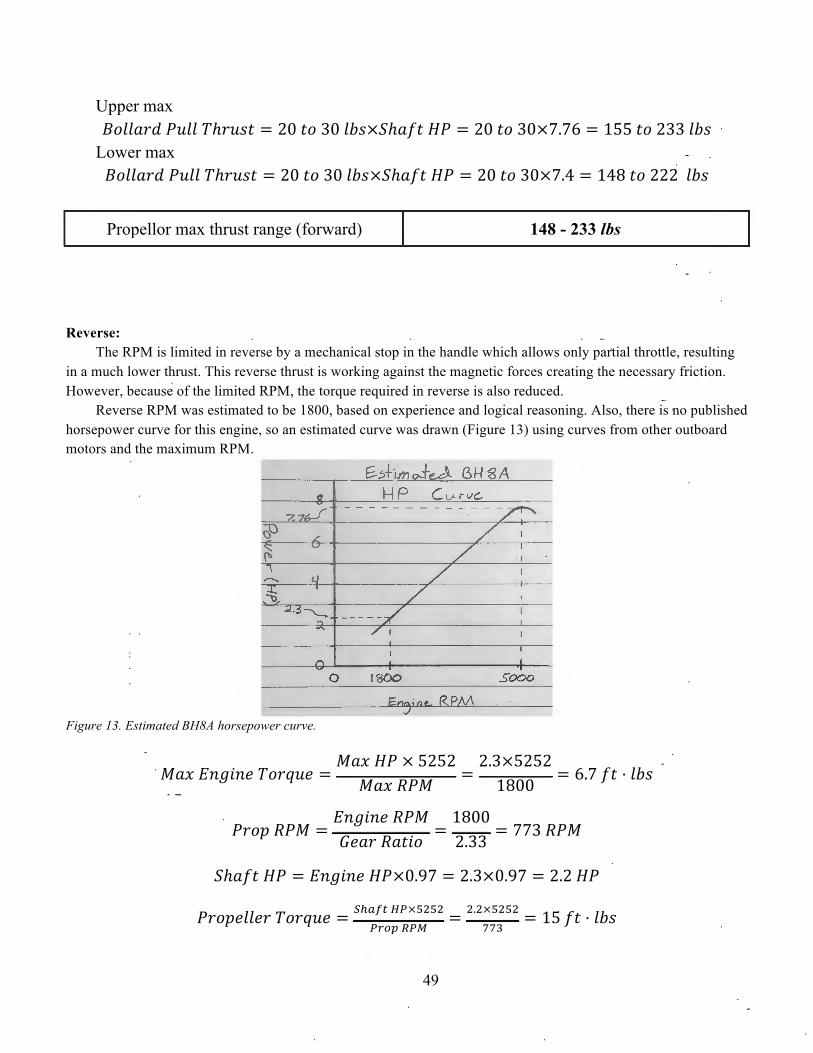
49
Upper max !"##$%&!!"##!!ℎ!"#$ = 20!!"!30!!"#×!ℎ!"#!!" = 20!!"!30×7.76 = 155!!"!233!!"#
Lower max !"##$%&!!"##!!ℎ!"#$ = 20!!"!30!!"#×!ℎ!"#!!" = 20!!"!30×7.4 = 148!!"!222!!!"#
Propellor max thrust range (forward) 148 - 233 lbs Reverse:
The RPM is limited in reverse by a mechanical stop in the handle which allows only partial throttle, resulting in a much lower thrust. This reverse thrust is working against the magnetic forces creating the necessary friction. However, because of the limited RPM, the torque required in reverse is also reduced.
Reverse RPM was estimated to be 1800, based on experience and logical reasoning. Also, there is no published horsepower curve for this engine, so an estimated curve was drawn (Figure 13) using curves from other outboard motors and the maximum RPM.
Figure 13. Estimated BH8A horsepower curve.
!"#!!"#$"%!!"#$%& = !"#!!"!×!5252!"#!!"# = 2.3×5252
1800 = 6.7!!" ⋅ !"#
!"#$!!"# = !"#$"%!!"#!"#$!!"#$% = 1800
2.33 = 773!!"#
!ℎ!"#!!" = !"#$"%!!"×0.97 = 2.3×0.97 = 2.2!!"
!"#$%&&%"!!"#$%& = !!!"#!!"×!"!"!"#$!!"# = !.!×!"!"
!!" = 15!!" ⋅ !"#
0 1800 sooo ------E:~ioe. RPM
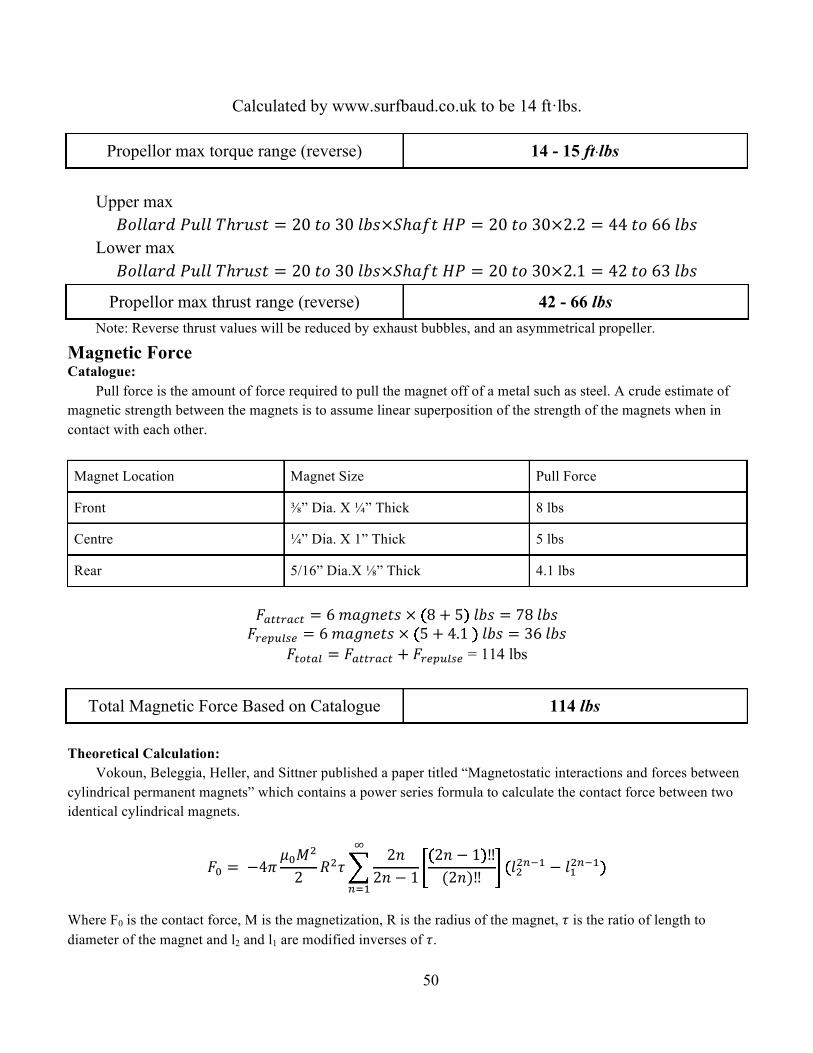
50
Calculated by www.surfbaud.co.uk to be 14 ft·lbs.
Propellor max torque range (reverse) 14 - 15 ft⋅lbs Upper max
!"##$%&!!"##!!ℎ!"#$ = 20!!"!30!!"#×!ℎ!"#!!" = 20!!"!30×2.2 = 44!!"!66!!"# Lower max
!"##$%&!!"##!!ℎ!"#$ = 20!!"!30!!"#×!ℎ!"#!!" = 20!!"!30×2.1 = 42!!"!63!!"#
Propellor max thrust range (reverse) 42 - 66 lbs Note: Reverse thrust values will be reduced by exhaust bubbles, and an asymmetrical propeller.
Magnetic Force Catalogue:
Pull force is the amount of force required to pull the magnet off of a metal such as steel. A crude estimate of magnetic strength between the magnets is to assume linear superposition of the strength of the magnets when in contact with each other.
Magnet Location Magnet Size Pull Force
Front ⅜” Dia. X ¼” Thick 8 lbs
Centre ¼” Dia. X 1” Thick 5 lbs
Rear 5/16” Dia.X ⅛” Thick 4.1 lbs
!!""#!$" = 6!!"#$%&'!×! 8+ 5 !!"# = 78!!"# !!"#$%&" = 6!!"#$%&'!×! 5+ 4.1! !!"# = 36!!"#
!!"!#$ = !!""#!$" + !!"#$%&" = 114 lbs
Total Magnetic Force Based on Catalogue 114 lbs Theoretical Calculation:
Vokoun, Beleggia, Heller, and Sittner published a paper titled “Magnetostatic interactions and forces between cylindrical permanent magnets” which contains a power series formula to calculate the contact force between two identical cylindrical magnets.
!! = !−4!!!!!
2 !!! 2!2! − 1
2! − 1 ‼(2!)‼ !!!!!! − !!!!!!
!
!!!
Where F0 is the contact force, M is the magnetization, R is the radius of the magnet, ! is the ratio of length to diameter of the magnet and l2 and l1 are modified inverses of !.
( ) ( )
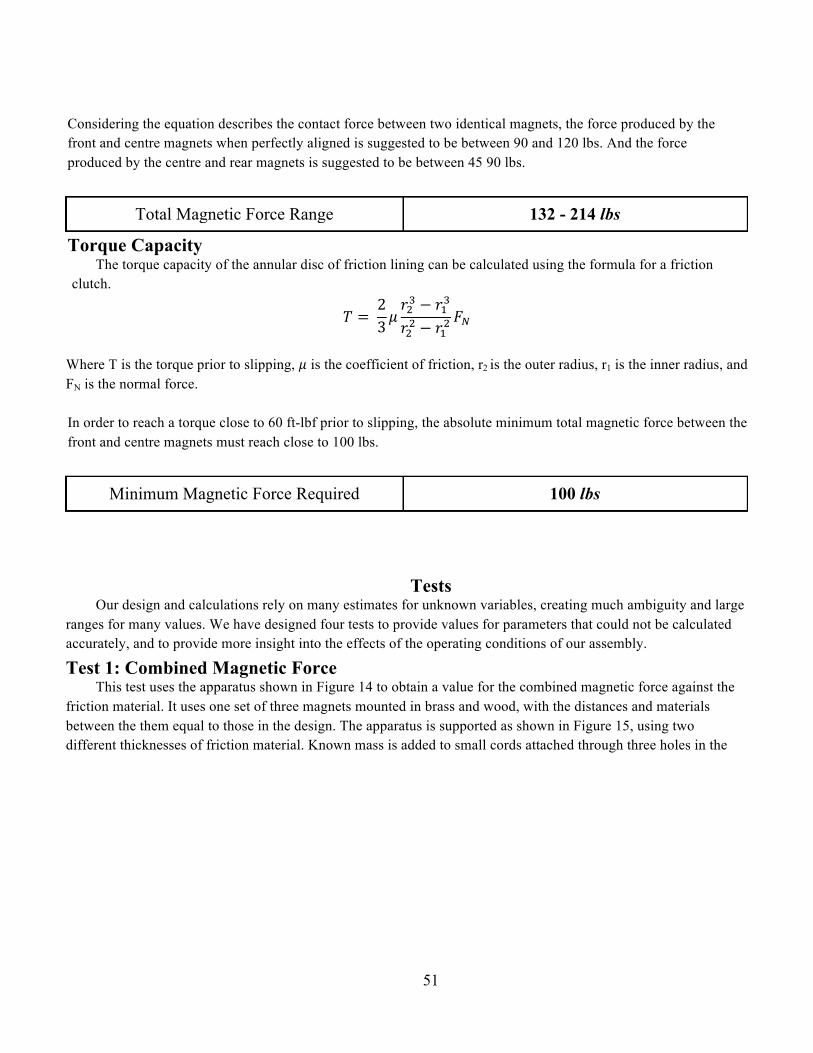
51
Considering the equation describes the contact force between two identical magnets, the force produced by the front and centre magnets when perfectly aligned is suggested to be between 90 and 120 lbs. And the force produced by the centre and rear magnets is suggested to be between 45 90 lbs.
Total Magnetic Force Range 132 - 214 lbs
Torque Capacity The torque capacity of the annular disc of friction lining can be calculated using the formula for a friction
clutch.
! = !23 !!!! − !!!!!! − !!!
!!
Where T is the torque prior to slipping, ! is the coefficient of friction, r2 is the outer radius, r1 is the inner radius, and FN is the normal force. In order to reach a torque close to 60 ft-lbf prior to slipping, the absolute minimum total magnetic force between the front and centre magnets must reach close to 100 lbs.
Minimum Magnetic Force Required 100 lbs
Tests
Our design and calculations rely on many estimates for unknown variables, creating much ambiguity and large ranges for many values. We have designed four tests to provide values for parameters that could not be calculated accurately, and to provide more insight into the effects of the operating conditions of our assembly.
Test 1: Combined Magnetic Force This test uses the apparatus shown in Figure 14 to obtain a value for the combined magnetic force against the
friction material. It uses one set of three magnets mounted in brass and wood, with the distances and materials between the them equal to those in the design. The apparatus is supported as shown in Figure 15, using two different thicknesses of friction material. Known mass is added to small cords attached through three holes in the

52
bottom to the moveable assembly, until it breaks free.
Figures 14, 15. Tests 1 and 2 apparatus. Apparatus orientation for Test 1, showing cords in red.
Test 2: Friction Force Using the same apparatus as Test 1, supported at right angles, Test 2 determines the linear friction force created by one set of magnets on one sixth of the surface area of the friction material. A small cord is tied directly around the friction material, as shown in Figure 16, and mass is added until the moveable assembly begins to slide. The mass of the moveable assembly is then subtracted from this value. It can be translated into the maximum release torque by multiplying it by six, then by the radius representing half of the friction surface area. This test is repeated wet and dry, for two different thicknesses of friction material.
Figure 16. Apparatus orientation for Test 2, showing cord from which mass is suspended in red.
L._.J I I
L ,..J
I
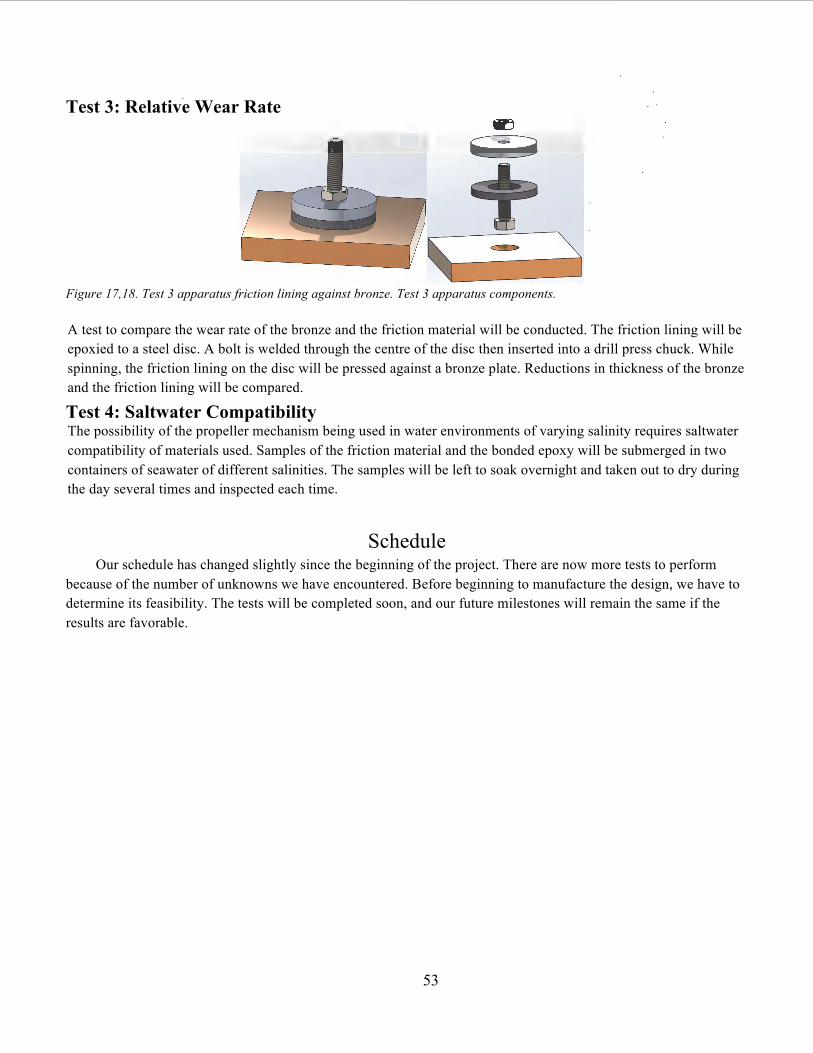
53
Test 3: Relative Wear Rate
Figure 17,18. Test 3 apparatus friction lining against bronze. Test 3 apparatus components. A test to compare the wear rate of the bronze and the friction material will be conducted. The friction lining will be epoxied to a steel disc. A bolt is welded through the centre of the disc then inserted into a drill press chuck. While spinning, the friction lining on the disc will be pressed against a bronze plate. Reductions in thickness of the bronze and the friction lining will be compared.
Test 4: Saltwater Compatibility The possibility of the propeller mechanism being used in water environments of varying salinity requires saltwater compatibility of materials used. Samples of the friction material and the bonded epoxy will be submerged in two containers of seawater of different salinities. The samples will be left to soak overnight and taken out to dry during the day several times and inspected each time.
Schedule Our schedule has changed slightly since the beginning of the project. There are now more tests to perform
because of the number of unknowns we have encountered. Before beginning to manufacture the design, we have to determine its feasibility. The tests will be completed soon, and our future milestones will remain the same if the results are favorable.
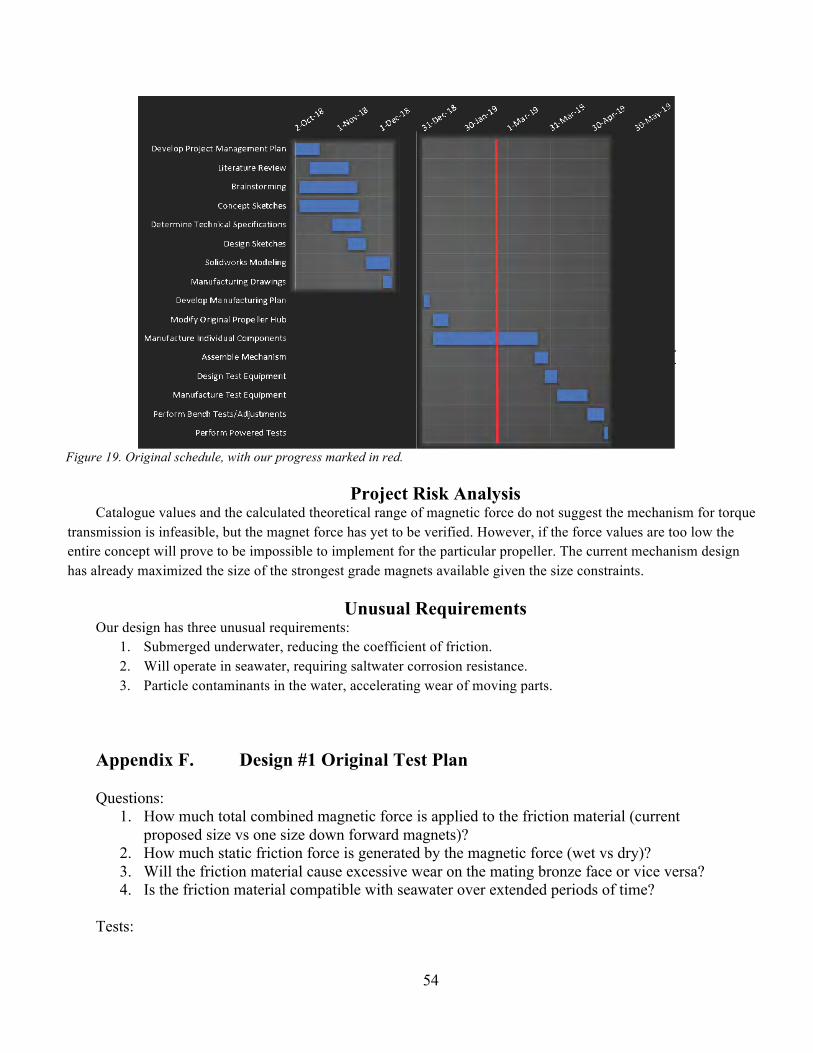
54
Figure 19. Original schedule, with our progress marked in red.
Project Risk Analysis Catalogue values and the calculated theoretical range of magnetic force do not suggest the mechanism for torque transmission is infeasible, but the magnet force has yet to be verified. However, if the force values are too low the entire concept will prove to be impossible to implement for the particular propeller. The current mechanism design has already maximized the size of the strongest grade magnets available given the size constraints.
Unusual Requirements Our design has three unusual requirements:
1. Submerged underwater, reducing the coefficient of friction. 2. Will operate in seawater, requiring saltwater corrosion resistance. 3. Particle contaminants in the water, accelerating wear of moving parts.
Appendix F. Design #1 Original Test Plan
Questions: 1. How much total combined magnetic force is applied to the friction material (current
proposed size vs one size down forward magnets)? 2. How much static friction force is generated by the magnetic force (wet vs dry)? 3. Will the friction material cause excessive wear on the mating bronze face or vice versa? 4. Is the friction material compatible with seawater over extended periods of time?
Tests:
Develop Project Management Plan
Literature Review
Brainstorming
Concept Sketches
Determine Technical Specifications
Design Sketches
Solidworks Modeling
Manufacturing Drawings
Develop Manufacturing Plan
Modify Original Propeller Hub
Manufacture Individual Components
Asserr,ble Mechanism
Design Test Equipment
Mar,ufacture Test Equipment
Perform Bench Tests/Adjustments
Per for rr, Powered Tests

55
1. Magnetic Force Produced by Magnet Arrangement 2. Static Friction Force Generated by Magnets 3. Wear Characteristics of Friction Material and Bronze 4. Compatibility of Friction Material with Saltwater
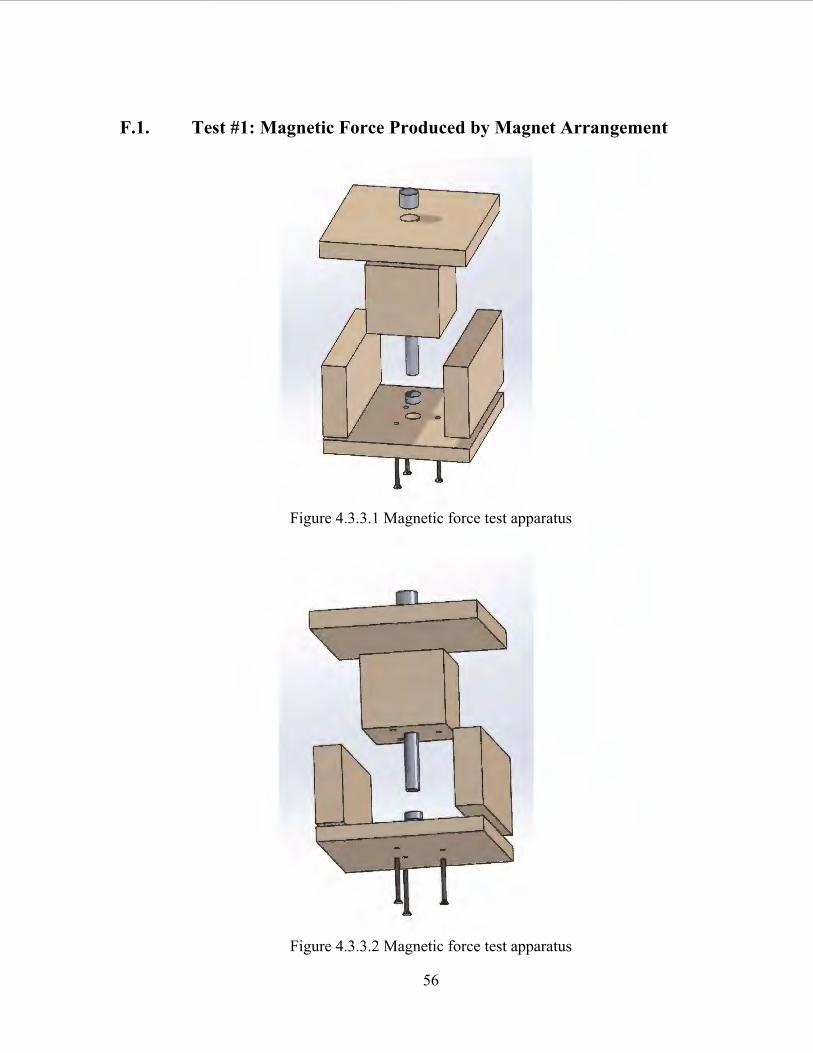
56
F.1. Test #1: Magnetic Force Produced by Magnet Arrangement
Figure 4.3.3.1 Magnetic force test apparatus
Figure 4.3.3.2 Magnetic force test apparatus
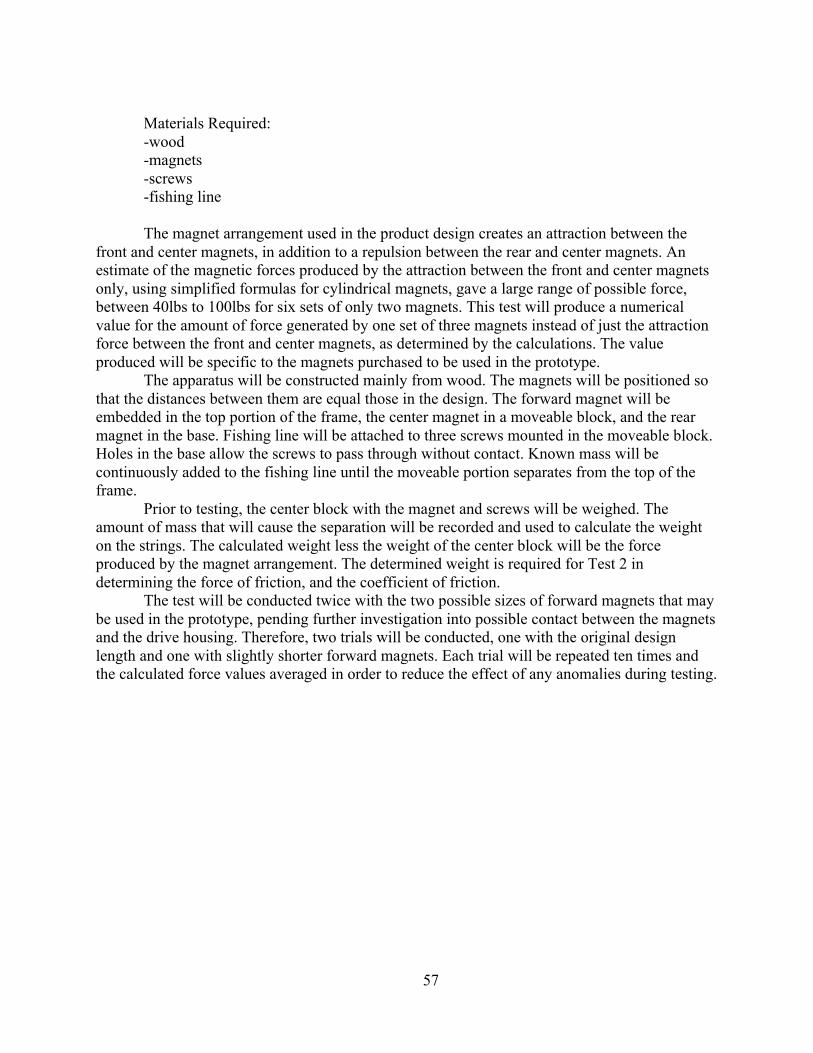
57
Materials Required: -wood -magnets -screws -fishing line The magnet arrangement used in the product design creates an attraction between the
front and center magnets, in addition to a repulsion between the rear and center magnets. An estimate of the magnetic forces produced by the attraction between the front and center magnets only, using simplified formulas for cylindrical magnets, gave a large range of possible force, between 40lbs to 100lbs for six sets of only two magnets. This test will produce a numerical value for the amount of force generated by one set of three magnets instead of just the attraction force between the front and center magnets, as determined by the calculations. The value produced will be specific to the magnets purchased to be used in the prototype.
The apparatus will be constructed mainly from wood. The magnets will be positioned so that the distances between them are equal those in the design. The forward magnet will be embedded in the top portion of the frame, the center magnet in a moveable block, and the rear magnet in the base. Fishing line will be attached to three screws mounted in the moveable block. Holes in the base allow the screws to pass through without contact. Known mass will be continuously added to the fishing line until the moveable portion separates from the top of the frame.
Prior to testing, the center block with the magnet and screws will be weighed. The amount of mass that will cause the separation will be recorded and used to calculate the weight on the strings. The calculated weight less the weight of the center block will be the force produced by the magnet arrangement. The determined weight is required for Test 2 in determining the force of friction, and the coefficient of friction.
The test will be conducted twice with the two possible sizes of forward magnets that may be used in the prototype, pending further investigation into possible contact between the magnets and the drive housing. Therefore, two trials will be conducted, one with the original design length and one with slightly shorter forward magnets. Each trial will be repeated ten times and the calculated force values averaged in order to reduce the effect of any anomalies during testing.
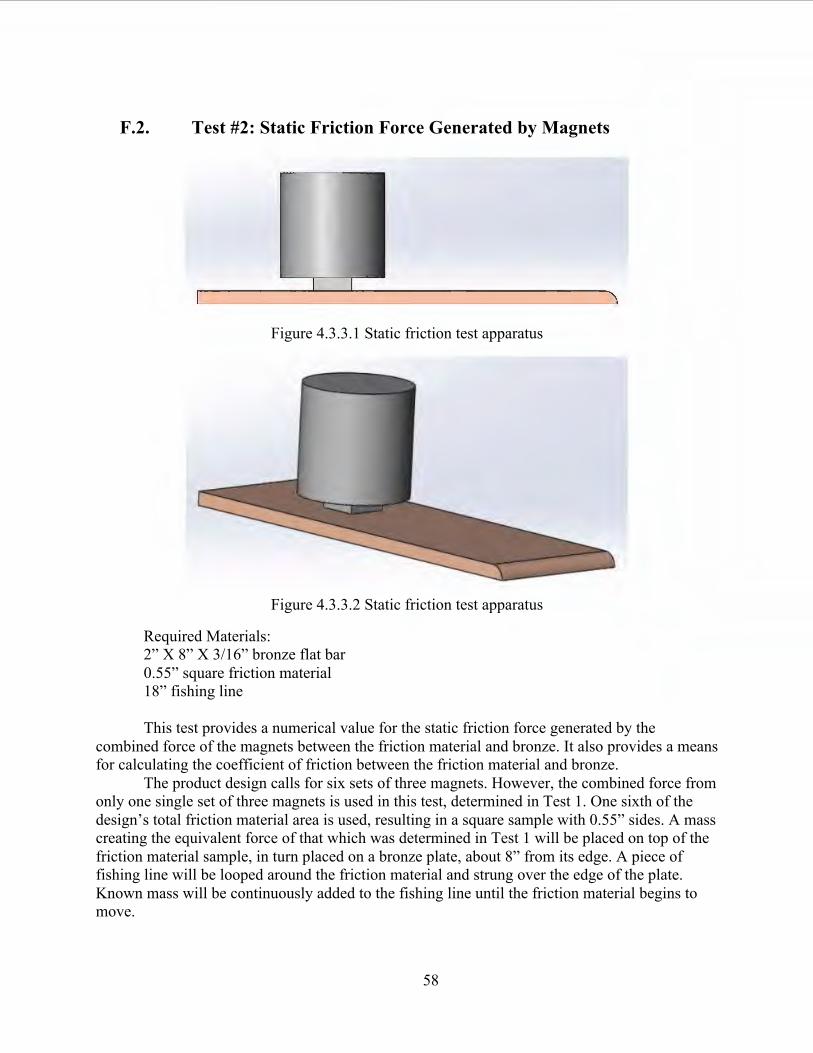
58
F.2. Test #2: Static Friction Force Generated by Magnets
Figure 4.3.3.1 Static friction test apparatus
Figure 4.3.3.2 Static friction test apparatus
Required Materials: 2” X 8” X 3/16” bronze flat bar 0.55” square friction material 18” fishing line This test provides a numerical value for the static friction force generated by the
combined force of the magnets between the friction material and bronze. It also provides a means for calculating the coefficient of friction between the friction material and bronze.
The product design calls for six sets of three magnets. However, the combined force from only one single set of three magnets is used in this test, determined in Test 1. One sixth of the design’s total friction material area is used, resulting in a square sample with 0.55” sides. A mass creating the equivalent force of that which was determined in Test 1 will be placed on top of the friction material sample, in turn placed on a bronze plate, about 8” from its edge. A piece of fishing line will be looped around the friction material and strung over the edge of the plate. Known mass will be continuously added to the fishing line until the friction material begins to move.
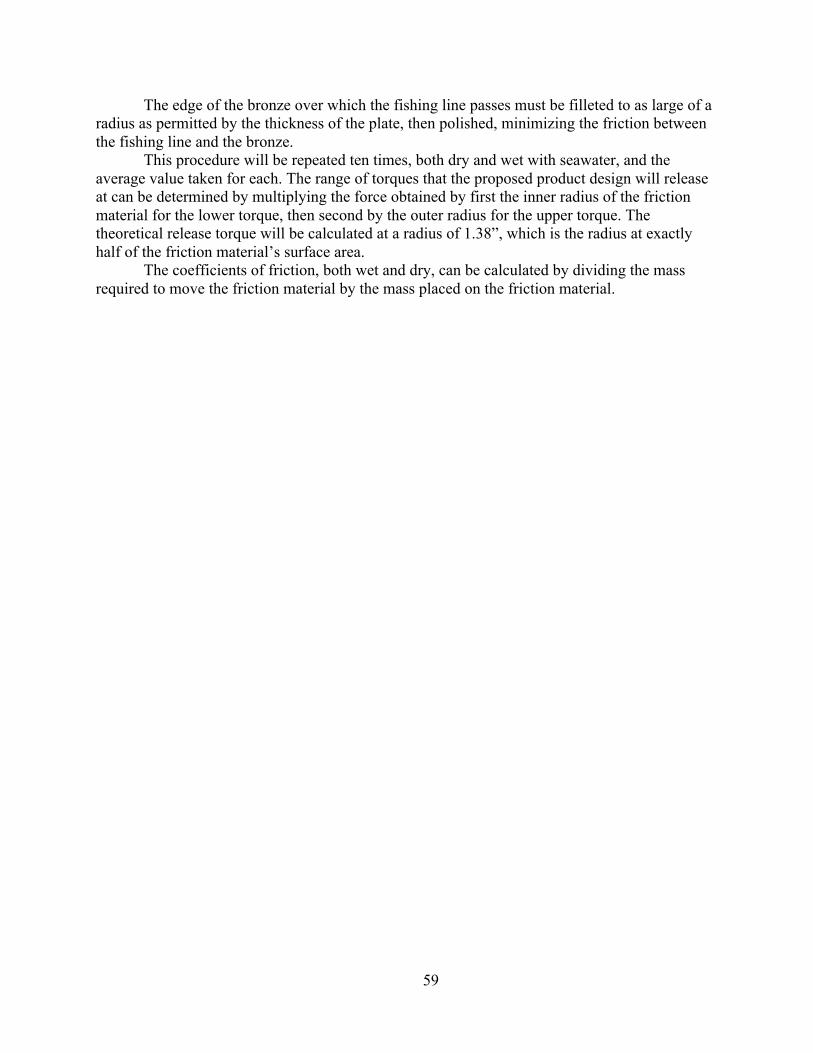
59
The edge of the bronze over which the fishing line passes must be filleted to as large of a radius as permitted by the thickness of the plate, then polished, minimizing the friction between the fishing line and the bronze.
This procedure will be repeated ten times, both dry and wet with seawater, and the average value taken for each. The range of torques that the proposed product design will release at can be determined by multiplying the force obtained by first the inner radius of the friction material for the lower torque, then second by the outer radius for the upper torque. The theoretical release torque will be calculated at a radius of 1.38”, which is the radius at exactly half of the friction material’s surface area.
The coefficients of friction, both wet and dry, can be calculated by dividing the mass required to move the friction material by the mass placed on the friction material.
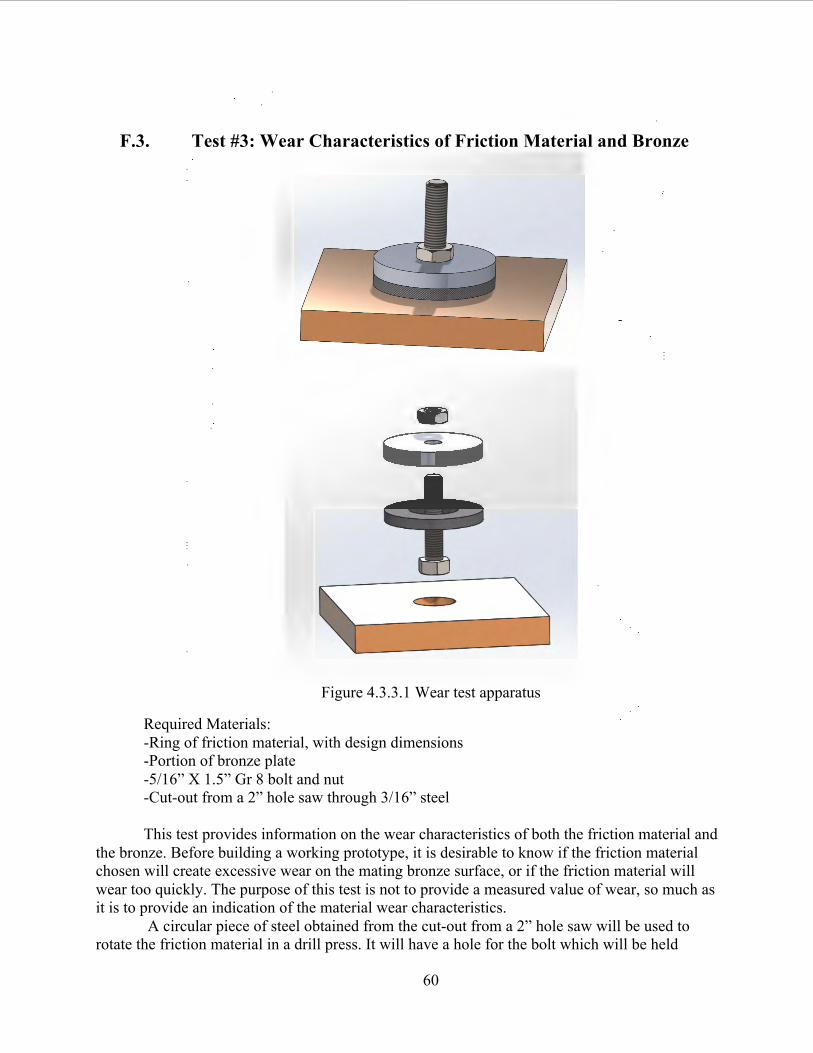
60
F.3. Test #3: Wear Characteristics of Friction Material and Bronze
Figure 4.3.3.1 Wear test apparatus
Required Materials: -Ring of friction material, with design dimensions -Portion of bronze plate -5/16” X 1.5” Gr 8 bolt and nut -Cut-out from a 2” hole saw through 3/16” steel This test provides information on the wear characteristics of both the friction material and
the bronze. Before building a working prototype, it is desirable to know if the friction material chosen will create excessive wear on the mating bronze surface, or if the friction material will wear too quickly. The purpose of this test is not to provide a measured value of wear, so much as it is to provide an indication of the material wear characteristics.
A circular piece of steel obtained from the cut-out from a 2” hole saw will be used to rotate the friction material in a drill press. It will have a hole for the bolt which will be held
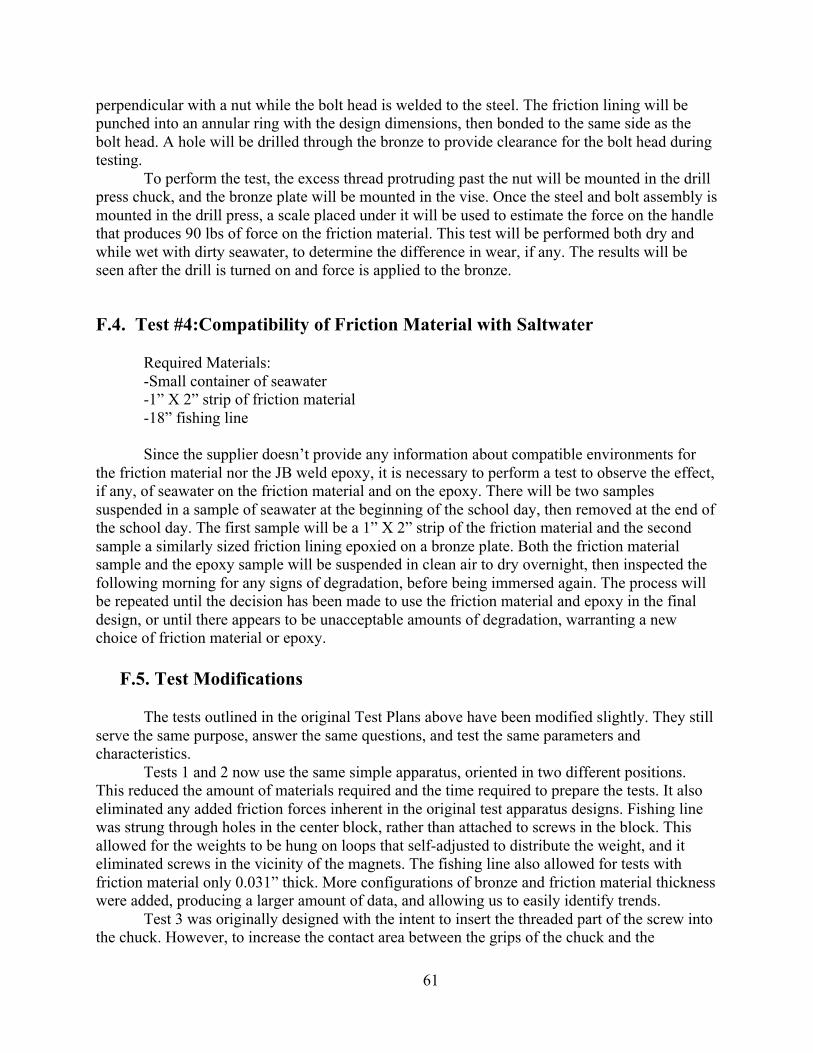
61
perpendicular with a nut while the bolt head is welded to the steel. The friction lining will be punched into an annular ring with the design dimensions, then bonded to the same side as the bolt head. A hole will be drilled through the bronze to provide clearance for the bolt head during testing.
To perform the test, the excess thread protruding past the nut will be mounted in the drill press chuck, and the bronze plate will be mounted in the vise. Once the steel and bolt assembly is mounted in the drill press, a scale placed under it will be used to estimate the force on the handle that produces 90 lbs of force on the friction material. This test will be performed both dry and while wet with dirty seawater, to determine the difference in wear, if any. The results will be seen after the drill is turned on and force is applied to the bronze.
F.4. Test #4:Compatibility of Friction Material with Saltwater Required Materials: -Small container of seawater -1” X 2” strip of friction material -18” fishing line Since the supplier doesn’t provide any information about compatible environments for
the friction material nor the JB weld epoxy, it is necessary to perform a test to observe the effect, if any, of seawater on the friction material and on the epoxy. There will be two samples suspended in a sample of seawater at the beginning of the school day, then removed at the end of the school day. The first sample will be a 1” X 2” strip of the friction material and the second sample a similarly sized friction lining epoxied on a bronze plate. Both the friction material sample and the epoxy sample will be suspended in clean air to dry overnight, then inspected the following morning for any signs of degradation, before being immersed again. The process will be repeated until the decision has been made to use the friction material and epoxy in the final design, or until there appears to be unacceptable amounts of degradation, warranting a new choice of friction material or epoxy.
F.5. Test Modifications
The tests outlined in the original Test Plans above have been modified slightly. They still
serve the same purpose, answer the same questions, and test the same parameters and characteristics.
Tests 1 and 2 now use the same simple apparatus, oriented in two different positions. This reduced the amount of materials required and the time required to prepare the tests. It also eliminated any added friction forces inherent in the original test apparatus designs. Fishing line was strung through holes in the center block, rather than attached to screws in the block. This allowed for the weights to be hung on loops that self-adjusted to distribute the weight, and it eliminated screws in the vicinity of the magnets. The fishing line also allowed for tests with friction material only 0.031” thick. More configurations of bronze and friction material thickness were added, producing a larger amount of data, and allowing us to easily identify trends.
Test 3 was originally designed with the intent to insert the threaded part of the screw into the chuck. However, to increase the contact area between the grips of the chuck and the
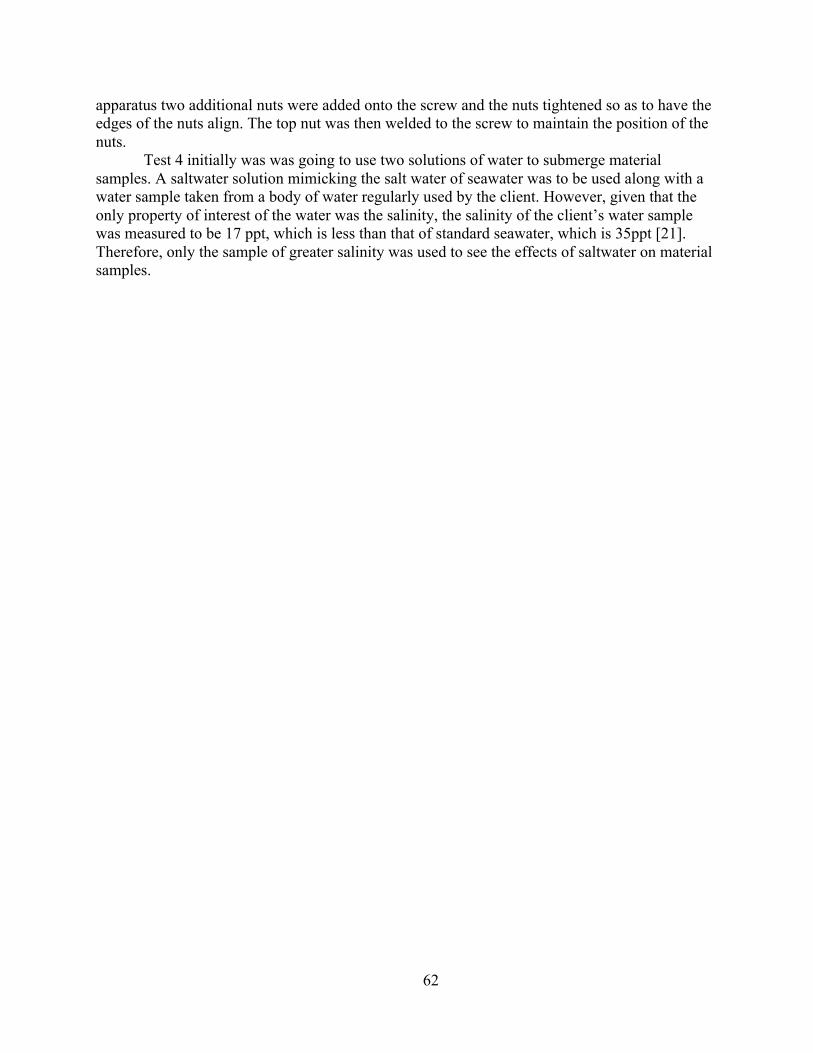
62
apparatus two additional nuts were added onto the screw and the nuts tightened so as to have the edges of the nuts align. The top nut was then welded to the screw to maintain the position of the nuts.
Test 4 initially was was going to use two solutions of water to submerge material samples. A saltwater solution mimicking the salt water of seawater was to be used along with a water sample taken from a body of water regularly used by the client. However, given that the only property of interest of the water was the salinity, the salinity of the client’s water sample was measured to be 17 ppt, which is less than that of standard seawater, which is 35ppt [21]. Therefore, only the sample of greater salinity was used to see the effects of saltwater on material samples.
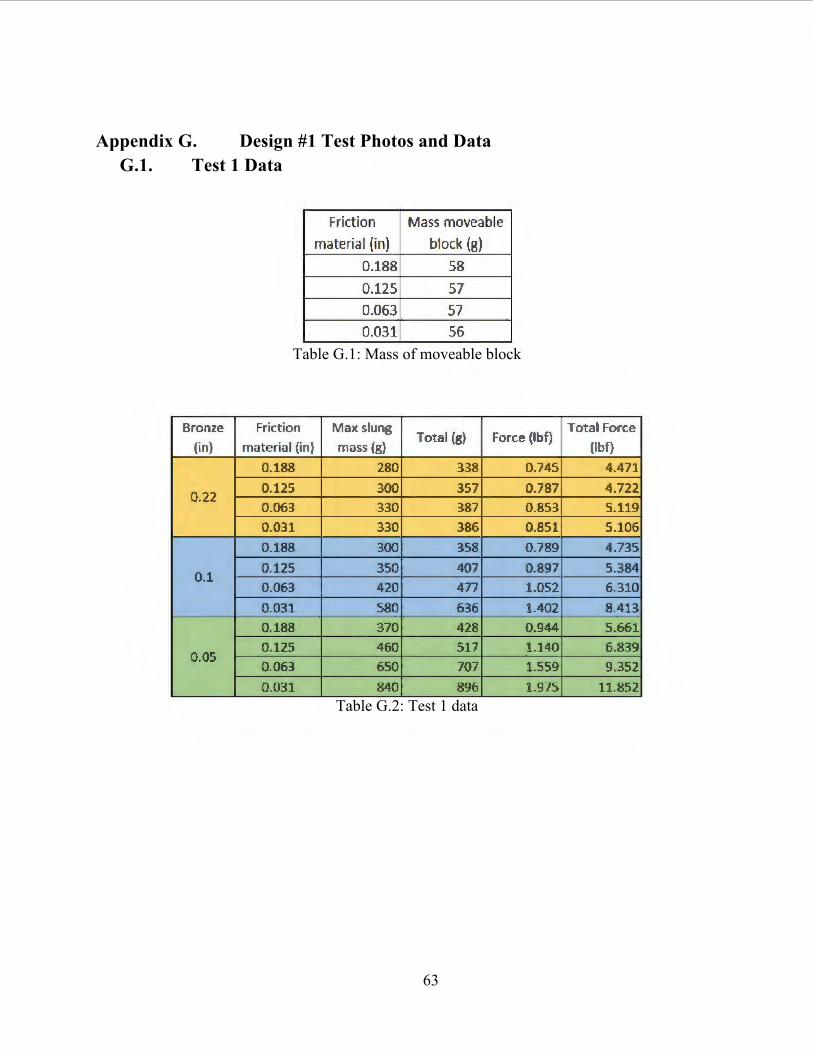
63
Appendix G. Design #1 Test Photos and Data G.1. Test 1 Data
Table G.1: Mass of moveable block
Table G.2: Test 1 data
Friction Mass moveable materia II {in) block (g)
0.188 58 0.125 57 0.063 57 0.031 56
Bronze Frktion Max s~ung To t a l (g) Force (llbf)
Totai Force (in) material (in) . mass (g) (lbf)
I
0.188 280 338 0.745 4.471
0 .22 0.125 300 357 0.787 4.722 0.063 330 387 0.853 5.119 0.031 330 386 0 .851 5.106 0.188 300 358 0.789 4.735
0.1 0.125 350 407 0.897 5.384 0.063 420 477 1.052 6.310 0.031 580 636 1.402 8.413 0 .188 370 428 0.944 5.661
0.05 0.125 460 517 1.140 6.839 0.063 650 707 1.559 9.352 0.031 840 896 1.975 11.852
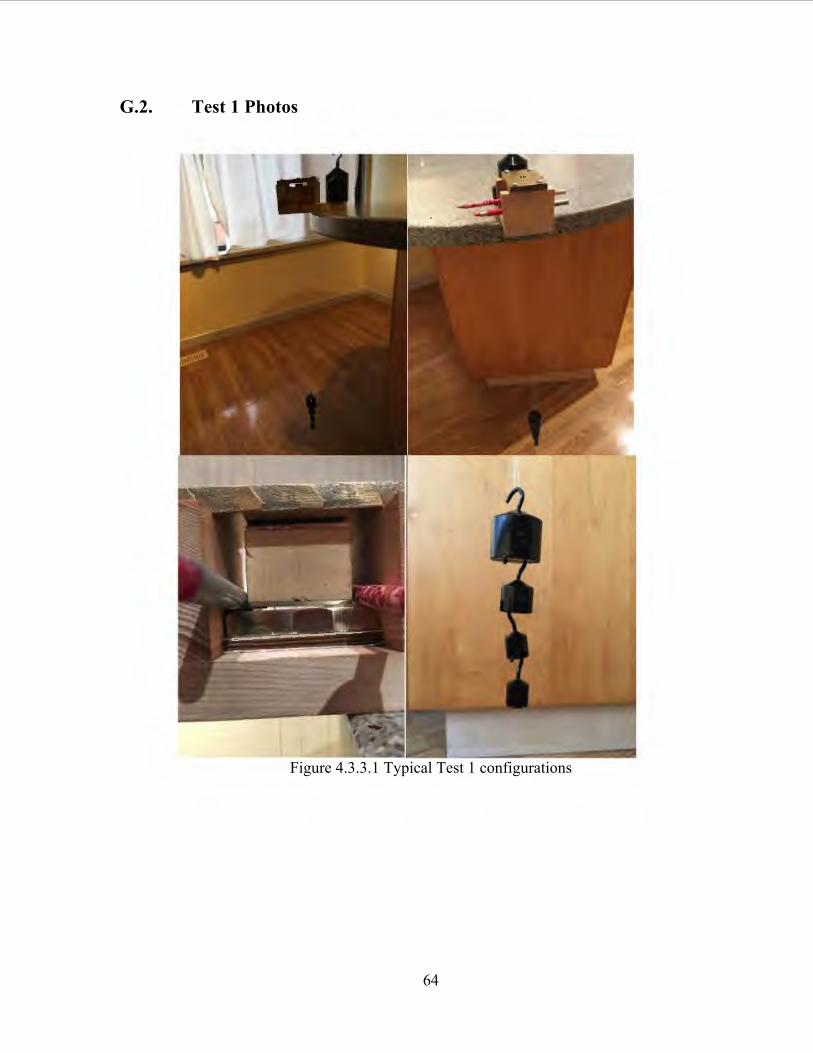
64
G.2. Test 1 Photos
Figure 4.3.3.1 Typical Test 1 configurations
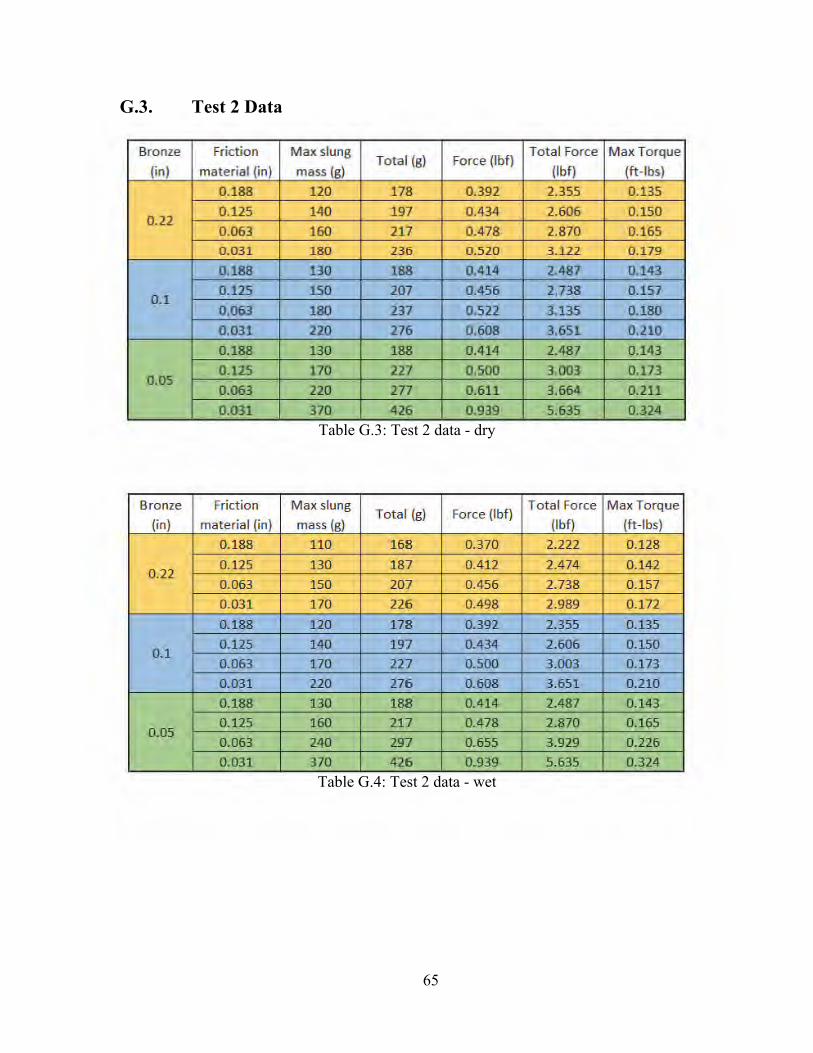
65
G.3. Test 2 Data
Table G.3: Test 2 data - dry
Table G.4: Test 2 data - wet
Bronze Friction Max slung Total (g) Force (]bf)
Total Force Max Torque (in) material (in) mass (g) (lbf) (ft- lbs)
0. 188 120 178 0.392 2.355 0.135
0.22 0. 125 140 197 0.434 2.606 0.150 0.063 160 217 0.478 2.870 0.165 0.031 180 236 0.520 3.122 0.179 0.188 130 188 0.414 2.487 0,143
0.1 0.125 150 207 0.456 2,738 0.157 0.063 180 237 0.522 3.135 0.180 0.031 220 276 0.608 3.651 0.210 0.188 130 188 0.414 2.487 0.143
0.05 0.125 170 227 0 ,500 3,003 0,173 0.063 220 277 0.611 3.664 0.211 0.031 370 426 0.939 5.635 0.324
Bronze Friction Max slung Total (g) Force (lbf) Total Force Max Torque
(in) material (in) mass (g) (lbf) (ft-lbs) 0.188 110 168 0.370 2.222 0.128
0.22 0.125 130 187 0.412 2.474 0.142 0.063 150 207 0.456 2.738 0.157 0.031 170 226 0.498 2.989 0.172 0.188 120 178 0.392 2.355 0.135
0.1 0.125 140 197 0.434 2.606 0.150 0.063 170 227 0.500 3.003 0.173 0.031 220 276 0.608 3.651 0.210 0.188 130 188 0.414 2.487 0.143 0. 125 160 217 0.478 2.870 0.165
0.05 0.063 240 297 0.655 3.929 0.226 0.031 370 426 0.939 5.635 0.324
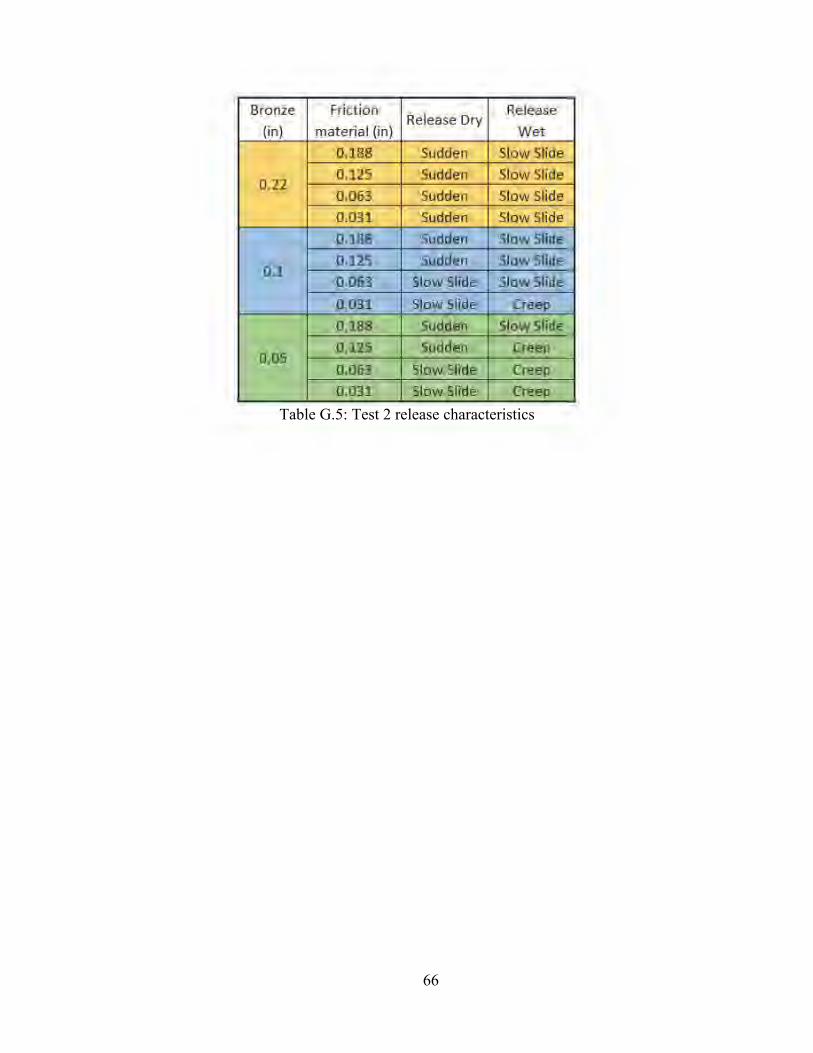
66
Table G.5: Test 2 release characteristics
Bronze Friction Release Dry Release {in) material {in) Wet
0.188 Sudden Slow Slide
0.22 0.125 Sudden Slow Slide 0.063 Sudden Slow Slide 0.031 Sudden Slow Slide 0.188 Sudden Slow Slide
0.1 0.125 Sudden Slow Slide 0.063 Slow Slide Slow Slide 0.031 Slow Slide Creep 0.188 Sudden Slow Slide 0.125 Sudden Creep
0.05 Slow Slide 0.063 Creep 0.031 Slow Slide Creep
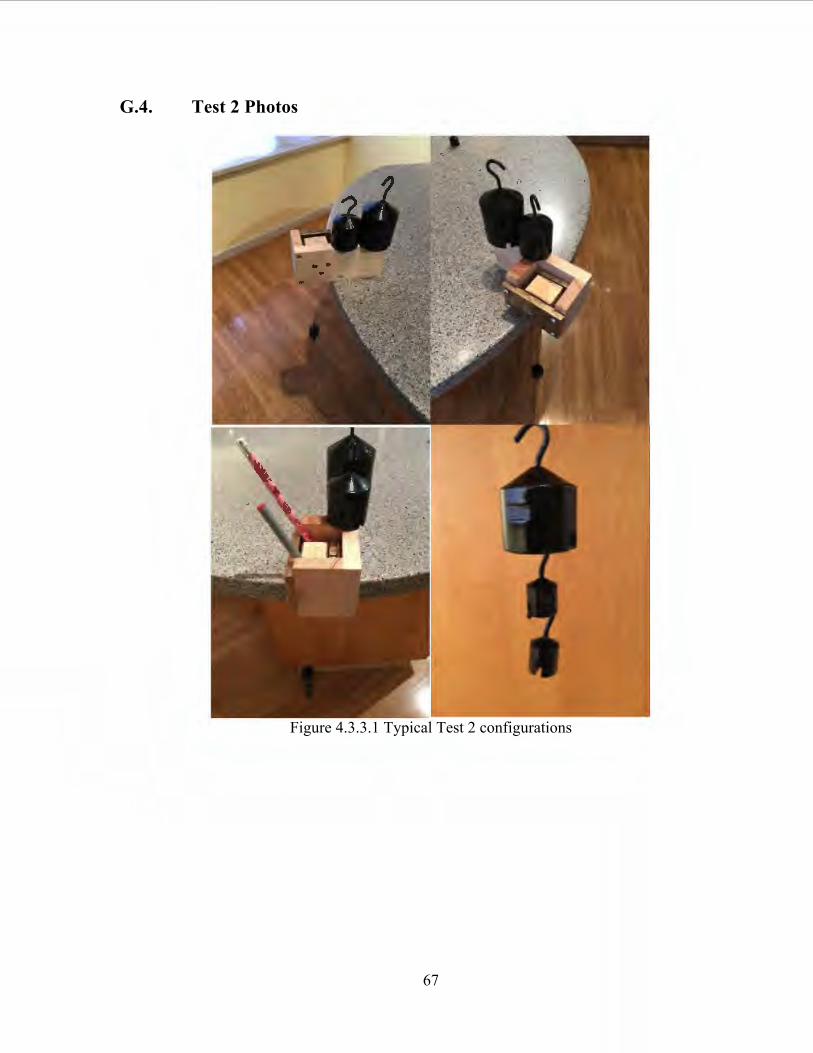
67
G.4. Test 2 Photos
Figure 4.3.3.1 Typical Test 2 configurations
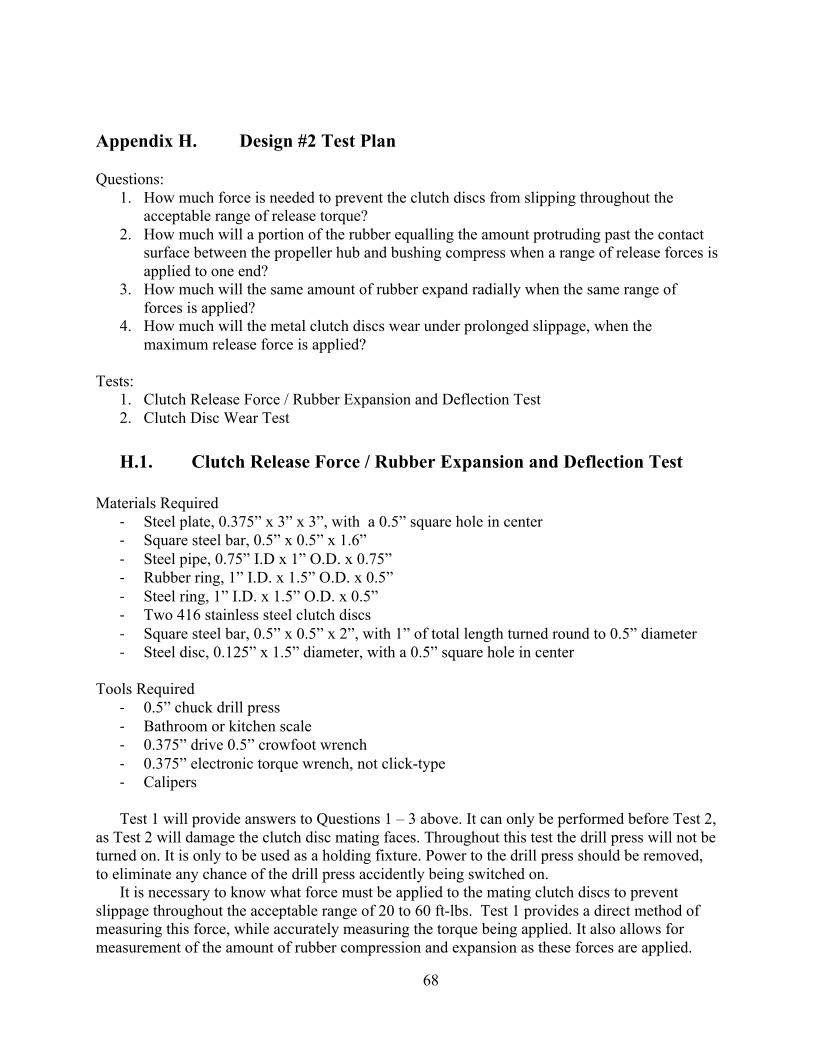
68
Appendix H. Design #2 Test Plan
Questions: 1. How much force is needed to prevent the clutch discs from slipping throughout the
acceptable range of release torque? 2. How much will a portion of the rubber equalling the amount protruding past the contact
surface between the propeller hub and bushing compress when a range of release forces is applied to one end?
3. How much will the same amount of rubber expand radially when the same range of forces is applied?
4. How much will the metal clutch discs wear under prolonged slippage, when the maximum release force is applied?
Tests:
1. Clutch Release Force / Rubber Expansion and Deflection Test 2. Clutch Disc Wear Test
H.1. Clutch Release Force / Rubber Expansion and Deflection Test
Materials Required
[ Steel plate, 0.375” x 3” x 3”, with a 0.5” square hole in center [ Square steel bar, 0.5” x 0.5” x 1.6” [ Steel pipe, 0.75” I.D x 1” O.D. x 0.75” [ Rubber ring, 1” I.D. x 1.5” O.D. x 0.5” [ Steel ring, 1” I.D. x 1.5” O.D. x 0.5” [ Two 416 stainless steel clutch discs [ Square steel bar, 0.5” x 0.5” x 2”, with 1” of total length turned round to 0.5” diameter [ Steel disc, 0.125” x 1.5” diameter, with a 0.5” square hole in center
Tools Required
[ 0.5” chuck drill press [ Bathroom or kitchen scale [ 0.375” drive 0.5” crowfoot wrench [ 0.375” electronic torque wrench, not click-type [ Calipers
Test 1 will provide answers to Questions 1 – 3 above. It can only be performed before Test 2,
as Test 2 will damage the clutch disc mating faces. Throughout this test the drill press will not be turned on. It is only to be used as a holding fixture. Power to the drill press should be removed, to eliminate any chance of the drill press accidently being switched on.
It is necessary to know what force must be applied to the mating clutch discs to prevent slippage throughout the acceptable range of 20 to 60 ft-lbs. Test 1 provides a direct method of measuring this force, while accurately measuring the torque being applied. It also allows for measurement of the amount of rubber compression and expansion as these forces are applied.

69
This test uses only a short section of rubber bushing, replicating the amount that protrudes past the contact surface between the propeller hub and rubber bushing. In the design, this protruding portion is the only amount that will compress during slippage. Various views of the apparatus are shown in Figure 4.3.3.1, Figure 4.3.3.2, and Figure 4.3.3.3.
Figure 4.3.3.1 Test 1 apparatus
Figure 4.3.3.2 Test 1 apparatus cross-section
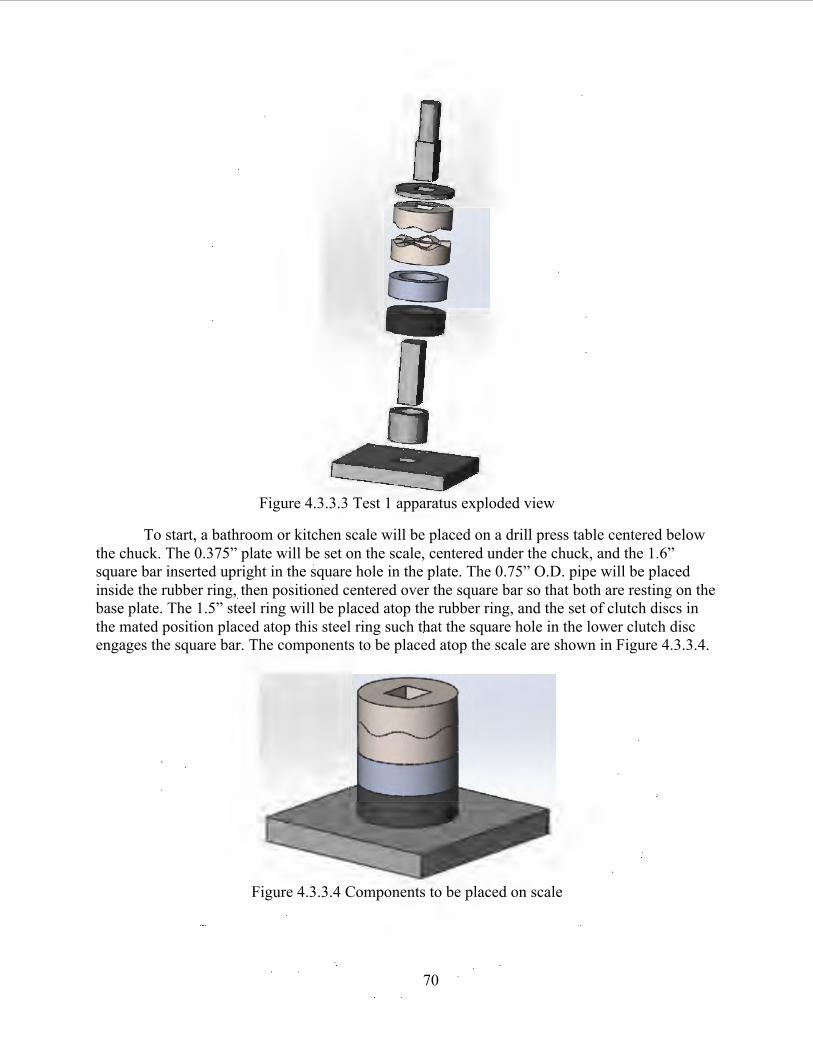
70
Figure 4.3.3.3 Test 1 apparatus exploded view
To start, a bathroom or kitchen scale will be placed on a drill press table centered below the chuck. The 0.375” plate will be set on the scale, centered under the chuck, and the 1.6” square bar inserted upright in the square hole in the plate. The 0.75” O.D. pipe will be placed inside the rubber ring, then positioned centered over the square bar so that both are resting on the base plate. The 1.5” steel ring will be placed atop the rubber ring, and the set of clutch discs in the mated position placed atop this steel ring such that the square hole in the lower clutch disc engages the square bar. The components to be placed atop the scale are shown in Figure 4.3.3.4.
Figure 4.3.3.4 Components to be placed on scale
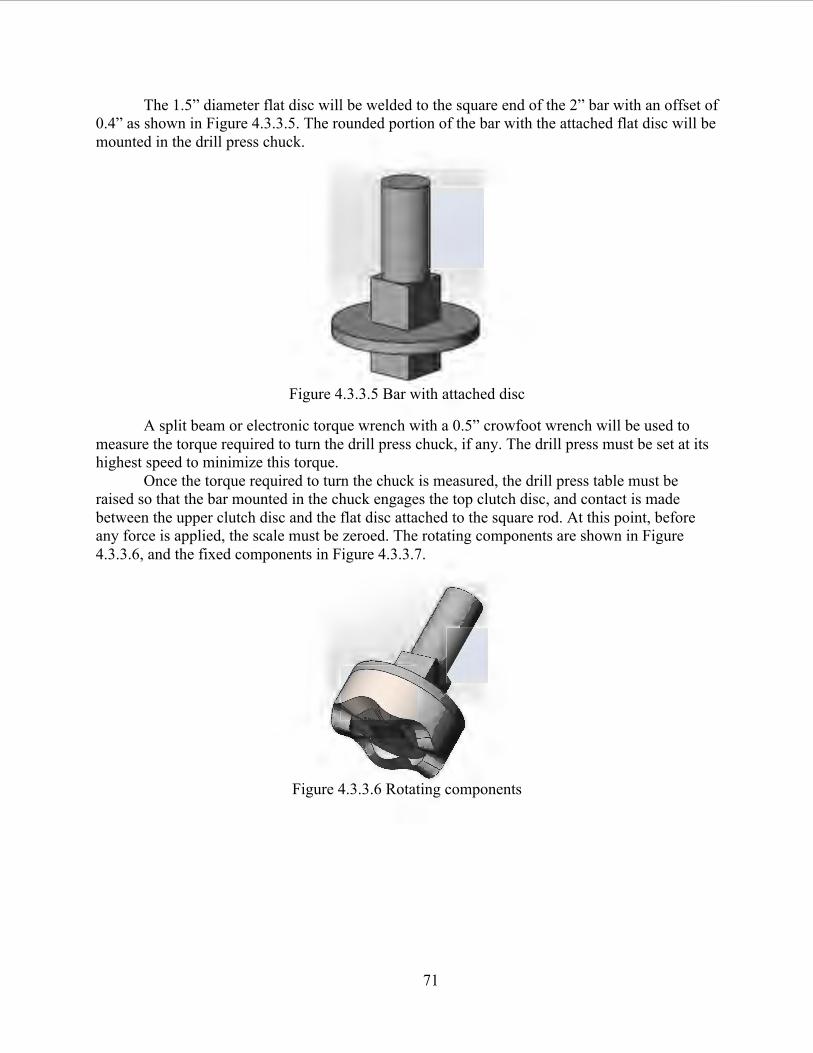
71
The 1.5” diameter flat disc will be welded to the square end of the 2” bar with an offset of 0.4” as shown in Figure 4.3.3.5. The rounded portion of the bar with the attached flat disc will be mounted in the drill press chuck.
Figure 4.3.3.5 Bar with attached disc!
A split beam or electronic torque wrench with a 0.5” crowfoot wrench will be used to measure the torque required to turn the drill press chuck, if any. The drill press must be set at its highest speed to minimize this torque.
Once the torque required to turn the chuck is measured, the drill press table must be raised so that the bar mounted in the chuck engages the top clutch disc, and contact is made between the upper clutch disc and the flat disc attached to the square rod. At this point, before any force is applied, the scale must be zeroed. The rotating components are shown in Figure 4.3.3.6, and the fixed components in Figure 4.3.3.7.
Figure 4.3.3.6 Rotating components
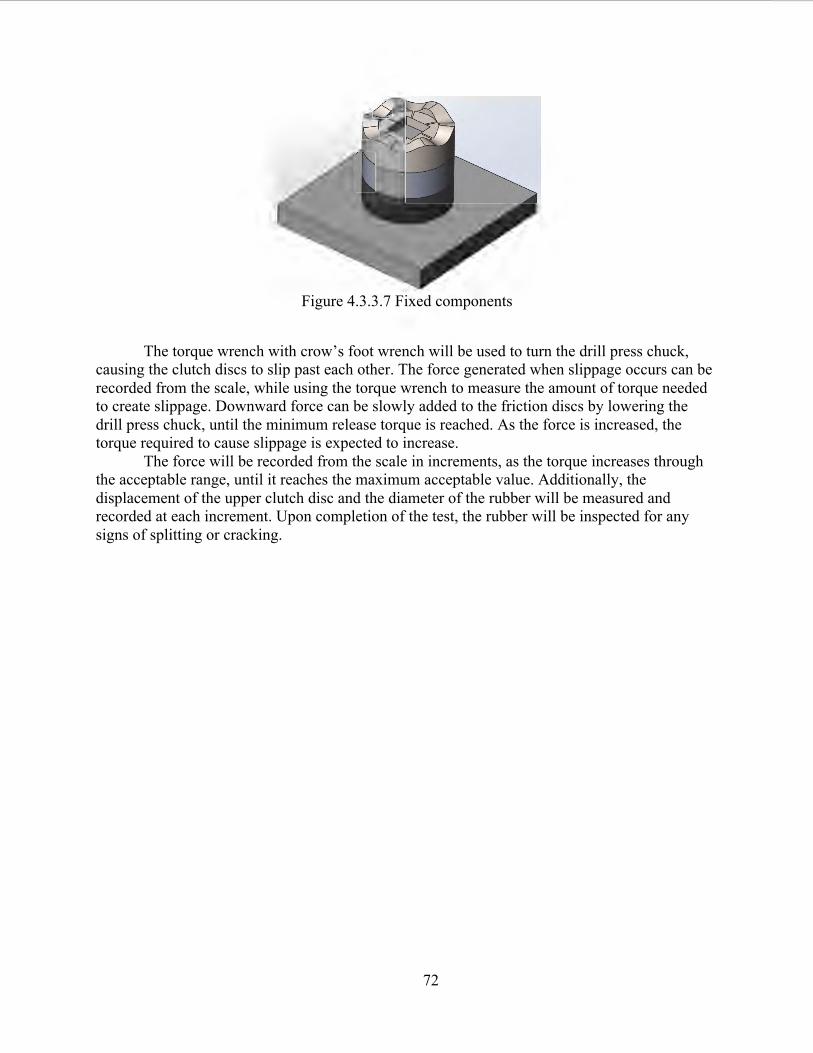
72
Figure 4.3.3.7 Fixed components
The torque wrench with crow’s foot wrench will be used to turn the drill press chuck,
causing the clutch discs to slip past each other. The force generated when slippage occurs can be recorded from the scale, while using the torque wrench to measure the amount of torque needed to create slippage. Downward force can be slowly added to the friction discs by lowering the drill press chuck, until the minimum release torque is reached. As the force is increased, the torque required to cause slippage is expected to increase.
The force will be recorded from the scale in increments, as the torque increases through the acceptable range, until it reaches the maximum acceptable value. Additionally, the displacement of the upper clutch disc and the diameter of the rubber will be measured and recorded at each increment. Upon completion of the test, the rubber will be inspected for any signs of splitting or cracking.
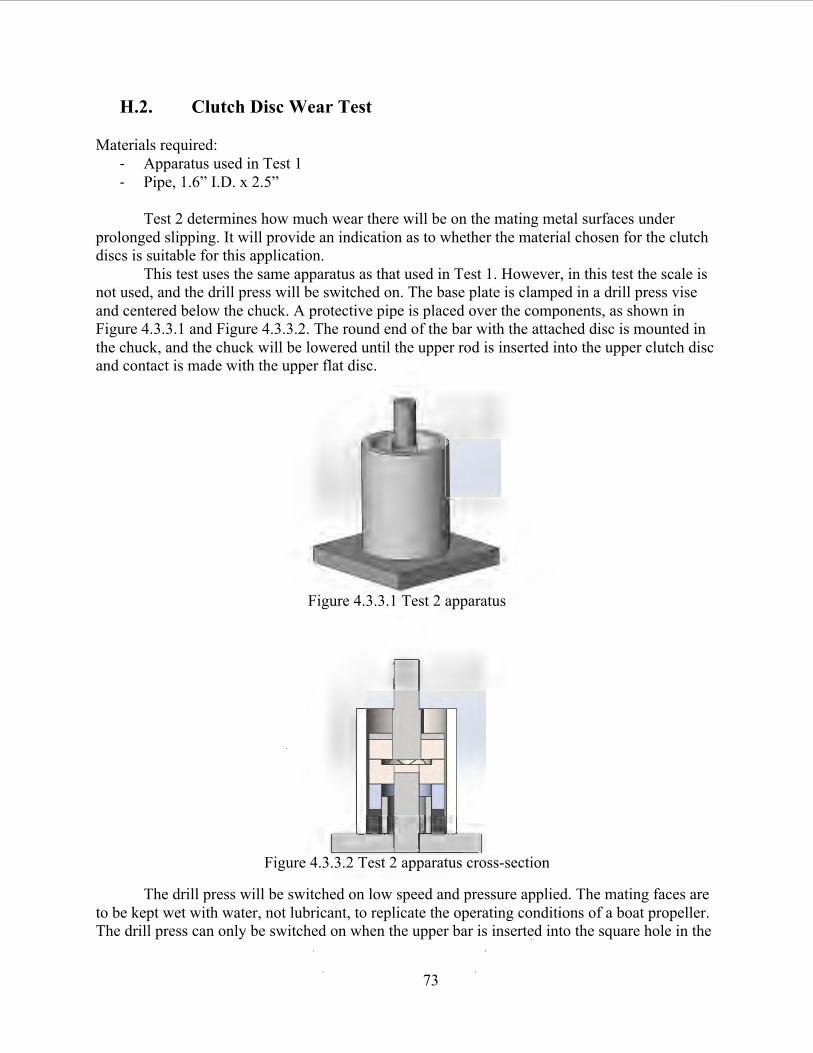
73
H.2. Clutch Disc Wear Test
Materials required: [ Apparatus used in Test 1 [ Pipe, 1.6” I.D. x 2.5”
Test 2 determines how much wear there will be on the mating metal surfaces under
prolonged slipping. It will provide an indication as to whether the material chosen for the clutch discs is suitable for this application.
This test uses the same apparatus as that used in Test 1. However, in this test the scale is not used, and the drill press will be switched on. The base plate is clamped in a drill press vise and centered below the chuck. A protective pipe is placed over the components, as shown in Figure 4.3.3.1 and Figure 4.3.3.2. The round end of the bar with the attached disc is mounted in the chuck, and the chuck will be lowered until the upper rod is inserted into the upper clutch disc and contact is made with the upper flat disc.
Figure 4.3.3.1 Test 2 apparatus
Figure 4.3.3.2 Test 2 apparatus cross-section
The drill press will be switched on low speed and pressure applied. The mating faces are to be kept wet with water, not lubricant, to replicate the operating conditions of a boat propeller. The drill press can only be switched on when the upper bar is inserted into the square hole in the
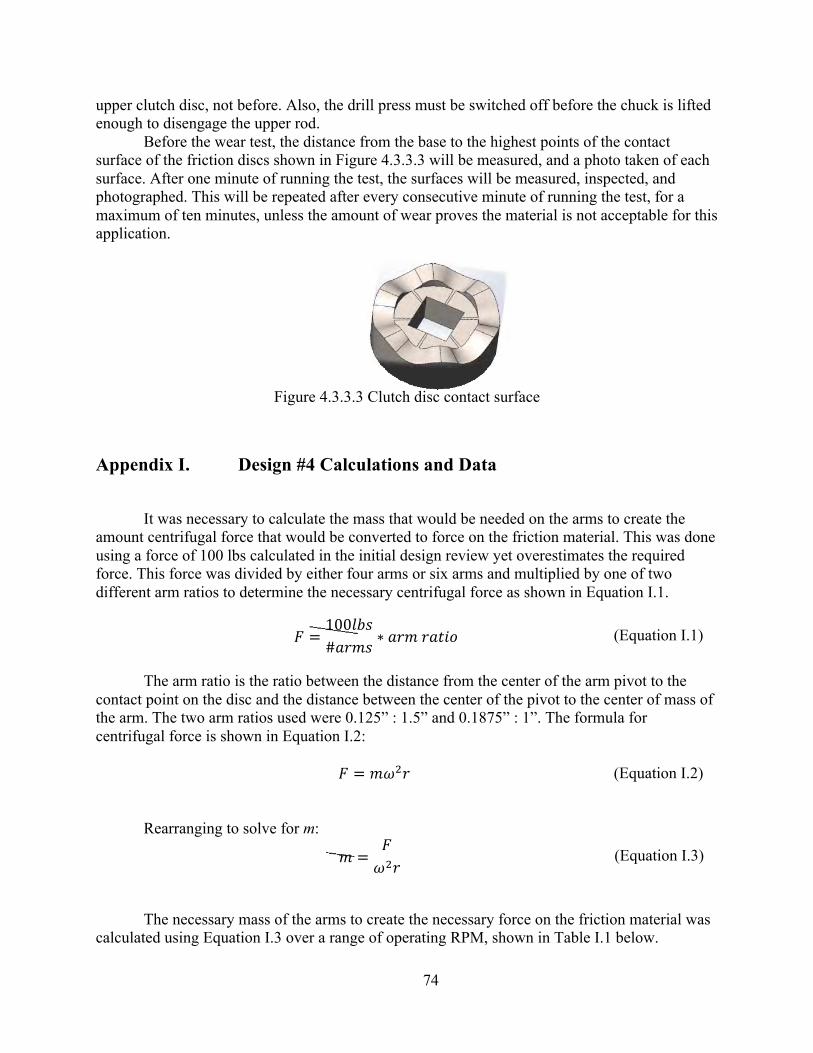
74
upper clutch disc, not before. Also, the drill press must be switched off before the chuck is lifted enough to disengage the upper rod.
Before the wear test, the distance from the base to the highest points of the contact surface of the friction discs shown in Figure 4.3.3.3 will be measured, and a photo taken of each surface. After one minute of running the test, the surfaces will be measured, inspected, and photographed. This will be repeated after every consecutive minute of running the test, for a maximum of ten minutes, unless the amount of wear proves the material is not acceptable for this application.
Figure 4.3.3.3 Clutch disc contact surface
Appendix I. Design #4 Calculations and Data
It was necessary to calculate the mass that would be needed on the arms to create the amount centrifugal force that would be converted to force on the friction material. This was done using a force of 100 lbs calculated in the initial design review yet overestimates the required force. This force was divided by either four arms or six arms and multiplied by one of two different arm ratios to determine the necessary centrifugal force as shown in Equation I.1.
! = 100!"##!"#$ ∗ !"#!!"#$% (Equation I.1)
The arm ratio is the ratio between the distance from the center of the arm pivot to the
contact point on the disc and the distance between the center of the pivot to the center of mass of the arm. The two arm ratios used were 0.125” : 1.5” and 0.1875” : 1”. The formula for centrifugal force is shown in Equation I.2:
! = !!!!! (Equation I.2)
Rearranging to solve for m:
! = !!!!! (Equation I.3)
The necessary mass of the arms to create the necessary force on the friction material was
calculated using Equation I.3 over a range of operating RPM, shown in Table I.1 below.

75
Table I.1: Arm mass (lbs) needed vs propeller RPM
To determine the tangential shear force formula of a thin layer of water between two
rotating discs the formula had to be derived from the formula for the tangential shear stress for a disc (Equation I.4) [15].
! = ! !"!" =!"#! !" (Equation I.4)
The formula for tangential shear force is derived in the following equations:
!" = !" = !"#
! 2!"#" (Equation I.5) Integrating over the area of a disc:
! = !"! 2! !!
!!
!!!" (Equation I.6)
Rotational Arm Ratio-0.0833 Arm Ratio-0.1875 Spe ed RPM 4 Arms. 6Arms 4Arms 6Arms 10 1550.51 1043.87 3496.95 2329.96 40 96.91 65.24 218.56 .1.45.62 60 43.07 29.00 97.14 64.72 80 24.23 16.31 54.64 36.41 100 15.51 10.44 34.97 23.30 200 3.88 2.61 8.74 5.82 300 1.72 1.16 3.89 2.59 400 0.97 0.65 2.19 1.46 500 0.62 0.42 1.40 0.93 600 0.43 0.29 0.97 0.65 700 0.32 0.21 0.71 0.48 800 0.24 0.16 0.55 0.36 900 0.19 0.13 0.43 0.29 1000 0.16 0.10 0.35 0.23 1250 0.10 0.07 0.22 0.15 1500 0.07 0.05 0.16 0.10 1750 0.05 0.03 0.11 0.08 2000 0.04 0.03 0.09 0.06 2250 0.03 0.02 0.07 0.05 2500 0.02 0.02 0.06 0.04
I
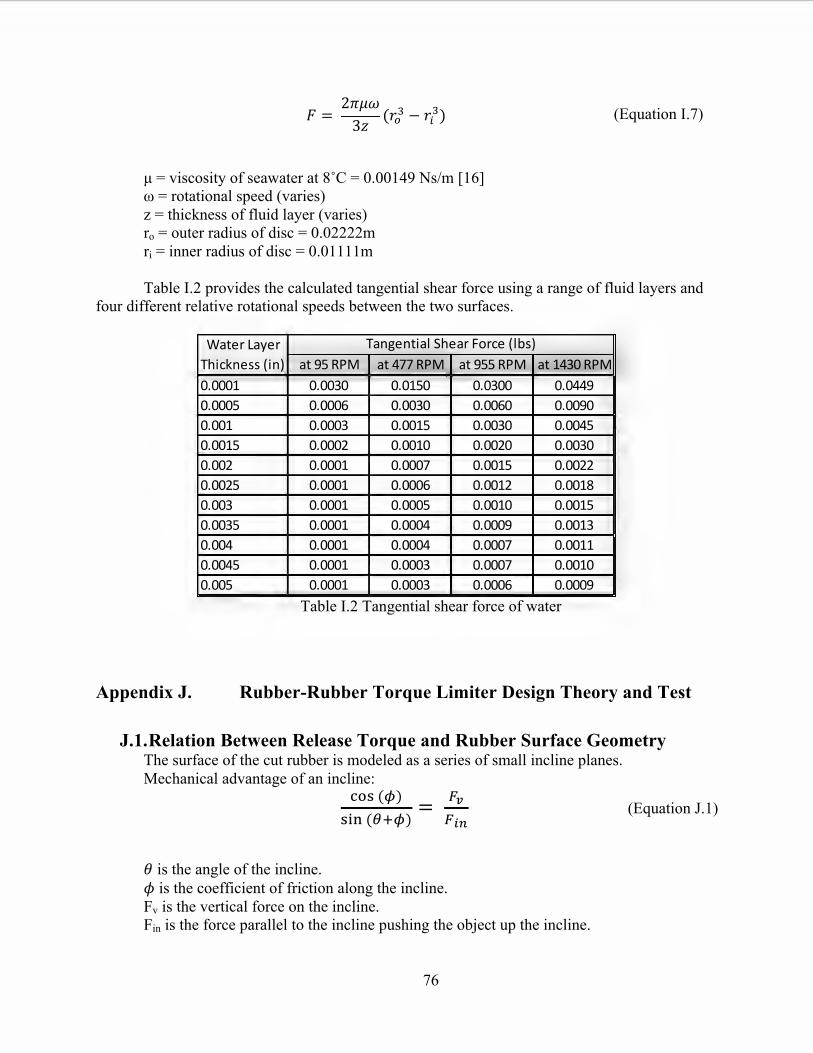
76
! = !2!"#3! (!!! − !!!) (Equation I.7)
µ = viscosity of seawater at 8˚C = 0.00149 Ns/m [16] ω = rotational speed (varies) z = thickness of fluid layer (varies) ro = outer radius of disc = 0.02222m ri = inner radius of disc = 0.01111m Table I.2 provides the calculated tangential shear force using a range of fluid layers and four different relative rotational speeds between the two surfaces.
Table I.2 Tangential shear force of water
Appendix J. Rubber-Rubber Torque Limiter Design Theory and Test
J.1. Relation Between Release Torque and Rubber Surface Geometry The surface of the cut rubber is modeled as a series of small incline planes.
Mechanical advantage of an incline: !"#!(!)!"#!(!!!) = !
!!!!"
(Equation J.1)
! is the angle of the incline. ! is the coefficient of friction along the incline. Fv is the vertical force on the incline. Fin is the force parallel to the incline pushing the object up the incline.
at#95#RPM at#477#RPM at#955#RPM at#1430#RPM0.0001 0.0030 0.0150 0.0300 0.04490.0005 0.0006 0.0030 0.0060 0.00900.001 0.0003 0.0015 0.0030 0.00450.0015 0.0002 0.0010 0.0020 0.00300.002 0.0001 0.0007 0.0015 0.00220.0025 0.0001 0.0006 0.0012 0.00180.003 0.0001 0.0005 0.0010 0.00150.0035 0.0001 0.0004 0.0009 0.00130.004 0.0001 0.0004 0.0007 0.00110.0045 0.0001 0.0003 0.0007 0.00100.005 0.0001 0.0003 0.0006 0.0009
Water#Layer#Thickness#(in)
Tangential#Shear#Force#(lbs)

77
When two inclined mating surfaces slip past each other on the rubber rings, the applied torque will produce a horizontal force, Fh, to push the other mating surface up the incline. The input force, Fin, will be a component of the horizontal force applied, Fh,
!!" = !!cos!(!) (Equation J.2)
Release torque: ! = !!!!! (Equation J.3)
T is the release torque. rm is the mean radius of the cylinder or ring. Relation between release torque and force pushing the surfaces together: Substituting Fin in Equation J.1 with Equation J.2 then solving for Fh and substituting into Equation J.3 produces Equation J.4 .
! = ! !!!"#$(!!!)!"#!(!) (Equation J.4)
The rubber test constructed tests the validity of this relation. The importance of this relation lies in how the slip condition between the faces occurs. Only when the opposite mating surface is lifted by the height of the incline will the surfaces move past each other then mate again. The expression is maximized for coefficients of friction of one, and begins to decrease when values are greater than one. The decrease in torque required at higher values of friction is nonphysical and therefore the equation is valid for coefficients of friction between zero and one
Relation between linear force and stiffness:
(Equation J.5)
! = !!! = !! !! !!
= !!!!"
! = ! !"#!! ! (Equation J.6)
If compression of the rubber ring instead of displacement of the rubber ring is assumed to
be the method by which the opposite mating surface is lifted the height of the incline in order to separate the surfaces then the force in Equation J.4 can be substituted by the relation in Equation J.6. The angle can be chosen in order to produce a value within the range of the required release torque.
Designing for the component size that would fit in the mechanism, the rubber would have an outer diameter of 1.75 inches and inner diameter of one inch. The supplier website specified the hardness of the rubber to be a value of 60A Shore hardness. The modulus can be estimated from the hardness, Equation J.7 [22].
! = !!.!"#!!!.!"#$ (Equation J.7)
I - -I
78
The modulus was estimated to be 0.0076 GPa. The coefficient of rubber-rubber interfaces is 1.6 but the next highest value is 0.85 for rubber and a road material [23]. This value was chosen because it was expected that water during boat operation would decrease the coefficient. The angle of the incline required is then 22° to achieve the minimum release torque of 17.3 ft-lbs.
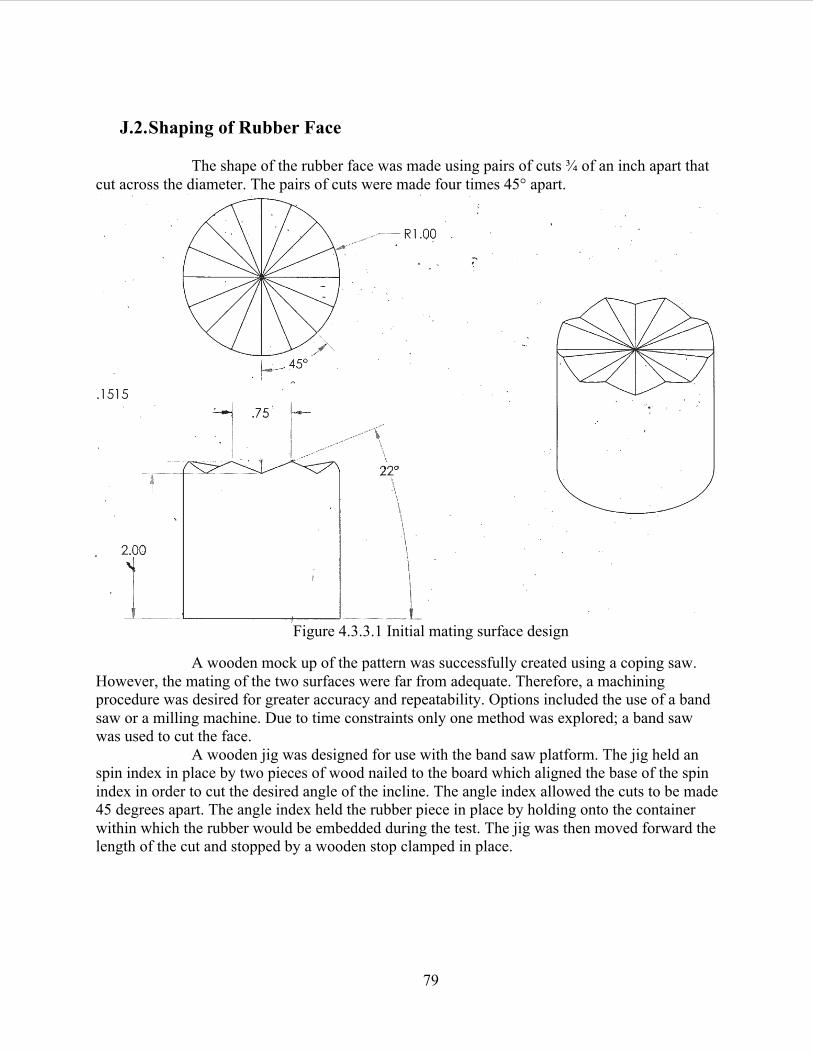
79
J.2. Shaping of Rubber Face
The shape of the rubber face was made using pairs of cuts ¾ of an inch apart that
cut across the diameter. The pairs of cuts were made four times 45° apart.
Figure 4.3.3.1 Initial mating surface design
A wooden mock up of the pattern was successfully created using a coping saw. However, the mating of the two surfaces were far from adequate. Therefore, a machining procedure was desired for greater accuracy and repeatability. Options included the use of a band saw or a milling machine. Due to time constraints only one method was explored; a band saw was used to cut the face.
A wooden jig was designed for use with the band saw platform. The jig held an spin index in place by two pieces of wood nailed to the board which aligned the base of the spin index in order to cut the desired angle of the incline. The angle index allowed the cuts to be made 45 degrees apart. The angle index held the rubber piece in place by holding onto the container within which the rubber would be embedded during the test. The jig was then moved forward the length of the cut and stopped by a wooden stop clamped in place.
Rl.OQ ·
.1515
1 2~0 \ .\
\ \
2.00 .
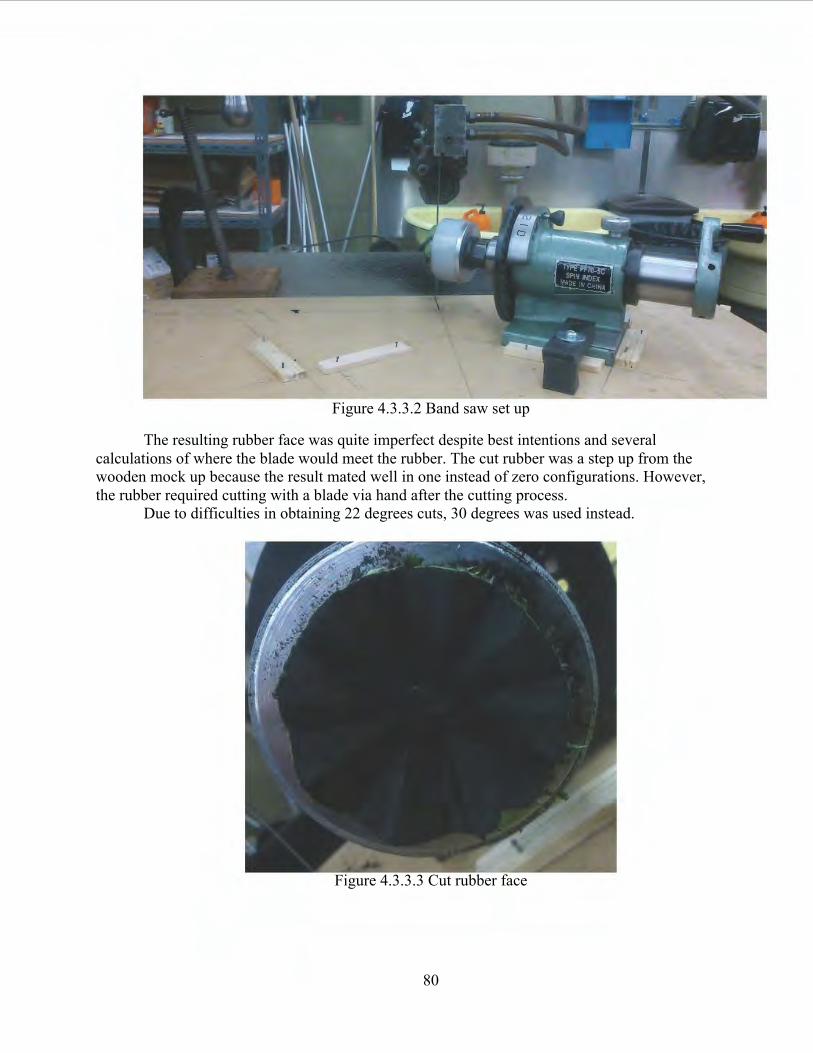
80
Figure 4.3.3.2 Band saw set up
The resulting rubber face was quite imperfect despite best intentions and several calculations of where the blade would meet the rubber. The cut rubber was a step up from the wooden mock up because the result mated well in one instead of zero configurations. However, the rubber required cutting with a blade via hand after the cutting process.
Due to difficulties in obtaining 22 degrees cuts, 30 degrees was used instead.
Figure 4.3.3.3 Cut rubber face
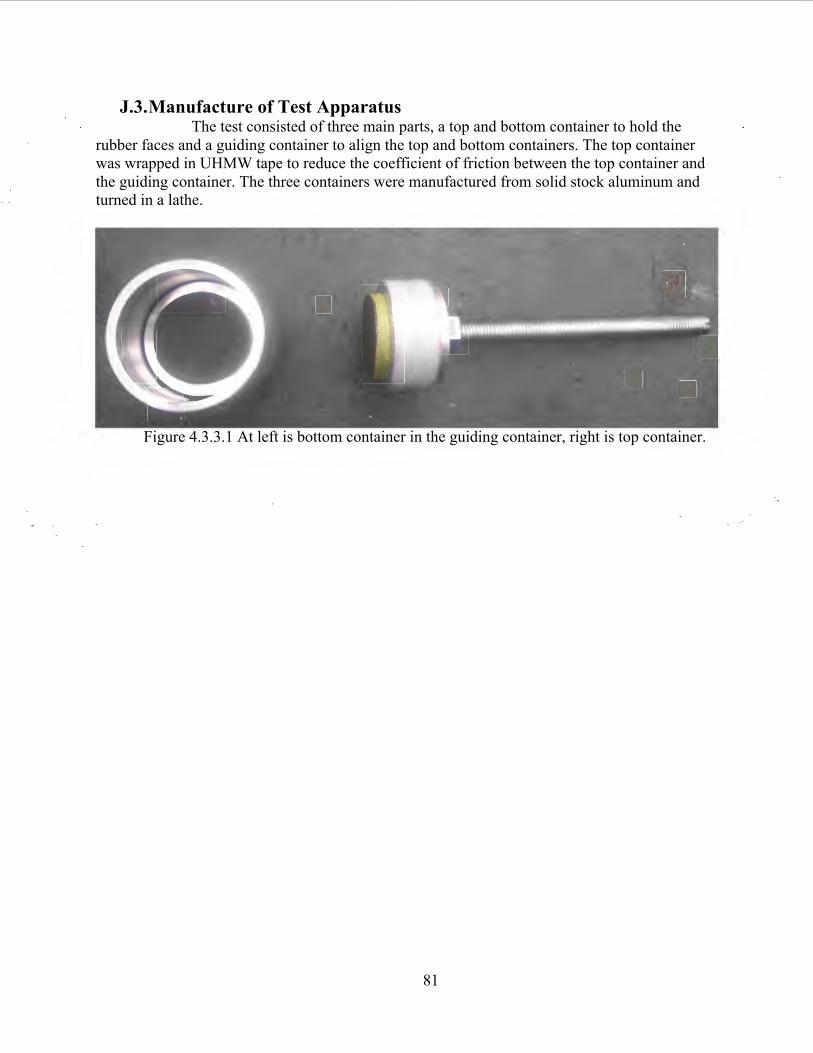
81
J.3. Manufacture of Test Apparatus The test consisted of three main parts, a top and bottom container to hold the
rubber faces and a guiding container to align the top and bottom containers. The top container was wrapped in UHMW tape to reduce the coefficient of friction between the top container and the guiding container. The three containers were manufactured from solid stock aluminum and turned in a lathe.
Figure 4.3.3.1 At left is bottom container in the guiding container, right is top container.
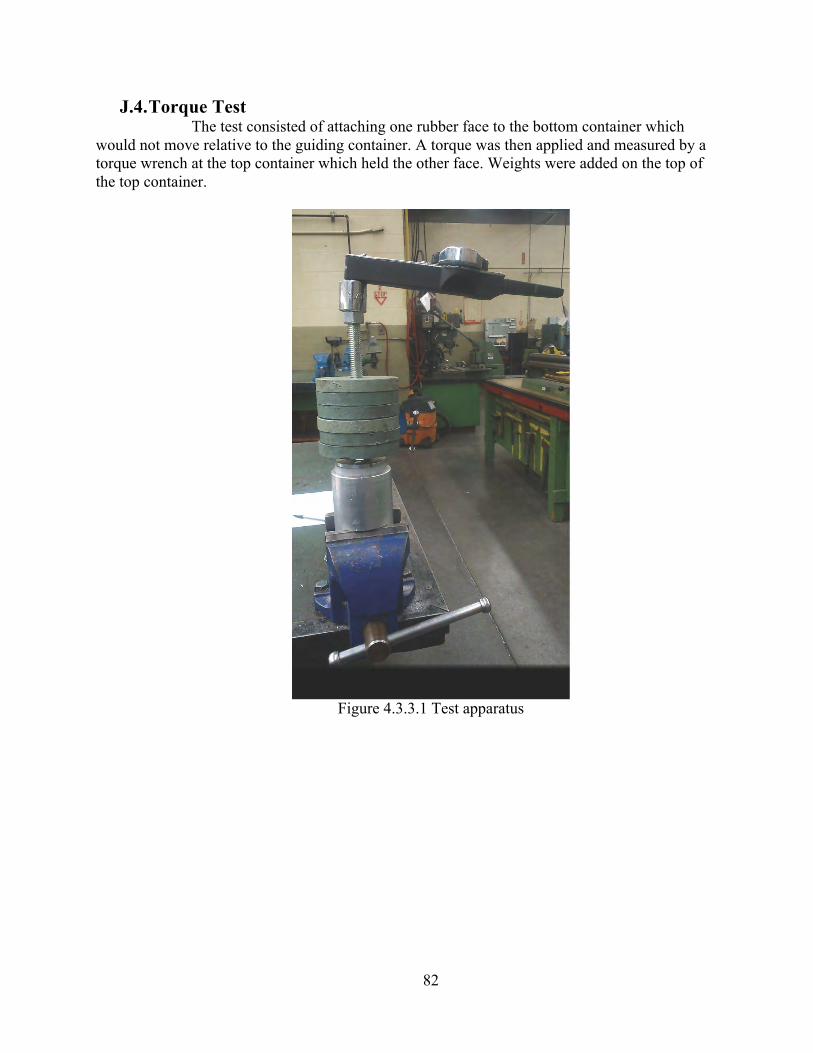
82
J.4. Torque Test The test consisted of attaching one rubber face to the bottom container which
would not move relative to the guiding container. A torque was then applied and measured by a torque wrench at the top container which held the other face. Weights were added on the top of the top container.
Figure 4.3.3.1 Test apparatus
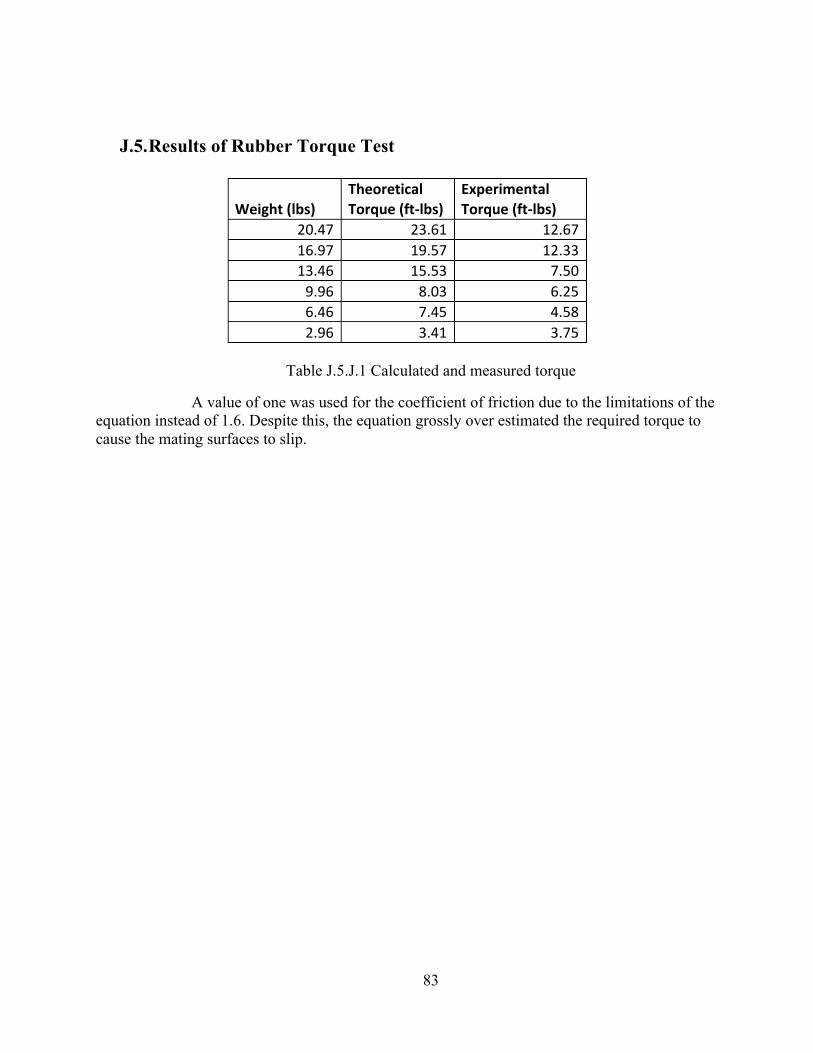
83
J.5. Results of Rubber Torque Test
'' Theoretical' Experimental'Weight'(lbs)' Torque'(ft*lbs)' Torque'(ft*lbs)'
20.47! 23.61! 12.67!16.97! 19.57! 12.33!13.46! 15.53! 7.50!9.96! 8.03! 6.25!6.46! 7.45! 4.58!2.96! 3.41! 3.75!
Table J.5.J.1 Calculated and measured torque
A value of one was used for the coefficient of friction due to the limitations of the equation instead of 1.6. Despite this, the equation grossly over estimated the required torque to cause the mating surfaces to slip.
84
Appendix K. Bibliography [
1] American Honda Motor Co., Inc, Owner's Manual Outboard Motor BF8A.
Alpharetta, Ga.: American Honda Motor Co., Inc, 1990. [
2] Inc. American Honda Motor Co., REPAIR MANUAL, need more info.
[3]
Scott Knicklebine. (2017, April) ehow. [Online]. https://www.ehow.co.uk/how_7705427_calculate-boat-propeller-torque.html
[4]
Arnot. (2009, May) boatdesign.net. [Online]. https://www.boatdesign.net/threads/propeller-shaft-torque.27373/
[5]
Surfbaud. (1999) Surfbaud Freeware Propeller Calculator. [Online]. http://www.surfbaud.co.uk/wave/
[6]
(2010) Power Boats: Choosing the Propeller. [Online]. http://www.youboat.net/boatpower4.aspx
[7]
David Cockey. (2011, June) boatdesign.net. [Online]. https://www.boatdesign.net/threads/prop-thrust-calculation.38283/
[8]
LFS Marine and Outdoor Inc. (2016) Go2marine. [Online]. https://www.go2marine.com/productcenters/propellers/propeller_fit_guide.shtml
[9]
HydroComp Inc. (2007) Bollard Pull, A HydroComp Technical Report. [Online]. https://hydrocompinc.com/wp-content/uploads/documents/HC110-BollardPull.pdf
[10]
International Marine Consultancy. (2005, August) Bollard Pull. [Online]. http://www.imcbrokers.com/blog/overview/detail/bollard-pull
[11]
Robert Bergeron. (2019, January) Outboard hop-up Hp theory. [Online]. https://www.dynomitedynamometer.com/articles/powerboat/powerboat_tech-talk_article.htm
[12]
(2014, March) Yachting and Boating World Forums. [Online]. http://www.ybw.com/forums/archive/index.php/t-389607.html
[13]
Smalley. (2019) Crest to Crest Wave Springs. [Online]. https://www.smalley.com/wave-springs/crest-crest-shim-ends
[14]
Xtreme Diesel Performance L.L.C. (2019) BD-POWER TORQUE CONVERTER (STREET & TOWING) 1070217X. [Online]. https://www.xtremediesel.com/bd-power-torque-converter-street-towing-1070217x
[15]
x-engineer. [Online]. https://x-engineer.org/automotive-engineering/drivetrain/coupling-devices/calculate-torque-capacity-clutch/
[16]
K&J Magnetics. [Online]. https://www.kjmagnetics.com/blog.asp?p=magnets-vs-steel
[17]
Marco Beleggia, Ludek Heller, Petr Sittner David Vokoun, "Magnetostatic interaction and forces between cylindrical permanent magnets," Journal of Magnetism and Magnetic Material, July 2009.
[18]
Wikipedia. [Online]. https://en.wikipedia.org/wiki/Vacuum_permeability
[19]
Wikipedia. [Online]. https://en.wikipedia.org/wiki/Remanence
85
[20]
Kohden. [Online]. http://www.hkd.co.jp/english/unit_conv/
[21]
Amazing Magnets. [Online]. https://www.amazingmagnets.com/t-magnetic-grade-chart.aspx
[22]
National Ocean Service. [Online]. https://oceanservice.noaa.gov/facts/whysalty.html
[23]
Youtube. (2007, September) Fluid Mechanics - Shearing stress on disk. [Online]. https://www.youtube.com/watch?v=-fcxGhBc6QA
[24]
The Engineering Toolbox. Sea Water Properties. [Online]. https://www.engineeringtoolbox.com/sea-water-properties-d_840.html
[25]
Don Patton. Sciencing. [Online]. https://sciencing.com/convert-durometer-youngs-modulus-7941189.html
[26]
Engineering Toolbox. [Online]. https://www.engineeringtoolbox.com/friction-coefficients-d_778.html