an integrated framework for the design of optimal web banners
TRANSCRIPT

An Integrated Framework
for the
Design of Optimal Web Banners
Lili Hai and Lan Zhao
Department of Mathematics and Computer Information Science
SUNY/College at Old Westbury
Old Westbury, New York 11568
and
Anna Nagurney
Isenberg School of Management
University of Massachusetts
Amherst, Massachusetts 01003
April 2008; revised February 2009 and September 2009
Netnomics 11: (2010), pp 69-83.
Abstract: In this paper, we present an integrated framework for the optimization of Internet
banner advertising. The framework consists of three parts: statistical predictive modeling
on web data, optimization through mixed integer programming, and the use of information
repository technology. The integrated, quantitative approach allows for the automatic im-
provement of banner advertising strategies and nonintrusive personalized advertising at a
variety of banner display levels.
Key Words: Web marketing, Banner design, Internet advertising, Optimization, Statistical
analysis, Mixed integer programming.
1

1. Introduction
Banners are a way of advertising on Internet websites and by email. They are advertise-
ments displayed at a certain position of a webpage during certain times for web visitors to
click. To browse the products, visitors enter the company’s website through the URL em-
bedded in banners. Banners help advertisers to meet such marketing objectives as branding,
increasing product awareness and/or revenue, etc. The banner visitors’ browsing behav-
ior can be recorded and made available to the advertiser on a weekly basis. This banner
measurability enables the evaluation of banner performance. Many websites accept banner
advertising. In fact, it is the major revenue source for most portals and content publishers
(Gauzente and Ranchhod (2001)). Banner advertising is charged on a “per activity” basis;
commonly accepted activities are the number of times a banner is viewed (the impression)
or click-through (Kazienko and Adamski (2007)).
While banner advertising has become prevalent, consumers have also become more se-
lective. Indeed, the banners’ click-through rate, which is the ratio of the number of click-
throughs to the number of exposures (times that the banner is shown to Internet surfers),
has declined precipitously to an average of less than one-half percent. In order to be fully
effective with banners, a scientifically sound approach using real time data is needed to de-
termine an optimal design (see also Chatterjee, Hoffman, and Novak (2003), Mitchell and
Valenzuela (2005), and Chandon and Chtourou (2005)).
This paper discusses how to use a statistical predictive technique and optimization meth-
ods to exploit the richness of data collected on banner visitors’ activities (called web data
in this paper) in order to achieve the goal of optimizing the banner designs. The optimiza-
tion procedure begins with establishing a banner information repository that complies with
database technology. The repository contains the following data:
1. banners organized, by id, for a variety of clusters of visitors;
2. the components of banners such as color, keywords, size, position, publisher name, em-
bedded URL, etc.;
3. the click-through rate of each banner.
2

The above data may change for each advertising cycle. After the establishment of the
information repository, the statistical predictive model is constructed based on the data. It
not only identifies the significant components, but also quantifies the contribution of each
component to the click-through rate of a banner. The predictive model sets click-through
rate as the function of banner components. Finally, mixed integer programming is used to
maximize the click-through rate as a function of the feasible set of components. In this special
banner repository, the optimized banners or sets of their components for different clusters
are created according to the results of the model solution and used in the next advertising
cycle. The benefits of this method are that it allows one to systematically improve banner
advertising by capturing the dynamics of browsers (Kazienko and Adamski (2007)) and to
“unintrusively” personalize web advertising (Tomlin (2000)) at the cluster-level.
In this paper, we target the very first step of Internet advertising – that of banner design
using the tools of statistical analysis and optimization. Optimization has been increasingly
used in Internet marketing. In Zhao and Nagurney (2005), optimal Internet advertising
strategies for allocating an ad budget to websites was modeled as a network optimization
problem, along with a special-purpose algorithm for the computation of the optimal solution.
In Zhao and Nagurney (2008), the network optimization modeling framework was expanded
to model Internet advertising competition in which multiple firms maximize their own ad
effects within their limited marketing budgets. In that paper, an elastic Internet marketing
budget was introduced in order to conjoin the online and offline marketing strategies. Conse-
quently, the multifirm competitive equilibrium problem was modeled as a Nash equilibrium
with network structure.
The current paper is organized as follows: In Section 2, we provide some background on
banner advertising in the context of mainstream Internet technology. Then, the optimization
model is presented in Section 3. Section 4 demonstrates how to build the model by use of a
statistical predictive method. In Section 5, we introduce the banner information repository.
Finally, in Section 6, we draw our conclusions and lay out our future research.
3

2. The Background
There are two or three distinct types of participants involved in the business of web adver-
tising: an advertiser, which is the company that wishes to post advertisements, usually, the
banners, on the Internet through some popular websites such as Yahoo!, Google, AOL, etc.,
and publishers, which are the said websites that the banners exist on. The advertiser usually
also has its own website and uses banner ads to pursue expanded e-marketing. Sometimes,
a broker works between the two as an intermediary agent.
We first briefly overview some technologies used in the industry. Google Adsense is
a tool to display relevant ads on a webpage. With this tool, the content of a webpage
is analyzed to determine a list of one or more topics associated with that webpage. An
advertisement, submitted by advertisers, is considered to be relevant to that webpage if it is
associated with keywords belonging to the list of one or more topics. One or more of these
relevant advertisements may be provided for rendering in conjunction with the webpage
or related webpages. The methods used are a series of searching and matching techniques
(Anderson et al. (2006)). On July 2, 2007 Yahoo! launched its patent-pending tool, Yahoo!
SmartAds (2007), to enhance its online advertising effectiveness. SmartAds takes advertisers’
creative campaign elements, automatically converts the elements and offerings into highly
customized and relevant display ads by delivering banner ads according to the web surfer’s
age, gender, location and online activities. Although the methodology behind SmartAds
is not fully known by the public and the academic community, people believe that it uses
behavioral, demographic and geographic segmentation capabilities for targeting (cf. Story
(2007)). SmartAds is currently in its pioneer stage where only Yahoo’s travel portal is using
it.
In the academic community, there have been efforts devoted to studying banner adver-
tising via linear programming or by data mining methods. In Chickering and Heckerman
(2003), to maximize the click-through rate, given inventory-management constraints in the
form of advertisement quotas, a system using predictive segments, in conjunction with a lin-
ear program to perform the constrained optimization, is developed. The system determines
the revenue-optimal advertisement schedules under a wide variety of pricing models for the
purpose of attracting advertisers (see also Amiri and Menon (2004)). Kazienko and Adamski
4

(2007) created the AdROSA system for automatic web banner personalization, which inte-
grates web usage and content mining techniques to reduce user input and to respect users’
privacy. While those publications, which focus on when and how to publish banners to max-
imize marketing efforts, are based on the assumption that the banners are well-designed,
the research in this paper focuses instead on the optimization and personalization of banner
design.
The issue of composing optimal banner ads had not received much attention in either
the academy or industry until recently with an example being Yahoo! SmartAds (Lohtia,
Donthu, and Hershberger (2003)). The dominant perspective, however, even in the case of
Yahoo’s SmartAds, for achieving the best ads efficiently is how to take advantage of searching
technologies employed by Search Engines (Langville and Meyer (2006)).
This paper tries to address the issue from an entirely different angle. Our approach is
based on the idea of experimental design. Experimental designs are often touted as the most
rigorous of all research designs to approximate truth about inferences regarding cause-effect
relationships (Trochim (2006)). This approach quantifies the effect of each factor on the
dependent variable, as well as the effects of interaction between factors on the dependent
variable. Experimental design techniques have been long applied in other fields such as
pharmaceutical research and are showing their potential in marketing (Almquist and Wyner
(2001), Yoon (2003)). We are adapting this technique and furthering this approach by
combining it, with mathematical programming, to identify optimal Internet banner ads
designs.
Currently, the banner design practice of many companies is to create many banners for
different occasions, products, or populations. For any given occasion, the conventional pro-
cedure is to first design a group of banners and then to submit to publishers to have them
placed on different web locations and time segments. These banners usually promote certain
products specifically targeted at a certain population demographic. Then, the statistical
data about each published banner such as the publisher (portal) name, the components used
in the banner, and the click-through rate are recorded by publishers and kept by advertisers.
By analyzing the data using a variety of methods, marketers identify “good” banners for
improvement, and web designers create the banners for the next round of advertising. Tra-
5

ditionally, a “good” banner is one which obtains a high click-through rate during a specified
time period. One drawback of this scheme is that a choice is made only among already
created banners which are just a few in total potentials, and advertisers cannot pinpoint
the factors that contribute to success; hence, there is a lack of information regarding the
direction for improvement. Another drawback of this scheme is the need for large amounts of
banner stocking. As a company’s business evolves, various banners made by combinations of
different design elements are accumulated. They are kept in inventory waiting to be selected
in the future. This causes difficulty in database management, since it is well-known that
the number of possible combinations of elements is, combinatorially, much greater than the
number of elements themselves.
Our approach is based on the fact that the success of a banner is dependent on the
collective contributions of all the elements in a banner. We first decompose banners into
consistent components such as: meaning, size, color, timing, position, image, keywords, URL,
etc. Secondly, we quantify the contribution of each element, and identify the effective factors.
Thirdly, we search for the best combined effect, rather than identify simply “good” banners
as is currently done in practice. This task can be accomplished through the combination of
optimization, statistical modeling, and Internet technology. Since the second step depends
on continuously collecting information from the web, the second and third steps should
be repeated to allow the new banner design to reflect the most recent banner usage. This
dynamic, cyclical self-learning scheme helps to enhance banner personalization and alleviates
the burden of banner inventory management. It also can provide the selected optimized
banner components to publishers that design banners by combining visitors’ information
with the banner data from the advertisers’ databases.
6

3. The Optimization Model
A banner is composed of many fundamental elements such as: color, size, position, key-
words, etc., and is rectangular in shape. How these elements are integrated is vital to
consumers’ perceptions and is directly related to their response rates. The purpose of our
proposed mathematical optimization model is to construct a formulation, whose solution will
yield the optimal combination among all possible choices that maximizes the consumers’ re-
sponse rate. Since some of the elements, such as keywords, take on discrete values, while
others, such as size, take on continuous values, the mathematical model is, therefore, a mixed
integer programming problem.
We first lay out the variables involved in the model. It is assumed that there is one
dependent variable. Based on the advertiser’s business objectives, it could be the click-
through rate, the purchase rate, or the revenue generated by clicking through the banner. If
the purpose of displaying the banner is for brand awareness, then the click-through rate is
the appropriate dependent variable; if the purpose is to generate revenue, then the purchase
rate will serve the purpose. Without loss of generality, in this paper, we use click-through
rate as the dependent variable in the model.
Independent variables are summarized in Table 1. Each combination of these values of
variables will yield a different banner which will perform differently. Each variable has its
own contribution to the banner’s performance. This contribution can be quantified through
the statistical predictive model which will be discussed in detail in Section 4. The list can
be expanded depending upon how subtle/detailed a banner is. In general, we assume that
there are I continuous variables, a total of J binary and discrete value variables, and K
categorical variables in our model and use AI to denote the set of the variables’ sub-indices
for continuous variables, BJ for binary variables, and CK for categorical variables. Thus, we
let xl; l ∈ AI⋃
BJ denote numerical variables, and we let Xk; k ∈ CK denote the categorical
variables.
7

Table 1: Independent Variables
Variable Name and Description Notation Type Possible ValuesTime span for banner to be x1 continuous 0 ≤ x1 ≤ TdisplayedYellow component of the color x2 continuous 0 ≤ x2 ≤ 255Blue component of the color x3 continuous 0 ≤ x3 ≤ 255red component of the color x4 continuous 0 ≤ x4 ≤ 255Size of the banner - x axis x5 discrete 0 ≤ x5 ≤ L in pixelsSize of the banner - y axis x6 discrete 0 ≤ x6 ≤ M in pixelsPosition of the banner on the X7 categorical shopping page,website email page, homepage, . . .Days to launch X8 categorical Monday, Tuesday,
Wednesday, . . .Animated or not animated x9 binary Yes (y) or No (n)Branded or not branded x10 binary Yes (y) or No (n)Tracking URL behind banner X11 categorical http://www.1800flowers.
com/dataset.do?dataset=10756Keywords/message X12 categorical “Sale!” “Holiday Shop”
“10% off!” . . .Images X13 categorical products, people, . . .Publisher X14 categorical AOL, Yahoo, Netscape. . . . . . . . . . . .
Suppose that there are Nk elements in the set Sk where categorical variable Xk; k ∈ CK
chooses values from. Then, let xk denote special ordered sets of type one (SOS1) where
xk(i) = 1, xk(j) = 0; ∀j 6= i; j = 1, 2, . . . , Nk if element i in set Nk is used. Special ordered
sets are a feature available in mixed integer programming (MIP) software packages to help
model certain situations in a way that allows for efficient problem solution; see, e.g., Dash
Optimization (2002).
Thus, each categorical variable will generate a SOS1. Hence, the total number of variables
in the optimization model would be I+J+CK with I continuous variables, J binary/discrete
variables, and CK SOS1 variables.
8

If cj; j ∈ AI ∪BJ is the contribution of one unit of variable xj to the click-through rate,
and ck ∈ RNk is the vector of coefficients presenting contribution of variable xk; k ∈ CK to
the click-through rate, then the optimization model may be expressed as:
Maximize Z =∑
j∈AI∪BJ
cjxj +∑
k∈CK
ckxk, (1)
∑j∈AI∪BJ
bjxj +∑
k∈CK
bkxk ≤ B (2)
such that:
lj ≤ xj ≤ uj; j ∈ AI ∪BJ , (3)
xj integer; j = 5, 6, (4)
xk SOS1 of size Nk; k ∈ CK , (5)
where (2) is the budget constraint; B denotes the amount of financial resources available; bj is
the price/cost associated per unit of xj; j ∈ AI∪BJ , and bk is the price/cost vector associated
with xk for k ∈ CK ; which is determined by the formula established in the business contract
between publishers and advertisers according to banners elements such as size, duration, and
popularity of pages where a banner is reside at. cj or ck, on the other hand, are determined
by analyzing banners’ performance data, with such methods as neural network analysis or
multivariable regression analysis. The latter one will be discussed in detail in Section 4. In
constraint (3), lj is nonnegative and is the lower bound on the value of xj and uj is its upper
bound. Constraint (4) guarantees that the variables x5 and x6 take on integer (discrete)
values. In marketing practice, depending on the business rule, constraints may be different
from the above, but the basic structure and principles are captured by (1) − (5), that is,
they are treated as linear constraints.
Problem (1) − (5) is a mixed integer programming problem. A banner usually contains
more than 10 categorical variables, some of which have hundreds of values which translate to
hundreds of binary variables. Fortunately, most software packages, such as SAS/OR, are able
to take advantage of SOS1 structure of these binary variables to reduce the complexity of the
math programming model. If the computed optimal solution is: x∗j ; j ∈ AI ∪BJ ; x∗k; k ∈ CK ,
then the best banner is the composition of the components of the solution.
9

Table 2: Data Collected from the Web Log
B ID Z(%) x1 x2 . . . x5 x6 . . . x9 x10 X11 X12 X13 X14 . . .b1 0.03 11 150 . . . 120 60 . . . n y gift.asp on sale flw1 AOL . . .b2 0.12 11 150 . . . 120 60 . . . y y gift.asp on sale flw1 ICQ . . .b3 0.03 11 150 120 60 y n gift.asp on sale flw2 AOLb4 0.24 11 150 120 60 n n gift.asp on sale vase1 ICQb5 0.07 21 120 468 60 n y gift.asp holiday vase1 YAHOOb6 0.03 21 120 468 60 y n prod.asp holiday fluit1 ICQb7 0.07 21 120 468 60 y y prod.asp holiday fluit1 YAHOOb8 0.03 21 120 468 60 y n prod.asp holiday heart1 ICQb9 0.23 30 120 468 60 n n prod.asp 20% off heart1 AOLb10 0.08 30 80 468 60 y n prod.asp 20% off heart1 YAHOOb11 0.21 30 80 468 60 y y prod.asp 20% off heart1 AOLb12 0.03 30 80 468 60 y y /0/1/0/0 20% off heart1 ICQb13 0.06 30 40 468 60 y y /0/1/0/0 20% off flw2 YAHOOb14 0.07 30 40 468 60 n n /0/1/0/0 20% off product 2 YAHOOb15 0.21 30 40 468 60 n n /0/1/0/0 20% off product 2 AOLb16 0.03 30 40 468 60 n y shop.com 20% off product 2 ICQb17 0.05 30 40 468 60 y n shop.com 20% off animal 1 YAHOOb18 0.07 30 60 234 60 n y shop.com 20% off animal 1 AOLb19 0.11 30 60 234 60 n y shop.com 20% off animal 1 YAHOOb20 0.06 30 60 234 60 n y shop.com 20% off animal 1 AOL
In the next section, we discuss how the objective function (1) is constructed as a result
of a predictive statistical model.
4. The Statistical Predictive Model
The advertising/marketing cycle of an Internet company consists of:
1. the creation of initial banners and their placement in Internet markets;
2. the collection of performance data;
3. the improvement of banner design based on historic data.
It is on this third step that the statistical predictive and optimization technique is applied.
Table 2 shows the typical data structure needed to build the predictive statistical model,
where B ID represents an individual banner that is composed of x1, x2, . . . ,X11, . . .X14,
. . . elements; the exposures and the number of click-throughs for each banner are kept in the
web log and the Z value, the click-through rate, are computed by click-through/exposures.
There exists some inherent relationship among the variables Z and xi and Xi; i =
10

1, 2, 3, . . . . The statistical aspect of the problem then becomes one of arriving at the best
estimate of the relationship between the variables. The most common and intuitive method
used in industry is the regression method, which searches for the regression equation fit to
the set of experimental data such as that in Table 2.
Upon inputting the data according to the specified format, statistical software, such as
SAS (cf. SAS Institute Inc. (1999a, b)), can accomplish the following: (1) determine the
linearly independent variables entering the regression equation; (2) determine the value of
the unit contribution cj and ck of each independent variable to the click-through rate Z.
As a result, a regression equation
Z =∑
j∈AI∪BJ
cjxj +∑
k∈CK
ckxk (6)
is built, which predicts the expected value of Z (denoted as Z) as a function of the inde-
pendent variables xj; j ∈ AI ∪ BJ and xk; k ∈ CK . Thus, the objective function of the
optimization model (1)− (5) is obtained.
In the following example, we use simplified data, but derived from reality, to further
demonstrate the procedure of building the predictive statistical model.
Example 1:
In this example, there are 234 banners that yield a different click-through rate Z logged in
234 records. The banners are composed of elements as follows:
Days of displaying: x1 in (0, 30);
Length of banner: x5 in [80, 468] in pixels;
Width of banner: x6 in [20, 240] in pixels;
Positions: X7 in {5.0 Email, EMAIL, FF, Homepage, Public, ROS, ROS - Budd, Run of
AIM, Webmail};Weekdays to launch banner: X8 in {Monday, Tuesday, Wednesday, Thursday, Friday, Sat-
urday, Sunday};Animated: x9 in {0, 1};Branded: x10 in {0, 1};Track URLs: X11 in {U1, U2, . . . , U13};
11

Portals: X14 in {AOL, AIM, ICQ, Netscape}.
Regression analysis (obtained with SAS proc reg ; see SAS Institute Inc. (1999a, b)) shows
that
Z = −0.07202 + 0.00121x6 − 0.21044x7 + 0.01763x38
+ 0.02942x58 + 0.02484x5
11 + 0.03705x611 + 0.05248x7
11 + 0.07337x811
+ 0.09460x911 + 0.10388x10
11 + 0.11499x1111 + 0.14194x12
11 + 0.23721x1311
+ 0.00639x114 + 0.00480x2
14 + 0.02388x314.
Based on this data, the predictive model shows that the click-through rate is affected
by the variables entering the regression equation, such as URLs (xi11; i = 1, 2, 3, . . . , 13), the
width of the banner (x6), and the weekdays (xi8; i = 1, 2, 3, . . . , 7) to launch the banners.
The variables, such as days of displaying, animated, branded, length of banner, etc. have
negligible effects, and, hence, do not enter the equation. If ‘Public’ position is chosen for
a banner, then the click-through rate would be decreased by 0.21044; if Friday is chosen
against Monday, the click-through rate would be increased by 0.02942.
The model was obtained with the combination of business rules and statistics principles.
We first used the stepwise option in SAS proc reg to identify the entering variables. Then, we,
purposely, forced some of statistically insignificant variables, such as the portals AOL and
AIM, into the model because of their business significance. The model’s overall significance
is F = 36.85, p < .0001, with R2 = 0.73. The stepwise option instructs SAS proc reg to
do a sequence of regression trials. The analysis starts at one independent variable. Then,
at each trial, it examines each of the independent variables, the variable that meets the
significance criteria and maximizes the fit of the model (mainly R2 value) is added to the
model or otherwise deleted from the model. The variables deleted from the model are
negligible in terms of their contribution to the dependent variable or sensitivity to R2 value
or their significant level in the model. In this particular example, the analysis is completed
after 15 trials and the significance criterion for the entering variable is set by SAS proc reg
automatically to be p = 0.15.
Ideally, the best banner would be composed by the most positive influential factors:
width=240, weekday=Friday, URL=U13, portal=ICQ.
12

It may contain variables, as necessary, that are not in the regression equation since they
have no statistically important impact on the the banner’s performance; it should avoid
taking negative factors such as position=Public. The expected click-through rate for an
optimal banner is 0.5037.
However, the company is bound by constraints. The most formidable one is the budget.
Therefore, the optimization method is then used to find an optimal solution.
Example 2:
Maximize Z = −0.07202 + 0.00121x6 − 0.21044x7
+ (0.01763, 0.02942)x8
+ (0.02484, 0.03705, 0.05248, 0.07337, 0.09460, 0.10388, 0.11499,
0.14194, 0.23721)x11
+ (0.00639, 0.00480, 0.02388)x14
subject to:
(2, 4, 8)x14 + x7 + 0.1x6 + (2, 4)x8 ≤ 14, (7)
20 ≤ x6 ≤ 240 (8)
x8, x11, x14 SOS1 of size 2, 9, 3 respectively (9)
This example is created for purposes of mathematical explanation. In reality, the budget
constraint (7) is created based on the contract with the banner publisher; constraint (9)
guarantees the mutually exclusive choice among URLs, publishers, or weekdays; and there
may be more constraints for business rules.
The optimal solution is: x∗14(1) = 1; x∗6 = 100; x∗8(1) = 1; x∗11(9) = 1 (obtained by using
SAS/OR, proc lp; see SAS Institute Inc. (1999a, b)). That is, within the budget, the most
effective banner should contain the elements:
width=100, weekday=Wednesday, URL=U13, portal=AOL
with an expected click-through rate of 0.31021. The banner without these elements would
perform worse statistically. It is worthwhile to point out that the optimal banner is a new
banner which is not in the existing collection. This example demonstrates the failure of the
13

Table 3: The RP Matrix
Portal 1 Portal 2 . . . Portal MCluster 1 Banner1,1 Banner1,2 . . . Banner1,M
Cluster 2 Banner2,1 Banner2,2 . . . Banner2,M
. . . . . . . . . . . . . . .Cluster L BannerL,1 BannerL,2 . . . BannerL,M
conventional method which selects the “good” banners from a pool of existing ones rather
than the optimal feasible one.
5. The Banner Information Repository and Advertising Management
In reality, many banners need to be created in order to attract a wide spread of cus-
tomers. Because the optimization and predictive models proposed in Sections 3 and 4,
respectively, are based on web data and a quantitative modeling approach, rather than an
artistic/aesthetic one, as many companies are currently using, it allows one to improve and
to manage the banner advertising in a dynamic, cyclic, and automatic way.
We propose RP (Remodeling Platform) and OP (Optimization Platform) matrices for
the purpose of updating, filtering good/bad banners, as well as organizing the banner ads
information repository.
The visitors are clustered according to their purchasing history, Internet browsing behav-
ior, and/or other possible criteria. The base matrix of RP is two-dimensional as shown in
Table 3. One dimension represents the user clusters and the other – the publishers (por-
tals). Assume L clusters and M portals. The element in each celli,j is a banner designed for
clusteri and should be published by portalj.
On the top of the base RP matrix, extra dimensions are possible. The number of extra
dimensions depends on the number of parameters that are independent of the company’s
decision. For example, “Holiday” could be an extra parameter for which companies need to
create banners for holiday sales to different clusters, published in different portals.
Another matrix, denoted by OP (see Table 4), is for storing banner components and the
14

Table 4: The OP Matrix
Click-Through Component . . . ComponentRate Z x1 xi
k
Banner1,1 0.03 5 0Banner1,2 0.10 3 1
. . . . . . . . . . . .Banner1,M 0.08 4 0
. . . . . . . . . . . .BannerL,M 0.01 7 0
click-through rate for every banner in the RP matrix.
Upon initialization, historical banners and their associated data are used to fill in the
RP and OP matrices. If there are not enough data, trial banners need to be posted for
data collection purposes. Then, the banner advertising optimization cycles start. Each cycle
includes the following steps:
1. Fill the OP matrix with the data gained from the last advertising cycle.
2. Find out the optimal banner for each cluster. On OP:
Loop for cluster i=1 to L
• Call the predictive model (6) based on data from (i − 1)m + 1 to iM
rows;
• Solve the mixed integer programming model (1)-(5);
• Output design of banneri,k, in which the best portalk is indicated as part
of the outcome;
End loop
3. Create improved banners and refill the RP matrix. On RP:
Loop for cluster i=1 to L
• Update celli,k with optimal banneri,k;
• Update celli,j, j 6= k, with trial banners for data collecting purpose;
15
End loop
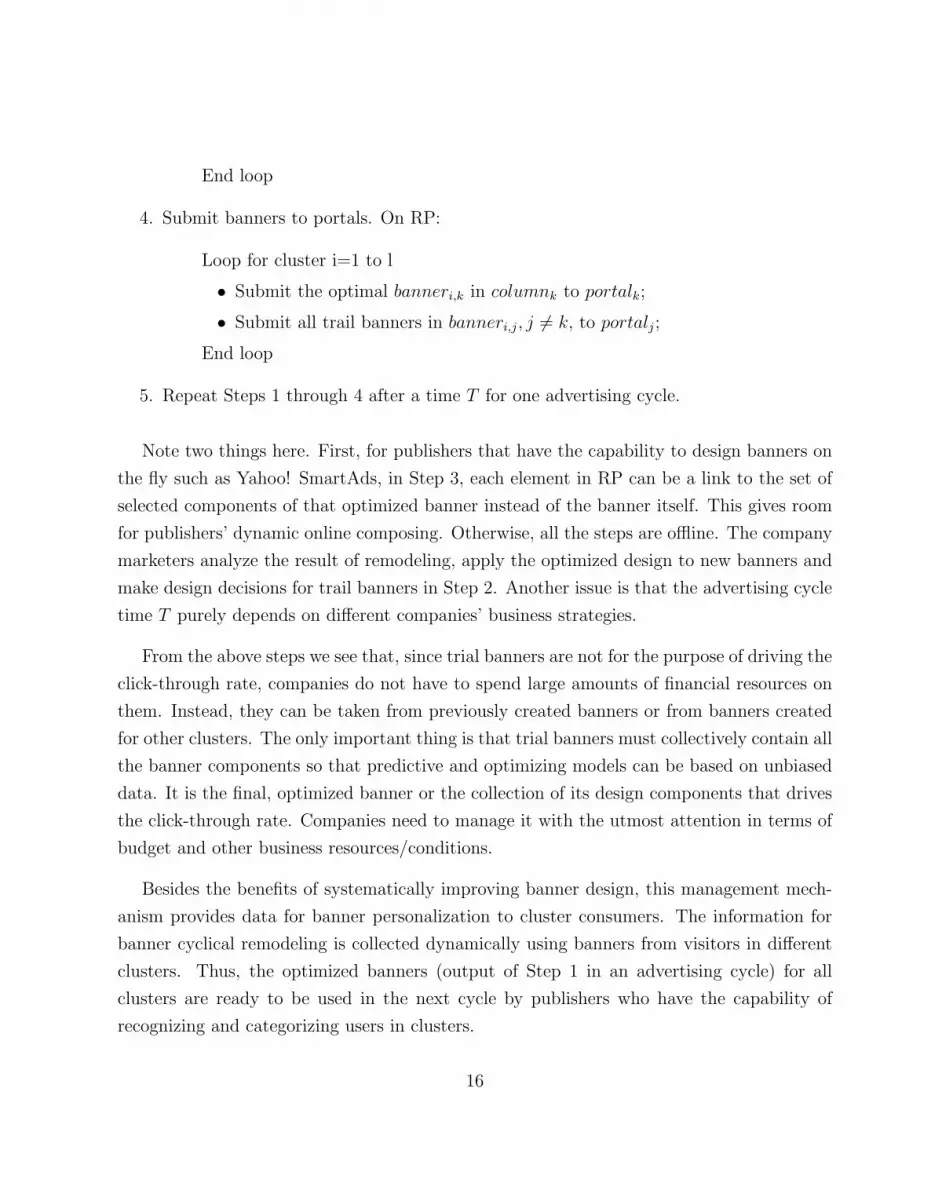
4. Submit banners to portals. On RP:
Loop for cluster i=1 to l
• Submit the optimal banneri,k in columnk to portalk;
• Submit all trail banners in banneri,j, j 6= k, to portalj;
End loop
5. Repeat Steps 1 through 4 after a time T for one advertising cycle.
Note two things here. First, for publishers that have the capability to design banners on
the fly such as Yahoo! SmartAds, in Step 3, each element in RP can be a link to the set of
selected components of that optimized banner instead of the banner itself. This gives room
for publishers’ dynamic online composing. Otherwise, all the steps are offline. The company
marketers analyze the result of remodeling, apply the optimized design to new banners and
make design decisions for trail banners in Step 2. Another issue is that the advertising cycle
time T purely depends on different companies’ business strategies.
From the above steps we see that, since trial banners are not for the purpose of driving the
click-through rate, companies do not have to spend large amounts of financial resources on
them. Instead, they can be taken from previously created banners or from banners created
for other clusters. The only important thing is that trial banners must collectively contain all
the banner components so that predictive and optimizing models can be based on unbiased
data. It is the final, optimized banner or the collection of its design components that drives
the click-through rate. Companies need to manage it with the utmost attention in terms of
budget and other business resources/conditions.
Besides the benefits of systematically improving banner design, this management mech-
anism provides data for banner personalization to cluster consumers. The information for
banner cyclical remodeling is collected dynamically using banners from visitors in different
clusters. Thus, the optimized banners (output of Step 1 in an advertising cycle) for all
clusters are ready to be used in the next cycle by publishers who have the capability of
recognizing and categorizing users in clusters.
16

The actual implementation of this personalization requires the collaboration of publishers
and advertisers. It needs the publisher’s banner personalization scheme, the advertisers’ ban-
ner database that bases on the RP and OP matrices, and accessibility to the database from
the publisher (or proper software communication between two sides with security considera-
tions). In fact, the approach presented in this paper can be applied by either advertisers or
publishers.
6. Summary and Conclusions
This paper presents an integrated framework for more effective banner advertising that
is scientifically-based. Using the web data collected in the most recent banner advertising
cycle, a statistical predictive model evaluates the banner components and quantifies the
contribution of components to banner performance. By maximizing the click-through rate,
the solution of a mixed integer programming model yields the optimal solution through the
selection of the “best” banner elements. To gain further improved banners, in a dynamic
context, a cyclical learning scheme, through a well-organized repository provides an appro-
priate platform for the implementation of the models and the accompanying mathematical
software for model solution.
The entire design of this scheme is user-oriented; thus, banners are created for different
clusters in each advertising cycle dependent on web data collected from those clusters. The
self-learning style fits this nonintrusive banner personalization. For the company that uses
these banners on its own pages, the personalization can be implemented on the site of the
company. Otherwise, the publishers should be provided with the banner database containing
the RP matrix (Remodeling Platform). Based on the optimized ready-to-use banners or sets
of components for designing the optimized banners, more efficient and powerful algorithms
may be applied by publishers as they can directly gain web users’ demographic, geographic
and behavioral information.
Moreover, there are many issues in our proposed scheme that are worthy of further dis-
cussion and investigation. Our next targets are:
(1) to study the sensitivity and stability of the solution of the mixed integer programming
model subject to changes in the data provided by the predictive model;
(2) to also address possible solutions for the cooperation between the publishers and the
17

companies providing the database of said framework to ensure that the advertising proce-
dure remains seamless and efficient;
(3) to conduct empirical tests. We have two options: a) to test our model in a company’s
actual publication procedure, or b) to test our model on a self-created website. Option a)
requires a company to accept our research into its business procedure, at least for the pe-
riod of one publishing cycle; Option b) requires that the website be sophisticated enough to
record clicks in different regions of a page.
Thus, together with two other papers (Zhao and Nagurney (2005, 2008)), we have fur-
thered a research stream that addresses how optimization can be applied to all phases of
Internet marketing, beginning with the design of advertisements; to the determination of
the budget allocation among Internet media; and, finally, to the computation of the budget
allocation among all media. We would like to also point out that the methodology proposed
in this paper is not limited by its application to the banner. It can also be applied to other
Internet marketing displays. Indeed, if we consider the webpage itself as a composition of
many components, then the mathematical essence of our proposal remains the same.
Acknowledgments
The authors are indebted to the two anonymous reviewers and to the Editor for many
helpful suggestions on an earlier version of this paper.
References
Almquist E. and Wyner G. (2001) Boost Your Marketing ROI with Experimental Design,
Harvard Business Review , October, 5-11.
Amiri, A. and Menon, S. (2004) Scheduling Banner Advertisements on the Web, INFORMS
Journal on Computing , 16, 95-105
Anderson, D., Buchheit, P., Carobus, A. P., Cui, Y., Dean, J. A., Harik, G. R., Jidal, D.,
Shivakumar, N. (2006) Serving Advertisements Based on Content, Patent # 7,136,875, US
Patent & Trademark Office, Patent Application Full Text and Image Database, November
14.
18

Chandon, J. L. and Chtourou, M. S. (2005) Factors Affecting Click-Through Rate, Online
Consumer Psychology: Understanding and Influencing Consumer Behavior in the Virtual
World , C. P. Haugtvedt, K. A. Machleit, and R. Yalch, Editors, Lawrence Erlbaum Asso-
ciates Publishers, Mahwah, New Jersey, 143-166.
Chatterjee, P., Hoffman, D. L., and Novak, T. P. (2003) Modeling the Clickstream: Impli-
cations for Web-based Advertising Efforts, Marketing Science 22, 520-541.
Chickering, D., and Heckerman, D. (2003) Targeted Advertising with Inventory Management,
Interfaces 33, 71-77.
Dash Optimization (2002) Special Ordered Sets;
http://www.optiware.co.kr/filedown/whitepapers/SpecialOrderedSets.pdf
Gauzente, C., and Ranchhod, A. (2001) Ethical Marketing for Competitive Advantage on
the Internet, Academy of Marketing Science Review 5(4).
Kazienko, P., and Adamski, M. (2007) AdROSA-Adaptive Personalization of Web Advertis-
ing, Information Sciences 177, 2269-2295.
Langville, A. N. and Meyer, C. D. (2006) Google’s Pagerank and Beyond: The Science of
Search Engine Rankings , Princeton University Press, Princeton, New Jersey.
Lohtia, R., Donthu, N. and Hershberger, E. (2003) The Impact of Content and Design
Elements on Banner Advertising Click-through Rates, Journal of Advertising Research 43,
410-418.
Mitchell, A., and Valenzuela, A. (2005) How Banner Ads Affect Brand Choice Without Click-
Through, Online Consumer Psychology: Understanding and Influencing Consumer Behavior
in the Virtual World , C. P. Haugtvedt, K. A. Machleit, and R. Yalch, Editors, Lawrence
Erlbaum Associates Publishers, Mahwah, New Jersey, 125-142.
SAS Institute Inc. (1999a) SAS OnlineDoc SAS/STAT User’s Guide, Cary, North Carolina.
SAS Institute Inc. (1999b) SAS OnlineDoc SAS/IML User’s Guide, Cary, North Carolina.
Story, L. (2007) Online Customized Ads Move a Step Closer, New York Times , July 2.
19

Tomlin, J. (2000) An Entropy Approach to Unintrusive Targeted Advertising on the Web,
Computer Networks 33, 767-774.
Trochim, W. M. K. (2006) Research Methods Knowledge Base,
http://www.socialresearchmethods.net/kb/index.php
Yahoo! (2007) Introducing Yahoo! SmartAds;
http://advertising.yahoo.com/central/marketing/smartads.html
Yoon, S. (2003) An Experimental Approach to Understanding Banner Adverts’ Effectiveness,
Journal of Targeting, Measurement and Analysis for Marketing 11, 255-272.
Zhao, L., and Nagurney, A. (2005) A Network Modeling Approach for the Optimization of
Internet-Based Advertising Strategies and Pricing with a Quantitative Explanation of Two
Paradoxes, Netnomics 7, 97-114.
Zhao, L., and Nagurney, A. (2008) A Network Equilibrium Framework for Internet Ad-
vertising: Models, Qualitative Analysis, and Algorithms, European Journal of Operational
Research 187, 456-472.
20