an independent financial costs: benefits analysis of the well
TRANSCRIPT
An Independent Financial Costs: Benefits Analysis of the Well@Work
Project delivered by Southampton City Council
(October 1st 2018 to February 29th 2020)
Authors Dr Mark Kilsby, Dr Stephen Beyer and Julie Allan
February 2020
Correspondence: Dr Mark Kilsby or Julie Allan Kilsby and Allan Ltd 13 Tewkesbury Place Cardiff CF24 4QU Tel: 02920 333707 Email:[email protected]
Contents Page Number
Executive Summary 1 Section 1: Introduction 2 Introduction and Context 2 Previous CBA’s in Supported Employment 2 Overview of Well@Work Costing Framework 5 Analysis Aims 6 Section 2: Method 7 Analysis Window 7 UK CBA Comparators 7 Well@Work Data Sources 7 List of Relevant Information for CBA 7 Numbers Engaged and Group Characteristics 8 Service Costs 8 Cost-Benefit Considerations 9 The Cost-Benefit Calculation 9 Sensitivity Analysis 12 Section 3: Results 13 Numbers of Employees Engaged and Work Retention Level 13 Group Characteristics 14 Well@Work Delivery Costs 14 Per capita Costs – 15 Months 15 Per Capita Costs – Per Annum 16 Costs Benefits Calculation Results 16 Sensitivity Analysis 16 Section 4: Conclusions and Study Limitations 19 Table 1: List of Relevant Information for CBA 7 Table 2: Financial Variables for Cost Comparison 8 Table 3: Summary of Costs and Flowbacks for Well@Work 10 Table 4: Results of Costs and Flowbacks for Well@Work 17 Figure 1: Numbers Engaged in Well@Work by Month 13 Figure 2: Breakdown of Well@Work Expenditure 14 Figure 3: Per-capita Costs for first 15 Months 15 Appendix 1: Welfare Benefit Rates Applied 21 Appendix 2: Income Tax and National Insurance Rates Applied 22
1
Executive Summary An independent financial cost-benefit analysis was conducted on the Well@Work project by the authors. It studied the first 15 months of the funding period (October 2018 to December 2019), based upon 110 beneficiaries engaging in the service; 103 of who completed baseline questionnaires in this period. It was conducted at the Taxpayer level, assessing the financial costs and benefits in terms of monies in and out of the Treasury. This CBA is based on the framework used by the authors in previous CBAs. It identifies the financial costs and cost avoidance savings in the situation where Well@Work exists, to a situation where it does not exist. This necessarily assumes that the Well@Work participants would not have sustained their jobs if the service had not intervened, and as a result would lead to a dependency upon more costly welfare benefits. The total budget allocated to Well@Work was £376,000 and as of December 2019 actual spend was £313,850. Eleven per cent of the costs were for project evaluation, highlighting the research focus within the Challenge Fund projects. These costs are excluded here as the focus is on the services delivered. The highest expenditure was staff salaries, accounting for 84% of total spend on delivery. The estimated yearly cost to deliver the initiative was calculated at £222,360 per annum and the cost per beneficiary at £2,159 per person per year for delivering the initiative. The cost to the Taxpayer of benefits being received by the beneficiaries while they were working is projected to be an average of £2,296 per person per annum. This brings the total yearly costs to £4,455. Balancing this is the financial flowback to the Taxpayer, in tax, national insurance and VAT on purchases, due to the beneficiaries being in work, estimated to be £8,009 over the same timescale. Taking both figures into account this gives us a benefit:cost ratio of 1.80 (a saving of £1.80p for every £1 invested in the service). Together, these represent an average net benefit to Taxpayers of £3,555 per beneficiary per year, as a result of helping these individuals retain employment. The second part of the analysis considered what would have happened to the beneficiaries if Well@Work had not existed. Given that all were at risk of losing their jobs when recruited, the analysis assumed that these jobs would have been lost, leading people to draw down additional Universal Credit payments. When corrections are made to exclude the housing cost element and include additional VAT income, this scenario leads to an overall net cost of £11,122 per person per annum to the Taxpayer if these beneficiaries had lost their jobs. If we take into account both this additional saving generated by not having people increase their benefits, and the net gains to the Taxpayer of the beneficiaries staying in work, the Well@Work service would benefit the Taxpayer on average £14,676 per beneficiary per annum. When we tested the impact of assuming a deadweight of 25% of those who retained work, the net saving changed from £14,676 to -£13,947 p.p p.a. and the benefit cost ratio to 1.55. A change to 12.5% changed the net saving from -£14,676 to -£14,364 p.p p.a. and the benefit cost ratio to 1.68. This shows that even if some people were assumed to have retained their jobs without Well@Work, the magnitude of savings here still demonstrates it to be a very cost-effective initiative.
2
Section 1: Introduction and Context Southampton City Council (SCC) commissioned our team to conduct a financial cost: benefit analysis (CBA) at the Taxpayer level to identify the financial outcomes associated with the Well@Work Project. Well@Work is funded through the the Work and Health Unit Challenge Fund, a joint initiative funded by the DWP and DHSC and as a collaboration between SCC (the prime service) and Portsmouth City Council over a 17-month duration from the 1st October 2018 to February 28th, 2020. The service aims to support employees with mental health and/or musculoskeletal conditions who are at-risk of losing their employment due to ill health, to retain their jobs. It is delivered in 3 main phases: a 3-month set-up phase (October to December 2018); a 12-month implementation phase for engaging at-risk employees, employers and health professionals (January to December 2019); and a 2-month consolidation phase during which no new referrals were taken (January to February 2020). While the service monitors the number and types of employees entering the project, there is also a research component with Southampton University monitoring any changes in the health conditions and wellbeing of the employees at-risk of losing their jobs entering Well@Work. The stated aims of Well@Work are to:
1. Find the most effective referral pathways for people with musculoskeletal or mental health difficulties who are at risk of losing their jobs;
2. Develop support strategies to help people to retain their jobs; 3. Identify how best to support people to retain their jobs in a cost efficient and scalable
way. This is to be achieved by:
• testing recruitment pathways from primary, secondary health services and employers;
• testing joint (health and employment) assessments and action planning to break down professional barriers;
• developing ways to engage with and upskill employers to retain staff with MSK/MH conditions.
This CBA focused on the first 15 months of Well@Work, through the 3-month set-up period up to the end of the 12-month employee engagement phase. This study supplements reports submitted by the service and Southampton University and focuses only upon fiscal outcomes. Clearly any accrued financial costs and/or savings identified must ultimately be judged alongside these reported outcomes, especially those associated with the health and personal wellbeing of the at-risk employees. Previous CBAs Relating to Supported Employment It is important to understand that financial savings come from different sources. A service can save Taxpayer’s money by ‘cost reduction’ (e.g. through budget cuts). It can also save Taxpayers significant amounts by ‘cost avoidance’. Here savings can be made because a service costs less than an alternative situation (e.g. being kept in work rather than receiving welfare benefits). Cost reductions tend to be more tangible than cost avoidance because they are observably and directly linked to a reduction in expenditure. Savings through cost
3
avoidance are largely based on estimation of what alternative costs would be if the service in question did not exist. Previous CBAs in the field of Supported Employment have shown that savings from cost avoidance accrue to the Taxpayer and Local Authorities when vulnerable groups are helped to obtain and keep paid jobs. Many of the earlier employment interventions (and hence CBAs) involved people with learning disabilities and these found considerable savings accrued at the Taxpayer and Local Authority levels due to the employment intervention: both in the USA 1,2,3,4 and in the UK. 5,6,7 A report in North Lanarkshire (2007) showed that people with Learning Disabilities were 113% financially better off after employment and found a 47.5% lower cost compared to Social Service Funded Day Service provision, resulting in a potential saving to the government of 25p for every £1 invested in the service. 8 A CBA of Kent Supported Employment Service (2011) estimated an avoidance saving of £1,290 to the Local Authority and £3,564 per person per year at the Taxpayer level.9 A study on Gloucestershire County Council’s Supported Employment services (2015) identified savings to the Local Authority of £144,170 per year, and a return of £1.42 for every £1 spent on the service, based on 91 beneficiaries with learning disabilities supported into paid work. 10 Some CBAs have shown that savings also accrue when applied to a variety of NEET vulnerable groups following supported employment. An analysis at the Taxpayer level of Kent County Council’s Vulnerable Learners Project in 2012 showed that Supported Apprenticeships could be cost effective for a number of vulnerable groups including young offenders, young single parents, people with mental health conditions, first time care leavers and people with learning disabilities. Although there were higher costs associated with the delivery phase, these were cancelled out at the Taxpayer level with 12 months paid employment and there was an on-going saving of £1.38 for every £1 invested.11
1 McCaughrin, W.B., Rusch, F.R. (1990). Supported Employment in Illinois: A benefit-cost analysis during the first two years. Urbana-Champaign, IL: The Secondary Transition Intervention Effectiveness Institute, University of Illinois. 2 Conley, R.W. & Noble, J.H. (1990). Benefit –cost analysis of Supported Employment. In F.Rusch (Ed.) Supported Employment: Models, issues and strategies Sycamore Publishing Co. 3 Hill, M., Banks, P., Handrick, R.,Hill, P. & Schafer, M (1987). Benefit Cost Analysis of Supported Employment for persons With Mental Retardation. Research in Developmental Disability, 8, 71-89. 4 Cimera, R.E. (2009) National Cost Efficiency of Supported Employees With Intellectual Disabilities: 2002 to 2007. American Association on Intellectual & Developmental Disabilities. 115, 1, 19–29. 5 Beyer, S. (2007). An evaluation of the Outcomes of Supported Employment in North Lanarkshire. Welsh Centre for Learning Disabilities, Cardiff. 6 Kilsby, M and Beyer, S (2011) A Financial Cost:Benefit Analysis of Kent Supported Employment - Establishing a Framework for Analysis. Kent County Council. 7 Kilsby, M., Allan, J. and Beyer, S. (2015) An Independent Financial Cost Benefit Analysis of Gloucestershire County Council’s Supported Employment Service. Gloucester County Council. 8 Beyer, S. (2007). An evaluation of the Outcomes of Supported Employment in North Lanarkshire. Welsh Centre for Learning Disabilities, Cardiff. 9 Kilsby, M and Beyer, S (2011) A Financial Cost:Benefit Analysis of Kent Supported Employment - Establishing a Framework for Analysis. Kent County Council. 10 Kilsby, M., Allan, J. and Beyer, S. (2015) An Independent Financial Cost Benefit Analysis of Gloucestershire County Council’s Supported Employment Service. 11 Kilsby, M and Allan, J (2012) Independent Review of the Vulnerable Learners Apprenticeship Project. Kent County Council.
4
In 2018 a CBA was conducted of Jersey Employment Trust’s Supported Employment service, across a range of vulnerable groups including people with long term health conditions, autism, learning disabilities, visual and/or hearing loss, mental health conditions and learning disabilities. Results showed that, even with service users earning National Minimum Wage (NMW) levels, the net costs to the Jersey Taxpayer was over £5,000 less per person per annum (p.p. p.a.) than being unemployed and receiving Income Support only. When wage rates were factored in, based on the mean wages by employment sector, the net balance of savings to the Taxpayer of the Jersey service were even more substantial at over £16,400 p.p. p.a. compared to a situation where the Jersey Employment Service did not exist.12 Attempting to judge the cost effectiveness of Well@Work by directly comparing the financial outcomes with those from previous CBAs is fruitless, as there are differences in the group compositions. However, we are interested to ascertain how certain characteristics can influence cost outcomes. Apart from employment status many things can and do effect cost outcomes: the person’s health condition may effect their amount and type of welfare benefit entitlement; age can dictate NMW levels, and wage rates dictate the amount of tax and national insurance contributions people pay. Clearly, the number of employees engaging in the project will impact on per capita costs, while employment retention rates will dictate the amount of cost avoidance savings accrued. Gender pay gaps can also have an impact and may be particularly relevant to Well@Work with research suggesting that there are approximately twice as many women as men with mental health conditions, and a higher prevalence for musculoskeletal conditions compared to men (32.5% verses 27.1%). Research in the UK has also shown that better financial outcomes are associated with supported employment when high levels of full-time work are observed. Previous studies show that many disabled people work less than 16 hours per week, this being the threshold above which benefits become affected.13 For the Well@Work service this is less of an issue as many of the participants are already in full time work, and if applicable, are retaining their in-work welfare benefits. Therefore, although our main focus is on the financial outcomes associated with Well@Work, identifying certain key outcomes provides information upon which the calculations are based and describes what outcomes funders can expect for their money. There are a number of reasons for supposing that Well@Work should be a financially viable option for the Taxpayer, as it provides financial ‘flowbacks’ such as maintained levels of tax revenue, the cost avoidance of people claiming out-of-work welfare benefits, and potentially less dependency on locally run health and social services. Few CBAs have been conducted specifically relating to people with mental health and/or musculoskeletal conditions or with regard to increasing employee job retention rates among these groups. Recent reports certainly suggest a need for employment intervention, showing that in the UK 54% of the disabled working age population have a mental health or musculoskeletal condition with both groups experiencing high unemployment rates. It is estimated that 37% of working age adults with musculoskeletal conditions and 60% of people with mental health conditions are unemployed, compared to 4% nationally. This increases to around 75% of those suffering
12 Kilsby, M., Allan, J. and Beyer, S. (2018) An Independent Quality Assurance Review of the Services Provided by Jersey Employment Trust. 13 Notably reductions in income support and the threshold upon which Working Tax Credits became available and people would transfer from IS onto ESA.
5
from a long-term mental illness. 14,15,16 People with musculoskeletal conditions are also more likely to retire early and account for around one in eight Employment and Support Allowance claimants.17,18 Overview of Well@Work Costing Framework This CBA is based on the framework used by the authors in previous CBAs. It identifies the financial costs and cost avoidance savings in the situation where Well@Work exists, to a situation where it does not exist.19 This necessarily assumes that the Well@Work participants would not have sustained their jobs if the service had not intervened, and as a result would lead to a dependency upon more costly welfare benefits. The eligibility criteria for accessing Well@Work is that:
• those referred to Well@Work were at ‘high risk of losing their jobs’ without support; • ill health was having a significant impact on their employment; • their employment was at risk as a result of their condition; • they wanted support to help them retain their employment;
In these circumstances, it is reasonable to assume that without the intervention some or all of the employees would have lost their jobs. If Well@Work is successful in meeting its 70% job retention target, then this would certainly generate cost avoidance savings due to the greater alternative financial costs that would arise for Taxpayers. While we are not able to estimate them, employers would also experience costs if the at-risk employees underperform, have long absences from work, or replacements had to be found and trained due to their employees having to leave their job. The net balance of financial costs and benefits between the situation with and without Well@Work can be calculated to produce a costs: savings ratio, identifying the net balance of savings to the Taxpayer for every £1 spent on the intervention.20 This will provide an indication of the financial viability and value for money of Well@Work. This CBA focuses on the Taxpayer level and does not attempt to calculate savings due to reductions in health and social services usage and we concentrate on the expenditure directly allocated to the delivery of the Well@Work intervention. This approach necessarily assumes that Well@Work is the primary intervention in tackling job retention issues for this cohort of workers. Although Well@Work applies to only 2 groups of participants, costing them separately is problematic because each group does not stand in isolation from the other. A cursory examination of the data showed that over 1 in 3 of the Well@Work participants
14 Office for National Statistics 2015, Labour Force Survey available at www.ons.gov.uk 15 Public Health England (2019) Health Matters: Health and Work https://www.gov.uk/government/publications/health-matters-health-and-work/health-matters-health-and-work 16 ONS. (2014). Full Report: Sickness Absence on the Labour Market, February 2014. Mental Health Foundation 17 Department for Work and Pensions (DWP). (2018) Employment and Support Allowance. 18 Stansfeld, S., Clark, C., Bebbington, P., King, M., Jenkins, R., & Hinchliffe, S. (2016). Chapter 2: Common mental disorders. In S. McManus, P. Bebbington, R. Jenkins, & T. Brugha (Eds.), Mental health and wellbeing in England: Adult Psychiatric Morbidity Survey 2014. Leeds: NHS Digital. 19 Detailed description of CBA framework in Method. 20 Sometimes referred to as ‘Net Present Value’
6
reported having both conditions, possibly due to depression being linked to their physical condition, or/and the instability they face at work due to their health problems.21 Analysis Aims This Analysis has the following main aims:
1. To develop a bespoke CBA framework specific to the Well@Work project; 2. To provide a description of the CBA methods, calculations, formulae, assumptions
and costing parameters; 3. To describe the group characteristics, in terms of type of condition, gender and age of
participants; 4. To identify the financial costs and savings that occur for the Taxpayer on a per
annum basis; 5. To produce a report of our methods and results which highlight the implications for
future funding and investment strategies; discusses the implications of the findings in relation to previous CBAs; and suggests way forward for developing future costing frameworks in this area.
21 Carnide, N, Franche RL, Hogg-Johnson, S, Cote, P, Breslin, FC, Severin, CN, Bultmann, U and Krause, N (2016) Course of Depressive Symptoms Following a Workplace Injury: A 12-Month Follow-Up Update. Journal of Occupational Rehabilitation, 26, 204–215.
7
Section 2: Method Analysis Window The analysis was conducted for the first 15 months of the project from October 2018 to December 2020. This window includes a 3-month set-up period (October to December 2018) and a 12-month period of beneficiary engagement (January to December 2019). At the time of the analysis there were 2 remaining months January and February 2020 of delivery remaining. UK CBA Comparators Although we cannot meaningfully directly compare the financial outcomes from previous CBAs with those of Well@Work due to group differences, we were interested to explore which determinants influenced financial outcomes (e.g., gender, hours worked, age and length of time in work). To do this we compared the employment outcomes observed for Well@Work, with those derived from four previous CBAs which adopting similar methodologies to this analysis: Service 1- South East of England;22 Service 2- The South West of England;23 Service 3- The English Midlands;24 and Service 4- The Channel Islands.25 Well@Work Data Sources The main data sources were the monitoring forms developed by the Well@Work service in conjunction with Southampton University. These were:
• The ‘intake forms’ conducted by Well@Work containing information about the person at the referral/intake stage;
• The ‘assessment forms’ conducted by Well@Work shortly after referral to assess the person’s work and health situation and form a retention action plan;
• The ‘baseline health questionnaire’ conducted at the Assessment Stage; • The Well@Work records of financial expenditure.
Table 1 shows the information provided by the service and Southampton University for the CBA contained within the main data sources.
Table 1: List of Relevant Information for CBA
Date of assessment Ages (DOB) Gender Marital status Participant condition Academic qualifications Occupation Job sector
Job start and finish dates Number of adults in household In household under 18 Household income Other dependents Accommodation State benefits
22 Kilsby, M and Beyer, S (2019) A Financial Cost:Benefit Analysis of Kent Supported Employment -Establishing a Framework for Analysis. Kent County Council. 23 Kilsby, M., Allan, J. and Beyer, S. (2015) An Independent Financial Cost Benefit Analysis of Gloucestershire County Council’s Supported Employment Service. 24 Kilsby, M (2010) The Cost Effectiveness of Mencap Derbyshire’s Supported Employment Programme. Derbyshire County Council. 25 Kilsby, M., Allan, J. and Beyer, S. (2018) An Independent Quality Assurance Review of the Services Provided by Jersey Employment Trust.
8
Numbers Engaged and Group Characteristics In order to describe what is being costed we identified the number of people engaging with Well@Work, their health condition, their ages and gender. We took the completion of the assessment stage as the point of engagement for the participants identifying the dates each person started their engagement and when and how many people had lost their jobs. This allowed us to accurately plot the cumulative growth in the numbers of people engaged in Well@Work over the 15 months and identify retention levels. No records were kept within the monitoring system for participant’s wage rates, and we therefore applied job-sector pay rate averages to estimate wages.26 We were able to identify the number of hours people worked and in which sectors/occupations their jobs were from. Service Costs Service costs were derived from the Well@Work budget for the period October 1st 2018 to December 31st 2020. We identified the total budget allocation and the actual spend and then identified the distribution of costs over the 15-month duration. We omitted research and evaluation costs, as these were not directly linked to delivery. Per capita costs were established in 2 ways:
1) By dividing the actual project spend by the numbers engaged in the project over the 15-month duration to derive an average cost per person. The service also kept data on actual numbers of people being supported at any one time over the duration. This allowed us to show how these per capita costs changed on a monthly basis over the period based on numbers retaining work and on the actual numbers of participants being supported at any one time.
2) To establish a ‘yearly cost’ we took the actual budget spend over the 15 month
duration (average cost per month) and then averaged this across 12 months. The per capita cost was then calculated by taking the total annual delivery costs (monthly average x12 months) and dividing this by the numbers of participants engaging in Well@Work over the full duration of the project, establishing an average cost per person per year. It is this cost that we carried forward into the analysis and its function is described in more detail later in this section.
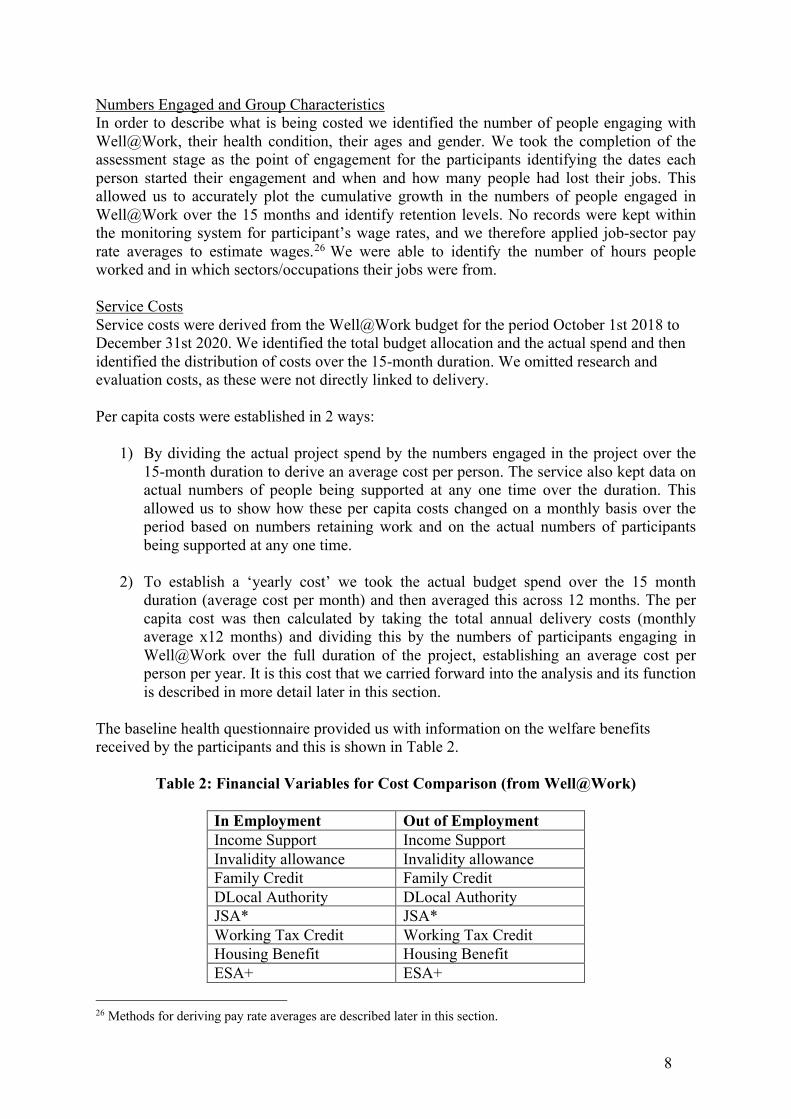
The baseline health questionnaire provided us with information on the welfare benefits received by the participants and this is shown in Table 2.
Table 2: Financial Variables for Cost Comparison (from Well@Work)
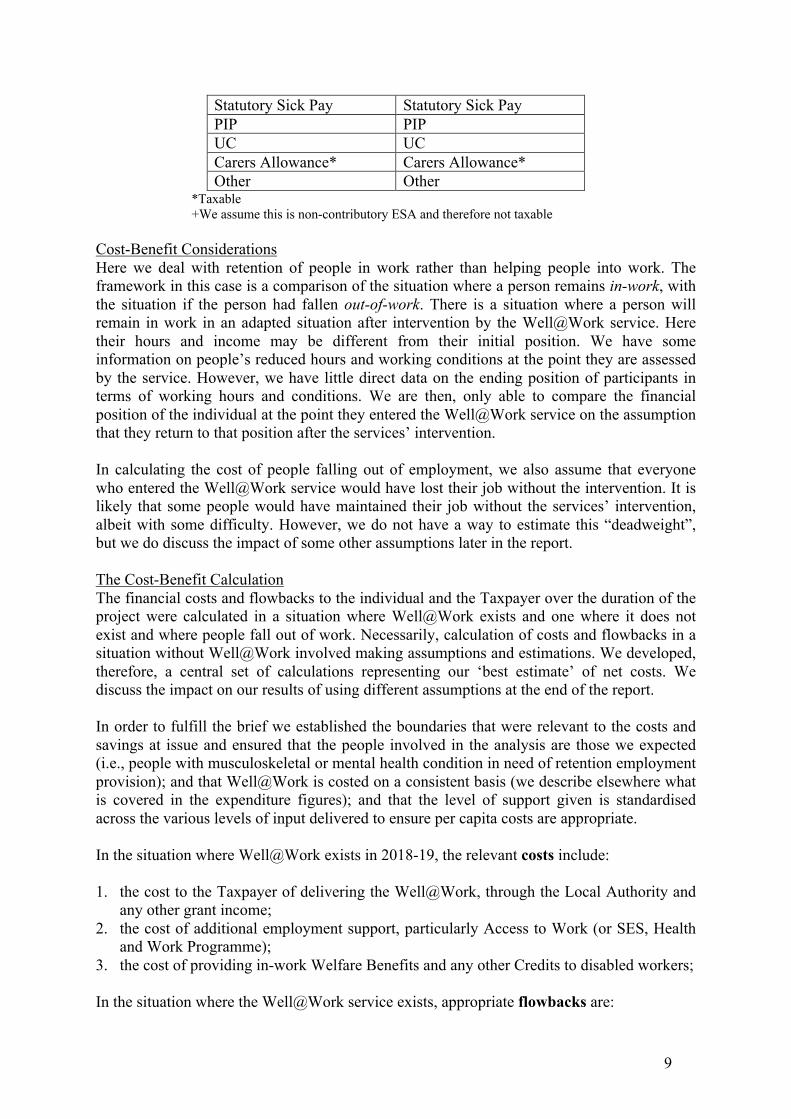
In Employment Out of Employment Income Support Income Support Invalidity allowance Invalidity allowance Family Credit Family Credit DLocal Authority DLocal Authority JSA* JSA* Working Tax Credit Working Tax Credit Housing Benefit Housing Benefit ESA+ ESA+
26 Methods for deriving pay rate averages are described later in this section.
9
Statutory Sick Pay Statutory Sick Pay
PIP PIP UC UC Carers Allowance* Carers Allowance* Other Other
*Taxable +We assume this is non-contributory ESA and therefore not taxable
Cost-Benefit Considerations Here we deal with retention of people in work rather than helping people into work. The framework in this case is a comparison of the situation where a person remains in-work, with the situation if the person had fallen out-of-work. There is a situation where a person will remain in work in an adapted situation after intervention by the Well@Work service. Here their hours and income may be different from their initial position. We have some information on people’s reduced hours and working conditions at the point they are assessed by the service. However, we have little direct data on the ending position of participants in terms of working hours and conditions. We are then, only able to compare the financial position of the individual at the point they entered the Well@Work service on the assumption that they return to that position after the services’ intervention. In calculating the cost of people falling out of employment, we also assume that everyone who entered the Well@Work service would have lost their job without the intervention. It is likely that some people would have maintained their job without the services’ intervention, albeit with some difficulty. However, we do not have a way to estimate this “deadweight”, but we do discuss the impact of some other assumptions later in the report. The Cost-Benefit Calculation The financial costs and flowbacks to the individual and the Taxpayer over the duration of the project were calculated in a situation where Well@Work exists and one where it does not exist and where people fall out of work. Necessarily, calculation of costs and flowbacks in a situation without Well@Work involved making assumptions and estimations. We developed, therefore, a central set of calculations representing our ‘best estimate’ of net costs. We discuss the impact on our results of using different assumptions at the end of the report. In order to fulfill the brief we established the boundaries that were relevant to the costs and savings at issue and ensured that the people involved in the analysis are those we expected (i.e., people with musculoskeletal or mental health condition in need of retention employment provision); and that Well@Work is costed on a consistent basis (we describe elsewhere what is covered in the expenditure figures); and that the level of support given is standardised across the various levels of input delivered to ensure per capita costs are appropriate. In the situation where Well@Work exists in 2018-19, the relevant costs include: 1. the cost to the Taxpayer of delivering the Well@Work, through the Local Authority and
any other grant income; 2. the cost of additional employment support, particularly Access to Work (or SES, Health
and Work Programme); 3. the cost of providing in-work Welfare Benefits and any other Credits to disabled workers; In the situation where the Well@Work service exists, appropriate flowbacks are:
10
4. the Tax and National Insurance paid by disabled workers on their income at the point that
they were assessed by the Well@Work service; 5. VAT receipts from disabled workers from their spending of income from paid income,
net of Tax and NI; In the situation where Well@Work does not exist, there would be no costs of delivering the Well@Work programme, but the following costs might be incurred by the Taxpayer: 6. Welfare Benefits and any Credits paid to disabled workers now unemployed. In the situation without Well@Work, and people fall out of work, flowbacks to the Taxpayer will occur through: 7. Indirect taxes, such as VAT, from the income received by disabled workers now
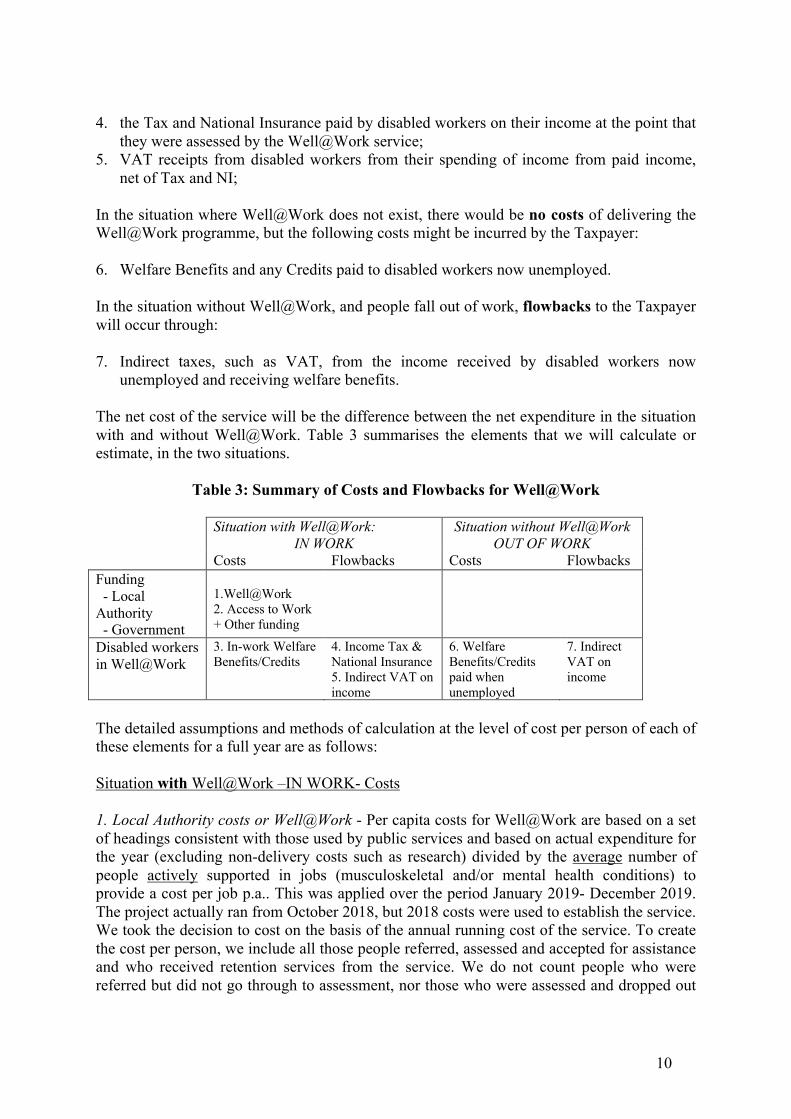
unemployed and receiving welfare benefits. The net cost of the service will be the difference between the net expenditure in the situation with and without Well@Work. Table 3 summarises the elements that we will calculate or estimate, in the two situations.
Table 3: Summary of Costs and Flowbacks for Well@Work Situation with Well@Work:
IN WORK Situation without Well@Work
OUT OF WORK Costs Flowbacks Costs Flowbacks Funding - Local Authority - Government
1.Well@Work 2. Access to Work + Other funding
Disabled workers in Well@Work
3. In-work Welfare Benefits/Credits
4. Income Tax & National Insurance 5. Indirect VAT on income
6. Welfare Benefits/Credits paid when unemployed
7. Indirect VAT on income
The detailed assumptions and methods of calculation at the level of cost per person of each of these elements for a full year are as follows: Situation with Well@Work –IN WORK- Costs 1. Local Authority costs or Well@Work - Per capita costs for Well@Work are based on a set of headings consistent with those used by public services and based on actual expenditure for the year (excluding non-delivery costs such as research) divided by the average number of people actively supported in jobs (musculoskeletal and/or mental health conditions) to provide a cost per job p.a.. This was applied over the period January 2019- December 2019. The project actually ran from October 2018, but 2018 costs were used to establish the service. We took the decision to cost on the basis of the annual running cost of the service. To create the cost per person, we include all those people referred, assessed and accepted for assistance and who received retention services from the service. We do not count people who were referred but did not go through to assessment, nor those who were assessed and dropped out
11
before receiving services. In addition, we need to establish the average per capita costs of any other grants flowing through Well@Work during the period. 2. Cost of additional employment support- We would normally include the average per capita costs of Access to Work, of other support programmes, or other work subsidy payments for any worker in a job during the period. These are also Taxpayer costs of the service. However, no data was available on whether Access to Work or any other programme was used for some people and, if it was, what these costs were. 3. Cost of in-work benefits and Credits- Average per capita costs of all in-work benefits and Credits received to any worker while in work. We were not supplied with a total figure for people’s welfare benefit income but we did have a list of in-work welfare benefits each person received: thirty-three people reported receiving welfare benefits while in work (32% of the total served). We estimated the total welfare benefit income for those in employment by applying standard national welfare benefit rates and regulations to each benefit received by each individual, divided by the average number of people being actively supported by Well@Work in the period to provide a cost p.p. p.a. (per person per annum). Benefit and Credit rates used and assumptions applied are provided in Appendix 1. We note that some welfare benefits recorded on the services data monitoring sheets no longer exist (e.g. Family Credit). Situation with Well@Work –IN WORK- Flowbacks 4. The Tax and National Insurance (NI) Flowbacks from Disabled Workers- Employee PAYE and contributions to NI are estimated from people’s gross salary figures (excluding bonuses and tax-free benefits). While start date on job, and industry were recorded, no gross wage income figures were available in the Well@Work data. We therefore estimate people’s gross income using nationally available hourly wage rate statistics, differentiated by South East Region, gender of the worker, and the Standard Occupational Classification (SOC) of the job people had, multiplied by the hours that people worked per week.27 We then applied national Tax and NI rate bands, excluding any additional tax allowances for married people or any other factors such as savings levels people had, that we were unable to identify through the database. The range of weekly Tax and NI yields were then totalled and multiplied by 52 weeks to provide an annual total. This was in turn divided by the average number of people actively supported in the period to provide a flowback to government p.p. p.a. The applicable Tax and National Insurance rates used are shown in Appendix 2. 5. Indirect Tax Flowbacks from Disabled Workers – For ease of analysis, we assume that all of people’s net earned and unearned income (gross wages and welfare benefits minus Tax and NI) will all be spent on VAT eligible goods generating a 20.0% yield for the Taxpayer.
Situation without Well@Work – OUT OF WORK- Costs 6. Welfare Benefits/Credits paid to disabled people when unemployed- The people with disabilities who have been in employment for some time may have received historic welfare benefits. Well@Work have identified what benefits people were claiming when they started with the service. However, the majority received no in-work welfare benefits. To establish
27 https://onsdigital.github.io/dp-classification-tools/standard-occupational-classification/ONS_SOC_occupation_coding_tool.html
12
any current saving, we calculated the amount the person would be receiving, based on them receiving basic Universal Credit with suitable Disability Premiums, at 2019 levels published rates. Universal Credit was introduced to Southampton in February 2017 and any new application for welfare benefit by working age claimants would be for Universal Credit. We considered eligibility for Housing Benefit and assumed all those who were renting accommodation while in work would receive Housing Costs as a part of Universal Credit in line with their occupancy by adults and children, their bedroom allowances in the benefit model, and the Southampton Local Housing Allowance rate when unemployed. Further, we assumed that those who were homeowners would not be eligible for housing costs through Universal Credit.28
Situation without Well@Work – OUT OF WORK- Flowbacks 8. Indirect tax Flowbacks from Disabled Workers when not employed- See 5 above. Well@Work Financial Cost:benefit Analysis at the Individual Worker Level For the person with a disability, their income before use of the Well@Work retention service will come from paid income and any in-work welfare benefits minus any Income Tax and NI they pay. Without the Well@Work retention services it is likely that people will become unemployed and then their income will come from welfare benefits received. Net financial cost:benefit for the individual will be the difference in their net income IN WORK and OUT of employment. With all of the income and welfare benefit receipt figures in work, and the welfare benefit receipts when out of work, being estimated, it is felt not useful to provide a further estimate of the difference between in work and out of work income individual by individual. Our estimated net average income per person in work was £20,967, and out of work was £14,274, suggesting that generally people in this group would be better off in work. Sensitivity Analysis Deadweight: Our central assumption in the analysis was that there was no deadweight, that is that all people served by Well@Work needed the service to stay in their jobs. We can test the impact of changing this assumption to one where 25% of those who retained work (approximately 26 individuals) would have done so without the service’s intervention. Since we cannot know whether the deadweight people are without in-work benefits, or if all have these benefits we can only deal with the overall average in-work benefit figure as it is and assume that flowbacks in a situation with the service will stay the same. Again, out-of-work welfare benefits without the service are likely to be the same also as they are also based on averages. Therefore, in calculating deadweight we took the delivery cost for the project and reduced the numbers supported, assuming a 25% deadweight of 26 people and divided this cost by this figure. We then applied this calculation assuming a deadweight of 12.5%
28 We are aware that some housing costs are provided through Universal Credit for those with a mortgage and that loans are available to maintain mortgage payment. We were unable to estimate these incomes however.
13
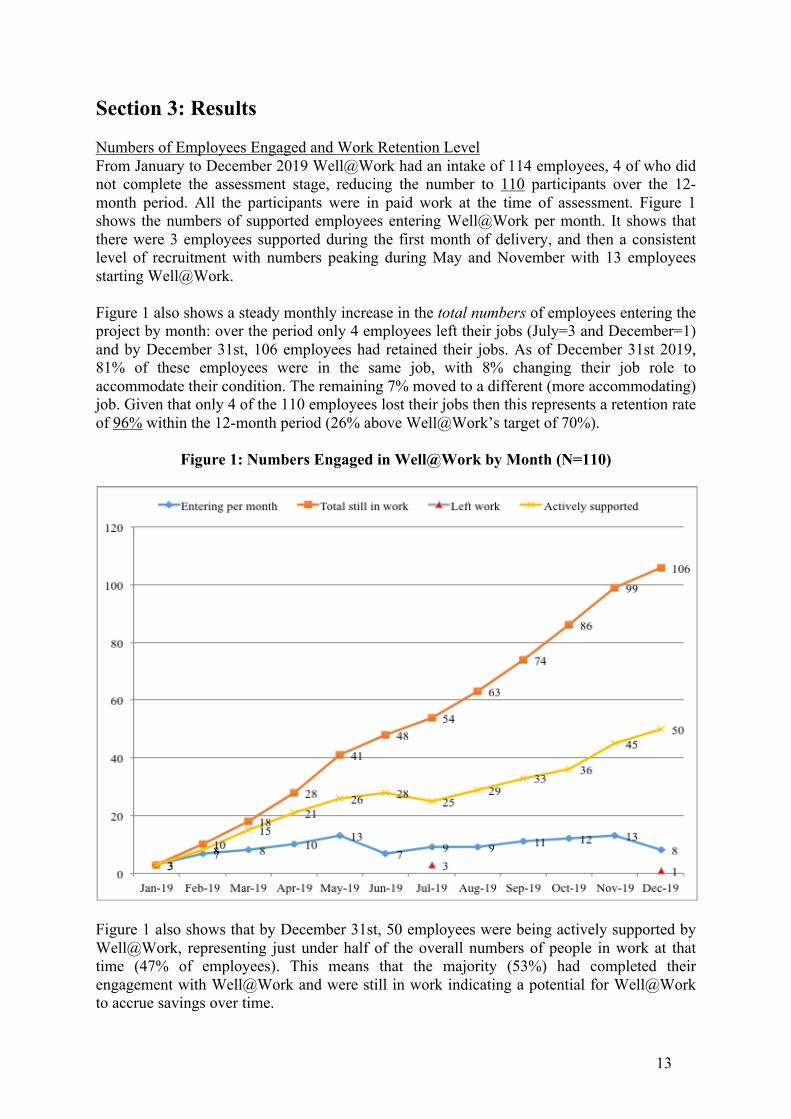
Section 3: Results Numbers of Employees Engaged and Work Retention Level From January to December 2019 Well@Work had an intake of 114 employees, 4 of who did not complete the assessment stage, reducing the number to 110 participants over the 12-month period. All the participants were in paid work at the time of assessment. Figure 1 shows the numbers of supported employees entering Well@Work per month. It shows that there were 3 employees supported during the first month of delivery, and then a consistent level of recruitment with numbers peaking during May and November with 13 employees starting Well@Work. Figure 1 also shows a steady monthly increase in the total numbers of employees entering the project by month: over the period only 4 employees left their jobs (July=3 and December=1) and by December 31st, 106 employees had retained their jobs. As of December 31st 2019, 81% of these employees were in the same job, with 8% changing their job role to accommodate their condition. The remaining 7% moved to a different (more accommodating) job. Given that only 4 of the 110 employees lost their jobs then this represents a retention rate of 96% within the 12-month period (26% above Well@Work’s target of 70%).
Figure 1: Numbers Engaged in Well@Work by Month (N=110)
Figure 1 also shows that by December 31st, 50 employees were being actively supported by Well@Work, representing just under half of the overall numbers of people in work at that time (47% of employees). This means that the majority (53%) had completed their engagement with Well@Work and were still in work indicating a potential for Well@Work to accrue savings over time.
14
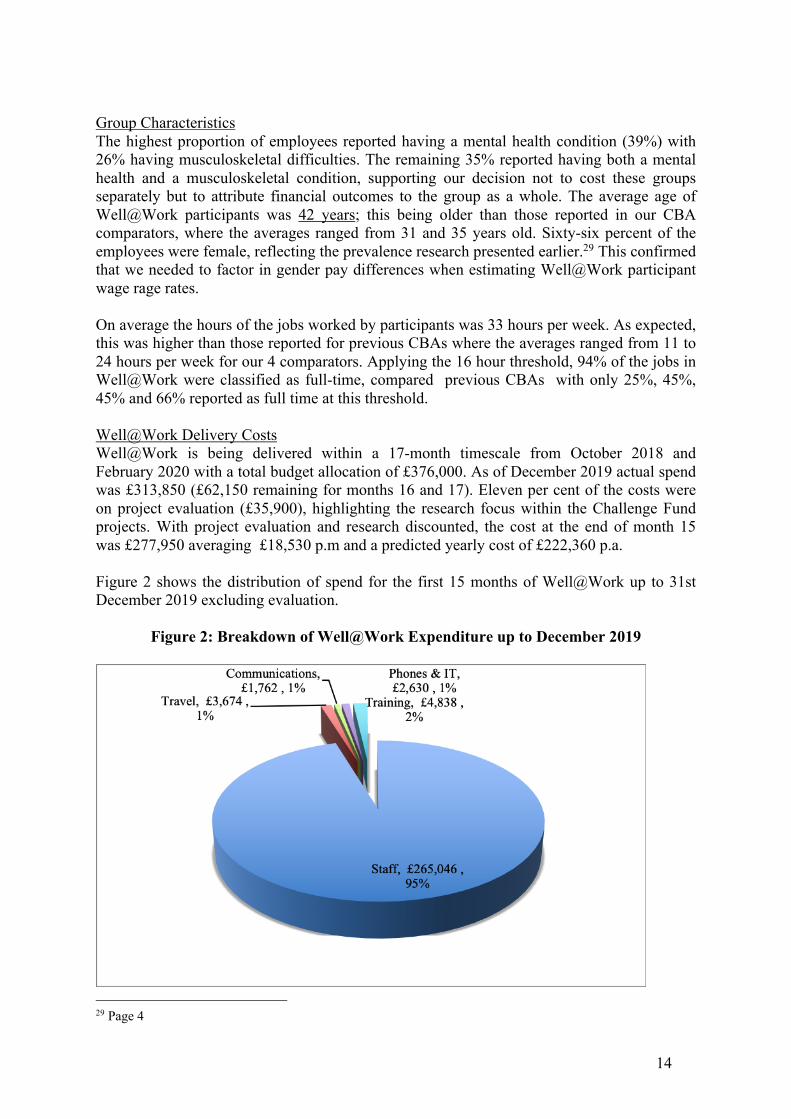
Group Characteristics The highest proportion of employees reported having a mental health condition (39%) with 26% having musculoskeletal difficulties. The remaining 35% reported having both a mental health and a musculoskeletal condition, supporting our decision not to cost these groups separately but to attribute financial outcomes to the group as a whole. The average age of Well@Work participants was 42 years; this being older than those reported in our CBA comparators, where the averages ranged from 31 and 35 years old. Sixty-six percent of the employees were female, reflecting the prevalence research presented earlier.29 This confirmed that we needed to factor in gender pay differences when estimating Well@Work participant wage rage rates. On average the hours of the jobs worked by participants was 33 hours per week. As expected, this was higher than those reported for previous CBAs where the averages ranged from 11 to 24 hours per week for our 4 comparators. Applying the 16 hour threshold, 94% of the jobs in Well@Work were classified as full-time, compared previous CBAs with only 25%, 45%, 45% and 66% reported as full time at this threshold. Well@Work Delivery Costs Well@Work is being delivered within a 17-month timescale from October 2018 and February 2020 with a total budget allocation of £376,000. As of December 2019 actual spend was £313,850 (£62,150 remaining for months 16 and 17). Eleven per cent of the costs were on project evaluation (£35,900), highlighting the research focus within the Challenge Fund projects. With project evaluation and research discounted, the cost at the end of month 15 was £277,950 averaging £18,530 p.m and a predicted yearly cost of £222,360 p.a. Figure 2 shows the distribution of spend for the first 15 months of Well@Work up to 31st December 2019 excluding evaluation.
Figure 2: Breakdown of Well@Work Expenditure up to December 2019
29 Page 4
15
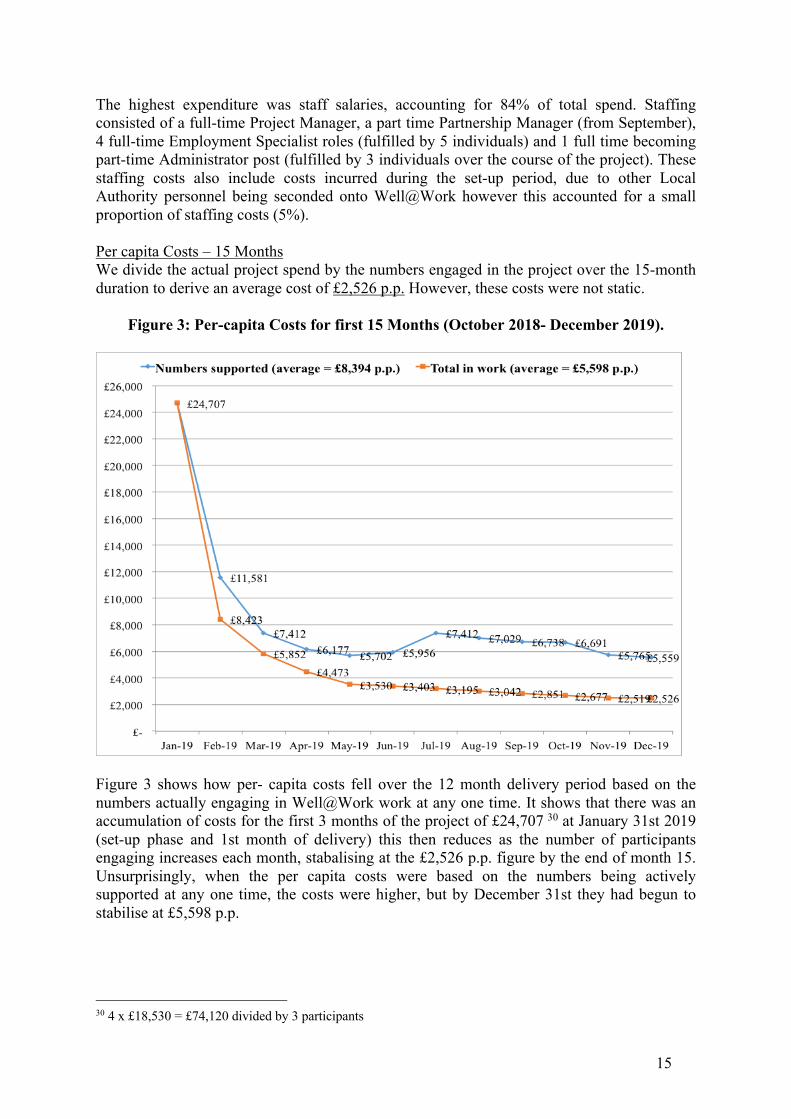
The highest expenditure was staff salaries, accounting for 84% of total spend. Staffing consisted of a full-time Project Manager, a part time Partnership Manager (from September), 4 full-time Employment Specialist roles (fulfilled by 5 individuals) and 1 full time becoming part-time Administrator post (fulfilled by 3 individuals over the course of the project). These staffing costs also include costs incurred during the set-up period, due to other Local Authority personnel being seconded onto Well@Work however this accounted for a small proportion of staffing costs (5%). Per capita Costs – 15 Months We divide the actual project spend by the numbers engaged in the project over the 15-month duration to derive an average cost of £2,526 p.p. However, these costs were not static.
Figure 3: Per-capita Costs for first 15 Months (October 2018- December 2019).
Figure 3 shows how per- capita costs fell over the 12 month delivery period based on the numbers actually engaging in Well@Work work at any one time. It shows that there was an accumulation of costs for the first 3 months of the project of £24,707 30 at January 31st 2019 (set-up phase and 1st month of delivery) this then reduces as the number of participants engaging increases each month, stabalising at the £2,526 p.p. figure by the end of month 15. Unsurprisingly, when the per capita costs were based on the numbers being actively supported at any one time, the costs were higher, but by December 31st they had begun to stabilise at £5,598 p.p.
30 4 x £18,530 = £74,120 divided by 3 participants
16
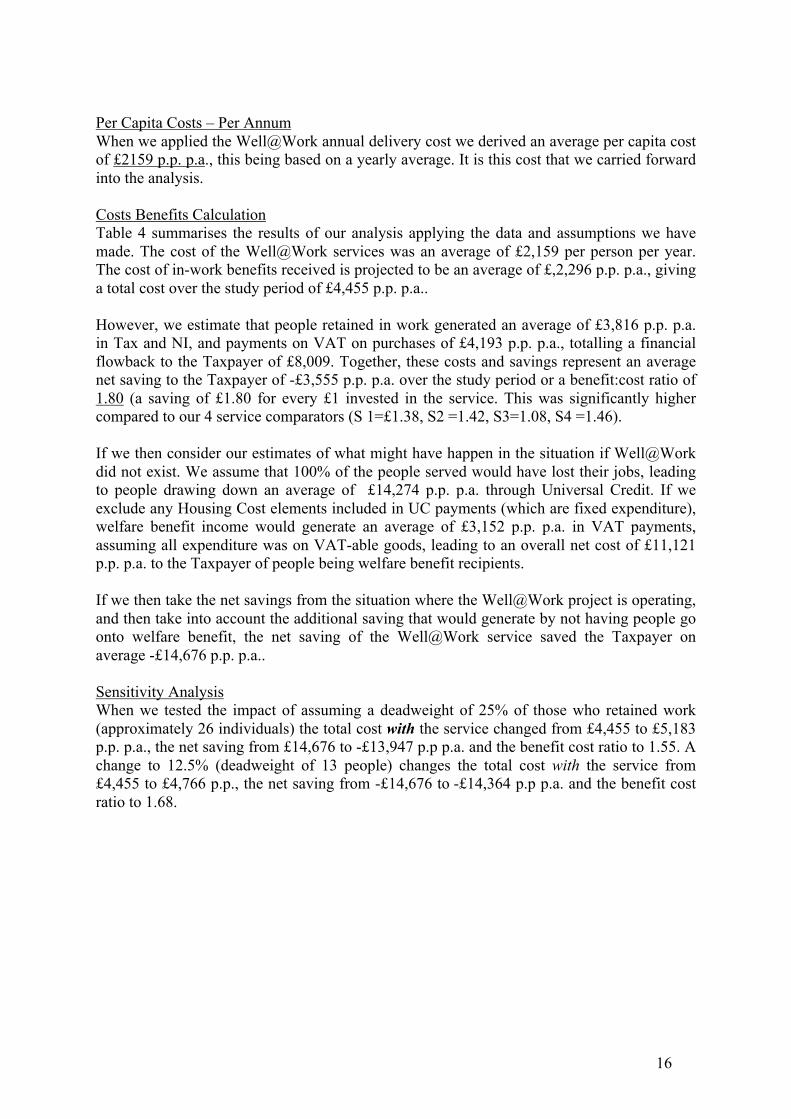
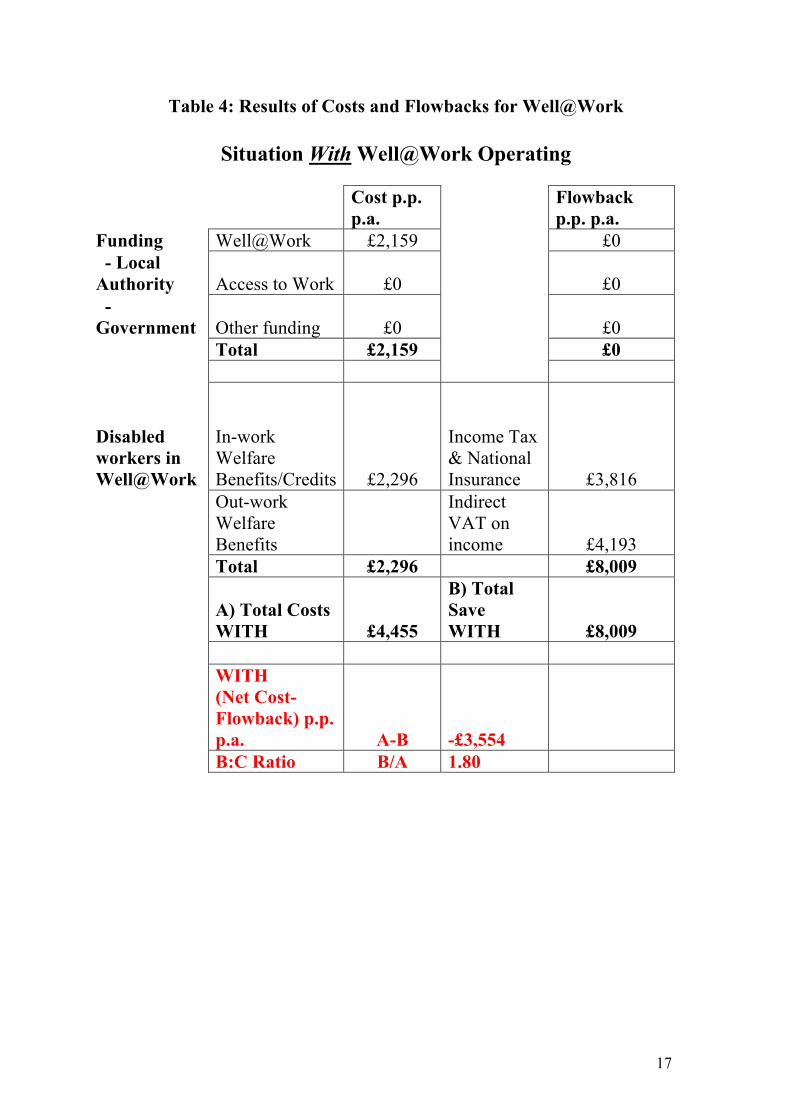
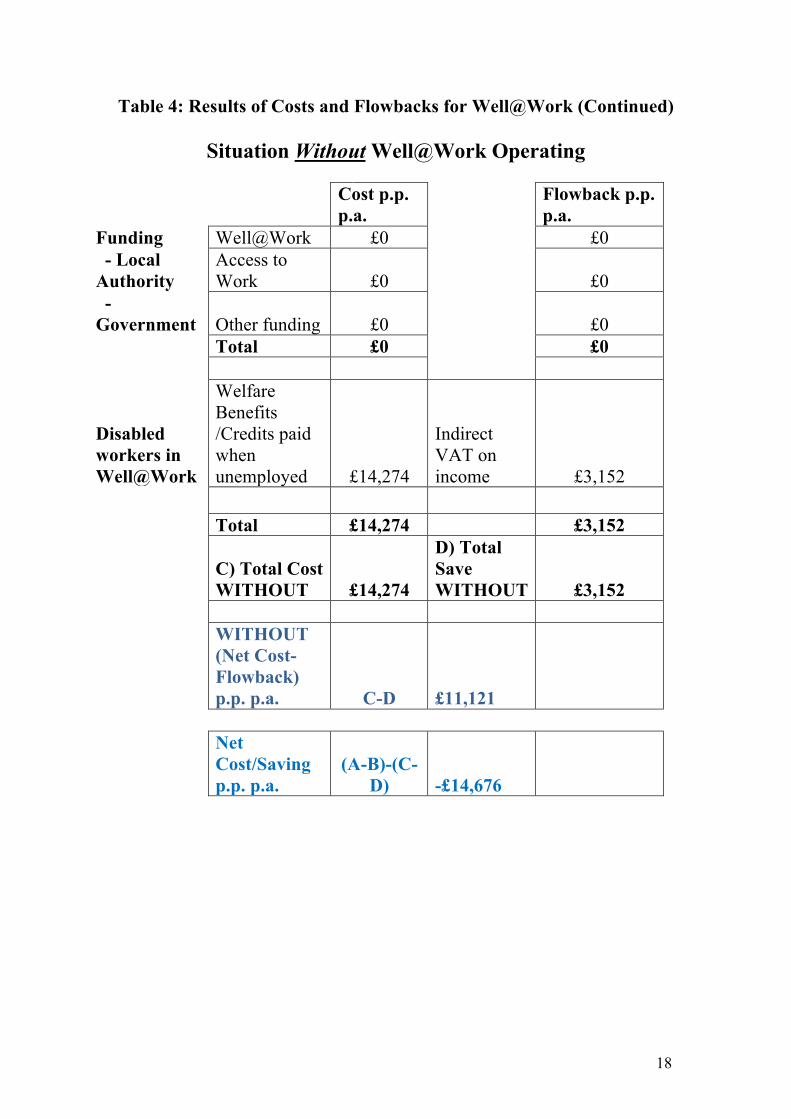
Per Capita Costs – Per Annum When we applied the Well@Work annual delivery cost we derived an average per capita cost of £2159 p.p. p.a., this being based on a yearly average. It is this cost that we carried forward into the analysis. Costs Benefits Calculation Table 4 summarises the results of our analysis applying the data and assumptions we have made. The cost of the Well@Work services was an average of £2,159 per person per year. The cost of in-work benefits received is projected to be an average of £,2,296 p.p. p.a., giving a total cost over the study period of £4,455 p.p. p.a.. However, we estimate that people retained in work generated an average of £3,816 p.p. p.a. in Tax and NI, and payments on VAT on purchases of £4,193 p.p. p.a., totalling a financial flowback to the Taxpayer of £8,009. Together, these costs and savings represent an average net saving to the Taxpayer of -£3,555 p.p. p.a. over the study period or a benefit:cost ratio of 1.80 (a saving of £1.80 for every £1 invested in the service. This was significantly higher compared to our 4 service comparators (S 1=£1.38, S2 =1.42, S3=1.08, S4 =1.46). If we then consider our estimates of what might have happen in the situation if Well@Work did not exist. We assume that 100% of the people served would have lost their jobs, leading to people drawing down an average of £14,274 p.p. p.a. through Universal Credit. If we exclude any Housing Cost elements included in UC payments (which are fixed expenditure), welfare benefit income would generate an average of £3,152 p.p. p.a. in VAT payments, assuming all expenditure was on VAT-able goods, leading to an overall net cost of £11,121 p.p. p.a. to the Taxpayer of people being welfare benefit recipients. If we then take the net savings from the situation where the Well@Work project is operating, and then take into account the additional saving that would generate by not having people go onto welfare benefit, the net saving of the Well@Work service saved the Taxpayer on average -£14,676 p.p. p.a.. Sensitivity Analysis When we tested the impact of assuming a deadweight of 25% of those who retained work (approximately 26 individuals) the total cost with the service changed from £4,455 to £5,183 p.p. p.a., the net saving from £14,676 to -£13,947 p.p p.a. and the benefit cost ratio to 1.55. A change to 12.5% (deadweight of 13 people) changes the total cost with the service from £4,455 to £4,766 p.p., the net saving from -£14,676 to -£14,364 p.p p.a. and the benefit cost ratio to 1.68.
17
Table 4: Results of Costs and Flowbacks for Well@Work
Situation With Well@Work Operating
Cost p.p. p.a.
Flowback p.p. p.a.
Funding Well@Work £2,159 £0 - Local Authority Access to Work £0 £0 - Government Other funding £0 £0 Total £2,159 £0
Disabled workers in Well@Work
In-work Welfare Benefits/Credits £2,296
Income Tax & National Insurance £3,816
Out-work Welfare Benefits
Indirect VAT on income £4,193
Total £2,296 £8,009
A) Total Costs WITH £4,455
B) Total Save WITH £8,009
WITH (Net Cost-Flowback) p.p. p.a. A-B -£3,554
B:C Ratio B/A 1.80
18
Table 4: Results of Costs and Flowbacks for Well@Work (Continued)
Situation Without Well@Work Operating
Cost p.p. p.a.
Flowback p.p. p.a.
Funding Well@Work £0 £0 - Local Authority
Access to Work £0 £0
- Government Other funding £0 £0 Total £0 £0
Disabled workers in Well@Work
Welfare Benefits /Credits paid when unemployed £14,274
Indirect VAT on income £3,152
Total £14,274 £3,152
C) Total Cost WITHOUT £14,274
D) Total Save WITHOUT £3,152
WITHOUT (Net Cost-Flowback) p.p. p.a. C-D £11,121
Net Cost/Saving p.p. p.a.
(A-B)-(C-D) -£14,676
19
Section 4: Conclusions and Study Limitations Results indicated that the Well@Work initiative generated significant savings to the Taxpayer, when the total yearly costs are balanced by the financial flowbacks in tax, National Insurance and VAT on purchases due to the beneficiaries being in work. This generated a saving of £1.80p for every £1 invested in the service. Overall, taking into account the additional savings generated by not having people go into receipt of welfare benefit there was an estimated average net saving to the Taxpayer of £14,676 p.p. p.a. Even when we applied our assumptions of Deadweight, Well@work still demonstrated to be highly cost effective. The magnitude of the savings observed compared to our previous studies highlights differences in the group composition and in wage characteristics associated with retention. In our comparator studies the vast majority of participants were unemployed prior to the employment intervention; most were people regarded as those furthest from the labour market, often with long histories of unemployment and underemployment, and in receipt of out-of-work state benefits, with some being limited to working below the 16 hour welfare benefit’s threshold. In contrast, the Well@Work participants were all employed on entering the project. On average, people had been in their jobs for 7 years, with 31% having been in their jobs for 10 years or more.31 They also tended to be older, reflecting the fact that older people were more likely to experience musculoskeletal conditions than younger people and to occupy more senior, and comparatively higher paid, positions. This naturally led them to pay higher payments of Income Tax and National Insurance and an increase in VAT revenue for the Taxpayer. Whatever the reasons, our estimates do serve to indicate the scale of return on investment that occurs for the Taxpayer from retention services of this type. Limitations of the study Some of the people who joined the Well@Work might have stayed in work even if the service was had not been available. We do not know how many. Given the strict eligibility criteria for accessing Well@Work, our calculations are based on the assumption that without the intervention all of the employees would have lost their jobs. Further evidence reinforces the need for the Well@Work intervention for this group. Nearly half (46%) of those applying for the service were on sick-leave with a Fit Note from a GP. A further 8% were working a reduced number of hours due to their ill health and 70% of the supported employees reported having missed work because of health problems within the previous 7 days prior to their assessment. The sensitivity analysis presented previously shows that even when a reasonable amount of dead-weight is factored in, the scale of savings demonstrates Well@Work can still be a very cost-effective initiative. As the CBA was post hoc its data requirements were not written into the design of the questionnaires and we had to make use of the data already collected and we had no record of actual wages earned, nor did we receive the amount of welfare benefit income received while in work. There was also little quantitative data available on the relationship between in-work welfare benefits received and any reduction in income due to the health or disability issues face by people that the Well@Work service came in to address. Without an accurate figure for total in-work welfare benefit receipt, and some sense how welfare benefit income relates to earned income, it is difficult to more accurately estimate the actual Income and
31 based on 94 respondents
20
Tax/National Insurance revenue generated by the cohort. This means that there is a heavy reliance on estimated data, and we did not have even sample data to estimate the margin of error in our assumptions about pay rates. We used published SOC-based hourly wage rate figures to estimate income as a precursor to estimating Tax and National Insurance yields. While grouped for gender and region, these classifications remain crude. Other estimations can be used, including using the Standard Industrial Categories (SIC) based on the mean incomes based on the descriptions of the worker’s job instead. We were not able to estimate any savings to the employers through the service: These include savings associated with reduced absenteeism, foregone recruitment, reduced loss of productivity, and avoiding retraining and up-skilling costs associated with having to replace experienced workers form the Well@Work cohort.32 Our calculations were based on delivery costs and do not include savings resulting from reductions in the use of local health and social services. It is likely that retaining work would lead to gains in the health and wellbeing of the participants, potentially reducing costs associated with GP, mental health physiotherapy and peripatetic social services. It is notoriously difficult to accurately estimate savings resulting from this, but they may be substantial, adding further to the overall cost effectiveness of the Well@Work service. Clearly, any accrued financial costs and/or savings identified must ultimately be judged alongside other reported outcomes, especially those associated with the health and personal wellbeing of the at-risk employees reported by the service and Southampton University.
32 Goetzel, Ron Z. PhD; Ozminkowski, Ronald J. PhD; Sederer, Lloyd I. MD; Mark, Tami L. (2002) The Business Case for Quality Mental Health Services: Why Employers Should Care About the Mental Health and Well-Being of Their Employees. Journal of Occupational Medicine 2002 Apr;44(4): 320-330.
21
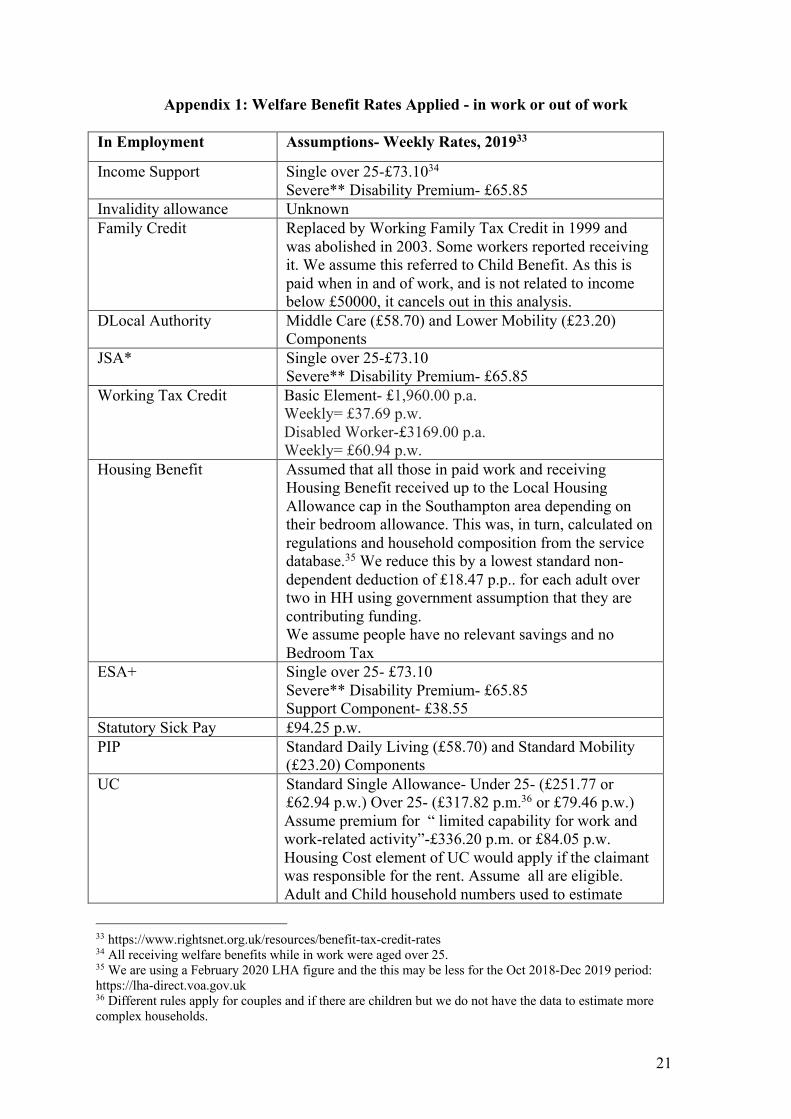
Appendix 1: Welfare Benefit Rates Applied - in work or out of work In Employment Assumptions- Weekly Rates, 201933
Income Support Single over 25-£73.1034 Severe** Disability Premium- £65.85
Invalidity allowance Unknown Family Credit Replaced by Working Family Tax Credit in 1999 and
was abolished in 2003. Some workers reported receiving it. We assume this referred to Child Benefit. As this is paid when in and of work, and is not related to income below £50000, it cancels out in this analysis.
DLocal Authority Middle Care (£58.70) and Lower Mobility (£23.20) Components
JSA* Single over 25-£73.10 Severe** Disability Premium- £65.85
Working Tax Credit Basic Element- £1,960.00 p.a. Weekly= £37.69 p.w. Disabled Worker-£3169.00 p.a. Weekly= £60.94 p.w.
Housing Benefit Assumed that all those in paid work and receiving Housing Benefit received up to the Local Housing Allowance cap in the Southampton area depending on their bedroom allowance. This was, in turn, calculated on regulations and household composition from the service database.35 We reduce this by a lowest standard non-dependent deduction of £18.47 p.p.. for each adult over two in HH using government assumption that they are contributing funding. We assume people have no relevant savings and no Bedroom Tax
ESA+ Single over 25- £73.10 Severe** Disability Premium- £65.85 Support Component- £38.55
Statutory Sick Pay £94.25 p.w. PIP Standard Daily Living (£58.70) and Standard Mobility
(£23.20) Components UC Standard Single Allowance- Under 25- (£251.77 or
£62.94 p.w.) Over 25- (£317.82 p.m.36 or £79.46 p.w.) Assume premium for “ limited capability for work and work-related activity”-£336.20 p.m. or £84.05 p.w. Housing Cost element of UC would apply if the claimant was responsible for the rent. Assume all are eligible. Adult and Child household numbers used to estimate
33 https://www.rightsnet.org.uk/resources/benefit-tax-credit-rates 34 All receiving welfare benefits while in work were aged over 25. 35 We are using a February 2020 LHA figure and the this may be less for the Oct 2018-Dec 2019 period: https://lha-direct.voa.gov.uk 36 Different rules apply for couples and if there are children but we do not have the data to estimate more complex households.
22
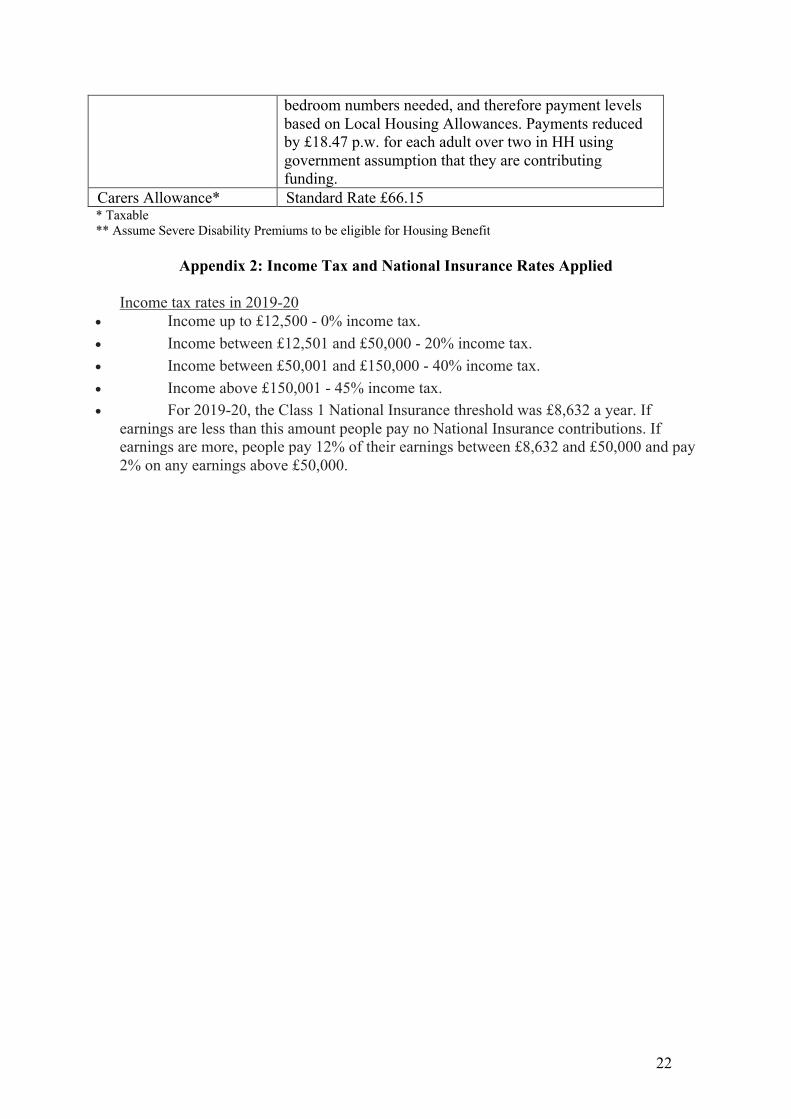
bedroom numbers needed, and therefore payment levels based on Local Housing Allowances. Payments reduced by £18.47 p.w. for each adult over two in HH using government assumption that they are contributing funding.
Carers Allowance* Standard Rate £66.15 * Taxable ** Assume Severe Disability Premiums to be eligible for Housing Benefit
Appendix 2: Income Tax and National Insurance Rates Applied Income tax rates in 2019-20
• Income up to £12,500 - 0% income tax. • Income between £12,501 and £50,000 - 20% income tax. • Income between £50,001 and £150,000 - 40% income tax. • Income above £150,001 - 45% income tax. • For 2019-20, the Class 1 National Insurance threshold was £8,632 a year. If
earnings are less than this amount people pay no National Insurance contributions. If earnings are more, people pay 12% of their earnings between £8,632 and £50,000 and pay 2% on any earnings above £50,000.