an equilibrium for phenotypic variance in fluctuating environments owing to epigenetics
TRANSCRIPT

J. R. Soc. Interface (2012) 9, 613–623
*Author for c
Electronic sup10.1098/rsif.2
doi:10.1098/rsif.2011.0390Published online 17 August 2011
Received 17 JAccepted 26 J
An equilibrium for phenotypicvariance in fluctuating environments
owing to epigeneticsOana Carja* and Marcus W. Feldman
Department of Biology, Stanford University, Stanford, CA 94305, USA
The connection between random environments and genetic and phenotypic variability hasbeen a major focus in the population genetic literature. By providing differential access tothe underlying genetic information, epigenetic variation could play an important role inthe interaction between environmental and phenotypic variation. Using simulation, wemodel epigenetic plasticity during development by investigating the dynamics of genetic reg-ulators of the epigenetic machinery that change the variance of the phenotype, while havingno effect on the phenotype’s mean. Previous studies have found that increased phenotypicvariance is selected for if the environment is fluctuating. Here, we find that when a var-iance-increasing allele achieves a sufficiently high frequency, it can be out-competed by avariance-reducing allele, with the consequence that the population evolves to an equilibriumphenotypic variability. This equilibrium is shown to be robust to different initial conditions,but to depend heavily on parameters of the model, such as the mutation rate, the fitness land-scape and the nature of the environmental fluctuation. Indeed, if there is no mutation at thegenes controlling the variance of the phenotype, reduction of this variance is favoured.
Keywords: epigenetics; epigenetic variation; phenotypic variation;fluctuating environments; evolution
1. INTRODUCTION
Since the beginning of quantitative genetics [1–3], phe-notypic variation has been understood to involvecontributions from both genetic and environmentalvariation. The ability of organisms to phenotypicallyrespond to environmental fluctuations has been recog-nized as a powerful adaptation [4–10]. Organismshave evolved an enormous variety of tactics thatenable them to cope with environmental changes:some use behavioural or physiological modificationsthat leave no permanent trace in the genes of their des-cendants (traits acquired or learned during the lifetimeof an individual; see, for example, [11–14]), while othersrespond to environmental change through the creationof diversity among their offspring, diversity that caneither be genetic or non-genetic [15–18].
Starting with the early work of Haldane & Jaya-kar [19], Levins [20], Kimura [21], Ewens [22] andFelsenstein [23], quantitative connections betweenenvironmental variance, genetic variance and phenoty-pic variance have been an important component ofevolutionary analysis. Dempster [24] introduced amodel in which temporal fluctuations in reproductivesuccess of competing genotypes favour the genotypewith the highest mean reproductive rate. Jablonkaet al. [25] found that carry-over effects (the persistence
orrespondence ([email protected]).
plementary material is available at http://dx.doi.org/011.0390 or via http://rsif.royalsocietypublishing.org.
une 2011uly 2011 613
of a particular phenotype for one or more generationsdespite a change in the environmental conditions thatfirst induced the phenotype) can provide an advantagein stochastic environments. Studies of the evolution ofphenotypic plasticity (the capacity of a single genotypeto result in different phenotypes that correlate withenvironmental variability) [26–29] suggest thatincreased plasticity has an advantageous effect in anon-stationary environment, allowing individuals toacclimate to rapid changes that cannot be tracked bythe normally slow evolutionary process [30–32]. Adifferent class of models has addressed the evolutionof stochastic switching. Under stochastic environmentalfluctuations, individual cells may switch among anumber of different heritable phenotypes and this hasbeen recognized as a possible case of bet-hedging [16–18,33–36]. These studies suggest that populations ofcells tune these switching rates to the rate of theenvironmental fluctuations; that is, fast-switchers out-grow slow-switchers when the environment fluctuatesrapidly [18,34]. These models suggest that increasedphenotypic heterogeneity enhances the fitness of apopulation under an appropriately changing environ-ment, because favoured phenotypes exist under eachenvironmental condition.
Superimposed on the DNA is a layer of heritable epi-genetic information that researchers have recentlybegun to read and understand. This epigenetic infor-mation is the result of chemical modifications tocytosine bases and/or to the histone proteins that
This journal is q 2011 The Royal Society

614 An equilibrium for phenotypic variance O. Carja and M. W. Feldman
package the genome. By regulating chromatin structureand DNA accessibility, these chemical changes influ-ence how genes are expressed across a diverse array ofdevelopmental stages, tissue types, disease states andabiotic environments [37–41]. Epigenetic variation con-tributes to phenotypic variance without altering thegenotype, by allowing the same structural genetic infor-mation to yield multiple cell types in different life cyclestages. It may also be responsible for potential alterna-tive developmental pathways in an organism based onits own and its ancestors’ environments. Therefore,understanding the role of epigenes in phenotypic varia-bility might provide new insights into patterns ofdiversity in fluctuating environments.
Phenotypic variability mediated by epigenetic mech-anisms was investigated in a recent simulation analysis[42] of genetic variants that do not change the meanphenotype, but do affect the variance of the phenotype.This model was intended to represent epigenetic plas-ticity during development, for example, by DNAmethylation patterns that affect stochastic phenotypicvariation through epigenetic mediators. It was inspiredby the dietary modifications of DNA methylation ofthe Agouti gene, and methylation of the Axin-fusedallele in kinked tail mice [43], which demonstrate howepigenetic differences can result in very diversephenotypes among genetically identical individuals.The model differs from previous transgenerationalepigenetic models [44–46], and from other stochastic-switching models because it focuses on the evolutionof genes that control the expression of statisticalvariance in the phenotype without affecting the meanphenotype.
Some previous attempts to incorporate epigeneticsinto evolutionary models have focused on neo-Lamarckian inheritance, allowing for the limited inheri-tance of acquired characteristics [44], such as culturallytransmitted traits [47,48]. Although these may be rel-evant in some cases, many epigenetic responses aredetermined and controlled by DNA-encoded genes(such as chromatin remodelling genes or genes thataffect or detect DNA methylation) and, from an evol-utionary perspective, epigenetic variation is, for themost part, likely to be subservient to the evolvingDNA sequence. That is, the machinery of epigeneticmodifications (e.g. DNA methyltransferases and his-tone deacetylases) is ultimately encoded by the DNAsequence, and whether a particular structural gene issubject to a particular epigenetic modification will bepartly dependent on the properties of the DNA itself.Moreover, the rate of structural DNA mutation ismuch smaller than the mutation rate for epialleles,which are less stable [49].
In their model of stochastic epigenetic variationunder fluctuating environments, Feinberg & Irizarry [42]provide two experimental results as proof of principlefor the existence of genes that do not change themean phenotype, but do change the variability of thephenotype. Their first experiment identified highlyvariable DNA-methylated regions in mouse andhuman liver and mouse brain associated with develop-ment and morphogenesis, thus supporting the conceptof stochastic epigenetic variation. Their second example,
J. R. Soc. Interface (2012)
the loss or gain of CpG dinucleotides, supports theexistence of heritable genetic mechanisms (i.e. the under-lying DNA sequence) that control methylation and as aconsequence have an effect on the variability of thephenotype, through epigenetic variation. Using simu-lations to model the evolution of genes that controlphenotypic variance, the authors find that, in a changingenvironment, the genetically inherited propensity forphenotypic variability substantially increases fitness.In this paper, we explore the model of Feinberg andIrizarry in more detail and find that their results holdonly in a limited parameter range and only in the initialgenerations of the population’s evolution.
We first replicate the simulations in Feinberg & Iri-zarry [42] and find that, in a fluctuating environment,if the initial phenotypic variability is small, then thephenotypic variance of the population does indeedincrease initially; that is, for about 1000 generations.After a longer time, however, we observe that the popu-lation variance of the phenotype reaches an equilibriumthat depends on the parameters of the model, but isrobust to initial conditions.
We then use an explicit population genetic model witha modifier gene that determines the extent of variation ofan individual’s phenotype to explore the conditionsunder which an increase in phenotypic variance is adap-tive and is selected for in a non-stationary environment.We find an equilibrium for the frequencies of the allelesat the locus controlling the phenotypic variability andstudy the properties of this equilibrium distribution bylooking at a range of different model parameters andtheir effect on this equilibrium. We find that phenotypicvariability does increase in populations undergoing rapidenvironmental change, but this effect disappears inenvironments that change very slowly. We also findthat increased phenotypic variance seems to be favouredin populations that are already adapted to their environ-ments as it may increase the populations’ exploration ofthe phenotypic space. By contrast, the response to anenvironment that is particularly deleterious seems to bea decrease in phenotypic variability, as the fitness advan-tage of a beneficial phenotype does not overcome thecosts of a deleterious one. We also find that this equili-brium depends strongly on the mutation rate at themodifier locus: if there is no mutation at the locus thataffects phenotypic variability, an allele that increasesthe variance of an individual’s phenotype will eventuallybe lost.
2. RESULTS
2.1. The general model
The stochastic model we present below is based on thatof Feinberg & Irizarry [42]. Consider a haploid popu-lation of fixed size, N ¼ 10 000. Each individual in thepopulation is defined by N1 genes (e.g. single nucleotidepolymorphisms) that control mean phenotype and N2
genes that control the variability of its phenotype. Wewill denote by X the set of genes that determinemean phenotype and by M the set of genes that controlthe variance of an individual’s phenotype. To incorpor-ate the possibility that a gene is not expressed in the

101.0(a) (b)
8
6
4
2
0
0.5
0
aver
age
phen
otyp
e in
the
popu
latio
n
stan
dard
dev
iatio
n of
the
popu
latio
n ph
enot
ype
0 10 000 20 000generations
30 000 40 000 0 10 000 20 000generations
30 000 40 000
–0.5
–1.0
Figure 1. (a) Average and (b) standard deviation of phenotype Yi in the population, as a function of generation time, over 40 000generations. The parameters are: a ¼24, b ¼ 4, m ¼ 1024, t ¼ (21, 21, 21, 21, 1, 1, 1, 1), g ¼ (21, 21, 21, 21, 1, 1, 1, 1)/2and N ¼ 10 000 individuals. The environment changes periodically every five generations and the simulation starts with an iso-genic population at the X genes, Xi ¼ (0, 0, 0, 0, 0, 0, 0, 0). There are three different initial conditions for the M genes: for everyindividual in the first generation, each one of its eight M genes is 0 with probabilities 0.9 (red curve), 0.5 (green curve) or 0 (bluecurve). Each point represents the average across 100 different runs of the simulation. The curves represent a fit to the data using ageneralized additive model with penalized cubic regression splines.
An equilibrium for phenotypic variance O. Carja and M. W. Feldman 615
phenotype, X and M are assumed to be vectors withelements 0 or 1, with 1 denoting expression. Therefore,for each individual i, X and M can be represented asvectors of elements 0, 1 of size N1 and N2, respectively:
Xi ¼ ðXi;1;Xi;2; . . . ;Xi;N1Þ
and
Mi ¼ ðMi;1;Mi;2; . . . ;Mi;N2Þ:
The phenotype Yi of an individual with genotype(Xi, Mi) is given by
Yi ¼ t1Xi;1 þ t2Xi;2 þ � � � þ tN1Xi;N1 þ ei;
where the vector t ¼ (t1, t2, . . . , tN1) records the
expected effects on the phenotype Yi from the loci(Xi,1, Xi,2, . . . , Xi,N1
) and e i represents the variationnot explained by Xi, which is added to the phenotype,with its variance determined by the genes Mi:
ei � N ð0;s2i Þ
and
log2ðsiÞ ¼ g1Mi;1 þ � � � þ gN2Mi;N2 :
Here g ¼ (g1, g2, . . . , gN2) is the analogue of t, on a log
scale, and determines the effect of the (Mi,1, Mi,2, . . .,Mi,N2
) loci on the variance of phenotype Yi.We assume there are two different environments, e1
and e2. Given an individual’s phenotype Yi, its prob-ability of survival, i.e. fitness, in each of the twoenvironments is computed as follows:
Pi ¼eaþbYi
1þ eaþbYi
J. R. Soc. Interface (2012)
in environment e1 and
Pi ¼ea�bYi
1þ ea�bYi
in environment e2 (general shapes of these functions arepresented in figure 3a,c). Here, a and b are parametersthat represent the baseline level of adaptation to theenvironment and the degree of difference between thetwo environments, respectively. If b is positive, positivephenotypes have a fitness advantage in environment e1,while negative phenotypes are better adapted to envi-ronment e2; the reverse is true for negative values of b.
To create the next generation, we sample N individualsfrom the current population, each individual having aprobability of being selected that is proportional to its fit-ness. The three forces acting on the population areselection, mutation and random genetic drift owing tofinite population size, in that order; we assume a constantmutation rate m for all N1+N2 loci and no recombination.
We first repeat the simulations in Feinberg & Irizarry[42], using the same parameter values and a wider rangeof initial conditions, but a longer evolutionary time. SetN1¼ 8, N2¼ 8, a¼24, b¼ 4, m¼ 1024, t¼ (21, 21,21, 21, 1, 1, 1, 1) and g ¼ (21, 21, 21, 21, 1, 1, 1, 1)/2.We assume that the environment changes periodically,every five generations. We start the simulation with an iso-genic population at the X genes, Xi¼ (0, 0, 0, 0, 0, 0, 0, 0)and three different initial conditions for the M genes: forevery individual in the first generation, each one of itseight M genes is 0 with probabilities 0.9, 0.5 or 0, respect-ively, for each of three different simulations presented infigure 1. We ran this simulation 100 times and averagedthe results. Figure 1 shows the average and standard devi-ation of the phenotypes Yi in the population, as a functionof generation time, over 40 000 generations.
In figure 1a, the average phenotypic value of thepopulation oscillates around a mean value of 0, as

616 An equilibrium for phenotypic variance O. Carja and M. W. Feldman
found by Feinberg & Irizarry [42]. Figure 1b, however,shows an interesting departure from their findings:while the standard deviation of the phenotypes Yi inthe population does increase initially, this increase even-tually ceases and we observe the appearance of anequilibrium for the phenotypic variance. The existenceof an equilibrium value for the phenotypic varianceseems to be robust to the numbers of loci N1 and N2
used in the simulation: electronic supplementarymaterial S1 presents a model with two loci controllingthe mean phenotype (Xi,1 and Xi,2) and one modifierlocus (Mi) controlling the variance of the phenotype.We again observe a brief initial increase (forapprox. 1000 generations), followed by approach to anequilibrium for the phenotypic variance in the population.
Sampling such large populations (N ¼ 10 000) iscomputationally costly, and since the population sizeis large, the effects of genetic drift are likely to be neg-ligible. We therefore propose that the results should bethe same if we iterate the corresponding recursions forgenotype frequencies in an infinite population model.In particular, we will examine the sensitivity of theabove finding to changes in the model parameters.
2.2. A deterministic model
We construct a deterministic model of haploid individ-uals with N1 ¼ 2 and N2 ¼ 1; this is based ontraditional population genetic theory models of modifierloci controlling a parameter of interest (see [50]). Thus,each individual is now defined by three genes: two genesA/a and B/b that control mean phenotype and onemodifier gene M/m that controls its variance. Wehave eight possible haploid genotypes: ABM, AbM,aBM, abM, ABm, Abm, aBm and abm, with correspond-ing frequencies x1, x2, x3, x4, x5, x6, x7, x8. Following theprevious model, we compute the phenotype values Yi
for these eight genotypes:
ABM Y1 ¼ e1
AbM Y2 ¼ t1 þ e1
aBM Y3 ¼ t2 þ e1
abM Y4 ¼ t1 þ t2 þ e1
ABm Y5 ¼ e2
Abm Y6 ¼ t1 þ e2
aBm Y7 ¼ t2 þ e2
abm Y8 ¼ t1 þ t2 þ e2;
where e1 � N(0,s 12 ) and e2 � N(0,s2
2). The M/m locusdoes not modify the mean phenotype; its sole effect ison the variance of the phenotype. In all of the following,we will set t1 ¼21 and t2 ¼ 1, thus ensuring that thealleles at the A/a and the B/b loci are, on average, sym-metrically deleterious or beneficial in the twoenvironments and any departures from the equilibriumgenotype frequencies of 1/8 will be due to selection atthe M/m modifier locus. (A more detailed explanationis in electronic supplementary material S1.) Forphenotype Yi, the survival probability is
Pi ¼eðaþbYiÞ
1þ eðaþbYiÞ
J. R. Soc. Interface (2012)
in environment e1 and
Pi ¼eða�bYiÞ
1þ eða�bYiÞ
in environment e2. We study the dynamics of the fre-quencies of the modifier alleles over time, following therecursion equations for the frequencies of the eight geno-types in the next generation as a function of the genotypefrequencies in the current generation; the complete recur-sion equations are presented in appendix A.
In figure 2, we use the following parameter values:a ¼ (24), b ¼ 4, m ¼ 1024, s1 ¼ 1, s2 ¼ 2, and anenvironmental change every five generations. Weaverage over 100 different runs of the simulation.The curves represent a fit to the data using a general-ized additive model with penalized cubic regressionsplines. We show robustness of the results to other fit-ting techniques and the fitting curves with 95%confidence intervals in electronic supplementarymaterial S5.
We first start with equal values of the alleles at themajor loci A/a and B/b and different initial conditionsfor the M/m locus, as presented in figure 2a. We againobserve an equilibrium for the frequencies of the allelesat the locus that controls phenotypic variance in thepopulation. We next investigate how this equilibriumdepends on the choice of the different model par-ameters. Of particular interest is the effect ofthe starting frequencies at the two major loci A/a andB/b on this equilibrium value. With the initial choiceof t ¼ (21,1), we guarantee that the loci modifyingmean phenotype are not the drivers of the evolutionaryprocess and the allelic frequencies are determined byselection operating at the M/m locus. We test this byperforming simulations in which we change the startingallele frequencies at the A/a and B/b loci across a widerange of values. Four of these are shown in figure 2b: inpanel 1, the frequencies of the A and B alleles start atzero; in panel 2, the frequencies of the A and B allelesstart at 0.5; in panel 3, the frequency of the A allele is0.9 and the frequency of the B allele is 0; in panel 4,the frequency of the A allele is 0.1 and the frequencyof the B allele is 0. Figure 2b presents the results fordifferent initial allele frequencies at the modifier locus,the other parameters being fixed at the followingvalues: a ¼ (24), b ¼ 4, s1 ¼ 1, s2 ¼ 2, m ¼ 1024 andthe environment changing every five generations. It iseasy to see that different initial frequencies at themajor loci A/a and B/b do not affect the equilibriumfrequencies of alleles at the M/m locus.
We tested the existence of the equilibria over thewhole range of parameters and present two moreexamples in electronic supplementary material S4.
We next examine the effect of a and b on theequilibrium frequency of the alleles at the M/m locus.It is first useful to visualize how a change in theparameter a affects the fitness function:
Pi ¼eaþbYi
1þ eaþbYi:
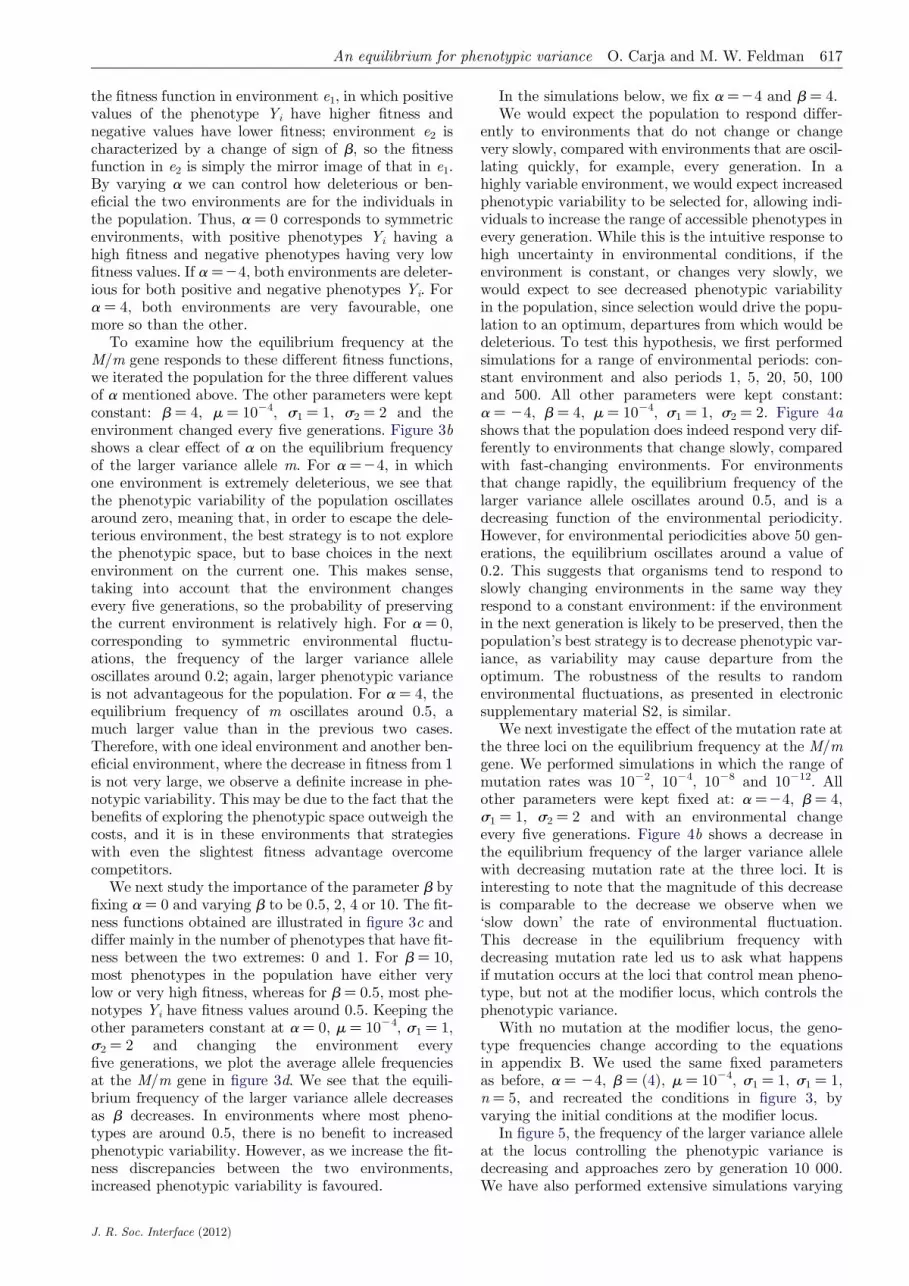
This is illustrated in figure 3a, where we fix b to be 4and vary a to be 2 4, 0 or 4. The plots correspond to
An equilibrium for phenotypic variance O. Carja and M. W. Feldman 617
the fitness function in environment e1, in which positivevalues of the phenotype Yi have higher fitness andnegative values have lower fitness; environment e2 ischaracterized by a change of sign of b, so the fitnessfunction in e2 is simply the mirror image of that in e1.By varying a we can control how deleterious or ben-eficial the two environments are for the individuals inthe population. Thus, a ¼ 0 corresponds to symmetricenvironments, with positive phenotypes Yi having ahigh fitness and negative phenotypes having very lowfitness values. If a ¼24, both environments are deleter-ious for both positive and negative phenotypes Yi. Fora ¼ 4, both environments are very favourable, onemore so than the other.
To examine how the equilibrium frequency at theM/m gene responds to these different fitness functions,we iterated the population for the three different valuesof a mentioned above. The other parameters were keptconstant: b ¼ 4, m ¼ 1024, s1 ¼ 1, s2 ¼ 2 and theenvironment changed every five generations. Figure 3bshows a clear effect of a on the equilibrium frequencyof the larger variance allele m. For a ¼24, in whichone environment is extremely deleterious, we see thatthe phenotypic variability of the population oscillatesaround zero, meaning that, in order to escape the dele-terious environment, the best strategy is to not explorethe phenotypic space, but to base choices in the nextenvironment on the current one. This makes sense,taking into account that the environment changesevery five generations, so the probability of preservingthe current environment is relatively high. For a ¼ 0,corresponding to symmetric environmental fluctu-ations, the frequency of the larger variance alleleoscillates around 0.2; again, larger phenotypic varianceis not advantageous for the population. For a ¼ 4, theequilibrium frequency of m oscillates around 0.5, amuch larger value than in the previous two cases.Therefore, with one ideal environment and another ben-eficial environment, where the decrease in fitness from 1is not very large, we observe a definite increase in phe-notypic variability. This may be due to the fact that thebenefits of exploring the phenotypic space outweigh thecosts, and it is in these environments that strategieswith even the slightest fitness advantage overcomecompetitors.
We next study the importance of the parameter b byfixing a ¼ 0 and varying b to be 0.5, 2, 4 or 10. The fit-ness functions obtained are illustrated in figure 3c anddiffer mainly in the number of phenotypes that have fit-ness between the two extremes: 0 and 1. For b ¼ 10,most phenotypes in the population have either verylow or very high fitness, whereas for b ¼ 0.5, most phe-notypes Yi have fitness values around 0.5. Keeping theother parameters constant at a ¼ 0, m ¼ 1024, s1 ¼ 1,s2 ¼ 2 and changing the environment everyfive generations, we plot the average allele frequenciesat the M/m gene in figure 3d. We see that the equili-brium frequency of the larger variance allele decreasesas b decreases. In environments where most pheno-types are around 0.5, there is no benefit to increasedphenotypic variability. However, as we increase the fit-ness discrepancies between the two environments,increased phenotypic variability is favoured.
J. R. Soc. Interface (2012)
In the simulations below, we fix a ¼24 and b ¼ 4.We would expect the population to respond differ-
ently to environments that do not change or changevery slowly, compared with environments that are oscil-lating quickly, for example, every generation. In ahighly variable environment, we would expect increasedphenotypic variability to be selected for, allowing indi-viduals to increase the range of accessible phenotypes inevery generation. While this is the intuitive response tohigh uncertainty in environmental conditions, if theenvironment is constant, or changes very slowly, wewould expect to see decreased phenotypic variabilityin the population, since selection would drive the popu-lation to an optimum, departures from which would bedeleterious. To test this hypothesis, we first performedsimulations for a range of environmental periods: con-stant environment and also periods 1, 5, 20, 50, 100and 500. All other parameters were kept constant:a ¼ 24, b ¼ 4, m ¼ 1024, s1 ¼ 1, s2 ¼ 2. Figure 4ashows that the population does indeed respond very dif-ferently to environments that change slowly, comparedwith fast-changing environments. For environmentsthat change rapidly, the equilibrium frequency of thelarger variance allele oscillates around 0.5, and is adecreasing function of the environmental periodicity.However, for environmental periodicities above 50 gen-erations, the equilibrium oscillates around a value of0.2. This suggests that organisms tend to respond toslowly changing environments in the same way theyrespond to a constant environment: if the environmentin the next generation is likely to be preserved, then thepopulation’s best strategy is to decrease phenotypic var-iance, as variability may cause departure from theoptimum. The robustness of the results to randomenvironmental fluctuations, as presented in electronicsupplementary material S2, is similar.
We next investigate the effect of the mutation rate atthe three loci on the equilibrium frequency at the M/mgene. We performed simulations in which the range ofmutation rates was 1022, 1024, 1028 and 10212. Allother parameters were kept fixed at: a ¼24, b ¼ 4,s1 ¼ 1, s2 ¼ 2 and with an environmental changeevery five generations. Figure 4b shows a decrease inthe equilibrium frequency of the larger variance allelewith decreasing mutation rate at the three loci. It isinteresting to note that the magnitude of this decreaseis comparable to the decrease we observe when we‘slow down’ the rate of environmental fluctuation.This decrease in the equilibrium frequency withdecreasing mutation rate led us to ask what happensif mutation occurs at the loci that control mean pheno-type, but not at the modifier locus, which controls thephenotypic variance.
With no mutation at the modifier locus, the geno-type frequencies change according to the equationsin appendix B. We used the same fixed parametersas before, a ¼ 24, b ¼ (4), m ¼ 1024, s1 ¼ 1, s1 ¼ 1,n ¼ 5, and recreated the conditions in figure 3, byvarying the initial conditions at the modifier locus.
In figure 5, the frequency of the larger variance alleleat the locus controlling the phenotypic variance isdecreasing and approaches zero by generation 10 000.We have also performed extensive simulations varying

1.0(a)
(c)
(b)
(d)
0.8
fitn
ess
freq
uenc
y of
the
larg
er
vari
ance
alle
lefr
eque
ncy
of th
e la
rger
va
rian
ce a
llele
0.6
0.4
0.2
0
1.0
0.8
0.6
0.4
0.2
0
0 1000 2000 3000generations
4000 5000
1.0
0.8
0.6
0.4
0.2
0
1.0
0.8
fitn
ess 0.6
0.4
0.2
0
–1.0 –0.5 0phenotype
0.5 1.0
Figure 3. Effect of varying a and b on the equilibrium frequency at the M/m locus. (a) Fitness functions, varying the a par-ameter, with b ¼ 4. (b) Effect of varying the a parameter on the equilibrium frequency at the M/m gene. The otherparameters are b ¼ 4, m ¼ 1024, s1 ¼ 1, s2 ¼ 2 and the environment changes periodically every five generations. (c) Fitness func-tions, varying the b parameter, with a ¼ 0. (d) Effect of varying the b parameter on the equilibrium frequency at the M/m locus.The other parameters are a ¼ 0, m ¼ 1024, s1 ¼ 1, s2 ¼ 2 and the environment changes periodically every five generations. In (b)and (d), each point represents the average across 100 different runs of the simulation. The plotted curves represent a fit to thedata using a generalized additive model with penalized cubic regression splines. (a) a: red curve, 24; green curve, 0; blue curve,4. (b) The a parameter: red curve, 24; green curve, 0; blue curve, 4. (c) b: red curve, 0.5; light green curve, 2; blue curve, 4; purplecurve, 10. (d) The b parameter: red curve, 0.5; light green curve, 2; blue curve, 4; purple curve, 10.
1.0(a) (b)
0.8
0.6
freq
uenc
y of
the
larg
er v
aria
nce
alle
le
0.4
0.2
0
1 2 3 4
010
0020
0030
0040
0050
00 010
0020
0030
0040
0050
00 010
0020
0030
0040
0050
00 010
0020
0030
0040
0050
000 1000 2000generations
generations
3000 4000 5000
Figure 2. Robustness of the equilibrium to initial conditions at the M/m locus. The parameters are: a ¼ (24), b ¼ 4, m ¼ 1024,s1 ¼ 1, s2 ¼ 2, the environment changes every five generations and we start with different initial frequencies of the M/m alleles atthe modifier locus. Each point represents the average across 100 different runs of the simulation. The plotted curves represent a fitto the data using a generalized additive model with penalized cubic regression splines. (a) Equal initial frequencies of the A/a andB/b alleles. (b) Panel 1 corresponds to starting frequencies for A and B of 0, panel 2 corresponds to initial frequencies of A and Bof 0.5, panel 3 corresponds to initial frequencies of A allele of 0.9 and B allele of 0 and panel 4 corresponds to initial frequencies ofalleles A and B of 0.1 and 0, respectively. (a,b) Initial frequencies of the larger variance allele: red curve, 1; light green curve, 0.9;dark green curve, 0.5; blue curve, 0.1; pink curve, 0.
618 An equilibrium for phenotypic variance O. Carja and M. W. Feldman
J. R. Soc. Interface (2012)

1.0
(a) (b)
0.8
0.6
0.4
0.2
freq
uenc
y of
the
larg
er v
aria
nce
alle
le
0
0 1000 2000 3000generations
4000 5000 0 1000 2000 3000generations
4000 5000
Figure 4. Effects of varying environmental periodicities and mutation rate m on equilibrium frequencies at the M/m gene. (a) Wevary the period of the environmental change (red curve, constant; brown curve, 1; light green curve, 5; dark green curve, 20; bluecurve, 50; purple curve, 100; pink curve, 500). The parameters are a ¼ (24), b ¼ 4, m ¼ 1024, s1 ¼ 1, s2 ¼ 2. (b) We vary themutation rate m at the three loci and present results for four different mutation rates: 1022 (red), 1024 (green), 1028 (blue), 10212
(purple). The other parameters are a ¼ (24), b ¼ 4, m ¼ 1024, s1 ¼ 1, s2 ¼ 10 and the environment changes every five gener-ations. Each point represents the average across 100 different runs of the simulation. The plotted curves represent a fit to the datausing a generalized additive model with penalized cubic regression splines.
1.0
0.8
cy o
f th
e la
rger
var
ianc
e al
lele
0.6
0.4
An equilibrium for phenotypic variance O. Carja and M. W. Feldman 619
all the other parameters of the model and in all simu-lations the larger variance allele always goes extinctby generation 10 000. The results suggest that whenthere is no mutation at the variance locus, thelarger variance allele eventually disappears from thepopulation; i.e. decreased phenotypic variability isfavoured. This seems to imply that either there is noselection for increased phenotypic variance, or selectionis very weak. In general, it is very difficult to distinguishbetween mutational variance and weak selection var-iance. The results in the other parameter regimes inthe paper suggest the latter. We see that even thoughthere is weak selection on the phenotypic variance, fora higher mutation rate, increased phenotypic variancecan be selected for, as demonstrated by figures 3and 4, for example.
freq
uen
0.2
0
0 5000 10 000generations
15 000 20 000
Figure 5. Simulations of the discrete model with no mutation atthe locus controlling the phenotypic variance. We start withequal frequencies of the A/a and B/b alleles, and differentinitial frequencies at the M/m locus. The other parametersare a ¼ (24), b ¼ 4, m ¼ 1024, s1 ¼ 1, s2 ¼ 10 and theenvironment changes every five generations. Each point rep-resents the average across 100 different runs of the simulation.The plotted curves represent a fit to the data using a general-ized additive model with penalized cubic regression splines.Initial frequencies of the larger variance allele: red curve, 1;brown curve, 0.9; green curve, 0.6; blue curve, 0.5; purplecurve, 0.4; pink curve, 0.1.
3. DISCUSSION
We have studied the impact of stochastic epigeneticvariation on phenotypic variance in fluctuatingenvironments. Motivated by the observation thatthere is significant and functionally important geneticvariability in genes responsible for epigenetic control[39], we studied the dynamics of genes that are regula-tors of the epigenetic machinery. We modelled genesthat do not change the mean phenotype of an individ-ual, but control the variance of this phenotype. Wehave explored the conditions under which increasedphenotypic variability is selected for, under a widerange of parameters and types of environmentalfluctuations.
The model we presented is based on that of Feinberg& Irizarry [42] and population genetic theory of modi-fier alleles [50,51]. Their paper suggests that stochasticepigenetic variation is increased in fluctuating environ-ments. We show that by 5000 generations the initialincrease has reversed and a sharp decrease in the
J. R. Soc. Interface (2012)

620 An equilibrium for phenotypic variance O. Carja and M. W. Feldman
phenotypic variance of the population may occur. Byabout 10 000 generations, this variance has reachedan equilibrium. This makes the conclusions of themodel highly relevant for a large number of popu-lations. Humans, for example, have a generation timeof around 25 years. Therefore, the time to equilibriumwould be 250 000 years, which is well under the timefor the emergence and spread of Homo sapiens nean-derthalensis. Thus, the approach to equilibriumvariance is relevant for hominid evolution.
Our most important result is that there is an equili-brium for the alleles at the locus controlling thephenotypic variance of the individual, an equilibriumthat may be very sensitive to changes in the differentparameters of the model. This appears to be the firsttime such an equilibrium has been found. Previousstudies of evolution in fluctuating environments suggestthat increased phenotypic variance increases the fitnessof a population in an appropriately changing environ-ment and that a genetically inherited propensity forphenotypic variability substantially increases fitnessand is selected for. The reasoning suggested is that varia-bility promotes the existence of favoured phenotypesunder each environmental condition. We have shown,however, that when a variance-increasing allele achievesa sufficiently high frequency, it can be out-competed bya variance-reducing allele, with the result that there is anoptimum level of phenotypic variability. This optimumis shown to depend on the details of the model, namelythe mutation rate, the fitness landscape and the natureof the environmental fluctuation.
The existence of such an equilibrium, robust toinitial conditions, but sensitive to the other parametersof the model, seems to suggest that, in fact, thedynamics of these systems and the question of phenoty-pic variability are more complicated than previouslythought. We have shown that whether increased pheno-typic variability is favoured is very dependent on thecharacteristics of the studied population and thenature of the environmental fluctuations. If one of theenvironments is highly deleterious, decreased phenoty-pic variability is selected for, since there is a high cost(seen as a decrease in fitness) to departing from theoptimum when the chance of being maladapted ishigh. By contrast, in beneficial environments, weobserve selection for increased phenotypic variabil-ity—in this case, it is beneficial for individuals toexplore the phenotypic space, since there are nomajor costs associated with this exploration. It isespecially in these environments that organismsincrease their phenotypic variance, taking advantageof even the slightest benefits available to them, asthey compete with other moderately adapted individ-uals. One parameter that has a significant impact isthe mutation rate at the modifier locus. In the absenceof constant reintroduction of the allele that increasesphenotypic variance, decreased phenotypic variance isselected for, irrespective of the other parameters ofthe model.
Our work tries to shed light on our understandingof the nature and relevance of phenotypic variation,especially in the context of changing environments.Is such variation available for adaptive change when
J. R. Soc. Interface (2012)
a population undergoes a rapid change in environmentand is therefore exposed to a new selection regime or isthe variation simply a consequence of recurrentmutations being introduced in the population? Ourresults seem to imply the former, but further work isneeded to understand the exact mechanisms thatdetermine the existence of such equilibria and theexact dependencies of the stable levels of variationon the characteristics of the systems under study.Important progress on these issues could be made byintegrating stochastic epigenetic variation into classicpopulation genetic models of phenotypic variation.Epigenetic phenomena and their contribution to phe-notypic variance have recently received considerableattention, both in theoretical [36,45,46,51,52] andexperimental studies [43,53,53–56]. Nevertheless, ourunderstanding of the molecular mechanisms of epige-nomic regulation and the extent of its importancefor phenotypic diversity is still far from complete.
The original definition of epigenetics by Waddingtonin [4]—the idea that phenotype arises from genotypethrough programmed change—is now central to devel-opmental biology. The modern definition ofepigenetics is information, other than the DNAsequence itself, that affects gene expression or function.There is extensive overlap between these two defi-nitions: regulation of developmental processes byepigenetic phenomena may be central to developmentbecause different cell types maintain their differencesduring cell division even though their DNA sequencesare essentially the same. Phenotypic changemediated by epigenetic change may, in some cases, beinherited across generations [46,57] and may lead tophenotypic heterogeneity among genetically identicalindividuals [58].
Epigenetic mechanisms appear to function primarilyas genome defences, but may result in the maintenanceof plasticity together with a degree of buffering of devel-opmental programmes: breakdown of epigeneticbuffering could potentially be deleterious for the organ-ism and/or cause variation in rates of phenotypicevolution. Stochastic and environmentally induced epi-genetic defects are also known to play a major role incancer and ageing [58–60]. Two decades ago, cancerepigenetics was viewed with scepticism, but now it iswidely accepted: there is compelling evidence that epi-genetic marks, such as chromatin modification, caninfluence cellular phenotypes through the regulation ofparticular genes, without structural variation in thesegenes, and alterations in methylation, imprintingand chromatin are ubiquitous in cancer cells [61–63].This also suggests that mutations in these genesinvolved in epigenetic control may have a major effectthroughout development.
Population level models may prove valuable in show-ing potential ways in which epigenomic variation withinpopulations may be related to phenotypic variation,and how patterns of epigenetic regulation may varybetween individuals and genomic regions, as well aswith the environment [64]. In order to develop suchmodels, it is important to understand the sources ofvariation in epigenetic marks: they may be verticallytransmitted, derive from parental environments, effects

An equilibrium for phenotypic variance O. Carja and M. W. Feldman 621
of ageing and of environment, stochastic events or geno-mic factors (for example, DNA sequence variants,expression differences in chromatin remodelling genesor genes that affect or detect DNA methylation).
In this paper, we have incorporated stochastic epige-netic variation into a population genetic model bystudying the dynamics of genetic regulators of the epi-genetic machinery that change the variance of thephenotype, while having no effect on the phenotype’smean. We found an equilibrium for the frequencies ofthe alleles at the locus controlling the phenotypic varia-bility and showed that this equilibrium is robust toinitial conditions, but depends on the details of themodel, namely the mutation rate, the fitness landscapeand the nature of the environmental fluctuation.
The authors thank Linda Liu, Diamantis Sellis, and theFeldman laboratory for reading the manuscript, commentsand suggestions. We also thank two anonymous reviewersfor their helpful comments. This research was supported inpart by NIH grant GM 28016. We also acknowledgeNational Science Foundation award CNS-0619926 forcomputer resources (Bio-X2 cluster).
APPENDIX A
Recursion equations for the frequencies of the eightgenotypes under the infinite population model:
vx 01 ¼ ð1� mÞ3P1x1 þ mð1� mÞ2P2x2
þ mð1� mÞ2P3x3 þ ð1� mÞm2P4x4
þ ð1� mÞ2mP5x5 þ m2ð1� mÞP6x6
þ m2ð1� mÞP7x7 þ m3P8x8;
vx 02 ¼ mð1� mÞ2P1x1 þ ð1� mÞ3P2x2
þ ð1� mÞm2P3x3 þ mð1� mÞ2P4x4
þ ð1� mÞm2P5x5 þ mð1� mÞ2P6x6
þ m3P7x7 þ m2ð1� mÞP8x8;
vx 03 ¼ mð1� mÞ2P1x1 þ m2ð1� mÞP2x2
þ ð1� mÞ3P3x3 þ mð1� mÞ2P4x4
þ ð1� mÞm2P5x5 þ mð1� mÞ2P6x6
þ m3P7x7 þ m2ð1� mÞP8x8;
vx 04 ¼ ð1� mÞm2P1x1 þ mð1� mÞ2P2x2
þ mð1� mÞ2P3x3 þ 1� mð Þ3 P4x4
þ m3P5x5 þ m2ð1� mÞP6x6
þ m2ð1�mÞP7x7 þ mð1� mÞ2P8x8;
vx 05 ¼ ð1� mÞ2mP1x1 þ m2ð1� mÞP2x2
þ m2ð1� mÞP3x3 þ m3P4x4
þ ð1� mÞ3P5x5 þ mð1� mÞ2P6x6
þ mð1� mÞ2P7x7 þ m2ð1� mÞP8x8;
J. R. Soc. Interface (2012)
vx 06 ¼ ð1� mÞm2P1x1 þ mð1� mÞ2P2x2 þ m3P3x3
þ ð1� mÞm2P4x4
þ mð1� mÞ2P5x5 þ ð1� mÞ3P6x6
þ ð1� mÞm2P7x7 þ mð1� mÞ2P8x8;
vx 07 ¼ ð1� mÞm2P1x1 þ m3P2x2 þ mð1� mÞ2P3x3
þ ð1� mÞm2P4x4
þ mð1� mÞ2P5x5 þ m2ð1� mÞP6x6
þ ð1� mÞ3P7x7 þ mð1� mÞ2P8x8
and vx 08¼m3P1x1þm2ð1�mÞP2x2þm2ð1�mÞP3x3
þð1�mÞ2mP4x4þm2ð1�mÞP5x5
þmð1�mÞ2P6x6þmð1�mÞ2P7x7þð1�mÞ3P8x8;
where v ¼ P1x1 þ P2x2 þ P3x3 þ P4x4 þ P5x5 þ P6x6þP7x7 þ P8x8 is the mean fitness of the population.
APPENDIX B
Recursion equations for the frequencies of the eight gen-otypes under the infinite population model, assumingno mutation at the modifier locus M/m:
vx 01 ¼ ð1� mÞ2P1x1 þ mð1� mÞP2x2
þ mð1� mÞP3x3 þ m2P4x4;
vx 02 ¼ mð1� mÞP1x1 þ ð1� mÞ2P2x2 þ m2P3x3
þ mð1� mÞP4x4;
vx 03 ¼ mð1� mÞP1x1 þ m2P2x2 þ ð1� mÞ2P3x3
þ mð1� mÞP4x4;
vx 04 ¼ m2P1x1 þ mð1� mÞP2x2 þ mð1� mÞP3x3
þ ð1� mÞ2P4x4;
vx 05 ¼ ð1� mÞ2P5x5 þ mð1� mÞP6x6
þ mð1� mÞP7x7 þ m2P8x8;
vx 06 ¼ mð1� mÞP5x5 þ ð1� mÞ2P6x6
þ m2P7x7 þ mð1� mÞP8x8;
vx 07 ¼ mð1� mÞP5x5 þ m2P6x6
þ ð1� mÞ2P7x7 þ mð1� mÞP8x8
and vx 08 ¼ m2P5x5 þ mð1� mÞP6x6 þ mð1� mÞP7x7
þ ð1� mÞ2P8x8;
where v ¼ P1x1 þ P2x2 þ P3x3 þ P4x4 þ P5x5 þ P6x6þP7x7 þ P8x8 is the mean fitness of the population.
REFERENCES
1 Fisher, R. A. 1918 Correlation between relatives on thesupposition of Mendelian inheritance. Phil. Trans. R.Soc. Edinb. 52, 399–433.

622 An equilibrium for phenotypic variance O. Carja and M. W. Feldman
2 Wright, S. 1931 Evolution in Mendelian populations.Genetics 16, 97–159.
3 Lush, J. L. 1937 Animal breeding plans. Ames, IA: IowaState University Press.
4 Waddington, C. H. 1942 Canalization of development andthe inheritance of acquired characteristics. Nature 150,563–565. (doi:10.1038/150563a0)
5 Wagner, A. 2007 Robustness and evolvability in living sys-tems. Princeton, NJ: Princeton University Press.
6 Lenski, R. E., Barrick, J. E. & Ofria, C. 2006 Balancingrobustness and evolvability. PLoS Biol. 4, e428. (doi:10.1371/journal.pbio.0040428)
7 Ciliberti, S., Martin, O. C. & Wagner, A. 2007 Innovationand robustness in complex regulatory networks. Proc. NatlAcad. Sci. USA 104, 13 591–13 596. (doi:10.1073/pnas.0705396104)
8 Wagner, A. 2008 Robustness and evolvability: a paradoxresolved. Proc. R. Soc. B 275, 91–100. (doi:10.1098/rspb.2007.1137)
9 Soyer, O. S. & Pfeiffer, T. 2010 Evolution under fluctuat-ing environments explains observed robustness inmetabolic networks. PLoS Comput. Biol. 6, e1000907.(doi:10.1371/journal.pcbi.1000907)
10 Draghi, J. & Wagner, G. P. 2009 The evolutionarydynamics of evolvability in a gene network. J. Evol. Biol.22, 599–611. (doi:10.1111/j.1420-9101.2008.01663.x)
11 Anderson, R. W. 1995 Learning and evolution: a quanti-tative genetics approach. J. Theor. Biol. 175, 89–101.(doi:10.1006/jtbi.1995.0123)
12 Feldman, M. W., Aoki, K. & Kumm, J. 1996 Individualversus social learning: evolutionary analysis in a fluctuat-ing environment. Anthropol. Sci. 104, 209–232.
13 Wakano, J. Y. & Aoki, K. 2006 A mixed strategy model forthe emergence and intensification of social learning in aperiodically changing environment. Theor. Popul. Biol.70, 486–497. (doi:10.1016/j.tpb.2006.04.003)
14 Borenstein, E., Feldman, M. W. & Aoki, K. 2008Evolution of learning in fluctuating environments:when selection favors both social and exploratory learning.Evolution 62, 586–602. (doi:10.1111/j.1558-5646.2007.00313.x)
15 Mitchell, A., Romano, G. H., Groisman, B., Yona, A., Dekel,E., Kupiec, M., Dahan, O. & Pilpel, Y. 2009 Adaptive predic-tion of environmental changes by microorganisms. Nature460, 220–225. (doi:10.1038/nature08112)
16 Wolf, D. M., Vazirani, V. V. & Arkin, A. P. 2005 Diversityin times of adversity: probabilistic strategies in microbialsurvival games. J. Theor. Biol. 234, 227–253. (doi:10.1016/j.jtbi.2004.11.020)
17 Kussell,E.&Leibler, S. 2005Phenotypicdiversity, populationgrowth, and information in fluctuating environments. Science309, 2075–2078. (doi:10.1126/science.1114383)
18 Acar, M., Mettetal, J. T. & van Oudenaarden, A. 2008Stochastic switching as a survival strategy in fluctuatingenvironments. Nat. Genet. 40, 471–475. (doi:10.1038/ng.110)
19 Haldane, J. B. S. & Jayakar, S. D. 1963 Polymorphism dueto selection of varying direction. J. Genet. 58, 237–242.(doi:10.1007/BF02986143)
20 Levins, R. 1968 Evolution in changing environments. Prin-ceton, NJ: Princeton University Press.
21 Kimura, M. 1965 A stochastic model concerning the main-tenance of genetic variability in quantitative characters.Proc. Natl Acad. Sci. USA 54, 731–737. (doi:10.1073/pnas.54.3.731)
22 Ewens, W. J. 1967 The probability of survival of anew mutant in a fluctuating environment. Heredity 22,438–443. (doi:10.1038/hdy.1967.53)
J. R. Soc. Interface (2012)
23 Felsenstein, J. 1976 The theoretical population genetics ofvariable selection and migration. Annu. Rev. Genet. 10,253–280. (doi:10.1146/annurev.ge.10.120176.001345)
24 Dempster, E. R. 1955 Maintenance of genetic heterogen-eity. Cold Spring Harbor Symp. Quant. Biol. 20, 25–32.
25 Jablonka, E., Oborny, B., Molnar, I., Kisdi, E., Hofbauer,J. & Czaran, T. 1995 The adaptive advantage of phenoty-pic memory in changing environments. Phil. Trans. R.Soc. Lond. B 350, 133–141. (doi:10.1098/rstb.1995.0147)
26 Ancel, L. & Fontana, W. 2000 Plasticity, evolvabilityand modularity in RNA. J. Exp. Zool. 288, 242–283.(doi:10.1002/1097-010X(20001015)288:3,242::AID-JEZ5.
3.0.CO;2-O)27 Pal, C. 1998 Plasticity, memory and the adaptive land-
scape of the genotype. Proc. R. Soc. Lond. B 265,1319–1323. (doi:10.1098/rspb.1998.0436)
28 Borenstein, E., Meilijson, I. & Ruppin, E. 2006 The effectof phenotypic plasticity on evolution in multipeakedfitness landscapes. J. Evol. Biol. 19, 1555–1570. (doi:10.1111/j.1420-9101.2006.01125.x)
29 West-Eberhard, M. J. 2003 Developmental plasticity andevolution. Oxford, UK: Oxford University Press.
30 Lachmann, M. & Jablonka, E. 1996 The inheritance ofphenotypes: an adaptation to fluctuating environments.J. Theor. Biol. 181, 1–9. (doi:10.1006/jtbi.1996.0109)
31 Via, S. 1993 Adaptive phenotypic plasticity: target or by-product of selection in a variable environment? Am. Nat.142, 352–365. (doi:10.1086/285542)
32 Freed, N. E., Silander, O. K., Stecher, B., Bohm, A.,Hardt, W.-D. & Ackermann, M. 2008 A simple screen toidentify promoters conferring high levels of phenotypicnoise. PLoS Genet. 4, e1000307. (doi:10.1371/journal.pgen.1000307)
33 Lim, H. N. & van Oudenaarden, A. 2007 A multistep epi-genetic switch enables the stable inheritance of DNAmethylation states. Nat. Genet. 39, 269–275. (doi:10.1038/ng1956)
34 Thattai, M. & van Oudenaarden, A. 2004 Stochastic geneexpression in fluctuating environments. Genetics 167,523–530. (doi:10.1534/genetics.167.1.523)
35 Leibler, S. & Kussell, E. 2010 Individual histories andselection in heterogeneous populations. Proc. NatlAcad. Sci. USA 107, 13 183–13 188. (doi:10.1073/pnas.0912538107)
36 Salathe, M., Van Cleve, J. & Feldman, M. W. 2009 Evol-ution of stochastic switching rates in asymmetric fitnesslandscapes. Genetics 182, 1159–1164. (doi:10.1534/gen-etics.109.103333)
37 Bernstein, B. E., Meissner, A. & Lander, E. S. 2007 Themammalian epigenome. Cell 128, 669–681. (doi:10.1016/j.cell.2007.01.033)
38 Gosden, R. G. & Feinberg, A. P. 2007 Genetics and epige-netics—nature’s pen-and-pencil set. N. Engl. J. Med. 356,731–733. (doi:10.1056/NEJMe068284)
39 Richards, E. J. 2008 Population epigenetics. Curr. Opin.Genet. Dev. 18, 221–226. (doi:10.1016/j.gde.2008.01.014)
40 Petronis, A. 2010 Epigenetics as a unifying principle in theaetiology of complex traits and diseases. Nature 465,721–727. (doi:10.1038/nature09230)
41 Tarakhovsky, A. 2010 Tools and landscapes of epigenetics.Nat. Immunol. 11, 565–568. (doi:10.1038/ni0710-565)
42 Feinberg, A. P. & Irizarry, R. A. 2010 Stochastic epige-netic variation as a driving force of development,evolutionary adaptation, and disease. Proc. Natl Acad.Sci. USA 107, 1757–1764. (doi:10.1073/pnas.0906183107)
43 Rakyan, V. K., Ching, S., Champ, M. E., Cuthbert, P. C.,Morgan, H. D., Luu, K. V. K. & Whitelaw, E. 2003

An equilibrium for phenotypic variance O. Carja and M. W. Feldman 623
Transgenerational inheritance of epigenetic states at themurine AxinFu allele occurs after maternal and paternaltransmission. Proc. Natl Acad. Sci. USA 100, 2538–2543. (doi:10.1073/pnas.0436776100)
44 Jablonka, E. & Lamb, M. J. 1995 Epigenetic inheritanceand evolution: the Lamarckian dimension. New York,NY: Oxford University Press.
45 Slatkin, M. 2009 Epigenetic inheritance and the missingheritability problem. Genetics 182, 845–850. (doi:10.1534/genetics.109.102798)
46 Tal, O., Kisdi, E. & Jablonka, E. 2010 Epigenetic contri-bution to the covariance between relatives. Genetics184, 1037–1050. (doi:10.1534/genetics.109.112466)
47 Feldman, M. W. & Cavalli-Sforza, L. L. 1976 Cultural andbiological evolutionary processes, selection for trait undercomplex transmission. Theor. Popul. Biol. 9, 238–259.(doi:10.1016/0040-5809(76)90047-2)
48 Cavalli-Sforza, L. L. & Feldman, M. W. 1981 Culturaltransmission and evolution: a quantitative approach. Prin-ceton, NJ: Princeton University Press.
49 Reik, W. 2007 Stability and flexibility of epigenetic generegulation in mammalian development. Nature 447,425–432. (doi:10.1038/nature05918)
50 Liberman, U. & Feldman, M. W. 1986 Modifiers of mutationrate: a general reduction principle. Theor. Popul. Biol. 30,125–142. (doi:10.1016/0040-5809(86)90028-6)
51 Liberman, U., van Cleve, J. & Feldman, M. W. 2011 Onthe evolution of mutation in changing environments:recombination and phenotypic switching. Genetics 187,837–851. (doi:10.1534/genetics.110.123620)
52 Bjornsson, H. T., Fallin, M. D. & Feinberg, A. P. 2004 Anintegrated epigenetic and genetic approach to commonhuman disease. Trends Genet. 20, 350–358. (doi:10.1016/j.tig.2004.06.009)
53 Cooney, C. A., Dave, A. A. & Wolff, G. L. 2002 Maternalmethyl supplements in mice affect epigenetic variationand DNA methylation of offspring. J. Nutr. 132,23 935–24 005.
J. R. Soc. Interface (2012)
54 Waterland, R. A. & Jirtle, R. I. 2003 Transposableelements: targets for early nutritional effects on epigeneticgene regulation. Mol. Cell. Biol. 23, 5293–5300. (doi:10.1128/MCB.23.15.5293-5300.2003)
55 Kucharski, R., Maleska, J., Foret, S. & Maleszka, R. 2008Nutritional control of reproductive status in honeybees viaDNA methylation. Science 319, 1827–1830. (doi:10.1126/science.1153069)
56 Lyko, F., Foret, S., Kucharski, R., Wolf, S., Falckenhayn,C. & Maleszka, R. 2010 The honey bee epigenomes: differ-ential methylation of brain DNA in queens and workers.PLoS Biol. 8, e1000506. (doi:10.1371/journal.pbio.1000506)
57 Youngson, N. A. & Whitelaw, E. 2008 Transgenerationalepigenetic effects. Annu. Rev. Genomics Hum. Genet. 9,233–257. (doi:10.1146/annurev.genom.9.081307.164445)
58 Fraga, M. F. et al. 2005 Epigenetic differences ariseduring the lifetime of monozygotic twins. Proc. NatlAcad. Sci. USA 102, 10 604–10 609. (doi:10.1073/pnas.0500398102)
59 Fraga, M. F. 2009 Genetic and epigenetic regulation ofaging. Curr. Opin. Immunol. 21, 446–453. (doi:10.1016/j.coi.2009.04.003)
60 Bock, C. & Lengauer, T. 2007 Computational epigenetics.Bioinformatics 24, 1–10. (doi:10.1093/bioinformatics/btm546)
61 Feinberg, A. P. & Tycko, B. 2004 The history of cancerepigenetics. Nat. Rev. Cancer 4, 143–152. (doi:10.1038/nrc1279)
62 Esteller, M. 2007 Cancer epigenomics: DNA methylomesand histone-modification maps. Nat. Rev. Genet. 8, 286–298. (doi:10.1038/nrg2005)
63 Feinberg, A. P. 2004 The epigenetics of cancer etiology.Semin. Cancer Biol. 14, 427–432. (doi:10.1016/j.semcan-cer.2004.06.005)
64 Johnson, L. J. & Tricker, P. J. 2010 Epigenomic plasticitywithin populations: its evolutionary significance and poten-tial. Heredity 105, 113–121. (doi:10.1038/hdy.2010.25)