an east asian monetary union: china included?
TRANSCRIPT
The Economics of China 01/09/2013
KATHOLIEKE UNIVERSITEIT LEUVEN
An East Asian Monetary Union: China Included?
Abstract:
This paper discusses the feasibility of China’s inclusion in an East Asian monetary union. A
broad-based empirical analysis is used to determine whether China satisfies the three classic
economic Optimum Currency Area (OCA) criteria. The group of countries that is selected for
analysis includes China and the ASEAN4 (Indonesia, Malaysia, the Philippines and
Thailand). The research results indicate that China is not yet ready for monetary integration
because it has underdeveloped money and capital markets, its economy is still relatively
closed for trade, its exports are not very diversified and trade intensity with the ASEAN4
countries is only limited. Nonetheless, some recent developments such as the China-ASEAN
Free Trade Agreement and China’s rapidly improving stage of economic development
indicate that China may alter its macroeconomic conditions in favor of monetary integration
with the East Asian region in the long run.
Submitted by Karel Vanhulle
On behalf of: Dr. Filip De Beule
1
1. Introduction
The dramatic consequences of the Asian financial crisis in 1997/1998 stimulated East Asian
policymakers to swiftly adopt measures that would strengthen the region’s financial resilience
in order to avoid any future crises. This led to the most advanced arrangement of financial
cooperation in the East Asian region: the Chiang Mai Initiative.
According to integration optimists, initiatives for financial cooperation in the East Asian
region after the Asian financial crisis constituted a ‘shining beacon of hope’. Initial studies on
the feasibility of monetary integration in East Asia, such as the study by Bayoumi and
Eichengreen (1999), highlighted that many East Asian economies satisfied the necessary
economic conditions for currency union membership. Therefore, there has been a proliferation
of studies that explored the feasibility of East Asian monetary integration since.
The main theory to assess the costs and benefits of monetary integration is the Optimum
Currency Area (OCA) theory. Two main research methods have been used to analyze the
OCA properties: the shock-symmetry approach and broad-based empirical studies. Most of
these studies conclude that the East Asian region as a whole does not constitute an optimum
currency area, but there are some clusters of countries that do indicate strong signs of
economic correlation. According to the shock-symmetry approach China is consistently
excluded as a potential member for East Asian monetary integration. More broad-based
empirical studies do however portray less uniform results about China’s exclusion.
Additionally, China’s rapid economic growth, its huge international reserves, adjustments in
its exchange rate regime and strongly increased intra-regional trade in the past decade may
change perspectives on China’s current position as a potential member of a currency union.
Therefore, this study discusses whether China reaches the necessary economic conditions for
monetary integration, based on an analysis of the three classic economic OCA criteria.
This paper is structured as follows: Section 2 gives an overview of the essential literature
about monetary integration, with a focus on China’s role. Section 3 describes the
methodology that is used to analyze China’s current economic position for monetary
integration. Section 4 presents the research results and section 5 concludes.
2. Literature Review
This literature review begins with the Asian financial crisis and how it led to more regional
monetary cooperation (section 2.1.). Thereafter, section 2.2. provides a review of the main
2
theory to assess the feasibility of monetary integration. Finally, the most important literature
on the feasibility of East Asian monetary integration is discussed in section 2.3.
2.1.The Asian Financial Crisis and Initiatives for Regional Monetary Cooperation
Massive currency attacks made the Thai government float its Baht in July 1997 (Katada,
2012), an event that announced the start of a severely contagious crisis. Since the crisis
proved to be regional, it quickly made the currencies of Indonesia, South Korea and other
neighboring countries also lose over 20% and more of their value (Webber, 2000). But even
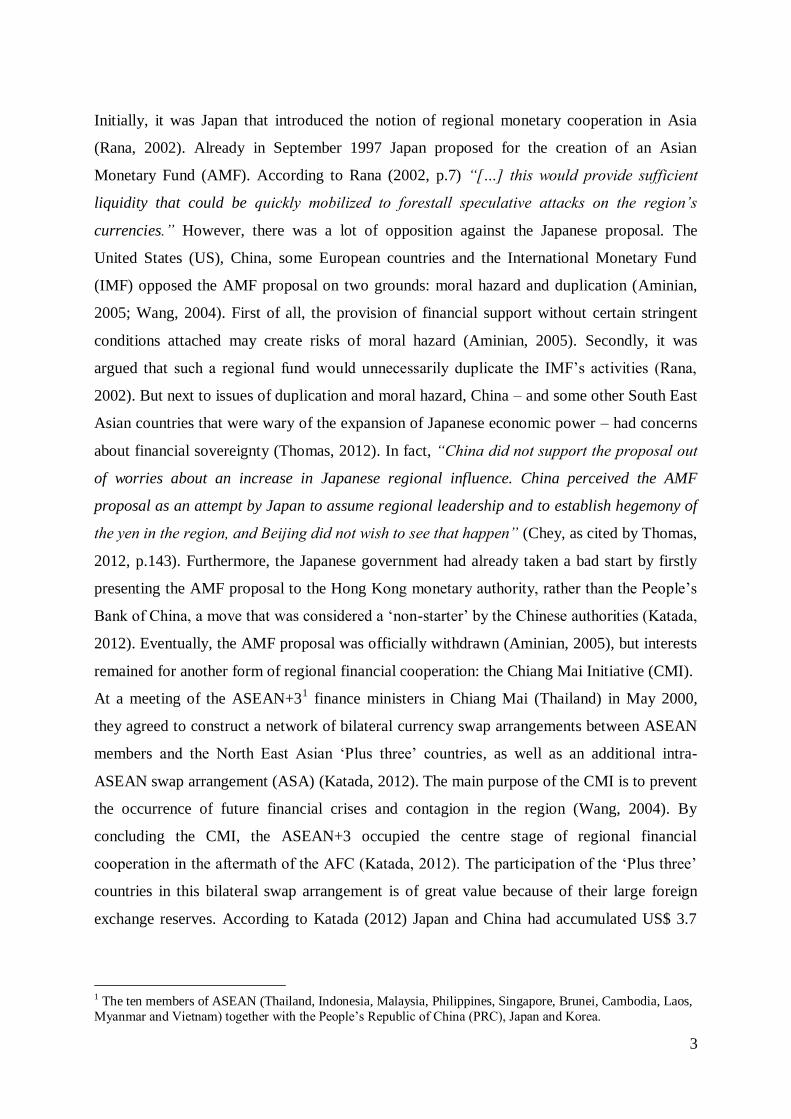
though the Asian Financial Crisis (AFC) began as a currency crisis, it had drastic effects on
the real economy of most East Asian nations (see Figure 1). One of the only countries that had
largely escaped the turmoil was China, which nonetheless did play an important role during
the event. First of all, the Chinese government rigorously defended the Hong Kong dollar
when it also came under attack (Webber, 2000). And secondly, China was able to resist the
pressure to devalue its own currency and compete with the East Asian economies whose
currencies had massively devaluated. As a result, China gained high marks with the East
Asian countries who aimed to ‘export their way out of crisis’ (Katada, 2012).
Although most East Asian economies were able to swiftly recover (see Figure 1), the crisis
did profoundly shock the region and changed opinions about obstacles for monetary
integration (Aminian, 2005). As stated by Katada (2012, p.130): “In many ways, this shock
gave immediate and unequivocal commitment to regional financial and monetary
cooperation.”
Figure 1: East Asian Growth Rates
Source: Ito, 2007
3
Initially, it was Japan that introduced the notion of regional monetary cooperation in Asia
(Rana, 2002). Already in September 1997 Japan proposed for the creation of an Asian
Monetary Fund (AMF). According to Rana (2002, p.7) “[…] this would provide sufficient
liquidity that could be quickly mobilized to forestall speculative attacks on the region’s
currencies.” However, there was a lot of opposition against the Japanese proposal. The
United States (US), China, some European countries and the International Monetary Fund
(IMF) opposed the AMF proposal on two grounds: moral hazard and duplication (Aminian,
2005; Wang, 2004). First of all, the provision of financial support without certain stringent
conditions attached may create risks of moral hazard (Aminian, 2005). Secondly, it was
argued that such a regional fund would unnecessarily duplicate the IMF’s activities (Rana,
2002). But next to issues of duplication and moral hazard, China – and some other South East
Asian countries that were wary of the expansion of Japanese economic power – had concerns
about financial sovereignty (Thomas, 2012). In fact, “China did not support the proposal out
of worries about an increase in Japanese regional influence. China perceived the AMF
proposal as an attempt by Japan to assume regional leadership and to establish hegemony of
the yen in the region, and Beijing did not wish to see that happen” (Chey, as cited by Thomas,
2012, p.143). Furthermore, the Japanese government had already taken a bad start by firstly
presenting the AMF proposal to the Hong Kong monetary authority, rather than the People’s
Bank of China, a move that was considered a ‘non-starter’ by the Chinese authorities (Katada,
2012). Eventually, the AMF proposal was officially withdrawn (Aminian, 2005), but interests
remained for another form of regional financial cooperation: the Chiang Mai Initiative (CMI).
At a meeting of the ASEAN+31 finance ministers in Chiang Mai (Thailand) in May 2000,
they agreed to construct a network of bilateral currency swap arrangements between ASEAN
members and the North East Asian ‘Plus three’ countries, as well as an additional intra-
ASEAN swap arrangement (ASA) (Katada, 2012). The main purpose of the CMI is to prevent
the occurrence of future financial crises and contagion in the region (Wang, 2004). By
concluding the CMI, the ASEAN+3 occupied the centre stage of regional financial
cooperation in the aftermath of the AFC (Katada, 2012). The participation of the ‘Plus three’
countries in this bilateral swap arrangement is of great value because of their large foreign
exchange reserves. According to Katada (2012) Japan and China had accumulated US$ 3.7
1 The ten members of ASEAN (Thailand, Indonesia, Malaysia, Philippines, Singapore, Brunei, Cambodia, Laos,
Myanmar and Vietnam) together with the People’s Republic of China (PRC), Japan and Korea.

4
trillion in dollar-denominated foreign exchange reserves as of September 2010, which makes
them able to provide the necessary emergency funding in dollars.
Asian policymakers however, mostly those of Japan that tried to push through the AMF
proposal, long strived to pool the CMI swap lines and create a multilateral emergency funding
institution (Katada, 2012). They achieved their goal in 2010 when the CMI was
multilateralized under the CMI Multilateralizion (CMIM) agreement, establishing a $120
billion crisis fund for the region (Rana et al., 2012). At the 15th
ASEAN+3 meeting in 2012,
the CMIM has even doubled in size to $240 billion (Ministry of Strategy and Finance, 2012).
Each member country does keep the same share of financial contributions and voting powers,
as displayed in Table 1. The table clearly indicates the valuable, financially balanced, role of
both China and Japan in East Asia’s most institutionalized and advanced construction of
financial cooperation.
Table 1: Financial Contributions to the CMIM per Country
Source: Ministry of Strategy and Finance, 2012
Additional major developments that enhance the financial resilience of the East Asian region
are two capital market initiatives that help to develop the regional bond markets (Yu et al.,
2010). According to Katada (2012) the AFC had highlighted the weakness of the region’s
financial market and thus created a need for increased facility in direct financing in the Asian
economies. First, on the funding side, the Asian Bond Fund (ABF) was launched in 2002 to
help fund and promote the development of regional and domestic bond markets (Yu et al.,
2010). Second, on the issuing side, the Asian Bond Market Initiative (ABMI) was launched in
2003 under the ASEAN+3 framework “[…] to develop efficient and liquid bond markets in
Asia” (Yu et al., 2010, p.2874).
However, according to Grimes, as cited by Katada (2012, p.132), the regional currency
arrangement is “arguably the most important component of regional financial cooperation in
East Asia that could have the most lasting long-term effects.” Although there is plenty of
discussion on the desirability of such an arrangement there has been no real progress in the
development of a regional currency arrangement so far (Katada, 2012).
5
Nonetheless, Katada (2012, p.129) states that: “[…] integration optimists argue that East
Asia’s financial cooperation provides a shining beacon of hope.” Supplementary are East
Asia’s surprisingly high levels of progress towards the Optimum Currency Area conditions
(Bayoumi and Eichengreen, 1999). Hence, these favorable conditions make some, such as
Mundell (2003), believe that Asia will eventually need a common currency. But before going
deeper into the discussion about the feasibility of such an East Asian common currency area,
the main theory to assess the costs and benefits of monetary integration will be elaborated on
in the following section.
2.2.The Theory of Optimum Currency Areas
According to Baldwin and Wyplosz (2011, p.402) the Optimum Currency Area theory
presents “a systematic way of trying to decide whether it makes sense for a group of countries
to abandon their national currencies.” It does so by employing a range of economic and
political criteria that recognize that the real economic cost of giving up the exchange rate
instrument arises in the presence of asymmetric shocks – shocks that do not affect all currency
union member countries (Baldwin and Wyplosz, 2011). Hence, the loss of the exchange rate
instrument is of little consequence when countries face similar/symmetric shocks, since it is
more likely that they would respond with similar policies (Lee and Azali, 2012).
Although the OCA theory does not really say anything about the optimality (to become part of
a currency union or not to?) it does balance out the costs and benefits of monetary integration.
Some of the main benefits of participating in a currency area include: increased usefulness of
money; savings in transaction and hedging costs; improved price stability, and; increased
trade. On the costs side countries can experience some of the following disadvantages when
becoming member of a currency union: changeover costs of switching to a new currency (on
the administrative, legal, hardware and psychological level); the loss of autonomous monetary
policy to cope with asymmetric disturbances, and; negative external effects because of
indebted member countries (Mongelli, 2002).
As mentioned, there is a range of economic and political criteria to determine the optimality
of monetary integration. Monegelli (2002) refers to these criteria as ‘OCA properties’.
According to the author, the number of properties and methods of analysis have greatly
evolved since the OCA theory has been developed 50 years ago. Nonetheless, Mongelli
(2002, p.24) states that “the basic ‘pioneering’ intuitions of the optimum currency area theory
were remarkably strong.” These pioneering intuitions include the theories of Mundell (1961),
6
McKinnon (1962) and Kenen (1969). These are also known as the ‘classic’ economic OCA
criteria. According to Mundell (1961), who was the first to suggest the concept of an
‘optimum currency area’, an essential ingredient of a common currency area is a high degree
of factor mobility. The rationale for this goes as follows: in the presence of an asymmetric
shock, country A may be struck with unemployment, while unaffected country B faces
inflationary pressure (Baldwin and Wyplosz, 2011). However, a high degree of labor mobility
can mitigate the effects of this asymmetric shock and thus have a stabilizing function. Since it
is conventionally assumed that capital is mobile (Baldwin and Wyplosz, 2011) and a common
currency would stimulate its mobility (Mundell, 1961), it is labor mobility that becomes the
real hurdle. The second ‘classic’ economic OCA property, McKinnon’s (1962) theory,
indicates that economies that are open to trade and trade heavily with one another form an
optimum currency area. First of all, exchange rate changes in a highly open economy will
mean great fluctuations in price variability, which makes the usage of national monetary
policies in open economies more costly (McKinnon, 1962). Hence, De Grauwe (2009, p.54)
concludes that “the cost of a monetary union most likely declines with the degree of openness
of a country.” Secondly, increased trade and thus more trade competition equalizes prices of
goods when expressed in the same currency (Baldwin and Wyplosz, 2011). Therefore, such
flexible prices make the loss of autonomous monetary policy less costly. Finally, according to
the theory of Kenen (1969) countries form an optimum currency area when their product
portfolio is highly diversified and when they produce similar goods. A highly diversified
product portfolio means that shocks will be smaller, whilst less diversity between countries’
structure of production makes shocks more symmetric. Furthermore, Mongelli (2002)
indicates that in the course of time additional OCA properties have been added, such as
similarity in inflation rates and fiscal and political integration. But despite the progress in the
development of the OCA theory, there is still no simple OCA-test with a clear-cut scoring
card (Mongelli, 2002). Therefore, Mongelli (2002, p.34) concludes that “[…] we are still far
away from a unified theory in this field.”
A final aspect inherent to single currency areas and crucial for the understanding of the OCA
theory is the rivalry between the paradigm of the ‘Krugman specialization hypothesis’ and the
paradigm of the ‘endogeneity of OCA hypothesis’. On one hand, Krugman (1993) argues that
if trade costs fall, which happens when a country becomes a member of a currency area, firms
will aim to exploit the increasing returns by relocating their business. As a result, national
specialization will lead to more inter-industry trade between countries, which consequently
causes business cycles to be more asynchronous and eventually turn currency areas less
7
optimal. On the other hand, Frankel and Rose (1998, p.22) argue that “a country is more
likely to satisfy the criteria for entry into a currency union ex post than ex ante.” According
to the authors, membership of a currency union decreases trading costs and thereby enhances
trade activity between member countries. In the case of more intra-industry trade it may result
into more synchronized business cycles, which makes the single currency area more ‘optimal’
(Frankel and Rose, 1998).
2.3.China in Studies on East Asian Optimum Currency Areas
To determine East Asia’s optimum currency area, scholars have mainly concentrated on two
approaches: analysis of the symmetry of shocks and broad-based empirical studies. First of
all, broad-based empirical studies focus on the OCA properties that were discussed in section
2.2. Because of the absence of a unifying framework, scholars have the opportunity to select
the properties which they argue that are best to determine the optimality of monetary
integration. However, because every scholar has the freedom to select the properties (s)he
likes, one can end up drawing different borders for a currency area by referring to different
OCA properties. This is called the ‘problem of inconclusiveness’ by Tavlas (1993). The
second methodology, the similarity of shocks approach, captures the interaction between
several properties, and is therefore known as a ‘catch all’ property (Mongelli, 2002).
According to this technique, countries that experience similar demand and supply shocks and
whose economy adjusts rapidly to shocks have lower value in exchange rate policy autonomy
and are better candidates for monetary integration (Lee and Koh, 2012).
Studies that have used the Structural Vector Autoregression (VAR) method to assess the
symmetry of macroeconomic disturbances (Bacha, 2008; Huang and Guo, 2006; Lee and
Koh, 2012; Sato et al., 2009) or a related method (Lee and Azali, 2012) all conclude that
China is not suitable as a member country of a monetary union in the East Asian region.
Basically it comes down to the fact that, according to the VAR approach, China displays
asymmetric shocks or insignificant correlations with the other East Asian economies. Most
studies however, provide the reader with additional information about China’s exclusion or
put forward a point of concern.
First of all, Lee and Azali (2012) indicate that the regional factor – which explains output
fluctuations – mostly increased for the worst-hit countries of the AFC. Therefore, the authors
conclude that it is possibly the contagion effect of the AFC which led to the increase in the
regional factor. Since China remained relatively intact by the AFC, it could not profit of an
8
increase in its regional factor. On the contrary, its country-specific factor in explaining output
fluctuations increased (Lee and Azali, 2012). Secondly, Huang and Guo (2012) indicate that
China shows no significant correlations with the rest of East Asia in its supply, demand and
monetary disturbances. Additionally, the authors state that China’s response to external
shocks is different from other countries, probably due to China’s fixed exchange rate
arrangement throughout the estimation period (which is limited to 2006). However, since
China has shifted to controlled appreciation from 2005 onwards (letting the nominal value of
the renminbi rise about 32 percent against the dollar (Henning, 2012)), this might have
important implications for the correlation of shocks between China and other East Asian
economies. Supplementary is the remark of Sato et al. (2009, p.2936) who state that their
“analysis may not be able to fully catch the marked development of recent regional
integration process and the growing presence of the Chinese economy in the last decade or
so, […].” Finally, Lee and Koh (2012) indicate that China’s supply shocks are not
synchronized with an ASEAN grouping. Nonetheless, the authors remark that the exclusion of
China from a monetary union raises a concern, because, being one of the fastest growing and
largest economies, it possesses huge international reserves which would enhance the stability
of a currency union.
Broad-based empirical studies that have used a variety of OCA properties (Aminian, 2005;
Quah, 2009) or a unique ‘hierarchical clustering approach’ (Quah and Crowley, 2010) to
assess the feasibility of monetary integration do not come to such a uniform conclusion as
scholars that used a symmetry of shocks approach. First of all, Quah (2009), who assesses the
feasibility of monetary integration with the US dollar as anchor currency, concludes that
China scores ‘moderately eligible’ to become part of such a dollar area. This indicates that
China obtains relatively good scores on various OCA properties for monetary integration.
Secondly, Quah and Crowley’s (2010) hierarchical clustering approach shows that China
shares strong pre-crisis OCA features with Malaysia and Thailand (which are merged at the
smallest distance). In the post-crisis period China shows strong symmetries with the
Philippines and Taiwan (Quah and Crowley, 2010). Finally, Aminian (2005) concludes that
East Asian economies may not constitute an OCA as a whole (which is confirmed by most
other studies on East Asian monetary integration), but regional clusters are possible. Aminian
(2005) indicates that there are two East Asian groupings with significantly correlated
9
economic structures: (1) Japan and Asian Newly Industrialized Economies2 (NIEs), and; (2)
ASEAN 43 plus China.
Overall, the symmetry of shocks approach consistently excludes China as a potential member
of a monetary union, whilst more broad-based empirical studies provide less uniform results.
Additionally, China’s rapid economic growth, its huge international reserves, adjustments in
its exchange rate regime and strongly increased intra-regional trade in the past decade may
shed a different light on China’s current position as a potential member of a currency union.
Therefore, this study will provide an assessment of China’s position in an East Asian
monetary union. The main goal of this study can be formulated in the following research
question:
Is China in a favorable economic position for monetary integration?
The grouping that is selected for analysis is determined according to the findings of Aminian
(2005), namely, China and the ASEAN 4. Japan and the NIE’s can logically be excluded from
an East Asian monetary union that includes China because of their highly developed
economic structures which would automatically lead to asynchronous business cycles and
thus higher costs for monetary integration.
3. Methodology
According to Mongelli (2002, p.26), studies that have analyzed the symmetry of shocks
“provide a useful benchmark of comparisons across many countries whose economic and
financial structures would be otherwise difficult to summarize.” However, the author also
refers to the fact that the results of such studies are ambiguous and often in conflict.
Because this study is limited to only five countries (China and the ASEAN4) it is feasible to
present a decent overview of the country-specific achievements to each OCA criterion. As
such, this study does not capture the interaction between several OCA properties as shock
symmetry-related methods do, but it provides the reader with better insights in each specific
OCA property. However, because there is still no OCA-test with a clear cut scoring card
(Mongelli, 2002), the OCA properties that will be analyzed can be selected according to the
preferences of the author.
2 These include: Korea, Taiwan, Singapore and Hong Kong 3 ASEAN4 refers to: Thailand, Malaysia, the Philippines and Indonesia
10
Since the basic ‘pioneering’ intuitions of the OCA theory have proven to be remarkably
strong (Mongelli, 2002), the three main classic economic OCA criteria are selected for
analysis. These include the theories of Mundell (1961), McKinnnon (1963) and Kenen (1969),
which were discussed in more detail in section 2.2. Hence, this study can be perceived as a
broad-based empirical study.
Along the analysis the cases of both East Asia and Europe are discussed. Since many
European countries have opted to proceed with monetary integration in 1999 (creating the
European Economic and Monetary Union), Europe provides an obvious metric for the Asian
economies (Bayoumi and Eichengreen, 1999).
The data sources include: UN Comtrade for data on trade, and; the World Bank website for
general macroeconomic data.
4. Research Findings
Section 4.1. discusses East Asia’s openness to trade and regional trade intensity.
Subsequently, section 4.2. discusses the similarity of East Asian economies and their export
diversification. Finally, section 4.3. examines whether capital and labor are mobile across the
East Asian grouping.
4.1.Openness to Trade and Trade Intensity
As stated by Baldwin and Wyplosz (2011, p. 422): “Openness, which may reduce the
usefulness of an independent exchange rate, is usually defined as the share of economic
activity devoted to international trade.” The ratio of the sum of exports and imports to Gross
Domestic Product (GDP) is ought to be an appropriate index to measure openness to trade. A
high index result indicates high openness to trade, and may even go beyond 100%. To
determine whether the East Asian countries of the selected grouping are open to trade (in
2012), a comparative analysis is made with the situation of the Euro area member countries in
1999. The results are shown in Figure 2.
Overall, the selected East Asian economies display similar levels of openness as the Euro area
members did when they opted for monetary integration. At the top level are Malaysia and
Thailand, which show very high levels of openness, most likely due to their export-oriented
growth strategy. The remaining East Asian economies, including China, display rather low
levels of openness, although they do reach a level that is comparable to that of leading
European powers such as Germany and France. Therefore, the European benchmark indicates

11
that one can assume that China’s level of openness – as is the case for the Philippines and
Indonesia – is not that much of an implication. Nonetheless, a higher degree of openness
remains preferable in order to decrease the costs of monetary integration.
Figure 2: Openness to Trade
Note: The index is the ratio of the sum of exports and imports to GDP. The data for the East Asian economies is from
2012 and the data for the Euro area members is from 1999.
Source: Author's calculations (Data from World Bank database and UN Comtrade)
Secondly, increased trade stimulates international competitiveness between companies, which
equalizes prizes and thus makes a common monetary policy less costly. To analyze trade
interdependency in greater depth, the bilateral trade linkages between China and the ASEAN4
countries are measured according to the ‘trade intensity index’, as used by Goto (2002). The
trade intensity index between country i and country j is defined as follows:
Ii,j = (Ti,j/Ti)/(Tw,j/Tw)
where Ti,j = trade volume of county i with country j,
Ti = total trade volume of country i,
Tw,j = trade volume of the world with country j,
and Tw = total trade volume of the world.
In order to eliminate the effect of the mere size of the country concerned, the index is
normalized by dividing by the relative share of the country in total world trade. If the degree
of trade interaction between country i and country j is equal to that between the world and
12
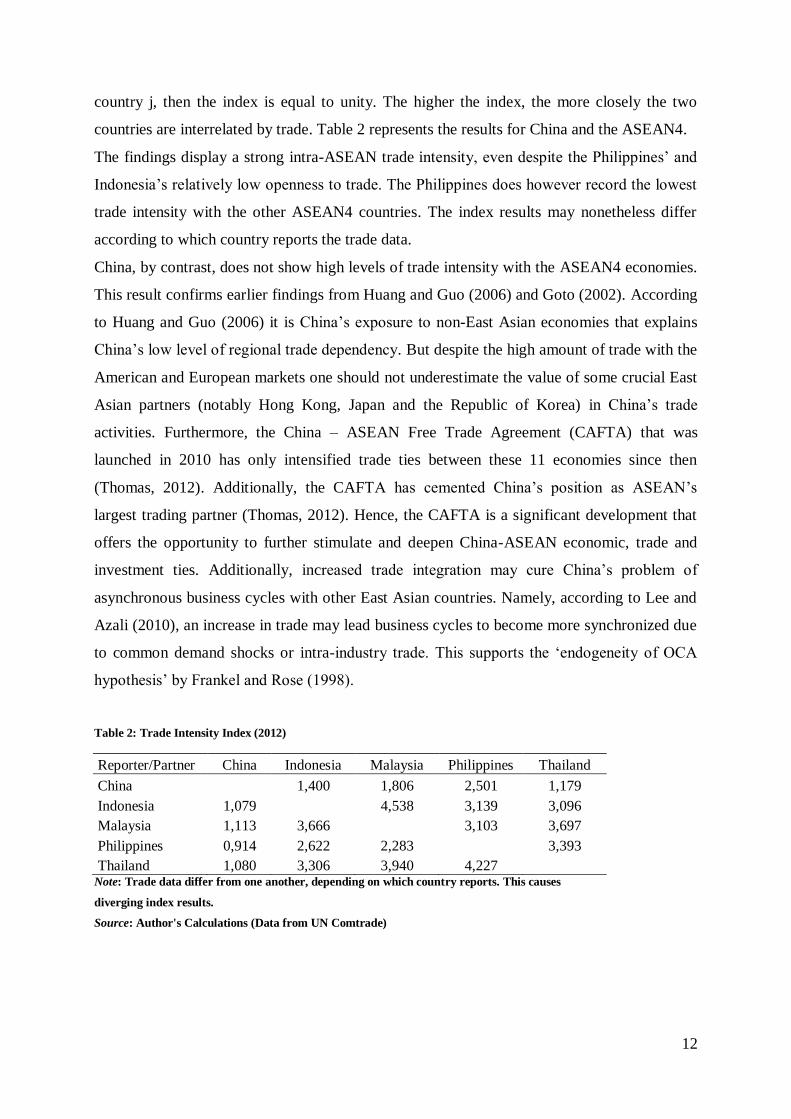
country j, then the index is equal to unity. The higher the index, the more closely the two
countries are interrelated by trade. Table 2 represents the results for China and the ASEAN4.
The findings display a strong intra-ASEAN trade intensity, even despite the Philippines’ and
Indonesia’s relatively low openness to trade. The Philippines does however record the lowest
trade intensity with the other ASEAN4 countries. The index results may nonetheless differ
according to which country reports the trade data.
China, by contrast, does not show high levels of trade intensity with the ASEAN4 economies.
This result confirms earlier findings from Huang and Guo (2006) and Goto (2002). According
to Huang and Guo (2006) it is China’s exposure to non-East Asian economies that explains
China’s low level of regional trade dependency. But despite the high amount of trade with the
American and European markets one should not underestimate the value of some crucial East
Asian partners (notably Hong Kong, Japan and the Republic of Korea) in China’s trade
activities. Furthermore, the China – ASEAN Free Trade Agreement (CAFTA) that was
launched in 2010 has only intensified trade ties between these 11 economies since then
(Thomas, 2012). Additionally, the CAFTA has cemented China’s position as ASEAN’s
largest trading partner (Thomas, 2012). Hence, the CAFTA is a significant development that
offers the opportunity to further stimulate and deepen China-ASEAN economic, trade and
investment ties. Additionally, increased trade integration may cure China’s problem of
asynchronous business cycles with other East Asian countries. Namely, according to Lee and
Azali (2010), an increase in trade may lead business cycles to become more synchronized due
to common demand shocks or intra-industry trade. This supports the ‘endogeneity of OCA
hypothesis’ by Frankel and Rose (1998).
Table 2: Trade Intensity Index (2012)
Reporter/Partner China Indonesia Malaysia Philippines Thailand
China
1,400 1,806 2,501 1,179
Indonesia 1,079
4,538 3,139 3,096
Malaysia 1,113 3,666
3,103 3,697
Philippines 0,914 2,622 2,283
3,393
Thailand 1,080 3,306 3,940 4,227 Note: Trade data differ from one another, depending on which country reports. This causes
diverging index results.
Source: Author's Calculations (Data from UN Comtrade)
13
4.2.Economic Similarity and Export Diversification
According to Bayoumi et al. (2000), countries that have similar levels of economic
development are better candidates for monetary integration. More similarity in the stage of
economic development – or less diversity – will lead to more symmetry in shocks, which
decreases the costs of monetary integration. A good measure for the stage of economic
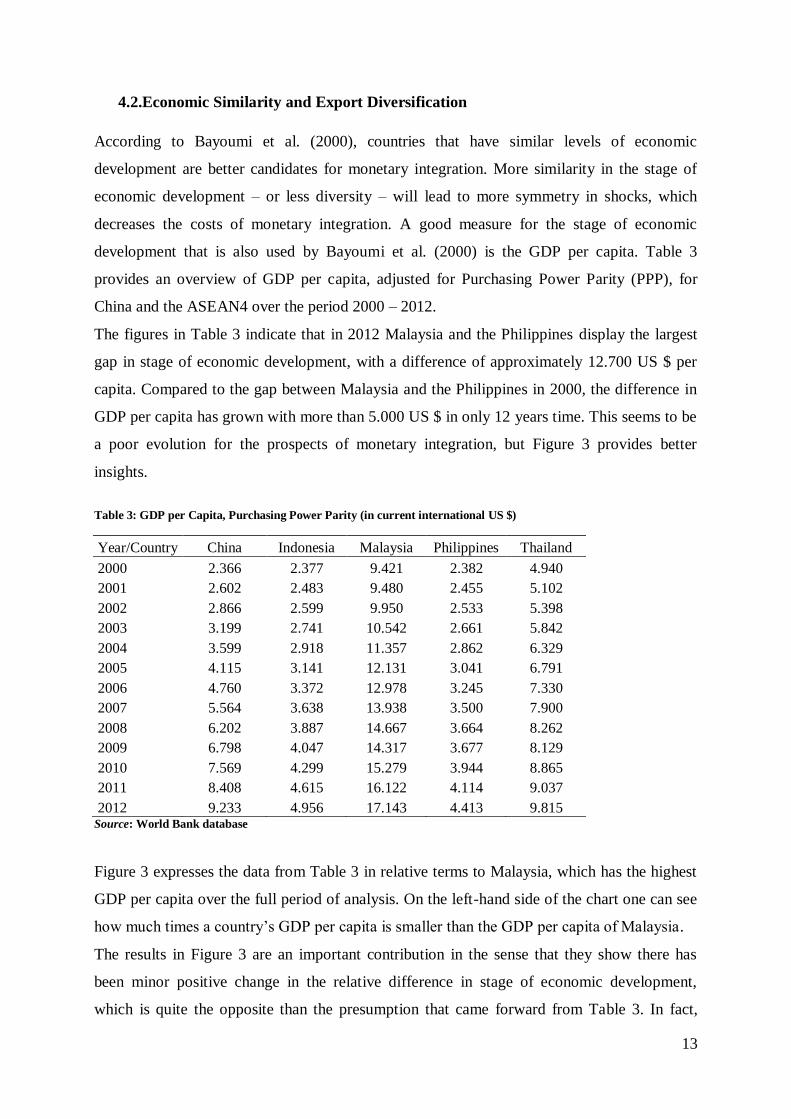
development that is also used by Bayoumi et al. (2000) is the GDP per capita. Table 3
provides an overview of GDP per capita, adjusted for Purchasing Power Parity (PPP), for
China and the ASEAN4 over the period 2000 – 2012.
The figures in Table 3 indicate that in 2012 Malaysia and the Philippines display the largest
gap in stage of economic development, with a difference of approximately 12.700 US $ per
capita. Compared to the gap between Malaysia and the Philippines in 2000, the difference in
GDP per capita has grown with more than 5.000 US $ in only 12 years time. This seems to be
a poor evolution for the prospects of monetary integration, but Figure 3 provides better
insights.
Table 3: GDP per Capita, Purchasing Power Parity (in current international US $)
Year/Country China Indonesia Malaysia Philippines Thailand
2000 2.366 2.377 9.421 2.382 4.940
2001 2.602 2.483 9.480 2.455 5.102
2002 2.866 2.599 9.950 2.533 5.398
2003 3.199 2.741 10.542 2.661 5.842
2004 3.599 2.918 11.357 2.862 6.329
2005 4.115 3.141 12.131 3.041 6.791
2006 4.760 3.372 12.978 3.245 7.330
2007 5.564 3.638 13.938 3.500 7.900
2008 6.202 3.887 14.667 3.664 8.262
2009 6.798 4.047 14.317 3.677 8.129
2010 7.569 4.299 15.279 3.944 8.865
2011 8.408 4.615 16.122 4.114 9.037
2012 9.233 4.956 17.143 4.413 9.815 Source: World Bank database
Figure 3 expresses the data from Table 3 in relative terms to Malaysia, which has the highest
GDP per capita over the full period of analysis. On the left-hand side of the chart one can see
how much times a country’s GDP per capita is smaller than the GDP per capita of Malaysia.
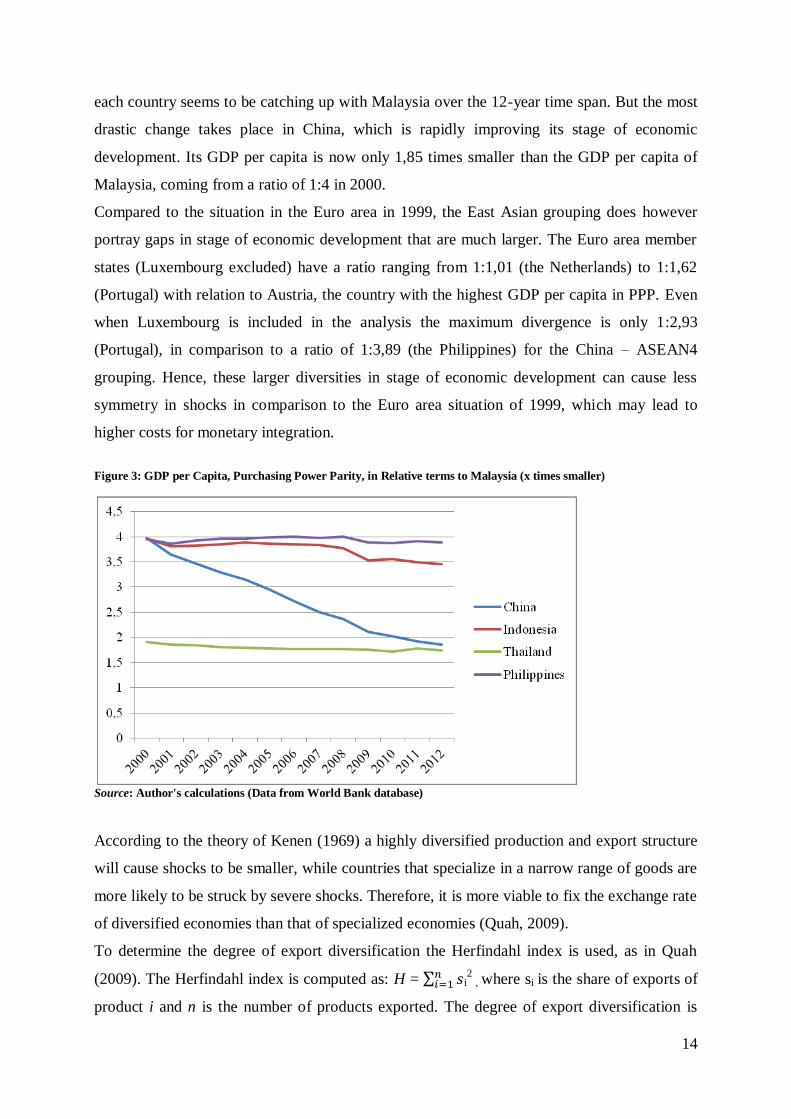
The results in Figure 3 are an important contribution in the sense that they show there has
been minor positive change in the relative difference in stage of economic development,
which is quite the opposite than the presumption that came forward from Table 3. In fact,
14
each country seems to be catching up with Malaysia over the 12-year time span. But the most
drastic change takes place in China, which is rapidly improving its stage of economic
development. Its GDP per capita is now only 1,85 times smaller than the GDP per capita of
Malaysia, coming from a ratio of 1:4 in 2000.
Compared to the situation in the Euro area in 1999, the East Asian grouping does however
portray gaps in stage of economic development that are much larger. The Euro area member
states (Luxembourg excluded) have a ratio ranging from 1:1,01 (the Netherlands) to 1:1,62
(Portugal) with relation to Austria, the country with the highest GDP per capita in PPP. Even
when Luxembourg is included in the analysis the maximum divergence is only 1:2,93
(Portugal), in comparison to a ratio of 1:3,89 (the Philippines) for the China – ASEAN4
grouping. Hence, these larger diversities in stage of economic development can cause less
symmetry in shocks in comparison to the Euro area situation of 1999, which may lead to
higher costs for monetary integration.
Figure 3: GDP per Capita, Purchasing Power Parity, in Relative terms to Malaysia (x times smaller)
Source: Author's calculations (Data from World Bank database)
According to the theory of Kenen (1969) a highly diversified production and export structure
will cause shocks to be smaller, while countries that specialize in a narrow range of goods are
more likely to be struck by severe shocks. Therefore, it is more viable to fix the exchange rate
of diversified economies than that of specialized economies (Quah, 2009).
To determine the degree of export diversification the Herfindahl index is used, as in Quah
(2009). The Herfindahl index is computed as: H = i
2 , where si is the share of exports of
product i and n is the number of products exported. The degree of export diversification is
15
measured by the inverse of the Herfindahl index, which is a popular indicator of the degree of
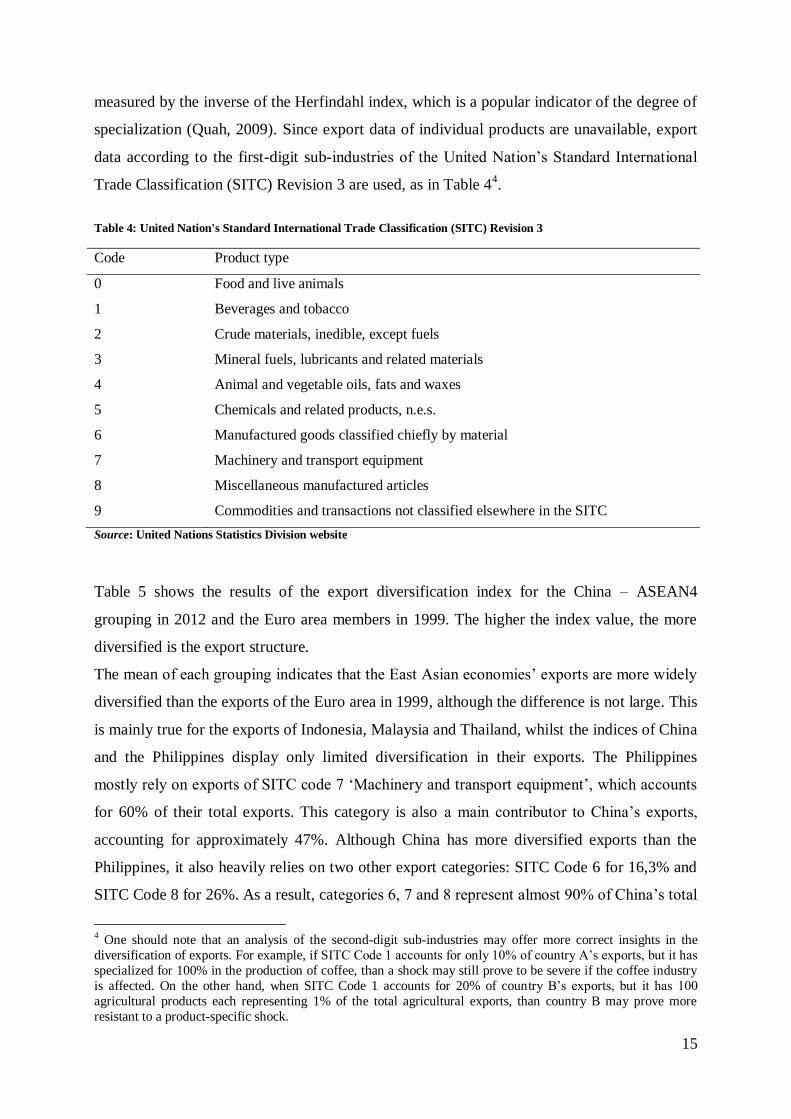
specialization (Quah, 2009). Since export data of individual products are unavailable, export
data according to the first-digit sub-industries of the United Nation’s Standard International
Trade Classification (SITC) Revision 3 are used, as in Table 44.
Table 4: United Nation's Standard International Trade Classification (SITC) Revision 3
Code Product type
0 Food and live animals
1 Beverages and tobacco
2 Crude materials, inedible, except fuels
3 Mineral fuels, lubricants and related materials
4 Animal and vegetable oils, fats and waxes
5 Chemicals and related products, n.e.s.
6 Manufactured goods classified chiefly by material
7 Machinery and transport equipment
8 Miscellaneous manufactured articles
9 Commodities and transactions not classified elsewhere in the SITC
Source: United Nations Statistics Division website
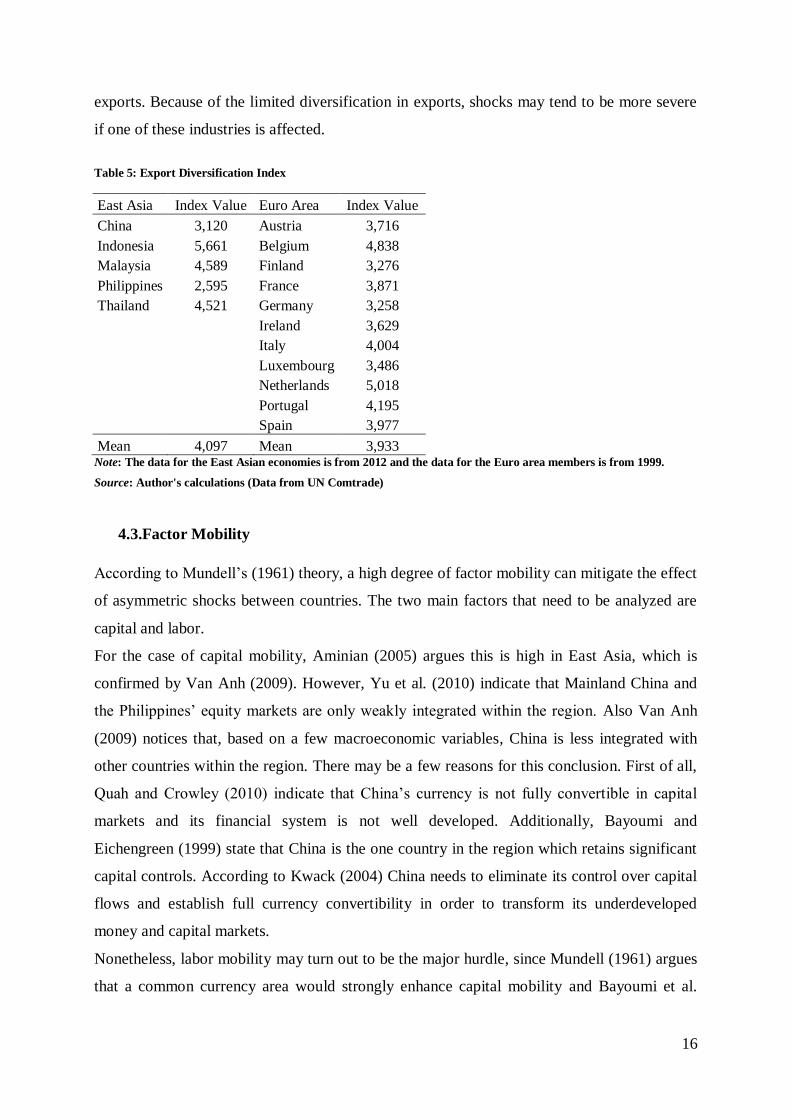
Table 5 shows the results of the export diversification index for the China – ASEAN4
grouping in 2012 and the Euro area members in 1999. The higher the index value, the more
diversified is the export structure.
The mean of each grouping indicates that the East Asian economies’ exports are more widely
diversified than the exports of the Euro area in 1999, although the difference is not large. This
is mainly true for the exports of Indonesia, Malaysia and Thailand, whilst the indices of China
and the Philippines display only limited diversification in their exports. The Philippines
mostly rely on exports of SITC code 7 ‘Machinery and transport equipment’, which accounts
for 60% of their total exports. This category is also a main contributor to China’s exports,
accounting for approximately 47%. Although China has more diversified exports than the
Philippines, it also heavily relies on two other export categories: SITC Code 6 for 16,3% and
SITC Code 8 for 26%. As a result, categories 6, 7 and 8 represent almost 90% of China’s total
4 One should note that an analysis of the second-digit sub-industries may offer more correct insights in the
diversification of exports. For example, if SITC Code 1 accounts for only 10% of country A’s exports, but it has
specialized for 100% in the production of coffee, than a shock may still prove to be severe if the coffee industry
is affected. On the other hand, when SITC Code 1 accounts for 20% of country B’s exports, but it has 100
agricultural products each representing 1% of the total agricultural exports, than country B may prove more
resistant to a product-specific shock.
16
exports. Because of the limited diversification in exports, shocks may tend to be more severe
if one of these industries is affected.
Table 5: Export Diversification Index
East Asia Index Value Euro Area Index Value
China 3,120 Austria 3,716
Indonesia 5,661 Belgium 4,838
Malaysia 4,589 Finland 3,276
Philippines 2,595 France 3,871
Thailand 4,521 Germany 3,258
Ireland 3,629
Italy 4,004
Luxembourg 3,486
Netherlands 5,018
Portugal 4,195
Spain 3,977
Mean 4,097 Mean 3,933 Note: The data for the East Asian economies is from 2012 and the data for the Euro area members is from 1999.
Source: Author's calculations (Data from UN Comtrade)
4.3.Factor Mobility
According to Mundell’s (1961) theory, a high degree of factor mobility can mitigate the effect
of asymmetric shocks between countries. The two main factors that need to be analyzed are
capital and labor.
For the case of capital mobility, Aminian (2005) argues this is high in East Asia, which is
confirmed by Van Anh (2009). However, Yu et al. (2010) indicate that Mainland China and
the Philippines’ equity markets are only weakly integrated within the region. Also Van Anh
(2009) notices that, based on a few macroeconomic variables, China is less integrated with
other countries within the region. There may be a few reasons for this conclusion. First of all,
Quah and Crowley (2010) indicate that China’s currency is not fully convertible in capital
markets and its financial system is not well developed. Additionally, Bayoumi and
Eichengreen (1999) state that China is the one country in the region which retains significant
capital controls. According to Kwack (2004) China needs to eliminate its control over capital
flows and establish full currency convertibility in order to transform its underdeveloped
money and capital markets.
Nonetheless, labor mobility may turn out to be the major hurdle, since Mundell (1961) argues
that a common currency area would strongly enhance capital mobility and Bayoumi et al.
17
(2000) argue that it would facilitate the harmonization of the various financial systems in East
Asia.
With regards to East Asian labor mobility there are contrasting opinions amongst scholars. On
one hand, Bayoumi and Eichengreen (1999) argue that labor mobility is relatively high in
Asia. This statement is mostly supported because of the fast adjustment to asymmetric shocks
in the East Asian region. But, Lee and Koh (2012) indicate that this high labor mobility is
mainly the case for the ASEAN region, thus China excluded.
Since it is hard to obtain comprehensive data for labor mobility, Tables 6 and 7 may provide
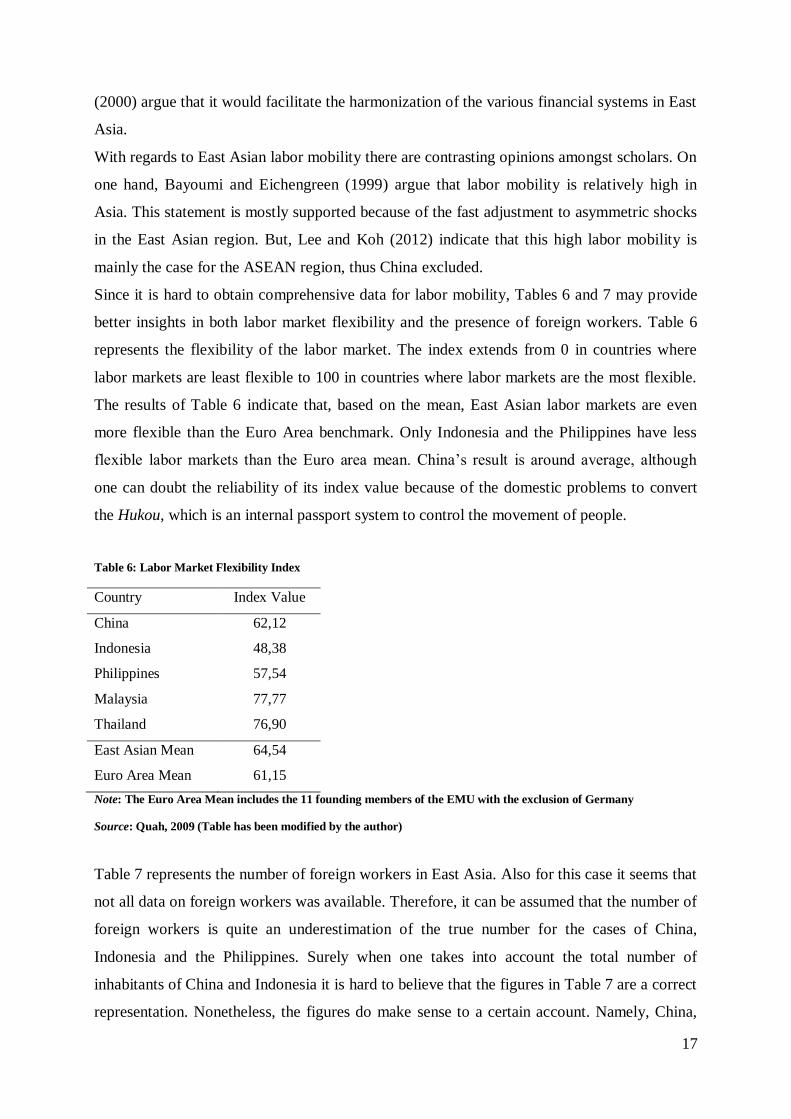
better insights in both labor market flexibility and the presence of foreign workers. Table 6
represents the flexibility of the labor market. The index extends from 0 in countries where
labor markets are least flexible to 100 in countries where labor markets are the most flexible.
The results of Table 6 indicate that, based on the mean, East Asian labor markets are even
more flexible than the Euro Area benchmark. Only Indonesia and the Philippines have less
flexible labor markets than the Euro area mean. China’s result is around average, although
one can doubt the reliability of its index value because of the domestic problems to convert
the Hukou, which is an internal passport system to control the movement of people.
Table 6: Labor Market Flexibility Index
Country Index Value
China 62,12
Indonesia 48,38
Philippines 57,54
Malaysia 77,77
Thailand 76,90
East Asian Mean 64,54
Euro Area Mean 61,15
Note: The Euro Area Mean includes the 11 founding members of the EMU with the exclusion of Germany
Source: Quah, 2009 (Table has been modified by the author)
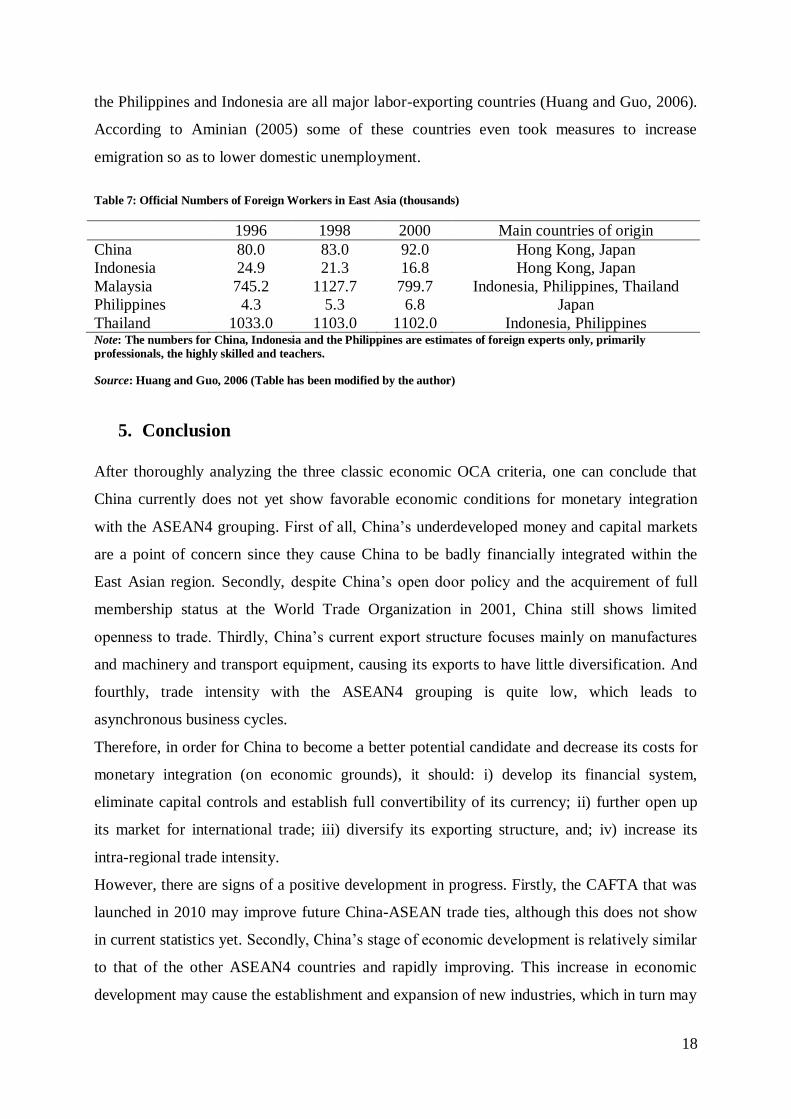
Table 7 represents the number of foreign workers in East Asia. Also for this case it seems that
not all data on foreign workers was available. Therefore, it can be assumed that the number of
foreign workers is quite an underestimation of the true number for the cases of China,
Indonesia and the Philippines. Surely when one takes into account the total number of
inhabitants of China and Indonesia it is hard to believe that the figures in Table 7 are a correct
representation. Nonetheless, the figures do make sense to a certain account. Namely, China,
18
the Philippines and Indonesia are all major labor-exporting countries (Huang and Guo, 2006).
According to Aminian (2005) some of these countries even took measures to increase
emigration so as to lower domestic unemployment.
Table 7: Official Numbers of Foreign Workers in East Asia (thousands)
1996 1998 2000 Main countries of origin
China 80.0 83.0 92.0 Hong Kong, Japan
Indonesia 24.9 21.3 16.8 Hong Kong, Japan
Malaysia 745.2 1127.7 799.7 Indonesia, Philippines, Thailand
Philippines 4.3 5.3 6.8 Japan
Thailand 1033.0 1103.0 1102.0 Indonesia, Philippines Note: The numbers for China, Indonesia and the Philippines are estimates of foreign experts only, primarily
professionals, the highly skilled and teachers.
Source: Huang and Guo, 2006 (Table has been modified by the author)
5. Conclusion
After thoroughly analyzing the three classic economic OCA criteria, one can conclude that
China currently does not yet show favorable economic conditions for monetary integration
with the ASEAN4 grouping. First of all, China’s underdeveloped money and capital markets
are a point of concern since they cause China to be badly financially integrated within the
East Asian region. Secondly, despite China’s open door policy and the acquirement of full
membership status at the World Trade Organization in 2001, China still shows limited
openness to trade. Thirdly, China’s current export structure focuses mainly on manufactures
and machinery and transport equipment, causing its exports to have little diversification. And
fourthly, trade intensity with the ASEAN4 grouping is quite low, which leads to
asynchronous business cycles.
Therefore, in order for China to become a better potential candidate and decrease its costs for
monetary integration (on economic grounds), it should: i) develop its financial system,
eliminate capital controls and establish full convertibility of its currency; ii) further open up
its market for international trade; iii) diversify its exporting structure, and; iv) increase its
intra-regional trade intensity.
However, there are signs of a positive development in progress. Firstly, the CAFTA that was
launched in 2010 may improve future China-ASEAN trade ties, although this does not show
in current statistics yet. Secondly, China’s stage of economic development is relatively similar
to that of the other ASEAN4 countries and rapidly improving. This increase in economic
development may cause the establishment and expansion of new industries, which in turn may
19
lead to more diversified exports. Thirdly, as stated by Mundell (1961) and Bayoumi and
Eichengreen (2000), the establishment of a common currency area may automatically lead to
more capital mobility and the harmonization of diverging financial systems. Therefore,
China’s underdeveloped financial system may not be that much of an issue for now.
This leads to the conclusion that China should not be put off as a potential member for Asian
monetary integration yet. Because of China’s economic size, its huge international currency
reserves and the potential for rapid improvements in China’s macroeconomic conditions for
monetary integration, the feasibility of an East Asian common currency union with China
included can still be a long-run objective.
A few limitations to this paper need to be mentioned. Firstly, this study only focuses on a
limited range of OCA properties, while a discussion of additional properties could give better
insights about China’s potential as an East Asian common currency area member. Secondly,
Mongelli (2002) indicates that in the case of successful currency unions, the political criteria
have often dominated the economic. Therefore, an additional assessment of the political
prerequisites for monetary integration would also be a valuable research contribution. Mainly
the Sino-Japanese rivalry for regional dominance may turn out to play a crucial role for
regional monetary integration.
References
Aminian, N. (2005) Economic integration and prospects for regional monetary cooperation in East Asia.
Structural Change and Economic Dynamics, 16: 91-110.
Bacha, O. I. (2008) A common currency area for ASEAN? Issues and feasibility. Applied Economics, 40: 515-
529.
Baldwin, R. and Wyplosz, C. (2011) The Economics of European Integration (4th ed.) Berkshire, McGraw-Hill
Education.
Bayoumi, T. and Eichengreen, B. (1999) Is Asia an optimum currency area? Can it Become one? Regional,
global and historical perspectives on Asian monetary relations, in “Exchange Rate Policies in Emerging
Asian Countries” (S. Collignon, J. Pisani-Ferry, and Y. Chul Park, Eds.), 347-367. Routledge, London.
Bayoumi, T., Eichengreen, B. and Mauro, P. (2000) On Regional Monetary Arrangements for ASEAN. Journal
of the Japanese and International Economies, 14: 121-148.
De Grauwe, P. (2009) Economics of monetary union (8th ed.) Oxford University Press.
20
Frankell, J.A. and Rose, A.K. (1998) The Endogeneity of the Optimum Currency Area Criteria. Economic
Journal, 108 (441): 1009-1025.
Goto, J. (2002) Economic Preconditions for Monetary Cooperation and Surveillance in East Asia. In Institute for
International Monetary Affairs, Japan Ministry of Finance. Strengthening Financial Cooperation and
Surveillance, 1- 26. Institute for International Monetary Affairs, Tokyo.
Henning, C.R. (2012) Choice and Coercion in East Asian Exchange Rate Regimes. Working paper, Peterson
Institute for International Economics.
Huang, Y. and Guo, F. (2006) Is currency union a feasible option in East Asia? A multivariate VAR approach.
Research in International Business and Finance, 20: 77-94.
Ito, T. (2007) Asian Currency Crisis and the International Monetary Fund, 10 Years Later: Overview. Asian
Economic Policy Review, 2: 16-49.
Katada, S.N. (2012) Regional Financial Cooperation, in “Routledge Handbook of Asian Regionalism” (Beeson,
M. and Stubbs, R., Eds.), 129-137. Routledge, London.
Kenen, P. (1969) The theory of optimum currency areas, in R. Mundell and A. Swoboda, eds., Monetary
Problems of the International Economy, Chicago University Press, Chicago.
Krugman, P. (1993) Lessons of Massachusetts for EMU, in F. Giavazzi and F. Torres, eds., The Transition to
Economic and Monetary Union in Europe, Cambdrige University Press, New York, 241-261.
Lee, G.H.Y. and Azali, M. (2010) The Endogeneity of the Optimum Currency Area Criteria in East Asia.
Economic Modelling, 77(1): 165-170.
Lee, G.H.Y. and Azali, M. (2012) Is East Asia an optimum currency area? Economic Modelling, 29: 87-95.
Lee, G.H.Y. and Koh, S.G.M. (2012) The prospects of a monetary union in East Asia. Economic Modelling, 29:
96-102.
McKinnon, R. (1962) Optimum Currency Areas. American Economic Review, 53: 717-725.
Ministry of Strategy and Finance (2012) ASEAN+3 finance ministers and central bank governors’ meeting
successfully concludes. Press Release, May 3.
Mongelli, F.P. (2002) “New” Views on the Optimum Currency Area Theory: What is EMU telling US?
Preliminary Draft, European Central Bank.
Mundell, R. (1961) A Theory of Optimum Currency Areas. American Economic Review, 51 (4): 657-665.
Mundell, R. (2003) Prospects for an Asian currency area. Journal of Asian Economic, 14: 1-10.
21
Quah, C-H. (2009) The Feasibility of East Asian Monetary Union as an Optimum Currency Area. International
Journal of Asia Pacific Studies, 5 (2): 65-88.
Quah, C-H. and Crowley, P.M. (2010) Monetary Integration in East Asia: A Hierarchical Clustering Approach.
International Finance, 13 (2): 283-309.
Rana, P.B., Chia, W-M. and Jinjarak, Y. (2012) Monetary integration in ASEAN+3: A perception survey of
opinion leaders. Journal of Asian Economics, 23: 1-12.
Sato, K., Zhang, Z. and Allen, D. (2009) The suitability of a monetary union in East Asia: What does the
cointegration approach tell? Mathematics and Computers in Simulation, 79: 2927-2937.
Tavlas, G.S. (1993) The ‘New’ Theory of Optimum Currency Areas. The World Economy, 16 (6): 663-685.
Thomas, N. (2012) China – ASEAN relations. The core of Asian regionalism, in “Routledge Handbook of Asian
Regionalism” (Beeson, M. and Stubbs, R., Eds.), 138-152. Routledge, London.
Van Anh, T.T. (2009) Financial integration in the Asia Pacific region. The economic studies, 26: 57-72.
Wang, Y. (2004) Financial cooperation and integration in East Asia. Journal of Asian Economics, 15: 939-955.
Webber, M. (2001) Finance and the real economy: theoretical implications of the financial crisis in Asia.
Geoforum, 32: 1-13.
Yu, I.W., Fung, K.P. and Tam, C.S. (2010) Assessing financial market integration in Asia – Equity markets.
Journal of Banking & Finance, 34: 2874-2885.