an agent-based model of cellular dynamics and circadian variability in human endotoxemia
TRANSCRIPT
An Agent-Based Model of Cellular Dynamics andCircadian Variability in Human EndotoxemiaTung T. Nguyen1, Steve E. Calvano3, Stephen F. Lowry3, Ioannis P. Androulakis2,3*
1 BioMaPS Institute for Quantitative Biology, Rutgers University, Piscataway, New Jersey, United States of America, 2 Department of Biomedical Engineering, Rutgers
University, Piscataway, New Jersey, United States of America, 3 Department of Surgery, Robert Wood Johnson Medical School, UMDNJ, New Brunswick, New Jersey, United
States of America
Abstract
As cellular variability and circadian rhythmicity play critical roles in immune and inflammatory responses, we present in thisstudy an agent-based model of human endotoxemia to examine the interplay between circadian controls, cellular variabilityand stochastic dynamics of inflammatory cytokines. The model is qualitatively validated by its ability to reproduce circadiandynamics of inflammatory mediators and critical inflammatory responses after endotoxin administration in vivo. Novelcomputational concepts are proposed to characterize the cellular variability and synchronization of inflammatory cytokines ina population of heterogeneous leukocytes. Our results suggest that there is a decrease in cell-to-cell variability of inflammatorycytokines while their synchronization is increased after endotoxin challenge. Model parameters that are responsible for IkBproduction stimulated by NFkB activation and for the production of anti-inflammatory cytokines have large impacts on systembehaviors. Additionally, examining time-dependent systemic responses revealed that the system is least vulnerable toendotoxin in the early morning and most vulnerable around midnight. Although much remains to be explored, proposedcomputational concepts and the model we have pioneered will provide important insights for future investigations andextensions, especially for single-cell studies to discover how cellular variability contributes to clinical implications.
Citation: Nguyen TT, Calvano SE, Lowry SF, Androulakis IP (2013) An Agent-Based Model of Cellular Dynamics and Circadian Variability in HumanEndotoxemia. PLoS ONE 8(1): e55550. doi:10.1371/journal.pone.0055550
Editor: Nikolaos Frangogiannis, Albert Einstein College of Medicine, United States of America
Received July 22, 2012; Accepted December 30, 2012; Published January 30, 2013
Copyright: � 2013 Nguyen et al. This is an open-access article distributed under the terms of the Creative Commons Attribution License, which permitsunrestricted use, distribution, and reproduction in any medium, provided the original author and source are credited.
Funding: TTN and IPA acknowledge support from National Institutes of Health (NIH) GM082974. SEC and SFL are supported, in part, from NIH GM34695. Thefunders had no role in study design, data collection and analysis, decision to publish, or preparation of the manuscript.
Competing Interests: Co-author Ioannis P Androulakis is a PLOS ONE Editorial Board member. This does not alter the authors’ adherence to all the PLOS ONEpolicies on sharing data and materials.
* E-mail: [email protected]
Introduction
Systemic inflammation is evoked by many stimuli, including
infection, trauma, invasive surgery and biological stressors in
general; also, it is typically observed in critical illness [1]. While the
host inflammatory response is essential to resolve an infection or
repair damage to restore homeostasis, it also plays a central
pathogenic role in a wide spectrum of diseases [2]. Under normal
circumstances, the inflammatory response is activated, initializes a
repair process and then abates [3]. However when anti-
inflammatory processes fail, an amplified pro-inflammatory signal
can turn what is normally a beneficial reparative process into a
detrimental physiological state of severe, uncontrolled systemic
inflammation [4]. Therefore, to gain a better understanding of the
molecular mechanisms and physiological significance associated
with inflammatory responses, alternative clinically relevant models
have been proposed, including the human endotoxemia model. In
this model, an intravenous administration of E.coli endotoxin
(lipopolysaccharide) is given to healthy human subjects [5,6].
Lipopolysaccharide (LPS), a component of the outer cell
membrane of gram-negative bacteria [7], induces its injurious
effects by a non-cytotoxic interaction with CD14-bearing inflam-
matory cells, such as macrophage-monocytes, circulating neutro-
phils and lung epithelial cells. These effector cells are activated
through a family of Toll-like receptors (TLR) and subsequently
release a network of inflammatory products. While we do not
argue that the human endotoxin challenge model can precisely
replicate an acute infectious or sepsis condition, we believe that
human endotoxin challenge does serve as a useful model of TLR4
agonist-induced systemic inflammation while at the same time
providing a reproducible experimental platform.
The inflammatory response is a complex non-linear process
involving a multi-scale cascade of events mediated by a large array
of immune cells and inflammatory cytokines [8]. At the cellular
level, innate immune cells are activated resulting in the production
and release of pro-inflammatory and anti-inflammatory cytokines
to the systemic circulation for cell communication [9,10]. Anti-
inflammatory cytokines counteract the effects of pro-inflammatory
cytokines and the relative concentration or balance between them
strongly affects to the degree and extent of the response [11,12]. At
a higher level, the hypothalamic-pituitary-adrenal (HPA) axis and
the sympathetic nervous system (SNS) produces stress hormones
[13] whose pattern of release follow broad circadian rhythmicity
which plays critical roles in immune responses [14,15,16,17]. This
rhythmicity is regulated by the 24 hour light/dark cycle, exerting
diurnal effects on numerous inflammatory cytokines [18,19]. The
complexity of the overall response has encouraged the develop-
ment of mathematical and computational models as a means of
exploring the connections between multiple components.
Various modeling approaches have been proposed, but
generally they can be classified into two main categories:
equation-based and agent-based modeling [20,21,22]. In previous
PLOS ONE | www.plosone.org 1 January 2013 | Volume 8 | Issue 1 | e55550
studies, we developed a mathematical model of the human
endotoxemia using equation-based modeling technique with
ordinary differential equations (ODE) [23,24,25]. However,
deterministic ODE models assume homogeneity and perfect
mixing within compartments, while ignoring spatial effects [21].
Given that stochasticity and heterogeneity have profound effects
on the function of biological systems [26,27,28], agent-based
modeling (ABM) – an alternative, more intuitive, approach has
been explored. ABM is an object-oriented, rule-based, and discrete
modeling method [29,30] where interactions between agents (cells,
molecules) are nonlinear, stochastic, spatial, and are described by
asynchronous movements through multiple compartments. The
usefulness and applicability of ABMs vary but some have been
applied to immunological problems and findings derived from
these models generated a lot of insights into the interactions and
dynamics at the cellular level in immune responses. For example,
Jenkins and colleagues [31] investigated B-T cell interactions in the
absence of directed cell chemotaxis during the first 50 hr of a
primary immune response to an antigen; Gary An and coworkers
have pioneered many ABMs to evaluate the dynamics of the innate
immune response, the efficacy of proposed interventions for SIRS/
multiple organ failure (MOF) [32,33], and the dynamics of the
TLR4 signal transduction cascade to study LPS preconditioning and
dose-dependent effects [34,35]. Furthermore, they also developed a
basic immune simulator (BIS) to qualitatively examine the interac-
tions between innate and adaptive interactions of the immune
responses to a viral infection [36]. In addition, there are a variety of
successful agent-based simulators that have been constructed as
frameworks for immunology/disease understanding and exploration
e.g. IMMSIM [37,38], SIMMUNE [39], CyCells [40].
In this study, we developed an ABM to investigate the cellular
variability through the interactions and dynamics of inflammatory
cytokines in acute inflammatory responses following endotoxin
administration. The model naturally incorporates key biological
features (e.g. stochasticity, heterogeneity, and discreteness) and
physicochemical properties of biological molecules. While in
previous studies [23,24,25] we focused on the possibility of
modeling the transcriptional dynamics of cellular responses, we
here attempt to capture stochastic variation in the transcriptional
process, one of the key factors leading to phenotypic variation in
addition to genetic and environmental variability [41,42,43,44].
Because stochasticity is an inherent property of agent interactions,
non-genetic cell-to-cell variability originated from stochastic
variance is captured by our proposed model. Therefore, elucidat-
ing the relationship between the behaviors measured at the single-
cell level and those measured in a population of cells is among the
aims of our study in order to provide insight into the host
inflammatory response under different external stimuli.
We first construct a homeostatic model of components involved
in the response to human endotoxemia using the agent-based
approach. Novel heuristics are proposed regarding parameter
tuning with process trending analysis techniques and time-scale
estimation by mapping in silico system behaviors to in vivo
transcriptional responses. Inevitably there is a level of abstraction
in the simulation when representing biological events using the
indirect response modeling technique [45] and thus the model is
validated through its ability to capture in vivo transcriptional
responses and reproduce circadian rhythms. A critical contribu-
tion of our work is the assessment of cellular variability derived
from stochastic variation in biological events, especially in
transcriptional processes. By proposing a novel hypothetical
measurement Fvar derived from the balance distribution of pro-
and anti-inflammatory mediators in the population of leukocytes,
we extract information content conveyed by cell-to-cell variability.
Sensitivity analysis is also performed to explore which model
parameters greatly influence system behaviors. All in all, the main
aim of this study is establishing a multi-scale modeling framework
capable of simulating main characteristics of critical components
in human endotoxemia to examine (i) the balance and distribution
of inflammatory cytokines in a population of heterogeneous
leukocytes and (ii) the interplay between circadian controls and
endotoxin treatments through a novel quantity based on the cell-
to-cell variability.
Model Construction
Assumptions and biological evidenceThe model is principally constructed based on our previous
studies [23,24,25]. First of all, high-dimensional transcriptional
profiling data from human blood leukocytes following LPS
administration are decomposed into four significant expression
patterns. These patterns capture the essence of three inflammatory
phases including a pro-inflammatory response (‘early-up’ &
‘middle-up’ expression pattern, P), a counter-regulatory/anti-
inflammatory response (‘late-up’ expression pattern, A), and a
dysregulation in leukocyte bioenergetics (‘down’ pattern, E) [46]
(see Materials and methods). They define the basic elements (state
variables) characterizing how leukocytes respond to endotoxemia.
A number of assumptions have been made to construct the
model, namely: (1) peripheral blood leukocytes can be approximat-
ed as a community of leukocytes whose main behavior is
characterized by asynchronous and stochastic activities without
intra-cellular spatial localization; (2) the dynamics of the pro-
inflammatory response, the counter-regulatory response, and the
dysregulation in leukocyte bioenergetics can be characterized by
patterns of corresponding pro-inflammatory cytokines, anti-inflam-
matory cytokines, and bio-energetic proteins; (3) different types of
pro-inflammatory cytokines, anti-inflammatory cytokines, and bio-
energetic proteins are represented by corresponding average
delegators as P, A, and E, respectively, whose main behaviors are
associated with asynchronous and stochastic activities. Lastly, it has
been observed that after LPS challenge, many pro-inflammatory
cytokines exhibit similar dynamics as is observed in their
corresponding mRNA temporal profiles e.g. TNFa, IL6, IL8, etc
[47]. IL10, an anti-inflammatory cytokine, shows a slight difference
between its mRNA and protein temporal profiles. While mRNA
levels of IL10 dropped during the first hour post-LPS and its protein
levels rose very modestly, both profiles still exhibit up-regulation
overall. Consequently, in this context, we hypothesize that the
common dynamics of pro- and anti-inflammatory cytokines can be
characterized by their average mRNA expression profiles.
Such expression dynamics of inflammatory cytokines are
assumed to be mainly regulated by the activation of relevant
transcription factors (TFs). Nuclear factor-kappa B (NFkB) was
selected as the representative signaling controller underpinning the
manifestation of transcriptional responses due to its essential role
in the immune system [48,49] and extensive prior computational
analyses [50]. Furthermore, NFkB activity is primarily modulated
by the activity of its kinase (IKK) and its inhibitor (IkB) through
the Toll-like receptor (TLR) signaling pathway – a pivotal pathway
subjected to crosstalk from other signals and pathways (e.g. JAK-
STAT [51,52]) [53,54]. Such regulation can be characterized by
the ubiquitous paradigm of a two-feedback mechanism: a positive-
and a negative- feedback [54,55,56,57]. Therefore, we hypothesize
that the dynamics of inflammatory cytokines are mainly regulated
by intra-cellular signaling cascades and transcription factors whose
activities can be characterized by the paradigm of a two-feedback
regulatory mechanism.
Agent-Based Model of Human Endotoxemia
PLOS ONE | www.plosone.org 2 January 2013 | Volume 8 | Issue 1 | e55550
At the systemic level, pro-inflammatory cytokines released from
the innate immune system induce signals activating the hypotha-
lamic-pituitary adrenal (HPA) axis, thus controlling the secretion
of glucocorticoids (cortisol in primates or corticosterone in rodents)
[58,59]. Of particular interest is the hormone melatonin given its
role as a mediator in the crosstalk between the suprachiasmatic
nucleus (SCN) and the immune system [60,61]. The correspond-
ing hormone levels exhibit a circadian pattern with strong effects
on the production of inflammatory cytokines [18,19]. While
cortisol reaches its peak in the early morning [62], melatonin’s
peak production occurs late at night and remains at a low level for
the rest of the day [61,63]. Therefore, in this model cortisol (F) is
hypothesized to be mainly controlled by the hypothalamus (HPT)
while melatonin (M) is regulated by the SCN. The representation
of the proposed model, including all components and associated
interactions, is shown in Figure 1. This describes how the system
is controlled and provides an intuitive illustration of the entire
model behavior. A snapshot of the implemented model is also
presented. Simulated molecular types and their corresponding
characteristics are shown in Table 1. Details of model compo-
nents, rules, and parameters are discussed as follows.
Agent rules and behaviorsAgents are simulated objects (cells, molecules) that follow
specific instructions on how they behave and interact with other
agents within or between compartments. The rule system is listed
in Table 2 and described briefly as follows. When LPS is
recognized by its receptor TLR-4, a signal transduction cascade
triggers downstream intracellular signalling modules to ultimately
activate the transcription of inflammatory genes. Such transcrip-
tional processes are assumed to be mainly regulated by transcrip-
tion factors for which NFkB serves as a proxy whose activities,
including activities of IKK and IkB in the NFkB-signaling module,
have critical roles in the inflammatory response [64,65]. Following
the activation of NFkB through the phosphorylation of the
inhibitor protein IkB by IKK, NFkB is translocated into the
nucleus to activate the transcriptional processes resulting in the
production of pro-inflammatory cytokines (e.g. TNFa) and IkB
[66,67,68]. After released to the systemic circulation, these pro-
inflammatory cytokines may bind to their corresponding receptors
on the membrane of leukocytes and either further activate the
NKkB-signaling module [67,69] or lead to production of
additional TLR-4 molecules [70,71]. On the other hand, they
also act as hormone-like signals that converge to activate the HPA
axis to stimulate production of glucocorticoids [58,59] or suppress
nocturnal melatonin production [72,73,74]. While glucocorticoids
have critical roles in the anti-inflammatory arm of the host defense
system by inducing the expression of anti-inflammatory proteins
such as IkB and anti-inflammatory cytokines (e.g. IL10) [58,75],
they also act as potential modulators that enhance the production
of melatonin [73,76,77]. Melatonin, in turn, can modulate the
production of pro-inflammatory cytokines [18,61]. In addition, to
establish the relationship between the inflammatory response and
the cellular energetic state, we assumed that there are a number of
bio-energetic molecules (E) in each cell which represent the overall
cellular energetic status. If the number of bio-energetic molecules
is positive, the cell can be able to produce new molecules; and if it
does, the default production of bio-energetic molecules is
inhibited. Since anti-inflammatory cytokines are responsible for
the counter-regulation of the pro-inflammatory responses, it is
hypothesized that they have a role in increasing the amount of bio-
energetic proteins.
In our simulations, there are four types of compartments: the
plasma, the brain, the cell cytoplasm, and the nucleus. The plasma
contains the brain compartment and all simulated cells (50 in this
study); each cell contains a cytoplasm and a nucleus. All agents
move in a random fashion following the ‘random walk’ model on a
2-dimensional grid (see Materials and methods). The plasma and
each cell have their own simulating grid while the brain and nucleus
directly occupy a region in the plasma and corresponding cell
simulating grid respectively. There is no special spatial arrangement
for agents. However, there are a number of restrictions on which
compartment a molecule can be in. Specifically, LPS can only move
in the plasma compartment; LPSR, IKK, NFkB.IkB, E, and GR
are only present in the cytoplasm; NFkB, IkB, and FR can be in
both the cytoplasm and the nucleus; M and A cannot be in the brain
compartment and F cannot be present in the nucleus while P can
move between any compartment. TLR4 molecules after produced
are transferred to the cell membrane i.e. when they reach the
boundary of the corresponding cell simulating grid; they are fixed
there until they are destroyed.
Molecules are translocated between compartments based on an
import- and export procedure. In the plasma compartment, if a
molecule has the same position with a cell or reach the region of the
brain, the system will check to determine whether it is imported or
not. Except LPS, other molecule types are imported to the brain
and cells with the approximate probability of LPS-binding TLR4 to
simulate the probability of the binding to receptors. This is
approximately the initial number of TLR4 molecules in a cell
divided by the number of positions on the boundary of the cell
simulating grid, which is about 30%. For LPS molecules, a random
position on the boundary of the cell simulating grid is assigned; if it is
overlapped with the position of some TLR4 molecule, it will be
imported. If imported to a cell, the molecule status is changed to
‘active’. In the cytoplasm compartment, active molecules are simply
translocated to the nucleus compartment when they reach the
nucleus regions in the corresponding simulating grid. On the other
hand, when a molecule reaches the boundary of a compartment, it
is exported to the outer compartment if it is not restricted (see
Materials S1 for details).
Each agent moves in a random direction for a random number
of times with a random delay time for each movement. However,
two interactive molecules X1, X2 with current positions
PX1x , PX1
y
n o, PX2
x , PX2y
n orespectively will move towards the posi-
tion where an interaction may occur if their distance is less than a
threshold d X1,X2ð Þ~ max PX1x {PX2
x
�� ��, PX1y {PX2
y
��� ���n oƒt ,t~1.
If two molecules have the same position on the simulating grid of the
corresponding compartment, they will interact (activation, inhibi-
tion, or degradation) following the rules showed in Figure 1a and
Table 2 e.g. A and P with the same status in any compartment,
LPSR and IKK, activated IKK and NFkB.IkB, F and GR in
cytoplasm, and NFkB and IkB in cytoplasm or nucleus. The rule is
also applied to the movement of molecules when adjacent to cells in
the plasma to increase the probability of entering a cell for molecules
in systemic circulation. Although there is no biological assumption
in cell and molecule movements, these movement rules come from
actual experiences in model implementation to increase the
probability of agent interactions and the model performance.
Finally, circadian controls are introduced in an attempt to
simulate the daily patterns of stress hormones [61,62,63]. In our
simulation, these rhythms are produced using sine waves. At every
tick during the time from the onset of the production to the
corresponding peak in a day (e.g. 3:00AM to 9:00AM for cortisol
and 10:00PM to 2:00AM for melatonin), a constant number of F
and M units (cfm) are added to the system where the probability for
each adding such a unit is
Agent-Based Model of Human Endotoxemia
PLOS ONE | www.plosone.org 3 January 2013 | Volume 8 | Issue 1 | e55550
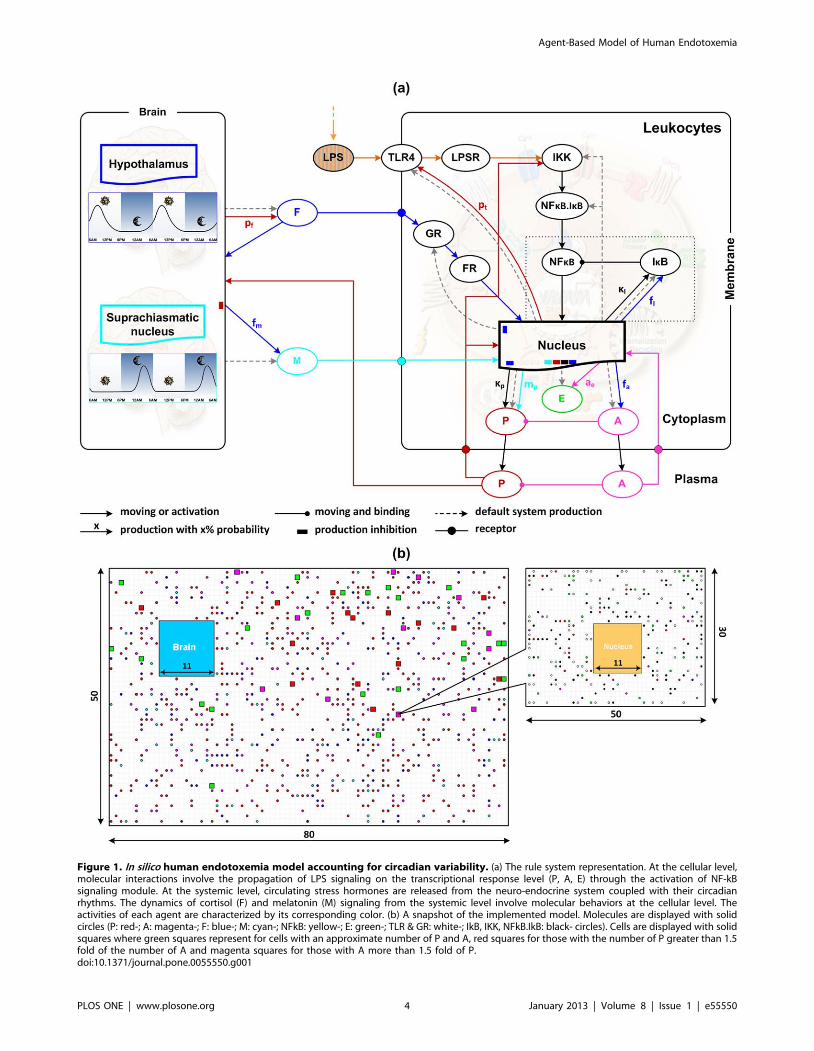
Figure 1. In silico human endotoxemia model accounting for circadian variability. (a) The rule system representation. At the cellular level,molecular interactions involve the propagation of LPS signaling on the transcriptional response level (P, A, E) through the activation of NF-kBsignaling module. At the systemic level, circulating stress hormones are released from the neuro-endocrine system coupled with their circadianrhythms. The dynamics of cortisol (F) and melatonin (M) signaling from the systemic level involve molecular behaviors at the cellular level. Theactivities of each agent are characterized by its corresponding color. (b) A snapshot of the implemented model. Molecules are displayed with solidcircles (P: red-; A: magenta-; F: blue-; M: cyan-; NFkB: yellow-; E: green-; TLR & GR: white-; IkB, IKK, NFkB.IkB: black- circles). Cells are displayed with solidsquares where green squares represent for cells with an approximate number of P and A, red squares for those with the number of P greater than 1.5fold of the number of A and magenta squares for those with A more than 1.5 fold of P.doi:10.1371/journal.pone.0055550.g001
Agent-Based Model of Human Endotoxemia
PLOS ONE | www.plosone.org 4 January 2013 | Volume 8 | Issue 1 | e55550
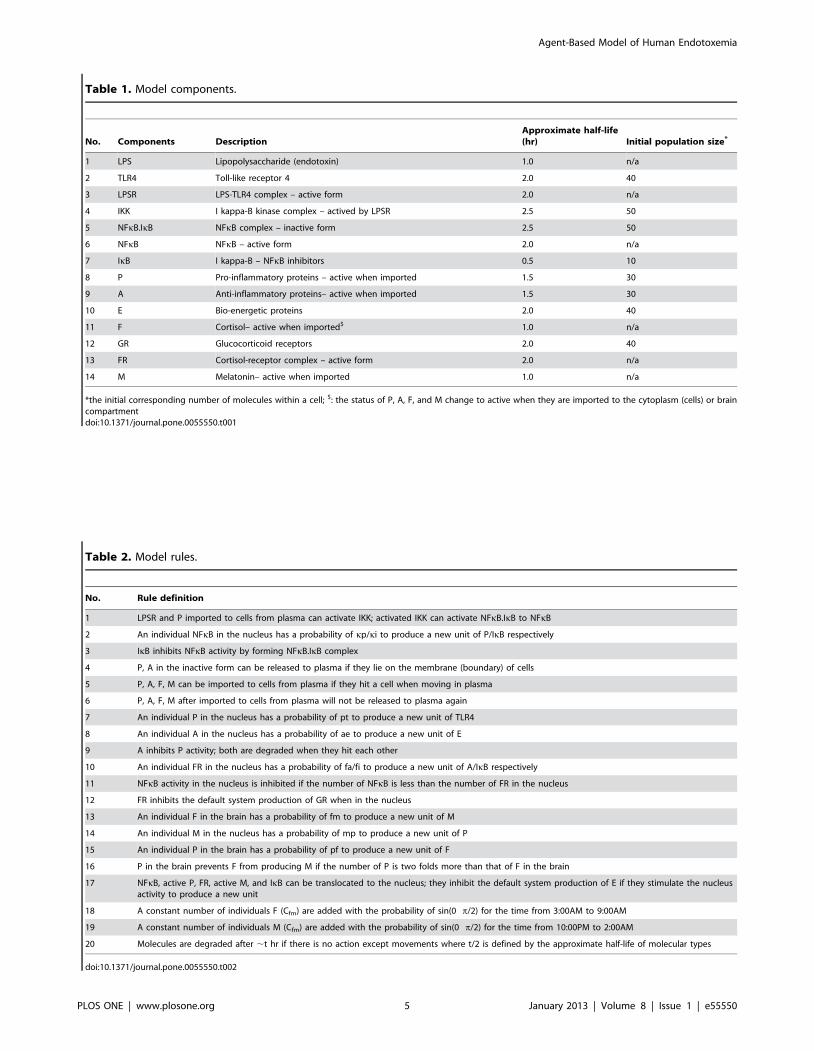
Table 1. Model components.
No. Components DescriptionApproximate half-life(hr) Initial population size*
1 LPS Lipopolysaccharide (endotoxin) 1.0 n/a
2 TLR4 Toll-like receptor 4 2.0 40
3 LPSR LPS-TLR4 complex – active form 2.0 n/a
4 IKK I kappa-B kinase complex – actived by LPSR 2.5 50
5 NFkB.IkB NFkB complex – inactive form 2.5 50
6 NFkB NFkB – active form 2.0 n/a
7 IkB I kappa-B – NFkB inhibitors 0.5 10
8 P Pro-inflammatory proteins – active when imported 1.5 30
9 A Anti-inflammatory proteins– active when imported 1.5 30
10 E Bio-energetic proteins 2.0 40
11 F Cortisol– active when imported$ 1.0 n/a
12 GR Glucocorticoid receptors 2.0 40
13 FR Cortisol-receptor complex – active form 2.0 n/a
14 M Melatonin– active when imported 1.0 n/a
*the initial corresponding number of molecules within a cell; $: the status of P, A, F, and M change to active when they are imported to the cytoplasm (cells) or braincompartmentdoi:10.1371/journal.pone.0055550.t001
Table 2. Model rules.
No. Rule definition
1 LPSR and P imported to cells from plasma can activate IKK; activated IKK can activate NFkB.IkB to NFkB
2 An individual NFkB in the nucleus has a probability of kp/ki to produce a new unit of P/IkB respectively
3 IkB inhibits NFkB activity by forming NFkB.IkB complex
4 P, A in the inactive form can be released to plasma if they lie on the membrane (boundary) of cells
5 P, A, F, M can be imported to cells from plasma if they hit a cell when moving in plasma
6 P, A, F, M after imported to cells from plasma will not be released to plasma again
7 An individual P in the nucleus has a probability of pt to produce a new unit of TLR4
8 An individual A in the nucleus has a probability of ae to produce a new unit of E
9 A inhibits P activity; both are degraded when they hit each other
10 An individual FR in the nucleus has a probability of fa/fi to produce a new unit of A/IkB respectively
11 NFkB activity in the nucleus is inhibited if the number of NFkB is less than the number of FR in the nucleus
12 FR inhibits the default system production of GR when in the nucleus
13 An individual F in the brain has a probability of fm to produce a new unit of M
14 An individual M in the nucleus has a probability of mp to produce a new unit of P
15 An individual P in the brain has a probability of pf to produce a new unit of F
16 P in the brain prevents F from producing M if the number of P is two folds more than that of F in the brain
17 NFkB, active P, FR, active M, and IkB can be translocated to the nucleus; they inhibit the default system production of E if they stimulate the nucleusactivity to produce a new unit
18 A constant number of individuals F (Cfm) are added with the probability of sin(0 p/2) for the time from 3:00AM to 9:00AM
19 A constant number of individuals M (Cfm) are added with the probability of sin(0 p/2) for the time from 10:00PM to 2:00AM
20 Molecules are degraded after ,t hr if there is no action except movements where t/2 is defined by the approximate half-life of molecular types
doi:10.1371/journal.pone.0055550.t002
Agent-Based Model of Human Endotoxemia
PLOS ONE | www.plosone.org 5 January 2013 | Volume 8 | Issue 1 | e55550
tF ~Tcur mod Ntpd ; tM~ tF z2|Ntph
� �mod Ntpd ;
Ntpd~24|NtphprobF ~ sin (tF {3|Ntph)|2 p
Ntpd
� �;
probM~ sin tM|3 p
Ntpd
� �
Simulated time is scaled from ‘ticks’, which is the simulation
counter, to hours. Tcur is the current tick of the simulation counter
which expresses the current simulated time. Ntph is the number of
ticks corresponding to one simulated hour. cfm is selected to have
the peaks of F and M approximately triple their corresponding
homeostatic levels (cfm = 3 in this study). These activities are
assumed to be controlled and taken place in the brain
compartment since they are all associated with behaviors of the
hypothalamus. Definition of the time-scale and the homeostatic
system will be discussed in the following section.
Model parametersModel parameters are classified into two categories: default- and
production- parameters. Default parameters are those related to
system settings and physicochemical properties of cells and
molecules, such as compartment extensions, simulation scales,
molecule lifetimes, or initial populations. For simplicity, in this
study all compartments are simulated with unitless rectangular
grids. The plasma is represented by an 80 6 50 rectangular
unitless grid and the cell with 40 6 30. The cell nucleus is about
10% of the total cell volume and thus it occupies a region of about
11 6 11 on the cell simulating grid. Similarly, the brain
compartment is also simulated by a region of 11 6 11 on the
plasma simulating grid (Figure 1b).
Since the relationship between the system response time and the
system production rate is still unclear, we thus define two scales (an
approximate number of simulated steps for an hour) in this
simulation: (1) the life-scale Lð Þ that characterizes for the lifetime
of molecules and the system production rate, and (2) the time-scale
Ntph
� �that characterizes for circadian controls and system
responses. The time-scale is initially equal to the life-scale but
adjusted later to match in silico system responses with in vivo
transcriptional responses. In order to identify the life-scale, the
system is set to have no activity except the default system production
and the protein degradation; thus the number of units of each
molecule type in a cell should be balanced over the time. Given the
default production rate is R%, after an hour a cell will produce R|Lnew units for a molecule type and thus there must be R|L units of
this molecule type degraded to keep the cell at homeostasis (R = 50%
in this study). Consequently, if a molecule has a certain lifetime, its
average lifetime will be approximately to its number of units divided
byR|L. In other words, the initial number of units of a molecule
type is set equally to its average lifetime multiplied by R|L.
In this simulation, the average lifetime of a unit is double its
approximate half-life which is listed in Table 1. Specifically, IkB
half-life is about 0.5 hour and the NFkB.IkB complex half-life is
five-fold more than that of IkB [65,78]; inflammatory cytokines
and stress hormones have the average half-life about 1 hour
[79,80]; the largest protein IKK is assumed to have a half-life
equal to that of the NFkB.IkB complex; and the rest are assumed
to have the average half-life about 2 hours. Let f be the initial
number of units of IkB in a cell, and the initial population of
NFkB.IkB, IKK, P, A, E, TLR4, and GR in a cell will be (5f, 5f,
3f, 3f, 4f, 4f, 4f) respectively. Since intracellular protein occupies
15–35% of cell volume [81], we thus assume that the number of
molecules in a homeostatic cell would be about 25% of the cell
volume, which is approximately 300 molecules. Consequently, the
total initial number of units (molecules) in a cell under the
assumption of the homeostatic system will be 29f, resulting in
f ~ 30029
&10 units. The estimated initial population size of each
molecule type in a cell is given in Table 1. The life-scale L, which
is the number of simulated steps per hour or the number of
simulated steps over the lifetime of an IkB, is therefore equal to f/
R or 20 ticks per hour. Additionally, the initial number of units for
P (or A) in the plasma is initialized by 10% of all P units in all cells
in the system. The default production of F and M is set to be the
activities of the brain compartment (see Figure S1 for the
programming architecture and initial parameter values).
Production parameters are the probabilities of producing new
molecules when some molecule type is involved in the transcrip-
tional process, characterizing by its present in the nucleus or the
brain compartment in this simulation. In order to justify these
parameters, we made use of the hypothesis that in a homeostatic
system there is a balance between protein synthesis and protein
degradation [82]. Thus, without any external stimulation and
circadian influences, production parameters need to be adjusted so
that the number of units of each molecule type in the system does
not change significantly over the time (Table 3). Techniques from
process trending analysis are utilized to obtain the set of adjusted
parameters whose values remain unchanged for subsequently
added mechanisms e.g. circadian rhythms, endotoxin treatments
[83,84] (see Materials and methods). The current configuration of
the homeostatic system, including all agents and their properties, is
saved for further experiments.
Results and Discussion
Qualitative assessment of model behaviors withexperimental observations
Circadian rhythms play an important role in many physiological
and metabolic processes in mammals. It is well established that
there is a bidirectional communication between circadian controls
and the immune system and that glucocorticoids and melatonin
are important hormones with strong circadian expression patterns
and critical roles in mediating cytokine production [60,61,62].
Since melatonin and cortisol are associated with the production of
pro-inflammatory and anti-inflammatory cytokines respectively,
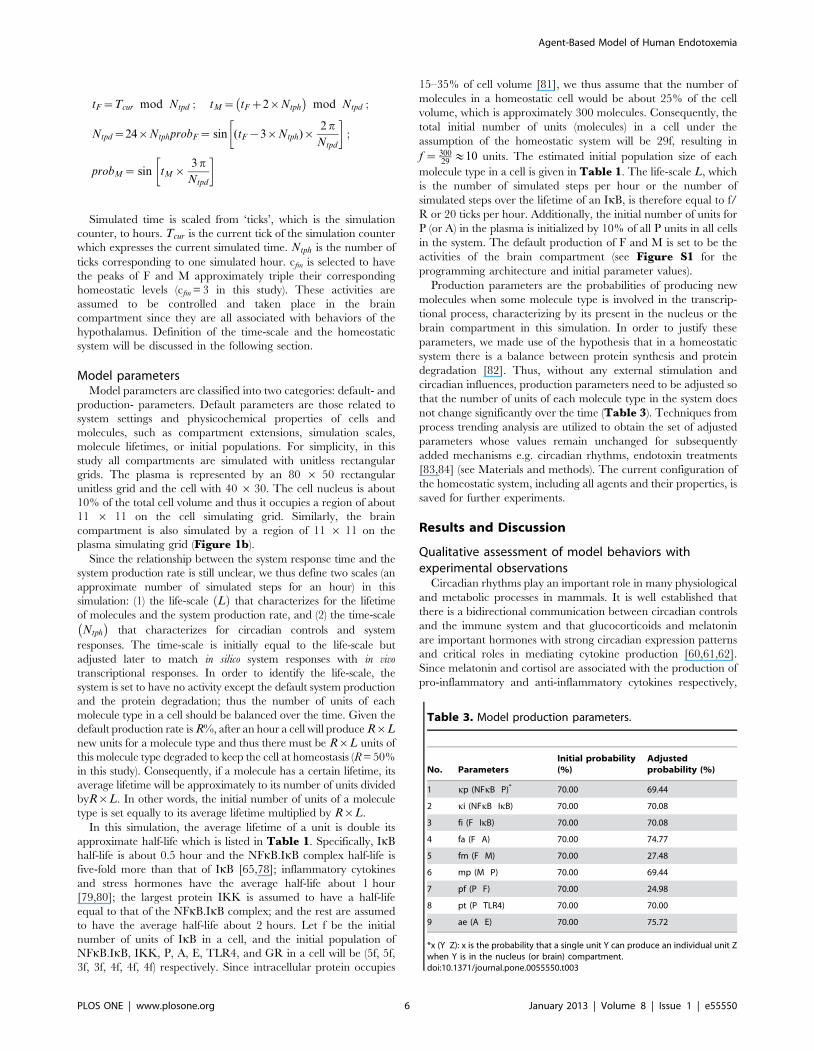
Table 3. Model production parameters.
No. ParametersInitial probability(%)
Adjustedprobability (%)
1 kp (NFkB P)* 70.00 69.44
2 ki (NFkB IkB) 70.00 70.08
3 fi (F IkB) 70.00 70.08
4 fa (F A) 70.00 74.77
5 fm (F M) 70.00 27.48
6 mp (M P) 70.00 69.44
7 pf (P F) 70.00 24.98
8 pt (P TLR4) 70.00 70.00
9 ae (A E) 70.00 75.72
*x (Y Z): x is the probability that a single unit Y can produce an individual unit Zwhen Y is in the nucleus (or brain) compartment.doi:10.1371/journal.pone.0055550.t003
Agent-Based Model of Human Endotoxemia
PLOS ONE | www.plosone.org 6 January 2013 | Volume 8 | Issue 1 | e55550
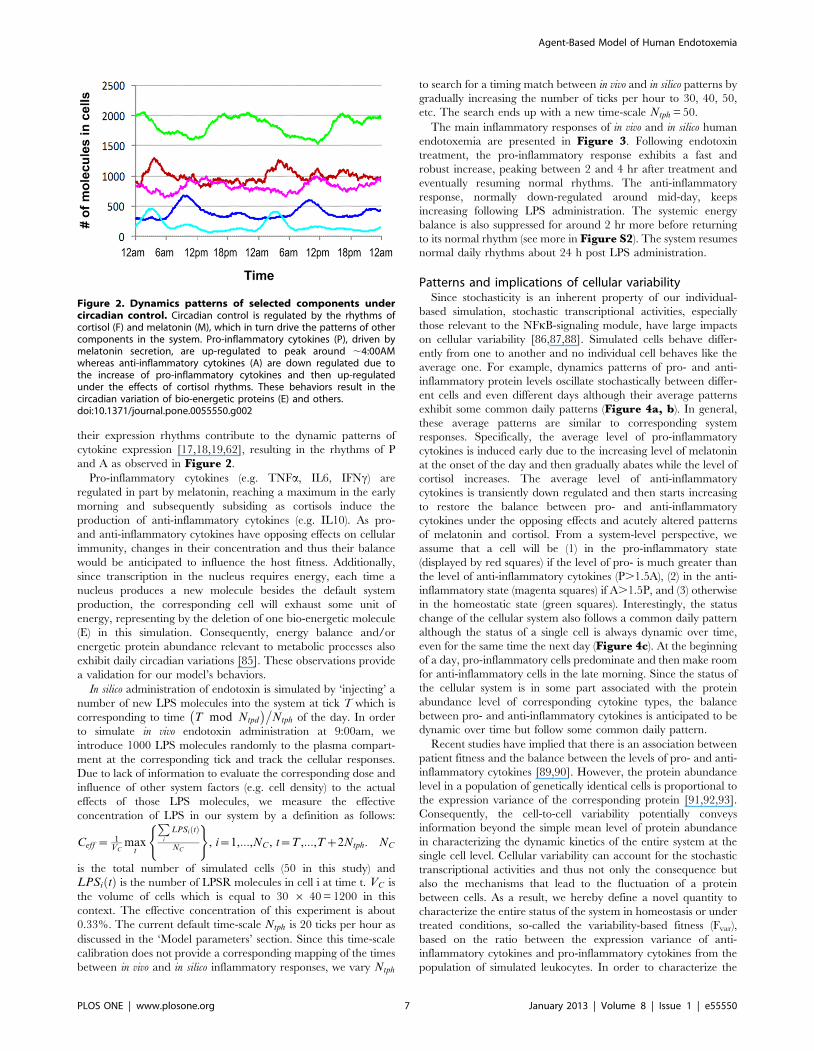
their expression rhythms contribute to the dynamic patterns of
cytokine expression [17,18,19,62], resulting in the rhythms of P
and A as observed in Figure 2.
Pro-inflammatory cytokines (e.g. TNFa, IL6, IFNc) are
regulated in part by melatonin, reaching a maximum in the early
morning and subsequently subsiding as cortisols induce the
production of anti-inflammatory cytokines (e.g. IL10). As pro-
and anti-inflammatory cytokines have opposing effects on cellular
immunity, changes in their concentration and thus their balance
would be anticipated to influence the host fitness. Additionally,
since transcription in the nucleus requires energy, each time a
nucleus produces a new molecule besides the default system
production, the corresponding cell will exhaust some unit of
energy, representing by the deletion of one bio-energetic molecule
(E) in this simulation. Consequently, energy balance and/or
energetic protein abundance relevant to metabolic processes also
exhibit daily circadian variations [85]. These observations provide
a validation for our model’s behaviors.
In silico administration of endotoxin is simulated by ‘injecting’ a
number of new LPS molecules into the system at tick T which is
corresponding to time T mod Ntpd
� ��Ntph of the day. In order
to simulate in vivo endotoxin administration at 9:00am, we
introduce 1000 LPS molecules randomly to the plasma compart-
ment at the corresponding tick and track the cellular responses.
Due to lack of information to evaluate the corresponding dose and
influence of other system factors (e.g. cell density) to the actual
effects of those LPS molecules, we measure the effective
concentration of LPS in our system by a definition as follows:
Ceff ~1
VCmax
t
Pi
LPSi tð Þ
NC
( ), i~1,:::,NC , t~T ,:::,Tz2Ntph. NC
is the total number of simulated cells (50 in this study) and
LPSi tð Þ is the number of LPSR molecules in cell i at time t. VC is
the volume of cells which is equal to 30 6 40 = 1200 in this
context. The effective concentration of this experiment is about
0.33%. The current default time-scale Ntph is 20 ticks per hour as
discussed in the ‘Model parameters’ section. Since this time-scale
calibration does not provide a corresponding mapping of the times
between in vivo and in silico inflammatory responses, we vary Ntph
to search for a timing match between in vivo and in silico patterns by
gradually increasing the number of ticks per hour to 30, 40, 50,
etc. The search ends up with a new time-scale Ntph = 50.
The main inflammatory responses of in vivo and in silico human
endotoxemia are presented in Figure 3. Following endotoxin
treatment, the pro-inflammatory response exhibits a fast and
robust increase, peaking between 2 and 4 hr after treatment and
eventually resuming normal rhythms. The anti-inflammatory
response, normally down-regulated around mid-day, keeps
increasing following LPS administration. The systemic energy
balance is also suppressed for around 2 hr more before returning
to its normal rhythm (see more in Figure S2). The system resumes
normal daily rhythms about 24 h post LPS administration.
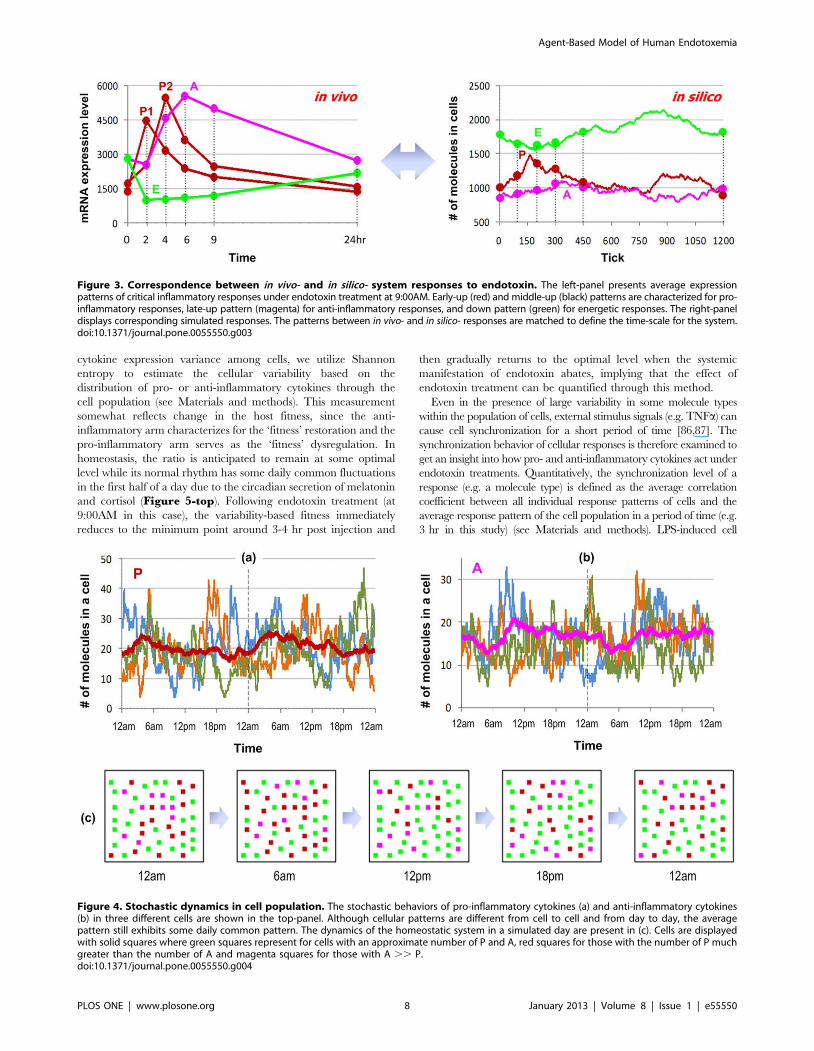
Patterns and implications of cellular variabilitySince stochasticity is an inherent property of our individual-
based simulation, stochastic transcriptional activities, especially
those relevant to the NFkB-signaling module, have large impacts
on cellular variability [86,87,88]. Simulated cells behave differ-
ently from one to another and no individual cell behaves like the
average one. For example, dynamics patterns of pro- and anti-
inflammatory protein levels oscillate stochastically between differ-
ent cells and even different days although their average patterns
exhibit some common daily patterns (Figure 4a, b). In general,
these average patterns are similar to corresponding system
responses. Specifically, the average level of pro-inflammatory
cytokines is induced early due to the increasing level of melatonin
at the onset of the day and then gradually abates while the level of
cortisol increases. The average level of anti-inflammatory
cytokines is transiently down regulated and then starts increasing
to restore the balance between pro- and anti-inflammatory
cytokines under the opposing effects and acutely altered patterns
of melatonin and cortisol. From a system-level perspective, we
assume that a cell will be (1) in the pro-inflammatory state
(displayed by red squares) if the level of pro- is much greater than
the level of anti-inflammatory cytokines (P.1.5A), (2) in the anti-
inflammatory state (magenta squares) if A.1.5P, and (3) otherwise
in the homeostatic state (green squares). Interestingly, the status
change of the cellular system also follows a common daily pattern
although the status of a single cell is always dynamic over time,
even for the same time the next day (Figure 4c). At the beginning
of a day, pro-inflammatory cells predominate and then make room
for anti-inflammatory cells in the late morning. Since the status of
the cellular system is in some part associated with the protein
abundance level of corresponding cytokine types, the balance
between pro- and anti-inflammatory cytokines is anticipated to be
dynamic over time but follow some common daily pattern.
Recent studies have implied that there is an association between
patient fitness and the balance between the levels of pro- and anti-
inflammatory cytokines [89,90]. However, the protein abundance
level in a population of genetically identical cells is proportional to
the expression variance of the corresponding protein [91,92,93].
Consequently, the cell-to-cell variability potentially conveys
information beyond the simple mean level of protein abundance
in characterizing the dynamic kinetics of the entire system at the
single cell level. Cellular variability can account for the stochastic
transcriptional activities and thus not only the consequence but
also the mechanisms that lead to the fluctuation of a protein
between cells. As a result, we hereby define a novel quantity to
characterize the entire status of the system in homeostasis or under
treated conditions, so-called the variability-based fitness (Fvar),
based on the ratio between the expression variance of anti-
inflammatory cytokines and pro-inflammatory cytokines from the
population of simulated leukocytes. In order to characterize the
Figure 2. Dynamics patterns of selected components undercircadian control. Circadian control is regulated by the rhythms ofcortisol (F) and melatonin (M), which in turn drive the patterns of othercomponents in the system. Pro-inflammatory cytokines (P), driven bymelatonin secretion, are up-regulated to peak around ,4:00AMwhereas anti-inflammatory cytokines (A) are down regulated due tothe increase of pro-inflammatory cytokines and then up-regulatedunder the effects of cortisol rhythms. These behaviors result in thecircadian variation of bio-energetic proteins (E) and others.doi:10.1371/journal.pone.0055550.g002
Agent-Based Model of Human Endotoxemia
PLOS ONE | www.plosone.org 7 January 2013 | Volume 8 | Issue 1 | e55550
cytokine expression variance among cells, we utilize Shannon
entropy to estimate the cellular variability based on the
distribution of pro- or anti-inflammatory cytokines through the
cell population (see Materials and methods). This measurement
somewhat reflects change in the host fitness, since the anti-
inflammatory arm characterizes for the ‘fitness’ restoration and the
pro-inflammatory arm serves as the ‘fitness’ dysregulation. In
homeostasis, the ratio is anticipated to remain at some optimal
level while its normal rhythm has some daily common fluctuations
in the first half of a day due to the circadian secretion of melatonin
and cortisol (Figure 5-top). Following endotoxin treatment (at
9:00AM in this case), the variability-based fitness immediately
reduces to the minimum point around 3-4 hr post injection and
then gradually returns to the optimal level when the systemic
manifestation of endotoxin abates, implying that the effect of
endotoxin treatment can be quantified through this method.
Even in the presence of large variability in some molecule types
within the population of cells, external stimulus signals (e.g. TNFa) can
cause cell synchronization for a short period of time [86,87]. The
synchronization behavior of cellular responses is therefore examined to
get an insight into how pro- and anti-inflammatory cytokines act under
endotoxin treatments. Quantitatively, the synchronization level of a
response (e.g. a molecule type) is defined as the average correlation
coefficient between all individual response patterns of cells and the
average response pattern of the cell population in a period of time (e.g.
3 hr in this study) (see Materials and methods). LPS-induced cell
Figure 3. Correspondence between in vivo- and in silico- system responses to endotoxin. The left-panel presents average expressionpatterns of critical inflammatory responses under endotoxin treatment at 9:00AM. Early-up (red) and middle-up (black) patterns are characterized for pro-inflammatory responses, late-up pattern (magenta) for anti-inflammatory responses, and down pattern (green) for energetic responses. The right-paneldisplays corresponding simulated responses. The patterns between in vivo- and in silico- responses are matched to define the time-scale for the system.doi:10.1371/journal.pone.0055550.g003
Figure 4. Stochastic dynamics in cell population. The stochastic behaviors of pro-inflammatory cytokines (a) and anti-inflammatory cytokines(b) in three different cells are shown in the top-panel. Although cellular patterns are different from cell to cell and from day to day, the averagepattern still exhibits some daily common pattern. The dynamics of the homeostatic system in a simulated day are present in (c). Cells are displayedwith solid squares where green squares represent for cells with an approximate number of P and A, red squares for those with the number of P muchgreater than the number of A and magenta squares for those with A .. P.doi:10.1371/journal.pone.0055550.g004
Agent-Based Model of Human Endotoxemia
PLOS ONE | www.plosone.org 8 January 2013 | Volume 8 | Issue 1 | e55550
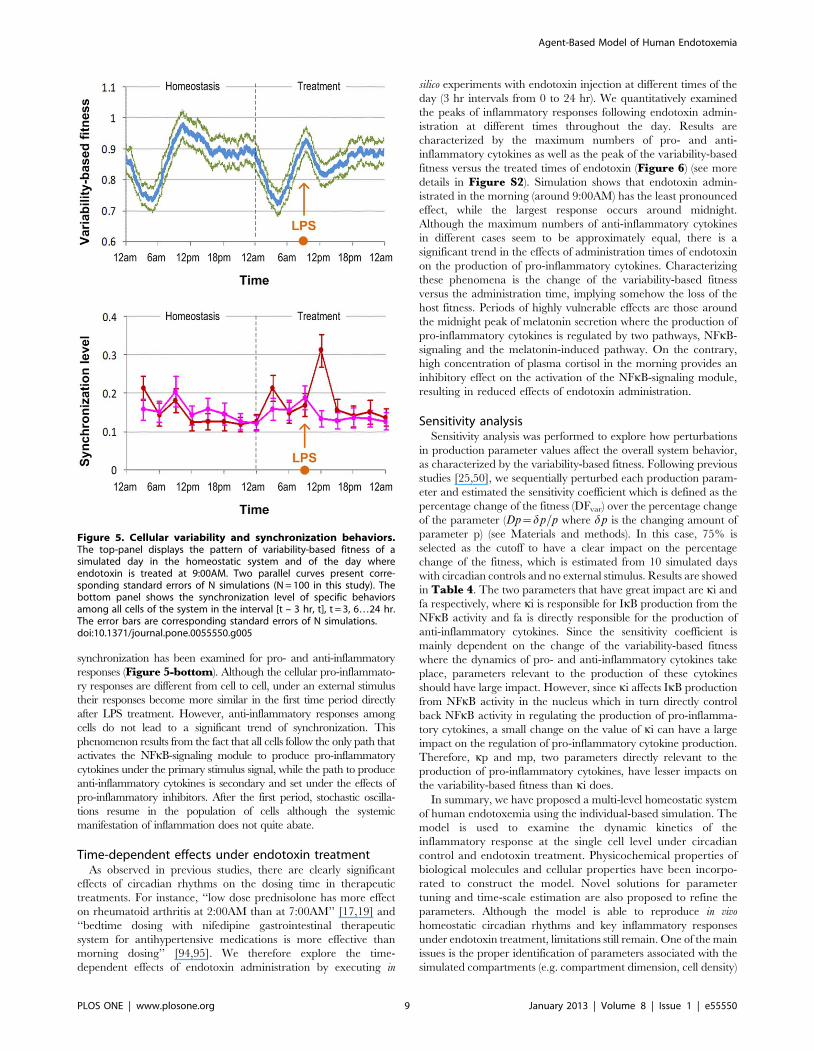
synchronization has been examined for pro- and anti-inflammatory
responses (Figure 5-bottom). Although the cellular pro-inflammato-
ry responses are different from cell to cell, under an external stimulus
their responses become more similar in the first time period directly
after LPS treatment. However, anti-inflammatory responses among
cells do not lead to a significant trend of synchronization. This
phenomenon results from the fact that all cells follow the only path that
activates the NFkB-signaling module to produce pro-inflammatory
cytokines under the primary stimulus signal, while the path to produce
anti-inflammatory cytokines is secondary and set under the effects of
pro-inflammatory inhibitors. After the first period, stochastic oscilla-
tions resume in the population of cells although the systemic
manifestation of inflammation does not quite abate.
Time-dependent effects under endotoxin treatmentAs observed in previous studies, there are clearly significant
effects of circadian rhythms on the dosing time in therapeutic
treatments. For instance, ‘‘low dose prednisolone has more effect
on rheumatoid arthritis at 2:00AM than at 7:00AM’’ [17,19] and
‘‘bedtime dosing with nifedipine gastrointestinal therapeutic
system for antihypertensive medications is more effective than
morning dosing’’ [94,95]. We therefore explore the time-
dependent effects of endotoxin administration by executing in
silico experiments with endotoxin injection at different times of the
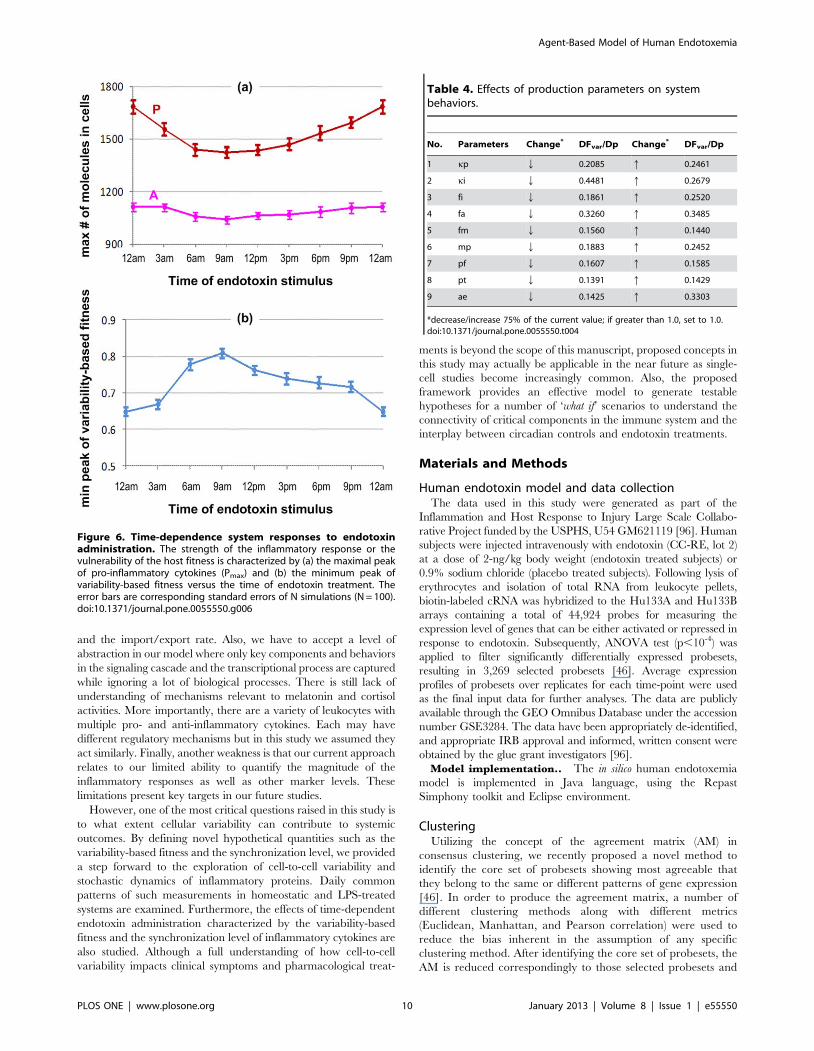
day (3 hr intervals from 0 to 24 hr). We quantitatively examined
the peaks of inflammatory responses following endotoxin admin-
istration at different times throughout the day. Results are
characterized by the maximum numbers of pro- and anti-
inflammatory cytokines as well as the peak of the variability-based
fitness versus the treated times of endotoxin (Figure 6) (see more
details in Figure S2). Simulation shows that endotoxin admin-
istrated in the morning (around 9:00AM) has the least pronounced
effect, while the largest response occurs around midnight.
Although the maximum numbers of anti-inflammatory cytokines
in different cases seem to be approximately equal, there is a
significant trend in the effects of administration times of endotoxin
on the production of pro-inflammatory cytokines. Characterizing
these phenomena is the change of the variability-based fitness
versus the administration time, implying somehow the loss of the
host fitness. Periods of highly vulnerable effects are those around
the midnight peak of melatonin secretion where the production of
pro-inflammatory cytokines is regulated by two pathways, NFkB-
signaling and the melatonin-induced pathway. On the contrary,
high concentration of plasma cortisol in the morning provides an
inhibitory effect on the activation of the NFkB-signaling module,
resulting in reduced effects of endotoxin administration.
Sensitivity analysisSensitivity analysis was performed to explore how perturbations
in production parameter values affect the overall system behavior,
as characterized by the variability-based fitness. Following previous
studies [25,50], we sequentially perturbed each production param-
eter and estimated the sensitivity coefficient which is defined as the
percentage change of the fitness (DFvar) over the percentage change
of the parameter (Dp~dp=p where dp is the changing amount of
parameter p) (see Materials and methods). In this case, 75% is
selected as the cutoff to have a clear impact on the percentage
change of the fitness, which is estimated from 10 simulated days
with circadian controls and no external stimulus. Results are showed
in Table 4. The two parameters that have great impact are ki and
fa respectively, where ki is responsible for IkB production from the
NFkB activity and fa is directly responsible for the production of
anti-inflammatory cytokines. Since the sensitivity coefficient is
mainly dependent on the change of the variability-based fitness
where the dynamics of pro- and anti-inflammatory cytokines take
place, parameters relevant to the production of these cytokines
should have large impact. However, since ki affects IkB production
from NFkB activity in the nucleus which in turn directly control
back NFkB activity in regulating the production of pro-inflamma-
tory cytokines, a small change on the value of ki can have a large
impact on the regulation of pro-inflammatory cytokine production.
Therefore, kp and mp, two parameters directly relevant to the
production of pro-inflammatory cytokines, have lesser impacts on
the variability-based fitness than ki does.
In summary, we have proposed a multi-level homeostatic system
of human endotoxemia using the individual-based simulation. The
model is used to examine the dynamic kinetics of the
inflammatory response at the single cell level under circadian
control and endotoxin treatment. Physicochemical properties of
biological molecules and cellular properties have been incorpo-
rated to construct the model. Novel solutions for parameter
tuning and time-scale estimation are also proposed to refine the
parameters. Although the model is able to reproduce in vivo
homeostatic circadian rhythms and key inflammatory responses
under endotoxin treatment, limitations still remain. One of the main
issues is the proper identification of parameters associated with the
simulated compartments (e.g. compartment dimension, cell density)
Figure 5. Cellular variability and synchronization behaviors.The top-panel displays the pattern of variability-based fitness of asimulated day in the homeostatic system and of the day whereendotoxin is treated at 9:00AM. Two parallel curves present corre-sponding standard errors of N simulations (N = 100 in this study). Thebottom panel shows the synchronization level of specific behaviorsamong all cells of the system in the interval [t – 3 hr, t], t = 3, 6…24 hr.The error bars are corresponding standard errors of N simulations.doi:10.1371/journal.pone.0055550.g005
Agent-Based Model of Human Endotoxemia
PLOS ONE | www.plosone.org 9 January 2013 | Volume 8 | Issue 1 | e55550
and the import/export rate. Also, we have to accept a level of
abstraction in our model where only key components and behaviors
in the signaling cascade and the transcriptional process are captured
while ignoring a lot of biological processes. There is still lack of
understanding of mechanisms relevant to melatonin and cortisol
activities. More importantly, there are a variety of leukocytes with
multiple pro- and anti-inflammatory cytokines. Each may have
different regulatory mechanisms but in this study we assumed they
act similarly. Finally, another weakness is that our current approach
relates to our limited ability to quantify the magnitude of the
inflammatory responses as well as other marker levels. These
limitations present key targets in our future studies.
However, one of the most critical questions raised in this study is
to what extent cellular variability can contribute to systemic
outcomes. By defining novel hypothetical quantities such as the
variability-based fitness and the synchronization level, we provided
a step forward to the exploration of cell-to-cell variability and
stochastic dynamics of inflammatory proteins. Daily common
patterns of such measurements in homeostatic and LPS-treated
systems are examined. Furthermore, the effects of time-dependent
endotoxin administration characterized by the variability-based
fitness and the synchronization level of inflammatory cytokines are
also studied. Although a full understanding of how cell-to-cell
variability impacts clinical symptoms and pharmacological treat-
ments is beyond the scope of this manuscript, proposed concepts in
this study may actually be applicable in the near future as single-
cell studies become increasingly common. Also, the proposed
framework provides an effective model to generate testable
hypotheses for a number of ‘what if’ scenarios to understand the
connectivity of critical components in the immune system and the
interplay between circadian controls and endotoxin treatments.
Materials and Methods
Human endotoxin model and data collectionThe data used in this study were generated as part of the
Inflammation and Host Response to Injury Large Scale Collabo-
rative Project funded by the USPHS, U54 GM621119 [96]. Human
subjects were injected intravenously with endotoxin (CC-RE, lot 2)
at a dose of 2-ng/kg body weight (endotoxin treated subjects) or
0.9% sodium chloride (placebo treated subjects). Following lysis of
erythrocytes and isolation of total RNA from leukocyte pellets,
biotin-labeled cRNA was hybridized to the Hu133A and Hu133B
arrays containing a total of 44,924 probes for measuring the
expression level of genes that can be either activated or repressed in
response to endotoxin. Subsequently, ANOVA test (p,10-4) was
applied to filter significantly differentially expressed probesets,
resulting in 3,269 selected probesets [46]. Average expression
profiles of probesets over replicates for each time-point were used
as the final input data for further analyses. The data are publicly
available through the GEO Omnibus Database under the accession
number GSE3284. The data have been appropriately de-identified,
and appropriate IRB approval and informed, written consent were
obtained by the glue grant investigators [96].
Model implementation.. The in silico human endotoxemia
model is implemented in Java language, using the Repast
Simphony toolkit and Eclipse environment.
ClusteringUtilizing the concept of the agreement matrix (AM) in
consensus clustering, we recently proposed a novel method to
identify the core set of probesets showing most agreeable that
they belong to the same or different patterns of gene expression
[46]. In order to produce the agreement matrix, a number of
different clustering methods along with different metrics
(Euclidean, Manhattan, and Pearson correlation) were used to
reduce the bias inherent in the assumption of any specific
clustering method. After identifying the core set of probesets, the
AM is reduced correspondingly to those selected probesets and
Figure 6. Time-dependence system responses to endotoxinadministration. The strength of the inflammatory response or thevulnerability of the host fitness is characterized by (a) the maximal peakof pro-inflammatory cytokines (Pmax) and (b) the minimum peak ofvariability-based fitness versus the time of endotoxin treatment. Theerror bars are corresponding standard errors of N simulations (N = 100).doi:10.1371/journal.pone.0055550.g006
Table 4. Effects of production parameters on systembehaviors.
No. Parameters Change* DFvar/Dp Change* DFvar/Dp
1 kp Q 0.2085 q 0.2461
2 ki Q 0.4481 q 0.2679
3 fi Q 0.1861 q 0.2520
4 fa Q 0.3260 q 0.3485
5 fm Q 0.1560 q 0.1440
6 mp Q 0.1883 q 0.2452
7 pf Q 0.1607 q 0.1585
8 pt Q 0.1391 q 0.1429
9 ae Q 0.1425 q 0.3303
*decrease/increase 75% of the current value; if greater than 1.0, set to 1.0.doi:10.1371/journal.pone.0055550.t004
Agent-Based Model of Human Endotoxemia
PLOS ONE | www.plosone.org 10 January 2013 | Volume 8 | Issue 1 | e55550

then the hierarchical clustering is applied on the reduced AM to
obtain significant patterns of gene expression. Four patterns of gene
expression which characterize critical dynamics of acute human
inflammation are obtained [46]. The ‘early-up’ (182 probesets) and
‘middle-up’ pattern (119 probesets) consist of genes that are involved
in critical pro-inflammatory signaling pathways including apoptosis,
Toll-like receptor (TLR) signaling, and cytokine-cytokine receptor
interaction. The ‘late-up’ pattern (284 probesets) characterizes for
anti-inflammatory processes with enriched inflammatory relevant
pathways e.g. TLR signalling, JAK-STAT cascade. Finally, the
‘down’ pattern (1118 probesets) is the most populated expression
motif characterized by genes involved in cellular bio-energetic
processes e.g. oxidative phosphorylation, ribosome, TCA cycle,
purine and pyruvate metabolism.
‘Random walk’ modelAgents (cells, molecules) move on a 2-dimensional grid in a
random fashion depending on two main factors: the time agents
wait before each movement and the number of times agents move in
a direction. For a specific agent U, at time t, let c tð Þ be the time
(number of ticks) U has to wait before moving and l(t) be the
number of times U will move in direction D, we have
c tz1ð Þ~c tð Þ{1 if c tð Þw0
rand 0, 1f gzstatus (U) if c tð Þ~0
(;
l tz1ð Þ~
l tð Þ if c tð Þw0 and l tð Þw0
l tð Þ{1 if c tð Þ~0 and l tð Þw0
rand 2, 3, 4f g| Ncompz1� �
if l tð Þ~0
8>><>>:
where status Uð Þ~rand 1, 2f g initial valueð Þ
0 if U is in the active form
(
Ncomp~ 0, 0, 1, 2f g
if U in nucleus, brain, cell, plasmaf g respectively
Each compartment or each cell has its own 2-dimensional
simulating grid. When c tð Þ is zero, U will move to the next grid-
space in the Moore neighbourhood of the corresponding simulating
grid which consists of 8 spaces immediately adjacent to and
surrounding the current position based on the current direction D.
D is one of 8 directions N, NE, E, SE, S, SW , W , NWf g (N:
north, E: east, S: south, and W: west). Let Px(t), Py tð Þ be the
current position of U in a 2-dimensional simulating grid, its next
position is defined as follows
Px tz1ð Þ~Px tð ÞzHx c tð Þ, D tð Þð Þ;
Py tz1ð Þ~Py tð ÞzHy c tð Þ, D tð Þð Þ
where
D tz1ð Þ~D tð Þ if l tð Þw0
rand N, NE, E, SE, S, SW , W , NWf g if l tð Þ~0
(
Hx c tð Þ, D tð Þð Þ~
0 if c tð Þw0 or D tð Þ[ N, Sf g
z1 if c tð Þ~0 and D tð Þ[ NE, E, SEf g{1 if c tð Þ~0 and D tð Þ[ NW , W , SWf g
8>><>>:
Hy c tð Þ, D tð Þð Þ~
0 if c tð Þw0 or D tð Þ[ E, Wf g
z1 if c tð Þ~0 and D tð Þ[ NW , N, NEf g
{1 if c tð Þ~0 and D tð Þ[ SW , S, SEf g
8>><>>:
Parameter tuningBased on the trend of the dynamics of each particular molecule
type X , we adjust the probability of the associated production
parameter pX (Table 3) so that the total number of X in the
system does not change significantly over time. For each simulated
day (24Ntph ticks), we sample the level of X each hour and
determine whether there is a significant change based on the
sample vector using ordinary least square regression and
significant mean difference [83].
Let xj be the number of molecules X in the system at hour
j, j~1, . . . J, J~24. The regression model used in this approach
is xj~azbjzej where a is the intercept, b is the slope, and ej are
random errors which are assumed to be independent and
identically distributed. The estimates of the slope and intercept
are given by
bb~
Pj
j{j� �
xj{x� �
Pj
j{j� � 2
; aa~x{bb j; x~1
J
Xj
xj
The standard error of the slope will be
SE bb�
~
ffiffiffiffiffiffiffiffiffiffiffiffiffiffiffiffiffiffiffiffiffiffiffiffiffiffiffiffiffiffiffiffiffiffiffiffiffiffiPj
xj{aa{bb j� 2
J{2ð ÞP
j
j{j� � 2
vuuuuutA 95% confidence interval for the slope b is
bb+t0:975, J{2 SE bb�
. If zero is not contained in the interval, we
conclude that the trend of change is significant.
Let m1, m2 be the means of the first and last half of the sample
vector
m1~XJ=2
j~1
xj ; m2~XJ
j~J=2z1
xj
If the percentage change between the first and last half of the
sample vectorm2{m1
m1is more than 10%, we conclude that the
change is significant and adjust the corresponding production
parameter. If the trend of the dynamics is increasing, the
parameter value pX will be decreased. Otherwise, if the trend of
the dynamics is decreasing, we increase pX . In order to estimate
the changing amount of pX , we assume that the percentage change
of the parameter would be approximately to the percentage
change of the molecule level between the first and last half of the
sample vector but set under the opposite effect. Therefore, the
estimate for the adjusted parameter value will be
p 0x{px
px
~{m2{m1
m1[ p 0x~px 1{
m2{m1
m1
� �
In the case that there are two associated production parameters,
the amount each parameter is changed will be half of that in the
normal case. The process is repeated until there is no change of all
production parameters in three consecutive simulated days.
Variability-based fitnessGiven NC cells, let xi tð Þ be the number of molecules X in cell
i, i~1,:::,NC at a specific time t. Since the distribution of xi tð Þ
Agent-Based Model of Human Endotoxemia
PLOS ONE | www.plosone.org 11 January 2013 | Volume 8 | Issue 1 | e55550
values may be sparse, we first contract the range of xi tð Þ by a
whole number division of r for all xi tð Þ (r~5 in this study).
yi~xi tð Þ
r
� �, i~1, . . . ,NC
Let p yið Þ be the probability of the presence of yi value in the
contracted array y~ yi, i~1, . . . ,Ncf g. The variability-based
fitness Fvar at a specific time t is defined as follows
Fvar tð Þ~ VAC2C
VPC2C
where VXC2C~{
XNC
i~1
p yið Þ ln p yið Þ, X~ A,P½ �
SynchronizationLet xi(t) be the number of molecules X in cell i and xx(t) be the
average number of molecules X from NC cells at time t. The
synchronization level of molecule X in the population of cells for a
period of time from 0:00 to 3:00AM is
Syn 0?3AMð Þ~ 1
NC
Xi
w xi(t), xx(t)ð Þ
where w xi(t), xx(t)ð Þ~
Pt
xi(t){xð Þ xx(t){xxð ÞffiffiffiffiffiffiffiffiffiffiffiffiffiffiffiffiffiffiffiffiffiffiffiffiffiffiffiffiffiffiffiffiffiffiffiffiffiffiffiffiffiffiffiffiffiffiffiffiffiffiffiffiffiffiffiffiffiffiffiffiffiffiffiPt
xi(t){xð Þ2P
t
xx(t){xxð Þ2r
xx(t)~1
NC
Xi
xi(t) ; x~1
T
Xt
xi(t); xx~1
T
Xt
xx(t)
i~1, . . . ,NC , t~1, . . . , T~3Ntph
Percentage change of the fitnessIn order to evaluate how a change impacts to the system
behaviors, we define a so-called percentage change of the fitness as
a ratio of the total changing amount between the variability-based
fitness of the original system and that of the new system over the
total amount in the original system during a period of time
(nday~10 in this study)
DFvar~
Pt
F0var tð Þ{Fvar tð Þ
��� ���Pt
Fvar tð Þ ; t~1, . . . ,nday|Ntpd
where Fvar(t) and F0var(t) are the variability-based finesses at
time t of the original system and the new system (i.e. the system
with new parameter values).
Supporting Information
Figure S1 Model architecture of the programming.There are two general classes (SimpleAgent and SimpleCompartment)
which are inherited by other classes in the system. Connecting
lines ending with the empty triangle reflect the inheritance
between the general class and a specific class while those ending
with the solid parallelogram exhibit an aggregation of containing
relationships. Initial parameters are also showed in the right table.
(TIFF)
Figure S2 System responses under a bolus injection ofendotoxin at different times of the day. Each case includes
the average system behaviors of inflammatory cytokines and stress
hormones from N simulations (N = 100 in this study), the
corresponding pattern of variability-based fitness, and the
synchronization level of pro- and anti-inflammatory responses
following intervals [t – 3 hr, t], t = 3, 6…24 hr. The error bars (or
two parallel curves) are corresponding standard errors of N
simulations.
(TIFF)
Materials S1 Pseudo-code of the implemented model.
(DOC)
Author Contributions
Discussion Input: TTN SEC SFL. Conceived and designed the
experiments: TTN IPA. Performed the experiments: TTN. Analyzed the
data: TTN. Contributed reagents/materials/analysis tools: SEC SFL.
Wrote the paper: TTN IPA.
References
1. Medzhitov R (2008) Origin and physiological roles of inflammation. Nature 454:
428–435.
2. Nathan C (2002) Points of control in inflammation. Nature 420: 846–852.
3. Hotchkiss RS, Karl IE (2003) The pathophysiology and treatment of sepsis.
N Engl J Med 348: 138–150.
4. Tetta C, Fonsato V, Ronco C, Camussi G (2005) Recent insights into the
pathogenesis of severe sepsis. Crit Care Resusc 7: 32–39.
5. Andreasen AS, Krabbe KS, Krogh-Madsen R, Taudorf S, Pedersen BK, et al.
(2008) Human endotoxemia as a model of systemic inflammation. Curr Med
Chem 15: 1697–1705.
6. Lowry SF (2005) Human endotoxemia: a model for mechanistic insight and
therapeutic targeting. Shock 24 Suppl 1: 94–100.
7. Opal SM, Scannon PJ, Vincent JL, White M, Carroll SF, et al. (1999)
Relationship between plasma levels of lipopolysaccharide (LPS) and LPS-
binding protein in patients with severe sepsis and septic shock. J Infect Dis 180:
1584–1589.
8. Rankin JA (2004) Biological mediators of acute inflammation. AACN Clin Issues
15: 3–17.
9. McInnes IB, Schett G (2007) Cytokines in the pathogenesis of rheumatoid
arthritis. Nat Rev Immunol 7: 429–442.
10. Opal SM, DePalo VA (2000) Anti-inflammatory cytokines. Chest 117: 1162–
1172.
11. Bone RC (1996) Immunologic dissonance: a continuing evolution in our
understanding of the systemic inflammatory response syndrome (SIRS) and the
multiple organ dysfunction syndrome (MODS). Ann Intern Med 125: 680–687.
12. Sivalingam SP, Thumboo J, Vasoo S, Thio ST, Tse C, et al. (2007) In vivo pro-
and anti-inflammatory cytokines in normal and patients with rheumatoid
arthritis. Ann Acad Med Singapore 36: 96–99.
13. Sternberg EM (2006) Neural regulation of innate immunity: a coordinated
nonspecific host response to pathogens. Nat Rev Immunol 6: 318–328.
14. Coogan AN, Wyse CA (2008) Neuroimmunology of the circadian clock. Brain
Res 1232: 104–112.
15. Levi F, Schibler U (2007) Circadian rhythms: mechanisms and therapeutic
implications. Annu Rev Pharmacol Toxicol 47: 593–628.
16. Sukumaran S, Almon RR, DuBois DC, Jusko WJ (2010) Circadian rhythms in
gene expression: Relationship to physiology, disease, drug disposition and drug
action. Adv Drug Deliv Rev 62: 904–917.
17. Cutolo M, Seriolo B, Craviotto C, Pizzorni C, Sulli A (2003) Circadian rhythms
in RA. Ann Rheum Dis 62: 593–596.
18. Lissoni P, Rovelli F, Brivio F, Brivio O, Fumagalli L (1998) Circadian secretions
of IL-2, IL-12, IL-6 and IL-10 in relation to the light/dark rhythm of the pineal
hormone melatonin in healthy humans. Nat Immun 16: 1–5.
19. Petrovsky N, McNair P, Harrison LC (1998) Diurnal rhythms of pro-
inflammatory cytokines: regulation by plasma cortisol and therapeutic
implications. Cytokine 10: 307–312.
20. An G, Mi Q, Dutta-Moscato J, Vodovotz Y (2009) Agent-based models in
translational systems biology. Wiley Interdiscip Rev Syst Biol Med 1: 159–171.
21. Vodovotz Y, Constantine G, Rubin J, Csete M, Voit EO, et al. (2009)
Mechanistic simulations of inflammation: current state and future prospects.
Math Biosci 217: 1–10.
Agent-Based Model of Human Endotoxemia
PLOS ONE | www.plosone.org 12 January 2013 | Volume 8 | Issue 1 | e55550
22. Bauer AL, Beauchemin CA, Perelson AS (2009) Agent-based modeling of host-pathogen systems: The successes and challenges. Inf Sci (Ny) 179: 1379–1389.
23. Foteinou PT, Calvano SE, Lowry SF, Androulakis IP (2009) In silico simulation
of corticosteroids effect on an NFkB- dependent physicochemical model of
systemic inflammation. PLoS One 4: e4706.
24. Foteinou PT, Calvano SE, Lowry SF, Androulakis IP (2009) Modelingendotoxin-induced systemic inflammation using an indirect response approach.
Math Biosci 217: 27–42.
25. Scheff JD, Calvano SE, Lowry SF, Androulakis IP (2010) Modeling the influence
of circadian rhythms on the acute inflammatory response. J Theor Biol 264:1068–1076.
26. Bahcall OG (2005) Single cell resolution in regulation of gene expression. Mol
Syst Biol 1: 2005 0015.
27. Blake WJ, M KA, Cantor CR, Collins JJ (2003) Noise in eukaryotic gene
expression. Nature 422: 633–637.
28. Rosenfeld N, Young JW, Alon U, Swain PS, Elowitz MB (2005) Gene regulation
at the single-cell level. Science 307: 1962–1965.
29. An G (2008) Introduction of an agent-based multi-scale modular architecture fordynamic knowledge representation of acute inflammation. Theor Biol Med
Model 5: 11.
30. Chavali AK, Gianchandani EP, Tung KS, Lawrence MB, Peirce SM, et al.
(2008) Characterizing emergent properties of immunological systems with multi-cellular rule-based computational modeling. Trends Immunol 29: 589–599.
31. Catron DM, Itano AA, Pape KA, Mueller DL, Jenkins MK (2004) Visualizingthe first 50 hr of the primary immune response to a soluble antigen. Immunity
21: 341–347.
32. An G (2004) In silico experiments of existing and hypothetical cytokine-directed
clinical trials using agent-based modeling. Crit Care Med 32: 2050–2060.
33. An G (2001) Agent-based computer simulation and sirs: building a bridgebetween basic science and clinical trials. Shock 16: 266–273.
34. An G (2009) A model of TLR4 signaling and tolerance using a qualitative,particle-event-based method: introduction of spatially configured stochastic
reaction chambers (SCSRC). Math Biosci 217: 43–52.
35. An GC, Faeder JR (2009) Detailed qualitative dynamic knowledge representa-
tion using a BioNetGen model of TLR-4 signaling and preconditioning. MathBiosci 217: 53–63.
36. Folcik VA, An GC, Orosz CG (2007) The Basic Immune Simulator: an agent-
based model to study the interactions between innate and adaptive immunity.Theor Biol Med Model 4: 39.
37. Baldazzi V, Castiglione F, Bernaschi M (2006) An enhanced agent based modelof the immune system response. Cell Immunol 244: 77–79.
38. Celada F, Seiden PE (1992) A computer model of cellular interactions in the
immune system. Immunol Today 13: 56–62.
39. Meier-Schellersheim M, Xu X, Angermann B, Kunkel EJ, Jin T, et al. (2006)
Key role of local regulation in chemosensing revealed by a new molecularinteraction-based modeling method. PLoS Comput Biol 2: e82.
40. Warrender C, Forrest S, Koster F (2006) Modeling intercellular interactions inearly Mycobacterium infection. Bull Math Biol 68: 2233–2261.
41. Kaern M, Elston TC, Blake WJ, Collins JJ (2005) Stochasticity in gene
expression: from theories to phenotypes. Nat Rev Genet 6: 451–464.
42. Kilfoil ML, Lasko P, Abouheif E (2009) Stochastic variation: from single cells to
superorganisms. Hfsp J 3: 379–385.
43. Niepel M, Spencer SL, Sorger PK (2009) Non-genetic cell-to-cell variability and
the consequences for pharmacology. Curr Opin Chem Biol 13: 556–561.
44. Raser JM, O’Shea EK (2005) Noise in gene expression: origins, consequences,and control. Science 309: 2010–2013.
45. Mager DE, Wyska E, Jusko WJ (2003) Diversity of mechanism-basedpharmacodynamic models. Drug Metab Dispos 31: 510–518.
46. Nguyen TT, Nowakowski RS, Androulakis IP (2009) Unsupervised selection of
highly coexpressed and noncoexpressed genes using a consensus clustering
approach. Omics 13: 219–237.
47. Prabhakar U, Conway TM, Murdock P, Mooney JL, Clark S, et al. (2005)Correlation of protein and gene expression profiles of inflammatory proteins
after endotoxin challenge in human subjects. DNA Cell Biol 24: 410–431.
48. Li Q, Verma IM (2002) NF-kappaB regulation in the immune system. Nat Rev
Immunol 2: 725–734.
49. Vallabhapurapu S, Karin M (2009) Regulation and function of NF-kappaBtranscription factors in the immune system. Annu Rev Immunol 27: 693–733.
50. Ihekwaba AE, Broomhead DS, Grimley RL, Benson N, Kell DB (2004)Sensitivity analysis of parameters controlling oscillatory signalling in the NF-
kappaB pathway: the roles of IKK and IkappaBalpha. Syst Biol (Stevenage) 1:93–103.
51. Natarajan M, Lin KM, Hsueh RC, Sternweis PC, Ranganathan R (2006) Aglobal analysis of cross-talk in a mammalian cellular signalling network. Nat Cell
Biol 8: 571–580.
52. Hu X, Chen J, Wang L, Ivashkiv LB (2007) Crosstalk among Jak-STAT, Toll-
like receptor, and ITAM-dependent pathways in macrophage activation.J Leukoc Biol 82: 237–243.
53. Akira S, Takeda K (2004) Toll-like receptor signalling. Nat Rev Immunol 4:
499–511.
54. O’Neill LA (2008) When signaling pathways collide: positive and negative
regulation of toll-like receptor signal transduction. Immunity 29: 12–20.
55. Croker BA, Kiu H, Nicholson SE (2008) SOCS regulation of the JAK/STAT
signalling pathway. Semin Cell Dev Biol 19: 414–422.
56. Shuai K, Liu B (2003) Regulation of JAK-STAT signalling in the immune
system. Nat Rev Immunol 3: 900–911.
57. Zi Z, Cho KH, Sung MH, Xia X, Zheng J, et al. (2005) In silico identification of
the key components and steps in IFN-gamma induced JAK-STAT signaling
pathway. FEBS Lett 579: 1101–1108.
58. Rhen T, Cidlowski JA (2005) Antiinflammatory action of glucocorticoids--new
mechanisms for old drugs. N Engl J Med 353: 1711–1723.
59. Webster JI, Tonelli L, Sternberg EM (2002) Neuroendocrine regulation of
immunity. Annu Rev Immunol 20: 125–163.
60. Carrillo-Vico A, Guerrero JM, Lardone PJ, Reiter RJ (2005) A review of the
multiple actions of melatonin on the immune system. Endocrine 27: 189–200.
61. Guerrero JM, Reiter RJ (2002) Melatonin-immune system relationships. Curr
Top Med Chem 2: 167–179.
62. Hermann C, von Aulock S, Dehus O, Keller M, Okigami H, et al. (2006)
Endogenous cortisol determines the circadian rhythm of lipopolysaccharide--
but not lipoteichoic acid--inducible cytokine release. Eur J Immunol 36: 371–
379.
63. Skwarlo-Sonta K, Majewski P, Markowska M, Oblap R, Olszanska B (2003)
Bidirectional communication between the pineal gland and the immune system.
Can J Physiol Pharmacol 81: 342–349.
64. Hoffmann A, Levchenko A, Scott ML, Baltimore D (2002) The IkappaB-NF-
kappaB signaling module: temporal control and selective gene activation.
Science 298: 1241–1245.
65. O’Dea EL, Barken D, Peralta RQ, Tran KT, Werner SL, et al. (2007) A
homeostatic model of IkappaB metabolism to control constitutive NF-kappaB
activity. Mol Syst Biol 3: 111.
66. Tak PP, Firestein GS (2001) NF-kappaB: a key role in inflammatory diseases.
J Clin Invest 107: 7–11.
67. Tripathi P, Aggarwal A (2006) NF-kB transcription factor: a key player in the
generation of immune response. Current Science 90: 519–531.
68. Kearns JD, Basak S, Werner SL, Huang CS, Hoffmann A (2006) IkappaBepsi-
lon provides negative feedback to control NF-kappaB oscillations, signaling
dynamics, and inflammatory gene expression. J Cell Biol 173: 659–664.
69. Karin M, Delhase M (2000) The I kappa B kinase (IKK) and NF-kappa B: key
elements of proinflammatory signalling. Semin Immunol 12: 85–98.
70. Calandra T, Roger T (2003) Macrophage migration inhibitory factor: a
regulator of innate immunity. Nat Rev Immunol 3: 791–800.
71. Roger T, David J, Glauser MP, Calandra T (2001) MIF regulates innate
immune responses through modulation of Toll-like receptor 4. Nature 414: 920–
924.
72. Cavadini G, Petrzilka S, Kohler P, Jud C, Tobler I, et al. (2007) TNF-alpha
suppresses the expression of clock genes by interfering with E-box-mediated
transcription. Proc Natl Acad Sci U S A 104: 12843–12848.
73. Fernandes PA, Cecon E, Markus RP, Ferreira ZS (2006) Effect of TNF-alpha on
the melatonin synthetic pathway in the rat pineal gland: basis for a ’feedback’ of
the immune response on circadian timing. J Pineal Res 41: 344–350.
74. Pontes GN, Cardoso EC, Carneiro-Sampaio MM, Markus RP (2007) Pineal
melatonin and the innate immune response: the TNF-alpha increase after
cesarean section suppresses nocturnal melatonin production. J Pineal Res 43:
365–371.
75. Smoak KA, Cidlowski JA (2004) Mechanisms of glucocorticoid receptor
signaling during inflammation. Mech Ageing Dev 125: 697–706.
76. Fernandes PA, Bothorel B, Clesse D, Monteiro AW, Calgari C, et al. (2009)
Local corticosterone infusion enhances nocturnal pineal melatonin production in
vivo. J Neuroendocrinol 21: 90–97.
77. Ferreira ZS, Fernandes PA, Duma D, Assreuy J, Avellar MC, et al. (2005)
Corticosterone modulates noradrenaline-induced melatonin synthesis through
inhibition of nuclear factor kappa B. J Pineal Res 38: 182–188.
78. Pando MP, Verma IM (2000) Signal-dependent and -independent degradation
of free and NF-kappa B-bound IkappaBalpha. J Biol Chem 275: 21278–21286.
79. Veldhuis JD, Iranmanesh A, Lizarralde G, Johnson ML (1989) Amplitude
modulation of a burstlike mode of cortisol secretion subserves the circadian
glucocorticoid rhythm. Am J Physiol 257: E6–14.
80. Waage A, Brandtzaeg P, Halstensen A, Kierulf P, Espevik T (1989) The complex
pattern of cytokines in serum from patients with meningococcal septic shock.
Association between interleukin 6, interleukin 1, and fatal outcome. J Exp Med
169: 333–338.
81. Brown GC (1991) Total cell protein concentration as an evolutionary constraint
on the metabolic control distribution in cells. J Theor Biol 153: 195–203.
82. Rothman S (2010) How is the balance between protein synthesis and
degradation achieved? Theor Biol Med Model 7: 25.
83. Hess A, Iyera H, Malmb W (2001) Linear trend analysis: a comparison of
methods. Atmospheric Environment 35: 5211–5222.
84. Maha RSH, Tamhanea AC, Tunga SH, Patela AN (1995) Process trending with
piecewise linear smoothing. Computers & Chemical Engineering 19: 129–137.
85. Bellet MM, Sassone-Corsi P (2010) Mammalian circadian clock and metabolism
- the epigenetic link. J Cell Sci 123: 3837–3848.
86. Nelson DE, Ihekwaba AE, Elliott M, Johnson JR, Gibney CA, et al. (2004)
Oscillations in NF-kappaB signaling control the dynamics of gene expression.
Science 306: 704–708.
87. Lipniacki T, Paszek P, Brasier AR, Luxon BA, Kimmel M (2006) Stochastic
regulation in early immune response. Biophys J 90: 725–742.
Agent-Based Model of Human Endotoxemia
PLOS ONE | www.plosone.org 13 January 2013 | Volume 8 | Issue 1 | e55550

88. Schooley K, Zhu P, Dower SK, Qwarnstrom EE (2003) Regulation of nuclear
translocation of nuclear factor-kappaB relA: evidence for complex dynamics atthe single-cell level. Biochem J 369: 331–339.
89. Gori AM, Cesari F, Marcucci R, Giusti B, Paniccia R, et al. (2009) The balance
between pro- and anti-inflammatory cytokines is associated with plateletaggregability in acute coronary syndrome patients. Atherosclerosis 202: 255–
262.90. Jerin A, Pozar-Lukanovic N, Sojar V, Stanisavljevic D, Paver-Erzen V, et al.
(2003) Balance of pro- and anti-inflammatory cytokines in liver surgery. Clin
Chem Lab Med 41: 899–903.91. Bar-Even A, Paulsson J, Maheshri N, Carmi M, O’Shea E, et al. (2006) Noise in
protein expression scales with natural protein abundance. Nat Genet 38: 636–643.
92. Rausenberger J, Kollmann M (2008) Quantifying origins of cell-to-cell variations
in gene expression. Biophys J 95: 4523–4528.
93. Sigal A, Milo R, Cohen A, Geva-Zatorsky N, Klein Y, et al. (2006) Variability
and memory of protein levels in human cells. Nature 444: 643–646.
94. Hermida RC, Ayala DE, Calvo C (2007) Optimal timing for antihypertensive
dosing: focus on valsartan. Ther Clin Risk Manag 3: 119–131.
95. Hermida RC, Ayala DE, Calvo C (2005) Administration-time-dependent effects
of antihypertensive treatment on the circadian pattern of blood pressure. Curr
Opin Nephrol Hypertens 14: 453–459.
96. Calvano SE, Xiao W, Richards DR, Felciano RM, Baker HV, et al. (2005) A
network-based analysis of systemic inflammation in humans. Nature 437: 1032–
1037.
Agent-Based Model of Human Endotoxemia
PLOS ONE | www.plosone.org 14 January 2013 | Volume 8 | Issue 1 | e55550