all india coordinated rice improvement project - aicrip
TRANSCRIPT
Vol. 2
(ENTOMOLOGY AND PLANT PATHOLOGY)
All India CoordinatedRice Improvement Project
Indian Institute of Rice Research(Indian Council of Agricultural Research)Rajendranagar, Hyderabad – 500 030, (Telangana)., India

Correct citation: ICAR-Indian Institute of Rice Research, 2021 Progress Report, 2020, Vol.2, Crop Protection
(Entomology, Plant Pathology) All India Coordinated Rice Improvement Project
ICAR-Indian Institute of Rice Research, Rajendranagar, Hyderabad – 500 030, Telangana State, India
PREFACE
Rice is the most important food crop of our country and identifying solutions
for issues faced in cultivation and production of the crop is key answer for
national food security. Under the All India Coordinated Rice Improvement
Project (AICRIP) evaluation of varietal improvement, crop production and
crop protection technologies across locations has been continuing to
contribute towards strategies strengthening rice farmers’ efforts towards
sustainable rice production. About 400 scientists, belonging to ICAR -
Indian Institute of Rice Research, 45 funded and more than hundred
voluntary centres of State Agricultural Universities, Departments of
Agriculture, ICAR Institutes and Private Undertakings work towards
progress of rice research under the umbrella of AICRIP.
This volume reports the salient findings of experimental trials in Entomology
and Plant Pathology during 2020. Despite unusual situation faced by nation
due to Covid-19 pandemic, the scientists involved in AICRIP system
conducted majority of the trials allotted showing their commitment to the
programme. The major goal of Crop Protection programme of AICRIP is to
develop broad based, environmental-friendly, cost effective and adoptable
IPM technologies which can help in alleviating socio-economic constraints
by providing gainful benefits for rice farmers. Emphasis is on ecologically
safe and cost optimizing IPM components such as host plant resistance,
ecological engineering and biodiversity, utilization as well as need based
application of safe chemicals. Regular monitoring of pest occurrence at
various locations across nation is undertaken to know changing pest
scenario and to have timely management interventions. Efforts are
underway to build decision support systems for assisting farmers in decision
making.
I compliment the efforts of the entire staff of Entomology and Plant
Pathology including Principal Investigators, Cooperating scientists, technical
and supporting personnel for their contribution in bringing out this
document containing useful and relevant information related to rice IPM.
(D. Subrahmanyam)
Director (Acting)
April 2021

2. ENTOMOLOGY
TRIALS
Kharif 2020
CONTENTS PAGE
SUMMARY i-vii
INTRODUCTION 2.1
2.1 HOST PLANT RESISTANCE STUDIES
Planthopper Screening Trial (PHS) 2.3
Gall Midge Screening Trial (GMS) 2.4
Gall Midge Special Screening Trial (GMSS) 2.5
Leaf Folder Screening Trial (LFST) 2.8
Stem Borer Screening Trial (SBST) 2.10
Multiple Resistance Screening Trial (MRST) 2.11
IIRR-National Screening Nurseries (IIRR-NSN) 2.13
NRRI-National Screening Nurseries (NRRI-NSN) 2.19
2.2 INSECT BIOTYPE STUDIES
Gall Midge Biotype Trial (GMBT) 2.22
Gall Midge Population Monitoring Trial (GMPM) 2.24
Planthopper Special Screening Trial (PHSS) 2.25
2.3 CHEMICAL CONTROL STUDIES
Insecticide-Botanicals Evaluation Trial (IBET) 2.27
2.4 ECOLOGICAL STUDIES
Effect of Planting Date on Insect Pest Incidence (EPDP) 2.42
Influence of Establishment Methods on Pest Incidence (IEMP) 2.61
Cropping Systems Influence on Pest incidence (CSIP) 2.66
Evaluation of Pheromone Blends for Insect pests of rice (EPBI) 2.69
2.5 BIOCONTROL AND BIODIVERSITY STUDIES
Ecological Engineering for Pest Management (EEPM) 2.71
Bio Intensive Pest Management trial (BIPM) 2.77
2.6 INTEGRATED PEST MANAGEMENT STUDIES
Integrated Pest Management special Trial (IPMs) 2.88
2.7 ASSESSMENT OF INSECT POPULATIONS THROUGHOUT
THE YEAR USING LIGHT TRAPS 2.114
TRIALS
Rabi 2019-20
SUMMARY
2.1 HOST PLANT RESISTANCE STUDIES
Stem Borer Screening Trial (SBST) 2.128
2.2 CHEMICAL CONTROL STUDIES
Insecticide-Botanicals Evaluation Trial (IBET) 2.131
2.3 ECOLOGICAL STUDIES
Effect of Planting Date on Insect pest Incidence (EPDP) 2.136
2.4 BIOCONTROL AND BIODIVERSITY STUDIES
Ecological engineering for pest management (EEPM) 2.140
Bio intensive pest management trial (BIPM) 2.142
2.5 INTEGRATED PEST MANAGEMENT STUDIES
Integrated Pest Management special Trial (IPMs) 2.143
ICAR-IIRR Annual Progress Report 2020 Vol 2 - Entomology
i
2 Entomology Kharif 2020
SUMMARY
All India Coordinated Entomology Programme was organized and
conducted during kharif 2020 with seven major trials encompassing various
aspects of rice Entomology were conducted at 42 locations (IIRR, 32 funded
& 9 voluntary centres) in 21 states and 2 Union territories.
During kharif 2020, 247 experiments (92.82%) were conducted in funded
centres and 38 experiments (80.85%) in voluntary centres. Details of
scientists involved in the program at headquarters, cooperating centres and
the performance of centres is provided in Appendices I and II.
2.1. Host plant resistance studies
Host plant resistance studies comprised of seven screening experiments
involving 1583 entries which included 1179 pre-breeding lines & varieties,
91 hybrids, 61 germplasm accessions and 90 checks. These entries were
evaluated against 13 insect pests in 132 valid tests (27 greenhouse reactions
+105 field reactions). The results of these reactions identified 97 entries
(6.1% of the tested) as promising against various insect pests. Of these,
promising materials, 43 entries (44.3%) were under retesting.
Planthopper screening trial (PHS) Evaluation of 150 entries against the
two planthoppers viz.,brown planthopper and white-backed planthopper in
9 greenhouse and 6 field tests indicated 21 entries (including 14 breeding
lines viz., BPT 3025, HWR-1-IR83784-5-28-B, HWR-8-IR 54751-1-2-44-15-
2-3-B, HWR-15-IR 75870-5-8-5-B-5-B, HWR-16-IR73382-80-9-3-13-2-2-1-
3-B, JGL 35076, JGL 35085, JGL 35158, KNM 7660, KNM 10081, RMS-
ISM-BPh33-1*, RP 221-3-5-2*, RP 179-3-9-1*, KNM 7629*, 2 germplasm
accessions from NRRI viz., CRCPT 7* and CRCPT 8*, two land races viz.,
PTB 21 and IBT-BPH 1 and three checks viz., PTB 33, MO1, RP2068-18-3-
5 as promising in 4 to12 tests. Of these, 6 entries are in the second year of
retesting.
Under Gall midge screening trial (GMS) 80 entries were evaluated in 6
field tests against 6 populations of gall midge (five identified biotypes) helped
in identification of IBT-WGL-4 and IBT-WGL-5 as promising in 4 tests.
Another 7 lines were promising in 3 tests of the 6 valid tests. Aganni was
promising in 4 tests and W1263 in 3 tests.
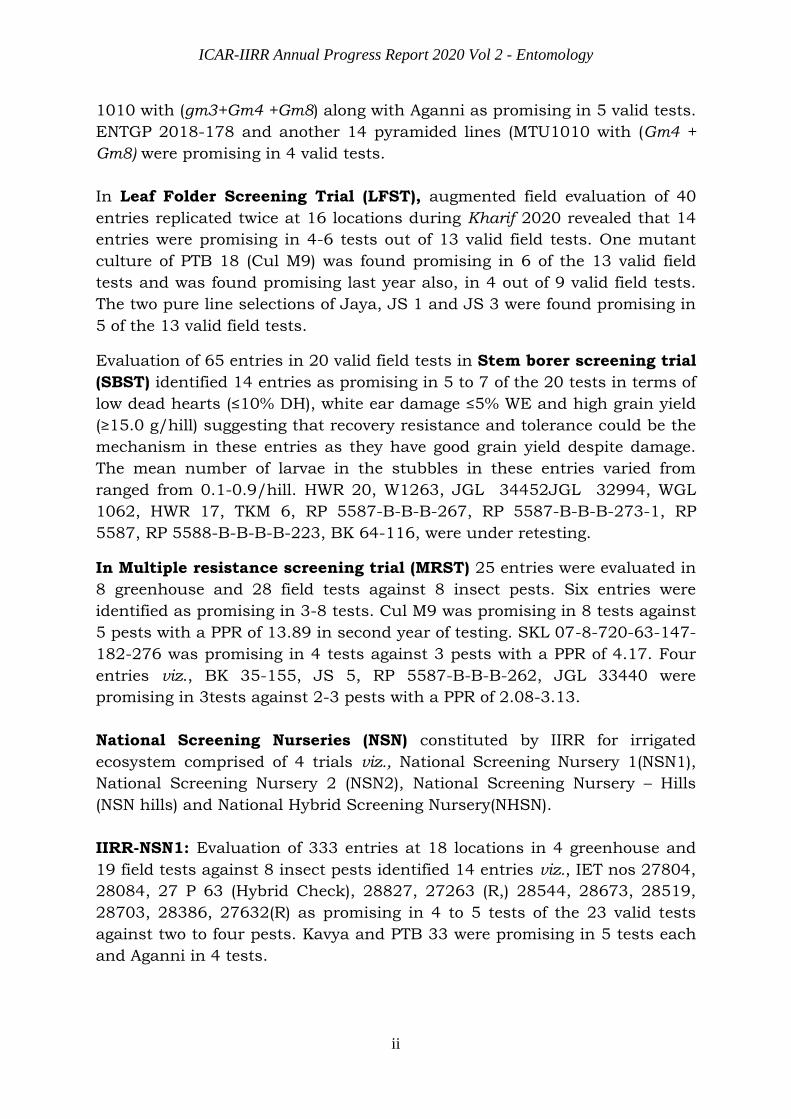
In Gall midge special Screening trial (GMSS) 85 donors were evaluated
against 5 gall midge biotypes in 6 field tests and identified 4 lines (MTU
ICAR-IIRR Annual Progress Report 2020 Vol 2 - Entomology
ii
1010 with (gm3+Gm4 +Gm8) along with Aganni as promising in 5 valid tests.
ENTGP 2018-178 and another 14 pyramided lines (MTU1010 with (Gm4 +
Gm8) were promising in 4 valid tests.
In Leaf Folder Screening Trial (LFST), augmented field evaluation of 40
entries replicated twice at 16 locations during Kharif 2020 revealed that 14
entries were promising in 4-6 tests out of 13 valid field tests. One mutant
culture of PTB 18 (Cul M9) was found promising in 6 of the 13 valid field
tests and was found promising last year also, in 4 out of 9 valid field tests.
The two pure line selections of Jaya, JS 1 and JS 3 were found promising in
5 of the 13 valid field tests.
Evaluation of 65 entries in 20 valid field tests in Stem borer screening trial
(SBST) identified 14 entries as promising in 5 to 7 of the 20 tests in terms of
low dead hearts (≤10% DH), white ear damage ≤5% WE and high grain yield
(≥15.0 g/hill) suggesting that recovery resistance and tolerance could be the
mechanism in these entries as they have good grain yield despite damage.
The mean number of larvae in the stubbles in these entries varied from
ranged from 0.1-0.9/hill. HWR 20, W1263, JGL 34452JGL 32994, WGL
1062, HWR 17, TKM 6, RP 5587-B-B-B-267, RP 5587-B-B-B-273-1, RP
5587, RP 5588-B-B-B-B-223, BK 64-116, were under retesting.
In Multiple resistance screening trial (MRST) 25 entries were evaluated in
8 greenhouse and 28 field tests against 8 insect pests. Six entries were
identified as promising in 3-8 tests. Cul M9 was promising in 8 tests against
5 pests with a PPR of 13.89 in second year of testing. SKL 07-8-720-63-147-
182-276 was promising in 4 tests against 3 pests with a PPR of 4.17. Four
entries viz., BK 35-155, JS 5, RP 5587-B-B-B-262, JGL 33440 were
promising in 3tests against 2-3 pests with a PPR of 2.08-3.13.
National Screening Nurseries (NSN) constituted by IIRR for irrigated
ecosystem comprised of 4 trials viz., National Screening Nursery 1(NSN1),
National Screening Nursery 2 (NSN2), National Screening Nursery – Hills
(NSN hills) and National Hybrid Screening Nursery(NHSN).
IIRR-NSN1: Evaluation of 333 entries at 18 locations in 4 greenhouse and
19 field tests against 8 insect pests identified 14 entries viz., IET nos 27804,
28084, 27 P 63 (Hybrid Check), 28827, 27263 (R,) 28544, 28673, 28519,
28703, 28386, 27632(R) as promising in 4 to 5 tests of the 23 valid tests
against two to four pests. Kavya and PTB 33 were promising in 5 tests each
and Aganni in 4 tests.

ICAR-IIRR Annual Progress Report 2020 Vol 2 - Entomology
iii
IIRR-NSN2: Evaluation of 557 entries in 5 greenhouse and 9 field tests
against 7 pests in 14 valid tests identified IET No 29510 as promising in 4
tests of the 14 valid tests along with PTB-33 and RP 2068-18-3-5.
NSN hills: Of the 114 hill entries that were evaluated at 8 locations in 7
greenhouse and 7 valid field tests against 7 insect pests, four test entries
viz., IET Nos 26594 (R)28925, Vivekdhan 62 and Vivekdhan 86 along with
three check lines were identified promising in 2 of the 14 valid tests.
2.2. INSECT BIOTYPE STUDIES comprising of three trials 1) Gall midge
biotype monitoring trial (GMBT) 2) Gall midge population monitoring(GMPM)
and 3) Plant hopper special screening trial (PHSS) were conducted to
monitor the virulence pattern of gall midge and brown planthopper
populations.
Evaluation of the gene differentials in 9 field tests in Gall Midge Biotype
Trial (GMBT) identified Aganni (Gm8) as promising in 7 of the 9 valid tests.
INRC 3021(Gm8) in 5 tests, RP5925-24 (Gm8), INRC 17470 and W1263
(Gm1) in 4 tests. Kavya was promising in 3 of the 9 valid tests. The results
suggest that Gm8 and Gm1 hold promise across locations.
Evaluation of the gene differentials through single female progeny testing in
Gall midge population monitoring (GMPM) revealed that populations at
Warangal were less virulent on Aganni (Gm8) as compared to populations at
Pattambi but there was an increase in virulence on RP 2068-18-3-5 (gm3).
This is a matter of concern as this trend has also been evident in GMBT trial
in the past few years.
Among the 17 gene differentials evaluated in Planthopper Special
Screening Trial (PHSS) two differentials viz., PTB 33 (with
bph2+Bph3+unknown factors) and RP 2068- 18-3-5 (with Bph33(t) gene)
were promising in 7 out of 8 locations. T12 (with bph7 gene) performed
better at 3 centres, while Swarnalatha with Bph6 gene and IR 36 with bph2
gene performed consistently at 2 centres, each. Six gene differentials viz.,
Rathu Heenati (with Bph3+Bph17 genes), ASD 7 with bph2, Babawee with
bph4 gene, Chinsaba with bph8 gene, ARC 10550 with bph5 gene and IR
65482-7-216-1-2-B with Bph18(t) gene showed low damage at one location
each. Swarnalatha showed superiority through low honeydew excretion,
nymphal survival and more days to wilt in tests conducted at Pantnagar.
Insecticide-Botanicals Evaluation Trial (IBET) was carried out at 28
locations across the country to evaluate performance of various treatments
having combinations of commercially available neem formulation, effective
ICAR-IIRR Annual Progress Report 2020 Vol 2 - Entomology
iv
plant oils along with recommended insecticides against major insect pests of
rice and consequent impact on natural enemies and grain yield during
Kharif, 2020. Based on the performance of the various treatment
combinations in controlling the pest damage at various locations, all
insecticides module was found to be superior in reducing stem borer
damage compared to other insecticide-botanical modules and was the most
effective treatment at both vegetative and reproductive phases. Among
combinations, lowest silver shoot damage was recorded in all botanical
treatment which was on par with all insecticides treatment. Combination of
Neemazal, neem oil and triflumezopyrim treatment was found to effective
against BPH. Against WBPH and GLH all insecticides combination was
found to be the most effective treatment. Against leaf folder also insecticides
module was effective in reducing leaf damage. Insecticide and botanical
combination treatments were found moderately effective in reducing damage
by hispa and whorl maggot pests. There was no significant difference in
natural enemy (mirid, spider and coccinellid) populations among treatments
signifying that both insecticides and botanicals are safe to beneficial
organisms. Among various treatments, all insecticides treatment recorded
highest yield of 6324.6 kg/ha with 44.2% increase over control followed by
treatment with applications of neemazal, neem oil and triflumezopyrim
showing yield of 5498.5 kg/ha (25.3% IOC). All the treatments were superior
as compared to untreated control.
Effect of planting dates on insect pest incidence (EPDP) trial was
conducted at 20 locations during Kharif 2020. Incidence of stem borer was
reported from 15 locations with maximum incidence in late planting. Dead
heart damage was high in late planting at Nawagam (22.78% DH) followed
by Pusa (19.69% DH) and Titabar (19.65% DH). White ear damage was high
in late planting at Nawagam (55.69%) followed by normal planting at
Arundhuthinagar (45.82%). Gall midge incidence was noticed at seven
locations and was low except at Sakoli in normal planting (17.47% SS).
Among the leaf feeding insects, leaf folder was observed at 19 locations with
highest damage in normal planting at Karaikal (29.72%) followed by Chatha
in normal planting (20.88%). Whorl maggot incidence was noticed in eight
locations with maximum damage at Arundhuthinagar in all the plantings
(21.15 - 27.69%). Incidence of hispa was reported from four locations with
highest damage in early planting at Malan (13.20%). Caseworm was
observed only at two locations with maximum damage in late planting at
Titabar (23.54%). Among the sap sucking pests, BPH was observed at 10
locations with maximum numbers in late planting at Raipur (67.50/5 hills)
followed by Gangavathi in late planting (49.06/5 hills). WBPH incidence was
reported from 10 locations and was highest at Gangavathi in normal
planting (66.18/5hills) and late planting (56.94/5 hills). Maximum numbers
ICAR-IIRR Annual Progress Report 2020 Vol 2 - Entomology
v
of GLH were recorded at Ranchi in late planting (36.85/5 hills) followed by
normal planting (30.00/5 hills). Low incidence of horned caterpillar at
Navasari (<2%), grasshopper (<7%) and rice skipper (<2%) at Khudwani was
reported.
Influence of crop establishment methods on pest incidence (IEMP) trial,
a collaborative trial with Agronomy, was conducted at seven locations during
Kharif 2020. Bengal planting was practiced only at Maruteru and aerobic
rice at Pantnagar. Incidence of stem borer, gall midge, leaf folder and BPH
was observed high in unpuddled direct seeded rice that was at par with
normal transplanting method. Incidence of gall midge was observed high in
unpuddled DSR (24.68% SS) at Aduthurai and in drum seeding (17.61% SS)
at Maruteru.
Cropping system influence on insect pest incidence (CSIP), a
collaborative trial with Agronomy was conducted at four locations during
Kharif 2020. Incidence of stem borer, leaf folder, whorl maggot, gall midge,
thrips and blue beetle was observed in different main plots and sub-plots.
Incidence of blue beetle was found significantly high in transplanting
method (58.3 – 67.7% DL) compared to wet seeding (17.2 – 26.2% DL) while
all other pests’ incidence was at par in various establishment methods and
sub-plot treatments of straw incorporation.
Evaluation of pheromone blends for insect pests of rice (EPBI) trial was
conducted at four locations during Kharif 2020.The field trial was
constituted with normal and slow release blends of rice leaf folder, yellow
stem borer and multispecies blend of both RLF and YSB pheromone
compounds, as well as pink stem borer (PSB) normal blend. Of these blends,
maximum cumulative catches were obtained in slow release blend of rice
leaf folder at IIRR (42) and slow release blend of yellow stem borer (35) and
multispecies blend (35) at Aduthurai. Further multi location field testing is
required to confirm the findings.
Ecological engineering for pest management (EEPM) was taken up in six
locations with a combination of interventions such as organic manuring,
alleyways, spacing management, water management and growing of
flowering plants on bunds. The results indicated that water management
along with ecological engineering significantly reduced hopper population at
Warangal (21.20/10 hills) when compared to farmers practice (30.03/10
hills) while increasing yields with the highest yield recorded in ecological
engineering with alternate wetting and drying treatment (3408.52 kg /ha)
while the lowest was in FP plots (2223.62 kg/ha). Pest damage was
significantly lower in ecological engineering treatments with various bund
crops at New Delhi. Such interventions increased the natural enemy

ICAR-IIRR Annual Progress Report 2020 Vol 2 - Entomology
vi
populations like mirids, spiders and coccinellids. At Warangal, the benefit
cost was also significantly higher with ecological engineering (1.48) when
compared to Farmers’ practice (0.88).
Bio intensive pest management (BIPM) trial was initiated to explore the
feasibility of bio-intensive approaches for management of pests for organic
rice cultivation. The trial was conducted in 11 locations during kharif, 2020.
The stem borer incidence was reduced in BIPM plots in Chinsurah (7.05 %),
Jagdalpur (4.69%) Masodha (4.78) and Titabar (4.54 %) as compared to
farmers practice where it was 23.02, 7.46, 30.22 and 10.53 % respectively.
In Raipur and Moncompu the pest incidence was on par with that of
Farmers’ practice. The natural enemies were higher in BIPM plots in almost
all locations.
Integrated Pest Management special (IPMs) trial was conducted at 15
locations involving 34 farmers’ in a participatory mode across the country
with an objective of managing insects, diseases and weeds in a holistic way
by providing a basket of options to the farmers. Across the locations, the
pest incidence was very low during Kharif 2020. Stem borer damage was
observed at 14 locations while it crossed ETL at Sakoli, Pusa and Titabar
and was found low in IPM plots compared to FP plots. Gall midge damage
was reported from four locations with maximum damage at Sakoli in FP plot
(16.7% SS). Hispa damage was very high at Malan throughout the crop
growth period with maximum damage in FP plot (59.43% HDL). BPH
incidence was observed at 9 locations and WBPH at five locations with
maximum numbers at Sakoli in IPM plot (101/ 5 hills). AUDPC of leaf blast
and neck blast diseases was significantly low in the experimental plots
where IPM practices were followed when compared to the farmers’ practices.
Interestingly, more incidence of sheath blight was reported in IPM practices
compared to farmer practices at Sakoli. At Rajendranagr and Titabar, the
IPM practices performed well compared to farmer practices against Sheath
blight. The sheath rot disease progression was slow in IPM practices as
compared to farmer’s practices at Sakoli. At Rajendranagar, false smut
disease progression was more under farmers’ practices compared to IPM
practices. In general, the trial results indicated that the IPM practices which
integrates all the necessary components for the reduction of pathogen
inoculum resulted in low disease progression. At all the locations weed
population and weed biomass was significantly reduced in IPM implemented
plots compared to farmers’ practices. Across the locations, grain yield was
high in IPM plots (3288 – 7780 kg/ ha) as compared to FP plots (2040 –
7652 kg/ha) with maximum yield at Ludhiana. Due to the high grain yield
and high gross returns, BC ratio was high in IPM plots compared to FP plots
at all the locations.
ICAR-IIRR Annual Progress Report 2020 Vol 2 - Entomology
vii
Population Dynamics of Rice Insect Pests Assessed Through Light Trap
Catches revealed that yellow stem borer, leaf folder, and hoppers continued
to be the most important pests in terms of numbers as well as spread across
the locations. Gall midge continues to be an endemic pest. However, case
worm, white stem borer, pink stem borer, black bug, gundhi bug, and zigzag
leaf hopper showed an increase in the spread and intensity of incidence
posing concern for future. Patterns in seasonal incidence and population
build up on the basis of light trap data indicates that the key pests are
reaching their peak levels in the months of October and November in the
kharif season. Therefore, strategies are to be timed accordingly for the
effective management of insect pests in rice.

ICAR-IIRR Annual Progress Report 2020 Vol 2 - Entomology
2.1
ENTOMOLOGY
INTRODUCTION
Insect pests are the prime constituents of biotic stresses creating hurdles
for sustainable rice production across the world. Global climatic change, in
recent times, has had a continued impact on crop cultivation practices resulting
in altered pest profiles in rice. Socio-economic changes and associated ecological
constraints make it particularly challenging for the farmers to battle the variety
of pests infesting rice in our country. The national pests viz., stem borer, gall
midge, planthoppers and leaf folder consistently occur and affect rice crop
across the diverse ecosystems. There are other pests of regional significance like
hispa, caseworm, swarming caterpillar, cut worms, etc. which also have the
potential to cause economic losses to rice farmers under unpredictable
situations.
Under All India Coordinated Rice Improvement Project (AICRIP)
Entomology programme, our research focus is to develop and strengthen the
theme of integrated rice pest management to achieve the sustainable goal of
ensuring social, economic and ecological benefits for the rice farmers.
Pest surveillance is the key initial step in any pest management
programme. Under AICRIP, Pest Survey Reports (PSR) are generated at
fortnightly interval by each cooperating centre that includes real time
information on insect pest incidence in farmers’ fields. In 2020, in the month of
January at reproductive stage of the crop there was an outbreak of brown
planthopper, white-backed planthopper, and green leaf hopper on BPT 5204,
White Ponni, and CR 1009 varieties at Karaikal (Puducherry). Gall midge was
also noticed in severe form on BPT 5204 at this location. At Aduthurai (Tamil
Nadu) severe incidence of gall midge and thrips (40-50 per cent damaged leaves)
was reported in nurseries. Severe incidence of brown planthopper and climbing
cutworm at Pattambi (Kerala), moderate level of black bug from Edathwa, and
Nedumudy (Kerala) were reported in the month of July. Gall midge was wide
spread in forest adjoining areas of Chattisgarh during July to September. Severe
incidence of caseworm inflicted considerable damage in nurseries at Malan
(Himachal Pradesh). Wide spread occurrence of rice panicle mite was reported
from Raipur, Bilaspur, Dhamtari and Kawardha districts particularly in
medium duration varieties and hybrids.
Development of multiple pest resistant varieties and strengthening all our
efforts to consistently maintain a strong host plant resistance programme is the
important activity at different centres and target pests include mainly-
planthoppers, gall midge, stem borer and leaf folder. Germplasm accessions of
both indigenous and exotic origin, landraces, wild rice resources and advanced
breeding lines at different stages are screened against insect pests and diseases
ICAR-IIRR Annual Progress Report 2020 Vol 2 - Entomology
2.2
at different centres, particularly hot spots for specific pests. Promising lines with
desirable resistance traits are identified for use in advanced breeding
programme.
In view of the importance of all-round plant health, insecticides with their
curative action and botanicals with their environment friendliness need to be
integrated into pest management programmes to protect the interests of rice
farmers. Hence, efforts are made not only to screen newer insecticide molecules
for bio efficacy and safety but also investigate the possibility of alternating their
use with botanicals possessing green chemistry and supplementary benefits as
components of organic means of managing insect pests.
Investigations are also being made to study the underlying impact of
climate change scenario on shift in cropping patterns and resultant alterations
in pest profile dynamics. Few collaborative trials require involvement from
agronomists at different cooperating centres.
Ecological engineering and bio-intensive pest management efforts aim to
understand the ways of intelligently exploiting the rice ecosystem rich with
natural enemy diversity for eco-friendly and economically gainful rice IPM.
Adoption of integrated pest management by farmers depends on the
effectiveness of holistic solution provided to alleviate their multiple pest
problems. In addition to enhanced yields farmers need to be convinced about
economic gains from IPM implementation. Under AICRIP, farmer participatory
multidisciplinary approach through involvement of Entomology, Plant Pathology
and Agronomy researchers is being advocated to validate location specific IPM
practices across the country.
Monitoring of insect pest populations through light traps at different
locations helps in short-and long-term assessment of pest populations for use
in pest forecasting.
The following report highlights the significant findings from the
greenhouse evaluations and field trials carried out at IIRR and its cooperating
centres under AICRIP during 2020.
ICAR-IIRR Annual Progress Report 2020 Vol 2 - Entomology
2.3
2.1. HOST PLANT RESISTANCE STUDIES
Identification and delineation of new sources of resistance to major insect pests
in pest specific trials, and evaluation of breeding lines against insect pests from
various National Screening Nurseries is the prime objective of host plant
resistance studies. These include multi-location evaluations in both greenhouse
and field trials to screen and evaluate the performance of germplasm accessions,
breeding lines as well as characterization of insect pest populations from various
hot spots. Seven trials viz., i) Planthopper Screening trial (PHS) ii) Gall Midge
Screening trial (GMS) iii) Gall Midge Special Screening trial (GMSS) iv)
LeafFolder Screening Trial (LFST) v) Stem Borer Screening Trial (SBST) vi)
Multiple Resistance Screening Trial (MRST) and vii) National ScreeningNurseries
(NSN) were constituted and conducted during Kharif 2020. In all, 1583 entries
were evaluated at 42 locations against 13 insect pests and 97 entries (6.1% of
the tested) were identified as promising. The detailed pest reaction of all the
entries in each trial is presented in a separate volume “Screening
Nurseries: – Diseases & Insect Pests Vol II”.
i) Planthopper screening trial (PHS) The planthopper screening trial was
constituted with 150 entries comprising of 8 breeding lines developed at RRU,
ANGRAU, Bapatla; 16 breeding lines developed at TNAU, Coimbatore; 13
breeding lines developed at RARS, PJTSAU, Jagtial; 13 breeding lines developed
at Kunaram, PJTSAU; 21 breeding lines developed at ARI, PJTSAU;
Rajendranagar, 2 germplasm accessions from NRRI, Cuttack, 3 mutants, 2 land
races and 1 breeding line developed from RARS, KAU, Pattambi; 1 local
collection and breeding lines from IBT, PJTSAU, Rajendranagar; 6 breeding
lines developed at RARS, Warangal; 5 breeding lines developed at RARS, Rudrur;
5 breeding lines developed at ARS, Machilipatnam; 25 breeding lines, and 3
introgression lines of Improved Samba Mahsuri possessing Bph33t (BC2F6)
developed at IIRR, Hyderabad along with three resistant checks PTB 33, RP
2068-18-3-5 (BPH) and MO1 (WBPH) as well as one susceptible check TN1. Of
these, six entries were under retesting. The entries were evaluated at 12
locations in 15 tests against brown planthopper (BPH), whitebacked
planthopper (WBPH) and mixed populations of planthoppers under both field
and greenhouse conditions. Evaluation of entries in 7 greenhouse and 1 field
test against brown planthopper, 2 greenhouse and 1 field test against
whitebacked planthopper and 4 field tests against mixed populations of
planthoppers revealed 14 breeding lines viz., BPT 3025, HWR-1-IR83784-5-28-
B, HWR-8-IR 54751-1-2-44-15-2-3-B, HWR-15-IR 75870-5-8-5-B-5-B, HWR-
16-IR73382-80-9-3-13-2-2-1-3-B, JGL 35076, JGL 35085, JGL 35158, KNM
7660, KNM 10081, RMS-ISM-BPh33-1, RP 221-3-5-2, RP 179-3-9-1, KNM 7629
as promising in 4-9 tests (Table 2.1). Two germplasm accessions viz., CRCPT 7
and CRCPT 8 from NRRI and four breeding lines viz., RMS-ISM-BPh33-1, RP
221-3-5-2, RP 179-3-9-1, KNM 7629 performed better in the second year of
ICAR-IIRR Annual Progress Report 2020 Vol 2 - Entomology
2.4
retesting. The susceptible check TN1 recorded damage score in the range of 6.2
to 9.0 in these valid tests. The universal checks - PTB 33 and MO1 performed
well in 12 and 6 tests respectively. The breeding line, RP 2068-18-3-5 carrying
BPH resistant Bph33t gene and gall midge resistant gm3 gene and identified as
a donor check line for BPH performed better in 9 tests. Mixed populations of
brown planthopper and whitebacked planthopper were present at Gangavathi,
Pantnagar, Sakoli and Jagitial. Data on BPH and WBPH populations during the
field evaluation at Gangavathi (WBPH: BPH in 1.2:1.0 ratio) revealed
predominance of WBPH over BPH. In Nawagam only WBPH was present. BPH
was predominant throughout the crop season at Pantnagar (BPH is 4-90 times
more). At Rajendranagar, only BPH population was present.
Evaluation of the entries against the two planthoppers BPH and WBPH in
9 greenhouse and 6 field tests indicated 21 entries (including 14 breeding lines,
2 germplasm accessions, 2 land races and three checks) as promising in 4 to 12
tests. Two germplasm accessions viz., CRCPT 7 and CRCPT 8 from NRRI and
four breeding lines viz., RMS-ISM-BPh33-1, RP 221-3-5-2, RP 179-3-9-1, KNM
7629 performed better in the second year of retesting.
ii) Gall midge screening trial (GMS)
The objective of this trial was to evaluate the performance of the breeding lines
developed from known sources of gall midge resistance against various
populations of gall midge. The trial was constituted with 80 entries (73 breeding
lines along with 6 resistant checks and one susceptible check). The nominations
included 13 entries found promising in NSN 2 in 2019 and the new material
developed from 33 crosses bred at 6 locations viz IIRR, Jagtial, IBT-PJTSAU,
Kunaram, Pattambi and Sindewahi. They were evaluated at 10 locations across
the country against 5 identified biotypes of gall midge. The valid data from 6
locations for various biotypes/populations were considered for analysis and the
salient findings are discussed as under:
JGL 34828, JGL 34993, KNM 11570, KNM 11575, KNM 11579, KNM 11588,
WGL 1515 and IBT-WGL-5 recorded nil damage at both Jagdalpur and CHP for
GMB1. Aganni, IBT-WGL-4, IBT-WGL-5, IBT-WGL-8 recorded nil damage at JGL
for biotype 3.
WGL 1513, WGL 1515, IBT-WGL-4, IBT-WGL-5, IBT-WGL-8 recorded nil
damage against biotype 4 at Sakoli but JGL 34993, KNM 11569, KNM 11574,
IET 28358, W1263 and Aganni recorded ≤10 % DP. All the entries were
susceptible at Warangal for Biotype 4M.KNM 11575 and KNM 11579 recorded
<10 % DP at Pattambi for biotype 5.
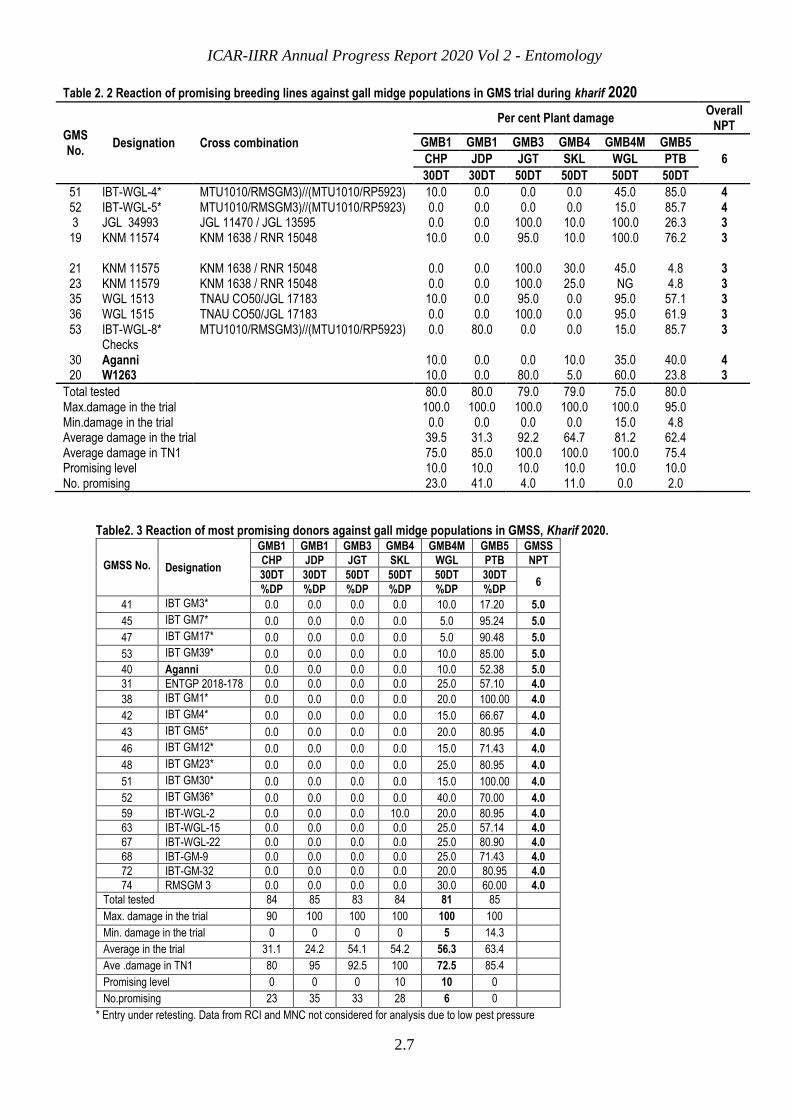
Evaluation of 80 entries in 6 field tests against 6 populations of gall midge (five
identified biotypes) helped in identification of IBT-WGL-4 and IBT-WGL-5 as
ICAR-IIRR Annual Progress Report 2020 Vol 2 - Entomology
2.5
promising in 4 tests. Another 7 lines were promising in 3 tests of the 6 valid tests
(Table 2.2). Aganni was promising in 4 tests and W1263 in 3 tests.
iii) Gall midge special screening trial (GMSS)
There is always a need to identify new sources of resistance to insect pests
in general and gall midge in particular where the resistance is governed by a
single gene. Under the present situation there are very few donors available that
are resistant to all the prevailing populations of gall midge. Hence this trial was
constituted with 85 entries (46 germplasm accessions and 33 gene pyramided
lines nominated from IBT, PJTSAU along with check varieties) and was carried
out in 8 locations to identify new sources of resistance to gall midge
biotypes/populations. Of these, 48 lines were under retesting. The valid data
from six locations which had >50% DP in TN1 were analysed and discussed
biotype/population wise as under:
Evaluation of the entries for GMB1 identified Aganni, IIRR-ENTGP-2018-178
IIRR-ENTGP-2018-198 and 17 gene pyramided lines (MTU1010 with Gm4 and
Gm8) (IBTGM3, IBT GM 4, IBT GM 5, IBT GM 7, IBT GM9, IBT GM 12, IBT
GM17, and IBT GM23, IBT GM 30, IBT, IBT GM36, IBT GM39, IBT-WGL-2, IBT-
WGL-15, IBT-WGL-16, IBT-WGL-21, IBT-WGL-22, IBT-WGL-31) as promising
with nil damage at both Jagdalpur and Chiplima.
Against biotype 3, ARC 5906, IC 576897, IIRR-ENT-2019-170, ENTGP 2018-
178, IBT WGL31, IBT GM1, IBT GM2 and Aganni, IBT GM3, IBT GM4, IBT GM5,
IBT GM6, IBT GM7, IBT GM12, IBT GM17 and IBT GM23showed nil damage at
Jagtial. Of these 14 entries are under retesting
IBT GM3, IBT GM7, IBT GM17, IBT GM39and IBT-GM-40 were promising with nil damage at Sakoli for biotype 4 and ≤10 % DP for biotype 4 M at Warangal.
All the entries were susceptible at Pattambi.
Evaluation of 85 donors against 5 gall midge biotypes in 6 field tests identified 4
lines ((MTU1010 with gm3+Gm4 +Gm8) along with Aganni as promising in 5 valid
tests. ENTGP 2018-178 and another 14 pyramided lines were promising in 4 valid
tests (Table 2.3).

ICAR-IIRR Annual Progress Report 2020 Vol 2 - Entomology
2.6
Table: 2.1 Performance of the most promising entries against planthoppers, PHS, kharif 2020
Entry No
Designation Cross
Brown Planthopper Whitebacked planthopper
Planthoppers No of Promising tests (NPT)
IIRR ADT CBT CTC LDN MND PNT RNR IIRR CBT NWG GNV JGT PNT SKL BPH WBPH PH Total
Greenhouse reaction Field Gr.h 80DT 80DT 50DT 110DT GH (7)
FR(1) GH (2)
FR (1)
FR (4)
15 DS DS No/10h DS No/10h %DT
5 BPT 3025 BPT 2231/MTU 1075 9.3 9.0 7.7 9.0 8.1 9.0 9.0 5.0 7.7 5.0 38 3 101 101 34.8 0 1 1 1 1 4
33 PTB 21 6.1 9.0 6.3 7.7 3.3 9.0 2.3 9.0 6.4 8.2 42 3 162 88 33.8 2 0 0 1 2 5
34 CRCPT 7* CR AC 35003 4.9 3.0 4.8 1.5 4.0 5.0 3.4 9.0 8.0 4.6 52 5 137 101 35.4 7 0 1 0 0 8
35 CRCPT 8* CR AC 34997 6.3 9.0 6.0 4.8 3.3 5.0 1.4 7.0 6.0 6.2 48 5 143 97 33.0 4 0 0 0 0 4
36 HWR-1-IR83784-5-28-B
IR31917-45-3-2 xO. latifolia100914(BC1F11)
4.6 9.0 5.6 5.6 3.9 7.0 4.7 9.0 6.5 5.0 52 7 133 104 31.3 3 0 1 0 0 4
39 HWR-8-IR 54751-1-2-44-15-2-3-B
O. sativa x O. officinalis acc. 100896(BC1F11)
5.0 9.0 9.1 8.6 8.3 9.0 9.0 9.0 6.4 7.4 42 3 96 107 43.5 1 0 0 1 2 4
42 HWR-15-IR 75870-5-8-5-B-5-B
IR 64 x O. glaberrima(BC1F11)
3.8 3.6 5.6 0.0 3.5 5.0 9.0 9.0 9.0 6.8 60 5 89 87 31.6 5 0 0 0 2 7
43 HWR-16-IR73382-80-9-3-13-2-2-1-3-B
IR 64 x O. rufipogon acc. 106412(BC1F11)
7.9 9.0 8.2 9.0 4.0 3.0 9.0 5.0 9.0 9.0 42 5 126 104 32.9 2 1 0 1 0 4
57 IBT-BPH 1 Local collection 3.9 3.6 6.5 7.5 2.7 5.0 2.6 9.0 5.0 7.7 64 5 129 94 34.5 5 0 1 0 0 6
75 JGL 35076 (JGL 19621 x NLR 34449) x NLR 34449
9.0 3.6 6.5 9.0 8.3 7.0 9.0 9.0 9.0 8.0 60 3 141 79 27.0 1 0 0 0 3 4
76 JGL 35085 (JGL 20171 x NLR 34449) x JGL 20171
7.1 7.6 5.3 NG NG 7.0 3.9 5.0 9.0 9.0 44 3 144 94 35.7 1 1 0 1 1 4
77 JGL 35158 IR 79156B x IR 58025B 6.5 3.6 5.9 8.1 3.0 5.0 2.0 7.0 8.2 5.5 52 5 105 95 34.5 4 0 0 0 0 4
85 KNM 7660 TME 80518xKNM 118 4.7 7.6 5.9 9.0 3.5 7.0 5.8 5.0 7.9 5.8 48 3 160 88 39.7 2 1 0 0 2 5
93 KNM 10081 IR83141-B-17BTME 80518//MTU1156xKNM 118
5.9 5.6 7.2 9.0 3.6 9.0 9.0 9.0 8.4 6.1 62 3 95 77 23.7 1 0 0 0 4 5
107 RMS-ISM-BPh33-1* ISM X RP2068 3.0 3.0 5.3 2.5 5.0 0.3 9.0 5.0 7.2 46 3 132 88 27.7 5 0 1 0 2 9
132 RP 221-3-5-2* MTU1121 / Vijetha 5.0 5.6 6.2 5.3 5.0 3.5 7.0 6.2 7.7 NG 3 106 107 33.0 3 0 0 0 1 4
133 RP 179-3-9-1* MTU1121 / Vijetha 5.0 5.6 5.9 NG 5.0 NG 3.0 5.1 7.1 42 1 128 98 54.9 2 1 0 1 1 5
147 KNM 7629* MTU 1156 X KNM 118 4.8 9.0 6.1 5.7 7.0 9.0 7.0 6.0 6.1 30 3 153 132 24.0 1 0 0 1 2 4
148 PTB33 R check 1.5 3.0 6.4 1.9 3.0 0.9 5.0 4.9 6.5 38 1 69 80 25.3 5 1 1 1 4 12
150 MO1 R check 4.3 5.6 4.3 NG 5.0 9.0 7.0 1.6 7.8 46 3 46 100 55.7 3 0 1 0 2 6
40 RP2068-18-3-5 R check 2.1 9.0 3.4 5.0 2.3 3.0 0.6 5.0 7.4 5.5 58 3 115 95 23.8 6 1 0 0 2 9
Promising level 5.0 5.0 5.0 5.0 5.0 5.0 5.0 5.0 5.0 5.0 45 3 100 90 28.0
No. of promising entries 24 24 6 7 41 31 21 23 8 5 19 51 19 26 17
ICAR-IIRR Annual Progress Report 2020 Vol 2 - Entomology
2.7
Table 2. 2 Reaction of promising breeding lines against gall midge populations in GMS trial during kharif 2020
GMS No.
Designation Cross combination
Per cent Plant damage Overall
NPT
GMB1 GMB1 GMB3 GMB4 GMB4M GMB5
6 CHP JDP JGT SKL WGL PTB
30DT 30DT 50DT 50DT 50DT 50DT
51 IBT-WGL-4* MTU1010/RMSGM3)//(MTU1010/RP5923) 10.0 0.0 0.0 0.0 45.0 85.0 4 52 IBT-WGL-5* MTU1010/RMSGM3)//(MTU1010/RP5923) 0.0 0.0 0.0 0.0 15.0 85.7 4 3 JGL 34993 JGL 11470 / JGL 13595 0.0 0.0 100.0 10.0 100.0 26.3 3
19 KNM 11574 KNM 1638 / RNR 15048 10.0 0.0 95.0 10.0 100.0 76.2 3
21 KNM 11575 KNM 1638 / RNR 15048 0.0 0.0 100.0 30.0 45.0 4.8 3 23 KNM 11579 KNM 1638 / RNR 15048 0.0 0.0 100.0 25.0 NG 4.8 3 35 WGL 1513 TNAU CO50/JGL 17183 10.0 0.0 95.0 0.0 95.0 57.1 3 36 WGL 1515 TNAU CO50/JGL 17183 0.0 0.0 100.0 0.0 95.0 61.9 3 53 IBT-WGL-8* MTU1010/RMSGM3)//(MTU1010/RP5923) 0.0 80.0 0.0 0.0 15.0 85.7 3 Checks
30 Aganni 10.0 0.0 0.0 10.0 35.0 40.0 4 20 W1263 10.0 0.0 80.0 5.0 60.0 23.8 3
Total tested 80.0 80.0 79.0 79.0 75.0 80.0 Max.damage in the trial 100.0 100.0 100.0 100.0 100.0 95.0 Min.damage in the trial 0.0 0.0 0.0 0.0 15.0 4.8 Average damage in the trial 39.5 31.3 92.2 64.7 81.2 62.4 Average damage in TN1 75.0 85.0 100.0 100.0 100.0 75.4 Promising level 10.0 10.0 10.0 10.0 10.0 10.0 No. promising 23.0 41.0 4.0 11.0 0.0 2.0
Table2. 3 Reaction of most promising donors against gall midge populations in GMSS, Kharif 2020.
GMSS No. Designation
GMB1 GMB1 GMB3 GMB4 GMB4M GMB5 GMSS
CHP JDP JGT SKL WGL PTB NPT
30DT 30DT 50DT 50DT 50DT 30DT 6
%DP %DP %DP %DP %DP %DP
41 IBT GM3* 0.0 0.0 0.0 0.0 10.0 17.20 5.0
45 IBT GM7* 0.0 0.0 0.0 0.0 5.0 95.24 5.0
47 IBT GM17* 0.0 0.0 0.0 0.0 5.0 90.48 5.0
53 IBT GM39* 0.0 0.0 0.0 0.0 10.0 85.00 5.0
40 Aganni 0.0 0.0 0.0 0.0 10.0 52.38 5.0
31 ENTGP 2018-178 0.0 0.0 0.0 0.0 25.0 57.10 4.0
38 IBT GM1* 0.0 0.0 0.0 0.0 20.0 100.00 4.0
42 IBT GM4* 0.0 0.0 0.0 0.0 15.0 66.67 4.0
43 IBT GM5* 0.0 0.0 0.0 0.0 20.0 80.95 4.0
46 IBT GM12* 0.0 0.0 0.0 0.0 15.0 71.43 4.0
48 IBT GM23* 0.0 0.0 0.0 0.0 25.0 80.95 4.0
51 IBT GM30* 0.0 0.0 0.0 0.0 15.0 100.00 4.0
52 IBT GM36* 0.0 0.0 0.0 0.0 40.0 70.00 4.0
59 IBT-WGL-2 0.0 0.0 0.0 10.0 20.0 80.95 4.0
63 IBT-WGL-15 0.0 0.0 0.0 0.0 25.0 57.14 4.0
67 IBT-WGL-22 0.0 0.0 0.0 0.0 25.0 80.90 4.0
68 IBT-GM-9 0.0 0.0 0.0 0.0 25.0 71.43 4.0
72 IBT-GM-32 0.0 0.0 0.0 0.0 20.0 80.95 4.0
74 RMSGM 3 0.0 0.0 0.0 0.0 30.0 60.00 4.0
Total tested 84 85 83 84 81 85
Max. damage in the trial 90 100 100 100 100 100
Min. damage in the trial 0 0 0 0 5 14.3
Average in the trial 31.1 24.2 54.1 54.2 56.3 63.4
Ave .damage in TN1 80 95 92.5 100 72.5 85.4
Promising level 0 0 0 10 10 0
No.promising 23 35 33 28 6 0
* Entry under retesting. Data from RCI and MNC not considered for analysis due to low pest pressure
ICAR-IIRR Annual Progress Report 2020 Vol 2 - Entomology
2.8
iv) Leaf Folder Screening Trial (LFST)
The main aim of constituting Leaf folder screening trial (LFST) was to identify
new sources of resistance to rice leaf folder, Cnaphalocrocis medinalis. The trial
comprised of 40 entries and three nominationsfrom Main Rice Research Station,
Nawagam; three nominations from Rice & Wheat Research station, Malan; 12
nominations from Regional Agricultural Research Station, Pattambi; two back-
cross inbred lines (BILs) of Swarna/Oryza nivarafrom IIRR and 16 nominations
from Rice section, Bapatla along with susceptible check (TN1) and resistant
check (W1263). During Kharif 2020, the trial was conducted at 16 locations with
36 entries replicated twice in a randomised block design. This is the second year
of testing of these entries except the entries nominated from Bapatla.
The average damage in the trial ranged between 8.4 and 47.2% while the
maximum damage varied from 13.0 to 63.1%. Data analysis revealed 14 entries
as promising in 4-6 tests of 13 valid field tests (Table 2.4). In the second year
of testing, the mutant culture of PTB 18(cul M9) was found promising in 6 out
of 13 valid tests. Two pureline selections from Jaya (JS 1 & JS 3) were found
promising in 5 out of 13 valid tests. Eleven nominations (JS 5, JS 6, Cul M8,
Cul M6-2, Matali, Ghocha, BPT 2932, BPT 2677, BPT 2954, BPT 3049 and NPS
54) were found promising in 4 out of 13 valid tests conducted at different
locations.
In Leaf Folder Screening Trial (LFST), augmented field evaluation of 40 entries
replicated twice at 16 locations during Kharif 2020 revealed that 14 entries were
promising in 4-6 tests out of 13 valid field tests. One mutant culture of PTB 18
(Cul M9) was found promising in 6 of the 13 valid field tests and was found
promising last year also, in 4 out of 9 valid field tests. The two pure line selections
of Jaya, JS 1 and JS 3 were found promising in 5 of the 13 valid field tests.
ICAR-IIRR Annual Progress Report 2020 Vol 2 - Entomology
2.9
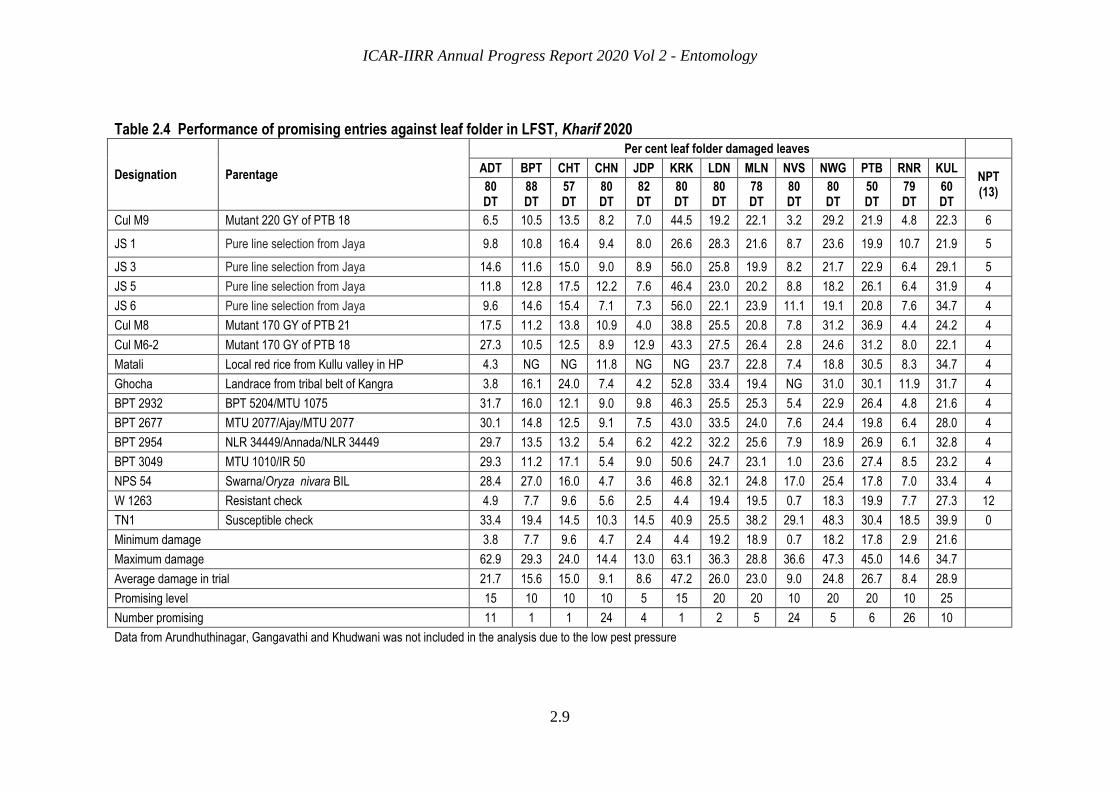
Table 2.4 Performance of promising entries against leaf folder in LFST, Kharif 2020
Designation Parentage
Per cent leaf folder damaged leaves
ADT BPT CHT CHN JDP KRK LDN MLN NVS NWG PTB RNR KUL NPT (13) 80
DT 88 DT
57 DT
80 DT
82 DT
80 DT
80 DT
78 DT
80 DT
80 DT
50 DT
79 DT
60 DT
Cul M9 Mutant 220 GY of PTB 18 6.5 10.5 13.5 8.2 7.0 44.5 19.2 22.1 3.2 29.2 21.9 4.8 22.3 6
JS 1 Pure line selection from Jaya 9.8 10.8 16.4 9.4 8.0 26.6 28.3 21.6 8.7 23.6 19.9 10.7 21.9 5
JS 3 Pure line selection from Jaya 14.6 11.6 15.0 9.0 8.9 56.0 25.8 19.9 8.2 21.7 22.9 6.4 29.1 5
JS 5 Pure line selection from Jaya 11.8 12.8 17.5 12.2 7.6 46.4 23.0 20.2 8.8 18.2 26.1 6.4 31.9 4
JS 6 Pure line selection from Jaya 9.6 14.6 15.4 7.1 7.3 56.0 22.1 23.9 11.1 19.1 20.8 7.6 34.7 4
Cul M8 Mutant 170 GY of PTB 21 17.5 11.2 13.8 10.9 4.0 38.8 25.5 20.8 7.8 31.2 36.9 4.4 24.2 4
Cul M6-2 Mutant 170 GY of PTB 18 27.3 10.5 12.5 8.9 12.9 43.3 27.5 26.4 2.8 24.6 31.2 8.0 22.1 4
Matali Local red rice from Kullu valley in HP 4.3 NG NG 11.8 NG NG 23.7 22.8 7.4 18.8 30.5 8.3 34.7 4
Ghocha Landrace from tribal belt of Kangra 3.8 16.1 24.0 7.4 4.2 52.8 33.4 19.4 NG 31.0 30.1 11.9 31.7 4
BPT 2932 BPT 5204/MTU 1075 31.7 16.0 12.1 9.0 9.8 46.3 25.5 25.3 5.4 22.9 26.4 4.8 21.6 4
BPT 2677 MTU 2077/Ajay/MTU 2077 30.1 14.8 12.5 9.1 7.5 43.0 33.5 24.0 7.6 24.4 19.8 6.4 28.0 4
BPT 2954 NLR 34449/Annada/NLR 34449 29.7 13.5 13.2 5.4 6.2 42.2 32.2 25.6 7.9 18.9 26.9 6.1 32.8 4
BPT 3049 MTU 1010/IR 50 29.3 11.2 17.1 5.4 9.0 50.6 24.7 23.1 1.0 23.6 27.4 8.5 23.2 4
NPS 54 Swarna/Oryza nivara BIL 28.4 27.0 16.0 4.7 3.6 46.8 32.1 24.8 17.0 25.4 17.8 7.0 33.4 4
W 1263 Resistant check 4.9 7.7 9.6 5.6 2.5 4.4 19.4 19.5 0.7 18.3 19.9 7.7 27.3 12
TN1 Susceptible check 33.4 19.4 14.5 10.3 14.5 40.9 25.5 38.2 29.1 48.3 30.4 18.5 39.9 0
Minimum damage 3.8 7.7 9.6 4.7 2.4 4.4 19.2 18.9 0.7 18.2 17.8 2.9 21.6
Maximum damage 62.9 29.3 24.0 14.4 13.0 63.1 36.3 28.8 36.6 47.3 45.0 14.6 34.7
Average damage in trial 21.7 15.6 15.0 9.1 8.6 47.2 26.0 23.0 9.0 24.8 26.7 8.4 28.9
Promising level 15 10 10 10 5 15 20 20 10 20 20 10 25
Number promising 11 1 1 24 4 1 2 5 24 5 6 26 10
Data from Arundhuthinagar, Gangavathi and Khudwani was not included in the analysis due to the low pest pressure
ICAR-IIRR Annual Progress Report 2020 Vol 2 - Entomology
2.10
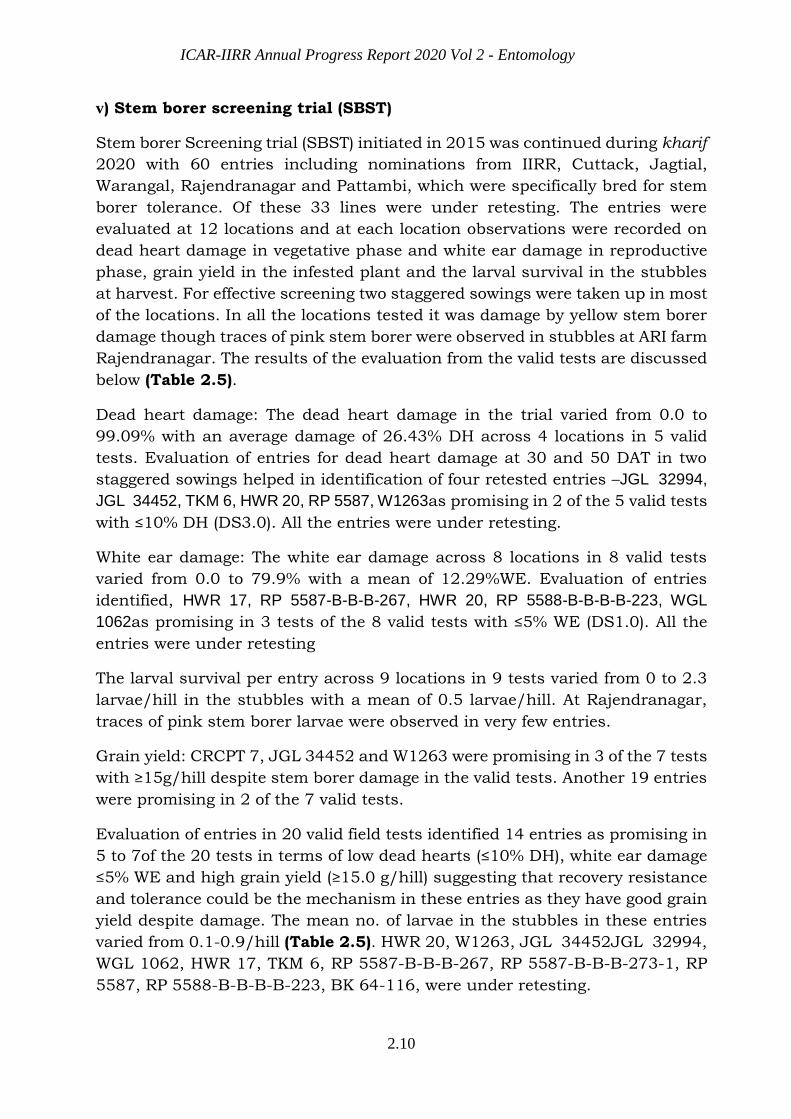
v) Stem borer screening trial (SBST)
Stem borer Screening trial (SBST) initiated in 2015 was continued during kharif
2020 with 60 entries including nominations from IIRR, Cuttack, Jagtial,
Warangal, Rajendranagar and Pattambi, which were specifically bred for stem
borer tolerance. Of these 33 lines were under retesting. The entries were
evaluated at 12 locations and at each location observations were recorded on
dead heart damage in vegetative phase and white ear damage in reproductive
phase, grain yield in the infested plant and the larval survival in the stubbles
at harvest. For effective screening two staggered sowings were taken up in most
of the locations. In all the locations tested it was damage by yellow stem borer
damage though traces of pink stem borer were observed in stubbles at ARI farm
Rajendranagar. The results of the evaluation from the valid tests are discussed
below (Table 2.5).
Dead heart damage: The dead heart damage in the trial varied from 0.0 to
99.09% with an average damage of 26.43% DH across 4 locations in 5 valid
tests. Evaluation of entries for dead heart damage at 30 and 50 DAT in two
staggered sowings helped in identification of four retested entries –JGL 32994,
JGL 34452, TKM 6, HWR 20, RP 5587, W1263as promising in 2 of the 5 valid tests
with ≤10% DH (DS3.0). All the entries were under retesting.
White ear damage: The white ear damage across 8 locations in 8 valid tests
varied from 0.0 to 79.9% with a mean of 12.29%WE. Evaluation of entries
identified, HWR 17, RP 5587-B-B-B-267, HWR 20, RP 5588-B-B-B-B-223, WGL
1062as promising in 3 tests of the 8 valid tests with ≤5% WE (DS1.0). All the
entries were under retesting
The larval survival per entry across 9 locations in 9 tests varied from 0 to 2.3
larvae/hill in the stubbles with a mean of 0.5 larvae/hill. At Rajendranagar,
traces of pink stem borer larvae were observed in very few entries.
Grain yield: CRCPT 7, JGL 34452 and W1263 were promising in 3 of the 7 tests
with ≥15g/hill despite stem borer damage in the valid tests. Another 19 entries
were promising in 2 of the 7 valid tests.
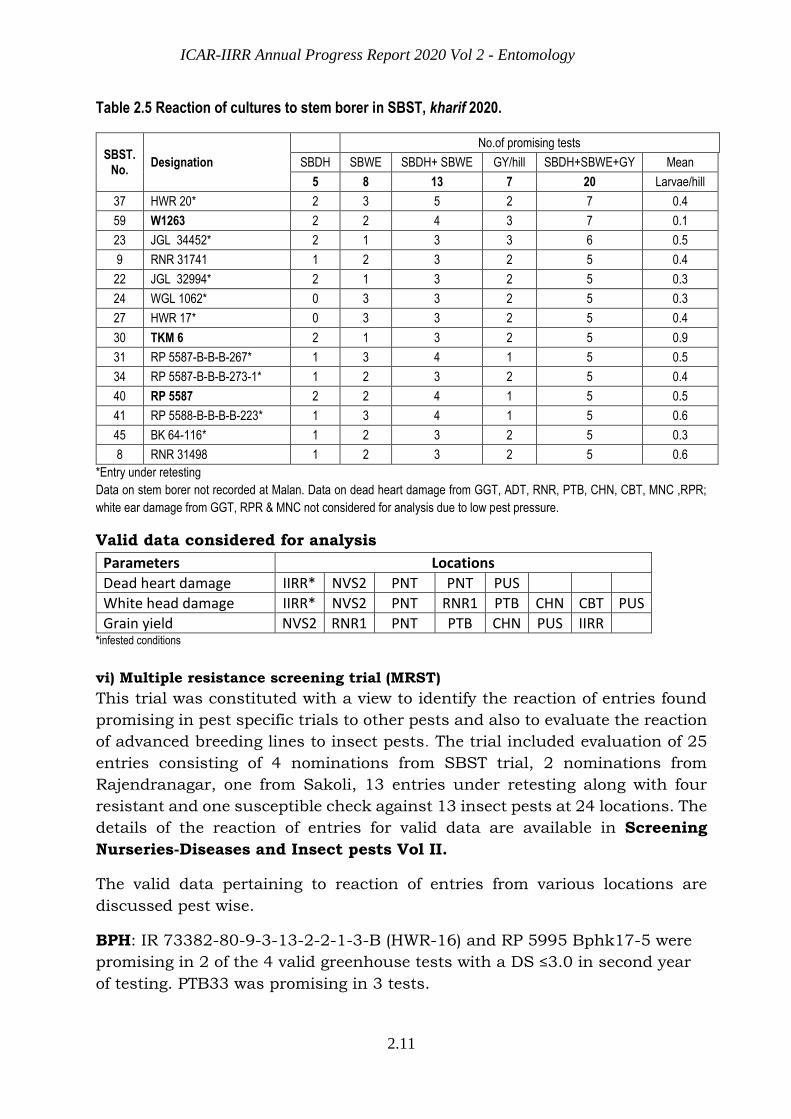
Evaluation of entries in 20 valid field tests identified 14 entries as promising in
5 to 7of the 20 tests in terms of low dead hearts (≤10% DH), white ear damage
≤5% WE and high grain yield (≥15.0 g/hill) suggesting that recovery resistance
and tolerance could be the mechanism in these entries as they have good grain
yield despite damage. The mean no. of larvae in the stubbles in these entries
varied from 0.1-0.9/hill (Table 2.5). HWR 20, W1263, JGL 34452JGL 32994,
WGL 1062, HWR 17, TKM 6, RP 5587-B-B-B-267, RP 5587-B-B-B-273-1, RP
5587, RP 5588-B-B-B-B-223, BK 64-116, were under retesting.
ICAR-IIRR Annual Progress Report 2020 Vol 2 - Entomology
2.11
Table 2.5 Reaction of cultures to stem borer in SBST, kharif 2020.
SBST.No.
Designation
No.of promising tests
SBDH SBWE SBDH+ SBWE GY/hill SBDH+SBWE+GY Mean
5 8 13 7 20 Larvae/hill
37 HWR 20* 2 3 5 2 7 0.4
59 W1263 2 2 4 3 7 0.1
23 JGL 34452* 2 1 3 3 6 0.5
9 RNR 31741 1 2 3 2 5 0.4
22 JGL 32994* 2 1 3 2 5 0.3
24 WGL 1062* 0 3 3 2 5 0.3
27 HWR 17* 0 3 3 2 5 0.4
30 TKM 6 2 1 3 2 5 0.9
31 RP 5587-B-B-B-267* 1 3 4 1 5 0.5
34 RP 5587-B-B-B-273-1* 1 2 3 2 5 0.4
40 RP 5587 2 2 4 1 5 0.5
41 RP 5588-B-B-B-B-223* 1 3 4 1 5 0.6
45 BK 64-116* 1 2 3 2 5 0.3
8 RNR 31498 1 2 3 2 5 0.6
*Entry under retesting
Data on stem borer not recorded at Malan. Data on dead heart damage from GGT, ADT, RNR, PTB, CHN, CBT, MNC ,RPR;
white ear damage from GGT, RPR & MNC not considered for analysis due to low pest pressure.
Valid data considered for analysis
Parameters Locations
Dead heart damage IIRR* NVS2 PNT PNT PUS
White head damage IIRR* NVS2 PNT RNR1 PTB CHN CBT PUS
Grain yield NVS2 RNR1 PNT PTB CHN PUS IIRR *infested conditions
vi) Multiple resistance screening trial (MRST)
This trial was constituted with a view to identify the reaction of entries found
promising in pest specific trials to other pests and also to evaluate the reaction
of advanced breeding lines to insect pests. The trial included evaluation of 25
entries consisting of 4 nominations from SBST trial, 2 nominations from
Rajendranagar, one from Sakoli, 13 entries under retesting along with four
resistant and one susceptible check against 13 insect pests at 24 locations. The
details of the reaction of entries for valid data are available in Screening
Nurseries-Diseases and Insect pests Vol II.
The valid data pertaining to reaction of entries from various locations are
discussed pest wise.
BPH: IR 73382-80-9-3-13-2-2-1-3-B (HWR-16) and RP 5995 Bphk17-5 were
promising in 2 of the 4 valid greenhouse tests with a DS ≤3.0 in second year
of testing. PTB33 was promising in 3 tests.
ICAR-IIRR Annual Progress Report 2020 Vol 2 - Entomology
2.12
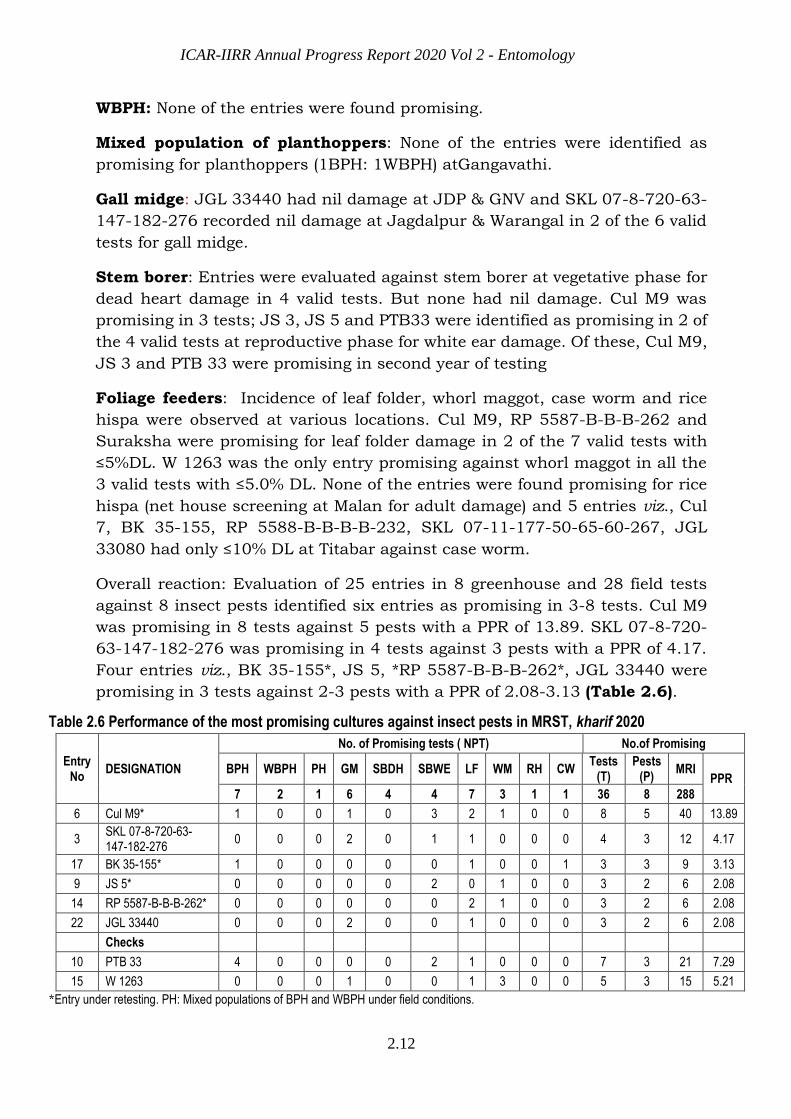
WBPH: None of the entries were found promising.
Mixed population of planthoppers: None of the entries were identified as
promising for planthoppers (1BPH: 1WBPH) atGangavathi.
Gall midge: JGL 33440 had nil damage at JDP & GNV and SKL 07-8-720-63-
147-182-276 recorded nil damage at Jagdalpur & Warangal in 2 of the 6 valid
tests for gall midge.
Stem borer: Entries were evaluated against stem borer at vegetative phase for
dead heart damage in 4 valid tests. But none had nil damage. Cul M9 was
promising in 3 tests; JS 3, JS 5 and PTB33 were identified as promising in 2 of
the 4 valid tests at reproductive phase for white ear damage. Of these, Cul M9,
JS 3 and PTB 33 were promising in second year of testing
Foliage feeders: Incidence of leaf folder, whorl maggot, case worm and rice
hispa were observed at various locations. Cul M9, RP 5587-B-B-B-262 and
Suraksha were promising for leaf folder damage in 2 of the 7 valid tests with
≤5%DL. W 1263 was the only entry promising against whorl maggot in all the
3 valid tests with ≤5.0% DL. None of the entries were found promising for rice
hispa (net house screening at Malan for adult damage) and 5 entries viz., Cul
7, BK 35-155, RP 5588-B-B-B-B-232, SKL 07-11-177-50-65-60-267, JGL
33080 had only ≤10% DL at Titabar against case worm.
Overall reaction: Evaluation of 25 entries in 8 greenhouse and 28 field tests
against 8 insect pests identified six entries as promising in 3-8 tests. Cul M9
was promising in 8 tests against 5 pests with a PPR of 13.89. SKL 07-8-720-
63-147-182-276 was promising in 4 tests against 3 pests with a PPR of 4.17.
Four entries viz., BK 35-155*, JS 5, *RP 5587-B-B-B-262*, JGL 33440 were
promising in 3 tests against 2-3 pests with a PPR of 2.08-3.13 (Table 2.6).
Table 2.6 Performance of the most promising cultures against insect pests in MRST, kharif 2020
Entry No
DESIGNATION
No. of Promising tests ( NPT) No.of Promising
BPH WBPH PH GM SBDH SBWE LF WM RH CW Tests
(T) Pests
(P) MRI
PPR
7 2 1 6 4 4 7 3 1 1 36 8 288
6 Cul M9* 1 0 0 1 0 3 2 1 0 0 8 5 40 13.89
3 SKL 07-8-720-63-147-182-276
0 0 0 2 0 1 1 0 0 0 4 3 12 4.17
17 BK 35-155* 1 0 0 0 0 0 1 0 0 1 3 3 9 3.13
9 JS 5* 0 0 0 0 0 2 0 1 0 0 3 2 6 2.08
14 RP 5587-B-B-B-262* 0 0 0 0 0 0 2 1 0 0 3 2 6 2.08
22 JGL 33440 0 0 0 2 0 0 1 0 0 0 3 2 6 2.08
Checks
10 PTB 33 4 0 0 0 0 2 1 0 0 0 7 3 21 7.29
15 W 1263 0 0 0 1 0 0 1 3 0 0 5 3 15 5.21
*Entry under retesting. PH: Mixed populations of BPH and WBPH under field conditions.
ICAR-IIRR Annual Progress Report 2020 Vol 2 - Entomology
2.13
PPR-Percent Promising reaction; MRI of test entryX100/Total MRI
Data was not received from CHN, MSD and NRRI. Data from IIRR for GM; WGL,JDP, ADT for planthoppers; JDP & ADT for GLH; PTB,ADT,
CBT,RCI,RNR,LDN,NVS for SBDH; PTB,ADT,LDN,RNR,WGL RGL, RPR,GNV for SBWE;JDP, MTU, LDN,PNT,GNV for LF; KHD for rice skipper and
Gr.h; PTB for BB not considered for analysis due to low pest pressure.
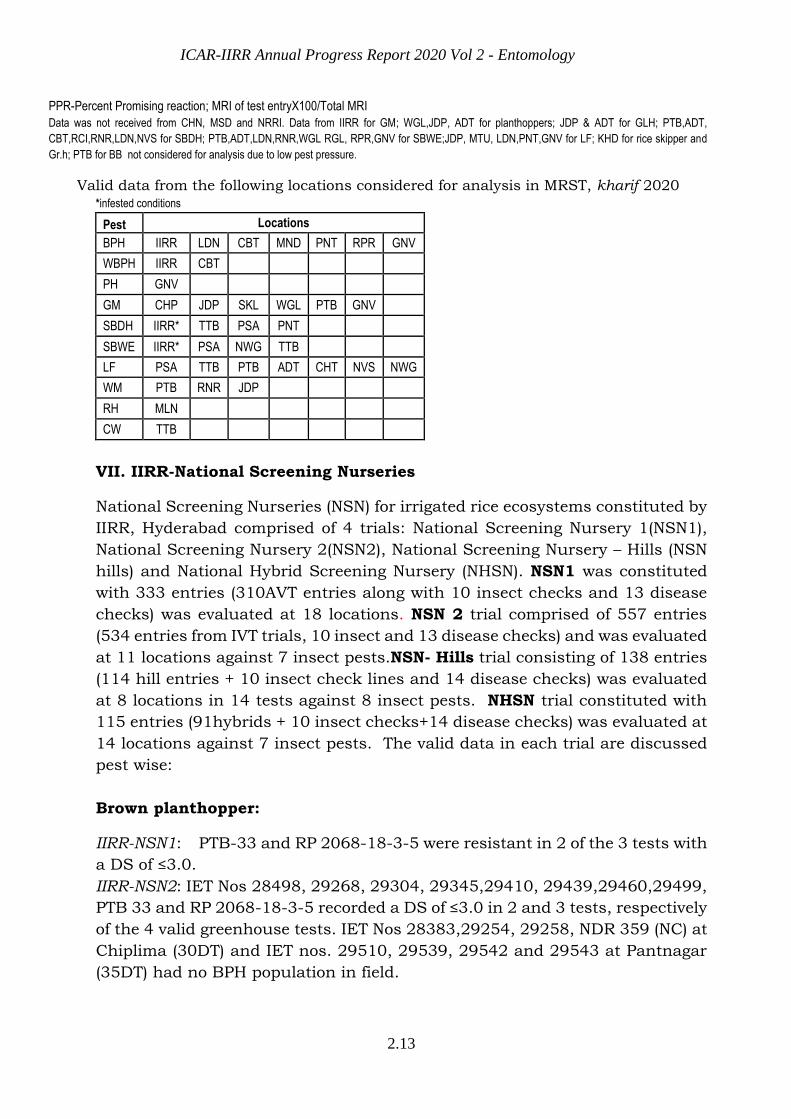
Valid data from the following locations considered for analysis in MRST, kharif 2020 *infested conditions
Pest Locations
BPH IIRR LDN CBT MND PNT RPR GNV
WBPH IIRR CBT PH GNV GM CHP JDP SKL WGL PTB GNV SBDH IIRR* TTB PSA PNT
SBWE IIRR* PSA NWG TTB LF PSA TTB PTB ADT CHT NVS NWG
WM PTB RNR JDP RH MLN CW TTB
VII. IIRR-National Screening Nurseries
National Screening Nurseries (NSN) for irrigated rice ecosystems constituted by
IIRR, Hyderabad comprised of 4 trials: National Screening Nursery 1(NSN1),
National Screening Nursery 2(NSN2), National Screening Nursery – Hills (NSN
hills) and National Hybrid Screening Nursery (NHSN). NSN1 was constituted
with 333 entries (310AVT entries along with 10 insect checks and 13 disease
checks) was evaluated at 18 locations. NSN 2 trial comprised of 557 entries
(534 entries from IVT trials, 10 insect and 13 disease checks) and was evaluated
at 11 locations against 7 insect pests.NSN- Hills trial consisting of 138 entries
(114 hill entries + 10 insect check lines and 14 disease checks) was evaluated
at 8 locations in 14 tests against 8 insect pests. NHSN trial constituted with
115 entries (91hybrids + 10 insect checks+14 disease checks) was evaluated at
14 locations against 7 insect pests. The valid data in each trial are discussed
pest wise:
Brown planthopper:
IIRR-NSN1: PTB-33 and RP 2068-18-3-5 were resistant in 2 of the 3 tests with
a DS of ≤3.0.
IIRR-NSN2: IET Nos 28498, 29268, 29304, 29345,29410, 29439,29460,29499,
PTB 33 and RP 2068-18-3-5 recorded a DS of ≤3.0 in 2 and 3 tests, respectively
of the 4 valid greenhouse tests. IET Nos 28383,29254, 29258, NDR 359 (NC) at
Chiplima (30DT) and IET nos. 29510, 29539, 29542 and 29543 at Pantnagar
(35DT) had no BPH population in field.
ICAR-IIRR Annual Progress Report 2020 Vol 2 - Entomology
2.14
IIRR-NSN hills: None of the test lines were promising across locations for BPH
damage. PTB33, M01 and RP2068-18-3-5 were resistant (DS≤3.0) in 2 of the
5 valid greenhouse tests.
IIRR-NHSN: Only PTB 33 and RP 2068-18-3-5 were promising in 4 and 3 tests,
respectivelyof the 5 valid tests with a DS≤ 3.0.
White- backed planthopper:
IIRR-NSN1: None of the test entries were observed to be promising for WBPH
except MO1.
IIRR-NSN2: All the entries were susceptible to WBPH except MO1.
IIRR-NSN hills: IET No 26594 (R) was promising in one greenhouse test at IIRR
of the two valid tests with a DS of 2.5.
IIRR-NHSN: Only MO1 was promising in a greenhouse test at IIRR with a DS of
≤3.0.
Planthoppers:
IIRR-NSN1: None of the entries were identified as tolerant to mixed populations
of planthoppers in the fieldat Gangavathi where the average number was 174
hoppers/10hills. The ratio of BPH to WBPH was 1:1.
IIRR-NSN2: None of the entries were found promisingin field reaction
atGangavathi.
IIRR-NHSN: None of the entries were found promising
Gall midge:
IIRR-NSN1: Of the three valid tests, W1263 and Aganni were promising in only
one tests with <5% DP at Sakoli.
IIRR-NSN2: IET Nos 29413 and 29437had nil damage in field reaction at
Aduthurai but susceptible at Gangavathi.
IIRR-NHSN: None of the entries were found promising in a field test at Pattambi.
Stem borer (SB):
IIRR- NSN1: IET nos27077, 27804, 27892, 27 P 63 (Hybrid Check), 28672,
28827, 28084, 27263 (R), Akshyadhan (RP), 28544, Kavyarecorded ≤10 % dead
heart damage in only one test of the 3 valid tests at vegetative phase. Hybrid
Check-27 P 63, IET Nos 28084, 28544 and Kavya were promising in 2 of the 4
tests for white ear damage at reproductive phase with ≤10% WE.
IIRR-NSN2: None of the entries recorded low damage at vegetative phasein field
evaluation at Pantnagar, All the entries remained in vegetative phase.
IIRR- NSN hills: Four lines viz., IET 28196, Shalimar Rice-3 (ZC), IET 28932
and IET 28925 had ≤10% dead heart damage at Pantnagar.IET 28925 had
<10% WE damagewhen evaluated at Pantnagar and Ludhiana.
IIRR- NHSN: IET Nos28992, 29003, 29018, BPT-5204 (NCV-2), HR 12 and Tetep
recorded nil white ear damage at CHN though they were susceptible at PNT.
WGL-14 (NCV-1) and ADT-49 (RCV) recorded ≤ 5 % WE damage in 2 of the 3
valid tests.
ICAR-IIRR Annual Progress Report 2020 Vol 2 - Entomology
2.15
However, these lines need to be further tested under greenhouse conditions for
validation of the reactions andto check that they are not escapesas it is more
common in very short and long duration varieties.
Leaf folder:
IIRR-NSN1: Field evaluation against leaffolder identified24 entries with ≤10 %
DL in only one of the tests of the two valid tests.
IIRR-NSN2: Nineteen entries had nil damage in a field reaction at Navsari at 50
DAT. Average leaf folder damage was only 15.5 % DL.
IIRR-NSN hills: All the entries were susceptible at Chatha.
IIRR NHSN: None of the entries were promising in two valid tests.
Whorl maggot:
IIRR-NSN1: IET Nos 28703, 28702,28386 and Benibhog recorded <5% DL in 2
valid testsat Rajendranagar and Jagdalpur.
IIRR-NSN2: Twentyseven entries had nil damage at Jagdalpur (70 DAT) and the
average damage in the trial was only 5.8 % DL.
NHSN: IET 28955 had nil damage at 30 DAT at PTB
Rice hispa:
At Malan, a net house screening technique was standardised for screening
against rice hispa.
NSN Hills: All the entries were found susceptible.
Other pests
Gundhi bug and Grasshopper and Rice thrips
IIRR-NSN Hills: None of the entries were promising for RT at Coimbatore, Gr.H
at Khudwani and GB at Chatha. Incidence of rice skipper was reported from
Khudwani.
IIRR- NSN2: At Jagdalpur, seven entries recorded nil damage.
NHSN: None of the entries were promising for RT at Coimbatore.
Case worm and rice thrips
IIRR-NSN1: All the entries were susceptible to rice thrips at Jagdalpur and 36
entries had ≤ 10 % DL against case worm at TTB.
Overall reaction
IIRR-NSN1: Evaluation of 333 entries at 18 locations in 4 greenhouse and 19
field tests against 8 insect pests identified 14 entries viz., IET nos27804, 28084,
27 P 63 (Hybrid Check), 28827, 27263 (R,)28544, 28673,
28519,28703,28386,27632(R)as promising in 4 to 5 tests of the 23 valid tests
against two to four pests. Kavya and PTB 33 andwere promising in 5tests each
and Aganni in 4 tests (Table 2.7).
ICAR-IIRR Annual Progress Report 2020 Vol 2 - Entomology
2.16
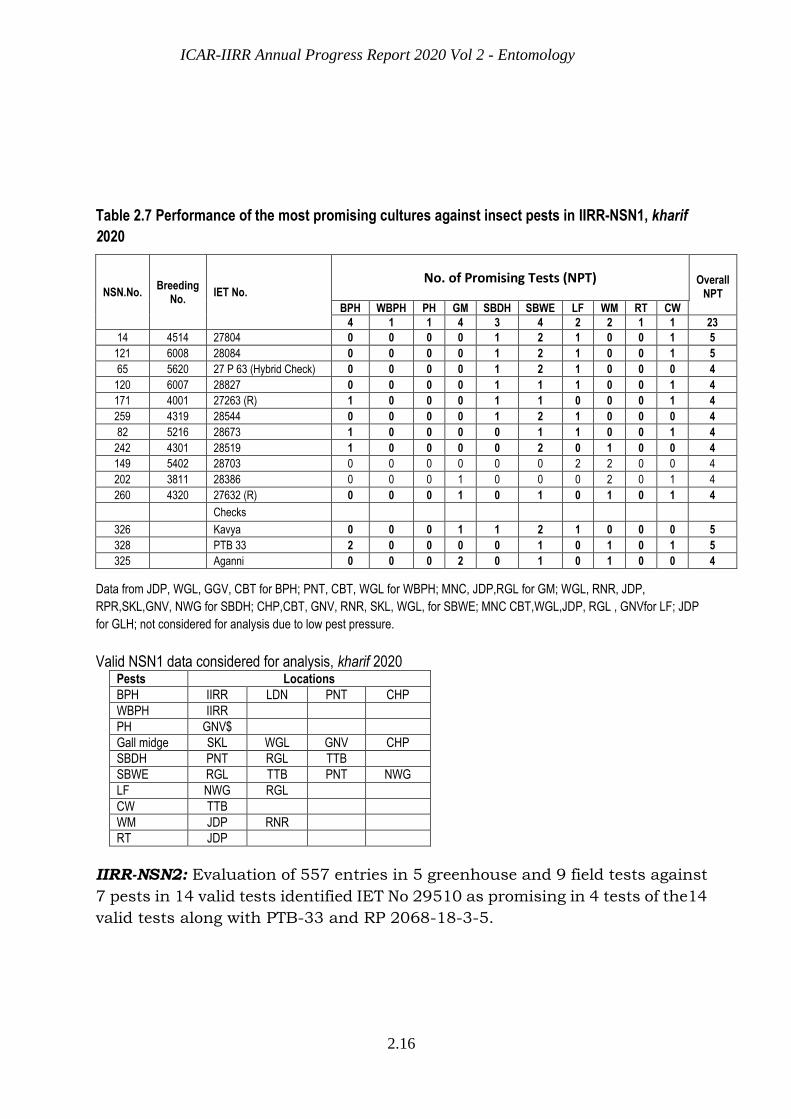
Table 2.7 Performance of the most promising cultures against insect pests in IIRR-NSN1, kharif
2020
NSN.No. Breeding
No. IET No.
No. of Promising Tests (NPT) Overall
NPT BPH WBPH PH GM SBDH SBWE LF WM RT CW
4 1 1 4 3 4 2 2 1 1 23
14 4514 27804 0 0 0 0 1 2 1 0 0 1 5
121 6008 28084 0 0 0 0 1 2 1 0 0 1 5
65 5620 27 P 63 (Hybrid Check) 0 0 0 0 1 2 1 0 0 0 4
120 6007 28827 0 0 0 0 1 1 1 0 0 1 4
171 4001 27263 (R) 1 0 0 0 1 1 0 0 0 1 4
259 4319 28544 0 0 0 0 1 2 1 0 0 0 4
82 5216 28673 1 0 0 0 0 1 1 0 0 1 4
242 4301 28519 1 0 0 0 0 2 0 1 0 0 4
149 5402 28703 0 0 0 0 0 0 2 2 0 0 4
202 3811 28386 0 0 0 1 0 0 0 2 0 1 4
260 4320 27632 (R) 0 0 0 1 0 1 0 1 0 1 4
Checks 326 Kavya 0 0 0 1 1 2 1 0 0 0 5
328 PTB 33 2 0 0 0 0 1 0 1 0 1 5
325 Aganni 0 0 0 2 0 1 0 1 0 0 4
Data from JDP, WGL, GGV, CBT for BPH; PNT, CBT, WGL for WBPH; MNC, JDP,RGL for GM; WGL, RNR, JDP,
RPR,SKL,GNV, NWG for SBDH; CHP,CBT, GNV, RNR, SKL, WGL, for SBWE; MNC CBT,WGL,JDP, RGL , GNVfor LF; JDP
for GLH; not considered for analysis due to low pest pressure.
Valid NSN1 data considered for analysis, kharif 2020
Pests Locations
BPH IIRR LDN PNT CHP
WBPH IIRR
PH GNV$
Gall midge SKL WGL GNV CHP
SBDH PNT RGL TTB
SBWE RGL TTB PNT NWG
LF NWG RGL
CW TTB
WM JDP RNR
RT JDP
IIRR-NSN2: Evaluation of 557 entries in 5 greenhouse and 9 field tests against
7 pests in 14 valid tests identified IET No 29510 as promising in 4 tests of the14
valid tests along with PTB-33 and RP 2068-18-3-5.
ICAR-IIRR Annual Progress Report 2020 Vol 2 - Entomology
2.17
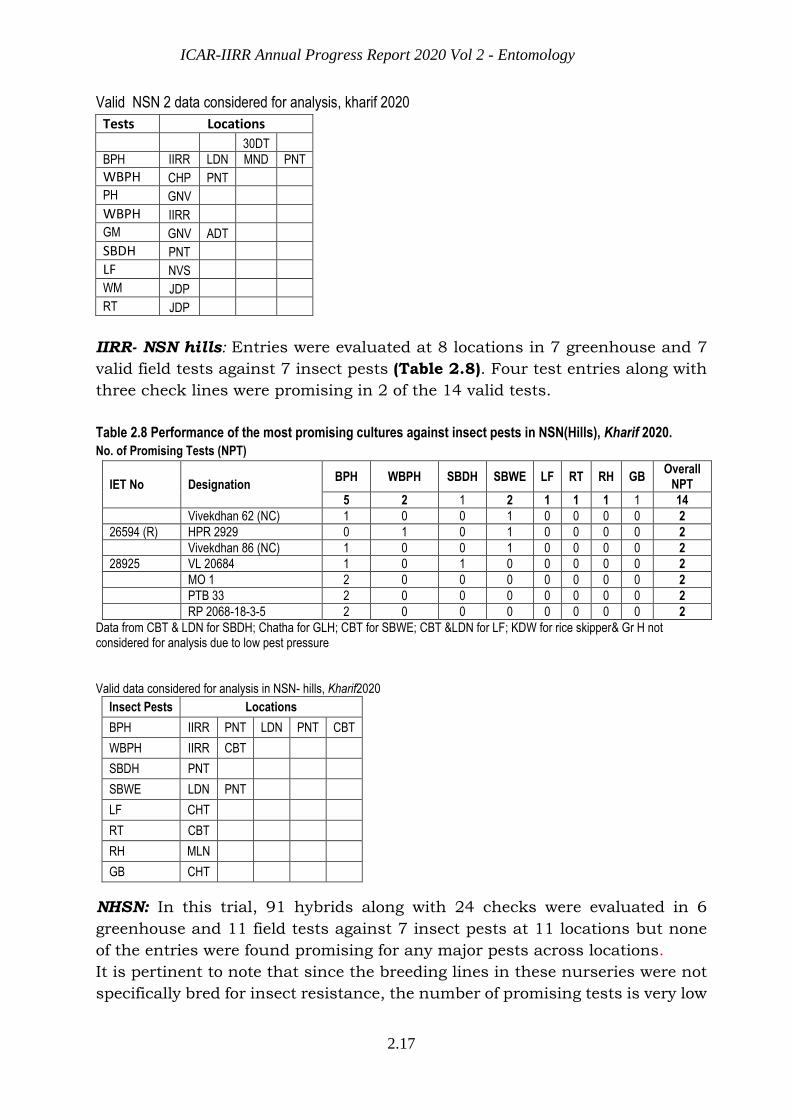
IIRR- NSN hills: Entries were evaluated at 8 locations in 7 greenhouse and 7
valid field tests against 7 insect pests (Table 2.8). Four test entries along with
three check lines were promising in 2 of the 14 valid tests.
Table 2.8 Performance of the most promising cultures against insect pests in NSN(Hills), Kharif 2020.
No. of Promising Tests (NPT)
IET No Designation BPH WBPH SBDH SBWE LF RT RH GB
Overall NPT
5 2 1 2 1 1 1 1 14
Vivekdhan 62 (NC) 1 0 0 1 0 0 0 0 2
26594 (R) HPR 2929 0 1 0 1 0 0 0 0 2
Vivekdhan 86 (NC) 1 0 0 1 0 0 0 0 2
28925 VL 20684 1 0 1 0 0 0 0 0 2
MO 1 2 0 0 0 0 0 0 0 2
PTB 33 2 0 0 0 0 0 0 0 2
RP 2068-18-3-5 2 0 0 0 0 0 0 0 2
Data from CBT & LDN for SBDH; Chatha for GLH; CBT for SBWE; CBT &LDN for LF; KDW for rice skipper& Gr H not considered for analysis due to low pest pressure Valid data considered for analysis in NSN- hills, Kharif2020
Insect Pests Locations
BPH IIRR PNT LDN PNT CBT
WBPH IIRR CBT
SBDH PNT
SBWE LDN PNT
LF CHT
RT CBT
RH MLN
GB CHT
NHSN: In this trial, 91 hybrids along with 24 checks were evaluated in 6
greenhouse and 11 field tests against 7 insect pests at 11 locations but none
of the entries were found promising for any major pests across locations.
It is pertinent to note that since the breeding lines in these nurseries were not
specifically bred for insect resistance, the number of promising tests is very low
Valid NSN 2 data considered for analysis, kharif 2020
Tests Locations 30DT
BPH IIRR LDN MND PNT
WBPH CHP PNT PH GNV WBPH IIRR GM GNV ADT SBDH PNT LF NVS WM JDP RT JDP

ICAR-IIRR Annual Progress Report 2020 Vol 2 - Entomology
2.18
in all the identified promising entries in the nurseries. So, these entries need
to be further tested, verified and validated under suitable pest pressure
situations for use in pest resistance breeding programmes.
valid data considered for analysis, NHSN kharif 2020 Pests Locations
BPH IIRR PNT CBT LDN MND
WBPH IIRR
PH (BPH + WBPH) PNT
GMB5 PTB
SBDH PNT CHN
SBWE NWG CHN PNT
LF NWG PTB
WM PTB
RT CBT
Data not received from GGT and MTU.Data from CBT, LDN, PTB, RNR, NWG & RPRfor SBDH damage; CBT, LDN, RNR,RPR for SBWE; CBT, PTB, MNC,RNR,&LDN for LF; RNR for WM, PTB for CW, MNC for GM not considered for analysis due to low pest pressure.
ICAR-IIRR Annual Progress Report 2020 Vol 2 - Entomology
2.19
NRRI-National Screening Nurseries
AT NRRI, National Screening Nurseries (NSN) consisting of two trials viz.,
National Screening Nursery-1 (NSN1) and National Screening Nursery-2 (NSN2)
were constituted this year with entries from EDS, RSL, SDW, DW, NIL (DRT)
and NIL (SUB) NSN1 trial constituted with 116 entries (106 AVT entries along
with 10 insect checks) was evaluated at 17 locations and NSN2 trial comprised
of 126 entries (116 AVT2 entries plus 10 insect checks) were evaluated at 15
locations. The valid data for the above said trials are presented according to
insect pest wise:
Brown Planthopper:
NRRI-NSN1: NIL (DRT)-6417(IET IR 64/ RP), was promising in one of the 2 tests
as against PTB-33 and RP2068-18-3-5 which were exhibited resistant reaction
(SES score ≤ 3) in all the 2 tests.
NRRI-NSN2: The following lines viz., EDS-208 (IET Shabhagidhan/NC), EDS-
213(IET 29046), EDS-218(IET 29051), SDW-608(IET 29117), RSL-419(IET
29087), RSL-424(IET 29091), RSL-432(IET 29099), RSL-438(IET 29105), RSL-
440(IET 29107), EDS-201(IET 29035), EDS-206(IET 29040), EDS-219(IET
29052), and EDS-227(IET 29059) were promising in one location out of the 3
tests under glasshouse condition; while EDS-207(IET 29041), RSL-402(IET
29071), RSL-408(IET 29077), RSL-409(IET 29078), RSL-426(IET 29093), were
promising in one location out of the 3 tests under field condition. RP2068-18-
3-5and PTB-33 exhibited resistant reaction in 3 and 2 tests, respectively.
Gall Midge:
NRRI-NSN1: NIL (DRT)-6418(IET 29024) and NIL (DRT)-6413(IET Swarna/RP)
recorded nil damage against gall midge in 2 and 1 out of the 3 tests,
respectively. Aganni and W-1263 were promising in all the 3 tests.
NRRI-NSN2: The following lines viz., SDW-602(IET 29112), SDW-610(IET
29119), RSL-429(IET 29096), RSL-430(IET 29097), RSL-434(IET 29101), RSL-
440(IET 29107), and RSL-432(IET 29099) was promising in one location out of
the 2 tests. Aganni and W-1263 were promising in all the 2 tests.
Stem borer:
NRRI-NSN1: SDW-502(IET 28311), SDW-504(IET 28317), SDW-506(IET
28294), SDW-507(IET 28296), SDW-516(IET 26671), RSL-306(IET 28283),
RSL-307(IET 28286), RSL-308(IET 26692 (R)), RSL-309(IET Pooja (RP)), RSL-
312(IET Swarna Sub 1 (NC)), RSL-315(IET 29027), RSL-328(IET 27538 (R)),
NIL(DRT) – 6413(IET Swarna(RP)), NIL (DRT) – 6417(IET IR 64 (RP)), NIL(DRT)
– 6420(IET 26753(R)) were promising against stem borer during reproductive
phase 1 out of the 2 tests.

ICAR-IIRR Annual Progress Report 2020 Vol 2 - Entomology
2.20
NRRI-NSN2: RSL-432(IET 29099) was promising at vegetative stage for dead
heart damage in 1 out of 2 tests. The following lines viz., EDS-203(IET 29037),
EDS-206(IET 29040), EDS-214(IET 29047), EDS-222(IET 29055), EDS-228
(IET Vandana (NC)), EDS-229(IET 29060), and EDS-234(IET 29063) was
promising in one location for white ear damage.
Leaf folder:
NRRI-NSN1: The lines NIL (DRT)-6401(IET 28017), and 6402 (IET Pusa 44 (RP))
were promising against leaf folder in one tests (DL <10%.) as against W-1263
which also exhibited resistance reaction (DL <7%).
Note: Since all these breeding lines have not been specifically developed for
insect pest resistance; hence all these identified promising entries needs to be
further tested and validated for their resistance against individual pest in
specific screening program under suitable pest pressure for further use in the
resistant breeding program.
Overall reaction:
NRRI-NSN1: Evaluation of 116 entries in NSN-1 in 3 greenhouse and 6 field
tests against 4 insect pests in 9 valid tests helped in identification of 3 entries
as promising in 2-3 tests against 2,3 insect pest damages (Table 1). Resistant
checks PTB 33 and RP 2068-18-3-5 were resistant to BPH in both the valid
tests. W1263 and Aganni were promising against gall midge and W1263 for leaf
folder.
NRRI- NSN2: Evaluation of 126 entries in NSN-2 in 3 greenhouse and 6 field
tests against 4 insect pests in 9 valid tests helped in identification of 3 entries
as promising in 2- 3 tests against 2,3 insect pest damages (Table 2). Resistant
checks PTB 33 and RP 2068-18-3-5 were resistant to BPH in both the valid
tests. W1263 and Aganni were promising against gall midge and W1263 for leaf
folder.
Table 1. Performance of most promising culture against insect pests in NRRI-NSN1, Kharif 2020
Sl. No.
IET No. Designation Cross combination
Number of promising tests (NPT) Overall NPT BPH GM SBDH SBWE LF
2 3 1 2 1 9
1 Swarna(RP) NIL(DRT)-413 Swarna (RP) 0 1 0 1 0 2
2 IR 64 (RP) NIL(DRT)-417 IR 64 (RP) 1 0 0 1 0 2
3 IET 29024 NIL(DRT)-418 Anjali/ IR84984-83-15-18-B-B-93 0 2 0 0 0 2
Resistant checks PTB-33 2 0 0 0 0 2
RP2068-18-3-5 2 0 0 0 0 2
Aganni 0 3 0 0 0 3
W-1263 0 3 0 0 1 4
*CHP, PNT for BPH; PNT for WBPH; CHP, RPR, SKL for SBDH; GNV, CHP, RPR, SKL for SBWE not considered for analysis due to low insect pest pressure
ICAR-IIRR Annual Progress Report 2020 Vol 2 - Entomology
2.21
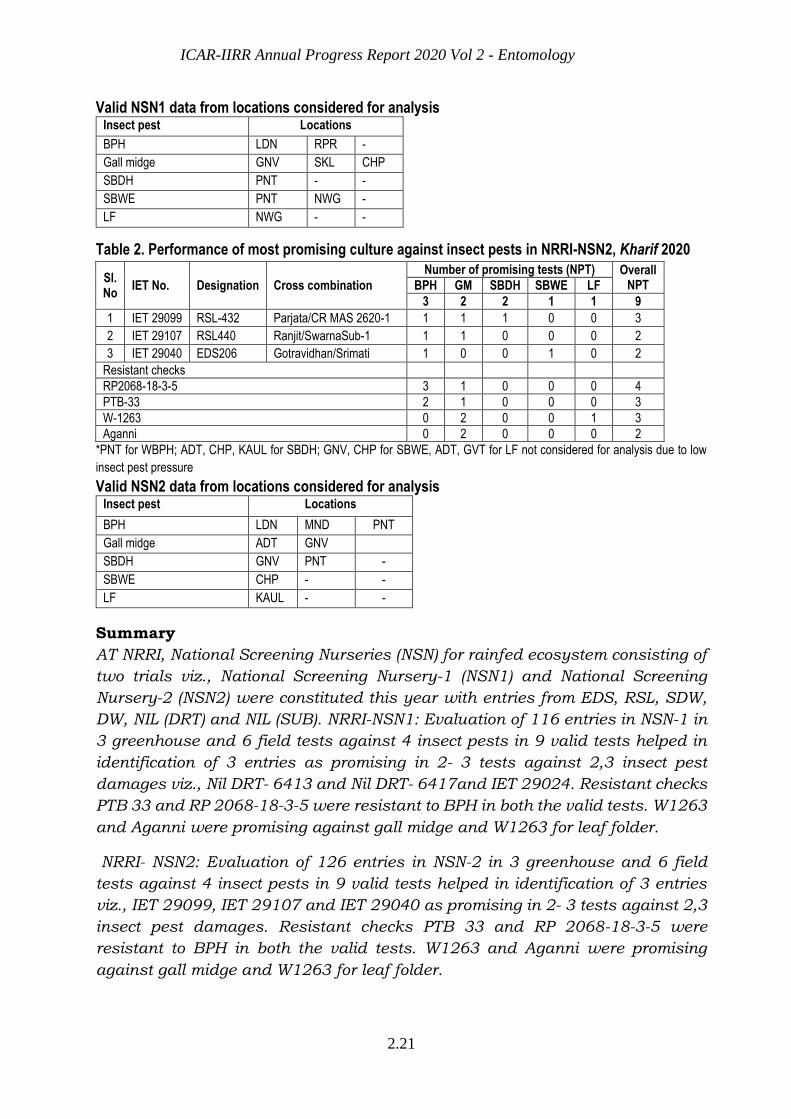
Valid NSN1 data from locations considered for analysis Insect pest Locations
BPH LDN RPR -
Gall midge GNV SKL CHP
SBDH PNT - -
SBWE PNT NWG -
LF NWG - -
Table 2. Performance of most promising culture against insect pests in NRRI-NSN2, Kharif 2020
Sl. No
IET No. Designation Cross combination
Number of promising tests (NPT) Overall NPT BPH GM SBDH SBWE LF
3 2 2 1 1 9
1 IET 29099 RSL-432 Parjata/CR MAS 2620-1 1 1 1 0 0 3
2 IET 29107 RSL440 Ranjit/SwarnaSub-1 1 1 0 0 0 2
3 IET 29040 EDS206 Gotravidhan/Srimati 1 0 0 1 0 2
Resistant checks
RP2068-18-3-5 3 1 0 0 0 4
PTB-33 2 1 0 0 0 3
W-1263 0 2 0 0 1 3
Aganni 0 2 0 0 0 2
*PNT for WBPH; ADT, CHP, KAUL for SBDH; GNV, CHP for SBWE, ADT, GVT for LF not considered for analysis due to low
insect pest pressure
Valid NSN2 data from locations considered for analysis Insect pest Locations
BPH LDN MND PNT
Gall midge ADT GNV
SBDH GNV PNT -
SBWE CHP - -
LF KAUL - -
Summary
AT NRRI, National Screening Nurseries (NSN) for rainfed ecosystem consisting of
two trials viz., National Screening Nursery-1 (NSN1) and National Screening
Nursery-2 (NSN2) were constituted this year with entries from EDS, RSL, SDW,
DW, NIL (DRT) and NIL (SUB). NRRI-NSN1: Evaluation of 116 entries in NSN-1 in
3 greenhouse and 6 field tests against 4 insect pests in 9 valid tests helped in
identification of 3 entries as promising in 2- 3 tests against 2,3 insect pest
damages viz., Nil DRT- 6413 and Nil DRT- 6417and IET 29024. Resistant checks
PTB 33 and RP 2068-18-3-5 were resistant to BPH in both the valid tests. W1263
and Aganni were promising against gall midge and W1263 for leaf folder.
NRRI- NSN2: Evaluation of 126 entries in NSN-2 in 3 greenhouse and 6 field
tests against 4 insect pests in 9 valid tests helped in identification of 3 entries
viz., IET 29099, IET 29107 and IET 29040 as promising in 2- 3 tests against 2,3
insect pest damages. Resistant checks PTB 33 and RP 2068-18-3-5 were
resistant to BPH in both the valid tests. W1263 and Aganni were promising
against gall midge and W1263 for leaf folder.

ICAR-IIRR Annual Progress Report 2020 Vol 2 - Entomology
2.22
2.2 INSECT BIOTYPE STUDIES
Variation in the response of host plant/ gene differentials to different pest
populations in endemic areas are monitored for two major pests viz.,
planthoppers and gall midge through Insect biotype studies comprising of three
trials 1) Gall midge biotype monitoring trial (GMBT), 2) Gall midge population
monitoring (GMPM) trial and 3) Planthopper screening trial (PHSS). The results
of the observed virulence pattern of gall midge populations during kharif 2020
are discussed below:
i) Gall midge biotype monitoring trial (GMBT)
Gall midge biotype trial was constituted with a set of 15 gene differentials
categorized into 5 groups and three gene pyramided lines in the background of
RPBio-226 viz,RP 5925-24 (Gm8), RP 5922-21 (Gm1) ,RP 5923 (gm3) and a
germplasm line INRC 17470 (new gene) along with a susceptible check (TN1)
and carried out at 12 locations. The results of the evaluation from the valid
data of 7 locations in 9 tests are summarized in (Table 2.9) and discussed as
under.
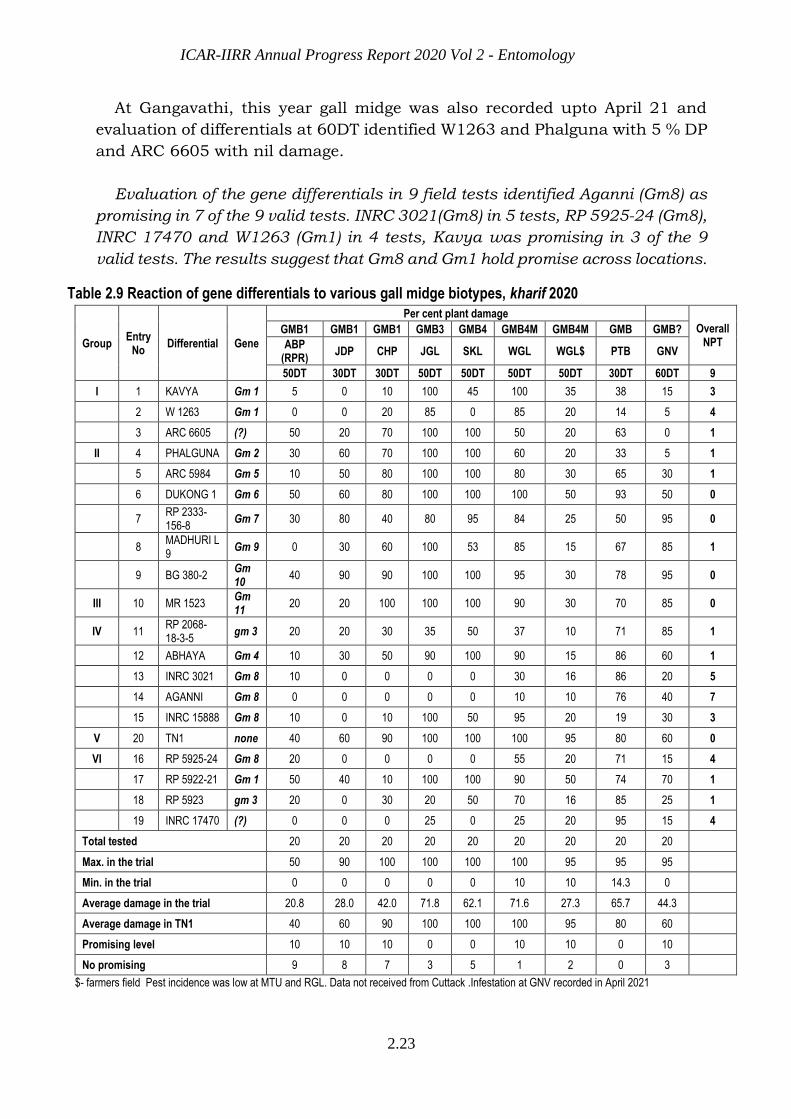
Biotype 1: This biotype is characterized by the reaction pattern R-R-R-R-S.
The populations at Chiplima, Jagdalpur and Ambikapur (near Raipur) were
grouped under this category. Variation in the reaction of the other donors was
also observed. However, INRC 3021, Aganni, INRC 15888 and Kavya had
recorded ≤10 % plant damage at all the three locations tested.
Biotype 3: Unlike the typical RSRRS pattern of this biotype, only differentials
with Gm8 gene (Aganni, INRC 3021 and RP5925-24) were promising against
the gall midge populations at Jagtial.
Biotype 4: Gall midge populations from Sakoli were designated as biotype 4
from earlier studies. But this year only W1263 (Gm1); Aganni, INRC 3021,
RP5925-24 (with Gm8) and INRC17470 showed promise.
Biotype 4M: Aganni (with Gm8) had 10 % DP and INRC 3021(with Gm8)
exhibited 30% DP damage whereas RP5925-24 had 55% DP when evaluated at
Warangal. But in farmer’s field 30 km from research farm, Aganni and RP 2068-
18-3-5 recorded 10 % DP, while INRC 3021 showed 15.8% DP.
Biotype5: At Pattambi, this year the infestation level was so high that all the
donors exhibited susceptibility and the average damage in the trial was 65.7
%.
ICAR-IIRR Annual Progress Report 2020 Vol 2 - Entomology
2.23
At Gangavathi, this year gall midge was also recorded upto April 21 and
evaluation of differentials at 60DT identified W1263 and Phalguna with 5 % DP
and ARC 6605 with nil damage.
Evaluation of the gene differentials in 9 field tests identified Aganni (Gm8) as
promising in 7 of the 9 valid tests. INRC 3021(Gm8) in 5 tests, RP 5925-24 (Gm8),
INRC 17470 and W1263 (Gm1) in 4 tests, Kavya was promising in 3 of the 9
valid tests. The results suggest that Gm8 and Gm1 hold promise across locations.
Table 2.9 Reaction of gene differentials to various gall midge biotypes, kharif 2020
Group Entry
No Differential Gene
Per cent plant damage
Overall NPT
GMB1 GMB1 GMB1 GMB3 GMB4 GMB4M GMB4M GMB GMB?
ABP (RPR)
JDP CHP JGL SKL WGL WGL$ PTB GNV
50DT 30DT 30DT 50DT 50DT 50DT 50DT 30DT 60DT 9
I 1 KAVYA Gm 1 5 0 10 100 45 100 35 38 15 3
2 W 1263 Gm 1 0 0 20 85 0 85 20 14 5 4
3 ARC 6605 (?) 50 20 70 100 100 50 20 63 0 1
II 4 PHALGUNA Gm 2 30 60 70 100 100 60 20 33 5 1
5 ARC 5984 Gm 5 10 50 80 100 100 80 30 65 30 1
6 DUKONG 1 Gm 6 50 60 80 100 100 100 50 93 50 0
7 RP 2333-156-8
Gm 7 30 80 40 80 95 84 25 50 95 0
8 MADHURI L 9
Gm 9 0 30 60 100 53 85 15 67 85 1
9 BG 380-2 Gm 10
40 90 90 100 100 95 30 78 95 0
III 10 MR 1523 Gm 11
20 20 100 100 100 90 30 70 85 0
IV 11 RP 2068-18-3-5
gm 3 20 20 30 35 50 37 10 71 85 1
12 ABHAYA Gm 4 10 30 50 90 100 90 15 86 60 1
13 INRC 3021 Gm 8 10 0 0 0 0 30 16 86 20 5
14 AGANNI Gm 8 0 0 0 0 0 10 10 76 40 7
15 INRC 15888 Gm 8 10 0 10 100 50 95 20 19 30 3
V 20 TN1 none 40 60 90 100 100 100 95 80 60 0
VI 16 RP 5925-24 Gm 8 20 0 0 0 0 55 20 71 15 4
17 RP 5922-21 Gm 1 50 40 10 100 100 90 50 74 70 1
18 RP 5923 gm 3 20 0 30 20 50 70 16 85 25 1
19 INRC 17470 (?) 0 0 0 25 0 25 20 95 15 4
Total tested 20 20 20 20 20 20 20 20 20
Max. in the trial 50 90 100 100 100 100 95 95 95
Min. in the trial 0 0 0 0 0 10 10 14.3 0
Average damage in the trial 20.8 28.0 42.0 71.8 62.1 71.6 27.3 65.7 44.3
Average damage in TN1 40 60 90 100 100 100 95 80 60
Promising level 10 10 10 0 0 10 10 0 10
No promising 9 8 7 3 5 1 2 0 3 $- farmers field Pest incidence was low at MTU and RGL. Data not received from Cuttack .Infestation at GNV recorded in April 2021
ICAR-IIRR Annual Progress Report 2020 Vol 2 - Entomology
2.24
ii) Gall midge population monitoring (GMPM)
The virulence pattern of the gall midge populations is monitored through
progeny testing of a single gall midge female in GMPM trial. This year the trial
was conducted on three differentials, W1263 (Gm1), RP2068-18-3-5 (gm3) and
Aganni (Gm8) along with Purple variety at Warangal, Pattambi and Jagtial. The
differentials were grown in a single pot with 5-10 seedlings each and labeled
appropriately. Each pot was infested with a single mated female collected from
light source and covered by a plastic bag placed tightly over the pot. The pots
were observed for the gall development and emergence of insects from the gall.
Number and sex of the emerging adults was also recorded from each pot. Based
on these observations, virulence status was assigned to the parent insect. The
results of this year’s trial are summarized in (Table 2.10) and discussed below.
Pattambi: Of the 180 females tested,92.2% were virulent on purple, 38.9% on
W1263, 95.6% on RP 2068-18-3-5 and 83.9% on Aganni but the damage was
low (only17.7%SS) on W1263.The sex ratio was highly favourable on all the
lines. This corroborates with the low damage observed in W1263 (Gm1) in the
other gall midge trials at this location. Male progeny was > 20 % in all the lines
tested.
Warangal: At this location, 250 females were tested, however, the number of
infested pots as well as galls were low. The percent virulent females were26.0%
on purple variety, 33.2%on W1263 and12.4% on RP 2068-18-3-5 and 2.8% on
Aganni. Aganni showed the lowest incidence (0.75% SS) followed by RP 2068-
18-3-5 (3.43%SS) and sex ratio was also in favour of males in RP 2068-18-3-5.
Jagtial: At this location 200 females were tested and Aganni showed nil
virulence and damage. The percent virulent females were 64.5% on purple
variety, 13.5% on W1263 and 56.5% on RP 2068-18-3-5, while the percent
male progeny was highest in RP 2068-18-3-5 but the damage in W1263 (1.89%
SS) and RP 2068-18-3-59 (3.76%SS) was very low and the sex ratio wasin
favour of females in all the four test lines.
Evaluation of the gene differentials through single female progeny testing
revealed that populations at Warangal were less virulent on Aganni (Gm8) as
compared to populations at Pattambi whereas there was increase in virulence on
RP 2068-18-3-5 (gm3). This is a matter of concern as this trend has also been
evident in GMBT trial in the past few years.
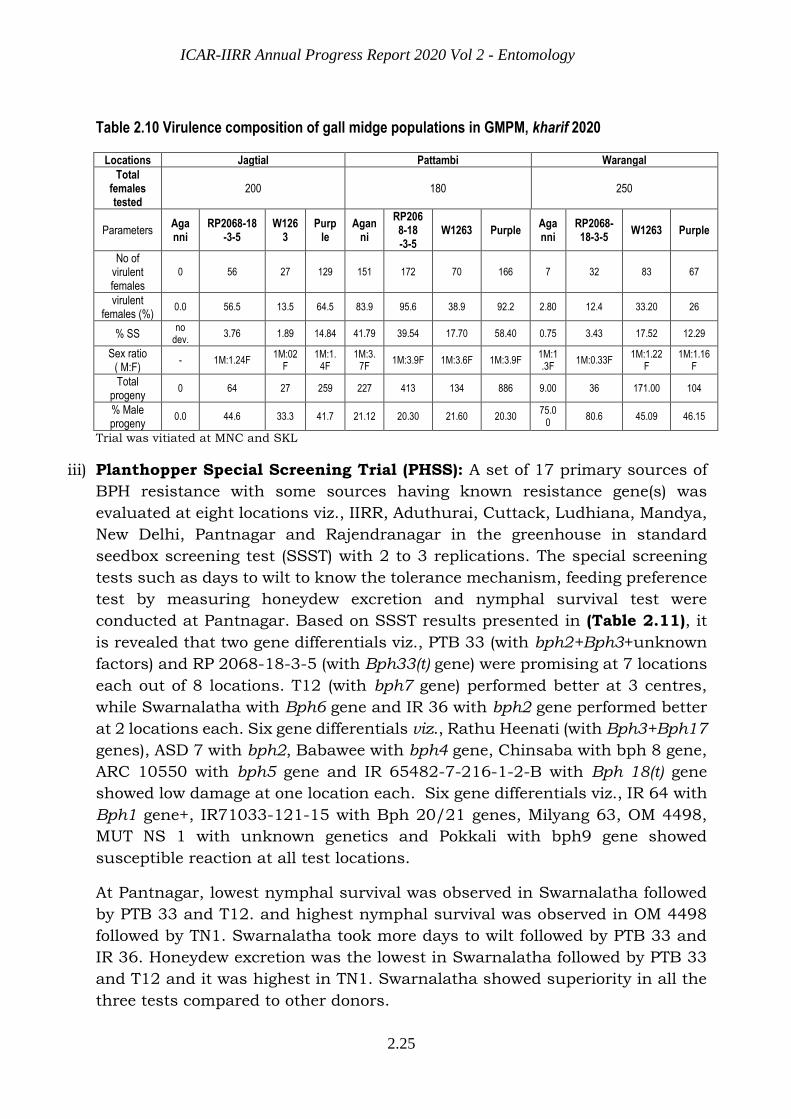
ICAR-IIRR Annual Progress Report 2020 Vol 2 - Entomology
2.25
Table 2.10 Virulence composition of gall midge populations in GMPM, kharif 2020
Locations Jagtial Pattambi Warangal
Total females tested
200 180 250
Parameters Aganni
RP2068-18 -3-5
W1263
Purple
Aganni
RP2068-18 -3-5
W1263 Purple Aganni
RP2068-18-3-5
W1263 Purple
No of virulent females
0 56 27 129 151 172 70 166 7 32 83 67
virulent females (%)
0.0 56.5 13.5 64.5 83.9 95.6 38.9 92.2 2.80 12.4 33.20 26
% SS no
dev. 3.76 1.89 14.84 41.79 39.54 17.70 58.40 0.75 3.43 17.52 12.29
Sex ratio ( M:F)
- 1M:1.24F 1M:02
F 1M:1.
4F 1M:3.
7F 1M:3.9F 1M:3.6F 1M:3.9F
1M:1.3F
1M:0.33F 1M:1.22
F 1M:1.16
F
Total progeny
0 64 27 259 227 413 134 886 9.00 36 171.00 104
% Male progeny
0.0 44.6 33.3 41.7 21.12 20.30 21.60 20.30 75.0
0 80.6 45.09 46.15
Trial was vitiated at MNC and SKL
iii) Planthopper Special Screening Trial (PHSS): A set of 17 primary sources of
BPH resistance with some sources having known resistance gene(s) was
evaluated at eight locations viz., IIRR, Aduthurai, Cuttack, Ludhiana, Mandya,
New Delhi, Pantnagar and Rajendranagar in the greenhouse in standard
seedbox screening test (SSST) with 2 to 3 replications. The special screening
tests such as days to wilt to know the tolerance mechanism, feeding preference
test by measuring honeydew excretion and nymphal survival test were
conducted at Pantnagar. Based on SSST results presented in (Table 2.11), it
is revealed that two gene differentials viz., PTB 33 (with bph2+Bph3+unknown
factors) and RP 2068-18-3-5 (with Bph33(t) gene) were promising at 7 locations
each out of 8 locations. T12 (with bph7 gene) performed better at 3 centres,
while Swarnalatha with Bph6 gene and IR 36 with bph2 gene performed better
at 2 locations each. Six gene differentials viz., Rathu Heenati (with Bph3+Bph17
genes), ASD 7 with bph2, Babawee with bph4 gene, Chinsaba with bph 8 gene,
ARC 10550 with bph5 gene and IR 65482-7-216-1-2-B with Bph 18(t) gene
showed low damage at one location each. Six gene differentials viz., IR 64 with
Bph1 gene+, IR71033-121-15 with Bph 20/21 genes, Milyang 63, OM 4498,
MUT NS 1 with unknown genetics and Pokkali with bph9 gene showed
susceptible reaction at all test locations.
At Pantnagar, lowest nymphal survival was observed in Swarnalatha followed
by PTB 33 and T12. and highest nymphal survival was observed in OM 4498
followed by TN1. Swarnalatha took more days to wilt followed by PTB 33 and
IR 36. Honeydew excretion was the lowest in Swarnalatha followed by PTB 33
and T12 and it was highest in TN1. Swarnalatha showed superiority in all the
three tests compared to other donors.
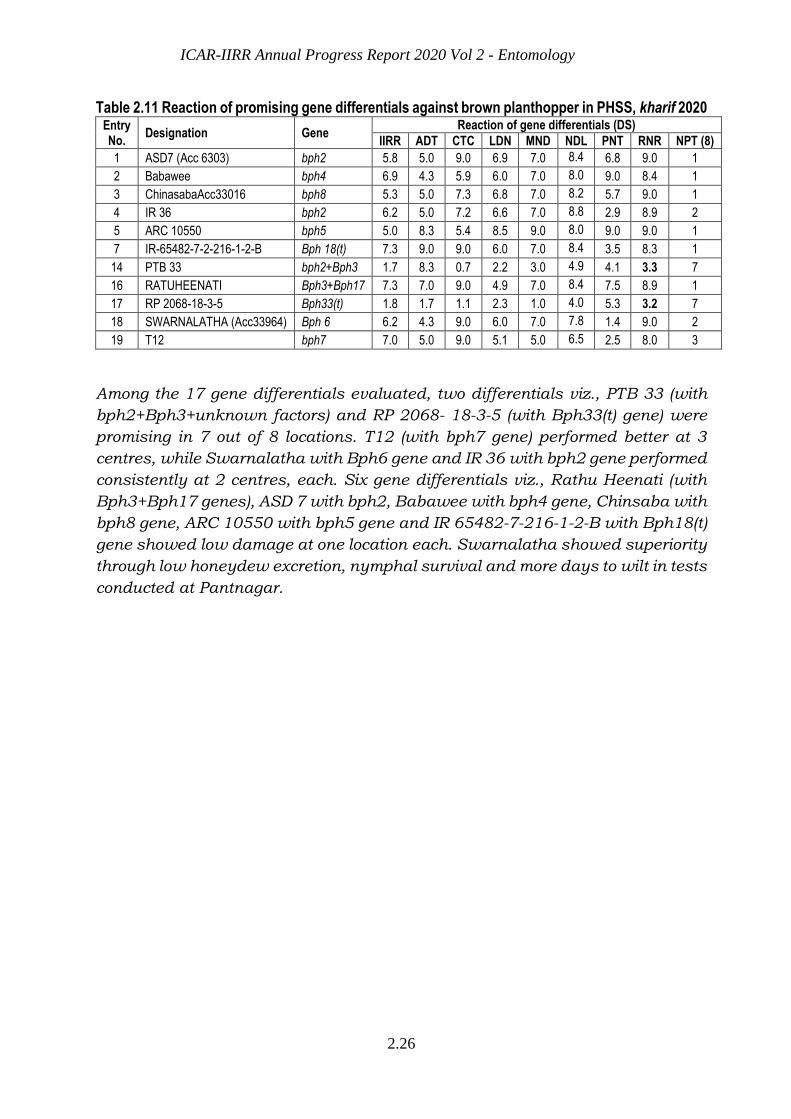
ICAR-IIRR Annual Progress Report 2020 Vol 2 - Entomology
2.26
Table 2.11 Reaction of promising gene differentials against brown planthopper in PHSS, kharif 2020 Entry No.
Designation Gene Reaction of gene differentials (DS)
IIRR ADT CTC LDN MND NDL PNT RNR NPT (8)
1 ASD7 (Acc 6303) bph2 5.8 5.0 9.0 6.9 7.0 8.4 6.8 9.0 1
2 Babawee bph4 6.9 4.3 5.9 6.0 7.0 8.0 9.0 8.4 1
3 ChinasabaAcc33016 bph8 5.3 5.0 7.3 6.8 7.0 8.2 5.7 9.0 1
4 IR 36 bph2 6.2 5.0 7.2 6.6 7.0 8.8 2.9 8.9 2
5 ARC 10550 bph5 5.0 8.3 5.4 8.5 9.0 8.0 9.0 9.0 1
7 IR-65482-7-2-216-1-2-B Bph 18(t) 7.3 9.0 9.0 6.0 7.0 8.4 3.5 8.3 1
14 PTB 33 bph2+Bph3 1.7 8.3 0.7 2.2 3.0 4.9 4.1 3.3 7
16 RATUHEENATI Bph3+Bph17 7.3 7.0 9.0 4.9 7.0 8.4 7.5 8.9 1
17 RP 2068-18-3-5 Bph33(t) 1.8 1.7 1.1 2.3 1.0 4.0 5.3 3.2 7
18 SWARNALATHA (Acc33964) Bph 6 6.2 4.3 9.0 6.0 7.0 7.8 1.4 9.0 2
19 T12 bph7 7.0 5.0 9.0 5.1 5.0 6.5 2.5 8.0 3
Among the 17 gene differentials evaluated, two differentials viz., PTB 33 (with
bph2+Bph3+unknown factors) and RP 2068- 18-3-5 (with Bph33(t) gene) were
promising in 7 out of 8 locations. T12 (with bph7 gene) performed better at 3
centres, while Swarnalatha with Bph6 gene and IR 36 with bph2 gene performed
consistently at 2 centres, each. Six gene differentials viz., Rathu Heenati (with
Bph3+Bph17 genes), ASD 7 with bph2, Babawee with bph4 gene, Chinsaba with
bph8 gene, ARC 10550 with bph5 gene and IR 65482-7-216-1-2-B with Bph18(t)
gene showed low damage at one location each. Swarnalatha showed superiority
through low honeydew excretion, nymphal survival and more days to wilt in tests
conducted at Pantnagar.
ICAR-IIRR Annual Progress Report 2020 Vol 2 - Entomology
2.27
2.3 CHEMICAL CONTROL STUDIES
Insecticide-Botanicals Evaluation Trial (IBET)
Use of plant extracts or botanicals is one of the earliest and traditional
practices in control of insect pests of crops. Botanicals can play a key role in
sustainable management of pests as they are environment-friendly, safe to non-
target organisms, renewable and cost effective. Integration of botanicals in rice
IPM will reduce pesticide load in environment, prevent insecticide resistance
and help in conserving natural enemy populations. Earlier efforts under AICRIP
were mainly focussed on evaluation of efficacy of various commercial botanical
formulations vis–a–vis insecticides against insect pests. Hence, it was felt
necessary to test combination of insecticide and botanical modules against
major pests of rice in order to identify the effective combination and
strategically integrate use of botanicals for ideal rice IPM. So, a trial consisting
of various treatments having combinations of effective and commercially
available oils with recommended insecticides was initiated last year during
kharif 2020 to evaluate their performance against major insect pests at 28
locations.
Treatments:
Four combination modules/treatments consisting of three insecticides-
Chlorantraniliprole 20% SC, Cartap hydrochloride 50% SC and
Triflumezopyrim 10% SC, one commercial neem formulation - Neemazal and
two oils - Neem and Eucalyptus oil procured from local market, Hyderabad
(Telangana) were compared along with untreated control (only water spray).
There were five treatments replicated four times and laid out in Randomized
Complete Block Design (RCBD). Spray applications of the treatments were done
based on pest incidence exceeding the economic threshold level guidelines at
10-15 day interval. All the treatments were applied as high-volume sprays @
500 litres of spray fluid/ha.
Standard observation procedures were followed to record insect pest
incidence at regular intervals throughout the crop growth period. To assess
stem borer and gall midge damage, observations were recorded on total tillers
(TT), dead hearts (DH) and silver shoots (SS) at 30 and 50 DAT, while stem
borer damage at heading stage was expressed as per cent white ears based on
counts of panicle bearing tillers (PBT) and white ear heads (WE). In case of
sucking pests such as brown planthopper (BPH), white-backed planthopper
(WBPH), green leafhopper (GLH) and natural enemies, number of insects were
recorded on 10 randomly selected hills. The damage due to foliage feeders such
as leaf folder, whorl maggot, hispa, blue beetle etc., was assessed based on
counts of damaged leaves/10 hills. At the time of harvest, the grain yield from
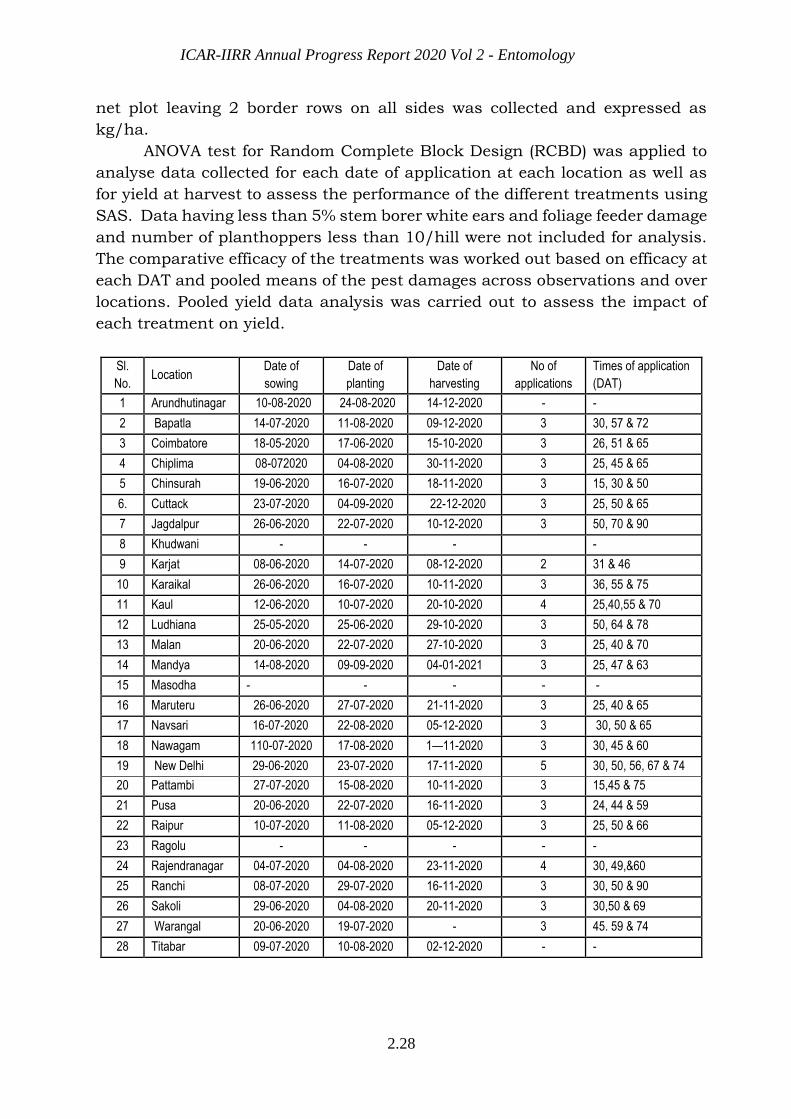
ICAR-IIRR Annual Progress Report 2020 Vol 2 - Entomology
2.28
net plot leaving 2 border rows on all sides was collected and expressed as
kg/ha.
ANOVA test for Random Complete Block Design (RCBD) was applied to
analyse data collected for each date of application at each location as well as
for yield at harvest to assess the performance of the different treatments using
SAS. Data having less than 5% stem borer white ears and foliage feeder damage
and number of planthoppers less than 10/hill were not included for analysis.
The comparative efficacy of the treatments was worked out based on efficacy at
each DAT and pooled means of the pest damages across observations and over
locations. Pooled yield data analysis was carried out to assess the impact of
each treatment on yield.
Sl.
No. Location
Date of
sowing
Date of
planting
Date of
harvesting
No of
applications
Times of application
(DAT)
1 Arundhutinagar 10-08-2020 24-08-2020 14-12-2020 - -
2 Bapatla 14-07-2020 11-08-2020 09-12-2020 3 30, 57 & 72
3 Coimbatore 18-05-2020 17-06-2020 15-10-2020 3 26, 51 & 65
4 Chiplima 08-072020 04-08-2020 30-11-2020 3 25, 45 & 65
5 Chinsurah 19-06-2020 16-07-2020 18-11-2020 3 15, 30 & 50
6. Cuttack 23-07-2020 04-09-2020 22-12-2020 3 25, 50 & 65
7 Jagdalpur 26-06-2020 22-07-2020 10-12-2020 3 50, 70 & 90
8 Khudwani - - - -
9 Karjat 08-06-2020 14-07-2020 08-12-2020 2 31 & 46
10 Karaikal 26-06-2020 16-07-2020 10-11-2020 3 36, 55 & 75
11 Kaul 12-06-2020 10-07-2020 20-10-2020 4 25,40,55 & 70
12 Ludhiana 25-05-2020 25-06-2020 29-10-2020 3 50, 64 & 78
13 Malan 20-06-2020 22-07-2020 27-10-2020 3 25, 40 & 70
14 Mandya 14-08-2020 09-09-2020 04-01-2021 3 25, 47 & 63
15 Masodha - - - - -
16 Maruteru 26-06-2020 27-07-2020 21-11-2020 3 25, 40 & 65
17 Navsari 16-07-2020 22-08-2020 05-12-2020 3 30, 50 & 65
18 Nawagam 110-07-2020 17-08-2020 1—11-2020 3 30, 45 & 60
19 New Delhi 29-06-2020 23-07-2020 17-11-2020 5 30, 50, 56, 67 & 74
20 Pattambi 27-07-2020 15-08-2020 10-11-2020 3 15,45 & 75
21 Pusa 20-06-2020 22-07-2020 16-11-2020 3 24, 44 & 59
22 Raipur 10-07-2020 11-08-2020 05-12-2020 3 25, 50 & 66
23 Ragolu - - - - -
24 Rajendranagar 04-07-2020 04-08-2020 23-11-2020 4 30, 49,&60
25 Ranchi 08-07-2020 29-07-2020 16-11-2020 3 30, 50 & 90
26 Sakoli 29-06-2020 04-08-2020 20-11-2020 3 30,50 & 69
27 Warangal 20-06-2020 19-07-2020 - 3 45. 59 & 74
28 Titabar 09-07-2020 10-08-2020 02-12-2020 - -
ICAR-IIRR Annual Progress Report 2020 Vol 2 - Entomology
2.29
Results
Pest Infestation (Table 2.12)
Stem borer infestation was observed in 17 locations and damage during
vegetative stage ranged from 0.3 to 15.1% dead hearts (DH) in all insecticide
treatments and 1.1 to19.5% in other combination treatments compared to 1.5
to 16.3% in untreated control, during 30 to 90 DAT. There were significant
differences in dead heart damage among the treatments at 15 locations. All
insecticides treatment module recorded the lowest mean damage of 4.0% when
compared to 13.2% in untreated control. Among other treatments, neemazal,
eucalyptus oil and cartap hydrochloride combination showed lowest mean
infestation of 6.6% DH.
White ears damage at heading stage in all insecticide treatment ranged from
1.3 to 12.9% compared to 6.3 to 37.5% in control across19 centres. There were
significant differences among treatments in white ear damage at 14 locations.
Highest white ear damage was reported from Nawagam which ranged from 8.9
to 37.5% while Rajendranagar reported the lowest (2.1-6.3%) among treatments
compared to a maximum of 37.5% in untreated control. Mean WE infestation
ranged from 5.1 to10.1% in treatments as compared to 15.81% in control.
Among modules, all insecticides module was found to be the best with 5.1%
mean white ear damage followed by neemazal, eucalyptus oil and cartap
hydrochloride module with 7.1% WE.
Overall, all insecticides module was found to be superior in reducing stem borer
damage compared to other insecticide-botanical modules and was the most
effective treatment at both vegetative and reproductive phases.
Gall midge occurrence was reported from 7 centres of which Chiplima recorded
highest damage ranging from 25.2to 28.0% SS in treatments and 43.4% SS in
control at 30 DAT. At other locations, the SS damage varied from 0.6 to 28.0%
across treatments and 6.1 to 43.4% in control. There were significant
differences in the efficacy among the treatments at 6 locations. Lowest mean
infestation was recorded in all insecticides treatment (13.5%) followed by all
botanical combination (14.0%) and significantly superior to control (21.8%).
Brown planthopper incidence was very high at Maruteru (104.7-121.5
hoppers/10hills) at 50 DAT followed by New Delhi with population of 14.0 to
153.2 at 89 DAT. Across 12 locations, combination of Neemazal, neem oil and
triflumezopyrim treatment was found to be the most effective one with mean
number of 21.5 hoppers/10hills followed by all botanical treatment in reducing
BPH populations (25.37) and they were significantly superior to control (33.0).
White-backed planthopper populations were observed at 11 locations and
Nawagam recorded the highest populations ranging from 36.0 to 260.0 and

ICAR-IIRR Annual Progress Report 2020 Vol 2 - Entomology
2.30
hoppers/10hills across the treatments at 60 DAT. Treatment consisting of all
insecticides was the most effective in reducing WBPH populations which ranged
from 1.2-36.0 across locations. Lowest mean hopper numbers (10.9/10hills)
was also recorded in all insecticide treatment. Botanical-insecticide
combination treatments also showed significant efficacy against the hoppers
(17.0 to 20.4) compared to that of control (34.2).
Green leafhopper infestation was high at Masodha (21.6-247.3 hoppers/10
hills) at 30-50 DAT among the 8 centres. All insecticides combination was the
most effective treatment showing mean population of 17.0followed by
neeamazal, eucalyptus oil and cartap hydrochloride combination (20.7)) and
were superior to control (47.0 hoppers/10hills). There were significant
differences in hopper populations among the treatments at 5 locations as well
as in populations recorded at 55 and53 DAT in Bapatla and Sakoli respectively.
Leaf folder damage was recorded from 16 locations and highest leaf damage
was recorded in Ranchi centre (36.4-43.7%) during 30 to 45 DAT followed by
Malan with 36.1% at 88 DAT. There were significant differences in leaf damage
among the treatments at 12 locations except 30 DAT at Jagdalpur and 55 DAT
at Ludhiana. All insecticides module was the most effective treatment showing
mean leaf damage of 5.0% followed by treatment with neemazl, Eucalyptus oil
and cartap hydrochloride (6.6% DL) when compared to untreated control
(14.3% DL).
Whorl maggot infestation was recorded at 6 centres and highest foliage
damage was noticed in New Delhi ranging from 9.7-15.7% in treatments at 29-
39 DAT followed by Titabar (4.3-13.6%) at 30-50 DAT. The lowest mean damage
was recorded in insecticides treatment (5.9% DL). A damage range of 6-8.6-
7.7% was recorded in botanical treatments compared to 11.3% in control.
Hispa damage was recorded at 2 centres viz., Malan and Ranchi. Highest leaf
damage of 46.5 to 86.7% was observed in Malan at 77 DAT followed by Ranchi
(7.3-31.3% at 35 DAT). Treatment consisting of all insecticides was the most
effective one with 31.1% mean leaf damage. Other treatments were also found
effective showing 34.8 to41.8% leaf damage compared to 59.1% in control.
Natural enemies The populations of mirid bug, an important natural enemy of
BPH, were recorded in 8 centres. High populations of 84.6 to 101.3 mirid
bugs/10hills were observed in Pattambi at 75 DAT followed by Sakoli with 54.0
to 58.0 at 60 DAT in treatments as against 100.6 and 72.5in control
respectively. Significant diiference in mirid population was recorded at 4
locations-Kaul, Ludhiana, Navasari and Sakoli. Mean mirid population was at
par in all 4 treatments (25.9-27.1 bugs/10hills) as compared to 31.8 in control
indicating that both botanicals and insecticides were safe to the predator.
ICAR-IIRR Annual Progress Report 2020 Vol 2 - Entomology
2.31
Spider populations were recorded in 10 locations, of which Maruteru reported
more spider numbers (22-7-28.0/10 hills at 50 DAT). There was significant
difference in spider populations at 5 locations. Mean spider population was at
par in all treatments and control (11.1-12.3) indicating the safety of these
treatments to spiders. Coccinellid populations were reported from 3 centres-
Bapatla, Mandya and Sakoli. There were significant differences in populations
among various treatments and control at 2 locations. The lowest mean
numbers of 4.2/10hills were recorded in botanicals and triflumezopyrim
treatment compared to 6.6 in control.
Grain Yield (Table 2.13)
There were significant differences in grain yield among the treatments including
control at all locations except Maruteru, Rajendranagar and New Delhi. Based
on mean yield of these locations, all insecticidestreatment - Chlorantraniliprole,
Cartap hydrochloride, Triflumezopyrim recorded the highest grain yield of
6324.6 kg/ha with 44.2% increase over control (IOC) followed by neemazal,
neem oil and triflumezopyrim with 5498.5kg/ha (25.3% IOC). All the
treatments were significantly superior to control plot which showed a yield of
4386.7kg/ha.
Insecticide Botanicals Evaluation Trial (IBET) was carried out at 28
locations across the country to evaluate performance of various treatments
having combinations of commercially available neem formulation, effective plant
oils along with recommended insecticides against major insect pests of rice and
consequent impact on natural enemies and grain yield during kharif,2020. Based
on the performance of the various treatment combinations in controlling the pest
damage at various locations, all insecticides module was found to be superior in
reducing stem borer damage compared to other insecticide-botanical modules
and was the most effective treatment at both vegetative and reproductive phases.
Among combinations, lowest silver shoot damage was recorded in all botanical
treatment which was on par with all insecticides treatment. Combination of
Neemazal, neem oil and triflumezopyrim treatment was found to effective against
BPH. Against WBPH and GLHall insecticides combination was found to be the
most effective treatment Against leaf folder also insecticides module was
effective in reducing leaf damage. Insecticide and botanical combination
treatments were found moderately effective in reducing damage by hispa and
whorl maggot pests. There was no significant difference in natural enemy (mirid,
spider and coccinellid) populations among treatments signifying that both
insecticides and botanicals are safe to beneficial organisms. Among various
treatments, all insecticides treatment recorded highest yield of 6324.6 kg/ha
with 44.2% increase over control followed by treatment with applications of
neemazal, neem oil and triflumezopyrim showing yield of 5498.5 kg/ha (25.3%
IOC). All the treatments were superior as compared to untreated control.
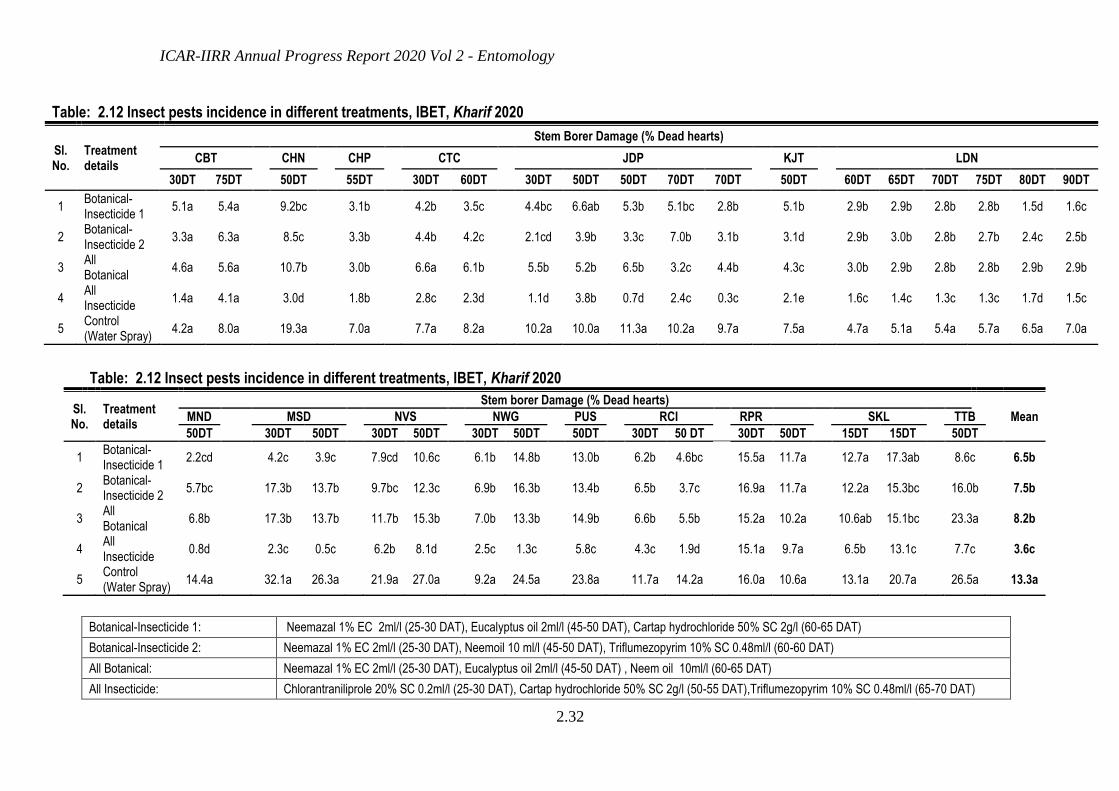
ICAR-IIRR Annual Progress Report 2020 Vol 2 - Entomology
2.32
Table: 2.12 Insect pests incidence in different treatments, IBET, Kharif 2020
Sl. No.
Treatment details
Stem Borer Damage (% Dead hearts)
CBT CHN CHP CTC JDP KJT LDN
30DT 75DT 50DT 55DT 30DT 60DT 30DT 50DT 50DT 70DT 70DT 50DT 60DT 65DT 70DT 75DT 80DT 90DT
1 Botanical-Insecticide 1
5.1a 5.4a 9.2bc 3.1b 4.2b 3.5c 4.4bc 6.6ab 5.3b 5.1bc 2.8b 5.1b 2.9b 2.9b 2.8b 2.8b 1.5d 1.6c
2 Botanical-Insecticide 2
3.3a 6.3a 8.5c 3.3b 4.4b 4.2c 2.1cd 3.9b 3.3c 7.0b 3.1b 3.1d 2.9b 3.0b 2.8b 2.7b 2.4c 2.5b
3 All Botanical
4.6a 5.6a 10.7b 3.0b 6.6a 6.1b 5.5b 5.2b 6.5b 3.2c 4.4b 4.3c 3.0b 2.9b 2.8b 2.8b 2.9b 2.9b
4 All Insecticide
1.4a 4.1a 3.0d 1.8b 2.8c 2.3d 1.1d 3.8b 0.7d 2.4c 0.3c 2.1e 1.6c 1.4c 1.3c 1.3c 1.7d 1.5c
5 Control (Water Spray)
4.2a 8.0a 19.3a 7.0a 7.7a 8.2a 10.2a 10.0a 11.3a 10.2a 9.7a 7.5a 4.7a 5.1a 5.4a 5.7a 6.5a 7.0a
Table: 2.12 Insect pests incidence in different treatments, IBET, Kharif 2020
Sl. No.
Treatment details
Stem borer Damage (% Dead hearts)
Mean MND MSD NVS NWG PUS RCI RPR SKL TTB
50DT 30DT 50DT 30DT 50DT 30DT 50DT 50DT 30DT 50 DT 30DT 50DT 15DT 15DT 50DT
1 Botanical-Insecticide 1
2.2cd 4.2c 3.9c 7.9cd 10.6c 6.1b 14.8b 13.0b 6.2b 4.6bc
15.5a 11.7a 12.7a 17.3ab 8.6c 6.5b
2 Botanical-Insecticide 2
5.7bc 17.3b 13.7b 9.7bc 12.3c 6.9b 16.3b 13.4b 6.5b 3.7c
16.9a 11.7a 12.2a 15.3bc 16.0b 7.5b
3 All Botanical
6.8b 17.3b 13.7b 11.7b 15.3b 7.0b 13.3b 14.9b 6.6b 5.5b
15.2a 10.2a 10.6ab 15.1bc 23.3a 8.2b
4 All Insecticide
0.8d 2.3c 0.5c 6.2b 8.1d 2.5c 1.3c 5.8c 4.3c 1.9d
15.1a 9.7a 6.5b 13.1c 7.7c 3.6c
5 Control (Water Spray)
14.4a 32.1a 26.3a 21.9a 27.0a 9.2a 24.5a 23.8a 11.7a 14.2a
16.0a 10.6a 13.1a 20.7a 26.5a 13.3a
Botanical-Insecticide 1: Neemazal 1% EC 2ml/l (25-30 DAT), Eucalyptus oil 2ml/l (45-50 DAT), Cartap hydrochloride 50% SC 2g/l (60-65 DAT)
Botanical-Insecticide 2: Neemazal 1% EC 2ml/l (25-30 DAT), Neemoil 10 ml/l (45-50 DAT), Triflumezopyrim 10% SC 0.48ml/l (60-60 DAT)
All Botanical: Neemazal 1% EC 2ml/l (25-30 DAT), Eucalyptus oil 2ml/l (45-50 DAT) , Neem oil 10ml/l (60-65 DAT)
All Insecticide: Chlorantraniliprole 20% SC 0.2ml/l (25-30 DAT), Cartap hydrochloride 50% SC 2g/l (50-55 DAT),Triflumezopyrim 10% SC 0.48ml/l (65-70 DAT)
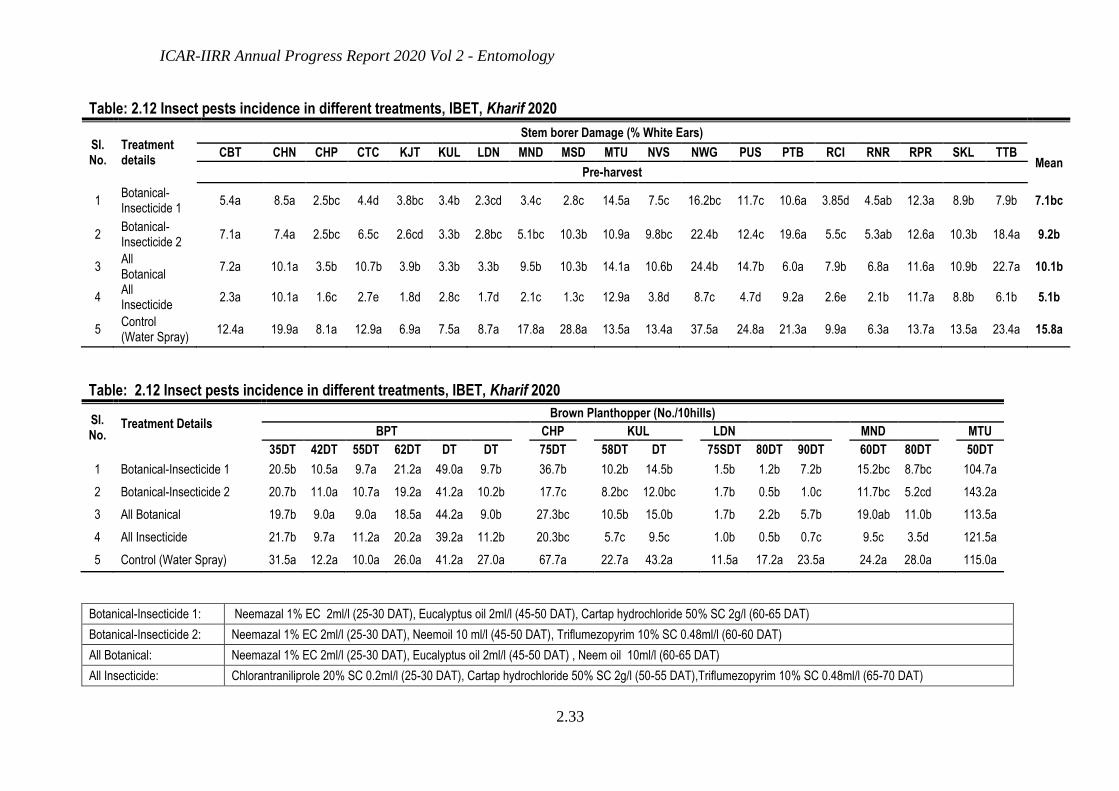
ICAR-IIRR Annual Progress Report 2020 Vol 2 - Entomology
2.33
Table: 2.12 Insect pests incidence in different treatments, IBET, Kharif 2020
Sl. No.
Treatment details
Stem borer Damage (% White Ears)
CBT CHN CHP CTC KJT KUL LDN MND MSD MTU NVS NWG PUS PTB RCI RNR RPR SKL TTB Mean
Pre-harvest
1 Botanical-Insecticide 1
5.4a 8.5a 2.5bc 4.4d 3.8bc 3.4b 2.3cd 3.4c 2.8c 14.5a 7.5c 16.2bc 11.7c 10.6a 3.85d 4.5ab 12.3a 8.9b 7.9b 7.1bc
2 Botanical-Insecticide 2
7.1a 7.4a 2.5bc 6.5c 2.6cd 3.3b 2.8bc 5.1bc 10.3b 10.9a 9.8bc 22.4b 12.4c 19.6a 5.5c 5.3ab 12.6a 10.3b 18.4a 9.2b
3 All Botanical
7.2a 10.1a 3.5b 10.7b 3.9b 3.3b 3.3b 9.5b 10.3b 14.1a 10.6b 24.4b 14.7b 6.0a 7.9b 6.8a 11.6a 10.9b 22.7a 10.1b
4 All Insecticide
2.3a 10.1a 1.6c 2.7e 1.8d 2.8c 1.7d 2.1c 1.3c 12.9a 3.8d 8.7c 4.7d 9.2a 2.6e 2.1b 11.7a 8.8b 6.1b 5.1b
5 Control (Water Spray)
12.4a 19.9a 8.1a 12.9a 6.9a 7.5a 8.7a 17.8a 28.8a 13.5a 13.4a 37.5a 24.8a 21.3a 9.9a 6.3a 13.7a 13.5a 23.4a 15.8a
Table: 2.12 Insect pests incidence in different treatments, IBET, Kharif 2020
Sl. No.
Treatment Details
Brown Planthopper (No./10hills)
BPT CHP KUL LDN MND MTU
35DT 42DT 55DT 62DT DT DT 75DT 58DT DT 75SDT 80DT 90DT 60DT 80DT 50DT
1 Botanical-Insecticide 1 20.5b 10.5a 9.7a 21.2a 49.0a 9.7b 36.7b 10.2b 14.5b 1.5b 1.2b 7.2b 15.2bc 8.7bc 104.7a
2 Botanical-Insecticide 2 20.7b 11.0a 10.7a 19.2a 41.2a 10.2b 17.7c 8.2bc 12.0bc 1.7b 0.5b 1.0c 11.7bc 5.2cd 143.2a
3 All Botanical 19.7b 9.0a 9.0a 18.5a 44.2a 9.0b 27.3bc 10.5b 15.0b 1.7b 2.2b 5.7b 19.0ab 11.0b 113.5a
4 All Insecticide 21.7b 9.7a 11.2a 20.2a 39.2a 11.2b 20.3bc 5.7c 9.5c 1.0b 0.5b 0.7c 9.5c 3.5d 121.5a
5 Control (Water Spray) 31.5a 12.2a 10.0a 26.0a 41.2a 27.0a 67.7a 22.7a 43.2a 11.5a 17.2a 23.5a 24.2a 28.0a 115.0a
Botanical-Insecticide 1: Neemazal 1% EC 2ml/l (25-30 DAT), Eucalyptus oil 2ml/l (45-50 DAT), Cartap hydrochloride 50% SC 2g/l (60-65 DAT)
Botanical-Insecticide 2: Neemazal 1% EC 2ml/l (25-30 DAT), Neemoil 10 ml/l (45-50 DAT), Triflumezopyrim 10% SC 0.48ml/l (60-60 DAT)
All Botanical: Neemazal 1% EC 2ml/l (25-30 DAT), Eucalyptus oil 2ml/l (45-50 DAT) , Neem oil 10ml/l (60-65 DAT)
All Insecticide: Chlorantraniliprole 20% SC 0.2ml/l (25-30 DAT), Cartap hydrochloride 50% SC 2g/l (50-55 DAT),Triflumezopyrim 10% SC 0.48ml/l (65-70 DAT)

ICAR-IIRR Annual Progress Report 2020 Vol 2 - Entomology
2.34
Table: 2.12 Insect pests incidence in different treatments, IBET, Kharif 2020
Sl. No.
Treatment Details
Brown Planthopper (No./10hills)
NDL NVS RGL RPR
59DT 64DT 69DT 74DT 79DT 89DT 80DT 83DT 30DT 50DT 75DT DT DT DT
1 Botanical-Insecticide 1 19.0a 49.5a 12.0a 26.7a 79.0a 115.7a 10.5a 7.7c 10.7a 21.0bc 34.7b 8.5 7.8 31.3
2 Botanical-Insecticide 2 12.2ab 33.2b 2.5a 18.0a 4.5a 14.0a 10.5a 6.2d 9.2a 18.0bc 29.7b 8.3 12.5 29.5
3 All Botanical 11.2ab 33.0b 12.0a 21.7a 34.0a 76.7a 10.5a 9.0b 13.7a 27.2b 39.7b 10.0 8.3 32.0
4 All Insecticide 11.5b 42.5ab 14.5a 20.5a 122.5a 153.2a 10.5a 4.5e 8.2a 16.0c 18.7c 7.5 5.8 29.0
5 Control (Water Spray) 13.0ab 36.5ab 10.5a 16.7a 50.2a 115.7a 10.5a 14.0a 12.2a 40.0a 57.2a 9.8 9.8 49.0
Table: 2.12 Insect pests incidence in different treatments, IBET, Kharif 2020
Sl. No.
Treatment Details
Brown Planthopper (No./10hills)
Mean SKL WGL
49DT 53DT 64DT 68DT 59DT 62DT 64DT 72DT 77DT 81DT 89DT
1 Botanical-Insecticide 1 36.0a 30.2b 71.2ab 67.0c 12.2a 17.5ab 36.7abc 21.7abc 15.2a 18.2bc 8.0a 27.2a
2 Botanical-Insecticide 2 39.7a 33.0b 69.5ab 68.2bc 11.7a 17.2ab 43.2a 24.0ab 10.0b 15.2cd 5.2c 21.5a
3 All Botanical 36.2a 35.7b 71.2ab 75.0b 14.0a 21.0a 38.7ab 24.2a 15.7a 19.2b 8.7b 25.4a
4 All Insecticide 37.0a 25.5b 66.0b 68.0bc 10.5a 7.7b 28.5c 21.2bc 10.5b 13.5d 5.5c 26.1a
5 Control (Water Spray) 36.7a 48.0a 76.5a 82.7a 10.5a 15.5b 33.7bc 19.2c 15.2a 24.0a 12.5a 33.0a
Botanical-Insecticide 1: Neemazal 1% EC 2ml/l (25-30 DAT), Eucalyptus oil 2ml/l (45-50 DAT), Cartap hydrochloride 50% SC 2g/l (60-65 DAT)
Botanical-Insecticide 2: Neemazal 1% EC 2ml/l (25-30 DAT), Neemoil 10 ml/l (45-50 DAT), Triflumezopyrim 10% SC 0.48ml/l (60-60 DAT)
All Botanical: Neemazal 1% EC 2ml/l (25-30 DAT), Eucalyptus oil 2ml/l (45-50 DAT) , Neem oil 10ml/l (60-65 DAT)
All Insecticide: Chlorantraniliprole 20% SC 0.2ml/l (25-30 DAT), Cartap hydrochloride 50% SC 2g/l (50-55 DAT),Triflumezopyrim 10% SC 0.48ml/l (65-70 DAT)

ICAR-IIRR Annual Progress Report 2020 Vol 2 - Entomology
2.35
Table: 2.12 Insect pests incidence in different treatments, IBET, Kharif 2020
Sl. No.
Treatment Details
Whitebacked Plant Hopper (No./10hills)
BPT KUL LDN MND MTU NDL
35DT 55DT 62DT DT DT 58DT 73DT 65DT 70DT 75DT 80DT 90DT 60DT 80DT 50DT 49DT 54DT 59DT
1 Botanical-Insecticide 1
17.7ab 7.7a 11.0a 38.2a 8.2b 12.5b 6.2b 14.7b 11.5b 11.7b 9.7b 10.0b 16.7a 6.5bc 10.5a 13.0a 11.7a 11.0b
2 Botanical-Insecticide 2
14.5b 8.7a 10.0a 35.2a 8.5.b 8.7c 4.7bc 14.5b 11.0b 11.5b 4.0c 4.5c 9.0b 2.2c 18.2a 9.2a 8.7a 10.5b
3 All Botanical
20.7a 7.7a 9.5a 43.7a 8.5b 13.0b 6.5b 15.0b 11.2b 11.5b 10.5b 10.7b 18.5a 9.7b 16.2a 15.2a 12.5a 16.2ab
4 All Insecticide
14.7b 7.7a 10.2a 34.2a 8.0b 7.7c 4.0c 12.0c 9.7b 10.5b 2.7c 3.7c 7.2b 2.2c 14.7a 13.0a 13.7a 16.5ab
5 Control (Water Spray)
20.2a 9.5a 14.2a 37.0a 26.0a 29.2a 15.7a 28.7a 33.7a 33.7a 32.5a 23.7a 21.2a 25.0a 15.2a 15.5a 12.7a 20.0a
Table: 2.12 Insect pests incidence in different treatments, IBET, Kharif 2020
Sl. No.
Treatment Details
Whitebacked Plant Hopper (No./10hills)
Mean NVS NWG RGL SKL WGL
63DT 80DT 83DT 50DT 60DT 70DT 30DT 50DT 75DT 49DT 64DT 68DT 59DT 64DT 81DT
1 Botanical-Insecticide 1 4.5c 12.2a 5.5c 52.0b 146.0b 34.0c 10.2ab 15.7bc 22.2bc 10.0a 10.5a 11.7b 13.0a 12.0a 7.0b 18.0b
2 Botanical-Insecticide 2 2.7d 12.5a 3.5d 53.0b 152.0b 31.0c 8.5b 14.5bc 23.0b 10.2a 10.0a 10..0b 13.2a 11.7a 5.7b 16.8b
3 All Botanical 5.5b 12.2a 6.5b 54.0b 155.0b 57.0b 12.0ab 21.5ab 26.0ab 8.7a 10.7a 12.0b 13.7a 11.7a 9.5a 20.3ab
4 All Insecticide 1.2e 12.5a 1.5e 24.0c 36.0c 4.0d 13.5ab 12.0c 11.2c 9.0a 8.5a 11.5b 10.7a 6.2a 5.7b 10.9b
5 Control (Water Spray) 10.7a 12.7a 14.5a 81.0a 260.0a 183.0a 16.2a 26.2a 36.2a 9.5a 10.5a 19.5a 13.5a 11.7a 10.7a 34.2a
Botanical-Insecticide 1: Neemazal 1% EC 2ml/l (25-30 DAT), Eucalyptus oil 2ml/l (45-50 DAT), Cartap hydrochloride 50% SC 2g/l (60-65 DAT)
Botanical-Insecticide 2: Neemazal 1% EC 2ml/l (25-30 DAT), Neemoil 10 ml/l (45-50 DAT), Triflumezopyrim 10% SC 0.48ml/l (60-60 DAT)
All Botanical: Neemazal 1% EC 2ml/l (25-30 DAT), Eucalyptus oil 2ml/l (45-50 DAT) , Neem oil 10ml/l (60-65 DAT)
All Insecticide: Chlorantraniliprole 20% SC 0.2ml/l (25-30 DAT), Cartap hydrochloride 50% SC 2g/l (50-55 DAT),Triflumezopyrim 10% SC 0.48ml/l (65-70 DAT)
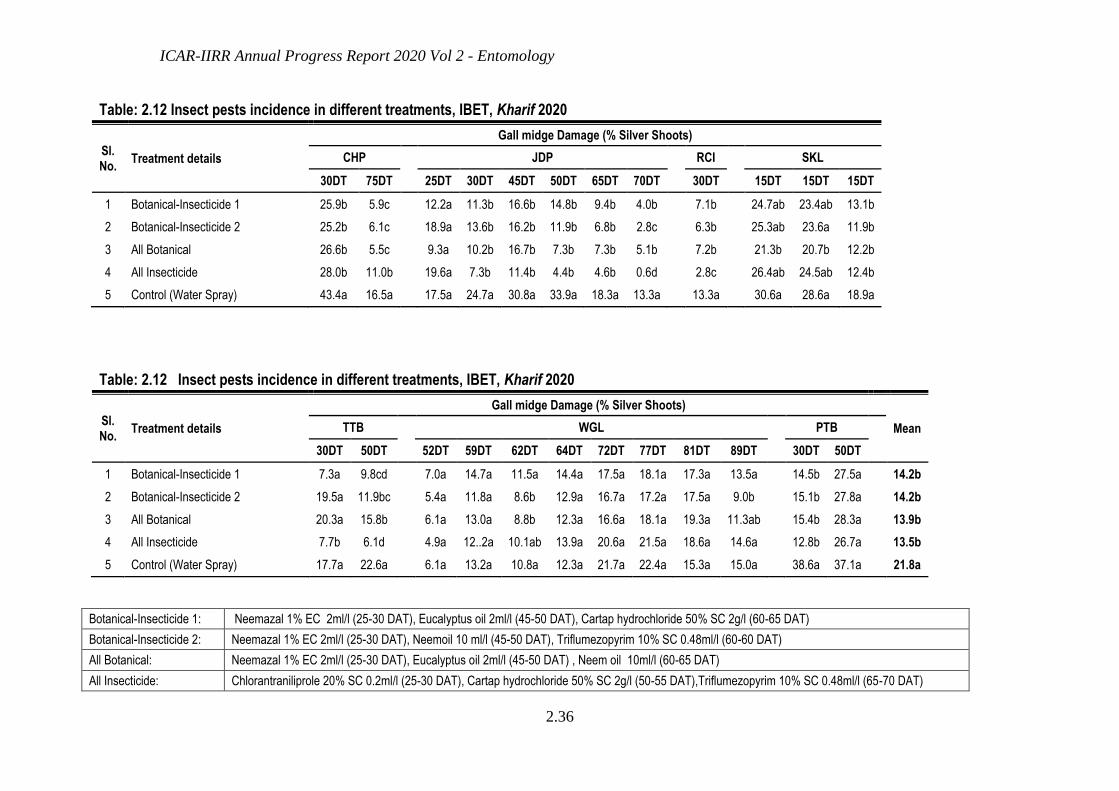
ICAR-IIRR Annual Progress Report 2020 Vol 2 - Entomology
2.36
Table: 2.12 Insect pests incidence in different treatments, IBET, Kharif 2020
Sl. No.
Treatment details
Gall midge Damage (% Silver Shoots)
CHP JDP RCI SKL
30DT 75DT 25DT 30DT 45DT 50DT 65DT 70DT 30DT 15DT 15DT 15DT
1 Botanical-Insecticide 1 25.9b 5.9c 12.2a 11.3b 16.6b 14.8b 9.4b 4.0b 7.1b 24.7ab 23.4ab 13.1b
2 Botanical-Insecticide 2 25.2b 6.1c 18.9a 13.6b 16.2b 11.9b 6.8b 2.8c 6.3b 25.3ab 23.6a 11.9b
3 All Botanical 26.6b 5.5c 9.3a 10.2b 16.7b 7.3b 7.3b 5.1b 7.2b 21.3b 20.7b 12.2b
4 All Insecticide 28.0b 11.0b 19.6a 7.3b 11.4b 4.4b 4.6b 0.6d 2.8c 26.4ab 24.5ab 12.4b
5 Control (Water Spray) 43.4a 16.5a 17.5a 24.7a 30.8a 33.9a 18.3a 13.3a 13.3a 30.6a 28.6a 18.9a
Table: 2.12 Insect pests incidence in different treatments, IBET, Kharif 2020
Sl. No.
Treatment details
Gall midge Damage (% Silver Shoots)
Mean TTB WGL PTB
30DT 50DT 52DT 59DT 62DT 64DT 72DT 77DT 81DT 89DT 30DT 50DT
1 Botanical-Insecticide 1 7.3a 9.8cd 7.0a 14.7a 11.5a 14.4a 17.5a 18.1a 17.3a 13.5a 14.5b 27.5a 14.2b
2 Botanical-Insecticide 2 19.5a 11.9bc 5.4a 11.8a 8.6b 12.9a 16.7a 17.2a 17.5a 9.0b 15.1b 27.8a 14.2b
3 All Botanical 20.3a 15.8b 6.1a 13.0a 8.8b 12.3a 16.6a 18.1a 19.3a 11.3ab 15.4b 28.3a 13.9b
4 All Insecticide 7.7b 6.1d 4.9a 12..2a 10.1ab 13.9a 20.6a 21.5a 18.6a 14.6a 12.8b 26.7a 13.5b
5 Control (Water Spray) 17.7a 22.6a 6.1a 13.2a 10.8a 12.3a 21.7a 22.4a 15.3a 15.0a 38.6a 37.1a 21.8a
Botanical-Insecticide 1: Neemazal 1% EC 2ml/l (25-30 DAT), Eucalyptus oil 2ml/l (45-50 DAT), Cartap hydrochloride 50% SC 2g/l (60-65 DAT)
Botanical-Insecticide 2: Neemazal 1% EC 2ml/l (25-30 DAT), Neemoil 10 ml/l (45-50 DAT), Triflumezopyrim 10% SC 0.48ml/l (60-60 DAT)
All Botanical: Neemazal 1% EC 2ml/l (25-30 DAT), Eucalyptus oil 2ml/l (45-50 DAT) , Neem oil 10ml/l (60-65 DAT)
All Insecticide: Chlorantraniliprole 20% SC 0.2ml/l (25-30 DAT), Cartap hydrochloride 50% SC 2g/l (50-55 DAT),Triflumezopyrim 10% SC 0.48ml/l (65-70 DAT)
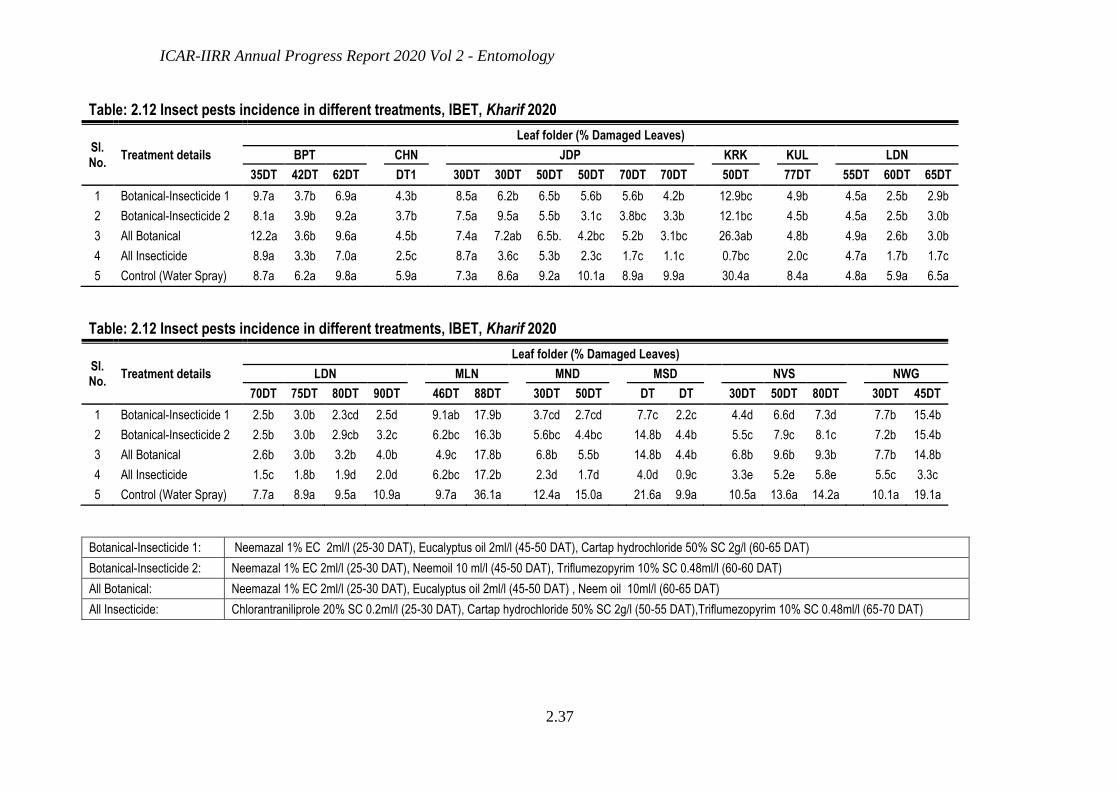
ICAR-IIRR Annual Progress Report 2020 Vol 2 - Entomology
2.37
Table: 2.12 Insect pests incidence in different treatments, IBET, Kharif 2020
Sl. No.
Treatment details
Leaf folder (% Damaged Leaves)
BPT CHN JDP KRK KUL LDN
35DT 42DT 62DT DT1 30DT 30DT 50DT 50DT 70DT 70DT 50DT 77DT 55DT 60DT 65DT
1 Botanical-Insecticide 1 9.7a 3.7b 6.9a 4.3b 8.5a 6.2b 6.5b 5.6b 5.6b 4.2b 12.9bc 4.9b 4.5a 2.5b 2.9b
2 Botanical-Insecticide 2 8.1a 3.9b 9.2a 3.7b 7.5a 9.5a 5.5b 3.1c 3.8bc 3.3b 12.1bc 4.5b 4.5a 2.5b 3.0b
3 All Botanical 12.2a 3.6b 9.6a 4.5b 7.4a 7.2ab 6.5b. 4.2bc 5.2b 3.1bc 26.3ab 4.8b 4.9a 2.6b 3.0b
4 All Insecticide 8.9a 3.3b 7.0a 2.5c 8.7a 3.6c 5.3b 2.3c 1.7c 1.1c 0.7bc 2.0c 4.7a 1.7b 1.7c
5 Control (Water Spray) 8.7a 6.2a 9.8a 5.9a 7.3a 8.6a 9.2a 10.1a 8.9a 9.9a 30.4a 8.4a 4.8a 5.9a 6.5a
Table: 2.12 Insect pests incidence in different treatments, IBET, Kharif 2020
Sl. No.
Treatment details
Leaf folder (% Damaged Leaves)
LDN MLN MND MSD NVS NWG
70DT 75DT 80DT 90DT 46DT 88DT 30DT 50DT DT DT 30DT 50DT 80DT 30DT 45DT
1 Botanical-Insecticide 1 2.5b 3.0b 2.3cd 2.5d 9.1ab 17.9b 3.7cd 2.7cd 7.7c 2.2c 4.4d 6.6d 7.3d 7.7b 15.4b
2 Botanical-Insecticide 2 2.5b 3.0b 2.9cb 3.2c 6.2bc 16.3b 5.6bc 4.4bc 14.8b 4.4b 5.5c 7.9c 8.1c 7.2b 15.4b
3 All Botanical 2.6b 3.0b 3.2b 4.0b 4.9c 17.8b 6.8b 5.5b 14.8b 4.4b 6.8b 9.6b 9.3b 7.7b 14.8b
4 All Insecticide 1.5c 1.8b 1.9d 2.0d 6.2bc 17.2b 2.3d 1.7d 4.0d 0.9c 3.3e 5.2e 5.8e 5.5c 3.3c
5 Control (Water Spray) 7.7a 8.9a 9.5a 10.9a 9.7a 36.1a 12.4a 15.0a 21.6a 9.9a 10.5a 13.6a 14.2a 10.1a 19.1a
Botanical-Insecticide 1: Neemazal 1% EC 2ml/l (25-30 DAT), Eucalyptus oil 2ml/l (45-50 DAT), Cartap hydrochloride 50% SC 2g/l (60-65 DAT)
Botanical-Insecticide 2: Neemazal 1% EC 2ml/l (25-30 DAT), Neemoil 10 ml/l (45-50 DAT), Triflumezopyrim 10% SC 0.48ml/l (60-60 DAT)
All Botanical: Neemazal 1% EC 2ml/l (25-30 DAT), Eucalyptus oil 2ml/l (45-50 DAT) , Neem oil 10ml/l (60-65 DAT)
All Insecticide: Chlorantraniliprole 20% SC 0.2ml/l (25-30 DAT), Cartap hydrochloride 50% SC 2g/l (50-55 DAT),Triflumezopyrim 10% SC 0.48ml/l (65-70 DAT)
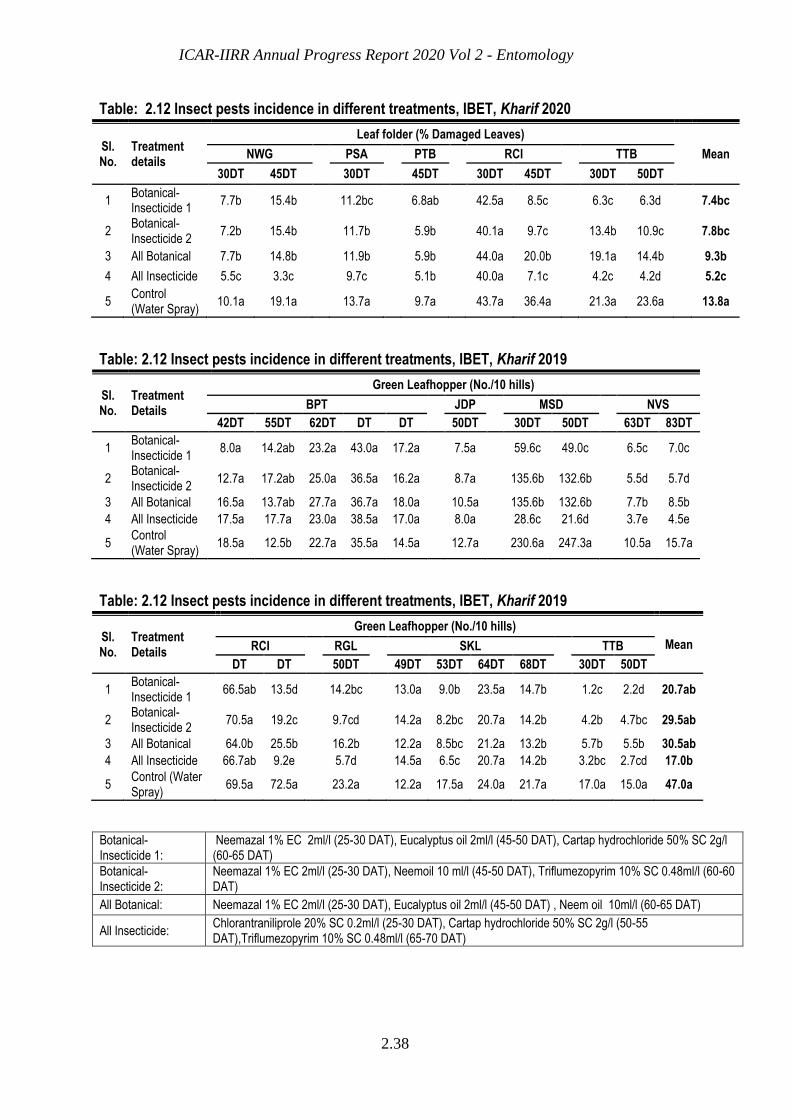
ICAR-IIRR Annual Progress Report 2020 Vol 2 - Entomology
2.38
Table: 2.12 Insect pests incidence in different treatments, IBET, Kharif 2020
Sl. No.
Treatment details
Leaf folder (% Damaged Leaves)
Mean NWG PSA PTB RCI TTB
30DT 45DT 30DT 45DT 30DT 45DT 30DT 50DT
1 Botanical-Insecticide 1
7.7b 15.4b 11.2bc 6.8ab 42.5a 8.5c 6.3c 6.3d 7.4bc
2 Botanical-Insecticide 2
7.2b 15.4b 11.7b 5.9b 40.1a 9.7c 13.4b 10.9c 7.8bc
3 All Botanical 7.7b 14.8b 11.9b 5.9b 44.0a 20.0b 19.1a 14.4b 9.3b
4 All Insecticide 5.5c 3.3c 9.7c 5.1b 40.0a 7.1c 4.2c 4.2d 5.2c
5 Control (Water Spray)
10.1a 19.1a 13.7a 9.7a 43.7a 36.4a 21.3a 23.6a 13.8a
Table: 2.12 Insect pests incidence in different treatments, IBET, Kharif 2019
Sl. No.
Treatment Details
Green Leafhopper (No./10 hills)
BPT JDP MSD NVS
42DT 55DT 62DT DT DT 50DT 30DT 50DT 63DT 83DT
1 Botanical-Insecticide 1
8.0a 14.2ab 23.2a 43.0a 17.2a 7.5a 59.6c 49.0c 6.5c 7.0c
2 Botanical-Insecticide 2
12.7a 17.2ab 25.0a 36.5a 16.2a 8.7a 135.6b 132.6b 5.5d 5.7d
3 All Botanical 16.5a 13.7ab 27.7a 36.7a 18.0a 10.5a 135.6b 132.6b 7.7b 8.5b
4 All Insecticide 17.5a 17.7a 23.0a 38.5a 17.0a 8.0a 28.6c 21.6d 3.7e 4.5e
5 Control (Water Spray)
18.5a 12.5b 22.7a 35.5a 14.5a 12.7a 230.6a 247.3a 10.5a 15.7a
Table: 2.12 Insect pests incidence in different treatments, IBET, Kharif 2019
Sl. No.
Treatment Details
Green Leafhopper (No./10 hills)
Mean RCI RGL SKL TTB
DT DT 50DT 49DT 53DT 64DT 68DT 30DT 50DT
1 Botanical-Insecticide 1
66.5ab 13.5d 14.2bc 13.0a 9.0b 23.5a 14.7b 1.2c 2.2d 20.7ab
2 Botanical-Insecticide 2
70.5a 19.2c 9.7cd 14.2a 8.2bc 20.7a 14.2b 4.2b 4.7bc 29.5ab
3 All Botanical 64.0b 25.5b 16.2b 12.2a 8.5bc 21.2a 13.2b 5.7b 5.5b 30.5ab
4 All Insecticide 66.7ab 9.2e 5.7d 14.5a 6.5c 20.7a 14.2b 3.2bc 2.7cd 17.0b
5 Control (Water Spray)
69.5a 72.5a 23.2a 12.2a 17.5a 24.0a 21.7a 17.0a 15.0a 47.0a
Botanical-Insecticide 1:
Neemazal 1% EC 2ml/l (25-30 DAT), Eucalyptus oil 2ml/l (45-50 DAT), Cartap hydrochloride 50% SC 2g/l (60-65 DAT)
Botanical-Insecticide 2:
Neemazal 1% EC 2ml/l (25-30 DAT), Neemoil 10 ml/l (45-50 DAT), Triflumezopyrim 10% SC 0.48ml/l (60-60 DAT)
All Botanical: Neemazal 1% EC 2ml/l (25-30 DAT), Eucalyptus oil 2ml/l (45-50 DAT) , Neem oil 10ml/l (60-65 DAT)
All Insecticide: Chlorantraniliprole 20% SC 0.2ml/l (25-30 DAT), Cartap hydrochloride 50% SC 2g/l (50-55 DAT),Triflumezopyrim 10% SC 0.48ml/l (65-70 DAT)
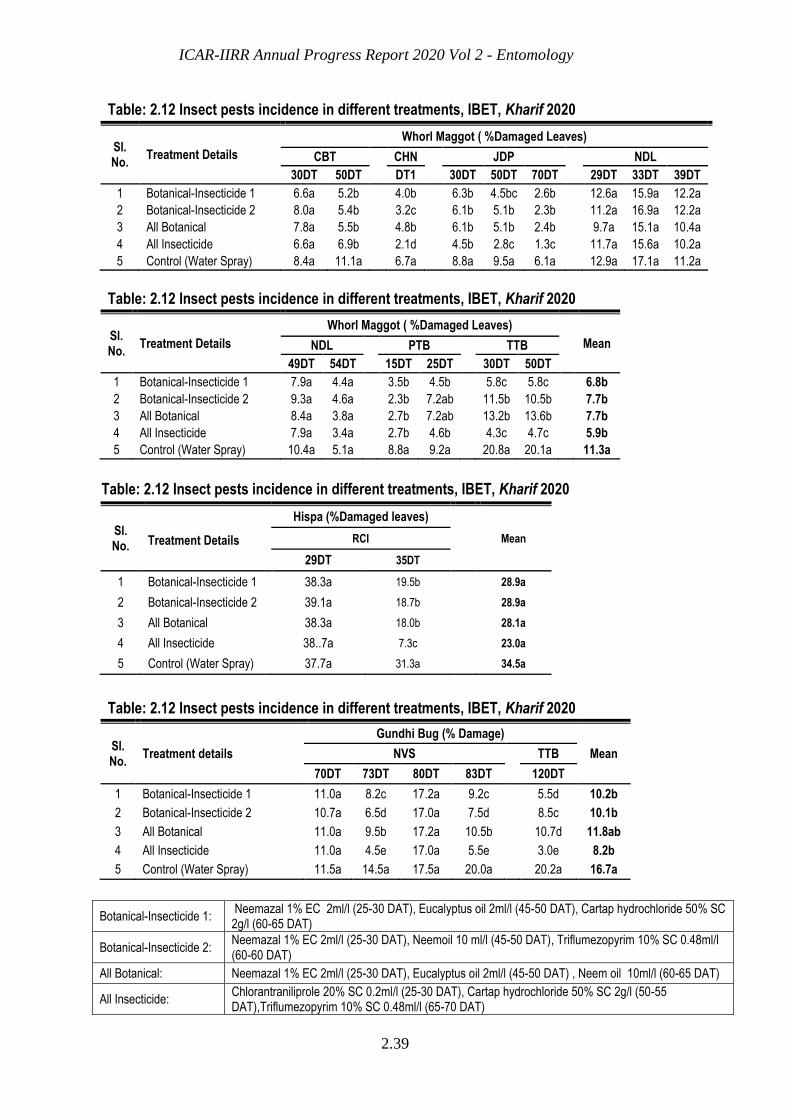
ICAR-IIRR Annual Progress Report 2020 Vol 2 - Entomology
2.39
Table: 2.12 Insect pests incidence in different treatments, IBET, Kharif 2020
Sl. No.
Treatment Details
Whorl Maggot ( %Damaged Leaves)
CBT CHN JDP NDL
30DT 50DT DT1 30DT 50DT 70DT 29DT 33DT 39DT
1 Botanical-Insecticide 1 6.6a 5.2b 4.0b 6.3b 4.5bc 2.6b 12.6a 15.9a 12.2a
2 Botanical-Insecticide 2 8.0a 5.4b 3.2c 6.1b 5.1b 2.3b 11.2a 16.9a 12.2a
3 All Botanical 7.8a 5.5b 4.8b 6.1b 5.1b 2.4b 9.7a 15.1a 10.4a
4 All Insecticide 6.6a 6.9b 2.1d 4.5b 2.8c 1.3c 11.7a 15.6a 10.2a
5 Control (Water Spray) 8.4a 11.1a 6.7a 8.8a 9.5a 6.1a 12.9a 17.1a 11.2a
Table: 2.12 Insect pests incidence in different treatments, IBET, Kharif 2020
Sl. No.
Treatment Details
Whorl Maggot ( %Damaged Leaves)
Mean NDL PTB TTB
49DT 54DT 15DT 25DT 30DT 50DT
1 Botanical-Insecticide 1 7.9a 4.4a 3.5b 4.5b 5.8c 5.8c 6.8b
2 Botanical-Insecticide 2 9.3a 4.6a 2.3b 7.2ab 11.5b 10.5b 7.7b
3 All Botanical 8.4a 3.8a 2.7b 7.2ab 13.2b 13.6b 7.7b
4 All Insecticide 7.9a 3.4a 2.7b 4.6b 4.3c 4.7c 5.9b
5 Control (Water Spray) 10.4a 5.1a 8.8a 9.2a 20.8a 20.1a 11.3a
Table: 2.12 Insect pests incidence in different treatments, IBET, Kharif 2020
Sl. No.
Treatment Details
Hispa (%Damaged leaves)
Mean
RCI
29DT 35DT
1 Botanical-Insecticide 1 38.3a 19.5b 28.9a 2 Botanical-Insecticide 2 39.1a 18.7b 28.9a 3 All Botanical 38.3a 18.0b 28.1a 4 All Insecticide 38..7a 7.3c 23.0a 5 Control (Water Spray) 37.7a 31.3a 34.5a
Table: 2.12 Insect pests incidence in different treatments, IBET, Kharif 2020
Sl. No.
Treatment details
Gundhi Bug (% Damage)
Mean NVS TTB
70DT 73DT 80DT 83DT 120DT
1 Botanical-Insecticide 1 11.0a 8.2c 17.2a 9.2c 5.5d 10.2b
2 Botanical-Insecticide 2 10.7a 6.5d 17.0a 7.5d 8.5c 10.1b
3 All Botanical 11.0a 9.5b 17.2a 10.5b 10.7d 11.8ab
4 All Insecticide 11.0a 4.5e 17.0a 5.5e 3.0e 8.2b
5 Control (Water Spray) 11.5a 14.5a 17.5a 20.0a 20.2a 16.7a
Botanical-Insecticide 1: Neemazal 1% EC 2ml/l (25-30 DAT), Eucalyptus oil 2ml/l (45-50 DAT), Cartap hydrochloride 50% SC 2g/l (60-65 DAT)
Botanical-Insecticide 2: Neemazal 1% EC 2ml/l (25-30 DAT), Neemoil 10 ml/l (45-50 DAT), Triflumezopyrim 10% SC 0.48ml/l (60-60 DAT)
All Botanical: Neemazal 1% EC 2ml/l (25-30 DAT), Eucalyptus oil 2ml/l (45-50 DAT) , Neem oil 10ml/l (60-65 DAT)
All Insecticide: Chlorantraniliprole 20% SC 0.2ml/l (25-30 DAT), Cartap hydrochloride 50% SC 2g/l (50-55 DAT),Triflumezopyrim 10% SC 0.48ml/l (65-70 DAT)
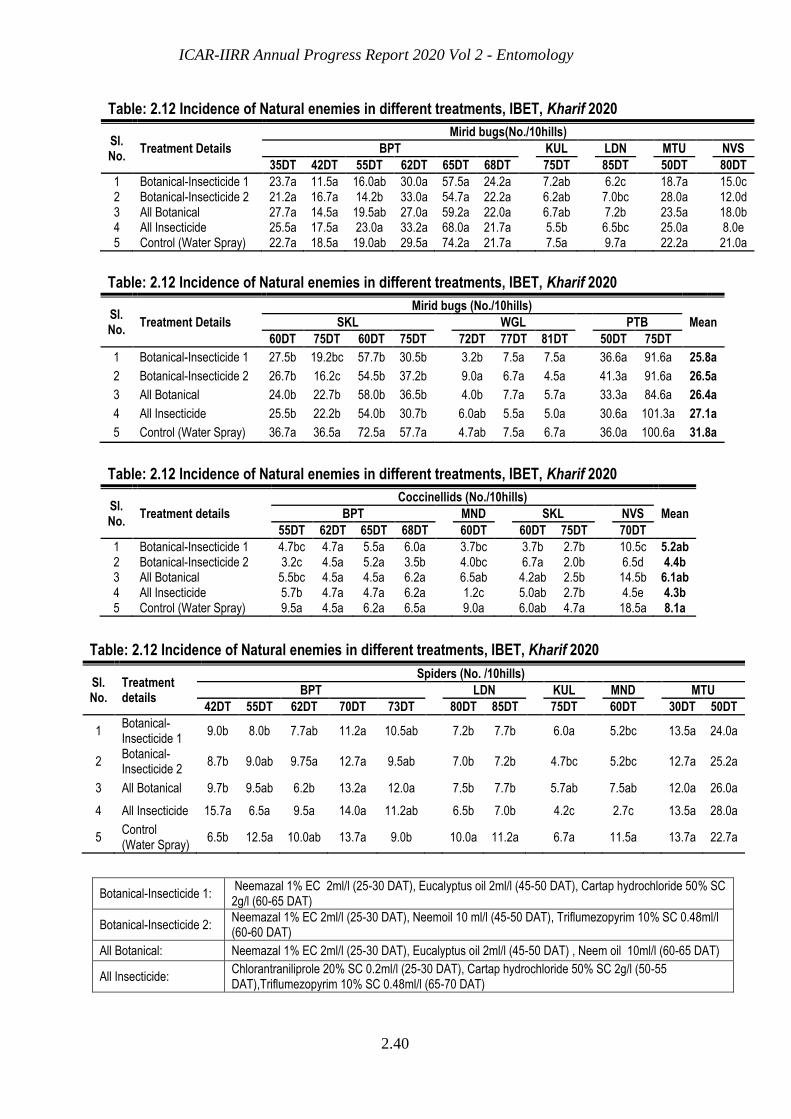
ICAR-IIRR Annual Progress Report 2020 Vol 2 - Entomology
2.40
Table: 2.12 Incidence of Natural enemies in different treatments, IBET, Kharif 2020
Sl. No.
Treatment Details
Mirid bugs(No./10hills)
BPT KUL LDN MTU NVS
35DT 42DT 55DT 62DT 65DT 68DT 75DT 85DT 50DT 80DT
1 Botanical-Insecticide 1 23.7a 11.5a 16.0ab 30.0a 57.5a 24.2a 7.2ab 6.2c 18.7a 15.0c 2 Botanical-Insecticide 2 21.2a 16.7a 14.2b 33.0a 54.7a 22.2a 6.2ab 7.0bc 28.0a 12.0d 3 All Botanical 27.7a 14.5a 19.5ab 27.0a 59.2a 22.0a 6.7ab 7.2b 23.5a 18.0b 4 All Insecticide 25.5a 17.5a 23.0a 33.2a 68.0a 21.7a 5.5b 6.5bc 25.0a 8.0e 5 Control (Water Spray) 22.7a 18.5a 19.0ab 29.5a 74.2a 21.7a 7.5a 9.7a 22.2a 21.0a
Table: 2.12 Incidence of Natural enemies in different treatments, IBET, Kharif 2020
Sl. No.
Treatment Details
Mirid bugs (No./10hills)
Mean SKL WGL PTB
60DT 75DT 60DT 75DT 72DT 77DT 81DT 50DT 75DT
1 Botanical-Insecticide 1 27.5b 19.2bc 57.7b 30.5b 3.2b 7.5a 7.5a 36.6a 91.6a 25.8a
2 Botanical-Insecticide 2 26.7b 16.2c 54.5b 37.2b 9.0a 6.7a 4.5a 41.3a 91.6a 26.5a
3 All Botanical 24.0b 22.7b 58.0b 36.5b 4.0b 7.7a 5.7a 33.3a 84.6a 26.4a
4 All Insecticide 25.5b 22.2b 54.0b 30.7b 6.0ab 5.5a 5.0a 30.6a 101.3a 27.1a
5 Control (Water Spray) 36.7a 36.5a 72.5a 57.7a 4.7ab 7.5a 6.7a 36.0a 100.6a 31.8a
Table: 2.12 Incidence of Natural enemies in different treatments, IBET, Kharif 2020
Sl. No.
Treatment details
Coccinellids (No./10hills)
Mean BPT MND SKL NVS
55DT 62DT 65DT 68DT 60DT 60DT 75DT 70DT
1 Botanical-Insecticide 1 4.7bc 4.7a 5.5a 6.0a 3.7bc 3.7b 2.7b 10.5c 5.2ab 2 Botanical-Insecticide 2 3.2c 4.5a 5.2a 3.5b 4.0bc 6.7a 2.0b 6.5d 4.4b 3 All Botanical 5.5bc 4.5a 4.5a 6.2a 6.5ab 4.2ab 2.5b 14.5b 6.1ab 4 All Insecticide 5.7b 4.7a 4.7a 6.2a 1.2c 5.0ab 2.7b 4.5e 4.3b 5 Control (Water Spray) 9.5a 4.5a 6.2a 6.5a 9.0a 6.0ab 4.7a 18.5a 8.1a
Table: 2.12 Incidence of Natural enemies in different treatments, IBET, Kharif 2020
Sl. No.
Treatment details
Spiders (No. /10hills)
BPT LDN KUL MND MTU
42DT 55DT 62DT 70DT 73DT 80DT 85DT 75DT 60DT 30DT 50DT
1 Botanical-Insecticide 1
9.0b 8.0b 7.7ab 11.2a 10.5ab 7.2b 7.7b 6.0a 5.2bc 13.5a 24.0a
2 Botanical-Insecticide 2
8.7b 9.0ab 9.75a 12.7a 9.5ab 7.0b 7.2b 4.7bc 5.2bc 12.7a 25.2a
3 All Botanical 9.7b 9.5ab 6.2b 13.2a 12.0a 7.5b 7.7b 5.7ab 7.5ab 12.0a 26.0a
4 All Insecticide 15.7a 6.5a 9.5a 14.0a 11.2ab 6.5b 7.0b 4.2c 2.7c 13.5a 28.0a
5 Control (Water Spray)
6.5b 12.5a 10.0ab 13.7a 9.0b 10.0a 11.2a 6.7a 11.5a 13.7a 22.7a
Botanical-Insecticide 1: Neemazal 1% EC 2ml/l (25-30 DAT), Eucalyptus oil 2ml/l (45-50 DAT), Cartap hydrochloride 50% SC 2g/l (60-65 DAT)
Botanical-Insecticide 2: Neemazal 1% EC 2ml/l (25-30 DAT), Neemoil 10 ml/l (45-50 DAT), Triflumezopyrim 10% SC 0.48ml/l (60-60 DAT)
All Botanical: Neemazal 1% EC 2ml/l (25-30 DAT), Eucalyptus oil 2ml/l (45-50 DAT) , Neem oil 10ml/l (60-65 DAT)
All Insecticide: Chlorantraniliprole 20% SC 0.2ml/l (25-30 DAT), Cartap hydrochloride 50% SC 2g/l (50-55 DAT),Triflumezopyrim 10% SC 0.48ml/l (65-70 DAT)
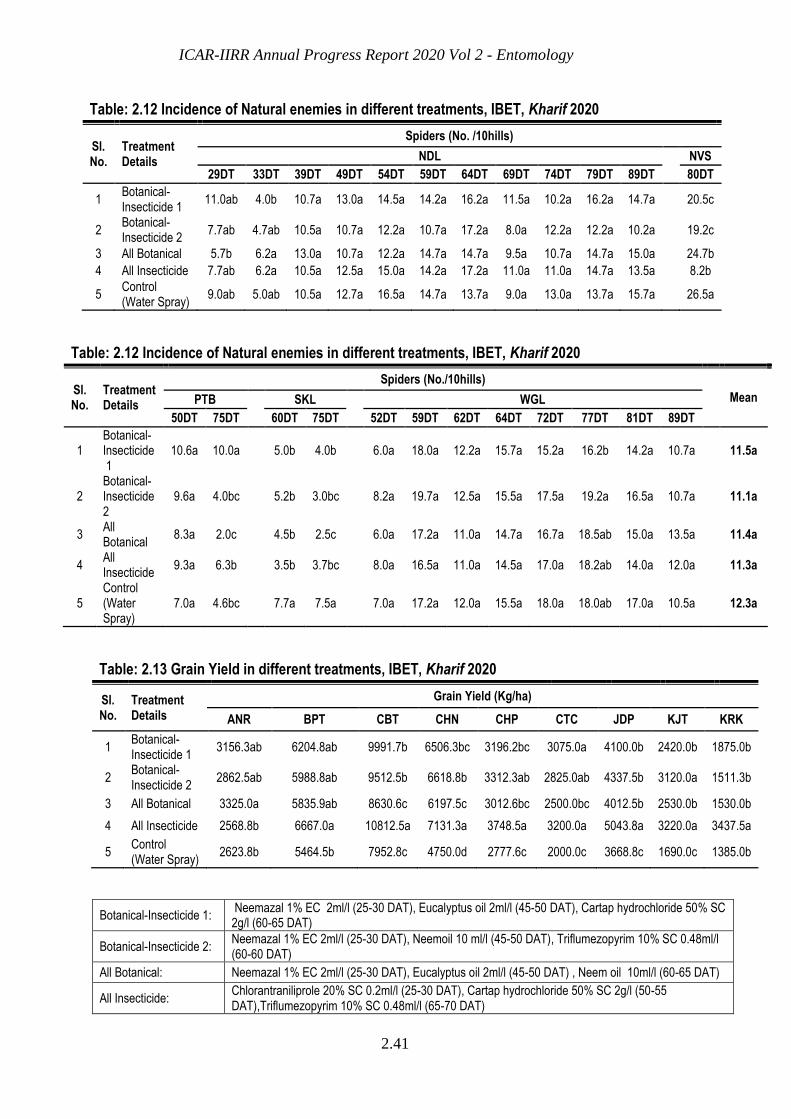
ICAR-IIRR Annual Progress Report 2020 Vol 2 - Entomology
2.41
Table: 2.12 Incidence of Natural enemies in different treatments, IBET, Kharif 2020
Sl. No.
Treatment Details
Spiders (No. /10hills)
NDL NVS
29DT 33DT 39DT 49DT 54DT 59DT 64DT 69DT 74DT 79DT 89DT 80DT
1 Botanical-Insecticide 1
11.0ab 4.0b 10.7a 13.0a 14.5a 14.2a 16.2a 11.5a 10.2a 16.2a 14.7a 20.5c
2 Botanical-Insecticide 2
7.7ab 4.7ab 10.5a 10.7a 12.2a 10.7a 17.2a 8.0a 12.2a 12.2a 10.2a 19.2c
3 All Botanical 5.7b 6.2a 13.0a 10.7a 12.2a 14.7a 14.7a 9.5a 10.7a 14.7a 15.0a 24.7b
4 All Insecticide 7.7ab 6.2a 10.5a 12.5a 15.0a 14.2a 17.2a 11.0a 11.0a 14.7a 13.5a 8.2b
5 Control (Water Spray)
9.0ab 5.0ab 10.5a 12.7a 16.5a 14.7a 13.7a 9.0a 13.0a 13.7a 15.7a 26.5a
Table: 2.12 Incidence of Natural enemies in different treatments, IBET, Kharif 2020
Sl. No.
Treatment Details
Spiders (No./10hills)
Mean PTB SKL WGL
50DT 75DT 60DT 75DT 52DT 59DT 62DT 64DT 72DT 77DT 81DT 89DT
1 Botanical-Insecticide 1
10.6a 10.0a 5.0b 4.0b 6.0a 18.0a 12.2a 15.7a 15.2a 16.2b 14.2a 10.7a 11.5a
2 Botanical-Insecticide 2
9.6a 4.0bc 5.2b 3.0bc 8.2a 19.7a 12.5a 15.5a 17.5a 19.2a 16.5a 10.7a 11.1a
3 All Botanical
8.3a 2.0c 4.5b 2.5c 6.0a 17.2a 11.0a 14.7a 16.7a 18.5ab 15.0a 13.5a 11.4a
4 All Insecticide
9.3a 6.3b 3.5b 3.7bc 8.0a 16.5a 11.0a 14.5a 17.0a 18.2ab 14.0a 12.0a 11.3a
5 Control (Water Spray)
7.0a 4.6bc 7.7a 7.5a 7.0a 17.2a 12.0a 15.5a 18.0a 18.0ab 17.0a 10.5a 12.3a
Table: 2.13 Grain Yield in different treatments, IBET, Kharif 2020
Sl. No.
Treatment Details
Grain Yield (Kg/ha)
ANR BPT CBT CHN CHP CTC JDP KJT KRK
1 Botanical-Insecticide 1
3156.3ab 6204.8ab 9991.7b 6506.3bc 3196.2bc 3075.0a 4100.0b 2420.0b 1875.0b
2 Botanical-Insecticide 2
2862.5ab 5988.8ab 9512.5b 6618.8b 3312.3ab 2825.0ab 4337.5b 3120.0a 1511.3b
3 All Botanical 3325.0a 5835.9ab 8630.6c 6197.5c 3012.6bc 2500.0bc 4012.5b 2530.0b 1530.0b
4 All Insecticide 2568.8b 6667.0a 10812.5a 7131.3a 3748.5a 3200.0a 5043.8a 3220.0a 3437.5a
5 Control (Water Spray)
2623.8b 5464.5b 7952.8c 4750.0d 2777.6c 2000.0c 3668.8c 1690.0c 1385.0b
Botanical-Insecticide 1: Neemazal 1% EC 2ml/l (25-30 DAT), Eucalyptus oil 2ml/l (45-50 DAT), Cartap hydrochloride 50% SC 2g/l (60-65 DAT)
Botanical-Insecticide 2: Neemazal 1% EC 2ml/l (25-30 DAT), Neemoil 10 ml/l (45-50 DAT), Triflumezopyrim 10% SC 0.48ml/l (60-60 DAT)
All Botanical: Neemazal 1% EC 2ml/l (25-30 DAT), Eucalyptus oil 2ml/l (45-50 DAT) , Neem oil 10ml/l (60-65 DAT)
All Insecticide: Chlorantraniliprole 20% SC 0.2ml/l (25-30 DAT), Cartap hydrochloride 50% SC 2g/l (50-55 DAT),Triflumezopyrim 10% SC 0.48ml/l (65-70 DAT)
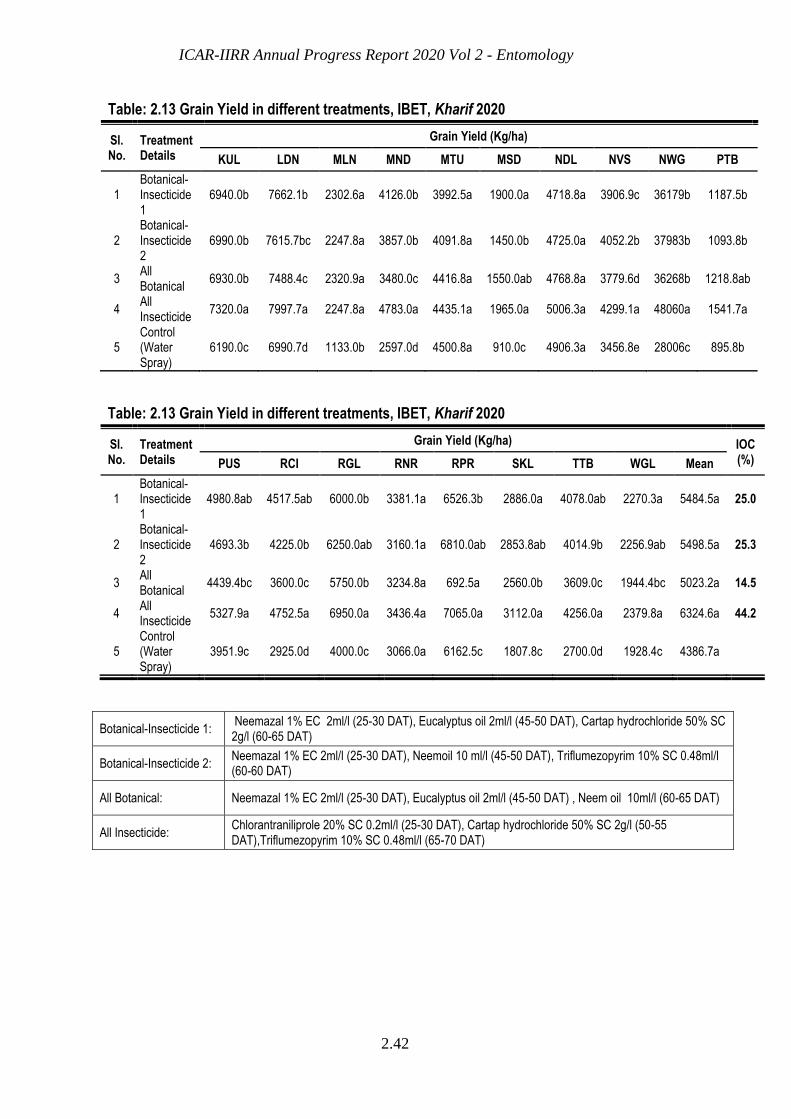
ICAR-IIRR Annual Progress Report 2020 Vol 2 - Entomology
2.42
Table: 2.13 Grain Yield in different treatments, IBET, Kharif 2020
Sl. No.
Treatment Details
Grain Yield (Kg/ha)
KUL LDN MLN MND MTU MSD NDL NVS NWG PTB
1 Botanical-Insecticide 1
6940.0b 7662.1b 2302.6a 4126.0b 3992.5a 1900.0a 4718.8a 3906.9c 36179b 1187.5b
2 Botanical-Insecticide 2
6990.0b 7615.7bc 2247.8a 3857.0b 4091.8a 1450.0b 4725.0a 4052.2b 37983b 1093.8b
3 All Botanical
6930.0b 7488.4c 2320.9a 3480.0c 4416.8a 1550.0ab 4768.8a 3779.6d 36268b 1218.8ab
4 All Insecticide
7320.0a 7997.7a 2247.8a 4783.0a 4435.1a 1965.0a 5006.3a 4299.1a 48060a 1541.7a
5 Control (Water Spray)
6190.0c 6990.7d 1133.0b 2597.0d 4500.8a 910.0c 4906.3a 3456.8e 28006c 895.8b
Table: 2.13 Grain Yield in different treatments, IBET, Kharif 2020
Sl. No.
Treatment Details
Grain Yield (Kg/ha) IOC (%) PUS RCI RGL RNR RPR SKL TTB WGL Mean
1 Botanical-Insecticide 1
4980.8ab 4517.5ab 6000.0b 3381.1a 6526.3b 2886.0a 4078.0ab 2270.3a 5484.5a 25.0
2 Botanical-Insecticide 2
4693.3b 4225.0b 6250.0ab 3160.1a 6810.0ab 2853.8ab 4014.9b 2256.9ab 5498.5a 25.3
3 All Botanical
4439.4bc 3600.0c 5750.0b 3234.8a 692.5a 2560.0b 3609.0c 1944.4bc 5023.2a 14.5
4 All Insecticide
5327.9a 4752.5a 6950.0a 3436.4a 7065.0a 3112.0a 4256.0a 2379.8a 6324.6a 44.2
5 Control (Water Spray)
3951.9c 2925.0d 4000.0c 3066.0a 6162.5c 1807.8c 2700.0d 1928.4c 4386.7a
Botanical-Insecticide 1: Neemazal 1% EC 2ml/l (25-30 DAT), Eucalyptus oil 2ml/l (45-50 DAT), Cartap hydrochloride 50% SC 2g/l (60-65 DAT)
Botanical-Insecticide 2: Neemazal 1% EC 2ml/l (25-30 DAT), Neemoil 10 ml/l (45-50 DAT), Triflumezopyrim 10% SC 0.48ml/l (60-60 DAT)
All Botanical: Neemazal 1% EC 2ml/l (25-30 DAT), Eucalyptus oil 2ml/l (45-50 DAT) , Neem oil 10ml/l (60-65 DAT)
All Insecticide: Chlorantraniliprole 20% SC 0.2ml/l (25-30 DAT), Cartap hydrochloride 50% SC 2g/l (50-55 DAT),Triflumezopyrim 10% SC 0.48ml/l (65-70 DAT)
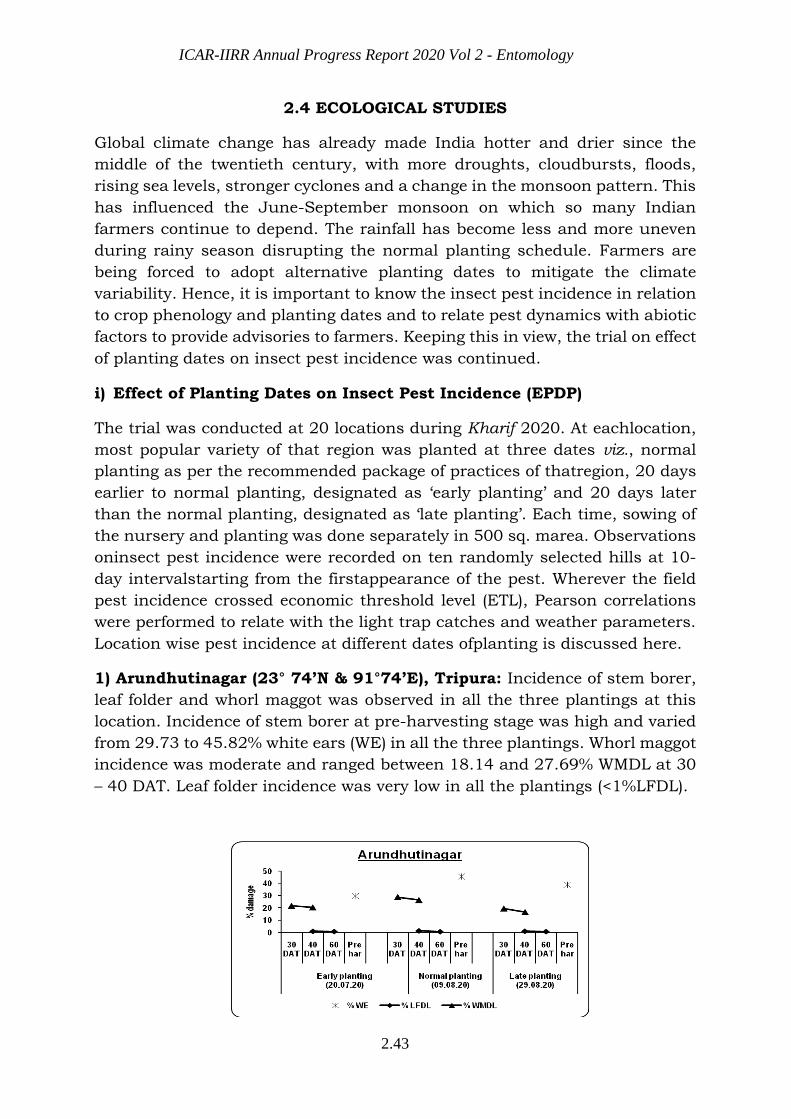
ICAR-IIRR Annual Progress Report 2020 Vol 2 - Entomology
2.43
2.4 ECOLOGICAL STUDIES
Global climate change has already made India hotter and drier since the
middle of the twentieth century, with more droughts, cloudbursts, floods,
rising sea levels, stronger cyclones and a change in the monsoon pattern. This
has influenced the June-September monsoon on which so many Indian
farmers continue to depend. The rainfall has become less and more uneven
during rainy season disrupting the normal planting schedule. Farmers are
being forced to adopt alternative planting dates to mitigate the climate
variability. Hence, it is important to know the insect pest incidence in relation
to crop phenology and planting dates and to relate pest dynamics with abiotic
factors to provide advisories to farmers. Keeping this in view, the trial on effect
of planting dates on insect pest incidence was continued.
i) Effect of Planting Dates on Insect Pest Incidence (EPDP)
The trial was conducted at 20 locations during Kharif 2020. At eachlocation,
most popular variety of that region was planted at three dates viz., normal
planting as per the recommended package of practices of thatregion, 20 days
earlier to normal planting, designated as ‘early planting’ and 20 days later
than the normal planting, designated as ‘late planting’. Each time, sowing of
the nursery and planting was done separately in 500 sq. marea. Observations
oninsect pest incidence were recorded on ten randomly selected hills at 10-
day intervalstarting from the firstappearance of the pest. Wherever the field
pest incidence crossed economic threshold level (ETL), Pearson correlations
were performed to relate with the light trap catches and weather parameters.
Location wise pest incidence at different dates ofplanting is discussed here.
1) Arundhutinagar (23° 74’N & 91°74’E), Tripura: Incidence of stem borer,
leaf folder and whorl maggot was observed in all the three plantings at this
location. Incidence of stem borer at pre-harvesting stage was high and varied
from 29.73 to 45.82% white ears (WE) in all the three plantings. Whorl maggot
incidence was moderate and ranged between 18.14 and 27.69% WMDL at 30
– 40 DAT. Leaf folder incidence was very low in all the plantings (<1%LFDL).
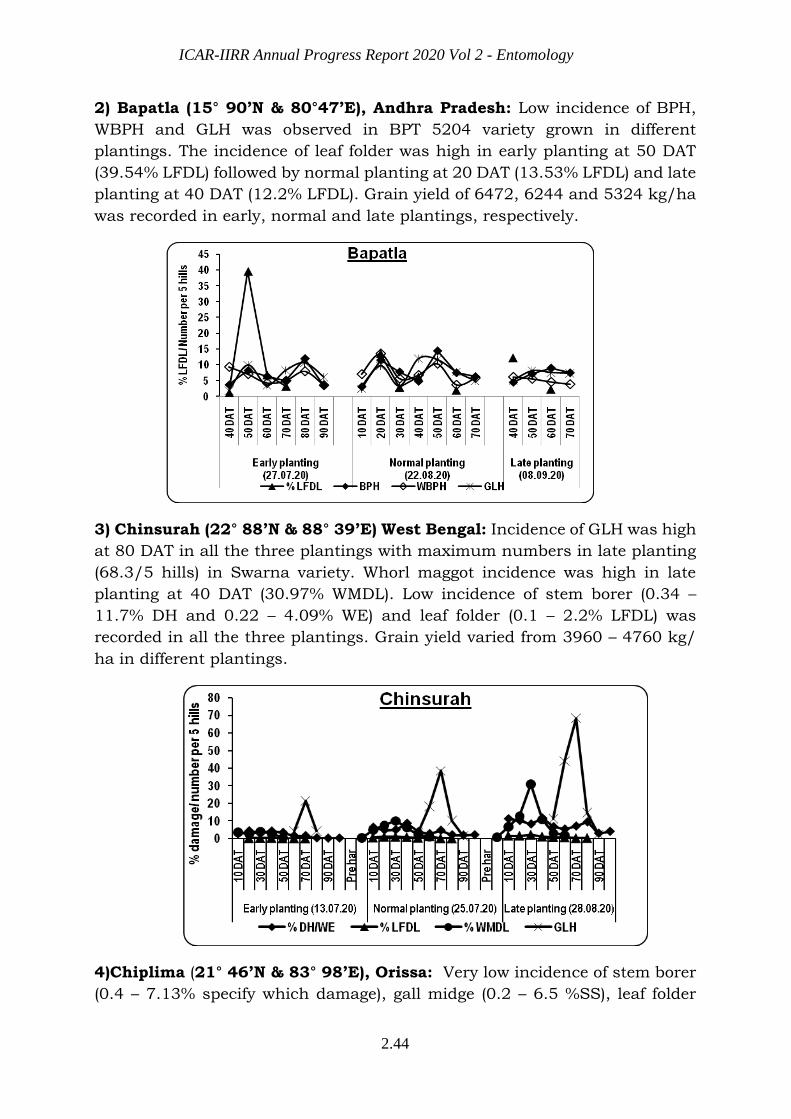
ICAR-IIRR Annual Progress Report 2020 Vol 2 - Entomology
2.44
2) Bapatla (15° 90’N & 80°47’E), Andhra Pradesh: Low incidence of BPH,
WBPH and GLH was observed in BPT 5204 variety grown in different
plantings. The incidence of leaf folder was high in early planting at 50 DAT
(39.54% LFDL) followed by normal planting at 20 DAT (13.53% LFDL) and late
planting at 40 DAT (12.2% LFDL). Grain yield of 6472, 6244 and 5324 kg/ha
was recorded in early, normal and late plantings, respectively.
3) Chinsurah (22° 88’N & 88° 39’E) West Bengal: Incidence of GLH was high
at 80 DAT in all the three plantings with maximum numbers in late planting
(68.3/5 hills) in Swarna variety. Whorl maggot incidence was high in late
planting at 40 DAT (30.97% WMDL). Low incidence of stem borer (0.34 –
11.7% DH and 0.22 – 4.09% WE) and leaf folder (0.1 – 2.2% LFDL) was
recorded in all the three plantings. Grain yield varied from 3960 – 4760 kg/
ha in different plantings.
4)Chiplima (21° 46’N & 83° 98’E), Orissa: Very low incidence of stem borer
(0.4 – 7.13% specify which damage), gall midge (0.2 – 6.5 %SS), leaf folder
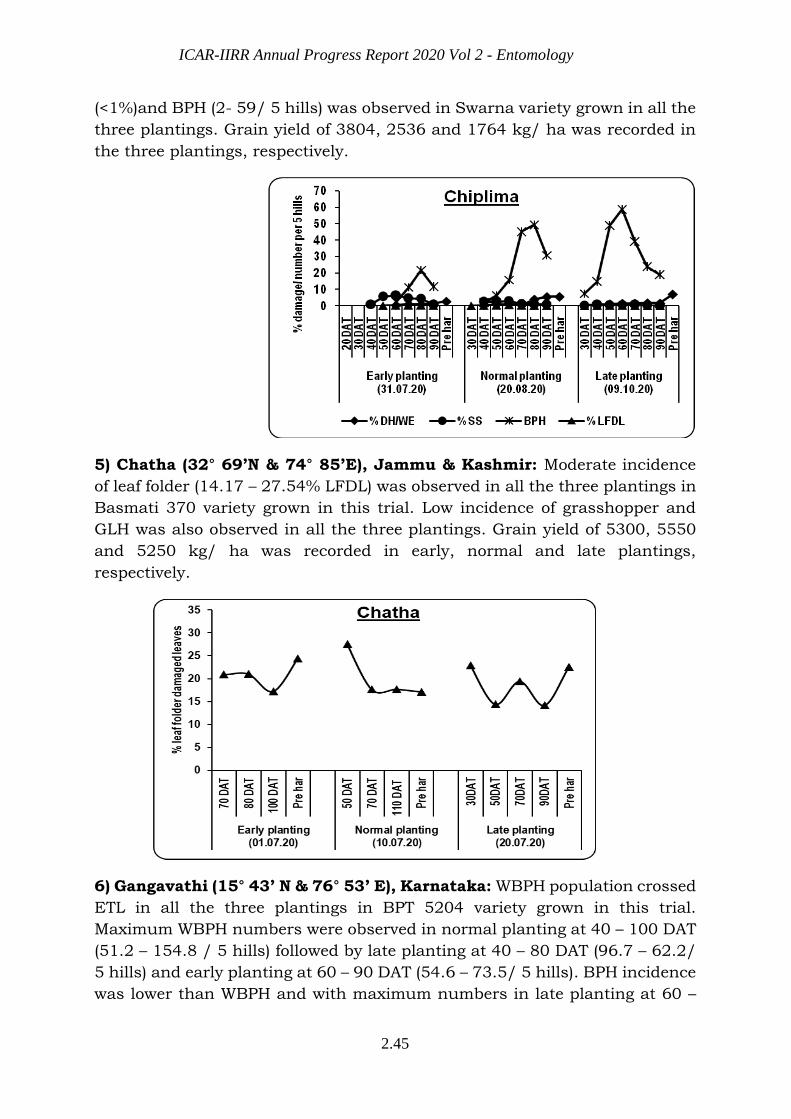
ICAR-IIRR Annual Progress Report 2020 Vol 2 - Entomology
2.45
(<1%)and BPH (2- 59/ 5 hills) was observed in Swarna variety grown in all the
three plantings. Grain yield of 3804, 2536 and 1764 kg/ ha was recorded in
the three plantings, respectively.
5) Chatha (32° 69’N & 74° 85’E), Jammu & Kashmir: Moderate incidence
of leaf folder (14.17 – 27.54% LFDL) was observed in all the three plantings in
Basmati 370 variety grown in this trial. Low incidence of grasshopper and
GLH was also observed in all the three plantings. Grain yield of 5300, 5550
and 5250 kg/ ha was recorded in early, normal and late plantings,
respectively.
6) Gangavathi (15° 43’ N & 76° 53’ E), Karnataka: WBPH population crossed
ETL in all the three plantings in BPT 5204 variety grown in this trial.
Maximum WBPH numbers were observed in normal planting at 40 – 100 DAT
(51.2 – 154.8 / 5 hills) followed by late planting at 40 – 80 DAT (96.7 – 62.2/
5 hills) and early planting at 60 – 90 DAT (54.6 – 73.5/ 5 hills). BPH incidence
was lower than WBPH and with maximum numbers in late planting at 60 –
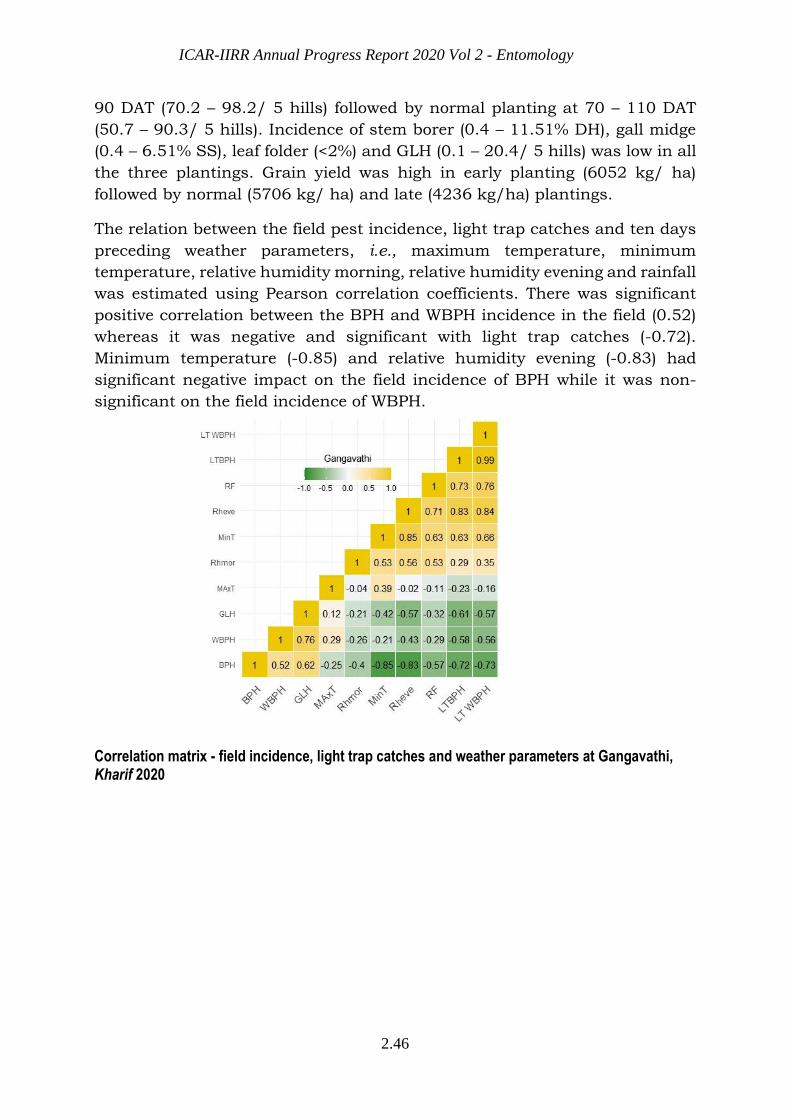
ICAR-IIRR Annual Progress Report 2020 Vol 2 - Entomology
2.46
90 DAT (70.2 – 98.2/ 5 hills) followed by normal planting at 70 – 110 DAT
(50.7 – 90.3/ 5 hills). Incidence of stem borer (0.4 – 11.51% DH), gall midge
(0.4 – 6.51% SS), leaf folder (<2%) and GLH (0.1 – 20.4/ 5 hills) was low in all
the three plantings. Grain yield was high in early planting (6052 kg/ ha)
followed by normal (5706 kg/ ha) and late (4236 kg/ha) plantings.
The relation between the field pest incidence, light trap catches and ten days
preceding weather parameters, i.e., maximum temperature, minimum
temperature, relative humidity morning, relative humidity evening and rainfall
was estimated using Pearson correlation coefficients. There was significant
positive correlation between the BPH and WBPH incidence in the field (0.52)
whereas it was negative and significant with light trap catches (-0.72).
Minimum temperature (-0.85) and relative humidity evening (-0.83) had
significant negative impact on the field incidence of BPH while it was non-
significant on the field incidence of WBPH.
Correlation matrix - field incidence, light trap catches and weather parameters at Gangavathi, Kharif 2020
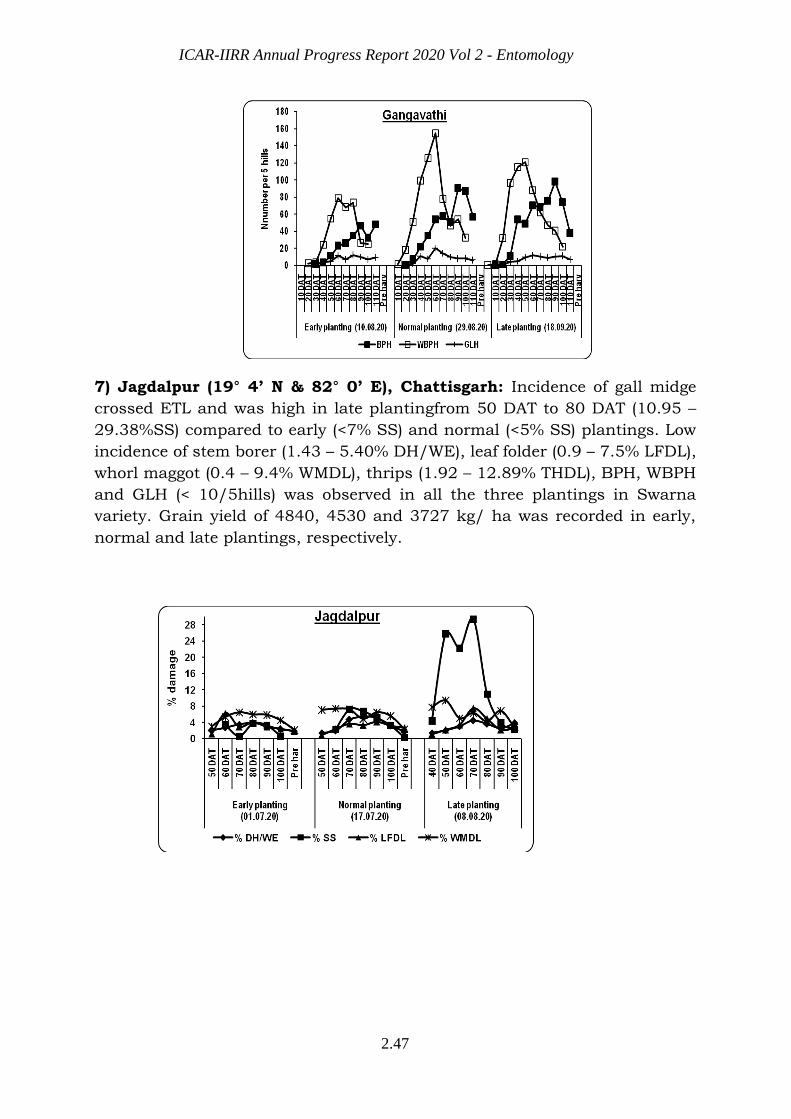
ICAR-IIRR Annual Progress Report 2020 Vol 2 - Entomology
2.47
7) Jagdalpur (19° 4’ N & 82° 0’ E), Chattisgarh: Incidence of gall midge
crossed ETL and was high in late plantingfrom 50 DAT to 80 DAT (10.95 –
29.38%SS) compared to early (<7% SS) and normal (<5% SS) plantings. Low
incidence of stem borer (1.43 – 5.40% DH/WE), leaf folder (0.9 – 7.5% LFDL),
whorl maggot (0.4 – 9.4% WMDL), thrips (1.92 – 12.89% THDL), BPH, WBPH
and GLH (< 10/5hills) was observed in all the three plantings in Swarna
variety. Grain yield of 4840, 4530 and 3727 kg/ ha was recorded in early,
normal and late plantings, respectively.
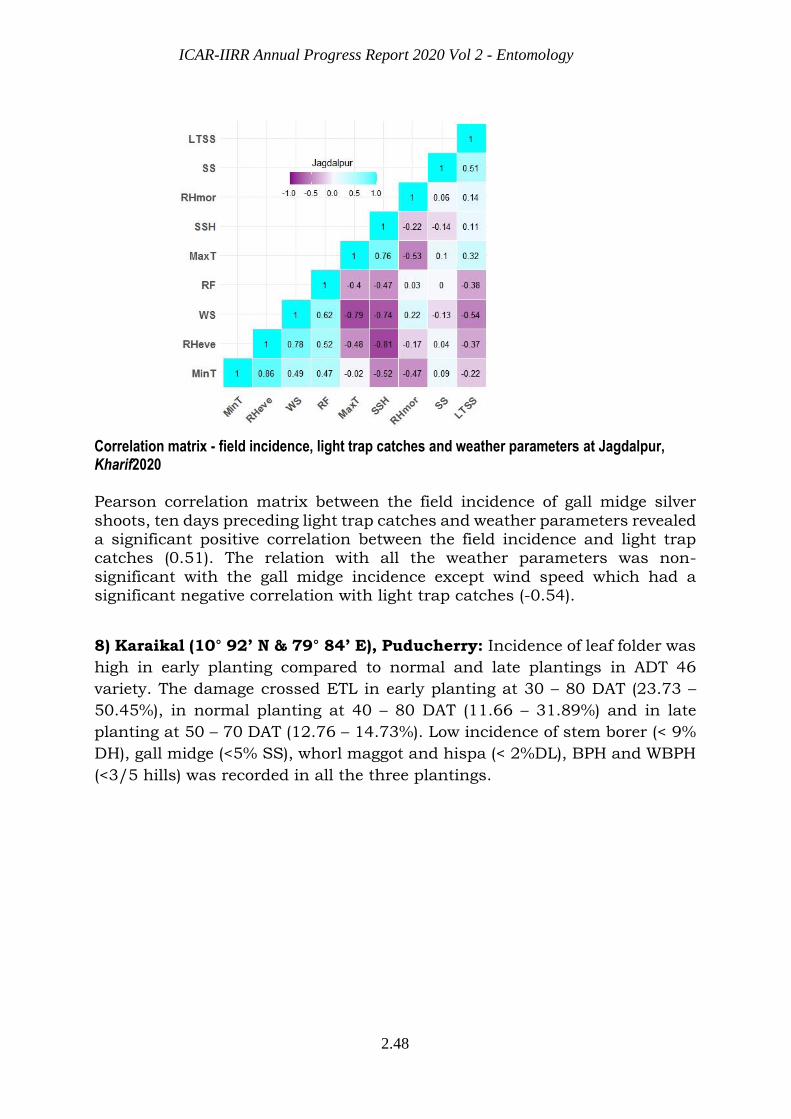
ICAR-IIRR Annual Progress Report 2020 Vol 2 - Entomology
2.48
Correlation matrix - field incidence, light trap catches and weather parameters at Jagdalpur, Kharif2020
Pearson correlation matrix between the field incidence of gall midge silver
shoots, ten days preceding light trap catches and weather parameters revealed a significant positive correlation between the field incidence and light trap catches (0.51). The relation with all the weather parameters was non-
significant with the gall midge incidence except wind speed which had a significant negative correlation with light trap catches (-0.54).
8) Karaikal (10° 92’ N & 79° 84’ E), Puducherry: Incidence of leaf folder was
high in early planting compared to normal and late plantings in ADT 46
variety. The damage crossed ETL in early planting at 30 – 80 DAT (23.73 –
50.45%), in normal planting at 40 – 80 DAT (11.66 – 31.89%) and in late
planting at 50 – 70 DAT (12.76 – 14.73%). Low incidence of stem borer (< 9%
DH), gall midge (<5% SS), whorl maggot and hispa (< 2%DL), BPH and WBPH
(<3/5 hills) was recorded in all the three plantings.
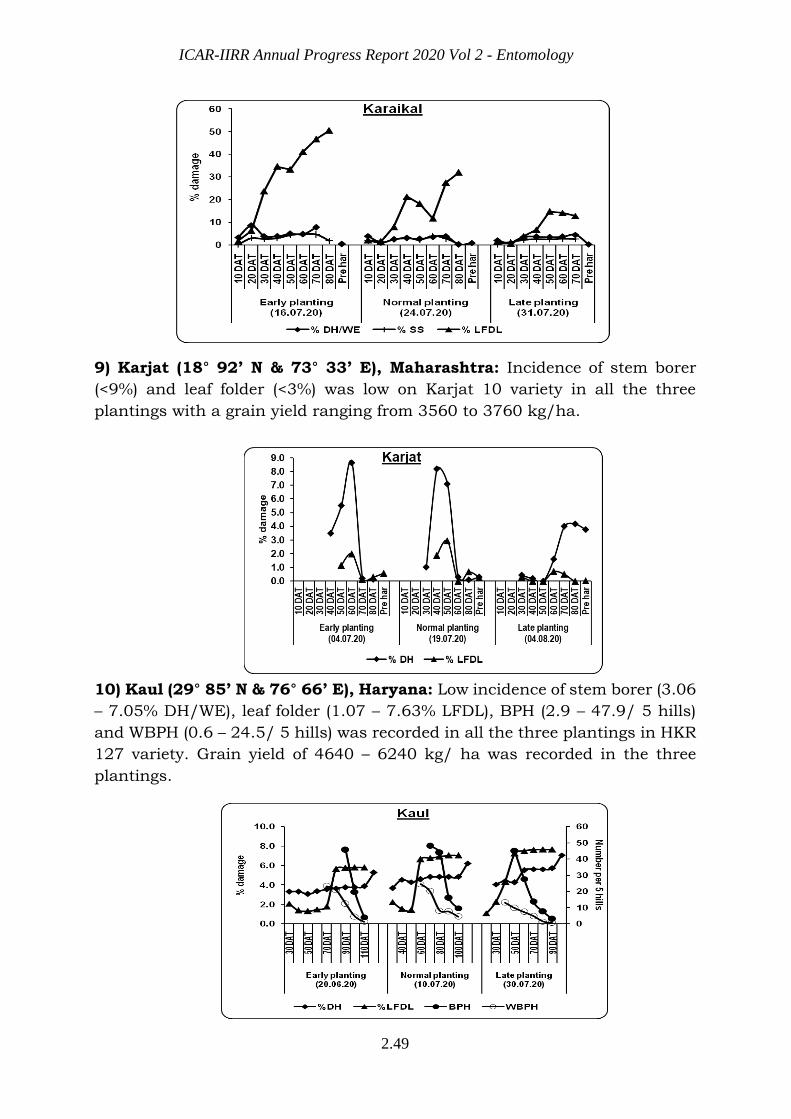
ICAR-IIRR Annual Progress Report 2020 Vol 2 - Entomology
2.49
9) Karjat (18° 92’ N & 73° 33’ E), Maharashtra: Incidence of stem borer
(<9%) and leaf folder (<3%) was low on Karjat 10 variety in all the three
plantings with a grain yield ranging from 3560 to 3760 kg/ha.
10) Kaul (29° 85’ N & 76° 66’ E), Haryana: Low incidence of stem borer (3.06
– 7.05% DH/WE), leaf folder (1.07 – 7.63% LFDL), BPH (2.9 – 47.9/ 5 hills)
and WBPH (0.6 – 24.5/ 5 hills) was recorded in all the three plantings in HKR
127 variety. Grain yield of 4640 – 6240 kg/ ha was recorded in the three
plantings.

ICAR-IIRR Annual Progress Report 2020 Vol 2 - Entomology
2.50
11) Khudwani (33° 71’ N & 75° 10’ E), Jammu & Kashmir: Incidence of
grasshopper (3.75 – 10.3% DL) and rice skipper (0.45 – 2.25% DL) was low in
Shalimar rice 4 variety in all the three plantings.
12) Malan (32° 11’ N & 76° 25’ E), Himachal Pradesh: Low to moderate
incidence of leaf folder (5.5 – 21% LFDL), whorl maggot (6.3 – 15.9% WMDL)
and hispa (3.2 – 31.6% HDL) was observed in the three plantings in Kasturi
variety.
13) New Delhi (28° 61’ N & 77° 20’ E): Moderate incidence of BPH in normal
planting at 80 – 90 DAT (20 -30/hill) and late planting at 60 -70 DAT (24 – 36/hill) was
observed in Pusa 1121 variety. Whorl maggot incidence was high at 30 – 40 DAT in
late planting (14.14 – 19.57% DL) followed by normal planting (13.70 - 15.90% DL).
Very low incidence of leaf folder (<4% DL) was also observed. Spiders (0.33 – 2.06/hill)
and rove beetles (0.01 – 0.23/hill) were also recorded in all the three plantings.
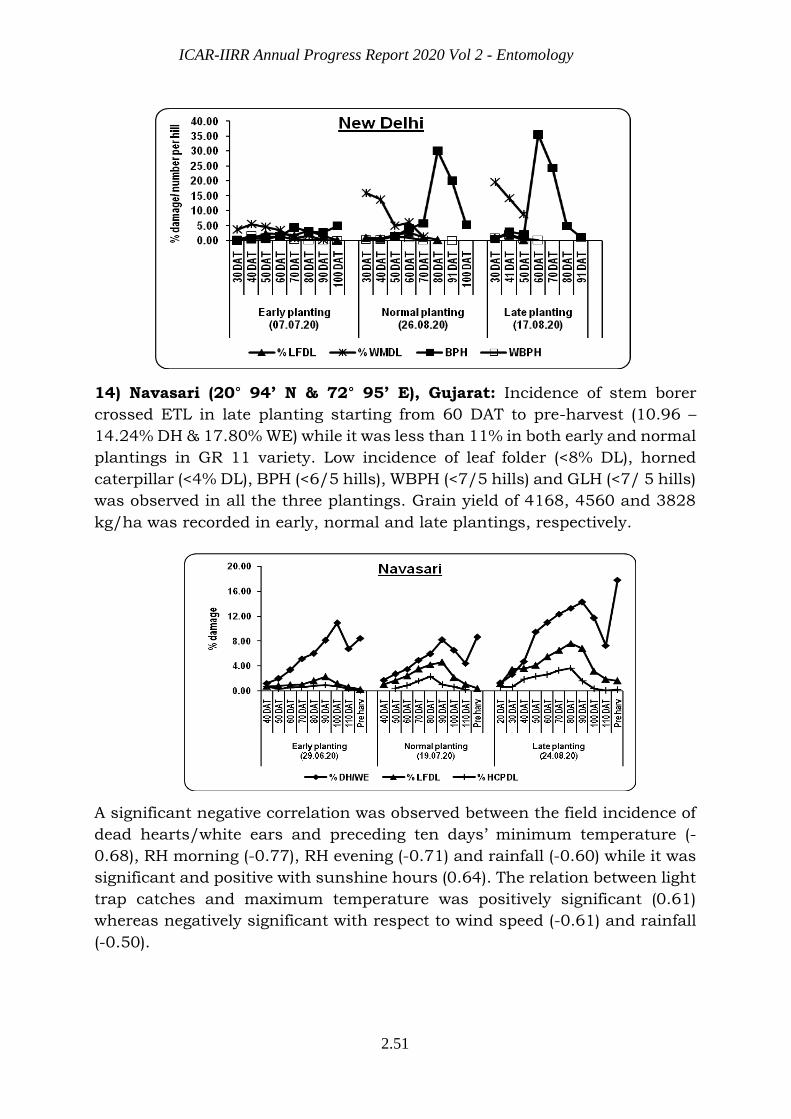
ICAR-IIRR Annual Progress Report 2020 Vol 2 - Entomology
2.51
14) Navasari (20° 94’ N & 72° 95’ E), Gujarat: Incidence of stem borer
crossed ETL in late planting starting from 60 DAT to pre-harvest (10.96 –
14.24% DH & 17.80% WE) while it was less than 11% in both early and normal
plantings in GR 11 variety. Low incidence of leaf folder (<8% DL), horned
caterpillar (<4% DL), BPH (<6/5 hills), WBPH (<7/5 hills) and GLH (<7/ 5 hills)
was observed in all the three plantings. Grain yield of 4168, 4560 and 3828
kg/ha was recorded in early, normal and late plantings, respectively.
A significant negative correlation was observed between the field incidence of
dead hearts/white ears and preceding ten days’ minimum temperature (-
0.68), RH morning (-0.77), RH evening (-0.71) and rainfall (-0.60) while it was
significant and positive with sunshine hours (0.64). The relation between light
trap catches and maximum temperature was positively significant (0.61)
whereas negatively significant with respect to wind speed (-0.61) and rainfall
(-0.50).

ICAR-IIRR Annual Progress Report 2020 Vol 2 - Entomology
2.52
Correlation matrix between field incidence, light trap catches and weather parameters at Navasari,
Kharif2020
15) Nawagam (23° 26’ N & 71°95’ E), Gujarat: High incidence of stem borer
was recorded in GR 11 in late planting starting from 60 DAT (19.75 – 42.75%
DH) and reached maximum at pre-harvest (55.69% WE). In normal planting,
the incidence crossed ETL at 70 DAT onwards (10.71 – 18.38% DH & 21.85%
WE). Early planting had low incidence (<5.2%). Similar trend was observed
with respect to leaf folder incidence with high damage in late planting (10.2 –
18.2% LFDL) followed by normal planting (12.3 – 20.1% LFDL). Low
population of WBPH was observed in all the three plantings (1 – 28/5 hills).
Grain yield ranged between 3767 and 8045 kg/ha in different plantings.
A significant negative correlation was observed between the field incidence of
stem borer and leaf folder with preceding ten days’ average minimum
temperature (-0.93 & -0.89), RH morning (-0.95 & -0.92) and RH evening (-
0.79 & -0.89). A significant positive correlation was observed between
sunshine hours and field damage of leaf folder (0.64) as well as light trap
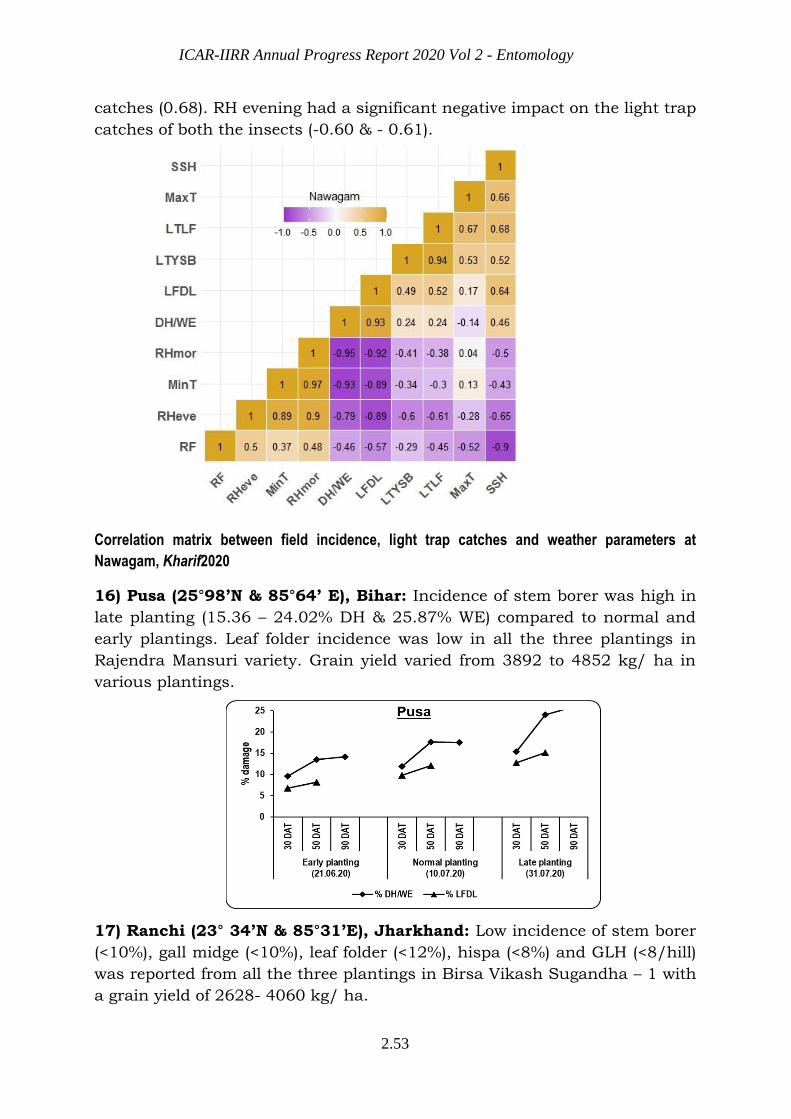
ICAR-IIRR Annual Progress Report 2020 Vol 2 - Entomology
2.53
catches (0.68). RH evening had a significant negative impact on the light trap
catches of both the insects (-0.60 & - 0.61).
Correlation matrix between field incidence, light trap catches and weather parameters at
Nawagam, Kharif2020
16) Pusa (25°98’N & 85°64’ E), Bihar: Incidence of stem borer was high in
late planting (15.36 – 24.02% DH & 25.87% WE) compared to normal and
early plantings. Leaf folder incidence was low in all the three plantings in
Rajendra Mansuri variety. Grain yield varied from 3892 to 4852 kg/ ha in
various plantings.
17) Ranchi (23° 34’N & 85°31’E), Jharkhand: Low incidence of stem borer
(<10%), gall midge (<10%), leaf folder (<12%), hispa (<8%) and GLH (<8/hill)
was reported from all the three plantings in Birsa Vikash Sugandha – 1 with
a grain yield of 2628- 4060 kg/ ha.

ICAR-IIRR Annual Progress Report 2020 Vol 2 - Entomology
2.54
18) Raipur (21° 25’N & 81°63’E), Chhattisgarh: Stem borer incidence
crossed ETL at 40 – 90 DAT (11.28 – 17.36% DH) in early planting and at 30
– 80 DAT (12.01 – 16.69% DH) in normal planting while it was below ETL in
late planting (<10%). White ear damage of 15.89,16.29 and 8.46 % was
recorded in early, normal and late plantings, respectively. BPH population was
high in late planting from 60 – 80 DAT (90 – 222/ 5 hills) and in normal
planting at 90 – 110 DAT (73 – 97/ 5 hills) while it was low in early planting
(12 – 21/ 5 hills). Low incidence of leaf folder (<4%), whorl maggot (<3%), hispa
(<2%), caseworm (<3%), thrips (<6%), WBPH (<1/hill) and GLH (<2/hill) was
observed in all the three plantings. Low yield (1211 kg/ha) was observed in
late planting due to the “hopper burn”. Grain yield of 6728 and 5882 kg/ ha
was recorded in early and normal plantings, respectively. Incidence of spiders
(1 – 2.30/5 hills), staphylinid beetles (0.3 – 4.0/ 5 hills), ground beetles (0.3 –
11.0/ 5 hills), coccinellids (0.5-22.30/ 5 hills) and mirid bugs (0.60 – 67.70/
5 hills).
A significant positive correlation was observed between the field incidence of
BPH and preceding ten days’ light trap catches (0.63). A significant negative
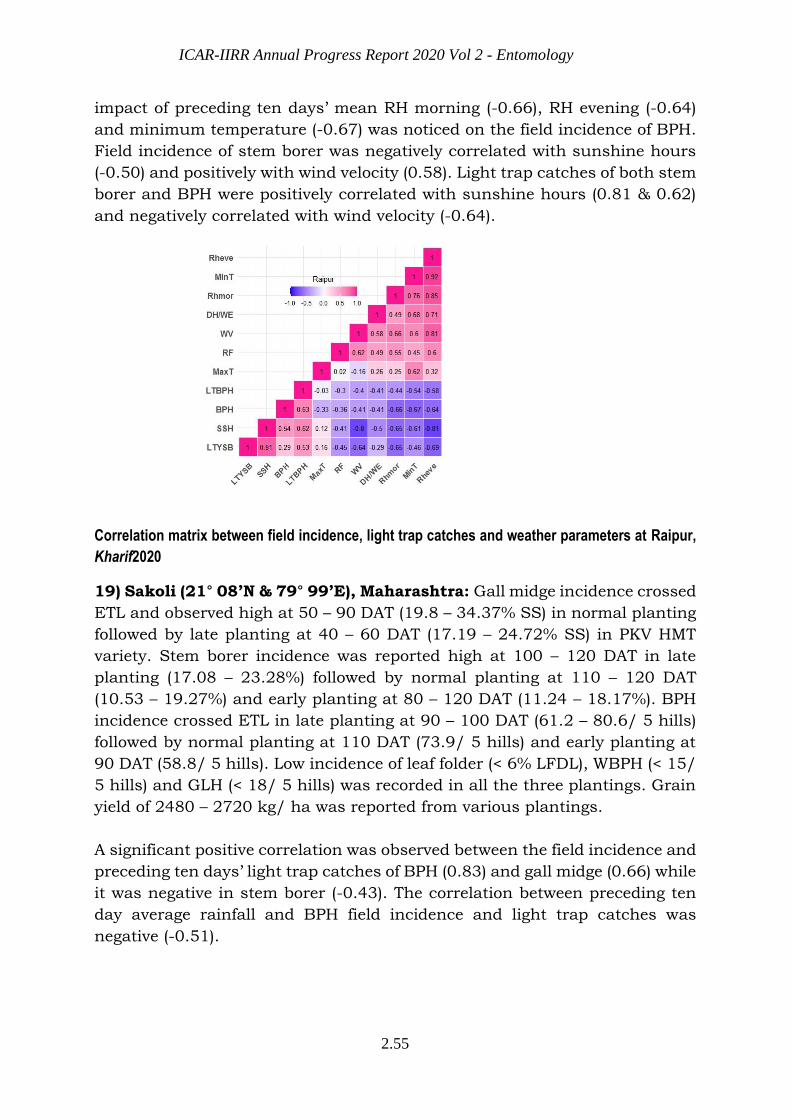
ICAR-IIRR Annual Progress Report 2020 Vol 2 - Entomology
2.55
impact of preceding ten days’ mean RH morning (-0.66), RH evening (-0.64)
and minimum temperature (-0.67) was noticed on the field incidence of BPH.
Field incidence of stem borer was negatively correlated with sunshine hours
(-0.50) and positively with wind velocity (0.58). Light trap catches of both stem
borer and BPH were positively correlated with sunshine hours (0.81 & 0.62)
and negatively correlated with wind velocity (-0.64).
Correlation matrix between field incidence, light trap catches and weather parameters at Raipur,
Kharif2020
19) Sakoli (21° 08’N & 79° 99’E), Maharashtra: Gall midge incidence crossed
ETL and observed high at 50 – 90 DAT (19.8 – 34.37% SS) in normal planting
followed by late planting at 40 – 60 DAT (17.19 – 24.72% SS) in PKV HMT
variety. Stem borer incidence was reported high at 100 – 120 DAT in late
planting (17.08 – 23.28%) followed by normal planting at 110 – 120 DAT
(10.53 – 19.27%) and early planting at 80 – 120 DAT (11.24 – 18.17%). BPH
incidence crossed ETL in late planting at 90 – 100 DAT (61.2 – 80.6/ 5 hills)
followed by normal planting at 110 DAT (73.9/ 5 hills) and early planting at
90 DAT (58.8/ 5 hills). Low incidence of leaf folder (< 6% LFDL), WBPH (< 15/
5 hills) and GLH (< 18/ 5 hills) was recorded in all the three plantings. Grain
yield of 2480 – 2720 kg/ ha was reported from various plantings.
A significant positive correlation was observed between the field incidence and
preceding ten days’ light trap catches of BPH (0.83) and gall midge (0.66) while
it was negative in stem borer (-0.43). The correlation between preceding ten
day average rainfall and BPH field incidence and light trap catches was
negative (-0.51).
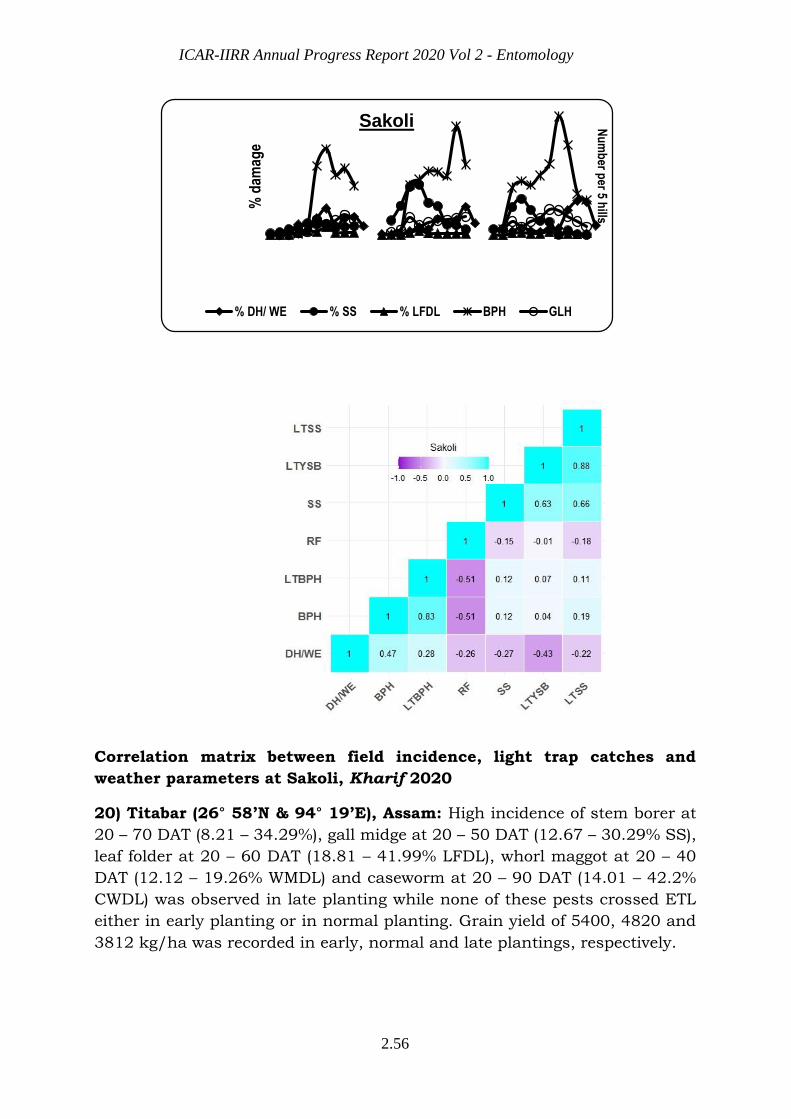
ICAR-IIRR Annual Progress Report 2020 Vol 2 - Entomology
2.56
Correlation matrix between field incidence, light trap catches and
weather parameters at Sakoli, Kharif 2020
20) Titabar (26° 58’N & 94° 19’E), Assam: High incidence of stem borer at
20 – 70 DAT (8.21 – 34.29%), gall midge at 20 – 50 DAT (12.67 – 30.29% SS),
leaf folder at 20 – 60 DAT (18.81 – 41.99% LFDL), whorl maggot at 20 – 40
DAT (12.12 – 19.26% WMDL) and caseworm at 20 – 90 DAT (14.01 – 42.2%
CWDL) was observed in late planting while none of these pests crossed ETL
either in early planting or in normal planting. Grain yield of 5400, 4820 and
3812 kg/ha was recorded in early, normal and late plantings, respectively.
Nu
mb
er per 5 h
ills
% d
amag
e
Sakoli
% DH/ WE % SS % LFDL BPH GLH
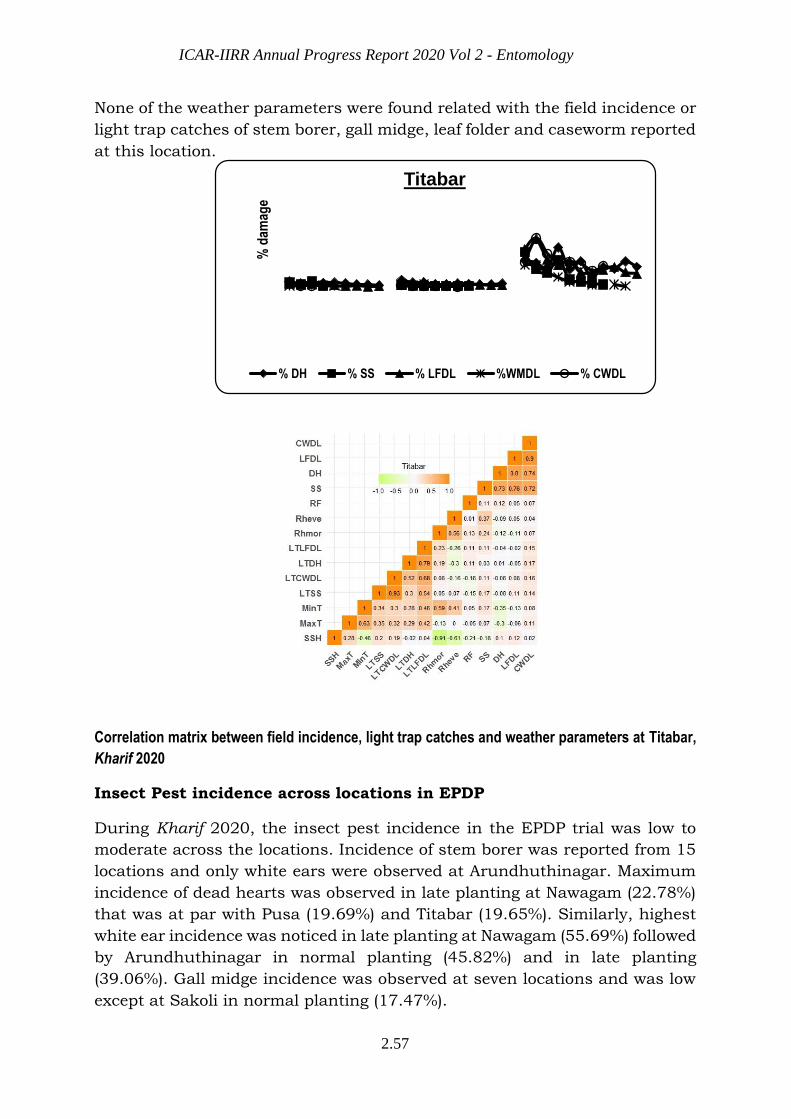
ICAR-IIRR Annual Progress Report 2020 Vol 2 - Entomology
2.57
None of the weather parameters were found related with the field incidence or
light trap catches of stem borer, gall midge, leaf folder and caseworm reported
at this location.
Correlation matrix between field incidence, light trap catches and weather parameters at Titabar,
Kharif 2020
Insect Pest incidence across locations in EPDP
During Kharif 2020, the insect pest incidence in the EPDP trial was low to
moderate across the locations. Incidence of stem borer was reported from 15
locations and only white ears were observed at Arundhuthinagar. Maximum
incidence of dead hearts was observed in late planting at Nawagam (22.78%)
that was at par with Pusa (19.69%) and Titabar (19.65%). Similarly, highest
white ear incidence was noticed in late planting at Nawagam (55.69%) followed
by Arundhuthinagar in normal planting (45.82%) and in late planting
(39.06%). Gall midge incidence was observed at seven locations and was low
except at Sakoli in normal planting (17.47%).
% d
amag
e
Titabar
% DH % SS % LFDL %WMDL % CWDL
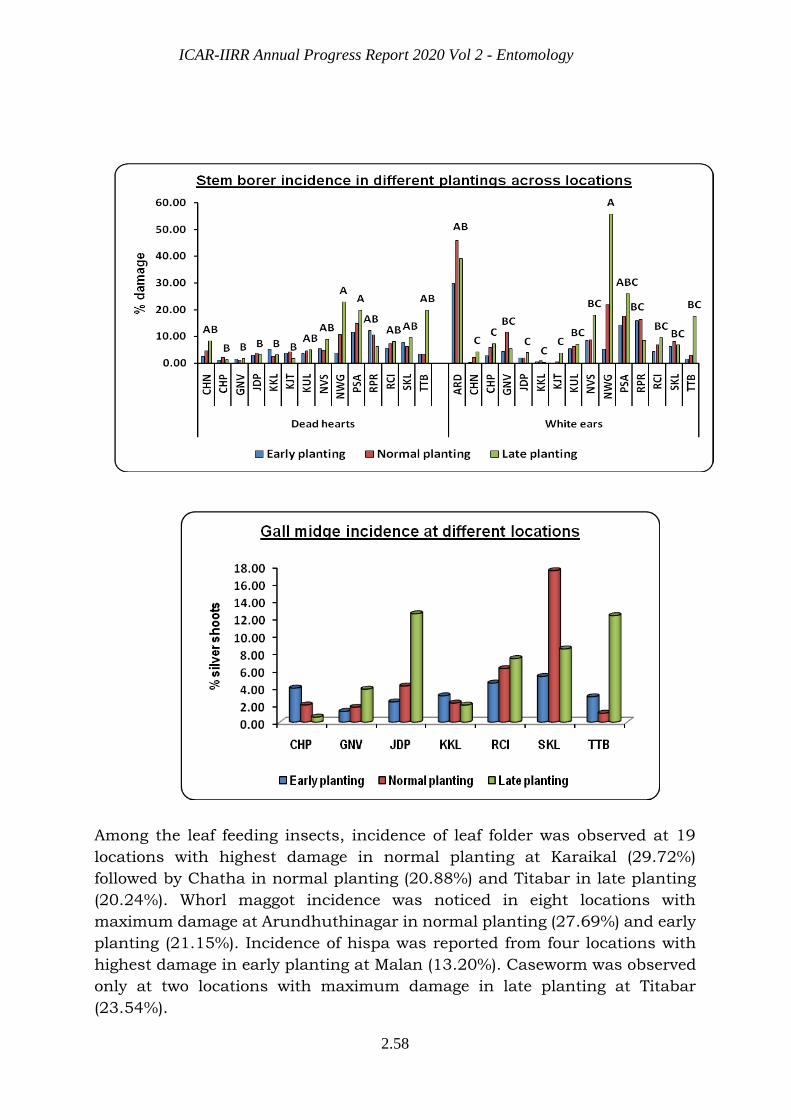
ICAR-IIRR Annual Progress Report 2020 Vol 2 - Entomology
2.58
Among the leaf feeding insects, incidence of leaf folder was observed at 19
locations with highest damage in normal planting at Karaikal (29.72%)
followed by Chatha in normal planting (20.88%) and Titabar in late planting
(20.24%). Whorl maggot incidence was noticed in eight locations with
maximum damage at Arundhuthinagar in normal planting (27.69%) and early
planting (21.15%). Incidence of hispa was reported from four locations with
highest damage in early planting at Malan (13.20%). Caseworm was observed
only at two locations with maximum damage in late planting at Titabar
(23.54%).
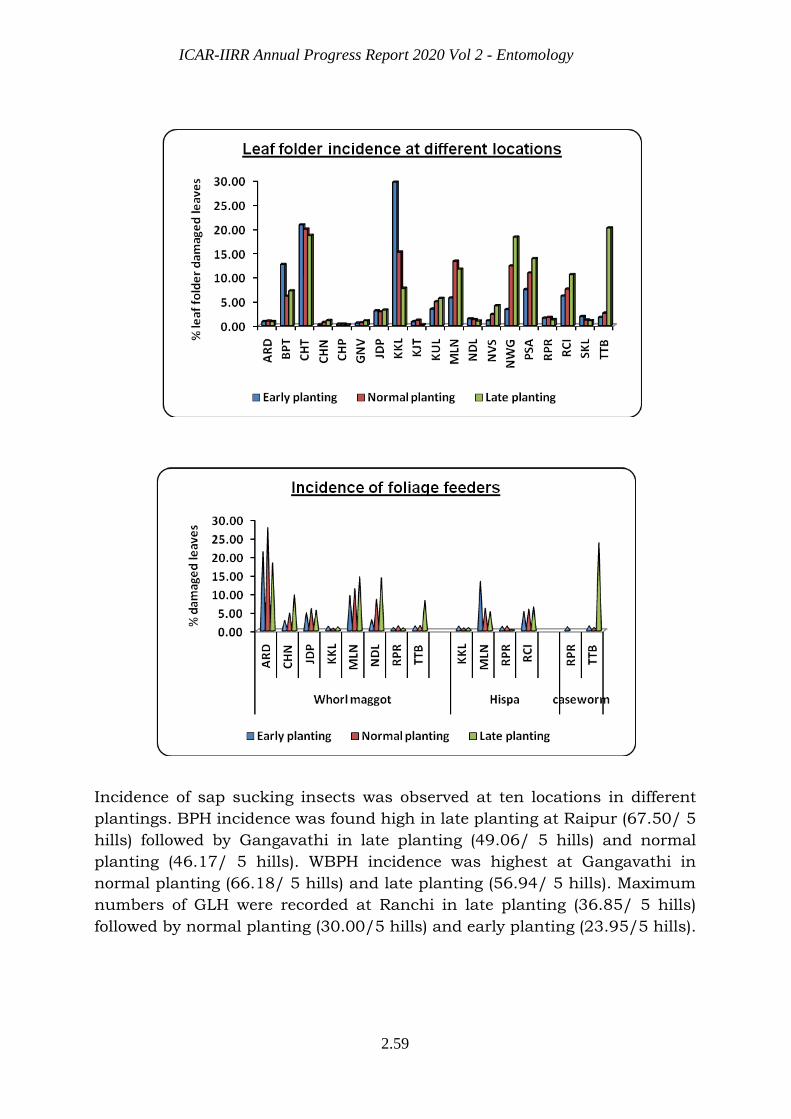
ICAR-IIRR Annual Progress Report 2020 Vol 2 - Entomology
2.59
Incidence of sap sucking insects was observed at ten locations in different
plantings. BPH incidence was found high in late planting at Raipur (67.50/ 5
hills) followed by Gangavathi in late planting (49.06/ 5 hills) and normal
planting (46.17/ 5 hills). WBPH incidence was highest at Gangavathi in
normal planting (66.18/ 5 hills) and late planting (56.94/ 5 hills). Maximum
numbers of GLH were recorded at Ranchi in late planting (36.85/ 5 hills)
followed by normal planting (30.00/5 hills) and early planting (23.95/5 hills).
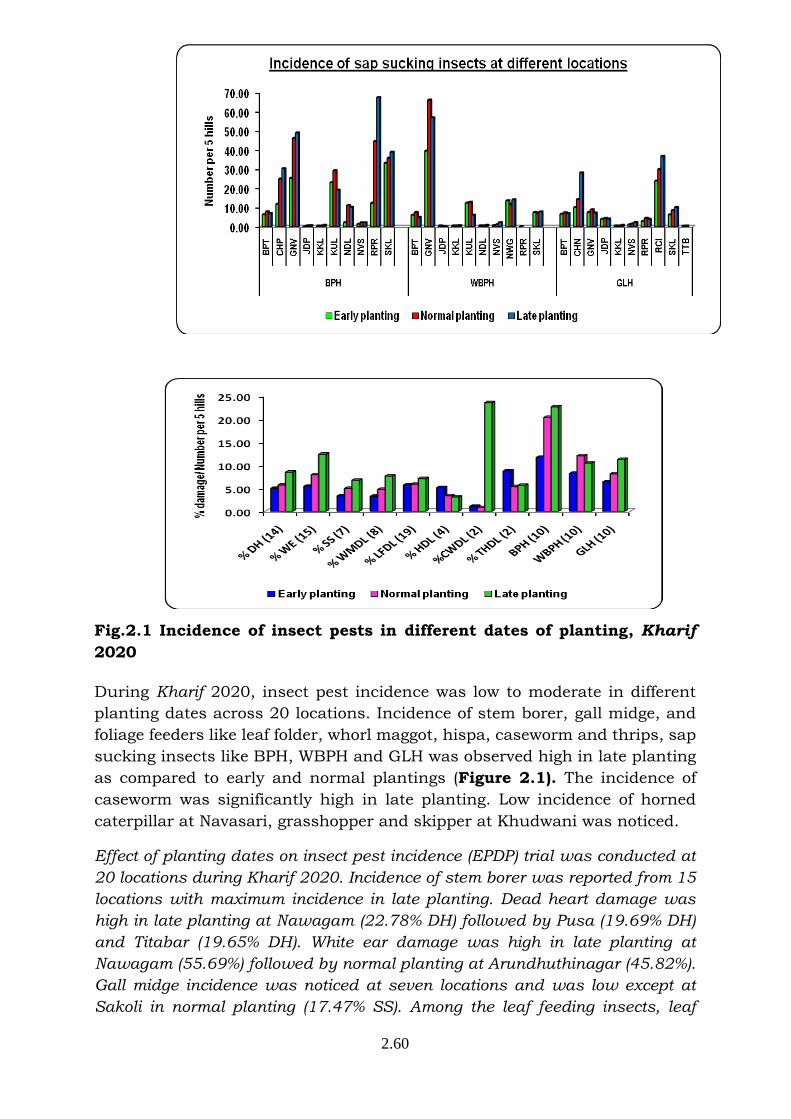
ICAR-IIRR Annual Progress Report 2020 Vol 2 - Entomology
2.60
Fig.2.1 Incidence of insect pests in different dates of planting, Kharif
2020
During Kharif 2020, insect pest incidence was low to moderate in different
planting dates across 20 locations. Incidence of stem borer, gall midge, and
foliage feeders like leaf folder, whorl maggot, hispa, caseworm and thrips, sap
sucking insects like BPH, WBPH and GLH was observed high in late planting
as compared to early and normal plantings (Figure 2.1). The incidence of
caseworm was significantly high in late planting. Low incidence of horned
caterpillar at Navasari, grasshopper and skipper at Khudwani was noticed.
Effect of planting dates on insect pest incidence (EPDP) trial was conducted at
20 locations during Kharif 2020. Incidence of stem borer was reported from 15
locations with maximum incidence in late planting. Dead heart damage was
high in late planting at Nawagam (22.78% DH) followed by Pusa (19.69% DH)
and Titabar (19.65% DH). White ear damage was high in late planting at
Nawagam (55.69%) followed by normal planting at Arundhuthinagar (45.82%).
Gall midge incidence was noticed at seven locations and was low except at
Sakoli in normal planting (17.47% SS). Among the leaf feeding insects, leaf
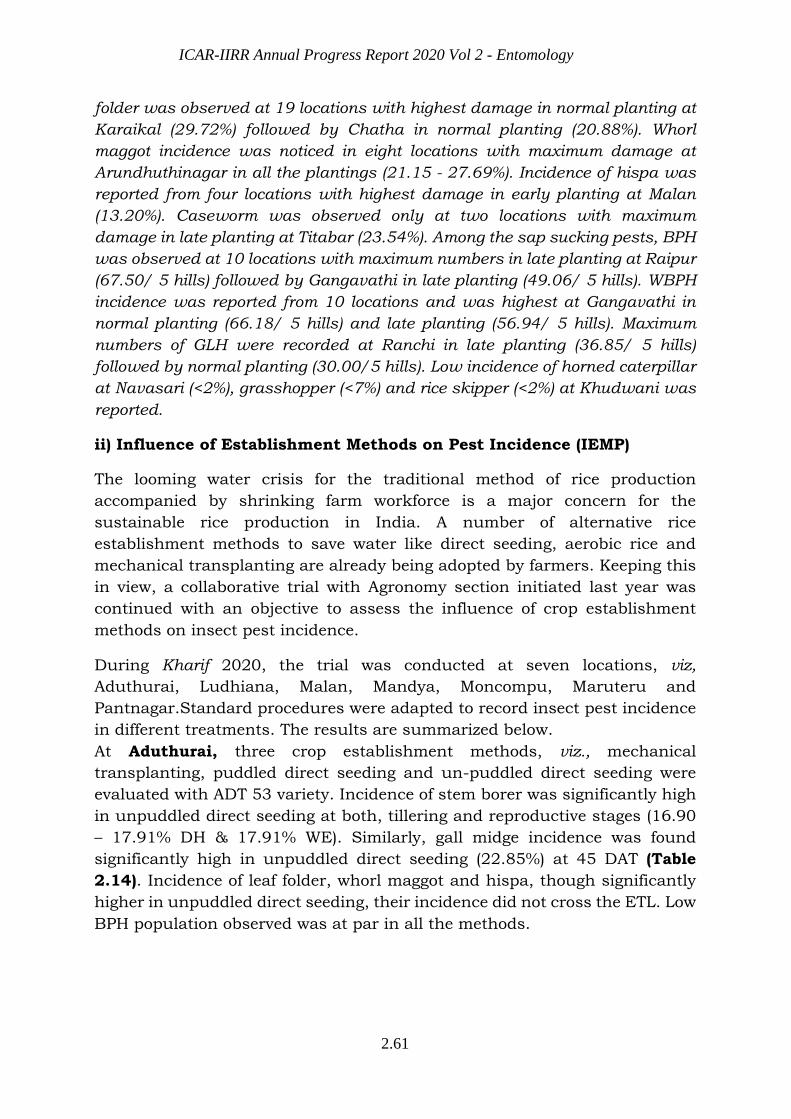
ICAR-IIRR Annual Progress Report 2020 Vol 2 - Entomology
2.61
folder was observed at 19 locations with highest damage in normal planting at
Karaikal (29.72%) followed by Chatha in normal planting (20.88%). Whorl
maggot incidence was noticed in eight locations with maximum damage at
Arundhuthinagar in all the plantings (21.15 - 27.69%). Incidence of hispa was
reported from four locations with highest damage in early planting at Malan
(13.20%). Caseworm was observed only at two locations with maximum
damage in late planting at Titabar (23.54%). Among the sap sucking pests, BPH
was observed at 10 locations with maximum numbers in late planting at Raipur
(67.50/ 5 hills) followed by Gangavathi in late planting (49.06/ 5 hills). WBPH
incidence was reported from 10 locations and was highest at Gangavathi in
normal planting (66.18/ 5 hills) and late planting (56.94/ 5 hills). Maximum
numbers of GLH were recorded at Ranchi in late planting (36.85/ 5 hills)
followed by normal planting (30.00/5 hills). Low incidence of horned caterpillar
at Navasari (<2%), grasshopper (<7%) and rice skipper (<2%) at Khudwani was
reported.
ii) Influence of Establishment Methods on Pest Incidence (IEMP)
The looming water crisis for the traditional method of rice production
accompanied by shrinking farm workforce is a major concern for the
sustainable rice production in India. A number of alternative rice
establishment methods to save water like direct seeding, aerobic rice and
mechanical transplanting are already being adopted by farmers. Keeping this
in view, a collaborative trial with Agronomy section initiated last year was
continued with an objective to assess the influence of crop establishment
methods on insect pest incidence.
During Kharif 2020, the trial was conducted at seven locations, viz,
Aduthurai, Ludhiana, Malan, Mandya, Moncompu, Maruteru and
Pantnagar.Standard procedures were adapted to record insect pest incidence
in different treatments. The results are summarized below.
At Aduthurai, three crop establishment methods, viz., mechanical
transplanting, puddled direct seeding and un-puddled direct seeding were
evaluated with ADT 53 variety. Incidence of stem borer was significantly high
in unpuddled direct seeding at both, tillering and reproductive stages (16.90
– 17.91% DH & 17.91% WE). Similarly, gall midge incidence was found
significantly high in unpuddled direct seeding (22.85%) at 45 DAT (Table
2.14). Incidence of leaf folder, whorl maggot and hispa, though significantly
higher in unpuddled direct seeding, their incidence did not cross the ETL. Low
BPH population observed was at par in all the methods.
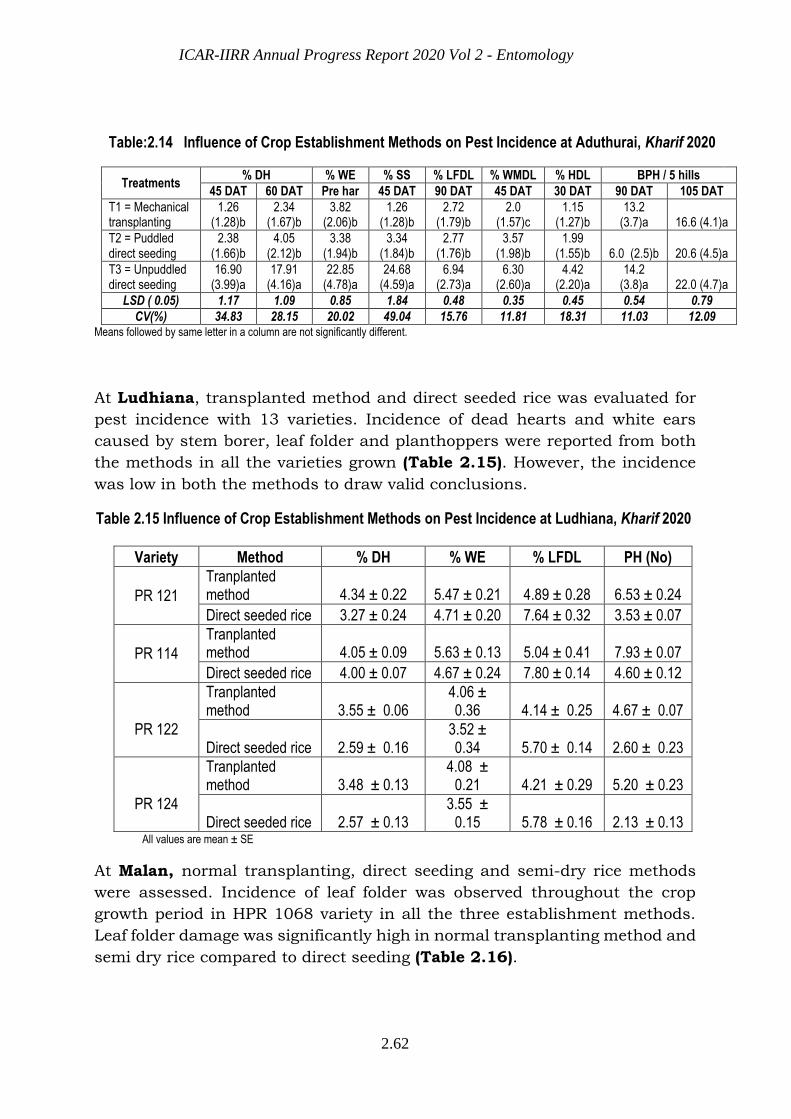
ICAR-IIRR Annual Progress Report 2020 Vol 2 - Entomology
2.62
Table:2.14 Influence of Crop Establishment Methods on Pest Incidence at Aduthurai, Kharif 2020
Treatments % DH % WE % SS % LFDL % WMDL % HDL BPH / 5 hills
45 DAT 60 DAT Pre har 45 DAT 90 DAT 45 DAT 30 DAT 90 DAT 105 DAT
T1 = Mechanical transplanting
1.26 (1.28)b
2.34 (1.67)b
3.82 (2.06)b
1.26 (1.28)b
2.72 (1.79)b
2.0 (1.57)c
1.15 (1.27)b
13.2 (3.7)a 16.6 (4.1)a
T2 = Puddled direct seeding
2.38 (1.66)b
4.05 (2.12)b
3.38 (1.94)b
3.34 (1.84)b
2.77 (1.76)b
3.57 (1.98)b
1.99 (1.55)b 6.0 (2.5)b 20.6 (4.5)a
T3 = Unpuddled direct seeding
16.90 (3.99)a
17.91 (4.16)a
22.85 (4.78)a
24.68 (4.59)a
6.94 (2.73)a
6.30 (2.60)a
4.42 (2.20)a
14.2 (3.8)a 22.0 (4.7)a
LSD ( 0.05) 1.17 1.09 0.85 1.84 0.48 0.35 0.45 0.54 0.79
CV(%) 34.83 28.15 20.02 49.04 15.76 11.81 18.31 11.03 12.09 Means followed by same letter in a column are not significantly different.
At Ludhiana, transplanted method and direct seeded rice was evaluated for
pest incidence with 13 varieties. Incidence of dead hearts and white ears
caused by stem borer, leaf folder and planthoppers were reported from both
the methods in all the varieties grown (Table 2.15). However, the incidence
was low in both the methods to draw valid conclusions.
Table 2.15 Influence of Crop Establishment Methods on Pest Incidence at Ludhiana, Kharif 2020
Variety Method % DH % WE % LFDL PH (No)
PR 121
Tranplanted method 4.34 ± 0.22 5.47 ± 0.21 4.89 ± 0.28 6.53 ± 0.24
Direct seeded rice 3.27 ± 0.24 4.71 ± 0.20 7.64 ± 0.32 3.53 ± 0.07
PR 114
Tranplanted method 4.05 ± 0.09 5.63 ± 0.13 5.04 ± 0.41 7.93 ± 0.07
Direct seeded rice 4.00 ± 0.07 4.67 ± 0.24 7.80 ± 0.14 4.60 ± 0.12
PR 122
Tranplanted method 3.55 ± 0.06
4.06 ± 0.36 4.14 ± 0.25 4.67 ± 0.07
Direct seeded rice 2.59 ± 0.16 3.52 ± 0.34 5.70 ± 0.14 2.60 ± 0.23
PR 124
Tranplanted method 3.48 ± 0.13
4.08 ± 0.21 4.21 ± 0.29 5.20 ± 0.23
Direct seeded rice 2.57 ± 0.13 3.55 ±
0.15 5.78 ± 0.16 2.13 ± 0.13 All values are mean ± SE
At Malan, normal transplanting, direct seeding and semi-dry rice methods
were assessed. Incidence of leaf folder was observed throughout the crop
growth period in HPR 1068 variety in all the three establishment methods.
Leaf folder damage was significantly high in normal transplanting method and
semi dry rice compared to direct seeding (Table 2.16).

ICAR-IIRR Annual Progress Report 2020 Vol 2 - Entomology
2.63
Table 2.16 Influence of Crop Establishment Methods on Pest Incidence at Malan, Kharif 2020
Establishment methods
% Leaf folder damaged leaves
45 DAT 60 DAT 75 DAT 90 DAT
Direct seeding 13.30 (3.6)b 14.44 (3.78)b 14.72 (3.82)a 17.85 (4.21)ab
Normal transplanting 17.68 (4.20)a 19.55 (4.42)a 17.00 (4.11)a 23.24 (4.81)a
Semi dry rice 15.65 (3.94)a 15.74 (3.94)ab 15.19 (3.89)a 16.32 (4.01)b
LSD 0.05 0.56 0.62 0.59 0.61
CV (%) 9.68 10.47 10.27 9.69 Means followed by same letter in a column are not significantly different
At Moncompu, drum seeding and normal transplanting methods were
practiced with cono-weeding and chemical weed control by spraying pre and
post emergence herbicides. Low incidence of stem borer (<3.0% DH), leaf folder
(<1% LFDL), BPH (<8/hill), WBPH (<3/hill) and GLH (<2/hill) was observed in
both the crop establishment methods and weed management sub plots (Table
2.17). Incidence of gall midge was also observed but only in chemical weed
control sub plot of normal transplanting method (<2% SS).
Table 2.17 Influence of Crop Establishment Methods on Pest Incidence at Moncompu, Kharif 2020
Main plots Sub plots % DH % LFDL BPH WBPH GLH
30DAT 45DAT 60DAT 45DAT 60DAT 90 DAT 90 DAT 90 DAT
Drum seeding
Cono weeding
0.32 ± 0.32
1.04 ± 0.71
0.23 ± 0.23
0.57 ± 0.25
0.22 ± 0.14
7.40 ± 4.66
2.20 ± 1.36
0.80 ± 0.37
Chemical weed control
0.21 ± 0.14
0.06 ± 0.06
0.60 ± 0.40
Transplanting
Cono weeding
0.16 ± 0.16
0.25 ± 0.15
0.40 ± 0.40
Chemical weed control
1.07 ± 0.72
2.37 ± 0.75
0.81 ± 0.54
0.10 ± 0.06
0.08 ± 0.08
0.60 ± 0.40
At Mandya, incidence of stem borer, leaf folder, case worm and BPH was
observed in KMP- 175 variety grown in three establishment methods, i.e.,
mechanical transplanting, direct seeding and normal transplanting (Table
2.18). Very low incidence of these pests was recorded except white ears in
direct seeding (12.99%) and normal transplanting method (10.89%).
Table 2.18 Influence of Crop Establishment Methods on Pest Incidence at Mandya, Kharif 2020
Establishment methods
% DH % WE % LFDL % CWDL BPH
30 DAT 45 DAT Pre har 45 DAT 60 DAT 75 DAT
Mechanical transplanting
4.10 ± 1.63 5.53 ± 1.06 7.93 ± 2.41 4.46 ± 0.55 1.97 ± 0.44 6.40 ± 0.98
Direct seeding 5.92 ± 1.37 7.57 ± 2.51 12.99 ± 3.49 6.57 ± 1.06 2.41 ± 0.66 6.80 ± 1.43
Normal transplanting
4.61 ± 1.52 5.51 ± 1.64 10.89 ± 3.17 4.50 ± 0.80 2.12 ± 0.34 11.4 ± 1.63
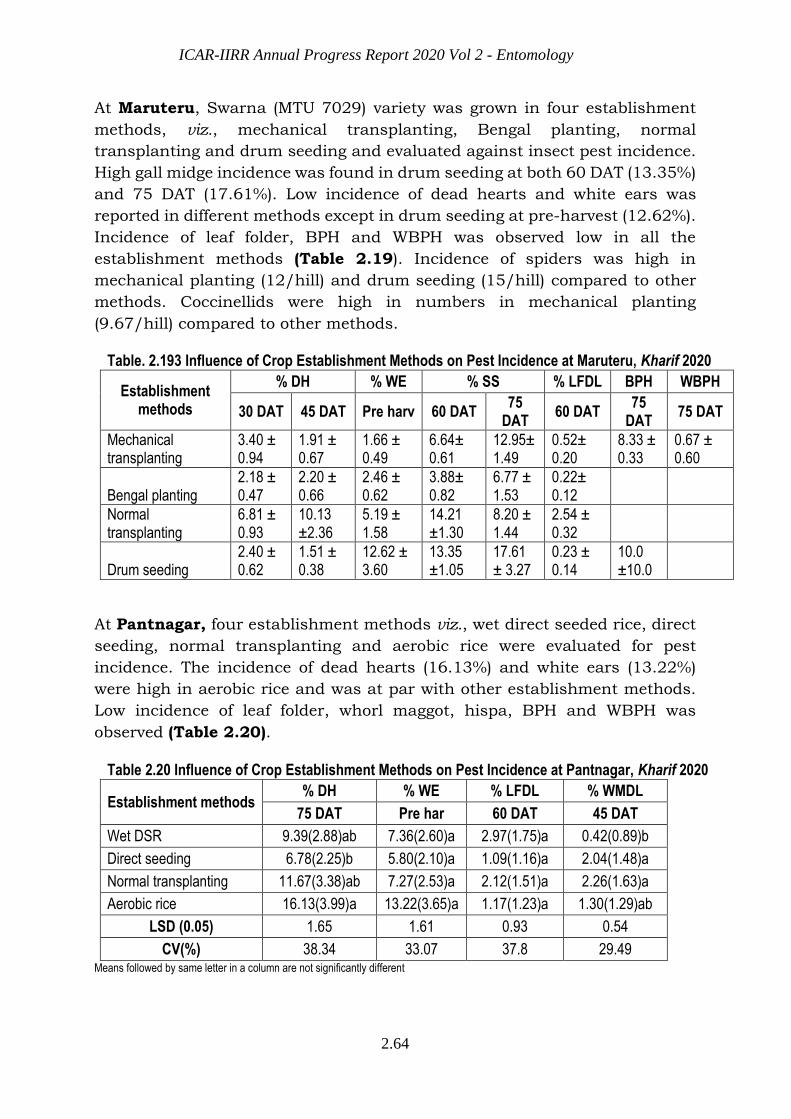
ICAR-IIRR Annual Progress Report 2020 Vol 2 - Entomology
2.64
At Maruteru, Swarna (MTU 7029) variety was grown in four establishment
methods, viz., mechanical transplanting, Bengal planting, normal
transplanting and drum seeding and evaluated against insect pest incidence.
High gall midge incidence was found in drum seeding at both 60 DAT (13.35%)
and 75 DAT (17.61%). Low incidence of dead hearts and white ears was
reported in different methods except in drum seeding at pre-harvest (12.62%).
Incidence of leaf folder, BPH and WBPH was observed low in all the
establishment methods (Table 2.19). Incidence of spiders was high in
mechanical planting (12/hill) and drum seeding (15/hill) compared to other
methods. Coccinellids were high in numbers in mechanical planting
(9.67/hill) compared to other methods.
Table. 2.193 Influence of Crop Establishment Methods on Pest Incidence at Maruteru, Kharif 2020
Establishment methods
% DH % WE % SS % LFDL BPH WBPH
30 DAT 45 DAT Pre harv 60 DAT 75
DAT 60 DAT
75 DAT
75 DAT
Mechanical transplanting
3.40 ± 0.94
1.91 ± 0.67
1.66 ± 0.49
6.64± 0.61
12.95± 1.49
0.52± 0.20
8.33 ± 0.33
0.67 ± 0.60
Bengal planting 2.18 ± 0.47
2.20 ± 0.66
2.46 ± 0.62
3.88± 0.82
6.77 ± 1.53
0.22± 0.12
Normal transplanting
6.81 ± 0.93
10.13 ±2.36
5.19 ± 1.58
14.21 ±1.30
8.20 ± 1.44
2.54 ± 0.32
Drum seeding 2.40 ± 0.62
1.51 ± 0.38
12.62 ± 3.60
13.35 ±1.05
17.61 ± 3.27
0.23 ± 0.14
10.0 ±10.0
At Pantnagar, four establishment methods viz., wet direct seeded rice, direct
seeding, normal transplanting and aerobic rice were evaluated for pest
incidence. The incidence of dead hearts (16.13%) and white ears (13.22%)
were high in aerobic rice and was at par with other establishment methods.
Low incidence of leaf folder, whorl maggot, hispa, BPH and WBPH was
observed (Table 2.20).
Table 2.20 Influence of Crop Establishment Methods on Pest Incidence at Pantnagar, Kharif 2020
Establishment methods % DH % WE % LFDL % WMDL
75 DAT Pre har 60 DAT 45 DAT
Wet DSR 9.39(2.88)ab 7.36(2.60)a 2.97(1.75)a 0.42(0.89)b
Direct seeding 6.78(2.25)b 5.80(2.10)a 1.09(1.16)a 2.04(1.48)a
Normal transplanting 11.67(3.38)ab 7.27(2.53)a 2.12(1.51)a 2.26(1.63)a
Aerobic rice 16.13(3.99)a 13.22(3.65)a 1.17(1.23)a 1.30(1.29)ab
LSD (0.05) 1.65 1.61 0.93 0.54
CV(%) 38.34 33.07 37.8 29.49 Means followed by same letter in a column are not significantly different
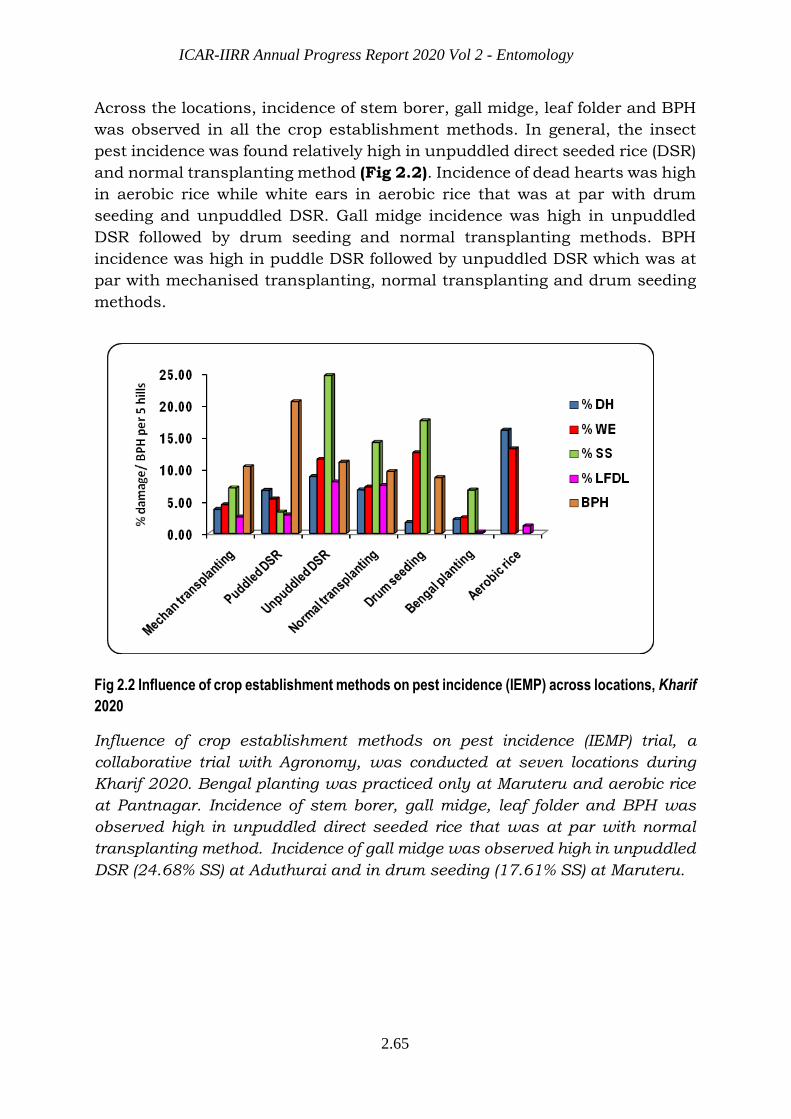
ICAR-IIRR Annual Progress Report 2020 Vol 2 - Entomology
2.65
Across the locations, incidence of stem borer, gall midge, leaf folder and BPH
was observed in all the crop establishment methods. In general, the insect
pest incidence was found relatively high in unpuddled direct seeded rice (DSR)
and normal transplanting method (Fig 2.2). Incidence of dead hearts was high
in aerobic rice while white ears in aerobic rice that was at par with drum
seeding and unpuddled DSR. Gall midge incidence was high in unpuddled
DSR followed by drum seeding and normal transplanting methods. BPH
incidence was high in puddle DSR followed by unpuddled DSR which was at
par with mechanised transplanting, normal transplanting and drum seeding
methods.
Fig 2.2 Influence of crop establishment methods on pest incidence (IEMP) across locations, Kharif
2020
Influence of crop establishment methods on pest incidence (IEMP) trial, a
collaborative trial with Agronomy, was conducted at seven locations during
Kharif 2020. Bengal planting was practiced only at Maruteru and aerobic rice
at Pantnagar. Incidence of stem borer, gall midge, leaf folder and BPH was
observed high in unpuddled direct seeded rice that was at par with normal
transplanting method. Incidence of gall midge was observed high in unpuddled
DSR (24.68% SS) at Aduthurai and in drum seeding (17.61% SS) at Maruteru.

ICAR-IIRR Annual Progress Report 2020 Vol 2 - Entomology
2.66
iii) Cropping Systems Influence on Pest Incidence (CSIP)
Cropping systems play a major role in the incidence of insect pests, their carry
over and further spread. In India, rice based cropping systems are the major
systems in rotation with cereals, pulses, cotton and vegetables Incorporation
of crop residues is known to improve the overall productivity of Rabi crops in
rice based cropping systems. As rice straw contains about 1-2% of Potassium,
incorporation of rice straw acts as a good source of nutrients for crops grown
after rice. Keeping these in view, a trial on cropping systems influence on pest
incidence (CSIP) was initiated last year in collaboration with Agronomy
section.
The field trial was laid out in split plot design with three replications. Main
plot treatments comprised of three different crop establishment methods (M1:
Transplanting, M2: Wet seeding (line sowing under puddled conditions) and
M3: Aerobic rice – Dry rice cultivation). The sub plot treatments comprised of
three different Residue/straw management techniques (S1: No residue, S2:
Incorporation of 15 cm height of rice straw from ground, S3: Incorporation of
30 cm height of rice straw from ground) to be superimposed for Rabi crops.
During Kharif 2020, the trial was conducted at four locations, viz, Jagdalpur,
Karjat, Pattambi and Rajendranagar. The results are summarized below.
At Jagdalpur, incidence of dead hearts, leaf folder, whorl maggot and thrips
was observed (Table.2.21). Incidence of thrips was at par in all the three
establishment methods whereas incorporation of rice straw up to 15 cm height
sub-plot resulted in significantly high incidence of thrips (13.6% DL)
compared to other treatments. Incidence of other pests was low to draw valid
conclusions.
At Karjat, low incidence of stem borer and leaf folder was observed in all the
three main plots and sub-plot treatments (Table2.22).
At Pattambi, high incidence of stem borer, gall midge, whorl maggot, leaf
folder and blue beetle was observed in all the plots. Maximum incidence of
white ears and blue beetle damage was noticed in transplanting and was
significantly different from wet seeding (Table 2.23). Sub-plot with 15 cm
straw incorporation resulted in significantly high damage of white ears
(48.26%) compared to other two treatments. Gall midge incidence was
significantly high in wet seeding (51 – 55.8%) and in 30 cm straw incorporated
plot at 60 DAT. Leaf folder and whorl maggot incidence was at par in both the
cultivation systems and blue beetle incidence was at par in all the sub-plot
treatments.
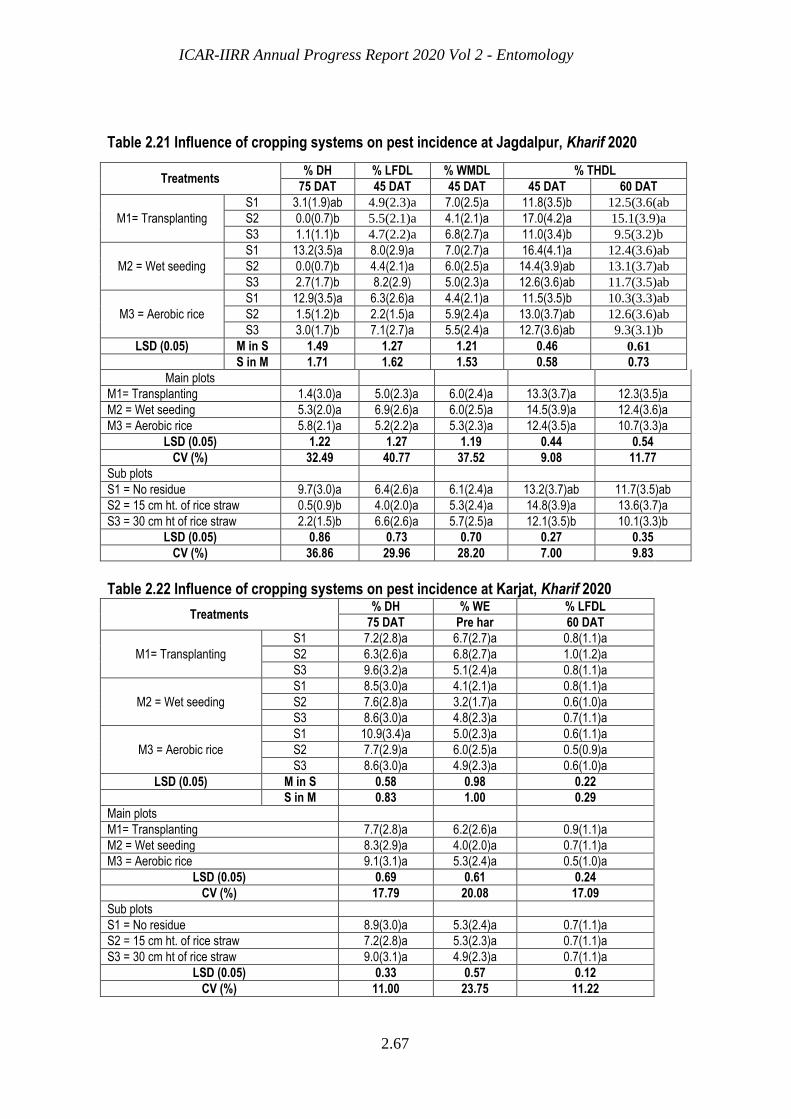
ICAR-IIRR Annual Progress Report 2020 Vol 2 - Entomology
2.67
Table 2.21 Influence of cropping systems on pest incidence at Jagdalpur, Kharif 2020
Treatments % DH % LFDL % WMDL % THDL
75 DAT 45 DAT 45 DAT 45 DAT 60 DAT
M1= Transplanting
S1 3.1(1.9)ab 4.9(2.3)a 7.0(2.5)a 11.8(3.5)b 12.5(3.6(ab
S2 0.0(0.7)b 5.5(2.1)a 4.1(2.1)a 17.0(4.2)a 15.1(3.9)a
S3 1.1(1.1)b 4.7(2.2)a 6.8(2.7)a 11.0(3.4)b 9.5(3.2)b
M2 = Wet seeding
S1 13.2(3.5)a 8.0(2.9)a 7.0(2.7)a 16.4(4.1)a 12.4(3.6)ab
S2 0.0(0.7)b 4.4(2.1)a 6.0(2.5)a 14.4(3.9)ab 13.1(3.7)ab
S3 2.7(1.7)b 8.2(2.9) 5.0(2.3)a 12.6(3.6)ab 11.7(3.5)ab
M3 = Aerobic rice
S1 12.9(3.5)a 6.3(2.6)a 4.4(2.1)a 11.5(3.5)b 10.3(3.3)ab
S2 1.5(1.2)b 2.2(1.5)a 5.9(2.4)a 13.0(3.7)ab 12.6(3.6)ab
S3 3.0(1.7)b 7.1(2.7)a 5.5(2.4)a 12.7(3.6)ab 9.3(3.1)b
LSD (0.05) M in S 1.49 1.27 1.21 0.46 0.61
S in M 1.71 1.62 1.53 0.58 0.73
Main plots
M1= Transplanting 1.4(3.0)a 5.0(2.3)a 6.0(2.4)a 13.3(3.7)a 12.3(3.5)a
M2 = Wet seeding 5.3(2.0)a 6.9(2.6)a 6.0(2.5)a 14.5(3.9)a 12.4(3.6)a
M3 = Aerobic rice 5.8(2.1)a 5.2(2.2)a 5.3(2.3)a 12.4(3.5)a 10.7(3.3)a
LSD (0.05) 1.22 1.27 1.19 0.44 0.54
CV (%) 32.49 40.77 37.52 9.08 11.77
Sub plots
S1 = No residue 9.7(3.0)a 6.4(2.6)a 6.1(2.4)a 13.2(3.7)ab 11.7(3.5)ab
S2 = 15 cm ht. of rice straw 0.5(0.9)b 4.0(2.0)a 5.3(2.4)a 14.8(3.9)a 13.6(3.7)a
S3 = 30 cm ht of rice straw 2.2(1.5)b 6.6(2.6)a 5.7(2.5)a 12.1(3.5)b 10.1(3.3)b
LSD (0.05) 0.86 0.73 0.70 0.27 0.35
CV (%) 36.86 29.96 28.20 7.00 9.83
Table 2.22 Influence of cropping systems on pest incidence at Karjat, Kharif 2020
Treatments % DH % WE % LFDL
75 DAT Pre har 60 DAT
M1= Transplanting
S1 7.2(2.8)a 6.7(2.7)a 0.8(1.1)a
S2 6.3(2.6)a 6.8(2.7)a 1.0(1.2)a
S3 9.6(3.2)a 5.1(2.4)a 0.8(1.1)a
M2 = Wet seeding
S1 8.5(3.0)a 4.1(2.1)a 0.8(1.1)a
S2 7.6(2.8)a 3.2(1.7)a 0.6(1.0)a
S3 8.6(3.0)a 4.8(2.3)a 0.7(1.1)a
M3 = Aerobic rice
S1 10.9(3.4)a 5.0(2.3)a 0.6(1.1)a
S2 7.7(2.9)a 6.0(2.5)a 0.5(0.9)a
S3 8.6(3.0)a 4.9(2.3)a 0.6(1.0)a
LSD (0.05) M in S 0.58 0.98 0.22
S in M 0.83 1.00 0.29
Main plots
M1= Transplanting 7.7(2.8)a 6.2(2.6)a 0.9(1.1)a
M2 = Wet seeding 8.3(2.9)a 4.0(2.0)a 0.7(1.1)a
M3 = Aerobic rice 9.1(3.1)a 5.3(2.4)a 0.5(1.0)a
LSD (0.05) 0.69 0.61 0.24
CV (%) 17.79 20.08 17.09
Sub plots
S1 = No residue 8.9(3.0)a 5.3(2.4)a 0.7(1.1)a
S2 = 15 cm ht. of rice straw 7.2(2.8)a 5.3(2.3)a 0.7(1.1)a
S3 = 30 cm ht of rice straw 9.0(3.1)a 4.9(2.3)a 0.7(1.1)a
LSD (0.05) 0.33 0.57 0.12
CV (%) 11.00 23.75 11.22
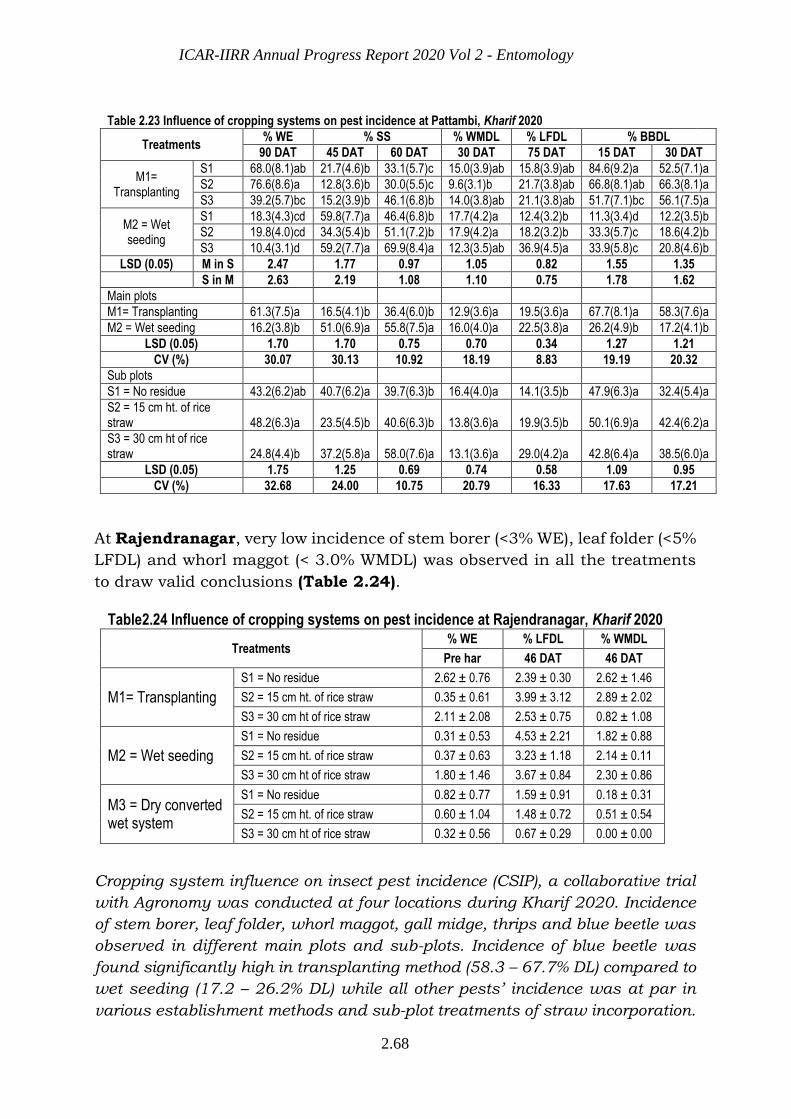
ICAR-IIRR Annual Progress Report 2020 Vol 2 - Entomology
2.68
Table 2.23 Influence of cropping systems on pest incidence at Pattambi, Kharif 2020
Treatments % WE % SS % WMDL % LFDL % BBDL
90 DAT 45 DAT 60 DAT 30 DAT 75 DAT 15 DAT 30 DAT
M1= Transplanting
S1 68.0(8.1)ab 21.7(4.6)b 33.1(5.7)c 15.0(3.9)ab 15.8(3.9)ab 84.6(9.2)a 52.5(7.1)a
S2 76.6(8.6)a 12.8(3.6)b 30.0(5.5)c 9.6(3.1)b 21.7(3.8)ab 66.8(8.1)ab 66.3(8.1)a
S3 39.2(5.7)bc 15.2(3.9)b 46.1(6.8)b 14.0(3.8)ab 21.1(3.8)ab 51.7(7.1)bc 56.1(7.5)a
M2 = Wet seeding
S1 18.3(4.3)cd 59.8(7.7)a 46.4(6.8)b 17.7(4.2)a 12.4(3.2)b 11.3(3.4)d 12.2(3.5)b
S2 19.8(4.0)cd 34.3(5.4)b 51.1(7.2)b 17.9(4.2)a 18.2(3.2)b 33.3(5.7)c 18.6(4.2)b
S3 10.4(3.1)d 59.2(7.7)a 69.9(8.4)a 12.3(3.5)ab 36.9(4.5)a 33.9(5.8)c 20.8(4.6)b
LSD (0.05) M in S 2.47 1.77 0.97 1.05 0.82 1.55 1.35
S in M 2.63 2.19 1.08 1.10 0.75 1.78 1.62
Main plots
M1= Transplanting 61.3(7.5)a 16.5(4.1)b 36.4(6.0)b 12.9(3.6)a 19.5(3.6)a 67.7(8.1)a 58.3(7.6)a
M2 = Wet seeding 16.2(3.8)b 51.0(6.9)a 55.8(7.5)a 16.0(4.0)a 22.5(3.8)a 26.2(4.9)b 17.2(4.1)b
LSD (0.05) 1.70 1.70 0.75 0.70 0.34 1.27 1.21
CV (%) 30.07 30.13 10.92 18.19 8.83 19.19 20.32
Sub plots
S1 = No residue 43.2(6.2)ab 40.7(6.2)a 39.7(6.3)b 16.4(4.0)a 14.1(3.5)b 47.9(6.3)a 32.4(5.4)a
S2 = 15 cm ht. of rice straw 48.2(6.3)a 23.5(4.5)b 40.6(6.3)b 13.8(3.6)a 19.9(3.5)b 50.1(6.9)a 42.4(6.2)a
S3 = 30 cm ht of rice straw 24.8(4.4)b 37.2(5.8)a 58.0(7.6)a 13.1(3.6)a 29.0(4.2)a 42.8(6.4)a 38.5(6.0)a
LSD (0.05) 1.75 1.25 0.69 0.74 0.58 1.09 0.95
CV (%) 32.68 24.00 10.75 20.79 16.33 17.63 17.21
At Rajendranagar, very low incidence of stem borer (<3% WE), leaf folder (<5%
LFDL) and whorl maggot (< 3.0% WMDL) was observed in all the treatments
to draw valid conclusions (Table 2.24).
Table2.24 Influence of cropping systems on pest incidence at Rajendranagar, Kharif 2020
Treatments % WE % LFDL % WMDL
Pre har 46 DAT 46 DAT
M1= Transplanting
S1 = No residue 2.62 ± 0.76 2.39 ± 0.30 2.62 ± 1.46
S2 = 15 cm ht. of rice straw 0.35 ± 0.61 3.99 ± 3.12 2.89 ± 2.02
S3 = 30 cm ht of rice straw 2.11 ± 2.08 2.53 ± 0.75 0.82 ± 1.08
M2 = Wet seeding
S1 = No residue 0.31 ± 0.53 4.53 ± 2.21 1.82 ± 0.88
S2 = 15 cm ht. of rice straw 0.37 ± 0.63 3.23 ± 1.18 2.14 ± 0.11
S3 = 30 cm ht of rice straw 1.80 ± 1.46 3.67 ± 0.84 2.30 ± 0.86
M3 = Dry converted wet system
S1 = No residue 0.82 ± 0.77 1.59 ± 0.91 0.18 ± 0.31
S2 = 15 cm ht. of rice straw 0.60 ± 1.04 1.48 ± 0.72 0.51 ± 0.54
S3 = 30 cm ht of rice straw 0.32 ± 0.56 0.67 ± 0.29 0.00 ± 0.00
Cropping system influence on insect pest incidence (CSIP), a collaborative trial
with Agronomy was conducted at four locations during Kharif 2020. Incidence
of stem borer, leaf folder, whorl maggot, gall midge, thrips and blue beetle was
observed in different main plots and sub-plots. Incidence of blue beetle was
found significantly high in transplanting method (58.3 – 67.7% DL) compared to
wet seeding (17.2 – 26.2% DL) while all other pests’ incidence was at par in
various establishment methods and sub-plot treatments of straw incorporation.
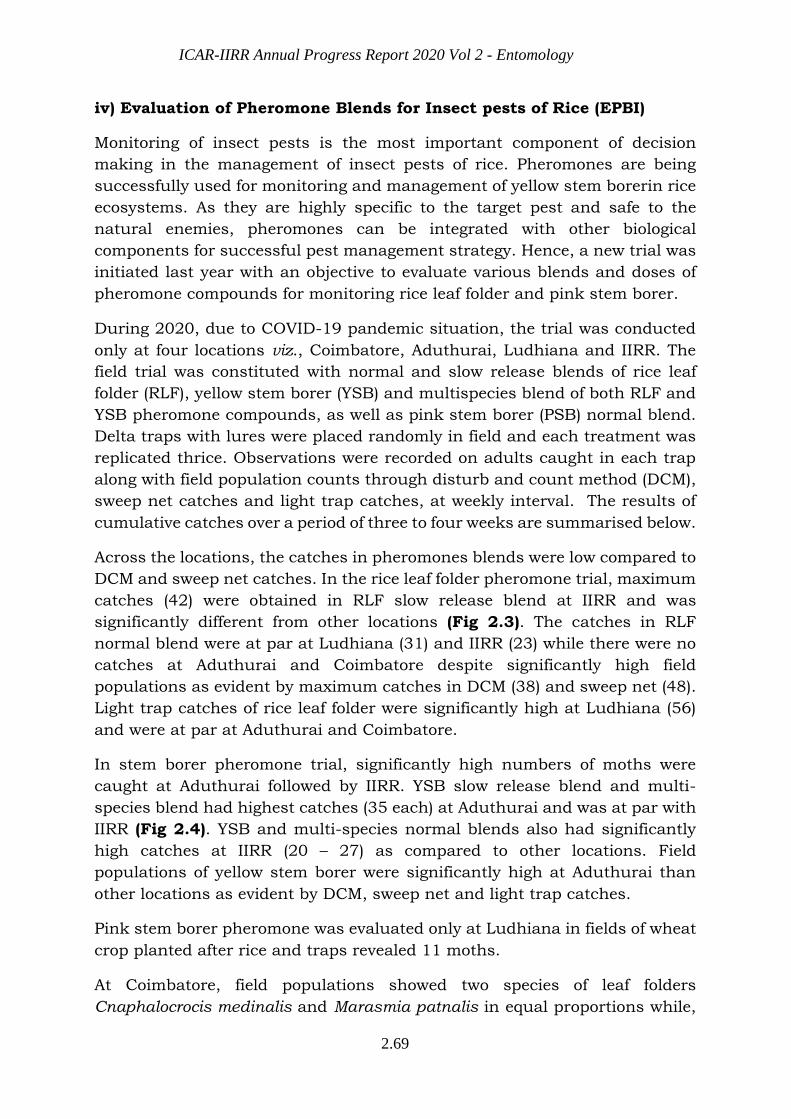
ICAR-IIRR Annual Progress Report 2020 Vol 2 - Entomology
2.69
iv) Evaluation of Pheromone Blends for Insect pests of Rice (EPBI)
Monitoring of insect pests is the most important component of decision
making in the management of insect pests of rice. Pheromones are being
successfully used for monitoring and management of yellow stem borerin rice
ecosystems. As they are highly specific to the target pest and safe to the
natural enemies, pheromones can be integrated with other biological
components for successful pest management strategy. Hence, a new trial was
initiated last year with an objective to evaluate various blends and doses of
pheromone compounds for monitoring rice leaf folder and pink stem borer.
During 2020, due to COVID-19 pandemic situation, the trial was conducted
only at four locations viz., Coimbatore, Aduthurai, Ludhiana and IIRR. The
field trial was constituted with normal and slow release blends of rice leaf
folder (RLF), yellow stem borer (YSB) and multispecies blend of both RLF and
YSB pheromone compounds, as well as pink stem borer (PSB) normal blend.
Delta traps with lures were placed randomly in field and each treatment was
replicated thrice. Observations were recorded on adults caught in each trap
along with field population counts through disturb and count method (DCM),
sweep net catches and light trap catches, at weekly interval. The results of
cumulative catches over a period of three to four weeks are summarised below.
Across the locations, the catches in pheromones blends were low compared to
DCM and sweep net catches. In the rice leaf folder pheromone trial, maximum
catches (42) were obtained in RLF slow release blend at IIRR and was
significantly different from other locations (Fig 2.3). The catches in RLF
normal blend were at par at Ludhiana (31) and IIRR (23) while there were no
catches at Aduthurai and Coimbatore despite significantly high field
populations as evident by maximum catches in DCM (38) and sweep net (48).
Light trap catches of rice leaf folder were significantly high at Ludhiana (56)
and were at par at Aduthurai and Coimbatore.
In stem borer pheromone trial, significantly high numbers of moths were
caught at Aduthurai followed by IIRR. YSB slow release blend and multi-
species blend had highest catches (35 each) at Aduthurai and was at par with
IIRR (Fig 2.4). YSB and multi-species normal blends also had significantly
high catches at IIRR (20 – 27) as compared to other locations. Field
populations of yellow stem borer were significantly high at Aduthurai than
other locations as evident by DCM, sweep net and light trap catches.
Pink stem borer pheromone was evaluated only at Ludhiana in fields of wheat
crop planted after rice and traps revealed 11 moths.
At Coimbatore, field populations showed two species of leaf folders
Cnaphalocrocis medinalis and Marasmia patnalis in equal proportions while,
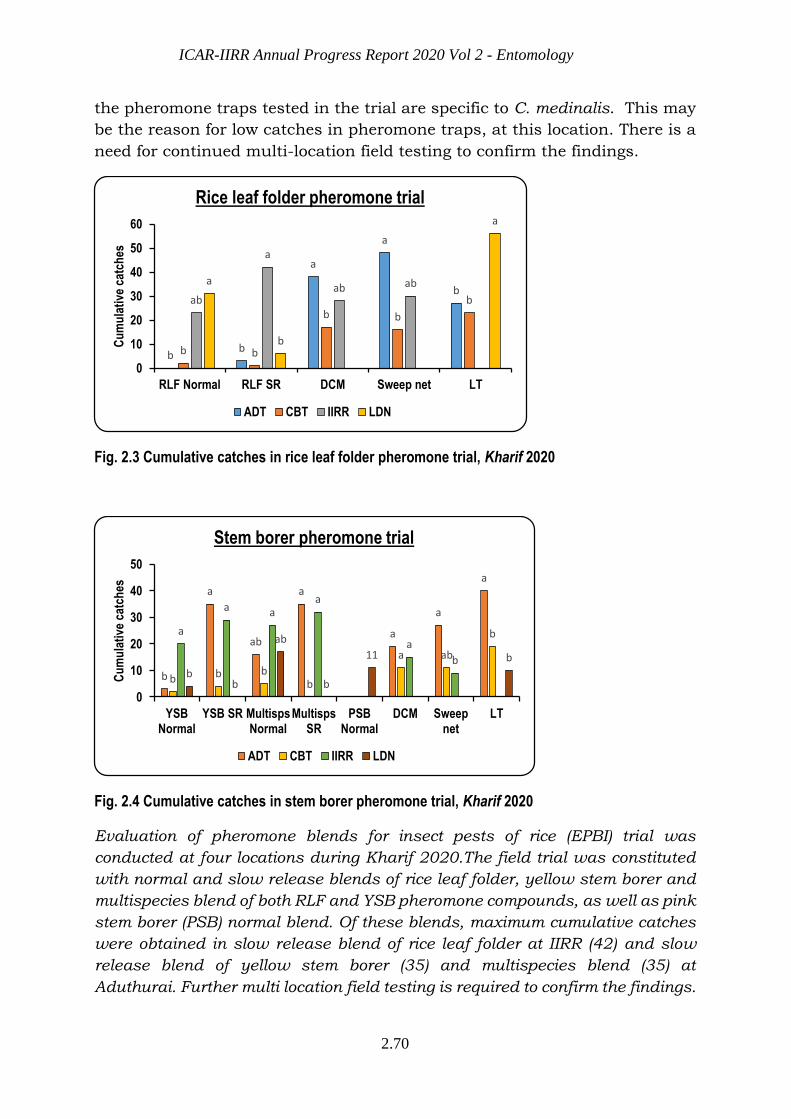
ICAR-IIRR Annual Progress Report 2020 Vol 2 - Entomology
2.70
the pheromone traps tested in the trial are specific to C. medinalis. This may
be the reason for low catches in pheromone traps, at this location. There is a
need for continued multi-location field testing to confirm the findings.
Fig. 2.3 Cumulative catches in rice leaf folder pheromone trial, Kharif 2020
Fig. 2.4 Cumulative catches in stem borer pheromone trial, Kharif 2020
Evaluation of pheromone blends for insect pests of rice (EPBI) trial was
conducted at four locations during Kharif 2020.The field trial was constituted
with normal and slow release blends of rice leaf folder, yellow stem borer and
multispecies blend of both RLF and YSB pheromone compounds, as well as pink
stem borer (PSB) normal blend. Of these blends, maximum cumulative catches
were obtained in slow release blend of rice leaf folder at IIRR (42) and slow
release blend of yellow stem borer (35) and multispecies blend (35) at
Aduthurai. Further multi location field testing is required to confirm the findings.
bb
a
a
b
b b
b b
bab
a
ab aba
b
a
0
10
20
30
40
50
60
RLF Normal RLF SR DCM Sweep net LT
Cu
mu
lati
ve c
atch
es
Rice leaf folder pheromone trial
ADT CBT IIRR LDN
b
a
ab
a
a
a
a
b b bb
a ab
ba
a aa
a
bb
b
ab
b
11 b
0
10
20
30
40
50
YSBNormal
YSB SR MultispsNormal
MultispsSR
PSBNormal
DCM Sweepnet
LT
Cu
mu
lati
ve c
atch
es
Stem borer pheromone trial
ADT CBT IIRR LDN
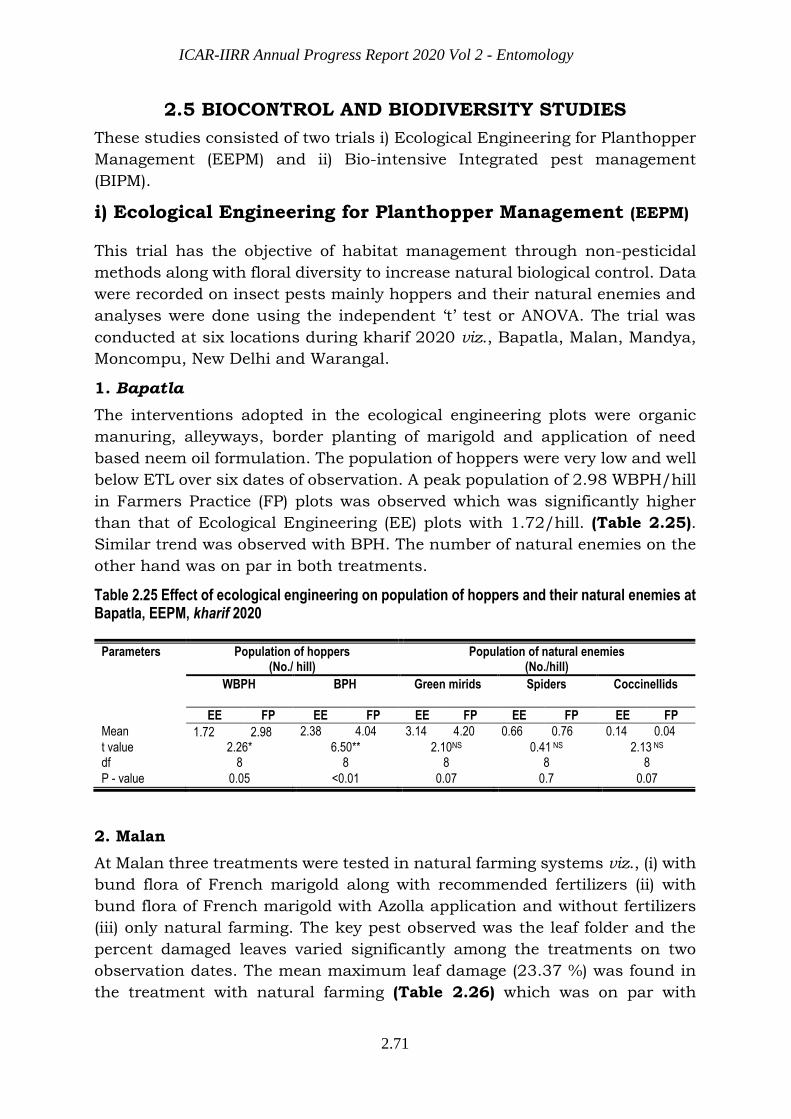
ICAR-IIRR Annual Progress Report 2020 Vol 2 - Entomology
2.71
2.5 BIOCONTROL AND BIODIVERSITY STUDIES
These studies consisted of two trials i) Ecological Engineering for Planthopper
Management (EEPM) and ii) Bio-intensive Integrated pest management
(BIPM).
i) Ecological Engineering for Planthopper Management (EEPM)
This trial has the objective of habitat management through non-pesticidal
methods along with floral diversity to increase natural biological control. Data
were recorded on insect pests mainly hoppers and their natural enemies and
analyses were done using the independent ‘t’ test or ANOVA. The trial was
conducted at six locations during kharif 2020 viz., Bapatla, Malan, Mandya,
Moncompu, New Delhi and Warangal.
1. Bapatla
The interventions adopted in the ecological engineering plots were organic
manuring, alleyways, border planting of marigold and application of need
based neem oil formulation. The population of hoppers were very low and well
below ETL over six dates of observation. A peak population of 2.98 WBPH/hill
in Farmers Practice (FP) plots was observed which was significantly higher
than that of Ecological Engineering (EE) plots with 1.72/hill. (Table 2.25).
Similar trend was observed with BPH. The number of natural enemies on the
other hand was on par in both treatments.
Table 2.25 Effect of ecological engineering on population of hoppers and their natural enemies at Bapatla, EEPM, kharif 2020
2. Malan
At Malan three treatments were tested in natural farming systems viz., (i) with
bund flora of French marigold along with recommended fertilizers (ii) with
bund flora of French marigold with Azolla application and without fertilizers
(iii) only natural farming. The key pest observed was the leaf folder and the
percent damaged leaves varied significantly among the treatments on two
observation dates. The mean maximum leaf damage (23.37 %) was found in
the treatment with natural farming (Table 2.26) which was on par with
Parameters Population of hoppers (No./ hill)
Population of natural enemies (No./hill)
WBPH
BPH
Green mirids
Spiders Coccinellids
EE FP EE FP EE FP EE FP EE FP
Mean 1.72 2.98 2.38 4.04 3.14 4.20 0.66 0.76 0.14 0.04
t value 2.26* 6.50** 2.10NS 0.41 NS 2.13 NS df 8 8 8 8 8
P - value 0.05 <0.01 0.07 0.7 0.07
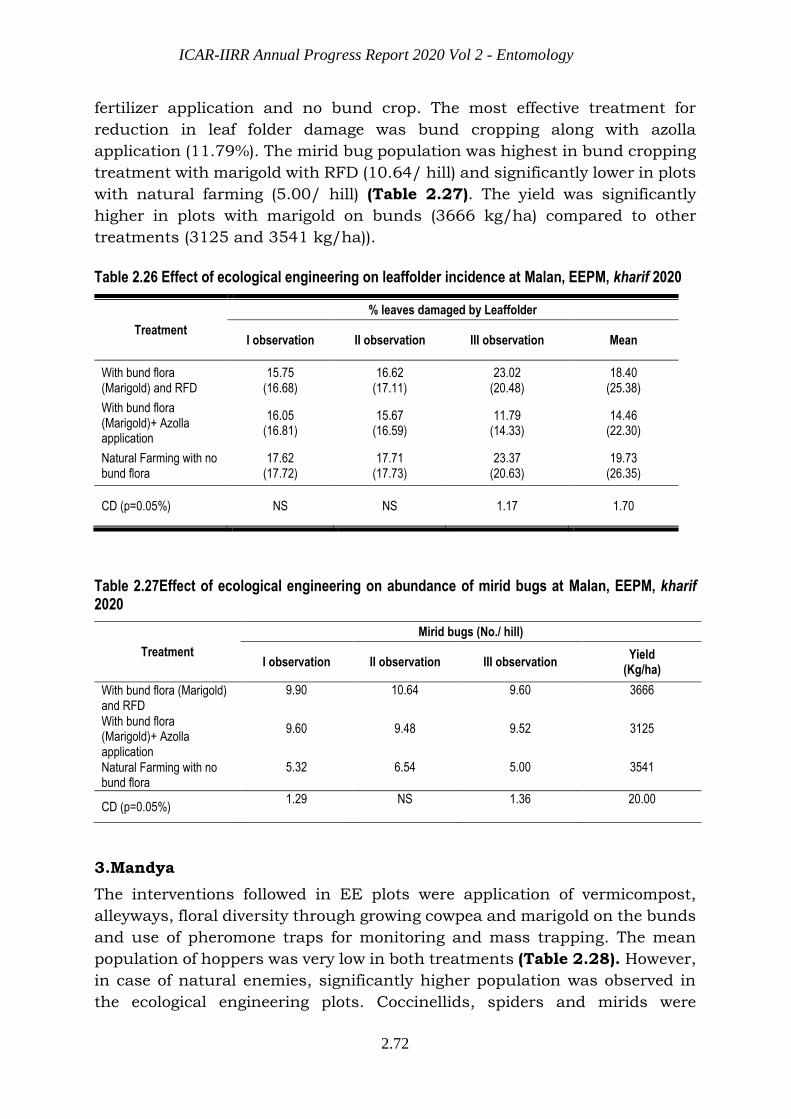
ICAR-IIRR Annual Progress Report 2020 Vol 2 - Entomology
2.72
fertilizer application and no bund crop. The most effective treatment for
reduction in leaf folder damage was bund cropping along with azolla
application (11.79%). The mirid bug population was highest in bund cropping
treatment with marigold with RFD (10.64/ hill) and significantly lower in plots
with natural farming (5.00/ hill) (Table 2.27). The yield was significantly
higher in plots with marigold on bunds (3666 kg/ha) compared to other
treatments (3125 and 3541 kg/ha)).
Table 2.26 Effect of ecological engineering on leaffolder incidence at Malan, EEPM, kharif 2020
Treatment
% leaves damaged by Leaffolder
I observation II observation III observation Mean
With bund flora (Marigold) and RFD
15.75 (16.68)
16.62 (17.11)
23.02 (20.48)
18.40 (25.38)
With bund flora (Marigold)+ Azolla application
16.05 (16.81)
15.67 (16.59)
11.79 (14.33)
14.46 (22.30)
Natural Farming with no bund flora
17.62 (17.72)
17.71 (17.73)
23.37 (20.63)
19.73 (26.35)
CD (p=0.05%) NS NS 1.17 1.70
Table 2.27Effect of ecological engineering on abundance of mirid bugs at Malan, EEPM, kharif 2020
Treatment
Mirid bugs (No./ hill)
I observation II observation III observation Yield
(Kg/ha)
With bund flora (Marigold) and RFD
9.90 10.64 9.60 3666
With bund flora (Marigold)+ Azolla application
9.60 9.48 9.52 3125
Natural Farming with no bund flora
5.32 6.54 5.00 3541
CD (p=0.05%) 1.29 NS 1.36 20.00
3.Mandya
The interventions followed in EE plots were application of vermicompost,
alleyways, floral diversity through growing cowpea and marigold on the bunds
and use of pheromone traps for monitoring and mass trapping. The mean
population of hoppers was very low in both treatments (Table 2.28). However,
in case of natural enemies, significantly higher population was observed in
the ecological engineering plots. Coccinellids, spiders and mirids were
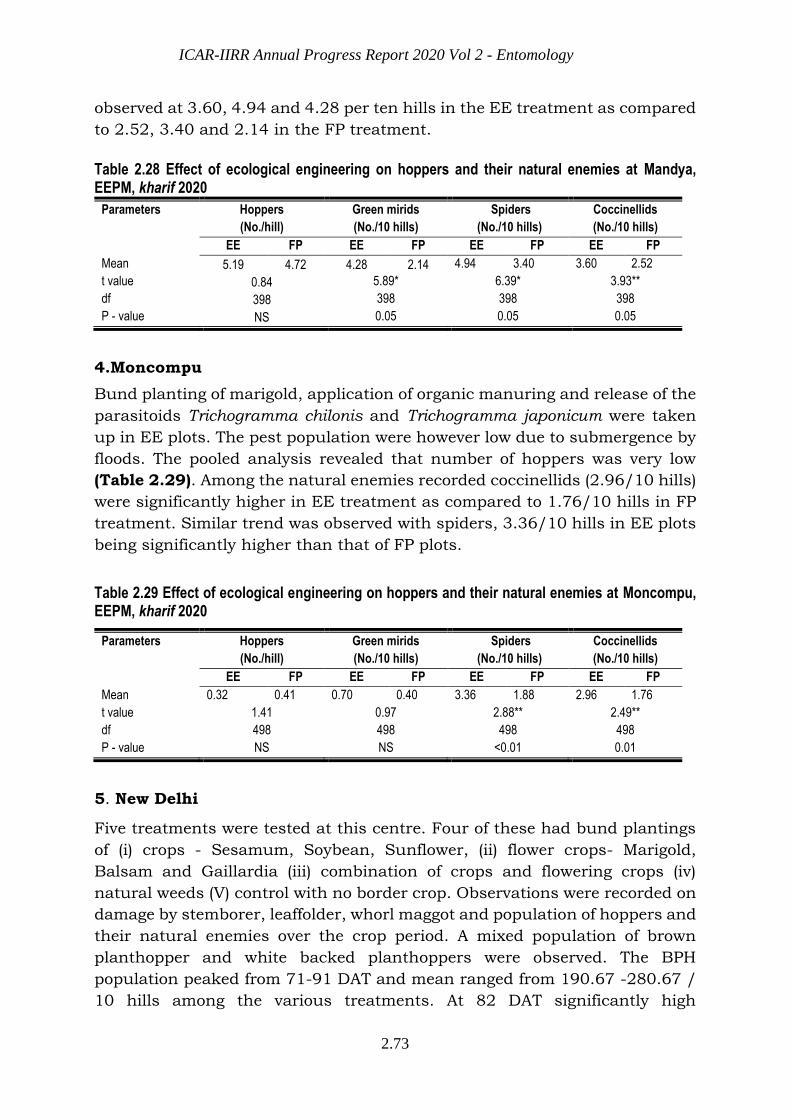
ICAR-IIRR Annual Progress Report 2020 Vol 2 - Entomology
2.73
observed at 3.60, 4.94 and 4.28 per ten hills in the EE treatment as compared
to 2.52, 3.40 and 2.14 in the FP treatment.
Table 2.28 Effect of ecological engineering on hoppers and their natural enemies at Mandya, EEPM, kharif 2020
Parameters Hoppers
(No./hill)
Green mirids
(No./10 hills)
Spiders
(No./10 hills)
Coccinellids
(No./10 hills)
EE FP EE FP EE FP EE FP
Mean 5.19 4.72 4.28 2.14 4.94 3.40 3.60 2.52
t value 0.84 5.89* 6.39* 3.93**
df 398 398 398 398
P - value NS 0.05 0.05 0.05
4.Moncompu
Bund planting of marigold, application of organic manuring and release of the
parasitoids Trichogramma chilonis and Trichogramma japonicum were taken
up in EE plots. The pest population were however low due to submergence by
floods. The pooled analysis revealed that number of hoppers was very low
(Table 2.29). Among the natural enemies recorded coccinellids (2.96/10 hills)
were significantly higher in EE treatment as compared to 1.76/10 hills in FP
treatment. Similar trend was observed with spiders, 3.36/10 hills in EE plots
being significantly higher than that of FP plots.
Table 2.29 Effect of ecological engineering on hoppers and their natural enemies at Moncompu, EEPM, kharif 2020
Parameters Hoppers
(No./hill)
Green mirids
(No./10 hills)
Spiders
(No./10 hills)
Coccinellids
(No./10 hills)
EE FP EE FP EE FP EE FP
Mean 0.32 0.41 0.70 0.40 3.36 1.88 2.96 1.76
t value 1.41 0.97 2.88** 2.49**
df 498 498 498 498
P - value NS NS <0.01 0.01
5. New Delhi
Five treatments were tested at this centre. Four of these had bund plantings
of (i) crops - Sesamum, Soybean, Sunflower, (ii) flower crops- Marigold,
Balsam and Gaillardia (iii) combination of crops and flowering crops (iv)
natural weeds (V) control with no border crop. Observations were recorded on
damage by stemborer, leaffolder, whorl maggot and population of hoppers and
their natural enemies over the crop period. A mixed population of brown
planthopper and white backed planthoppers were observed. The BPH
population peaked from 71-91 DAT and mean ranged from 190.67 -280.67 /
10 hills among the various treatments. At 82 DAT significantly high
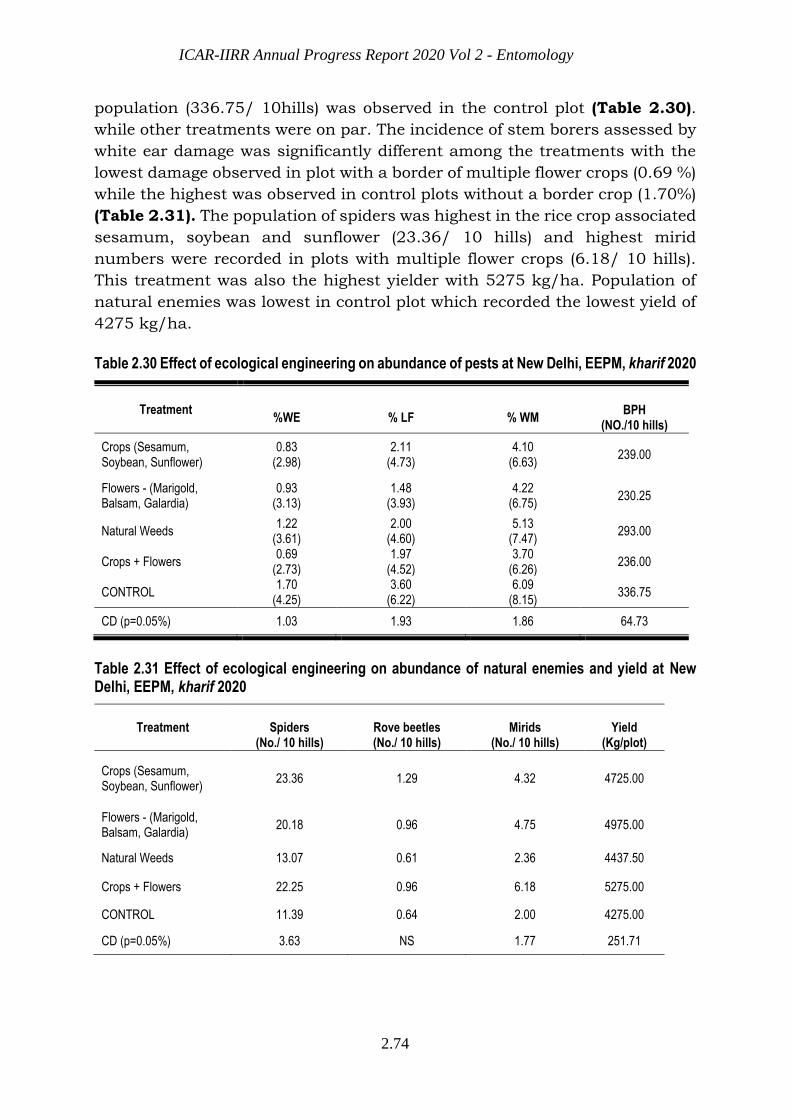
ICAR-IIRR Annual Progress Report 2020 Vol 2 - Entomology
2.74
population (336.75/ 10hills) was observed in the control plot (Table 2.30).
while other treatments were on par. The incidence of stem borers assessed by
white ear damage was significantly different among the treatments with the
lowest damage observed in plot with a border of multiple flower crops (0.69 %)
while the highest was observed in control plots without a border crop (1.70%)
(Table 2.31). The population of spiders was highest in the rice crop associated
sesamum, soybean and sunflower (23.36/ 10 hills) and highest mirid
numbers were recorded in plots with multiple flower crops (6.18/ 10 hills).
This treatment was also the highest yielder with 5275 kg/ha. Population of
natural enemies was lowest in control plot which recorded the lowest yield of
4275 kg/ha.
Table 2.30 Effect of ecological engineering on abundance of pests at New Delhi, EEPM, kharif 2020
Treatment
%WE % LF % WM BPH
(NO./10 hills)
Crops (Sesamum, Soybean, Sunflower)
0.83 (2.98)
2.11 (4.73)
4.10 (6.63)
239.00
Flowers - (Marigold, Balsam, Galardia)
0.93 (3.13)
1.48 (3.93)
4.22 (6.75)
230.25
Natural Weeds 1.22
(3.61) 2.00
(4.60) 5.13
(7.47) 293.00
Crops + Flowers 0.69
(2.73) 1.97
(4.52) 3.70
(6.26) 236.00
CONTROL 1.70
(4.25) 3.60
(6.22) 6.09
(8.15) 336.75
CD (p=0.05%) 1.03 1.93 1.86 64.73
Table 2.31 Effect of ecological engineering on abundance of natural enemies and yield at New Delhi, EEPM, kharif 2020
Treatment
Spiders (No./ 10 hills)
Rove beetles (No./ 10 hills)
Mirids (No./ 10 hills)
Yield (Kg/plot)
Crops (Sesamum, Soybean, Sunflower)
23.36 1.29 4.32 4725.00
Flowers - (Marigold, Balsam, Galardia)
20.18 0.96 4.75 4975.00
Natural Weeds 13.07 0.61 2.36 4437.50
Crops + Flowers 22.25 0.96 6.18 5275.00
CONTROL 11.39 0.64 2.00 4275.00
CD (p=0.05%) 3.63 NS 1.77 251.71
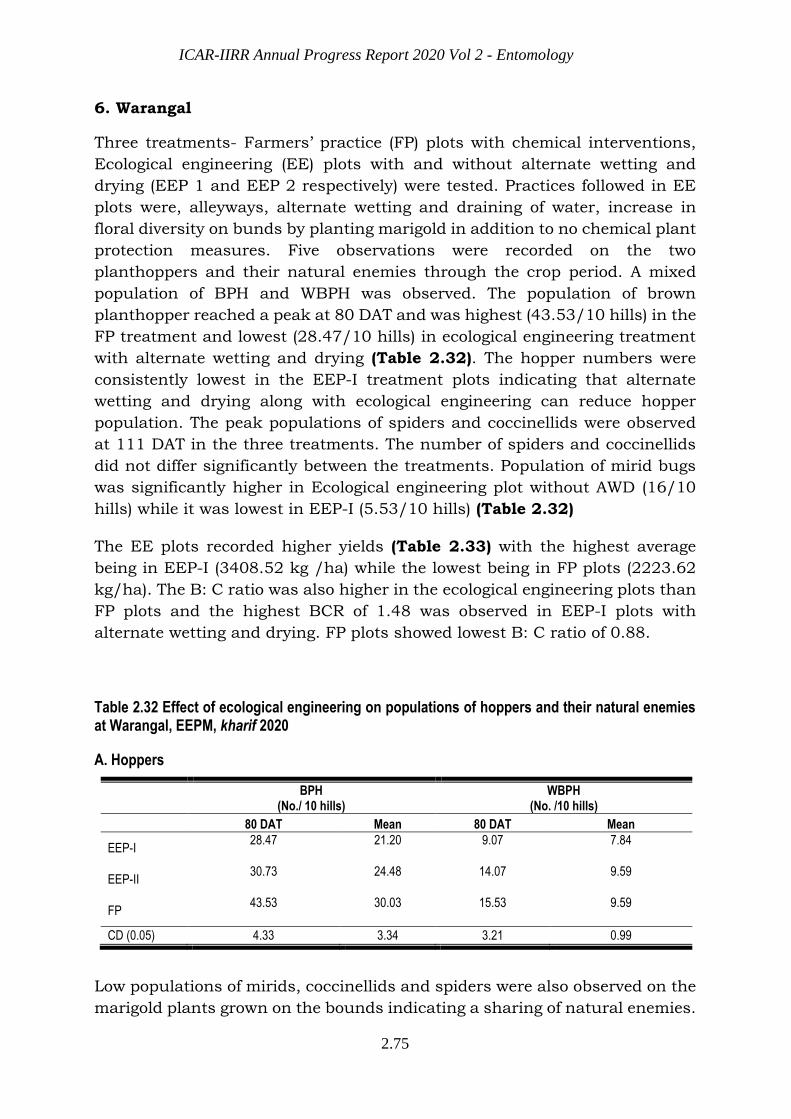
ICAR-IIRR Annual Progress Report 2020 Vol 2 - Entomology
2.75
6. Warangal
Three treatments- Farmers’ practice (FP) plots with chemical interventions,
Ecological engineering (EE) plots with and without alternate wetting and
drying (EEP 1 and EEP 2 respectively) were tested. Practices followed in EE
plots were, alleyways, alternate wetting and draining of water, increase in
floral diversity on bunds by planting marigold in addition to no chemical plant
protection measures. Five observations were recorded on the two
planthoppers and their natural enemies through the crop period. A mixed
population of BPH and WBPH was observed. The population of brown
planthopper reached a peak at 80 DAT and was highest (43.53/10 hills) in the
FP treatment and lowest (28.47/10 hills) in ecological engineering treatment
with alternate wetting and drying (Table 2.32). The hopper numbers were
consistently lowest in the EEP-I treatment plots indicating that alternate
wetting and drying along with ecological engineering can reduce hopper
population. The peak populations of spiders and coccinellids were observed
at 111 DAT in the three treatments. The number of spiders and coccinellids
did not differ significantly between the treatments. Population of mirid bugs
was significantly higher in Ecological engineering plot without AWD (16/10
hills) while it was lowest in EEP-I (5.53/10 hills) (Table 2.32)
The EE plots recorded higher yields (Table 2.33) with the highest average
being in EEP-I (3408.52 kg /ha) while the lowest being in FP plots (2223.62
kg/ha). The B: C ratio was also higher in the ecological engineering plots than
FP plots and the highest BCR of 1.48 was observed in EEP-I plots with
alternate wetting and drying. FP plots showed lowest B: C ratio of 0.88.
Table 2.32 Effect of ecological engineering on populations of hoppers and their natural enemies at Warangal, EEPM, kharif 2020
A. Hoppers
BPH
(No./ 10 hills) WBPH
(No. /10 hills)
80 DAT Mean 80 DAT Mean
EEP-I 28.47 21.20 9.07 7.84
EEP-II 30.73 24.48 14.07 9.59
FP 43.53 30.03 15.53 9.59
CD (0.05) 4.33 3.34 3.21 0.99
Low populations of mirids, coccinellids and spiders were also observed on the
marigold plants grown on the bounds indicating a sharing of natural enemies.

ICAR-IIRR Annual Progress Report 2020 Vol 2 - Entomology
2.76
B. Natural enemies of hoppers
Treatments Spiders
No. /10 hills Coccinellids No. /10 hills
Mirids No. /10 hills
111 DAT 111 DAT 111 DAT
EEP-I 18.93 5.00 5.53
EEP-II 17.60 2.67 16.00
FP 18.80 4.67 7.53
CD(0.05) NS NS 4.20
Table 2.33 Grain Yield and Benefit cost ratio of Ecological engineering at Warangal, EEPM, kharif 2020
Treatment Grain yield (Kg/ha) B:C ratio
EEP-I 3408.52 1.48
EEP-II 2530.11 1.11
FP 2223.62 0.88
CD (0.05) 371.89 0.15
Ecological engineering for pest management was taken up in six locations with a combination of interventions such as organic manuring, alleyways, spacing management, water management and growing of flowering plants on bunds. The results indicated that water management along with ecological engineering significantly reduced hopper population at Warangal (21.20/10 hills) when compared to farmers practice (30.03/10 hills) while increasing yields with the highest yield recorded in ecological engineering with alternate wetting and drying treatment (3408.52 kg /ha) while the lowest was in FP plots (2223.62 kg/ha). Pest damage was significantly lower in ecological engineering treatments with various bund crops at New Delhi. Such interventions increased the natural enemy populations like mirids, spiders and coccinellids. At Warangal, the benefit cost was also significantly higher with ecological engineering (1.48) when compared to Farmers’ practice (0.88).
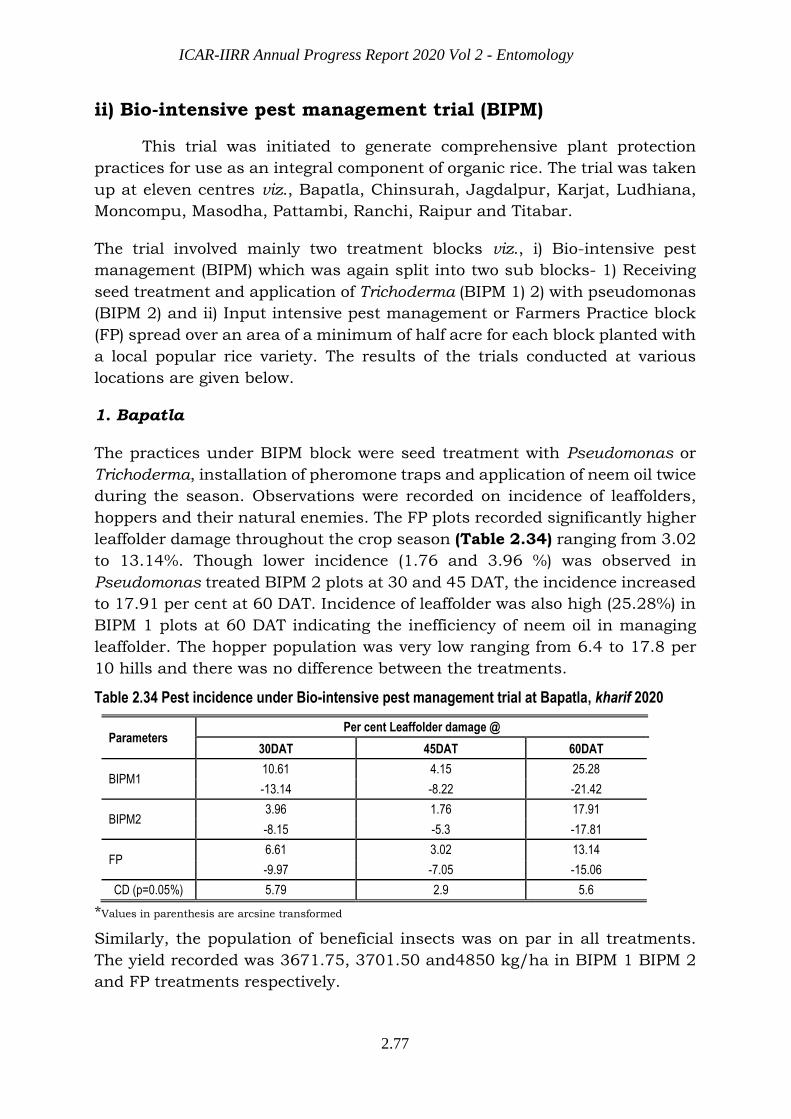
ICAR-IIRR Annual Progress Report 2020 Vol 2 - Entomology
2.77
ii) Bio-intensive pest management trial (BIPM)
This trial was initiated to generate comprehensive plant protection
practices for use as an integral component of organic rice. The trial was taken
up at eleven centres viz., Bapatla, Chinsurah, Jagdalpur, Karjat, Ludhiana,
Moncompu, Masodha, Pattambi, Ranchi, Raipur and Titabar.
The trial involved mainly two treatment blocks viz., i) Bio-intensive pest
management (BIPM) which was again split into two sub blocks- 1) Receiving
seed treatment and application of Trichoderma (BIPM 1) 2) with pseudomonas
(BIPM 2) and ii) Input intensive pest management or Farmers Practice block
(FP) spread over an area of a minimum of half acre for each block planted with
a local popular rice variety. The results of the trials conducted at various
locations are given below.
1. Bapatla
The practices under BIPM block were seed treatment with Pseudomonas or
Trichoderma, installation of pheromone traps and application of neem oil twice
during the season. Observations were recorded on incidence of leaffolders,
hoppers and their natural enemies. The FP plots recorded significantly higher
leaffolder damage throughout the crop season (Table 2.34) ranging from 3.02
to 13.14%. Though lower incidence (1.76 and 3.96 %) was observed in
Pseudomonas treated BIPM 2 plots at 30 and 45 DAT, the incidence increased
to 17.91 per cent at 60 DAT. Incidence of leaffolder was also high (25.28%) in
BIPM 1 plots at 60 DAT indicating the inefficiency of neem oil in managing
leaffolder. The hopper population was very low ranging from 6.4 to 17.8 per
10 hills and there was no difference between the treatments.
Table 2.34 Pest incidence under Bio-intensive pest management trial at Bapatla, kharif 2020
Parameters Per cent Leaffolder damage @
30DAT 45DAT 60DAT
BIPM1 10.61 4.15 25.28
-13.14 -8.22 -21.42
BIPM2 3.96 1.76 17.91
-8.15 -5.3 -17.81
FP 6.61 3.02 13.14
-9.97 -7.05 -15.06
CD (p=0.05%) 5.79 2.9 5.6
*Values in parenthesis are arcsine transformed
Similarly, the population of beneficial insects was on par in all treatments.
The yield recorded was 3671.75, 3701.50 and4850 kg/ha in BIPM 1 BIPM 2
and FP treatments respectively.
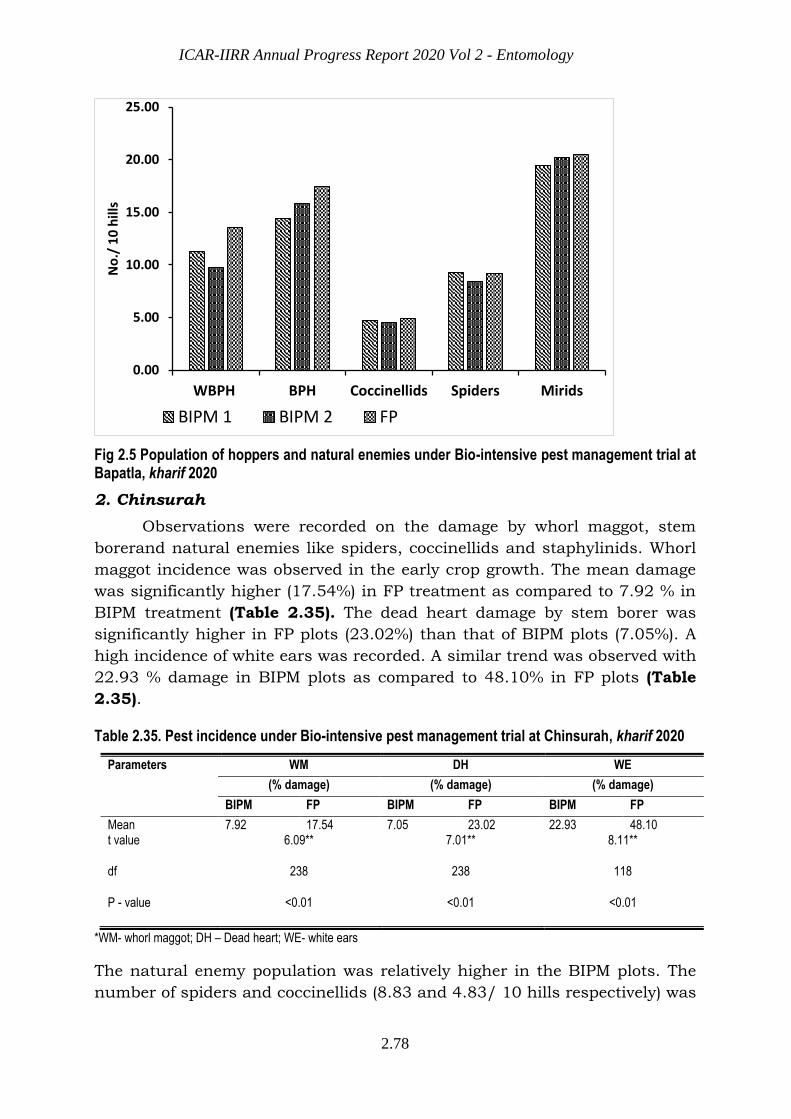
ICAR-IIRR Annual Progress Report 2020 Vol 2 - Entomology
2.78
Fig 2.5 Population of hoppers and natural enemies under Bio-intensive pest management trial at Bapatla, kharif 2020
2. Chinsurah
Observations were recorded on the damage by whorl maggot, stem
borerand natural enemies like spiders, coccinellids and staphylinids. Whorl
maggot incidence was observed in the early crop growth. The mean damage
was significantly higher (17.54%) in FP treatment as compared to 7.92 % in
BIPM treatment (Table 2.35). The dead heart damage by stem borer was
significantly higher in FP plots (23.02%) than that of BIPM plots (7.05%). A
high incidence of white ears was recorded. A similar trend was observed with
22.93 % damage in BIPM plots as compared to 48.10% in FP plots (Table
2.35).
Table 2.35. Pest incidence under Bio-intensive pest management trial at Chinsurah, kharif 2020
Parameters WM DH WE
(% damage) (% damage) (% damage)
BIPM FP BIPM FP BIPM FP
Mean 7.92 17.54 7.05 23.02 22.93 48.10 t value 6.09** 7.01** 8.11**
df 238 238 118
P - value <0.01 <0.01 <0.01
*WM- whorl maggot; DH – Dead heart; WE- white ears
The natural enemy population was relatively higher in the BIPM plots. The
number of spiders and coccinellids (8.83 and 4.83/ 10 hills respectively) was
0.00
5.00
10.00
15.00
20.00
25.00
WBPH BPH Coccinellids Spiders Mirids
No
./ 1
0 h
ills
BIPM 1 BIPM 2 FP

ICAR-IIRR Annual Progress Report 2020 Vol 2 - Entomology
2.79
significantly higher than that of FP plots (3.50 and 1.83/10 hills respectively)
(Table 2.36).
Table 2.36 Population of natural enemies Bio-intensive pest management trial at Chinsurah, kharif 2020
Parameters Spiders Coccinellids
(No./10 hills) (No./10 hills)
BIPM FP BIPM FP
Mean 8.83 3.50 4.83 1.83
t value 3.43** 2.98*
df 118 118
P - value 0.01 0.02
3. Jagdalpur
Incidence of whorl maggot, thrips, leaffolder, stem borer, BPH and GLH
were observed. The pest incidence was low for all pests. The per cent leaves
damaged by leaffolder and thrips were lower (3.58 and 7.91 % respectively) in
BIPM plots compared to farmer’s practice plots (5.41 and 9.47 % respectively).
Damage by gall midge in the form of silver shoots (5.76%) and dead hearts
(4.69%) by stem borer was also significantly lower in BIPM plots as compared
to farmers’ practice (10.50 and 7.46% respectively) (Table 2.37). BIPM
treatment gave significantly higher yield (4623 kg/ha than that of FP
treatment (4016 kg/ha).
Table 2.37. Pest incidence under Bio-intensive pest management trial at Jagdalpur, kharif 2020
Para-meters
Per cent damage by
WM Thrips LF SS SB
BIPM FP BIPM FP BIPM FP BIPM FP BIPM FP
Mean 4.42 5.78 7.91 9.47 3.58 5.41 5.76 10.50 4.69 7.46
t value 2.28NS 2.76* 3.56** 1.82* 3.48**
df 70 70 70 70 70 P - value 0.13 0.04 0.01 0.05 0.01
*WM- whorl maggot; LF- leaffolder; SB- stemborer; SS – silver shoots
4. Karjat
At this location, three modules were tested in a farmer’s field in the village
Dahigaon. The BIPM 1 and 2 differed in spraying with two organisms,
Trichoderma and Pseudomonas respectively and were similar in all other bio
intensive interventions. Observations were recorded on the incidence of
leaffolder and stem borer. Though the mean damage caused by stem borer
(8.73%) and leaffolder (1.05%) were higher in FP treatment they were on par
BIPM treatments (Table 2.38). The yield was significantly higher in the BIPM
plots (3640 and 3540 kg/ha) compared to FP treatment (2733.33 kg/ha).
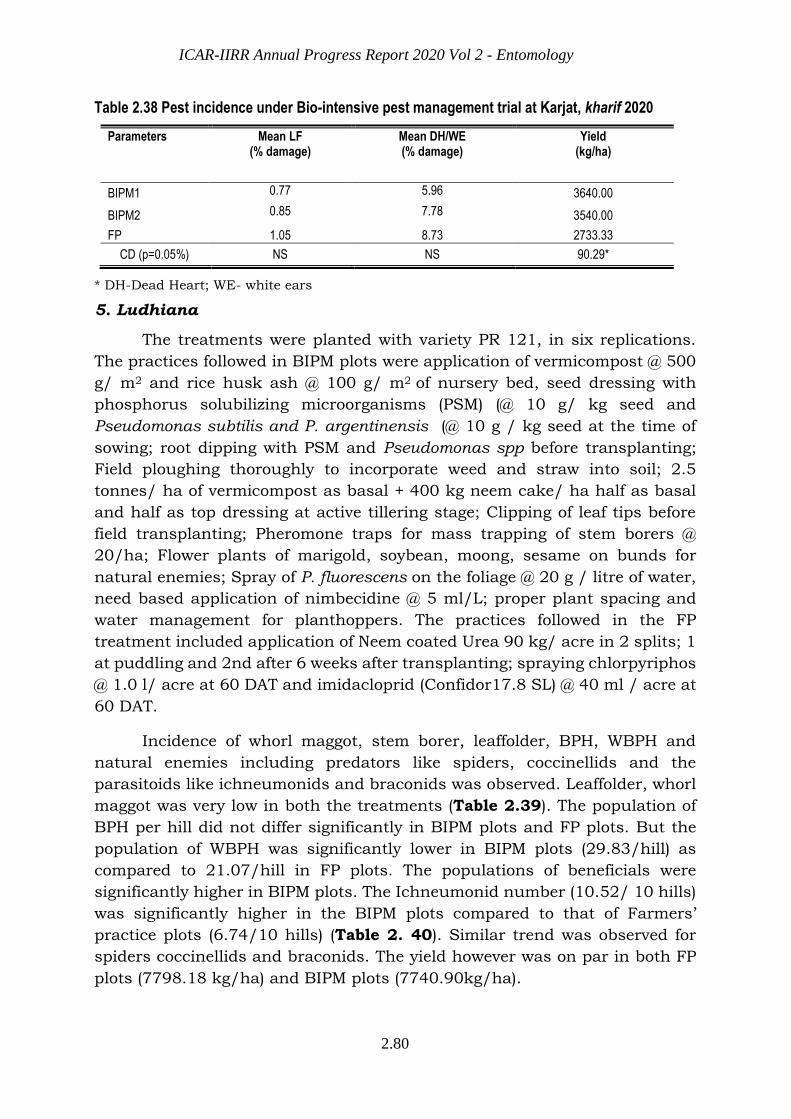
ICAR-IIRR Annual Progress Report 2020 Vol 2 - Entomology
2.80
Table 2.38 Pest incidence under Bio-intensive pest management trial at Karjat, kharif 2020
Parameters Mean LF (% damage)
Mean DH/WE (% damage)
Yield (kg/ha)
BIPM1 0.77 5.96 3640.00
BIPM2 0.85 7.78 3540.00
FP 1.05 8.73 2733.33
CD (p=0.05%) NS NS 90.29*
* DH-Dead Heart; WE- white ears
5. Ludhiana
The treatments were planted with variety PR 121, in six replications.
The practices followed in BIPM plots were application of vermicompost @ 500
g/ m2 and rice husk ash @ 100 g/ m2 of nursery bed, seed dressing with
phosphorus solubilizing microorganisms (PSM) (@ 10 g/ kg seed and
Pseudomonas subtilis and P. argentinensis (@ 10 g / kg seed at the time of
sowing; root dipping with PSM and Pseudomonas spp before transplanting;
Field ploughing thoroughly to incorporate weed and straw into soil; 2.5
tonnes/ ha of vermicompost as basal + 400 kg neem cake/ ha half as basal
and half as top dressing at active tillering stage; Clipping of leaf tips before
field transplanting; Pheromone traps for mass trapping of stem borers @
20/ha; Flower plants of marigold, soybean, moong, sesame on bunds for
natural enemies; Spray of P. fluorescens on the foliage @ 20 g / litre of water,
need based application of nimbecidine @ 5 ml/L; proper plant spacing and
water management for planthoppers. The practices followed in the FP
treatment included application of Neem coated Urea 90 kg/ acre in 2 splits; 1
at puddling and 2nd after 6 weeks after transplanting; spraying chlorpyriphos
@ 1.0 l/ acre at 60 DAT and imidacloprid (Confidor17.8 SL) @ 40 ml / acre at
60 DAT.
Incidence of whorl maggot, stem borer, leaffolder, BPH, WBPH and
natural enemies including predators like spiders, coccinellids and the
parasitoids like ichneumonids and braconids was observed. Leaffolder, whorl
maggot was very low in both the treatments (Table 2.39). The population of
BPH per hill did not differ significantly in BIPM plots and FP plots. But the
population of WBPH was significantly lower in BIPM plots (29.83/hill) as
compared to 21.07/hill in FP plots. The populations of beneficials were
significantly higher in BIPM plots. The Ichneumonid number (10.52/ 10 hills)
was significantly higher in the BIPM plots compared to that of Farmers’
practice plots (6.74/10 hills) (Table 2. 40). Similar trend was observed for
spiders coccinellids and braconids. The yield however was on par in both FP
plots (7798.18 kg/ha) and BIPM plots (7740.90kg/ha).
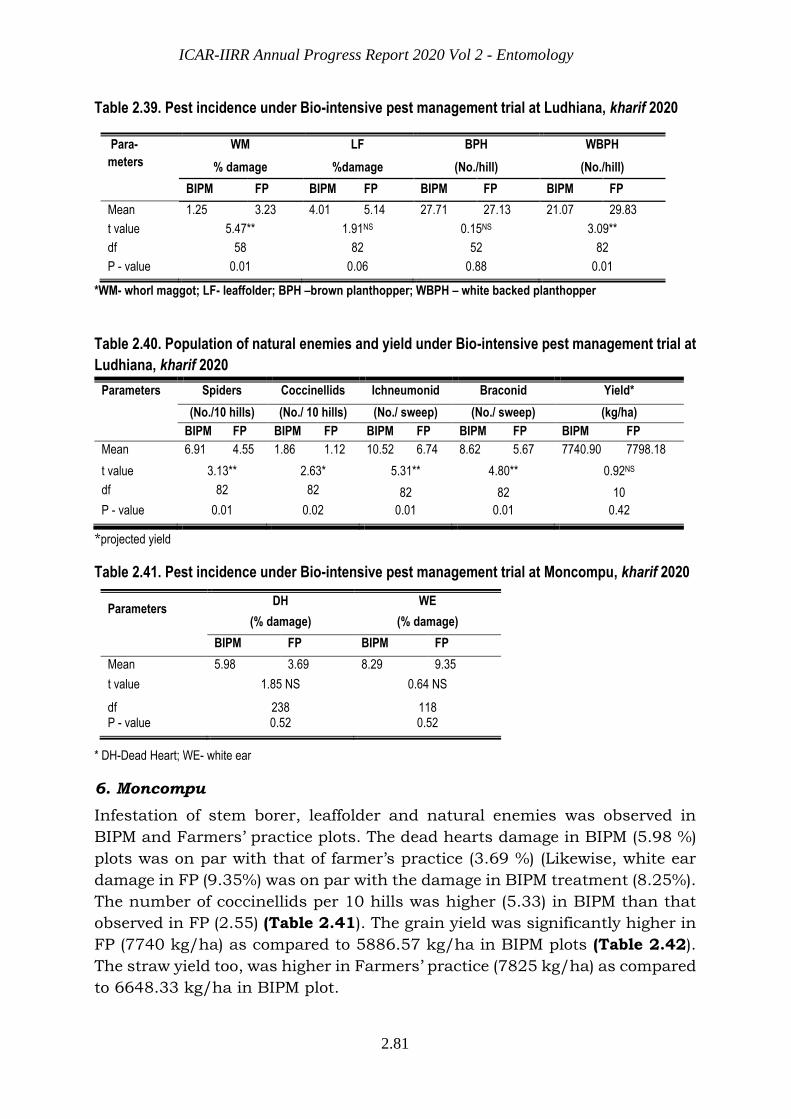
ICAR-IIRR Annual Progress Report 2020 Vol 2 - Entomology
2.81
Table 2.39. Pest incidence under Bio-intensive pest management trial at Ludhiana, kharif 2020
Para-
meters
WM LF BPH WBPH
% damage %damage (No./hill) (No./hill)
BIPM FP BIPM FP BIPM FP BIPM FP
Mean 1.25 3.23 4.01 5.14 27.71 27.13 21.07 29.83
t value 5.47** 1.91NS 0.15NS 3.09**
df 58 82 52 82
P - value 0.01 0.06 0.88 0.01
*WM- whorl maggot; LF- leaffolder; BPH –brown planthopper; WBPH – white backed planthopper
Table 2.40. Population of natural enemies and yield under Bio-intensive pest management trial at
Ludhiana, kharif 2020
Parameters Spiders Coccinellids Ichneumonid Braconid Yield*
(No./10 hills) (No./ 10 hills) (No./ sweep) (No./ sweep) (kg/ha)
BIPM FP BIPM FP BIPM FP BIPM FP BIPM FP
Mean 6.91 4.55 1.86 1.12 10.52 6.74 8.62 5.67 7740.90 7798.18
t value 3.13** 2.63* 5.31** 4.80** 0.92NS
df 82 82 82 82 10
P - value 0.01 0.02 0.01 0.01 0.42
*projected yield
Table 2.41. Pest incidence under Bio-intensive pest management trial at Moncompu, kharif 2020
Parameters DH WE
(% damage) (% damage)
BIPM FP BIPM FP
Mean 5.98 3.69 8.29 9.35
t value 1.85 NS 0.64 NS
df 238 118 P - value 0.52 0.52
* DH-Dead Heart; WE- white ear
6. Moncompu
Infestation of stem borer, leaffolder and natural enemies was observed in
BIPM and Farmers’ practice plots. The dead hearts damage in BIPM (5.98 %)
plots was on par with that of farmer’s practice (3.69 %) (Likewise, white ear
damage in FP (9.35%) was on par with the damage in BIPM treatment (8.25%).
The number of coccinellids per 10 hills was higher (5.33) in BIPM than that
observed in FP (2.55) (Table 2.41). The grain yield was significantly higher in
FP (7740 kg/ha) as compared to 5886.57 kg/ha in BIPM plots (Table 2.42).
The straw yield too, was higher in Farmers’ practice (7825 kg/ha) as compared
to 6648.33 kg/ha in BIPM plot.
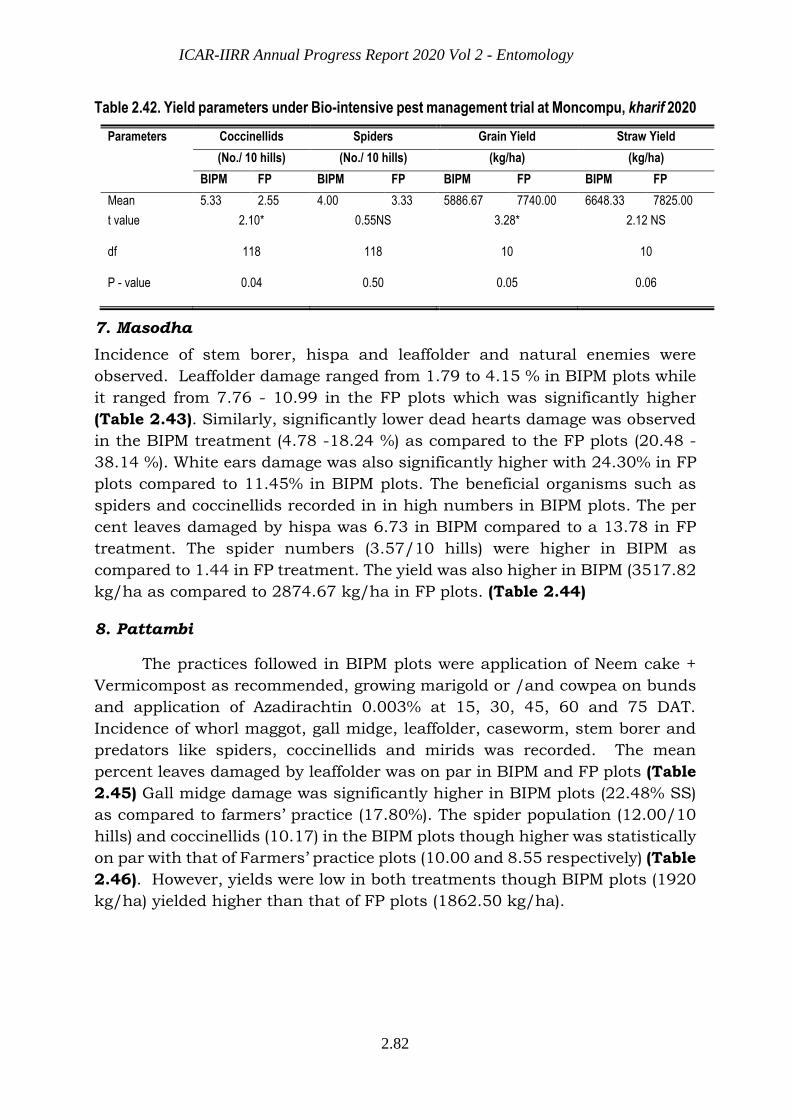
ICAR-IIRR Annual Progress Report 2020 Vol 2 - Entomology
2.82
Table 2.42. Yield parameters under Bio-intensive pest management trial at Moncompu, kharif 2020
Parameters Coccinellids Spiders Grain Yield Straw Yield
(No./ 10 hills) (No./ 10 hills) (kg/ha) (kg/ha)
BIPM FP BIPM FP BIPM FP BIPM FP
Mean 5.33 2.55 4.00 3.33 5886.67 7740.00 6648.33 7825.00
t value 2.10* 0.55NS 3.28* 2.12 NS
df 118 118 10 10
P - value 0.04 0.50 0.05 0.06
7. Masodha
Incidence of stem borer, hispa and leaffolder and natural enemies were
observed. Leaffolder damage ranged from 1.79 to 4.15 % in BIPM plots while
it ranged from 7.76 - 10.99 in the FP plots which was significantly higher
(Table 2.43). Similarly, significantly lower dead hearts damage was observed
in the BIPM treatment (4.78 -18.24 %) as compared to the FP plots (20.48 -
38.14 %). White ears damage was also significantly higher with 24.30% in FP
plots compared to 11.45% in BIPM plots. The beneficial organisms such as
spiders and coccinellids recorded in in high numbers in BIPM plots. The per
cent leaves damaged by hispa was 6.73 in BIPM compared to a 13.78 in FP
treatment. The spider numbers (3.57/10 hills) were higher in BIPM as
compared to 1.44 in FP treatment. The yield was also higher in BIPM (3517.82
kg/ha as compared to 2874.67 kg/ha in FP plots. (Table 2.44)
8. Pattambi
The practices followed in BIPM plots were application of Neem cake +
Vermicompost as recommended, growing marigold or /and cowpea on bunds
and application of Azadirachtin 0.003% at 15, 30, 45, 60 and 75 DAT.
Incidence of whorl maggot, gall midge, leaffolder, caseworm, stem borer and
predators like spiders, coccinellids and mirids was recorded. The mean
percent leaves damaged by leaffolder was on par in BIPM and FP plots (Table
2.45) Gall midge damage was significantly higher in BIPM plots (22.48% SS)
as compared to farmers’ practice (17.80%). The spider population (12.00/10
hills) and coccinellids (10.17) in the BIPM plots though higher was statistically
on par with that of Farmers’ practice plots (10.00 and 8.55 respectively) (Table
2.46). However, yields were low in both treatments though BIPM plots (1920
kg/ha) yielded higher than that of FP plots (1862.50 kg/ha).

ICAR-IIRR Annual Progress Report 2020 Vol 2 - Entomology
2.83
Table 2.43. Pest incidence under Bio-intensive pest management trial at Masodha, kharif 2020
Para-
meters
Leaffolder
(% damage)
Stemborer
(% Dead hearts)
Stem borer
30 DAT 45 DAT 60 DAT 30 DAT 45 DAT 60 DAT 75 DAT % White ears
BIPM FP BIPM FP BIPM FP BIPM FP BIPM FP BIPM FP BIPM FP BIPM FP
Mean 1.79 7.76 6.84 10.99 4.15 10.78 4.78 30.22 8.13 33.24 6.33 20.48 18.24 38.14 11.45 24.30
t value 11.16** 6.40** 3.19** 12.56** 12.67** 13.85** 12.12** 13.91**
df 10 10 10 10 10 10 10 22
P - value <0.01 <0.01 <0.01 <0.01 <0.01 <0.01 <0.01 <0.01
Table 2.44. Pest, natural enemies and yield parameters under Bio-intensive pest management trial at Masodha, kharif 2020
Parameters Hispa Coccinellids Spiders Grain Yield
(% damage) (No./ 10 hills) (No./ 10 hills) (kg/ha)
BIPM FP BIPM FP BIPM FP BIPM FP
Mean 6.73 13.78 2.58 1.15 3.57 1.44 3517.83 2874.67
t value 3.75** 8.68NS 14.7* 6.23NS
df 22 58 58 10
P - value 0.04 0.50 0.05 0.06

ICAR-IIRR Annual Progress Report 2020 Vol 2 - Entomology
2.84
Table 2.45. Population of pests and yield under Bio-intensive pest management trial at Pattambi, kharif 2020
Parameters Leaffolder Gall Midge Yield*
(% damage) (% SS) (kg/ha)
BIPM FP BIPM FP BIPM FP
Mean 11.21 10.67 22.48 17.80 1920 1862.50
t value 0.43NS 2.05* 0.29NS df 10 34
38 P - value 0.10 0.04 0.10
*projected yield
Table 2.46. Population of natural enemies under Bio-intensive pest management trial at Pattambi, kharif 2020
Parameters Spiders Coccinellids Mirid (No./10 hills) (No./10 hills) (No./10 hills)
BIPM FP BIPM FP BIPM FP
Mean 12.00 10.00 10.17 8.55 13.67 11.09 t value 1.43NS 1.26 1.49NS df 118 118 118 P - value 0.16 0.16 0.10
9. Raipur
Two BIPM modules with variations of Pseudomonas (BIPM1) and
Trichoderma (BIPM2) treatments and farmers’ practices were tested. Incidence of
stem borer and predators like spiders, coccinellids were recorded throughout the
crop growth period. The per cent leaves damaged by whorl maggot and leaffolder
were low in both treatments. The mean per cent dead hearts were on par in BIPM
1, 2 and FP1 (14.14, 14.24 and 15.81 respectively) (Table 2.47). There were no
significant differences in the incidence of white ears among the treatments.
Population of BPH was higher in the FP treatments (26.19 and 27.15 per 10 hills)
as compared to the BIPM treatment (11.851/10 hills). Populations of all the
natural enemies were on par in all three treatments (Table 2.48).
The egg parasitisation of stem borers was assessed and a mean egg mass
parasitisation of 81.37 % was observed in BIPM plots. Three egg parasitoids -
Tetrastichus, Telenomus and Trichogramma were observed accounting for 37.39,
37.93 and 24.67 per cent of the parasitoids respectively. The yield was highest in
BIPM 1 plot (4797.56 kg/ha) (Table 2.47).
10. Ranchi
Incidence of hispa, stem borer, leaffolder and gall midge were recorded throughout
the crop growth period. Leaffolder incidence (4.15%) in BIPM was
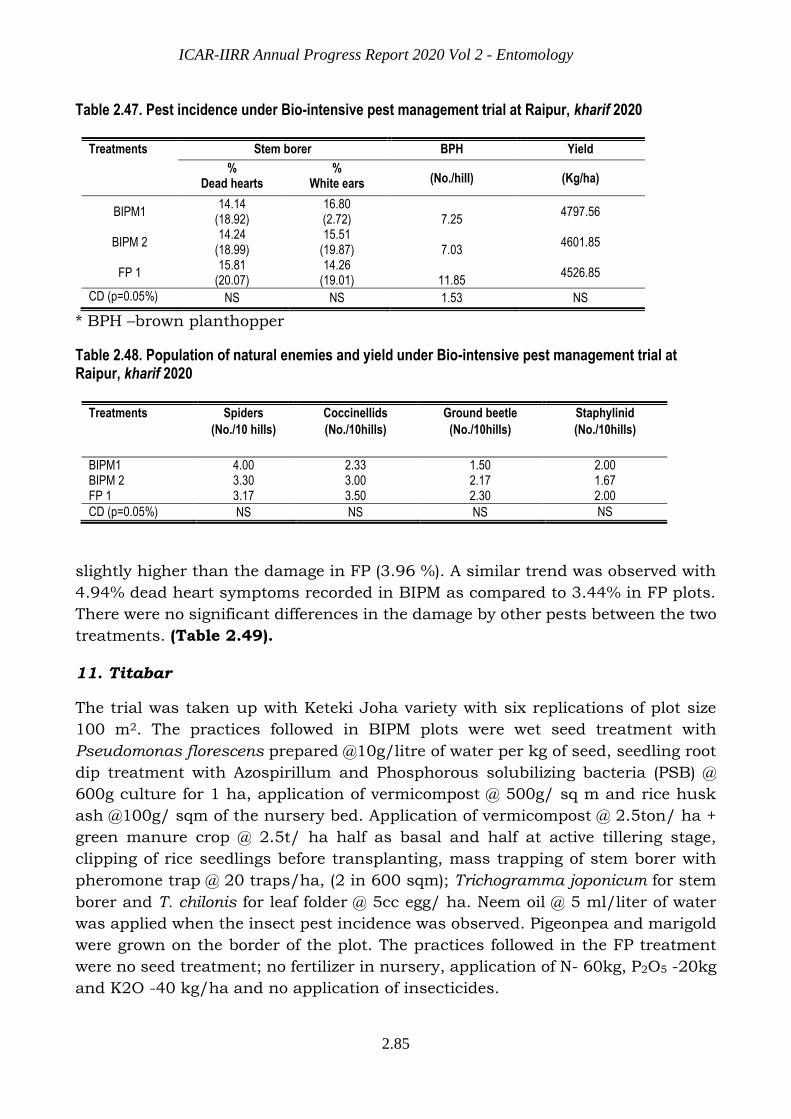
ICAR-IIRR Annual Progress Report 2020 Vol 2 - Entomology
2.85
Table 2.47. Pest incidence under Bio-intensive pest management trial at Raipur, kharif 2020
Treatments Stem borer BPH Yield
% Dead hearts
% White ears (No./hill) (Kg/ha)
BIPM1 14.14
(18.92) 16.80 (2.72) 7.25
4797.56
BIPM 2 14.24
(18.99) 15.51
(19.87) 7.03 4601.85
FP 1 15.81
(20.07) 14.26
(19.01) 11.85 4526.85
CD (p=0.05%) NS NS 1.53 NS
* BPH –brown planthopper
Table 2.48. Population of natural enemies and yield under Bio-intensive pest management trial at Raipur, kharif 2020
Treatments Spiders Coccinellids Ground beetle Staphylinid
(No./10 hills) (No./10hills) (No./10hills) (No./10hills)
BIPM1 4.00 2.33 1.50 2.00 BIPM 2 3.30 3.00 2.17 1.67 FP 1 3.17 3.50 2.30 2.00
CD (p=0.05%) NS NS NS NS
slightly higher than the damage in FP (3.96 %). A similar trend was observed with
4.94% dead heart symptoms recorded in BIPM as compared to 3.44% in FP plots.
There were no significant differences in the damage by other pests between the two
treatments. (Table 2.49).
11. Titabar
The trial was taken up with Keteki Joha variety with six replications of plot size
100 m2. The practices followed in BIPM plots were wet seed treatment with
Pseudomonas florescens prepared @10g/litre of water per kg of seed, seedling root
dip treatment with Azospirillum and Phosphorous solubilizing bacteria (PSB) @
600g culture for 1 ha, application of vermicompost @ 500g/ sq m and rice husk
ash @100g/ sqm of the nursery bed. Application of vermicompost @ 2.5ton/ ha +
green manure crop @ 2.5t/ ha half as basal and half at active tillering stage,
clipping of rice seedlings before transplanting, mass trapping of stem borer with
pheromone trap @ 20 traps/ha, (2 in 600 sqm); Trichogramma joponicum for stem
borer and T. chilonis for leaf folder @ 5cc egg/ ha. Neem oil @ 5 ml/liter of water
was applied when the insect pest incidence was observed. Pigeonpea and marigold
were grown on the border of the plot. The practices followed in the FP treatment
were no seed treatment; no fertilizer in nursery, application of N- 60kg, P2O5 -20kg
and K2O -40 kg/ha and no application of insecticides.
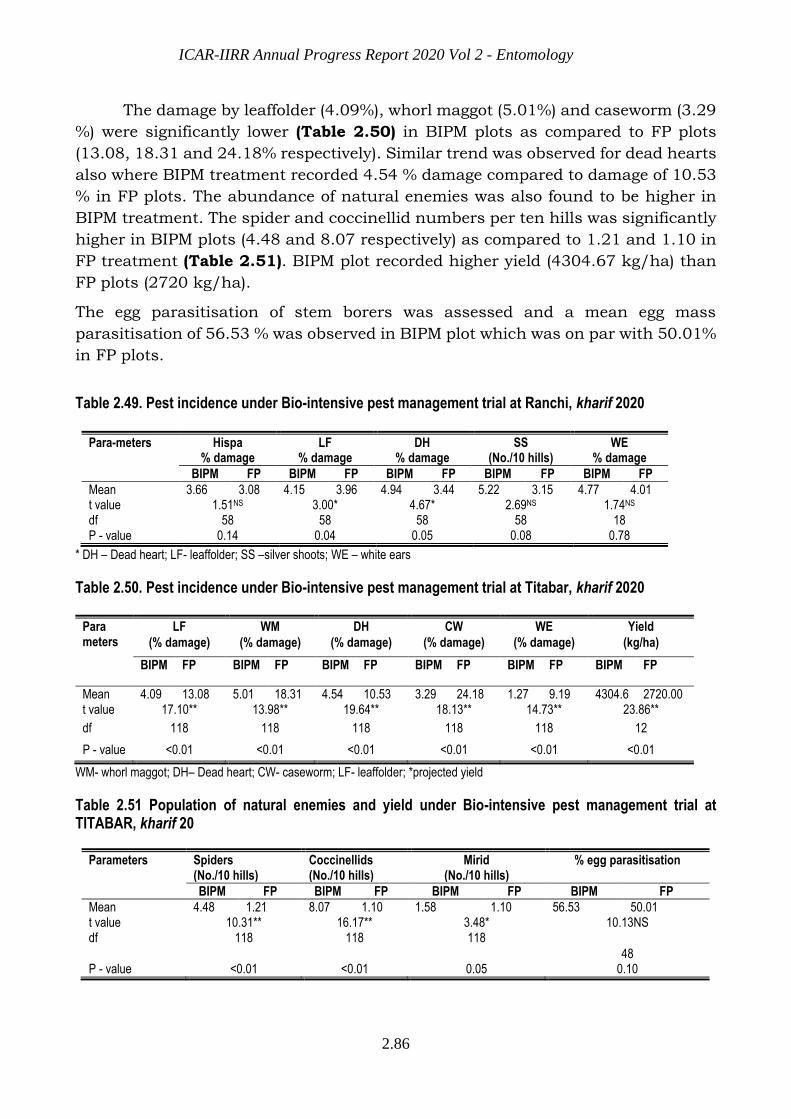
ICAR-IIRR Annual Progress Report 2020 Vol 2 - Entomology
2.86
The damage by leaffolder (4.09%), whorl maggot (5.01%) and caseworm (3.29
%) were significantly lower (Table 2.50) in BIPM plots as compared to FP plots
(13.08, 18.31 and 24.18% respectively). Similar trend was observed for dead hearts
also where BIPM treatment recorded 4.54 % damage compared to damage of 10.53
% in FP plots. The abundance of natural enemies was also found to be higher in
BIPM treatment. The spider and coccinellid numbers per ten hills was significantly
higher in BIPM plots (4.48 and 8.07 respectively) as compared to 1.21 and 1.10 in
FP treatment (Table 2.51). BIPM plot recorded higher yield (4304.67 kg/ha) than
FP plots (2720 kg/ha).
The egg parasitisation of stem borers was assessed and a mean egg mass
parasitisation of 56.53 % was observed in BIPM plot which was on par with 50.01%
in FP plots.
Table 2.49. Pest incidence under Bio-intensive pest management trial at Ranchi, kharif 2020
Para-meters Hispa LF DH SS WE % damage % damage % damage (No./10 hills) % damage
BIPM FP BIPM FP BIPM FP BIPM FP BIPM FP
Mean 3.66 3.08 4.15 3.96 4.94 3.44 5.22 3.15 4.77 4.01 t value 1.51NS 3.00* 4.67* 2.69NS 1.74NS
df 58 58 58 58 18 P - value 0.14 0.04 0.05 0.08 0.78
* DH – Dead heart; LF- leaffolder; SS –silver shoots; WE – white ears
Table 2.50. Pest incidence under Bio-intensive pest management trial at Titabar, kharif 2020
Para meters
LF WM DH CW WE Yield
(% damage) (% damage) (% damage) (% damage) (% damage) (kg/ha)
BIPM FP BIPM FP BIPM FP BIPM FP BIPM FP BIPM FP
Mean 4.09 13.08 5.01 18.31 4.54 10.53 3.29 24.18 1.27 9.19 4304.6 2720.00 t value 17.10** 13.98** 19.64** 18.13** 14.73** 23.86**
df 118 118 118 118 118 12
P - value <0.01 <0.01 <0.01 <0.01 <0.01 <0.01
WM- whorl maggot; DH– Dead heart; CW- caseworm; LF- leaffolder; *projected yield
Table 2.51 Population of natural enemies and yield under Bio-intensive pest management trial at TITABAR, kharif 20
Parameters Spiders Coccinellids Mirid % egg parasitisation (No./10 hills) (No./10 hills) (No./10 hills)
BIPM FP BIPM FP BIPM FP BIPM FP
Mean 4.48 1.21 8.07 1.10 1.58 1.10 56.53 50.01 t value 10.31** 16.17** 3.48* 10.13NS df 118 118 118
48 P - value <0.01 <0.01 0.05 0.10
ICAR-IIRR Annual Progress Report 2020 Vol 2 - Entomology
2.87
Bio intensive pest management (BIPM) trial was initiated to explore the feasibility of
bio-intensive approaches for management of pests for organic rice cultivation. The
trial was conducted in 10 locations during kharif, 2020. The stem borer incidence
was reduced in BIPM plots in Chinsurah (7.05 %), Jagdalpur (4.69%) Masodha (4.78)
and Titabar (4.54 %) as compared to farmers practice where it was 23.02, 7.46,
30.22 and 10.53 % respectively. In Raipur and Moncompu the pest incidence was on
par with that of Farmers’ practice. The natural enemies were higher in BIPM plots in
almost all locations.
ICAR-IIRR Annual Progress Report 2020 Vol 2 - Entomology
2.88
2.6 Integrated pest management special trial (IPMs)
Rice crop is ravaged by a number of biotic constraints like insect pests, diseases
and weeds throughout the crop growth period and management of these pests in a
holistic way is of major concern to the farmers. Implementation of IPM at farmers’
level is limited due to its knowledge intensive nature and requirement of certain
skills for taking decisions and selecting IPM options for the sustainable
management of pests. In order to overcome these limitations, participatory IPMs
trial was continued in collaboration with agronomists and plant pathologists with
an objective to validate IPM practices from a basket of options available and
demonstrate to farmers the management of pests (including insects, diseases and
weeds) in a holistic way.
During 2020, IPMs trial was conducted at 15 locations. At 9 locations viz.,
Coimbatore, Karjat, Kaul, Mandya, Pantnagar, Pusa, Rajendranagar, Raipur and
Sakoli, the trial was conducted in 3 farmers’ fields while it was conducted in 2
farmers’ fields at Jagdalpur. At 5 locations viz., Chinsurah, Gangavathi, Ludhiana,
Malan and Titabar, the trial was conducted at one farmer’s field. The pest
management practices followed in IPM and farmers’ practice at these locations are
given in Tables. The details of pest incidence at each location are discussed here:
Coimbatore: IPMs trial was conducted at three farmers’ fields viz., Sri.
Patteeswaran’s field in N. Kaliapuram village, Sri. Sampath kumar and Sri.
Dhanapal’s fields in Anaimalai village of Anaimalai block, Coimbatore district.
Details of practices followed in both IPM and farmer practices were given in a table
below. Co 51 was grown in both IPM and farmer practices plots of one acre each.
Low incidence of stem borer (< 3.0%) and leaf folder (<5.0%) was observed in both
IPM and FP plots at all the three farmers’ fields (Table 2.52). Low incidence (<2/hill)
of mirid bugs and spiders were also reported throughout the crop growth period.
The weed population at 25 and 60DAT in IPM plots was lower than farmers practice
by 46.15 and 87.5%, respectively. The mean grain yield advantage was 7.35 % in
IPM adopted plots. Grain yield was significantly high in IPM plot (5445 kg/ha)
compared to FP plots (5045 kg/ha) and yield in Sri Patteswaran’s field was
significantly high (6228 kg/ha) compared to other two farmers. BC ratio was
highest in all the IPM plots (2.27 – 3.84) compared to farmers’ practices (1.57 –
2.71) mainly due to the high grain yield and low cost of cultivation (Table 2.53).
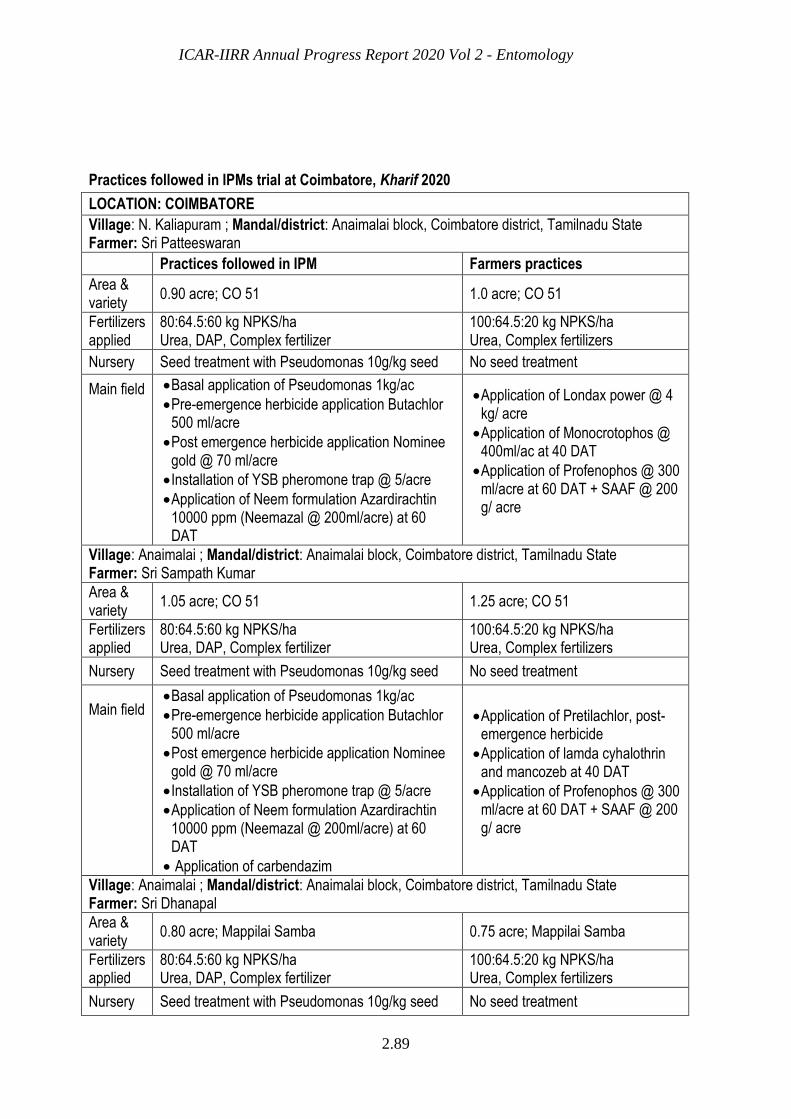
ICAR-IIRR Annual Progress Report 2020 Vol 2 - Entomology
2.89
Practices followed in IPMs trial at Coimbatore, Kharif 2020
LOCATION: COIMBATORE
Village: N. Kaliapuram ; Mandal/district: Anaimalai block, Coimbatore district, Tamilnadu State Farmer: Sri Patteeswaran
Practices followed in IPM Farmers practices
Area & variety
0.90 acre; CO 51 1.0 acre; CO 51
Fertilizers applied
80:64.5:60 kg NPKS/ha Urea, DAP, Complex fertilizer
100:64.5:20 kg NPKS/ha Urea, Complex fertilizers
Nursery Seed treatment with Pseudomonas 10g/kg seed No seed treatment
Main field
Basal application of Pseudomonas 1kg/ac
Pre-emergence herbicide application Butachlor 500 ml/acre
Post emergence herbicide application Nominee gold @ 70 ml/acre
Installation of YSB pheromone trap @ 5/acre
Application of Neem formulation Azardirachtin 10000 ppm (Neemazal @ 200ml/acre) at 60 DAT
Application of Londax power @ 4 kg/ acre
Application of Monocrotophos @ 400ml/ac at 40 DAT
Application of Profenophos @ 300 ml/acre at 60 DAT + SAAF @ 200 g/ acre
Village: Anaimalai ; Mandal/district: Anaimalai block, Coimbatore district, Tamilnadu State Farmer: Sri Sampath Kumar
Area & variety
1.05 acre; CO 51 1.25 acre; CO 51
Fertilizers applied
80:64.5:60 kg NPKS/ha Urea, DAP, Complex fertilizer
100:64.5:20 kg NPKS/ha Urea, Complex fertilizers
Nursery Seed treatment with Pseudomonas 10g/kg seed No seed treatment
Main field
Basal application of Pseudomonas 1kg/ac
Pre-emergence herbicide application Butachlor 500 ml/acre
Post emergence herbicide application Nominee gold @ 70 ml/acre
Installation of YSB pheromone trap @ 5/acre
Application of Neem formulation Azardirachtin 10000 ppm (Neemazal @ 200ml/acre) at 60 DAT
Application of carbendazim
Application of Pretilachlor, post-emergence herbicide
Application of lamda cyhalothrin and mancozeb at 40 DAT
Application of Profenophos @ 300 ml/acre at 60 DAT + SAAF @ 200 g/ acre
Village: Anaimalai ; Mandal/district: Anaimalai block, Coimbatore district, Tamilnadu State Farmer: Sri Dhanapal
Area & variety
0.80 acre; Mappilai Samba 0.75 acre; Mappilai Samba
Fertilizers applied
80:64.5:60 kg NPKS/ha Urea, DAP, Complex fertilizer
100:64.5:20 kg NPKS/ha Urea, Complex fertilizers
Nursery Seed treatment with Pseudomonas 10g/kg seed No seed treatment
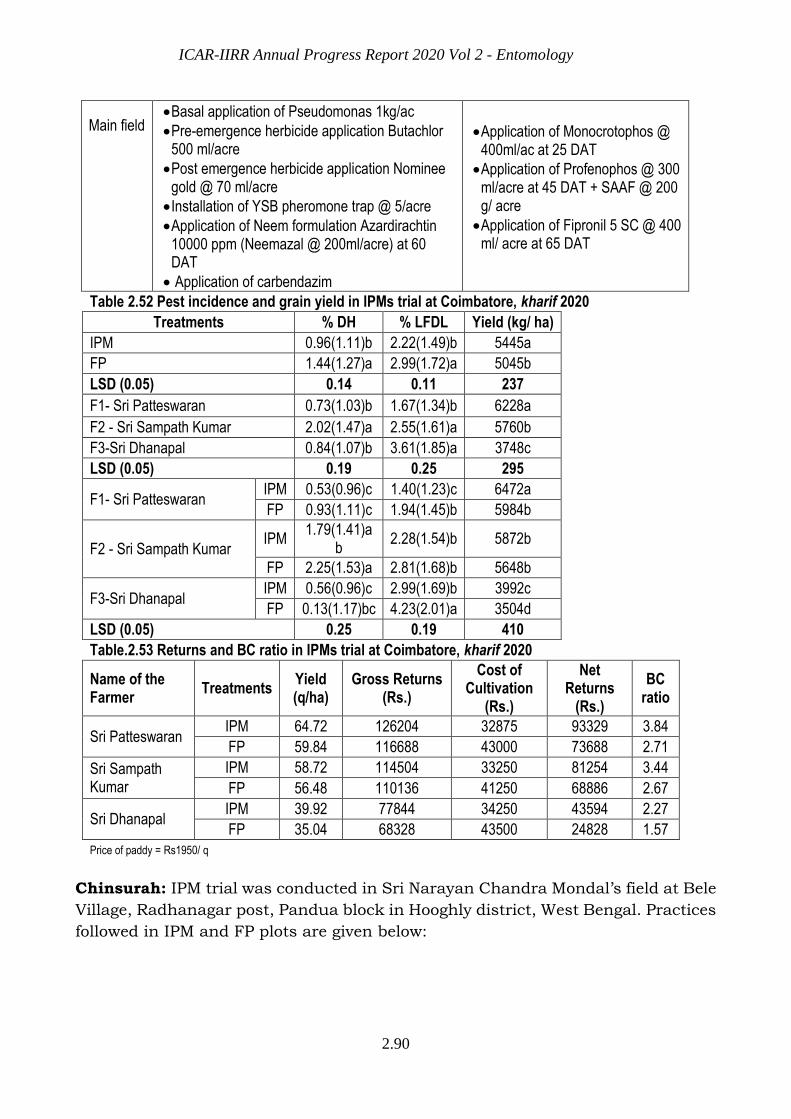
ICAR-IIRR Annual Progress Report 2020 Vol 2 - Entomology
2.90
Main field
Basal application of Pseudomonas 1kg/ac
Pre-emergence herbicide application Butachlor 500 ml/acre
Post emergence herbicide application Nominee gold @ 70 ml/acre
Installation of YSB pheromone trap @ 5/acre
Application of Neem formulation Azardirachtin 10000 ppm (Neemazal @ 200ml/acre) at 60 DAT
Application of carbendazim
Application of Monocrotophos @ 400ml/ac at 25 DAT
Application of Profenophos @ 300 ml/acre at 45 DAT + SAAF @ 200 g/ acre
Application of Fipronil 5 SC @ 400 ml/ acre at 65 DAT
Table 2.52 Pest incidence and grain yield in IPMs trial at Coimbatore, kharif 2020
Treatments % DH % LFDL Yield (kg/ ha)
IPM 0.96(1.11)b 2.22(1.49)b 5445a
FP 1.44(1.27)a 2.99(1.72)a 5045b
LSD (0.05) 0.14 0.11 237
F1- Sri Patteswaran 0.73(1.03)b 1.67(1.34)b 6228a
F2 - Sri Sampath Kumar 2.02(1.47)a 2.55(1.61)a 5760b
F3-Sri Dhanapal 0.84(1.07)b 3.61(1.85)a 3748c
LSD (0.05) 0.19 0.25 295
F1- Sri Patteswaran IPM 0.53(0.96)c 1.40(1.23)c 6472a
FP 0.93(1.11)c 1.94(1.45)b 5984b
F2 - Sri Sampath Kumar IPM
1.79(1.41)ab
2.28(1.54)b 5872b
FP 2.25(1.53)a 2.81(1.68)b 5648b
F3-Sri Dhanapal IPM 0.56(0.96)c 2.99(1.69)b 3992c
FP 0.13(1.17)bc 4.23(2.01)a 3504d
LSD (0.05) 0.25 0.19 410
Table.2.53 Returns and BC ratio in IPMs trial at Coimbatore, kharif 2020
Name of the Farmer
Treatments Yield (q/ha)
Gross Returns (Rs.)
Cost of Cultivation
(Rs.)
Net Returns
(Rs.)
BC ratio
Sri Patteswaran IPM 64.72 126204 32875 93329 3.84
FP 59.84 116688 43000 73688 2.71
Sri Sampath Kumar
IPM 58.72 114504 33250 81254 3.44
FP 56.48 110136 41250 68886 2.67
Sri Dhanapal IPM 39.92 77844 34250 43594 2.27
FP 35.04 68328 43500 24828 1.57
Price of paddy = Rs1950/ q
Chinsurah: IPM trial was conducted in Sri Narayan Chandra Mondal’s field at Bele
Village, Radhanagar post, Pandua block in Hooghly district, West Bengal. Practices
followed in IPM and FP plots are given below:
ICAR-IIRR Annual Progress Report 2020 Vol 2 - Entomology
2.91
Practices followed in IPMs trial at Chinsurah, Kharif 2020
IPM practices Farmers practices
Area/
variety
1 acre; Swarna 1 acre; Swarna
Nursery Application of 8 kg of 10:26:28 complex Application of mustard cake @ 3 kg/ bed
Main field Application of 105:100:27 kg urea, SSP & MOP
Application of Butachlor + one hand weeding
Application of Ferterra @ 4 kg/ acre
Application of Coragen @ 60 ml/ acre
Application of carbendazim
Installation of pheromone traps @ 6/acre for stem borer mass trapping
Application of 80 kg10-26-26; Urea 40 kg
Hand weeding two times
Application of Phorate 10 G @ 4.5 kg/ acre
Triazophos @ 750 ml/ acre two times
Application of Carbendazim
Very low incidence of stem borer, leaf folder, whorl maggot, hispa, BPH, WBPH and
GLH was observed in Swarna variety grown at this location in farmer practices
plots whereas hispa and BPH incidence was not noticed in IPM plot (Table2.54).
The data on weed population and weed biomass were recorded at 30 and 60 DAT.
Significant decrease in weed population by 42.55 and 33.59% and weed dry
biomass by 48.48 and 35.20%, respectively in IPM implemented fields, resulted in
higher growth, yield attributes and grain yield increase by 18.83% of the variety
Swarna (Table 2.55). Higher BC ratio (1.60) was obtained in IPM plot compared to
FP plot (1.30) mainly due to higher grain yield that resulted in increased returns.
Table 2.54 Insect pest incidence in IPMs trial at Chinsurah, Kharif 2020
Treatments % DH % WE % LFDL %
WMDL % HDL BPH WBPH GLH
50 DAT Pre har 57 DAT 29 DAT 36 DAT 50 DAT 64 DAT 78 DAT
IPM 0.36
±0.23 0.3
±0.19 0.11
±0.07 1.58
±0.42 0.00 ± 0.00
0.00 ± 0.00
0.80 ±0.49
9.20 ±2.48
FP 9.00
±0.36 9.39
±0.61 1.51
±0.19 5.28
±0.71 0.33 ± 0.16
14.40 ±1.60
3.20 ±1.07
47.20 ±5.66
Table 2.55 Weed population, dry mass, returns and BC ratio in IPMs trial at Chinsurah, Kharif 2020
Treatments
Weed Population
(No/m2)
Weed Dry Biomass
(g/m2) Yield
(q/ha)
Gross
Returns
(Rs.)
Cost of
Cultivation
(Rs)
Net
Returns
(Rs.)
BC
Ratio 30 DAT 60 DAT 30 DAT 60 DAT
IPM 38.60
(6.21)
68.40
(8.28) 3.91 6.92 48.48 86294 53938 32356 1.60
FP 67.20
(8.21)
103.00
(10.13) 7.59 10.68 37.52 66786 51450 15336 1.30
Exp. Mean 7.21 9.20 5.75 8.80
CD (0.05) 1.03 1.25 1.53 2.51
Price of paddy = 1780 Rs/ q
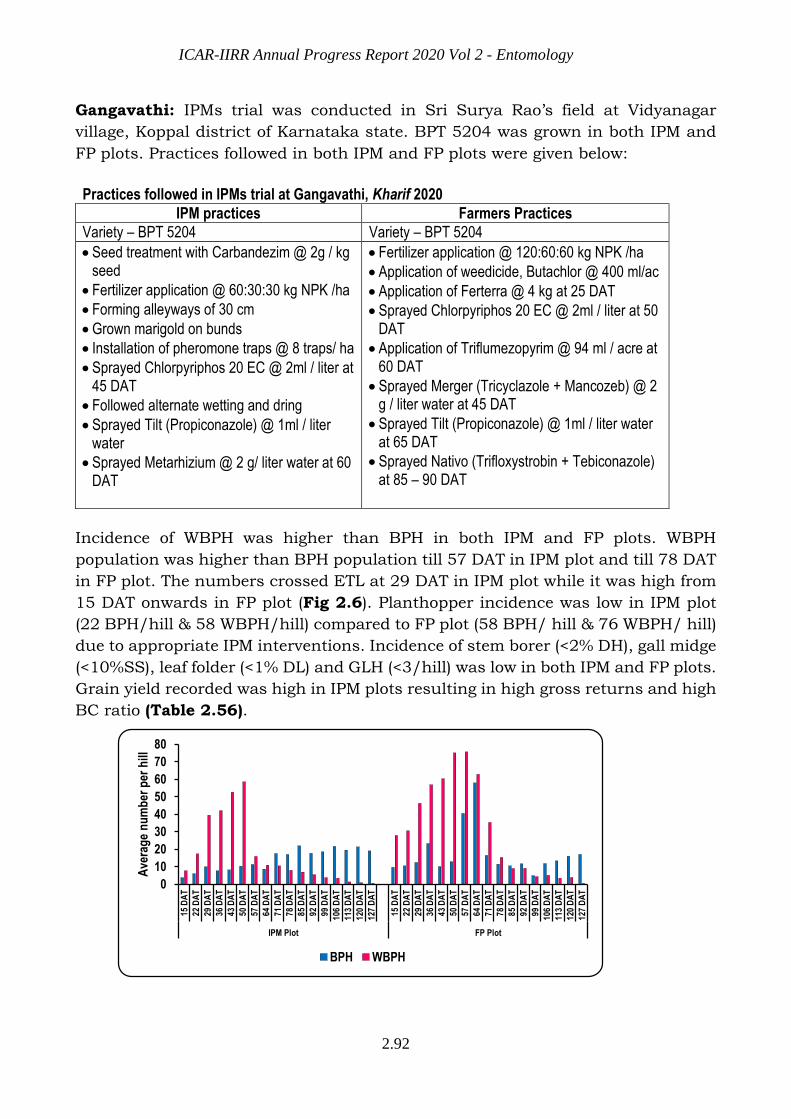
ICAR-IIRR Annual Progress Report 2020 Vol 2 - Entomology
2.92
Gangavathi: IPMs trial was conducted in Sri Surya Rao’s field at Vidyanagar
village, Koppal district of Karnataka state. BPT 5204 was grown in both IPM and
FP plots. Practices followed in both IPM and FP plots were given below:
Incidence of WBPH was higher than BPH in both IPM and FP plots. WBPH
population was higher than BPH population till 57 DAT in IPM plot and till 78 DAT
in FP plot. The numbers crossed ETL at 29 DAT in IPM plot while it was high from
15 DAT onwards in FP plot (Fig 2.6). Planthopper incidence was low in IPM plot
(22 BPH/hill & 58 WBPH/hill) compared to FP plot (58 BPH/ hill & 76 WBPH/ hill)
due to appropriate IPM interventions. Incidence of stem borer (<2% DH), gall midge
(<10%SS), leaf folder (<1% DL) and GLH (<3/hill) was low in both IPM and FP plots.
Grain yield recorded was high in IPM plots resulting in high gross returns and high
BC ratio (Table 2.56).
Practices followed in IPMs trial at Gangavathi, Kharif 2020
IPM practices Farmers Practices
Variety – BPT 5204 Variety – BPT 5204
Seed treatment with Carbandezim @ 2g / kg seed
Fertilizer application @ 60:30:30 kg NPK /ha
Forming alleyways of 30 cm
Grown marigold on bunds
Installation of pheromone traps @ 8 traps/ ha
Sprayed Chlorpyriphos 20 EC @ 2ml / liter at 45 DAT
Followed alternate wetting and dring
Sprayed Tilt (Propiconazole) @ 1ml / liter water
Sprayed Metarhizium @ 2 g/ liter water at 60 DAT
Fertilizer application @ 120:60:60 kg NPK /ha
Application of weedicide, Butachlor @ 400 ml/ac
Application of Ferterra @ 4 kg at 25 DAT
Sprayed Chlorpyriphos 20 EC @ 2ml / liter at 50 DAT
Application of Triflumezopyrim @ 94 ml / acre at 60 DAT
Sprayed Merger (Tricyclazole + Mancozeb) @ 2 g / liter water at 45 DAT
Sprayed Tilt (Propiconazole) @ 1ml / liter water at 65 DAT
Sprayed Nativo (Trifloxystrobin + Tebiconazole) at 85 – 90 DAT
0
10
20
30
40
50
60
70
80
15 D
AT
22 D
AT
29 D
AT
36 D
AT
43 D
AT
50 D
AT
57 D
AT
64 D
AT
71 D
AT
78 D
AT
85 D
AT
92 D
AT
99 D
AT
106
DA
T
113
DA
T
120
DA
T
127
DA
T
15 D
AT
22 D
AT
29 D
AT
36 D
AT
43 D
AT
50 D
AT
57 D
AT
64 D
AT
71 D
AT
78 D
AT
85 D
AT
92 D
AT
99 D
AT
106
DA
T
113
DA
T
120
DA
T
127
DA
T
IPM Plot FP Plot
Ave
rag
e n
um
ber
per
hill
BPH WBPH
ICAR-IIRR Annual Progress Report 2020 Vol 2 - Entomology
2.93
Table 2.56 Pest incidence and BC ratio in IPMs trial at Gangavathi, kharif 2020
Treat-ments
% DH % SS % LFDL BPH WBPH GLH Yield (q/ha)
Gross Returns
(Rs.)
Cost of Cultivation
(Rs.)
Net Returns
(Rs.)
BC ratio
IPM 1.92
(1.49)a 9.99
(3.07)a 0.51
(0.98)a 14.01
(3.71)a 16.68
(3.55)b 2.27
(1.56)a 63.42 123669 50826 72843 2.43
FP 1.25
(1.28)b 2.79
(1.75)b 0.45
(0.96)a 17.0
(3.98)a 30.58
(4.90)a 3.00
(1.66)a 49.95 97403 58182 39221 1.67
LSD (0.05)
0.51 1.56 0.46 0.19 0.50 1.79 875
CV(%) 24.76 26.45 19.77 31.77 25.71 36.63 8.79 Price of paddy = 1950 Rs/ q
Jagdalpur: IPMs trial was conducted in two farmer’s field’s viz., Sri Sonasai Baghel
of Chokar village and Sri Lachhin Kashyap of Marlenga village in Bastar district of
Chattisgarh. Practices followed in IPM and FP plots were given below. Incidence of
stem borer, gall midge, leaf folder, whorl maggot, thrips and GLH was low in both
IPM and FP plots (Table2.57). Grain yields were significantly high in IPM plots
(3884 kg/ha) compared to FP plots (3102 kg/ha). BC ratio was also higher in IPM
plots (3.99 – 4.44) compared to FP plots (2.67 – 2.91) mainly due to the high price
of paddy resulting in high gross returns and low cost of cultivation (Table 2.58).
Practices followed in IPMs trial at Jagdalpur, Kharif 2020
IPM Practices Farmers Practices
Area 1 acre 1 acre
Variety Safri Safri
Nursery Application of 5 kg N, 3 kg P, 1.2 kg K / 400m2nursery Application of 2 kg N, 1 kg P / 400m2
nursery
Main
field
Application of 80:50:30 kg NPK per hectare
Seedlings transplanted at spacing of 20/15 cm; Left alleyways of 30 cm after 10 rows.
Applied Butachlor 1.5 kg ai/ha at 4 DAT+ 1 hand weeding
Nitrogen top dressing at 45 DAT
Application of 80 kg N, 50 kg P & 30 Kg K/ acre
Applied Crabofuran 3G @ 5kg/acre
Hand weeding twice
ICAR-IIRR Annual Progress Report 2020 Vol 2 - Entomology
2.94
Table 2.57 Pest incidence and grain yield in IPMs trial at Jagdalpur, kharif 2020
Treatments % DH % SS % LFDL % WMDL % THDL GLH Yield (kg/
ha)
IPM 2.85 (1.63)b
3.14 (1.68)b
2.68 (1.67)a
4.02 (2.02)a
2.24 (1.90)a 2.50 (1.61)b
3884a
FP 6.22 (2.36)a
5.49 (2.26)a
3.07 (1.81)a
4.31 (2.06)a
5.68 (2.08)a 5.39 (2.28)a
3102b
LSD (0.05) 0.4 0.36 0.35 0.22 0.21 1.20 223
F1- Sri Sonsai Baghel
5.32 (2.18)a
4.62 (2.03)a
3.04 (1.80)a
3.41 (1.88)b
3.38 (1.61)b 4.60 (2.11)a
3560a
F2 - Sri Lachin Kashyap
3.75 (1.82)a
4.01 (1.90)a
2.71 (1.68)a
4.92 (2.21)a
4.54 (2.37)a 3.29 (1.78)b
3426a
LSD (0.05) 0.39 0.4 0.35 0.21 0.19 372
F1- Sri Sonsai Baghel
IPM 3.36 (1.77)bc
3.73 (1.83)ab
1.91 (1.49)c
2.93 (1.77)b
2.46 (1.68)c 2.88 (1.73)c
3804a
FP 7.29 (2.58)a
5.51 (2.24)a
4.17 (2.11)a
3.89 (1.99)ab
4.30 (2.12)b 6.31 (2.48)a
3048b
F2 - Sri Lachhin Kashyap
IPM 2.34 (1.49)c
2.55 (1.53)b
3.46 (1.86)b
5.12 (2.27)a
2.01 (1.53)c 2.11 (1.50)c
3964a
FP 5.14 (2.15)ab
5.48 (2.27)a
1.97 (1.51)c
4.71 (2.15)a
7.08(2.63)a 4.46 (2.07)b
3156b
LSD (0.05) 0.56 0.38 0.24 0.31 0.27 315
Table 2.58 Returns and BC ratio in IPMs trial at Jagdalpur, kharif 2020
Name of the Farmer Treatments Yield (q/ha)
Gross Returns (Rs.)
Cost of Cultivation (Rs.)
Net Returns (Rs.)
BC ratio
Sri Sonsai Baghel IPM 38.04 79884 20000 59884 3.99
FP 30.48 64008 24000 40008 2.67
Sri Lachhin Kashyap IPM 39.64 83244 18750 64494 4.44
FP 31.56 66276 22750 43526 2.91 Price of Paddy = Rs. 2100/q
Karjat: IPMs trial was conducted in three farmers’ fields’ viz., Sri Dattatreya
Sitaram Deshmukh of Dahigaon village, Sri Ashok Tamhane of Gaurkamath village
and Sri Ajit Dalvi of Vadap village in Karjat taluq of Raigad district, Maharashtra
State. Practices followed in both IPM and FP plots were given below:
Practices followed in IPMs trial at Karjat, Kharif 2020
Practices IPM practices Farmers practices
Area 1 acre 1 acre
Varieties 1) Sri Dattatray Sitaram Deshmukh, Dahigaon village – karjat 7 2) Sri Ashok Tamhane, Gaurkamath village - Karjat 3 3) Sri Ajit Dalvi, Vadap village – Karjat 7
Nursery Seed treatment with carbendazim @ 10 g/ 10 kg seed Raised bed 3x1m treated with rice husk (hull) ash @3kg/bed
Land burned with waste materials
Main field Deep ploughing
Application of FYM 4 T, Suphala 215 Kg, Urea 87 Kg
2-3 seedlings transplanted at a spacing 20 x15 cm.
Alleyways of 40cm left after every 10 rows
Bispyribasodium 250ml/ha (Nomini gold).
Deep ploughing
Application of FYM 2 T, Urea 180 kg, Suphala 75 kg
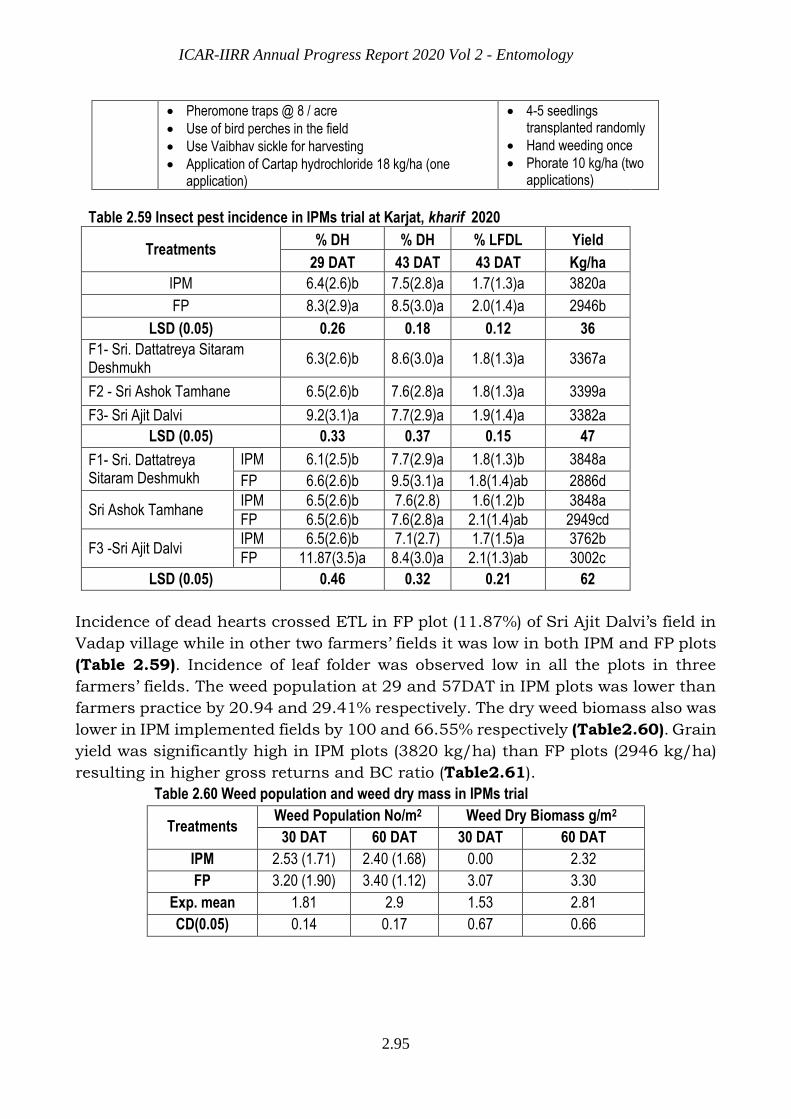
ICAR-IIRR Annual Progress Report 2020 Vol 2 - Entomology
2.95
Pheromone traps @ 8 / acre
Use of bird perches in the field
Use Vaibhav sickle for harvesting
Application of Cartap hydrochloride 18 kg/ha (one application)
4-5 seedlings transplanted randomly
Hand weeding once
Phorate 10 kg/ha (two applications)
Table 2.59 Insect pest incidence in IPMs trial at Karjat, kharif 2020
Treatments % DH % DH % LFDL Yield
29 DAT 43 DAT 43 DAT Kg/ha
IPM 6.4(2.6)b 7.5(2.8)a 1.7(1.3)a 3820a
FP 8.3(2.9)a 8.5(3.0)a 2.0(1.4)a 2946b
LSD (0.05) 0.26 0.18 0.12 36
F1- Sri. Dattatreya Sitaram Deshmukh
6.3(2.6)b 8.6(3.0)a 1.8(1.3)a 3367a
F2 - Sri Ashok Tamhane 6.5(2.6)b 7.6(2.8)a 1.8(1.3)a 3399a
F3- Sri Ajit Dalvi 9.2(3.1)a 7.7(2.9)a 1.9(1.4)a 3382a
LSD (0.05) 0.33 0.37 0.15 47
F1- Sri. Dattatreya Sitaram Deshmukh
IPM 6.1(2.5)b 7.7(2.9)a 1.8(1.3)b 3848a
FP 6.6(2.6)b 9.5(3.1)a 1.8(1.4)ab 2886d
Sri Ashok Tamhane IPM 6.5(2.6)b 7.6(2.8) 1.6(1.2)b 3848a
FP 6.5(2.6)b 7.6(2.8)a 2.1(1.4)ab 2949cd
F3 -Sri Ajit Dalvi IPM 6.5(2.6)b 7.1(2.7) 1.7(1.5)a 3762b
FP 11.87(3.5)a 8.4(3.0)a 2.1(1.3)ab 3002c
LSD (0.05) 0.46 0.32 0.21 62
Incidence of dead hearts crossed ETL in FP plot (11.87%) of Sri Ajit Dalvi’s field in
Vadap village while in other two farmers’ fields it was low in both IPM and FP plots
(Table 2.59). Incidence of leaf folder was observed low in all the plots in three
farmers’ fields. The weed population at 29 and 57DAT in IPM plots was lower than
farmers practice by 20.94 and 29.41% respectively. The dry weed biomass also was
lower in IPM implemented fields by 100 and 66.55% respectively (Table2.60). Grain
yield was significantly high in IPM plots (3820 kg/ha) than FP plots (2946 kg/ha)
resulting in higher gross returns and BC ratio (Table2.61).
Table 2.60 Weed population and weed dry mass in IPMs trial
Treatments Weed Population No/m2 Weed Dry Biomass g/m2
30 DAT 60 DAT 30 DAT 60 DAT
IPM 2.53 (1.71) 2.40 (1.68) 0.00 2.32
FP 3.20 (1.90) 3.40 (1.12) 3.07 3.30
Exp. mean 1.81 2.9 1.53 2.81
CD(0.05) 0.14 0.17 0.67 0.66
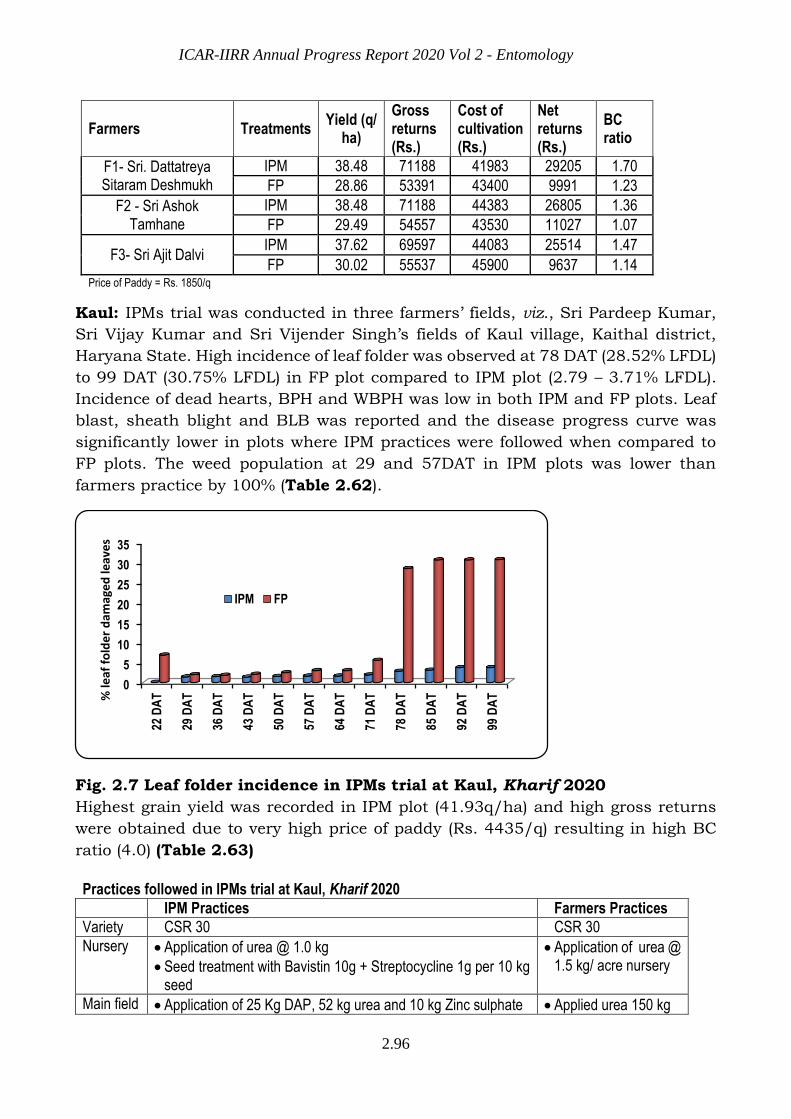
ICAR-IIRR Annual Progress Report 2020 Vol 2 - Entomology
2.96
Farmers Treatments Yield (q/
ha)
Gross returns (Rs.)
Cost of cultivation (Rs.)
Net returns (Rs.)
BC ratio
F1- Sri. Dattatreya Sitaram Deshmukh
IPM 38.48 71188 41983 29205 1.70
FP 28.86 53391 43400 9991 1.23
F2 - Sri Ashok Tamhane
IPM 38.48 71188 44383 26805 1.36
FP 29.49 54557 43530 11027 1.07
F3- Sri Ajit Dalvi IPM 37.62 69597 44083 25514 1.47
FP 30.02 55537 45900 9637 1.14 Price of Paddy = Rs. 1850/q
Kaul: IPMs trial was conducted in three farmers’ fields, viz., Sri Pardeep Kumar,
Sri Vijay Kumar and Sri Vijender Singh’s fields of Kaul village, Kaithal district,
Haryana State. High incidence of leaf folder was observed at 78 DAT (28.52% LFDL)
to 99 DAT (30.75% LFDL) in FP plot compared to IPM plot (2.79 – 3.71% LFDL).
Incidence of dead hearts, BPH and WBPH was low in both IPM and FP plots. Leaf
blast, sheath blight and BLB was reported and the disease progress curve was
significantly lower in plots where IPM practices were followed when compared to
FP plots. The weed population at 29 and 57DAT in IPM plots was lower than
farmers practice by 100% (Table 2.62).
Fig. 2.7 Leaf folder incidence in IPMs trial at Kaul, Kharif 2020
Highest grain yield was recorded in IPM plot (41.93q/ha) and high gross returns
were obtained due to very high price of paddy (Rs. 4435/q) resulting in high BC
ratio (4.0) (Table 2.63)
0
5
10
15
20
25
30
35
22 D
AT
29 D
AT
36 D
AT
43 D
AT
50 D
AT
57 D
AT
64 D
AT
71 D
AT
78 D
AT
85 D
AT
92 D
AT
99 D
AT%
leaf
fo
lde
r d
amag
ed
leav
es
IPM FP
Practices followed in IPMs trial at Kaul, Kharif 2020
IPM Practices Farmers Practices
Variety CSR 30 CSR 30
Nursery Application of urea @ 1.0 kg
Seed treatment with Bavistin 10g + Streptocycline 1g per 10 kg seed
Application of urea @ 1.5 kg/ acre nursery
Main field Application of 25 Kg DAP, 52 kg urea and 10 kg Zinc sulphate Applied urea 150 kg

ICAR-IIRR Annual Progress Report 2020 Vol 2 - Entomology
2.97
Table 2.62 Insect pests, diseases and weed incidence in IPMs trial at Kaul, kharif 2020
Treatments % DH %
LFDL BPH WBPH
Weed population (No./m2)
Leaf blast
Sheath blight
BLB
30 DAT 60 DAT Area under disease progress
curve (AUDPC)
IPM 3.4
(1.9)b 3.7
(1.9)b 12.5
(3.3)b 6.9
(2.6)b 0.00
(0.71) 0.00
(0.71) 250.48 176.86 25.9
FP 3.9
(2.1)a 14.1
(3.3)a 44.6
(5.8)a 19.2
(4.2)b 3.00
(1.74) 1.50
(1.35) 378.93 248.03 42.7
LSD (0.05) 0.15 1.56 1.04 1.65 1.26 0.8
CV(%) 8.74 22.67 41.08 27.57 AUDPC = Area under disease progress curve
Table 2.63 Returns and BC ratio in IPMs trial at Kaul, Kharif 2020
Treatments Yield (q/ha)
Gross Returns (Rs.)
Cost of Cultivation
(Rs.)
Net Returns
(Rs.)
BC ratio
IPM 41.93 185960 46463 139497 4.00
FP 38.13 169107 50268 118839 3.36 Price of Paddy = 4435 Rs/ q
Ludhiana: PR 121 variety was grown in IPMs trial conducted at Sri Inderjit Singh’s
field of Sudhar village, Ludhiana district, Punjab State. Very low incidence of stem
borer, leaf folder, whorl maggot, BPH and WBPH was observed in both the
treatments. The weed population at 30 DAT in IPM plots was lower than farmers
practice by 58.82% (Table 2.64). Observations on natural enemies like spiders,
coccinellids, ichneumonids and braconids were also taken in both IPM and FP
plots. Grain yield was relatively high in IPM (77.80 q/ ha) as compared to FP plot
(76.52 q/ ha) resulting in higher BC ratio (3.45) due to high gross returns and low
cost of cultivation (Table 2.65).

ICAR-IIRR Annual Progress Report 2020 Vol 2 - Entomology
2.98
Table 2.64 Insect pest and weed incidence in IPMs trial at Ludhiana, kharif 2020
Treatments % DH % WE % LFDL
% WMDL
BPH WBPH Weed
population (No./m2)
65 DAT Pre har 86 DAT 44 DAT 93
DAT 65 DAT 30 DAT
IPM 5.29 ±
1.41 5.52
±0.73 5.36
±0.27 5.20 ± 0.70
20.60 ± 1.17
22.0 ± 1.20
1.75 (1.48)
FP 2.50 ± 0.76
7.33 ± 1.05
7.22 ± 0.54
6.04 ± 0.75
24.40 ± 1.17
29.20 ± 1.20
4.25 (2.04)
Malan: The trial was conducted in Sri Ramesh Chand’s field of Jia Haar village,
Kangra district, Himachal Pradesh. HPR 2880 was grown in IPM field and Jheni, a
local variety was grown in FP plot. Very high incidence of hispa was observed
starting from 15 DAT onwards in farmers’ practices (35.56%) and increased with
crop growth reaching up to 97.14% HDL at 85 DAT. In IPM plot, hispa damage
increased slightly till 57 DAT but later decreased due to the appropriate IPM
interventions (Fig 2.7). Dead hearts caused by black beetle incidence was
significantly low in IPM plot (17.16%) compared to FP plot. The weed population at
29 and57 DAT in IPM plots was lower than farmers practice by 43.71 and 65.87%
Practices followed in IPMs trial at Ludhiana, Kharif 2020
IPM Practices Farmers Practices
Variety PR 121 PR 121
Nursery Application of urea @ 1.0 kg and Zinc sulphate @ 1 kg/ acre nursery
Application of urea @ 1.0 kg/ acre nursery and Zinc sulphate @ 1 kg/ acre nursery
Main field Alley ways of 30 cm after every 2 m
Application of Butachlor @ 1.2 L/ acre
Sprayed Fame 480 SC @ 20 ml/acre
Sprayed Confidor 17.8 SL @ 40 ml/ acre & Tilt @ 200ml/ acre
Recommended dose of neem coated urea-90 kg/ acre
Growing flowering plants like green gram, black gram, soybean, cowpea, sesamum, Marigold.
Water management for planthoppers
Applied urea 120 kg and zinc sulphate 25 kg/ acre
Application of Butachlor @ 1.2 L/ acre
Application of Mortar @ 170 g/ acre
Sprayed Confidor 17.8 SL @ 40 ml/ acre Sprayed Tilt + Nativo @ 200 + 80 ml/ acre
Table 2.65 Yield and Returns in IPMs trial at Ludhiana, Kharif 2020
Treatments Yield Gross
Returns (Rs.)
Cost of cultivation
(Rs.)
Net Returns
(Rs.) BC ratio
Q/ ha
IPM 77.80 141207 40970 100237 3.45
FP 76.52 138884 44960 93924 3.09
Price of paddy = Rs.1815/q
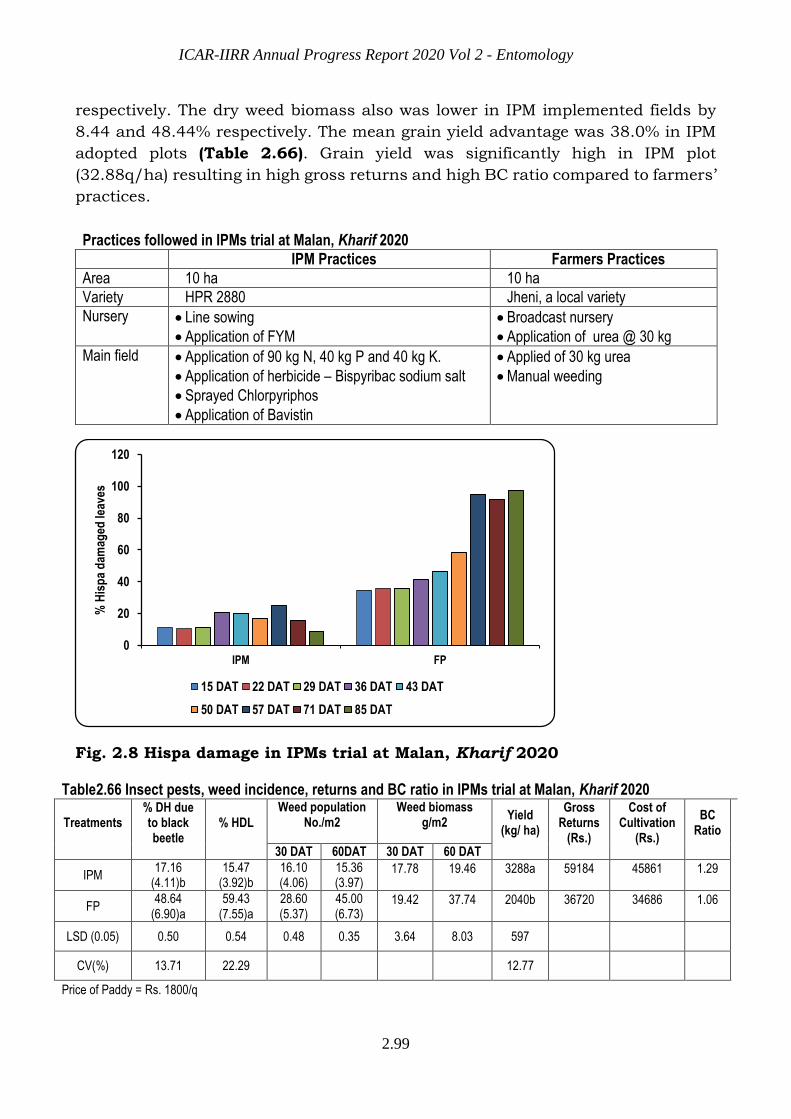
ICAR-IIRR Annual Progress Report 2020 Vol 2 - Entomology
2.99
respectively. The dry weed biomass also was lower in IPM implemented fields by
8.44 and 48.44% respectively. The mean grain yield advantage was 38.0% in IPM
adopted plots (Table 2.66). Grain yield was significantly high in IPM plot
(32.88q/ha) resulting in high gross returns and high BC ratio compared to farmers’
practices.
Fig. 2.8 Hispa damage in IPMs trial at Malan, Kharif 2020 Table2.66 Insect pests, weed incidence, returns and BC ratio in IPMs trial at Malan, Kharif 2020
Treatments % DH due to black beetle
% HDL
Weed population No./m2
Weed biomass g/m2
Yield (kg/ ha)
Gross Returns
(Rs.)
Cost of Cultivation
(Rs.)
BC Ratio
30 DAT 60DAT 30 DAT 60 DAT
IPM 17.16
(4.11)b 15.47
(3.92)b 16.10 (4.06)
15.36 (3.97)
17.78 19.46 3288a 59184 45861 1.29
FP 48.64
(6.90)a 59.43
(7.55)a 28.60 (5.37)
45.00 (6.73)
19.42 37.74 2040b 36720 34686 1.06
LSD (0.05) 0.50 0.54 0.48 0.35 3.64 8.03 597
CV(%) 13.71 22.29
12.77
Price of Paddy = Rs. 1800/q
0
20
40
60
80
100
120
IPM FP
% H
isp
a d
amag
ed le
aves
15 DAT 22 DAT 29 DAT 36 DAT 43 DAT
50 DAT 57 DAT 71 DAT 85 DAT
Practices followed in IPMs trial at Malan, Kharif 2020
IPM Practices Farmers Practices
Area 10 ha 10 ha
Variety HPR 2880 Jheni, a local variety
Nursery Line sowing
Application of FYM
Broadcast nursery
Application of urea @ 30 kg
Main field Application of 90 kg N, 40 kg P and 40 kg K.
Application of herbicide – Bispyribac sodium salt
Sprayed Chlorpyriphos
Application of Bavistin
Applied of 30 kg urea
Manual weeding
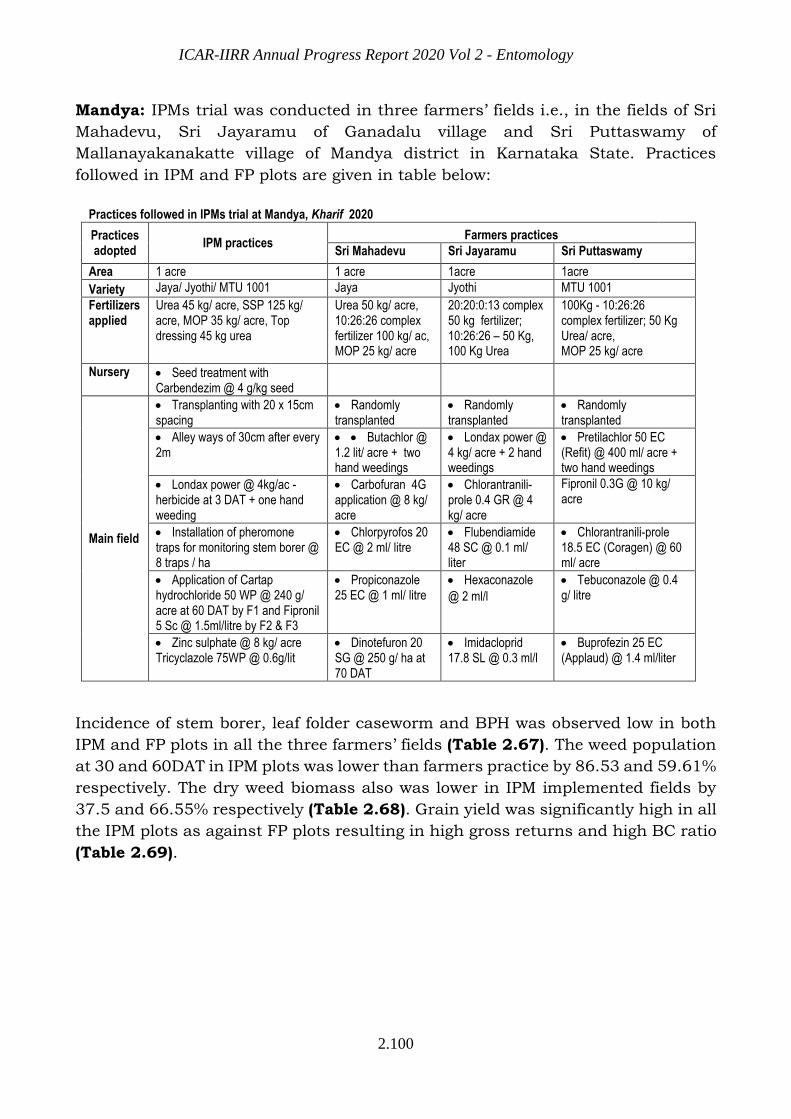
ICAR-IIRR Annual Progress Report 2020 Vol 2 - Entomology
2.100
Mandya: IPMs trial was conducted in three farmers’ fields i.e., in the fields of Sri
Mahadevu, Sri Jayaramu of Ganadalu village and Sri Puttaswamy of
Mallanayakanakatte village of Mandya district in Karnataka State. Practices
followed in IPM and FP plots are given in table below:
Practices followed in IPMs trial at Mandya, Kharif 2020
Practices adopted
IPM practices Farmers practices
Sri Mahadevu Sri Jayaramu Sri Puttaswamy
Area 1 acre 1 acre 1acre 1acre
Variety Jaya/ Jyothi/ MTU 1001 Jaya Jyothi MTU 1001
Fertilizers applied
Urea 45 kg/ acre, SSP 125 kg/ acre, MOP 35 kg/ acre, Top dressing 45 kg urea
Urea 50 kg/ acre, 10:26:26 complex fertilizer 100 kg/ ac, MOP 25 kg/ acre
20:20:0:13 complex 50 kg fertilizer; 10:26:26 – 50 Kg, 100 Kg Urea
100Kg - 10:26:26 complex fertilizer; 50 Kg Urea/ acre, MOP 25 kg/ acre
Nursery Seed treatment with Carbendezim @ 4 g/kg seed
Main field
Transplanting with 20 x 15cm spacing
Randomly transplanted
Randomly transplanted
Randomly transplanted
Alley ways of 30cm after every 2m
Butachlor @ 1.2 lit/ acre + two hand weedings
Londax power @ 4 kg/ acre + 2 hand weedings
Pretilachlor 50 EC (Refit) @ 400 ml/ acre + two hand weedings
Londax power @ 4kg/ac - herbicide at 3 DAT + one hand weeding
Carbofuran 4G application @ 8 kg/ acre
Chlorantranili-prole 0.4 GR @ 4 kg/ acre
Fipronil 0.3G @ 10 kg/ acre
Installation of pheromone traps for monitoring stem borer @ 8 traps / ha
Chlorpyrofos 20 EC @ 2 ml/ litre
Flubendiamide 48 SC @ 0.1 ml/ liter
Chlorantranili-prole 18.5 EC (Coragen) @ 60 ml/ acre
Application of Cartap hydrochloride 50 WP @ 240 g/ acre at 60 DAT by F1 and Fipronil 5 Sc @ 1.5ml/litre by F2 & F3
Propiconazole 25 EC @ 1 ml/ litre
Hexaconazole
@ 2 ml/l
Tebuconazole @ 0.4 g/ litre
Zinc sulphate @ 8 kg/ acre Tricyclazole 75WP @ 0.6g/lit
Dinotefuron 20 SG @ 250 g/ ha at 70 DAT
Imidacloprid 17.8 SL @ 0.3 ml/l
Buprofezin 25 EC (Applaud) @ 1.4 ml/liter
Incidence of stem borer, leaf folder caseworm and BPH was observed low in both
IPM and FP plots in all the three farmers’ fields (Table 2.67). The weed population
at 30 and 60DAT in IPM plots was lower than farmers practice by 86.53 and 59.61%
respectively. The dry weed biomass also was lower in IPM implemented fields by
37.5 and 66.55% respectively (Table 2.68). Grain yield was significantly high in all
the IPM plots as against FP plots resulting in high gross returns and high BC ratio
(Table 2.69).

ICAR-IIRR Annual Progress Report 2020 Vol 2 - Entomology
2.101
Table 2.67 Insect pest and disease incidence in IPMs trial at Mandya, Kharif 2020
Farmer Name Treat ments
% DH % WE % LFDL % CWDL BPH
50 DAT Pre har 43 DAT 50 DAT 85 DAT
F1- Sri Mahadevu
IPM 3.4 ± 0.9 5.4 ± 1.0 0.9 ± 0.3 0.8 ± 0.2 5.6 ± 0.5
FP 6.9. ±1.7 9.3 ± 3.7 4.5 ± 0.7 2.1 ± 0.4 12.2 ± 1.1
F2 - Sri Jayaramu
IPM 4.8 ± 1. 1 4.7 ± 1.3 1.5 ± 0.3 1.0 ± 0.4 5.8 ± 3.1
FP 6.6 ± 1.5 8.1 ± 2.5 4.5 ± 0.5 2.4 ± 0.6 11.0 ± 3.8
F3- Sri Puttaswamy
IPM 4.3 ± 0.7 5.5 ± 1.3 1.6 ± 0.6 1.8 ± 0.4 4.8 ± 0.9
FP 6.4 ± 1.6 7.5 ± 2.5 2.6± 0.8 2.3 ± 0.6 9.0 ± 1.7
IPM 4.2 5.2 1.3 1.2 5
FP 6.6 8.3 3.9 2.3 11
Table 2.68 Weed population and biomass in IPMs trial at Mandya, Kharif 2020
Farmer Name Treat ments
Weed population No./m2 Weed biomass g/ m2
30 DAT 60 DAT 30 DAT 60 DAT
F1- Sri Mahadevu
IPM 12.00 ± 2.86 12.40 ± 2.01 1.50 ± 0.29 1.76 ± 0.50
FP 13.80 ± 2.42 20.20 ± 4.42 2.04 ± 0.43 2.72 ± 0.52
F2 - Sri Jayaramu
IPM 8.80 ± 1.46 11.40 ± 1.86 1.08 ± 0.28 1.58 ± 0.32
FP 10.60 ± 2.36 12.20 ± 1.50 1.44 ± 0.34 1.62 ± 0.55
F3- Sri Puttaswamy
IPM 10.20 ± 1.32 14.30 ± 2.94 1.30 ± 0.23 1.72 ± 0.43
FP 15.60 ± 2.34 18.40 ± 2.84 1.98 ± 0.47 2.28 ± 0.45
IPM 10.33 12.7 1.29 1.69
FP 13.33 16.93 1.82 2.21
Table 2.69 Grain yield , Gross returns and BC ratio in IPMs trial at Mandya, Kharif 2020
Farmer name Treatments Yield Gross
Returns (Rs.)
Cost of cultivation
(Rs.)
Net Returns
(Rs.) BC ratio
q/ha
F1- Sri Mahadevu
IPM 60.74a 114191 49300 64891 2.32
FP 53.09ab 99809 55000 44809 1.81
F2 - Sri Jayaramu
IPM 55.43ab 104208 49550 54658 2.10
FP 48.24abc 90691 58150 32541 1.56
F3- Sri Puttaswamy
IPM 44.59bc 83829 49175 34654 1.70
FP 38.54c 72455 57125 15330 1.27
IPM 53.59 100743 49342 51401 2.04
FP 46.62 87652 56758 30894 1.55
Price of paddy = Rs.1880/q
Pantnagar: IPM trial was conducted in two villages in three farmers’ fields’ viz., Sri
Anil Kushwaha’s field, Sri SN Viswakarma’s field and Sri Sanjay Kushwaha’s field
in Pratappur Kichha village, Udham Singh Nagar district of Uttarakhand State.
Varieties grown and practices followed in IPM and FP plots are given below:
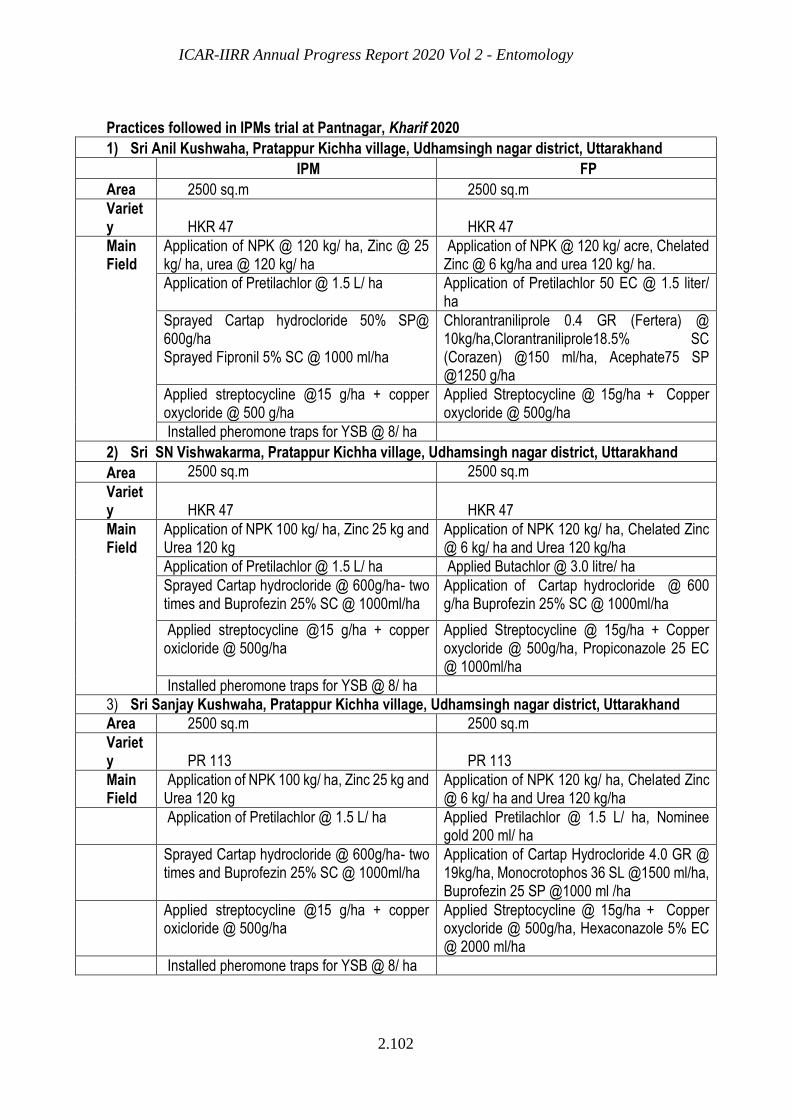
ICAR-IIRR Annual Progress Report 2020 Vol 2 - Entomology
2.102
Practices followed in IPMs trial at Pantnagar, Kharif 2020
1) Sri Anil Kushwaha, Pratappur Kichha village, Udhamsingh nagar district, Uttarakhand
IPM FP
Area 2500 sq.m 2500 sq.m
Variety HKR 47 HKR 47
Main Field
Application of NPK @ 120 kg/ ha, Zinc @ 25 kg/ ha, urea @ 120 kg/ ha
Application of NPK @ 120 kg/ acre, Chelated Zinc @ 6 kg/ha and urea 120 kg/ ha.
Application of Pretilachlor @ 1.5 L/ ha Application of Pretilachlor 50 EC @ 1.5 liter/ ha
Sprayed Cartap hydrocloride 50% SP@ 600g/ha Sprayed Fipronil 5% SC @ 1000 ml/ha
Chlorantraniliprole 0.4 GR (Fertera) @ 10kg/ha,Clorantraniliprole18.5% SC (Corazen) @150 ml/ha, Acephate75 SP @1250 g/ha
Applied streptocycline @15 g/ha + copper oxycloride @ 500 g/ha
Applied Streptocycline @ 15g/ha + Copper oxycloride @ 500g/ha
Installed pheromone traps for YSB @ 8/ ha
2) Sri SN Vishwakarma, Pratappur Kichha village, Udhamsingh nagar district, Uttarakhand
Area 2500 sq.m 2500 sq.m
Variety HKR 47 HKR 47
Main Field
Application of NPK 100 kg/ ha, Zinc 25 kg and Urea 120 kg
Application of NPK 120 kg/ ha, Chelated Zinc @ 6 kg/ ha and Urea 120 kg/ha
Application of Pretilachlor @ 1.5 L/ ha Applied Butachlor @ 3.0 litre/ ha
Sprayed Cartap hydrocloride @ 600g/ha- two times and Buprofezin 25% SC @ 1000ml/ha
Application of Cartap hydrocloride @ 600 g/ha Buprofezin 25% SC @ 1000ml/ha
Applied streptocycline @15 g/ha + copper oxicloride @ 500g/ha
Applied Streptocycline @ 15g/ha + Copper oxycloride @ 500g/ha, Propiconazole 25 EC @ 1000ml/ha
Installed pheromone traps for YSB @ 8/ ha
3) Sri Sanjay Kushwaha, Pratappur Kichha village, Udhamsingh nagar district, Uttarakhand
Area 2500 sq.m 2500 sq.m
Variety PR 113 PR 113
Main Field
Application of NPK 100 kg/ ha, Zinc 25 kg and Urea 120 kg
Application of NPK 120 kg/ ha, Chelated Zinc @ 6 kg/ ha and Urea 120 kg/ha
Application of Pretilachlor @ 1.5 L/ ha Applied Pretilachlor @ 1.5 L/ ha, Nominee
gold 200 ml/ ha
Sprayed Cartap hydrocloride @ 600g/ha- two times and Buprofezin 25% SC @ 1000ml/ha
Application of Cartap Hydrocloride 4.0 GR @ 19kg/ha, Monocrotophos 36 SL @1500 ml/ha, Buprofezin 25 SP @1000 ml /ha
Applied streptocycline @15 g/ha + copper oxicloride @ 500g/ha
Applied Streptocycline @ 15g/ha + Copper oxycloride @ 500g/ha, Hexaconazole 5% EC @ 2000 ml/ha
Installed pheromone traps for YSB @ 8/ ha
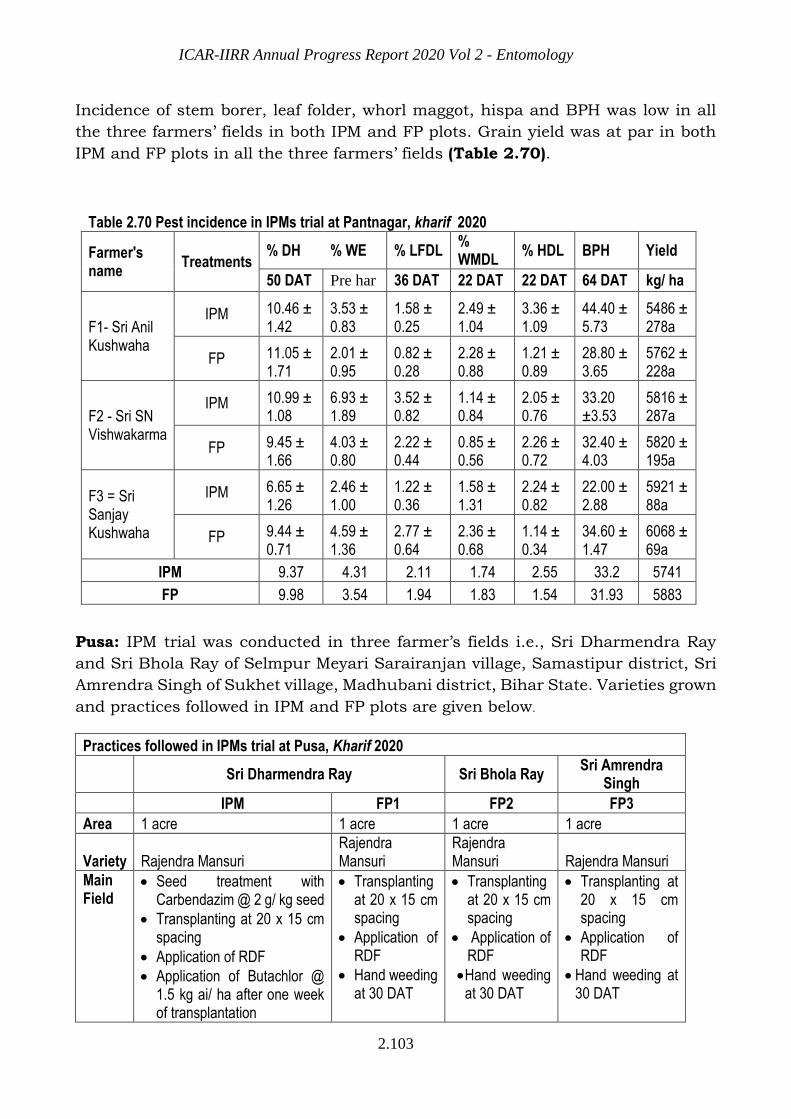
ICAR-IIRR Annual Progress Report 2020 Vol 2 - Entomology
2.103
Incidence of stem borer, leaf folder, whorl maggot, hispa and BPH was low in all
the three farmers’ fields in both IPM and FP plots. Grain yield was at par in both
IPM and FP plots in all the three farmers’ fields (Table 2.70).
Table 2.70 Pest incidence in IPMs trial at Pantnagar, kharif 2020
Farmer's name
Treatments % DH % WE % LFDL
% WMDL
% HDL BPH Yield
50 DAT Pre har 36 DAT 22 DAT 22 DAT 64 DAT kg/ ha
F1- Sri Anil Kushwaha
IPM 10.46 ± 1.42
3.53 ± 0.83
1.58 ± 0.25
2.49 ± 1.04
3.36 ± 1.09
44.40 ± 5.73
5486 ± 278a
FP 11.05 ± 1.71
2.01 ± 0.95
0.82 ± 0.28
2.28 ± 0.88
1.21 ± 0.89
28.80 ± 3.65
5762 ± 228a
F2 - Sri SN Vishwakarma
IPM 10.99 ± 1.08
6.93 ± 1.89
3.52 ± 0.82
1.14 ± 0.84
2.05 ± 0.76
33.20 ±3.53
5816 ± 287a
FP 9.45 ± 1.66
4.03 ± 0.80
2.22 ± 0.44
0.85 ± 0.56
2.26 ± 0.72
32.40 ± 4.03
5820 ± 195a
F3 = Sri Sanjay Kushwaha
IPM 6.65 ± 1.26
2.46 ± 1.00
1.22 ± 0.36
1.58 ± 1.31
2.24 ± 0.82
22.00 ± 2.88
5921 ± 88a
FP 9.44 ± 0.71
4.59 ± 1.36
2.77 ± 0.64
2.36 ± 0.68
1.14 ± 0.34
34.60 ± 1.47
6068 ± 69a
IPM 9.37 4.31 2.11 1.74 2.55 33.2 5741
FP 9.98 3.54 1.94 1.83 1.54 31.93 5883
Pusa: IPM trial was conducted in three farmer’s fields i.e., Sri Dharmendra Ray
and Sri Bhola Ray of Selmpur Meyari Sarairanjan village, Samastipur district, Sri
Amrendra Singh of Sukhet village, Madhubani district, Bihar State. Varieties grown
and practices followed in IPM and FP plots are given below.
Practices followed in IPMs trial at Pusa, Kharif 2020
Sri Dharmendra Ray Sri Bhola Ray
Sri Amrendra Singh
IPM FP1 FP2 FP3
Area 1 acre 1 acre 1 acre 1 acre
Variety Rajendra Mansuri Rajendra Mansuri
Rajendra Mansuri Rajendra Mansuri
Main Field
Seed treatment with Carbendazim @ 2 g/ kg seed
Transplanting at 20 x 15 cm spacing
Application of RDF
Application of Butachlor @ 1.5 kg ai/ ha after one week of transplantation
Transplanting at 20 x 15 cm spacing
Application of RDF
Hand weeding at 30 DAT
Transplanting at 20 x 15 cm spacing
Application of RDF
Hand weeding at 30 DAT
Transplanting at 20 x 15 cm spacing
Application of RDF
Hand weeding at 30 DAT

ICAR-IIRR Annual Progress Report 2020 Vol 2 - Entomology
2.104
Incidence of stem borer crossed ETL and was high in farmers’ practices in all
the three farmers’ fields starting from 29 DAAT to 71 DAT (10.21 – 20.01% DH)
compared to IPM plot (5.28 – 8.07 % DH). Similarly, leaf folder incidence crossed
ETL in farmers’ practices in Sri Bhola Ray’s and Sri Amarendra Singh’s fields
(Table 2.71). The weed population at 29 and 57DAT in IPM plots was lower than
farmers practice by 41.99 and 34.41% respectively. The dry weed biomass also was
lower in IPM implemented fields by 35.17 and 32.61% respectively. The mean grain
yield advantage was 21.25% in IPM adopted plots (Table 2.72). High grain yield
was recorded in IPM plot (5266 kg/ ha) as compared to FP plots (4145 kg/ha)
resulting in high gross returns. However, BC ratio was low in IPM plot due to the
high cost of cultivation compared to FP plots.
Table2.71 Insect pest incidence, grain yield and BC ratio in IPMs trial at Pusa, Kharif 2020
Treatments
% DH % LFDL Yield Gross
Return
s (Rs.)
Cost of
cultivati
on (Rs.)
Net
Retur
ns
(Rs.)
BC
Ratio 29
DAT 50
DAT 71
DAT 29
DAT 50
DAT Kg/ha
IPM 8.07 ± 0.44
6.62 ± 0.37
5.28 ± 0.28
7.27 ± 0.24
4.92 ± 0.48
5266
± 189 98369 40975 57394 2.40
FP1 10.21 ± 0.36
14.51 ± 0.72
19.71 ± 0.64
8.33 ± 0.50
6.32 ± 0.27
4407 ± 173
82323 33320 49003 2.47
FP2 14.54 ± 0.57
18.42 ± 0.33
21.14 ± 0.90
13.18 ± 0.40
14.78 ± 0.75
3988 ± 139
74496 31710 42786 2.35
FP3 14.94 ± 0.53
20.01 ± 0.66
22.74 ± 0.70
12.70 ± 0.73
14.04 ± 0.48
4040 ± 142
75467 29710 45757 2.54
IPM 8.07 6.62 5.28 7.27 4.92 5266 98369 40975 57394 2.40
FP 15.92 17.64 21.19 11.4 11.71 4145 77429 31580 45849 2.45
Price of paddy = Rs.1868/q
Table 2.72 Weed population and biomass in IPMs at Pusa, Kharif 2020
Treatments Weed population No./m2 Weed biomass g/m2
30 DAT 60 DAT 30 DAT 60 DAT
IPM 7.64(2.85) 9.78(3.20) 9.75 11.82
FP 13.17(3.69) 14.91(3.92) 15.04 17.54
Exp. mean 3.27 3.56 12.4 14.68
CD(0.05) 0.11 0.12 0.81 1.09
Installed pheromone traps for YSB @ 3/ acre
Application of Bispyribac sodium 20 g ai/ ha at 20 DAT
Application cartap hydrochloride 50 WP @ 600g / ha at 50 DAT
Application of Carbaryl 50 WP @ 30 kg/ha
Application of Carbaryl 50 WP @ 30 kg/ ha
Application of Carbaryl 50 WP @ 30 kg/ ha
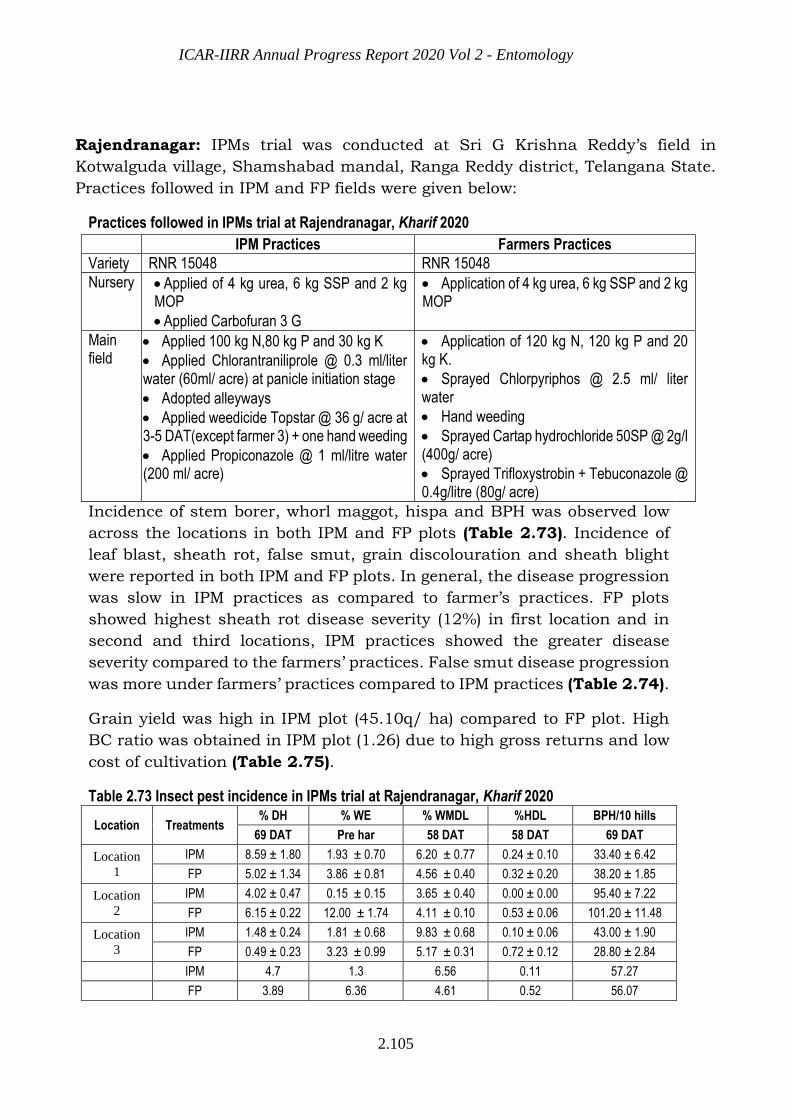
ICAR-IIRR Annual Progress Report 2020 Vol 2 - Entomology
2.105
Rajendranagar: IPMs trial was conducted at Sri G Krishna Reddy’s field in
Kotwalguda village, Shamshabad mandal, Ranga Reddy district, Telangana State.
Practices followed in IPM and FP fields were given below:
Practices followed in IPMs trial at Rajendranagar, Kharif 2020
IPM Practices Farmers Practices
Variety RNR 15048 RNR 15048
Nursery Applied of 4 kg urea, 6 kg SSP and 2 kg MOP
Applied Carbofuran 3 G
Application of 4 kg urea, 6 kg SSP and 2 kg MOP
Main field
Applied 100 kg N,80 kg P and 30 kg K
Applied Chlorantraniliprole @ 0.3 ml/liter water (60ml/ acre) at panicle initiation stage
Adopted alleyways
Applied weedicide Topstar @ 36 g/ acre at 3-5 DAT(except farmer 3) + one hand weeding
Applied Propiconazole @ 1 ml/litre water (200 ml/ acre)
Application of 120 kg N, 120 kg P and 20 kg K.
Sprayed Chlorpyriphos @ 2.5 ml/ liter water
Hand weeding
Sprayed Cartap hydrochloride 50SP @ 2g/l (400g/ acre)
Sprayed Trifloxystrobin + Tebuconazole @ 0.4g/litre (80g/ acre)
Incidence of stem borer, whorl maggot, hispa and BPH was observed low
across the locations in both IPM and FP plots (Table 2.73). Incidence of
leaf blast, sheath rot, false smut, grain discolouration and sheath blight
were reported in both IPM and FP plots. In general, the disease progression
was slow in IPM practices as compared to farmer’s practices. FP plots
showed highest sheath rot disease severity (12%) in first location and in
second and third locations, IPM practices showed the greater disease
severity compared to the farmers’ practices. False smut disease progression
was more under farmers’ practices compared to IPM practices (Table 2.74).
Grain yield was high in IPM plot (45.10q/ ha) compared to FP plot. High
BC ratio was obtained in IPM plot (1.26) due to high gross returns and low
cost of cultivation (Table 2.75).
Table 2.73 Insect pest incidence in IPMs trial at Rajendranagar, Kharif 2020
Location Treatments % DH % WE % WMDL %HDL BPH/10 hills
69 DAT Pre har 58 DAT 58 DAT 69 DAT
Location
1
IPM 8.59 ± 1.80 1.93 ± 0.70 6.20 ± 0.77 0.24 ± 0.10 33.40 ± 6.42
FP 5.02 ± 1.34 3.86 ± 0.81 4.56 ± 0.40 0.32 ± 0.20 38.20 ± 1.85
Location
2
IPM 4.02 ± 0.47 0.15 ± 0.15 3.65 ± 0.40 0.00 ± 0.00 95.40 ± 7.22
FP 6.15 ± 0.22 12.00 ± 1.74 4.11 ± 0.10 0.53 ± 0.06 101.20 ± 11.48
Location
3
IPM 1.48 ± 0.24 1.81 ± 0.68 9.83 ± 0.68 0.10 ± 0.06 43.00 ± 1.90
FP 0.49 ± 0.23 3.23 ± 0.99 5.17 ± 0.31 0.72 ± 0.12 28.80 ± 2.84
IPM 4.7 1.3 6.56 0.11 57.27
FP 3.89 6.36 4.61 0.52 56.07
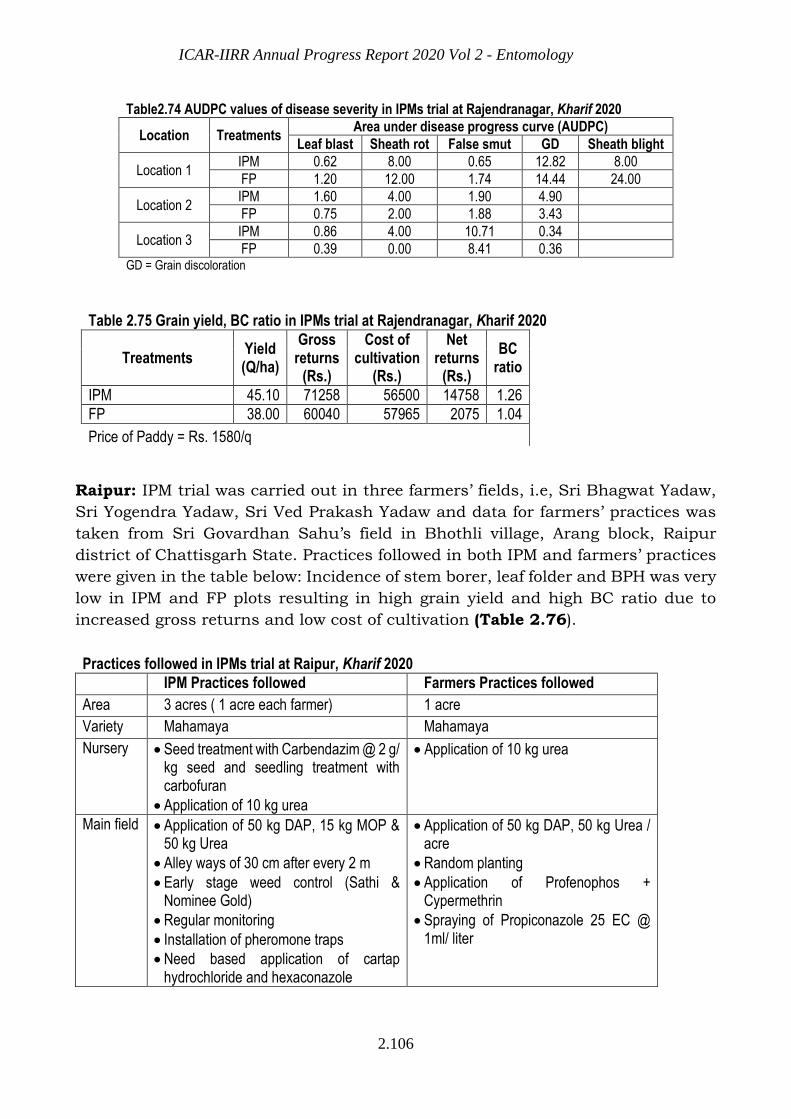
ICAR-IIRR Annual Progress Report 2020 Vol 2 - Entomology
2.106
Table2.74 AUDPC values of disease severity in IPMs trial at Rajendranagar, Kharif 2020
Location Treatments Area under disease progress curve (AUDPC)
Leaf blast Sheath rot False smut GD Sheath blight
Location 1 IPM 0.62 8.00 0.65 12.82 8.00
FP 1.20 12.00 1.74 14.44 24.00
Location 2 IPM 1.60 4.00 1.90 4.90
FP 0.75 2.00 1.88 3.43
Location 3 IPM 0.86 4.00 10.71 0.34
FP 0.39 0.00 8.41 0.36 GD = Grain discoloration
Table 2.75 Grain yield, BC ratio in IPMs trial at Rajendranagar, Kharif 2020
Treatments Yield (Q/ha)
Gross returns
(Rs.)
Cost of cultivation
(Rs.)
Net returns
(Rs.)
BC ratio
IPM 45.10 71258 56500 14758 1.26
FP 38.00 60040 57965 2075 1.04
Price of Paddy = Rs. 1580/q
Raipur: IPM trial was carried out in three farmers’ fields, i.e, Sri Bhagwat Yadaw,
Sri Yogendra Yadaw, Sri Ved Prakash Yadaw and data for farmers’ practices was
taken from Sri Govardhan Sahu’s field in Bhothli village, Arang block, Raipur
district of Chattisgarh State. Practices followed in both IPM and farmers’ practices
were given in the table below: Incidence of stem borer, leaf folder and BPH was very
low in IPM and FP plots resulting in high grain yield and high BC ratio due to
increased gross returns and low cost of cultivation (Table 2.76).
Practices followed in IPMs trial at Raipur, Kharif 2020
IPM Practices followed Farmers Practices followed
Area 3 acres ( 1 acre each farmer) 1 acre
Variety Mahamaya Mahamaya
Nursery Seed treatment with Carbendazim @ 2 g/ kg seed and seedling treatment with carbofuran
Application of 10 kg urea
Application of 10 kg urea
Main field Application of 50 kg DAP, 15 kg MOP & 50 kg Urea
Alley ways of 30 cm after every 2 m
Early stage weed control (Sathi & Nominee Gold)
Regular monitoring
Installation of pheromone traps
Need based application of cartap hydrochloride and hexaconazole
Application of 50 kg DAP, 50 kg Urea / acre
Random planting
Application of Profenophos + Cypermethrin
Spraying of Propiconazole 25 EC @ 1ml/ liter
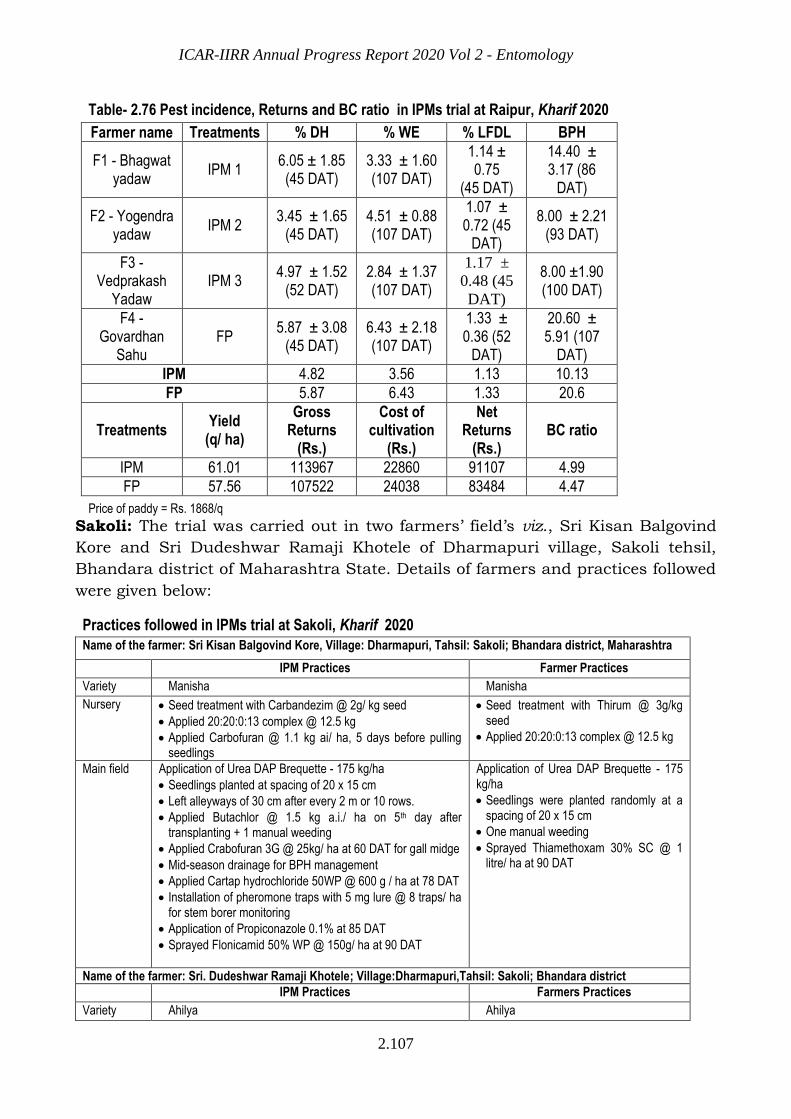
ICAR-IIRR Annual Progress Report 2020 Vol 2 - Entomology
2.107
Table- 2.76 Pest incidence, Returns and BC ratio in IPMs trial at Raipur, Kharif 2020
Farmer name Treatments % DH % WE % LFDL BPH
F1 - Bhagwat yadaw
IPM 1 6.05 ± 1.85 (45 DAT)
3.33 ± 1.60 (107 DAT)
1.14 ± 0.75
(45 DAT)
14.40 ± 3.17 (86
DAT)
F2 - Yogendra yadaw
IPM 2 3.45 ± 1.65
(45 DAT) 4.51 ± 0.88 (107 DAT)
1.07 ± 0.72 (45
DAT)
8.00 ± 2.21 (93 DAT)
F3 - Vedprakash
Yadaw IPM 3
4.97 ± 1.52 (52 DAT)
2.84 ± 1.37 (107 DAT)
1.17 ±
0.48 (45
DAT)
8.00 ±1.90 (100 DAT)
F4 - Govardhan
Sahu FP
5.87 ± 3.08 (45 DAT)
6.43 ± 2.18 (107 DAT)
1.33 ± 0.36 (52
DAT)
20.60 ± 5.91 (107
DAT)
IPM 4.82 3.56 1.13 10.13
FP 5.87 6.43 1.33 20.6
Treatments Yield
(q/ ha)
Gross Returns
(Rs.)
Cost of cultivation
(Rs.)
Net Returns
(Rs.) BC ratio
IPM 61.01 113967 22860 91107 4.99
FP 57.56 107522 24038 83484 4.47
Price of paddy = Rs. 1868/q
Sakoli: The trial was carried out in two farmers’ field’s viz., Sri Kisan Balgovind
Kore and Sri Dudeshwar Ramaji Khotele of Dharmapuri village, Sakoli tehsil,
Bhandara district of Maharashtra State. Details of farmers and practices followed
were given below:
Practices followed in IPMs trial at Sakoli, Kharif 2020
Name of the farmer: Sri Kisan Balgovind Kore, Village: Dharmapuri, Tahsil: Sakoli; Bhandara district, Maharashtra
IPM Practices Farmer Practices
Variety Manisha Manisha
Nursery Seed treatment with Carbandezim @ 2g/ kg seed
Applied 20:20:0:13 complex @ 12.5 kg
Applied Carbofuran @ 1.1 kg ai/ ha, 5 days before pulling seedlings
Seed treatment with Thirum @ 3g/kg seed
Applied 20:20:0:13 complex @ 12.5 kg
Main field Application of Urea DAP Brequette - 175 kg/ha
Seedlings planted at spacing of 20 x 15 cm
Left alleyways of 30 cm after every 2 m or 10 rows.
Applied Butachlor @ 1.5 kg a.i./ ha on 5th day after transplanting + 1 manual weeding
Applied Crabofuran 3G @ 25kg/ ha at 60 DAT for gall midge
Mid-season drainage for BPH management
Applied Cartap hydrochloride 50WP @ 600 g / ha at 78 DAT
Installation of pheromone traps with 5 mg lure @ 8 traps/ ha for stem borer monitoring
Application of Propiconazole 0.1% at 85 DAT
Sprayed Flonicamid 50% WP @ 150g/ ha at 90 DAT
Application of Urea DAP Brequette - 175 kg/ha
Seedlings were planted randomly at a spacing of 20 x 15 cm
One manual weeding
Sprayed Thiamethoxam 30% SC @ 1 litre/ ha at 90 DAT
Name of the farmer: Sri. Dudeshwar Ramaji Khotele; Village:Dharmapuri,Tahsil: Sakoli; Bhandara district
IPM Practices Farmers Practices
Variety Ahilya Ahilya
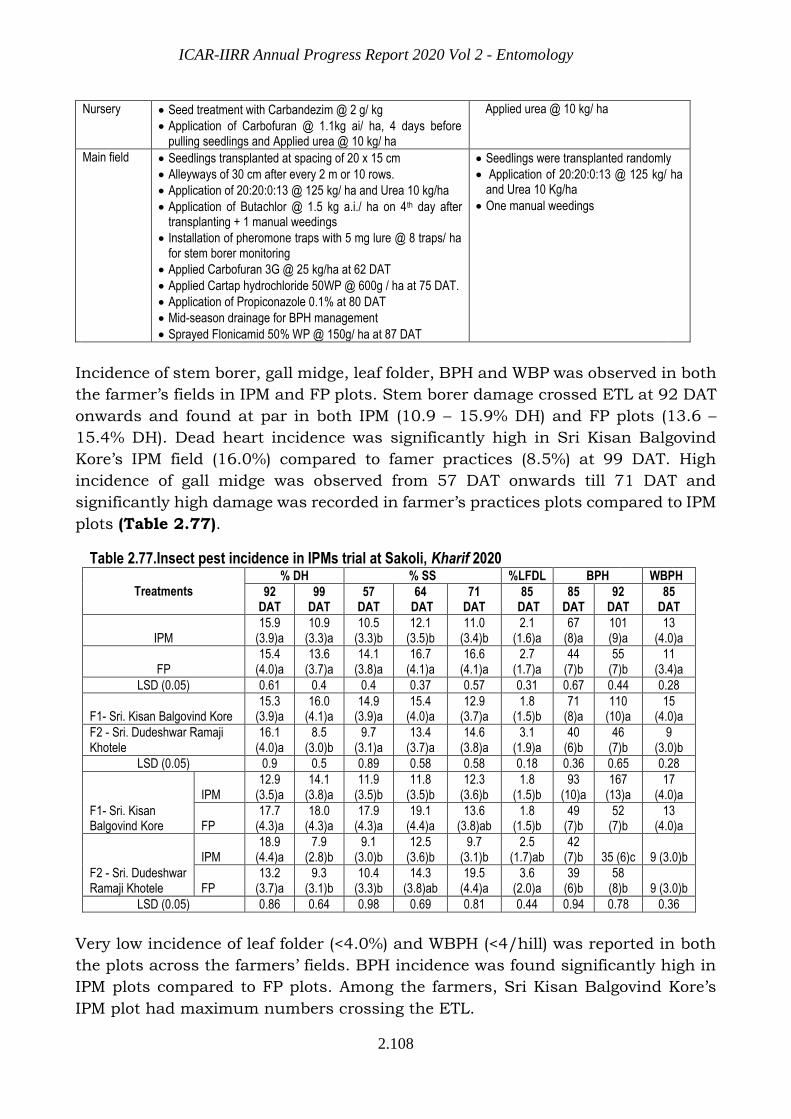
ICAR-IIRR Annual Progress Report 2020 Vol 2 - Entomology
2.108
Nursery Seed treatment with Carbandezim @ 2 g/ kg
Application of Carbofuran @ 1.1kg ai/ ha, 4 days before pulling seedlings and Applied urea @ 10 kg/ ha
Applied urea @ 10 kg/ ha
Main field Seedlings transplanted at spacing of 20 x 15 cm
Alleyways of 30 cm after every 2 m or 10 rows.
Application of 20:20:0:13 @ 125 kg/ ha and Urea 10 kg/ha
Application of Butachlor @ 1.5 kg a.i./ ha on 4th day after transplanting + 1 manual weedings
Installation of pheromone traps with 5 mg lure @ 8 traps/ ha for stem borer monitoring
Applied Carbofuran 3G @ 25 kg/ha at 62 DAT
Applied Cartap hydrochloride 50WP @ 600g / ha at 75 DAT.
Application of Propiconazole 0.1% at 80 DAT
Mid-season drainage for BPH management
Sprayed Flonicamid 50% WP @ 150g/ ha at 87 DAT
Seedlings were transplanted randomly
Application of 20:20:0:13 @ 125 kg/ ha and Urea 10 Kg/ha
One manual weedings
Incidence of stem borer, gall midge, leaf folder, BPH and WBP was observed in both
the farmer’s fields in IPM and FP plots. Stem borer damage crossed ETL at 92 DAT
onwards and found at par in both IPM (10.9 – 15.9% DH) and FP plots (13.6 –
15.4% DH). Dead heart incidence was significantly high in Sri Kisan Balgovind
Kore’s IPM field (16.0%) compared to famer practices (8.5%) at 99 DAT. High
incidence of gall midge was observed from 57 DAT onwards till 71 DAT and
significantly high damage was recorded in farmer’s practices plots compared to IPM
plots (Table 2.77).
Table 2.77.Insect pest incidence in IPMs trial at Sakoli, Kharif 2020
Treatments % DH % SS %LFDL BPH WBPH
92 DAT
99 DAT
57 DAT
64 DAT
71 DAT
85 DAT
85 DAT
92 DAT
85 DAT
IPM 15.9
(3.9)a 10.9
(3.3)a 10.5
(3.3)b 12.1
(3.5)b 11.0
(3.4)b 2.1
(1.6)a 67
(8)a 101 (9)a
13 (4.0)a
FP 15.4
(4.0)a 13.6
(3.7)a 14.1
(3.8)a 16.7
(4.1)a 16.6
(4.1)a 2.7
(1.7)a 44
(7)b 55
(7)b 11
(3.4)a
LSD (0.05) 0.61 0.4 0.4 0.37 0.57 0.31 0.67 0.44 0.28
F1- Sri. Kisan Balgovind Kore 15.3
(3.9)a 16.0
(4.1)a 14.9
(3.9)a 15.4
(4.0)a 12.9
(3.7)a 1.8
(1.5)b 71
(8)a 110
(10)a 15
(4.0)a
F2 - Sri. Dudeshwar Ramaji Khotele
16.1 (4.0)a
8.5 (3.0)b
9.7 (3.1)a
13.4 (3.7)a
14.6 (3.8)a
3.1 (1.9)a
40 (6)b
46 (7)b
9 (3.0)b
LSD (0.05) 0.9 0.5 0.89 0.58 0.58 0.18 0.36 0.65 0.28
F1- Sri. Kisan Balgovind Kore
IPM 12.9
(3.5)a 14.1
(3.8)a 11.9
(3.5)b 11.8
(3.5)b 12.3
(3.6)b 1.8
(1.5)b 93
(10)a 167
(13)a 17
(4.0)a
FP 17.7
(4.3)a 18.0
(4.3)a 17.9
(4.3)a 19.1
(4.4)a 13.6
(3.8)ab 1.8
(1.5)b 49
(7)b 52
(7)b 13
(4.0)a
F2 - Sri. Dudeshwar Ramaji Khotele
IPM 18.9
(4.4)a 7.9
(2.8)b 9.1
(3.0)b 12.5
(3.6)b 9.7
(3.1)b 2.5
(1.7)ab 42
(7)b 35 (6)c 9 (3.0)b
FP 13.2
(3.7)a 9.3
(3.1)b 10.4
(3.3)b 14.3
(3.8)ab 19.5
(4.4)a 3.6
(2.0)a 39
(6)b 58
(8)b 9 (3.0)b
LSD (0.05) 0.86 0.64 0.98 0.69 0.81 0.44 0.94 0.78 0.36
Very low incidence of leaf folder (<4.0%) and WBPH (<4/hill) was reported in both
the plots across the farmers’ fields. BPH incidence was found significantly high in
IPM plots compared to FP plots. Among the farmers, Sri Kisan Balgovind Kore’s
IPM plot had maximum numbers crossing the ETL.
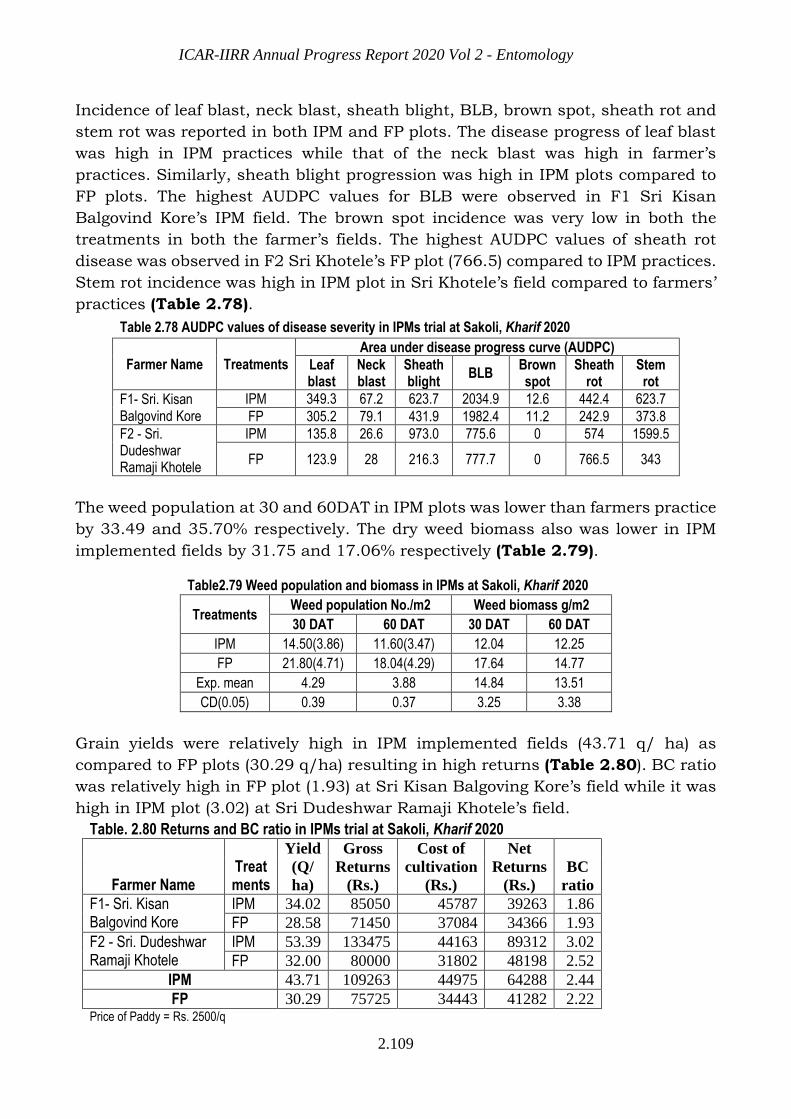
ICAR-IIRR Annual Progress Report 2020 Vol 2 - Entomology
2.109
Incidence of leaf blast, neck blast, sheath blight, BLB, brown spot, sheath rot and
stem rot was reported in both IPM and FP plots. The disease progress of leaf blast
was high in IPM practices while that of the neck blast was high in farmer’s
practices. Similarly, sheath blight progression was high in IPM plots compared to
FP plots. The highest AUDPC values for BLB were observed in F1 Sri Kisan
Balgovind Kore’s IPM field. The brown spot incidence was very low in both the
treatments in both the farmer’s fields. The highest AUDPC values of sheath rot
disease was observed in F2 Sri Khotele’s FP plot (766.5) compared to IPM practices.
Stem rot incidence was high in IPM plot in Sri Khotele’s field compared to farmers’
practices (Table 2.78).
Table 2.78 AUDPC values of disease severity in IPMs trial at Sakoli, Kharif 2020
Farmer Name Treatments Area under disease progress curve (AUDPC)
Leaf blast
Neck blast
Sheath blight
BLB Brown spot
Sheath rot
Stem rot
F1- Sri. Kisan Balgovind Kore
IPM 349.3 67.2 623.7 2034.9 12.6 442.4 623.7
FP 305.2 79.1 431.9 1982.4 11.2 242.9 373.8
F2 - Sri. Dudeshwar Ramaji Khotele
IPM 135.8 26.6 973.0 775.6 0 574 1599.5
FP 123.9 28 216.3 777.7 0 766.5 343
The weed population at 30 and 60DAT in IPM plots was lower than farmers practice
by 33.49 and 35.70% respectively. The dry weed biomass also was lower in IPM
implemented fields by 31.75 and 17.06% respectively (Table 2.79).
Table2.79 Weed population and biomass in IPMs at Sakoli, Kharif 2020
Treatments Weed population No./m2 Weed biomass g/m2
30 DAT 60 DAT 30 DAT 60 DAT
IPM 14.50(3.86) 11.60(3.47) 12.04 12.25
FP 21.80(4.71) 18.04(4.29) 17.64 14.77
Exp. mean 4.29 3.88 14.84 13.51
CD(0.05) 0.39 0.37 3.25 3.38
Grain yields were relatively high in IPM implemented fields (43.71 q/ ha) as
compared to FP plots (30.29 q/ha) resulting in high returns (Table 2.80). BC ratio
was relatively high in FP plot (1.93) at Sri Kisan Balgoving Kore’s field while it was
high in IPM plot (3.02) at Sri Dudeshwar Ramaji Khotele’s field.
Table. 2.80 Returns and BC ratio in IPMs trial at Sakoli, Kharif 2020
Farmer Name Treat ments
Yield
(Q/
ha)
Gross
Returns
(Rs.)
Cost of
cultivation
(Rs.)
Net
Returns
(Rs.)
BC
ratio
F1- Sri. Kisan Balgovind Kore
IPM 34.02 85050 45787 39263 1.86
FP 28.58 71450 37084 34366 1.93
F2 - Sri. Dudeshwar Ramaji Khotele
IPM 53.39 133475 44163 89312 3.02
FP 32.00 80000 31802 48198 2.52
IPM 43.71 109263 44975 64288 2.44
FP 30.29 75725 34443 41282 2.22 Price of Paddy = Rs. 2500/q
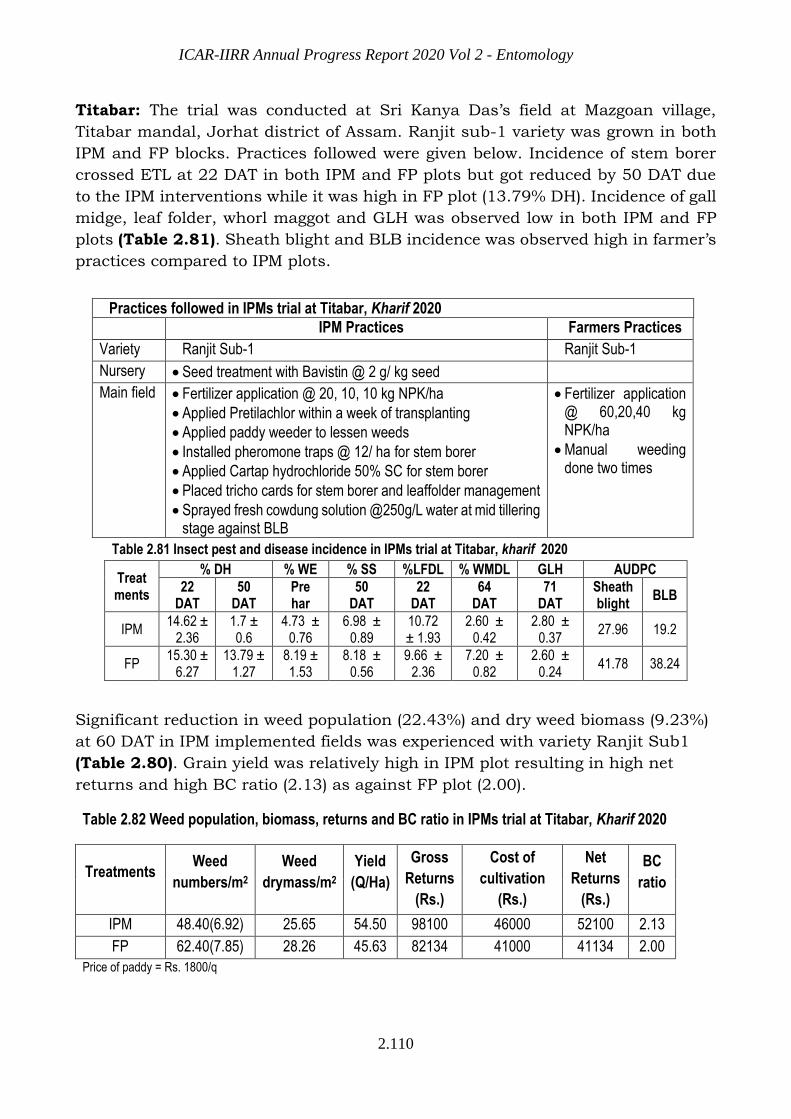
ICAR-IIRR Annual Progress Report 2020 Vol 2 - Entomology
2.110
Titabar: The trial was conducted at Sri Kanya Das’s field at Mazgoan village,
Titabar mandal, Jorhat district of Assam. Ranjit sub-1 variety was grown in both
IPM and FP blocks. Practices followed were given below. Incidence of stem borer
crossed ETL at 22 DAT in both IPM and FP plots but got reduced by 50 DAT due
to the IPM interventions while it was high in FP plot (13.79% DH). Incidence of gall
midge, leaf folder, whorl maggot and GLH was observed low in both IPM and FP
plots (Table 2.81). Sheath blight and BLB incidence was observed high in farmer’s
practices compared to IPM plots.
Table 2.81 Insect pest and disease incidence in IPMs trial at Titabar, kharif 2020
Treatments
% DH % WE % SS %LFDL % WMDL GLH AUDPC
22 DAT
50 DAT
Pre har
50 DAT
22 DAT
64 DAT
71 DAT
Sheath blight
BLB
IPM 14.62 ±
2.36 1.7 ± 0.6
4.73 ± 0.76
6.98 ± 0.89
10.72 ± 1.93
2.60 ± 0.42
2.80 ± 0.37
27.96 19.2
FP 15.30 ±
6.27 13.79 ±
1.27 8.19 ± 1.53
8.18 ± 0.56
9.66 ± 2.36
7.20 ± 0.82
2.60 ± 0.24
41.78 38.24
Significant reduction in weed population (22.43%) and dry weed biomass (9.23%)
at 60 DAT in IPM implemented fields was experienced with variety Ranjit Sub1
(Table 2.80). Grain yield was relatively high in IPM plot resulting in high net
returns and high BC ratio (2.13) as against FP plot (2.00).
Table 2.82 Weed population, biomass, returns and BC ratio in IPMs trial at Titabar, Kharif 2020
Treatments Weed
numbers/m2
Weed
drymass/m2
Yield
(Q/Ha)
Gross
Returns
(Rs.)
Cost of
cultivation
(Rs.)
Net
Returns
(Rs.)
BC
ratio
IPM 48.40(6.92) 25.65 54.50 98100 46000 52100 2.13
FP 62.40(7.85) 28.26 45.63 82134 41000 41134 2.00
Price of paddy = Rs. 1800/q
Practices followed in IPMs trial at Titabar, Kharif 2020
IPM Practices Farmers Practices
Variety Ranjit Sub-1 Ranjit Sub-1
Nursery Seed treatment with Bavistin @ 2 g/ kg seed
Main field Fertilizer application @ 20, 10, 10 kg NPK/ha
Applied Pretilachlor within a week of transplanting
Applied paddy weeder to lessen weeds
Installed pheromone traps @ 12/ ha for stem borer
Applied Cartap hydrochloride 50% SC for stem borer
Placed tricho cards for stem borer and leaffolder management
Sprayed fresh cowdung solution @250g/L water at mid tillering stage against BLB
Fertilizer application @ 60,20,40 kg NPK/ha
Manual weeding done two times

ICAR-IIRR Annual Progress Report 2020 Vol 2 - Entomology
2.111
IPMs trial was conducted at 15 locations in 34 farmers’ fields during Kharif 2020.
Incidence of insect pests, diseases and weeds across locations were given in Table
2.83. Dead hearts caused by stem borer was observed at 14 locations and exceeded
ETL only at three locations, viz., Sakoli, Titabar and Pusa. The dead heart damage
was at par in both IPM and FP plots except at Pusa where low damage was observed
in IPM plot (8.07% DH) compared to FP plot (15.92% DH). Low incidence of white
ears was observed at 10 locations Gall midge incidence was reported from four
locations with maximum damage in FP plot (16.7% SS) at Sakoli. Low incidence of
leaf folder was noticed at 13 locations and whorl maggot at six locations. Hispa
damage was recorded at four locations with maximum in FP plot (59.43% HDL) at
Malan. BPH incidence was observed at 9 locations with maximum numbers in IPM
plot at Sakoli (101/5 hills). At five locations, low WBPH incidence was observed.
Disease incidence was recorded at 6 different locations viz., Mandya, Kaul,
Rajendranagar, Titabar, Navsari and Sakoli. AUDPC of leaf blast and neck blast
diseases indicating that the disease progress was significantly lower in the
experimental plots where IPM practices were followed when compared to the
farmers’ practices. The sheath rot disease progression was slow in IPM practices
as compared to farmer’s practices at Sakoli. At Rajendranagar, false smut disease
progression was more under farmers’ practices compared to IPM practices. In
general, IPM practices resulted in slow progression of diseases across locations.
Weed population and weed biomass was reported from nine locations and IPM
implementation resulted in low weed numbers and dry biomass across locations
as compared to farmer practices. Across the locations, grain yield was high in IPM
plots (3288 – 7780 kg/ ha) as compared to FP plots (2040 – 7652 kg/ha) with
maximum yield at Ludhiana. Due to the high grain yield and high gross returns,
BC ratio was high in IPM plots compared to FP plots at all the locations.
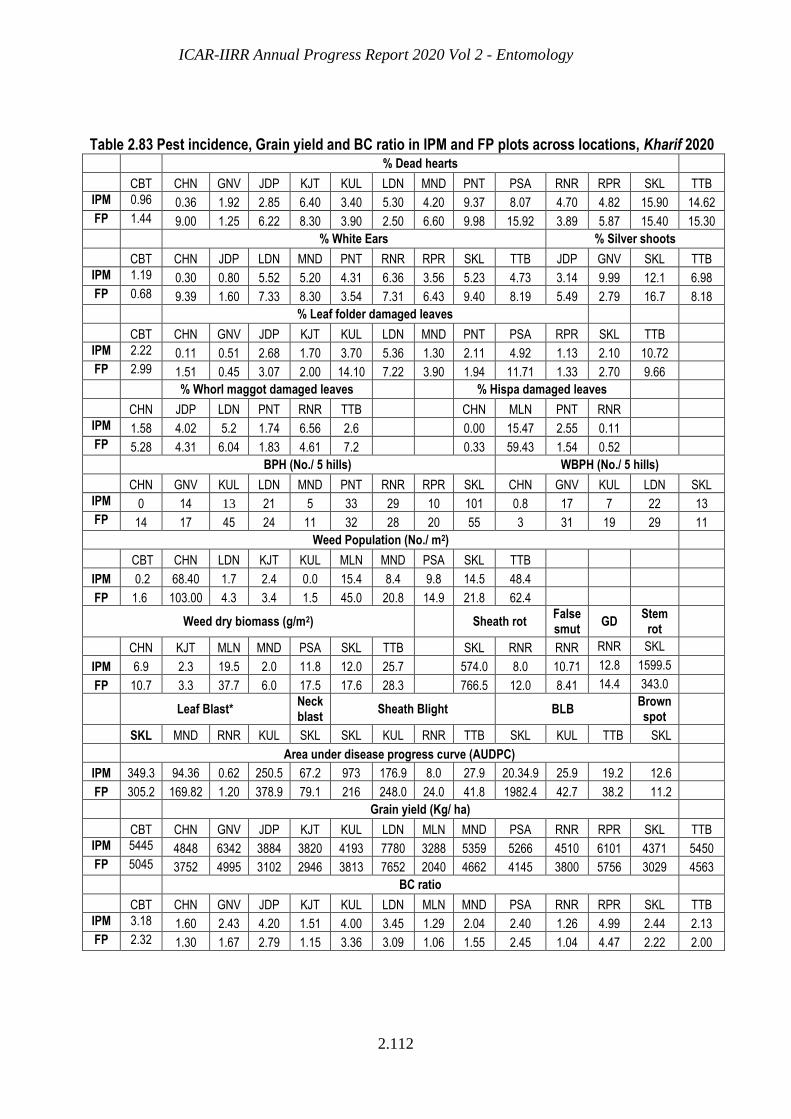
ICAR-IIRR Annual Progress Report 2020 Vol 2 - Entomology
2.112
Table 2.83 Pest incidence, Grain yield and BC ratio in IPM and FP plots across locations, Kharif 2020
% Dead hearts
CBT CHN GNV JDP KJT KUL LDN MND PNT PSA RNR RPR SKL TTB
IPM 0.96 0.36 1.92 2.85 6.40 3.40 5.30 4.20 9.37 8.07 4.70 4.82 15.90 14.62
FP 1.44 9.00 1.25 6.22 8.30 3.90 2.50 6.60 9.98 15.92 3.89 5.87 15.40 15.30
% White Ears % Silver shoots
CBT CHN JDP LDN MND PNT RNR RPR SKL TTB JDP GNV SKL TTB
IPM 1.19 0.30 0.80 5.52 5.20 4.31 6.36 3.56 5.23 4.73 3.14 9.99 12.1 6.98
FP 0.68 9.39 1.60 7.33 8.30 3.54 7.31 6.43 9.40 8.19 5.49 2.79 16.7 8.18
% Leaf folder damaged leaves
CBT CHN GNV JDP KJT KUL LDN MND PNT PSA RPR SKL TTB
IPM 2.22 0.11 0.51 2.68 1.70 3.70 5.36 1.30 2.11 4.92 1.13 2.10 10.72
FP 2.99 1.51 0.45 3.07 2.00 14.10 7.22 3.90 1.94 11.71 1.33 2.70 9.66
% Whorl maggot damaged leaves % Hispa damaged leaves
CHN JDP LDN PNT RNR TTB CHN MLN PNT RNR
IPM 1.58 4.02 5.2 1.74 6.56 2.6 0.00 15.47 2.55 0.11
FP 5.28 4.31 6.04 1.83 4.61 7.2 0.33 59.43 1.54 0.52
BPH (No./ 5 hills) WBPH (No./ 5 hills)
CHN GNV KUL LDN MND PNT RNR RPR SKL CHN GNV KUL LDN SKL
IPM 0 14 13 21 5 33 29 10 101 0.8 17 7 22 13
FP 14 17 45 24 11 32 28 20 55 3 31 19 29 11
Weed Population (No./ m2)
CBT CHN LDN KJT KUL MLN MND PSA SKL TTB
IPM 0.2 68.40 1.7 2.4 0.0 15.4 8.4 9.8 14.5 48.4
FP 1.6 103.00 4.3 3.4 1.5 45.0 20.8 14.9 21.8 62.4
Weed dry biomass (g/m2) Sheath rot False smut
GD Stem
rot
CHN KJT MLN MND PSA SKL TTB SKL RNR RNR RNR SKL
IPM 6.9 2.3 19.5 2.0 11.8 12.0 25.7 574.0 8.0 10.71 12.8 1599.5
FP 10.7 3.3 37.7 6.0 17.5 17.6 28.3 766.5 12.0 8.41 14.4 343.0
Leaf Blast*
Neck blast
Sheath Blight BLB Brown spot
SKL MND RNR KUL SKL SKL KUL RNR TTB SKL KUL TTB SKL
Area under disease progress curve (AUDPC)
IPM 349.3 94.36 0.62 250.5 67.2 973 176.9 8.0 27.9 20.34.9 25.9 19.2 12.6
FP 305.2 169.82 1.20 378.9 79.1 216 248.0 24.0 41.8 1982.4 42.7 38.2 11.2
Grain yield (Kg/ ha)
CBT CHN GNV JDP KJT KUL LDN MLN MND PSA RNR RPR SKL TTB
IPM 5445 4848 6342 3884 3820 4193 7780 3288 5359 5266 4510 6101 4371 5450
FP 5045 3752 4995 3102 2946 3813 7652 2040 4662 4145 3800 5756 3029 4563
BC ratio
CBT CHN GNV JDP KJT KUL LDN MLN MND PSA RNR RPR SKL TTB
IPM 3.18 1.60 2.43 4.20 1.51 4.00 3.45 1.29 2.04 2.40 1.26 4.99 2.44 2.13
FP 2.32 1.30 1.67 2.79 1.15 3.36 3.09 1.06 1.55 2.45 1.04 4.47 2.22 2.00
ICAR-IIRR Annual Progress Report 2020 Vol 2 - Entomology
2.113
Integrated Pest Management special (IPMs) trial was conducted at 15 locations
involving 34 farmers’ in a participatory mode across the country with an objective of
managing insects, diseases and weeds in a holistic way by providing a basket of
options to the farmers. Across the locations, the pest incidence was very low during
Kharif 2020. Stem borer damage was observed at 14 locations while it crossed ETL
at Sakoli, Pusa and Titabar and was found low in IPM plots compared to FP plots.
Gall midge damage was reported from four locations with maximum damage at
Sakoli in FP plot (16.7% SS). Hispa damage was very high at Malan throughout the
crop growth period with maximum damage in FP plot (59.43% HDL). BPH incidence
was observed at 9 locations and WBPH at five locations with maximum numbers at
Sakoli in IPM plot (101/ 5 hills). Area Under Disease Progress Curve (AUDPC) of leaf
blast and neck blast diseases was significantly low in the experimental plots where
IPM practices were followed when compared to the farmers’ practices. Interestingly,
more incidence of sheath blight was reported in IPM practices compared to farmer
practices at Sakoli. At Rajendranagr and Titabar, the IPM practices performed well
compared to farmer practices against Sheath blight. The sheath rot disease
progression was slow in IPM practices as compared to farmer’s practices at Sakoli.
At Rajendranagar, false smut disease progression was more under farmers’
practices compared to IPM practices. In general, the trial results indicated that the
IPM practices which integrates all the necessary components for the reduction of
pathogen inoculum resulted in low disease progression. At all the locations weed
population and weed biomass was significantly reduced in IPM implemented plots
compared to farmers’ practices. Across the locations, grain yield was high in IPM
plots (3288 – 7780 kg/ ha) as compared to FP plots (2040 – 7652 kg/ha) with
maximum yield at Ludhiana. Due to the high grain yield and high gross returns, BC
ratio was high in IPM plots compared to FP plots at all the locations.
ICAR-IIRR Annual Progress Report 2020 Vol 2 - Entomology
2.114
2.7. POPULATION DYNAMICS OF RICE INSECT PESTS ASSESSED
THROUGH LIGHT TRAP CATCHES
The population dynamics of insect pests and their natural enemies vary with
the geographic location and cropping system. Insect pest populations, during the
crop season are always a function of abiotic and biotic factors. Besides biotic
potential, to a large extent, abiotic factors like temperature, rainfall, relative
humidity, sun shine hours, etc. and biotic factors such as predators, parasitoids,
entomopathogenic organisms, etc. determine the abundance of insect pests in a
crop ecosystem. Therefore, to design any effective location specific pest
management strategies, knowledge of population dynamics of insect pests in
relation to abiotic and biotic factors becomes vital. Since rice is grown in diverse
agro-climatic zones in India, concerted efforts are being made under AICRIP to
study the population dynamics of insect pests of rice at different locations across
the country to understand short and long term changes in rice pest scenario.
During 2020, insect populations in rice ecosystems were recorded daily,
throughout the year using light traps (Chinsurah/Robinson type) in 28 locations.
Corresponding weather data on temperature, rainfall, relative humidity, sunshine
hours, etc. were also collected. Weekly cumulative catches of insects and weekly
averages of weather parameters were worked out on standard week (SW) basis.
Highlights and trends of the data collected during the year 2020 are presented
zone-wise hereunder:
Zone I- Hills
1. Himachal Pradesh-Malan (22-44 SW): WSB, CW, LF, BPH, GLH, WM, and
black beetle were recorded at this location. LF was found active throughout the
recording period. However, LF incidence was lower (highest of 189 moths in
39th SW) as compared to previous year (highest of 864 moths in 37th SW). WSB
made its first appearance in 26th SW and continued up to 42rd SW with a peak
population of 864 moths in 37thSW. CW was found from 27th SW to 43rd SW.
During 32nd to 39th SW it was most active with a peak population of 462 moths
in 38th SW. Black beetle was also recorded throughout the observation period
and was most active in 41st SW (61 beetles). Incidences of GLH, BPH and WM
were low.
2. Jammu & Kashmir-Khudwani (13-44 SW): BPH, WBPH, CW, LF, skipper, LF,
scarabids, and cutworms were recorded at this centre. Overall, insect pest
incidence was less, attributable to very low minimum temperatures (-1.3 ◦C to
18.8 ◦C) and low morning relative humidity (0 to 16.4 percent). Only white grub
occurred continuously from 18th to 34th SW with a maximum population of 31
grubs in 33rd SW.
ICAR-IIRR Annual Progress Report 2020 Vol 2 - Entomology
2.115
Zone II- Northern
3. Haryana-Kaul (19-46 SW): YSB, PSB, LF, and BPH were recorded at this
location. PSB was dominant amongst the stem borers and was first appeared
in 39th SW, thereafter continuously up to 46th SW. Maximum number of moths
(31) was recorded in 42nd SW. LF was recorded from 23rd to 46th SWs with a
highest catch of 110 moths in 37th SW. BPH was found during 34 to 44 SWs
and highest population was recorded in 39th SW (1589).
4. Jammu & Kashmir-Chatha (1-52 SW): White grub, GSB, GH, LF, GLH and
Cofana sp. were recorded. White grub appeared continuously from 18-44 SWs
with peak activity during 36th SW (136). GSB also started appearing from 18th
SW and continued up to 41st SW. Highest catch was in 27th SW (28). GH was
recorded throughout the year except in 2nd to 4th and 50th SW. Highest catch
was recorded in 32nd SW. LF activity started late in the season, from 38th SW
and was at peak in 41th SW (55). GLH was observed throughout the year.
Largest catch was in 36th SW (172).
5. Punjab-Ludhiana (1-52 SW): Three species of stem borers; YSB, PSB and WSB
were recorded at this location. YSB and WSB catches were confined to the rainy
season from 31st to 40th SWs and were low (12 in 39th SW and 8 in 37th SW
respectively). PSB showed two distinct periods of activity 9th to 17th and 33to
47th SWs and the highest catch of 24 moths was found in 45th SW. LF, BPH,
and WBPH were also found but only in the rainy season. LF catches appeared
from 28th SW till 48th SW and gradually increased to a maximum of 145 moths
in 41st SW. BPH was found during 35th to 47th SWs with a peak population of
1635 in 40th SW. WBPH catches were small, highest being 137 in 39th SW.
6. Uttarakhand-Pantnagar (22-48 SW): YSB, LF, GLH, BPH, WBPH, RH and
RGB were recorded at this location. YSB appeared up to 43rd SW. YSB
population increased gradually, and reached maximum level during 38th SW
followed by a decline and catches consisted, mostly of females. Highest catch
was recorded in 38th SW (1882 females and 234 males). LF was recorded from
23rd to 43 SWs and showed maximum activity in 34th and 36th SWs (132). GLH
and BPH were active during 31st -45th SWs whereas, WBPH was active during
35th to 44th SWs. BPH and WBPH were most active (33361 and 6785
respectively) in 39th SW. RGB was found active during 34th to 46th SWs with a
peak catch of 180 in 39th SW.
ICAR-IIRR Annual Progress Report 2020 Vol 2 - Entomology
2.116
Zone III-Eastern
7. Odisha-Chiplima (27-52 SW): SB, GM, LF, GLH, BPH, WBPH and CW were
reported from this centre. During the rainy season, YSB activity started from
30th SW showing a steady build up to reach the peak level in 42nd SW (37
female and 55 male moths). GM was active during 30th to 46th SWs with a peak
activity in 41st SW (311). Both the species of GLH; N. virescens and N.
nigropictus were recorded and the combined catch was largest (3135) in 42nd
SW. BPH and WBPH populations showed a gradual build up from the first
appearance in 34th and 36th SWs attaining maximum level during 42nd SW
(98754) and 41st SW (12880) respectively followed by a decline. LF also showed
a similar trend in their population build up with a maximum catch of 115 in
39th SW. CW was found in moderate numbers reaching up to 122 in 38th SW.
8. West Bengal-Chinsurah (1-52 SW): SBs, LF, GLH, BPH, WBPH, WLH and
RGB were found active throughout the year. Also, insect catches in Kharif
were larger as compared to Rabi. In case of YSB, males were more abundant.
Maximum number of moths (491 females and 1283 males) was recorded in
the 41st SW. GLH catches were recorded up to 176 in 40th SW. BPH and WBPH
were also most active in 41st (485 and 49 respectively). Moderate numbers of
WLH were also observed and highest catch (42) was recorded in 15th, 38th, and
50th SWs.
9. Assam-Titabar (1-52 SW): YSB, WSB, WM, CW, Blue beetle, GM, LF, GLH,
BPH, WBPH, WLH, Black bug, Mole cricket, GH and RGB were recorded from
this location. Except stem borers, remaining pests were predominantly found
in the rainy season. YSB and WSB made first appearance in 5th and 6th SWs
respectively and both the borers showed cyclical fluctuations in the population
with highs followed by lows. Maximum number of YSB moths (336 females and
319 males) was in 37th SW. WSB numbers also peaked in the same week with
293 moths. GM was active from 18th to 37th SWs and highest activity was in
35th SW (195). LF was active from 14th to 51st SWs and was caught in highest
numbers in 40th SW (224). BPH and WBPH were negligible and were recorded
only in 31st SW. Other pests namely, WM, CW, blue beetle, black bug, GH,
mole cricket, and RGB also were recorded in significant numbers during the
rainy season. Among the natural enemies, general predators namely,
dragonfly, damsel fly and ground beetles were recorded in moderate numbers
during the rainy season.
ICAR-IIRR Annual Progress Report 2020 Vol 2 - Entomology
2.117
Zone V- Central
10. Chhattisgarh-Raipur (1-52 SW): YSB, PSB, LF, GLH, BPH, ZZLH, CW, RGB
and blue beetle and Spodoptera sp. were recorded at this location. Both the
stem borers were found throughout the year. YSB catches were highest (99
females and 290 males) in 43rd SW. LF was found active in Kharif season for a
limited period i.e., 36th to 52nd SWs and maximum catch (115) was in 42nd SW.
BPH and ZZLH showed distinct seasonal pattern that was corresponding to
crop growth period. It was most active during 18th to 20th SWs in Rabi and 45th
to 48th SWs in Kharif and the catch was highest (33810) in 47th SW. Significant
catches of ZZLH were also observed, but more in rabi season, with a maximum
catch (3900) in 20th SW. CW, Blue beetle and RGB occurred in the rainy season
in moderate numbers. Spodoptera moths were attracted in small numbers
throughout the year. Generalist predators like coccinellids, ground beetles,
and rove beetles also were recorded round the year though were more
abundant in the rain season.
11. Chhattisgarh-Jagdalpur (1-12, 26-52 SW): YSB, GM, CW, LF, GLH, BPH,
WBPH, ZZLH, RGB, and GH were recorded at this location. From 13th SW to
25th SW data was not recorded due to lockdown. YSB occurred throughout the
year and incidence was more during the crop growth period. Maximum
population was recorded in 44th SW (34 females and 41 males). GM was found
during 33 to 48 SWs with a maximum catch of 62 in 42nd SW. LF occurrence
was highest (61) in 46 SW. GLH was more active during the Kharif season and
the combined catch of N. virescens and N. nigropictus reached up to 10726 in
45th SW. BPH and WBPH populations were not considerable. ZZLH population
was recorded up to 203 hoppers in 41st SW. Grasshopper activity picked up in
the rainy season and was highest in 43rd SW (26). Among the natural enemies,
coccinellids and ground beetles were recorded round the year with a maximum
of 344 and 145respectively in 45 SW.
12. Maharashtra-Sakoli (1-52 SW): YSB, GM, LF, GLH, BPH, WBPH and rice moth
were recorded at this location. YSB was found active throughout the year. In
Rabi, YSB was more active (331 females and 110 males) in 18th SW whereas,
during Kharif the catches were highest during 39th SW (161 females and 41
males). GM occurred during 31st to 45th SWs and the highest catch was
recorded in 40th SW (569). LF was found continuously from 31 SW onwards
with a peak activity in 37th SW (49). Hoppers showed a distinct seasonal
activity corresponding to the crop growth period. GLH population was highest
(586) in 13th SW. BPH population reached maximum (962) in 43rd SW.
Whereas, WBPH was highest in 15th SW (468). Rice moth was found up to 18th
SW and from 46th to 52nd SW and was most active in 48th and 49th SWs (47).
Among the natural enemies, coccinellids were recorded during rainy season.
ICAR-IIRR Annual Progress Report 2020 Vol 2 - Entomology
2.118
13. Uttar Pradesh-Mashoda (22-52 SW): YSB, LF, GLH, CW and GH were
recorded from this location throughout the recording period. YSB showed two
peaks one in 33rdSW (706) and other in 45th SW (479). LF catch was maximum
during 34th SW (620). GLH was highest (2664) in 42nd SW. CW moth population
also was considerable at this location, with a highest catch of 1208 moths in
36th SW. GH were most active in 44thSW (419).
Zone VI- Western
14. Gujarat-Navsari (1-52 SW): SBs, LF, GLH, BPH, WBPH, RGB, and paddy skipper were recorded in this location. No catches were recorded during the rabi season. YSB appeared from 22nd SW and increased gradually along with
other SBs reaching peak population (251 females and 57 males) in 40th SW followed by a decline. LF started from 24thSW and reached peak in 36th SW
(596). Sucking pests appeared late in the season, after 34th SW. But the populations were not considerable. Paddy skipper was first recorded in 23rdSW and increased up to 244 in 40th SW followed by a gradual decline.
15. Gujarat-Nawagam (1-52 SW): YSB, LF, BPH, and WBPH were recorded at this
location in moderate numbers and incidence was relatively higher in the rainy
season. Highest levels of YSB and LF were recorded in 44th SW (63 and 31
respectively). BPH incidence was from 9th to 48th SWs with a maximum activity
in 43rd SW (49). Whereas, WBPH incidence was higher in 18th SW (66) followed
by a gradual decline by 27th SW and again increase. Among the natural
enemies rove beetles occurred continuously from 17th to 50th SW and
maximum activity was in 42nd SW (119).
16. Maharashtra-Karjat (1-52 SW): YSB, LF, GLH, and RGB were recorded at
this centre. Except GLH, other pests appeared in the rainy season only. YSB
started appearing from 23rd SW and reached the maximum level by 30th SW
(25 female and 32 male moths). LF appeared from 28th SW with a highest level
of 15 moths in 24th and 47th SWs. GLH was recorded from 2nd-11th and 24th-
52nd SWs. However, numbers were higher in the rainy season and the
maximum population was recorded in 43rd SW (296).
VII-Southern
17. Andhra Pradesh-Maruteru (22-52 SW): YSB, GM, LF, GLH, BPH, WBPH,
ZZLH, black bug, coccinellids and mirid bug were reported from this centre.
Pest activity started from 25th SW and continues up to 52 SW. YSB catches
were highest (485 females and 1080 males) in 45th SW. GM was most active
(255) during 43rdSW. Among the plant hoppers, BPH was predominant and
ICAR-IIRR Annual Progress Report 2020 Vol 2 - Entomology
2.119
the largest catch was of 11487 in 43 SW. Whereas, WBPH was more active in
43 SW (719). Black bug was found throughout the recording period and was
most active (386) in 50thSW. Among the natural enemies, mirid bugs were
recorded and the largest catch (1263) was in 43rdSW.
18. Andhra Pradesh-Ragolu (30-52 SW): SBs, GM, LF, GLH, BPH, WBPH and
mirid bug were reported from this centre. YSB incidence was low with a highest
catch of 11 females and 11 males in 41st SW. GM appeared in 37th and
gradually population increased to a maximum of 183 in 44th SW. BPH and
WBPH were nearly in equal proportion. Plant hoppers activity picked up from
34th SW peaking in 43rd SW (993 and 1260 respectively) followed by a decline.
Mirids closely followed hoppers population and reached maximum level in 42nd
SW (374).
19. Telangana-Jagityal (1-52 SW): YSB, GM, BPH and GLH were recorded at this
centre. YSB though was found throughout the year, incidence level was low.
In Rabi 4th to 12th SWs and in Kharif, 43rd to 47th SWs were found favourable
with a peak population of 33 and 42 respectively. GM was found in the rainy
season in low level from 28th to 45th SWs with a maximum level of 11 in 40th
SW. BPH was present throughout the year and was highest in 47th SW (425).
GLH also exhibited a similar pattern and reached peak population level in 44th
SW (152)
20. Telangana-Rajendra Nagar (1-52 SW): YSB, PSB, CW, LF, GLH, BPH, blue
beetle, GLH, GSB, coccinellids and mirid bug were recorded at this centre.
Overall, insect catches were small. YSB activity was spread across the rabi
season and late in the kharif season. In 4th SW its activity was at peak (106
females and 33 males). BPH was more active during 42nd to 44th SWs; with a
peak population of 7765 in 42nd SW. GSB also was most abundant (1070) in
42nd SW.
21. Telangana-Warangal (1-52 SW): YSB, WSB, GM, LF, BPH, WBPH, GLH, and
GSB were recorded at this centre. YSB population was generally low. Highest
catch was recorded in 43rd SW (80 males and 34 females). GM was found from
4th to 15th SW and 34th to 52nd SW. It was more active during the rainy season
and peak activity was observed in 44th SW (753 females and 244 males).
Hoppers activity coincided with cropping season and was more active in the
rainy season. Highest BPH and WBPH populations were in 44th SW (1833 and
1537 respectively). GLH though recorded throughout the year except 24th to
27th SWs; was more active in the rainy season with a maximum population of
2036 in 42nd SW. Among the natural enemies; coccinellids, mirid bug and rove
beetle were recorded. Mirid bug was most active during 43rd SW (2970).
ICAR-IIRR Annual Progress Report 2020 Vol 2 - Entomology
2.120
22. Tamil Nadu-Aduthurai (1-52 SW): YSB, LF, GLH, WLH, BPH, black bug, mole
cricket and water beetle were recorded at this location. Except LF, all the
insects were active throughout the year. YSB incidence was highest in 6th SW
(1247). BPH, GLH, WLH, and coccinellid populations showed a spurt in 31st
SW and reached highest levels of 2193, 43262, 13572 and 50176 respectively
in this week. LF occurred from 1st to 9th SW and 40th to 52nd SWs. Black bug
showed high activity during 30th-38th SWs with a peak population level in 36th
SW (175834).
23. Tamil Nadu-Coimbatore (1-52 SW): YSB, CW, LF, GLH, BPH, WBPH, WLH,
RGB, GSB, rove beetle and mirid bug were recorded at this location. Overall,
the insect catches were small. Mirid numbers were highest in 6th SW (290).
24. Kerala-Moncompu (1-52 SW): SBs, LF, GLH, BPH, WBPH, black bug, and
natural enemies were recorded. Generally, insect incidence was low at this
location. Black bug occurred during 27th to 32nd SWs. Water bug was found
almost throughout the year, with a peak population of 233 in 38th SW. YSB
and other stem borers occurred during 1st-10th, 27th-32nd, and 43rd-51st SWs
with a maximum activity in 29th SW (11 females and 4 males). BPH and mirid
bug, showing a similar pattern in their activity were found during 1st to 11th
SWs. Highest activity of BPH and mirid bug was recorded in 10th and 5th SWs
(27 and 20 respectively).
25. Kerala-Pattambi (1-52 SW): YSB, WSB, GM, LF, GLH, BPH, WLH, and CW
were recorded in light trap catches. High incidence of YSB was recorded at this
location and was active from 1st-21st and 36th to 52nd SWs. Its activity peaked
(1416) by 5th SW followed by a decline. BPH population also similar trend and
reached maximum level in 6th SW (2426). WSB catches were comparatively
smaller and maximum (50) was in 48th SW. GM was active during 26th to 52nd
SWs with a maximum catch of 712 in 37th SW. GLH was found throughout the
year and was more active late in the year. Both the species, N. nigropictus
(3131) and N. virescens (2850) reached their peak population levels in the 52nd
SW. WLH also occurred throughout the year and was maximum in 6th SW
(843). CW was more active in the rain season with a steady population (highest
of 82) in 30th SW. Among the natural enemies, ground beetles, rove beetles
and mirid bugs were recorded in good numbers throughout the year. Mirid
bugs were abundant showing clear trend in population dynamics. Maximum
mirid bug catch (5186) was recorded in 52ndSW.
26. Karnataka-Mandya (1-52 SW): YSB, LF, CW, GLH, and BPH were recorded at
this centre. YSB was found throughout the year with fluctuations in population
ICAR-IIRR Annual Progress Report 2020 Vol 2 - Entomology
2.121
corresponding to the crop growth seasons. The pest was more active in kharif
with a maximum population (221 females and 160 males) in 40th SW. LF
showed two favorable periods of activity with a high population in 13th and 14th
SWs (101) in rabi and in 44th SW (204) in the kharif season. CW occurred in
6th to 12th and 28th to 48th SWs, with a maximum population (82) in 38th SW.
GLH and BPH also showed similar trends in fluctuations in the population
levels with moderate numbers (high of 41 in 39th SW and 364 in 46th SW
respectively).
27. Karnataka-Gangavati (1-52 SW): YSB and other stem borers, GM, LF, GLH,
BPH and WBPH were recorded at this location. From 13th to 17th SWs data was
not recorded due to lockdown. However, insects were found active throughout
the year. YSB populations were highest in 19th SW (255 females and 148
males). In kharif, GM appeared from 34th SW with a peak activity in 40th SW
(1169). LF was in the range of 12-94 moths per week and the highest was in
6th SW. Plant hoppers were more active during 18th to 22nd SW and 37th to 39th
SWs. Highest weekly catches of BPH and WBPH were in 20th SW (2685) and
19th SW (2094) respectively. Stem borers, other than YSB were also reported
in significant numbers, with a yearly cumulative catch of 2410 moths.
28. Puducherry-Karaikal (1-52 SW): SBs, LF, GLH, BPH, WBPH, WLH, and
natural enemies were recorded in small numbers at this centre up to 11th SW
and sparsely thereafter. Among the natural enemies, ground beetle,
coccinellids, and rove beetle were recorded. However, staphylinid predator
catches were considerable during the crop season from 1st to 11th SWs and
35th to 48th SWs.
Pest-wise analysis of light trap catches:
Yellow Stem borer
Yellow stem borer was recorded in 25 locations, except in KHD, MLN and CHT.
Annual cumulative catches were highest at CNS (18996) followed by ADT (11038),
and PNT (9785). Weekly highest catch also was in CNS (1774) in 41st SW followed
by PNT (2116) in 38th SW and MTU (1565) in 45th SW. In the previous year annual
cumulative catch was highest at TTB (50144) followed by MTU (16755) and CHN
(13710) (Fig. 2.8).

ICAR-IIRR Annual Progress Report 2020 Vol 2 - Entomology
2.122
Fig. 2.8 Annual and weekly cumulative light trap catches of yellow stem borer SW- Peak catch
standard week
Gall midge
Gall midge occurrence was observed at eleven locations. It was not recorded from
Hills, Northern and Western Zone. Annual cumulative catches were highest in GNV
(14005) followed by WGL (4273) and SKL (3072). In terms of weekly cumulative
catch, it was most active in GNV (1334) in 49th SW, followed by WGL (1061) in 40th
SW and PTB (712) in 37th SW (Fig. 2.9). Data reveals that late rainy season
conditions are favourable for its population build up. In the previous year on the
basis of yearly cumulative catch, it was most active in TTB (3746) followed by MTU
(3470) and SKL (2335).
Fig. 2.9 Annual and weekly cumulative light trap catches of gall midge SW- Peak catch standard week
17741247
2116
381
1416655 441
1565706 389 403 308 114
18996
11038
9785
7566 72806837
6217 6122
39703037 2968
2471
1071
41
6
3840
5
37
18
45
33
43
19
40
45
0
5
10
15
20
25
30
35
40
45
50
0
2000
4000
6000
8000
10000
12000
14000
16000
18000
20000
CNS ADT PNT MND PTB TTB SKL MTU MSD RPR GNV NVS RNR
Highestweeklycumulative
Annualcumulative
SW
14005
4273
3072 2815
17641651
904 871383 74
1334 1061561 712
311 255 195 183 62 10
49
40 4037
4143
35
4442 41
0
10
20
30
40
50
60
0
2000
4000
6000
8000
10000
12000
14000
16000
GNV WGL SKL PTB CHP MTU TTB RGL JDP JGT
Yearlycumulative
Highestweeklycumulative
SW
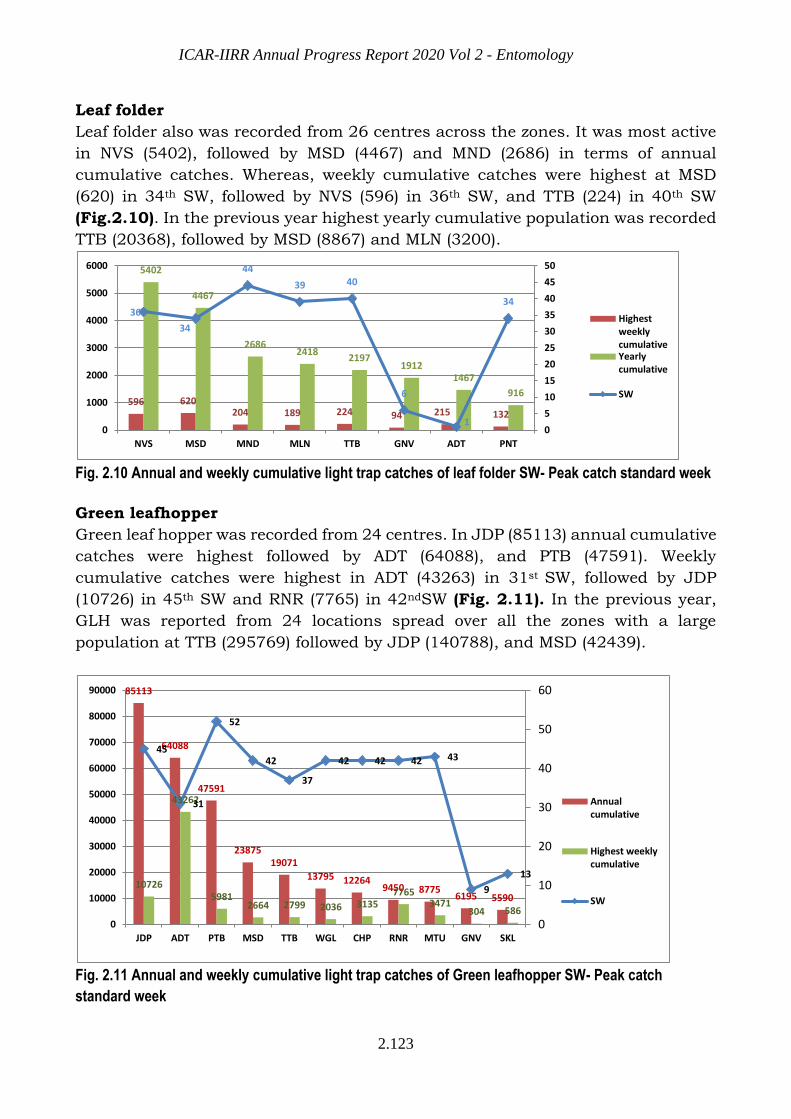
ICAR-IIRR Annual Progress Report 2020 Vol 2 - Entomology
2.123
Leaf folder
Leaf folder also was recorded from 26 centres across the zones. It was most active
in NVS (5402), followed by MSD (4467) and MND (2686) in terms of annual
cumulative catches. Whereas, weekly cumulative catches were highest at MSD
(620) in 34th SW, followed by NVS (596) in 36th SW, and TTB (224) in 40th SW
(Fig.2.10). In the previous year highest yearly cumulative population was recorded
TTB (20368), followed by MSD (8867) and MLN (3200).
Fig. 2.10 Annual and weekly cumulative light trap catches of leaf folder SW- Peak catch standard week
Green leafhopper
Green leaf hopper was recorded from 24 centres. In JDP (85113) annual cumulative
catches were highest followed by ADT (64088), and PTB (47591). Weekly
cumulative catches were highest in ADT (43263) in 31st SW, followed by JDP
(10726) in 45th SW and RNR (7765) in 42ndSW (Fig. 2.11). In the previous year,
GLH was reported from 24 locations spread over all the zones with a large
population at TTB (295769) followed by JDP (140788), and MSD (42439).
Fig. 2.11 Annual and weekly cumulative light trap catches of Green leafhopper SW- Peak catch
standard week
596 620204 189 224 94 215 132
5402
4467
26862418
21971912
1467
916
36
34
44
39 40
6
1
34
0
5
10
15
20
25
30
35
40
45
50
0
1000
2000
3000
4000
5000
6000
NVS MSD MND MLN TTB GNV ADT PNT
HighestweeklycumulativeYearlycumulative
SW
85113
64088
47591
2387519071
13795 122649450 8775
6195 559010726
43262
59812664 2799 2036 3135
77653471
304 586
45
31
52
42
37
42 42 42 43
9
13
0
10
20
30
40
50
60
0
10000
20000
30000
40000
50000
60000
70000
80000
90000
JDP ADT PTB MSD TTB WGL CHP RNR MTU GNV SKL
Annualcumulative
Highest weeklycumulative
SW

ICAR-IIRR Annual Progress Report 2020 Vol 2 - Entomology
2.124
Brown planthopper
Brown plant hopper was recorded in 24 locations BPH was most abundant in CHP
(294262), followed by RPR (158186) and PNT (76419) on yearly cumulative basis.
Weekly cumulative catches were also highest in CHP (98754) in 42nd SW, followed
by GNV (50176) in 31st SW and RPR (33810) in 47th SW. In the previous year, it was
most abundant RPR (71422), followed by MTU (68637) and ADT (23481) on yearly
basis (Fig. 2.12).
White-backed planthopper
White backed plant hopper was recorded in 19 locations. Annual cumulative
catches were highest in GNV (24120) followed by CHP (28862) and PNT (13671).
Whereas, weekly cumulative catches were highest in GNV (175834) in 36th SW
followed by CHP (12880) in 41st SW and PNT (6785) in 39th SW (Fig. 2.13). In the
preceding year it was recorded at 16 locations with a yearly maximum cumulative
population in MTU (15935) followed by GNV (63745) and SKL (6217).
Fig. 2.12 Annual and weekly cumulative light trap catches of brown planthopper SW- Peak catch
standard week
Fig. 2.13 Annual and weekly cumulative light trap catches of white backed plant hopper SW- Peak catch
standard week
98754
33810 3336150176
114871675 2426 2193 962
294262
158186
7641956320
43413
18709
16226
1417713316
42
47
39
31
43
13
6
31
45
0
5
10
15
20
25
30
35
40
45
50
0
50000
100000
150000
200000
250000
300000
350000
CHP RPR PNT GNV MTU WGL PTB ADT SKL
Weekly cumulative
Yearly cumulative
SW
175834
12880 6785 1537 468 1260 719 364 66
246120
2886213671 11715 6961 5130.5 3522 3484 1028
36
4139
44
15
43 4346
18
0
5
10
15
20
25
30
35
40
45
50
0
50000
100000
150000
200000
250000
300000
GNV CHP PNT WGL SKL RGL MTU MND NWG
Highestweeklycumulative
Yearlycumulative
SW
ICAR-IIRR Annual Progress Report 2020 Vol 2 - Entomology
2.125
Among the insect pests of minor importance, case worm was recorded in 11
locations: MSD, MLN, TTB, MND, RPR, CHP, JDP, CBT, PTB, KUD, and RNR. It
was most active in MSD (9495), followed by MLN (2595) and TTB (1963). Rice
gundhi bug was recorded at 8 locations: TTB, CNS, NVS, KJT, PNT, JDP, RPR, and
CBT. Its activity was high in TTB (1604), followed by NVS (1295), and PNT (929). It
was found more active in September and October months coinciding with the
reproductive stage of the crop. White stem borer was reported from TTB, MLN, PTB,
WGL, and LDN. WSB incidence was at considerable level at TTB (3042) and MLN
(3015). At TTB, it first appeared in 6th SW and attained its maximum level in 37th
SW (293). Pink stem borer was also reported from four locations: RPR, KUL, LDN,
and RNR. At RPR it was present throughout the year with a highest weekly
cumulative catch size of 13 in 17th,18th, and 40th SWs. Whereas, in the remaining
three locations it was predominantly a pest of Rabi season. Black bug was reported
from five locations: MLN, ADT, TTB, MTU, and MNC. At ADT, though was recorded
throughout the year, it was most active during June-July months with a highest
weekly catch of 175834 bugs in 36th SW. Zigzag leaf hopper was found in three
locations: RPR, MTU, and JDP. Paddy skipper was reported from KHD and NVS.
White grub was a concern at KHD and CHT.
Overall the light trap data revealed that yellow stem borer, leaf folder, and
hoppers continued to be the most important pests in terms of numbers as well as
spread across the locations. Gall midge continues to be an endemic pest. However,
case worm, white stem borer, pink stem borer, black bug, gundhi bug, and zigzag
leaf hopper showed an increase in the spread and intensity of incidence posing
concern for future. Patterns in seasonal incidence and population build up on the
basis of light trap data indicates that the key pests are reaching their peak levels in
the months of October and November in the kharif season. Therefore, strategies are
to be timed accordingly for the effective management of insect pests in rice.

ICAR-IIRR Annual Progress Report 2020 Vol 2 - Entomology
2.126
Rabi 2019-20
Summary
Stem borer screening trial (SBST) Evaluation of 65 entries in 8 valid field tests
identified 3 entries NND5, WGL 1293, HWR 17 as promising in 5 tests in terms of
low dead hearts, white ear damage and high grain yield suggesting that recovery
resistance and tolerance could be the mechanism in these entries as they recorded
good grain yield despite damage.
Insecticides and Botanical Evaluation Trial (IBET) was carried out at 5 locations
to to evaluate the efficacy of four combination modules/treatments against major
insect pests of rice and consequent impact on natural enemies and grain yield
during Rabi, 2019-20. Based on the performance of the treatments in reducing the
pest incidence at various locations, all insecticide treatment-Chlorantraniliprole,
Cartap hydrochloride and Triflumezopyrim–was found effective against damage by
stem borer, plant hoppers, leaf folder and whorl maggot. Neemazal, eucalyptus oil
and cartap hydrochloride treatment was found effective against pests and its
efficacy was superior to control. Highest grain yield of 6534.5kg/ha was recorded
in all insecticide treatment with 37.1% increase over control.
Effect of planting dates on insect pest incidence (EPDP) trial was conducted at
Aduthurai, Chinsurah, Maruteru and Raipur during Rabi 2019-20. Incidence of
dead hearts crossed ETL at Raipur in all the three sowings (10.54 – 20.51) and in
early planting at Aduthurai (14.69 –16.14% DH). Incidence of white ear heads was
high in normal planting (11.36%) than the other two plantings (7.88 –10.70%)
across the locations. Low incidence of leaf folder (1.14 – 2.74%), whorl maggot (1.73
– 2.55%), hispa (0.84 – 2.52%) was observed in all the three plantings across the
locations. Gall midge incidence was observed only at Aduthurai and was high in
early planting (7.47% SS). WBPH incidence was observed only at Maruteru and was
low (<2/hill) in all the three plantings. Across the locations, grain yield was high in
early and normal plantings compared to the late planting.
Ecological engineering for planthopper management(EEPM) was taken up in
Aduthurai and Maruteru with a combination of interventions such as organic
manuring, and growing of flowering plants on bunds. The population of hoppers
was significantly lower in ecological engineering as compared to farmer’s practices.
Ecological engineering also significantly increased population of all the natural
enemies at Aduthurai and spiders at Maruteru centres.
Bio intensive pest management(BIPM) trial was taken up at Pattambi during Rabi 2019-20. The natural enemy population was significantly higher in BIPM
plots. Higher yield was recorded in BIPM plots (2287.5 kg/ha) but was on par with Farmers’ practice treatment (2125 kg/ha)
ICAR-IIRR Annual Progress Report 2020 Vol 2 - Entomology
2.127
Integrated Pest Management special (IPMs) trial was conducted at Aduthurai,
Chinsurah, Maruteru and Pattambi during Rabi 2019-20. Incidence of stem borer
and gall midge crossed ETL in all the farmers’ fields and was found high in FP plots
21.36% DH, 25.09% WE, 26.61% SS) compared to IPM plots (9.95% DH, 15.29%
WE, 13.88% SS) at Aduthurai. BPH incidence crossed ETL from 43 – 57 DAT in
both IPM (65 – 72/ 5 hills) and FP plots (41 – 81/ 5 hills) at Maruteru. The incidence
of dead hearts (27.64%), white ears (11.91%), leaf folder (11.73%), whorl maggot
(26.55%) and caseworm (15.47%) was high in FP plot compared to IPM plot at
Pattambi while the damage was low in both IPM and FP plots at Chinsurah and
Maruteru. Across the locations, gross returns were high in IPM plots due to the
high grain yield and low cost of cultivation resulting in high BC ratio.
ICAR-IIRR Annual Progress Report 2020 Vol 2 - Entomology
2.128
Rabi 2019-20
1) Stem borer screening trial (SBST)
The trial was initiated in 2015 was continued during Rabi 2019-20 with 65 entries,
including nominations from IIRR, Jagtial, and Pattambi, warangal and NRRI
Cuttack which were specifically bred for stem borer tolerance. The entries were
evaluated at 5 locations and at each location observations were recorded on dead
heart damage at vegetative phase and white ear damage, grain yield in the infested
plant and the larval survival in the stubbles at harvest. For effective screening two
staggered sowings were taken up in most of the locations or efforts were made to
infest the plants. The results of the evaluation against yellow stem borer damage
from the valid tests are discussed below and some of the best lines are suggested.
Dead heart damage: The dead heart damage in the trial varied from 0.0 to 74.0%
with an average damage of 10.8% DH across 3 locations in 3 valid tests. Evaluation
of entries for dead heart damage in two staggered sowings helped in identification
of CRCPT 7, JGL 32994, JGL 33016, JGL 33310, WGL 1293, HWR 17and RP
5587as promising in 3 tests with ≤10% DH (DS of 3.0).
White ear damage: The white ear damage across 3 locations in 3 valid tests varied
from 0 to 64.5% with a mean of 20.7%WE. Evaluation of entries identified NND5
as promising in 2 tests with ≤10% WE (DS of 3.0). The low white ear damage needs
to be confirmed in green house conditions. The larval survival per entry across two
locations varied from 1 to 6.5 larvae/hill in the stubbles with a mean of 1.2
larvae/hill.
Grain yield: HWR17, KAUPTB 0627-2-14 and IET 27540 were promising in two
valid tests with ≥10-15g/hill for grain yield /hill despite stem borer damage in the
valid test.
However, RP5587, HWR 17, JGL 32994, JGL 33016, JGL 33310, IET 27540 and
CRCPT 5 which had high stem borer damage also recorded high grain yield (≥10-
15g/hill).
Overall reaction: Evaluation of entries in 8 valid field tests identified 3 entries as
promising NND5, WGL 1293, HWR 17 as promising in 5 tests in terms of low dead
hearts, white ear damage and high grain yield suggesting that recovery resistance
and tolerance could be the mechanism in these entries as they recorded good grain
yield despite damage (Table 2.84). Six other cultures were promising in 4 tests.
The mean number of larvae in the stubbles in these entries varied from ranged
from 0.3-4.5/hill.
ICAR-IIRR Annual Progress Report 2020 Vol 2 - Entomology
2.129
Summary: Evaluation of 65 entries in 8 valid field tests identified 3 entries NND5,
WGL 1293, HWR 17 as promising in 5 tests in terms of low dead hearts, white ear
damage and high grain yield suggesting that recovery resistance and tolerance
could be the mechanism in these entries as they recorded good grain yield despite
damage.
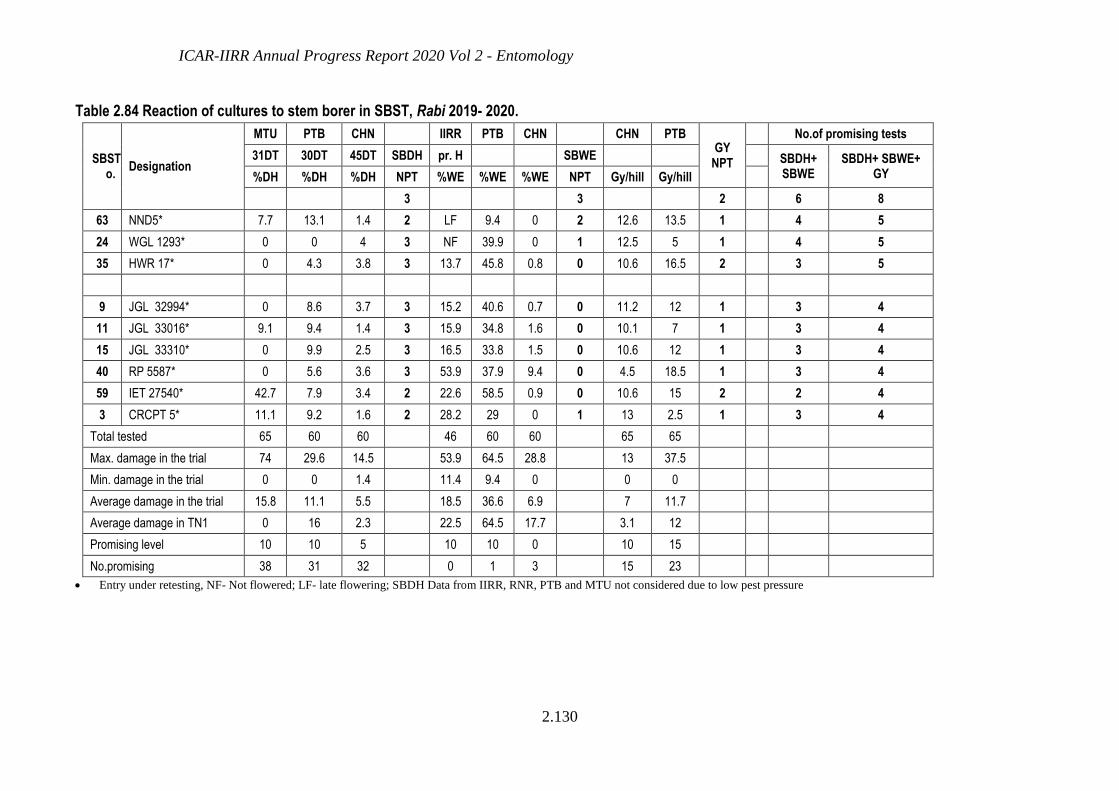
ICAR-IIRR Annual Progress Report 2020 Vol 2 - Entomology
2.130
Table 2.84 Reaction of cultures to stem borer in SBST, Rabi 2019- 2020.
SBSTNo.
Designation
MTU PTB CHN IIRR PTB CHN CHN PTB GY
NPT
No.of promising tests
31DT 30DT 45DT SBDH pr. H SBWE SBDH+ SBWE
SBDH+ SBWE+ GY %DH %DH %DH NPT %WE %WE %WE NPT Gy/hill Gy/hill
3 3 2 6 8
63 NND5* 7.7 13.1 1.4 2 LF 9.4 0 2 12.6 13.5 1 4 5
24 WGL 1293* 0 0 4 3 NF 39.9 0 1 12.5 5 1 4 5
35 HWR 17* 0 4.3 3.8 3 13.7 45.8 0.8 0 10.6 16.5 2 3 5
9 JGL 32994* 0 8.6 3.7 3 15.2 40.6 0.7 0 11.2 12 1 3 4
11 JGL 33016* 9.1 9.4 1.4 3 15.9 34.8 1.6 0 10.1 7 1 3 4
15 JGL 33310* 0 9.9 2.5 3 16.5 33.8 1.5 0 10.6 12 1 3 4
40 RP 5587* 0 5.6 3.6 3 53.9 37.9 9.4 0 4.5 18.5 1 3 4
59 IET 27540* 42.7 7.9 3.4 2 22.6 58.5 0.9 0 10.6 15 2 2 4
3 CRCPT 5* 11.1 9.2 1.6 2 28.2 29 0 1 13 2.5 1 3 4
Total tested 65 60 60 46 60 60 65 65
Max. damage in the trial 74 29.6 14.5 53.9 64.5 28.8 13 37.5
Min. damage in the trial 0 0 1.4 11.4 9.4 0 0 0
Average damage in the trial 15.8 11.1 5.5 18.5 36.6 6.9 7 11.7
Average damage in TN1 0 16 2.3 22.5 64.5 17.7 3.1 12
Promising level 10 10 5 10 10 0 10 15
No.promising 38 31 32 0 1 3 15 23
Entry under retesting, NF- Not flowered; LF- late flowering; SBDH Data from IIRR, RNR, PTB and MTU not considered due to low pest pressure
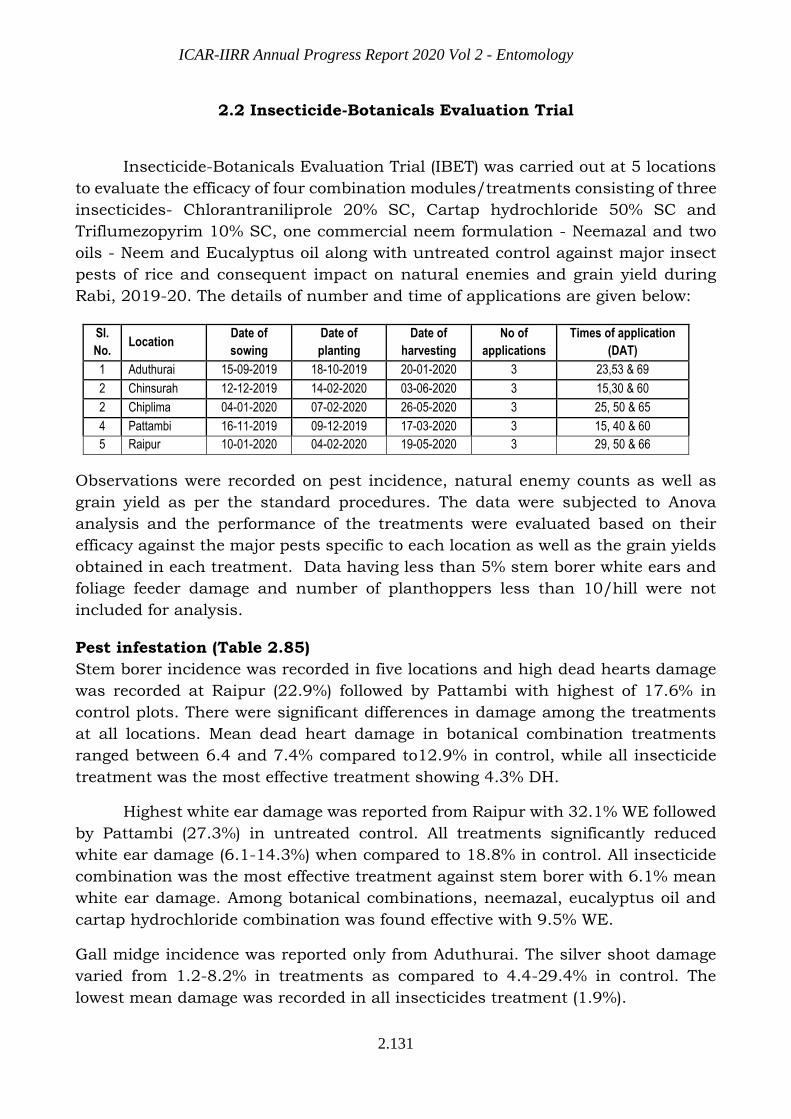
ICAR-IIRR Annual Progress Report 2020 Vol 2 - Entomology
2.131
2.2 Insecticide-Botanicals Evaluation Trial
Insecticide-Botanicals Evaluation Trial (IBET) was carried out at 5 locations
to evaluate the efficacy of four combination modules/treatments consisting of three
insecticides- Chlorantraniliprole 20% SC, Cartap hydrochloride 50% SC and
Triflumezopyrim 10% SC, one commercial neem formulation - Neemazal and two
oils - Neem and Eucalyptus oil along with untreated control against major insect
pests of rice and consequent impact on natural enemies and grain yield during
Rabi, 2019-20. The details of number and time of applications are given below:
Sl.
No. Location
Date of
sowing
Date of
planting
Date of
harvesting
No of
applications
Times of application
(DAT)
1 Aduthurai 15-09-2019 18-10-2019 20-01-2020 3 23,53 & 69
2 Chinsurah 12-12-2019 14-02-2020 03-06-2020 3 15,30 & 60
2 Chiplima 04-01-2020 07-02-2020 26-05-2020 3 25, 50 & 65
4 Pattambi 16-11-2019 09-12-2019 17-03-2020 3 15, 40 & 60
5 Raipur 10-01-2020 04-02-2020 19-05-2020 3 29, 50 & 66
Observations were recorded on pest incidence, natural enemy counts as well as
grain yield as per the standard procedures. The data were subjected to Anova
analysis and the performance of the treatments were evaluated based on their
efficacy against the major pests specific to each location as well as the grain yields
obtained in each treatment. Data having less than 5% stem borer white ears and
foliage feeder damage and number of planthoppers less than 10/hill were not
included for analysis.
Pest infestation (Table 2.85)
Stem borer incidence was recorded in five locations and high dead hearts damage
was recorded at Raipur (22.9%) followed by Pattambi with highest of 17.6% in
control plots. There were significant differences in damage among the treatments
at all locations. Mean dead heart damage in botanical combination treatments
ranged between 6.4 and 7.4% compared to12.9% in control, while all insecticide
treatment was the most effective treatment showing 4.3% DH.
Highest white ear damage was reported from Raipur with 32.1% WE followed
by Pattambi (27.3%) in untreated control. All treatments significantly reduced
white ear damage (6.1-14.3%) when compared to 18.8% in control. All insecticide
combination was the most effective treatment against stem borer with 6.1% mean
white ear damage. Among botanical combinations, neemazal, eucalyptus oil and
cartap hydrochloride combination was found effective with 9.5% WE.
Gall midge incidence was reported only from Aduthurai. The silver shoot damage
varied from 1.2-8.2% in treatments as compared to 4.4-29.4% in control. The
lowest mean damage was recorded in all insecticides treatment (1.9%).
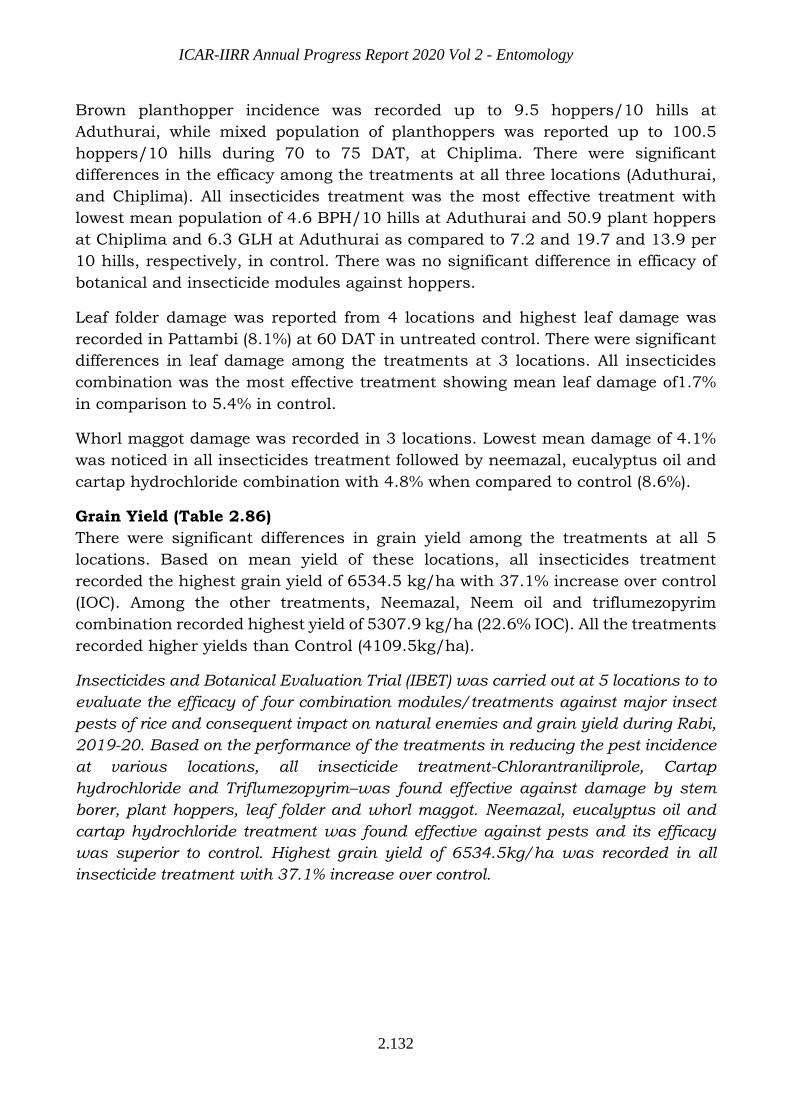
ICAR-IIRR Annual Progress Report 2020 Vol 2 - Entomology
2.132
Brown planthopper incidence was recorded up to 9.5 hoppers/10 hills at
Aduthurai, while mixed population of planthoppers was reported up to 100.5
hoppers/10 hills during 70 to 75 DAT, at Chiplima. There were significant
differences in the efficacy among the treatments at all three locations (Aduthurai,
and Chiplima). All insecticides treatment was the most effective treatment with
lowest mean population of 4.6 BPH/10 hills at Aduthurai and 50.9 plant hoppers
at Chiplima and 6.3 GLH at Aduthurai as compared to 7.2 and 19.7 and 13.9 per
10 hills, respectively, in control. There was no significant difference in efficacy of
botanical and insecticide modules against hoppers.
Leaf folder damage was reported from 4 locations and highest leaf damage was
recorded in Pattambi (8.1%) at 60 DAT in untreated control. There were significant
differences in leaf damage among the treatments at 3 locations. All insecticides
combination was the most effective treatment showing mean leaf damage of1.7%
in comparison to 5.4% in control.
Whorl maggot damage was recorded in 3 locations. Lowest mean damage of 4.1%
was noticed in all insecticides treatment followed by neemazal, eucalyptus oil and
cartap hydrochloride combination with 4.8% when compared to control (8.6%).
Grain Yield (Table 2.86)
There were significant differences in grain yield among the treatments at all 5
locations. Based on mean yield of these locations, all insecticides treatment
recorded the highest grain yield of 6534.5 kg/ha with 37.1% increase over control
(IOC). Among the other treatments, Neemazal, Neem oil and triflumezopyrim
combination recorded highest yield of 5307.9 kg/ha (22.6% IOC). All the treatments
recorded higher yields than Control (4109.5kg/ha).
Insecticides and Botanical Evaluation Trial (IBET) was carried out at 5 locations to to
evaluate the efficacy of four combination modules/treatments against major insect
pests of rice and consequent impact on natural enemies and grain yield during Rabi,
2019-20. Based on the performance of the treatments in reducing the pest incidence
at various locations, all insecticide treatment-Chlorantraniliprole, Cartap
hydrochloride and Triflumezopyrim–was found effective against damage by stem
borer, plant hoppers, leaf folder and whorl maggot. Neemazal, eucalyptus oil and
cartap hydrochloride treatment was found effective against pests and its efficacy
was superior to control. Highest grain yield of 6534.5kg/ha was recorded in all
insecticide treatment with 37.1% increase over control.

ICAR-IIRR Annual Progress Report 2020 Vol 2 - Entomology
2.133
Table: 2.85 Insect pests incidence in different treatments, IBET, Rabi 2019-20
Sl. No.
Treatment Details
Stem borer Damage (%Dead hearts)
Mean ADT CHN CHP RPR PTB
30DT 50DT 30DT 50DT 56DT 75DT 40DT 60DT 30DT 50DT
1 Botanical-Insecticide 1 6.1b 3.9b 9.1b 7.2c 1.7b 2.4b 8.9bc 14.8b 6.5bc 3.2b 6.4b 2 Botanical-Insecticide 2 5.1bc 4.4b 7.1c 5.9c 2.1b 2.7b 11.2b 17.2b 12.7a 5.8b 7.4b 3 All Botanical 4..8bc 4.6b 9.8b 9.8b 1.7b 1.9b 10.4b 15.7b 9.9ab 5.6b 7.4b 4 All Insecticide 3.9c 2.3b 4.4d 3.9b 0.7c 0.9c 7.2c 14.5b 4.7c 0.0c 4.3b 5 Control (Water Spray) 9.0a 9.5a 15.2a 16.7a 3.8a 6.5a 15.3a 22.9a 12.6a 17.6a 12.9a
Table: 2.85 Insect pests incidence in different treatments, IBET, Rabi 2019-20
Sl. No. Treatment Details
Stem borer Damage (%White Ears)
Mean ADT CHN CHP RPR PTB
Pre Harvest
1 Botanical-Insecticide 1 5.5b 9.5b 2.9bc 18.1c 11.9bc 9.5ab 2 Botanical-Insecticide 2 4.2b 6.7c 4.0b 25.4b 31..5a 14.3ab 3 All Botanical 6.1b 10.2b 3.6b 20.4c 22.2abc 12.5ab 4 All Insecticide 2.8b 4.9c 2.0c 12.3d 8.3c 6.1ab 5 Control (Water Spray) 14.4a 16.8a 8.5a 32.1a 27.2ab 19.8a
Table: 2.85 Insect pests incidence in different treatments, IBET, Rabi 2019-20
Sl. No.
Treatment Details
Brown Planthopper (No./10hills)
Mean
BPH+WBPH (No./10hills)
Mean
GLH
(No/10hills)
Mean
ADT CHP ADT
25DT 30DT 60DT 69DT 70DT 75DT 60DT 69DT
1 Botanical-Insecticide 1
6.0b 4.0b 9.7a 5.0a 6.2a 64.5bc 80.2b 72.3a 12.0ab 7.7bc 9.8ab
2 Botanical-Insecticide 2
6.7ab 4.2a
b 9.2a 4.5a 6.2a 62.2c 28.7c 45.4a 12.0ab 6.5bc 9.2ab
3 All Botanical 7.2ab 4.7a
b 8.7a 4.0ab 6.2a 64.7bc 74.2b 69.4a 10.2bc 9.2ab 9.7ab
4 All Insecticide 6.2b 4.0b 5.5b 2.7b 4.6a 74.7ab 27.2c 50.9a 8.5c 4.2c 6.3b
5 Control (Water Spray)
9.0a 5.7a 9.5a 4.7a 7.2a 81.0a 100.5a 90.7a 14.7a 13.2a 13.9a
Table: 2.85 Insect pests incidence in different treatments, IBET, Rabi 2019-20
Sl. No. Treatment Details
Gall midge Damage (% Silver Shoots)
Mean ADT
30DT 50DT
1 Botanical-Insecticide 1 2.2b 8.2b 5.2a 2 Botanical-Insecticide 2 1.8b 4.4b 3.1a 3 All Botanical 1.9b 7.1b 4.5a 4 All Insecticide 1.2b 2.7b 1.9a 5 Control (Water Spray) 4.4a 29.4a 16.9a
Botanical-Insecticide 1: Neemazal 1% EC 2ml/l (25-30 DAT), Eucalyptus oil 2ml/l (45-50 DAT), Cartap hydrochloride 50% SC 2g/l (60-65 DAT)
Botanical-Insecticide 2: Neemazal 1% EC 2ml/l (25-30 DAT), Neemoil 10 ml/l (45-50 DAT), Triflumezopyrim 10% SC 0.48ml/l (60-60 DAT)
All Botanical: Neemazal 1% EC 2ml/l (25-30 DAT), Eucalyptus oil 2ml/l (45-50 DAT) , Neem oil 10ml/l (60-65 DAT)
All Insecticide: Chlorantraniliprole 20% SC 0.2ml/l (25-30 DAT), Cartap hydrochloride 50% SC 2g/l (50-55 DAT),Triflumezopyrim 10% SC 0.48ml/l (65-70 DAT)
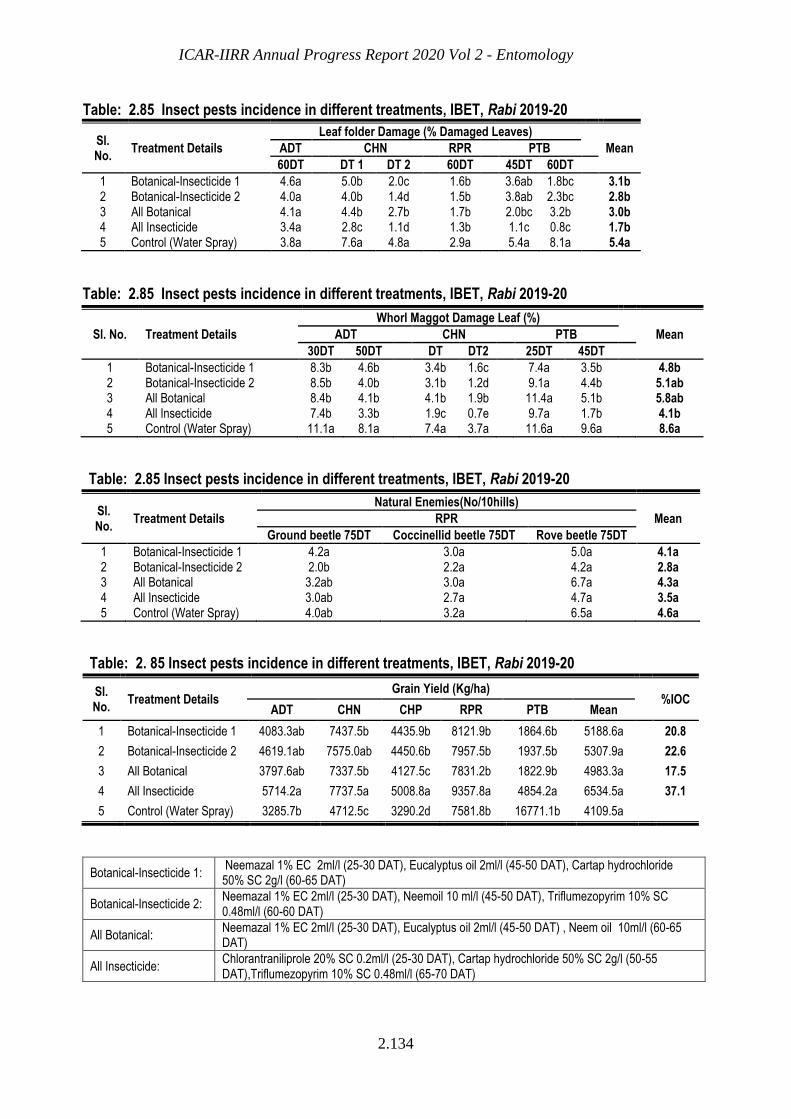
ICAR-IIRR Annual Progress Report 2020 Vol 2 - Entomology
2.134
Table: 2.85 Insect pests incidence in different treatments, IBET, Rabi 2019-20
Sl. No.
Treatment Details
Leaf folder Damage (% Damaged Leaves)
Mean ADT CHN RPR PTB
60DT DT 1 DT 2 60DT 45DT 60DT
1 Botanical-Insecticide 1 4.6a 5.0b 2.0c 1.6b 3.6ab 1.8bc 3.1b 2 Botanical-Insecticide 2 4.0a 4.0b 1.4d 1.5b 3.8ab 2.3bc 2.8b 3 All Botanical 4.1a 4.4b 2.7b 1.7b 2.0bc 3.2b 3.0b 4 All Insecticide 3.4a 2.8c 1.1d 1.3b 1.1c 0.8c 1.7b 5 Control (Water Spray) 3.8a 7.6a 4.8a 2.9a 5.4a 8.1a 5.4a
Table: 2.85 Insect pests incidence in different treatments, IBET, Rabi 2019-20
Sl. No. Treatment Details
Whorl Maggot Damage Leaf (%)
Mean ADT CHN PTB
30DT 50DT DT DT2 25DT 45DT
1 Botanical-Insecticide 1 8.3b 4.6b 3.4b 1.6c 7.4a 3.5b 4.8b 2 Botanical-Insecticide 2 8.5b 4.0b 3.1b 1.2d 9.1a 4.4b 5.1ab 3 All Botanical 8.4b 4.1b 4.1b 1.9b 11.4a 5.1b 5.8ab 4 All Insecticide 7.4b 3.3b 1.9c 0.7e 9.7a 1.7b 4.1b 5 Control (Water Spray) 11.1a 8.1a 7.4a 3.7a 11.6a 9.6a 8.6a
Table: 2.85 Insect pests incidence in different treatments, IBET, Rabi 2019-20
Sl. No.
Treatment Details
Natural Enemies(No/10hills)
Mean RPR
Ground beetle 75DT Coccinellid beetle 75DT Rove beetle 75DT
1 Botanical-Insecticide 1 4.2a 3.0a 5.0a 4.1a 2 Botanical-Insecticide 2 2.0b 2.2a 4.2a 2.8a 3 All Botanical 3.2ab 3.0a 6.7a 4.3a 4 All Insecticide 3.0ab 2.7a 4.7a 3.5a 5 Control (Water Spray) 4.0ab 3.2a 6.5a 4.6a
Table: 2. 85 Insect pests incidence in different treatments, IBET, Rabi 2019-20
Sl. No.
Treatment Details Grain Yield (Kg/ha)
%IOC ADT CHN CHP RPR PTB Mean
1 Botanical-Insecticide 1 4083.3ab 7437.5b 4435.9b 8121.9b 1864.6b 5188.6a 20.8
2 Botanical-Insecticide 2 4619.1ab 7575.0ab 4450.6b 7957.5b 1937.5b 5307.9a 22.6
3 All Botanical 3797.6ab 7337.5b 4127.5c 7831.2b 1822.9b 4983.3a 17.5
4 All Insecticide 5714.2a 7737.5a 5008.8a 9357.8a 4854.2a 6534.5a 37.1
5 Control (Water Spray) 3285.7b 4712.5c 3290.2d 7581.8b 16771.1b 4109.5a
Botanical-Insecticide 1: Neemazal 1% EC 2ml/l (25-30 DAT), Eucalyptus oil 2ml/l (45-50 DAT), Cartap hydrochloride 50% SC 2g/l (60-65 DAT)
Botanical-Insecticide 2: Neemazal 1% EC 2ml/l (25-30 DAT), Neemoil 10 ml/l (45-50 DAT), Triflumezopyrim 10% SC 0.48ml/l (60-60 DAT)
All Botanical: Neemazal 1% EC 2ml/l (25-30 DAT), Eucalyptus oil 2ml/l (45-50 DAT) , Neem oil 10ml/l (60-65 DAT)
All Insecticide: Chlorantraniliprole 20% SC 0.2ml/l (25-30 DAT), Cartap hydrochloride 50% SC 2g/l (50-55 DAT),Triflumezopyrim 10% SC 0.48ml/l (65-70 DAT)

ICAR-IIRR Annual Progress Report 2020 Vol 2 - Entomology
2.135
Table: 2.86 Grain Yield in different treatments, IBET, Rabi 2019-20
Sl. No.
Treatment Details Grain Yield (Kg/ha)
%IOC ADT CHN CHP RPR PTB Mean
1 Botanical-Insecticide 1 4083.3ab 7437.5b 4435.9b 8121.9b 1864.6b 5188.6a 20.8
2 Botanical-Insecticide 2 4619.1ab 7575.0ab 4450.6b 7957.5b 1937.5b 5307.9a 22.6
3 All Botanical 3797.6ab 7337.5b 4127.5c 7831.2b 1822.9b 4983.3a 17.5
4 All Insecticide 5714.2a 7737.5a 5008.8a 9357.8a 4854.2a 6534.5a 37.1
5 Control (Water Spray) 3285.7b 4712.5c 3290.2d 7581.8b 16771.1b 4109.5a
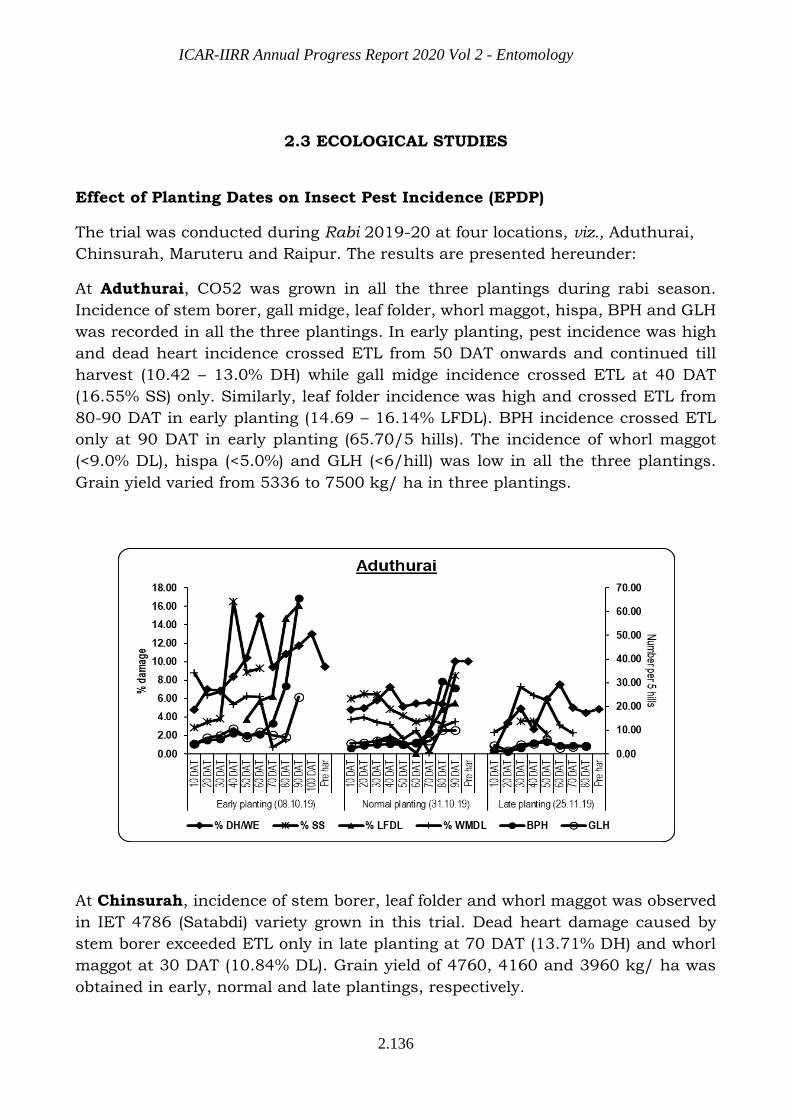
ICAR-IIRR Annual Progress Report 2020 Vol 2 - Entomology
2.136
2.3 ECOLOGICAL STUDIES
Effect of Planting Dates on Insect Pest Incidence (EPDP)
The trial was conducted during Rabi 2019-20 at four locations, viz., Aduthurai,
Chinsurah, Maruteru and Raipur. The results are presented hereunder:
At Aduthurai, CO52 was grown in all the three plantings during rabi season.
Incidence of stem borer, gall midge, leaf folder, whorl maggot, hispa, BPH and GLH
was recorded in all the three plantings. In early planting, pest incidence was high
and dead heart incidence crossed ETL from 50 DAT onwards and continued till
harvest (10.42 – 13.0% DH) while gall midge incidence crossed ETL at 40 DAT
(16.55% SS) only. Similarly, leaf folder incidence was high and crossed ETL from
80-90 DAT in early planting (14.69 – 16.14% LFDL). BPH incidence crossed ETL
only at 90 DAT in early planting (65.70/5 hills). The incidence of whorl maggot
(<9.0% DL), hispa (<5.0%) and GLH (<6/hill) was low in all the three plantings.
Grain yield varied from 5336 to 7500 kg/ ha in three plantings.
At Chinsurah, incidence of stem borer, leaf folder and whorl maggot was observed
in IET 4786 (Satabdi) variety grown in this trial. Dead heart damage caused by
stem borer exceeded ETL only in late planting at 70 DAT (13.71% DH) and whorl
maggot at 30 DAT (10.84% DL). Grain yield of 4760, 4160 and 3960 kg/ ha was
obtained in early, normal and late plantings, respectively.
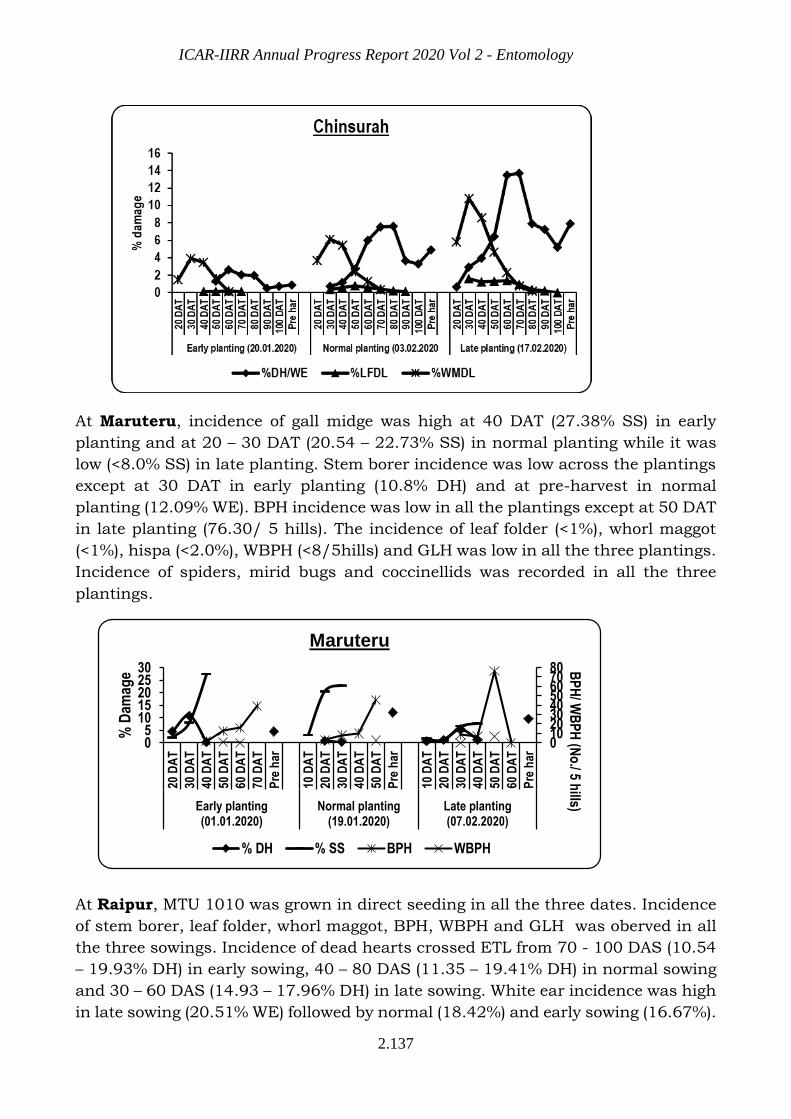
ICAR-IIRR Annual Progress Report 2020 Vol 2 - Entomology
2.137
At Maruteru, incidence of gall midge was high at 40 DAT (27.38% SS) in early
planting and at 20 – 30 DAT (20.54 – 22.73% SS) in normal planting while it was
low (<8.0% SS) in late planting. Stem borer incidence was low across the plantings
except at 30 DAT in early planting (10.8% DH) and at pre-harvest in normal
planting (12.09% WE). BPH incidence was low in all the plantings except at 50 DAT
in late planting (76.30/ 5 hills). The incidence of leaf folder (<1%), whorl maggot
(<1%), hispa (<2.0%), WBPH (<8/5hills) and GLH was low in all the three plantings.
Incidence of spiders, mirid bugs and coccinellids was recorded in all the three
plantings.
At Raipur, MTU 1010 was grown in direct seeding in all the three dates. Incidence
of stem borer, leaf folder, whorl maggot, BPH, WBPH and GLH was oberved in all
the three sowings. Incidence of dead hearts crossed ETL from 70 - 100 DAS (10.54
– 19.93% DH) in early sowing, 40 – 80 DAS (11.35 – 19.41% DH) in normal sowing
and 30 – 60 DAS (14.93 – 17.96% DH) in late sowing. White ear incidence was high
in late sowing (20.51% WE) followed by normal (18.42%) and early sowing (16.67%).
01020304050607080
05
1015202530
20 D
AT
30 D
AT
40 D
AT
50 D
AT
60 D
AT
70 D
AT
Pre
har
10 D
AT
20 D
AT
30 D
AT
40 D
AT
50 D
AT
Pre
har
10 D
AT
20 D
AT
30 D
AT
40 D
AT
50 D
AT
60 D
AT
Pre
har
Early planting(01.01.2020)
Normal planting(19.01.2020)
Late planting(07.02.2020)
BP
H/ W
BP
H (N
o./ 5 h
ills)
% D
amag
e
Maruteru
% DH % SS BPH WBPH
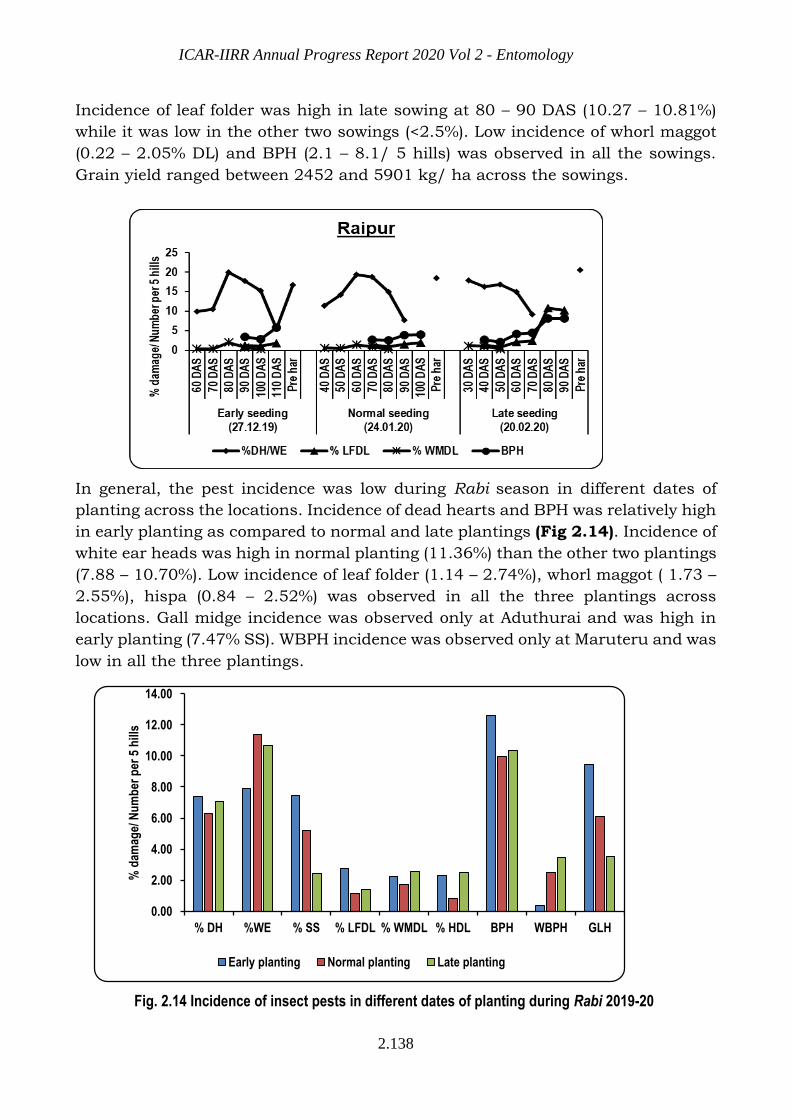
ICAR-IIRR Annual Progress Report 2020 Vol 2 - Entomology
2.138
Incidence of leaf folder was high in late sowing at 80 – 90 DAS (10.27 – 10.81%)
while it was low in the other two sowings (<2.5%). Low incidence of whorl maggot
(0.22 – 2.05% DL) and BPH (2.1 – 8.1/ 5 hills) was observed in all the sowings.
Grain yield ranged between 2452 and 5901 kg/ ha across the sowings.
In general, the pest incidence was low during Rabi season in different dates of
planting across the locations. Incidence of dead hearts and BPH was relatively high
in early planting as compared to normal and late plantings (Fig 2.14). Incidence of
white ear heads was high in normal planting (11.36%) than the other two plantings
(7.88 – 10.70%). Low incidence of leaf folder (1.14 – 2.74%), whorl maggot ( 1.73 –
2.55%), hispa (0.84 – 2.52%) was observed in all the three plantings across
locations. Gall midge incidence was observed only at Aduthurai and was high in
early planting (7.47% SS). WBPH incidence was observed only at Maruteru and was
low in all the three plantings.
Fig. 2.14 Incidence of insect pests in different dates of planting during Rabi 2019-20
0.00
2.00
4.00
6.00
8.00
10.00
12.00
14.00
% DH %WE % SS % LFDL % WMDL % HDL BPH WBPH GLH
% d
amag
e/ N
um
ber
per
5 h
ills
Early planting Normal planting Late planting
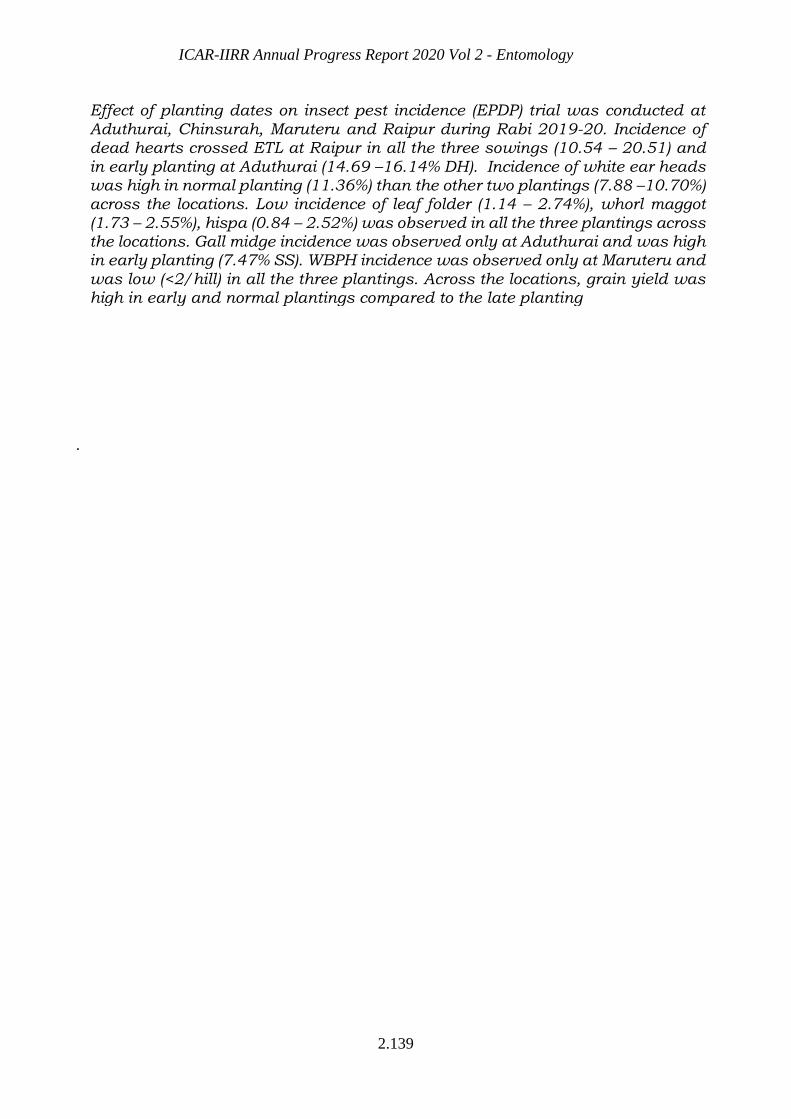
ICAR-IIRR Annual Progress Report 2020 Vol 2 - Entomology
2.139
Effect of planting dates on insect pest incidence (EPDP) trial was conducted at Aduthurai, Chinsurah, Maruteru and Raipur during Rabi 2019-20. Incidence of dead hearts crossed ETL at Raipur in all the three sowings (10.54 – 20.51) and in early planting at Aduthurai (14.69 –16.14% DH). Incidence of white ear heads was high in normal planting (11.36%) than the other two plantings (7.88 –10.70%) across the locations. Low incidence of leaf folder (1.14 – 2.74%), whorl maggot (1.73 – 2.55%), hispa (0.84 – 2.52%) was observed in all the three plantings across the locations. Gall midge incidence was observed only at Aduthurai and was high in early planting (7.47% SS). WBPH incidence was observed only at Maruteru and was low (<2/hill) in all the three plantings. Across the locations, grain yield was high in early and normal plantings compared to the late planting
.
ICAR-IIRR Annual Progress Report 2020 Vol 2 - Entomology
2.140
2.3 BIOCONTROL AND BIODIVERSITY STUDIES
i) Ecological Engineering for Planthopper Management (EEPM)
This trial was carried out at Aduthurai and Maruteru centres during Rabi 2019-2020.
Table.2.87 Effect of ecological engineering on hoppers and its natural enemies at Aduthurai, Rabi 2019-20
Parameters Hoppers
(No./ hill)
Green
mirids
(No./10
hills)
Spiders
(No./10
hills)
Coccinellids
(No./10 hills)
Drynids
(No./10
hills)
EE FP EE FP EE FP EE FP EE FP
Mean 7.15 13.13 13.70 11.45 15.80 12.20 15.05 11.05 14.15 9.95
t value 13.00 2.43 3.79 4.41 4.52
df 38 38 38 38 38
P - value <0.01 0.01 <0.01 <0.01 <0.01
The observations on hoppers and their natural enemies were recorded four times through the crop period. The mean BPH population was significantly lower in ecological engineering (EE) treatment (7.15/hill) compared to farmer’s practice
(FP) treatment (13.13/hill) (Table 2.87). The population of natural enemies such as green mirids, spiders and coccinellids were significantly higher in EE (13.70, 15.80 and 15.05/10 hills respectively) compared to FP plots (11.45, 12.20 and
11.05/ 10 hills respectively).
Table.2.88 Effect of ecological engineering on hoppers and its natural enemies at Maruteru, Rabi 2019-20
Parameters BPH
(No./ hill)
Green mirids
(No./10 hills)
Spiders
(No./ 10 hills)
Coccinellids
(No./hill)
EE FP EE FP EE FP EE FP
Mean 10.24 23.90 53.60 74.80 14.00 6.70 3.20 2.24
t value 4.23 2.20 6.57 1.12 df 98 98 98 98
P - value 0.01 0.03 0.01 0.26
The EE interventions tested at Maruteru were alleyways, organic manuring
and planting of bund flora. The observations on pests and their natural enemies
were recorded five times over the crop growth period. The mean BPH population was significantly higher in FP treatment (23.90/hill) compared to EE (10.24 hoppers/hill) (Table 2.88). The population of green mirids was significantly higher
in FP compared to EE treatment (74.80 and 53.60/10 hills respectively). On the other hand, the spiders were more abundant in EE plots (14.0/10 hills) than that
of FP plots (6.70/10hills). The coccinellid numbers were on par in both treatments. The damage caused by stem borer and gall midge was on par in EE and FP treatments (Table 2.89).
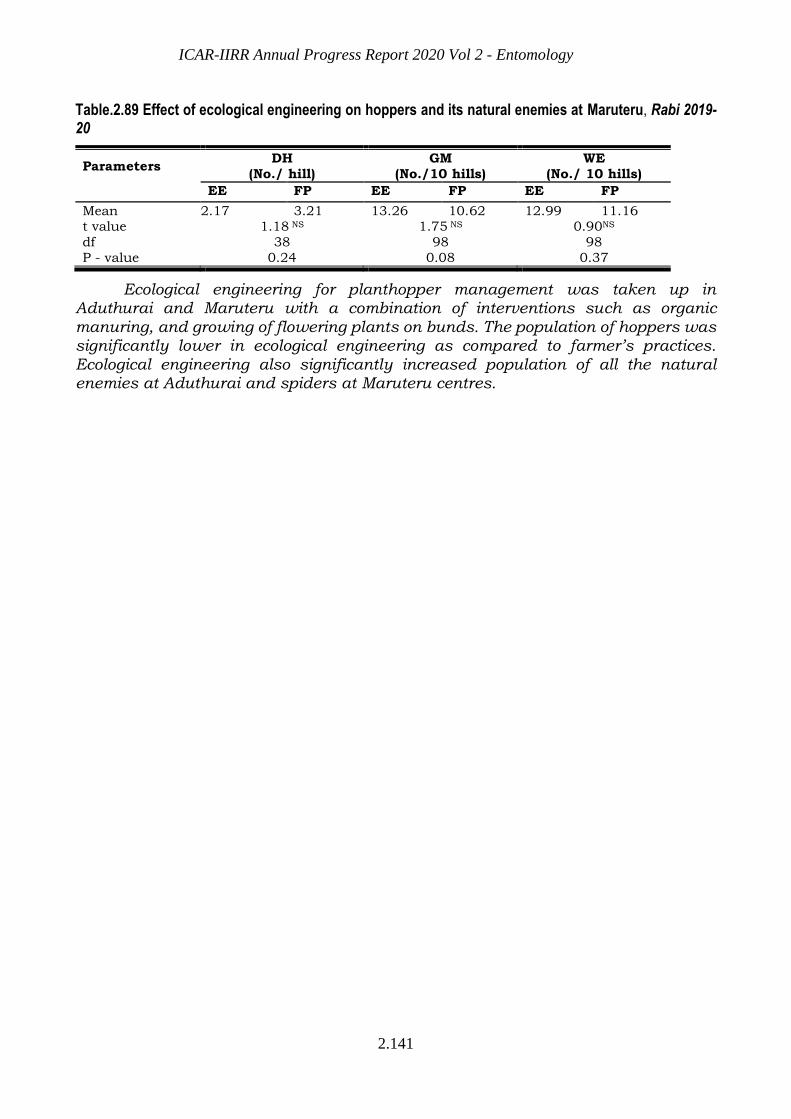
ICAR-IIRR Annual Progress Report 2020 Vol 2 - Entomology
2.141
Table.2.89 Effect of ecological engineering on hoppers and its natural enemies at Maruteru, Rabi 2019-20
Parameters DH
(No./ hill)
GM
(No./10 hills)
WE
(No./ 10 hills)
EE FP EE FP EE FP
Mean 2.17 3.21 13.26 10.62 12.99 11.16 t value 1.18 NS 1.75 NS 0.90NS
df 38 98 98
P - value 0.24 0.08 0.37
Ecological engineering for planthopper management was taken up in Aduthurai and Maruteru with a combination of interventions such as organic manuring, and growing of flowering plants on bunds. The population of hoppers was significantly lower in ecological engineering as compared to farmer’s practices. Ecological engineering also significantly increased population of all the natural enemies at Aduthurai and spiders at Maruteru centres.
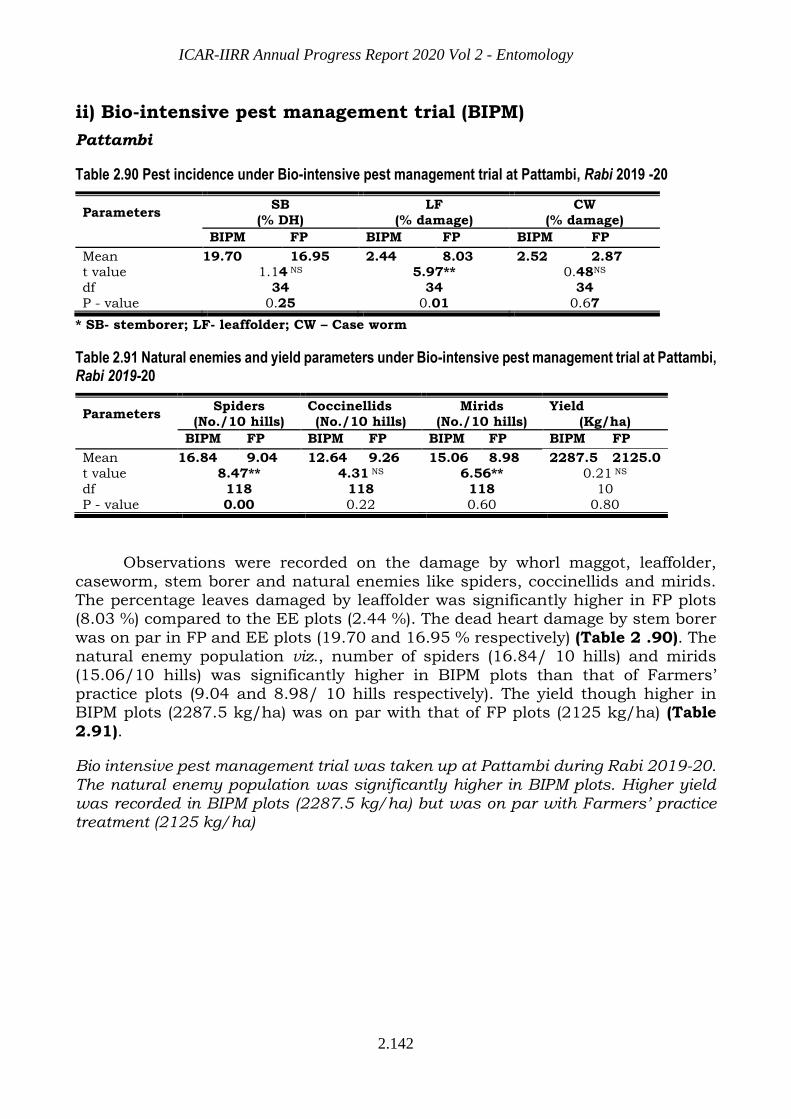
ICAR-IIRR Annual Progress Report 2020 Vol 2 - Entomology
2.142
ii) Bio-intensive pest management trial (BIPM)
Pattambi
Table 2.90 Pest incidence under Bio-intensive pest management trial at Pattambi, Rabi 2019 -20
Parameters SB
(% DH)
LF
(% damage)
CW
(% damage)
BIPM FP BIPM FP BIPM FP
Mean 19.70 16.95 2.44 8.03 2.52 2.87 t value 1.14 NS 5.97** 0.48NS
df 34 34 34
P - value 0.25 0.01 0.67
* SB- stemborer; LF- leaffolder; CW – Case worm
Table 2.91 Natural enemies and yield parameters under Bio-intensive pest management trial at Pattambi, Rabi 2019-20
Parameters Spiders
(No./10 hills)
Coccinellids
(No./10 hills)
Mirids
(No./10 hills)
Yield
(Kg/ha)
BIPM FP BIPM FP BIPM FP BIPM FP
Mean 16.84 9.04 12.64 9.26 15.06 8.98 2287.5 2125.0
t value 8.47** 4.31 NS 6.56** 0.21 NS
df 118 118 118 10
P - value 0.00 0.22 0.60 0.80
Observations were recorded on the damage by whorl maggot, leaffolder,
caseworm, stem borer and natural enemies like spiders, coccinellids and mirids. The percentage leaves damaged by leaffolder was significantly higher in FP plots (8.03 %) compared to the EE plots (2.44 %). The dead heart damage by stem borer
was on par in FP and EE plots (19.70 and 16.95 % respectively) (Table 2 .90). The natural enemy population viz., number of spiders (16.84/ 10 hills) and mirids
(15.06/10 hills) was significantly higher in BIPM plots than that of Farmers’ practice plots (9.04 and 8.98/ 10 hills respectively). The yield though higher in BIPM plots (2287.5 kg/ha) was on par with that of FP plots (2125 kg/ha) (Table
2.91).
Bio intensive pest management trial was taken up at Pattambi during Rabi 2019-20. The natural enemy population was significantly higher in BIPM plots. Higher yield was recorded in BIPM plots (2287.5 kg/ha) but was on par with Farmers’ practice treatment (2125 kg/ha)
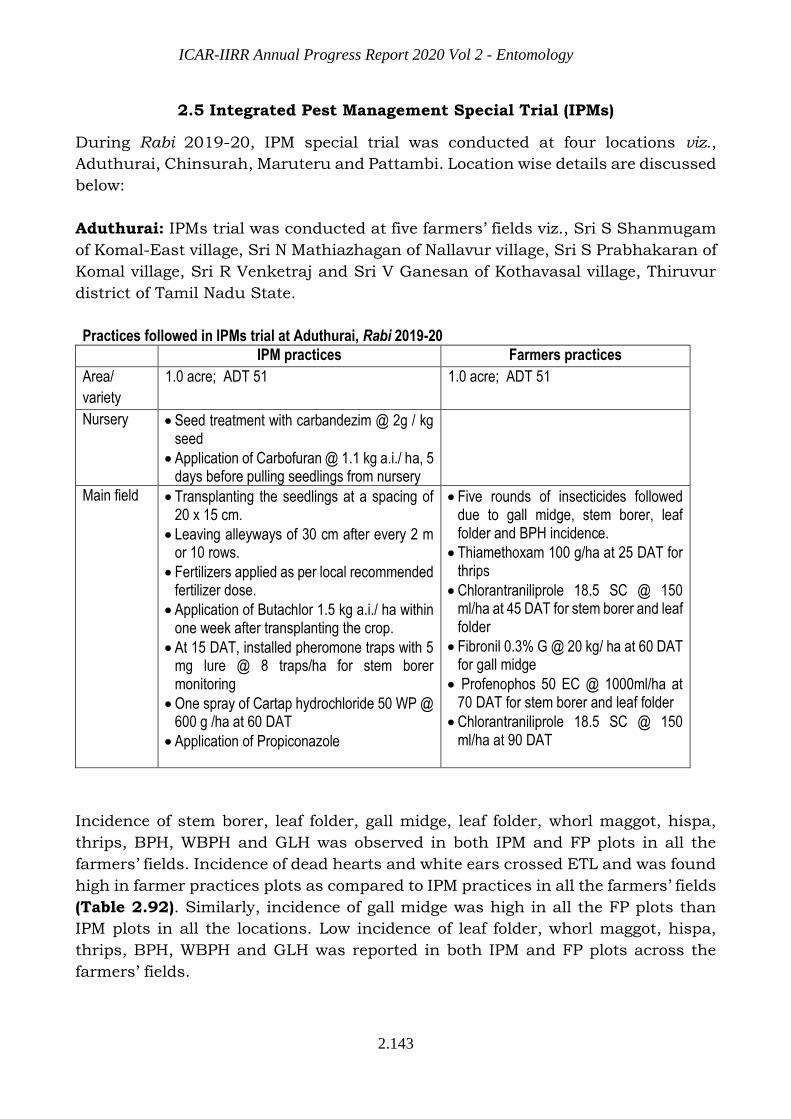
ICAR-IIRR Annual Progress Report 2020 Vol 2 - Entomology
2.143
2.5 Integrated Pest Management Special Trial (IPMs)
During Rabi 2019-20, IPM special trial was conducted at four locations viz.,
Aduthurai, Chinsurah, Maruteru and Pattambi. Location wise details are discussed
below:
Aduthurai: IPMs trial was conducted at five farmers’ fields viz., Sri S Shanmugam
of Komal-East village, Sri N Mathiazhagan of Nallavur village, Sri S Prabhakaran of
Komal village, Sri R Venketraj and Sri V Ganesan of Kothavasal village, Thiruvur
district of Tamil Nadu State.
Practices followed in IPMs trial at Aduthurai, Rabi 2019-20
IPM practices Farmers practices
Area/
variety
1.0 acre; ADT 51 1.0 acre; ADT 51
Nursery Seed treatment with carbandezim @ 2g / kg seed
Application of Carbofuran @ 1.1 kg a.i./ ha, 5 days before pulling seedlings from nursery
Main field Transplanting the seedlings at a spacing of 20 x 15 cm.
Leaving alleyways of 30 cm after every 2 m or 10 rows.
Fertilizers applied as per local recommended fertilizer dose.
Application of Butachlor 1.5 kg a.i./ ha within one week after transplanting the crop.
At 15 DAT, installed pheromone traps with 5 mg lure @ 8 traps/ha for stem borer monitoring
One spray of Cartap hydrochloride 50 WP @ 600 g /ha at 60 DAT
Application of Propiconazole
Five rounds of insecticides followed due to gall midge, stem borer, leaf folder and BPH incidence.
Thiamethoxam 100 g/ha at 25 DAT for thrips
Chlorantraniliprole 18.5 SC @ 150 ml/ha at 45 DAT for stem borer and leaf folder
Fibronil 0.3% G @ 20 kg/ ha at 60 DAT for gall midge
Profenophos 50 EC @ 1000ml/ha at 70 DAT for stem borer and leaf folder
Chlorantraniliprole 18.5 SC @ 150 ml/ha at 90 DAT
Incidence of stem borer, leaf folder, gall midge, leaf folder, whorl maggot, hispa,
thrips, BPH, WBPH and GLH was observed in both IPM and FP plots in all the
farmers’ fields. Incidence of dead hearts and white ears crossed ETL and was found
high in farmer practices plots as compared to IPM practices in all the farmers’ fields
(Table 2.92). Similarly, incidence of gall midge was high in all the FP plots than
IPM plots in all the locations. Low incidence of leaf folder, whorl maggot, hispa,
thrips, BPH, WBPH and GLH was reported in both IPM and FP plots across the
farmers’ fields.
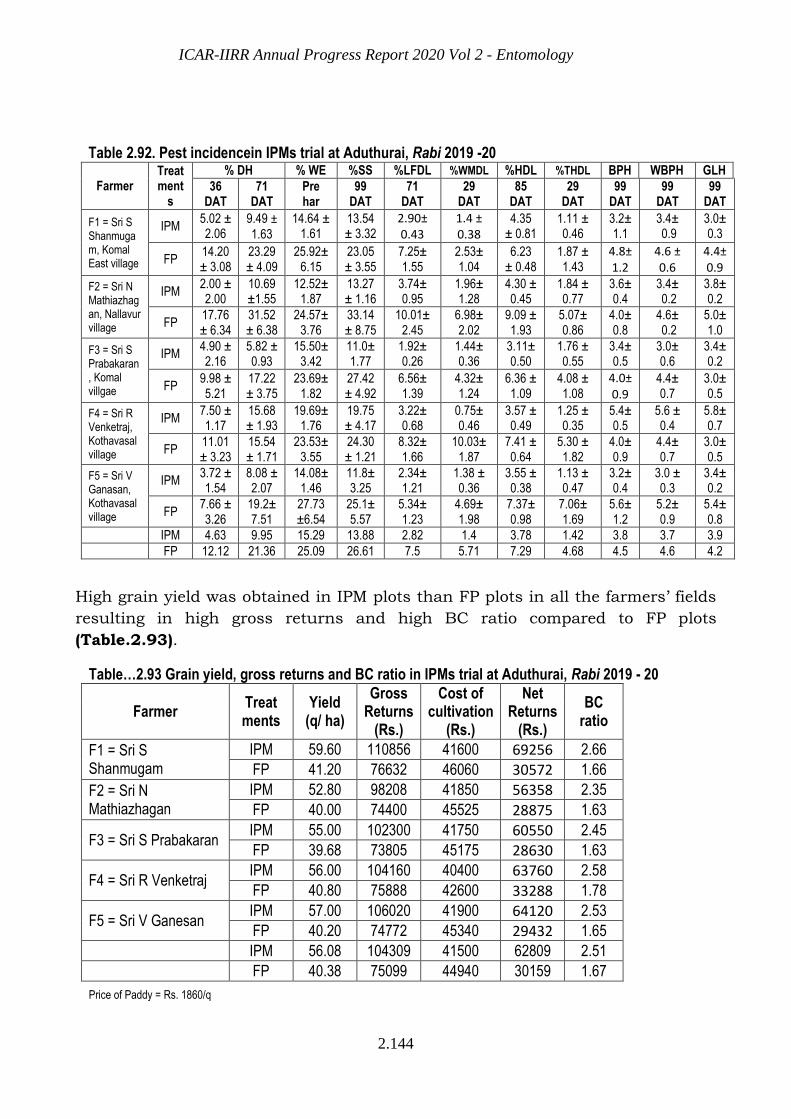
ICAR-IIRR Annual Progress Report 2020 Vol 2 - Entomology
2.144
Table 2.92. Pest incidencein IPMs trial at Aduthurai, Rabi 2019 -20
Farmer Treat ment
s
% DH % WE %SS %LFDL %WMDL %HDL %THDL BPH WBPH GLH
36 DAT
71 DAT
Pre har
99 DAT
71 DAT
29 DAT
85 DAT
29 DAT
99 DAT
99 DAT
99 DAT
F1 = Sri S Shanmugam, Komal East village
IPM 5.02 ± 2.06
9.49 ±
1.63
14.64 ± 1.61
13.54 ± 3.32
2.90± 0.43
1.4 ± 0.38
4.35 ± 0.81
1.11 ± 0.46
3.2± 1.1
3.4± 0.9
3.0± 0.3
FP 14.20± 3.08
23.29± 4.09
25.92± 6.15
23.05 ± 3.55
7.25± 1.55
2.53± 1.04
6.23 ± 0.48
1.87 ± 1.43
4.8± 1.2
4.6 ± 0.6
4.4± 0.9
F2 = Sri N Mathiazhagan, Nallavur village
IPM 2.00 ± 2.00
10.69±1.55
12.52± 1.87
13.27 ± 1.16
3.74± 0.95
1.96± 1.28
4.30 ± 0.45
1.84 ± 0.77
3.6± 0.4
3.4± 0.2
3.8± 0.2
FP 17.76± 6.34
31.52 ± 6.38
24.57± 3.76
33.14 ± 8.75
10.01± 2.45
6.98± 2.02
9.09 ± 1.93
5.07± 0.86
4.0± 0.8
4.6± 0.2
5.0± 1.0
F3 = Sri S Prabakaran, Komal villgae
IPM 4.90 ± 2.16
5.82 ± 0.93
15.50± 3.42
11.0± 1.77
1.92± 0.26
1.44± 0.36
3.11± 0.50
1.76 ± 0.55
3.4± 0.5
3.0± 0.6
3.4± 0.2
FP 9.98 ± 5.21
17.22± 3.75
23.69± 1.82
27.42± 4.92
6.56± 1.39
4.32± 1.24
6.36 ± 1.09
4.08 ± 1.08
4.0±0.9
4.4± 0.7
3.0± 0.5
F4 = Sri R Venketraj, Kothavasal village
IPM 7.50 ± 1.17
15.68 ± 1.93
19.69± 1.76
19.75 ± 4.17
3.22± 0.68
0.75± 0.46
3.57 ± 0.49
1.25 ± 0.35
5.4± 0.5
5.6 ± 0.4
5.8± 0.7
FP 11.01± 3.23
15.54± 1.71
23.53± 3.55
24.30 ± 1.21
8.32± 1.66
10.03± 1.87
7.41 ± 0.64
5.30 ± 1.82
4.0± 0.9
4.4± 0.7
3.0± 0.5
F5 = Sri V Ganasan, Kothavasal village
IPM 3.72 ± 1.54
8.08 ± 2.07
14.08± 1.46
11.8± 3.25
2.34± 1.21
1.38 ± 0.36
3.55 ± 0.38
1.13 ± 0.47
3.2± 0.4
3.0 ± 0.3
3.4± 0.2
FP 7.66 ± 3.26
19.2± 7.51
27.73 ±6.54
25.1± 5.57
5.34± 1.23
4.69± 1.98
7.37± 0.98
7.06± 1.69
5.6± 1.2
5.2± 0.9
5.4± 0.8
IPM 4.63 9.95 15.29 13.88 2.82 1.4 3.78 1.42 3.8 3.7 3.9
FP 12.12 21.36 25.09 26.61 7.5 5.71 7.29 4.68 4.5 4.6 4.2
High grain yield was obtained in IPM plots than FP plots in all the farmers’ fields
resulting in high gross returns and high BC ratio compared to FP plots
(Table.2.93).
Table…2.93 Grain yield, gross returns and BC ratio in IPMs trial at Aduthurai, Rabi 2019 - 20
Farmer Treat ments
Yield (q/ ha)
Gross Returns
(Rs.)
Cost of cultivation
(Rs.)
Net Returns
(Rs.)
BC ratio
F1 = Sri S Shanmugam
IPM 59.60 110856 41600 69256 2.66
FP 41.20 76632 46060 30572 1.66
F2 = Sri N Mathiazhagan
IPM 52.80 98208 41850 56358 2.35
FP 40.00 74400 45525 28875 1.63
F3 = Sri S Prabakaran IPM 55.00 102300 41750 60550 2.45
FP 39.68 73805 45175 28630 1.63
F4 = Sri R Venketraj IPM 56.00 104160 40400 63760 2.58
FP 40.80 75888 42600 33288 1.78
F5 = Sri V Ganesan IPM 57.00 106020 41900 64120 2.53
FP 40.20 74772 45340 29432 1.65
IPM 56.08 104309 41500 62809 2.51
FP 40.38 75099 44940 30159 1.67
Price of Paddy = Rs. 1860/q
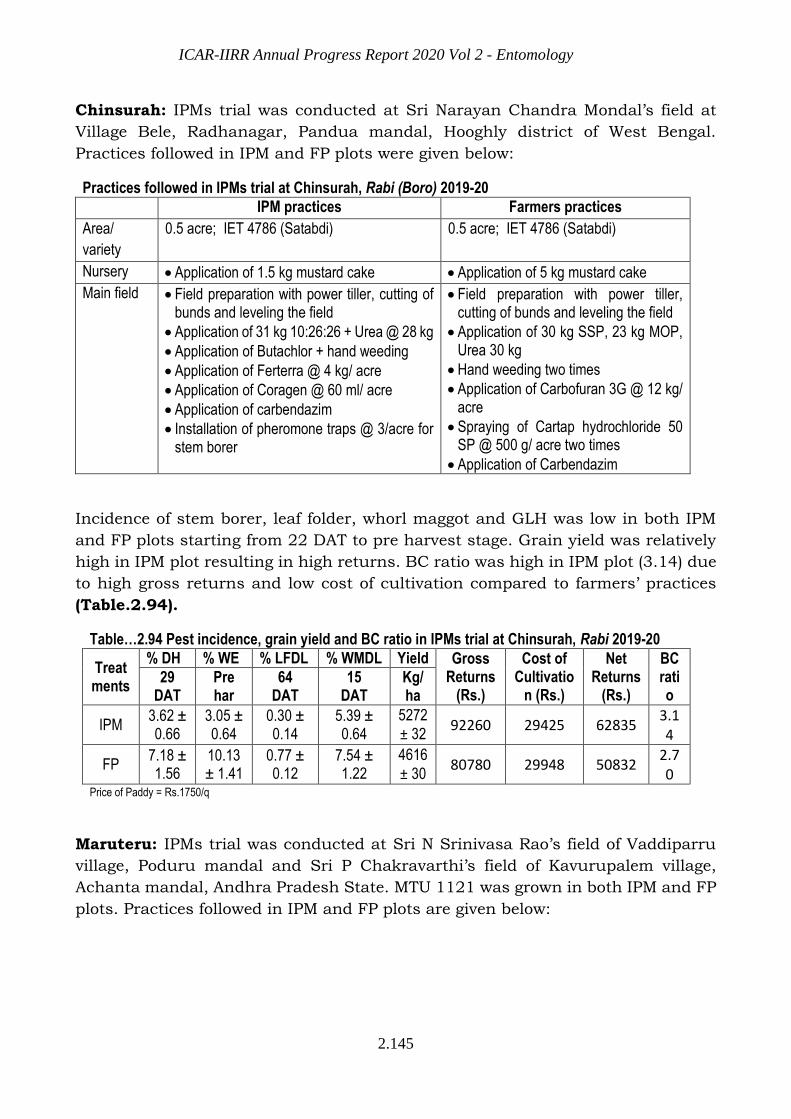
ICAR-IIRR Annual Progress Report 2020 Vol 2 - Entomology
2.145
Chinsurah: IPMs trial was conducted at Sri Narayan Chandra Mondal’s field at
Village Bele, Radhanagar, Pandua mandal, Hooghly district of West Bengal.
Practices followed in IPM and FP plots were given below:
Practices followed in IPMs trial at Chinsurah, Rabi (Boro) 2019-20
IPM practices Farmers practices
Area/
variety
0.5 acre; IET 4786 (Satabdi) 0.5 acre; IET 4786 (Satabdi)
Nursery Application of 1.5 kg mustard cake Application of 5 kg mustard cake
Main field Field preparation with power tiller, cutting of bunds and leveling the field
Application of 31 kg 10:26:26 + Urea @ 28 kg
Application of Butachlor + hand weeding
Application of Ferterra @ 4 kg/ acre
Application of Coragen @ 60 ml/ acre
Application of carbendazim
Installation of pheromone traps @ 3/acre for stem borer
Field preparation with power tiller, cutting of bunds and leveling the field
Application of 30 kg SSP, 23 kg MOP, Urea 30 kg
Hand weeding two times
Application of Carbofuran 3G @ 12 kg/ acre
Spraying of Cartap hydrochloride 50 SP @ 500 g/ acre two times
Application of Carbendazim
Incidence of stem borer, leaf folder, whorl maggot and GLH was low in both IPM
and FP plots starting from 22 DAT to pre harvest stage. Grain yield was relatively
high in IPM plot resulting in high returns. BC ratio was high in IPM plot (3.14) due
to high gross returns and low cost of cultivation compared to farmers’ practices
(Table.2.94).
Table…2.94 Pest incidence, grain yield and BC ratio in IPMs trial at Chinsurah, Rabi 2019-20
Treatments
% DH % WE % LFDL % WMDL Yield Gross Returns
(Rs.)
Cost of Cultivatio
n (Rs.)
Net Returns
(Rs.)
BC ratio
29 DAT
Pre har
64 DAT
15 DAT
Kg/ ha
IPM 3.62 ± 0.66
3.05 ± 0.64
0.30 ± 0.14
5.39 ± 0.64
5272
± 32 92260 29425 62835
3.14
FP 7.18 ± 1.56
10.13 ± 1.41
0.77 ± 0.12
7.54 ± 1.22
4616
± 30 80780 29948 50832
2.70
Price of Paddy = Rs.1750/q
Maruteru: IPMs trial was conducted at Sri N Srinivasa Rao’s field of Vaddiparru
village, Poduru mandal and Sri P Chakravarthi’s field of Kavurupalem village,
Achanta mandal, Andhra Pradesh State. MTU 1121 was grown in both IPM and FP
plots. Practices followed in IPM and FP plots are given below:
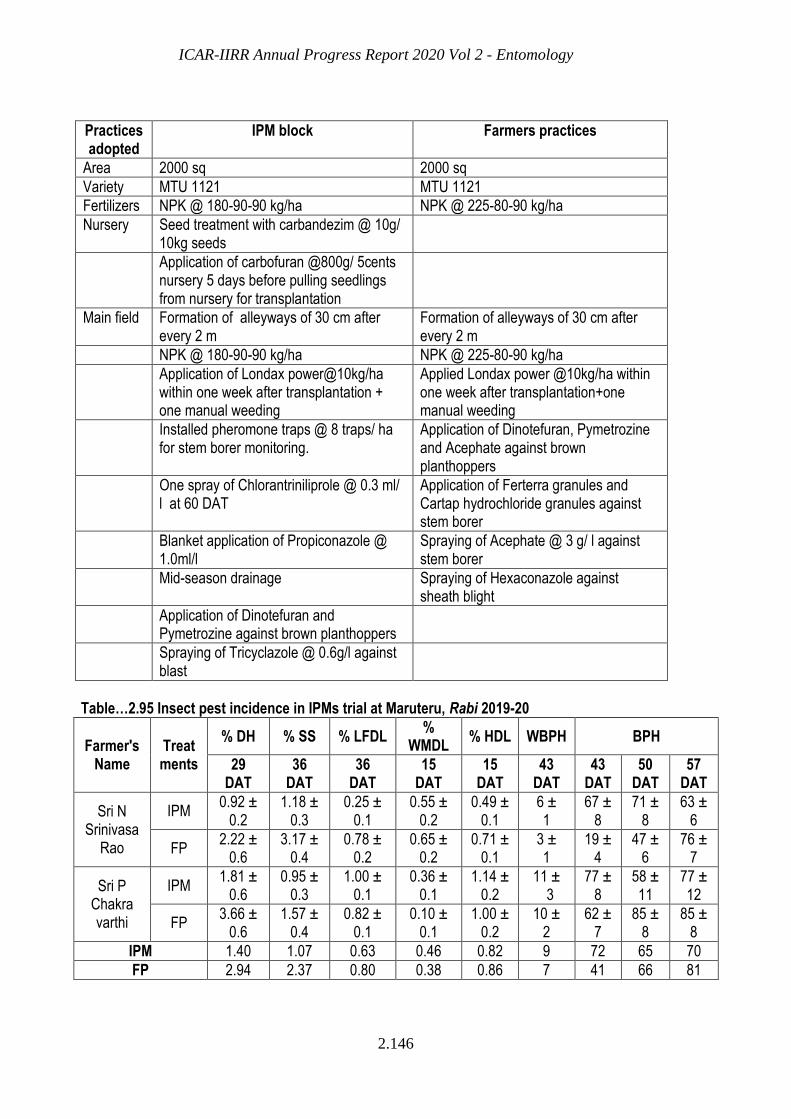
ICAR-IIRR Annual Progress Report 2020 Vol 2 - Entomology
2.146
Table…2.95 Insect pest incidence in IPMs trial at Maruteru, Rabi 2019-20
Farmer's Name
Treatments
% DH % SS % LFDL %
WMDL % HDL WBPH BPH
29 DAT
36 DAT
36 DAT
15 DAT
15 DAT
43 DAT
43 DAT
50 DAT
57 DAT
Sri N Srinivasa
Rao
IPM 0.92 ±
0.2 1.18 ±
0.3 0.25 ±
0.1 0.55 ±
0.2 0.49 ±
0.1 6 ± 1
67 ± 8
71 ± 8
63 ± 6
FP 2.22 ±
0.6 3.17 ±
0.4 0.78 ±
0.2 0.65 ±
0.2 0.71 ±
0.1 3 ± 1
19 ± 4
47 ± 6
76 ± 7
Sri P Chakra varthi
IPM 1.81 ±
0.6 0.95 ±
0.3 1.00 ±
0.1 0.36 ±
0.1 1.14 ±
0.2 11 ± 3
77 ± 8
58 ± 11
77 ± 12
FP 3.66 ±
0.6 1.57 ±
0.4 0.82 ±
0.1 0.10 ±
0.1 1.00 ±
0.2 10 ±
2 62 ±
7 85 ±
8 85 ±
8
IPM 1.40 1.07 0.63 0.46 0.82 9 72 65 70
FP 2.94 2.37 0.80 0.38 0.86 7 41 66 81
Practices adopted
IPM block Farmers practices
Area 2000 sq 2000 sq
Variety MTU 1121 MTU 1121
Fertilizers NPK @ 180-90-90 kg/ha NPK @ 225-80-90 kg/ha
Nursery Seed treatment with carbandezim @ 10g/ 10kg seeds
Application of carbofuran @800g/ 5cents nursery 5 days before pulling seedlings from nursery for transplantation
Main field Formation of alleyways of 30 cm after every 2 m
Formation of alleyways of 30 cm after every 2 m
NPK @ 180-90-90 kg/ha NPK @ 225-80-90 kg/ha
Application of Londax power@10kg/ha within one week after transplantation + one manual weeding
Applied Londax power @10kg/ha within one week after transplantation+one manual weeding
Installed pheromone traps @ 8 traps/ ha for stem borer monitoring.
Application of Dinotefuran, Pymetrozine and Acephate against brown planthoppers
One spray of Chlorantriniliprole @ 0.3 ml/ l at 60 DAT
Application of Ferterra granules and Cartap hydrochloride granules against stem borer
Blanket application of Propiconazole @ 1.0ml/l
Spraying of Acephate @ 3 g/ l against stem borer
Mid-season drainage Spraying of Hexaconazole against sheath blight
Application of Dinotefuran and Pymetrozine against brown planthoppers
Spraying of Tricyclazole @ 0.6g/l against blast
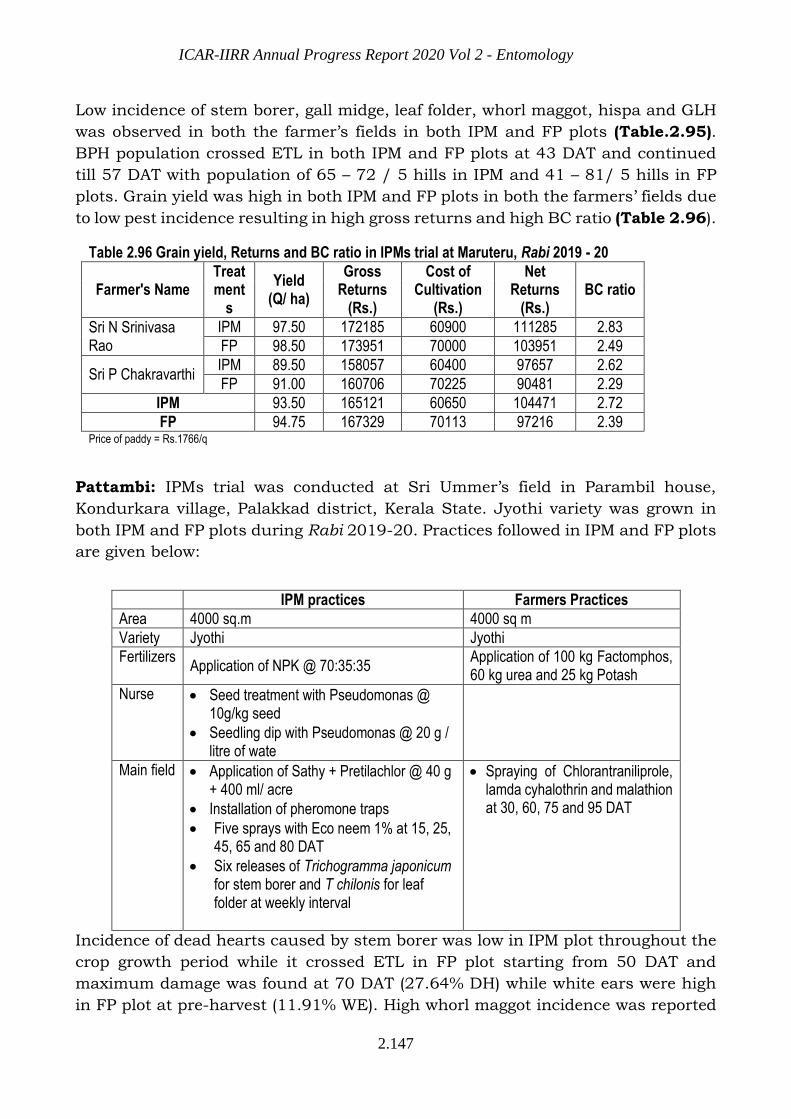
ICAR-IIRR Annual Progress Report 2020 Vol 2 - Entomology
2.147
Low incidence of stem borer, gall midge, leaf folder, whorl maggot, hispa and GLH
was observed in both the farmer’s fields in both IPM and FP plots (Table.2.95).
BPH population crossed ETL in both IPM and FP plots at 43 DAT and continued
till 57 DAT with population of 65 – 72 / 5 hills in IPM and 41 – 81/ 5 hills in FP
plots. Grain yield was high in both IPM and FP plots in both the farmers’ fields due
to low pest incidence resulting in high gross returns and high BC ratio (Table 2.96).
Table 2.96 Grain yield, Returns and BC ratio in IPMs trial at Maruteru, Rabi 2019 - 20
Farmer's Name Treatment
s
Yield (Q/ ha)
Gross Returns
(Rs.)
Cost of Cultivation
(Rs.)
Net Returns
(Rs.) BC ratio
Sri N Srinivasa Rao
IPM 97.50 172185 60900 111285 2.83
FP 98.50 173951 70000 103951 2.49
Sri P Chakravarthi IPM 89.50 158057 60400 97657 2.62
FP 91.00 160706 70225 90481 2.29
IPM 93.50 165121 60650 104471 2.72
FP 94.75 167329 70113 97216 2.39 Price of paddy = Rs.1766/q
Pattambi: IPMs trial was conducted at Sri Ummer’s field in Parambil house,
Kondurkara village, Palakkad district, Kerala State. Jyothi variety was grown in
both IPM and FP plots during Rabi 2019-20. Practices followed in IPM and FP plots
are given below:
Incidence of dead hearts caused by stem borer was low in IPM plot throughout the
crop growth period while it crossed ETL in FP plot starting from 50 DAT and
maximum damage was found at 70 DAT (27.64% DH) while white ears were high
in FP plot at pre-harvest (11.91% WE). High whorl maggot incidence was reported
IPM practices Farmers Practices
Area 4000 sq.m 4000 sq m
Variety Jyothi Jyothi
Fertilizers Application of NPK @ 70:35:35
Application of 100 kg Factomphos, 60 kg urea and 25 kg Potash
Nurse Seed treatment with Pseudomonas @ 10g/kg seed
Seedling dip with Pseudomonas @ 20 g / litre of wate
Main field Application of Sathy + Pretilachlor @ 40 g + 400 ml/ acre
Installation of pheromone traps
Five sprays with Eco neem 1% at 15, 25, 45, 65 and 80 DAT
Six releases of Trichogramma japonicum for stem borer and T chilonis for leaf folder at weekly interval
Spraying of Chlorantraniliprole, lamda cyhalothrin and malathion at 30, 60, 75 and 95 DAT
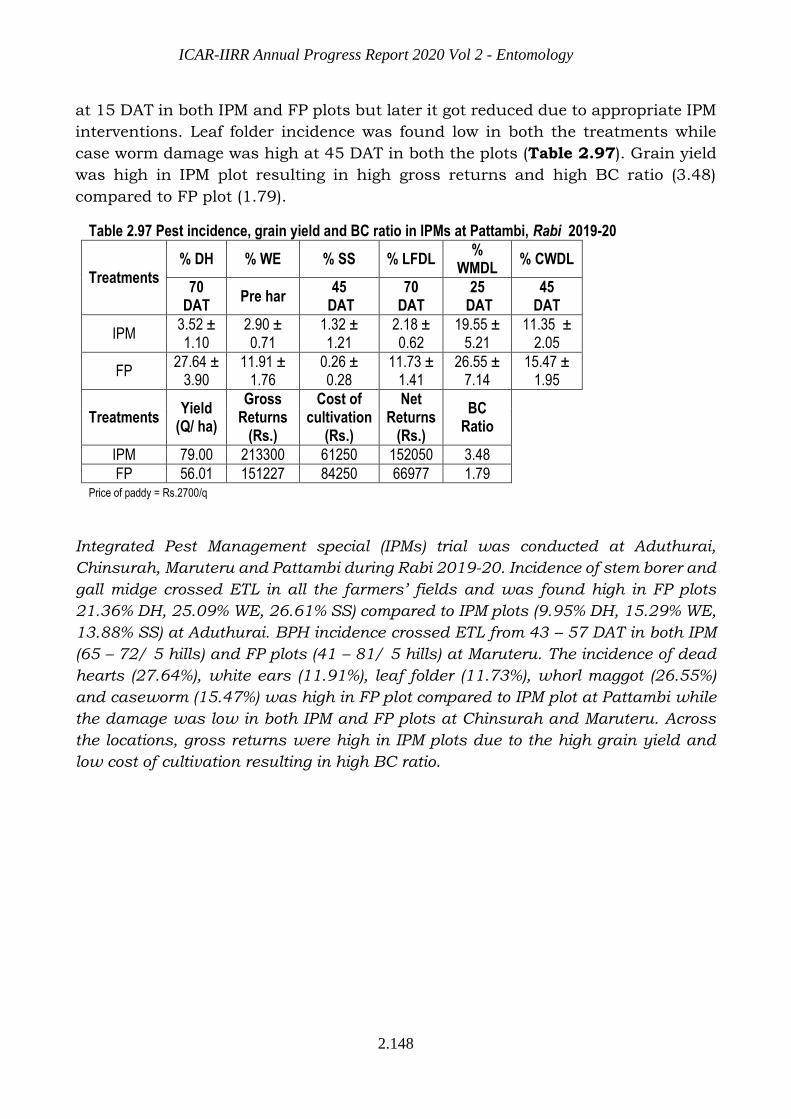
ICAR-IIRR Annual Progress Report 2020 Vol 2 - Entomology
2.148
at 15 DAT in both IPM and FP plots but later it got reduced due to appropriate IPM
interventions. Leaf folder incidence was found low in both the treatments while
case worm damage was high at 45 DAT in both the plots (Table 2.97). Grain yield
was high in IPM plot resulting in high gross returns and high BC ratio (3.48)
compared to FP plot (1.79).
Table 2.97 Pest incidence, grain yield and BC ratio in IPMs at Pattambi, Rabi 2019-20
Treatments % DH % WE % SS % LFDL
% WMDL
% CWDL
70 DAT
Pre har 45
DAT 70
DAT 25
DAT 45
DAT
IPM 3.52 ± 1.10
2.90 ± 0.71
1.32 ± 1.21
2.18 ± 0.62
19.55 ± 5.21
11.35 ± 2.05
FP 27.64 ±
3.90 11.91 ±
1.76 0.26 ± 0.28
11.73 ± 1.41
26.55 ± 7.14
15.47 ± 1.95
Treatments Yield
(Q/ ha)
Gross Returns
(Rs.)
Cost of cultivation
(Rs.)
Net Returns
(Rs.)
BC Ratio
IPM 79.00 213300 61250 152050 3.48
FP 56.01 151227 84250 66977 1.79 Price of paddy = Rs.2700/q
Integrated Pest Management special (IPMs) trial was conducted at Aduthurai,
Chinsurah, Maruteru and Pattambi during Rabi 2019-20. Incidence of stem borer and
gall midge crossed ETL in all the farmers’ fields and was found high in FP plots
21.36% DH, 25.09% WE, 26.61% SS) compared to IPM plots (9.95% DH, 15.29% WE,
13.88% SS) at Aduthurai. BPH incidence crossed ETL from 43 – 57 DAT in both IPM
(65 – 72/ 5 hills) and FP plots (41 – 81/ 5 hills) at Maruteru. The incidence of dead
hearts (27.64%), white ears (11.91%), leaf folder (11.73%), whorl maggot (26.55%)
and caseworm (15.47%) was high in FP plot compared to IPM plot at Pattambi while
the damage was low in both IPM and FP plots at Chinsurah and Maruteru. Across
the locations, gross returns were high in IPM plots due to the high grain yield and
low cost of cultivation resulting in high BC ratio.
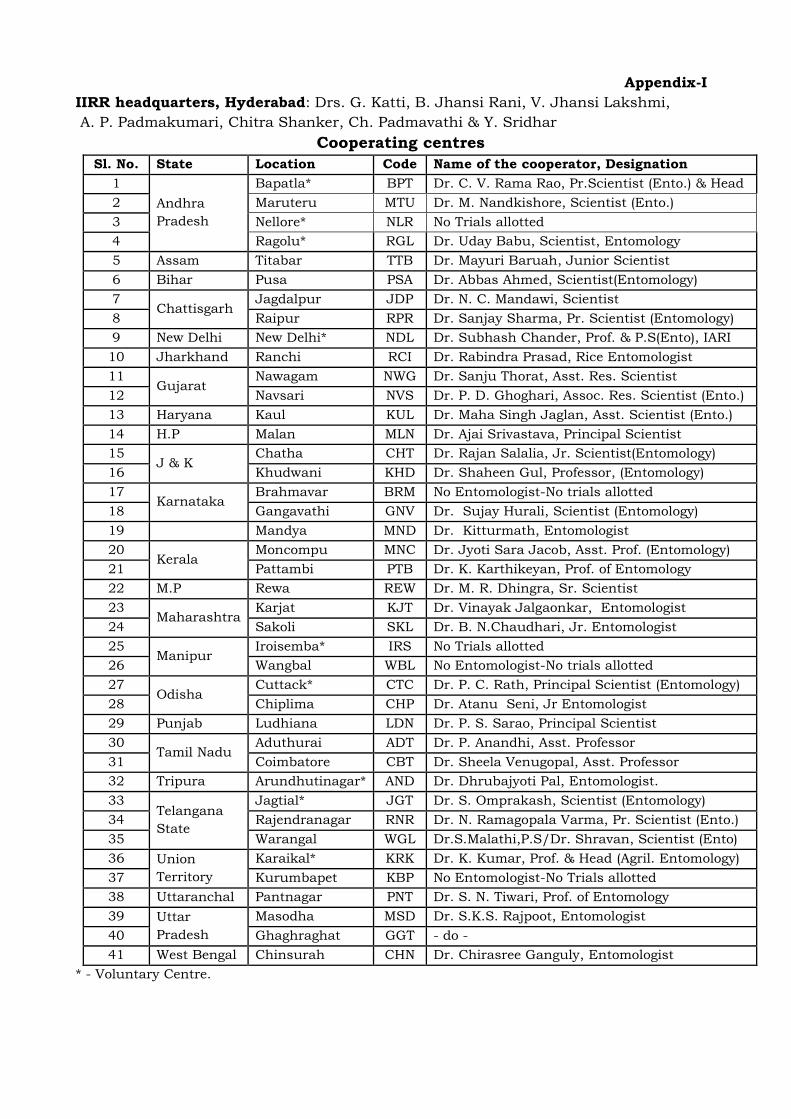
Appendix-I
IIRR headquarters, Hyderabad: Drs. G. Katti, B. Jhansi Rani, V. Jhansi Lakshmi,
A. P. Padmakumari, Chitra Shanker, Ch. Padmavathi & Y. Sridhar
Cooperating centres
Sl. No. State Location Code Name of the cooperator, Designation
1
Andhra
Pradesh
Bapatla* BPT Dr. C. V. Rama Rao, Pr.Scientist (Ento.) & Head
2 Maruteru MTU Dr. M. Nandkishore, Scientist (Ento.)
3 Nellore* NLR No Trials allotted
4 Ragolu* RGL Dr. Uday Babu, Scientist, Entomology
5 Assam Titabar TTB Dr. Mayuri Baruah, Junior Scientist
6 Bihar Pusa PSA Dr. Abbas Ahmed, Scientist(Entomology)
7 Chattisgarh
Jagdalpur JDP Dr. N. C. Mandawi, Scientist
8 Raipur RPR Dr. Sanjay Sharma, Pr. Scientist (Entomology)
9 New Delhi New Delhi* NDL Dr. Subhash Chander, Prof. & P.S(Ento), IARI
10 Jharkhand Ranchi RCI Dr. Rabindra Prasad, Rice Entomologist
11 Gujarat
Nawagam NWG Dr. Sanju Thorat, Asst. Res. Scientist
12 Navsari NVS Dr. P. D. Ghoghari, Assoc. Res. Scientist (Ento.)
13 Haryana Kaul KUL Dr. Maha Singh Jaglan, Asst. Scientist (Ento.)
14 H.P Malan MLN Dr. Ajai Srivastava, Principal Scientist
15 J & K
Chatha CHT Dr. Rajan Salalia, Jr. Scientist(Entomology)
16 Khudwani KHD Dr. Shaheen Gul, Professor, (Entomology)
17 Karnataka
Brahmavar BRM No Entomologist-No trials allotted
18 Gangavathi GNV Dr. Sujay Hurali, Scientist (Entomology)
19 Mandya MND Dr. Kitturmath, Entomologist
20 Kerala
Moncompu MNC Dr. Jyoti Sara Jacob, Asst. Prof. (Entomology)
21 Pattambi PTB Dr. K. Karthikeyan, Prof. of Entomology
22 M.P Rewa REW Dr. M. R. Dhingra, Sr. Scientist
23 Maharashtra
Karjat KJT Dr. Vinayak Jalgaonkar, Entomologist
24 Sakoli SKL Dr. B. N.Chaudhari, Jr. Entomologist
25 Manipur
Iroisemba* IRS No Trials allotted
26 Wangbal WBL No Entomologist-No trials allotted
27 Odisha
Cuttack* CTC Dr. P. C. Rath, Principal Scientist (Entomology)
28 Chiplima CHP Dr. Atanu Seni, Jr Entomologist
29 Punjab Ludhiana LDN Dr. P. S. Sarao, Principal Scientist
30 Tamil Nadu
Aduthurai ADT Dr. P. Anandhi, Asst. Professor
31 Coimbatore CBT Dr. Sheela Venugopal, Asst. Professor
32 Tripura Arundhutinagar* AND Dr. Dhrubajyoti Pal, Entomologist.
33 Telangana
State
Jagtial* JGT Dr. S. Omprakash, Scientist (Entomology)
34 Rajendranagar RNR Dr. N. Ramagopala Varma, Pr. Scientist (Ento.)
35 Warangal WGL Dr.S.Malathi,P.S/Dr. Shravan, Scientist (Ento)
36 Union
Territory
Karaikal* KRK Dr. K. Kumar, Prof. & Head (Agril. Entomology)
37 Kurumbapet KBP No Entomologist-No Trials allotted
38 Uttaranchal Pantnagar PNT Dr. S. N. Tiwari, Prof. of Entomology
39 Uttar
Pradesh
Masodha MSD Dr. S.K.S. Rajpoot, Entomologist
40 Ghaghraghat GGT - do -
41 West Bengal Chinsurah CHN Dr. Chirasree Ganguly, Entomologist
* - Voluntary Centre.
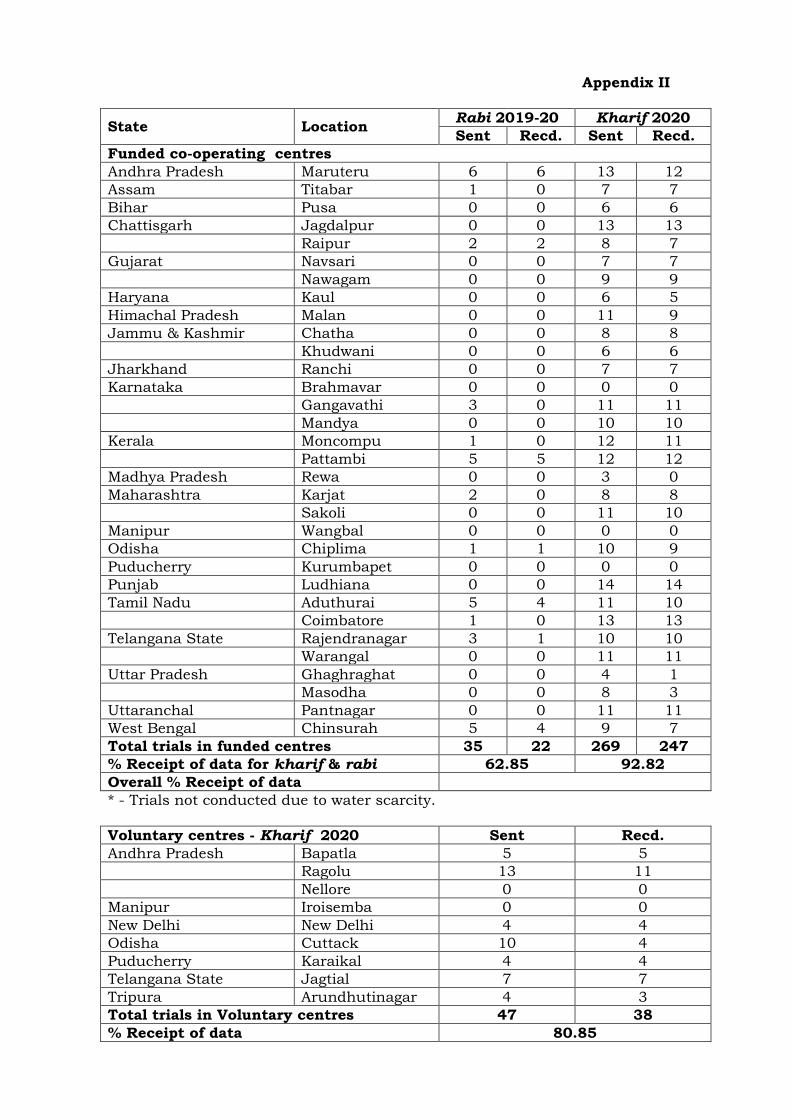
Appendix II
State Location Rabi 2019-20 Kharif 2020
Sent Recd. Sent Recd.
Funded co-operating centres
Andhra Pradesh Maruteru 6 6 13 12
Assam Titabar 1 0 7 7
Bihar Pusa 0 0 6 6
Chattisgarh Jagdalpur 0 0 13 13
Raipur 2 2 8 7
Gujarat Navsari 0 0 7 7
Nawagam 0 0 9 9
Haryana Kaul 0 0 6 5
Himachal Pradesh Malan 0 0 11 9
Jammu & Kashmir Chatha 0 0 8 8
Khudwani 0 0 6 6
Jharkhand Ranchi 0 0 7 7
Karnataka Brahmavar 0 0 0 0
Gangavathi 3 0 11 11
Mandya 0 0 10 10
Kerala Moncompu 1 0 12 11
Pattambi 5 5 12 12
Madhya Pradesh Rewa 0 0 3 0
Maharashtra Karjat 2 0 8 8
Sakoli 0 0 11 10
Manipur Wangbal 0 0 0 0
Odisha Chiplima 1 1 10 9
Puducherry Kurumbapet 0 0 0 0
Punjab Ludhiana 0 0 14 14
Tamil Nadu Aduthurai 5 4 11 10
Coimbatore 1 0 13 13
Telangana State Rajendranagar 3 1 10 10
Warangal 0 0 11 11
Uttar Pradesh Ghaghraghat 0 0 4 1
Masodha 0 0 8 3
Uttaranchal Pantnagar 0 0 11 11
West Bengal Chinsurah 5 4 9 7
Total trials in funded centres 35 22 269 247
% Receipt of data for kharif & rabi 62.85 92.82
Overall % Receipt of data
* - Trials not conducted due to water scarcity.
Voluntary centres - Kharif 2020 Sent Recd.
Andhra Pradesh Bapatla 5 5
Ragolu 13 11
Nellore 0 0
Manipur Iroisemba 0 0
New Delhi New Delhi 4 4
Odisha Cuttack 10 4
Puducherry Karaikal 4 4
Telangana State Jagtial 7 7
Tripura Arundhutinagar 4 3
Total trials in Voluntary centres 47 38
% Receipt of data 80.85
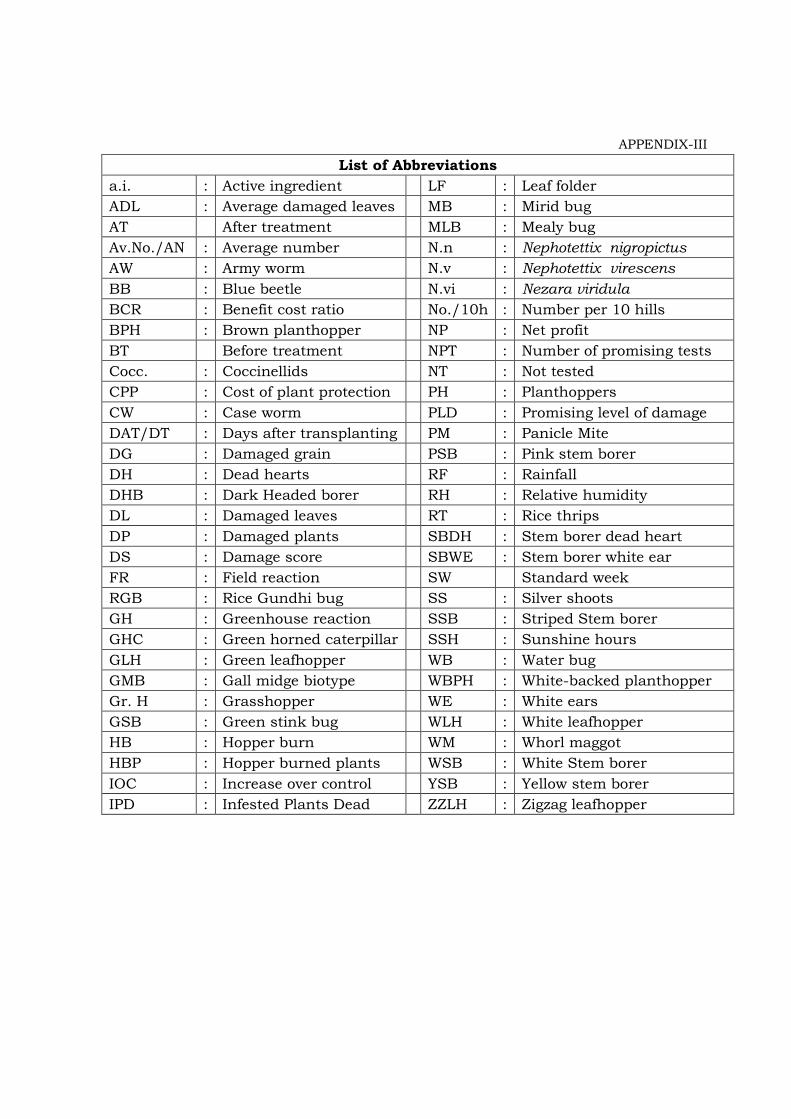
APPENDIX-III
List of Abbreviations
a.i. : Active ingredient LF : Leaf folder
ADL : Average damaged leaves MB : Mirid bug
AT After treatment MLB : Mealy bug
Av.No./AN : Average number N.n : Nephotettix nigropictus
AW : Army worm N.v : Nephotettix virescens
BB : Blue beetle N.vi : Nezara viridula
BCR : Benefit cost ratio No./10h : Number per 10 hills
BPH : Brown planthopper NP : Net profit
BT Before treatment NPT : Number of promising tests
Cocc. : Coccinellids NT : Not tested
CPP : Cost of plant protection PH : Planthoppers
CW : Case worm PLD : Promising level of damage
DAT/DT : Days after transplanting PM : Panicle Mite
DG : Damaged grain PSB : Pink stem borer
DH : Dead hearts RF : Rainfall
DHB : Dark Headed borer RH : Relative humidity
DL : Damaged leaves RT : Rice thrips
DP : Damaged plants SBDH : Stem borer dead heart
DS : Damage score SBWE : Stem borer white ear
FR : Field reaction SW Standard week
RGB : Rice Gundhi bug SS : Silver shoots
GH : Greenhouse reaction SSB : Striped Stem borer
GHC : Green horned caterpillar SSH : Sunshine hours
GLH : Green leafhopper WB : Water bug
GMB : Gall midge biotype WBPH : White-backed planthopper
Gr. H : Grasshopper WE : White ears
GSB : Green stink bug WLH : White leafhopper
HB : Hopper burn WM : Whorl maggot
HBP : Hopper burned plants WSB : White Stem borer
IOC : Increase over control YSB : Yellow stem borer
IPD : Infested Plants Dead ZZLH : Zigzag leafhopper

ACKNOWLEDGEMENTS
Our thanks are due to the scientists located at different cooperating centres for
the conduct of trials as a part of the Coordinated Entomology Program.Thanks are also
due to Dr. B. Sailaja, Principal Scientist and Dr. Santosha Rathod, Scientist, Agril.
Statistics for helping in the statistical analysis of data. Thanks are due to Dr. N.
Somasekhar, Principal Scientist of Entomology section for assistance and technical staff
of Entomology Section, Sri. A. Narsing Rao, Sri. P. M. Chirutkar, Sri. T. Venkaiah and Sri.
K. Shravan Kumar for their efforts in conduct of the trials and/or preparation of the
report at IIRR. Special thanks are due to Sri. Amudhan Srinivasan, Asst. Chief Technical
Officer, Entomology Section, for support in conduct of the trials, preparation and printing
of the report.


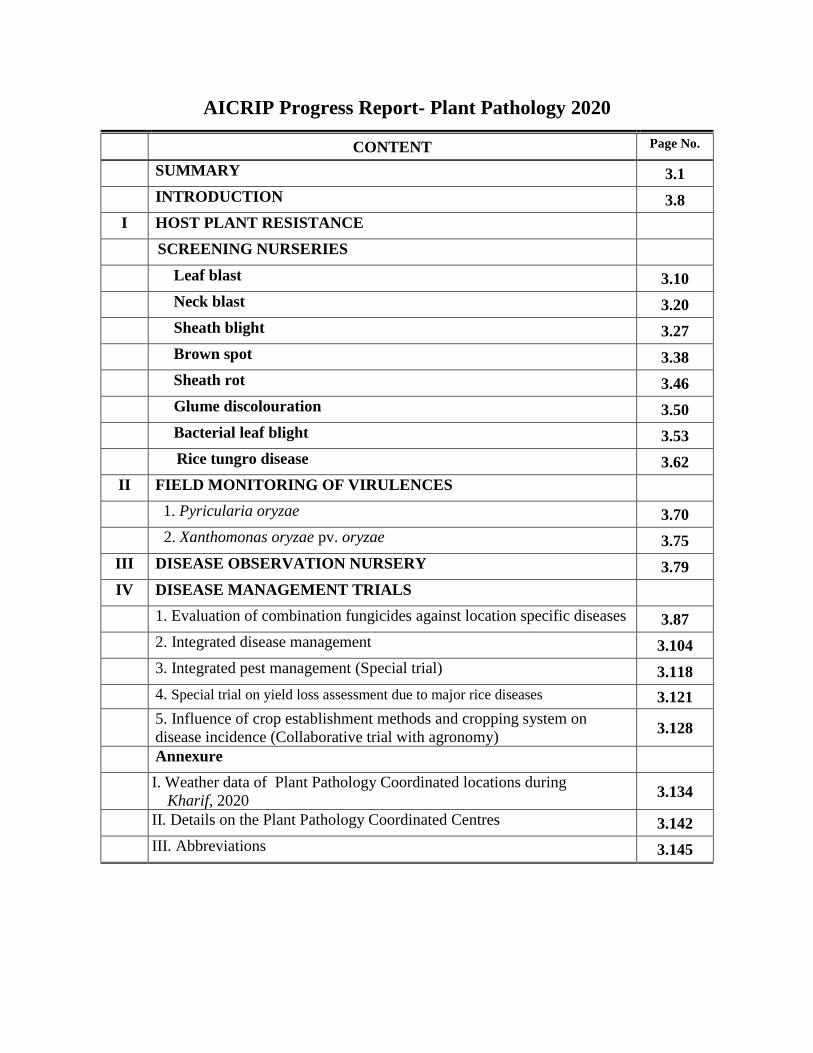
AICRIP Progress Report- Plant Pathology 2020
CONTENT Page No.
SUMMARY 3.1
INTRODUCTION 3.8
I HOST PLANT RESISTANCE
SCREENING NURSERIES
Leaf blast 3.10
Neck blast 3.20
Sheath blight 3.27
Brown spot 3.38
Sheath rot 3.46
Glume discolouration 3.50
Bacterial leaf blight 3.53
Rice tungro disease 3.62
II FIELD MONITORING OF VIRULENCES
1. Pyricularia oryzae 3.70
2. Xanthomonas oryzae pv. oryzae 3.75
III DISEASE OBSERVATION NURSERY 3.79
IV DISEASE MANAGEMENT TRIALS
1. Evaluation of combination fungicides against location specific diseases 3.87
2. Integrated disease management 3.104
3. Integrated pest management (Special trial) 3.118
4. Special trial on yield loss assessment due to major rice diseases 3.121
5. Influence of crop establishment methods and cropping system on
disease incidence (Collaborative trial with agronomy) 3.128
Annexure
I. Weather data of Plant Pathology Coordinated locations during
Kharif, 2020 3.134
II. Details on the Plant Pathology Coordinated Centres 3.142
III. Abbreviations 3.145


ICAR-IIRR AICRIP – Annual Progress Report 2020, Vol.2, Plant Pathology
3.1
3. PATHOLOGY
SUMMARY
The All India Coordinated Rice Pathology Program of the ICAR-Indian Rice Research
Institute (formerly as Directorate of Rice Research) is an example of effective linkage and testing
mechanism to assess the advanced breeding lines over a wide range of climatic and disease
epidemic conditions and to identify broad spectrum of resistance to major rice diseases. This also
helps in developing need-based management options for controlling major diseases of rice.
During 2020, a total of 15 trials were conducted at 50 locations on host plant resistance, field
monitoring of virulence of major pathogens and disease management methods. The details on
screening nurseries and disease management trials proposed and conducted at various test
locations are given in Table 1. The summary of observations is given below. Detailed data on
extensive screening of diverse genotypes are furnished in a separate report entitled ‘National
Screening Nurseries, 2020’.
1. HOST PLANT RESISTANCE (NSN-1, NSN-2, NSN-H, NHSN and DSN)
LEAF BLAST
The entries for leaf blast resistance were evaluated under NSN-1, NSN-2, NSN-Hills,
NHSN and DSN at 26, 14, 12, 24 and 10 locations respectively. The disease pressure was
moderate to high in majority of the centres in different nurseries. The centers such as Mandya in
NSN-2 (7.8) and DSN (7.5), Umium (7.9) in NSN-H showed very high (LSI >7) disease
pressure. The disease pressure was low (LSI <4) at Rewa, Hazaribagh and Wangbal across all
the nurseries. None of the entries were found highly resistant (SI<3) to leaf blast across all the
nurseries. The entries that exhibited low over all disease score and high promising index
included IET# 28645, 28451, 28421, 28178, 28171, 27358, 28664 and 28641 under NSN-1; IET
#29398, 29223, 28378, 29333, 29147, 29442, 29164 and 29344 under NSN-2. IET # 28890,
28913, 28887, 28222 and 27472 under NSN-H. The promising entries under NHSN included
IET #28952, 28979, 28959, 28950, 28964, 28977, 29017, 29018 and 28955. The donors viz.,
HWR-30, HWR-24, HWR-16, HWR-29, RP-Bio-Patho-4, RP-Bio-Patho-5, RP-Patho-8, KNM
7660, RP-Patho-7, HWR-10, and HWR-22 were reported promising under DSN.
NECK BLAST
The entries were evaluated under NSN-1, NSN-2, NSN-Hills, NHSN and DSN at 8, 2, 5,
9 and 5 centers respectively. In most of the centers the screening was carried out under natural
infection condition except at few locations, where artificial method of inoculation was followed.
In majority of the locations the disease pressure was moderate to high, which was good enough
for selection of the best entries. The entries that exhibited low over all disease score and high
promising index under NSN-1were IET# 27823, 28489, 27686, 27641, 28507, 27037, 27851,
28732, 27637, 28654, 28664, 28451, 27829, 28491, 29178, 28452, 27077, 27438, 28818, 28160,
28683, 27907, 27358, 28750, 28136 and 27809. In NSN-2, selection was not done because one
centre data not helps in understanding the resistance/susceptible nature of entries. The entries
ICAR-IIRR AICRIP – Annual Progress Report 2020, Vol.2, Plant Pathology
3.2
with IET No. 28196, 28212, 28235, 28898, 28927, 27468 and 27498 under NSN-H; IET #
28988, 28983, 28969, 29012 and 28971 under NHSN were found to be promising against neck
blast disease with low diseases score across the locations. Under DSN, 39 entries were
performed better against neck blast disease with low disease score (≤4).
SHEATH BLIGHT
The entries were evaluated under NSN-1, NSN-2, NSN-Hills, NHSN, and DSN at 17, 9,
4, 22 and 19 locations, respectively. In majority of the locations, the disease pressure was
moderate to very high. None of the entries were found resistant (SI≤3) against sheath blight in all
the nurseries during Kharif-2020. The promising entries to sheath blight were IET Nos. 25692,
28163, 28778, 27438, 28416 and 26418 in NSN-1; IET Nos. 29549, 29225, 29416, 28419,
29427, 29475, 29445, 29343, 29404 and 29257 in NSN-2; IET Nos. 28921, 28200, 28897,
28892,27468, 28235, 28918, 28925, 28880, 28932, 28929 and 28928 in NSN-H; IET Nos. IET
29019, 29020, 29016, 28959, 28971, 28998, 29017, 29001 and 29022 in NHSN and entries viz.,
., HWR-31, KNM 7786, HWR-16, JGL 34828, WGL 1518, CB 16118, CB 17135, MTU 1010,
CB 16148, HWR-24, HWR-28, KNM 7715, RP-Bio-Patho-5, WGL 1525 and HWR-15 in DSN.
BROWN SPOT
The entries were evaluated under NSN-1, NSN-2, NSN-Hills, NHSN and DSN at 14, 7.
7, 15 and 14 centers respectively against brown spot disease across India. In most of the centres
the screening was carried out under natural infection condition except at few locations screening
was carried out artificially by spraying spore suspension. In majority of the centres the brown
spot pressure was moderate to high; and at few centres it was very high with LSI >7 (Gangavathi
centre across all the nurseries and Cuttack in NSN-H). None of entries very high resistance (<3)
reaction across all screening nurseries. However, the promising entries with low over all disease
score and high promising index included IET # 28746, 28066, 29207, 28674, 28391, 28115,
28401, 28513, 28032, 27823, 28425, 28415, 28122, 28396, 26898, 28409 and 28497 under
NSN-1(SI 4-4.5); IET # 29548, 29227, 29340, 29240, 29250, 29550, 29395, 29465, 29474,
29482 and 29513 under NSN-2 (SI 3.7-4.5). The entries with IET No. 28928, 28885, 28919,
28920, 28930, 28923, 28880, 28916, 28047, 28913, 28892, 28236, 28887, 28884, 28889, 28909,
28879, 28041, 28921, 28931, 28888 and 28890 under NSN-H; IET#29018, 28965, 28950, 28951,
28976, 28980 and 28960 under NHSN. The promising donors against brown spot disease were
HWR-33, HWR-31, HWR-17, HWR-16, HWR-15, JGL 34994, RP-Bio.Patho-3, RP-Patho-3,
RNR 29086, WGL 1472, HWR-7, HWR-26, KNM 10104, CB 16118, CB16101 and RP-Patho-7.
SHEATH ROT
The entries under NSN-1, NSN-2, NSN-H, NHSN and DSN were screened against sheath
rot at 10, 1, 1, 10 and 8 locations, respectively. Some of the highly promising entries in different
nurseries were: IET 28452, IET 28181, IET 28717, IET 27332, IET 28471, IET 28490, IET
28343, IET27836, in NSN-1; IET 28612, IET 28618, IET 29383, IET 29384, IET 29238, IET
29242 in NSN-2; IET 27468, IET 28212, IET 28910, IET 27471in NSN-H; IET 28968, IET
29003, IET 28989, IET 29000, IET 29007 and IET 28997 in NHSN and CB 17135, HWR-16,
ICAR-IIRR AICRIP – Annual Progress Report 2020, Vol.2, Plant Pathology
3.3
JB-19378, RNR 31479, RP-Patho-7, RP-Patho-8, WGL 1511, JGL 35071 and JB-19344 in
DSN.
GLUME DISCOLOURATION
Glume discolouration was observed at three locations viz., at Lonavala, Navasari and
Nawagam during Kharif 2020. Some of the promising entries were: IET 27329, IET 27438, IET
28634, IET 28358, IET 27686 and IET 28145 in NSN 1; IET 28967, IET 28969, IET 28983, IET 29001,
IET 29016 and IET 29018 in NHSN and HWR-31, IBT-WGL-21, IBT-WGL-31, RP-Patho-7, Tetep,
HWR-35, HWR-36, RNR 28361 and WGL 1525 in DSN.
BCTERIAL LEAF BLIGHT
The test entries and various checks in different bacterial blight screening nurseries viz.,
NSN-1, NSN-2, NSN-Hills, NHSN and DSN were evaluated at 23, 9, 4, 21 and 21 locations,
respectively. The number of entries including checks in different nurseries was 323 in NSN1,
557 in NSN-2, 128 in NSN-Hills, 105 in NHSN and 150 in DSN. Some of the promising entries
against bacterial blight in different nursery were IET # 28452, 28391, 28014 (R),28491, 28180,
28732, 28163, 29207, 28784 (R), 28122, 28442, 28177, 27920 and 28789 in NSN 1; IET #
29245, 29417, 27908, 29353, 29262, 28503, 29299, 29567, 29412, 29190, 29585, 29512, 28523,
29336 and 29401 in NSN 2; IET # 28222, 28884, 28890, 28910, 28919, 28236 and 28900 in
NSN-Hills; IET # 28997, 28967, 29000, 28998, 28959, 29022, 29005, 28979, 28983, 28999,
28994, 29003, 29009 and 29004 in NHSN and IBT-GM-39, RP-Bio-Patho-4, IBT-GM-17, IBT-
GM-3, RP-Bio-Patho-10, HWR-7, RP-Bio-Patho-11, IBT-GM-5, IBT-WGL-21, HWR-36,
HWR-6, IBT-GM-12, IBT-GM-40, RP-Bio-Patho-9, RP-Bio-Patho-5 and IBT-GM-7 in DSN.
RICE TUNGRO DISEASE
The entries in NSN-1, NSN-2, NHSN and DSN were evaluated at 2 locations for rice
tungro virus disease. The promising entries identified in different nurseries were: IET 28396 and
IET 27907 in NSN-1; IET 29241, IET 29283, IET 29417, IET 29441, IET 29483, IET 29166
and IET 28010 in NSN 2; IET 28913, IET 28050 in IET 28913, IET 28050 in NHSN and HWR-31,
JGL 35071, JGL 35076, JGL 36181, KNM 10081, C 101 LAC, RNR 28361, CB 16687 and CB 16629 in
DSN.
MULTIPLE DISEASE RESISTANT LINES
Among the entries tested across the locations, total of sixty-nine entries found moderately
resistant to minimum of two and maximum of four diseases. In NSN-1, a total of 15 entries had
shown resistant/moderately resistant reaction to two or three diseases. Among them IET # 27358
performed well against leaf blast, neck blast, sheath blight and bacterial leaf blight. The other
three entries viz., IET # 28178 (leaf blast, neck blast, sheath blight); 28452 (neck blast) and
28654 (LB, NB, SHB) showed moderate resistant reaction against three diseases. In NSN-2 only
one entry IET # 29417 found promising against BLB and RTD. In NSN-H, thirteen entries
expressed moderate resistant reaction to more than two or three diseases. IET # 28880 (SHB, BS,
BLB), 28913 (LB, SHB, RTD) and 28890 (LB, BS, BLB) expressed moderate resistant reaction
against three diseases. In NHSN, among the nineteen entries, majority of the entries (14) showed
ICAR-IIRR AICRIP – Annual Progress Report 2020, Vol.2, Plant Pathology
3.4
promising reaction three diseases. The IET # were 28959 (LB, SHB, BLB), 28960 (LB, SHB,
BS), 28965 (LB, BS, RTD), 28967 (LB, BLB, RTD), 28969 (LB, NB, SHB), 28971(LB, NB,
SHB), 28997 (LB, BLB, RTD), 28980 (LB, BS, RTD), 28983 (LB, NB, BLB), 28998 (LB, SHB,
BLB), 29000 (LB, SHB, BLB), 29006 (LB, SHB, RTD), 29009 (LB, BLB, RTD), and 29022
(LB, SHB, BLB), 28950 (LB, BS). In DSN, total of 21 entries found promising. Entries shown
moderate resistant reaction more than two diseases were HWR-16 (LB, NB, SHB, BS), CB
16118 (NB, SHB, BS), HWR-15 (NB, SHB, BS), HWR-24 (LB, NB, SHB), HWR-31 (SHB, BS,
RTD), RP-Bio-Patho-4 (LB, NB, BLB), RP-Bio-Patho-5 (LB, NB, BLB) and RP-Patho-7 (LB,
NB, BS). Remaining thirteen entries viz., HWR-17, HWR-26, HWR-29, HWR-7, KNM 10104,
KNM 7786, RP-Bio-Patho-10, RP-Bio-Patho-11, RP-Bio-Patho-3, RP-Bio-Patho-9, RP-Patho-3,
WGL 1472 and WGL 1525 found promising against minimum of two diseases.
II. FIELD MONITORING OF VIRULENCE
1. Pyricularia oryzae
The nursery included thirty-five cultivars consisting of near isogenic lines, international
differentials, donors and commercial cultivars. The experiment was conducted at twenty-five
locations during the crop season to monitor the blast reaction on different host genotypes. The
disease pressure was high at Mandya, Gangavati, Ghaghara and Imphal. It was moderate at
Khudwani, New Delhi, Navsari and Ponnampet and it as low at Almora, Karjat, Nawagam,
Mugad, Upper Shillong, Rudrur, Gudalur, Lonovala, Jagdalpur, Ranchi, Coimbatore,
Rajendranagar, IIRR, Jagityala, Pattambi, Malan and Hazaribagh. Tetep was highly resistant at
most of the locations about 16 locations that showed its potentiality as the best donors for
resistance against blast disease. Tetep was susceptible at Gudalur and Ghaghraghat and
moderately susceptible at Mandya, Mugad, Upper Shillong and Almora. Raminad str-3 was
susceptible at Gudalur, Imphal, Khudwani and Rudrur and also moderately susceptible at
Ghaghraghat and Ponnampet. RP Patho-7 was showing resistant all the locations except
Ghaghraghat, Khudwan, Navasari, Karjat, Mugad, Ponnampet and Upper Shillong and also
Tadukan was showing resistant all the locations except Gangavati, Rudrur, Khudwani, Almora,
Ghaghraghat, Upper Shillong, and Mugad. The susceptible checks like HR-12 and Co-39 are
showing susceptible reaction at most of the locations but HR-12 recorded resistant reaction at
Karjat and Jagityala; similarly, Co-39 also recorded resistant reaction Karjat. The resistant check
Rasi was highly susceptible at Mandya, Almora, Gangavati, Imphal, Rudrur and Rajendranagar.
The reaction pattern at Almora, Gudalur, Ghaghraghat, Khudhwani, Ponnampet, Nawagam,
Imphal, Mandya, Navasari, Gangavati, Mugad, UppperShillong, Karjat, Coimbatore, New Delhi,
Ranchi and Lonovala were in group one; Ranchi and Rudrur were in group two and three.
Jagdalpur and Jagityal were in group four. Hazaribagh, Malan, IIRR and Pattambi were in group
five, six, seven and eight respectively.
2. Xanthomonas oryzae pv. oryzae
Trial on monitoring virulence of bacterial blight (BB) pathogen, Xanthomonas oryzae pv.
oryzae (Xoo) was conducted at 26 locations. The Rice differentials used in this trial consisted of
eleven near isogenic lines (IRBB lines) possessing different single BB resistant genes in the
ICAR-IIRR AICRIP – Annual Progress Report 2020, Vol.2, Plant Pathology
3.5
genetic background of rice cultivar IR 24. Susceptible check variety, TN1 and resistant check
variety Improved Samba Mahsuri was also included in the trial. Most of the differentials
possessing single bacterial blight resistance genes like Xa1, Xa3, Xa4, xa5, Xa7, xa8, Xa10, Xa11
and Xa14 were susceptible at most of the locations. BB resistance gene xa13 was susceptible in
10 locations while Xa21 was susceptible in 11 locations. Based on their virulence, the isolates
were grouped into high, moderate and low virulence groups. Cluster analysis of Xoo reaction on
differentials possessing different single BB resistance genes also clearly grouped the isolates
belonging to different virulence groups. The reactions of all these isolates to differentials
possessing different combinations of BB resistance genes were also recorded.
III. DISEASE OBSERVATION NURSERY
The trial of disease observation nursery (DON) was proposed to be conducted in 13
locations, but actually conducted at 10 locations with different sowing dates viz., early, normal
and late with respect to the respective locations with an aim to estimate the effect of such varied
sowing/planting dates on the occurrence and severity of the disease in the respective endemic
regions. The incidence of leaf blast was found to be relatively less in this year when compared to
the previous year. Further the incidence was also more in the late sown crops than when
compared to the early and normal sown crops in the centres. The centre Maruteru has reported
the highest incidence of BLB in the early and sown crops (94.8 and 77 % DS respectively) when
compared to the late sown crops (64.44% DS). In general, the incidence of sheath blight was
found to be more in the early sown crops when compared to the normal and late sown crops.
Maruteru centre had the highest percent disease severity of sheath blight (80.3% DS at 120DAT)
in the early sown crop among all the other centres and all the sowing periods. Kaul centre has
reported the incidence of Bakanae, in the early sown crop and the variety PB1121 was found to
be more susceptible than CSR-30.
IV. DISEASE MANAGEMENT TRIALS
1. EVALUATION OF FUNGICIDES AGAINST LOCATION SPECIFIC DISEASES
Trial was conducted with an objective to identify the effective fungicidal molecule
against rice diseases. The trail constituted with fungicidal molecules viz., difenoconazole 25%
EC, isoprothiolane 40% EC, kasugamycin 3% SL, kitazin 48% EC, propineb 70% WP,
tebuconazole 25.9% EC and thifluzamide 24% SC. The fungicides were evaluated against leaf
blast (nine locations), neck blast (nine locations), sheath blight (twelve locations), sheath rot (six
locations), brown spot (three locations) and grain discoloration (two locations).
Commercial products Isoprothiolane 40% EC (1.5 ml/l) and Kitazin 48% EC (1.0 ml/l)
found effective in minimising the leaf and neck blast disease and increasing the yield.
Thifluzamide 24% SC (0.8g/l), Difenoconazole 25% EC (0.5 ml/l) and Tebuconazole 25.9% EC
(1.5 ml/l) found effective in sheath blight management and increased the yield. Difenoconazole
25% EC (0.5 ml/l) was identified as a best molecule to manage Sheath rot and brown spot
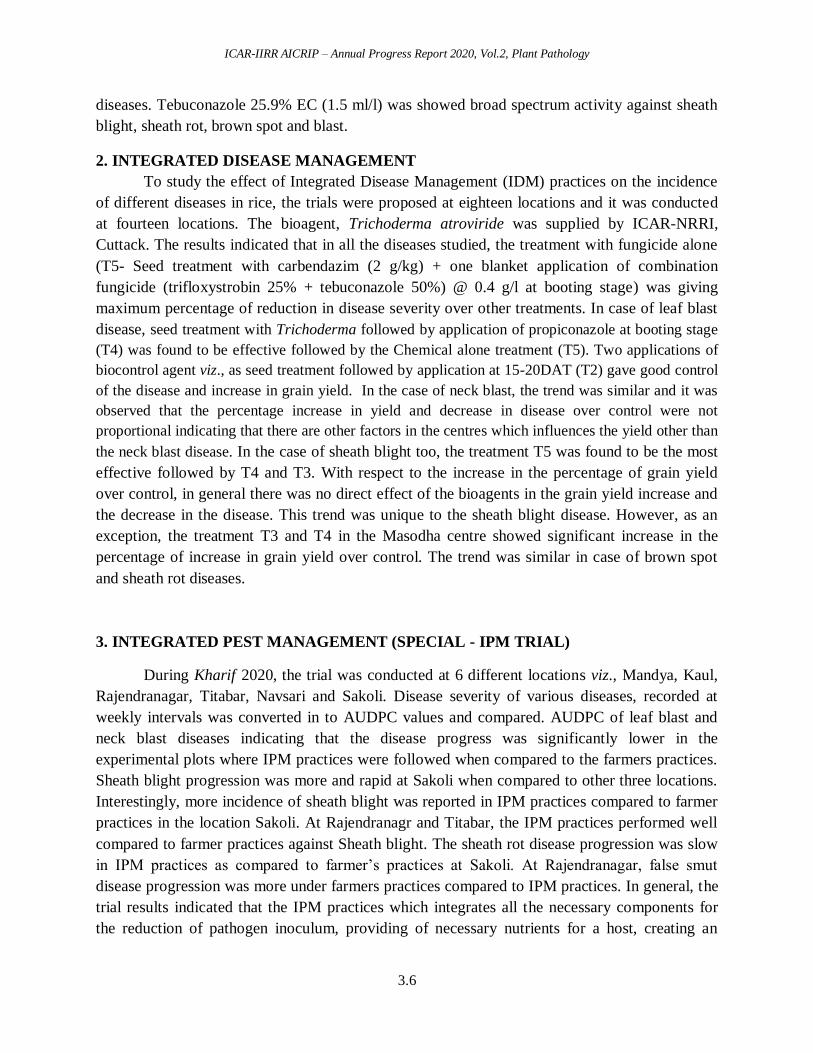
ICAR-IIRR AICRIP – Annual Progress Report 2020, Vol.2, Plant Pathology
3.6
diseases. Tebuconazole 25.9% EC (1.5 ml/l) was showed broad spectrum activity against sheath
blight, sheath rot, brown spot and blast.
2. INTEGRATED DISEASE MANAGEMENT
To study the effect of Integrated Disease Management (IDM) practices on the incidence
of different diseases in rice, the trials were proposed at eighteen locations and it was conducted
at fourteen locations. The bioagent, Trichoderma atroviride was supplied by ICAR-NRRI,
Cuttack. The results indicated that in all the diseases studied, the treatment with fungicide alone
(T5- Seed treatment with carbendazim (2 g/kg) + one blanket application of combination
fungicide (trifloxystrobin 25% + tebuconazole 50%) @ 0.4 g/l at booting stage) was giving
maximum percentage of reduction in disease severity over other treatments. In case of leaf blast
disease, seed treatment with Trichoderma followed by application of propiconazole at booting stage
(T4) was found to be effective followed by the Chemical alone treatment (T5). Two applications of
biocontrol agent viz., as seed treatment followed by application at 15-20DAT (T2) gave good control
of the disease and increase in grain yield. In the case of neck blast, the trend was similar and it was
observed that the percentage increase in yield and decrease in disease over control were not
proportional indicating that there are other factors in the centres which influences the yield other than
the neck blast disease. In the case of sheath blight too, the treatment T5 was found to be the most
effective followed by T4 and T3. With respect to the increase in the percentage of grain yield
over control, in general there was no direct effect of the bioagents in the grain yield increase and
the decrease in the disease. This trend was unique to the sheath blight disease. However, as an
exception, the treatment T3 and T4 in the Masodha centre showed significant increase in the
percentage of increase in grain yield over control. The trend was similar in case of brown spot
and sheath rot diseases.
3. INTEGRATED PEST MANAGEMENT (SPECIAL - IPM TRIAL)
During Kharif 2020, the trial was conducted at 6 different locations viz., Mandya, Kaul,
Rajendranagar, Titabar, Navsari and Sakoli. Disease severity of various diseases, recorded at
weekly intervals was converted in to AUDPC values and compared. AUDPC of leaf blast and
neck blast diseases indicating that the disease progress was significantly lower in the
experimental plots where IPM practices were followed when compared to the farmers practices.
Sheath blight progression was more and rapid at Sakoli when compared to other three locations.
Interestingly, more incidence of sheath blight was reported in IPM practices compared to farmer
practices in the location Sakoli. At Rajendranagr and Titabar, the IPM practices performed well
compared to farmer practices against Sheath blight. The sheath rot disease progression was slow
in IPM practices as compared to farmer’s practices at Sakoli. At Rajendranagar, false smut
disease progression was more under farmers practices compared to IPM practices. In general, the
trial results indicated that the IPM practices which integrates all the necessary components for
the reduction of pathogen inoculum, providing of necessary nutrients for a host, creating an
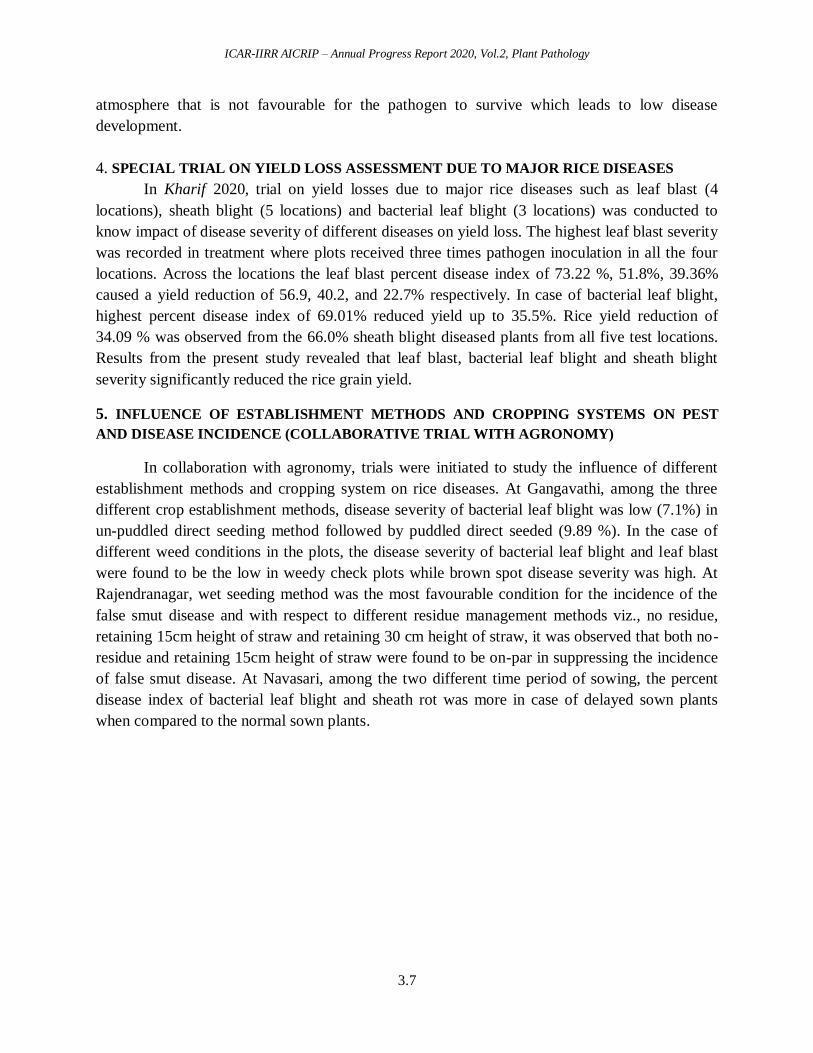
ICAR-IIRR AICRIP – Annual Progress Report 2020, Vol.2, Plant Pathology
3.7
atmosphere that is not favourable for the pathogen to survive which leads to low disease
development.
4. SPECIAL TRIAL ON YIELD LOSS ASSESSMENT DUE TO MAJOR RICE DISEASES
In Kharif 2020, trial on yield losses due to major rice diseases such as leaf blast (4
locations), sheath blight (5 locations) and bacterial leaf blight (3 locations) was conducted to
know impact of disease severity of different diseases on yield loss. The highest leaf blast severity
was recorded in treatment where plots received three times pathogen inoculation in all the four
locations. Across the locations the leaf blast percent disease index of 73.22 %, 51.8%, 39.36%
caused a yield reduction of 56.9, 40.2, and 22.7% respectively. In case of bacterial leaf blight,
highest percent disease index of 69.01% reduced yield up to 35.5%. Rice yield reduction of
34.09 % was observed from the 66.0% sheath blight diseased plants from all five test locations.
Results from the present study revealed that leaf blast, bacterial leaf blight and sheath blight
severity significantly reduced the rice grain yield.
5. INFLUENCE OF ESTABLISHMENT METHODS AND CROPPING SYSTEMS ON PEST
AND DISEASE INCIDENCE (COLLABORATIVE TRIAL WITH AGRONOMY)
In collaboration with agronomy, trials were initiated to study the influence of different
establishment methods and cropping system on rice diseases. At Gangavathi, among the three
different crop establishment methods, disease severity of bacterial leaf blight was low (7.1%) in
un-puddled direct seeding method followed by puddled direct seeded (9.89 %). In the case of
different weed conditions in the plots, the disease severity of bacterial leaf blight and leaf blast
were found to be the low in weedy check plots while brown spot disease severity was high. At
Rajendranagar, wet seeding method was the most favourable condition for the incidence of the
false smut disease and with respect to different residue management methods viz., no residue,
retaining 15cm height of straw and retaining 30 cm height of straw, it was observed that both no-
residue and retaining 15cm height of straw were found to be on-par in suppressing the incidence
of false smut disease. At Navasari, among the two different time period of sowing, the percent
disease index of bacterial leaf blight and sheath rot was more in case of delayed sown plants
when compared to the normal sown plants.
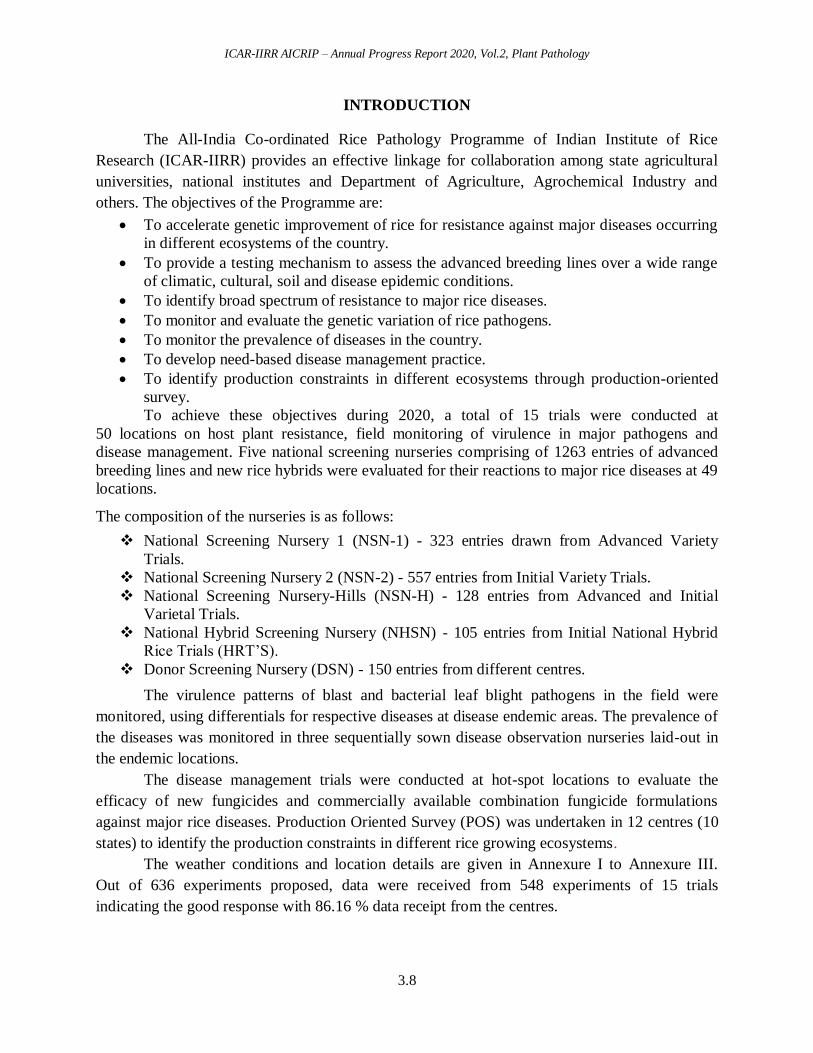
ICAR-IIRR AICRIP – Annual Progress Report 2020, Vol.2, Plant Pathology
3.8
INTRODUCTION
The All-India Co-ordinated Rice Pathology Programme of Indian Institute of Rice
Research (ICAR-IIRR) provides an effective linkage for collaboration among state agricultural
universities, national institutes and Department of Agriculture, Agrochemical Industry and
others. The objectives of the Programme are:
To accelerate genetic improvement of rice for resistance against major diseases occurring
in different ecosystems of the country.
To provide a testing mechanism to assess the advanced breeding lines over a wide range
of climatic, cultural, soil and disease epidemic conditions.
To identify broad spectrum of resistance to major rice diseases.
To monitor and evaluate the genetic variation of rice pathogens.
To monitor the prevalence of diseases in the country.
To develop need-based disease management practice.
To identify production constraints in different ecosystems through production-oriented
survey.
To achieve these objectives during 2020, a total of 15 trials were conducted at
50 locations on host plant resistance, field monitoring of virulence in major pathogens and
disease management. Five national screening nurseries comprising of 1263 entries of advanced
breeding lines and new rice hybrids were evaluated for their reactions to major rice diseases at 49
locations.
The composition of the nurseries is as follows:
National Screening Nursery 1 (NSN-1) - 323 entries drawn from Advanced Variety
Trials.
National Screening Nursery 2 (NSN-2) - 557 entries from Initial Variety Trials.
National Screening Nursery-Hills (NSN-H) - 128 entries from Advanced and Initial
Varietal Trials.
National Hybrid Screening Nursery (NHSN) - 105 entries from Initial National Hybrid
Rice Trials (HRT’S).
Donor Screening Nursery (DSN) - 150 entries from different centres.
The virulence patterns of blast and bacterial leaf blight pathogens in the field were
monitored, using differentials for respective diseases at disease endemic areas. The prevalence of
the diseases was monitored in three sequentially sown disease observation nurseries laid-out in
the endemic locations.
The disease management trials were conducted at hot-spot locations to evaluate the
efficacy of new fungicides and commercially available combination fungicide formulations
against major rice diseases. Production Oriented Survey (POS) was undertaken in 12 centres (10
states) to identify the production constraints in different rice growing ecosystems.
The weather conditions and location details are given in Annexure I to Annexure III.
Out of 636 experiments proposed, data were received from 548 experiments of 15 trials
indicating the good response with 86.16 % data receipt from the centres.
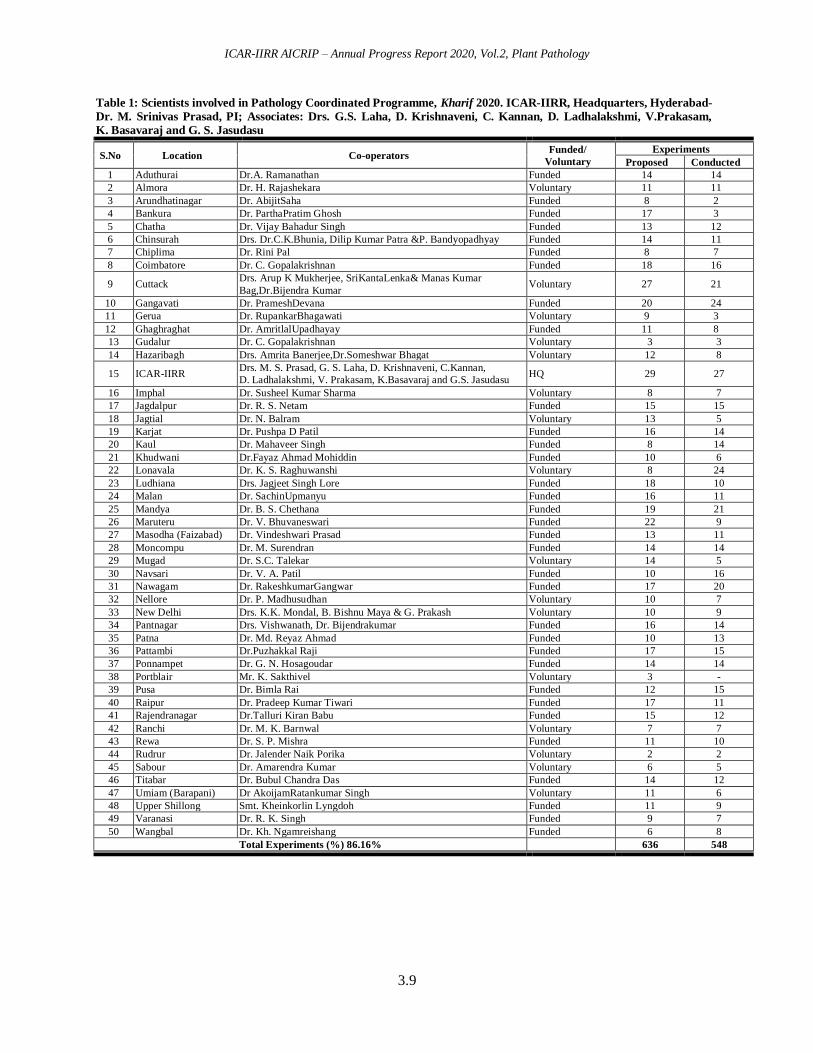
ICAR-IIRR AICRIP – Annual Progress Report 2020, Vol.2, Plant Pathology
3.9
Table 1: Scientists involved in Pathology Coordinated Programme, Kharif 2020. ICAR-IIRR, Headquarters, Hyderabad-
Dr. M. Srinivas Prasad, PI; Associates: Drs. G.S. Laha, D. Krishnaveni, C. Kannan, D. Ladhalakshmi, V.Prakasam,
K. Basavaraj and G. S. Jasudasu
S.No Location Co-operators Funded/
Voluntary
Experiments
Proposed Conducted
1 Aduthurai Dr.A. Ramanathan Funded 14 14
2 Almora Dr. H. Rajashekara Voluntary 11 11
3 Arundhatinagar Dr. AbijitSaha Funded 8 2
4 Bankura Dr. ParthaPratim Ghosh Funded 17 3
5 Chatha Dr. Vijay Bahadur Singh Funded 13 12
6 Chinsurah Drs. Dr.C.K.Bhunia, Dilip Kumar Patra &P. Bandyopadhyay Funded 14 11
7 Chiplima Dr. Rini Pal Funded 8 7
8 Coimbatore Dr. C. Gopalakrishnan Funded 18 16
9 Cuttack Drs. Arup K Mukherjee, SriKantaLenka& Manas Kumar
Bag,Dr.Bijendra Kumar Voluntary 27 21
10 Gangavati Dr. PrameshDevana Funded 20 24
11 Gerua Dr. RupankarBhagawati Voluntary 9 3
12 Ghaghraghat Dr. AmritlalUpadhayay Funded 11 8
13 Gudalur Dr. C. Gopalakrishnan Voluntary 3 3
14 Hazaribagh Drs. Amrita Banerjee,Dr.Someshwar Bhagat Voluntary 12 8
15 ICAR-IIRR Drs. M. S. Prasad, G. S. Laha, D. Krishnaveni, C.Kannan,
D. Ladhalakshmi, V. Prakasam, K.Basavaraj and G.S. Jasudasu HQ 29 27
16 Imphal Dr. Susheel Kumar Sharma Voluntary 8 7
17 Jagdalpur Dr. R. S. Netam Funded 15 15
18 Jagtial Dr. N. Balram Voluntary 13 5
19 Karjat Dr. Pushpa D Patil Funded 16 14
20 Kaul Dr. Mahaveer Singh Funded 8 14
21 Khudwani Dr.Fayaz Ahmad Mohiddin Funded 10 6
22 Lonavala Dr. K. S. Raghuwanshi Voluntary 8 24
23 Ludhiana Drs. Jagjeet Singh Lore Funded 18 10
24 Malan Dr. SachinUpmanyu Funded 16 11
25 Mandya Dr. B. S. Chethana Funded 19 21
26 Maruteru Dr. V. Bhuvaneswari Funded 22 9
27 Masodha (Faizabad) Dr. Vindeshwari Prasad Funded 13 11
28 Moncompu Dr. M. Surendran Funded 14 14
29 Mugad Dr. S.C. Talekar Voluntary 14 5
30 Navsari Dr. V. A. Patil Funded 10 16
31 Nawagam Dr. RakeshkumarGangwar Funded 17 20
32 Nellore Dr. P. Madhusudhan Voluntary 10 7
33 New Delhi Drs. K.K. Mondal, B. Bishnu Maya & G. Prakash Voluntary 10 9
34 Pantnagar Drs. Vishwanath, Dr. Bijendrakumar Funded 16 14
35 Patna Dr. Md. Reyaz Ahmad Funded 10 13
36 Pattambi Dr.Puzhakkal Raji Funded 17 15
37 Ponnampet Dr. G. N. Hosagoudar Funded 14 14
38 Portblair Mr. K. Sakthivel Voluntary 3 -
39 Pusa Dr. Bimla Rai Funded 12 15
40 Raipur Dr. Pradeep Kumar Tiwari Funded 17 11
41 Rajendranagar Dr.Talluri Kiran Babu Funded 15 12
42 Ranchi Dr. M. K. Barnwal Voluntary 7 7
43 Rewa Dr. S. P. Mishra Funded 11 10
44 Rudrur Dr. Jalender Naik Porika Voluntary 2 2
45 Sabour Dr. Amarendra Kumar Voluntary 6 5
46 Titabar Dr. Bubul Chandra Das Funded 14 12
47 Umiam (Barapani) Dr AkoijamRatankumar Singh Voluntary 11 6
48 Upper Shillong Smt. Kheinkorlin Lyngdoh Funded 11 9
49 Varanasi Dr. R. K. Singh Funded 9 7
50 Wangbal Dr. Kh. Ngamreishang Funded 6 8
Total Experiments (%) 86.16% 636 548
ICAR-IIRR AICRIP – Annual Progress Report 2020, Vol.2, Plant Pathology
3.10
1. HOST PLANT RESISTANCE
Screening Nursery (NSN-1, NSN-2, NSN-H, NHSN and DSN)
LEAF BLAST
National Screening Nursery-1 (NSN-1)
The National Screening Nursery (NSN-1) comprised of 323 entries that included
national, regional and pathology checks. The nursery was evaluated at 26 locations across India
under different-agro ecological Zones. The frequency distribution of disease scores and the
representative location severity index (LSI) are presented in the Table 2. In 50% of the locations
screening was carried out under artificial inoculation while in remaining 50% under natural
infection conditions. None of the locations showed a very high (LSI =>7.0) disease pressure
under NSN-1. The highest disease pressures were recorded at Gudalur and Mandya (LSI 6.8) and
lowest at Gerua (LSI-1.2). The disease pressure was high (LSI 6-7) at Gudalur (6.8), Mandya
(6.8), Almora (6.2) and Gangavathi (6.1). The disease pressure was moderate (LSI 4-6) at most
of the locations evaluated and that included Jagdalpur (5.8), New Delhi (5.6), Gagarghat (5.5),
Malan (5.4), Rajendranagar (5.4), Nawagam (5.2), Nellore (5.2), Upper Shillong (5.2), Jagtial
(5.0), Navasari (5.0), IIRR (4.8), Ranchi (4.8), Coimbatore (4.7), Ponnampet (4.6), Umiam (4.4)
and Lonavala (4.2). The data from locations (Gerua, Hazaribagh, Khudwani, Karjat, Rewa and
Wangbal), where disease pressure was low (<4.0) was not considered for the selection of
promising entries.
None of the entries recorded score ≤3; however entries that scored SI≤4.2 were
considered as promising and presented in Table 3. The entries included IET Nos. 28645, 28451,
28421, 28178, 28171, 27358, 28664 and 28641 were promising.
National Screening Nursery-2 (NSN-2)
The nursery consists of 557 lines drawn from initial variety trials (IVTs). These were
evaluated at 14 centers under various ecological zones. The disease pressure was very high at
Mandya (LSI 7.8), while it was high at (LSI 6-7) Almora (7.0), Gangavathi (6.5) and Jagadalpur
(6.5). In most of the locations disease pressure was moderate (LSI 4-6) and that included Nellore
(5.9), Ranchi (5.7), Gagarghat (5.5), Umiam (5.5), IIRR (5.1), Ponnampet (5.0), Coimbatore
(4.6) and Rajendranagar (4.0). The Performance of entries at locations viz., Rewa (3.8) and
Hazaribagh (3.4) was not considered for the selection of best entries, where disease pressure was
low (<4.0) (Table 4).
None of the entries were recorded SI less than 3.0, but a few promising entries with low
susceptibility index (<=4.2) was presented in Table 5 and that included IET # 29398, 29223,
28378, 29333, 29147, 29442, 29164 and 29344.
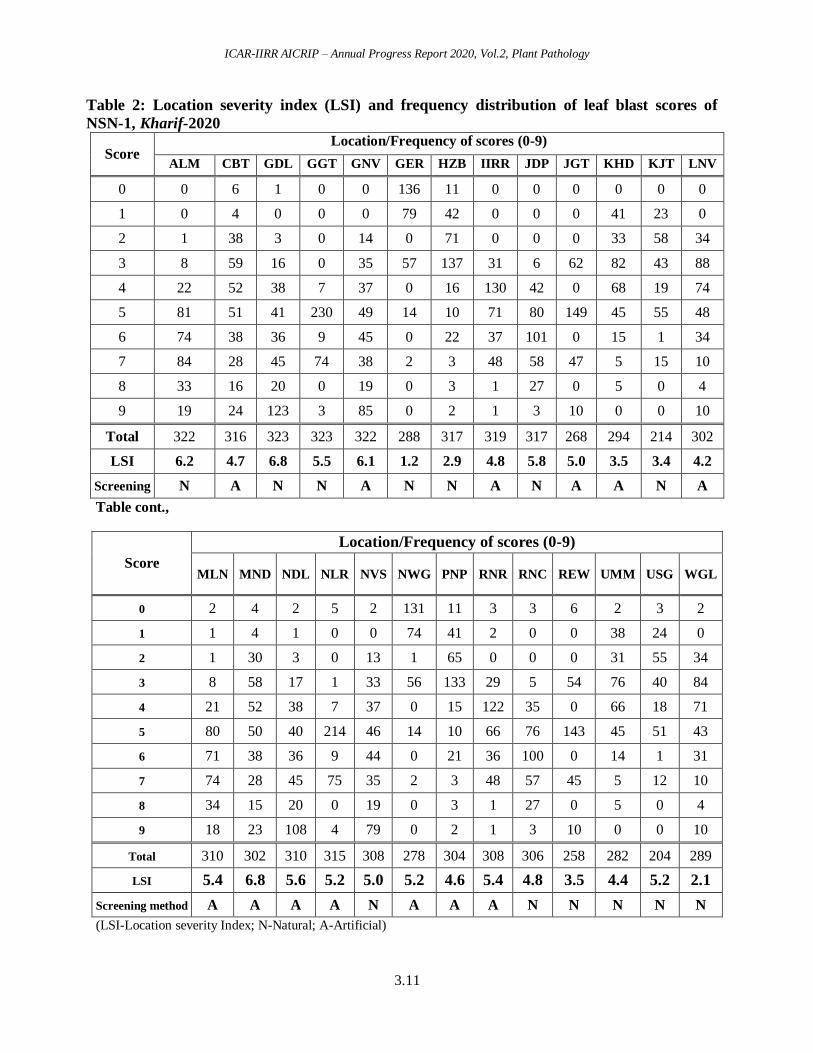
ICAR-IIRR AICRIP – Annual Progress Report 2020, Vol.2, Plant Pathology
3.11
Table 2: Location severity index (LSI) and frequency distribution of leaf blast scores of
NSN-1, Kharif-2020
Score Location/Frequency of scores (0-9)
ALM CBT GDL GGT GNV GER HZB IIRR JDP JGT KHD KJT LNV
0 0 6 1 0 0 136 11 0 0 0 0 0 0
1 0 4 0 0 0 79 42 0 0 0 41 23 0
2 1 38 3 0 14 0 71 0 0 0 33 58 34
3 8 59 16 0 35 57 137 31 6 62 82 43 88
4 22 52 38 7 37 0 16 130 42 0 68 19 74
5 81 51 41 230 49 14 10 71 80 149 45 55 48
6 74 38 36 9 45 0 22 37 101 0 15 1 34
7 84 28 45 74 38 2 3 48 58 47 5 15 10
8 33 16 20 0 19 0 3 1 27 0 5 0 4
9 19 24 123 3 85 0 2 1 3 10 0 0 10
Total 322 316 323 323 322 288 317 319 317 268 294 214 302
LSI 6.2 4.7 6.8 5.5 6.1 1.2 2.9 4.8 5.8 5.0 3.5 3.4 4.2
Screening N A N N A N N A N A A N A
Table cont.,
Score
Location/Frequency of scores (0-9)
MLN MND NDL NLR NVS NWG PNP RNR RNC REW UMM USG WGL
0 2 4 2 5 2 131 11 3 3 6 2 3 2
1 1 4 1 0 0 74 41 2 0 0 38 24 0
2 1 30 3 0 13 1 65 0 0 0 31 55 34
3 8 58 17 1 33 56 133 29 5 54 76 40 84
4 21 52 38 7 37 0 15 122 35 0 66 18 71
5 80 50 40 214 46 14 10 66 76 143 45 51 43
6 71 38 36 9 44 0 21 36 100 0 14 1 31
7 74 28 45 75 35 2 3 48 57 45 5 12 10
8 34 15 20 0 19 0 3 1 27 0 5 0 4
9 18 23 108 4 79 0 2 1 3 10 0 0 10
Total 310 302 310 315 308 278 304 308 306 258 282 204 289
LSI 5.4 6.8 5.6 5.2 5.0 5.2 4.6 5.4 4.8 3.5 4.4 5.2 2.1
Screening method A A A A N A A A N N N N N
(LSI-Location severity Index; N-Natural; A-Artificial)
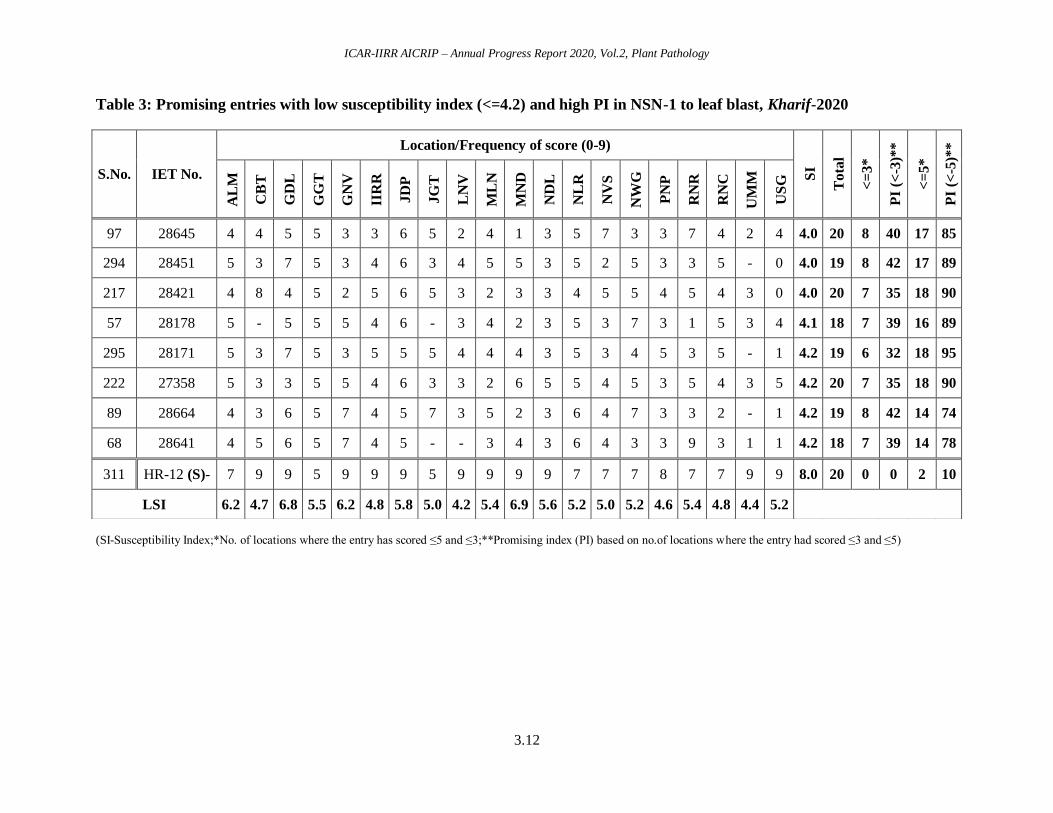
ICAR-IIRR AICRIP – Annual Progress Report 2020, Vol.2, Plant Pathology
3.12
Table 3: Promising entries with low susceptibility index (<=4.2) and high PI in NSN-1 to leaf blast, Kharif-2020
(SI-Susceptibility Index;*No. of locations where the entry has scored ≤5 and ≤3;**Promising index (PI) based on no.of locations where the entry had scored ≤3 and ≤5)
S.No. IET No.
Location/Frequency of score (0-9)
SI
Tota
l
<=
3*
PI
(<-3
)**
<=
5*
PI
(<-5
)**
AL
M
CB
T
GD
L
GG
T
GN
V
IIR
R
JD
P
JG
T
LN
V
ML
N
MN
D
ND
L
NL
R
NV
S
NW
G
PN
P
RN
R
RN
C
UM
M
US
G
97 28645 4 4 5 5 3 3 6 5 2 4 1 3 5 7 3 3 7 4 2 4 4.0 20 8 40 17 85
294 28451 5 3 7 5 3 4 6 3 4 5 5 3 5 2 5 3 3 5 - 0 4.0 19 8 42 17 89
217 28421 4 8 4 5 2 5 6 5 3 2 3 3 4 5 5 4 5 4 3 0 4.0 20 7 35 18 90
57 28178 5 - 5 5 5 4 6 - 3 4 2 3 5 3 7 3 1 5 3 4 4.1 18 7 39 16 89
295 28171 5 3 7 5 3 5 5 5 4 4 4 3 5 3 4 5 3 5 - 1 4.2 19 6 32 18 95
222 27358 5 3 3 5 5 4 6 3 3 2 6 5 5 4 5 3 5 4 3 5 4.2 20 7 35 18 90
89 28664 4 3 6 5 7 4 5 7 3 5 2 3 6 4 7 3 3 2 - 1 4.2 19 8 42 14 74
68 28641 4 5 6 5 7 4 5 - - 3 4 3 6 4 3 3 9 3 1 1 4.2 18 7 39 14 78
311 HR-12 (S)- 7 9 9 5 9 9 9 5 9 9 9 9 7 7 7 8 7 7 9 9 8.0 20 0 0 2 10
LSI 6.2 4.7 6.8 5.5 6.2 4.8 5.8 5.0 4.2 5.4 6.9 5.6 5.2 5.0 5.2 4.6 5.4 4.8 4.4 5.2
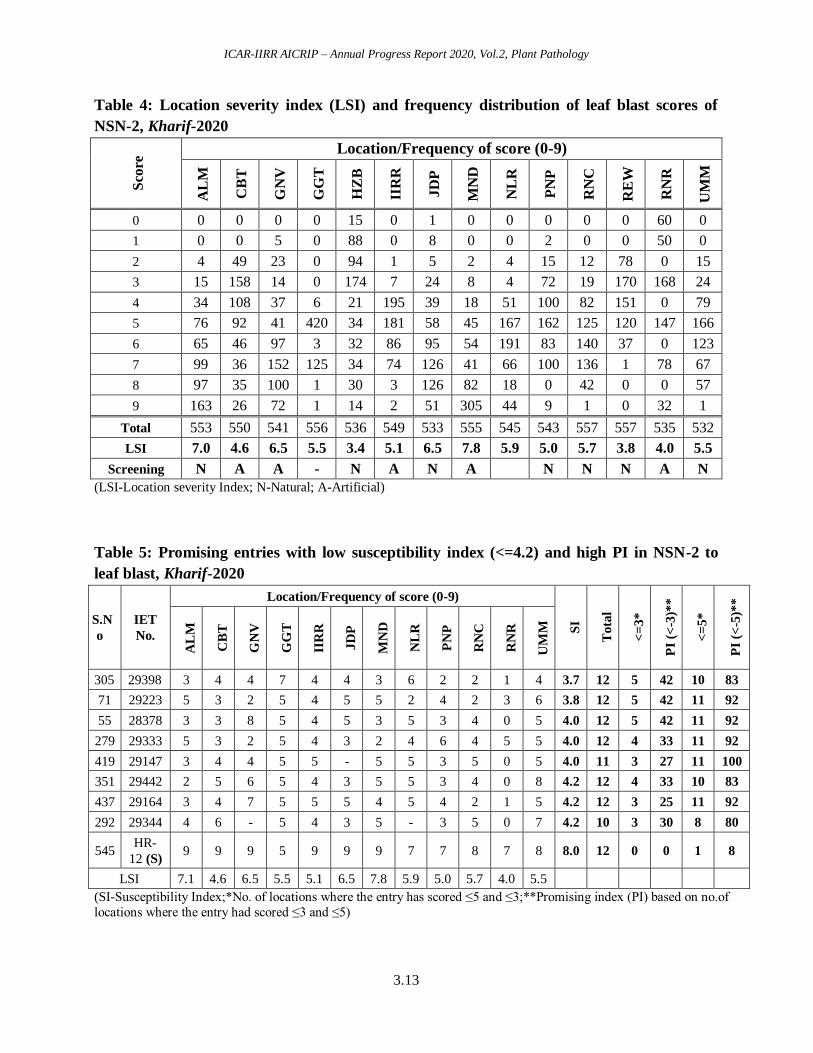
ICAR-IIRR AICRIP – Annual Progress Report 2020, Vol.2, Plant Pathology
3.13
Table 4: Location severity index (LSI) and frequency distribution of leaf blast scores of
NSN-2, Kharif-2020 S
core
Location/Frequency of score (0-9)
AL
M
CB
T
GN
V
GG
T
HZ
B
IIR
R
JD
P
MN
D
NL
R
PN
P
RN
C
RE
W
RN
R
UM
M
0 0 0 0 0 15 0 1 0 0 0 0 0 60 0
1 0 0 5 0 88 0 8 0 0 2 0 0 50 0
2 4 49 23 0 94 1 5 2 4 15 12 78 0 15
3 15 158 14 0 174 7 24 8 4 72 19 170 168 24
4 34 108 37 6 21 195 39 18 51 100 82 151 0 79
5 76 92 41 420 34 181 58 45 167 162 125 120 147 166
6 65 46 97 3 32 86 95 54 191 83 140 37 0 123
7 99 36 152 125 34 74 126 41 66 100 136 1 78 67
8 97 35 100 1 30 3 126 82 18 0 42 0 0 57
9 163 26 72 1 14 2 51 305 44 9 1 0 32 1
Total 553 550 541 556 536 549 533 555 545 543 557 557 535 532
LSI 7.0 4.6 6.5 5.5 3.4 5.1 6.5 7.8 5.9 5.0 5.7 3.8 4.0 5.5
Screening N A A - N A N A
N N N A N
(LSI-Location severity Index; N-Natural; A-Artificial)
Table 5: Promising entries with low susceptibility index (<=4.2) and high PI in NSN-2 to
leaf blast, Kharif-2020
S.N
o
IET
No.
Location/Frequency of score (0-9)
SI
Tota
l
<=
3*
PI
(<-3
)**
<=
5*
PI
(<-5
)**
AL
M
CB
T
GN
V
GG
T
IIR
R
JD
P
MN
D
NL
R
PN
P
RN
C
RN
R
UM
M
305 29398 3 4 4 7 4 4 3 6 2 2 1 4 3.7 12 5 42 10 83
71 29223 5 3 2 5 4 5 5 2 4 2 3 6 3.8 12 5 42 11 92
55 28378 3 3 8 5 4 5 3 5 3 4 0 5 4.0 12 5 42 11 92
279 29333 5 3 2 5 4 3 2 4 6 4 5 5 4.0 12 4 33 11 92
419 29147 3 4 4 5 5 - 5 5 3 5 0 5 4.0 11 3 27 11 100
351 29442 2 5 6 5 4 3 5 5 3 4 0 8 4.2 12 4 33 10 83
437 29164 3 4 7 5 5 5 4 5 4 2 1 5 4.2 12 3 25 11 92
292 29344 4 6 - 5 4 3 5 - 3 5 0 7 4.2 10 3 30 8 80
545 HR-
12 (S) 9 9 9 5 9 9 9 7 7 8 7 8 8.0 12 0 0 1 8
LSI 7.1 4.6 6.5 5.5 5.1 6.5 7.8 5.9 5.0 5.7 4.0 5.5
(SI-Susceptibility Index;*No. of locations where the entry has scored ≤5 and ≤3;**Promising index (PI) based on no.of
locations where the entry had scored ≤3 and ≤5)
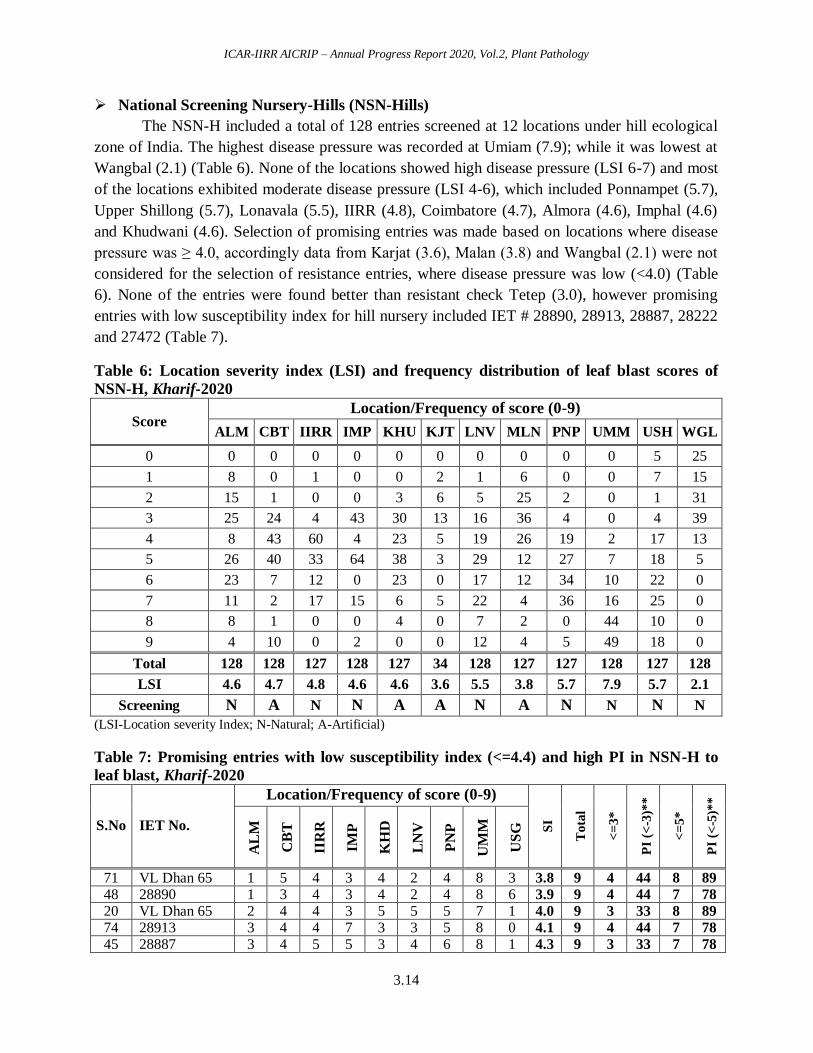
ICAR-IIRR AICRIP – Annual Progress Report 2020, Vol.2, Plant Pathology
3.14
National Screening Nursery-Hills (NSN-Hills)
The NSN-H included a total of 128 entries screened at 12 locations under hill ecological
zone of India. The highest disease pressure was recorded at Umiam (7.9); while it was lowest at
Wangbal (2.1) (Table 6). None of the locations showed high disease pressure (LSI 6-7) and most
of the locations exhibited moderate disease pressure (LSI 4-6), which included Ponnampet (5.7),
Upper Shillong (5.7), Lonavala (5.5), IIRR (4.8), Coimbatore (4.7), Almora (4.6), Imphal (4.6)
and Khudwani (4.6). Selection of promising entries was made based on locations where disease
pressure was ≥ 4.0, accordingly data from Karjat (3.6), Malan (3.8) and Wangbal (2.1) were not
considered for the selection of resistance entries, where disease pressure was low (<4.0) (Table
6). None of the entries were found better than resistant check Tetep (3.0), however promising
entries with low susceptibility index for hill nursery included IET # 28890, 28913, 28887, 28222
and 27472 (Table 7).
Table 6: Location severity index (LSI) and frequency distribution of leaf blast scores of
NSN-H, Kharif-2020
Score Location/Frequency of score (0-9)
ALM CBT IIRR IMP KHU KJT LNV MLN PNP UMM USH WGL
0 0 0 0 0 0 0 0 0 0 0 5 25
1 8 0 1 0 0 2 1 6 0 0 7 15
2 15 1 0 0 3 6 5 25 2 0 1 31
3 25 24 4 43 30 13 16 36 4 0 4 39
4 8 43 60 4 23 5 19 26 19 2 17 13
5 26 40 33 64 38 3 29 12 27 7 18 5
6 23 7 12 0 23 0 17 12 34 10 22 0
7 11 2 17 15 6 5 22 4 36 16 25 0
8 8 1 0 0 4 0 7 2 0 44 10 0
9 4 10 0 2 0 0 12 4 5 49 18 0
Total 128 128 127 128 127 34 128 127 127 128 127 128
LSI 4.6 4.7 4.8 4.6 4.6 3.6 5.5 3.8 5.7 7.9 5.7 2.1
Screening N A N N A A N A N N N N
(LSI-Location severity Index; N-Natural; A-Artificial)
Table 7: Promising entries with low susceptibility index (<=4.4) and high PI in NSN-H to
leaf blast, Kharif-2020
S.No IET No.
Location/Frequency of score (0-9)
SI
Tota
l
<=
3*
PI
(<-3
)**
<=
5*
PI
(<-5
)**
AL
M
CB
T
IIR
R
IMP
KH
D
LN
V
PN
P
UM
M
US
G
71 VL Dhan 65 1 5 4 3 4 2 4 8 3 3.8 9 4 44 8 89 48 28890 1 3 4 3 4 2 4 8 6 3.9 9 4 44 7 78 20 VL Dhan 65 2 4 4 3 5 5 5 7 1 4.0 9 3 33 8 89 74 28913 3 4 4 7 3 3 5 8 0 4.1 9 4 44 7 78 45 28887 3 4 5 5 3 4 6 8 1 4.3 9 3 33 7 78
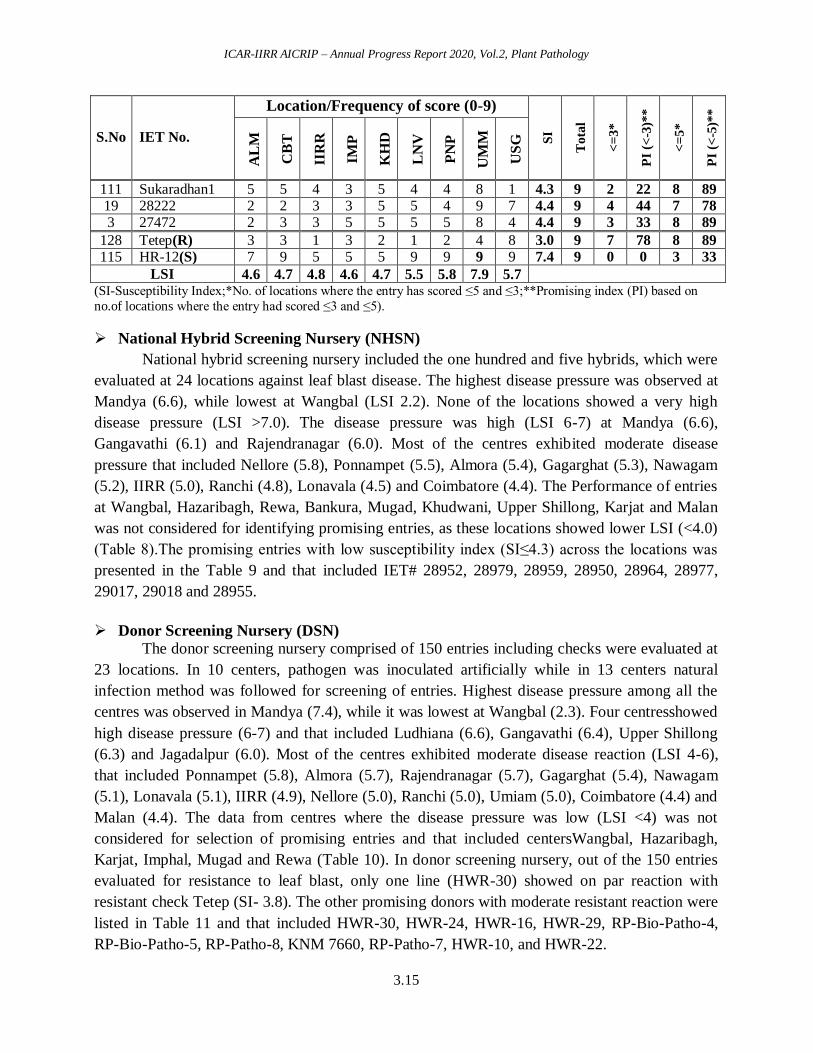
ICAR-IIRR AICRIP – Annual Progress Report 2020, Vol.2, Plant Pathology
3.15
S.No IET No.
Location/Frequency of score (0-9)
SI
Tota
l
<=
3*
PI
(<-3
)**
<=
5*
PI
(<-5
)**
AL
M
CB
T
IIR
R
IMP
KH
D
LN
V
PN
P
UM
M
US
G
111 Sukaradhan1 5 5 4 3 5 4 4 8 1 4.3 9 2 22 8 89 19 28222 2 2 3 3 5 5 4 9 7 4.4 9 4 44 7 78 3 27472 2 3 3 5 5 5 5 8 4 4.4 9 3 33 8 89
128 Tetep(R) 3 3 1 3 2 1 2 4 8 3.0 9 7 78 8 89 115 HR-12(S) 7 9 5 5 5 9 9 9 9 7.4 9 0 0 3 33
LSI 4.6 4.7 4.8 4.6 4.7 5.5 5.8 7.9 5.7 (SI-Susceptibility Index;*No. of locations where the entry has scored ≤5 and ≤3;**Promising index (PI) based on
no.of locations where the entry had scored ≤3 and ≤5).
National Hybrid Screening Nursery (NHSN)
National hybrid screening nursery included the one hundred and five hybrids, which were
evaluated at 24 locations against leaf blast disease. The highest disease pressure was observed at
Mandya (6.6), while lowest at Wangbal (LSI 2.2). None of the locations showed a very high
disease pressure (LSI >7.0). The disease pressure was high (LSI 6-7) at Mandya (6.6),
Gangavathi (6.1) and Rajendranagar (6.0). Most of the centres exhibited moderate disease
pressure that included Nellore (5.8), Ponnampet (5.5), Almora (5.4), Gagarghat (5.3), Nawagam
(5.2), IIRR (5.0), Ranchi (4.8), Lonavala (4.5) and Coimbatore (4.4). The Performance of entries
at Wangbal, Hazaribagh, Rewa, Bankura, Mugad, Khudwani, Upper Shillong, Karjat and Malan
was not considered for identifying promising entries, as these locations showed lower LSI (<4.0)
(Table 8).The promising entries with low susceptibility index (SI≤4.3) across the locations was
presented in the Table 9 and that included IET# 28952, 28979, 28959, 28950, 28964, 28977,
29017, 29018 and 28955.
Donor Screening Nursery (DSN)
The donor screening nursery comprised of 150 entries including checks were evaluated at
23 locations. In 10 centers, pathogen was inoculated artificially while in 13 centers natural
infection method was followed for screening of entries. Highest disease pressure among all the
centres was observed in Mandya (7.4), while it was lowest at Wangbal (2.3). Four centresshowed
high disease pressure (6-7) and that included Ludhiana (6.6), Gangavathi (6.4), Upper Shillong
(6.3) and Jagadalpur (6.0). Most of the centres exhibited moderate disease reaction (LSI 4-6),
that included Ponnampet (5.8), Almora (5.7), Rajendranagar (5.7), Gagarghat (5.4), Nawagam
(5.1), Lonavala (5.1), IIRR (4.9), Nellore (5.0), Ranchi (5.0), Umiam (5.0), Coimbatore (4.4) and
Malan (4.4). The data from centres where the disease pressure was low (LSI <4) was not
considered for selection of promising entries and that included centersWangbal, Hazaribagh,
Karjat, Imphal, Mugad and Rewa (Table 10). In donor screening nursery, out of the 150 entries
evaluated for resistance to leaf blast, only one line (HWR-30) showed on par reaction with
resistant check Tetep (SI- 3.8). The other promising donors with moderate resistant reaction were
listed in Table 11 and that included HWR-30, HWR-24, HWR-16, HWR-29, RP-Bio-Patho-4,
RP-Bio-Patho-5, RP-Patho-8, KNM 7660, RP-Patho-7, HWR-10, and HWR-22.
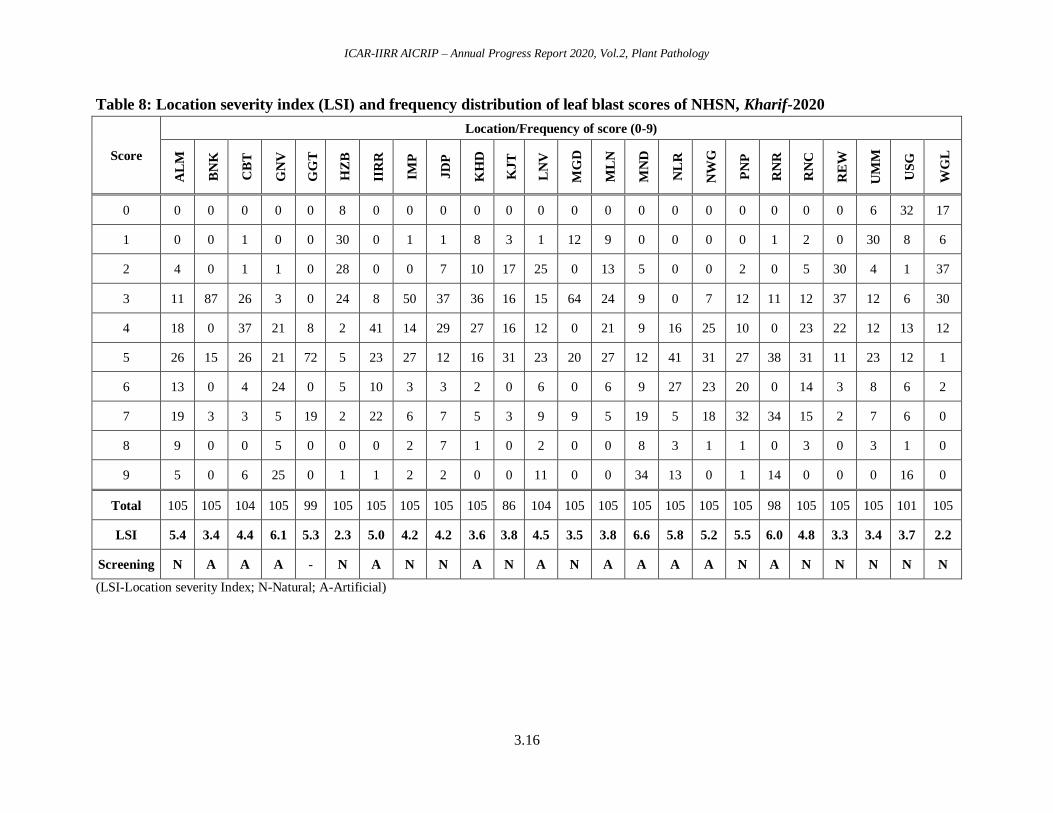
ICAR-IIRR AICRIP – Annual Progress Report 2020, Vol.2, Plant Pathology
3.16
Table 8: Location severity index (LSI) and frequency distribution of leaf blast scores of NHSN, Kharif-2020
Score
Location/Frequency of score (0-9)
AL
M
BN
K
CB
T
GN
V
GG
T
HZ
B
IIR
R
IMP
JD
P
KH
D
KJ
T
LN
V
MG
D
ML
N
MN
D
NL
R
NW
G
PN
P
RN
R
RN
C
RE
W
UM
M
US
G
WG
L
0 0 0 0 0 0 8 0 0 0 0 0 0 0 0 0 0 0 0 0 0 0 6 32 17
1 0 0 1 0 0 30 0 1 1 8 3 1 12 9 0 0 0 0 1 2 0 30 8 6
2 4 0 1 1 0 28 0 0 7 10 17 25 0 13 5 0 0 2 0 5 30 4 1 37
3 11 87 26 3 0 24 8 50 37 36 16 15 64 24 9 0 7 12 11 12 37 12 6 30
4 18 0 37 21 8 2 41 14 29 27 16 12 0 21 9 16 25 10 0 23 22 12 13 12
5 26 15 26 21 72 5 23 27 12 16 31 23 20 27 12 41 31 27 38 31 11 23 12 1
6 13 0 4 24 0 5 10 3 3 2 0 6 0 6 9 27 23 20 0 14 3 8 6 2
7 19 3 3 5 19 2 22 6 7 5 3 9 9 5 19 5 18 32 34 15 2 7 6 0
8 9 0 0 5 0 0 0 2 7 1 0 2 0 0 8 3 1 1 0 3 0 3 1 0
9 5 0 6 25 0 1 1 2 2 0 0 11 0 0 34 13 0 1 14 0 0 0 16 0
Total 105 105 104 105 99 105 105 105 105 105 86 104 105 105 105 105 105 105 98 105 105 105 101 105
LSI 5.4 3.4 4.4 6.1 5.3 2.3 5.0 4.2 4.2 3.6 3.8 4.5 3.5 3.8 6.6 5.8 5.2 5.5 6.0 4.8 3.3 3.4 3.7 2.2
Screening N A A A - N A N N A N A N A A A A N A N N N N N
(LSI-Location severity Index; N-Natural; A-Artificial)

ICAR-IIRR AICRIP – Annual Progress Report 2020, Vol.2, Plant Pathology
3.17
Table 9: Promising entries with low susceptibility index (<=4.3) and high PI in NHSN to leaf blast, Kharif-2020
S. No. IET No.
Location/Frequency of score (0-9)
SI
Tota
l
<=
3*
PI
(<-3
)**
<=
5*
PI
(<-5
)**
AL
M
CB
T
GN
V
GG
T
IIR
R
IMP
JD
P
LN
V
MN
D
NL
R
NW
G
PN
P
RN
R
RN
C
3 28952 5 3 5 5 3 3 3 2 3 4 4 2 7 4 3.8 14 7 50 13 93
28 Gontra Bidhan-3 (NCV) 3 3 4 5 5 4 2 - 3 4 5 7 3 4 4.0 13 5 38 12 92
36 28979 2 5 4 5 4 5 3 3 2 4 5 5 5 4 4.0 14 4 29 14 100
11 28959 3 4 4 5 4 5 4 2 2 5 4 3 7 4 4.0 14 4 29 13 93
1 28950 3 4 6 5 4 5 3 2 3 4 6 3 9 1 4.1 14 6 43 11 79
18 28964 2 3 5 5 5 6 3 2 3 5 5 5 5 4 4.1 14 5 36 13 93
34 28977 4 5 6 4 4 3 3 2 3 4 6 5 5 5 4.2 14 4 29 12 86
80 29017 6 4 3 5 4 3 6 3 4 4 4 6 3 5 4.3 14 4 29 11 79
82 29018 5 4 6 5 5 3 4 5 4 5 4 5 1 4 4.3 14 2 14 13 93
6 28955 4 4 4 7 4 5 4 2 4 4 4 4 5 5 4.3 14 1 7 13 93
105 Tetep(R)- 4 1 4 - 3 3 1 1 4 5 4 3 7 2 3.2 13 7 54 12 92
92 HR-12 (S)- 9 9 9 5 9 7 8 9 9 9 6 9 7 8 8.1 14 0 0 1 7
LSI 5.5 4.4 6.2 5.3 5.0 4.2 4.3 4.6 6.6 5.8 5.2 5.5 6.0 4.9
(SI-Susceptibility Index;*No. of locations where the entry has scored ≤5 and ≤3;**Promising index (PI) based on no.of locations where the entry had scored ≤3 and ≤5)
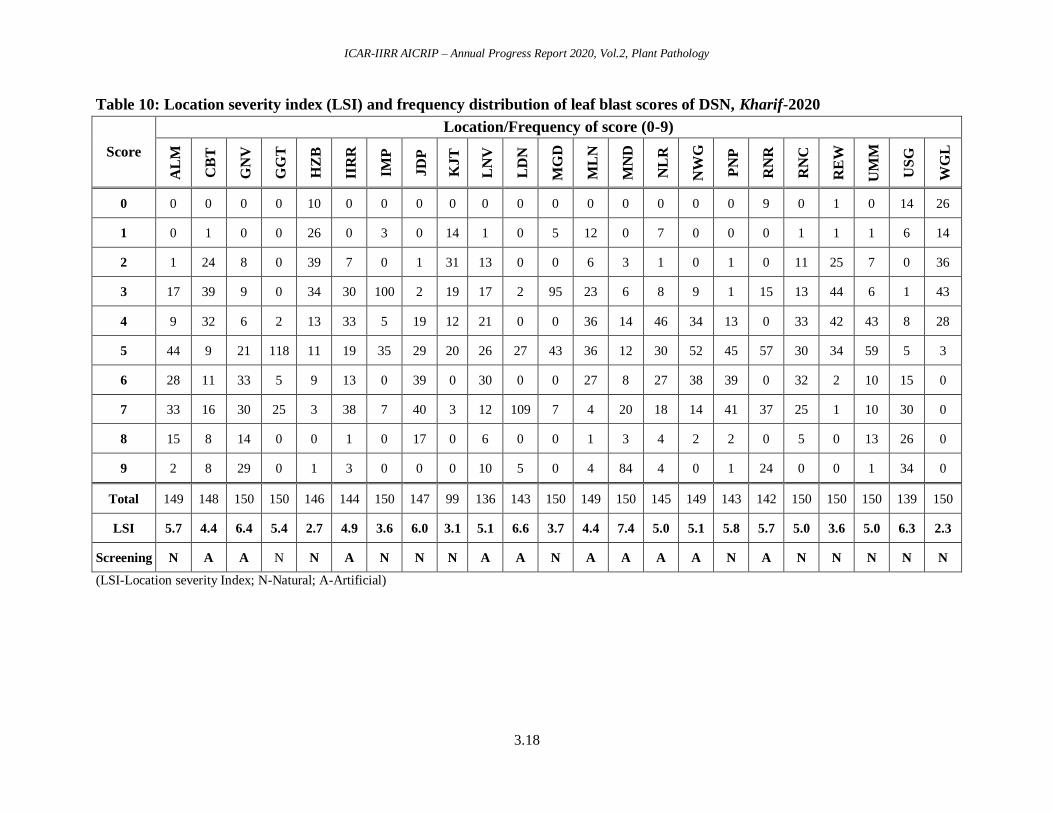
ICAR-IIRR AICRIP – Annual Progress Report 2020, Vol.2, Plant Pathology
3.18
Table 10: Location severity index (LSI) and frequency distribution of leaf blast scores of DSN, Kharif-2020
Score
Location/Frequency of score (0-9)
AL
M
CB
T
GN
V
GG
T
HZ
B
IIR
R
IMP
JD
P
KJT
LN
V
LD
N
MG
D
ML
N
MN
D
NL
R
NW
G
PN
P
RN
R
RN
C
RE
W
UM
M
US
G
WG
L
0 0 0 0 0 10 0 0 0 0 0 0 0 0 0 0 0 0 9 0 1 0 14 26
1 0 1 0 0 26 0 3 0 14 1 0 5 12 0 7 0 0 0 1 1 1 6 14
2 1 24 8 0 39 7 0 1 31 13 0 0 6 3 1 0 1 0 11 25 7 0 36
3 17 39 9 0 34 30 100 2 19 17 2 95 23 6 8 9 1 15 13 44 6 1 43
4 9 32 6 2 13 33 5 19 12 21 0 0 36 14 46 34 13 0 33 42 43 8 28
5 44 9 21 118 11 19 35 29 20 26 27 43 36 12 30 52 45 57 30 34 59 5 3
6 28 11 33 5 9 13 0 39 0 30 0 0 27 8 27 38 39 0 32 2 10 15 0
7 33 16 30 25 3 38 7 40 3 12 109 7 4 20 18 14 41 37 25 1 10 30 0
8 15 8 14 0 0 1 0 17 0 6 0 0 1 3 4 2 2 0 5 0 13 26 0
9 2 8 29 0 1 3 0 0 0 10 5 0 4 84 4 0 1 24 0 0 1 34 0
Total 149 148 150 150 146 144 150 147 99 136 143 150 149 150 145 149 143 142 150 150 150 139 150
LSI 5.7 4.4 6.4 5.4 2.7 4.9 3.6 6.0 3.1 5.1 6.6 3.7 4.4 7.4 5.0 5.1 5.8 5.7 5.0 3.6 5.0 6.3 2.3
Screening N A A N N A N N N A A N A A A A N A N N N N N
(LSI-Location severity Index; N-Natural; A-Artificial)
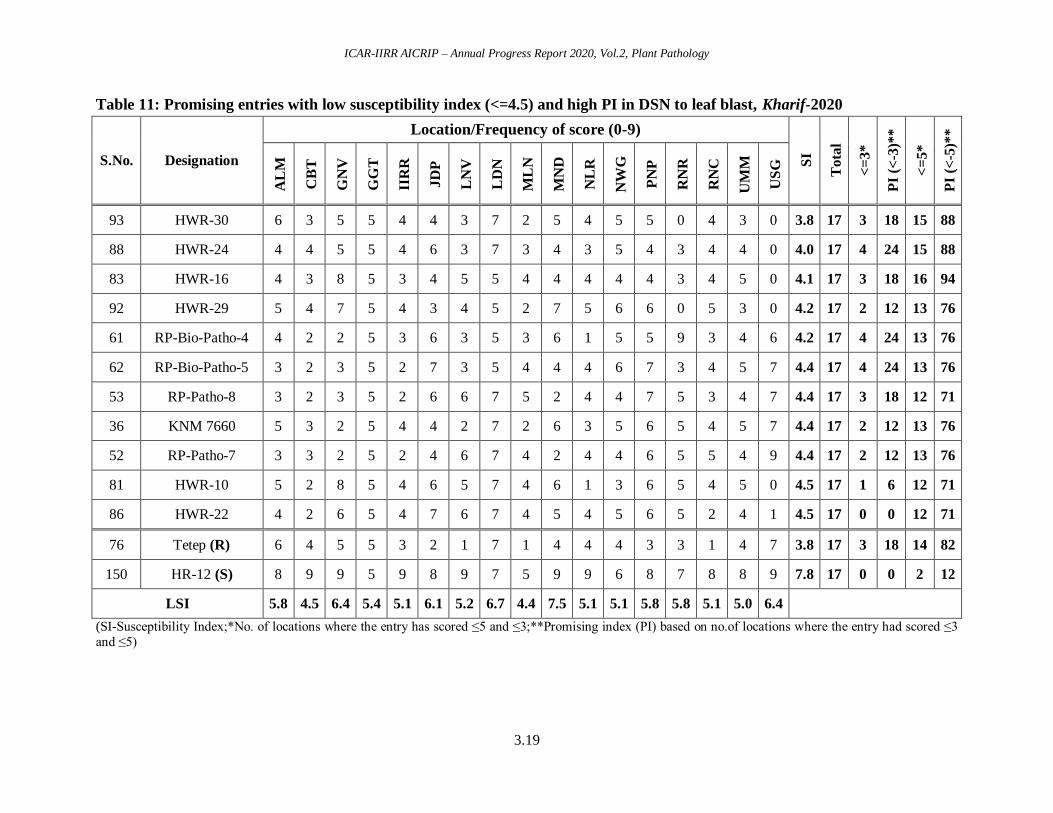
ICAR-IIRR AICRIP – Annual Progress Report 2020, Vol.2, Plant Pathology
3.19
Table 11: Promising entries with low susceptibility index (<=4.5) and high PI in DSN to leaf blast, Kharif-2020
S.No. Designation
Location/Frequency of score (0-9)
SI
Tota
l
<=
3*
PI
(<-3
)**
<=
5*
PI
(<-5
)**
AL
M
CB
T
GN
V
GG
T
IIR
R
JD
P
LN
V
LD
N
ML
N
MN
D
NL
R
NW
G
PN
P
RN
R
RN
C
UM
M
US
G
93 HWR-30 6 3 5 5 4 4 3 7 2 5 4 5 5 0 4 3 0 3.8 17 3 18 15 88
88 HWR-24 4 4 5 5 4 6 3 7 3 4 3 5 4 3 4 4 0 4.0 17 4 24 15 88
83 HWR-16 4 3 8 5 3 4 5 5 4 4 4 4 4 3 4 5 0 4.1 17 3 18 16 94
92 HWR-29 5 4 7 5 4 3 4 5 2 7 5 6 6 0 5 3 0 4.2 17 2 12 13 76
61 RP-Bio-Patho-4 4 2 2 5 3 6 3 5 3 6 1 5 5 9 3 4 6 4.2 17 4 24 13 76
62 RP-Bio-Patho-5 3 2 3 5 2 7 3 5 4 4 4 6 7 3 4 5 7 4.4 17 4 24 13 76
53 RP-Patho-8 3 2 3 5 2 6 6 7 5 2 4 4 7 5 3 4 7 4.4 17 3 18 12 71
36 KNM 7660 5 3 2 5 4 4 2 7 2 6 3 5 6 5 4 5 7 4.4 17 2 12 13 76
52 RP-Patho-7 3 3 2 5 2 4 6 7 4 2 4 4 6 5 5 4 9 4.4 17 2 12 13 76
81 HWR-10 5 2 8 5 4 6 5 7 4 6 1 3 6 5 4 5 0 4.5 17 1 6 12 71
86 HWR-22 4 2 6 5 4 7 6 7 4 5 4 5 6 5 2 4 1 4.5 17 0 0 12 71
76 Tetep (R) 6 4 5 5 3 2 1 7 1 4 4 4 3 3 1 4 7 3.8 17 3 18 14 82
150 HR-12 (S) 8 9 9 5 9 8 9 7 5 9 9 6 8 7 8 8 9 7.8 17 0 0 2 12
LSI 5.8 4.5 6.4 5.4 5.1 6.1 5.2 6.7 4.4 7.5 5.1 5.1 5.8 5.8 5.1 5.0 6.4
(SI-Susceptibility Index;*No. of locations where the entry has scored ≤5 and ≤3;**Promising index (PI) based on no.of locations where the entry had scored ≤3
and ≤5)
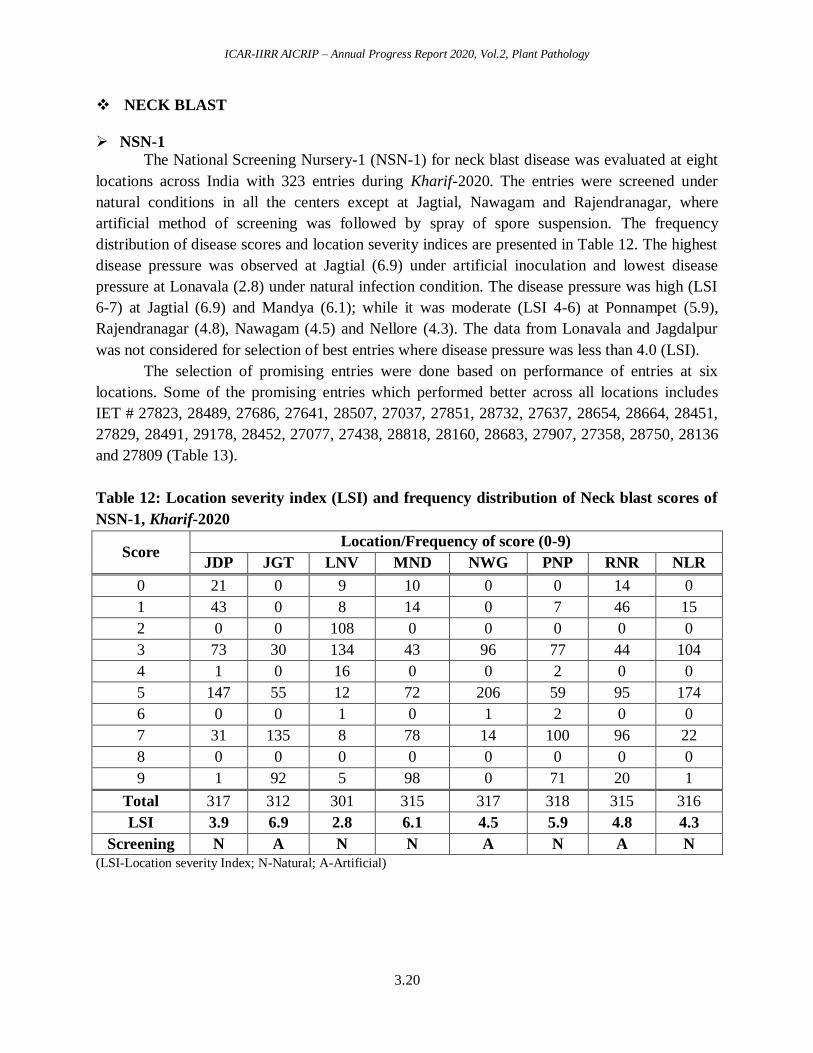
ICAR-IIRR AICRIP – Annual Progress Report 2020, Vol.2, Plant Pathology
3.20
NECK BLAST
NSN-1
The National Screening Nursery-1 (NSN-1) for neck blast disease was evaluated at eight
locations across India with 323 entries during Kharif-2020. The entries were screened under
natural conditions in all the centers except at Jagtial, Nawagam and Rajendranagar, where
artificial method of screening was followed by spray of spore suspension. The frequency
distribution of disease scores and location severity indices are presented in Table 12. The highest
disease pressure was observed at Jagtial (6.9) under artificial inoculation and lowest disease
pressure at Lonavala (2.8) under natural infection condition. The disease pressure was high (LSI
6-7) at Jagtial (6.9) and Mandya (6.1); while it was moderate (LSI 4-6) at Ponnampet (5.9),
Rajendranagar (4.8), Nawagam (4.5) and Nellore (4.3). The data from Lonavala and Jagdalpur
was not considered for selection of best entries where disease pressure was less than 4.0 (LSI).
The selection of promising entries were done based on performance of entries at six
locations. Some of the promising entries which performed better across all locations includes
IET # 27823, 28489, 27686, 27641, 28507, 27037, 27851, 28732, 27637, 28654, 28664, 28451,
27829, 28491, 29178, 28452, 27077, 27438, 28818, 28160, 28683, 27907, 27358, 28750, 28136
and 27809 (Table 13).
Table 12: Location severity index (LSI) and frequency distribution of Neck blast scores of
NSN-1, Kharif-2020
Score Location/Frequency of score (0-9)
JDP JGT LNV MND NWG PNP RNR NLR
0 21 0 9 10 0 0 14 0
1 43 0 8 14 0 7 46 15
2 0 0 108 0 0 0 0 0
3 73 30 134 43 96 77 44 104
4 1 0 16 0 0 2 0 0
5 147 55 12 72 206 59 95 174
6 0 0 1 0 1 2 0 0
7 31 135 8 78 14 100 96 22
8 0 0 0 0 0 0 0 0
9 1 92 5 98 0 71 20 1
Total 317 312 301 315 317 318 315 316
LSI 3.9 6.9 2.8 6.1 4.5 5.9 4.8 4.3
Screening N A N N A N A N
(LSI-Location severity Index; N-Natural; A-Artificial)
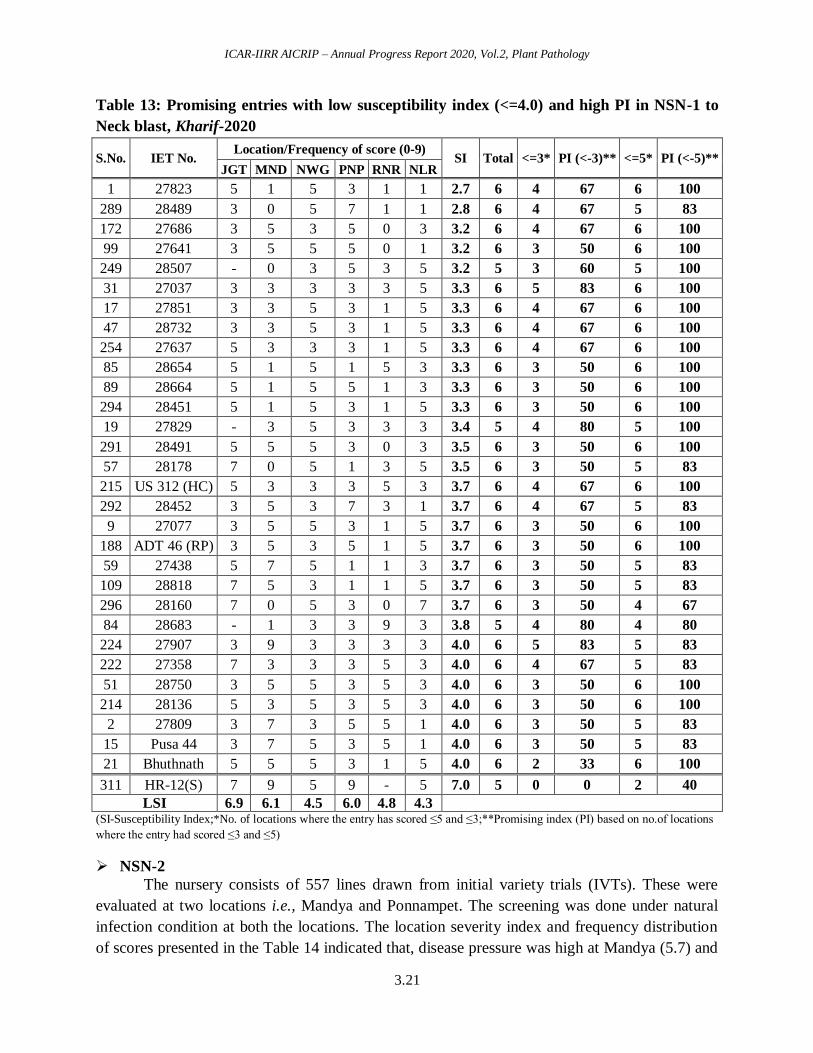
ICAR-IIRR AICRIP – Annual Progress Report 2020, Vol.2, Plant Pathology
3.21
Table 13: Promising entries with low susceptibility index (<=4.0) and high PI in NSN-1 to
Neck blast, Kharif-2020
S.No. IET No. Location/Frequency of score (0-9)
SI Total <=3* PI (<-3)** <=5* PI (<-5)** JGT MND NWG PNP RNR NLR
1 27823 5 1 5 3 1 1 2.7 6 4 67 6 100
289 28489 3 0 5 7 1 1 2.8 6 4 67 5 83
172 27686 3 5 3 5 0 3 3.2 6 4 67 6 100
99 27641 3 5 5 5 0 1 3.2 6 3 50 6 100
249 28507 - 0 3 5 3 5 3.2 5 3 60 5 100
31 27037 3 3 3 3 3 5 3.3 6 5 83 6 100
17 27851 3 3 5 3 1 5 3.3 6 4 67 6 100
47 28732 3 3 5 3 1 5 3.3 6 4 67 6 100
254 27637 5 3 3 3 1 5 3.3 6 4 67 6 100
85 28654 5 1 5 1 5 3 3.3 6 3 50 6 100
89 28664 5 1 5 5 1 3 3.3 6 3 50 6 100
294 28451 5 1 5 3 1 5 3.3 6 3 50 6 100
19 27829 - 3 5 3 3 3 3.4 5 4 80 5 100
291 28491 5 5 5 3 0 3 3.5 6 3 50 6 100
57 28178 7 0 5 1 3 5 3.5 6 3 50 5 83
215 US 312 (HC) 5 3 3 3 5 3 3.7 6 4 67 6 100
292 28452 3 5 3 7 3 1 3.7 6 4 67 5 83
9 27077 3 5 5 3 1 5 3.7 6 3 50 6 100
188 ADT 46 (RP) 3 5 3 5 1 5 3.7 6 3 50 6 100
59 27438 5 7 5 1 1 3 3.7 6 3 50 5 83
109 28818 7 5 3 1 1 5 3.7 6 3 50 5 83
296 28160 7 0 5 3 0 7 3.7 6 3 50 4 67
84 28683 - 1 3 3 9 3 3.8 5 4 80 4 80
224 27907 3 9 3 3 3 3 4.0 6 5 83 5 83
222 27358 7 3 3 3 5 3 4.0 6 4 67 5 83
51 28750 3 5 5 3 5 3 4.0 6 3 50 6 100
214 28136 5 3 5 3 5 3 4.0 6 3 50 6 100
2 27809 3 7 3 5 5 1 4.0 6 3 50 5 83
15 Pusa 44 3 7 5 3 5 1 4.0 6 3 50 5 83
21 Bhuthnath 5 5 5 3 1 5 4.0 6 2 33 6 100
311 HR-12(S) 7 9 5 9 - 5 7.0 5 0 0 2 40
LSI 6.9 6.1 4.5 6.0 4.8 4.3
(SI-Susceptibility Index;*No. of locations where the entry has scored ≤5 and ≤3;**Promising index (PI) based on no.of locations
where the entry had scored ≤3 and ≤5)
NSN-2
The nursery consists of 557 lines drawn from initial variety trials (IVTs). These were
evaluated at two locations i.e., Mandya and Ponnampet. The screening was done under natural
infection condition at both the locations. The location severity index and frequency distribution
of scores presented in the Table 14 indicated that, disease pressure was high at Mandya (5.7) and
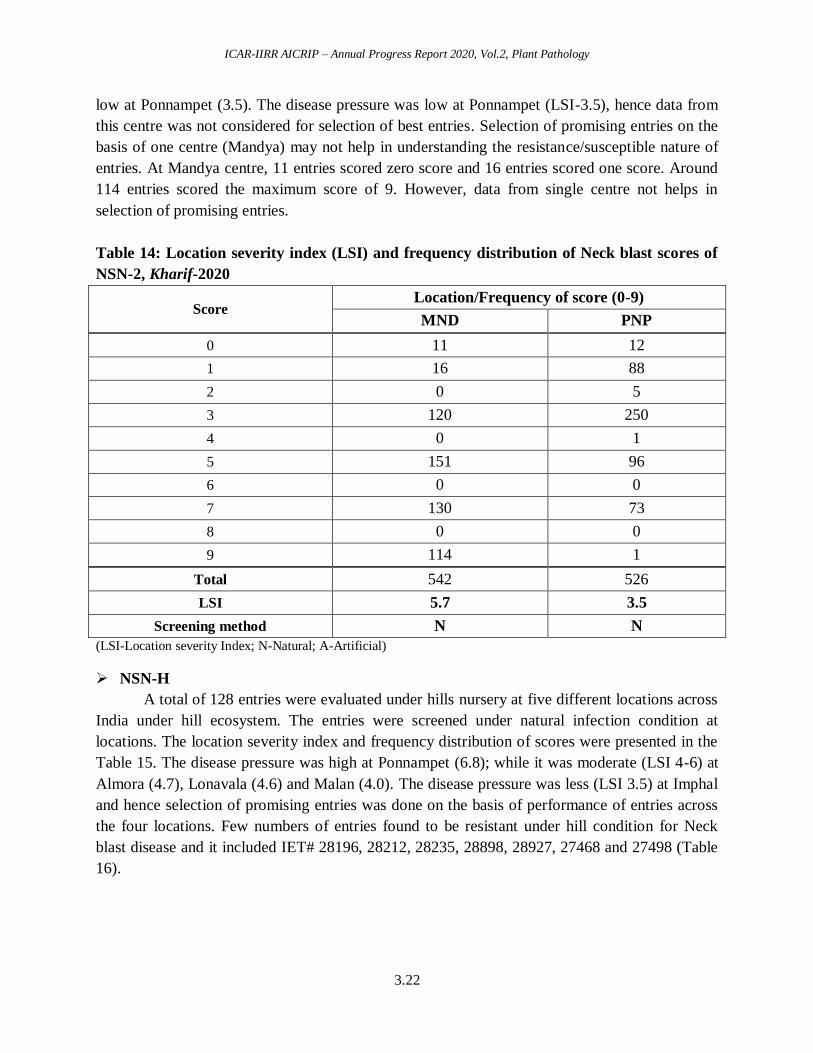
ICAR-IIRR AICRIP – Annual Progress Report 2020, Vol.2, Plant Pathology
3.22
low at Ponnampet (3.5). The disease pressure was low at Ponnampet (LSI-3.5), hence data from
this centre was not considered for selection of best entries. Selection of promising entries on the
basis of one centre (Mandya) may not help in understanding the resistance/susceptible nature of
entries. At Mandya centre, 11 entries scored zero score and 16 entries scored one score. Around
114 entries scored the maximum score of 9. However, data from single centre not helps in
selection of promising entries.
Table 14: Location severity index (LSI) and frequency distribution of Neck blast scores of
NSN-2, Kharif-2020
Score Location/Frequency of score (0-9)
MND PNP
0 11 12
1 16 88
2 0 5
3 120 250
4 0 1
5 151 96
6 0 0
7 130 73
8 0 0
9 114 1
Total 542 526
LSI 5.7 3.5
Screening method N N
(LSI-Location severity Index; N-Natural; A-Artificial)
NSN-H
A total of 128 entries were evaluated under hills nursery at five different locations across
India under hill ecosystem. The entries were screened under natural infection condition at
locations. The location severity index and frequency distribution of scores were presented in the
Table 15. The disease pressure was high at Ponnampet (6.8); while it was moderate (LSI 4-6) at
Almora (4.7), Lonavala (4.6) and Malan (4.0). The disease pressure was less (LSI 3.5) at Imphal
and hence selection of promising entries was done on the basis of performance of entries across
the four locations. Few numbers of entries found to be resistant under hill condition for Neck
blast disease and it included IET# 28196, 28212, 28235, 28898, 28927, 27468 and 27498 (Table
16).
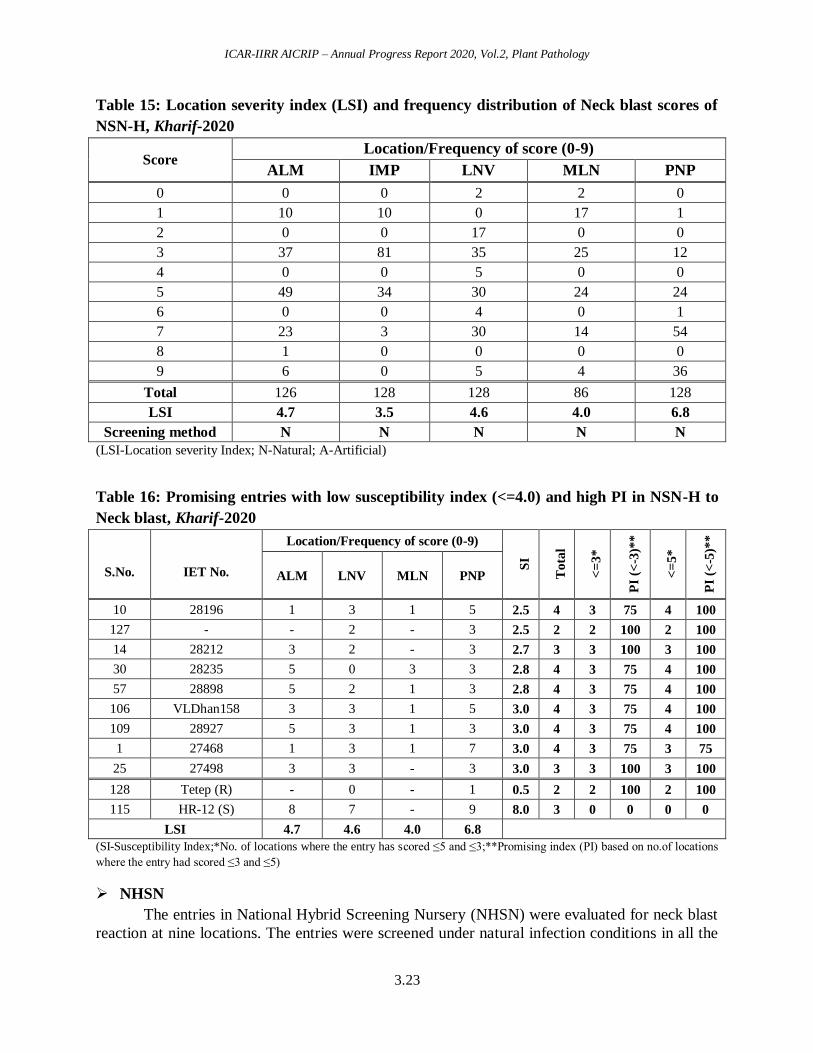
ICAR-IIRR AICRIP – Annual Progress Report 2020, Vol.2, Plant Pathology
3.23
Table 15: Location severity index (LSI) and frequency distribution of Neck blast scores of
NSN-H, Kharif-2020
Score Location/Frequency of score (0-9)
ALM IMP LNV MLN PNP
0 0 0 2 2 0
1 10 10 0 17 1
2 0 0 17 0 0
3 37 81 35 25 12
4 0 0 5 0 0
5 49 34 30 24 24
6 0 0 4 0 1
7 23 3 30 14 54
8 1 0 0 0 0
9 6 0 5 4 36
Total 126 128 128 86 128
LSI 4.7 3.5 4.6 4.0 6.8
Screening method N N N N N
(LSI-Location severity Index; N-Natural; A-Artificial)
Table 16: Promising entries with low susceptibility index (<=4.0) and high PI in NSN-H to
Neck blast, Kharif-2020
S.No.
IET No.
Location/Frequency of score (0-9)
SI
Tota
l
<=
3*
PI
(<-3
)**
<=
5*
PI
(<-5
)**
ALM LNV MLN PNP
10 28196 1 3 1 5 2.5 4 3 75 4 100
127 - - 2 - 3 2.5 2 2 100 2 100
14 28212 3 2 - 3 2.7 3 3 100 3 100
30 28235 5 0 3 3 2.8 4 3 75 4 100
57 28898 5 2 1 3 2.8 4 3 75 4 100
106 VLDhan158 3 3 1 5 3.0 4 3 75 4 100
109 28927 5 3 1 3 3.0 4 3 75 4 100
1 27468 1 3 1 7 3.0 4 3 75 3 75
25 27498 3 3 - 3 3.0 3 3 100 3 100
128 Tetep (R) - 0 - 1 0.5 2 2 100 2 100
115 HR-12 (S) 8 7 - 9 8.0 3 0 0 0 0
LSI 4.7 4.6 4.0 6.8
(SI-Susceptibility Index;*No. of locations where the entry has scored ≤5 and ≤3;**Promising index (PI) based on no.of locations
where the entry had scored ≤3 and ≤5)
NHSN
The entries in National Hybrid Screening Nursery (NHSN) were evaluated for neck blast
reaction at nine locations. The entries were screened under natural infection conditions in all the
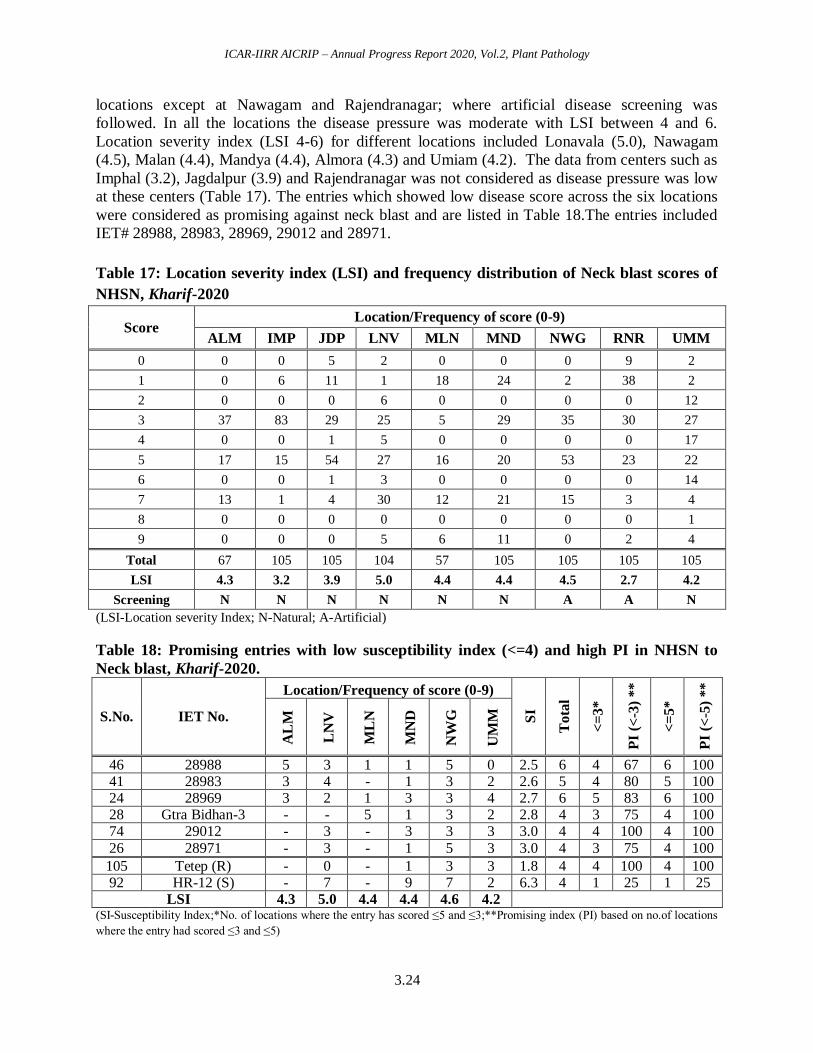
ICAR-IIRR AICRIP – Annual Progress Report 2020, Vol.2, Plant Pathology
3.24
locations except at Nawagam and Rajendranagar; where artificial disease screening was
followed. In all the locations the disease pressure was moderate with LSI between 4 and 6.
Location severity index (LSI 4-6) for different locations included Lonavala (5.0), Nawagam
(4.5), Malan (4.4), Mandya (4.4), Almora (4.3) and Umiam (4.2). The data from centers such as
Imphal (3.2), Jagdalpur (3.9) and Rajendranagar was not considered as disease pressure was low
at these centers (Table 17). The entries which showed low disease score across the six locations
were considered as promising against neck blast and are listed in Table 18.The entries included
IET# 28988, 28983, 28969, 29012 and 28971.
Table 17: Location severity index (LSI) and frequency distribution of Neck blast scores of
NHSN, Kharif-2020
Score Location/Frequency of score (0-9)
ALM IMP JDP LNV MLN MND NWG RNR UMM
0 0 0 5 2 0 0 0 9 2
1 0 6 11 1 18 24 2 38 2
2 0 0 0 6 0 0 0 0 12
3 37 83 29 25 5 29 35 30 27
4 0 0 1 5 0 0 0 0 17
5 17 15 54 27 16 20 53 23 22
6 0 0 1 3 0 0 0 0 14
7 13 1 4 30 12 21 15 3 4
8 0 0 0 0 0 0 0 0 1
9 0 0 0 5 6 11 0 2 4
Total 67 105 105 104 57 105 105 105 105
LSI 4.3 3.2 3.9 5.0 4.4 4.4 4.5 2.7 4.2
Screening N N N N N N A A N
(LSI-Location severity Index; N-Natural; A-Artificial)
Table 18: Promising entries with low susceptibility index (<=4) and high PI in NHSN to
Neck blast, Kharif-2020.
S.No. IET No.
Location/Frequency of score (0-9)
SI
To
tal
<=
3*
PI
(<-3
) **
<=
5*
PI
(<-5
) **
AL
M
LN
V
ML
N
MN
D
NW
G
UM
M
46 28988 5 3 1 1 5 0 2.5 6 4 67 6 100 41 28983 3 4 - 1 3 2 2.6 5 4 80 5 100 24 28969 3 2 1 3 3 4 2.7 6 5 83 6 100 28 Gtra Bidhan-3 - - 5 1 3 2 2.8 4 3 75 4 100 74 29012 - 3 - 3 3 3 3.0 4 4 100 4 100
26 28971 - 3 - 1 5 3 3.0 4 3 75 4 100
105 Tetep (R) - 0 - 1 3 3 1.8 4 4 100 4 100 92 HR-12 (S) - 7 - 9 7 2 6.3 4 1 25 1 25
LSI 4.3 5.0 4.4 4.4 4.6 4.2 (SI-Susceptibility Index;*No. of locations where the entry has scored ≤5 and ≤3;**Promising index (PI) based on no.of locations
where the entry had scored ≤3 and ≤5)
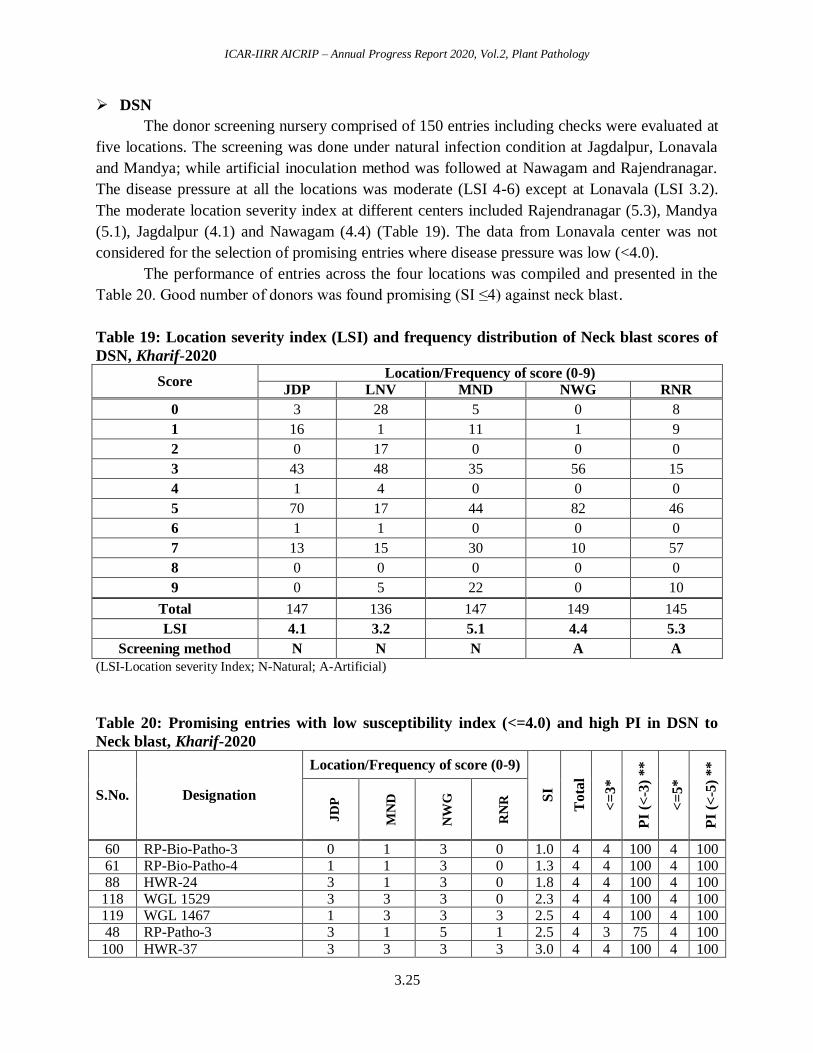
ICAR-IIRR AICRIP – Annual Progress Report 2020, Vol.2, Plant Pathology
3.25
DSN
The donor screening nursery comprised of 150 entries including checks were evaluated at
five locations. The screening was done under natural infection condition at Jagdalpur, Lonavala
and Mandya; while artificial inoculation method was followed at Nawagam and Rajendranagar.
The disease pressure at all the locations was moderate (LSI 4-6) except at Lonavala (LSI 3.2).
The moderate location severity index at different centers included Rajendranagar (5.3), Mandya
(5.1), Jagdalpur (4.1) and Nawagam (4.4) (Table 19). The data from Lonavala center was not
considered for the selection of promising entries where disease pressure was low (<4.0).
The performance of entries across the four locations was compiled and presented in the
Table 20. Good number of donors was found promising (SI ≤4) against neck blast.
Table 19: Location severity index (LSI) and frequency distribution of Neck blast scores of
DSN, Kharif-2020
Score Location/Frequency of score (0-9)
JDP LNV MND NWG RNR
0 3 28 5 0 8
1 16 1 11 1 9
2 0 17 0 0 0
3 43 48 35 56 15
4 1 4 0 0 0
5 70 17 44 82 46
6 1 1 0 0 0
7 13 15 30 10 57
8 0 0 0 0 0
9 0 5 22 0 10
Total 147 136 147 149 145
LSI 4.1 3.2 5.1 4.4 5.3
Screening method N N N A A
(LSI-Location severity Index; N-Natural; A-Artificial)
Table 20: Promising entries with low susceptibility index (<=4.0) and high PI in DSN to
Neck blast, Kharif-2020
S.No. Designation
Location/Frequency of score (0-9)
SI
To
tal
<=
3*
PI
(<-3
) *
*
<=
5*
PI
(<-5
) *
*
JD
P
MN
D
NW
G
RN
R
60 RP-Bio-Patho-3 0 1 3 0 1.0 4 4 100 4 100 61 RP-Bio-Patho-4 1 1 3 0 1.3 4 4 100 4 100 88 HWR-24 3 1 3 0 1.8 4 4 100 4 100 118 WGL 1529 3 3 3 0 2.3 4 4 100 4 100 119 WGL 1467 1 3 3 3 2.5 4 4 100 4 100 48 RP-Patho-3 3 1 5 1 2.5 4 3 75 4 100
100 HWR-37 3 3 3 3 3.0 4 4 100 4 100
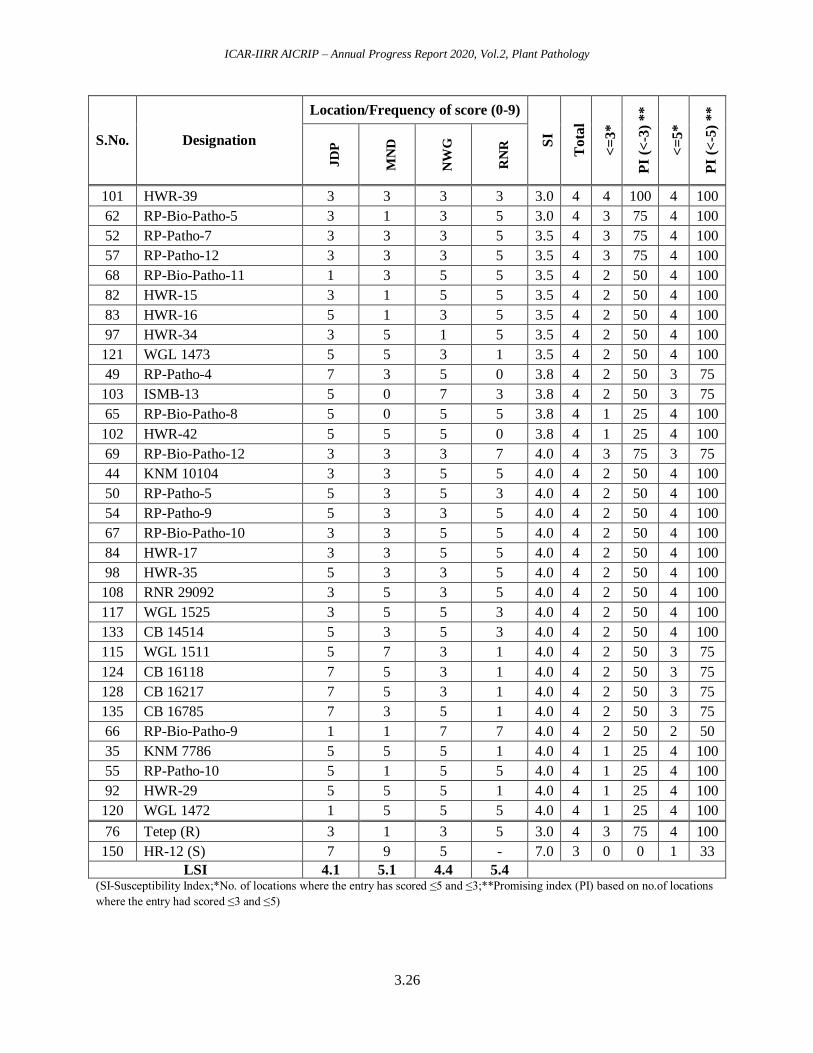
ICAR-IIRR AICRIP – Annual Progress Report 2020, Vol.2, Plant Pathology
3.26
S.No. Designation
Location/Frequency of score (0-9)
SI
To
tal
<=
3*
PI
(<-3
) *
*
<=
5*
PI
(<-5
) *
*
JD
P
MN
D
NW
G
RN
R
101 HWR-39 3 3 3 3 3.0 4 4 100 4 100
62 RP-Bio-Patho-5 3 1 3 5 3.0 4 3 75 4 100
52 RP-Patho-7 3 3 3 5 3.5 4 3 75 4 100
57 RP-Patho-12 3 3 3 5 3.5 4 3 75 4 100
68 RP-Bio-Patho-11 1 3 5 5 3.5 4 2 50 4 100
82 HWR-15 3 1 5 5 3.5 4 2 50 4 100
83 HWR-16 5 1 3 5 3.5 4 2 50 4 100
97 HWR-34 3 5 1 5 3.5 4 2 50 4 100
121 WGL 1473 5 5 3 1 3.5 4 2 50 4 100
49 RP-Patho-4 7 3 5 0 3.8 4 2 50 3 75
103 ISMB-13 5 0 7 3 3.8 4 2 50 3 75
65 RP-Bio-Patho-8 5 0 5 5 3.8 4 1 25 4 100
102 HWR-42 5 5 5 0 3.8 4 1 25 4 100
69 RP-Bio-Patho-12 3 3 3 7 4.0 4 3 75 3 75
44 KNM 10104 3 3 5 5 4.0 4 2 50 4 100
50 RP-Patho-5 5 3 5 3 4.0 4 2 50 4 100
54 RP-Patho-9 5 3 3 5 4.0 4 2 50 4 100
67 RP-Bio-Patho-10 3 3 5 5 4.0 4 2 50 4 100
84 HWR-17 3 3 5 5 4.0 4 2 50 4 100
98 HWR-35 5 3 3 5 4.0 4 2 50 4 100
108 RNR 29092 3 5 3 5 4.0 4 2 50 4 100
117 WGL 1525 3 5 5 3 4.0 4 2 50 4 100
133 CB 14514 5 3 5 3 4.0 4 2 50 4 100
115 WGL 1511 5 7 3 1 4.0 4 2 50 3 75
124 CB 16118 7 5 3 1 4.0 4 2 50 3 75
128 CB 16217 7 5 3 1 4.0 4 2 50 3 75
135 CB 16785 7 3 5 1 4.0 4 2 50 3 75
66 RP-Bio-Patho-9 1 1 7 7 4.0 4 2 50 2 50
35 KNM 7786 5 5 5 1 4.0 4 1 25 4 100
55 RP-Patho-10 5 1 5 5 4.0 4 1 25 4 100
92 HWR-29 5 5 5 1 4.0 4 1 25 4 100
120 WGL 1472 1 5 5 5 4.0 4 1 25 4 100
76 Tetep (R) 3 1 3 5 3.0 4 3 75 4 100
150 HR-12 (S) 7 9 5 - 7.0 3 0 0 1 33
LSI 4.1 5.1 4.4 5.4
(SI-Susceptibility Index;*No. of locations where the entry has scored ≤5 and ≤3;**Promising index (PI) based on no.of locations
where the entry had scored ≤3 and ≤5)
ICAR-IIRR AICRIP – Annual Progress Report 2020, Vol.2, Plant Pathology
3.27
SHEATH BLIGHT
NSN-1
The National Screening Nursery-1 (NSN-1) was evaluated for resistance to sheath blight at
17 locations across India. The entries were screened by artificial inoculation at most of the
centres except Pattambi where the entries were evaluated under natural condition and disease
pressure was 6.2. The highest disease pressure was recorded at Mandya (8.5) and lowest at
Moncompu (3.1) through artificial inoculation. The frequency distribution of disease scores and
location severity indices (LSI) were presented in Table 21. The disease pressure was very high
(LSI >7) at Mandya (8.5), Gangavati (7.1) and Cuttack (7.1); high (LSI 6 - 7) atLudhiana
(6.9),Masodha (6.5), Chiplima (6.4), New Delhi (6.4), IIRR (6.3), Pattambi (6.2), Maruteru (6.1)
and Navasari (6.1); and moderate(LSI 3-6) at Pant Nagar (5.8), Aduthurai (5.7), Raipur
(5.6),Titabar (5.5), Varanasi (4.0) and Moncompu (3.1). The selection of best entries in NSN-1
was done based on the reaction at those locations where LSI was ≥3. Some of the promising
entries with SI ≤ 5.3 are presented in the Table 22. None of the entries were found resistant
(SI≤3.0) against sheath blight disease. Promising entries were IET Nos. 25692, 28163, 28778,
27438, 28416 and 26418. Some of the other promising entries were selected based on low
susceptibility index than Swarnadhan (tolerant check) are 28757, 28087, 28677, 28070, 28178,
28493, 28126, 27900, 27838, 28513, 28702, 28510, and 28654.
NSN-2
The National Screening Nursery-2 (NSN-2) was evaluated for their resistance to sheath
blight at 9 locations. The entries were screened by artificial inoculation at most of the centres
except Pattambi where the entries were evaluated under natural condition and observed moderate
level of (LSI <3.8) disease severity. The frequency distribution of disease scores and location
severity index (LSI) are presented in Table 23. The disease pressure was very high (LSI >7) at
Mandya (8.6) and Gangavati (7.5); high (LSI 6 - 7) at IIRR (6.8), Pattambi (6.3) and Masodha
(6.0); and moderate (LSI 3-6) at Pant Nagar (5.6), Aduthurai (5.3), Maruteru (4.4) and
Moncompu (3.8).The selection of promising entries in NSN-2 was done based on the reaction at
those locations where LSI was ≥3.0. Some of the promising entries with SI ≤ 5.0 are presented in
the Table 24. None of the entries were resistant (SI≤3.0) against sheath blight based on similarity
index. A few promising entries namely 29549, 29225, 29416, 28419, 29427, 29475, 29445,
29343, 29404 and 29257 were found better than tolerant check (Swarnadhan). Besides, some of
the other promising entries viz., IET Nos. 29257, 29507, 29241, 29571, 29520, 29419, 28455,
28371, 29492, 29264 and 29278 were selected and they found better than Swarnadhan (tolerant
check).
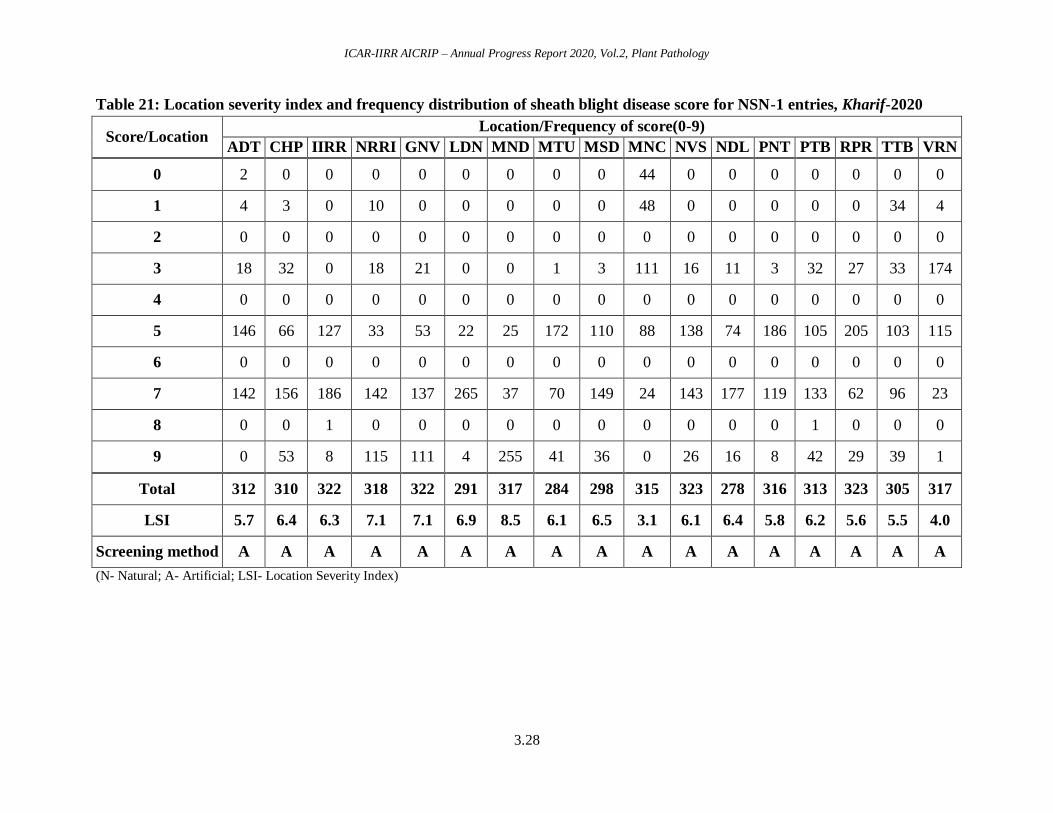
ICAR-IIRR AICRIP – Annual Progress Report 2020, Vol.2, Plant Pathology
3.28
Table 21: Location severity index and frequency distribution of sheath blight disease score for NSN-1 entries, Kharif-2020
Score/Location Location/Frequency of score(0-9)
ADT CHP IIRR NRRI GNV LDN MND MTU MSD MNC NVS NDL PNT PTB RPR TTB VRN
0 2 0 0 0 0 0 0 0 0 44 0 0 0 0 0 0 0
1 4 3 0 10 0 0 0 0 0 48 0 0 0 0 0 34 4
2 0 0 0 0 0 0 0 0 0 0 0 0 0 0 0 0 0
3 18 32 0 18 21 0 0 1 3 111 16 11 3 32 27 33 174
4 0 0 0 0 0 0 0 0 0 0 0 0 0 0 0 0 0
5 146 66 127 33 53 22 25 172 110 88 138 74 186 105 205 103 115
6 0 0 0 0 0 0 0 0 0 0 0 0 0 0 0 0 0
7 142 156 186 142 137 265 37 70 149 24 143 177 119 133 62 96 23
8 0 0 1 0 0 0 0 0 0 0 0 0 0 1 0 0 0
9 0 53 8 115 111 4 255 41 36 0 26 16 8 42 29 39 1
Total 312 310 322 318 322 291 317 284 298 315 323 278 316 313 323 305 317
LSI 5.7 6.4 6.3 7.1 7.1 6.9 8.5 6.1 6.5 3.1 6.1 6.4 5.8 6.2 5.6 5.5 4.0
Screening method A A A A A A A A A A A A A A A A A
(N- Natural; A- Artificial; LSI- Location Severity Index)
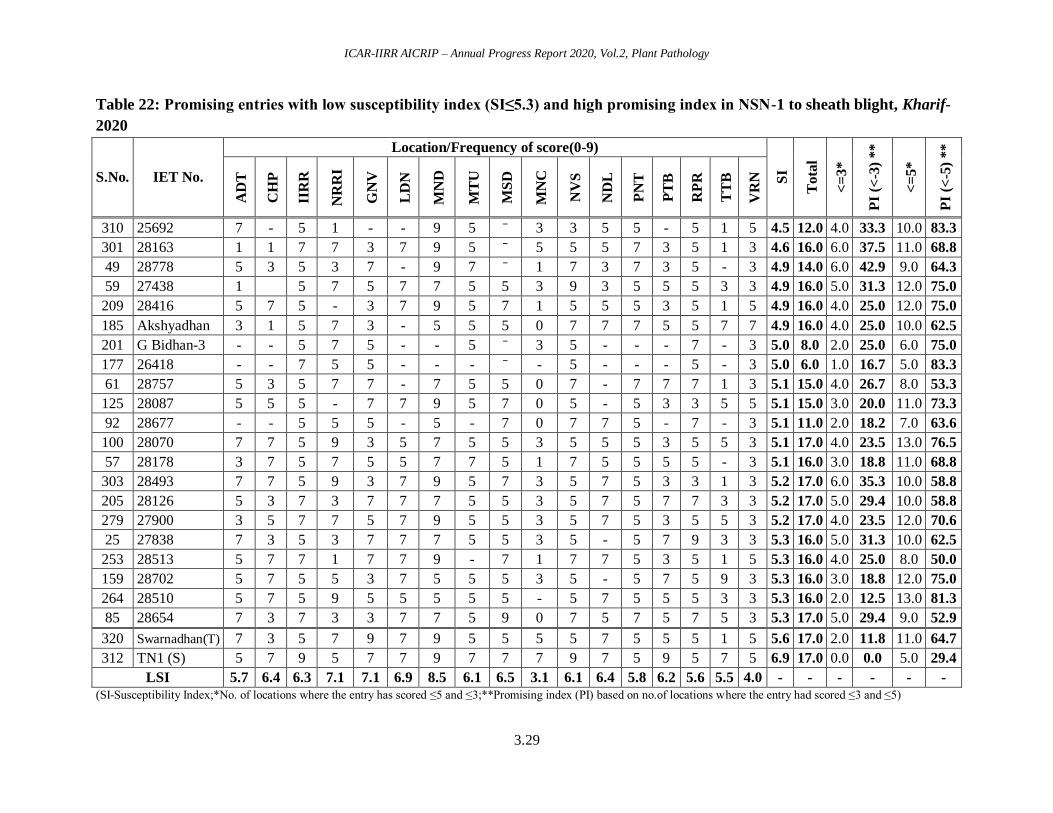
ICAR-IIRR AICRIP – Annual Progress Report 2020, Vol.2, Plant Pathology
3.29
Table 22: Promising entries with low susceptibility index (SI≤5.3) and high promising index in NSN-1 to sheath blight, Kharif-
2020
S.No. IET No.
Location/Frequency of score(0-9)
SI
Tota
l
<=
3*
PI
(<-3
) **
<=
5*
PI
(<-5
) **
AD
T
CH
P
IIR
R
NR
RI
GN
V
LD
N
MN
D
MT
U
MS
D
MN
C
NV
S
ND
L
PN
T
PT
B
RP
R
TT
B
VR
N
310 25692 7 - 5 1 - - 9 5 ⁻ 3 3 5 5 - 5 1 5 4.5 12.0 4.0 33.3 10.0 83.3
301 28163 1 1 7 7 3 7 9 5 ⁻ 5 5 5 7 3 5 1 3 4.6 16.0 6.0 37.5 11.0 68.8
49 28778 5 3 5 3 7 - 9 7 ⁻ 1 7 3 7 3 5 - 3 4.9 14.0 6.0 42.9 9.0 64.3
59 27438 1 5 7 5 7 7 5 5 3 9 3 5 5 5 3 3 4.9 16.0 5.0 31.3 12.0 75.0
209 28416 5 7 5 - 3 7 9 5 7 1 5 5 5 3 5 1 5 4.9 16.0 4.0 25.0 12.0 75.0
185 Akshyadhan 3 1 5 7 3 - 5 5 5 0 7 7 7 5 5 7 7 4.9 16.0 4.0 25.0 10.0 62.5
201 G Bidhan-3 - - 5 7 5 - - 5 ⁻ 3 5 - - - 7 - 3 5.0 8.0 2.0 25.0 6.0 75.0
177 26418 - - 7 5 5 - - - ⁻ - 5 - - - 5 - 3 5.0 6.0 1.0 16.7 5.0 83.3
61 28757 5 3 5 7 7 - 7 5 5 0 7 - 7 7 7 1 3 5.1 15.0 4.0 26.7 8.0 53.3
125 28087 5 5 5 - 7 7 9 5 7 0 5 - 5 3 3 5 5 5.1 15.0 3.0 20.0 11.0 73.3
92 28677 - - 5 5 5 - 5 - 7 0 7 7 5 - 7 - 3 5.1 11.0 2.0 18.2 7.0 63.6
100 28070 7 7 5 9 3 5 7 5 5 3 5 5 5 3 5 5 3 5.1 17.0 4.0 23.5 13.0 76.5
57 28178 3 7 5 7 5 5 7 7 5 1 7 5 5 5 5 - 3 5.1 16.0 3.0 18.8 11.0 68.8
303 28493 7 7 5 9 3 7 9 5 7 3 5 7 5 3 3 1 3 5.2 17.0 6.0 35.3 10.0 58.8
205 28126 5 3 7 3 7 7 7 5 5 3 5 7 5 7 7 3 3 5.2 17.0 5.0 29.4 10.0 58.8
279 27900 3 5 7 7 5 7 9 5 5 3 5 7 5 3 5 5 3 5.2 17.0 4.0 23.5 12.0 70.6
25 27838 7 3 5 3 7 7 7 5 5 3 5 - 5 7 9 3 3 5.3 16.0 5.0 31.3 10.0 62.5
253 28513 5 7 7 1 7 7 9 - 7 1 7 7 5 3 5 1 5 5.3 16.0 4.0 25.0 8.0 50.0
159 28702 5 7 5 5 3 7 5 5 5 3 5 - 5 7 5 9 3 5.3 16.0 3.0 18.8 12.0 75.0
264 28510 5 7 5 9 5 5 5 5 5 - 5 7 5 5 5 3 3 5.3 16.0 2.0 12.5 13.0 81.3
85 28654 7 3 7 3 3 7 7 5 9 0 7 5 7 5 7 5 3 5.3 17.0 5.0 29.4 9.0 52.9
320 Swarnadhan(T) 7 3 5 7 9 7 9 5 5 5 5 7 5 5 5 1 5 5.6 17.0 2.0 11.8 11.0 64.7
312 TN1 (S) 5 7 9 5 7 7 9 7 7 7 9 7 5 9 5 7 5 6.9 17.0 0.0 0.0 5.0 29.4
LSI 5.7 6.4 6.3 7.1 7.1 6.9 8.5 6.1 6.5 3.1 6.1 6.4 5.8 6.2 5.6 5.5 4.0 - - - - - -
(SI-Susceptibility Index;*No. of locations where the entry has scored ≤5 and ≤3;**Promising index (PI) based on no.of locations where the entry had scored ≤3 and ≤5)

ICAR-IIRR AICRIP – Annual Progress Report 2020, Vol.2, Plant Pathology
3.30
Table 23: Location severity index and frequency distribution of sheath blight disease score
for NSN-2 entries, Kharif-2020
Score/Location Location/Frequency of score(0-9)
ADT GNV IIRR MND MTU MSD MNC PNT PTB
0 8 0 0 0 0 0 41 0 0
1 26 0 7 0 0 0 73 0 0
2 0 0 0 0 0 0 0 0 0
3 60 6 11 2 87 6 176 5 49
4 0 0 0 0 0 0 0 0 0
5 233 91 72 15 181 306 172 383 202
6 0 0 0 0 0 0 0 0 0
7 197 218 370 86 0 178 88 151 192
8 0 0 2 0 0 0 0 0 0
9 12 228 64 453 0 47 1 7 103
Total 536 543 526 556 268 537 551 546 546
LSI 5.3 7.5 6.8 8.6 4.4 6.0 3.8 5.6 6.3
Screening method A A A A A A A A A
(N- Natural; A- Artificial; LSI- Location Severity Index)
Table 24: Promising entries with low susceptibility index (SI≤5.0) and high promising index
in NSN-2 to sheath blight, Kharif-2020
S.
No.
IET No.
AD
T
GN
V
IIR
R
MN
D
MT
U
MS
D
MN
C
PN
T
PT
B
SI
Tota
l
<=
3*
PI
(<-3
) **
<=
5*
PI
(<-5
) **
158 29549 1 7 5 5 3 5 3 5 3 4.1 9 4 44.4 8 88.9
73 29225 3 5 5 3 - 5 3 7 5 4.5 8 3 37.5 7 87.5
324 29416 3 9 7 5 3 ⁻ 0 5 5 4.6 8 3 37.5 6 75.0
182 28419 3 7 5 7 5 5 0 5 5 4.7 9 2 22.2 7 77.8
335 29427 5 7 7 5 - 5 1 5 3 4.8 8 2 25.0 6 75.0
400 29475 - - - 9 - 5 0 5 - 4.8 4 1 25.0 3 75.0
354 29445 3 5 7 7 3 5 3 5 5 4.8 9 3 33.3 7 77.8
291 29343 1 7 5 9 - 5 0 7 5 4.9 8 2 25.0 5 62.5
311 29404 5 5 3 9 5 5 0 5 7 4.9 9 2 22.2 7 77.8
188 29257 5 7 7 5 5 5 0 7 3 4.9 9 2 22.2 6 66.7
497 29507 5 - - 9 3 7 1 - - 5.0 5 2 40.0 3 60.0
92 29241 5 7 5 5 3 3 3 7 7 5.0 9 3 33.3 6 66.7
134 29571 1 5 7 9 5 7 3 5 3 5.0 9 3 33.3 6 66.7
511 29520 5 5 - 9 - 7 1 - 3 5.0 6 2 33.3 4 66.7
327 29419 3 9 - 7 5 ⁻ 1 5 5 5.0 7 2 28.6 5 71.4
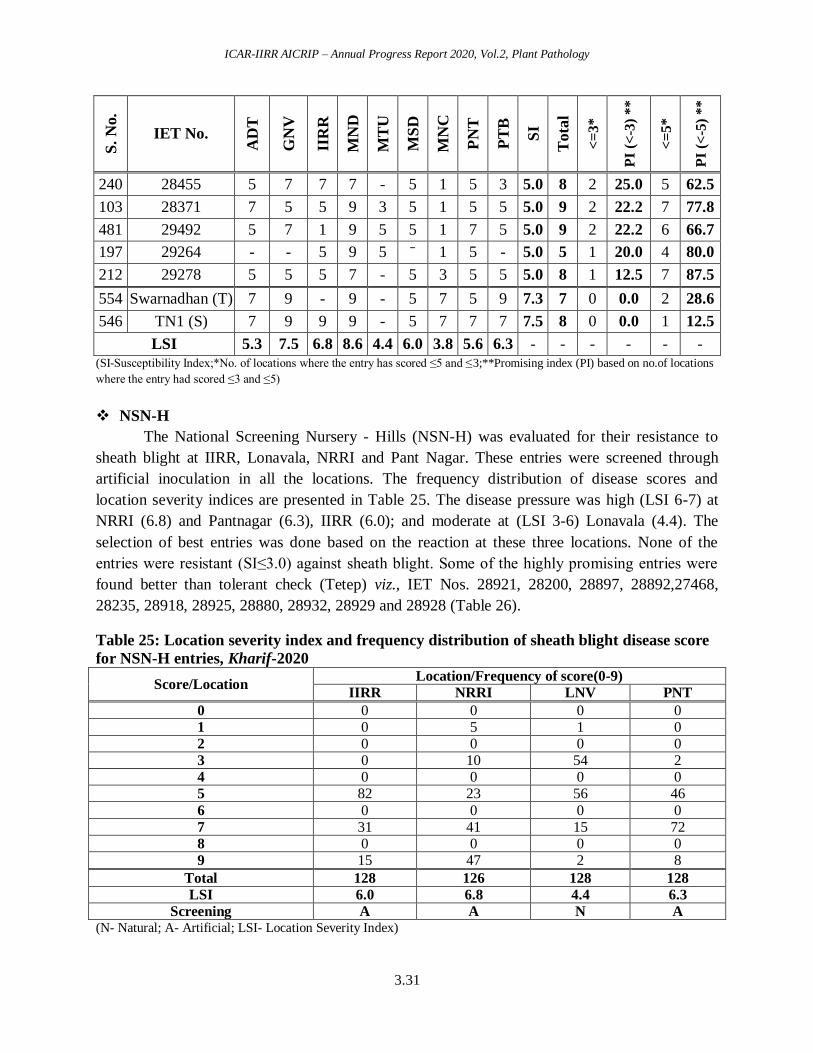
ICAR-IIRR AICRIP – Annual Progress Report 2020, Vol.2, Plant Pathology
3.31
S.
No.
IET No.
AD
T
GN
V
IIR
R
MN
D
MT
U
MS
D
MN
C
PN
T
PT
B
SI
Tota
l
<=
3*
PI
(<-3
) *
*
<=
5*
PI
(<-5
) *
*
240 28455 5 7 7 7 - 5 1 5 3 5.0 8 2 25.0 5 62.5
103 28371 7 5 5 9 3 5 1 5 5 5.0 9 2 22.2 7 77.8
481 29492 5 7 1 9 5 5 1 7 5 5.0 9 2 22.2 6 66.7
197 29264 - - 5 9 5 ⁻ 1 5 - 5.0 5 1 20.0 4 80.0
212 29278 5 5 5 7 - 5 3 5 5 5.0 8 1 12.5 7 87.5
554 Swarnadhan (T) 7 9 - 9 - 5 7 5 9 7.3 7 0 0.0 2 28.6
546 TN1 (S) 7 9 9 9 - 5 7 7 7 7.5 8 0 0.0 1 12.5
LSI 5.3 7.5 6.8 8.6 4.4 6.0 3.8 5.6 6.3 - - - - - - (SI-Susceptibility Index;*No. of locations where the entry has scored ≤5 and ≤3;**Promising index (PI) based on no.of locations
where the entry had scored ≤3 and ≤5)
NSN-H
The National Screening Nursery - Hills (NSN-H) was evaluated for their resistance to
sheath blight at IIRR, Lonavala, NRRI and Pant Nagar. These entries were screened through
artificial inoculation in all the locations. The frequency distribution of disease scores and
location severity indices are presented in Table 25. The disease pressure was high (LSI 6-7) at
NRRI (6.8) and Pantnagar (6.3), IIRR (6.0); and moderate at (LSI 3-6) Lonavala (4.4). The
selection of best entries was done based on the reaction at these three locations. None of the
entries were resistant (SI≤3.0) against sheath blight. Some of the highly promising entries were
found better than tolerant check (Tetep) viz., IET Nos. 28921, 28200, 28897, 28892,27468,
28235, 28918, 28925, 28880, 28932, 28929 and 28928 (Table 26).
Table 25: Location severity index and frequency distribution of sheath blight disease score
for NSN-H entries, Kharif-2020
Score/Location Location/Frequency of score(0-9)
IIRR NRRI LNV PNT
0 0 0 0 0 1 0 5 1 0 2 0 0 0 0 3 0 10 54 2 4 0 0 0 0 5 82 23 56 46
6 0 0 0 0 7 31 41 15 72 8 0 0 0 0 9 15 47 2 8
Total 128 126 128 128
LSI 6.0 6.8 4.4 6.3
Screening A A N A (N- Natural; A- Artificial; LSI- Location Severity Index)
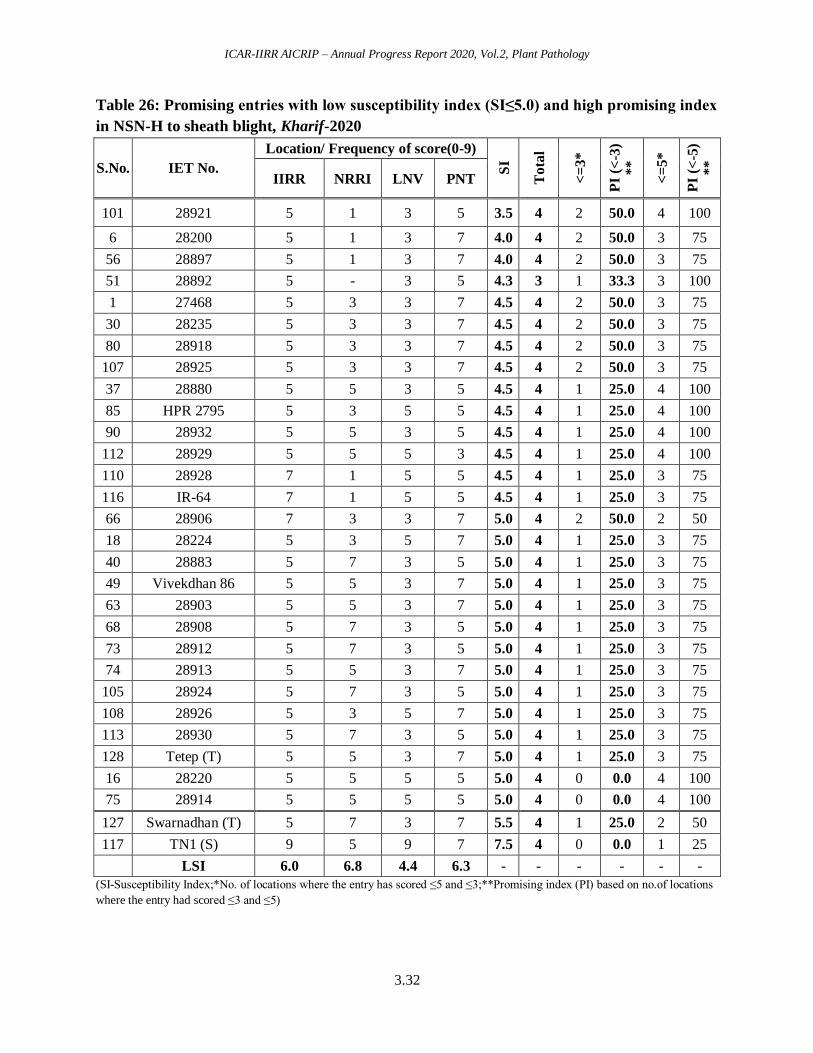
ICAR-IIRR AICRIP – Annual Progress Report 2020, Vol.2, Plant Pathology
3.32
Table 26: Promising entries with low susceptibility index (SI≤5.0) and high promising index
in NSN-H to sheath blight, Kharif-2020
S.No. IET No.
Location/ Frequency of score(0-9)
SI
To
tal
<=
3*
PI
(<-3
) *
*
<=
5*
PI
(<-5
) *
*
IIRR NRRI LNV PNT
101 28921 5 1 3 5 3.5 4 2 50.0 4 100
6 28200 5 1 3 7 4.0 4 2 50.0 3 75
56 28897 5 1 3 7 4.0 4 2 50.0 3 75
51 28892 5 - 3 5 4.3 3 1 33.3 3 100
1 27468 5 3 3 7 4.5 4 2 50.0 3 75
30 28235 5 3 3 7 4.5 4 2 50.0 3 75
80 28918 5 3 3 7 4.5 4 2 50.0 3 75
107 28925 5 3 3 7 4.5 4 2 50.0 3 75
37 28880 5 5 3 5 4.5 4 1 25.0 4 100
85 HPR 2795 5 3 5 5 4.5 4 1 25.0 4 100
90 28932 5 5 3 5 4.5 4 1 25.0 4 100
112 28929 5 5 5 3 4.5 4 1 25.0 4 100
110 28928 7 1 5 5 4.5 4 1 25.0 3 75
116 IR-64 7 1 5 5 4.5 4 1 25.0 3 75
66 28906 7 3 3 7 5.0 4 2 50.0 2 50
18 28224 5 3 5 7 5.0 4 1 25.0 3 75
40 28883 5 7 3 5 5.0 4 1 25.0 3 75
49 Vivekdhan 86 5 5 3 7 5.0 4 1 25.0 3 75
63 28903 5 5 3 7 5.0 4 1 25.0 3 75
68 28908 5 7 3 5 5.0 4 1 25.0 3 75
73 28912 5 7 3 5 5.0 4 1 25.0 3 75
74 28913 5 5 3 7 5.0 4 1 25.0 3 75
105 28924 5 7 3 5 5.0 4 1 25.0 3 75
108 28926 5 3 5 7 5.0 4 1 25.0 3 75
113 28930 5 7 3 5 5.0 4 1 25.0 3 75
128 Tetep (T) 5 5 3 7 5.0 4 1 25.0 3 75
16 28220 5 5 5 5 5.0 4 0 0.0 4 100
75 28914 5 5 5 5 5.0 4 0 0.0 4 100
127 Swarnadhan (T) 5 7 3 7 5.5 4 1 25.0 2 50
117 TN1 (S) 9 5 9 7 7.5 4 0 0.0 1 25
LSI 6.0 6.8 4.4 6.3 - - - - - -
(SI-Susceptibility Index;*No. of locations where the entry has scored ≤5 and ≤3;**Promising index (PI) based on no.of locations
where the entry had scored ≤3 and ≤5)
ICAR-IIRR AICRIP – Annual Progress Report 2020, Vol.2, Plant Pathology
3.33
NHSN
The National Hybrid Screening Nursery (NHSN) was evaluated for their resistance to
sheath blight at 22 varied locations. The entries were screened by artificial inoculation at most of
the centres except Arundhatinagar, Lonavala, Patna and Pattambi where the entries were
evaluated under natural incidence with moderate disease pressure. The frequency distribution of
disease score and location severity index (LSI) are presented in the Table 27. The disease
pressure was very high (LSI >7) at Mandya (8.4), Gangavathi (8.1), Chinsurah (7.3), Ludhiana
(7.3), NRRI (7.0); High (LSI 6-7) at Maruteru (6.8), Pattambi (6.4), IIRR (6.2),Masodha (6.1),
and Pant Nagar (6.0); moderate (LSI 3-6) at Aduthurai (5.8),Raipur (5.7), Navasari (5.7), Titabar
(4.8), Varanasi (4.6), Moncompu (4.5), Lonavala (4.2), Kaul (3.9), New Delhi (5.2), Bankura
(5.4); and low (LSI <3) at Patna (3.6) and Arundhatinagar (2.8). Therefore, the data from those
centers having LSI ≤4.0 was not considered for selecting the promising entries.None of the
entries were showed resistant against sheath blight (Table 28). IET No 29000 showed high level
oftolerance compared to Tetep. Some of the selected promising entries were IET 29019, 29020,
29016, 28959, 28971, 28998, 29017, 29001 and 29022 showed less disease severity index when
compare to tolerant check (Swarnadhan).
DSN
The Donor Screening Nursery (DSN) was evaluated for resistance to sheath blight at 19
disease hot spot locations in India. The entries were screened by artificial inoculation at all the
centres except Lonavala, Patna and Pattambi where the entries were evaluated under natural
conditions. The frequency distribution of disease scores and location severity index (LSI) were
presented in Table 29. The disease pressure was very high (LSI >7) at Mandya (8.5), Gangavati
(7.7);high (LSI 6-7) at Ludhiana (6.9), Masodha (6.9), Aduthurai (6.8), Cuttack (6.7),Raipur
(6.7),Pattambi (6.2), Maruteru (6.2) and IIRR (6.0); and moderate (LSI 3-6) at Pant Nagar (5.9),
New Delhi (5.7), Navasari (5.7), Chiplima (5.5), Varanasi (5.3), Moncompu (3.6), Patna (3.2),
Lonavala (4.4) andTitabar (4.2). The selection of promising entries in DSN was done based on
the reaction at those locations where LSI was ≥3.0. None of the entries were showed resistant
(≤3) against sheath blight. However, some of the promising entries were presented in the Table
30. The selected promising entries viz.,HWR-31, KNM 7786, HWR-16, JGL 34828, WGL 1518,
CB 16118, CB 17135, MTU 1010, CB 16148, HWR-24, HWR-28, KNM 7715, RP-Bio-Patho-5,
WGL 1525 and HWR-15.
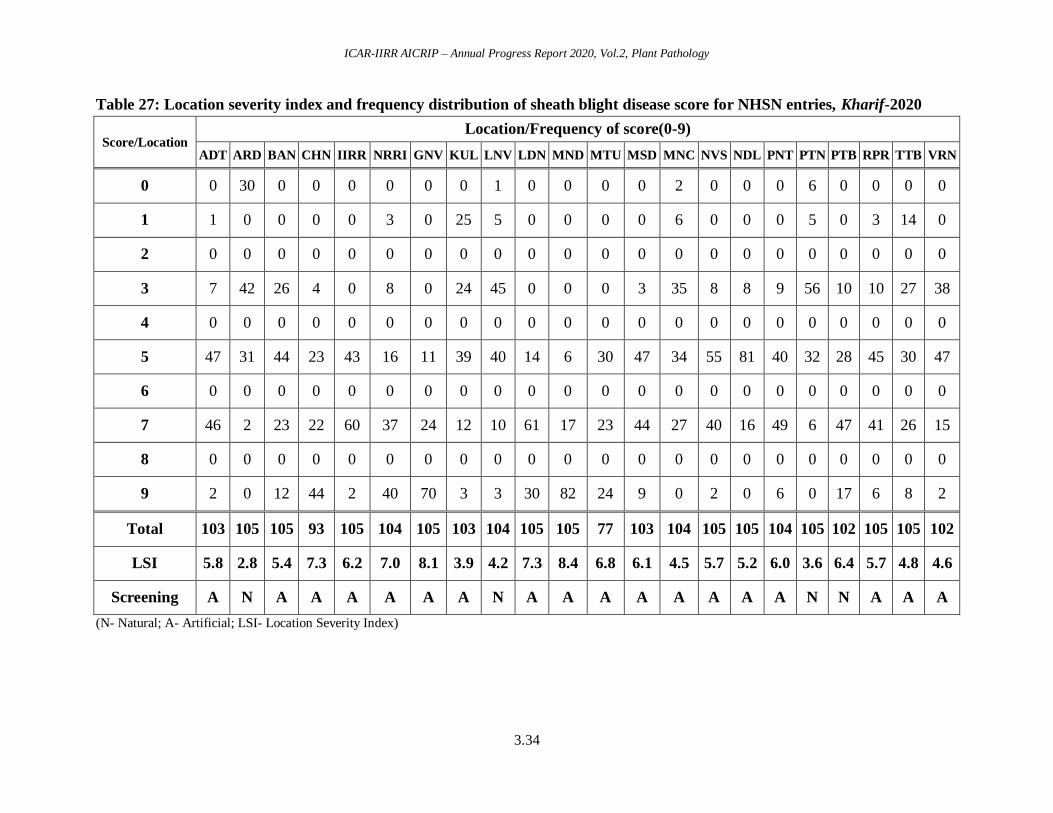
ICAR-IIRR AICRIP – Annual Progress Report 2020, Vol.2, Plant Pathology
3.34
Table 27: Location severity index and frequency distribution of sheath blight disease score for NHSN entries, Kharif-2020
Score/Location Location/Frequency of score(0-9)
ADT ARD BAN CHN IIRR NRRI GNV KUL LNV LDN MND MTU MSD MNC NVS NDL PNT PTN PTB RPR TTB VRN
0 0 30 0 0 0 0 0 0 1 0 0 0 0 2 0 0 0 6 0 0 0 0
1 1 0 0 0 0 3 0 25 5 0 0 0 0 6 0 0 0 5 0 3 14 0
2 0 0 0 0 0 0 0 0 0 0 0 0 0 0 0 0 0 0 0 0 0 0
3 7 42 26 4 0 8 0 24 45 0 0 0 3 35 8 8 9 56 10 10 27 38
4 0 0 0 0 0 0 0 0 0 0 0 0 0 0 0 0 0 0 0 0 0 0
5 47 31 44 23 43 16 11 39 40 14 6 30 47 34 55 81 40 32 28 45 30 47
6 0 0 0 0 0 0 0 0 0 0 0 0 0 0 0 0 0 0 0 0 0 0
7 46 2 23 22 60 37 24 12 10 61 17 23 44 27 40 16 49 6 47 41 26 15
8 0 0 0 0 0 0 0 0 0 0 0 0 0 0 0 0 0 0 0 0 0 0
9 2 0 12 44 2 40 70 3 3 30 82 24 9 0 2 0 6 0 17 6 8 2
Total 103 105 105 93 105 104 105 103 104 105 105 77 103 104 105 105 104 105 102 105 105 102
LSI 5.8 2.8 5.4 7.3 6.2 7.0 8.1 3.9 4.2 7.3 8.4 6.8 6.1 4.5 5.7 5.2 6.0 3.6 6.4 5.7 4.8 4.6
Screening A N A A A A A A N A A A A A A A A N N A A A
(N- Natural; A- Artificial; LSI- Location Severity Index)
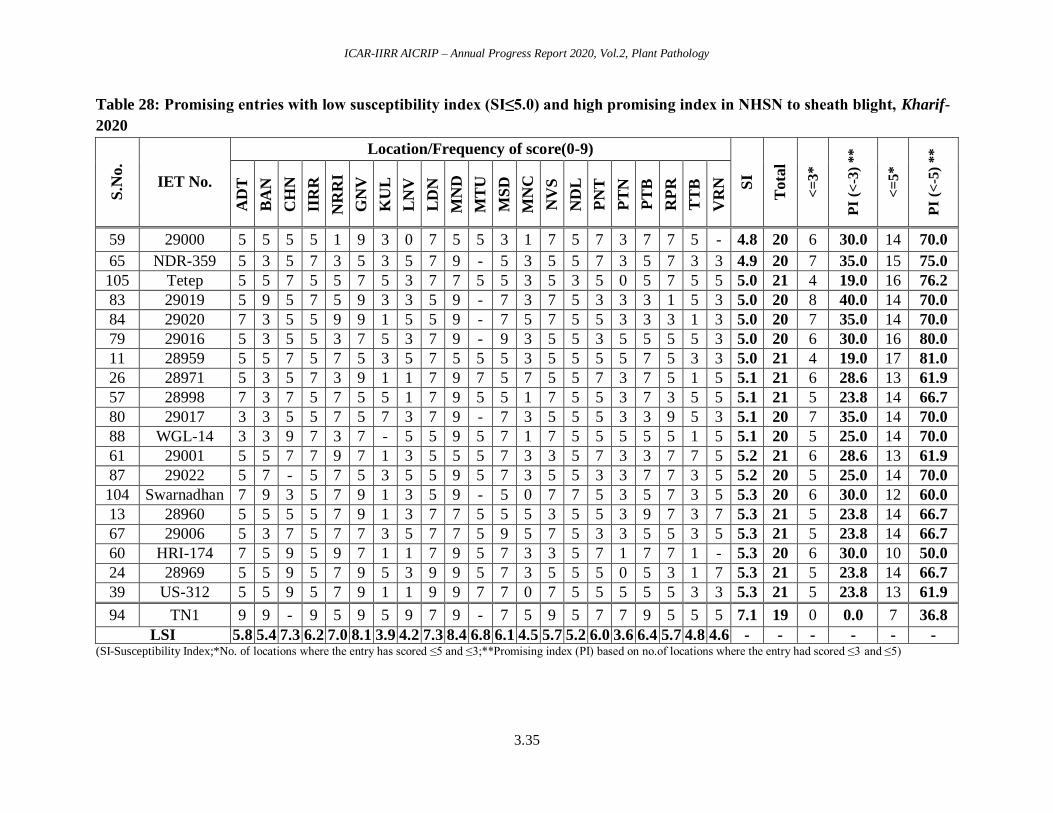
ICAR-IIRR AICRIP – Annual Progress Report 2020, Vol.2, Plant Pathology
3.35
Table 28: Promising entries with low susceptibility index (SI≤5.0) and high promising index in NHSN to sheath blight, Kharif-
2020 S
.No.
IET No.
Location/Frequency of score(0-9)
SI
Tota
l
<=
3*
PI
(<-3
) **
<=
5*
PI
(<-5
) **
AD
T
BA
N
CH
N
IIR
R
NR
RI
GN
V
KU
L
LN
V
LD
N
MN
D
MT
U
MS
D
MN
C
NV
S
ND
L
PN
T
PT
N
PT
B
RP
R
TT
B
VR
N
59 29000 5 5 5 5 1 9 3 0 7 5 5 3 1 7 5 7 3 7 7 5 - 4.8 20 6 30.0 14 70.0
65 NDR-359 5 3 5 7 3 5 3 5 7 9 - 5 3 5 5 7 3 5 7 3 3 4.9 20 7 35.0 15 75.0
105 Tetep 5 5 7 5 5 7 5 3 7 7 5 5 3 5 3 5 0 5 7 5 5 5.0 21 4 19.0 16 76.2
83 29019 5 9 5 7 5 9 3 3 5 9 - 7 3 7 5 3 3 3 1 5 3 5.0 20 8 40.0 14 70.0
84 29020 7 3 5 5 9 9 1 5 5 9 - 7 5 7 5 5 3 3 3 1 3 5.0 20 7 35.0 14 70.0
79 29016 5 3 5 5 3 7 5 3 7 9 - 9 3 5 5 3 5 5 5 5 3 5.0 20 6 30.0 16 80.0
11 28959 5 5 7 5 7 5 3 5 7 5 5 5 3 5 5 5 5 7 5 3 3 5.0 21 4 19.0 17 81.0
26 28971 5 3 5 7 3 9 1 1 7 9 7 5 7 5 5 7 3 7 5 1 5 5.1 21 6 28.6 13 61.9
57 28998 7 3 7 5 7 5 5 1 7 9 5 5 1 7 5 5 3 7 3 5 5 5.1 21 5 23.8 14 66.7
80 29017 3 3 5 5 7 5 7 3 7 9 - 7 3 5 5 5 3 3 9 5 3 5.1 20 7 35.0 14 70.0
88 WGL-14 3 3 9 7 3 7 - 5 5 9 5 7 1 7 5 5 5 5 5 1 5 5.1 20 5 25.0 14 70.0
61 29001 5 5 7 7 9 7 1 3 5 5 5 7 3 3 5 7 3 3 7 7 5 5.2 21 6 28.6 13 61.9
87 29022 5 7 - 5 7 5 3 5 5 9 5 7 3 5 5 3 3 7 7 3 5 5.2 20 5 25.0 14 70.0
104 Swarnadhan 7 9 3 5 7 9 1 3 5 9 - 5 0 7 7 5 3 5 7 3 5 5.3 20 6 30.0 12 60.0
13 28960 5 5 5 5 7 9 1 3 7 7 5 5 5 3 5 5 3 9 7 3 7 5.3 21 5 23.8 14 66.7
67 29006 5 3 7 5 7 7 3 5 7 7 5 9 5 7 5 3 3 5 5 3 5 5.3 21 5 23.8 14 66.7
60 HRI-174 7 5 9 5 9 7 1 1 7 9 5 7 3 3 5 7 1 7 7 1 - 5.3 20 6 30.0 10 50.0
24 28969 5 5 9 5 7 9 5 3 9 9 5 7 3 5 5 5 0 5 3 1 7 5.3 21 5 23.8 14 66.7
39 US-312 5 5 9 5 7 9 1 1 9 9 7 7 0 7 5 5 5 5 5 3 3 5.3 21 5 23.8 13 61.9
94 TN1 9 9 - 9 5 9 5 9 7 9 - 7 5 9 5 7 7 9 5 5 5 7.1 19 0 0.0 7 36.8
LSI 5.8 5.4 7.3 6.2 7.0 8.1 3.9 4.2 7.3 8.4 6.8 6.1 4.5 5.7 5.2 6.0 3.6 6.4 5.7 4.8 4.6 - - - - - - (SI-Susceptibility Index;*No. of locations where the entry has scored ≤5 and ≤3;**Promising index (PI) based on no.of locations where the entry had scored ≤3 and ≤5)
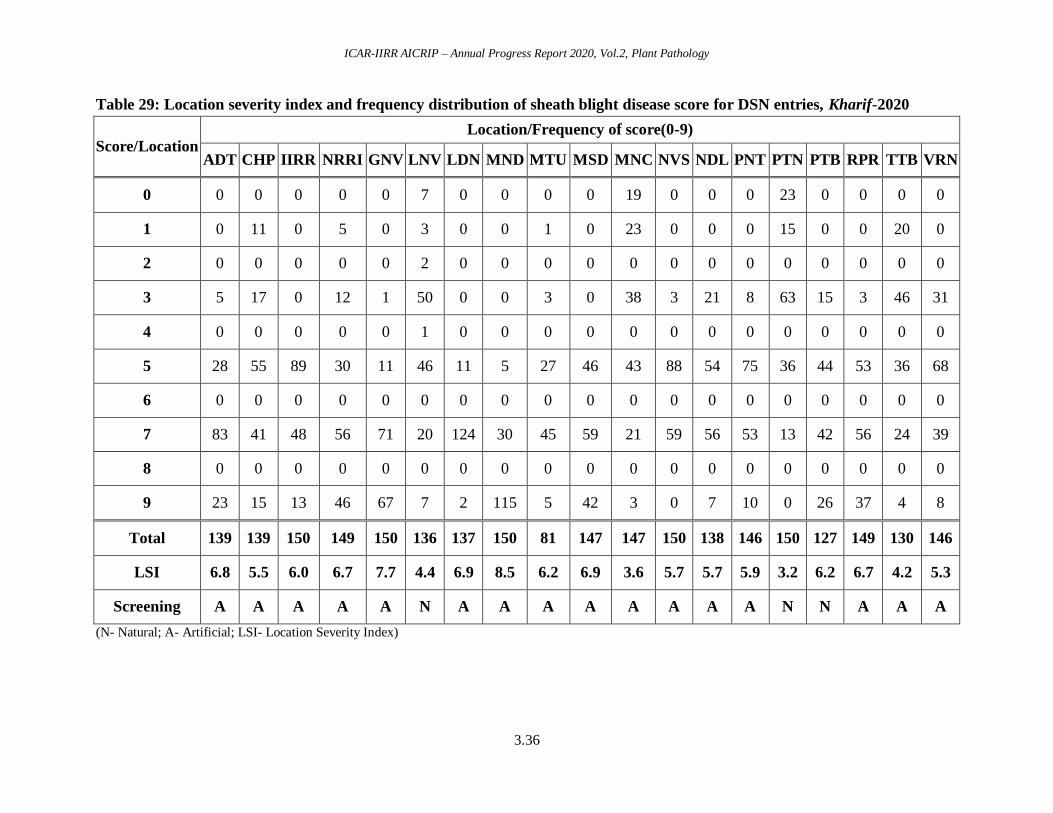
ICAR-IIRR AICRIP – Annual Progress Report 2020, Vol.2, Plant Pathology
3.36
Table 29: Location severity index and frequency distribution of sheath blight disease score for DSN entries, Kharif-2020
Score/Location Location/Frequency of score(0-9)
ADT CHP IIRR NRRI GNV LNV LDN MND MTU MSD MNC NVS NDL PNT PTN PTB RPR TTB VRN
0 0 0 0 0 0 7 0 0 0 0 19 0 0 0 23 0 0 0 0
1 0 11 0 5 0 3 0 0 1 0 23 0 0 0 15 0 0 20 0
2 0 0 0 0 0 2 0 0 0 0 0 0 0 0 0 0 0 0 0
3 5 17 0 12 1 50 0 0 3 0 38 3 21 8 63 15 3 46 31
4 0 0 0 0 0 1 0 0 0 0 0 0 0 0 0 0 0 0 0
5 28 55 89 30 11 46 11 5 27 46 43 88 54 75 36 44 53 36 68
6 0 0 0 0 0 0 0 0 0 0 0 0 0 0 0 0 0 0 0
7 83 41 48 56 71 20 124 30 45 59 21 59 56 53 13 42 56 24 39
8 0 0 0 0 0 0 0 0 0 0 0 0 0 0 0 0 0 0 0
9 23 15 13 46 67 7 2 115 5 42 3 0 7 10 0 26 37 4 8
Total 139 139 150 149 150 136 137 150 81 147 147 150 138 146 150 127 149 130 146
LSI 6.8 5.5 6.0 6.7 7.7 4.4 6.9 8.5 6.2 6.9 3.6 5.7 5.7 5.9 3.2 6.2 6.7 4.2 5.3
Screening A A A A A N A A A A A A A A N N A A A
(N- Natural; A- Artificial; LSI- Location Severity Index)
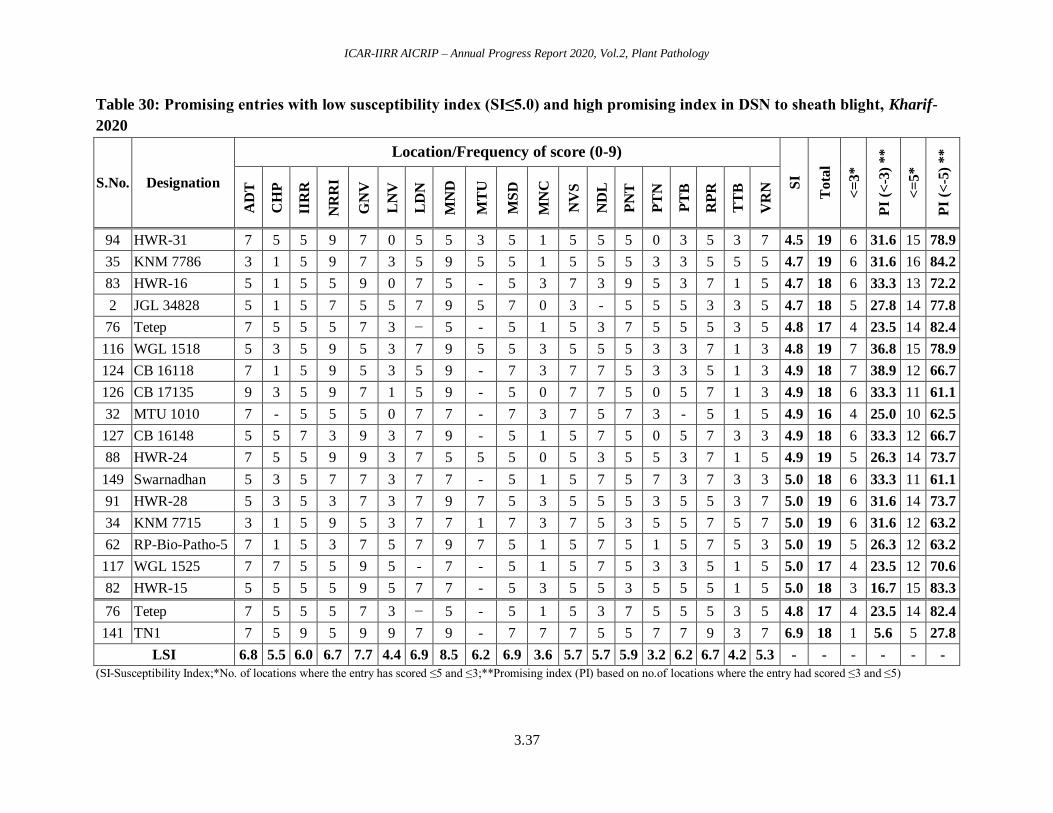
ICAR-IIRR AICRIP – Annual Progress Report 2020, Vol.2, Plant Pathology
3.37
Table 30: Promising entries with low susceptibility index (SI≤5.0) and high promising index in DSN to sheath blight, Kharif-
2020
S.No. Designation
Location/Frequency of score (0-9)
SI
Tota
l
<=
3*
PI
(<-3
) **
<=
5*
PI
(<-5
) **
AD
T
CH
P
IIR
R
NR
RI
GN
V
LN
V
LD
N
MN
D
MT
U
MS
D
MN
C
NV
S
ND
L
PN
T
PT
N
PT
B
RP
R
TT
B
VR
N
94 HWR-31 7 5 5 9 7 0 5 5 3 5 1 5 5 5 0 3 5 3 7 4.5 19 6 31.6 15 78.9
35 KNM 7786 3 1 5 9 7 3 5 9 5 5 1 5 5 5 3 3 5 5 5 4.7 19 6 31.6 16 84.2
83 HWR-16 5 1 5 5 9 0 7 5 - 5 3 7 3 9 5 3 7 1 5 4.7 18 6 33.3 13 72.2
2 JGL 34828 5 1 5 7 5 5 7 9 5 7 0 3 - 5 5 5 3 3 5 4.7 18 5 27.8 14 77.8
76 Tetep 7 5 5 5 7 3 − 5 - 5 1 5 3 7 5 5 5 3 5 4.8 17 4 23.5 14 82.4
116 WGL 1518 5 3 5 9 5 3 7 9 5 5 3 5 5 5 3 3 7 1 3 4.8 19 7 36.8 15 78.9
124 CB 16118 7 1 5 9 5 3 5 9 - 7 3 7 7 5 3 3 5 1 3 4.9 18 7 38.9 12 66.7
126 CB 17135 9 3 5 9 7 1 5 9 - 5 0 7 7 5 0 5 7 1 3 4.9 18 6 33.3 11 61.1
32 MTU 1010 7 - 5 5 5 0 7 7 - 7 3 7 5 7 3 - 5 1 5 4.9 16 4 25.0 10 62.5
127 CB 16148 5 5 7 3 9 3 7 9 - 5 1 5 7 5 0 5 7 3 3 4.9 18 6 33.3 12 66.7
88 HWR-24 7 5 5 9 9 3 7 5 5 5 0 5 3 5 5 3 7 1 5 4.9 19 5 26.3 14 73.7
149 Swarnadhan 5 3 5 7 7 3 7 7 - 5 1 5 7 5 7 3 7 3 3 5.0 18 6 33.3 11 61.1
91 HWR-28 5 3 5 3 7 3 7 9 7 5 3 5 5 5 3 5 5 3 7 5.0 19 6 31.6 14 73.7
34 KNM 7715 3 1 5 9 5 3 7 7 1 7 3 7 5 3 5 5 7 5 7 5.0 19 6 31.6 12 63.2
62 RP-Bio-Patho-5 7 1 5 3 7 5 7 9 7 5 1 5 7 5 1 5 7 5 3 5.0 19 5 26.3 12 63.2
117 WGL 1525 7 7 5 5 9 5 - 7 - 5 1 5 7 5 3 3 5 1 5 5.0 17 4 23.5 12 70.6
82 HWR-15 5 5 5 5 9 5 7 7 - 5 3 5 5 3 5 5 5 1 5 5.0 18 3 16.7 15 83.3
76 Tetep 7 5 5 5 7 3 − 5 - 5 1 5 3 7 5 5 5 3 5 4.8 17 4 23.5 14 82.4
141 TN1 7 5 9 5 9 9 7 9 - 7 7 7 5 5 7 7 9 3 7 6.9 18 1 5.6 5 27.8
LSI 6.8 5.5 6.0 6.7 7.7 4.4 6.9 8.5 6.2 6.9 3.6 5.7 5.7 5.9 3.2 6.2 6.7 4.2 5.3 - - - - - -
(SI-Susceptibility Index;*No. of locations where the entry has scored ≤5 and ≤3;**Promising index (PI) based on no.of locations where the entry had scored ≤3 and ≤5)
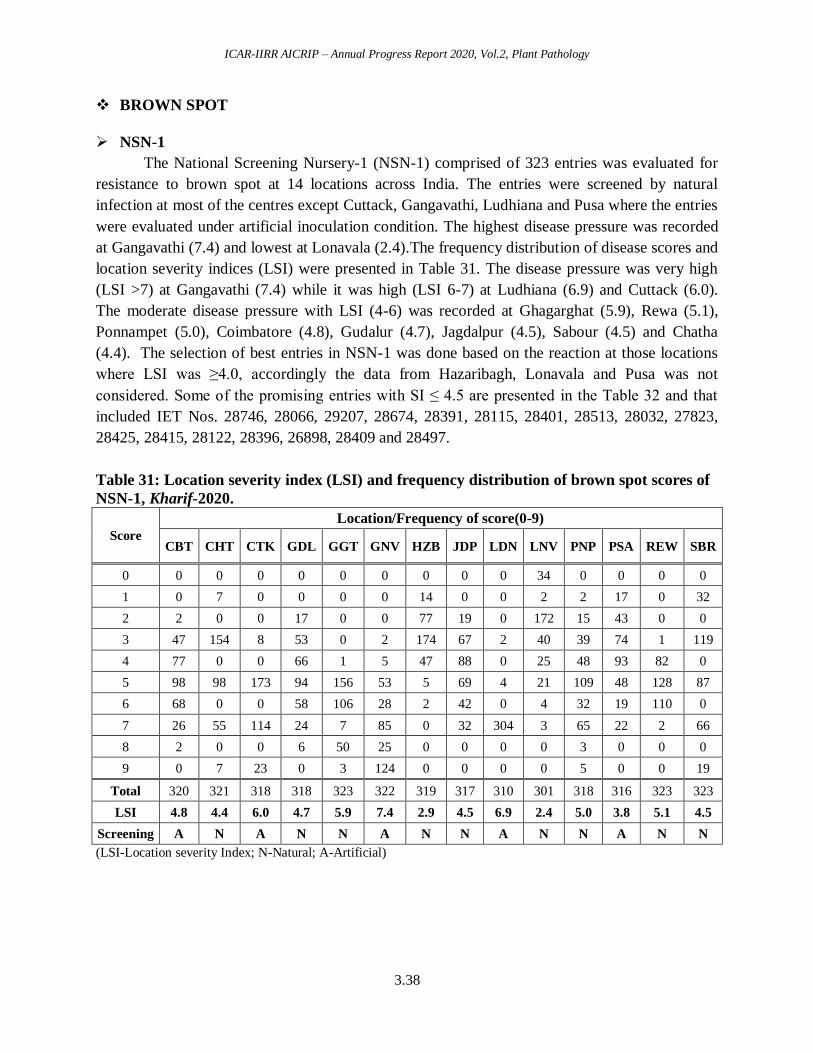
ICAR-IIRR AICRIP – Annual Progress Report 2020, Vol.2, Plant Pathology
3.38
BROWN SPOT
NSN-1
The National Screening Nursery-1 (NSN-1) comprised of 323 entries was evaluated for
resistance to brown spot at 14 locations across India. The entries were screened by natural
infection at most of the centres except Cuttack, Gangavathi, Ludhiana and Pusa where the entries
were evaluated under artificial inoculation condition. The highest disease pressure was recorded
at Gangavathi (7.4) and lowest at Lonavala (2.4).The frequency distribution of disease scores and
location severity indices (LSI) were presented in Table 31. The disease pressure was very high
(LSI >7) at Gangavathi (7.4) while it was high (LSI 6-7) at Ludhiana (6.9) and Cuttack (6.0).
The moderate disease pressure with LSI (4-6) was recorded at Ghagarghat (5.9), Rewa (5.1),
Ponnampet (5.0), Coimbatore (4.8), Gudalur (4.7), Jagdalpur (4.5), Sabour (4.5) and Chatha
(4.4). The selection of best entries in NSN-1 was done based on the reaction at those locations
where LSI was ≥4.0, accordingly the data from Hazaribagh, Lonavala and Pusa was not
considered. Some of the promising entries with SI ≤ 4.5 are presented in the Table 32 and that
included IET Nos. 28746, 28066, 29207, 28674, 28391, 28115, 28401, 28513, 28032, 27823,
28425, 28415, 28122, 28396, 26898, 28409 and 28497.
Table 31: Location severity index (LSI) and frequency distribution of brown spot scores of
NSN-1, Kharif-2020.
Score
Location/Frequency of score(0-9)
CBT CHT CTK GDL GGT GNV HZB JDP LDN LNV PNP PSA REW SBR
0 0 0 0 0 0 0 0 0 0 34 0 0 0 0
1 0 7 0 0 0 0 14 0 0 2 2 17 0 32
2 2 0 0 17 0 0 77 19 0 172 15 43 0 0
3 47 154 8 53 0 2 174 67 2 40 39 74 1 119
4 77 0 0 66 1 5 47 88 0 25 48 93 82 0
5 98 98 173 94 156 53 5 69 4 21 109 48 128 87
6 68 0 0 58 106 28 2 42 0 4 32 19 110 0
7 26 55 114 24 7 85 0 32 304 3 65 22 2 66
8 2 0 0 6 50 25 0 0 0 0 3 0 0 0
9 0 7 23 0 3 124 0 0 0 0 5 0 0 19
Total 320 321 318 318 323 322 319 317 310 301 318 316 323 323
LSI 4.8 4.4 6.0 4.7 5.9 7.4 2.9 4.5 6.9 2.4 5.0 3.8 5.1 4.5
Screening A N A N N A N N A N N A N N
(LSI-Location severity Index; N-Natural; A-Artificial)

ICAR-IIRR AICRIP – Annual Progress Report 2020, Vol.2, Plant Pathology
3.39
Table 32: Promising entries with low susceptibility index (<4.5) and high PI in NSN-1 to
brown spot, Kharif-2020
S.No. IET No.
Location/Frequency of score (0-9)
SI
Tota
l
<=
3*
PI
(<-3
)**
<=
5*
PI
(<-5
)**
CB
T
CH
T
CT
K
GD
L
GG
T
GN
V
JD
P
LD
N
PN
P
RE
W
SB
R
58 28746 2 5 5 2 5 5 4 7 2 5 3 4.1 11 4 36 10 91
103 28066 3 3 5 2 5 7 3 7 2 6 3 4.2 11 6 55 8 73
268 29207 4 1 5 4 5 8 4 7 3 4 1 4.2 11 3 27 9 82
96 28674 4 3 5 4 6 5 6 - 2 4 3 4.2 10 3 30 8 80
193 28391 4 3 3 4 5 5 2 7 6 5 3 4.3 11 4 36 9 82
147 28115 3 3 5 2 5 8 4 7 4 4 3 4.4 11 4 36 9 82
158 Chittimuty 4 3 5 3 5 6 3 7 4 5 3 4.4 11 4 36 9 82
196 28401 4 3 5 4 5 5 3 7 5 4 3 4.4 11 3 27 10 91
253 28513 4 3 5 4 5 6 4 7 5 4 1 4.4 11 2 18 9 82
234 28032 (R) 4 3 5 3 6 9 3 7 2 4 3 4.5 11 5 45 8 73
1 27823 5 3 5 4 5 6 3 7 3 5 3 4.5 11 4 36 9 82
223 28425 3 5 3 3 5 5 4 7 5 6 3 4.5 11 4 36 9 82
76 CRDhan201 3 3 5 3 5 4 5 7 4 5 5 4.5 11 3 27 10 91
198 28415 3 3 5 3 6 7 2 7 7 6 1 4.5 11 5 45 6 55
146 28122 4 3 7 2 5 7 2 7 5 5 3 4.5 11 4 36 8 73
195 28396 4 3 5 3 6 6 3 7 5 5 3 4.5 11 4 36 8 73
39 26898 2 3 5 2 6 7 4 7 5 6 3 4.5 11 4 36 7 64
232 NLR34449 4 3 3 2 6 7 2 7 4 5 7 4.5 11 4 36 7 64
221 28409 4 3 5 4 8 5 3 7 4 6 1 4.5 11 3 27 8 73
257 28497 4 1 5 2 5 7 5 7 7 4 3 4.5 11 3 27 8 73
318 Benibhog 6 5 9 6 5 8 6 7 4 7 3 6.0 11 1 9 4 36
LSI 4.8 4.4 6.0 4.7 5.9 7.4 4.5 6.9 5.0 5.1 4.5
(SI-Susceptibility Index;*No. of locations where the entry has scored ≤5 and ≤3;**Promising index (PI) based on no.of locations
where the entry had scored ≤3 and ≤5)
NSN-2
The National Screening Nursery-2 (NSN-2) comprised of 557 entries was evaluated for
their resistance to brown spot at seven locations. The entries were screened under natural
infection condition at Ghagarghat, Jagdalpur, Ponnampet and Rewa; while under artificial
inoculation condition at Coimbatore, Cuttack and Gangavathi. The frequency distribution of
disease scores and location severity index (LSI) are presented in Table 33. The disease pressure
was very high (LSI >7) at Gangavathi (7.6) and it was moderate (LSI 4-6) at Cuttack (5.9),
Ghagarghat (5.8), Coimbatore (5.1), Rewa (5.1) and Jagdalpur (4.0).The selection of promising
entries in NSN-2 was done based on the reaction at those locations where LSI was ≥4.0,
accordingly Ponnampet (3.1) was not considered. Some of the promising entries with SI ≤ 4.5
are presented in the Table 34 and that include IET# 29548, 29227, 29340, 29240, 29250, 29550,
29395, 29465, 29474, 29482 and 29513.
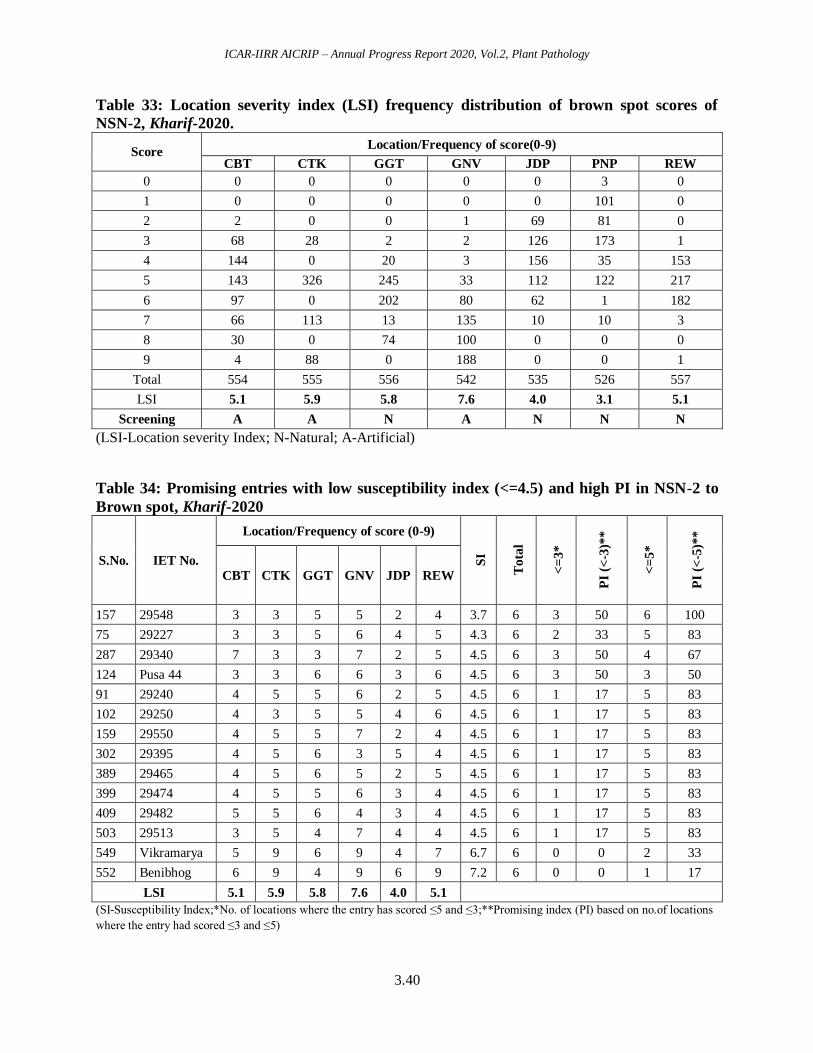
ICAR-IIRR AICRIP – Annual Progress Report 2020, Vol.2, Plant Pathology
3.40
Table 33: Location severity index (LSI) frequency distribution of brown spot scores of
NSN-2, Kharif-2020.
Score Location/Frequency of score(0-9)
CBT CTK GGT GNV JDP PNP REW
0 0 0 0 0 0 3 0
1 0 0 0 0 0 101 0
2 2 0 0 1 69 81 0
3 68 28 2 2 126 173 1
4 144 0 20 3 156 35 153
5 143 326 245 33 112 122 217
6 97 0 202 80 62 1 182
7 66 113 13 135 10 10 3
8 30 0 74 100 0 0 0
9 4 88 0 188 0 0 1
Total 554 555 556 542 535 526 557
LSI 5.1 5.9 5.8 7.6 4.0 3.1 5.1
Screening A A N A N N N
(LSI-Location severity Index; N-Natural; A-Artificial)
Table 34: Promising entries with low susceptibility index (<=4.5) and high PI in NSN-2 to
Brown spot, Kharif-2020
S.No. IET No.
Location/Frequency of score (0-9)
SI
Tota
l
<=
3*
PI
(<-3
)**
<=
5*
PI
(<-5
)**
CBT CTK GGT GNV JDP REW
157 29548 3 3 5 5 2 4 3.7 6 3 50 6 100
75 29227 3 3 5 6 4 5 4.3 6 2 33 5 83
287 29340 7 3 3 7 2 5 4.5 6 3 50 4 67
124 Pusa 44 3 3 6 6 3 6 4.5 6 3 50 3 50
91 29240 4 5 5 6 2 5 4.5 6 1 17 5 83
102 29250 4 3 5 5 4 6 4.5 6 1 17 5 83
159 29550 4 5 5 7 2 4 4.5 6 1 17 5 83
302 29395 4 5 6 3 5 4 4.5 6 1 17 5 83
389 29465 4 5 6 5 2 5 4.5 6 1 17 5 83
399 29474 4 5 5 6 3 4 4.5 6 1 17 5 83
409 29482 5 5 6 4 3 4 4.5 6 1 17 5 83
503 29513 3 5 4 7 4 4 4.5 6 1 17 5 83
549 Vikramarya 5 9 6 9 4 7 6.7 6 0 0 2 33
552 Benibhog 6 9 4 9 6 9 7.2 6 0 0 1 17
LSI 5.1 5.9 5.8 7.6 4.0 5.1
(SI-Susceptibility Index;*No. of locations where the entry has scored ≤5 and ≤3;**Promising index (PI) based on no.of locations
where the entry had scored ≤3 and ≤5)
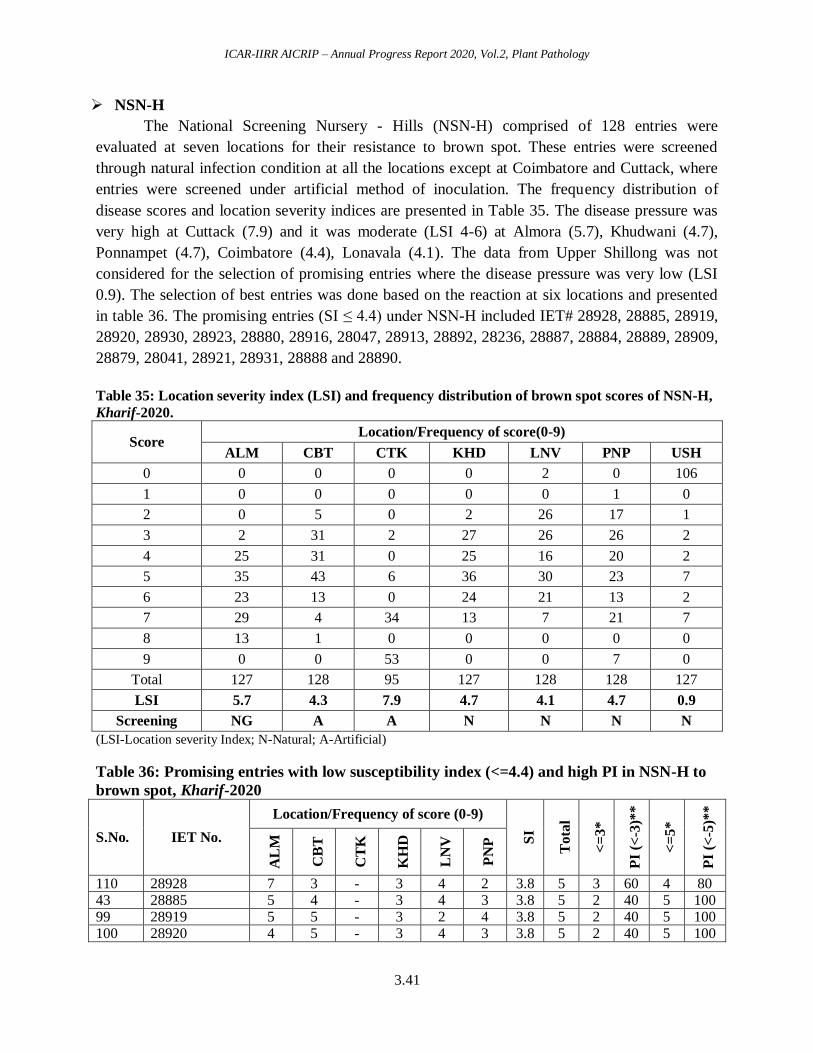
ICAR-IIRR AICRIP – Annual Progress Report 2020, Vol.2, Plant Pathology
3.41
NSN-H
The National Screening Nursery - Hills (NSN-H) comprised of 128 entries were
evaluated at seven locations for their resistance to brown spot. These entries were screened
through natural infection condition at all the locations except at Coimbatore and Cuttack, where
entries were screened under artificial method of inoculation. The frequency distribution of
disease scores and location severity indices are presented in Table 35. The disease pressure was
very high at Cuttack (7.9) and it was moderate (LSI 4-6) at Almora (5.7), Khudwani (4.7),
Ponnampet (4.7), Coimbatore (4.4), Lonavala (4.1). The data from Upper Shillong was not
considered for the selection of promising entries where the disease pressure was very low (LSI
0.9). The selection of best entries was done based on the reaction at six locations and presented
in table 36. The promising entries (SI ≤ 4.4) under NSN-H included IET# 28928, 28885, 28919,
28920, 28930, 28923, 28880, 28916, 28047, 28913, 28892, 28236, 28887, 28884, 28889, 28909,
28879, 28041, 28921, 28931, 28888 and 28890.
Table 35: Location severity index (LSI) and frequency distribution of brown spot scores of NSN-H,
Kharif-2020.
Score Location/Frequency of score(0-9)
ALM CBT CTK KHD LNV PNP USH
0 0 0 0 0 2 0 106
1 0 0 0 0 0 1 0
2 0 5 0 2 26 17 1
3 2 31 2 27 26 26 2
4 25 31 0 25 16 20 2
5 35 43 6 36 30 23 7
6 23 13 0 24 21 13 2
7 29 4 34 13 7 21 7
8 13 1 0 0 0 0 0
9 0 0 53 0 0 7 0
Total 127 128 95 127 128 128 127
LSI 5.7 4.3 7.9 4.7 4.1 4.7 0.9
Screening NG A A N N N N
(LSI-Location severity Index; N-Natural; A-Artificial)
Table 36: Promising entries with low susceptibility index (<=4.4) and high PI in NSN-H to
brown spot, Kharif-2020
S.No. IET No.
Location/Frequency of score (0-9)
SI
To
tal
<=
3*
PI
(<-3
)**
<=
5*
PI
(<-5
)**
AL
M
CB
T
CT
K
KH
D
LN
V
PN
P
110 28928 7 3 - 3 4 2 3.8 5 3 60 4 80 43 28885 5 4 - 3 4 3 3.8 5 2 40 5 100 99 28919 5 5 - 3 2 4 3.8 5 2 40 5 100 100 28920 4 5 - 3 4 3 3.8 5 2 40 5 100
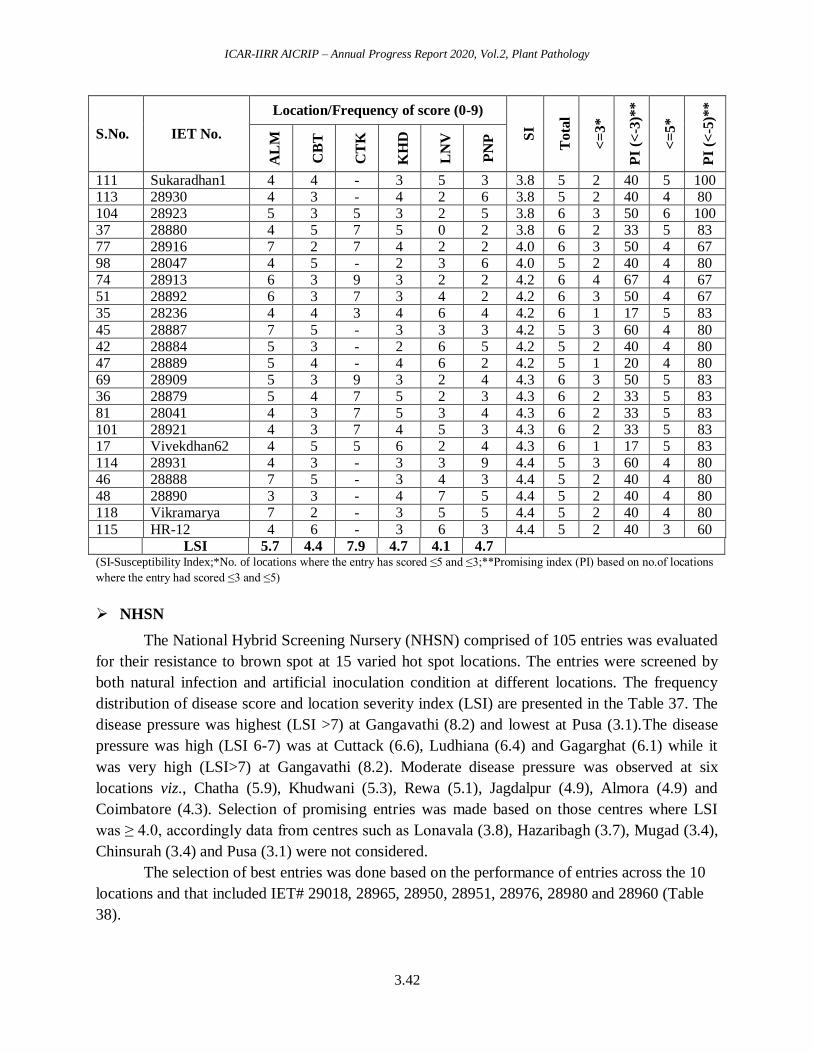
ICAR-IIRR AICRIP – Annual Progress Report 2020, Vol.2, Plant Pathology
3.42
S.No. IET No.
Location/Frequency of score (0-9)
SI
To
tal
<=
3*
PI
(<-3
)**
<=
5*
PI
(<-5
)**
AL
M
CB
T
CT
K
KH
D
LN
V
PN
P
111 Sukaradhan1 4 4 - 3 5 3 3.8 5 2 40 5 100 113 28930 4 3 - 4 2 6 3.8 5 2 40 4 80 104 28923 5 3 5 3 2 5 3.8 6 3 50 6 100 37 28880 4 5 7 5 0 2 3.8 6 2 33 5 83 77 28916 7 2 7 4 2 2 4.0 6 3 50 4 67 98 28047 4 5 - 2 3 6 4.0 5 2 40 4 80 74 28913 6 3 9 3 2 2 4.2 6 4 67 4 67 51 28892 6 3 7 3 4 2 4.2 6 3 50 4 67 35 28236 4 4 3 4 6 4 4.2 6 1 17 5 83
45 28887 7 5 - 3 3 3 4.2 5 3 60 4 80 42 28884 5 3 - 2 6 5 4.2 5 2 40 4 80 47 28889 5 4 - 4 6 2 4.2 5 1 20 4 80 69 28909 5 3 9 3 2 4 4.3 6 3 50 5 83 36 28879 5 4 7 5 2 3 4.3 6 2 33 5 83 81 28041 4 3 7 5 3 4 4.3 6 2 33 5 83 101 28921 4 3 7 4 5 3 4.3 6 2 33 5 83 17 Vivekdhan62 4 5 5 6 2 4 4.3 6 1 17 5 83 114 28931 4 3 - 3 3 9 4.4 5 3 60 4 80 46 28888 7 5 - 3 4 3 4.4 5 2 40 4 80 48 28890 3 3 - 4 7 5 4.4 5 2 40 4 80 118 Vikramarya 7 2 - 3 5 5 4.4 5 2 40 4 80
115 HR-12 4 6 - 3 6 3 4.4 5 2 40 3 60
LSI 5.7 4.4 7.9 4.7 4.1 4.7
(SI-Susceptibility Index;*No. of locations where the entry has scored ≤5 and ≤3;**Promising index (PI) based on no.of locations
where the entry had scored ≤3 and ≤5)
NHSN
The National Hybrid Screening Nursery (NHSN) comprised of 105 entries was evaluated
for their resistance to brown spot at 15 varied hot spot locations. The entries were screened by
both natural infection and artificial inoculation condition at different locations. The frequency
distribution of disease score and location severity index (LSI) are presented in the Table 37. The
disease pressure was highest (LSI >7) at Gangavathi (8.2) and lowest at Pusa (3.1).The disease
pressure was high (LSI 6-7) was at Cuttack (6.6), Ludhiana (6.4) and Gagarghat (6.1) while it
was very high (LSI>7) at Gangavathi (8.2). Moderate disease pressure was observed at six
locations viz., Chatha (5.9), Khudwani (5.3), Rewa (5.1), Jagdalpur (4.9), Almora (4.9) and
Coimbatore (4.3). Selection of promising entries was made based on those centres where LSI
was ≥ 4.0, accordingly data from centres such as Lonavala (3.8), Hazaribagh (3.7), Mugad (3.4),
Chinsurah (3.4) and Pusa (3.1) were not considered.
The selection of best entries was done based on the performance of entries across the 10
locations and that included IET# 29018, 28965, 28950, 28951, 28976, 28980 and 28960 (Table
38).
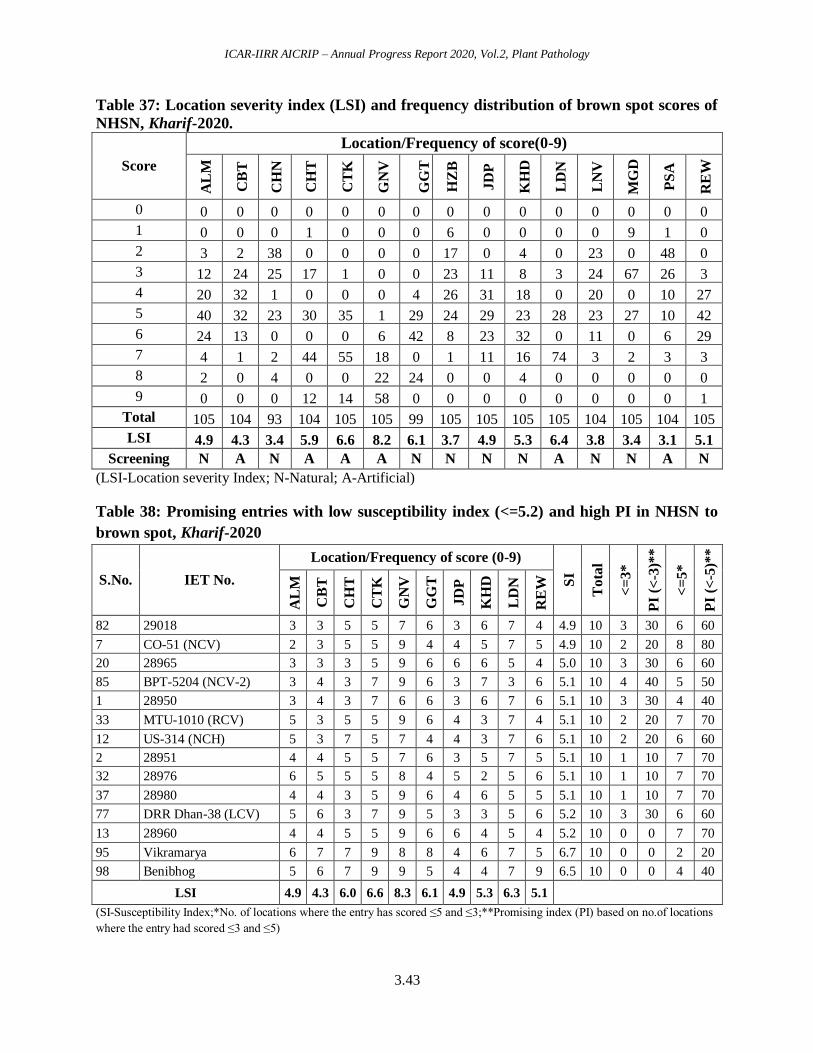
ICAR-IIRR AICRIP – Annual Progress Report 2020, Vol.2, Plant Pathology
3.43
Table 37: Location severity index (LSI) and frequency distribution of brown spot scores of
NHSN, Kharif-2020.
Score
Location/Frequency of score(0-9)
AL
M
CB
T
CH
N
CH
T
CT
K
GN
V
GG
T
HZ
B
JD
P
KH
D
LD
N
LN
V
MG
D
PS
A
RE
W
0 0 0 0 0 0 0 0 0 0 0 0 0 0 0 0
1 0 0 0 1 0 0 0 6 0 0 0 0 9 1 0
2 3 2 38 0 0 0 0 17 0 4 0 23 0 48 0
3 12 24 25 17 1 0 0 23 11 8 3 24 67 26 3
4 20 32 1 0 0 0 4 26 31 18 0 20 0 10 27
5 40 32 23 30 35 1 29 24 29 23 28 23 27 10 42
6 24 13 0 0 0 6 42 8 23 32 0 11 0 6 29
7 4 1 2 44 55 18 0 1 11 16 74 3 2 3 3
8 2 0 4 0 0 22 24 0 0 4 0 0 0 0 0
9 0 0 0 12 14 58 0 0 0 0 0 0 0 0 1
Total 105 104 93 104 105 105 99 105 105 105 105 104 105 104 105
LSI 4.9 4.3 3.4 5.9 6.6 8.2 6.1 3.7 4.9 5.3 6.4 3.8 3.4 3.1 5.1
Screening N A N A A A N N N N A N N A N
(LSI-Location severity Index; N-Natural; A-Artificial)
Table 38: Promising entries with low susceptibility index (<=5.2) and high PI in NHSN to
brown spot, Kharif-2020
S.No. IET No.
Location/Frequency of score (0-9) S
I
Tota
l
<=
3*
PI
(<-3
)**
<=
5*
PI
(<-5
)**
AL
M
CB
T
CH
T
CT
K
GN
V
GG
T
JD
P
KH
D
LD
N
RE
W
82 29018 3 3 5 5 7 6 3 6 7 4 4.9 10 3 30 6 60
7 CO-51 (NCV) 2 3 5 5 9 4 4 5 7 5 4.9 10 2 20 8 80
20 28965 3 3 3 5 9 6 6 6 5 4 5.0 10 3 30 6 60
85 BPT-5204 (NCV-2) 3 4 3 7 9 6 3 7 3 6 5.1 10 4 40 5 50
1 28950 3 4 3 7 6 6 3 6 7 6 5.1 10 3 30 4 40
33 MTU-1010 (RCV) 5 3 5 5 9 6 4 3 7 4 5.1 10 2 20 7 70
12 US-314 (NCH) 5 3 7 5 7 4 4 3 7 6 5.1 10 2 20 6 60
2 28951 4 4 5 5 7 6 3 5 7 5 5.1 10 1 10 7 70
32 28976 6 5 5 5 8 4 5 2 5 6 5.1 10 1 10 7 70
37 28980 4 4 3 5 9 6 4 6 5 5 5.1 10 1 10 7 70
77 DRR Dhan-38 (LCV) 5 6 3 7 9 5 3 3 5 6 5.2 10 3 30 6 60
13 28960 4 4 5 5 9 6 6 4 5 4 5.2 10 0 0 7 70
95 Vikramarya 6 7 7 9 8 8 4 6 7 5 6.7 10 0 0 2 20
98 Benibhog 5 6 7 9 9 5 4 4 7 9 6.5 10 0 0 4 40
LSI 4.9 4.3 6.0 6.6 8.3 6.1 4.9 5.3 6.3 5.1
(SI-Susceptibility Index;*No. of locations where the entry has scored ≤5 and ≤3;**Promising index (PI) based on no.of locations
where the entry had scored ≤3 and ≤5)

ICAR-IIRR AICRIP – Annual Progress Report 2020, Vol.2, Plant Pathology
3.44
DSN
The Donor Screening Nursery (DSN) comprised of 150 entries was evaluated for
resistance to brown spot at 14 hot spot locations in India. The entries were screened under
natural infection condition at most of the locations. The frequency distribution of disease scores
and location severity index (LSI) were presented in Table 39. The highest disease pressure was
observed at Gangavathi (8.1) and lowest at Hazaribagh (1.4). The disease pressure was high (LSI
6-7) at Ludhiana (6.6) and Cuttack (6.2); while it was very high (LSI >7.0) at Gangavathi (8.1).
Moderate disease pressure was observed at most of the locations and that included Ghagarghat
(5.8), Almora (4.9), Rewa (4.9), Coimbatore (4.9), Chatha (4.4), Jagdalpur (4.1) and Sabour
(4.0). The selection of promising entries in DSN were done based on the reaction at those
locations where LSI was ≥4.0, accordingly the locations such as Mugad (3.5), Lonavala (3.0),
Pusa (2.7) and Hazaribagh (1.4) were not considered.
None of the donors showed high resistant reaction against brown spot, however some of
the promising donors with SI ≥ 4.8 included HWR-33, HWR-31, HWR-17, HWR-16, HWR-15,
JGL 34994, RP-BIO.Patho-3, RP-Patho-3, RNR 29086, WGL 1472, HWR-7, HWR-26, KNM
10104, CB 16118, CB 16101 and RP-Patho-7.
Table 39: Location severity index (LSI) and frequency distribution of brown spot scores of
DSN, Kharif-2020.
Score
Location/Frequency of score(0-9)
AL
M
CB
T
CH
T
CT
K
GG
T
GN
V
HZ
B
JD
P
LD
N
LN
V
MG
D
PS
A
RE
W
SB
R
0 0 0 0 0 0 0 0 0 0 17 0 0 1 0
1 0 0 9 0 0 0 106 0 0 1 4 2 0 23
2 1 0 0 0 0 0 32 11 0 42 0 67 3 0
3 12 21 61 1 0 0 8 44 0 27 103 48 8 62
4 38 36 1 0 8 1 2 46 0 12 0 21 33 0
5 60 45 39 74 65 2 0 26 27 29 40 3 55 35
6 22 35 0 0 50 8 0 11 0 7 0 1 45 0
7 15 11 28 56 0 31 0 9 117 1 2 0 2 25
8 1 0 0 0 27 36 0 0 0 0 0 0 0 0
9 0 0 3 17 0 72 0 0 0 0 0 0 1 4
Total 149 148 141 148 150 150 148 147 144 136 149 142 148 149
LSI 4.9 4.9 4.4 6.2 5.8 8.1 1.4 4.1 6.6 3.0 3.5 2.7 4.9 4.0
Screening N A N A N A N N A N N A N N
(LSI-Location severity Index; N-Natural; A-Artificial)
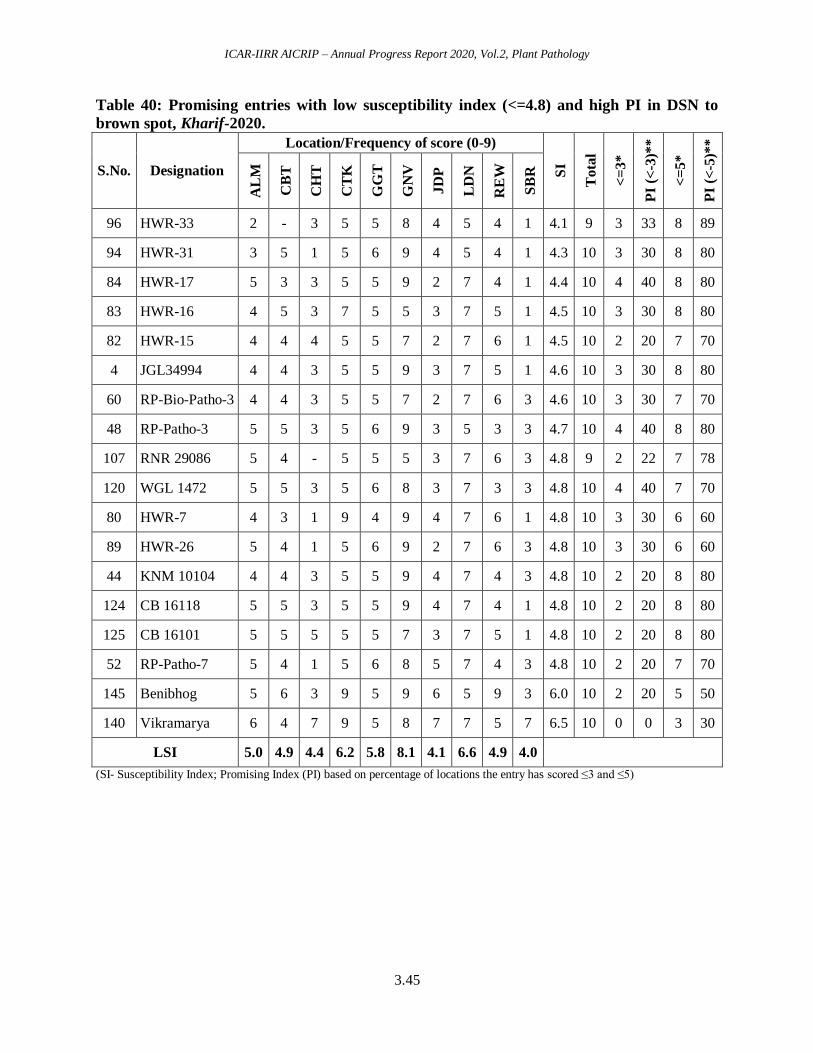
ICAR-IIRR AICRIP – Annual Progress Report 2020, Vol.2, Plant Pathology
3.45
Table 40: Promising entries with low susceptibility index (<=4.8) and high PI in DSN to
brown spot, Kharif-2020.
S.No. Designation
Location/Frequency of score (0-9)
SI
To
tal
<=
3*
PI
(<-3
)**
<=
5*
PI
(<-5
)**
AL
M
CB
T
CH
T
CT
K
GG
T
GN
V
JD
P
LD
N
RE
W
SB
R
96 HWR-33 2 - 3 5 5 8 4 5 4 1 4.1 9 3 33 8 89
94 HWR-31 3 5 1 5 6 9 4 5 4 1 4.3 10 3 30 8 80
84 HWR-17 5 3 3 5 5 9 2 7 4 1 4.4 10 4 40 8 80
83 HWR-16 4 5 3 7 5 5 3 7 5 1 4.5 10 3 30 8 80
82 HWR-15 4 4 4 5 5 7 2 7 6 1 4.5 10 2 20 7 70
4 JGL34994 4 4 3 5 5 9 3 7 5 1 4.6 10 3 30 8 80
60 RP-Bio-Patho-3 4 4 3 5 5 7 2 7 6 3 4.6 10 3 30 7 70
48 RP-Patho-3 5 5 3 5 6 9 3 5 3 3 4.7 10 4 40 8 80
107 RNR 29086 5 4 - 5 5 5 3 7 6 3 4.8 9 2 22 7 78
120 WGL 1472 5 5 3 5 6 8 3 7 3 3 4.8 10 4 40 7 70
80 HWR-7 4 3 1 9 4 9 4 7 6 1 4.8 10 3 30 6 60
89 HWR-26 5 4 1 5 6 9 2 7 6 3 4.8 10 3 30 6 60
44 KNM 10104 4 4 3 5 5 9 4 7 4 3 4.8 10 2 20 8 80
124 CB 16118 5 5 3 5 5 9 4 7 4 1 4.8 10 2 20 8 80
125 CB 16101 5 5 5 5 5 7 3 7 5 1 4.8 10 2 20 8 80
52 RP-Patho-7 5 4 1 5 6 8 5 7 4 3 4.8 10 2 20 7 70
145 Benibhog 5 6 3 9 5 9 6 5 9 3 6.0 10 2 20 5 50
140 Vikramarya 6 4 7 9 5 8 7 7 5 7 6.5 10 0 0 3 30
LSI 5.0 4.9 4.4 6.2 5.8 8.1 4.1 6.6 4.9 4.0
(SI- Susceptibility Index; Promising Index (PI) based on percentage of locations the entry has scored ≤3 and ≤5)
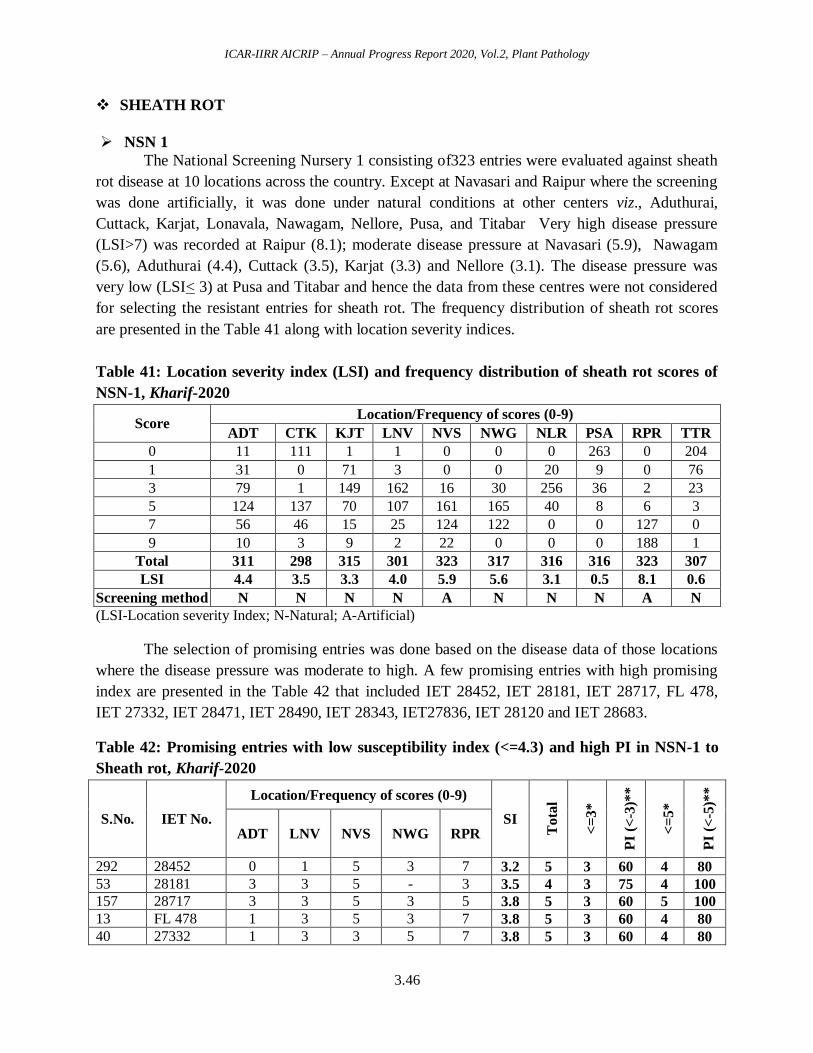
ICAR-IIRR AICRIP – Annual Progress Report 2020, Vol.2, Plant Pathology
3.46
SHEATH ROT
NSN 1
The National Screening Nursery 1 consisting of323 entries were evaluated against sheath
rot disease at 10 locations across the country. Except at Navasari and Raipur where the screening
was done artificially, it was done under natural conditions at other centers viz., Aduthurai,
Cuttack, Karjat, Lonavala, Nawagam, Nellore, Pusa, and Titabar Very high disease pressure
(LSI>7) was recorded at Raipur (8.1); moderate disease pressure at Navasari (5.9), Nawagam
(5.6), Aduthurai (4.4), Cuttack (3.5), Karjat (3.3) and Nellore (3.1). The disease pressure was
very low (LSI< 3) at Pusa and Titabar and hence the data from these centres were not considered
for selecting the resistant entries for sheath rot. The frequency distribution of sheath rot scores
are presented in the Table 41 along with location severity indices.
Table 41: Location severity index (LSI) and frequency distribution of sheath rot scores of
NSN-1, Kharif-2020
Score Location/Frequency of scores (0-9)
ADT CTK KJT LNV NVS NWG NLR PSA RPR TTR
0 11 111 1 1 0 0 0 263 0 204
1 31 0 71 3 0 0 20 9 0 76
3 79 1 149 162 16 30 256 36 2 23
5 124 137 70 107 161 165 40 8 6 3
7 56 46 15 25 124 122 0 0 127 0
9 10 3 9 2 22 0 0 0 188 1
Total 311 298 315 301 323 317 316 316 323 307
LSI 4.4 3.5 3.3 4.0 5.9 5.6 3.1 0.5 8.1 0.6
Screening method N N N N A N N N A N
(LSI-Location severity Index; N-Natural; A-Artificial)
The selection of promising entries was done based on the disease data of those locations
where the disease pressure was moderate to high. A few promising entries with high promising
index are presented in the Table 42 that included IET 28452, IET 28181, IET 28717, FL 478,
IET 27332, IET 28471, IET 28490, IET 28343, IET27836, IET 28120 and IET 28683.
Table 42: Promising entries with low susceptibility index (<=4.3) and high PI in NSN-1 to
Sheath rot, Kharif-2020
S.No. IET No.
Location/Frequency of scores (0-9)
SI
To
tal
<=
3*
PI
(<-3
)**
<=
5*
PI
(<-5
)**
ADT LNV NVS NWG RPR
292 28452 0 1 5 3 7 3.2 5 3 60 4 80
53 28181 3 3 5 - 3 3.5 4 3 75 4 100
157 28717 3 3 5 3 5 3.8 5 3 60 5 100
13 FL 478 1 3 5 3 7 3.8 5 3 60 4 80
40 27332 1 3 3 5 7 3.8 5 3 60 4 80
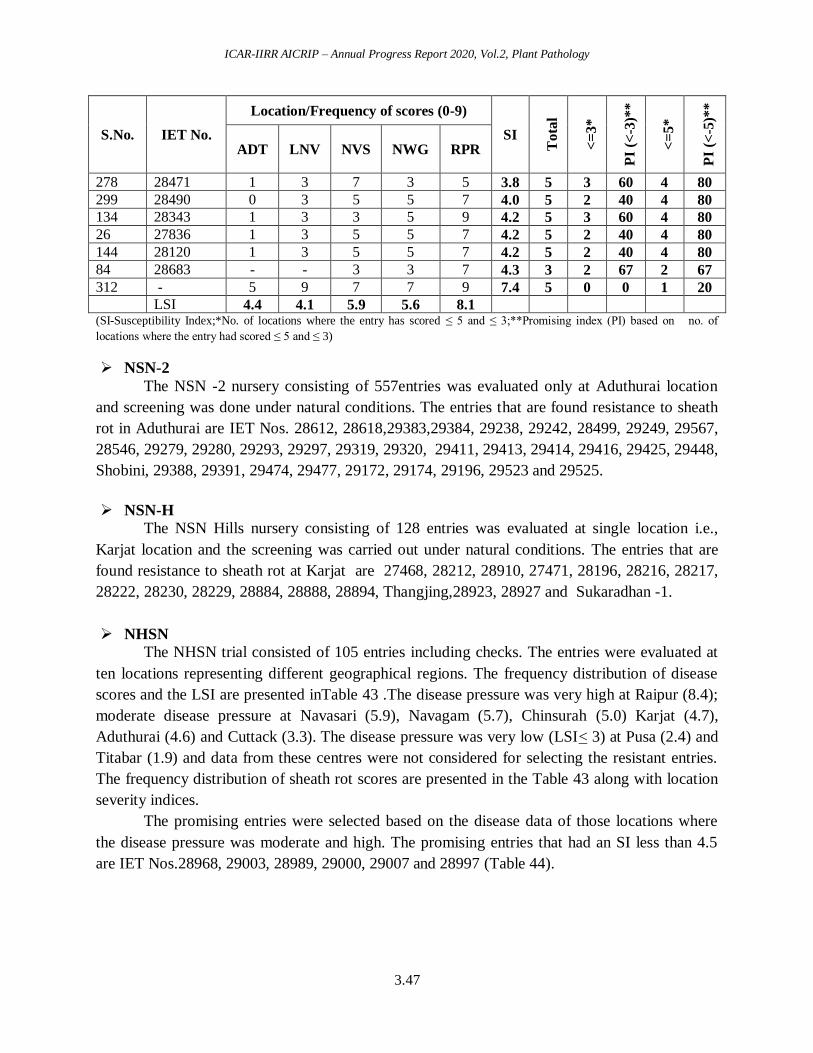
ICAR-IIRR AICRIP – Annual Progress Report 2020, Vol.2, Plant Pathology
3.47
S.No. IET No.
Location/Frequency of scores (0-9)
SI
To
tal
<=
3*
PI
(<-3
)**
<=
5*
PI
(<-5
)**
ADT LNV NVS NWG RPR
278 28471 1 3 7 3 5 3.8 5 3 60 4 80
299 28490 0 3 5 5 7 4.0 5 2 40 4 80
134 28343 1 3 3 5 9 4.2 5 3 60 4 80
26 27836 1 3 5 5 7 4.2 5 2 40 4 80
144 28120 1 3 5 5 7 4.2 5 2 40 4 80
84 28683 - - 3 3 7 4.3 3 2 67 2 67
312 - 5 9 7 7 9 7.4 5 0 0 1 20
LSI 4.4 4.1 5.9 5.6 8.1
(SI-Susceptibility Index;*No. of locations where the entry has scored ≤ 5 and ≤ 3;**Promising index (PI) based on no. of
locations where the entry had scored ≤ 5 and ≤ 3)
NSN-2
The NSN -2 nursery consisting of 557entries was evaluated only at Aduthurai location
and screening was done under natural conditions. The entries that are found resistance to sheath
rot in Aduthurai are IET Nos. 28612, 28618,29383,29384, 29238, 29242, 28499, 29249, 29567,
28546, 29279, 29280, 29293, 29297, 29319, 29320, 29411, 29413, 29414, 29416, 29425, 29448,
Shobini, 29388, 29391, 29474, 29477, 29172, 29174, 29196, 29523 and 29525.
NSN-H
The NSN Hills nursery consisting of 128 entries was evaluated at single location i.e.,
Karjat location and the screening was carried out under natural conditions. The entries that are
found resistance to sheath rot at Karjat are 27468, 28212, 28910, 27471, 28196, 28216, 28217,
28222, 28230, 28229, 28884, 28888, 28894, Thangjing,28923, 28927 and Sukaradhan -1.
NHSN
The NHSN trial consisted of 105 entries including checks. The entries were evaluated at
ten locations representing different geographical regions. The frequency distribution of disease
scores and the LSI are presented inTable 43 .The disease pressure was very high at Raipur (8.4);
moderate disease pressure at Navasari (5.9), Navagam (5.7), Chinsurah (5.0) Karjat (4.7),
Aduthurai (4.6) and Cuttack (3.3). The disease pressure was very low (LSI< 3) at Pusa (2.4) and
Titabar (1.9) and data from these centres were not considered for selecting the resistant entries.
The frequency distribution of sheath rot scores are presented in the Table 43 along with location
severity indices.
The promising entries were selected based on the disease data of those locations where
the disease pressure was moderate and high. The promising entries that had an SI less than 4.5
are IET Nos.28968, 29003, 28989, 29000, 29007 and 28997 (Table 44).
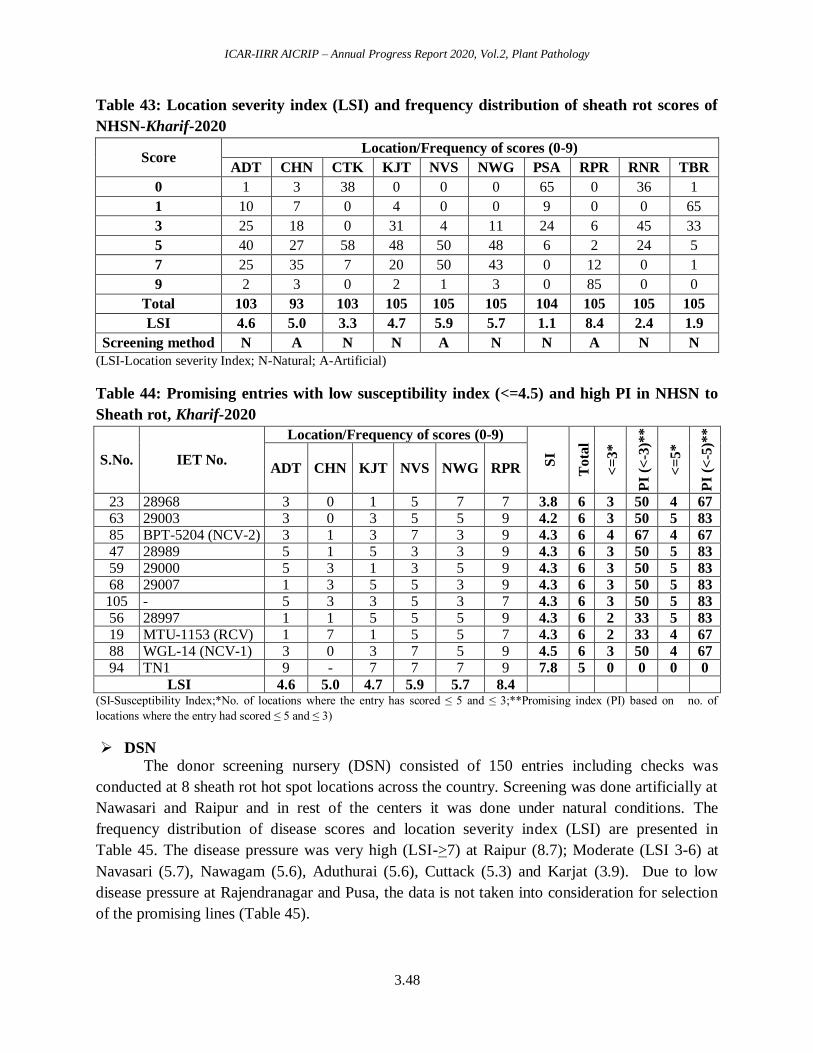
ICAR-IIRR AICRIP – Annual Progress Report 2020, Vol.2, Plant Pathology
3.48
Table 43: Location severity index (LSI) and frequency distribution of sheath rot scores of
NHSN-Kharif-2020
Score Location/Frequency of scores (0-9)
ADT CHN CTK KJT NVS NWG PSA RPR RNR TBR
0 1 3 38 0 0 0 65 0 36 1
1 10 7 0 4 0 0 9 0 0 65
3 25 18 0 31 4 11 24 6 45 33
5 40 27 58 48 50 48 6 2 24 5
7 25 35 7 20 50 43 0 12 0 1
9 2 3 0 2 1 3 0 85 0 0
Total 103 93 103 105 105 105 104 105 105 105
LSI 4.6 5.0 3.3 4.7 5.9 5.7 1.1 8.4 2.4 1.9
Screening method N A N N A N N A N N
(LSI-Location severity Index; N-Natural; A-Artificial)
Table 44: Promising entries with low susceptibility index (<=4.5) and high PI in NHSN to
Sheath rot, Kharif-2020
S.No. IET No.
Location/Frequency of scores (0-9)
SI
Tota
l
<=
3*
PI
(<-3
)**
<=
5*
PI
(<-5
)**
ADT CHN KJT NVS NWG RPR
23 28968 3 0 1 5 7 7 3.8 6 3 50 4 67
63 29003 3 0 3 5 5 9 4.2 6 3 50 5 83
85 BPT-5204 (NCV-2) 3 1 3 7 3 9 4.3 6 4 67 4 67
47 28989 5 1 5 3 3 9 4.3 6 3 50 5 83
59 29000 5 3 1 3 5 9 4.3 6 3 50 5 83
68 29007 1 3 5 5 3 9 4.3 6 3 50 5 83
105 - 5 3 3 5 3 7 4.3 6 3 50 5 83
56 28997 1 1 5 5 5 9 4.3 6 2 33 5 83
19 MTU-1153 (RCV) 1 7 1 5 5 7 4.3 6 2 33 4 67
88 WGL-14 (NCV-1) 3 0 3 7 5 9 4.5 6 3 50 4 67
94 TN1 9 - 7 7 7 9 7.8 5 0 0 0 0
LSI 4.6 5.0 4.7 5.9 5.7 8.4
(SI-Susceptibility Index;*No. of locations where the entry has scored ≤ 5 and ≤ 3;**Promising index (PI) based on no. of
locations where the entry had scored ≤ 5 and ≤ 3)
DSN
The donor screening nursery (DSN) consisted of 150 entries including checks was
conducted at 8 sheath rot hot spot locations across the country. Screening was done artificially at
Nawasari and Raipur and in rest of the centers it was done under natural conditions. The
frequency distribution of disease scores and location severity index (LSI) are presented in
Table 45. The disease pressure was very high (LSI->7) at Raipur (8.7); Moderate (LSI 3-6) at
Navasari (5.7), Nawagam (5.6), Aduthurai (5.6), Cuttack (5.3) and Karjat (3.9). Due to low
disease pressure at Rajendranagar and Pusa, the data is not taken into consideration for selection
of the promising lines (Table 45).
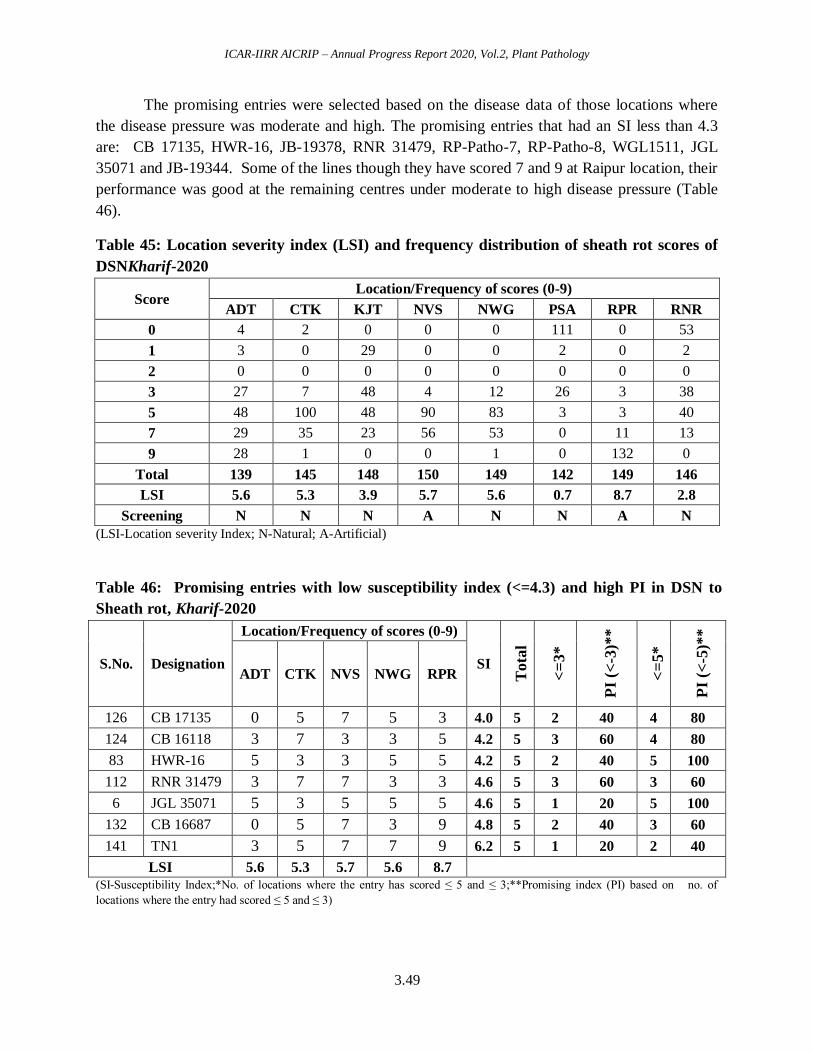
ICAR-IIRR AICRIP – Annual Progress Report 2020, Vol.2, Plant Pathology
3.49
The promising entries were selected based on the disease data of those locations where
the disease pressure was moderate and high. The promising entries that had an SI less than 4.3
are: CB 17135, HWR-16, JB-19378, RNR 31479, RP-Patho-7, RP-Patho-8, WGL1511, JGL
35071 and JB-19344. Some of the lines though they have scored 7 and 9 at Raipur location, their
performance was good at the remaining centres under moderate to high disease pressure (Table
46).
Table 45: Location severity index (LSI) and frequency distribution of sheath rot scores of
DSNKharif-2020
Score Location/Frequency of scores (0-9)
ADT CTK KJT NVS NWG PSA RPR RNR
0 4 2 0 0 0 111 0 53
1 3 0 29 0 0 2 0 2
2 0 0 0 0 0 0 0 0
3 27 7 48 4 12 26 3 38
5 48 100 48 90 83 3 3 40
7 29 35 23 56 53 0 11 13
9 28 1 0 0 1 0 132 0
Total 139 145 148 150 149 142 149 146
LSI 5.6 5.3 3.9 5.7 5.6 0.7 8.7 2.8
Screening N N N A N N A N
(LSI-Location severity Index; N-Natural; A-Artificial)
Table 46: Promising entries with low susceptibility index (<=4.3) and high PI in DSN to
Sheath rot, Kharif-2020
S.No. Designation
Location/Frequency of scores (0-9)
SI
Tota
l
<=
3*
PI
(<-3
)**
<=
5*
PI
(<-5
)**
ADT CTK NVS NWG RPR
126 CB 17135 0 5 7 5 3 4.0 5 2 40 4 80
124 CB 16118 3 7 3 3 5 4.2 5 3 60 4 80
83 HWR-16 5 3 3 5 5 4.2 5 2 40 5 100
112 RNR 31479 3 7 7 3 3 4.6 5 3 60 3 60
6 JGL 35071 5 3 5 5 5 4.6 5 1 20 5 100
132 CB 16687 0 5 7 3 9 4.8 5 2 40 3 60
141 TN1 3 5 7 7 9 6.2 5 1 20 2 40
LSI 5.6 5.3 5.7 5.6 8.7
(SI-Susceptibility Index;*No. of locations where the entry has scored ≤ 5 and ≤ 3;**Promising index (PI) based on no. of
locations where the entry had scored ≤ 5 and ≤ 3)
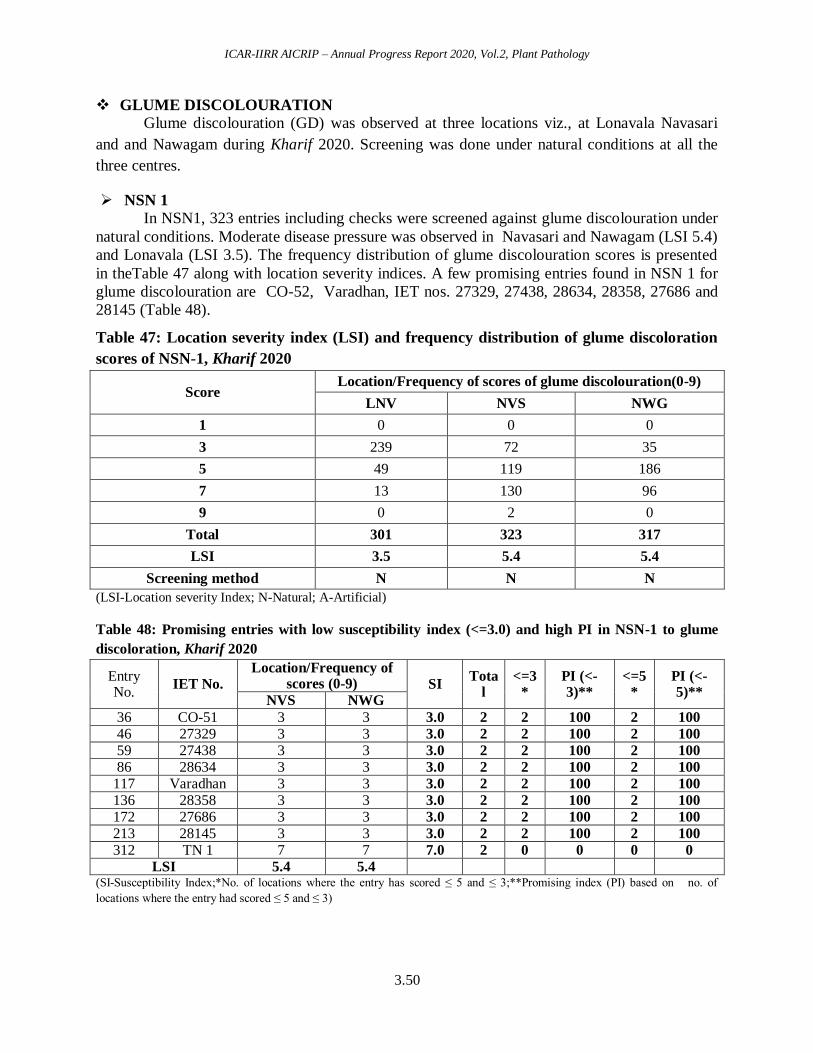
ICAR-IIRR AICRIP – Annual Progress Report 2020, Vol.2, Plant Pathology
3.50
GLUME DISCOLOURATION
Glume discolouration (GD) was observed at three locations viz., at Lonavala Navasari
and and Nawagam during Kharif 2020. Screening was done under natural conditions at all the
three centres.
NSN 1
In NSN1, 323 entries including checks were screened against glume discolouration under
natural conditions. Moderate disease pressure was observed in Navasari and Nawagam (LSI 5.4)
and Lonavala (LSI 3.5). The frequency distribution of glume discolouration scores is presented
in theTable 47 along with location severity indices. A few promising entries found in NSN 1 for
glume discolouration are CO-52, Varadhan, IET nos. 27329, 27438, 28634, 28358, 27686 and
28145 (Table 48).
Table 47: Location severity index (LSI) and frequency distribution of glume discoloration
scores of NSN-1, Kharif 2020
Score Location/Frequency of scores of glume discolouration(0-9)
LNV NVS NWG
1 0 0 0
3 239 72 35
5 49 119 186
7 13 130 96
9 0 2 0
Total 301 323 317
LSI 3.5 5.4 5.4
Screening method N N N
(LSI-Location severity Index; N-Natural; A-Artificial)
Table 48: Promising entries with low susceptibility index (<=3.0) and high PI in NSN-1 to glume
discoloration, Kharif 2020
Entry No.
IET No. Location/Frequency of
scores (0-9) SI Tota
l <=3
* PI (<-3)**
<=5*
PI (<-5)**
NVS NWG
36 CO-51 3 3 3.0 2 2 100 2 100
46 27329 3 3 3.0 2 2 100 2 100
59 27438 3 3 3.0 2 2 100 2 100
86 28634 3 3 3.0 2 2 100 2 100
117 Varadhan 3 3 3.0 2 2 100 2 100
136 28358 3 3 3.0 2 2 100 2 100
172 27686 3 3 3.0 2 2 100 2 100
213 28145 3 3 3.0 2 2 100 2 100
312 TN 1 7 7 7.0 2 0 0 0 0
LSI 5.4 5.4
(SI-Susceptibility Index;*No. of locations where the entry has scored ≤ 5 and ≤ 3;**Promising index (PI) based on no. of
locations where the entry had scored ≤ 5 and ≤ 3)
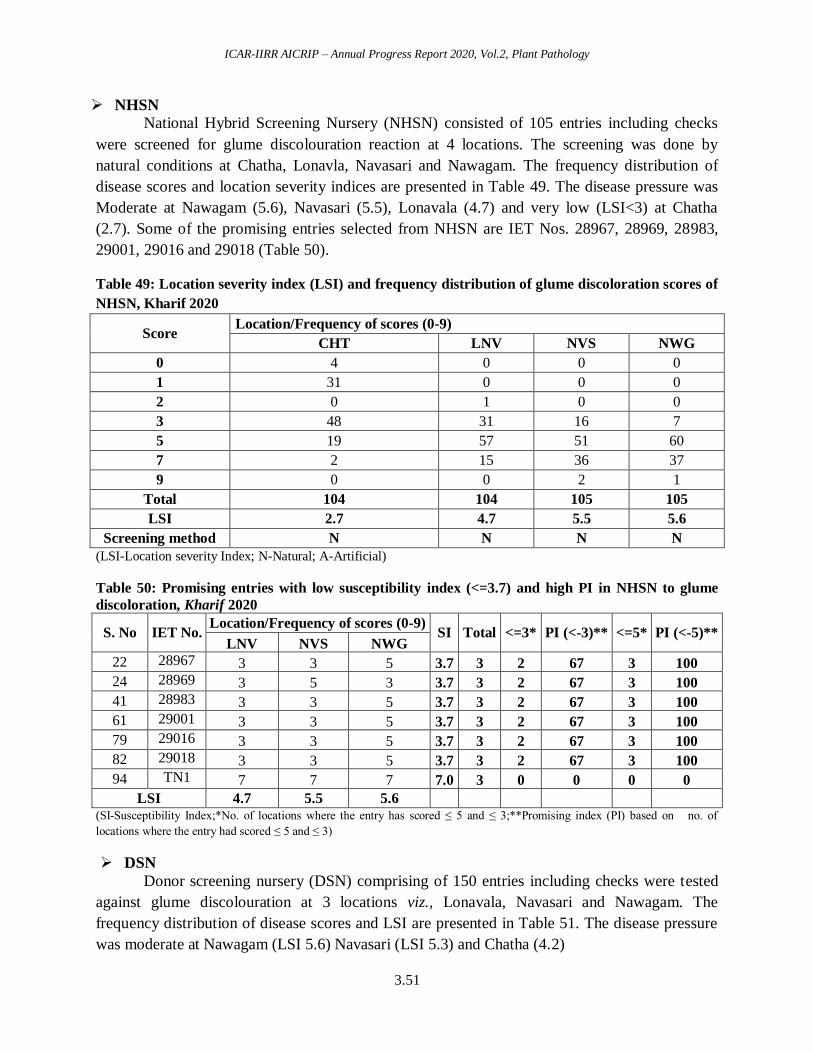
ICAR-IIRR AICRIP – Annual Progress Report 2020, Vol.2, Plant Pathology
3.51
NHSN
National Hybrid Screening Nursery (NHSN) consisted of 105 entries including checks
were screened for glume discolouration reaction at 4 locations. The screening was done by
natural conditions at Chatha, Lonavla, Navasari and Nawagam. The frequency distribution of
disease scores and location severity indices are presented in Table 49. The disease pressure was
Moderate at Nawagam (5.6), Navasari (5.5), Lonavala (4.7) and very low (LSI<3) at Chatha
(2.7). Some of the promising entries selected from NHSN are IET Nos. 28967, 28969, 28983,
29001, 29016 and 29018 (Table 50).
Table 49: Location severity index (LSI) and frequency distribution of glume discoloration scores of
NHSN, Kharif 2020
Score Location/Frequency of scores (0-9)
CHT LNV NVS NWG
0 4 0 0 0
1 31 0 0 0
2 0 1 0 0
3 48 31 16 7
5 19 57 51 60
7 2 15 36 37
9 0 0 2 1
Total 104 104 105 105
LSI 2.7 4.7 5.5 5.6
Screening method N N N N
(LSI-Location severity Index; N-Natural; A-Artificial)
Table 50: Promising entries with low susceptibility index (<=3.7) and high PI in NHSN to glume
discoloration, Kharif 2020
S. No IET No. Location/Frequency of scores (0-9)
SI Total <=3* PI (<-3)** <=5* PI (<-5)** LNV NVS NWG
22 28967 3 3 5 3.7 3 2 67 3 100
24 28969 3 5 3 3.7 3 2 67 3 100
41 28983 3 3 5 3.7 3 2 67 3 100
61 29001 3 3 5 3.7 3 2 67 3 100
79 29016 3 3 5 3.7 3 2 67 3 100
82 29018 3 3 5 3.7 3 2 67 3 100
94 TN1 7 7 7 7.0 3 0 0 0 0
LSI 4.7 5.5 5.6
(SI-Susceptibility Index;*No. of locations where the entry has scored ≤ 5 and ≤ 3;**Promising index (PI) based on no. of
locations where the entry had scored ≤ 5 and ≤ 3)
DSN
Donor screening nursery (DSN) comprising of 150 entries including checks were tested
against glume discolouration at 3 locations viz., Lonavala, Navasari and Nawagam. The
frequency distribution of disease scores and LSI are presented in Table 51. The disease pressure
was moderate at Nawagam (LSI 5.6) Navasari (LSI 5.3) and Chatha (4.2)
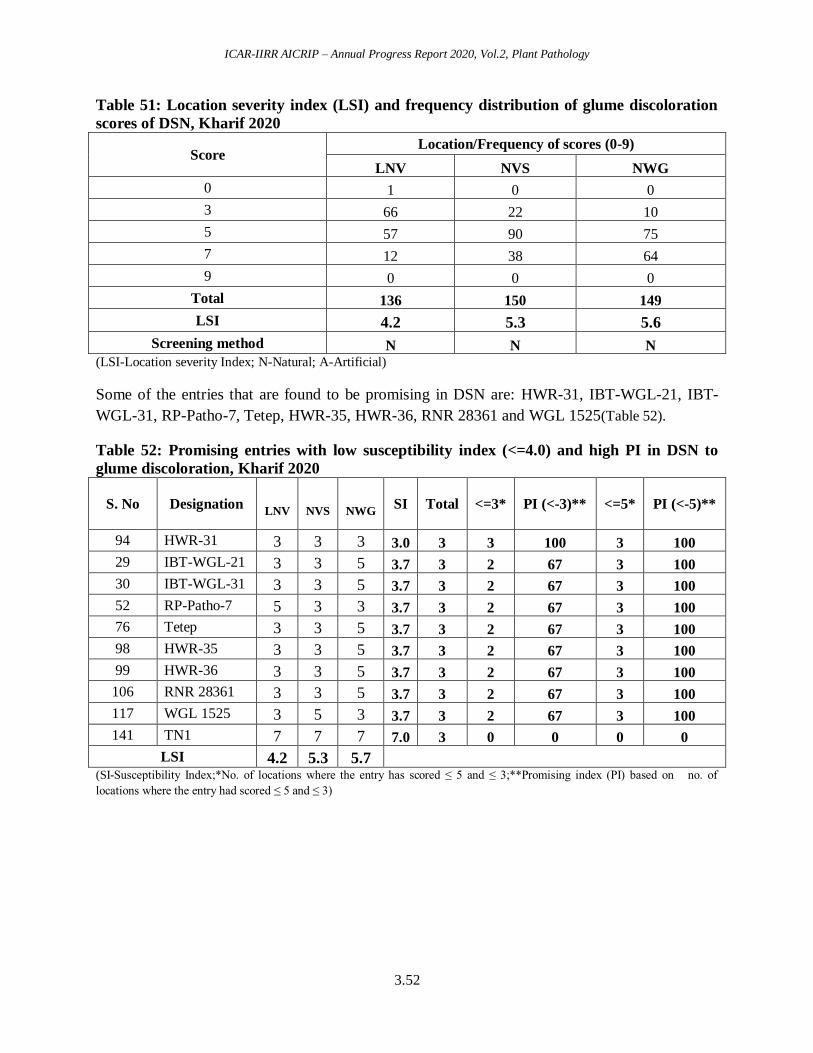
ICAR-IIRR AICRIP – Annual Progress Report 2020, Vol.2, Plant Pathology
3.52
Table 51: Location severity index (LSI) and frequency distribution of glume discoloration
scores of DSN, Kharif 2020
Score Location/Frequency of scores (0-9)
LNV NVS NWG
0 1 0 0
3 66 22 10
5 57 90 75
7 12 38 64
9 0 0 0
Total 136 150 149
LSI 4.2 5.3 5.6
Screening method N N N (LSI-Location severity Index; N-Natural; A-Artificial)
Some of the entries that are found to be promising in DSN are: HWR-31, IBT-WGL-21, IBT-
WGL-31, RP-Patho-7, Tetep, HWR-35, HWR-36, RNR 28361 and WGL 1525(Table 52).
Table 52: Promising entries with low susceptibility index (<=4.0) and high PI in DSN to
glume discoloration, Kharif 2020
S. No Designation
LNV
NVS
NWG SI Total <=3* PI (<-3)** <=5* PI (<-5)**
94 HWR-31 3 3 3 3.0 3 3 100 3 100
29 IBT-WGL-21 3 3 5 3.7 3 2 67 3 100
30 IBT-WGL-31 3 3 5 3.7 3 2 67 3 100
52 RP-Patho-7 5 3 3 3.7 3 2 67 3 100
76 Tetep 3 3 5 3.7 3 2 67 3 100
98 HWR-35 3 3 5 3.7 3 2 67 3 100
99 HWR-36 3 3 5 3.7 3 2 67 3 100
106 RNR 28361 3 3 5 3.7 3 2 67 3 100
117 WGL 1525 3 5 3 3.7 3 2 67 3 100
141 TN1 7 7 7 7.0 3 0 0 0 0
LSI 4.2 5.3 5.7 (SI-Susceptibility Index;*No. of locations where the entry has scored ≤ 5 and ≤ 3;**Promising index (PI) based on no. of
locations where the entry had scored ≤ 5 and ≤ 3)
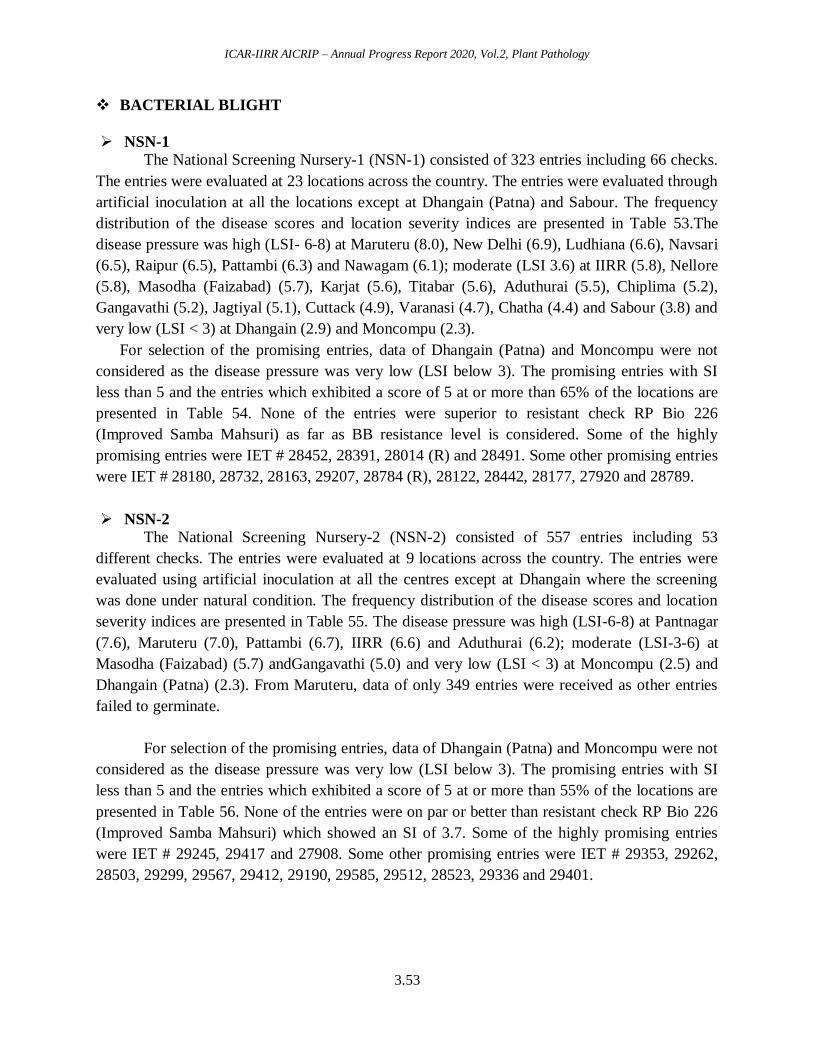
ICAR-IIRR AICRIP – Annual Progress Report 2020, Vol.2, Plant Pathology
3.53
BACTERIAL BLIGHT
NSN-1
The National Screening Nursery-1 (NSN-1) consisted of 323 entries including 66 checks.
The entries were evaluated at 23 locations across the country. The entries were evaluated through
artificial inoculation at all the locations except at Dhangain (Patna) and Sabour. The frequency
distribution of the disease scores and location severity indices are presented in Table 53.The
disease pressure was high (LSI- 6-8) at Maruteru (8.0), New Delhi (6.9), Ludhiana (6.6), Navsari
(6.5), Raipur (6.5), Pattambi (6.3) and Nawagam (6.1); moderate (LSI 3.6) at IIRR (5.8), Nellore
(5.8), Masodha (Faizabad) (5.7), Karjat (5.6), Titabar (5.6), Aduthurai (5.5), Chiplima (5.2),
Gangavathi (5.2), Jagtiyal (5.1), Cuttack (4.9), Varanasi (4.7), Chatha (4.4) and Sabour (3.8) and
very low (LSI < 3) at Dhangain (2.9) and Moncompu (2.3).
For selection of the promising entries, data of Dhangain (Patna) and Moncompu were not
considered as the disease pressure was very low (LSI below 3). The promising entries with SI
less than 5 and the entries which exhibited a score of 5 at or more than 65% of the locations are
presented in Table 54. None of the entries were superior to resistant check RP Bio 226
(Improved Samba Mahsuri) as far as BB resistance level is considered. Some of the highly
promising entries were IET # 28452, 28391, 28014 (R) and 28491. Some other promising entries
were IET # 28180, 28732, 28163, 29207, 28784 (R), 28122, 28442, 28177, 27920 and 28789.
NSN-2
The National Screening Nursery-2 (NSN-2) consisted of 557 entries including 53
different checks. The entries were evaluated at 9 locations across the country. The entries were
evaluated using artificial inoculation at all the centres except at Dhangain where the screening
was done under natural condition. The frequency distribution of the disease scores and location
severity indices are presented in Table 55. The disease pressure was high (LSI-6-8) at Pantnagar
(7.6), Maruteru (7.0), Pattambi (6.7), IIRR (6.6) and Aduthurai (6.2); moderate (LSI-3-6) at
Masodha (Faizabad) (5.7) andGangavathi (5.0) and very low (LSI < 3) at Moncompu (2.5) and
Dhangain (Patna) (2.3). From Maruteru, data of only 349 entries were received as other entries
failed to germinate.
For selection of the promising entries, data of Dhangain (Patna) and Moncompu were not
considered as the disease pressure was very low (LSI below 3). The promising entries with SI
less than 5 and the entries which exhibited a score of 5 at or more than 55% of the locations are
presented in Table 56. None of the entries were on par or better than resistant check RP Bio 226
(Improved Samba Mahsuri) which showed an SI of 3.7. Some of the highly promising entries
were IET # 29245, 29417 and 27908. Some other promising entries were IET # 29353, 29262,
28503, 29299, 29567, 29412, 29190, 29585, 29512, 28523, 29336 and 29401.
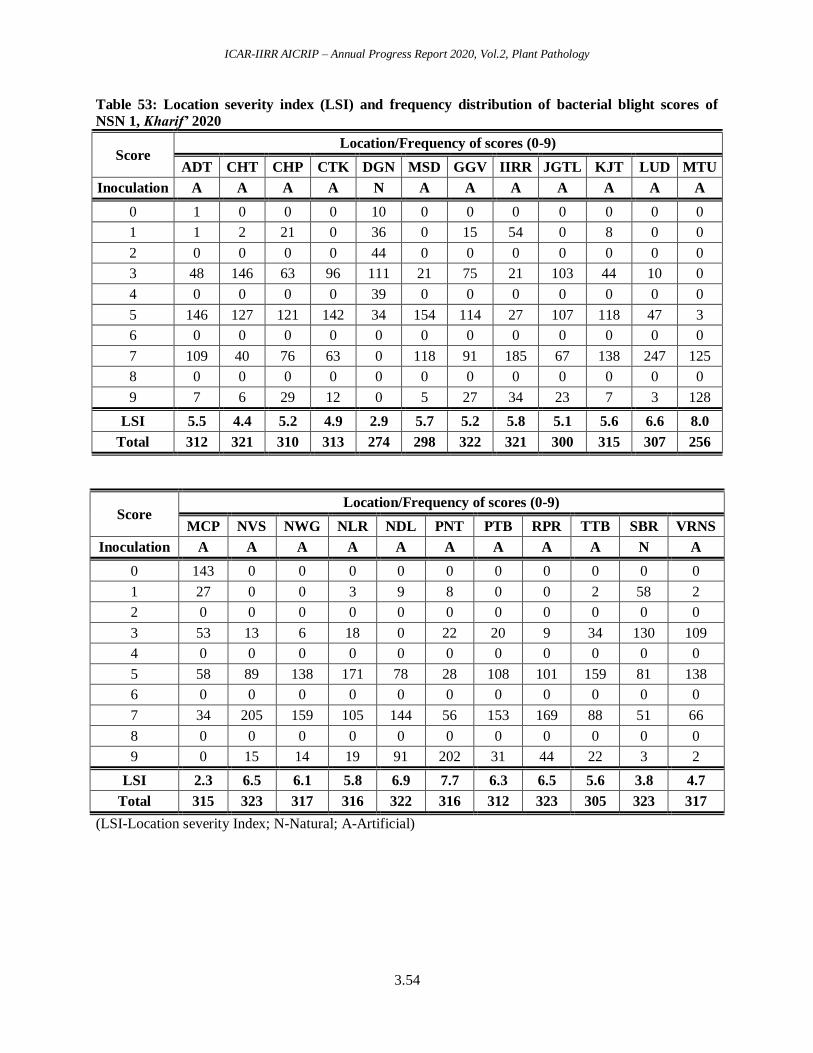
ICAR-IIRR AICRIP – Annual Progress Report 2020, Vol.2, Plant Pathology
3.54
Table 53: Location severity index (LSI) and frequency distribution of bacterial blight scores of
NSN 1, Kharif’ 2020
Score Location/Frequency of scores (0-9)
ADT CHT CHP CTK DGN MSD GGV IIRR JGTL KJT LUD MTU
Inoculation A A A A N A A A A A A A
0 1 0 0 0 10 0 0 0 0 0 0 0
1 1 2 21 0 36 0 15 54 0 8 0 0
2 0 0 0 0 44 0 0 0 0 0 0 0
3 48 146 63 96 111 21 75 21 103 44 10 0
4 0 0 0 0 39 0 0 0 0 0 0 0
5 146 127 121 142 34 154 114 27 107 118 47 3
6 0 0 0 0 0 0 0 0 0 0 0 0
7 109 40 76 63 0 118 91 185 67 138 247 125
8 0 0 0 0 0 0 0 0 0 0 0 0
9 7 6 29 12 0 5 27 34 23 7 3 128
LSI 5.5 4.4 5.2 4.9 2.9 5.7 5.2 5.8 5.1 5.6 6.6 8.0
Total 312 321 310 313 274 298 322 321 300 315 307 256
Score Location/Frequency of scores (0-9)
MCP NVS NWG NLR NDL PNT PTB RPR TTB SBR VRNS
Inoculation A A A A A A A A A N A
0 143 0 0 0 0 0 0 0 0 0 0
1 27 0 0 3 9 8 0 0 2 58 2
2 0 0 0 0 0 0 0 0 0 0 0
3 53 13 6 18 0 22 20 9 34 130 109
4 0 0 0 0 0 0 0 0 0 0 0
5 58 89 138 171 78 28 108 101 159 81 138
6 0 0 0 0 0 0 0 0 0 0 0
7 34 205 159 105 144 56 153 169 88 51 66
8 0 0 0 0 0 0 0 0 0 0 0
9 0 15 14 19 91 202 31 44 22 3 2
LSI 2.3 6.5 6.1 5.8 6.9 7.7 6.3 6.5 5.6 3.8 4.7
Total 315 323 317 316 322 316 312 323 305 323 317
(LSI-Location severity Index; N-Natural; A-Artificial)
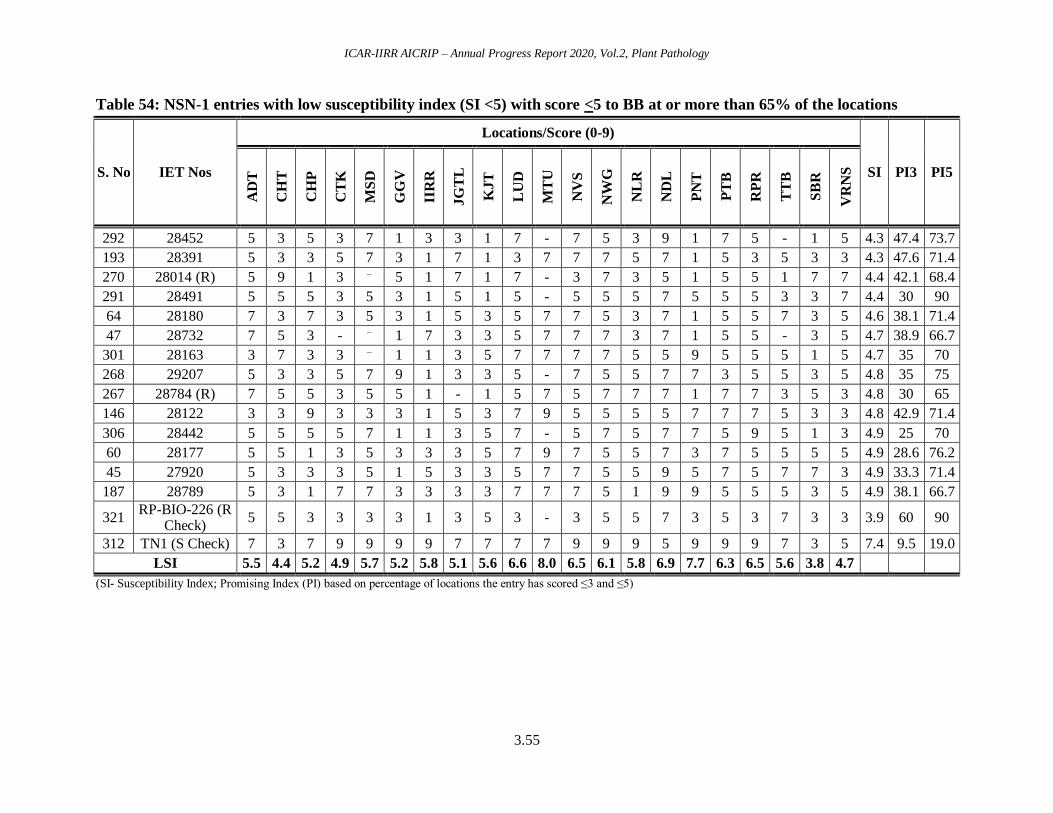
ICAR-IIRR AICRIP – Annual Progress Report 2020, Vol.2, Plant Pathology
3.55
Table 54: NSN-1 entries with low susceptibility index (SI <5) with score <5 to BB at or more than 65% of the locations
S. No IET Nos
Locations/Score (0-9)
SI PI3 PI5
AD
T
CH
T
CH
P
CT
K
MS
D
GG
V
IIR
R
JG
TL
KJT
LU
D
MT
U
NV
S
NW
G
NL
R
ND
L
PN
T
PT
B
RP
R
TT
B
SB
R
VR
NS
292 28452 5 3 5 3 7 1 3 3 1 7 - 7 5 3 9 1 7 5 - 1 5 4.3 47.4 73.7
193 28391 5 3 3 5 7 3 1 7 1 3 7 7 7 5 7 1 5 3 5 3 3 4.3 47.6 71.4
270 28014 (R) 5 9 1 3 ⁻ 5 1 7 1 7 - 3 7 3 5 1 5 5 1 7 7 4.4 42.1 68.4
291 28491 5 5 5 3 5 3 1 5 1 5 - 5 5 5 7 5 5 5 3 3 7 4.4 30 90
64 28180 7 3 7 3 5 3 1 5 3 5 7 7 5 3 7 1 5 5 7 3 5 4.6 38.1 71.4
47 28732 7 5 3 - ⁻ 1 7 3 3 5 7 7 7 3 7 1 5 5 - 3 5 4.7 38.9 66.7
301 28163 3 7 3 3 ⁻ 1 1 3 5 7 7 7 7 5 5 9 5 5 5 1 5 4.7 35 70
268 29207 5 3 3 5 7 9 1 3 3 5 - 7 5 5 7 7 3 5 5 3 5 4.8 35 75
267 28784 (R) 7 5 5 3 5 5 1 - 1 5 7 5 7 7 7 1 7 7 3 5 3 4.8 30 65
146 28122 3 3 9 3 3 3 1 5 3 7 9 5 5 5 5 7 7 7 5 3 3 4.8 42.9 71.4
306 28442 5 5 5 5 7 1 1 3 5 7 - 5 7 5 7 7 5 9 5 1 3 4.9 25 70
60 28177 5 5 1 3 5 3 3 3 5 7 9 7 5 5 7 3 7 5 5 5 5 4.9 28.6 76.2
45 27920 5 3 3 3 5 1 5 3 3 5 7 7 5 5 9 5 7 5 7 7 3 4.9 33.3 71.4
187 28789 5 3 1 7 7 3 3 3 3 7 7 7 5 1 9 9 5 5 5 3 5 4.9 38.1 66.7
321 RP-BIO-226 (R
Check) 5 5 3 3 3 3 1 3 5 3 - 3 5 5 7 3 5 3 7 3 3 3.9 60 90
312 TN1 (S Check) 7 3 7 9 9 9 9 7 7 7 7 9 9 9 5 9 9 9 7 3 5 7.4 9.5 19.0
LSI 5.5 4.4 5.2 4.9 5.7 5.2 5.8 5.1 5.6 6.6 8.0 6.5 6.1 5.8 6.9 7.7 6.3 6.5 5.6 3.8 4.7
(SI- Susceptibility Index; Promising Index (PI) based on percentage of locations the entry has scored ≤3 and ≤5)
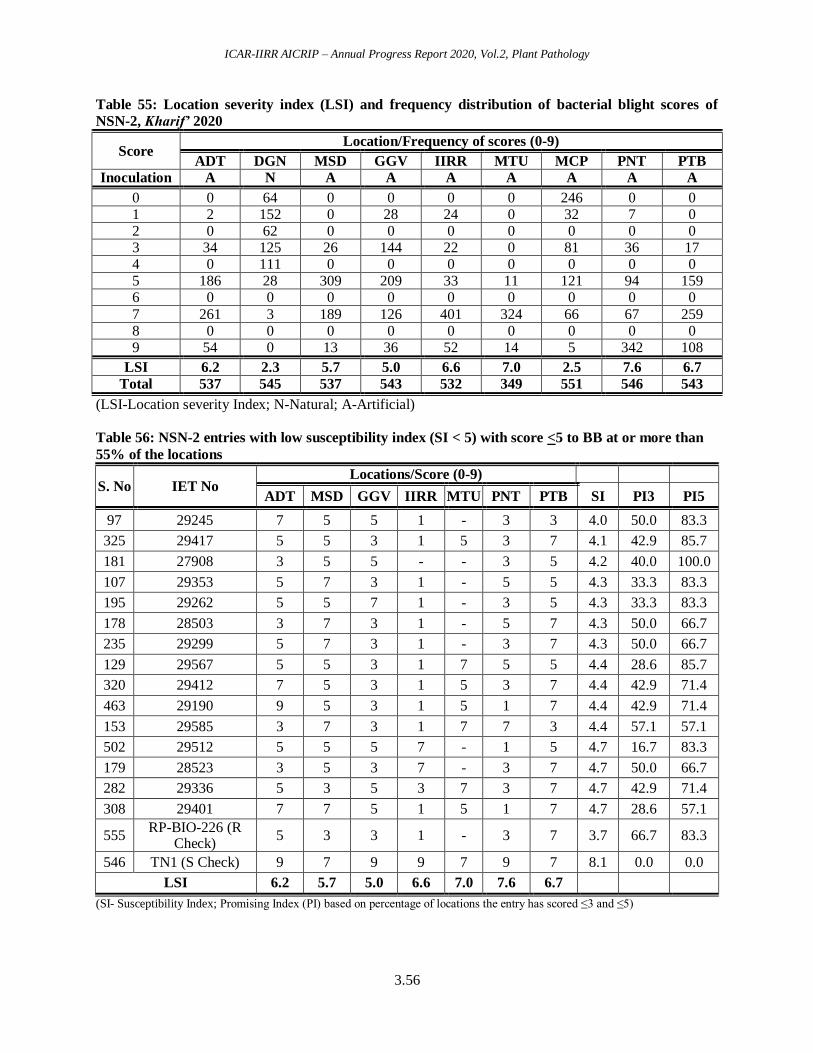
ICAR-IIRR AICRIP – Annual Progress Report 2020, Vol.2, Plant Pathology
3.56
Table 55: Location severity index (LSI) and frequency distribution of bacterial blight scores of
NSN-2, Kharif’ 2020
Score Location/Frequency of scores (0-9)
ADT DGN MSD GGV IIRR MTU MCP PNT PTB
Inoculation A N A A A A A A A
0 0 64 0 0 0 0 246 0 0 1 2 152 0 28 24 0 32 7 0 2 0 62 0 0 0 0 0 0 0 3 34 125 26 144 22 0 81 36 17 4 0 111 0 0 0 0 0 0 0 5 186 28 309 209 33 11 121 94 159 6 0 0 0 0 0 0 0 0 0
7 261 3 189 126 401 324 66 67 259 8 0 0 0 0 0 0 0 0 0 9 54 0 13 36 52 14 5 342 108
LSI 6.2 2.3 5.7 5.0 6.6 7.0 2.5 7.6 6.7
Total 537 545 537 543 532 349 551 546 543
(LSI-Location severity Index; N-Natural; A-Artificial)
Table 56: NSN-2 entries with low susceptibility index (SI < 5) with score <5 to BB at or more than
55% of the locations
S. No IET No Locations/Score (0-9)
ADT MSD GGV IIRR MTU PNT PTB SI PI3 PI5
97 29245 7 5 5 1 - 3 3 4.0 50.0 83.3
325 29417 5 5 3 1 5 3 7 4.1 42.9 85.7
181 27908 3 5 5 - - 3 5 4.2 40.0 100.0
107 29353 5 7 3 1 - 5 5 4.3 33.3 83.3
195 29262 5 5 7 1 - 3 5 4.3 33.3 83.3
178 28503 3 7 3 1 - 5 7 4.3 50.0 66.7
235 29299 5 7 3 1 - 3 7 4.3 50.0 66.7
129 29567 5 5 3 1 7 5 5 4.4 28.6 85.7
320 29412 7 5 3 1 5 3 7 4.4 42.9 71.4
463 29190 9 5 3 1 5 1 7 4.4 42.9 71.4
153 29585 3 7 3 1 7 7 3 4.4 57.1 57.1
502 29512 5 5 5 7 - 1 5 4.7 16.7 83.3
179 28523 3 5 3 7 - 3 7 4.7 50.0 66.7
282 29336 5 3 5 3 7 3 7 4.7 42.9 71.4
308 29401 7 7 5 1 5 1 7 4.7 28.6 57.1
555 RP-BIO-226 (R
Check) 5 3 3 1 - 3 7 3.7 66.7 83.3
546 TN1 (S Check) 9 7 9 9 7 9 7 8.1 0.0 0.0
LSI 6.2 5.7 5.0 6.6 7.0 7.6 6.7
(SI- Susceptibility Index; Promising Index (PI) based on percentage of locations the entry has scored ≤3 and ≤5)
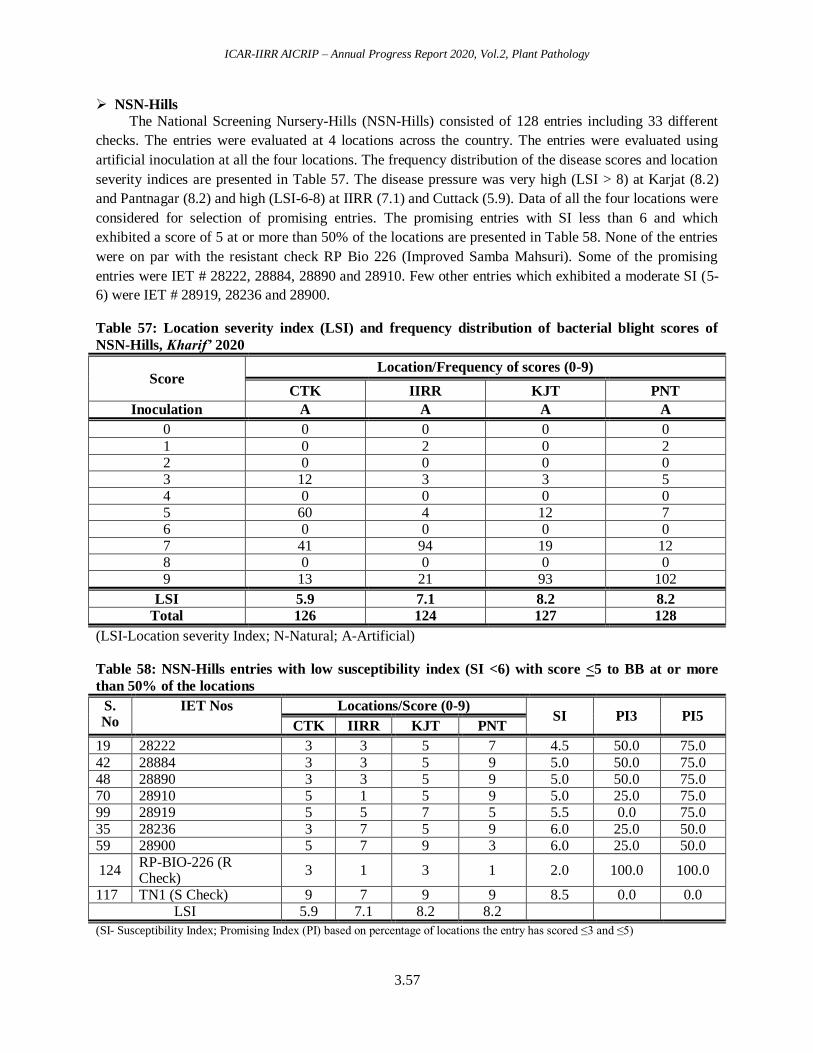
ICAR-IIRR AICRIP – Annual Progress Report 2020, Vol.2, Plant Pathology
3.57
NSN-Hills
The National Screening Nursery-Hills (NSN-Hills) consisted of 128 entries including 33 different
checks. The entries were evaluated at 4 locations across the country. The entries were evaluated using
artificial inoculation at all the four locations. The frequency distribution of the disease scores and location
severity indices are presented in Table 57. The disease pressure was very high (LSI > 8) at Karjat (8.2)
and Pantnagar (8.2) and high (LSI-6-8) at IIRR (7.1) and Cuttack (5.9). Data of all the four locations were
considered for selection of promising entries. The promising entries with SI less than 6 and which
exhibited a score of 5 at or more than 50% of the locations are presented in Table 58. None of the entries
were on par with the resistant check RP Bio 226 (Improved Samba Mahsuri). Some of the promising
entries were IET # 28222, 28884, 28890 and 28910. Few other entries which exhibited a moderate SI (5-
6) were IET # 28919, 28236 and 28900.
Table 57: Location severity index (LSI) and frequency distribution of bacterial blight scores of
NSN-Hills, Kharif’ 2020
Score Location/Frequency of scores (0-9)
CTK IIRR KJT PNT
Inoculation A A A A
0 0 0 0 0
1 0 2 0 2 2 0 0 0 0 3 12 3 3 5 4 0 0 0 0 5 60 4 12 7 6 0 0 0 0 7 41 94 19 12 8 0 0 0 0 9 13 21 93 102
LSI 5.9 7.1 8.2 8.2
Total 126 124 127 128
(LSI-Location severity Index; N-Natural; A-Artificial)
Table 58: NSN-Hills entries with low susceptibility index (SI <6) with score <5 to BB at or more
than 50% of the locations
S. No
IET Nos Locations/Score (0-9) SI PI3 PI5
CTK IIRR KJT PNT
19 28222 3 3 5 7 4.5 50.0 75.0
42 28884 3 3 5 9 5.0 50.0 75.0 48 28890 3 3 5 9 5.0 50.0 75.0 70 28910 5 1 5 9 5.0 25.0 75.0 99 28919 5 5 7 5 5.5 0.0 75.0 35 28236 3 7 5 9 6.0 25.0 50.0 59 28900 5 7 9 3 6.0 25.0 50.0
124 RP-BIO-226 (R Check)
3 1 3 1 2.0 100.0 100.0
117 TN1 (S Check) 9 7 9 9 8.5 0.0 0.0 LSI 5.9 7.1 8.2 8.2
(SI- Susceptibility Index; Promising Index (PI) based on percentage of locations the entry has scored ≤3 and ≤5)
ICAR-IIRR AICRIP – Annual Progress Report 2020, Vol.2, Plant Pathology
3.58
NHSN
The National Hybrid Screening Nursery (NHSN) consisted of 105 entries including 31
different checks. The entries were evaluated at 21 locations across the country. The entries were
evaluated using artificial inoculation at all the centres except at Dhangain (Patna). The frequency
distribution of the disease scores and location severity indices are presented in Table 59. The
disease pressure was very high (LSI > 8) at Aduthurai (8.2), Pantnagar (8.2) and Maruteru (8.0);
high (LSI-6-8) at Chinsurah (7.7), Pattambi (7.6), New Delhi (6.9), Raipur (6.5), Karjat (6.4),
Navsari (6.4), Nawagam (6.2) and Gangavathi (6.1); moderate (LSI-3-6) at Masodha (Faizabad)
(5.9), Varanasi (5.5), IIRR (5.2), Chatha (5.0), Titabar (4.8), Cuttack (4.7), Dhangain (4.3) and
Moncompu (3.8) and very low (LSI (< 3) at Arundhatinagar (1.6).
For selection of promising entries, data of Arundhatinagar were not considered as the
disease pressure was very low (LSI-1.6). The promising entries with SI less than 5.5 and which
exhibited a score of 5 at or more than 50% of the locations are presented in Table 60. None of
the entries were on par or better than the resistant check RP Bio 226 (Improved Samba Mahsuri).
Some of the promising entries were IET # 28997, 28967, 29000, 28998, 28959, 29022, 29005,
28979, 28983, 28999, 28994, 29003, 29009 and 29004.
DSN
The Donor Screening Nursery (DSN) consisted of 150 entries including 21 different
checks. The entries were evaluated at 21 locations across the country. The entries were evaluated
using artificial inoculation at all the centres except at Dhangain (Patna). The frequency
distribution of the disease scores and location severity indices are presented in Table61. The
disease pressure was very high (LSI > 8) at Aduthurai (8.7); high (LSI-6-8) at Pantnagar (7.7),
Pattambi (7.3), New Delhi (7.1), Raipur (7.0), Maruteru (6.7), Ludhiana (6.6), Karjat (6.7),
Gangavathi (6.1) and Nawagam (6.0); moderate (LSI-3-6) at Navsari (5.8), Chiplima (5.7), IIRR
(5.5), Masodha (Faizabad) (5.4), Cuttack (5.1), Titabar (5.2), Varanasi (5.1), Chatha (4.7),
Dhangain (4.0) and Gerua (3.3) and very low (LSI (< 3) at Moncompu (2.8).
For selection of the promising entries, data of those locations were considered where the
disease pressure was moderate to very high. Accordingly, the data from Moncompu were not
considered for selection of promising entries in DSN. The promising entries with SI less than or
equal to 5 and which exhibited a score of 5 at or more than 60% of the locations are presented in
Table 62. Some of the entries which were on par or better than resistant check, Improved Samba
Mahsuri were IBT-GM-39, RP-Bio-Patho-4, IBT-GM-17 and IBT-GM-3. Some of the other
promising entries were RP-Bio-Patho-10, HWR-7, RP-Bio-Patho-11, IBT-GM-5, IBT-WGL-21,
HWR-36, HWR-6, IBT-GM-12, IBT-GM-40, RP-Bio-Patho-9, RP-Bio-Patho-5 and IBT-GM-7.
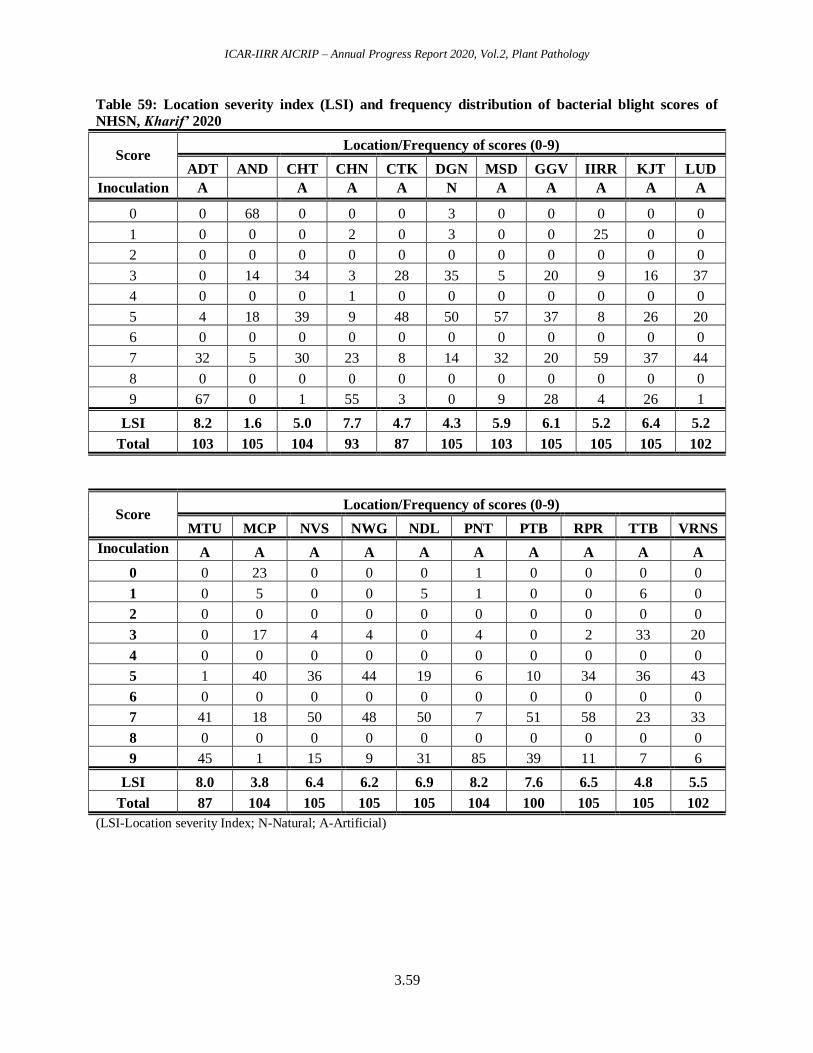
ICAR-IIRR AICRIP – Annual Progress Report 2020, Vol.2, Plant Pathology
3.59
Table 59: Location severity index (LSI) and frequency distribution of bacterial blight scores of
NHSN, Kharif’ 2020
Score Location/Frequency of scores (0-9)
ADT AND CHT CHN CTK DGN MSD GGV IIRR KJT LUD
Inoculation A
A A A N A A A A A
0 0 68 0 0 0 3 0 0 0 0 0
1 0 0 0 2 0 3 0 0 25 0 0
2 0 0 0 0 0 0 0 0 0 0 0
3 0 14 34 3 28 35 5 20 9 16 37
4 0 0 0 1 0 0 0 0 0 0 0
5 4 18 39 9 48 50 57 37 8 26 20
6 0 0 0 0 0 0 0 0 0 0 0
7 32 5 30 23 8 14 32 20 59 37 44
8 0 0 0 0 0 0 0 0 0 0 0
9 67 0 1 55 3 0 9 28 4 26 1
LSI 8.2 1.6 5.0 7.7 4.7 4.3 5.9 6.1 5.2 6.4 5.2
Total 103 105 104 93 87 105 103 105 105 105 102
Score Location/Frequency of scores (0-9)
MTU MCP NVS NWG NDL PNT PTB RPR TTB VRNS
Inoculation A A A A A A A A A A
0 0 23 0 0 0 1 0 0 0 0
1 0 5 0 0 5 1 0 0 6 0
2 0 0 0 0 0 0 0 0 0 0
3 0 17 4 4 0 4 0 2 33 20
4 0 0 0 0 0 0 0 0 0 0
5 1 40 36 44 19 6 10 34 36 43
6 0 0 0 0 0 0 0 0 0 0
7 41 18 50 48 50 7 51 58 23 33
8 0 0 0 0 0 0 0 0 0 0
9 45 1 15 9 31 85 39 11 7 6
LSI 8.0 3.8 6.4 6.2 6.9 8.2 7.6 6.5 4.8 5.5
Total 87 104 105 105 105 104 100 105 105 102
(LSI-Location severity Index; N-Natural; A-Artificial)
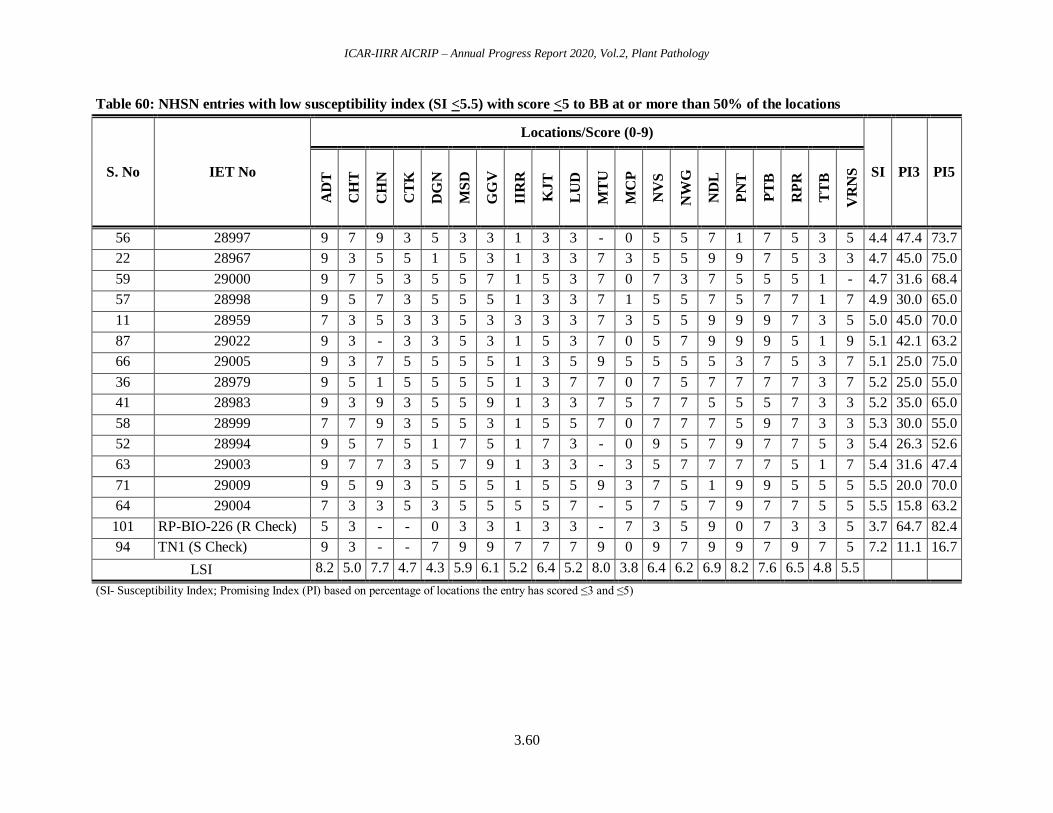
ICAR-IIRR AICRIP – Annual Progress Report 2020, Vol.2, Plant Pathology
3.60
Table 60: NHSN entries with low susceptibility index (SI <5.5) with score <5 to BB at or more than 50% of the locations
S. No IET No
Locations/Score (0-9)
SI PI3 PI5
AD
T
CH
T
CH
N
CT
K
DG
N
MS
D
GG
V
IIR
R
KJT
LU
D
MT
U
MC
P
NV
S
NW
G
ND
L
PN
T
PT
B
RP
R
TT
B
VR
NS
56 28997 9 7 9 3 5 3 3 1 3 3 - 0 5 5 7 1 7 5 3 5 4.4 47.4 73.7
22 28967 9 3 5 5 1 5 3 1 3 3 7 3 5 5 9 9 7 5 3 3 4.7 45.0 75.0
59 29000 9 7 5 3 5 5 7 1 5 3 7 0 7 3 7 5 5 5 1 - 4.7 31.6 68.4
57 28998 9 5 7 3 5 5 5 1 3 3 7 1 5 5 7 5 7 7 1 7 4.9 30.0 65.0
11 28959 7 3 5 3 3 5 3 3 3 3 7 3 5 5 9 9 9 7 3 5 5.0 45.0 70.0
87 29022 9 3 - 3 3 5 3 1 5 3 7 0 5 7 9 9 9 5 1 9 5.1 42.1 63.2
66 29005 9 3 7 5 5 5 5 1 3 5 9 5 5 5 5 3 7 5 3 7 5.1 25.0 75.0
36 28979 9 5 1 5 5 5 5 1 3 7 7 0 7 5 7 7 7 7 3 7 5.2 25.0 55.0
41 28983 9 3 9 3 5 5 9 1 3 3 7 5 7 7 5 5 5 7 3 3 5.2 35.0 65.0
58 28999 7 7 9 3 5 5 3 1 5 5 7 0 7 7 7 5 9 7 3 3 5.3 30.0 55.0
52 28994 9 5 7 5 1 7 5 1 7 3 - 0 9 5 7 9 7 7 5 3 5.4 26.3 52.6
63 29003 9 7 7 3 5 7 9 1 3 3 - 3 5 7 7 7 7 5 1 7 5.4 31.6 47.4
71 29009 9 5 9 3 5 5 5 1 5 5 9 3 7 5 1 9 9 5 5 5 5.5 20.0 70.0
64 29004 7 3 3 5 3 5 5 5 5 7 - 5 7 5 7 9 7 7 5 5 5.5 15.8 63.2
101 RP-BIO-226 (R Check) 5 3 - - 0 3 3 1 3 3 - 7 3 5 9 0 7 3 3 5 3.7 64.7 82.4
94 TN1 (S Check) 9 3 - - 7 9 9 7 7 7 9 0 9 7 9 9 7 9 7 5 7.2 11.1 16.7
LSI 8.2 5.0 7.7 4.7 4.3 5.9 6.1 5.2 6.4 5.2 8.0 3.8 6.4 6.2 6.9 8.2 7.6 6.5 4.8 5.5
(SI- Susceptibility Index; Promising Index (PI) based on percentage of locations the entry has scored ≤3 and ≤5)
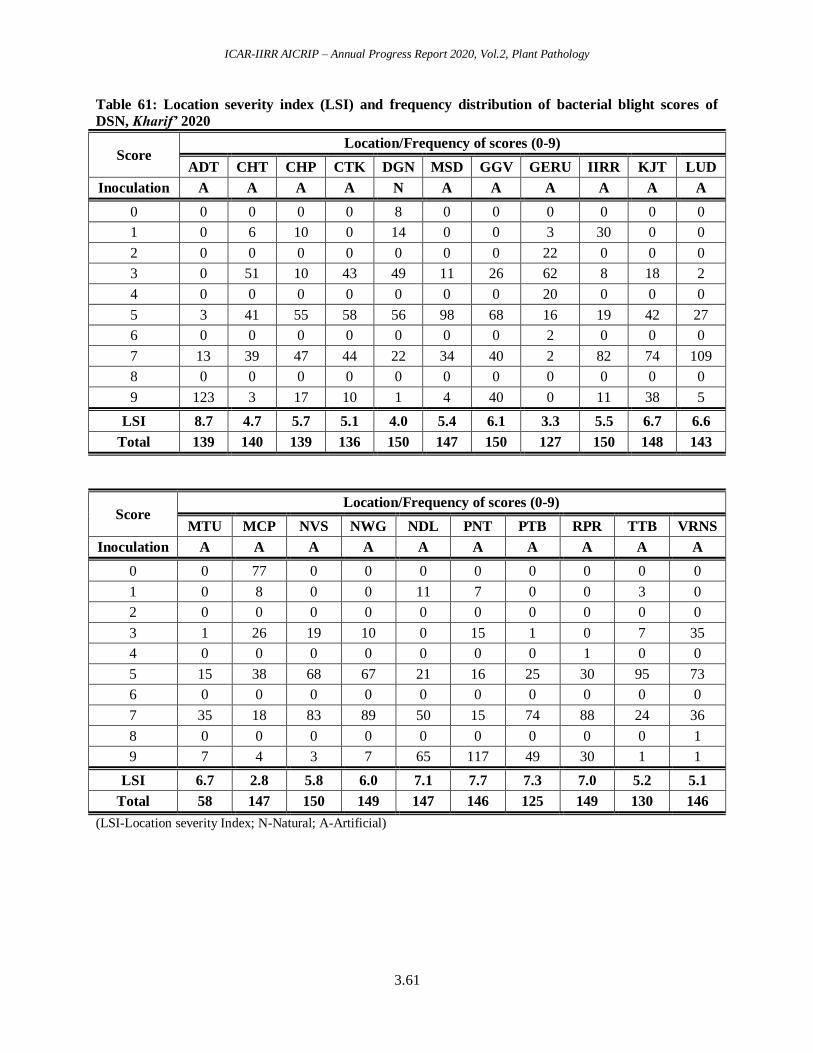
ICAR-IIRR AICRIP – Annual Progress Report 2020, Vol.2, Plant Pathology
3.61
Table 61: Location severity index (LSI) and frequency distribution of bacterial blight scores of
DSN, Kharif’ 2020
Score Location/Frequency of scores (0-9)
ADT CHT CHP CTK DGN MSD GGV GERU IIRR KJT LUD
Inoculation A A A A N A A A A A A
0 0 0 0 0 8 0 0 0 0 0 0
1 0 6 10 0 14 0 0 3 30 0 0
2 0 0 0 0 0 0 0 22 0 0 0
3 0 51 10 43 49 11 26 62 8 18 2
4 0 0 0 0 0 0 0 20 0 0 0
5 3 41 55 58 56 98 68 16 19 42 27
6 0 0 0 0 0 0 0 2 0 0 0
7 13 39 47 44 22 34 40 2 82 74 109
8 0 0 0 0 0 0 0 0 0 0 0
9 123 3 17 10 1 4 40 0 11 38 5
LSI 8.7 4.7 5.7 5.1 4.0 5.4 6.1 3.3 5.5 6.7 6.6
Total 139 140 139 136 150 147 150 127 150 148 143
Score Location/Frequency of scores (0-9)
MTU MCP NVS NWG NDL PNT PTB RPR TTB VRNS
Inoculation A A A A A A A A A A
0 0 77 0 0 0 0 0 0 0 0
1 0 8 0 0 11 7 0 0 3 0
2 0 0 0 0 0 0 0 0 0 0
3 1 26 19 10 0 15 1 0 7 35
4 0 0 0 0 0 0 0 1 0 0
5 15 38 68 67 21 16 25 30 95 73
6 0 0 0 0 0 0 0 0 0 0
7 35 18 83 89 50 15 74 88 24 36
8 0 0 0 0 0 0 0 0 0 1
9 7 4 3 7 65 117 49 30 1 1
LSI 6.7 2.8 5.8 6.0 7.1 7.7 7.3 7.0 5.2 5.1
Total 58 147 150 149 147 146 125 149 130 146
(LSI-Location severity Index; N-Natural; A-Artificial)

ICAR-IIRR AICRIP – Annual Progress Report 2020, Vol.2, Plant Pathology
3.62
Table 62: DSN entries with low susceptibility index (SI <5) with score <5 to BB at or more than 60% of the locations
SNo Designation
Locations/Score (0-9)
SI PI3 PI5
AD
T
CH
T
CH
P
CT
K
DG
N
MS
D
GG
V
GE
RU
IIR
R
KJT
LU
D
MT
U
NV
S
NW
G
ND
L
PN
T
PT
B
RP
R
TT
B
VR
NS
27 IBT-GM-39 - 3 - - 3 7 5 2 1 5 - - 7 7 1 3 - 7 - - 4.3 50.0 66.7
61 RP-Bio-Patho-4 7 5 3 3 0 7 7 3 1 3 5 - 5 5 5 9 - 5 5 3 4.5 38.9 77.8
22 IBT-GM-17 - 3 - - 3 7 5 3 1 5 - - 5 5 5 3 5 9
5 4.6 35.7 85.7
16 IBT-GM-3 9 1 5 3 3 7 3 5 1 3 3 5 7 5 1 5 7 9 5 5 4.6 40.0 75.0
67 RP-Bio-Patho-10 9 3 7 5 3 5 5 3 1 3 5 - 3 5 7 7 5 5 3 5 4.7 36.8 78.9
80 HWR-7 9 3 1 3 3 3 7 4 1 5 7 - 7 5 - 5 5 7 5 5 4.7 33.3 72.2
18 IBT-GM-5 9 - 5 3 3 5 3 4 1 3 3 7 7 7 1 1 9 9 5 5 4.7 42.1 68.4
68 RP-Bio-Patho-11 9 7 5 3 1 7 5 4 1 3 5 - 5 5 7 7 5 5 3 3 4.7 31.6 73.7
29 IBT-WGL-21 9 - 7 7 3 5 5 5 1 7 7 7 3 5 1 1 - 7 1 5 4.8 33.3 61.1
99 HWR-36 9 3 3 7 5 3 5 3 1 7 7 - 5 5 5 1 5 5 5 7 4.8 31.6 73.7
79 HWR-6 9 7 1 3 0 5 5 2 1 7 7 5 5 5 7 3 7 7 5 5 4.8 30.0 65.0
21 IBT-GM-12 9 5 7 3 3 5 3 3 1 5 7 5 7 5 5 3 5 9 1 7 4.9 35.0 70.0
28 IBT-GM-40 9 7 3 - 1 7 5 4 1 7 - - 7 7 1 3 - 7 - 5 4.9 33.3 53.3
66 RP-Bio-Patho-9 9 7 5 3 0 5 9 5 1 5 7 - 3 7 5 5 5 5 3 5 4.9 26.3 73.7
62 RP-Bio-Patho-5 9 3 7 5 0 5 9 3 1 3 5 5 7 7 7 5 3 5 5 5 5.0 30.0 70.0
19 IBT-GM-7 9 3 7 3 3 5 7 3 1 5 7 5 5 7 1 1 7 9 - 7 5.0 36.8 57.9
72 ISM (R Check) 7 3 3 3 3 3 3 2 1 7 5 7 3 5 9 9 5 5 5 3 4.6 50.0 75.0
141 TN1 (S Check) 7 5 9 9 7 9 9 - 7 9 7 - 9 9 7 9 7 7 5 8 7.7 0.0 11.1
LSI 8.7 4.7 5.7 5.1 4.0 5.4 6.1 3.3 5.5 6.7 6.6 6.7 5.8 6.0 7.1 7.7 7.3 7.0 5.2 5.1
(SI- Susceptibility Index; Promising Index (PI) based on percentage of locations the entry has scored ≤3 and ≤5)
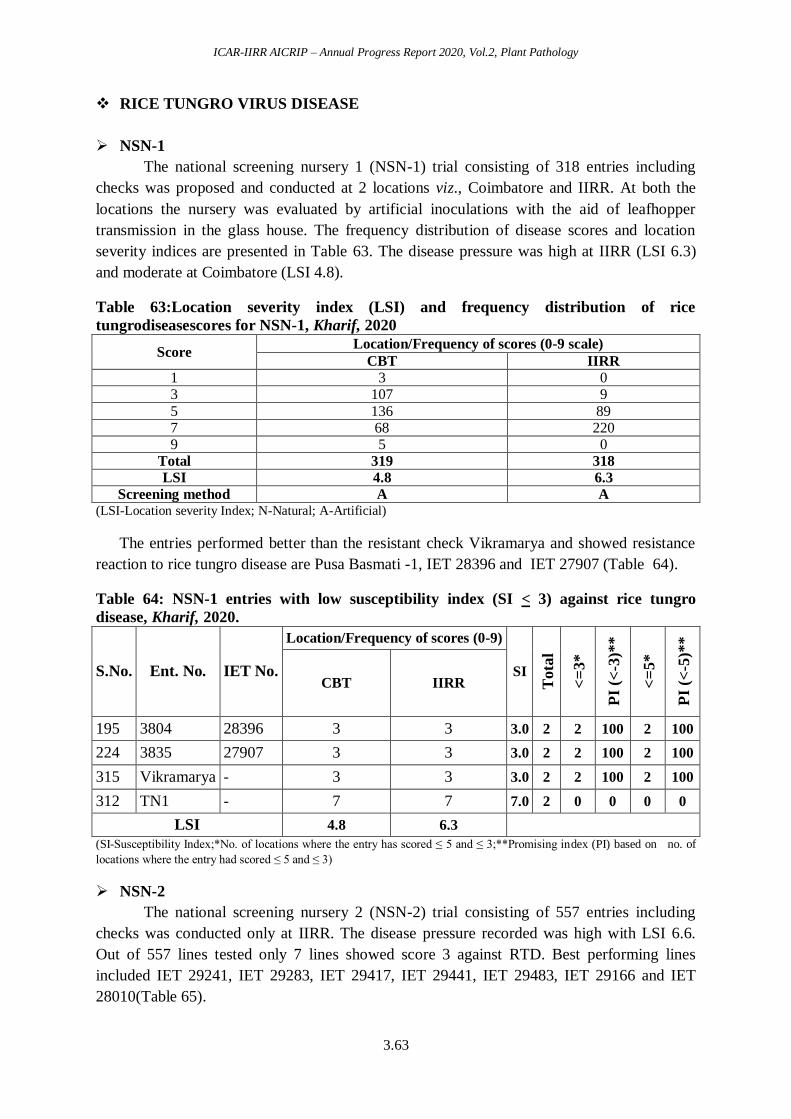
ICAR-IIRR AICRIP – Annual Progress Report 2020, Vol.2, Plant Pathology
3.63
RICE TUNGRO VIRUS DISEASE
NSN-1
The national screening nursery 1 (NSN-1) trial consisting of 318 entries including
checks was proposed and conducted at 2 locations viz., Coimbatore and IIRR. At both the
locations the nursery was evaluated by artificial inoculations with the aid of leafhopper
transmission in the glass house. The frequency distribution of disease scores and location
severity indices are presented in Table 63. The disease pressure was high at IIRR (LSI 6.3)
and moderate at Coimbatore (LSI 4.8).
Table 63:Location severity index (LSI) and frequency distribution of rice
tungrodiseasescores for NSN-1, Kharif, 2020
Score Location/Frequency of scores (0-9 scale)
CBT IIRR
1 3 0 3 107 9
5 136 89 7 68 220 9 5 0
Total 319 318
LSI 4.8 6.3
Screening method A A (LSI-Location severity Index; N-Natural; A-Artificial)
The entries performed better than the resistant check Vikramarya and showed resistance
reaction to rice tungro disease are Pusa Basmati -1, IET 28396 and IET 27907 (Table 64).
Table 64: NSN-1 entries with low susceptibility index (SI < 3) against rice tungro
disease, Kharif, 2020.
S.No. Ent. No. IET No.
Location/Frequency of scores (0-9)
SI
Tota
l
<=
3*
PI
(<-3
)**
<=
5*
PI
(<-5
)**
CBT IIRR
195 3804 28396 3 3 3.0 2 2 100 2 100
224 3835 27907 3 3 3.0 2 2 100 2 100
315 Vikramarya - 3 3 3.0 2 2 100 2 100
312 TN1 - 7 7 7.0 2 0 0 0 0
LSI 4.8 6.3
(SI-Susceptibility Index;*No. of locations where the entry has scored ≤ 5 and ≤ 3;**Promising index (PI) based on no. of
locations where the entry had scored ≤ 5 and ≤ 3)
NSN-2
The national screening nursery 2 (NSN-2) trial consisting of 557 entries including
checks was conducted only at IIRR. The disease pressure recorded was high with LSI 6.6.
Out of 557 lines tested only 7 lines showed score 3 against RTD. Best performing lines
included IET 29241, IET 29283, IET 29417, IET 29441, IET 29483, IET 29166 and IET
28010(Table 65).
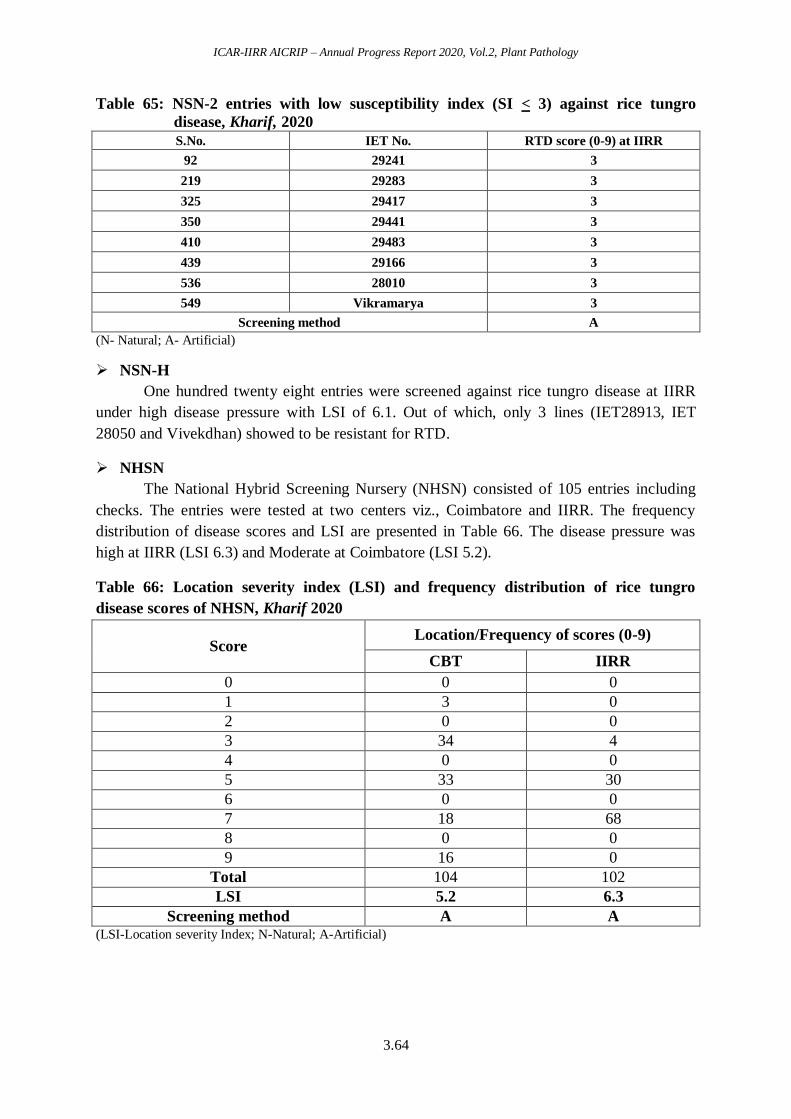
ICAR-IIRR AICRIP – Annual Progress Report 2020, Vol.2, Plant Pathology
3.64
Table 65: NSN-2 entries with low susceptibility index (SI < 3) against rice tungro
disease, Kharif, 2020
S.No. IET No. RTD score (0-9) at IIRR
92 29241 3
219 29283 3
325 29417 3
350 29441 3
410 29483 3
439 29166 3
536 28010 3
549 Vikramarya 3
Screening method A
(N- Natural; A- Artificial)
NSN-H
One hundred twenty eight entries were screened against rice tungro disease at IIRR
under high disease pressure with LSI of 6.1. Out of which, only 3 lines (IET28913, IET
28050 and Vivekdhan) showed to be resistant for RTD.
NHSN
The National Hybrid Screening Nursery (NHSN) consisted of 105 entries including
checks. The entries were tested at two centers viz., Coimbatore and IIRR. The frequency
distribution of disease scores and LSI are presented in Table 66. The disease pressure was
high at IIRR (LSI 6.3) and Moderate at Coimbatore (LSI 5.2).
Table 66: Location severity index (LSI) and frequency distribution of rice tungro
disease scores of NHSN, Kharif 2020
Score Location/Frequency of scores (0-9)
CBT IIRR
0 0 0
1 3 0
2 0 0
3 34 4
4 0 0
5 33 30
6 0 0
7 18 68
8 0 0
9 16 0
Total 104 102
LSI 5.2 6.3
Screening method A A (LSI-Location severity Index; N-Natural; A-Artificial)
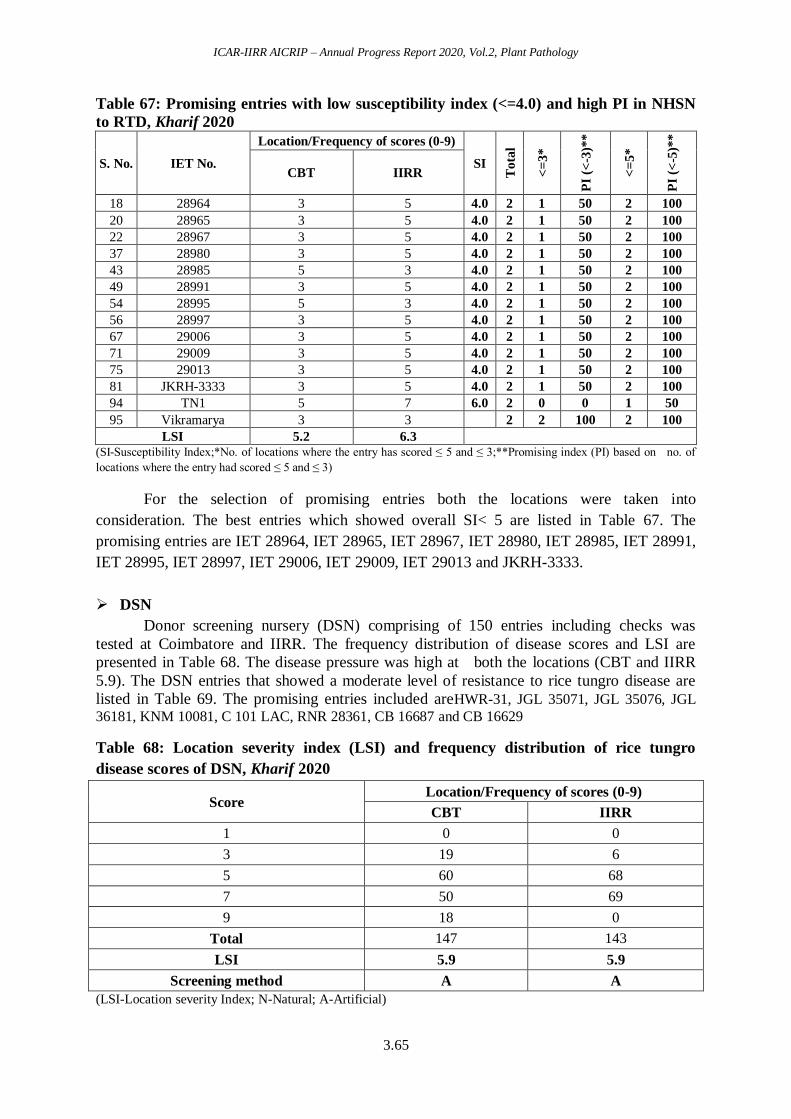
ICAR-IIRR AICRIP – Annual Progress Report 2020, Vol.2, Plant Pathology
3.65
Table 67: Promising entries with low susceptibility index (<=4.0) and high PI in NHSN
to RTD, Kharif 2020
S. No. IET No.
Location/Frequency of scores (0-9)
SI
Tota
l
<=
3*
PI
(<-3
)**
<=
5*
PI
(<-5
)**
CBT IIRR
18 28964 3 5 4.0 2 1 50 2 100
20 28965 3 5 4.0 2 1 50 2 100
22 28967 3 5 4.0 2 1 50 2 100
37 28980 3 5 4.0 2 1 50 2 100
43 28985 5 3 4.0 2 1 50 2 100
49 28991 3 5 4.0 2 1 50 2 100
54 28995 5 3 4.0 2 1 50 2 100
56 28997 3 5 4.0 2 1 50 2 100
67 29006 3 5 4.0 2 1 50 2 100
71 29009 3 5 4.0 2 1 50 2 100
75 29013 3 5 4.0 2 1 50 2 100
81 JKRH-3333 3 5 4.0 2 1 50 2 100
94 TN1 5 7 6.0 2 0 0 1 50
95 Vikramarya 3 3 2 2 100 2 100
LSI 5.2 6.3
(SI-Susceptibility Index;*No. of locations where the entry has scored ≤ 5 and ≤ 3;**Promising index (PI) based on no. of
locations where the entry had scored ≤ 5 and ≤ 3)
For the selection of promising entries both the locations were taken into
consideration. The best entries which showed overall SI< 5 are listed in Table 67. The
promising entries are IET 28964, IET 28965, IET 28967, IET 28980, IET 28985, IET 28991,
IET 28995, IET 28997, IET 29006, IET 29009, IET 29013 and JKRH-3333.
DSN
Donor screening nursery (DSN) comprising of 150 entries including checks was
tested at Coimbatore and IIRR. The frequency distribution of disease scores and LSI are
presented in Table 68. The disease pressure was high at both the locations (CBT and IIRR
5.9). The DSN entries that showed a moderate level of resistance to rice tungro disease are
listed in Table 69. The promising entries included areHWR-31, JGL 35071, JGL 35076, JGL
36181, KNM 10081, C 101 LAC, RNR 28361, CB 16687 and CB 16629
Table 68: Location severity index (LSI) and frequency distribution of rice tungro
disease scores of DSN, Kharif 2020
Score Location/Frequency of scores (0-9)
CBT IIRR
1 0 0
3 19 6
5 60 68
7 50 69
9 18 0
Total 147 143
LSI 5.9 5.9
Screening method A A
(LSI-Location severity Index; N-Natural; A-Artificial)
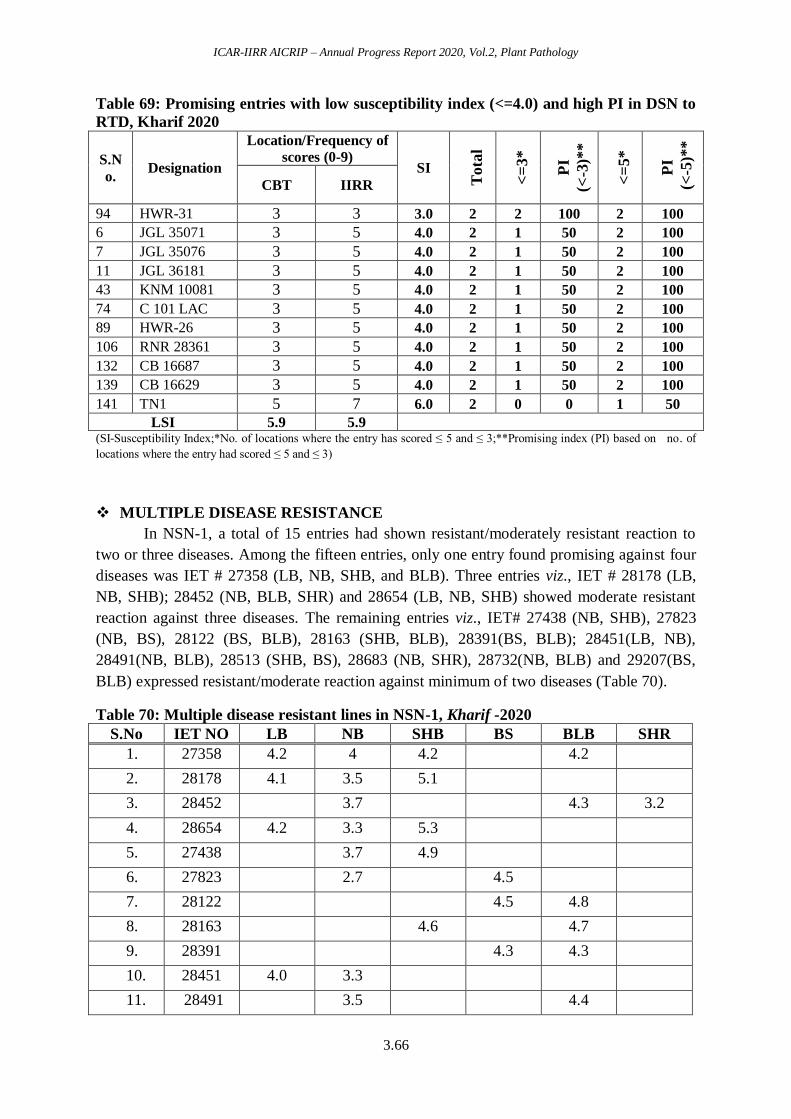
ICAR-IIRR AICRIP – Annual Progress Report 2020, Vol.2, Plant Pathology
3.66
Table 69: Promising entries with low susceptibility index (<=4.0) and high PI in DSN to
RTD, Kharif 2020
S.N
o. Designation
Location/Frequency of
scores (0-9) SI
Tota
l
<=
3*
PI
(<-3
)**
<=
5*
PI
(<
-5)*
*
CBT IIRR
94 HWR-31 3 3 3.0 2 2 100 2 100
6 JGL 35071 3 5 4.0 2 1 50 2 100
7 JGL 35076 3 5 4.0 2 1 50 2 100
11 JGL 36181 3 5 4.0 2 1 50 2 100
43 KNM 10081 3 5 4.0 2 1 50 2 100
74 C 101 LAC 3 5 4.0 2 1 50 2 100
89 HWR-26 3 5 4.0 2 1 50 2 100
106 RNR 28361 3 5 4.0 2 1 50 2 100
132 CB 16687 3 5 4.0 2 1 50 2 100
139 CB 16629 3 5 4.0 2 1 50 2 100
141 TN1 5 7 6.0 2 0 0 1 50
LSI 5.9 5.9
(SI-Susceptibility Index;*No. of locations where the entry has scored ≤ 5 and ≤ 3;**Promising index (PI) based on no. of
locations where the entry had scored ≤ 5 and ≤ 3)
MULTIPLE DISEASE RESISTANCE
In NSN-1, a total of 15 entries had shown resistant/moderately resistant reaction to
two or three diseases. Among the fifteen entries, only one entry found promising against four
diseases was IET # 27358 (LB, NB, SHB, and BLB). Three entries viz., IET # 28178 (LB,
NB, SHB); 28452 (NB, BLB, SHR) and 28654 (LB, NB, SHB) showed moderate resistant
reaction against three diseases. The remaining entries viz., IET# 27438 (NB, SHB), 27823
(NB, BS), 28122 (BS, BLB), 28163 (SHB, BLB), 28391(BS, BLB); 28451(LB, NB),
28491(NB, BLB), 28513 (SHB, BS), 28683 (NB, SHR), 28732(NB, BLB) and 29207(BS,
BLB) expressed resistant/moderate reaction against minimum of two diseases (Table 70).
Table 70: Multiple disease resistant lines in NSN-1, Kharif -2020
S.No IET NO LB NB SHB BS BLB SHR
1. 27358 4.2 4 4.2 4.2
2. 28178 4.1 3.5 5.1
3. 28452 3.7 4.3 3.2
4. 28654 4.2 3.3 5.3
5. 27438 3.7 4.9
6. 27823 2.7 4.5
7. 28122 4.5 4.8
8. 28163 4.6 4.7
9. 28391 4.3 4.3
10. 28451 4.0 3.3
11. 28491 3.5 4.4

ICAR-IIRR AICRIP – Annual Progress Report 2020, Vol.2, Plant Pathology
3.67
S.No IET NO LB NB SHB BS BLB SHR
12. 28513 5.3 4.4
13. 28683 3.8 4.3
14. 28732 3.3 4.7
15. 29207 4.2 4.8
(LB-Leaf Blast; NB-Neck blast; ShB-Sheath Blight; BS-Brown spot; BLB-Bacterial leaf blight; ShR – Sheath
rot)
In NSN-2 only one entry IET # 29417 found promising against BLB and RTD.
In NSN-H, thirteen entries expressed moderate resistant reaction to more than two or
three diseases. IET # 28880 (SHB, BS, BLB), 28913 (LB, SHB, RTD) and 28890 (LB, BS,
BLB) expressed moderate resistant reaction against three diseases. Remaining ten entries viz.,
IET # 27468 (NB, SHB), 28222 (LB, BLB), 28235 (NB, SHB), 28236 (BS, BLB), 28887
(LB, BS), 28892 (SHB, BS), 28919 (BS, BLB), 28921(SHB, BS), 28928 (SHB, BS) and
28930 (SHB, BS) showed moderate resistant reaction against minimum of two diseases
(Table 71).
In NHSN, among the nineteen entries, majority of the entries (14) showed promising
reaction three diseases. The IET # were 28959 (LB, SHB, BLB), 28960 (LB, SHB, BS),
28965 (LB, BS, RTD), 28967 (LB, BLB, RTD), 28969 (LB, NB, SHB), 28971(LB, NB,
SHB), 28997 (LB, BLB, RTD), 28980 (LB, BS, RTD), 28983 (LB, NB, BLB), 28998 (LB,
SHB, BLB), 29000 (LB, SHB, BLB), 29006 (LB, SHB, RTD), 29009 (LB, BLB, RTD), and
29022 (LB, SHB, BLB), 28950 (LB, BS). The remaining entires IET # 28950, 28964, 28979,
29017 and 29018 expressed moderate resistant reaction two diseases (Table 72).
Table 71: Multiple disease resistant lines in NSN-H, Kharif -2020
S.No IET No. LB NB SHB BS BLB RTD
1. 28880
4.5 3.8 5.0
2. 28913 4.1
5.0
3.0
3. 28890 3.9
4.4 5.0
4. 27468
3.0 4.5
5. 28222 4.4
4.5
6. 28235
2.8 4.5
7. 28236
4.2 6.0
8. 28887 4.3
4.2
9. 28892
4.3 4.2
10. 28919
3.8 5.5
11. 28921
3.5 4.3
12. 28928
4.5 3.8
13. 28930
5.0 3.8
(LB-Leaf Blast; NB-Neck blast; ShB-Sheath Blight; BS-Brown spot; BLB-Bacterial leaf blight; RTD- Rice
tungro virus)
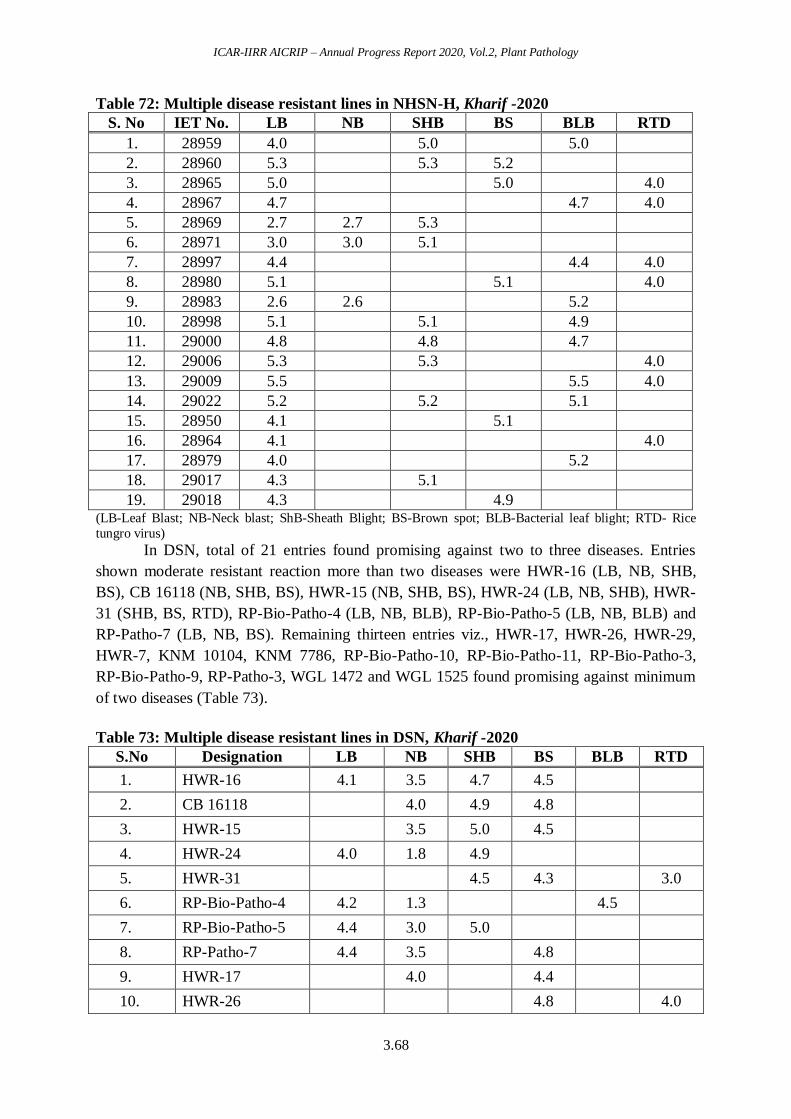
ICAR-IIRR AICRIP – Annual Progress Report 2020, Vol.2, Plant Pathology
3.68
Table 72: Multiple disease resistant lines in NHSN-H, Kharif -2020
S. No IET No. LB NB SHB BS BLB RTD
1. 28959 4.0
5.0
5.0
2. 28960 5.3
5.3 5.2
3. 28965 5.0
5.0
4.0
4. 28967 4.7
4.7 4.0
5. 28969 2.7 2.7 5.3
6. 28971 3.0 3.0 5.1
7. 28997 4.4
4.4 4.0
8. 28980 5.1
5.1
4.0
9. 28983 2.6 2.6
5.2
10. 28998 5.1
5.1
4.9
11. 29000 4.8
4.8
4.7
12. 29006 5.3
5.3
4.0
13. 29009 5.5
5.5 4.0
14. 29022 5.2
5.2
5.1
15. 28950 4.1
5.1
16. 28964 4.1
4.0
17. 28979 4.0
5.2
18. 29017 4.3
5.1
19. 29018 4.3
4.9
(LB-Leaf Blast; NB-Neck blast; ShB-Sheath Blight; BS-Brown spot; BLB-Bacterial leaf blight; RTD- Rice
tungro virus) In DSN, total of 21 entries found promising against two to three diseases. Entries
shown moderate resistant reaction more than two diseases were HWR-16 (LB, NB, SHB,
BS), CB 16118 (NB, SHB, BS), HWR-15 (NB, SHB, BS), HWR-24 (LB, NB, SHB), HWR-
31 (SHB, BS, RTD), RP-Bio-Patho-4 (LB, NB, BLB), RP-Bio-Patho-5 (LB, NB, BLB) and
RP-Patho-7 (LB, NB, BS). Remaining thirteen entries viz., HWR-17, HWR-26, HWR-29,
HWR-7, KNM 10104, KNM 7786, RP-Bio-Patho-10, RP-Bio-Patho-11, RP-Bio-Patho-3,
RP-Bio-Patho-9, RP-Patho-3, WGL 1472 and WGL 1525 found promising against minimum
of two diseases (Table 73).
Table 73: Multiple disease resistant lines in DSN, Kharif -2020
S.No Designation LB NB SHB BS BLB RTD
1. HWR-16 4.1 3.5 4.7 4.5
2. CB 16118
4.0 4.9 4.8
3. HWR-15
3.5 5.0 4.5
4. HWR-24 4.0 1.8 4.9
5. HWR-31
4.5 4.3
3.0
6. RP-Bio-Patho-4 4.2 1.3
4.5
7. RP-Bio-Patho-5 4.4 3.0 5.0
8. RP-Patho-7 4.4 3.5
4.8
9. HWR-17
4.0
4.4
10. HWR-26
4.8
4.0
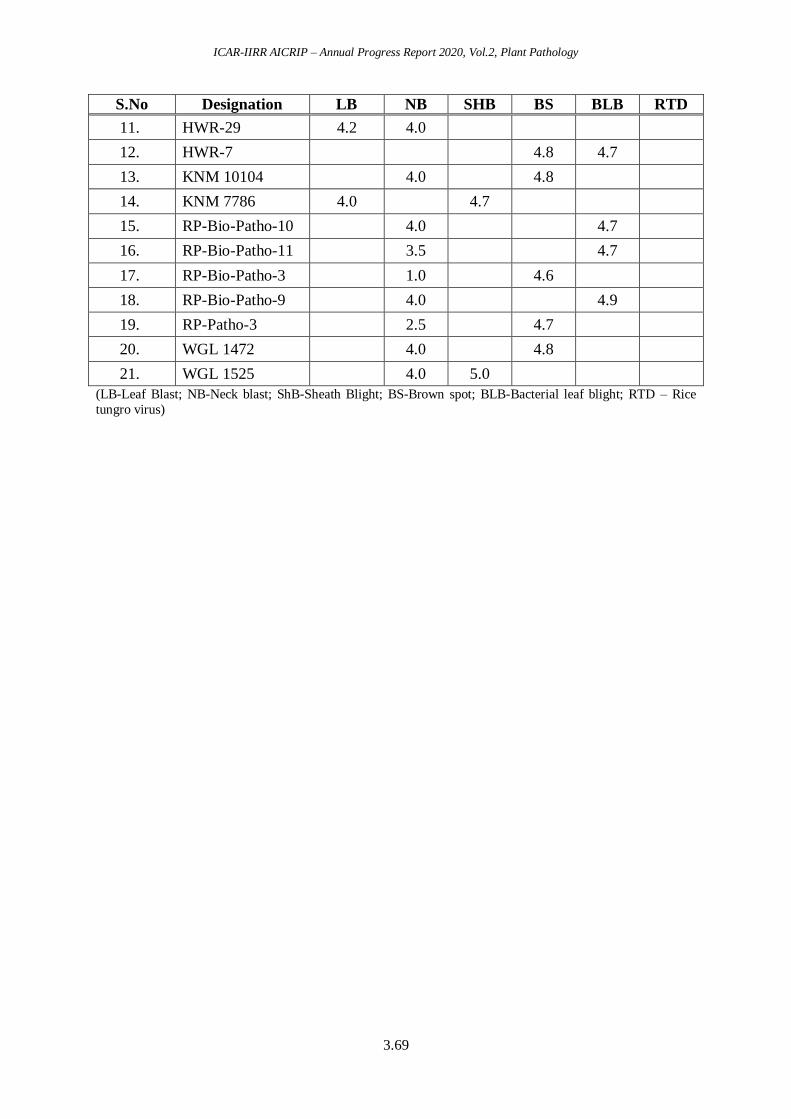
ICAR-IIRR AICRIP – Annual Progress Report 2020, Vol.2, Plant Pathology
3.69
S.No Designation LB NB SHB BS BLB RTD
11. HWR-29 4.2 4.0
12. HWR-7
4.8 4.7
13. KNM 10104
4.0
4.8
14. KNM 7786 4.0
4.7
15. RP-Bio-Patho-10
4.0
4.7
16. RP-Bio-Patho-11
3.5
4.7
17. RP-Bio-Patho-3
1.0
4.6
18. RP-Bio-Patho-9
4.0
4.9
19. RP-Patho-3
2.5
4.7
20. WGL 1472
4.0
4.8
21. WGL 1525
4.0 5.0
(LB-Leaf Blast; NB-Neck blast; ShB-Sheath Blight; BS-Brown spot; BLB-Bacterial leaf blight; RTD – Rice
tungro virus)
ICAR-IIRR AICRIP – Annual Progress Report 2020, Vol.2, Plant Pathology
3.70
II. FIELD MONITORING OF VIRULENCE
1. Pyricularia oryzae
The experiment was conducted at 25 locations across India against Pyricularia oryzae
during Kharif 2020. The aim of this experiment was to monitor virulence pattern in the
population of rice blast pathogen. The nursery included thirty-five cultivars consisting ofnear
isogenic lines, international differentials, donors and commercial cultivars. The experiment
was conducted at twenty-five locations during the crop season to monitor the blast reaction
on different host genotypes and is presented in Figure 1. The disease pressure was high (LSI
6.1, 5.8, 5.8 and 5.5) at Mandya, Gangavati, Ghaghraghat and Imphal. It was moderate (LSI
5.3 to 4.5) Khudwani, New Delhi, Navsari and Ponnampet and it as low (LSI 4.4 to 2.7) at
Almora, Karjat, Nawagam, Mugad, Upper Shillong, Rudrur, Gudalur, Lonovala, Jagdalpur,
Ranchi, Coimbatore, Rajendranagar, IIRR, Jagityal, Pattambi, Malan and Hazaribagh. The
datafrom these locations are presented in Table 74.
Tetep, Raminad str-3, RP Patho-7, Tadukan, RP Patho-2 and RP Patho-8 were
resistant across the locations with SI 2.5, 3.2, 3.3, 3.3, 3.3 and 3.5 respectively. Tetep was
highly resistant at most of the locations about 16locations that showed its potentiality as the
best donors for resistance against blast disease. Tetep was susceptible at Gudalur and
Ghaghraghat and moderately susceptible atMandya, Mugad, Upper Shillong and Almora.
Raminad str-3 was susceptible at Gudalur, Imphal, Khudwani and Rudrur and also
moderately susceptible at Ghaghraghat and Ponnampet. RP Patho-7 was showing resistant all
the locations except Ghaghraghat, Khudwan, Navasari, Karjat, Mugad, Ponnampet and Upper
Shillong and also Tadukan was showing resistant all the locations except Gangavati, Rudrur,
Khudwani, Almora, Ghaghraghat, Upper Shillong,andMugad. RP Patho-2 was highly
susceptible at Rudrur, Upper Shillong, Mugad, Karjat, Khudwani, Ghaghraghat and
Ponnampet; similarly, RP Patho-8 also highly susceptible at Ghaghraghat, Rudrur, Karjat and
Navasari. The susceptible checks like HR-12 andCo-39 are showing susceptible reaction at
most of the locations but HR-12 recordedresistant reaction at Karjat and Jagityala; similarly,
Co-39 also recorded resistant reaction Karjat. The resistant check Rasi was highly susceptible
at Mandya, Almora, Gangavati, Imphal, Rudrur and Rajendranagar. IR 64 was sowing
susceptible reaction at Mandya, Gangavati, Imphal and Lonovala.
The difference in disease reaction score of susceptible and resistant checks reveals
that a shift in the pathogen population. Cluster analysis of Pyriaculria oryzae reaction on 35
different genotypes at 25 locations was done and is presented in Figure 2. The reaction
pattern ofgenotypes at all the locations was grouped into eight major groups at 55 percent
similarity coefficient. The reaction pattern at Almora, Gudalur, Ghaghraghat, Khudhwani,
Ponnampet, Nawagam, Imphal, Mandya, Navasari, Gangavati, Mugad, UppperShillong,
Karjat, Coimbatore, New Delhi, Ranchi and Lonovala were in group one; Ranchi and Rudrur
were in group two and three. Jagdalpur and Jagityal were in group four. Hazaribagh, Malan,
IIRR and Pattambi were in group five, six, seven and eight respectively.
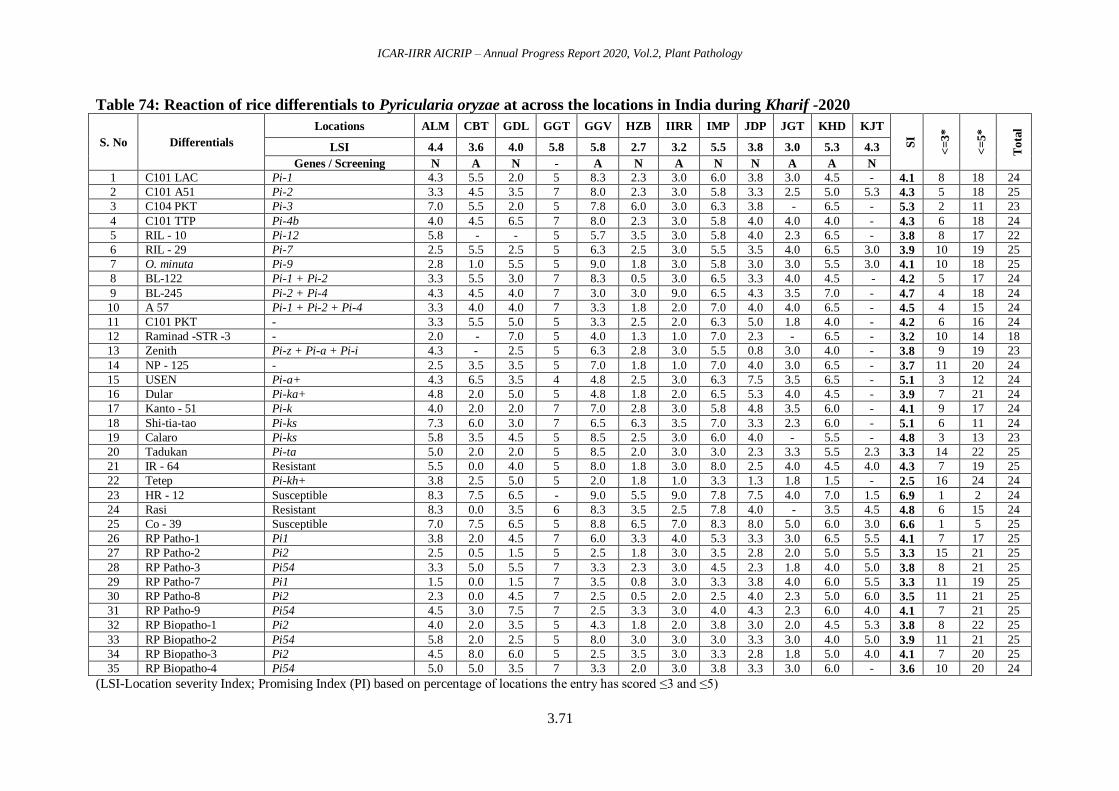
ICAR-IIRR AICRIP – Annual Progress Report 2020, Vol.2, Plant Pathology
3.71
Table 74: Reaction of rice differentials to Pyricularia oryzae at across the locations in India during Kharif -2020
S. No Differentials
Locations ALM CBT GDL GGT GGV HZB IIRR IMP JDP JGT KHD KJT
SI
<=
3*
<=
5*
Tota
l
LSI 4.4 3.6 4.0 5.8 5.8 2.7 3.2 5.5 3.8 3.0 5.3 4.3
Genes / Screening N A N - A N A N N A A N
1 C101 LAC Pi-1 4.3 5.5 2.0 5 8.3 2.3 3.0 6.0 3.8 3.0 4.5 - 4.1 8 18 24
2 C101 A51 Pi-2 3.3 4.5 3.5 7 8.0 2.3 3.0 5.8 3.3 2.5 5.0 5.3 4.3 5 18 25
3 C104 PKT Pi-3 7.0 5.5 2.0 5 7.8 6.0 3.0 6.3 3.8 - 6.5 - 5.3 2 11 23
4 C101 TTP Pi-4b 4.0 4.5 6.5 7 8.0 2.3 3.0 5.8 4.0 4.0 4.0 - 4.3 6 18 24
5 RIL - 10 Pi-12 5.8 - - 5 5.7 3.5 3.0 5.8 4.0 2.3 6.5 - 3.8 8 17 22
6 RIL - 29 Pi-7 2.5 5.5 2.5 5 6.3 2.5 3.0 5.5 3.5 4.0 6.5 3.0 3.9 10 19 25
7 O. minuta Pi-9 2.8 1.0 5.5 5 9.0 1.8 3.0 5.8 3.0 3.0 5.5 3.0 4.1 10 18 25
8 BL-122 Pi-1 + Pi-2 3.3 5.5 3.0 7 8.3 0.5 3.0 6.5 3.3 4.0 4.5 - 4.2 5 17 24
9 BL-245 Pi-2 + Pi-4 4.3 4.5 4.0 7 3.0 3.0 9.0 6.5 4.3 3.5 7.0 - 4.7 4 18 24
10 A 57 Pi-1 + Pi-2 + Pi-4 3.3 4.0 4.0 7 3.3 1.8 2.0 7.0 4.0 4.0 6.5 - 4.5 4 15 24
11 C101 PKT - 3.3 5.5 5.0 5 3.3 2.5 2.0 6.3 5.0 1.8 4.0 - 4.2 6 16 24
12 Raminad -STR -3 - 2.0 - 7.0 5 4.0 1.3 1.0 7.0 2.3 - 6.5 - 3.2 10 14 18
13 Zenith Pi-z + Pi-a + Pi-i 4.3 - 2.5 5 6.3 2.8 3.0 5.5 0.8 3.0 4.0 - 3.8 9 19 23
14 NP - 125 - 2.5 3.5 3.5 5 7.0 1.8 1.0 7.0 4.0 3.0 6.5 - 3.7 11 20 24
15 USEN Pi-a+ 4.3 6.5 3.5 4 4.8 2.5 3.0 6.3 7.5 3.5 6.5 - 5.1 3 12 24
16 Dular Pi-ka+ 4.8 2.0 5.0 5 4.8 1.8 2.0 6.5 5.3 4.0 4.5 - 3.9 7 21 24
17 Kanto - 51 Pi-k 4.0 2.0 2.0 7 7.0 2.8 3.0 5.8 4.8 3.5 6.0 - 4.1 9 17 24
18 Shi-tia-tao Pi-ks 7.3 6.0 3.0 7 6.5 6.3 3.5 7.0 3.3 2.3 6.0 - 5.1 6 11 24
19 Calaro Pi-ks 5.8 3.5 4.5 5 8.5 2.5 3.0 6.0 4.0 - 5.5 - 4.8 3 13 23
20 Tadukan Pi-ta 5.0 2.0 2.0 5 8.5 2.0 3.0 3.0 2.3 3.3 5.5 2.3 3.3 14 22 25
21 IR - 64 Resistant 5.5 0.0 4.0 5 8.0 1.8 3.0 8.0 2.5 4.0 4.5 4.0 4.3 7 19 25
22 Tetep Pi-kh+ 3.8 2.5 5.0 5 2.0 1.8 1.0 3.3 1.3 1.8 1.5 - 2.5 16 24 24
23 HR - 12 Susceptible 8.3 7.5 6.5 - 9.0 5.5 9.0 7.8 7.5 4.0 7.0 1.5 6.9 1 2 24
24 Rasi Resistant 8.3 0.0 3.5 6 8.3 3.5 2.5 7.8 4.0 - 3.5 4.5 4.8 6 15 24
25 Co - 39 Susceptible 7.0 7.5 6.5 5 8.8 6.5 7.0 8.3 8.0 5.0 6.0 3.0 6.6 1 5 25
26 RP Patho-1 Pi1 3.8 2.0 4.5 7 6.0 3.3 4.0 5.3 3.3 3.0 6.5 5.5 4.1 7 17 25
27 RP Patho-2 Pi2 2.5 0.5 1.5 5 2.5 1.8 3.0 3.5 2.8 2.0 5.0 5.5 3.3 15 21 25
28 RP Patho-3 Pi54 3.3 5.0 5.5 7 3.3 2.3 3.0 4.5 2.3 1.8 4.0 5.0 3.8 8 21 25
29 RP Patho-7 Pi1 1.5 0.0 1.5 7 3.5 0.8 3.0 3.3 3.8 4.0 6.0 5.5 3.3 11 19 25
30 RP Patho-8 Pi2 2.3 0.0 4.5 7 2.5 0.5 2.0 2.5 4.0 2.3 5.0 6.0 3.5 11 21 25
31 RP Patho-9 Pi54 4.5 3.0 7.5 7 2.5 3.3 3.0 4.0 4.3 2.3 6.0 4.0 4.1 7 21 25
32 RP Biopatho-1 Pi2 4.0 2.0 3.5 5 4.3 1.8 2.0 3.8 3.0 2.0 4.5 5.3 3.8 8 22 25
33 RP Biopatho-2 Pi54 5.8 2.0 2.5 5 8.0 3.0 3.0 3.0 3.3 3.0 4.0 5.0 3.9 11 21 25
34 RP Biopatho-3 Pi2 4.5 8.0 6.0 5 2.5 3.5 3.0 3.3 2.8 1.8 5.0 4.0 4.1 7 20 25
35 RP Biopatho-4 Pi54 5.0 5.0 3.5 7 3.3 2.0 3.0 3.8 3.3 3.0 6.0 - 3.6 10 20 24
(LSI-Location severity Index; Promising Index (PI) based on percentage of locations the entry has scored ≤3 and ≤5)
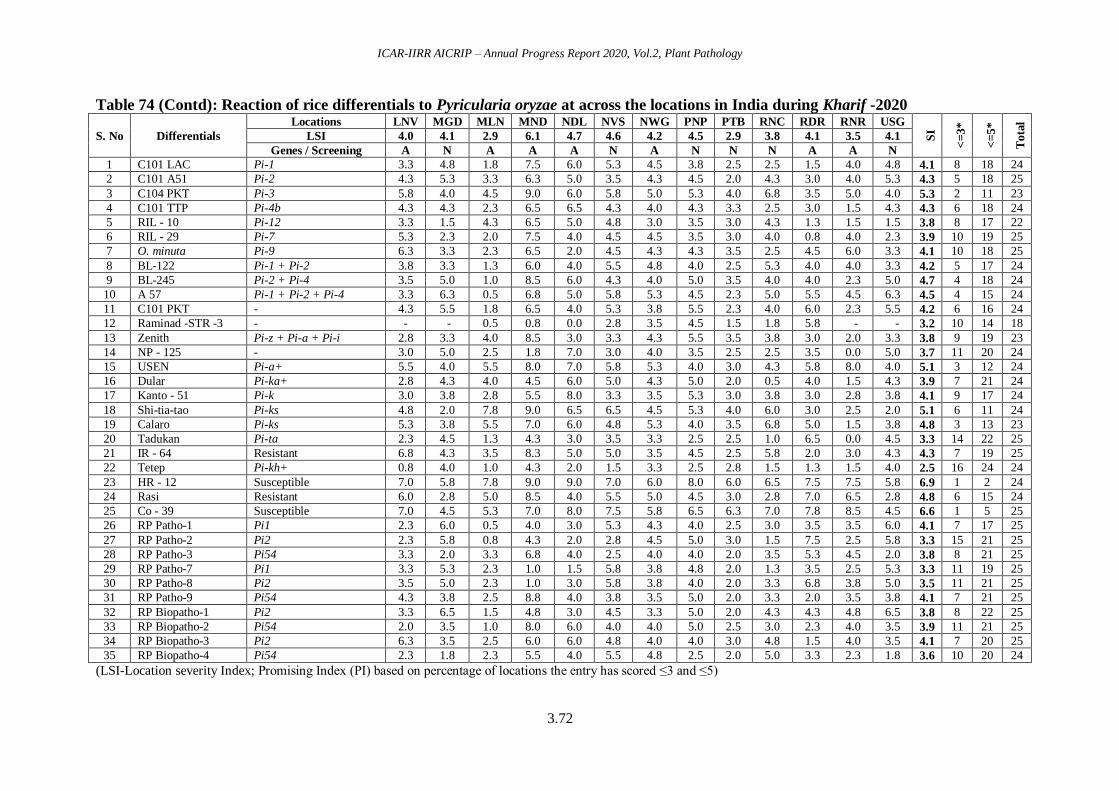
ICAR-IIRR AICRIP – Annual Progress Report 2020, Vol.2, Plant Pathology
3.72
Table 74 (Contd): Reaction of rice differentials to Pyricularia oryzae at across the locations in India during Kharif -2020
S. No Differentials
Locations LNV MGD MLN MND NDL NVS NWG PNP PTB RNC RDR RNR USG
SI
<=
3*
<=
5*
Tota
l
LSI 4.0 4.1 2.9 6.1 4.7 4.6 4.2 4.5 2.9 3.8 4.1 3.5 4.1
Genes / Screening A N A A A N A N N N A A N
1 C101 LAC Pi-1 3.3 4.8 1.8 7.5 6.0 5.3 4.5 3.8 2.5 2.5 1.5 4.0 4.8 4.1 8 18 24
2 C101 A51 Pi-2 4.3 5.3 3.3 6.3 5.0 3.5 4.3 4.5 2.0 4.3 3.0 4.0 5.3 4.3 5 18 25
3 C104 PKT Pi-3 5.8 4.0 4.5 9.0 6.0 5.8 5.0 5.3 4.0 6.8 3.5 5.0 4.0 5.3 2 11 23
4 C101 TTP Pi-4b 4.3 4.3 2.3 6.5 6.5 4.3 4.0 4.3 3.3 2.5 3.0 1.5 4.3 4.3 6 18 24
5 RIL - 10 Pi-12 3.3 1.5 4.3 6.5 5.0 4.8 3.0 3.5 3.0 4.3 1.3 1.5 1.5 3.8 8 17 22
6 RIL - 29 Pi-7 5.3 2.3 2.0 7.5 4.0 4.5 4.5 3.5 3.0 4.0 0.8 4.0 2.3 3.9 10 19 25
7 O. minuta Pi-9 6.3 3.3 2.3 6.5 2.0 4.5 4.3 4.3 3.5 2.5 4.5 6.0 3.3 4.1 10 18 25
8 BL-122 Pi-1 + Pi-2 3.8 3.3 1.3 6.0 4.0 5.5 4.8 4.0 2.5 5.3 4.0 4.0 3.3 4.2 5 17 24
9 BL-245 Pi-2 + Pi-4 3.5 5.0 1.0 8.5 6.0 4.3 4.0 5.0 3.5 4.0 4.0 2.3 5.0 4.7 4 18 24
10 A 57 Pi-1 + Pi-2 + Pi-4 3.3 6.3 0.5 6.8 5.0 5.8 5.3 4.5 2.3 5.0 5.5 4.5 6.3 4.5 4 15 24
11 C101 PKT - 4.3 5.5 1.8 6.5 4.0 5.3 3.8 5.5 2.3 4.0 6.0 2.3 5.5 4.2 6 16 24
12 Raminad -STR -3 - - - 0.5 0.8 0.0 2.8 3.5 4.5 1.5 1.8 5.8 - - 3.2 10 14 18
13 Zenith Pi-z + Pi-a + Pi-i 2.8 3.3 4.0 8.5 3.0 3.3 4.3 5.5 3.5 3.8 3.0 2.0 3.3 3.8 9 19 23
14 NP - 125 - 3.0 5.0 2.5 1.8 7.0 3.0 4.0 3.5 2.5 2.5 3.5 0.0 5.0 3.7 11 20 24
15 USEN Pi-a+ 5.5 4.0 5.5 8.0 7.0 5.8 5.3 4.0 3.0 4.3 5.8 8.0 4.0 5.1 3 12 24
16 Dular Pi-ka+ 2.8 4.3 4.0 4.5 6.0 5.0 4.3 5.0 2.0 0.5 4.0 1.5 4.3 3.9 7 21 24
17 Kanto - 51 Pi-k 3.0 3.8 2.8 5.5 8.0 3.3 3.5 5.3 3.0 3.8 3.0 2.8 3.8 4.1 9 17 24
18 Shi-tia-tao Pi-ks 4.8 2.0 7.8 9.0 6.5 6.5 4.5 5.3 4.0 6.0 3.0 2.5 2.0 5.1 6 11 24
19 Calaro Pi-ks 5.3 3.8 5.5 7.0 6.0 4.8 5.3 4.0 3.5 6.8 5.0 1.5 3.8 4.8 3 13 23
20 Tadukan Pi-ta 2.3 4.5 1.3 4.3 3.0 3.5 3.3 2.5 2.5 1.0 6.5 0.0 4.5 3.3 14 22 25
21 IR - 64 Resistant 6.8 4.3 3.5 8.3 5.0 5.0 3.5 4.5 2.5 5.8 2.0 3.0 4.3 4.3 7 19 25
22 Tetep Pi-kh+ 0.8 4.0 1.0 4.3 2.0 1.5 3.3 2.5 2.8 1.5 1.3 1.5 4.0 2.5 16 24 24
23 HR - 12 Susceptible 7.0 5.8 7.8 9.0 9.0 7.0 6.0 8.0 6.0 6.5 7.5 7.5 5.8 6.9 1 2 24
24 Rasi Resistant 6.0 2.8 5.0 8.5 4.0 5.5 5.0 4.5 3.0 2.8 7.0 6.5 2.8 4.8 6 15 24
25 Co - 39 Susceptible 7.0 4.5 5.3 7.0 8.0 7.5 5.8 6.5 6.3 7.0 7.8 8.5 4.5 6.6 1 5 25
26 RP Patho-1 Pi1 2.3 6.0 0.5 4.0 3.0 5.3 4.3 4.0 2.5 3.0 3.5 3.5 6.0 4.1 7 17 25
27 RP Patho-2 Pi2 2.3 5.8 0.8 4.3 2.0 2.8 4.5 5.0 3.0 1.5 7.5 2.5 5.8 3.3 15 21 25
28 RP Patho-3 Pi54 3.3 2.0 3.3 6.8 4.0 2.5 4.0 4.0 2.0 3.5 5.3 4.5 2.0 3.8 8 21 25
29 RP Patho-7 Pi1 3.3 5.3 2.3 1.0 1.5 5.8 3.8 4.8 2.0 1.3 3.5 2.5 5.3 3.3 11 19 25
30 RP Patho-8 Pi2 3.5 5.0 2.3 1.0 3.0 5.8 3.8 4.0 2.0 3.3 6.8 3.8 5.0 3.5 11 21 25
31 RP Patho-9 Pi54 4.3 3.8 2.5 8.8 4.0 3.8 3.5 5.0 2.0 3.3 2.0 3.5 3.8 4.1 7 21 25
32 RP Biopatho-1 Pi2 3.3 6.5 1.5 4.8 3.0 4.5 3.3 5.0 2.0 4.3 4.3 4.8 6.5 3.8 8 22 25
33 RP Biopatho-2 Pi54 2.0 3.5 1.0 8.0 6.0 4.0 4.0 5.0 2.5 3.0 2.3 4.0 3.5 3.9 11 21 25
34 RP Biopatho-3 Pi2 6.3 3.5 2.5 6.0 6.0 4.8 4.0 4.0 3.0 4.8 1.5 4.0 3.5 4.1 7 20 25
35 RP Biopatho-4 Pi54 2.3 1.8 2.3 5.5 4.0 5.5 4.8 2.5 2.0 5.0 3.3 2.3 1.8 3.6 10 20 24
(LSI-Location severity Index; Promising Index (PI) based on percentage of locations the entry has scored ≤3 and ≤5)
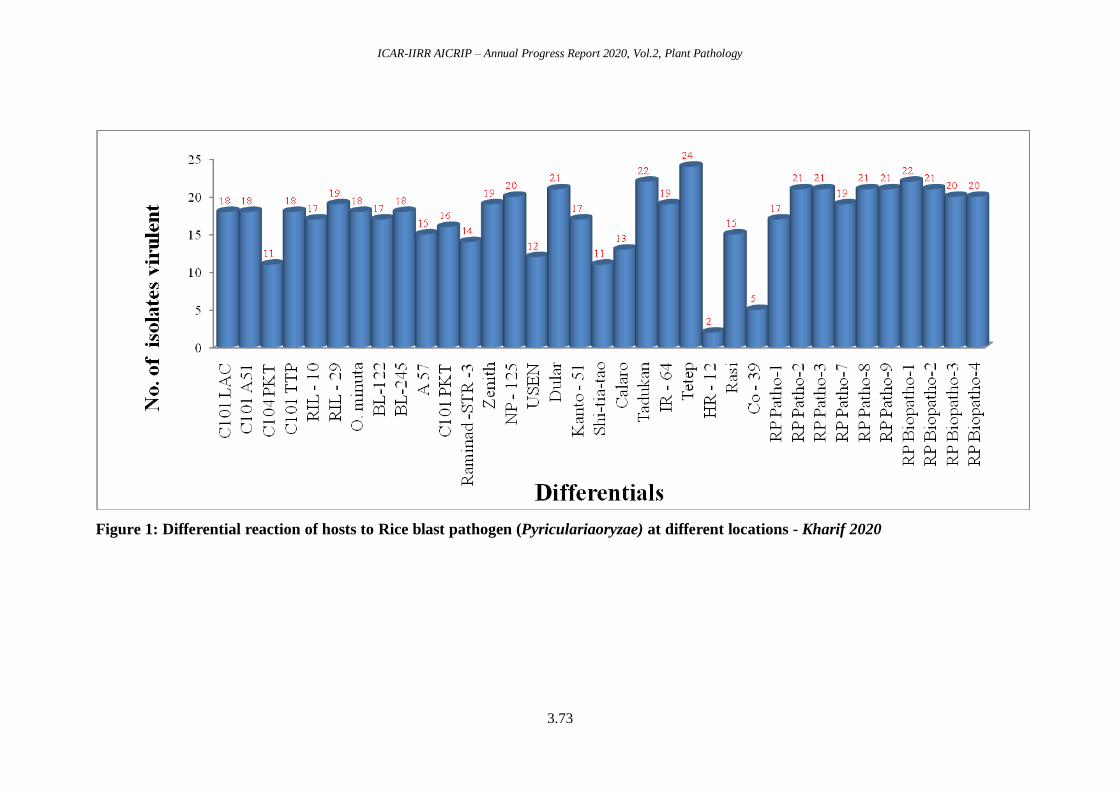
ICAR-IIRR AICRIP – Annual Progress Report 2020, Vol.2, Plant Pathology
3.73
Figure 1: Differential reaction of hosts to Rice blast pathogen (Pyriculariaoryzae) at different locations - Kharif 2020
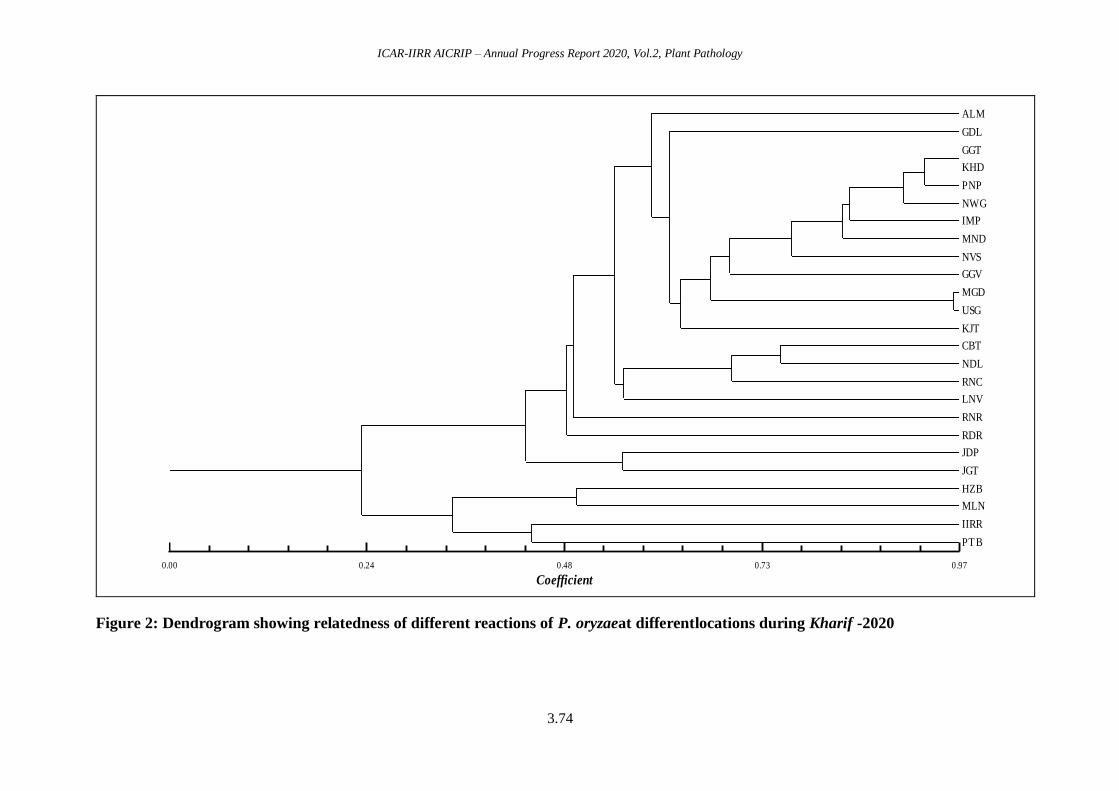
ICAR-IIRR AICRIP – Annual Progress Report 2020, Vol.2, Plant Pathology
3.74
Coefficient
0.00 0.24 0.48 0.73 0.97
ALM
GDL
GGT
KHD
PNP
NWG
IMP
MND
NVS
GGV
MGD
USG
KJT
CBT
NDL
RNC
LNV
RNR
RDR
JDP
JGT
HZB
MLN
IIRR
PTB
Figure 2: Dendrogram showing relatedness of different reactions of P. oryzaeat differentlocations during Kharif -2020
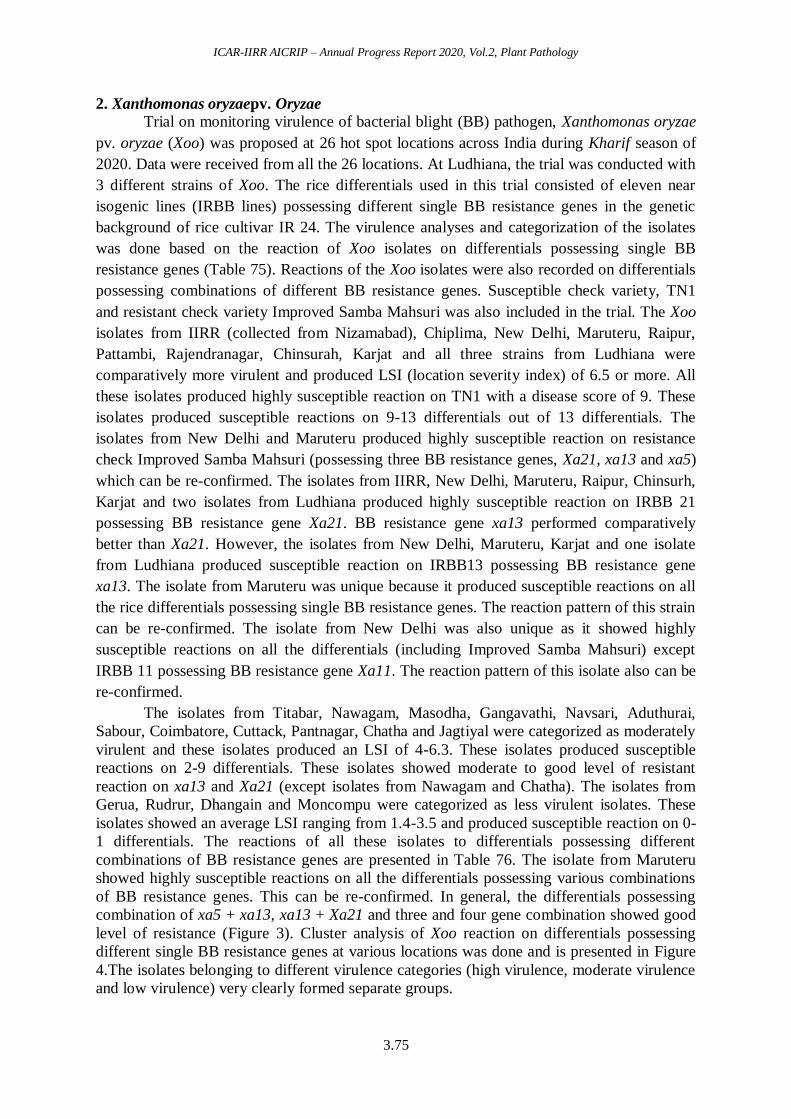
ICAR-IIRR AICRIP – Annual Progress Report 2020, Vol.2, Plant Pathology
3.75
2. Xanthomonas oryzaepv. Oryzae
Trial on monitoring virulence of bacterial blight (BB) pathogen, Xanthomonas oryzae
pv. oryzae (Xoo) was proposed at 26 hot spot locations across India during Kharif season of
2020. Data were received from all the 26 locations. At Ludhiana, the trial was conducted with
3 different strains of Xoo. The rice differentials used in this trial consisted of eleven near
isogenic lines (IRBB lines) possessing different single BB resistance genes in the genetic
background of rice cultivar IR 24. The virulence analyses and categorization of the isolates
was done based on the reaction of Xoo isolates on differentials possessing single BB
resistance genes (Table 75). Reactions of the Xoo isolates were also recorded on differentials
possessing combinations of different BB resistance genes. Susceptible check variety, TN1
and resistant check variety Improved Samba Mahsuri was also included in the trial. The Xoo
isolates from IIRR (collected from Nizamabad), Chiplima, New Delhi, Maruteru, Raipur,
Pattambi, Rajendranagar, Chinsurah, Karjat and all three strains from Ludhiana were
comparatively more virulent and produced LSI (location severity index) of 6.5 or more. All
these isolates produced highly susceptible reaction on TN1 with a disease score of 9. These
isolates produced susceptible reactions on 9-13 differentials out of 13 differentials. The
isolates from New Delhi and Maruteru produced highly susceptible reaction on resistance
check Improved Samba Mahsuri (possessing three BB resistance genes, Xa21, xa13 and xa5)
which can be re-confirmed. The isolates from IIRR, New Delhi, Maruteru, Raipur, Chinsurh,
Karjat and two isolates from Ludhiana produced highly susceptible reaction on IRBB 21
possessing BB resistance gene Xa21. BB resistance gene xa13 performed comparatively
better than Xa21. However, the isolates from New Delhi, Maruteru, Karjat and one isolate
from Ludhiana produced susceptible reaction on IRBB13 possessing BB resistance gene
xa13. The isolate from Maruteru was unique because it produced susceptible reactions on all
the rice differentials possessing single BB resistance genes. The reaction pattern of this strain
can be re-confirmed. The isolate from New Delhi was also unique as it showed highly
susceptible reactions on all the differentials (including Improved Samba Mahsuri) except
IRBB 11 possessing BB resistance gene Xa11. The reaction pattern of this isolate also can be
re-confirmed.
The isolates from Titabar, Nawagam, Masodha, Gangavathi, Navsari, Aduthurai,
Sabour, Coimbatore, Cuttack, Pantnagar, Chatha and Jagtiyal were categorized as moderately
virulent and these isolates produced an LSI of 4-6.3. These isolates produced susceptible
reactions on 2-9 differentials. These isolates showed moderate to good level of resistant
reaction on xa13 and Xa21 (except isolates from Nawagam and Chatha). The isolates from
Gerua, Rudrur, Dhangain and Moncompu were categorized as less virulent isolates. These
isolates showed an average LSI ranging from 1.4-3.5 and produced susceptible reaction on 0-
1 differentials. The reactions of all these isolates to differentials possessing different
combinations of BB resistance genes are presented in Table 76. The isolate from Maruteru
showed highly susceptible reactions on all the differentials possessing various combinations
of BB resistance genes. This can be re-confirmed. In general, the differentials possessing
combination of xa5 + xa13, xa13 + Xa21 and three and four gene combination showed good
level of resistance (Figure 3). Cluster analysis of Xoo reaction on differentials possessing
different single BB resistance genes at various locations was done and is presented in Figure
4.The isolates belonging to different virulence categories (high virulence, moderate virulence
and low virulence) very clearly formed separate groups.

ICAR-IIRR AICRIP – Annual Progress Report 2020, Vol.2, Plant Pathology
3.76
Table 75: Reaction of rice differentials possessing different single BB resistance genes to
Xanthomonasoryzaepv. oryzae at different locations during Kharif’2020
Differentials Genes
Highly virulent Moderately
virulent
IIR
R
LU
D-1
0
CH
P
ND
L
MT
U
RP
R
LU
D-8
LU
D-7
PT
B
RN
R
CH
N
KJT
TT
B
NW
G
IRBB 1 Xa1 9 9 8 9 8 8 9 9 7 8 6 5 8 6
IRBB 3 Xa3 9 9 9 7 7 9 9 9 7 7 8 7 8 6
IRBB 4 Xa4 9 7 8 7 7 8 3 7 7 8 7 7 8 8
IRBB 5 xa5 9 9 9 7 7 8 1 7 7 8 6 7 4 7
IRBB 7 Xa7 9 9 8 7 8 9 7 9 9 8 7 7 7 6
IRBB 8 xa8 9 9 8 9 8 7 7 3 7 7 8 7 5 4
IRBB 10 Xa10 9 9 9 7 7 8 9 9 7 9 7 7 8 5
IRBB 11 Xa11 9 9 8 5 7 7 9 9 7 8 8 6 7 8
IRBB 13 xa13 5 3 6 7 7 6 9 3 6 3 3 7 5 7
IRBB 14 Xa14 9 9 8 7 7 6 9 9 7 6 6 7 7 5
IRBB 21 Xa21 7 7 6 9 7 7 9 5 5 5 8 7 5 6
ISM xa5+xa13+Xa21 1 3 4 9 9 3 3 3 5 0 2 1 3 5
TN1 9 9 9 9 9 9 9 9 9 9 9 9 7 8
LSI 7.9 7.8 7.7 7.6 7.5 7.3 7.2 7.0 6.9 6.6 6.5 6.5 6.3 6.2
Min Score 1 3 4 5 7 3 1 3 5 0 2 1 3 4
Max Score 9 9 9 9 9 9 9 9 9 9 9 9 8 8
# entries >5 11 11 12 12 13 12 10 9 11 10 11 11 8 9
Moderately virulent Less virulent
Differentials Genes
MS
D
GG
V
NV
S
AD
T
SB
R
Coim
CT
K
PN
T
CH
T
JG
TL
GE
R
RD
R
DG
N
MC
P
IRBB 1 Xa1 7 7 7 5 5 3 7 3 4 4 4 2 3 0
IRBB 3 Xa3 9 6 6 4 3 5 7 3 5 3 4 2 2 1
IRBB 4 Xa4 5 7 6 7 3 7 5 4 6 4 4 2 1 0
IRBB 5 xa5 6 5 5 7 5 6 3 5 4 5 3 3 1 2
IRBB 7 Xa7 5 4 7 5 7 2 5 3 5 3 4 4 3 1
IRBB 8 xa8 7 7 5 4 7 6 3 3 2 7 4 5 0 1
IRBB 10 Xa10 5 5 7 5 3 6 5 9 3 6 3 3 0 0
IRBB 11 Xa11 5 7 6 5 5 6 5 8 3 4 4 4 1 0
IRBB 13 xa13 5 6 3 5 3 4 3 3 7 2 3 2 2 2
IRBB 14 Xa14 7 8 4 4 7 5 3 2 4 5 4 2 4 2
IRBB 21 Xa21 4 3 5 5 5 6 3 3 3 2 3 3 3 0
ISM xa5+xa13+Xa21 3 2 3 4 3 3 3 1 4 2 4 2 1 0
TN1 9 9 8 6 9 5 9 9 4 5 2 7 5 9
LSI 5.9 5.8 5.5 5.1 5.0 4.9 4.7 4.3 4.2 4.0 3.5 3.2 2.0 1.4
Min Score 3 2 3 4 3 2 3 1 2 2 2 2 0 0
Max Score 9 9 8 7 9 7 9 9 7 7 4 7 5 9
# entries >5 6 8 7 3 4 6 3 3 2 2 0 1 0 1
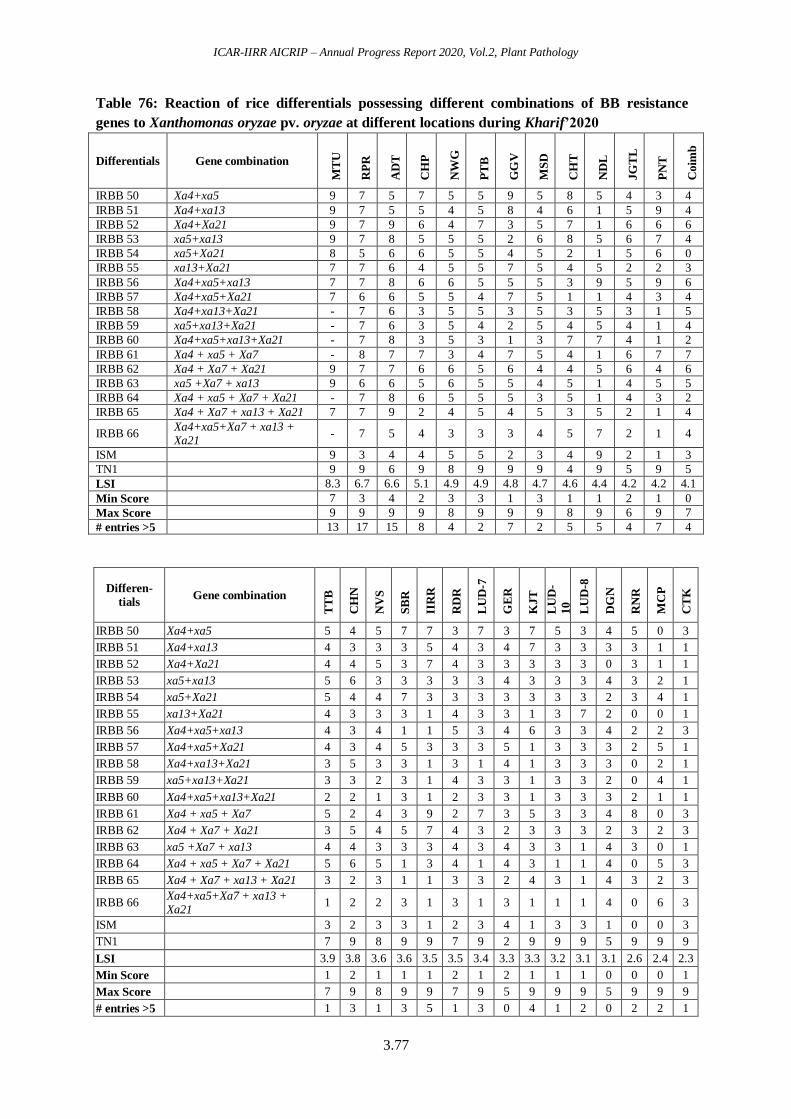
ICAR-IIRR AICRIP – Annual Progress Report 2020, Vol.2, Plant Pathology
3.77
Table 76: Reaction of rice differentials possessing different combinations of BB resistance
genes to Xanthomonas oryzae pv. oryzae at different locations during Kharif’2020
Differentials Gene combination
MT
U
RP
R
AD
T
CH
P
NW
G
PT
B
GG
V
MS
D
CH
T
ND
L
JG
TL
PN
T
Coim
b
IRBB 50 Xa4+xa5 9 7 5 7 5 5 9 5 8 5 4 3 4
IRBB 51 Xa4+xa13 9 7 5 5 4 5 8 4 6 1 5 9 4
IRBB 52 Xa4+Xa21 9 7 9 6 4 7 3 5 7 1 6 6 6
IRBB 53 xa5+xa13 9 7 8 5 5 5 2 6 8 5 6 7 4
IRBB 54 xa5+Xa21 8 5 6 6 5 5 4 5 2 1 5 6 0
IRBB 55 xa13+Xa21 7 7 6 4 5 5 7 5 4 5 2 2 3
IRBB 56 Xa4+xa5+xa13 7 7 8 6 6 5 5 5 3 9 5 9 6
IRBB 57 Xa4+xa5+Xa21 7 6 6 5 5 4 7 5 1 1 4 3 4
IRBB 58 Xa4+xa13+Xa21 - 7 6 3 5 5 3 5 3 5 3 1 5
IRBB 59 xa5+xa13+Xa21 - 7 6 3 5 4 2 5 4 5 4 1 4
IRBB 60 Xa4+xa5+xa13+Xa21 - 7 8 3 5 3 1 3 7 7 4 1 2
IRBB 61 Xa4 + xa5 + Xa7 - 8 7 7 3 4 7 5 4 1 6 7 7
IRBB 62 Xa4 + Xa7 + Xa21 9 7 7 6 6 5 6 4 4 5 6 4 6
IRBB 63 xa5 +Xa7 + xa13 9 6 6 5 6 5 5 4 5 1 4 5 5
IRBB 64 Xa4 + xa5 + Xa7 + Xa21 - 7 8 6 5 5 5 3 5 1 4 3 2
IRBB 65 Xa4 + Xa7 + xa13 + Xa21 7 7 9 2 4 5 4 5 3 5 2 1 4
IRBB 66 Xa4+xa5+Xa7 + xa13 + Xa21
- 7 5 4 3 3 3 4 5 7 2 1 4
ISM 9 3 4 4 5 5 2 3 4 9 2 1 3
TN1 9 9 6 9 8 9 9 9 4 9 5 9 5
LSI 8.3 6.7 6.6 5.1 4.9 4.9 4.8 4.7 4.6 4.4 4.2 4.2 4.1
Min Score 7 3 4 2 3 3 1 3 1 1 2 1 0
Max Score 9 9 9 9 8 9 9 9 8 9 6 9 7
# entries >5 13 17 15 8 4 2 7 2 5 5 4 7 4
Differen-
tials Gene combination
TT
B
CH
N
NV
S
SB
R
IIR
R
RD
R
LU
D-7
GE
R
KJT
LU
D-
10
LU
D-8
DG
N
RN
R
MC
P
CT
K
IRBB 50 Xa4+xa5 5 4 5 7 7 3 7 3 7 5 3 4 5 0 3
IRBB 51 Xa4+xa13 4 3 3 3 5 4 3 4 7 3 3 3 3 1 1
IRBB 52 Xa4+Xa21 4 4 5 3 7 4 3 3 3 3 3 0 3 1 1
IRBB 53 xa5+xa13 5 6 3 3 3 3 3 4 3 3 3 4 3 2 1
IRBB 54 xa5+Xa21 5 4 4 7 3 3 3 3 3 3 3 2 3 4 1
IRBB 55 xa13+Xa21 4 3 3 3 1 4 3 3 1 3 7 2 0 0 1
IRBB 56 Xa4+xa5+xa13 4 3 4 1 1 5 3 4 6 3 3 4 2 2 3
IRBB 57 Xa4+xa5+Xa21 4 3 4 5 3 3 3 5 1 3 3 3 2 5 1
IRBB 58 Xa4+xa13+Xa21 3 5 3 3 1 3 1 4 1 3 3 3 0 2 1
IRBB 59 xa5+xa13+Xa21 3 3 2 3 1 4 3 3 1 3 3 2 0 4 1
IRBB 60 Xa4+xa5+xa13+Xa21 2 2 1 3 1 2 3 3 1 3 3 3 2 1 1
IRBB 61 Xa4 + xa5 + Xa7 5 2 4 3 9 2 7 3 5 3 3 4 8 0 3
IRBB 62 Xa4 + Xa7 + Xa21 3 5 4 5 7 4 3 2 3 3 3 2 3 2 3
IRBB 63 xa5 +Xa7 + xa13 4 4 3 3 3 4 3 4 3 3 1 4 3 0 1
IRBB 64 Xa4 + xa5 + Xa7 + Xa21 5 6 5 1 3 4 1 4 3 1 1 4 0 5 3
IRBB 65 Xa4 + Xa7 + xa13 + Xa21 3 2 3 1 1 3 3 2 4 3 1 4 3 2 3
IRBB 66 Xa4+xa5+Xa7 + xa13 + Xa21
1 2 2 3 1 3 1 3 1 1 1 4 0 6 3
ISM 3 2 3 3 1 2 3 4 1 3 3 1 0 0 3
TN1 7 9 8 9 9 7 9 2 9 9 9 5 9 9 9
LSI 3.9 3.8 3.6 3.6 3.5 3.5 3.4 3.3 3.3 3.2 3.1 3.1 2.6 2.4 2.3
Min Score 1 2 1 1 1 2 1 2 1 1 1 0 0 0 1
Max Score 7 9 8 9 9 7 9 5 9 9 9 5 9 9 9
# entries >5 1 3 1 3 5 1 3 0 4 1 2 0 2 2 1
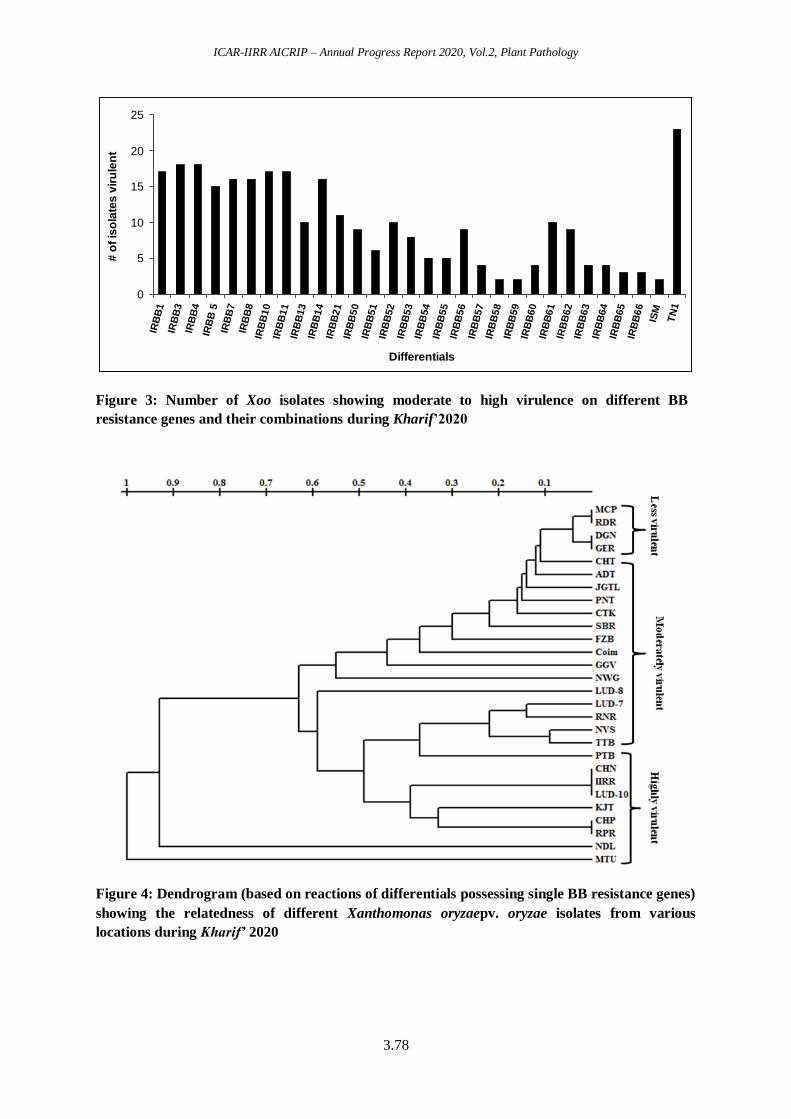
ICAR-IIRR AICRIP – Annual Progress Report 2020, Vol.2, Plant Pathology
3.78
0
5
10
15
20
25
IRB
B1
IRB
B3
IRB
B4
IRB
B 5
IRB
B7
IRB
B8
IRB
B10
IRB
B11
IRB
B13
IRB
B14
IRB
B21
IRB
B50
IRB
B51
IRB
B52
IRB
B53
IRB
B54
IRB
B55
IRB
B56
IRB
B57
IRB
B58
IRB
B59
IRB
B60
IRB
B61
IRB
B62
IRB
B63
IRB
B64
IRB
B65
IRB
B66
ISM
TN
1
Differentials
# o
f is
ola
tes
vir
ule
nt
Figure 3: Number of Xoo isolates showing moderate to high virulence on different BB
resistance genes and their combinations during Kharif’2020
Figure 4: Dendrogram (based on reactions of differentials possessing single BB resistance genes)
showing the relatedness of different Xanthomonas oryzaepv. oryzae isolates from various
locations during Kharif’ 2020
ICAR-IIRR AICRIP – Annual Progress Report 2020, Vol.2, Plant Pathology
3.79
III. DISEASE OBSERVATION NURSERY – Kharif-2020
The disease observation nursery (DON) trial was proposed to be conducted in 13
locations, but actually conducted at 10 locations with different sowing dates viz., early,
normal and late with respect to the respective locations with an aim to estimate the effect of
such varied sowing/planting dates on the occurrence and severity of the disease in the
respective endemic regions. Disease development is generally known to depend on the
availability of susceptible host, virulent pathogen and prevalence of favorable weather
condition. In this context the trial was formulated with susceptible variety to take up sowing
in three different dates to collect the information on the incidence of the disease and also data
was recorded as percent disease index of various rice diseases throughout the cropping period
in a particular locality. Knowledge on the occurrence of particular disease on specific
location based on susceptible host and time of sowing may help us to formulate the
management strategy. The trial was proposed at 13 locations viz., Chinsurah, Gangavathi,
IIRR, Kaul, Malan, Mandya, Maruteru, Moncompu, Nawagam, Nellore, NRRI, Pusa and
Raipur. However only locations viz., Chinsurah, Gangavathi, Kaul, Mandya, Maruteru,
Malan, Pusa and Moncompu, Nawagam and Nellore had actually conducted the trails. The
salient findings of this study are presented on location-wise below.
Chinsurah:
Three different sowing dates viz., 03.06.20, 25.06.20 and 14.07.20 were followed as
early, normal and late sowing periods respectively. The variety MTU 7029 was used to study
the disease progress of different diseases in that region. The diseases that were prevalent in
this centre were sheath blight, sheath rot, brown spot and bacterial leaf blight (BLB). The
observations were taken from 30 DAT to 110 DAT at 10 days interval. In general, the
incidence of sheath blight disease was found early and tillering stages of the crop (30 to 90
DAT) and in the early and normal sowing periods (11 to 56% PDI and 5 to 35 % PDI
respectively) and significantly less during the late sown crop i.e., 2 to 25 % PDI. Sheath rot
disease was present in the grain filling stage in all the sowing periods (80 to 110 DAT) and
relatively more in normal and late sown crops (11 to 15% and 10 to 46.5% PDI respectively)
than when compared to the early (5 to 25% PDI). Brown spot disease was generally less in all
the sowings, was found to occur in the tillering to grain filling stages (70 to 100 DAT) and
more in the late sown crop (2 to 15% PDI) when compared to early sown crop (PDI–2.5 to
5%) and normal sown crop (PDI - 2 to 10%).Similarly BLB was also very less (2.5 and 10%
PDI) and it was only during the early stages of the crop (40 to 60 DAT). The infected plants
recovered with the age of the plants and did not show further symptoms (Table 77).
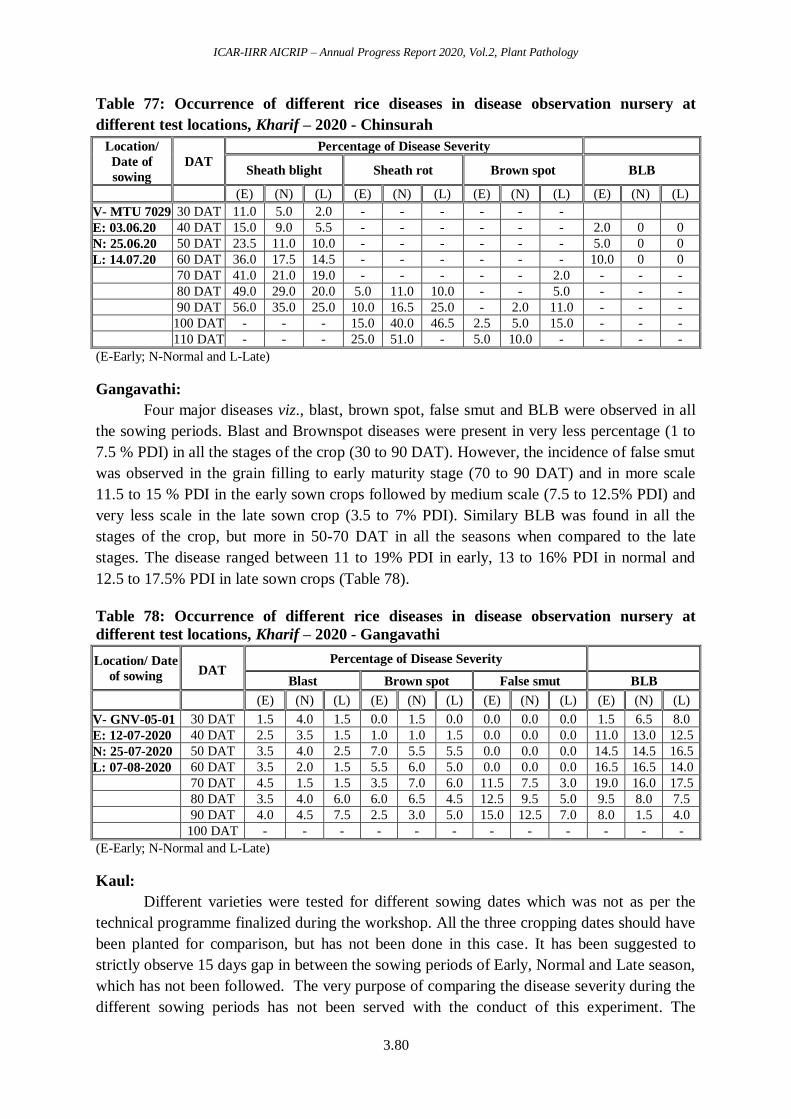
ICAR-IIRR AICRIP – Annual Progress Report 2020, Vol.2, Plant Pathology
3.80
Table 77: Occurrence of different rice diseases in disease observation nursery at
different test locations, Kharif – 2020 - Chinsurah
Location/
Date of
sowing
DAT
Percentage of Disease Severity
Sheath blight Sheath rot Brown spot BLB
(E) (N) (L) (E) (N) (L) (E) (N) (L) (E) (N) (L)
V- MTU 7029 30 DAT 11.0 5.0 2.0 - - - - - -
E: 03.06.20 40 DAT 15.0 9.0 5.5 - - - - - - 2.0 0 0
N: 25.06.20 50 DAT 23.5 11.0 10.0 - - - - - - 5.0 0 0
L: 14.07.20 60 DAT 36.0 17.5 14.5 - - - - - - 10.0 0 0
70 DAT 41.0 21.0 19.0 - - - - - 2.0 - - -
80 DAT 49.0 29.0 20.0 5.0 11.0 10.0 - - 5.0 - - -
90 DAT 56.0 35.0 25.0 10.0 16.5 25.0 - 2.0 11.0 - - -
100 DAT - - - 15.0 40.0 46.5 2.5 5.0 15.0 - - -
110 DAT - - - 25.0 51.0 - 5.0 10.0 - - - -
(E-Early; N-Normal and L-Late)
Gangavathi:
Four major diseases viz., blast, brown spot, false smut and BLB were observed in all
the sowing periods. Blast and Brownspot diseases were present in very less percentage (1 to
7.5 % PDI) in all the stages of the crop (30 to 90 DAT). However, the incidence of false smut
was observed in the grain filling to early maturity stage (70 to 90 DAT) and in more scale
11.5 to 15 % PDI in the early sown crops followed by medium scale (7.5 to 12.5% PDI) and
very less scale in the late sown crop (3.5 to 7% PDI). Similary BLB was found in all the
stages of the crop, but more in 50-70 DAT in all the seasons when compared to the late
stages. The disease ranged between 11 to 19% PDI in early, 13 to 16% PDI in normal and
12.5 to 17.5% PDI in late sown crops (Table 78).
Table 78: Occurrence of different rice diseases in disease observation nursery at
different test locations, Kharif – 2020 - Gangavathi
Location/ Date
of sowing
DAT Percentage of Disease Severity
Blast Brown spot False smut BLB
(E) (N) (L) (E) (N) (L) (E) (N) (L) (E) (N) (L)
V- GNV-05-01 30 DAT 1.5 4.0 1.5 0.0 1.5 0.0 0.0 0.0 0.0 1.5 6.5 8.0
E: 12-07-2020 40 DAT 2.5 3.5 1.5 1.0 1.0 1.5 0.0 0.0 0.0 11.0 13.0 12.5
N: 25-07-2020 50 DAT 3.5 4.0 2.5 7.0 5.5 5.5 0.0 0.0 0.0 14.5 14.5 16.5
L: 07-08-2020 60 DAT 3.5 2.0 1.5 5.5 6.0 5.0 0.0 0.0 0.0 16.5 16.5 14.0
70 DAT 4.5 1.5 1.5 3.5 7.0 6.0 11.5 7.5 3.0 19.0 16.0 17.5
80 DAT 3.5 4.0 6.0 6.0 6.5 4.5 12.5 9.5 5.0 9.5 8.0 7.5
90 DAT 4.0 4.5 7.5 2.5 3.0 5.0 15.0 12.5 7.0 8.0 1.5 4.0
100 DAT - - - - - - - - - - - -
(E-Early; N-Normal and L-Late)
Kaul:
Different varieties were tested for different sowing dates which was not as per the
technical programme finalized during the workshop. All the three cropping dates should have
been planted for comparison, but has not been done in this case. It has been suggested to
strictly observe 15 days gap in between the sowing periods of Early, Normal and Late season,
which has not been followed. The very purpose of comparing the disease severity during the
different sowing periods has not been served with the conduct of this experiment. The
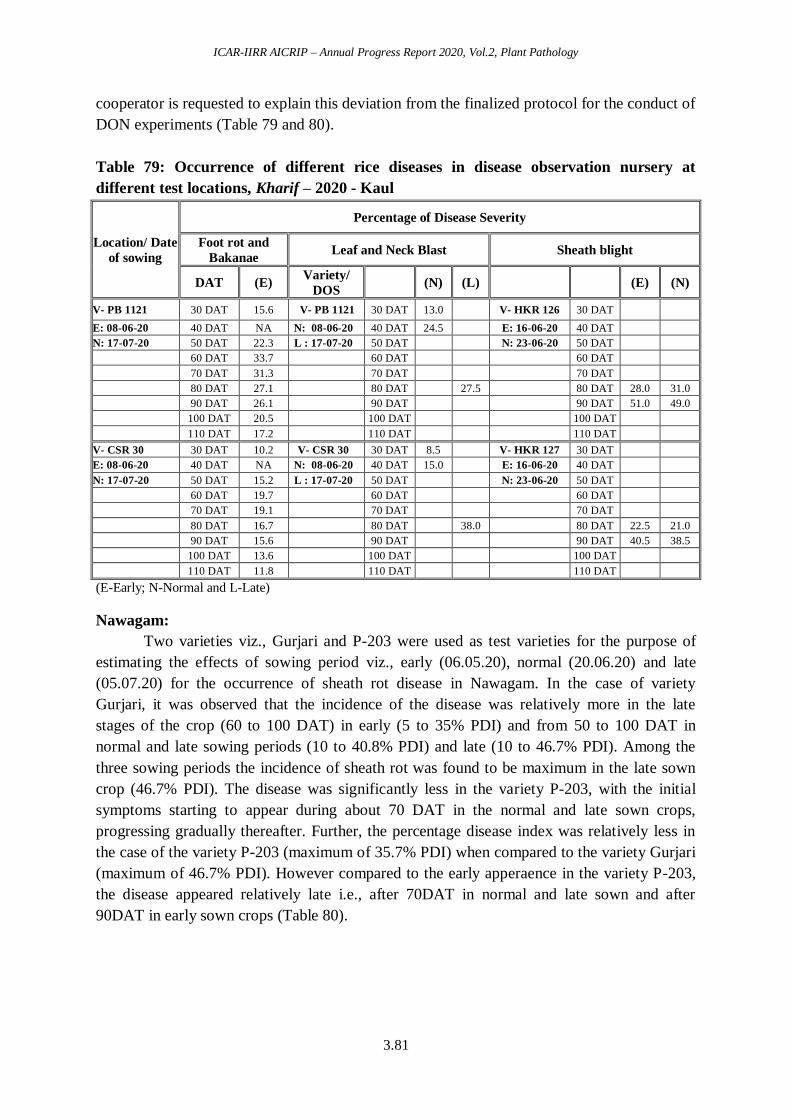
ICAR-IIRR AICRIP – Annual Progress Report 2020, Vol.2, Plant Pathology
3.81
cooperator is requested to explain this deviation from the finalized protocol for the conduct of
DON experiments (Table 79 and 80).
Table 79: Occurrence of different rice diseases in disease observation nursery at
different test locations, Kharif – 2020 - Kaul
Location/ Date
of sowing
Percentage of Disease Severity
Foot rot and
Bakanae Leaf and Neck Blast Sheath blight
DAT (E) Variety/
DOS (N) (L)
(E) (N)
V- PB 1121 30 DAT 15.6 V- PB 1121 30 DAT 13.0 V- HKR 126 30 DAT
E: 08-06-20 40 DAT NA N: 08-06-20 40 DAT 24.5 E: 16-06-20 40 DAT
N: 17-07-20 50 DAT 22.3 L : 17-07-20 50 DAT N: 23-06-20 50 DAT
60 DAT 33.7 60 DAT
60 DAT
70 DAT 31.3 70 DAT 70 DAT
80 DAT 27.1 80 DAT 27.5 80 DAT 28.0 31.0
90 DAT 26.1 90 DAT 90 DAT 51.0 49.0
100 DAT 20.5 100 DAT 100 DAT
110 DAT 17.2 110 DAT 110 DAT
V- CSR 30 30 DAT 10.2 V- CSR 30 30 DAT 8.5 V- HKR 127 30 DAT
E: 08-06-20 40 DAT NA N: 08-06-20 40 DAT 15.0 E: 16-06-20 40 DAT
N: 17-07-20 50 DAT 15.2 L : 17-07-20 50 DAT N: 23-06-20 50 DAT
60 DAT 19.7 60 DAT 60 DAT
70 DAT 19.1 70 DAT 70 DAT
80 DAT 16.7 80 DAT 38.0 80 DAT 22.5 21.0
90 DAT 15.6 90 DAT 90 DAT 40.5 38.5
100 DAT 13.6 100 DAT 100 DAT
110 DAT 11.8 110 DAT 110 DAT
(E-Early; N-Normal and L-Late)
Nawagam:
Two varieties viz., Gurjari and P-203 were used as test varieties for the purpose of
estimating the effects of sowing period viz., early (06.05.20), normal (20.06.20) and late
(05.07.20) for the occurrence of sheath rot disease in Nawagam. In the case of variety
Gurjari, it was observed that the incidence of the disease was relatively more in the late
stages of the crop (60 to 100 DAT) in early (5 to 35% PDI) and from 50 to 100 DAT in
normal and late sowing periods (10 to 40.8% PDI) and late (10 to 46.7% PDI). Among the
three sowing periods the incidence of sheath rot was found to be maximum in the late sown
crop (46.7% PDI). The disease was significantly less in the variety P-203, with the initial
symptoms starting to appear during about 70 DAT in the normal and late sown crops,
progressing gradually thereafter. Further, the percentage disease index was relatively less in
the case of the variety P-203 (maximum of 35.7% PDI) when compared to the variety Gurjari
(maximum of 46.7% PDI). However compared to the early apperaence in the variety P-203,
the disease appeared relatively late i.e., after 70DAT in normal and late sown and after
90DAT in early sown crops (Table 80).

ICAR-IIRR AICRIP – Annual Progress Report 2020, Vol.2, Plant Pathology
3.82
Table 80: Occurrence of different rice diseases in disease observation nursery at
different test locations, Kharif – 2020–Kaul and Nawagam
Location/ Date
of sowing
Percentage of Disease Severity
Kaul Nawagam
Brown spot Sheath rot
Variety/
DOS DAT (N) Variety/DOS DAT (E) (N) (L)
V- PB 1121 V- CSR 30 30 DAT Gurjari
E: 08-06-20 N: 26-06-20 40 DAT E: 06-05-20 30 DAT 0.0 0.0 0.0
N: 17-07-20 50 DAT N: 20-06-20 40 DAT 0.0 0.0 0.0
60 DAT 4.0 L: 05-07-20 50 DAT 0.0 10.0 10.0
70 DAT 6.0 60 DAT 0.0 13.4 28.7
80 DAT 9.0 70 DAT 5.0 23.0 33.0
90 DAT 13.5 80 DAT 23.4 33.0 38.9
100 DAT 90 DAT 29.0 37.9 41.1
110 DAT 100 DAT 35.0 40.8 46.7
P-203 30 DAT 0.0 0.0 0.0
E: 06-05-20 40 DAT 0.0 0.0 0.0
N: 20-06-20 50 DAT 0.0 0.0 0.0
L: 05-07-20 60 DAT 0.0 0.0 0.0
70 DAT 0.0 10.0 13.3
80 DAT 0.0 18.4 17.4
90 DAT 15.0 23.3 28.0
100 DAT 20.0 28.0 30,4
110 DAT 24.7 32.9 35.7
(E-Early; N-Normal and L-Late)
Malan:
Variety HPU 2216 was used as the susceptible variety against leaf blast and the crop
was sown relatively earlier i.e., 21.05.20 (early), 05.06.20 (normal) and 20.06.20 (late). The
early sown crop was found to be relatively disease free (1.2% PDI) when compared to the
normal (7.2 to 25.6% PDI) and late sown (4.3 to 37.8% PDI) crop. Excess moisture during
the early stages of the crops under the late sown conditions led to the more incidence of the
disease, when compared to the relatively dry season during early sown conditions and as a
result the initial stage of the crop was relatively dry and the crop matured when the humidity
starts building up during late stages of the crop (Table 81).
Pusa:
Variety Sugandha was used for the purpose of studying the effect of sowing dates in
the incidence and progress of brown spot disease of rice. The crop was sown onviz., 15.06.20
(early), 30.06.20(normal) and 15.07.20 (late). The disease was found to be relatively more
severe in early (2.5 to 62% PDI) and late (1.5 to 69% PDI) sown crops when compared to he
normal sown (1.5 to 40 %PDI) crops. Further the disease was found to initiate much early in
the late and normal sown crops (30 and 40DAT) when compared to 50DAT in the early sown
crops (Table 81).
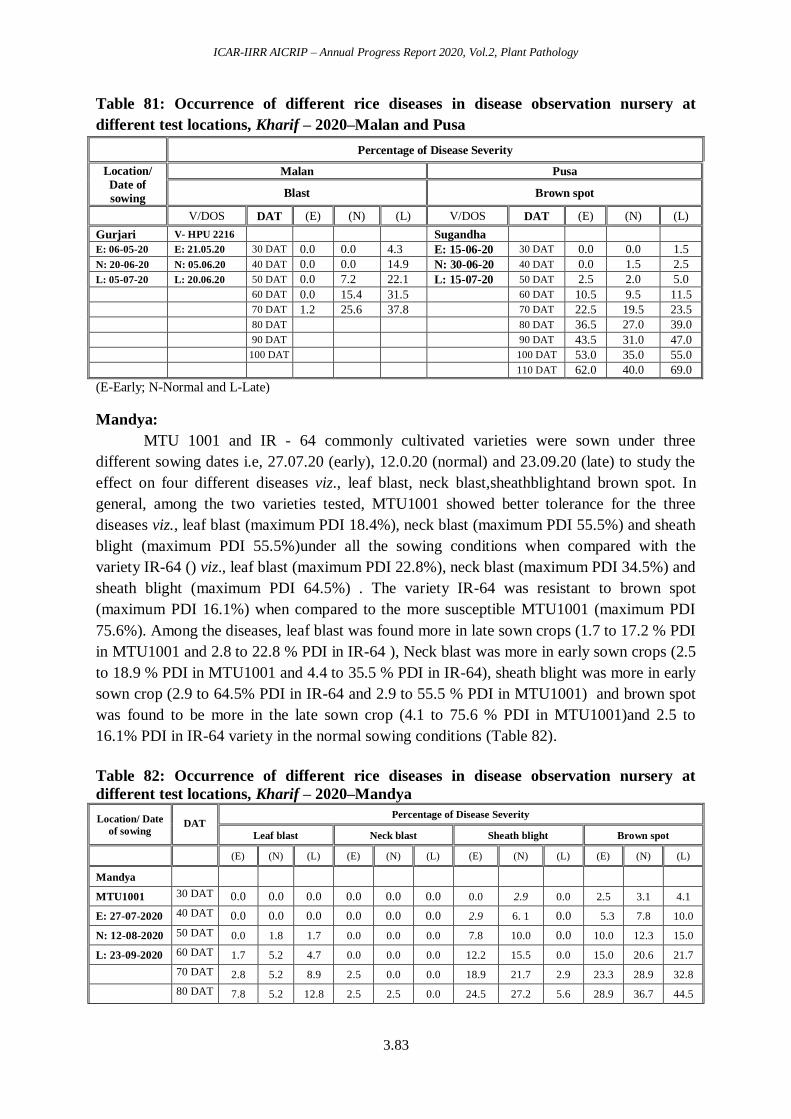
ICAR-IIRR AICRIP – Annual Progress Report 2020, Vol.2, Plant Pathology
3.83
Table 81: Occurrence of different rice diseases in disease observation nursery at
different test locations, Kharif – 2020–Malan and Pusa
Percentage of Disease Severity
Location/
Date of
sowing
Malan Pusa
Blast Brown spot
V/DOS DAT (E) (N) (L) V/DOS DAT (E) (N) (L)
Gurjari V- HPU 2216 Sugandha
E: 06-05-20 E: 21.05.20 30 DAT 0.0 0.0 4.3 E: 15-06-20 30 DAT 0.0 0.0 1.5
N: 20-06-20 N: 05.06.20 40 DAT 0.0 0.0 14.9 N: 30-06-20 40 DAT 0.0 1.5 2.5
L: 05-07-20 L: 20.06.20 50 DAT 0.0 7.2 22.1 L: 15-07-20 50 DAT 2.5 2.0 5.0
60 DAT 0.0 15.4 31.5
60 DAT 10.5 9.5 11.5
70 DAT 1.2 25.6 37.8 70 DAT 22.5 19.5 23.5
80 DAT 80 DAT 36.5 27.0 39.0
90 DAT 90 DAT 43.5 31.0 47.0
100 DAT 100 DAT 53.0 35.0 55.0
110 DAT 62.0 40.0 69.0
(E-Early; N-Normal and L-Late)
Mandya:
MTU 1001 and IR - 64 commonly cultivated varieties were sown under three
different sowing dates i.e, 27.07.20 (early), 12.0.20 (normal) and 23.09.20 (late) to study the
effect on four different diseases viz., leaf blast, neck blast,sheathblightand brown spot. In
general, among the two varieties tested, MTU1001 showed better tolerance for the three
diseases viz., leaf blast (maximum PDI 18.4%), neck blast (maximum PDI 55.5%) and sheath
blight (maximum PDI 55.5%)under all the sowing conditions when compared with the
variety IR-64 () viz., leaf blast (maximum PDI 22.8%), neck blast (maximum PDI 34.5%) and
sheath blight (maximum PDI 64.5%) . The variety IR-64 was resistant to brown spot
(maximum PDI 16.1%) when compared to the more susceptible MTU1001 (maximum PDI
75.6%). Among the diseases, leaf blast was found more in late sown crops (1.7 to 17.2 % PDI
in MTU1001 and 2.8 to 22.8 % PDI in IR-64 ), Neck blast was more in early sown crops (2.5
to 18.9 % PDI in MTU1001 and 4.4 to 35.5 % PDI in IR-64), sheath blight was more in early
sown crop (2.9 to 64.5% PDI in IR-64 and 2.9 to 55.5 % PDI in MTU1001) and brown spot
was found to be more in the late sown crop (4.1 to 75.6 % PDI in MTU1001)and 2.5 to
16.1% PDI in IR-64 variety in the normal sowing conditions (Table 82).
Table 82: Occurrence of different rice diseases in disease observation nursery at
different test locations, Kharif – 2020–Mandya
Location/ Date
of sowing
DAT Percentage of Disease Severity
Leaf blast Neck blast Sheath blight Brown spot
(E) (N) (L) (E) (N) (L) (E) (N) (L) (E) (N) (L)
Mandya
MTU1001 30 DAT 0.0 0.0 0.0 0.0 0.0 0.0 0.0 2.9 0.0 2.5 3.1 4.1
E: 27-07-2020 40 DAT 0.0 0.0 0.0 0.0 0.0 0.0 2.9 6. 1 0.0 5.3 7.8 10.0
N: 12-08-2020 50 DAT 0.0 1.8 1.7 0.0 0.0 0.0 7.8 10.0 0.0 10.0 12.3 15.0
L: 23-09-2020 60 DAT 1.7 5.2 4.7 0.0 0.0 0.0 12.2 15.5 0.0 15.0 20.6 21.7
70 DAT 2.8 5.2 8.9 2.5 0.0 0.0 18.9 21.7 2.9 23.3 28.9 32.8
80 DAT 7.8 5.2 12.8 2.5 2.5 0.0 24.5 27.2 5.6 28.9 36.7 44.5

ICAR-IIRR AICRIP – Annual Progress Report 2020, Vol.2, Plant Pathology
3.84
Location/ Date
of sowing
DAT Percentage of Disease Severity
Leaf blast Neck blast Sheath blight Brown spot
(E) (N) (L) (E) (N) (L) (E) (N) (L) (E) (N) (L)
90 DAT 9.9 7.7 13.9 4.5 4.5 2.5 35.5 29.9 7.8 36.1 44.45 54.5
100 DAT 9.9 7.7 18.4 11.1 11.1 4.4 43.9 35.6 12.2 40.5 54.5 65.6
110 DAT 14.2 7.7 17.2 18.9 11.1 7.2 55.5 42.2 16.7 47.3 67.8 75.6
IR-64 30 DAT 0.0 0.0 0.0 0.0 0.0 0.0 0.0 7.8 0.0 0.0 0.0 2.5
E: 27-07-2020 40 DAT 0.0 0.0 0.0 0.0 0.0 0.0 2.9 13.3 0.0 0.0 0.0 2.5
N: 12-08-2020 50 DAT 0.0 2.8 2.8 0.0 0.0 0.0 10.0 18.9 2.9 0.0 2.5 2. 9
L: 23-09-2020 60 DAT 1.7 4.8 5.3 0.0 0.0 0.0 18.9 21.7 7.8 0.0 4.1 5.3
70 DAT 4.9 5.6 11.1 0.00 0.0 0.0 27.8 25.0 9.9 2.5 6.1 5.3
80 DAT 7.2 6.5 13.3 4.4 4.4 0.0 35.6 29.9 16.1 3.7 10.0 7.2
90 DAT 9.5 7.8 16.1 12.2 12.2 4.44 43.9 35.6 21.1 4.9 12.2 9.4
100 DAT 17.8 9.0 22.2 21.1 21.1 11.11 56.7 43.9 31.1 5.6 13.9 12.2
110 DAT 21.9 9.0 22.8 34.5 24.4 13.33 64.5 55.6 35.5 10.0 16.1 14.5
(E-Early; N-Normal and L-Late)
Moncompu:
Varieties Pournami, Shreyas, Prathyasa and Uma were sown on different dates i.e,
17.09.20 (early), 06.10.20 (normal) and 21.10.19 (late) for the studies on the effect of the
different periods of sowing on sheath blight and BLB intensity on rice. The intensity of the
disease was very less this year, may be because of the weather conditions which was
relatively dry during all the sowing seasons. Among the sowing seasons, both sheath blight
and BLB was relatively high during the fag end of the crop in the normal sown crop. Sheath
blight was more in the normal sown varieties Uma and Prathyasa(28.9 and 25 % PDI) than
the varieties Shreyas and Pournami (21.7 and 9.4% PDI). BLB was higher in the variety
Shreyas and Uma (22.2 and 21.7 % PDI) (Table 83).
Table 83: Occurrence of different rice diseases in disease observation nursery at
different test locations, Kharif – 2020–Moncompu
Location/
Date of sowing
Percentage of Disease Severity
Sheath blight BLB
DAT (E) (N) (L) (E) (N) (L)
Pournami 30 DAT 0.0 0.0 0.0 0.0 2.2 0.0
MTU1001 40 DAT 0.0 0.0 0.0 0.0 0.0 0.0
E: 17-09-2020 50 DAT 0.0 0.0 0.0 0.0 0.0 0.0
N: 06-10-2020 60 DAT 0.0 0.0 0.0 0.0 0.0 0.0
L: 21-10-2020 70 DAT 0.0 0.0 0.0 0.0 0.0 0.0
80 DAT 0.0 0.6 0.0 2.8 15.4 0.0
90 DAT 0.0 1.7 0.0 3.3 8.0 3.8
100 DAT 1.1 5.5 0.3 3.5 8.6 4.9
110 DAT 3.3 9.4 0.9 3.9 9.4 5.8
Shreyas 30 DAT 0.0 0.0 0.0 0.0 0.0 0.0
E: 17-09-2020 40 DAT 0.0 0.0 0.0 0.0 0.0 0.0
N: 06-10-2020 50 DAT 0.0 0.0 0.0 0.0 0.0 0.0
L: 21-10-2020 60 DAT 0.0 0.0 0.0 0.0 0.0 0.0
70 DAT 0.0 0.0 0.0 0.0 0.0 0.0
80 DAT 0.3 2.3 0.00 2.4 1.9 0.0
90 DAT 0.7 6.1 0.6 3.3 3.9 1.1
100 DAT 1.7 6.1 1.5 3.7 13.2 1.9
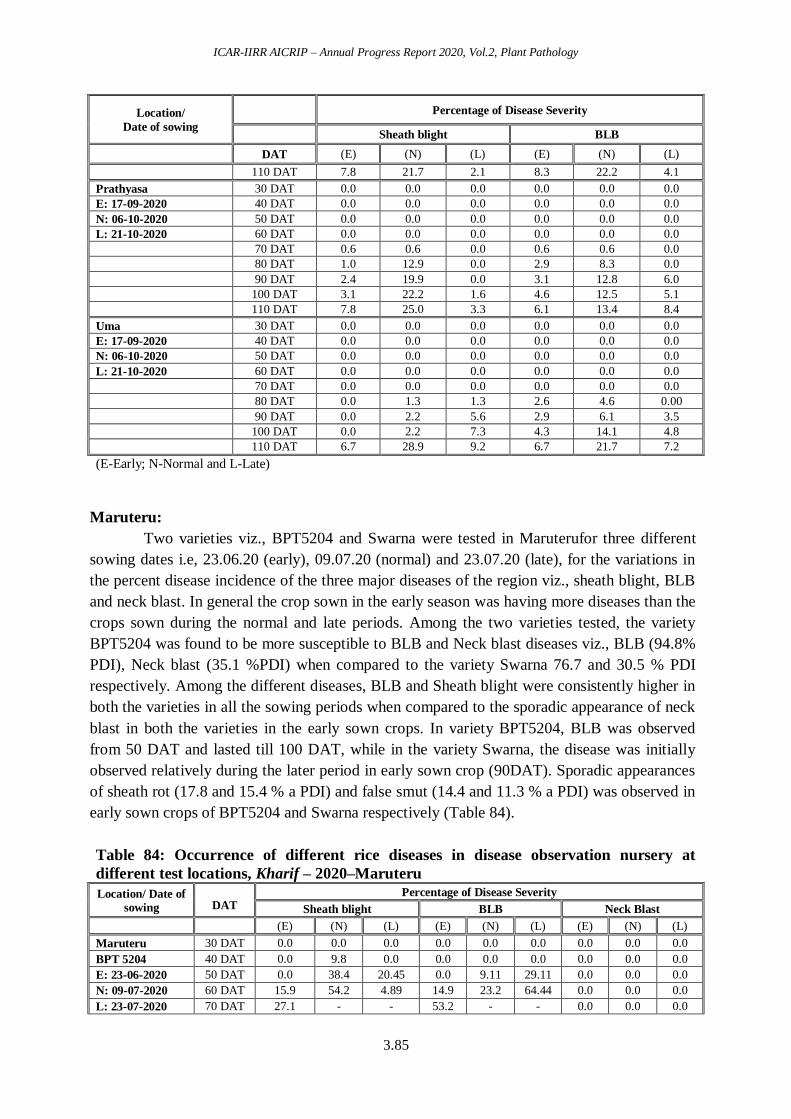
ICAR-IIRR AICRIP – Annual Progress Report 2020, Vol.2, Plant Pathology
3.85
Location/
Date of sowing
Percentage of Disease Severity
Sheath blight BLB
DAT (E) (N) (L) (E) (N) (L)
110 DAT 7.8 21.7 2.1 8.3 22.2 4.1
Prathyasa 30 DAT 0.0 0.0 0.0 0.0 0.0 0.0
E: 17-09-2020 40 DAT 0.0 0.0 0.0 0.0 0.0 0.0
N: 06-10-2020 50 DAT 0.0 0.0 0.0 0.0 0.0 0.0
L: 21-10-2020 60 DAT 0.0 0.0 0.0 0.0 0.0 0.0
70 DAT 0.6 0.6 0.0 0.6 0.6 0.0
80 DAT 1.0 12.9 0.0 2.9 8.3 0.0
90 DAT 2.4 19.9 0.0 3.1 12.8 6.0
100 DAT 3.1 22.2 1.6 4.6 12.5 5.1
110 DAT 7.8 25.0 3.3 6.1 13.4 8.4
Uma 30 DAT 0.0 0.0 0.0 0.0 0.0 0.0
E: 17-09-2020 40 DAT 0.0 0.0 0.0 0.0 0.0 0.0
N: 06-10-2020 50 DAT 0.0 0.0 0.0 0.0 0.0 0.0
L: 21-10-2020 60 DAT 0.0 0.0 0.0 0.0 0.0 0.0
70 DAT 0.0 0.0 0.0 0.0 0.0 0.0
80 DAT 0.0 1.3 1.3 2.6 4.6 0.00
90 DAT 0.0 2.2 5.6 2.9 6.1 3.5
100 DAT 0.0 2.2 7.3 4.3 14.1 4.8
110 DAT 6.7 28.9 9.2 6.7 21.7 7.2
(E-Early; N-Normal and L-Late)
Maruteru:
Two varieties viz., BPT5204 and Swarna were tested in Maruterufor three different
sowing dates i.e, 23.06.20 (early), 09.07.20 (normal) and 23.07.20 (late), for the variations in
the percent disease incidence of the three major diseases of the region viz., sheath blight, BLB
and neck blast. In general the crop sown in the early season was having more diseases than the
crops sown during the normal and late periods. Among the two varieties tested, the variety
BPT5204 was found to be more susceptible to BLB and Neck blast diseases viz., BLB (94.8%
PDI), Neck blast (35.1 %PDI) when compared to the variety Swarna 76.7 and 30.5 % PDI
respectively. Among the different diseases, BLB and Sheath blight were consistently higher in
both the varieties in all the sowing periods when compared to the sporadic appearance of neck
blast in both the varieties in the early sown crops. In variety BPT5204, BLB was observed
from 50 DAT and lasted till 100 DAT, while in the variety Swarna, the disease was initially
observed relatively during the later period in early sown crop (90DAT). Sporadic appearances
of sheath rot (17.8 and 15.4 % a PDI) and false smut (14.4 and 11.3 % a PDI) was observed in
early sown crops of BPT5204 and Swarna respectively (Table 84).
Table 84: Occurrence of different rice diseases in disease observation nursery at
different test locations, Kharif – 2020–Maruteru
Location/ Date of
sowing
DAT Percentage of Disease Severity
Sheath blight BLB Neck Blast
(E) (N) (L) (E) (N) (L) (E) (N) (L)
Maruteru 30 DAT 0.0 0.0 0.0 0.0 0.0 0.0 0.0 0.0 0.0
BPT 5204 40 DAT 0.0 9.8 0.0 0.0 0.0 0.0 0.0 0.0 0.0
E: 23-06-2020 50 DAT 0.0 38.4 20.45 0.0 9.11 29.11 0.0 0.0 0.0
N: 09-07-2020 60 DAT 15.9 54.2 4.89 14.9 23.2 64.44 0.0 0.0 0.0
L: 23-07-2020 70 DAT 27.1 - - 53.2 - - 0.0 0.0 0.0
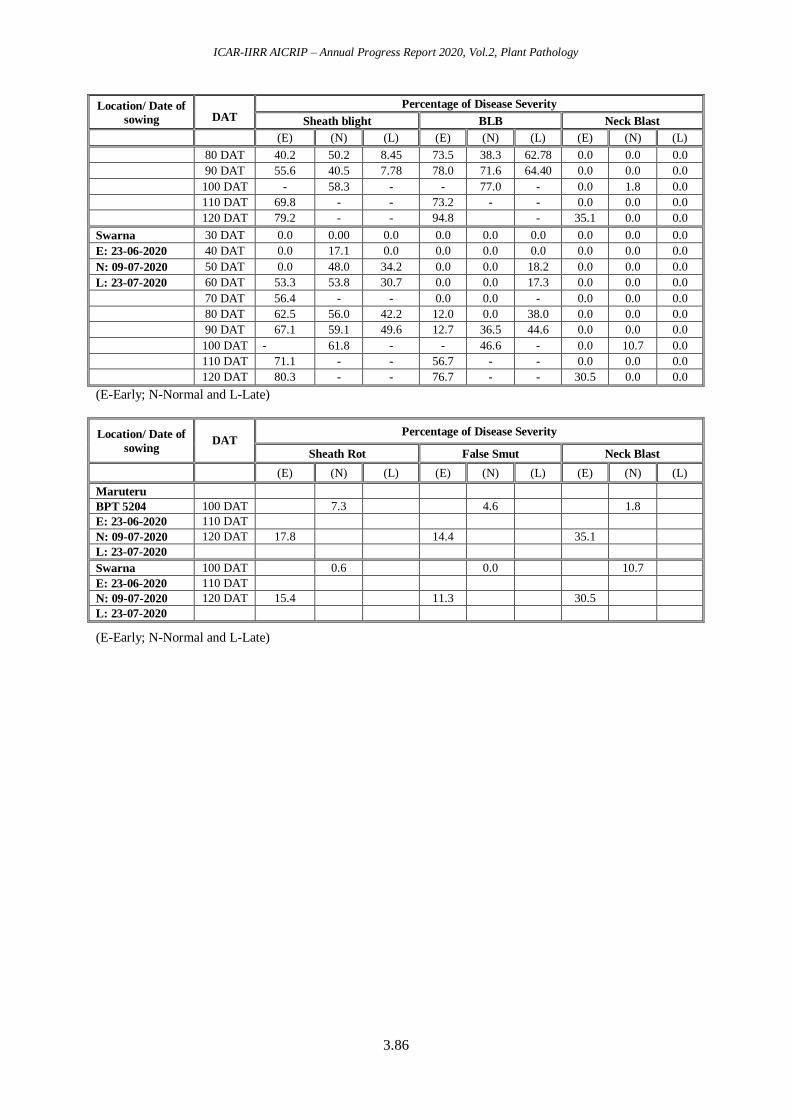
ICAR-IIRR AICRIP – Annual Progress Report 2020, Vol.2, Plant Pathology
3.86
Location/ Date of
sowing
DAT Percentage of Disease Severity
Sheath blight BLB Neck Blast
(E) (N) (L) (E) (N) (L) (E) (N) (L)
80 DAT 40.2 50.2 8.45 73.5 38.3 62.78 0.0 0.0 0.0
90 DAT 55.6 40.5 7.78 78.0 71.6 64.40 0.0 0.0 0.0
100 DAT - 58.3 - - 77.0 - 0.0 1.8 0.0
110 DAT 69.8 - - 73.2 - - 0.0 0.0 0.0
120 DAT 79.2 - - 94.8 - 35.1 0.0 0.0
Swarna 30 DAT 0.0 0.00 0.0 0.0 0.0 0.0 0.0 0.0 0.0
E: 23-06-2020 40 DAT 0.0 17.1 0.0 0.0 0.0 0.0 0.0 0.0 0.0
N: 09-07-2020 50 DAT 0.0 48.0 34.2 0.0 0.0 18.2 0.0 0.0 0.0
L: 23-07-2020 60 DAT 53.3 53.8 30.7 0.0 0.0 17.3 0.0 0.0 0.0
70 DAT 56.4 - - 0.0 0.0 - 0.0 0.0 0.0
80 DAT 62.5 56.0 42.2 12.0 0.0 38.0 0.0 0.0 0.0
90 DAT 67.1 59.1 49.6 12.7 36.5 44.6 0.0 0.0 0.0
100 DAT - 61.8 - - 46.6 - 0.0 10.7 0.0
110 DAT 71.1 - - 56.7 - - 0.0 0.0 0.0
120 DAT 80.3 - - 76.7 - - 30.5 0.0 0.0
(E-Early; N-Normal and L-Late)
Location/ Date of
sowing
DAT Percentage of Disease Severity
Sheath Rot False Smut Neck Blast
(E) (N) (L) (E) (N) (L) (E) (N) (L)
Maruteru
BPT 5204 100 DAT
7.3
4.6
1.8
E: 23-06-2020 110 DAT
N: 09-07-2020 120 DAT 17.8 14.4 35.1
L: 23-07-2020
Swarna 100 DAT 0.6 0.0 10.7
E: 23-06-2020 110 DAT
N: 09-07-2020 120 DAT 15.4 11.3 30.5
L: 23-07-2020
(E-Early; N-Normal and L-Late)
ICAR-IIRR AICRIP – Annual Progress Report 2020, Vol.2, Plant Pathology
3.87
IV. DISEASE MANANGMENT TRIALS
1. EVALUATION OF FUNGICIDES AGAINST LOCATION SPECIFIC DISEASES
The trial was formulated and conducted with twin objectives, first, to identify the
effective fungicidal molecule against blast and sheath blight from the commonly available
commercial product. Second, select the single broad-spectrum fungicide for managing a
greater number of diseases. The trail was constituted withfungicidal molecules viz.,
difenoconazole 25% EC, isoprothiolane 40% EC, kasugamycin 3% SL, kitazin 48% EC,
propineb 70% WP, tebuconazole 25.9% EC and thifluzamide 24% SC. The treatments were
composed based on the commercial availability of fungicides in the rice growing areas, mode
of action, spectrum and status of AICRIP testing in the preceding years. All the fungicides
are recommended to manage the various rice diseases in India by Central Insecticide Board
(CIB). These molecules comprises of different formulations such as suspension concentrates
(SC), Slurry Liquid (SL), emulsifyable concentrates (EC) and wet-able powder. Trail was
conducted in location specific diseases of all the agro-climatic zones. The trail was conducted
during Kharif-2020 by using Randomised Block Design (RBD) as a statistical method with
four or three replications in each centre.
The trial was proposed at 38 centres and conducted the experiment at 30 centres
during Kharif-2020. The centres are Aduthurai, Bankura, Chatha, Chinsurah, Chiplima,
Coimbatore, ICAR-IIRR, Cuttack (ICAR-NRRI), Masodha (Faizabad), Gangavati, Jagdalpur,
Kaul, Lonavala, Ludhiana, Malan, Mandya, Maruteru, Moncompu, Navsari, Nawagam,
Pantnagar, Ponnampet, Pusa, Raipur, Rajendranagar, Ranchi, Rewa, Sabour, Titabar and
Varanasi across the rice growing regions in India. The experiment was conducted with locally
popular disease susceptible rice varieties among the farmers. In general, sowings were taken
up during June and July across the locations except in Coimbatore and Mandya during
August, and in Aduthurai and Moncompu where sowing was done in the month of
September.The details related to test variety used, date of sowing, date of transplanting,
method of screening, date of initial symptoms observed, number of spray, spraying dates,
disease observation and date of harvesting are mentioned in the Table 85. In general
fungicides were sprayed immediately after noticing the initial symptoms at all the locations
either it’s a natural disease incidence or artificial disease augmentation. Each fungicidal
product were applied at the rate of two sprays with an intravel of 10-15 days in most of the
test centres except Aduthurai, Jagdalpur, Lonavala, Mandya, Moncompu, Ponnempet and
Titabar where various number of sprays were given. The data from the centres were
statistically transformed for their analysis and compilation. The fungicides were evaluated
against leaf blast (nine locations), neck blast (nine locations), sheath blight (twelve locations),
sheath rot (six locations), brown spot (three locations) and grain discoloration (two locations).
Leaf blast: The fungicides were evaluated against leaf blast disease at nine locations across
the rice growing region of the country. In most of the centres uniformly two sprays of
fungicides were applied except Jagadalpur (four), Lonavala (three) and Aduthurai and
Ponnampet (one) where different spray was given, respectively. Disease severity was

ICAR-IIRR AICRIP – Annual Progress Report 2020, Vol.2, Plant Pathology
3.88
Table 85: Experimental details of fungicidal evaluation against location specific diseases of rice during, Kharif-2020
S. No Location Disease Recorded Test Variety Screening
Date of activities
Sowing/
Transplanting Inoculation
Initial
symptom
No of
Spray Spraying Observation Harvesting
1 Aduthurai Brown spot;
Sheath rot BPT-5204 Natural
07.09.2020/
14.10.2020 - 10.12.2020 1 22.12.2020 - 28.01.2011
2 Bankura Sheath blight Swarna (MTU7029) Artificial 15.07.2020
02.09.2020 12.09.2020 17.09.2020 2
01.10.2020
16.10.2020
01.10.2020
16.10.2020
30.10.2020
27.11.2020
3 Chatha Brown spot Basmati-370 Natural 15.07.2020
05.08.2020 - 18.09.2020 2
22.09.2020
07.10.2020 - 28.11.2020
4 Coimbatore Leaf blast CO39 Natural 27.08.2020
17.09.2020 - 03.11.2020 2
06.11.2020
18.11.2020
25.11.2020
30.11.2020 17.12.2020
5 Chinsurah
Sheath blight Swarna (MTU 7029) Artificial 25.06.2020
22.07.2020 14.09.2020 24.09.2020 2
24.09.2020
01.10.2020 - 10.11.2020
Sheath rot Swarna (MTU 7029) Artificial 14.07.2020
07.08.2020 15.10.2020 02.11.2020 2
04.11.2020
11.11.2020 - 25.11.2020
6 Chiplima Sheath blight Swarna Artificial 03.07.2020
31.07.2020 18.09.2020 30.09.2020 2
03.10.2020
19.10.2020
19.10.2020
03.11.2020 24.12.2020
7 Cuttack (ICAR-
NRRI) Sheath blight Tapaswini Artificial
27.07.2020
07.09.2020 07.10.2020 16.10.2020 2
26.10.2020
04.11.2020
14.11.2020
24.11.2020 26.12.2020
8 ICAR-IIRR
Leaf blast HR-12 Artificial 13.06.2020/
10.07.2020
22.08.2020
23.08.2020 02.09.2020 2
03.09.2020
10.09.2020
12.9.2020
22.9.2020
01.10.2020
26.10.2020
Sheath blight BPT-5204 Artificial 06.07.2020/
07.08.2020 01.10.20 03.10.2020 2
04.10.2020/
19.10.2020
19.10.2020/
03.11.2020 20.11.2020
9 Masodha
(Faizabad) Sheath blight Pusa Basmati 1 Artificial
25.06.2020
24.07.2020 - 18.09.2020 2
29.09.2020
14.10.2020
13.10.2020
03.11.2020 16.11.2020
10 Gangavati Sheath blight BPT-5204 Artificial 15.07.2020
18.08.2020 10.03.2020 10.08.2020 2
10.09.2020
19.10.2020
18.10.2020
11.07.2020 -
11 Jagadalpur Leaf blast;
Neck blast Swarna Natural
23.06.2020
24.07.2020 - - 4
10.09.2020
25.09.2020
13.10.2020
28.10.2020
07.09.2020
20.09.2020
01.10.2020
28.12.2020
12 Kaul Neck blast CSR 30 Natural 19.06.2020
31.07.2020 - 05.10.2020 2
08.10.2020
18.10.2020
28.10.2020
05.11.2020 23.11.2020
13 Lonavala
Leaf Blast EK-70 Natural 26.06.2020
30.07.2020 - 22.07.2020 3
24.07.2020
08.09.2020
26.08.2020
22.07.2020
09.08.2020
26.08.2020
20.11.2020
Neck blast EK-70 Natural 26.6.2020
30.7.2020 - 17.09.2020 2
21.09.2020
06.10.2020
17.09.2020
05.10.2020 20.11.2020
14 Ludhiana Sheath blight PR114 Artificial 9.6.2020
9.7.2020 08.09.020 11.09.2020 2
10.09.2020
22.09.2020 01.10.2020 20.10.2020
15 Malan Neck blast HPU 2216 Natural 20.06.2020
18.07.2020 - - 2
09.09.2020
24.09.2020 - 31.10.2020

ICAR-IIRR AICRIP – Annual Progress Report 2020, Vol.2, Plant Pathology
3.89
S. No Location Disease Recorded Test Variety Screening
Date of activities
Sowing/
Transplanting Inoculation
Initial
symptom
No of
Spray Spraying Observation Harvesting
16 Mandya Neck blast KRH 4 Natural 06.08.2020
10.09.2020 - - 1 09.11.2020 19.12.2020 15.01.2021
17 Maruteru Sheath blight/ Neck
blast Swarna (MTU 7029) Artificial
26.06.2020
30.07.2020 03.09.2020 11.09.2020 2
21.9.2020
06.10.2020
21.10.2020
02.11.2020,
23.11.2020
01.12.2020
18 Moncompu Sheath blight and
Grain discolouration Uma Natural
17.09.2020
10.06.2020 - 15.12.2020 1 17.12.2020
15.12.2020
01.1.2021 03.02.2021
19 Navasari Sheath rot Jaya Natural 16.07.2020
13.08.2020 - 27.9.2020 2
16.10.2020
27.10.2020
23.10.2020
04.11.2020 12.05.2020
20 Nawagam
Leaf blast
Gurjari Artificial
24.07.2020
02.09.2020
21.09.2020
07.10.2020 19.10.2020 2
20.10.2020
5.11.2020
20.10.2020
05.11.2020
20.11.2020
12.08.2020
Sheat rot Gurjari Natural 24.07.2020
02.09.2020 - 15.10.2020 2
20.10.2020
5.11.2020
20.10.2020
05.11.2020
20.11.2020
12.08.2020
21 Pantnagar Sheath blight Pant Dhan-4 Artificial 07.06.2020
01.07.2020 01.09.2020 07.09.2020 2
07.09.2020
22.09.2020
09.09.2020
08.10.2020 09.11.2020
22 Ponnampet
Leaf blast
Intan Natural
29.07.2020
31.08.2020
- 14.09.2020 1 21.09.2020
29.12.2020
22.10.2020 2.2.2020
Neck blast Intan Natural - 22.12.2020 1 18.01.2020 2.2.2021
23 Pusa Brown spot Pankaj (HS) Natural 15.06.2020/
03.07.2020 - 05.9.2020 2
25.09.2020
12.10.2020
25.09.2020
12.10.2020- 27.11.2020
24 Raipur Sheath blight Swarna Artificial
07.07.2020
30.07.2020 12.10.2020 - 2
16.10.2020
23.10.2020
22.10.2020
03.11.2020 12.02.2020
25 Rajendranagar Neck blast Tellahamsa Artificial 04.07.2020
04.08.2020 01.10.2020 16.10.2020 2
18.09.2020
06.10.2020
05.10.2020
11.11.2020
23.11.2020
24.11.2020
Sheath Rot / GD Tellahamsa Natural 04.07.2020
04.08.2020 -
30.10.2020/
27.11.2020 - - -
23.11.2020
24.11.2020
26 Ranchi
Leaf blast Pusa sugandha-3 Artificial 28.06.2020
21.07.2021 10.08.2020 14.08.2020 2
16.08.2020
28.08.2020
26.08.2020
08.09.2020 20.11.2020
Neck blast Pusa sugandha-3 Artificial 28.06.2020
21.07.2020 10.08.2020 14.08.2020 2
16.08.2020
28.08.2020 16.11.2020 20.11.2020
27 Rewa Leaf blast PS4 Artificial 20.07.2020
06.08.2020 21.08.2020 3.9.2020 2
12.09.2020
27.09.2020
28.09.2020
13.10.2020 22.11.2020
28 Sabour Brown spot Rajendra Mahsuri-1 Natural 26.06.2020
22.07.2020 - 01.09.2020 2
01.10.2020
11.10.2020
05.10.2020
29.10.2020 25.11.2020
29 Titabar Sheath rot Gitesh Artificial 21.07.2020
21.08.2020 21.08.2020 20.10.2020 3
20.10.2020
30.10.2020
10.11.2020
20.10.2020 12.12.2020
30 Varanasi Leaf blast HUR-105 Natural 07.08.2020
8.13.2020 - 09.08.2020 2
25.09.2020
08.10.2020 24.10.2020 07.11.2020
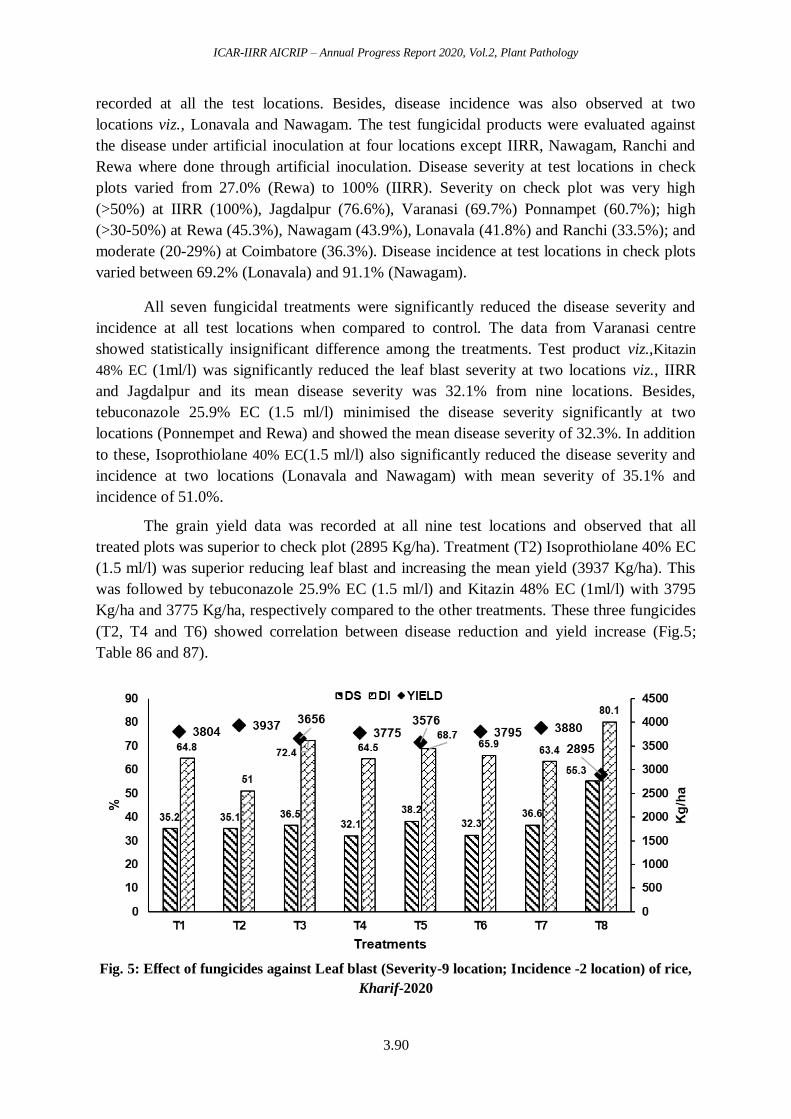
ICAR-IIRR AICRIP – Annual Progress Report 2020, Vol.2, Plant Pathology
3.90
recorded at all the test locations. Besides, disease incidence was also observed at two
locations viz., Lonavala and Nawagam. The test fungicidal products were evaluated against
the disease under artificial inoculation at four locations except IIRR, Nawagam, Ranchi and
Rewa where done through artificial inoculation. Disease severity at test locations in check
plots varied from 27.0% (Rewa) to 100% (IIRR). Severity on check plot was very high
(>50%) at IIRR (100%), Jagdalpur (76.6%), Varanasi (69.7%) Ponnampet (60.7%); high
(>30-50%) at Rewa (45.3%), Nawagam (43.9%), Lonavala (41.8%) and Ranchi (33.5%); and
moderate (20-29%) at Coimbatore (36.3%). Disease incidence at test locations in check plots
varied between 69.2% (Lonavala) and 91.1% (Nawagam).
All seven fungicidal treatments were significantly reduced the disease severity and
incidence at all test locations when compared to control. The data from Varanasi centre
showed statistically insignificant difference among the treatments. Test product viz.,Kitazin
48% EC (1ml/l) was significantly reduced the leaf blast severity at two locations viz., IIRR
and Jagdalpur and its mean disease severity was 32.1% from nine locations. Besides,
tebuconazole 25.9% EC (1.5 ml/l) minimised the disease severity significantly at two
locations (Ponnempet and Rewa) and showed the mean disease severity of 32.3%. In addition
to these, Isoprothiolane 40% EC(1.5 ml/l) also significantly reduced the disease severity and
incidence at two locations (Lonavala and Nawagam) with mean severity of 35.1% and
incidence of 51.0%.
The grain yield data was recorded at all nine test locations and observed that all
treated plots was superior to check plot (2895 Kg/ha). Treatment (T2) Isoprothiolane 40% EC
(1.5 ml/l) was superior reducing leaf blast and increasing the mean yield (3937 Kg/ha). This
was followed by tebuconazole 25.9% EC (1.5 ml/l) and Kitazin 48% EC (1ml/l) with 3795
Kg/ha and 3775 Kg/ha, respectively compared to the other treatments. These three fungicides
(T2, T4 and T6) showed correlation between disease reduction and yield increase (Fig.5;
Table 86 and 87).
Fig. 5: Effect of fungicides against Leaf blast (Severity-9 location; Incidence -2 location) of rice,
Kharif-2020
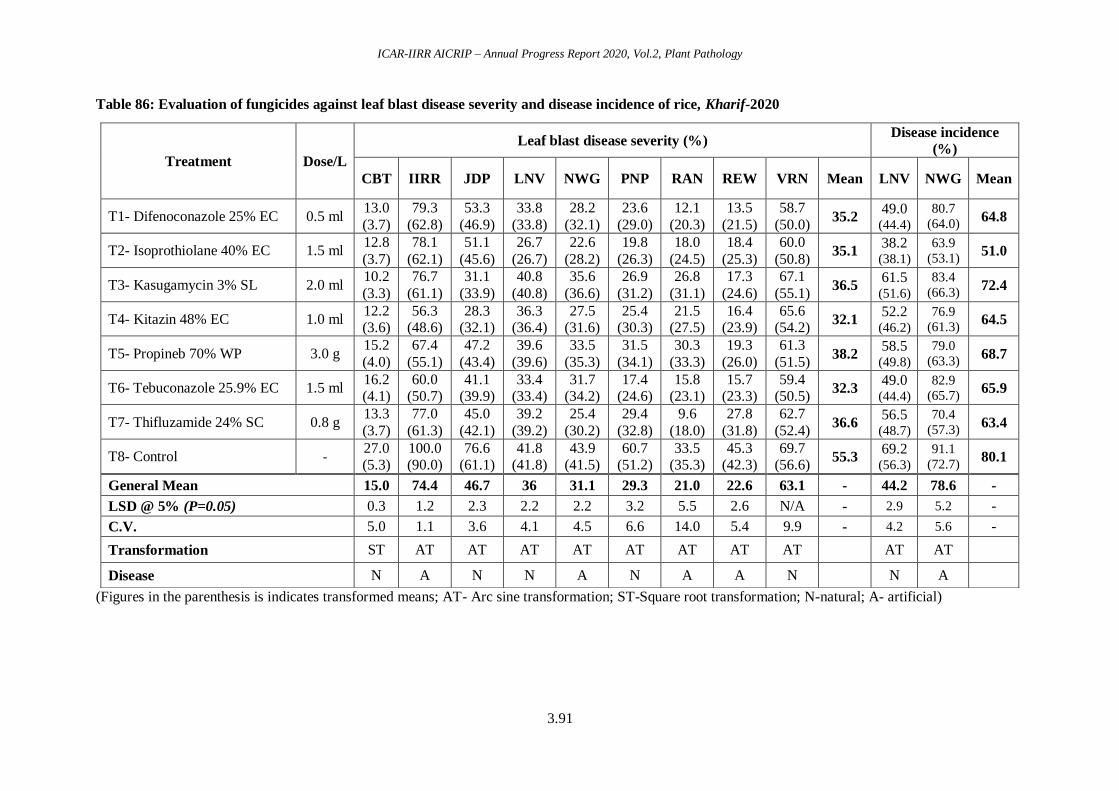
ICAR-IIRR AICRIP – Annual Progress Report 2020, Vol.2, Plant Pathology
3.91
Table 86: Evaluation of fungicides against leaf blast disease severity and disease incidence of rice, Kharif-2020
(Figures in the parenthesis is indicates transformed means; AT- Arc sine transformation; ST-Square root transformation; N-natural; A- artificial)
Treatment Dose/L
Leaf blast disease severity (%) Disease incidence
(%)
CBT IIRR JDP LNV NWG PNP RAN REW VRN Mean LNV NWG Mean
T1- Difenoconazole 25% EC 0.5 ml 13.0
(3.7)
79.3
(62.8)
53.3
(46.9)
33.8
(33.8)
28.2
(32.1)
23.6
(29.0)
12.1
(20.3)
13.5
(21.5)
58.7
(50.0) 35.2
49.0 (44.4)
80.7
(64.0) 64.8
T2- Isoprothiolane 40% EC 1.5 ml 12.8
(3.7)
78.1
(62.1)
51.1
(45.6)
26.7
(26.7)
22.6
(28.2)
19.8
(26.3)
18.0
(24.5)
18.4
(25.3)
60.0
(50.8) 35.1
38.2 (38.1)
63.9
(53.1) 51.0
T3- Kasugamycin 3% SL 2.0 ml 10.2
(3.3)
76.7
(61.1)
31.1
(33.9)
40.8
(40.8)
35.6
(36.6)
26.9
(31.2)
26.8
(31.1)
17.3
(24.6)
67.1
(55.1) 36.5
61.5 (51.6)
83.4
(66.3) 72.4
T4- Kitazin 48% EC 1.0 ml 12.2 (3.6)
56.3 (48.6)
28.3 (32.1)
36.3 (36.4)
27.5 (31.6)
25.4 (30.3)
21.5 (27.5)
16.4 (23.9)
65.6 (54.2)
32.1 52.2 (46.2)
76.9
(61.3) 64.5
T5- Propineb 70% WP 3.0 g 15.2
(4.0)
67.4
(55.1)
47.2
(43.4)
39.6
(39.6)
33.5
(35.3)
31.5
(34.1)
30.3
(33.3)
19.3
(26.0)
61.3
(51.5) 38.2
58.5 (49.8)
79.0
(63.3) 68.7
T6- Tebuconazole 25.9% EC 1.5 ml 16.2 (4.1)
60.0 (50.7)
41.1 (39.9)
33.4 (33.4)
31.7 (34.2)
17.4 (24.6)
15.8 (23.1)
15.7 (23.3)
59.4 (50.5)
32.3 49.0 (44.4)
82.9
(65.7) 65.9
T7- Thifluzamide 24% SC 0.8 g 13.3
(3.7)
77.0
(61.3)
45.0
(42.1)
39.2
(39.2)
25.4
(30.2)
29.4
(32.8)
9.6
(18.0)
27.8
(31.8)
62.7
(52.4) 36.6
56.5 (48.7)
70.4
(57.3) 63.4
T8- Control - 27.0 (5.3)
100.0 (90.0)
76.6 (61.1)
41.8 (41.8)
43.9 (41.5)
60.7 (51.2)
33.5 (35.3)
45.3 (42.3)
69.7 (56.6)
55.3 69.2 (56.3)
91.1
(72.7) 80.1
General Mean 15.0 74.4 46.7 36 31.1 29.3 21.0 22.6 63.1 - 44.2 78.6 -
LSD @ 5% (P=0.05) 0.3 1.2 2.3 2.2 2.2 3.2 5.5 2.6 N/A - 2.9 5.2 -
C.V. 5.0 1.1 3.6 4.1 4.5 6.6 14.0 5.4 9.9 - 4.2 5.6 -
Transformation ST AT AT AT AT AT AT AT AT
AT AT
Disease N A N N A N A A N
N A
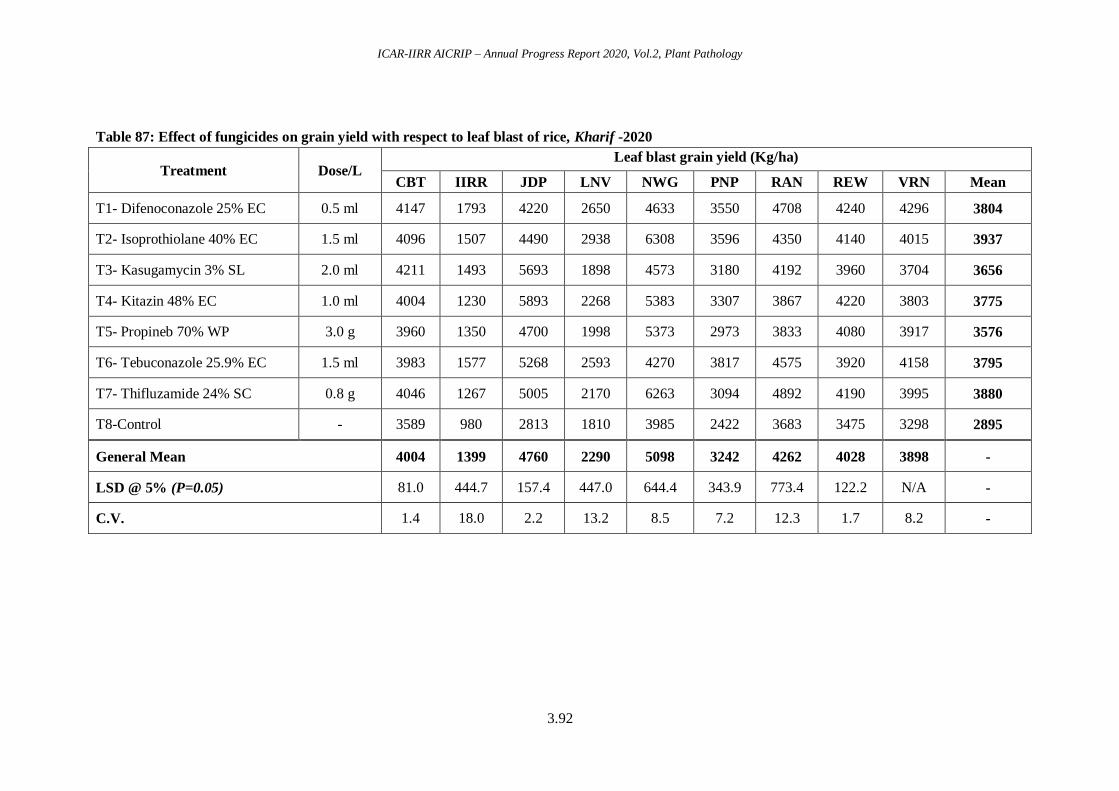
ICAR-IIRR AICRIP – Annual Progress Report 2020, Vol.2, Plant Pathology
3.92
Table 87: Effect of fungicides on grain yield with respect to leaf blast of rice, Kharif -2020
Treatment Dose/L Leaf blast grain yield (Kg/ha)
CBT IIRR JDP LNV NWG PNP RAN REW VRN Mean
T1- Difenoconazole 25% EC 0.5 ml 4147 1793 4220 2650 4633 3550 4708 4240 4296 3804
T2- Isoprothiolane 40% EC 1.5 ml 4096 1507 4490 2938 6308 3596 4350 4140 4015 3937
T3- Kasugamycin 3% SL 2.0 ml 4211 1493 5693 1898 4573 3180 4192 3960 3704 3656
T4- Kitazin 48% EC 1.0 ml 4004 1230 5893 2268 5383 3307 3867 4220 3803 3775
T5- Propineb 70% WP 3.0 g 3960 1350 4700 1998 5373 2973 3833 4080 3917 3576
T6- Tebuconazole 25.9% EC 1.5 ml 3983 1577 5268 2593 4270 3817 4575 3920 4158 3795
T7- Thifluzamide 24% SC 0.8 g 4046 1267 5005 2170 6263 3094 4892 4190 3995 3880
T8-Control - 3589 980 2813 1810 3985 2422 3683 3475 3298 2895
General Mean 4004 1399 4760 2290 5098 3242 4262 4028 3898 -
LSD @ 5% (P=0.05) 81.0 444.7 157.4 447.0 644.4 343.9 773.4 122.2 N/A -
C.V. 1.4 18.0 2.2 13.2 8.5 7.2 12.3 1.7 8.2 -
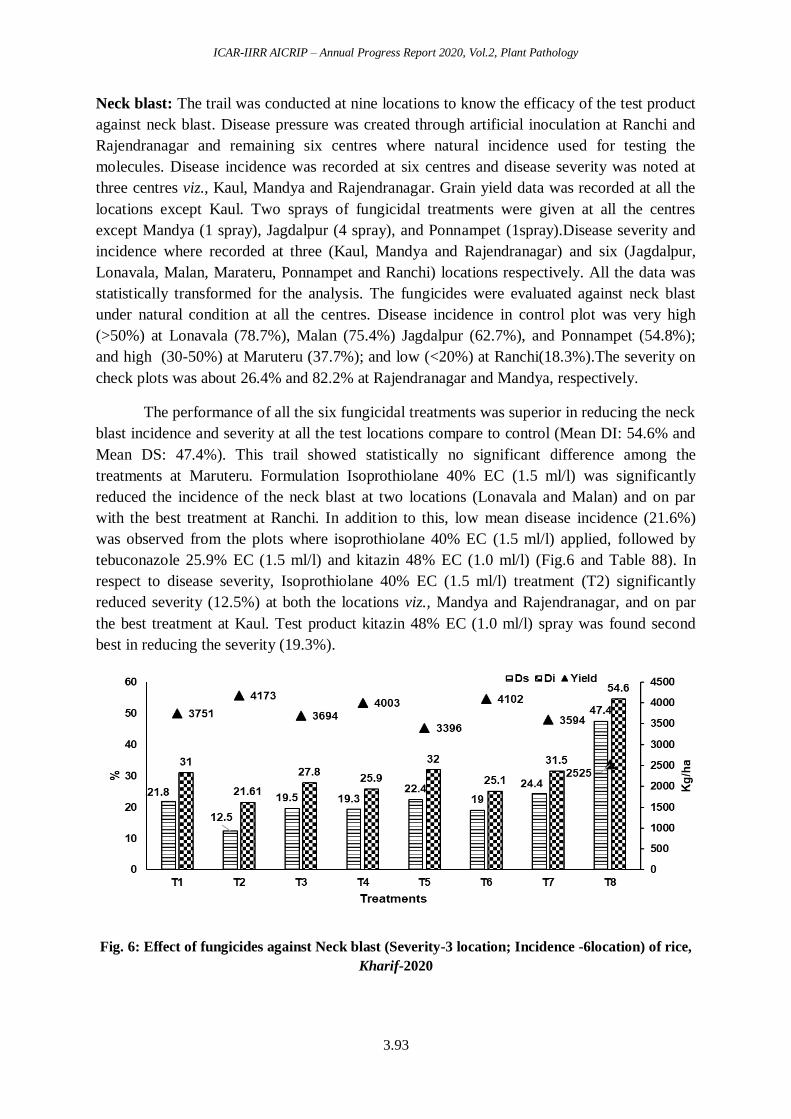
ICAR-IIRR AICRIP – Annual Progress Report 2020, Vol.2, Plant Pathology
3.93
Neck blast: The trail was conducted at nine locations to know the efficacy of the test product
against neck blast. Disease pressure was created through artificial inoculation at Ranchi and
Rajendranagar and remaining six centres where natural incidence used for testing the
molecules. Disease incidence was recorded at six centres and disease severity was noted at
three centres viz., Kaul, Mandya and Rajendranagar. Grain yield data was recorded at all the
locations except Kaul. Two sprays of fungicidal treatments were given at all the centres
except Mandya (1 spray), Jagdalpur (4 spray), and Ponnampet (1spray).Disease severity and
incidence where recorded at three (Kaul, Mandya and Rajendranagar) and six (Jagdalpur,
Lonavala, Malan, Marateru, Ponnampet and Ranchi) locations respectively. All the data was
statistically transformed for the analysis. The fungicides were evaluated against neck blast
under natural condition at all the centres. Disease incidence in control plot was very high
(>50%) at Lonavala (78.7%), Malan (75.4%) Jagdalpur (62.7%), and Ponnampet (54.8%);
and high (30-50%) at Maruteru (37.7%); and low (<20%) at Ranchi(18.3%).The severity on
check plots was about 26.4% and 82.2% at Rajendranagar and Mandya, respectively.
The performance of all the six fungicidal treatments was superior in reducing the neck
blast incidence and severity at all the test locations compare to control (Mean DI: 54.6% and
Mean DS: 47.4%). This trail showed statistically no significant difference among the
treatments at Maruteru. Formulation Isoprothiolane 40% EC (1.5 ml/l) was significantly
reduced the incidence of the neck blast at two locations (Lonavala and Malan) and on par
with the best treatment at Ranchi. In addition to this, low mean disease incidence (21.6%)
was observed from the plots where isoprothiolane 40% EC (1.5 ml/l) applied, followed by
tebuconazole 25.9% EC (1.5 ml/l) and kitazin 48% EC (1.0 ml/l) (Fig.6 and Table 88). In
respect to disease severity, Isoprothiolane 40% EC (1.5 ml/l) treatment (T2) significantly
reduced severity (12.5%) at both the locations viz., Mandya and Rajendranagar, and on par
the best treatment at Kaul. Test product kitazin 48% EC (1.0 ml/l) spray was found second
best in reducing the severity (19.3%).
Fig. 6: Effect of fungicides against Neck blast (Severity-3 location; Incidence -6location) of rice,
Kharif-2020
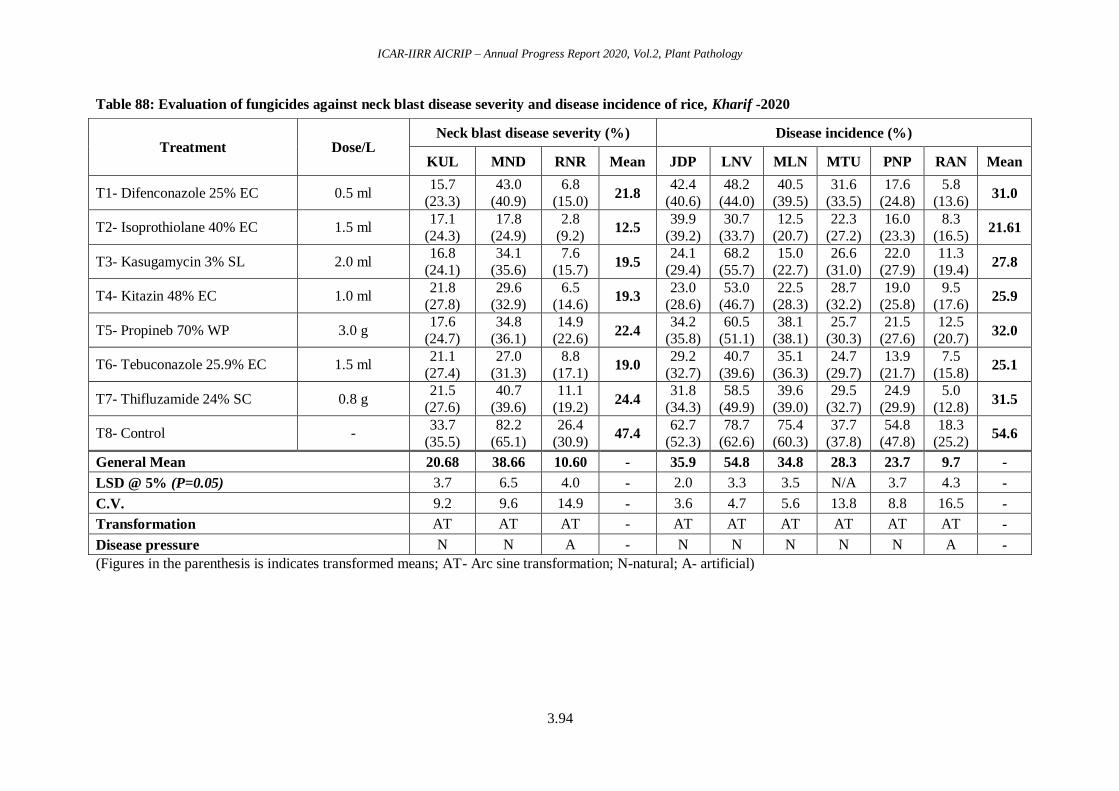
ICAR-IIRR AICRIP – Annual Progress Report 2020, Vol.2, Plant Pathology
3.94
Table 88: Evaluation of fungicides against neck blast disease severity and disease incidence of rice, Kharif -2020
(Figures in the parenthesis is indicates transformed means; AT- Arc sine transformation; N-natural; A- artificial)
Treatment Dose/L Neck blast disease severity (%) Disease incidence (%)
KUL MND RNR Mean JDP LNV MLN MTU PNP RAN Mean
T1- Difenconazole 25% EC 0.5 ml 15.7
(23.3)
43.0
(40.9)
6.8
(15.0) 21.8
42.4
(40.6)
48.2
(44.0)
40.5
(39.5)
31.6
(33.5)
17.6
(24.8)
5.8
(13.6) 31.0
T2- Isoprothiolane 40% EC 1.5 ml 17.1
(24.3)
17.8
(24.9)
2.8
(9.2) 12.5
39.9
(39.2)
30.7
(33.7)
12.5
(20.7)
22.3
(27.2)
16.0
(23.3)
8.3
(16.5) 21.61
T3- Kasugamycin 3% SL 2.0 ml 16.8
(24.1)
34.1
(35.6)
7.6
(15.7) 19.5
24.1
(29.4)
68.2
(55.7)
15.0
(22.7)
26.6
(31.0)
22.0
(27.9)
11.3
(19.4) 27.8
T4- Kitazin 48% EC 1.0 ml 21.8
(27.8)
29.6
(32.9)
6.5
(14.6) 19.3
23.0
(28.6)
53.0
(46.7)
22.5
(28.3)
28.7
(32.2)
19.0
(25.8)
9.5
(17.6) 25.9
T5- Propineb 70% WP 3.0 g 17.6
(24.7)
34.8
(36.1)
14.9
(22.6) 22.4
34.2
(35.8)
60.5
(51.1)
38.1
(38.1)
25.7
(30.3)
21.5
(27.6)
12.5
(20.7) 32.0
T6- Tebuconazole 25.9% EC 1.5 ml 21.1
(27.4)
27.0
(31.3)
8.8
(17.1) 19.0
29.2
(32.7)
40.7
(39.6)
35.1
(36.3)
24.7
(29.7)
13.9
(21.7)
7.5
(15.8) 25.1
T7- Thifluzamide 24% SC 0.8 g 21.5
(27.6)
40.7
(39.6)
11.1
(19.2) 24.4
31.8
(34.3)
58.5
(49.9)
39.6
(39.0)
29.5
(32.7)
24.9
(29.9)
5.0
(12.8) 31.5
T8- Control - 33.7
(35.5)
82.2
(65.1)
26.4
(30.9) 47.4
62.7
(52.3)
78.7
(62.6)
75.4
(60.3)
37.7
(37.8)
54.8
(47.8)
18.3
(25.2) 54.6
General Mean 20.68 38.66 10.60 - 35.9 54.8 34.8 28.3 23.7 9.7 -
LSD @ 5% (P=0.05) 3.7 6.5 4.0 - 2.0 3.3 3.5 N/A 3.7 4.3 -
C.V. 9.2 9.6 14.9 - 3.6 4.7 5.6 13.8 8.8 16.5 -
Transformation AT AT AT - AT AT AT AT AT AT -
Disease pressure N N A - N N N N N A -
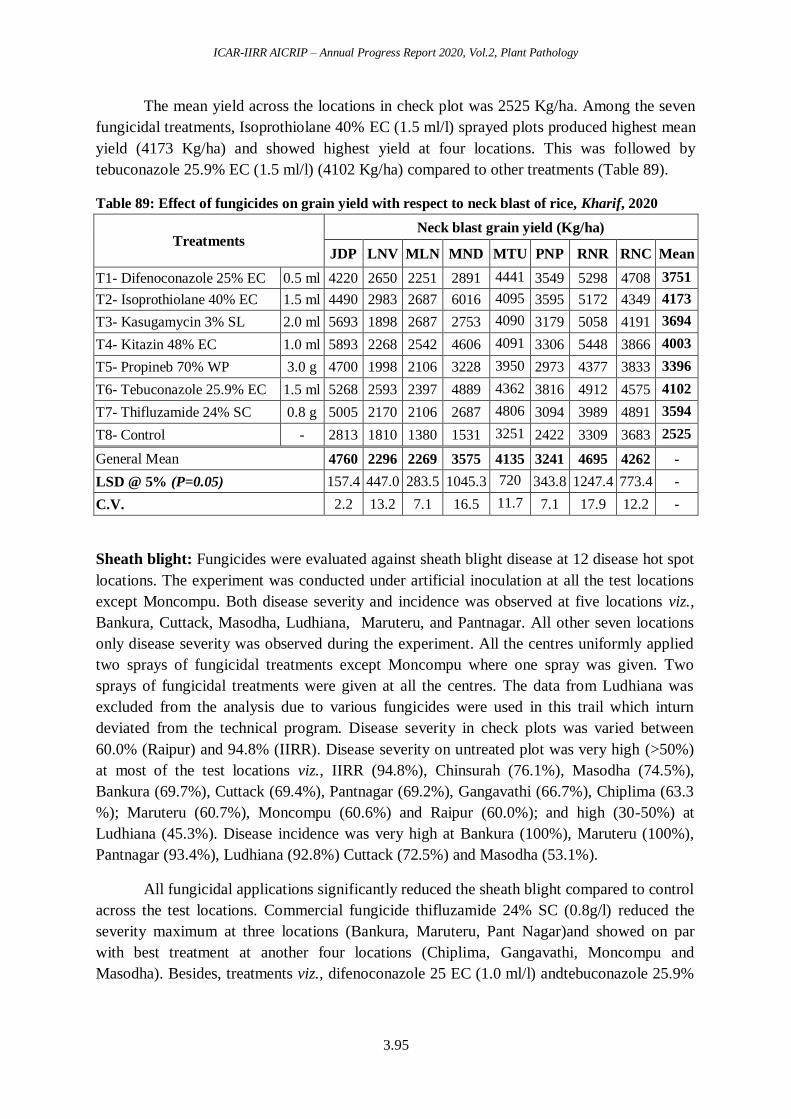
ICAR-IIRR AICRIP – Annual Progress Report 2020, Vol.2, Plant Pathology
3.95
The mean yield across the locations in check plot was 2525 Kg/ha. Among the seven
fungicidal treatments, Isoprothiolane 40% EC (1.5 ml/l) sprayed plots produced highest mean
yield (4173 Kg/ha) and showed highest yield at four locations. This was followed by
tebuconazole 25.9% EC (1.5 ml/l) (4102 Kg/ha) compared to other treatments (Table 89).
Table 89: Effect of fungicides on grain yield with respect to neck blast of rice, Kharif, 2020
Treatments Neck blast grain yield (Kg/ha)
JDP LNV MLN MND MTU PNP RNR RNC Mean
T1- Difenoconazole 25% EC 0.5 ml 4220 2650 2251 2891 4441 3549 5298 4708 3751
T2- Isoprothiolane 40% EC 1.5 ml 4490 2983 2687 6016 4095 3595 5172 4349 4173
T3- Kasugamycin 3% SL 2.0 ml 5693 1898 2687 2753 4090 3179 5058 4191 3694
T4- Kitazin 48% EC 1.0 ml 5893 2268 2542 4606 4091 3306 5448 3866 4003
T5- Propineb 70% WP 3.0 g 4700 1998 2106 3228 3950 2973 4377 3833 3396
T6- Tebuconazole 25.9% EC 1.5 ml 5268 2593 2397 4889 4362 3816 4912 4575 4102
T7- Thifluzamide 24% SC 0.8 g 5005 2170 2106 2687 4806 3094 3989 4891 3594
T8- Control - 2813 1810 1380 1531 3251 2422 3309 3683 2525
General Mean 4760 2296 2269 3575 4135 3241 4695 4262 -
LSD @ 5% (P=0.05) 157.4 447.0 283.5 1045.3 720 343.8 1247.4 773.4 -
C.V. 2.2 13.2 7.1 16.5 11.7 7.1 17.9 12.2 -
Sheath blight: Fungicides were evaluated against sheath blight disease at 12 disease hot spot
locations. The experiment was conducted under artificial inoculation at all the test locations
except Moncompu. Both disease severity and incidence was observed at five locations viz.,
Bankura, Cuttack, Masodha, Ludhiana, Maruteru, and Pantnagar. All other seven locations
only disease severity was observed during the experiment. All the centres uniformly applied
two sprays of fungicidal treatments except Moncompu where one spray was given. Two
sprays of fungicidal treatments were given at all the centres. The data from Ludhiana was
excluded from the analysis due to various fungicides were used in this trail which inturn
deviated from the technical program. Disease severity in check plots was varied between
60.0% (Raipur) and 94.8% (IIRR). Disease severity on untreated plot was very high (>50%)
at most of the test locations viz., IIRR (94.8%), Chinsurah (76.1%), Masodha (74.5%),
Bankura (69.7%), Cuttack (69.4%), Pantnagar (69.2%), Gangavathi (66.7%), Chiplima (63.3
%); Maruteru (60.7%), Moncompu (60.6%) and Raipur (60.0%); and high (30-50%) at
Ludhiana (45.3%). Disease incidence was very high at Bankura (100%), Maruteru (100%),
Pantnagar (93.4%), Ludhiana (92.8%) Cuttack (72.5%) and Masodha (53.1%).
All fungicidal applications significantly reduced the sheath blight compared to control
across the test locations. Commercial fungicide thifluzamide 24% SC (0.8g/l) reduced the
severity maximum at three locations (Bankura, Maruteru, Pant Nagar)and showed on par
with best treatment at another four locations (Chiplima, Gangavathi, Moncompu and
Masodha). Besides, treatments viz., difenoconazole 25 EC (1.0 ml/l) andtebuconazole 25.9%
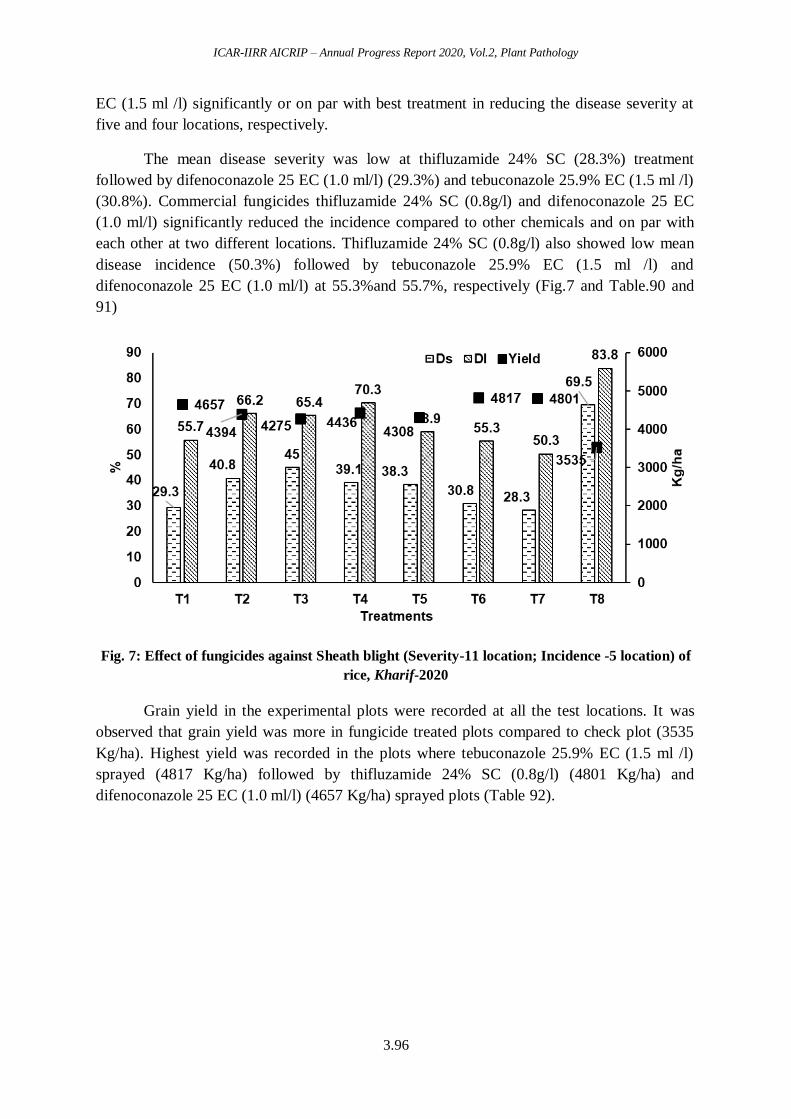
ICAR-IIRR AICRIP – Annual Progress Report 2020, Vol.2, Plant Pathology
3.96
EC (1.5 ml /l) significantly or on par with best treatment in reducing the disease severity at
five and four locations, respectively.
The mean disease severity was low at thifluzamide 24% SC (28.3%) treatment
followed by difenoconazole 25 EC (1.0 ml/l) (29.3%) and tebuconazole 25.9% EC (1.5 ml /l)
(30.8%). Commercial fungicides thifluzamide 24% SC (0.8g/l) and difenoconazole 25 EC
(1.0 ml/l) significantly reduced the incidence compared to other chemicals and on par with
each other at two different locations. Thifluzamide 24% SC (0.8g/l) also showed low mean
disease incidence (50.3%) followed by tebuconazole 25.9% EC (1.5 ml /l) and
difenoconazole 25 EC (1.0 ml/l) at 55.3%and 55.7%, respectively (Fig.7 and Table.90 and
91)
Fig. 7: Effect of fungicides against Sheath blight (Severity-11 location; Incidence -5 location) of
rice, Kharif-2020
Grain yield in the experimental plots were recorded at all the test locations. It was
observed that grain yield was more in fungicide treated plots compared to check plot (3535
Kg/ha). Highest yield was recorded in the plots where tebuconazole 25.9% EC (1.5 ml /l)
sprayed (4817 Kg/ha) followed by thifluzamide 24% SC (0.8g/l) (4801 Kg/ha) and
difenoconazole 25 EC (1.0 ml/l) (4657 Kg/ha) sprayed plots (Table 92).
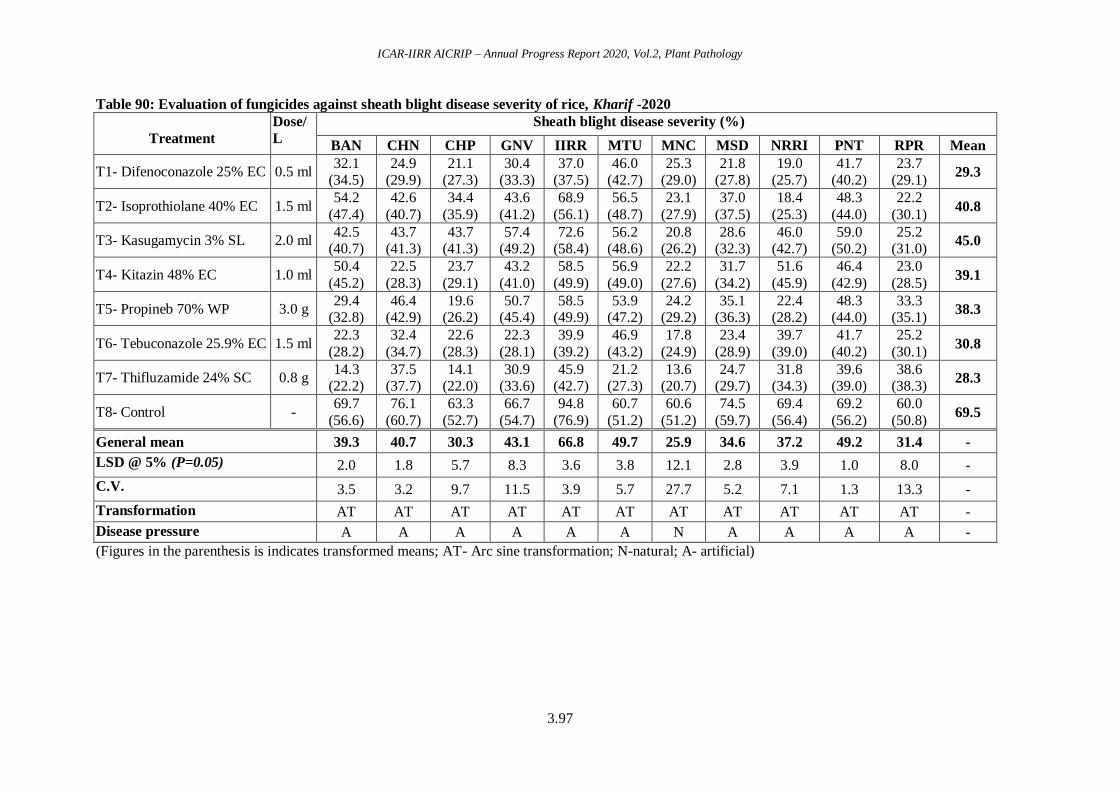
ICAR-IIRR AICRIP – Annual Progress Report 2020, Vol.2, Plant Pathology
3.97
Table 90: Evaluation of fungicides against sheath blight disease severity of rice, Kharif -2020
Treatment
Dose/
L
Sheath blight disease severity (%)
BAN CHN CHP GNV IIRR MTU MNC MSD NRRI PNT RPR Mean
T1- Difenoconazole 25% EC 0.5 ml 32.1
(34.5) 24.9
(29.9) 21.1
(27.3) 30.4
(33.3) 37.0
(37.5) 46.0
(42.7) 25.3
(29.0) 21.8
(27.8) 19.0
(25.7) 41.7
(40.2) 23.7
(29.1) 29.3
T2- Isoprothiolane 40% EC 1.5 ml 54.2
(47.4)
42.6
(40.7)
34.4
(35.9)
43.6
(41.2)
68.9
(56.1)
56.5
(48.7)
23.1
(27.9)
37.0
(37.5)
18.4
(25.3)
48.3
(44.0)
22.2
(30.1) 40.8
T3- Kasugamycin 3% SL 2.0 ml 42.5
(40.7) 43.7
(41.3) 43.7
(41.3) 57.4
(49.2) 72.6
(58.4) 56.2
(48.6) 20.8
(26.2) 28.6
(32.3) 46.0
(42.7) 59.0
(50.2) 25.2
(31.0) 45.0
T4- Kitazin 48% EC 1.0 ml 50.4
(45.2)
22.5
(28.3)
23.7
(29.1)
43.2
(41.0)
58.5
(49.9)
56.9
(49.0)
22.2
(27.6)
31.7
(34.2)
51.6
(45.9)
46.4
(42.9)
23.0
(28.5) 39.1
T5- Propineb 70% WP 3.0 g 29.4
(32.8) 46.4
(42.9) 19.6
(26.2) 50.7
(45.4) 58.5
(49.9) 53.9
(47.2) 24.2
(29.2) 35.1
(36.3) 22.4
(28.2) 48.3
(44.0) 33.3
(35.1) 38.3
T6- Tebuconazole 25.9% EC 1.5 ml 22.3
(28.2)
32.4
(34.7)
22.6
(28.3)
22.3
(28.1)
39.9
(39.2)
46.9
(43.2)
17.8
(24.9)
23.4
(28.9)
39.7
(39.0)
41.7
(40.2)
25.2
(30.1) 30.8
T7- Thifluzamide 24% SC 0.8 g 14.3
(22.2) 37.5
(37.7) 14.1
(22.0) 30.9
(33.6) 45.9
(42.7) 21.2
(27.3) 13.6
(20.7) 24.7
(29.7) 31.8
(34.3) 39.6
(39.0) 38.6
(38.3) 28.3
T8- Control - 69.7
(56.6)
76.1
(60.7)
63.3
(52.7)
66.7
(54.7)
94.8
(76.9)
60.7
(51.2)
60.6
(51.2)
74.5
(59.7)
69.4
(56.4)
69.2
(56.2)
60.0
(50.8) 69.5
General mean 39.3 40.7 30.3 43.1 66.8 49.7 25.9 34.6 37.2 49.2 31.4 -
LSD @ 5% (P=0.05) 2.0 1.8 5.7 8.3 3.6 3.8 12.1 2.8 3.9 1.0 8.0 -
C.V. 3.5 3.2 9.7 11.5 3.9 5.7 27.7 5.2 7.1 1.3 13.3 -
Transformation AT AT AT AT AT AT AT AT AT AT AT -
Disease pressure A A A A A A N A A A A -
(Figures in the parenthesis is indicates transformed means; AT- Arc sine transformation; N-natural; A- artificial)
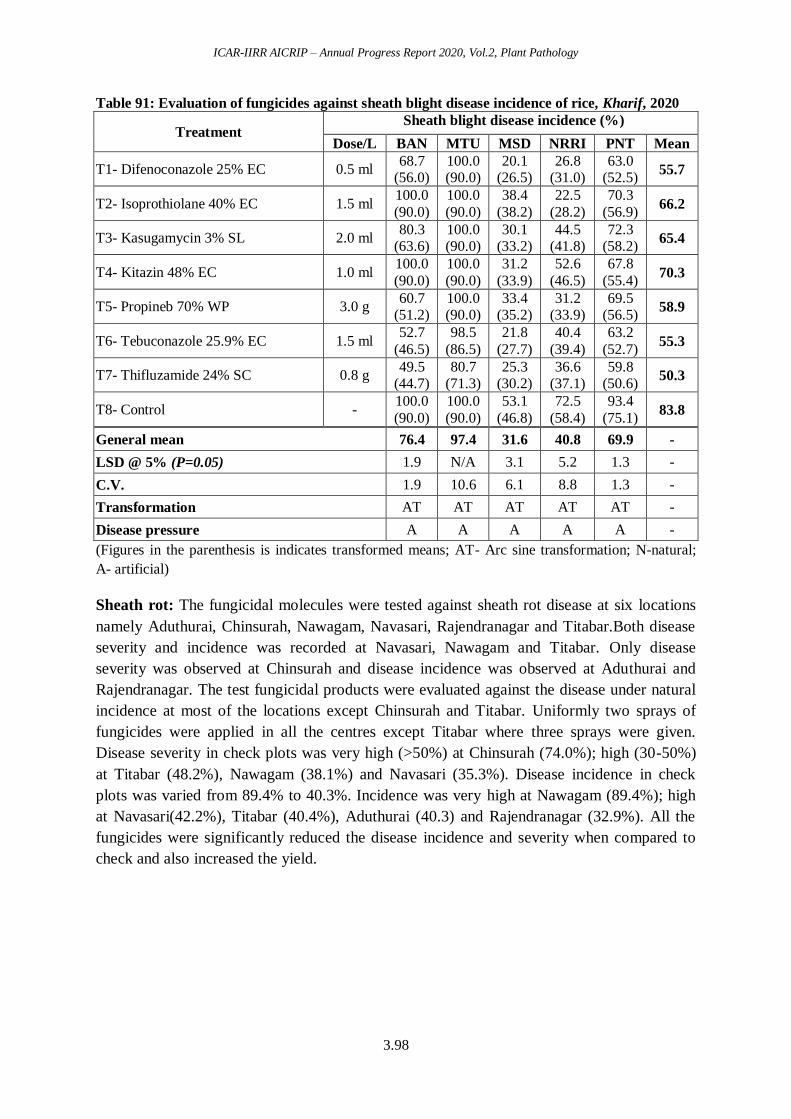
ICAR-IIRR AICRIP – Annual Progress Report 2020, Vol.2, Plant Pathology
3.98
Table 91: Evaluation of fungicides against sheath blight disease incidence of rice, Kharif, 2020
Treatment Sheath blight disease incidence (%)
Dose/L BAN MTU MSD NRRI PNT Mean
T1- Difenoconazole 25% EC 0.5 ml 68.7
(56.0) 100.0 (90.0)
20.1 (26.5)
26.8 (31.0)
63.0 (52.5)
55.7
T2- Isoprothiolane 40% EC 1.5 ml 100.0
(90.0)
100.0
(90.0)
38.4
(38.2)
22.5
(28.2)
70.3
(56.9) 66.2
T3- Kasugamycin 3% SL 2.0 ml 80.3
(63.6) 100.0 (90.0)
30.1 (33.2)
44.5 (41.8)
72.3 (58.2)
65.4
T4- Kitazin 48% EC 1.0 ml 100.0
(90.0)
100.0
(90.0)
31.2
(33.9)
52.6
(46.5)
67.8
(55.4) 70.3
T5- Propineb 70% WP 3.0 g 60.7
(51.2) 100.0 (90.0)
33.4 (35.2)
31.2 (33.9)
69.5 (56.5)
58.9
T6- Tebuconazole 25.9% EC 1.5 ml 52.7
(46.5)
98.5
(86.5)
21.8
(27.7)
40.4
(39.4)
63.2
(52.7) 55.3
T7- Thifluzamide 24% SC 0.8 g 49.5
(44.7) 80.7
(71.3) 25.3
(30.2) 36.6
(37.1) 59.8
(50.6) 50.3
T8- Control - 100.0
(90.0)
100.0
(90.0)
53.1
(46.8)
72.5
(58.4)
93.4
(75.1) 83.8
General mean 76.4 97.4 31.6 40.8 69.9 -
LSD @ 5% (P=0.05) 1.9 N/A 3.1 5.2 1.3 -
C.V. 1.9 10.6 6.1 8.8 1.3 -
Transformation AT AT AT AT AT -
Disease pressure A A A A A -
(Figures in the parenthesis is indicates transformed means; AT- Arc sine transformation; N-natural;
A- artificial)
Sheath rot: The fungicidal molecules were tested against sheath rot disease at six locations
namely Aduthurai, Chinsurah, Nawagam, Navasari, Rajendranagar and Titabar.Both disease
severity and incidence was recorded at Navasari, Nawagam and Titabar. Only disease
severity was observed at Chinsurah and disease incidence was observed at Aduthurai and
Rajendranagar. The test fungicidal products were evaluated against the disease under natural
incidence at most of the locations except Chinsurah and Titabar. Uniformly two sprays of
fungicides were applied in all the centres except Titabar where three sprays were given.
Disease severity in check plots was very high (>50%) at Chinsurah (74.0%); high (30-50%)
at Titabar (48.2%), Nawagam (38.1%) and Navasari (35.3%). Disease incidence in check
plots was varied from 89.4% to 40.3%. Incidence was very high at Nawagam (89.4%); high
at Navasari(42.2%), Titabar (40.4%), Aduthurai (40.3) and Rajendranagar (32.9%). All the
fungicides were significantly reduced the disease incidence and severity when compared to
check and also increased the yield.
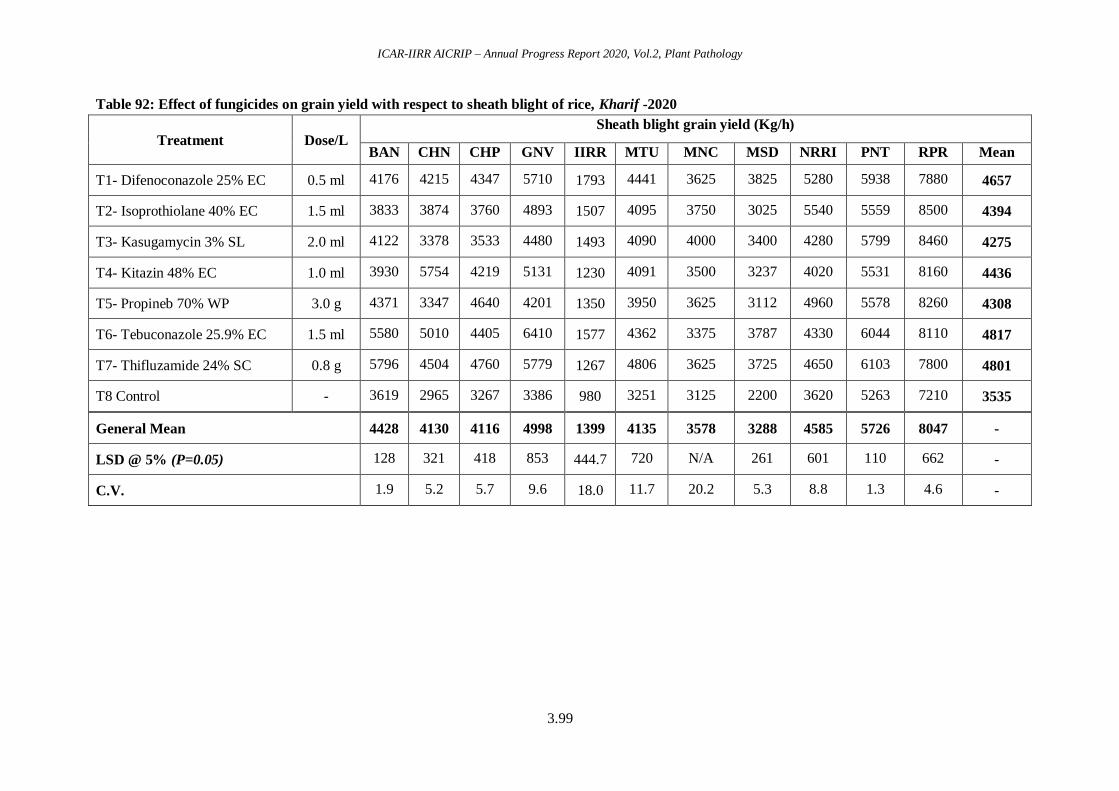
ICAR-IIRR AICRIP – Annual Progress Report 2020, Vol.2, Plant Pathology
3.99
Table 92: Effect of fungicides on grain yield with respect to sheath blight of rice, Kharif -2020
Treatment Dose/L Sheath blight grain yield (Kg/h)
BAN CHN CHP GNV IIRR MTU MNC MSD NRRI PNT RPR Mean
T1- Difenoconazole 25% EC 0.5 ml 4176 4215 4347 5710 1793 4441 3625 3825 5280 5938 7880 4657
T2- Isoprothiolane 40% EC 1.5 ml 3833 3874 3760 4893 1507 4095 3750 3025 5540 5559 8500 4394
T3- Kasugamycin 3% SL 2.0 ml 4122 3378 3533 4480 1493 4090 4000 3400 4280 5799 8460 4275
T4- Kitazin 48% EC 1.0 ml 3930 5754 4219 5131 1230 4091 3500 3237 4020 5531 8160 4436
T5- Propineb 70% WP 3.0 g 4371 3347 4640 4201 1350 3950 3625 3112 4960 5578 8260 4308
T6- Tebuconazole 25.9% EC 1.5 ml 5580 5010 4405 6410 1577 4362 3375 3787 4330 6044 8110 4817
T7- Thifluzamide 24% SC 0.8 g 5796 4504 4760 5779 1267 4806 3625 3725 4650 6103 7800 4801
T8 Control - 3619 2965 3267 3386 980 3251 3125 2200 3620 5263 7210 3535
General Mean 4428 4130 4116 4998 1399 4135 3578 3288 4585 5726 8047 -
LSD @ 5% (P=0.05) 128 321 418 853 444.7 720 N/A 261 601 110 662 -
C.V. 1.9 5.2 5.7 9.6 18.0 11.7 20.2 5.3 8.8 1.3 4.6 -
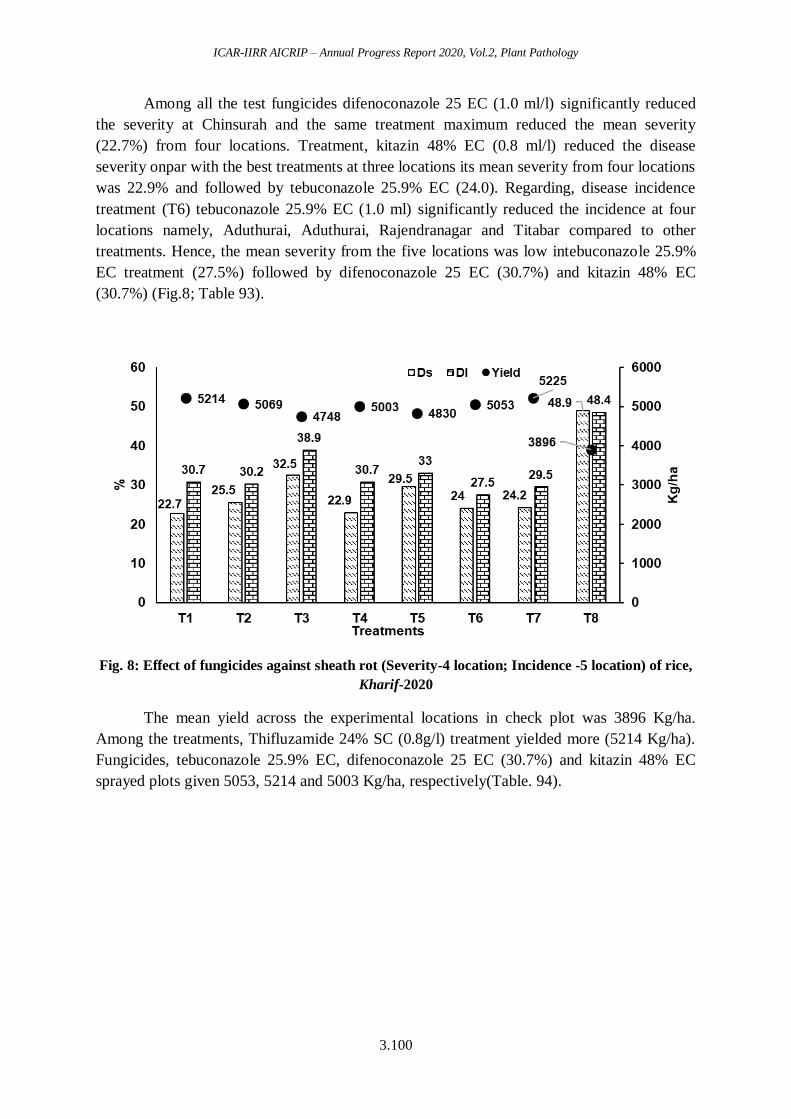
ICAR-IIRR AICRIP – Annual Progress Report 2020, Vol.2, Plant Pathology
3.100
Among all the test fungicides difenoconazole 25 EC (1.0 ml/l) significantly reduced
the severity at Chinsurah and the same treatment maximum reduced the mean severity
(22.7%) from four locations. Treatment, kitazin 48% EC (0.8 ml/l) reduced the disease
severity onpar with the best treatments at three locations its mean severity from four locations
was 22.9% and followed by tebuconazole 25.9% EC (24.0). Regarding, disease incidence
treatment (T6) tebuconazole 25.9% EC (1.0 ml) significantly reduced the incidence at four
locations namely, Aduthurai, Aduthurai, Rajendranagar and Titabar compared to other
treatments. Hence, the mean severity from the five locations was low intebuconazole 25.9%
EC treatment (27.5%) followed by difenoconazole 25 EC (30.7%) and kitazin 48% EC
(30.7%) (Fig.8; Table 93).
Fig. 8: Effect of fungicides against sheath rot (Severity-4 location; Incidence -5 location) of rice,
Kharif-2020
The mean yield across the experimental locations in check plot was 3896 Kg/ha.
Among the treatments, Thifluzamide 24% SC (0.8g/l) treatment yielded more (5214 Kg/ha).
Fungicides, tebuconazole 25.9% EC, difenoconazole 25 EC (30.7%) and kitazin 48% EC
sprayed plots given 5053, 5214 and 5003 Kg/ha, respectively(Table. 94).
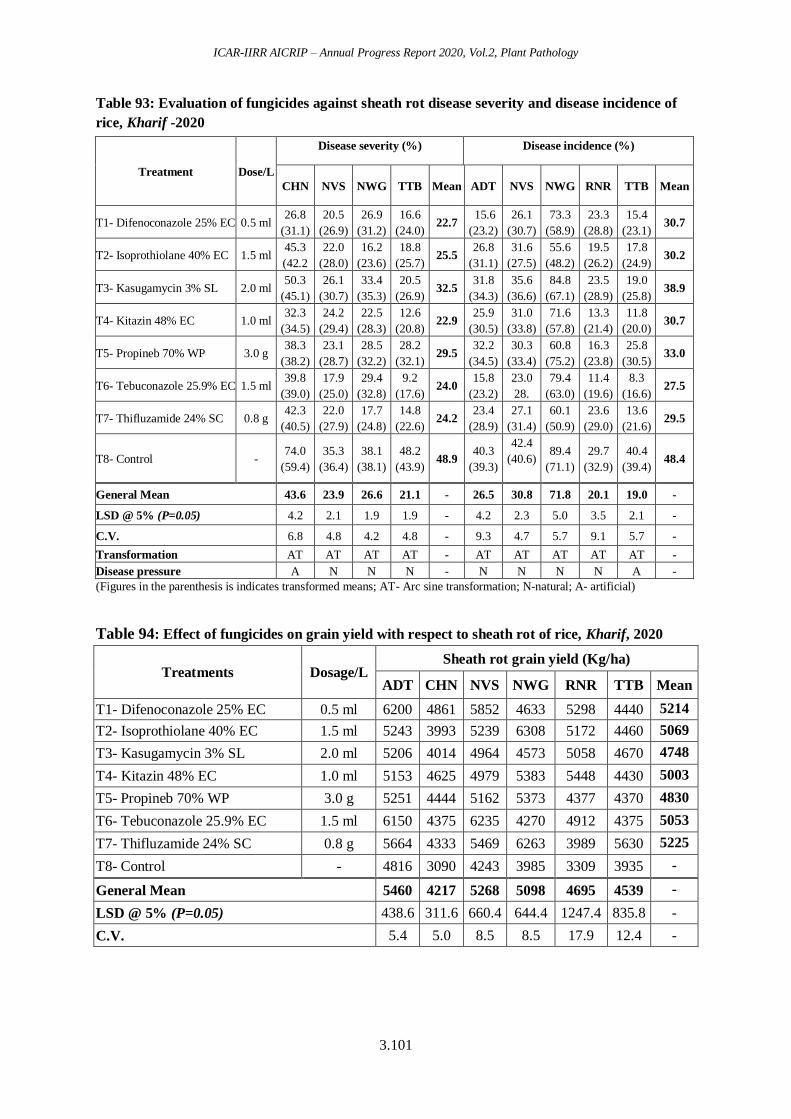
ICAR-IIRR AICRIP – Annual Progress Report 2020, Vol.2, Plant Pathology
3.101
Table 93: Evaluation of fungicides against sheath rot disease severity and disease incidence of
rice, Kharif -2020
(Figures in the parenthesis is indicates transformed means; AT- Arc sine transformation; N-natural; A- artificial)
Table 94: Effect of fungicides on grain yield with respect to sheath rot of rice, Kharif, 2020
Treatments Dosage/L Sheath rot grain yield (Kg/ha)
ADT CHN NVS NWG RNR TTB Mean
T1- Difenoconazole 25% EC 0.5 ml 6200 4861 5852 4633 5298 4440 5214
T2- Isoprothiolane 40% EC 1.5 ml 5243 3993 5239 6308 5172 4460 5069
T3- Kasugamycin 3% SL 2.0 ml 5206 4014 4964 4573 5058 4670 4748
T4- Kitazin 48% EC 1.0 ml 5153 4625 4979 5383 5448 4430 5003
T5- Propineb 70% WP 3.0 g 5251 4444 5162 5373 4377 4370 4830
T6- Tebuconazole 25.9% EC 1.5 ml 6150 4375 6235 4270 4912 4375 5053
T7- Thifluzamide 24% SC 0.8 g 5664 4333 5469 6263 3989 5630 5225
T8- Control - 4816 3090 4243 3985 3309 3935 -
General Mean 5460 4217 5268 5098 4695 4539 -
LSD @ 5% (P=0.05) 438.6 311.6 660.4 644.4 1247.4 835.8 -
C.V. 5.4 5.0 8.5 8.5 17.9 12.4 -
Treatment Dose/L
Disease severity (%) Disease incidence (%)
CHN NVS NWG TTB Mean ADT NVS NWG RNR TTB Mean
T1- Difenoconazole 25% EC 0.5 ml 26.8
(31.1)
20.5
(26.9)
26.9
(31.2)
16.6
(24.0) 22.7
15.6
(23.2)
26.1
(30.7)
73.3
(58.9)
23.3
(28.8)
15.4
(23.1) 30.7
T2- Isoprothiolane 40% EC 1.5 ml 45.3
(42.2
22.0
(28.0)
16.2
(23.6)
18.8
(25.7) 25.5
26.8
(31.1)
31.6
(27.5)
55.6
(48.2)
19.5
(26.2)
17.8
(24.9) 30.2
T3- Kasugamycin 3% SL 2.0 ml 50.3
(45.1)
26.1
(30.7)
33.4
(35.3)
20.5
(26.9) 32.5
31.8
(34.3)
35.6
(36.6)
84.8
(67.1)
23.5
(28.9)
19.0
(25.8) 38.9
T4- Kitazin 48% EC 1.0 ml 32.3
(34.5)
24.2
(29.4)
22.5
(28.3)
12.6
(20.8) 22.9
25.9
(30.5)
31.0
(33.8)
71.6
(57.8)
13.3
(21.4)
11.8
(20.0) 30.7
T5- Propineb 70% WP 3.0 g 38.3
(38.2)
23.1
(28.7)
28.5
(32.2)
28.2
(32.1) 29.5
32.2
(34.5)
30.3
(33.4)
60.8
(75.2)
16.3
(23.8)
25.8
(30.5) 33.0
T6- Tebuconazole 25.9% EC 1.5 ml 39.8
(39.0)
17.9
(25.0)
29.4
(32.8)
9.2
(17.6) 24.0
15.8
(23.2)
23.0
28.
79.4
(63.0)
11.4
(19.6)
8.3
(16.6) 27.5
T7- Thifluzamide 24% SC 0.8 g 42.3
(40.5)
22.0
(27.9)
17.7
(24.8)
14.8
(22.6) 24.2
23.4
(28.9)
27.1
(31.4)
60.1
(50.9)
23.6
(29.0)
13.6
(21.6) 29.5
T8- Control - 74.0
(59.4)
35.3
(36.4)
38.1
(38.1)
48.2
(43.9) 48.9
40.3
(39.3)
42.4
(40.6)
89.4
(71.1)
29.7
(32.9)
40.4
(39.4) 48.4
General Mean 43.6 23.9 26.6 21.1 - 26.5 30.8 71.8 20.1 19.0 -
LSD @ 5% (P=0.05) 4.2 2.1 1.9 1.9 - 4.2 2.3 5.0 3.5 2.1 -
C.V. 6.8 4.8 4.2 4.8 - 9.3 4.7 5.7 9.1 5.7 -
Transformation AT AT AT AT - AT AT AT AT AT -
Disease pressure A N N N - N N N N A -
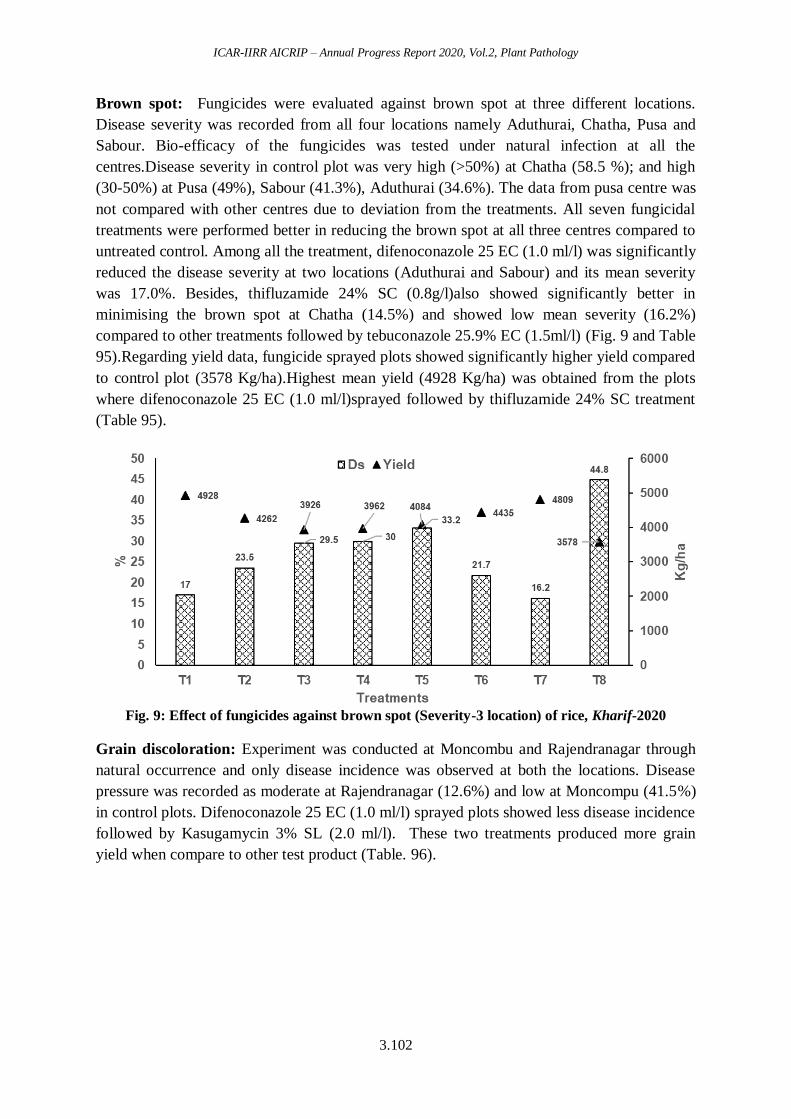
ICAR-IIRR AICRIP – Annual Progress Report 2020, Vol.2, Plant Pathology
3.102
Brown spot: Fungicides were evaluated against brown spot at three different locations.
Disease severity was recorded from all four locations namely Aduthurai, Chatha, Pusa and
Sabour. Bio-efficacy of the fungicides was tested under natural infection at all the
centres.Disease severity in control plot was very high (>50%) at Chatha (58.5 %); and high
(30-50%) at Pusa (49%), Sabour (41.3%), Aduthurai (34.6%). The data from pusa centre was
not compared with other centres due to deviation from the treatments. All seven fungicidal
treatments were performed better in reducing the brown spot at all three centres compared to
untreated control. Among all the treatment, difenoconazole 25 EC (1.0 ml/l) was significantly
reduced the disease severity at two locations (Aduthurai and Sabour) and its mean severity
was 17.0%. Besides, thifluzamide 24% SC (0.8g/l)also showed significantly better in
minimising the brown spot at Chatha (14.5%) and showed low mean severity (16.2%)
compared to other treatments followed by tebuconazole 25.9% EC (1.5ml/l) (Fig. 9 and Table
95).Regarding yield data, fungicide sprayed plots showed significantly higher yield compared
to control plot (3578 Kg/ha).Highest mean yield (4928 Kg/ha) was obtained from the plots
where difenoconazole 25 EC (1.0 ml/l)sprayed followed by thifluzamide 24% SC treatment
(Table 95).
Fig. 9: Effect of fungicides against brown spot (Severity-3 location) of rice, Kharif-2020
Grain discoloration: Experiment was conducted at Moncombu and Rajendranagar through
natural occurrence and only disease incidence was observed at both the locations. Disease
pressure was recorded as moderate at Rajendranagar (12.6%) and low at Moncompu (41.5%)
in control plots. Difenoconazole 25 EC (1.0 ml/l) sprayed plots showed less disease incidence
followed by Kasugamycin 3% SL (2.0 ml/l). These two treatments produced more grain
yield when compare to other test product (Table. 96).
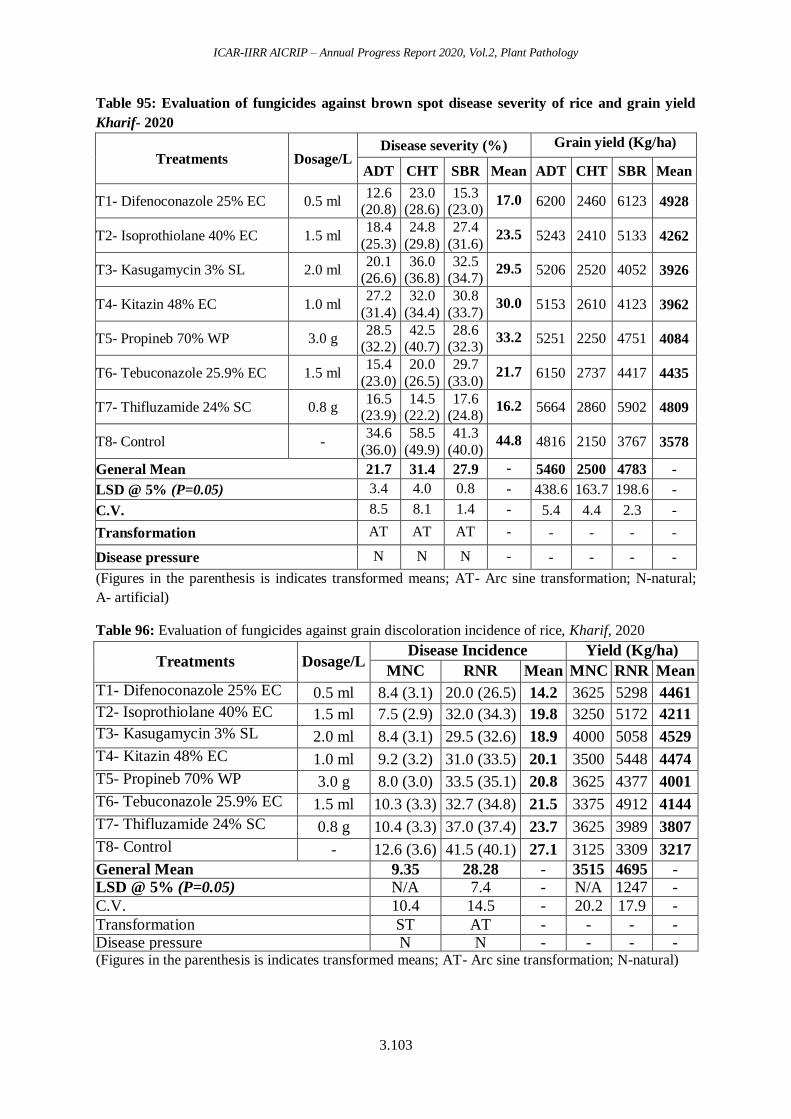
ICAR-IIRR AICRIP – Annual Progress Report 2020, Vol.2, Plant Pathology
3.103
Table 95: Evaluation of fungicides against brown spot disease severity of rice and grain yield
Kharif- 2020
Treatments Dosage/L Disease severity (%) Grain yield (Kg/ha)
ADT CHT SBR Mean ADT CHT SBR Mean
T1- Difenoconazole 25% EC 0.5 ml 12.6
(20.8) 23.0
(28.6) 15.3
(23.0) 17.0 6200 2460 6123 4928
T2- Isoprothiolane 40% EC 1.5 ml 18.4
(25.3)
24.8
(29.8)
27.4
(31.6) 23.5 5243 2410 5133 4262
T3- Kasugamycin 3% SL 2.0 ml 20.1
(26.6) 36.0
(36.8) 32.5
(34.7) 29.5 5206 2520 4052 3926
T4- Kitazin 48% EC 1.0 ml 27.2
(31.4)
32.0
(34.4)
30.8
(33.7) 30.0 5153 2610 4123 3962
T5- Propineb 70% WP 3.0 g 28.5
(32.2) 42.5
(40.7) 28.6
(32.3) 33.2 5251 2250 4751 4084
T6- Tebuconazole 25.9% EC 1.5 ml 15.4
(23.0)
20.0
(26.5)
29.7
(33.0) 21.7 6150 2737 4417 4435
T7- Thifluzamide 24% SC 0.8 g 16.5
(23.9) 14.5
(22.2) 17.6
(24.8) 16.2 5664 2860 5902 4809
T8- Control - 34.6
(36.0)
58.5
(49.9)
41.3
(40.0) 44.8 4816 2150 3767 3578
General Mean 21.7 31.4 27.9 - 5460 2500 4783 -
LSD @ 5% (P=0.05) 3.4 4.0 0.8 - 438.6 163.7 198.6 -
C.V. 8.5 8.1 1.4 - 5.4 4.4 2.3 -
Transformation AT AT AT - - - - -
Disease pressure N N N - - - - -
(Figures in the parenthesis is indicates transformed means; AT- Arc sine transformation; N-natural;
A- artificial)
Table 96: Evaluation of fungicides against grain discoloration incidence of rice, Kharif, 2020
Treatments Dosage/L Disease Incidence Yield (Kg/ha)
MNC RNR Mean MNC RNR Mean
T1- Difenoconazole 25% EC 0.5 ml 8.4 (3.1) 20.0 (26.5) 14.2 3625 5298 4461
T2- Isoprothiolane 40% EC 1.5 ml 7.5 (2.9) 32.0 (34.3) 19.8 3250 5172 4211
T3- Kasugamycin 3% SL 2.0 ml 8.4 (3.1) 29.5 (32.6) 18.9 4000 5058 4529
T4- Kitazin 48% EC 1.0 ml 9.2 (3.2) 31.0 (33.5) 20.1 3500 5448 4474
T5- Propineb 70% WP 3.0 g 8.0 (3.0) 33.5 (35.1) 20.8 3625 4377 4001
T6- Tebuconazole 25.9% EC 1.5 ml 10.3 (3.3) 32.7 (34.8) 21.5 3375 4912 4144
T7- Thifluzamide 24% SC 0.8 g 10.4 (3.3) 37.0 (37.4) 23.7 3625 3989 3807
T8- Control - 12.6 (3.6) 41.5 (40.1) 27.1 3125 3309 3217
General Mean 9.35 28.28 - 3515 4695 -
LSD @ 5% (P=0.05) N/A 7.4 - N/A 1247 -
C.V. 10.4 14.5 - 20.2 17.9 -
Transformation ST AT - - - - Disease pressure N N - - - - (Figures in the parenthesis is indicates transformed means; AT- Arc sine transformation; N-natural)
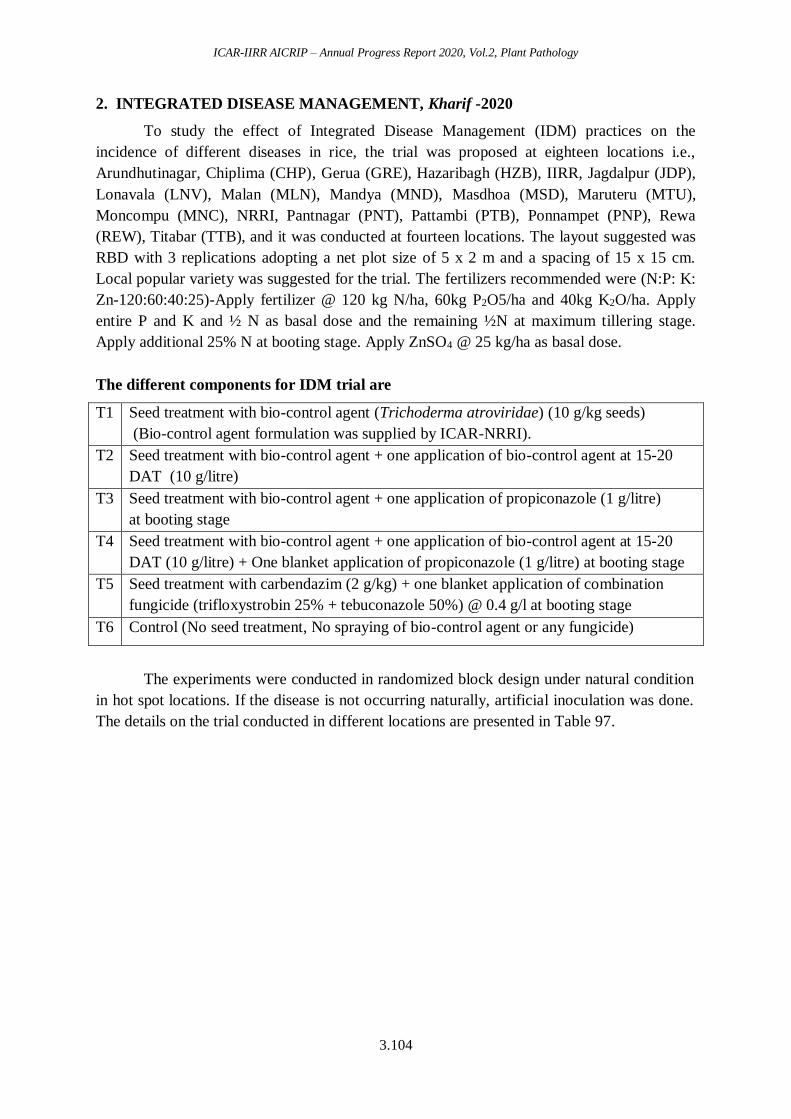
ICAR-IIRR AICRIP – Annual Progress Report 2020, Vol.2, Plant Pathology
3.104
2. INTEGRATED DISEASE MANAGEMENT, Kharif -2020
To study the effect of Integrated Disease Management (IDM) practices on the
incidence of different diseases in rice, the trial was proposed at eighteen locations i.e.,
Arundhutinagar, Chiplima (CHP), Gerua (GRE), Hazaribagh (HZB), IIRR, Jagdalpur (JDP),
Lonavala (LNV), Malan (MLN), Mandya (MND), Masdhoa (MSD), Maruteru (MTU),
Moncompu (MNC), NRRI, Pantnagar (PNT), Pattambi (PTB), Ponnampet (PNP), Rewa
(REW), Titabar (TTB), and it was conducted at fourteen locations. The layout suggested was
RBD with 3 replications adopting a net plot size of 5 x 2 m and a spacing of 15 x 15 cm.
Local popular variety was suggested for the trial. The fertilizers recommended were (N:P: K:
Zn-120:60:40:25)-Apply fertilizer @ 120 kg N/ha, 60kg P2O5/ha and 40kg K2O/ha. Apply
entire P and K and ½ N as basal dose and the remaining ½N at maximum tillering stage.
Apply additional 25% N at booting stage. Apply ZnSO4 @ 25 kg/ha as basal dose.
The different components for IDM trial are
T1 Seed treatment with bio-control agent (Trichoderma atroviridae) (10 g/kg seeds)
(Bio-control agent formulation was supplied by ICAR-NRRI).
T2 Seed treatment with bio-control agent + one application of bio-control agent at 15-20
DAT (10 g/litre)
T3 Seed treatment with bio-control agent + one application of propiconazole (1 g/litre)
at booting stage
T4 Seed treatment with bio-control agent + one application of bio-control agent at 15-20
DAT (10 g/litre) + One blanket application of propiconazole (1 g/litre) at booting stage
T5 Seed treatment with carbendazim (2 g/kg) + one blanket application of combination
fungicide (trifloxystrobin 25% + tebuconazole 50%) @ 0.4 g/l at booting stage
T6 Control (No seed treatment, No spraying of bio-control agent or any fungicide)
The experiments were conducted in randomized block design under natural condition
in hot spot locations. If the disease is not occurring naturally, artificial inoculation was done.
The details on the trial conducted in different locations are presented in Table 97.
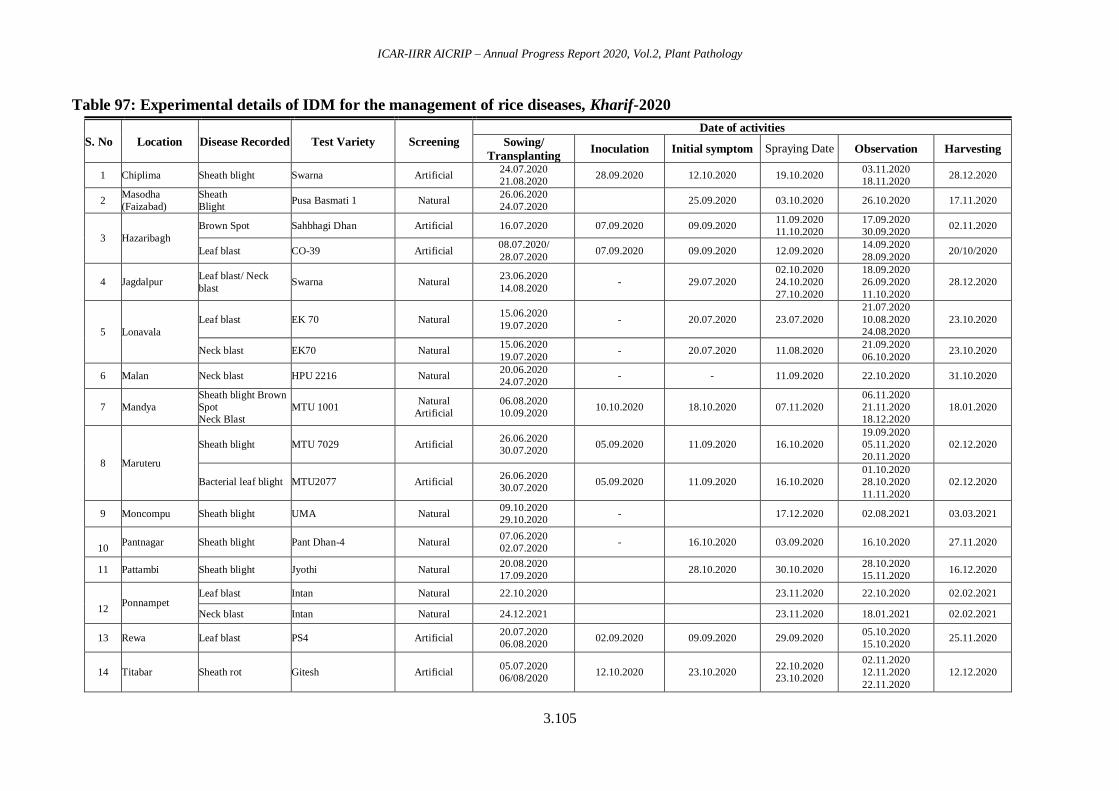
ICAR-IIRR AICRIP – Annual Progress Report 2020, Vol.2, Plant Pathology
3.105
Table 97: Experimental details of IDM for the management of rice diseases, Kharif-2020
S. No Location Disease Recorded Test Variety Screening
Date of activities
Sowing/
Transplanting Inoculation Initial symptom Spraying Date Observation Harvesting
1 Chiplima Sheath blight Swarna Artificial 24.07.2020
21.08.2020 28.09.2020 12.10.2020 19.10.2020
03.11.2020
18.11.2020 28.12.2020
2 Masodha
(Faizabad)
Sheath
Blight Pusa Basmati 1 Natural
26.06.2020
24.07.2020 25.09.2020 03.10.2020 26.10.2020 17.11.2020
3 Hazaribagh
Brown Spot Sahbhagi Dhan Artificial 16.07.2020 07.09.2020 09.09.2020 11.09.2020
11.10.2020
17.09.2020
30.09.2020 02.11.2020
Leaf blast CO-39 Artificial 08.07.2020/
28.07.2020 07.09.2020 09.09.2020 12.09.2020
14.09.2020
28.09.2020 20/10/2020
4 Jagdalpur Leaf blast/ Neck
blast Swarna Natural
23.06.2020
14.08.2020 - 29.07.2020
02.10.2020
24.10.2020
27.10.2020
18.09.2020
26.09.2020
11.10.2020
28.12.2020
5 Lonavala
Leaf blast EK 70 Natural 15.06.2020
19.07.2020 - 20.07.2020 23.07.2020
21.07.2020
10.08.2020
24.08.2020
23.10.2020
Neck blast EK70 Natural 15.06.2020
19.07.2020 - 20.07.2020 11.08.2020
21.09.2020
06.10.2020 23.10.2020
6 Malan Neck blast HPU 2216 Natural 20.06.2020
24.07.2020 - - 11.09.2020 22.10.2020 31.10.2020
7 Mandya
Sheath blight Brown
Spot
Neck Blast
MTU 1001 Natural
Artificial
06.08.2020
10.09.2020 10.10.2020 18.10.2020 07.11.2020
06.11.2020
21.11.2020
18.12.2020
18.01.2020
8 Maruteru
Sheath blight MTU 7029 Artificial 26.06.2020
30.07.2020 05.09.2020 11.09.2020 16.10.2020
19.09.2020
05.11.2020
20.11.2020
02.12.2020
Bacterial leaf blight MTU2077 Artificial 26.06.2020
30.07.2020 05.09.2020 11.09.2020 16.10.2020
01.10.2020
28.10.2020
11.11.2020
02.12.2020
9 Moncompu Sheath blight UMA Natural 09.10.2020
29.10.2020 - 17.12.2020 02.08.2021 03.03.2021
10 Pantnagar Sheath blight Pant Dhan-4 Natural
07.06.2020
02.07.2020 - 16.10.2020 03.09.2020 16.10.2020 27.11.2020
11 Pattambi Sheath blight Jyothi Natural 20.08.2020
17.09.2020
28.10.2020 30.10.2020
28.10.2020
15.11.2020 16.12.2020
12 Ponnampet
Leaf blast Intan Natural 22.10.2020 23.11.2020 22.10.2020 02.02.2021
Neck blast Intan Natural 24.12.2021 23.11.2020 18.01.2021 02.02.2021
13 Rewa Leaf blast PS4 Artificial 20.07.2020
06.08.2020 02.09.2020 09.09.2020 29.09.2020
05.10.2020
15.10.2020 25.11.2020
14 Titabar Sheath rot Gitesh Artificial 05.07.2020
06/08/2020 12.10.2020 23.10.2020
22.10.2020
23.10.2020
02.11.2020
12.11.2020
22.11.2020
12.12.2020
ICAR-IIRR AICRIP – Annual Progress Report 2020, Vol.2, Plant Pathology
3.106
Effect of integrated management practices against severity of leaf blast of rice - Kharif,
2020
Jagdalpur, Hazaribagh, Lonavala, Ponnampet and Rewa centres conducted the study
to analyze the effects of the IDM treatments on the disease severity of leaf blast in rice.
Among the three centres tested (Table 97 a & b), Jagdalpur showed maximum disease
severity (75% DS) in control followed by Hazaribagh (73.53% DS), PNP (58.94% DS), LNV
(49% DS) and Rewa (21.5% DS). Among the different treatments, the seed treatment with
carbendazim (2 g/kg) + one blanket application of combination fungicide (Trifloxystrobin
25% + Tebuconazole 50%) @ 0.4 g/l at booting stage (T5) was found to be very effective,
giving the maximum reduction percentage disease (83.67% DS, Lonavala and 83.04%
Hazaribagh) and increase in grain yield (97.92% Hazaribagh and 92.98% Lonavala) over
control. Seed treatment with Trichoderma followed by application of propiconazole at
booting stage (T4) was found to be effective followed by the chemical alone treatment T5,
(72.94% decrease over control and 82.22% increase of grain yield over control in HZB). Two
applications of biocontrol agent viz., seed treatment with biocontrol agent alone @10g/kg of
seeds followed by application at 15-20DAT (T2) gave good control of the disease and
increase in grain yield viz., 54.37% decrease in disease over control and 52.1972 % increase
of grain yield over control in HZB, The seed treatment with biocontrol agent alone @10g/kg
of seeds gave a fairly good control of the disease in PNP viz., 50.24% decrease in disease
over control and 35.72 % increase of grain yield over control(Table 98 a & b).
Effect of integrated management practices against severity of neck blast and grain yield
at different locations - Kharif, 2020
Five centres viz., Malan, Jagdalpur, Ponnampet, Lonavala and Mandya conducted
IDM trials to study the effect of the bio-agents along with chemicals for the management of
neck blast disease in rice. Among the different centres tested, Mandya was found to have
maximum disease in the control plots (87.41% DS) followed by Lonavala (66% DI), Malan
(61%DI), Jagdalpur (59.29% DI) and PNP (52.70% DI). Among the five treatments, the
chemical treatment, T5 was found to be most effective at Mandya (91.53% decrease in
disease over control and 56.64% increase in grain yield over control) and 70.05 % decrease
of disease index over control) followed by JDP (73.96 and 57.25 respectively). The
percentage increase in yield and decrease in disease over control were not proportional in
other centres except Lonavala i.e., in Mandya the percentage increase in yield was 56.64 %
but decrease in disease over control was 91.53 when compared to 89.27 percentage increase
in yield and only 49.84% decrease in disease over control. This indicates that there are other
factors in the centres which influences the yield other than the neck blast disease. However,
in the case of Jagdalpur and Ponnampet, the treatment T4 (seed treatment followed by field
application of bioagent and spray of propiconazole) was found to be near (33.33 and 65.74%
reduction in PDI over control respectively) to the effect of chemical alone treatment, T5
(35.70 and 72.58% reduction in PDI over control respectively). PNP centre reported the
maximum suppression of disease over control (68.48%) in the bioagent alone treatment
applied as seed treatment followed by the foliar application on 15-20 DAT (treatment T2).
With respect to the increase in grain yield of the crop over control, the PNP centre showed
maximum increase (57.25%) in the treatment T5 followed. The treatments with bioagent
ICAR-IIRR AICRIP – Annual Progress Report 2020, Vol.2, Plant Pathology
3.107
alone (T1 and T2) and an additional spray of propiconazole with the bioagent (T3 and T4)
were on par with each other. However, in the case of JDP, the additional spray of
propiconazole with the bioagent (T4 and T3) had significantly increased the percentage
suppression of disease over control (33.33 and 28.69% respectively) and increased the
percentage grain yield over control (21.55 and 18.25% respectively) when compared with (T2
and T1), the treatments with bioagents alone, percentage suppression of disease over control
(16.53 and 13.4% respectively ) and the percentage grain yield over control (8.84 and 4.39%
respectively) (Table 99 a &b).
Effect of integrated management practices against severity of sheath blight and grain
yield at different locations - Kharif, 2020
A total of seven centres viz., Chiplima, Masodha, Mandya, Maruteru, Moncompu,
Pantnagar and Pattambi conducted the IDM trials to study the effect of the bioagent and
standard chemical application to study their effect on the severity and incidence on the sheath
blight disease of rice. Among the different centres, Maruteru, Masodha and Moncompu had
the highest PDS in the control plots (82.4%, 66.3% and 65.55% respectively) followed
closely by Pantnagar (64.47%), Pattambi (61.88%). The complete chemical treatment viz.,
seed treatment with carbendazim @2g/kg of seeds plus spray of 0.4g/l of trifloxystrobin
25%+ tebuconazole 50% (T5) resulted in the most effective decrease in the per cent disease
severity percentage over control and percentage increase in grain yield over control i.e.,
Mandya (84.21% and 56.64% respectively), Moncompu (76.70% and 46.75% respectively).
At Maruteru, the same treatment decreased the disease severity was up to 22.50% compared
to control and thereby increased the grain yield up to 10.40%. The treatment where seeds are
treated with the biocontrol agent @10g/kg followed by application of the bioagent at 15-
20DAT and one spray of propiconazole at the booting stage (T4) was the most effective after
T5 in percent decrease over control and increase in grain yield over viz., Mandya (68.42%
and 49.49% respectively) followed by Masodha (66.86% and 54.64% respectively).
Moncompu centre reported the maximum suppression of disease over control (44.91%) in the
bioagent alone treatment applied as seed treatment followed by the foliar application on 15-
20 DAT (treatment T2), followed by Mandya (36.84%) (Table 100 a &b).
With respect to the increase in the percentage of grain yield over control, in general
there was no direct effect of the bioagents in the grain yield increase and the decrease in the
disease. This trend was unique to the sheath blight disease. However, as an exception, the
treatment T3 and T4 in the Masodha centre showed significant increase in the percentage of
increase in grain yield over control (54.647% and 44.85% respectively) which is above or on
par even the chemical alone treatment T5 (46.91%) (Table 100 a &b).

ICAR-IIRR AICRIP – Annual Progress Report 2020, Vol.2, Plant Pathology
3.108
Table 98a: Effect of integrated management practices against leaf blast and grain yield - Kharif, 2020
Treatment
Leaf blast
JDP HZB LNV
DS (%)
%
decrease
over
control
%
increase
in Grain
Yield
(Kg/ha)
DI
(%) DS (%)
%
decrease
over
control
(DS)
%
increase
in Grain
Yield
(Kg/ha)
DI
(%)
DS
(%)
%
decrease
over
control
(DS)
%
increase in
Grain
Yield
(Kg/ha)
T1 = ST with Bio-control agent @ (10 g/kg)
58.89 (50.10)
21.48 21.16 35.39
(36.49) 44.10
(41.59) 40.02 42.98
60.25 (50.90)
42.75 (40.80)
12.76 8.13
T2 = T1 + bio-control agent at 15-20 DAT
53.89 (47.21)
28.15 28.88 30.1
(33.26) 33.55
(35.38) 54.37 52.19
52.75 (46.56)
42.25 (40.51)
13.78 7.36
T3 = T1 + one spray of propiconazole at booting stage
51.67 (45.94)
31.11 41.89 23.62
(29.07) 26.01
(30.65) 64.63 67.11
40.00 (39.21)
35.75 (36.70)
27.04 29.97
T4 = T2 + one spray of propiconazole at booting stage
37.78 (37.89)
49.63 68.78 16.8
(24.19) 19.90
(26.48) 72.94 82.22
31.25 (33.96)
28.75 (32.37)
41.33 57.02
*T5 = ST with carbendazim (2 g/kg) + spray of trifloxystrobin 25% + tebuconazole 50%) @ 0.4 g/l at booting stage
30.56 (33.54)
59.26 81.44 10.45
(18.86) 12.47
(20.67) 83.04 97.92
13.35 (21.48)
8.00 (16.38)
83.67 92.98
T6 = control 75.00
(60.00) 0.00 0.00
53.90 (47.22)
73.53 (59.03)
0.00 0.00 71.00
(57.42) 49.00
(44.41) 0.00 0.00
C.V (%) 2.51 1.41 2.02 3.65 5.68
LSD @ 5% (P= 0.05) 1.73 0.67 1.09 2.29 3.02
Transformation AT AT AT AT AT
(* - Best treatment; DI – Disease Incidence; Figures in the parenthesis indicate transformed means; AT- Arc sine transformation)
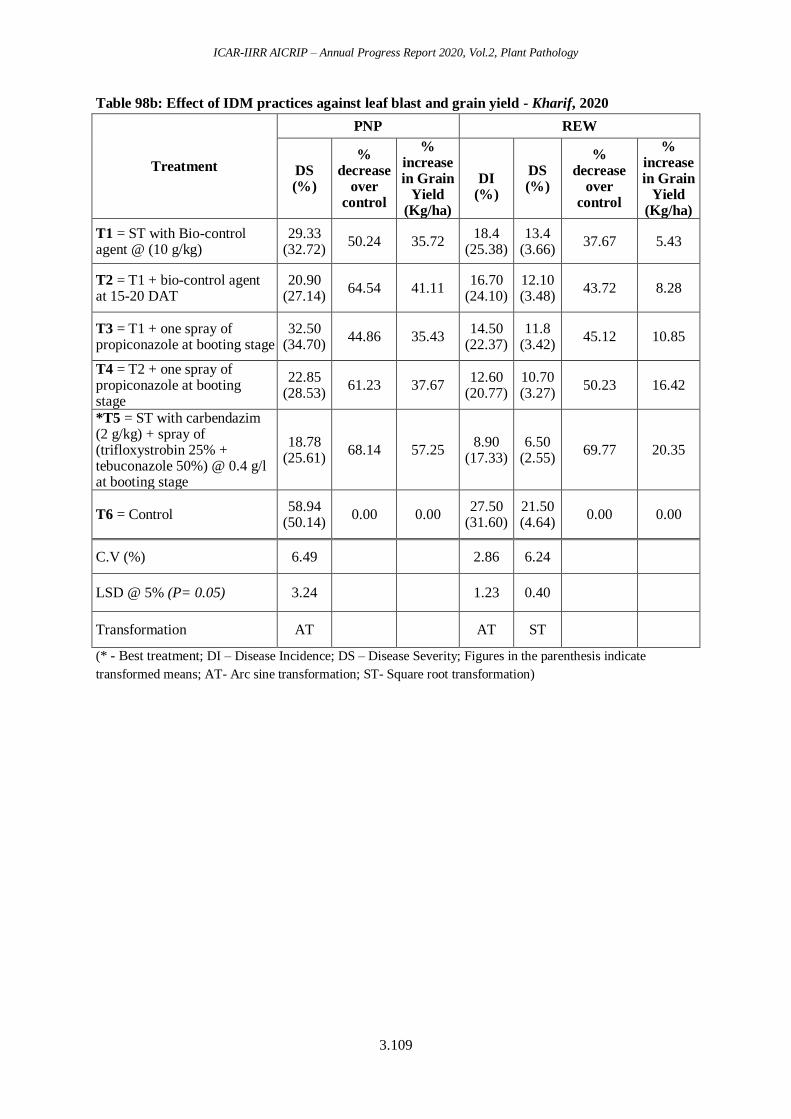
ICAR-IIRR AICRIP – Annual Progress Report 2020, Vol.2, Plant Pathology
3.109
Table 98b: Effect of IDM practices against leaf blast and grain yield - Kharif, 2020
Treatment
PNP REW
DS (%)
% decrease
over control
% increase in Grain
Yield (Kg/ha)
DI
(%)
DS (%)
% decrease
over control
% increase in Grain
Yield (Kg/ha)
T1 = ST with Bio-control agent @ (10 g/kg)
29.33 (32.72)
50.24 35.72 18.4
(25.38) 13.4
(3.66) 37.67 5.43
T2 = T1 + bio-control agent at 15-20 DAT
20.90 (27.14)
64.54 41.11 16.70
(24.10) 12.10 (3.48)
43.72 8.28
T3 = T1 + one spray of propiconazole at booting stage
32.50 (34.70)
44.86 35.43 14.50
(22.37) 11.8
(3.42) 45.12 10.85
T4 = T2 + one spray of propiconazole at booting stage
22.85 (28.53)
61.23 37.67 12.60
(20.77) 10.70 (3.27)
50.23 16.42
*T5 = ST with carbendazim (2 g/kg) + spray of (trifloxystrobin 25% + tebuconazole 50%) @ 0.4 g/l at booting stage
18.78 (25.61)
68.14 57.25 8.90
(17.33) 6.50
(2.55) 69.77 20.35
T6 = Control 58.94
(50.14) 0.00 0.00
27.50 (31.60)
21.50 (4.64)
0.00 0.00
C.V (%) 6.49 2.86 6.24
LSD @ 5% (P= 0.05) 3.24 1.23 0.40
Transformation AT AT ST
(* - Best treatment; DI – Disease Incidence; DS – Disease Severity; Figures in the parenthesis indicate
transformed means; AT- Arc sine transformation; ST- Square root transformation)
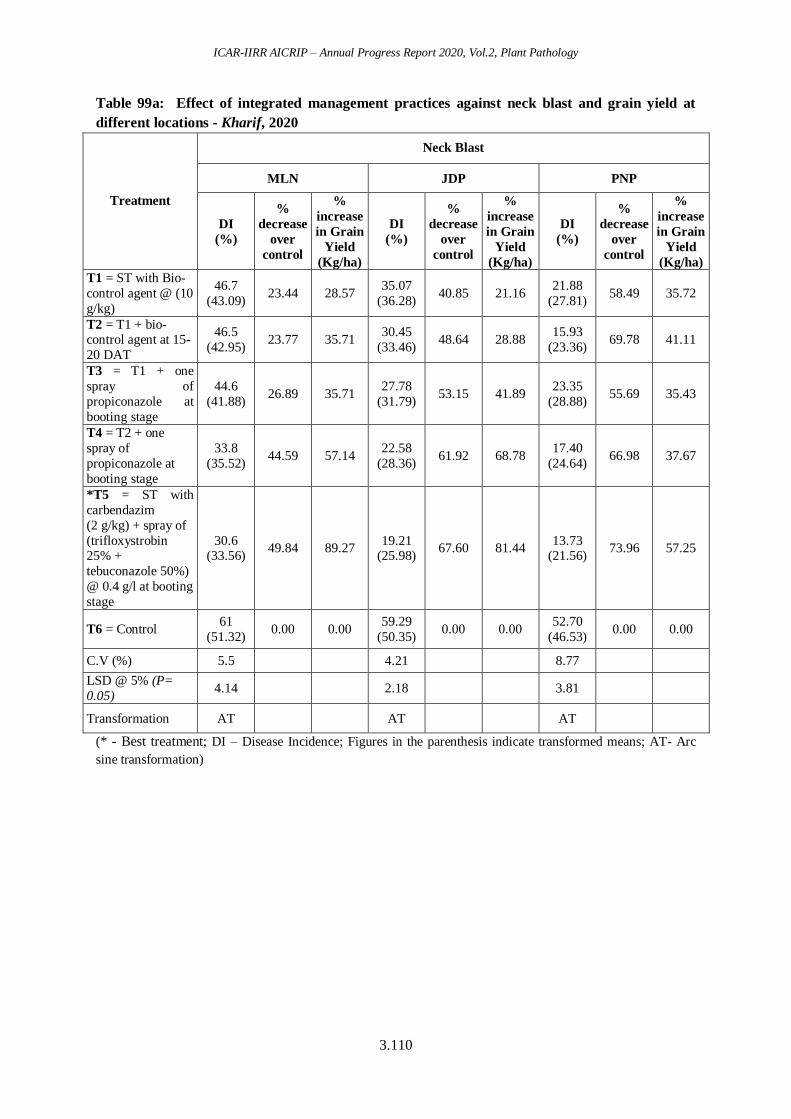
ICAR-IIRR AICRIP – Annual Progress Report 2020, Vol.2, Plant Pathology
3.110
Table 99a: Effect of integrated management practices against neck blast and grain yield at
different locations - Kharif, 2020
Treatment
Neck Blast
MLN JDP PNP
DI
(%)
%
decrease
over
control
%
increase
in Grain
Yield
(Kg/ha)
DI
(%)
%
decrease
over
control
%
increase
in Grain
Yield
(Kg/ha)
DI
(%)
%
decrease
over
control
%
increase
in Grain
Yield
(Kg/ha)
T1 = ST with Bio-
control agent @ (10
g/kg)
46.7
(43.09) 23.44 28.57
35.07
(36.28) 40.85 21.16
21.88
(27.81) 58.49 35.72
T2 = T1 + bio-control agent at 15-
20 DAT
46.5
(42.95) 23.77 35.71
30.45
(33.46) 48.64 28.88
15.93
(23.36) 69.78 41.11
T3 = T1 + one
spray of
propiconazole at
booting stage
44.6
(41.88) 26.89 35.71
27.78
(31.79) 53.15 41.89
23.35
(28.88) 55.69 35.43
T4 = T2 + one
spray of
propiconazole at
booting stage
33.8
(35.52) 44.59 57.14
22.58
(28.36) 61.92 68.78
17.40
(24.64) 66.98 37.67
*T5 = ST with
carbendazim
(2 g/kg) + spray of
(trifloxystrobin 25% +
tebuconazole 50%)
@ 0.4 g/l at booting
stage
30.6 (33.56)
49.84 89.27 19.21
(25.98) 67.60 81.44
13.73 (21.56)
73.96 57.25
T6 = Control 61
(51.32) 0.00 0.00
59.29
(50.35) 0.00 0.00
52.70
(46.53) 0.00 0.00
C.V (%) 5.5 4.21 8.77
LSD @ 5% (P=
0.05) 4.14 2.18 3.81
Transformation AT AT AT
(* - Best treatment; DI – Disease Incidence; Figures in the parenthesis indicate transformed means; AT- Arc
sine transformation)
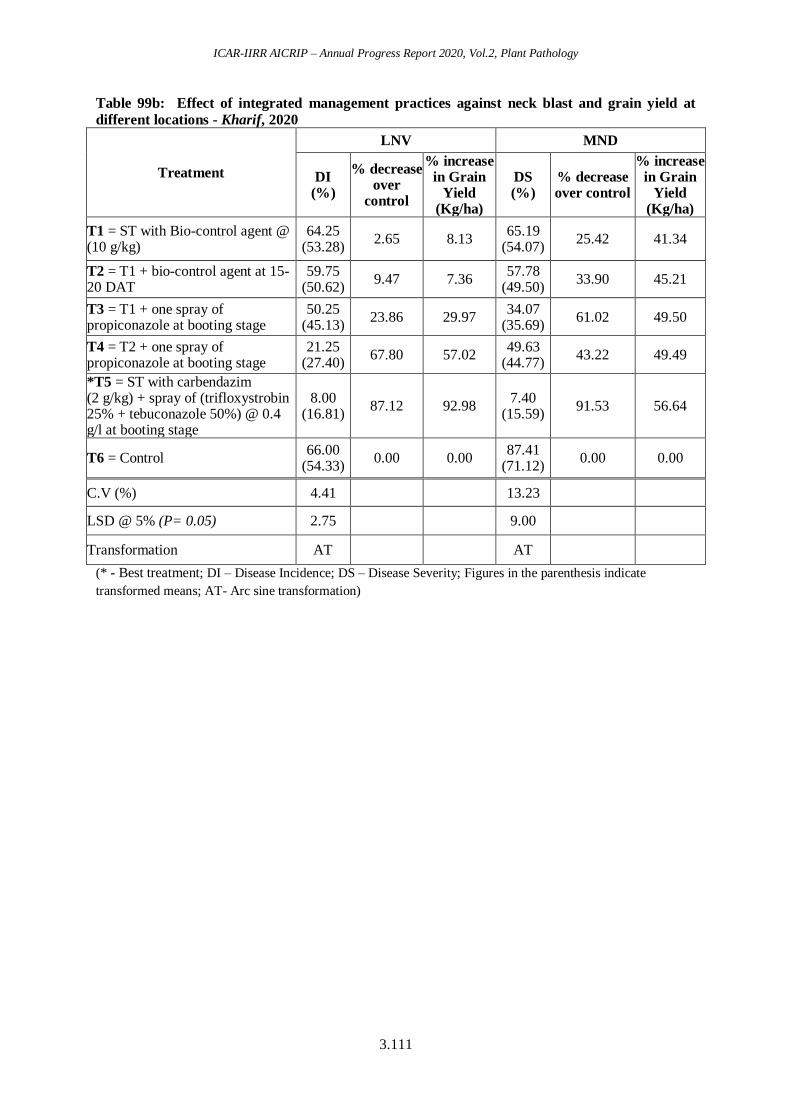
ICAR-IIRR AICRIP – Annual Progress Report 2020, Vol.2, Plant Pathology
3.111
Table 99b: Effect of integrated management practices against neck blast and grain yield at
different locations - Kharif, 2020
Treatment
LNV MND
DI (%)
% decrease over
control
% increase in Grain
Yield (Kg/ha)
DS (%)
% decrease over control
% increase in Grain
Yield (Kg/ha)
T1 = ST with Bio-control agent @ (10 g/kg)
64.25 (53.28)
2.65 8.13 65.19
(54.07) 25.42 41.34
T2 = T1 + bio-control agent at 15-20 DAT
59.75 (50.62)
9.47 7.36 57.78
(49.50) 33.90 45.21
T3 = T1 + one spray of propiconazole at booting stage
50.25 (45.13)
23.86 29.97 34.07
(35.69) 61.02 49.50
T4 = T2 + one spray of propiconazole at booting stage
21.25 (27.40)
67.80 57.02 49.63
(44.77) 43.22 49.49
*T5 = ST with carbendazim (2 g/kg) + spray of (trifloxystrobin 25% + tebuconazole 50%) @ 0.4 g/l at booting stage
8.00 (16.81)
87.12 92.98 7.40
(15.59) 91.53 56.64
T6 = Control 66.00
(54.33) 0.00 0.00
87.41 (71.12)
0.00 0.00
C.V (%) 4.41 13.23
LSD @ 5% (P= 0.05) 2.75 9.00
Transformation AT AT
(* - Best treatment; DI – Disease Incidence; DS – Disease Severity; Figures in the parenthesis indicate
transformed means; AT- Arc sine transformation)
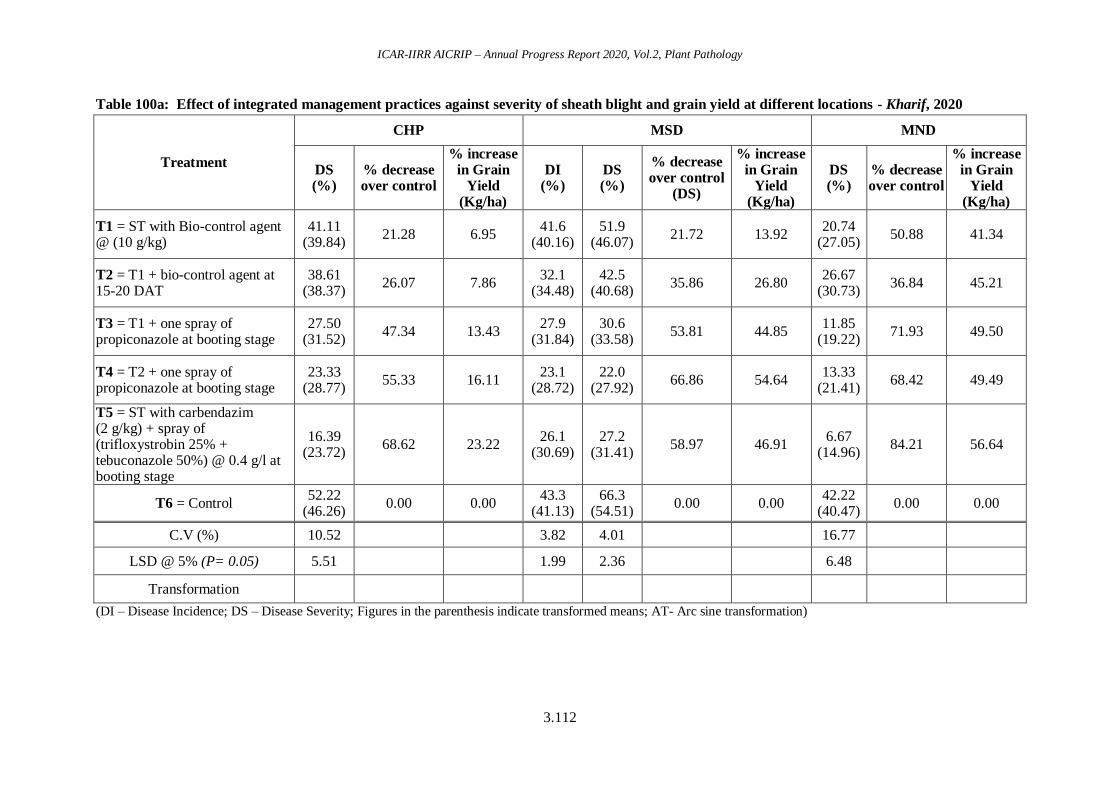
ICAR-IIRR AICRIP – Annual Progress Report 2020, Vol.2, Plant Pathology
3.112
Table 100a: Effect of integrated management practices against severity of sheath blight and grain yield at different locations - Kharif, 2020
Treatment
CHP MSD MND
DS (%)
% decrease over control
% increase in Grain
Yield (Kg/ha)
DI (%)
DS (%)
% decrease over control
(DS)
% increase in Grain
Yield (Kg/ha)
DS (%)
% decrease over control
% increase in Grain
Yield (Kg/ha)
T1 = ST with Bio-control agent @ (10 g/kg)
41.11 (39.84)
21.28 6.95 41.6
(40.16) 51.9
(46.07) 21.72 13.92
20.74 (27.05)
50.88 41.34
T2 = T1 + bio-control agent at 15-20 DAT
38.61 (38.37)
26.07 7.86 32.1
(34.48) 42.5
(40.68) 35.86 26.80
26.67 (30.73)
36.84 45.21
T3 = T1 + one spray of propiconazole at booting stage
27.50 (31.52)
47.34 13.43 27.9
(31.84) 30.6
(33.58) 53.81 44.85
11.85 (19.22)
71.93 49.50
T4 = T2 + one spray of propiconazole at booting stage
23.33 (28.77)
55.33 16.11 23.1
(28.72) 22.0
(27.92) 66.86 54.64
13.33 (21.41)
68.42 49.49
T5 = ST with carbendazim (2 g/kg) + spray of (trifloxystrobin 25% + tebuconazole 50%) @ 0.4 g/l at booting stage
16.39 (23.72)
68.62 23.22 26.1
(30.69) 27.2
(31.41) 58.97 46.91
6.67 (14.96)
84.21 56.64
T6 = Control 52.22
(46.26) 0.00 0.00
43.3 (41.13)
66.3 (54.51)
0.00 0.00 42.22
(40.47) 0.00 0.00
C.V (%) 10.52 3.82 4.01 16.77
LSD @ 5% (P= 0.05) 5.51 1.99 2.36 6.48
Transformation
(DI – Disease Incidence; DS – Disease Severity; Figures in the parenthesis indicate transformed means; AT- Arc sine transformation)

ICAR-IIRR AICRIP – Annual Progress Report 2020, Vol.2, Plant Pathology
3.113
Table 100b: Effect of integrated management practices against severity of sheath blight and
grain yield at different locations - Kharif, 2020
Treatment
MNC MTU
DS (%)
% decrease
over control
% increase in Grain
Yield (Kg/ha)
DI (%)
DS (%)
% decrease
over control
(DS)
% increase in Grain
Yield (Kg/ha)
T1 = ST with Bio-control agent @ (10 g/kg)
43.61 (41.30)
33.47 23.08 81.84
(71.45) 75.89
(61.08) 7.95 0.49
T2 = T1 + bio-control agent at 15-20 DAT
36.11 (36.86)
44.91 25.74 80.92
(68.22) 77.33
(61.98) 6.19 1.65
T3 = T1 + one spray of propiconazole at booting stage
24.16 (29.06)
63.14 30.77 76.61
(66.59) 72.44
(58.54) 12.12 5.18
T4 = T2 + one spray of propiconazole at booting stage
25.28 (28.93)
61.43 31.36 77.71
(66.93) 72.22
(58.27) 12.39 5.65
*T5 = ST with carbendazim (2 g/kg) + spray of trifloxystrobin 25% + tebuconazole 50%) @ 0.4 g/l at booting stage
15.27 (22.67)
76.70 46.75 67.91
(59.42) 63.89
(53.16) 22.50 10.40
T6 = Control 65.55
(54.20) 0.00 0.00
79.01 (66.70)
82.44 (65.42)
0.00 0.00
C.V (%) 20.26 9.47 7.62
LSD @ 5% (P= 0.05)
10.84 9.50 6.86
Transformation AT AT AT
(* - Best treatment; DI – Disease Incidence; DS – Disease Severity; Figures in the parenthesis indicate
transformed means; AT- Arc sine transformation)

ICAR-IIRR AICRIP – Annual Progress Report 2020, Vol.2, Plant Pathology
3.114
Table 100b: Effect of integrated management practices against severity of sheath blight and
grain yield at different locations - Kharif, 2020 (Conti…)
Treatment
PNT PTB
DI (%)
DS (%)
% decrease
over control
(DS)
% increase in Grain
Yield (Kg/ha)
DS (%)
% decrease
over control
% increase in Grain
Yield (Kg/ha)
T1 = ST with Bio-control agent @ (10 g/kg)
69.72 (56.60)
50.02 (44.99)
22.42 7.53 56.85
(48.92) 8.12 5.51
T2 = T1 + bio-control agent at 15-20 DAT
68.79 (56.02)
46.54 (42.99)
27.81 9.24 52.25
(46.27) 15.56 3.55
T3 = T1 + one spray of propiconazole at booting stage
65.12 (53.79)
41.40 (40.03)
35.79 11.35 46.63
(43.04) 24.64 12.17
T4 = T2 + one spray of propiconazole at booting stage
63.33 (52.72)
38.61 (38.40)
40.11 13.90 46.50
(42.97) 24.85 14.12
T5 = ST with carbendazim (2 g/kg) + spray of (trifloxystrobin 25% + tebuconazole 50%) @ 0.4 g/l at booting stage
54.96 (47.83)
32.11 (34.50)
50.19 16.58 48.00
(43.83) 22.42 11.78
T6 = Control 89.13
(70.89) 64.47
(53.39) 0.00 0.00
61.88 (51.86)
0.00 0.00
C.V (%) 2.90 1.69 1.81 3.09 5.78
LSD @ 5% (P= 0.05)
2.46 1.08 156 2.15 299
Transformation AT AT AT
(DI – Disease Incidence; DS – Disease Severity; Figures in the parenthesis indicate transformed means; AT-
Arc sine transformation)

ICAR-IIRR AICRIP – Annual Progress Report 2020, Vol.2, Plant Pathology
3.115
Effect of integrated management practices against severity of Brown spot disease of rice
Hazaribagh and Mandya centres have conducted the trial on use of bioagents along
with the chemicals. Among these two locations, Mandya had the highest percent disease
incidence (48.89%) when compared to Hazaribagh (21.72%). Among the different
treatments, the chemical only treatment T5, was found to be the most effective in reducing
the disease over control in Hazaribagh (73.24%) followed by the treatment T4, where in the
bioagents were applied as seed treatment followed by foliar spray and spray of combi product
(trifloxystrobin 25% + tebuconazole 50%) @ 0.4 g/l at booting stage (67.46%). Similarly
Hazaribagh had the highest percent decrease in over control in bioagent alone applied as seed
treatment followed by application on 15-20 DAT was able to suppress the disease to about
53.43% over control. The general increase in the percentage grain yield over was
significantly in all the bioagent and propiconazole spray treatments (T1 to T4) with the
highest in T4 (62.89% HZB) followed by T3 (63.82% HZB). The chemical alone treatment
T5 gave the highest increase in grain yield percentage (92.09%) over control in Hazaribagh
(Table 101).
Effect of integrated management practices against severity of sheath rot
Titabar centre conducted the trails on the integrated management of sheath rot using
bioagent along with the chemicals. The centre has reported a maximum disease severity of
40.80% and 42.55% of disease incidence in the control plots. The chemical alone treatment
was the most effective in reducing about 72.79% of the disease over control. The treatment
T4 with the bioagents applied twice as seed treatment followed by application as foliar spray
on 15-20 DAT and a foliar application of propiconazole at booting stage was also found to be
very effective in suppressing the disease to the tune of 67.95% over control. The bioagent
alone treatment T2, was able to suppress the disease to the tune of 44.67% over control. The
percentage disease suppression in the case of sheath rot of rice by the above treatments did
not directly affect the percentage increase in the grain yield of rice in the respective
treatments. The maximum percentage increase in the grain yield over control was observed in
the chemical alone treatment T5 (19.57) followed by other treatments T4 and T3 (16.05 and
15.73% respectively). The bioagents alone treatments (T1 and T2) were on par with each
other (Table 101).
Effect of integrated management practices against bacterial leaf blight
The trial was conducted at Maruteru. Artificial disease pressure was created and very
high disease severity of 66.80% was recorded in the control treatment and none of the
treatments either decrease the disease severity or increase the grain yield (Table 102).
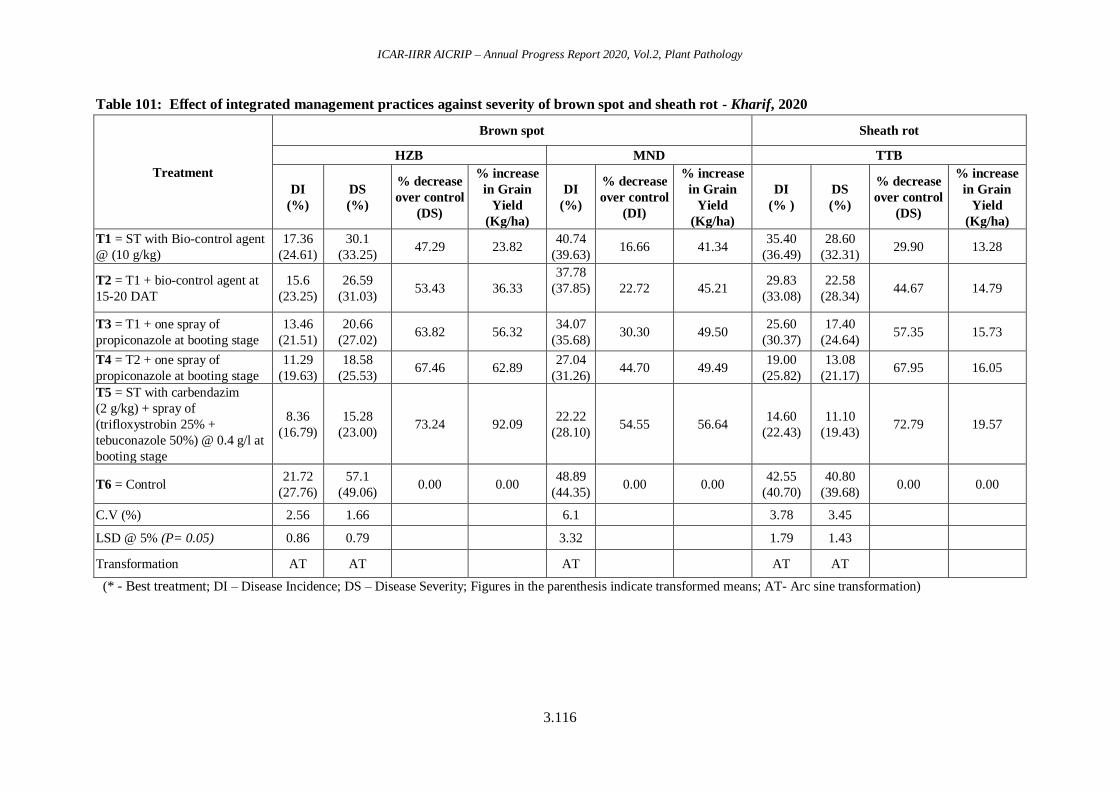
ICAR-IIRR AICRIP – Annual Progress Report 2020, Vol.2, Plant Pathology
3.116
Table 101: Effect of integrated management practices against severity of brown spot and sheath rot - Kharif, 2020
Treatment
Brown spot Sheath rot
HZB MND TTB
DI
(%)
DS
(%)
% decrease
over control
(DS)
% increase
in Grain
Yield
(Kg/ha)
DI
(%)
% decrease
over control
(DI)
% increase
in Grain
Yield
(Kg/ha)
DI
(% )
DS
(%)
% decrease
over control
(DS)
% increase
in Grain
Yield
(Kg/ha)
T1 = ST with Bio-control agent
@ (10 g/kg)
17.36
(24.61)
30.1
(33.25) 47.29 23.82
40.74
(39.63) 16.66 41.34
35.40
(36.49)
28.60
(32.31) 29.90 13.28
T2 = T1 + bio-control agent at
15-20 DAT
15.6
(23.25)
26.59
(31.03) 53.43 36.33
37.78
(37.85)
22.72 45.21 29.83
(33.08)
22.58
(28.34) 44.67 14.79
T3 = T1 + one spray of
propiconazole at booting stage
13.46
(21.51)
20.66
(27.02) 63.82 56.32
34.07
(35.68) 30.30 49.50
25.60
(30.37)
17.40
(24.64) 57.35 15.73
T4 = T2 + one spray of
propiconazole at booting stage
11.29
(19.63)
18.58
(25.53) 67.46 62.89
27.04
(31.26) 44.70 49.49
19.00
(25.82)
13.08
(21.17) 67.95 16.05
T5 = ST with carbendazim
(2 g/kg) + spray of
(trifloxystrobin 25% +
tebuconazole 50%) @ 0.4 g/l at
booting stage
8.36
(16.79)
15.28
(23.00) 73.24 92.09
22.22
(28.10) 54.55 56.64
14.60
(22.43)
11.10
(19.43) 72.79 19.57
T6 = Control 21.72
(27.76)
57.1
(49.06) 0.00 0.00
48.89
(44.35) 0.00 0.00
42.55
(40.70)
40.80
(39.68) 0.00 0.00
C.V (%) 2.56 1.66 6.1 3.78 3.45
LSD @ 5% (P= 0.05) 0.86 0.79 3.32 1.79 1.43
Transformation AT AT AT AT AT
(* - Best treatment; DI – Disease Incidence; DS – Disease Severity; Figures in the parenthesis indicate transformed means; AT- Arc sine transformation)
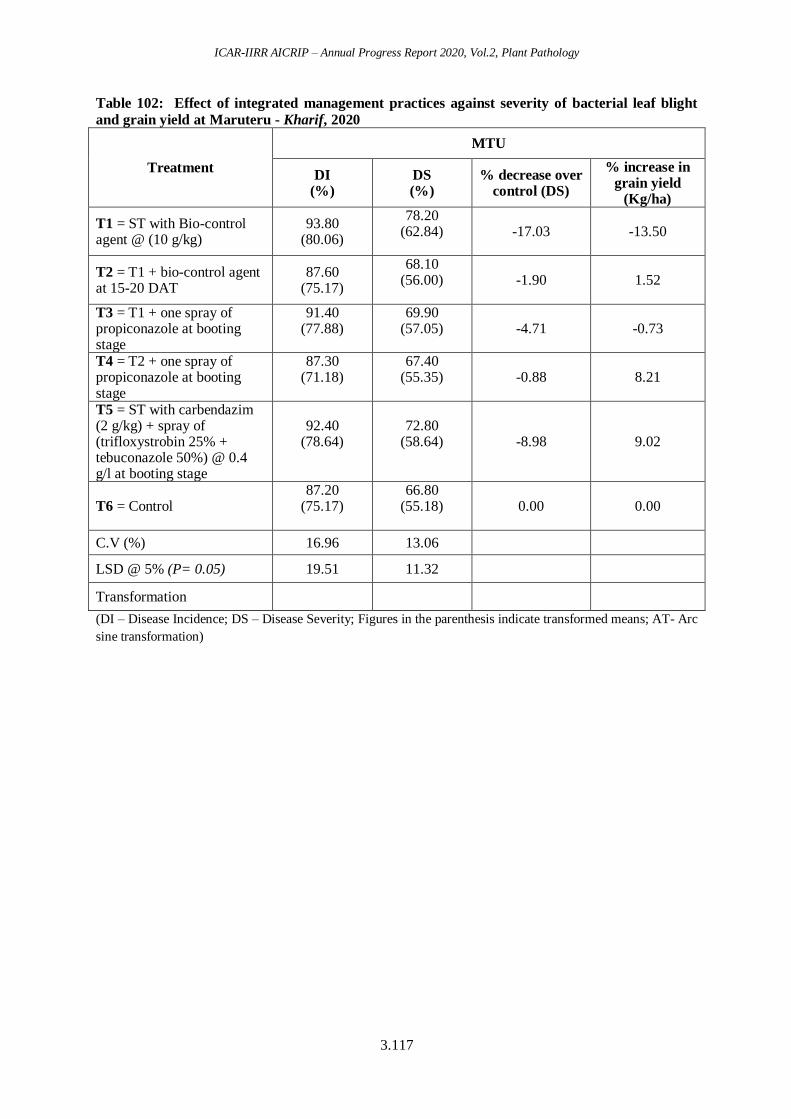
ICAR-IIRR AICRIP – Annual Progress Report 2020, Vol.2, Plant Pathology
3.117
Table 102: Effect of integrated management practices against severity of bacterial leaf blight
and grain yield at Maruteru - Kharif, 2020
Treatment
MTU
DI (%)
DS (%)
% decrease over control (DS)
% increase in grain yield
(Kg/ha)
T1 = ST with Bio-control agent @ (10 g/kg)
93.80 (80.06)
78.20 (62.84)
-17.03 -13.50
T2 = T1 + bio-control agent at 15-20 DAT
87.60 (75.17)
68.10 (56.00)
-1.90 1.52
T3 = T1 + one spray of propiconazole at booting stage
91.40 (77.88)
69.90 (57.05)
-4.71 -0.73
T4 = T2 + one spray of propiconazole at booting stage
87.30 (71.18)
67.40 (55.35)
-0.88 8.21
T5 = ST with carbendazim (2 g/kg) + spray of (trifloxystrobin 25% + tebuconazole 50%) @ 0.4 g/l at booting stage
92.40 (78.64)
72.80 (58.64)
-8.98 9.02
T6 = Control 87.20
(75.17)
66.80 (55.18)
0.00 0.00
C.V (%) 16.96 13.06
LSD @ 5% (P= 0.05) 19.51 11.32
Transformation
(DI – Disease Incidence; DS – Disease Severity; Figures in the parenthesis indicate transformed means; AT- Arc
sine transformation)

ICAR-IIRR AICRIP – Annual Progress Report 2020, Vol.2, Plant Pathology
3.118
3. SPECIAL IPM TRIAL
Considering the environmental pollution and pesticide toxicity issues in the food
products, an integrated pest management trial was formulated with the objective of following
a holistic management of the crop, including the management of all biotic stresses and
minimizing the use of chemical pesticides. Need based application of fungicides was an
important concept in the IPM trials. During Kharif 2020, the trial was conducted at 6 different
locations viz., Mandya, Kaul, Rajendranagar, Titabar, Navsari and Sakoli. This was
conducted as a coordinated trial, by the experts from different fields of crop science and the
data obtained are segregated discipline wise. In the following paragraphs, data with respect to
the IPM in disease management are summarized only from the centers where disease stress
was observed and recorded. Further only the concise information regarding the per cent
disease incidence observed in the IPM and farmers practice plots are given and the readers
may please refer the IPM trial report in the entomology portion of this report for more
detailed information regarding the yield and cost benefit ratio between the two methods of
cultivation.
The area under the disease progress curve (AUDPC) is a useful quantitative
assessment of disease intensity over time, for comparison across years, locations, or
management tactics. The progression of disease over a time is also studied by AUDPC. By
plotting the disease severity values in Y axis and time interval of observations on X axis a
curve is obtained. By plotting slopes to the curve at regular intervals will give the area under
disease progress curve.
Area under disease progress curve (AUDPC) of leaf blast and neck blast diseases at
various locations, Kharif – 2020.
AUDPC of leaf blast and neck blast diseases were calculated from the disease severity
of IPM trials conducted at four locations viz., Sakoli, Mandya, and Kaul and disease severity
(%) were incorporated for the location Rajendranagar and compared with the farmers
practices. The data revealed that, in general the disease progress was significantly lower in the
experimental plots where IPM practices were followed when compared to the farmers
practices (Table 103). Further the disease progress of leaf blast disease was more in
Sakolicentre when compared to the other three centres viz., Mandya, Rajendranagar and Kaul.
AUDPC values of 349.3 and 135.8 were observed at two locations of Sakoli. Similarly neck
blast symptoms were observed in Sakoli. The AUDPC values indicating that the progression
of Neck blast was more in farmer practices compared to IPM practices.
Table 103: AUDPC values based on 0-9 scale at different dates/disease severity (%)/of
leaf blast and neck blast diseases at various locations, Kharif – 2020
Treatment
AUDPC
LEAF BLAST NECK
BLAST
Sakoli Mandya RNR* KUL SAKOLI
L1 L2 L1 L2 L3 L1 L2 L3 L1 L1 L2
IPM 349.3 135.8 94.36 130.34 101.64 0.624 1.6 0.86 250.48 67.2 26.6
FP 305.2 123.9 169.82 151.06 98 1.202 0.75 0.39 378.93 79.1 28
(L- Location; * Disease was recorded in terms of disease severity)
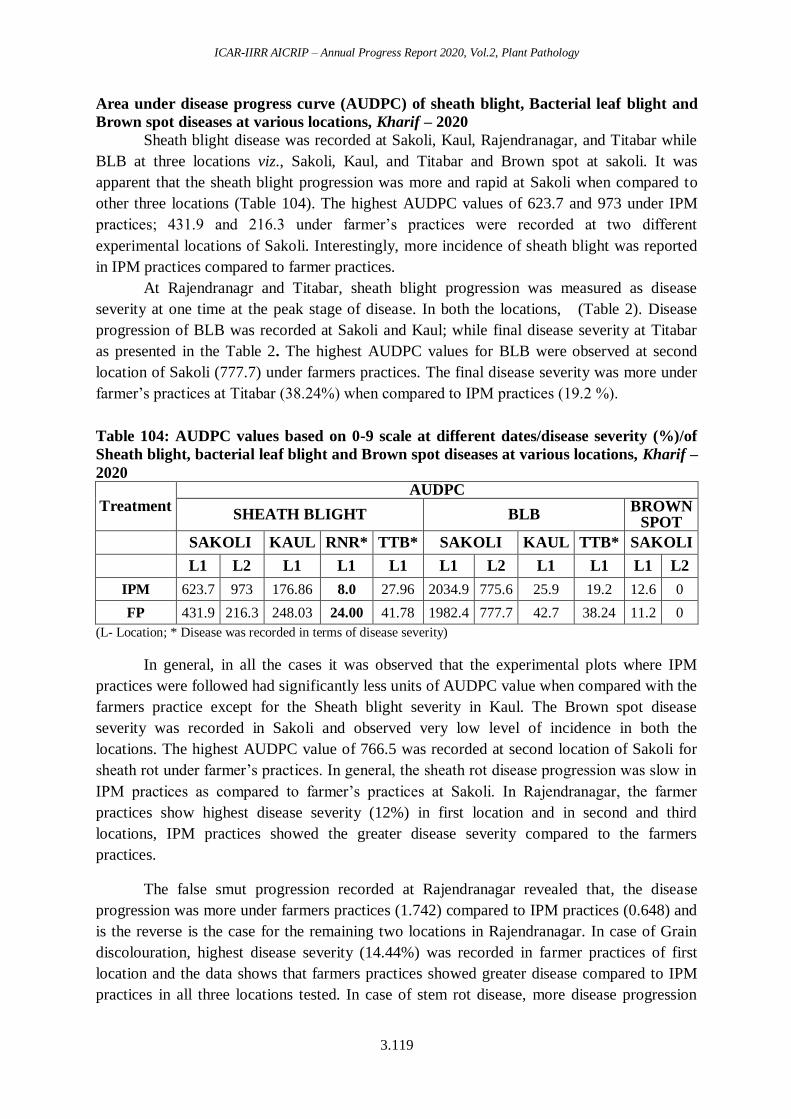
ICAR-IIRR AICRIP – Annual Progress Report 2020, Vol.2, Plant Pathology
3.119
Area under disease progress curve (AUDPC) of sheath blight, Bacterial leaf blight and
Brown spot diseases at various locations, Kharif – 2020
Sheath blight disease was recorded at Sakoli, Kaul, Rajendranagar, and Titabar while
BLB at three locations viz., Sakoli, Kaul, and Titabar and Brown spot at sakoli. It was
apparent that the sheath blight progression was more and rapid at Sakoli when compared to
other three locations (Table 104). The highest AUDPC values of 623.7 and 973 under IPM
practices; 431.9 and 216.3 under farmer’s practices were recorded at two different
experimental locations of Sakoli. Interestingly, more incidence of sheath blight was reported
in IPM practices compared to farmer practices.
At Rajendranagr and Titabar, sheath blight progression was measured as disease
severity at one time at the peak stage of disease. In both the locations, (Table 2). Disease
progression of BLB was recorded at Sakoli and Kaul; while final disease severity at Titabar
as presented in the Table 2. The highest AUDPC values for BLB were observed at second
location of Sakoli (777.7) under farmers practices. The final disease severity was more under
farmer’s practices at Titabar (38.24%) when compared to IPM practices (19.2 %).
Table 104: AUDPC values based on 0-9 scale at different dates/disease severity (%)/of
Sheath blight, bacterial leaf blight and Brown spot diseases at various locations, Kharif –
2020
Treatment AUDPC
SHEATH BLIGHT BLB BROWN
SPOT
SAKOLI KAUL RNR* TTB* SAKOLI KAUL TTB* SAKOLI
L1 L2 L1 L1 L1 L1 L2 L1 L1 L1 L2
IPM 623.7 973 176.86 8.0 27.96 2034.9 775.6 25.9 19.2 12.6 0
FP 431.9 216.3 248.03 24.00 41.78 1982.4 777.7 42.7 38.24 11.2 0
(L- Location; * Disease was recorded in terms of disease severity)
In general, in all the cases it was observed that the experimental plots where IPM
practices were followed had significantly less units of AUDPC value when compared with the
farmers practice except for the Sheath blight severity in Kaul. The Brown spot disease
severity was recorded in Sakoli and observed very low level of incidence in both the
locations. The highest AUDPC value of 766.5 was recorded at second location of Sakoli for
sheath rot under farmer’s practices. In general, the sheath rot disease progression was slow in
IPM practices as compared to farmer’s practices at Sakoli. In Rajendranagar, the farmer
practices show highest disease severity (12%) in first location and in second and third
locations, IPM practices showed the greater disease severity compared to the farmers
practices.
The false smut progression recorded at Rajendranagar revealed that, the disease
progression was more under farmers practices (1.742) compared to IPM practices (0.648) and
is the reverse is the case for the remaining two locations in Rajendranagar. In case of Grain
discolouration, highest disease severity (14.44%) was recorded in farmer practices of first
location and the data shows that farmers practices showed greater disease compared to IPM
practices in all three locations tested. In case of stem rot disease, more disease progression
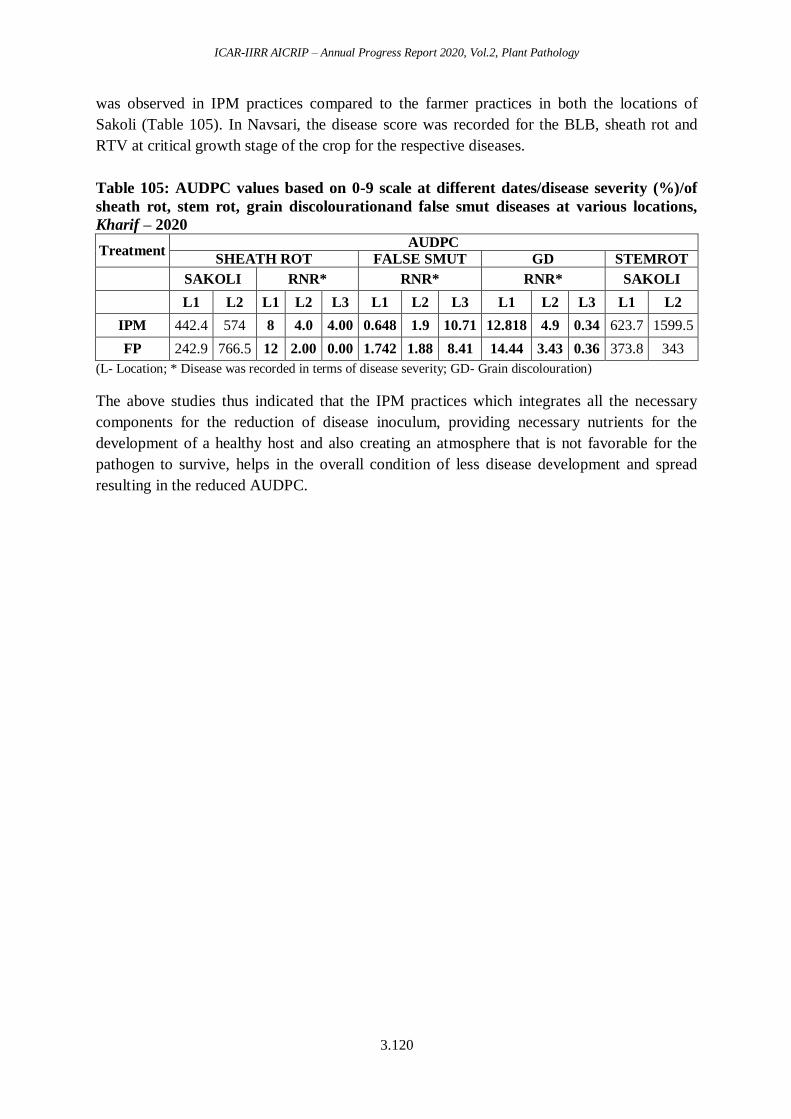
ICAR-IIRR AICRIP – Annual Progress Report 2020, Vol.2, Plant Pathology
3.120
was observed in IPM practices compared to the farmer practices in both the locations of
Sakoli (Table 105). In Navsari, the disease score was recorded for the BLB, sheath rot and
RTV at critical growth stage of the crop for the respective diseases.
Table 105: AUDPC values based on 0-9 scale at different dates/disease severity (%)/of
sheath rot, stem rot, grain discolourationand false smut diseases at various locations,
Kharif – 2020
Treatment AUDPC
SHEATH ROT FALSE SMUT GD STEMROT
SAKOLI RNR* RNR* RNR* SAKOLI
L1 L2 L1 L2 L3 L1 L2 L3 L1 L2 L3 L1 L2
IPM 442.4 574 8 4.0 4.00 0.648 1.9 10.71 12.818 4.9 0.34 623.7 1599.5
FP 242.9 766.5 12 2.00 0.00 1.742 1.88 8.41 14.44 3.43 0.36 373.8 343
(L- Location; * Disease was recorded in terms of disease severity; GD- Grain discolouration)
The above studies thus indicated that the IPM practices which integrates all the necessary
components for the reduction of disease inoculum, providing necessary nutrients for the
development of a healthy host and also creating an atmosphere that is not favorable for the
pathogen to survive, helps in the overall condition of less disease development and spread
resulting in the reduced AUDPC.
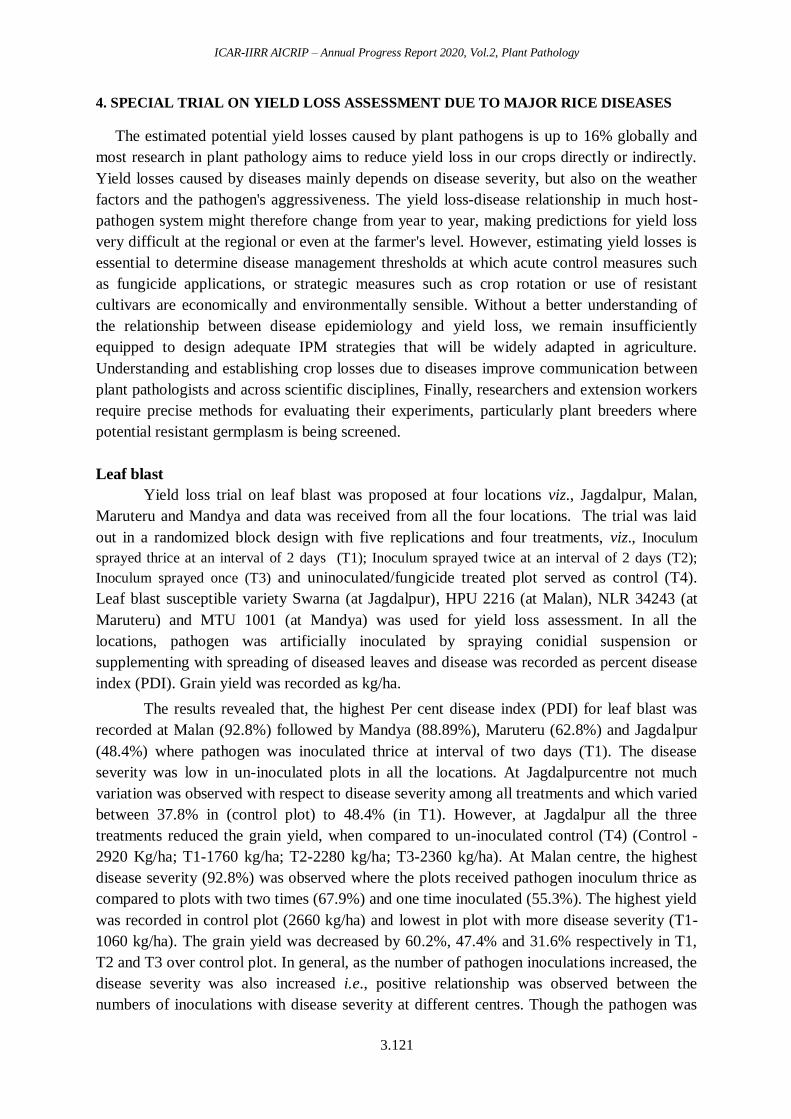
ICAR-IIRR AICRIP – Annual Progress Report 2020, Vol.2, Plant Pathology
3.121
4. SPECIAL TRIAL ON YIELD LOSS ASSESSMENT DUE TO MAJOR RICE DISEASES
The estimated potential yield losses caused by plant pathogens is up to 16% globally and
most research in plant pathology aims to reduce yield loss in our crops directly or indirectly.
Yield losses caused by diseases mainly depends on disease severity, but also on the weather
factors and the pathogen's aggressiveness. The yield loss-disease relationship in much host-
pathogen system might therefore change from year to year, making predictions for yield loss
very difficult at the regional or even at the farmer's level. However, estimating yield losses is
essential to determine disease management thresholds at which acute control measures such
as fungicide applications, or strategic measures such as crop rotation or use of resistant
cultivars are economically and environmentally sensible. Without a better understanding of
the relationship between disease epidemiology and yield loss, we remain insufficiently
equipped to design adequate IPM strategies that will be widely adapted in agriculture.
Understanding and establishing crop losses due to diseases improve communication between
plant pathologists and across scientific disciplines, Finally, researchers and extension workers
require precise methods for evaluating their experiments, particularly plant breeders where
potential resistant germplasm is being screened.
Leaf blast
Yield loss trial on leaf blast was proposed at four locations viz., Jagdalpur, Malan,
Maruteru and Mandya and data was received from all the four locations. The trial was laid
out in a randomized block design with five replications and four treatments, viz., Inoculum
sprayed thrice at an interval of 2 days (T1); Inoculum sprayed twice at an interval of 2 days (T2);
Inoculum sprayed once (T3) and uninoculated/fungicide treated plot served as control (T4).
Leaf blast susceptible variety Swarna (at Jagdalpur), HPU 2216 (at Malan), NLR 34243 (at
Maruteru) and MTU 1001 (at Mandya) was used for yield loss assessment. In all the
locations, pathogen was artificially inoculated by spraying conidial suspension or
supplementing with spreading of diseased leaves and disease was recorded as percent disease
index (PDI). Grain yield was recorded as kg/ha.
The results revealed that, the highest Per cent disease index (PDI) for leaf blast was
recorded at Malan (92.8%) followed by Mandya (88.89%), Maruteru (62.8%) and Jagdalpur
(48.4%) where pathogen was inoculated thrice at interval of two days (T1). The disease
severity was low in un-inoculated plots in all the locations. At Jagdalpurcentre not much
variation was observed with respect to disease severity among all treatments and which varied
between 37.8% in (control plot) to 48.4% (in T1). However, at Jagdalpur all the three
treatments reduced the grain yield, when compared to un-inoculated control (T4) (Control -
2920 Kg/ha; T1-1760 kg/ha; T2-2280 kg/ha; T3-2360 kg/ha). At Malan centre, the highest
disease severity (92.8%) was observed where the plots received pathogen inoculum thrice as
compared to plots with two times (67.9%) and one time inoculated (55.3%). The highest yield
was recorded in control plot (2660 kg/ha) and lowest in plot with more disease severity (T1-
1060 kg/ha). The grain yield was decreased by 60.2%, 47.4% and 31.6% respectively in T1,
T2 and T3 over control plot. In general, as the number of pathogen inoculations increased, the
disease severity was also increased i.e., positive relationship was observed between the
numbers of inoculations with disease severity at different centres. Though the pathogen was
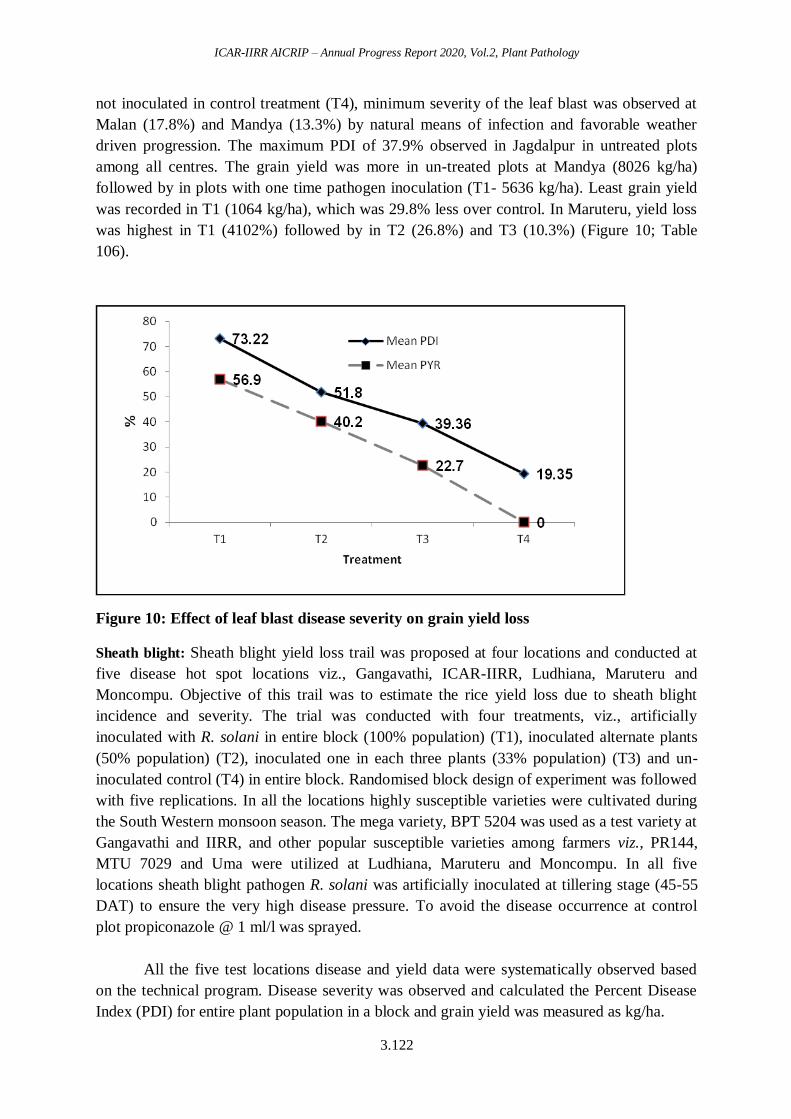
ICAR-IIRR AICRIP – Annual Progress Report 2020, Vol.2, Plant Pathology
3.122
not inoculated in control treatment (T4), minimum severity of the leaf blast was observed at
Malan (17.8%) and Mandya (13.3%) by natural means of infection and favorable weather
driven progression. The maximum PDI of 37.9% observed in Jagdalpur in untreated plots
among all centres. The grain yield was more in un-treated plots at Mandya (8026 kg/ha)
followed by in plots with one time pathogen inoculation (T1- 5636 kg/ha). Least grain yield
was recorded in T1 (1064 kg/ha), which was 29.8% less over control. In Maruteru, yield loss
was highest in T1 (4102%) followed by in T2 (26.8%) and T3 (10.3%) (Figure 10; Table
106).
Figure 10: Effect of leaf blast disease severity on grain yield loss
Sheath blight: Sheath blight yield loss trail was proposed at four locations and conducted at
five disease hot spot locations viz., Gangavathi, ICAR-IIRR, Ludhiana, Maruteru and
Moncompu. Objective of this trail was to estimate the rice yield loss due to sheath blight
incidence and severity. The trial was conducted with four treatments, viz., artificially
inoculated with R. solani in entire block (100% population) (T1), inoculated alternate plants
(50% population) (T2), inoculated one in each three plants (33% population) (T3) and un-
inoculated control (T4) in entire block. Randomised block design of experiment was followed
with five replications. In all the locations highly susceptible varieties were cultivated during
the South Western monsoon season. The mega variety, BPT 5204 was used as a test variety at
Gangavathi and IIRR, and other popular susceptible varieties among farmers viz., PR144,
MTU 7029 and Uma were utilized at Ludhiana, Maruteru and Moncompu. In all five
locations sheath blight pathogen R. solani was artificially inoculated at tillering stage (45-55
DAT) to ensure the very high disease pressure. To avoid the disease occurrence at control
plot propiconazole @ 1 ml/l was sprayed.
All the five test locations disease and yield data were systematically observed based
on the technical program. Disease severity was observed and calculated the Percent Disease
Index (PDI) for entire plant population in a block and grain yield was measured as kg/ha.

ICAR-IIRR AICRIP – Annual Progress Report 2020, Vol.2, Plant Pathology
3.123
The entire test location disease varied among the treatments from 78% (Gangavathi)
to 0.01% (IIRR and Ludhiana). In 100% inoculated treatment (T1) Very high disease pressure
noticed at Gangavathi (78.0%), IIRR (74.55%), Maruteru (67.93%) and Moncompu (59.77%)
and moderate level at Ludhiana (49.81%). Alternate plants inoculated (50% plants) treatment
(T2) very high disease noticed at Gangavathi (60.25%); high at IIRR (40.23%) and Maruteru
(37.68%); moderate at Ludhiana (25.74) and; low at Moncompu (17.27). Treatment (T3)
disease severity high at Gangavathi (45.50%) and Maruteru (37.68%); moderate IIRR
(28.79%); and low at Ludhiana (17.72%) and Moncompu (9.86%). Finally, in un-inoculated
treatment also natural occurrence of disease was noticed at low level in Maruteru (10.49%)
and Moncompu (8.66%). Among all four treatments, population mean disease severity was
high at 100% diseased block (66.0%) followed by 50% diseased block (35.26%), 33%
diseased block (27.95%) and naturally diseased plants (3.96%). Among all the centres, grain
yield was very high at un-inoculated check (T4) followed by 30% diseased block (T3), 50%
diseased block (T2) and 100% diseased block (T1). All the treatments reduced the grain yield
based on the population disease severity in the treatment. The mean percent yield reduction
over control (PDR) showed the yield reduction of 34.09% in 100% diseased block (T1),
20.38% in 50% diseased block (T2), 12.27% in 30% diseased block (T3) and 0% in naturally
diseased block (T4) (Table 107). Results from the present study revealed that sheath blight
severity increases and rice grain yield reduces in the ratio of 2:1 (Fig. 11). Sheath blight
disease severity and yield were negatively correlated with each other.
Figure 11: Effect of sheath blight disease severity on grain yield loss
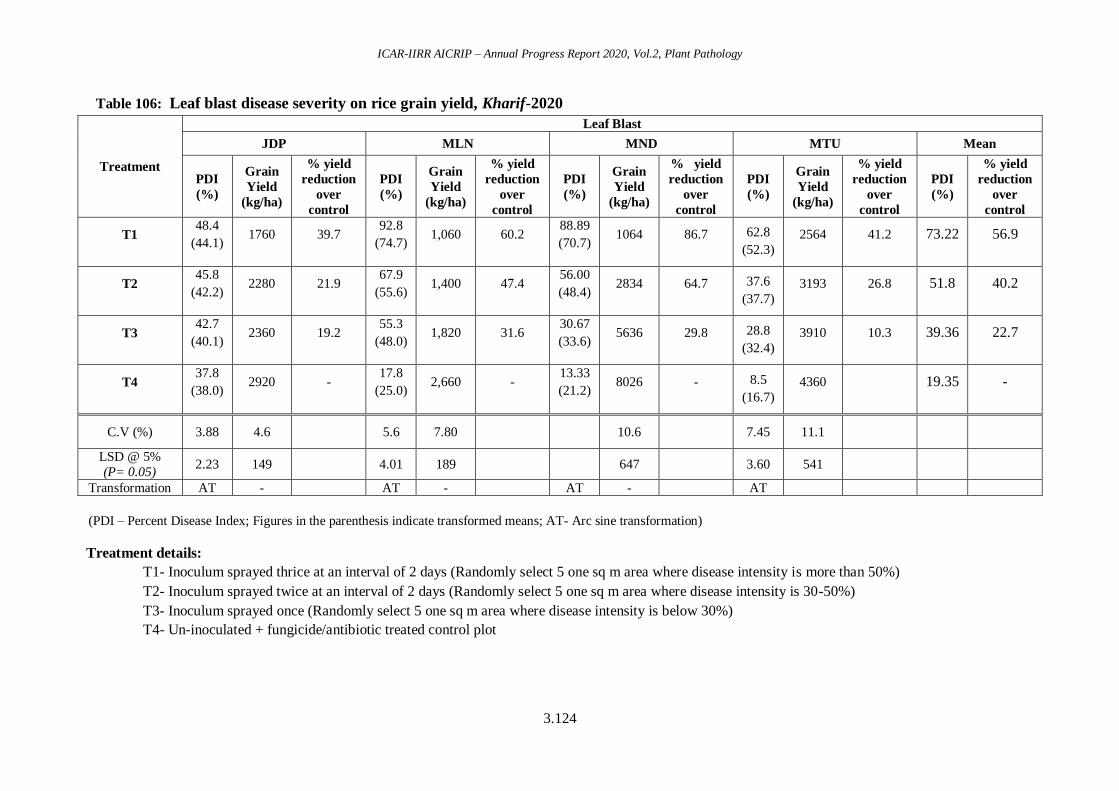
ICAR-IIRR AICRIP – Annual Progress Report 2020, Vol.2, Plant Pathology
3.124
Table 106: Leaf blast disease severity on rice grain yield, Kharif-2020
Treatment
Leaf Blast
JDP MLN MND MTU Mean
PDI
(%)
Grain
Yield
(kg/ha)
% yield
reduction
over
control
PDI
(%)
Grain
Yield
(kg/ha)
% yield
reduction
over
control
PDI
(%)
Grain
Yield
(kg/ha)
% yield
reduction
over
control
PDI
(%)
Grain
Yield
(kg/ha)
% yield
reduction
over
control
PDI
(%)
% yield
reduction
over
control
T1 48.4
(44.1) 1760 39.7
92.8
(74.7) 1,060 60.2
88.89
(70.7) 1064 86.7 62.8
(52.3)
2564 41.2 73.22 56.9
T2 45.8
(42.2) 2280 21.9
67.9
(55.6) 1,400 47.4
56.00
(48.4) 2834 64.7 37.6
(37.7)
3193 26.8 51.8 40.2
T3 42.7
(40.1) 2360 19.2
55.3
(48.0) 1,820 31.6
30.67
(33.6) 5636 29.8 28.8
(32.4)
3910 10.3 39.36 22.7
T4 37.8
(38.0) 2920 -
17.8
(25.0) 2,660 -
13.33
(21.2) 8026 - 8.5
(16.7)
4360 19.35 -
C.V (%) 3.88 4.6 5.6 7.80 10.6 7.45 11.1
LSD @ 5%
(P= 0.05) 2.23 149 4.01 189 647 3.60 541
Transformation AT - AT - AT - AT
(PDI – Percent Disease Index; Figures in the parenthesis indicate transformed means; AT- Arc sine transformation)
Treatment details:
T1- Inoculum sprayed thrice at an interval of 2 days (Randomly select 5 one sq m area where disease intensity is more than 50%)
T2- Inoculum sprayed twice at an interval of 2 days (Randomly select 5 one sq m area where disease intensity is 30-50%)
T3- Inoculum sprayed once (Randomly select 5 one sq m area where disease intensity is below 30%)
T4- Un-inoculated + fungicide/antibiotic treated control plot
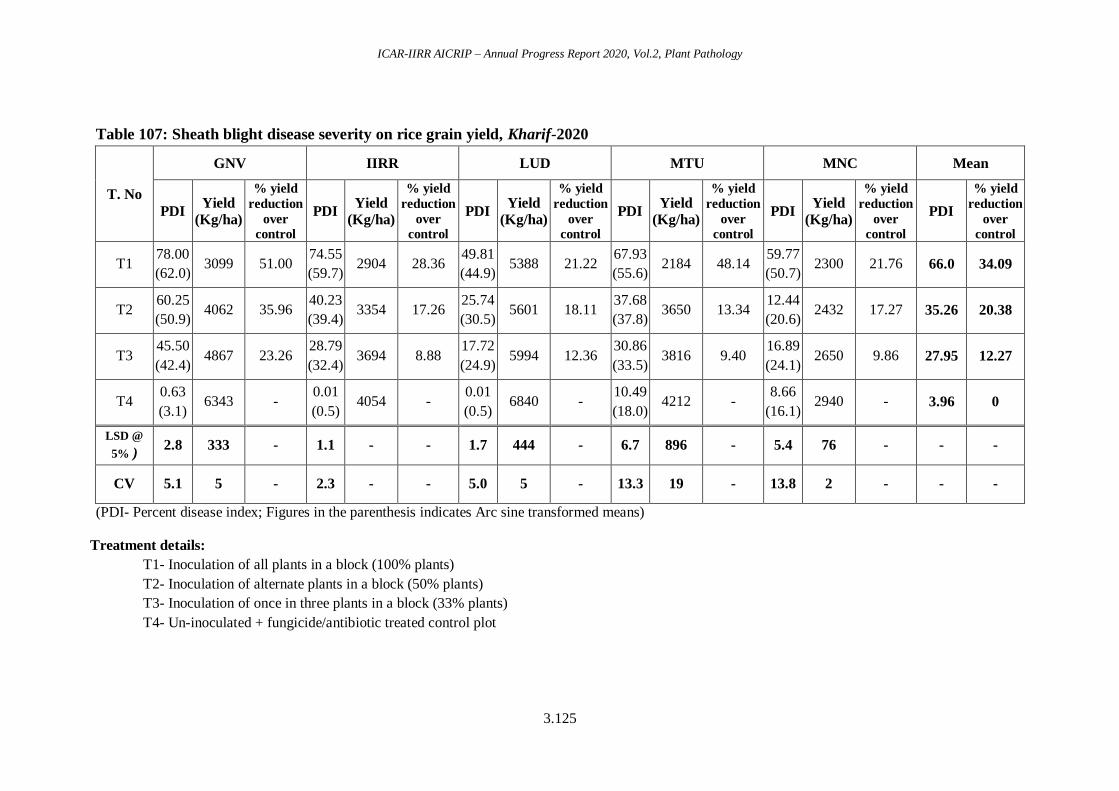
ICAR-IIRR AICRIP – Annual Progress Report 2020, Vol.2, Plant Pathology
3.125
Table 107: Sheath blight disease severity on rice grain yield, Kharif-2020
T. No
GNV IIRR LUD MTU MNC Mean
PDI Yield
(Kg/ha)
% yield
reduction
over
control
PDI Yield
(Kg/ha)
% yield
reduction
over
control
PDI Yield
(Kg/ha)
% yield
reduction
over
control
PDI Yield
(Kg/ha)
% yield
reduction
over
control
PDI Yield
(Kg/ha)
% yield
reduction
over
control
PDI
% yield
reduction
over
control
T1 78.00
(62.0) 3099 51.00
74.55
(59.7) 2904 28.36
49.81
(44.9) 5388 21.22
67.93
(55.6) 2184 48.14
59.77
(50.7) 2300 21.76 66.0 34.09
T2 60.25
(50.9) 4062 35.96
40.23
(39.4) 3354 17.26
25.74
(30.5) 5601 18.11
37.68
(37.8) 3650 13.34
12.44
(20.6) 2432 17.27 35.26 20.38
T3 45.50
(42.4) 4867 23.26
28.79
(32.4) 3694 8.88
17.72
(24.9) 5994 12.36
30.86
(33.5) 3816 9.40
16.89
(24.1) 2650 9.86 27.95 12.27
T4 0.63
(3.1) 6343 -
0.01
(0.5) 4054 -
0.01
(0.5) 6840 -
10.49
(18.0) 4212 -
8.66
(16.1) 2940 - 3.96 0
LSD @
5% ) 2.8 333 - 1.1 - - 1.7 444 - 6.7 896 - 5.4 76 - - -
CV 5.1 5 - 2.3 - - 5.0 5 - 13.3 19 - 13.8 2 - - -
(PDI- Percent disease index; Figures in the parenthesis indicates Arc sine transformed means)
Treatment details:
T1- Inoculation of all plants in a block (100% plants)
T2- Inoculation of alternate plants in a block (50% plants)
T3- Inoculation of once in three plants in a block (33% plants)
T4- Un-inoculated + fungicide/antibiotic treated control plot
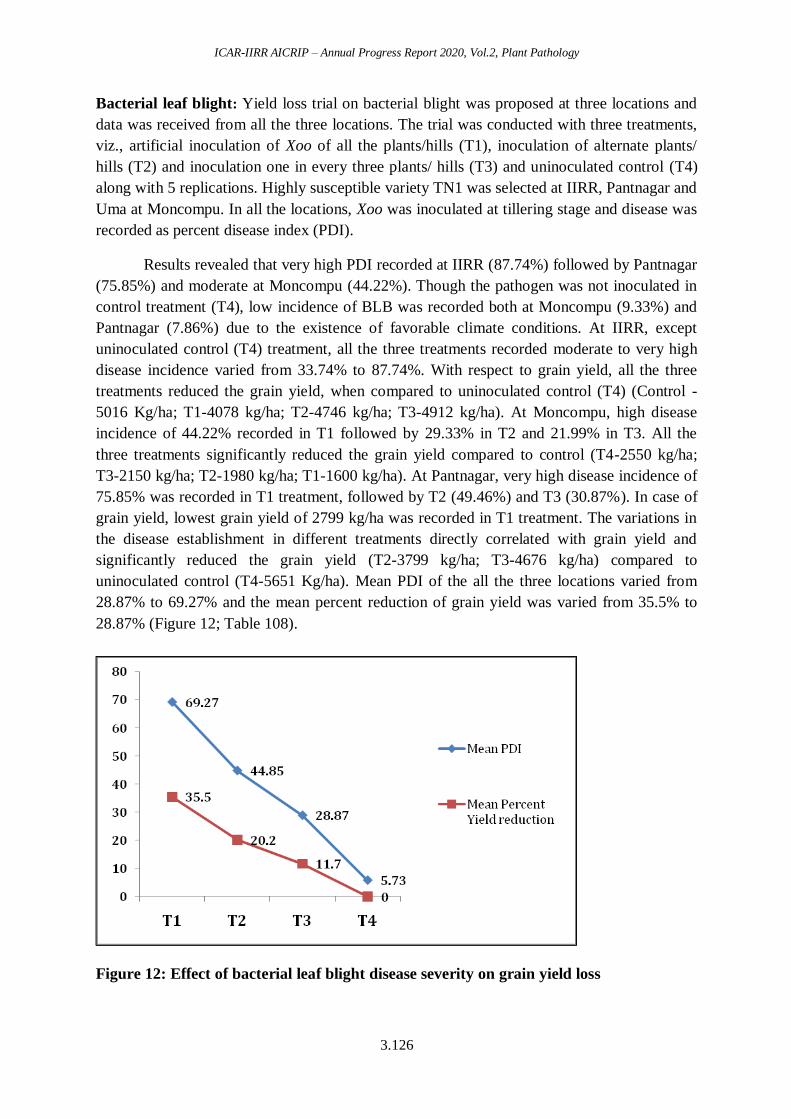
ICAR-IIRR AICRIP – Annual Progress Report 2020, Vol.2, Plant Pathology
3.126
Bacterial leaf blight: Yield loss trial on bacterial blight was proposed at three locations and
data was received from all the three locations. The trial was conducted with three treatments,
viz., artificial inoculation of Xoo of all the plants/hills (T1), inoculation of alternate plants/
hills (T2) and inoculation one in every three plants/ hills (T3) and uninoculated control (T4)
along with 5 replications. Highly susceptible variety TN1 was selected at IIRR, Pantnagar and
Uma at Moncompu. In all the locations, Xoo was inoculated at tillering stage and disease was
recorded as percent disease index (PDI).
Results revealed that very high PDI recorded at IIRR (87.74%) followed by Pantnagar
(75.85%) and moderate at Moncompu (44.22%). Though the pathogen was not inoculated in
control treatment (T4), low incidence of BLB was recorded both at Moncompu (9.33%) and
Pantnagar (7.86%) due to the existence of favorable climate conditions. At IIRR, except
uninoculated control (T4) treatment, all the three treatments recorded moderate to very high
disease incidence varied from 33.74% to 87.74%. With respect to grain yield, all the three
treatments reduced the grain yield, when compared to uninoculated control (T4) (Control -
5016 Kg/ha; T1-4078 kg/ha; T2-4746 kg/ha; T3-4912 kg/ha). At Moncompu, high disease
incidence of 44.22% recorded in T1 followed by 29.33% in T2 and 21.99% in T3. All the
three treatments significantly reduced the grain yield compared to control (T4-2550 kg/ha;
T3-2150 kg/ha; T2-1980 kg/ha; T1-1600 kg/ha). At Pantnagar, very high disease incidence of
75.85% was recorded in T1 treatment, followed by T2 (49.46%) and T3 (30.87%). In case of
grain yield, lowest grain yield of 2799 kg/ha was recorded in T1 treatment. The variations in
the disease establishment in different treatments directly correlated with grain yield and
significantly reduced the grain yield (T2-3799 kg/ha; T3-4676 kg/ha) compared to
uninoculated control (T4-5651 Kg/ha). Mean PDI of the all the three locations varied from
28.87% to 69.27% and the mean percent reduction of grain yield was varied from 35.5% to
28.87% (Figure 12; Table 108).
Figure 12: Effect of bacterial leaf blight disease severity on grain yield loss
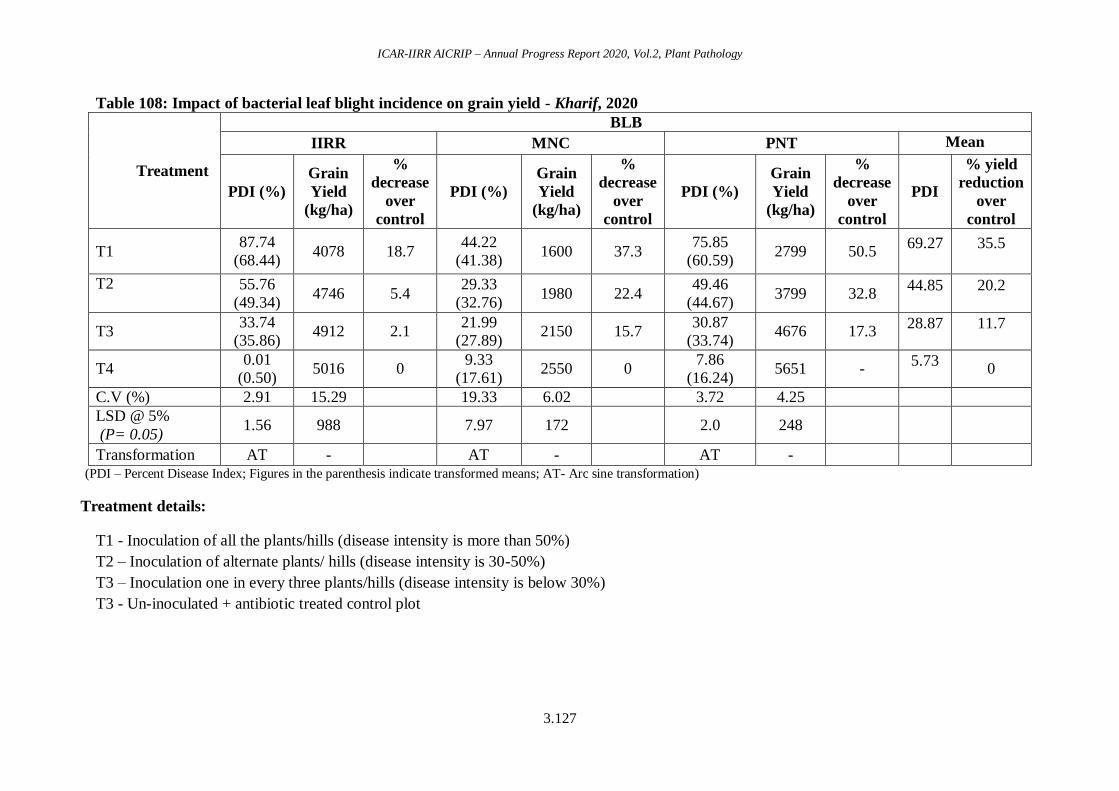
ICAR-IIRR AICRIP – Annual Progress Report 2020, Vol.2, Plant Pathology
3.127
Table 108: Impact of bacterial leaf blight incidence on grain yield - Kharif, 2020
Treatment
BLB
IIRR MNC PNT Mean
PDI (%)
Grain
Yield
(kg/ha)
%
decrease
over
control
PDI (%)
Grain
Yield
(kg/ha)
%
decrease
over
control
PDI (%)
Grain
Yield
(kg/ha)
%
decrease
over
control
PDI
% yield
reduction
over
control
T1 87.74
(68.44) 4078 18.7
44.22
(41.38) 1600 37.3
75.85
(60.59) 2799 50.5
69.27 35.5
T2 55.76
(49.34) 4746 5.4
29.33
(32.76) 1980 22.4
49.46
(44.67) 3799 32.8
44.85 20.2
T3 33.74
(35.86) 4912 2.1
21.99
(27.89) 2150 15.7
30.87
(33.74) 4676 17.3
28.87 11.7
T4 0.01
(0.50) 5016 0
9.33
(17.61) 2550 0
7.86
(16.24) 5651 -
5.73 0
C.V (%) 2.91 15.29 19.33 6.02 3.72 4.25
LSD @ 5%
(P= 0.05) 1.56 988 7.97 172 2.0 248
Transformation AT - AT - AT - (PDI – Percent Disease Index; Figures in the parenthesis indicate transformed means; AT- Arc sine transformation)
Treatment details:
T1 - Inoculation of all the plants/hills (disease intensity is more than 50%)
T2 – Inoculation of alternate plants/ hills (disease intensity is 30-50%)
T3 – Inoculation one in every three plants/hills (disease intensity is below 30%)
T3 - Un-inoculated + antibiotic treated control plot
ICAR-IIRR AICRIP – Annual Progress Report 2020, Vol.2, Plant Pathology
3.128
5. COLLABORATIVE TRIAL WITH AGRONOMY
In collaboration with agronomy, trials were initiated to study the influence of different
establishment methods and cropping system on rice diseases. The technical details can be
referred from agronomy technical programme Kharif 2020. The results of the trials are given
below.
I. Influence of Establishment Methods on Pest and Disease Incidence (IEMP)
At Gangavathi, experiments were conducted to study the effect of three different crop
establishment methods viz., manual transplanting, puddled direct seeded and un-puddled
direct seeding under different weed conditions in the plots viz., weed free check, weedy
check, mechanical weeding using weeder and chemical weed control on the disease severity
of Bacterial leaf blight, Leaf blast and Brown spot. Accordingly, among the three different
crop establishment methods, un-puddled direct seeding method was most effective in creating
conditions for the lowest disease severity of BLB (7.1%) and puddled direct seeded (9.89 %)
when compared to a high DS in manual transplanting (19.07%). However, in case of LB, the
lowest disease severity was observed in the manually transplanted plants (3.64% DS) and un-
puddled direct planted plants (5.42% DS) when compared to the high disease severity in
puddled direct seeded plants (10.42%DS). In the case of brown spot disease, the highest %
DS was observed in un-puddled direct planted plants (22.32 %DS) followed by puddled
direct seeded plants (15.19 %DS) and manually transplanted plants (10.33 % DS) (Table
109a).
In the case of plants under different weed conditions in the plots, the plants in weedy
check plots the disease severity of BLB and LB were found to be the lowest (5.77 and 3.17
%DS respectively). The low disease may be due to low availability of less nutrients to the rice
plants, which might have taken up weeds. The disease severity in the other weed conditions
was almost on par. In case of brown spot disease, the disease severity was found to be lowest
in the weed free plots (9.35% DS) followed by plots in mechanical weeding (12.75 % DS)
and chemical weeding (14.33% DS). The plants in weedy check were found to have highest
disease severity of 27.35% DS (Table 109 b).
At Rajendranagar, different crop establishment methods viz., transplanting, wet
seeding and dry converted wet system was studied along with residue management. Data
from the table indicates that among three different crop establishment methods viz.,
transplanting, wet seeding and dry converted wet system, the system of wet seeding was
making the most favourable condition for the incidence of the false smut disease in rice
(16.98% DI) when compared to the other two methods. Since it is observed that compared to
transplanted method in dry converted wet rice method about 30% of water can be saved and
the crop matures 7-10 days earlier, the later can be a better alternative because of its on-par
performance of inhibiting the false smut disease (9.47% DI) along with the transplanting
system (8.96% DI). Among the three different residue management methods viz., no residue,
retaining 15cm height of straw and retaining 30 cm height of straw, it was observed that both
no-residue and retaining 15cm height of straw were found to be on-par in suppressing the
incidence of false smut disease (9.27 and 9.67% DI) when compared to the system where 30
cm height of straw was retained (16.47% DI). Since this is being the first year of the trial, we
would be observing the trend in the coming years for a much better understanding of the
systems and their influence on false smut disease of rice (Table 110).
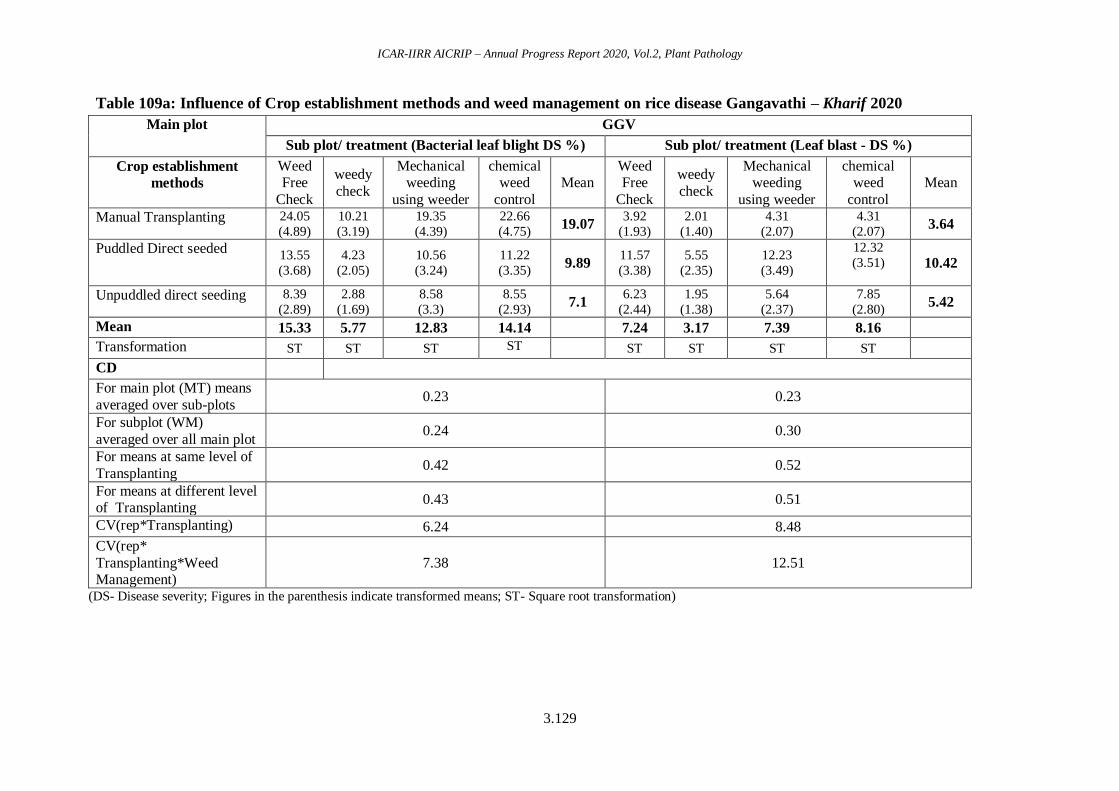
ICAR-IIRR AICRIP – Annual Progress Report 2020, Vol.2, Plant Pathology
3.129
Table 109a: Influence of Crop establishment methods and weed management on rice disease Gangavathi – Kharif 2020
Main plot GGV
Sub plot/ treatment (Bacterial leaf blight DS %) Sub plot/ treatment (Leaf blast - DS %)
Crop establishment
methods
Weed Free
Check
weedy
check
Mechanical weeding
using weeder
chemical weed
control
Mean Weed Free
Check
weedy
check
Mechanical weeding
using weeder
chemical weed
control
Mean
Manual Transplanting 24.05
(4.89)
10.21
(3.19)
19.35
(4.39)
22.66
(4.75) 19.07
3.92
(1.93)
2.01
(1.40)
4.31
(2.07)
4.31
(2.07) 3.64
Puddled Direct seeded 13.55
(3.68)
4.23
(2.05)
10.56
(3.24)
11.22
(3.35) 9.89
11.57
(3.38)
5.55
(2.35)
12.23
(3.49)
12.32
(3.51)
10.42
Unpuddled direct seeding 8.39
(2.89)
2.88
(1.69)
8.58
(3.3)
8.55
(2.93) 7.1
6.23
(2.44)
1.95
(1.38)
5.64
(2.37)
7.85
(2.80) 5.42
Mean 15.33 5.77 12.83 14.14
7.24 3.17 7.39 8.16
Transformation ST ST ST ST
ST ST ST ST
CD
For main plot (MT) means
averaged over sub-plots 0.23 0.23
For subplot (WM)
averaged over all main plot 0.24 0.30
For means at same level of
Transplanting 0.42 0.52
For means at different level of Transplanting
0.43 0.51
CV(rep*Transplanting) 6.24 8.48
CV(rep*
Transplanting*Weed Management)
7.38 12.51
(DS- Disease severity; Figures in the parenthesis indicate transformed means; ST- Square root transformation)
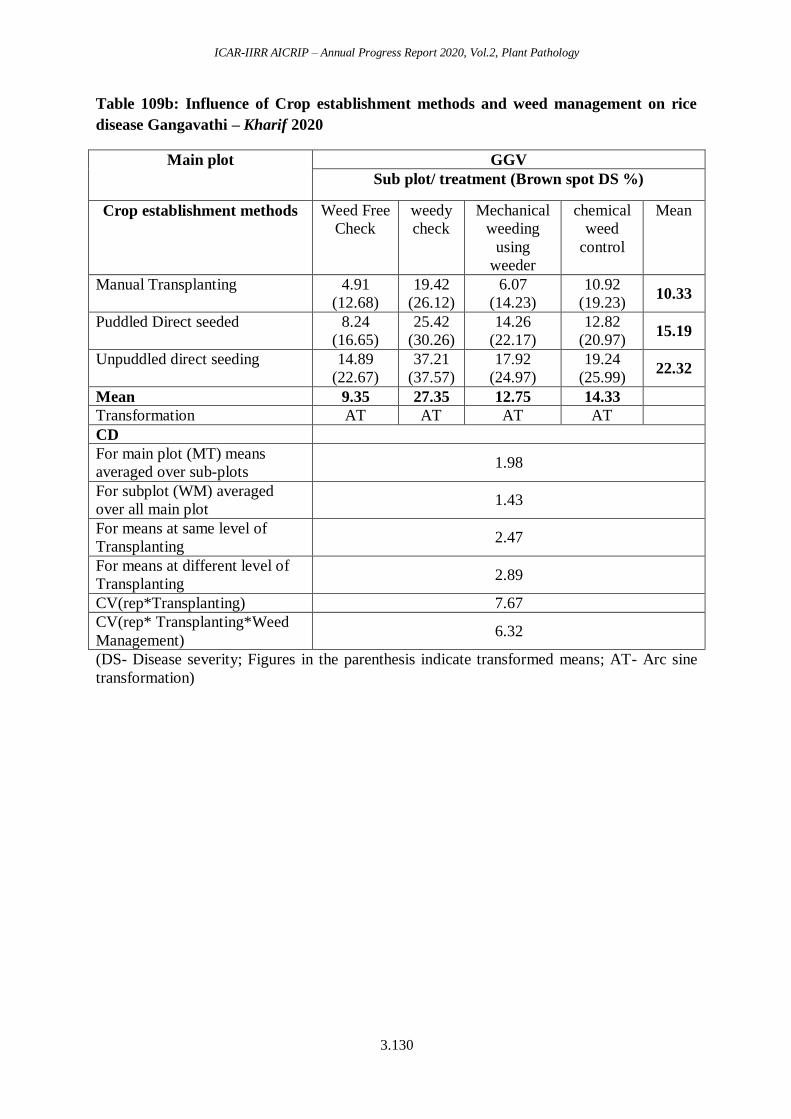
ICAR-IIRR AICRIP – Annual Progress Report 2020, Vol.2, Plant Pathology
3.130
Table 109b: Influence of Crop establishment methods and weed management on rice
disease Gangavathi – Kharif 2020
Main plot GGV
Sub plot/ treatment (Brown spot DS %)
Crop establishment methods Weed Free
Check
weedy
check
Mechanical
weeding
using
weeder
chemical
weed
control
Mean
Manual Transplanting 4.91
(12.68)
19.42
(26.12)
6.07
(14.23)
10.92
(19.23) 10.33
Puddled Direct seeded 8.24
(16.65)
25.42
(30.26)
14.26
(22.17)
12.82
(20.97) 15.19
Unpuddled direct seeding 14.89
(22.67)
37.21
(37.57)
17.92
(24.97)
19.24
(25.99) 22.32
Mean 9.35 27.35 12.75 14.33
Transformation AT AT AT AT
CD
For main plot (MT) means
averaged over sub-plots 1.98
For subplot (WM) averaged
over all main plot 1.43
For means at same level of
Transplanting 2.47
For means at different level of
Transplanting 2.89
CV(rep*Transplanting) 7.67
CV(rep* Transplanting*Weed
Management) 6.32
(DS- Disease severity; Figures in the parenthesis indicate transformed means; AT- Arc sine
transformation)

ICAR-IIRR AICRIP – Annual Progress Report 2020, Vol.2, Plant Pathology
3.131
Table 110: Influence of Crop establishment methods and residue management on False
smut disease Incidence at Rajendranagar – Kharif 2020
Main plot
RNR
Residue management / (False smut Disease
Incidence %)
Crop establishment methods
No
residue
(S1)
15 cm height of
rice straw (S2)
30 cm
height of
rice straw
(S3)
Mean
Transplanting 4.60
(12.30)
7.94
(16.14)
14.33
(22.22) 8.96
Wet Seeding 14.40
(22.20)
13.20
(21.22)
23.33
(28.76) 16.98
Dry Converted Wet system 8.80
(17.14)
7.87
(16.01)
11.75
(20.87) 9.47
Mean 9.27 9.67 16.47
Transformation AT AT AT
CD
For main plot (MT) means averaged
over sub-plots 5.21
For subplot (WM) averaged over all
main plot 2.25
For means at same level of Crop
establishment methods 3.90
For means at different level of
Crop establishment methods 6.06
CV(rep*Crop establishment
methods) 20.24
CV(rep* Crop establishment
methods*Residue management) 11.16
(Figures in the parenthesis indicate transformed means; AT- Arc sine transformation)
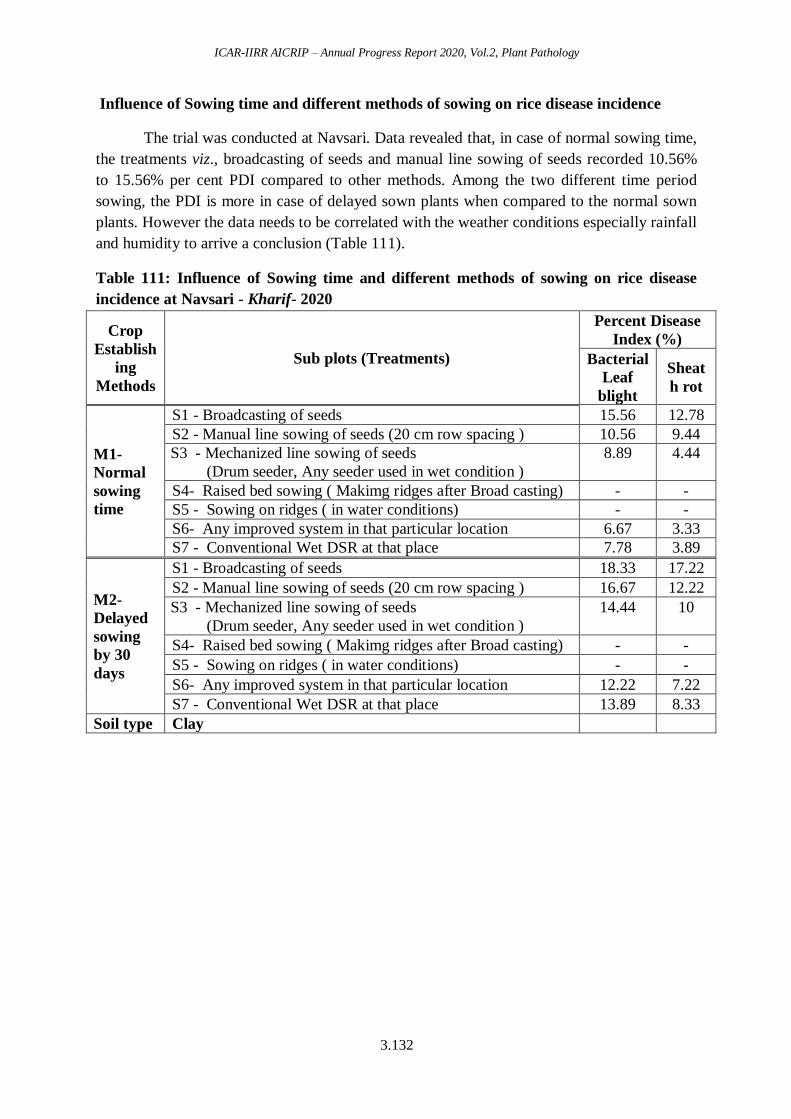
ICAR-IIRR AICRIP – Annual Progress Report 2020, Vol.2, Plant Pathology
3.132
Influence of Sowing time and different methods of sowing on rice disease incidence
The trial was conducted at Navsari. Data revealed that, in case of normal sowing time,
the treatments viz., broadcasting of seeds and manual line sowing of seeds recorded 10.56%
to 15.56% per cent PDI compared to other methods. Among the two different time period
sowing, the PDI is more in case of delayed sown plants when compared to the normal sown
plants. However the data needs to be correlated with the weather conditions especially rainfall
and humidity to arrive a conclusion (Table 111).
Table 111: Influence of Sowing time and different methods of sowing on rice disease
incidence at Navsari - Kharif- 2020
Crop
Establish
ing
Methods
Sub plots (Treatments)
Percent Disease
Index (%)
Bacterial
Leaf
blight
Sheat
h rot
M1-
Normal
sowing
time
S1 - Broadcasting of seeds 15.56 12.78
S2 - Manual line sowing of seeds (20 cm row spacing ) 10.56 9.44
S3 - Mechanized line sowing of seeds
(Drum seeder, Any seeder used in wet condition )
8.89 4.44
S4- Raised bed sowing ( Makimg ridges after Broad casting) - -
S5 - Sowing on ridges ( in water conditions) - -
S6- Any improved system in that particular location 6.67 3.33
S7 - Conventional Wet DSR at that place 7.78 3.89
M2-
Delayed
sowing
by 30
days
S1 - Broadcasting of seeds 18.33 17.22
S2 - Manual line sowing of seeds (20 cm row spacing ) 16.67 12.22
S3 - Mechanized line sowing of seeds
(Drum seeder, Any seeder used in wet condition )
14.44 10
S4- Raised bed sowing ( Makimg ridges after Broad casting) - -
S5 - Sowing on ridges ( in water conditions) - -
S6- Any improved system in that particular location 12.22 7.22
S7 - Conventional Wet DSR at that place 13.89 8.33
Soil type Clay
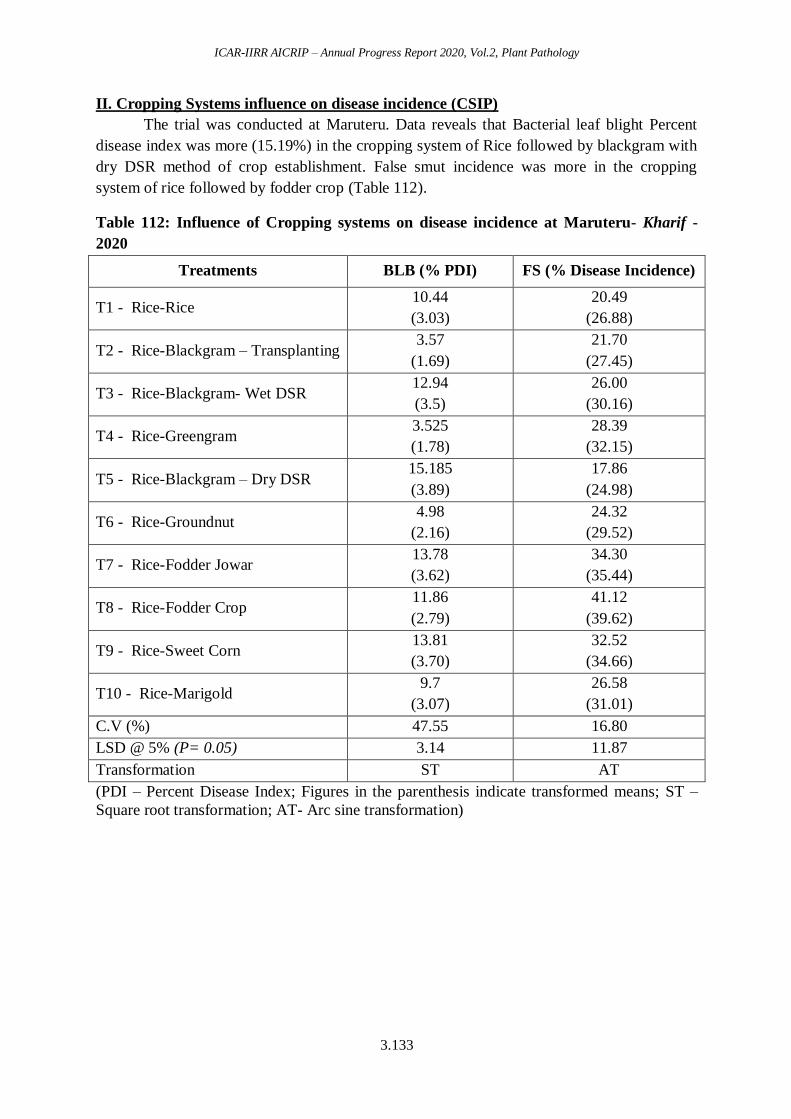
ICAR-IIRR AICRIP – Annual Progress Report 2020, Vol.2, Plant Pathology
3.133
II. Cropping Systems influence on disease incidence (CSIP)
The trial was conducted at Maruteru. Data reveals that Bacterial leaf blight Percent
disease index was more (15.19%) in the cropping system of Rice followed by blackgram with
dry DSR method of crop establishment. False smut incidence was more in the cropping
system of rice followed by fodder crop (Table 112).
Table 112: Influence of Cropping systems on disease incidence at Maruteru- Kharif -
2020
Treatments BLB (% PDI) FS (% Disease Incidence)
T1 - Rice-Rice 10.44
(3.03)
20.49
(26.88)
T2 - Rice-Blackgram – Transplanting 3.57
(1.69)
21.70
(27.45)
T3 - Rice-Blackgram- Wet DSR 12.94
(3.5)
26.00
(30.16)
T4 - Rice-Greengram 3.525
(1.78)
28.39
(32.15)
T5 - Rice-Blackgram – Dry DSR 15.185
(3.89)
17.86
(24.98)
T6 - Rice-Groundnut 4.98
(2.16)
24.32
(29.52)
T7 - Rice-Fodder Jowar 13.78
(3.62)
34.30
(35.44)
T8 - Rice-Fodder Crop 11.86
(2.79)
41.12
(39.62)
T9 - Rice-Sweet Corn 13.81
(3.70)
32.52
(34.66)
T10 - Rice-Marigold 9.7
(3.07)
26.58
(31.01)
C.V (%) 47.55 16.80
LSD @ 5% (P= 0.05) 3.14 11.87
Transformation ST AT
(PDI – Percent Disease Index; Figures in the parenthesis indicate transformed means; ST –
Square root transformation; AT- Arc sine transformation)
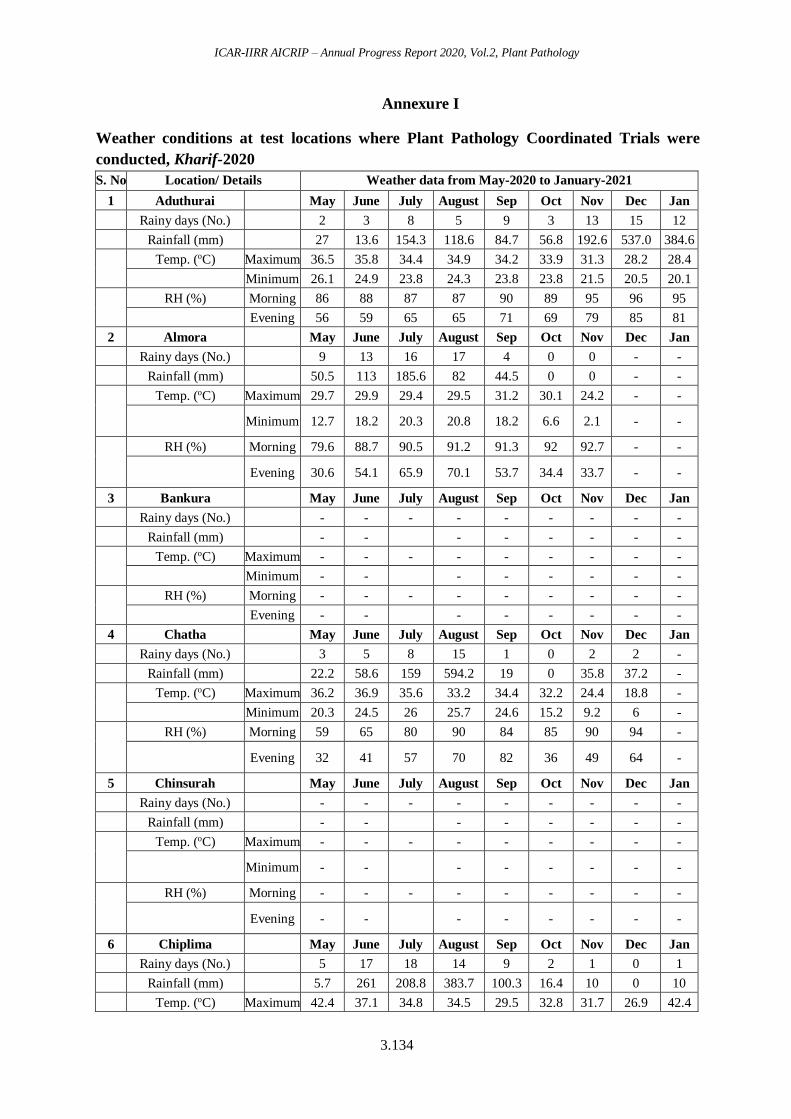
ICAR-IIRR AICRIP – Annual Progress Report 2020, Vol.2, Plant Pathology
3.134
Annexure I
Weather conditions at test locations where Plant Pathology Coordinated Trials were
conducted, Kharif-2020
S. No Location/ Details Weather data from May-2020 to January-2021
1 Aduthurai
May June July August Sep Oct Nov Dec Jan
Rainy days (No.)
2 3 8 5 9 3 13 15 12
Rainfall (mm)
27 13.6 154.3 118.6 84.7 56.8 192.6 537.0 384.6
Temp. (oC) Maximum 36.5 35.8 34.4 34.9 34.2 33.9 31.3 28.2 28.4
Minimum 26.1 24.9 23.8 24.3 23.8 23.8 21.5 20.5 20.1
RH (%) Morning 86 88 87 87 90 89 95 96 95
Evening 56 59 65 65 71 69 79 85 81
2 Almora
May June July August Sep Oct Nov Dec Jan
Rainy days (No.)
9 13 16 17 4 0 0 - -
Rainfall (mm)
50.5 113 185.6 82 44.5 0 0 - -
Temp. (oC) Maximum 29.7 29.9 29.4 29.5 31.2 30.1 24.2 - -
Minimum 12.7 18.2 20.3 20.8 18.2 6.6 2.1 - -
RH (%) Morning 79.6 88.7 90.5 91.2 91.3 92 92.7 - -
Evening 30.6 54.1 65.9 70.1 53.7 34.4 33.7 - -
3 Bankura
May June July August Sep Oct Nov Dec Jan
Rainy days (No.)
- - - - - - - - -
Rainfall (mm)
- - - - - - - -
Temp. (oC) Maximum - - - - - - - - -
Minimum - - - - - - - -
RH (%) Morning - - - - - - - - -
Evening - -
- - - - - -
4 Chatha
May June July August Sep Oct Nov Dec Jan
Rainy days (No.)
3 5 8 15 1 0 2 2 -
Rainfall (mm)
22.2 58.6 159 594.2 19 0 35.8 37.2 -
Temp. (oC) Maximum 36.2 36.9 35.6 33.2 34.4 32.2 24.4 18.8 -
Minimum 20.3 24.5 26 25.7 24.6 15.2 9.2 6 -
RH (%) Morning 59 65 80 90 84 85 90 94 -
Evening 32 41 57 70 82 36 49 64 -
5 Chinsurah
May June July August Sep Oct Nov Dec Jan
Rainy days (No.)
- - - - - - - - -
Rainfall (mm)
- - - - - - - -
Temp. (oC) Maximum - - - - - - - - -
Minimum - - - - - - - -
RH (%) Morning - - - - - - - - -
Evening - - - - - - - -
6 Chiplima
May June July August Sep Oct Nov Dec Jan
Rainy days (No.)
5 17 18 14 9 2 1 0 1
Rainfall (mm)
5.7 261 208.8 383.7 100.3 16.4 10 0 10
Temp. (oC) Maximum 42.4 37.1 34.8 34.5 29.5 32.8 31.7 26.9 42.4
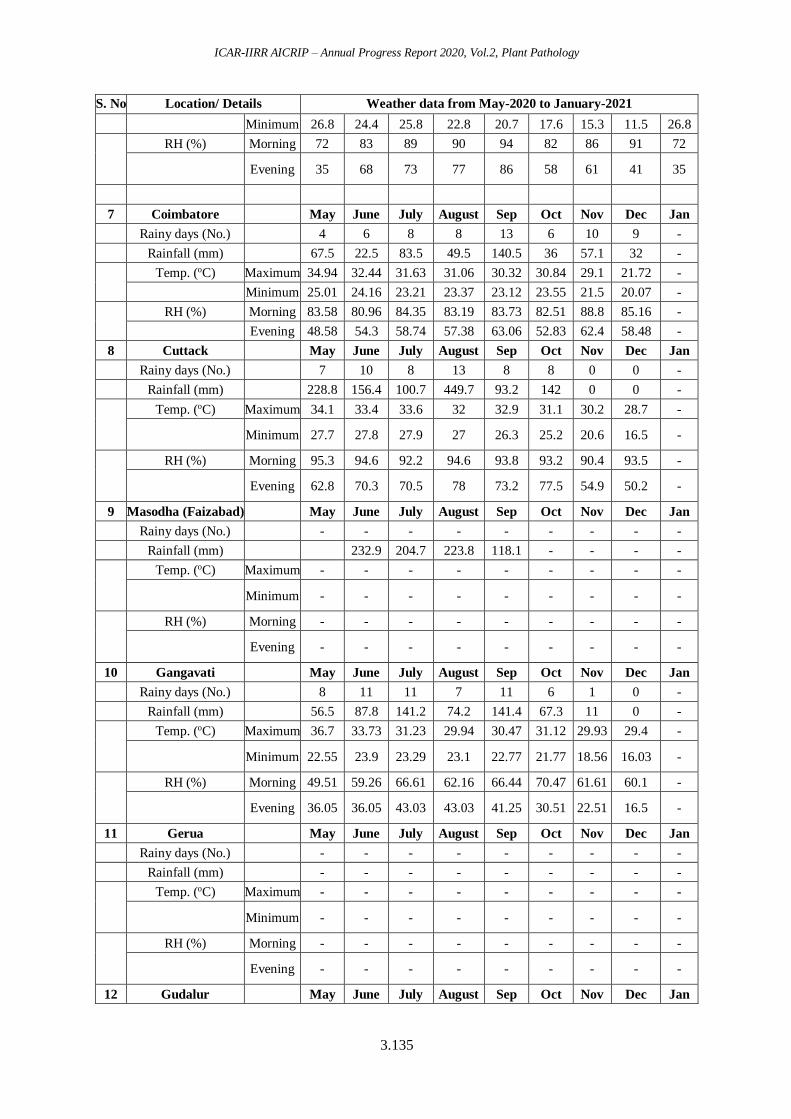
ICAR-IIRR AICRIP – Annual Progress Report 2020, Vol.2, Plant Pathology
3.135
S. No Location/ Details Weather data from May-2020 to January-2021
Minimum 26.8 24.4 25.8 22.8 20.7 17.6 15.3 11.5 26.8
RH (%) Morning 72 83 89 90 94 82 86 91 72
Evening 35 68 73 77 86 58 61 41 35
7 Coimbatore
May June July August Sep Oct Nov Dec Jan
Rainy days (No.)
4 6 8 8 13 6 10 9 -
Rainfall (mm)
67.5 22.5 83.5 49.5 140.5 36 57.1 32 -
Temp. (oC) Maximum 34.94 32.44 31.63 31.06 30.32 30.84 29.1 21.72 -
Minimum 25.01 24.16 23.21 23.37 23.12 23.55 21.5 20.07 -
RH (%) Morning 83.58 80.96 84.35 83.19 83.73 82.51 88.8 85.16 -
Evening 48.58 54.3 58.74 57.38 63.06 52.83 62.4 58.48 -
8 Cuttack
May June July August Sep Oct Nov Dec Jan
Rainy days (No.)
7 10 8 13 8 8 0 0 -
Rainfall (mm)
228.8 156.4 100.7 449.7 93.2 142 0 0 -
Temp. (oC) Maximum 34.1 33.4 33.6 32 32.9 31.1 30.2 28.7 -
Minimum 27.7 27.8 27.9 27 26.3 25.2 20.6 16.5 -
RH (%) Morning 95.3 94.6 92.2 94.6 93.8 93.2 90.4 93.5 -
Evening 62.8 70.3 70.5 78 73.2 77.5 54.9 50.2 -
9 Masodha (Faizabad)
May June July August Sep Oct Nov Dec Jan
Rainy days (No.)
- - - - - - - - -
Rainfall (mm)
232.9 204.7 223.8 118.1 - - - -
Temp. (oC) Maximum - - - - - - - - -
Minimum - - - - - - - - -
RH (%) Morning - - - - - - - - -
Evening - - - - - - - - -
10 Gangavati
May June July August Sep Oct Nov Dec Jan
Rainy days (No.)
8 11 11 7 11 6 1 0 -
Rainfall (mm)
56.5 87.8 141.2 74.2 141.4 67.3 11 0 -
Temp. (oC) Maximum 36.7 33.73 31.23 29.94 30.47 31.12 29.93 29.4 -
Minimum 22.55 23.9 23.29 23.1 22.77 21.77 18.56 16.03 -
RH (%) Morning 49.51 59.26 66.61 62.16 66.44 70.47 61.61 60.1 -
Evening 36.05 36.05 43.03 43.03 41.25 30.51 22.51 16.5 -
11 Gerua
May June July August Sep Oct Nov Dec Jan
Rainy days (No.)
- - - - - - - - -
Rainfall (mm)
- - - - - - - - -
Temp. (oC) Maximum - - - - - - - - -
Minimum - - - - - - - - -
RH (%) Morning - - - - - - - - -
Evening - - - - - - - - -
12 Gudalur
May June July August Sep Oct Nov Dec Jan
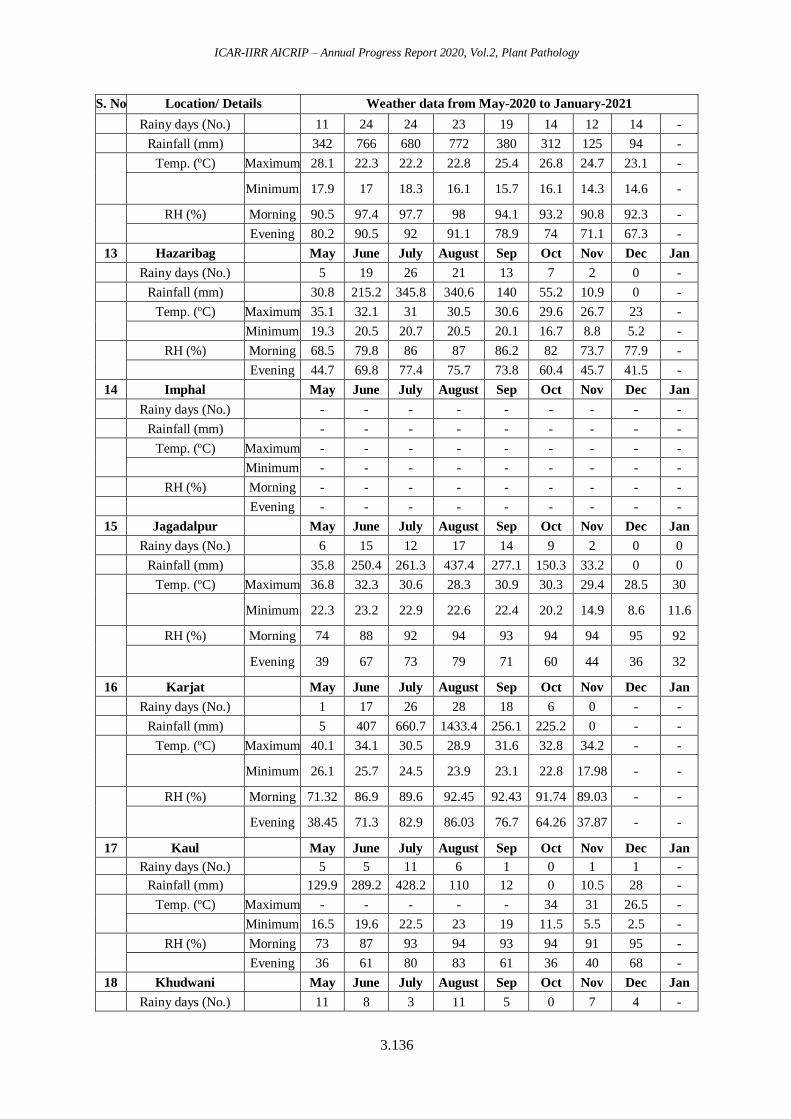
ICAR-IIRR AICRIP – Annual Progress Report 2020, Vol.2, Plant Pathology
3.136
S. No Location/ Details Weather data from May-2020 to January-2021
Rainy days (No.)
11 24 24 23 19 14 12 14 -
Rainfall (mm)
342 766 680 772 380 312 125 94 -
Temp. (oC) Maximum 28.1 22.3 22.2 22.8 25.4 26.8 24.7 23.1 -
Minimum 17.9 17 18.3 16.1 15.7 16.1 14.3 14.6 -
RH (%) Morning 90.5 97.4 97.7 98 94.1 93.2 90.8 92.3 -
Evening 80.2 90.5 92 91.1 78.9 74 71.1 67.3 -
13 Hazaribag
May June July August Sep Oct Nov Dec Jan
Rainy days (No.)
5 19 26 21 13 7 2 0 -
Rainfall (mm)
30.8 215.2 345.8 340.6 140 55.2 10.9 0 -
Temp. (oC) Maximum 35.1 32.1 31 30.5 30.6 29.6 26.7 23 -
Minimum 19.3 20.5 20.7 20.5 20.1 16.7 8.8 5.2 -
RH (%) Morning 68.5 79.8 86 87 86.2 82 73.7 77.9 -
Evening 44.7 69.8 77.4 75.7 73.8 60.4 45.7 41.5 -
14 Imphal
May June July August Sep Oct Nov Dec Jan
Rainy days (No.)
- - - - - - - - -
Rainfall (mm)
- - - - - - - - -
Temp. (oC) Maximum - - - - - - - - -
Minimum - - - - - - - - -
RH (%) Morning - - - - - - - - -
Evening - - - - - - - - -
15 Jagadalpur
May June July August Sep Oct Nov Dec Jan
Rainy days (No.)
6 15 12 17 14 9 2 0 0
Rainfall (mm)
35.8 250.4 261.3 437.4 277.1 150.3 33.2 0 0
Temp. (oC) Maximum 36.8 32.3 30.6 28.3 30.9 30.3 29.4 28.5 30
Minimum 22.3 23.2 22.9 22.6 22.4 20.2 14.9 8.6 11.6
RH (%) Morning 74 88 92 94 93 94 94 95 92
Evening 39 67 73 79 71 60 44 36 32
16 Karjat
May June July August Sep Oct Nov Dec Jan
Rainy days (No.)
1 17 26 28 18 6 0 - -
Rainfall (mm)
5 407 660.7 1433.4 256.1 225.2 0 - -
Temp. (oC) Maximum 40.1 34.1 30.5 28.9 31.6 32.8 34.2 - -
Minimum 26.1 25.7 24.5 23.9 23.1 22.8 17.98 - -
RH (%) Morning 71.32 86.9 89.6 92.45 92.43 91.74 89.03 - -
Evening 38.45 71.3 82.9 86.03 76.7 64.26 37.87 - -
17 Kaul
May June July August Sep Oct Nov Dec Jan
Rainy days (No.)
5 5 11 6 1 0 1 1 -
Rainfall (mm)
129.9 289.2 428.2 110 12 0 10.5 28 -
Temp. (oC) Maximum - - - - - 34 31 26.5 -
Minimum 16.5 19.6 22.5 23 19 11.5 5.5 2.5 -
RH (%) Morning 73 87 93 94 93 94 91 95 -
Evening 36 61 80 83 61 36 40 68 -
18 Khudwani
May June July August Sep Oct Nov Dec Jan
Rainy days (No.)
11 8 3 11 5 0 7 4 -
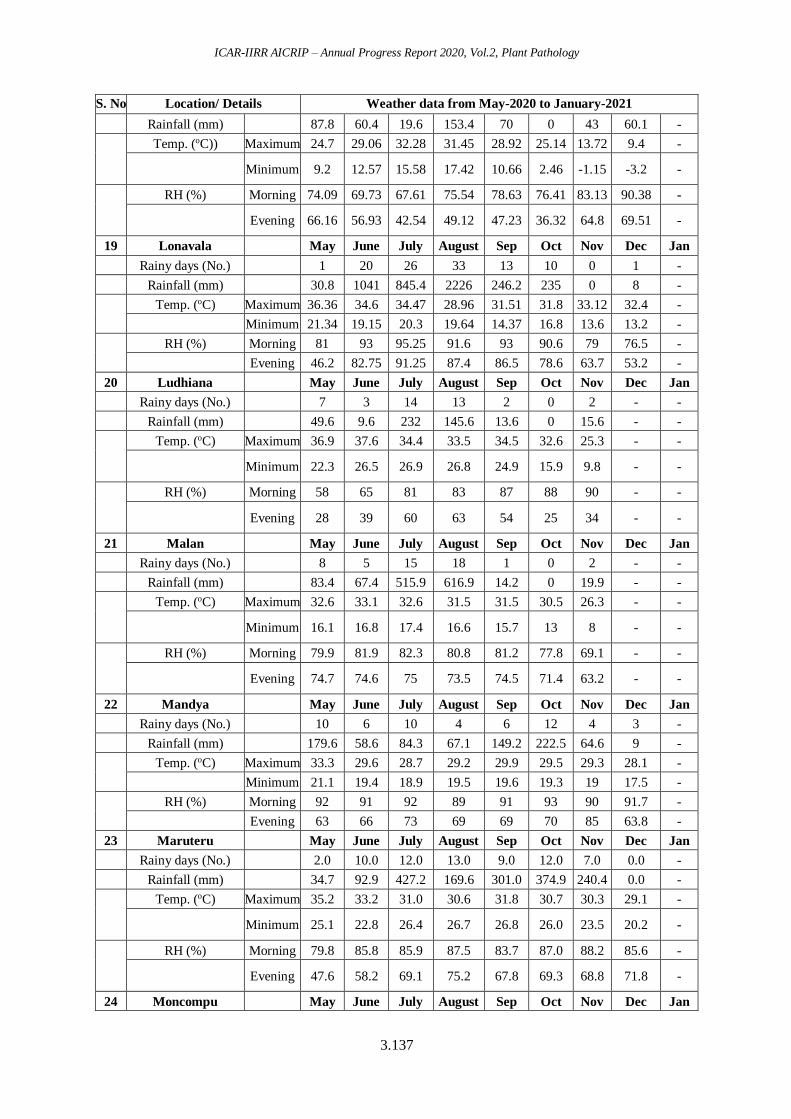
ICAR-IIRR AICRIP – Annual Progress Report 2020, Vol.2, Plant Pathology
3.137
S. No Location/ Details Weather data from May-2020 to January-2021
Rainfall (mm)
87.8 60.4 19.6 153.4 70 0 43 60.1 -
Temp. (oC)) Maximum 24.7 29.06 32.28 31.45 28.92 25.14 13.72 9.4 -
Minimum 9.2 12.57 15.58 17.42 10.66 2.46 -1.15 -3.2 -
RH (%) Morning 74.09 69.73 67.61 75.54 78.63 76.41 83.13 90.38 -
Evening 66.16 56.93 42.54 49.12 47.23 36.32 64.8 69.51 -
19 Lonavala
May June July August Sep Oct Nov Dec Jan
Rainy days (No.) 1 20 26 33 13 10 0 1 -
Rainfall (mm) 30.8 1041 845.4 2226 246.2 235 0 8 -
Temp. (oC) Maximum 36.36 34.6 34.47 28.96 31.51 31.8 33.12 32.4 -
Minimum 21.34 19.15 20.3 19.64 14.37 16.8 13.6 13.2 -
RH (%) Morning 81 93 95.25 91.6 93 90.6 79 76.5 -
Evening 46.2 82.75 91.25 87.4 86.5 78.6 63.7 53.2 -
20 Ludhiana
May June July August Sep Oct Nov Dec Jan
Rainy days (No.)
7 3 14 13 2 0 2 - -
Rainfall (mm)
49.6 9.6 232 145.6 13.6 0 15.6 - -
Temp. (oC) Maximum 36.9 37.6 34.4 33.5 34.5 32.6 25.3 - -
Minimum 22.3 26.5 26.9 26.8 24.9 15.9 9.8 - -
RH (%) Morning 58 65 81 83 87 88 90 - -
Evening 28 39 60 63 54 25 34 - -
21 Malan
May June July August Sep Oct Nov Dec Jan
Rainy days (No.)
8 5 15 18 1 0 2 - -
Rainfall (mm)
83.4 67.4 515.9 616.9 14.2 0 19.9 - -
Temp. (oC) Maximum 32.6 33.1 32.6 31.5 31.5 30.5 26.3 - -
Minimum 16.1 16.8 17.4 16.6 15.7 13 8 - -
RH (%) Morning 79.9 81.9 82.3 80.8 81.2 77.8 69.1 - -
Evening 74.7 74.6 75 73.5 74.5 71.4 63.2 - -
22 Mandya
May June July August Sep Oct Nov Dec Jan
Rainy days (No.)
10 6 10 4 6 12 4 3 -
Rainfall (mm)
179.6 58.6 84.3 67.1 149.2 222.5 64.6 9 -
Temp. (oC) Maximum 33.3 29.6 28.7 29.2 29.9 29.5 29.3 28.1 -
Minimum 21.1 19.4 18.9 19.5 19.6 19.3 19 17.5 -
RH (%) Morning 92 91 92 89 91 93 90 91.7 -
Evening 63 66 73 69 69 70 85 63.8 -
23 Maruteru
May June July August Sep Oct Nov Dec Jan
Rainy days (No.)
2.0 10.0 12.0 13.0 9.0 12.0 7.0 0.0 -
Rainfall (mm)
34.7 92.9 427.2 169.6 301.0 374.9 240.4 0.0 -
Temp. (oC) Maximum 35.2 33.2 31.0 30.6 31.8 30.7 30.3 29.1 -
Minimum 25.1 22.8 26.4 26.7 26.8 26.0 23.5 20.2 -
RH (%) Morning 79.8 85.8 85.9 87.5 83.7 87.0 88.2 85.6 -
Evening 47.6 58.2 69.1 75.2 67.8 69.3 68.8 71.8 -
24 Moncompu
May June July August Sep Oct Nov Dec Jan
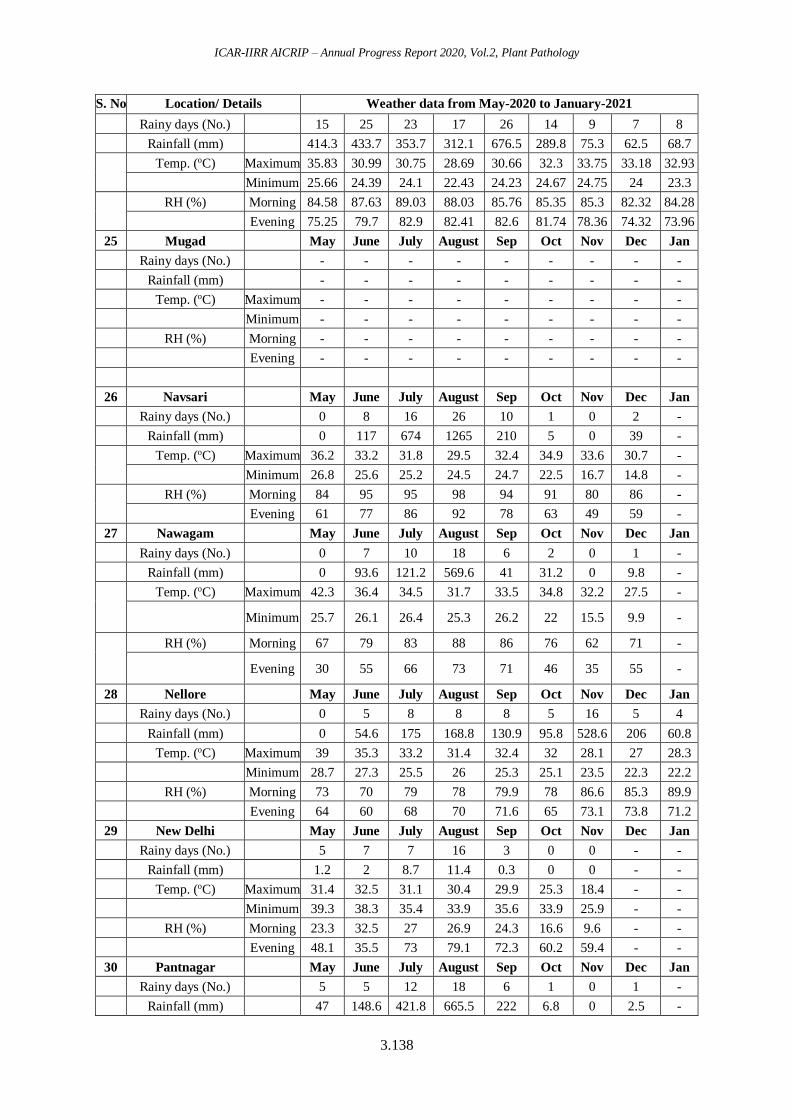
ICAR-IIRR AICRIP – Annual Progress Report 2020, Vol.2, Plant Pathology
3.138
S. No Location/ Details Weather data from May-2020 to January-2021
Rainy days (No.)
15 25 23 17 26 14 9 7 8
Rainfall (mm)
414.3 433.7 353.7 312.1 676.5 289.8 75.3 62.5 68.7
Temp. (oC) Maximum 35.83 30.99 30.75 28.69 30.66 32.3 33.75 33.18 32.93
Minimum 25.66 24.39 24.1 22.43 24.23 24.67 24.75 24 23.3
RH (%) Morning 84.58 87.63 89.03 88.03 85.76 85.35 85.3 82.32 84.28
Evening 75.25 79.7 82.9 82.41 82.6 81.74 78.36 74.32 73.96
25 Mugad May June July August Sep Oct Nov Dec Jan
Rainy days (No.) - - - - - - - - -
Rainfall (mm) - - - - - - - - -
Temp. (oC) Maximum - - - - - - - - -
Minimum - - - - - - - - -
RH (%) Morning - - - - - - - - -
Evening - - - - - - - - -
26 Navsari
May June July August Sep Oct Nov Dec Jan
Rainy days (No.)
0 8 16 26 10 1 0 2 -
Rainfall (mm)
0 117 674 1265 210 5 0 39 -
Temp. (oC) Maximum 36.2 33.2 31.8 29.5 32.4 34.9 33.6 30.7 -
Minimum 26.8 25.6 25.2 24.5 24.7 22.5 16.7 14.8 -
RH (%) Morning 84 95 95 98 94 91 80 86 -
Evening 61 77 86 92 78 63 49 59 -
27 Nawagam
May June July August Sep Oct Nov Dec Jan
Rainy days (No.)
0 7 10 18 6 2 0 1 -
Rainfall (mm)
0 93.6 121.2 569.6 41 31.2 0 9.8 -
Temp. (oC) Maximum 42.3 36.4 34.5 31.7 33.5 34.8 32.2 27.5 -
Minimum 25.7 26.1 26.4 25.3 26.2 22 15.5 9.9 -
RH (%) Morning 67 79 83 88 86 76 62 71 -
Evening 30 55 66 73 71 46 35 55 -
28 Nellore May June July August Sep Oct Nov Dec Jan
Rainy days (No.) 0 5 8 8 8 5 16 5 4
Rainfall (mm) 0 54.6 175 168.8 130.9 95.8 528.6 206 60.8
Temp. (oC) Maximum 39 35.3 33.2 31.4 32.4 32 28.1 27 28.3
Minimum 28.7 27.3 25.5 26 25.3 25.1 23.5 22.3 22.2
RH (%) Morning 73 70 79 78 79.9 78 86.6 85.3 89.9
Evening 64 60 68 70 71.6 65 73.1 73.8 71.2
29 New Delhi May June July August Sep Oct Nov Dec Jan
Rainy days (No.) 5 7 7 16 3 0 0 - -
Rainfall (mm) 1.2 2 8.7 11.4 0.3 0 0 - -
Temp. (oC) Maximum 31.4 32.5 31.1 30.4 29.9 25.3 18.4 - -
Minimum 39.3 38.3 35.4 33.9 35.6 33.9 25.9 - -
RH (%) Morning 23.3 32.5 27 26.9 24.3 16.6 9.6 - -
Evening 48.1 35.5 73 79.1 72.3 60.2 59.4 - -
30 Pantnagar
May June July August Sep Oct Nov Dec Jan
Rainy days (No.)
5 5 12 18 6 1 0 1 -
Rainfall (mm)
47 148.6 421.8 665.5 222 6.8 0 2.5 -
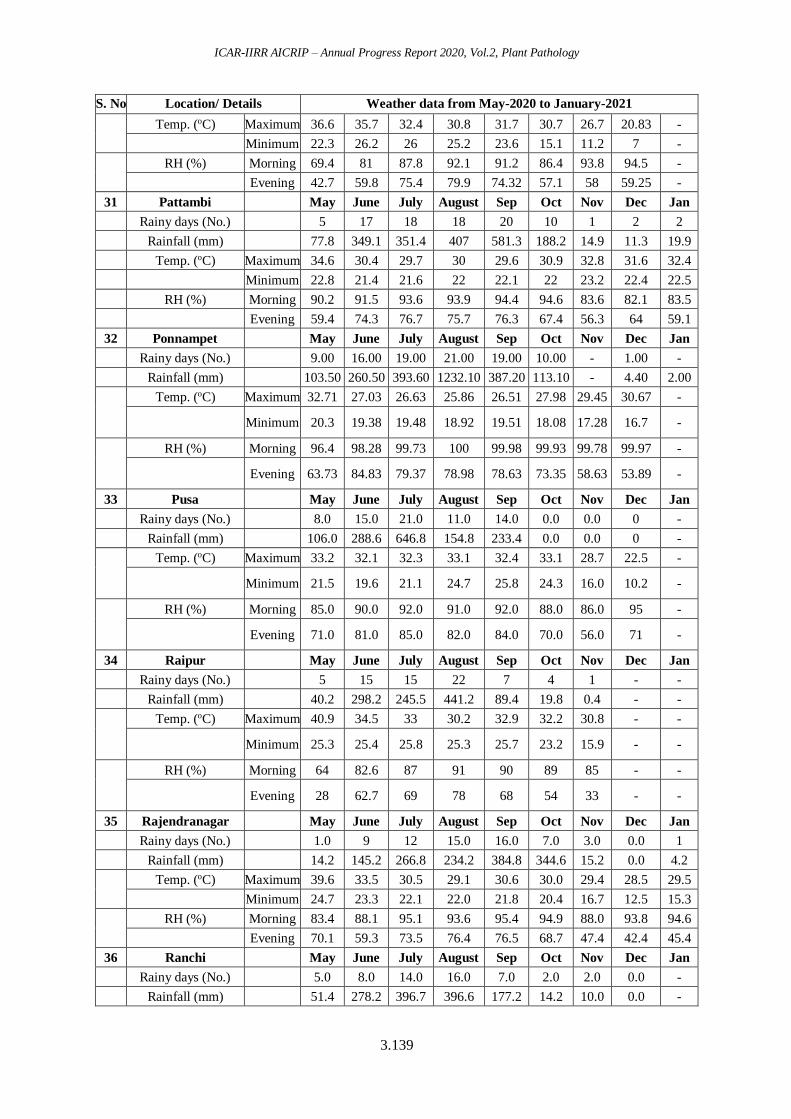
ICAR-IIRR AICRIP – Annual Progress Report 2020, Vol.2, Plant Pathology
3.139
S. No Location/ Details Weather data from May-2020 to January-2021
Temp. (oC) Maximum 36.6 35.7 32.4 30.8 31.7 30.7 26.7 20.83 -
Minimum 22.3 26.2 26 25.2 23.6 15.1 11.2 7 -
RH (%) Morning 69.4 81 87.8 92.1 91.2 86.4 93.8 94.5 -
Evening 42.7 59.8 75.4 79.9 74.32 57.1 58 59.25 -
31 Pattambi May June July August Sep Oct Nov Dec Jan
Rainy days (No.) 5 17 18 18 20 10 1 2 2
Rainfall (mm) 77.8 349.1 351.4 407 581.3 188.2 14.9 11.3 19.9
Temp. (oC) Maximum 34.6 30.4 29.7 30 29.6 30.9 32.8 31.6 32.4
Minimum 22.8 21.4 21.6 22 22.1 22 23.2 22.4 22.5
RH (%) Morning 90.2 91.5 93.6 93.9 94.4 94.6 83.6 82.1 83.5
Evening 59.4 74.3 76.7 75.7 76.3 67.4 56.3 64 59.1
32 Ponnampet
May June July August Sep Oct Nov Dec Jan
Rainy days (No.)
9.00 16.00 19.00 21.00 19.00 10.00 - 1.00 -
Rainfall (mm)
103.50 260.50 393.60 1232.10 387.20 113.10 - 4.40 2.00
Temp. (oC) Maximum 32.71 27.03 26.63 25.86 26.51 27.98 29.45 30.67 -
Minimum 20.3 19.38 19.48 18.92 19.51 18.08 17.28 16.7 -
RH (%) Morning 96.4 98.28 99.73 100 99.98 99.93 99.78 99.97 -
Evening 63.73 84.83 79.37 78.98 78.63 73.35 58.63 53.89 -
33 Pusa
May June July August Sep Oct Nov Dec Jan
Rainy days (No.)
8.0 15.0 21.0 11.0 14.0 0.0 0.0 0 -
Rainfall (mm)
106.0 288.6 646.8 154.8 233.4 0.0 0.0 0 -
Temp. (oC) Maximum 33.2 32.1 32.3 33.1 32.4 33.1 28.7 22.5 -
Minimum 21.5 19.6 21.1 24.7 25.8 24.3 16.0 10.2 -
RH (%) Morning 85.0 90.0 92.0 91.0 92.0 88.0 86.0 95 -
Evening 71.0 81.0 85.0 82.0 84.0 70.0 56.0 71 -
34 Raipur
May June July August Sep Oct Nov Dec Jan
Rainy days (No.)
5 15 15 22 7 4 1 - -
Rainfall (mm)
40.2 298.2 245.5 441.2 89.4 19.8 0.4 - -
Temp. (oC) Maximum 40.9 34.5 33 30.2 32.9 32.2 30.8 - -
Minimum 25.3 25.4 25.8 25.3 25.7 23.2 15.9 - -
RH (%) Morning 64 82.6 87 91 90 89 85 - -
Evening 28 62.7 69 78 68 54 33 - -
35 Rajendranagar
May June July August Sep Oct Nov Dec Jan
Rainy days (No.)
1.0 9 12 15.0 16.0 7.0 3.0 0.0 1
Rainfall (mm)
14.2 145.2 266.8 234.2 384.8 344.6 15.2 0.0 4.2
Temp. (oC) Maximum 39.6 33.5 30.5 29.1 30.6 30.0 29.4 28.5 29.5
Minimum 24.7 23.3 22.1 22.0 21.8 20.4 16.7 12.5 15.3
RH (%) Morning 83.4 88.1 95.1 93.6 95.4 94.9 88.0 93.8 94.6
Evening 70.1 59.3 73.5 76.4 76.5 68.7 47.4 42.4 45.4
36 Ranchi May June July August Sep Oct Nov Dec Jan
Rainy days (No.) 5.0 8.0 14.0 16.0 7.0 2.0 2.0 0.0 -
Rainfall (mm) 51.4 278.2 396.7 396.6 177.2 14.2 10.0 0.0 -
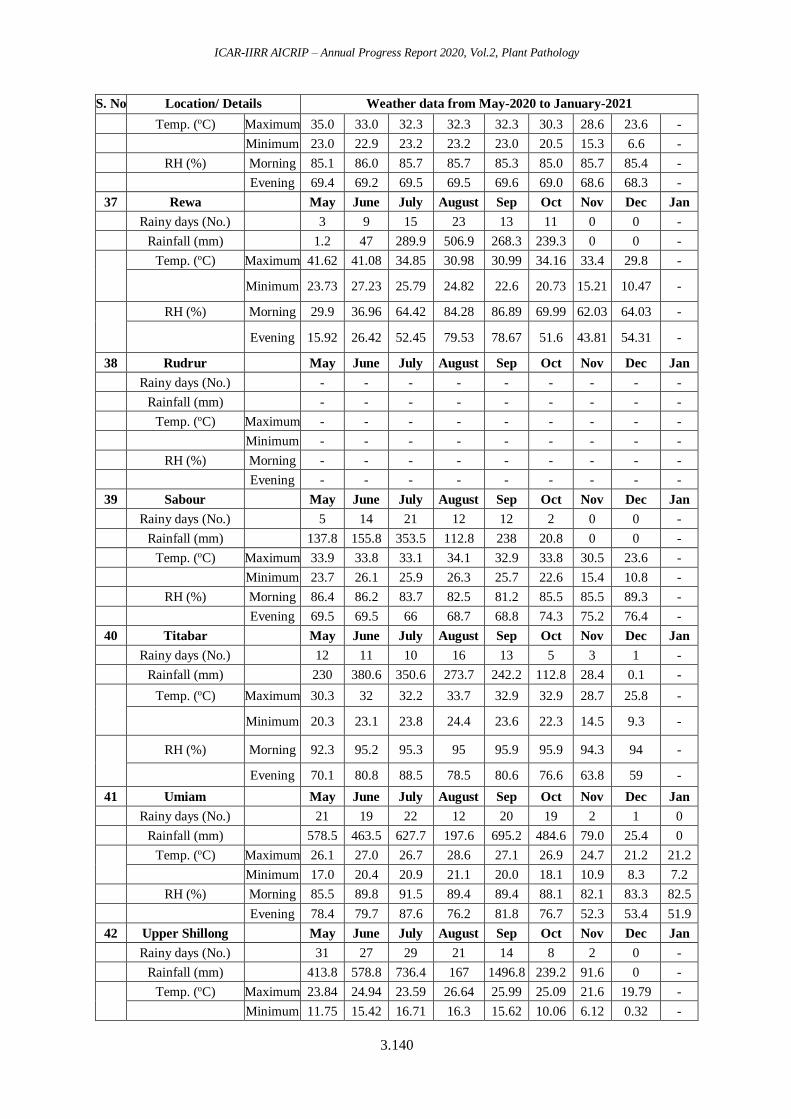
ICAR-IIRR AICRIP – Annual Progress Report 2020, Vol.2, Plant Pathology
3.140
S. No Location/ Details Weather data from May-2020 to January-2021
Temp. (oC) Maximum 35.0 33.0 32.3 32.3 32.3 30.3 28.6 23.6 -
Minimum 23.0 22.9 23.2 23.2 23.0 20.5 15.3 6.6 -
RH (%) Morning 85.1 86.0 85.7 85.7 85.3 85.0 85.7 85.4 -
Evening 69.4 69.2 69.5 69.5 69.6 69.0 68.6 68.3 -
37 Rewa
May June July August Sep Oct Nov Dec Jan
Rainy days (No.)
3 9 15 23 13 11 0 0 -
Rainfall (mm)
1.2 47 289.9 506.9 268.3 239.3 0 0 -
Temp. (oC) Maximum 41.62 41.08 34.85 30.98 30.99 34.16 33.4 29.8 -
Minimum 23.73 27.23 25.79 24.82 22.6 20.73 15.21 10.47 -
RH (%) Morning 29.9 36.96 64.42 84.28 86.89 69.99 62.03 64.03 -
Evening 15.92 26.42 52.45 79.53 78.67 51.6 43.81 54.31 -
38 Rudrur
May June July August Sep Oct Nov Dec Jan
Rainy days (No.)
- - - - - - - - -
Rainfall (mm)
- - - - - - - - -
Temp. (oC) Maximum - - - - - - - - -
Minimum - - - - - - - - -
RH (%) Morning - - - - - - - - -
Evening - - - - - - - - -
39 Sabour May June July August Sep Oct Nov Dec Jan
Rainy days (No.) 5 14 21 12 12 2 0 0 -
Rainfall (mm) 137.8 155.8 353.5 112.8 238 20.8 0 0 -
Temp. (oC) Maximum 33.9 33.8 33.1 34.1 32.9 33.8 30.5 23.6 -
Minimum 23.7 26.1 25.9 26.3 25.7 22.6 15.4 10.8 -
RH (%) Morning 86.4 86.2 83.7 82.5 81.2 85.5 85.5 89.3 -
Evening 69.5 69.5 66 68.7 68.8 74.3 75.2 76.4 -
40 Titabar
May June July August Sep Oct Nov Dec Jan
Rainy days (No.)
12 11 10 16 13 5 3 1 -
Rainfall (mm)
230 380.6 350.6 273.7 242.2 112.8 28.4 0.1 -
Temp. (oC) Maximum 30.3 32 32.2 33.7 32.9 32.9 28.7 25.8 -
Minimum 20.3 23.1 23.8 24.4 23.6 22.3 14.5 9.3 -
RH (%) Morning 92.3 95.2 95.3 95 95.9 95.9 94.3 94 -
Evening 70.1 80.8 88.5 78.5 80.6 76.6 63.8 59 -
41 Umiam
May June July August Sep Oct Nov Dec Jan
Rainy days (No.)
21 19 22 12 20 19 2 1 0
Rainfall (mm)
578.5 463.5 627.7 197.6 695.2 484.6 79.0 25.4 0
Temp. (oC) Maximum 26.1 27.0 26.7 28.6 27.1 26.9 24.7 21.2 21.2
Minimum 17.0 20.4 20.9 21.1 20.0 18.1 10.9 8.3 7.2
RH (%) Morning 85.5 89.8 91.5 89.4 89.4 88.1 82.1 83.3 82.5
Evening 78.4 79.7 87.6 76.2 81.8 76.7 52.3 53.4 51.9
42 Upper Shillong
May June July August Sep Oct Nov Dec Jan
Rainy days (No.)
31 27 29 21 14 8 2 0 -
Rainfall (mm)
413.8 578.8 736.4 167 1496.8 239.2 91.6 0 -
Temp. (oC) Maximum 23.84 24.94 23.59 26.64 25.99 25.09 21.6 19.79 -
Minimum 11.75 15.42 16.71 16.3 15.62 10.06 6.12 0.32 -
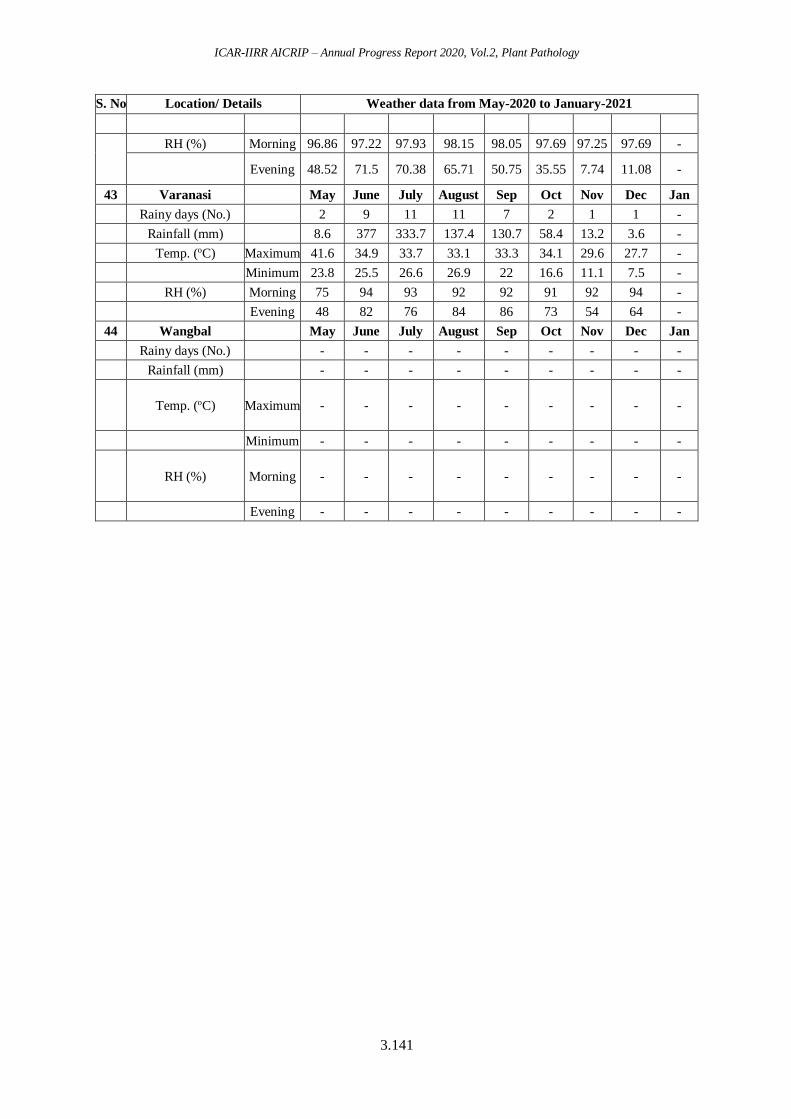
ICAR-IIRR AICRIP – Annual Progress Report 2020, Vol.2, Plant Pathology
3.141
S. No Location/ Details Weather data from May-2020 to January-2021
RH (%) Morning 96.86 97.22 97.93 98.15 98.05 97.69 97.25 97.69 -
Evening 48.52 71.5 70.38 65.71 50.75 35.55 7.74 11.08 -
43 Varanasi May June July August Sep Oct Nov Dec Jan
Rainy days (No.) 2 9 11 11 7 2 1 1 -
Rainfall (mm) 8.6 377 333.7 137.4 130.7 58.4 13.2 3.6 -
Temp. (oC) Maximum 41.6 34.9 33.7 33.1 33.3 34.1 29.6 27.7 -
Minimum 23.8 25.5 26.6 26.9 22 16.6 11.1 7.5 -
RH (%) Morning 75 94 93 92 92 91 92 94 -
Evening 48 82 76 84 86 73 54 64 -
44 Wangbal
May June July August Sep Oct Nov Dec Jan
Rainy days (No.)
- - - - - - - - -
Rainfall (mm)
- - - - - - - - -
Temp. (oC) Maximum - - - - - - - - -
Minimum - - - - - - - - -
RH (%) Morning - - - - - - - - -
Evening - - - - - - - - -

ICAR-IIRR AICRIP – Annual Progress Report 2020, Vol.2, Plant Pathology
3.142
Annexure - II
Details on the locations where Coordinated Pathology Screening trials were conducted during, Kharif 2020-2021
S. No. Location Latitude
(North)
Longitude
(East)
Elevation
(m. from MSL) Ecosystem
Sowing
(Year, 2020)
Fertilizer Basal -
NPK (Kg/ha)
Fertilizer top dressing
(Kg/ha)
1 Aduthurai 10o N 79’E 19.5 m Irrigated 04-09-2020 37.5:50:25 112.5:0:25 (NPK)
2 Almora 29o36’N 79o40’E 1250 m Upland 04.08.2020 FYM @10 t/ha
60:60:40 (20kg N)
40 N, 20+20 N (1st and 2nd
top dressing)
3 Bankura 23o24’ N 87o05’E 84 m Upland (Rainfed) - - -
4 Chatha 32o40’N 74o18’E 293 m Irrigated 29.07.2020 40:60:30 40+40 N (1st and
2nd top dressing)
5 Chinsurah 22o52’N 88o24’E 8.62 m Irrigated - - -
6 Chiplima 20º21’N 80º55’E 178.8 m Irrigated 06.08.2020 120:40:40
60:40:20
30:0:20 (25 DAP)
30:0:0 (45 DAP)
7 Coimbatore 11o N 77oE 409 m Irrigated 10.06.20 - 15 N Blast nursery bed
10g/pot (RTD)
8 Cuttack 20º23’N 850 17’E 36 m Irrigated
Shallow lowland 27.07.20 40:0:0 20 N
9
Masodha
(Faizabad) 26o47’N 82o12’E 113 m Irrigated 31.07.20
ShB- 120:60:6
BLB-150:60:60 ShB-60, BLB-75 N, 25 Zn
10 Gangavati 15o43’N 76o53’E 419 m Irrigated
20-10-17 LB
04-10-20 BS
07-08-20 ShB,BLB
250:75:75-
Blast, ShB,LB
50:75:75- BS
-
11 Gerua 26o14’N 91o33’E 49 m Rainfed lowland - -- -
12 Gudalur 11o30’N 76o30’E 409 m Irrigated 24-08-20 - 15 N Blast nursery bed
10g/pot (RTD)
13 Hazaribagh 23° 95'91’’
N 85° 37'20’’ E 614 m Rainfed Upland
23-07-20-BS
14-.8-20-LB
75:60:30- LBt
50:60:30-BS 75:0:0- LB
14 Imphal 24o45' N 93o54' E 774 m Rainfed lowland - - -
15 Jagadalpur 19°05' N 81o57'E 556 m Upland/rainfed
Irrigated 30-07-20 60:60:60 30:30:0 (NPK)
16 Karjat 18o55’ N 73o15’E 51.7 m Rainfed
lowland
BLB &ShR:
30-07-20
BL:02-12-20
- 70 N
17 Kaul 29o51’N 76039’E 230.7 m Irrigated 28-07-20 50:0:60 100 N
18 Khudwani 33.73oN 75.15oE 1601 m Irrigated 06-08-20 60:60:30 60 N

ICAR-IIRR AICRIP – Annual Progress Report 2020, Vol.2, Plant Pathology
3.143
S. No. Location Latitude
(North)
Longitude
(East)
Elevation
(m. from MSL) Ecosystem
Sowing
(Year, 2020)
Fertilizer Basal -
NPK (Kg/ha)
Fertilizer top dressing
(Kg/ha)
19 Lonavala 18.9oN 73.5oE 622m Rainfed
lowland 03-07-20 60:50:50 60 N
20 Ludhiana 30o90’N 75o 85’E 262 m Irrigated 27-07-20 Urea 37kg/Acre Urea 74kg/acre
21 Malan 32o1’N 76.2oE 950 m Upland 05-08-20 120:40:40
60:40:40 60 N
22 Mandya 1236’N 76o15’E 694.64 m Irrigated
NB:21-08-20
ShB-22-09-20
BL-22-10-20
200:50:50
100:50:50
50:0:0 (15 DAT)
50:0:0 (30 DAT)
23 Maruteru 1638’N 81o44’E 5m Irrigated 20-07-20 150:40:40
50:40:20
50:0:0 (NPK)
50:0:20
24 Moncompu 9051’N 76 o5’E -10 m Irrigated 14-10-20 90:45:45 Kg/ha
1/2N,1/3P&K
15DAP-1/4N, 1/3P&K,
40DAP-1/4N, 1/3P&K
25 Mugad - - - - - - -
26 Navsari 20 o57’N 72o29’E 10 m Irrigated 30-07-20 150:50:0
75:50:0 75 N
27 Nawagam 22o48’N 71o38’E 32.4 m Irrigated 24-07-20 120:30:0
60 N + 30 P2O5. 60 N + 20 ZnSO4
28 Nellore 14o27’N 79o59’E 20 m Irrigated 21-09-20
15:60:40
75:60:20
20 kg/acre-Zn
37.5+37.5 N 30DAT &
60DAT)
29 New Delhi 22 o 08’N 77o12’E 216 m Irrigated
30-07-2020-BLB
31-07-20-ShB
07-08-20-BL
FYM-10t/ha
20:60:40 20+20 N (30DAT & 60DAT)
30 Pantnagar 29oN 79030’E 343.84 m Irrigated 29-07-20 60:60:40-15Kg
(ZnSO4) 60N + 5 (ZnSO4)
31 Pattambi 10o48’N 76o12’E 25.35 m Upland
Rainfed lowland
21-07-20-Bl
26-08-20-ShB &
BLB
120:30:30
80:30:15 40:0:15
32 Ponnampet 12o29’N 75o56’E 856 m Rainfed
Lowland
08-10-20-UBN
29-07-20-Field
75:75:90
37.5:75:45 37.5:0:45
33 Pusa 25.9oN 85.40’E 51.8 m Irrigated 11-08-20 80:40:20 20+20 N
34 Raipur 21o 16’N 81o36’E 681 m Irrigated 26-07-20 120
60 60N
35 Rajendranagar 17o 19’N 78o23’E 542 m Irrigated LB : 21-11-20 45:60:40 2.5 N +2g/L- Zn - UBN
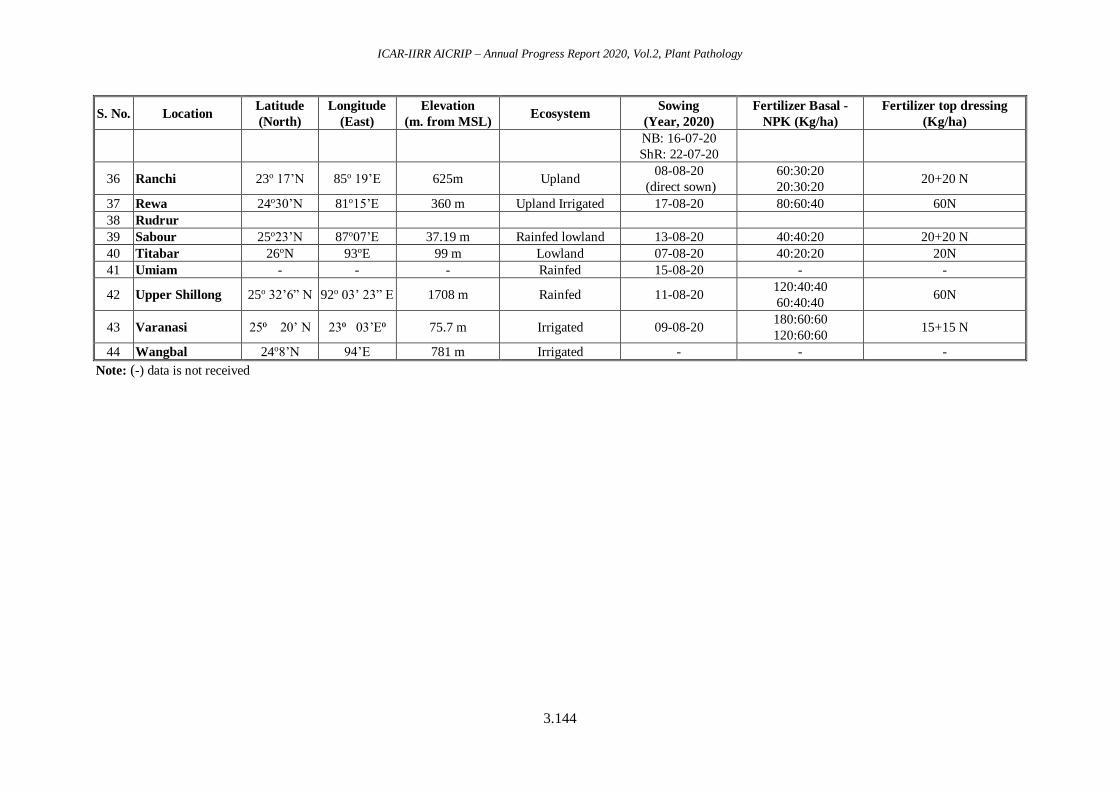
ICAR-IIRR AICRIP – Annual Progress Report 2020, Vol.2, Plant Pathology
3.144
S. No. Location Latitude
(North)
Longitude
(East)
Elevation
(m. from MSL) Ecosystem
Sowing
(Year, 2020)
Fertilizer Basal -
NPK (Kg/ha)
Fertilizer top dressing
(Kg/ha)
NB: 16-07-20
ShR: 22-07-20
36 Ranchi 23o 17’N 85o 19’E 625m Upland 08-08-20
(direct sown)
60:30:20
20:30:20 20+20 N
37 Rewa 24o30’N 81o15’E 360 m Upland Irrigated 17-08-20 80:60:40 60N
38 Rudrur
39 Sabour 25o23’N 87o07’E 37.19 m Rainfed lowland 13-08-20 40:40:20 20+20 N
40 Titabar 26oN 93oE 99 m Lowland 07-08-20 40:20:20 20N
41 Umiam - - - Rainfed 15-08-20 - -
42 Upper Shillong 25o 32’6” N 92o 03’ 23” E 1708 m Rainfed 11-08-20 120:40:40
60:40:40 60N
43 Varanasi 25⁰ 20’ N 23⁰ 03’E⁰ 75.7 m Irrigated 09-08-20 180:60:60
120:60:60 15+15 N
44 Wangbal 24o8’N 94’E 781 m Irrigated - - -
Note: (-) data is not received
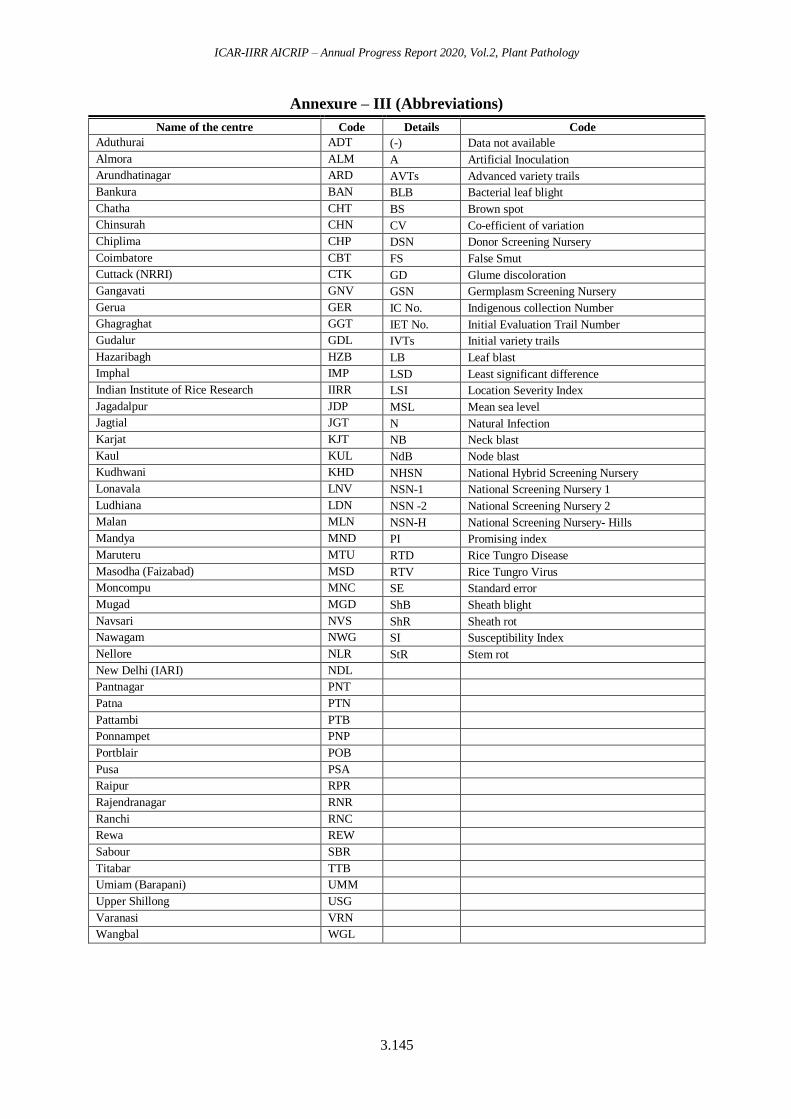
ICAR-IIRR AICRIP – Annual Progress Report 2020, Vol.2, Plant Pathology
3.145
Annexure – III (Abbreviations)
Name of the centre Code Details Code
Aduthurai ADT (-) Data not available
Almora ALM A Artificial Inoculation
Arundhatinagar ARD AVTs Advanced variety trails
Bankura BAN BLB Bacterial leaf blight
Chatha CHT BS Brown spot
Chinsurah CHN CV Co-efficient of variation
Chiplima CHP DSN Donor Screening Nursery
Coimbatore CBT FS False Smut
Cuttack (NRRI) CTK GD Glume discoloration
Gangavati GNV GSN Germplasm Screening Nursery
Gerua GER IC No. Indigenous collection Number
Ghagraghat GGT IET No. Initial Evaluation Trail Number
Gudalur GDL IVTs Initial variety trails
Hazaribagh HZB LB Leaf blast
Imphal IMP LSD Least significant difference
Indian Institute of Rice Research IIRR LSI Location Severity Index
Jagadalpur JDP MSL Mean sea level
Jagtial JGT N Natural Infection
Karjat KJT NB Neck blast
Kaul KUL NdB Node blast
Kudhwani KHD NHSN National Hybrid Screening Nursery
Lonavala LNV NSN-1 National Screening Nursery 1
Ludhiana LDN NSN -2 National Screening Nursery 2
Malan MLN NSN-H National Screening Nursery- Hills
Mandya MND PI Promising index
Maruteru MTU RTD Rice Tungro Disease
Masodha (Faizabad) MSD RTV Rice Tungro Virus
Moncompu MNC SE Standard error
Mugad MGD ShB Sheath blight
Navsari NVS ShR Sheath rot
Nawagam NWG SI Susceptibility Index
Nellore NLR StR Stem rot
New Delhi (IARI) NDL
Pantnagar PNT
Patna PTN
Pattambi PTB
Ponnampet PNP
Portblair POB
Pusa PSA
Raipur RPR
Rajendranagar RNR
Ranchi RNC
Rewa REW
Sabour SBR
Titabar TTB
Umiam (Barapani) UMM
Upper Shillong USG
Varanasi VRN
Wangbal WGL

ICAR-IIRR AICRIP – Annual Progress Report 2020, Vol.2, Plant Pathology
3.146
Progress Report-2020 report was compiled by the following scientists of
Department of Plant Pathology, ICAR-IIRR, Hyderabad.
Drs. M. Srinivas Prasad, G. S. Laha, D. Krishnaveni, C. Kannan,
D. Ladhalakshmi, V. Prakasam, K.Basavaraj and G.S Jasudasu
Acknowledgement
Our thanks are due to the Scientists of all the Cooperating Research Centers for
conduct of Plant Pathology Coordinated Trials and dispatch of the data.
Thanks are also due to the Technical Staff of the Department of Plant Pathology,
Sri Y. Roseswar Rao and Mr. P. Chandrakanth for their help in conduct of the coordinated
trials at IIRR (ICAR-IIRR), Hyderabad. Thanks are due to Mr. S. Vijay Kumar and
for his assistance during report preparation.