coordinated integrated monitoring program (cimp) - for the
TRANSCRIPT
COORDINATED INTEGRATED MONITORING
PROGRAM (CIMP) FOR THE BEACH CITIES WATERSHED MANAGEMENT
GROUP
Submitted to
The Los Angeles Regional Water Quality Control Board
Prepared by
Beach Cities Watershed Management Group
(Cities of Hermosa Beach, Manhattan Beach, Redondo Beach, and Torrance and the Los Angeles County Flood Control District)
September 2015
Beach Cities WMG CIMP September 2015
- ii -
Table of Contents
EXECUTIVE SUMMARY .......................................................................................................... 1
1.0 INTRODUCTION............................................................................................................... 4
1.1 Beach Cities Watershed Management Group Watershed Management Plan Area Overview ..................................................................................................................................... 4
1.1.1 Santa Monica Bay Watershed ..................................................................................... 8 1.1.2 Dominguez Channel Watershed ................................................................................. 8 1.1.3 Beach Cities WMG Land Uses ................................................................................... 8 1.1.4 Hydrologic Units ....................................................................................................... 11
1.2 Water Quality Priorities ................................................................................................... 14 1.3 CIMP Overview ............................................................................................................... 16
1.3.1 Receiving Water Monitoring .................................................................................... 16 1.3.2 Stormwater Outfall Monitoring ................................................................................ 16 1.3.3 Non-Stormwater Outfall Program ............................................................................. 17 1.3.4 New Development and Redevelopment Effectiveness Tracking .............................. 17 1.3.5 Regional Studies ....................................................................................................... 17 1.3.6 Special Studies .............................................................................................................. 17
2.0 RECEIVING WATER MONITORING PROGRAM ................................................... 18
2.1 Receiving Water Monitoring Objectives ......................................................................... 18 2.2 Receiving Water Monitoring Sites .................................................................................. 18
2.2.1 Santa Monica Bay ..................................................................................................... 21 2.2.2 Dominguez Channel .................................................................................................. 21 2.2.3 TMDL Monitoring .................................................................................................... 21
2.3 Monitored Frequency, Parameters, and Duration of Monitoring .................................... 26 2.3.1 SMB TMDLs ............................................................................................................ 26 2.3.2 Wet-Weather ............................................................................................................. 27 2.3.3 Dry-Weather ............................................................................................................. 28
3.0 GIS DATABASE ............................................................................................................... 29
3.1 Program Objectives ......................................................................................................... 30 3.2 Available Information...................................................................................................... 30 3.3 Pending Information and Schedule for Completion ........................................................ 30
4.0 STORMWATER OUTFALL MONITORING .............................................................. 32
4.1 Program Objectives ......................................................................................................... 32 4.2 Stormwater Outfall Monitoring Sites .............................................................................. 32
4.2.1 OF-BCEG-1 .............................................................................................................. 36 4.2.2 OF-BCEG-2 .............................................................................................................. 38 4.2.3 OF-BCEG-3 .............................................................................................................. 40 4.2.4 OF-BCEG-4 .............................................................................................................. 42 4.2.5 OF-BCEG-5 .............................................................................................................. 44 4.2.6 OF-BCEG-6 .............................................................................................................. 46 4.2.7 OF-BCEG-7 .............................................................................................................. 48 4.2.8 Existing WMG Machado Lake and Harbor Monitoring ........................................... 50
Beach Cities WMG CIMP September 2015
- iii -
4.3 Monitoring Frequency, Parameters, and Duration .......................................................... 50
5.0 NON-STORMWATER OUTFALL SCREENING AND MONITORING PROGRAM 52
5.1 Program Objectives ......................................................................................................... 52 5.2 Outfall Screening and Identification of Outfalls with Significant Non-Stormwater Discharge ................................................................................................................................... 55 5.3 MS4 Outfall Inventory .................................................................................................... 56 5.4 Prioritized Source Identification ...................................................................................... 57
5.4.1 SMB-O-7................................................................................................................... 57 5.5 Source Identification of Significant Non-Stormwater Discharge .................................... 58 5.6 Monitoring of Non-Stormwater Outfalls Exceeding Criteria .......................................... 59
5.6.1 Non-Stormwater Outfall Monitoring Sites ............................................................... 60 5.6.2 Monitored Parameters and Frequency ...................................................................... 60
6.0 NEW DEVELOPMENT/RE-DEVELOPMENT EFFECTIVENESS ......................... 62
7.0 REGIONAL STUDIES ..................................................................................................... 64
7.1 Regional Study Participation ........................................................................................... 64
8.0 SPECIAL STUDIES ......................................................................................................... 65
9.0 NON-DIRECT MEASUREMENTS................................................................................ 66
10.0 ADAPTIVE MANAGEMENT ..................................................................................... 67
10.1 Annual Assessment and Reporting .............................................................................. 67 10.2 CIMP Revision Process ................................................................................................ 67
11.0 REPORTING ................................................................................................................. 69
11.1 Documents and Records ............................................................................................... 69 11.1.1 Semi-Annual Analytical Data Submittal ............................................................... 69
11.2 Monitoring Reports ...................................................................................................... 70 11.3 Signatory and Certification Requirements ................................................................... 70
12.0 SCHEDULE FOR CIMP IMPLEMENTATION ....................................................... 72
13.0 REFERENCES .............................................................................................................. 73
List of Figures
Figure 1 Beach Cities Watershed Management Group Location within Los Angeles County ..... 6 Figure 2 Jurisdictional Boundaries for the Beach Cities WMG .................................................... 7 Figure 3 Land Use Categories within the Beach Cities WMG Area ........................................... 10 Figure 4 Equivalent HUC-12 Watersheds and Impaired Water Bodies ...................................... 12 Figure 5 MS4 Drainage System Elements and Outfalls identified by the Beach Cities WMG ... 13 Figure 6 Beach Cities WMG Receiving Water Monitoring Locations ........................................ 20 Figure 7 Reported Monitoring Stations within the Beach Cities WMG Area ............................. 25 Figure 8 Stormwater Outfalls Monitoring Site Locations ........................................................... 35 Figure 9 Stormwater Outfall Monitoring Site OF-BCEG-1 Drainage Area ................................ 37 Figure 10 Stormwater Outfall Monitoring Site OF-BCEG-2 Drainage Area ............................... 39
Beach Cities WMG CIMP September 2015
- iv -
Figure 11 Stormwater Outfall Monitoring Site OF-BCEG-3 Drainage Area .............................. 41 Figure 12 Stormwater Outfall Monitoring Site OF-BCEG-4 Drainage Area .............................. 43 Figure 13 Stormwater Outfall Monitoring Site OF-BCEG-5 Drainage Area .............................. 45 Figure 14 Stormwater Outfall Monitoring Site OF-BCEG-6 Drainage Area .............................. 47 Figure 15 Stormwater Outfall Monitoring Site OF-BCEG-7 Drainage Area .............................. 49 Figure 16 Non-Stormwater Outfall Monitoring Program Flow Chart ......................................... 54
List of Tables
Table 1 Land Use Summary by HUC-12 Area and Beach Cities WMG Jurisdiction ................... 9 Table 2 Water Body Pollutant Prioritization ............................................................................... 14 Table 3 Summary of Receiving Water Monitoring Site .............................................................. 21 Table 4 Beach Cities TMDLs ...................................................................................................... 21 Table 5 Santa Monica Bay Beaches Bacteria TMDL Shoreline Monitoring Sites Sampling Schedule ........................................................................................................................................ 26 Table 6 Receiving Water Monitoring Sites, Constituents, and Annual Monitoring Frequency .. 28 Table 7 Beach Cities WMG Outfall Tributary Area Percentages (of 20,254 acre Total) ........... 33 Table 8 Summary of Stormwater Outfall Based Monitoring Sites .............................................. 33 Table 9 Stormwater Outfall Monitoring Rotation Schedule ........................................................ 34 Table 10 Stormwater Outfall Monitoring Site OF-BCEG-1 (City of Manhattan Beach) ............ 36 Table 11 Stormwater Outfall Monitoring Site OF-BCEG-2 (City of Hermosa Beach) ............. 38 Table 12 Stormwater Outfall Monitoring Site OF-BCEG-3 (City of Redondo Beach) ............. 40 Table 13 Stormwater Outfall Monitoring Site OF-BCEG-4 (City of Torrance) ......................... 42 Table 14 Stormwater Outfall Monitoring Site OF-BCEG-5 (City of Manhattan Beach) ............ 44 Table 15 Stormwater Outfall Monitoring Site OF-BCEG-6 (City of Redondo Beach) .............. 46 Table 16 Stormwater Outfall Monitoring Site OF-BCEG-7 (City of Torrance) ......................... 48 Table 17 List of Constituents for Stormwater Outfall Monitoring .............................................. 51 Table 18 Summary of Source Identification Types ..................................................................... 59 Table 19 List of Constituents for Non-Stormwater Outfall Monitoring ...................................... 61
List of Appendices
Appendix A Total Maximum Daily Loads Requirements and Existing Monitoring Program
Appendix B Monitoring and Reporting Plan, Machado Lake Nutrient and Toxics TMDL / Special Study Work Plan, Machado Lake Nutrient TMDL
Appendix C Monitoring Site Fact Sheets
Appendix D Analytical and Monitoring Procedures
Appendix E Survey of Laboratory Minimum Levels (Table E-2) Summary
Appendix F Los Angeles County Flood Control District Background Information
Appendix G Summary of Data at SMB Observational Monitoring Sites
Beach Cities WMG CIMP September 2015
- v -
List of Acronyms AL Action Levels AMP Adaptive Management Process BMP Best Management Practice CERCLA Comprehensive Environmental Response, Compensation, and Liability Act CFU (Microbial) Colony Forming Unit CIMP Coordinated Integrated Monitoring Program CTR California Toxics Rule CWA Clean Water Act DO Dissolved Oxygen EO Executive Officer EWMP Enhanced Watershed Management Program GIS Geographic Information System HUC Hydrologic Unit Code IC/ID Illicit Connection/Illicit Discharge LACDPW Los Angeles County Department of Public Works LACFCD Los Angeles County Flood Control District LARWQCB Los Angeles Regional Water Quality Control Board LFD Low Flow Diversion MAL Municipal Action Limit MCM Minimum Control Measures MES Mass Emission Station MRP Monitoring and Reporting Program MS4 Municipal Separate Storm Sewer System NOI Notice of Intent NPDES National Pollutant Discharge Elimination System NSWD Non-stormwater Discharge NSW Non-Stormwater NSWD Non-Stormwater Discharge RAA Reasonable Assurance Analysis RWL Receiving Water Limitation SCCWRP Southern California Coastal Water Research Project SMC Stormwater Monitoring Coalition SSC Suspended Sediment Concentration TIE Toxicity Identification Evaluation TMDL Total Maximum Daily Load TSS Total Suspended Solids USEPA United States Environmental Protection Agency WBPC Water Body- Pollutant Combination WDR Waste Discharge Requirements WLA Waste Load Allocation WMA Watershed Management Area WQO Water Quality Objectives WQBEL Water Quality-Based Effluent Limitation
Beach Cities WMG CIMP September 2015
- 1 -
Executive Summary The Cities of Hermosa Beach, Manhattan Beach, Redondo Beach and Torrance, and the Los Angeles County Flood Control District (LACFCD), collectively known as the Beach Cities Watershed Management Group (Beach Cities WMG), are working jointly to preserve and protect local and regional water resources from adverse impacts associated with pollutants in stormwater and urban runoff. On November 8, 2012, the Los Angeles Regional Water Quality Control Board (Regional Board) adopted the fourth National Pollutant Discharge Elimination System Permit under the Federal Clean Water Act for discharges from the municipal separate storm sewer system within the coastal watersheds of Los Angeles County (Permit). The Permit became effective on December 28, 2012. The Permit identifies conditions, requirements and programs that municipalities must comply with to protect regional water resources from adverse impacts associated with pollutants in stormwater and urban runoff. In addition, the Permit includes increased and expanded monitoring requirements including applicable TMDL monitoring, receiving water monitoring, stormwater outfall based monitoring, non-stormwater outfall based monitoring, and regional monitoring. The Draft Coordinated Integrated Monitoring Program (CIMP) for the Beach Cities WMG was submitted to meet the Permit deadline of June 30, 2014. This Final CIMP incorporates comments received from the Regional Board on the Draft CIMP on May 22, 2015. The objective of the Permit is to ensure that MS4 discharges in the County of Los Angeles do not cause or contribute to the exceedance of water quality standards in regional water bodies. These standards include receiving water beneficial uses, water quality objectives and criteria that are established at levels sufficient to protect those uses, and the Regional Board anti-degradation policy. The Permit encourages Permittees to develop an Enhanced Watershed Management Program (EWMP) to implement the Permit requirements on a watershed scale through flexible customized strategies, control measures and best management practices (BMPs) to comply with water quality standards. The Permit encourages watershed management groups (WMGs) collaborating on the development of an EWMP to also coordinate their monitoring efforts through a CIMP. Although the CIMP can be customized by the WMG, it must achieve the 5 primary objectives described in the Permit and have certain required elements. The customization allows a group of agencies to realize efficiencies in terms of cost through coordination and elimination of duplication of effort. The primary objectives of the CIMP are to:
1. Assess the chemical, physical, and biological impacts of municipal stormwater discharges on receiving waters;
2. Assess compliance with Receiving Water Limitations (RWLs) and Water Quality-Based Effluent Limitations (WQBELs) established to implement Total Maximum Daily Load (TMDL) wet-weather and dry-weather waste load allocations (WLAs);
3. Characterize pollutant loads in municipal stormwater discharges; 4. Identify sources of pollutants in municipal stormwater discharges; and
Beach Cities WMG CIMP September 2015
- 2 -
5. Measure and improve the effectiveness of pollutant controls implemented under the Permit.
The Beach Cities WMG CIMP describes an adaptive management process approach to satisfying the requirements and objectives of the Permit Monitoring and Reporting Program (MRP). This CIMP is designed to assess compliance with RWLs and WQBELs and provide the information necessary to guide water quality management decisions and assess the effectiveness of watershed source control measures in the EWMP. This CIMP addresses the six required Permit MRP elements:
1. Receiving Water Monitoring 2. Stormwater Outfall Monitoring 3. Non-Stormwater Outfall Monitoring 4. New/Redevelopment Effectiveness Tracking 5. Regional Studies 6. Special Studies
Receiving water monitoring is intended to assess water quality relative to water quality objectives, impacts to beneficial uses, and trends in pollutant concentrations. The CIMP proposes two (2) new near-shore monitoring locations in the Santa Monica Bay (approximately 1,000 feet from the shoreline at the 30-foot depth contour) for sampling and analysis of an expanded, Permit-required suite of analytical parameters designed to assess the impacts from the storm drain discharges on water quality in the Santa Monica Bay. Ongoing Coordinated Shoreline Monitoring ankle-deep in the wave wash consistent with the Santa Monica Bay Beaches Bacteria TMDL will continue at the same frequency and at the same eleven (11) locations as specified in the approved Coordinated Shoreline Monitoring Plan consistent with the Santa Monica Bay Beaches Bacteria TMDL. The CIMP is proposing four (4) Santa Monica Bay and three (3) Dominguez Channel stormwater outfall based monitoring locations which will be monitored on an alternating annual basis. These monitoring locations were chosen in order to provide a representative outfall monitoring location from each jurisdiction discharging to each watershed. Each monitoring location was chosen based on its drainage being representative of land use from the jurisdiction in which it is located. The resulting monitoring data will be used to assess compliance with TMDL WLAs, expressed as WQBELs or RWLs, and the attainment of water quality objectives. The Non-Stormwater Program provides an assessment of whether there are dry-weather discharges which may potentially impact receiving waters and defines a process to identify potential sources of those significant non-stormwater discharges. It complements the Permittees’ Illicit Connection/Illicit Discharge (IC/ID) Minimum Control Measure (MCM) programs and focuses on any significant discharges from major outfalls to receiving waters in the Beach Cities WMG areas: 1) the Santa Monica Bay shoreline; 2) the Dominguez Channel within the City of Torrance; and 3) the Torrance Carson Lateral near Western Avenue. Along the Santa Monica Bay portion of the WMG, there are seven year-round Low Flow Diversions (LFDs) which divert flows from the storm drains to the sanitary sewer system, or to subsurface infiltration systems, preventing non-stormwater discharges from reaching the receiving water. In the year following
Beach Cities WMG CIMP September 2015
- 3 -
CIMP submittal, major outfalls will be screened over three events for significant and persistent non-stormwater discharges and a GIS inventory summarizing the findings of this screening will be completed. If non-stormwater discharge sources cannot be identified as authorized, or else eliminated or diverted from the MS4, then such discharges will be added to the monitoring program. The number and location of outfalls monitored may vary on an annual basis as non-stormwater discharges are identified, addressed and eliminated. To address the New Development/Re-Development Effectiveness Tracking Program requirements, the Beach Cities WMG Permittees will individually maintain informational database records for each new development/re-development project subject to their individual adopted Low Impact Development (LID) Ordinances. To address the Regional Monitoring requirement, the LACFCD will continue to participate in the Regional Watershed Monitoring Program (Bioassessment Program) being managed by the Southern California Stormwater Monitoring Coalition (SMC). The LACFCD will contribute resources to the SMC’s bioassessment monitoring program during the current permit cycle. Initiated in 2008, the SMC’s Regional Bioassessment Program is designed to run over a five‐year cycle. Monitoring under the first cycle concluded in 2013, with reporting of findings and additional special studies planned to occur in 2014. SMC, including LACFCD, is currently working on designing the bioassessment monitoring program for the next five‐year cycle, which is scheduled to run from 2015 to 2019. The Beach Cities WMG does not anticipate additional special studies beyond those approved for Machado Lake, which were provided to the Regional Board and are included as an Appendix to the CIMP. When warranted, future special studies may be implemented through the adaptive management process or as a CIMP or EWMP revision. Once approved by the Regional Board and implemented by the Beach Cities WMG, the CIMP will provide an expanded set of water quality data and information for use in future assessment of EWMP effectiveness and to guide watershed management decision making. The EWMP and CIMP are expected to undergo revision to reflect changing conditions in the watershed. CIMP programs will be re-evaluated every two years in parallel with the EWMP adaptive management process, and recommended changes will be submitted to the Regional Board for approval. Any proposed CIMP revisions will be implemented upon Regional Board EO approval or within 60 days if no objections are expressed. Monitoring data will be electronically submitted semi-annually, as required by the MRP. An Integrated Monitoring Compliance Report will be submitted to the Regional Board as part of the Annual Report on December 15th of each year, covering the reporting year which extends from July 1 through June 30th preceding the December 15th submittal.
Beach Cities WMG CIMP September 2015
- 4 -
1.0 Introduction In December 2013, the Cities of Hermosa Beach, Manhattan Beach, Redondo Beach and Torrance, together with the Los Angeles County Flood Control District (LACFCD), collectively referred to as the Beach Cities Watershed Management Group (Beach Cities WMG), submitted a Revised Notice of Intent (NOI) to develop an Enhanced Watershed Management Program (EWMP) and Coordinated Integrated Monitoring Program (CIMP). Following receipt of the Regional Water Quality Control Board, Los Angeles Region (Regional Board or LARWQCB) Executive Officer’s approval of the Revised NOI on March 27, 2014, the Beach Cities WMG began CIMP development to fulfill the requirements of the National Pollutant Discharge Elimination System (NPDES) Municipal Separate Storm Sewer System (MS4) Permit No. R4-2012-0175 (Permit) for Los Angeles County issued by the Los Angeles Regional Water Quality Control Board (Regional Board). The Permit was adopted on November 8, 2012, by the Regional Board and became effective December 28, 2012. This Permit replaced the previous MS4 permit (Order No. 01-182). The purpose of the Permit is to ensure the MS4s in the County of Los Angeles are not causing or contributing to exceedances of water quality objectives set to protect the beneficial uses in the receiving waters in the Los Angeles region. The Permit allows the Permittees to customize their stormwater programs to achieve Receiving Water Limitations (RWL) and Water Quality-Based Effluent Limits (WQBELs). The Beach Cities WMG’s CIMP addresses the requirements presented in Permit Attachment E, the Monitoring and Reporting Program (MRP). The primary objectives for the MRP are listed in Part II.A of the MRP and are summarized as follows:
1. Assess the chemical, physical, and biological impacts of discharges from the MS4 on receiving waters;
2. Assess compliance with Total Maximum Daily Load (TMDL) wet-weather and dry-weather numeric limit waste load allocations (WLAs);
3. Characterize pollutant loads in MS4 discharges; 4. Identify sources of pollutants in MS4 discharges; and 5. Measure and improve the effectiveness of pollutant controls implemented under the
Permit. The Permit encourages watershed management groups (WMGs) developing and implementing an EWMP to also coordinate their monitoring efforts through a CIMP. Although the CIMP can be customized by the WMG, it must achieve the 5 primary objectives described in the stormwater Permit and have certain required elements. The customization allows a group of agencies to realize efficiencies in terms of cost through coordination and elimination of duplication of effort.
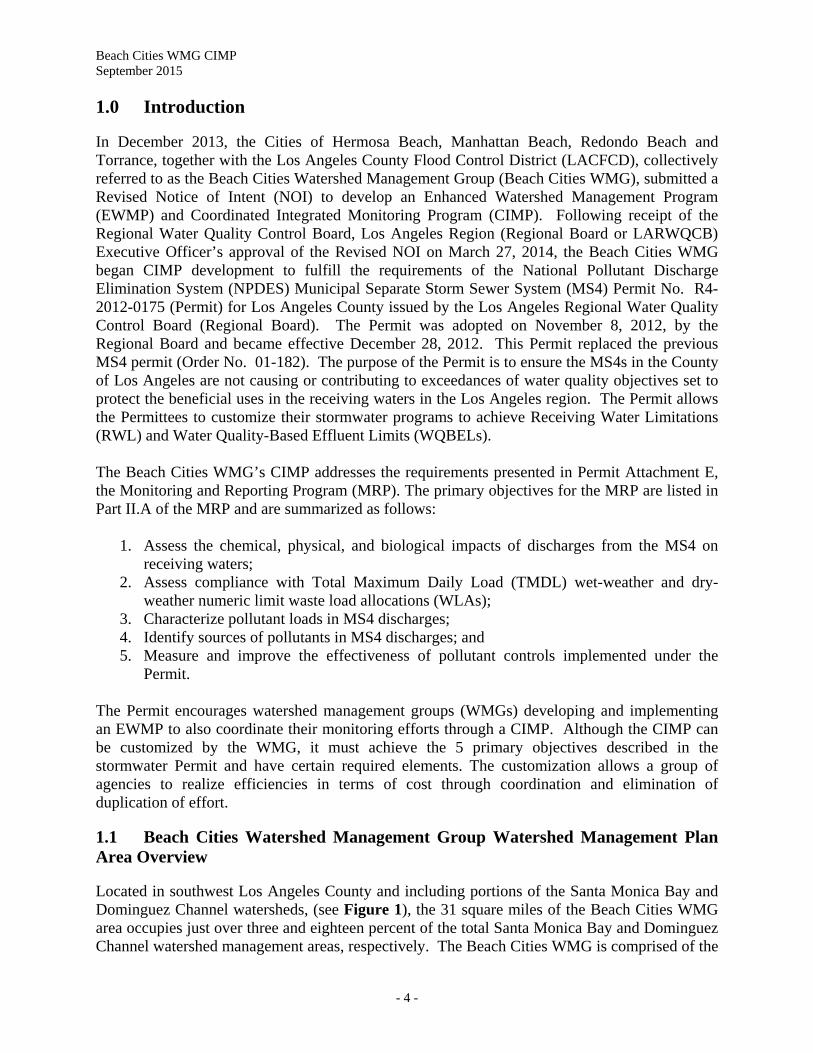
1.1 Beach Cities Watershed Management Group Watershed Management Plan Area Overview Located in southwest Los Angeles County and including portions of the Santa Monica Bay and Dominguez Channel watersheds, (see Figure 1), the 31 square miles of the Beach Cities WMG area occupies just over three and eighteen percent of the total Santa Monica Bay and Dominguez Channel watershed management areas, respectively. The Beach Cities WMG is comprised of the

Beach Cities WMG CIMP September 2015
- 5 -
Cities of Hermosa Beach, Manhattan Beach, Redondo Beach, and Torrance and the Los Angeles County Flood Control District (LACFCD). These Cities, along with the major subwatershed boundaries shown in yellow, are identified in Figure 2.
Beach Cities WMG CIMP September 2015
- 6 -
Figure 1 Beach Cities Watershed Management Group Location within Los Angeles County

Beach Cities WMG CIMP September 2015
- 7 -
Figure 2 Jurisdictional Boundaries for the Beach Cities WMG
Beach Cities WMG CIMP September 2015
- 8 -
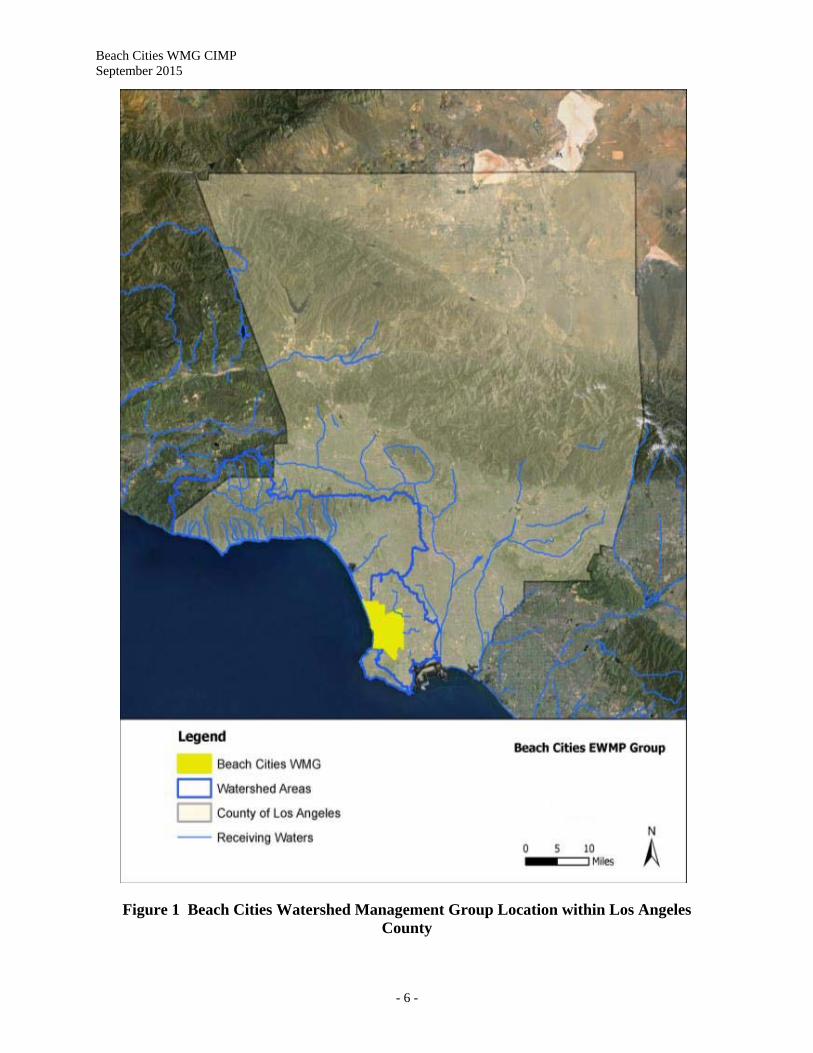
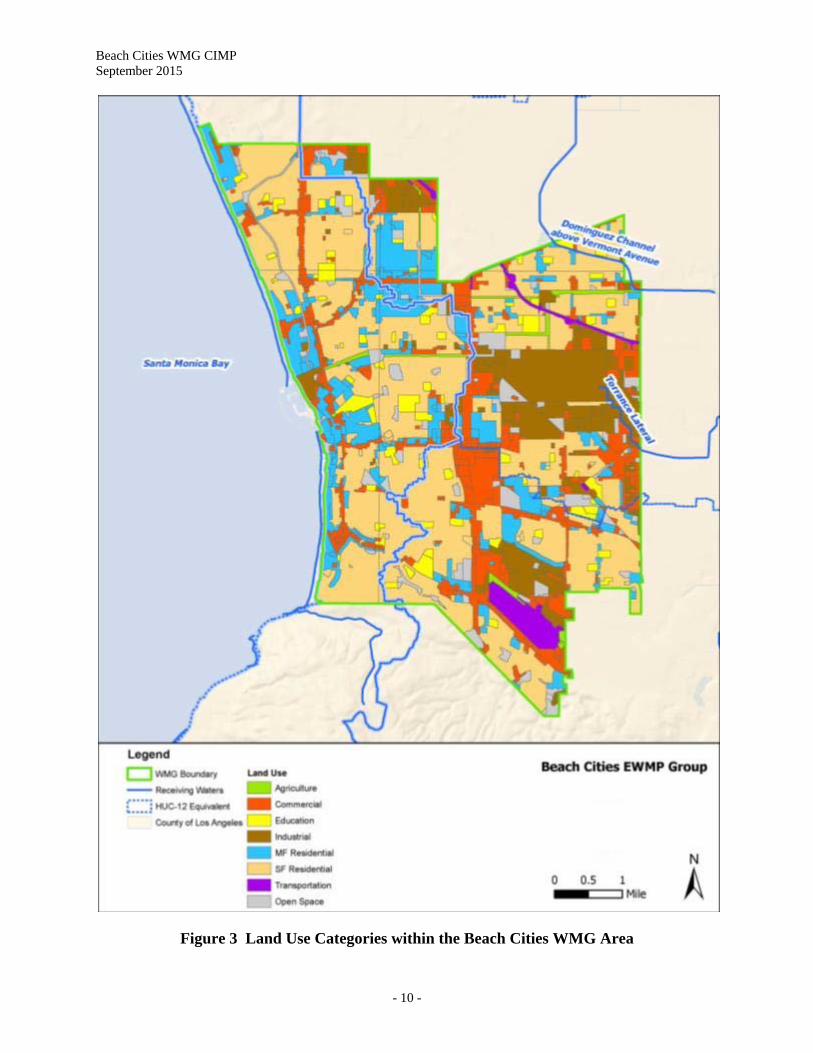
1.1.1 Santa Monica Bay Watershed As a regional component of the Southern California Bight, the Santa Monica Bay is the largest coastal element of Los Angeles County and extends from Point Dume, in the north near the Ventura County line, to the Palos Verdes Peninsula, in the south. The approximately 414 square mile Santa Monica Bay watershed begins as ridgelines in the south Ventura and Los Angeles County border area that traverse east across the Santa Monica Mountains to Griffith Park, then southwest across the Los Angeles Coastal Plain to include Ballona Creek and the northern side of the Baldwin Hills. South of Ballona Creek, the watershed includes a relatively narrow coastal bluff that extends to the Palos Verdes Peninsula and forms the southern boundary area. Within the greater Santa Monica Bay watershed, the Regional Board identified nine subwatersheds, including the Hermosa and Redondo subwatersheds, which fall into the Beach Cities WMG, with approximate catchment areas of 2,718 and 5,377 acres, respectively. These two subwatersheds were also designated by the Regional Board as Jurisdictional Groups 5 and 6 (JG5/6) in the Santa Monica Bay Beaches Bacteria TMDL. JG5 includes portions of the Cities of El Segundo, Hermosa Beach, and Manhattan Beach (lead agency) and the California Department of Transportation (Caltrans). JG6 includes portions of the Cities of Hermosa Beach, Manhattan Beach, Redondo Beach (lead agency), and Torrance, and Caltrans. The Beach Cities WMG extends beyond JG5/6 to include areas in the Dominguez Channel, while JG5/6 includes areas, such as the City of El Segundo and Caltrans that are not Beach Cities WMG members. 1.1.2 Dominguez Channel Watershed The Dominguez Channel watershed is located within southern Los Angeles County and encompasses approximately 133 square miles of land and water which covers the harbor areas. Approximately 81 percent of the watershed area, or 93 percent of the land area, is developed. Residential development covers nearly 40 percent of the watershed, 41 percent is overlaid by industrial, commercial and transportation land uses, 12 percent is educational or open spaces, and 7 percent consists of water. Included within the Dominguez Channel watershed is the Machado Lake subwatershed (20 square miles), along with fresh and estuarine channel areas. 1.1.3 Beach Cities WMG Land Uses The Beach Cities WMG area is predominately composed of residential areas, with significant commercial land use areas adjacent to major boulevards. Within the Torrance-Carson Lateral subwatershed of the Dominguez Channel watershed portion of the City of Torrance there are significant industrial land use areas, including an extensive refinery complex. Agricultural, education, open space, and transportation land uses typically represent minor fractions within each jurisdiction. For each Hydrologic Unit Code (HUC-12) and agency within the Beach Cities WMG, a summary of approximate area and percent of land use categories is summarized in Table 1 and presented in Figure 3.
Beach Cities WMG CIMP September 2015
- 9 -
Table 1 Land Use Summary by HUC-12 Area and Beach Cities WMG Jurisdiction
Area
(Acres) Percent of Beach Cities EWMP Area1
Ag Com Ind Edu Res Trans Open Total
Breakdown by HUC-12
HUC-12: Long Beach Harbor
5,180 0% 5% 2% 1% 14% 1% 2% 26%
Redondo Beach 1 0% 0% 0% 0% 0% 0% 0% 0%
Torrance 5,178 0% 5% 2% 1% 14% 1% 2% 26% HUC-12: Lower Dominguez Channel
7,424 1% 6% 10% 1% 16% 1% 2% 37%
Manhattan Beach 361 0% 1% 0% 0% 1% 0% 0% 2%
Redondo Beach 1,251 0% 1% 1% 0% 4% 0% 0% 6%
Torrance 5,812 0% 4% 9% 1% 12% 0% 2% 29% HUC-12: Manhattan Beach- Frontal Santa Monica
7,651 0% 4% 1% 2% 29% 0% 2% 38%
Hermosa Beach 845 0% 1% 0% 0% 3% 0% 0% 4%
Manhattan Beach 2,086 0% 1% 0% 1% 8% 0% 1% 10%
Redondo Beach 2,607 0% 2% 0% 1% 9% 0% 1% 13%
Torrance 2,113 0% 1% 0% 1% 8% 0% 1% 10%
Breakdown by Agency
Hermosa Beach 845 0% 15% 2% 2% 75% 0% 6% 100%
Manhattan Beach 2,447 0% 13% 4% 5% 71% 0% 7% 100%
Redondo Beach 3,859 1% 14% 8% 4% 68% 0.5% 4.5% 100%
Torrance 13,104 1% 16% 16% 4% 54% 3% 6% 100%
LACFCD N/A N/A N/A N/A N/A N/A N/A N/A N/A
Beach Cities WMG Total
20,255 1% 15% 13% 4% 59% 2% 6% 100% 1 Land use classifications include: agriculture (Ag), commercial (Com), industrial (Ind), education (Edu), residential (Res),
transportation (Trans), and open space (Open). Land uses from Southern California Association of Governments (SCAG) data, 2005.
Beach Cities WMG CIMP September 2015
- 10 -
Figure 3 Land Use Categories within the Beach Cities WMG Area
Beach Cities WMG CIMP September 2015
- 11 -
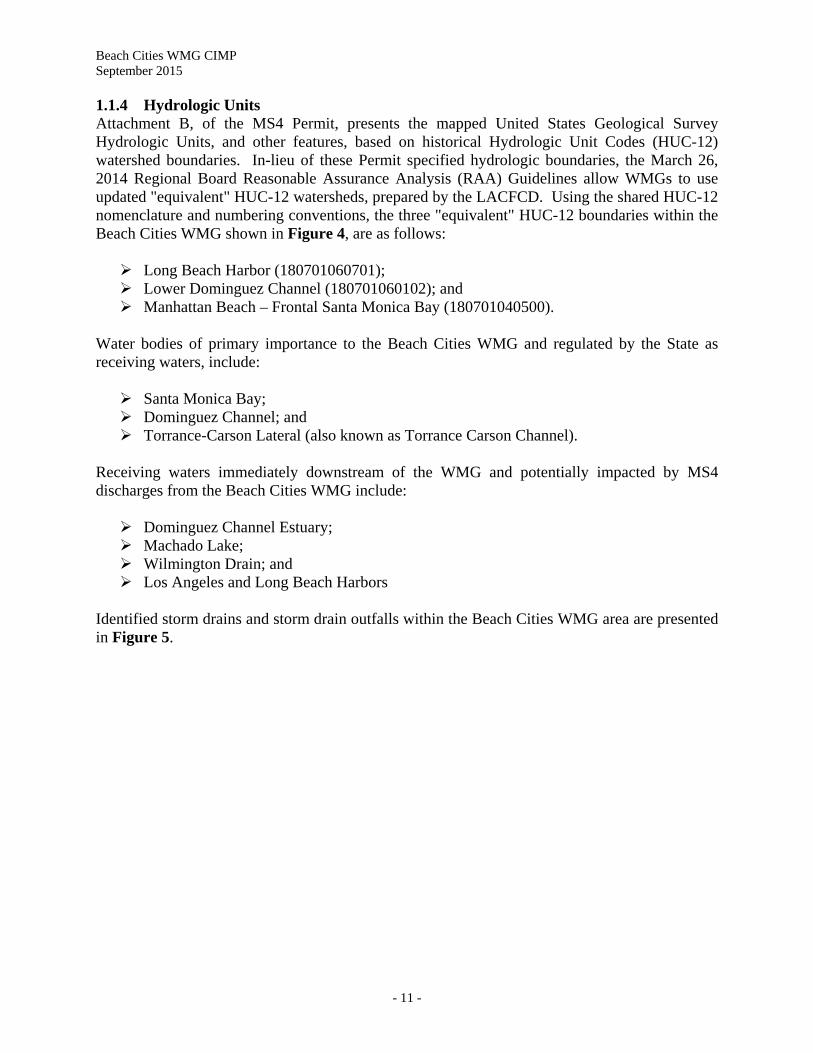
1.1.4 Hydrologic Units Attachment B, of the MS4 Permit, presents the mapped United States Geological Survey Hydrologic Units, and other features, based on historical Hydrologic Unit Codes (HUC-12) watershed boundaries. In-lieu of these Permit specified hydrologic boundaries, the March 26, 2014 Regional Board Reasonable Assurance Analysis (RAA) Guidelines allow WMGs to use updated "equivalent" HUC-12 watersheds, prepared by the LACFCD. Using the shared HUC-12 nomenclature and numbering conventions, the three "equivalent" HUC-12 boundaries within the Beach Cities WMG shown in Figure 4, are as follows: Long Beach Harbor (180701060701); Lower Dominguez Channel (180701060102); and Manhattan Beach – Frontal Santa Monica Bay (180701040500).
Water bodies of primary importance to the Beach Cities WMG and regulated by the State as receiving waters, include: Santa Monica Bay; Dominguez Channel; and Torrance-Carson Lateral (also known as Torrance Carson Channel).
Receiving waters immediately downstream of the WMG and potentially impacted by MS4 discharges from the Beach Cities WMG include: Dominguez Channel Estuary; Machado Lake; Wilmington Drain; and Los Angeles and Long Beach Harbors
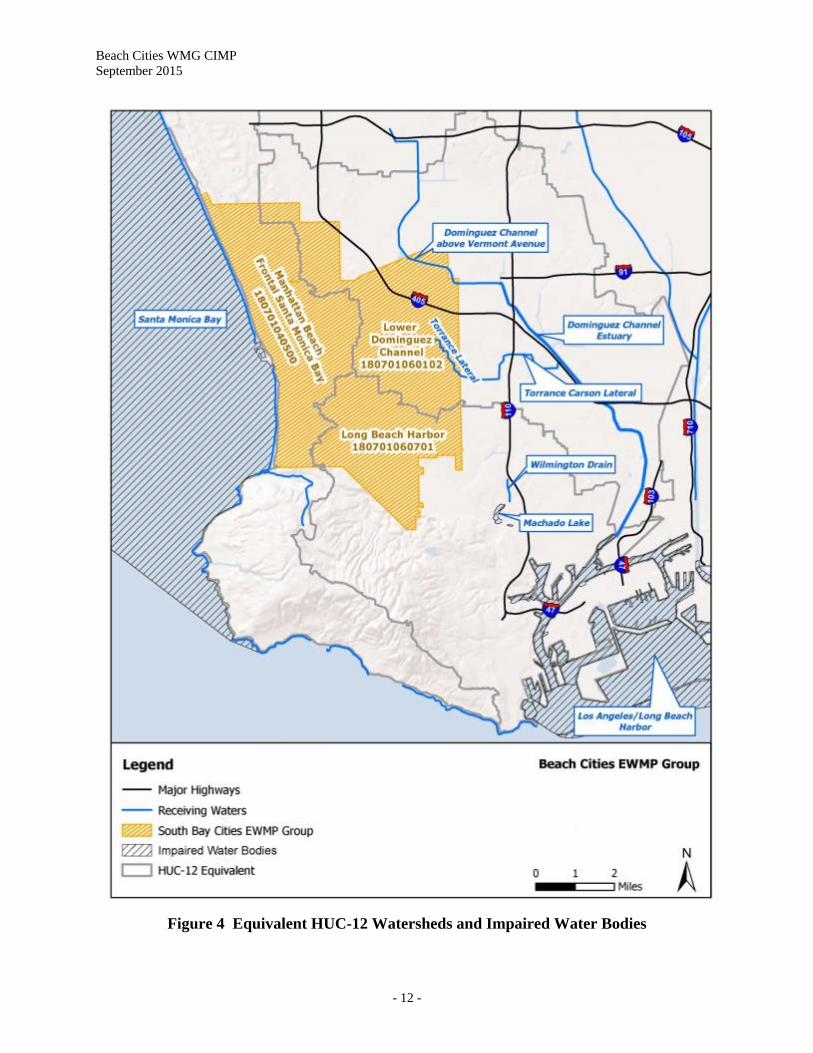
Identified storm drains and storm drain outfalls within the Beach Cities WMG area are presented in Figure 5.
Beach Cities WMG CIMP September 2015
- 12 -
Figure 4 Equivalent HUC-12 Watersheds and Impaired Water Bodies
Beach Cities WMG CIMP September 2015
- 13 -
Figure 5 MS4 Drainage System Elements and Outfalls identified by the Beach Cities WMG
Beach Cities WMG CIMP September 2015
- 14 -
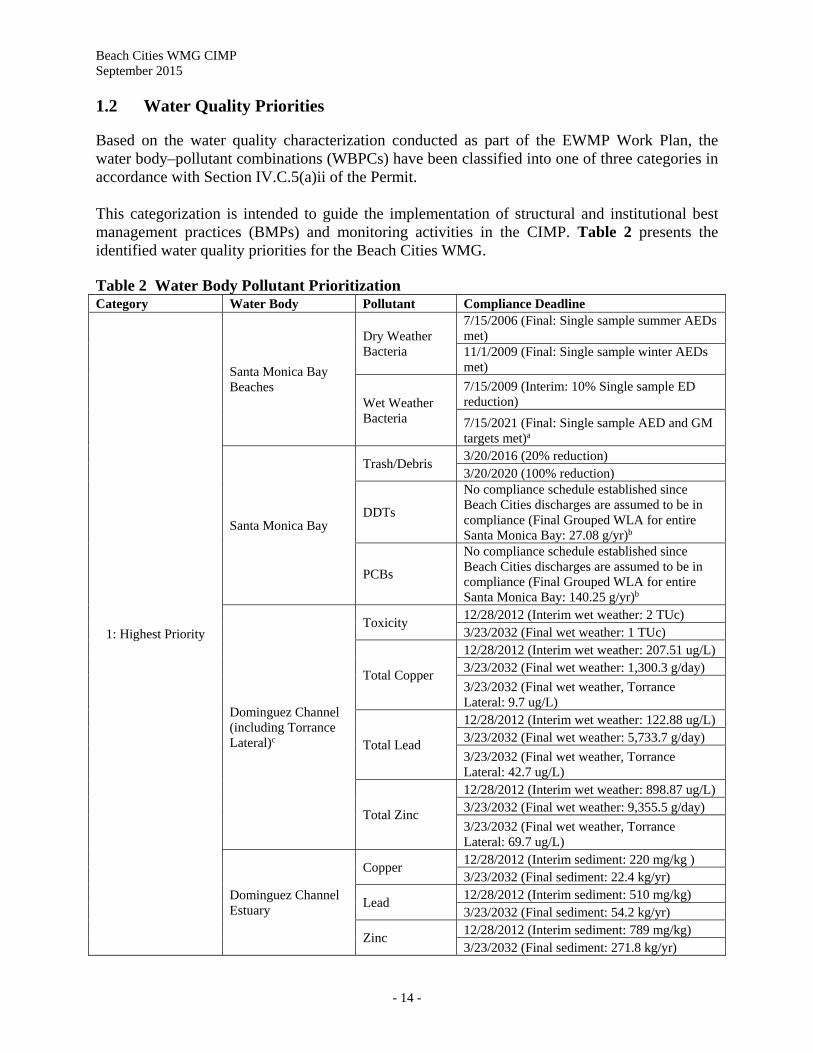
1.2 Water Quality Priorities Based on the water quality characterization conducted as part of the EWMP Work Plan, the water body–pollutant combinations (WBPCs) have been classified into one of three categories in accordance with Section IV.C.5(a)ii of the Permit. This categorization is intended to guide the implementation of structural and institutional best management practices (BMPs) and monitoring activities in the CIMP. Table 2 presents the identified water quality priorities for the Beach Cities WMG. Table 2 Water Body Pollutant Prioritization Category Water Body Pollutant Compliance Deadline
1: Highest Priority
Santa Monica Bay Beaches
Dry Weather Bacteria
7/15/2006 (Final: Single sample summer AEDs met) 11/1/2009 (Final: Single sample winter AEDs met)
Wet Weather Bacteria
7/15/2009 (Interim: 10% Single sample ED reduction)
7/15/2021 (Final: Single sample AED and GM targets met)a
Santa Monica Bay
Trash/Debris 3/20/2016 (20% reduction) 3/20/2020 (100% reduction)
DDTs
No compliance schedule established since Beach Cities discharges are assumed to be in compliance (Final Grouped WLA for entire Santa Monica Bay: 27.08 g/yr)b
PCBs
No compliance schedule established since Beach Cities discharges are assumed to be in compliance (Final Grouped WLA for entire Santa Monica Bay: 140.25 g/yr)b
Dominguez Channel (including Torrance Lateral)c
Toxicity 12/28/2012 (Interim wet weather: 2 TUc) 3/23/2032 (Final wet weather: 1 TUc)
Total Copper
12/28/2012 (Interim wet weather: 207.51 ug/L) 3/23/2032 (Final wet weather: 1,300.3 g/day)
3/23/2032 (Final wet weather, Torrance Lateral: 9.7 ug/L)
Total Lead
12/28/2012 (Interim wet weather: 122.88 ug/L) 3/23/2032 (Final wet weather: 5,733.7 g/day)
3/23/2032 (Final wet weather, Torrance Lateral: 42.7 ug/L)
Total Zinc
12/28/2012 (Interim wet weather: 898.87 ug/L) 3/23/2032 (Final wet weather: 9,355.5 g/day)
3/23/2032 (Final wet weather, Torrance Lateral: 69.7 ug/L)
Dominguez Channel Estuary
Copper 12/28/2012 (Interim sediment: 220 mg/kg ) 3/23/2032 (Final sediment: 22.4 kg/yr)
Lead 12/28/2012 (Interim sediment: 510 mg/kg) 3/23/2032 (Final sediment: 54.2 kg/yr)
Zinc 12/28/2012 (Interim sediment: 789 mg/kg) 3/23/2032 (Final sediment: 271.8 kg/yr)
Beach Cities WMG CIMP September 2015
- 15 -
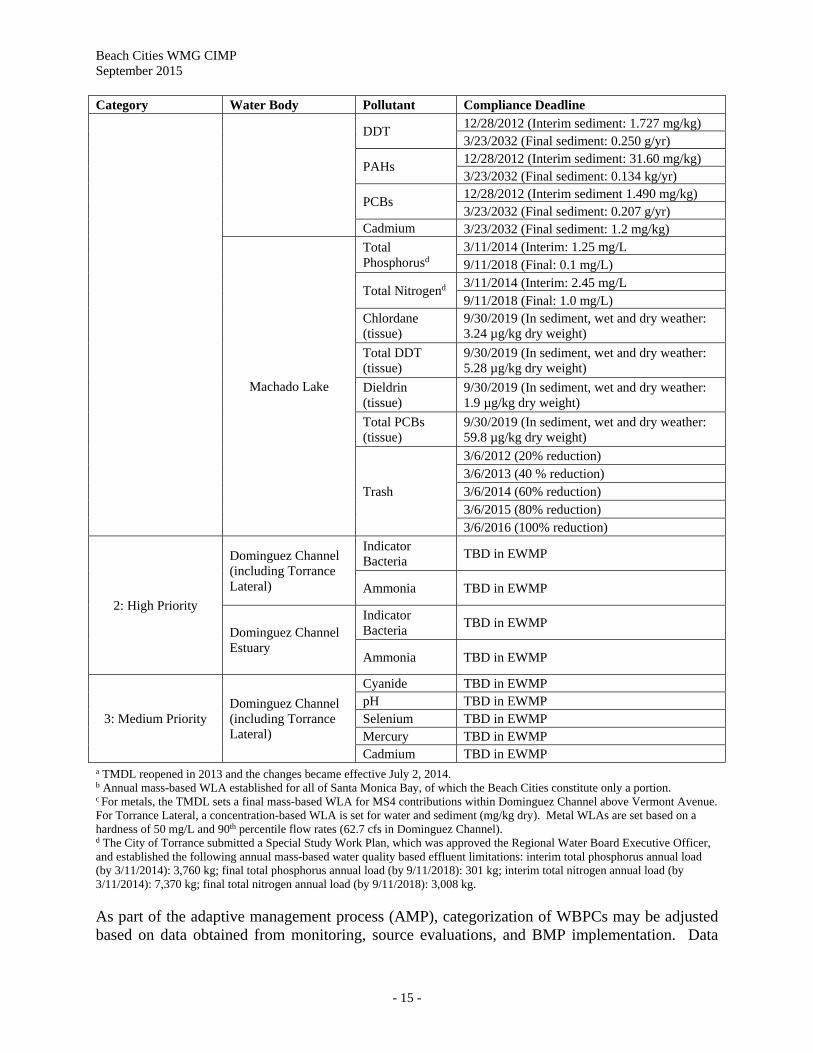
Category Water Body Pollutant Compliance Deadline
DDT 12/28/2012 (Interim sediment: 1.727 mg/kg) 3/23/2032 (Final sediment: 0.250 g/yr)
PAHs 12/28/2012 (Interim sediment: 31.60 mg/kg) 3/23/2032 (Final sediment: 0.134 kg/yr)
PCBs 12/28/2012 (Interim sediment 1.490 mg/kg) 3/23/2032 (Final sediment: 0.207 g/yr)
Cadmium 3/23/2032 (Final sediment: 1.2 mg/kg)
Machado Lake
Total Phosphorusd
3/11/2014 (Interim: 1.25 mg/L 9/11/2018 (Final: 0.1 mg/L)
Total Nitrogend 3/11/2014 (Interim: 2.45 mg/L 9/11/2018 (Final: 1.0 mg/L)
Chlordane (tissue)
9/30/2019 (In sediment, wet and dry weather: 3.24 µg/kg dry weight)
Total DDT (tissue)
9/30/2019 (In sediment, wet and dry weather: 5.28 µg/kg dry weight)
Dieldrin (tissue)
9/30/2019 (In sediment, wet and dry weather: 1.9 µg/kg dry weight)
Total PCBs (tissue)
9/30/2019 (In sediment, wet and dry weather: 59.8 µg/kg dry weight)
Trash
3/6/2012 (20% reduction) 3/6/2013 (40 % reduction) 3/6/2014 (60% reduction) 3/6/2015 (80% reduction) 3/6/2016 (100% reduction)
2: High Priority
Dominguez Channel (including Torrance Lateral)
Indicator Bacteria
TBD in EWMP
Ammonia TBD in EWMP
Dominguez Channel Estuary
Indicator Bacteria
TBD in EWMP
Ammonia TBD in EWMP
3: Medium Priority Dominguez Channel (including Torrance Lateral)
Cyanide TBD in EWMP pH TBD in EWMP Selenium TBD in EWMP Mercury TBD in EWMP Cadmium TBD in EWMP
a TMDL reopened in 2013 and the changes became effective July 2, 2014. b Annual mass-based WLA established for all of Santa Monica Bay, of which the Beach Cities constitute only a portion. c For metals, the TMDL sets a final mass-based WLA for MS4 contributions within Dominguez Channel above Vermont Avenue. For Torrance Lateral, a concentration-based WLA is set for water and sediment (mg/kg dry). Metal WLAs are set based on a hardness of 50 mg/L and 90th percentile flow rates (62.7 cfs in Dominguez Channel). d The City of Torrance submitted a Special Study Work Plan, which was approved the Regional Water Board Executive Officer, and established the following annual mass-based water quality based effluent limitations: interim total phosphorus annual load (by 3/11/2014): 3,760 kg; final total phosphorus annual load (by 9/11/2018): 301 kg; interim total nitrogen annual load (by 3/11/2014): 7,370 kg; final total nitrogen annual load (by 9/11/2018): 3,008 kg.
As part of the adaptive management process (AMP), categorization of WBPCs may be adjusted based on data obtained from monitoring, source evaluations, and BMP implementation. Data
Beach Cities WMG CIMP September 2015
- 16 -
collected following CIMP approval may result in the addition of Category 3 designations in instances when receiving water limits are exceeded and MS4 discharges are identified as contributing to such exceedances. Under these conditions, the appropriate agencies will adhere to Section VI.C.2.a.iii of the Permit. Additional details and supporting information for monitoring to address priorities can be found in the Beach Cities WMG EWMP Work Plan.
1.3 CIMP Overview The CIMP is designed to provide the information necessary to guide management decisions in addition to providing a means to measure compliance with the Permit. The Beach Cities WMG’s CIMP addresses the six required elements: 1. Receiving Water Monitoring 2. Stormwater Outfall Monitoring 3. Non-Stormwater Outfall Monitoring 4. New Development and Redevelopment Effectiveness Tracking 5. Regional Studies 6. Special Studies Each of the six CIMP elements is briefly discussed below. 1.3.1 Receiving Water Monitoring Receiving water monitoring is intended to assess whether water quality objectives are being achieved, to determine if beneficial uses are being supported, and to track trends in constituent concentrations over time. The CIMP proposes two (2) new near-shore monitoring locations in the Santa Monica Bay for sampling and analysis of the MRP-required suite of analytical parameters designed to assess the impacts from the storm drain discharges on water quality in the Santa Monica Bay. Ongoing Coordinated Shoreline Monitoring ankle-deep in the wave wash consistent with the Santa Monica Bay Beaches Bacteria TMDL will continue at the same frequency and at the same eleven (11) locations as specified in the approved Coordinated Shoreline Monitoring Plan consistent with the Santa Monica Bay Beaches Bacteria TMDL. Similarly mass emissions monitoring at the Dominguez Channel within the Beach Cities WMG will also continue. Receiving water at Torrance Lateral will also be included in this CIMP. Section 2 discusses the Beach Cities WMG’s receiving water monitoring program in further detail. 1.3.2 Stormwater Outfall Monitoring Stormwater outfall monitoring is intended to assess discharge water quality relative to municipal action limits (MALs), WQBELs derived from TMDL WLAs, as well as the potential to have caused or contributed to exceedances of RWLs derived from TMDL WLAs or receiving water quality objectives.
Beach Cities WMG CIMP September 2015
- 17 -
Seven stormwater outfall monitoring sites were selected. The selected sites are representative of a combination of the HUC-12s, jurisdictions, and/or land uses within each catchment area. A synopsis of each potential outfall catchment area, along with an analysis of its land use/zoning characteristics is summarized in Section 4. 1.3.3 Non-Stormwater Outfall Program To fulfill the Permit requirements, the MRP requires Permittees to implement a non-stormwater outfall based screening and monitoring program. The Non-Stormwater Outfall Screening and Monitoring Program (Non-Stormwater Program) is focused on non-stormwater discharges to receiving waters from MS4 outfalls. The Beach Cities WMG has been addressing non-stormwater flow to Santa Monica Bay through the installation of low flow diversions (LFDs). The Beach Cities WMG’s Non-Stormwater Program will collect information necessary to identify significant non-stormwater discharges from major outfalls and conduct the screening process and prioritization prior to non-stormwater outfall monitoring. Details of the Non-Stormwater Program are presented in Section 5. 1.3.4 New Development and Redevelopment Effectiveness Tracking The New Development/Re-Development Effectiveness Tracking is required to identify the information necessary for data management and annual compliance reporting. Each jurisdiction will be individually responsible for tracking Permit requirements based on their specific operational procedures and internal processes. Each individual Permittee within the Beach Cities WMG will maintain an informational database record for each new development/re-development project subject to the Permit’s Planning and Land Development Program as adopted via each Permittee’s Low Impact Development (LID) Ordinance. Section 6 summarizes the new development and redevelopment effectiveness tracking program to be implemented by the Beach Cities WMG Permittees. 1.3.5 Regional Studies LACFCD will continue to participate in the Regional Watershed Monitoring Program (Bioassessment Program) being managed by the Southern California Stormwater Monitoring Coalition (SMC). The LACFCD will contribute resources to implement the bioassessment monitoring during the current Permit cycle. Section 7 presents the regional studies approach for the Beach Cities WMG. 1.3.6 Special Studies The MRP requires each Permittee to be responsible for conducting special studies if required in an effective TMDL or an approved TMDL Monitoring Plan. The City of Torrance has received approval for a Special Study Work Plan for the Machado Lake Nutrient TMDL (see Appendix B). There are no other required special studies applicable to the Beach Cities WMG. Optional special studies are further discussed in Section 8.
Beach Cities WMG CIMP September 2015
- 18 -
2.0 Receiving Water Monitoring Program While the Permit does not specify a required number of receiving water monitoring sites, The MRP suggests that receiving water monitoring be performed at: (1) previously designated mass emission stations (MES); (2) TMDL receiving water compliance points; and (3) additional receiving water locations representative of the impacts from MS4 discharges. These locations serve to address the receiving water monitoring program objectives described in the MRP introduction, in particular that a robust dataset of past monitoring data can facilitate trends analyses. Receiving water monitoring site locations that were selected and the basis for their selection are addressed in the following subsections.
2.1 Receiving Water Monitoring Objectives The objectives of the receiving water monitoring include the following (Part II.E.1 of the MRP): Determine whether the receiving water limitations are being achieved; Assess trends in pollutant concentrations over time, or during specified conditions; and Determine whether the designated beneficial uses are fully supported as determined by
water chemistry, as well as aquatic toxicity and bioassessment monitoring.
To accomplish these objectives, TMDL receiving water monitoring as specified in approved TMDL monitoring plans will continue and additional Permit receiving water monitoring will be conducted to meet the Permit monitoring objectives to assess the effects of MS4 discharges on receiving water quality.
2.2 Receiving Water Monitoring Sites As stated above, the primary objective of receiving water monitoring is to assess trends in pollutant concentrations over time, or during specified conditions. For that reason, an important characteristic of an ideal receiving water monitoring site is that it has a large dataset from previously collected monitoring events that covers both a large timespan as well as a range of conditions. As summarized and presented in Appendix A and Appendix B, an existing MES within the Beach Cities WMG area along the Dominguez Channel (S28) will serve as the receiving water monitoring location for the Beach Cities WMG on the Dominguez Channel. The County of Los Angeles has committed to maintaining this monitoring station. The CIMP proposes two (2) new near-shore monitoring locations within 1,000 feet from the shoreline in the Santa Monica Bay in line with the two largest outfalls from the Beach Cities WMG for sampling and analysis of an expanded, Permit-required suite of analytical parameters designed to assess the impacts from the storm drain discharges on water quality in the Santa Monica Bay. Ongoing Coordinated Shoreline Monitoring ankle-deep in the wave wash consistent with the Santa Monica Bay Beaches Bacteria TMDL will continue at the same frequency and at the same eleven (11) locations as specified in the approved Coordinated Shoreline Monitoring Plan consistent with the Santa Monica Bay Beaches Bacteria TMDL. While the existing shoreline monitoring sites will achieve monitoring objectives for the existing TMDL monitoring program for water-contact recreational beneficial uses, the
Beach Cities WMG CIMP September 2015
- 19 -
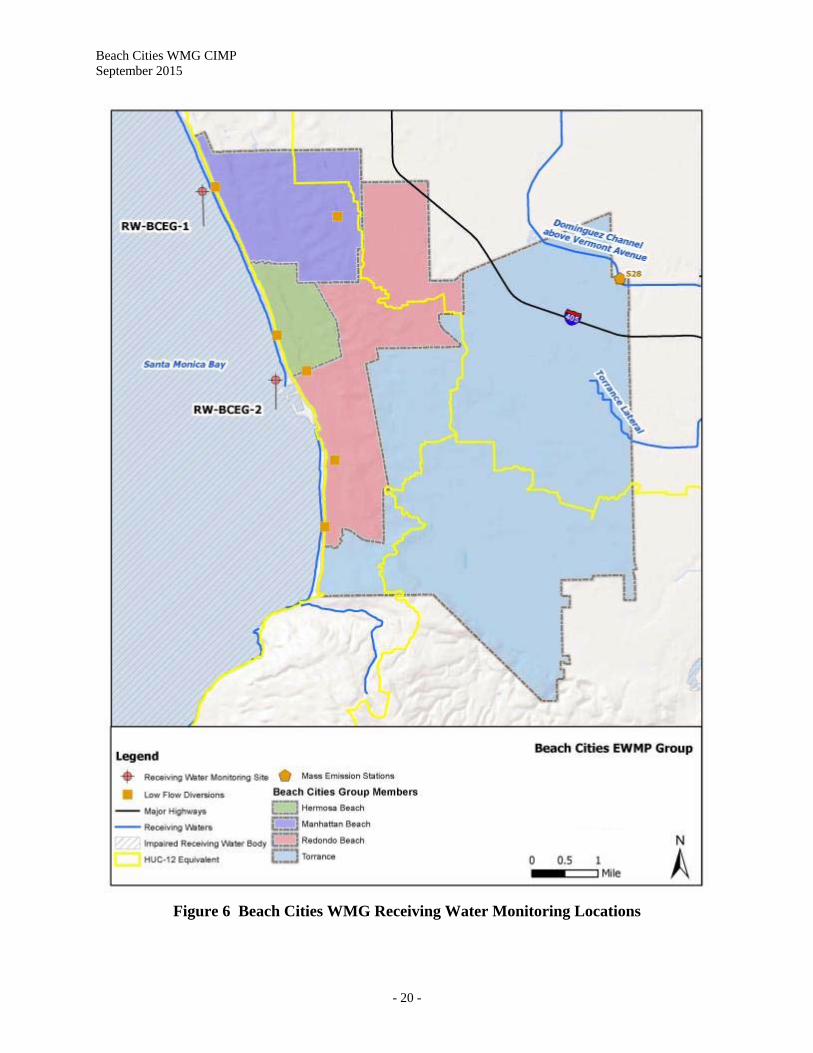
nearshore monitoring locations will more accurately assess the overall impact of the MS4 on the other beneficial uses of Santa Monica Bay. The City of Los Angeles, as lead agency for other WMGs, has agreed to share their CIMP monitoring data from the Torrance Lateral, Dominguez Channel Estuary, Dominguez Channel, and Machado Lake with the Beach Cities WMG (A. Magallanes, 2015). These monitoring data will be incorporated into the Beach Cities WMG annual reports assuming timely receipt of the data from the City of Los Angeles. If data are not received in time for inclusion into the annual report, they will be included in the subsequent year’s annual report. Therefore, the Beach Cities WMG is not proposing any receiving water monitoring stations in these waterbodies. Figure 6 presents the approximate locations of the receiving water monitoring sites RW-BCEG-1 and -2 and the MES site in the Beach Cities WMG. Fact sheets summarizing characteristics of sites RW-BCEG-1 and -2 are presented in Appendix C.
Beach Cities WMG CIMP September 2015
- 20 -
Figure 6 Beach Cities WMG Receiving Water Monitoring Locations
Beach Cities WMG CIMP September 2015
- 21 -
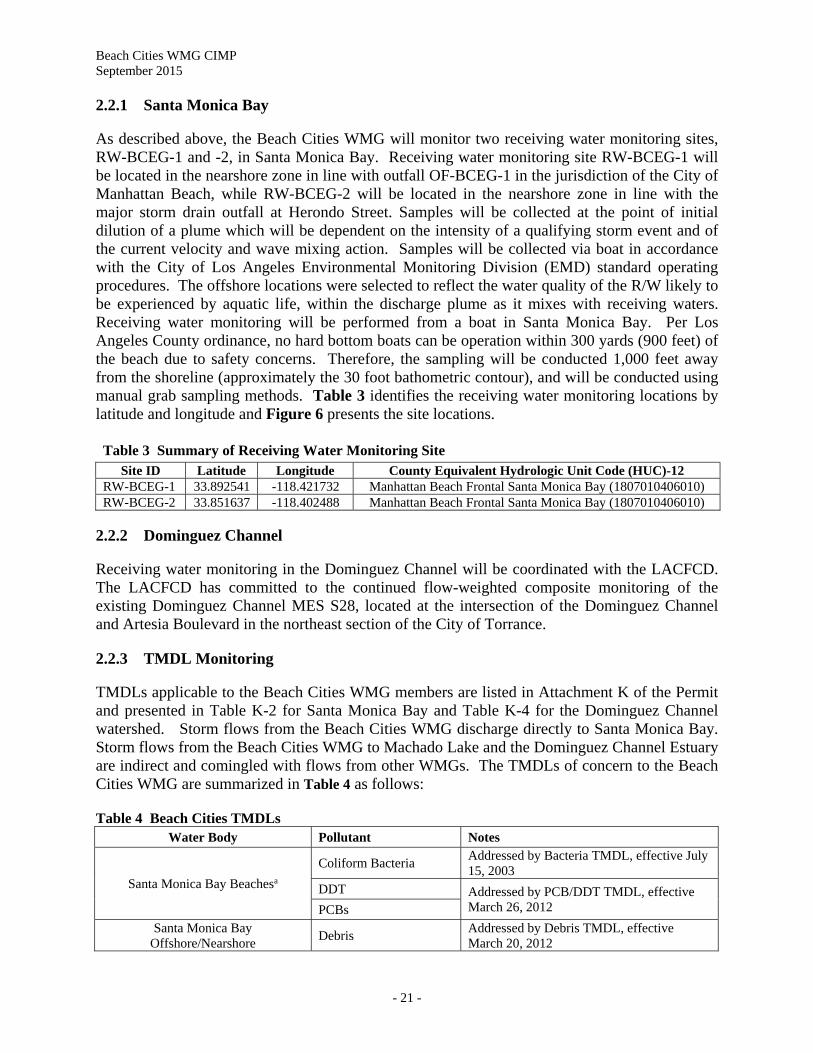
2.2.1 Santa Monica Bay As described above, the Beach Cities WMG will monitor two receiving water monitoring sites, RW-BCEG-1 and -2, in Santa Monica Bay. Receiving water monitoring site RW-BCEG-1 will be located in the nearshore zone in line with outfall OF-BCEG-1 in the jurisdiction of the City of Manhattan Beach, while RW-BCEG-2 will be located in the nearshore zone in line with the major storm drain outfall at Herondo Street. Samples will be collected at the point of initial dilution of a plume which will be dependent on the intensity of a qualifying storm event and of the current velocity and wave mixing action. Samples will be collected via boat in accordance with the City of Los Angeles Environmental Monitoring Division (EMD) standard operating procedures. The offshore locations were selected to reflect the water quality of the R/W likely to be experienced by aquatic life, within the discharge plume as it mixes with receiving waters. Receiving water monitoring will be performed from a boat in Santa Monica Bay. Per Los Angeles County ordinance, no hard bottom boats can be operation within 300 yards (900 feet) of the beach due to safety concerns. Therefore, the sampling will be conducted 1,000 feet away from the shoreline (approximately the 30 foot bathometric contour), and will be conducted using manual grab sampling methods. Table 3 identifies the receiving water monitoring locations by latitude and longitude and Figure 6 presents the site locations.
Table 3 Summary of Receiving Water Monitoring Site Site ID Latitude Longitude County Equivalent Hydrologic Unit Code (HUC)-12
RW-BCEG-1 33.892541 -118.421732 Manhattan Beach Frontal Santa Monica Bay (1807010406010) RW-BCEG-2 33.851637 -118.402488 Manhattan Beach Frontal Santa Monica Bay (1807010406010)
2.2.2 Dominguez Channel Receiving water monitoring in the Dominguez Channel will be coordinated with the LACFCD. The LACFCD has committed to the continued flow-weighted composite monitoring of the existing Dominguez Channel MES S28, located at the intersection of the Dominguez Channel and Artesia Boulevard in the northeast section of the City of Torrance. 2.2.3 TMDL Monitoring TMDLs applicable to the Beach Cities WMG members are listed in Attachment K of the Permit and presented in Table K-2 for Santa Monica Bay and Table K-4 for the Dominguez Channel watershed. Storm flows from the Beach Cities WMG discharge directly to Santa Monica Bay. Storm flows from the Beach Cities WMG to Machado Lake and the Dominguez Channel Estuary are indirect and comingled with flows from other WMGs. The TMDLs of concern to the Beach Cities WMG are summarized in Table 4 as follows: Table 4 Beach Cities TMDLs
Water Body Pollutant Notes
Santa Monica Bay Beachesa
Coliform Bacteria Addressed by Bacteria TMDL, effective July 15, 2003
DDT Addressed by PCB/DDT TMDL, effective March 26, 2012 PCBs
Santa Monica Bay Offshore/Nearshore
Debris Addressed by Debris TMDL, effective March 20, 2012
Beach Cities WMG CIMP September 2015
- 22 -
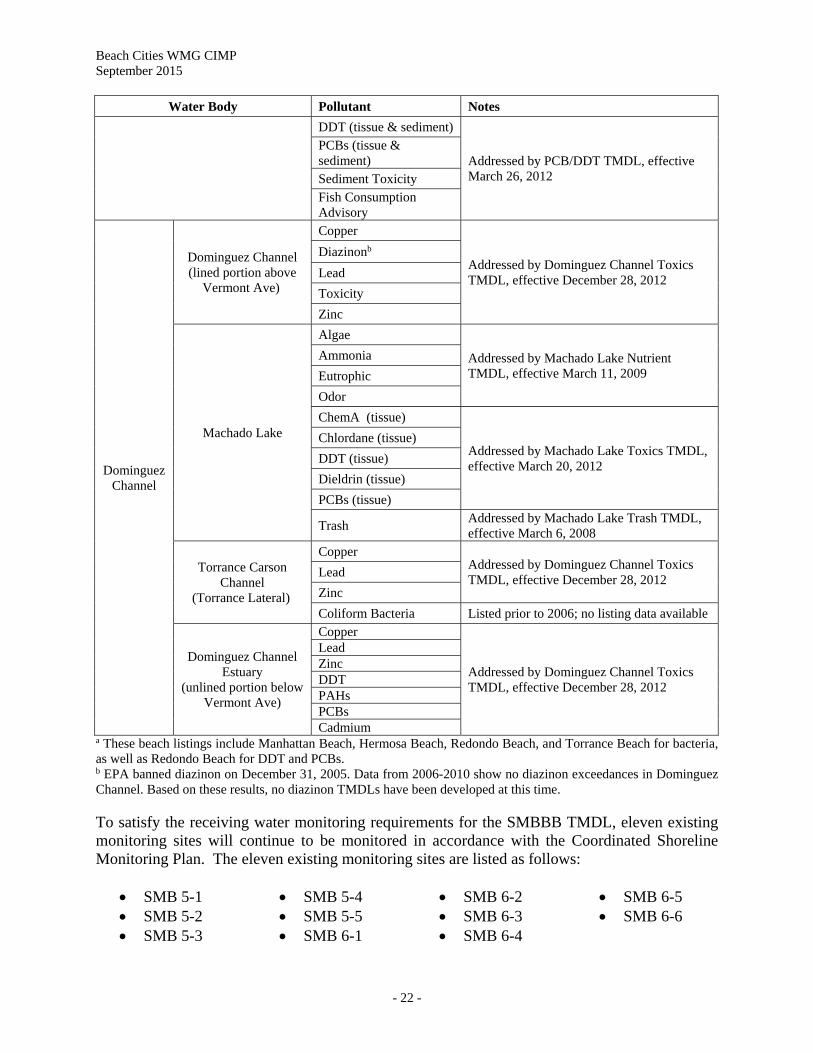
Water Body Pollutant Notes
DDT (tissue & sediment)
Addressed by PCB/DDT TMDL, effective March 26, 2012
PCBs (tissue & sediment) Sediment Toxicity Fish Consumption Advisory
Dominguez Channel
Dominguez Channel (lined portion above
Vermont Ave)
Copper
Addressed by Dominguez Channel Toxics TMDL, effective December 28, 2012
Diazinonb
Lead
Toxicity
Zinc
Machado Lake
Algae
Addressed by Machado Lake Nutrient TMDL, effective March 11, 2009
Ammonia
Eutrophic
Odor
ChemA (tissue)
Addressed by Machado Lake Toxics TMDL, effective March 20, 2012
Chlordane (tissue)
DDT (tissue)
Dieldrin (tissue)
PCBs (tissue)
Trash Addressed by Machado Lake Trash TMDL, effective March 6, 2008
Torrance Carson Channel
(Torrance Lateral)
Copper Addressed by Dominguez Channel Toxics TMDL, effective December 28, 2012
Lead
Zinc
Coliform Bacteria Listed prior to 2006; no listing data available
Dominguez Channel Estuary
(unlined portion below Vermont Ave)
Copper
Addressed by Dominguez Channel Toxics TMDL, effective December 28, 2012
Lead Zinc DDT PAHs PCBs Cadmium
a These beach listings include Manhattan Beach, Hermosa Beach, Redondo Beach, and Torrance Beach for bacteria, as well as Redondo Beach for DDT and PCBs. b EPA banned diazinon on December 31, 2005. Data from 2006-2010 show no diazinon exceedances in Dominguez Channel. Based on these results, no diazinon TMDLs have been developed at this time.
To satisfy the receiving water monitoring requirements for the SMBBB TMDL, eleven existing monitoring sites will continue to be monitored in accordance with the Coordinated Shoreline Monitoring Plan. The eleven existing monitoring sites are listed as follows:
SMB 5-1 SMB 5-4 SMB 6-2 SMB 6-5 SMB 5-2 SMB 5-5 SMB 6-3 SMB 6-6 SMB 5-3 SMB 6-1 SMB 6-4
Beach Cities WMG CIMP September 2015
- 23 -
As part of the Coordinated Shoreline Monitoring Plan, qualitative data have also been collected at three observational sites: SMB O-6, O-7, and O-8. Observations include a qualitative description of the amount of flow observed (dry, ponded, low flow, medium flow, or high flow) and whether or not the flow was reaching the surf zone. As defined in Section 5.2 of the CIMP, “significant non-stormwater flows will be designated if non-stormwater flow was observed reaching the wave wash from the particular outfall during two of the three outfall screenings…” Because observations are made on a weekly basis at the observational sites, this definition of significance has been assumed equivalent to observations of dry weather flow reaching the wave wash at a rate greater than 66% over the past three years. On this basis, a review of the past three years’ of data (July 2012 – May 2015) indicates that there are no significant non-stormwater discharges at these sites:
At SMB O-6, 2% of dry weather observation days noted flows reaching the wave wash. The two occasions of flow reaching the surf zone both occurred nearly three years ago, in August of 2012.
At SMB O-7, 11% of dry weather observation days noted flows reaching the wave wash. Despite weekly observations, there has only been one occasion of flow reaching the surf zone at this site in 2015.
At SMB O-8, 11% of dry weather observation days noted flows reaching the wave wash. Despite weekly observations, there has only been one occasion of flow reaching the surf zone at this site in 2015. The other most recent notable observations occurred over a year ago, in April of 2014.
A summary of these observational results is provided in Appendix G. Given the lack of significant non-stormwater flows, observational monitoring at SMB O-6 and SMB O-8 will be discontinued upon approval of this CIMP. Monitoring at SMB O-7 will be conducted in accordance with the Non-Stormwater Outfall Screening and Monitoring Program described in Section 5. Attainment of the SMB DDT and PCB TMDL WLAs for the Beach Cities WMG will be addressed through stormwater outfall monitoring to assess the WMG mean sediment borne loading of DDT and PCBs from the MS4 to SMB, using a three year average for concentration and flow from the combined group SMB discharges. This is considered to be an appropriate approach for the following reasons:
The TMDL (page 56) recommended that monitoring be conducted on a coordinated watershed-wide basis, which is what the Beach Cities WMG is proposing (i.e., coordinated and watershed wide within the WMG). USEPA also stated that estimates of mass loading will require extrapolation from a few locations to the entire watershed, so this approach is consistent with that.
The Beach Cities WMG is providing four outfall monitoring sites to Santa Monica Bay and will be monitoring them in pairs in alternating years so that will create a data set of a total of 18 wet weather outfall monitoring events over the three year period to provide a data set from which to extrapolate the mass loading from the Beach Cities WMG.
Since the WLA in the MS4 Permit is an annual mass-based WLA applied to the entire MS4 group of Permittees discharging to Santa Monica Bay, the Beach Cities WMG will
Beach Cities WMG CIMP September 2015
- 24 -
evaluate whether their aggregate discharge meets their share of the total WLA on an area share basis. This is consistent with the TMDL (page 50) which states that grouped waste load allocations should be apportioned based on relevant percent area within the watersheds draining to Santa Monica Bay.
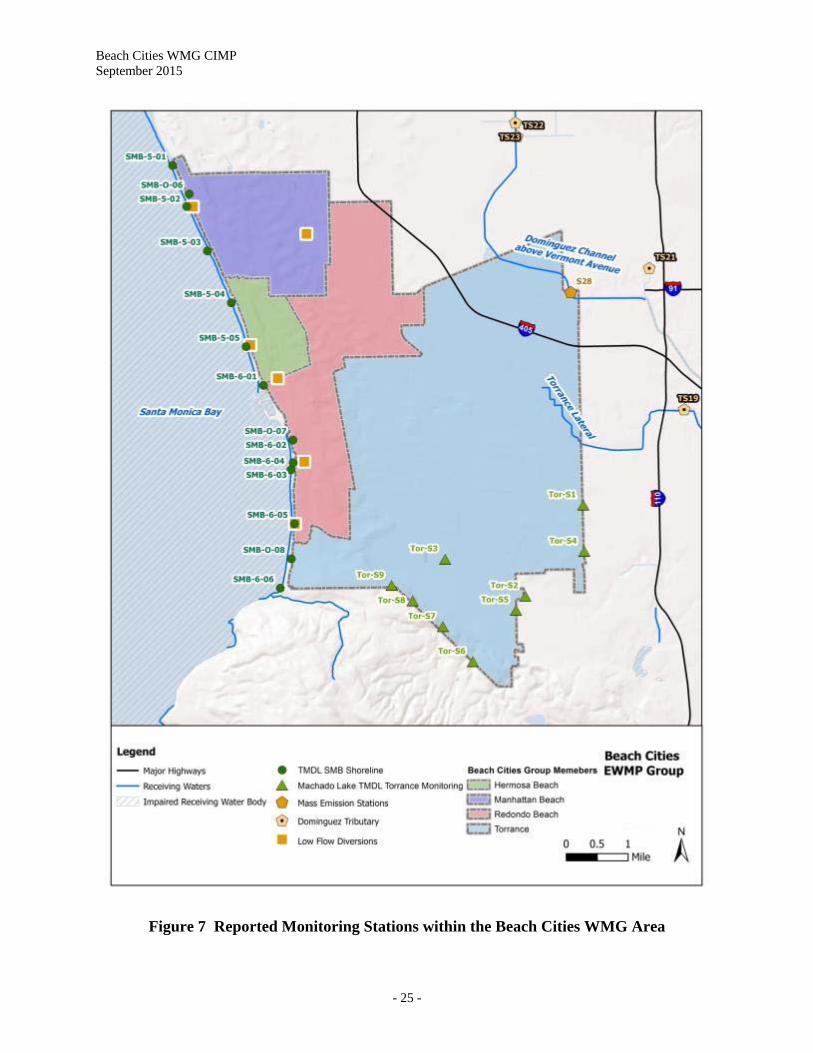
The SMB Debris TMDL does not require receiving water monitoring, and the Beach Cities WMG members are not required to conduct any type of monitoring if complying with the WLAs through the implementation of BMPs, such as full capture systems. WMG members are to report compliance strategy through the development of a Trash Monitoring and Reporting Plan (TMRP) and Plastic Pellets Monitoring and Reporting Plan (PMRP), or demonstrate that a PMRP is not required, to be approved by the Regional Board. All Permittees within the Beach Cities WMG required to submit a TMRP and/or PMRP have done so. Submitted TMRPs and PMRPs for each jurisdiction will be implemented individually by the corresponding jurisdiction, once approved by the Regional Board. The City of Torrance has previously developed and submitted Monitoring Plans required by the Machado Lake Nutrient, Toxics and Trash TMDLs to the Regional Board. This portion of the Beach Cities WMG TMDL requirements, summarized in Appendix A, will be addressed by the individual Monitoring Plans submitted for approval to the Regional Board. Copies of the submitted Monitoring Plans are attached in Appendix B. Figure 7 presents TMDL and other existing monitoring sites within the Beach Cities WMG.
Beach Cities WMG CIMP September 2015
- 25 -
Figure 7 Reported Monitoring Stations within the Beach Cities WMG Area
Beach Cities WMG CIMP September 2015
- 26 -
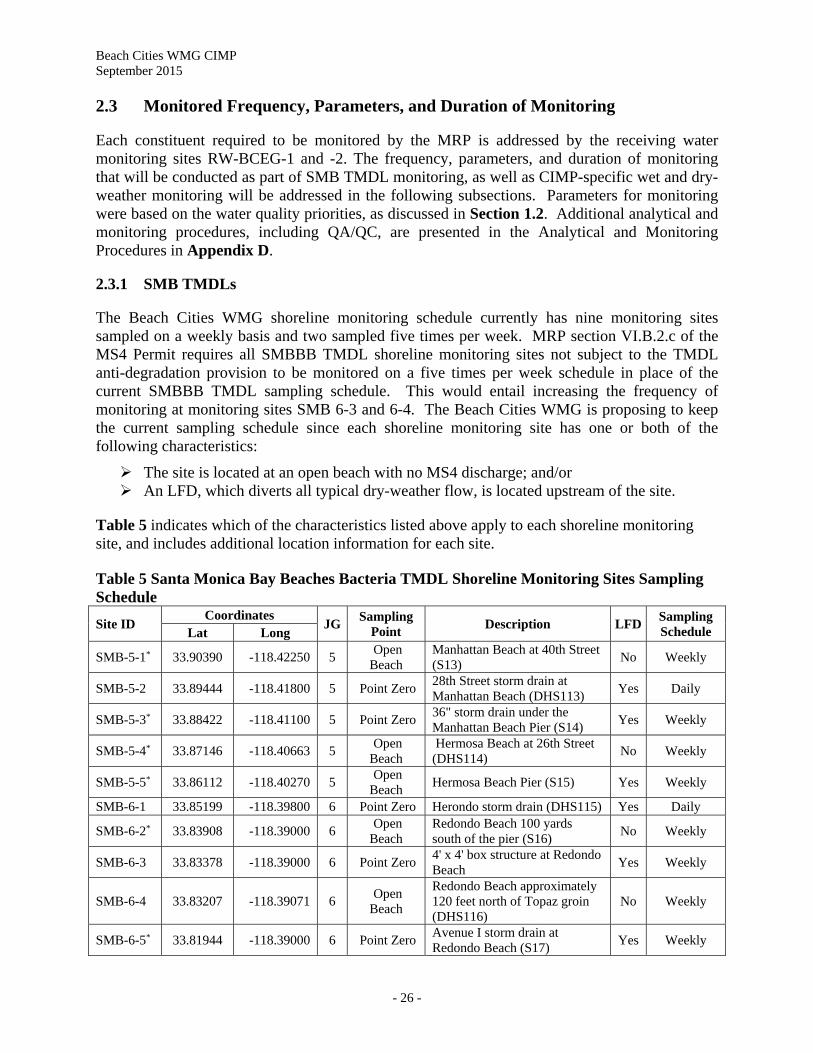
2.3 Monitored Frequency, Parameters, and Duration of Monitoring Each constituent required to be monitored by the MRP is addressed by the receiving water monitoring sites RW-BCEG-1 and -2. The frequency, parameters, and duration of monitoring that will be conducted as part of SMB TMDL monitoring, as well as CIMP-specific wet and dry-weather monitoring will be addressed in the following subsections. Parameters for monitoring were based on the water quality priorities, as discussed in Section 1.2. Additional analytical and monitoring procedures, including QA/QC, are presented in the Analytical and Monitoring Procedures in Appendix D. 2.3.1 SMB TMDLs The Beach Cities WMG shoreline monitoring schedule currently has nine monitoring sites sampled on a weekly basis and two sampled five times per week. MRP section VI.B.2.c of the MS4 Permit requires all SMBBB TMDL shoreline monitoring sites not subject to the TMDL anti-degradation provision to be monitored on a five times per week schedule in place of the current SMBBB TMDL sampling schedule. This would entail increasing the frequency of monitoring at monitoring sites SMB 6-3 and 6-4. The Beach Cities WMG is proposing to keep the current sampling schedule since each shoreline monitoring site has one or both of the following characteristics:
The site is located at an open beach with no MS4 discharge; and/or An LFD, which diverts all typical dry-weather flow, is located upstream of the site.
Table 5 indicates which of the characteristics listed above apply to each shoreline monitoring site, and includes additional location information for each site. Table 5 Santa Monica Bay Beaches Bacteria TMDL Shoreline Monitoring Sites Sampling Schedule
Site ID Coordinates
JGSampling
Point Description LFD
Sampling Schedule Lat Long
SMB-5-1* 33.90390 -118.42250 5 Open Beach
Manhattan Beach at 40th Street (S13)
No Weekly
SMB-5-2 33.89444 -118.41800 5 Point Zero 28th Street storm drain at Manhattan Beach (DHS113)
Yes Daily
SMB-5-3* 33.88422 -118.41100 5 Point Zero 36" storm drain under the Manhattan Beach Pier (S14)
Yes Weekly
SMB-5-4* 33.87146 -118.40663 5 Open Beach
Hermosa Beach at 26th Street (DHS114)
No Weekly
SMB-5-5* 33.86112 -118.40270 5 Open Beach
Hermosa Beach Pier (S15) Yes Weekly
SMB-6-1 33.85199 -118.39800 6 Point Zero Herondo storm drain (DHS115) Yes Daily
SMB-6-2* 33.83908 -118.39000 6 Open Beach
Redondo Beach 100 yards south of the pier (S16)
No Weekly
SMB-6-3 33.83378 -118.39000 6 Point Zero 4' x 4' box structure at Redondo Beach
Yes Weekly
SMB-6-4 33.83207 -118.39071 6 Open Beach
Redondo Beach approximately 120 feet north of Topaz groin (DHS116)
No Weekly
SMB-6-5* 33.81944 -118.39000 6 Point Zero Avenue I storm drain at Redondo Beach (S17)
Yes Weekly
Beach Cities WMG CIMP September 2015
- 27 -
Site ID Coordinates
JGSampling
Point Description LFD
Sampling Schedule Lat Long
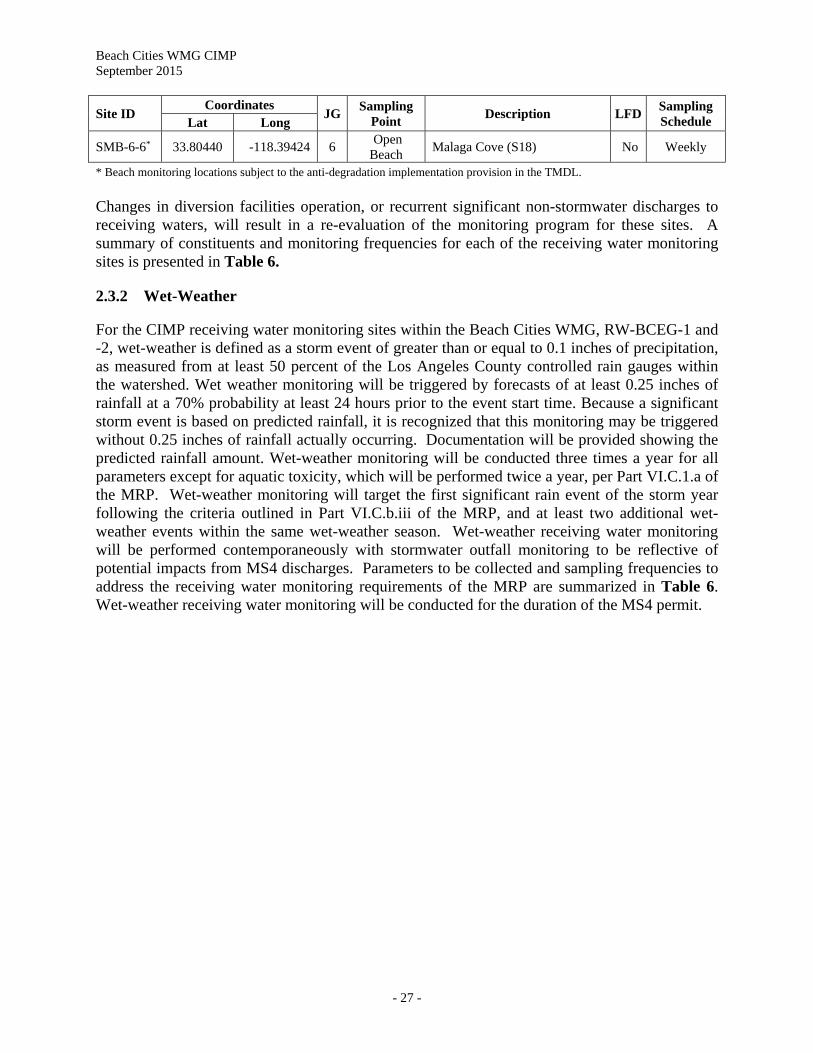
SMB-6-6* 33.80440 -118.39424 6 Open Beach
Malaga Cove (S18) No Weekly
* Beach monitoring locations subject to the anti-degradation implementation provision in the TMDL.
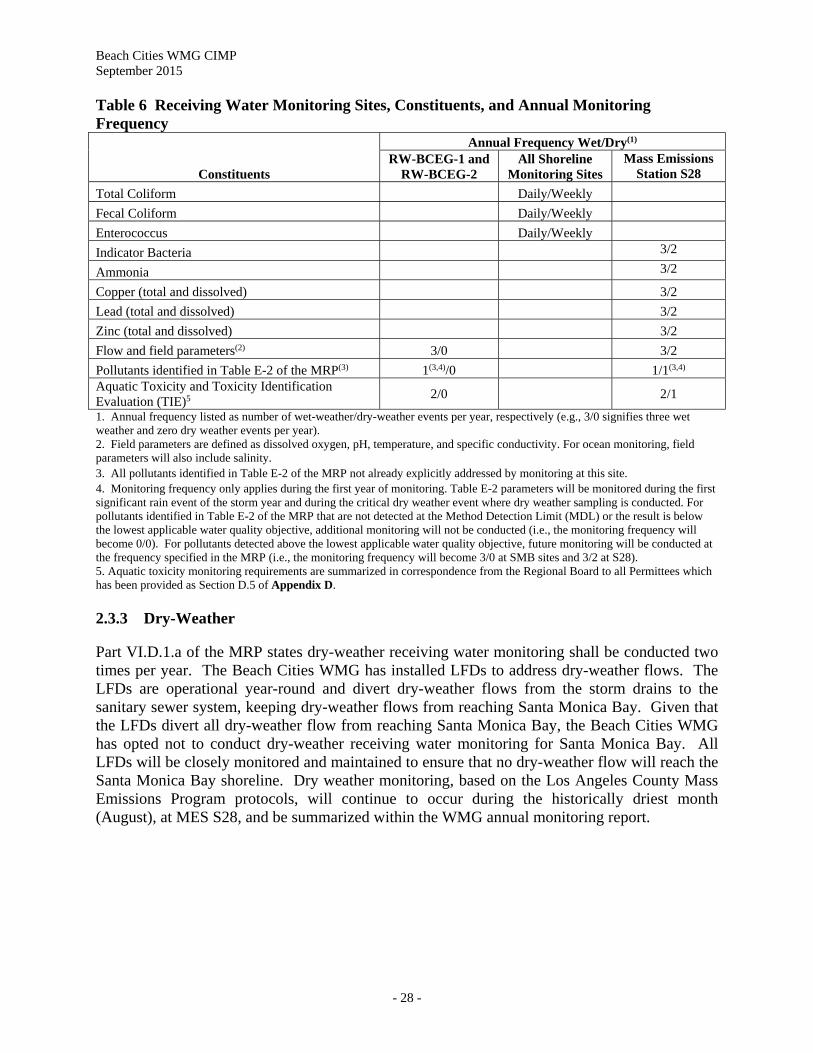
Changes in diversion facilities operation, or recurrent significant non-stormwater discharges to receiving waters, will result in a re-evaluation of the monitoring program for these sites. A summary of constituents and monitoring frequencies for each of the receiving water monitoring sites is presented in Table 6. 2.3.2 Wet-Weather For the CIMP receiving water monitoring sites within the Beach Cities WMG, RW-BCEG-1 and -2, wet-weather is defined as a storm event of greater than or equal to 0.1 inches of precipitation, as measured from at least 50 percent of the Los Angeles County controlled rain gauges within the watershed. Wet weather monitoring will be triggered by forecasts of at least 0.25 inches of rainfall at a 70% probability at least 24 hours prior to the event start time. Because a significant storm event is based on predicted rainfall, it is recognized that this monitoring may be triggered without 0.25 inches of rainfall actually occurring. Documentation will be provided showing the predicted rainfall amount. Wet-weather monitoring will be conducted three times a year for all parameters except for aquatic toxicity, which will be performed twice a year, per Part VI.C.1.a of the MRP. Wet-weather monitoring will target the first significant rain event of the storm year following the criteria outlined in Part VI.C.b.iii of the MRP, and at least two additional wet-weather events within the same wet-weather season. Wet-weather receiving water monitoring will be performed contemporaneously with stormwater outfall monitoring to be reflective of potential impacts from MS4 discharges. Parameters to be collected and sampling frequencies to address the receiving water monitoring requirements of the MRP are summarized in Table 6. Wet-weather receiving water monitoring will be conducted for the duration of the MS4 permit.
Beach Cities WMG CIMP September 2015
- 28 -
Table 6 Receiving Water Monitoring Sites, Constituents, and Annual Monitoring Frequency
Constituents
Annual Frequency Wet/Dry(1) RW-BCEG-1 and
RW-BCEG-2 All Shoreline
Monitoring Sites Mass Emissions
Station S28
Total Coliform Daily/Weekly
Fecal Coliform Daily/Weekly
Enterococcus Daily/Weekly
Indicator Bacteria 3/2
Ammonia 3/2
Copper (total and dissolved) 3/2
Lead (total and dissolved) 3/2
Zinc (total and dissolved) 3/2
Flow and field parameters(2) 3/0 3/2
Pollutants identified in Table E-2 of the MRP(3) 1(3,4)/0 1/1(3,4) Aquatic Toxicity and Toxicity Identification Evaluation (TIE)5
2/0 2/1
1. Annual frequency listed as number of wet-weather/dry-weather events per year, respectively (e.g., 3/0 signifies three wet weather and zero dry weather events per year). 2. Field parameters are defined as dissolved oxygen, pH, temperature, and specific conductivity. For ocean monitoring, field parameters will also include salinity. 3. All pollutants identified in Table E-2 of the MRP not already explicitly addressed by monitoring at this site. 4. Monitoring frequency only applies during the first year of monitoring. Table E-2 parameters will be monitored during the first significant rain event of the storm year and during the critical dry weather event where dry weather sampling is conducted. For pollutants identified in Table E-2 of the MRP that are not detected at the Method Detection Limit (MDL) or the result is below the lowest applicable water quality objective, additional monitoring will not be conducted (i.e., the monitoring frequency will become 0/0). For pollutants detected above the lowest applicable water quality objective, future monitoring will be conducted at the frequency specified in the MRP (i.e., the monitoring frequency will become 3/0 at SMB sites and 3/2 at S28). 5. Aquatic toxicity monitoring requirements are summarized in correspondence from the Regional Board to all Permittees which has been provided as Section D.5 of Appendix D.
2.3.3 Dry-Weather Part VI.D.1.a of the MRP states dry-weather receiving water monitoring shall be conducted two times per year. The Beach Cities WMG has installed LFDs to address dry-weather flows. The LFDs are operational year-round and divert dry-weather flows from the storm drains to the sanitary sewer system, keeping dry-weather flows from reaching Santa Monica Bay. Given that the LFDs divert all dry-weather flow from reaching Santa Monica Bay, the Beach Cities WMG has opted not to conduct dry-weather receiving water monitoring for Santa Monica Bay. All LFDs will be closely monitored and maintained to ensure that no dry-weather flow will reach the Santa Monica Bay shoreline. Dry weather monitoring, based on the Los Angeles County Mass Emissions Program protocols, will continue to occur during the historically driest month (August), at MES S28, and be summarized within the WMG annual monitoring report.
Beach Cities WMG CIMP September 2015
- 29 -
3.0 GIS Database To meet the requirements of Part VII of the MRP, a map(s) and/or database of the MS4 storm drains, channels, and outfalls will be submitted with the CIMP and include the following information (Part VII.A of the MRP):
1. Surface water bodies within the Permittee(s) jurisdiction 2. Sub-watershed (HUC-12) boundaries 3. Land use overlay 4. Effective Impervious Area (EIA) overlay (if available) 5. Jurisdictional boundaries 6. The location and length of all open channel and underground pipes 18 inches in diameter
or greater (with the exception of catch basin connector pipes) 7. The location of all dry-weather diversions 8. The location of all major MS4 outfalls within the Permittee’s jurisdictional boundary.
Each major outfall shall be assigned an alphanumeric identifier, which must be noted on the map
9. Notation of outfalls with significant non-stormwater discharges (to be updated annually) 10. Storm drain outfall catchment areas for each major outfall within the Permittee(s)
jurisdiction 11. Each mapped MS4 outfall shall be linked to a database containing descriptive and
monitoring data associated with the outfall. The data shall include:
a. Ownership b. Coordinates c. Physical description d. Photographs of the outfall, where possible, to provide baseline information to track
operation and maintenance needs over time e. Determination of whether the outfall conveys significant non-stormwater discharges f. Stormwater and non-stormwater monitoring data
Attachment A of the MS4 Permit defines a major MS4 outfall (or ‘‘major outfall’’) as a municipal separate storm sewer outfall that discharges from a single pipe with an inside diameter of 36 inches or more or its equivalent (discharge from a single conveyance other than a circular pipe which is associated with a drainage area of more than 50 acres); or for municipal separate storm sewers that receive stormwater from lands zoned for industrial activity (based on comprehensive zoning plans or the equivalent), an outfall that discharges from a single pipe with an inside diameter of 12 inches or more or from its equivalent (discharge from other than a circular pipe associated with a drainage area of 2 acres or more) (40 CFR § 122.26(b)(5)). Available GIS data were reviewed to determine whether components 1 through 11 from the list specified in the MRP were available for submittal. The availability of these components and, if applicable, the schedule for obtaining them are discussed in Sections 3.2 and 3.3.
Beach Cities WMG CIMP September 2015
- 30 -
3.1 Program Objectives Each year, a storm drain, channel, and outfall map as well as an associated database for the Beach Cities WMG are required to be updated to incorporate the most recent characterization data for outfalls with significant non-stormwater discharge.
3.2 Available Information The Beach Cities WMG reviewed Part VII.A of the MRP and gathered the available information for the group. The following data are readily available for submittal as a map and/or in a database (Note: the numbering below corresponds to the item number in the Permit list):
1. Surface water bodies within the Permittee(s) jurisdiction 2. Sub-watershed (HUC-12) boundaries 3. Land use overlay 5. Jurisdictional boundaries 6. The location and length of all open channel and underground pipes 18 inches in diameter
or greater (with the exception of catch basin connector pipes) 7. The location of all dry-weather diversions 8. The location of all major MS4 outfalls within the Permittee’s jurisdictional boundary 10. Storm drain outfall catchment areas for each major outfall within the Permittee(s)
jurisdiction 11. Each mapped MS4 outfall shall be linked to a database containing descriptive and
monitoring data associated with the outfall. The data shall include: a. Ownership b. Coordinates c. Physical description
Figure 2, 3, 5 and 6 present the information listed above for the Beach Cities WMG.
3.3 Pending Information and Schedule for Completion From the review, the following data are not currently available for submittal as a map and/or in a database, but are scheduled for completion:
4. Effective Impervious Area (EIA) overlay (if available) 9. Notation of outfalls with significant non-stormwater discharges (to be updated annually) 11. Each mapped MS4 outfall shall be linked to a database containing descriptive and
monitoring data associated with the outfall. The data shall include: d. Photographs of the outfall, where possible, to provide baseline information to
track operation and maintenance needs over time e. Determination of whether the outfall conveys significant non-stormwater
discharges f. Stormwater and non-stormwater monitoring data.
Completion of the data listed above is in progress and will be collected through the implementation of the CIMP, specifically the Non-Stormwater Outfall Monitoring Program. The

Beach Cities WMG CIMP September 2015
- 31 -
EIA overlay will be created as part of the Beach Cities’ EWMP and will be based on land use information and assumed impervious values. Each year, the storm drains, channels and outfalls map and associated database will be updated to incorporate the most recent characterization data for outfalls with significant non-stormwater discharge. The updated maps and/or associated database will be submitted each year with the Annual Report.
Beach Cities WMG CIMP September 2015
- 32 -
4.0 Stormwater Outfall Monitoring Stormwater outfall monitoring is intended to assess discharge water quality relative to municipal action limits (MALs) and WQBELs derived from TMDL WLAs, and evaluates the potential of outfall discharges to have caused or contributed to exceedances of RWLs derived from TMDL WLAs or receiving water quality objectives. Drainage of storm drains within the Beach Cities WMG differs between each equivalent HUC-12 subwatershed. An analysis of land uses within equivalent HUC-12 subwatersheds, jurisdictional areas represented by each outfall site, and each site’s drainage area was conducted for each outfall monitoring site.
4.1 Program Objectives As outlined in the MRP (Part VIII.A of the MRP), stormwater discharges from the MS4 shall be monitored at outfalls and/or alternative access points such as manholes, or in channels representative of the land uses within the Permittee’s jurisdiction to support meeting the three objectives of the stormwater outfall monitoring program:
1. Determine the quality of a Permittee’s discharge relative to municipal action levels, as described in Attachment G of the MS4 Permit;
2. Determine whether a Permittee’s discharge is in compliance with applicable stormwater WQBELs derived from TMDL WLAs; and
3. Determine whether a Permittee’s discharge causes or contributes to an exceedance of receiving water limitations.
Each stormwater outfall monitoring site was evaluated with regards to how representative they are of the surrounding land use of the overall Beach Cities WMG, the individual jurisdictions in which their drainage areas are located, and the equivalent HUC-12. Each zoning category provided by the RAA guidance manual was fit into one of the following eight land use categories:
Agricultural; Commercial; Industrial; Education; Single Family Residential; Multi-Family Residential; and Open Space; Transportation.
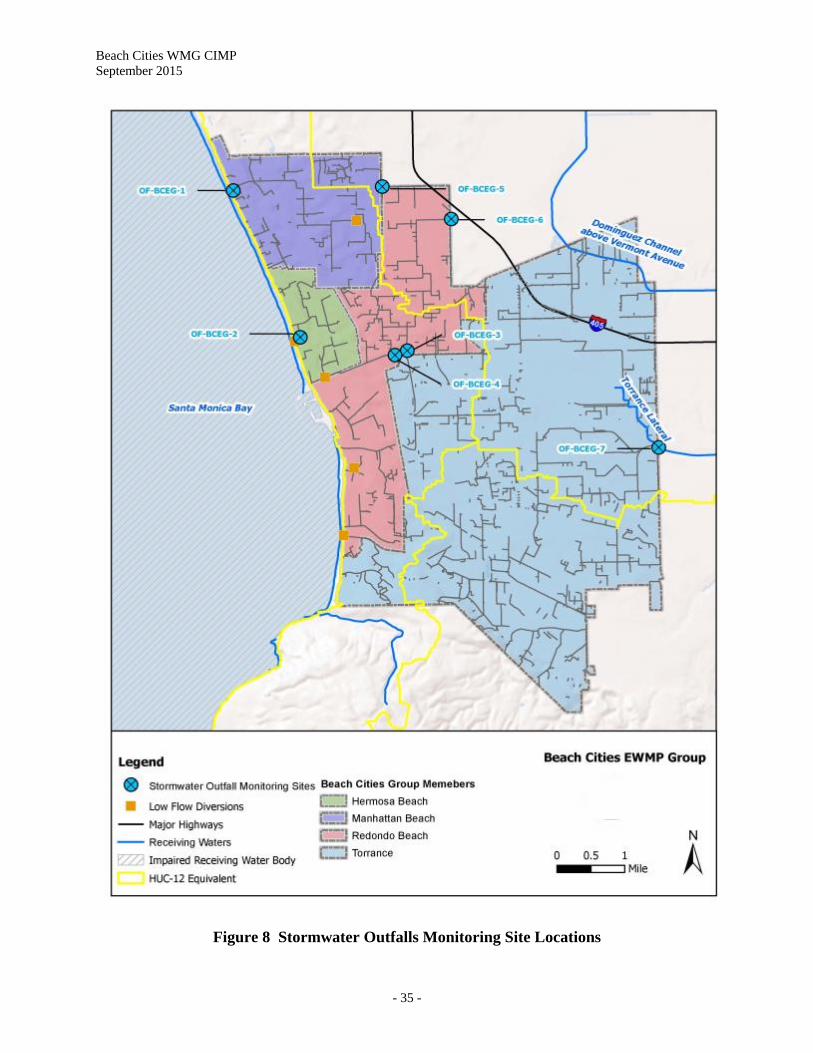
4.2 Stormwater Outfall Monitoring Sites The Permit provides monitoring site “default” requirements - one site per HUC-12 per jurisdiction - for achieving stormwater outfall monitoring objectives. The MS4 Permit also allows for an alternative approach to increase the cost efficiency and effectiveness of the monitoring program. The Beach Cities WMG has chosen the default Permit approach within the Santa Monica Bay and Dominguez Channel Watersheds. The previously approved monitoring program addressing the Machado Lake and Long Beach Harbor HUC-12 area is included as Appendix B to this CIMP; therefore, no new outfall monitoring sites in this HUC-12 have been identified in this document. Seven stormwater outfall monitoring sites, as shown in Figure 8, were selected as part of the approach. As indicated by Table 7 these monitoring locations together comprise about a third of the total Beach Cities WMG area.
Beach Cities WMG CIMP September 2015
- 33 -
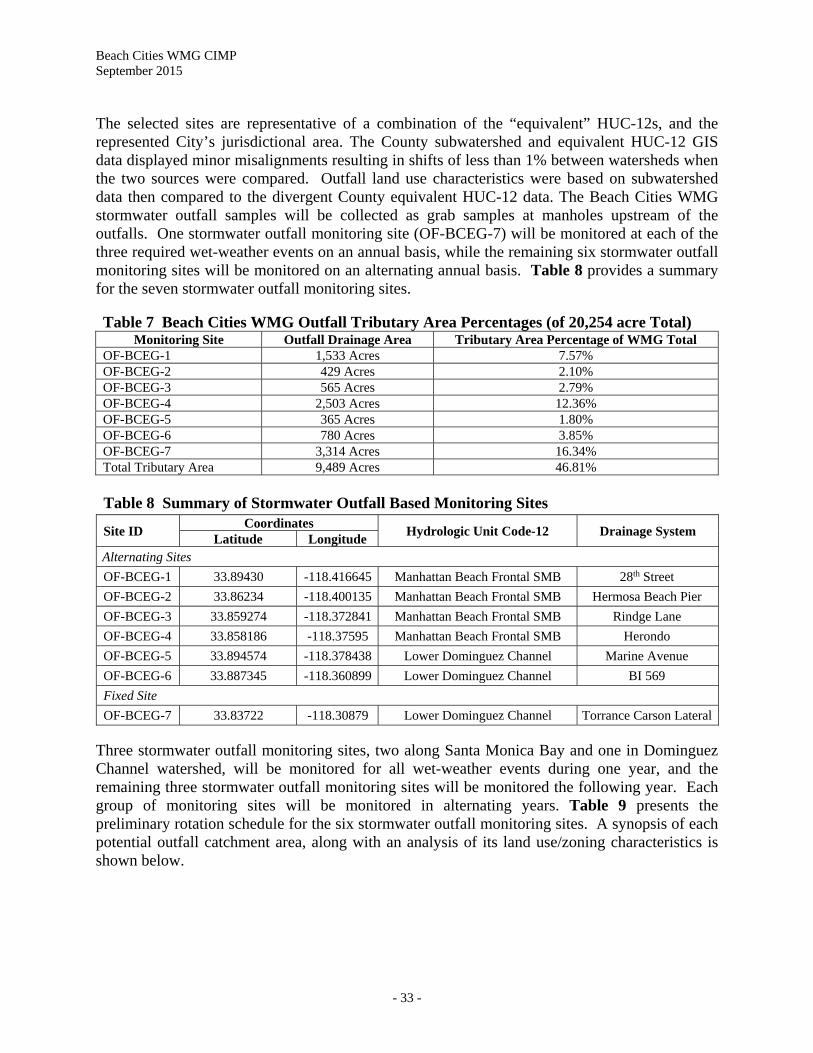
The selected sites are representative of a combination of the “equivalent” HUC-12s, and the represented City’s jurisdictional area. The County subwatershed and equivalent HUC-12 GIS data displayed minor misalignments resulting in shifts of less than 1% between watersheds when the two sources were compared. Outfall land use characteristics were based on subwatershed data then compared to the divergent County equivalent HUC-12 data. The Beach Cities WMG stormwater outfall samples will be collected as grab samples at manholes upstream of the outfalls. One stormwater outfall monitoring site (OF-BCEG-7) will be monitored at each of the three required wet-weather events on an annual basis, while the remaining six stormwater outfall monitoring sites will be monitored on an alternating annual basis. Table 8 provides a summary for the seven stormwater outfall monitoring sites. Table 7 Beach Cities WMG Outfall Tributary Area Percentages (of 20,254 acre Total)
Monitoring Site Outfall Drainage Area Tributary Area Percentage of WMG Total OF-BCEG-1 1,533 Acres 7.57% OF-BCEG-2 429 Acres 2.10% OF-BCEG-3 565 Acres 2.79% OF-BCEG-4 2,503 Acres 12.36% OF-BCEG-5 365 Acres 1.80% OF-BCEG-6 780 Acres 3.85% OF-BCEG-7 3,314 Acres 16.34% Total Tributary Area 9,489 Acres 46.81%
Table 8 Summary of Stormwater Outfall Based Monitoring Sites
Site ID Coordinates
Hydrologic Unit Code-12 Drainage System Latitude Longitude
Alternating Sites
OF-BCEG-1 33.89430 -118.416645 Manhattan Beach Frontal SMB 28th Street
OF-BCEG-2 33.86234 -118.400135 Manhattan Beach Frontal SMB Hermosa Beach Pier
OF-BCEG-3 33.859274 -118.372841 Manhattan Beach Frontal SMB Rindge Lane
OF-BCEG-4 33.858186 -118.37595 Manhattan Beach Frontal SMB Herondo
OF-BCEG-5 33.894574 -118.378438 Lower Dominguez Channel Marine Avenue
OF-BCEG-6 33.887345 -118.360899 Lower Dominguez Channel BI 569
Fixed Site
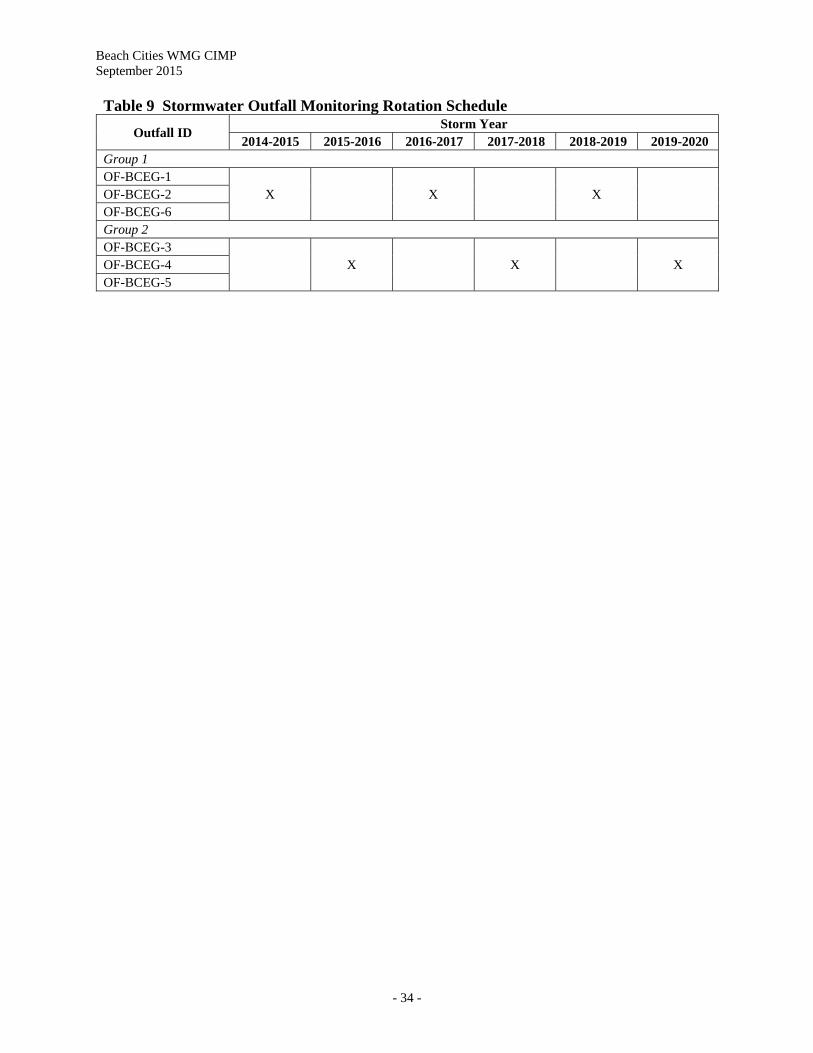
OF-BCEG-7 33.83722 -118.30879 Lower Dominguez Channel Torrance Carson Lateral Three stormwater outfall monitoring sites, two along Santa Monica Bay and one in Dominguez Channel watershed, will be monitored for all wet-weather events during one year, and the remaining three stormwater outfall monitoring sites will be monitored the following year. Each group of monitoring sites will be monitored in alternating years. Table 9 presents the preliminary rotation schedule for the six stormwater outfall monitoring sites. A synopsis of each potential outfall catchment area, along with an analysis of its land use/zoning characteristics is shown below.
Beach Cities WMG CIMP September 2015
- 34 -
Table 9 Stormwater Outfall Monitoring Rotation Schedule
Outfall ID Storm Year
2014-2015 2015-2016 2016-2017 2017-2018 2018-2019 2019-2020 Group 1 OF-BCEG-1
X
X
X
OF-BCEG-2 OF-BCEG-6 Group 2 OF-BCEG-3
X
X
X OF-BCEG-4
OF-BCEG-5
Beach Cities WMG CIMP September 2015
- 35 -
Figure 8 Stormwater Outfalls Monitoring Site Locations
Beach Cities WMG CIMP September 2015
- 36 -
4.2.1 OF-BCEG-1 Stormwater outfall monitoring site OF-BCEG-1, receives discharges from the 28th Street storm drain. The catchment area comprises approximately 74% of the City of Manhattan Beach within the Manhattan Beach Frontal Santa Monica Bay HUC-12 area and 20% of the Beach Cities WMG area within the Manhattan Beach Frontal Santa Monica Bay HUC-12. Land use characteristics of OF-BCEG-1 drainage area are depicted in Figure 9. Table 10 demonstrates that based on the preponderance of single family residential land use area, the OF-BCEG-1 appears to be representative of the City of Manhattan Beach and the Beach Cities WMG area within the Santa Monica Bay Watershed. Table 10 Stormwater Outfall Monitoring Site OF-BCEG-1 (City of Manhattan Beach)
OF-BCEG-1 Catchment
Manhattan Beach Portion of SMB MB
HUC-12 area Beach Cities WMG Portion of SMB MB HUC-12 area
Acres Percent Acres Percent Acres Percent Land Use Category Agricultural 0 0% 0 0% 53.44 0.70% Commercial 129.37 8.44% 207.63 9.98% 791.58 10.38% Education 91.83 5.99% 120.53 5.80% 392.49 5.15% Industrial 12.63 0.82% 12.77 0.61% 150.2 1.97% Multi-Family Residential 100.83 6.58% 208.19 10.01% 1408.82 18.47% Open Space 68.9 4.49% 107.72 5.18% 374.98 4.92% Single Family Residential 1129.5 73.68% 1423 68.42% 4456.36 58.42% Total 1533.1 100% 2079.8 100% 7627.87 100% Municipal Jurisdiction Hermosa Beach 0 0% 0 0% 844.95 11.04% Manhattan Beach 1533 99.99% 2079.8 100% 2087.02 27.27% Redondo Beach 0.1 0.01% 0 0% 2606.7 34.06% Torrance 0 0% 0 0% 2115.28 27.64% Total 1533.1 100% 2079.8 100% 7653.95 100%
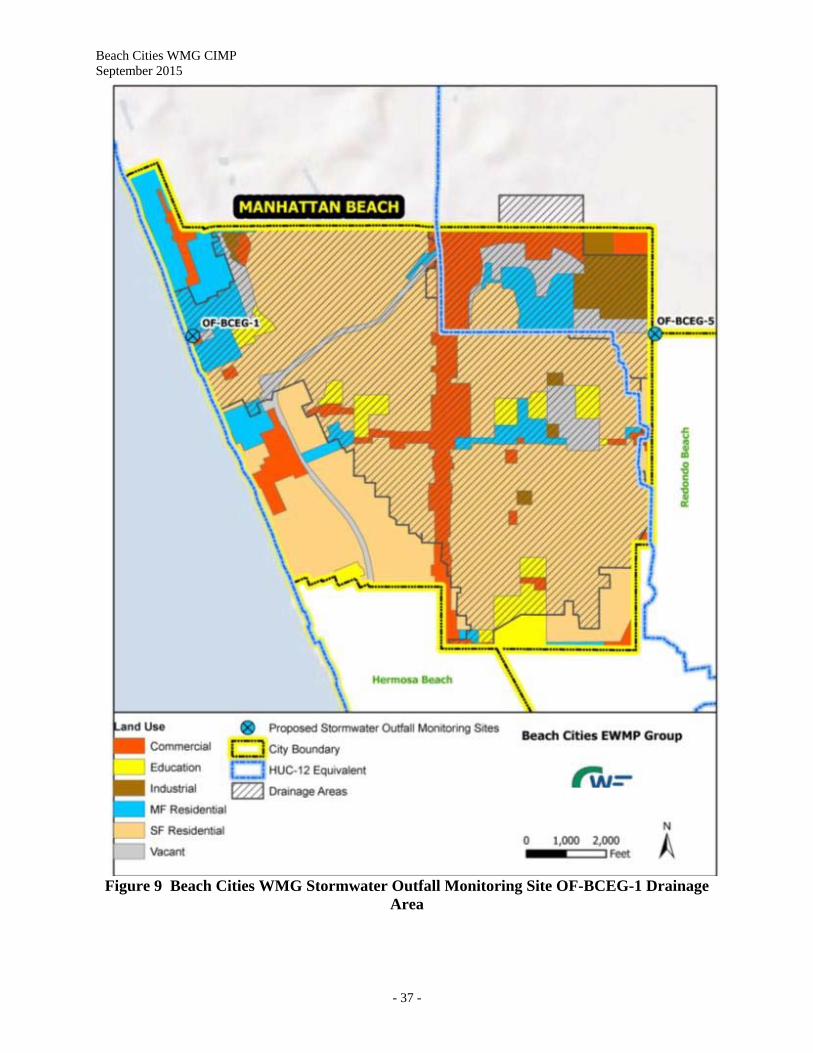
Beach Cities WMG CIMP September 2015
- 37 -
Figure 9 Beach Cities WMG Stormwater Outfall Monitoring Site OF-BCEG-1 Drainage Area
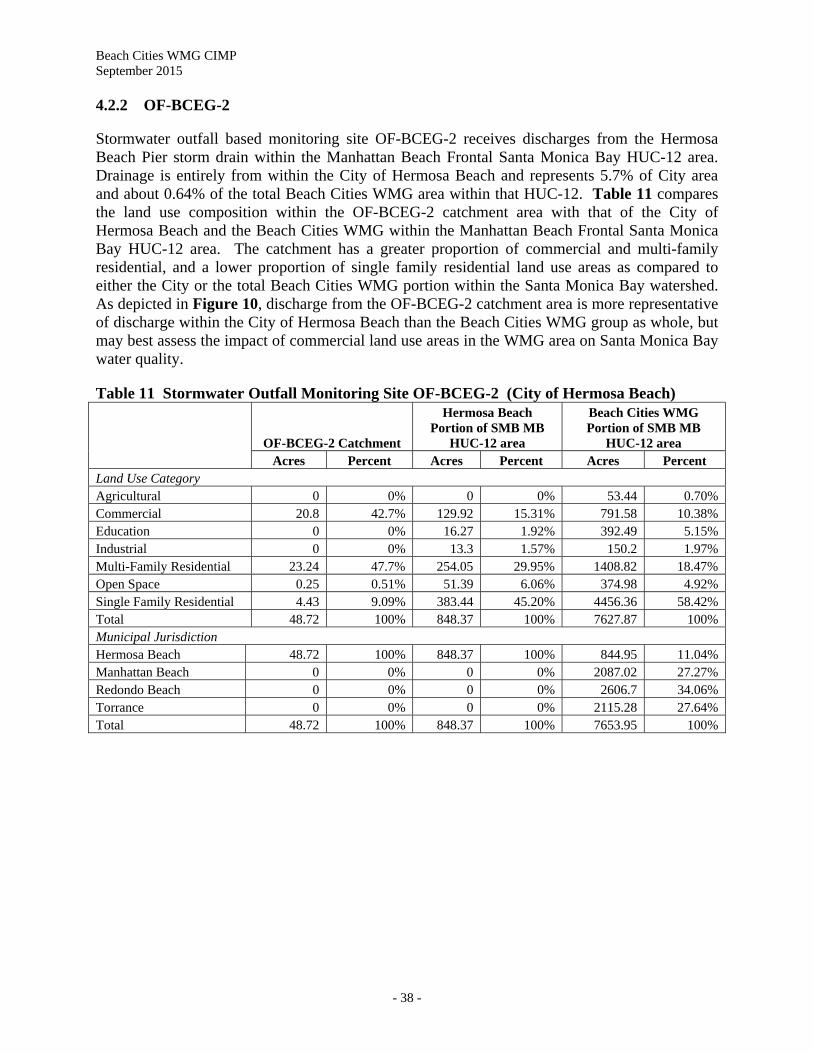
Beach Cities WMG CIMP September 2015
- 38 -
4.2.2 OF-BCEG-2 Stormwater outfall based monitoring site OF-BCEG-2 receives discharges from the Hermosa Beach Pier storm drain within the Manhattan Beach Frontal Santa Monica Bay HUC-12 area. Drainage is entirely from within the City of Hermosa Beach and represents 5.7% of City area and about 0.64% of the total Beach Cities WMG area within that HUC-12. Table 11 compares the land use composition within the OF-BCEG-2 catchment area with that of the City of Hermosa Beach and the Beach Cities WMG within the Manhattan Beach Frontal Santa Monica Bay HUC-12 area. The catchment has a greater proportion of commercial and multi-family residential, and a lower proportion of single family residential land use areas as compared to either the City or the total Beach Cities WMG portion within the Santa Monica Bay watershed. As depicted in Figure 10, discharge from the OF-BCEG-2 catchment area is more representative of discharge within the City of Hermosa Beach than the Beach Cities WMG group as whole, but may best assess the impact of commercial land use areas in the WMG area on Santa Monica Bay water quality.
Table 11 Stormwater Outfall Monitoring Site OF-BCEG-2 (City of Hermosa Beach)
OF-BCEG-2 Catchment
Hermosa Beach Portion of SMB MB
HUC-12 area
Beach Cities WMG Portion of SMB MB
HUC-12 area Acres Percent Acres Percent Acres Percent
Land Use Category Agricultural 0 0% 0 0% 53.44 0.70% Commercial 20.8 42.7% 129.92 15.31% 791.58 10.38% Education 0 0% 16.27 1.92% 392.49 5.15% Industrial 0 0% 13.3 1.57% 150.2 1.97% Multi-Family Residential 23.24 47.7% 254.05 29.95% 1408.82 18.47% Open Space 0.25 0.51% 51.39 6.06% 374.98 4.92% Single Family Residential 4.43 9.09% 383.44 45.20% 4456.36 58.42% Total 48.72 100% 848.37 100% 7627.87 100% Municipal Jurisdiction Hermosa Beach 48.72 100% 848.37 100% 844.95 11.04% Manhattan Beach 0 0% 0 0% 2087.02 27.27% Redondo Beach 0 0% 0 0% 2606.7 34.06% Torrance 0 0% 0 0% 2115.28 27.64% Total 48.72 100% 848.37 100% 7653.95 100%
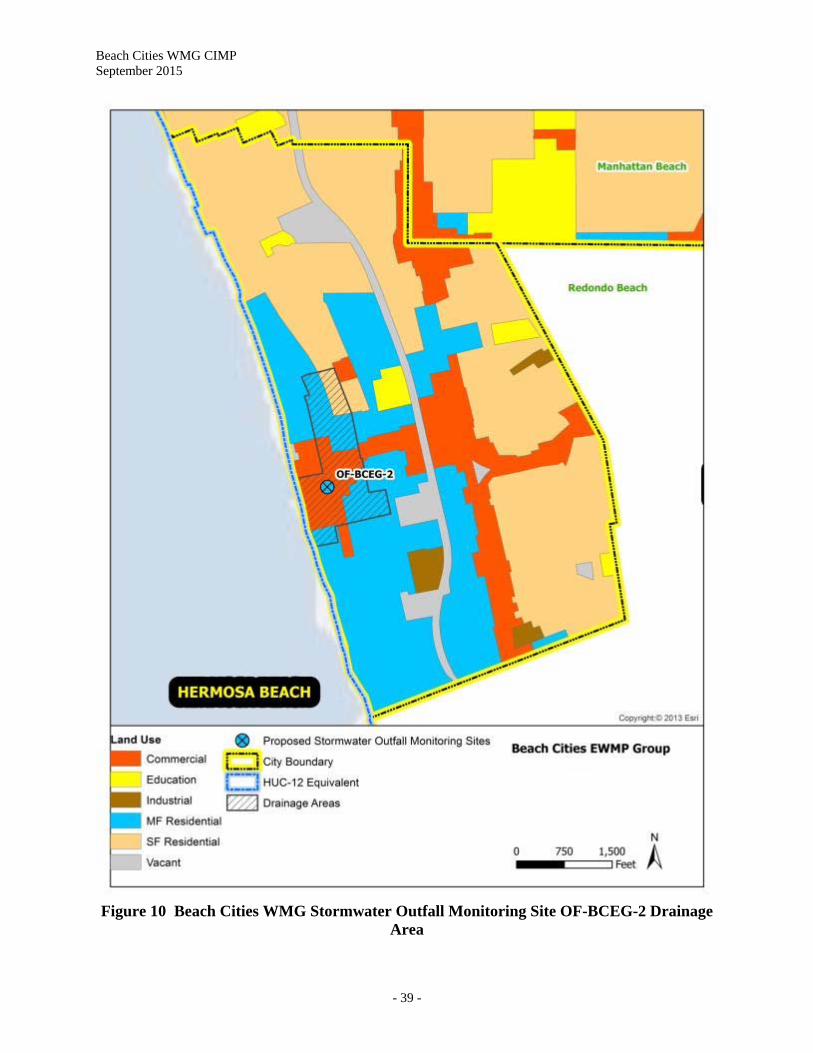
Beach Cities WMG CIMP September 2015
- 39 -
Figure 10 Beach Cities WMG Stormwater Outfall Monitoring Site OF-BCEG-2 Drainage Area
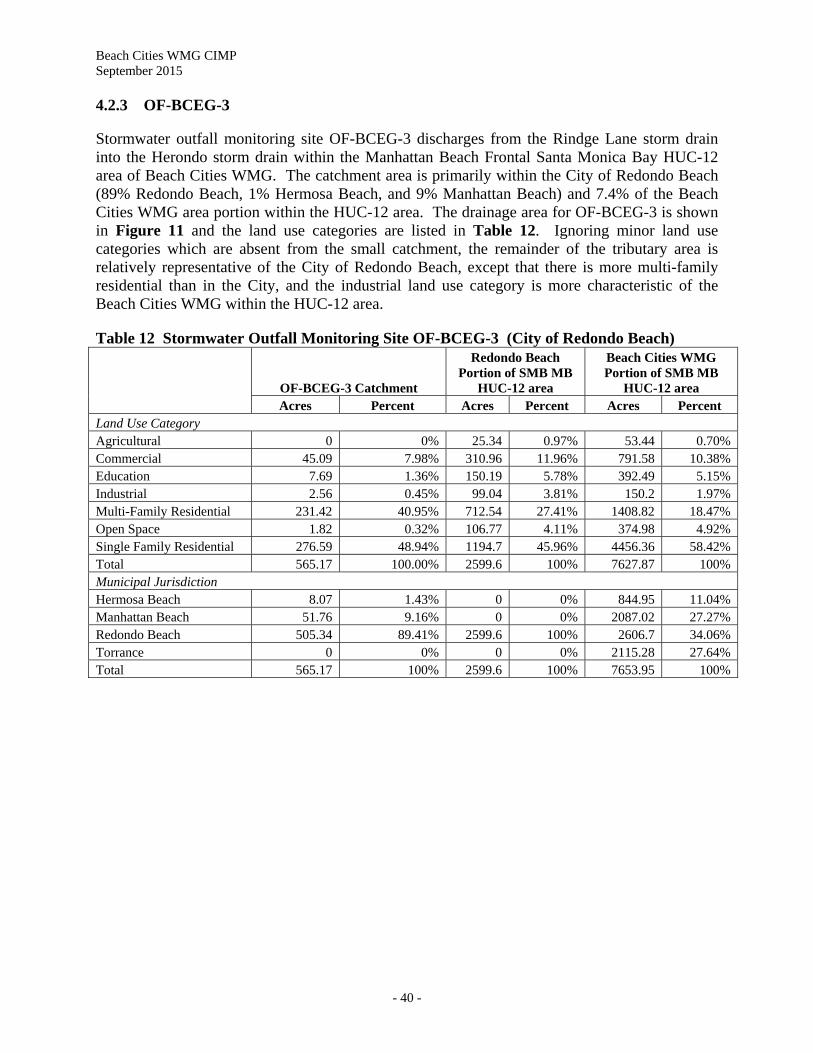
Beach Cities WMG CIMP September 2015
- 40 -
4.2.3 OF-BCEG-3 Stormwater outfall monitoring site OF-BCEG-3 discharges from the Rindge Lane storm drain into the Herondo storm drain within the Manhattan Beach Frontal Santa Monica Bay HUC-12 area of Beach Cities WMG. The catchment area is primarily within the City of Redondo Beach (89% Redondo Beach, 1% Hermosa Beach, and 9% Manhattan Beach) and 7.4% of the Beach Cities WMG area portion within the HUC-12 area. The drainage area for OF-BCEG-3 is shown in Figure 11 and the land use categories are listed in Table 12. Ignoring minor land use categories which are absent from the small catchment, the remainder of the tributary area is relatively representative of the City of Redondo Beach, except that there is more multi-family residential than in the City, and the industrial land use category is more characteristic of the Beach Cities WMG within the HUC-12 area.
Table 12 Stormwater Outfall Monitoring Site OF-BCEG-3 (City of Redondo Beach)
OF-BCEG-3 Catchment
Redondo Beach Portion of SMB MB
HUC-12 area
Beach Cities WMG Portion of SMB MB
HUC-12 area Acres Percent Acres Percent Acres Percent
Land Use Category Agricultural 0 0% 25.34 0.97% 53.44 0.70% Commercial 45.09 7.98% 310.96 11.96% 791.58 10.38% Education 7.69 1.36% 150.19 5.78% 392.49 5.15% Industrial 2.56 0.45% 99.04 3.81% 150.2 1.97% Multi-Family Residential 231.42 40.95% 712.54 27.41% 1408.82 18.47% Open Space 1.82 0.32% 106.77 4.11% 374.98 4.92% Single Family Residential 276.59 48.94% 1194.7 45.96% 4456.36 58.42% Total 565.17 100.00% 2599.6 100% 7627.87 100% Municipal Jurisdiction Hermosa Beach 8.07 1.43% 0 0% 844.95 11.04% Manhattan Beach 51.76 9.16% 0 0% 2087.02 27.27% Redondo Beach 505.34 89.41% 2599.6 100% 2606.7 34.06% Torrance 0 0% 0 0% 2115.28 27.64% Total 565.17 100% 2599.6 100% 7653.95 100%
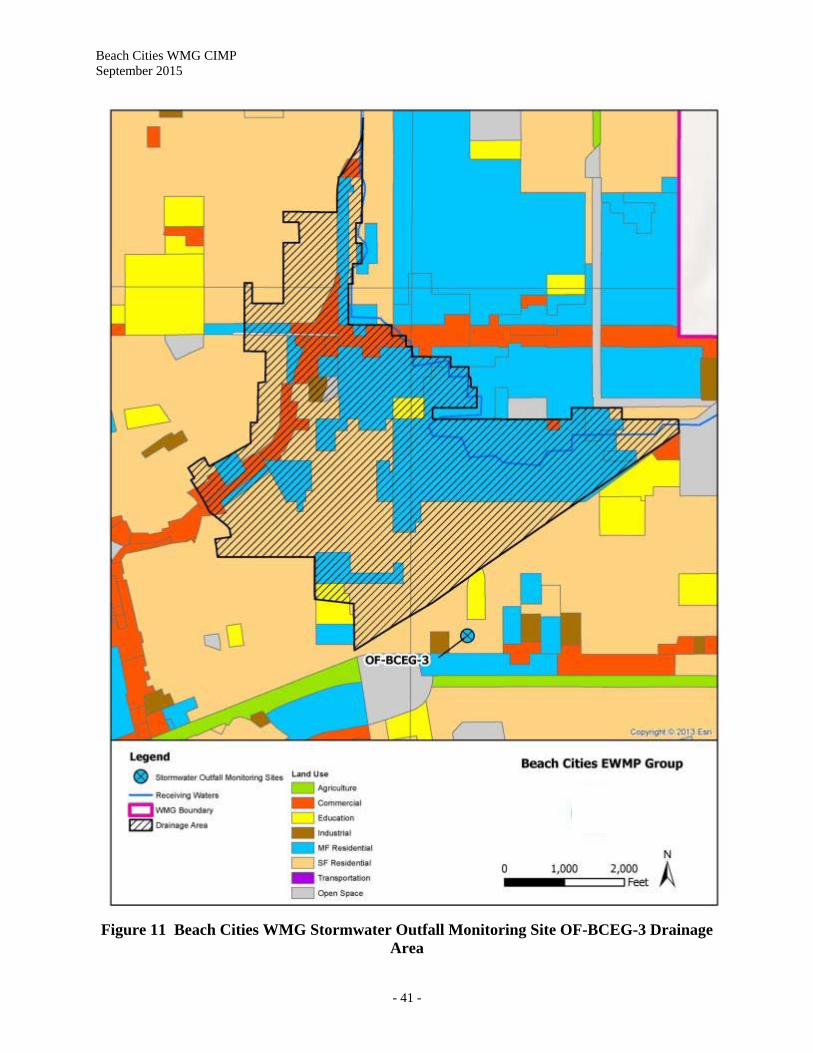
Beach Cities WMG CIMP September 2015
- 41 -
Figure 11 Beach Cities WMG Stormwater Outfall Monitoring Site OF-BCEG-3 Drainage Area
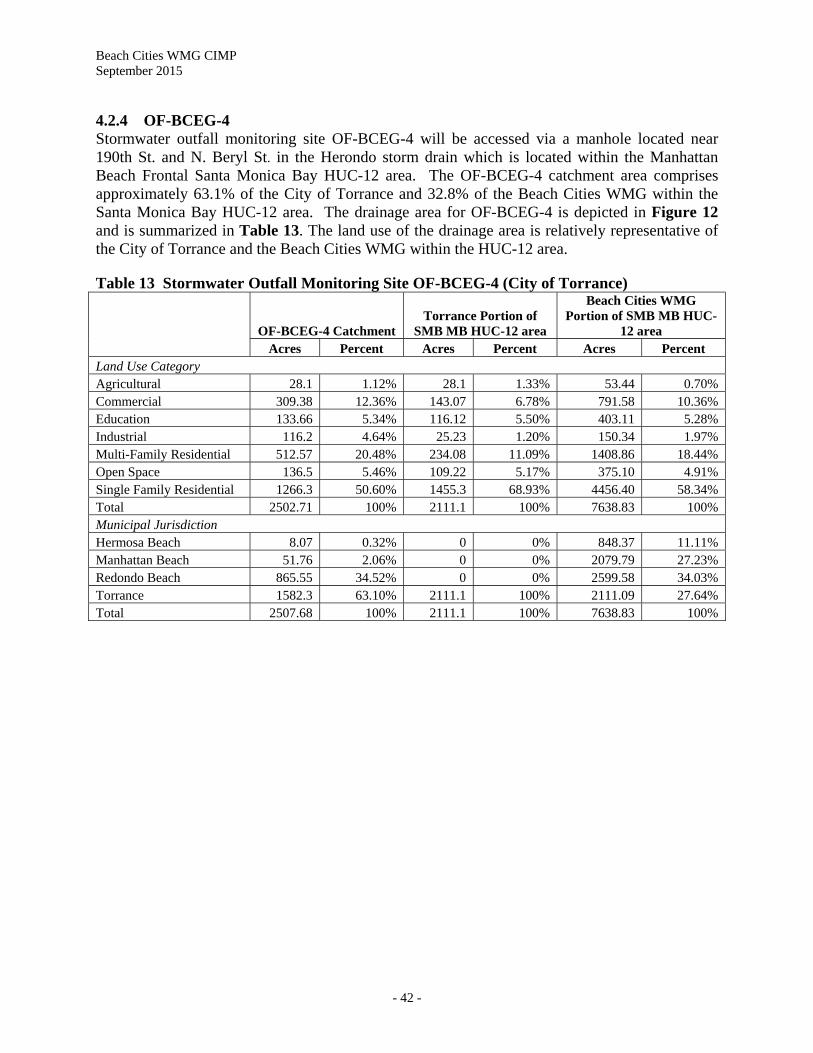
Beach Cities WMG CIMP September 2015
- 42 -
4.2.4 OF-BCEG-4 Stormwater outfall monitoring site OF-BCEG-4 will be accessed via a manhole located near 190th St. and N. Beryl St. in the Herondo storm drain which is located within the Manhattan Beach Frontal Santa Monica Bay HUC-12 area. The OF-BCEG-4 catchment area comprises approximately 63.1% of the City of Torrance and 32.8% of the Beach Cities WMG within the Santa Monica Bay HUC-12 area. The drainage area for OF-BCEG-4 is depicted in Figure 12 and is summarized in Table 13. The land use of the drainage area is relatively representative of the City of Torrance and the Beach Cities WMG within the HUC-12 area.
Table 13 Stormwater Outfall Monitoring Site OF-BCEG-4 (City of Torrance)
OF-BCEG-4 Catchment Torrance Portion of
SMB MB HUC-12 area
Beach Cities WMG Portion of SMB MB HUC-
12 area Acres Percent Acres Percent Acres Percent
Land Use Category Agricultural 28.1 1.12% 28.1 1.33% 53.44 0.70% Commercial 309.38 12.36% 143.07 6.78% 791.58 10.36% Education 133.66 5.34% 116.12 5.50% 403.11 5.28% Industrial 116.2 4.64% 25.23 1.20% 150.34 1.97% Multi-Family Residential 512.57 20.48% 234.08 11.09% 1408.86 18.44% Open Space 136.5 5.46% 109.22 5.17% 375.10 4.91% Single Family Residential 1266.3 50.60% 1455.3 68.93% 4456.40 58.34% Total 2502.71 100% 2111.1 100% 7638.83 100% Municipal Jurisdiction Hermosa Beach 8.07 0.32% 0 0% 848.37 11.11% Manhattan Beach 51.76 2.06% 0 0% 2079.79 27.23% Redondo Beach 865.55 34.52% 0 0% 2599.58 34.03% Torrance 1582.3 63.10% 2111.1 100% 2111.09 27.64% Total 2507.68 100% 2111.1 100% 7638.83 100%
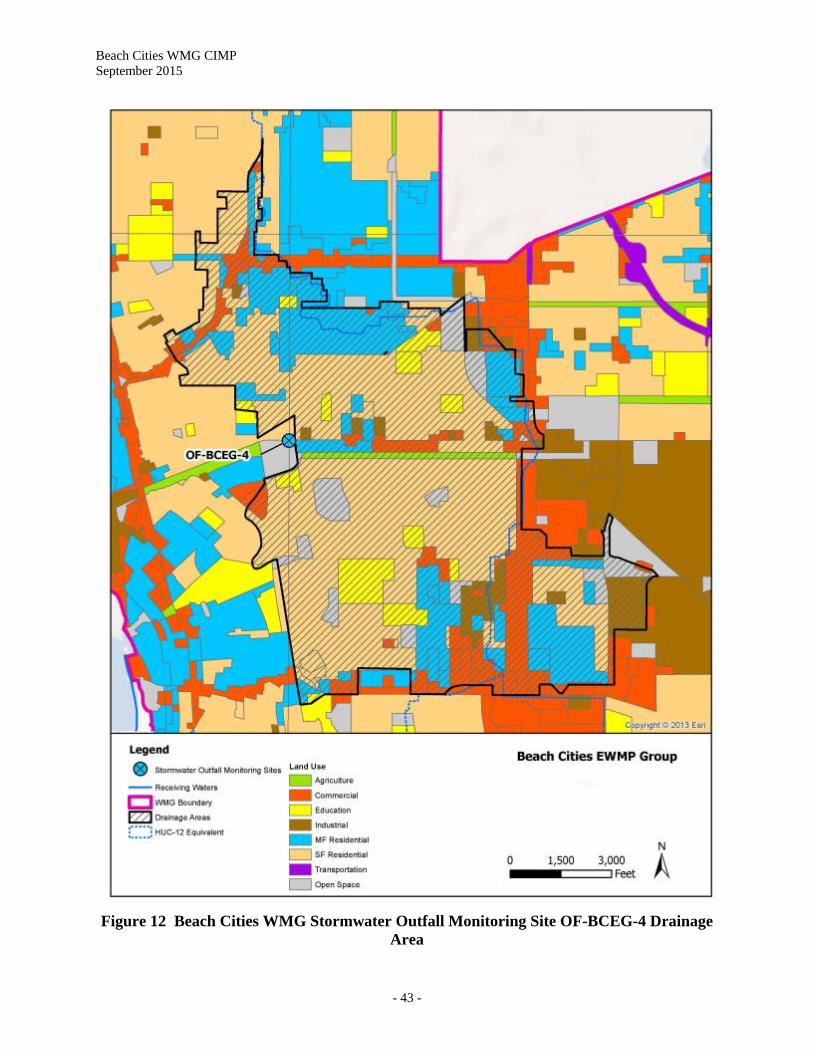
Beach Cities WMG CIMP September 2015
- 43 -
Figure 12 Beach Cities WMG Stormwater Outfall Monitoring Site OF-BCEG-4 Drainage Area
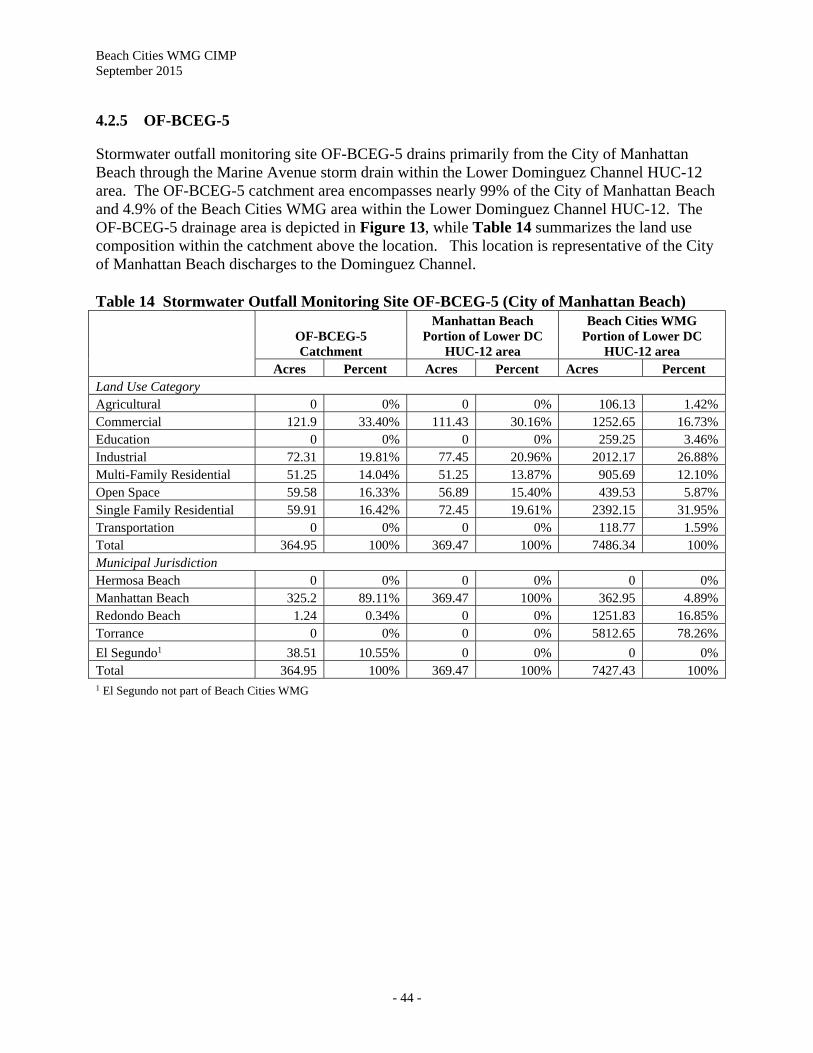
Beach Cities WMG CIMP September 2015
- 44 -
4.2.5 OF-BCEG-5 Stormwater outfall monitoring site OF-BCEG-5 drains primarily from the City of Manhattan Beach through the Marine Avenue storm drain within the Lower Dominguez Channel HUC-12 area. The OF-BCEG-5 catchment area encompasses nearly 99% of the City of Manhattan Beach and 4.9% of the Beach Cities WMG area within the Lower Dominguez Channel HUC-12. The OF-BCEG-5 drainage area is depicted in Figure 13, while Table 14 summarizes the land use composition within the catchment above the location. This location is representative of the City of Manhattan Beach discharges to the Dominguez Channel. Table 14 Stormwater Outfall Monitoring Site OF-BCEG-5 (City of Manhattan Beach)
OF-BCEG-5 Catchment
Manhattan Beach Portion of Lower DC
HUC-12 area
Beach Cities WMG Portion of Lower DC
HUC-12 area Acres Percent Acres Percent Acres Percent
Land Use Category Agricultural 0 0% 0 0% 106.13 1.42% Commercial 121.9 33.40% 111.43 30.16% 1252.65 16.73% Education 0 0% 0 0% 259.25 3.46% Industrial 72.31 19.81% 77.45 20.96% 2012.17 26.88% Multi-Family Residential 51.25 14.04% 51.25 13.87% 905.69 12.10% Open Space 59.58 16.33% 56.89 15.40% 439.53 5.87% Single Family Residential 59.91 16.42% 72.45 19.61% 2392.15 31.95% Transportation 0 0% 0 0% 118.77 1.59% Total 364.95 100% 369.47 100% 7486.34 100% Municipal Jurisdiction Hermosa Beach 0 0% 0 0% 0 0% Manhattan Beach 325.2 89.11% 369.47 100% 362.95 4.89% Redondo Beach 1.24 0.34% 0 0% 1251.83 16.85% Torrance 0 0% 0 0% 5812.65 78.26%
El Segundo1 38.51 10.55% 0 0% 0 0% Total 364.95 100% 369.47 100% 7427.43 100% 1 El Segundo not part of Beach Cities WMG
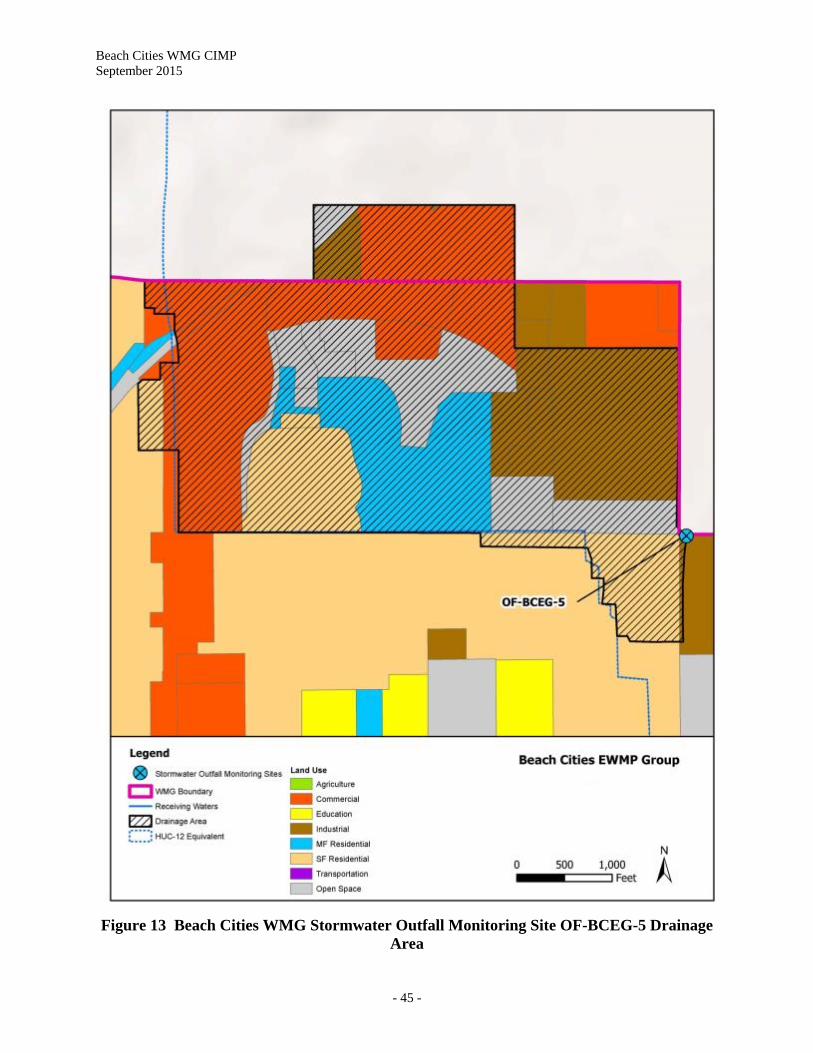
Beach Cities WMG CIMP September 2015
- 45 -
Figure 13 Beach Cities WMG Stormwater Outfall Monitoring Site OF-BCEG-5 Drainage Area
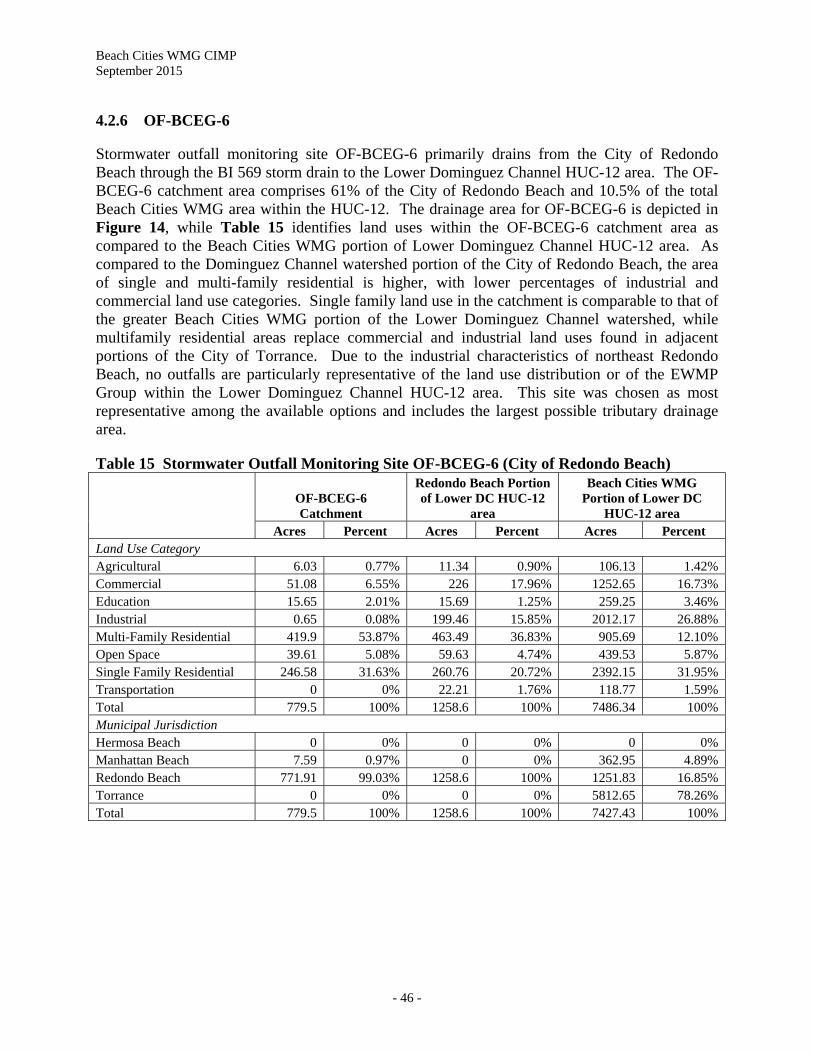
Beach Cities WMG CIMP September 2015
- 46 -
4.2.6 OF-BCEG-6 Stormwater outfall monitoring site OF-BCEG-6 primarily drains from the City of Redondo Beach through the BI 569 storm drain to the Lower Dominguez Channel HUC-12 area. The OF-BCEG-6 catchment area comprises 61% of the City of Redondo Beach and 10.5% of the total Beach Cities WMG area within the HUC-12. The drainage area for OF-BCEG-6 is depicted in Figure 14, while Table 15 identifies land uses within the OF-BCEG-6 catchment area as compared to the Beach Cities WMG portion of Lower Dominguez Channel HUC-12 area. As compared to the Dominguez Channel watershed portion of the City of Redondo Beach, the area of single and multi-family residential is higher, with lower percentages of industrial and commercial land use categories. Single family land use in the catchment is comparable to that of the greater Beach Cities WMG portion of the Lower Dominguez Channel watershed, while multifamily residential areas replace commercial and industrial land uses found in adjacent portions of the City of Torrance. Due to the industrial characteristics of northeast Redondo Beach, no outfalls are particularly representative of the land use distribution or of the EWMP Group within the Lower Dominguez Channel HUC-12 area. This site was chosen as most representative among the available options and includes the largest possible tributary drainage area.
Table 15 Stormwater Outfall Monitoring Site OF-BCEG-6 (City of Redondo Beach)
OF-BCEG-6 Catchment
Redondo Beach Portion of Lower DC HUC-12
area
Beach Cities WMG Portion of Lower DC
HUC-12 area Acres Percent Acres Percent Acres Percent
Land Use Category Agricultural 6.03 0.77% 11.34 0.90% 106.13 1.42% Commercial 51.08 6.55% 226 17.96% 1252.65 16.73% Education 15.65 2.01% 15.69 1.25% 259.25 3.46% Industrial 0.65 0.08% 199.46 15.85% 2012.17 26.88% Multi-Family Residential 419.9 53.87% 463.49 36.83% 905.69 12.10% Open Space 39.61 5.08% 59.63 4.74% 439.53 5.87% Single Family Residential 246.58 31.63% 260.76 20.72% 2392.15 31.95% Transportation 0 0% 22.21 1.76% 118.77 1.59% Total 779.5 100% 1258.6 100% 7486.34 100% Municipal Jurisdiction Hermosa Beach 0 0% 0 0% 0 0% Manhattan Beach 7.59 0.97% 0 0% 362.95 4.89% Redondo Beach 771.91 99.03% 1258.6 100% 1251.83 16.85% Torrance 0 0% 0 0% 5812.65 78.26% Total 779.5 100% 1258.6 100% 7427.43 100%
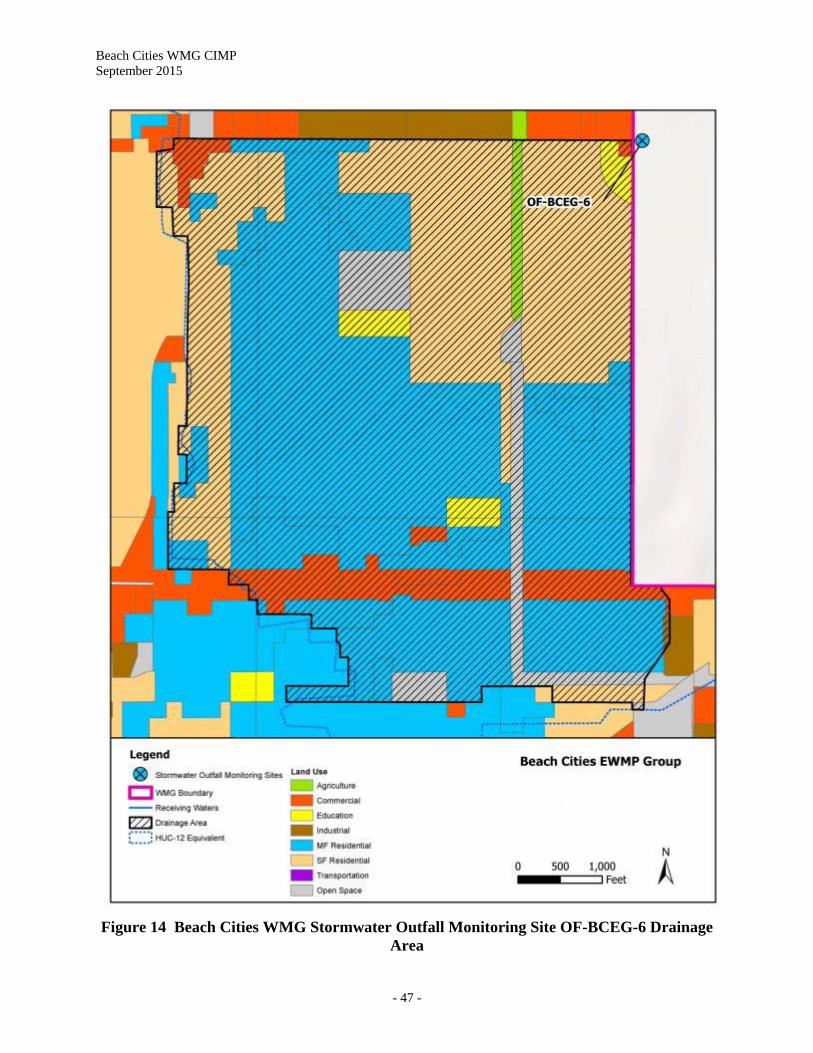
Beach Cities WMG CIMP September 2015
- 47 -
Figure 14 Beach Cities WMG Stormwater Outfall Monitoring Site OF-BCEG-6 Drainage Area
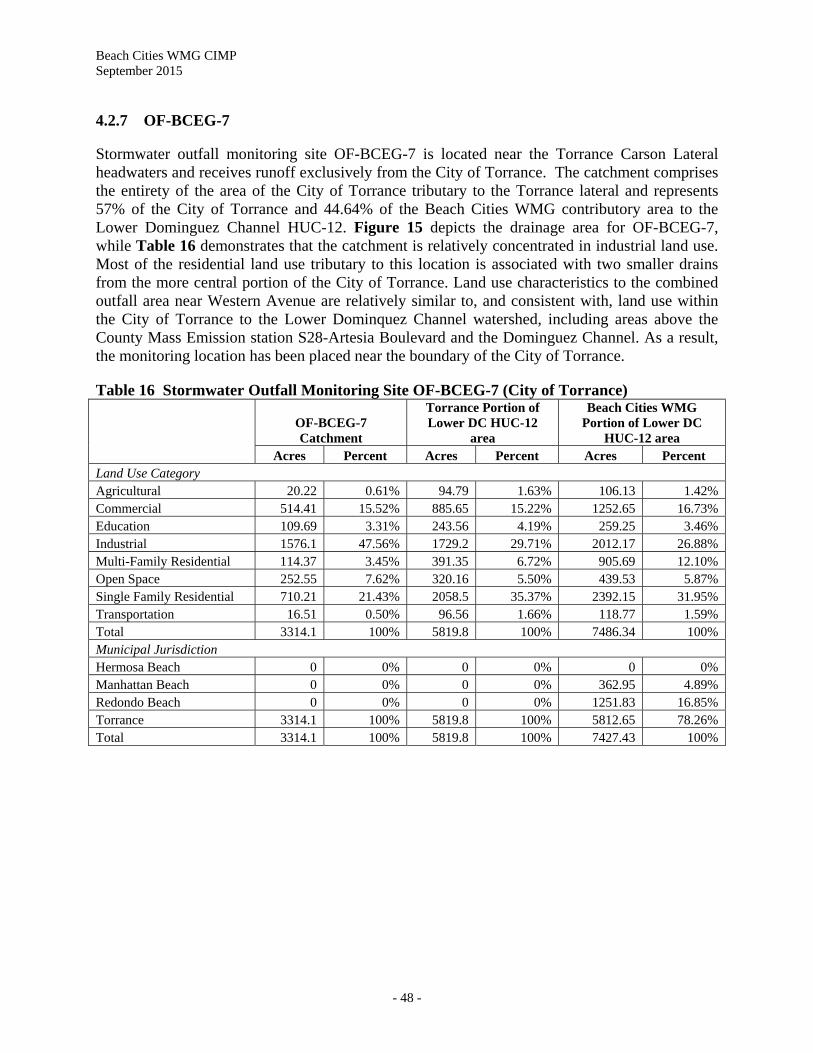
Beach Cities WMG CIMP September 2015
- 48 -
4.2.7 OF-BCEG-7 Stormwater outfall monitoring site OF-BCEG-7 is located near the Torrance Carson Lateral headwaters and receives runoff exclusively from the City of Torrance. The catchment comprises the entirety of the area of the City of Torrance tributary to the Torrance lateral and represents 57% of the City of Torrance and 44.64% of the Beach Cities WMG contributory area to the Lower Dominguez Channel HUC-12. Figure 15 depicts the drainage area for OF-BCEG-7, while Table 16 demonstrates that the catchment is relatively concentrated in industrial land use. Most of the residential land use tributary to this location is associated with two smaller drains from the more central portion of the City of Torrance. Land use characteristics to the combined outfall area near Western Avenue are relatively similar to, and consistent with, land use within the City of Torrance to the Lower Dominquez Channel watershed, including areas above the County Mass Emission station S28-Artesia Boulevard and the Dominguez Channel. As a result, the monitoring location has been placed near the boundary of the City of Torrance.
Table 16 Stormwater Outfall Monitoring Site OF-BCEG-7 (City of Torrance)
OF-BCEG-7 Catchment
Torrance Portion of Lower DC HUC-12
area
Beach Cities WMG Portion of Lower DC
HUC-12 area Acres Percent Acres Percent Acres Percent
Land Use Category Agricultural 20.22 0.61% 94.79 1.63% 106.13 1.42% Commercial 514.41 15.52% 885.65 15.22% 1252.65 16.73% Education 109.69 3.31% 243.56 4.19% 259.25 3.46% Industrial 1576.1 47.56% 1729.2 29.71% 2012.17 26.88% Multi-Family Residential 114.37 3.45% 391.35 6.72% 905.69 12.10% Open Space 252.55 7.62% 320.16 5.50% 439.53 5.87% Single Family Residential 710.21 21.43% 2058.5 35.37% 2392.15 31.95% Transportation 16.51 0.50% 96.56 1.66% 118.77 1.59% Total 3314.1 100% 5819.8 100% 7486.34 100% Municipal Jurisdiction Hermosa Beach 0 0% 0 0% 0 0% Manhattan Beach 0 0% 0 0% 362.95 4.89% Redondo Beach 0 0% 0 0% 1251.83 16.85% Torrance 3314.1 100% 5819.8 100% 5812.65 78.26% Total 3314.1 100% 5819.8 100% 7427.43 100%
Beach Cities WMG CIMP September 2015
- 49 -
Figure 15 Beach Cities WMG Stormwater Outfall Monitoring Site OF-BCEG-7 Drainage Area
Beach Cities WMG CIMP September 2015
- 50 -
4.2.8 Existing WMG Machado Lake and Harbor Monitoring Appendix B of this CIMP includes the Board-approved Machado Lake Monitoring and Reporting Plan, which addresses monitoring within the Long Beach Harbor HUC-12 area.
4.3 Monitoring Frequency, Parameters, and Duration Stormwater outfall water quality samples would initially be manually composited as aliquots taken at 20 minute increments over a three hour period. Upon Permittee determination of cost effectiveness and improved safety, an automatic sampler, using a flow-weighted routine, may replace manual collection. For composite samples, analytes with short holding times, such as bacteria, cyanide, oxygen demand, or oil and grease, along with field parameters, would always be collected as grab samples, typically late in the storm event, although not necessarily as the last sample collected. Stormwater outfall monitoring sites will be monitored for three storm events per year, prior to receiving water monitoring, for all required constituents except aquatic toxicity. Aquatic toxicity will be monitored when triggered by recent receiving water toxicity monitoring, where a toxicity identification evaluation (TIE) on the observed receiving water toxicity test was inconclusive. Aquatic toxicity monitoring requirements are summarized in correspondence from the Regional Board to all Permittees which has been provided as Section D.5 of Appendix D. The requirements for monitored constituents at each outfall are outlined in the MRP Section VIII.B.1.c and presented in Table 17. Monitoring conducted in the Machado Lake watershed is described in the approved Machado Lake Watershed Monitoring Plan, included as Appendix B. Parameters in Table E-2 of the MRP, will not be identified as exceeding applicable water quality objectives until after the first year of receiving water monitoring. Monitoring for the selected sites would occur for at least the duration of the Permit term, unless an alternative site is warranted, per the adaptive management process, as presented in Section 10. Additional analytical and monitoring procedures are discussed in the Analytical and Monitoring Procedures per Appendix D.
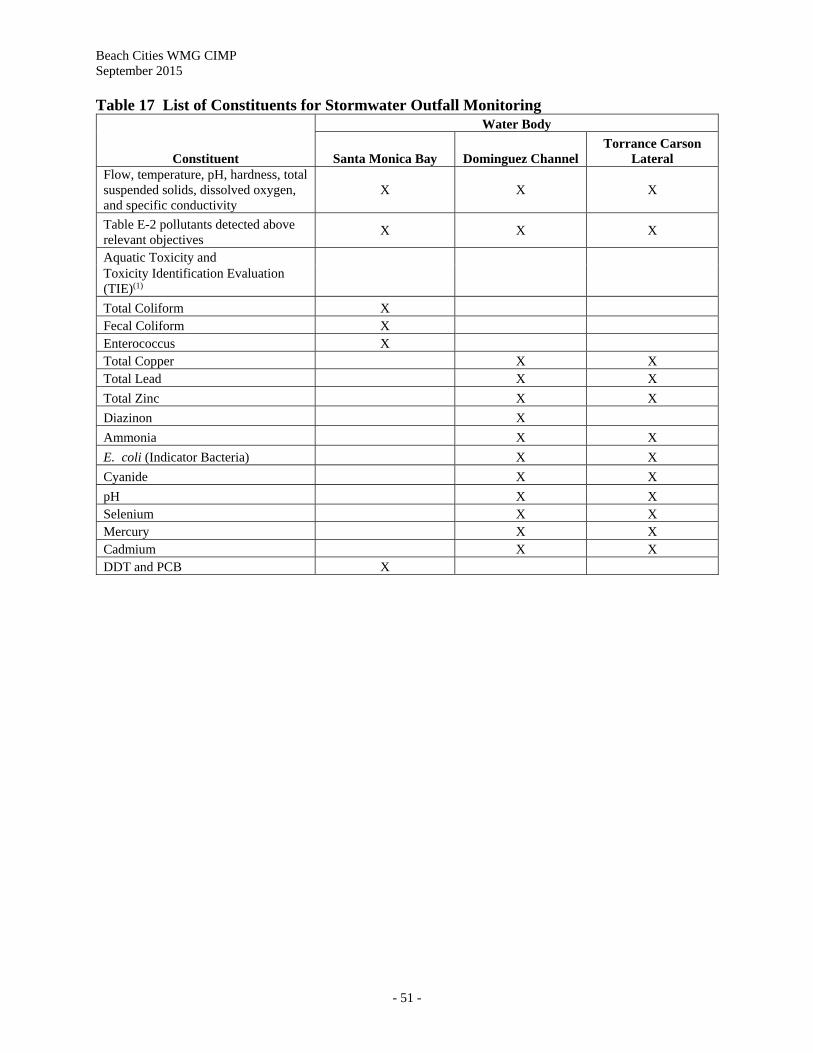
Beach Cities WMG CIMP September 2015
- 51 -
Table 17 List of Constituents for Stormwater Outfall Monitoring
Constituent
Water Body
Santa Monica Bay Dominguez Channel Torrance Carson
Lateral Flow, temperature, pH, hardness, total suspended solids, dissolved oxygen, and specific conductivity
X X X
Table E-2 pollutants detected above relevant objectives
X X X
Aquatic Toxicity and
Toxicity Identification Evaluation (TIE)(1)
Total Coliform X Fecal Coliform X Enterococcus X Total Copper X X Total Lead X X
Total Zinc X X
Diazinon X
Ammonia X X
E. coli (Indicator Bacteria) X X
Cyanide X X
pH X X Selenium X X Mercury X X Cadmium X X DDT and PCB X
Beach Cities WMG CIMP September 2015
- 52 -
5.0 Non-Stormwater Outfall Screening and Monitoring Program The Non-Stormwater Outfall Screening and Monitoring Program (Non-Stormwater Program) is focused on dry-weather discharges to receiving waters from major outfalls. The program fills two roles: (1) to provide assessment of whether the non-stormwater discharges are potentially impacting the receiving water, and (2) to determine whether significant non-stormwater discharges are allowable. The Beach Cities WMG has been addressing non-stormwater flow to Santa Monica Bay with the installation of LFDs. The Beach Cities WMG has installed seven LFDs, throughout the Santa Monica Bay portion of the WMGs area. These LFDs are operational year-round and divert non-stormwater flows from storm drains to the sanitary sewer or subsurface infiltration systems, preventing the flows from directly discharging into Santa Monica Bay. These systems will periodically be inspected to verify that they are working as designed and preventing any flow from discharging to SMB. Outfalls containing LFDs will only be included in the outfall screening process if their LFDs have been shown to not be functioning adequately. The Non-Stormwater Program is complimentary to the IC/ID MCM. Non-stormwater outfall monitoring sites will be determined after outfall screening, determination of discharge significance, and source identification. The outfall screening and monitoring process is intended to prioritize outfalls for assessment and, where appropriate, support scheduling of BMPs to address non-stormwater flows.
5.1 Program Objectives The objectives of the Non-Stormwater Program include the following (Part II.E.3 of the MRP):
a. Determine whether a Permittee’s discharge is in compliance with applicable non-stormwater WQBELs derived from TMDL WLAs;
b. Determine whether a Permittee’s discharge exceeds non-stormwater action levels, as described in Attachment G of the MS4 Permit;
c. Determine whether a Permittee’s discharge causes or contributes to an exceedance of receiving water limitations; and
d. Assist Permittees in identifying illicit discharges as described in Part VI.D.10 of the MS4 Permit.
Additionally, the outfall screening and monitoring process is intended to meet the following objectives (Part IX.A of the MRP):
1. Develop criteria or other means to ensure that all outfalls with significant non-stormwater discharges are identified and assessed during the term of this MS4 Permit.
2. For outfalls determined to have significant non-stormwater flow, determine whether flows are the result of illicit connections or illicit discharges (IC/IDs), authorized or conditionally exempt non-stormwater flows, natural flows, or from unknown sources.
3. Refer information related to identified IC/IDs to the IC/ID Elimination Program (Part VI.D.10 of the MS4 Permit) for appropriate action.
Beach Cities WMG CIMP September 2015
- 53 -
4. Based on existing screening or monitoring data or other institutional knowledge, assess the impact of non-stormwater discharges (other than identified IC/IDs) on the receiving water.
5. Prioritize monitoring of outfalls considering the potential threat to the receiving water and applicable TMDL compliance schedules.
6. Conduct monitoring or other investigations to identify the source of pollutants in non-stormwater discharges.
7. Use results of the screening process to evaluate the conditionally exempt non-stormwater discharges identified in Parts III.A.2 and III.A.3 of the MS4 Permit and take appropriate actions pursuant to Part III.A.4.d of the MS4 Permit for those discharges that have been found to be a source of pollutants. Any future reclassification shall occur per the conditions in Parts III.A.2 or III.A.6 of the MS4 Permit.
8. Conduct monitoring or assess existing monitoring data to determine the impact of non-stormwater discharges on the receiving water.
9. Maximize the use of Permittee resources by integrating the screening and monitoring process into existing or planned Integrated Monitoring Program (IMP) and/or CIMP efforts.
The outfall screening and source identification investigations must be completed prior to initiating monitoring at an individual outfall. A flowchart of the Non-Stormwater Program is presented as Figure 16. Detailed discussion of the major program elements is provided in the following subsections.
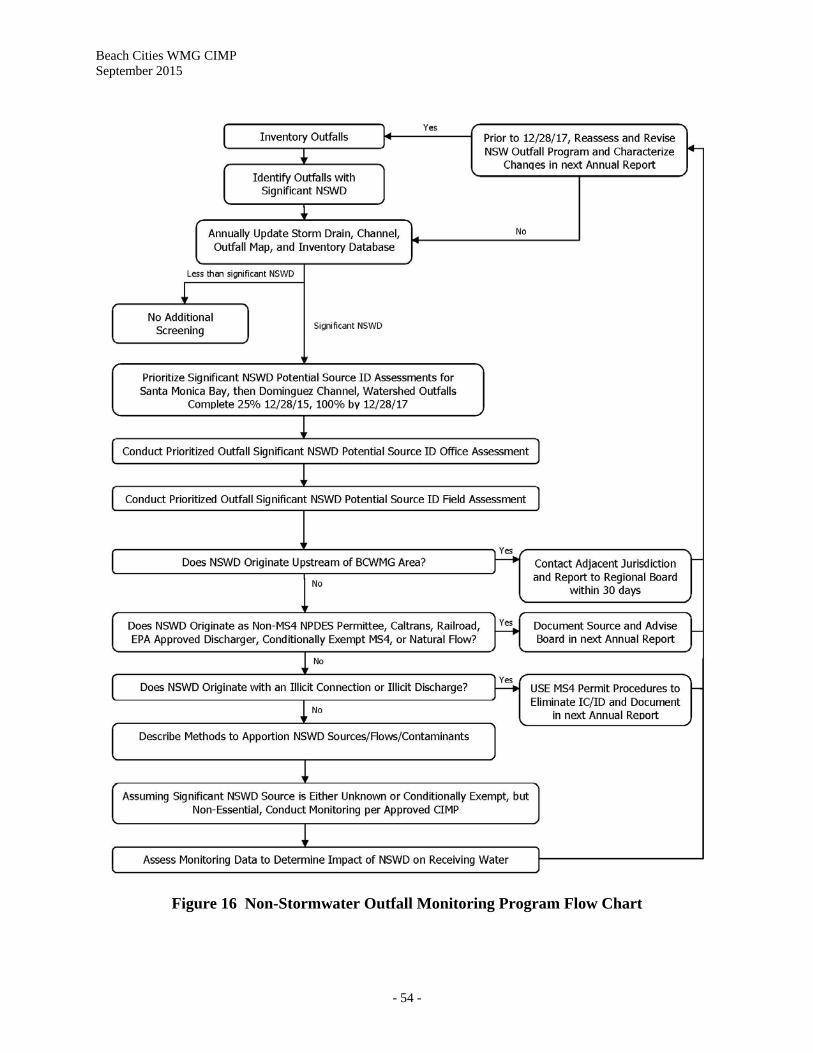
Beach Cities WMG CIMP September 2015
- 54 -
Figure 16 Non-Stormwater Outfall Monitoring Program Flow Chart
Beach Cities WMG CIMP September 2015
- 55 -
5.2 Outfall Screening and Identification of Outfalls with Significant Non-Stormwater Discharge Based on a review of the available information, identification of significant non-stormwater discharges is not possible at this time. Under this task, each Beach Cities WMG member will undertake three outfall screenings to evaluate all major outfalls within their jurisdiction area1. The major outfalls for the Beach Cities WMG are defined as follows: 36-inch or larger pipes, or non-circular drains with a drainage area of more than 50 acres,
and 12-inch or larger pipes, or non-circular drains from industrial zoned areas with a drainage
area of 2 acres or more. In order to collect data to determine significant non-stormwater outfalls, the Beach Cities will perform three outfall screenings during the first year after CIMP approval. The outfall screening is necessary to collect the information to identify outfalls exhibiting significant non-stormwater discharges and to develop the information needed for the inventory of outfalls with significant non-stormwater discharges. Each member agency within the Beach Cities WMG has agreed to use the same screening criteria for the non-stormwater outfall screening process; however significance criteria for non-stormwater discharges will differ between the two watersheds, Santa Monica Bay and Dominguez Channel. Significance for the two watersheds will be deemed as follows:
a. For Santa Monica Bay watershed, significant non-stormwater flows will be designated if non-stormwater flow was observed reaching the wave wash from the particular outfall during two of the three outfall screenings. Flow of any amount that reaches the wave wash will be considered significant for Santa Monica Bay outfalls due to the high recreational use of the beaches, and will require source identification of the discharge.
b. For Dominguez Channel watershed, significant non-stormwater flow will be designated if persistent flows, exceeding 10 gallons per minute (gpm) (approximately the flow of a garden hose), are observed during two of the three screening events. Outfalls within the Dominguez Channel watershed will be screened during working hours and three days or longer after a rain event. The first screening event will note flow observation, whether flow was observed or not observed. During the second and third screening event, flow rate will be estimated and measured using a container and stop watch. If flow of 10 gpm was observed for a particular outfall at two of the three screening events, the outfall will then be designated as having significant non-stormwater discharge and will require source identification of the discharge.
The initial first screening serves the dual purpose of data collection for completing the MS4 infrastructure database, addressed in Section 3, and the initial evaluation of outfalls for
1 The previously approved Monitoring and Reporting Plan for Machado Lake (Appendix B) includes both dry weather sampling and continuous flow measurement of all outfalls from the Machado Lake watershed in Torrance. Therefore, additional non-stormwater outfall screening described in this Section need not be performed in that watershed.
Beach Cities WMG CIMP September 2015
- 56 -
significant non-stormwater discharge. Each outfall in the Beach Cities WMG area will be visited during the first screening. A standard field data collection form will be used, consisting of the following:
Date, time, weather; Photos of outfall and receiving water; Descriptions of site condition and accessibility; Discharge characteristics, such as odor and color; Field probe measurements of conventional parameters such as pH, temperature, etc.; and Receiving water characteristics.
Additionally, outstanding information for the MS4 inventory database will be collected as discussed in Section 3. Outfalls with significant non-stormwater discharges will be determined after the three outfall screening events conducted by each member agency within their own jurisdictional area.
5.3 MS4 Outfall Inventory An inventory of MS4 Outfalls will be developed and maintained by each Beach Cities WMG member after the outfall screening. The Beach Cities WMG inventory database will include available existing data from past outfall screening efforts, monitoring, and other data collection efforts. The data within the database will include the physical attributes of MS4 outfalls determined to have significant non-stormwater discharges as well as a list of those outfalls requiring no further assessment. If the MS4 outfall requires no further assessment, the inventory will include the rationale for the determination of no further action required based on the following:
The outfall does not have flow; The outfall does not have a known significant non-stormwater discharge; or Discharges observed were determined to be exempt during the source identification
(Section 5.5). The inventory will be recorded in the database as required in Part VII.A of the MRP. Each year, the inventory will be updated to incorporate the most recent characterization data for outfalls with significant non-stormwater discharges. The following physical attributes of outfalls with significant non-stormwater discharges will be included in the inventory and should be collected as part of the screening process:
Date and time of last visual observation or inspection; Outfall alpha-numeric identifier; Description of outfall structure including size (e.g., diameter and shape); Description of receiving water at the point of discharge (e.g., concrete channel); Latitude/longitude coordinates; Nearest street address; Parking, access, and safety considerations; Photographs of outfall condition; Photographs of significant non-stormwater discharge (or indicators of discharge) unless
safety considerations preclude obtaining photographs;
Beach Cities WMG CIMP September 2015
- 57 -
Estimation of discharge rate; All diversions either upstream or downstream of the outfall; Observations regarding discharge characteristics such as turbidity, odor, color, presence
of debris, floatables, or monitoring characteristics that could aid in pollutant source identification; and
Monitoring data.
5.4 Prioritized Source Identification Once the significant non-stormwater outfalls have been identified through the screening process and incorporated into the inventory, Part IX.E of the MRP requires Permittees to prioritize outfalls for further source investigations. The MRP identifies the following prioritization criteria for outfalls with significant non-stormwater discharges:
Outfalls discharging directly to receiving waters with WQBELs or receiving water limitations in the TMDL provisions for which final compliance deadlines have passed.
All major outfalls and other outfalls that discharge to a receiving water subject to a TMDL shall be prioritized according to TMDL compliance schedules.
Outfalls for which monitoring data exist and indicate recurring exceedances of one or more of the Action Levels identified in Attachment G of the Permit.
All other major outfalls identified to have significant non-stormwater discharges. In addition to the Permit requirements, the following criteria may be considered when developing the prioritization schedule:
Rate of discharge based on visual flow observations Drainage area to outfall and/or size of outfall Odor, color and clarity of discharge Results of the field measurements of pH, temperature, DO, and EC Presence of flow in the receiving water
Once the prioritization is complete, a source identification schedule will be developed. The scheduling will focus on the outfalls with the highest priorities first. Unless the results of the field screening justify a modification to the schedule in the MRP, the schedule will ensure that source investigations are completed on no less than 25% of the outfalls with significant non-stormwater discharges by December 28, 2015 and 100% by December 28, 2017. 5.4.1 SMB-O-7 As shown in Appendix G, Observational Monitoring Site SMB-O-7 is a major outfall at the Redondo Beach Pier that was observed to have non-stormwater discharge reach the surf on 8 of 74 (11 percent) observed dry weather days between July 2012 and May 2015. Per conversations with the Regional Board on September 11 and September 17, 2015, the Beach Cities Group has agreed to classify this outfall as a priority outfall and will seek to initiate a source investigation by December 28, 2015. The source investigation will take place in accordance with Section 5.5 below. If outfall monitoring is required based on results of the source identification, it will be initiated within 90 days of the completion of the source identification and will be conducted in accordance with Section 5.6.
Beach Cities WMG CIMP September 2015
- 58 -
If the source identification and monitoring at SMB-O-7 demonstrate that non-stormwater flows are causing or contributing to exceedances of the bacteria objectives in Santa Monica Bay, the responsible agency/agencies will seek to eliminate all dry weather flows at this location with the installation of a dry weather diversion or equivalent BMP (e.g., diversion and infiltration). If determined not to be required, the Beach Cities Group will coordinate with the Regional Board on a plan for future monitoring or observations at this location. 5.5 Source Identification of Significant Non-Stormwater Discharge After the prioritization and schedule have been determined, source identification of the major outfalls with significant non-stormwater discharge will be conducted to identify the source(s) or potential source(s) of non-stormwater discharge. Part IX.A.2 of the MRP requires Permittees to classify the source identification results into the following types which are summarized in Table 18:
A. IC/IDs: If the source is determined to be an illicit discharge, the Permittee must implement procedures to eliminate the discharge consistent with IC/ID requirements (Permit Part VI.D.10) and document actions.
A. Authorized or conditionally exempt non-stormwater discharges: If the source is determined to be an NPDES permitted discharge, a discharge subject to the Comprehensive Environmental Response, Compensation, and Liability Act (CERCLA), or a conditionally exempt essential discharge, the group member must document the source. For non-essential conditionally exempt discharges, the group member must conduct monitoring consistent with Part IX.G of the MRP to determine whether the discharge should remain conditionally exempt or be prohibited.
B. Natural flows: If the source is determined to be a natural flow (e.g. groundwater), the Permittee must document the source.
C. Unknown sources: If the source is unknown, the Permittee must conduct monitoring consistent with Part IX.G of the MRP.
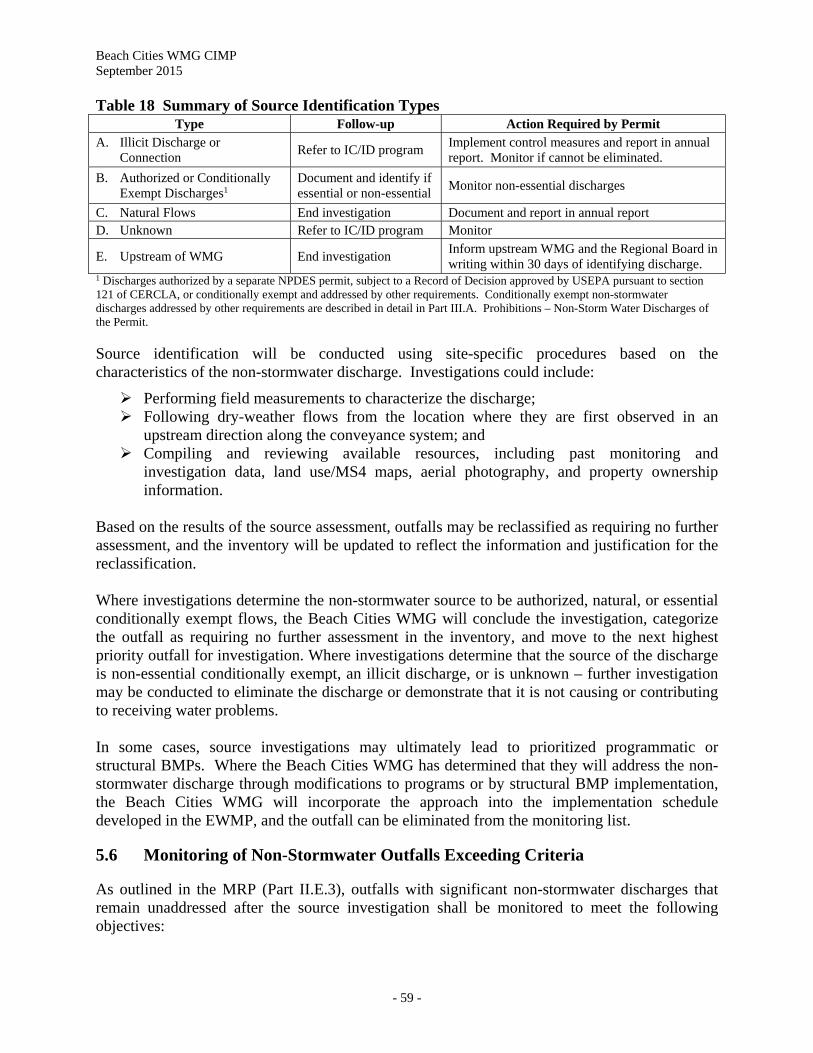
Beach Cities WMG CIMP September 2015
- 59 -
Table 18 Summary of Source Identification Types Type Follow-up Action Required by Permit
A. Illicit Discharge or Connection
Refer to IC/ID program Implement control measures and report in annual report. Monitor if cannot be eliminated.
B. Authorized or Conditionally Exempt Discharges1
Document and identify if essential or non-essential
Monitor non-essential discharges
C. Natural Flows End investigation Document and report in annual report D. Unknown Refer to IC/ID program Monitor
E. Upstream of WMG End investigation Inform upstream WMG and the Regional Board in writing within 30 days of identifying discharge.
1 Discharges authorized by a separate NPDES permit, subject to a Record of Decision approved by USEPA pursuant to section 121 of CERCLA, or conditionally exempt and addressed by other requirements. Conditionally exempt non-stormwater discharges addressed by other requirements are described in detail in Part III.A. Prohibitions – Non-Storm Water Discharges of the Permit. Source identification will be conducted using site-specific procedures based on the characteristics of the non-stormwater discharge. Investigations could include:
Performing field measurements to characterize the discharge; Following dry-weather flows from the location where they are first observed in an
upstream direction along the conveyance system; and Compiling and reviewing available resources, including past monitoring and
investigation data, land use/MS4 maps, aerial photography, and property ownership information.
Based on the results of the source assessment, outfalls may be reclassified as requiring no further assessment, and the inventory will be updated to reflect the information and justification for the reclassification. Where investigations determine the non-stormwater source to be authorized, natural, or essential conditionally exempt flows, the Beach Cities WMG will conclude the investigation, categorize the outfall as requiring no further assessment in the inventory, and move to the next highest priority outfall for investigation. Where investigations determine that the source of the discharge is non-essential conditionally exempt, an illicit discharge, or is unknown – further investigation may be conducted to eliminate the discharge or demonstrate that it is not causing or contributing to receiving water problems. In some cases, source investigations may ultimately lead to prioritized programmatic or structural BMPs. Where the Beach Cities WMG has determined that they will address the non-stormwater discharge through modifications to programs or by structural BMP implementation, the Beach Cities WMG will incorporate the approach into the implementation schedule developed in the EWMP, and the outfall can be eliminated from the monitoring list.
5.6 Monitoring of Non-Stormwater Outfalls Exceeding Criteria As outlined in the MRP (Part II.E.3), outfalls with significant non-stormwater discharges that remain unaddressed after the source investigation shall be monitored to meet the following objectives:
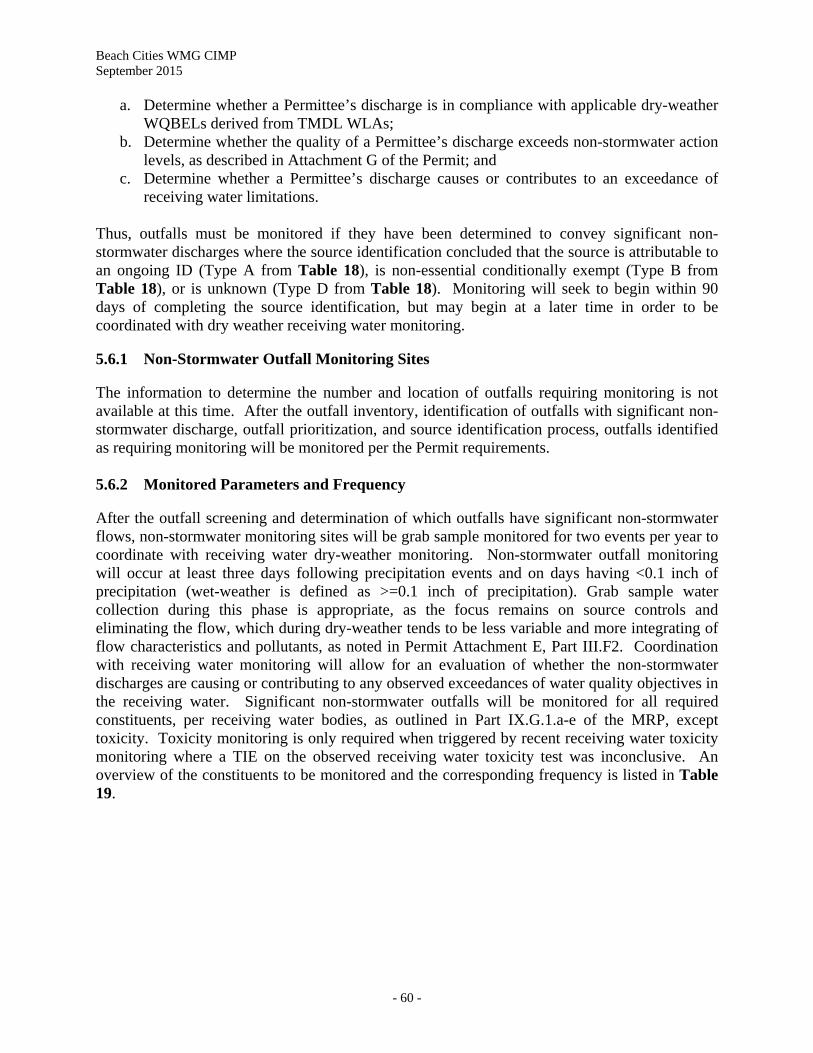
Beach Cities WMG CIMP September 2015
- 60 -
a. Determine whether a Permittee’s discharge is in compliance with applicable dry-weather WQBELs derived from TMDL WLAs;
b. Determine whether the quality of a Permittee’s discharge exceeds non-stormwater action levels, as described in Attachment G of the Permit; and
c. Determine whether a Permittee’s discharge causes or contributes to an exceedance of receiving water limitations.
Thus, outfalls must be monitored if they have been determined to convey significant non-stormwater discharges where the source identification concluded that the source is attributable to an ongoing ID (Type A from Table 18), is non-essential conditionally exempt (Type B from Table 18), or is unknown (Type D from Table 18). Monitoring will seek to begin within 90 days of completing the source identification, but may begin at a later time in order to be coordinated with dry weather receiving water monitoring. 5.6.1 Non-Stormwater Outfall Monitoring Sites The information to determine the number and location of outfalls requiring monitoring is not available at this time. After the outfall inventory, identification of outfalls with significant non-stormwater discharge, outfall prioritization, and source identification process, outfalls identified as requiring monitoring will be monitored per the Permit requirements. 5.6.2 Monitored Parameters and Frequency After the outfall screening and determination of which outfalls have significant non-stormwater flows, non-stormwater monitoring sites will be grab sample monitored for two events per year to coordinate with receiving water dry-weather monitoring. Non-stormwater outfall monitoring will occur at least three days following precipitation events and on days having <0.1 inch of precipitation (wet-weather is defined as >=0.1 inch of precipitation). Grab sample water collection during this phase is appropriate, as the focus remains on source controls and eliminating the flow, which during dry-weather tends to be less variable and more integrating of flow characteristics and pollutants, as noted in Permit Attachment E, Part III.F2. Coordination with receiving water monitoring will allow for an evaluation of whether the non-stormwater discharges are causing or contributing to any observed exceedances of water quality objectives in the receiving water. Significant non-stormwater outfalls will be monitored for all required constituents, per receiving water bodies, as outlined in Part IX.G.1.a-e of the MRP, except toxicity. Toxicity monitoring is only required when triggered by recent receiving water toxicity monitoring where a TIE on the observed receiving water toxicity test was inconclusive. An overview of the constituents to be monitored and the corresponding frequency is listed in Table 19.
Beach Cities WMG CIMP September 2015
- 61 -
Table 19 List of Constituents for Non-Stormwater Outfall Monitoring
Constituent
Water Body
Santa Monica Bay
Dominguez Channel
Torrance Carson Lateral
Flow, hardness, pH, dissolved oxygen, temperature, specific conductivity, and total suspended solids X X X
Table E-2 pollutants detected above relevant objectives X X X Aquatic Toxicity and Toxicity Identification Evaluation (TIE)1 Total Coliform X Fecal Coliform X Enterococcus X Total Copper X X Total Lead X X
Total Zinc X X
Diazinon X Ammonia X X
E. coli (Indicator Bacteria) X X
Cyanide X X
pH X X Selenium X X Mercury X X Cadmium X X 1. Toxicity is only monitored from outfalls when triggered by recent receiving water toxicity monitoring where a TIE on the observed receiving water toxicity test was inconclusive. If toxicity is observed at the outfall a TIE must be conducted. Outfalls on the monitoring list will be monitored for at least the duration of the Permit term, or until the non-stormwater discharge is eliminated. Additional analytical and monitoring procedures are discussed in the Analytical and Monitoring Procedures per Appendix D.
Beach Cities WMG CIMP September 2015
- 62 -
6.0 New Development/Re-Development Effectiveness New Development/Re-Development Effectiveness Tracking is used for tracking data on new development and re-development activities. The procedures for reviewing projects, tracking data, and reporting are different for each jurisdiction and may even be different across departments within the same jurisdiction. Due to the complexity of land development processes across jurisdictions, data management and tracking procedures will vary by jurisdiction. The WMG will develop a complete tracking system that works for their individual needs and internal processes. The database will track the following information:
1. Name of the Project and Developer, 2. Mapped project location (preferably linked to the Geographic Information System (GIS)
storm drain map), 3. Issuance date of the project Certificate of Occupancy, 4. 85th percentile 24-hour storm event for project design (inches), 5. 95th percentile 24-hour storm event for projects draining to natural water bodies (inches), 6. Other design criteria required to meet hydromodification requirements for drainages to
natural water bodies, 7. Project design storm (inches per 24 hours), 8. Project design storm volume (gallons or MGD), 9. Percent of design storm volume to be retained onsite, 10. Design volume for water quality mitigation treatment BMPs (if any), 11. If flow-through BMPs are approved, provide the one-year, one-hour storm intensity as
depicted on the most recently issued isohyetal map published by the Los Angeles County Hydrologist,
12. Percent of design storm volume to be infiltrated at an off-site mitigation or groundwater replenishment project site,
13. Percent of design storm volume to be retained or treated with biofiltration at an off-site retrofit project,
14. Location and maps (preferably linked to the GIS storm drain map) of off-site mitigation, groundwater replenishment, or retrofit sites, and
15. Documentation of issuance of requirements to the developer.
Until the EWMP is approved by the Regional Board or the Executive Officer, the Beach Cities WMG is only required to implement and track MCM information in its existing stormwater management program per Part V.C.4.d.i. In addition to the requirements in Part X.A of the MRP, Part VI.D.7.d.iv of the Permit requires that the Beach Cities WMG implement a tracking system for new development/re-development projects that have planned post-construction BMPs. The following information is to be tracked using GIS or another electronic system:
1. Municipal Project ID 2. State Waste Discharge Identification (WDID) Number 3. Project Acreage 4. BMP Type and Description 5. BMP Location (coordinates) 6. Date of Acceptance 7. Date of Maintenance Agreement
Beach Cities WMG CIMP September 2015
- 63 -
8. Maintenance Records 9. Inspection Date and Summary 10. Corrective Action 11. Date Certificate of Occupancy Issued 12. Replacement or Repair Date
Participating agencies have developed mechanisms for tracking new development/re-development projects that have been conditioned for post-construction BMPs pursuant to MS4 Permit Part VI.D.7 Agencies also have developed mechanisms for tracking the effectiveness of these BMPs pursuant to MS4 Permit Attachment E.X.
Beach Cities WMG CIMP September 2015
- 64 -
7.0 Regional Studies The MRP identifies one regional study: the SMC Regional Watershed Monitoring Program. The SMC Program is a collaborative effort between SCCWRP, the State Water Board’s Surface Water Ambient Monitoring Program (SWAMP), three Southern California Regional Water Quality Control Boards, and several county stormwater agencies. SCCWRP acts as a facilitator to organize the monitoring program, conducts the data analysis, and prepares monitoring results reports. The goal of the SMC Program is to develop a monitoring program on a regional level for Southern California’s coastal streams and rivers.
7.1 Regional Study Participation The MRP states that each Permittee shall be responsible for supporting the monitoring described at the sites within the watershed management area(s) that overlap with the Permittee’s jurisdictional area. One program initiated under the SMC is the Regionally Consistent and Integrated Freshwater Stream Bioassessment Monitoring Program (Bioassessment Program), which included six monitoring sites that were monitored annually within the WMP Group area. The SMC initiated the Bioassessment Program, which is structured to occur in cycles of five years, in 2009. Sampling under the 2009 cycle concluded in 2013. The next five-year cycle is scheduled to begin in 2015, with additional special study monitoring scheduled to occur in 2014. The Beach Cities WMG will continue to participate in the Biosassessment Program being managed by the SMC, through the LACFCD. The LACFCD will continue to participate in the Regional Watershed Monitoring Program (Bioassessment Program) being managed by the Southern California Stormwater Monitoring Coalition (SMC). The LACFCD will contribute resources to SMC’s bioassessment monitoring program during the current permit cycle. Initiated in 2008, the SMC’s Regional Bioassessment Program is designed to run over a five-year cycle. Monitoring under the first cycle concluded in 2013, with reporting of findings and additional special studies planned to occur in 2014. SMC, including LACFCD, is currently working on designing the bioassessment monitoring program for the next five-year cycle, which is scheduled to run from 2015 to 2019.
Beach Cities WMG CIMP September 2015
- 65 -
8.0 Special Studies The Beach Cities WMG is responsible for conducting special studies that are required in an effective TMDL or an approved TMDL Monitoring Plan applicable to a watershed that is within the Beach Cities WMG’s jurisdictional boundary. At this time there are no special studies required by any of the TMDLs within the Beach Cities WMG; therefore, the Beach Cities WMG will not participate in any special studies. At a future date, if implementation of a special study is desirable, then a separate work plan coordinated with the CIMP will be developed.
Beach Cities WMG CIMP September 2015
- 66 -
9.0 Non-Direct Measurements Existing monitoring programs that collect water quality data in the WMG area, as summarized in Appendix A, will be incorporated into the CIMP database to the extent practicable. Gathering and compiling information from outside the CIMP programs will be dictated by cost. Water quality data reported by these monitoring programs will be evaluated for suitability for inclusion in the CIMP database.
Beach Cities WMG CIMP September 2015
- 67 -
10.0 Adaptive Management An adaptive management approach provides a structured process that allows for taking action under uncertain conditions based on the best available science, closely monitoring and evaluating outcomes, and re-evaluating and adjusting decisions as more information is collected. The CIMP, as with the EWMP, is to be implemented as an adaptive process. As new program elements are implemented and data are gathered over time, the EWMP and CIMP will undergo revision to reflect the most current understanding of the watershed and present a sound approach to addressing changing conditions. As such, the EWMP and CIMP will employ an adaptive management process utilizing BMPs that meet the maximum extent practicable (MEP) standard and will allow the programs to evolve. 10.1 Annual Assessment and Reporting Part XVIII.A of the MRP details the annual assessment and reporting that is required as part of the annual report. The annual assessment and reporting is composed of seven parts, which are the following:
1. Stormwater Control Measures 2. Effectiveness Assessment of Stormwater Control Measures 3. Non-stormwater Control Measures 4. Effectiveness Assessment of Non-stormwater Control Measures 5. Integrated Monitoring Compliance Report 6. Adaptive Management Strategies 7. Supporting Data and Information
Based on the findings of the annual assessment, revisions to the CIMP will be included as part of the Adaptive Management Strategies.
10.2 CIMP Revision Process Implementation of the CIMP is used to gather data on receiving water conditions and stormwater/non-stormwater quality to assess the effectiveness of the EWMP. As part of the adaptive management process, re-evaluation of the CIMP will need to be conducted to better inform the Beach Cities WMG of ever changing conditions of the watershed. Each program of the CIMP will be re-evaluated every two years, in line with the EWMP’s Adaptive Management Strategies, for the following:
Monitored site locations: As water quality priorities change and certain WBPCs are being addressed or identified, monitoring site locations may need to be added or changed.
Monitoring constituents: Eliminate or reduce monitoring of certain constituents. If constituents were initially detected during initiation of the CIMP and are not being addressed by a watershed control measure.
Monitoring frequency: Increased or decreased based on the evaluation of RWL, WQBELs, or non-stormwater action levels.

Beach Cities WMG CIMP September 2015
- 68 -
Based on the re-evaluation, CIMP revisions will be made and submitted to the Regional Board for approval.
Beach Cities WMG CIMP September 2015
- 69 -
11.0 Reporting Analysis and reporting of data is an integral part of communicating to the Regional Board whether the CIMP is meeting MRP objectives. The MRP establishes NPDES permit monitoring, reporting, and recordkeeping requirements, including those for large MS4s, based on federal Clean Water Act (CWA) section 308(a) and Code of Federal Regulations (40 CFR) sections 122.26(d)(2)(i)(F), (iii)(D), 122.41(h)-(l), 122.42(c), and 122.48. In addition, California Water Code (CWC) section 13383 authorizes the Regional Board to establish monitoring, inspection, entry, reporting, and recordkeeping requirements. The sections below will outline the CIMP reporting process for the Beach Cities WMG. 11.1 Documents and Records Consistent with the Part XIV.A of the MRP requirements, the Beach Cities WMG will retain records of all monitoring information, including: all calibration, major maintenance records, all original lab and field data sheets, all original strip chart recordings for continuous monitoring instrumentations, copies of all reports required by the Permit, and records of data used to complete the application for the Permit for a period of at least 3 years from the date of the sample, measurement, report, or application. Records of monitoring will include:
1. The date, time of sampling or measurements, exact place, weather conditions, and rain fall amount;
2. The individual(s) who performed the sampling or measurements; 3. The date(s) analyses were performed; 4. The individual(s) who performed the analyses; 5. The analytical techniques or methods used; 6. The results of such analyses; and 7. The data sheets showing toxicity test results.
11.1.1 Semi-Annual Analytical Data Submittal Monitoring data will be submitted semi-annually (by June 15 and December 15 of each year), as stated in Part XIV.L of the MRP. The transmitted data will be in the most recent update of the Southern California Municipal Storm Water Monitoring Coalition's (SMC) Standardized Data Transfer Formats (SDTFs) and sent electronically to the Regional Board at [email protected] with the subject line “LA County MS4 Permit – Beach Cities WMG Monitoring Data”. The SMC SDTFs can be found at the Southern California Coastal Water Research Project (SCCWRP) web page http://www.sccwrp.org/data/DataSubmission.aspx. The monitoring data should highlight the following:
1. Exceedances of applicable WQBELs, 2. Receiving water limitations, 3. Action levels, 4. Municipal action levels (MALs), and/or
Beach Cities WMG CIMP September 2015
- 70 -
5. Aquatic toxicity thresholds for all test results, with corresponding sampling dates per receiving water monitoring station.
11.2 Monitoring Reports Part XVIII.A.5, of the MRP presents the requirements of the Integrated Monitoring Compliance Report (IMCR) that will be included and submitted on an annual basis as part of the Annual Report. As discussed in Section 10, the IMCR is one of seven parts of the Annual Assessment and Reporting. The IMCR will include the following information as required by the MRP:
Summary of exceedances against all applicable MALs, RWLs, WQBELs, non-stormwater action levels, and aquatic toxicity thresholds for:
1. Receiving water monitoring – wet- and dry-weather; 2. Stormwater outfall monitoring; and 3. Non-stormwater outfall monitoring.
Summary of actions taken: 1. To address exceedances for WQBELs, non-stormwater action levels, or aquatic
toxicity for stormwater and non-stormwater outfall monitoring. 2. To determine whether MS4 discharges contributed to RWL exceedances and
efforts taken to control the discharge causing the exceedances to the receiving water.
If aquatic toxicity was confirmed and a TIE was conducted, identify the toxic chemicals determined by the TIE, and include all relevant data to allow the Regional Board to review the adequacy and findings of the TIE.
The IMCR may serve as MAL assessment reports provided that the IMCRs include an assessment of the stormwater outfall data as compared to the MALs (as noted above). Additionally, the IMCRs in conjunction with the EWMP may meet the requirement for a MAL Action Plan if the EWMP addresses the waterbody-pollutant combination(s) for which the MAL(s) was exceeded, or where the Group requests modifications to its EWMP to address the MAL exceedances. The IMCR will be submitted as part of the Annual Assessment Report to the Regional Board by December 15th of each year, for at least the duration of the Permit term. As indicated above, event summary reports will be attached to the IMCR.
11.3 Signatory and Certification Requirements Part V.B of Attachment D of the Permit presents the Signatory and Certification Requirements and states:
1. All applications, reports, or information submitted to the Regional Water Board, State Water Board, and/or USEPA shall be signed and certified in accordance with Standard Provisions – Reporting V.B.2, V.B.3, V.B.4, and V.B.5 below [40 CFR section 122.41(k)(1)].
2. All applications submitted to the Regional Water Board shall be signed by either a principal executive officer or ranking elected official. For purposes of this section, a principal executive officer includes: (i) the chief executive officer of the agency (e.g.,
Beach Cities WMG CIMP September 2015
- 71 -
Mayor), or (ii) a senior executive officer having responsibility for the overall operations of a principal geographic unit of the agency (e.g., City Manager, Director of Public Works, City Engineer, etc.).[40 CFR section 122.22(a)(3)].
3. All reports required by this Order and other information requested by the Regional Water Board, State Water Board, or USEPA shall be signed by a person described in Standard Provisions – Reporting V.B.2 above, or by a duly authorized representative of that person. A person is a duly authorized representative only if:
a. The authorization is made in writing by a person described in Standard Provisions – Reporting V.B.2 above [40 CFR section 122.22(b)(1)];
b. The authorization specifies either an individual or a position having responsibility for the overall operation of the regulated facility or activity such as the position of plant manager, operator of a well or a well field, superintendent, position of equivalent responsibility, or an individual or position having overall responsibility for environmental matters for the company. (A duly authorized representative may thus be either a named individual or any individual occupying a named position.) [40 CFR section 122.22(b)(2)]; and
c. The written authorization is submitted to the Regional Water Board [40 CFR section 122.22(b)(3)].
4. If an authorization under Standard Provisions – Reporting V.B.3 above is no longer accurate because a different individual or position has responsibility for the overall operation of the facility, a new authorization satisfying the requirements of Standard Provisions – Reporting V.B.3 above must be submitted to the Regional Water Board prior to or together with any reports, information, or applications, to be signed by an authorized representative [40 CFR section 122.22(c)].
5. Any person signing a document under Standard Provisions – Reporting V.B.2 or V.B.3 above shall make the following certification: “I certify under penalty of law that this document and all attachments were prepared under my direction or supervision in accordance with a system designed to assure that qualified personnel properly gather and evaluate the information submitted. Based on my inquiry of the person or persons who manage the system or those persons directly responsible for gathering the information, the information submitted is, to the best of my knowledge and belief, true, accurate, and complete. I am aware that there are significant penalties for submitting false information, including the possibility of fine and imprisonment for knowing violations.” [40 CFR section 122.22(d)].
All required signatures and statements will be included as an attachment to the Annual Report, which will be submitted to the Regional Board by December 15th of each year, for the duration of the Permit term.
Beach Cities WMG CIMP September 2015
- 72 -
12.0 Schedule for CIMP Implementation As stated in Part IV.C.6 of the MRP, the Beach Cities WMG’s CIMP will commence within 90 days after approval by the Executive Officer of the Regional Board. Existing monitoring will continue to be conducted and beginning summer of 2014, the dry weather screening of major outfalls will commence. Implementation of new monitoring programs and modifications to existing monitoring programs will be implemented beginning 90 days after the approval of the CIMP.
Beach Cities WMG CIMP September 2015
- 73 -
13.0 References A. Magallanes (personal communication, June 19, 2015) California Department of Fish and Wildlife. Ecosystem Restoration Program, Adaptive
Management https://www.dfg.ca.gov/erp/adaptive_management.asp. April 2014. California Regional Water Quality Control Board, Los Angeles Region, Order No. R4-2012-
0175 NPDES Permit No. CAS004001, Waste Discharge Requirements for Municipal Separate Storm Sewer System (MS4) Discharges within the Coastal Watersheds of Los Angeles County, Except Those Discharges Originating From The City of Long Beach MS4. November 2012.
California Regional Water Quality Control Board, Los Angeles Region, Santa Monica Bay
Nearshore and Offshore Debris TMDL, October 2010. City of Los Angeles, Environmental Monitoring Division, Santa Monica Bay Shoreline
Monitoring Municipal Separate Storm Sewer System (MS4) Report (June 1, 2011 – May 30, 2012), 2012.
City of Los Angeles, Watershed Protection Division, Concept Memo #5 Outfall and Receiving
Water Monitoring Approach. December 2013. Cowgill, U.M. and D.P. Milazzo. 1990. The sensitivity of two cladocerans to water quality
variables, salinity and hardness. Arch. Hydrobiol. 120:185–196.
Kayhanian, M., C. Stransky, S. Bay, S. Lau, M.K. Stenstrom. 2008. Toxicity of urban highway runoff with respect to sorm duration. Science of the Total Environment 389:109-128
Lee, G. F. and A. Jones-Lee. “Review of the City of Stockton Urban Stormwater Runoff
Aquatic Life Toxicity Studies Conducted by the CVRWQCB, DeltaKeeper and the University of California, Davis, Aquatic Toxicology Laboratory between 1994 and 2000,” Report to the Central Valley Regional Water Quality Control Board, G. Fred Lee & Associates, El Macero, CA, October (2001).
Los Angeles RWQCB, Attachment A to Resolution No. 2002-022 Final – 12/12/02 1 Amendment
to the Water Quality Control Plan – Los Angeles Region to incorporate Implementation Provisions for the Region’s Bacteria Objectives and to incorporate the Santa Monica Bay Beaches Wet-Weather Bacteria TMDL, 2002.
Los Angeles RWQCB, Water Quality in the Santa Monica Bay Watershed Under the Surface
Water Ambient Monitoring Program Fiscal Year 2001-2002, 2005. Los Angeles RWQCB, Order No.R4-2010-0200 NPDES No. CA0109991 Waste Discharge
Requirements and National Pollutant Discharge Elimination System Permit for the City of Los Angeles, Hyperion Treatment Plant Discharge to the Pacific Ocean, 2010.
Beach Cities WMG CIMP September 2015
- 74 -
Palumbo, A., Fojut, T., TenBrook, P. and Tjerdeema, R. 2010a. Water Quality Criteria Report
for Diazinon. Prepared for the Central Valley Regional Water Quality Control Board by the Department of Environmental Toxicology, University of California, Davis. March.
Palumbo, A., Fojut, T., Brander, S., and Tjerdeema, R. 2010b. Water Quality Criteria Report
for Bifenthrin. Prepared for the Central Valley Regional Water Quality Control Board by the Department of Environmental Toxicology, University of California, Davis. March.
Santa Monica Public Works. SMURRF: Santa Monica Urban Runoff Recycling Facility.
http://www.smgov.net/Departments/PublicWorks/ContentCivEng.aspx?id=7796. December 2013
Santa Monica Public Works. SMURRF: Santa Monica Urban Runoff Recycling Facility Fact
Sheet. http://www.smgov.net/uploadedFiles/Departments/OSE/Categories/Urban_Runoff/UR_SMURRF_Info_Sheets.pdf. December 2013
Schiff, K., Bax, B., Markle, P., Fleming, T. and Newman, J. 2007. Wet and Dry Weather
Toxicity in the San Gabriel River. Bulletin of the Southern California Academy of Sciences: Vol. 106: 3.Available at: http://scholar.oxy.edu/scas/vol106/iss3/2
Southern California Coastal Water Research Project, Bight’13 Contaminant Impact Assessment
Field Operations Manual - Appendix A, 2013 http://www.sccwrp.org/Documents/BightDocuments/Bight13Documents/Bight13PlanningDocuments.aspx.
Technical Steering Committee City of Los Angeles and County of Los Angeles, Co-Chairs,
Santa Monica Bay Beaches Bacterial TMDLs Coordinated Shoreline Monitoring Plan, 2004
United States Environmental Protection Agency (USEPA). 1991. Methods for Aquatic Toxicity
Identification Evaluations: Phase I. Toxicity Characterization Procedures. 2nd Edition. EPA-600-6-91-003. National Effluent Toxicity Assessment Center, Duluth, MN.
United States Environmental Protection Agency (USEPA). 1992. Toxicity Identification
Evaluation: Characterization of Chronically Toxic Effluents, Phase I. EPA/600/6-91/005F. May 1992. National Effluent Toxicity Assessment Center, Duluth, MN.
United States Environmental Protection Agency (USEPA). 1993a. Methods for Aquatic
Toxicity Identification Evaluations- Phase II Toxicity Identification Procedures for Samples Exhibiting Acute and Chronic Toxicity. EPA-600-R-92-080. National Effluent Toxicity Assessment Center, Duluth, MN.
United States Environmental Protection Agency (USEPA). 1993b. Methods for Aquatic
Toxicity Identification Evaluations- Phase III Toxicity Confirmation Procedures for
Beach Cities WMG CIMP September 2015
- 75 -
Samples Exhibiting Acute and Chronic Toxicity. EPA-600-R-92-081. National Effluent Toxicity Assessment Center, Duluth, MN.
United States Environmental Protection Agency (USEPA). 1995. Short-term Methods for Estimating the Chronic Toxicity of Effluents and Receiving Waters to West Coast Marine and Estuarine Organisms. EPA-600-R-95-136. August, 1995.
United States Environmental Protection Agency (USEPA). 1996. Marine toxicity identification
evaluation (TIE): Phase I guidance document. EPA/600/R-96/054. National Health and Environmental Effects Research Laboratory. Narragansett, RI.
United States Environmental Protection Agency (USEPA). 2002a. Short-term Methods for
Estimating the Chronic Toxicity of Effluents and Receiving Waters to Freshwater Organisms. Fourth Edition. October. EPA-821-R-02-013.
United States Environmental Protection Agency (USEPA). 2002b. Methods for Measuring the
Acute Toxicity of Effluent and Receiving Waters to Freshwater and Marine Organisms. Fifth Edition. October. EPA-821-R-02-012.
United States Environmental Protection Agency (USEPA), Region 2, 2004, Guidance for the
Development of Quality Assurance Project Plans for Environmental Monitoring Projects. April 12, 2004
United States Environmental Protection Agency (USEPA). 2007. Sediment toxicity
identification evaluation (TIE) phases I, II, and III guidance document. EPA/600/R-07/080. U.S. Environmental Protection Agency, Office of Research and Development, Atlantic Ecology Division. Narragansett, RI.
United States Environmental Protection Agency (USEPA) 2009, New England, Quality
Assurance Project Plan Guidance for Environmental Projects Using Only Existing (Secondary) Data. October 2009
United States Environmental Protection Agency (USEPA). 2010. National Pollutant Discharge
Elimination System Test of Significant Toxicity Technical Document. EPA/833-R-10-004, U.S. Environmental Protection Agency, Office of Environmental Management, Washington, DC.
United States Environmental Protection Agency, Region IX, 2013, Santa Monica Bay Total
Maximum Daily Loads for DDTs and PCBs. March 2013 Wheelock, C., Miller, J., Miller, M., Gee, S., Shan, G. and Hammock, B. 2004. Development
of Toxicity Identification Evaluation (TIE) procedures for pyrethroid detection using esterase activity. Environmental Toxicology and Chemistry 23:2699-2708
Beach Cities CIMP Appendix A
Total Maximum Daily Load Requirements and Existing Monitoring Programs
July 2015
Appendix A. TMDL Requirements and Existing Monitoring Programs July 2015
- 2 -
A.1 Total Maximum Daily Load Monitoring Requirements
Attachment K to the 2012 MS4 Permit identifies Total Maximum Daily Loads (TMDLs) applicable to each Permittee and the Beach Cities Watershed Management Group (Beach Cities WMG) Permittees are included on Tables K-2 for the Santa Monica Bay (SMB) and K-4 for the Dominguez Channel (DC) Watersheds. The Beach Cities Permittees directly discharge to Santa Monica Bay and those TMDLs are of highest priority and most immediate concern. Since flows from the Beach Cities WMG only indirectly flow to Machado Lake, which is actively managed by the City of Los Angeles, the Watershed Management Area (WMA) will coordinate with the City to share monitoring data for those lake TMDLs. Similar coordination is anticipated with respect to the DC and Greater Harbor Toxic Pollutants TMDL, which has a significant legacy component and large stakeholder group.1 Water samples at the outlet of the storm drains discharging to the Dominguez Channel will be monitored at OF-BVEG-5 and OF-BCEG-6 (see CIMP Figure 8). Receiving water at Torrance Lateral will be monitored at OF-BCEG-7. Monitoring data will be shared by the City of Los Angeles, as part of other WMG CIMPs, for the Dominguez Channel, Dominguez Channel Estuary, Torrance Lateral, and Machado Lake, and will be incorporated into the Beach Cities WMG annual report by reference. The TMDLs of greatest concern to the Beach Cities WMG are further characterized in the following subsections and include the following:
Los Angeles Regional Water Quality Control Board (LARWQCB) Santa Monica Bay Beaches Bacteria TMDLs, effective July 15, 2003 (SMBBB TMDL);
United States Environmental Protection Agency (USEPA) Santa Monica Bay TMDL for Dichlorodiphenyltrichloroethane (DDTs) and Polychlorinated biphenyls (PCBs), March 26, 2012 (SMB DDT and PCB TMDL);
LARWQCB Santa Monica Bay Nearshore and Offshore Debris TMDL, effective March 20, 2012 (SMB Debris TMDL);
LARWQCB Trash TMDL for Machado Lake in the Dominguez Channel Watershed, effective March 6, 2008 (Machado Lake Trash TMDL);
LARWQCB Machado Lake Eutrophic, Algae, Ammonia, and Odors (Nutrient) TMDL, effective March 11, 2009 (Machado Lake Nutrient TMDL);
LARWQCB Machado Lake Pesticides and PCBs TMDL, effective March 20, 2012 (Machado Lake Toxics TMDL); and
LARWQCB Dominguez Channel and Greater Los Angeles and Long Beach Harbor Waters Toxic Pollutants TMDL, effective March 23, 2012 (Harbors Toxics TMDL).
Appendix D details the Monitoring and Reporting Plan and the Quality Assurance Project Plan with includes QA/QC elements.
A.1.1 Santa Monica Bay Beaches Bacteria TMDL The July 2, 2014 adopted revision of the SMB Beaches Bacteria TMDL establishes multi-part numeric targets for total coliform, fecal coliform and enterococcus densities, reported as bacteria counts (Most Probable Number/MPN or Colony Forming Units/CFU) per 100 milliliters of sample. The TMDL Waste Load Allocation (WLA), expressed as Water Quality-Based Effluent Limitations (WQBELs) for outfall discharges, are based on the Los Angeles Basin Plan objectives for body-contact recreation (REC-1) and summarized in Table A-1. Dry-weather WQBELs compliance was required as of December 28, 2012, the effective date of the MS4 Permit, while wet-weather compliance is required by July 15, 2021. The Daily Maximum WQBEL applies to single samples, while the Geometric mean is calculated using all applicable samples collected during the prior 30 days.
1 The Beach Cities WMG will coordinate with the DC EWMP group to share DC Estuary data for the Harbor Toxics TMDL.
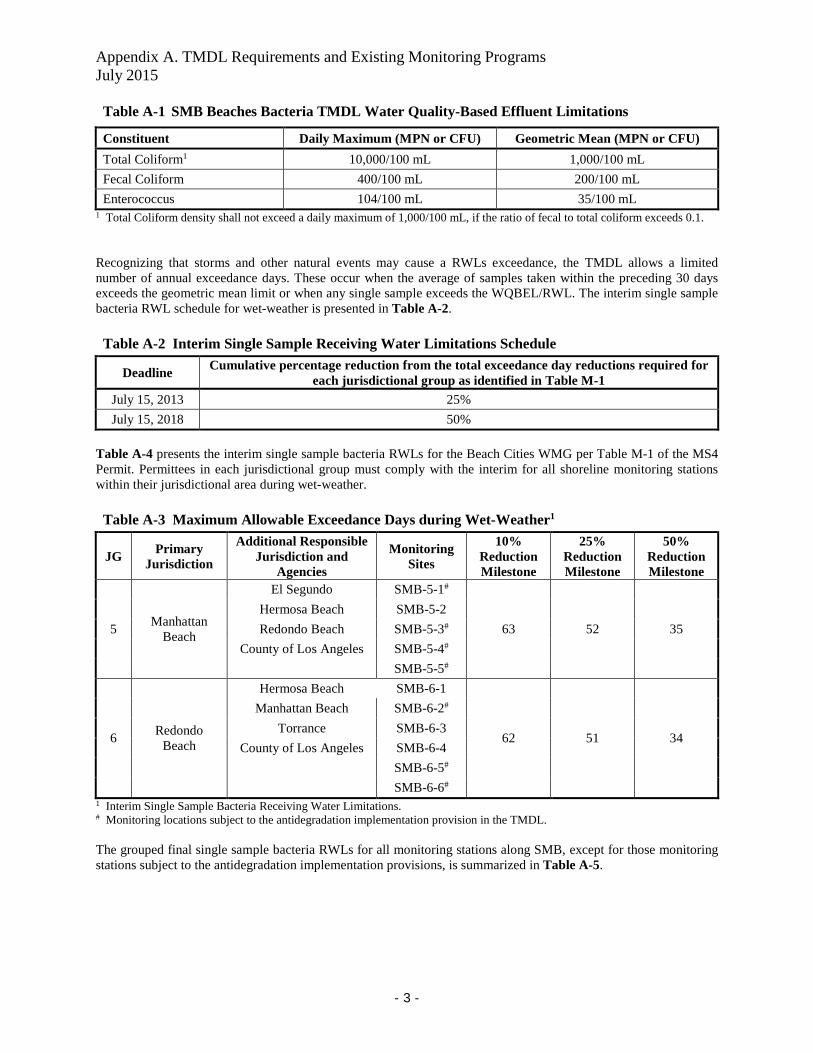
Appendix A. TMDL Requirements and Existing Monitoring Programs July 2015
- 3 -
Table A-1 SMB Beaches Bacteria TMDL Water Quality-Based Effluent Limitations
Constituent Daily Maximum (MPN or CFU) Geometric Mean (MPN or CFU)
Total Coliform1 10,000/100 mL 1,000/100 mL
Fecal Coliform 400/100 mL 200/100 mL
Enterococcus 104/100 mL 35/100 mL 1 Total Coliform density shall not exceed a daily maximum of 1,000/100 mL, if the ratio of fecal to total coliform exceeds 0.1. Recognizing that storms and other natural events may cause a RWLs exceedance, the TMDL allows a limited number of annual exceedance days. These occur when the average of samples taken within the preceding 30 days exceeds the geometric mean limit or when any single sample exceeds the WQBEL/RWL. The interim single sample bacteria RWL schedule for wet-weather is presented in Table A-2.
Table A-2 Interim Single Sample Receiving Water Limitations Schedule
Deadline Cumulative percentage reduction from the total exceedance day reductions required for
each jurisdictional group as identified in Table M-1
July 15, 2013 25%
July 15, 2018 50%
Table A-4 presents the interim single sample bacteria RWLs for the Beach Cities WMG per Table M-1 of the MS4 Permit. Permittees in each jurisdictional group must comply with the interim for all shoreline monitoring stations within their jurisdictional area during wet-weather.
Table A-3 Maximum Allowable Exceedance Days during Wet-Weather1
JG Primary
Jurisdiction
Additional Responsible Jurisdiction and
Agencies
Monitoring Sites
10% Reduction Milestone
25% Reduction Milestone
50% Reduction Milestone
5 Manhattan
Beach
El Segundo SMB-5-1#
63 52 35
Hermosa Beach SMB-5-2
Redondo Beach SMB-5-3#
County of Los Angeles SMB-5-4#
SMB-5-5#
6 Redondo
Beach
Hermosa Beach SMB-6-1
62 51 34
Manhattan Beach SMB-6-2#
Torrance SMB-6-3
County of Los Angeles SMB-6-4
SMB-6-5#
SMB-6-6#
1 Interim Single Sample Bacteria Receiving Water Limitations. # Monitoring locations subject to the antidegradation implementation provision in the TMDL. The grouped final single sample bacteria RWLs for all monitoring stations along SMB, except for those monitoring stations subject to the antidegradation implementation provisions, is summarized in Table A-5.
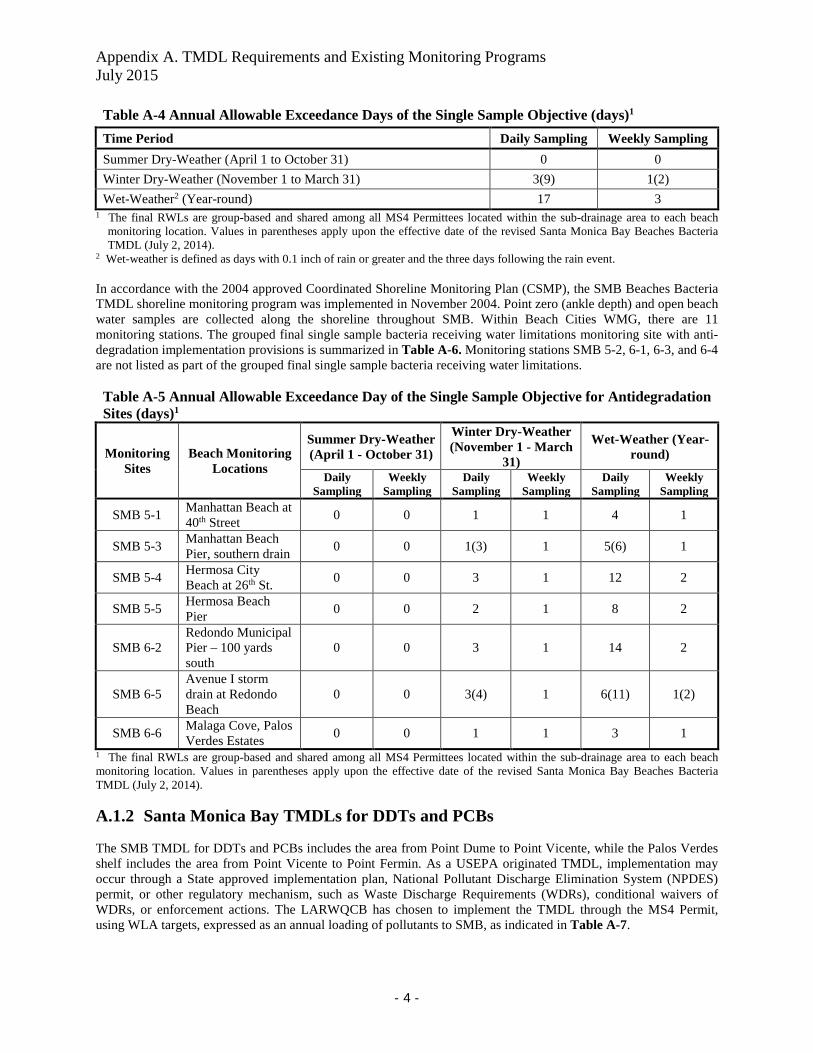
Appendix A. TMDL Requirements and Existing Monitoring Programs July 2015
- 4 -
Table A-4 Annual Allowable Exceedance Days of the Single Sample Objective (days)1
Time Period Daily Sampling Weekly Sampling
Summer Dry-Weather (April 1 to October 31) 0 0
Winter Dry-Weather (November 1 to March 31) 3(9) 1(2)
Wet-Weather2 (Year-round) 17 3 1 The final RWLs are group-based and shared among all MS4 Permittees located within the sub-drainage area to each beach
monitoring location. Values in parentheses apply upon the effective date of the revised Santa Monica Bay Beaches Bacteria TMDL (July 2, 2014).
2 Wet-weather is defined as days with 0.1 inch of rain or greater and the three days following the rain event. In accordance with the 2004 approved Coordinated Shoreline Monitoring Plan (CSMP), the SMB Beaches Bacteria TMDL shoreline monitoring program was implemented in November 2004. Point zero (ankle depth) and open beach water samples are collected along the shoreline throughout SMB. Within Beach Cities WMG, there are 11 monitoring stations. The grouped final single sample bacteria receiving water limitations monitoring site with anti-degradation implementation provisions is summarized in Table A-6. Monitoring stations SMB 5-2, 6-1, 6-3, and 6-4 are not listed as part of the grouped final single sample bacteria receiving water limitations. Table A-5 Annual Allowable Exceedance Day of the Single Sample Objective for Antidegradation Sites (days)1
Monitoring Sites
Beach Monitoring Locations
Summer Dry-Weather (April 1 - October 31)
Winter Dry-Weather (November 1 - March
31)
Wet-Weather (Year-round)
Daily Sampling
Weekly Sampling
Daily Sampling
Weekly Sampling
Daily Sampling
Weekly Sampling
SMB 5-1 Manhattan Beach at 40th Street
0 0 1 1 4 1
SMB 5-3 Manhattan Beach Pier, southern drain
0 0 1(3) 1 5(6) 1
SMB 5-4 Hermosa City Beach at 26th St.
0 0 3 1 12 2
SMB 5-5 Hermosa Beach Pier
0 0 2 1 8 2
SMB 6-2 Redondo Municipal Pier – 100 yards south
0 0 3 1 14 2
SMB 6-5 Avenue I storm drain at Redondo Beach
0 0 3(4) 1 6(11) 1(2)
SMB 6-6 Malaga Cove, Palos Verdes Estates
0 0 1 1 3 1
1 The final RWLs are group-based and shared among all MS4 Permittees located within the sub-drainage area to each beach monitoring location. Values in parentheses apply upon the effective date of the revised Santa Monica Bay Beaches Bacteria TMDL (July 2, 2014).
A.1.2 Santa Monica Bay TMDLs for DDTs and PCBs The SMB TMDL for DDTs and PCBs includes the area from Point Dume to Point Vicente, while the Palos Verdes shelf includes the area from Point Vicente to Point Fermin. As a USEPA originated TMDL, implementation may occur through a State approved implementation plan, National Pollutant Discharge Elimination System (NPDES) permit, or other regulatory mechanism, such as Waste Discharge Requirements (WDRs), conditional waivers of WDRs, or enforcement actions. The LARWQCB has chosen to implement the TMDL through the MS4 Permit, using WLA targets, expressed as an annual loading of pollutants to SMB, as indicated in Table A-7.
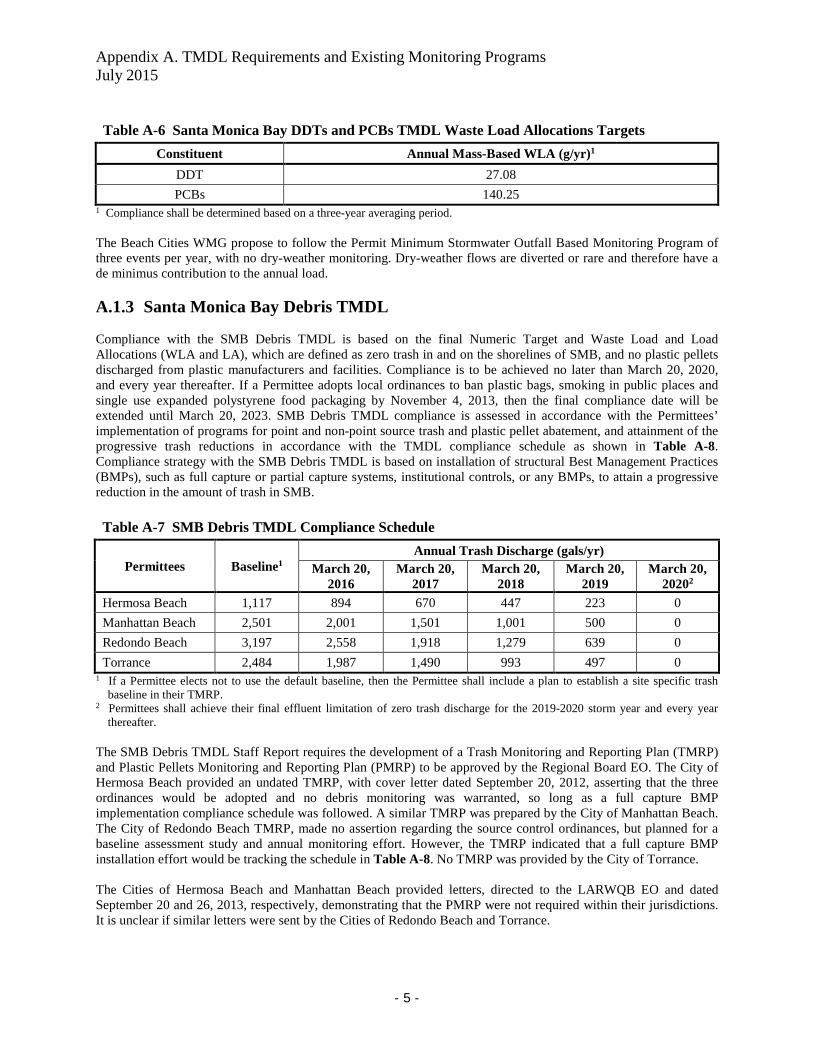
Appendix A. TMDL Requirements and Existing Monitoring Programs July 2015
- 5 -
Table A-6 Santa Monica Bay DDTs and PCBs TMDL Waste Load Allocations Targets
Constituent Annual Mass-Based WLA (g/yr)1
DDT 27.08
PCBs 140.25 1 Compliance shall be determined based on a three-year averaging period. The Beach Cities WMG propose to follow the Permit Minimum Stormwater Outfall Based Monitoring Program of three events per year, with no dry-weather monitoring. Dry-weather flows are diverted or rare and therefore have a de minimus contribution to the annual load.
A.1.3 Santa Monica Bay Debris TMDL Compliance with the SMB Debris TMDL is based on the final Numeric Target and Waste Load and Load Allocations (WLA and LA), which are defined as zero trash in and on the shorelines of SMB, and no plastic pellets discharged from plastic manufacturers and facilities. Compliance is to be achieved no later than March 20, 2020, and every year thereafter. If a Permittee adopts local ordinances to ban plastic bags, smoking in public places and single use expanded polystyrene food packaging by November 4, 2013, then the final compliance date will be extended until March 20, 2023. SMB Debris TMDL compliance is assessed in accordance with the Permittees’ implementation of programs for point and non-point source trash and plastic pellet abatement, and attainment of the progressive trash reductions in accordance with the TMDL compliance schedule as shown in Table A-8. Compliance strategy with the SMB Debris TMDL is based on installation of structural Best Management Practices (BMPs), such as full capture or partial capture systems, institutional controls, or any BMPs, to attain a progressive reduction in the amount of trash in SMB.
Table A-7 SMB Debris TMDL Compliance Schedule
Permittees Baseline1 Annual Trash Discharge (gals/yr)
March 20, 2016
March 20, 2017
March 20, 2018
March 20, 2019
March 20, 20202
Hermosa Beach 1,117 894 670 447 223 0
Manhattan Beach 2,501 2,001 1,501 1,001 500 0
Redondo Beach 3,197 2,558 1,918 1,279 639 0
Torrance 2,484 1,987 1,490 993 497 0 1 If a Permittee elects not to use the default baseline, then the Permittee shall include a plan to establish a site specific trash
baseline in their TMRP. 2 Permittees shall achieve their final effluent limitation of zero trash discharge for the 2019-2020 storm year and every year
thereafter. The SMB Debris TMDL Staff Report requires the development of a Trash Monitoring and Reporting Plan (TMRP) and Plastic Pellets Monitoring and Reporting Plan (PMRP) to be approved by the Regional Board EO. The City of Hermosa Beach provided an undated TMRP, with cover letter dated September 20, 2012, asserting that the three ordinances would be adopted and no debris monitoring was warranted, so long as a full capture BMP implementation compliance schedule was followed. A similar TMRP was prepared by the City of Manhattan Beach. The City of Redondo Beach TMRP, made no assertion regarding the source control ordinances, but planned for a baseline assessment study and annual monitoring effort. However, the TMRP indicated that a full capture BMP installation effort would be tracking the schedule in Table A-8. No TMRP was provided by the City of Torrance. The Cities of Hermosa Beach and Manhattan Beach provided letters, directed to the LARWQB EO and dated September 20 and 26, 2013, respectively, demonstrating that the PMRP were not required within their jurisdictions. It is unclear if similar letters were sent by the Cities of Redondo Beach and Torrance.
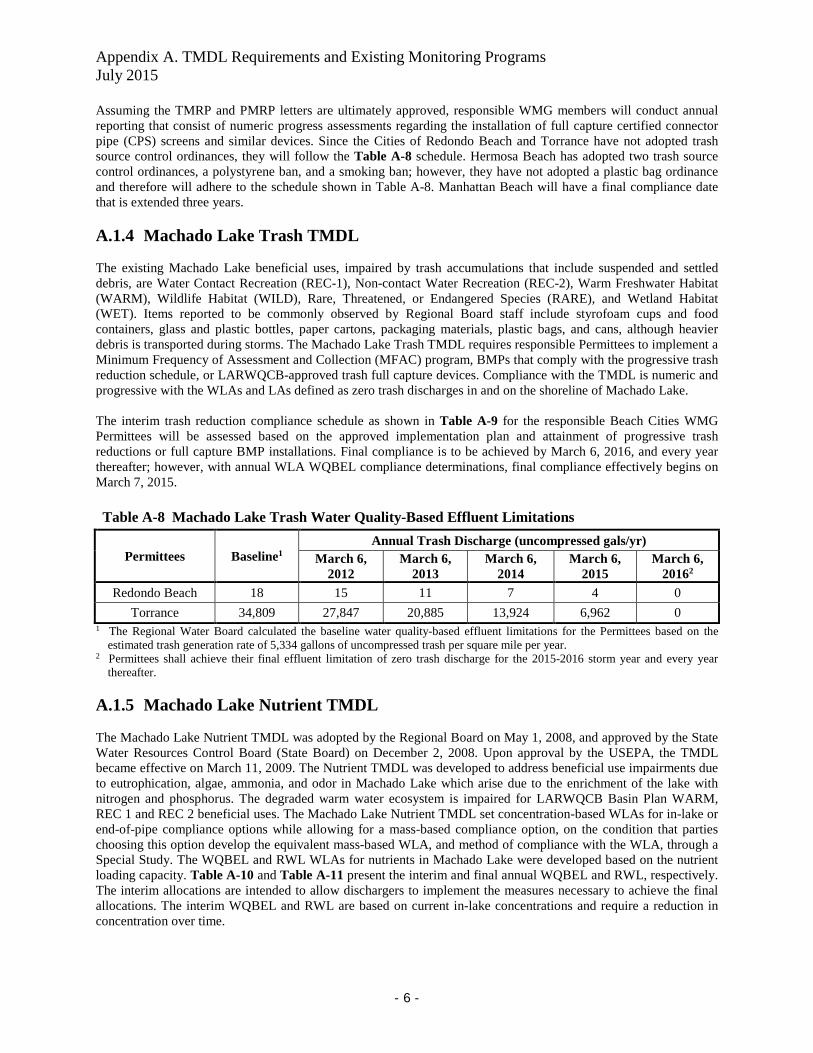
Appendix A. TMDL Requirements and Existing Monitoring Programs July 2015
- 6 -
Assuming the TMRP and PMRP letters are ultimately approved, responsible WMG members will conduct annual reporting that consist of numeric progress assessments regarding the installation of full capture certified connector pipe (CPS) screens and similar devices. Since the Cities of Redondo Beach and Torrance have not adopted trash source control ordinances, they will follow the Table A-8 schedule. Hermosa Beach has adopted two trash source control ordinances, a polystyrene ban, and a smoking ban; however, they have not adopted a plastic bag ordinance and therefore will adhere to the schedule shown in Table A-8. Manhattan Beach will have a final compliance date that is extended three years.
A.1.4 Machado Lake Trash TMDL The existing Machado Lake beneficial uses, impaired by trash accumulations that include suspended and settled debris, are Water Contact Recreation (REC-1), Non-contact Water Recreation (REC-2), Warm Freshwater Habitat (WARM), Wildlife Habitat (WILD), Rare, Threatened, or Endangered Species (RARE), and Wetland Habitat (WET). Items reported to be commonly observed by Regional Board staff include styrofoam cups and food containers, glass and plastic bottles, paper cartons, packaging materials, plastic bags, and cans, although heavier debris is transported during storms. The Machado Lake Trash TMDL requires responsible Permittees to implement a Minimum Frequency of Assessment and Collection (MFAC) program, BMPs that comply with the progressive trash reduction schedule, or LARWQCB-approved trash full capture devices. Compliance with the TMDL is numeric and progressive with the WLAs and LAs defined as zero trash discharges in and on the shoreline of Machado Lake. The interim trash reduction compliance schedule as shown in Table A-9 for the responsible Beach Cities WMG Permittees will be assessed based on the approved implementation plan and attainment of progressive trash reductions or full capture BMP installations. Final compliance is to be achieved by March 6, 2016, and every year thereafter; however, with annual WLA WQBEL compliance determinations, final compliance effectively begins on March 7, 2015.
Table A-8 Machado Lake Trash Water Quality-Based Effluent Limitations
Permittees Baseline1 Annual Trash Discharge (uncompressed gals/yr)
March 6, 2012
March 6, 2013
March 6, 2014
March 6, 2015
March 6, 20162
Redondo Beach 18 15 11 7 4 0
Torrance 34,809 27,847 20,885 13,924 6,962 0 1 The Regional Water Board calculated the baseline water quality-based effluent limitations for the Permittees based on the
estimated trash generation rate of 5,334 gallons of uncompressed trash per square mile per year. 2 Permittees shall achieve their final effluent limitation of zero trash discharge for the 2015-2016 storm year and every year
thereafter.
A.1.5 Machado Lake Nutrient TMDL The Machado Lake Nutrient TMDL was adopted by the Regional Board on May 1, 2008, and approved by the State Water Resources Control Board (State Board) on December 2, 2008. Upon approval by the USEPA, the TMDL became effective on March 11, 2009. The Nutrient TMDL was developed to address beneficial use impairments due to eutrophication, algae, ammonia, and odor in Machado Lake which arise due to the enrichment of the lake with nitrogen and phosphorus. The degraded warm water ecosystem is impaired for LARWQCB Basin Plan WARM, REC 1 and REC 2 beneficial uses. The Machado Lake Nutrient TMDL set concentration-based WLAs for in-lake or end-of-pipe compliance options while allowing for a mass-based compliance option, on the condition that parties choosing this option develop the equivalent mass-based WLA, and method of compliance with the WLA, through a Special Study. The WQBEL and RWL WLAs for nutrients in Machado Lake were developed based on the nutrient loading capacity. Table A-10 and Table A-11 present the interim and final annual WQBEL and RWL, respectively. The interim allocations are intended to allow dischargers to implement the measures necessary to achieve the final allocations. The interim WQBEL and RWL are based on current in-lake concentrations and require a reduction in concentration over time.
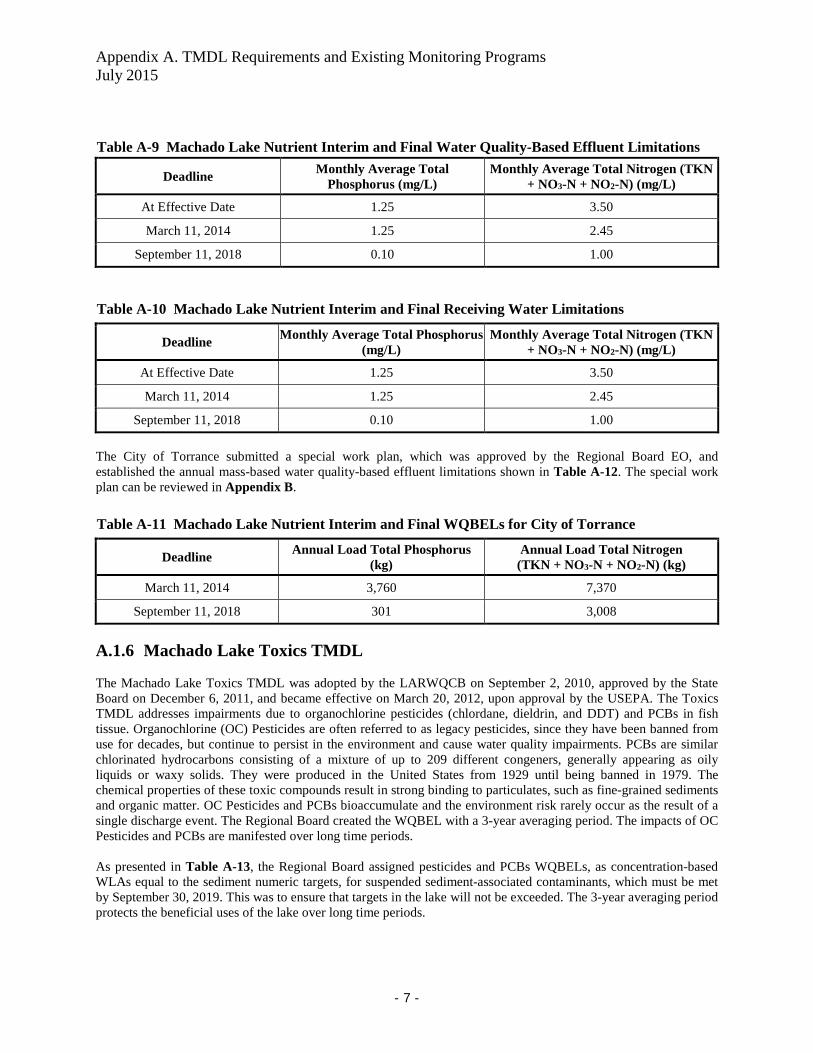
Appendix A. TMDL Requirements and Existing Monitoring Programs July 2015
- 7 -
Table A-9 Machado Lake Nutrient Interim and Final Water Quality-Based Effluent Limitations
Deadline Monthly Average Total
Phosphorus (mg/L) Monthly Average Total Nitrogen (TKN
+ NO3-N + NO2-N) (mg/L)
At Effective Date 1.25 3.50
March 11, 2014 1.25 2.45
September 11, 2018 0.10 1.00
Table A-10 Machado Lake Nutrient Interim and Final Receiving Water Limitations
Deadline Monthly Average Total Phosphorus
(mg/L) Monthly Average Total Nitrogen (TKN
+ NO3-N + NO2-N) (mg/L)
At Effective Date 1.25 3.50
March 11, 2014 1.25 2.45
September 11, 2018 0.10 1.00
The City of Torrance submitted a special work plan, which was approved by the Regional Board EO, and established the annual mass-based water quality-based effluent limitations shown in Table A-12. The special work plan can be reviewed in Appendix B.
Table A-11 Machado Lake Nutrient Interim and Final WQBELs for City of Torrance
Deadline Annual Load Total Phosphorus
(kg) Annual Load Total Nitrogen
(TKN + NO3-N + NO2-N) (kg)
March 11, 2014 3,760 7,370
September 11, 2018 301 3,008
A.1.6 Machado Lake Toxics TMDL The Machado Lake Toxics TMDL was adopted by the LARWQCB on September 2, 2010, approved by the State Board on December 6, 2011, and became effective on March 20, 2012, upon approval by the USEPA. The Toxics TMDL addresses impairments due to organochlorine pesticides (chlordane, dieldrin, and DDT) and PCBs in fish tissue. Organochlorine (OC) Pesticides are often referred to as legacy pesticides, since they have been banned from use for decades, but continue to persist in the environment and cause water quality impairments. PCBs are similar chlorinated hydrocarbons consisting of a mixture of up to 209 different congeners, generally appearing as oily liquids or waxy solids. They were produced in the United States from 1929 until being banned in 1979. The chemical properties of these toxic compounds result in strong binding to particulates, such as fine-grained sediments and organic matter. OC Pesticides and PCBs bioaccumulate and the environment risk rarely occur as the result of a single discharge event. The Regional Board created the WQBEL with a 3-year averaging period. The impacts of OC Pesticides and PCBs are manifested over long time periods. As presented in Table A-13, the Regional Board assigned pesticides and PCBs WQBELs, as concentration-based WLAs equal to the sediment numeric targets, for suspended sediment-associated contaminants, which must be met by September 30, 2019. This was to ensure that targets in the lake will not be exceeded. The 3-year averaging period protects the beneficial uses of the lake over long time periods.
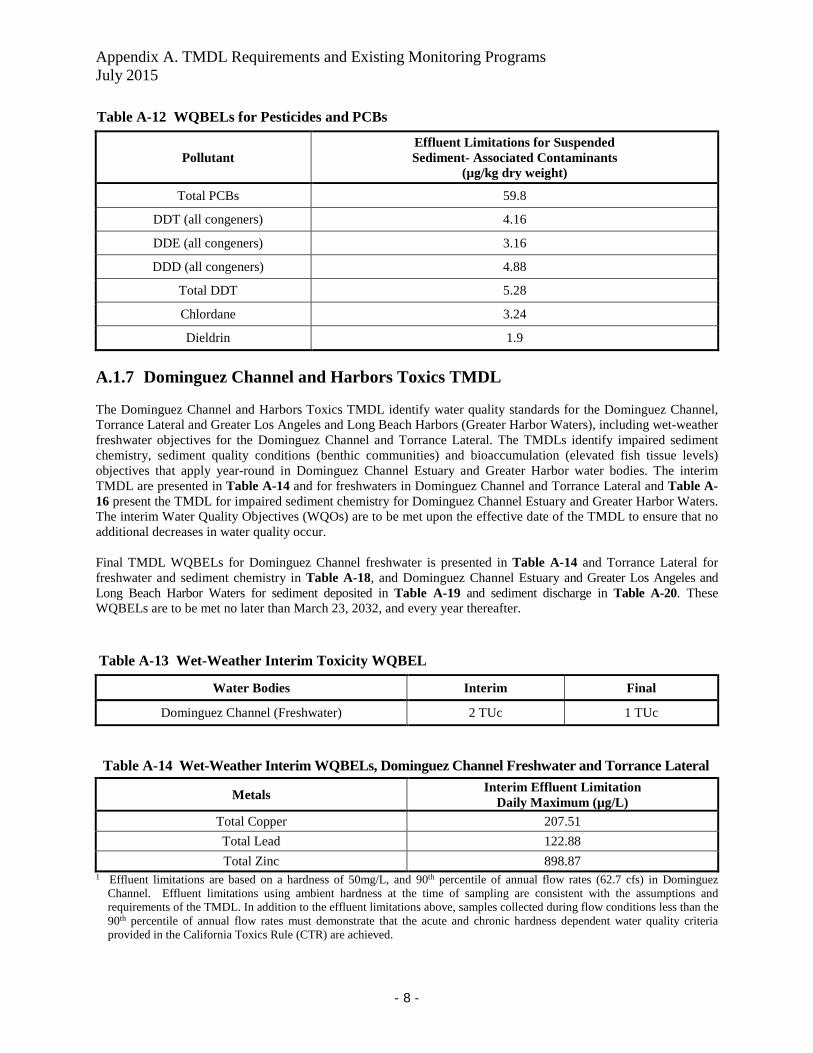
Appendix A. TMDL Requirements and Existing Monitoring Programs July 2015
- 8 -
Table A-12 WQBELs for Pesticides and PCBs
Pollutant Effluent Limitations for Suspended Sediment- Associated Contaminants
(µg/kg dry weight)
Total PCBs 59.8
DDT (all congeners) 4.16
DDE (all congeners) 3.16
DDD (all congeners) 4.88
Total DDT 5.28
Chlordane 3.24
Dieldrin 1.9
A.1.7 Dominguez Channel and Harbors Toxics TMDL The Dominguez Channel and Harbors Toxics TMDL identify water quality standards for the Dominguez Channel, Torrance Lateral and Greater Los Angeles and Long Beach Harbors (Greater Harbor Waters), including wet-weather freshwater objectives for the Dominguez Channel and Torrance Lateral. The TMDLs identify impaired sediment chemistry, sediment quality conditions (benthic communities) and bioaccumulation (elevated fish tissue levels) objectives that apply year-round in Dominguez Channel Estuary and Greater Harbor water bodies. The interim TMDL are presented in Table A-14 and for freshwaters in Dominguez Channel and Torrance Lateral and Table A-16 present the TMDL for impaired sediment chemistry for Dominguez Channel Estuary and Greater Harbor Waters. The interim Water Quality Objectives (WQOs) are to be met upon the effective date of the TMDL to ensure that no additional decreases in water quality occur. Final TMDL WQBELs for Dominguez Channel freshwater is presented in Table A-14 and Torrance Lateral for freshwater and sediment chemistry in Table A-18, and Dominguez Channel Estuary and Greater Los Angeles and Long Beach Harbor Waters for sediment deposited in Table A-19 and sediment discharge in Table A-20. These WQBELs are to be met no later than March 23, 2032, and every year thereafter.
Table A-13 Wet-Weather Interim Toxicity WQBEL
Water Bodies Interim Final
Dominguez Channel (Freshwater) 2 TUc 1 TUc
Table A-14 Wet-Weather Interim WQBELs, Dominguez Channel Freshwater and Torrance Lateral
Metals Interim Effluent Limitation
Daily Maximum (µg/L)
Total Copper 207.51
Total Lead 122.88
Total Zinc 898.87 1 Effluent limitations are based on a hardness of 50mg/L, and 90th percentile of annual flow rates (62.7 cfs) in Dominguez
Channel. Effluent limitations using ambient hardness at the time of sampling are consistent with the assumptions and requirements of the TMDL. In addition to the effluent limitations above, samples collected during flow conditions less than the 90th percentile of annual flow rates must demonstrate that the acute and chronic hardness dependent water quality criteria provided in the California Toxics Rule (CTR) are achieved.
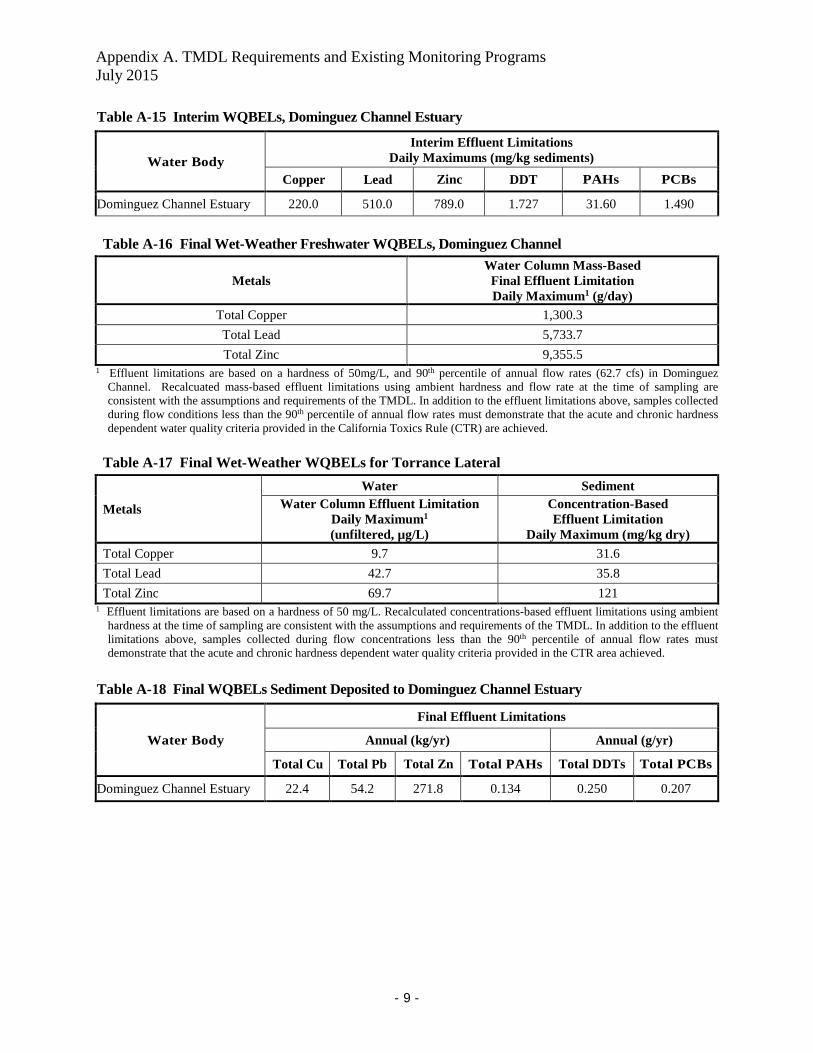
Appendix A. TMDL Requirements and Existing Monitoring Programs July 2015
- 9 -
Table A-15 Interim WQBELs, Dominguez Channel Estuary
Water Body
Interim Effluent Limitations Daily Maximums (mg/kg sediments)
Copper Lead Zinc DDT PAHs PCBs
Dominguez Channel Estuary 220.0 510.0 789.0 1.727 31.60 1.490
Table A-16 Final Wet-Weather Freshwater WQBELs, Dominguez Channel
Metals Water Column Mass-Based
Final Effluent Limitation Daily Maximum1 (g/day)
Total Copper 1,300.3
Total Lead 5,733.7
Total Zinc 9,355.5 1 Effluent limitations are based on a hardness of 50mg/L, and 90th percentile of annual flow rates (62.7 cfs) in Dominguez
Channel. Recalcuated mass-based effluent limitations using ambient hardness and flow rate at the time of sampling are consistent with the assumptions and requirements of the TMDL. In addition to the effluent limitations above, samples collected during flow conditions less than the 90th percentile of annual flow rates must demonstrate that the acute and chronic hardness dependent water quality criteria provided in the California Toxics Rule (CTR) are achieved.
Table A-17 Final Wet-Weather WQBELs for Torrance Lateral
Metals
Water Sediment Water Column Effluent Limitation
Daily Maximum1 (unfiltered, µg/L)
Concentration-Based Effluent Limitation
Daily Maximum (mg/kg dry)
Total Copper 9.7 31.6
Total Lead 42.7 35.8
Total Zinc 69.7 121 1 Effluent limitations are based on a hardness of 50 mg/L. Recalculated concentrations-based effluent limitations using ambient
hardness at the time of sampling are consistent with the assumptions and requirements of the TMDL. In addition to the effluent limitations above, samples collected during flow concentrations less than the 90th percentile of annual flow rates must demonstrate that the acute and chronic hardness dependent water quality criteria provided in the CTR area achieved.
Table A-18 Final WQBELs Sediment Deposited to Dominguez Channel Estuary
Water Body
Final Effluent Limitations
Annual (kg/yr) Annual (g/yr)
Total Cu Total Pb Total Zn Total PAHs Total DDTs Total PCBs
Dominguez Channel Estuary 22.4 54.2 271.8 0.134 0.250 0.207
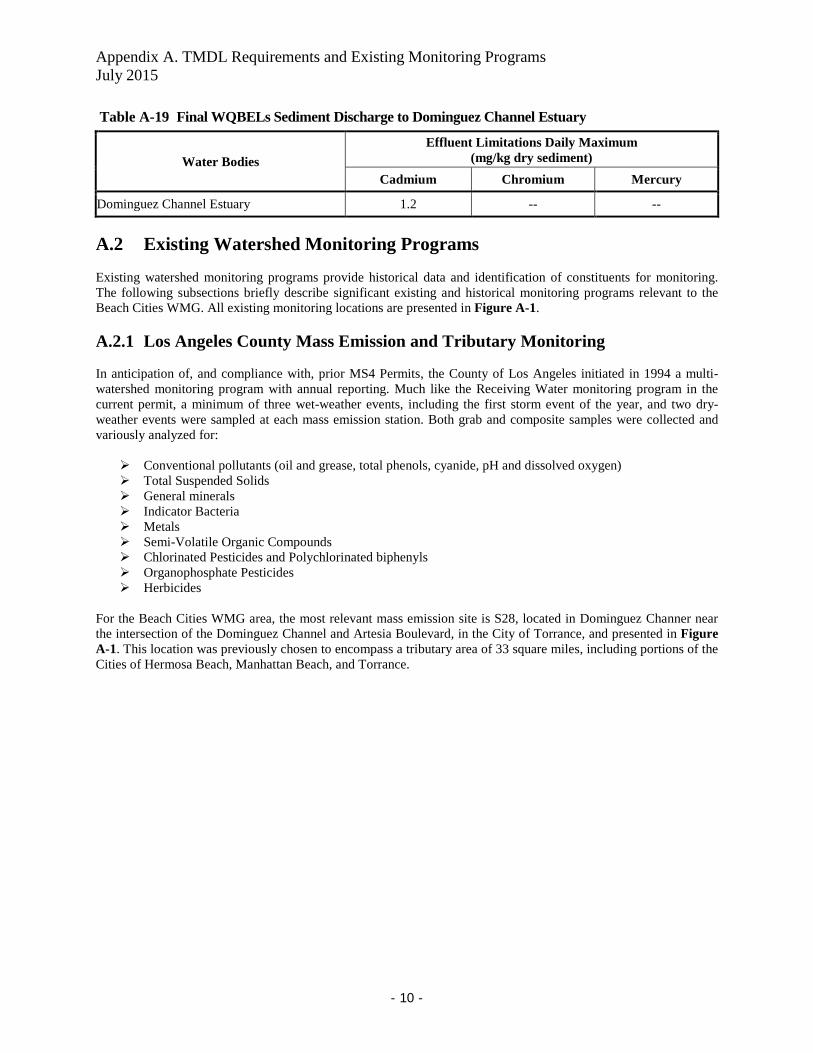
Appendix A. TMDL Requirements and Existing Monitoring Programs July 2015
- 10 -
Table A-19 Final WQBELs Sediment Discharge to Dominguez Channel Estuary
Water Bodies Effluent Limitations Daily Maximum
(mg/kg dry sediment)
Cadmium Chromium Mercury
Dominguez Channel Estuary 1.2 -- --
A.2 Existing Watershed Monitoring Programs Existing watershed monitoring programs provide historical data and identification of constituents for monitoring. The following subsections briefly describe significant existing and historical monitoring programs relevant to the Beach Cities WMG. All existing monitoring locations are presented in Figure A-1.
A.2.1 Los Angeles County Mass Emission and Tributary Monitoring In anticipation of, and compliance with, prior MS4 Permits, the County of Los Angeles initiated in 1994 a multi-watershed monitoring program with annual reporting. Much like the Receiving Water monitoring program in the current permit, a minimum of three wet-weather events, including the first storm event of the year, and two dry-weather events were sampled at each mass emission station. Both grab and composite samples were collected and variously analyzed for:
Conventional pollutants (oil and grease, total phenols, cyanide, pH and dissolved oxygen) Total Suspended Solids General minerals Indicator Bacteria Metals Semi-Volatile Organic Compounds Chlorinated Pesticides and Polychlorinated biphenyls Organophosphate Pesticides Herbicides
For the Beach Cities WMG area, the most relevant mass emission site is S28, located in Dominguez Channer near the intersection of the Dominguez Channel and Artesia Boulevard, in the City of Torrance, and presented in Figure A-1. This location was previously chosen to encompass a tributary area of 33 square miles, including portions of the Cities of Hermosa Beach, Manhattan Beach, and Torrance.
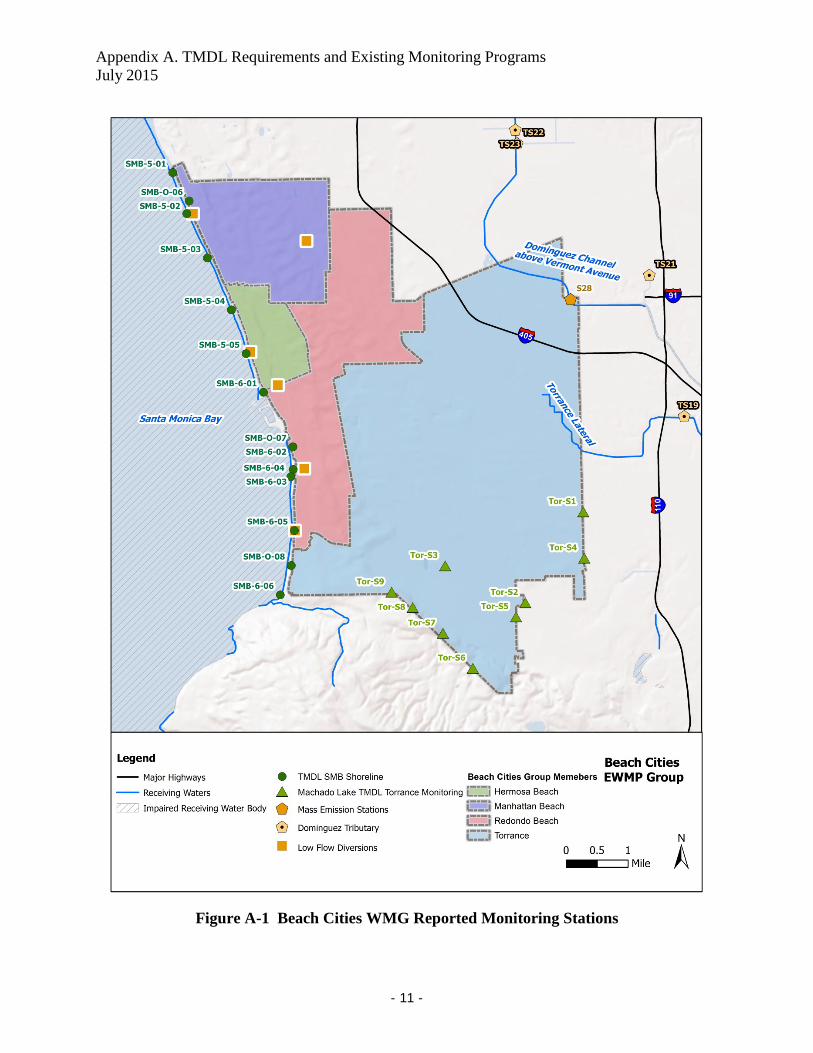
Appendix A. TMDL Requirements and Existing Monitoring Programs July 2015
- 11 -
Figure A-1 Beach Cities WMG Reported Monitoring Stations
Appendix A. TMDL Requirements and Existing Monitoring Programs July 2015
- 12 -
A.2.2 Santa Monica Bay Beaches Bacteria TMDL Shoreline Monitoring The Los Angeles County Department of Health Services (LACDHS) and Los Angeles County Sanitation Districts (LACSD) historically monitored shoreline water quality at 55 sites along the Santa Monica Bay and Palos Verdes Peninsula (Attachment A to Resolution No. 2002-022). In 1998, the Santa Monica Bay Beaches were listed as impaired in the 1998 Clean Water Act 303(d) list of impaired waters due to excessive coliform bacteria. In 2003, following USEPA approval, the Santa Monica Bay Beaches Bacteria TMDL for dry- and wet-weather conditions became effective. To comply with the requirements of the TMDL, the associated Jurisdictional Groups developed and implemented the Coordinated Shoreline Monitoring Plan (CSMP). Currently the LACDHS and a Private Laboratory monitor water quality at eleven Jurisdictional Group 5 and 6 sites within the Beach Cities WMG area. A description of these monitoring sites is presented in Table A-21 and shown in Figure A-1.
Table A-20 Santa Monica Bay Beaches Bacteria TMDL Monitoring Sites
Station Name
JG Type LFD Sampling Agency
Location Description Sample
Schedule
SMB 5-1# 5 Open Beach No Private Lab 40th Street, Manhattan Beach Weekly
SMB 5-2 5 Point Zero Yes(2) LACDHS 27/28th Street extended, Manhattan Beach
Daily
SMB 5-3# 5 Point Zero Yes Private Lab 50 yards south of Manhattan Beach Pier Weekly
SMB 5-4# 5 Open Beach No LACDHS 26th Street extended, Hermosa Beach Weekly
SMB 5-5# 5 Open Beach Yes Private Lab 50 yards south of Hermosa Beach Pier Weekly
SMB 6-1 6 Point Zero Yes LACDHS Herondo Street extended (at Herondo drain)
Daily
SMB 6-2# 6 Open Beach No Private Lab 50 yards south of Redondo Beach Pier Weekly
SMB 6-3 6 Point Zero Yes Private Lab Project of Sapphire Street drain Weekly
SMB 6-4 6 Open Beach No LACDHS Topaz Street extended (north of groin/jetty)
Weekly
SMB 6-5# 6 Point Zero Yes Private Lab Avenue I, Redondo Beach Weekly
SMB 6-6# 6 Open Beach No Private Lab Malaga Cove Weekly # Monitoring locations subject to anti-degradation implementation provision in the TMDL.
A.2.3 Machado Lake Nutrients and Toxics TMDL Monitoring The Machado Lake Nutrients and Toxics TMDLs named the Cities of Redondo Beach and Torrance, and LACFCD, within Beach Cities WMG, as responsible parties. These three agencies conducted the Machado Lake Nutrient TMDL Special Study and developed a combined monitoring and reporting plan for the two TMDLs. Nine water quality sampling stations (Tor-S1 through Tor-S9), shown in Figure A-1, are sampled for nutrient and toxic analytes monthly and during qualifying wet-weather events. During these visits flow sensor data at each site is downloaded and the sensors serviced. Appendix B contains the monitoring plan and special study that have been submitted to the Regional Board for approval.
A.2.5 Bight Regional Monitoring Regional monitoring, of the California Bight occurred in 1994, 1998, 2003, 2008, and 2013, with the objectives of the 2013 Bight Program (SCCWRP, 2013) being to answer the following questions:
1. What is the extent and magnitude of direct impact from sediment contaminants? 2. What is the trend in extent and magnitude of direct impacts from sediment contaminants? 3. What is the indirect risk of sediment contaminants to seabirds?
Appendix A. TMDL Requirements and Existing Monitoring Programs July 2015
- 13 -
Sampling occurred at the sites shown in Figure A-2 and included analyses for metals, PCBs, PAHs, polybrominated diphenyl ethers (PBDEs), chlorinated hydrocarbons, total organic carbon (TOC), nitrogen, phosphorus, and sediment grain size.
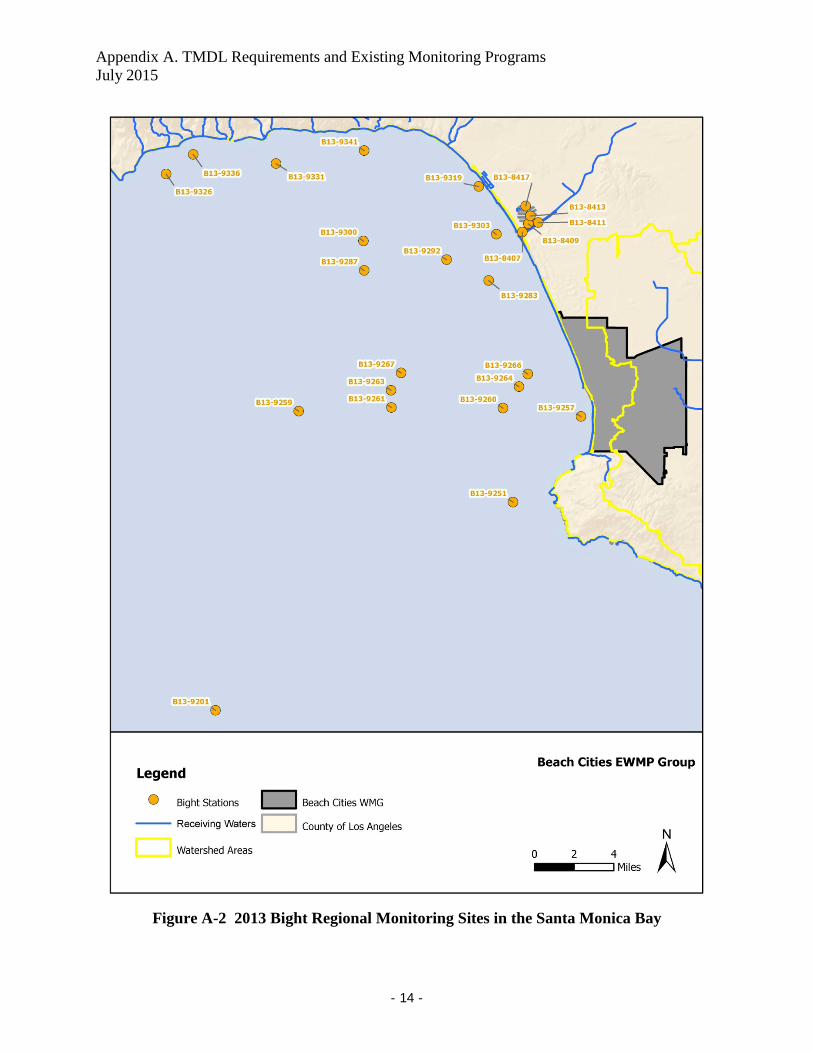
Appendix A. TMDL Requirements and Existing Monitoring Programs July 2015
- 14 -
Figure A-2 2013 Bight Regional Monitoring Sites in the Santa Monica Bay
Beach Cities CIMP Appendix B
Monitoring and Reporting Plan, Machado Lake Nutrients and Toxics TMDL / Special Study Work
Plan, Machado Lake Nutrient TMDL
July 2015
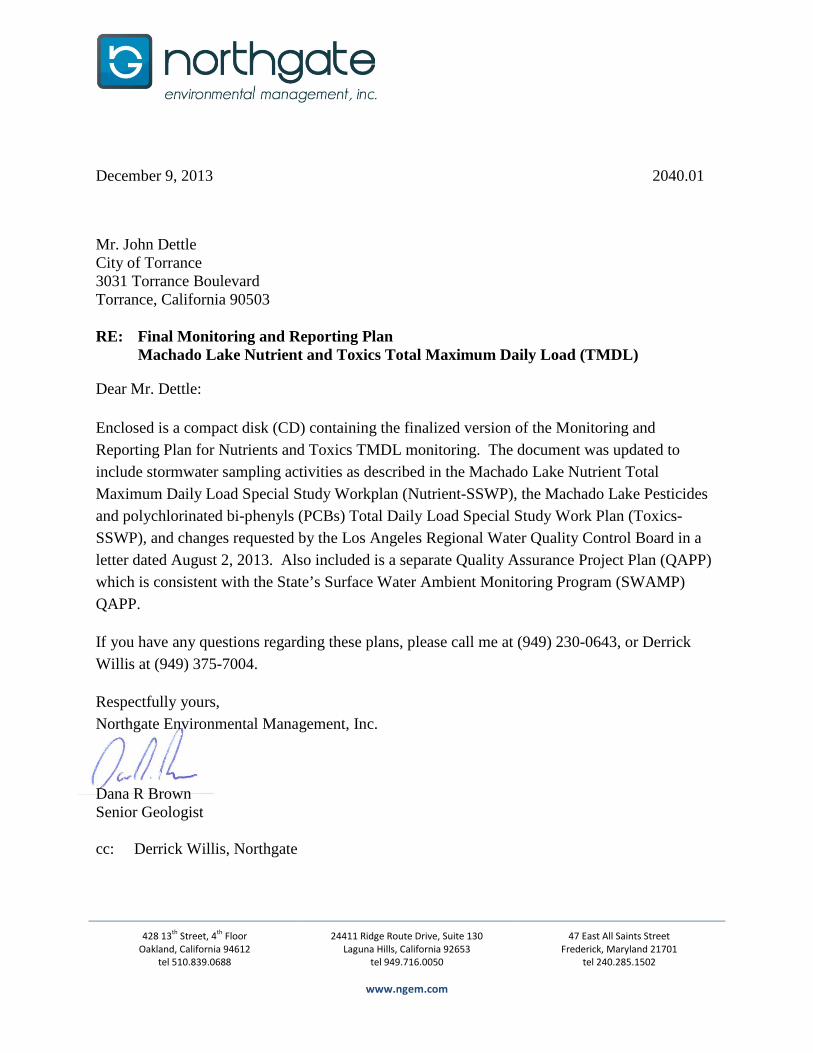
428 13th Street, 4th Floor Oakland, California 94612
tel 510.839.0688
24411 Ridge Route Drive, Suite 130 Laguna Hills, California 92653
tel 949.716.0050
www.ngem.com
47 East All Saints Street Frederick, Maryland 21701
tel 240.285.1502
December 9, 2013 2040.01
Mr. John Dettle City of Torrance 3031 Torrance Boulevard Torrance, California 90503 RE: Final Monitoring and Reporting Plan
Machado Lake Nutrient and Toxics Total Maximum Daily Load (TMDL)
Dear Mr. Dettle:
Enclosed is a compact disk (CD) containing the finalized version of the Monitoring and Reporting Plan for Nutrients and Toxics TMDL monitoring. The document was updated to include stormwater sampling activities as described in the Machado Lake Nutrient Total Maximum Daily Load Special Study Workplan (Nutrient-SSWP), the Machado Lake Pesticides and polychlorinated bi-phenyls (PCBs) Total Daily Load Special Study Work Plan (Toxics-SSWP), and changes requested by the Los Angeles Regional Water Quality Control Board in a letter dated August 2, 2013. Also included is a separate Quality Assurance Project Plan (QAPP) which is consistent with the State’s Surface Water Ambient Monitoring Program (SWAMP) QAPP.
If you have any questions regarding these plans, please call me at (949) 230-0643, or Derrick Willis at (949) 375-7004.
Respectfully yours, Northgate Environmental Management, Inc.
Dana R Brown Senior Geologist cc: Derrick Willis, Northgate
428 13th Street, 4th Floor Oakland, California 94612
tel 510.839.0688
24411 Ridge Route Drive, Suite 130 Laguna Hills, California 92653
tel 949.716.0050
www.ngem.com
47 East All Saints Street Frederick, Maryland 21701
tel 240.285.1502
`
MONITORING AND REPORTING PLAN Machado Lake Nutrient and Toxics Total Maximum Daily Load (TMDL) Torrance, California
Prepared For:
City of Torrance 3031 Torrance Boulevard
Torrance, CA 90503
Prepared By:
Northgate Environmental Management, Inc. 24411 Ridge Route Drive, Suite 130
Laguna Hills, California 92653
December 9, 2013
Project No. 2040.01
2040.01
MONITORING AND REPORTING PLAN
Machado Lake Nutrient and Toxics Total Maximum Daily Load (TMDL)
Torrance, California
December 9, 2013
Prepared For:
City of Torrance 3031 Torrance Boulevard
Torrance, California 90503
Prepared By:
Northgate Environmental Management, Inc. 24411 Ridge Route Drive, Suite 130
Laguna Hills, California 92653
Derrick S. Willis
Principal
Dana R. Brown, P.G. Project Manager
Monitoring and Reporting Plan Nutrient and Toxics TMDL, City of Torrance, California
i December 9, 2013
TABLE OF CONTENTS
ABBREVIATIONS AND ACRONYMS .................................................................................... iv
1.0 INTRODUCTION ................................................................................................................ 1 1.1 Background ................................................................................................................... 1
1.1.1 Nutrient TMDL ................................................................................................. 2 1.1.2 Toxics TMDL ................................................................................................... 2
1.2 Summary of Proposed Activities .................................................................................. 3 1.2.1 Nutrient TMDL Monitoring Summary ............................................................. 3 1.2.2 Toxics TMDL Monitoring Summary................................................................ 4
1.3 Work Plan Organization ............................................................................................... 4
2.0 PROJECT OBJECTIVES ................................................................................................... 5
3.0 SAMPLING PROCEDURES .............................................................................................. 6 3.1 Sampling Methodology ................................................................................................. 6
3.1.1 Nutrient TMDL Dry Weather Sampling ........................................................... 6 3.1.1.1 Sampling Equipment ........................................................................ 6 3.1.1.2 Sampling Procedures ........................................................................ 6
3.1.2 Nutrient TMDL Wet Weather Sampling .......................................................... 8 3.1.3 Toxics TMDL Wet Weather Sampling ............................................................. 8
3.2 Flow Measurement........................................................................................................ 9 3.2.1 Flow Measurement Methods............................................................................. 9
3.2.1.1 Flow Measurement in Subsurface Storm Drains ............................ 10 3.2.1.2 Flow Measurement in Open Channels ........................................... 10 3.2.1.3 Flow Measurement – Sheet Flow Conditions ................................ 10
3.3 Decontamination Procedures ...................................................................................... 11 3.4 Sample Containers and Preservation .......................................................................... 11
3.4.1 Nutrient TMDL Sample Containers and Preservation .................................... 11 3.4.2 Toxics TMDL Sample Containers and Preservation ...................................... 12
3.5 Sample Handling, Packaging, and Shipping ............................................................... 13 3.6 Sample Naming Convention ....................................................................................... 14 3.7 Chain-of-Custody Procedures ..................................................................................... 14 3.8 Analytical Methods and Limits ................................................................................... 15
3.8.1 Nutrient TMDL Monitoring ............................................................................ 15 3.8.2 Toxics TMDL Monitoring .............................................................................. 16 3.8.3 Field Measurements ........................................................................................ 16
3.9 No Sample Taken Procedures ..................................................................................... 17
4.0 MONITORING SITES ...................................................................................................... 18 4.1 Station Tor-S1 (RDD 339) .......................................................................................... 19 4.2 Station Tor-S2 (Project 2) ........................................................................................... 19 4.3 Station Tor-S3 (Project 245) ....................................................................................... 20
Monitoring and Reporting Plan Nutrient and Toxics TMDL, City of Torrance, California
ii December 9, 2013
4.4 Station Tor-S4 (Project 8101) ..................................................................................... 21 4.5 Station Tor-S5 (Project 540) ....................................................................................... 22 4.6 Station Tor-S6 (PD 1032) ........................................................................................... 23 4.7 Station Tor-S7 ............................................................................................................. 23 4.8 Station Tor-S8 ............................................................................................................. 24 4.9 Station Tor-S9 ............................................................................................................. 25
5.0 MONITORING SCHEDULE AND FREQUENCY ....................................................... 26 5.1 Nutrient TMDL Monitoring ........................................................................................ 27
5.1.1 Dry Weather Sampling ................................................................................... 28 5.1.2 Wet Weather Sampling ................................................................................... 28 5.1.3 Pumping Event Sampling ............................................................................... 28
5.2 Toxics TMDL Monitoring .......................................................................................... 29
6.0 QA/QC ................................................................................................................................. 30 6.1 Field Sampling QA/QC Procedures ............................................................................ 30
6.1.1 Field Duplicates .............................................................................................. 30 6.1.2 Matrix Spike/Matrix Spike Duplicates ........................................................... 31 6.1.3 Equipment Blanks ........................................................................................... 31 6.1.4 Temperature Blanks ........................................................................................ 31
6.2 Laboratory QA/QC Procedures................................................................................... 32 6.2.1 Method Blank.................................................................................................. 32 6.2.2 Spikes .............................................................................................................. 32 6.2.3 Laboratory Sample Custody ........................................................................... 33
7.0 REFERENCES ................................................................................................................... 34
TABLES
1 Nutrient TMDL Mass-Based Waste Load Allocations ................................................. 2
2 Toxics TMDL Concentration-Based Waste Load Allocations ..................................... 3
3 Analytical Methods, Bottle Types, Preservatives and Holding Times ....................... 12
4 Sample Naming Convention ....................................................................................... 14
5 Nutrient TMDL Monitoring Analytical Methods and Limits ..................................... 15
6 Toxics TMDL Monitoring Analytical Methods and Limits ....................................... 16
7 Field Measurements .................................................................................................... 16
8 Monitoring Site Summary........................................................................................... 18
9 Monitoring Schedule and Frequency .......................................................................... 26
10 QA/QC Sampling Summary ....................................................................................... 30
Monitoring and Reporting Plan Nutrient and Toxics TMDL, City of Torrance, California
iii December 9, 2013
FIGURES
1 Site Location Map
2 Water Quality Monitoring Sites: Tor-S1, RDD 339
3 Water Quality Monitoring Sites: Tor-S2, Project 2
4 Water Quality Monitoring Sites: Tor-S3, Project 245
5 Water Quality Monitoring Sites: Tor-S4, Project 8101
6 Water Quality Monitoring Sites: Tor-S5, Project 540
7 Water Quality Monitoring Sites: Tor-S6, PD 1032
8 Water Quality Monitoring Sites: Tor-S7
9 Water Quality Monitoring Sites: Tor-S8
10 Water Quality Monitoring Sites: Tor-S9
APPENDICES
A Site-Specific Health and Safety Plan
B Field Forms
C Quality Assurance Project Plan
Monitoring and Reporting Plan Nutrient and Toxics TMDL, City of Torrance, California
iv December 9, 2013
ABBREVIATIONS AND ACRONYMS
BMP Best Management Practices CLP Contract Laboratory Program COC Chain-of-Custody DDD Dichlorodiphenyldichloroethane DDE Dichlorodiphenyldichloroethylene DDT Dichlorodiphenyltrichloroethane EB Equipment Blank FD Field Duplicate Sample H2SO4 Sulfuric Acid HASP Health and Safety Plan kg Kilogram LACDPW Los Angeles County Department of Public Works LCS Laboratory Control Sample MDL Method Detection Limit
µmhos/cm Micro ohms per Centimeter
mg/l Milligram per Liter ml Milliliter MRP Monitoring and Reporting Plan MS4 Municipal Separate Stormwater Systems MS/MSD Matrix Spike/Matrix Spike Duplicate NH3+ Ammonia-Ammonium NO2 Nitrite NO3 Nitrate Northgate Northgate Environmental Management, Inc. Nutrient TMDL Machado Lake Nutrient Total Maximum Daily Load NTU Nephelometric Turbidity Unit OCP Organochlorine Pesticide PCB Polychlorinated Biphenyl PO4 Phosphate QAPP Quality Assurance Project Plan QA Quality Assurance QC Quality Control RL Laboratory Reporting Limit RWQCB Los Angeles Regional Water Quality Control Board SSWP Special Study Work Plan
Monitoring and Reporting Plan Nutrient and Toxics TMDL, City of Torrance, California
v December 9, 2013
SWAMP Surface Water Ambient Monitoring Program TB Temperature Blank TKN Total Kjeldahl Nitrogen TMDL Total Maximum Daily Load TN Total Nitrogen TOC Total Organic Carbon Toxics TMDL Machado Lake Pesticides and PCBs Total Maximum Daily Load TP Total Phosphorus TSS Total Suspended Solids USEPA United States Environmental Protection Agency VOA Volatile Organic Analysis WLA Waste Load Allocation
Monitoring and Reporting Plan Nutrient and Toxics TMDL, City of Torrance, California
1 December 9, 2013
1.0 INTRODUCTION
Northgate Environmental Management, Inc. (Northgate) has prepared this Monitoring and Reporting Program (MRP) for the City of Torrance (the City) to comply with provisions of both the Machado Lake Nutrient Total Maximum Daily Load (Nutrient TMDL), and the Machado Lake Pesticides and polychlorinated biphenyls (PCBs) Total Maximum Daily Load (Toxics TMDL).
The mass-based waste load allocation (WLA) compliance alternative for the Nutrient TMDL is currently addressed in the ongoing work performed as part of the Special Study Work Plan (SSWP) for the Pre-Best Management Practices Implementation Study Period (Carollo, 2011a). The Toxics TMDL will be addressed in work performed under this MRP.
The MRP outlines the specific activities to be performed and the procedures to be used for performing the Nutrient and Toxics TMDL sampling. The MRP documents sample collection methods, analytical procedures, data analysis, and data reporting. Appendix A of the MRP contains a site-specific Health and Safety Plan (HASP) that includes confined space entry procedures and protocols for working inside the below ground portions of manholes.
1.1 Background
Machado Lake is located in the City of Los Angeles’ Ken Malloy Harbor Regional Park. It is approximately 40 acres in size, and averages approximately 3 feet in depth. Machado Lake is listed on the 1998, 2002, and 2006 Clean Water Act Section 303(d) lists of impaired water bodies due to eutrophic conditions, algae and odors (Nutrients): and chlordane, dichlorodiphenyltrichloroethane (DDT), dieldrin, Chem A, and PCBs in tissue; and impaired sediment due to chlordane, DDT, and PCBs (Toxics). The listed impairments are caused by the overloading of nutrients, such as nitrogen and phosphorus, resulting in excessive algal growth which leads to increased turbidity, decreased levels of oxygen, and odor problems.
The City is situated in the western portion of the Machado Lake subwatershed, which is bounded to the north by the City, to the east by the City of Los Angeles, and to the south and west, by the Pacific Ocean. The City is located about 15 miles south of Downtown Los Angeles, in southern Los Angeles County, just north of the Palos Verdes Hills. The City was incorporated on May 12, 1921, and is just over 20.5 square miles in area. The City is bounded by Redondo Beach on the west and north, Lawndale and Gardena on the north, Los Angeles on the east, Lomita to the southeast, and Rolling Hills Estates and Palos Verdes Estates on the south. The City is also bounded by approximately 4,000 feet of Santa Monica Bay coastline.
Monitoring and Reporting Plan Nutrient and Toxics TMDL, City of Torrance, California
2 December 9, 2013
The City’s stormwater conveyance systems are interconnected with neighboring city systems. Neighboring cities located at generally higher elevation such as Rolling Hills Estates and Palos Verde Estates discharge stormwater into stormwater conveyance systems located within the City’s boundaries. Figure 1 shows a regional site location map of the City.
The Regional Water Quality Control Board – Los Angeles Region (RWQCB) established TMDLs for Machado Lake for algae, ammonia and odors (Nutrients) on May 1, 2008 (RWQCB, 2008), and for Pesticides and PCBs (Toxics) on September 2, 2010 (RWQCB, 2010).
1.1.1 Nutrient TMDL
The City has elected to establish annual mass-based WLAs for Nutrients equivalent to monthly average concentrations of 0.1 milligrams per liter (mg/l) total phosphorus (TP) and 1.0 mg/l total nitrogen (TN) based on approved flow conditions. When the concentration-based WLAs are met under the approved flow condition of 8.45 cubic hectometers per year, the annual mass of the TP discharged to Machado Lake will be 845 kilograms (kg) and the annual mass of TN discharged to the lake will be 8,450 kg. The City mass-based WLAs will be proportional to the City owned area in the sub-watershed. The City area accounts for 35.6 percent of the Machado Lake Watershed. Table 1 lists the interim and final WLAs based on this area.
Table 1: Nutrient TMDL Mass-Based Waste Load Allocations Responsible Party Years after TMDL
Effective Date Total
Phosphorus (kg) Total Nitrogen
(kg) City of Torrance 5 3,760 7,370
9.5 (final WLAs) 301 3,008 Notes: mg/l = milligrams per liter
1.1.2 Toxics TMDL
The Toxics TMDL assigned WLAs for municipal separate storm sewer systems (MS4) permitees as concentration-based allocations (equal to the sediment numeric targets) for suspended sediment-associated contaminants as shown in Table 2.
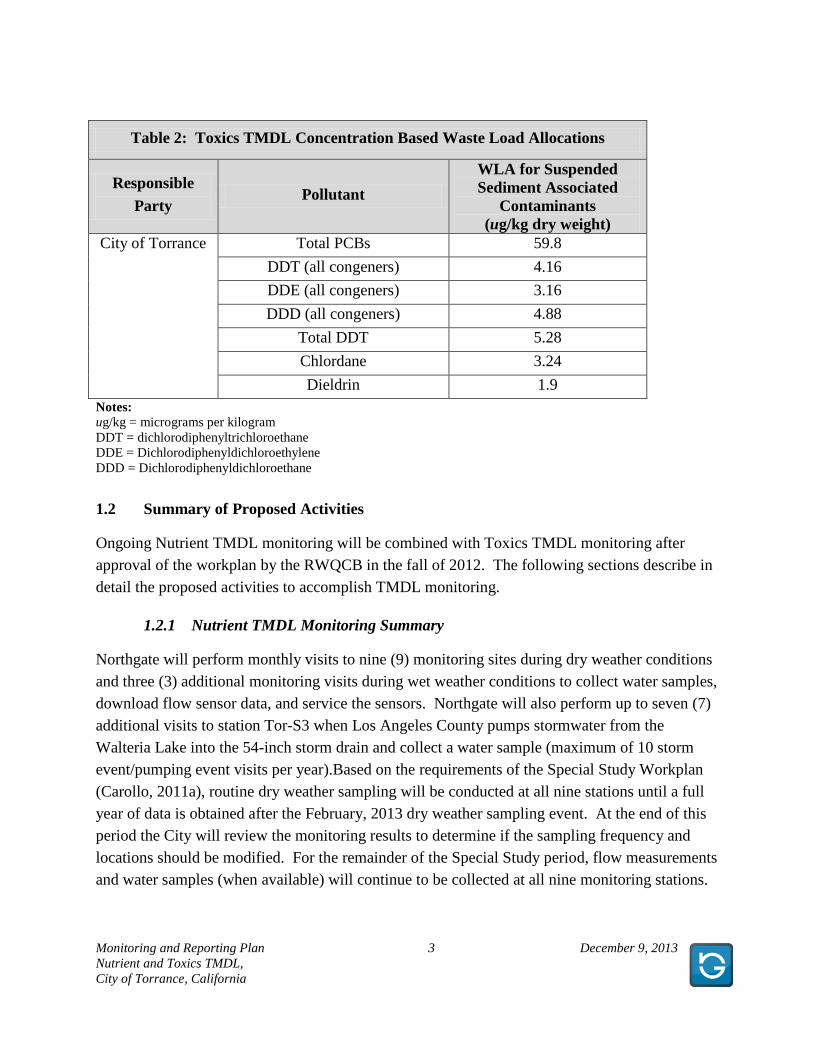
Monitoring and Reporting Plan Nutrient and Toxics TMDL, City of Torrance, California
3 December 9, 2013
Table 2: Toxics TMDL Concentration Based Waste Load Allocations
Responsible
Party Pollutant
WLA for Suspended Sediment Associated
Contaminants (ug/kg dry weight)
City of Torrance Total PCBs 59.8
DDT (all congeners) 4.16
DDE (all congeners) 3.16
DDD (all congeners) 4.88
Total DDT 5.28
Chlordane 3.24
Dieldrin 1.9 Notes: ug/kg = micrograms per kilogram DDT = dichlorodiphenyltrichloroethane DDE = Dichlorodiphenyldichloroethylene DDD = Dichlorodiphenyldichloroethane
1.2 Summary of Proposed Activities
Ongoing Nutrient TMDL monitoring will be combined with Toxics TMDL monitoring after approval of the workplan by the RWQCB in the fall of 2012. The following sections describe in detail the proposed activities to accomplish TMDL monitoring.
1.2.1 Nutrient TMDL Monitoring Summary
Northgate will perform monthly visits to nine (9) monitoring sites during dry weather conditions and three (3) additional monitoring visits during wet weather conditions to collect water samples, download flow sensor data, and service the sensors. Northgate will also perform up to seven (7) additional visits to station Tor-S3 when Los Angeles County pumps stormwater from the Walteria Lake into the 54-inch storm drain and collect a water sample (maximum of 10 storm event/pumping event visits per year).Based on the requirements of the Special Study Workplan (Carollo, 2011a), routine dry weather sampling will be conducted at all nine stations until a full year of data is obtained after the February, 2013 dry weather sampling event. At the end of this period the City will review the monitoring results to determine if the sampling frequency and locations should be modified. For the remainder of the Special Study period, flow measurements and water samples (when available) will continue to be collected at all nine monitoring stations.
Monitoring and Reporting Plan Nutrient and Toxics TMDL, City of Torrance, California
4 December 9, 2013
Details of the monitoring locations, frequency of sampling, and sampling parameters are included in Sections 3.0 to 5.0 of the MRP.
1.2.2 Toxics TMDL Monitoring Summary
The Toxics TMDL monitoring will consist of two phases of wet weather sampling designed to collect suspended solids for the analysis of pollutants in bulk sediments. Phase I monitoring will be conducted for a two (2) year period, and Phase II monitoring will commence once Phase I monitoring has been completed. In Phase I monitoring, samples will be collected during three (3) qualifying wet weather events at all stations for the first year, including the first significant storm event of the season. In the second year of Phase I activity samples will still be collected at stations representing discharge from the City during three qualifying wet weather events (Tor-S1, Tor-S2, Tor-S4, and Tor-S5), but the remaining stations will only be sampled during one qualifying wet weather event. During Phase II monitoring the number of sampling events will be decreased to one per year, and the frequency decreased to every other year, and all nine sampling stations will be visited.
At the end of the fourth year of wet weather monitoring, the City will assess the data to determine if the monitoring schedule should be altered. Details of the monitoring locations, frequency of sampling, and sampling parameters are included in Sections 3.0 to 5.0 of the MRP.
1.3 Work Plan Organization
Section 2.0 presents the MRP objectives. Section 3.0 summarizes the field methods and materials to be used in performing the scope of work. Section 4.0 summarizes the sampling locations, and Section 5.0 presents the sampling schedule and frequency. Section 6.0 presents the quality assurance/quality control (QA/QC) procedures to be used in the performance of this work.
Monitoring and Reporting Plan Nutrient and Toxics TMDL, City of Torrance, California
5 December 9, 2013
2.0 PROJECT OBJECTIVES
The objective of this project is to ensure that the City is in compliance with the requirements of the Machado Lake Nutrient and Toxics TMDLs. The specific objectives of the work to be performed under this MRP are:
• Monitor attainment of WLAs as required by the TMDLs;
• Guide the design of future implementation actions;
• Monitor the effectiveness of implementation actions in improving water quality; and
• Guide pollutant source investigations.
Knowledge gained through the Special Studies (Carollo, 2011a and 2011b) will be used to modify the monitoring approach, number and location of monitoring sites, and sample collection techniques to adequately characterize and document the City’s pollutant loads, progress toward pollutant load reductions, and improvement in water and sediment quality.
Monitoring and Reporting Plan Nutrient and Toxics TMDL, City of Torrance, California
6 December 9, 2013
3.0 SAMPLING PROCEDURES
This section documents the procedural and analytical requirements for sampling events performed to collect water quality data as part of the MRP. All work conducted as part of the project is to be in accordance with provisions of the HASP, attached as Appendix A.
3.1 Sampling Methodology
Sampling will be conducted by a team of at least two workers using a combination of non-dedicated and dedicated sampling equipment. All sampling will be conducted in a manner that minimizes the possibility of sample contamination. Sampling equipment will be decontaminated prior to use. Grab samples will be collected in laboratory-supplied pre-preserved containers. Other types of discrete samples will also be collected and described separately.
After collection, the sample containers will be labeled, sealed in plastic bags, and placed in a cooler with ice for transportation under proper chain-of-custody (COC) protocol to the analytical laboratory. QA/QC samples will be collected and analyzed for each sampling event. Field personnel shall adhere to established sample collection protocols to ensure the collection of representative and uncontaminated samples for laboratory analysis. Deviations from the standard protocol must be recorded on the Water Sample Data Sheet at the time of sampling. The following sections describe the specific protocols for stormwater sample collection and handling.
3.1.1 Nutrient TMDL Dry Weather Sampling
3.1.1.1 Sampling Equipment
Sampling equipment shall typically consist of reusable polyethylene dippers or polyethylene buckets suspended on a disposable rope. Non-dedicated sampling equipment shall be decontaminated prior to each use according to the methods listed in Section 3.3 Decontamination Procedures. Non-dedicated sampling equipment will be stored and transported in resealable plastic bags to prevent contamination.
3.1.1.2 Sampling Procedures
A checklist is to be used by the field team at each monitoring site to ensure that the team members comply with all appropriate health and safety protocols during the sampling task. A Water Sample Data Sheet will also be used to document the sample collection, flow
Monitoring and Reporting Plan Nutrient and Toxics TMDL, City of Torrance, California
7 December 9, 2013
measurement, and water conditions. The checklist for site visits and Water Sample Data Sheets are attached in Appendix B.
Upon arrival at a monitoring site, the sampling team will inspect the location for general safety and deploy traffic cones to delineate the working zone around the vehicle, and alert drivers of the potential hazard. Prior to water sample collection, specific observations concerning the weather, water conditions, and flow conditions will be recorded on the Water Sample Data Sheet. Care must be taken to avoid disturbing the channel sediment or debris on the walls of the manhole access port prior to sample collection.
Grab samples will be collected from approximately mid-channel and at a depth where the flow is greatest (typically 60% of total depth). If the monitoring site lacks sufficient flow no sample will be collected and observations of the flow width and velocity (if measurable) will be recorded on the Water Sample Data Sheet. Pools of water with no visible flow should not be sampled as data collected at those locations may not represent surface flows. Care should be exercised to not capture algae, sediment, or other particulates from the bottom or sides of the channel to avoid bias in the collected sample.
A grab sample of the water will be collected by dipping the sampler into the water and emptying it three times to acclimate, then dipping a sample and pouring directly into the sample container containing preservative acid. The sampler will be held facing upstream during sample collection, and retrieved quickly to avoid mixing of the water. Care must be taken not to touch the sampler, or allow the sampler to touch vegetation, the rim or sides of the manhole, or other objects that would contaminate it as the sample is retrieved.
After filling and capping the sample bottles, the bottles will be labeled and placed in resealable plastic bags. The bags will be placed upright in a cooler and the samples surrounded with bagged ice so that the ice is around, beside, and above the samples. The samples will then be entered on the COC record and the sample cooler secured from unauthorized access.
Following sample collection, flow measurements stored in the dedicated flow sensors will be downloaded and the sensor data reset. At some locations, direct flow measurements will be performed with field-portable equipment and the results compared to the flow sensor data. Section 3.2 describes methods and procedures for performing flow measurements in subsurface storm drains and open channels.
Monitoring and Reporting Plan Nutrient and Toxics TMDL, City of Torrance, California
8 December 9, 2013
3.1.2 Nutrient TMDL Wet Weather Sampling
Nutrient TMDL wet weather sampling is very similar to dry weather sampling, using the same equipment and sampling handling protocols. The only significant difference between wet and dry weather Nutrient TMDL sampling is the qualification procedure for validating a wet weather event that must be used prior to performing wet weather sampling (see Section 5.1.2 for a description of the procedure used to qualify a wet weather sampling event).
3.1.3 Toxics TMDL Wet Weather Sampling
Toxics TMDL sampling involves both water sample and suspended sediment sample collection during qualifying wet weather events. An attempt will be made to collect flow-weighted composite samples during each storm event, but due to the uncertainty associated with storm event durations that may not always be possible. When that is not possible the sampling period will be concluded when enough sample has been collected to supply water and sediment for the required analyses. In some cases where the storm event and resulting discharge ceases rapidly, the falling limb of the storm hydrograph may not be sampled in its entirety.
Water samples will be collected as grab samples, using the procedures described above for wet and dry weather Nutrient TMDL sampling. Samples will be retrieved as grab samples using a polyethylene dipper, bucket, or disposable Teflon bailer; and then transferred to the sample containers. Sufficient volumes of water will be collected to allow for separation of the suspended solids and analysis of toxics in the bulk sediment. The volume of sample to be retrieved in order to obtain at least 10 grams of sediment may require the use of larger capacity sampling equipment to recover sufficient volumes of sample. General water chemistry parameters including temperature, dissolved oxygen, pH, and electrical conductivity will be determined in the field at the time of water sample collection.
A minimum of six unfiltered water samples in 1-liter amber bottles will be collected during the rising and falling limbs of a storm event, then combined in 6:1 ratio to form a composite sample for subsequent analysis. Suspended solids will be extracted from the composite sample for analysis. Because of the highly variable amount of total suspended solids (TSS) present in natural waters, efforts will be made in the field to qualify the sample as containing enough suspended solids to provide the necessary sediment for analysis. A total of 10 grams of sediment is required when all grab samples are combined, so each sample bottle must be screened for the presence of sediment, and evaluated to determine the amount of unfiltered water sample that will be collected to produce a total of 10 grams of sediment.
Monitoring and Reporting Plan Nutrient and Toxics TMDL, City of Torrance, California
9 December 9, 2013
Following collection, each unfiltered sample will be allowed to settle in the cooler for a period of at least fifteen minutes. After that time the amount of sediment collected on the bottom of the container will be evaluated, and additional samples collected (if required) to capture enough suspended solids for analysis.
An attempt will be made to collect grab samples at all locations within the first 1 to 2 hours of stormwater discharge (first flush) wherever practical. As the storm event continues, the sampling team will return to all the sampling stations in rotation, and continue collection of grab samples. When the storm event declines or precipitation ceases, an attempt will be made to collect additional grab samples at all stations representing the falling limb of the hydrograph, but this may not be possible in all cases.
Grab samples will be transported under COC protocol to the analytical laboratory where they will be combined into one aliquot and filtered prior to analysis. Analytical methods and target reporting limits (RLs) are discussed in Section 3.8.
3.2 Flow Measurement
Continuous flow data will be recorded at all nine stations using dedicated flow sensors. Instantaneous flow measurements using an alternate measurement technique will also be obtained wherever possible during wet weather events, and when practical during dry weather events.
Instantaneous flow measurements will consist of a minimum of three velocity measurements will made immediately following sample collection. The flow measurements will be made using a digital water velocity meter (Global Water FP111 or equivalent), or area-velocity meter calibrated for the particular conveyance structure to be monitored (Global Water FC220 or equivalent), or both. The flow (Q) will be calculated using the average velocity (V) multiplied by the cross-sectional area (A) using the formula A x V = Q.
The cross-sectional area of each structure will be obtained from construction drawings, and verified by measurements collected within the conveyance during the site visit.
3.2.1 Flow Measurement Methods
Flow measurements will be collected at a fixed location in culverts or pipes. The measurement stations and channel profiles will be established during the initial site visit, when detailed measurements of the conveyance geometry will be collected. All subsequent measurements will
Monitoring and Reporting Plan Nutrient and Toxics TMDL, City of Torrance, California
10 December 9, 2013
be performed at the same locations to ensure uniformity and repeatability within the collected data.
3.2.1.1 Flow Measurement in Subsurface Storm Drains
For conduits or pipes, the flow velocity probe will be moved smoothly and uniformly throughout the flow profile. When a steady average reading is obtained, the average velocity for the flow stream and depth of water will be recorded on the Water Sample Data Sheet (see Appendix B). Three readings will be collected at each station, and the results of the readings averaged to obtain the calculated flow for the station.
3.2.1.2 Flow Measurement in Open Channels
To determine flow velocity in a stream, the flow velocity probe will be held at fixed measurement stations along a traverse of the channel and the velocity will be measured at 2/3 channel depth. Flow velocity and water depth will be recorded for each station along the traverse on the Discharge Measurement Note (see Appendix B), and the flow value for each segment of the profile will be measured to determine total flow through the channel profile. The value of flow within the channel will be obtained by calculating the average velocity for each subsection of the channel, then combining the results to obtain the total flow within the channel.
3.2.1.3 Flow Measurement – Sheet Flow Conditions
If the depth of flow does not allow measurement with the flow velocity probe (<0.1 foot), a “float” will be used to measure the velocity of flowing water. The width, depth, velocity, cross section and flow rate will be estimated based on the channel geometry, water depth, and amount of time it took a float to travel a marked distance three times. The estimated flow rate (Q) can then be calculated as follows:
Q = f x (cross section) x (average surface velocity)
Where:
Q = the flow rate in feet per second
f = dimensionless number
Cross section is the measured value in feet, and average velocity is the measured value in feet per second.
Monitoring and Reporting Plan Nutrient and Toxics TMDL, City of Torrance, California
11 December 9, 2013
The coefficient f is used to account for friction effects on the channel bottom. The float travels on the water surface, but the average velocity (not the surface velocity) determines the flow rate so f converts the surface velocity to the average velocity. Typical f values range from 0.60 to 0.90 based on the roughness of the surface, in this project a value of 0.75 will be used.
3.3 Decontamination Procedures
Non-dedicated sampling equipment will be decontaminated immediately prior to and after each use. Decontamination will be performed using a three-stage process with phosphate-free detergent wash, tap water rinse, and final deionized/distilled water rinse.
Decontamination will be performed in a designated area, using a plastic sheet as a liner to protect the ground against spilled solutions. The decontamination procedure is as follows:
1) Wash with non-phosphate detergent (e.g. Alconox ®) using bristles brush if necessary;
2) Rinse with tap water; and
3) Rinse with de-ionized/distilled water.
Following decontamination, if the item is not to used immediately; it will be wrapped in plastic or stored on plastic sheeting to prevent contamination. Used decontamination solutions will be containerized for appropriate disposal off-site in a municipal sanitary sewer.
3.4 Sample Containers and Preservation
The following sections detail sample containers and preservation methods for water and sediment samples collected as part of Nutrient and Toxics TMDL monitoring.
3.4.1 Nutrient TMDL Sample Containers and Preservation
The analytical laboratory will provide sample containers for all water samples collected by the field team. Samples collected for nitrate-nitrite will use one 500 milliliter (ml) polyethylene bottle. Samples collected for TPand total Kjeldahl nitrogen (TKN) will each use one 500 ml polyethylene bottle, containing a small amount of concentrated H2SO4 (Sulfuric Acid), used as a sample preservative. Table 3 provides a summary of the sample container and preservative use used for each analytical method.
The sample containers must be stored properly to prevent accidental release of the acid during transport and handling. The field team will keep the sample bottles stored inside plastic bags that are kept within a bulk bottle cooler to ensure they are clean and do not become contaminated
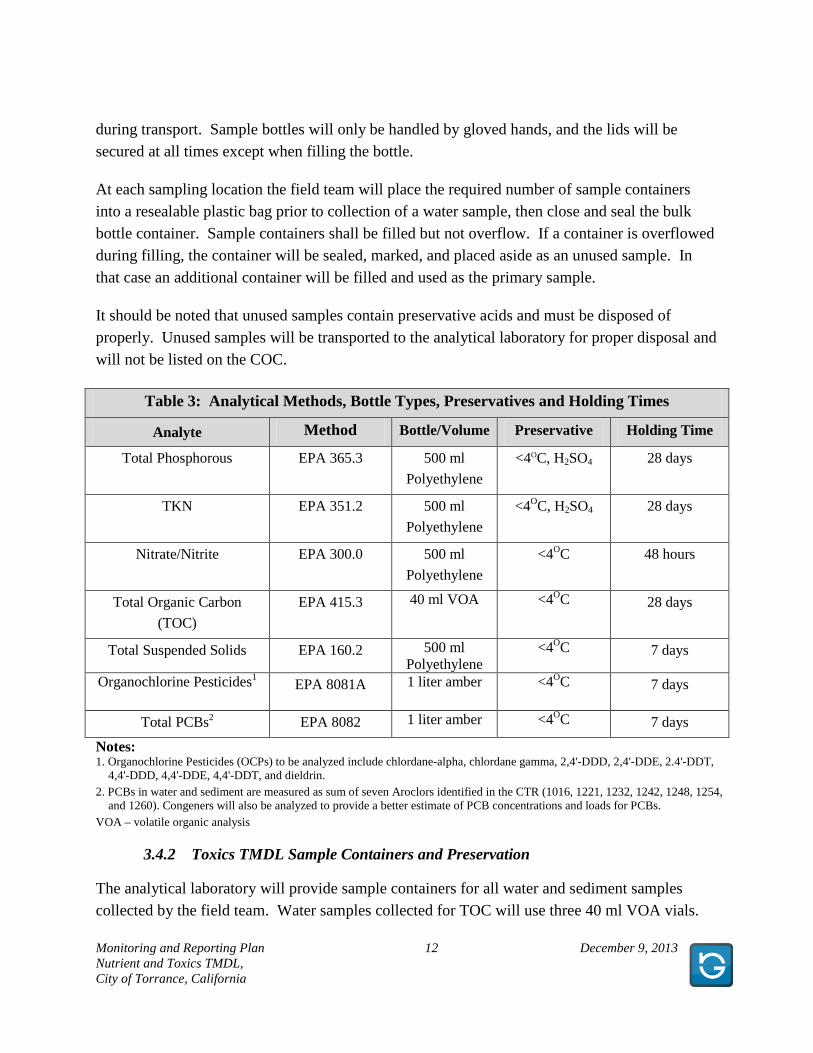
Monitoring and Reporting Plan Nutrient and Toxics TMDL, City of Torrance, California
12 December 9, 2013
during transport. Sample bottles will only be handled by gloved hands, and the lids will be secured at all times except when filling the bottle.
At each sampling location the field team will place the required number of sample containers into a resealable plastic bag prior to collection of a water sample, then close and seal the bulk bottle container. Sample containers shall be filled but not overflow. If a container is overflowed during filling, the container will be sealed, marked, and placed aside as an unused sample. In that case an additional container will be filled and used as the primary sample.
It should be noted that unused samples contain preservative acids and must be disposed of properly. Unused samples will be transported to the analytical laboratory for proper disposal and will not be listed on the COC.
Table 3: Analytical Methods, Bottle Types, Preservatives and Holding Times
Analyte Method Bottle/Volume Preservative Holding Time
Total Phosphorous EPA 365.3 500 ml
Polyethylene
<4OC, H2SO4 28 days
TKN EPA 351.2 500 ml
Polyethylene
<4OC, H2SO4 28 days
Nitrate/Nitrite EPA 300.0 500 ml
Polyethylene
<4OC 48 hours
Total Organic Carbon
(TOC)
EPA 415.3 40 ml VOA <4OC 28 days
Total Suspended Solids EPA 160.2 500 ml Polyethylene
<4OC 7 days
Organochlorine Pesticides1 EPA 8081A 1 liter amber <4OC 7 days
Total PCBs2 EPA 8082 1 liter amber <4OC 7 days
Notes: 1. Organochlorine Pesticides (OCPs) to be analyzed include chlordane-alpha, chlordane gamma, 2,4'-DDD, 2,4'-DDE, 2.4'-DDT,
4,4'-DDD, 4,4'-DDE, 4,4'-DDT, and dieldrin. 2. PCBs in water and sediment are measured as sum of seven Aroclors identified in the CTR (1016, 1221, 1232, 1242, 1248, 1254,
and 1260). Congeners will also be analyzed to provide a better estimate of PCB concentrations and loads for PCBs.
VOA – volatile organic analysis
3.4.2 Toxics TMDL Sample Containers and Preservation
The analytical laboratory will provide sample containers for all water and sediment samples collected by the field team. Water samples collected for TOC will use three 40 ml VOA vials.
Monitoring and Reporting Plan Nutrient and Toxics TMDL, City of Torrance, California
13 December 9, 2013
Water samples for TSS analysis will use one 500 ml polyethylene bottle. Water samples collected for sediment analysis of OCPs and PCBs will be collected in 1-liter glass amber bottles. Table 3 provides a summary of the sample container and preservative use used for each analytical method.
3.5 Sample Handling, Packaging, and Shipping
The handling and transportation of samples must be accomplished in a manner that protects the integrity of the samples and complies with the provisions of the MRP. As few people as possible will handle the samples. The field team will have custody of the samples during the monitoring event, and COC forms will accompany all samples during shipment or delivery to the analytical laboratory.
The field team shall package samples carefully to avoid breakage or contamination, maintain samples at the proper temperature (4OC), and ship samples daily to the analytical laboratory under COC protocol. The following sample packaging requirements shall be followed:
1) Sample bottle lids must not be mixed, all sample lids must stay with the original containers;
2) Sample bottles will be placed in a resealable plastic bag to minimize leakage in case a bottle breaks during shipment;
3) The samples will be cooled by placing ice in sealed plastic bags and placing the sealed ice-filled bags around, between, and above the sample containers;
4) Any remaining space in the sample shipping container shall be filled with clean, inert packing material such as bubble-wrap;
5) The COC document must be sealed in a resealable plastic bag and placed in the shipping container. The resealable plastic bag will be taped to the inside lid of the sample cooler, and sealed with shipping tape;
6) Clear strapping tape will be wrapped around the cooler in at least two locations, sealing the container to prevent the contents from spilling; and
7) Custody seals will be affixed over the shipping tape in at least two locations (normally the front and right side of the cooler); in a manner that access to the container can only be gained by breaking a seal. A layer of clear strapping tape will be placed over the seals to ensure that they are not broken accidentally during shipping. Custody seals shall be constructed with security slots designed to break if the seals are disturbed.
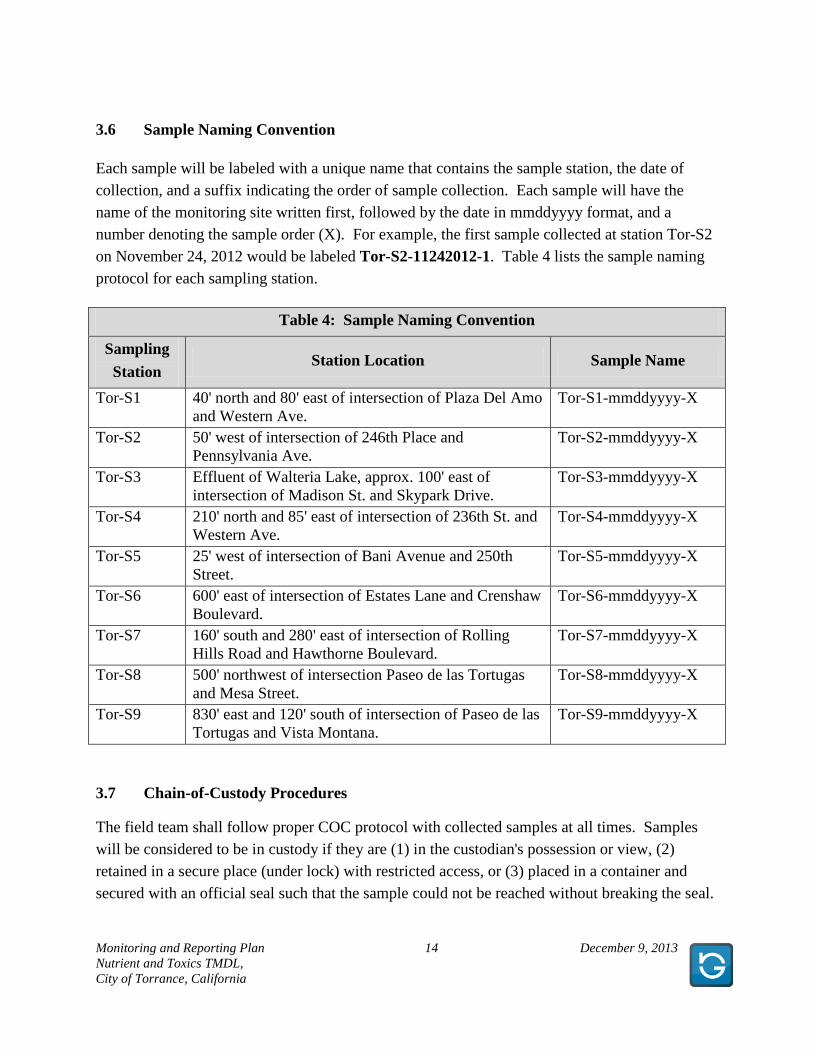
Monitoring and Reporting Plan Nutrient and Toxics TMDL, City of Torrance, California
14 December 9, 2013
3.6 Sample Naming Convention
Each sample will be labeled with a unique name that contains the sample station, the date of collection, and a suffix indicating the order of sample collection. Each sample will have the name of the monitoring site written first, followed by the date in mmddyyyy format, and a number denoting the sample order (X). For example, the first sample collected at station Tor-S2 on November 24, 2012 would be labeled Tor-S2-11242012-1. Table 4 lists the sample naming protocol for each sampling station.
Table 4: Sample Naming Convention
Sampling
Station Station Location Sample Name
Tor-S1 40' north and 80' east of intersection of Plaza Del Amo and Western Ave.
Tor-S1-mmddyyyy-X
Tor-S2 50' west of intersection of 246th Place and Pennsylvania Ave.
Tor-S2-mmddyyyy-X
Tor-S3 Effluent of Walteria Lake, approx. 100' east of intersection of Madison St. and Skypark Drive.
Tor-S3-mmddyyyy-X
Tor-S4 210' north and 85' east of intersection of 236th St. and Western Ave.
Tor-S4-mmddyyyy-X
Tor-S5 25' west of intersection of Bani Avenue and 250th Street.
Tor-S5-mmddyyyy-X
Tor-S6 600' east of intersection of Estates Lane and Crenshaw Boulevard.
Tor-S6-mmddyyyy-X
Tor-S7 160' south and 280' east of intersection of Rolling Hills Road and Hawthorne Boulevard.
Tor-S7-mmddyyyy-X
Tor-S8 500' northwest of intersection Paseo de las Tortugas and Mesa Street.
Tor-S8-mmddyyyy-X
Tor-S9 830' east and 120' south of intersection of Paseo de las Tortugas and Vista Montana.
Tor-S9-mmddyyyy-X
3.7 Chain-of-Custody Procedures
The field team shall follow proper COC protocol with collected samples at all times. Samples will be considered to be in custody if they are (1) in the custodian's possession or view, (2) retained in a secure place (under lock) with restricted access, or (3) placed in a container and secured with an official seal such that the sample could not be reached without breaking the seal.
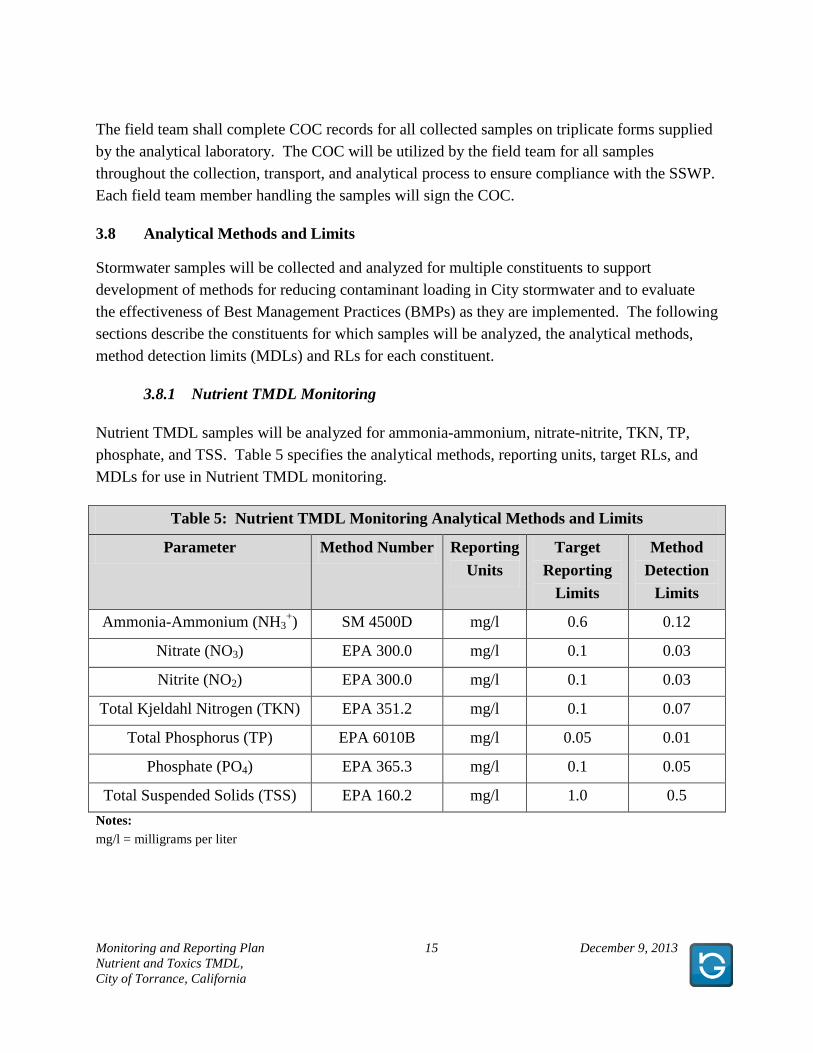
Monitoring and Reporting Plan Nutrient and Toxics TMDL, City of Torrance, California
15 December 9, 2013
The field team shall complete COC records for all collected samples on triplicate forms supplied by the analytical laboratory. The COC will be utilized by the field team for all samples throughout the collection, transport, and analytical process to ensure compliance with the SSWP. Each field team member handling the samples will sign the COC.
3.8 Analytical Methods and Limits
Stormwater samples will be collected and analyzed for multiple constituents to support development of methods for reducing contaminant loading in City stormwater and to evaluate the effectiveness of Best Management Practices (BMPs) as they are implemented. The following sections describe the constituents for which samples will be analyzed, the analytical methods, method detection limits (MDLs) and RLs for each constituent.
3.8.1 Nutrient TMDL Monitoring
Nutrient TMDL samples will be analyzed for ammonia-ammonium, nitrate-nitrite, TKN, TP, phosphate, and TSS. Table 5 specifies the analytical methods, reporting units, target RLs, and MDLs for use in Nutrient TMDL monitoring.
Table 5: Nutrient TMDL Monitoring Analytical Methods and Limits
Parameter Method Number Reporting
Units
Target
Reporting
Limits
Method
Detection
Limits
Ammonia-Ammonium (NH3+) SM 4500D mg/l 0.6 0.12
Nitrate (NO3) EPA 300.0 mg/l 0.1 0.03
Nitrite (NO2) EPA 300.0 mg/l 0.1 0.03
Total Kjeldahl Nitrogen (TKN) EPA 351.2 mg/l 0.1 0.07
Total Phosphorus (TP) EPA 6010B mg/l 0.05 0.01
Phosphate (PO4) EPA 365.3 mg/l 0.1 0.05
Total Suspended Solids (TSS) EPA 160.2 mg/l 1.0 0.5
Notes:
mg/l = milligrams per liter
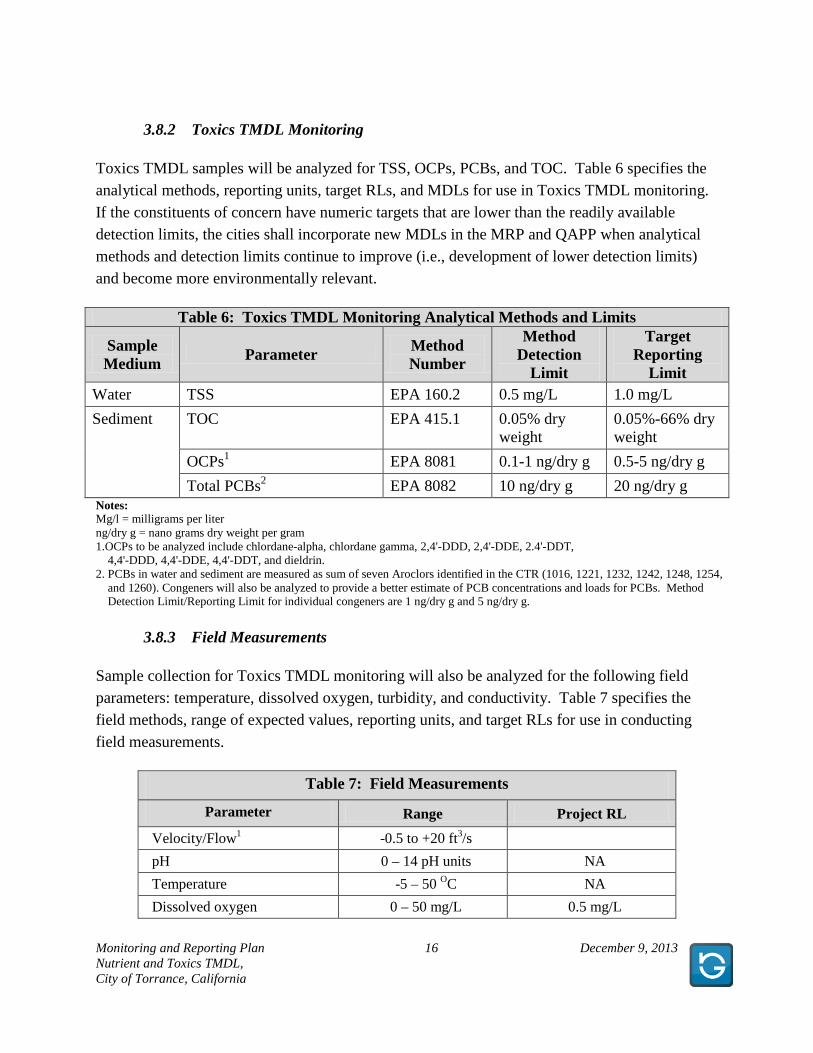
Monitoring and Reporting Plan Nutrient and Toxics TMDL, City of Torrance, California
16 December 9, 2013
3.8.2 Toxics TMDL Monitoring
Toxics TMDL samples will be analyzed for TSS, OCPs, PCBs, and TOC. Table 6 specifies the analytical methods, reporting units, target RLs, and MDLs for use in Toxics TMDL monitoring. If the constituents of concern have numeric targets that are lower than the readily available detection limits, the cities shall incorporate new MDLs in the MRP and QAPP when analytical methods and detection limits continue to improve (i.e., development of lower detection limits) and become more environmentally relevant.
Table 6: Toxics TMDL Monitoring Analytical Methods and Limits
Sample Medium
Parameter Method Number
Method Detection
Limit
Target Reporting
Limit Water TSS EPA 160.2 0.5 mg/L 1.0 mg/L
Sediment TOC EPA 415.1 0.05% dry weight
0.05%-66% dry weight
OCPs1 EPA 8081 0.1-1 ng/dry g 0.5-5 ng/dry g
Total PCBs2 EPA 8082 10 ng/dry g 20 ng/dry g Notes: Mg/l = milligrams per liter ng/dry g = nano grams dry weight per gram 1.OCPs to be analyzed include chlordane-alpha, chlordane gamma, 2,4'-DDD, 2,4'-DDE, 2.4'-DDT,
4,4'-DDD, 4,4'-DDE, 4,4'-DDT, and dieldrin. 2. PCBs in water and sediment are measured as sum of seven Aroclors identified in the CTR (1016, 1221, 1232, 1242, 1248, 1254,
and 1260). Congeners will also be analyzed to provide a better estimate of PCB concentrations and loads for PCBs. Method Detection Limit/Reporting Limit for individual congeners are 1 ng/dry g and 5 ng/dry g.
3.8.3 Field Measurements
Sample collection for Toxics TMDL monitoring will also be analyzed for the following field parameters: temperature, dissolved oxygen, turbidity, and conductivity. Table 7 specifies the field methods, range of expected values, reporting units, and target RLs for use in conducting field measurements.
Table 7: Field Measurements
Parameter Range Project RL
Velocity/Flow1 -0.5 to +20 ft3/s
pH 0 – 14 pH units NA
Temperature -5 – 50 OC NA
Dissolved oxygen 0 – 50 mg/L 0.5 mg/L
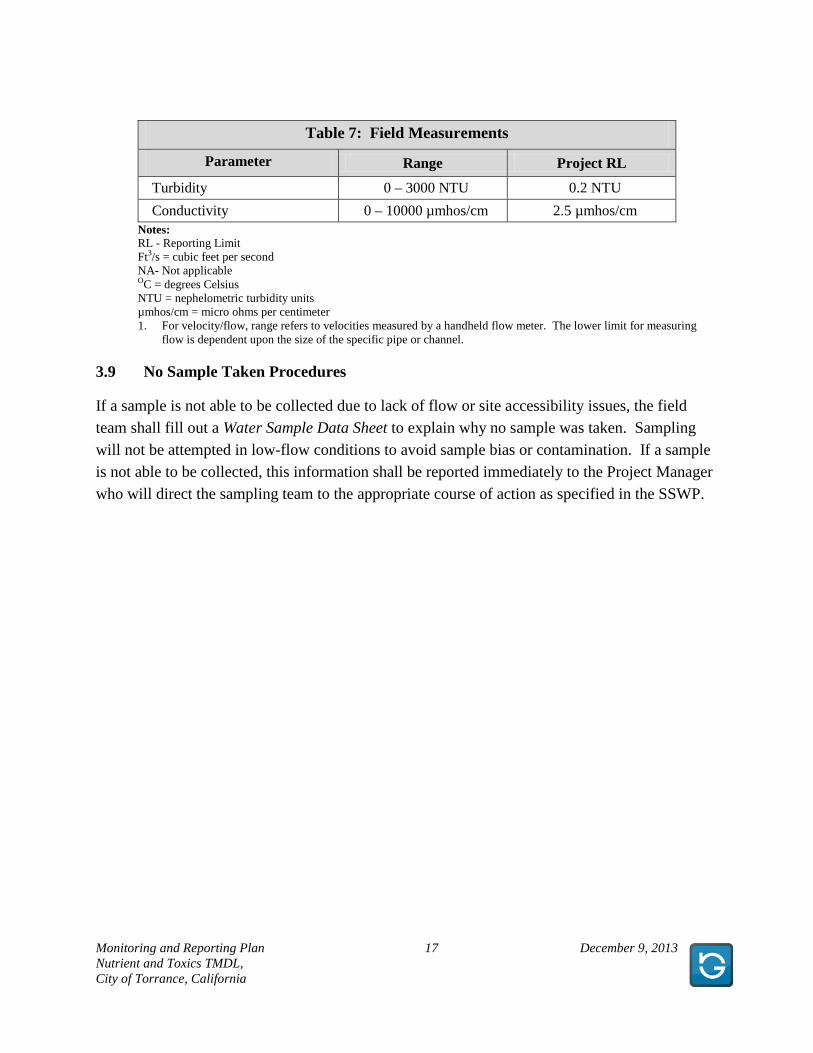
Monitoring and Reporting Plan Nutrient and Toxics TMDL, City of Torrance, California
17 December 9, 2013
Table 7: Field Measurements
Parameter Range Project RL
Turbidity 0 – 3000 NTU 0.2 NTU
Conductivity 0 – 10000 µmhos/cm 2.5 µmhos/cm Notes: RL - Reporting Limit Ft3/s = cubic feet per second NA- Not applicable OC = degrees Celsius NTU = nephelometric turbidity units µmhos/cm = micro ohms per centimeter 1. For velocity/flow, range refers to velocities measured by a handheld flow meter. The lower limit for measuring
flow is dependent upon the size of the specific pipe or channel.
3.9 No Sample Taken Procedures
If a sample is not able to be collected due to lack of flow or site accessibility issues, the field team shall fill out a Water Sample Data Sheet to explain why no sample was taken. Sampling will not be attempted in low-flow conditions to avoid sample bias or contamination. If a sample is not able to be collected, this information shall be reported immediately to the Project Manager who will direct the sampling team to the appropriate course of action as specified in the SSWP.
Monitoring and Reporting Plan Nutrient and Toxics TMDL, City of Torrance, California
18 December 9, 2013
4.0 MONITORING SITES
Nine (9) water quality sampling stations (Tor-S1 through Tor-S9) will be visited by the monitoring crew on a monthly basis and during qualifying wet weather events (see Figure 1). One sampling station (Tor-S3) will also be visited by the crew when Los Angeles County pumps stormwater out of Walteria Lake into the 54-inch storm drain. Six (6) of the monitoring sites are owned by the County of Los Angeles (Tor-S1 through Tor-S6), stations Tor-S7, Tor-S8, and Tor-S9 are owned by the City of Torrance. Table 8 provides a summary of the monitoring sites, and Figures 2 through 10 are detailed maps of the monitoring site locations.
Table 8: Monitoring Site Summary
Site Name
Site Ownership
Drainage System
System Description
Site Location GPS Coordinates
Tor-S1 LA Co FCD RDD 339 36" RCP 40' north and 80' east of intersection of Plaza Del Amo
and Western Ave.
33° 49.3572' N, 118° 18.5208' W
Tor-S2 LA Co FCD Project 2 33" RCP 50' west of intersection of 246th Place and Pennsylvania Ave.
33° 48.093' N, 118° 19.5252' W
Tor-S3 LA Co FCD Project 245 54" Effluent of Walteria Lake, approx. 100' east of intersection
of Madison St. and Skypark Drive.
33° 48.6312' N, 118° 20.8674' W
Tor-S4 LA Co FCD Project 8101
9'-2"W x 11' H RCB
210' north and 85' east of intersection of 236th St. and
Western Ave.
33° 48.7056' N, 118° 18.5196' W
Tor-S5 LA Co FCD Project 540 54” 39' east of intersection of Pennsylvania Avenue and
250th Street.
33° 47.8956' N, 118° 19.6872' W
Tor-S6 LA Co FCD PD 1032 36" RCP 600' east of intersection of Estates Lane and Crenshaw
Boulevard.
33° 47.1822' N, 118° 20.43' W
Tor-S7 City of Torrance
N/A 10' x 10' RCB
160' south and 280' east of intersection of Rolling Hills
Road and Hawthorne Boulevard.
33° 47.6826' N, 118° 20.9232' W
Tor-S8 City of Torrance
N/A 24" RCP 500' northwest of intersection Paseo de las Tortugas and Mesa
Street.
33° 48.0522' N, 118° 21.4254' W
Tor-S9 City of Torrance
N/A 42" RCP 830' east and 120' south of intersection of Paseo de las
Tortugas and Vista Montana.
33° 48.2742' N, 118° 21.7776' W
The following sections provide a detailed description of each monitoring station.
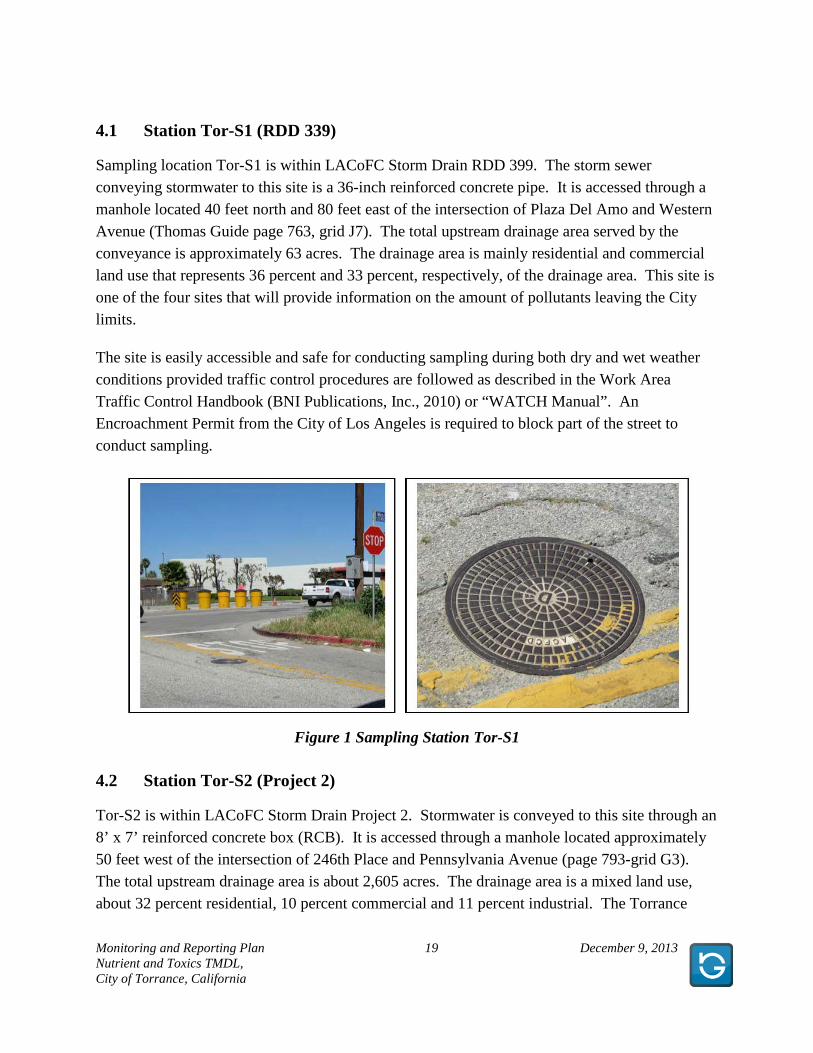
Monitoring and Reporting Plan Nutrient and Toxics TMDL, City of Torrance, California
19 December 9, 2013
4.1 Station Tor-S1 (RDD 339)
Sampling location Tor-S1 is within LACoFC Storm Drain RDD 399. The storm sewer conveying stormwater to this site is a 36-inch reinforced concrete pipe. It is accessed through a manhole located 40 feet north and 80 feet east of the intersection of Plaza Del Amo and Western Avenue (Thomas Guide page 763, grid J7). The total upstream drainage area served by the conveyance is approximately 63 acres. The drainage area is mainly residential and commercial land use that represents 36 percent and 33 percent, respectively, of the drainage area. This site is one of the four sites that will provide information on the amount of pollutants leaving the City limits.
The site is easily accessible and safe for conducting sampling during both dry and wet weather conditions provided traffic control procedures are followed as described in the Work Area Traffic Control Handbook (BNI Publications, Inc., 2010) or “WATCH Manual”. An Encroachment Permit from the City of Los Angeles is required to block part of the street to conduct sampling.
Figure 1 Sampling Station Tor-S1
4.2 Station Tor-S2 (Project 2)
Tor-S2 is within LACoFC Storm Drain Project 2. Stormwater is conveyed to this site through an 8’ x 7’ reinforced concrete box (RCB). It is accessed through a manhole located approximately 50 feet west of the intersection of 246th Place and Pennsylvania Avenue (page 793-grid G3). The total upstream drainage area is about 2,605 acres. The drainage area is a mixed land use, about 32 percent residential, 10 percent commercial and 11 percent industrial. The Torrance
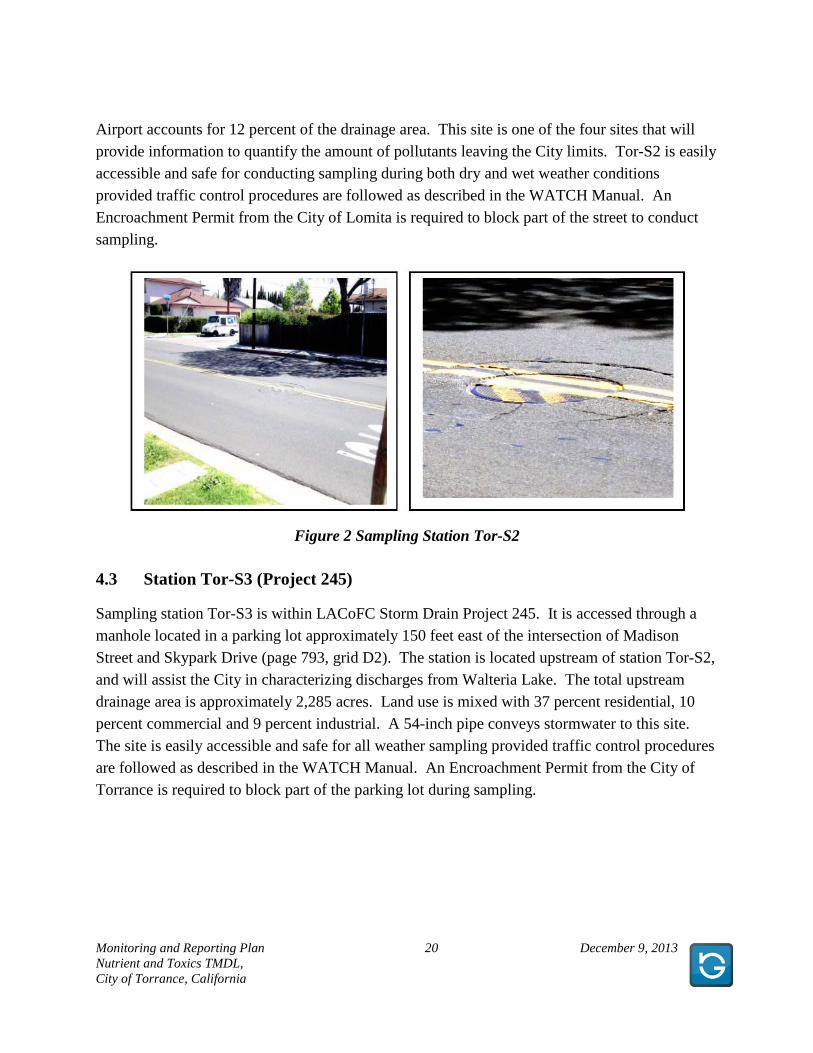
Monitoring and Reporting Plan Nutrient and Toxics TMDL, City of Torrance, California
20 December 9, 2013
Airport accounts for 12 percent of the drainage area. This site is one of the four sites that will provide information to quantify the amount of pollutants leaving the City limits. Tor-S2 is easily accessible and safe for conducting sampling during both dry and wet weather conditions provided traffic control procedures are followed as described in the WATCH Manual. An Encroachment Permit from the City of Lomita is required to block part of the street to conduct sampling.
Figure 2 Sampling Station Tor-S2
4.3 Station Tor-S3 (Project 245)
Sampling station Tor-S3 is within LACoFC Storm Drain Project 245. It is accessed through a manhole located in a parking lot approximately 150 feet east of the intersection of Madison Street and Skypark Drive (page 793, grid D2). The station is located upstream of station Tor-S2, and will assist the City in characterizing discharges from Walteria Lake. The total upstream drainage area is approximately 2,285 acres. Land use is mixed with 37 percent residential, 10 percent commercial and 9 percent industrial. A 54-inch pipe conveys stormwater to this site. The site is easily accessible and safe for all weather sampling provided traffic control procedures are followed as described in the WATCH Manual. An Encroachment Permit from the City of Torrance is required to block part of the parking lot during sampling.
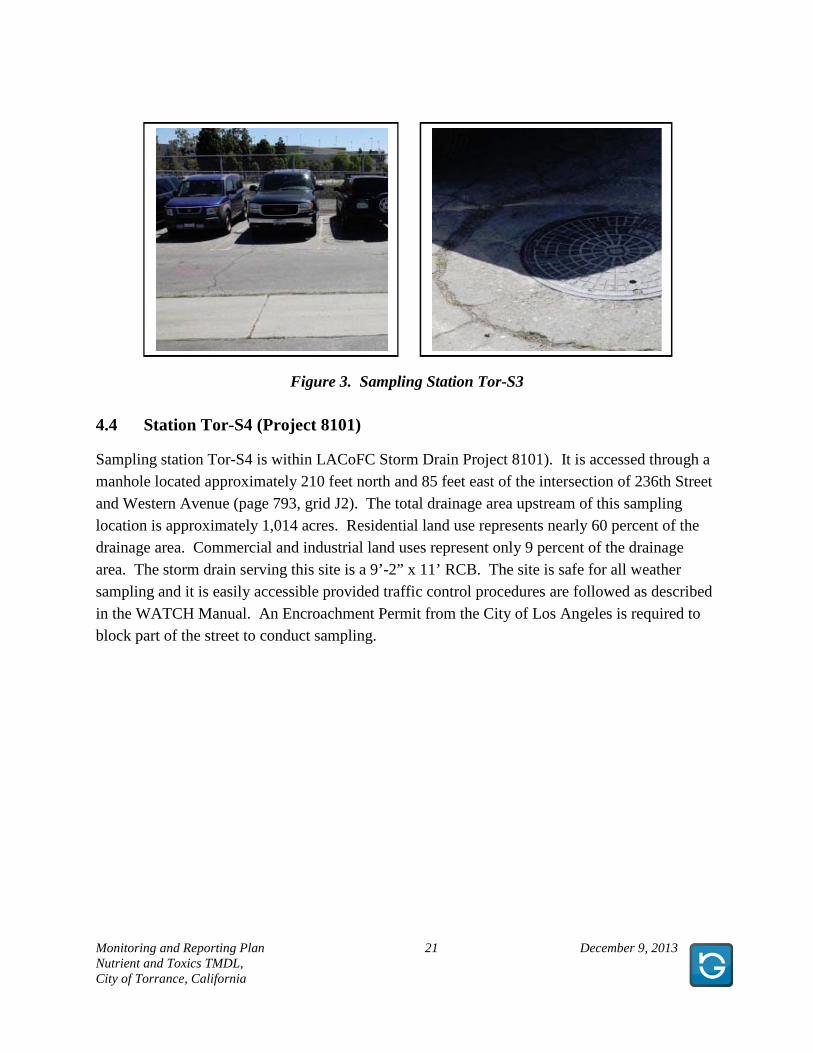
Monitoring and Reporting Plan Nutrient and Toxics TMDL, City of Torrance, California
21 December 9, 2013
Figure 3. Sampling Station Tor-S3
4.4 Station Tor-S4 (Project 8101)
Sampling station Tor-S4 is within LACoFC Storm Drain Project 8101). It is accessed through a manhole located approximately 210 feet north and 85 feet east of the intersection of 236th Street and Western Avenue (page 793, grid J2). The total drainage area upstream of this sampling location is approximately 1,014 acres. Residential land use represents nearly 60 percent of the drainage area. Commercial and industrial land uses represent only 9 percent of the drainage area. The storm drain serving this site is a 9’-2” x 11’ RCB. The site is safe for all weather sampling and it is easily accessible provided traffic control procedures are followed as described in the WATCH Manual. An Encroachment Permit from the City of Los Angeles is required to block part of the street to conduct sampling.
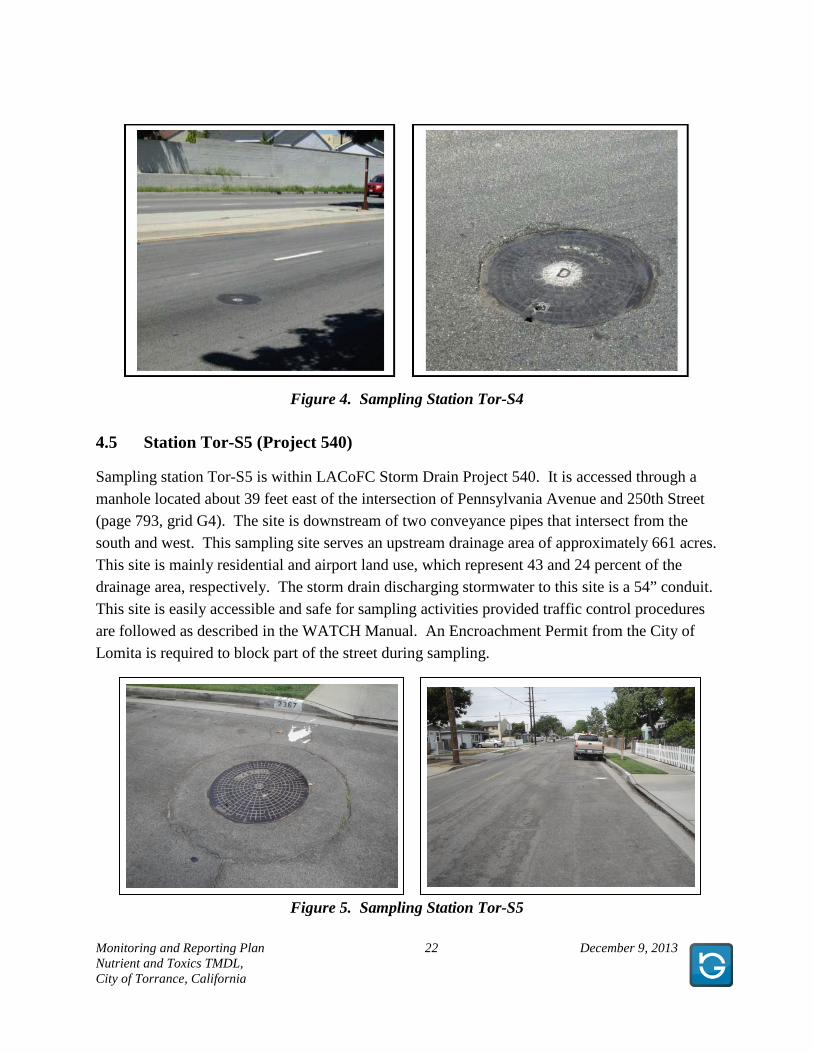
Monitoring and Reporting Plan Nutrient and Toxics TMDL, City of Torrance, California
22 December 9, 2013
Figure 4. Sampling Station Tor-S4
4.5 Station Tor-S5 (Project 540)
Sampling station Tor-S5 is within LACoFC Storm Drain Project 540. It is accessed through a manhole located about 39 feet east of the intersection of Pennsylvania Avenue and 250th Street (page 793, grid G4). The site is downstream of two conveyance pipes that intersect from the south and west. This sampling site serves an upstream drainage area of approximately 661 acres. This site is mainly residential and airport land use, which represent 43 and 24 percent of the drainage area, respectively. The storm drain discharging stormwater to this site is a 54” conduit. This site is easily accessible and safe for sampling activities provided traffic control procedures are followed as described in the WATCH Manual. An Encroachment Permit from the City of Lomita is required to block part of the street during sampling.
Figure 5. Sampling Station Tor-S5
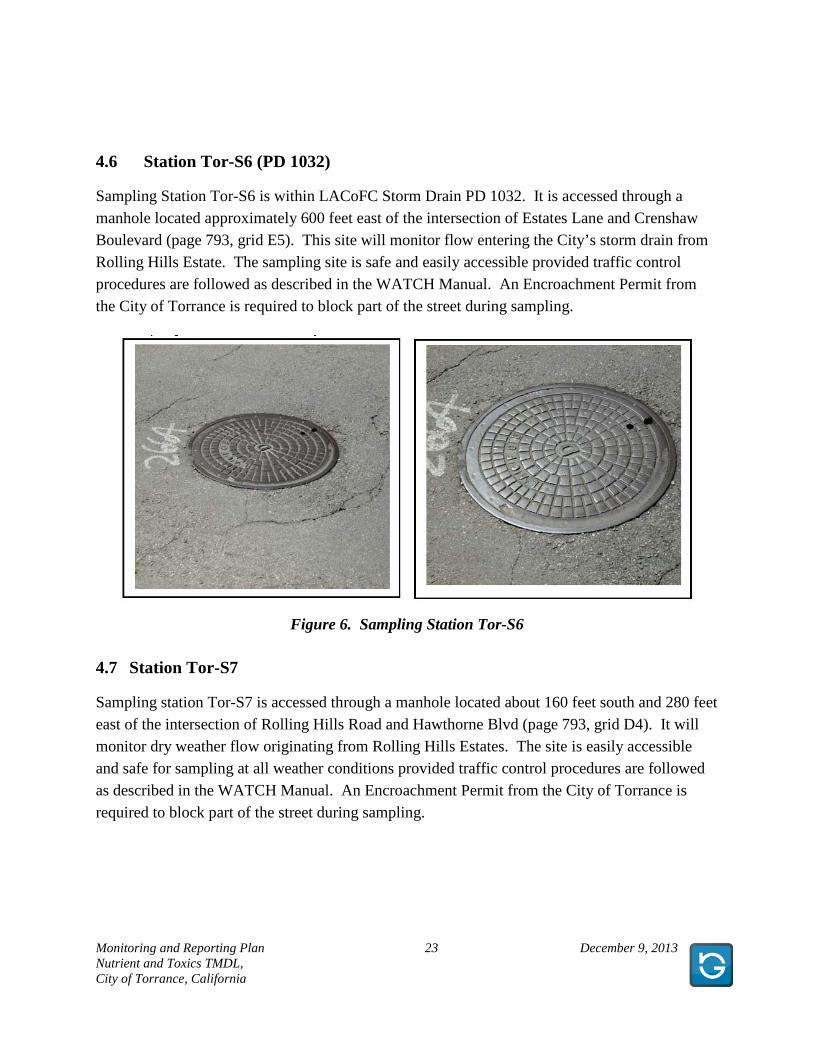
Monitoring and Reporting Plan Nutrient and Toxics TMDL, City of Torrance, California
23 December 9, 2013
4.6 Station Tor-S6 (PD 1032)
Sampling Station Tor-S6 is within LACoFC Storm Drain PD 1032. It is accessed through a manhole located approximately 600 feet east of the intersection of Estates Lane and Crenshaw Boulevard (page 793, grid E5). This site will monitor flow entering the City’s storm drain from Rolling Hills Estate. The sampling site is safe and easily accessible provided traffic control procedures are followed as described in the WATCH Manual. An Encroachment Permit from the City of Torrance is required to block part of the street during sampling.
Figure 6. Sampling Station Tor-S6
4.7 Station Tor-S7
Sampling station Tor-S7 is accessed through a manhole located about 160 feet south and 280 feet east of the intersection of Rolling Hills Road and Hawthorne Blvd (page 793, grid D4). It will monitor dry weather flow originating from Rolling Hills Estates. The site is easily accessible and safe for sampling at all weather conditions provided traffic control procedures are followed as described in the WATCH Manual. An Encroachment Permit from the City of Torrance is required to block part of the street during sampling.
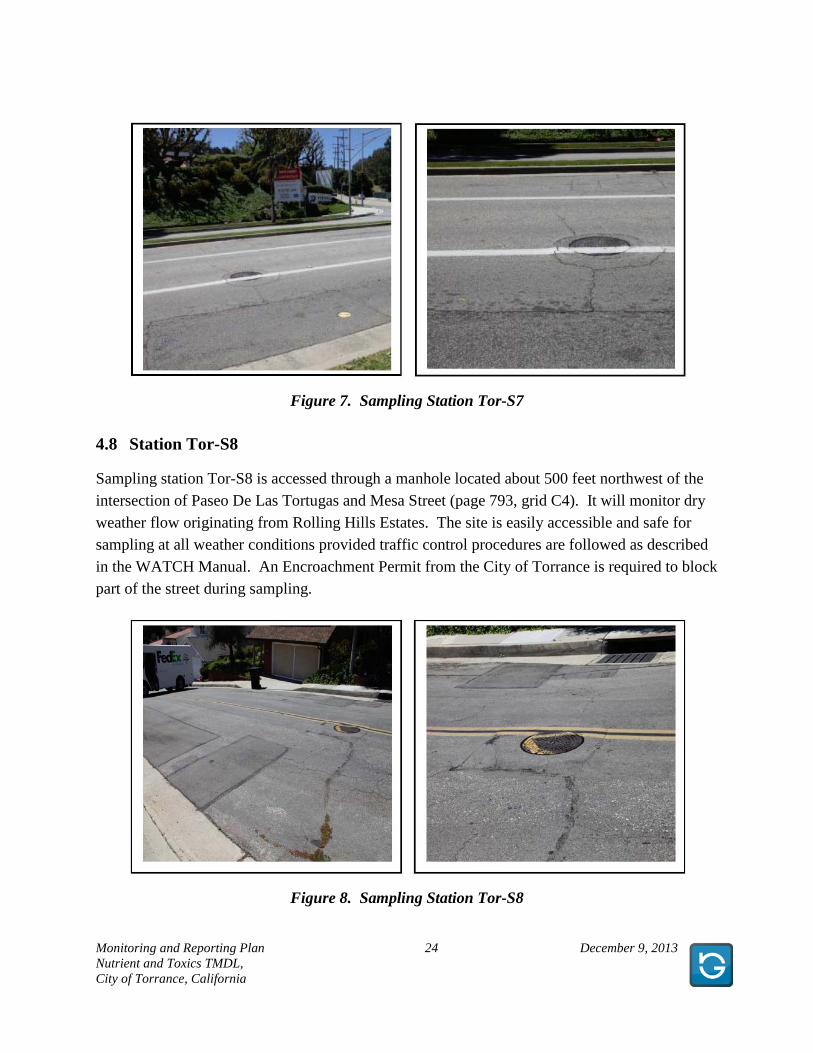
Monitoring and Reporting Plan Nutrient and Toxics TMDL, City of Torrance, California
24 December 9, 2013
Figure 7. Sampling Station Tor-S7
4.8 Station Tor-S8
Sampling station Tor-S8 is accessed through a manhole located about 500 feet northwest of the intersection of Paseo De Las Tortugas and Mesa Street (page 793, grid C4). It will monitor dry weather flow originating from Rolling Hills Estates. The site is easily accessible and safe for sampling at all weather conditions provided traffic control procedures are followed as described in the WATCH Manual. An Encroachment Permit from the City of Torrance is required to block part of the street during sampling.
Figure 8. Sampling Station Tor-S8
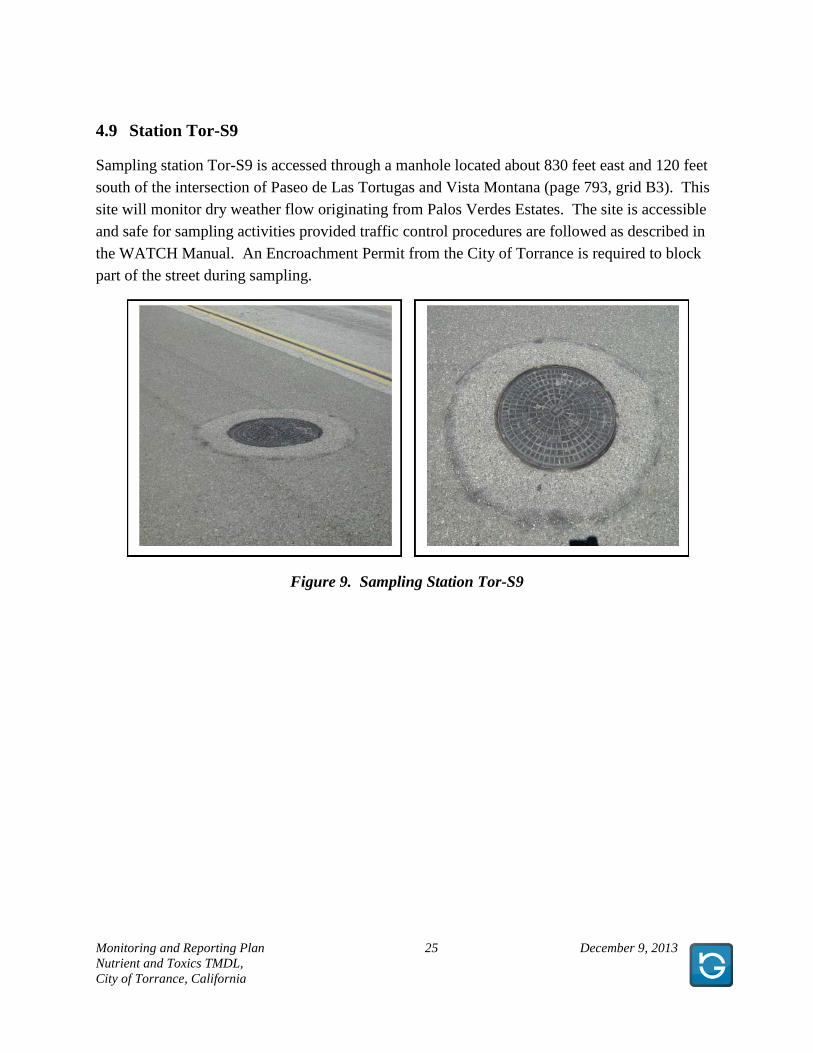
Monitoring and Reporting Plan Nutrient and Toxics TMDL, City of Torrance, California
25 December 9, 2013
4.9 Station Tor-S9
Sampling station Tor-S9 is accessed through a manhole located about 830 feet east and 120 feet south of the intersection of Paseo de Las Tortugas and Vista Montana (page 793, grid B3). This site will monitor dry weather flow originating from Palos Verdes Estates. The site is accessible and safe for sampling activities provided traffic control procedures are followed as described in the WATCH Manual. An Encroachment Permit from the City of Torrance is required to block part of the street during sampling.
Figure 9. Sampling Station Tor-S9
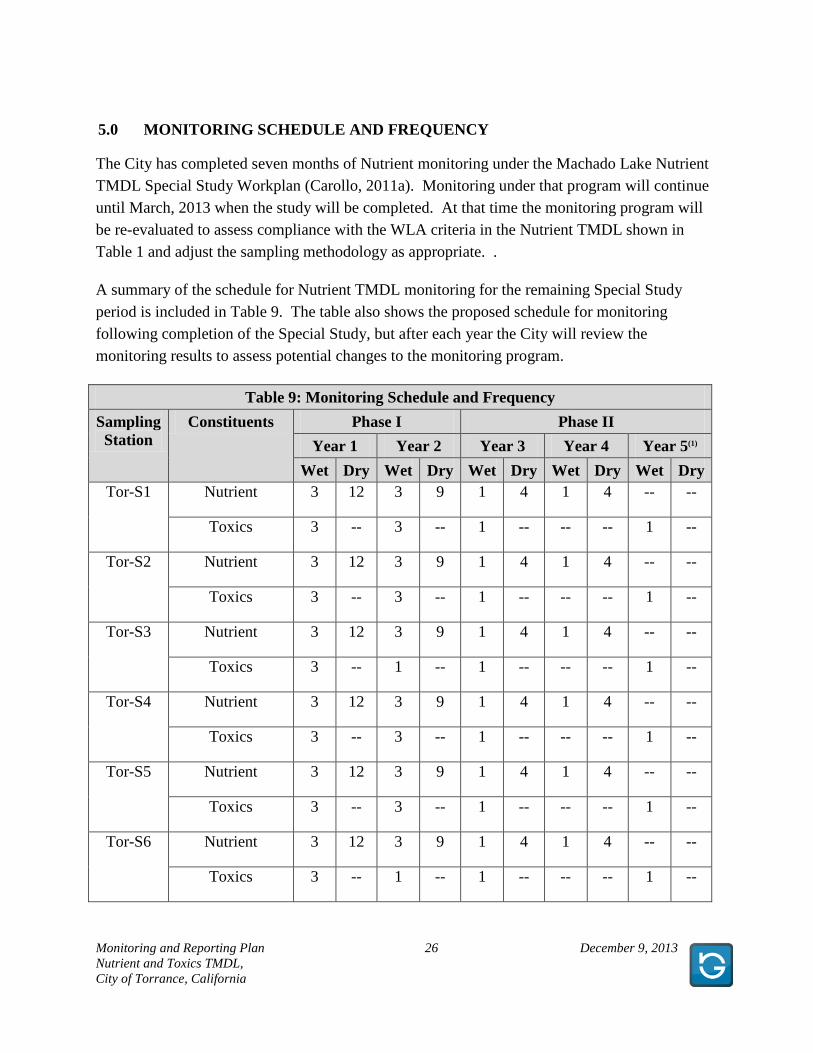
Monitoring and Reporting Plan Nutrient and Toxics TMDL, City of Torrance, California
26 December 9, 2013
5.0 MONITORING SCHEDULE AND FREQUENCY
The City has completed seven months of Nutrient monitoring under the Machado Lake Nutrient TMDL Special Study Workplan (Carollo, 2011a). Monitoring under that program will continue until March, 2013 when the study will be completed. At that time the monitoring program will be re-evaluated to assess compliance with the WLA criteria in the Nutrient TMDL shown in Table 1 and adjust the sampling methodology as appropriate. .
A summary of the schedule for Nutrient TMDL monitoring for the remaining Special Study period is included in Table 9. The table also shows the proposed schedule for monitoring following completion of the Special Study, but after each year the City will review the monitoring results to assess potential changes to the monitoring program.
Table 9: Monitoring Schedule and Frequency
Sampling Station
Constituents Phase I Phase II
Year 1 Year 2 Year 3 Year 4 Year 5(1)
Wet Dry Wet Dry Wet Dry Wet Dry Wet Dry Tor-S1 Nutrient 3 12 3 9 1 4 1 4 -- --
Toxics 3 -- 3 -- 1 -- -- -- 1 --
Tor-S2 Nutrient 3 12 3 9 1 4 1 4 -- --
Toxics 3 -- 3 -- 1 -- -- -- 1 --
Tor-S3 Nutrient 3 12 3 9 1 4 1 4 -- --
Toxics 3 -- 1 -- 1 -- -- -- 1 --
Tor-S4 Nutrient 3 12 3 9 1 4 1 4 -- --
Toxics 3 -- 3 -- 1 -- -- -- 1 --
Tor-S5 Nutrient 3 12 3 9 1 4 1 4 -- --
Toxics 3 -- 3 -- 1 -- -- -- 1 --
Tor-S6 Nutrient 3 12 3 9 1 4 1 4 -- --
Toxics 3 -- 1 -- 1 -- -- -- 1 --
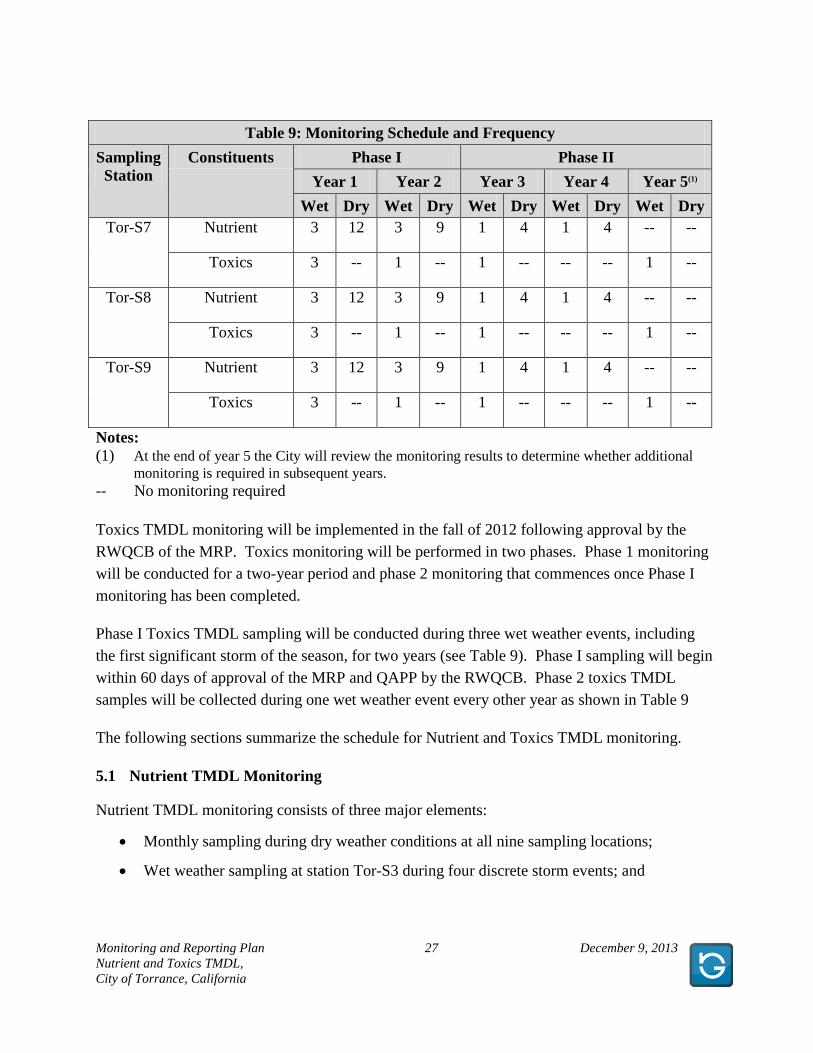
Monitoring and Reporting Plan Nutrient and Toxics TMDL, City of Torrance, California
27 December 9, 2013
Table 9: Monitoring Schedule and Frequency
Sampling Station
Constituents Phase I Phase II
Year 1 Year 2 Year 3 Year 4 Year 5(1)
Wet Dry Wet Dry Wet Dry Wet Dry Wet Dry Tor-S7 Nutrient 3 12 3 9 1 4 1 4 -- --
Toxics 3 -- 1 -- 1 -- -- -- 1 --
Tor-S8 Nutrient 3 12 3 9 1 4 1 4 -- --
Toxics 3 -- 1 -- 1 -- -- -- 1 --
Tor-S9 Nutrient 3 12 3 9 1 4 1 4 -- --
Toxics 3 -- 1 -- 1 -- -- -- 1 --
Notes: (1) At the end of year 5 the City will review the monitoring results to determine whether additional
monitoring is required in subsequent years. -- No monitoring required
Toxics TMDL monitoring will be implemented in the fall of 2012 following approval by the RWQCB of the MRP. Toxics monitoring will be performed in two phases. Phase 1 monitoring will be conducted for a two-year period and phase 2 monitoring that commences once Phase I monitoring has been completed.
Phase I Toxics TMDL sampling will be conducted during three wet weather events, including the first significant storm of the season, for two years (see Table 9). Phase I sampling will begin within 60 days of approval of the MRP and QAPP by the RWQCB. Phase 2 toxics TMDL samples will be collected during one wet weather event every other year as shown in Table 9
The following sections summarize the schedule for Nutrient and Toxics TMDL monitoring.
5.1 Nutrient TMDL Monitoring
Nutrient TMDL monitoring consists of three major elements:
• Monthly sampling during dry weather conditions at all nine sampling locations;
• Wet weather sampling at station Tor-S3 during four discrete storm events; and
Monitoring and Reporting Plan Nutrient and Toxics TMDL, City of Torrance, California
28 December 9, 2013
• Up to six pumping event samples from station Tor-S3 when the Los Angeles County Department of Public Works (LACDPW) discharges water from Walteria Lake.
The following sections describe the schedule for Nutrient TMDL monitoring for each type of sampling event.
5.1.1 Dry Weather Sampling
Dry weather sampling will be conducted monthly at the nine (9) primary monitoring stations. The sampling will occur on a Thursday during the first full week of the month to facilitate traffic control at station Tor-S2 (parking at the station Tor-S2 is restricted on Thursday mornings). Dry weather conditions must be preceded by at least 24 hours of no greater than trace precipitation, or have an intensity of less than 0.1 inches of rain in a 24-hour period.
5.1.2 Wet Weather Sampling
Three wet weather sampling events are scheduled for the fall and winter of 2012 to complete the Special Study #3. Following acceptance by the RWQCB of the City’s BMP Evaluation and Selection Study Report, the MRP will be modified to accomplish sampling specific to the needs for assessment of future compliance with the Nutrient TMDL. At that time the wet weather sampling schedule and locations will be revised, and the number of samples collected and events scheduled is predicted to increase (see Table 8).
For the 2012 fall and winter season, only station Tor-S3 will be sampled during qualifying wet weather events. Qualifying events occur during a storm with at least 0.1 inch of precipitation (defined as a “measurable” event). Wet weather sampling will not occur at a frequency greater than once every 72 hours, and sampling will not occur unless there has been at least 72 hours of continuous dry weather immediately preceding the “measurable” event. Weather forecasts for the 90503 zip code will be evaluated before deciding whether or not to sample a particular storm event.
5.1.3 Pumping Event Sampling
Whenever LACDPW pumps stormwater from Walteria Lake into the 54-inch storm drain, the City will conduct sampling at station Tor-S3. The pumping schedule will be obtained from LACDPW, and a decision regarding which events to sample will be made by the City. A maximum of seven (7) pumping events will be sampled yearly.
Monitoring and Reporting Plan Nutrient and Toxics TMDL, City of Torrance, California
29 December 9, 2013
5.2 Toxics TMDL Monitoring
The frequency for Toxics TMDL sampling will follow the requirements of the Machado Lake Pesticides and PCBs Total Maximum Daily Load Special Study Workplan (Carollo, 2011b), and requirements set forth in the R10-008 (RWQCB, 2010). Phase I sampling will begin within 60 days of approval of the MRP and QAPP by the RWQCB. Phase I Toxics TMDL sampling will be conducted during three wet weather events, including the first significant storm of the season, for two years (see Table 8). Phase 2 toxics TMDL samples will be collected during one wet weather event every other year as shown in Table 8.
Monitoring and Reporting Plan Nutrient and Toxics TMDL, City of Torrance, California
30 December 9, 2013
6.0 QA/QC
This section describes the QA/QC measures that will be implemented for field and laboratory activities outlined in this plan.
6.1 Field Sampling QA/QC Procedures
QA/QC samples will be collected to ensure that the project QA objectives outlined in the Special Studies Workplan are met. QA/QC samples will include field duplicates (FD), matrix spike/matrix spike duplicates (MS/MSD), equipment blanks (EB), and temperature blanks (TB). Table 10 lists the QA/QC sample types, initial frequency of collection, and ongoing frequency of collection.
Table 10: QA/QC Sampling Summary QA/QC Sample Type
Initial Sampling Frequency
Ongoing Sampling Frequency Naming Convention
FD 1 per event, rotating location
1 per event, rotating location Tor-S30-mmddyyy-A
MS/MSD 1 every other sampling event, rotating location
1 every other sampling event, rotating location
Primary sample ID plus suffix -MS or -
MSD
EB 1 per decontamination method per event
1 per decontamination method per every 20 samples or at field staff change, decontamination method
change, or sampling device change whichever is more frequent
Tor-S31-mmddyyy-A
TB 1 per cooler 1 per cooler Temperature Blank
The following sections describe the purpose, collection method, sample naming conventions, and frequency of collection for QA/QC samples.
6.1.1 Field Duplicates
Collection of FD samples will be at the same time and place, and in sequential order from the primary sample. It shall be collected as soon as possible after the primary sample, and will be subjected to identical handling and analysis. The FD is a blind duplicate, and shall be identified with a fictitious sample ID (i.e. "Tor-S30-mmddyyy-A"), and assigned a time one hour prior to the first sample collection event of the day. A minimum of one (1) FD shall be collected each
Monitoring and Reporting Plan Nutrient and Toxics TMDL, City of Torrance, California
31 December 9, 2013
sampling day, and the location of the FD shall be rotated among the monitoring sites from one event to the next.
6.1.2 Matrix Spike/Matrix Spike Duplicates
Collection of MS/MSD samples is performed to allow the analytical laboratory to perform duplicate and spike analysis on the primary samples to evaluate accuracy, precision, and potential matrix interferences. MS/MSD samples consist of triple volume (3X) samples collected at the same time and place, and in sequential order from the primary sample. The MS/MSD shall be collected as soon as possible after the primary sample, and will be subjected to identical handling and analysis.
One set of sample bottles will be labeled with the standard primary sample ID. A second set of sample bottles will be labeled with the primary sample ID, followed by the suffix -MS. The third set of sample bottles will be labeled with the primary sample ID, followed by the suffix -MSD. All three sets of samples will be listed on the COC document. The CMP does not specify a frequency for MS/MSD sample collection, but one (1) every other sampling event is proposed for the frequency of collection.
6.1.3 Equipment Blanks
Non-dedicated sampling equipment will be tested with equipment blanks (EBs) to evaluate the potential for cross-contamination associated with decontamination procedures. Prior to collecting an EB, decontaminate the sampling equipment using the procedure in Section 4.5 Decontamination Procedures. The EB will be collected by pouring laboratory grade reagent water into the sampling device, and then transferring it to the sample bottles. The EB is a blind sample, and shall be identified with a fictitious sample ID (i.e. "Tor-S31-mmddyyy-A). The EB shall be collected at the frequency of one (1) per sampling event for the first two (2) events; at a reduced frequency of one (1) per fifty (50) samples (2 percent) thereafter or one (1) per every change in field personnel, decontamination methodology, or change in sampling device - whichever is more frequent.
6.1.4 Temperature Blanks
Sample bottles containing tap water for use as temperature blanks (TBs) shall be provided by the analytical laboratory with each batch of sample bottles. The TBs are used to check for proper temperature of sample preservation by the receiving laboratory. The sampling team will include one TB per sample cooler, and label the bottle "Temperature Blank". The TB will not be listed on the COC.
Monitoring and Reporting Plan Nutrient and Toxics TMDL, City of Torrance, California
32 December 9, 2013
6.2 Laboratory QA/QC Procedures
Samples will be submitted under COC protocol to the analytical laboratory. The analytical laboratory will have its own internal QC program, and will follow the QC requirements for each analytical method. The laboratory shall maintain logs sufficient to track each sample submitted, and will analyze or preserve each sample within the specified holding times.
All analytical data generated by the laboratory will undergo a QC review prior to release of the reported data. Each step of this review process involves evaluation of data quality based on both the results of the QC data and the professional judgment of those performing the review. This application of technical knowledge and experience to the data evaluation is essential so that data of high quality are generated consistently.
6.2.1 Method Blank
A method blank will be analyzed with every batch of 20 or fewer samples to measure laboratory contamination. The method blank will consist of analyte-free (laboratory reagent-grade) water and will be carried through the entire preparation and analysis procedure. Acceptance criteria for method blanks must conform to reference method requirements when specified. Generally, corrective action, including data flagging, is required when method blank concentrations are greater than the reporting detection limit, and the samples must be reprocessed if sample target compound/analyte concentrations are not greater than 10 times the method blank concentrations.
6.2.2 Spikes
A laboratory control sample (LCS) will be analyzed with every batch containing 20 samples or less to measure accuracy. The LCS will consist of a method blank spiked with a known amount of analyte, and it will be carried through the entire preparation and analysis procedure. The standards source will be separate from that used to prepare calibration standards. All analytes will be used for spiking the LCS. The recoveries will be plotted on control charts, and control limits will be calculated based upon historical data. If control limits are exceeded, the analysis will be stopped and the problem corrected. Samples associated with the out-of-control LCS will be reanalyzed in another batch.
One MS will be analyzed for one out of every 20 samples to measure matrix effects on accuracy. MS samples will consist of additional alilquots of sample spiked with a known amount of analyte. All analytes will be spiked. If a valid spike recovery is outside acceptable limits, but the LCS in control, matrix interference may be indicated.
Monitoring and Reporting Plan Nutrient and Toxics TMDL, City of Torrance, California
33 December 9, 2013
One MSD will be analyzed for one out of every 20 samples to measure precision. For any batch of samples that does not contain a FD or MSD, two LCS samples (LCS and LCS duplicate) will be separately prepared and analyzed. If the relative percent difference does not meet the required acceptance limits, the problem will be investigated and corrected. Any affected samples will be reanalyzed in a separate batch.
6.2.3 Laboratory Sample Custody
The analytical laboratory will maintain custody procedures that conform to those required by the Contract Laboratory Program (CLP), as outlined in the CLP User's Guide (USEPA, 1991 and USEPA, 2002). The procedures include designation of a sample custodian who will accept the samples and document sample condition; complete the COC, any required sample tags, and the laboratory request sheets. The custodian will follow laboratory sample tracking and documentation procedures, and ensure secure sample storage in the appropriate environment to maintain preservation.
The laboratory will maintain records documenting all phases of sample handling, from receipt to final report of analysis. Accountable documents include sample receipt forms, laboratory operation logbooks, COC records, bench work sheets, and other documents related to sample preparation and analysis. The laboratory shall utilize a document numbering and identification system for all documents/logs.
Monitoring and Reporting Plan Nutrient and Toxics TMDL, City of Torrance, California
34 December 9, 2013
7.0 REFERENCES
BNI Publications, Inc., 2010. Work Area Traffic Control Handbook “WATCH Manual”.
The State of California, California Regional Water Quality Control Board, Los Angeles Region (RWQCB), 2008. Resolution No. R08-006, Amendment to the Water Quality Control Plan for the Los Angeles Region to Incorporate a Total Daily Maximum Load for Eutrophic, Algae, Ammonia, and Odors (Nutrients) for Machado Lake: Dated May 1, 2008.
RWQCB, 2010. Resolution No. R10-008, Amendment to the Water Quality Control Plan for the Los Angeles Region to Incorporate a Total Daily Maximum Load for Pesticides and PCBs for Machado Lake: Dated September 2, 2010.
Carollo Engineers, 2011a. Machado Lake Nutrient Total Maximum Daily Load Special Study Workplan: Dated May 18, 2011.
Carollo Engineers, 2011b. Machado Lake Pesticides and PCBs Total Maximum Daily Load Special Study Workplan: Dated August 31, 2011.
U.S. Environmental Protection Agency (USEPA), 1991. User's Guide to the Contract Laboratory Program. Office of Emergency and Remedial Response. EPA/540/P-921/002. January, 1991.
U.S. Environmental Protection Agency (USEPA), 2002. USEPA Contract Laboratory Program National Functional Guidelines for Data Review-Inorganics. EPA-540-R-01-008. July, 2002.

FIGURES
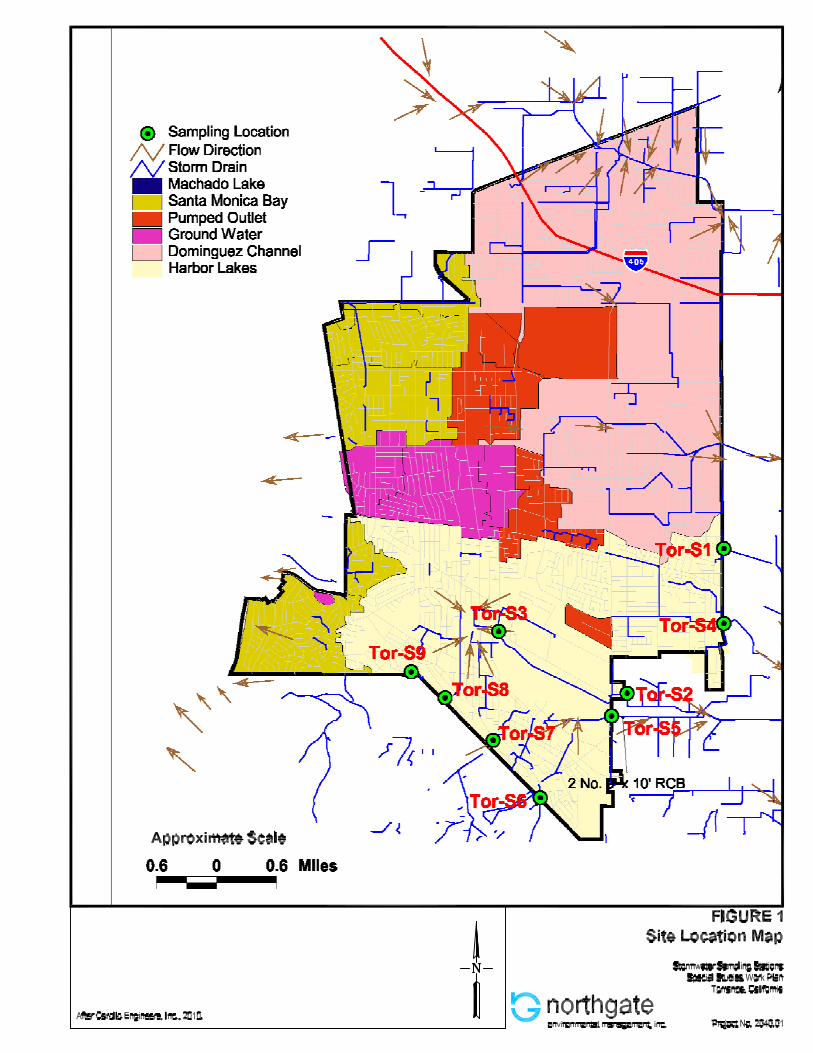
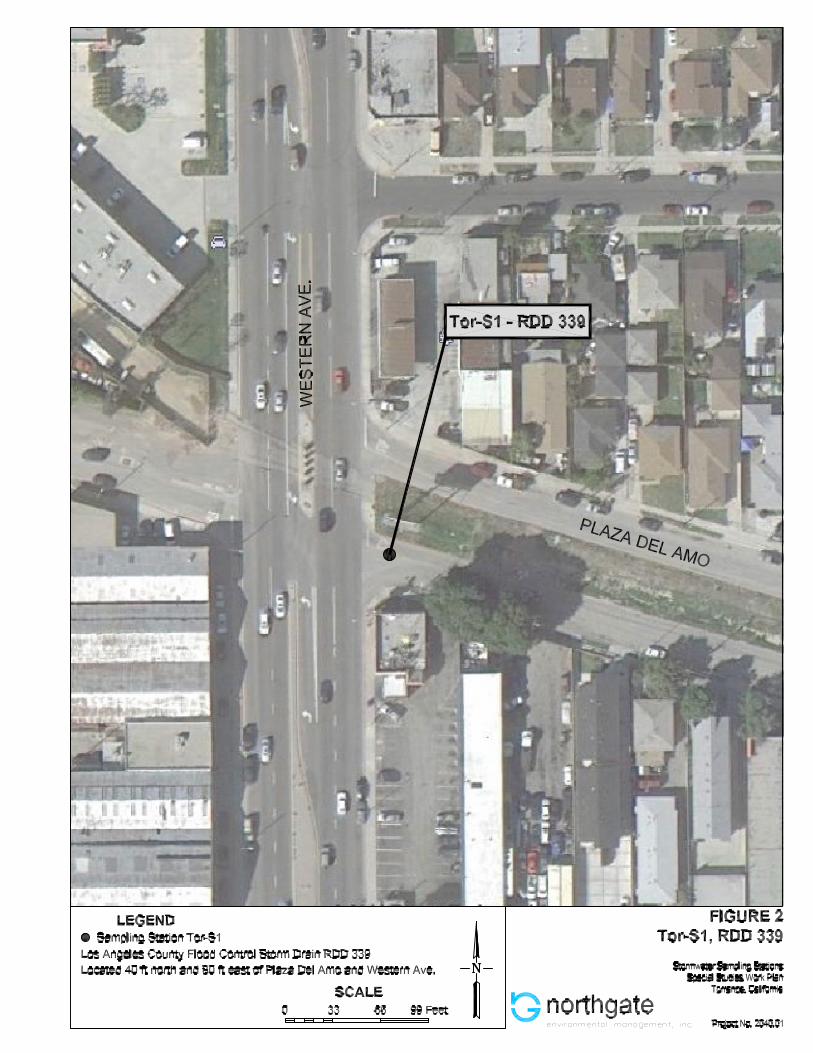
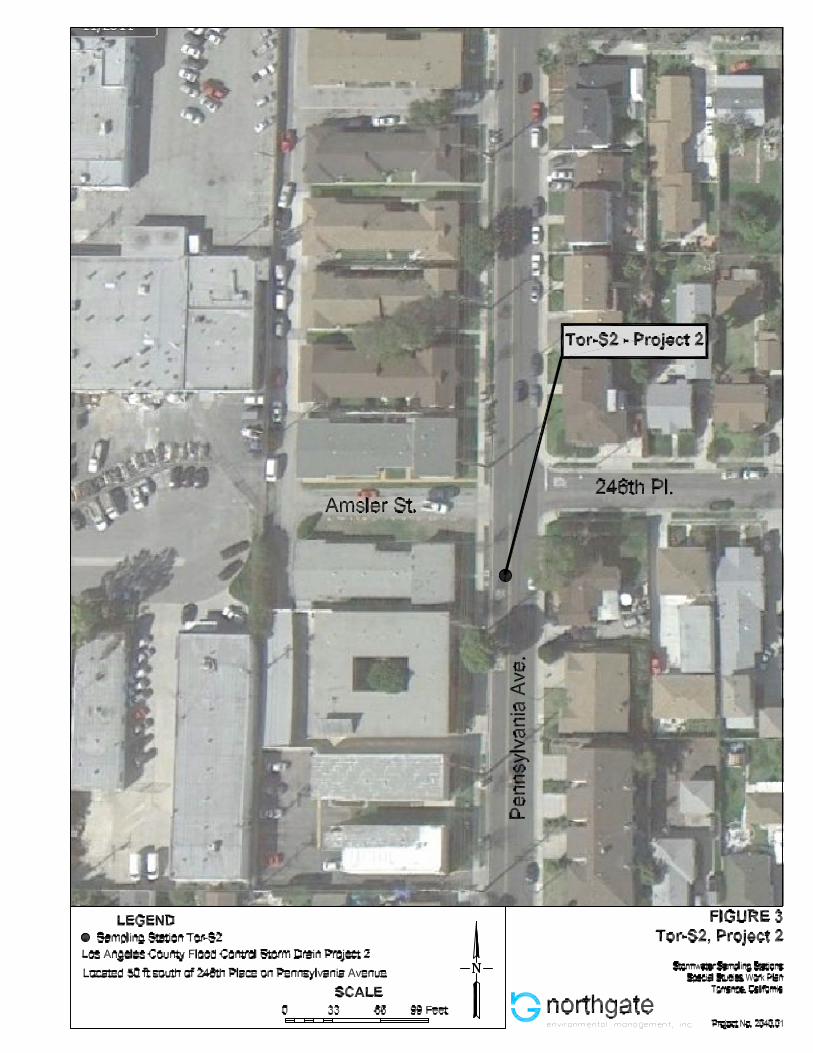
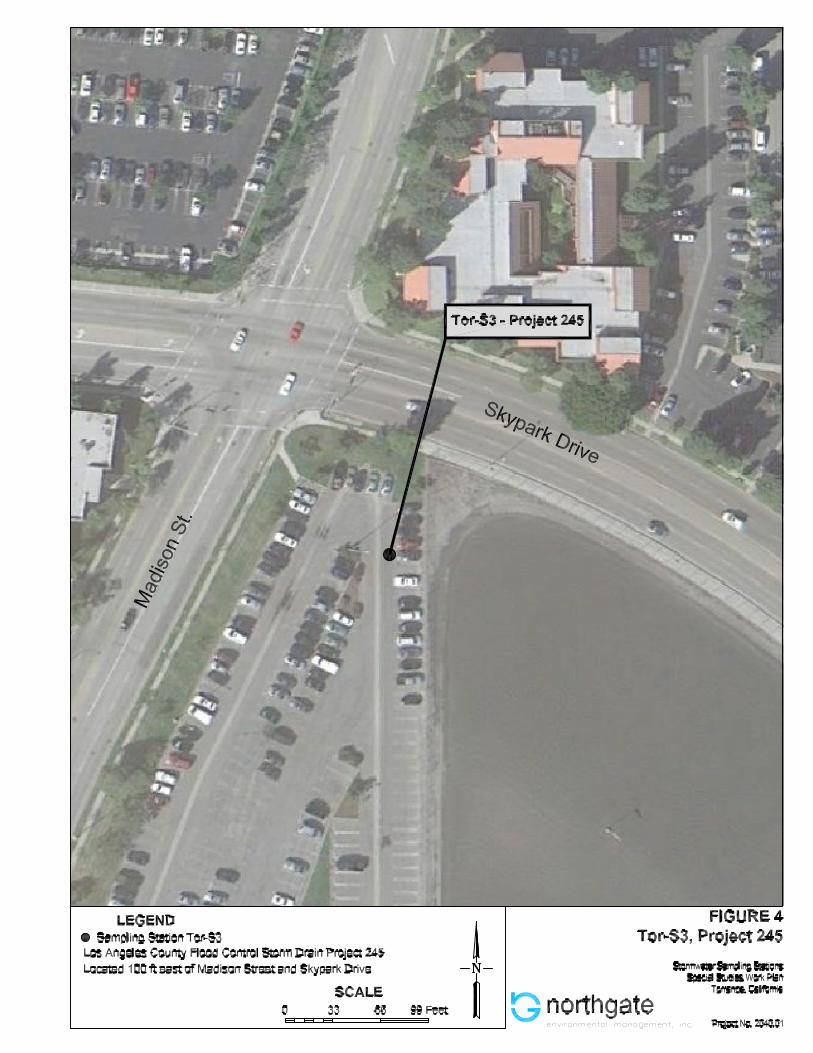
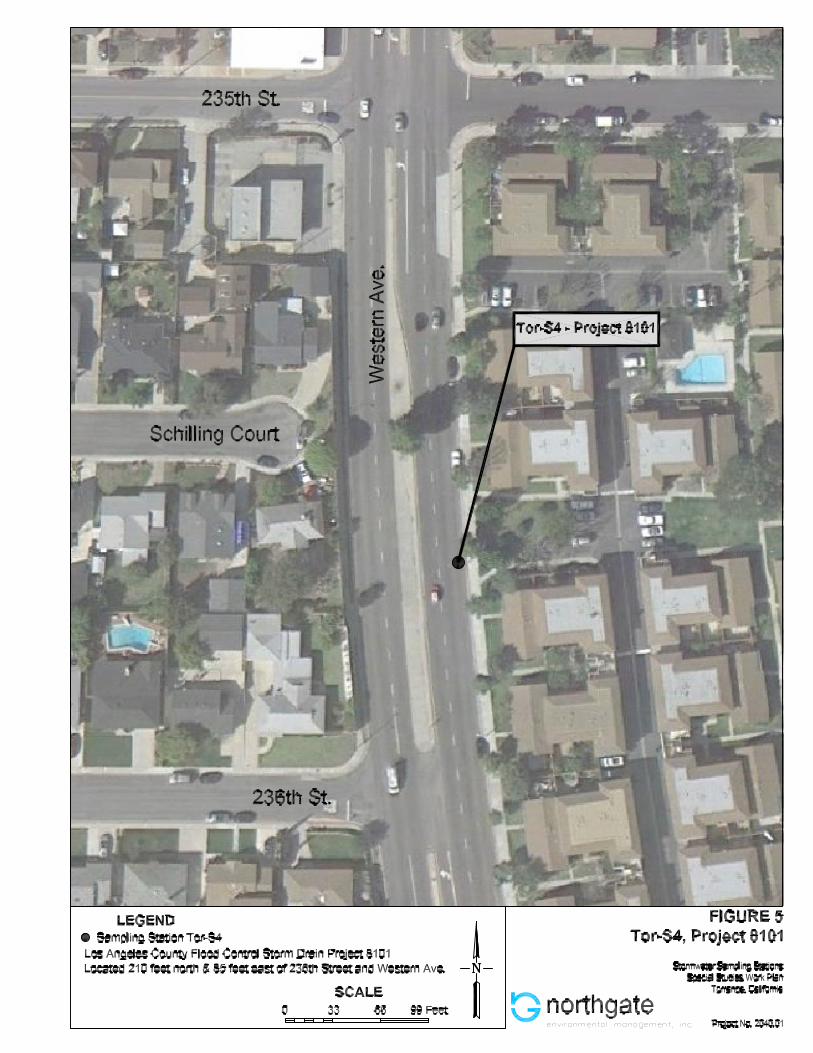
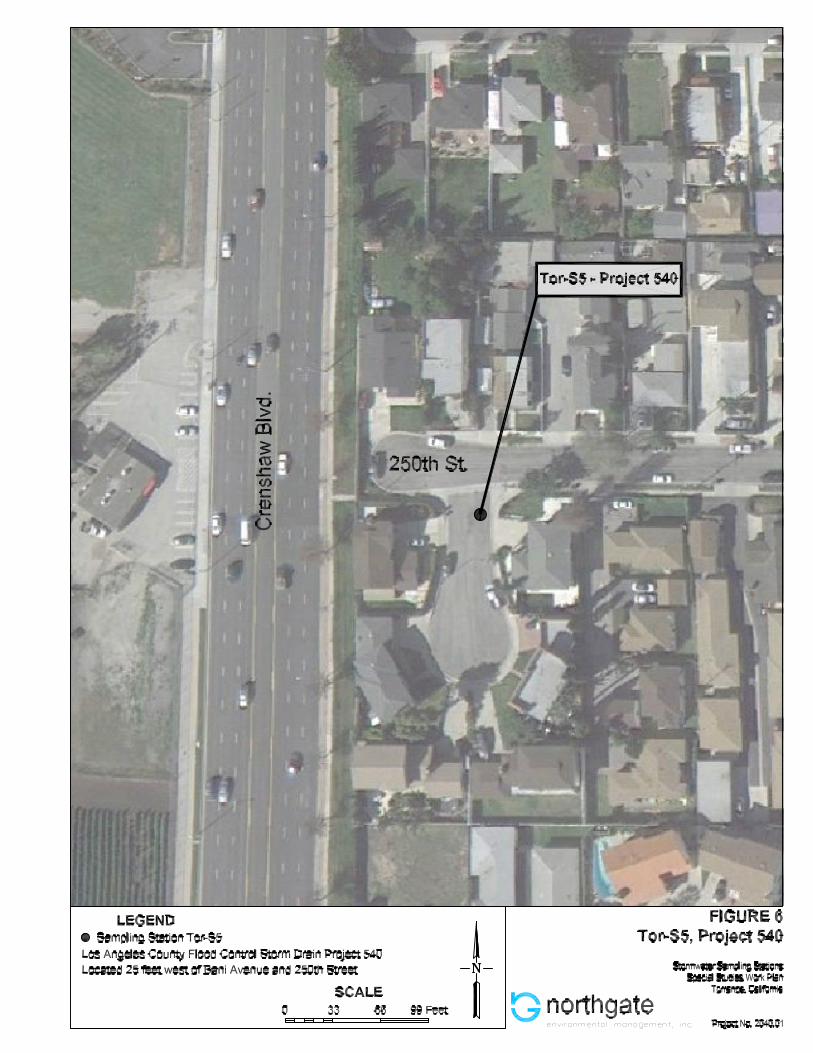
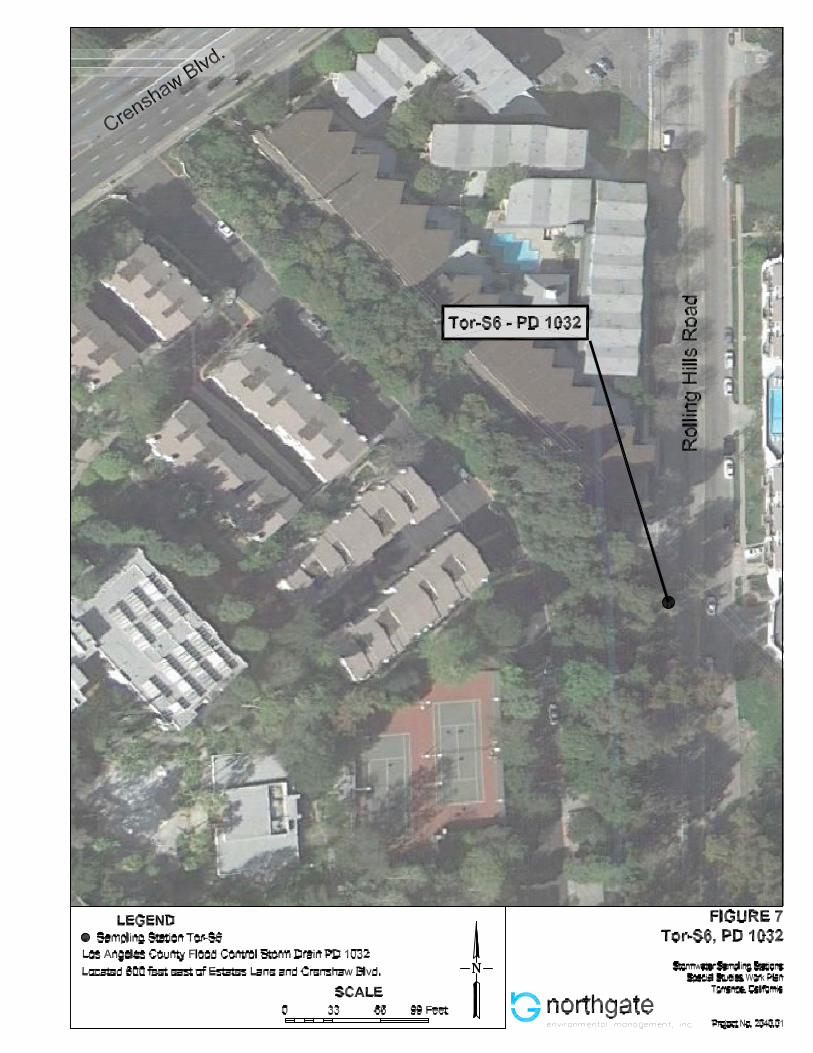
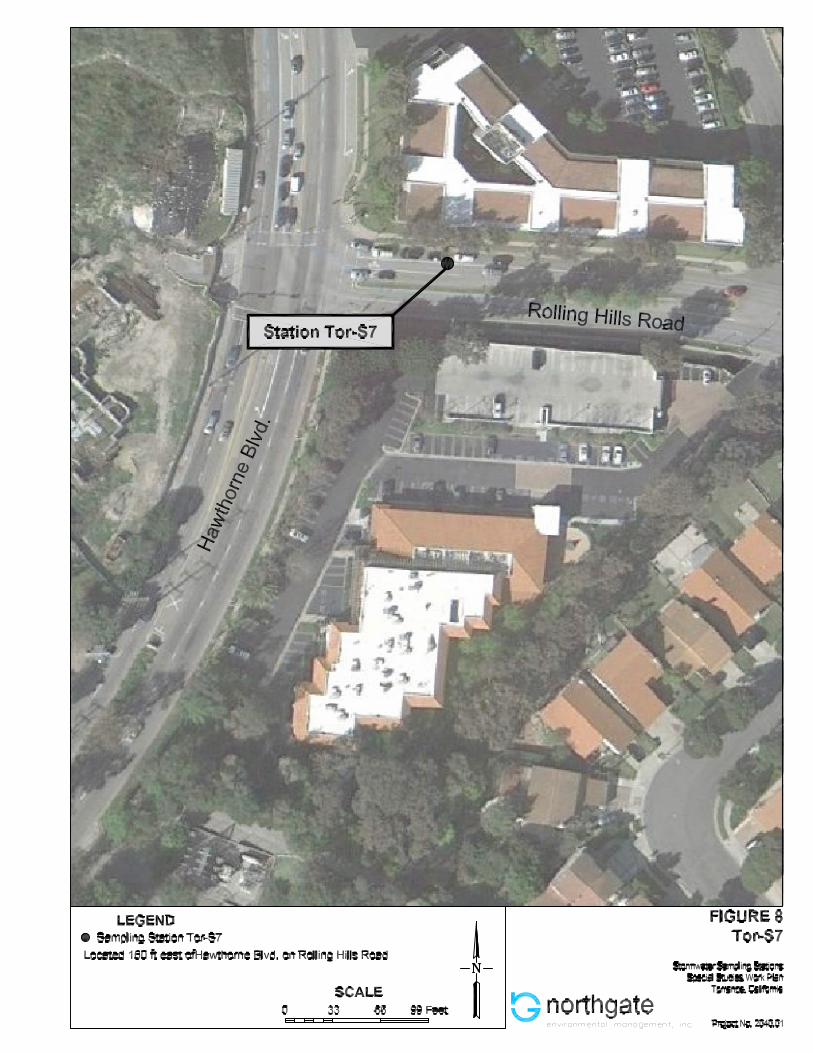
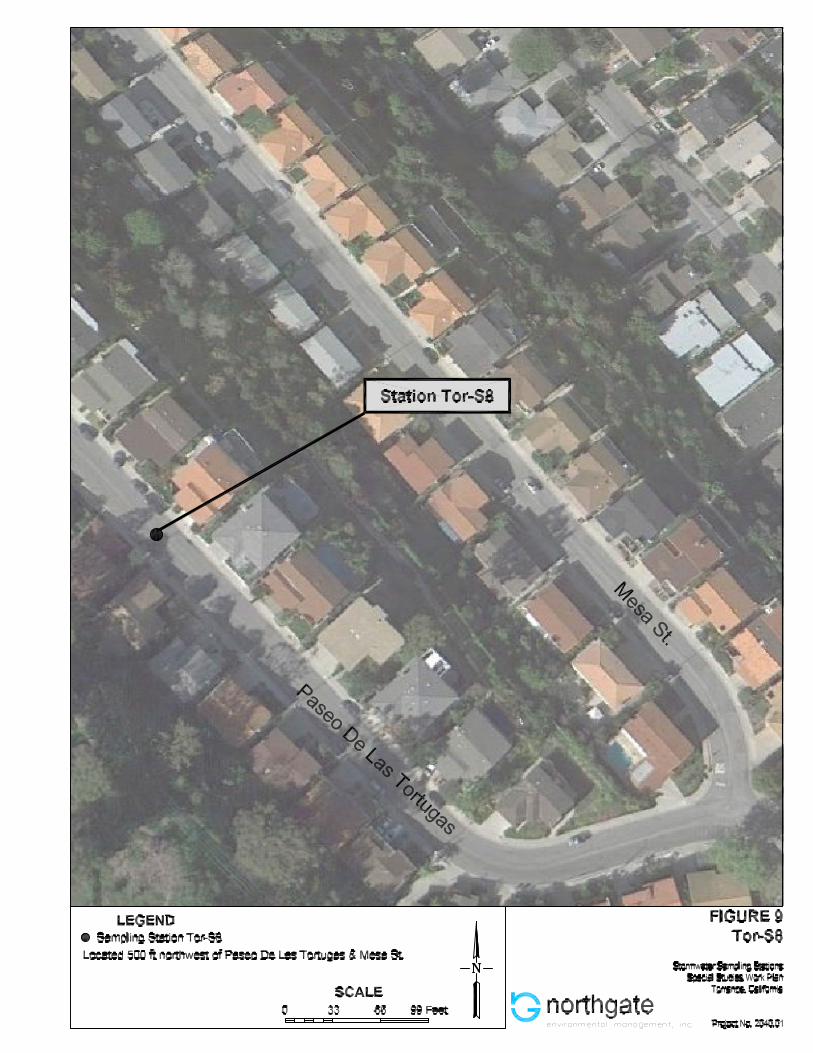
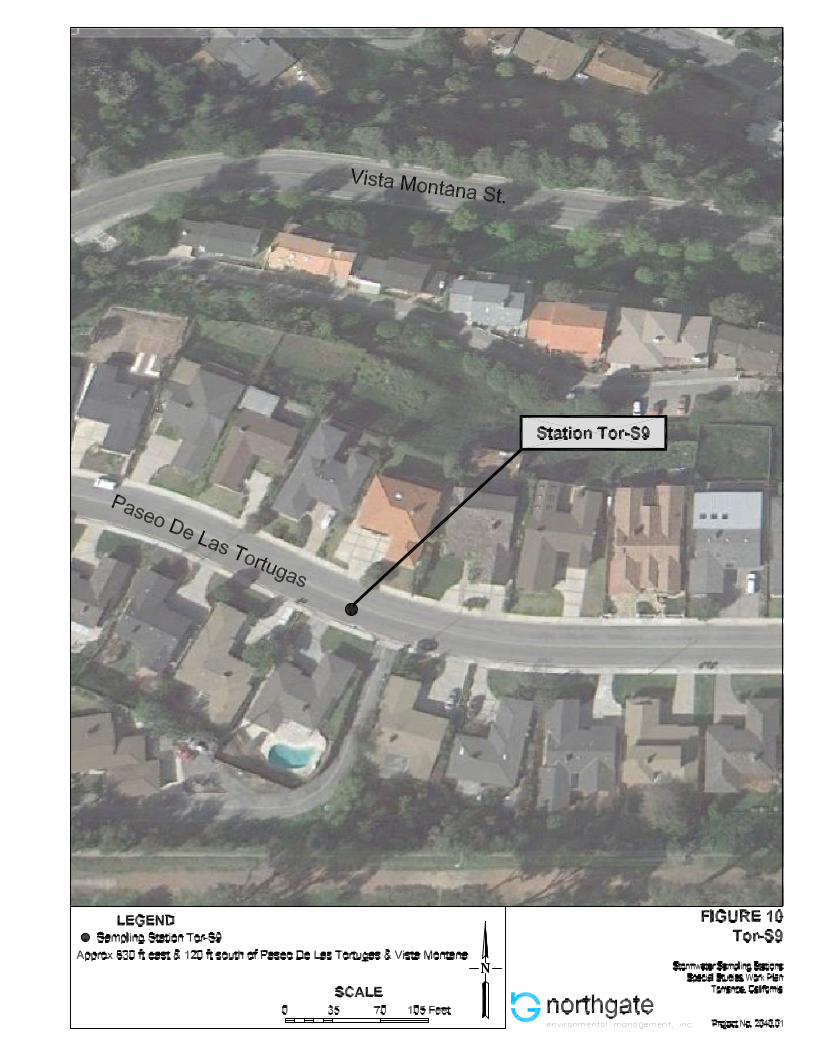
APPENDIX A
Site-Specific Health and Safety Plan
2040.01
Health and Safety Plan
For Stormwater Sampling Activities
City of Torrance Torrance, California
February 29, 2012
Prepared For:
City of Torrance 3031 Torrance Boulevard
Torrance, California 90503
Prepared By:
Northgate Environmental Management, Inc. 24411 Ridge Route Drive, Suite 130
Laguna Hills, California 92653
Health and Safety Plan i February 29, 2012For Stormwater Sampling Activities Torrance, California
TABLE OF CONTENTS
1.0 GENERAL ......................................................................................................................... 1
2.0 SITE DESCRIPTION AND BACKGROUND ............................................................... 3
3.0 PLANNED SITE ACTIVITIES ...................................................................................... 4
4.0 KEY PROJECT PERSONNEL AND RESPONSIBILITIES ...................................... 5 4.1 Project Manager .............................................................................................................. 5 4.2 Site Safety Officer ........................................................................................................... 5 4.3 Subcontractor Personnel ................................................................................................. 5
5.0 HAZARDS OF KNOWN OR EXPECTED SUBSTANCES OF CONCERN ............. 7
6.0 PHYSICAL HAZARDS ................................................................................................... 8 6.1 General Safe Work Practices .......................................................................................... 8 6.2 Rapidly Flowing Water ................................................................................................... 9 6.3 Open Manholes ............................................................................................................... 9 6.4 Heat Stress ...................................................................................................................... 9 6.5 Cold Stress .................................................................................................................... 10 6.6 Inclement Weather ........................................................................................................ 11 6.7 Materials and Equipment Handling Procedures ........................................................... 11 6.8 Lightning/Electrical Storms .......................................................................................... 11 6.9 Traffic ........................................................................................................................... 12
7.0 PERSONAL PROTECTIVE EQUIPMENT ................................................................ 13 7.1 Level D Protection ........................................................................................................ 13 7.2 Confined Space Entry ................................................................................................... 13 7.3 Manhole Safety ............................................................................................................. 14
8.0 SAFETY PROCEDURES AND SITE REQUIREMENTS......................................... 16 8.1 Training Requirements.................................................................................................. 16 8.2 Medical Surveillance Requirements ............................................................................. 16
9.0 SITE CONTROL MEASURES ..................................................................................... 17 9.1 Establishing Work Zones .............................................................................................. 17 9.2 Decontamination Procedures ........................................................................................ 18
10.0 CONTINGENCY PROCEDURES................................................................................ 19 10.1 Injury/Illness ................................................................................................................. 19 10.2 Fire ................................................................................................................................ 20 10.3 Underground Utilities ................................................................................................... 20 10.4 Evacuation..................................................................................................................... 20 10.5 Hazardous Material Spill .............................................................................................. 21
11.0 EMERGENCY CONTACTS ......................................................................................... 22
12.0 NORTHGATE APPROVALS ....................................................................................... 24
13.0 SIGNATURE PAGE ....................................................................................................... 25
Health and Safety Plan ii February 29, 2012For Stormwater Sampling Activities Torrance, California
APPENDICES
A. Compound Descriptions B. Confined Space Entry Procedure
C. Confined Space Entry Emergency Action Plan
D. Manhole Safe Work Practices E. Forms
Daily Tailgate Safety Meeting Form Site Safety Checklist Air Monitoring Form Incident Report Form
F. Hospital Route Maps
Health and Safety Plan 1 February 29, 2012For Stormwater Sampling Activities Torrance, California
1.0 GENERAL
Northgate Environmental Management (Northgate) has prepared this Health and Safety Plan
(HASP) for use during water sampling activities conducted at monitoring stations in the City of
Torrance (the Site) as part of the Special Studies Workplan. Activities conducted under
Northgate’s direction at the Site will be in compliance with applicable Occupational Safety and
Health Administration (OSHA) regulations, particularly those in Title 8 California Code of
Regulations (CCR) 5192, and other applicable federal, state, and local laws, regulations, and
statutes. A copy of this HASP will be kept on Site during scheduled field activities.
This HASP addresses the potential hazards associated with planned field activities at the Site. It
presents the minimum health and safety requirements for establishing and maintaining a safe
working environment during the course of work. In the event of conflicting requirements, the
procedures or practices that provide the highest degree of personnel protection will be
implemented. If work plan specifications change or if site conditions encountered during the
course of the work are found to differ substantially from those anticipated, the Director of Health
and Safety must be informed immediately upon discovery, and appropriate changes will be made
to this HASP.
It is the Project Manager’s responsibility to ensure that health and safety procedures are enforced
at the Site. Project personnel, including subcontractors, shall receive a copy of this HASP and
sign the form to indicate acceptance before on-site project activities begin.
Northgate’s health and safety programs and procedures, including medical monitoring,
respiratory protection, injury and illness prevention, hazard communication, and personal
protective equipment (PPE), are documented in the Northgate Corporate Health and Safety
Manual. These health and safety procedures are incorporated herein by reference, and Northgate
employees will adhere to the procedures specified in the manual.
When specified in contract documents, this HASP may cover the activities of Northgate
subcontractors. However, this HASP may not address hazards associated with tasks and
equipment that are specialties of the subcontractor (e.g., operation of a drill rig). Subcontractors
are responsible for developing, maintaining, and implementing their own health and safety
programs, policies, and procedures.
Northgate is responsible for the safety of its employees and subcontractors under its control, but
assumes no responsibility for the activities of other contractors or their subcontractors who may
be working concurrently at the general project location. Northgate will use a reasonable degree
Health and Safety Plan 2 February 29, 2012For Stormwater Sampling Activities Torrance, California
of care when marking potentially hazardous areas within its project work site and restricting
access as appropriate. Northgate will not be responsible for others outside its control that
disregard such marked hazards or restricted access. This HASP has been prepared specifically
for this project and is intended to address health and safety issues solely with respect to
Northgate’s work. All references, therefore, to the site, the work, activities, site personnel,
workers, persons, or subcontractors in this HASP are with respect to Northgate work only.
Health and Safety Plan 3 February 29, 2012For Stormwater Sampling Activities Torrance, California
2.0 SITE DESCRIPTION AND BACKGROUND
There are nine locations (9) where monthly stormwater sampling will be performed on behalf of
the City of Torrance. The stormwater will also be sampled during qualifying wet weather events
and during pumping events where Walteria Lake is lowered. In the City of Torrance, stormwater
flows generally toward the east, contributing flow to drainage systems entering Machado Lake.
Stormwater from the City of Torrance accounts for approximately 35.6% of the Machado Lake
watershed (Carollo Engineers, 2011).
Machado Lake is located in the City of Los Angeles at the Ken Malloy Harbor Regional Park. It
is approximately 40 acres in size, and averages approximately 3 feet in depth. Machado Lake is
listed on the 1998, 2002, and 2006 Clean Water Act Section 303(d) lists of impaired water
bodies due to eutrophic conditions, algae and odors. The listed impairments are caused by the
overloading of nutrients, such as nitrogen and phosphorus, resulting in excessive algal growth
which leads to increased turbidity, decreased levels of oxygen, and odor problems. The Los
Angeles Regional Water Quality Control Board established total maximum daily loads (TMDLs)
for Machado Lake for algae, ammonia and odors (nutrient) on May 1, 2008.
Health and Safety Plan 4 February 29, 2012For Stormwater Sampling Activities Torrance, California
3.0 PLANNED SITE ACTIVITIES
Project work will consist of the following activities:
Placement of dedicated flow sensors;
Stormwater sample collection; and
Water flow measurement.
Stormwater sampling and flow measurements are expected to be taken from subsurface storm
drains and conveyances in dry weather on a monthly basis, in wet weather during qualifying
storm events, and during up to 10 yearly pumping events where water is transferred from
Walteria Lake into the storm drain system. Access to the conveyances is via manholes located
within the public right-of-way. Work within the manholes or an underground conveyance is
subject to confined space entry protocols and safe work practices.
Health and Safety Plan 5 February 29, 2012For Stormwater Sampling Activities Torrance, California
4.0 KEY PROJECT PERSONNEL AND RESPONSIBILITIES
Project Manager Dana Brown
Site Safety Officer (SSO) Nicky Galloway
The responsibilities of key project personnel are outlined below.
4.1 Project Manager
The Project Manager has the ultimate responsibility for the health and safety of Northgate
personnel at the Site. The Project Manager is responsible for:
Ensuring that project personnel review and understand the requirements of this HASP;
Keeping the Director of Health and Safety informed of project developments;
Keeping on-site personnel, including subcontractors, informed of the expected hazards and appropriate protective measures at the Site; and
Providing resources necessary for maintaining a safe and healthy work environment for Northgate personnel.
4.2 Site Safety Officer
The SSO is responsible for enforcing the requirements of this HASP once Site work begins. The
SSO has the authority to immediately correct situations where noncompliance with this HASP is
noted and to immediately stop work in cases where an immediate danger to Site workers or the
environment is perceived. Responsibilities of the SSO also include:
Obtaining and distributing PPE and air monitoring equipment necessary for this project;
Limiting access at the Site to authorized personnel;
Communicating unusual or unforeseen conditions at the Site to the Project Manager;
Supervising and monitoring the safety performance of site personnel to evaluate the effectiveness of health and safety procedures and correct deficiencies;
Conducting daily tailgate safety meetings before each day’s activities begin; and
Conducting a Site safety inspection prior to the commencement of each day’s field activities.
4.3 Subcontractor Personnel
Subcontractor personnel are expected to comply with the minimum requirements specified in this
HASP. Failure to do so may result in the removal of the subcontractor or any of the
Health and Safety Plan 6 February 29, 2012For Stormwater Sampling Activities Torrance, California
subcontractor’s workers from the job site. Subcontractors may employ health and safety
procedures that afford them a greater measure of personal protection than those specified in this
plan so long as they do not pose additional hazards to themselves, the environment, or others
working in the area.
Health and Safety Plan 7 February 29, 2012For Stormwater Sampling Activities Torrance, California
5.0 HAZARDS OF KNOWN OR EXPECTED SUBSTANCES OF CONCERN
Anticipated Compounds Source (soil/water/drum, etc.)
Known Concentration Range (ppm, mg/kg, mg/l)
Lowest Highest
Nitrate-Nitrite Stormwater unknown unknown
Total Kjeldahl Nitrogen (TKN)
Stormwater unknown unknown
Total Phosphorus Stormwater unknown unknown
Compounds to be tested in stormwater include those in the table above. Exposure pathways of
concern for these compounds are direct skin contact with contaminated materials and incidental
ingestion of affected media. Wearing protective equipment and following decontamination
procedures listed in Section 9.0 can minimize dermal contact and incidental ingestion.
Descriptions of the compounds of concern are located in Appendix A.
In addition, there is a potential for exposure to bacteria in stormwater. Wearing of protective
equipment and proper decontamination procedures will also minimize exposure to bacteria.
Health and Safety Plan 8 February 29, 2012For Stormwater Sampling Activities Torrance, California
6.0 PHYSICAL HAZARDS
The following potential physical hazards may be encountered during scheduled activities at the
Site:
Rapidly flowing water;
Open manholes;
Slips, trips, and falls;
Heat stress;
Cold stress;
Inclement weather;
Materials and equipment handling;
Lightning/electrical storms; and
Traffic.
6.1 General Safe Work Practices
Workers will thoroughly clean their hands, faces, and other potentially contaminated areas before smoking, eating, or leaving the Site;
Accidents and/or injuries associated with work at the Site will be immediately reported to the SSO. If necessary, an incident report will be initiated by the SSO;
Periodic safety briefings will be held to discuss current Site conditions, field tasks being performed, planned modifications, and work concerns;
Site conditions may include uneven, unstable, or slippery work surfaces. Substantial care and personal observation is required on the part of each employee to prevent injuries from slips, trips, and falls;
Workers will maintain good housekeeping practices during field activities to maintain a safe working environment. The work site will be kept free of debris, waste, and trash;
The “buddy system” will be used whenever appropriate;
To prevent head injury, ANSI-approved hard hats will be worn at all times while the worker is in an area where overhead obstructions or falling objects may be encountered; and
To prevent eye injuries, workers must wear ANSI-approved safety glasses during field activities.
Health and Safety Plan 9 February 29, 2012For Stormwater Sampling Activities Torrance, California
6.2 Rapidly Flowing Water
In accordance with CFR 1926.106, employees working over or near water, where the danger of
drowning exists, shall be provided with U.S. Coast Guard-approved life jackets or buoyant work
vests. Prior to and after each use, the buoyant work vests or life preservers shall be inspected for
defects that would alter their strength or buoyancy. Defective units shall not be used.
Workers will not enter water deeper than the knee under any circumstance. Workers will not
enter flowing water when the product of depth (in feet) and velocity (in feet per second) equals
12 or greater. When water conditions preclude safe water entry, water depths and current
velocity will be measured from a traverse located atop the culvert or drain inlet structure and
reported as an approximate value.
6.3 Open Manholes
Manholes will be opened by a team of two workers using hooks or a lid lifting tool. When
preparing to remove a manhole cover make sure it is not locked with a bolt, setscrew, or other
locking device. When handling a cover, keep feet solidly placed and clear of the cover should it
drop. Take a working position with knees slightly bent and unseat the cover by both workers
pulling at the same time. Re-position the feet and continue to make additional pulls until the
cover is clean from the frame and will not interfere with the work being done. Workers will
deploy a safety fence around the manhole opening to create an exclusion zone and limit access to
authorized personnel. Replacing the cover can be done in a similar manner by moving it until
the cover seats itself in the frame.
When the manhole is located in a public right of way, traffic control measures will be placed
according to requirements published in the Work Area Traffic Control Handbook (WATCH
Manual) (BNI, 2010). Traffic control measures will be placed according to Northgate standard
Safe Work Practices and all applicable permit conditions.
6.4 Heat Stress
Adverse climate conditions, primarily heat, are important considerations in planning and
conducting Site operations. Heat-related illnesses range from heat fatigue to heat stroke, with
heat stroke being the most serious condition. The effects of ambient temperature can cause
physical discomfort, loss of efficiency, and personal injury, and can increase the probability of
accidents. In particular, protective clothing that decreases the body’s ventilation can be an
important factor leading to heat-related illnesses.
Health and Safety Plan 10 February 29, 2012For Stormwater Sampling Activities Torrance, California
To reduce the possibility of heat-related illness, workers should drink plenty of fluids and
establish a work schedule that will provide sufficient rest periods for cooling down. Personnel
shall maintain an adequate supply of non-caffeinated drinking fluids on Site for personal
hydration. Workers should be aware of signs and symptoms of heat-related illnesses, as well as
first aid for these conditions. These are summarized in the table below.
Condition Signs Symptoms Response
Heat Rash or Prickly Heat
Red rash on skin. Intense itching and inflammation.
Increase fluid intake and observe affected worker.
Heat Cramps Heavy sweating, lack of muscle coordination.
Muscle spasms, and pain in hands, feet, or abdomen.
Increase fluid uptake and rest periods. Closely observe affected worker for more serious symptoms.
Heat Exhaustion Heavy sweating; pale, cool, moist skin; lack of coordination; fainting.
Weakness, headache, dizziness, nausea.
Remove worker to a cool, shady area. Administer fluids and allow worker to rest until fully recovered. Increase rest periods and closely observe worker for additional signs of heat exhaustion. If symptoms of heat exhaustion recur, treat as above and release worker from the day’s activities after he/she has fully recovered.
Heat Stroke Red, hot, dry skin; disorientation; unconsciousness
Lack of or reduced perspiration; nausea; dizziness and confusion; strong, rapid pulse.
Immediately contact emergency medical services by dialing 911. Remove the victim to a cool, shady location and observe for signs of shock. Attempt to comfort and cool the victim by administering small amounts of cool water (if conscious), loosening clothing, and placing cool compresses at locations where major arteries occur close to the body’s surface (neck, underarms, and groin areas). Carefully follow instructions given by emergency medical services until help arrives.
6.5 Cold Stress
Workers performing activities during winter and spring months may encounter extremely cold
temperatures, as well as conditions of snow and ice, making activities in the field difficult.
Adequate cold weather gear, especially head and foot wear, is required under these conditions.
Health and Safety Plan 11 February 29, 2012For Stormwater Sampling Activities Torrance, California
Workers should be aware of signs and symptoms of hypothermia and frostbite, as well as first
aid for these conditions. These are summarized in the table below.
Condition Signs Symptoms Response
Hypothermia Confusion, slurred speech, slow movement.
Sleepiness, confusion, warm
feeling.
Remove subject to warm area, such as truck cab; give warm fluids; warm
body core as rapidly as possible; remove outer clothing and wrap torso in blankets with hot water bottle or other heat source. Get medical attention immediately.
Frostbite Reddish area on skin, frozen skin.
Numbness or lack of feeling
on exposed skin.
Place affected extremity in warm, not hot, water, or wrap in warm towels. Get medical attention.
6.6 Inclement Weather
Rain and wet conditions increase slipping and tripping hazards, braking distances of vehicles,
and the potential for slippage or handling difficulties of field equipment. Winter storms will
bring in colder than normal temperatures to the area. Sampling teams should be prepared to
work long hours in wet and cold conditions and should wear extra layers of clothing under rain
gear since there may be a variety of temperature changes. Traffic control equipment should be
placed with the consideration that vehicles will take longer to stop on wetted roadways, and the
work area should be protected from traffic by positioning a truck between the work area and
direction of traffic flow as a buffer.
6.7 Materials and Equipment Handling Procedures
The movement and handling of heavy equipment and materials on the Site pose a risk to workers
in the form of muscle strains and minor injuries. These injuries can be avoided by using safe
handling practices, proper lifting techniques, and proper personal safety equipment such as steel-
toed boots and sturdy work gloves. Where practical, mechanical devices such as hand carts,
manhole hooks, pry bars, and lid lifting tools will be utilized to assist in the movement of heavy
equipment or materials. Workers will not attempt to move heavy objects by themselves without
using appropriate mechanical aids.
6.8 Lightning/Electrical Storms
Lightning can be unpredictable and may strike many miles in front of, or behind, a thunderstorm.
Workers will therefore cease field operations at the first sign of lightning and suspend activities
Health and Safety Plan 12 February 29, 2012For Stormwater Sampling Activities Torrance, California
until at least 30 minutes after the last observed occurrence of lightning or thunder. For purposes
of this HASP, signs of a thunderstorm will include any visible lightning or audible thunder.
In the event of a thunderstorm, workers will take the following actions:
Get inside a permanent building structure (not a shed or canopy) or fully enclosed metal vehicle (not a convertible or camper shell) with the windows fully up.
Stay away from tall isolated objects, such as trees, telephone poles, or flag poles.
Avoid touching pry bars, metal lifting hooks, or metal manhole covers and store them on the ground away from the vehicle.
Avoid large open areas, such as fields or parking lots, where a person is the relatively highest object.
Stay away from lakes, ponds, railroad tracks, fences, culverts and storm drains that contain water, and other objects that could transmit current from a distant lightning strike.
6.9 Traffic
Vehicular traffic at sample stations located in right-of-ways presents opportunities for serious
injury to persons or property. Traffic may consist of automobiles and trucks, and workers are
clearly at risk during periods of heavy traffic and/or inclement weather. Risk from motor vehicle
operations may be minimized by good operating practices, alertness, and care on the part of
workers and pedestrians.
Site personnel will wear high-visibility safety vests whenever activities are conducted in areas
with vehicular traffic. Work vehicles and traffic control devices will be placed according to the
standards published in the WATCH manual (BNI, 2009) as appropriate for each sampling
location. The equipment will be in conformance with the Manual on Uniform Traffic Control
Devices for Streets and Highways (United States Department of Transportation, 2009), and the
California Manual on Uniform Traffic Control Devices for Streets and Highways (California
Department of Transportation, 2012). The equipment shall be arranged to serve as a barrier
between Site workers and vehicular traffic. If required by local ordinances or Site location, a
traffic control plan will be developed and implemented.
Health and Safety Plan 13 February 29, 2012For Stormwater Sampling Activities Torrance, California
7.0 PERSONAL PROTECTIVE EQUIPMENT
The purpose of PPE is to protect employees from hazards and potential hazards they are likely to
encounter during Site work. The amount and type of PPE used will be based on the nature of the
anticipated or encountered hazards, but at a minimum, dermal protection and eye protection will
be worn whenever contact with stormwater is anticipated.
Northgate personnel will be provided with appropriate personal safety equipment and protective
clothing. The SSO is to inform each worker about necessary protection and must provide proper
training in the use of the safety equipment. The required PPE to be worn for Site work is
described below.
7.1 Level D Protection
It is anticipated that collection of stormwater samples will normally require Level D PPE.
Dermal protection is required whenever contact with stormwater is anticipated. Higher levels of
PPE are not expected to be required unless confined space entry is performed. The following
equipment is specified as the minimum PPE required to conduct work at the Site:
Work shirt and long pants;
Waterproof gloves;
ANSI-approved steel-toed boots or safety shoes;
ANSI approved hard hat;
Reflective traffic safety vest; and
ANSI-approved safety glasses.
Other personal protection readily available for use, if necessary, includes the following:
Waders, when direct contact with stormwater is anticipated
U.S. Coast Guard-approved life jacket or buoyant work vest; and
Chemical splash goggles.
7.2 Confined Space Entry
Work inside a manhole or underground stormwater conveyance requires the implementation of
confined space entry protocols and manhole safe work practices. The confined space entry
protocol contains a summary of tasks that are required to be performed prior to entering the
confined space (see Appendix B). In the event of an emergency involving the worker within the
Health and Safety Plan 14 February 29, 2012For Stormwater Sampling Activities Torrance, California
confined space, a Confined Space Entry Emergency Action Plan will be followed by the
attendant (see Appendix C). Appendix D contains the Manhole Safe Work Practices protocol,
and a summary of confined space entry and manhole safety is contained in the following
paragraphs.
During confined space entry, atmospheric monitoring is required to determine if a hazardous
condition exists. If a hazardous condition is present, in order to continue working within the
confined space Level B protection is required. Level B PPE consists of the standard Level D
PPE plus a supplied air respirator (SAR). The following are conditions that require the use of
SARs:
Oxygen-deficient atmosphere (less than 19.5% oxygen);
Carbon Monoxide level above 25 parts per million (ppm);
Hydrogen Sulfide level above 10 ppm;
Entry into confined or unventilated areas which may contain airborne contaminants that have not been characterized;
Presence of unidentified contaminants; or
Identified substances which have inadequate warning properties.
The SSO shall ensure that employees using SARs be supplied with breathing gases of high
purity. Compressed breathing air shall meet at least the requirements for Grade D breathing air
described in ANSI/Compressed Gas Association Commodity Specification for Air, G-7. 1-1989.
Breathing air couplings shall be incompatible with outlets for nonrespirable worksite air or other
gas systems.
7.3 Manhole Safety
The use of appropriate PPE is required for all work in and around a manhole, and selection of the
PPE shall be based on the expected hazard(s). At a minimum Level D PPE shall be worn and an
approved rescue system (harness-safety line-tripod) shall be utilized whenever a worker enters a
manhole.
A fresh air blower ventilation system shall be set up and in operation before and during all
confined space entry procedures. The blower shall provide a continuous source of fresh air to
the breathing zone of a worker within the confined space. Operation of the blower shall be
monitored by a worker outside the confined space to ensure it remains operational during the
entire time a worker is within the confined space.
Health and Safety Plan 15 February 29, 2012For Stormwater Sampling Activities Torrance, California
After the ventilation system has been in operation for at least 15 minutes, and the confined space
has been tested and determined to be safe for entry; workers entering the confined space shall be
equipped at a minimum with the following:
Rescue equipment including harness, lifeline, and safety retrieval system;
An approved, properly calibrated gas detector;
Hard hat;
Coveralls;
Steel-toed safety shoes;
Dust mask;
Safety Glasses with side shields or goggles; and
Gloves.
Health and Safety Plan 16 February 29, 2012For Stormwater Sampling Activities Torrance, California
8.0 SAFETY PROCEDURES AND SITE REQUIREMENTS
A daily morning briefing to cover safety procedures and contingency plans in the event of an
emergency is to be included with a discussion of the day’s activities. These daily meetings will
be recorded on Northgate Daily Tailgate Safety Meeting Forms. A debriefing to cover the
activities is to be held upon completion of the work. A copy of the Daily Tailgate Safety
Meeting Form is included in Appendix E.
The SSO will conduct a safety inspection of the work site before each day’s activities begin to
verify compliance with the requirements of the HASP. Results of the first day’s inspection will
be documented on a Northgate Site Safety Checklist. A copy of the checklist is included in
Appendix E.
Minimum emergency equipment maintained on Site will include a fully charged 20-pound ABC
dry chemical fire extinguisher, an adequately stocked first aid kit, and an emergency eyewash
station (when corrosive chemicals are present).
8.1 Training Requirements
Site personnel, including subcontractors and visitors conducting work in controlled areas of the
Site, must have completed the appropriate training as required by 8 CCR 5192. Further Site-
specific training will be conducted by the SSO prior to the initiation of project activities. This
training will include, but will not necessarily be limited to, emergency procedures, Site control,
personnel responsibilities, and the provisions of this HASP.
General Site workers (such as equipment operators, general laborers, and supervisory personnel)
engaged in hazardous substance removal or other activities that could expose them to hazardous
substances must have successfully completed an initial 40-hour Hazardous Waste Operations and
Emergency Response (HAZWOPER) training course. In addition, each employee must have
attended an eight-hour annual HAZWOPER refresher training course within the past 12 months
if their initial 40-hour HAZWOPER training course was completed more than 12 months prior.
8.2 Medical Surveillance Requirements
Site personnel, including subcontractors and Site visitors, who will or may work in an area
designated as an exclusion zone must have fulfilled the appropriate medical monitoring
requirements in accordance with 8 CCR 5192(f). Each individual entering an exclusion zone
must have completed an annual surveillance examination and/or an initial baseline examination
within the last 12 months.
Health and Safety Plan 17 February 29, 2012For Stormwater Sampling Activities Torrance, California
9.0 SITE CONTROL MEASURES
Procedures must be followed to maintain Site control so that persons who may be unaware of
Site conditions and oncoming traffic are not exposed to hazards. The vehicle parking area will
be marked with cones to warn oncoming traffic. The work area will be barricaded by tape,
warning signs, or other appropriate means. Pertinent equipment will be secured and stored
safely.
Access inside the specified work area will be limited to authorized personnel. Only Northgate
employees and designated Northgate subcontracted personnel, as well as designated employees
of the client, will be admitted to the work Site. Personnel entering the work area are required to
sign the signature page of this HASP, indicating they have read and accepted the health and
safety practices outlined in this plan.
9.1 Establishing Work Zones
In some instances it may be necessary to define established work zones: an Exclusion Zone, a
Contamination Reduction Zone, and a Support Zone. Work zones may be established based on
the extent of anticipated contamination, projected work activities, and the presence or absence of
non-project personnel. The physical dimensions and applicability of work zones will be
determined for each area based on the nature of job activity and hazards present. Within these
zones, prescribed operations will occur using appropriate PPE. Movement between zones will
be controlled at checkpoints.
Considerable judgment is needed to maintain a safe working area for each zone, balanced against
practical work considerations. Physical and topographical barriers may constrain ideal locations.
Field measurements combined with climatic conditions may, in part, determine the control zone
distances. Even when work is performed in an area that does not require the use of chemical-
resistant clothing, work zone procedures may still be necessary to limit the movement of
personnel and retain adequate Site control.
Personnel entering the designated Exclusion Zone should exit at the same location. There must
be an alternate exit established for emergency situations. In all instances, worker safety will take
precedence over decontamination procedures. If decontamination of personnel is necessary,
exiting the Site will include the decontamination procedures described below.
Health and Safety Plan 18 February 29, 2012For Stormwater Sampling Activities Torrance, California
9.2 Decontamination Procedures
Despite protective procedures, personnel may come in contact with potentially hazardous
compounds while performing work tasks. If so, decontamination needs to take place using an
Alconox or Liquinox wash, followed by a rinse with clean water. Standard decontamination
procedures for Level D are as follows:
Equipment drop;
Boot cover and outer glove wash and rinse;
Boot cover and outer glove removal;
Suit wash and rinse;
Suit removal;
Safety boot wash and rinse;
Inner glove wash and rinse;
Inner glove removal; and
Field wash of hands and face.
Workers should employ only applicable steps in accordance with level of PPE worn and extent
of contamination present. The SSO shall maintain adequate quantities of clean water to be used
for personal decontamination (i.e., field wash of hands and face) whenever a suitable washing
facility is not located in the immediate vicinity of the work area. Disposable items will be
disposed of in an appropriate container. Wash and rinse water generated from decontamination
activities will be handled and disposed of properly. Non-disposable items may need to be
sanitized before reuse. Each Site worker is responsible for the maintenance, decontamination,
and sanitizing of his/her own PPE.
Used equipment may be decontaminated as follows:
An Alconox or Liquinox and water solution will be used to wash the equipment; and
The equipment will then be rinsed with clean water.
Each person must follow these procedures to reduce the potential for transferring chemically
affected materials off Site.
Health and Safety Plan 19 February 29, 2012For Stormwater Sampling Activities Torrance, California
10.0 CONTINGENCY PROCEDURES
In the event of an emergency, Site personnel will signal distress with three blasts of a horn (a
vehicle horn will be sufficient), or other predetermined signal. Communication signals, such as
hand signals, must be established where communication equipment is not feasible or in areas of
loud noise.
It is the SSO’s duty to evaluate the seriousness of the situation and to notify appropriate
authorities. Section 11 of this plan contains emergency telephone numbers as well as directions
to the hospital. Nearby telephone access must be identified and available to communicate with
local authorities. If a nearby telephone is not available, a cellular telephone will be maintained
on Site during work activities.
Personnel should contact local emergency services in the event of an emergency (see
Section 11). After emergency services are notified, the Project Manager and Director of Health
and Safety will be notified of the situation as soon as possible. If personal injury, property
damage, or equipment damage occurs, the Project Manager and Northgate Corporate
Administration will be contacted as soon as practicable. An Incident Report form will be
completed within 24 hours by the SSO or another designated person. A copy of the Northgate
Incident Report form is included in Appendix E.
10.1 Injury/Illness
If an exposure or injury occurs, work will be temporarily halted until an assessment can be made
of whether it is safe to continue work. The SSO, in consultation with the Director of Health and
Safety, will make the decision regarding the safety of continuing work. The SSO will conduct an
investigation to determine the cause of the incident and steps to be taken to prevent recurrence.
In the event of an injury, the extent and nature of the victim’s injuries will be assessed and first
aid will be rendered as appropriate. If necessary, the individual may be transported to the nearby
medical center. The mode of transportation and the eventual destination will be based on the
nature and extent of the injury. A hospital route map for each sample station is included in
Appendix F.
In the event of a life-threatening emergency, the injured person will be given immediate first aid
and emergency medical services will be contacted by dialing the number listed in Section 11.
The individual rendering first aid will follow directions given by emergency medical personnel
Health and Safety Plan 20 February 29, 2012For Stormwater Sampling Activities Torrance, California
via telephone. When working in areas where medical services are not readily available, a person
trained in first aid/CPR techniques will be present during field activities.
10.2 Fire
In the event of fire, personnel should contact the local fire department immediately by dialing
911. When representatives of the fire department arrive, the SSO, or designated representative,
will advise the commanding officer of the location, nature, and identification of hazardous
materials on Site. Only trained, experienced fire fighters should attempt to extinguish substantial
fires at the Site. Site personnel should not attempt to fight fires, unless properly trained and
equipped to do so.
Smoking is not permitted in controlled areas (i.e., exclusion or contamination reduction zones),
near flammable or combustible materials, or in areas designated by the facility as non-smoking
areas.
10.3 Underground Utilities
In the event that an underground conduit or manhole cover is damaged during sampling
activities, mechanized equipment will immediately be shut off and the lead agency will be
notified of the damage. Sampling will be discontinued, and the team will remain onsite until a
representative of the lead agency has arrived to inspect the damage and take a report of the
incident.
10.4 Evacuation
The SSO will designate evacuation routes and refuge areas to be used in the event of an
emergency. Site personnel will stay upwind from vapors or smoke and upgradient from spills. If
workers are in an Exclusion or Contamination Reduction Zone at the start of an emergency, they
should exit through the established decontamination areas whenever possible. If evacuation
cannot be done through an established decontamination area, Site personnel will go to the nearest
safe location and remove contaminated clothing there or, if possible, leave it near the Exclusion
Zone. Personnel will assemble at the predetermined refuge following evacuation and
decontamination. The SSO, or designated representative, will count and identify Site personnel
to verify that all have been evacuated safely.
Health and Safety Plan 21 February 29, 2012For Stormwater Sampling Activities Torrance, California
10.5 Hazardous Material Spill
If a hazardous material spill occurs, Site personnel should locate the source of the spill and
determine the hazard to the health and safety of Site workers and the public. Attempt to stop or
reduce the flow if it can be done without risk to personnel. Isolate the spill area and do not allow
entry by unauthorized personnel. De-energize sources of ignition within 100 feet of the spill,
including vehicle engines. Should a spill be of the nature or extent that it cannot be safely
contained, or poses an imminent threat to human health or the environment, an emergency
cleanup contractor will be called out as soon as possible. Spill containment measures listed
below are examples of responses to spills.
Right or rotate containers to stop the flow of liquids. This step may be accomplished as soon as the spill or leak occurs, providing it is safe to do so;
Sorbent pads, booms, or adjacent soil may be used to dike or berm materials, subject to flow, and to solidify liquids;
Sorbent pads, soil, or booms, if used, shall be placed in appropriate containers after use, pending disposal; and
Contaminated tools and equipment shall be collected for subsequent cleaning or disposal.
Health and Safety Plan 22 February 29, 2012For Stormwater Sampling Activities Torrance, California
11.0 EMERGENCY CONTACTS
Emergency Services (Police/Fire Department/Ambulance): 911
National Response Center: (800) 424-8802
Poison Control Center: (800) 876-4766 or (800) 222-1222
CHEMTREC: (800) 424-9300
Northgate Project Manager: (Dana Brown) (949) 716-0050 ext. 107 Cell Phone: (949) 230-0643
Northgate Oakland office: (510) 839-0688
Nearby Hospital:
Torrance Memorial Medical Center 3330 Lomita Boulevard Torrance, CA 90505 (310) 517-4750
Emergency entrance is on east side of Hospital
Directions to the Hospital from sampling stations:
Hospital route maps are included in Appendix F.
Tor-S1: Head south on Western Avenue to Sepulveda Blvd. Turn right (west) on Sepulveda
and proceed to Crenshaw Blvd. Turn left (south) onto Crenshaw and proceed to Lomita
Boulevard. Turn left (west) onto Lomita Boulevard; hospital will be on the left (south) side.
Emergency entrance is on the East side of the hospital. Total drive time approximately 6
minutes, 3.7 miles.
Tor-S2: Head south on Pennsylvania Avenue to 227th Street. Turn right (west) onto 227th Street
and proceed to Crenshaw Blvd. Turn left (south) onto Crenshaw and proceed to Lomita
Boulevard. Turn left (west) onto Lomita Boulevard; hospital will be on the left (south) side.
Emergency entrance is on the East side of the hospital. Total drive time approximately 4
minutes, 2.2 miles.
Tor-S3: Head north on Madison Street to Lomita Boulevard. Turn right (east) on Lomita
Boulevard; hospital will be on the right (south) side. Emergency entrance is on the East side of
the hospital. Total drive time approximately 2 minutes, 0.4 miles.
Health and Safety Plan 23 February 29, 2012For Stormwater Sampling Activities Torrance, California
Tor-S4: Head south on Western Avenue to Lomita Boulevard. Turn right (west) onto Lomita
Boulevard and proceed 2.4 miles. Hospital will be on the left (south) side. Emergency entrance
is on the East side of the hospital. Total drive time approximately 6 minutes, 3.3 miles.
Tor-S5: Turn right(east) on 250th Street and proceed 0.1 miles to Pennsylvania Avenue. Turn
left (north) on Pennsylvania Avenue and proceed 0.4 miles to Lomita Boulevard. Turn left
(west) on Lomita Boulevard and proceed 1.2 miles. Hospital will be on the left (south) side.
Emergency entrance is on the East side of the hospital. Total drive time approximately 4
minutes, 1.8 miles.
Tor-S6: Head north on Rolling Hills Road toward Crenshaw Boulevard. Turn right (north) on
Crenshaw Boulevard and proceed 1.6 miles to Lomita Boulevard. Turn left (west) onto Lomita
Boulevard and proceed 1.1 miles, the Hospital will be on the left (south) side. Emergency
entrance is on the East side of the hospital. Total drive time approximately 4 minutes, 2.8 miles.
Tor-S7: Head west on Rolling Hills Road toward Hawthorne Boulevard. Turn right on
Hawthorne Boulevard and proceed 1.5 miles north on Hawthorn Boulevard to Lomita Boulevard.
Turn right (east) onto Lomita Boulevard and proceed 0.4 miles, the Hospital will be on the right
(south) side. Emergency entrance is on the East side of the hospital. Total drive time
approximately 4 minutes, 2.0 miles.
Tor-S8: Head southeast on Paseo de las Tortugas toward Mesa Street. Turn left (east) onto Via
Valmonte. Proceed to Hawthorne Boulevard and turn left (north). Proceed 1.2 miles north on
Hawthorn Boulevard to Lomita Boulevard. Turn right (east) onto Lomita Boulevard and proceed
0.4 miles, the Hospital will be on the right (south) side. Emergency entrance is on the East side
of the hospital. Total drive time approximately 4 minutes, 2.0 miles.
Tor-S9: Head northwest on Paseo de las Tortugas toward Vista Montana. Take the 1st right
onto Vista Montana. Proceed 0,6 miles to Pacific Coast Highway. Turn right (southeast) on
Pacific Coast Highway and proceed 0.4 miles to Hawthorne Boulevard. Turn left (north) on
Hawthorne Boulevard and proceed 0.8 miles to Lomita Boulevard. Turn right (east) onto Lomita
Boulevard and proceed 0.4 miles, the Hospital will be on the right (south) side. Emergency
entrance is on the East side of the hospital. Total drive time approximately 5 minutes, 2.4 miles.
Health and Safety Plan 24 February 29, 2012For Stormwater Sampling Activities Torrance, California
12.0 NORTHGATE APPROVALS
This HASP has been prepared for the following project:
Water Quality Monitoring Services – TMDL Compliance The City of Torrance, California
Northgate Project Number: 2040.01.01S
This HASP has been reviewed and approved by the following Northgate personnel:
February 29, 2012 Dana R. Brown, P.G. Date Project Manager
February 29, 2012 Derrick Willis Date Principal in Charge
Health and Safety Plan 25 February 29, 2012For Stormwater Sampling Activities Torrance, California
13.0 SIGNATURE PAGE
The following signatures indicate that this Health and Safety Plan has been read and accepted by
Northgate personnel as well as subcontractors and their personnel.
NAME COMPANY SIGNATURE DATE
Important notice to subcontractor(s):
This Health and Safety Plan has been prepared solely for the use of Northgate personnel. It is
supplied to you for informational purposes only and may not be relied upon for protection of
your employees. The Subcontractor is responsible for providing, at its cost, all personal
protective clothing and equipment required for its employees to perform their work in a safe
manner and in compliance with all applicable state and federal OSHA regulations.
Subcontractor is responsible for ensuring that such equipment is in good condition and is
properly inspected and maintained. Subcontractor must, at a minimum, use the equipment and
follow the procedures described in this HASP. Failure to do so may result in immediate
termination of Subcontractor’s services. This does not relieve Subcontractor of the responsibility
to provide equipment and institute procedures affording a greater degree of protection than those
specified in this HASP should Subcontractor determine such measures are necessary to protect
the health and welfare of its employees, second-tier subcontractors, or others under its control or
direction.
APPENDIX A
Compound Descriptions
HASP – Compound Descriptions A-1 February 29, 2012City of Torrance Sampling and Analysis Plan Torrance, California
COMPOUND DESCRIPTIONS
The following descriptions are presented for compounds that will be analyzed in stormwater
from the Site.
NITRATE-NITRITE
Nitrate and nitrite are nitrogen-oxygen chemical units which combine with various organic and
inorganic compounds. Once taken into the body, nitrates are converted into nitrites. The
greatest use of nitrates is as a fertilizer.
The EPA Maximum Contaminant Level (MCL) for nitrate (as N) is 10 mg/l.
The California MCL for nitrate (as NO3) is 45mg/l.
The EPA and California MCL for nitrite is 1 ppm.
TOTAL KJELDAHL NITROGEN AND PHOSPHORUS
TKN is the total of nitrogen, ammonia, and ammonium.
Excess nitrogen and phosphorus in water lead to harmful algal blooms, hypoxia, and declines in
wildlife and wildlife habitat.
There are no MCLs for total kjeldahl nitrogen and phosphorus.

APPENDIX B
Confined Space Entry Procedure
HASP – Confined Space Entry Procedure B-1 February 29, 2012City of Torrance Sampling and Analysis Plan Torrance, California
CONFINED SPACE ENTRY PROCEDURE
Manholes are a confined space and special protocols must be followed to ensure worker safety
when performing tasks within a confined space. Although most manholes are relatively safe to
enter, some might contain an unsafe atmosphere or other hazards. Before entering a manhole
workers must have confined space entry training, and must follow Northgate standard operating
protocols and safe work procedures for entry into a confined space.
At a minimum, the following procedures will be followed before entering any manhole or
stormwater conveyance:
1) Set up the manhole guard/barrier and any other required worker area protection.
2) Before removing the manhole cover, test the atmosphere inside the manhole with an air monitoring device attached to a wand or tubing inserted through the small hole in the cover. Do not remove the cover until you are sure there is no flammable gas collected inside it.
3) If there is no indication of a flammable gas in the manhole, then remove the cover and test the space from top to bottom with the air monitoring device. To avoid back injury, use the manhole cover lifting tool and wear leather gloves.
4) If the only potential hazard is the atmosphere and it has been tested and is safe to enter, then the space may be designated a non-permit confined space.
5) Purge and ventilate the manhole with fresh air from a portable blower.
6) When possible, pump out any water that has collected in the manhole and dispose of it as required by local laws.
7) Set up a rescue winch, cable, and tripod over the manhole.
8) Don the required PPE including rescue harness and chemical splash goggles.
9) Review Entrant and Observer communication protocols, the Confined Space Entry Emergency Action Plan, and then begin observation of the entrant.
10) You may now enter the manhole and begin work.
During work within the manhole, periodically or continuously monitor the atmosphere in the
manhole to ensure that it remains safe. Take the air monitoring device into the manhole to
monitor, or have the attendant monitor from outside the manhole.
HASP – Confined Space Entry Procedure B-2 February 29, 2012City of Torrance Sampling and Analysis Plan Torrance, California
In the event of an emergency-e.g., a worker is in a manhole and is unresponsive-DO NOT
ENTER THE MANHOLE because it may contain a hazardous environment. Follow the
Confined Space Entry Emergency Action Plan and immediately implement emergency
procedures including call 9-1-1 and notify the Site Safety Officer or Project Manager. While
waiting for the rescue team, DO NOT ENTER THE MANHOLE, continuously pump fresh air
into the manhole and keep unnecessary workers and bystanders away from the manhole.
APPENDIX C
Confined Space Emergency Action Plan
HASP - Confined Space Emergency Action Plan C-1 February 29, 2012City of Torrance Sampling and Analysis Plan Torrance, California
1.0 CONFINED SPACE EMERGENCY ACTION PLAN
The precautions and procedures outlined in our written Confined Space Safety Program are
designed to ensure that our employees are safe while working in permit spaces. Under no
circumstances do we expect our employees to enter a permit space where hazards have not been
eliminated or effectively controlled.
Additionally, we recognize that unexpected situations might arise that prevent entrants from self-
rescue. In response, the following rescue and emergency action plan has been developed and will
be strictly enforced.
This plan must be filled out prior to entering any confined space.
CONFINED SPACE SITE INFORMATION
Site Address:
Date: Confined Space Description: Purpose of Entry:
We have decided to use:
On-site rescue services which include: Non-entry rescue procedures Entry rescue procedures
Off-site entry rescue services.
Emergency Preparation Checklist:
1) ___________________ will ensure that each member of the firm’s rescue service is appropriately trained;
2) ___________________ will ensure that each member of the rescue service will receive basic first aid and cardiopulmonary resuscitation (CPR). At least one of these members must hold current certification in first aid and CPR;
3) ___________________ will ensure that rescue team members will practice rescue techniques at least annually from the actual or similarly configured spaces(s);
4) ___________________ has made arrangements with ______________________ for off-site rescue and emergency services and they have consented to provide this service;

HASP - Confined Space Emergency Action Plan C-2 February 29, 2012City of Torrance Sampling and Analysis Plan Torrance, California
5) ______________________ has informed ________________________ of the hazards they may encounter if they are summoned; and
6) ____________________ has also provided access to the rescue service so they can evaluate the permit spaces to develop appropriate rescue plans and practice rescue operations.
2.0 CONFINED SPACE EMERGENCY PROCEDURES
If rescue and emergency services are needed, the following procedures will go into effect:
Whenever possible, Entrant should first attempt self-rescue;
If self-rescue is not possible or has failed, the Attendant must not enter the permit space until additional personnel have arrived, and afterwards only if the Attendant has received emergency response training;
If available, non-entry rescue measures should be implemented if self-rescue has failed; o Attendant should consider any possible injuries that the Entrant may have
sustained before attempting any non-entry rescue measures.
If the above recovery actions cannot be implemented or have failed, the Attendant should immediately contact the rescue service specified below;
In cases of serious injury, the emergency medical service should also be contacted;
Attendant should continue to monitor and maintain existing hazard controls while waiting for additional personnel; and
Once additional personnel or off-site rescue service personnel have arrived, trained emergency rescuers should analyze the situation and perform appropriate response actions.
To summon rescue and emergency services for our specific work site:
(The site address is located on the first page of this document).
RESCUE SERVICE: ________________________________ Location:______________________
Telephone: __________________________________________ ______________________
Approximate response time:_____________________________ ______________________
MEDICAL SERVICE:________________________________ Location:______________________
Telephone:___________________________________________ ______________________
Approximate response time:_____________________________ ______________________
APPENDIX D
Manhole Safe Work Practices
HASP - Manhole Safe Work Practices D-1 February 29, 2012City of Torrance Sampling and Analysis Plan Torrance, California
1.0 CONFINED SPACE ENTRY AND MANHOLE SAFETY
This document provides an overview of safe work practices and procedures for complying with
OSHA requirements (29 CFR 1910.146) when entering into the confined space inside a manhole,
or working around an open manhole. Entry into a manhole, work around an open manhole, and
opening/closing manholes require personnel to work in coordinated teams, use specialized safety
equipment, and follow confined space entry procedures.
1.1 Introduction
A manhole structure is a confined space that presents possible fall hazards, the potential for toxic
gases or oxygen deficient atmosphere to be present, and other general safety hazards. Entry into
the confined space of a manhole requires a two man team where one worker is the Entrant, the
other an Attendant. At a minimum the following safety equipment must be present and in use
whenever a confined space is entered:
Approved gas detector (properly calibrated);
Fresh air blower;
Safety harness, tripod, and wire line safety system; and
Level D PPE including coveralls, gloves, hard hat and eye protection.
1.2 Confined Space Entry Procedure
No employee may enter a confined space until several requirements are met. These requirements
include:
Conducting pre-entry atmospheric testing;
Ventilating and cleaning the confined space as necessary;
Use of appropriate PPE;
Having an Attendant in place;
Having rescue equipment in place; and
Having an approved Emergency Action Plan.
HASP - Manhole Safe Work Practices D-2 February 29, 2012City of Torrance Sampling and Analysis Plan Torrance, California
A description of each requirement of the Confined Space Entry Procedure is contained in the
following sections.
1.2.1 Atmospheric Testing
Atmospheric testing is required prior to entering the confined space, and air monitoring within
the confined space is required to be performed during the entire time the employee is working
inside the confined space. Combustible gases (CG) and oxygen (O2) will be measured
continuously in the worker breathing space using a combination CG/O2 sensor (QRAE-II or
equivalent). Before allowing any personnel inside the confined space, ambient air within the
space is tested for a minimum of four atmospheric conditions:
Oxygen content;
Flammable or explosive gases;
Carbon monoxide; and
Hydrogen sulfide.
The following sections describe the testing methods and limits for atmospheric conditions and
hazardous vapors:
Oxygen Content. The oxygen content must be at least 19.5% in the confined space, measured at all levels (bottom, middle, and top). The safe oxygen level is between 19.5% and 21%. Do not enter the confined space if the oxygen level is below 19.5% or above 21%. Due to the extreme danger of suffocation in confined spaces, constant and continuous oxygen monitoring is required throughout each work period. Oxygen content above 23% can cause explosions and vigorous burning of flammable materials, including hair or clothing;
Flammable or Explosive Gases. The flammable nature of the confined space must be measured at all levels within the confined space (bottom, middle, and top). Flammability is measured in terms of the Lower Flammable Limit (LFL) or the Lower Explosive Limit (LEL). This is the smallest concentration of a combustible gas in air that will explode when it contacts a spark or open flame. Prior to entry into a confined space, the level of flammable gases measured at all levels (bottom, middle, and top), must be below 10% of LEL. The safe flammable gas level is below 10% of the LEL; Do not enter the confined space if the LEL is above 10%;
Carbon Monoxide. There is a potential for toxic concentrations of Carbon Monoxide (CO) to be present in the confined space. CO is an odorless, invisible gas that can be extremely toxic to humans. Because it cannot be detected without instruments, it is possible for workers to advance far enough into a space containing CO that they can no
HASP - Manhole Safe Work Practices D-3 February 29, 2012City of Torrance Sampling and Analysis Plan Torrance, California
longer self-rescue when the symptoms manifest. For that reason the concentration of CO must be measured and compared to the Threshold Limit Values (TLVs) for CO of 25 ppm by the field team prior to entering a confined space, and continuously when working inside a confined space; and
Hydrogen Sulfide. There is a potential for toxic concentrations of Hydrogen Sulfide (H2S) vapors to be present in the confined space. H2S is a flammable, toxic, and acid gas which irritates the eyes and mucus membranes at concentrations between 20 to 150 ppm. Slightly higher concentrations cause irritation to the upper respiratory tract. Concentrations above 600 ppm can be fatal within 30 minutes due to respiratory paralysis. Smell alone cannot be relied upon to detect the presence of H2S due to the paralyzing effect it has on the olfactory nerves. H2S must be measured and compared to the TLV of 10 ppm by the field team prior to entering a confined space and continuously when working inside a confined space.
1.2.2 Ventilation
A fresh air blower ventilation system shall be set up and in operation before and during all
confined space entry procedures. The blower shall provide a continuous source of fresh air to
the breathing zone of a worker within the confined space. Operation of the blower shall be
monitored by a worker outside the confined space to ensure it remains operational during the
entire time a worker is within the confined space.
1.2.3 Personal Protective Equipment
The use of appropriate PPE is required for all work in and around the manhole, and selection of
the PPE shall be based on the expected hazard(s). At a minimum Level D PPE shall be worn and
an approved rescue system (harness-safety line-tripod) shall be utilized.
After the ventilation system has been in operation for at least 15 minutes, and the confined space
has been tested and determined to be safe for entry; workers entering the confined space shall be
equipped at a minimum with the following:
Rescue equipment including harness, lifeline, and safety retrieval system;
An approved, properly calibrated gas detector;
Hard hat;
Coveralls;
Steel-toed safety shoes;
Dust mask;
HASP - Manhole Safe Work Practices D-4 February 29, 2012City of Torrance Sampling and Analysis Plan Torrance, California
Safety Glasses with side shields or goggles; and
Gloves.
1.2.4 Rescue Equipment
No person shall enter a confined space without the use of specialized rescue equipment designed
to aid the removal of the worker from the confined space if they become incapacitated. The
specialized equipment shall consist of a safety harness, lifeline, and tripod safety system with
attached winch.
The harness shall consist of an OSHA and ASNI compliant full body harness with back D ring.
The harness must be fitted to the individual worker, and shall contain stress-indicating safety
tabs to indicate when the harness has been involved in a fall and should be removed from
service. The harness shall have a minimum breaking strength of 5,000 pounds, and feature
mating buckles to prevent improper connection.
The lifeline will consist of a galvanized steel cable at least 3/16” in thickness with a breaking
strength in excess of 5,000 pounds. The cable shall be secured to a fully enclosed spool with
anti-backlash system and brake. The spool will be contained in a winch offering at least 5:1 gear
ratio and ratchet crank handle.
The Tripod safety system is an anchor point for the winch and pulley, providing at least 5,000
pound loading strength. It is used to anchor the ratcheting winch, and must be capable of
operation by a single worker. The tripod and pulley system provides a mechanical advantage
during the retrieval of a worker from the confined space, and allows personnel at the surface to
provide assistance without entering the confined space.
1.2.5 Duties of the Entrant and Attendant
A confined space team consists of a minimum of two members: Entrant and Attendant. The
Entrant does the work, and the Attendant remains outside while the work is being performed.
The Entrant and Attendant have specific responsibilities that include use of appropriate PPE, pre-
entry atmospheric testing, use of safety equipment, area and personnel monitoring, and
performance of the assigned task within the confined space. Specific responsibilities for each
position are detailed in the following sections.
HASP - Manhole Safe Work Practices D-5 February 29, 2012City of Torrance Sampling and Analysis Plan Torrance, California
Entrant
The Entrant does the assigned task within the confined space. He is required to wear the
appropriate safety equipment and be trained to use the equipment in an emergency. The Entrant
is responsible for performance of continuous air monitoring when inside the confined space, and
for monitoring their own physical reactions that could signal an unsafe condition. The Entrant
shall maintain contact with the Attendant, and respond to evacuation orders if given. If the
Entrant senses any reaction to the environment, he or she should signal the attendant for help, if
necessary, and leave the confined space immediately.
Attendant
The Attendant shall be stationed immediately outside the confined space and remain there for the
duration of activity within the confined space. The Attendant shall be physically capable of
assisting any employee inside the confined space in the event of an emergency. This individual
will be responsible for alerting others that a rescue is in progress and for taking appropriate
measures to ensure the safety of all co-workers in the area. No employee is to enter a confined
space if another employee goes down! In the event of emergency the Attendant shall activate
the Emergency Action Plan and always seek assistance.
The Attendant shall:
Not enter the confined space;
Remain at the entry point unless relieved by another trained attendant;
Be trained in rescue protocols;
Keep track of who is in the confined space at all times;
Keep unauthorized people out of the area;
Make sure the ventilation equipment is working;
Attend to the lifeline worn by the Entrant;
Maintain continuous communication, visual or voice, with the Entrant during entry;
Remain alert for early symptoms of danger within the confined space;
Watch for hazards outside and inside the confined space;
Notify the Entrant and order evacuation if conditions warrant;
Have means to summon assistance; and
Have safety and rescue equipment on hand.
HASP - Manhole Safe Work Practices D-6 February 29, 2012City of Torrance Sampling and Analysis Plan Torrance, California
1.2.6 Emergency Action Plan
No person shall enter a confined space to retrieve someone who is unconscious without having
additional trained personnel above ground to assist. Employees shall follow the Emergency
Action Plan in the event of a jobsite emergency. The plan provides procedures to be used in case
of jobsite emergency, and directs the Attendant to summon the authorities before commencing
any rescue activity on a worker who is within the confined space area. The person entering the
confined space for rescue purposes must be equipped with the required rescue equipment and
follow the specific rescue procedure. A qualified person shall inspect all safety devices and
instruct all involved employees on proper confined space safety procedures. All defective safety
devices shall be reported to the foreman immediately.

APPENDIX E
Forms
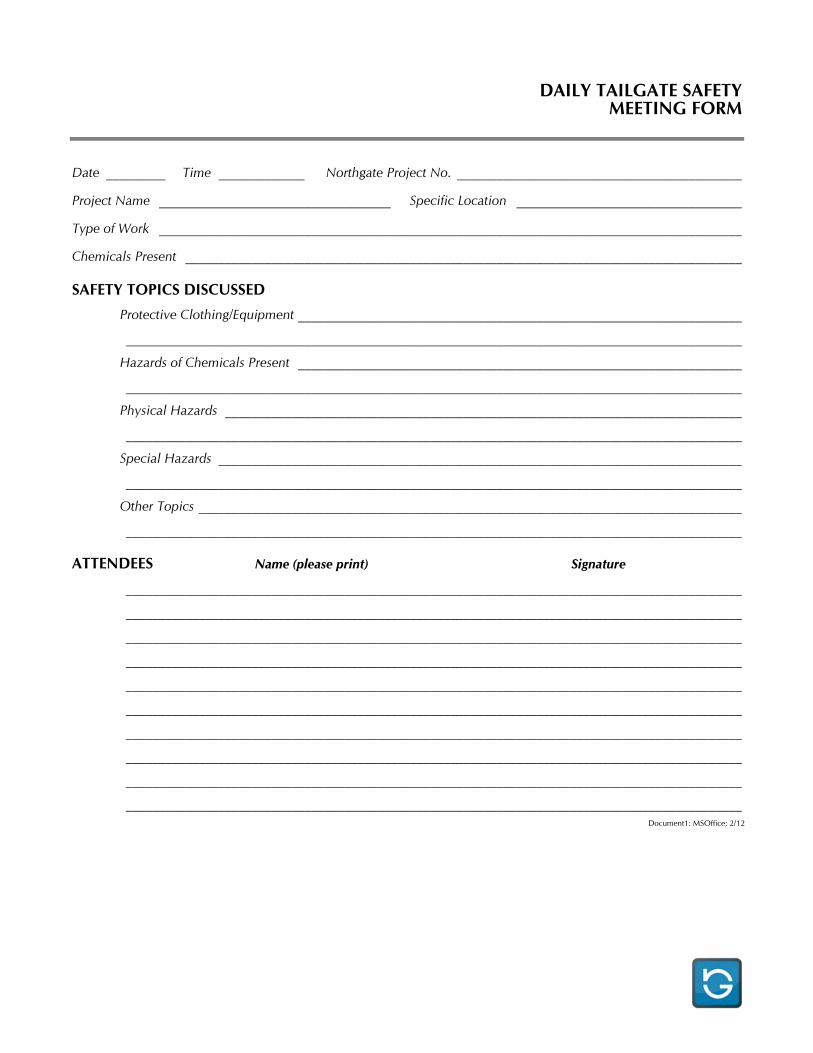
DAILY TAILGATE SAFETY MEETING FORM
Date _________ Time _____________ Northgate Project No. ___________________________________________
Project Name ___________________________________ Specific Location __________________________________
Type of Work ________________________________________________________________________________________
Chemicals Present ____________________________________________________________________________________
SAFETY TOPICS DISCUSSED
Protective Clothing/Equipment ___________________________________________________________________
_____________________________________________________________________________________________
Hazards of Chemicals Present ___________________________________________________________________
_____________________________________________________________________________________________
Physical Hazards ______________________________________________________________________________
_____________________________________________________________________________________________
Special Hazards _______________________________________________________________________________
_____________________________________________________________________________________________
Other Topics __________________________________________________________________________________
_____________________________________________________________________________________________
ATTENDEES Name (please print) Signature
_____________________________________________________________________________________________
_____________________________________________________________________________________________
_____________________________________________________________________________________________
_____________________________________________________________________________________________
_____________________________________________________________________________________________
_____________________________________________________________________________________________
_____________________________________________________________________________________________
_____________________________________________________________________________________________
_____________________________________________________________________________________________
_____________________________________________________________________________________________ Document1: MSOffice; 2/12
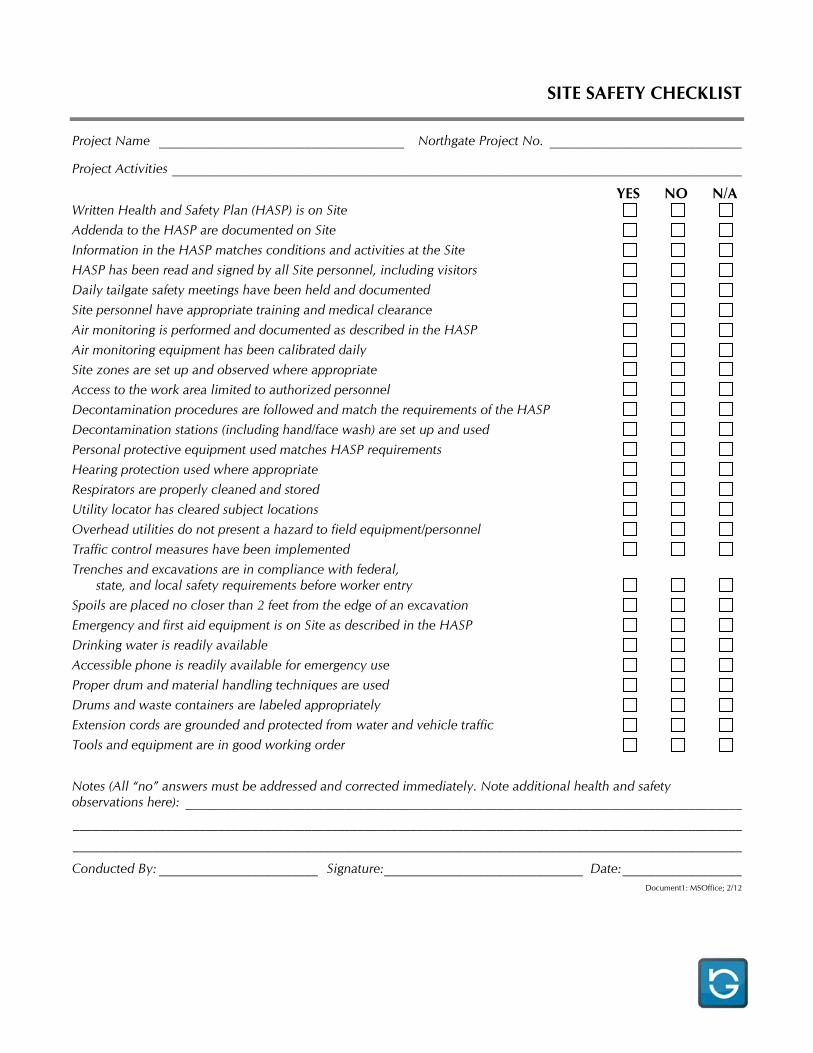
SITE SAFETY CHECKLIST
Project Name _____________________________________ Northgate Project No. _____________________________
Project Activities ______________________________________________________________________________________
YES NO N/A Written Health and Safety Plan (HASP) is on Site
Addenda to the HASP are documented on Site
Information in the HASP matches conditions and activities at the Site
HASP has been read and signed by all Site personnel, including visitors
Daily tailgate safety meetings have been held and documented
Site personnel have appropriate training and medical clearance
Air monitoring is performed and documented as described in the HASP
Air monitoring equipment has been calibrated daily
Site zones are set up and observed where appropriate
Access to the work area limited to authorized personnel
Decontamination procedures are followed and match the requirements of the HASP
Decontamination stations (including hand/face wash) are set up and used
Personal protective equipment used matches HASP requirements
Hearing protection used where appropriate
Respirators are properly cleaned and stored
Utility locator has cleared subject locations
Overhead utilities do not present a hazard to field equipment/personnel
Traffic control measures have been implemented
Trenches and excavations are in compliance with federal, state, and local safety requirements before worker entry
Spoils are placed no closer than 2 feet from the edge of an excavation
Emergency and first aid equipment is on Site as described in the HASP
Drinking water is readily available
Accessible phone is readily available for emergency use
Proper drum and material handling techniques are used
Drums and waste containers are labeled appropriately
Extension cords are grounded and protected from water and vehicle traffic
Tools and equipment are in good working order
Notes (All “no” answers must be addressed and corrected immediately. Note additional health and safety observations here): ____________________________________________________________________________________
_____________________________________________________________________________________________________
_____________________________________________________________________________________________________
Conducted By: ________________________ Signature: ______________________________ Date: __________________ Document1: MSOffice; 2/12

AIR MONITORING FORM page of
Date ______________________________ Northgate Project No. ___________________________________________
Project Name ______________________ Type of Activities _______________________________________________
Type of PID/FID _________________________________ Serial No. _________________________________________
Initial Calibration Reading _________________ End-of-Use Calibration Check _________________________
Calibration Standard/Concentration ______________________________________________________________
Mini-RAM Serial No. _____________________________________________ Zeroed in Z-Bag? Yes No
Time Activity/Location PID/FID (ppm) Mini-RAM (mg/m3)
____________ __________________________________________ ___________________ ___________________
____________ __________________________________________ ___________________ ___________________
____________ __________________________________________ ___________________ ___________________
____________ __________________________________________ ___________________ ___________________
____________ __________________________________________ ___________________ ___________________
____________ __________________________________________ ___________________ ___________________
____________ __________________________________________ ___________________ ___________________
____________ __________________________________________ ___________________ ___________________
____________ __________________________________________ ___________________ ___________________
____________ __________________________________________ ___________________ ___________________
____________ __________________________________________ ___________________ ___________________
____________ __________________________________________ ___________________ ___________________
____________ __________________________________________ ___________________ ___________________
____________ __________________________________________ ___________________ ___________________
____________ __________________________________________ ___________________ ___________________
____________ __________________________________________ ___________________ ___________________
____________ __________________________________________ ___________________ ___________________
____________ __________________________________________ ___________________ ___________________
Name (print) _____________________________________ Signature _________________________________________
Document1: MSOffice; 2/12
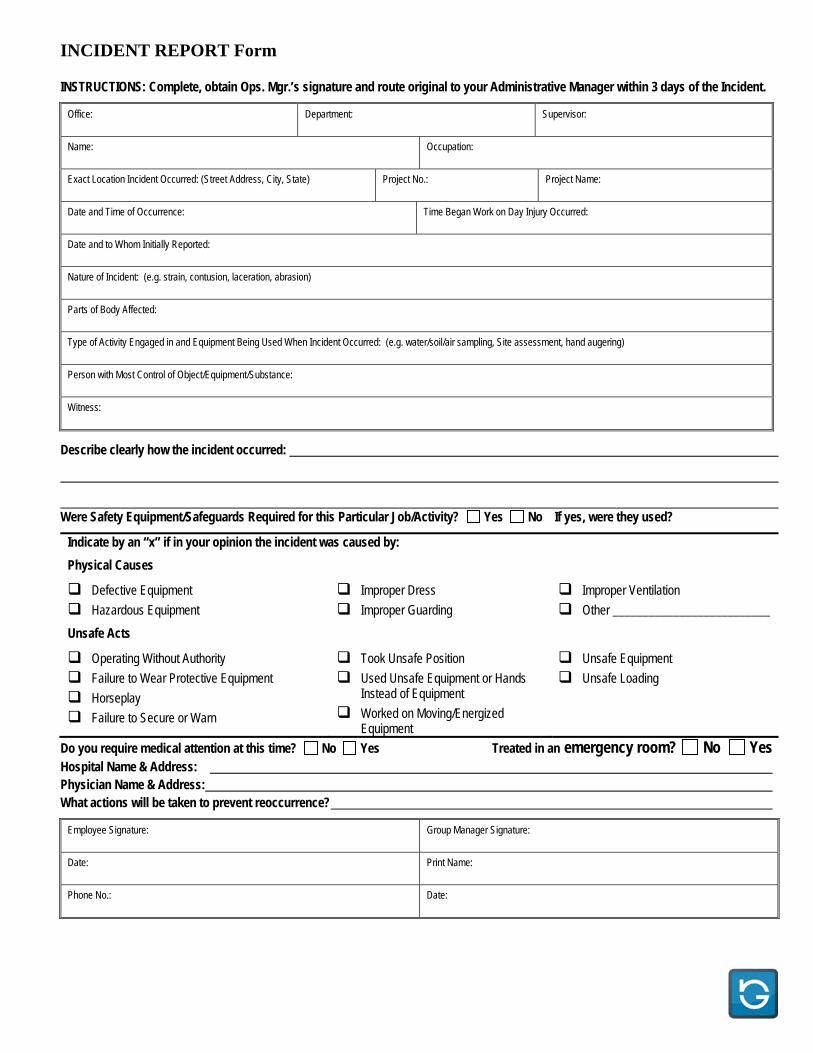
INCIDENT REPORT Form
INSTRUCTIONS: Complete, obtain Ops. Mgr.’s signature and route original to your Administrative Manager within 3 days of the Incident.
Office: Department: Supervisor:
Name: Occupation:
Exact Location Incident Occurred: (Street Address, City, State) Project No.: Project Name:
Date and Time of Occurrence: Time Began Work on Day Injury Occurred:
Date and to Whom Initially Reported:
Nature of Incident: (e.g. strain, contusion, laceration, abrasion)
Parts of Body Affected:
Type of Activity Engaged in and Equipment Being Used When Incident Occurred: (e.g. water/soil/air sampling, Site assessment, hand augering)
Person with Most Control of Object/Equipment/Substance:
Witness:
Describe clearly how the incident occurred:
Were Safety Equipment/Safeguards Required for this Particular Job/Activity? Yes No If yes, were they used?
Indicate by an “x” if in your opinion the incident was caused by:
Physical Causes
Defective Equipment
Hazardous Equipment
Improper Dress
Improper Guarding
Improper Ventilation
Other __________________________
Unsafe Acts
Operating Without Authority
Failure to Wear Protective Equipment
Horseplay
Failure to Secure or Warn
Took Unsafe Position
Used Unsafe Equipment or Hands Instead of Equipment
Worked on Moving/Energized Equipment
Unsafe Equipment
Unsafe Loading
Do you require medical attention at this time? No Yes Treated in an emergency room? No Yes Hospital Name & Address: Physician Name & Address: What actions will be taken to prevent reoccurrence?
Employee Signature: Group Manager Signature:
Date: Print Name:
Phone No.: Date:

APPENDIX F
Hospital Route Maps
Trip to:3330 Lomita BlvdTorrance, CA 90505-50023.76 miles7 minutes
Notes
Station Tor-S1
Torrance Memorial Medical Center3330 Lomita BoulevardTorrance, CA 90505
(310) 517-4750Emergency entrance is on east side of bldg.
1677 Plaza Del AmoTorrance, CA 9050133.822731644427165, -118.30835250241213(Address is approximate)
Miles PerSection
Miles Driven
1. Start out going west on Plaza del Amo toward S Western Ave / CA-213. Go 0.03 Mi 0.03 mi
2. Turn left onto S Western Ave / CA-213. Go 0.4 Mi 0.4 mi
3. Turn right onto Sepulveda Blvd.Sepulveda Blvd is 0.1 miles past W 228th StConroy's Flowers is on the cornerIf you reach W 234th St you've gone about 0.2 miles too far
Go 1.2 Mi 1.6 mi
4. Turn left onto Crenshaw Blvd.Crenshaw Blvd is 0.1 miles past Plum AveIf you reach Eriel Ave you've gone about 0.1 miles too far
Go 1.1 Mi 2.7 mi
5. Turn right onto Lomita Blvd.Lomita Blvd is 0.1 miles past W 239th StBamboo Song is on the cornerIf you reach Torrance Crossroads you've gone about 0.1 miles too far
Go 1.1 Mi 3.8 mi
6. 3330 LOMITA BLVD is on the left.Your destination is 0.3 miles past Telo AveIf you reach Medical Center Dr you've gone a little too far
3.8 mi
3330 Lomita BlvdTorrance, CA 90505-5002
3.8 mi 3.8 mi
Driving Directions from 1677 Plaza Del Amo, Torrance, California 90501... http://www.mapquest.com/print?a=app.core.cdfb7d02830ac5cd4a3bcf1d
1 of 2 12/16/2011 10:45 AM
Total Travel Estimate: 3.76 miles - about 7 minutes
©2011 MapQuest, Inc. Use of directions and maps is subject to the MapQuest Terms of Use. We make no guarantee of the accuracy of their content, road conditionsor route usability. You assume all risk of use. View Terms of Use
©2011 MapQuest - Portions ©2011 , Intermap | Terms
Driving Directions from 1677 Plaza Del Amo, Torrance, California 90501... http://www.mapquest.com/print?a=app.core.cdfb7d02830ac5cd4a3bcf1d
2 of 2 12/16/2011 10:45 AM
Trip to:3330 Lomita BlvdTorrance, CA 90505-50021.38 miles2 minutes
Notes
Station Tor-S2
Torrance Memorial Medical Center3330 Lomita BoulevardTorrance, CA 90505
(310) 517-4750Emergency entrance is on east side of bldg.
2392 246th StLomita, CA 9071733.80255440064128, -118.32525041920529(Address is approximate)
Miles PerSection
Miles Driven
1. Start out going west on 246th St toward Pennsylvania Ave. Go 0.01 Mi 0.01 mi
2. Turn right onto Pennsylvania Ave. Go 0.1 Mi 0.2 mi
3. Take the 1st left onto Lomita Blvd.Lomita Blvd is 0.1 miles past Austinbrook CtCafe La Vida is on the cornerIf you reach 241st St you've gone about 0.1 miles too far
Go 1.2 Mi 1.4 mi
4. 3330 LOMITA BLVD is on the left.Your destination is 0.3 miles past Telo AveIf you reach Medical Center Dr you've gone a little too far
1.4 mi
3330 Lomita BlvdTorrance, CA 90505-5002
1.4 mi 1.4 mi
Driving Directions from 2392 246th St, Lomita, California 90717 to 3330... http://www.mapquest.com/print?a=app.core.cdfb7d02830ac5cd4a3bcf1d
1 of 2 12/16/2011 10:49 AM
Total Travel Estimate: 1.38 miles - about 2 minutes
©2011 MapQuest, Inc. Use of directions and maps is subject to the MapQuest Terms of Use. We make no guarantee of the accuracy of their content, road conditionsor route usability. You assume all risk of use. View Terms of Use
©2011 MapQuest - Portions ©2011 , Intermap | Terms
Driving Directions from 2392 246th St, Lomita, California 90717 to 3330... http://www.mapquest.com/print?a=app.core.cdfb7d02830ac5cd4a3bcf1d
2 of 2 12/16/2011 10:49 AM
Trip to:3330 Lomita BlvdTorrance, CA 90505-50020.58 miles1 minute
Notes
Station Tor-S3
Torrance Memorial Medical Center3330 Lomita BoulevardTorrance, CA 90505
(310) 517-4750Emergency entrance is on east side of bldg.
23823 Madison StTorrance, CA 9050533.8086120850382, -118.34899333340414(Address is approximate)
Miles PerSection
Miles Driven
1. Start out going north on Madison St toward Skypark Dr. Go 0.4 Mi 0.4 mi
2. Turn right onto Lomita Blvd.Hope Chapel Torrance is on the corner
Go 0.2 Mi 0.6 mi
3. 3330 LOMITA BLVD is on the right.Your destination is just past Medical Center DrIf you reach Telo Ave you've gone about 0.3 miles too far
0.6 mi
3330 Lomita BlvdTorrance, CA 90505-5002
0.6 mi 0.6 mi
Driving Directions from 23823 Madison St, Torrance, California 90505 t... http://www.mapquest.com/print?a=app.core.cdfb7d02830ac5cd4a3bcf1d
1 of 2 12/16/2011 10:39 AM
Total Travel Estimate: 0.58 miles - about 1 minute
©2011 MapQuest, Inc. Use of directions and maps is subject to the MapQuest Terms of Use. We make no guarantee of the accuracy of their content, road conditionsor route usability. You assume all risk of use. View Terms of Use
©2011 MapQuest - Portions ©2011 , Intermap | Terms
Driving Directions from 23823 Madison St, Torrance, California 90505 t... http://www.mapquest.com/print?a=app.core.cdfb7d02830ac5cd4a3bcf1d
2 of 2 12/16/2011 10:39 AM
Trip to:3330 Lomita BlvdTorrance, CA 90505-50023.32 miles6 minutes
Notes
Station Tor-S4
Torrance Memorial Medical Center3330 Lomita BoulevardTorrance, CA 90505
(310) 517-4750Emergency entrance is on east side of bldg.
23535 S Western AveTorrance, CA 9050133.81169648066995, -118.3088460288708(Address is approximate)
Miles PerSection
Miles Driven
1. Start out going south on S Western Ave / CA-213 S toward W 236th St. Go 1.0 Mi 1.0 mi
2. Turn right onto Lomita Blvd.Lomita Blvd is just past 249th StDuke Service Center is on the cornerIf you reach 251st St you've gone a little too far
Go 2.4 Mi 3.3 mi
3. 3330 LOMITA BLVD is on the left.Your destination is 0.3 miles past Telo AveIf you reach Medical Center Dr you've gone a little too far
3.3 mi
3330 Lomita BlvdTorrance, CA 90505-5002
3.3 mi 3.3 mi
Driving Directions from 23535 S Western Ave, Torrance, California 9050... http://www.mapquest.com/print?a=app.core.cdfb7d02830ac5cd4a3bcf1d
1 of 2 12/16/2011 10:52 AM
Total Travel Estimate: 3.32 miles - about 6 minutes
©2011 MapQuest, Inc. Use of directions and maps is subject to the MapQuest Terms of Use. We make no guarantee of the accuracy of their content, road conditionsor route usability. You assume all risk of use. View Terms of Use
, Intermap | Terms
Driving Directions from 23535 S Western Ave, Torrance, California 9050... http://www.mapquest.com/print?a=app.core.cdfb7d02830ac5cd4a3bcf1d
2 of 2 12/16/2011 10:52 AM
Trip to:3330 Lomita BlvdTorrance, CA 90505-50021.82 miles4 minutes
Notes
Station Tor-S5
Torrance Memorial Medical Center3330 Lomita BoulevardTorrance, CA 90505
(310) 517-4750Emergency entrance is on east side of bldg.
25062 Bani AveLomita, CA 9071733.79801197039075, -118.3278146110234(Address is approximate)
Miles PerSection
Miles Driven
1. Start out going north on Bani Ave toward 250th St. Go 0.02 Mi 0.02 mi
2. Turn right onto 250th St. Go 0.1 Mi 0.2 mi
3. Take the 1st left onto Pennsylvania Ave.If you reach Cypress St you've gone about 0.1 miles too far
Go 0.4 Mi 0.6 mi
4. Turn left onto Lomita Blvd.Lomita Blvd is 0.1 miles past Austinbrook CtCafe La Vida is on the cornerIf you reach 241st St you've gone about 0.1 miles too far
Go 1.2 Mi 1.8 mi
5. 3330 LOMITA BLVD is on the left.Your destination is 0.3 miles past Telo AveIf you reach Medical Center Dr you've gone a little too far
1.8 mi
3330 Lomita BlvdTorrance, CA 90505-5002
1.8 mi 1.8 mi
Driving Directions from 25062 Bani Ave, Lomita, California 90717 to 33... http://www.mapquest.com/print?a=app.core.cdfb7d02830ac5cd4a3bcf1d
1 of 2 12/16/2011 10:35 AM
Total Travel Estimate: 1.82 miles - about 4 minutes
©2011 MapQuest, Inc. Use of directions and maps is subject to the MapQuest Terms of Use. We make no guarantee of the accuracy of their content, road conditionsor route usability. You assume all risk of use. View Terms of Use
©2011 MapQuest - Portions ©2011 , Intermap | Terms
Driving Directions from 25062 Bani Ave, Lomita, California 90717 to 33... http://www.mapquest.com/print?a=app.core.cdfb7d02830ac5cd4a3bcf1d
2 of 2 12/16/2011 10:35 AM
Trip to:3330 Lomita BlvdTorrance, CA 90505-50022.88 miles4 minutes
Notes
Station Tor-S6
Torrance Memorial Medical Center3330 Lomita BoulevardTorrance, CA 90505(310) 517-4750Emergency entrance is on the east side of bldg.
25974 Rolling Hills RdTorrance, CA 9050533.785125524948995, -118.34039127508564(Address is approximate)
Miles PerSection
Miles Driven
1. Start out going north on Rolling Hills Rd toward Crenshaw Blvd. Go 0.2 Mi 0.2 mi
2. Take the 1st right onto Crenshaw Blvd.Ralphs is on the cornerIf you reach Fallenleaf Dr you've gone about 0.1 miles too far
Go 1.6 Mi 1.8 mi
3. Turn left onto Lomita Blvd.Lomita Blvd is 0.1 miles past Torrance CrossroadsBamboo Song is on the rightIf you reach W 239th St you've gone about 0.1 miles too far
Go 1.1 Mi 2.9 mi
4. 3330 LOMITA BLVD is on the left.Your destination is 0.3 miles past Telo AveIf you reach Medical Center Dr you've gone a little too far
2.9 mi
3330 Lomita BlvdTorrance, CA 90505-5002
2.9 mi 2.9 mi
Driving Directions from 25974 Rolling Hills Rd, Torrance, California 90... http://www.mapquest.com/print?a=app.core.cdfb7d02830ac5cd4a3bcf1d
1 of 2 12/16/2011 10:33 AM
Total Travel Estimate: 2.88 miles - about 4 minutes
©2011 MapQuest, Inc. Use of directions and maps is subject to the MapQuest Terms of Use. We make no guarantee of the accuracy of their content, road conditionsor route usability. You assume all risk of use. View Terms of Use
©2011 MapQuest - Portions ©2011 , Intermap | Terms
Driving Directions from 25974 Rolling Hills Rd, Torrance, California 90... http://www.mapquest.com/print?a=app.core.cdfb7d02830ac5cd4a3bcf1d
2 of 2 12/16/2011 10:33 AM
Trip to:3330 Lomita BlvdTorrance, CA 90505-50022.00 miles3 minutes
Notes
Station Tor-S7
Torrance Memorial Medical Center3330 Lomita BoulevardTorrance, CA 90505
(310) 517-4750Emergency entrance is on east side of bldg.
3319 Rolling Hills RdTorrance, CA 9050533.79477550893578, -118.34794190747031(Address is approximate)
Miles PerSection
Miles Driven
1. Start out going west on Rolling Hills Rd toward Hawthorne Blvd. Go 0.06 Mi 0.06 mi
2. Take the 1st right onto Hawthorne Blvd.If you are on Hawthorne Blvd and reach Ernie Howlett Park Rd you've gone about 0.3 miles too far
Go 1.0 Mi 1.1 mi
3. Stay straight to go onto Hawthorne Blvd / CA-107 N. Go 0.5 Mi 1.6 mi
4. Turn right onto Lomita Blvd.Lomita Blvd is 0.1 miles past W 234th PlYoshinoya Beef Bowl Restaurant is on the cornerIf you reach W 230th St you've gone about 0.1 miles too far
Go 0.4 Mi 2.0 mi
5. 3330 LOMITA BLVD is on the right.Your destination is just past Medical Center DrIf you reach Telo Ave you've gone about 0.3 miles too far
2.0 mi
3330 Lomita BlvdTorrance, CA 90505-5002
2.0 mi 2.0 mi
Driving Directions from 3319 Rolling Hills Rd, Torrance, California 9050... http://www.mapquest.com/print?a=app.core.cdfb7d02830ac5cd4a3bcf1d
1 of 2 12/16/2011 10:53 AM
Total Travel Estimate: 2.00 miles - about 3 minutes
©2011 MapQuest, Inc. Use of directions and maps is subject to the MapQuest Terms of Use. We make no guarantee of the accuracy of their content, road conditionsor route usability. You assume all risk of use. View Terms of Use
©2011 MapQuest - Portions ©2011 , Intermap | Terms
Driving Directions from 3319 Rolling Hills Rd, Torrance, California 9050... http://www.mapquest.com/print?a=app.core.cdfb7d02830ac5cd4a3bcf1d
2 of 2 12/16/2011 10:53 AM
Trip to:3330 Lomita BlvdTorrance, CA 90505-50022.07 miles4 minutes
Notes
Station Tor-S8
Torrance Memorial Medical Center3330 Lomita BoulevardTorrance, CA 90505
(310) 517-4750Emergency entrance is on east side of bldg.
4013 Paseo De Las TortugasTorrance, CA 9050533.800668808715066, -118.35695412976(Address is approximate)
Miles PerSection
Miles Driven
1. Start out going southeast on Paseo de las Tortugas toward Mesa St. Go 0.2 Mi 0.2 mi
2. Turn left onto Via Valmonte. Go 0.2 Mi 0.4 mi
3. Turn left onto Hawthorne Blvd.Il Toscano Restaurant in Hillside Village Shops is on the corner
Go 0.7 Mi 1.1 mi
4. Stay straight to go onto Hawthorne Blvd / CA-107 N. Go 0.5 Mi 1.6 mi
5. Turn right onto Lomita Blvd.Lomita Blvd is 0.1 miles past W 234th PlYoshinoya Beef Bowl Restaurant is on the cornerIf you reach W 230th St you've gone about 0.1 miles too far
Go 0.4 Mi 2.1 mi
6. 3330 LOMITA BLVD is on the right.Your destination is just past Medical Center DrIf you reach Telo Ave you've gone about 0.3 miles too far
2.1 mi
3330 Lomita BlvdTorrance, CA 90505-5002
2.1 mi 2.1 mi
Driving Directions from 4013 Paseo De Las Tortugas, Torrance, Californi... http://www.mapquest.com/print?a=app.core.cdfb7d02830ac5cd4a3bcf1d
1 of 2 12/16/2011 10:56 AM
Total Travel Estimate: 2.07 miles - about 4 minutes
©2011 MapQuest, Inc. Use of directions and maps is subject to the MapQuest Terms of Use. We make no guarantee of the accuracy of their content, road conditionsor route usability. You assume all risk of use. View Terms of Use
©2011 MapQuest - Portions ©2011 , Intermap | Terms
Driving Directions from 4013 Paseo De Las Tortugas, Torrance, Californi... http://www.mapquest.com/print?a=app.core.cdfb7d02830ac5cd4a3bcf1d
2 of 2 12/16/2011 10:56 AM
Trip to:3330 Lomita BlvdTorrance, CA 90505-50022.39 miles5 minutes
Notes
Station Tor-S9
Torrance Memorial Medical Center3330 Lomita BoulevardTorrance, CA 90505
(310) 517-4750Emergency entrance is on east side of bldg.
4519 Paseo De Las TortugasTorrance, CA 9050533.80461825150893, -118.36304810864156(Address is approximate)
Miles PerSection
MilesDriven
1. Start out going northwest on Paseo de las Tortugas toward VistaMontana.
Go 0.2 Mi 0.2 mi
2. Take the 1st right onto Vista Montana.If you reach Calle de Arboles you've gone about 0.1 miles too far
Go 0.6 Mi 0.8 mi
3. Turn right onto Pacific Coast Hwy / CA-1.Pacific Coast Hwy is 0.1 miles past Newton StShandiz Kebob in Village Ctr is on the rightIf you are on Anza Ave and reach W 239th St you've gone a little too far
Go 0.4 Mi 1.2 mi
4. Turn left onto Hawthorne Blvd / CA-107 N.Starbucks Coffee is on the cornerIf you reach Ward St you've gone about 0.1 miles too far
Go 0.8 Mi 1.9 mi
5. Turn right onto Lomita Blvd.Lomita Blvd is 0.1 miles past W 234th PlYoshinoya Beef Bowl Restaurant is on the cornerIf you reach W 230th St you've gone about 0.1 miles too far
Go 0.4 Mi 2.4 mi
6. 3330 LOMITA BLVD is on the right.Your destination is just past Medical Center DrIf you reach Telo Ave you've gone about 0.3 miles too far
2.4 mi
3330 Lomita BlvdTorrance, CA 90505-5002
2.4 mi 2.4 mi
Driving Directions from 4519 Paseo De Las Tortugas, Torrance, Californi... http://www.mapquest.com/print?a=app.core.cdfb7d02830ac5cd4a3bcf1d
1 of 2 12/16/2011 10:59 AM
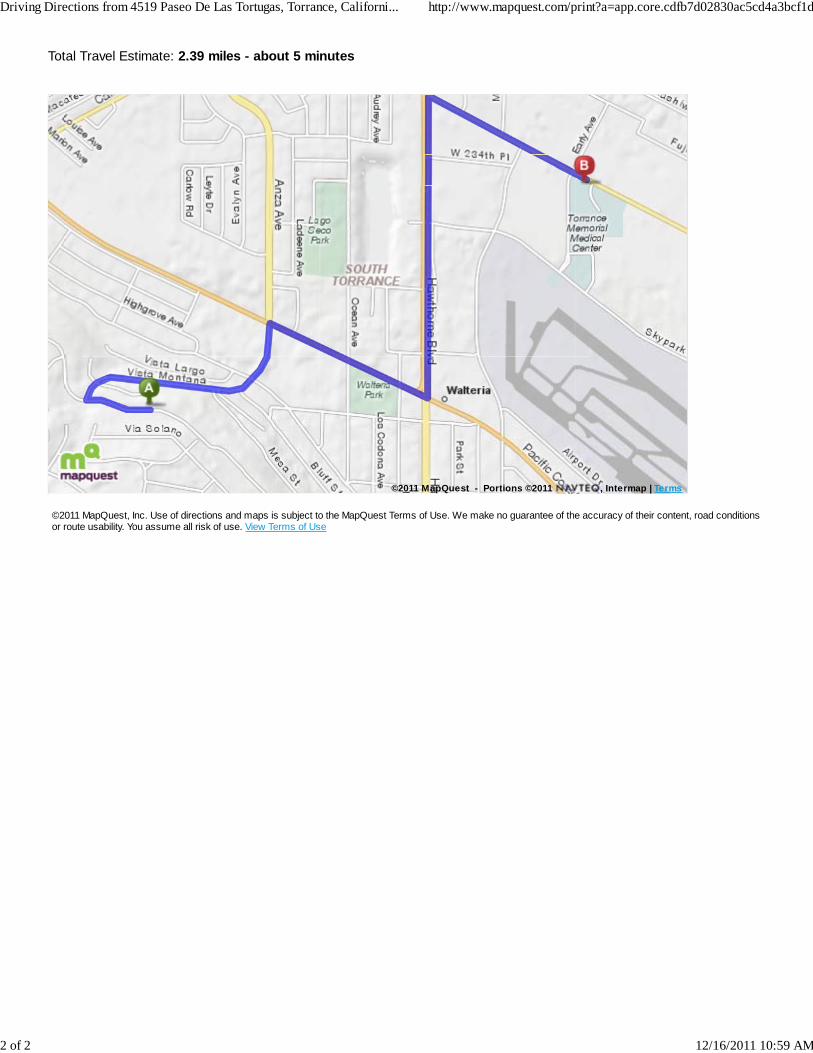
Total Travel Estimate: 2.39 miles - about 5 minutes
©2011 MapQuest, Inc. Use of directions and maps is subject to the MapQuest Terms of Use. We make no guarantee of the accuracy of their content, road conditionsor route usability. You assume all risk of use. View Terms of Use
©2011 MapQuest - Portions ©2011 , Intermap | Terms
Driving Directions from 4519 Paseo De Las Tortugas, Torrance, Californi... http://www.mapquest.com/print?a=app.core.cdfb7d02830ac5cd4a3bcf1d
2 of 2 12/16/2011 10:59 AM
APPENDIX B
Field Forms
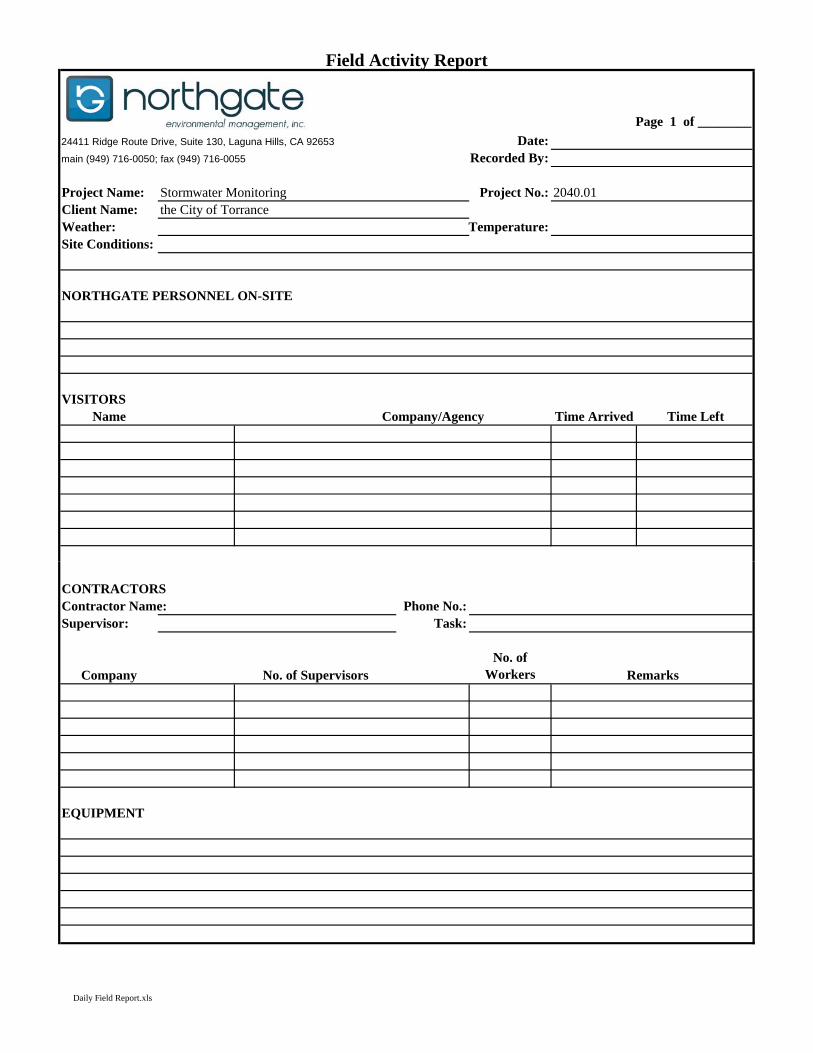
Field Activity Report
Page 1 of ________
24411 Ridge Route Drive, Suite 130, Laguna Hills, CA 92653 Date:main (949) 716-0050; fax (949) 716-0055 Recorded By:
Project Name: Stormwater Monitoring Project No.: 2040.01Client Name: the City of TorranceWeather: Temperature:Site Conditions:
NORTHGATE PERSONNEL ON-SITE
VISITORSName Company/Agency Time Arrived Time Left
CONTRACTORSContractor Name: Phone No.:Supervisor: Task:
Company No. of SupervisorsNo. of
Workers
EQUIPMENT
Remarks
Daily Field Report.xls
Field Activity Report
Page 2 of ________
24411 Ridge Route Drive, Suite 130, Laguna Hills, CA 92653 Date:main (949) 716-0050; fax (949) 716-0055 Recorded By:
Project Name: Stormwater Monitoring Project No.: 2040.01Client Name: The City of Torrance
ACTIVITIESTime: Activities (include event, time, observations, observers, etc.)
Print Name: Signature:
Daily Field Report.xls
DISCHARGE MEASUREMENT NOTE
Page 1 of ________
24411 Ridge Route Drive, Suite 130, Laguna Hills, CA 92653 Date:main (949) 716-0050; fax (949) 716-0055 Arrival Time:
Leaving Time:Project Name: Stormwater Monitoring Project No.: 2040.01Client Name: the City of Torrance Recorded By:
Station Name:
Section #:
Method:
Meter Type:
AT POINTMEAN IN
VERTICAL
DISTANCE FROM INITIAL POINT
VELOCITY (F/S)DEPTH (FT)
LEW or REW (circle one) at time =
WIDTH (FT)OBSER DEPTH
REVS TIME (SEC)
Observations:
AREA (FT)DISCHARGE
(CFS)
LEW or REW (circle one) at time =
Discharge Measurement Note.xls
DAILY SITE SAFETY MEETING RECORD
24411 Ridge Route Drive, Suite 130, Laguna Hills, CA 92653 Page 1 of 1main (949) 716-0050; fax (949) 716-0055
Recorded By:Date & Time: Project No.: 2040.01
Project Name: Stormwater Monitoring Project Location:Field Activities:
Chemicals Present:
Protective Clothing/Equipment:
Hazards of Chemicals Present:
Physical Hazards:
Special Hazards:
Level D: Steel-toed safety shoes, coveralls, gloves, safety glasses, hardhat, reflective traffic vest.
SAFETY TOPICS DISCUSSED
Stormwater sampling & stream flow measurement in underground storm drains.
and subsurface storm drains.
Nitrate-nitrate, Total Kjeldahl Nitrogen, Total Phosphorus.
Torrance, CA
No hazardous levels of site specific chemicals have been determined yet. Bacterial hazards from
the stormwater may be present and exposure should be prevented.
Truck and vehicle traffic; heavy lifting; slips-trips-falls; pinch points;
Spiders or insects inside manholes; reptiles or rodents in landscape surrounding manholes; Spec a a a ds
Other Topics of Concern:
YES NOAttached Signature Page - No, see below XWritten Health and Safety Plan (HASP) is on-site XInformation in the HASP matches conditions and activities at the site XSite personnel have appropriate training and certification and medical clearance XAir monitoring equipment has been calibrated daily XSite zones are set up and observed where appropriate XAccess to Work Areas is limited to authorized personnel XDecontamination stations (including hand/face wash) are set up and used XPersonal protective equipment used matches HASP requirements XEmergency and First Aid equipment is on-site as described in the HASP XDrinking water is readily available X
Note: All "NO" answers must be addressed & corrected immediately. Note additionally health and safety observations here.
Conducted BySignature: Date:
pinch points by keeping feet away from the cover as lid is moved. Wear leather gloves when using manhole hooks.
SITE SAFETY CHECKLIST
Sp de s o sects s de a o es; ept es o ode ts a dscape su ou d g a o es;
Use proper lifting procedures (bend at knees, do not use back to lift) when moving manhole covers. Avoid
Site Safety Meeting Log.xls
Water Sample Data Sheet
Page 1 of ________
24411 Ridge Route Drive, Suite 130, Laguna Hills, CA 92653 Date:main (949) 716-0050; fax (949) 716-0055 Arrival Time:
Leaving Time:Project Name: Stormwater Monitoring Project No.: 2040.01Client Name: the City of Torrance Recorded By:
Water Sample DataSite Name:Sample ID:
Time of Sample Collection:Date:
Number of Containers:
Flow MeasurementsDepth of Water: in, ftWidth of Flow: in, ft
Flow Rate: gal/minTime: 24-hour format
Depth of Water: in, ftWidth of Flow: in, ft
Flow Rate: gal/minTime: 24-hour format
Depth of Water: in, ftWidth f Fl i ftWidth of Flow: in, ft
Flow Rate: gal/minTime: 24-hour format
Water Conditions Circle the Appropriate IdentifierOdor: None, Musty, Sewage, Rotten Egg, Sour milk, Fishy, Other:Color: None, Yellow, Brown, Grey, Green, Red, Other:
Clarity: Clear, Cloudy, Opaque, Suspended solids, Other:Floatables: None, Oil sheen, Foam, Animal waste, Green waste, Food, Paper, Plastic, Grease, Hydrophytes,
Trash, Other:Settleables: None, Salt, Clay, Oil, Rust, Microbes, Other:
Weeds: None, Normal, Excessive, Note:Biology: None, Algae bloom, Larvae, Crawfish, Frog, Fish, Waterfowl, Hydrophytes, Blue-green algae
Other:Sky: Stormy, Overcast, Partial clouds, Haze, Fog, Clear
Wind: Calm,Light breeze, Strong breeze, Windy, GustyFlow Characterization: Storm/Flood, Rapid, Tranquil, Laminar, Standing, Dry
Low Flow/No Flow ConditionsWas there flow?: Yes, No If there was flow, but no sample was taken, explain why.
Water Sample Data Sheet.xls
APPENDIX C
Quality Assurance Project Plan
2040.01
Quality Assurance Project Plan Monitoring and Reporting Plan
Machado Lake Nutrient and Toxics Total Maximum Daily Load (TMDL)
Torrance, California
December 9, 2013
Prepared For:
City of Torrance
3031 Torrance Boulevard Torrance, California 90503
Prepared By:
Northgate Environmental Management, Inc. 24411 Ridge Route Drive, Suite 130
Laguna Hills, California 92653
Derrick S. Willis Principal
Dana R. Brown, P.G. Project Manager
Appendix C - Quality Assurance Project Plan i December 9, 2013 Monitoring and Reporting Plan Nutrients and Toxics TMDLs Torrance, California
TABLE OF CONTENTS
1.0 INTRODUCTION AND PROJECT MANGEMENT ................................................... 1 1.1 Introduction ............................................................................................................. 1 1.2 Distribution List ...................................................................................................... 1 1.3 Project Organization ............................................................................................... 1
1.3.1 Management Responsibilities ..................................................................... 2 1.3.2 Quality Assurance Responsibilities ............................................................ 3 1.3.3 Field Responsibilities .................................................................................. 3 1.3.4 Laboratory Responsibilities ........................................................................ 4 1.3.5 Regulatory Agency ..................................................................................... 4
1.4 Problem Definition/Background ............................................................................. 4 1.4.1 Background ................................................................................................. 4 1.4.2 Nutrient TMDL ........................................................................................... 5 1.4.3 Toxics TMDL ............................................................................................. 5
1.5 Project/Task Description ......................................................................................... 6 1.5.1 Nutrient TMDL Monitoring Summary ....................................................... 6 1.5.2 Toxics TMDL Monitoring Summary .......................................................... 6
1.6 Quality Objectives and Criteria for Measurement Data ......................................... 7 1.6.1 Data Quality Objectives .............................................................................. 7 1.6.2 Data Quality Indicators for Measurement Data .......................................... 7
1.7 Special Training/Certifications and Permits ........................................................... 8 1.7.1 Training ....................................................................................................... 8 1.7.2 Certifications ............................................................................................... 9 1.7.3 Permits ........................................................................................................ 9
1.8 Documentation and Records ................................................................................... 9 1.8.1 Project Files ................................................................................................ 9 1.8.2 Field Records .............................................................................................. 9 1.8.3 Laboratory Records ................................................................................... 10 1.8.4 Reporting................................................................................................... 11
2.0 DATA GENERATION AND ACQUISITION ............................................................. 12 2.1 Sampling Process Design ...................................................................................... 12 2.2 Sampling Methods ................................................................................................ 12 2.3 Sample Handling and Custody .............................................................................. 12
2.3.1 Sample Labeling and Identification .......................................................... 13 2.3.2 Chain-of-Custody Procedures ................................................................... 13 2.3.3 Sample Handling, Packaging, and Shipping ............................................. 13
2.4 Analytical Methods ............................................................................................... 14 2.4.1 Laboratory Analytical Methods and Reporting Limits ............................. 14 2.4.2 Field Measurements .................................................................................. 16
2.5 Quality Control ..................................................................................................... 16 2.5.1 Laboratory QA/QC Procedures ................................................................. 16 2.5.2 Laboratory Corrective Action ................................................................... 18 2.5.3 Field Sampling QA/QC Procedures .......................................................... 18 2.5.4 Field Corrective Action ............................................................................. 20
2.6 Instrument Testing, Inspection, and Maintenance ................................................ 21 2.7 Instrument Calibration and Frequency .................................................................. 21
Appendix C - Quality Assurance Project Plan ii December 9, 2013 Monitoring and Reporting Plan Nutrients and Toxics TMDLs Torrance, California
2.8 Non-Direct Measurements .................................................................................... 21 2.9 Data Management ................................................................................................. 21
3.0 ASSESSMENT AND OVERSIGHT ............................................................................. 23 3.1 Assessments and Response Actions...................................................................... 23
3.1.1 Data Assessments...................................................................................... 23 3.1.2 Response Actions ...................................................................................... 24
3.2 Reports to Management ........................................................................................ 25
4.0 DATA VERIFICATION, VALIDATION, AND USABILITY................................... 26 4.1 Data Review, Verification, and Validation ........................................................... 26
4.1.1 Field Data .................................................................................................. 26 4.1.2 Internal Laboratory Review ...................................................................... 26 4.1.3 Data Verification and Validation .............................................................. 27
4.2 Verification and Validation Methods .................................................................... 27 4.2.1 Verification ............................................................................................... 27 4.2.2 Validation .................................................................................................. 27
4.3 Reconciliation with User Requirements ............................................................... 28 4.3.1 Comparison to Measurement Objectives .................................................. 28 4.3.2 Comparison to Project Objectives ............................................................ 29 4.3.3 Data Qualifier Flags .................................................................................. 29
5.0 REFERENCES ................................................................................................................ 31
TABLES
1.1 Distribution List .............................................................................................................1 1.2 Nutrient TMDL Mass-Based Waste Load Allocations ..................................................5 1.3 Toxics TMDL Concentration Based Waste Load Allocations ......................................5 2.1 Nutrient TMDL Monitoring Analytical Methods and Limits ......................................15 2.2 Toxics TMDL Monitoring Analytical Methods and Limits ........................................15 2.3 Field Measurements .....................................................................................................16 2.4 QA/QC Sampling Summary ........................................................................................18
FIGURE
1 Program Organization Chart ..........................................................................................2
Appendix C - Quality Assurance Project Plan iii December 9, 2013 Monitoring and Reporting Plan Nutrients and Toxics TMDLs Torrance, California
ABBREVIATIONS AND ACRONYMS
BMP Best Management Practices COC Chain-of-Custody DDD Dichloro-diphenyl-dichloroethane DDE Dichloro-diphenyl-dichloroethylene DDT Dichloro-diphenyl-trichloroethane DO Dissolved Oxygen DQO Data Quality Objective DPM Diesel Particulate Matter EB Equipment Blank EDD Electronic Data Deliverable FD Field Duplicate Sample HASP Health and Safety Plan kg Kilogram MDL Method Detection Limit
µmhos/cm Microohms per Centimeter
mg/l Milligram per Liter MRP Monitoring and Reporting Plan MS4 Municipal Separate Stormwater Systems MS/MSD Matrix Spike/Matrix Spike Duplicate NH3+ Ammonia-Ammonium NO2 Nitrite NO3 Nitrate NTU Nephelometric Turbidity Unit PCB Polychlorinated Biphenyl PO4 Phosphate QAPP Quality Assurance Project Plan QAPrP Quality Assurance Program Plan QA Quality Assurance QC Quality Control RL Laboratory Reporting Limit RPD Relative Percent Difference RWQCB Los Angeles Regional Water Quality Control Board SOP Standard Operating Procedure SWAMP Surface Water Ambient Monitoring Program TB Trip Blank TKN Total Kjeldahl Nitrogen TMDL Total Maximum Daily Load
Appendix C - Quality Assurance Project Plan iv December 9, 2013 Monitoring and Reporting Plan Nutrients and Toxics TMDLs Torrance, California
TN Total Nitrogen TOC Total Organic Carbon TP Total Phosphorus TSS Total Suspended Solids USEPA United States Environmental Protection Agency WLA Waste Load Allocation
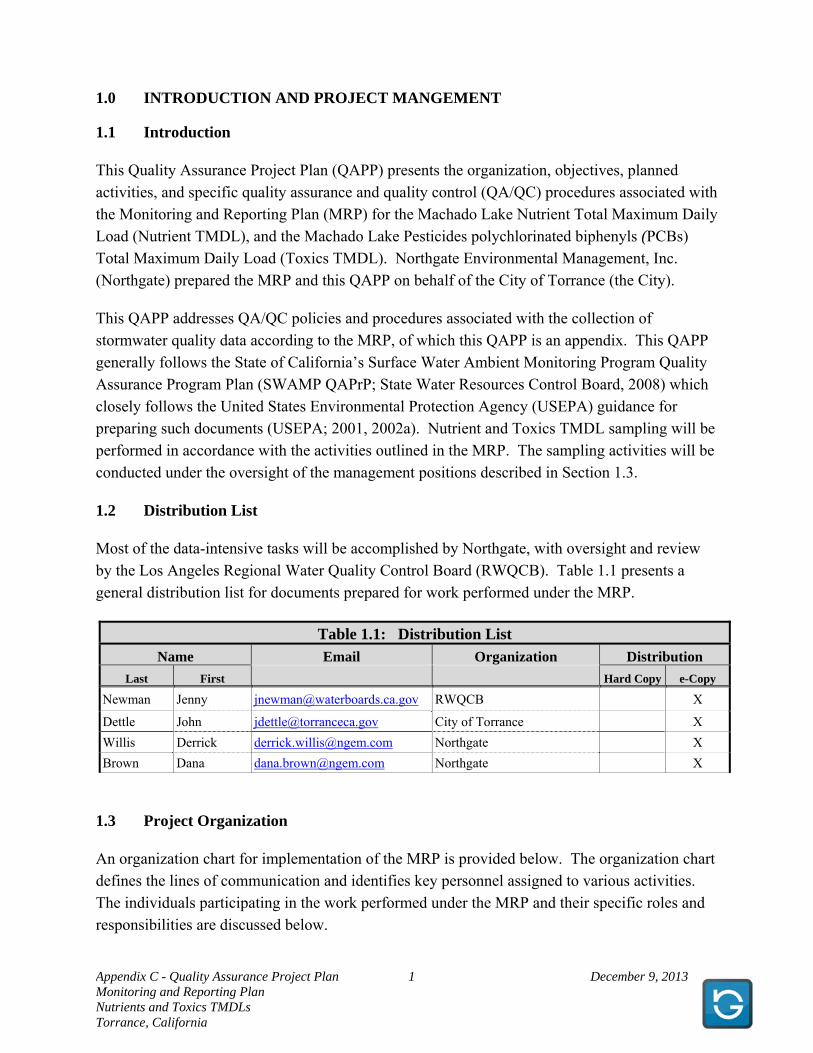
Appendix C - Quality Assurance Project Plan 1 December 9, 2013 Monitoring and Reporting Plan Nutrients and Toxics TMDLs Torrance, California
1.0 INTRODUCTION AND PROJECT MANGEMENT
1.1 Introduction
This Quality Assurance Project Plan (QAPP) presents the organization, objectives, planned activities, and specific quality assurance and quality control (QA/QC) procedures associated with the Monitoring and Reporting Plan (MRP) for the Machado Lake Nutrient Total Maximum Daily Load (Nutrient TMDL), and the Machado Lake Pesticides polychlorinated biphenyls (PCBs) Total Maximum Daily Load (Toxics TMDL). Northgate Environmental Management, Inc. (Northgate) prepared the MRP and this QAPP on behalf of the City of Torrance (the City).
This QAPP addresses QA/QC policies and procedures associated with the collection of stormwater quality data according to the MRP, of which this QAPP is an appendix. This QAPP generally follows the State of California’s Surface Water Ambient Monitoring Program Quality Assurance Program Plan (SWAMP QAPrP; State Water Resources Control Board, 2008) which closely follows the United States Environmental Protection Agency (USEPA) guidance for preparing such documents (USEPA; 2001, 2002a). Nutrient and Toxics TMDL sampling will be performed in accordance with the activities outlined in the MRP. The sampling activities will be conducted under the oversight of the management positions described in Section 1.3.
1.2 Distribution List
Most of the data-intensive tasks will be accomplished by Northgate, with oversight and review by the Los Angeles Regional Water Quality Control Board (RWQCB). Table 1.1 presents a general distribution list for documents prepared for work performed under the MRP.
Table 1.1: Distribution List
Name Email Organization Distribution
Last First Hard Copy e-Copy
Newman Jenny [email protected] RWQCB X
Dettle John [email protected] City of Torrance X
Willis Derrick [email protected] Northgate X
Brown Dana [email protected] Northgate X
1.3 Project Organization
An organization chart for implementation of the MRP is provided below. The organization chart defines the lines of communication and identifies key personnel assigned to various activities. The individuals participating in the work performed under the MRP and their specific roles and responsibilities are discussed below.
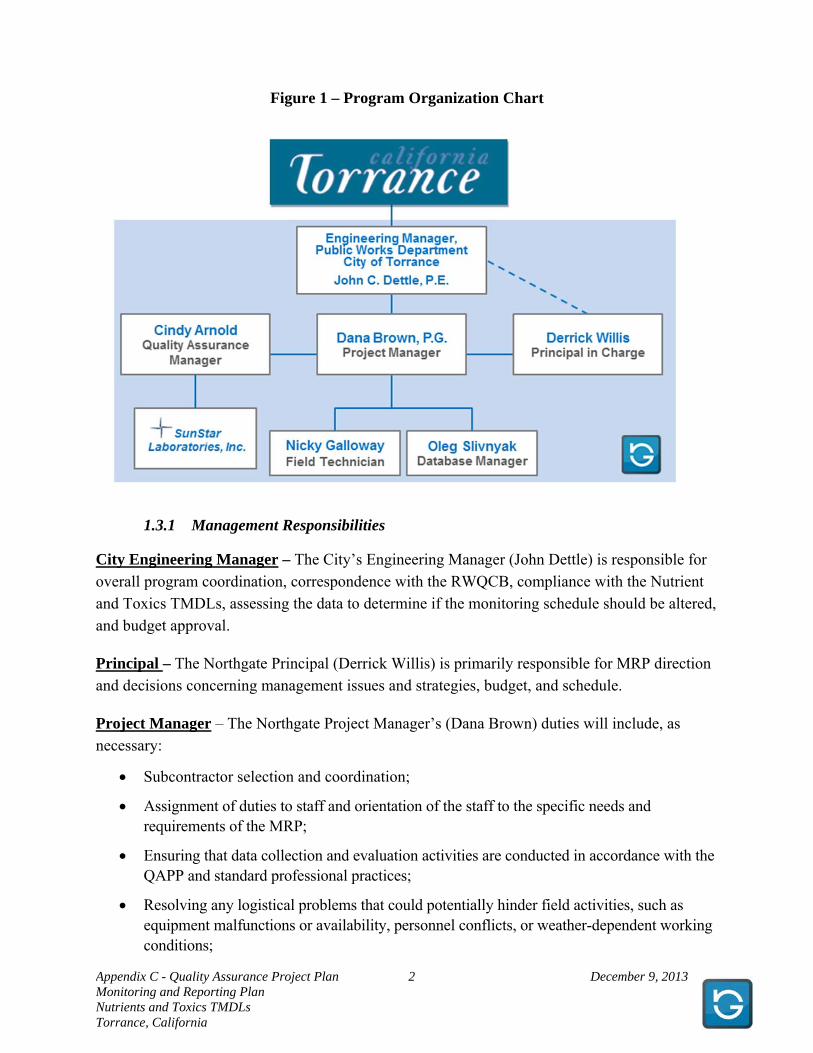
Appendix C - Quality Assurance Project Plan 2 December 9, 2013 Monitoring and Reporting Plan Nutrients and Toxics TMDLs Torrance, California
Figure 1 – Program Organization Chart
1.3.1 Management Responsibilities
City Engineering Manager – The City’s Engineering Manager (John Dettle) is responsible for overall program coordination, correspondence with the RWQCB, compliance with the Nutrient and Toxics TMDLs, assessing the data to determine if the monitoring schedule should be altered, and budget approval.
Principal – The Northgate Principal (Derrick Willis) is primarily responsible for MRP direction and decisions concerning management issues and strategies, budget, and schedule.
Project Manager – The Northgate Project Manager’s (Dana Brown) duties will include, as necessary:
Subcontractor selection and coordination;
Assignment of duties to staff and orientation of the staff to the specific needs and requirements of the MRP;
Ensuring that data collection and evaluation activities are conducted in accordance with the QAPP and standard professional practices;
Resolving any logistical problems that could potentially hinder field activities, such as equipment malfunctions or availability, personnel conflicts, or weather-dependent working conditions;

Appendix C - Quality Assurance Project Plan 3 December 9, 2013 Monitoring and Reporting Plan Nutrients and Toxics TMDLs Torrance, California
Serving as the focus for coordination, communication, and reporting with the City and regulators; and
Maintenance of the project files.
Database Manager – The Northgate Database Manager (Oleg Slivnyak) has overall responsibility for database development and management. Database Manager’s duties will include:
Receiving analytical data from the laboratory;
Following completion of QA/QC procedures by the QA Manager (below), processing monitoring and analytical data for loading into a project database;
Notifying the Project Manager of problems associated with the raw data; and
Preparation of data reports as requested by the Project Manager.
1.3.2 Quality Assurance Responsibilities
QA Manager – The Northgate QA Manager (Cindy Arnold) has overall responsibility for quality assurance oversight. The QA Manager communicates directly to the Project Manager. Specific responsibilities include:
Reviewing and approving QA procedures, including any modifications to existing approved procedures;
Providing QA technical assistance to staff;
Ensuring that data validation/data assessment is conducted in accordance with the QAPP; and
Reporting on the adequacy, status, and effectiveness of the QA program to the Project Manager.
1.3.3 Field Responsibilities
Field Technician – The Northgate Field Technician (Nicky Galloway) has responsibility for completion of all field activities in accordance with the MRP and QAPP and communicates directly with the Project Manager. Specific responsibilities of the Field Technician include:
Collecting samples, conducting field measurements, and decontaminating equipment according to documented procedures stated in the MRP and QAPP;
Implementing field QC, including issuance and tracking of measurement and test equipment, the proper labeling, handling, storage, shipping, and chain-of-custody (COC) procedures used at the time of sampling, and control and collection of all field documentation;
Ensuring that field instruments are properly operated, calibrated, and maintained, and that adequate documentation is kept for all instruments;
Appendix C - Quality Assurance Project Plan 4 December 9, 2013 Monitoring and Reporting Plan Nutrients and Toxics TMDLs Torrance, California
Collecting the required QC samples and thoroughly documenting QC sample collection;
Ensuring that field documentation and data are complete and accurate; and
Communicating any non-conformance or potential data quality issues to the Project Manager at the earliest opportunity.
1.3.4 Laboratory Responsibilities
Laboratory Manager – SunStar Laboratories, Inc. (SunStar), which undergoes routine audits of analytical procedures by the USEPA, will perform chemical analyses of samples collected. The SunStar Laboratory Manager is ultimately responsible for the data produced by the laboratory. Specific responsibilities of the Laboratory Manager and his/her staff include:
Implementing and adhering to the laboratory QA manual and all corporate policies and procedures within the laboratory;
Approving the standard operating procedures (SOPs);
Reviewing data packages for completeness and compliance to client needs;
Performing QA assessments; and
Reviewing and approving corrective action plans for non-conformances, tracking trends of non-conformances to detect systematic problems, and implementing additional corrective actions as needed.
1.3.5 Regulatory Agency
The RWQCB will oversee the monitoring activities performed according to the MRP.
RWQCB Representative – RWQCB staff or designee will review reports and may independently perform oversight of the sampling program.
1.4 Problem Definition/Background
1.4.1 Background
Machado Lake is located in the City of Los Angeles’ Ken Malloy Harbor Regional Park. It is approximately 40 acres in size, and averages approximately 3 feet in depth. Machado Lake is listed on the 1998, 2002, and 2006 Clean Water Act Section 303(d) lists of impaired water bodies due to eutrophic conditions, algae and odors (Nutrients): and chlordane, dichlorodiphenyltrichloroethane (DDT), dieldrin, Chem A, and PCBs in tissue; and impaired sediment due to chlordane, DDT, and PCBs (Toxics). The RWQCB established TMDLs for Machado Lake for algae, ammonia and odors (Nutrients) on May 1, 2008 (RWQCB, 2008), and for Pesticides and PCBs (Toxics) on September 2, 2010 (RWQCB, 2010).
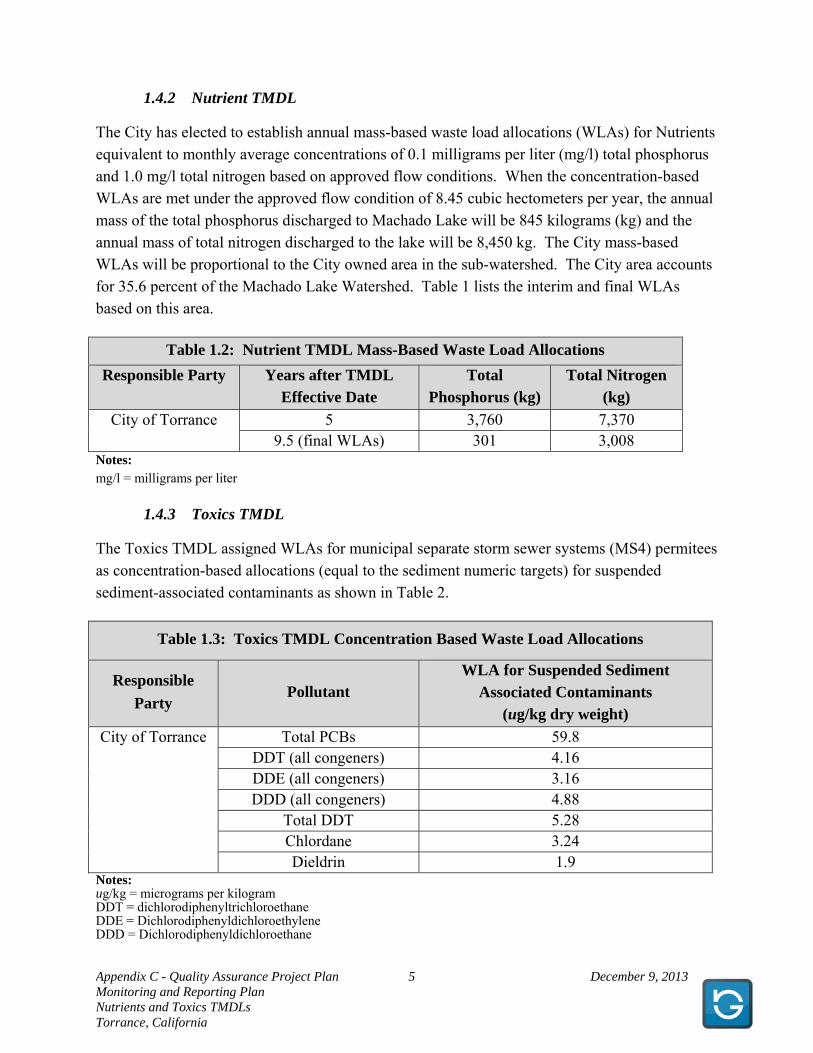
Appendix C - Quality Assurance Project Plan 5 December 9, 2013 Monitoring and Reporting Plan Nutrients and Toxics TMDLs Torrance, California
1.4.2 Nutrient TMDL
The City has elected to establish annual mass-based waste load allocations (WLAs) for Nutrients equivalent to monthly average concentrations of 0.1 milligrams per liter (mg/l) total phosphorus and 1.0 mg/l total nitrogen based on approved flow conditions. When the concentration-based WLAs are met under the approved flow condition of 8.45 cubic hectometers per year, the annual mass of the total phosphorus discharged to Machado Lake will be 845 kilograms (kg) and the annual mass of total nitrogen discharged to the lake will be 8,450 kg. The City mass-based WLAs will be proportional to the City owned area in the sub-watershed. The City area accounts for 35.6 percent of the Machado Lake Watershed. Table 1 lists the interim and final WLAs based on this area.
Table 1.2: Nutrient TMDL Mass-Based Waste Load Allocations
Responsible Party Years after TMDL Effective Date
Total Phosphorus (kg)
Total Nitrogen (kg)
City of Torrance 5 3,760 7,370 9.5 (final WLAs) 301 3,008
Notes: mg/l = milligrams per liter
1.4.3 Toxics TMDL
The Toxics TMDL assigned WLAs for municipal separate storm sewer systems (MS4) permitees as concentration-based allocations (equal to the sediment numeric targets) for suspended sediment-associated contaminants as shown in Table 2.
Table 1.3: Toxics TMDL Concentration Based Waste Load Allocations
Responsible
Party Pollutant
WLA for Suspended Sediment Associated Contaminants
(ug/kg dry weight)
City of Torrance Total PCBs 59.8 DDT (all congeners) 4.16 DDE (all congeners) 3.16 DDD (all congeners) 4.88
Total DDT 5.28 Chlordane 3.24 Dieldrin 1.9
Notes: ug/kg = micrograms per kilogram DDT = dichlorodiphenyltrichloroethane DDE = Dichlorodiphenyldichloroethylene DDD = Dichlorodiphenyldichloroethane
Appendix C - Quality Assurance Project Plan 6 December 9, 2013 Monitoring and Reporting Plan Nutrients and Toxics TMDLs Torrance, California
1.5 Project/Task Description
Ongoing Nutrient TMDL monitoring will be combined with Toxics TMDL monitoring according to the MRP. The following sections describe in detail the proposed activities to accomplish TMDL monitoring.
1.5.1 Nutrient TMDL Monitoring Summary
Northgate will perform monthly visits to nine (9) monitoring sites during dry weather conditions and three (3) additional monitoring visits during wet weather conditions to collect water samples, download flow sensor data, and service the sensors. Northgate will also perform up to seven (7) additional visits to station Tor-S3 when Los Angeles County pumps stormwater from the Walteria Lake into the 54-inch storm drain and collect a water sample (maximum of 10 storm event/pumping event visits per year).
Based on the requirements of the Special Study Workplan (Carollo, 2011a), routine dry weather sampling will be conducted at all nine stations until a full year of data is obtained after the February, 2013 dry weather sampling event. At the end of this period the City will review the monitoring results to determine if the sampling frequency and locations should be modified. For the remainder of the Special Study period, flow measurements and water samples (when available) will continue to be collected at all nine monitoring stations. Details of the monitoring locations, frequency of sampling, and sampling parameters are included in Sections 3.0 to 5.0 of the MRP.
1.5.2 Toxics TMDL Monitoring Summary
The Toxics TMDL monitoring will consist of two phases of wet weather sampling designed to collect suspended solids for the analysis of pollutants in bulk sediments. Phase I monitoring will be conducted for a two (2) year period, and Phase II monitoring will commence once Phase I monitoring has been completed. In Phase I monitoring, samples will be collected during three (3) qualifying wet weather events at all stations for the first year, including the first significant storm event of the season. In the second year of Phase I activity samples will still be collected at stations representing discharge from the City during three qualifying wet weather events (Tor-S1, Tor-S2, Tor-S4, and Tor-S5), but the remaining stations will only be sampled during one qualifying wet weather event. During Phase II monitoring the number of sampling events will be decreased to one per year, and the frequency decreased to every other year, and all nine sampling stations will be visited.
At the end of the fourth year of wet weather monitoring, the City will assess the data to determine if the monitoring schedule should be altered. Details of the monitoring locations, frequency of sampling, and sampling parameters are included in Sections 3.0 to 5.0 of the MRP.
Appendix C - Quality Assurance Project Plan 7 December 9, 2013 Monitoring and Reporting Plan Nutrients and Toxics TMDLs Torrance, California
1.6 Quality Objectives and Criteria for Measurement Data
1.6.1 Data Quality Objectives
The Data Quality Objectives (DQOs) were developed in general accordance with the USEPA Guidance (USEPA, 2006). The objective of the MRP is to gather sufficient monitoring data to ensure that the City is in compliance with the requirements of the Machado Lake Nutrient and Toxics TMDLs. Specific project objectives are presented in Section 2.0 of the MRP and the DQOs of the MRP are based on:
Sample collection protocols designed to obtain sufficient data to meet the objectives of tracking and characterization;
The use of sample collection and handling procedures that will ensure the representativeness and integrity of the samples; and
An analytical program designed to generate definitive data of sufficient quality and sensitivity to meet the MRP objectives.
Data deliverables will provide sufficient information to allow validation of the data.
1.6.2 Data Quality Indicators for Measurement Data
Precision – Precision is a measure of the degree to which two or more measurements are in agreement. Field precision is assessed through the collection and measurement of field duplicates. Field duplicates will be collected once per sampling event at a rotating location. Precision will be measured through the calculation of relative percent difference (RPD). The objectives for field precision RPDs are <50% RPD for the stormwater samples.
Precision in the laboratory is assessed through the calculation of RPD for a matrix spike/matrix spike duplicate (MS/MSD) pair. A MS/MSD sample will be collected once every other sampling event at a rotating location. Precision control limits for laboratory analyses will be consistent with the current statistical limits used by the laboratory at the time of analyses.
Accuracy – Accuracy is the degree of agreement between the observed value and an accepted reference or true value. Accuracy in the field is assessed through the adherence to all sample handling, preservation, and holding time requirements. Equipment blanks will be used for non-dedicated sampling equipment to evaluate the potential for cross-contamination and effectiveness of decontamination procedures and will be collected approximately once per decontamination method per sampling event. Equipment blank samples will be collected using laboratory-grade reagent water. Temperature blank samples will be incorporated at a rate of one per cooler to check for proper temperature. Temperature blanks will be supplied by the laboratory or made up by the field team.
Appendix C - Quality Assurance Project Plan 8 December 9, 2013 Monitoring and Reporting Plan Nutrients and Toxics TMDLs Torrance, California
Laboratory accuracy is assessed through the analysis of laboratory blanks, matrix spike recovery, and calibration checks. Accuracy control limits for laboratory analyses will be consistent with the current statistical limits used by the laboratory at the time of analyses.
Representativeness – Representativeness is “a qualitative term that expresses the degree to
which data accurately and precisely represent a characteristic of a population, parameter variations at a sampling point, a process condition, or an environmental condition” (USEPA, 2002a). The QA/QC process will include a qualitative assessment of whether it appears that measurements are made and samples collected in such a manner that the resulting data appropriately reflect the conditions of the Machado Lake subwatershed.
Comparability – Comparability is a qualitative term that expresses the measure of confidence that one data set can be compared to another and can be combined for the purposes of decision-making. A determination of comparability may include comparison of sample collection and handling methods, sample preparation and analytical procedures, holding times, stability issues, and QA protocols. Comparability of data collected during work performed under the MRP will be evaluated in annual progress reports.
Completeness – Completeness is a measure of the amount of valid data obtained from a measurement system compared to the amount expected to be obtained under normal conditions. “Normal conditions” are defined as the conditions expected if the MRP was implemented as planned.
Field completeness is a measure of the amount of valid samples obtained during all sampling for the MRP. The field completeness goal is 90 percent.
Laboratory completeness is a measure of the amount of valid measurements obtained from all the measurements taken in the project. The laboratory completeness goal is 95 percent.
Sensitivity – Sensitivity of analytical data is demonstrated by laboratory method detection limits (MDLs) and by laboratory reporting limits (RLs). Target MDLs and RLs are specified in Section 2.4 of this QAPP.
1.7 Special Training/Certifications and Permits
1.7.1 Training
Monitoring personnel will meet the educational, work experience, responsibility, and training requirements for their respective positions. Personnel will have familiarity with the quality documents described in the SWAMP QAPrP and make use of SWAMP training tools as necessary. Prior to performing measurement and sampling activities, personnel will be given instructions by the Project Manager specific to the MRP, covering the following areas:
Appendix C - Quality Assurance Project Plan 9 December 9, 2013 Monitoring and Reporting Plan Nutrients and Toxics TMDLs Torrance, California
Organization and lines of communication and authority;
Overview of the MRP and QAPP;
QA/QC requirements;
Documentation requirements; and
Health and safety requirements.
1.7.2 Certifications
No special certifications are anticipated or required for stormwater sampling personnel.
1.7.3 Permits
Prior to commencing field work, access agreements and required permits will be obtained from
agencies responsible for stormwater conveyances and public right-of-ways at the sampling
locations. Access agreements and permits may include the following: Flood Control District
Permit from the County of Los Angeles Department of Public Works; Construction/Excavation
Permit from the City of Torrance; Encroachment permit from the City of Lomita; Building
Materials Permits from the City of Los Angeles; and Road Permit Applications from the County
of Los Angeles.
1.8 Documentation and Records
1.8.1 Project Files
The MRP files will be kept in a central repository on a secure network drive backed up regularly and maintained by Northgate. These files will include all documents relevant to sampling and analysis activities described in this QAPP. The files for this investigation, including all relevant records, final reports, logs, field notebooks, pictures, subcontractor reports, and data validation reviews, will be maintained in a secure, limited access area and under custody of the Project Manager. The files for the MRP will be maintained by Northgate at the Laguna Hills office for a period of five years after the final project report is issued.
1.8.2 Field Records
Field data sheets provide the means of recording the sample and field data collecting activities performed during the investigations.
The title page of each data sheet should contain the following:
Appendix C - Quality Assurance Project Plan 10 December 9, 2013 Monitoring and Reporting Plan Nutrients and Toxics TMDLs Torrance, California
Person who is recording the data;
Project name and number;
Project start date; and
End date.
Entries on the field forms will contain a variety of information. At the beginning of each entry, the date, start time, weather, names of field team members present, and the signature of the person making the entry will be entered. The names of visitors observing field activities and the purpose of their visit will also be recorded.
Standardized field measurement and sample data forms will be utilized. All measurements made and samples collected will be recorded. All entries will be made in permanent ink, signed, and dated, and no erasures or obliterations will be made. If an incorrect entry is made, the information will be crossed out with a single strike mark, which is to be signed and dated by the sampler. Whenever a sample is collected, or a measurement is made, the sampling location will be recorded. All equipment used to make measurements will be identified, along with the date of calibration. Sample field forms for use in this project are provided in Appendix B of the MRP.
1.8.3 Laboratory Records
Laboratory data reduction procedures should be performed according to the following protocol. All information related to analysis will be documented in controlled laboratory logbooks, instrument printouts, or other approved forms. All entries that are not generated by an automated data system will be made neatly and legibly in permanent, waterproof ink. Information will not be erased or obliterated. Corrections will be made by drawing a single line through the error and entering the correct information adjacent to the strike-out. All changes will be initialed, dated, and if appropriate, accompanied by a brief explanation. Unused pages or portions of pages will be crossed out to prevent future data entry. Analytical laboratory records will be reviewed by the supervisory personnel on a regular basis, and by the Laboratory Manager or his/her designee periodically, to verify adherence to documentation requirements.
Analytical data deliverables will be provided within a one-week turnaround time from date of sample receipt at the laboratory. The laboratory will provide one copy of an electronic data deliverable (EDD) for each set of samples submitted. The laboratory will also provide a laboratory analytical report at least annually, which will include laboratory certification that the results have been reviewed and validated and will include the QA and laboratory replicate results.
Appendix C - Quality Assurance Project Plan 11 December 9, 2013 Monitoring and Reporting Plan Nutrients and Toxics TMDLs Torrance, California
If new or different laboratories are used during the course of the work performed under the MRP, their qualifications and QA/QC procedures will be reviewed and approved by the Project Manager and the RWQCB, as appropriate, prior to engagement.
1.8.4 Reporting
Annual progress reports will be prepared by Northgate and submitted to the RWQCB to present results of the Nutrient and Toxics TMDL monitoring. The reports will include monthly and year-to date totals for total nitrogen (TN), total phosphorous (TP), and toxics (total PCBs, DDT, DDE, DDD, total DDT, chlordane, and dieldrin) in stormwater, project progress for the calendar year, and summarize the collected analytical data, flow data, and QA/QC data.
Appendix C - Quality Assurance Project Plan 12 December 9, 2013 Monitoring and Reporting Plan Nutrients and Toxics TMDLs Torrance, California
2.0 DATA GENERATION AND ACQUISITION
2.1 Sampling Process Design
A detailed discussion of the sampling design rationale and methods is provided in the MRP (of which this QAPP is an Appendix). The objective of this project is to ensure that the City is in compliance with the requirements of the Machado Lake Nutrient and Toxics TMDLs. The specific objectives of the work to be performed under the MRP are:
Monitor attainment of WLAs as required by the TMDLs;
Guide the design of future implementation actions;
Monitor the effectiveness of implementation actions in improving water quality; and
Guide pollutant source investigations.
2.2 Sampling Methods
The detailed sampling methodology is provided in the MRP (Section 3.2) including specific equipment and procedures for nutrient TMDL dry weather sampling, nutrient TMDL wet weather sampling, toxics TMDL wet weather sampling, and flow measurement. Section 3.3 of the MRP presents decontamination procedures and Section 3.4 describes sample containers and preservation. The monitoring schedule and frequency is described in detail in Section 5.0 of the MRP.
Sampling will be conducted by a team of at least two workers using a combination of non-dedicated and dedicated sampling equipment. All sampling will be conducted in a manner that minimizes the possibility of sample contamination. Sampling equipment will be decontaminated prior to use. Grab samples will be collected in laboratory-supplied pre-preserved containers. Other types of discrete samples will also be collected and described separately.
After collection, the sample containers will be labeled, sealed in plastic bags, and placed in a cooler with ice for transportation under proper chain-of-custody protocol to the analytical laboratory. QA/QC samples will be collected and analyzed for each sampling event. Field personnel shall adhere to established sample collection protocols to ensure the collection of representative and uncontaminated samples for laboratory analysis. Deviations from the standard protocol must be recorded on the Water Sample Data Sheet at the time of sampling.
2.3 Sample Handling and Custody
The purpose of this element of the QAPP is to ensure that samples maintain their original physical form and chemical composition throughout the process of sample collection, transport, and analysis.
Appendix C - Quality Assurance Project Plan 13 December 9, 2013 Monitoring and Reporting Plan Nutrients and Toxics TMDLs Torrance, California
2.3.1 Sample Labeling and Identification
Each sample will be labeled with a unique name that contains the sample station, the date of collection, and a suffix indicating the order of sample collection. Each sample will have the name of the monitoring site written first, followed by the date in mmddyyyy format, and a number denoting the sample order (X). For example, the first sample collected at station Tor-S2 on November 24, 2012 would be labeled Tor-S2-11242012-1. Table 4 lists the sample naming protocol for each sampling station.
2.3.2 Chain-of-Custody Procedures
The field team shall follow proper chain-of-custody protocol with collected samples at all times. Samples will be considered to be in custody if they are (1) in the custodian's possession or view, (2) retained in a secure place (under lock) with restricted access, or (3) placed in a container and secured with an official seal such that the sample could not be reached without breaking the seal.
The field team shall complete chain-of-custody records for all collected samples on triplicate forms supplied by the analytical laboratory. The chain-of-custody will be utilized by the field team for all samples throughout the collection, transport, and analytical process to ensure compliance with the SSWP. Each field team member handling the samples will sign the chain-of-custody.
2.3.3 Sample Handling, Packaging, and Shipping
The handling and transportation of samples must be accomplished in a manner that protects the integrity of the samples and complies with the provisions of the MRP. As few of people as possible will handle the samples. The field team will have custody of the samples during the monitoring event, and chain-of-custody (COC) forms will accompany all samples during shipment or delivery to the analytical laboratory.
The field team shall package samples carefully to avoid breakage or contamination, maintain samples at the proper temperature (4OC), and ship samples daily to the analytical laboratory under chain-of-custody protocol. The following sample packaging requirements shall be followed:
1) Sample bottle lids must not be mixed, all sample lids must stay with the original containers;
2) Sample bottles will be placed in a resealable plastic bag to minimize leakage in case a bottle breaks during shipment;
3) The samples will be cooled by placing ice in sealed plastic bags and placing the sealed ice-filled bags around, between, and above the sample containers;
Appendix C - Quality Assurance Project Plan 14 December 9, 2013 Monitoring and Reporting Plan Nutrients and Toxics TMDLs Torrance, California
4) Any remaining space in the sample shipping container shall be filled with clean, inert packing material such as bubble-wrap;
5) The chain-of-custody document must be sealed in a resealable plastic bag and placed in the shipping container. The resealable plastic bag will be taped to the inside lid of the sample cooler, and sealed with shipping tape;
6) Clear strapping tape will be wrapped around the cooler in at least two locations, sealing the container to prevent the contents from spilling; and
7) Custody seals will be affixed over the shipping tape in at least two locations (normally the front and right side of the cooler); in a manner that access to the container can only be gained by breaking a seal. A layer of clear strapping tape will be placed over the seals to ensure that they are not broken accidentally during shipping. Custody seals shall be constructed with security slots designed to break if the seals are disturbed.
2.4 Analytical Methods
Stormwater samples will be collected and analyzed for multiple constituents to support development of methods for reducing contaminant loading in City stormwater and to evaluate the effectiveness of BMPs as they are implemented. The following sections describe the constituents for which samples will be analyzed, the analytical methods, method detection limits and reporting limits for each constituent.
2.4.1 Laboratory Analytical Methods and Reporting Limits
Samples collected under the MRP will be sent to SunStar for analysis according to the analytical methods described below. The contact information for SunStar is the following:
SunStar Laboratories, Inc. 25712 Commercentre Drive Lake Forest CA, 92630 (949) 297-5020
2.4.1.1 Nutrient TMDL Monitoring
Nutrient TMDL samples will be analyzed for ammonia-ammonium, nitrate-nitrite, total Kjeldahl nitrogen (TKN), total phosphorus, phosphate, and total suspended solids. Table 5 specifies the analytical methods, reporting units, target reporting limits, and method detection limits for use in Nutrient TMDL monitoring.
Appendix C - Quality Assurance Project Plan 15 December 9, 2013 Monitoring and Reporting Plan Nutrients and Toxics TMDLs Torrance, California
Table 2.1: Nutrient TMDL Monitoring Analytical Methods and Limits
Parameter Method Number Reporting
Units
Target
Reporting
Limits
Method
Detection
Limits
Ammonia-Ammonium (NH3+) SM 4500D mg/l 0.6 0.12
Nitrate (NO3) EPA 300.0 mg/l 0.1 0.03
Nitrite (NO2) EPA 300.0 mg/l 0.1 0.03
Total Kjeldahl Nitrogen (TKN) EPA 351.2 mg/l 0.1 0.07
Total Phosphorus (TP) EPA 365.3 mg/l 0.05 0.01
Phosphate(PO4) EPA 365.3 mg/l 0.13 0.16
Total Suspended Solids (TSS) EPA 160.2 mg/l 1.0 0.5
Notes:
mg/l = milligrams per liter
2.4.1.2 Toxics TMDL Monitoring
Toxics TMDL samples will be analyzed for TSS, organochlorine Pesticides, PCBs, and total organic carbon (TOC). Table 6 specifies the analytical methods, reporting units, target reporting limits, and method detection limits for use in Toxics TMDL monitoring.
Table 2.2: Toxics TMDL Monitoring Analytical Methods and Limits
Sample Medium
Parameter Method Number
Method Detection
Limit
Target Reporting
Limit
Water Total Suspended Solids EPA 160.2 0.5 mg/L 1.0 mg/L
Sediment Total Organic Carbon (TOC) EPA 415.1 0.05% dry
weight
0.05%-66% dry
weight
Organochlorine Pesticides1 EPA 8081 0.1-1 ng/dry g 0.5-5 ng/dry g
Total PCBs2 EPA 8082 10 ng/dry g 20 ng/dry g
Notes: Mg/l = milligrams per liter ng/dry g = nano grams dry weight per gram 1. Organochlorine Pesticides to be analyzed include chlordane-alpha, chlordane gamma, 2,4'-DDD, 2,4'-DDE, 2.4'-DDT,
4,4'-DDD, 4,4'-DDE, 4,4'-DDT, and dieldrin. 2. PCBs in water and sediment are measured as sum of seven Aroclors identified in the CTR (1016, 1221, 1232, 1242, 1248, 1254,
and 1260). Congeners will also be analyzed to provide a better estimate of PCB concentrations and loads for PCBs. Method Detection Limit/Reporting Limit for individual congeners are 1 ng/dry g and 5 ng/dry g.
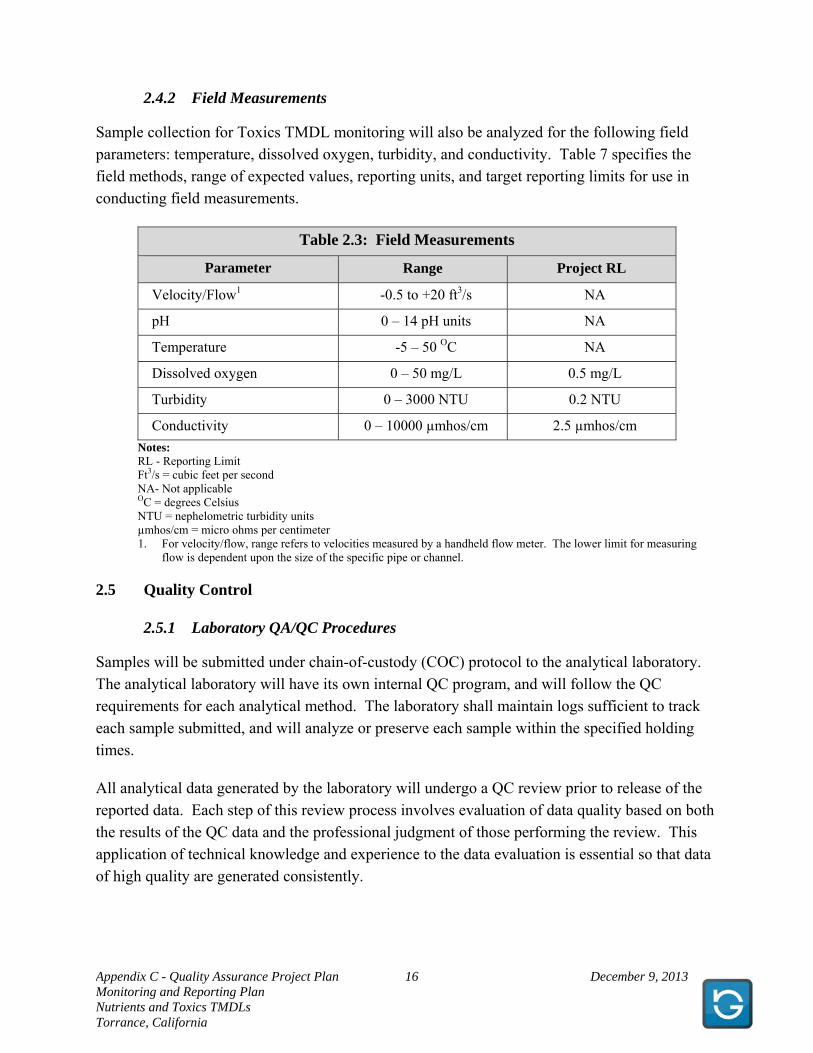
Appendix C - Quality Assurance Project Plan 16 December 9, 2013 Monitoring and Reporting Plan Nutrients and Toxics TMDLs Torrance, California
2.4.2 Field Measurements
Sample collection for Toxics TMDL monitoring will also be analyzed for the following field parameters: temperature, dissolved oxygen, turbidity, and conductivity. Table 7 specifies the field methods, range of expected values, reporting units, and target reporting limits for use in conducting field measurements.
Table 2.3: Field Measurements
Parameter Range Project RL
Velocity/Flow1 -0.5 to +20 ft3/s NA
pH 0 – 14 pH units NA
Temperature -5 – 50 OC NA
Dissolved oxygen 0 – 50 mg/L 0.5 mg/L
Turbidity 0 – 3000 NTU 0.2 NTU
Conductivity 0 – 10000 µmhos/cm 2.5 µmhos/cm
Notes: RL - Reporting Limit Ft3/s = cubic feet per second NA- Not applicable OC = degrees Celsius NTU = nephelometric turbidity units µmhos/cm = micro ohms per centimeter 1. For velocity/flow, range refers to velocities measured by a handheld flow meter. The lower limit for measuring
flow is dependent upon the size of the specific pipe or channel.
2.5 Quality Control
2.5.1 Laboratory QA/QC Procedures
Samples will be submitted under chain-of-custody (COC) protocol to the analytical laboratory. The analytical laboratory will have its own internal QC program, and will follow the QC requirements for each analytical method. The laboratory shall maintain logs sufficient to track each sample submitted, and will analyze or preserve each sample within the specified holding times.
All analytical data generated by the laboratory will undergo a QC review prior to release of the reported data. Each step of this review process involves evaluation of data quality based on both the results of the QC data and the professional judgment of those performing the review. This application of technical knowledge and experience to the data evaluation is essential so that data of high quality are generated consistently.
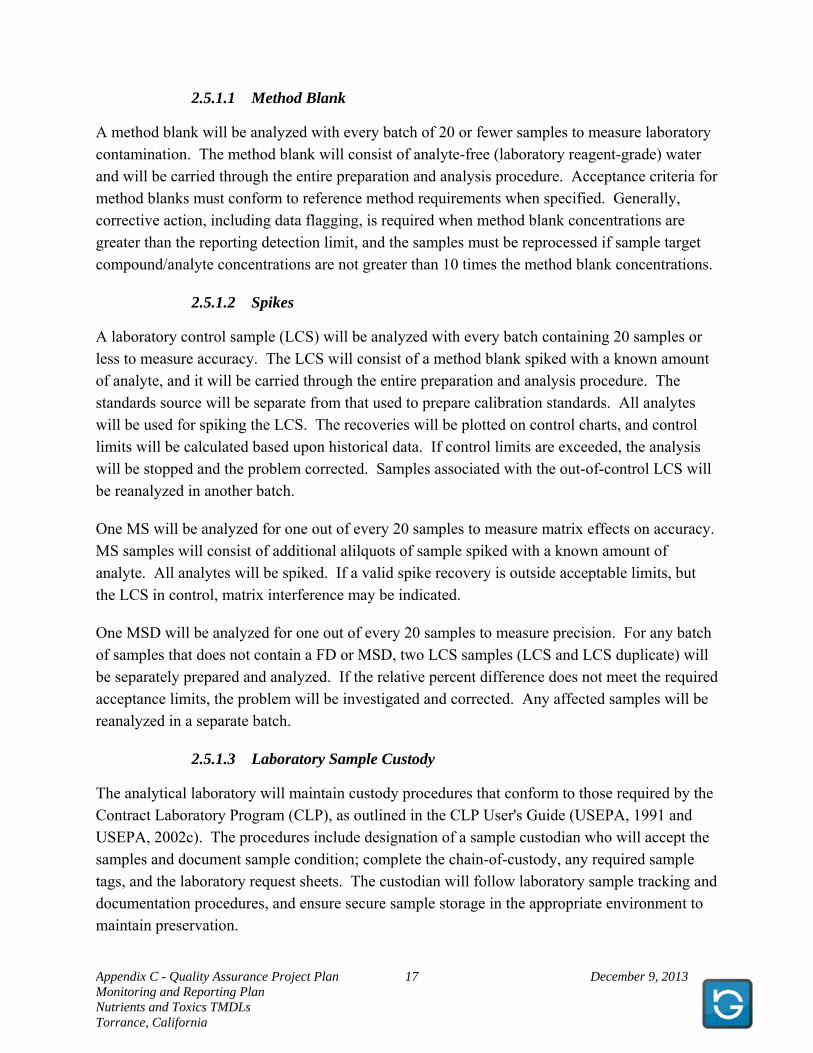
Appendix C - Quality Assurance Project Plan 17 December 9, 2013 Monitoring and Reporting Plan Nutrients and Toxics TMDLs Torrance, California
2.5.1.1 Method Blank
A method blank will be analyzed with every batch of 20 or fewer samples to measure laboratory contamination. The method blank will consist of analyte-free (laboratory reagent-grade) water and will be carried through the entire preparation and analysis procedure. Acceptance criteria for method blanks must conform to reference method requirements when specified. Generally, corrective action, including data flagging, is required when method blank concentrations are greater than the reporting detection limit, and the samples must be reprocessed if sample target compound/analyte concentrations are not greater than 10 times the method blank concentrations.
2.5.1.2 Spikes
A laboratory control sample (LCS) will be analyzed with every batch containing 20 samples or less to measure accuracy. The LCS will consist of a method blank spiked with a known amount of analyte, and it will be carried through the entire preparation and analysis procedure. The standards source will be separate from that used to prepare calibration standards. All analytes will be used for spiking the LCS. The recoveries will be plotted on control charts, and control limits will be calculated based upon historical data. If control limits are exceeded, the analysis will be stopped and the problem corrected. Samples associated with the out-of-control LCS will be reanalyzed in another batch.
One MS will be analyzed for one out of every 20 samples to measure matrix effects on accuracy. MS samples will consist of additional alilquots of sample spiked with a known amount of analyte. All analytes will be spiked. If a valid spike recovery is outside acceptable limits, but the LCS in control, matrix interference may be indicated.
One MSD will be analyzed for one out of every 20 samples to measure precision. For any batch of samples that does not contain a FD or MSD, two LCS samples (LCS and LCS duplicate) will be separately prepared and analyzed. If the relative percent difference does not meet the required acceptance limits, the problem will be investigated and corrected. Any affected samples will be reanalyzed in a separate batch.
2.5.1.3 Laboratory Sample Custody
The analytical laboratory will maintain custody procedures that conform to those required by the Contract Laboratory Program (CLP), as outlined in the CLP User's Guide (USEPA, 1991 and USEPA, 2002c). The procedures include designation of a sample custodian who will accept the samples and document sample condition; complete the chain-of-custody, any required sample tags, and the laboratory request sheets. The custodian will follow laboratory sample tracking and documentation procedures, and ensure secure sample storage in the appropriate environment to maintain preservation.
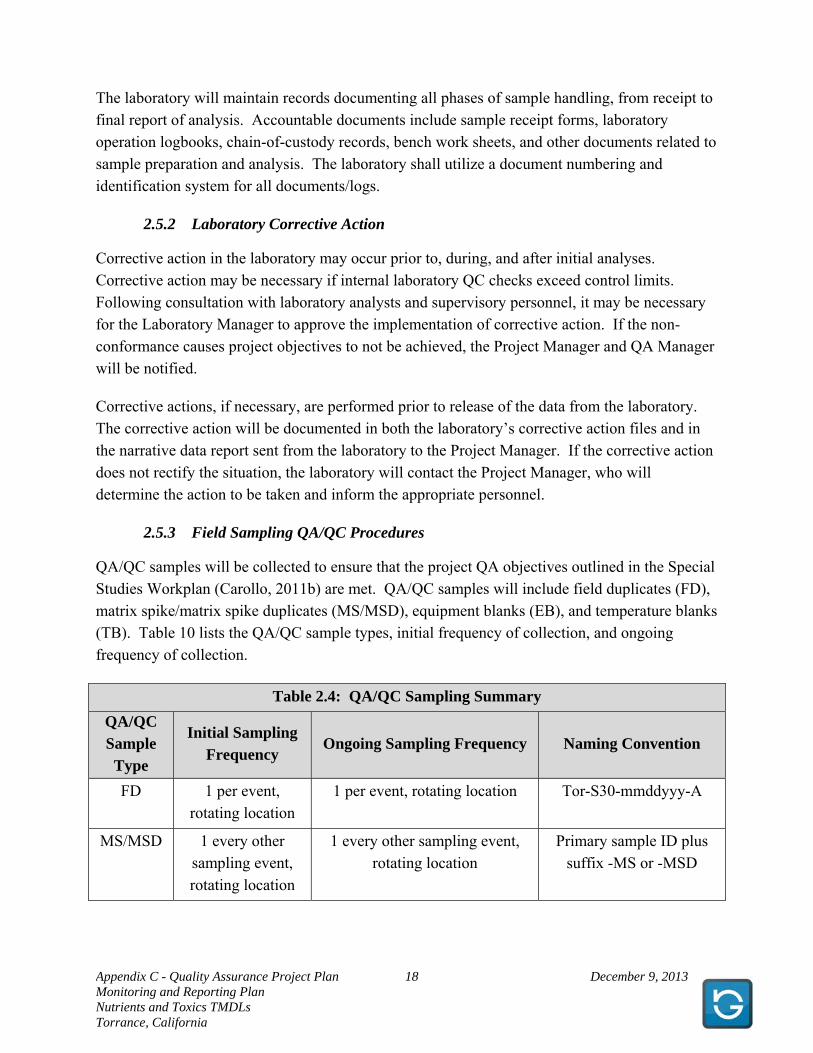
Appendix C - Quality Assurance Project Plan 18 December 9, 2013 Monitoring and Reporting Plan Nutrients and Toxics TMDLs Torrance, California
The laboratory will maintain records documenting all phases of sample handling, from receipt to final report of analysis. Accountable documents include sample receipt forms, laboratory operation logbooks, chain-of-custody records, bench work sheets, and other documents related to sample preparation and analysis. The laboratory shall utilize a document numbering and identification system for all documents/logs.
2.5.2 Laboratory Corrective Action
Corrective action in the laboratory may occur prior to, during, and after initial analyses. Corrective action may be necessary if internal laboratory QC checks exceed control limits. Following consultation with laboratory analysts and supervisory personnel, it may be necessary for the Laboratory Manager to approve the implementation of corrective action. If the non-conformance causes project objectives to not be achieved, the Project Manager and QA Manager will be notified.
Corrective actions, if necessary, are performed prior to release of the data from the laboratory. The corrective action will be documented in both the laboratory’s corrective action files and in the narrative data report sent from the laboratory to the Project Manager. If the corrective action does not rectify the situation, the laboratory will contact the Project Manager, who will determine the action to be taken and inform the appropriate personnel.
2.5.3 Field Sampling QA/QC Procedures
QA/QC samples will be collected to ensure that the project QA objectives outlined in the Special Studies Workplan (Carollo, 2011b) are met. QA/QC samples will include field duplicates (FD), matrix spike/matrix spike duplicates (MS/MSD), equipment blanks (EB), and temperature blanks (TB). Table 10 lists the QA/QC sample types, initial frequency of collection, and ongoing frequency of collection.
Table 2.4: QA/QC Sampling Summary
QA/QC Sample
Type
Initial Sampling Frequency
Ongoing Sampling Frequency Naming Convention
FD 1 per event, rotating location
1 per event, rotating location Tor-S30-mmddyyy-A
MS/MSD 1 every other sampling event,
rotating location
1 every other sampling event, rotating location
Primary sample ID plus suffix -MS or -MSD
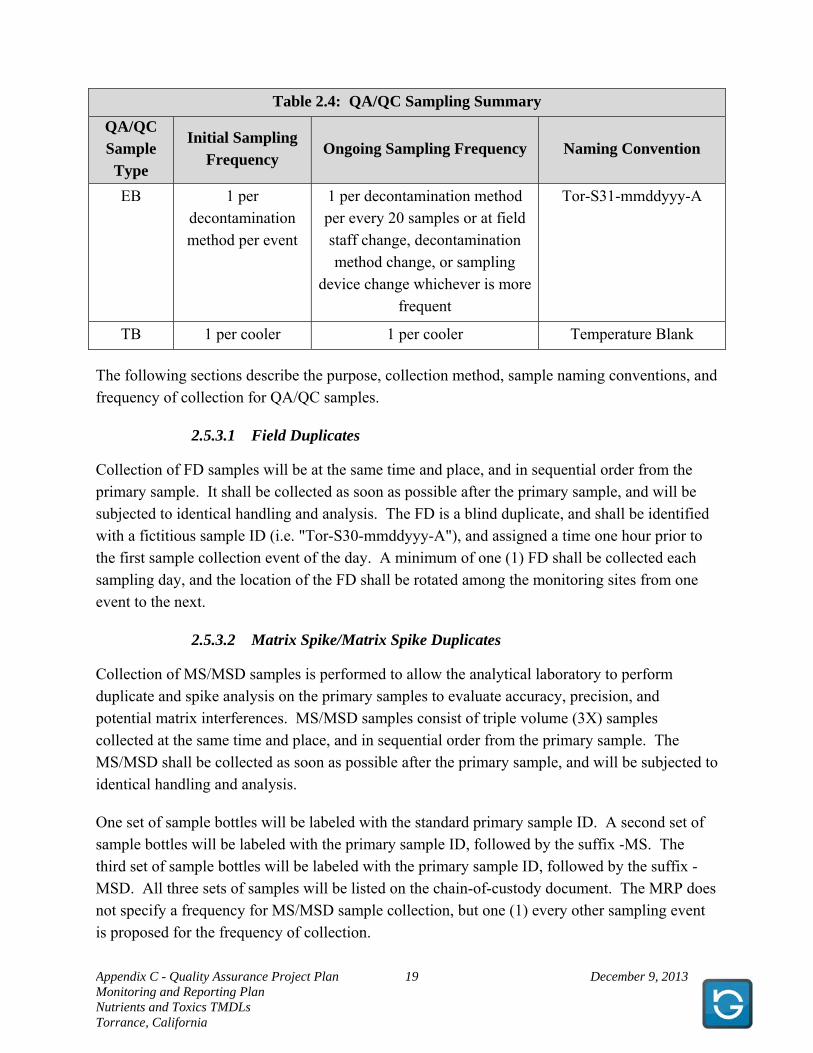
Appendix C - Quality Assurance Project Plan 19 December 9, 2013 Monitoring and Reporting Plan Nutrients and Toxics TMDLs Torrance, California
Table 2.4: QA/QC Sampling Summary
QA/QC Sample
Type
Initial Sampling Frequency
Ongoing Sampling Frequency Naming Convention
EB 1 per decontamination
method per event
1 per decontamination method per every 20 samples or at field staff change, decontamination method change, or sampling
device change whichever is more
frequent
Tor-S31-mmddyyy-A
TB 1 per cooler 1 per cooler Temperature Blank
The following sections describe the purpose, collection method, sample naming conventions, and frequency of collection for QA/QC samples.
2.5.3.1 Field Duplicates
Collection of FD samples will be at the same time and place, and in sequential order from the primary sample. It shall be collected as soon as possible after the primary sample, and will be subjected to identical handling and analysis. The FD is a blind duplicate, and shall be identified with a fictitious sample ID (i.e. "Tor-S30-mmddyyy-A"), and assigned a time one hour prior to the first sample collection event of the day. A minimum of one (1) FD shall be collected each sampling day, and the location of the FD shall be rotated among the monitoring sites from one event to the next.
2.5.3.2 Matrix Spike/Matrix Spike Duplicates
Collection of MS/MSD samples is performed to allow the analytical laboratory to perform duplicate and spike analysis on the primary samples to evaluate accuracy, precision, and potential matrix interferences. MS/MSD samples consist of triple volume (3X) samples collected at the same time and place, and in sequential order from the primary sample. The MS/MSD shall be collected as soon as possible after the primary sample, and will be subjected to identical handling and analysis.
One set of sample bottles will be labeled with the standard primary sample ID. A second set of sample bottles will be labeled with the primary sample ID, followed by the suffix -MS. The third set of sample bottles will be labeled with the primary sample ID, followed by the suffix -MSD. All three sets of samples will be listed on the chain-of-custody document. The MRP does not specify a frequency for MS/MSD sample collection, but one (1) every other sampling event is proposed for the frequency of collection.
Appendix C - Quality Assurance Project Plan 20 December 9, 2013 Monitoring and Reporting Plan Nutrients and Toxics TMDLs Torrance, California
2.5.3.3 Equipment Blanks
Non-dedicated sampling equipment will be tested with equipment blanks (EBs) to evaluate the potential for cross-contamination associated with decontamination procedures. Prior to collecting an EB, decontaminate the sampling equipment using the procedure in Section 4.5 Decontamination Procedures. The EB will be collected by pouring laboratory grade reagent water into the sampling device, and then transferring it to the sample bottles. The EB is a blind sample, and shall be identified with a fictitious sample ID (i.e. "Tor-S31-mmddyyy-A). The EB shall be collected at the frequency of one (1) per sampling event for the first two (2) events; at a reduced frequency of one (1) per twenty (20) samples (5 percent) thereafter or one (1) per every change in field personnel, decontamination methodology, or change in sampling device - whichever is more frequent.
2.5.3.4 Temperature Blanks
Sample bottles containing tap water for use as temperature blanks (TBs) shall be provided by the analytical laboratory with each batch of sample bottles. The TBs are used to check for proper temperature of sample preservation by the receiving laboratory. The sampling team will include one TB per sample cooler, and label the bottle "Temperature Blank". The TB will not be listed on the chain-of-custody.
2.5.4 Field Corrective Action
Corrective action in the field may be needed when the sample network is changed (e.g., greater or fewer samples, sampling locations other than those specified in the MRP, etc.) or when sampling procedures and/or field analytical procedures require modification due to unexpected conditions. The field team, Field Technician, Project Manager, or QA Manager may identify the need for corrective action. The Project Manager in consultation with the QA Manager will approve the corrective measure. The Field Technician will ensure that the corrective measure is implemented in the field.
Corrective action resulting from internal field audits will be implemented immediately if data may be adversely affected due to unapproved or improper use of approved methods. The QA Manager will identify deficiencies and recommend corrective action to the Project Manager. Implementation of corrective actions will be performed by the Field Technician. Corrective actions will be documented in the daily field logs or field logbook. Documentation will include:
A description of the circumstances that initiated the corrective action;
The action taken in response;
The final resolution; and
Any necessary approvals.
Appendix C - Quality Assurance Project Plan 21 December 9, 2013 Monitoring and Reporting Plan Nutrients and Toxics TMDLs Torrance, California
2.6 Instrument Testing, Inspection, and Maintenance
Samples collected for Toxics TMDL monitoring will be analyzed for field parameters as described in Section 2.4.2 of the QAPP. Instrumentation used for monitoring will be subject to routine testing, inspection, and maintenance in accordance with standard operating procedures and manufacturer protocols.
2.7 Instrument Calibration and Frequency
Calibration of field monitoring instrumentation will be performed in the field prior to collection of field measurements on at least a monthly basis. Routine manufacturer calibration of the instrumentation will also be performed as necessary.
2.8 Non-Direct Measurements
Non-direct data, including those produced by a calculation involving multiple direct measurements, historical reports, maps, literature searches, and previously collected analytical data, will be reviewed prior to use to determine its acceptability based on the end use of the data. In particular, procedures will be implemented to verify that calculations performed using direct measurements are consistent and that results are transcribed correctly. These procedures will include the use of repeatable processes to perform calculations and verification of those processes and calculations by the Project Manager.
2.9 Data Management
Data management operations include data recording, validation, transformation, transmittal, reduction, analysis, tracking, storage, and retrieval. Monitoring activities will be documented in plans and reports, which in turn will be supported by field documents (e.g., daily field logs, field logbooks, standardized forms, etc.), laboratory analytical reports, and other related documents.
Laboratory documentation requirements are delineated in the laboratory contracts and include specifications for data report composition, report format, turn-around time, and records retention. Laboratory data are recorded in a format that includes sample identification, analysis date, parameter values, detection limits, and uncertainties.
As analytical data are received, a variety of QC checks are performed to ensure data integrity. These checks include:
Audits to ensure that laboratories have reported all requested analyses;
Checks that all analytes are consistently and correctly identified;
Reviews to ensure that units of measurement are provided and are consistent; and
Appendix C - Quality Assurance Project Plan 22 December 9, 2013 Monitoring and Reporting Plan Nutrients and Toxics TMDLs Torrance, California
Reports to review sample information (dates, locations);
A separate database will be maintained by the Database Manager on a secure network drive that is backed up regularly. Verification and validation of analytical results will be performed in accordance with the procedures described in Section 4.1.
Appendix C - Quality Assurance Project Plan 23 December 9, 2013 Monitoring and Reporting Plan Nutrients and Toxics TMDLs Torrance, California
3.0 ASSESSMENT AND OVERSIGHT
Prior to beginning of field work, all members of the team will review the QAPP, the MRP, the Health and Safety Plan (HASP), and any other governing documents. The Project Manager will promptly distribute any updates or addenda to the entire project team. The Field Technician will assemble necessary field supplies including field logs, field forms, copies of the MRP and HASP, field instruments and calibration equipment, COC forms and seals, sample coolers, and any other equipment or materials needed for field work. The Field Technician will contact the analytical laboratory in advance to schedule analyses and arrange for shipping and delivery of samples to and from the laboratory.
3.1 Assessments and Response Actions
3.1.1 Data Assessments
Assessments include technical audits of field and laboratory activities, data packages, and data validation procedures conducted to ensure that the QAPP is being implemented as approved. Assessments are to be conducted throughout the extent of work performed under the MRP to identify potential problems early and provide timely corrective action.
Field Activity Review – The Project Manager will oversee work performed under the MRP to ensure that field work is performed in accordance with the approved QAPP and the MRP, including sampling activities, documentation of accuracy, completeness and consistency, packaging and shipping of samples to the laboratory, and field instrument monitoring and calibration. The Project Manager will communicate as necessary with the QA Manager regarding field activities and any changes or correction that will be implemented. During and following any field work, the Project Manager will review field documents and field measurements for accuracy and completeness and will periodically provide the information to the QA Manager for additional review.
The QA Manager may periodically audit field activities to evaluate adherence to specified methods for sample collection, documentation, packaging, and other field activities. If conducted, the QA Manager will prepare an audit report for the Project Manager that summarizes the audit findings, identifies deficiencies, and recommends corrective action. The Project Manager is responsible for ensuring that corrective measures are implemented and documented, as necessary.
Laboratory Audit – The purpose of the laboratory audit is to evaluate the laboratory’s ability to perform the required analyses. No laboratory audit specific to this QAPP is proposed, however, laboratory audits may be conducted at the discretion of the Program Manager. The laboratory audit typically includes a review of the following areas:
Appendix C - Quality Assurance Project Plan 24 December 9, 2013 Monitoring and Reporting Plan Nutrients and Toxics TMDLs Torrance, California
QA organization and procedures;
Personnel training and qualifications;
Sample log-in procedures;
Samples storage facilities;
Analyst technique;
Adherence to the laboratory SOP and project QAPP;
Compliance with QA/QC objectives;
Instrument calibration and maintenance;
Data recording, reduction, review, and reporting; and
Cleanliness and housekeeping.
If conducted, preliminary results of the laboratory audit will be discussed with the Laboratory Manager. A written report that summarizes audit findings and recommends corrective actions will be prepared and submitted to the Laboratory Manager for response. The final report, including the laboratory’s response, will be distributed to the Project Manager and the City Engineering Manager.
Data Package Audits – Audits of analytical data packages will be conducted for 100 percent of the packages received as part of the data validation process (Section 4.1). The review will include an evaluation of the package to ensure that all required deliverables are provided and the package contains the information necessary to reproduce the reported results. Any deficiencies will be communicated to the laboratory and documented in the data validation reports.
Data Validation Audits – Each analytical data package will be validated as described in Section 4.1.3. As part of the validation process, a review of each completed validation package will be conducted by a validator other than the one performing the validation. The review will verify that the analytical deliverable package was complete and that any missing information requested from the laboratory was supplied, that validation worksheets were filled out accurately and completely, that validation actions were consistent with the validation guidelines established for this program and/or best professional judgment, and that the validation reports and data qualifiers accurately reflect the validation actions as documented on the worksheets.
3.1.2 Response Actions
Corrective action is the process of identifying, recommending, approving, and implementing measures to counter unacceptable procedures or out-of-control QC performance that can affect data quality. Corrective actions can be related to field activities, laboratory analyses, data validation, and data assessment. Field and laboratory correction actions are described in
Appendix C - Quality Assurance Project Plan 25 December 9, 2013 Monitoring and Reporting Plan Nutrients and Toxics TMDLs Torrance, California
Section 2.5 of this QAPP. The need for corrective action may also be identified during data verification or assessment. Potential types of corrective action may include higher level data validation, reanalysis of samples by the laboratory, or re-sampling by the field team. These actions are dependent upon the ability to mobilize the field team and whether or not the data to be collected are necessary to meet the required QA objectives.
3.2 Reports to Management
QA reports will be submitted to the Project Manager to ensure that any problems identified during the measurement, sampling and analysis programs are investigated and the proper corrective measures taken in response. The QA reports will include:
All results of field and laboratory audits;
Problems noted during data validation and assessment; and
Significant QA/QC problems, recommended corrective actions, and the outcome of corrective actions.
QA reports will be prepared by the QA Manager and submitted on an as-needed basis.
Appendix C - Quality Assurance Project Plan 26 December 9, 2013 Monitoring and Reporting Plan Nutrients and Toxics TMDLs Torrance, California
4.0 DATA VERIFICATION, VALIDATION, AND USABILITY
The scope and content of verification and validation tasks that will be conducted on laboratory analytical data are described below and at a minimum include the USEPA’s recommended Stage 2A verification and validation checks (USEPA; 2002b, 2009).
4.1 Data Review, Verification, and Validation
4.1.1 Field Data
Field records will be reviewed by the Field Technician or Project Manager to ensure that the records are complete, accurate, and legible, and to verify that the measurement and sample collection procedures are in accordance with the protocols specified in the MRP and this QAPP. This includes ensuring that:
Daily field logs and field logbooks and standardized forms have been filled out completely and that the information recorded accurately reflects the activities that were performed;
Records are in accordance with good recordkeeping practices (e.g., entries are signed and dated, data are not obliterated, changes are initialed, dated, and explained, etc.); and
Sample collection, handling, and storage procedures were conducted in accordance with the protocols described in the MRP and QAPP, and that any deviations were documented and approved by the appropriate personnel.
4.1.2 Internal Laboratory Review
Prior to the release of any data from the laboratory as final, laboratory data will proceed through a tiered review process. The first two levels of review will be performed by laboratory personnel. Initially review will be performed by the laboratory analyst performing the work to verify that work was done correctly. Following the completion of the initial verification by the analyst, a systematic check of the data will be performed by an experienced peer or supervisor. This check will be performed to ensure that initial review has been completed correctly and thoroughly, and typically includes a review to ensure accuracy of calculations, acceptability of QC data, and correct interpretation of any chromatograms, mass spectra, etc., as applicable. Unresolved problems should be discussed with the QA Manager and described in the report narrative.
A third-level review will be performed before results are published. This review serves to verify the completeness of the data report and to ensure that the DQOs are met for the analyses performed.
Appendix C - Quality Assurance Project Plan 27 December 9, 2013 Monitoring and Reporting Plan Nutrients and Toxics TMDLs Torrance, California
4.1.3 Data Verification and Validation
Verification and validation of the laboratory deliverables will be performed by the QA Manager or another qualified party independent of the laboratory. Verification and validation will be performed on 100 percent of the data. Data verification is the process of evaluating the correctness, conformance, compliance, and completeness of a specific data set against method, procedural, or contractual requirements. Data validation is an analyte- and sample-specific process that evaluates the information after the verification process to determine analytical quality and any limitations.
4.2 Verification and Validation Methods
4.2.1 Verification
Data verification will be performed by the QA Manager or designated representative. Verification will include field data and laboratory verification. Field data verification is discussed in Section 4.1.1 of this QAPP. Laboratory data verification includes review of Microsoft Excel files submitted by the laboratory and review of hardcopy data packages. Data verification will include, but is not limited to, reviewing the following:
Completeness of the deliverable, including the case narrative, COC documentation, and sample condition upon receipt;
Sample documentation, including dates and times;
Analytical methods, dates, and units;
Sample preservation, if applicable; and
Laboratory qualifiers.
4.2.2 Validation
Data validation will be performed by the QA Manager or designated representative. Data validation includes further review and checks for compliance of:
Laboratory method and equipment blank contamination;
Holding times;
Matrix spike/matrix spike duplicates (MS/MSDs);
Reporting limits;
Method blanks;
QC sample frequencies as stipulated in this QAPP; and
Initial and continuing calibrations.
Appendix C - Quality Assurance Project Plan 28 December 9, 2013 Monitoring and Reporting Plan Nutrients and Toxics TMDLs Torrance, California
4.3 Reconciliation with User Requirements
4.3.1 Comparison to Measurement Objectives
The field and laboratory data collected during this project will be used to achieve the objectives identified in Section 1.6.1 of this QAPP. The QC results associated with each analytical parameter for each matrix will be compared to the measurement objectives as defined in Section 1.6.2. Only data generated in association with QC results meeting the stated acceptance criteria will be considered usable for decision-making purposes. The primary goal is to ensure that the data reported will be representative of the measured conditions at a particular point in time and can be compared to the Nutrient and Toxics TMDLs.
4.3.1.1 Precision Assessment
The RPD between the primary sample and field duplicate, and the laboratory MS/MSD pair, is calculated to compare to the precision objective. The RPD will be calculated according to the following formula:
Failure to achieve precision objectives may result in the qualification of the associated data and limitations placed upon their use. The objectives for field precision is ≤50% RPD the ambient air samples. The precision control objectives for laboratory analyses of replicates will be specified by the laboratory at the time of analyses.
4.3.1.2 Accuracy Assessment
One measure of accuracy will be the percent recovery (%R) for a MS sample according to the following equation:
100 AA
% xddedmountKnown
ueOfSampleMeasureValdSamplelueOfSpikeMeasuredVaR
The percent recovery objective for laboratory analyses of a MS sample will be specified by the laboratory at the time of analyses. Blank samples are also used to assess accuracy. The blanks associated with sampling events include laboratory method blanks and equipment blanks. The results of the laboratory and equipment blanks will be compared to an accuracy objective. Failure to meet the objectives may indicate a systematic laboratory or field problem that should be investigated and resolved immediately. Associated data may be qualified and limitations placed on their use, depending on the magnitude of the problem.
100 )2 1 ( 5.0
)2 1 (x
SampleinAmountSampleinAmount
SampleinAmountSampleinAmountRPD
Appendix C - Quality Assurance Project Plan 29 December 9, 2013 Monitoring and Reporting Plan Nutrients and Toxics TMDLs Torrance, California
4.3.1.3 Completeness Assessment
Completeness is the ratio of the number of valid sample results to the total number of samples analyzed with a specific matrix and/or analysis. Following completion of the analytical testing, the percent completeness will be calculated by the following equation:
Failure to meet the completeness objective will require an assessment to determine if the missing or invalid data are critical to achieving the project objectives and/or if corrective actions are warranted. The completeness objective for valid samples is 90%.
4.3.2 Comparison to Project Objectives
The data obtained will be both qualitatively and quantitatively assessed. Factors to be considered in this assessment of field, monitoring, and laboratory data include but are not necessarily limited to the following:
Conformance to the field methodologies and procedures proposed in the QAPP;
Conformance to the analytical methodologies provided in the QAPP;
Adherence to proposed sampling strategy;
Presence of elevated detection limits due to matrix interferences or contaminants present at high concentrations;
Effect of qualifiers applied as a result of data verification or validation on the ability to implement the project decision rules; and
Status of all issues requiring corrective action.
The effect of non-conformance (procedures or requirements) or non-compliant data will be evaluated. Minor deviations from approved field and laboratory procedures and sampling approach will likely not affect the adequacy of the data as a whole in meeting the DQOs. Any instances of extreme bias will be evaluated on a case-by-case basis to determine the limitations, if any, of the data usability. Missing or rejected data will be reviewed to determine if the data are critical to attaining the objectives.
4.3.3 Data Qualifier Flags
The data qualification scheme is the basis for determining if sample results should be qualified, but the reviewer’s judgment is also critical in determining if data quality and usability have been systematically influenced and if data points require qualification. The staff performing the
100 ) (
) (x
plannedtsmeasuremenofnumber
tsmeasuremenvalidofnumberssCompletene
Appendix C - Quality Assurance Project Plan 30 December 9, 2013 Monitoring and Reporting Plan Nutrients and Toxics TMDLs Torrance, California
assessment must understand the analytical procedures being reviewed, understand how the data will be used, and be an experienced chemist. If QC results are unacceptable, the data will be qualified using the analysis flags identified by the laboratory.
Appendix C - Quality Assurance Project Plan 31 December 9, 2013 Monitoring and Reporting Plan Nutrients and Toxics TMDLs Torrance, California
5.0 REFERENCES
California Regional Water Quality Control Board, Los Angeles Region (RWQCB), 2008.
Resolution No. R08-006, Amendment to the Water Quality Control Plan for the Los Angeles Region to Incorporate a Total Daily Maximum Load for Eutrophic, Algae, Ammonia, and Odors (Nutrients) for Machado Lake: Dated May 1, 2008.
RWQCB, 2010. Resolution No. R10-008, Amendment to the Water Quality Control Plan for the
Los Angeles Region to Incorporate a Total Daily Maximum Load for Pesticides and PCBs for Machado Lake: Dated September 2, 2010.
Carollo Engineers, 2011a. Machado Lake Nutrient Total Maximum Daily Load Special Study Workplan: Dated May 18, 2011.
Carollo Engineers, 2011b. Machado Lake Pesticides and PCBs Total Maximum Daily Load Special Study Workplan: Dated August 31, 2011.
U.S. Environmental Protection Agency (USEPA), 1991. User's Guide to the Contract
Laboratory Program. Office of Emergency and Remedial Response. EPA/540/P-921/002. January, 1991.
USEPA, 2001. Region 9 Requirements for Quality Assurance Program Plans, R9QA/03.1, Draft, August 2001.
USEPA, 2002a. Guidance for Quality Assurance Project Plans, EPA QA/G-5, EPA/240/R-02/009, December 2002.
USEPA, 2002b. Guidance on Environmental Data Verification and Data Validation, EPA QA/G-8, EPA/240/R-02/004, November 2002.
USEPA, 2002c. USEPA Contract Laboratory Program National Functional Guidelines for Data
Review-Inorganics. EPA-540-R-01-008. July, 2002.
USEPA, 2006. Guidance on Systematic Planning Using the Data Quality Objectives Process, EPA QA/G-4, February 2006.
USEPA, 2009. Guidance for Labeling Externally Validated Laboratory Analytical Data for Superfund Use, EPA/540/R-08/005, January 13.
State Water Resources Control Board, 2008. Surface Water Ambient Monitoring Program Quality Assurance Program Plan, Version 1.0, September 1.
3031 Torrance Boulevard • Torrance, California 90503 • Phone: 310.618.5880 • Fax: 310.618.5891 pw:\\Carollo\Documents\Client\CA\Torrance\8419A00\Deliverables\SpecialStudyWorkPlan - Nutrient TMDL-edits.docx
City of Torrance, California
MACHADO LAKE NUTRIENT TOTAL MAXIMUM DAILY LOAD SPECIAL STUDY WORK PLAN May 18, 2011
CAROLLO ENGINEERS i May 2011 pw:\\Carollo\Documents\Client\CA\Torrance\8419A00\Deliverables\SpecialStudyWorkPlan - Nutrient TMDL-edits.docx
City of Torrance, California
MACHADO LAKE NUTRIENT TOTAL MAXIMUM DAILY LOAD
SPECIAL STUDY WORK PLAN
May 18, 2011
TABLE OF CONTENTS Page No.
1.0 INTRODUCTION .......................................................................................................... 1 1.1 Background ....................................................................................................... 1 1.2 Site Conditions and Characteristics .................................................................. 2
1.2.1 Study Site Location ........................................................................... 2 1.2.2 Hydrology and Hydraulics ................................................................. 2 1.2.3 Land Use .......................................................................................... 3 1.2.4 Water Quality Issues ........................................................................ 4
1.3 Special Study Work Plan ................................................................................ 10
2.0 PRE-BMP IMPLEMENTATION STUDY ..................................................................... 11 2.1 Introduction ..................................................................................................... 11 2.2 Objectives of the Pre-BMP Implementation Study .......................................... 11
2.2.1 Pollutant Loading and Analysis Tool (PLAT) .................................. 12
3.0 FIELD SAMPLING PLAN ........................................................................................... 12 3.1 Sampling Locations and Access ..................................................................... 12 3.2 Sample Collection Frequency ......................................................................... 20 3.3 Selection of Analytical Parameters ................................................................. 20 3.4 Continuous Flow Monitoring ........................................................................... 21 3.5 The Sampling Team ....................................................................................... 21
4.0 SAMPLE COLLECTION PROCEDURES ................................................................... 22 4.1 Preparation for conducting the sampling ........................................................ 22
4.1.1 Sampling Equipment ...................................................................... 22 4.2 Sampling Method ............................................................................................ 23 4.3 Personal Safety .............................................................................................. 24 4.4 Clean Sampling Techniques ........................................................................... 24 4.5 Sample Packing and Shipping ........................................................................ 24 4.6 Chain of Custody ............................................................................................ 25
5.0 QUALITY ASSURANCE AND QUALITY CONTROL ................................................. 25 5.1 Data Quality Objective .................................................................................... 25
5.1.1 Field Quality Control Samples ........................................................ 26 5.2 Field Quality Assurance/Quality Control ......................................................... 27
5.2.1 Equipment Blanks ........................................................................... 27 5.2.2 Field Duplicate Samples ................................................................. 27 5.2.3 Matrix Spike Samples ..................................................................... 27
CITY OF TORRANCE, CALIFORNIA SPECIAL STUDY WORK PLAN
CAROLLO ENGINEERS ii May 2011 pw:\\Carollo\Documents\Client\CA\Torrance\8419A00\Deliverables\SpecialStudyWorkPlan - Nutrient TMDL-edits.docx
5.3 Laboratory Quality Control .............................................................................. 27 5.3.1 Method Blanks ................................................................................ 27 5.3.2 Matrix Spike and Laboratory Control Samples ............................... 27
6.0 DATA MANAGEMENT AND REPORTING ................................................................ 28 APPENDIX A – Detailed Maps of Sampling Locations APPENDIX B – Field Data Sheet APPENDIX C – Chain of Custody
LIST OF TABLES Table 1 Waste Load Allocations ....................................................................................... 2 Table 2 Total Annual Nutrient Load Entering Machado Lake(1) ........................................ 4 Table 3 Schedule or Work Plan Elements ..................................................................... 11 Table 4 Sampling Location Characteristics .................................................................... 14 Table 5 Monitoring Constituents .................................................................................... 21 Table 6 Monitoring Constituents and Sample Container Requirements ........................ 23 Table 7 Quality Assurance Objective ............................................................................. 26 Table 8 Field Quality Control Sample Types .................................................................. 26
LIST OF FIGURES Figure 1 Regional Map of Torrance ................................................................................... 6 Figure 2 Subregional Watersheds ..................................................................................... 7 Figure 3 Existing Land Use ............................................................................................... 8 Figure 4 2007 Satellite Imagery of Machado Lake and Ken Malloy Harbor Regional Park
Overview ............................................................................................................. 9 Figure 5 General Location Map of Sampling Locations .................................................. 15
CAROLLO ENGINEERS 1 May 2011 pw:\\Carollo\Documents\Client\CA\Torrance\8419A00\Deliverables\SpecialStudyWorkPlan - Nutrient TMDL-edits.docx
City of Torrance, California
SPECIAL STUDY WORK PLAN
1.0 INTRODUCTION This Field Sampling Plan (FSP) presents the approach and procedures to implement stormwater sampling activities in 2011 for a Special Study of the City of Torrance (City) storm drains discharging stormwater into Machado Lake. The field study sampling procedures, methods, and analyses for stormwater are described in this document.
1.1 Background
The City is subject to the requirements of the Machado Lake Eutrophic, Algae, Ammonia, and Odors (Nutrient) Total Maximum Daily Load (TMDL) per the Los Angeles Regional Quality Control Board’s (Regional Board’s) Resolution R08-006. Under the Regional Board’s resolution, the City shall submit to the Regional Board’s Executive Officer a Monitoring and Reporting Plan (MRP) within 1 year of the effective date of the resolution or propose a Special Study Work Plan following the requirements of one of three optional studies. This Special Study Work Plan details the approach proposed by the City to perform Optional Study No. 3, to assess compliance with the Waste Load Allocations (WLA) on a mass basis for total nitrogen and total phosphorus originating from the City’s watersheds. The Special Study Work Plan proposes a pre-Best Management Practices (BMP) Implementation Study including field sampling and data collection to be followed by submittals to the Regional Board including a BMP Evaluation and Selection Report, a MRP, and a BMP Implementation Report to be provided at a later date.
Machado Lake is identified on the 1998 and 2002 Clean Water Act 300(d) list of impaired water bodies as impaired due to eutrophic conditions, algae, ammonia, and odors. Resource agencies, local governments, project implementers, the scientific community, environmental groups, decision-makers at the city, county, state, and federal levels, and many others have continued to take meaningful steps towards the restoration of Machado Lake and its basin. Among these efforts, restoration activities are expanding through continued implementation of erosion control, stormwater management, and riparian restoration projects, development of the Machado Lake Nutrient TMDL that is providing a quantitative, science-based approach for pollutant reduction, and a strong research/monitoring effort to evaluate key ecological processes and response to water quality improvement projects.
The Machado Lake Nutrient TMDL allows for the establishment of annual mass-based WLAs for total phosphorus (TP) and total nitrogen (TN) equivalent to monthly average concentrations of 0.1 mg/L TP and 1.0 mg/L TN, based on approved flow conditions. When the concentration based WLAs are met under the approved flow condition of 8.45 hm3, the annual mass of the TP discharged to the lake will be 845 kg and the annual mass of TN discharged to the lake will be 8,450 kg. The City of Torrance mass-based WLA will be proportional to the City owned area in the sub-watershed. The City of Torrance area
CITY OF TORRANCE, CALIFORNIA SPECIAL STUDY WORK PLAN
CAROLLO ENGINEERS 2 May 2011 pw:\\Carollo\Documents\Client\CA\Torrance\8419A00\Deliverables\SpecialStudyWorkPlan - Nutrient TMDL-edits.docx
accounts for 35.6% of the Machado Lake Watershed. Table 1 lists the interim and final WLAs based on this area. Table 1 Waste Load Allocations
Responsible Party Years after TMDL Effective Date
TP (kg) TN (kg)
City of Torrance
5 3,760 7,370
9.5
(final WLAs) 301 3,008
1.2 Site Conditions and Characteristics
1.2.1 Study Site Location
The City is located about 15 miles south of Downtown Los Angeles (LA), in southern LA County, just north of the Palos Verdes Hills. The City was incorporated on May 12, 1921, and is just over 20.5 square miles in area. The City is bounded by Redondo Beach on the west and north, Lawndale and Gardena on the north, LA on the east, Lomita to the southeast, and Rolling Hills Estates and Palos Verdes Estates on the south. The City is also bounded by approximately 4,000 feet of Santa Monica Bay coastline. The City’s storm conveyance systems are interconnected with neighboring city systems. Neighboring cities located at generally higher elevation such as Rolling Hills Estate and Palos Verde Estate discharge stormwater into the City’s and/or LA County’s storm conveyance systems located within the City’s boundaries. Figure 1 shows a regional location map of the City.
1.2.2 Hydrology and Hydraulics
The Machado Lake subwatershed is located in the southwestern area of the Dominguez Watershed and includes portions of the Cities of Los Angeles, Torrance, Lomita, Rolling Hills, Rolling Hills Estates, Carson, Palos Verdes Estates, Rancho Palos Verdes, Redondo Beach, and the communities of unincorporated Los Angeles County, including Wilmington and Harbor City. However, much of the Machado Lake watershed consists of the hilly regions of Rolling Hills Estates and Rolling Hills. This portion of the watershed is unique, as it consists of relatively steep hills with drainage into the canyons. The Machado Lake Watershed covers an area of approximately 20 square miles and is itself divided into six primary subdrainage areas. These subdrainages are the Walteria Lake, Project 77/510, Wilmington Drain, Project 643 (72-inch Storm Drain), Project 643 (Figueroa Drain), and Private Drain 553.
Machado Lake, about 40 acres in area and the Machado Lake Wetlands (64 acres) are located within the Ken Malloy Harbor Regional Park in the southeastern corner of the Machado Lake Watershed. Both Machado Lake and the Machado Lake wetlands serve as flood retention basins for the Machado Lake Watershed.
CITY OF TORRANCE, CALIFORNIA SPECIAL STUDY WORK PLAN
CAROLLO ENGINEERS 3 May 2011 pw:\\Carollo\Documents\Client\CA\Torrance\8419A00\Deliverables\SpecialStudyWorkPlan - Nutrient TMDL-edits.docx
1.2.2.1 Storm Drain
As the area is highly urbanized, drainage is primarily conducted through an extensive network of underground storm drain facilities. The Los Angeles County Department of Public Works maintains the system of storm drains in the City of Rolling Hills Estates. The primary use of the Dominguez Channel and all other open channels in the Dominguez Watershed (including Wilmington Drain, Machado Lake, and Madrona Marsh) is flood protection.
Machado Lake receives urban and storm water runoff from a complex network of storm drain systems. The first of three primary storm drain channels that flow into Machado Lake is the Wilmington Drain. Approximately 65 percent of the runoff from the Machado Lake Watershed flows through the Wilmington Drain into Machado Lake. The other two primary storm drain channels are the Project No. 77 Drain and the Harbor City Relief Drain. Several smaller storm drains also discharges into Machado Lake, including Project No. 643’s Figueroa Street Outlet and a 72-inch storm drain outlet. Machado Lake discharges at the southern end by overflowing a concrete dam into the Machado Lake wetland. Water discharges from the wetland through the Harbor Outflow structure and into the West Basin of the Los Angeles Harbor.
The Walteria Lake, located within the City’s boundaries, is owned and operated by LA County. It is approximately 1,005 acre-feet in capacity and receives raw stormwater mainly from Rolling Hills Estates and Palos Verdes Estates. Effluent from the lake is pumped at a maximum rate of 57 cubic feet per second (cfs) through a force main system into a 54-inch drain line that lies under Skypark Drive. The discharge eventually leaves the City near the intersection of Crenshaw Boulevard and Amsler Street.
Figure 2 shows the drainage basins and stormwater conveyance infrastructure in the City. The figure also shows nearby communities discharging stormwater into the City’s drainage system.
1.2.3 Land Use
The City of Torrance is predominantly residential land use, with concentrations of industrial and commercial uses. This reflects the City’s history as a “company town,” where homes were built to house the local work force of industries. Residential development covered almost half of the City’s land area. Industrial uses occupied the second largest land area, at 22 percent. Commercial and Public/Quasi-Public/Open Space uses represent the third largest land uses in the City, about 12 percent each. Torrance also had a limited supply of vacant land mostly within commercial and industrial areas. Given the built-out character of the community, only minor land use changes from baseline year 2010 conditions will occur over the long term.
Residential uses are located throughout Torrance at varying development densities. The highest residential densities occur along major streets and near major transportation corridors, in older neighborhoods, and in apartment or condominium developments and Planned Development communities around Sepulveda Boulevard and Plaza Del Amo between Hawthorne and Crenshaw Boulevards. The lowest residential densities are largely
CITY OF TORRANCE, CALIFORNIA SPECIAL STUDY WORK PLAN
CAROLLO ENGINEERS 4 May 2011 pw:\\Carollo\Documents\Client\CA\Torrance\8419A00\Deliverables\SpecialStudyWorkPlan - Nutrient TMDL-edits.docx
located in the western and southern portions of the City. Figure 3 identifies the land uses in Torrance.
1.2.4 Water Quality Issues
Machado Lake, located in the Dominguez Channel watershed in southern LA County, is identified on the 1998 and 2002 Clean Water Act 303(d) list of impaired water bodies as impaired due to eutrophic conditions, algae, ammonia, and odors. The Machado Lake eutrophic, algae, and odor impairments are caused by excessive loading of nutrients, including nitrogen and phosphorus, to Machado Lake (Machado Lake Eutrophic, Algae, Ammonia, and Odors (Nutrient) TMDL, Revised Draft – April 2008). Ammonia is found to be at levels below the toxicity standards, but nevertheless, these concentrations contribute to the total nitrogen loading in the Lake. Table 2 provides a summary of the quantifiable loads entering Machado Lake on an annual basis (Machado Lake Eutrophic, Algae, Ammonia, and Odors (Nutrient) TMDL, Revised Draft – April 2008). Nutrient flux from the sediments and atmospheric nitrogen deposition are the two directly quantifiable non-point sources included as part of the total nutrient load. The total annual nitrogen and phosphorus loads are estimated to be 24,327 kg and 10,421 kg, respectively.
Machado Lake is located in the Ken Malloy Harbor Regional Park (KMHRP), which is a 231 acres LA City Park serving the Wilmington and Harbor City areas. As shown on Figure 4, the park is located west of the Harbor freeway (110) and east of Vermont Avenue between the Tosco Refinery on the south and the Pacific Coast Highway on the North. Machado Lake is one of the last lake and wetland systems in LA; the area is approximately 103.5 acres in total size. The upper portion, which includes the open water area, is approximately 40 acres and the lower wetland portion is about 63.5 acres. Machado Lake is a shallow polymictic lake; the depth is generally 0.5 to 1.5 meters; the average depth is approximately 1.0 meter. The lake was originally developed as part of Harbor Regional Park in 1971 and intended for boating and fishing. Over the years water quality generally declined; boating was stopped and signs were posted warning of the risk of eating fish from the lake.
Table 2 Total Annual Nutrient Load Entering Machado Lake(1)
Source Total N (kg) Total P (kg) Ortho-P (kg) Inorg-N (kg) External Load 7,587 3,260 737 3,736
Sediment Flux 16,520 7,161 4,963 16,520
Atmospheric Deposition 220
Total Annual Load 24,327 10,421 5,700 20,256 Notes: 1. Source: Machado Lake Eutrophic, Algae, Ammonia, and Odors (Nutrient) TMDL, Revised Draft - April 2008.
The dominant land use in the Machado Lake Watershed is high-density single-family residential, accounting for approximately 45 percent of the land use. Industrial, vacant, retail/commercial, multi-family residential, transportation, and educational institutions each account for 5 to 7 percent of the land use, while "all other" accounts for the remaining 23
CITY OF TORRANCE, CALIFORNIA SPECIAL STUDY WORK PLAN
CAROLLO ENGINEERS 5 May 2011 pw:\\Carollo\Documents\Client\CA\Torrance\8419A00\Deliverables\SpecialStudyWorkPlan - Nutrient TMDL-edits.docx
percent. Machado Lake is a receiving body of urban and stormwater runoff from a network of storm drains throughout the watershed. As indicated on Figure 4, there are three discharge points into Machado Lake from the following storm drain channels:
Wilmington Drain.
Project No. 77.
Harbor City Relief Drain.
Approximately 88 percent of the Machado Lake Watershed drainage area flows through the Wilmington Drain into Machado Lake.
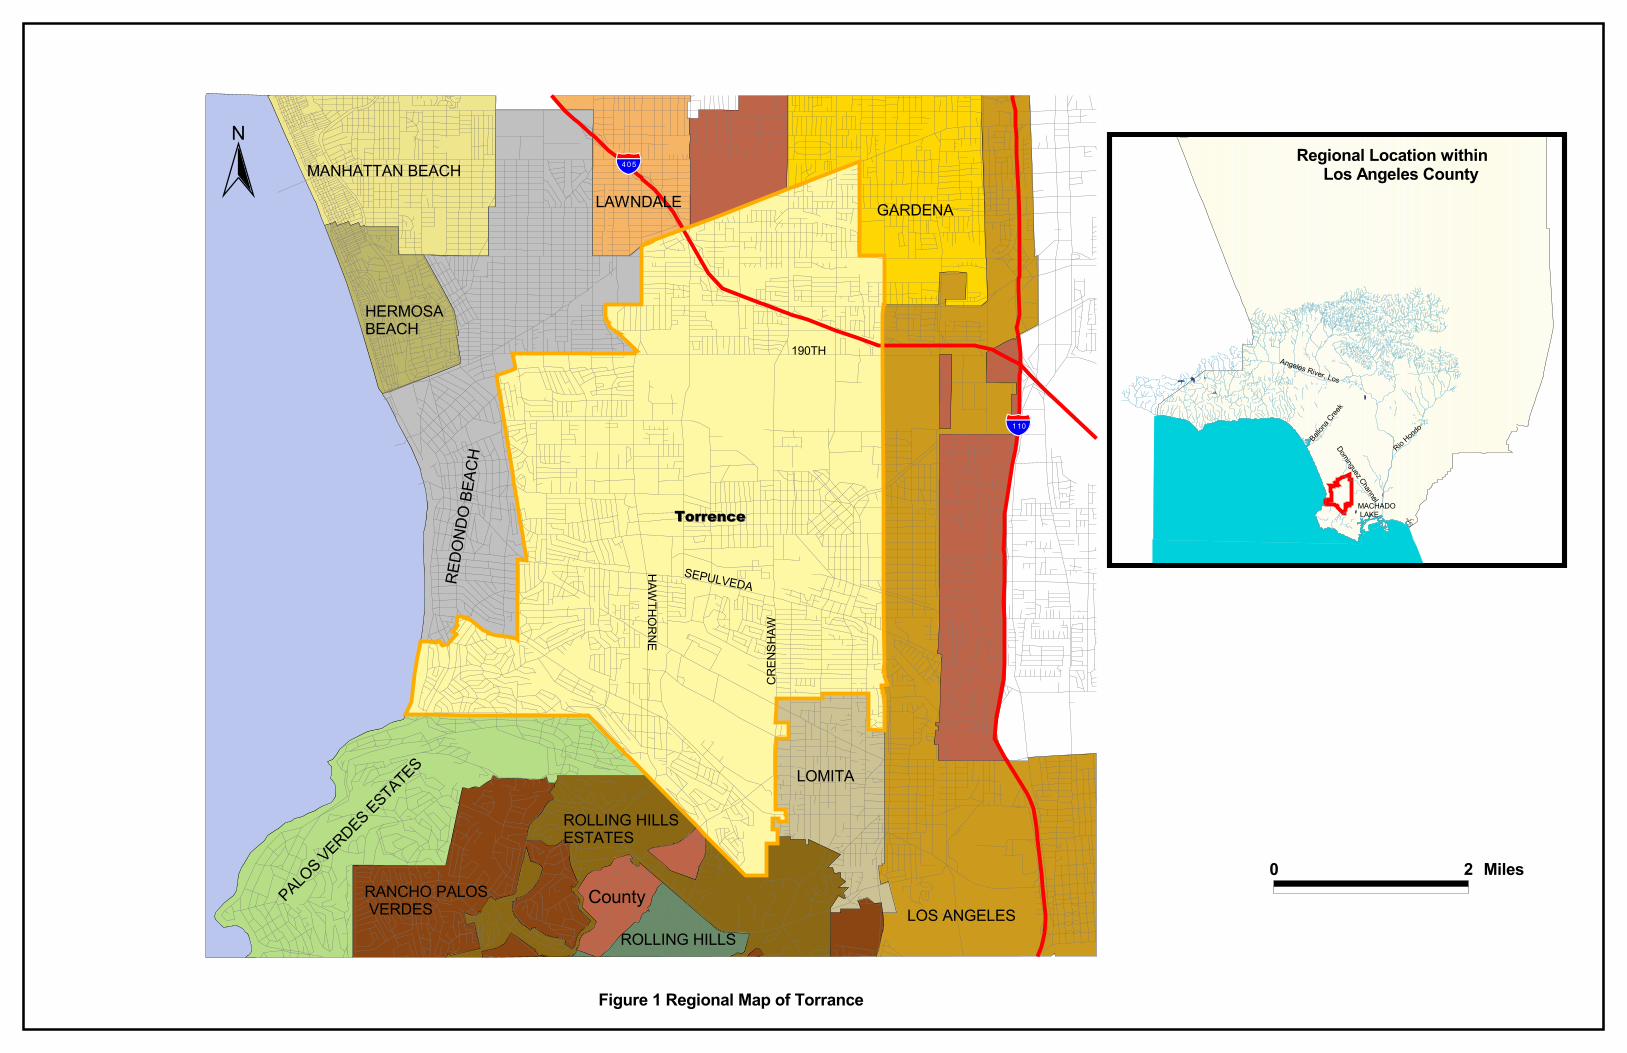
������
������
����������������
�����������
��
���
����
�����
������
����
����
����
����
��
��� ���������� �������
������� ������������
��� ������������
���������
������� ����
��������
����
��� ���
���
� ��
������
�
� � �����
����� ������������������������
������ �!"�#$���
�%����
%��#��
&
!�� �
�'�
�(!����)��*%����
��� �����+��
�������������������������������������������
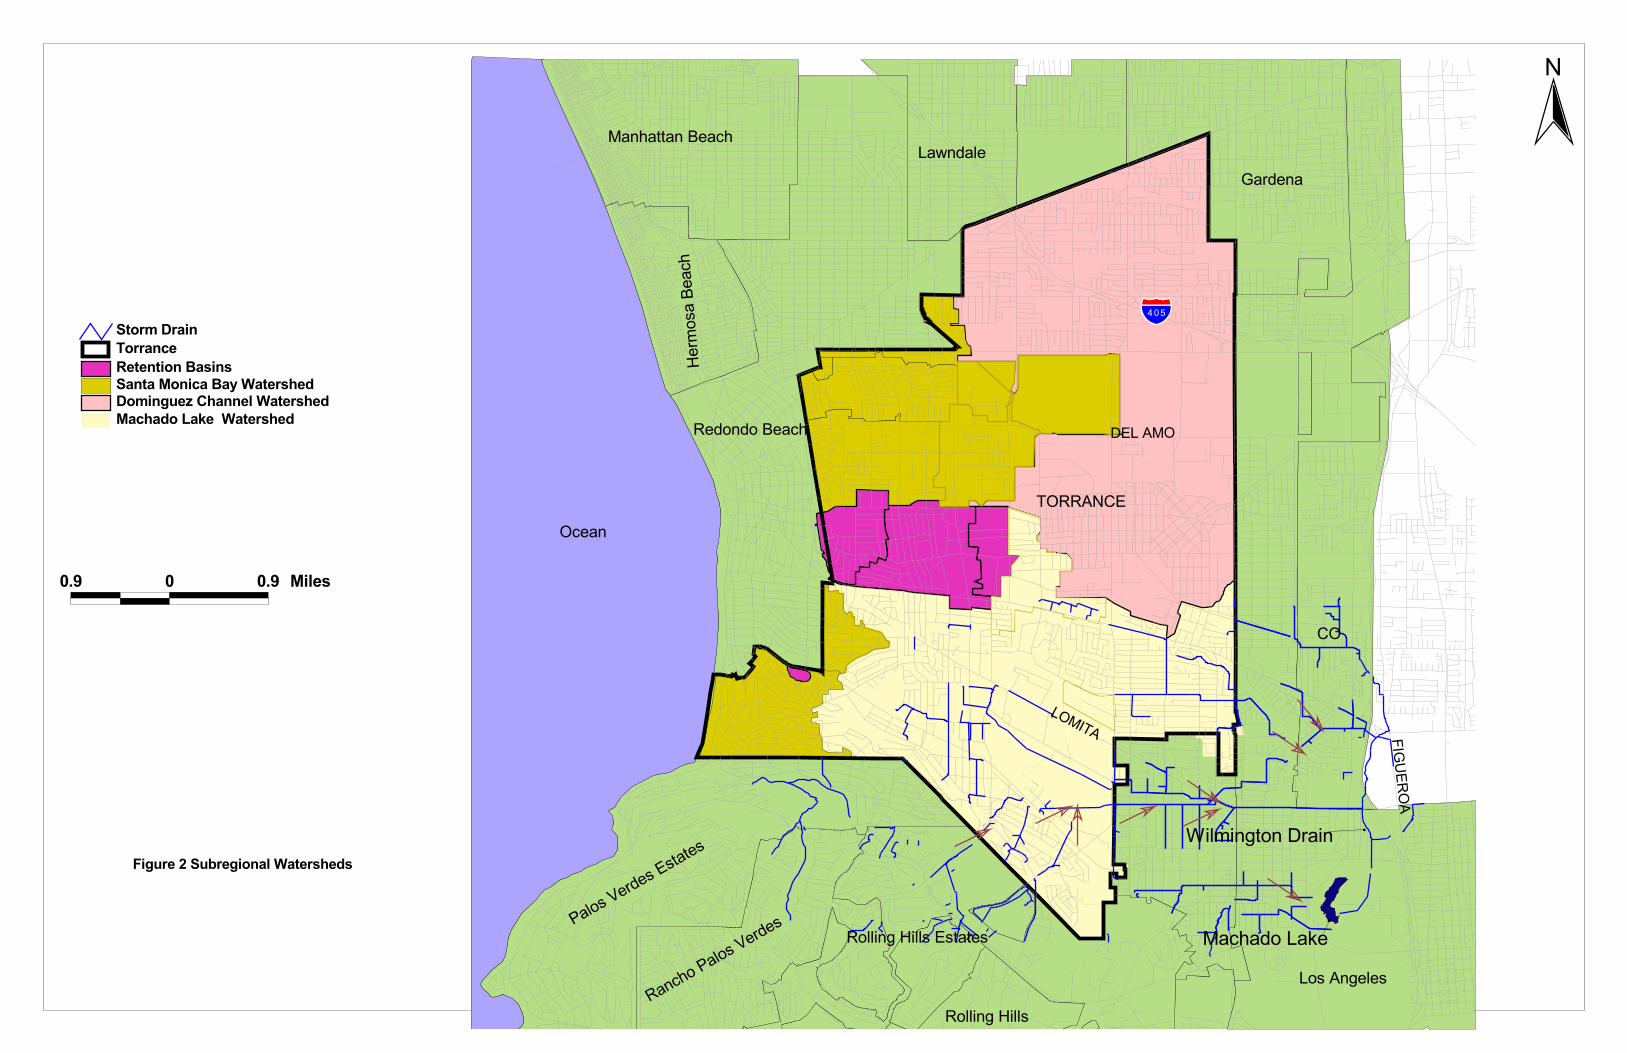
�����������
�
� ���������
��� �� ������
�������
��� ����
��������
����
�����������������������
� �������������������
����� �
��� ����
����
���� ����
����
� �����������
��������� �� ����
�
������ ���!�
������
���"�� #"�$����
��������������������� ���������������������� ����������������������� ������������������� ������ ��� ���
��� � ��� ����
��� �!���" ���������� ����
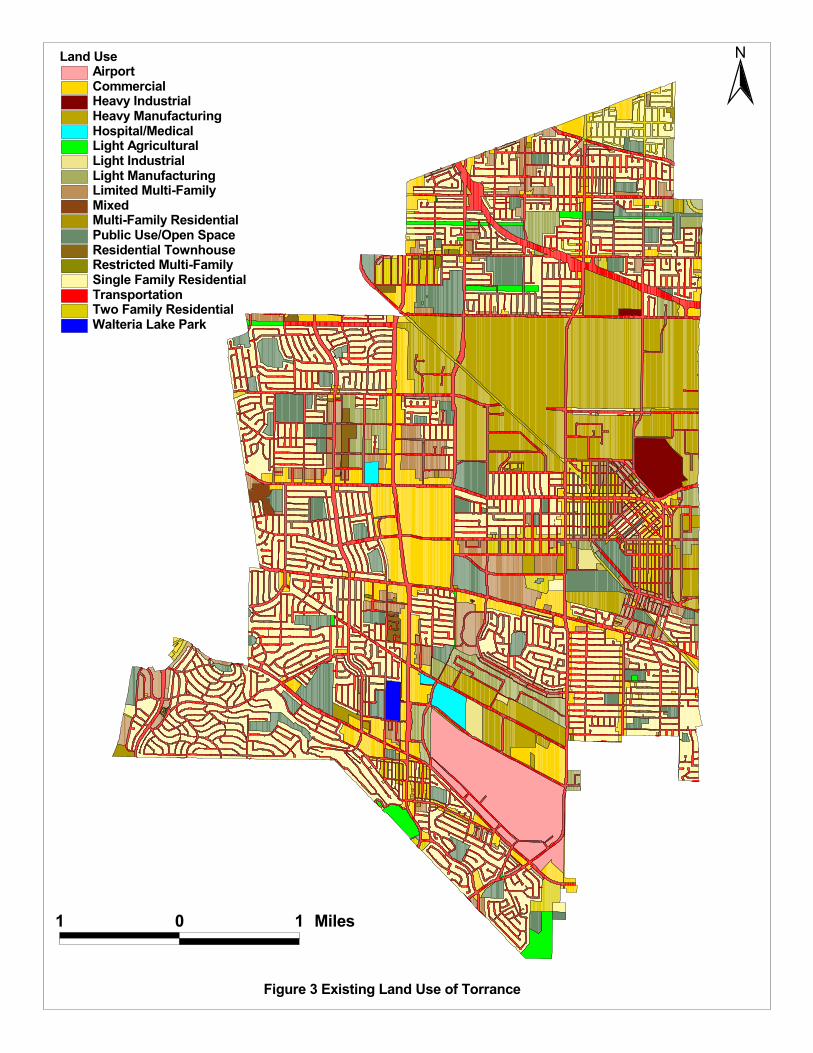
� � � �����
��� ����������������������������������������������������������������������������������������������������������������������� ������!�������� �����"��������#�$���� ���%���&���"���������'�(�����"���������������� ����&����� �����"��������'���������'(�� �����"��������)�������*��#�*
�
������+�,!��������� ������'�����
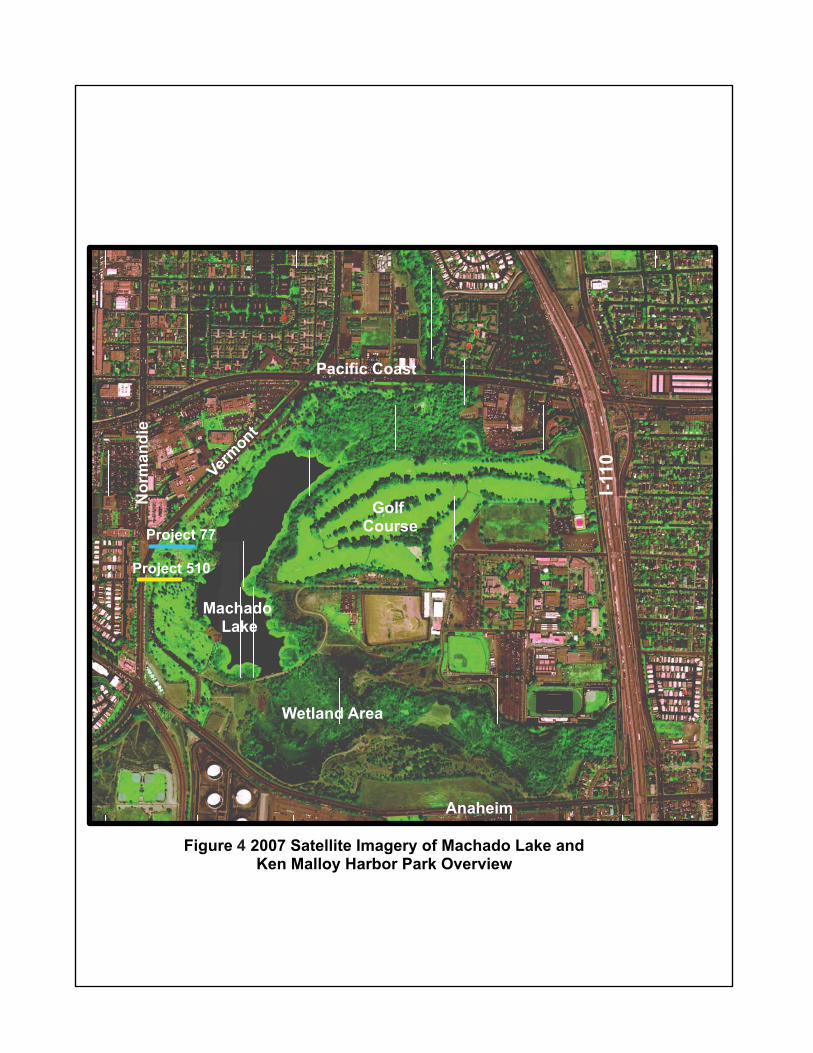
I-110
Anaheim
Nor
man
die
Vermont
Pacific Coast
Wetland Area
Machado Lake
Golf CourseProject 77
Project 510
Figure 3 2007 Satellite Imagery of Machado Lake andKen Malloy Harbor Park Overview
4
CITY OF TORRANCE, CALIFORNIA SPECIAL STUDY WORK PLAN
CAROLLO ENGINEERS 10 May 2011 pw:\\Carollo\Documents\Client\CA\Torrance\8419A00\Deliverables\SpecialStudyWorkPlan - Nutrient TMDL-edits.docx
1.3 Special Study Work Plan
This document provides the overall structure of the Special Study Work Plan with submittals to the Regional Board, as well as providing the initial Pre-BMP Implementation Study Plan (including a proposed field data collection and sampling plan). The Special Study Work Plan addresses the requirements of Optional Study No. 3 to assess compliance with WLAs for total nitrogen and total phosphorus originating from the City’s watersheds. The scope of work for this plan includes the following:
Pre-BMP Implementation Study Period - Including conducting dry weather sampling as outlined within this submittal as well as reviewing water quality models developed by LA County for wet weather events and Machado Lake.
BMP Evaluation and Selection Study Report - This study report is to be submitted at a later date (see proposed schedule of work plan elements), and will summarize the collected field data and the applicable results obtained from the regional water quality model being developed by LA County for wet weather conditions. The field data and the water quality model data will be used to assess compliance with WLAs under the TMDL. Based on the assessment of compliance, the BMP and Selection Study Report will identify and screen structural BMPs for mitigation to bring the City into compliance with the TMDL.
Monitoring and Reporting Plan - Subsequent to acceptance by the Regional Board of the findings and conclusions of the City’s BMP Evaluation and Selection Study Report, the City will submit an MRP specific to the needs for assessment of future compliance with the TMDL.
BMP Implementation Report - This report will summarize the monitoring data collected after 12 months of BMP implementation and will provide to the Regional Board an assessment of the success of the structural BMPs implemented by the City to support compliance with the TMDL.
The actual start date for the sampling will be determined following the Regional Board’s approval of this Special Study Work Plan. Other conditions that may affect the sampling schedule are weather and equipment conditions and availability. The schedule for the work plan is summarized in Table 3.
The Special Study Work Plan identifies the proposed tasks the City agrees to perform, their timelines, and the roles and responsibilities of various parties in completing the work. The purpose of this document is to serve as a starting point for work planning discussions between the City and the Regional Board.
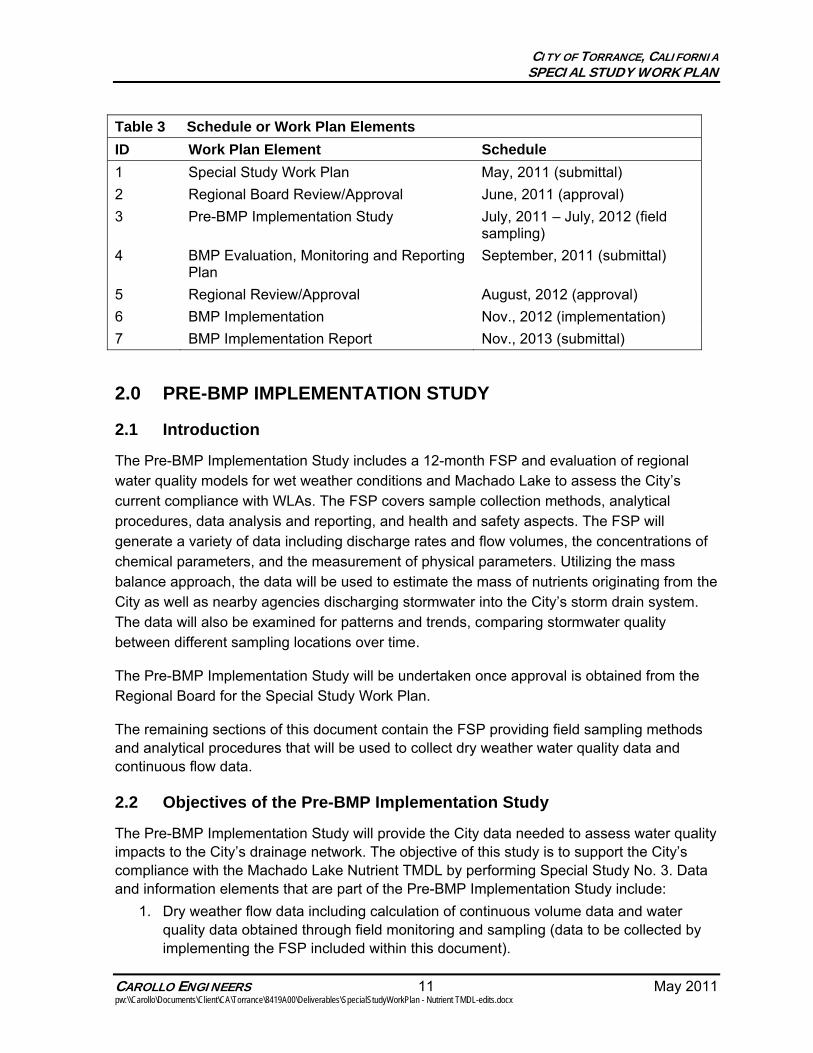
CITY OF TORRANCE, CALIFORNIA SPECIAL STUDY WORK PLAN
CAROLLO ENGINEERS 11 May 2011 pw:\\Carollo\Documents\Client\CA\Torrance\8419A00\Deliverables\SpecialStudyWorkPlan - Nutrient TMDL-edits.docx
Table 3 Schedule or Work Plan Elements ID Work Plan Element Schedule 1 Special Study Work Plan May, 2011 (submittal)
2 Regional Board Review/Approval June, 2011 (approval)
3 Pre-BMP Implementation Study July, 2011 – July, 2012 (field sampling)
4 BMP Evaluation, Monitoring and Reporting Plan
September, 2011 (submittal)
5 Regional Review/Approval August, 2012 (approval)
6 BMP Implementation Nov., 2012 (implementation)
7 BMP Implementation Report Nov., 2013 (submittal)
2.0 PRE-BMP IMPLEMENTATION STUDY
2.1 Introduction
The Pre-BMP Implementation Study includes a 12-month FSP and evaluation of regional water quality models for wet weather conditions and Machado Lake to assess the City’s current compliance with WLAs. The FSP covers sample collection methods, analytical procedures, data analysis and reporting, and health and safety aspects. The FSP will generate a variety of data including discharge rates and flow volumes, the concentrations of chemical parameters, and the measurement of physical parameters. Utilizing the mass balance approach, the data will be used to estimate the mass of nutrients originating from the City as well as nearby agencies discharging stormwater into the City’s storm drain system. The data will also be examined for patterns and trends, comparing stormwater quality between different sampling locations over time.
The Pre-BMP Implementation Study will be undertaken once approval is obtained from the Regional Board for the Special Study Work Plan.
The remaining sections of this document contain the FSP providing field sampling methods and analytical procedures that will be used to collect dry weather water quality data and continuous flow data.
2.2 Objectives of the Pre-BMP Implementation Study
The Pre-BMP Implementation Study will provide the City data needed to assess water quality impacts to the City’s drainage network. The objective of this study is to support the City’s compliance with the Machado Lake Nutrient TMDL by performing Special Study No. 3. Data and information elements that are part of the Pre-BMP Implementation Study include:
1. Dry weather flow data including calculation of continuous volume data and water quality data obtained through field monitoring and sampling (data to be collected by implementing the FSP included within this document).
CITY OF TORRANCE, CALIFORNIA SPECIAL STUDY WORK PLAN
CAROLLO ENGINEERS 12 May 2011 pw:\\Carollo\Documents\Client\CA\Torrance\8419A00\Deliverables\SpecialStudyWorkPlan - Nutrient TMDL-edits.docx
2. Estimates of wet weather stormwater quality impacts identified using an integrated water quality model developed by the City of Torrance. The water quality model is described in Section 2.2.1.
3. Identification of BMPs that will be implemented by the City to mitigate observed water quality impacts in the City’s outflows to Machado Lake.
2.2.1 Pollutant Loading and Analysis Tool (PLAT)
In order to estimate wet weather stormwater quality impacts, the City has developed an integrated watershed modeling tool to simulate watershed hydrology, nutrient, sediment, and contaminant dynamics. This tool called Pollutant Loading and Analysis Tool (PLAT), incorporates existing and commonly used watershed models. The main models used by PLAT are PLOAD, Program for Predicting Polluting Particle Passage thru Pits, Puddles, and Ponds (P8), and U.S EPA SUSTAIN model. PLAT is based on spatially distributed inputs derived from high resolution satellite imagery. PLAT has four main components: pollutant hot-spots characterization, BMP screening, continuous simulation, and BMP design, optimization, and placement. The SUSTAIN model provides an optimization routine that helps identify the appropriate size of BMPs for treating stormwater runoff from respective source areas to meet TMDL reduction goals. The tool has been validated with results from the LA County Watershed Management Model System (WMMS).
3.0 FIELD SAMPLING PLAN The 12-month FSP is designed to collect continuous flow data and discrete dry weather water quality data to support the overall study objectives summarized in Section 2.
3.1 Sampling Locations and Access
Site selection is a major challenge, given the scarcity of funding for sampling and laboratory analysis. The number of locations to be sampled was decided based on the program objectives, regulatory requirements, and the size and complexity of the drainage sub-basins and conveyance system. In addition, the frequency of sampling at each location was considered.
As a first step in the selection process, the City’s watersheds, sub-basins and drainage system network were reviewed. Based on this review, nine locations were identified that could be used to characterize the flows in and out of each subbasin. Four of these locations are needed at a minimum to characterize the flows conveyed to Machado Lake. The final selection of sample locations was based on factors such as site permission, access, clustering, personal safety, equipment safety, and the likelihood that stormwater would flow at the location. Table 4 summarizes the proposed stormwater sampling locations, types, and characteristics. The general sampling locations are depicted on Figure 5. Appendix A shows detailed characteristics of each sampling location.
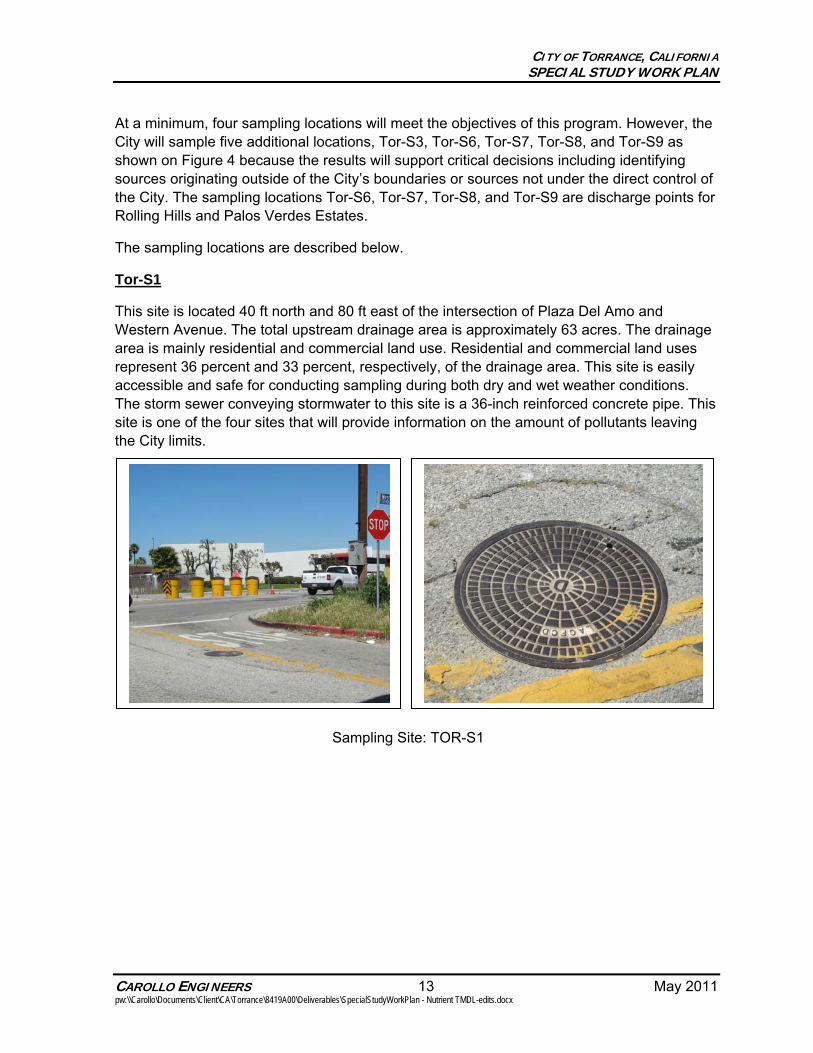
CITY OF TORRANCE, CALIFORNIA SPECIAL STUDY WORK PLAN
CAROLLO ENGINEERS 13 May 2011 pw:\\Carollo\Documents\Client\CA\Torrance\8419A00\Deliverables\SpecialStudyWorkPlan - Nutrient TMDL-edits.docx
At a minimum, four sampling locations will meet the objectives of this program. However, the City will sample five additional locations, Tor-S3, Tor-S6, Tor-S7, Tor-S8, and Tor-S9 as shown on Figure 4 because the results will support critical decisions including identifying sources originating outside of the City’s boundaries or sources not under the direct control of the City. The sampling locations Tor-S6, Tor-S7, Tor-S8, and Tor-S9 are discharge points for Rolling Hills and Palos Verdes Estates.
The sampling locations are described below.
Tor-S1
This site is located 40 ft north and 80 ft east of the intersection of Plaza Del Amo and Western Avenue. The total upstream drainage area is approximately 63 acres. The drainage area is mainly residential and commercial land use. Residential and commercial land uses represent 36 percent and 33 percent, respectively, of the drainage area. This site is easily accessible and safe for conducting sampling during both dry and wet weather conditions. The storm sewer conveying stormwater to this site is a 36-inch reinforced concrete pipe. This site is one of the four sites that will provide information on the amount of pollutants leaving the City limits.
Sampling Site: TOR-S1
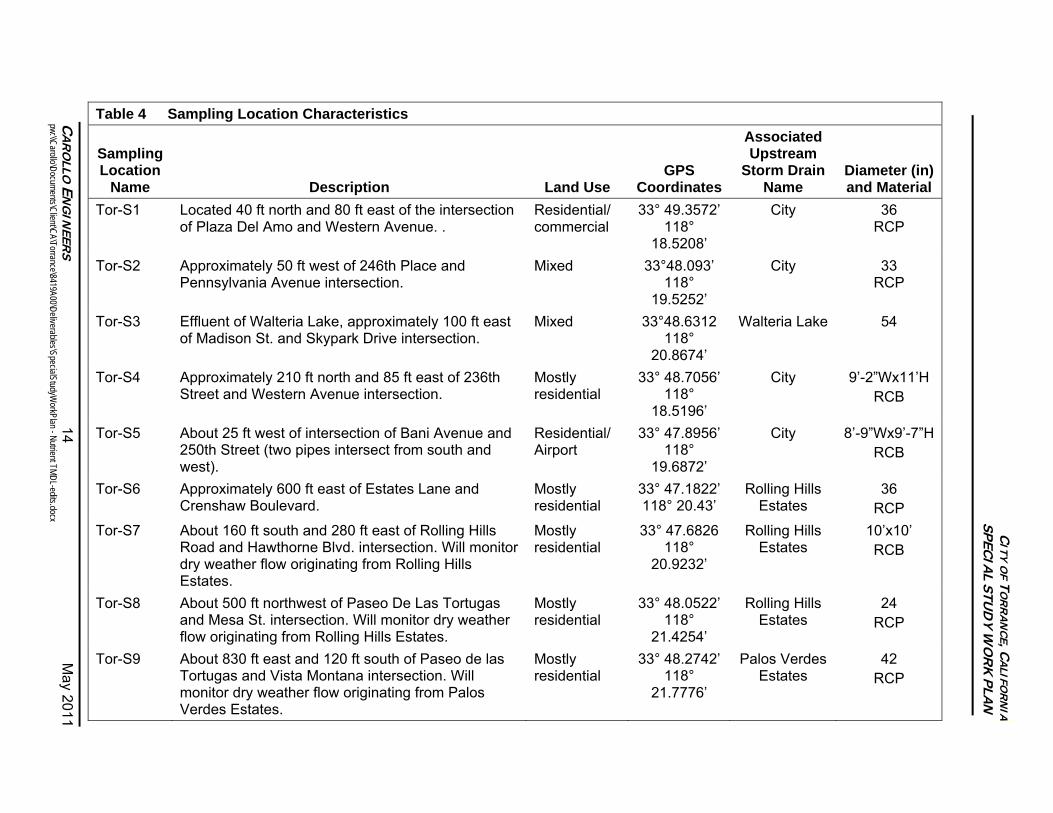
CA
RO
LLO E
NG
INEER
S 14
May 2011
pw:\\C
arollo\Docum
ents\Client\C
A\Torrance\8419A00\Deliverables\SpecialStudyW
orkPlan - Nutrient TM
DL-edits.docx
C
ITY OF T
OR
RA
NCE, C
ALIFO
RN
IASPECIA
L STU
DY
WO
RK
PLAN
Table 4 Sampling Location Characteristics
Sampling Location
Name Description Land Use GPS
Coordinates
Associated Upstream
Storm Drain Name
Diameter (in) and Material
Tor-S1 Located 40 ft north and 80 ft east of the intersection of Plaza Del Amo and Western Avenue. .
Residential/ commercial
33° 49.3572’118°
18.5208’
City 36 RCP
Tor-S2 Approximately 50 ft west of 246th Place and Pennsylvania Avenue intersection.
Mixed 33°48.093’ 118°
19.5252’
City 33 RCP
Tor-S3 Effluent of Walteria Lake, approximately 100 ft east of Madison St. and Skypark Drive intersection.
Mixed 33°48.6312 118°
20.8674’
Walteria Lake 54
Tor-S4 Approximately 210 ft north and 85 ft east of 236th Street and Western Avenue intersection.
Mostly residential
33° 48.7056’118°
18.5196’
City 9’-2”Wx11’H RCB
Tor-S5 About 25 ft west of intersection of Bani Avenue and 250th Street (two pipes intersect from south and west).
Residential/ Airport
33° 47.8956’118°
19.6872’
City 8’-9”Wx9’-7”HRCB
Tor-S6 Approximately 600 ft east of Estates Lane and Crenshaw Boulevard.
Mostly residential
33° 47.1822’118° 20.43’
Rolling Hills Estates
36 RCP
Tor-S7 About 160 ft south and 280 ft east of Rolling Hills Road and Hawthorne Blvd. intersection. Will monitor dry weather flow originating from Rolling Hills Estates.
Mostly residential
33° 47.6826118°
20.9232’
Rolling Hills Estates
10’x10’ RCB
Tor-S8 About 500 ft northwest of Paseo De Las Tortugas and Mesa St. intersection. Will monitor dry weather flow originating from Rolling Hills Estates.
Mostly residential
33° 48.0522’118°
21.4254’
Rolling Hills Estates
24 RCP
Tor-S9 About 830 ft east and 120 ft south of Paseo de las Tortugas and Vista Montana intersection. Will monitor dry weather flow originating from Palos Verdes Estates.
Mostly residential
33° 48.2742’118°
21.7776’
Palos Verdes Estates
42 RCP
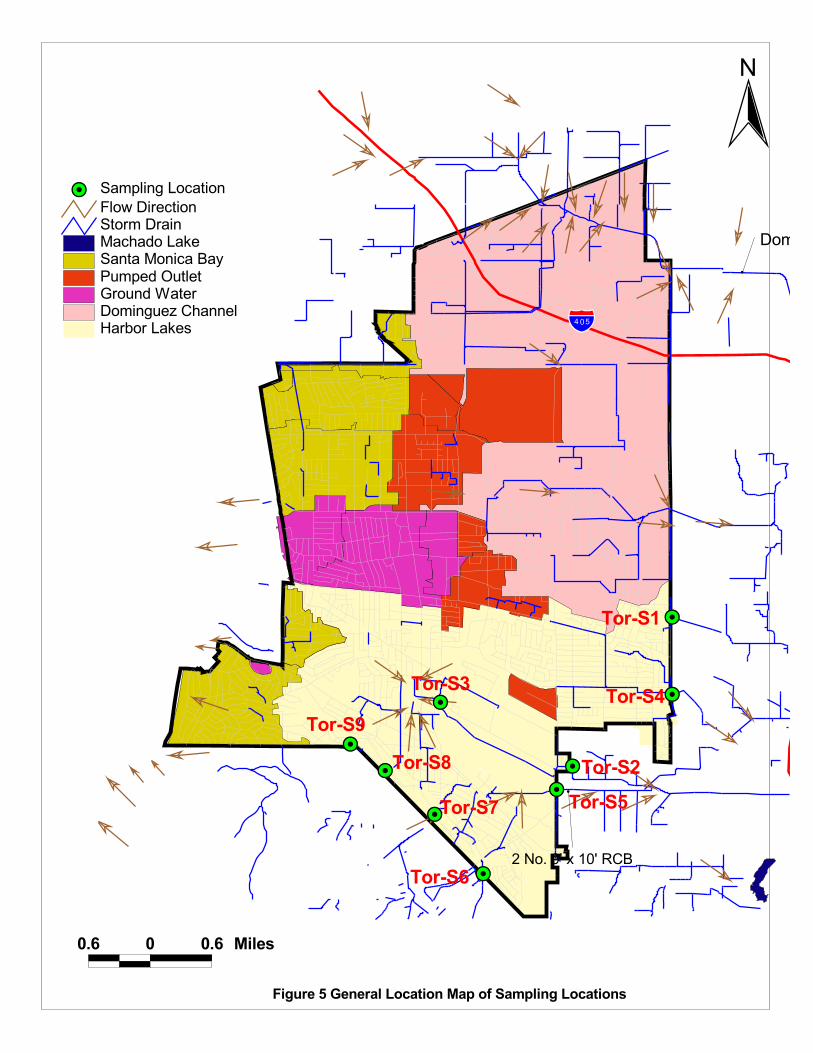
��
��
��
��
��
��
����
��
�
������
�
�������������
������
������
������
������
�����
�����
������
�����������
������
� ����� ������������� ��������� ! "��#��$� %�"��"& �" '���( � )' (� �� ��&"����� ��*��+����("���
�� & �$������( "���
��� � ��� �����
�
���������������������������� ��!���" ��������������
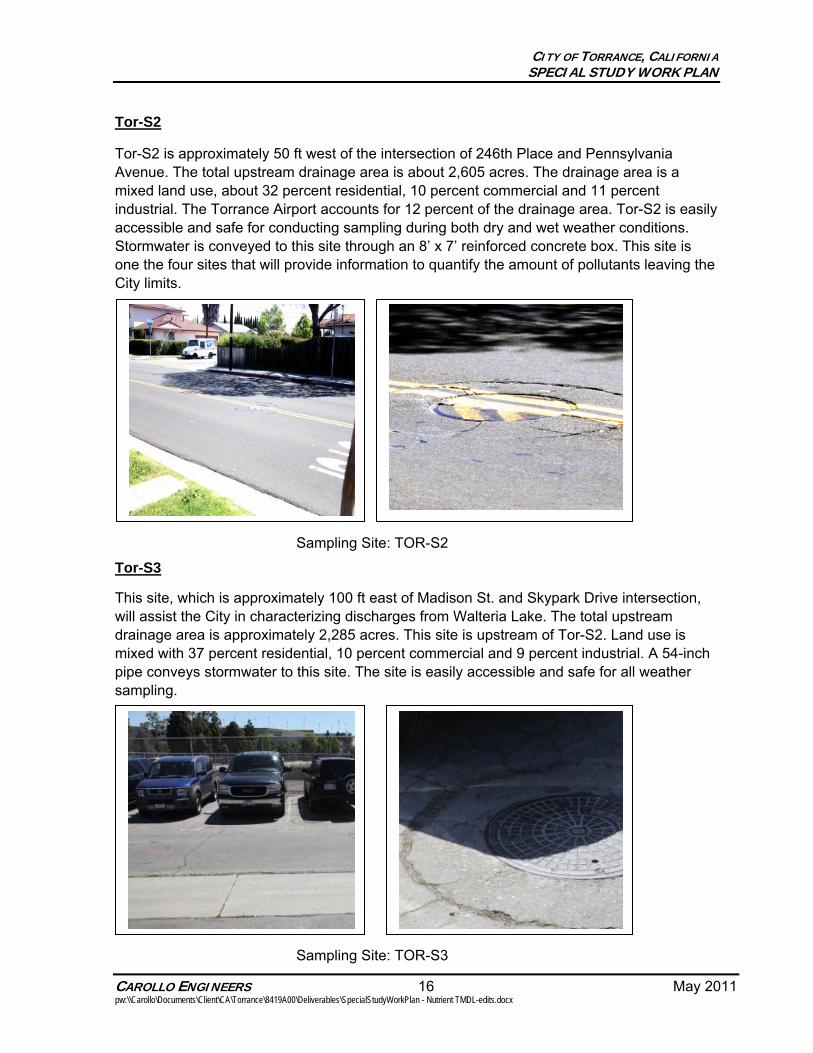
CITY OF TORRANCE, CALIFORNIA SPECIAL STUDY WORK PLAN
CAROLLO ENGINEERS 16 May 2011 pw:\\Carollo\Documents\Client\CA\Torrance\8419A00\Deliverables\SpecialStudyWorkPlan - Nutrient TMDL-edits.docx
Tor-S2
Tor-S2 is approximately 50 ft west of the intersection of 246th Place and Pennsylvania Avenue. The total upstream drainage area is about 2,605 acres. The drainage area is a mixed land use, about 32 percent residential, 10 percent commercial and 11 percent industrial. The Torrance Airport accounts for 12 percent of the drainage area. Tor-S2 is easily accessible and safe for conducting sampling during both dry and wet weather conditions. Stormwater is conveyed to this site through an 8’ x 7’ reinforced concrete box. This site is one the four sites that will provide information to quantify the amount of pollutants leaving the City limits.
Sampling Site: TOR-S2
Tor-S3
This site, which is approximately 100 ft east of Madison St. and Skypark Drive intersection, will assist the City in characterizing discharges from Walteria Lake. The total upstream drainage area is approximately 2,285 acres. This site is upstream of Tor-S2. Land use is mixed with 37 percent residential, 10 percent commercial and 9 percent industrial. A 54-inch pipe conveys stormwater to this site. The site is easily accessible and safe for all weather sampling.
Sampling Site: TOR-S3
Sampling Site: TOR-S3
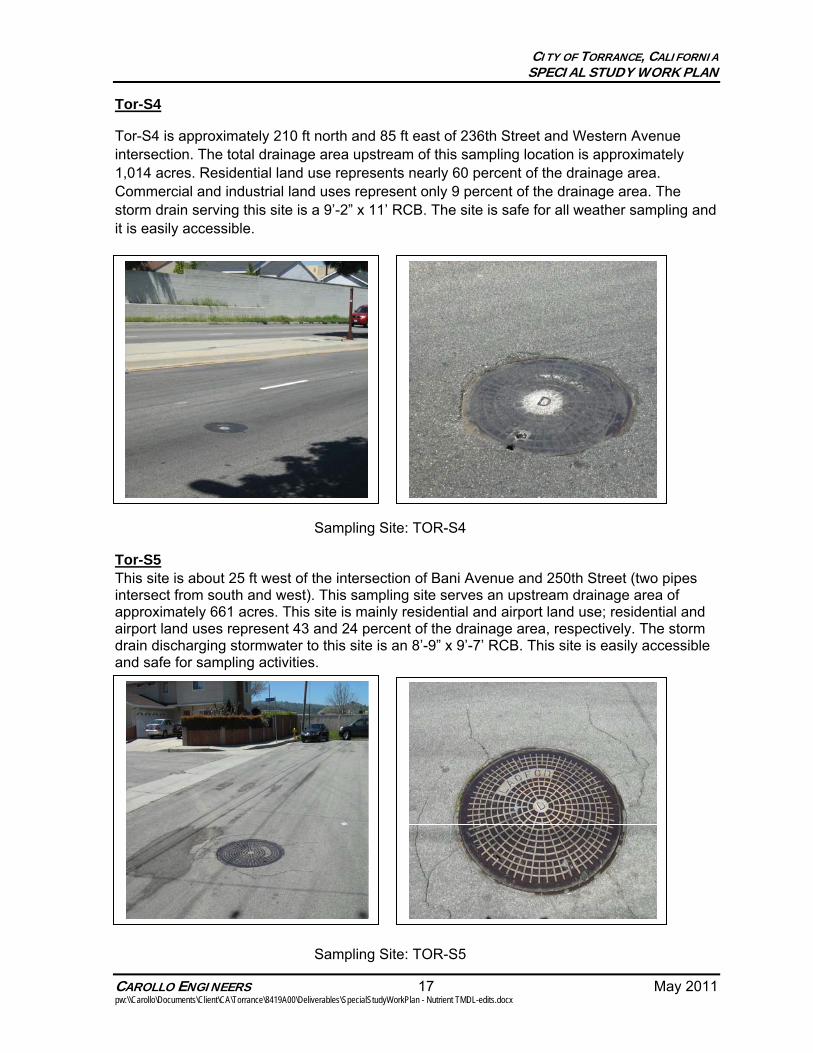
CITY OF TORRANCE, CALIFORNIA SPECIAL STUDY WORK PLAN
CAROLLO ENGINEERS 17 May 2011 pw:\\Carollo\Documents\Client\CA\Torrance\8419A00\Deliverables\SpecialStudyWorkPlan - Nutrient TMDL-edits.docx
Tor-S4
Tor-S4 is approximately 210 ft north and 85 ft east of 236th Street and Western Avenue intersection. The total drainage area upstream of this sampling location is approximately 1,014 acres. Residential land use represents nearly 60 percent of the drainage area. Commercial and industrial land uses represent only 9 percent of the drainage area. The storm drain serving this site is a 9’-2” x 11’ RCB. The site is safe for all weather sampling and it is easily accessible.
Sampling Site: TOR-S4
Tor-S5 This site is about 25 ft west of the intersection of Bani Avenue and 250th Street (two pipes intersect from south and west). This sampling site serves an upstream drainage area of approximately 661 acres. This site is mainly residential and airport land use; residential and airport land uses represent 43 and 24 percent of the drainage area, respectively. The storm drain discharging stormwater to this site is an 8’-9” x 9’-7’ RCB. This site is easily accessible and safe for sampling activities.
Sampling Site: TOR-S5
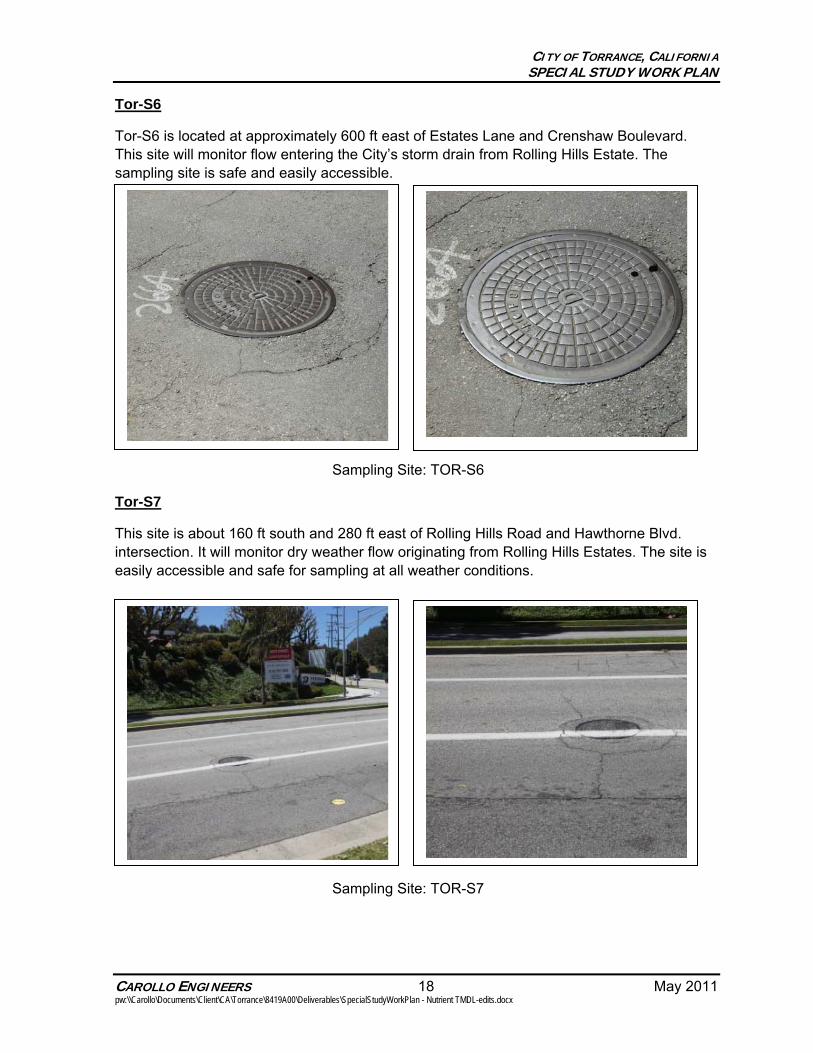
CITY OF TORRANCE, CALIFORNIA SPECIAL STUDY WORK PLAN
CAROLLO ENGINEERS 18 May 2011 pw:\\Carollo\Documents\Client\CA\Torrance\8419A00\Deliverables\SpecialStudyWorkPlan - Nutrient TMDL-edits.docx
Tor-S6
Tor-S6 is located at approximately 600 ft east of Estates Lane and Crenshaw Boulevard. This site will monitor flow entering the City’s storm drain from Rolling Hills Estate. The sampling site is safe and easily accessible.
Sampling Site: TOR-S6
Tor-S7
This site is about 160 ft south and 280 ft east of Rolling Hills Road and Hawthorne Blvd. intersection. It will monitor dry weather flow originating from Rolling Hills Estates. The site is easily accessible and safe for sampling at all weather conditions.
Sampling Site: TOR-S7
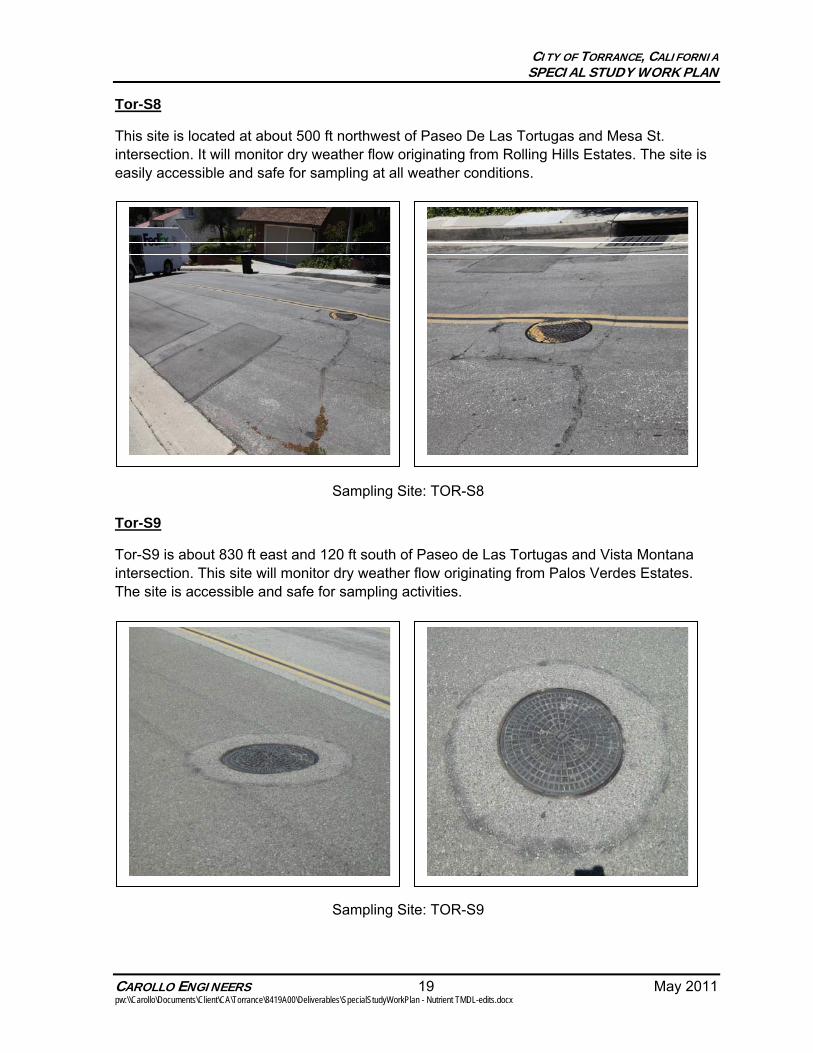
CITY OF TORRANCE, CALIFORNIA SPECIAL STUDY WORK PLAN
CAROLLO ENGINEERS 19 May 2011 pw:\\Carollo\Documents\Client\CA\Torrance\8419A00\Deliverables\SpecialStudyWorkPlan - Nutrient TMDL-edits.docx
Tor-S8
This site is located at about 500 ft northwest of Paseo De Las Tortugas and Mesa St. intersection. It will monitor dry weather flow originating from Rolling Hills Estates. The site is easily accessible and safe for sampling at all weather conditions.
Sampling Site: TOR-S8
Tor-S9
Tor-S9 is about 830 ft east and 120 ft south of Paseo de Las Tortugas and Vista Montana intersection. This site will monitor dry weather flow originating from Palos Verdes Estates. The site is accessible and safe for sampling activities.
Sampling Site: TOR-S9
CITY OF TORRANCE, CALIFORNIA SPECIAL STUDY WORK PLAN
CAROLLO ENGINEERS 20 May 2011 pw:\\Carollo\Documents\Client\CA\Torrance\8419A00\Deliverables\SpecialStudyWorkPlan - Nutrient TMDL-edits.docx
3.2 Sample Collection Frequency
The City’s sampling program consists of three major elements:
1. Monthly sampling during dry weather conditions for all sampling locations. Grab samples will be collected from each sampling location. Dry weather conditions must be preceded by at least 24 hours of no greater than trace precipitation or have an intensity of less than 0.1 inches of rain in a 24-hour period.
2. Samples will be collected from Tor-S3 during four discrete storm events and anytime time the LA County pumps stormwater from the Walteria Lake into the 54-inch storm drain. Pumping schedule will be obtained from LA County.
3. Continuous recording of stage or flow depth during dry weather periods for flow estimation will be collected from the proposed sample locations during dry weather flow conditions.
Regarding Tor-S3, one grab sample for each of the four storm events will be collected under the following conditions:
1. Sampling will occur during a storm event with at least 0.1 inch of precipitation (defined as a “measurable” event). Weather forecasts will be evaluated before deciding whether or not to sample a particular rain event. The monitoring manager will periodically establish a modem connection with each sampling unit to monitor rainfall, flow rates, and sampling activity. The monitoring manager will download stored data from the National Weather Service as needed.
2. Sampling will not occur at a frequency greater than once every 72 hours.
3. Sampling will not occur unless there has been at least 72 hours of continuous dry weather immediately preceding the “measurable” event.
4. Grab samples will be collected from this location during approximately the first 30 minutes to 1 hour of stormwater discharge (where possible).
The intention of the sample collection frequency and stormwater event requirements described above is to collect samples that are representative of runoff conditions from Tor-S3. No samples will be collected from the remaining eight sampling locations during storm events. The City’s Pollutant Loading and Analysis Tool (PLAT) will be used to estimate nutrient loading for these sampling location during storm events.
3.3 Selection of Analytical Parameters
The City proposes to use a mass based WLA compliance option to evaluate TMDL compliance. Samples submitted for nutrients will be tested for ammonia-N (NH3
+), ammonium, nitrite (NO2), nitrate (NO3), total Kjeldahl nitrogen (TKN), total phosphorus (TP), and phosphate (PO4). Water samples submitted for conventional water parameters (general chemistry) will be tested for alkalinity, pH, chloride, total suspended solids (TSS), total solids, dissolved solids, turbidity, dissolved organic carbon (DOC), total organic carbon (TOC), and standard metals. The constituents to be sampled are listed in Table 5.
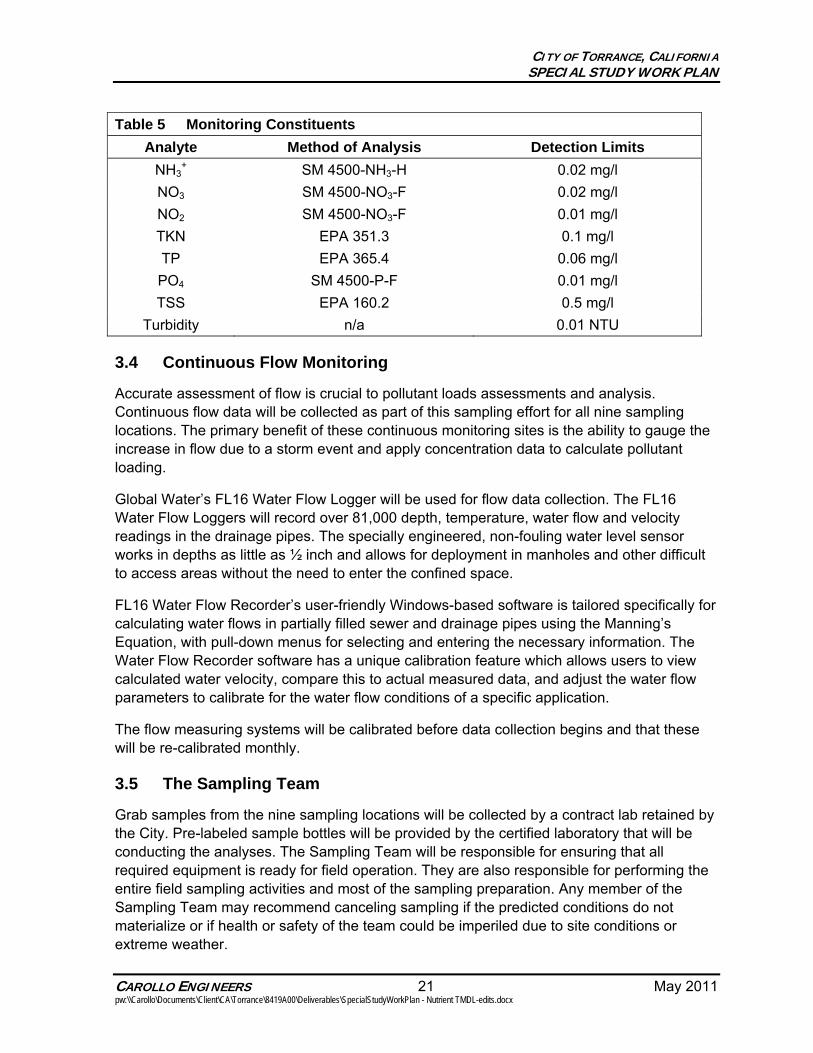
CITY OF TORRANCE, CALIFORNIA SPECIAL STUDY WORK PLAN
CAROLLO ENGINEERS 21 May 2011 pw:\\Carollo\Documents\Client\CA\Torrance\8419A00\Deliverables\SpecialStudyWorkPlan - Nutrient TMDL-edits.docx
Table 5 Monitoring Constituents
Analyte Method of Analysis Detection Limits NH3
+ SM 4500-NH3-H 0.02 mg/l
NO3 SM 4500-NO3-F 0.02 mg/l
NO2 SM 4500-NO3-F 0.01 mg/l
TKN EPA 351.3 0.1 mg/l
TP EPA 365.4 0.06 mg/l
PO4 SM 4500-P-F 0.01 mg/l
TSS EPA 160.2 0.5 mg/l
Turbidity n/a 0.01 NTU
3.4 Continuous Flow Monitoring
Accurate assessment of flow is crucial to pollutant loads assessments and analysis. Continuous flow data will be collected as part of this sampling effort for all nine sampling locations. The primary benefit of these continuous monitoring sites is the ability to gauge the increase in flow due to a storm event and apply concentration data to calculate pollutant loading.
Global Water’s FL16 Water Flow Logger will be used for flow data collection. The FL16 Water Flow Loggers will record over 81,000 depth, temperature, water flow and velocity readings in the drainage pipes. The specially engineered, non-fouling water level sensor works in depths as little as ½ inch and allows for deployment in manholes and other difficult to access areas without the need to enter the confined space.
FL16 Water Flow Recorder’s user-friendly Windows-based software is tailored specifically for calculating water flows in partially filled sewer and drainage pipes using the Manning’s Equation, with pull-down menus for selecting and entering the necessary information. The Water Flow Recorder software has a unique calibration feature which allows users to view calculated water velocity, compare this to actual measured data, and adjust the water flow parameters to calibrate for the water flow conditions of a specific application.
The flow measuring systems will be calibrated before data collection begins and that these will be re-calibrated monthly.
3.5 The Sampling Team
Grab samples from the nine sampling locations will be collected by a contract lab retained by the City. Pre-labeled sample bottles will be provided by the certified laboratory that will be conducting the analyses. The Sampling Team will be responsible for ensuring that all required equipment is ready for field operation. They are also responsible for performing the entire field sampling activities and most of the sampling preparation. Any member of the Sampling Team may recommend canceling sampling if the predicted conditions do not materialize or if health or safety of the team could be imperiled due to site conditions or extreme weather.
CITY OF TORRANCE, CALIFORNIA SPECIAL STUDY WORK PLAN
CAROLLO ENGINEERS 22 May 2011 pw:\\Carollo\Documents\Client\CA\Torrance\8419A00\Deliverables\SpecialStudyWorkPlan - Nutrient TMDL-edits.docx
4.0 SAMPLE COLLECTION PROCEDURES This section describes the sampling procedures, record keeping, sample handling, storage, and field quality control procedures that will be used during stormwater sampling.
4.1 Preparation for conducting the sampling
Several things will be done to prepare to conduct stormwater sampling. First, the laboratory to analyze the samples will be contacted. The following information will be sought from the lab:
Type and size of bottles needed
Procedures to filling the bottles
Sample volume requirements
Labels or additional forms required
Explanation of the chain of custody form
Sample preservation requirements and/or holding time restrictions
Means of sample delivery to the lab
Overnight delivery requirements
Costs
Once a lab has been selected the sampling equipment (sampling bottles from a lab, sampling instruments, and personal safety equipment) will be made ready, as well as the field sheet to document the required information. Table 6 lists constituents and sample container requirements.
Field personnel will complete a field condition data sheet. The following items will be listed on the field sampling sheet and included in the stormwater discharge monitoring report:
Person who conducted the sampling
Date and time of discharge
Length of storm event
Time between sampled storm event and previous storm event (at least 72 hrs)
Total rainfall during storm event
Photo documentation
A field data sheet is attached as Appendix B.
4.1.1 Sampling Equipment Monitoring equipment will be gathered ahead of time because opportunities to sample during rainfall events often come with little advanced notice. The following equipments will be required for the sampling efforts:
Field forms
Waterproof pens
Permanent markers
CITY OF TORRANCE, CALIFORNIA SPECIAL STUDY WORK PLAN
CAROLLO ENGINEERS 23 May 2011 pw:\\Carollo\Documents\Client\CA\Torrance\8419A00\Deliverables\SpecialStudyWorkPlan - Nutrient TMDL-edits.docx
Powder-free nitrile gloves
Clear glass jar for visual examinations
Sample containers
Sample preservatives
Sample container labels
COC forms
COC seals
Ice chests
Ice
Foul-weather gear
Manhole sampler
Table 6 Monitoring Constituents and Sample Container Requirements
Analyte Container Volume Preservation Holding Time
NH3+ Plastic 50 ml ≤ 6°C H2SO4 PH < 2 28 days
NO3 Plastic 50 ml ≤ 6°C, H2SO4 PH <2 48 hours
NO2 Plastic 50 ml ≤ 6°C, H2SO4 PH <2 48 hours
TKN Plastic 50 ml ≤ 6°C, H2SO4 PH <2 28 days
TP Plastic 50 ml ≤ 6°C, H2SO4 PH <2 28 days
PO4 Plastic 50 ml ≤ 6°C 48 hours
TSS Plastic 200 ml ≤ 6°C 7 days
4.2 Sampling Method
Water samples will be collected from storm sewer manhole and outfall sites. All samples will be collected as individual grabs. Samples will be collected directly into sample containers or with a laboratory-supplied container attached to a pole with duct tape or other means. Sampling containers will be held with container openings facing upstream to prevent contamination during sampling. Field personnel will wear powder-free nitrile disposable gloves. Each sample will be given a field identification, tagged, and kept cool at 4 degrees C. Chain-of-custody (COC) procedures will be observed and samples delivered to the laboratory within the allowable holding times for each parameter.
It is assumed that sampling locations will have well-mixed conditions so that single grabs are representative of water quality. Field personnel will record the degree of turbulence or quiescence as well as the dimensions of the conveyance sampled and/or a description of water flowing in the conveyance. Field personnel will also record the date and time of sample collection and the flow rate.
CITY OF TORRANCE, CALIFORNIA SPECIAL STUDY WORK PLAN
CAROLLO ENGINEERS 24 May 2011 pw:\\Carollo\Documents\Client\CA\Torrance\8419A00\Deliverables\SpecialStudyWorkPlan - Nutrient TMDL-edits.docx
Sampling containers for direct grabs (either by hand or with pole attached to laboratory supplied container) will be pre-cleaned by the laboratory. It will be made certain that if a sample is transferred (either for collection purposes or to form grab-composite samples), that only laboratory-supplied containers are permitted to come in contact with the sample.
4.3 Personal Safety
A Health and Safety Plan approved by the contract lab will be reviewed by the all field personnel before the sampling operations covered in this monitoring plan begin. Personal safety will be of primary concern while conducting all stormwater sampling related activities. All persons involved in the sampling operation will be made aware of the hazards associated with monitoring and should freely voice any concerns if potential hazards become apparent. The Occupational Safety and Health Administration (OSHA) provides regulations and guidance on occupational safety, many of which are directly applicable to the types of activities involved in stormwater monitoring. It is the direct responsibility of each person involved in the monitoring program to read the Health and Safety Plan and adhere to its requirements. The following list provides a few basic health and safety procedures that will help to create a safer sampling environment.
Do not sample alone, a minimum of two-person field crews will be used for stormwater sampling.
Do not enter a confined space without proper training, equipment, and surface support.
Never remove or replace manhole covers with your bare hands or feet.
Never leave an open manhole unattended.
Do not start staging or sampling until traffic control has been established.
4.4 Clean Sampling Techniques
Clean sample collection techniques will be followed to minimize the potential for contamination of stormwater runoff samples. Care will be taken during all sampling operations to avoid contamination of the water samples by human, atmospheric, or other potential sources of contamination. The monitoring team should prevent contamination of any of the following items: composite bottles, lids, sample, tubing, and strainers.
4.5 Sample Packing and Shipping
Monitoring personnel will deliver the samples to the laboratory. Sample bottles will be placed in coolers or some other package that is rigid enough to provide protection of the samples and is insulated to keep samples cold. During packing, the sample from one monitoring location will not be separated into separate shipping containers unless bottles of one size need to be shipped together because of container size. If samples from a location are separated a copy of the field-sampling sheet pertaining to the bottles will be enclosed in each shipping container. Prior to shipping, all sample bottles will be recorded on the packing lists, which will include the shipping date and the method of transporting the samples. Samples will be delivered to the analytical laboratory within 4 hours of sampling to ensure the maximum holding time for bacteria of 6 hours is not exceeded.
CITY OF TORRANCE, CALIFORNIA SPECIAL STUDY WORK PLAN
CAROLLO ENGINEERS 25 May 2011 pw:\\Carollo\Documents\Client\CA\Torrance\8419A00\Deliverables\SpecialStudyWorkPlan - Nutrient TMDL-edits.docx
4.6 Chain of Custody
After samples have been obtained and the collection procedures properly documented, a written record of the COC of each sample will be made. This record ensures that samples will not be tampered with or inadvertently compromised in any way, and it also tracks the requested analysis for the analytical laboratory. COC refers to the documented account of changes in possession that occur for samples.
The COC record tracks the sampling path from origin through laboratory analysis. Information necessary in the COC includes:
Name of the persons collecting the sample(s).
Date and time of sample collection.
Location of sample collection.
Names and signatures of all persons handling the samples in the field and in the laboratory.
Laboratory analysis requested and control information (e.g., duplicate or spiked samples etc.) and any special instructions (e.g., time sensitive analyses).
To ensure that all necessary information is documented a COC form will accompany each sample or set of samples. COC forms will be printed on multipart carbonless paper so that all personnel handling the samples may obtain a copy. A COC record should accompany all sample shipments and the sample originator will retain a copy of the forms. When transferring custody of samples the transferee will sign and record the date and time of each transfer. Each person who takes custody will complete the appropriate portion of the chain of custody documentation. A sample COC form to be used for this field sampling is attached as Appendix C.
5.0 QUALITY ASSURANCE AND QUALITY CONTROL
5.1 Data Quality Objective
The quality assurance/quality control (QA/QC) program will be implemented to satisfy the data quality objectives of the monitoring program. The primary data quality objectives are to obtain defensible data of acceptable sensitivity and quality to:
Evaluate the stormwater management program.
Evaluate stormwater quality.
Evaluate of BMP as corrective measure.
The analytical laboratory selected for this study will evaluate the accuracy of its sample extraction and/or analytical procedures using spiked samples, which may include matrix spikes (MS), laboratory control samples (LCS) and surrogate spikes. Acceptable spike recoveries must fall within statistically derived laboratory “control limits.” Precision is the agreement among a set a replicate measurements of the same parameter. The analytical laboratory will evaluate precision by performing matrix spike duplicate (MSD), laboratory control sample duplicate (LCSD) and duplicate stormwater sample analyses (typically
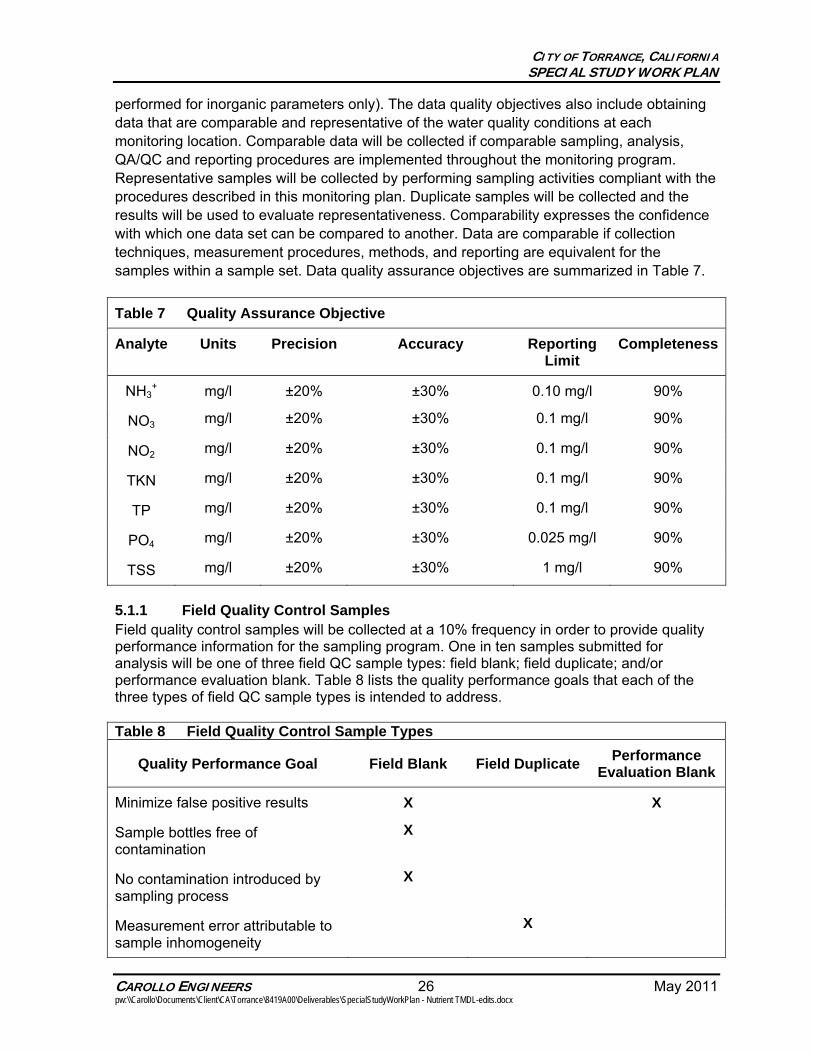
CITY OF TORRANCE, CALIFORNIA SPECIAL STUDY WORK PLAN
CAROLLO ENGINEERS 26 May 2011 pw:\\Carollo\Documents\Client\CA\Torrance\8419A00\Deliverables\SpecialStudyWorkPlan - Nutrient TMDL-edits.docx
performed for inorganic parameters only). The data quality objectives also include obtaining data that are comparable and representative of the water quality conditions at each monitoring location. Comparable data will be collected if comparable sampling, analysis, QA/QC and reporting procedures are implemented throughout the monitoring program. Representative samples will be collected by performing sampling activities compliant with the procedures described in this monitoring plan. Duplicate samples will be collected and the results will be used to evaluate representativeness. Comparability expresses the confidence with which one data set can be compared to another. Data are comparable if collection techniques, measurement procedures, methods, and reporting are equivalent for the samples within a sample set. Data quality assurance objectives are summarized in Table 7.
Table 7 Quality Assurance Objective
Analyte Units Precision Accuracy Reporting Limit
Completeness
NH3+ mg/l ±20% ±30% 0.10 mg/l 90%
NO3 mg/l ±20% ±30% 0.1 mg/l 90%
NO2 mg/l ±20% ±30% 0.1 mg/l 90%
TKN mg/l ±20% ±30% 0.1 mg/l 90%
TP mg/l ±20% ±30% 0.1 mg/l 90%
PO4 mg/l ±20% ±30% 0.025 mg/l 90%
TSS mg/l ±20% ±30% 1 mg/l 90%
5.1.1 Field Quality Control Samples Field quality control samples will be collected at a 10% frequency in order to provide quality performance information for the sampling program. One in ten samples submitted for analysis will be one of three field QC sample types: field blank; field duplicate; and/or performance evaluation blank. Table 8 lists the quality performance goals that each of the three types of field QC sample types is intended to address. Table 8 Field Quality Control Sample Types
Quality Performance Goal Field Blank Field Duplicate Performance Evaluation Blank
Minimize false positive results X X
Sample bottles free of contamination
X
No contamination introduced by sampling process
X
Measurement error attributable to sample inhomogeneity
X
CITY OF TORRANCE, CALIFORNIA SPECIAL STUDY WORK PLAN
CAROLLO ENGINEERS 27 May 2011 pw:\\Carollo\Documents\Client\CA\Torrance\8419A00\Deliverables\SpecialStudyWorkPlan - Nutrient TMDL-edits.docx
5.2 Field Quality Assurance/Quality Control
This section summarizes the QA/QC procedures that will be implemented by field personnel to evaluate sample contamination, sampling precision, and matrix interference.
5.2.1 Equipment Blanks
After the intermediate sample container or scoop is cleaned, an equipment blank will be collected by pouring reagent-grade water into the apparatus. The water will be transferred into sample bottles and analyzed for the full analytical suite.
5.2.2 Field Duplicate Samples
Field duplicate samples will be collected to evaluate the precision and representativeness of the sample collection procedures as well as sample homogeneity. The duplicate sample will be collected using the specified manual grab sampling techniques. Twice the volume required for the analytical suite will be collected with each duplicate sample. For grab samples, intermediate sample containers will be used, and the volume collected will be apportioned equally between the intermediate containers. The water in each intermediate container will be poured into a discrete set of sample bottles. One set of bottles will be labeled with fictitious sample identification and submitted “blind” to the laboratory.
5.2.3 Matrix Spike Samples
MS and MSD analyses will be performed by the laboratory using project samples. Field crews will submit twice the required sample volume for the sample selected as the matrix spike sample. Field personnel will identify the MS/MSD sample on the COC form.
5.3 Laboratory Quality Control
This sub-section summarizes the QC procedures the laboratory will perform and report with the analytical data packages. These procedures are not inclusive of the QA/QC that is required for compliance with the analytical method.
5.3.1 Method Blanks
A method blank is prepared using reagent-grade water, and is extracted and analyzed with each sample batch (typically 20 samples extracted and/or analyzed on a given day). Method blank results are used to identify potential sources of sample contamination resulting from laboratory procedures. Target analytes should not be detected in the method blank above the practical quantitative limit.
5.3.2 Matrix Spike and Laboratory Control Samples
MS, MSDs, LCS, and LCSDs will be performed by the laboratory to evaluate the accuracy of the sample extraction and analysis procedures. MS/MSDs will also be performed to evaluate matrix interference. Matrix interference is the effect of the sample matrix on the analysis, which may partially or completely mask the response of the analytical instrumentation to the target analyte(s). Matrix interference may affect the accuracy of the extraction and/or analysis procedures to varying degrees, and may bias the sample results high or low. The
CITY OF TORRANCE, CALIFORNIA SPECIAL STUDY WORK PLAN
CAROLLO ENGINEERS 28 May 2011 pw:\\Carollo\Documents\Client\CA\Torrance\8419A00\Deliverables\SpecialStudyWorkPlan - Nutrient TMDL-edits.docx
MS/MSD is prepared by adding known quantities of target analytes to a sample. The sample is then extracted and/or analyzed as a typical environmental sample, and the results are reported as percent recovery.
6.0 DATA MANAGEMENT AND REPORTING The sampling results will be reported by the laboratory as hard copy and as electronic files. Hard copy data will be entered into an electronic format, and checked at least once by a different person. Electronic submittal of results will be discussed with the analytical laboratory in advance of delivery and its format arranged. A separate record will be generated for each sample analysis.
In addition, the key information such as station ID, sample date and time, name of sampler, name of constituent, all results, units, detection limits, methods used, name of the laboratory, and any field notes will be entered into the database. Additional information, such as compositing of multiple samples, or the use of grab will also be included.
When reporting the laboratory results for each stormwater sample the following information will be provided:
Sample site.
Sample date and time.
Sample number (or identification).
Sampling technician(s).
Detection limit and reliability limit of analytical procedure(s).
Sample results with clearly specified units.
The results of all samples collected under this plan will be submitted to Regional Board in a monitoring report. Monitoring report will include:
Introduction and background information
Documentation and summary of each sampling event, including photos
Electronic copies of field conditions data sheets
Summary discussion of results
Tabular results of all samples, including quality assurance quality control samples, in electronic format, (Excel)
Evaluation data quality based on QAPP requirements.
APPENDIX A
Detailed Maps of Sampling Locations
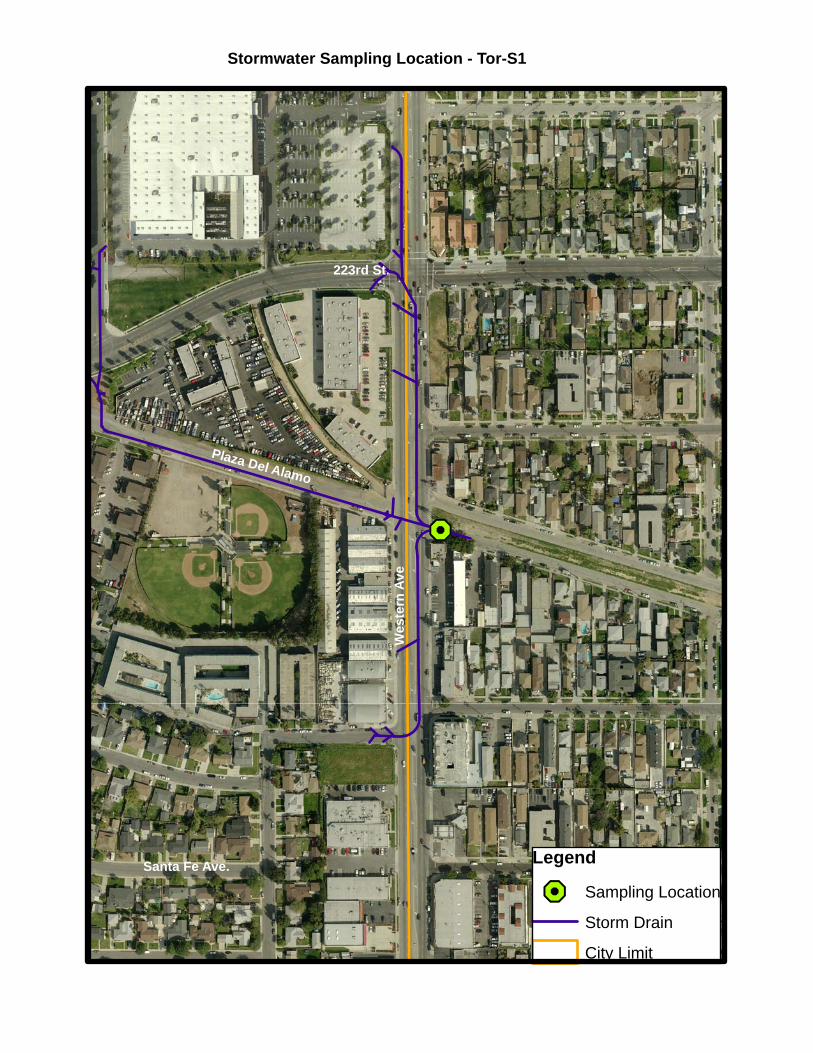
&M
Legend
&M Sampling Location
Storm Drain
City Limit
Stormwater Sampling Location - Tor-S1
223rd St.
Plaza Del Alamo
Wes
tern
Ave
Santa Fe Ave.
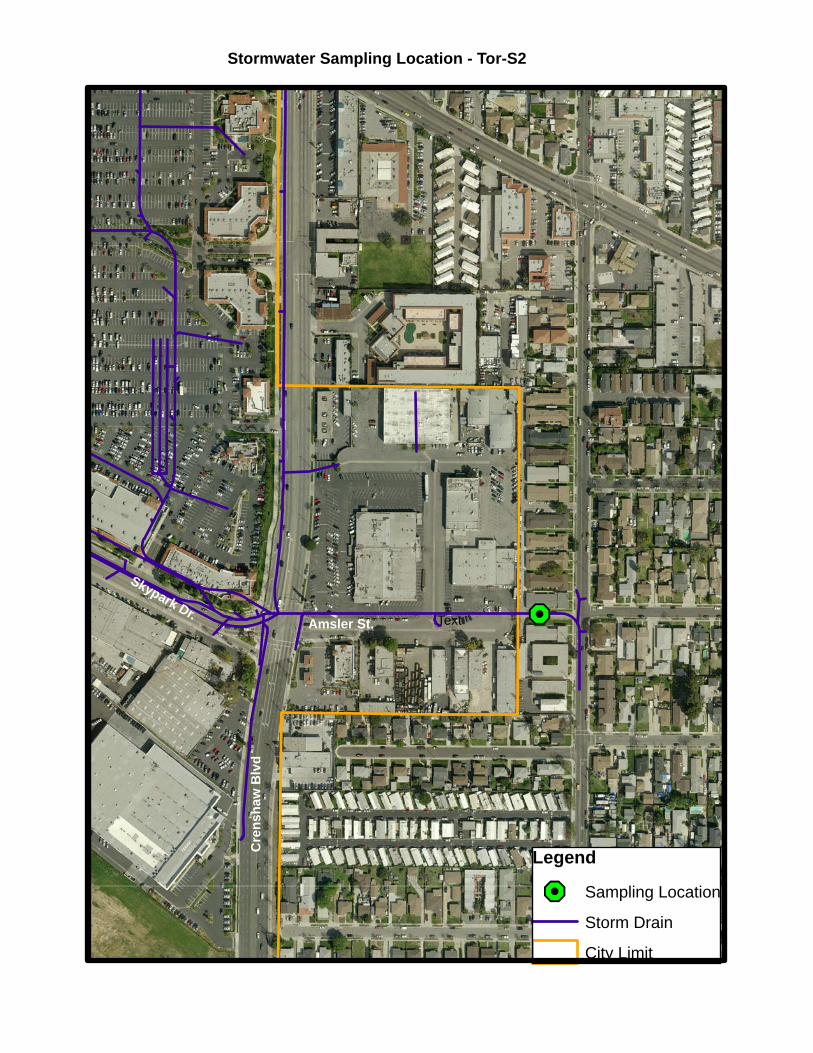
&M
Legend
&M Sampling Location
Storm Drain
City Limit
Stormwater Sampling Location - Tor-S2
Cre
nsha
w B
lvd
TextAmsler St.
Skypark Dr.
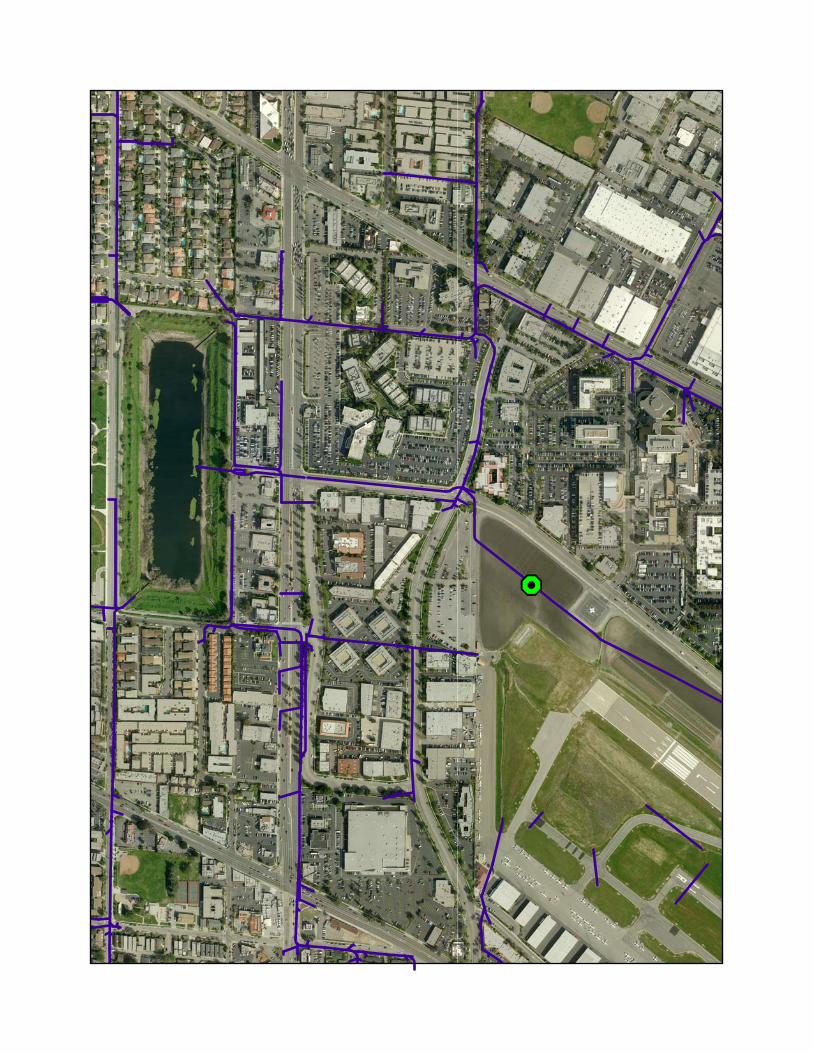
&M
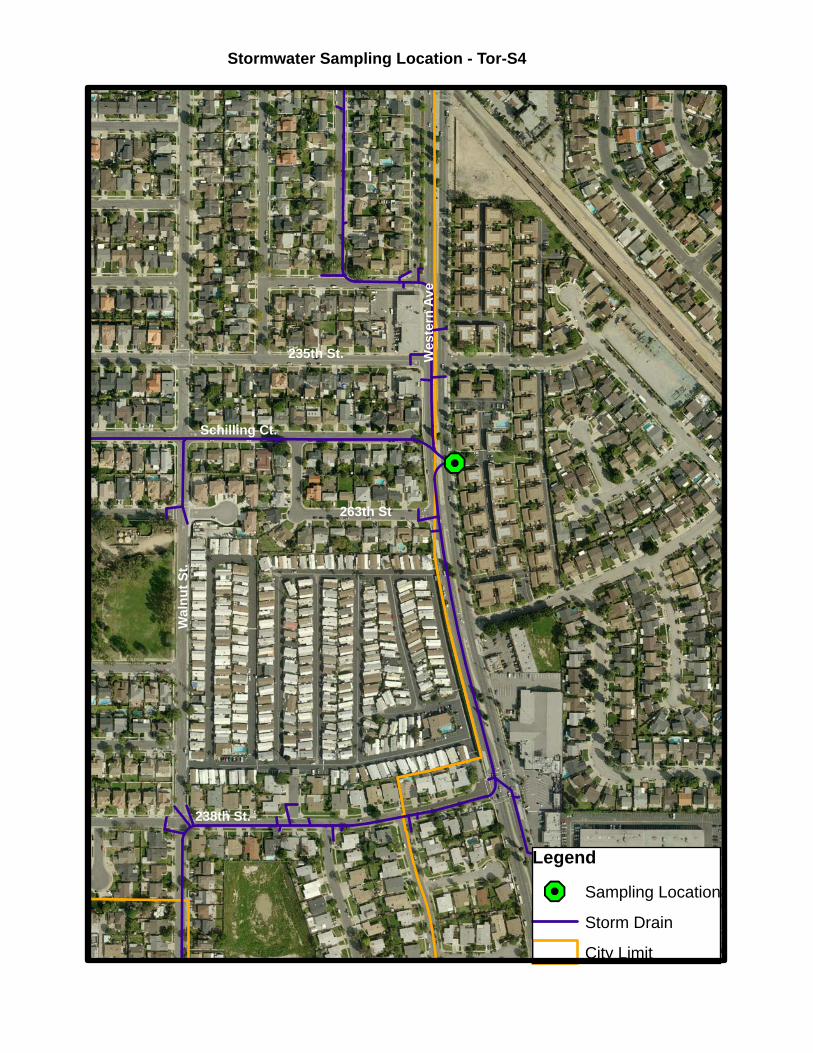
&M
Legend
&M Sampling Location
Storm Drain
City Limit
Stormwater Sampling Location - Tor-S4
Wes
tern
Ave
235th St.
263th St
Schilling Ct.
Wal
nut S
t.
238th St.
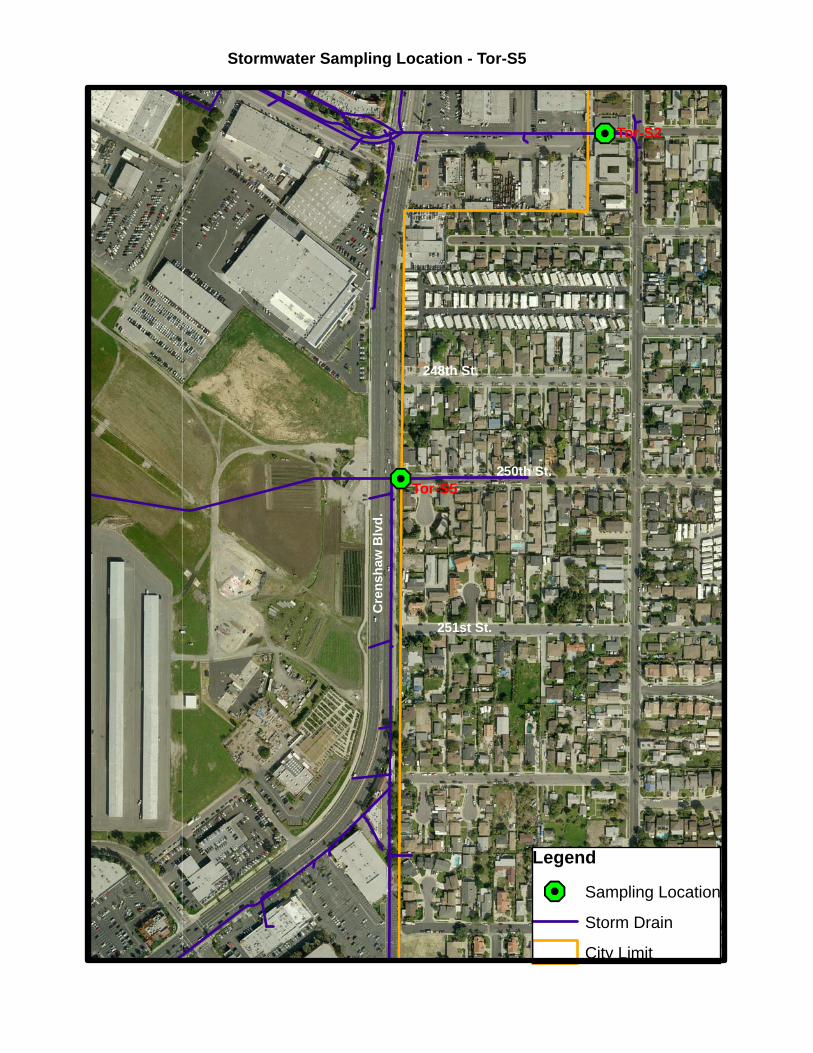
&M
&M
Legend
&M Sampling Location
Storm Drain
City Limit
Stormwater Sampling Location - Tor-S5
251st St.
Tor-S5
Tor-S2
Cre
nsha
w B
lvd.
250th St.
248th St.
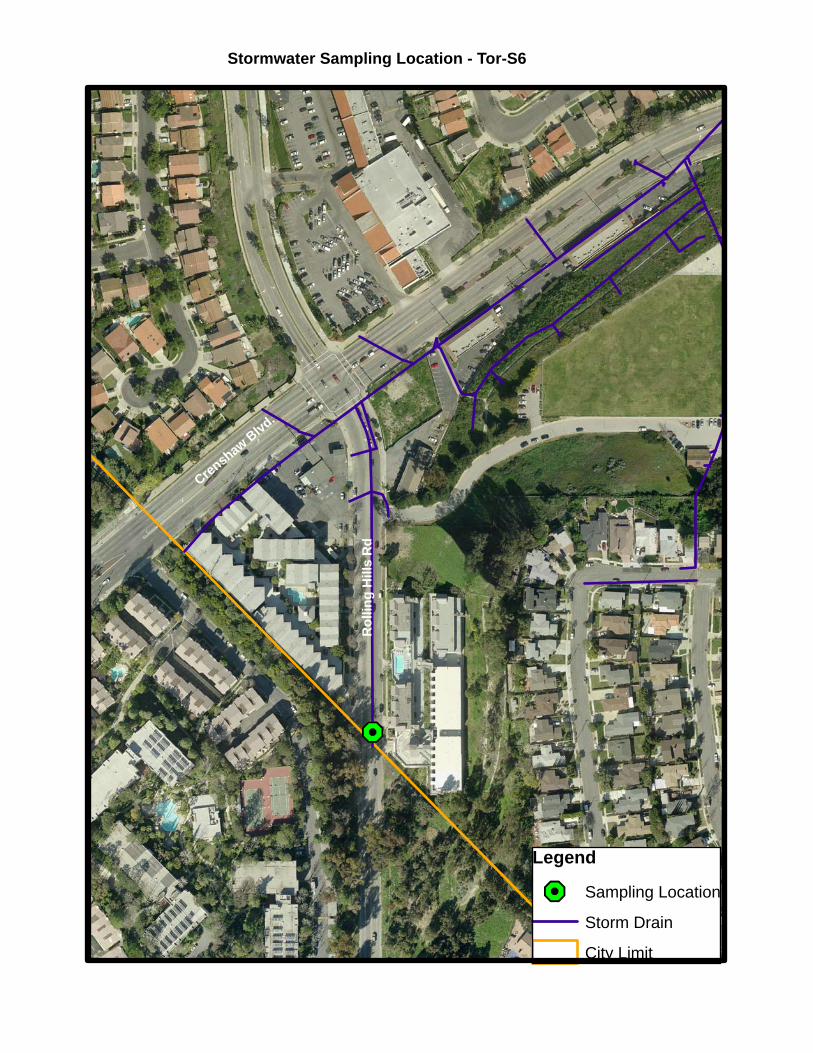
&M
Legend
&M Sampling Location
Storm Drain
City Limit
Stormwater Sampling Location - Tor-S6
Rol
ling
Hill
s R
d
Crenshaw Blvd.
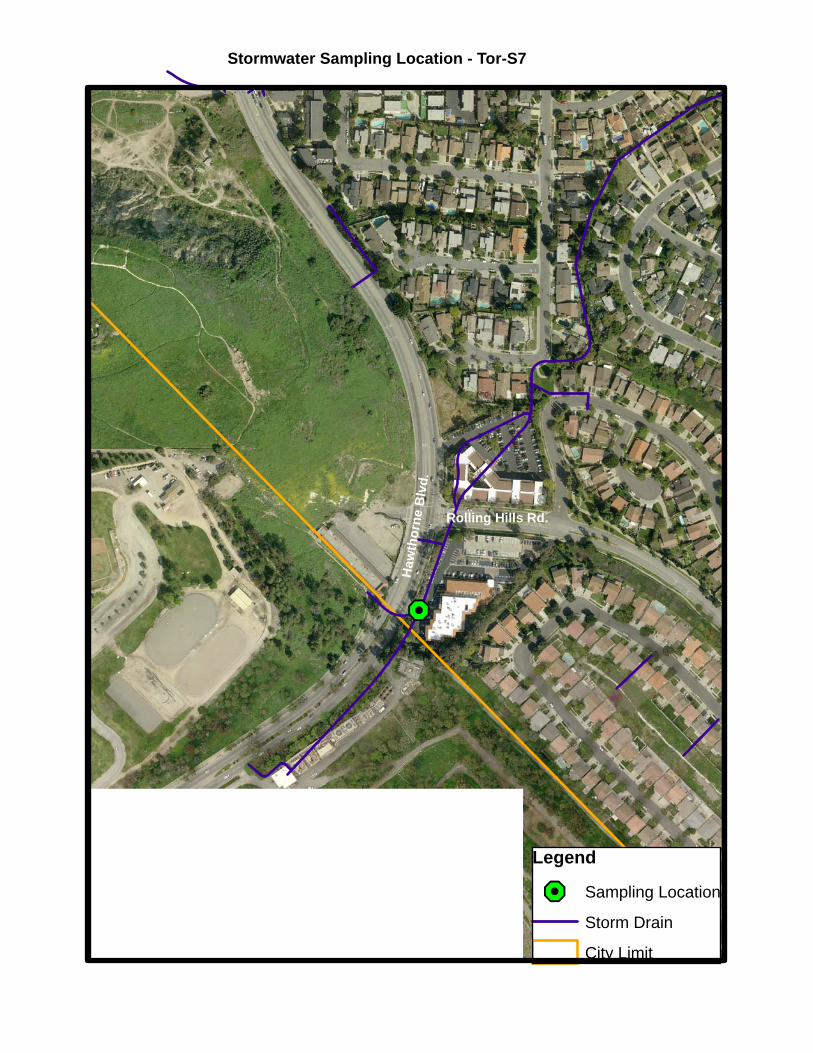
&M
Legend
&M Sampling Location
Storm Drain
City Limit
Stormwater Sampling Location - Tor-S7
Haw
thor
ne B
lvd.
Rolling Hills Rd.
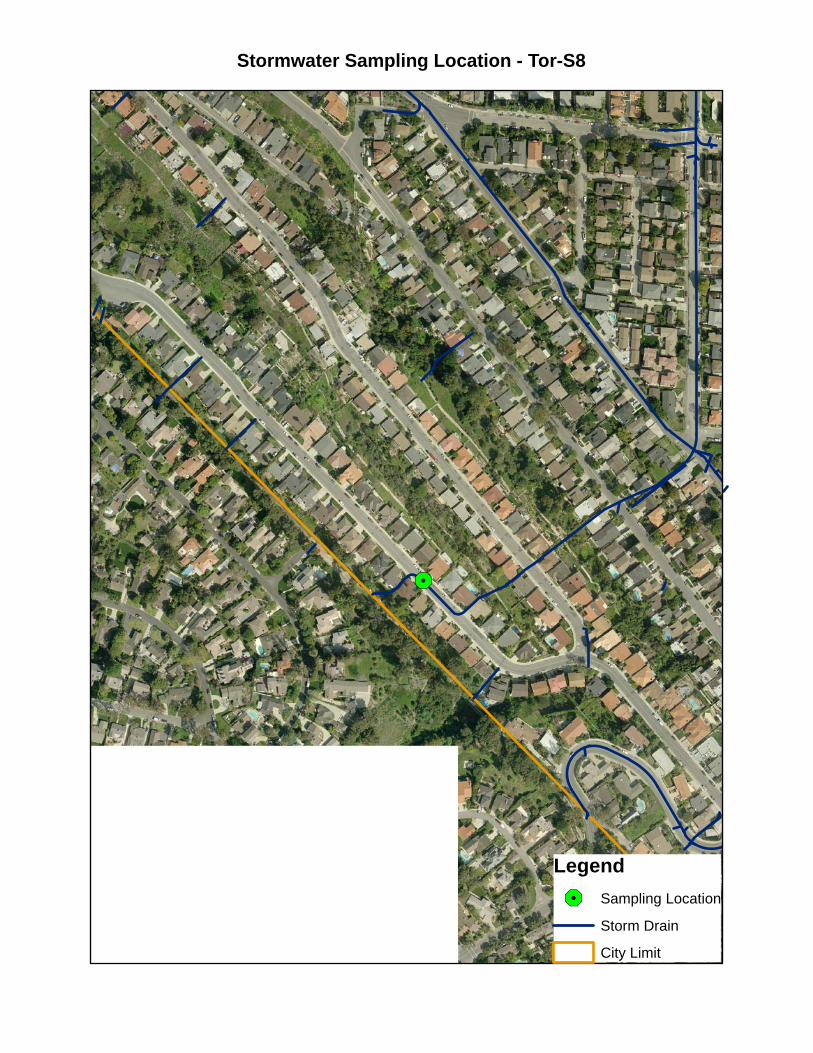
&3
Legend&3 Sampling Location
Storm Drain
City Limit
Stormwater Sampling Location - Tor-S8
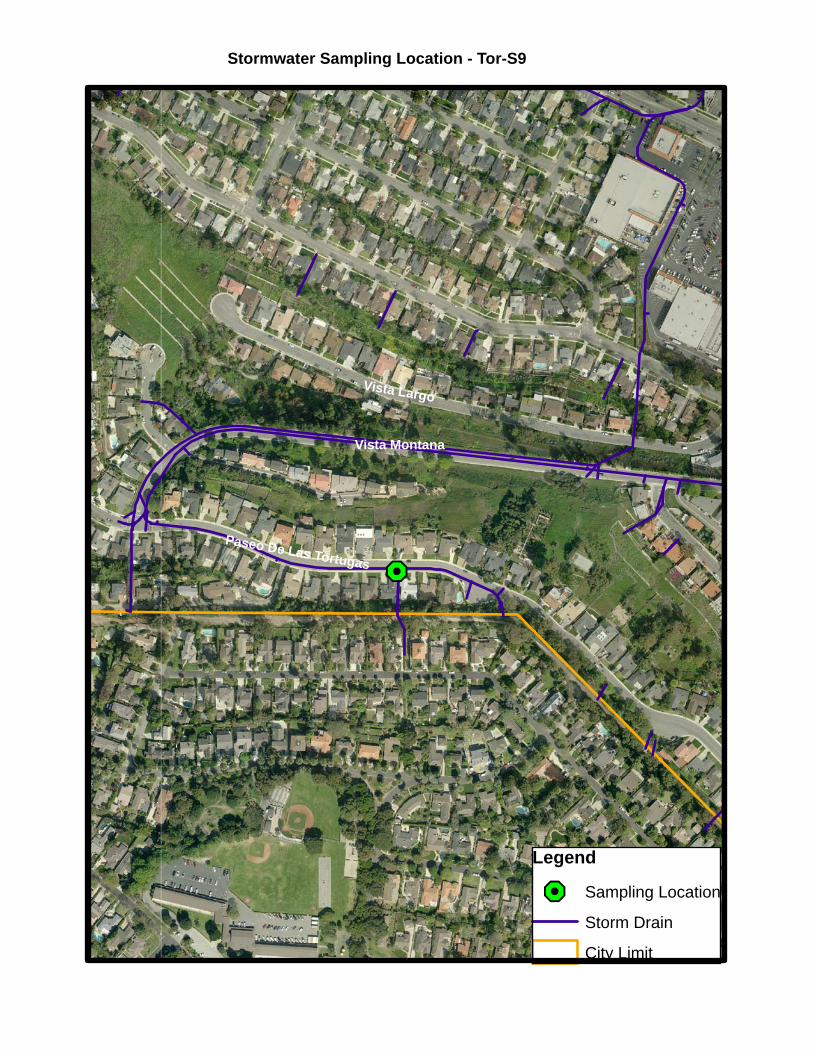
&M
Legend
&M Sampling Location
Storm Drain
City Limit
Stormwater Sampling Location - Tor-S9
Paseo De Las Tortugas
Vista Montana
Vista Largo
�
�
�
�
�
�
�
�
���������B�
���������������������� �������������
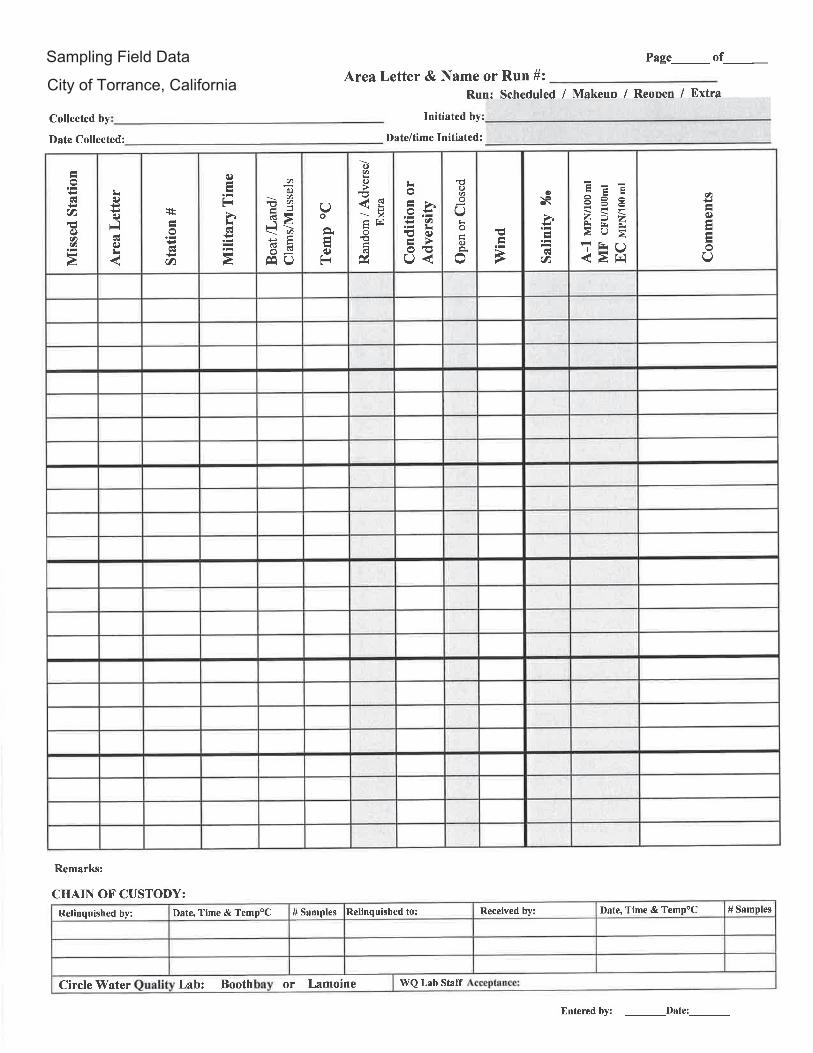
Sampling Field Data
City of Torrance, California
�
�
�
�
�
�
�
�
����������
�������������������� ������������
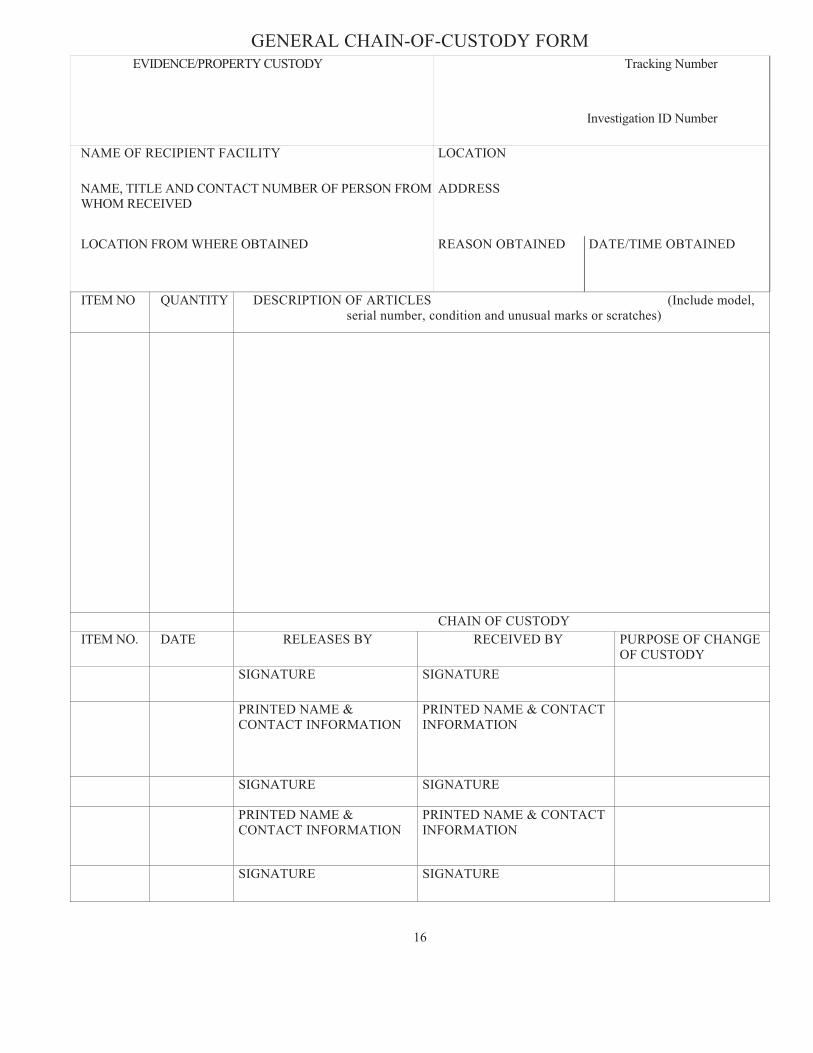
16
GENERAL CHAIN-OF-CUSTODY FORM EVIDENCE/PROPERTY CUSTODY Tracking Number
Investigation ID Number
NAME OF RECIPIENT FACILITY LOCATION
NAME, TITLE AND CONTACT NUMBER OF PERSON FROM WHOM RECEIVED
ADDRESS
LOCATION FROM WHERE OBTAINED REASON OBTAINED DATE/TIME OBTAINED
ITEM NO QUANTITY DESCRIPTION OF ARTICLES (Include model, serial number, condition and unusual marks or scratches)
CHAIN OF CUSTODY ITEM NO. DATE RELEASES BY RECEIVED BY PURPOSE OF CHANGE
OF CUSTODY SIGNATURE SIGNATURE
PRINTED NAME & CONTACT INFORMATION
PRINTED NAME & CONTACT INFORMATION
SIGNATURE SIGNATURE
PRINTED NAME & CONTACT INFORMATION
PRINTED NAME & CONTACT INFORMATION
SIGNATURE SIGNATURE
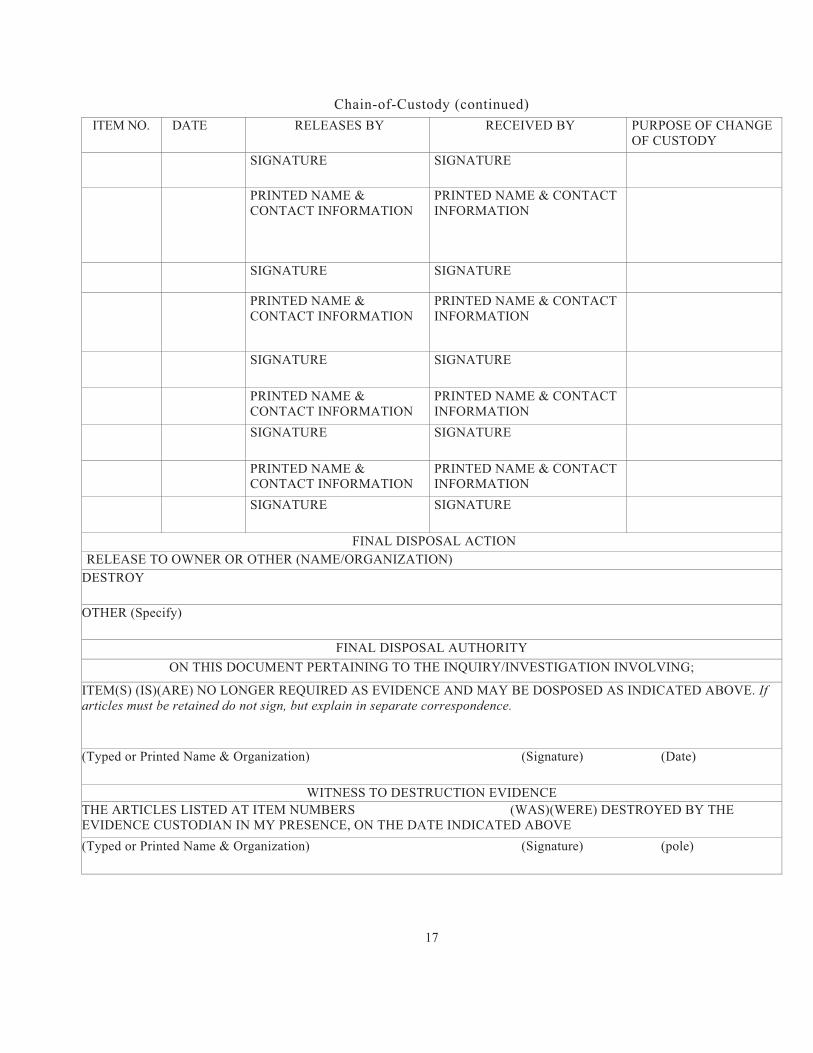
17
Chain-of-Custody (continued) ITEM NO. DATE RELEASES BY RECEIVED BY PURPOSE OF CHANGE
OF CUSTODY SIGNATURE SIGNATURE
PRINTED NAME & CONTACT INFORMATION
PRINTED NAME & CONTACT INFORMATION
SIGNATURE SIGNATURE
PRINTED NAME & CONTACT INFORMATION
PRINTED NAME & CONTACT INFORMATION
SIGNATURE SIGNATURE
PRINTED NAME & CONTACT INFORMATION
PRINTED NAME & CONTACT INFORMATION
SIGNATURE SIGNATURE
PRINTED NAME & CONTACT INFORMATION
PRINTED NAME & CONTACT INFORMATION
SIGNATURE SIGNATURE
FINAL DISPOSAL ACTION RELEASE TO OWNER OR OTHER (NAME/ORGANIZATION)
DESTROY
OTHER (Specify)
FINAL DISPOSAL AUTHORITY ON THIS DOCUMENT PERTAINING TO THE INQUIRY/INVESTIGATION INVOLVING;
ITEM(S) (IS)(ARE) NO LONGER REQUIRED AS EVIDENCE AND MAY BE DOSPOSED AS INDICATED ABOVE. If articles must be retained do not sign, but explain in separate correspondence.
(Typed or Printed Name & Organization) (Signature) (Date)
WITNESS TO DESTRUCTION EVIDENCE THE ARTICLES LISTED AT ITEM NUMBERS (WAS)(WERE) DESTROYED BY THE EVIDENCE CUSTODIAN IN MY PRESENCE, ON THE DATE INDICATED ABOVE (Typed or Printed Name & Organization) (Signature) (pole)
Beach Cities CIMP Appendix C
Monitoring Location Fact Sheets
July 2015
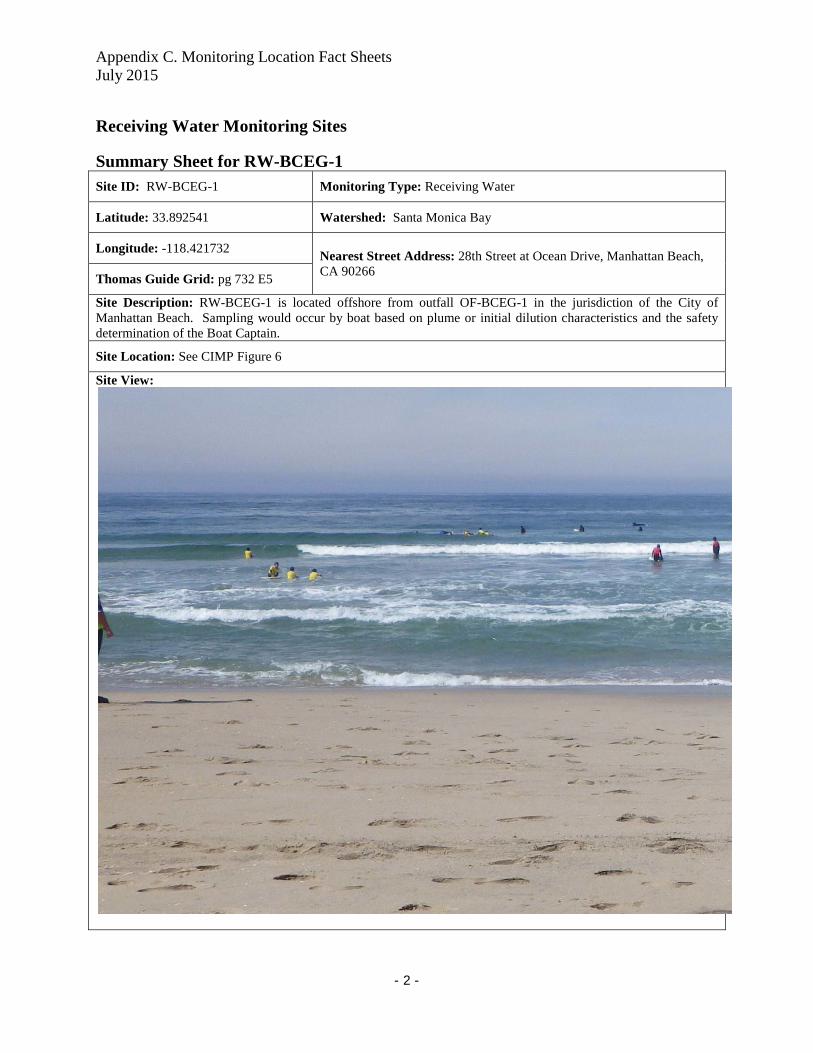
Appendix C. Monitoring Location Fact Sheets July 2015
- 2 -
Receiving Water Monitoring Sites
Summary Sheet for RW-BCEG-1 Site ID: RW-BCEG-1 Monitoring Type: Receiving Water
Latitude: 33.892541 Watershed: Santa Monica Bay
Longitude: -118.421732 Nearest Street Address: 28th Street at Ocean Drive, Manhattan Beach, CA 90266
Thomas Guide Grid: pg 732 E5
Site Description: RW-BCEG-1 is located offshore from outfall OF-BCEG-1 in the jurisdiction of the City of Manhattan Beach. Sampling would occur by boat based on plume or initial dilution characteristics and the safety determination of the Boat Captain.
Site Location: See CIMP Figure 6
Site View:
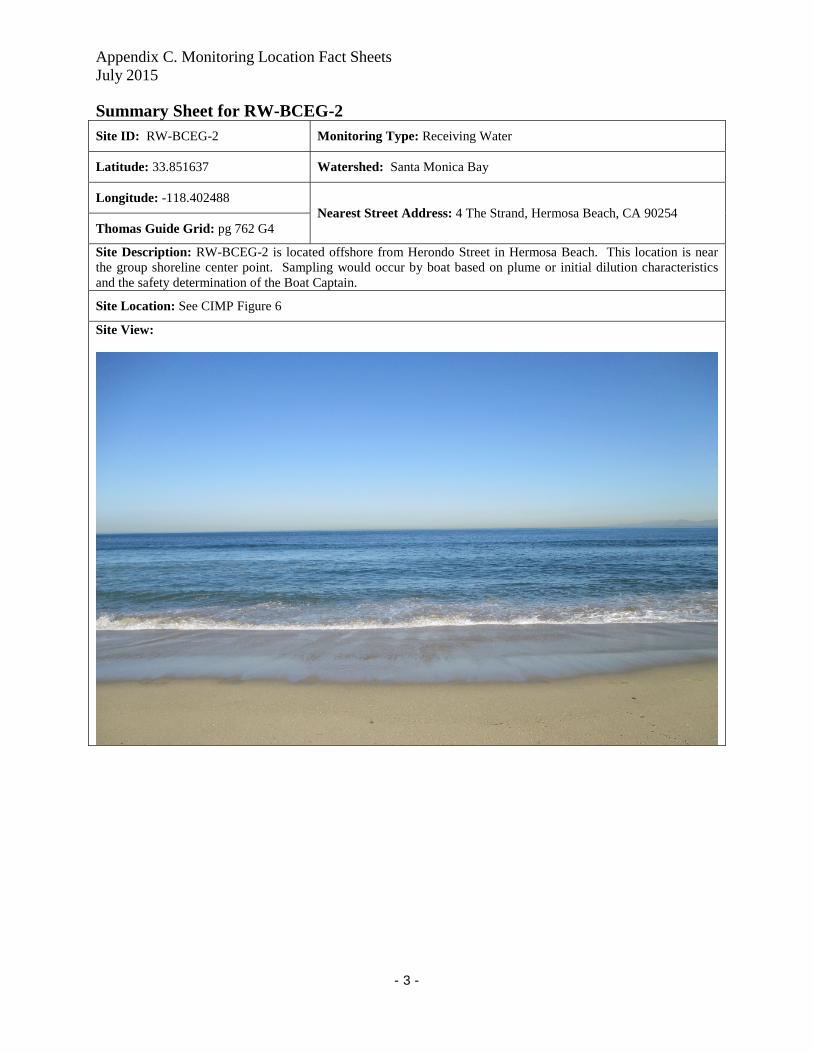
Appendix C. Monitoring Location Fact Sheets July 2015
- 3 -
Summary Sheet for RW-BCEG-2 Site ID: RW-BCEG-2 Monitoring Type: Receiving Water
Latitude: 33.851637 Watershed: Santa Monica Bay
Longitude: -118.402488 Nearest Street Address: 4 The Strand, Hermosa Beach, CA 90254
Thomas Guide Grid: pg 762 G4
Site Description: RW-BCEG-2 is located offshore from Herondo Street in Hermosa Beach. This location is near the group shoreline center point. Sampling would occur by boat based on plume or initial dilution characteristics and the safety determination of the Boat Captain.
Site Location: See CIMP Figure 6
Site View:
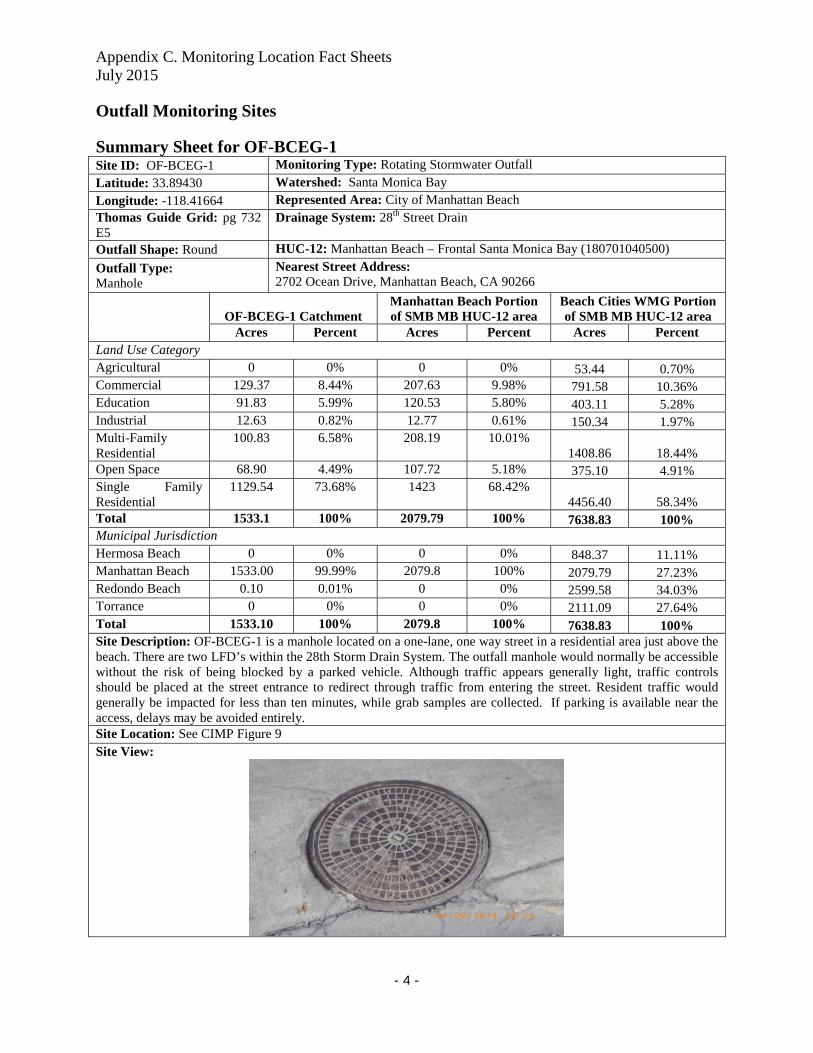
Appendix C. Monitoring Location Fact Sheets July 2015
- 4 -
Outfall Monitoring Sites Summary Sheet for OF-BCEG-1 Site ID: OF-BCEG-1 Monitoring Type: Rotating Stormwater Outfall
Latitude: 33.89430 Watershed: Santa Monica Bay
Longitude: -118.41664 Represented Area: City of Manhattan Beach Thomas Guide Grid: pg 732 E5
Drainage System: 28th Street Drain
Outfall Shape: Round HUC-12: Manhattan Beach – Frontal Santa Monica Bay (180701040500)
Outfall Type: Manhole
Nearest Street Address: 2702 Ocean Drive, Manhattan Beach, CA 90266
OF-BCEG-1 Catchment
Manhattan Beach Portion of SMB MB HUC-12 area
Beach Cities WMG Portion of SMB MB HUC-12 area
Acres Percent Acres Percent Acres Percent Land Use Category Agricultural 0 0% 0 0% 53.44 0.70% Commercial 129.37 8.44% 207.63 9.98% 791.58 10.36% Education 91.83 5.99% 120.53 5.80% 403.11 5.28% Industrial 12.63 0.82% 12.77 0.61% 150.34 1.97% Multi-Family Residential
100.83 6.58% 208.19 10.01% 1408.86 18.44%
Open Space 68.90 4.49% 107.72 5.18% 375.10 4.91% Single Family Residential
1129.54 73.68% 1423 68.42% 4456.40 58.34%
Total 1533.1 100% 2079.79 100% 7638.83 100% Municipal Jurisdiction Hermosa Beach 0 0% 0 0% 848.37 11.11% Manhattan Beach 1533.00 99.99% 2079.8 100% 2079.79 27.23% Redondo Beach 0.10 0.01% 0 0% 2599.58 34.03% Torrance 0 0% 0 0% 2111.09 27.64% Total 1533.10 100% 2079.8 100% 7638.83 100% Site Description: OF-BCEG-1 is a manhole located on a one-lane, one way street in a residential area just above the beach. There are two LFD’s within the 28th Storm Drain System. The outfall manhole would normally be accessible without the risk of being blocked by a parked vehicle. Although traffic appears generally light, traffic controls should be placed at the street entrance to redirect through traffic from entering the street. Resident traffic would generally be impacted for less than ten minutes, while grab samples are collected. If parking is available near the access, delays may be avoided entirely. Site Location: See CIMP Figure 9 Site View:
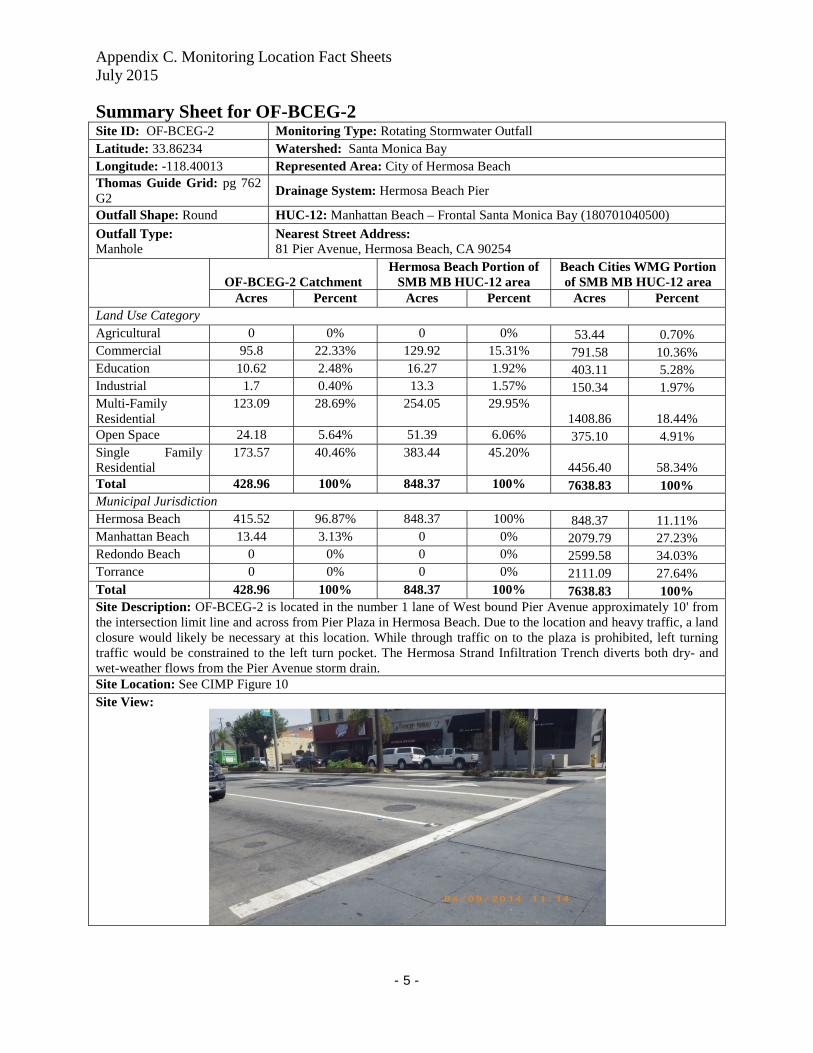
Appendix C. Monitoring Location Fact Sheets July 2015
- 5 -
Summary Sheet for OF-BCEG-2 Site ID: OF-BCEG-2 Monitoring Type: Rotating Stormwater Outfall Latitude: 33.86234 Watershed: Santa Monica Bay Longitude: -118.40013 Represented Area: City of Hermosa Beach Thomas Guide Grid: pg 762 G2
Drainage System: Hermosa Beach Pier
Outfall Shape: Round HUC-12: Manhattan Beach – Frontal Santa Monica Bay (180701040500)
Outfall Type: Manhole
Nearest Street Address: 81 Pier Avenue, Hermosa Beach, CA 90254
OF-BCEG-2 Catchment
Hermosa Beach Portion of SMB MB HUC-12 area
Beach Cities WMG Portion of SMB MB HUC-12 area
Acres Percent Acres Percent Acres Percent Land Use Category Agricultural 0 0% 0 0% 53.44 0.70% Commercial 95.8 22.33% 129.92 15.31% 791.58 10.36% Education 10.62 2.48% 16.27 1.92% 403.11 5.28% Industrial 1.7 0.40% 13.3 1.57% 150.34 1.97% Multi-Family Residential
123.09 28.69% 254.05 29.95% 1408.86 18.44%
Open Space 24.18 5.64% 51.39 6.06% 375.10 4.91% Single Family Residential
173.57 40.46% 383.44 45.20% 4456.40 58.34%
Total 428.96 100% 848.37 100% 7638.83 100% Municipal Jurisdiction Hermosa Beach 415.52 96.87% 848.37 100% 848.37 11.11% Manhattan Beach 13.44 3.13% 0 0% 2079.79 27.23% Redondo Beach 0 0% 0 0% 2599.58 34.03% Torrance 0 0% 0 0% 2111.09 27.64% Total 428.96 100% 848.37 100% 7638.83 100% Site Description: OF-BCEG-2 is located in the number 1 lane of West bound Pier Avenue approximately 10' from the intersection limit line and across from Pier Plaza in Hermosa Beach. Due to the location and heavy traffic, a land closure would likely be necessary at this location. While through traffic on to the plaza is prohibited, left turning traffic would be constrained to the left turn pocket. The Hermosa Strand Infiltration Trench diverts both dry- and wet-weather flows from the Pier Avenue storm drain. Site Location: See CIMP Figure 10 Site View:
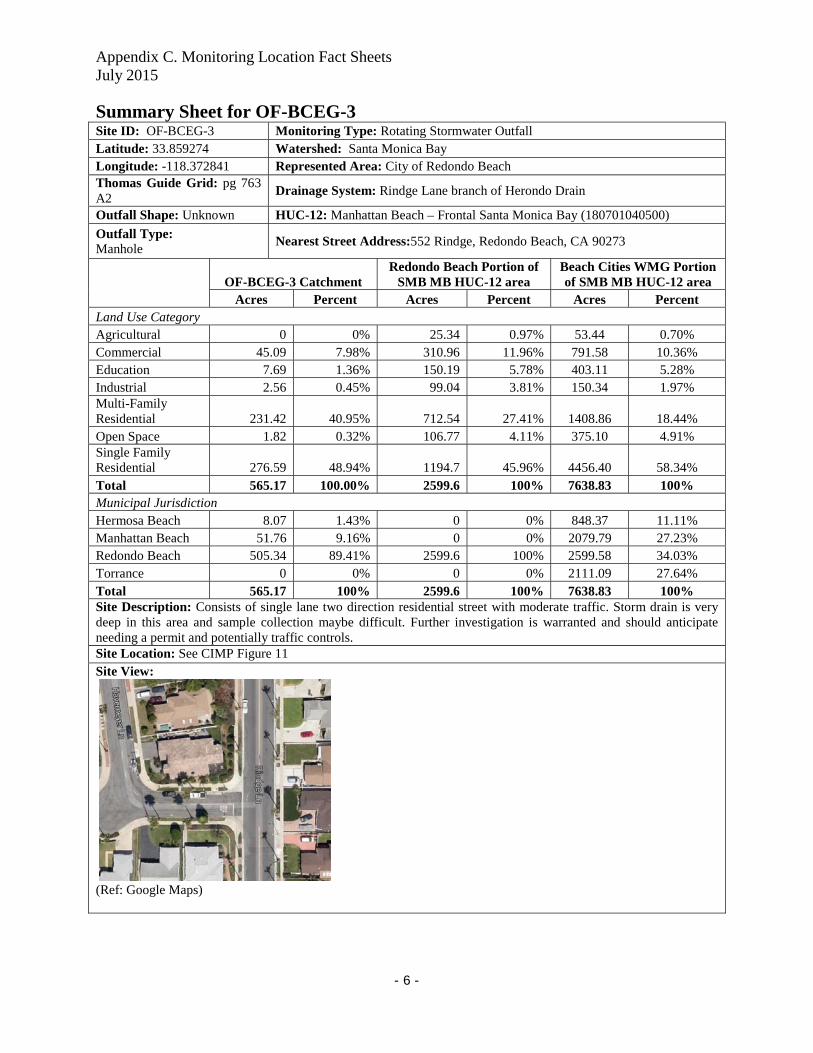
Appendix C. Monitoring Location Fact Sheets July 2015
- 6 -
Summary Sheet for OF-BCEG-3 Site ID: OF-BCEG-3 Monitoring Type: Rotating Stormwater Outfall Latitude: 33.859274 Watershed: Santa Monica Bay Longitude: -118.372841 Represented Area: City of Redondo Beach Thomas Guide Grid: pg 763 A2
Drainage System: Rindge Lane branch of Herondo Drain
Outfall Shape: Unknown HUC-12: Manhattan Beach – Frontal Santa Monica Bay (180701040500)
Outfall Type: Manhole
Nearest Street Address:552 Rindge, Redondo Beach, CA 90273
OF-BCEG-3 Catchment
Redondo Beach Portion of SMB MB HUC-12 area
Beach Cities WMG Portion of SMB MB HUC-12 area
Acres Percent Acres Percent Acres Percent Land Use Category Agricultural 0 0% 25.34 0.97% 53.44 0.70% Commercial 45.09 7.98% 310.96 11.96% 791.58 10.36% Education 7.69 1.36% 150.19 5.78% 403.11 5.28% Industrial 2.56 0.45% 99.04 3.81% 150.34 1.97% Multi-Family Residential 231.42 40.95% 712.54 27.41% 1408.86 18.44% Open Space 1.82 0.32% 106.77 4.11% 375.10 4.91% Single Family Residential 276.59 48.94% 1194.7 45.96% 4456.40 58.34% Total 565.17 100.00% 2599.6 100% 7638.83 100% Municipal Jurisdiction Hermosa Beach 8.07 1.43% 0 0% 848.37 11.11% Manhattan Beach 51.76 9.16% 0 0% 2079.79 27.23% Redondo Beach 505.34 89.41% 2599.6 100% 2599.58 34.03% Torrance 0 0% 0 0% 2111.09 27.64% Total 565.17 100% 2599.6 100% 7638.83 100% Site Description: Consists of single lane two direction residential street with moderate traffic. Storm drain is very deep in this area and sample collection maybe difficult. Further investigation is warranted and should anticipate needing a permit and potentially traffic controls. Site Location: See CIMP Figure 11 Site View:
(Ref: Google Maps)
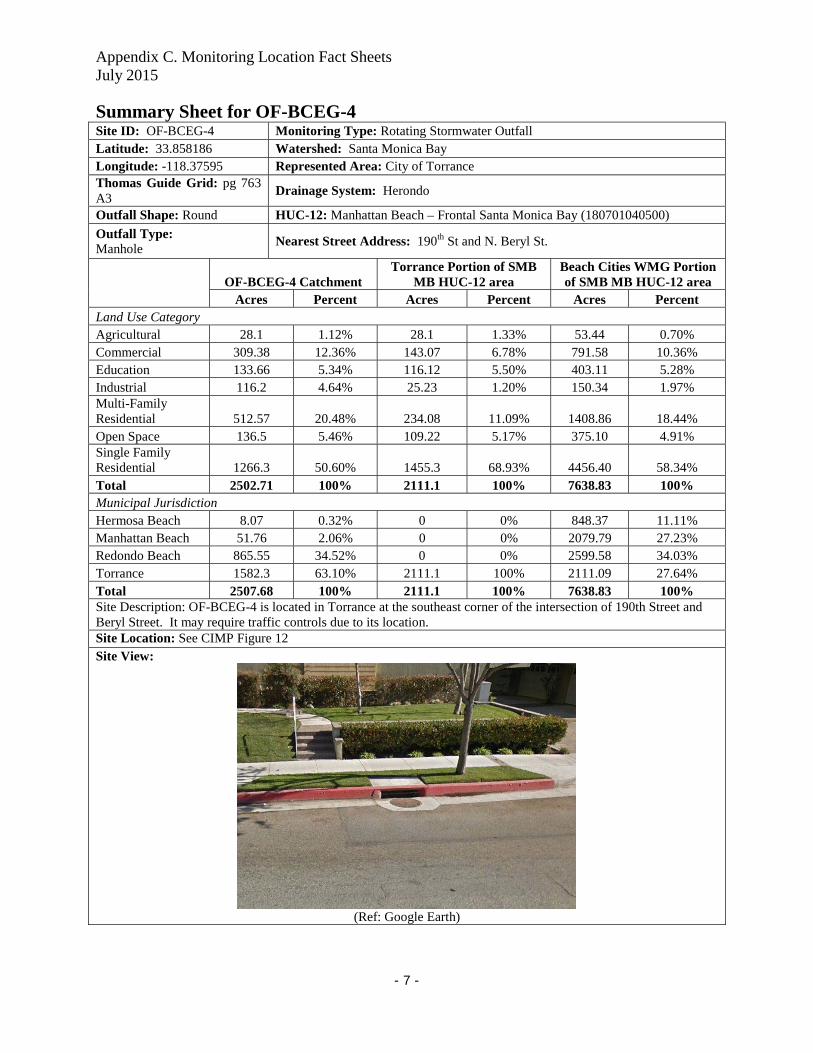
Appendix C. Monitoring Location Fact Sheets July 2015
- 7 -
Summary Sheet for OF-BCEG-4Site ID: OF-BCEG-4 Monitoring Type: Rotating Stormwater Outfall Latitude: 33.858186 Watershed: Santa Monica Bay Longitude: -118.37595 Represented Area: City of Torrance Thomas Guide Grid: pg 763 A3
Drainage System: Herondo
Outfall Shape: Round HUC-12: Manhattan Beach – Frontal Santa Monica Bay (180701040500)
Outfall Type: Manhole
Nearest Street Address: 190th St and N. Beryl St.
OF-BCEG-4 Catchment
Torrance Portion of SMB MB HUC-12 area
Beach Cities WMG Portion of SMB MB HUC-12 area
Acres Percent Acres Percent Acres Percent Land Use Category Agricultural 28.1 1.12% 28.1 1.33% 53.44 0.70% Commercial 309.38 12.36% 143.07 6.78% 791.58 10.36% Education 133.66 5.34% 116.12 5.50% 403.11 5.28% Industrial 116.2 4.64% 25.23 1.20% 150.34 1.97% Multi-Family Residential 512.57 20.48% 234.08 11.09% 1408.86 18.44% Open Space 136.5 5.46% 109.22 5.17% 375.10 4.91% Single Family Residential 1266.3 50.60% 1455.3 68.93% 4456.40 58.34% Total 2502.71 100% 2111.1 100% 7638.83 100% Municipal Jurisdiction Hermosa Beach 8.07 0.32% 0 0% 848.37 11.11% Manhattan Beach 51.76 2.06% 0 0% 2079.79 27.23% Redondo Beach 865.55 34.52% 0 0% 2599.58 34.03% Torrance 1582.3 63.10% 2111.1 100% 2111.09 27.64% Total 2507.68 100% 2111.1 100% 7638.83 100% Site Description: OF-BCEG-4 is located in Torrance at the southeast corner of the intersection of 190th Street and Beryl Street. It may require traffic controls due to its location. Site Location: See CIMP Figure 12 Site View:
(Ref: Google Earth)
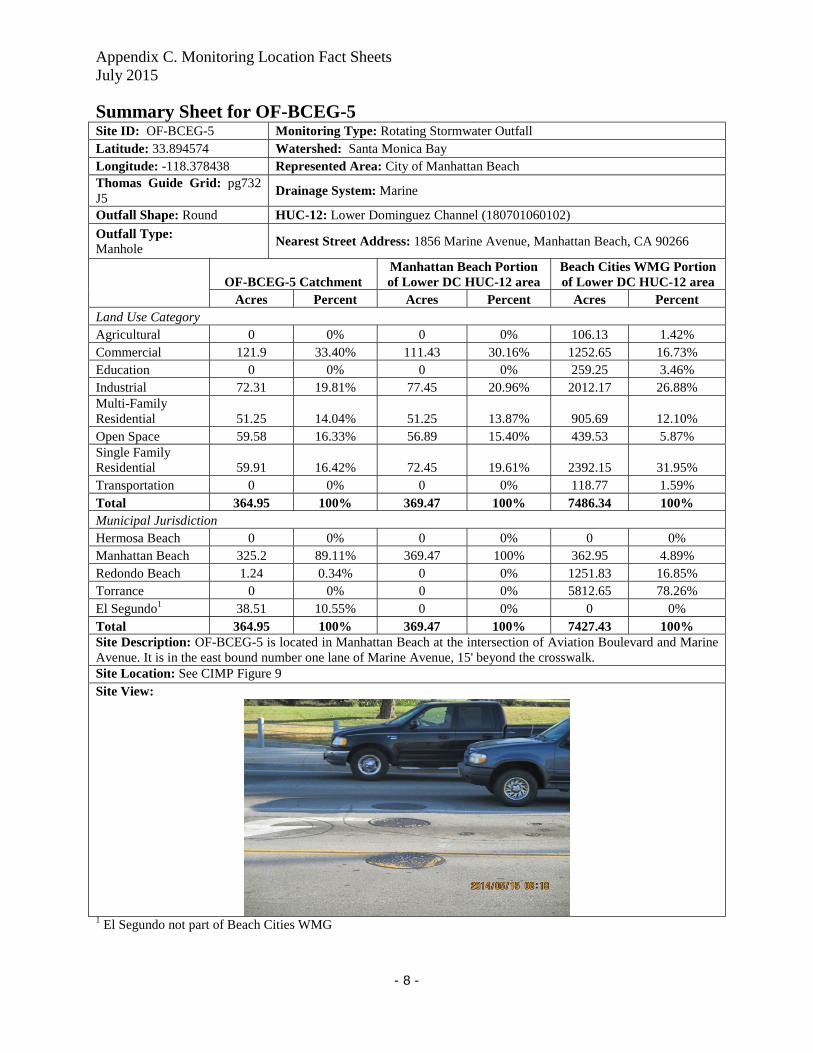
Appendix C. Monitoring Location Fact Sheets July 2015
- 8 -
Summary Sheet for OF-BCEG-5 Site ID: OF-BCEG-5 Monitoring Type: Rotating Stormwater Outfall Latitude: 33.894574 Watershed: Santa Monica Bay Longitude: -118.378438 Represented Area: City of Manhattan Beach Thomas Guide Grid: pg732 J5
Drainage System: Marine
Outfall Shape: Round HUC-12: Lower Dominguez Channel (180701060102)
Outfall Type: Manhole
Nearest Street Address: 1856 Marine Avenue, Manhattan Beach, CA 90266
OF-BCEG-5 Catchment
Manhattan Beach Portion of Lower DC HUC-12 area
Beach Cities WMG Portion of Lower DC HUC-12 area
Acres Percent Acres Percent Acres Percent Land Use Category Agricultural 0 0% 0 0% 106.13 1.42% Commercial 121.9 33.40% 111.43 30.16% 1252.65 16.73% Education 0 0% 0 0% 259.25 3.46% Industrial 72.31 19.81% 77.45 20.96% 2012.17 26.88% Multi-Family Residential 51.25 14.04% 51.25 13.87% 905.69 12.10% Open Space 59.58 16.33% 56.89 15.40% 439.53 5.87% Single Family Residential 59.91 16.42% 72.45 19.61% 2392.15 31.95% Transportation 0 0% 0 0% 118.77 1.59% Total 364.95 100% 369.47 100% 7486.34 100% Municipal Jurisdiction Hermosa Beach 0 0% 0 0% 0 0% Manhattan Beach 325.2 89.11% 369.47 100% 362.95 4.89% Redondo Beach 1.24 0.34% 0 0% 1251.83 16.85% Torrance 0 0% 0 0% 5812.65 78.26% El Segundo1 38.51 10.55% 0 0% 0 0% Total 364.95 100% 369.47 100% 7427.43 100% Site Description: OF-BCEG-5 is located in Manhattan Beach at the intersection of Aviation Boulevard and Marine Avenue. It is in the east bound number one lane of Marine Avenue, 15' beyond the crosswalk. Site Location: See CIMP Figure 9 Site View:
1 El Segundo not part of Beach Cities WMG
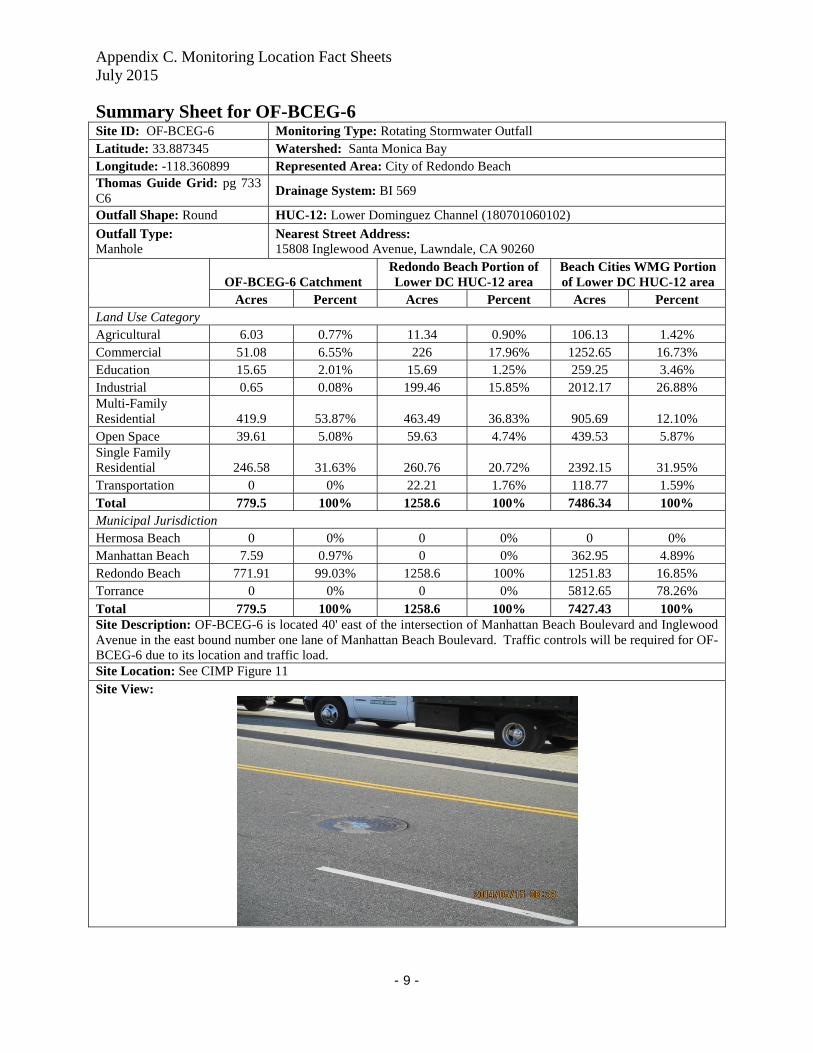
Appendix C. Monitoring Location Fact Sheets July 2015
- 9 -
Summary Sheet for OF-BCEG-6 Site ID: OF-BCEG-6 Monitoring Type: Rotating Stormwater Outfall Latitude: 33.887345 Watershed: Santa Monica Bay Longitude: -118.360899 Represented Area: City of Redondo Beach Thomas Guide Grid: pg 733 C6
Drainage System: BI 569
Outfall Shape: Round HUC-12: Lower Dominguez Channel (180701060102)
Outfall Type: Manhole
Nearest Street Address: 15808 Inglewood Avenue, Lawndale, CA 90260
OF-BCEG-6 Catchment
Redondo Beach Portion of Lower DC HUC-12 area
Beach Cities WMG Portion of Lower DC HUC-12 area
Acres Percent Acres Percent Acres Percent Land Use Category Agricultural 6.03 0.77% 11.34 0.90% 106.13 1.42% Commercial 51.08 6.55% 226 17.96% 1252.65 16.73% Education 15.65 2.01% 15.69 1.25% 259.25 3.46% Industrial 0.65 0.08% 199.46 15.85% 2012.17 26.88% Multi-Family Residential 419.9 53.87% 463.49 36.83% 905.69 12.10% Open Space 39.61 5.08% 59.63 4.74% 439.53 5.87% Single Family Residential 246.58 31.63% 260.76 20.72% 2392.15 31.95% Transportation 0 0% 22.21 1.76% 118.77 1.59% Total 779.5 100% 1258.6 100% 7486.34 100% Municipal Jurisdiction Hermosa Beach 0 0% 0 0% 0 0% Manhattan Beach 7.59 0.97% 0 0% 362.95 4.89% Redondo Beach 771.91 99.03% 1258.6 100% 1251.83 16.85% Torrance 0 0% 0 0% 5812.65 78.26% Total 779.5 100% 1258.6 100% 7427.43 100% Site Description: OF-BCEG-6 is located 40' east of the intersection of Manhattan Beach Boulevard and Inglewood Avenue in the east bound number one lane of Manhattan Beach Boulevard. Traffic controls will be required for OF-BCEG-6 due to its location and traffic load. Site Location: See CIMP Figure 11 Site View:
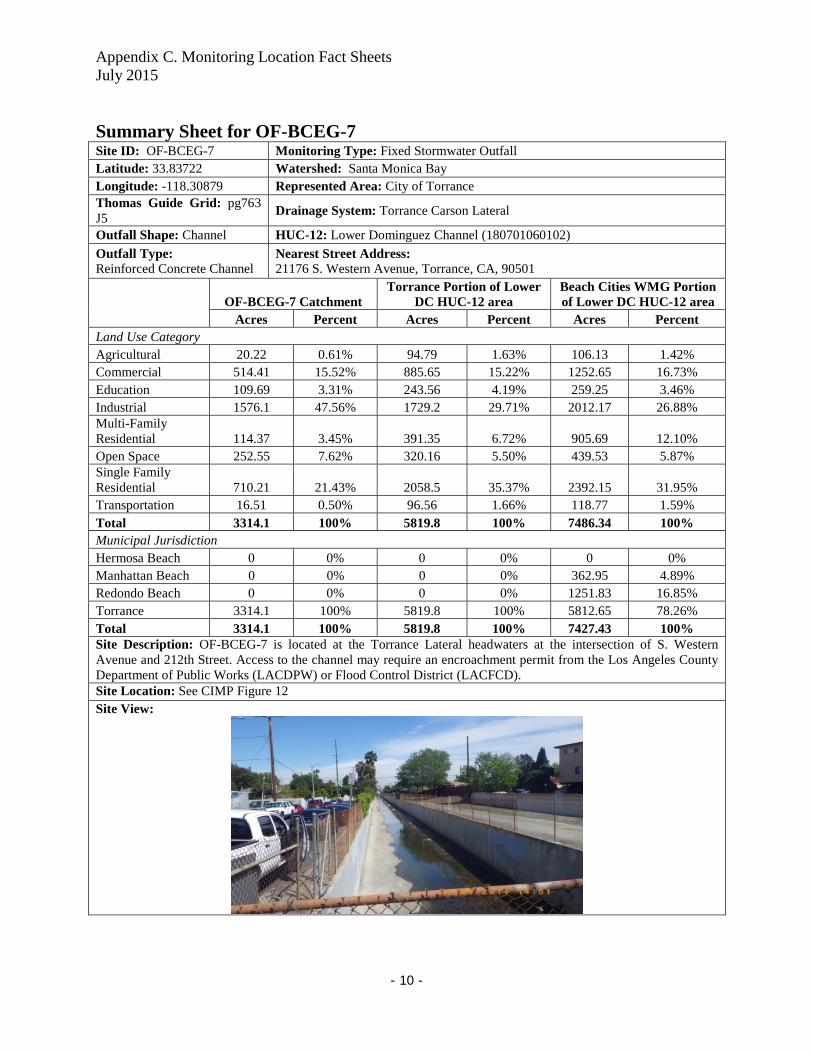
Appendix C. Monitoring Location Fact Sheets July 2015
- 10 -
Summary Sheet for OF-BCEG-7 Site ID: OF-BCEG-7 Monitoring Type: Fixed Stormwater Outfall Latitude: 33.83722 Watershed: Santa Monica Bay Longitude: -118.30879 Represented Area: City of Torrance Thomas Guide Grid: pg763 J5
Drainage System: Torrance Carson Lateral
Outfall Shape: Channel HUC-12: Lower Dominguez Channel (180701060102)
Outfall Type: Reinforced Concrete Channel
Nearest Street Address: 21176 S. Western Avenue, Torrance, CA, 90501
OF-BCEG-7 Catchment
Torrance Portion of Lower DC HUC-12 area
Beach Cities WMG Portion of Lower DC HUC-12 area
Acres Percent Acres Percent Acres Percent Land Use Category Agricultural 20.22 0.61% 94.79 1.63% 106.13 1.42% Commercial 514.41 15.52% 885.65 15.22% 1252.65 16.73% Education 109.69 3.31% 243.56 4.19% 259.25 3.46% Industrial 1576.1 47.56% 1729.2 29.71% 2012.17 26.88% Multi-Family Residential 114.37 3.45% 391.35 6.72% 905.69 12.10% Open Space 252.55 7.62% 320.16 5.50% 439.53 5.87% Single Family Residential 710.21 21.43% 2058.5 35.37% 2392.15 31.95% Transportation 16.51 0.50% 96.56 1.66% 118.77 1.59% Total 3314.1 100% 5819.8 100% 7486.34 100% Municipal Jurisdiction Hermosa Beach 0 0% 0 0% 0 0% Manhattan Beach 0 0% 0 0% 362.95 4.89% Redondo Beach 0 0% 0 0% 1251.83 16.85% Torrance 3314.1 100% 5819.8 100% 5812.65 78.26% Total 3314.1 100% 5819.8 100% 7427.43 100% Site Description: OF-BCEG-7 is located at the Torrance Lateral headwaters at the intersection of S. Western Avenue and 212th Street. Access to the channel may require an encroachment permit from the Los Angeles County Department of Public Works (LACDPW) or Flood Control District (LACFCD). Site Location: See CIMP Figure 12 Site View:
Beach Cities CIMP Appendix D Analytical and Monitoring Procedures
July 2015
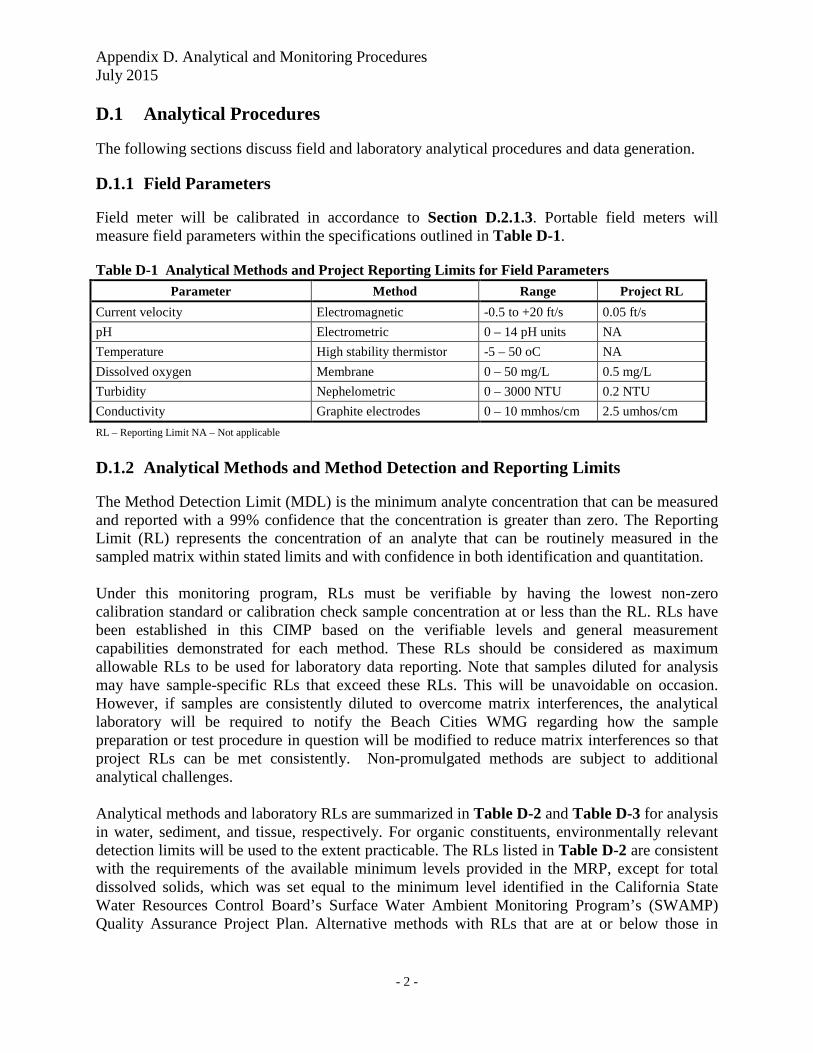
Appendix D. Analytical and Monitoring Procedures July 2015
- 2 -
D.1 Analytical Procedures The following sections discuss field and laboratory analytical procedures and data generation.
D.1.1 Field Parameters Field meter will be calibrated in accordance to Section D.2.1.3. Portable field meters will measure field parameters within the specifications outlined in Table D-1. Table D-1 Analytical Methods and Project Reporting Limits for Field Parameters
Parameter Method Range Project RL
Current velocity Electromagnetic -0.5 to +20 ft/s 0.05 ft/s
pH Electrometric 0 – 14 pH units NA
Temperature High stability thermistor -5 – 50 oC NA
Dissolved oxygen Membrane 0 – 50 mg/L 0.5 mg/L
Turbidity Nephelometric 0 – 3000 NTU 0.2 NTU
Conductivity Graphite electrodes 0 – 10 mmhos/cm 2.5 umhos/cm
RL – Reporting Limit NA – Not applicable
D.1.2 Analytical Methods and Method Detection and Reporting Limits The Method Detection Limit (MDL) is the minimum analyte concentration that can be measured and reported with a 99% confidence that the concentration is greater than zero. The Reporting Limit (RL) represents the concentration of an analyte that can be routinely measured in the sampled matrix within stated limits and with confidence in both identification and quantitation. Under this monitoring program, RLs must be verifiable by having the lowest non-zero calibration standard or calibration check sample concentration at or less than the RL. RLs have been established in this CIMP based on the verifiable levels and general measurement capabilities demonstrated for each method. These RLs should be considered as maximum allowable RLs to be used for laboratory data reporting. Note that samples diluted for analysis may have sample-specific RLs that exceed these RLs. This will be unavoidable on occasion. However, if samples are consistently diluted to overcome matrix interferences, the analytical laboratory will be required to notify the Beach Cities WMG regarding how the sample preparation or test procedure in question will be modified to reduce matrix interferences so that project RLs can be met consistently. Non-promulgated methods are subject to additional analytical challenges. Analytical methods and laboratory RLs are summarized in Table D-2 and Table D-3 for analysis in water, sediment, and tissue, respectively. For organic constituents, environmentally relevant detection limits will be used to the extent practicable. The RLs listed in Table D-2 are consistent with the requirements of the available minimum levels provided in the MRP, except for total dissolved solids, which was set equal to the minimum level identified in the California State Water Resources Control Board’s Surface Water Ambient Monitoring Program’s (SWAMP) Quality Assurance Project Plan. Alternative methods with RLs that are at or below those in
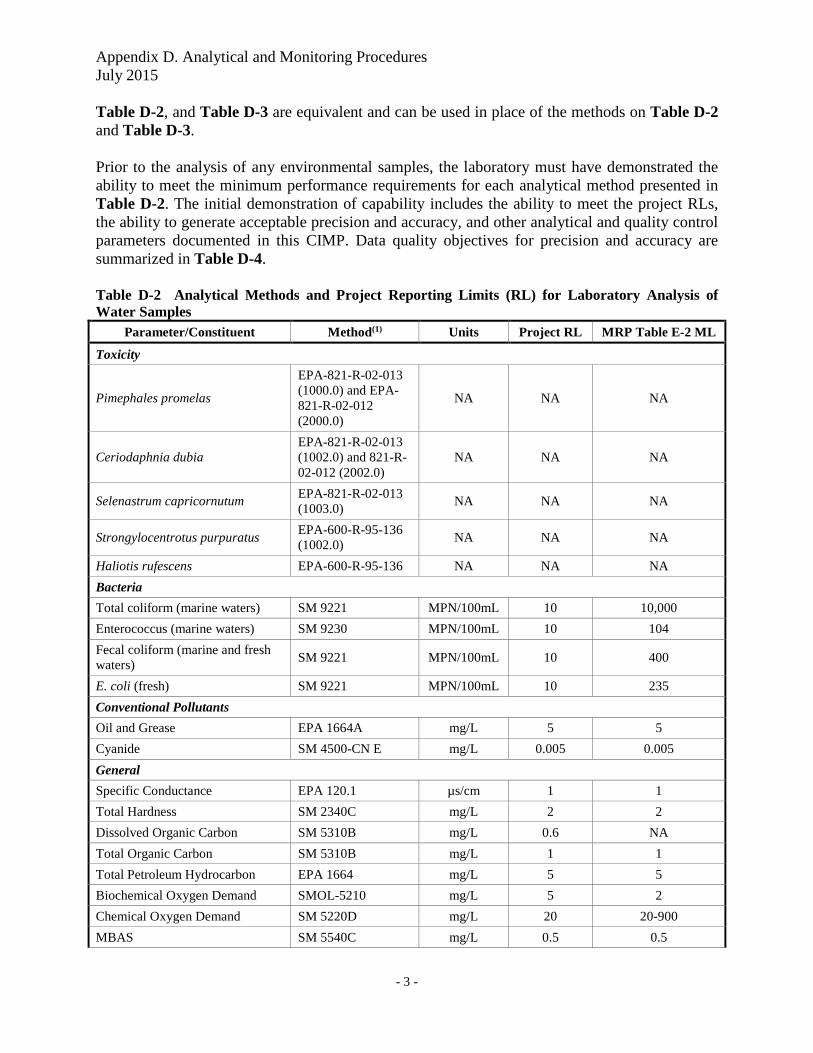
Appendix D. Analytical and Monitoring Procedures July 2015
- 3 -
Table D-2, and Table D-3 are equivalent and can be used in place of the methods on Table D-2 and Table D-3. Prior to the analysis of any environmental samples, the laboratory must have demonstrated the ability to meet the minimum performance requirements for each analytical method presented in Table D-2. The initial demonstration of capability includes the ability to meet the project RLs, the ability to generate acceptable precision and accuracy, and other analytical and quality control parameters documented in this CIMP. Data quality objectives for precision and accuracy are summarized in Table D-4. Table D-2 Analytical Methods and Project Reporting Limits (RL) for Laboratory Analysis of Water Samples
Parameter/Constituent Method(1) Units Project RL MRP Table E-2 ML
Toxicity
Pimephales promelas
EPA-821-R-02-013 (1000.0) and EPA-821-R-02-012 (2000.0)
NA NA NA
Ceriodaphnia dubia EPA-821-R-02-013 (1002.0) and 821-R-02-012 (2002.0)
NA NA NA
Selenastrum capricornutum EPA-821-R-02-013 (1003.0)
NA NA NA
Strongylocentrotus purpuratus EPA-600-R-95-136 (1002.0)
NA NA NA
Haliotis rufescens EPA-600-R-95-136 NA NA NA
Bacteria
Total coliform (marine waters) SM 9221 MPN/100mL 10 10,000
Enterococcus (marine waters) SM 9230 MPN/100mL 10 104
Fecal coliform (marine and fresh waters)
SM 9221 MPN/100mL 10 400
E. coli (fresh) SM 9221 MPN/100mL 10 235
Conventional Pollutants
Oil and Grease EPA 1664A mg/L 5 5
Cyanide SM 4500-CN E mg/L 0.005 0.005
General Specific Conductance EPA 120.1 µs/cm 1 1
Total Hardness SM 2340C mg/L 2 2
Dissolved Organic Carbon SM 5310B mg/L 0.6 NA
Total Organic Carbon SM 5310B mg/L 1 1
Total Petroleum Hydrocarbon EPA 1664 mg/L 5 5
Biochemical Oxygen Demand SMOL-5210 mg/L 5 2
Chemical Oxygen Demand SM 5220D mg/L 20 20-900
MBAS SM 5540C mg/L 0.5 0.5
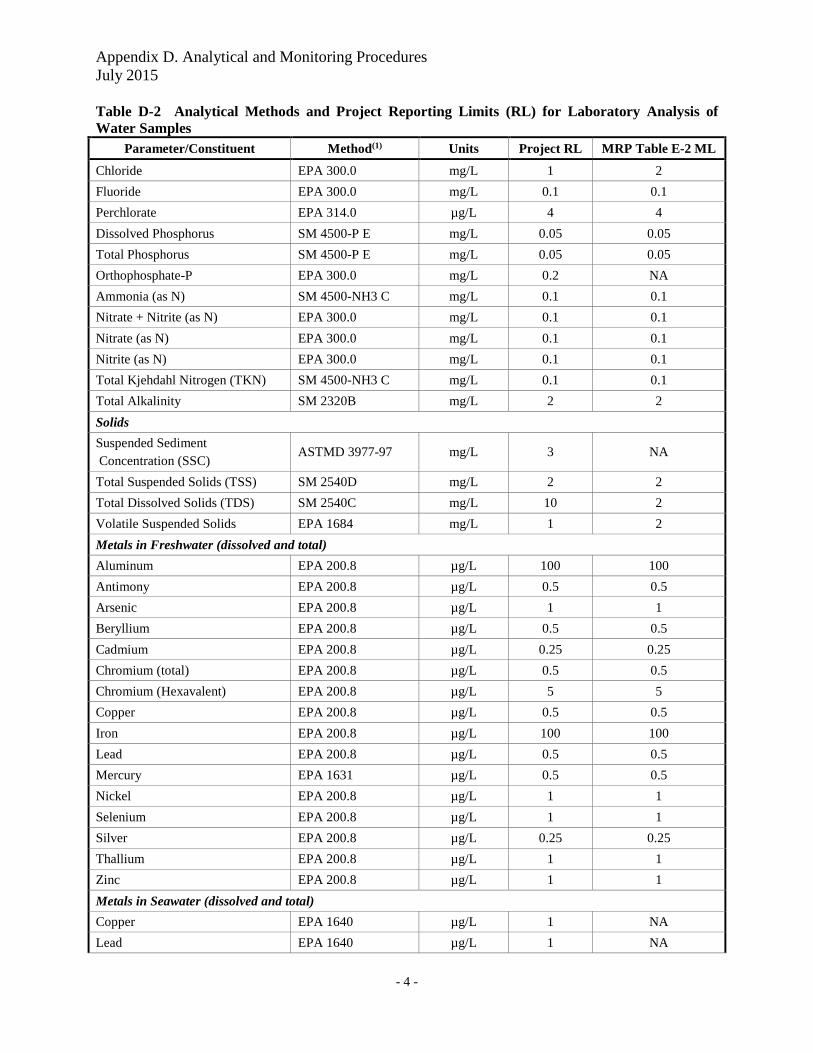
Appendix D. Analytical and Monitoring Procedures July 2015
- 4 -
Table D-2 Analytical Methods and Project Reporting Limits (RL) for Laboratory Analysis of Water Samples
Parameter/Constituent Method(1) Units Project RL MRP Table E-2 ML
Chloride EPA 300.0 mg/L 1 2
Fluoride EPA 300.0 mg/L 0.1 0.1
Perchlorate EPA 314.0 µg/L 4 4
Dissolved Phosphorus SM 4500-P E mg/L 0.05 0.05
Total Phosphorus SM 4500-P E mg/L 0.05 0.05
Orthophosphate-P EPA 300.0 mg/L 0.2 NA
Ammonia (as N) SM 4500-NH3 C mg/L 0.1 0.1
Nitrate + Nitrite (as N) EPA 300.0 mg/L 0.1 0.1
Nitrate (as N) EPA 300.0 mg/L 0.1 0.1
Nitrite (as N) EPA 300.0 mg/L 0.1 0.1
Total Kjehdahl Nitrogen (TKN) SM 4500-NH3 C mg/L 0.1 0.1
Total Alkalinity SM 2320B mg/L 2 2
Solids
Suspended Sediment Concentration (SSC)
ASTMD 3977-97 mg/L 3 NA
Total Suspended Solids (TSS) SM 2540D mg/L 2 2
Total Dissolved Solids (TDS) SM 2540C mg/L 10 2
Volatile Suspended Solids EPA 1684 mg/L 1 2
Metals in Freshwater (dissolved and total) Aluminum EPA 200.8 µg/L 100 100
Antimony EPA 200.8 µg/L 0.5 0.5
Arsenic EPA 200.8 µg/L 1 1
Beryllium EPA 200.8 µg/L 0.5 0.5
Cadmium EPA 200.8 µg/L 0.25 0.25
Chromium (total) EPA 200.8 µg/L 0.5 0.5
Chromium (Hexavalent) EPA 200.8 µg/L 5 5
Copper EPA 200.8 µg/L 0.5 0.5
Iron EPA 200.8 µg/L 100 100
Lead EPA 200.8 µg/L 0.5 0.5
Mercury EPA 1631 µg/L 0.5 0.5
Nickel EPA 200.8 µg/L 1 1
Selenium EPA 200.8 µg/L 1 1
Silver EPA 200.8 µg/L 0.25 0.25
Thallium EPA 200.8 µg/L 1 1
Zinc EPA 200.8 µg/L 1 1
Metals in Seawater (dissolved and total) Copper EPA 1640 µg/L 1 NA
Lead EPA 1640 µg/L 1 NA
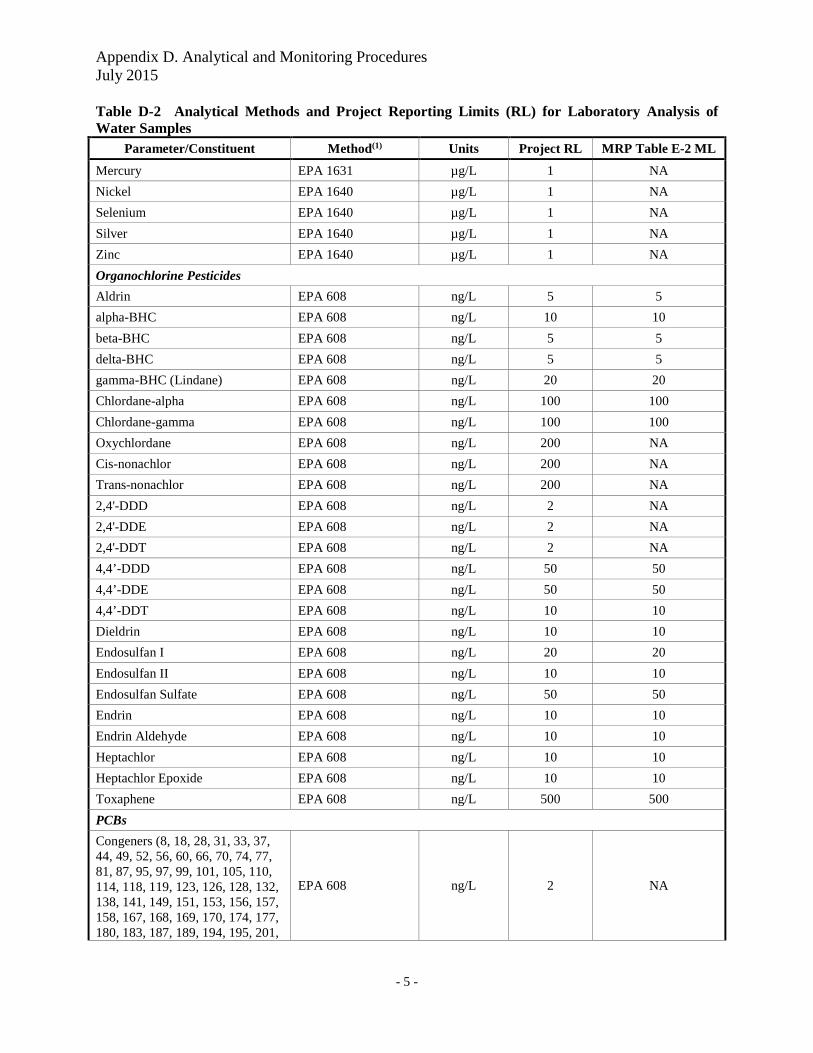
Appendix D. Analytical and Monitoring Procedures July 2015
- 5 -
Table D-2 Analytical Methods and Project Reporting Limits (RL) for Laboratory Analysis of Water Samples
Parameter/Constituent Method(1) Units Project RL MRP Table E-2 ML
Mercury EPA 1631 µg/L 1 NA
Nickel EPA 1640 µg/L 1 NA
Selenium EPA 1640 µg/L 1 NA
Silver EPA 1640 µg/L 1 NA
Zinc EPA 1640 µg/L 1 NA
Organochlorine Pesticides
Aldrin EPA 608 ng/L 5 5
alpha-BHC EPA 608 ng/L 10 10
beta-BHC EPA 608 ng/L 5 5
delta-BHC EPA 608 ng/L 5 5
gamma-BHC (Lindane) EPA 608 ng/L 20 20
Chlordane-alpha EPA 608 ng/L 100 100
Chlordane-gamma EPA 608 ng/L 100 100
Oxychlordane EPA 608 ng/L 200 NA
Cis-nonachlor EPA 608 ng/L 200 NA
Trans-nonachlor EPA 608 ng/L 200 NA
2,4'-DDD EPA 608 ng/L 2 NA
2,4'-DDE EPA 608 ng/L 2 NA
2,4'-DDT EPA 608 ng/L 2 NA
4,4’-DDD EPA 608 ng/L 50 50
4,4’-DDE EPA 608 ng/L 50 50
4,4’-DDT EPA 608 ng/L 10 10
Dieldrin EPA 608 ng/L 10 10
Endosulfan I EPA 608 ng/L 20 20
Endosulfan II EPA 608 ng/L 10 10
Endosulfan Sulfate EPA 608 ng/L 50 50
Endrin EPA 608 ng/L 10 10
Endrin Aldehyde EPA 608 ng/L 10 10
Heptachlor EPA 608 ng/L 10 10
Heptachlor Epoxide EPA 608 ng/L 10 10
Toxaphene EPA 608 ng/L 500 500
PCBs
Congeners (8, 18, 28, 31, 33, 37, 44, 49, 52, 56, 60, 66, 70, 74, 77, 81, 87, 95, 97, 99, 101, 105, 110, 114, 118, 119, 123, 126, 128, 132, 138, 141, 149, 151, 153, 156, 157, 158, 167, 168, 169, 170, 174, 177, 180, 183, 187, 189, 194, 195, 201,
EPA 608 ng/L 2 NA
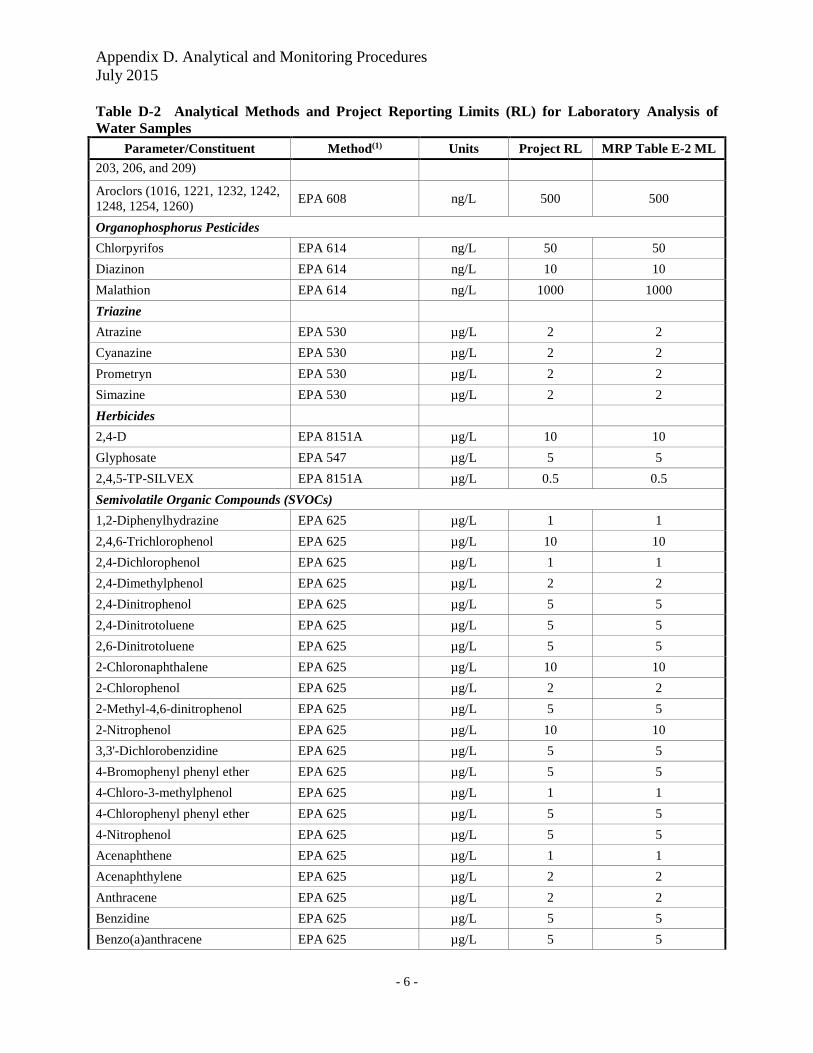
Appendix D. Analytical and Monitoring Procedures July 2015
- 6 -
Table D-2 Analytical Methods and Project Reporting Limits (RL) for Laboratory Analysis of Water Samples
Parameter/Constituent Method(1) Units Project RL MRP Table E-2 ML
203, 206, and 209)
Aroclors (1016, 1221, 1232, 1242, 1248, 1254, 1260)
EPA 608 ng/L 500 500
Organophosphorus Pesticides
Chlorpyrifos EPA 614 ng/L 50 50
Diazinon EPA 614 ng/L 10 10
Malathion EPA 614 ng/L 1000 1000
Triazine
Atrazine EPA 530 µg/L 2 2
Cyanazine EPA 530 µg/L 2 2
Prometryn EPA 530 µg/L 2 2
Simazine EPA 530 µg/L 2 2
Herbicides
2,4-D EPA 8151A µg/L 10 10
Glyphosate EPA 547 µg/L 5 5
2,4,5-TP-SILVEX EPA 8151A µg/L 0.5 0.5
Semivolatile Organic Compounds (SVOCs) 1,2-Diphenylhydrazine EPA 625 µg/L 1 1
2,4,6-Trichlorophenol EPA 625 µg/L 10 10
2,4-Dichlorophenol EPA 625 µg/L 1 1
2,4-Dimethylphenol EPA 625 µg/L 2 2
2,4-Dinitrophenol EPA 625 µg/L 5 5
2,4-Dinitrotoluene EPA 625 µg/L 5 5
2,6-Dinitrotoluene EPA 625 µg/L 5 5
2-Chloronaphthalene EPA 625 µg/L 10 10
2-Chlorophenol EPA 625 µg/L 2 2
2-Methyl-4,6-dinitrophenol EPA 625 µg/L 5 5
2-Nitrophenol EPA 625 µg/L 10 10
3,3'-Dichlorobenzidine EPA 625 µg/L 5 5
4-Bromophenyl phenyl ether EPA 625 µg/L 5 5
4-Chloro-3-methylphenol EPA 625 µg/L 1 1
4-Chlorophenyl phenyl ether EPA 625 µg/L 5 5
4-Nitrophenol EPA 625 µg/L 5 5
Acenaphthene EPA 625 µg/L 1 1
Acenaphthylene EPA 625 µg/L 2 2
Anthracene EPA 625 µg/L 2 2
Benzidine EPA 625 µg/L 5 5
Benzo(a)anthracene EPA 625 µg/L 5 5
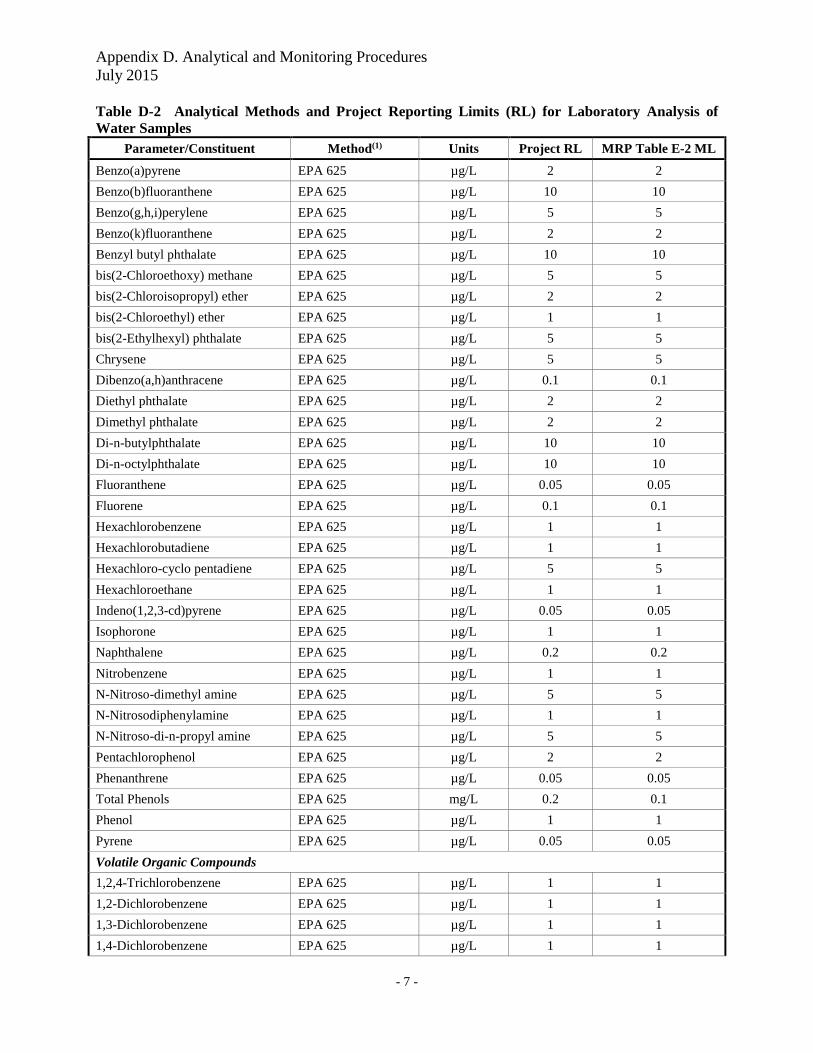
Appendix D. Analytical and Monitoring Procedures July 2015
- 7 -
Table D-2 Analytical Methods and Project Reporting Limits (RL) for Laboratory Analysis of Water Samples
Parameter/Constituent Method(1) Units Project RL MRP Table E-2 ML
Benzo(a)pyrene EPA 625 µg/L 2 2
Benzo(b)fluoranthene EPA 625 µg/L 10 10
Benzo(g,h,i)perylene EPA 625 µg/L 5 5
Benzo(k)fluoranthene EPA 625 µg/L 2 2
Benzyl butyl phthalate EPA 625 µg/L 10 10
bis(2-Chloroethoxy) methane EPA 625 µg/L 5 5
bis(2-Chloroisopropyl) ether EPA 625 µg/L 2 2
bis(2-Chloroethyl) ether EPA 625 µg/L 1 1
bis(2-Ethylhexyl) phthalate EPA 625 µg/L 5 5
Chrysene EPA 625 µg/L 5 5
Dibenzo(a,h)anthracene EPA 625 µg/L 0.1 0.1
Diethyl phthalate EPA 625 µg/L 2 2
Dimethyl phthalate EPA 625 µg/L 2 2
Di-n-butylphthalate EPA 625 µg/L 10 10
Di-n-octylphthalate EPA 625 µg/L 10 10
Fluoranthene EPA 625 µg/L 0.05 0.05
Fluorene EPA 625 µg/L 0.1 0.1
Hexachlorobenzene EPA 625 µg/L 1 1
Hexachlorobutadiene EPA 625 µg/L 1 1
Hexachloro-cyclo pentadiene EPA 625 µg/L 5 5
Hexachloroethane EPA 625 µg/L 1 1
Indeno(1,2,3-cd)pyrene EPA 625 µg/L 0.05 0.05
Isophorone EPA 625 µg/L 1 1
Naphthalene EPA 625 µg/L 0.2 0.2
Nitrobenzene EPA 625 µg/L 1 1
N-Nitroso-dimethyl amine EPA 625 µg/L 5 5
N-Nitrosodiphenylamine EPA 625 µg/L 1 1
N-Nitroso-di-n-propyl amine EPA 625 µg/L 5 5
Pentachlorophenol EPA 625 µg/L 2 2
Phenanthrene EPA 625 µg/L 0.05 0.05
Total Phenols EPA 625 mg/L 0.2 0.1
Phenol EPA 625 µg/L 1 1
Pyrene EPA 625 µg/L 0.05 0.05
Volatile Organic Compounds
1,2,4-Trichlorobenzene EPA 625 µg/L 1 1
1,2-Dichlorobenzene EPA 625 µg/L 1 1
1,3-Dichlorobenzene EPA 625 µg/L 1 1
1,4-Dichlorobenzene EPA 625 µg/L 1 1
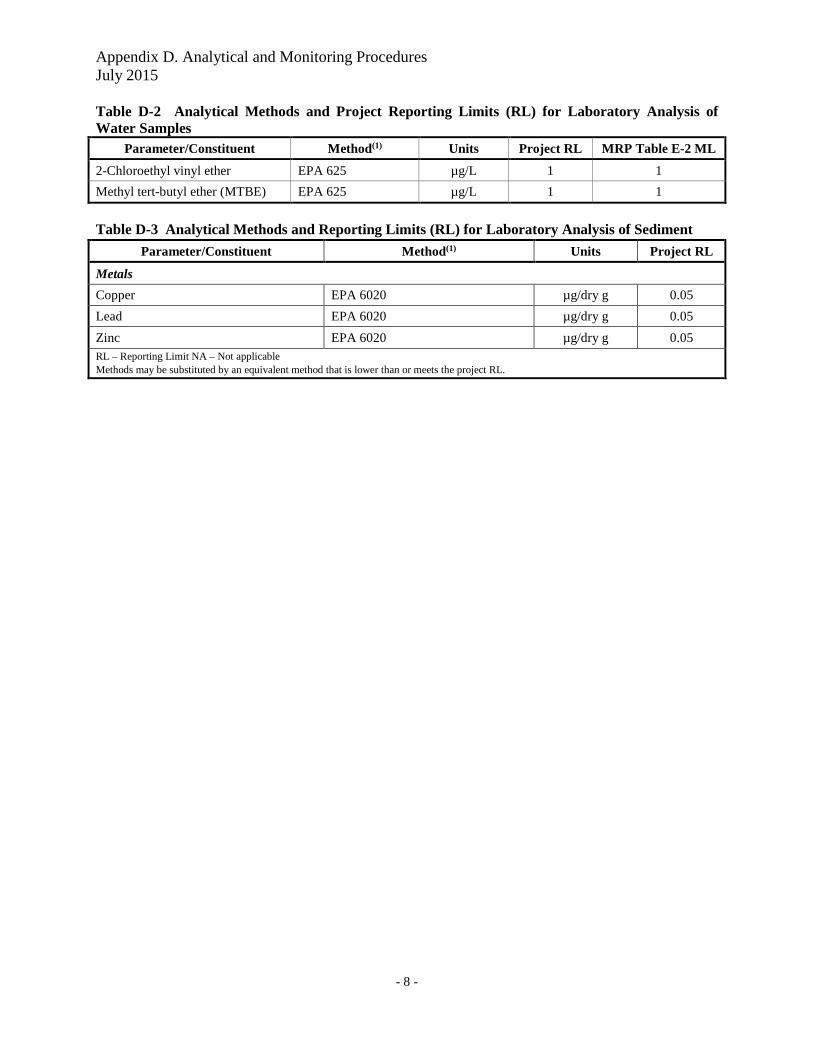
Appendix D. Analytical and Monitoring Procedures July 2015
- 8 -
Table D-2 Analytical Methods and Project Reporting Limits (RL) for Laboratory Analysis of Water Samples
Parameter/Constituent Method(1) Units Project RL MRP Table E-2 ML
2-Chloroethyl vinyl ether EPA 625 µg/L 1 1
Methyl tert-butyl ether (MTBE) EPA 625 µg/L 1 1
Table D-3 Analytical Methods and Reporting Limits (RL) for Laboratory Analysis of Sediment
Parameter/Constituent Method(1) Units Project RL
Metals
Copper EPA 6020 µg/dry g 0.05
Lead EPA 6020 µg/dry g 0.05
Zinc EPA 6020 µg/dry g 0.05 RL – Reporting Limit NA – Not applicable Methods may be substituted by an equivalent method that is lower than or meets the project RL.
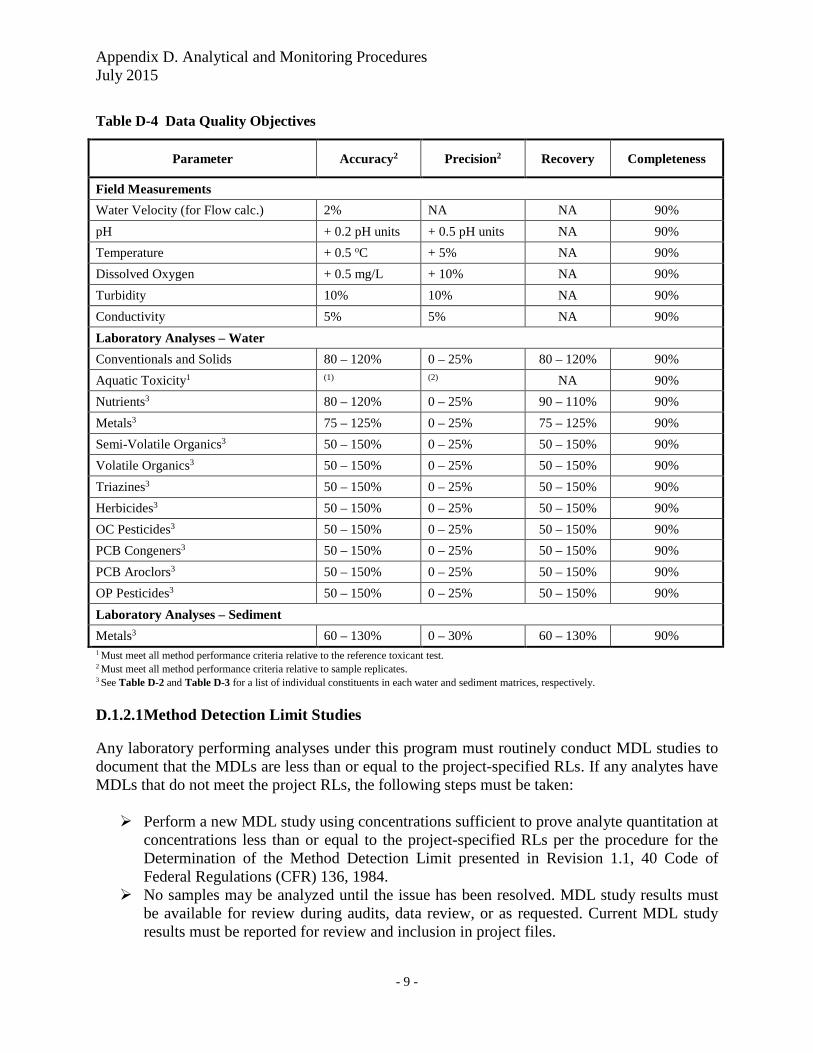
Appendix D. Analytical and Monitoring Procedures July 2015
- 9 -
Table D-4 Data Quality Objectives
Parameter Accuracy2 Precision2 Recovery Completeness
Field Measurements
Water Velocity (for Flow calc.) 2% NA NA 90%
pH + 0.2 pH units + 0.5 pH units NA 90%
Temperature + 0.5 oC + 5% NA 90%
Dissolved Oxygen + 0.5 mg/L + 10% NA 90%
Turbidity 10% 10% NA 90%
Conductivity 5% 5% NA 90%
Laboratory Analyses – Water
Conventionals and Solids 80 – 120% 0 – 25% 80 – 120% 90%
Aquatic Toxicity1 (1) (2) NA 90%
Nutrients3 80 – 120% 0 – 25% 90 – 110% 90%
Metals3 75 – 125% 0 – 25% 75 – 125% 90%
Semi-Volatile Organics3 50 – 150% 0 – 25% 50 – 150% 90%
Volatile Organics3 50 – 150% 0 – 25% 50 – 150% 90%
Triazines3 50 – 150% 0 – 25% 50 – 150% 90%
Herbicides3 50 – 150% 0 – 25% 50 – 150% 90%
OC Pesticides3 50 – 150% 0 – 25% 50 – 150% 90%
PCB Congeners3 50 – 150% 0 – 25% 50 – 150% 90%
PCB Aroclors3 50 – 150% 0 – 25% 50 – 150% 90%
OP Pesticides3 50 – 150% 0 – 25% 50 – 150% 90%
Laboratory Analyses – Sediment
Metals3 60 – 130% 0 – 30% 60 – 130% 90% 1 Must meet all method performance criteria relative to the reference toxicant test. 2 Must meet all method performance criteria relative to sample replicates. 3 See Table D-2 and Table D-3 for a list of individual constituents in each water and sediment matrices, respectively.
D.1.2.1 Method Detection Limit Studies Any laboratory performing analyses under this program must routinely conduct MDL studies to document that the MDLs are less than or equal to the project-specified RLs. If any analytes have MDLs that do not meet the project RLs, the following steps must be taken: Perform a new MDL study using concentrations sufficient to prove analyte quantitation at
concentrations less than or equal to the project-specified RLs per the procedure for the Determination of the Method Detection Limit presented in Revision 1.1, 40 Code of Federal Regulations (CFR) 136, 1984.
No samples may be analyzed until the issue has been resolved. MDL study results must be available for review during audits, data review, or as requested. Current MDL study results must be reported for review and inclusion in project files.
Appendix D. Analytical and Monitoring Procedures July 2015
- 10 -
An MDL is developed from seven aliquots of a standard containing all analytes of interest spiked at five times the expected MDL. These aliquots are processed and analyzed in the same manner as environmental samples. The results are then used to calculate the MDL. If the calculated MDL is less than 0.33 times the spiked concentration, another MDL study should be performed using lower spiked concentrations. D.1.2.2 Project Reporting Limits Laboratories generally establish RLs that are reported with the analytical results—these may be called reporting limits, detection limits, reporting detection limits, or several other terms by the reporting laboratory. These laboratory limits must be less than or equal to the project RLs listed in Table D-2. Wherever possible, project RLs are lower than the relevant numeric criteria or toxicity thresholds. Laboratories performing analyses for this project must have documentation to support quantitation at the required levels. D.1.2.3 Laboratory Standards and Reagents All stock standards and reagents used for standard solutions and extractions must be tracked through the laboratory. The preparation and use of all working standards must be documented according to procedures outlined in each laboratory’s Quality Assurance (QA) Manual; standards must be traceable according to USEPA, A2LA or National Institute for Standards and Technology (NIST) criteria. Records must have sufficient detail to allow determination of the identity, concentration, and viability of the standards, including any dilutions performed to obtain the working standard. Date of preparation, analyte or mixture, concentration, name of preparer, lot or cylinder number, and expiration date, if applicable, must be recorded on each working standard. D.1.2.4 Sample Containers, Storage, Preservation, and Holding Times Sample containers must be pre-cleaned and certified free of contamination according to the USEPA specification for the appropriate methods. Sample container, storage and preservation, and holding time requirements are provided in Table D-5. The analytical laboratories will supply sample containers that already contain preservative (Table D-5), including ultra-pure hydrochloric and nitric acid, where applicable. After collection, samples will be stored at 4°C until arrival at the contract laboratory.
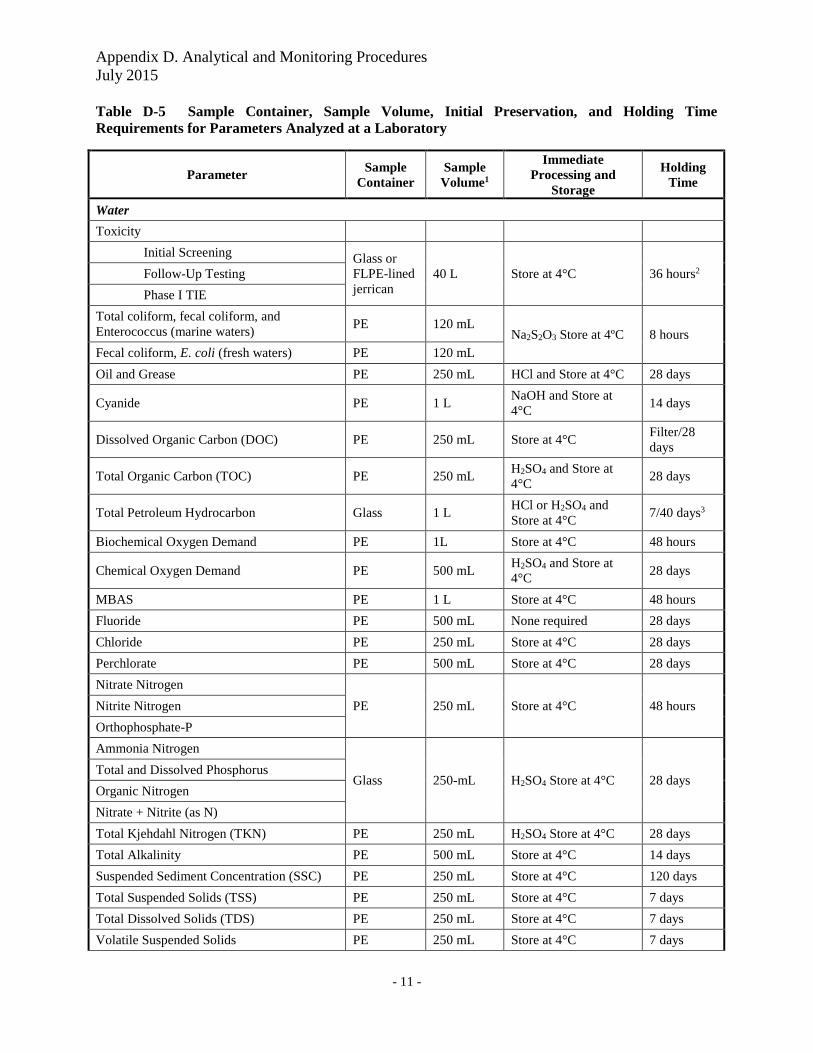
Appendix D. Analytical and Monitoring Procedures July 2015
- 11 -
Table D-5 Sample Container, Sample Volume, Initial Preservation, and Holding Time Requirements for Parameters Analyzed at a Laboratory
Parameter Sample
Container Sample
Volume1
Immediate Processing and
Storage
Holding Time
Water
Toxicity
Initial Screening Glass or FLPE-lined jerrican
40 L Store at 4°C 36 hours2 Follow-Up Testing
Phase I TIE
Total coliform, fecal coliform, and Enterococcus (marine waters)
PE 120 mL Na2S2O3 Store at 4ºC 8 hours
Fecal coliform, E. coli (fresh waters) PE 120 mL
Oil and Grease PE 250 mL HCl and Store at 4°C 28 days
Cyanide PE 1 L NaOH and Store at 4°C
14 days
Dissolved Organic Carbon (DOC) PE 250 mL Store at 4°C Filter/28 days
Total Organic Carbon (TOC) PE 250 mL H2SO4 and Store at 4°C
28 days
Total Petroleum Hydrocarbon Glass 1 L HCl or H2SO4 and Store at 4°C
7/40 days3
Biochemical Oxygen Demand PE 1L Store at 4°C 48 hours
Chemical Oxygen Demand PE 500 mL H2SO4 and Store at 4°C
28 days
MBAS PE 1 L Store at 4°C 48 hours
Fluoride PE 500 mL None required 28 days
Chloride PE 250 mL Store at 4°C 28 days
Perchlorate PE 500 mL Store at 4°C 28 days
Nitrate Nitrogen
PE 250 mL Store at 4°C 48 hours Nitrite Nitrogen
Orthophosphate-P
Ammonia Nitrogen
Glass 250-mL H2SO4 Store at 4°C 28 days Total and Dissolved Phosphorus
Organic Nitrogen
Nitrate + Nitrite (as N)
Total Kjehdahl Nitrogen (TKN) PE 250 mL H2SO4 Store at 4°C 28 days
Total Alkalinity PE 500 mL Store at 4°C 14 days
Suspended Sediment Concentration (SSC) PE 250 mL Store at 4°C 120 days
Total Suspended Solids (TSS) PE 250 mL Store at 4°C 7 days
Total Dissolved Solids (TDS) PE 250 mL Store at 4°C 7 days
Volatile Suspended Solids PE 250 mL Store at 4°C 7 days
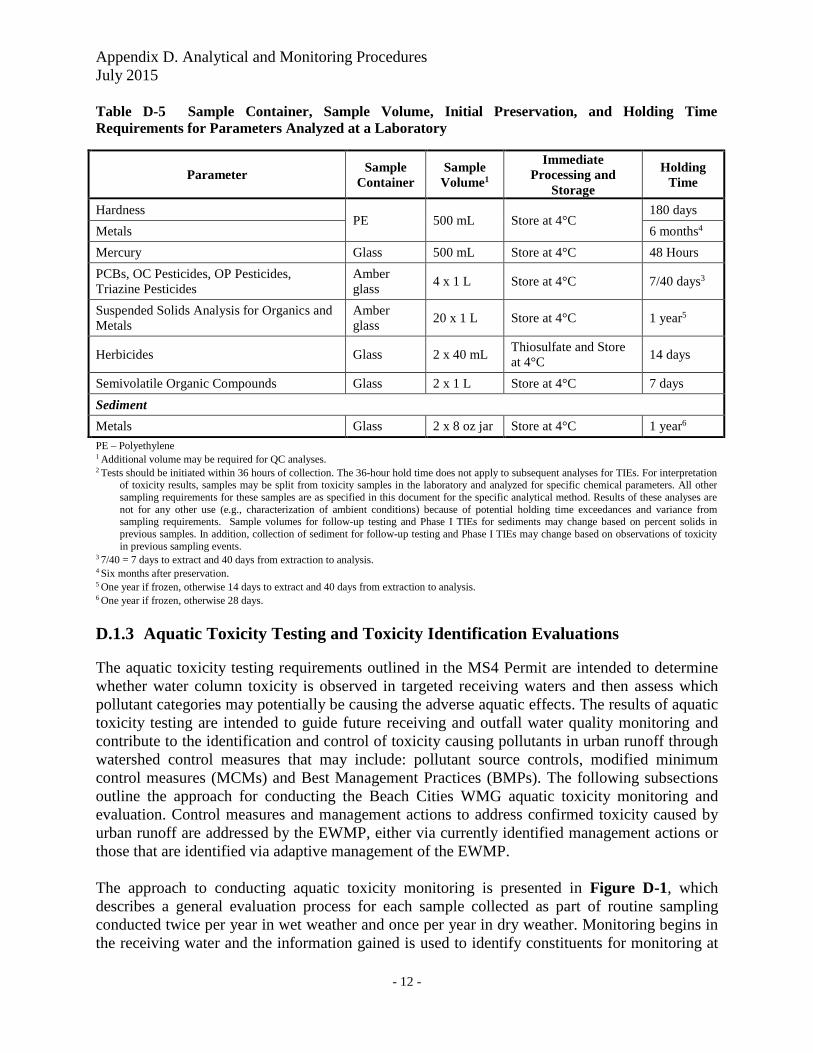
Appendix D. Analytical and Monitoring Procedures July 2015
- 12 -
Table D-5 Sample Container, Sample Volume, Initial Preservation, and Holding Time Requirements for Parameters Analyzed at a Laboratory
Parameter Sample
Container Sample
Volume1
Immediate Processing and
Storage
Holding Time
Hardness PE 500 mL Store at 4°C
180 days
Metals 6 months4
Mercury Glass 500 mL Store at 4°C 48 Hours
PCBs, OC Pesticides, OP Pesticides, Triazine Pesticides
Amber glass
4 x 1 L Store at 4°C 7/40 days3
Suspended Solids Analysis for Organics and Metals
Amber glass
20 x 1 L Store at 4°C 1 year5
Herbicides Glass 2 x 40 mL Thiosulfate and Store at 4°C
14 days
Semivolatile Organic Compounds Glass 2 x 1 L Store at 4°C 7 days
Sediment Metals Glass 2 x 8 oz jar Store at 4°C 1 year6
PE – Polyethylene 1 Additional volume may be required for QC analyses. 2 Tests should be initiated within 36 hours of collection. The 36-hour hold time does not apply to subsequent analyses for TIEs. For interpretation
of toxicity results, samples may be split from toxicity samples in the laboratory and analyzed for specific chemical parameters. All other sampling requirements for these samples are as specified in this document for the specific analytical method. Results of these analyses are not for any other use (e.g., characterization of ambient conditions) because of potential holding time exceedances and variance from sampling requirements. Sample volumes for follow-up testing and Phase I TIEs for sediments may change based on percent solids in previous samples. In addition, collection of sediment for follow-up testing and Phase I TIEs may change based on observations of toxicity in previous sampling events.
3 7/40 = 7 days to extract and 40 days from extraction to analysis. 4 Six months after preservation. 5 One year if frozen, otherwise 14 days to extract and 40 days from extraction to analysis. 6 One year if frozen, otherwise 28 days.
D.1.3 Aquatic Toxicity Testing and Toxicity Identification Evaluations The aquatic toxicity testing requirements outlined in the MS4 Permit are intended to determine whether water column toxicity is observed in targeted receiving waters and then assess which pollutant categories may potentially be causing the adverse aquatic effects. The results of aquatic toxicity testing are intended to guide future receiving and outfall water quality monitoring and contribute to the identification and control of toxicity causing pollutants in urban runoff through watershed control measures that may include: pollutant source controls, modified minimum control measures (MCMs) and Best Management Practices (BMPs). The following subsections outline the approach for conducting the Beach Cities WMG aquatic toxicity monitoring and evaluation. Control measures and management actions to address confirmed toxicity caused by urban runoff are addressed by the EWMP, either via currently identified management actions or those that are identified via adaptive management of the EWMP. The approach to conducting aquatic toxicity monitoring is presented in Figure D-1, which describes a general evaluation process for each sample collected as part of routine sampling conducted twice per year in wet weather and once per year in dry weather. Monitoring begins in the receiving water and the information gained is used to identify constituents for monitoring at
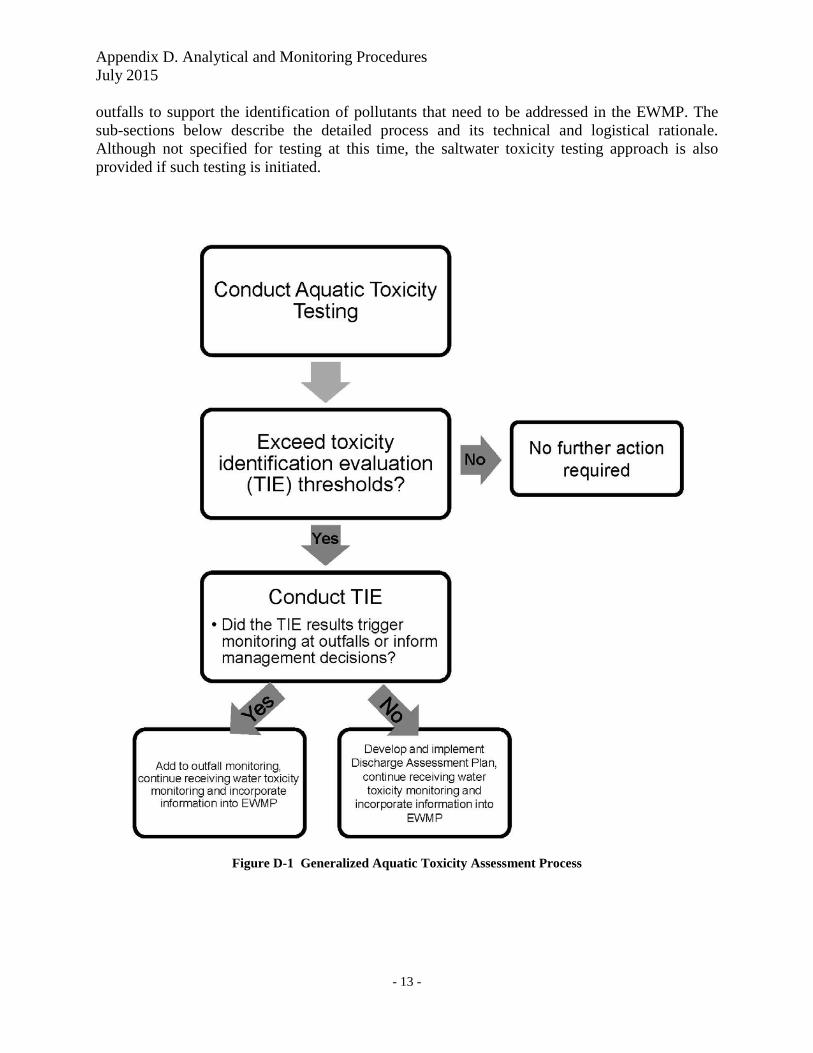
Appendix D. Analytical and Monitoring Procedures July 2015
- 13 -
outfalls to support the identification of pollutants that need to be addressed in the EWMP. The sub-sections below describe the detailed process and its technical and logistical rationale. Although not specified for testing at this time, the saltwater toxicity testing approach is also provided if such testing is initiated.
Figure D-1 Generalized Aquatic Toxicity Assessment Process

Appendix D. Analytical and Monitoring Procedures July 2015
- 14 -
D.1.3.1 Sensitive Species Selection The MRP (page E-32) states that a sensitivity screening to select the most sensitive test species should be conducted unless “a sensitive test species has already been determined, or if there is prior knowledge of potential toxicant(s) and a test species is sensitive to such toxicant(s), then monitoring shall be conducted using only that test species.” Previous relevant studies conducted in the watershed should be considered. Such studies may have been completed via previous MS4 sampling, wastewater NPDES sampling, or special studies conducted within the watershed. The following sub-sections discuss the species section process for assessing aquatic toxicity in receiving waters. D.1.3.1.1 Freshwater Sensitive Species Selection As described in the MRP (page E-31), if samples are collected in receiving waters with salinity less than 1 part per thousand (ppt), or from outfalls discharging to receiving waters with salinity less than 1 ppt, toxicity tests should be conducted on the most sensitive test species in accordance with species and short-term test methods in Short-term Methods for Estimating the Chronic Toxicity of Effluents and Receiving Waters to Freshwater Organisms (EPA/821/R-02/013, 2002; Table IA, 40 CFR Part 136). Static renewal freshwater toxicity test species identified in the MRP are:
Fathead minnow, Pimephales promelas (Larval Survival and Growth Test Method 1000.04).
Daphnid, Ceriodaphnia dubia (Survival and Reproduction Test Method 1002.05). Green alga, Selenastrum capricornutum (Raphidocelis subcapitata) (Growth Test
1003.0). Low salinity (fresh) receiving water toxicity testing data, from within the Beach Cities WMG area, were not identified during CIMP preparation. Toxicity data from the Dominguez Channel and other regional receiving waters, suggest that organophosphate pesticides, pyrethroids, and metals may contribute to aquatic toxicity. Assuming the potential presence of these toxicants in the WMG area, relative sensitivity to these pollutants was a primary consideration in selecting from among the three common test species. Ceriodaphnia dubia (C. dubia) is often used locally and reported upon nationally, as a broad spectrum test species that is sensitive for historical and current use pesticides and metals, and studies indicate that it is more sensitive to the toxicants of concern than Pimephales promelas (P. promelas) or Selenastrum capricornutum (S. capricornutum). In Aquatic Life Ambient Freshwater Quality Criteria - Copper, the USEPA reports greater sensitivity of C. dubia to copper (species mean acute value of 5.93 µg/l) than for P. promelas (species mean acute value of 69.93 µg/l; EPA, 2007). C. dubia’s relative sensitivity to copper, extends to multiple metals. Additionally, researchers at the University of California (UC), Davis reviewed available reported species sensitivity values in developing pesticide criteria for the Central Valley Regional Water Quality Control Board. In developing pesticide criteria for the Central Valley Regional Water Quality Control Board, researchers at University of California at Davis, reported higher sensitivity of C. dubia to diazinon and bifenthrin (species mean acute value of 0.34 µg/l and
Appendix D. Analytical and Monitoring Procedures July 2015
- 15 -
0.105 µg/l) compared to P. promelas (species mean acute value of 7804 µg/l and 0.405 µg/l; Palumbo et al., 2010a,b). Additionally, in a stormwater study for the City of Stockton, urban stormwater runoff found acute and chronic toxicity to C. dubia, with no toxicity to S. capricornutum or P. promelas (Lee and Lee, 2001). The toxicity was attributed to organophosphate pesticides, indicating a higher sensitivity of C. dubia compared to S. capricornutum or P. promelas. While P. promelas is generally less sensitive to metals and pesticides, this species can be more sensitive to ammonia than C. dubia. However, as ammonia is not typically a constituent of concern for urban runoff and ammonia is not consistently observed above the toxic thresholds in the watershed, P. promelas is not considered a particularly sensitive species for evaluating the impacts of urban runoff in receiving waters in the watershed. S. capricornutum is a species sensitive to herbicides; however, while sometimes present in urban runoff, herbicides are not identified as a potential toxicant in the watershed. Additionally, S. capricornutum is not considered the most sensitive species as it is not sensitive to pyrethroids or organophosphate pesticides and is not as sensitive to metals as C. dubia. Additionally, the S. capricornutum growth test can be affected by high concentrations of suspended and dissolved solids, color, and pH extremes, which can interfere with the determination of sample toxicity. As a result, it is common to manipulate the sample by centrifugation and filtration to remove solids in order to conduct the toxicity test; however, this process may affect the toxicity of the sample. In a study of urban highway stormwater runoff (Kayhanian et. al, 2008), S. capricornutum response to the stormwater samples was more variable than the C. dubia and the P. promelas and in some cases the algal growth was possibly enhanced due to the presence of stimulatory nutrients. Also, in a study on the City of Stockton urban stormwater runoff (Lee and Lee, 2001) the S. capricornutum tests rarely detected toxicity where the C. dubia and the P. promelas regularly detected toxicity. Based on best professional judgment and local experience with the Permit identified fresh water species, C. dubia is most sensitive to the broadest range of potential toxicant(s) typically found in local fresh receiving waters impacted by urban runoff and will be selected for fresh water toxicity testing by the Beach Cities WMG. The species can be maintained laboratory cultures making them generally available year round. The simplicity of the test, the ease of interpreting results, and relatively small sample volume necessary to run the test, make the test a valuable screening tool. The ease of sample collection and higher sensitivity will support assessing the presence of ambient receiving water toxicity or long term effects of toxic stormwater over time. As such, toxicity testing in the freshwater portions of the watershed will be conducted using C. dubia. However, C. dubia test organisms are typically cultured in moderately hard waters (80-100 mg/L CaCO3) and can have increased sensitivity to elevated water hardness greater than 400 mg/L CaCO3), which is beyond their typical habitat range. Because of this, in instances where hardness in site waters exceeds 400 mg/L (CaCO3), an alternative test species may be used. Daphnia magna is more tolerant to high hardness levels and is a suitable substitution for C. dubia in these instances (Cowgill and Milazzo, 1990). D.1.3.1.2 Saltwater Sensitive Species Selection Samples collected in receiving waters with salinity equal to or greater than 1 ppt or from outfalls discharging to receiving waters with salinity that is equal to or greater than 1 ppt, should be
Appendix D. Analytical and Monitoring Procedures July 2015
- 16 -
tested using the most sensitive test species in accordance with Short-term Methods for Estimating the Chronic Toxicity of Effluents and Receiving Waters to West Coast Marine and Estuarine Organisms (EPA/600/R-95/136, 1995). The marine and estuarine test species identified in the MRP are: A static renewal toxicity test with the topsmelt, Atherinops affinis (Larval Survival and
Growth Test Method 1006.015). A static non-renewal toxicity test with the purple sea urchin, Strongylocentrotus
purpuratus (Fertilization Test Method 1008.0). A static non-renewal toxicity test with the giant kelp, Macrocystis pyrifera (Germination
and Growth Test Method 1009.0). In addition to the three species identified in the MRP, the red abalone, Haliotis rufescens (H. rufescens), larval development test was also considered given the extensive use in region. Although all the species mentioned have been demonstrated as sensitive to a wide variety of toxicants and have been subject to numerous inter- and intra-laboratory testing using standardized toxicants, two species: Macrocystis pyrifera (M. pyrifera) and Atherinops affinis (A. affinis); have limitations when used to assess the toxicity of stormwater, as compared to the sea urchin fertilization test and the red abalone larval development test. The method for M. pyrifera is a 48-hour chronic toxicity test that measures the percent zoospore germination and the length of the gametophyte germ tube. Although the test may be sensitive to herbicides, fungicides, and treatment plant effluent, the use of M. pyrifera as a test species for stormwater monitoring may not be ideal. Obtaining sporophylls for stormwater testing could also be a limiting factor for selecting this test. Collection of M. pyrifera sporophylls from the field is necessary prior to initiating the test and the target holding time for any receiving water or stormwater sample is 36 hours; however, 72 hours is the maximum time a sample may be held prior to test initiation. During the dry season, meeting the 36-72 hour holding time will be achievable; however, field collection during wet weather may be delayed beyond the maximum holding time due to heavy seas and inaccessible collection sites. In addition, collection of M. pyrifera sporophylls during the storm season may include increased safety risks that can be avoided by selection of a different species. The A. affinis test measures the survival and growth test of a larval fish over seven days. At the end of seven days of exposure to a suspected toxicant, the number of surviving fish are recorded, along with their weights, and compared to those exposed to non-contaminated seawater. Positive characteristics of the A. affiniss chronic test include the ability to purchase test organisms from commercial suppliers as well as being one of the few indigenous test species that may be used to test undiluted stormwater by the addition of artificial sea salts to within the range of marine receiving waters. Unfortunately, the tolerance of A. affinis to chemicals in artificial sea salts may also explain their lack of sensitivity to changes in water quality compared to other test organisms such as the sea urchin or red abalone. There are concerns with the comparability of conducting a seven-day exposure test when most rain events do not occur over a seven-day period.
Appendix D. Analytical and Monitoring Procedures July 2015
- 17 -
The Strongylocentrotus purpuratus (S. purpuratus) fertilization test measures the ability of S. purpuratus sperm to fertilize an egg when exposed to a suspected toxicant. The S. purpuratus fertilization has been selected as a chronic toxicity test organism in previous MS4 permits and has been used to assess ambient receiving water toxicity, sediment pore water toxicity, as well as stormwater toxicity. The S. purpuratus fertilization test is also among the most sensitive test species to metals. The adult test organisms may be purchased and held in the lab prior to fertilization, and the sample volume necessary to conduct the test is small with respect to the other suggested tests. The minimal exposure period (20 min) allows for a large number of tests to be conducted over a short period of time and permits the testing of toxicants that may lose their potency over long periods of time. The red abalone larval development test measures the percent of abnormal shell development in larvae exposed to toxic samples for 48 hours. The red abalone is commonly used to test treatment plant effluent, but has had limited use in stormwater compared to the S. purpuratus fertilization test. The advantages of the red abalone test include a sensitive endpoint, the ability to purchase abalone from commercial suppliers and hold test organisms prior to spawning, and low variability in results compared to other species (e.g., S. purpuratus fertilization test). Thus, though not listed as a potential test species for use in stormwater monitoring in the MS4 permit, it was considered as a potentially sensitive species for the purposes of selecting the most sensitive species. Due to the limitations of the giant kelp germination and growth test and the topsmelt survival and growth test, in addition to not being particularly sensitive to the constituents identified as problematic in stormwater water runoff from the watershed, these tests are not considered particularly helpful in supporting the identification of pollutants of concern. Based on the sensitivity, smaller test volume requirements, their ability to be housed in the lab prior to testing, and shorter exposure times, the S. purpuratus fertilization test and the red abalone development test will be considered during sensitive species selection to measure toxicity in marine and estuarine environments. Based on historical data of the sensitivity of the S. purpuratus and red abalone tests, and the limiting factors associated with the topsmelt and giant kelp tests, the sensitive species test for marine and estuarine species will be conducted with the S. purpuratus and red abalone tests. Species screening was determined to be appropriate for these two species (as opposed to selecting just one) as testing conducted within the region with both species have shown varying sensitivity. Thus, it is appropriate to test both to determine sensitivity at a given site. After the screening testing is completed, monitoring will be conducted with the most-sensitive species. D.1.3.2 Testing Period The following subsections characterize the toxicity testing periods for samples collected during dry and wet weather conditions. D.1.3.2.1 Freshwater Testing Periods Acute toxicity tests would normally be utilized for stormwater toxicity testing to be consistent with the relatively shorter exposure periods of watershed species to potential urban stormwater
Appendix D. Analytical and Monitoring Procedures July 2015
- 18 -
toxicants and would be conducted in accordance with Methods for Measuring the Acute Toxicity of Effluents and Receiving Waters to Freshwater and Marine Organisms (EPA, 2002b). Despite the test duration not being typical of stormwater flows, Board staff has directed that a chronic testing period (typically 7 days) be used for toxicity testing for both survival and reproductive/growth endpoints for C. dubia in samples. Chronic testing will be conducted on undiluted samples in accordance with Short-term Methods for Estimating the Chronic Toxicity of Effluents and Receiving Waters to Freshwater Organisms (USEPA, 2002a). Although the utilization of chronic tests to assess wet weather samples, may generate results that are unrepresentative of receiving water conditions, chronic toxicity testing will be used for freshwater testing. D.1.3.2.2 Saltwater Testing Period Two marine and estuarine toxicity species tests utilize methods that have short durations (20 minutes for the S. purpuratus fertilization test and 48 hours for the H. rufescens development test), the end points are sub-lethal and can be considered representative of acute or chronic effects. Both test species and test methods are suitable for wet weather and dry weather monitoring. Chronic toxicity testing will be used for saltwater testing. D.1.3.3 Toxicity Endpoint Assessment and Toxicity Identification Evaluation Triggers As directed by the Permit MRP, acute and chronic toxicity test endpoints will be analyzed using the Test of Significant Toxicity (TST) t-test approach specified by the USEPA (USEPA, 2010). The Permit specifies that the chronic in-stream waste concentration (IWC) be set at 100% receiving water for receiving water samples and 100% discharge for outfall samples. Follow-up triggers are generally based on the Permit specified statistical assessment as described below. For acute C. dubia toxicity testing, follow up toxicity identification evaluation (TIE) testing is warranted if a statistically significant 50% difference in mortality is observed between the sample and laboratory control, a toxicity identification evaluation (TIE) will be performed. TIE procedures are further discussed in detail in the following subsection. Experience conducting TIEs in regional receiving waters supports using a 50% mortality trigger to provide a reasonable opportunity for a successful TIE. During 2003 and 2004 TMDL monitoring in the Calleguas Creek Watershed (CCW), TIEs were initiated for samples exceeding the 50% threshold, the majority of which displayed 100% mortality. In that study, toxicity had degraded in approximately 40% of the samples on which the procedures were initiated making the effort unsuccessful in pinpointing specific toxicants. The Regional Board approved monitoring program for the CCW Toxicity, Chlorpyrifos and Diazinon TMDL utilizes a 50% threshold for TIE initiation. Additionally, a 50% mortality threshold is utilized in the Ventura County MS4 Permit. For chronic C. dubia toxicity testing, if a statistically significant 50% difference in mortality is observed between the sample and laboratory control, a TIE will be performed. If a statistically significant 50% difference in a sub-lethal endpoint is observed between the sample and laboratory control, a confirmatory sample will be collected from the receiving water within two weeks of obtaining the results of the initial sample. If a statistically significant 50% difference in
Appendix D. Analytical and Monitoring Procedures July 2015
- 19 -
mortality or sub-lethal endpoint is observed between the sample and laboratory control on the confirmatory sample, a TIE will be performed. For the chronic marine and estuarine tests, the percent effect will be calculated. The percent effect is defined as the difference between the mean control response and the mean IWC response divided by the control response, multiplied by 100. A TIE will be performed if the percent effect value is equal to or greater than 50 percent. The TIE procedures will be initiated as soon as possible after the toxicity trigger threshold is observed to reduce the potential for loss of toxicity during sample storage. If the cause of toxicity is readily apparent or is caused by pathogen related mortality (PRM) or epibiont interference, the result will be rejected. In cases where significant endpoint toxicity effects greater than 50% are observed in the original sample, but the follow-up TIE positive control “signal” is not statistically significant, the cause of toxicity will be considered non-persistent and no sample follow-up testing is required. Future test results should be evaluated to determine if parallel TIE treatments are necessary to provide an opportunity to identify the cause of toxicity. D.1.3.4 Toxicity Identification Evaluation Approach The results of toxicity testing will be used to trigger further investigations to determine the cause of observed laboratory toxicity. The primary purpose of conducting TIEs is to support the identification of management actions that will remove toxicants from the receiving waters. Successful TIEs will guide adaptive outfall monitoring strategies to identify and analyze for suspect pollutant(s) and guide source control efforts The TIE approach is divided into three phases as described in USEPA’s 1991 Methods for Aquatic Toxicity Identification Evaluations – Phase I Toxicity Characterization Procedures – Second Edition (EPA/600/6-9/003) and briefly summarized as follows: Phase I utilizes methods to characterize the physical/chemical nature of the constituents
which cause toxicity. Such characteristics as solubility, volatility and filterability are determined without specifically identifying the toxicants. Phase I results are intended as a first step in specifically identifying the toxicants but the data generated can also be used to develop treatment methods that remove the toxicity without specifically identifying the toxicants.
Phase II utilizes methods to specifically identify toxicants, or toxicant pollutant class. Phase III utilizes methods to confirm the identity of suspected toxicant(s).
TIE methods will generally adhere to USEPA procedures documented in conducting TIEs (USEPA, 1991, 1992, 1993a-b). A Phase I TIE will be conducted on samples that exceed the TIE. Water quality data will be reviewed to support future evaluation of potential toxicants. TIEs will perform the manipulations described in Table D-6. Toxicity causation will be tentatively identified based on the treatments in Table D-6 and, when possible, the results verified based on water column chemistry analyses. After an initial determination of the cause of toxicity, the information may be used during future TIEs to target the expected toxicant (s) or provide new treatments to narrowly identify the toxicant cause(s).

Appendix D. Analytical and Monitoring Procedures July 2015
- 20 -
Moreover, if the toxicant or toxicant class is not initially identified, toxicity monitoring during subsequent events will confirm if the toxicant is persistent or a short-term episodic occurrence.
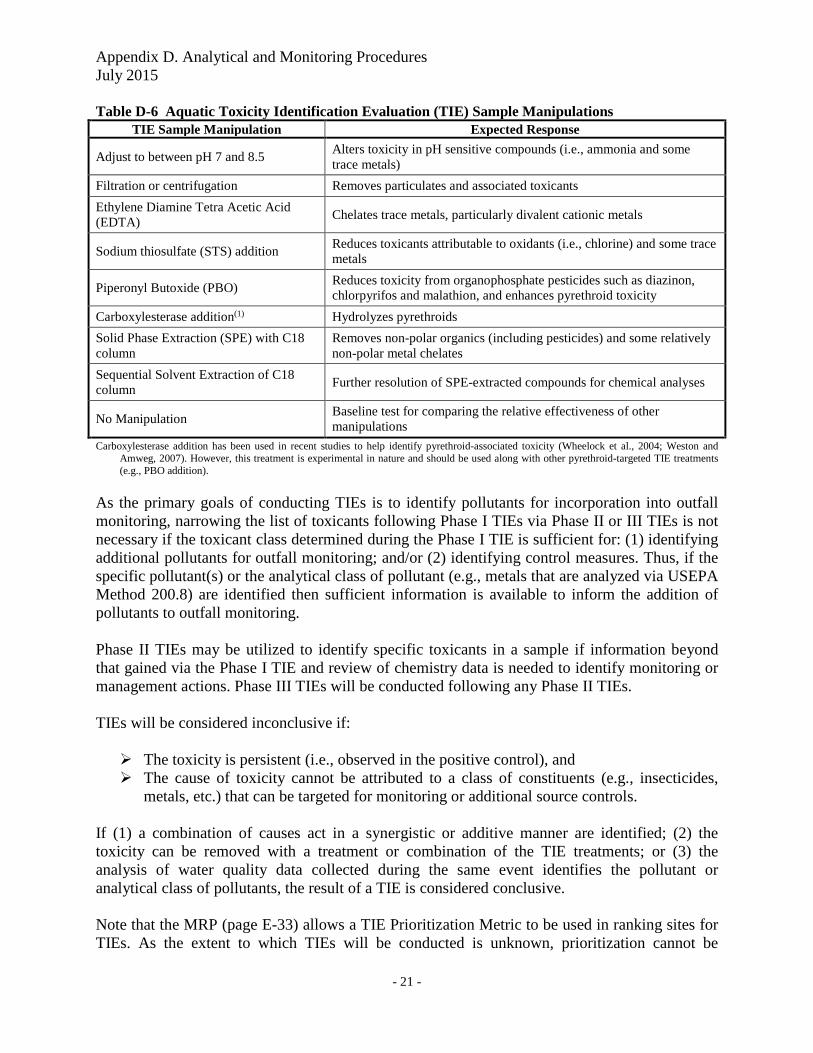
Appendix D. Analytical and Monitoring Procedures July 2015
- 21 -
Table D-6 Aquatic Toxicity Identification Evaluation (TIE) Sample Manipulations TIE Sample Manipulation Expected Response
Adjust to between pH 7 and 8.5 Alters toxicity in pH sensitive compounds (i.e., ammonia and some trace metals)
Filtration or centrifugation Removes particulates and associated toxicants
Ethylene Diamine Tetra Acetic Acid (EDTA)
Chelates trace metals, particularly divalent cationic metals
Sodium thiosulfate (STS) addition Reduces toxicants attributable to oxidants (i.e., chlorine) and some trace metals
Piperonyl Butoxide (PBO) Reduces toxicity from organophosphate pesticides such as diazinon, chlorpyrifos and malathion, and enhances pyrethroid toxicity
Carboxylesterase addition(1) Hydrolyzes pyrethroids
Solid Phase Extraction (SPE) with C18 column
Removes non-polar organics (including pesticides) and some relatively non-polar metal chelates
Sequential Solvent Extraction of C18 column
Further resolution of SPE-extracted compounds for chemical analyses
No Manipulation Baseline test for comparing the relative effectiveness of other manipulations
Carboxylesterase addition has been used in recent studies to help identify pyrethroid-associated toxicity (Wheelock et al., 2004; Weston and Amweg, 2007). However, this treatment is experimental in nature and should be used along with other pyrethroid-targeted TIE treatments (e.g., PBO addition).
As the primary goals of conducting TIEs is to identify pollutants for incorporation into outfall monitoring, narrowing the list of toxicants following Phase I TIEs via Phase II or III TIEs is not necessary if the toxicant class determined during the Phase I TIE is sufficient for: (1) identifying additional pollutants for outfall monitoring; and/or (2) identifying control measures. Thus, if the specific pollutant(s) or the analytical class of pollutant (e.g., metals that are analyzed via USEPA Method 200.8) are identified then sufficient information is available to inform the addition of pollutants to outfall monitoring. Phase II TIEs may be utilized to identify specific toxicants in a sample if information beyond that gained via the Phase I TIE and review of chemistry data is needed to identify monitoring or management actions. Phase III TIEs will be conducted following any Phase II TIEs. TIEs will be considered inconclusive if: The toxicity is persistent (i.e., observed in the positive control), and The cause of toxicity cannot be attributed to a class of constituents (e.g., insecticides,
metals, etc.) that can be targeted for monitoring or additional source controls. If (1) a combination of causes act in a synergistic or additive manner are identified; (2) the toxicity can be removed with a treatment or combination of the TIE treatments; or (3) the analysis of water quality data collected during the same event identifies the pollutant or analytical class of pollutants, the result of a TIE is considered conclusive. Note that the MRP (page E-33) allows a TIE Prioritization Metric to be used in ranking sites for TIEs. As the extent to which TIEs will be conducted is unknown, prioritization cannot be
Appendix D. Analytical and Monitoring Procedures July 2015
- 22 -
assessed at this time, but may be utilized in the future based on the results of toxicity monitoring and the CIMP adaptive management. D.1.3.5 Discharge Assessment The Beach Cities WMG will prepare a Discharge Assessment Plan (DAP), if TIEs, from consecutive sampling events, are inconclusive. The Discharge Assessment will only be initiated after consecutive inconclusive TIEs, because of the inherit variability associated with the toxicity and TIE testing methods. The DAP will consider observed receiving and outfall toxicants, above known species effect levels and the relevant exposure periods compared to the duration of the observed toxicity. The DAP will identify: Additional potential receiving water toxicity monitoring to evaluate the spatial extent of
toxicity. The toxicity test species to be utilized. If a different species is proposed, justification for
the substitution will be provided. The number and location of monitoring sites and their spatial relation to the observed
receiving water toxicity. The number of monitoring events that will be conducted, a schedule for conducting the
monitoring, and a process for evaluating the completion of the assessment monitoring. The DAP will be submitted to Regional Board staff for comment within 60 days of receipt of notification of the second consecutive inconclusive result. If no comments are received within 30 days, it will be assumed that the approach is appropriate for the given situation and the DAP will be implemented within 90-days of submittal. If comments are received within 30 days, the Plan will be resubmitted to Regional Board staff and the DAP will be implemented within 90-days of submittal of a version of the Plan that does not receive comments from Regional Board staff. D.1.3.6 Follow Up on Toxicity Testing Results The MRP (page E-33) indicates the following actions should be taken when a toxicant or class of toxicants is identified through a TIE: Beach Cities WMG Members shall analyze for the toxicant(s) during the next scheduled
sampling event in the discharge from the outfall(s) upstream of the receiving water location.
If the toxicant is present in the discharge from the outfall at levels above the applicable receiving water limitation, a toxicity reduction evaluation (TRE) will be performed for that toxicant.
The list of constituents monitored at outfalls identified in the CIMP will be modified based on the results of the TIEs.
Monitoring for constituents identified based on the results of a TIE will occur as soon as feasible following the completion of a successful TIE (i.e., the next monitoring event that is at least 45 days following the toxicity laboratory’s report transmitting the results of a successful TIE).
Appendix D. Analytical and Monitoring Procedures July 2015
- 23 -
The requirements of the TREs will be met as part of the adaptive management process in the Beach Cities WMG rather than conducted via the CIMP. The identification and implementation of control measures to address the causes of toxicity are tied to management of the stormwater program, not the CIMP. It is expected that the requirements of TREs will only be conducted for toxicants that are not already addressed by an existing Permit requirement (i.e., TMDLs) or existing or planned management actions. D.1.3.7 Summary of Aquatic Toxicity Monitoring The approach to conducting aquatic toxicity monitoring as described in the previous sections is summarized in detail in Figure D-2. The intent of the approach is to identify the cause of toxicity observed in receiving water to the extent possible with the toxicity testing tools available, thereby directing outfall monitoring for the pollutants causing toxicity with the ultimate goal of supporting the development and implementation of management actions.
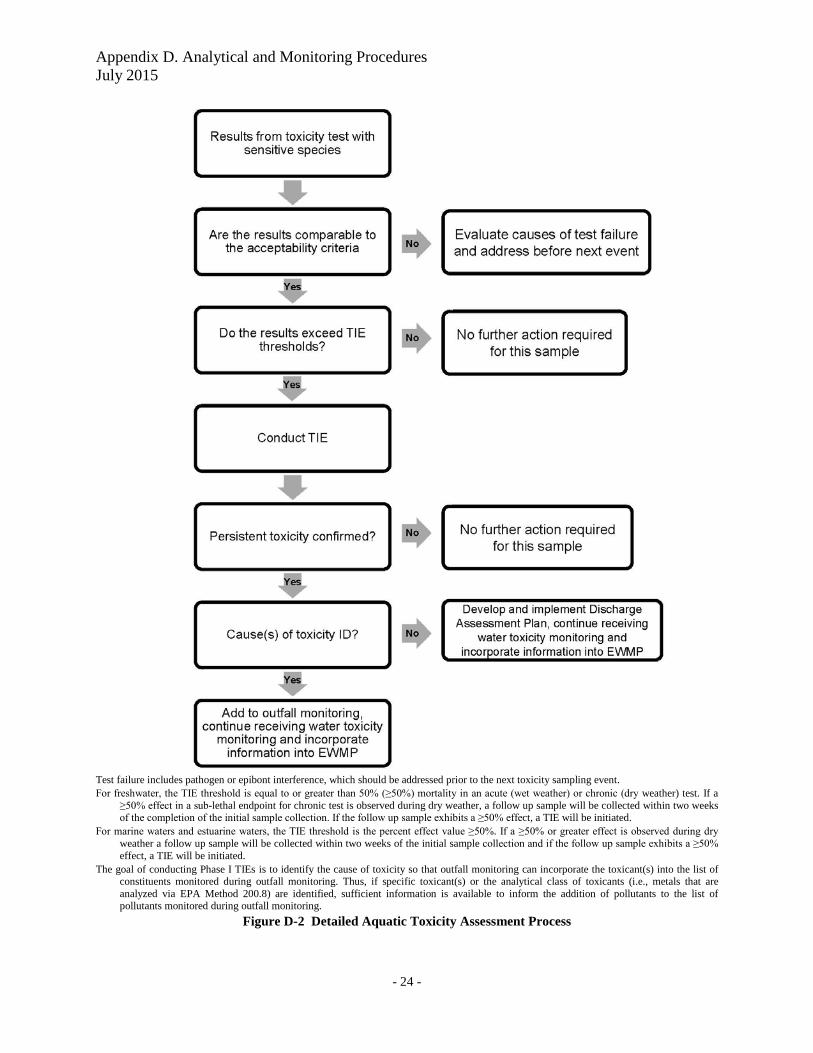
Appendix D. Analytical and Monitoring Procedures July 2015
- 24 -
Test failure includes pathogen or epibont interference, which should be addressed prior to the next toxicity sampling event. For freshwater, the TIE threshold is equal to or greater than 50% (≥50%) mortality in an acute (wet weather) or chronic (dry weather) test. If a
≥50% effect in a sub-lethal endpoint for chronic test is observed during dry weather, a follow up sample will be collected within two weeks of the completion of the initial sample collection. If the follow up sample exhibits a ≥50% effect, a TIE will be initiated.
For marine waters and estuarine waters, the TIE threshold is the percent effect value ≥50%. If a ≥50% or greater effect is observed during dry weather a follow up sample will be collected within two weeks of the initial sample collection and if the follow up sample exhibits a ≥50% effect, a TIE will be initiated.
The goal of conducting Phase I TIEs is to identify the cause of toxicity so that outfall monitoring can incorporate the toxicant(s) into the list of constituents monitored during outfall monitoring. Thus, if specific toxicant(s) or the analytical class of toxicants (i.e., metals that are analyzed via EPA Method 200.8) are identified, sufficient information is available to inform the addition of pollutants to the list of pollutants monitored during outfall monitoring.
Figure D-2 Detailed Aquatic Toxicity Assessment Process
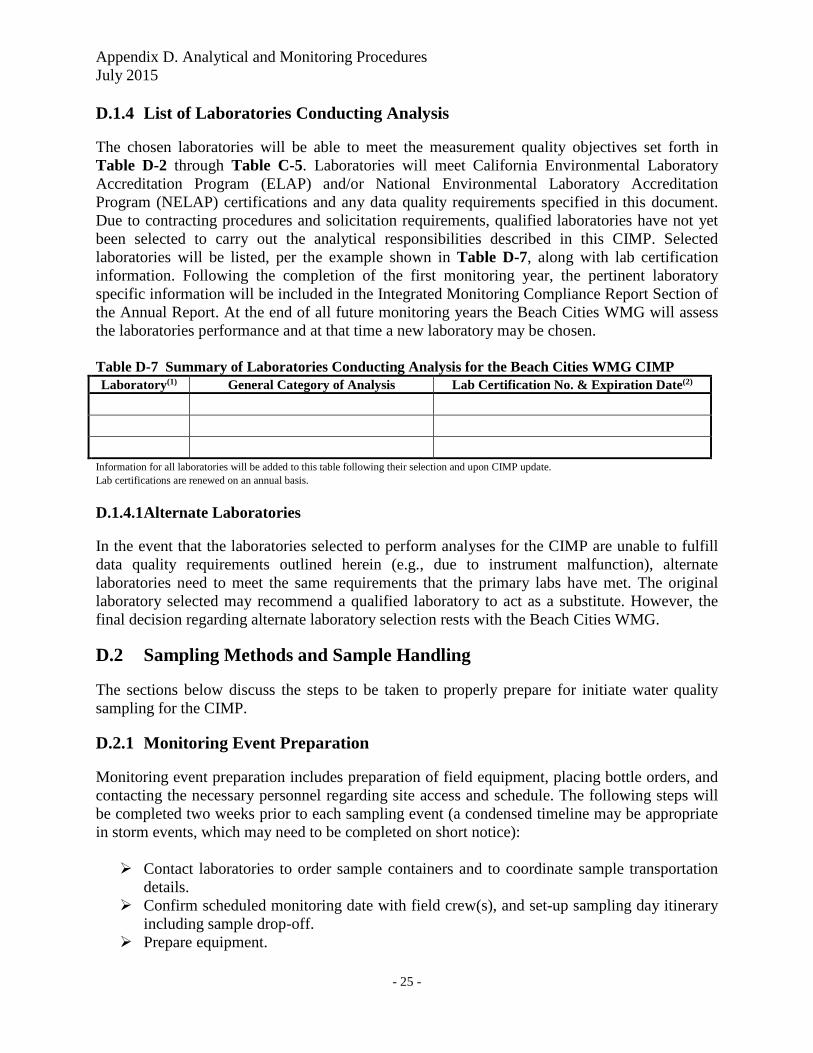
Appendix D. Analytical and Monitoring Procedures July 2015
- 25 -
D.1.4 List of Laboratories Conducting Analysis The chosen laboratories will be able to meet the measurement quality objectives set forth in Table D-2 through Table C-5. Laboratories will meet California Environmental Laboratory Accreditation Program (ELAP) and/or National Environmental Laboratory Accreditation Program (NELAP) certifications and any data quality requirements specified in this document. Due to contracting procedures and solicitation requirements, qualified laboratories have not yet been selected to carry out the analytical responsibilities described in this CIMP. Selected laboratories will be listed, per the example shown in Table D-7, along with lab certification information. Following the completion of the first monitoring year, the pertinent laboratory specific information will be included in the Integrated Monitoring Compliance Report Section of the Annual Report. At the end of all future monitoring years the Beach Cities WMG will assess the laboratories performance and at that time a new laboratory may be chosen. Table D-7 Summary of Laboratories Conducting Analysis for the Beach Cities WMG CIMP Laboratory(1) General Category of Analysis Lab Certification No. & Expiration Date(2)
Information for all laboratories will be added to this table following their selection and upon CIMP update. Lab certifications are renewed on an annual basis.
D.1.4.1 Alternate Laboratories In the event that the laboratories selected to perform analyses for the CIMP are unable to fulfill data quality requirements outlined herein (e.g., due to instrument malfunction), alternate laboratories need to meet the same requirements that the primary labs have met. The original laboratory selected may recommend a qualified laboratory to act as a substitute. However, the final decision regarding alternate laboratory selection rests with the Beach Cities WMG.
D.2 Sampling Methods and Sample Handling The sections below discuss the steps to be taken to properly prepare for initiate water quality sampling for the CIMP.
D.2.1 Monitoring Event Preparation Monitoring event preparation includes preparation of field equipment, placing bottle orders, and contacting the necessary personnel regarding site access and schedule. The following steps will be completed two weeks prior to each sampling event (a condensed timeline may be appropriate in storm events, which may need to be completed on short notice): Contact laboratories to order sample containers and to coordinate sample transportation
details. Confirm scheduled monitoring date with field crew(s), and set-up sampling day itinerary
including sample drop-off. Prepare equipment.
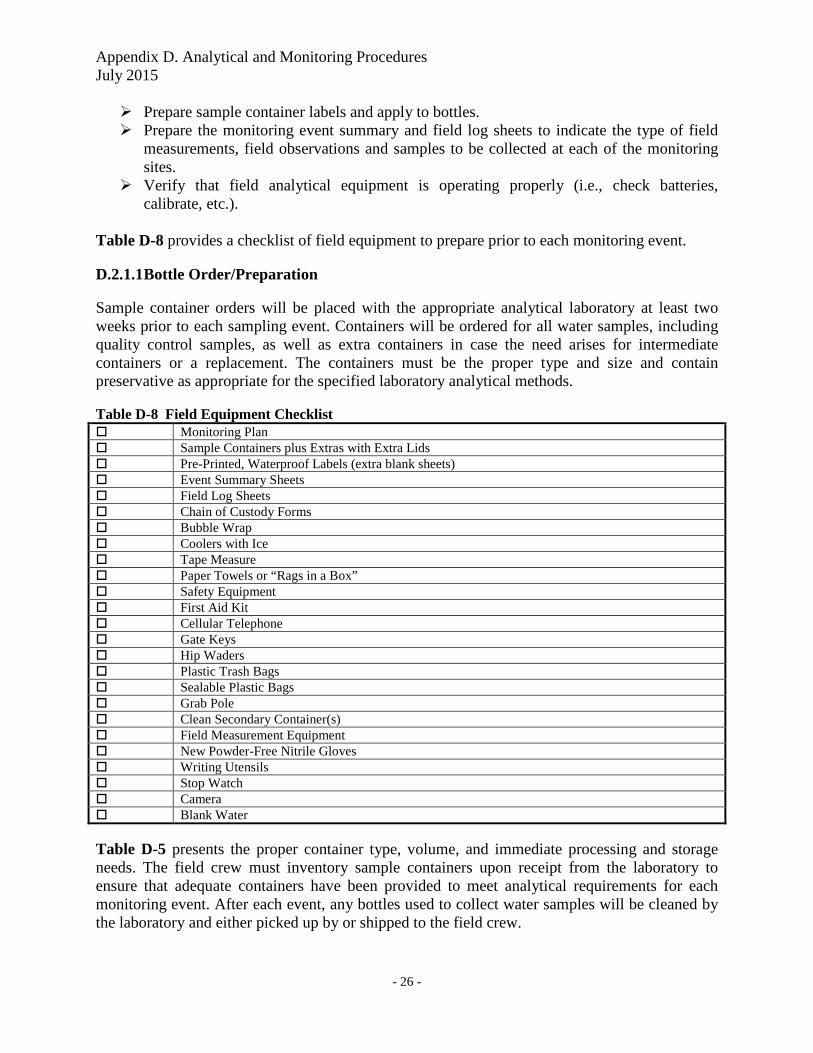
Appendix D. Analytical and Monitoring Procedures July 2015
- 26 -
Prepare sample container labels and apply to bottles. Prepare the monitoring event summary and field log sheets to indicate the type of field
measurements, field observations and samples to be collected at each of the monitoring sites.
Verify that field analytical equipment is operating properly (i.e., check batteries, calibrate, etc.).
Table D-8 provides a checklist of field equipment to prepare prior to each monitoring event. D.2.1.1 Bottle Order/Preparation Sample container orders will be placed with the appropriate analytical laboratory at least two weeks prior to each sampling event. Containers will be ordered for all water samples, including quality control samples, as well as extra containers in case the need arises for intermediate containers or a replacement. The containers must be the proper type and size and contain preservative as appropriate for the specified laboratory analytical methods. Table D-8 Field Equipment Checklist Monitoring Plan Sample Containers plus Extras with Extra Lids Pre-Printed, Waterproof Labels (extra blank sheets) Event Summary Sheets Field Log Sheets Chain of Custody Forms Bubble Wrap Coolers with Ice Tape Measure Paper Towels or “Rags in a Box” Safety Equipment First Aid Kit Cellular Telephone Gate Keys Hip Waders Plastic Trash Bags Sealable Plastic Bags Grab Pole Clean Secondary Container(s) Field Measurement Equipment New Powder-Free Nitrile Gloves Writing Utensils Stop Watch Camera Blank Water Table D-5 presents the proper container type, volume, and immediate processing and storage needs. The field crew must inventory sample containers upon receipt from the laboratory to ensure that adequate containers have been provided to meet analytical requirements for each monitoring event. After each event, any bottles used to collect water samples will be cleaned by the laboratory and either picked up by or shipped to the field crew.
Appendix D. Analytical and Monitoring Procedures July 2015
- 27 -
D.2.1.2 Container Labeling and Sample Identification Scheme All samples will be identified with a unique identification code to ensure that results are properly reported and interpreted. Samples will be identified such that the site, sampling location, matrix, sampling equipment and sample type (i.e., environmental sample or QC sample) can be distinguished by a data reviewer or user. Sample identification codes will consist of a site identification code, a matrix code, and a unique sample identification code. The format for sample identification codes is AAAA - ### - XXX, where: AAAA indicates the unique site ID for each Beach Cities WMG monitoring site. ###- identifies the sequentially numbered monitoring event or sample collection date,
where # is an optional indicator for re-samples collected for the same event. Sample events are numbered from 001 to 999 and will not be repeated.
XXX identifies the sample number unique to a sample bottle collected for a single event. Sample bottles are numbered sequentially from 001 to 999 and will not be repeated within a single event.
Custom bottle labels should be produced using blank waterproof labels and labeling software. This approach will allow the site and analytical constituent information to be entered in advance and printed as needed prior to each monitoring event. Labels will be placed on the appropriate bottles in a dry environment; applying labels to wet sample bottles should be avoided. Labels should be placed on sides of bottles rather than on bottle caps. All sample containers will be pre-labeled before each sampling event to the extent practicable. Pre-labeling sample containers simplifies field activities, leaving only sample collection time and date and field crew initials to be filled out in the field. Labels should include the following information:
Program Name Station ID Sample ID
Date Collection Time Sampling
Personnel
Analytical Requirements Preservative
Requirements Analytical Laboratory
D.2.1.3 Field Meter Calibration Calibration of field measurement equipment is performed as described in the owner’s manuals for each individual instrument. Each individual field crew will be responsible for calibrating their field measurement equipment. Field monitoring equipment must meet the requirements outlined in Table D-1 and be calibrated before field events based on manufacturer guidance, but at a minimum prior to each event. Table D-9 outlines the typical field instrument calibration procedures for each piece of equipment requiring calibration. Each calibration will be documented on each event’s calibration log sheet (presented in Appendix E). If calibration results do not meet manufacturer specifications, the field crew should first try to recalibrate using fresh aliquots of calibration solution. If recalibration is unsuccessful, new calibration solution should be used and/or maintenance should be performed. Each attempt should be recorded on the equipment calibration log. If the calibration results cannot meet manufacturer’s specifications, the field crew should use a spare field measuring device that can be successfully calibrated. If a spare field measuring device that can be successfully calibrated is
Appendix D. Analytical and Monitoring Procedures July 2015
- 28 -
unavailable, field crews shall note the use of unsuccessfully calibrated equipment on each appropriate field log sheet. Additionally, the Beach Cities WMG should be notified. Calibration should be verified using at least one calibration fluid within the expected range of field measurements, both immediately following calibration and at the end of each monitoring day. Individual parameters should be recalibrated if the field meters do not measure a calibration fluid within the range of accuracy presented in Table D-1. Calibration verification documentation will be retained in the event’s calibration verification log (presented in Appendix E).
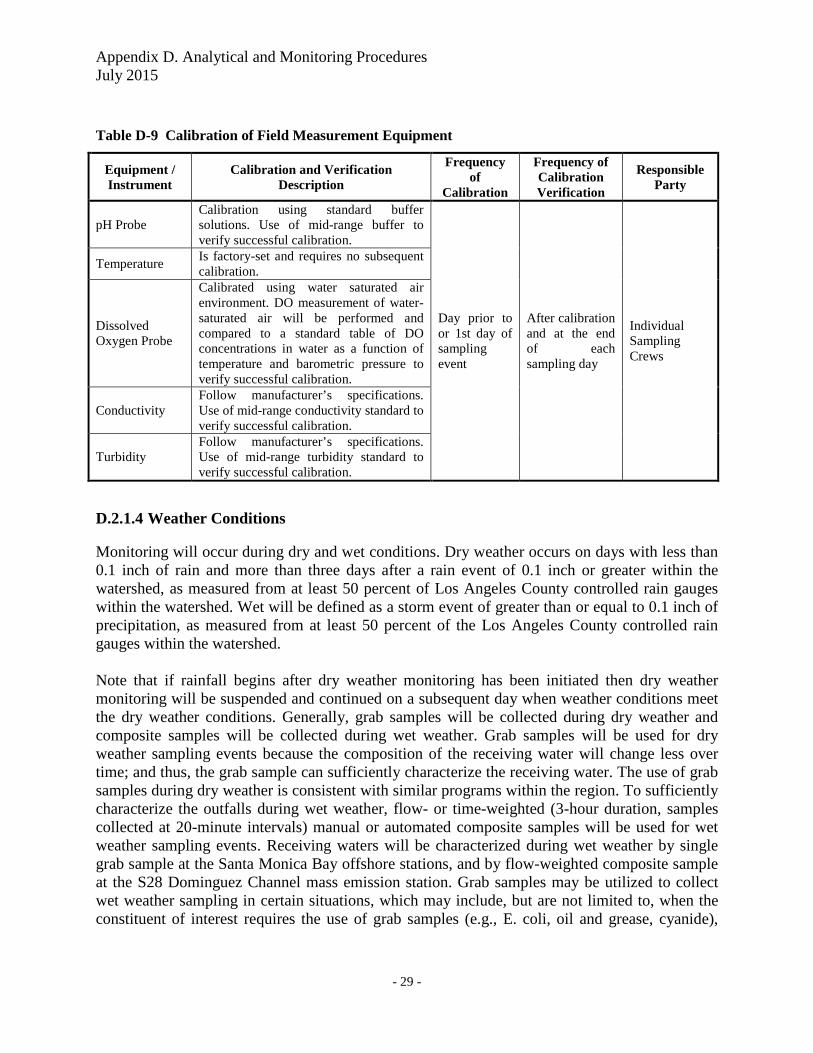
Appendix D. Analytical and Monitoring Procedures July 2015
- 29 -
Table D-9 Calibration of Field Measurement Equipment
Equipment / Instrument
Calibration and Verification Description
Frequency of
Calibration
Frequency of Calibration Verification
Responsible Party
pH Probe Calibration using standard buffer solutions. Use of mid-range buffer to verify successful calibration.
Day prior to or 1st day of sampling event
After calibration and at the end of each sampling day
Individual Sampling Crews
Temperature Is factory-set and requires no subsequent calibration.
Dissolved Oxygen Probe
Calibrated using water saturated air environment. DO measurement of water-saturated air will be performed and compared to a standard table of DO concentrations in water as a function of temperature and barometric pressure to verify successful calibration.
Conductivity Follow manufacturer’s specifications. Use of mid-range conductivity standard to verify successful calibration.
Turbidity Follow manufacturer’s specifications. Use of mid-range turbidity standard to verify successful calibration.
D.2.1.4 Weather Conditions Monitoring will occur during dry and wet conditions. Dry weather occurs on days with less than 0.1 inch of rain and more than three days after a rain event of 0.1 inch or greater within the watershed, as measured from at least 50 percent of Los Angeles County controlled rain gauges within the watershed. Wet will be defined as a storm event of greater than or equal to 0.1 inch of precipitation, as measured from at least 50 percent of the Los Angeles County controlled rain gauges within the watershed. Note that if rainfall begins after dry weather monitoring has been initiated then dry weather monitoring will be suspended and continued on a subsequent day when weather conditions meet the dry weather conditions. Generally, grab samples will be collected during dry weather and composite samples will be collected during wet weather. Grab samples will be used for dry weather sampling events because the composition of the receiving water will change less over time; and thus, the grab sample can sufficiently characterize the receiving water. The use of grab samples during dry weather is consistent with similar programs within the region. To sufficiently characterize the outfalls during wet weather, flow- or time-weighted (3-hour duration, samples collected at 20-minute intervals) manual or automated composite samples will be used for wet weather sampling events. Receiving waters will be characterized during wet weather by single grab sample at the Santa Monica Bay offshore stations, and by flow-weighted composite sample at the S28 Dominguez Channel mass emission station. Grab samples may be utilized to collect wet weather sampling in certain situations, which may include, but are not limited to, when the constituent of interest requires the use of grab samples (e.g., E. coli, oil and grease, cyanide),
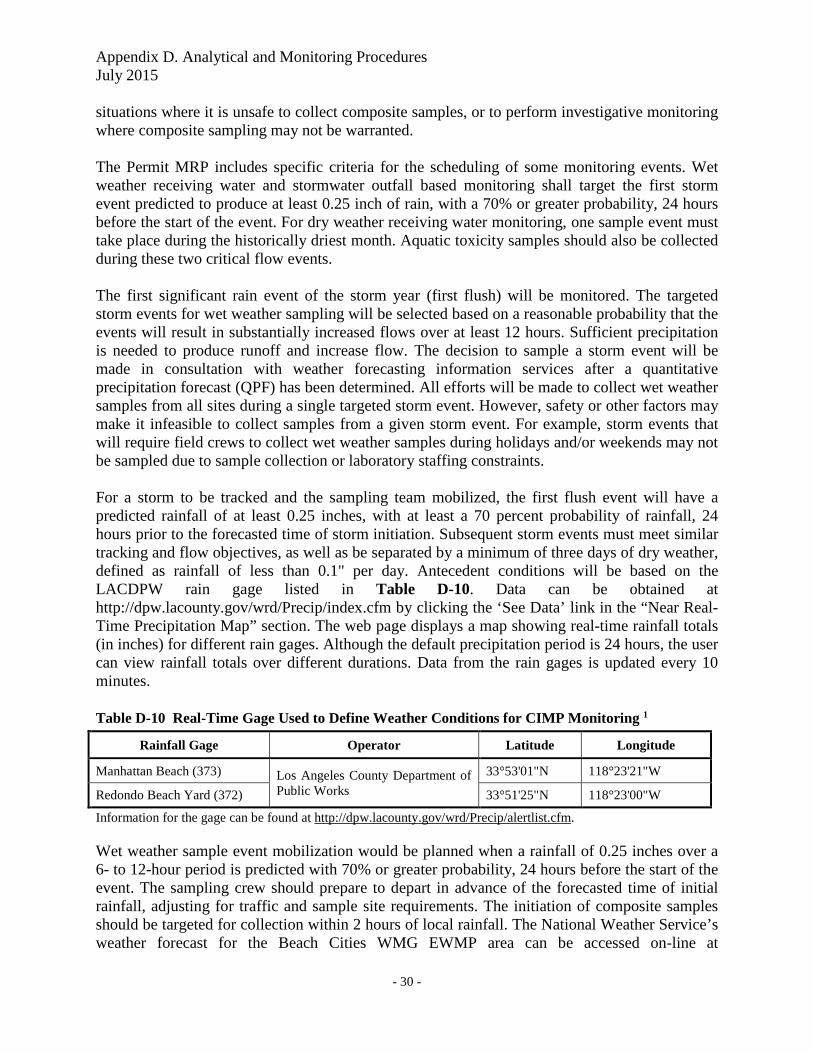
Appendix D. Analytical and Monitoring Procedures July 2015
- 30 -
situations where it is unsafe to collect composite samples, or to perform investigative monitoring where composite sampling may not be warranted. The Permit MRP includes specific criteria for the scheduling of some monitoring events. Wet weather receiving water and stormwater outfall based monitoring shall target the first storm event predicted to produce at least 0.25 inch of rain, with a 70% or greater probability, 24 hours before the start of the event. For dry weather receiving water monitoring, one sample event must take place during the historically driest month. Aquatic toxicity samples should also be collected during these two critical flow events. The first significant rain event of the storm year (first flush) will be monitored. The targeted storm events for wet weather sampling will be selected based on a reasonable probability that the events will result in substantially increased flows over at least 12 hours. Sufficient precipitation is needed to produce runoff and increase flow. The decision to sample a storm event will be made in consultation with weather forecasting information services after a quantitative precipitation forecast (QPF) has been determined. All efforts will be made to collect wet weather samples from all sites during a single targeted storm event. However, safety or other factors may make it infeasible to collect samples from a given storm event. For example, storm events that will require field crews to collect wet weather samples during holidays and/or weekends may not be sampled due to sample collection or laboratory staffing constraints. For a storm to be tracked and the sampling team mobilized, the first flush event will have a predicted rainfall of at least 0.25 inches, with at least a 70 percent probability of rainfall, 24 hours prior to the forecasted time of storm initiation. Subsequent storm events must meet similar tracking and flow objectives, as well as be separated by a minimum of three days of dry weather, defined as rainfall of less than 0.1" per day. Antecedent conditions will be based on the LACDPW rain gage listed in Table D-10. Data can be obtained at http://dpw.lacounty.gov/wrd/Precip/index.cfm by clicking the ‘See Data’ link in the “Near Real-Time Precipitation Map” section. The web page displays a map showing real-time rainfall totals (in inches) for different rain gages. Although the default precipitation period is 24 hours, the user can view rainfall totals over different durations. Data from the rain gages is updated every 10 minutes.
Table D-10 Real-Time Gage Used to Define Weather Conditions for CIMP Monitoring 1
Rainfall Gage Operator Latitude Longitude
Manhattan Beach (373) Los Angeles County Department of Public Works
33°53'01"N 118°23'21"W
Redondo Beach Yard (372) 33°51'25"N 118°23'00"W
Information for the gage can be found at http://dpw.lacounty.gov/wrd/Precip/alertlist.cfm. Wet weather sample event mobilization would be planned when a rainfall of 0.25 inches over a 6- to 12-hour period is predicted with 70% or greater probability, 24 hours before the start of the event. The sampling crew should prepare to depart in advance of the forecasted time of initial rainfall, adjusting for traffic and sample site requirements. The initiation of composite samples should be targeted for collection within 2 hours of local rainfall. The National Weather Service’s weather forecast for the Beach Cities WMG EWMP area can be accessed on-line at
Appendix D. Analytical and Monitoring Procedures July 2015
- 31 -
http://www.wrh.noaa.gov/lox/ then click on the location of the Beach Cities WMG EWMP area on the area map. From the forecast page, the link to “Quantitative Precipitation Forecast” provides forecasted precipitation in inches for the next 24 hours, in 3-hour increments for the first 12 hours and in 6-hour increments for the last 12 hours.
D.2.2 Sample Handling Proper sampling handling ensures the samples will comply with the monitoring methods and analytical hold time and provides traceable documentation throughout the history of the sample. D.2.2.1 Documentation Procedures The Beach Cities WMG is responsible for ensuring that each field sampling team adheres to proper custody and documentation procedures. Field log sheets documenting sample collection and other monitoring activities for each site will be bound in a separate master logbook for each event. Field personnel have the following responsibilities: Keep an accurate written record of sample collection activities on the field log sheets. Ensure that all field log sheet entries are legible and contain accurate and inclusive
documentation of all field activities. Note errors or changes using a single line to cross out the entry and date and initial the
change. Ensure that a label is affixed to each sample collected and that the labels uniquely
identify samples with a sample ID, site ID, date and time of sample collection and the sampling crew initials.
Complete the chain of custody forms accurately and legibly. D.2.2.2 Field Documentation/Field Log Field crews will keep a field log book for each sampling event that contains a calibration log sheet, a field log sheet for each site, and appropriate contact information. The following items should be recorded on the field log sheet for each sampling event: Monitoring station location (Station ID); Date and time(s) of sample collection; Name(s) of sampling personnel; Sample collection depth; Sample ID numbers and unique IDs for any replicate or blank samples; QC sample type (if appropriate); Requested analyses (specific parameters or method references); Sample type (e.g., grab or composite); The results of field measurements (e.g., flow, temperature, dissolved oxygen, pH,
conductivity, turbidity) and the time that measurements were made; Qualitative descriptions of relevant water conditions (e.g., water color, flow level, clarity)
or weather (e.g., wind, rain) at the time of sample collection; Trash observations (presence/absence); Observations of recreational activities;
Appendix D. Analytical and Monitoring Procedures July 2015
- 32 -
A description of any unusual occurrences associated with the sampling event, particularly those that may affect sample or data quality.
The field log will be scanned into a PDF within one week of the conclusion of each sampling event. Alternatively, all measurements could be collected on an electronic device such as laptop or tablet computer. Appendix E contains an example of the field log sheet. D.2.2.3 Sample Handling and Shipment The field crews will maintain custody of samples during each monitoring event. Chain-of-custody (COC) forms will accompany all samples during shipment to contract laboratories to identify the shipment contents. All water quality samples will be transported to the analytical laboratory by the field crew or by courier. The original COC form will accompany the shipment, and a signed copy of the COC form will be sent, typically via email or fax, by the laboratory to the field crew to be retained in the project file. While in the field, samples will be stored on ice in an insulated container. Samples that must be shipped to the laboratory must be examined to ensure that container lids are tight and placed on ice to maintain the appropriate temperature. The ice packed with samples must be approximately 2 inches deep at the top and bottom of the cooler, and must contact each sample to maintain temperature. The original COC form(s) will be double-bagged in re-sealable plastic bags and either taped to the outside of the cooler or to the inside lid. Samples must be shipped to the contract laboratory according to transportation standards. The method(s) of shipment, courier name, and other pertinent information should be entered in the “Received By” or “Remarks” section of the COC form. Coolers must be sealed with packing tape before shipping, unless transported by field or lab personnel, and must not leak. It is assumed that samples in tape-sealed ice chests are secure whether being transported by common carrier or by commercial package delivery. The laboratory’s sample receiving department will examine the shipment of samples for correct documentation, proper preservation and compliance with holding times. The following procedures are used to prevent bottle breakage and cross-contamination: Bubble wrap or foam pouches are used to keep glass bottles from contacting one another
to prevent breakage, re-sealable bags will be used if available. All samples are transported inside hard plastic coolers or other contamination-free
shipping containers. If arrangements are not made in advance, the laboratory’s sample receiving personnel
must be notified prior to sample shipment. All samples remaining after successful completion of analyses will be disposed of properly. It is the responsibility of the personnel of each analytical laboratory to ensure that all applicable regulations are followed in the disposal of samples or related chemicals. Samples will be stored and transported as noted in Table D-5. Samples not analyzed locally will be sent on the same day that the sample collection process is completed, if possible. Samples will be delivered to the
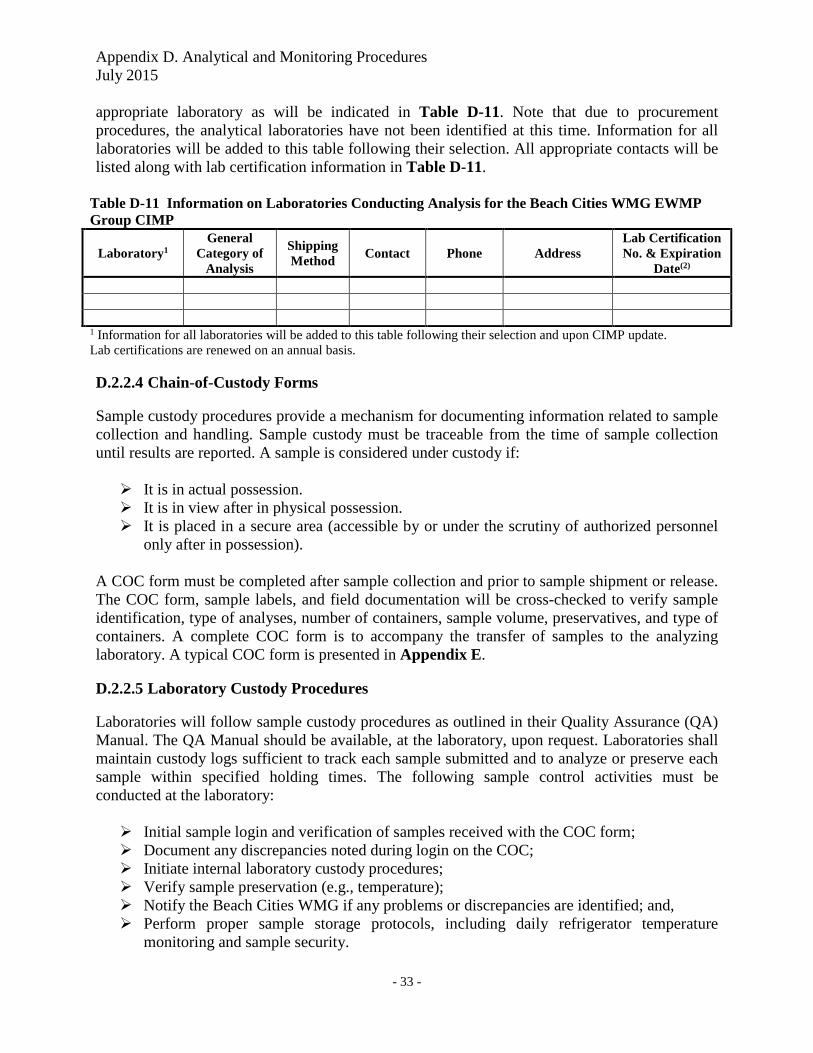
Appendix D. Analytical and Monitoring Procedures July 2015
- 33 -
appropriate laboratory as will be indicated in Table D-11. Note that due to procurement procedures, the analytical laboratories have not been identified at this time. Information for all laboratories will be added to this table following their selection. All appropriate contacts will be listed along with lab certification information in Table D-11.
Table D-11 Information on Laboratories Conducting Analysis for the Beach Cities WMG EWMP Group CIMP
Laboratory1 General
Category of Analysis
Shipping Method
Contact Phone Address Lab Certification No. & Expiration
Date(2) 1 Information for all laboratories will be added to this table following their selection and upon CIMP update. Lab certifications are renewed on an annual basis. D.2.2.4 Chain-of-Custody Forms Sample custody procedures provide a mechanism for documenting information related to sample collection and handling. Sample custody must be traceable from the time of sample collection until results are reported. A sample is considered under custody if: It is in actual possession. It is in view after in physical possession. It is placed in a secure area (accessible by or under the scrutiny of authorized personnel
only after in possession). A COC form must be completed after sample collection and prior to sample shipment or release. The COC form, sample labels, and field documentation will be cross-checked to verify sample identification, type of analyses, number of containers, sample volume, preservatives, and type of containers. A complete COC form is to accompany the transfer of samples to the analyzing laboratory. A typical COC form is presented in Appendix E. D.2.2.5 Laboratory Custody Procedures Laboratories will follow sample custody procedures as outlined in their Quality Assurance (QA) Manual. The QA Manual should be available, at the laboratory, upon request. Laboratories shall maintain custody logs sufficient to track each sample submitted and to analyze or preserve each sample within specified holding times. The following sample control activities must be conducted at the laboratory: Initial sample login and verification of samples received with the COC form; Document any discrepancies noted during login on the COC; Initiate internal laboratory custody procedures; Verify sample preservation (e.g., temperature); Notify the Beach Cities WMG if any problems or discrepancies are identified; and, Perform proper sample storage protocols, including daily refrigerator temperature
monitoring and sample security.
Appendix D. Analytical and Monitoring Procedures July 2015
- 34 -
Laboratories shall maintain records to document that the above procedures are followed. Once samples have been analyzed, samples will be stored at the laboratory for at least 60 days. After this period, samples may be disposed of properly. D.2.3 Field Protocols Briefly, the key aspects of quality control associated with field protocols for sample collection for eventual chemical and toxicological analyses are as follows: Field personnel will be thoroughly trained in the proper use of sample collection gear and
will be able to distinguish acceptable versus unacceptable water samples in accordance with pre-established criteria.
Field personnel will be thoroughly trained to recognize and avoid potential sources of sample contamination (e.g., engine exhaust, ice used for cooling).
Sampling gear and utensils which come in direct contact with the sample will be made of non-contaminating materials (e.g., borosilicate glass, high-quality stainless steel and/or Teflon™, according to protocol) and will be thoroughly cleaned between sampling stations according to appropriate cleaning protocol (rinsing thoroughly at minimum).
Sample containers will be of the recommended material and contaminant free (i.e., pre-cleaned).
Conditions for sample collection, preservation, and holding times will be followed. Field crews will be comprised of two persons per crew, minimum. To ensure safety, field crews will have the necessary field equipment such as safety vest, steel toe boots/or rubber boots, nitrile gloves, lighting, if required, etc. Other constraints on sampling events include, but are not limited to, lab closures and toxicity testing organism availability. Sampling events should proceed in the following manner: Before leaving the sampling crew base of operations, confirm number and type of sample
containers as well as the complete equipment list. Proceed to the first sampling site. Fill-out the general information on the field log sheet. Collect the environmental and quality assurance/quality control (QA/QC) samples
indicated on the event summary sheet and store samples appropriately. Using the field log sheet, confirm that all appropriate containers were filled.
Collect field measurements and observations, and record these on the field log sheet. Repeat the procedures in steps 3, 4, and 5 for each of the remaining sampling sites. Complete the COC forms using the information on the field log sheets. After sample collection is completed, deliver and/or ship samples to appropriate
laboratory.
D.2.4 Sample Collection All samples will be collected in a manner appropriate for the specific analytical methods to be used. The proper sampling techniques, outlined in this section, will ensure that the collected samples are representative of the waterbodies sampled. Should field crews feel that it is unsafe to
Appendix D. Analytical and Monitoring Procedures July 2015
- 35 -
collect samples for any reason, the field crews SHOULD NOT COLLECT a sample and note on the field log that the sample was not collected, why the sample was not collected, and provide photo documentation, if feasible. Because a significant storm event is based on predicted rainfall, it is recognized that this monitoring may be triggered without 0.25 inches of rainfall actually occurring. In this case, the monitoring event will still qualify as meeting this requirement provided that sufficient sample volume is collected to do all required laboratory analysis. Documentation will be provided showing the predicted rainfall amount.
D.2.4.1 Overview of Sampling Techniques As described below, the method used to collect water samples is dependent on the depth, flow, and sampling location (receiving water, outfall). Nonetheless, in all cases: Throughout each sample collection event, the sampler should exercise aseptic techniques
to avoid any contamination (i.e., do not touch the inner surfaces or lip edges of the sample bottle or cap).
The sampler should use clean, powder-free, nitrile gloves for each site to prevent contamination.
When collecting the sample, the sampler should not breathe, sneeze, or cough in the direction of the container.
Gloves should be changed if they are soiled, or if the potential for cross-contamination exists from handling sampling materials or samples.
While the sample is collected, the bottle lid shall not be placed on the ground. The sampler should not eat or drink during sample collection. The sampler should not smoke during sample collection. Each person on the field crew should wear clean clothing that is free of dirt, grease, or
other substances that could contaminate the sampling apparatus or sample bottles. Sampling should not occur near a running vehicle. Vehicles should not be parked within
the immediate sample collection area, even non-running vehicles. When the sample is collected, ample air space should be left in the bottle to facilitate
mixing by shaking for lab analysis, unless otherwise required by the method. After the sample is collected and the cap is tightly screwed back on the bottle, the time of
sampling should be recorded on the field log sheet. Any QA/QC samples that are collected should be also be noted on the field log sheet and
labeled according the convention described in Section D.2.1 of this Attachment. Samples should be stored as previously described. COC forms should be filled out as described in Section D.2.2 of this Attachment and
delivered to the appropriate laboratory as soon as feasible to ensure hold times are met. To prevent contamination of samples, clean metal sampling techniques using USEPA protocols outlined in USEPA Method 16691 will be used throughout all phases of the water sample collection. The protocol for clean metal sampling, based on USEPA Method 1669, is summarized below:
1 USEPA. April 1995. Method 1669: Sampling Ambient Water for Trace Metals at EPA Water Quality Criteria Levels. EPA 821-R-95-034.
Appendix D. Analytical and Monitoring Procedures July 2015
- 36 -
Samples are collected in rigorously pre-cleaned sample bottles with any tubing specially
processed to clean sampling standards. At least two persons, wearing clean, powder-free nitrile or latex gloves at all times, are
required on a sampling crew. One person, referred to as “dirty hands”, opens only the outer bag of all double-bagged
sample bottles. The other person, referred to as “clean hands”, reaches into the outer bag, opens the inner
bag and removes the clean sample bottle. Clean hands rinses the bottle at least two times by submerging the bottle, removing the
bottle lid, filling the bottle approximately one-third full, replacing the bottle lid, gently shaking and then emptying the bottle. Clean hands then collects the sample by submerging the bottle, removing the lid, filling the bottle and replacing the bottle cap while the bottle is still submerged.
After the sample is collected, the sample bottle is double-bagged in the opposite order from which it was removed from the same double-bagging.
Clean, powder-free gloves are changed whenever something not known to be clean has been touched.
D.2.4.2 Field Measurements and Observations Field measurements will be collected and observations made at each sampling site during sample collection. Field measurements will include the parameters identified in the CIMP for which a laboratory analysis is not being conducted. Field monitoring equipment must meet the requirements outlined in Table D-4. Field measurements for sediment samples shall be collected from within one meter of the sediment. All field measurement results and field observations will be recorded on a field log sheet similar to the one presented in Appendix E and as described in Section D.2.2 of this Attachment. Measurements (except for flow) will be collected at approximately mid-stream, mid-depth at the location of greatest flow (if feasible) with a Hydrolab DS4 multi-probe meter, or comparable instrument(s). If at any time the collection of field measurements by wading appears to be unsafe, field crews will not attempt to collect mid-stream, mid-depth measurements. Rather, field measurements will be made either directly from a stable, unobstructed area at the channel edge, or by using a telescoping pole and intermediate container to obtain a sample for field measurements and for filling sample containers. For situations where flows are not sufficiently deep to submerge the probes, an intermediate container will be utilized. The location of field measurements will be documented on the field log sheet. Flow measurements will be collected as outlined in the following subsections at freshwater receiving water and non-stormwater outfall monitoring sites. Regardless of measurement technique used, if a staff gage is present the gage height will be noted. Field crews may not be able to measure flow at several sites during wet weather because of inaccessibility of the site. If this is the case, site inaccessibility will be documented on the field log sheet.
Appendix D. Analytical and Monitoring Procedures July 2015
- 37 -
The field sampling crew has the primary responsibility for responding to failures in the sampling or measurement systems. Deviations from established monitoring protocols will be documented in the comment section of the field log sheet and noted in the post event summaries. If monitoring equipment fails, monitoring personnel will report the problem in the notes section of the field log sheet and will not record data values for the variables in question. Broken equipment will be replaced or repaired prior to the next field use. Data collected using faulty equipment will not be used. D.2.4.2.1 Velocity Meter Flow Measurements For sampling sites where water is deep enough (>0.1-foot) a velocity meter will be utilized. For these cases, velocity will be measured at approximately equal increments across the width of the flowing water using a Marsh-McBirney Flo-Mate® velocity meter2 or equivalent, which uses an electromagnetic velocity sensor. A “flow pole” will be used to measure the water depth at each measurement point and to properly align the sensor so that the depth of each velocity measurement is approximately equal to 0.6 * total depth, which is representative of the average velocity. The distance between velocity measurements taken across the stream is dependent on the total width. No more than 10% of the flow will pass through any one cross section. D.2.4.2.2 Shallow Sheet Flow Measurements If the depth of flow does not allow for the measurement of flow with a velocity meter (<0.1-foot) a “float” will be used to measure the velocity of the flowing water. The width, depth, velocity, cross section, and corresponding flow rate will be estimated as follows: Sheet flow width: The width (W) of the flowing water (not the entire part of the channel
that is damp) is measured at the “top”, “middle”, and “bottom” of a marked-off distance –
generally 10 feet (e.g., for a 10-foot marked-off section, TopW is measured at 0-feet, MidW
is measured at 5 feet, and BottomW is measured at 10 feet). Sheet flow depth: The depth of the sheet flow is measured at the top, middle, and bottom
of the marked-off distance. Specifically, the depth (D) of the sheet flow is measured at
25%, 50%, and 75% of the flowing width (e.g., MidD %50 is the depth of the water at middle of
the section in the middle of the sheet flow) at each of the width measurement locations. It is assumed that the depth at the edge of the sheet flow (i.e., at 0% and 100% of the flowing width) is zero.
Representative cross-section: Based on the collected depth and width measurements, the representative cross-sectional area across the marked-off sheet flow is approximated as follows:
2 For more information, see http://marsh-mcbirney.com/Products/2000.htm
Appendix D. Analytical and Monitoring Procedures July 2015
- 38 -
( ) ( )
( ) ( )
( ) ( ) }
{
)]2222
(4
[
)],2222
(4
[
)],2222
(4
[
Re
%75%50%75%25%50%25
%75%50%75%25%50%25
%75%50%75%25%50%25
BottomBottomBottomBottomBottomBottomBottom
MidMidMidMidMidMidMid
TopTopTopTopTopTopTop
DDDDDDW
DDDDDDW
DDDDDDWAverage
SectionCrossvepresentati
++
++
+×
++
++
+×
++
++
+×
=
Sheet flow velocity: Velocity is calculated based on the amount of time it took a float to
travel the marked-off distance (typically 10-feet or more). Floats are normally pieces of leaves, litter, or floatables (suds, etc.). The time it takes the float to travel the marked-off distance is measured at least three times. Then average velocity is calculated as follows:
Average Surface Velocity = Distance Marked off for Float Measurement Average Time for Float to Travel Marked off Distance
Flow Rate calculation: For sheet flows, based on the above measurements/estimates, the
estimated flow rate, Q, is calculated by:
Q = f x (Representative Cross Section) x (Average Surface Velocity) The coefficient f is used to account for friction effects of the channel bottom. That is, the float travels on the water surface, which is the most rapidly-traveling portion of the water column. The average velocity, not the surface velocity, determines the flow rate, and thus f is used to “convert” surface velocity to average velocity. In general, the value of f typically ranges from 0.60 – 0.90 (USGS 1982). Based on flow rate measurements taken during the LA River Bacteria Source Identification Study (CREST 2008) a value of 0.75 will be used for f. D.2.4.2.3 Free-Flowing Outfalls Some storm drain outfalls are free-flowing, meaning the runoff falls from an elevated outfall into the channel, which allows for collection of the entire flowing stream of water into a container of known volume (e.g., graduated bucket or graduated Ziploc bag). The time it takes to fill the known volume is measured using a stopwatch, and recorded on the field log. The time it takes to fill the container will be measured three times and averaged to ensure that the calculated discharge is representative. In some cases, a small portion of the runoff may flow around or under the container. For each measurement, “percent capture”, or the proportion of flow estimated to enter the bucket, will be recorded. For free-flowing outfalls, the estimated flow rate, Q, is calculated by:
])()(
[CaptureEstimatedContainerFilltoTime
VolumecontainerFilledAverageQ×
=
Appendix D. Analytical and Monitoring Procedures July 2015
- 39 -
Based on measurements of free-flowing outfalls during the LA River Bacteria Source Identification Study (CREST, 2008), estimated capture typically ranges from 0.75 – 1.0. D.2.4.2.4 Manhole Flow Rate Estimation Several alternative methods maybe applied to flow estimation in manholes, depending on field conditions. Shallow manholes may be most effectively assessed using a velocity meter as characterized in this section. Alternatively, runoff depth may be assessed using "dipsticks" or staff gauges to assess runoff water depth and compared with the facility design plans to allow an open channel flow rate calculation as indicated above. In situations where flow weighted compositing is required, an ultrasonic depth measurement may be suitable especially for mid-depth manholes of 10 to 30 feet in depth. Final decisions regarding development of this data will be made following monitoring consultant selection. D.2.4.3 Sampling Techniques for the Collection of Water The following subsections provide details on the various techniques that can be utilized to collect water quality samples. Should field crews feel that it is unsafe to collect samples for any reason, the field crews SHOULD NOT COLLECT a sample and note on the field log that the sample was not collected, why the sample was not collected, and provide photo documentation, if feasible. D.2.4.3.1 Direct Submission: Hand Technique Where practical, all grab samples will be collected by direct submersion at mid-stream, mid-depth using the following procedures: Follow the standard sampling procedures described in Section D.2.4.1 of this
Attachment. Remove the lid, submerge the container to mid-stream/mid-depth, let the container fill
and secure the lid. In the case of mercury samples, remove the lid underwater to reduce the potential for contamination from the air.
Place the sample on ice. Collect the remaining samples including quality control samples, if required, using the
same protocols described above.
Follow the sample handling procedures described in Section D.2.2 of this Attachment. D.2.4.3.2 Intermediate Container Technique Samples may be collected with the use of a clean intermediate container, if necessary, following the steps listed below. An intermediate container may include a container that is similar in composition to the sample container, a pre-cleaned pitcher made of the same material as the sample container, or a Ziploc bag. An intermediate container should not be reused at a different site without appropriate cleaning.
Appendix D. Analytical and Monitoring Procedures July 2015
- 40 -
Follow the standard sampling procedures described in Section D.2.4.1 of this Attachment.
Submerge the intermediate container to mid-stream/mid-depth (if possible), let the container fill, and quickly transfer the sample into the individual sample container(s) and secure the lid(s).
Place the sample(s) on ice. Collect remaining samples including quality control samples, if required, using the same
protocols described above. Follow the sample handling procedures described in Section D.2.2 of this Attachment.
Some flows may be too shallow to fill a container without using an intermediate container. When collecting samples from shallow sheet flows it is very important to not scoop up algae, sediment, or other particulate matter on the bottom because such debris is not representative of flowing water. To prevent scooping up such debris either: (1) find a spot where the bottom is relatively clean and allow the sterile intermediate container to fill without scooping; or (2) lay a clean sterile Ziploc® bag on the bottom and collect the water sample from on top of the bag. A fresh Ziploc® bag must be used at each site. D.2.4.3.4 Pumping Samples may be collected with the use of a peristaltic pump and specially cleaned tubing following the steps listed below. Sample tubing should not be reused at a different site without appropriate cleaning. Follow the standard sampling procedures described in Section D.2.4.1 of this
Attachment. Attach pre-cleaned tubing into the pump, exercising caution to avoid allowing tubing
ends to touch any surface known not to be clean. A separate length of clean tubing must be used at each sample location for which the pump is used.
Place one end of the tubing below the surface of the water. To the extent possible, avoid placing the tubing near the bottom so that settled solids are not pumped into the sample container.
Hold the other end of the tubing over the opening of the sample container, exercising care not to touch the tubing to the sample container.
Pump the necessary sample volume into the sample container and secure the lid. Place the sample on ice. Collect remaining samples including quality control samples, if required, using the same
protocols described above. Follow the sample handling procedures described in Section D.2.2 of this Attachment. D.2.4.3.5 Autosamplers Automatic sample compositors (autosamplers) are used to characterize the entire flow of a storm in one analysis. They can be programmed to take aliquots at either time- or flow-based specified intervals. Before beginning setup in the field, it is recommended to read the manufacturer’s instructions. The general steps to set up the autosampler are described below:
Appendix D. Analytical and Monitoring Procedures July 2015
- 41 -
Connect power source to autosampler. This can be in the form of a battery or a power
cable. Install pre-cleaned tubing into the pump. Clean tubing will be used at each site and for
each event, in order to minimize contamination. Attach strainer to intake end of the tubing and install in sampling channel. If running flow based composite samples; install flow sensor in sampling channel and
connect it to the automatic compositor. Label and install composite bottle(s). If sampler is not refrigerated, then add enough ice
to the composite bottle chamber to keep sample cold for the duration of sampling or until such time as ice can be refreshed. Make sure not to contaminate the inside of the composite bottle with any of the ice.
Program the autosampler as per the manufacturer’s instructions and make sure the autosampler is powered and running before leaving the site.
After the sample collection is completed the following steps must be taken to ensure proper sample handling: Upon returning to the site, check the status of the autosampler and record any errors or
missed samples. Note on the field log the time of the last sample, as this will be used for filling out the COCs.
Remove the composite bottle and store on ice. If dissolved metals are required, then begin the sample filtration process outlined in the following subsection, within 15 minutes of the last composite sample, unless compositing must occur at another location, in which case the filtration process should occur as soon as possible upon sample compositing.
Power down autosampler and leave sampling site.
The composite sample will need to be split into the separate analysis bottles either before being shipped to the laboratory or at the laboratory. This is best done in a clean and weatherproof environment, using clean sampling technique. D.2.4.3.6 Dissolved Metals Field Filtration Samples for dissolved metals will be filtered by the laboratory. In the event samples for dissolved metals are required to be filtered in the field, the following method for dissolved field filtration will be conducted. A 50mL plastic syringe with a 0.45µm filter attached will be used to collect and filter the dissolved metals sample in the field. The apparatus will either come certified pre-cleaned from the manufacturer and confirmed by the analytical laboratory or be pre-cleaned by and confirmed by the analytical laboratory at least once per year. The apparatus will be double bagged in Ziploc plastic bags. Alternative an equivalent method may be utilized, if necessary. To collect the sample for dissolved metals, first collect the total metals sample using clean sampling techniques. The dissolved sample will be taken from this container. Immediately prior to collecting the dissolved sample, shake the total metals sample. To collect the dissolved metals
Appendix D. Analytical and Monitoring Procedures July 2015
- 42 -
sample using clean sampling techniques, remove the syringe from the bag and place the tip of the syringe into the bottle containing the total metals sample and draw up 50 mL of sample into the syringe. Next, remove the filter from the zip-lock bag and screw it tightly into the tip of the syringe. Then put the tip of the syringe with the filter into the clean dissolved metals container and push the sample through the filter taking care not to touch the inside surface of the sample container with the apparatus. The sample volume needs to be a minimum of 20 mL. If the filter becomes clogged prior to generating 20 mL of sample, remove and dispose of the used filter and replace it with a new clean filter (using the clean sampling techniques). Continue to filter the sample. When 20 mL has been collected, cap the sample bottle tightly and store on ice for delivery to the laboratory. D.2.4.4 Receiving Water Sample Collection Receiving water sites are located approximately 1,000 feet offshore and a boat will be used to access the site. Determination when and where to precisely sample is health and safety dependent and will be determined by the Boat Captain, based on predicted and observed conditions. Samples will be collected as grab samples, which are discrete individual samples. Should field crews feel that it is unsafe to collect samples for any reason, the field crews SHOULD NOT COLLECT a sample and note on the field log that the sample was not collected, why the sample was not collected, and provide photo documentation, if feasible. Grab samples will be used for dry weather sampling events and will be collected as described in Section D.2.4.3 of this Attachment. Monitoring site configuration and consideration of safety will dictate grab sample collection technique. The potential exists for monitoring sites to lack discernable flow. The lack of discernable flow may generate unrepresentative data. To address the potential confounding interference that can occur under such conditions, sites sampled should be assessed for the following conditions and sampled or not sampled accordingly: Pools of water with no flow or no visible connection to another surface water body
should not be sampled. The field log should be completed for non-water quality data (including date and time of visit) and the site condition should be photo-documented.
Flowing water (i.e., based on visual observations, flow measurements, and a photo-documented assessment of conditions immediately upstream and downstream of the sampling site) site should be sampled.
It is the combined responsibility of all members of the sampling crew to determine if the performance requirements of the specific sampling method have been met, and to collect additional samples if required. If the performance requirements outlined above or documented in sampling protocols are not met, the sample will be re-collected. If contamination of the sample container is suspected, a fresh sample container will be used. The SMB EWMP Group will be contacted if at any time the sampling crew has questions about procedures or issues based on site-specific conditions. D.2.4.5 Stormwater Outfall Sample Collection Stormwater outfalls will be monitored with methods similar to those discussed in Section D.2.4.4 of this Attachment. Sampling will not be undertaken if the outfalls are not flowing or if
Appendix D. Analytical and Monitoring Procedures July 2015
- 43 -
conditions exist where the receiving water is back-flowing into the outfall. It is the combined responsibility of all members of the sampling crew to determine if the performance requirements of the specific sampling method have been met, and to collect additional samples if required. If the performance requirements outlined above or documented in sampling protocols are not met, the sample will be re-collected. If contamination of the sample container is suspected, a fresh sample container will be used. The Beach Cities WMG will be contacted if at any time the sampling crew has questions about procedures or issues based on site-specific conditions. Two outfall sites are located in major arterial roadways and would be collected as grab samples to avoid extended traffic delays and risks from traffic related accidents. Other outfall sites that can be safely accessed over the sampling duration would be sampled as time-weighted equal volume aliquots, collected either manually or using an auto-sampler, which would be composited by the selected analytical laboratory. A time-weighted composite is created by mixing multiple aliquots collected at equally specified time intervals. D.2.4.6 Preparation for Outfall Surveys Preparation for outfall surveys includes preparation of field equipment, placing bottle orders, and contacting the necessary personnel regarding site access and schedule. The following steps should be completed two weeks prior to each outfall survey: Check weather reports and LACDPW rain gage to ensure that antecedent dry weather
conditions are suitable. Contact appropriate Flood Maintenance Division personnel from LACDPW to notify
them of dates and times of any activities in flood control channels. Contact laboratories to order bottles and to coordinate sample pick-ups. Confirm scheduled sampling date with field crews. Set-up sampling day itinerary including sample drop-offs and pick-ups. Compile field equipment. Prepare sample labels. Prepare event summaries to indicate the type of field measurements, field observations,
and samples to be taken at each of the outfalls. Prepare COCs. Charge the batteries of field tablets (if used).
D.2.4.6.1 Non-Stormwater Sample Collection Water quality samples will be collected consistent with the dry weather requirements outlined in the receiving water monitoring section using the direct submersion, intermediate container, shallow sheet flow, or pumping methods described in Section D.2.4.3 of this Attachment. D.2.4.7 Stormborne Sediment Collection No sediment collection sampling would be conducted under this program in the receiving waters. Data from the BIGHT analysis will be used to evaluate data and applicability of control measures.
Appendix D. Analytical and Monitoring Procedures July 2015
- 44 -
D.2.4.8 Bioaccumulation Sample Collection No Bioaccumulation sampling will be conducted under this program. D.2.4.9 Trash Monitoring The Beach Cities WMG members are implementing the Santa Monica Bay Debris TMDLs through the installation of full capture devices. As such, no specific monitoring is required or will be conducted for the Santa Monica Bay Debris TMDLs for these jurisdictions. D.2.4.10 Plastic Pellet Monitoring See Appendix A for details on plastic pellet monitoring and reporting requirements. D.2.4.11 Quality Control Sample Collection Quality control samples will be collected in conjunction with representative samples to verify data quality. Quality control samples collected in the field will generally be collected in the same manner as environmental samples. Detailed descriptions of quality control samples are presented in Section D.3 of this Attachment.
D.3 Quality Assurance/Quality Control This section describes the quality assurance and quality control requirements and processes. Quality control samples will be collected in conjunction with environmental samples to verify data quality. Quality control samples collected in the field will generally be collected in the same manner as environmental samples. There are no requirements for quality control for field analysis of general parameters (e.g., temperature, pH, conductivity, dissolved oxygen, and pH) outlined in the SWAMP. However, field crews will be required to calibrate equipment as outlined in Section D.2 of this Attachment. Table D-12 presents the quality assurance parameter addressed by each quality assurance requirement as well as the appropriate corrective action if the acceptance limit is exceeded.
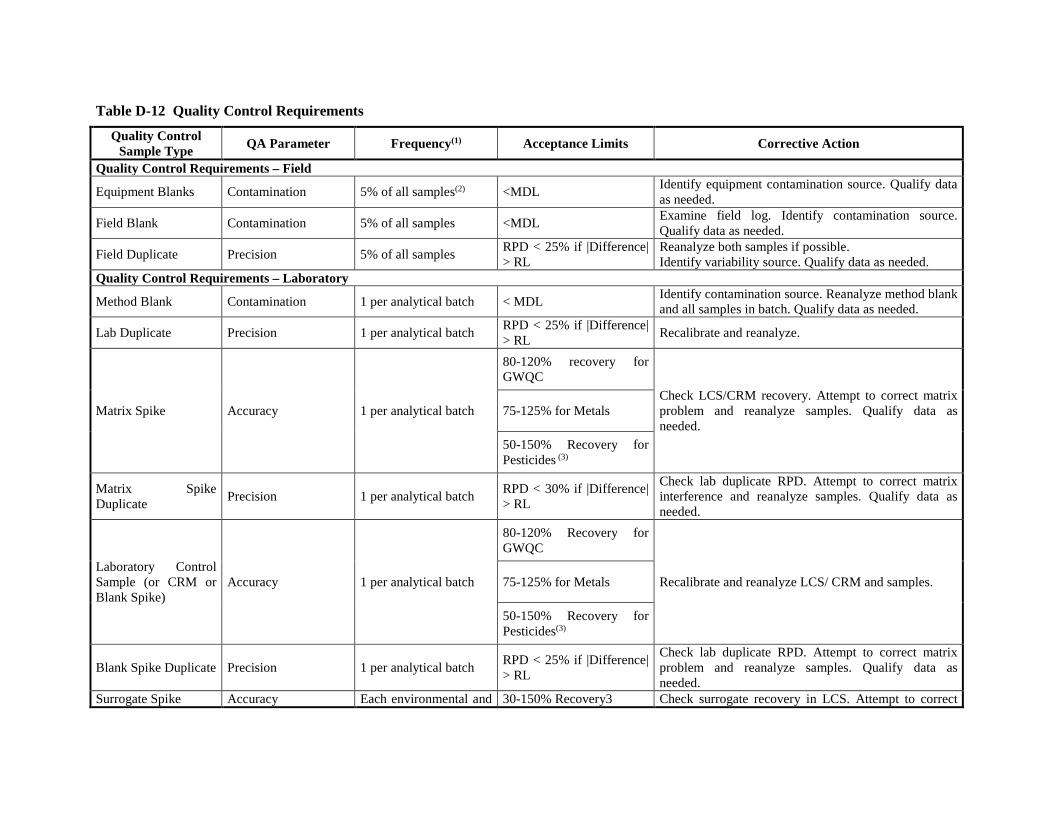
Table D-12 Quality Control Requirements
Quality Control Sample Type
QA Parameter Frequency(1) Acceptance Limits Corrective Action
Quality Control Requirements – Field
Equipment Blanks Contamination 5% of all samples(2) <MDL Identify equipment contamination source. Qualify data as needed.
Field Blank Contamination 5% of all samples <MDL Examine field log. Identify contamination source. Qualify data as needed.
Field Duplicate Precision 5% of all samples RPD < 25% if |Difference| > RL
Reanalyze both samples if possible. Identify variability source. Qualify data as needed.
Quality Control Requirements – Laboratory
Method Blank Contamination 1 per analytical batch < MDL Identify contamination source. Reanalyze method blank and all samples in batch. Qualify data as needed.
Lab Duplicate Precision 1 per analytical batch RPD < 25% if |Difference| > RL
Recalibrate and reanalyze.
Matrix Spike Accuracy 1 per analytical batch
80-120% recovery for GWQC
Check LCS/CRM recovery. Attempt to correct matrix problem and reanalyze samples. Qualify data as needed.
75-125% for Metals
50-150% Recovery for Pesticides (3)
Matrix Spike Duplicate
Precision 1 per analytical batch RPD < 30% if |Difference| > RL
Check lab duplicate RPD. Attempt to correct matrix interference and reanalyze samples. Qualify data as needed.
Laboratory Control Sample (or CRM or Blank Spike)
Accuracy 1 per analytical batch
80-120% Recovery for GWQC
Recalibrate and reanalyze LCS/ CRM and samples. 75-125% for Metals
50-150% Recovery for Pesticides(3)
Blank Spike Duplicate Precision 1 per analytical batch RPD < 25% if |Difference| > RL
Check lab duplicate RPD. Attempt to correct matrix problem and reanalyze samples. Qualify data as needed.
Surrogate Spike Accuracy Each environmental and 30-150% Recovery3 Check surrogate recovery in LCS. Attempt to correct
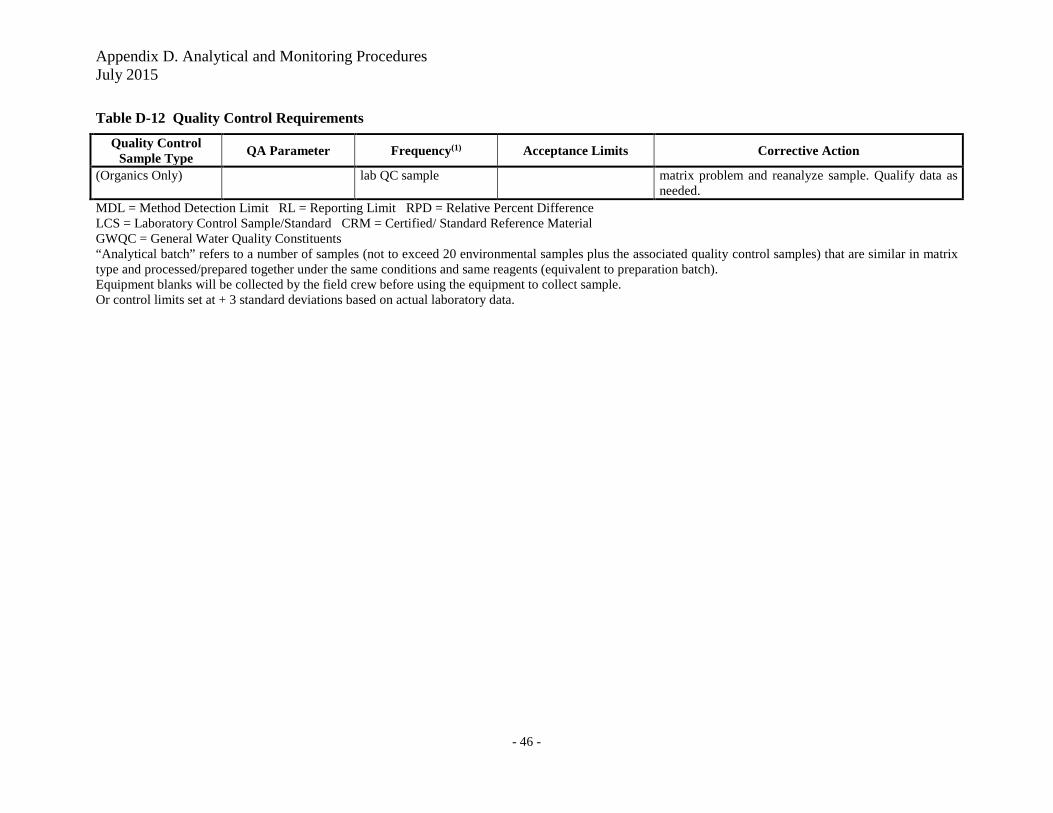
Appendix D. Analytical and Monitoring Procedures July 2015
- 46 -
Table D-12 Quality Control Requirements
Quality Control Sample Type
QA Parameter Frequency(1) Acceptance Limits Corrective Action
(Organics Only) lab QC sample matrix problem and reanalyze sample. Qualify data as needed.
MDL = Method Detection Limit RL = Reporting Limit RPD = Relative Percent Difference LCS = Laboratory Control Sample/Standard CRM = Certified/ Standard Reference Material GWQC = General Water Quality Constituents “Analytical batch” refers to a number of samples (not to exceed 20 environmental samples plus the associated quality control samples) that are similar in matrix type and processed/prepared together under the same conditions and same reagents (equivalent to preparation batch). Equipment blanks will be collected by the field crew before using the equipment to collect sample. Or control limits set at + 3 standard deviations based on actual laboratory data.
D.3.1 QA/QC Requirements and Objectives D.3.1.1 Comparability Comparability of the data can be defined as the similarity of data generated by different monitoring programs. For this monitoring program, this objective will be ensured mainly through use of standardized procedures for field measurements, sample collection, sample preparation, laboratory analysis, and site selection; adherence to quality assurance protocols and holding times; and reporting in standard units. Additionally, comparability of analytical data will be addressed through the use of standard operating procedures and extensive analyst training at the analyzing laboratory. D.3.1.2 Representativeness Representativeness can be defined as the degree to which the environmental data generated by the monitoring program accurately and precisely represent actual environmental conditions. For the CIMP, this objective will be addressed by the overall design of the program. Representativeness is attained through the selection of sampling locations, methods, and frequencies for each parameter of interest, and by maintaining the integrity of each sample after collection. Sampling locations were chosen that are representative of various areas within the watershed and discharges from the MS4, which will allow for the characterization of the watershed and impacts MS4 discharges may have on water quality. D.3.1.3 Completeness Data completeness is a measure of the amount of successfully collected and validated data relative to the amount of data planned to be collected for the project. It is usually expressed as a percentage value. A project objective for percent completeness is typically based on the percentage of the data needed for the program or study to reach valid conclusions. Because the CIMP is intended to be a long term monitoring program, data that are not successfully collected during a specific sample event will not be recollected at a later date. Rather subsequent events conducted over the course of the monitoring will provide robust data sets to appropriately characterize conditions at individual sampling sites and the watershed in general. For this reason, most of the data planned for collection cannot be considered absolutely critical, and it is difficult to set a meaningful objective for data completeness. However, some reasonable objectives for data are desirable, if only to measure the effectiveness of the program when conditions allow for the collection of samples (i.e., flow is present). The program goals for data completeness, shown in Table D-4, are based on the planned sampling frequency, SWAMP recommendations, and a subjective determination of the relative importance of the monitoring element within the CIMP. If, however, sampling sites do not allow for the collection of enough samples to provide representative data due to conditions (i.e., no flow) alternate sites will be considered. Data completeness will be evaluated on a yearly basis.
Appendix D. Analytical and Monitoring Procedures July 2015
- 48 -
D.3.2 QA/QC Field Procedures Quality control samples to be prepared in the field will consist of equipment blanks, field blanks, and field duplicates as described below.
D.3.2.1 Equipment Blanks The purpose of analyzing equipment blanks is to demonstrate that sampling equipment is free from contamination. Equipment blanks will be collected by the analytical laboratory responsible for cleaning equipment and analyzed for relevant pollutants before sending the equipment to the field crew. Equipment blanks will consist of laboratory-prepared blank water (certified to be contaminant-free by the laboratory) processed through the sampling equipment that will be used to collect environmental samples. The equipment blanks will be analyzed using the same analytical methods specified for environmental samples. If any analytes of interest are detected at levels greater than the MDL, the source(s) of contamination will be identified and eliminated (if possible), the affected batch of equipment will be re-cleaned, and new equipment blanks will be prepared and analyzed before the equipment is returned to the field crew for use. D.3.2.2 Field Blanks The purpose of analyzing field blanks is to demonstrate that sampling procedures do not result in contamination of the environmental samples. Per the Quality Assurance Management Plan for SWAMP (SWRCB, 2008) field blanks are to be collected as follows: At a frequency of 5% of samples collected for the following constituents: trace metals in
water (including mercury), VOC samples in water and sediment, DOC samples in water, and bacteria samples.
Field blanks for other media and analytes should be conducted upon initiation of
sampling, and if field blank performance is acceptable (as described in Table D-12), further collection and analysis of field blanks for these other media and analytes need only be performed on an as-needed basis, or during field performance audits. An as-needed basis for the Beach Cities WMG CIMP will be annually.
Field blanks will consist of laboratory-prepared blank water (certified to be contaminant-free by the laboratory) processed through the sampling equipment using the same procedures used for environmental samples. If any analytes of interest are detected at levels greater than the MDL, the source(s) of contamination should be identified and eliminated, if possible. The sampling crew should be notified so that the source of contamination can be identified (if possible) and corrective measures taken prior to the next sampling event.

Appendix D. Analytical and Monitoring Procedures July 2015
- 49 -
D.3.2.3 Field Duplicates The purpose of analyzing field duplicates is to demonstrate the precision of sampling and analytical processes. Field duplicates will be prepared at the rate of 5% of all samples, and analyzed along with the associated environmental samples. Field duplicates will consist of two samples collected simultaneously, to the extent practicable. If the Relative Percent Difference (RPD) of field duplicate results is greater than the percentage stated in Table D-12 and the absolute difference is greater than the RL, both samples should be reanalyzed, if possible. The sampling crew should be notified so that the source of sampling variability can be identified (if possible) and corrective measures taken prior to the next sampling event.
D.3.3 QA/QC Laboratory Analyses Quality control samples prepared in the laboratory will consist of method blanks, laboratory duplicates, matrix spikes/duplicates, laboratory control samples (standard reference materials), and toxicity quality controls. D.3.3. 1 Method Blanks The purpose of analyzing method blanks is to demonstrate that sample preparation and analytical procedures do not result in sample contamination. Method blanks will be prepared and analyzed by the contract laboratory at a rate of at least one for each analytical batch. Method blanks will consist of laboratory-prepared blank water processed along with the batch of environmental samples. If the result for a single method blank is greater than the MDL, or if the average blank concentration plus two standard deviations of three or more blanks is greater than the RL, the source(s) of contamination should be corrected, and the associated samples should be reanalyzed. D.3.3.2 Laboratory Blanks The purpose of analyzing laboratory duplicates is to demonstrate the precision of the sample preparation and analytical methods. Laboratory duplicates will be analyzed at the rate of one pair per sample batch. Laboratory duplicates will consist of duplicate laboratory fortified method blanks. If the RPD for any analyte is greater than the percentage stated in Table D-12 and the absolute difference between duplicates is greater than the RL, the analytical process is not being performed adequately for that analyte. In this case, the sample batch should be prepared again, and laboratory duplicates should be reanalyzed. D.3.3.3 Matrix Spikes and Matrix Spike Duplicates The purpose of analyzing matrix spikes and matrix spike duplicates is to demonstrate the performance of the sample preparation and analytical methods in a particular sample matrix. Matrix spikes and matrix spike duplicates will be analyzed at the rate of one pair per sample batch. Each matrix spike and matrix spike duplicate will consist of an aliquot of laboratory-fortified environmental sample. Spike concentrations should be added at five to ten times the reporting limit for the analyte of interest.
Appendix D. Analytical and Monitoring Procedures July 2015
- 50 -
If the matrix spike recovery of any analyte is outside the acceptable range, the results for that analyte have failed to meet acceptance criteria. If recovery of laboratory control samples is acceptable, the analytical process is being performed adequately for that analyte, and the problem is attributable to the sample matrix. An attempt will be made to correct the problem (e.g., by dilution, concentration, etc.), and the samples and matrix spikes will be re-analyzed. If the matrix spike duplicate RPD for any analyte is outside the acceptable range, the results for that analyte have failed to meet acceptance criteria. If the RPD for laboratory duplicates is acceptable, the analytical process is being performed adequately for that analyte, and the problem is attributable to the sample matrix. An attempt will be made to correct the problem (e.g., by dilution, concentration, etc.), and the samples and matrix spikes will be re-analyzed. D.3.3.4 Laboratory Control Samples The purpose of analyzing laboratory control samples (or a standard reference material) is to demonstrate the accuracy of the sample preparation and analytical methods. Laboratory control samples will be analyzed at the rate of one per sample batch. Laboratory control samples will consist of laboratory fortified method blanks or a standard reference material. If recovery of any analyte is outside the acceptable range, the analytical process is not being performed adequately for that analyte. In this case, the sample batch should be prepared again, and the laboratory control sample should be reanalyzed. D.3.3.5 Surrogate Spikes Surrogate recovery results are used to evaluate the accuracy of analytical measurements for organics analyses on a sample-specific basis. A surrogate is a compound (or compounds) added by the laboratory to method blanks, samples, matrix spikes, and matrix spike duplicates prior to sample preparation, as specified in the analytical methodology. Surrogates are generally brominated, fluorinated or isotopically labeled compounds that are not usually present in environmental media. Results are expressed as percent recovery of the surrogate spike. Surrogate spikes are applicable for analysis of semi-volatile, PCBs and pesticides. D.3.3.6 Toxicity Quality Control For aquatic toxicity tests, the acceptability of test results is determined primarily by performance-based criteria for test organisms, culture and test conditions, and the results of control bioassays. Control bioassays include monthly reference toxicant testing. Test acceptability requirements are documented in the method documents for each bioassay method.
D.4 Instrument/Equipment Calibration and Frequency Frequencies and procedures for calibration of analytical equipment used by each contract laboratory are documented in the QA Manual for that laboratory. Any deficiencies in analytical equipment calibration should be managed in accordance with the QA Manual for each contract laboratory. Any deficiencies that affect analysis of samples submitted through this program must be reported to the Beach Cities WMG. Laboratory QA Manuals are available for review at the analyzing laboratory.
Appendix D. Analytical and Monitoring Procedures July 2015
- 51 -
D.5 Toxicity Follow-Up Monitoring Requirements The following memorandum, provided by the Los Angeles Regional Board, provides clarification on follow-up monitoring requirements in response to observed toxicity in receiving waters, and is therefore incorporated into the Beach Cities CIMP.
EDMUND G . BROWN JR. OOvEA.NOA.
Water Boards ~ M"TTHEW RODRIQUEZ l ~~ S£CRETAA 'f FOR ~ E.IIIYIA.ONMEN TAL PROTeCTION
Los Angeles Regional Water Quality Control Board
TO:
FROM:
DATE:
SUBJECT:
Los Angeles County MS4 Permittees and City of Long Beach
Samuel Unger, P.E. a. fl • ~ Executive Officer ~ V "-~
August 7, 2015
CLARIFICATION REGARDING FOLLOW-UP MONITORING REQUIREMENTS IN RESPONSE TO OBSERVED TOXICITY IN RECEIVING WATERS PURSUANT TO THE MONITORING & REPORTING PROGRAM (ATTACHMENT E) OF THE LOS ANGELES COUNTY MS4 PERMIT (ORDER NO. R4-2012-0175)
The Los Angeles County MS4 Permit, Attachment E requires chronic aquatic toxicity monitoring in receiving waters during both wet and dry weather conditions to determine whether designated beneficial uses are fully supported. Further, Attachment E requires additional monitoring at MS4 outfalls where. aquatic toxicity is present above a certain effect level in downstream receiving waters to determine whether MS4 discharges are causing or contributing to the aquatic toxicity. In this situation, outfall monitoring must either entail monitoring for specific pollutants identified in a toxicity identification evaluation (TIE) in the downstream receiving water, or for aquatic toxicity itself, where the specific pollutants could not be identified through the TIE conducted on the downstream receiving water.
In its comments on the draft Integrated Monitoring Programs (IMPs) and Coordinated Integrated Monitoring Programs (CIMPs) submitted per the Los Angeles County MS4 Permit, the Los Angeles Water Board provided clarification and recommendations to Permittees regarding aquatic toxicity monitoring, particularly pertaining to the requirement to conduct chronic toxicity tests in dry and wet weather conditions and requirements for conducting a TIE and outfall monitoring. Subsequently, on December 9, 2014, Board staff met with several Permittees regarding its comments. During this meeting it was apparent that further clarification was necessary regarding requirements for follow-up monitoring when aquatic toxicity is present in downstream receiving waters. This memo provides additional clarification and applies to aU IMPs and CIMPs developed pursuant to Part VI.B of the Los Angeles County MS4 Permit and Part VII.B of the City of Long Beach MS4 Permit.
It is acknowledged, however, that this memo may not address every situation that is encountered. We encourage the Permittees to approach tbxicity testing and the TIE and TRE procedures thoughtfully and thoroughly in the interest of identifying and eliminating any source(s) of toxicity in MS4 discharges as expeditiously as possible and to consult with Los Angeles Water Board staff if you need assistance or clarification.
C HARLES STRINGER, CHAIR I SAMUEL u NG ER, EXECUTIVE OFFICER
320 West 4th St .. Suite 200, Los Angeles, CA 90013 I www.waterboards.ca.gov/ losangeles
0 RECYCLED PAPER
P a g e | 2
An inconclusive TIE is one for
which the cause of toxicity
cannot be identified after the
conclusion of TIE Phases I and II.
If a TIE is inconclusive:
� Check QA/QC
� Evaluate sensitive species
selection
� Initiate future TIEs earlier (to
address non-persistent
toxicity)
� Conduct all phases of TIE
If you have any questions regarding these clarifications, please contact Renee Purdy at [email protected] or Shirley Birosik at [email protected].
The memo addresses requirements for follow-up monitoring in four receiving water scenarios
where toxicity is present:
• Toxicity is present, but not above the TIE trigger as defined in Attachment E, Part XII.I.11;
• Toxicity is present above the TIE trigger and the TIE identifies the constituent(s) causing
the toxicity;
• Toxicity is present above the TIE trigger during wet weather, but the TIE is inconclusive;
and
• Toxicity is present above the TIE trigger during dry weather, but the TIE is inconclusive.
The memo also addresses the several scenarios once outfall toxicity testing has been triggered.
Attached to the memo are several simplified flowcharts to aid in understanding the process.
An inconclusive TIE is defined as a TIE for which the cause of toxicity cannot be attributed to a constituent or class of constituents (e.g., metals, insecticides, etc.) that can be targeted for monitoring even after conducting appropriate Phase I and Phase II TIE treatments. This outcome may result from either non-persistent toxicity such that the TIE treatments cannot be successfully completed on the toxic sample, or from the inability with available Phase I and Phase II TIE
treatments to isolate the constituent or class of constituents causing the toxicity. If the TIE is inconclusive due to non-persistent toxicity, the Los Angeles Water Board expects that Permittees will proactively identify and implement actions during the subsequent upstream and/or outfall toxicity sampling event to improve the likelihood of a conclusive TIE, while also following the steps below. Where a TIE is inconclusive due to the inability to determine the constituent(s) causing the toxicity, Permittees should evaluate further steps to improve the TIE outcome including sensitive species selection, QA/QC, and the need to conduct Phases I through III of a TIE, among others.
1 Permit references correspond to the Los Angeles County MS4 Permit (Order No. R4-2012-0175)
P a g e | 3
TRIGGERS FOR ADDING TOXICITY MONITORING TO UPSTREAM RECEIVING
WATER MONITORING / OUTFALL MONITORING:
1. If toxicity is present as determined based on a fail of the Test of Significant Toxicity (TST) t-
test as specified in the Permit (Attachment E, Part XII.G.4) during wet or dry weather, but
not above the TIE trigger (which is defined as when the survival or sublethal endpoint
demonstrates a >=50 Percent Effect at the IWC as per Attachment E, Part XII.I.1), then:
a. Toxicity monitoring will be added to the next existing upstream receiving water
site(s) during the same condition (wet or dry weather) for which toxicity was
determined to be present. Monitoring for toxicity at the next existing upstream
receiving water site(s) will occur during the next monitoring event that is at least 30
days following the original toxicity sample collection. Toxicity monitoring at
individual receiving water sites will continue until (1) the deactivation criterion (i.e.,
two consecutive samples that pass the pass/fail TST t-test during the same condition)
is met at the receiving water site or (2) a TIE is triggered and conclusively identifies
the constituent or class of constituents causing toxicity, in which case the process
outlined in Bullet 2 below is followed. OR
b. If there is no upstream receiving water monitoring site already established as part of
the monitoring program, continue receiving water toxicity monitoring at the original
site until (1) the deactivation criterion (i.e., two consecutive samples that pass the
pass/fail TST t-test during the same condition) is met at the original receiving water
site or (2) a TIE is triggered at the original site and conclusively identifies the
constituent or class of constituents causing toxicity, in which case the process
outlined in Bullet 2 below is followed. Also, conduct an evaluation similar to the TRE
outlined in Attachment E, Part XII.J to identify, to the extent practicable, the
source(s) of toxicity with the goal of identifying cause(s) of toxicity, paying particular
attention to sources of potential constituent(s) causing toxicity (e.g., fipronil).
i. If there is no upstream receiving water monitoring site already established as
part of the monitoring program and toxicity is present during dry weather,
actions taken as part of the non-stormwater program (e.g., source
identification and elimination or treatment of unauthorized non-stormwater
discharges that are a source of pollutants) should be utilized to support the
TRE.
ii. If there is no upstream receiving water monitoring site already established as
part of the monitoring program and toxicity is present during wet weather,
consider the following actions to support TRE: evaluating land uses and
potential associated source(s) in the drainage area, evaluation of other
permitted discharges, and evaluation of inspection activities. AND
c. If there is no upstream receiving monitoring site already established as part of the
monitoring program and more than one occurrence of a fail of the TST t-test occurs at
the original receiving water site within 3 years, then evaluate opportunities to conduct
toxicity monitoring at upstream receiving water sites (either newly established or sites
utilized by other monitoring programs), including tributaries.
P a g e | 4
2. If toxicity is present at a level exceeding the TIE trigger and the TIE identifies the constituent
or class of constituents causing toxicity, then:
a. Do not add toxicity monitoring to upstream sites. AND
a. During the same condition, add the identified constituent or constituents within the
class of constituents2 to the monitoring site where toxicity was identified, the
upstream receiving water site(s), and upstream outfall site(s) starting with the next
monitoring event that is at least 45 days following the toxicity sample collection.
Monitoring for the identified constituent(s) will continue until the deactivation
criterion (i.e., two consecutive samples do not exceed Receiving Water Limitations
(RWLs), Water Quality Based Effluent Limitations (WQBELs), or other appropriate
threshold or guideline if there is no numeric RWL or WQBEL, for the identified
constituents during the same condition) is met at the individual site. Where
constituent(s) are identified in the outfall(s) above the RWL(s), WQBEL(s), or other
appropriate threshold or guideline commence TRE at each corresponding outfall
location per Attachment E, Part XII.J.
3. If toxicity is present at a level exceeding the TIE trigger during wet weather and the TIE is
inconclusive, then:
a. Add toxicity monitoring to the next existing upstream receiving water site(s) during
the next monitoring event that is at least 45 days following the original toxicity
sample collection. Toxicity monitoring at individual receiving water site(s) will
continue until (1) the deactivation criterion (i.e., two consecutive samples that pass
the pass/fail TST t-test during the same condition) is met at the receiving water site or
(2) a TIE is triggered and conclusively identifies the constituent or class of
constituents causing toxicity, in which case the process outlined in Bullet 2 above is
followed. AND
b. The second inconclusive TIE in 3 years during wet weather would trigger outfall
toxicity testing at upstream outfall sites (i.e., (1) outfall sites located between the
receiving water site and the nearest upstream receiving water site located on the same
waterbody and (2) outfall sites located on tributaries that have a confluence with the
waterbody where the confluence is located between the receiving water site and the
nearest upstream receiving water site located on the same waterbody) following the
process outlined below in “Steps Related Outfall Toxicity Testing” during the next
monitoring event that is at least 45 days following the original toxicity sample
collection. OR
c. As an alternative to the outfall monitoring described in Bullet 3.b., Permittees may
propose an alternative approach any time after the first inconclusive TIE, which could
include utilizing upstream receiving water sites (either newly established or sites
utilized by other monitoring programs), including tributaries, additional outfall sites,
and/or different outfall sites. However, the outfall monitoring approach described in
Bullet 3.b. must be followed until Regional Water Board EO approval of the
alternative approach.
2 Using appropriate detection limits
P a g e | 5
4. If toxicity is present at a level exceeding the TIE trigger during dry weather and the TIE is
inconclusive, then:
a. Add toxicity monitoring to the next existing upstream receiving water site(s) during
the next monitoring event that is at least 45 days following the original toxicity
sample collection. Toxicity monitoring at individual receiving water site(s) will
continue until (1) the deactivation criterion (i.e., two consecutive samples that pass
the pass/fail TST t-test during the same condition) is met at the receiving water site or
(2) a TIE is triggered and conclusively identifies the constituent or class of
constituents causing toxicity, in which case the process outlined in Bullet 2 above is
followed during the next monitoring event that is at least 45 days following the
original toxicity sample collection. AND
b. Add toxicity testing to upstream outfall sites (i.e., (1) outfall sites located between the
receiving water site and the nearest upstream receiving water site located on the same
waterbody and (2) outfall sites located on tributaries that have a confluence with the
waterbody where the confluence is located between the receiving water site and the
nearest upstream receiving water site located on the same waterbody) following the
process outlined below in “Steps Related Outfall Toxicity Testing” during the next
monitoring event that is at least 45 days following the original toxicity sample
collection. OR
c. As an alternative to the outfall monitoring described in Bullet 4.b above, Permittees
may propose an alternative approach any time after the first inconclusive TIE, which
could include utilizing upstream receiving water sites (either newly established or
sites utilized by other monitoring programs), including tributaries, additional outfall
sites, and/or different outfall sites. However, the outfall monitoring approach
described in Bullet 4.b above must be followed until Regional Water Board EO
approval of the alternative approach.
STEPS RELATED TO OUTFALL TOXICITY TESTING ONCE TRIGGERED:
1. If toxicity is not present as determined based on pass of the TST t-test as specified in the
Permit, then continue toxicity testing during the same condition
2. (i.e. wet or dry weather) until (1) meeting the deactivation criterion (i.e., two consecutive
samples that pass the pass/fail TST t-test during the same condition), or (2) a TIE conducted
at the downstream receiving water site conclusively identifies the constituent or class of
constituents causing toxicity, or (3) the discharge is eliminated.
3. If toxicity is present as determined based on fail of the TST t-test as specified in the Permit,
but not above the TIE trigger, then continue toxicity testing during the same condition until
(1) meeting the deactivation criterion (i.e., two consecutive samples that pass the pass/fail
TST t-test during the same condition), or (2) a TIE conducted at a downstream receiving
water site conclusively identifies the constituent or class of constituents causing toxicity, or
(3) the discharge is eliminated. Concurrently conduct an evaluation similar to the TRE in
Attachment E, Part XII.J to identify, to the extent practicable, the source(s) of toxicity with
the goal of addressing cause(s) of toxicity, paying particular attention to sources of potential
constituent(s) causing toxicity (e.g., fipronil).
P a g e | 6
a. If toxicity is present in the non-stormwater discharge, actions taken as part of the non-
stormwater program (e.g., source identification and elimination or treatment of
unauthorized non-stormwater discharges that are a source of pollutants) should be
utilized to support the TRE.
b. If toxicity is present in the stormwater discharge, consider the following actions to
support the TRE: evaluating land uses and potential associated source(s) in the
drainage area, evaluation of other permitted discharges, and evaluation of inspection
activities.
4. If toxicity is present at a level exceeding the TIE trigger and the TIE identifies the
constituent or class of constituents causing toxicity, then:
a. Discontinue toxicity testing at the outfall. AND
b. Add the identified constituent or constituents within the identified class of
constituents3 during the same condition starting with the next monitoring event that is
at least 45 days following the toxicity sample collection and monitor for those
constituents at the outfall until meeting the deactivation criterion for those
constituents (i.e., two consecutive samples do not exceed RWLs, WQBELs, or other
appropriate threshold or guideline if there is no numeric RWL or WQBEL, for
identified constituents), while simultaneously performing a TRE for the constituent(s)
causing toxicity per Attachment E, Part XII.J.
5. If toxicity is present at a level exceeding the TIE trigger and the TIE is inconclusive, then
continue toxicity testing during the same condition until (1) meeting the deactivation
criterion (i.e., two consecutive samples that pass the pass/fail TST t-test during the same
condition), or (2) a TIE identifies the constituent or class of constituents causing toxicity
(proceed with following the process outlined in Bullet 3, above), or (3) eliminate the
discharge. Concurrently conduct an evaluation similar to the TRE in Attachment E, Part XII.J
to identify, to the extent practicable, the source(s) of toxicity with the goal of addressing
cause(s) of toxicity, paying particular attention to identifying sources of potential
constituent(s) causing toxicity that may not have been evaluated in the TIE (e.g., fipronil).
a. If the TIE is inconclusive in the non-stormwater discharge, actions taken as part of
the non-stormwater program (e.g., source identification and elimination or treatment
of unauthorized non-stormwater discharges that are a source of pollutants) should be
utilized to support the TRE.
b. If the TIE is inconclusive in the stormwater discharge, consider the following actions
to support the TRE: evaluating land uses and potential associated source(s) in the
drainage area, evaluation of other permitted discharges, and evaluation of inspection
activities.
3 Using appropriate detection limits
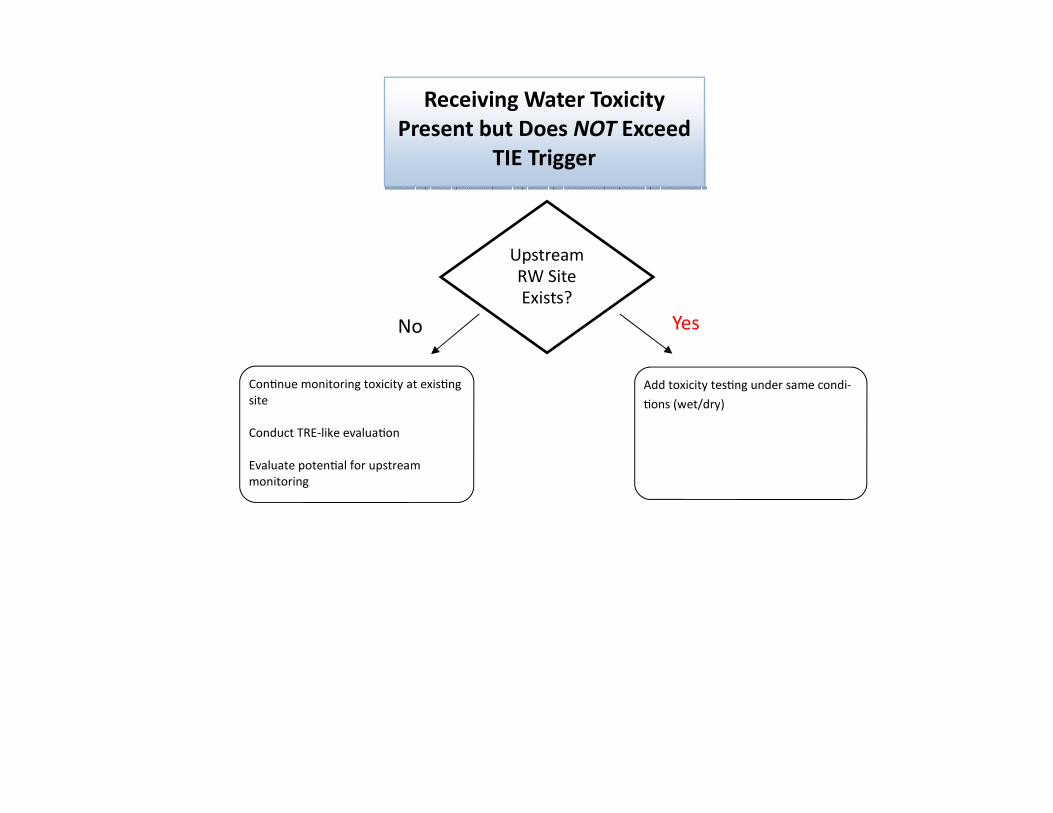
Receiving Water Toxicity
Present but Does NOT Exceed
TIE Trigger
Upstream
RW Site
Exists?
Yes No
Con�nue monitoring toxicity at exis�ng
site
Conduct TRE-like evalua�on
Evaluate poten�al for upstream
monitoring
Add toxicity tes�ng under same condi-
�ons (wet/dry)
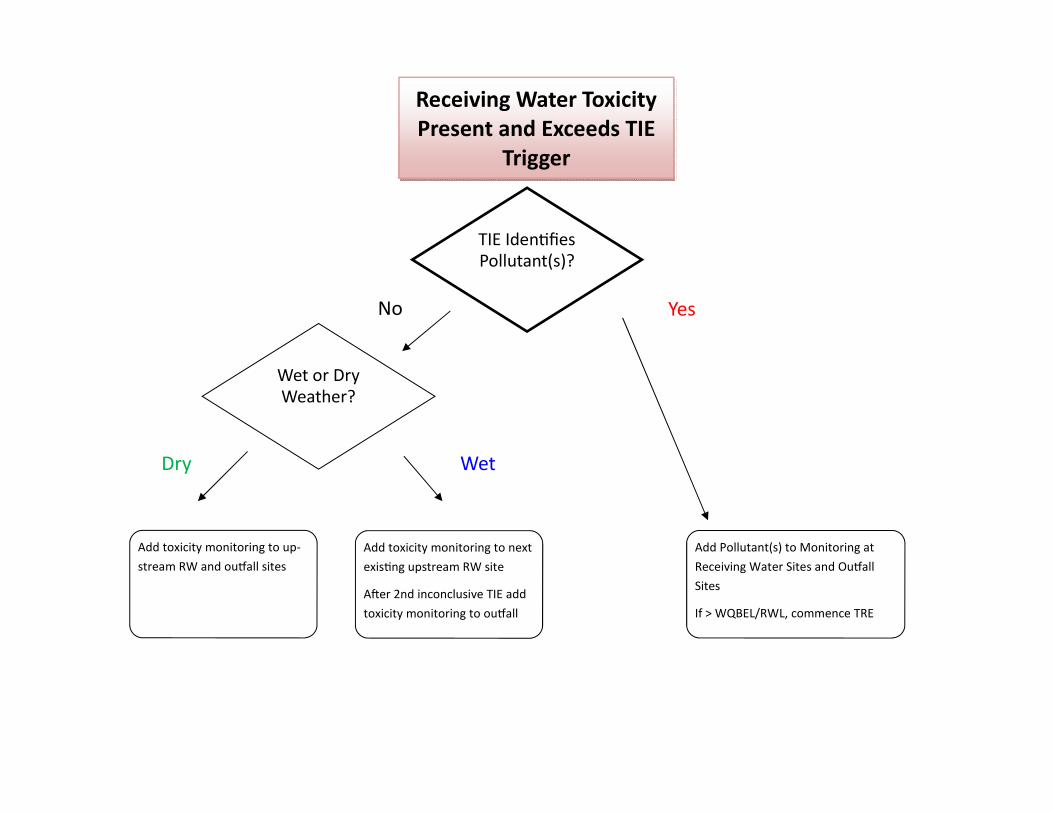
Receiving Water Toxicity
Present and Exceeds TIE
Trigger
Add toxicity monitoring to up-
stream RW and ou'all sites
Add toxicity monitoring to next
exis�ng upstream RW site
A(er 2nd inconclusive TIE add
toxicity monitoring to ou'all
Add Pollutant(s) to Monitoring at
Receiving Water Sites and Ou'all
Sites
If > WQBEL/RWL, commence TRE
TIE Iden�fies
Pollutant(s)?
No Yes
Wet Dry
Wet or Dry
Weather?
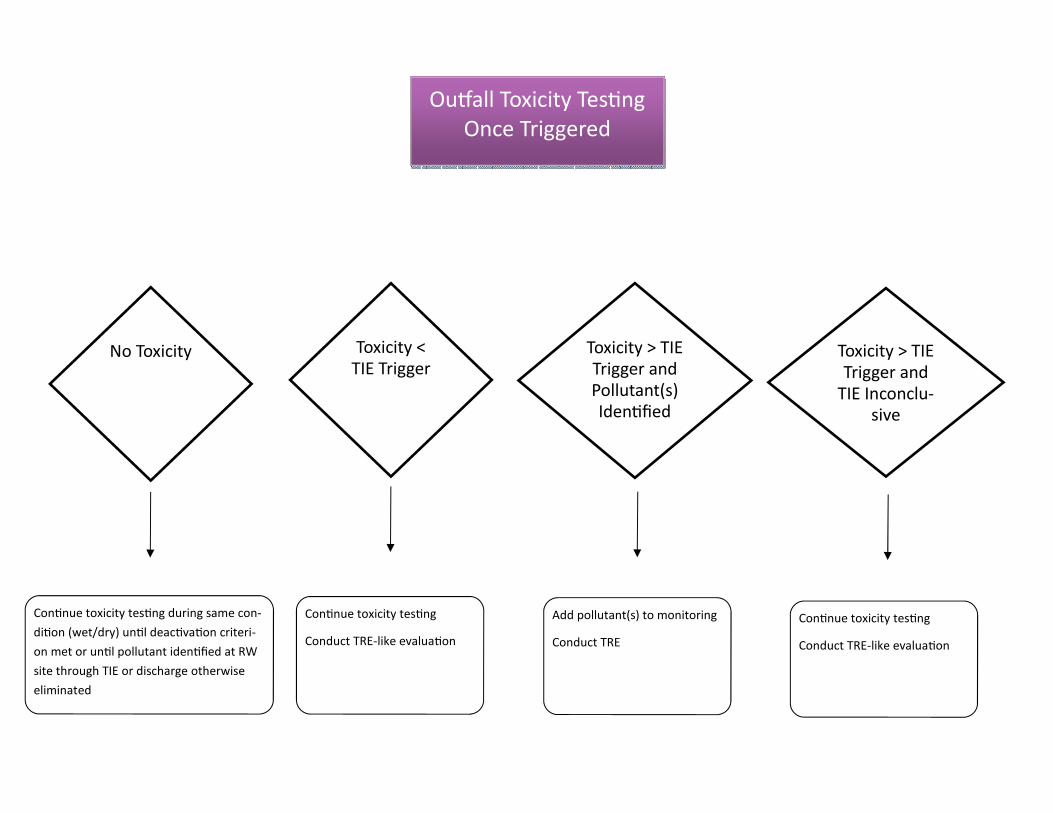
Ou'all Toxicity Tes�ng
Once Triggered
Toxicity > TIE
Trigger and
Pollutant(s)
Iden�fied
Toxicity <
TIE Trigger Toxicity > TIE
Trigger and
TIE Inconclu-
sive
Con�nue toxicity tes�ng
Conduct TRE-like evalua�on
Add pollutant(s) to monitoring
Conduct TRE
Con�nue toxicity tes�ng
Conduct TRE-like evalua�on
No Toxicity
Con�nue toxicity tes�ng during same con-
di�on (wet/dry) un�l deac�va�on criteri-
on met or un�l pollutant iden�fied at RW
site through TIE or discharge otherwise
eliminated

Beach Cities CIMP Appendix E
Survey of Laboratories Minimum Levels Summary
July 2015
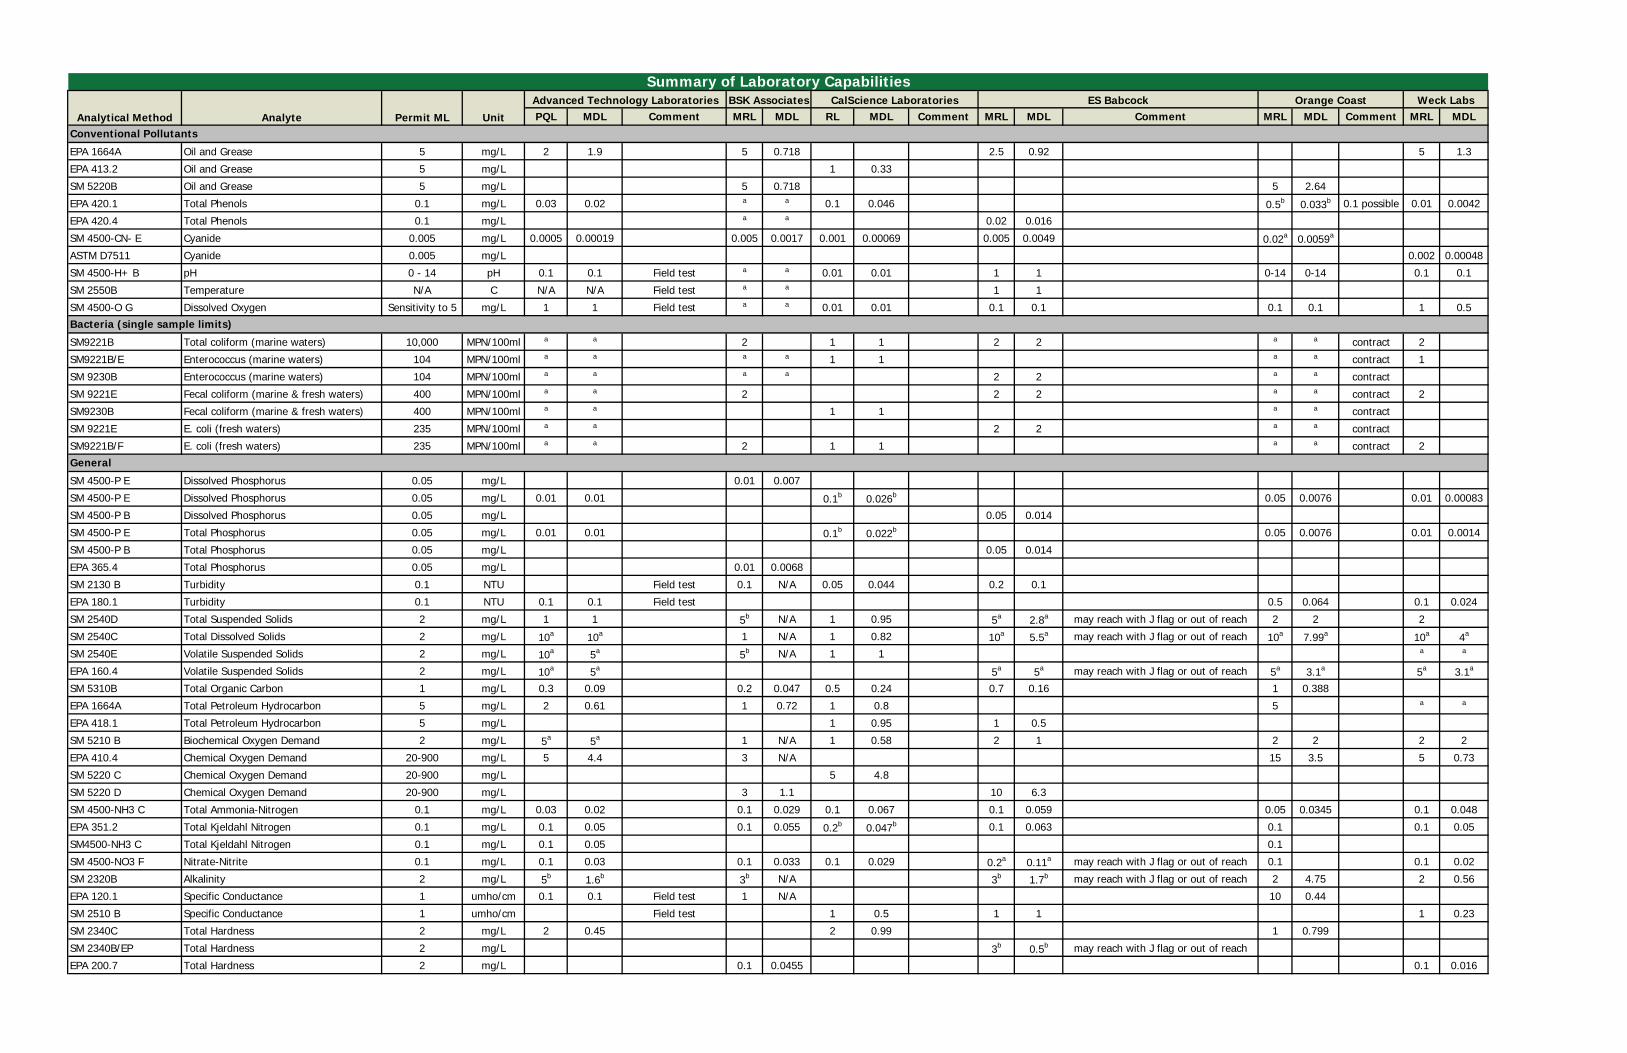
PQL MDL Comment MRL MDL RL MDL Comment MRL MDL Comment MRL MDL Comment MRL MDL
EPA 1664A Oil and Grease 5 mg/L 2 1.9 5 0.718 2.5 0.92 5 1.3
EPA 413.2 Oil and Grease 5 mg/L 1 0.33
SM 5220B Oil and Grease 5 mg/L 5 0.718 5 2.64
EPA 420.1 Total Phenols 0.1 mg/L 0.03 0.02 a a 0.1 0.046 0.5b 0.033b 0.1 possible 0.01 0.0042
EPA 420.4 Total Phenols 0.1 mg/L a a 0.02 0.016
SM 4500-CN- E Cyanide 0.005 mg/L 0.0005 0.00019 0.005 0.0017 0.001 0.00069 0.005 0.0049 0.02a 0.0059a
ASTM D7511 Cyanide 0.005 mg/L 0.002 0.00048
SM 4500-H+ B pH 0 - 14 pH 0.1 0.1 Field test a a 0.01 0.01 1 1 0-14 0-14 0.1 0.1
SM 2550B Temperature N/A C N/A N/A Field test a a 1 1
SM 4500-O G Dissolved Oxygen Sensitivity to 5 mg/L 1 1 Field test a a 0.01 0.01 0.1 0.1 0.1 0.1 1 0.5
SM9221B Total coliform (marine waters) 10,000 MPN/100ml a a 2 1 1 2 2 a a contract 2
SM9221B/E Enterococcus (marine waters) 104 MPN/100ml a a a a 1 1 a a contract 1
SM 9230B Enterococcus (marine waters) 104 MPN/100ml a a a a 2 2 a a contract
SM 9221E Fecal coliform (marine & fresh waters) 400 MPN/100ml a a 2 2 2 a a contract 2
SM9230B Fecal coliform (marine & fresh waters) 400 MPN/100ml a a 1 1 a a contract
SM 9221E E. coli (fresh waters) 235 MPN/100ml a a 2 2 a a contract
SM9221B/F E. coli (fresh waters) 235 MPN/100ml a a 2 1 1 a a contract 2
SM 4500-P E Dissolved Phosphorus 0.05 mg/L 0.01 0.007
SM 4500-P E Dissolved Phosphorus 0.05 mg/L 0.01 0.01 0.1b 0.026b 0.05 0.0076 0.01 0.00083
SM 4500-P B Dissolved Phosphorus 0.05 mg/L 0.05 0.014
SM 4500-P E Total Phosphorus 0.05 mg/L 0.01 0.01 0.1b 0.022b 0.05 0.0076 0.01 0.0014
SM 4500-P B Total Phosphorus 0.05 mg/L 0.05 0.014
EPA 365.4 Total Phosphorus 0.05 mg/L 0.01 0.0068
SM 2130 B Turbidity 0.1 NTU Field test 0.1 N/A 0.05 0.044 0.2 0.1
EPA 180.1 Turbidity 0.1 NTU 0.1 0.1 Field test 0.5 0.064 0.1 0.024
SM 2540D Total Suspended Solids 2 mg/L 1 1 5b N/A 1 0.95 5a 2.8a may reach with J flag or out of reach 2 2 2
SM 2540C Total Dissolved Solids 2 mg/L 10a 10a 1 N/A 1 0.82 10a 5.5a may reach with J flag or out of reach 10a 7.99a 10a 4a
SM 2540E Volatile Suspended Solids 2 mg/L 10a 5a 5b N/A 1 1 a a
EPA 160.4 Volatile Suspended Solids 2 mg/L 10a 5a 5a 5a may reach with J flag or out of reach 5a 3.1a 5a 3.1a
SM 5310B Total Organic Carbon 1 mg/L 0.3 0.09 0.2 0.047 0.5 0.24 0.7 0.16 1 0.388
EPA 1664A Total Petroleum Hydrocarbon 5 mg/L 2 0.61 1 0.72 1 0.8 5 a a
EPA 418.1 Total Petroleum Hydrocarbon 5 mg/L 1 0.95 1 0.5
SM 5210 B Biochemical Oxygen Demand 2 mg/L 5a 5a 1 N/A 1 0.58 2 1 2 2 2 2
EPA 410.4 Chemical Oxygen Demand 20-900 mg/L 5 4.4 3 N/A 15 3.5 5 0.73
SM 5220 C Chemical Oxygen Demand 20-900 mg/L 5 4.8
SM 5220 D Chemical Oxygen Demand 20-900 mg/L 3 1.1 10 6.3
SM 4500-NH3 C Total Ammonia-Nitrogen 0.1 mg/L 0.03 0.02 0.1 0.029 0.1 0.067 0.1 0.059 0.05 0.0345 0.1 0.048
EPA 351.2 Total Kjeldahl Nitrogen 0.1 mg/L 0.1 0.05 0.1 0.055 0.2b 0.047b 0.1 0.063 0.1 0.1 0.05
SM4500-NH3 C Total Kjeldahl Nitrogen 0.1 mg/L 0.1 0.05 0.1
SM 4500-NO3 F Nitrate-Nitrite 0.1 mg/L 0.1 0.03 0.1 0.033 0.1 0.029 0.2a 0.11a may reach with J flag or out of reach 0.1 0.1 0.02
SM 2320B Alkalinity 2 mg/L 5b 1.6b 3b N/A 3b 1.7b may reach with J flag or out of reach 2 4.75 2 0.56
EPA 120.1 Specific Conductance 1 umho/cm 0.1 0.1 Field test 1 N/A 10 0.44
SM 2510 B Specific Conductance 1 umho/cm Field test 1 0.5 1 1 1 0.23
SM 2340C Total Hardness 2 mg/L 2 0.45 2 0.99 1 0.799
SM 2340B/EP Total Hardness 2 mg/L 3b 0.5b may reach with J flag or out of reach
EPA 200.7 Total Hardness 2 mg/L 0.1 0.0455 0.1 0.016
Summary of Laboratory Capabilities
Analytical Method Analyte Permit ML Unit
Advanced Technology Laboratories BSK Associates CalScience Laboratories ES Babcock Orange Coast Weck Labs
Conventional Pollutants
Bacteria (single sample limits)
General
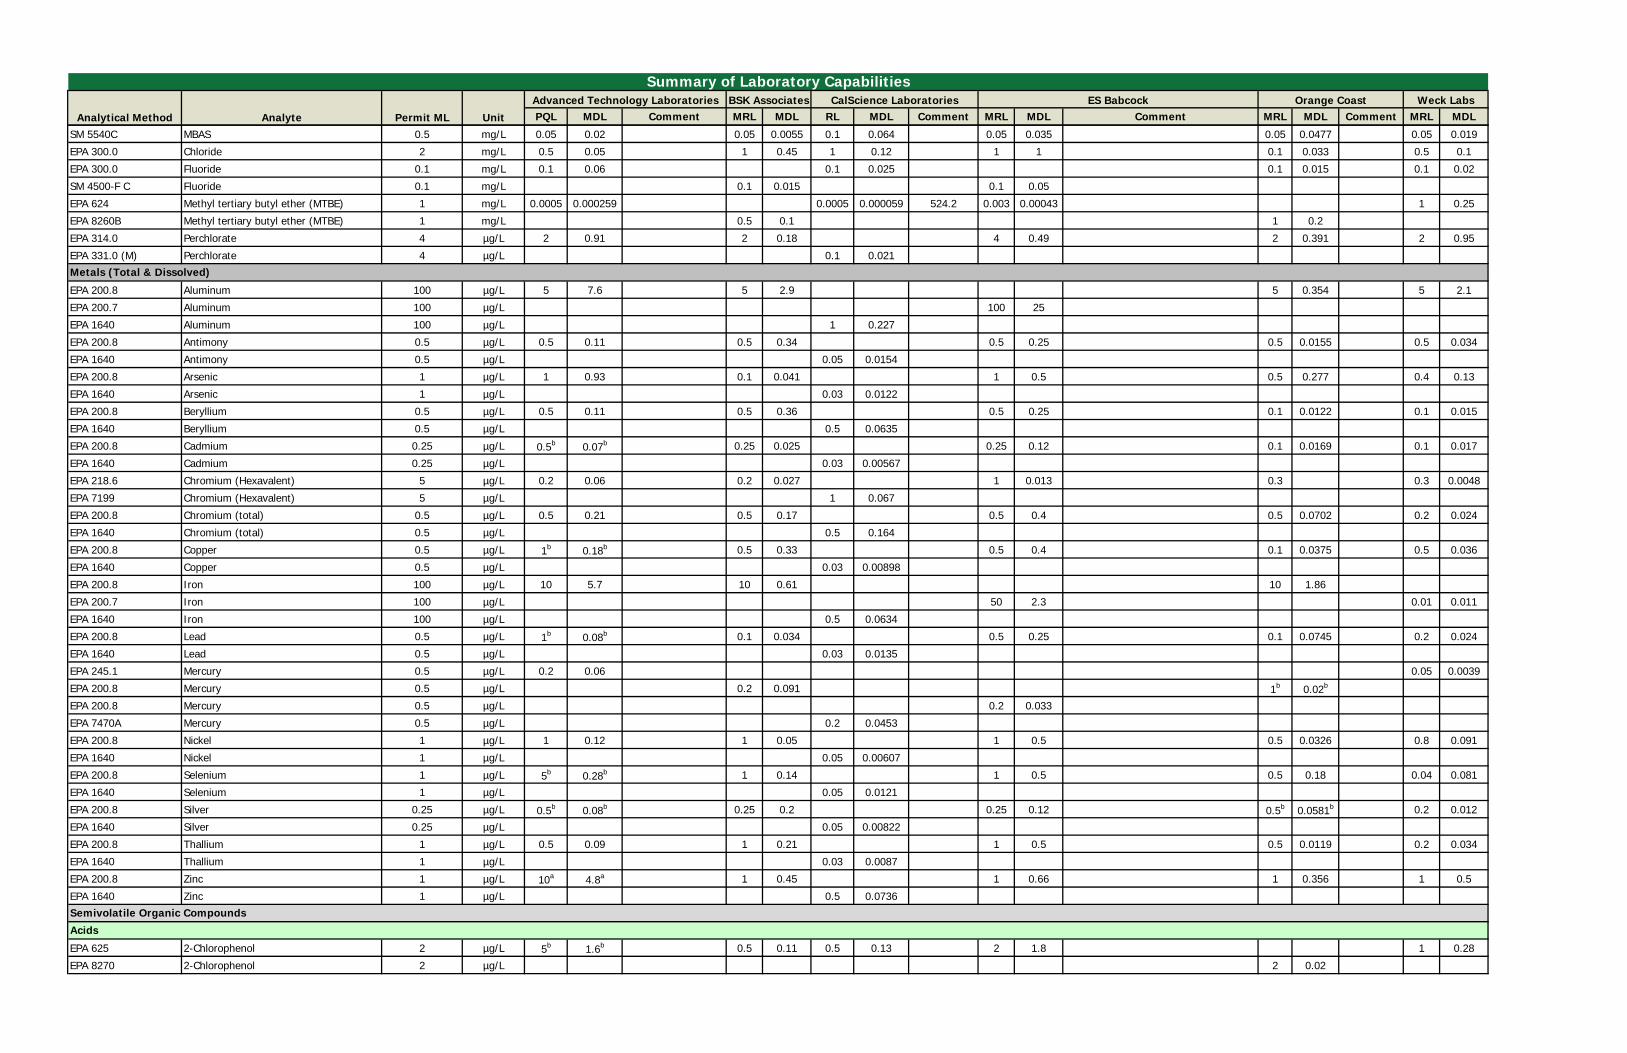
PQL MDL Comment MRL MDL RL MDL Comment MRL MDL Comment MRL MDL Comment MRL MDL
Summary of Laboratory Capabilities
Analytical Method Analyte Permit ML Unit
Advanced Technology Laboratories BSK Associates CalScience Laboratories ES Babcock Orange Coast Weck Labs
SM 5540C MBAS 0.5 mg/L 0.05 0.02 0.05 0.0055 0.1 0.064 0.05 0.035 0.05 0.0477 0.05 0.019
EPA 300.0 Chloride 2 mg/L 0.5 0.05 1 0.45 1 0.12 1 1 0.1 0.033 0.5 0.1
EPA 300.0 Fluoride 0.1 mg/L 0.1 0.06 0.1 0.025 0.1 0.015 0.1 0.02
SM 4500-F C Fluoride 0.1 mg/L 0.1 0.015 0.1 0.05
EPA 624 Methyl tertiary butyl ether (MTBE) 1 mg/L 0.0005 0.000259 0.0005 0.000059 524.2 0.003 0.00043 1 0.25
EPA 8260B Methyl tertiary butyl ether (MTBE) 1 mg/L 0.5 0.1 1 0.2
EPA 314.0 Perchlorate 4 µg/L 2 0.91 2 0.18 4 0.49 2 0.391 2 0.95
EPA 331.0 (M) Perchlorate 4 µg/L 0.1 0.021
EPA 200.8 Aluminum 100 µg/L 5 7.6 5 2.9 5 0.354 5 2.1
EPA 200.7 Aluminum 100 µg/L 100 25
EPA 1640 Aluminum 100 µg/L 1 0.227
EPA 200.8 Antimony 0.5 µg/L 0.5 0.11 0.5 0.34 0.5 0.25 0.5 0.0155 0.5 0.034
EPA 1640 Antimony 0.5 µg/L 0.05 0.0154
EPA 200.8 Arsenic 1 µg/L 1 0.93 0.1 0.041 1 0.5 0.5 0.277 0.4 0.13
EPA 1640 Arsenic 1 µg/L 0.03 0.0122
EPA 200.8 Beryllium 0.5 µg/L 0.5 0.11 0.5 0.36 0.5 0.25 0.1 0.0122 0.1 0.015
EPA 1640 Beryllium 0.5 µg/L 0.5 0.0635
EPA 200.8 Cadmium 0.25 µg/L 0.5b 0.07b 0.25 0.025 0.25 0.12 0.1 0.0169 0.1 0.017
EPA 1640 Cadmium 0.25 µg/L 0.03 0.00567
EPA 218.6 Chromium (Hexavalent) 5 µg/L 0.2 0.06 0.2 0.027 1 0.013 0.3 0.3 0.0048
EPA 7199 Chromium (Hexavalent) 5 µg/L 1 0.067
EPA 200.8 Chromium (total) 0.5 µg/L 0.5 0.21 0.5 0.17 0.5 0.4 0.5 0.0702 0.2 0.024
EPA 1640 Chromium (total) 0.5 µg/L 0.5 0.164
EPA 200.8 Copper 0.5 µg/L 1b 0.18b 0.5 0.33 0.5 0.4 0.1 0.0375 0.5 0.036
EPA 1640 Copper 0.5 µg/L 0.03 0.00898
EPA 200.8 Iron 100 µg/L 10 5.7 10 0.61 10 1.86
EPA 200.7 Iron 100 µg/L 50 2.3 0.01 0.011
EPA 1640 Iron 100 µg/L 0.5 0.0634
EPA 200.8 Lead 0.5 µg/L 1b 0.08b 0.1 0.034 0.5 0.25 0.1 0.0745 0.2 0.024
EPA 1640 Lead 0.5 µg/L 0.03 0.0135
EPA 245.1 Mercury 0.5 µg/L 0.2 0.06 0.05 0.0039
EPA 200.8 Mercury 0.5 µg/L 0.2 0.091 1b 0.02b
EPA 200.8 Mercury 0.5 µg/L 0.2 0.033
EPA 7470A Mercury 0.5 µg/L 0.2 0.0453
EPA 200.8 Nickel 1 µg/L 1 0.12 1 0.05 1 0.5 0.5 0.0326 0.8 0.091
EPA 1640 Nickel 1 µg/L 0.05 0.00607
EPA 200.8 Selenium 1 µg/L 5b 0.28b 1 0.14 1 0.5 0.5 0.18 0.04 0.081
EPA 1640 Selenium 1 µg/L 0.05 0.0121
EPA 200.8 Silver 0.25 µg/L 0.5b 0.08b 0.25 0.2 0.25 0.12 0.5b 0.0581b 0.2 0.012
EPA 1640 Silver 0.25 µg/L 0.05 0.00822
EPA 200.8 Thallium 1 µg/L 0.5 0.09 1 0.21 1 0.5 0.5 0.0119 0.2 0.034
EPA 1640 Thallium 1 µg/L 0.03 0.0087
EPA 200.8 Zinc 1 µg/L 10a 4.8a 1 0.45 1 0.66 1 0.356 1 0.5
EPA 1640 Zinc 1 µg/L 0.5 0.0736
EPA 625 2-Chlorophenol 2 µg/L 5b 1.6b 0.5 0.11 0.5 0.13 2 1.8 1 0.28
EPA 8270 2-Chlorophenol 2 µg/L 2 0.02
Acids
Semivolatile Organic Compounds
Metals (Total & Dissolved)
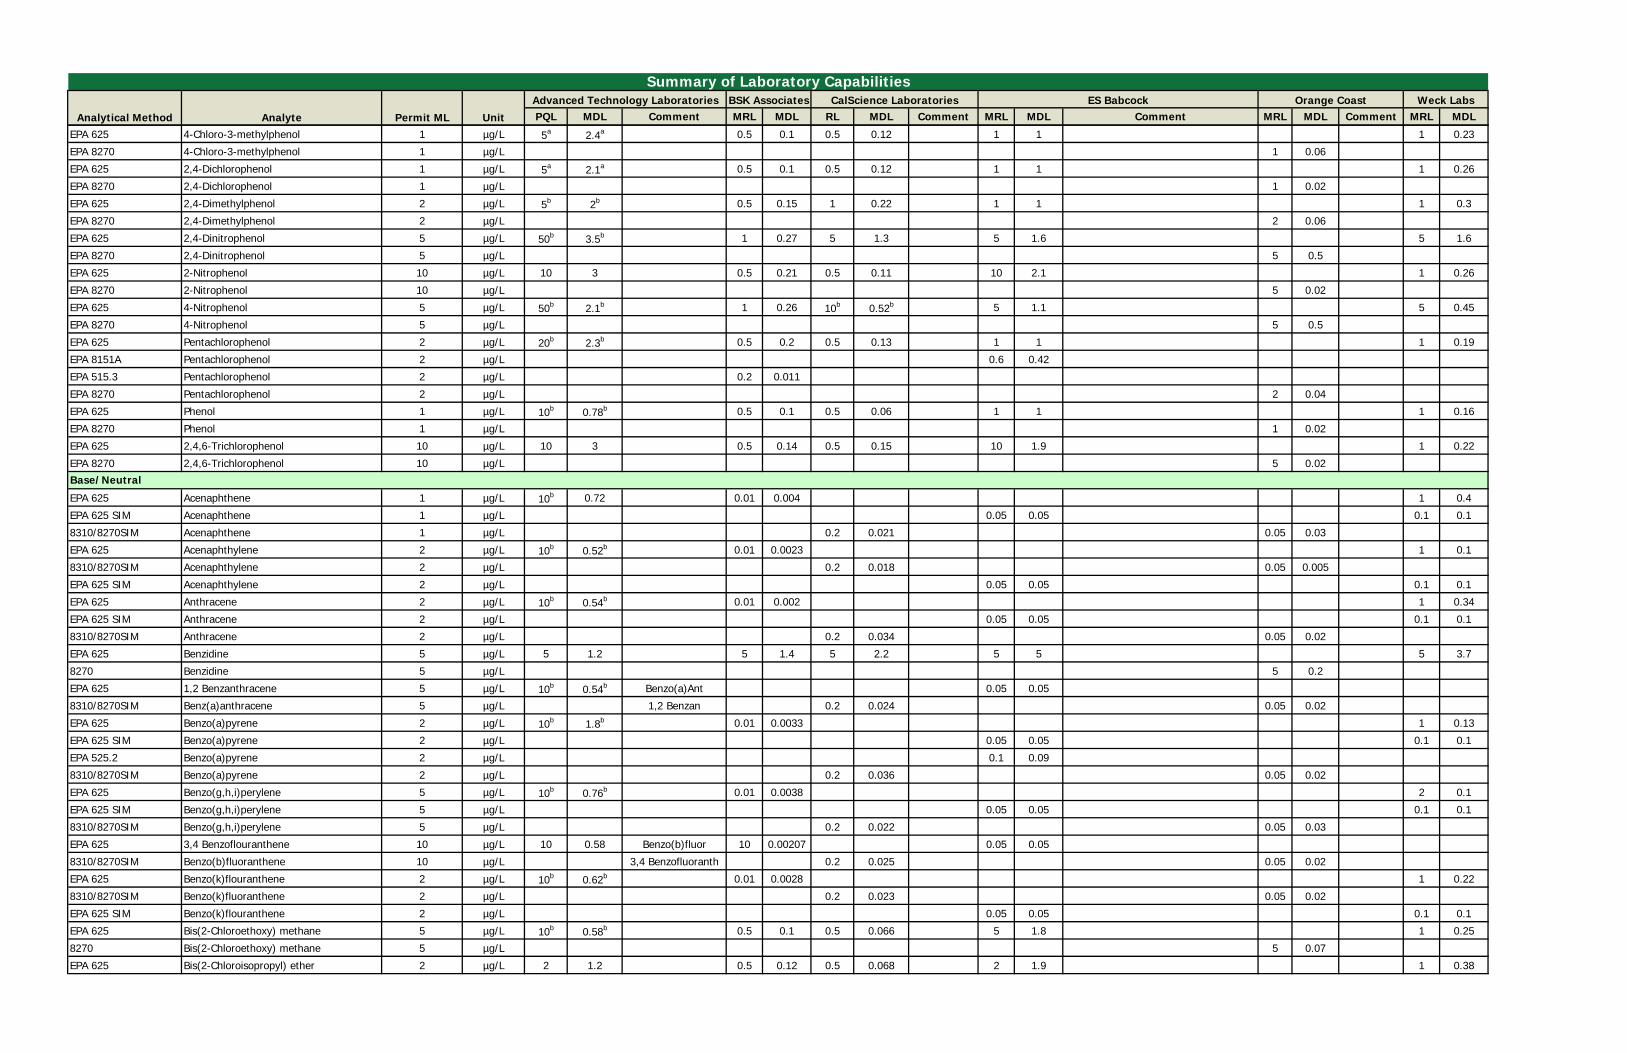
PQL MDL Comment MRL MDL RL MDL Comment MRL MDL Comment MRL MDL Comment MRL MDL
Summary of Laboratory Capabilities
Analytical Method Analyte Permit ML Unit
Advanced Technology Laboratories BSK Associates CalScience Laboratories ES Babcock Orange Coast Weck Labs
EPA 625 4-Chloro-3-methylphenol 1 µg/L 5a 2.4a 0.5 0.1 0.5 0.12 1 1 1 0.23
EPA 8270 4-Chloro-3-methylphenol 1 µg/L 1 0.06
EPA 625 2,4-Dichlorophenol 1 µg/L 5a 2.1a 0.5 0.1 0.5 0.12 1 1 1 0.26
EPA 8270 2,4-Dichlorophenol 1 µg/L 1 0.02
EPA 625 2,4-Dimethylphenol 2 µg/L 5b 2b 0.5 0.15 1 0.22 1 1 1 0.3
EPA 8270 2,4-Dimethylphenol 2 µg/L 2 0.06
EPA 625 2,4-Dinitrophenol 5 µg/L 50b 3.5b 1 0.27 5 1.3 5 1.6 5 1.6
EPA 8270 2,4-Dinitrophenol 5 µg/L 5 0.5
EPA 625 2-Nitrophenol 10 µg/L 10 3 0.5 0.21 0.5 0.11 10 2.1 1 0.26
EPA 8270 2-Nitrophenol 10 µg/L 5 0.02
EPA 625 4-Nitrophenol 5 µg/L 50b 2.1b 1 0.26 10b 0.52b 5 1.1 5 0.45
EPA 8270 4-Nitrophenol 5 µg/L 5 0.5
EPA 625 Pentachlorophenol 2 µg/L 20b 2.3b 0.5 0.2 0.5 0.13 1 1 1 0.19
EPA 8151A Pentachlorophenol 2 µg/L 0.6 0.42
EPA 515.3 Pentachlorophenol 2 µg/L 0.2 0.011
EPA 8270 Pentachlorophenol 2 µg/L 2 0.04
EPA 625 Phenol 1 µg/L 10b 0.78b 0.5 0.1 0.5 0.06 1 1 1 0.16
EPA 8270 Phenol 1 µg/L 1 0.02
EPA 625 2,4,6-Trichlorophenol 10 µg/L 10 3 0.5 0.14 0.5 0.15 10 1.9 1 0.22
EPA 8270 2,4,6-Trichlorophenol 10 µg/L 5 0.02
EPA 625 Acenaphthene 1 µg/L 10b 0.72 0.01 0.004 1 0.4
EPA 625 SIM Acenaphthene 1 µg/L 0.05 0.05 0.1 0.1
8310/8270SIM Acenaphthene 1 µg/L 0.2 0.021 0.05 0.03
EPA 625 Acenaphthylene 2 µg/L 10b 0.52b 0.01 0.0023 1 0.1
8310/8270SIM Acenaphthylene 2 µg/L 0.2 0.018 0.05 0.005
EPA 625 SIM Acenaphthylene 2 µg/L 0.05 0.05 0.1 0.1
EPA 625 Anthracene 2 µg/L 10b 0.54b 0.01 0.002 1 0.34
EPA 625 SIM Anthracene 2 µg/L 0.05 0.05 0.1 0.1
8310/8270SIM Anthracene 2 µg/L 0.2 0.034 0.05 0.02
EPA 625 Benzidine 5 µg/L 5 1.2 5 1.4 5 2.2 5 5 5 3.7
8270 Benzidine 5 µg/L 5 0.2
EPA 625 1,2 Benzanthracene 5 µg/L 10b 0.54b Benzo(a)Ant 0.05 0.05
8310/8270SIM Benz(a)anthracene 5 µg/L 1,2 Benzan 0.2 0.024 0.05 0.02
EPA 625 Benzo(a)pyrene 2 µg/L 10b 1.8b 0.01 0.0033 1 0.13
EPA 625 SIM Benzo(a)pyrene 2 µg/L 0.05 0.05 0.1 0.1
EPA 525.2 Benzo(a)pyrene 2 µg/L 0.1 0.09
8310/8270SIM Benzo(a)pyrene 2 µg/L 0.2 0.036 0.05 0.02
EPA 625 Benzo(g,h,i)perylene 5 µg/L 10b 0.76b 0.01 0.0038 2 0.1
EPA 625 SIM Benzo(g,h,i)perylene 5 µg/L 0.05 0.05 0.1 0.1
8310/8270SIM Benzo(g,h,i)perylene 5 µg/L 0.2 0.022 0.05 0.03
EPA 625 3,4 Benzoflouranthene 10 µg/L 10 0.58 Benzo(b)fluor 10 0.00207 0.05 0.05
8310/8270SIM Benzo(b)fluoranthene 10 µg/L 3,4 Benzofluoranth 0.2 0.025 0.05 0.02
EPA 625 Benzo(k)flouranthene 2 µg/L 10b 0.62b 0.01 0.0028 1 0.22
8310/8270SIM Benzo(k)fluoranthene 2 µg/L 0.2 0.023 0.05 0.02
EPA 625 SIM Benzo(k)flouranthene 2 µg/L 0.05 0.05 0.1 0.1
EPA 625 Bis(2-Chloroethoxy) methane 5 µg/L 10b 0.58b 0.5 0.1 0.5 0.066 5 1.8 1 0.25
8270 Bis(2-Chloroethoxy) methane 5 µg/L 5 0.07
EPA 625 Bis(2-Chloroisopropyl) ether 2 µg/L 2 1.2 0.5 0.12 0.5 0.068 2 1.9 1 0.38
Base/Neutral
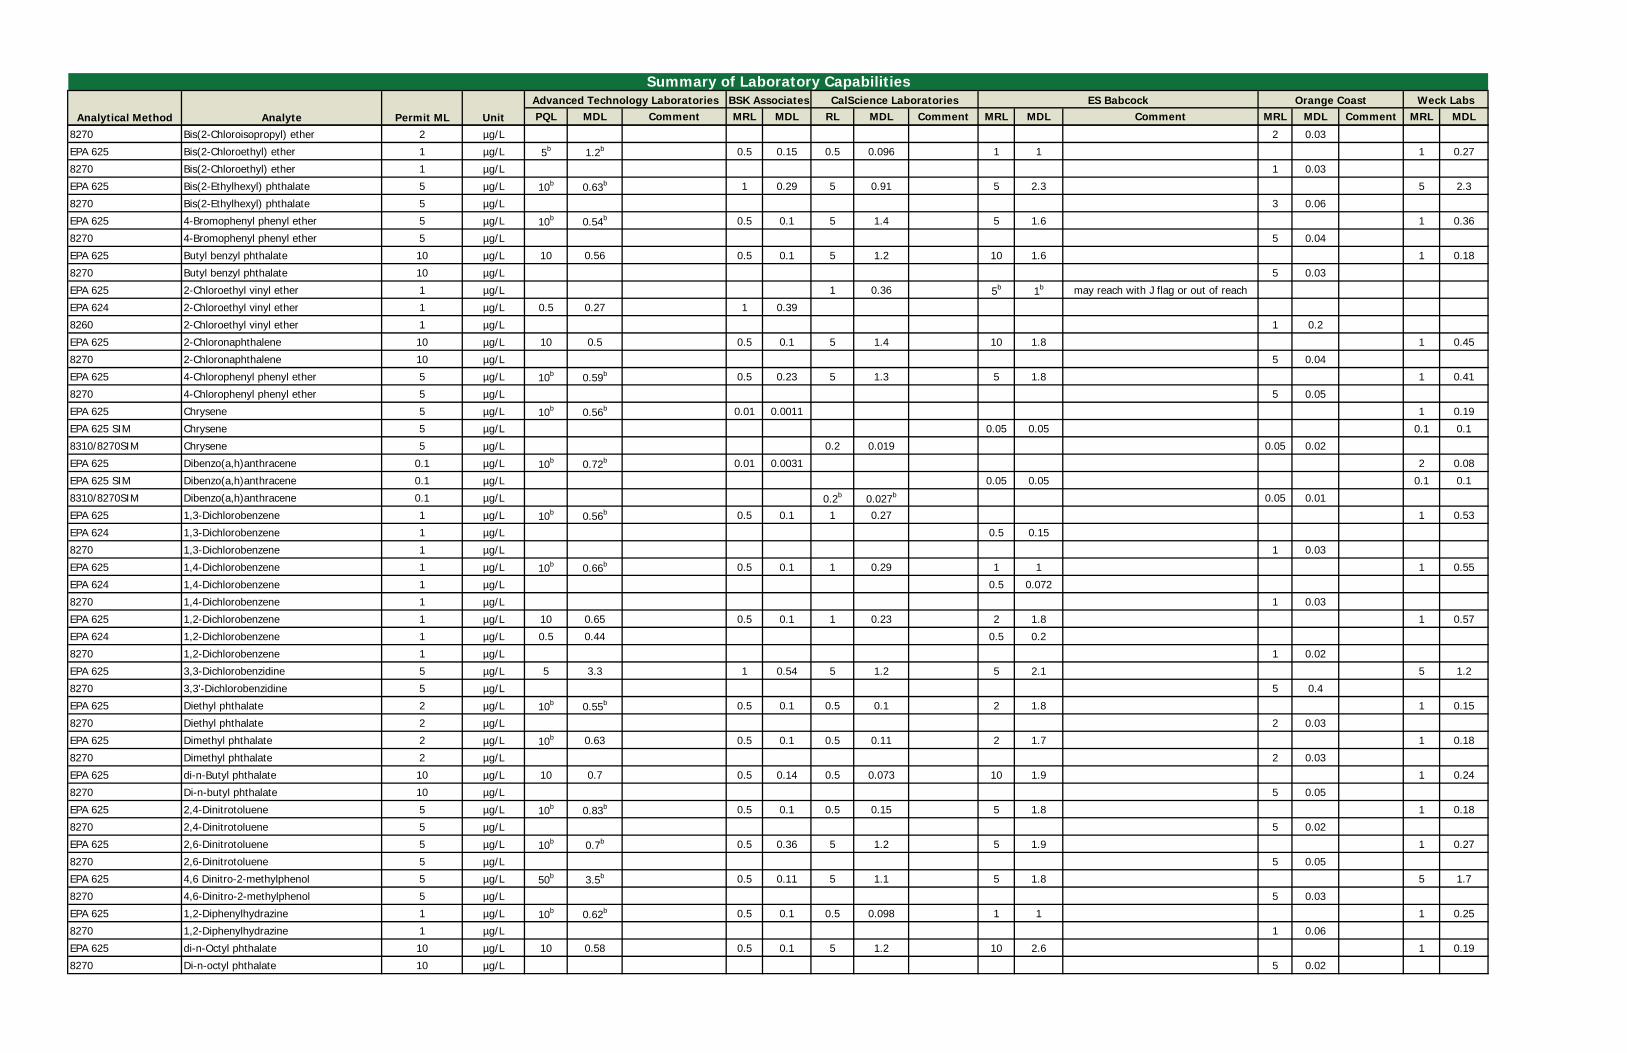
PQL MDL Comment MRL MDL RL MDL Comment MRL MDL Comment MRL MDL Comment MRL MDL
Summary of Laboratory Capabilities
Analytical Method Analyte Permit ML Unit
Advanced Technology Laboratories BSK Associates CalScience Laboratories ES Babcock Orange Coast Weck Labs
8270 Bis(2-Chloroisopropyl) ether 2 µg/L 2 0.03
EPA 625 Bis(2-Chloroethyl) ether 1 µg/L 5b 1.2b 0.5 0.15 0.5 0.096 1 1 1 0.27
8270 Bis(2-Chloroethyl) ether 1 µg/L 1 0.03
EPA 625 Bis(2-Ethylhexyl) phthalate 5 µg/L 10b 0.63b 1 0.29 5 0.91 5 2.3 5 2.3
8270 Bis(2-Ethylhexyl) phthalate 5 µg/L 3 0.06
EPA 625 4-Bromophenyl phenyl ether 5 µg/L 10b 0.54b 0.5 0.1 5 1.4 5 1.6 1 0.36
8270 4-Bromophenyl phenyl ether 5 µg/L 5 0.04
EPA 625 Butyl benzyl phthalate 10 µg/L 10 0.56 0.5 0.1 5 1.2 10 1.6 1 0.18
8270 Butyl benzyl phthalate 10 µg/L 5 0.03
EPA 625 2-Chloroethyl vinyl ether 1 µg/L 1 0.36 5b 1b may reach with J flag or out of reach
EPA 624 2-Chloroethyl vinyl ether 1 µg/L 0.5 0.27 1 0.39
8260 2-Chloroethyl vinyl ether 1 µg/L 1 0.2
EPA 625 2-Chloronaphthalene 10 µg/L 10 0.5 0.5 0.1 5 1.4 10 1.8 1 0.45
8270 2-Chloronaphthalene 10 µg/L 5 0.04
EPA 625 4-Chlorophenyl phenyl ether 5 µg/L 10b 0.59b 0.5 0.23 5 1.3 5 1.8 1 0.41
8270 4-Chlorophenyl phenyl ether 5 µg/L 5 0.05
EPA 625 Chrysene 5 µg/L 10b 0.56b 0.01 0.0011 1 0.19
EPA 625 SIM Chrysene 5 µg/L 0.05 0.05 0.1 0.1
8310/8270SIM Chrysene 5 µg/L 0.2 0.019 0.05 0.02
EPA 625 Dibenzo(a,h)anthracene 0.1 µg/L 10b 0.72b 0.01 0.0031 2 0.08
EPA 625 SIM Dibenzo(a,h)anthracene 0.1 µg/L 0.05 0.05 0.1 0.1
8310/8270SIM Dibenzo(a,h)anthracene 0.1 µg/L 0.2b 0.027b 0.05 0.01
EPA 625 1,3-Dichlorobenzene 1 µg/L 10b 0.56b 0.5 0.1 1 0.27 1 0.53
EPA 624 1,3-Dichlorobenzene 1 µg/L 0.5 0.15
8270 1,3-Dichlorobenzene 1 µg/L 1 0.03
EPA 625 1,4-Dichlorobenzene 1 µg/L 10b 0.66b 0.5 0.1 1 0.29 1 1 1 0.55
EPA 624 1,4-Dichlorobenzene 1 µg/L 0.5 0.072
8270 1,4-Dichlorobenzene 1 µg/L 1 0.03
EPA 625 1,2-Dichlorobenzene 1 µg/L 10 0.65 0.5 0.1 1 0.23 2 1.8 1 0.57
EPA 624 1,2-Dichlorobenzene 1 µg/L 0.5 0.44 0.5 0.2
8270 1,2-Dichlorobenzene 1 µg/L 1 0.02
EPA 625 3,3-Dichlorobenzidine 5 µg/L 5 3.3 1 0.54 5 1.2 5 2.1 5 1.2
8270 3,3'-Dichlorobenzidine 5 µg/L 5 0.4
EPA 625 Diethyl phthalate 2 µg/L 10b 0.55b 0.5 0.1 0.5 0.1 2 1.8 1 0.15
8270 Diethyl phthalate 2 µg/L 2 0.03
EPA 625 Dimethyl phthalate 2 µg/L 10b 0.63 0.5 0.1 0.5 0.11 2 1.7 1 0.18
8270 Dimethyl phthalate 2 µg/L 2 0.03
EPA 625 di-n-Butyl phthalate 10 µg/L 10 0.7 0.5 0.14 0.5 0.073 10 1.9 1 0.24
8270 Di-n-butyl phthalate 10 µg/L 5 0.05
EPA 625 2,4-Dinitrotoluene 5 µg/L 10b 0.83b 0.5 0.1 0.5 0.15 5 1.8 1 0.18
8270 2,4-Dinitrotoluene 5 µg/L 5 0.02
EPA 625 2,6-Dinitrotoluene 5 µg/L 10b 0.7b 0.5 0.36 5 1.2 5 1.9 1 0.27
8270 2,6-Dinitrotoluene 5 µg/L 5 0.05
EPA 625 4,6 Dinitro-2-methylphenol 5 µg/L 50b 3.5b 0.5 0.11 5 1.1 5 1.8 5 1.7
8270 4,6-Dinitro-2-methylphenol 5 µg/L 5 0.03
EPA 625 1,2-Diphenylhydrazine 1 µg/L 10b 0.62b 0.5 0.1 0.5 0.098 1 1 1 0.25
8270 1,2-Diphenylhydrazine 1 µg/L 1 0.06
EPA 625 di-n-Octyl phthalate 10 µg/L 10 0.58 0.5 0.1 5 1.2 10 2.6 1 0.19
8270 Di-n-octyl phthalate 10 µg/L 5 0.02
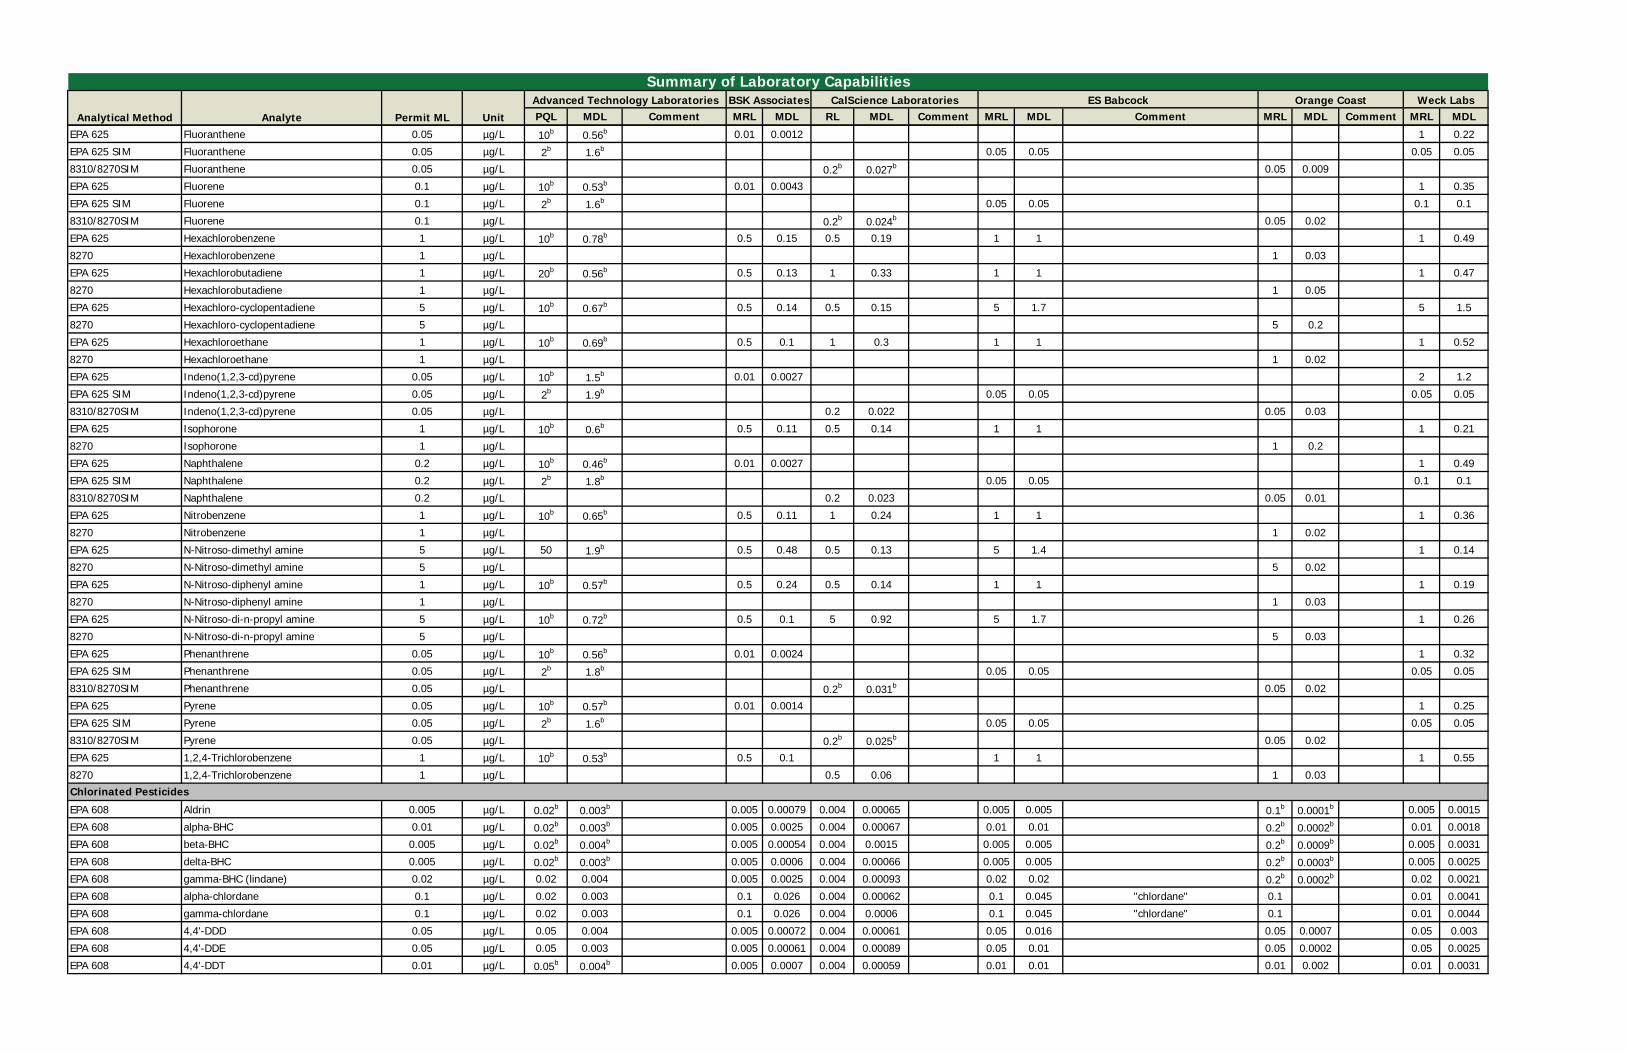
PQL MDL Comment MRL MDL RL MDL Comment MRL MDL Comment MRL MDL Comment MRL MDL
Summary of Laboratory Capabilities
Analytical Method Analyte Permit ML Unit
Advanced Technology Laboratories BSK Associates CalScience Laboratories ES Babcock Orange Coast Weck Labs
EPA 625 Fluoranthene 0.05 µg/L 10b 0.56b 0.01 0.0012 1 0.22
EPA 625 SIM Fluoranthene 0.05 µg/L 2b 1.6b 0.05 0.05 0.05 0.05
8310/8270SIM Fluoranthene 0.05 µg/L 0.2b 0.027b 0.05 0.009
EPA 625 Fluorene 0.1 µg/L 10b 0.53b 0.01 0.0043 1 0.35
EPA 625 SIM Fluorene 0.1 µg/L 2b 1.6b 0.05 0.05 0.1 0.1
8310/8270SIM Fluorene 0.1 µg/L 0.2b 0.024b 0.05 0.02
EPA 625 Hexachlorobenzene 1 µg/L 10b 0.78b 0.5 0.15 0.5 0.19 1 1 1 0.49
8270 Hexachlorobenzene 1 µg/L 1 0.03
EPA 625 Hexachlorobutadiene 1 µg/L 20b 0.56b 0.5 0.13 1 0.33 1 1 1 0.47
8270 Hexachlorobutadiene 1 µg/L 1 0.05
EPA 625 Hexachloro-cyclopentadiene 5 µg/L 10b 0.67b 0.5 0.14 0.5 0.15 5 1.7 5 1.5
8270 Hexachloro-cyclopentadiene 5 µg/L 5 0.2
EPA 625 Hexachloroethane 1 µg/L 10b 0.69b 0.5 0.1 1 0.3 1 1 1 0.52
8270 Hexachloroethane 1 µg/L 1 0.02
EPA 625 Indeno(1,2,3-cd)pyrene 0.05 µg/L 10b 1.5b 0.01 0.0027 2 1.2
EPA 625 SIM Indeno(1,2,3-cd)pyrene 0.05 µg/L 2b 1.9b 0.05 0.05 0.05 0.05
8310/8270SIM Indeno(1,2,3-cd)pyrene 0.05 µg/L 0.2 0.022 0.05 0.03
EPA 625 Isophorone 1 µg/L 10b 0.6b 0.5 0.11 0.5 0.14 1 1 1 0.21
8270 Isophorone 1 µg/L 1 0.2
EPA 625 Naphthalene 0.2 µg/L 10b 0.46b 0.01 0.0027 1 0.49
EPA 625 SIM Naphthalene 0.2 µg/L 2b 1.8b 0.05 0.05 0.1 0.1
8310/8270SIM Naphthalene 0.2 µg/L 0.2 0.023 0.05 0.01
EPA 625 Nitrobenzene 1 µg/L 10b 0.65b 0.5 0.11 1 0.24 1 1 1 0.36
8270 Nitrobenzene 1 µg/L 1 0.02
EPA 625 N-Nitroso-dimethyl amine 5 µg/L 50 1.9b 0.5 0.48 0.5 0.13 5 1.4 1 0.14
8270 N-Nitroso-dimethyl amine 5 µg/L 5 0.02
EPA 625 N-Nitroso-diphenyl amine 1 µg/L 10b 0.57b 0.5 0.24 0.5 0.14 1 1 1 0.19
8270 N-Nitroso-diphenyl amine 1 µg/L 1 0.03
EPA 625 N-Nitroso-di-n-propyl amine 5 µg/L 10b 0.72b 0.5 0.1 5 0.92 5 1.7 1 0.26
8270 N-Nitroso-di-n-propyl amine 5 µg/L 5 0.03
EPA 625 Phenanthrene 0.05 µg/L 10b 0.56b 0.01 0.0024 1 0.32
EPA 625 SIM Phenanthrene 0.05 µg/L 2b 1.8b 0.05 0.05 0.05 0.05
8310/8270SIM Phenanthrene 0.05 µg/L 0.2b 0.031b 0.05 0.02
EPA 625 Pyrene 0.05 µg/L 10b 0.57b 0.01 0.0014 1 0.25
EPA 625 SIM Pyrene 0.05 µg/L 2b 1.6b 0.05 0.05 0.05 0.05
8310/8270SIM Pyrene 0.05 µg/L 0.2b 0.025b 0.05 0.02
EPA 625 1,2,4-Trichlorobenzene 1 µg/L 10b 0.53b 0.5 0.1 1 1 1 0.55
8270 1,2,4-Trichlorobenzene 1 µg/L 0.5 0.06 1 0.03
EPA 608 Aldrin 0.005 µg/L 0.02b 0.003b 0.005 0.00079 0.004 0.00065 0.005 0.005 0.1b 0.0001b 0.005 0.0015
EPA 608 alpha-BHC 0.01 µg/L 0.02b 0.003b 0.005 0.0025 0.004 0.00067 0.01 0.01 0.2b 0.0002b 0.01 0.0018
EPA 608 beta-BHC 0.005 µg/L 0.02b 0.004b 0.005 0.00054 0.004 0.0015 0.005 0.005 0.2b 0.0009b 0.005 0.0031
EPA 608 delta-BHC 0.005 µg/L 0.02b 0.003b 0.005 0.0006 0.004 0.00066 0.005 0.005 0.2b 0.0003b 0.005 0.0025
EPA 608 gamma-BHC (lindane) 0.02 µg/L 0.02 0.004 0.005 0.0025 0.004 0.00093 0.02 0.02 0.2b 0.0002b 0.02 0.0021
EPA 608 alpha-chlordane 0.1 µg/L 0.02 0.003 0.1 0.026 0.004 0.00062 0.1 0.045 "chlordane" 0.1 0.01 0.0041
EPA 608 gamma-chlordane 0.1 µg/L 0.02 0.003 0.1 0.026 0.004 0.0006 0.1 0.045 "chlordane" 0.1 0.01 0.0044
EPA 608 4,4'-DDD 0.05 µg/L 0.05 0.004 0.005 0.00072 0.004 0.00061 0.05 0.016 0.05 0.0007 0.05 0.003
EPA 608 4,4'-DDE 0.05 µg/L 0.05 0.003 0.005 0.00061 0.004 0.00089 0.05 0.01 0.05 0.0002 0.05 0.0025
EPA 608 4,4'-DDT 0.01 µg/L 0.05b 0.004b 0.005 0.0007 0.004 0.00059 0.01 0.01 0.01 0.002 0.01 0.0031
Chlorinated Pesticides
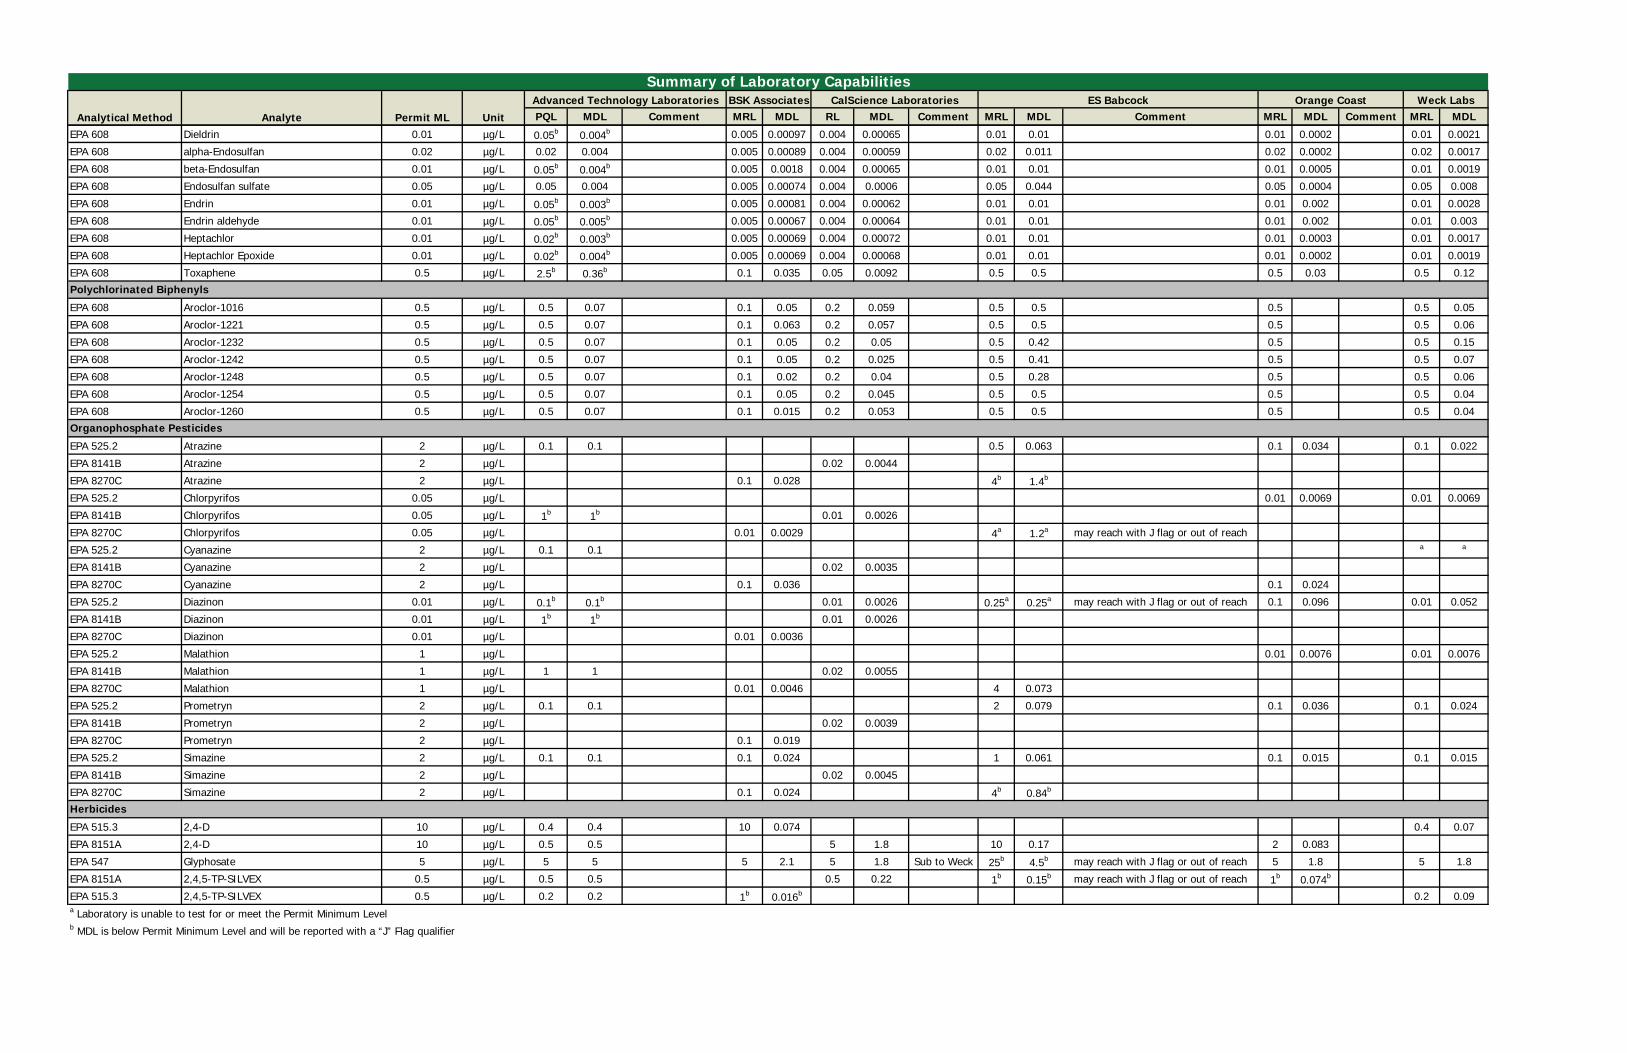
PQL MDL Comment MRL MDL RL MDL Comment MRL MDL Comment MRL MDL Comment MRL MDL
Summary of Laboratory Capabilities
Analytical Method Analyte Permit ML Unit
Advanced Technology Laboratories BSK Associates CalScience Laboratories ES Babcock Orange Coast Weck Labs
EPA 608 Dieldrin 0.01 µg/L 0.05b 0.004b 0.005 0.00097 0.004 0.00065 0.01 0.01 0.01 0.0002 0.01 0.0021
EPA 608 alpha-Endosulfan 0.02 µg/L 0.02 0.004 0.005 0.00089 0.004 0.00059 0.02 0.011 0.02 0.0002 0.02 0.0017
EPA 608 beta-Endosulfan 0.01 µg/L 0.05b 0.004b 0.005 0.0018 0.004 0.00065 0.01 0.01 0.01 0.0005 0.01 0.0019
EPA 608 Endosulfan sulfate 0.05 µg/L 0.05 0.004 0.005 0.00074 0.004 0.0006 0.05 0.044 0.05 0.0004 0.05 0.008
EPA 608 Endrin 0.01 µg/L 0.05b 0.003b 0.005 0.00081 0.004 0.00062 0.01 0.01 0.01 0.002 0.01 0.0028
EPA 608 Endrin aldehyde 0.01 µg/L 0.05b 0.005b 0.005 0.00067 0.004 0.00064 0.01 0.01 0.01 0.002 0.01 0.003
EPA 608 Heptachlor 0.01 µg/L 0.02b 0.003b 0.005 0.00069 0.004 0.00072 0.01 0.01 0.01 0.0003 0.01 0.0017
EPA 608 Heptachlor Epoxide 0.01 µg/L 0.02b 0.004b 0.005 0.00069 0.004 0.00068 0.01 0.01 0.01 0.0002 0.01 0.0019
EPA 608 Toxaphene 0.5 µg/L 2.5b 0.36b 0.1 0.035 0.05 0.0092 0.5 0.5 0.5 0.03 0.5 0.12
EPA 608 Aroclor-1016 0.5 µg/L 0.5 0.07 0.1 0.05 0.2 0.059 0.5 0.5 0.5 0.5 0.05
EPA 608 Aroclor-1221 0.5 µg/L 0.5 0.07 0.1 0.063 0.2 0.057 0.5 0.5 0.5 0.5 0.06
EPA 608 Aroclor-1232 0.5 µg/L 0.5 0.07 0.1 0.05 0.2 0.05 0.5 0.42 0.5 0.5 0.15
EPA 608 Aroclor-1242 0.5 µg/L 0.5 0.07 0.1 0.05 0.2 0.025 0.5 0.41 0.5 0.5 0.07
EPA 608 Aroclor-1248 0.5 µg/L 0.5 0.07 0.1 0.02 0.2 0.04 0.5 0.28 0.5 0.5 0.06
EPA 608 Aroclor-1254 0.5 µg/L 0.5 0.07 0.1 0.05 0.2 0.045 0.5 0.5 0.5 0.5 0.04
EPA 608 Aroclor-1260 0.5 µg/L 0.5 0.07 0.1 0.015 0.2 0.053 0.5 0.5 0.5 0.5 0.04
EPA 525.2 Atrazine 2 µg/L 0.1 0.1 0.5 0.063 0.1 0.034 0.1 0.022
EPA 8141B Atrazine 2 µg/L 0.02 0.0044
EPA 8270C Atrazine 2 µg/L 0.1 0.028 4b 1.4b
EPA 525.2 Chlorpyrifos 0.05 µg/L 0.01 0.0069 0.01 0.0069
EPA 8141B Chlorpyrifos 0.05 µg/L 1b 1b 0.01 0.0026
EPA 8270C Chlorpyrifos 0.05 µg/L 0.01 0.0029 4a 1.2a may reach with J flag or out of reach
EPA 525.2 Cyanazine 2 µg/L 0.1 0.1 a a
EPA 8141B Cyanazine 2 µg/L 0.02 0.0035
EPA 8270C Cyanazine 2 µg/L 0.1 0.036 0.1 0.024
EPA 525.2 Diazinon 0.01 µg/L 0.1b 0.1b 0.01 0.0026 0.25a 0.25a may reach with J flag or out of reach 0.1 0.096 0.01 0.052
EPA 8141B Diazinon 0.01 µg/L 1b 1b 0.01 0.0026
EPA 8270C Diazinon 0.01 µg/L 0.01 0.0036
EPA 525.2 Malathion 1 µg/L 0.01 0.0076 0.01 0.0076
EPA 8141B Malathion 1 µg/L 1 1 0.02 0.0055
EPA 8270C Malathion 1 µg/L 0.01 0.0046 4 0.073
EPA 525.2 Prometryn 2 µg/L 0.1 0.1 2 0.079 0.1 0.036 0.1 0.024
EPA 8141B Prometryn 2 µg/L 0.02 0.0039
EPA 8270C Prometryn 2 µg/L 0.1 0.019
EPA 525.2 Simazine 2 µg/L 0.1 0.1 0.1 0.024 1 0.061 0.1 0.015 0.1 0.015
EPA 8141B Simazine 2 µg/L 0.02 0.0045
EPA 8270C Simazine 2 µg/L 0.1 0.024 4b 0.84b
EPA 515.3 2,4-D 10 µg/L 0.4 0.4 10 0.074 0.4 0.07
EPA 8151A 2,4-D 10 µg/L 0.5 0.5 5 1.8 10 0.17 2 0.083
EPA 547 Glyphosate 5 µg/L 5 5 5 2.1 5 1.8 Sub to Weck 25b 4.5b may reach with J flag or out of reach 5 1.8 5 1.8
EPA 8151A 2,4,5-TP-SILVEX 0.5 µg/L 0.5 0.5 0.5 0.22 1b 0.15b may reach with J flag or out of reach 1b 0.074b
EPA 515.3 2,4,5-TP-SILVEX 0.5 µg/L 0.2 0.2 1b 0.016b 0.2 0.09a Laboratory is unable to test for or meet the Permit Minimum Levelb MDL is below Permit Minimum Level and will be reported with a “J” Flag qualifier
Polychlorinated Biphenyls
Organophosphate Pesticides
Herbicides
Beach Cities CIMP Appendix F Los Angeles County Flood Control District
Background Information
July 2015
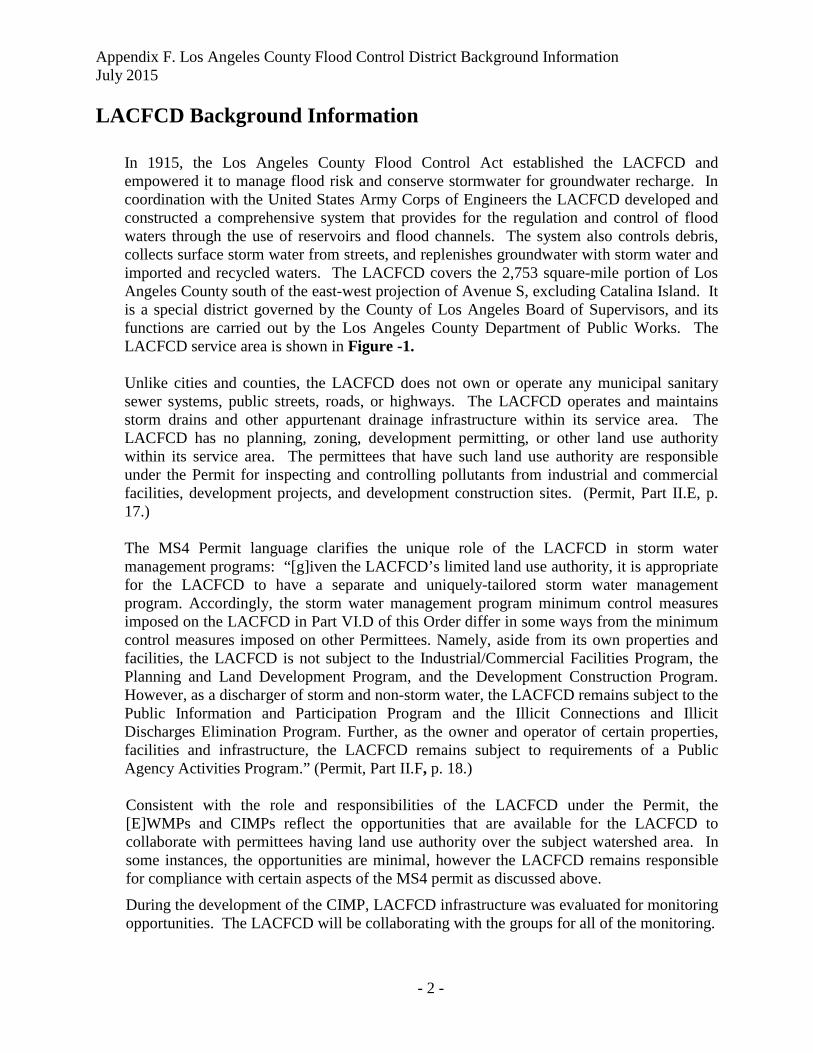
Appendix F. Los Angeles County Flood Control District Background Information July 2015
- 2 -
LACFCD Background Information
In 1915, the Los Angeles County Flood Control Act established the LACFCD and empowered it to manage flood risk and conserve stormwater for groundwater recharge. In coordination with the United States Army Corps of Engineers the LACFCD developed and constructed a comprehensive system that provides for the regulation and control of flood waters through the use of reservoirs and flood channels. The system also controls debris, collects surface storm water from streets, and replenishes groundwater with storm water and imported and recycled waters. The LACFCD covers the 2,753 square-mile portion of Los Angeles County south of the east-west projection of Avenue S, excluding Catalina Island. It is a special district governed by the County of Los Angeles Board of Supervisors, and its functions are carried out by the Los Angeles County Department of Public Works. The LACFCD service area is shown in Figure -1. Unlike cities and counties, the LACFCD does not own or operate any municipal sanitary sewer systems, public streets, roads, or highways. The LACFCD operates and maintains storm drains and other appurtenant drainage infrastructure within its service area. The LACFCD has no planning, zoning, development permitting, or other land use authority within its service area. The permittees that have such land use authority are responsible under the Permit for inspecting and controlling pollutants from industrial and commercial facilities, development projects, and development construction sites. (Permit, Part II.E, p. 17.) The MS4 Permit language clarifies the unique role of the LACFCD in storm water management programs: “[g]iven the LACFCD’s limited land use authority, it is appropriate for the LACFCD to have a separate and uniquely-tailored storm water management program. Accordingly, the storm water management program minimum control measures imposed on the LACFCD in Part VI.D of this Order differ in some ways from the minimum control measures imposed on other Permittees. Namely, aside from its own properties and facilities, the LACFCD is not subject to the Industrial/Commercial Facilities Program, the Planning and Land Development Program, and the Development Construction Program. However, as a discharger of storm and non-storm water, the LACFCD remains subject to the Public Information and Participation Program and the Illicit Connections and Illicit Discharges Elimination Program. Further, as the owner and operator of certain properties, facilities and infrastructure, the LACFCD remains subject to requirements of a Public Agency Activities Program.” (Permit, Part II.F, p. 18.) Consistent with the role and responsibilities of the LACFCD under the Permit, the [E]WMPs and CIMPs reflect the opportunities that are available for the LACFCD to collaborate with permittees having land use authority over the subject watershed area. In some instances, the opportunities are minimal, however the LACFCD remains responsible for compliance with certain aspects of the MS4 permit as discussed above.
During the development of the CIMP, LACFCD infrastructure was evaluated for monitoring opportunities. The LACFCD will be collaborating with the groups for all of the monitoring.
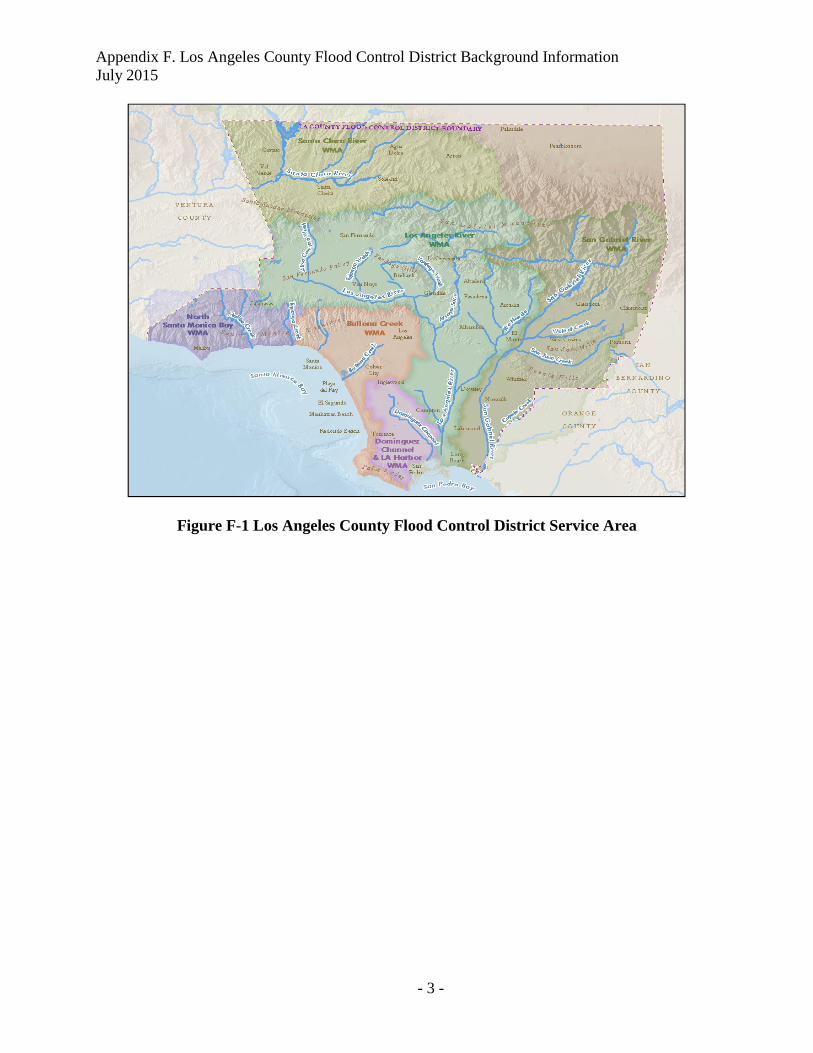
Appendix F. Los Angeles County Flood Control District Background Information July 2015
- 3 -
Figure F-1 Los Angeles County Flood Control District Service Area
Beach Cities CIMP Appendix G Summary of Data at SMB Observational
Monitoring Sites
July 2015
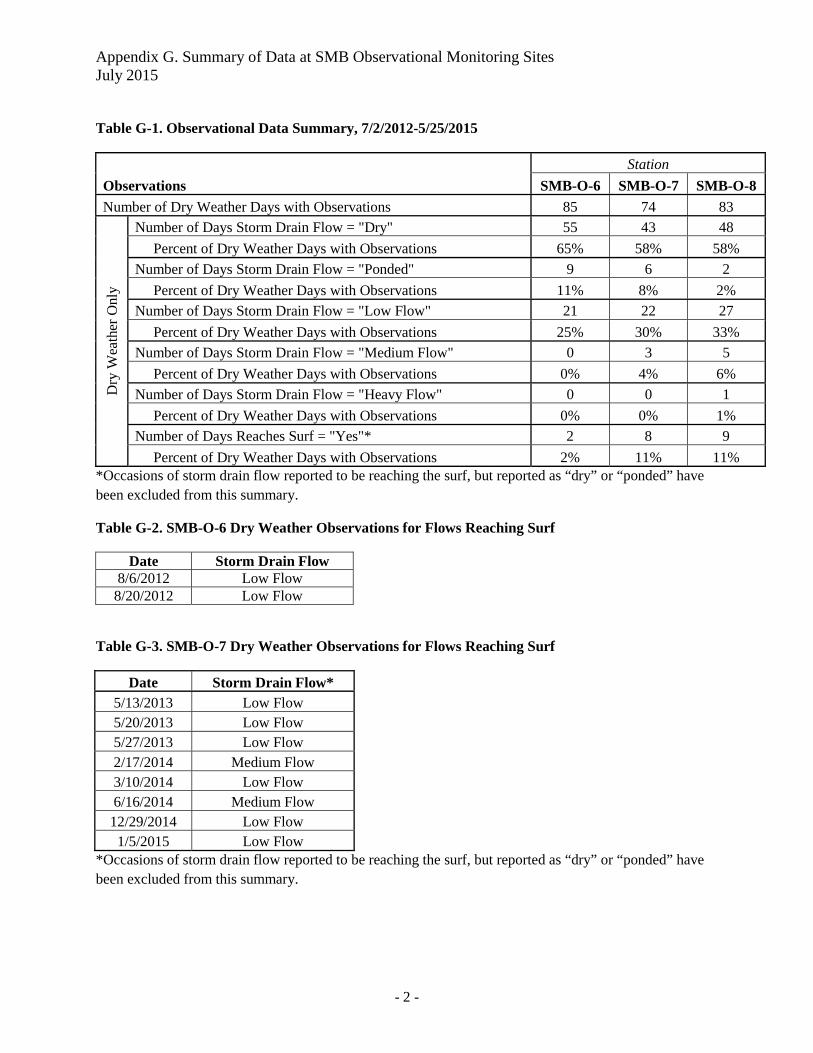
Appendix G. Summary of Data at SMB Observational Monitoring Sites July 2015
- 2 -
Table G-1. Observational Data Summary, 7/2/2012-5/25/2015
Observations
Station
SMB-O-6 SMB-O-7 SMB-O-8
Number of Dry Weather Days with Observations 85 74 83
Dry
Wea
ther
Onl
y
Number of Days Storm Drain Flow = "Dry" 55 43 48
Percent of Dry Weather Days with Observations 65% 58% 58%
Number of Days Storm Drain Flow = "Ponded" 9 6 2
Percent of Dry Weather Days with Observations 11% 8% 2%
Number of Days Storm Drain Flow = "Low Flow" 21 22 27
Percent of Dry Weather Days with Observations 25% 30% 33%
Number of Days Storm Drain Flow = "Medium Flow" 0 3 5
Percent of Dry Weather Days with Observations 0% 4% 6%
Number of Days Storm Drain Flow = "Heavy Flow" 0 0 1
Percent of Dry Weather Days with Observations 0% 0% 1%
Number of Days Reaches Surf = "Yes"* 2 8 9
Percent of Dry Weather Days with Observations 2% 11% 11% *Occasions of storm drain flow reported to be reaching the surf, but reported as “dry” or “ponded” have been excluded from this summary.
Table G-2. SMB-O-6 Dry Weather Observations for Flows Reaching Surf
Date Storm Drain Flow 8/6/2012 Low Flow
8/20/2012 Low Flow
Table G-3. SMB-O-7 Dry Weather Observations for Flows Reaching Surf
*Occasions of storm drain flow reported to be reaching the surf, but reported as “dry” or “ponded” have been excluded from this summary.
Date Storm Drain Flow* 5/13/2013 Low Flow 5/20/2013 Low Flow 5/27/2013 Low Flow 2/17/2014 Medium Flow 3/10/2014 Low Flow 6/16/2014 Medium Flow
12/29/2014 Low Flow 1/5/2015 Low Flow
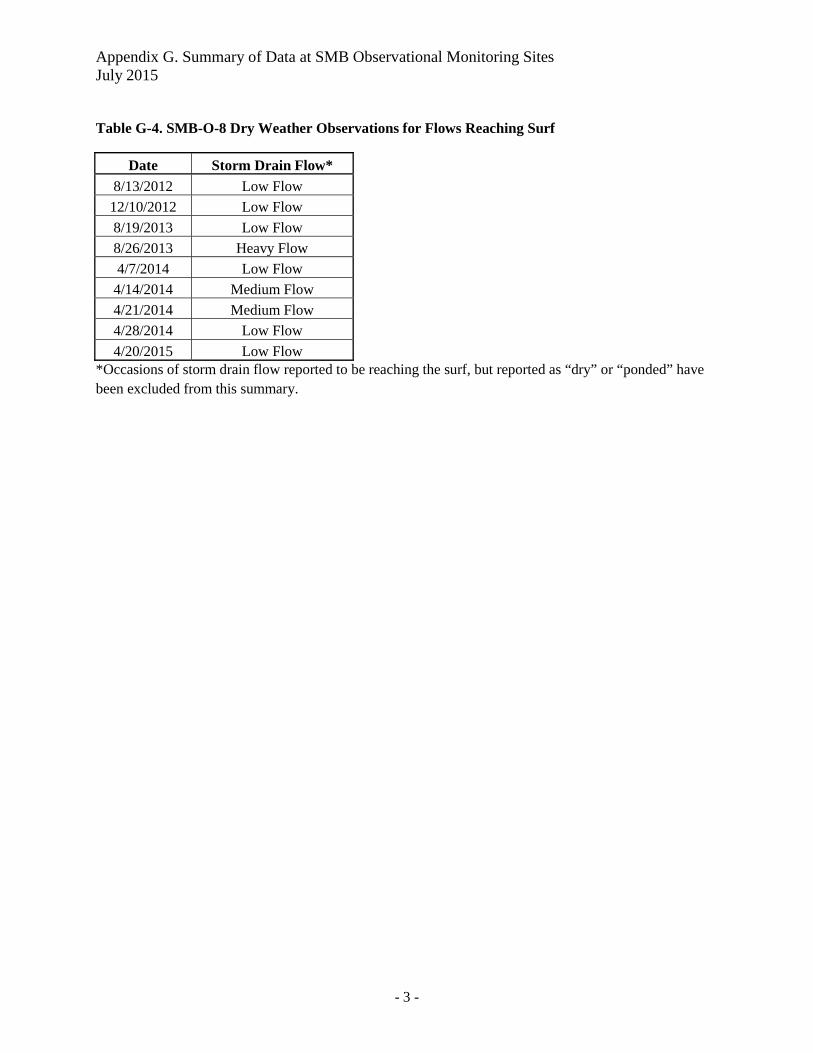
Appendix G. Summary of Data at SMB Observational Monitoring Sites July 2015
- 3 -
Table G-4. SMB-O-8 Dry Weather Observations for Flows Reaching Surf
Date Storm Drain Flow*
8/13/2012 Low Flow
12/10/2012 Low Flow
8/19/2013 Low Flow
8/26/2013 Heavy Flow
4/7/2014 Low Flow
4/14/2014 Medium Flow
4/21/2014 Medium Flow
4/28/2014 Low Flow
4/20/2015 Low Flow *Occasions of storm drain flow reported to be reaching the surf, but reported as “dry” or “ponded” have been excluded from this summary.