aid and fiscal deficits: lessons from uganda on the implications for macroeconomic management and...
TRANSCRIPT
Development Policy Review, 2007, 25 (2): 193-213
© The Authors 2007. Journal compilation © 2007 Overseas Development Institute.
Published by Blackwell Publishing, Oxford OX4 2DQ, UK and 350 Main Street, Malden, MA 02148, USA.
Aid and Fiscal Deficits: Lessons from Uganda on the Implications for Macroeconomic Management and Fiscal Sustainability
Martin Brownbridge and Emmanuel Tumusiime-Mutebile∗
This article contributes to the ongoing debate on the macroeconomic management of large aid inflows to low-income countries by analysing lessons drawn from Uganda, where the fiscal deficit before grants, which was largely aid-funded, doubled to over 12% of GDP in the early 2000s. It focuses on the implications of the widening fiscal deficit for monetary policy, the real exchange rate, debt sustainability and the vulnerability of the budget to fiscal shocks, and argues that large fiscal deficits, even when funded predominantly by aid, risk undermining macroeconomic objectives and long-run fiscal sustainability.
1 Introduction The prospect of increased development aid to sub-Saharan Africa (SSA) to support the fight against poverty has stimulated interest in the macroeconomic management of large aid inflows (Foster and Killick, 2006; Gupta et al., 2005; Heller, 2005), with the impact of aid on the real exchange rate and exports being a particular focus of attention for researchers (Adam, 2005; Elbadawi, 1999; Rajan and Subramanian, 2005). As a large share of aid is channelled to the government budgets of the recipient countries, increased aid flows have important implications for fiscal policy, and are likely to widen fiscal deficits, at least when deficits are defined to exclude grants.
The link between aid and fiscal deficits, and the public policy choices facing SSA countries which are able to access more aid, have been highlighted by the experience of Uganda, a country which has been seen, in some respects, as a test case for these issues. Both government spending and the fiscal deficit before grants increased by around 6 percentage points of GDP between the late 1990s and 2001/2, an increase which was mainly funded by increased donor budget support1 and debt relief. The availability of higher aid inflows to Uganda in the early 2000s offered policy-makers a genuine policy choice regarding the size of public expenditure and the fiscal deficit before grants, and this prompted a lively policy debate within the country as well as among aid agencies
∗Emmanuel Tumusiime-Mutebile is Governor, Bank of Uganda and formerly Permanent Secretary/Secretary to the Treasury, Ministry of Finance, Planning and Economic Development, Uganda. Martin Brownbridge is the former macroeconomic adviser to the Ministry of Finance, Planning and Economic Development, Uganda ([email protected]). They write here in their personal capacities.
1. Budget support (or programme aid) is aid which is channelled directly to the government budget and contributes to a common pool of budget resources which are used to fund general government expenditures, as distinct from project support which is earmarked for specific project expenditures.
194 Martin Brownbridge and Emmanuel Tumusiime-Mutebile
© The Authors 2007. Journal compilation © 2007 Overseas Development Institute. Development Policy Review 25 (2)
and academic researchers. On one side of the debate were some of the line ministries and donor agencies which advocated a further expansion of the share of government spending in GDP, funded by more donor aid, in an effort to achieve the Millennium Development Goals (MDGs),2 a view which found support among some researchers who argued that higher aid inflows to Uganda would have a generally positive macroeconomic impact, and would not necessarily impede export growth through real exchange-rate appreciation (Adam and Bevan, 2003; Nkusu, 2004). On the other side of the debate were the Ministry of Finance, Planning and Economic Development (MFPED) and the Central Bank – the Bank of Uganda (BoU) – which advocated a medium-term strategy of fiscal-deficit reduction and reduced aid dependence because of concerns about the adverse macroeconomic effects and the sustainability of large fiscal deficits. The government began implementing this strategy of fiscal consolidation in 2002/3.
This article analyses the impact of the increase in the fiscal deficit on macroeconomic management and on the sustainability of public finances, and argues that the medium-term strategy of fiscal consolidation advocated by the MFPED and the BoU and now being pursued by the government is the correct course for Uganda to follow, despite the attractions of being able to access potentially larger inflows of aid. This is a view also expressed by Kitabire (2005). The premise of the article is that fiscal policy must support rapid economic growth, because in a low-income country this is a prerequisite for income-poverty reduction as well as for achieving key social targets such as improvements in health status.3 Because rapid economic growth is most likely to be sustainable if it is driven by private investment and exports, fiscal policy must provide room for growth in private-sector credit and allow price incentives to shift in favour of the export sector. Fiscal policy must also be sustainable, because the consequences of running an unsustainable fiscal policy, in the event of a major fiscal shock, are likely to prove very damaging for both macroeconomic stability and the delivery of public services. Fiscal sustainability is usually analysed in terms of the impact of the fiscal deficit on government indebtedness, but, for aid-dependent countries, it must also be evaluated in terms of the sustainability of budgetary resources over which government has no direct control, notably donor aid.
The article contributes to the ongoing debate about aid and macroeconomic management in developing countries. We believe that lessons can be drawn from the experience of Uganda which will have relevance for a wider range of countries in SSA and elsewhere in the developing world. The article is organised as follows. Section 2 reviews trends in fiscal aggregates since the mid-1990s. Section 3 examines the impact of the widening fiscal deficit on macroeconomic management. Section 4 evaluates two
2. Estimates of how much extra government spending would be required to meet the MDGs vary. EPRC
(2002) estimated the annual budgetary cost of meeting MDG-related targets in three sectors – education, health and water – based on cost estimates in the respective sector investment plans and demographic projections up to 2015. It estimated a funding gap equivalent to 6.4% of GDP in 2003, which declines to 4.8% of GDP in 2015. The Millennium Project (2003) estimated that government expenditure would have to rise by about 13.5% of GDP to meet all of the MDGs over the period 2005-15.
3. Health status is highly correlated with per capita income levels. Cross-country econometric analysis by Filmer and Pritchett (1997) found that 84% of the cross-country variation in child mortality is explained by per capita income.
Aid and Fiscal Deficits: Lessons from Uganda 195
© The Authors 2007. Journal compilation © 2007 Overseas Development Institute. Development Policy Review 25 (2)
aspects of fiscal sustainability: government debt sustainability and the vulnerability of the government budget to donor aid. Section 5 concludes.
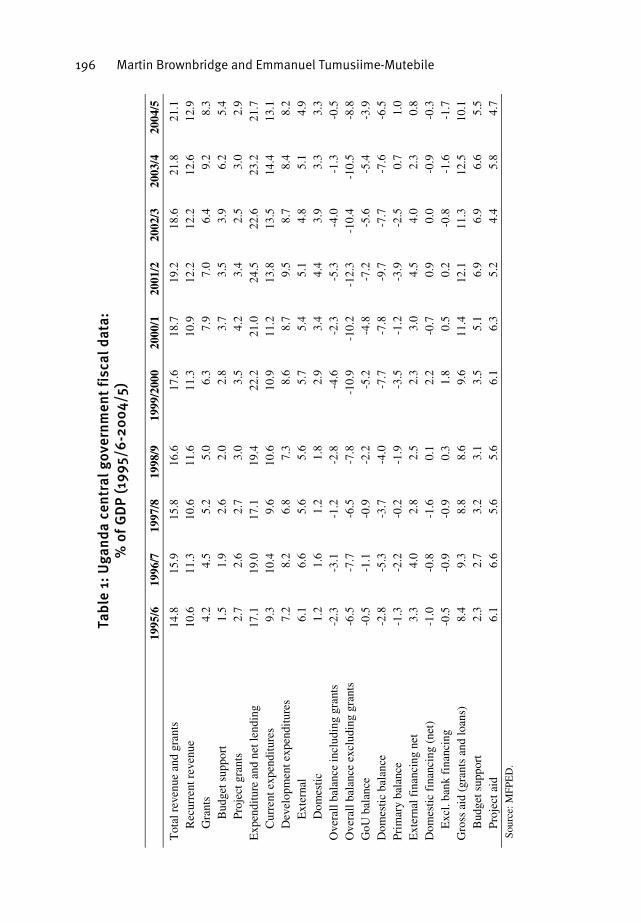
2 Trends in fiscal aggregates in Uganda Table 1 presents the main components of central government fiscal data, in percentages of GDP, for the period 1995/6-2004/5. The central government budget comprises two components. The larger component is termed the government of Uganda (GoU) budget and includes all expenditures which are funded from general budgetary resources, including tax revenue and donor budget support, held in government accounts in the Central Bank. Expenditures under the GoU budget are subject to a common set of budgetary procedures, which include appropriation by Parliament and the release of funds by the MFPED. The second component of the budget consists of projects which are funded directly by donors outside of the normal budgetary process.
Two standard measures of the fiscal balance (surplus or deficit) are reported in the fiscal statistics: the overall balance including grants (or after grants), and the overall balance excluding grants (or before grants). The former (which is often termed the ‘conventional balance’) treats donor grants as an above-the-line item of revenue, whereas the latter excludes donor grants from revenue. Table 1 also shows the GoU budget balance, which is defined as domestic revenues minus GoU expenditures, the domestic balance, which is defined as the overall balance excluding grants minus expenditures on external interest and government imports, and the primary balance, which is equal to the conventional balance excluding interest payments.
In the early 1990s Uganda implemented fiscal reforms which enabled the MFPED to control government expenditure and curb domestic financing of the fiscal deficit. These reforms were crucial to the restoration of macroeconomic stability which in turn laid the basis for the robust economic growth which Uganda experienced during the 1990s (Henstridge and Kasekende, 2001). Government expenditures, revenues and fiscal deficits were relatively stable in the mid-1990s, but beginning in 1998/9 government expenditure increased rapidly, by 7.4 percentage points of GDP, from 17.1% of GDP in 1997/8 to 24.5% in 2001/2. This increase was almost entirely attributable to the growth in the GoU budget: in contrast, expenditures on externally funded development projects were fairly flat as a percentage of GDP.
The increase in government spending was driven mainly by higher aid inflows, largely in the form of budget support including debt relief under the Heavily-Indebted Poor Countries (HIPC) Initiative. Gross aid rose from 8.8% of GDP in 1997/8 to 12.1% of GDP in 2001/2. Domestic revenues increased less quickly, rising from 10.6% of GDP in 1997/98 to 12.2% of GDP in 2001/2. Also of note was the reversal of the government’s domestic financing requirement, from a saving of 1.6% of GDP in 1997/8 to a borrowing of 0.9% of GDP in 2001/2, which was mainly attributable to actual aid disbursements falling short of what had been programmed when the annual budgets were drawn up.
Given that government expenditures rose far more rapidly than domestic revenues, the overall fiscal deficit, excluding grants, widened sharply, almost doubling from 6.5% of GDP in 1997/8 to 12.3% of GDP in 2001/2. The increase in the fiscal deficit before
Tab
le 1
: U
gan
da
cen
tral
gov
ern
men
t fi
scal
dat
a:
% o
f G
DP
(19
95/
6-2
00
4/5)
19
95/6
19
96/7
19
97/8
19
98/9
19
99/2
000
2000
/1
2001
/2
2002
/3
2003
/4
2004
/5
Tot
al r
even
ue a
nd g
rant
s 14
.8
15.9
15
.8
16.6
17
.6
18.7
19
.2
18.6
21
.8
21.1
R
ecur
rent
rev
enue
G
rant
s 10
.6
4.2
11.3
4.
5 10
.6
5.2
11.6
5.
0 11
.3
6.3
10.9
7.
9 12
.2
7.0
12.2
6.
4 12
.6
9.2
12.9
8.
3 B
udge
t sup
port
Pr
ojec
t gra
nts
1.5
2.7
1.9
2.6
2.6
2.7
2.0
3.0
2.8
3.5
3.7
4.2
3.5
3.4
3.9
2.5
6.2
3.0
5.4
2.9
Exp
endi
ture
and
net
lend
ing
17.1
19
.0
17.1
19
.4
22.2
21
.0
24.5
22
.6
23.2
21
.7
Cur
rent
exp
endi
ture
s D
evel
opm
ent e
xpen
ditu
res
9.3
7.2
10.4
8.
2 9.
6 6.
8 10
.6
7.3
10.9
8.
6 11
.2
8.7
13.8
9.
5 13
.5
8.7
14.4
8.
4 13
.1
8.2
Ext
erna
l D
omes
tic
6.1
1.2
6.6
1.6
5.6
1.2
5.6
1.8
5.7
2.9
5.4
3.4
5.1
4.4
4.8
3.9
5.1
3.3
4.9
3.3
Ove
rall
bala
nce
incl
udin
g gr
ants
-2
.3
-3.1
-1
.2
-2.8
-4
.6
-2.3
-5
.3
-4.0
-1
.3
-0.5
O
vera
ll ba
lanc
e ex
clud
ing
gran
ts
-6.5
-7
.7
-6.5
-7
.8
-10.
9 -1
0.2
-12.
3 -1
0.4
-10.
5 -8
.8
GoU
bal
ance
-0
.5
-1.1
-0
.9
-2.2
-5
.2
-4.8
-7
.2
-5.6
-5
.4
-3.9
D
omes
tic
bala
nce
-2.8
-5
.3
-3.7
-4
.0
-7.7
-7
.8
-9.7
-7
.7
-7.6
-6
.5
Prim
ary
bala
nce
-1.3
-2
.2
-0.2
-1
.9
-3.5
-1
.2
-3.9
-2
.5
0.7
1.0
Ext
erna
l fin
anci
ng n
et
3.3
4.0
2.8
2.5
2.3
3.0
4.5
4.0
2.3
0.8
Dom
estic
fin
anci
ng (
net)
-1
.0
-0.8
-1
.6
0.1
2.2
-0.7
0.
9 0.
0 -0
.9
-0.3
E
xcl.
bank
fin
anci
ng
-0.5
-0
.9
-0.9
0.
3 1.
8 0.
5 0.
2 -0
.8
-1.6
-1
.7
Gro
ss a
id (
gran
ts a
nd lo
ans)
8.
4 9.
3 8.
8 8.
6 9.
6 11
.4
12.1
11
.3
12.5
10
.1
Bud
get s
uppo
rt
Proj
ect a
id
2.3
6.1
2.7
6.6
3.2
5.6
3.1
5.6
3.5
6.1
5.1
6.3
6.9
5.2
6.9
4.4
6.6
5.8
5.5
4.7
Sour
ce: M
FPE
D.
196 Martin Brownbridge and Emmanuel Tumusiime-Mutebile
Aid and Fiscal Deficits: Lessons from Uganda 197
© The Authors 2007. Journal compilation © 2007 Overseas Development Institute. Development Policy Review 25 (2)
grants after 1997/8 was planned – because more aid was available, the government expanded its budget – and was not the result of poor expenditure control, nor of shortfalls in domestic revenue. Aggregate expenditure control was effective in this period, in that expenditures were kept within programmed levels. What this means is that aggregate expenditures under the GoU budget were maintained within the budget, adjusted for any shortfalls in domestic revenue.4 Hence, with the (minor) exception of 1999/2000, the GoU deficit outturns have been no larger, in absolute value, than budgeted deficits.
Because they were to be funded by aid, larger fiscal deficits were not initially viewed by policy-makers in Uganda as problematic: in the 1990s the binding constraint on government spending was the size of the budget resource envelope, so that, at the margin, higher aid meant higher spending. But the macroeconomic management of the widening fiscal deficit proved difficult, as explained in the next section, and the increasing dependence of the budget on donor aid raised concerns about fiscal sustainability. This motivated the government to implement a medium-term strategy, beginning in 2002/3, of scaling back the fiscal deficit before grants, through a combination of boosting domestic revenues and curbing expenditure growth. By 2004/5 the fiscal deficit before grants had been reduced to 8.8% of GDP, a reduction of 3.5% of GDP from its peak in 2001/2. This reduction in the overall deficit was achieved almost entirely by cutting the GoU deficit, with very little contribution from reduced externally funded project expenditures.
3 The macroeconomic management of large aid-funded
fiscal deficits The channel through which large fiscal deficits undermine macroeconomic stability is usually excessive domestic financing of the deficit, leading to money creation and the crowding-out of the private sector from credit markets. A fiscal deficit which is predominantly funded by donor aid is usually regarded as less problematic for macroeconomic stability than one funded by domestic borrowing. However, even aid-funded fiscal deficits, if too large, create problems for macroeconomic management. The problems are twofold. First, the expansion of the fiscal deficit increases aggregate demand, which can induce an appreciation of the real effective exchange rate (REER), and this in turn may undermine efforts to promote the expansion and diversification of exports. As such, an aid-funded fiscal expansion has effects which are similar to those of Dutch disease. Secondly, the expansion of the fiscal deficit leads to an increase in the volume of domestic liquidity in the form of base money created by fiscal operations which must be sterilised by the Central Bank to maintain control of monetary aggregates. These issues are discussed below, beginning with the problems caused by the expansion of the fiscal deficit for monetary management.
4. This is the budget-control rule followed by the MFPED, and is consistent with meeting the government
domestic borrowing target in the Poverty Reduction and Growth Facility (PRGF) programme agreed with the IMF. External interest payments are excluded from the GoU expenditures for the purposes of this budget-control rule.
198 Martin Brownbridge and Emmanuel Tumusiime-Mutebile
© The Authors 2007. Journal compilation © 2007 Overseas Development Institute. Development Policy Review 25 (2)
3.1 Monetary management Equations (1) and (2) below show the link between the fiscal deficit and the control of base money5 by the Bank of Uganda. The definition of the fiscal deficit which is most relevant to this link is the GoU deficit (defined in Section 2), because the revenues and expenditures which determine this deficit all flow through accounts in the Bank of Uganda and, therefore, affect its assets and liabilities. In equation (1) the injection of base money from fiscal operations (∆BM) is equal to the GoU deficit (GoU def),6 minus external interest payments (ext r) and government imports funded through the Bank of Uganda (GoUm).7 The Bank of Uganda has an operating target for the increase in base money, denoted by s, which is determined by the projected growth in demand for base money holdings, given the target inflation rate. To meet the operating target for base money, the BoU must mop up the difference between the injection of base money from fiscal operations and the target, using two instruments: (i) net sales of domestic securities such as Treasury Bills (∆TBs), and (ii) net sales of foreign exchange (∆FX) traded to commercial banks through the Inter-bank Foreign Exchange Market (IFEM),8 which is shown in equation (2).
GoU def - ext r – GoUm = ∆BM (1)
∆BM - s = ∆TBs + ∆FX (2)
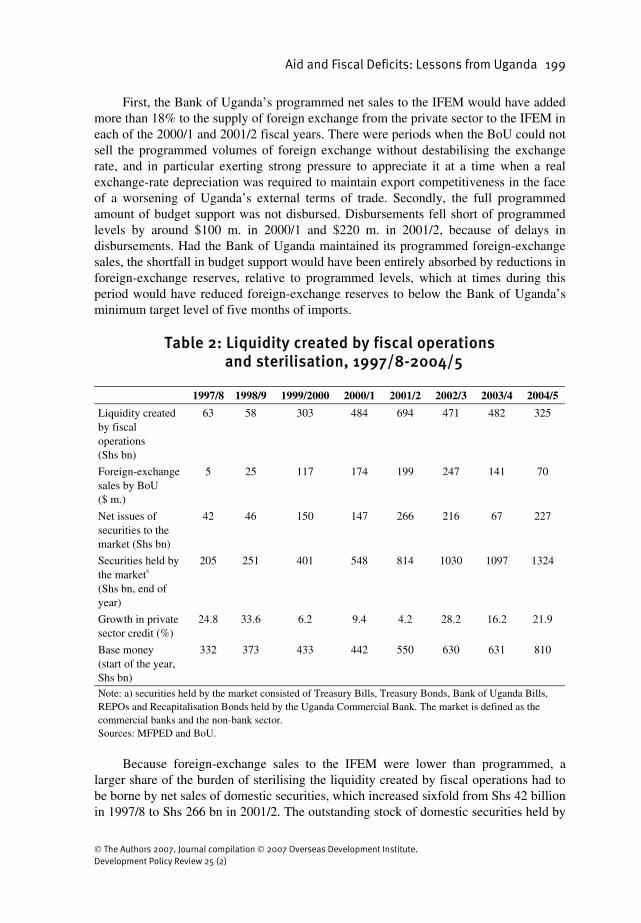
The rise in the GoU deficit between 1997/8 and 2001/2 mirrored that of the overall
fiscal deficit before grants, because both deficits were affected by the same trend: the expansion of GoU expenditures funded mainly by higher inflows of budget support and debt relief. Because of the rise in the GoU deficit, the liquidity (base money) created by fiscal operations increased tenfold (Table 2). By 2001/2, fiscal operations created more than Shs 694 billion (6.8% of GDP) of liquidity, which was more than the existing base-money stock at the start of the fiscal year. The Bank of Uganda planned to sterilise this liquidity creation, minus its target for the growth of base money, through a combination of sales of foreign exchange and government securities, with the emphasis on the former. Consequently, there was a fourfold rise in the BoU’s programmed foreign-exchange sales between 1998/9 and 2001/2, but actual sales of foreign exchange to the IFEM fell short of the programmed levels, by $34 million in 2000/1 and $56 m. in the following fiscal year, for two reasons.
5. Base money is also called reserve, or high-powered, money. 6. In equation 1 a deficit is defined to have a positive sign. 7. External interest payments and GoU imports are incurred directly in foreign exchange and hence do not
contribute to base-money creation. Until recently, most donor-funded project transactions had no impact on base money because the external resources and associated expenditures did not flow through the Central Bank. However, in 2004/5 the government began switching project accounts into the Bank of Uganda from commercial banks, which means that some of the transactions on these project accounts will affect base money.
8. For simplicity, we have omitted minor sources of base-money creation such as the Central Bank’s own operations.
Aid and Fiscal Deficits: Lessons from Uganda 199
© The Authors 2007. Journal compilation © 2007 Overseas Development Institute. Development Policy Review 25 (2)
First, the Bank of Uganda’s programmed net sales to the IFEM would have added more than 18% to the supply of foreign exchange from the private sector to the IFEM in each of the 2000/1 and 2001/2 fiscal years. There were periods when the BoU could not sell the programmed volumes of foreign exchange without destabilising the exchange rate, and in particular exerting strong pressure to appreciate it at a time when a real exchange-rate depreciation was required to maintain export competitiveness in the face of a worsening of Uganda’s external terms of trade. Secondly, the full programmed amount of budget support was not disbursed. Disbursements fell short of programmed levels by around $100 m. in 2000/1 and $220 m. in 2001/2, because of delays in disbursements. Had the Bank of Uganda maintained its programmed foreign-exchange sales, the shortfall in budget support would have been entirely absorbed by reductions in foreign-exchange reserves, relative to programmed levels, which at times during this period would have reduced foreign-exchange reserves to below the Bank of Uganda’s minimum target level of five months of imports.
Table 2: Liquidity created by fiscal operations
and sterilisation, 1997/8-2004/5 1997/8 1998/9 1999/2000 2000/1 2001/2 2002/3 2003/4 2004/5
Liquidity created by fiscal operations (Shs bn)
63 58 303 484 694 471 482 325
Foreign-exchange sales by BoU ($ m.)
5 25 117 174 199 247 141 70
Net issues of securities to the market (Shs bn)
42 46 150 147 266 216 67 227
Securities held by the marketa (Shs bn, end of year)
205 251 401 548 814 1030 1097 1324
Growth in private sector credit (%)
24.8 33.6 6.2 9.4 4.2 28.2 16.2 21.9
Base money (start of the year, Shs bn)
332 373 433 442 550 630 631 810
Note: a) securities held by the market consisted of Treasury Bills, Treasury Bonds, Bank of Uganda Bills, REPOs and Recapitalisation Bonds held by the Uganda Commercial Bank. The market is defined as the commercial banks and the non-bank sector. Sources: MFPED and BoU.
Because foreign-exchange sales to the IFEM were lower than programmed, a
larger share of the burden of sterilising the liquidity created by fiscal operations had to be borne by net sales of domestic securities, which increased sixfold from Shs 42 billion in 1997/8 to Shs 266 bn in 2001/2. The outstanding stock of domestic securities held by
200 Martin Brownbridge and Emmanuel Tumusiime-Mutebile
© The Authors 2007. Journal compilation © 2007 Overseas Development Institute. Development Policy Review 25 (2)
0%
10%
20%
30%
40%
50%
60%
1995 1996 1997 1998 1999 2000 2001 2002 2003 2004 20050%
1%
2%
3%
4%
5%
6%
7%
8%
Securities/Deposits LHS
PSC/Deposits LHS
PSC/GDP RHS
0%
10%
20%
30%
40%
50%
60%
1995 1996 1997 1998 1999 2000 2001 2002 2003 2004 20050%
1%
2%
3%
4%
5%
6%
7%
8%
Securities/Deposits LHS
PSC/Deposits LHS
PSC/GDP RHS
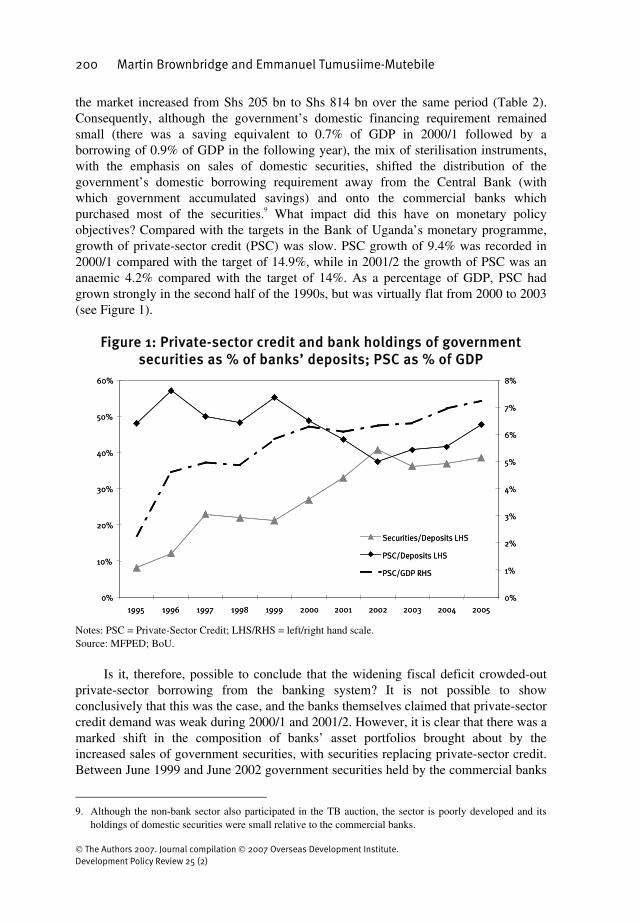
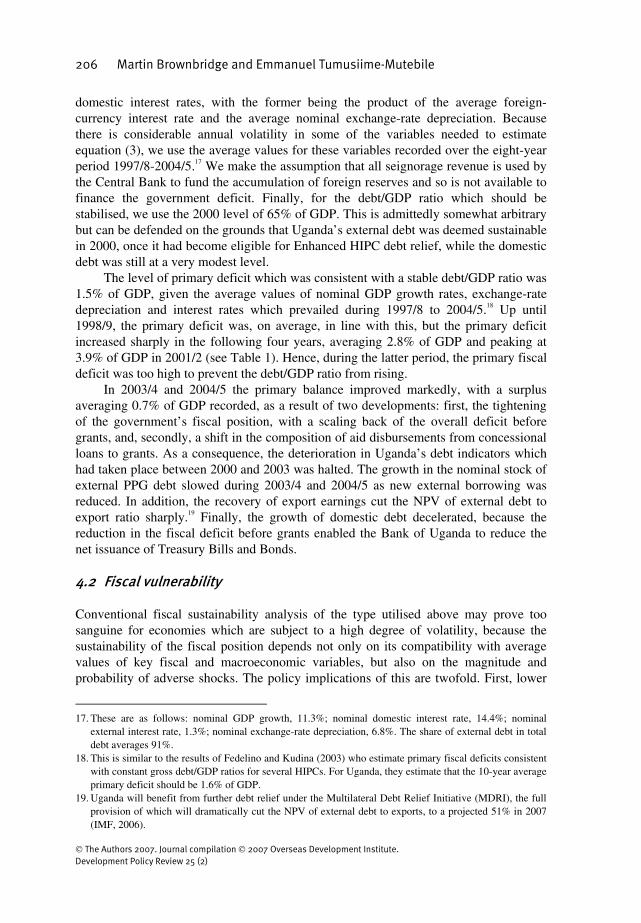
the market increased from Shs 205 bn to Shs 814 bn over the same period (Table 2). Consequently, although the government’s domestic financing requirement remained small (there was a saving equivalent to 0.7% of GDP in 2000/1 followed by a borrowing of 0.9% of GDP in the following year), the mix of sterilisation instruments, with the emphasis on sales of domestic securities, shifted the distribution of the government’s domestic borrowing requirement away from the Central Bank (with which government accumulated savings) and onto the commercial banks which purchased most of the securities.9 What impact did this have on monetary policy objectives? Compared with the targets in the Bank of Uganda’s monetary programme, growth of private-sector credit (PSC) was slow. PSC growth of 9.4% was recorded in 2000/1 compared with the target of 14.9%, while in 2001/2 the growth of PSC was an anaemic 4.2% compared with the target of 14%. As a percentage of GDP, PSC had grown strongly in the second half of the 1990s, but was virtually flat from 2000 to 2003 (see Figure 1).
Figure 1: Private-sector credit and bank holdings of government
securities as % of banks’ deposits; PSC as % of GDP
Notes: PSC = Private-Sector Credit; LHS/RHS = left/right hand scale. Source: MFPED; BoU.
Is it, therefore, possible to conclude that the widening fiscal deficit crowded-out
private-sector borrowing from the banking system? It is not possible to show conclusively that this was the case, and the banks themselves claimed that private-sector credit demand was weak during 2000/1 and 2001/2. However, it is clear that there was a marked shift in the composition of banks’ asset portfolios brought about by the increased sales of government securities, with securities replacing private-sector credit. Between June 1999 and June 2002 government securities held by the commercial banks
9. Although the non-bank sector also participated in the TB auction, the sector is poorly developed and its
holdings of domestic securities were small relative to the commercial banks.
Aid and Fiscal Deficits: Lessons from Uganda 201
© The Authors 2007. Journal compilation © 2007 Overseas Development Institute. Development Policy Review 25 (2)
almost doubled as a share of their deposits, from 21% to 41%. This was matched by an almost equivalent fall in loans to the private sector, from 55% of the banks’ deposits at end-June 1999 to 38% at end-June 2002 (see Figure 1). Even if private-sector credit demand had been weak during 2000/1 and the following fiscal year, the banks had little incentive to seek out new borrowers, given the rapidly expanding supply of government securities offered to the market by the Central Bank.
One of the prime motivations for scaling back the fiscal deficit after 2001/2 was to create more room for PSC growth. Liquidity created by fiscal operations fell by around a third in the following two fiscal years, allowing net issues of securities to be reduced. As a result, holdings of government securities as a share of commercial banks’ deposits fell back by about 4 percentage points in 2002/3 and then rose only slightly in the following two years. In contrast, PSC growth picked up again, with the fall in loans to the private sector as a share of banks’ deposits which had taken place between 1999 and 2002 being reversed (Table 2 and Figure 1). PSC growth was relatively strong in the three years after 2001/2, averaging 22% per annum compared with the average of just 7% in the previous three years. While correlation does not prove causation, it does indicate a strong link between the sale of government securities to the domestic market and private-sector credit growth.
3.2 The real exchange rate and exports The second reason why the widening fiscal deficit is a cause of concern for macroeconomic management arises from its potential impact on exports, through the REER. Most government expenditure consists of non-traded goods, the increased demand for which could appreciate the REER. In open economies in which the government budget includes substantial transactions with the external sector, such as budgetary resources mobilised from donor aid, it is useful to compute a measure of the ‘domestic deficit’, which aims to capture only those components of the budget which directly affect the domestic economy (Blejer and Cheasty, 1991: 1653). The domestic deficit reflects the impact of fiscal policy on aggregate demand in the economy. The domestic balance is shown in Table 1, and is defined as domestic revenues minus government expenditures, except for expenditures on imports of goods and services and external interest payments. Between 1997/8 and 2001/2 the widening domestic deficit added 5.6 percentage points of GDP to aggregate demand. A key question for policy-makers is whether this would have a negative impact on export promotion, brought about by an appreciation of the REER.
Nkusu (2004) argues that increased aid-funded public spending in Uganda will not necessarily appreciate the REER because of, inter alia, unemployed factors of production and limited factor mobility between the public sector and the agricultural export sector. However, given that the economy has experienced continuous and strong real growth since the mid-1980s, it is not clear why it should be still producing within its production possibility frontier, with unemployed factors which can be brought into production simply by boosting demand.
Adam and Bevan (2003) construct a Computable General Equilibrium model of Uganda in which the increase in aid-funded public expenditure complements private investment and as a result boosts economic growth and exports in the long run, although
202 Martin Brownbridge and Emmanuel Tumusiime-Mutebile
© The Authors 2007. Journal compilation © 2007 Overseas Development Institute. Development Policy Review 25 (2)
there are short-run Dutch disease-type effects. However, these results are dependent upon the assumption of complementarity between the increase in public expenditure and private investment, which may not be valid. A crucial question in this debate is whether the benefits of higher public spending in stimulating growth, for example by providing public infrastructure which complements private investment, outweigh any adverse affects on growth through the impact on the REER. This question revolves around three issues: whether or not the expansion in public spending is allocated to sectors which support growth, which in turn tends to focus on whether the additional expenditure is on public capital formation or public consumption; the efficiency of increased public spending; and the import content of increased public spending.
On the first issue, the evidence is mixed in Uganda. About half of the increase in government expenditure between 1998/9 and 2001/2 was allocated to capital expenditure, although all capital expenditure does not necessarily complement private investment, and some of the increases in current expenditure, especially in the education sector, may have more benefits for economic growth in the long term. Of more concern is the evidence, albeit somewhat fragmentary, that the efficiency of public investment was undermined because the growth in demand in the late 1990s and early 2000s, especially in the construction industry, outstripped domestic supply capacities for what is essentially a non-tradeable good. In the roads sector, there were rapid unit-cost increases, cost overruns and delays in starting donor-funded projects. There were also many reports of shoddy work on road projects and classroom construction projects (Kitabire, 2005: 42). In addition, it is probable, although precise data are lacking to confirm this, that the rapidly rising costs of public construction projects pushed up construction costs for the private sector.
Dutch-disease effects would not occur to the extent that additional government spending is met directly by imports, such as imports of capital goods, because this spending would then have no impact on aggregate demand in the domestic economy. However, the import content of the increased government spending in Uganda was low, because it mainly comprised social and administrative services, maintenance and construction in which the main inputs are workers and construction materials, most of which are domestically produced because of the high transport costs. Most public goods and services consist of non-tradeable goods, and hence there is only marginal scope for shifting the government budget towards expenditures with a higher import content, without distorting the efficiency of budget allocations (Kitabire, 2005: 41).10
Moreover, even if the long-run effects of higher aid-funded public investment on exports are potentially beneficial, the short-run impact cannot be ignored, because it is likely that the REER appreciation will overshoot its long-term level, and that the damage done by this overshooting to tradeable goods sectors might be irreversible. A short-run REER appreciation could have irreversible effects for several reasons: for example, if exporters cannot borrow to cover temporary losses because of financial market imperfections, or if they perceive the overshooting of the REER as permanent, rather than temporary, and disinvest from the export sector (Adam, 2005).
10. The import content of capital investment by public utilities, such as the electricity industry, is much
higher, but most of this investment is not funded from the government budget. Instead, government policy is to encourage private investment in the electricity industry.
Aid and Fiscal Deficits: Lessons from Uganda 203
© The Authors 2007. Journal compilation © 2007 Overseas Development Institute. Development Policy Review 25 (2)
The empirical evidence on the impact of the widening fiscal deficit on the REER and exports in Uganda is somewhat unclear, in part because there were two countervailing factors influencing the REER between the mid-1990s and the early 2000s. A steep fall in the external terms of trade (ToT), caused mainly by a fall in world market coffee prices, reduced export earnings and acted to offset the impact of higher aid inflows. Between 1997 and 2003 the REER depreciated by about 40% on a cumulative basis, but this is not, per se, evidence that the widening fiscal deficit had a benign impact on the REER, for two reasons. First, given the fall in the ToT, a depreciation of the REER was necessary to maintain export competitiveness. Secondly, as was noted in the previous section, the Bank of Uganda shifted the mix of monetary sterilisation instruments towards Treasury Bills and away from foreign-exchange sales in 2000/1 and 2001/2 in order to allow for more depreciation of the exchange rate, but at the cost of crowding-out private-sector borrowers from the credit market. Consequently, the impact on absorption (total spending on goods and services in the economy) was dampened. Foster and Killick (2006) show that, whereas 74% of the increase in aid during 1999-2002 was spent by the government, only 27% was absorbed in higher aggregate spending on goods and services in the economy (i.e. the higher government spending was partly offset by lower private-sector spending).11
It is also pertinent to ask what would be required of the REER to support the government’s long-term strategy of export-led growth. Uganda’s merchandise export earnings are less than 10% of GDP, which is very low by comparison with other low-income countries, let alone successful export-led growth economies. Although Uganda’s non-coffee exports have grown strongly since the late 1990s, by an average of 17% per annum from 1998/9 to 2004/5, this was from a very low base. Export-led growth will depend on stimulating rapid and sustained growth of non-traditional exports (NTEs). Atingi-Ego and Sebudde (2000) found that Uganda’s NTEs, as a share of total exports, are sensitive to the level of the REER. Rapid export growth may require non-price policy support, but it is difficult to envisage that exports will grow more rapidly than GDP unless relative price incentives are shifted systematically in favour of exports through a sustained depreciation of the REER. An increase in the rate of GDP growth may also require a REER depreciation. Hausmann et al. (2004) study episodes of growth accelerations in a large multi-country study and find that growth accelerations are correlated with increases in trade ratios and large real exchange-rate depreciations. Therefore a sustained depreciation of the REER should be a policy priority for Uganda, but that is not likely to be compatible with a large fiscal deficit before grants.
4 Fiscal sustainability Fiscal sustainability is usually analysed in terms of government borrowing. A sustainable fiscal position is defined as one which does not lead to government defaulting on, or monetising, its debt or which will not require a massive future fiscal
11. Several SSA countries have been concerned to protect the profitability of exports by avoiding REER
appreciation, as a result of which absorption of aid was relatively low. Of seven countries surveyed by Foster and Killick (2006), four (Ethiopia, Ghana, Tanzania and Uganda) absorbed 30% or less of the increase in aid.
204 Martin Brownbridge and Emmanuel Tumusiime-Mutebile
© The Authors 2007. Journal compilation © 2007 Overseas Development Institute. Development Policy Review 25 (2)
adjustment to avoid debt default or monetisation (Alvarado et al., 2004). Fiscal sustainability must also take into account the vulnerability of the budget to fiscal shocks. Fiscal vulnerability is defined as a situation where the fiscal position may be sustainable in current circumstances, but would become unsustainable in the event of an exogenous shock to revenues or expenditures (Ize, 1991: 67).
This section evaluates the consequences for fiscal sustainability of the widening of the fiscal deficit which occurred between 1997/8 and 2001/2. It begins by examining the evolution of government debt and the link between this and the fiscal deficit.
12 This is
followed by an assessment of fiscal vulnerability, focusing on the vulnerability arising from the dependence of the budget on aid.
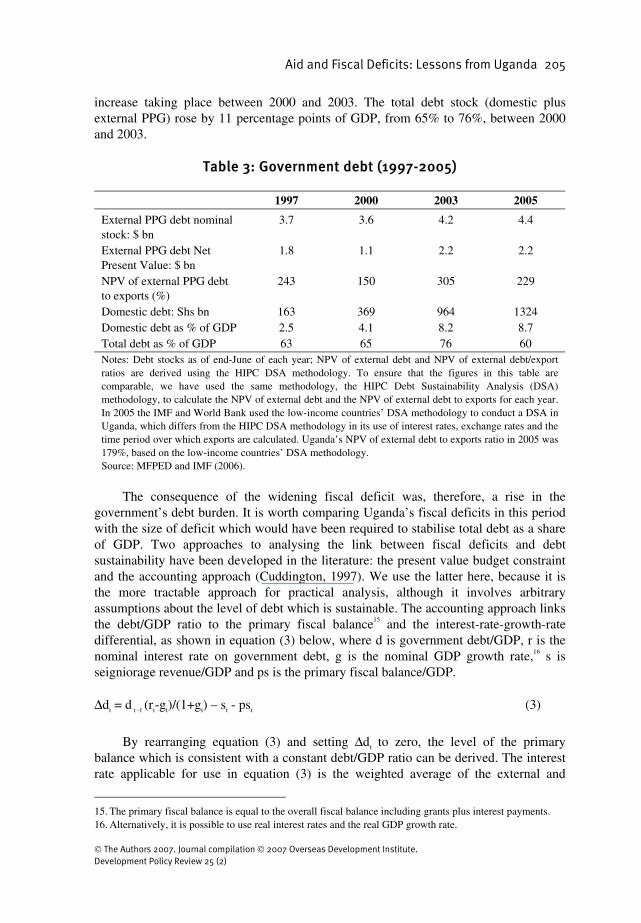
4.1 Government debt Uganda government debt comprises two components: external public and publicly guaranteed (PPG) debt, almost all of which was contracted on concessional terms, and domestic debt contracted on commercial terms. Approximately 40% of gross aid disbursements to the Ugandan government during 1997/8 to 2002/3 were in the form of concessional loans. Table 3 shows the outstanding stocks of government external and domestic debt during the period 1997-2005. Domestic debt is defined as government securities held outside the Bank of Uganda.13 For external PPG debt, Table 3 shows the nominal stock of the debt and its net present value (NPV), plus the NPV of debt to exports, which is the measure used to assess external debt sustainability under the HIPC debt relief initiative.
Uganda reached the completion points for the HIPC and enhanced HIPC debt relief initiatives in 1998 and 2000 respectively, and the impact of this debt relief is evident from Table 3: the NPV of external debt fell from $1.8 bn in 1997 to $1.1 bn in 2000. In the subsequent three years, however, the nominal stock of external debt increased by 18%, from $3.6 bn to $4.2 bn, because of new borrowings by the government. Meanwhile, the NPV of the external debt rose by $1.1 bn, because of both the rise in the nominal stock of debt and a fall in the level of concessionality.14 In addition, export earnings stagnated because of the steep fall in coffee prices on the world market. The sustainability threshold for the NPV of external debt used in the Enhanced HIPC Initiative is 150% of exports. At the end of 2002/3, Uganda’s NPV of external debt had risen to more than 300% of exports. Domestic debt rose rapidly between 1997 and 2003, from 2.5% to 8.2% of GDP, because of the large issuance of Treasury Bills to sterilise the fiscal deficit discussed in Section 3, with most of the
12. Articles which have examined the link between aid and non-concessional borrowing in developing
countries include Feeny and McGillivray (2003) and Ouattara (2004). The former finds a positive link between aid and non-concessional borrowing and discusses why this might be so. The latter, which uses a fiscal response model, finds a negative link between aid and non-concessional borrowing.
13. These securities consisted of Treasury Bills and Bonds plus Recapitalisation Bonds held by the Uganda Commercial Bank. The government domestic debt stock figures in Table 3 are slightly lower than the stock of securities held by the market in Table 2 because the latter includes REPOs and Bank of Uganda Bills, which are liabilities of the Bank of Uganda.
14. The concessionality of external debt fell because of a fall in world market interest rates, which are used as the discount rates to compute the NPV of a given stream of nominal debt-service payments.
Aid and Fiscal Deficits: Lessons from Uganda 205
© The Authors 2007. Journal compilation © 2007 Overseas Development Institute. Development Policy Review 25 (2)
increase taking place between 2000 and 2003. The total debt stock (domestic plus external PPG) rose by 11 percentage points of GDP, from 65% to 76%, between 2000 and 2003.
Table 3: Government debt (1997-2005)
1997 2000 2003 2005
External PPG debt nominal stock: $ bn
3.7 3.6 4.2 4.4
External PPG debt Net Present Value: $ bn
1.8 1.1 2.2 2.2
NPV of external PPG debt to exports (%)
243 150 305 229
Domestic debt: Shs bn 163 369 964 1324 Domestic debt as % of GDP 2.5 4.1 8.2 8.7 Total debt as % of GDP 63 65 76 60 Notes: Debt stocks as of end-June of each year; NPV of external debt and NPV of external debt/export ratios are derived using the HIPC DSA methodology. To ensure that the figures in this table are comparable, we have used the same methodology, the HIPC Debt Sustainability Analysis (DSA) methodology, to calculate the NPV of external debt and the NPV of external debt to exports for each year. In 2005 the IMF and World Bank used the low-income countries’ DSA methodology to conduct a DSA in Uganda, which differs from the HIPC DSA methodology in its use of interest rates, exchange rates and the time period over which exports are calculated. Uganda’s NPV of external debt to exports ratio in 2005 was 179%, based on the low-income countries’ DSA methodology. Source: MFPED and IMF (2006).
The consequence of the widening fiscal deficit was, therefore, a rise in the
government’s debt burden. It is worth comparing Uganda’s fiscal deficits in this period with the size of deficit which would have been required to stabilise total debt as a share of GDP. Two approaches to analysing the link between fiscal deficits and debt sustainability have been developed in the literature: the present value budget constraint and the accounting approach (Cuddington, 1997). We use the latter here, because it is the more tractable approach for practical analysis, although it involves arbitrary assumptions about the level of debt which is sustainable. The accounting approach links the debt/GDP ratio to the primary fiscal balance15 and the interest-rate-growth-rate differential, as shown in equation (3) below, where d is government debt/GDP, r is the nominal interest rate on government debt, g is the nominal GDP growth rate,16 s is seigniorage revenue/GDP and ps is the primary fiscal balance/GDP.
∆dt = d t -1 (rt-gt)/(1+gt) – st - pst (3)
By rearranging equation (3) and setting ∆dt to zero, the level of the primary balance which is consistent with a constant debt/GDP ratio can be derived. The interest rate applicable for use in equation (3) is the weighted average of the external and
15. The primary fiscal balance is equal to the overall fiscal balance including grants plus interest payments. 16. Alternatively, it is possible to use real interest rates and the real GDP growth rate.
206 Martin Brownbridge and Emmanuel Tumusiime-Mutebile
© The Authors 2007. Journal compilation © 2007 Overseas Development Institute. Development Policy Review 25 (2)
domestic interest rates, with the former being the product of the average foreign-currency interest rate and the average nominal exchange-rate depreciation. Because there is considerable annual volatility in some of the variables needed to estimate equation (3), we use the average values for these variables recorded over the eight-year period 1997/8-2004/5.17 We make the assumption that all seignorage revenue is used by the Central Bank to fund the accumulation of foreign reserves and so is not available to finance the government deficit. Finally, for the debt/GDP ratio which should be stabilised, we use the 2000 level of 65% of GDP. This is admittedly somewhat arbitrary but can be defended on the grounds that Uganda’s external debt was deemed sustainable in 2000, once it had become eligible for Enhanced HIPC debt relief, while the domestic debt was still at a very modest level.
The level of primary deficit which was consistent with a stable debt/GDP ratio was 1.5% of GDP, given the average values of nominal GDP growth rates, exchange-rate depreciation and interest rates which prevailed during 1997/8 to 2004/5.18 Up until 1998/9, the primary deficit was, on average, in line with this, but the primary deficit increased sharply in the following four years, averaging 2.8% of GDP and peaking at 3.9% of GDP in 2001/2 (see Table 1). Hence, during the latter period, the primary fiscal deficit was too high to prevent the debt/GDP ratio from rising.
In 2003/4 and 2004/5 the primary balance improved markedly, with a surplus averaging 0.7% of GDP recorded, as a result of two developments: first, the tightening of the government’s fiscal position, with a scaling back of the overall deficit before grants, and, secondly, a shift in the composition of aid disbursements from concessional loans to grants. As a consequence, the deterioration in Uganda’s debt indicators which had taken place between 2000 and 2003 was halted. The growth in the nominal stock of external PPG debt slowed during 2003/4 and 2004/5 as new external borrowing was reduced. In addition, the recovery of export earnings cut the NPV of external debt to export ratio sharply.19 Finally, the growth of domestic debt decelerated, because the reduction in the fiscal deficit before grants enabled the Bank of Uganda to reduce the net issuance of Treasury Bills and Bonds.
4.2 Fiscal vulnerability Conventional fiscal sustainability analysis of the type utilised above may prove too sanguine for economies which are subject to a high degree of volatility, because the sustainability of the fiscal position depends not only on its compatibility with average values of key fiscal and macroeconomic variables, but also on the magnitude and probability of adverse shocks. The policy implications of this are twofold. First, lower
17. These are as follows: nominal GDP growth, 11.3%; nominal domestic interest rate, 14.4%; nominal
external interest rate, 1.3%; nominal exchange-rate depreciation, 6.8%. The share of external debt in total debt averages 91%.
18. This is similar to the results of Fedelino and Kudina (2003) who estimate primary fiscal deficits consistent with constant gross debt/GDP ratios for several HIPCs. For Uganda, they estimate that the 10-year average primary deficit should be 1.6% of GDP.
19. Uganda will benefit from further debt relief under the Multilateral Debt Relief Initiative (MDRI), the full provision of which will dramatically cut the NPV of external debt to exports, to a projected 51% in 2007 (IMF, 2006).
Aid and Fiscal Deficits: Lessons from Uganda 207
© The Authors 2007. Journal compilation © 2007 Overseas Development Institute. Development Policy Review 25 (2)
primary deficits (or higher surpluses) and/or lower debt ratios than would be implied by conventional sustainability analysis are required to ensure fiscal sustainability in economies subject to fiscal shocks (Alvarado et al., 2004; Burnside, 2004; Mora 2004). Secondly, medium-term fiscal planning should aim to reduce the vulnerability of the budget to fiscal shocks. Key questions for policy-makers are: what are the most likely sources of fiscal shocks? how vulnerable is the budget to such shocks? and how can this vulnerability be reduced?
One of the most important sources of fiscal vulnerability in the Uganda budget is its excessive reliance on donor aid, because the government has no direct control over aid disbursements and because they are inherently volatile. In the early 2000s, aid contributed an average of about 50% to total budget resources (defined as gross aid disbursements plus domestic revenues), an increase of about 5 percentage points over the average level in the second half of the 1990s. As will be seen below, although this does not appear to be a very steep increase in aid dependence, its impact on fiscal vulnerability is greater because of the structure of the budget and its lack of flexibility.
Fiscal vulnerability from aid dependence is exacerbated for two reasons. First, expenditure increases, once implemented, are very difficult to reverse, especially if they involve increases in the public payroll or statutory expenditures: it is far easier to increase public spending than to reduce it. Consequently, to avoid risking a fiscal crisis in the future, a permanent rise in expenditure must be matched with a permanent increase in budget resources, but this can only be guaranteed if the increased budget resources comprise domestic revenues and not donor aid.
Secondly, donor aid, and especially budget support, is both volatile and unpredictable in aid-dependent countries. Bulir and Hamann (2003) examined the volatility of aid flows in a sample of 72 developing countries, finding that aid was more volatile than fiscal revenues (expressed as a percentage of GDP), and that the relative volatility of aid compared with that of revenues is higher in the more aid-dependent countries. They also found a systematic tendency for aid commitments from donors to exceed aid disbursements, and that, in an econometric test of the value of aid commitments as a forecast of disbursements, the commitments had no statistically significant predictive value in most countries in the sample, and especially in poorer and highly aid-dependent countries. In countries with IMF programmes, disbursements of programme aid (for example, budget support) were on average more than 30% less than the projections in the programmes, and even those countries with no interruptions to their programmes (i.e. their IMF programmes were ‘on track’) received on average 25% less programme aid than had been projected.
Aid is more volatile than domestic revenues in Uganda. Disbursements of budget support fell short of the budgeted amount by 54% in 1999/2000, by 30% in 2000/1, by 38% in 2001/2 and by 10% in 2003/4, and exceeded the budgeted amount by 2% in 2002/3 (Atingi-Ego, 2006: 356). Although domestic revenues have often fallen short of programmed targets, the shortfalls have been relatively limited: the largest shortfall in the eight years from 1997/8 to 2004/5 was 8.9% of budgeted revenues, while no other shortfall was larger than 4%. Even more pertinent, however, is the fact that the government can exert some control over domestic revenues, in that it can increase taxes if additional revenue is needed, whereas decisions to disburse donor aid are taken ultimately by donors, not by the government.
208 Martin Brownbridge and Emmanuel Tumusiime-Mutebile
© The Authors 2007. Journal compilation © 2007 Overseas Development Institute. Development Policy Review 25 (2)
The fiscal vulnerability arising from short-term volatility in budget-support disbursements can be mitigated by using foreign-exchange reserves as a buffer (Eifert and Gelb, 2005). Foreign reserves are used for this purpose in Uganda. Also, following the large shortfalls in the early 2000s, the MFPED began in 2002/3 to make more prudent projections of budget support for the purposes of budget planning, by applying a discount factor to donor pledges, thereby reducing the projected budget-resource envelope. The key problem for fiscal vulnerability is not short-term volatility, but the danger that the large increase in aid flows to Uganda which occurred after 1998/9 will not prove sustainable: i.e. they will not represent a permanent budget resource. Foreign reserves could not be used as a buffer against a permanently lower level of budget-support inflows. Future donor aid disbursements may not actually fall, but the heavy reliance on aid to fund the budget makes the fiscal position vulnerable to events which are outside the government’s control.
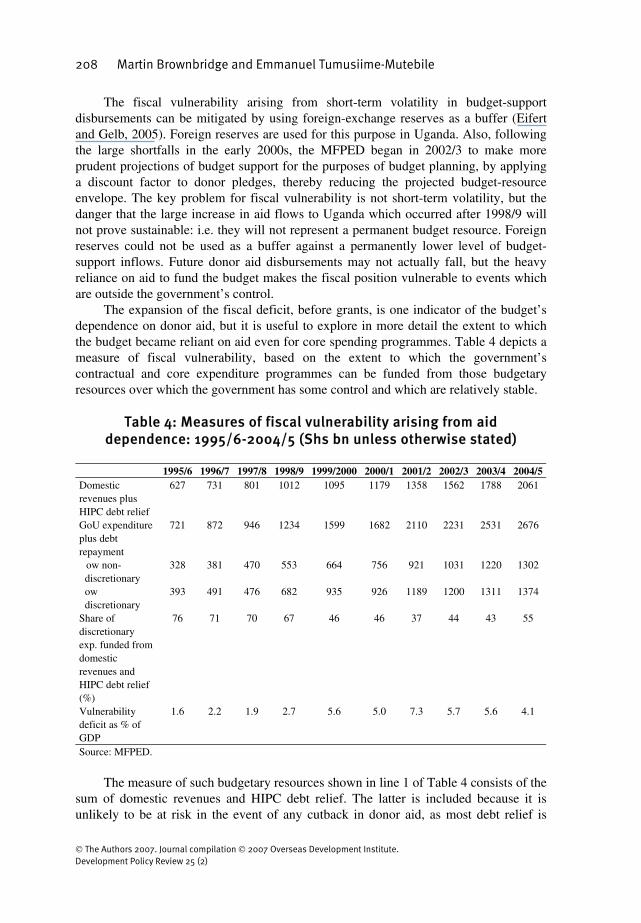
The expansion of the fiscal deficit, before grants, is one indicator of the budget’s dependence on donor aid, but it is useful to explore in more detail the extent to which the budget became reliant on aid even for core spending programmes. Table 4 depicts a measure of fiscal vulnerability, based on the extent to which the government’s contractual and core expenditure programmes can be funded from those budgetary resources over which the government has some control and which are relatively stable.
Table 4: Measures of fiscal vulnerability arising from aid
dependence: 1995/6-2004/5 (Shs bn unless otherwise stated) 1995/6 1996/7 1997/8 1998/9 1999/2000 2000/1 2001/2 2002/3 2003/4 2004/5 Domestic revenues plus HIPC debt relief
627 731 801 1012 1095 1179 1358 1562 1788 2061
GoU expenditure plus debt repayment
721 872 946 1234 1599 1682 2110 2231 2531 2676
ow non-discretionary ow discretionary
328
393
381
491
470
476
553
682
664
935
756
926
921
1189
1031
1200
1220
1311
1302
1374
Share of discretionary exp. funded from domestic revenues and HIPC debt relief (%)
76 71 70 67 46 46 37 44 43 55
Vulnerability deficit as % of GDP
1.6 2.2 1.9 2.7 5.6 5.0 7.3 5.7 5.6 4.1
Source: MFPED.
The measure of such budgetary resources shown in line 1 of Table 4 consists of the
sum of domestic revenues and HIPC debt relief. The latter is included because it is unlikely to be at risk in the event of any cutback in donor aid, as most debt relief is
Aid and Fiscal Deficits: Lessons from Uganda 209
© The Authors 2007. Journal compilation © 2007 Overseas Development Institute. Development Policy Review 25 (2)
guaranteed under contractual debt relief agreements with creditors, hence it can be regarded as a stable and predictable budget resource.
On the expenditure side (line 2 of Table 4), we include all of the GoU budget but not donor-funded projects, on the grounds that cutbacks in donor project aid affect only the specific projects financed by this form of aid, and so would be much less disruptive to the budget than cutbacks in budget support which help to fund the core expenditure programmes in the GoU budget, including most of the wage bill, the operational and maintenance costs of line ministries and local authorities, and all of the statutory expenditures. We also include the government’s contractual external debt-repayment obligations, but not repayments of domestic debt, because the latter consists of short- and medium-term securities which we assume can be rolled over at the weekly securities auctions.
The vulnerability deficit, shown in the bottom line in Table 4, is the difference between the revenues and expenditures defined above. A deficit of this nature, in the event of shortfalls in donor budget support, would have to be met by cutting discretionary expenditures within core budget programmes, or financed by borrowing from the domestic financial system. As a percentage of GDP, the vulnerability deficit rose from around 2% in the mid to late 1990s to a high of 7.3% in 2001/2. The increase of over 5 percentage points of GDP is of a similar magnitude to the increase in the overall deficit excluding grants and the GoU deficit, because these deficits have a common cause: the expansion of GoU expenditure funded from increased budget support and, to a lesser extent, domestic borrowing.
To measure the potential severity of budget cuts arising from a loss of budget support, Table 4 also disaggregates the core budget expenditures into those which are discretionary and those which are non-discretionary. The latter include all statutory expenditures plus the wage bill. The wage bill is effectively non-discretionary, because of the political constraints of cutting the public-service payroll and also because this would require expenditure on redundancy payments, so that the potential for making significant savings on the wage bill is limited, at least in the short term. Non-discretionary expenditures have first call on budget resources in the event of resource shortfalls, hence the burden of any shortfalls is inevitably borne by the discretionary expenditures. Line 5 of Table 4 shows the extent to which discretionary expenditures could be met from domestic revenues plus HIPC debt relief, assuming that all non-discretionary expenditures are fully funded. By 2001/2, when the fiscal deficit before grants reached its peak, little more than a third of the discretionary expenditures in the GoU budget could be funded from domestic revenues and HIPC debt relief: the fall from 70% in 1997/8 illustrates the extent to which fiscal vulnerability had intensified. Consequently, in the event of a non-temporary shortfall in budget support, the government would have faced two unpalatable options: to make very deep cuts in discretionary expenditures which would severely impede the delivery of public services, or to finance the deficit by domestic borrowing, which, given the magnitude of the

210 Martin Brownbridge and Emmanuel Tumusiime-Mutebile
© The Authors 2007. Journal compilation © 2007 Overseas Development Institute. Development Policy Review 25 (2)
deficit, would have had serious consequences for macroeconomic stability and the private sector’s access to credit.20
One of the motivations for the fiscal consolidation begun in 2002/3 was to alleviate the vulnerability of the budget to cuts in aid. By cutting the fiscal deficit before grants, the share of discretionary expenditures which could be funded by domestic revenues and HIPC debt relief was pushed back up to 55% by 2004/5, while the vulnerability deficit was brought down to 4.1% of GDP.
5 Conclusion Policy-makers need to balance multiple objectives in an uncertain world. For fiscal policy, major objectives are the provision of essential public services, the compatibility of the fiscal stance with macroeconomic stability and economic growth, and avoiding an unsustainable fiscal position which could lead to a fiscal crisis. Fiscal policy must be guided by medium- to long-term considerations, because budgetary decisions taken today cannot be readily reversed and will have consequences for many years to come (Heller, 2003). Once implemented, expenditure increases are very difficult to scale back, especially if they comprise salaries and statutory expenditures. In a volatile economic environment, prudent fiscal policy demands that the budget retain some flexibility to adjust to fiscal shocks, one of the implications of which is that policy-makers adopt a relatively cautious approach to reliance on budgetary resources which are less certain over the medium to long term.
The increase in aid to Uganda offered policy-makers the opportunity to accelerate the expansion of public services. As a consequence, the fiscal deficit before grants almost doubled between 1997/8 and 2001/2 to over 12% of GDP. A crucial lesson of Uganda’s experience is that, even if the government’s domestic borrowing requirement remains low, a large aid-funded fiscal deficit can destabilise domestic financial markets because it entails the creation of liquidity. To control the money supply in the face of a steep rise in liquidity arising from fiscal operations, the Central Bank had to step up the issuance of government securities to the domestic financial market. Consequently, private-sector credit stagnated as the government competed increasingly with private-sector borrowers for scarce credit in the domestic financial system. The only alternative sterilisation instrument which the Central Bank could have used was larger sales of foreign exchange, but this would have risked destabilising the exchange rate.
It is difficult to draw definitive conclusions about the impact of the widening fiscal deficit on incentives for exporters, because the REER was also affected by a steep fall in the external terms of trade during this period. However, it is not prudent to disregard the potentially negative impact of a large aid-funded fiscal deficit on the country’s long-term objective of export-led growth, because price incentives are important for exporters, especially non-traditional exporters, even if non-price-policy measures are also required to support the sector, and because there is likely to be, at least, a short-run appreciation of the REER which could do irreversible damage to exporters.
20. If a shortfall in budget support were purely temporary, as would occur if disbursements were simply
delayed, the foreign-exchange reserves of the Bank of Uganda could be used to bridge the shortfall, but this obviously could not be sustained without depleting the reserves.
Aid and Fiscal Deficits: Lessons from Uganda 211
© The Authors 2007. Journal compilation © 2007 Overseas Development Institute. Development Policy Review 25 (2)
A second important lesson to be drawn from Uganda’s experience is that a larger fiscal deficit has implications for fiscal sustainability, even if that deficit is mainly funded by aid. Fiscal sustainability in Uganda was undermined by the widening of the fiscal deficit for two reasons. First, there was a large increase in government debt, because almost 40% of aid inflows comprised loans, albeit on concessional terms, and also because of the government securities which were issued to sterilise the liquidity created by the fiscal deficit. Secondly, the core government budget became increasingly dependent on donor aid, the consequences of which for fiscal vulnerability were exacerbated because of the inflexibility of large parts of the budget. As a result, a major cutback in aid would either require severe cuts to be made in discretionary expenditures or force the government to resort to domestic borrowing.
Uganda’s medium-term strategy of fiscal consolidation, which began in 2002/3, was motivated by these lessons. As noted at the start of this conclusion, policy decisions are inevitably made in the face of uncertainty: for example, it is very difficult to predict precisely how the future stance of fiscal policy will affect exports and economic growth, or to predict the nature and magnitude of fiscal shocks. Given such uncertainty, it is important to avoid locking the budget into a pattern of expenditures, deficits and aid-dependence which risks undermining macroeconomic objectives and/or fiscal sustainability, but can only be unwound by incurring painful costs. The fiscal strategy entails a gradual scaling back of the fiscal deficit before grants to 6.5% of GDP by 2008/9 (MFPED, 2004). More than half of the targeted reduction in the deficit had already been achieved by 2004/5, with the fiscal deficit before grants cut back by 3.5 percentage points to 8.8% of GDP. This has already yielded benefits for the macroeconomy, with a reduction in issues of government securities allowing space for a recovery of private-sector credit. It has also enhanced fiscal sustainability by slowing the growth in government debt and alleviating the dependence on donor aid to fund core budget expenditures.
The pledges made by the donor community to boost aid to sub-Saharan Africa have widened the options facing policy-makers in the region: there are now genuine policy choices to be made as to how much to increase public spending and the associated fiscal deficit before grants, where additional aid is available to fund this. In countries where public services are underfunded, there will be strong pressures to use all of the promised increase in aid to expand public expenditures, but Uganda’s experience shows that this is not necessarily the optimal choice for policy-makers. Decisions regarding the size of the fiscal deficit should take account of its macroeconomic implications, together with the long-run consequences for government borrowing and the fiscal vulnerability arising from excessive aid dependence.
first submitted May 2006 final revision accepted September 2006
References Adam, Christopher (2005) ‘Exogenous Inflows and Real Exchange Rates: Theoretical
Quirk or Empirical Reality?’. Paper presented at the IMF Seminar on Foreign Aid and Macroeconomic Management, Maputo, March.
212 Martin Brownbridge and Emmanuel Tumusiime-Mutebile
© The Authors 2007. Journal compilation © 2007 Overseas Development Institute. Development Policy Review 25 (2)
Adam, Christopher S. and Bevan, David L. (2003) Aid, Public Expenditure and Dutch Disease. Working Paper No. 184. Oxford: Centre for the Study of African Economies.
Alvarado, Carlos Diaz, Izquierdo, Alejandro and Panizza, Ugo (2004) Fiscal Sustainability in Emerging Market Countries with an Application to Ecuador. Working Paper No. 511. Washington, DC: Inter-American Development Bank.
Atingi-Ego, Michael (2006) ‘Budget Support, Aid Dependency, and Dutch Disease: The Case of Uganda’, in Stefan Koeberle, Zoran Stavreski and Jan Walliser (eds), Budget Support as More Effective Aid: Recent Experiences and Emerging Lessons. Washington, DC: World Bank.
Atingi-Ego, Michael and Sebudde, Rachel Kaggwa (2000) ‘Uganda’s Equilibrium Real Exchange Rate and Its Implications for Non-Traditional Export Performance’, Staff Papers 2 (1), Bank of Uganda, pp. 1-43.
Blejer, Mario and Cheasty, Adrienne (1991) ‘The Measurement of Fiscal Deficits’, Journal of Economic Literature XX1X (December): 1644-88.
Bulir, Ales and Hamann, A. Javier (2003) ‘Aid Volatility: An Empirical Assessment’, IMF Staff Papers 50 (1): 64-89.
Burnside, Craig (2004) ‘Assessing New Approaches to Fiscal Sustainability Analysis’. Paper written for the World Bank Latin American and Caribbean Department’s Report on Debt Sustainability Analysis. Durham, NC: Duke University (mimeo).
Cuddington, John T. (1997) Analysing the Sustainability of Fiscal Deficits in Developing Countries. Working Paper No. 1784. Washington, DC: World Bank.
Economic Policy Research Centre (2002) ‘Costing the Millennium Development Goals: Uganda Country Study’. Kampala: Makerere University (mimeo).
Eifert, Benn and Gelb, Alan (2005) Improving the Dynamics of Aid: Towards More Predictable Budget Support. Policy Research Working Paper No. 3732. Washington, DC: World Bank.
Elbadawi, Ibrahim A. (1999) ‘External Aid: Help or Hindrance to Export Orientation in Africa?’, Journal of African Economies 8 (4): 578-616.
Feeny, Simon and McGillivray, Mark (2003) ‘Aid and Public Sector Borrowing in Developing Countries’, Journal of International Development 15 (8): 989-98.
Fedelino, Annalisa and Kudina, Alina (2003) Fiscal Sustainability in African HIPC Countries: A Policy Dilemma? Working Paper WP/03/187. Washington, DC: International Monetary Fund.
Filmer, Deon and Pritchett, Lant (1997) Child Mortality and Public Spending on Health: How Much Does Money Matter? Policy Research Working Paper No. 1864. Washington, DC: World Bank.
Foster, Mick and Killick, Tony (2006) What Would Doubling Aid do for Macroeconomic Management in Africa? Working Paper No. 264. London: Overseas Development Institute.
Gupta, Sanjeev, Powell, Robert and Yang, Yongzheng (2005) The Macroeconomic Challenges of Scaling up Aid to Africa. Working Paper WP/05/179. Washington, DC: International Monetary Fund.
Hausmann, Ricardo, Pritchett, Lant and Rodrik, Dani (2004) Growth Accelerations. Working Paper No. 10566. Cambridge, MA: National Bureau of Economic Research.
Aid and Fiscal Deficits: Lessons from Uganda 213
© The Authors 2007. Journal compilation © 2007 Overseas Development Institute. Development Policy Review 25 (2)
Heller, Peter S. (2005) Pity the Finance Minister: Issues in Managing a Substantial Scaling Up of Aid Flows. Working Paper WP/05/180. Washington, DC: International Monetary Fund.
Heller, Peter S. (2003) Who Will Pay? Coping with Aging Societies, Climate Change and Other Long Term Fiscal Challenges. Washington, DC: International Monetary Fund.
Henstridge, Mark and Kasekende, Louis (2001) ‘Exchange Reforms, Stabilisation and Fiscal Management’ in Ritva Reinikka and Paul Collier (eds), Uganda’s Recovery: the Role of Farms, Firms and Government. Kampala: Fountain Publishers.
International Monetary Fund (2006) Uganda: Sixth Review Under the Three Year Arrangement Under the Poverty Reduction and Growth Facility, Request for Waiver of Performance Criteria and Request for Policy Support Instrument. IMF Country Report No. 06/43. Washington, DC: IMF.
Ize, Alain (1991) ‘Measurement of Fiscal Performance in IMF-Supported Programs: Some Methodological Issues’ in Mario I. Blejer and Adrienne Cheasty (eds), How to Measure the Fiscal Deficit. Washington, DC: International Monetary Fund.
Kitabire, Damoni (2005) ‘Implications of Substantially Increased Development Aid: The Case of Uganda’, IDS Bulletin 36 (3): 40-4.
Ministry of Finance, Planning and Economic Development (2004) Long-Term Expenditure Framework. Kampala: MFPED.
Millennium Project (2003) ‘Millennium Project MDG Country Case Studies: Methodology and Very Preliminary Results’. New York: UN Millennium Project (mimeo).
Mora, Humberto (2004) ‘Assessing Fiscal Sustainability with Alternative Methodologies’. Paper written for the World Bank Latin America and Caribbean Regional Studies Project on Debt Sustainability.
Nkusu, Mwanza (2004) Financing Uganda’s Poverty Reduction Strategy: Is Aid Causing More Pain than Gain? Working Paper WP/04/170. Washington, DC: International Monetary Fund.
Ouattara, B. (2004) Does Aid Promote Fiscal Indiscipline? Evidence from Dynamic Panel Model. Discussion Paper No. 0407. Manchester: University of Manchester Press.
Rajan, Raghuram and Subramanian, Arvind (2005) What Undermines Aid’s Impact on Growth? Working Paper No. 11657. Cambridge, MA: National Bureau of Economic Research.