agricultural water nonpoint pollution control under uncertainty and climate variability
TRANSCRIPT
ANALYSIS
Agricultural water nonpoint pollution control under uncertainty
and climate variability
Anne Lacroixa,*, Nicolas Beaudoinb, David Makowskic
aUMR GAEL National Institute for Agricultural Research-Pierre Mendes France University, Box 47, 38040 Grenoble Cedex 9, FrancebNational Institute for Agricultural Research, Agronomy Unit Laon-Peronne, rue Ferdinand Christ, 02007 Laon Cedex, France
cNational Institute for Agricultural Research, Agronomy Unit INRA-INA PG, 78850 Thivernal-Grignon, France
Received 10 January 2003; received in revised form 3 December 2003; accepted 4 November 2004
Available online 1 February 2005
Abstract
The objective of this paper is to study the probabilistic cost-effectiveness of the farm management practices supported by the
European Union for reducing nitrate pollution. Our method consists in using a bio-physical model to evaluate the environmental
and economic impacts of various scenarios characterized by a set of farm practices. The cost-effectiveness of each scenario is
calculated for a catchment area located in the northeast of France, for various climatic years and under different assumptions of
crop prices. The results show that it is not realistic to obtain a rapid reduction of nitrate concentrations by implementing the
scenarios tested. In the long run and irrespective of the economic context simulated, the optimum scenario in the case studied is
one that combines integrated fertilization with the introduction of catch crops. Our findings thus highlight the effectiveness of
catch crops that are able to reduce variability of nitrate concentration and thus significantly reduce the risk of exceeding
environmental constraints. They therefore provide some recommendations for policy-makers.
D 2004 Elsevier B.V. All rights reserved.
Keywords: Stochastic nitrate pollution; Interdisciplinary approach; Cost-effectiveness analysis; Cropping systems; Environmental policies;
Environmental constraints
1. Introduction
For several years, scientists and environmental
agencies have reported an increase in the water nitrate
concentration, especially in Europe and the USA. It
has been established that this pollution is due, for the
most part, to agricultural activities especially to
intensive farm management practices (European
Environment Agency, 2001; US Geological Survey,
1999). Although the effect of high nitrate concen-
tration on human health is still a controversial issue
(Addiscott et al., 1991; Apfelbaum, 1998), several
environmental policies have been defined in order to
control agricultural nitrate pollution. Controlling
nitrate pollution is usually considered as the first step
towards a wider control of agricultural water pollution
0921-8009/$ - see front matter D 2004 Elsevier B.V. All rights reserved.
doi:10.1016/j.ecolecon.2004.11.001
* Corresponding author. Tel.: +33 4 76 82 54 47; fax: +33 4 76 82
54 55.
E-mail address: [email protected] (A. Lacroix).
Ecological Economics 53 (2005) 115–127
www.elsevier.com/locate/ecolecon

in the sense that a better management of the nitrogen
cycle will initiate an essential process of technical and
organizational learning-by-doing to control phospho-
rus and pesticide pollutions as well. These policies
rely mainly on legal instruments (command and
control approach), such as limitation on the authorized
level of pollutants or the designation of protected
areas, and rarely use economic instruments (incentive-
based approach). Some economic incentives have
nevertheless been implemented in order to encourage
farmers to improve their practices. These schemes are
voluntary and involve farmers entering into manage-
ment agreements in return for financial compensation.
Contractual obligations regulate such production
practices as the dbest management practicesT (Clean
Water Act Amendments, 1987) in the USA, the dagri-
environmental measuresT (Council Regulation No.
2078/92/EEC) in Europe and the dNitrate Sensitive
Areas schemeT in the United Kingdom (Szoege et al.,
1996). Similar environmental policies are likely to be
more important in the near future, especially in
European Union countries. Economic and environ-
mental assessment of these policies is therefore of
prime importance.
Contractual obligations are based on agronomic
recommendations but their efficiency conditions have
not been precisely assessed. The uncertainty and
climate variability of their economic and environ-
mental impacts have not been significantly explored.
Can these standard practices have a significant
environmental impact every year, in any agronomic
and hydrologic system? Can they minimize the
economic burden of pollution control in any context?
This paper considers these questions. The aim is to
provide useful assessments for policy makers in order
to determine efficient management practices for
controlling agricultural pollution.
Due to the complexity of interactions between
economic, agronomic and hydrologic systems, to the
stochastic nature of some factors (e.g. climate, soil,
topographic conditions), and to the lack of knowl-
edge, the consequences of management practices
recommended by state authorities cannot be accu-
rately predicted. Uncertainty is particularly high in the
case of nitrate pollution because many factors are
involved. For instance, climate and pests affect crop
growth and nitrogen use efficiency, temperature
influences the nitrogen cycle in the soil, especially
nitrogen mineralization, and the nitrate runoff depends
on rainfall and soil characteristics. Mc Sweeny and
Shortle (1990) have developed the cost-effectiveness
approach in order to take into account uncertainties in
both the efficiency and the cost of the proposed
management practices. In their approach, known as
the probabilistic cost-effectiveness approach, the
uncertainty in the runoff rate value is described by
means of a random variable. Bystrom et al. (2000)
used a similar approach to study the interest of
wetlands for controlling nitrate pollution. The main
limitation of these studies is that uncertainty is
described very roughly by means of very simple
probability functions. In these functions, uncertainty
due to climate variability and uncertainty due to lack
of knowledge are not distinguished. Moreover, the
level of uncertainty (i.e. the variances of the random
variables) is fixed arbitrarily.
An alternative solution would be to use bio-
physical models. Such models can serve to predict
crop yield, crop quality, water and nitrogen flows in
relation to field characteristics and management
practices (Wagenet and Hutson, 1996). Agronomists
and economists have already explored this way
(Ribaudo et al., 2001; Vatn et al., 1999; Weaver et
al., 1996). However, they used a deterministic
function for analyzing water-related environmental
impacts of agriculture and did not study the influence
of climate variability on the results of a pollution
control policy. Most of the bio-physical models
include climatic variables. Since they are linked with
economic models, implemented at the catchment
scale, such models can be interesting for studying
the between-year variability of the cost-effectiveness
of various farm management practices. Another
advantage of bio-physical models is that, in some
cases, the errors of the model have been extensively
studied (Gorres and Gold, 1996). It is then possible to
define realistic probability functions for describing
model errors on the basis of large data sets. Such
probability functions give a realistic representation of
uncertainty due to the lack of knowledge.
In this paper we use a bio-physical model to assess
the probabilistic cost-effectiveness of the farm man-
agement practices supported by the European Union
for reducing nitrate pollution. Six nutrient manage-
ment scenarios are examined. Each scenario is
characterized by a set of farm practices defined for
A. Lacroix et al. / Ecological Economics 53 (2005) 115–127116
controlling nitrate pollution. The cost-effectiveness of
each scenario is calculated for various climatic years
under different assumptions of crop prices and for a
catchment area located in the northeast of France. The
methodological framework is described in detail in
Section 2. The case study based on empirical data is
presented in Section 3. The cost-effectiveness of the
scenarios is analysed in Section 4. In Section 5, the
implications of our findings are discussed for agri-
environmental policy design.
2. The model
A model is defined here to evaluate the cost-
effectiveness of a series of scenarios for reducing the
nitrate concentration in drained water. The scenarios
are evaluated for a catchment area covering several
fields and for several years. Our approach consists of
four steps. First, the farm practices associated with the
different scenarios are determined for each field of the
catchment area and for each year. Second, the
consequences of the different farm practices on yield,
grain quality and water nitrate content are simulated
for each field and each year by means of crop models.
Third, costs induced by the different scenarios are
calculated at the catchment level for each year on the
basis of crop model outputs. Finally, scenarios
inducing low monetary costs for farmers and satisfy-
ing constraints on water nitrate content are identified.
Details are given below.
2.1. Costs of scenarios
We show here how to calculate the costs of I
scenarios applied during J years in a catchment area
covering K fields. We use vijk to denote a vector
whose elements describe the farm practices (amount
of fertilizer applied, nature of the crop, date of sowing
of the catch crop, etc.) for year j and field k when
scenario i is applied, i=1,. . .,I, j=1,. . .,J, k=1,. . .,K.
As farm practices are year and field-dependent, the
practices associated with a given scenario vary
between years and between fields. For each value of
vijk we calculate a yield value denoted as yijk and,
when the crop is a cereal, a grain protein content value
denoted as pijk. We consider that yijk and pijk are
calculated by means of crop models. The advantage of
using crop models is that these models take into
account the soil characteristics of the different fields,
the impact of soil nitrogen supply on the nitrogen
plant uptake, the climate and the farm practices.
Consequently, crop models are likely to give realistic
values of yield and grain protein content. However,
errors associated with crop model predictions can be
substantial due to uncertainty in equations, parameter
values and input variables. This leads us to define
random variables for describing crop model errors.
We denote eijky and eijk
p as the random error terms
associated with the values of yijk and pijk, respectively.
The farmer’s income per unit of area obtained for year
j and field k when scenario i is applied is denoted as
mijk and is calculated from crop characteristics (yield,
grain protein content) and from the farm practices by
using a function f:
mijk ¼ f mijk ; yijk þ eyijk ; pijk þ e
pijk
��
ð1Þ
Various expressions of f that differ on grain price
values can be considered (see the case study). As yield
and grain protein content are defined as stochastic
variables, mijk is also stochastic. Let pij denote the
income at the catchment area level obtained for
scenario i and year j. pij is defined by
pij ¼X
K
k¼1
mijkxk ð2Þ
where xk is the area of the kth field. Cost values are
calculated relatively to a baseline scenario. Thus, the
cost Cij obtained for scenario i and year j is defined
by
Cij ¼ p1j � pij ¼X
K
k¼1
m1jkxk �X
K
k¼1
mijkxk ð3Þ
where m1jk and p1j are the incomes obtained for year
j, for field k and for the catchment area, respectively,
when the baseline scenario (i=1) is applied. The cost
averaged over years for scenario i is then:
Ci ¼1
J
X
J
j¼1
Cij ð4Þ
As farmers’ incomes are defined as stochastic
variables, Cij and C�i are also stochastic.
A. Lacroix et al. / Ecological Economics 53 (2005) 115–127 117
2.2. Nitrate concentration in drained water
We denote Eij as the nitrate concentration in
drained water at the catchment level for year j when
scenario i is applied. Eij is predicted in relation to
climate characteristics and farm practices by means of
crop models.
Eij ¼
PKk¼1 lijk þ e
lijk
� �
xkPK
k¼1 dijkxkð5Þ
where lijk and dijk are respectively the nitrate leaching
and the depth of drained water for year j and field k
when scenario i is applied. Here also, model predic-
tions are expected to be realistic but not exactly equal
to true nitrate leaching values. Errors of prediction of
lijk are described by a random term noted eijkl . Error of
prediction of the drainage amount is neglected.
The nitrate concentration averaged over years is
defined by
E i ¼1
J
X
J
j¼1
Eij ð6Þ
As the nitrate leaching values associated with the
different fields are stochastic, the values of Eij and of
E�i are also stochastic.
2.3. Optimal scenario
An optimal scenario is defined here as a scenario
that minimizes E(C�i) (i.e. the expected cost value)
subject to a constraint on the nitrate concentration of
the drained water at the catchment level. Because of
between-year variability and of uncertainty in crop
model predictions, various constraints on nitrate
concentration can be defined.
First, constraints can be defined for limiting the
nitrate concentration averaged over years E�i. Such
constraints are relevant in a long-term perspective.
They therefore concern aquifers with a long water
residence time, i.e. groundwater. As shown above, E�i
is stochastic because of the crop model errors. Two
approaches can be considered to take into account
uncertainty in E�i. The first approach consists simply in
defining a constraint on the expected value of E�i:
E Ei
�
V50 mg l�1�
ð7Þ
where E(EU
i) is the expected value of EU
i. Constraint
(7) ensures that the expected nitrate concentration is
lower than the European Union limit for drinking
water (Council Directive 80/778/EEC). However, this
constraint does not take into account the risk due to
errors of prediction. In the second approach we
require that the environmental pollution constraint
be achieved with a certain probability:
P EiV50 mg l�1�
za�
ð8Þ
By specifying an acceptable probability level a, it
is possible to monitor the risk of violating pollution
constraint.
With constraints (7) and (8), the nitrate concen-
tration is not necessarily lower than 50 mg l�1 every
year. We now present two constraints concerning
annual nitrate concentrations that are relevant in the
short term, i.e. when the aim is to secure rapid
reductions in nitrate concentration. This temporal
scale would concern shallow water resources.
The first constraint considers the expected values
of the yearly nitrate concentrations:
E Eijjj�
V50 mg l�1; 8ja 1; . . . ; J½ :
�
ð9Þ
With constraint (9), the expected value of the
nitrate concentration is lower than 50 mg l�1 for each
of the J years. Like constraint (7), constraint (9) does
not take into account the risk due to crop model errors.
The next constraint requires that the environmental
pollution constraint be achieved with a certain
probability every year:
P EijV50 mg l�1jj� �
zc; 8ja 1; . . . ; J½ ð10Þ
Minimizing the expected value of the average cost
defined by Eq. (4) subject to one of the four
constraints (7), (8), (9), or (10) gives an optimal
scenario.
3. Illustration
To illustrate the framework presented above, we
consider the Bruyeres catchment area (Beaudoin et al.,
1999; Mary et al., 1997). This site is located in the
intensive cropping region of the Parisian Basin in the
northeast of France. It is of moderate size (145
cultivated ha) and its economic activity is exclusively
A. Lacroix et al. / Ecological Economics 53 (2005) 115–127118
agricultural. Crop intensification has been continuous
since the 1950s and increased by clearance of grass-
lands. The nitrate content of water has therefore
increased regularly by 1 mg/year since 1975,1 even
though best agricultural practices have been engaged
in since 1989.2
The unsaturated zone, with a thickness of 20–35 m,
is responsible for the slow response to changes in
agricultural practices at the outlet. The mean residence
time of water has been estimated at 20–25 years. To
assess the impacts of changes in agricultural practices
on water quality, simulations concerning the nitrate
concentration in drained water are needed.
3.1. Data
The catchment area covers 36 fields which differ
widely due to the variability of the underlying parent
material. Four main soil types are present: loam, sand,
marl and stones, and limestone. These soil character-
istics induce considerable variability of potential
yields that are modelled.
The climate is oceanic with a continental
influence. The study period covers 6 years: 1991–
1997. The averaged temperature and rainfall
recorded on the site for these years are close to
normal, in spite of a very high level of inter-annual
variability (Table 1). The simulations of annual
drainage3 show that the years 1992–1993 were close
to the mean recorded in 36 years; 1993–1994 was
almost the highest (35 rank); 1995–1996 was the
lowest. The study period is thus representative of the
36 years as regards the means and extreme values for
drainage volumes.
The crops and their rotations considered in this
work are the ones really practiced by farmers during
the 6 years (Table 2). Spring crops account for 41% of
the agricultural surface; consequently, bare land is
frequent during winter (33% of the surface has a 237-
day inter-cropping interval). But the area devoted to
spring crops varies with the year, ranging from 29% in
1996–1997 to 71% in 1994–1995.
3.2. Scenarios simulated
Six scenarios are considered. Four of them
simulate farm management practices that have been
suggested by the European Union with a view to
reducing agricultural nonpoint pollution. The other
two simulate agronomists’ recommendations. Main
characteristics of these scenarios are displayed in
Table 3.
The first scenario comes under the dcode of good
agricultural practiceT (Council Directive 91/676/CEE).
Table 1
Climatic characteristics: rainfall, air temperature and simulated
drainage
Period Rainfall
(mm year�1)
Temperature
(8C)
Simulated
drainage
(mm year�1)
1991–1992 672 9.8 97
1992–1993 599 9.5 217
1993–1994 939 10.0 409
1994–1995 788 10.7 364
1995–1996 575 9.2 40
1996–1997 680 9.6 177
1991–1997 Average 709 9.8 217
1961–1997 Average 695 9.7 226
1961–1997 Minimum 436 8.5 40
1961–1997 Maximum 939 11.0 420
Table 2
Type and frequency of crops grown in the Bruyeres catchment area
during the years 1991–1997 and mean sowing and harvest dates
Crop Frequency
(% area)
Sowing period Harvest
date
Winter rapeseed 6.1 20–31 August 20 July
Winter barley 12.3 20–30 September 15 July
Winter wheat 37.7 1–20 October 5 August
Spring barley 2.8 20–28 February 31 July
Spring peas 16.4 1–10 March 05 August
Sugar beet 17.8 20 March–10 April 25 October
Maize 1.5 20–30 April 31 October
Sunflower 3.8 25 April–5 May 5 October
Covered set aside 1.5
1 In 1975, the nitrate concentration of the water-catchment was
less than 25 mg NO3 l�1, in 2000 it was around of 60 mg l�1.
2 At this date, farmers agreed to change their cropping practices in
the frame of a voluntary agreement. They committed themselves to
(i) apply the recommended fertilization; (ii) to sow a catch crop
before any spring crop; and (iii) bury the crop residues that were
poor in nitrogen. Since 1996, this agreement has been supported by
Europe as an dagri-environmental measureT.
3 The drainage was calculated for a rotation winter wheat–winter
barley–sugarbeet–winter wheat–peas, in a soil with a PAW equal to
175 mm (Beaudoin et al., 1998).
A. Lacroix et al. / Ecological Economics 53 (2005) 115–127 119
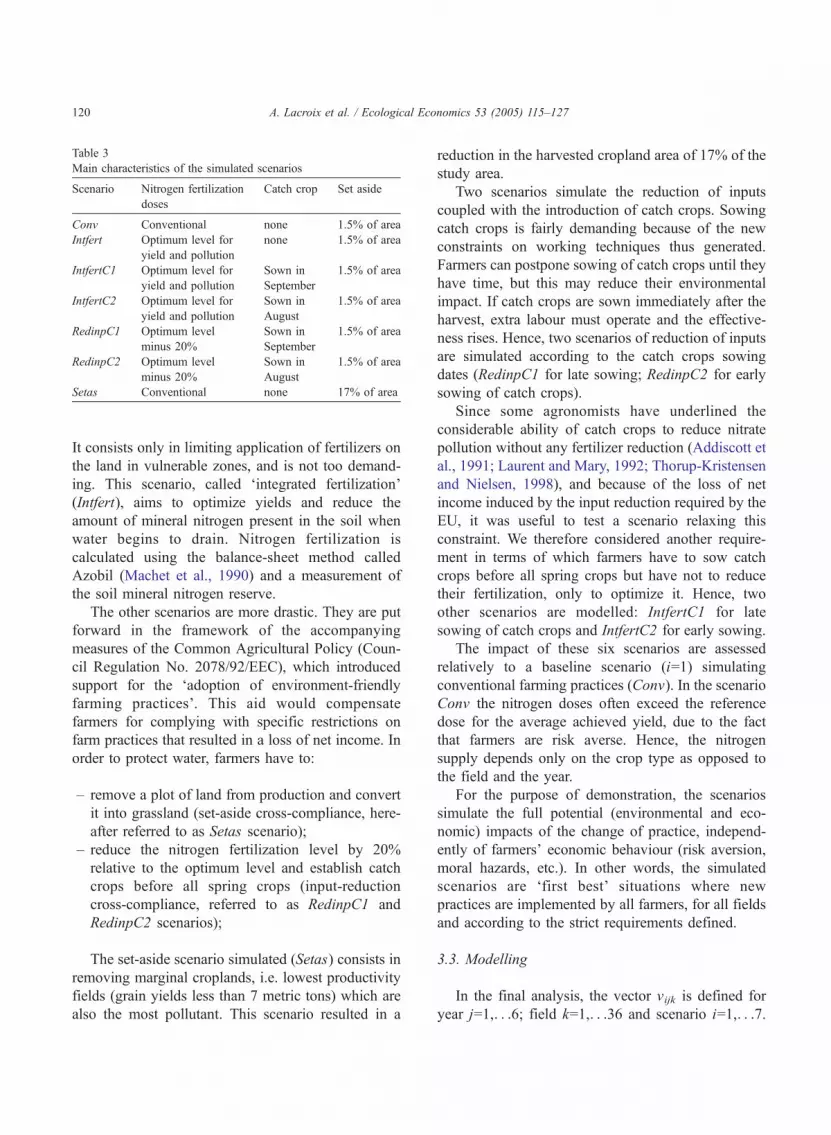
It consists only in limiting application of fertilizers on
the land in vulnerable zones, and is not too demand-
ing. This scenario, called dintegrated fertilizationT
(Intfert), aims to optimize yields and reduce the
amount of mineral nitrogen present in the soil when
water begins to drain. Nitrogen fertilization is
calculated using the balance-sheet method called
Azobil (Machet et al., 1990) and a measurement of
the soil mineral nitrogen reserve.
The other scenarios are more drastic. They are put
forward in the framework of the accompanying
measures of the Common Agricultural Policy (Coun-
cil Regulation No. 2078/92/EEC), which introduced
support for the dadoption of environment-friendly
farming practicesT. This aid would compensate
farmers for complying with specific restrictions on
farm practices that resulted in a loss of net income. In
order to protect water, farmers have to:
– remove a plot of land from production and convert
it into grassland (set-aside cross-compliance, here-
after referred to as Setas scenario);
– reduce the nitrogen fertilization level by 20%
relative to the optimum level and establish catch
crops before all spring crops (input-reduction
cross-compliance, referred to as RedinpC1 and
RedinpC2 scenarios);
The set-aside scenario simulated (Setas) consists in
removing marginal croplands, i.e. lowest productivity
fields (grain yields less than 7 metric tons) which are
also the most pollutant. This scenario resulted in a
reduction in the harvested cropland area of 17% of the
study area.
Two scenarios simulate the reduction of inputs
coupled with the introduction of catch crops. Sowing
catch crops is fairly demanding because of the new
constraints on working techniques thus generated.
Farmers can postpone sowing of catch crops until they
have time, but this may reduce their environmental
impact. If catch crops are sown immediately after the
harvest, extra labour must operate and the effective-
ness rises. Hence, two scenarios of reduction of inputs
are simulated according to the catch crops sowing
dates (RedinpC1 for late sowing; RedinpC2 for early
sowing of catch crops).
Since some agronomists have underlined the
considerable ability of catch crops to reduce nitrate
pollution without any fertilizer reduction (Addiscott et
al., 1991; Laurent and Mary, 1992; Thorup-Kristensen
and Nielsen, 1998), and because of the loss of net
income induced by the input reduction required by the
EU, it was useful to test a scenario relaxing this
constraint. We therefore considered another require-
ment in terms of which farmers have to sow catch
crops before all spring crops but have not to reduce
their fertilization, only to optimize it. Hence, two
other scenarios are modelled: IntfertC1 for late
sowing of catch crops and IntfertC2 for early sowing.
The impact of these six scenarios are assessed
relatively to a baseline scenario (i=1) simulating
conventional farming practices (Conv). In the scenario
Conv the nitrogen doses often exceed the reference
dose for the average achieved yield, due to the fact
that farmers are risk averse. Hence, the nitrogen
supply depends only on the crop type as opposed to
the field and the year.
For the purpose of demonstration, the scenarios
simulate the full potential (environmental and eco-
nomic) impacts of the change of practice, independ-
ently of farmers’ economic behaviour (risk aversion,
moral hazards, etc.). In other words, the simulated
scenarios are dfirst bestT situations where new
practices are implemented by all farmers, for all fields
and according to the strict requirements defined.
3.3. Modelling
In the final analysis, the vector vijk is defined for
year j=1,. . .6; field k=1,. . .36 and scenario i=1,. . .7.
Table 3
Main characteristics of the simulated scenarios
Scenario Nitrogen fertilization
doses
Catch crop Set aside
Conv Conventional none 1.5% of area
Intfert Optimum level for
yield and pollution
none 1.5% of area
IntfertC1 Optimum level for
yield and pollution
Sown in
September
1.5% of area
IntfertC2 Optimum level for
yield and pollution
Sown in
August
1.5% of area
RedinpC1 Optimum level
minus 20%
Sown in
September
1.5% of area
RedinpC2 Optimum level
minus 20%
Sown in
August
1.5% of area
Setas Conventional none 17% of area
A. Lacroix et al. / Ecological Economics 53 (2005) 115–127120
The modelled temporal scale is the two-crop succes-
sion (18 months); two crop models are run succes-
sively, for each value of vijk in order to achieve the
robustness of the simulations. First, values of yield
grain protein content and soil mineral nitrogen at
harvest are calculated by using the crop model
described by Beaudoin et al. (1998) and Makowski
et al. (1999). The input variables of this model are soil
characteristics, nature of preceding crops and of
current crops, and amounts of nitrogen fertilizer
applied. Second, values of drained water and nitrogen
leached from the autumn to the following spring are
calculated by means of the STICS model (Brisson et
al., 1998). The input variables of STICS are those of
the model of Makowski et al. (1999) and additional
input variables, namely following crop, presence or
absence of catch crop, daily climate variables (temper-
atures, rainfall, radiation), soil water content, sowing
date and dates of fertilizer application.
Parameter estimation and model evaluation were
performed in previous studies for the different crops
and catch crops cultivated in the Bruyeres catchment
area by means of experimental data (Brisson et al.,
1998; Beaudoin et al., 1998; Makowski et al., 1999;
2001). Model errors were described by defining
model parameters as random variables (Makowski et
al., 2001). Model parameters were supposed to be
normally distributed. Expected values, variances and
covariances of random parameters were estimated by
means of experimental databases from the Parisian
Basin (Beaudoin et al., 1998; Makowski et al., 2001).
The resulting probability distributions describe the
uncertainty on parameter values.
The selection of an optimal scenario requires the
calculations of E(C�i) and the evaluation of the
constraints (7)–(10) for all scenarios. A first approach
would be to derive the exact analytical expressions of
E(C�i) and of the constraints. This is not possible here
because our models are nonlinear and somewhat
complex. As a consequence, the true analytical
expression of the probability distributions of the error
terms eijky , eijk
p , and eijkl cannot be deduced from the
probability distributions of the parameters. Another
method would consist in converting the probabilistic
constraints (8)–(10) to their deterministic equivalents
(Hardaker et al., 1991; Kampas and White, 2003). The
idea is to approximate the true distribution of the
random variables by a probability distribution that can
easily be computed. Kampas and White (2003)
proposed three deterministic constraints that could
be used to approximate the probabilistic constraints
(8)–(10), but this approach is difficult to apply here.
Each of the three proposed deterministic constraints
has its own limitations. Some are appropriate when
the number of individual fields is high and when the
variables are unbounded. Here, the number of fields is
only equal to 36 and the nitrate emissions are always
positive. Other approximations give satisfactory
results when all the variables are independent (Kam-
pas and White, 2003). This is not a realistic
assumption for the nitrate emissions of the individual
fields. Another problem is that computation of the
proposed deterministic equivalents requires knowl-
edge of the variances of the random terms. Some of
these deterministic equivalents also take into account
the covariances of the random terms. But the
variances and covariances of the random terms eijky ,
eijkp , and eijk
l are unknown.
For all these reasons, the optimal scenario is
selected in this case study by means of a Monte Carlo
method. We generate 100 values of eijky , eijk
p , and eijkl
from the parameter probability distributions for each
field, each year and each scenario. The expected cost
values and the constraints are then computed from
these samples. The advantages of this method are that
it can be implemented with the original probabilistic
constraints, and that it only requires the knowledge of
the probability distribution of the model parameters.
Yet, our method does not assess policy optimality
because the probability is determined for fixed policy.
Our purpose is only to stress the optimal scenario, i.e.
the farm management practices that have the best
environmental and economic impacts when they are
implemented by all farmers, for all plots of land. This
scenario will be selected in heterogeneous conditions
and would be the scenario enforced by policy makers.
Values of scenario costs are calculated taking into
account yield and protein content values, costs of
establishing catch crops, and profit losses due to set-
aside farmland. Three assumptions of agricultural
policy and market conditions (crop prices and income
support) have been made:
– 1997 circumstances: The crop prices and income
supports are those in force during 1997. Note that a
small bonus is granted for quality wheat and quality
A. Lacroix et al. / Ecological Economics 53 (2005) 115–127 121
spring barley. If the protein content is satisfactory,
wheat can be used for bread, spring barley can be
used in beer, and crop prices are higher;
– Agenda 2000: According to the CAP reform agreed
on by the EU government in 1999, cereal prices
should have decreased by 15% by 2006 and income
support increases. A small increase in bonuses for
quality cereals is taken into account according to the
terms of payment presently in application;
– Quality bonus appreciation: Because of the
decrease of cereal prices provided for in the CAP
reform, the cereal market segmentation could be
reinforced. Prospective planning has therefore been
foreseen: the Agenda 2000 conditions are associ-
ated with a large increase of bonuses for quality
cereals.
4. Results
The results of cost-effectiveness analysis of the
farm management scenarios are shown in terms of the
two temporal scales discriminated above. First, we
aim to minimize costs of the scenario to achieve an
average threshold: the nitrate concentration is limited
to the European maximum in the long term. Second,
the cost is minimized to achieve a yearly threshold:
the nitrate concentration is limited to the European
maximum every year.
4.1. Probabilistic cost-effectiveness in the long term
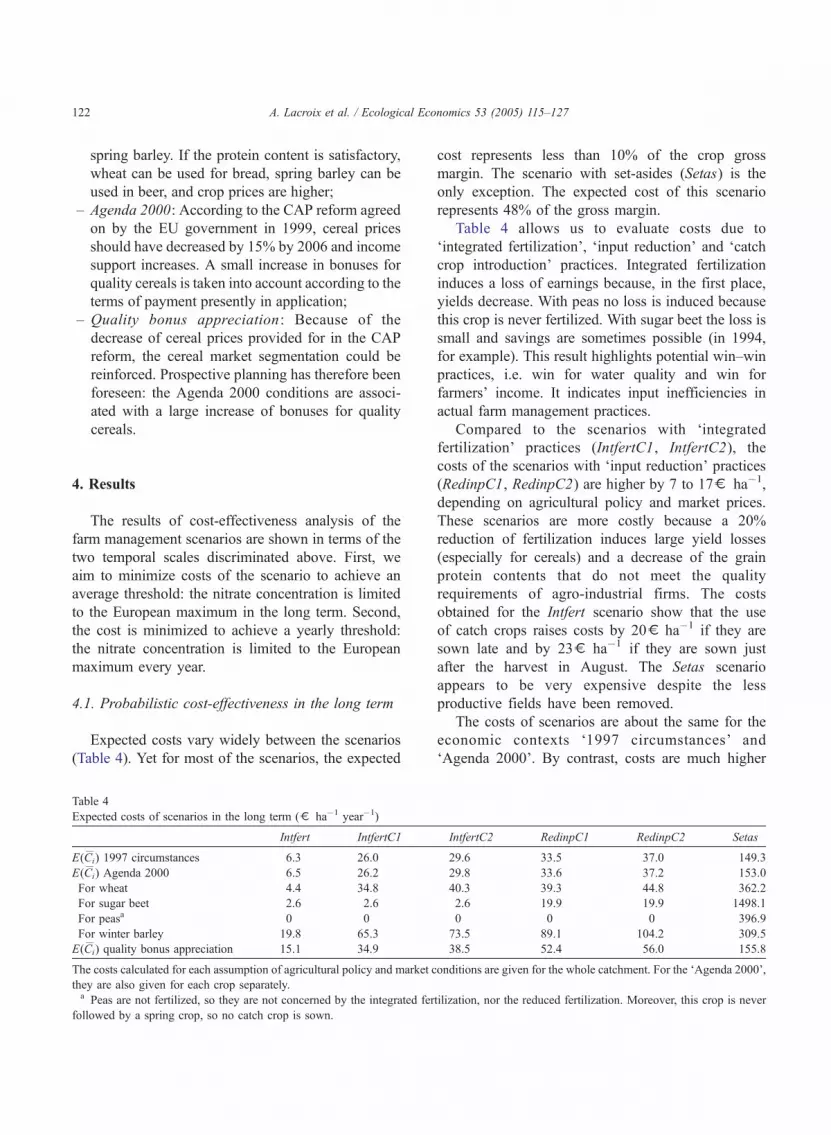
Expected costs vary widely between the scenarios
(Table 4). Yet for most of the scenarios, the expected
cost represents less than 10% of the crop gross
margin. The scenario with set-asides (Setas) is the
only exception. The expected cost of this scenario
represents 48% of the gross margin.
Table 4 allows us to evaluate costs due to
dintegrated fertilizationT, dinput reductionT and dcatch
crop introductionT practices. Integrated fertilization
induces a loss of earnings because, in the first place,
yields decrease. With peas no loss is induced because
this crop is never fertilized. With sugar beet the loss is
small and savings are sometimes possible (in 1994,
for example). This result highlights potential win–win
practices, i.e. win for water quality and win for
farmers’ income. It indicates input inefficiencies in
actual farm management practices.
Compared to the scenarios with dintegrated
fertilizationT practices (IntfertC1, IntfertC2), the
costs of the scenarios with dinput reductionT practices
(RedinpC1, RedinpC2) are higher by 7 to 17o ha�1,
depending on agricultural policy and market prices.
These scenarios are more costly because a 20%
reduction of fertilization induces large yield losses
(especially for cereals) and a decrease of the grain
protein contents that do not meet the quality
requirements of agro-industrial firms. The costs
obtained for the Intfert scenario show that the use
of catch crops raises costs by 20o ha�1 if they are
sown late and by 23o ha�1 if they are sown just
after the harvest in August. The Setas scenario
appears to be very expensive despite the less
productive fields have been removed.
The costs of scenarios are about the same for the
economic contexts d1997 circumstancesT and
dAgenda 2000T. By contrast, costs are much higher
Table 4
Expected costs of scenarios in the long term (o ha�1 year�1)
Intfert IntfertC1 IntfertC2 RedinpC1 RedinpC2 Setas
E(C�i) 1997 circumstances 6.3 26.0 29.6 33.5 37.0 149.3
E(C�i) Agenda 2000 6.5 26.2 29.8 33.6 37.2 153.0
For wheat 4.4 34.8 40.3 39.3 44.8 362.2
For sugar beet 2.6 2.6 2.6 19.9 19.9 1498.1
For peasa 0 0 0 0 0 396.9
For winter barley 19.8 65.3 73.5 89.1 104.2 309.5
E(C�i) quality bonus appreciation 15.1 34.9 38.5 52.4 56.0 155.8
The costs calculated for each assumption of agricultural policy and market conditions are given for the whole catchment. For the dAgenda 2000T,
they are also given for each crop separately.a Peas are not fertilized, so they are not concerned by the integrated fertilization, nor the reduced fertilization. Moreover, this crop is never
followed by a spring crop, so no catch crop is sown.
A. Lacroix et al. / Ecological Economics 53 (2005) 115–127122
for the economic context dQuality bonusT. The
difference is particularly large for the RedinpC1
and RedinpC2 scenarios. These two scenarios are
characterized by a reduction of the amounts of
applied fertilizer. This reduction decreases the grain
quality of wheat crops and therefore the prices at
which wheat is sold.
Table 5 shows that conventional agricultural
practices (Conv) generate a high average value of
nitrate leaching. This is due to over-fertilization and to
a high proportion of spring crops within the study
area.
Table 5 also shows that changes in cropping
practices can reduce water pollution. Integrated
fertilization (Intfert) decreases the nitrate concentra-
tion by about 6 NO3 mg l�1. The introduction of catch
crops is more efficient. It decreases nitrate concen-
tration by 15 to 25 mg l�1 depending on the date of
sowing (IntfertC1, IntfertC2). A reduction of fertilizer
doses (RedinpC1, RedinpC2) decreases the nitrate
concentration only by 4 mg l�1. The introduction of
fallows (Setas) decreases the nitrate concentration by
18 mg l�1.
The two scenarios with early catch crops
(IntfertC2, RedinpC2) satisfy the constraint (7). The
RedinpC1 scenario is almost satisfactory. Because of
uncertainty in crop model predictions, only the
IntfertC2 and RedinpC2 scenarios satisfy constraint
(8) with a high probability level.
Which scenario is optimal in the long run? The
results displayed in Tables 4 and 5 show that the
IntfertC2 scenario is the most cost-effective. It is for
this scenario that the environmental constraints are
satisfied at the lowest cost, irrespective of the
simulated economic context. Our results show that
the sowing dates of the catch crops have a strong
influence on the nitrate concentration. Thus, it seems
important to define these sowing dates precisely in the
administrative measures concerning the reduction of
nitrate pollution.
4.2. Probabilistic cost-effectiveness under climate
variability
Table 6 shows the expected costs of scenarios
for the 6 years considered in the case study and for
the dAgenda 2000T assumption. Although climate
variability is very high, the variability of costs
between years is relatively low. Similar results are
obtained for the other market and policy assump-
tions. This is due to the fact that the costs displayed
in Table 6 represent differences of incomes relative
to the baseline scenario (Conv). The climate has the
same influence both on the baseline scenario and on
the other scenarios. For instance, a dry year
decreases the yield values both for the baseline
scenario and for the other scenarios. Consequently,
the year factor has only a small influence on the
cost values.
By contrast, nitrate concentration values vary
widely between years (Table 7), especially for
conventional practices (Conv): the difference between
the maximum and the minimum nitrate concentration
is equal to 69.5 mg NO3 l�1. The variability is lower
for all scenarios, especially for those that include
catch crops. The variability is particularly low for the
RedinpC2 scenario. For this scenario, the difference
between the maximum and minimum value is only
equal to 29.1 mg NO3 l�1.
No scenario can reduce the nitrate concentrate
below 50 mg NO3 l�1 every year. Constraints (9) and
Table 5
Expected concentration and abatement (mg NO3 l�1); probability of achieving EU target in the long term
Conv Intfert IntfertC1 IntfertC2 RedinpC1 RedinpC2 Setas
E(E�i) 77.0 70.3 55.2 44.8 50.8 41.0 58.7
E(E�i�E�1) 0.0 6.7 21.8 32.2 26.2 36.0 18.3
P½E�iV50 mg l�1 0.00 0.00 0.00 1.00 0.23 1.00 0.00
Table 6
Annual expected costs of scenarios (o ha�1) for Agenda 2000
assumption
Intfert IntfertC1 IntfertC2 RedinpC1 RedinpC2 Setas
E(Ci1991) 6.0 25.7 29.3 33.5 37.1 150.6
E(Ci1992) 6.2 26.0 29.6 32.6 36.2 151.6
E(Ci1993) 6.4 26.1 29.7 33.9 37.4 153.1
E(Ci1994) 6.7 26.4 30.0 33.4 37.0 149.9
E(Ci1995) 6.4 26.2 29.8 33.5 37.1 154.3
E(Ci1996) 7.0 26.8 30.4 34.4 38.0 151.7
A. Lacroix et al. / Ecological Economics 53 (2005) 115–127 123
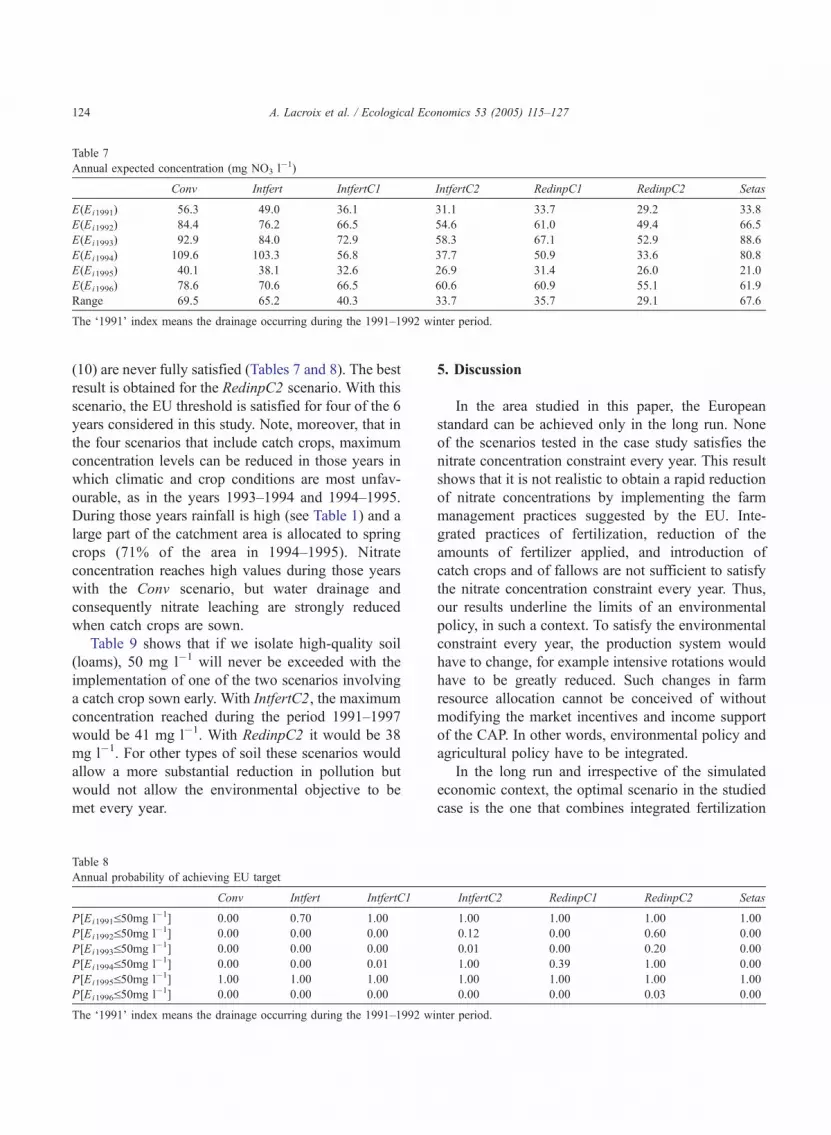
(10) are never fully satisfied (Tables 7 and 8). The best
result is obtained for the RedinpC2 scenario. With this
scenario, the EU threshold is satisfied for four of the 6
years considered in this study. Note, moreover, that in
the four scenarios that include catch crops, maximum
concentration levels can be reduced in those years in
which climatic and crop conditions are most unfav-
ourable, as in the years 1993–1994 and 1994–1995.
During those years rainfall is high (see Table 1) and a
large part of the catchment area is allocated to spring
crops (71% of the area in 1994–1995). Nitrate
concentration reaches high values during those years
with the Conv scenario, but water drainage and
consequently nitrate leaching are strongly reduced
when catch crops are sown.
Table 9 shows that if we isolate high-quality soil
(loams), 50 mg l�1 will never be exceeded with the
implementation of one of the two scenarios involving
a catch crop sown early. With IntfertC2, the maximum
concentration reached during the period 1991–1997
would be 41 mg l�1. With RedinpC2 it would be 38
mg l�1. For other types of soil these scenarios would
allow a more substantial reduction in pollution but
would not allow the environmental objective to be
met every year.
5. Discussion
In the area studied in this paper, the European
standard can be achieved only in the long run. None
of the scenarios tested in the case study satisfies the
nitrate concentration constraint every year. This result
shows that it is not realistic to obtain a rapid reduction
of nitrate concentrations by implementing the farm
management practices suggested by the EU. Inte-
grated practices of fertilization, reduction of the
amounts of fertilizer applied, and introduction of
catch crops and of fallows are not sufficient to satisfy
the nitrate concentration constraint every year. Thus,
our results underline the limits of an environmental
policy, in such a context. To satisfy the environmental
constraint every year, the production system would
have to change, for example intensive rotations would
have to be greatly reduced. Such changes in farm
resource allocation cannot be conceived of without
modifying the market incentives and income support
of the CAP. In other words, environmental policy and
agricultural policy have to be integrated.
In the long run and irrespective of the simulated
economic context, the optimal scenario in the studied
case is the one that combines integrated fertilization
Table 7
Annual expected concentration (mg NO3 l�1)
Conv Intfert IntfertC1 IntfertC2 RedinpC1 RedinpC2 Setas
E(E i1991) 56.3 49.0 36.1 31.1 33.7 29.2 33.8
E(E i1992) 84.4 76.2 66.5 54.6 61.0 49.4 66.5
E(E i1993) 92.9 84.0 72.9 58.3 67.1 52.9 88.6
E(E i1994) 109.6 103.3 56.8 37.7 50.9 33.6 80.8
E(E i1995) 40.1 38.1 32.6 26.9 31.4 26.0 21.0
E(E i1996) 78.6 70.6 66.5 60.6 60.9 55.1 61.9
Range 69.5 65.2 40.3 33.7 35.7 29.1 67.6
The d1991T index means the drainage occurring during the 1991–1992 winter period.
Table 8
Annual probability of achieving EU target
Conv Intfert IntfertC1 IntfertC2 RedinpC1 RedinpC2 Setas
P[E i1991V50mg l�1] 0.00 0.70 1.00 1.00 1.00 1.00 1.00
P[E i1992V50mg l�1] 0.00 0.00 0.00 0.12 0.00 0.60 0.00
P[E i1993V50mg l�1] 0.00 0.00 0.00 0.01 0.00 0.20 0.00
P[E i1994V50mg l�1] 0.00 0.00 0.01 1.00 0.39 1.00 0.00
P[E i1995V50mg l�1] 1.00 1.00 1.00 1.00 1.00 1.00 1.00
P[E i1996V50mg l�1] 0.00 0.00 0.00 0.00 0.00 0.03 0.00
The d1991T index means the drainage occurring during the 1991–1992 winter period.
A. Lacroix et al. / Ecological Economics 53 (2005) 115–127124

with planting of catch crops immediately after the
harvest. In order to reduce the nitrate level below the
50 mg l�1 critical level, this scenario is less expensive
than water purification. Water purification costs
(depreciation and operating expenses) have been
evaluated at 0.27o/m3 on average in France (Lacroix
and Balduchi, 1995); for small rural districts, this cost
has been estimated at between 0.3 and 0.5 o/m3. In
the case study, the cost of the optimal scenario (taking
into account domestic water consumption in the study
area) is in the range 0.06–0.08 o/m3, depending on
the economic context. Other economic studies report
similar results: in the long run, agricultural measures
are cheaper than water treatment (De Haen, 1990;
Guillemin and Roux, 1992; Mollard, 1997).
Our results highlight the considerable effective-
ness of catch crops which really do act as a buffer
against climatic, cropping and soil conditions.
Because they catch most of the nitrogen remaining
in the soil at harvesting, they are able to reduce
variability of nitrate concentrations and thus sub-
stantially reduce the risk of exceeding the environ-
mental constraint.
These results were obtained for an area that is
representative of the Paris basin. Thus, our results are
valid for most of the catchment areas located in this
basin. They may even have a more general scope in so
far as they are consistent with the results of other
studies. Machet et al. (1997) and Justes et al. (1999)
also highlight the effectiveness of catch crops. In
particular, they emphasize the fact that these crops
mitigate impacts of farmers’ prediction error: climate
variability makes yield predictions and therefore
nitrogen requirement predictions uncertain. Vatn et
al. (1997) show that catch crops have substantial
effects on losses and that they are particularly well
suited to cereal-growing areas. In fact, they are more
cost-effective than any other measure.
Many studies confirm that in such agricultural
contexts the other solutions normally envisaged fail.
Thus, results that converge with ours are obtained on
the setting-aside of land. This practice is very costly
and should be applied only if their other environ-
mental benefits (improve the biodiversity, reduce the
soil erosion, etc.) could be valorized. The scenarios of
land retirement in the USA simulated by Ribaudo et
al. (1994) generate higher social costs than water
quality benefits. Other results show that the setting-
aside of land can have effects that are difficult to
control. For example, it may result in shifts in regional
crop production and crop mix (Ribaudo et al., 1994)
and so in pollution transfers. It may also have
undesirable effects in the long term (Meissner et al.,
1998).
Other research, apart from ours, also shows the low
level of effectiveness of fertilizer reduction. Weaver et
al. (1996) show that for field cropping in a Pennsyl-
vania setting, a 10% decrease in fertilizer application
rates has no statistically significant effect on the
pollution level. Pan and Hodge (1994) show that in
order not to exceed 50 mg l�1 in an area of intensive
agricultural production in eastern England, nitrogen
application must be reduced by 81%. But is such
reduction realistic? From this point of view, Ribaudo
et al. (2001) show that in the Mississippi Basin,
reducing nitrogen fertilizer use by up to 50% is more
costly than an alternative strategy usually considered
as very expensive, i.e. wetlands restoration in order to
filter nutrients coming off cropland. These different
results highlight the fact that for field crops, fertilizer
inputs are often close to optimum levels, and their
reduction can rarely be substantial without incurring
high costs.
Although restrictions on fertilizer application
rates have a limited effect on pollution, this measure
is unavoidable for any pollution control policy. It
seems to be indispensable to offset farm operators’
inefficiencies since they do exist, as we have
shown. It furthermore helps to draw farmers’
attention to the non-separability of production,
Table 9
Maximum of annual expected concentration (mg NO3 l�1) for the different types of soil
Conv Intfert IntfertC1 IntfertC2 RedinpC1 RedinpC2 Setas
Loam 72.6 65.5 52.3 40.7 49.5 38.3 72.6
Sand 197.7 157.5 130.2 114.1 119.5 104.6 93.5
Marl and stones 89.3 86.3 72.0 63.4 63.9 56.2 59.1
Limestone 141.2 135.5 90.0 57.5 80.1 49.3 130.4
A. Lacroix et al. / Ecological Economics 53 (2005) 115–127 125

pollution and abatement. But in most cases, in order
to comply with EU environmental constraints, it has
to be combined with other production practice
requirements. From this point of view, the fact of
combining it with catch crops seems fully relevant.
Yet our results show that it is more cost-effective to
demand early sowing of catch crops than to demand
20% reductions of nitrogen inputs, as in the EU
specifications. The following recommendations can
therefore be made to policy-makers: control of the
implementation of these specifications must pay
more attention to the date of introduction of catch
crops than to the reduction of inputs. Note, more-
over, that it is easier to control the date of sowing
than to control reduction of inputs. This could help
to reduce the administrative costs of this agri-
environmental measure.
Acknowledgements
The results of this study are drawn from a report
submitted to the French Ministry of Agriculture
(Beaudoin et al., 1998). We are particularly grateful
to the Aisne Chamber of Agriculture for its support
throughout this programme and to farmers in the
study area for their close cooperation. We would also
like to thank two anonymous referees for their helpful
comments.
References
Addiscott, T.M., Whitmore, A.P., Powlson, D.S., 1991. Farming,
Fertilizers and the Nitrate Problem. CAB International, Leaper
and Gard, Bristol. 170 pp.
Apfelbaum, M. (Ed.), Risques et Peurs Alimentaires. O. Jacob
Editions, Paris. 284 pp.
Beaudoin, N., Makowski, D., Parnaudeau, V., Parisseaux, B.,
Wallach, D., Mary, B., Meynard, J.M., 1998. Evaluation de
l’impact economique et environnemental de la mesure agri-
environnementale breduction d’intrantsQ au moyen de modeles
agronomiques. Rapp. Minist. Agric. 79 pp.
Beaudoin, N., Makowski, D., Parnaudeau, V., Mary, B., 1999.
Impact of agricultural scenarios on nitrate pollution at the
catchment scale. 10th Nitrogen Workshop. Royal Veterinary and
Agricultural University, Copenhagen.
Brisson, N., Mary, B., Ripoche, D., Jeuffroy, M.-H., Ruget, F.,
Gate, P., Devienne, F., Antonioletti, R., Dqrr, C., Nicoullaud,
B., Richard, G., Beaudoin, N., Recous, S., Tayot, X., Plenet,
D., Cellier, P., Machet, J.M., Meynard, J.M., Delecolle, R.,
1998. STICS: a generic model for the simulation of crops
and their water and nitrogen balance: I. Theory and
parametrization applied to wheat and corn. Agronomie 18,
311–346.
Bystrom, O., Andersson, H., Gren, I.M., 2000. Economic criteria
for using wetlands ass nitrogen sinks under uncertainty. Ecol.
Econ. 35, 35–45.
De Haen, H., 1990. Economic aspects of controlling the nitrate
contamination of drinking water. In: Calvet, R. (Ed.), Nitrates-
Eau-Agriculture. INRA, Versailles, pp. 23–40.
European Environment Agency, 2001. Environmental Signals 2001.
Copenhagen. 113 pp.
Gorres, J., Gold, A.J., 1996. Incorporating spatial variability into
GIS to estimate nitrate leaching at the aquifer scale. J. Environ.
Qual. 25, 491–498.
Guillemin, C., Roux, J.C., 1992. Pollution des eaux souterraines en
France. BRGM, Orleans. 262 pp.
Hardaker, J.B., Pandey, S., Patten, L.H., 1991. Farm planning under
uncertainty: a review of alternative programming models. Rev.
Mark. Agric. Econ. 59, 9–22.
Justes, E., Mary, B., Nicolardot, B., 1999. Comparing the
effectiveness of radish cover crop, oilseed rape volunteers and
oilseed rape residues incorporation for reducing nitrate leaching.
Nutr. Cycl. Agroecosyst. 55, 207–220.
Kampas, A., White, B., 2003. Probabilistic programming for nitrate
pollution control: comparing different probabilistic constraint
approximations. Eur. J. Oper. Res. 147, 217–228.
Lacroix, A., Balduchi, F., 1995. Le traitement des nitrates de l’eau
potable. Bilan economique perspectives. Tech. Sci. Methodes
12, 923–929.
Laurent, F., Mary, B., 1992. Management of nitrogen in farming
systems and the prevention of nitrate leaching. Asp. Appl. Biol.
30, 45–62.
Machet, J.M., Dubrulle, P., Louis, P., 1990. AZOBIL: a computer
program for fertilizer N recommendations based on a predictive
balance-sheet method. First ESA Congress, Paris.
Machet, J.M., Laurent, F., Chapot, J.Y., Dore, T., Dulout, A., 1997.
Maıtrise de l’azote dans les intercultures et les jacheres. In:
Lemaire, G., Nicolardot, B. (Eds.), Maıtrise de l’azote dans les
agrosystemes. INRA, Paris, pp. 271–288.
Makowski, D., Wallach, D., Meynard, J.M., 1999. Models of yield,
grain protein and residual mineral N responses to applied N for
winter wheat. Agron. J. 91, 377–385.
Makowski, D., Wallach, D., Meynard, J.-M., 2001. Statistical
methods for predicting the responses to applied N and for
calculating optimal N rates. Agron. J. 93, 531–539.
Mary, B., Beaudoin, N., Benoit, M., 1997. Prevention de la
pollution nitrique a l’echelle du bassin d’alimentation en eau.
In: Lemaire, G., Nicolardot, B. (Eds.), Maıtrise de l’azote dans
les agrosystemes. INRA, Paris, pp. 289–312.
Mc Sweeny, W.T., Shortle, J.S., 1990. Probabilistic cost effective-
ness in agricultural nonpoint pollution control. South. J. Agric.
Econ., 95–104.
Meissner, R., Seeger, J., Rupp, H., 1998. Lysimeter studies in East
Germany concerning the influence of set aside of intensively
farmed land on the seepage water quality. Agric. Ecosyst.
Environ. 67, 161–174.
A. Lacroix et al. / Ecological Economics 53 (2005) 115–127126
Mollard, A., 1997. Solutions curatives ou preventives a la pollution
diffuse de lTeau? Une approche de la soutenabilite de la
ressource en eau. Nat. Sci. Soc. 3, 5–21.
Pan, J.H., Hodge, I., 1994. Land use permits as an alternative to
fertiliser and leaching taxes for the control of nitrate pollution. J.
Agric. Econ. 45, 102–112.
Ribaudo, M.O., Osborn, C.T., Konyar, K., 1994. Land retirement as
a tool for reducing agricultural nonpoint source pollution. Land
Econ. 70, 77–87.
Ribaudo, M.O., Heimlich, R., Claassen, R., Peters, M., 2001. Least-
cost management of nonpoint source pollution: source reduction
versus interception strategies for controlling nitrogen loss in the
Mississippi Basin. Ecol. Econ. 37, 183–197.
Szoege, H.M., Crabtree, B., Edwards, T., 1996. Policy cost-
effectiveness for reducing non-point agricultural groundwater
pollution in the UK. J. Environ. Plan. Manag. 39 (2), 205–222.
Thorup-Kristensen, K., Nielsen, N.E., 1998. Modelling and
measuring the effect of nitrogen catch crops on the nitrogen
supply for succeeding crops. Plant Soil 203, 79–89.
US Geological Survey, 1999. The quality of our nation’s waters:
nutrients and pesticides. Circular, vol. 1225. Reston, Virginia.
82 pp.
Vatn, A., Bakken, L.R., Lundeby, H., Romstad, E., Rorstad, P.K.,
Vold, A., Botterweg, P., 1997. Regulating non-point pollution
from agriculture: an integrated modelling analysis. Eur. Rev.
Agric. Econ. 24, 207–229.
Vatn, A., Bakken, L., Botterweg, P., Romstad, E., 1999.
ECECMOD: an interdisciplinary modelling system for analyz-
ing nutrient and soil losses from agriculture. Ecol. Econ. 30,
189–206.
Wagenet, R.J., Hutson, N., 1996. Scale-dependency of solute
transport modeling: GIS applications. J. Environ. Qual. 25,
449–510.
Weaver, R.D., Harper, J.K., Gillmeister, W.J., 1996. Efficacy of
standards vs. incentives for managing the environmental
impacts of agriculture. J. Environ. Manag. 46, 173–188.
A. Lacroix et al. / Ecological Economics 53 (2005) 115–127 127