aerosol optical depth measurements by airborne sun photometer in solve ii: comparison to sage iii...
TRANSCRIPT
Atmos. Chem. Phys., 5, 1311–1339, 2005www.atmos-chem-phys.org/acp/5/1311/SRef-ID: 1680-7324/acp/2005-5-1311European Geosciences Union
AtmosphericChemistry
and Physics
Aerosol optical depth measurements by airborne sun photometer inSOLVE II: Comparisons to SAGE III, POAM III and airbornespectrometer measurements
P. Russell1, J. Livingston2, B. Schmid3, J. Eilers1, R. Kolyer1, J. Redemann3, S. Ramirez3, J.-H. Yee4, W. Swartz4,R. Shetter5, C. Trepte6, A. Risley Jr.7, B. Wenny7, J. Zawodny6, W. Chu6, M. Pitts6, J. Lumpe8, M. Fromm9,C. Randall10, K. Hoppel9, and R. Bevilacqua9
1NASA Ames Research Center, MS 245-5, Moffett Field, CA 94035-1000, USA2SRI International, Menlo Park, CA 94025, USA3Bay Area Environmental Research Institute, Sonoma, CA 95476, USA4Applied Physics Laboratory, Johns Hopkins University, Laurel, MD 20723-6099, USA5National Center for Atmospheric Research, Boulder, CO 80307-3000, USA6NASA Langley Research Center, Hampton, VA 23681-2199, USA7SAIC, NASA Langley Research Center, Hampton, VA 23681-0001, USA8Computational Physics, Inc., Springfield, VA 22151, USA9Naval Research Laboratory, Washington, DC 20375-5351, USA10Laboratory for Atmospheric and Space Physics, University of Colorado, Boulder, CO 80309-0392, USA
Received: 8 October 2004 – Published in Atmos. Chem. Phys. Discuss.: 5 November 2004Revised: 25 February 2005 – Accepted: 1 April 2005 – Published: 1 June 2005
Abstract. The 14-channel NASA Ames Airborne Track-ing Sunphotometer (AATS-14) measured solar- beam trans-mission on the NASA DC-8 during the second SAGE IIIOzone Loss and Validation Experiment (SOLVE II). Thispaper presents AATS-14 results for multiwavelength aerosoloptical depth (AOD), including comparisons to results fromtwo satellite sensors and another DC-8 instrument, namelythe Stratospheric Aerosol and Gas Experiment III (SAGEIII), the Polar Ozone and Aerosol Measurement III (POAMIII) and the Direct-beam Irradiance Airborne Spectrometer(DIAS). AATS-14 provides aerosol results at 13 wavelengthsλ spanning the range of SAGE III and POAM III aerosolwavelengths. Because most AATS measurements were madeat solar zenith angles (SZA) near 90◦, retrievedAODs arestrongly affected by uncertainties in the relative optical air-mass of the aerosols and other constituents along the line ofsight (LOS) between instrument and sun. To reduce depen-dence of the AATS-satellite comparisons on airmass, we per-form the comparisons in LOS transmission and LOS opticalthickness (OT) as well as in vertical OT (i.e., optical depth,OD). We also use a new airmass algorithm that validates thealgorithm we previously used to within 2% forSZA<90◦,and in addition provides results forSZA≥90◦.
Correspondence to:P. Russell([email protected])
For 6 DC-8 flights, 19 January–2 February 2003, AATSand DIAS results for LOS aerosol OT atλ=400 nm agreeto ≤12% of the AATS value. Mean and root-mean-square(RMS) differences, (DIAS-AATS)/AATS, are−2.3% and7.7%, respectively. For DC-8 altitudes, AATS-satellite com-parisons are possible only forλ>440 nm, because of signaldepletion for shorterλ on the satellite full-limb LOS. For the4 AATS-SAGE and 4 AATS–POAM near-coincidences con-ducted 19–31 January 2003, AATS-satelliteAODdifferenceswere ≤0.0041 for allλ>440 nm. RMS differences were≤0.0022 for SAGE–AATS and≤0.0026 for POAM–AATS.RMS relative differences inAOD ([SAGE–AATS]/AATS)were≤33% forλ<∼755 nm, but grew to 59% for 1020 nmand 66% at 1545 nm. Forλ>∼755 nm, AATS–POAM dif-ferences were less than AATS-SAGE differences, and RMSrelative differences inAOD ([AATS–POAM]/AATS) were≤31% for all λ between 440 and 1020 nm. Unexplaineddifferences that remain are associated with transmissiondifferences, rather than differences in gas subtraction orconversion from LOS to vertical quantities. The very smallstratosphericAOD values that occurred during SOLVE IIadded to the challenge of the comparisons, but do not explainall the differences.
© 2005 Author(s). This work is licensed under a Creative Commons License.
1312 P. Russell et al.: Comparison of aerosol optical depths from aircraft and satellite in SOLVE II
0.0
4.0
8.0
12.0
16.0
20.0
24.0
28.0
32.0
MPV (PVU)
3.850•105
3.870•105
3.890•105
3.910•105
3.930•105
MNST (J/kg^-1)
WND2 (m/s)
12 UTC on 19 January, 2003 on the 460.0 K surfaceNMC, Grid: GG1X1Seq: E01, Spec: SSIAVN
3.870•1053.890•105
3.890•105
3.910•105
3.910•105
12 UTC on 24 January, 2003 on the 460.0 K surface
3.85
0•10
53.870•105
3.870•105
3.890•105
3.890•105
3.910•105
3.910•105
3.930•105
12 UTC on 29 January, 2003 on the 460.0 K surface
3.85
0•10
53.85
0•10
5
3.870•105
3.87
0•10
5
3.89
0•10
5
12 UTC on 31 January, 2003 on the 460.0 K surface
3.87
0•10
5
3.87
0•10
53.
890•
105
3.91
0•105
3.910•105
3.930•105
3.950•105
3.950•105
12 UTC on 21 January, 2003 on the 460.0 K surface
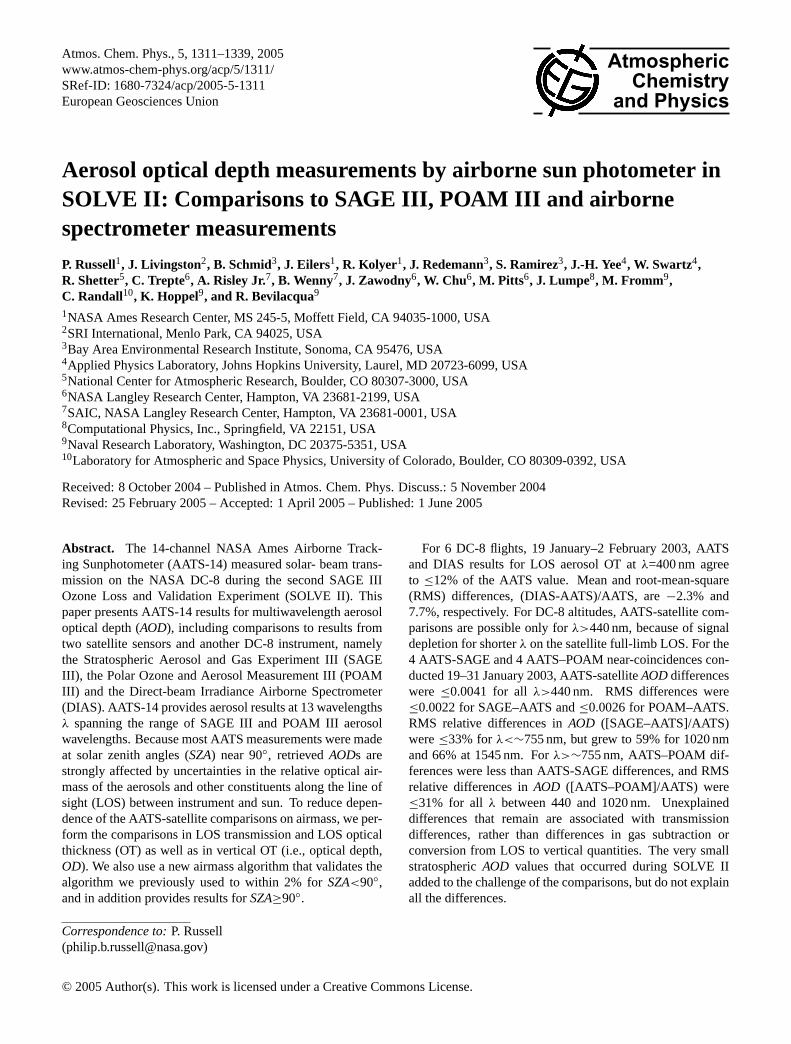
Fig. 1. DC-8 flight tracks (black) superimposed on 12 Z analysis maps of modified potential vorticity (MPV) for the 460 K isentropicsurface. White and blue points mark occultations by SAGE III and POAM III, respectively. Maps were produced by L. Lait, M. Schoeberl,and P. Newman.
1 Introduction
The 14-channel NASA Ames Airborne Tracking Sunpho-tometer (AATS-14) measured solar- beam transmission onthe NASA DC-8 during the second SAGE III Ozone Lossand Validation Experiment (SOLVE II). Flights were made
out of Kiruna, Sweden, and Dryden Flight Research Facil-ity in Southern California, USA. Livingston et al. (2005)describe the AATS-14 instrument, measurement procedures,and results for ozone. This paper presents AATS-14 resultsfor multiwavelength aerosol optical depth (AOD), includingits spatial structure and its relationship to results from two
Atmos. Chem. Phys., 5, 1311–1339, 2005 www.atmos-chem-phys.org/acp/5/1311/
P. Russell et al.: Comparison of aerosol optical depths from aircraft and satellite in SOLVE II 1313
satellite sensors and another DC-8 instrument. These arethe Stratospheric Aerosol and Gas Experiment III (SAGEIII), the Polar Ozone and Aerosol Measurement III (POAMIII) and the Direct beam Irradiance Airborne Spectrometer(DIAS).
AATS-14 provides aerosol results at 13 wavelengthsλ be-tween 354 and 2139 nm, spanning the full range of aerosolwavelengths for SAGE III (384–1545 nm) and POAM III(353–1018 nm). In this paper we show AATS results onlyfor wavelengths 354–1558 nm, because no correlative mea-surements are available to compare to the AATS results at2139 nm. The AATS-14 channels used in this paper havefull width at half maximum (FWHM) of 2.0 to 5.6 nm, withmost channel FWHMs∼5 nm. Because most AATS mea-surements in SOLVE II were made at solar zenith angles(SZA) near 90◦, retrievedAODs are strongly affected by un-certainties in the relative optical airmass (here called airmassfor brevity) of the aerosols and other constituents along the(generally refracted) line of sight (LOS) between instrumentand sun. For any given constituent and/or wavelength, air-mass is defined as the ratio of LOS optical thickness (OT)to vertical OT. (In this paper we define vertical OT as op-tical depth (OD), and restrict use ofOD to apply only tothe vertical.) ForSZAnear 90◦, airmass of a given attenu-ator is sensitive to its vertical profile shape. Uncertainties insuch vertical profiles therefore produce corresponding uncer-tainties in the associated airmass. To reduce dependence ofthe AATS-satellite comparisons on airmass, we perform thecomparisons in LOS transmission and LOS OT as well as invertical OT (or optical depth).
This paper shows AATS-satellite comparisons from DC-8flights on five days: 19, 21, 24, 29, and 31 January 2003. Fig-ure 1 shows the DC-8 flight tracks for those days in relationto occultation locations of SAGE III and POAM III, super-imposed on maps of modified potential vorticity. This paperalso shows AATS–DIAS comparisons for each of those fivedays, plus a sixth, 2 February 2003.
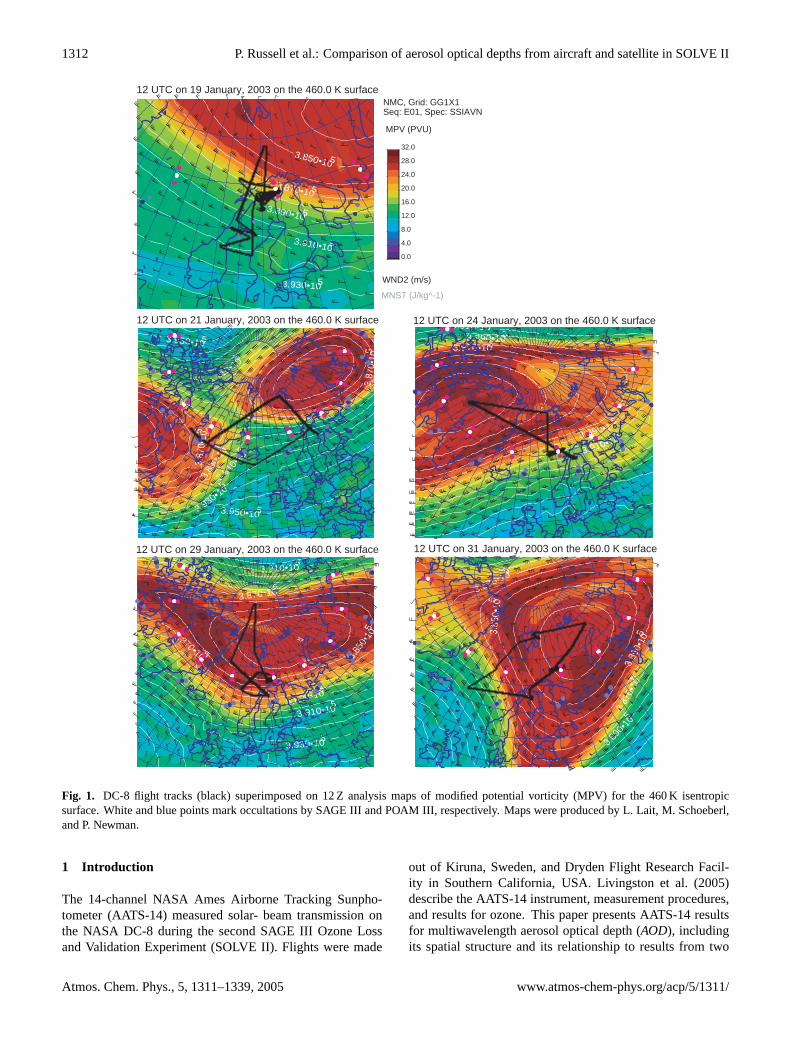
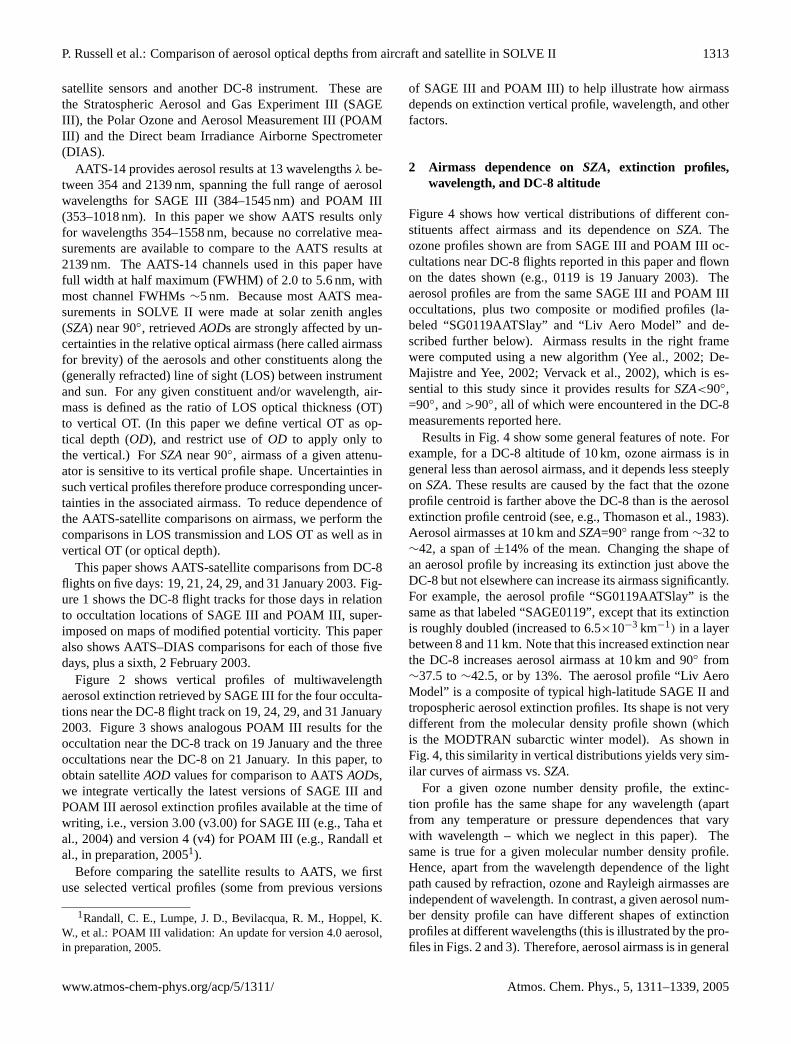
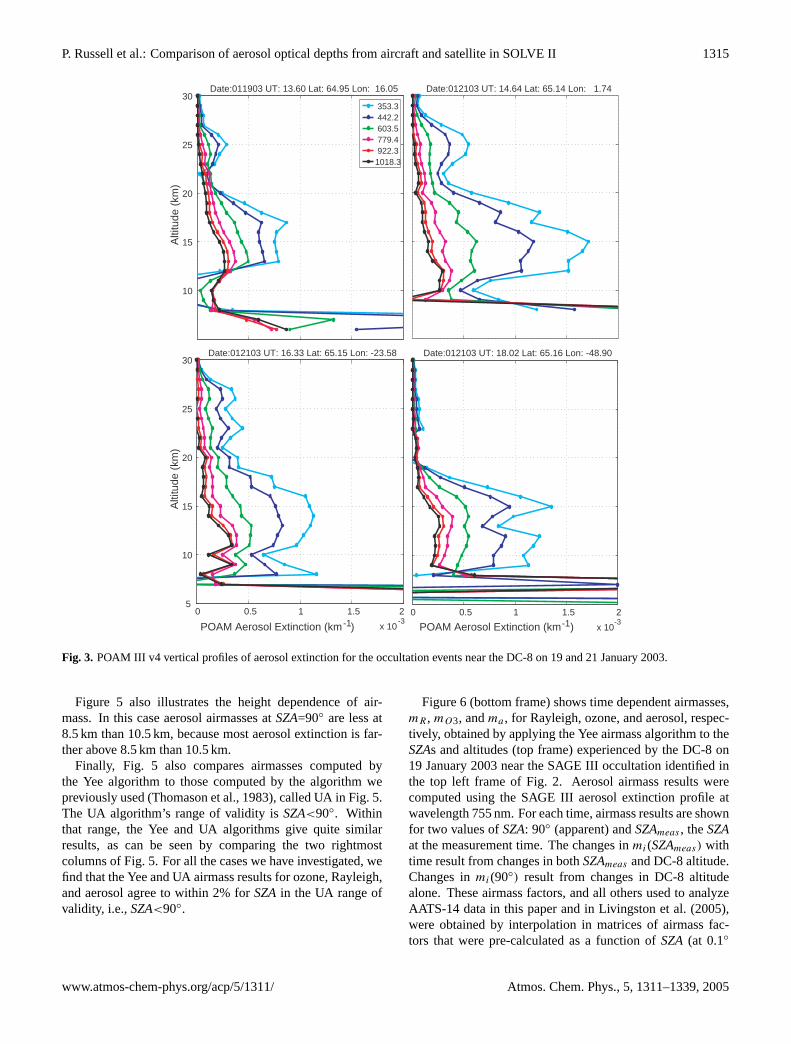
Figure 2 shows vertical profiles of multiwavelengthaerosol extinction retrieved by SAGE III for the four occulta-tions near the DC-8 flight track on 19, 24, 29, and 31 January2003. Figure 3 shows analogous POAM III results for theoccultation near the DC-8 track on 19 January and the threeoccultations near the DC-8 on 21 January. In this paper, toobtain satelliteAOD values for comparison to AATSAODs,we integrate vertically the latest versions of SAGE III andPOAM III aerosol extinction profiles available at the time ofwriting, i.e., version 3.00 (v3.00) for SAGE III (e.g., Taha etal., 2004) and version 4 (v4) for POAM III (e.g., Randall etal., in preparation, 20051).
Before comparing the satellite results to AATS, we firstuse selected vertical profiles (some from previous versions
1Randall, C. E., Lumpe, J. D., Bevilacqua, R. M., Hoppel, K.W., et al.: POAM III validation: An update for version 4.0 aerosol,in preparation, 2005.
of SAGE III and POAM III) to help illustrate how airmassdepends on extinction vertical profile, wavelength, and otherfactors.
2 Airmass dependence onSZA, extinction profiles,wavelength, and DC-8 altitude
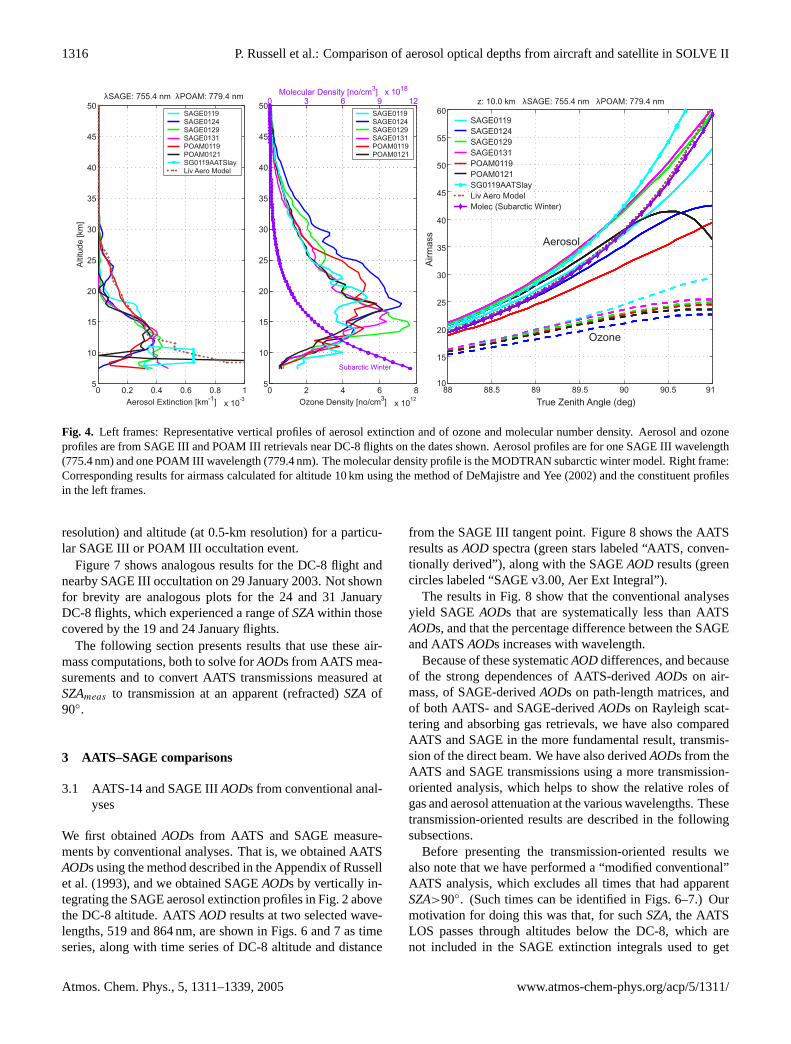
Figure 4 shows how vertical distributions of different con-stituents affect airmass and its dependence onSZA. Theozone profiles shown are from SAGE III and POAM III oc-cultations near DC-8 flights reported in this paper and flownon the dates shown (e.g., 0119 is 19 January 2003). Theaerosol profiles are from the same SAGE III and POAM IIIoccultations, plus two composite or modified profiles (la-beled “SG0119AATSlay” and “Liv Aero Model” and de-scribed further below). Airmass results in the right framewere computed using a new algorithm (Yee al., 2002; De-Majistre and Yee, 2002; Vervack et al., 2002), which is es-sential to this study since it provides results forSZA<90◦,=90◦, and>90◦, all of which were encountered in the DC-8measurements reported here.
Results in Fig. 4 show some general features of note. Forexample, for a DC-8 altitude of 10 km, ozone airmass is ingeneral less than aerosol airmass, and it depends less steeplyon SZA. These results are caused by the fact that the ozoneprofile centroid is farther above the DC-8 than is the aerosolextinction profile centroid (see, e.g., Thomason et al., 1983).Aerosol airmasses at 10 km andSZA=90◦ range from∼32 to∼42, a span of±14% of the mean. Changing the shape ofan aerosol profile by increasing its extinction just above theDC-8 but not elsewhere can increase its airmass significantly.For example, the aerosol profile “SG0119AATSlay” is thesame as that labeled “SAGE0119”, except that its extinctionis roughly doubled (increased to 6.5×10⁻³ km−1) in a layerbetween 8 and 11 km. Note that this increased extinction nearthe DC-8 increases aerosol airmass at 10 km and 90◦ from∼37.5 to∼42.5, or by 13%. The aerosol profile “Liv AeroModel” is a composite of typical high-latitude SAGE II andtropospheric aerosol extinction profiles. Its shape is not verydifferent from the molecular density profile shown (whichis the MODTRAN subarctic winter model). As shown inFig. 4, this similarity in vertical distributions yields very sim-ilar curves of airmass vs.SZA.
For a given ozone number density profile, the extinc-tion profile has the same shape for any wavelength (apartfrom any temperature or pressure dependences that varywith wavelength – which we neglect in this paper). Thesame is true for a given molecular number density profile.Hence, apart from the wavelength dependence of the lightpath caused by refraction, ozone and Rayleigh airmasses areindependent of wavelength. In contrast, a given aerosol num-ber density profile can have different shapes of extinctionprofiles at different wavelengths (this is illustrated by the pro-files in Figs. 2 and 3). Therefore, aerosol airmass is in general
www.atmos-chem-phys.org/acp/5/1311/ Atmos. Chem. Phys., 5, 1311–1339, 2005
1314 P. Russell et al.: Comparison of aerosol optical depths from aircraft and satellite in SOLVE II
5
10
15
20
25
30
Alti
tude
(km
)
yyyyddd: 2003019, UT: 9.87, lat: 69.31, lon: 24.20 (10 km)
384.3
448.5
520.3
601.2
675.6
755.4
869.3
1021.6
1545.2
yyyyddd: 2003024, UT:10.98, lat: 70.61, lon: 11.10 (10 km)
0 0.2 0.4 0.6 0.8 1 1.2
x 10-3
Aerosol Extinction (km -1)
yyyyddd: 2003031,UT: 9.72, lat: 72.55, lon: 36.90 (10 km)
0 0.2 0.4 0.6 0.8 1 1.2
x 10-3
5
10
15
20
25
30
Aerosol Extinction (km -1)
Alti
tude
(km
)
yyyyddd: 2003029, UT:10.33, lat: 72.00, lon: 25.74 (10 km)
Fig. 2. SAGE III v3.00 vertical profiles of aerosol extinction for the occultation events near the DC-8 on 19, 24, 29, and 31 January.
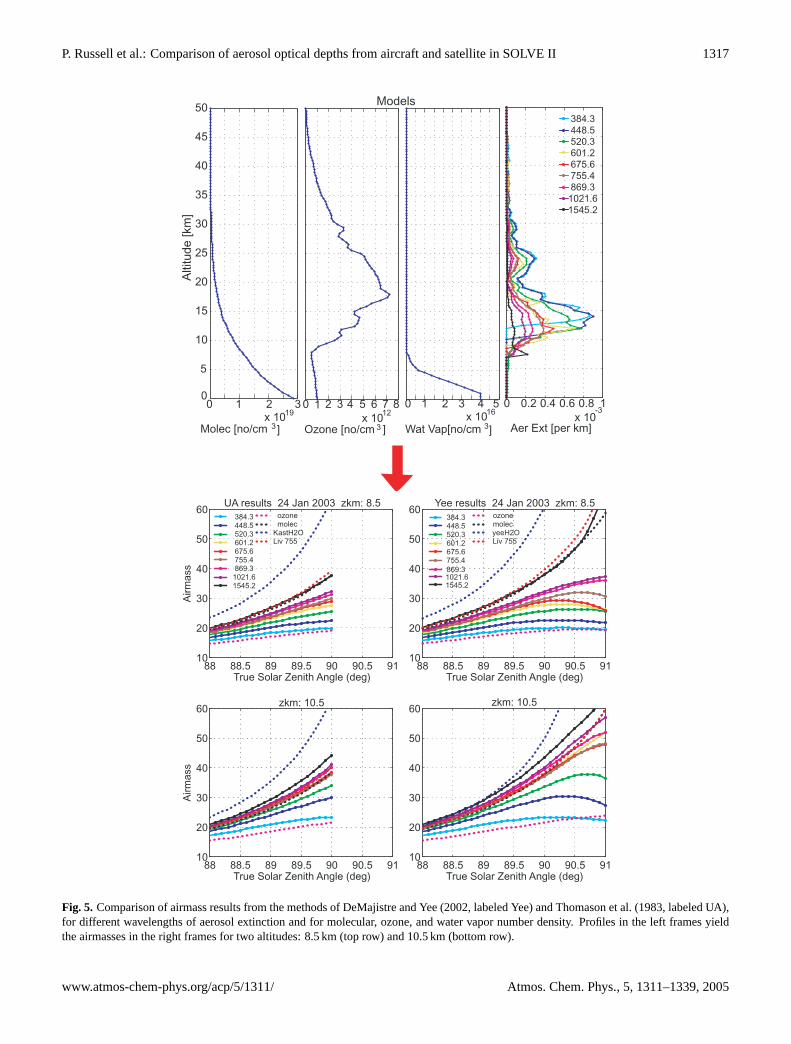
a function of wavelength. Whereas the aerosol airmass re-sults in Fig. 4 are for two very similar wavelengths (755.4 nmfor SAGE III and 779.4 nm for POAM III), Fig. 5 illustratesthe dependence of aerosol airmass on wavelength over therange 384 to 1545 nm. Shown are aerosol extinction profilesand corresponding airmass results for the SAGE III occul-tation near the DC-8 on 24 January 2003. For these cases,aerosol airmass increases with increasing wavelength, a con-sequence of the fact that increasingly longer wavelengthshave extinction profiles with lower altitude centroids. (Theselower centroids result from larger particles being increas-ingly dominant at lower altitudes, owing to sedimentation or
to growth in higher relative humidity). Results in the lowerrightmost frame of Fig. 5 show that, at 10.5 km and 90◦, in-creasing the wavelength from 449 to 1545 nm causes the air-mass to increase from∼30 to∼43. This range is±18% ofthe mean airmass, 36.5. Note that the intermediate wave-length, 755 nm, has airmass very near this mean. Note alsothat we have excluded the shortest wavelength, 384 nm, fromthis discussion, since SAGE III extinction profiles for thiswavelength do not extend this low in altitude, owing to sig-nal depletion. We will return to these results when we discussthe sensitivity of ourAODretrievals to the assumptions in ouranalyses.
Atmos. Chem. Phys., 5, 1311–1339, 2005 www.atmos-chem-phys.org/acp/5/1311/
P. Russell et al.: Comparison of aerosol optical depths from aircraft and satellite in SOLVE II 1315
10
15
20
25
30
Alti
tude
(km
)
Date:011903 UT: 13.60 Lat: 64.95 Lon: 16.05
353.3 442.2 603.5 779.4 922.31018.3
Date:012103 UT: 14.64 Lat: 65.14 Lon: 1.74
0 0.5 1 1.5 2
x 10-3
5
10
15
20
25
30
POAM Aerosol Extinction (km-1)
Alti
tude
(km
)
Date:012103 UT: 16.33 Lat: 65.15 Lon: -23.58
0 0.5 1 1.5 2
x 10-3POAM Aerosol Extinction (km-1)
Date:012103 UT: 18.02 Lat: 65.16 Lon: -48.90
Fig. 3. POAM III v4 vertical profiles of aerosol extinction for the occultation events near the DC-8 on 19 and 21 January 2003.
Figure 5 also illustrates the height dependence of air-mass. In this case aerosol airmasses atSZA=90◦ are less at8.5 km than 10.5 km, because most aerosol extinction is far-ther above 8.5 km than 10.5 km.
Finally, Fig. 5 also compares airmasses computed bythe Yee algorithm to those computed by the algorithm wepreviously used (Thomason et al., 1983), called UA in Fig. 5.The UA algorithm’s range of validity isSZA<90◦. Withinthat range, the Yee and UA algorithms give quite similarresults, as can be seen by comparing the two rightmostcolumns of Fig. 5. For all the cases we have investigated, wefind that the Yee and UA airmass results for ozone, Rayleigh,and aerosol agree to within 2% forSZAin the UA range ofvalidity, i.e.,SZA<90◦.
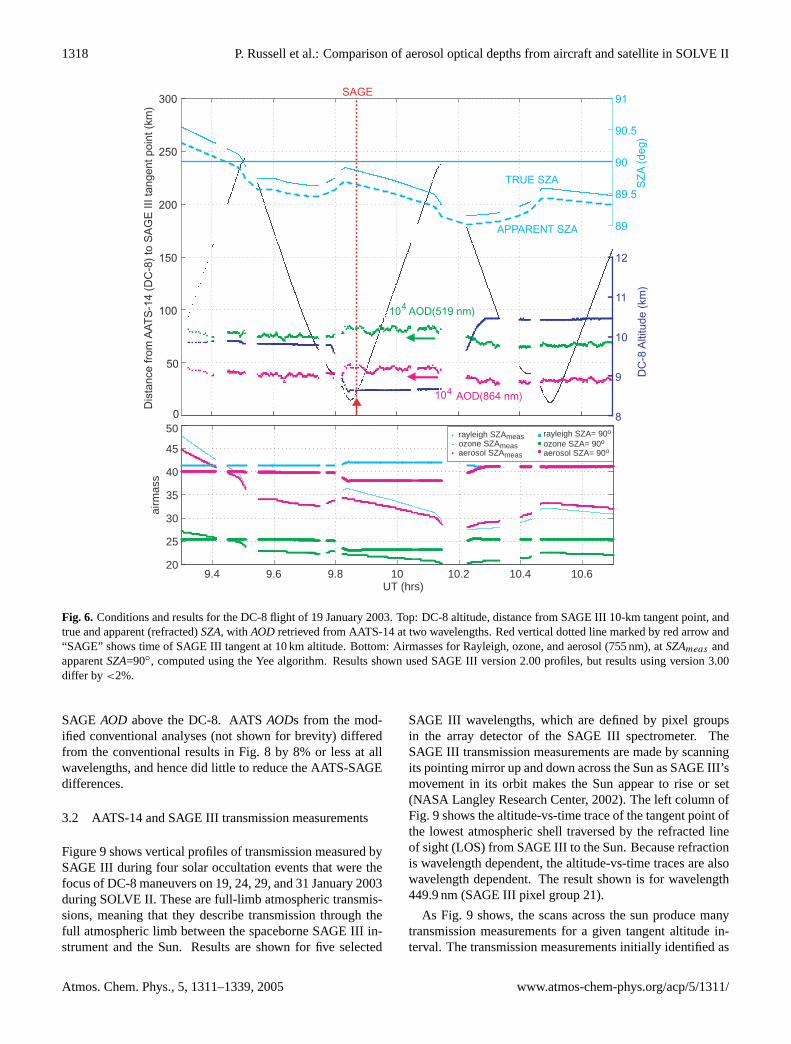
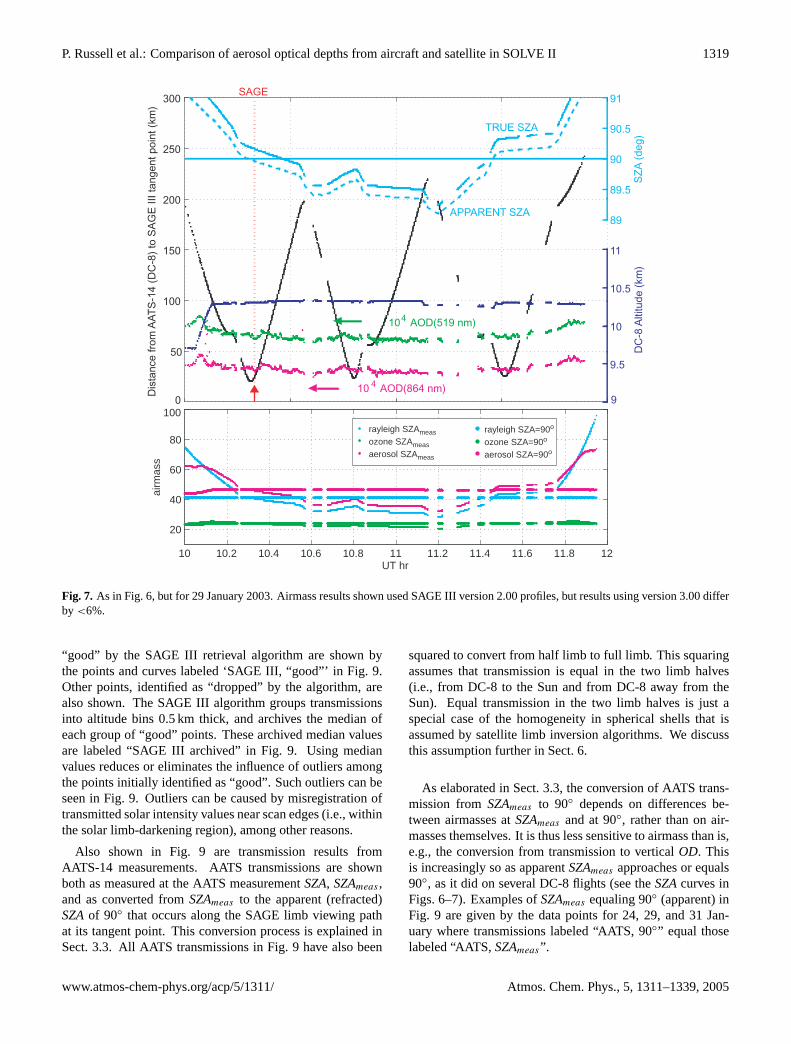
Figure 6 (bottom frame) shows time dependent airmasses,mR, mO3, andma , for Rayleigh, ozone, and aerosol, respec-tively, obtained by applying the Yee airmass algorithm to theSZAs and altitudes (top frame) experienced by the DC-8 on19 January 2003 near the SAGE III occultation identified inthe top left frame of Fig. 2. Aerosol airmass results werecomputed using the SAGE III aerosol extinction profile atwavelength 755 nm. For each time, airmass results are shownfor two values ofSZA: 90◦ (apparent) andSZAmeas , theSZAat the measurement time. The changes inmi(SZAmeas) withtime result from changes in bothSZAmeas and DC-8 altitude.Changes inmi(90◦) result from changes in DC-8 altitudealone. These airmass factors, and all others used to analyzeAATS-14 data in this paper and in Livingston et al. (2005),were obtained by interpolation in matrices of airmass fac-tors that were pre-calculated as a function ofSZA(at 0.1◦
www.atmos-chem-phys.org/acp/5/1311/ Atmos. Chem. Phys., 5, 1311–1339, 2005
1316 P. Russell et al.: Comparison of aerosol optical depths from aircraft and satellite in SOLVE II
0 0.2 0.4 0.6 0.8 1
x 10-3
5
10
15
20
25
30
35
40
45
50
Altitude [km
]
Aerosol Extinction [km-1
]
λSAGE: 755.4 nm λPOAM: 779.4 nm
SAGE0119SAGE0124SAGE0129SAGE0131POAM0119POAM0121SG0119AATSlayLiv Aero Model
0 2 4 6 8
x 1012
5
10
15
20
25
30
35
40
45
50
Ozone Density [no/cm3]
SAGE0119SAGE0124SAGE0129SAGE0131POAM0119POAM0121
0 3 6 9 12Molecular Density [no/cm
3] x 10
18
Subarctic Winter
88 88.5 89 89.5 90 90.5 9110
15
20
25
30
35
40
45
50
55
60
True Zenith Angle (deg)
Airm
ass
Aerosol
Ozone
SAGE0119
SAGE0124
SAGE0129
SAGE0131
POAM0119
POAM0121
SG0119AATSlay
Liv Aero Model
Molec (Subarctic Winter)
z: 10.0 km λSAGE: 755.4 nm λPOAM: 779.4 nm
Fig. 4. Left frames: Representative vertical profiles of aerosol extinction and of ozone and molecular number density. Aerosol and ozoneprofiles are from SAGE III and POAM III retrievals near DC-8 flights on the dates shown. Aerosol profiles are for one SAGE III wavelength(775.4 nm) and one POAM III wavelength (779.4 nm). The molecular density profile is the MODTRAN subarctic winter model. Right frame:Corresponding results for airmass calculated for altitude 10 km using the method of DeMajistre and Yee (2002) and the constituent profilesin the left frames.
resolution) and altitude (at 0.5-km resolution) for a particu-lar SAGE III or POAM III occultation event.
Figure 7 shows analogous results for the DC-8 flight andnearby SAGE III occultation on 29 January 2003. Not shownfor brevity are analogous plots for the 24 and 31 JanuaryDC-8 flights, which experienced a range ofSZAwithin thosecovered by the 19 and 24 January flights.
The following section presents results that use these air-mass computations, both to solve forAODs from AATS mea-surements and to convert AATS transmissions measured atSZAmeas to transmission at an apparent (refracted)SZAof90◦.
3 AATS–SAGE comparisons
3.1 AATS-14 and SAGE IIIAODs from conventional anal-yses
We first obtainedAODs from AATS and SAGE measure-ments by conventional analyses. That is, we obtained AATSAODs using the method described in the Appendix of Russellet al. (1993), and we obtained SAGEAODs by vertically in-tegrating the SAGE aerosol extinction profiles in Fig. 2 abovethe DC-8 altitude. AATSAOD results at two selected wave-lengths, 519 and 864 nm, are shown in Figs. 6 and 7 as timeseries, along with time series of DC-8 altitude and distance
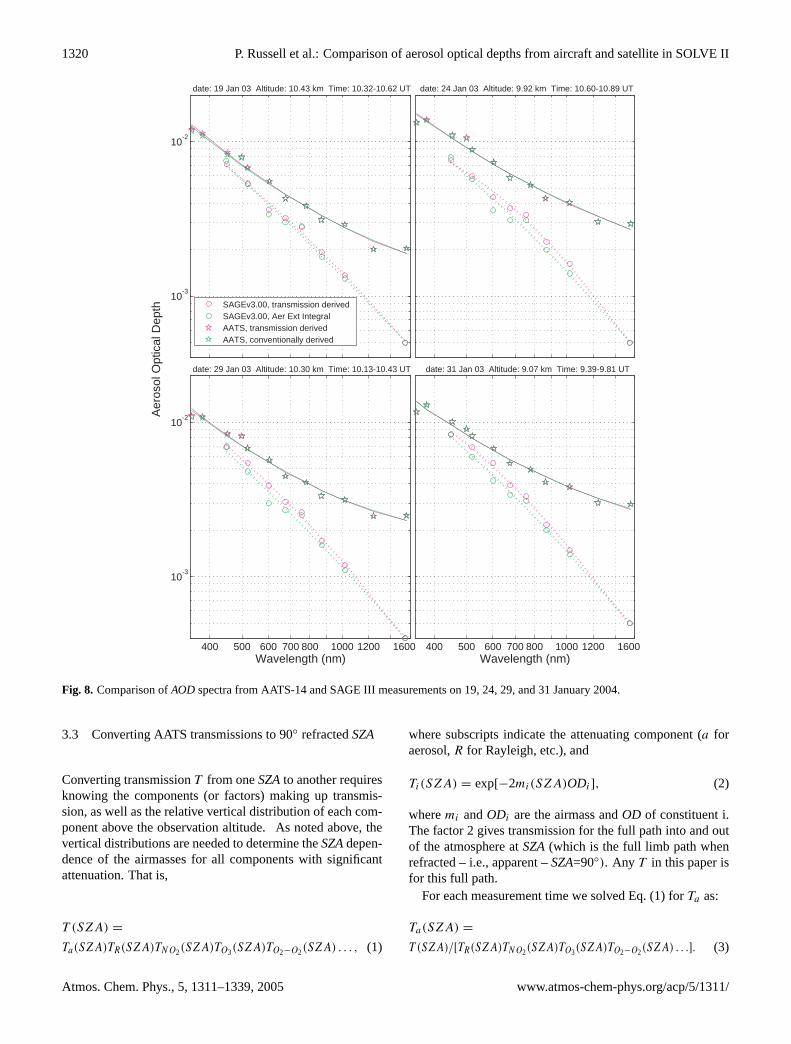
from the SAGE III tangent point. Figure 8 shows the AATSresults asAOD spectra (green stars labeled “AATS, conven-tionally derived”), along with the SAGEAOD results (greencircles labeled “SAGE v3.00, Aer Ext Integral”).
The results in Fig. 8 show that the conventional analysesyield SAGE AODs that are systematically less than AATSAODs, and that the percentage difference between the SAGEand AATSAODs increases with wavelength.
Because of these systematicAODdifferences, and becauseof the strong dependences of AATS-derivedAODs on air-mass, of SAGE-derivedAODs on path-length matrices, andof both AATS- and SAGE-derivedAODs on Rayleigh scat-tering and absorbing gas retrievals, we have also comparedAATS and SAGE in the more fundamental result, transmis-sion of the direct beam. We have also derivedAODs from theAATS and SAGE transmissions using a more transmission-oriented analysis, which helps to show the relative roles ofgas and aerosol attenuation at the various wavelengths. Thesetransmission-oriented results are described in the followingsubsections.
Before presenting the transmission-oriented results wealso note that we have performed a “modified conventional”AATS analysis, which excludes all times that had apparentSZA>90◦. (Such times can be identified in Figs. 6–7.) Ourmotivation for doing this was that, for suchSZA, the AATSLOS passes through altitudes below the DC-8, which arenot included in the SAGE extinction integrals used to get
Atmos. Chem. Phys., 5, 1311–1339, 2005 www.atmos-chem-phys.org/acp/5/1311/
P. Russell et al.: Comparison of aerosol optical depths from aircraft and satellite in SOLVE II 1317
88 88.5 89 89.5 90 90.5 9110
20
30
40
50
60
True Solar Zenith Angle (deg)
Airm
ass
UA results 24 Jan 2003 zkm: 8.5
384.3 448.5 520.3 601.2 675.6 755.4 869.3 1021.6 1545.2
ozone molecKastH2OLiv 755
88 88.5 89 89.5 90 90.5 9110
20
30
40
50
60
True Solar Zenith Angle (deg)
Yee results 24 Jan 2003 zkm: 8.5
384.3 448.5 520.3 601.2 675.6 755.4
869.3 1021.6 1545.2
ozone molec yeeH2OLiv 755
88 88.5 89 89.5 90 90.5 9110
20
30
40
50
60
True Solar Zenith Angle (deg)
Airm
ass
zkm: 10.5
88 88.5 89 89.5 90 90.5 9110
20
30
40
50
60
True Solar Zenith Angle (deg)
zkm: 10.5
0 1 2 3x 10
19
0
5
10
15
20
25
30
35
40
45
50
Molec [no/cm 3]
Altitu
de
[km
]
0 1 2 3 4 5x 10
16
Wat Vap[no/cm 3]
0 1 2 3 4 5 6 7 8
x 1012
Ozone [no/cm 3 ]
0 0.2 0.4 0.6 0.8 1
x 10-3
Aer Ext [per km]
384.3
448.5
520.3
601.2
675.6
755.4
869.3
1021.6
1545.2
Models
Fig. 5. Comparison of airmass results from the methods of DeMajistre and Yee (2002, labeled Yee) and Thomason et al. (1983, labeled UA),for different wavelengths of aerosol extinction and for molecular, ozone, and water vapor number density. Profiles in the left frames yieldthe airmasses in the right frames for two altitudes: 8.5 km (top row) and 10.5 km (bottom row).
www.atmos-chem-phys.org/acp/5/1311/ Atmos. Chem. Phys., 5, 1311–1339, 2005
1318 P. Russell et al.: Comparison of aerosol optical depths from aircraft and satellite in SOLVE II
0
50
100
150
200
250
300
Dis
tan
ce
fro
m A
AT
S-1
4 (
DC
-8)
to S
AG
E I
II t
an
ge
nt
po
int
(km
)
104 AOD(519 nm)
104 AOD(864 nm)
8
9
10
11
12
DC
-8 A
ltitu
de
(km
)
89
89.5
90
90.5
91
SZ
A (
de
g)
TRUE SZA
APPARENT SZA
SAGE
9.4 9.6 9.8 10 10.2 10.4 10.620
25
30
35
40
45
50
UT (hrs)
airm
ass
rayleigh SZAmeasozone SZAmeasaerosol SZAmeas
rayleigh SZA= 90o
ozone SZA= 90o
aerosol SZA= 90o
Fig. 6. Conditions and results for the DC-8 flight of 19 January 2003. Top: DC-8 altitude, distance from SAGE III 10-km tangent point, andtrue and apparent (refracted)SZA, with AOD retrieved from AATS-14 at two wavelengths. Red vertical dotted line marked by red arrow and“SAGE” shows time of SAGE III tangent at 10 km altitude. Bottom: Airmasses for Rayleigh, ozone, and aerosol (755 nm), atSZAmeas andapparentSZA=90◦, computed using the Yee algorithm. Results shown used SAGE III version 2.00 profiles, but results using version 3.00differ by <2%.
SAGE AOD above the DC-8. AATSAODs from the mod-ified conventional analyses (not shown for brevity) differedfrom the conventional results in Fig. 8 by 8% or less at allwavelengths, and hence did little to reduce the AATS-SAGEdifferences.
3.2 AATS-14 and SAGE III transmission measurements
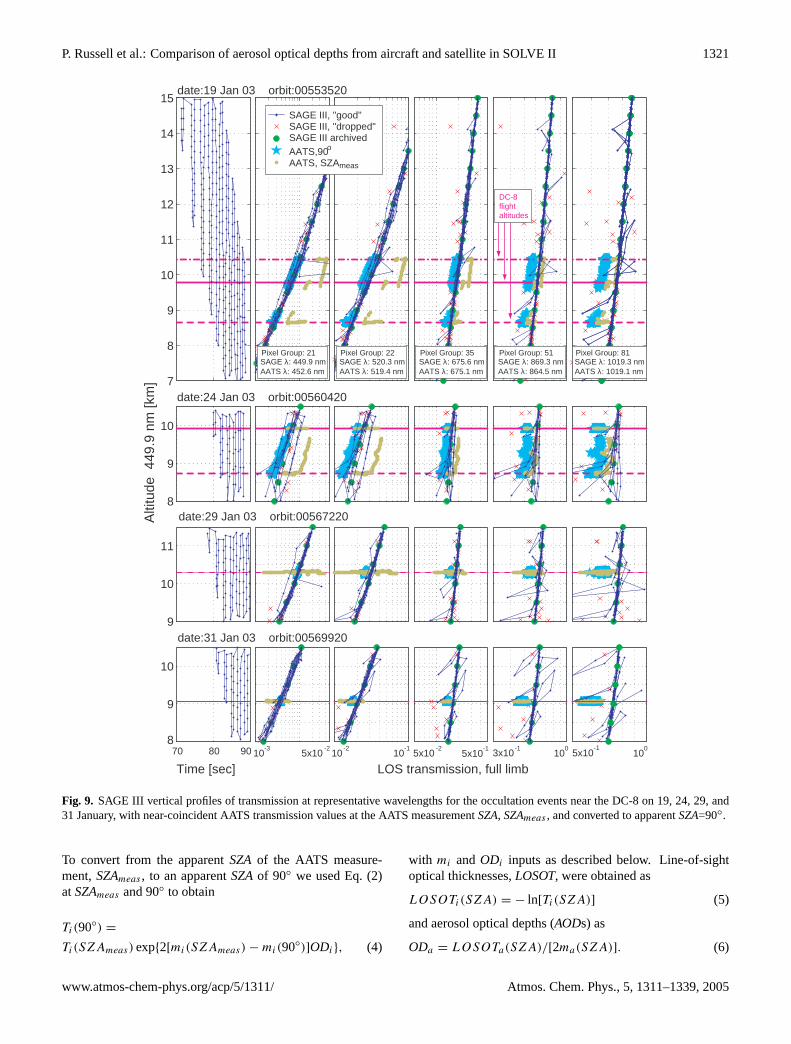
Figure 9 shows vertical profiles of transmission measured bySAGE III during four solar occultation events that were thefocus of DC-8 maneuvers on 19, 24, 29, and 31 January 2003during SOLVE II. These are full-limb atmospheric transmis-sions, meaning that they describe transmission through thefull atmospheric limb between the spaceborne SAGE III in-strument and the Sun. Results are shown for five selected
SAGE III wavelengths, which are defined by pixel groupsin the array detector of the SAGE III spectrometer. TheSAGE III transmission measurements are made by scanningits pointing mirror up and down across the Sun as SAGE III’smovement in its orbit makes the Sun appear to rise or set(NASA Langley Research Center, 2002). The left column ofFig. 9 shows the altitude-vs-time trace of the tangent point ofthe lowest atmospheric shell traversed by the refracted lineof sight (LOS) from SAGE III to the Sun. Because refractionis wavelength dependent, the altitude-vs-time traces are alsowavelength dependent. The result shown is for wavelength449.9 nm (SAGE III pixel group 21).
As Fig. 9 shows, the scans across the sun produce manytransmission measurements for a given tangent altitude in-terval. The transmission measurements initially identified as
Atmos. Chem. Phys., 5, 1311–1339, 2005 www.atmos-chem-phys.org/acp/5/1311/
P. Russell et al.: Comparison of aerosol optical depths from aircraft and satellite in SOLVE II 1319
0
50
100
150
200
250
300
Dis
tan
ce
fro
m A
AT
S-1
4 (
DC
-8)
to S
AG
E I
II t
an
ge
nt
po
int
(km
)
104
AOD(519 nm)
104
AOD(864 nm)9
9.5
10
10.5
11
DC
-8 A
ltitu
de
(km
)
89
89.5
90
90.5
91
SZ
A (
de
g)
TRUE SZA
APPARENT SZA
SAGE
10 10.2 10.4 10.6 10.8 11 11.2 11.4 11.6 11.8 12
20
40
60
80
100
UT hr
airm
ass
rayleigh SZAmeas
ozone SZAmeas
aerosol SZAmeas
rayleigh SZA=90o
ozone SZA=90o
aerosol SZA=90o
Fig. 7. As in Fig. 6, but for 29 January 2003. Airmass results shown used SAGE III version 2.00 profiles, but results using version 3.00 differby <6%.
“good” by the SAGE III retrieval algorithm are shown bythe points and curves labeled ‘SAGE III, “good”’ in Fig. 9.Other points, identified as “dropped” by the algorithm, arealso shown. The SAGE III algorithm groups transmissionsinto altitude bins 0.5 km thick, and archives the median ofeach group of “good” points. These archived median valuesare labeled “SAGE III archived” in Fig. 9. Using medianvalues reduces or eliminates the influence of outliers amongthe points initially identified as “good”. Such outliers can beseen in Fig. 9. Outliers can be caused by misregistration oftransmitted solar intensity values near scan edges (i.e., withinthe solar limb-darkening region), among other reasons.
Also shown in Fig. 9 are transmission results fromAATS-14 measurements. AATS transmissions are shownboth as measured at the AATS measurementSZA, SZAmeas ,and as converted fromSZAmeas to the apparent (refracted)SZAof 90◦ that occurs along the SAGE limb viewing pathat its tangent point. This conversion process is explained inSect. 3.3. All AATS transmissions in Fig. 9 have also been
squared to convert from half limb to full limb. This squaringassumes that transmission is equal in the two limb halves(i.e., from DC-8 to the Sun and from DC-8 away from theSun). Equal transmission in the two limb halves is just aspecial case of the homogeneity in spherical shells that isassumed by satellite limb inversion algorithms. We discussthis assumption further in Sect. 6.
As elaborated in Sect. 3.3, the conversion of AATS trans-mission fromSZAmeas to 90◦ depends on differences be-tween airmasses atSZAmeas and at 90◦, rather than on air-masses themselves. It is thus less sensitive to airmass than is,e.g., the conversion from transmission to verticalOD. Thisis increasingly so as apparentSZAmeas approaches or equals90◦, as it did on several DC-8 flights (see theSZAcurves inFigs. 6–7). Examples ofSZAmeas equaling 90◦ (apparent) inFig. 9 are given by the data points for 24, 29, and 31 Jan-uary where transmissions labeled “AATS, 90◦” equal thoselabeled “AATS,SZAmeas”.
www.atmos-chem-phys.org/acp/5/1311/ Atmos. Chem. Phys., 5, 1311–1339, 2005
1320 P. Russell et al.: Comparison of aerosol optical depths from aircraft and satellite in SOLVE II
10-3
10-2
date: 19 Jan 03 Altitude: 10.43 km Time: 10.32-10.62 UT
SAGEv3.00, transmission derivedSAGEv3.00, Aer Ext IntegralAATS, transmission derivedAATS, conventionally derived
date: 24 Jan 03 Altitude: 9.92 km Time: 10.60-10.89 UT
400 500 600 700 800 1000 1200 1600
10-3
10-2
Wavelength (nm)
Aer
osol
Opt
ical
Dep
th
date: 29 Jan 03 Altitude: 10.30 km Time: 10.13-10.43 UT
400 500 600 700 800 1000 1200 1600Wavelength (nm)
date: 31 Jan 03 Altitude: 9.07 km Time: 9.39-9.81 UT
Fig. 8. Comparison ofAODspectra from AATS-14 and SAGE III measurements on 19, 24, 29, and 31 January 2004.
3.3 Converting AATS transmissions to 90◦ refractedSZA
Converting transmissionT from oneSZAto another requiresknowing the components (or factors) making up transmis-sion, as well as the relative vertical distribution of each com-ponent above the observation altitude. As noted above, thevertical distributions are needed to determine theSZAdepen-dence of the airmasses for all components with significantattenuation. That is,
T (SZA) =
Ta(SZA)TR(SZA)TNO2(SZA)TO3(SZA)TO2−O2(SZA) . . . , (1)
where subscripts indicate the attenuating component (a foraerosol,R for Rayleigh, etc.), and
Ti(SZA) = exp[−2mi(SZA)ODi], (2)
wheremi andODi are the airmass andOD of constituent i.The factor 2 gives transmission for the full path into and outof the atmosphere atSZA(which is the full limb path whenrefracted – i.e., apparent –SZA=90◦). Any T in this paper isfor this full path.
For each measurement time we solved Eq. (1) for Ta as:
Ta(SZA) =
T (SZA)/[TR(SZA)TNO2(SZA)TO3(SZA)TO2−O2(SZA) . . .]. (3)
Atmos. Chem. Phys., 5, 1311–1339, 2005 www.atmos-chem-phys.org/acp/5/1311/
P. Russell et al.: Comparison of aerosol optical depths from aircraft and satellite in SOLVE II 1321
7
8
9
10
11
12
13
14
15date:19 Jan 03 orbit:00553520
8
9
10
Alti
tude
449
.9 n
m [k
m]
date:24 Jan 03 orbit:00560420
9
10
11
date:29 Jan 03 orbit:00567220
70 80 908
9
10
Time [sec] LOS transmission, full limb
date:31 Jan 03 orbit:00569920
10-3
5x10⁻²
10-2
10-1
5x10⁻²
100
100
SAGE III, "good"SAGE III, "dropped"SAGE III archivedAATS,90o
AATS, SZAmeas
Pixel Group: 21SAGE λ: 449.9 nmAATS λ: 452.6 nm
Pixel Group: 22SAGE λ: 520.3 nmAATS λ: 519.4 nm
Pixel Group: 35SAGE λ: 675.6 nmAATS λ: 675.1 nm
Pixel Group: 51SAGE λ: 869.3 nmAATS λ: 864.5 nm
Pixel Group: 81SAGE λ: 1019.3 nmAATS λ: 1019.1 nm
DC-8 flight altitudes
-15x10 3x10
-1 -15x10
Fig. 9. SAGE III vertical profiles of transmission at representative wavelengths for the occultation events near the DC-8 on 19, 24, 29, and31 January, with near-coincident AATS transmission values at the AATS measurementSZA, SZAmeas , and converted to apparentSZA=90◦.
To convert from the apparentSZAof the AATS measure-ment,SZAmeas , to an apparentSZAof 90◦ we used Eq. (2)atSZAmeas and 90◦ to obtain
Ti(90◦) =
Ti(SZAmeas) exp{2[mi(SZAmeas) − mi(90◦)]ODi}, (4)
with mi andODi inputs as described below. Line-of-sightoptical thicknesses,LOSOT, were obtained as
LOSOTi(SZA) = − ln[Ti(SZA)] (5)
and aerosol optical depths (AODs) as
ODa = LOSOTa(SZA)/[2ma(SZA)]. (6)
www.atmos-chem-phys.org/acp/5/1311/ Atmos. Chem. Phys., 5, 1311–1339, 2005
1322 P. Russell et al.: Comparison of aerosol optical depths from aircraft and satellite in SOLVE II
10-2
10-1
100
LOS
tran
smis
sion
(fu
ll lim
b)
O3 column AATS=254.76 DU
NO2 column =7.45e+014 cm-2
date: 19 Jan 03 Altitude: 10.43 km Time: 10.32-10.6 2 UT
10-2
10-1
100
LOS
Opt
ical
Thi
ckne
ss (
full
limb) TOTAL
Rayleigh
Aerosol
O3
NO2
O2
O2-O
2
DIAS,SZAmeas
400 500 600 700 800 900 1000 1200 1400 160010
-4
10-3
10-2
Wavelength (nm)
Ver
tical
Opt
ical
Dep
th
SZAmeasSZA=90o
+
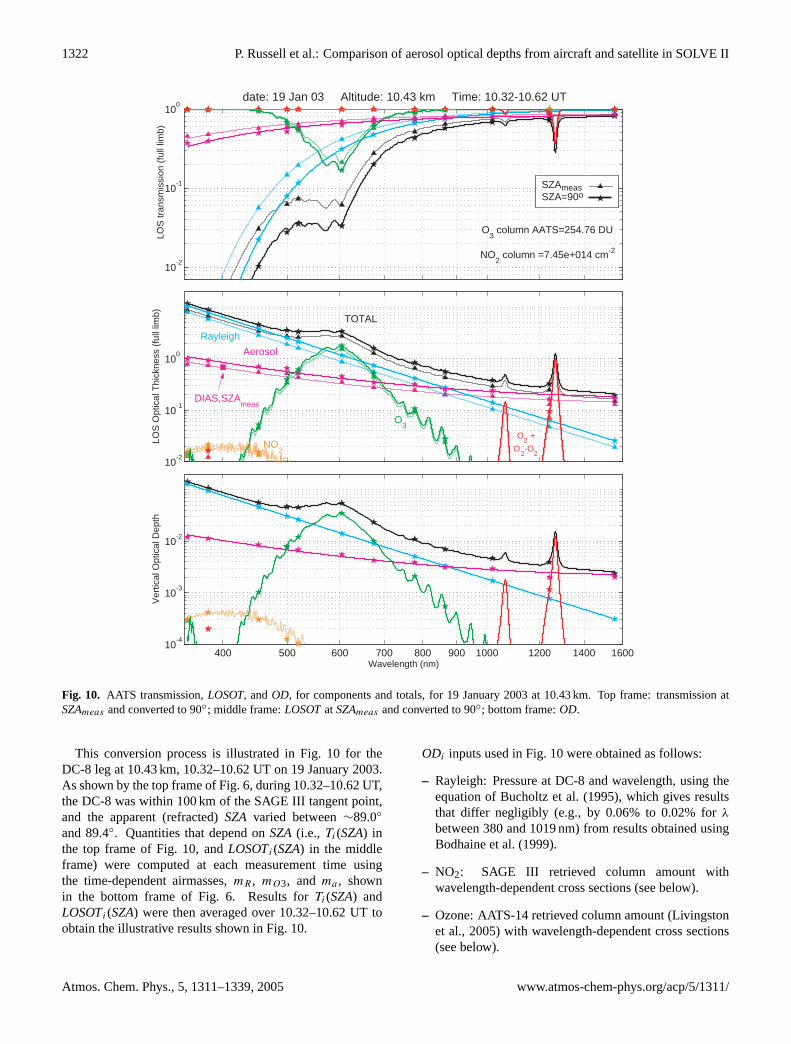
Fig. 10. AATS transmission,LOSOT, andOD, for components and totals, for 19 January 2003 at 10.43 km. Top frame: transmission atSZAmeas and converted to 90◦; middle frame:LOSOTatSZAmeas and converted to 90◦; bottom frame:OD.
This conversion process is illustrated in Fig. 10 for theDC-8 leg at 10.43 km, 10.32–10.62 UT on 19 January 2003.As shown by the top frame of Fig. 6, during 10.32–10.62 UT,the DC-8 was within 100 km of the SAGE III tangent point,and the apparent (refracted)SZA varied between∼89.0◦
and 89.4◦. Quantities that depend onSZA(i.e., Ti(SZA) inthe top frame of Fig. 10, andLOSOTi(SZA) in the middleframe) were computed at each measurement time usingthe time-dependent airmasses,mR, mO3, and ma , shownin the bottom frame of Fig. 6. Results forTi(SZA) andLOSOTi(SZA) were then averaged over 10.32–10.62 UT toobtain the illustrative results shown in Fig. 10.
ODi inputs used in Fig. 10 were obtained as follows:
– Rayleigh: Pressure at DC-8 and wavelength, using theequation of Bucholtz et al. (1995), which gives resultsthat differ negligibly (e.g., by 0.06% to 0.02% forλbetween 380 and 1019 nm) from results obtained usingBodhaine et al. (1999).
– NO2: SAGE III retrieved column amount withwavelength-dependent cross sections (see below).
– Ozone: AATS-14 retrieved column amount (Livingstonet al., 2005) with wavelength-dependent cross sections(see below).
Atmos. Chem. Phys., 5, 1311–1339, 2005 www.atmos-chem-phys.org/acp/5/1311/
P. Russell et al.: Comparison of aerosol optical depths from aircraft and satellite in SOLVE II 1323
10-2
10-1
100
LOS
tran
smis
sion
(fu
ll lim
b)
O3 column AATS=254.76 DU
O3 column SAGE=283.60 DU
NO2 column =7.45e+014 cm-2
date: 19 Jan 03 Altitude: 10.43 km Time: 10.32-10.6 2 UT
10-2
10-1
100
LOS
Opt
ical
Thi
ckne
ss (
full
limb) TOTAL
Rayleigh
Aerosol
O3
NO2
O2 +
O2 - O
2
400 500 600 700 800 900 1000 1200 1400 160010
-4
10-3
10-2
Wavelength (nm)
Ver
tical
Opt
ical
Dep
thSAGE:AATS:SZA=90o
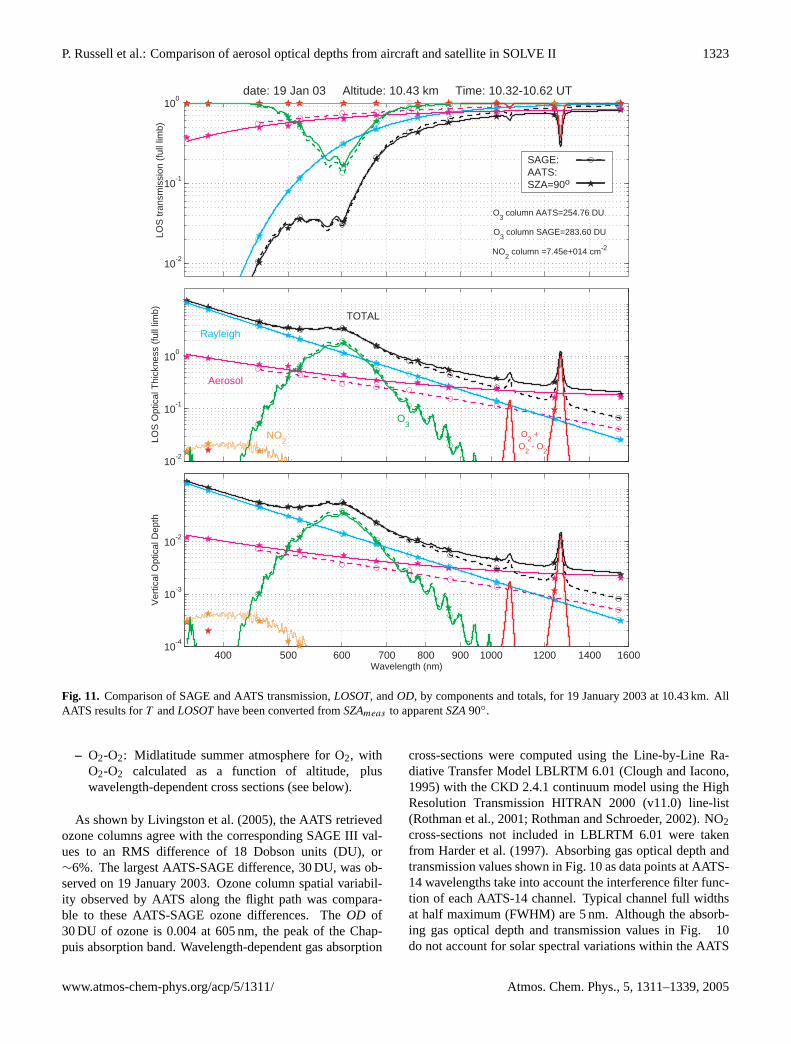
Fig. 11. Comparison of SAGE and AATS transmission,LOSOT, andOD, by components and totals, for 19 January 2003 at 10.43 km. AllAATS results forT andLOSOThave been converted fromSZAmeas to apparentSZA90◦.
– O2-O2: Midlatitude summer atmosphere for O2, withO2-O2 calculated as a function of altitude, pluswavelength-dependent cross sections (see below).
As shown by Livingston et al. (2005), the AATS retrievedozone columns agree with the corresponding SAGE III val-ues to an RMS difference of 18 Dobson units (DU), or∼6%. The largest AATS-SAGE difference, 30 DU, was ob-served on 19 January 2003. Ozone column spatial variabil-ity observed by AATS along the flight path was compara-ble to these AATS-SAGE ozone differences. TheOD of30 DU of ozone is 0.004 at 605 nm, the peak of the Chap-puis absorption band. Wavelength-dependent gas absorption
cross-sections were computed using the Line-by-Line Ra-diative Transfer Model LBLRTM 6.01 (Clough and Iacono,1995) with the CKD 2.4.1 continuum model using the HighResolution Transmission HITRAN 2000 (v11.0) line-list(Rothman et al., 2001; Rothman and Schroeder, 2002). NO2cross-sections not included in LBLRTM 6.01 were takenfrom Harder et al. (1997). Absorbing gas optical depth andtransmission values shown in Fig. 10 as data points at AATS-14 wavelengths take into account the interference filter func-tion of each AATS-14 channel. Typical channel full widthsat half maximum (FWHM) are 5 nm. Although the absorb-ing gas optical depth and transmission values in Fig. 10do not account for solar spectral variations within the AATS
www.atmos-chem-phys.org/acp/5/1311/ Atmos. Chem. Phys., 5, 1311–1339, 2005
1324 P. Russell et al.: Comparison of aerosol optical depths from aircraft and satellite in SOLVE II
10-4
10-3
10-2
10-1
O3 column AATS=254.76 DU
O3 column SAGE=283.60 DU
NO2 column =7.45e+014 cm-2TOTAL
Rayleigh
Aerosol
O3
NO2
O +2
O2-O
2
date: 19 Jan 03 Altitude: 10.43 km Time: 10.32-10.62 UT
O3 column AATS=411.70 DU
O3 column SAGE=422.00 DU
NO2 column =1.32e+015 cm-2
date: 24 Jan 03 Altitude: 9.92 km Time: 10.60-10.89 UT
400 500 600 700 800 1000 1200 160010
-4
10-3
10-2
10-1
Wavelength (nm)
Ver
tical
Opt
ical
Dep
th
O3 column AATS=372.46 DU
O3 column SAGE=353.00 DU
NO2 column =1.3e+015 cm-2
date: 29 Jan 03 Altitude: 10.30 km Time: 10.13-10.43 UT
400 500 600 700 800 1000 1200 1600Wavelength (nm)
O3 column AATS=315.45 DU
O3 column SAGE=308.00 DU
NO2 column =1.8e+015 cm-2
date: 31 Jan 03 Altitude: 9.07 km Time: 9.39-9.81 UT
SAGE:AATS:SZA=90o
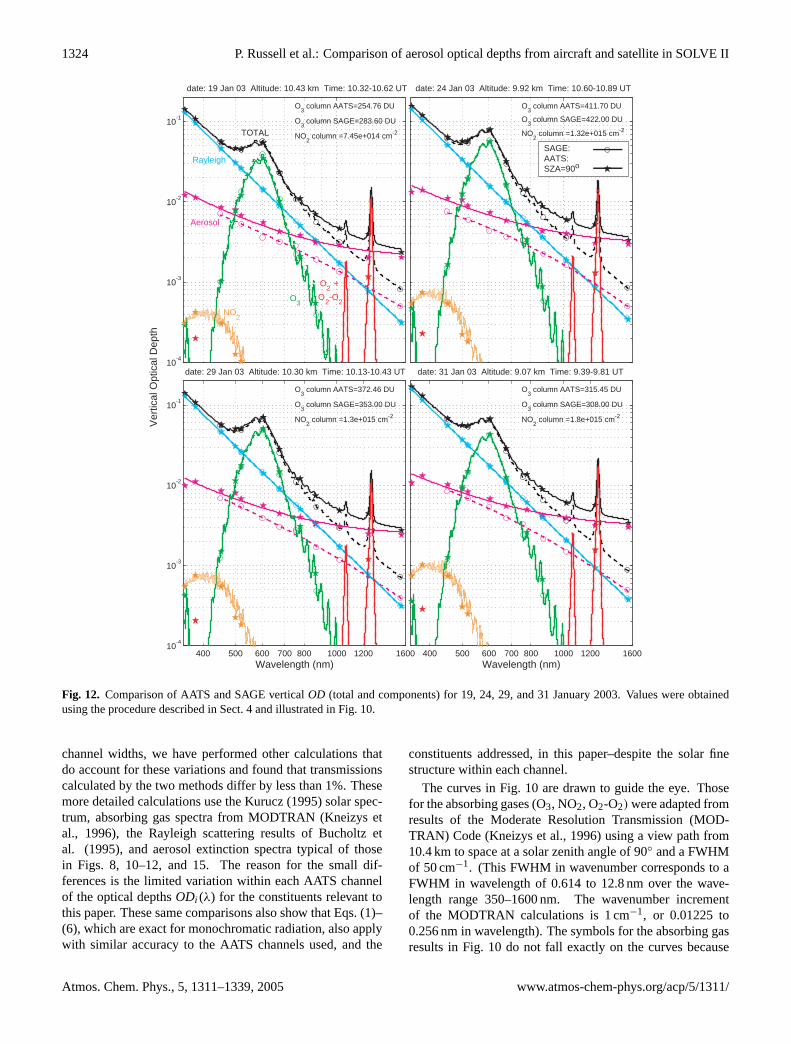
Fig. 12. Comparison of AATS and SAGE verticalOD (total and components) for 19, 24, 29, and 31 January 2003. Values were obtainedusing the procedure described in Sect. 4 and illustrated in Fig. 10.
channel widths, we have performed other calculations thatdo account for these variations and found that transmissionscalculated by the two methods differ by less than 1%. Thesemore detailed calculations use the Kurucz (1995) solar spec-trum, absorbing gas spectra from MODTRAN (Kneizys etal., 1996), the Rayleigh scattering results of Bucholtz etal. (1995), and aerosol extinction spectra typical of thosein Figs. 8, 10–12, and 15. The reason for the small dif-ferences is the limited variation within each AATS channelof the optical depthsODi(λ) for the constituents relevant tothis paper. These same comparisons also show that Eqs. (1)–(6), which are exact for monochromatic radiation, also applywith similar accuracy to the AATS channels used, and the
constituents addressed, in this paper–despite the solar finestructure within each channel.
The curves in Fig. 10 are drawn to guide the eye. Thosefor the absorbing gases (O3, NO2, O2-O2) were adapted fromresults of the Moderate Resolution Transmission (MOD-TRAN) Code (Kneizys et al., 1996) using a view path from10.4 km to space at a solar zenith angle of 90◦ and a FWHMof 50 cm−1. (This FWHM in wavenumber corresponds to aFWHM in wavelength of 0.614 to 12.8 nm over the wave-length range 350–1600 nm. The wavenumber incrementof the MODTRAN calculations is 1 cm−1, or 0.01225 to0.256 nm in wavelength). The symbols for the absorbing gasresults in Fig. 10 do not fall exactly on the curves because
Atmos. Chem. Phys., 5, 1311–1339, 2005 www.atmos-chem-phys.org/acp/5/1311/
P. Russell et al.: Comparison of aerosol optical depths from aircraft and satellite in SOLVE II 1325
of the different methods used to calculate symbol and curvepositions. That is, the symbol positions are calculated us-ing AATS-14 filter functions with LBLRTM, HITRAN, etc.(details above), whereas the curves use MODTRAN with aFWHM fixed in wavenumber but varying in wavelength. De-spite these differences, we feel that the curves help to illus-trate the physics behind the symbol positions. We emphasizethat it is the symbols that give the values used for each AATS-14 channel when converting fromSZAmeas to 90◦ and whenderiving aerosol LOS OT andOD.
We have excluded from Fig. 10 the AATS-14 channel at941 nm, which is strongly affected by water vapor absorptionand in fact used to retrieve water vapor (e.g., Schmid et al.,1996, 2001). The other AATS-14 channels shown in Fig. 10are only weakly affected by water vapor absorption, and sothe analyses shown here do not account for water vapor ef-fects (though our traditional analyses do – see, e.g., Schmidet al., 1996, 2001).
The curves for aerosolOD andLOSOTin Fig. 10 are fitsof the form
logODa=c0 + c1 logλ + c2(logλ)2, (7)
where the ci are fitting coefficients (see also Livingston et al.,2005). As with the absorbing gas curves, they are drawn toguide the eye, and are not used in deriving aerosolOD andLOSOTat AATS-14 wavelengths. AerosolLOSOTandODare derived at each AATS-14 channel wavelength by usingEqs. (5) and (6) above.
Curves for totalOD and totalLOSOTin Fig. 10 were ob-tained by adding curves for components. Curves for totaltransmissionT were obtained by multiplying curves for com-ponents, as in Eq. (1).
Vertical profile inputs used to getmi in Fig. 6 (henceFig. 10) were obtained as follows (see also Sect. 2):
– Rayleigh: The MODTRAN subarctic winter moleculardensity model.
– NO2: Same as ozone (see below).
– Ozone: The SAGE III or POAM III profile closest tothe DC-8. (If a profile did not extend down to the DC-8altitude, it was extended using the ozone concentrationmeasured on the DC-8.)
– O2-O2: Same as Rayleigh.
– Aerosol: SAGE III aerosol extinction profiles at wave-length 755 nm (Fig. 2. Changes in SAGE III data ver-sions affect extinction profile shapes, and therefore air-mass values. However, the change from SAGE III v2.00to v3.00 affected aerosol airmass by<2%.)
Notice in Fig. 10 (middle frame) that converting fromSZAmeas to 90◦ shifts ozoneLOSOT results less thanRayleigh and aerosolLOSOT. This is explained by Eq. (4)along with the facts that1mO3<1mR and 1mO3<1ma ,
where1mi=mi(90◦)−mi(SZAmeas). The relevant values ofmi are shown in, e.g., Figs. 4 and 6. As mentioned in Sect. 2,the reason thatmO3<mR andmO3<ma is that most ozoneextinction was farther from the DC-8 than most Rayleigh andaerosol extinction.
3.4 Transmission-derived AATS-SAGE comparison results
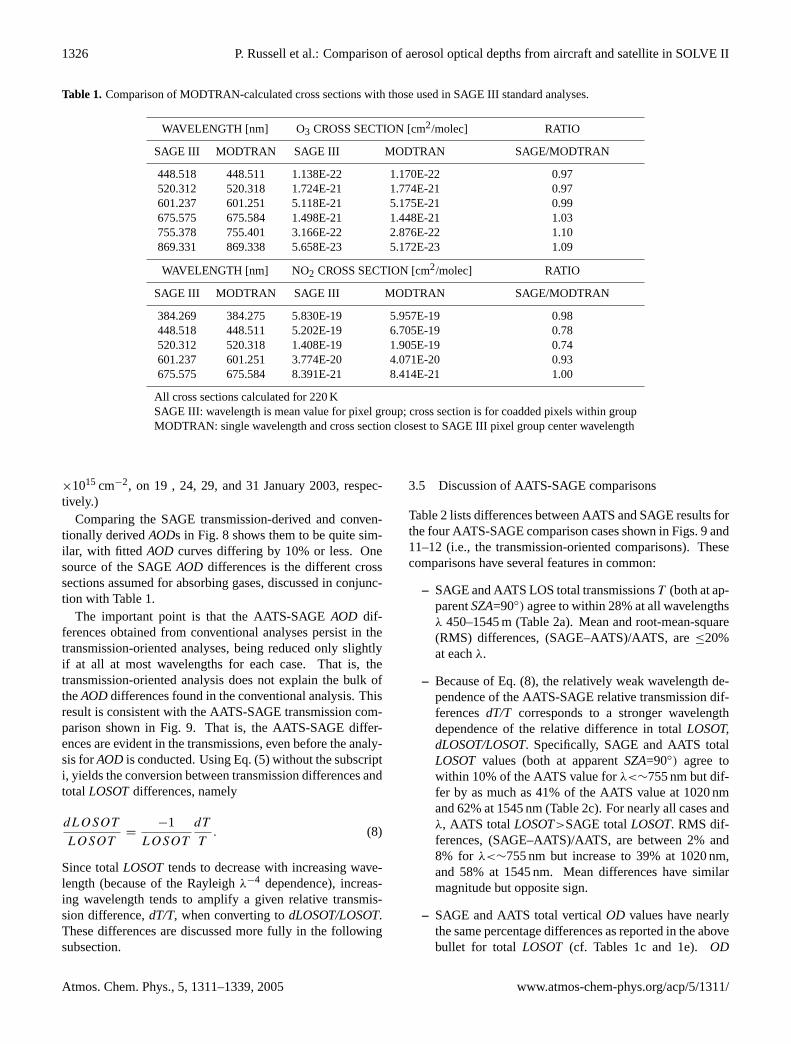
Figure 11 shows, for 19 January at 10.43 km, the SAGEarchived values for total transmissionT (which were previ-ously shown at selected wavelengths in the top row of Fig. 9),for total LOSOT(obtained fromT using Eq. (5) without thesubscripti), and totalOD (obtained using components as fol-lows). Results for the components (aerosol, Rayleigh, NO2,ozone, O2-O2) were obtained by applying to the SAGE to-tal transmission values the method of Sect. 3.3. That is, weused Eqs. (3) and (2) at apparent (refracted)SZA=90◦, withthe inputs listed in Sect. 3.3 – except that SAGE-retrievedozone was used in place of AATS-retrieved ozone. Also, ateach SAGE wavelength, we used absorbing gas cross sec-tions computed from MODTRAN as described in Sect. 3.3.These cross sections differ somewhat from the cross sec-tions used in the standard processing that produces the SAGEarchived data products. Table 1 shows how the MODTRANand SAGE-standard cross sections compare. Note, for ex-ample, that, at the 601-nm peak of the Chappuis ozone ab-sorption band, the MODTRAN and SAGE-standard crosssections agree to within a few percent. Percent differencesare larger at other wavelengths and for NO2. However,where cross section differences exceed 10%, the cross sec-tions themselves are relatively small, producing absorbinggas optical depths that are less than or equal to aerosol opti-cal depth (AOD). This can be seen by comparing the entriesin Table 1 with the optical depths shown in Fig. 11. Hence,these cross section differences would impact the SAGEAODvalues we derive by 10% or less.
To facilitate AATS-SAGE comparisons, we also show inFig. 11 the AATS results, for components and totals, at ap-parentSZA=90◦, previously shown in Fig. 10.
This same transmission-oriented analysis was applied tothe AATS-SAGE near-coincidences on 24, 29, and 31 Jan-uary 2003. Resulting AATS-SAGE comparisons, in termsof verticalOD (total and components) are shown in Fig. 12,along with the results for 19 January.
For ease of comparison we also repeat in Fig. 8 thetransmission-derivedAODs from both AATS and SAGE.Comparing the AATS transmission-derived and convention-ally derivedAODs shows them to be identical forλ>600 nm,and to differ by less than a few % forλ<600 nm. The rea-son for the differences in AATSAODs at short wavelengthsis the assumed NO2 column values, which are 2×1015 cm−2
on all days for the AATS conventional analyses but set equalto the SAGE retrieved value above the DC-8 altitude forthe transmission-oriented analyses. (The SAGE retrievedvalues, shown in Fig. 12 are 0.75, 1.32, 1.33, and 1.81, all
www.atmos-chem-phys.org/acp/5/1311/ Atmos. Chem. Phys., 5, 1311–1339, 2005
1326 P. Russell et al.: Comparison of aerosol optical depths from aircraft and satellite in SOLVE II
Table 1. Comparison of MODTRAN-calculated cross sections with those used in SAGE III standard analyses.
WAVELENGTH [nm] O3 CROSS SECTION [cm2/molec] RATIO
SAGE III MODTRAN SAGE III MODTRAN SAGE/MODTRAN
448.518 448.511 1.138E-22 1.170E-22 0.97520.312 520.318 1.724E-21 1.774E-21 0.97601.237 601.251 5.118E-21 5.175E-21 0.99675.575 675.584 1.498E-21 1.448E-21 1.03755.378 755.401 3.166E-22 2.876E-22 1.10869.331 869.338 5.658E-23 5.172E-23 1.09
WAVELENGTH [nm] NO2 CROSS SECTION [cm2/molec] RATIO
SAGE III MODTRAN SAGE III MODTRAN SAGE/MODTRAN
384.269 384.275 5.830E-19 5.957E-19 0.98448.518 448.511 5.202E-19 6.705E-19 0.78520.312 520.318 1.408E-19 1.905E-19 0.74601.237 601.251 3.774E-20 4.071E-20 0.93675.575 675.584 8.391E-21 8.414E-21 1.00
All cross sections calculated for 220 KSAGE III: wavelength is mean value for pixel group; cross section is for coadded pixels within groupMODTRAN: single wavelength and cross section closest to SAGE III pixel group center wavelength
×1015 cm−2, on 19 , 24, 29, and 31 January 2003, respec-tively.)
Comparing the SAGE transmission-derived and conven-tionally derivedAODs in Fig. 8 shows them to be quite sim-ilar, with fitted AOD curves differing by 10% or less. Onesource of the SAGEAOD differences is the different crosssections assumed for absorbing gases, discussed in conjunc-tion with Table 1.
The important point is that the AATS-SAGEAOD dif-ferences obtained from conventional analyses persist in thetransmission-oriented analyses, being reduced only slightlyif at all at most wavelengths for each case. That is, thetransmission-oriented analysis does not explain the bulk oftheAODdifferences found in the conventional analysis. Thisresult is consistent with the AATS-SAGE transmission com-parison shown in Fig. 9. That is, the AATS-SAGE differ-ences are evident in the transmissions, even before the analy-sis forAOD is conducted. Using Eq. (5) without the subscripti, yields the conversion between transmission differences andtotalLOSOTdifferences, namely
dLOSOT
LOSOT=
−1
LOSOT
dT
T. (8)
Since totalLOSOTtends to decrease with increasing wave-length (because of the Rayleighλ−4 dependence), increas-ing wavelength tends to amplify a given relative transmis-sion difference,dT/T, when converting todLOSOT/LOSOT.These differences are discussed more fully in the followingsubsection.
3.5 Discussion of AATS-SAGE comparisons
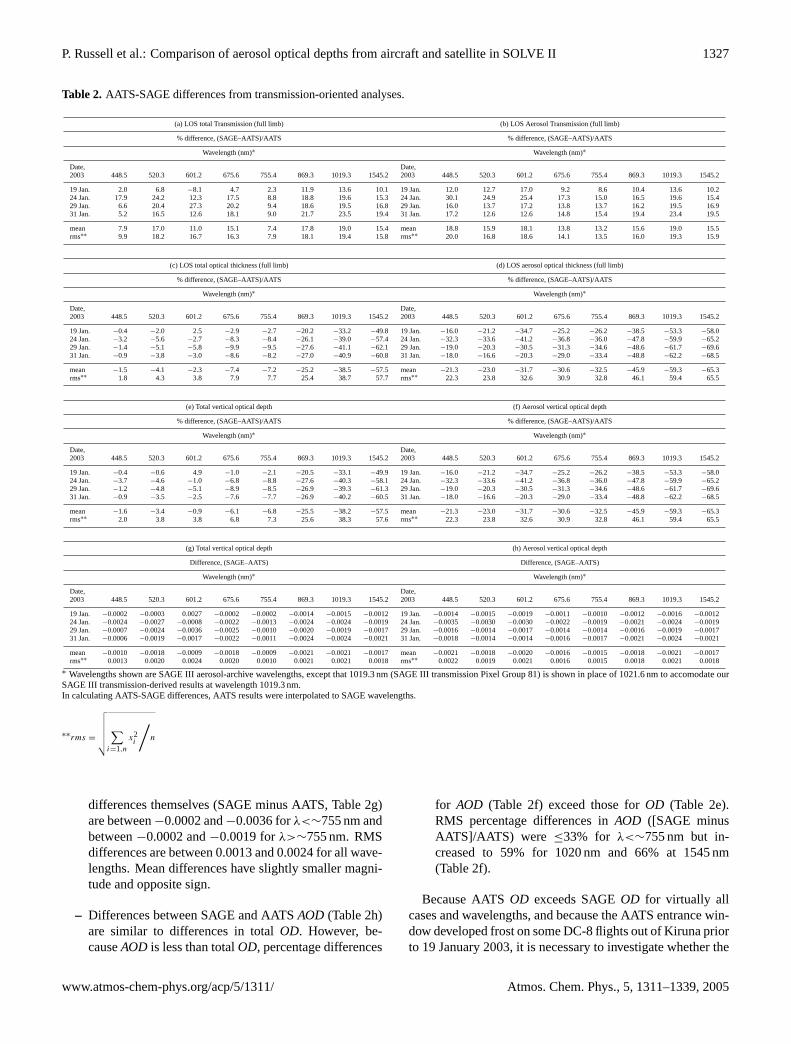
Table 2 lists differences between AATS and SAGE results forthe four AATS-SAGE comparison cases shown in Figs. 9 and11–12 (i.e., the transmission-oriented comparisons). Thesecomparisons have several features in common:
– SAGE and AATS LOS total transmissionsT (both at ap-parentSZA=90◦) agree to within 28% at all wavelengthsλ 450–1545 m (Table 2a). Mean and root-mean-square(RMS) differences, (SAGE–AATS)/AATS, are≤20%at eachλ.
– Because of Eq. (8), the relatively weak wavelength de-pendence of the AATS-SAGE relative transmission dif-ferencesdT/T corresponds to a stronger wavelengthdependence of the relative difference in totalLOSOT,dLOSOT/LOSOT. Specifically, SAGE and AATS totalLOSOT values (both at apparentSZA=90◦) agree towithin 10% of the AATS value forλ<∼755 nm but dif-fer by as much as 41% of the AATS value at 1020 nmand 62% at 1545 nm (Table 2c). For nearly all cases andλ, AATS total LOSOT>SAGE totalLOSOT. RMS dif-ferences, (SAGE–AATS)/AATS, are between 2% and8% for λ<∼755 nm but increase to 39% at 1020 nm,and 58% at 1545 nm. Mean differences have similarmagnitude but opposite sign.
– SAGE and AATS total verticalOD values have nearlythe same percentage differences as reported in the abovebullet for total LOSOT (cf. Tables 1c and 1e).OD
Atmos. Chem. Phys., 5, 1311–1339, 2005 www.atmos-chem-phys.org/acp/5/1311/
P. Russell et al.: Comparison of aerosol optical depths from aircraft and satellite in SOLVE II 1327
Table 2. AATS-SAGE differences from transmission-oriented analyses.
(a) LOS total Transmission (full limb) (b) LOS Aerosol Transmission (full limb)
% difference, (SAGE–AATS)/AATS % difference, (SAGE–AATS)/AATS
Wavelength (nm)∗ Wavelength (nm)∗
Date, Date,2003 448.5 520.3 601.2 675.6 755.4 869.3 1019.3 1545.2 2003 448.5 520.3 601.2 675.6 755.4 869.3 1019.3 1545.2
19 Jan. 2.0 6.8 −8.1 4.7 2.3 11.9 13.6 10.1 19 Jan. 12.0 12.7 17.0 9.2 8.6 10.4 13.6 10.224 Jan. 17.9 24.2 12.3 17.5 8.8 18.8 19.6 15.3 24 Jan. 30.1 24.9 25.4 17.3 15.0 16.5 19.6 15.429 Jan. 6.6 20.4 27.3 20.2 9.4 18.6 19.5 16.8 29 Jan. 16.0 13.7 17.2 13.8 13.7 16.2 19.5 16.931 Jan. 5.2 16.5 12.6 18.1 9.0 21.7 23.5 19.4 31 Jan. 17.2 12.6 12.6 14.8 15.4 19.4 23.4 19.5
mean 7.9 17.0 11.0 15.1 7.4 17.8 19.0 15.4 mean 18.8 15.9 18.1 13.8 13.2 15.6 19.0 15.5rms∗∗ 9.9 18.2 16.7 16.3 7.9 18.1 19.4 15.8 rms∗∗ 20.0 16.8 18.6 14.1 13.5 16.0 19.3 15.9
(c) LOS total optical thickness (full limb) (d) LOS aerosol optical thickness (full limb)
% difference, (SAGE–AATS)/AATS % difference, (SAGE–AATS)/AATS
Wavelength (nm)∗ Wavelength (nm)∗
Date, Date,2003 448.5 520.3 601.2 675.6 755.4 869.3 1019.3 1545.2 2003 448.5 520.3 601.2 675.6 755.4 869.3 1019.3 1545.2
19 Jan. −0.4 −2.0 2.5 −2.9 −2.7 −20.2 −33.2 −49.8 19 Jan. −16.0 −21.2 −34.7 −25.2 −26.2 −38.5 −53.3 −58.024 Jan. −3.2 −5.6 −2.7 −8.3 −8.4 −26.1 −39.0 −57.4 24 Jan. −32.3 −33.6 −41.2 −36.8 −36.0 −47.8 −59.9 −65.229 Jan. −1.4 −5.1 −5.8 −9.9 −9.5 −27.6 −41.1 −62.1 29 Jan. −19.0 −20.3 −30.5 −31.3 −34.6 −48.6 −61.7 −69.631 Jan. −0.9 −3.8 −3.0 −8.6 −8.2 −27.0 −40.9 −60.8 31 Jan. −18.0 −16.6 −20.3 −29.0 −33.4 −48.8 −62.2 −68.5
mean −1.5 −4.1 −2.3 −7.4 −7.2 −25.2 −38.5 −57.5 mean −21.3 −23.0 −31.7 −30.6 −32.5 −45.9 −59.3 −65.3rms∗∗ 1.8 4.3 3.8 7.9 7.7 25.4 38.7 57.7 rms∗∗ 22.3 23.8 32.6 30.9 32.8 46.1 59.4 65.5
(e) Total vertical optical depth (f) Aerosol vertical optical depth
% difference, (SAGE–AATS)/AATS % difference, (SAGE–AATS)/AATS
Wavelength (nm)∗ Wavelength (nm)∗
Date, Date,2003 448.5 520.3 601.2 675.6 755.4 869.3 1019.3 1545.2 2003 448.5 520.3 601.2 675.6 755.4 869.3 1019.3 1545.2
19 Jan. −0.4 −0.6 4.9 −1.0 −2.1 −20.5 −33.1 −49.9 19 Jan. −16.0 −21.2 −34.7 −25.2 −26.2 −38.5 −53.3 −58.024 Jan. −3.7 −4.6 −1.0 −6.8 −8.8 −27.6 −40.3 −58.1 24 Jan. −32.3 −33.6 −41.2 −36.8 −36.0 −47.8 −59.9 −65.229 Jan. −1.2 −4.8 −5.1 −8.9 −8.5 −26.9 −39.3 −61.3 29 Jan. −19.0 −20.3 −30.5 −31.3 −34.6 −48.6 −61.7 −69.631 Jan. −0.9 −3.5 −2.5 −7.6 −7.7 −26.9 −40.2 −60.5 31 Jan. −18.0 −16.6 −20.3 −29.0 −33.4 −48.8 −62.2 −68.5
mean −1.6 −3.4 −0.9 −6.1 −6.8 −25.5 −38.2 −57.5 mean −21.3 −23.0 −31.7 −30.6 −32.5 −45.9 −59.3 −65.3rms∗∗ 2.0 3.8 3.8 6.8 7.3 25.6 38.3 57.6 rms∗∗ 22.3 23.8 32.6 30.9 32.8 46.1 59.4 65.5
(g) Total vertical optical depth (h) Aerosol vertical optical depth
Difference, (SAGE–AATS) Difference, (SAGE–AATS)
Wavelength (nm)∗ Wavelength (nm)∗
Date, Date,2003 448.5 520.3 601.2 675.6 755.4 869.3 1019.3 1545.2 2003 448.5 520.3 601.2 675.6 755.4 869.3 1019.3 1545.2
19 Jan. −0.0002 −0.0003 0.0027 −0.0002 −0.0002 −0.0014 −0.0015 −0.0012 19 Jan. −0.0014 −0.0015 −0.0019 −0.0011 −0.0010 −0.0012 −0.0016 −0.001224 Jan. −0.0024 −0.0027 −0.0008 −0.0022 −0.0013 −0.0024 −0.0024 −0.0019 24 Jan. −0.0035 −0.0030 −0.0030 −0.0022 −0.0019 −0.0021 −0.0024 −0.001929 Jan. −0.0007 −0.0024 −0.0036 −0.0025 −0.0010 −0.0020 −0.0019 −0.0017 29 Jan. −0.0016 −0.0014 −0.0017 −0.0014 −0.0014 −0.0016 −0.0019 −0.001731 Jan. −0.0006 −0.0019 −0.0017 −0.0022 −0.0011 −0.0024 −0.0024 −0.0021 31 Jan. −0.0018 −0.0014 −0.0014 −0.0016 −0.0017 −0.0021 −0.0024 −0.0021
mean −0.0010 −0.0018 −0.0009 −0.0018 −0.0009 −0.0021 −0.0021 −0.0017 mean −0.0021 −0.0018 −0.0020 −0.0016 −0.0015 −0.0018 −0.0021 −0.0017rms∗∗ 0.0013 0.0020 0.0024 0.0020 0.0010 0.0021 0.0021 0.0018 rms∗∗ 0.0022 0.0019 0.0021 0.0016 0.0015 0.0018 0.0021 0.0018
∗ Wavelengths shown are SAGE III aerosol-archive wavelengths, except that 1019.3 nm (SAGE III transmission Pixel Group 81) is shown in place of 1021.6 nm to accomodate ourSAGE III transmission-derived results at wavelength 1019.3 nm.In calculating AATS-SAGE differences, AATS results were interpolated to SAGE wavelengths.
∗∗rms =
√√√√√√ ∑i=1,n
x2i
/n
differences themselves (SAGE minus AATS, Table 2g)are between−0.0002 and−0.0036 forλ<∼755 nm andbetween−0.0002 and−0.0019 forλ>∼755 nm. RMSdifferences are between 0.0013 and 0.0024 for all wave-lengths. Mean differences have slightly smaller magni-tude and opposite sign.
– Differences between SAGE and AATSAOD (Table 2h)are similar to differences in totalOD. However, be-causeAOD is less than totalOD, percentage differences
for AOD (Table 2f) exceed those forOD (Table 2e).RMS percentage differences inAOD ([SAGE minusAATS]/AATS) were ≤33% for λ<∼755 nm but in-creased to 59% for 1020 nm and 66% at 1545 nm(Table 2f).
Because AATSOD exceeds SAGEOD for virtually allcases and wavelengths, and because the AATS entrance win-dow developed frost on some DC-8 flights out of Kiruna priorto 19 January 2003, it is necessary to investigate whether the
www.atmos-chem-phys.org/acp/5/1311/ Atmos. Chem. Phys., 5, 1311–1339, 2005
1328 P. Russell et al.: Comparison of aerosol optical depths from aircraft and satellite in SOLVE II
larger AATS-retrievedODs could be caused by window frost.However, as described more fully in Appendix A, we haveperformed four tests for the presence of window frost in eachof the cases presented here, and all tests indicated no frost.The tests and the AATS-14 design also imply no deposit onany other optical element in the instrument optical path (aninterference filter and detector for each channel). These re-sults lead us to conclude that the combined frost-preventionmeasures used in these cases – window heating and more ex-tensive purging with dry nitrogen than for the early flights –were successful. Additional evidence against AATS windowfrost or other deposits on AATS optical surfaces is providedby comparison of AATS results with those from the Direct-beam Irradiance Airborne Spectrometer (DIAS), reported inSect. 4.
In a similar fashion, differences between SAGE III andAATS AOD could be attributed to SAGE III. From Fig. 9and Table 2a, it is clear that the differences originate at thetransmission level, so the clearing of molecular scatter andabsorption by ozone, nitrogen dioxide, water vapor, and car-bon dioxide (at 1540 nm only) cannot be the primary sourcesof the discrepancy. The most likely scenario would be a sys-tematic error in altitude registration of the individual spec-tra. However, to produce the observedAOD differences, the1020-nm channel would need to be consistently located lowby about 2 km and the 1550-nm channel by over 5 km. This isextremely unlikely because altitude errors of this magnitudewould cause catastrophic problems in other products likeozone and short wavelength aerosol that are not observed.Also, since altitude registration is linked between channels,it is not possible for the quality of the altitude registrationto vary significantly from channel to channel. Comparisonsof transmission between SAGE II and SAGE III at 1020 nmshow a difference of about 10% and are consistent with the∼20% difference in aerosol extinction at this wavelength re-ported by Thomason and Taha (2003). Aerosol extinctionspectra computed from in situ measurements made by a Fo-cused Cavity Aerosol Spectrometer (FCAS) aboard the DC-8tend to agree with SAGE III aerosol extinction spectra ex-cept at 1550 nm where the computed extinctions are signifi-cantly less than SAGE III values (see also Taha et al., 2004).Comparisons of aerosol extinction spectra computed fromthe University of Wyoming Optical Particle Counter (OPC)are consistently significantly less than SAGE III values.
We note that the flatter wavelength dependence of AATS-derivedAOD as compared to SAGE IIIAOD implies largerparticle sizes than would be derived from the SAGE III spec-tra. However, at DC-8 altitudes, there are several mecha-nisms that make larger particle sizes plausible. For example,Fahey et al. (2001) and Northway et al. (2002) report exten-sive measurements of large (5 to>20µm diameter) nitricacid-containing particles over a large altitude range (16–21 km) and horizontal extent (1800 km) in the Arctic strato-sphere during several weeks of the 1999–2000 winter. Theynote that such particles have sedimentation speeds capable
of falling out of the stratosphere (thereby denitrifying it),and that the particles are transported horizontally by windsas they sediment over periods of several days. McKinneyet al. (2004) show that the observations are consistent withparticle trajectory calculations that assume a composition ofnitric acid trihydrate. Large ice particles associated withforming or dissipating cirrus are also not uncommon at DC-8altitudes. And finally, as shown in Sect. 5, POAM III Version4 data giveAOD spectra with slopes very similar to thosefound by AATS. DC-8 in situ measurements might also beused to test for the presence of large particles at DC-8 alti-tudes. Indeed, the FCAS measurements mentioned above donot show the presence of such particles. However, these mea-surements do not describe all the AATS-viewed path, and onemust also bear in mind the difficulty of preserving all opti-cally significant large particles when sampling through inletand instrument systems at DC-8 speeds.
We note also that the AATS-SAGE comparisons in Figs. 8and 11–12 approximate aerosol airmass ma as wavelength-independent, setting ma(λ)=ma(755 nm). A more com-plete (and cumbersome) treatment would use wavelength-dependent ma . As discussed in Sect. 2, using wavelength-dependent ma would decrease AATS-retrievedAOD atλ>755 nm and increase it atλ<755 nm. The size ofthe changes can be estimated from Fig. 5, which showsthat, for DC-8 altitude 10.5 km, maximum differencesat the shortest available SAGE wavelength, 449 nm, i.e.,[ma(449 nm)−ma(755 nm)]/ma(755 nm) are 14% for trueSZAmeas=90◦, 8% for SZAmeas=89◦ and less for smallerSZAmeas . Differences for the longest SAGE wavelength,1550 nm, are similar (with opposite sign), because, as notedin Sect. 2 and shown in Fig. 5, ma(755 nm) is very close tothe mean of ma(449 nm) and ma(1550 nm). Thus the changesin AATS AOD that would result from using wavelength-dependent ma are too small to explain the longer-wavelengthAATS-SAGE AOD differences in Figs. 8 and 11–12 andin Table 2f, which are mostly>∼50% of AATS AOD at1020 nm and>∼60% at 1545 nm.
4 DIAS-AATS Comparisons
The NCAR Direct-beam Irradiance Airborne Spectrometer(DIAS) flew on-board the DC-8 with AATS-14 and measureddirect solar UV and visible irradiance from 290 to 630 nm.DIAS achieves a resolution of roughly 1 nm (comparable toSAGE III) by using a scanning double monochromator de-tection system, based on an instrument used by Shetter andMuller (1999). The DIAS optical collector viewed the Sunthrough a fused silica optical window mounted on the leftside of the DC-8 cabin. Yee et al. (2004) and Swartz etal. (2005) have used the DIAS data (320–630 nm) to derivetotal LOSOT, as well as the individual ozone, aerosol, andO2-O2 LOSOT. They do not attempt to infer vertical col-umn amounts, and focus entirely on the LOS path, because
Atmos. Chem. Phys., 5, 1311–1339, 2005 www.atmos-chem-phys.org/acp/5/1311/
P. Russell et al.: Comparison of aerosol optical depths from aircraft and satellite in SOLVE II 1329
inference of vertical columns requires additional assump-tions and leads to more uncertainty (cf. Sect. 2).
The middle frame of Fig. 10 includes an example DIAS re-sult, the aerosolLOSOTatλ=400 nm on 19 January at 10.48–10.80 UT, shown in comparison to the AATS result for thepartially overlapping period 10.32–10.62 UT. The DIAS andAATS values are 0.68 and 0.67, respectively (both doubledto convert from the DC-8-viewed half limb to a symmetricalfull limb), thus agreeing to within 2%. For the fully over-lapping time period 10.48–10.62 UT the DIAS and AATSfull-limb values are 0.68 and 0.71, respectively, agreeing to4% (Table 3, 19 January, 10.48–10.62 UT).
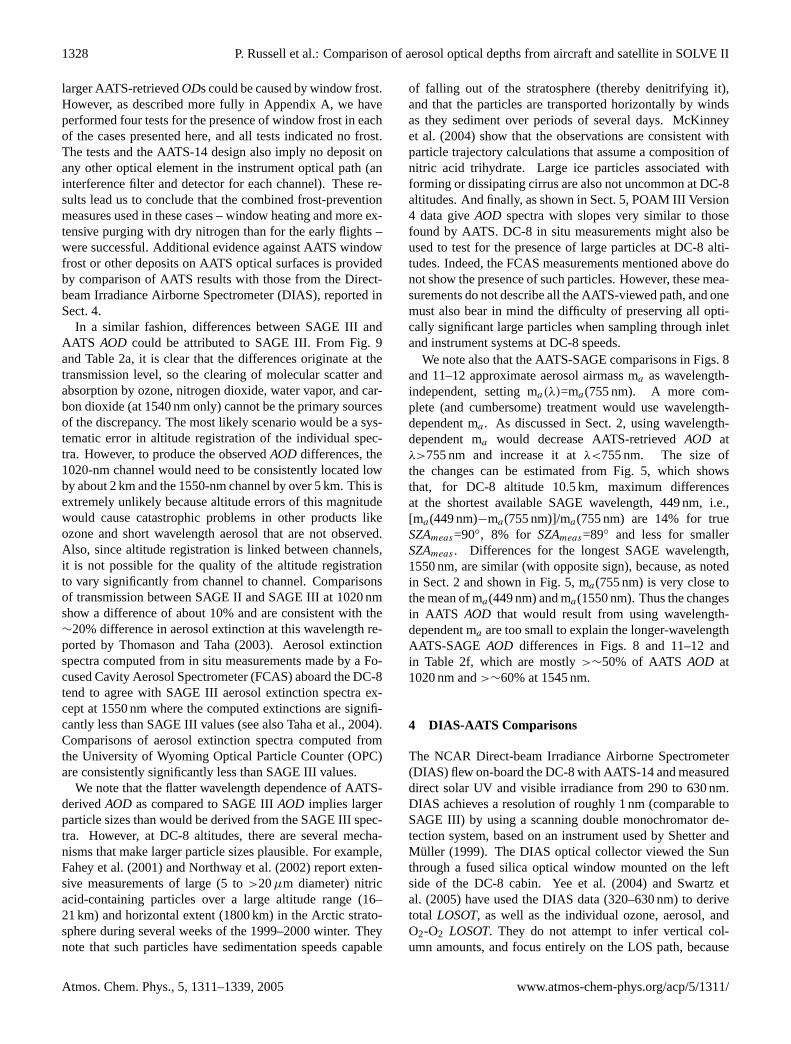
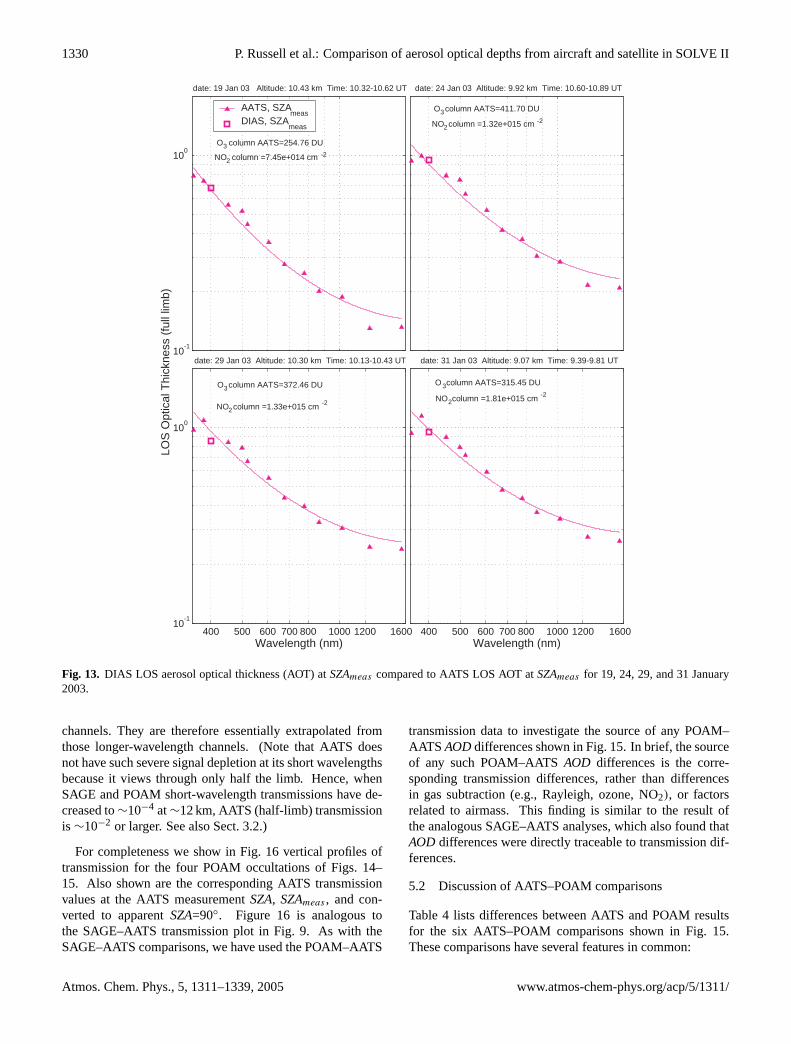
Figure 13 shows DIAS LOS aerosol optical thickness(AOT) atSZAmeas compared to AATS LOS AOT atSZAmeas
for 19, 24, 29, and 31 January 2003. The AATS–DIAS differ-ences for these days and two others (21 January and 2 Febru-ary) are listed in Table 3. For all 6 days, AATS–DIAS dif-ferences in LOS AOT at 400 nm andSZAmeas were≤12%.The mean difference was<3%, and RMS difference<8%.These differences are much less than the SAGE–AATS LOSAOT differences reported in Table 2d, which had mean andRMS values of−21% and 22%, respectively, at the shortestavailable wavelength, 449.9 nm.
The good agreement between DIAS and AATS reportedabove is especially significant since DIAS, located withinthe DC-8 cabin, viewed the sun through an optical windowthat was continuously viewed by on-board experimenters andshowed no evidence of frost. Thus this good AATS–DIASagreement provides additional evidence that the AATS win-dow was frost-free during the measurements reported here.(See also Appendix A.)
5 AATS–POAM comparisons
5.1 AATS–POAM comparison results
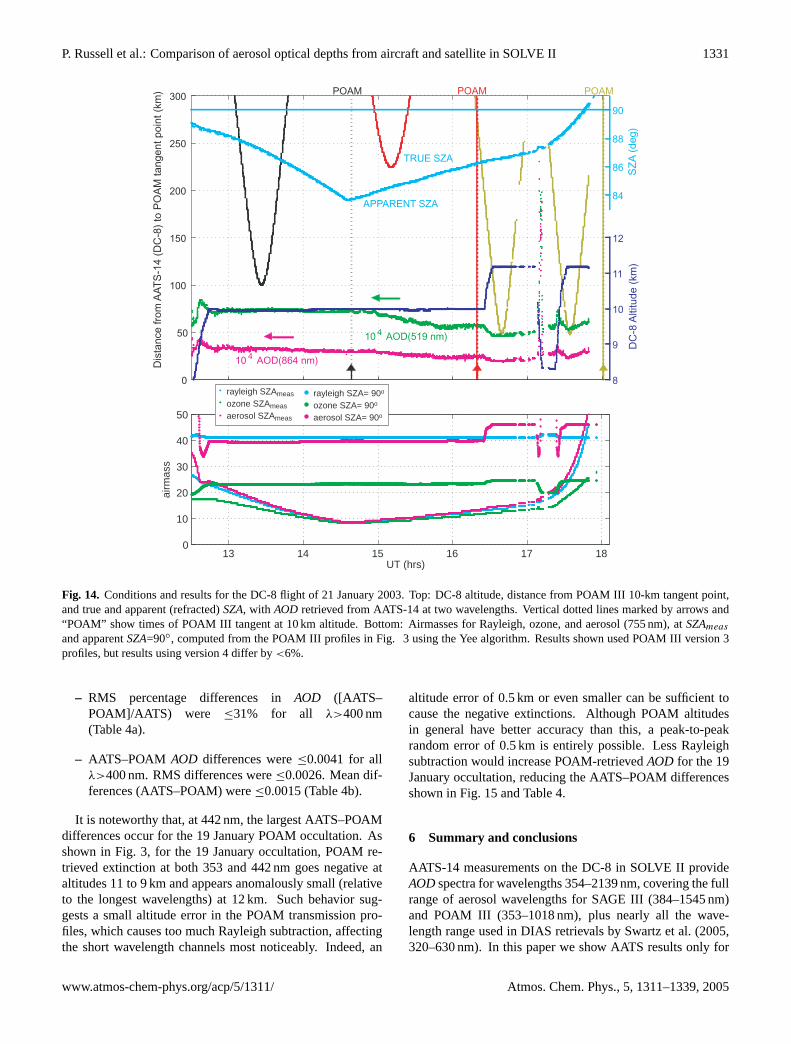
As shown in Fig. 1, the DC-8 flew near one POAM occulta-tion on 19 January 2003 and near three POAM occultationson 21 January. Figure 3 shows the POAM version 4 retrievedaerosol extinction profiles. For the 21 January POAM oc-cultations, the top frame in Fig. 14 shows theSZAs and al-titude of the DC-8, along with the distance from the DC-8to the POAM tangent point and the AATS-retrievedAOD attwo selected wavelengths. Time dependent airmasses,mR,mO3, andma , for Rayleigh, ozone, and aerosol, respectively(obtained by applying the Yee airmass algorithm), are shownin the bottom frame. Aerosol airmass resultsma were com-puted using the POAM III aerosol extinction profile at wave-length 779 nm. Not shown for brevity are analogous resultsfor the 19 January occultation, for which the DC-8 experi-encedSZAvalues within the range shown in Fig. 14.
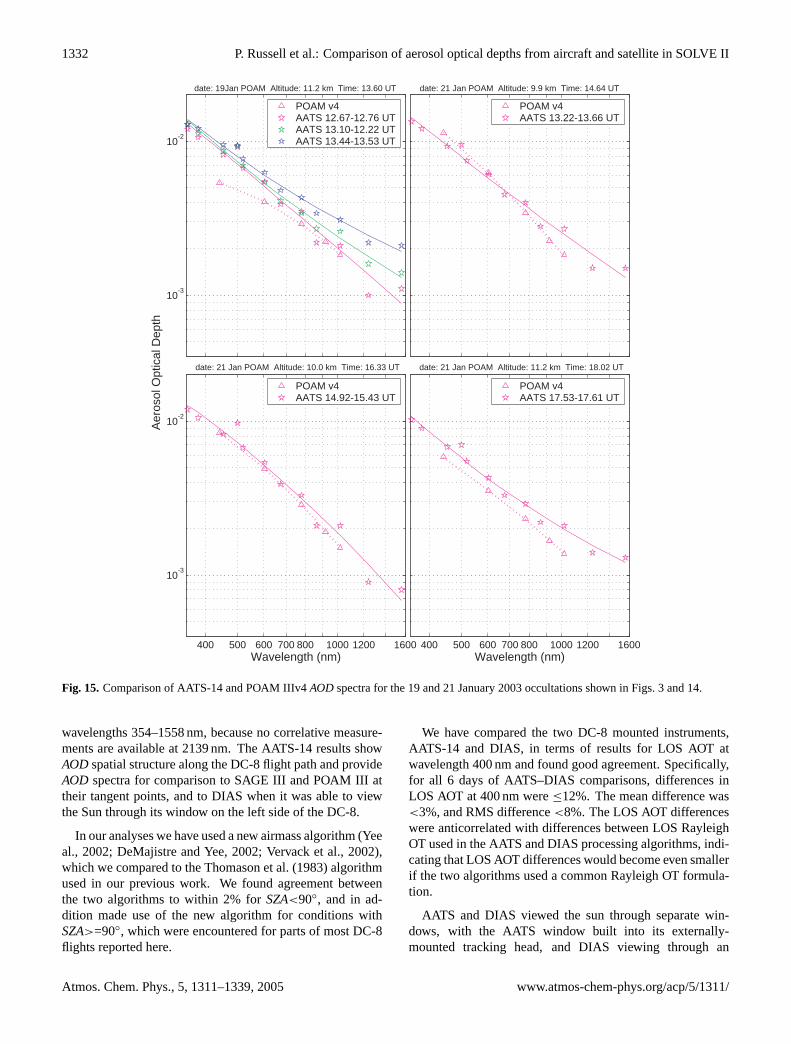
Figure 15 compares the AATS and POAMAOD spectraobtained for the three periods on 19 January and the threeperiods on 21 January when the DC-8 was within 100 km
Table 3. DIAS-AATS differences in LOS aerosol OT (AOT) atwavelength 400 nm.
UT Start UT End % difference,(DIAS–AATS)/AATS
19 Jan. 9.83 10.13 12.019 Jan. 10.48 10.62 −4.021 Jan. 14.61 16.25 −0.424 Jan. 10.60 10.86 −0.224 Jan. 11.22 11.49 8.029 Jan. 10.27 10.43 −7.029 Jan. 10.87 11.13 −7.029 Jan. 11.48 11.64 −9.031 Jan. 9.63 9.81 −5.02 Feb. 12.46 12.80 −10.0
mean −2.3rms∗∗ 7.7
∗∗rms =
√√√√ ∑i=1,n
x2i
/n
of a POAM tangent point. (Note that the three such periodson 19 January were for a single POAM occultation, whereaseach such period on 21 January was for a different POAMoccultation.) The AATS and POAM results were obtainedby conventional analyses, as defined in Sect. 3.1. That is,we obtained AATSAODs using the method described by theAppendix of Russell et al. (1993), and we obtained POAMAODs by vertically integrating the POAM aerosol extinctionprofiles in Fig. 3 above the DC-8 altitude.
Notice that we have excluded the shortest POAM wave-length, 353 nm, from the POAMAODs in Fig. 15, eventhough POAM retrievedAOD values at this wavelength areshown extending down to DC-8 altitudes in Fig. 3. Thereason for excluding POAMAODs at 353 nm is analogousto that for excluding SAGE IIIAODs at the SAGE 384-nmwavelength, i.e., at DC-8 altitudes the transmission signal isso depleted that signal-to-noise is virtually zero. This de-pletion leads to the erroneous values for SAGE III aerosolextinction at 384 nm that are quite evident in Fig. 2 below∼11 km. Corresponding errors in POAM III 353-nm ex-tinction are not readily evident in Fig. 3, but this is a re-sult of the fact that the POAM retrieval solves for the pa-rameters of an assumed extinction functional form (anal-ogous to Eq. (7)), rather than solving for aerosol extinc-tion at each wavelength independently. In solving for fit-ting parameters, the POAM III retrieval weights channelsby the signal-to-noise ratio, and hence the 353-nm chan-nel has essentially zero weight below∼12 km. There-fore, POAM III retrieved extinction values at 353 nm andsuch altitudes are determined by fitting coefficients deter-mined almost entirely by the signals in the longer-wavelength
www.atmos-chem-phys.org/acp/5/1311/ Atmos. Chem. Phys., 5, 1311–1339, 2005
1330 P. Russell et al.: Comparison of aerosol optical depths from aircraft and satellite in SOLVE II
10-1
100
O3 column AATS=254.76 DU
NO2 column =7.45e+014 cm
-2
date: 19 Jan 03 Altitude: 10.43 km Time: 10.32-10.62 UT
AATS, SZAmeas
DIAS, SZAmeas
O3 column AATS=411.70 DU
NO2 column =1.32e+015 cm -2
date: 24 Jan 03 Altitude: 9.92 km Time: 10.60-10.89 UT
400 500 600 700 800 1000 1200 160010
-1
100
Wavelength (nm)
LOS
Opt
ical
Thi
ckne
ss (
full
limb)
O3 column AATS=372.46 DU
NO2 column =1.33e+015 cm -2
date: 29 Jan 03 Altitude: 10.30 km Time: 10.13-10.43 UT
400 500 600 700 800 1000 1200 1600Wavelength (nm)
O3 column AATS=315.45 DU
NO2 column =1.81e+015 cm -2
date: 31 Jan 03 Altitude: 9.07 km Time: 9.39-9.81 UT
-2
Fig. 13. DIAS LOS aerosol optical thickness (AOT) atSZAmeas compared to AATS LOS AOT atSZAmeas for 19, 24, 29, and 31 January2003.
channels. They are therefore essentially extrapolated fromthose longer-wavelength channels. (Note that AATS doesnot have such severe signal depletion at its short wavelengthsbecause it views through only half the limb. Hence, whenSAGE and POAM short-wavelength transmissions have de-creased to∼10−4 at∼12 km, AATS (half-limb) transmissionis ∼10−2 or larger. See also Sect. 3.2.)
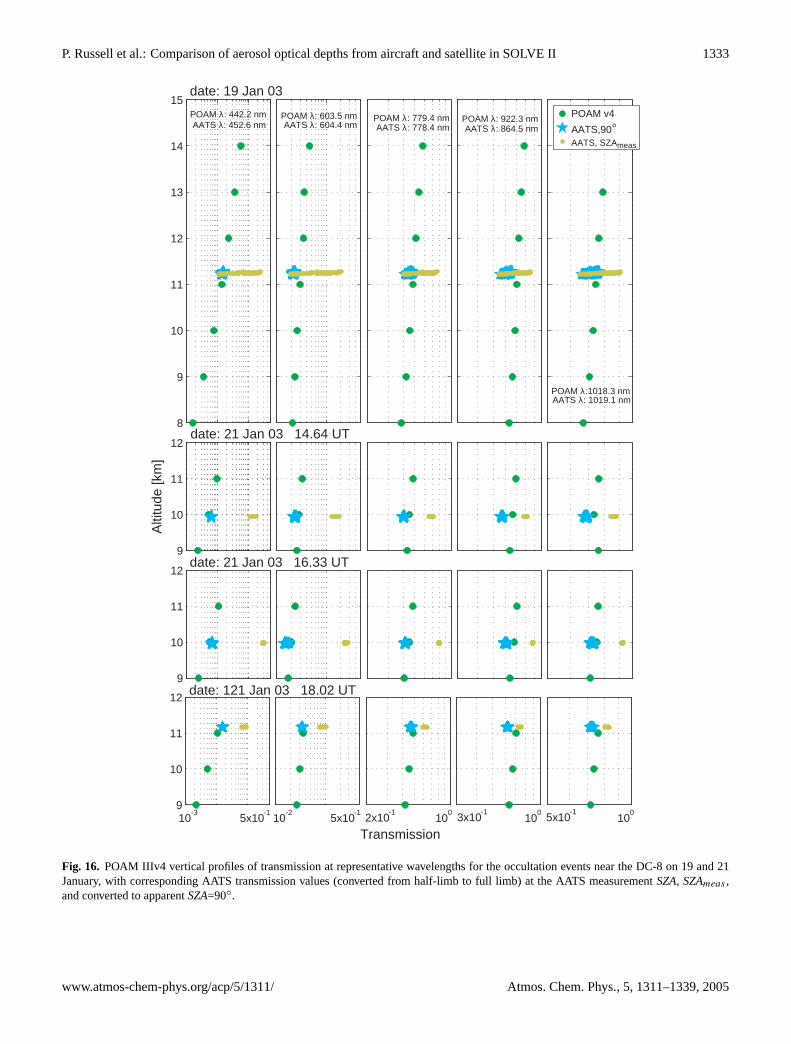
For completeness we show in Fig. 16 vertical profiles oftransmission for the four POAM occultations of Figs. 14–15. Also shown are the corresponding AATS transmissionvalues at the AATS measurementSZA, SZAmeas , and con-verted to apparentSZA=90◦. Figure 16 is analogous tothe SAGE–AATS transmission plot in Fig. 9. As with theSAGE–AATS comparisons, we have used the POAM–AATS
transmission data to investigate the source of any POAM–AATS AODdifferences shown in Fig. 15. In brief, the sourceof any such POAM–AATSAOD differences is the corre-sponding transmission differences, rather than differencesin gas subtraction (e.g., Rayleigh, ozone, NO2), or factorsrelated to airmass. This finding is similar to the result ofthe analogous SAGE–AATS analyses, which also found thatAOD differences were directly traceable to transmission dif-ferences.
5.2 Discussion of AATS–POAM comparisons
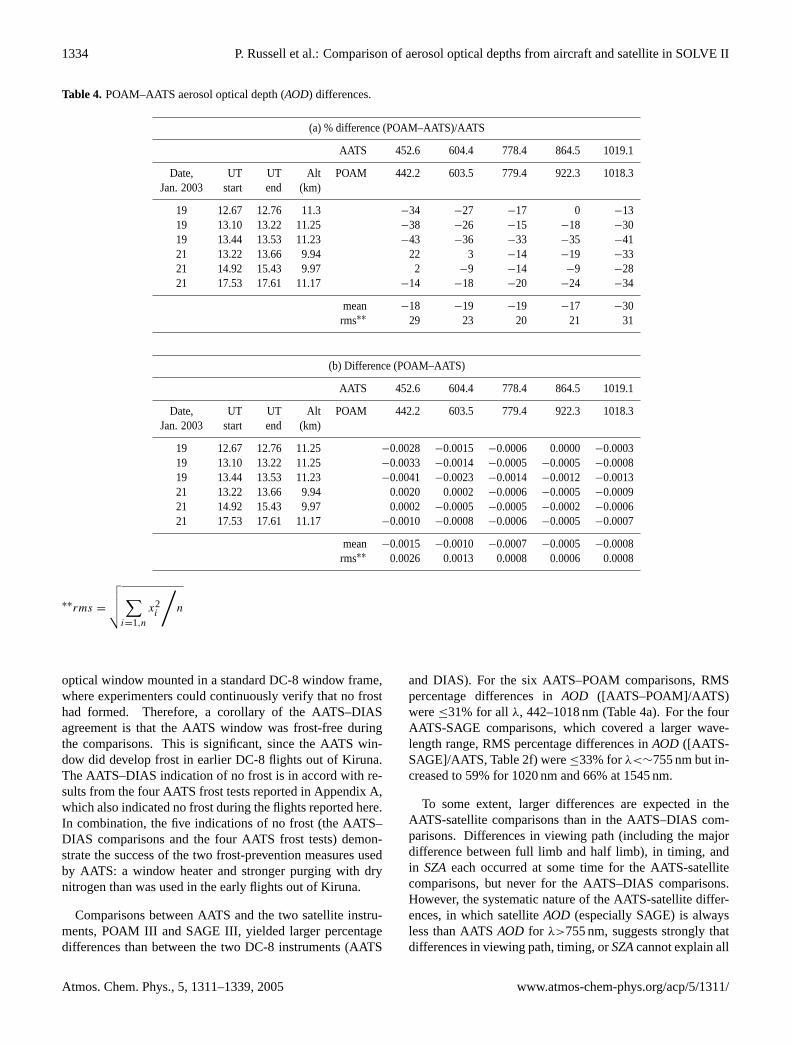
Table 4 lists differences between AATS and POAM resultsfor the six AATS–POAM comparisons shown in Fig. 15.These comparisons have several features in common:
Atmos. Chem. Phys., 5, 1311–1339, 2005 www.atmos-chem-phys.org/acp/5/1311/
P. Russell et al.: Comparison of aerosol optical depths from aircraft and satellite in SOLVE II 1331
0
50
100
150
200
250
300
Dis
tan
ce
fro
m A
AT
S-1
4 (
DC
-8)
to P
OA
M t
an
ge
nt
po
int
(km
)
104
AOD(519 nm)
104
AOD(864 nm)
8
9
10
11
12
DC
-8 A
ltitu
de
(km
)
84
86
88
90
SZ
A (
de
g)
TRUE SZA
APPARENT SZA
POAM POAMPOAM
13 14 15 16 17 180
10
20
30
40
50
UT (hrs)
airm
ass
rayleigh SZAmeas
ozone SZAmeas
aerosol SZAmeas
rayleigh SZA= 90o
ozone SZA= 90o
aerosol SZA= 90o
Fig. 14. Conditions and results for the DC-8 flight of 21 January 2003. Top: DC-8 altitude, distance from POAM III 10-km tangent point,and true and apparent (refracted)SZA, with AOD retrieved from AATS-14 at two wavelengths. Vertical dotted lines marked by arrows and“POAM” show times of POAM III tangent at 10 km altitude. Bottom: Airmasses for Rayleigh, ozone, and aerosol (755 nm), atSZAmeas
and apparentSZA=90◦, computed from the POAM III profiles in Fig. 3 using the Yee algorithm. Results shown used POAM III version 3profiles, but results using version 4 differ by<6%.
– RMS percentage differences inAOD ([AATS–POAM]/AATS) were ≤31% for all λ>400 nm(Table 4a).
– AATS–POAM AOD differences were≤0.0041 for allλ>400 nm. RMS differences were≤0.0026. Mean dif-ferences (AATS–POAM) were≤0.0015 (Table 4b).
It is noteworthy that, at 442 nm, the largest AATS–POAMdifferences occur for the 19 January POAM occultation. Asshown in Fig. 3, for the 19 January occultation, POAM re-trieved extinction at both 353 and 442 nm goes negative ataltitudes 11 to 9 km and appears anomalously small (relativeto the longest wavelengths) at 12 km. Such behavior sug-gests a small altitude error in the POAM transmission pro-files, which causes too much Rayleigh subtraction, affectingthe short wavelength channels most noticeably. Indeed, an
altitude error of 0.5 km or even smaller can be sufficient tocause the negative extinctions. Although POAM altitudesin general have better accuracy than this, a peak-to-peakrandom error of 0.5 km is entirely possible. Less Rayleighsubtraction would increase POAM-retrievedAOD for the 19January occultation, reducing the AATS–POAM differencesshown in Fig. 15 and Table 4.
6 Summary and conclusions
AATS-14 measurements on the DC-8 in SOLVE II provideAODspectra for wavelengths 354–2139 nm, covering the fullrange of aerosol wavelengths for SAGE III (384–1545 nm)and POAM III (353–1018 nm), plus nearly all the wave-length range used in DIAS retrievals by Swartz et al. (2005,320–630 nm). In this paper we show AATS results only for
www.atmos-chem-phys.org/acp/5/1311/ Atmos. Chem. Phys., 5, 1311–1339, 2005
1332 P. Russell et al.: Comparison of aerosol optical depths from aircraft and satellite in SOLVE II
10-3
10-2
date: 19Jan POAM Altitude: 11.2 km Time: 13.60 UT
POAM v4AATS 12.67-12.76 UTAATS 13.10-12.22 UTAATS 13.44-13.53 UT
date: 21 Jan POAM Altitude: 9.9 km Time: 14.64 UT
POAM v4AATS 13.22-13.66 UT
400 500 600 700 800 1000 1200 1600
10-3
10-2
Wavelength (nm)
Aer
osol
Opt
ical
Dep
th
date: 21 Jan POAM Altitude: 10.0 km Time: 16.33 UT
POAM v4AATS 14.92-15.43 UT
400 500 600 700 800 1000 1200 1600Wavelength (nm)
date: 21 Jan POAM Altitude: 11.2 km Time: 18.02 UT
POAM v4AATS 17.53-17.61 UT
Fig. 15. Comparison of AATS-14 and POAM IIIv4AODspectra for the 19 and 21 January 2003 occultations shown in Figs. 3 and 14.
wavelengths 354–1558 nm, because no correlative measure-ments are available at 2139 nm. The AATS-14 results showAODspatial structure along the DC-8 flight path and provideAOD spectra for comparison to SAGE III and POAM III attheir tangent points, and to DIAS when it was able to viewthe Sun through its window on the left side of the DC-8.
In our analyses we have used a new airmass algorithm (Yeeal., 2002; DeMajistre and Yee, 2002; Vervack et al., 2002),which we compared to the Thomason et al. (1983) algorithmused in our previous work. We found agreement betweenthe two algorithms to within 2% forSZA<90◦, and in ad-dition made use of the new algorithm for conditions withSZA>=90◦, which were encountered for parts of most DC-8flights reported here.
We have compared the two DC-8 mounted instruments,AATS-14 and DIAS, in terms of results for LOS AOT atwavelength 400 nm and found good agreement. Specifically,for all 6 days of AATS–DIAS comparisons, differences inLOS AOT at 400 nm were≤12%. The mean difference was<3%, and RMS difference<8%. The LOS AOT differenceswere anticorrelated with differences between LOS RayleighOT used in the AATS and DIAS processing algorithms, indi-cating that LOS AOT differences would become even smallerif the two algorithms used a common Rayleigh OT formula-tion.
AATS and DIAS viewed the sun through separate win-dows, with the AATS window built into its externally-mounted tracking head, and DIAS viewing through an
Atmos. Chem. Phys., 5, 1311–1339, 2005 www.atmos-chem-phys.org/acp/5/1311/
P. Russell et al.: Comparison of aerosol optical depths from aircraft and satellite in SOLVE II 1333
8
9
10
11
12
13
14
15POAM λ: 442.2 nmAATS λ: 452.6 nm
date: 19 Jan 03
POAM λ: 603.5 nmAATS λ: 604.4 nm
POAM λ: 779.4 nmAATS λ: 778.4 nm
POAM λ: 922.3 nmAATS λ: 864.5 nm
POAM λ:1018.3 nmAATS λ: 1019.1 nm
POAM v4
AATS,90o
AATS, SZAmeas
9
10
11
12
Alti
tude
[km
]
date: 21 Jan 03 14.64 UT
9
10
11
12date: 21 Jan 03 16.33 UT
9
10
11
12date: 121 Jan 03 18.02 UT
10-2
5x10⁻¹
Transmission10
010
010
010
-35x10
-12x10
-13x10
-15x10
-1
Fig. 16. POAM IIIv4 vertical profiles of transmission at representative wavelengths for the occultation events near the DC-8 on 19 and 21January, with corresponding AATS transmission values (converted from half-limb to full limb) at the AATS measurementSZA, SZAmeas ,and converted to apparentSZA=90◦.
www.atmos-chem-phys.org/acp/5/1311/ Atmos. Chem. Phys., 5, 1311–1339, 2005
1334 P. Russell et al.: Comparison of aerosol optical depths from aircraft and satellite in SOLVE II
Table 4. POAM–AATS aerosol optical depth (AOD) differences.
(a) % difference (POAM–AATS)/AATS
AATS 452.6 604.4 778.4 864.5 1019.1
Date, UT UT Alt POAM 442.2 603.5 779.4 922.3 1018.3Jan. 2003 start end (km)
19 12.67 12.76 11.3 −34 −27 −17 0 −1319 13.10 13.22 11.25 −38 −26 −15 −18 −3019 13.44 13.53 11.23 −43 −36 −33 −35 −4121 13.22 13.66 9.94 22 3 −14 −19 −3321 14.92 15.43 9.97 2 −9 −14 −9 −2821 17.53 17.61 11.17 −14 −18 −20 −24 −34
mean −18 −19 −19 −17 −30rms∗∗ 29 23 20 21 31
(b) Difference (POAM–AATS)
AATS 452.6 604.4 778.4 864.5 1019.1
Date, UT UT Alt POAM 442.2 603.5 779.4 922.3 1018.3Jan. 2003 start end (km)
19 12.67 12.76 11.25 −0.0028 −0.0015 −0.0006 0.0000 −0.000319 13.10 13.22 11.25 −0.0033 −0.0014 −0.0005 −0.0005 −0.000819 13.44 13.53 11.23 −0.0041 −0.0023 −0.0014 −0.0012 −0.001321 13.22 13.66 9.94 0.0020 0.0002−0.0006 −0.0005 −0.000921 14.92 15.43 9.97 0.0002 −0.0005 −0.0005 −0.0002 −0.000621 17.53 17.61 11.17 −0.0010 −0.0008 −0.0006 −0.0005 −0.0007
mean −0.0015 −0.0010 −0.0007 −0.0005 −0.0008rms∗∗ 0.0026 0.0013 0.0008 0.0006 0.0008
∗∗rms =
√√√√ ∑i=1,n
x2i
/n
optical window mounted in a standard DC-8 window frame,where experimenters could continuously verify that no frosthad formed. Therefore, a corollary of the AATS–DIASagreement is that the AATS window was frost-free duringthe comparisons. This is significant, since the AATS win-dow did develop frost in earlier DC-8 flights out of Kiruna.The AATS–DIAS indication of no frost is in accord with re-sults from the four AATS frost tests reported in Appendix A,which also indicated no frost during the flights reported here.In combination, the five indications of no frost (the AATS–DIAS comparisons and the four AATS frost tests) demon-strate the success of the two frost-prevention measures usedby AATS: a window heater and stronger purging with drynitrogen than was used in the early flights out of Kiruna.
Comparisons between AATS and the two satellite instru-ments, POAM III and SAGE III, yielded larger percentagedifferences than between the two DC-8 instruments (AATS
and DIAS). For the six AATS–POAM comparisons, RMSpercentage differences inAOD ([AATS–POAM]/AATS)were≤31% for allλ, 442–1018 nm (Table 4a). For the fourAATS-SAGE comparisons, which covered a larger wave-length range, RMS percentage differences inAOD ([AATS-SAGE]/AATS, Table 2f) were≤33% forλ<∼755 nm but in-creased to 59% for 1020 nm and 66% at 1545 nm.
To some extent, larger differences are expected in theAATS-satellite comparisons than in the AATS–DIAS com-parisons. Differences in viewing path (including the majordifference between full limb and half limb), in timing, andin SZAeach occurred at some time for the AATS-satellitecomparisons, but never for the AATS–DIAS comparisons.However, the systematic nature of the AATS-satellite differ-ences, in which satelliteAOD (especially SAGE) is alwaysless than AATSAOD for λ>755 nm, suggests strongly thatdifferences in viewing path, timing, orSZAcannot explain all
Atmos. Chem. Phys., 5, 1311–1339, 2005 www.atmos-chem-phys.org/acp/5/1311/
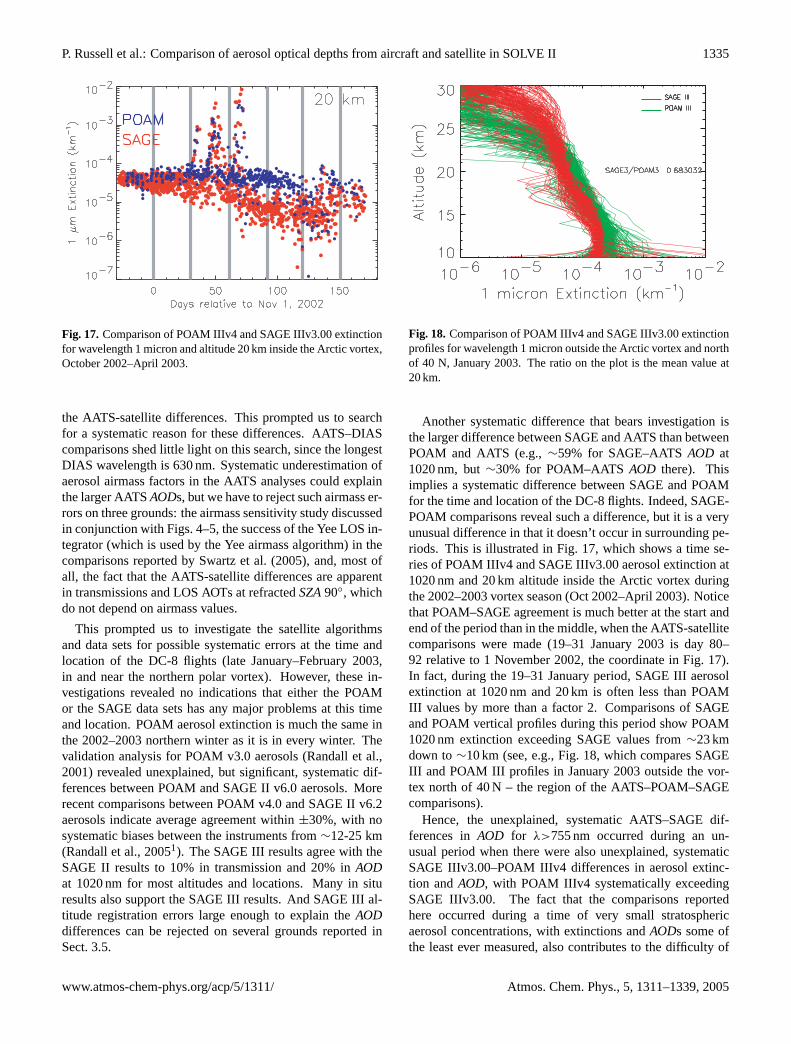
P. Russell et al.: Comparison of aerosol optical depths from aircraft and satellite in SOLVE II 1335
Fig. 17.Comparison of POAM IIIv4 and SAGE IIIv3.00 extinctionfor wavelength 1 micron and altitude 20 km inside the Arctic vortex,October 2002–April 2003.
the AATS-satellite differences. This prompted us to searchfor a systematic reason for these differences. AATS–DIAScomparisons shed little light on this search, since the longestDIAS wavelength is 630 nm. Systematic underestimation ofaerosol airmass factors in the AATS analyses could explainthe larger AATSAODs, but we have to reject such airmass er-rors on three grounds: the airmass sensitivity study discussedin conjunction with Figs. 4–5, the success of the Yee LOS in-tegrator (which is used by the Yee airmass algorithm) in thecomparisons reported by Swartz et al. (2005), and, most ofall, the fact that the AATS-satellite differences are apparentin transmissions and LOS AOTs at refractedSZA90◦, whichdo not depend on airmass values.
This prompted us to investigate the satellite algorithmsand data sets for possible systematic errors at the time andlocation of the DC-8 flights (late January–February 2003,in and near the northern polar vortex). However, these in-vestigations revealed no indications that either the POAMor the SAGE data sets has any major problems at this timeand location. POAM aerosol extinction is much the same inthe 2002–2003 northern winter as it is in every winter. Thevalidation analysis for POAM v3.0 aerosols (Randall et al.,2001) revealed unexplained, but significant, systematic dif-ferences between POAM and SAGE II v6.0 aerosols. Morerecent comparisons between POAM v4.0 and SAGE II v6.2aerosols indicate average agreement within±30%, with nosystematic biases between the instruments from∼12-25 km(Randall et al., 20051). The SAGE III results agree with theSAGE II results to 10% in transmission and 20% inAODat 1020 nm for most altitudes and locations. Many in situresults also support the SAGE III results. And SAGE III al-titude registration errors large enough to explain theAODdifferences can be rejected on several grounds reported inSect. 3.5.
Fig. 18.Comparison of POAM IIIv4 and SAGE IIIv3.00 extinctionprofiles for wavelength 1 micron outside the Arctic vortex and northof 40 N, January 2003. The ratio on the plot is the mean value at20 km.
Another systematic difference that bears investigation isthe larger difference between SAGE and AATS than betweenPOAM and AATS (e.g.,∼59% for SAGE–AATSAOD at1020 nm, but∼30% for POAM–AATSAOD there). Thisimplies a systematic difference between SAGE and POAMfor the time and location of the DC-8 flights. Indeed, SAGE-POAM comparisons reveal such a difference, but it is a veryunusual difference in that it doesn’t occur in surrounding pe-riods. This is illustrated in Fig. 17, which shows a time se-ries of POAM IIIv4 and SAGE IIIv3.00 aerosol extinction at1020 nm and 20 km altitude inside the Arctic vortex duringthe 2002–2003 vortex season (Oct 2002–April 2003). Noticethat POAM–SAGE agreement is much better at the start andend of the period than in the middle, when the AATS-satellitecomparisons were made (19–31 January 2003 is day 80–92 relative to 1 November 2002, the coordinate in Fig. 17).In fact, during the 19–31 January period, SAGE III aerosolextinction at 1020 nm and 20 km is often less than POAMIII values by more than a factor 2. Comparisons of SAGEand POAM vertical profiles during this period show POAM1020 nm extinction exceeding SAGE values from∼23 kmdown to∼10 km (see, e.g., Fig. 18, which compares SAGEIII and POAM III profiles in January 2003 outside the vor-tex north of 40 N – the region of the AATS–POAM–SAGEcomparisons).
Hence, the unexplained, systematic AATS–SAGE dif-ferences inAOD for λ>755 nm occurred during an un-usual period when there were also unexplained, systematicSAGE IIIv3.00–POAM IIIv4 differences in aerosol extinc-tion andAOD, with POAM IIIv4 systematically exceedingSAGE IIIv3.00. The fact that the comparisons reportedhere occurred during a time of very small stratosphericaerosol concentrations, with extinctions andAODs some ofthe least ever measured, also contributes to the difficulty of
www.atmos-chem-phys.org/acp/5/1311/ Atmos. Chem. Phys., 5, 1311–1339, 2005
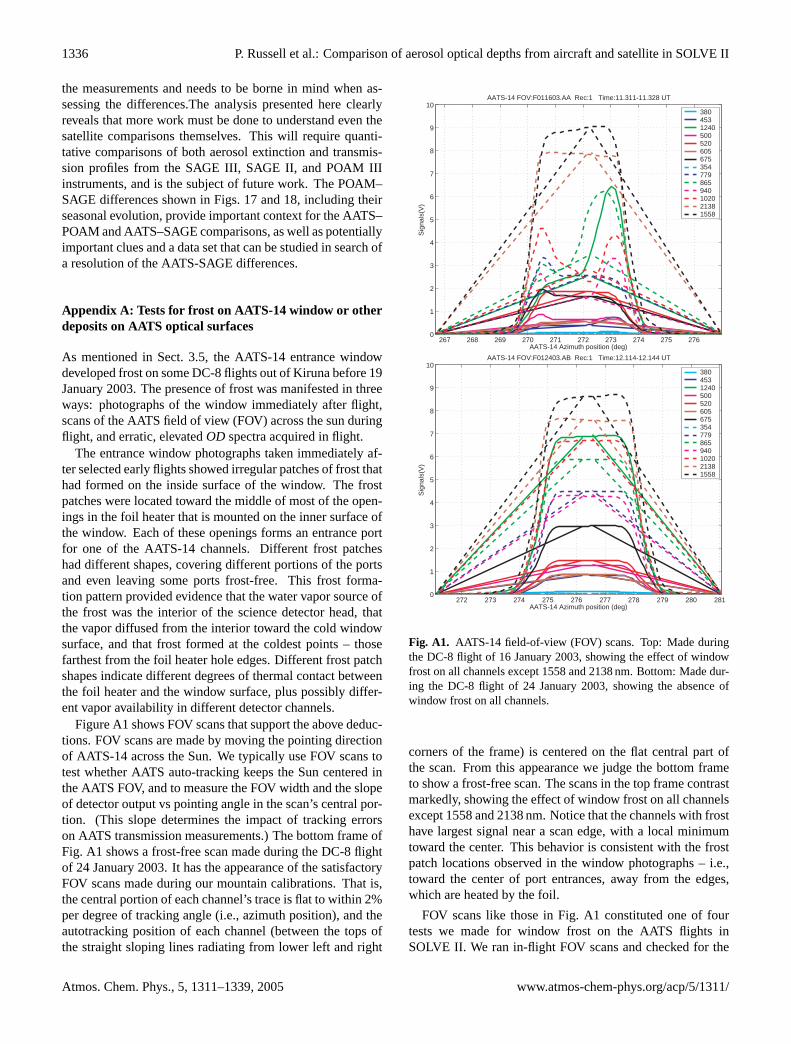
1336 P. Russell et al.: Comparison of aerosol optical depths from aircraft and satellite in SOLVE II
the measurements and needs to be borne in mind when as-sessing the differences.The analysis presented here clearlyreveals that more work must be done to understand even thesatellite comparisons themselves. This will require quanti-tative comparisons of both aerosol extinction and transmis-sion profiles from the SAGE III, SAGE II, and POAM IIIinstruments, and is the subject of future work. The POAM–SAGE differences shown in Figs. 17 and 18, including theirseasonal evolution, provide important context for the AATS–POAM and AATS–SAGE comparisons, as well as potentiallyimportant clues and a data set that can be studied in search ofa resolution of the AATS-SAGE differences.
Appendix A: Tests for frost on AATS-14 window or otherdeposits on AATS optical surfaces
As mentioned in Sect. 3.5, the AATS-14 entrance windowdeveloped frost on some DC-8 flights out of Kiruna before 19January 2003. The presence of frost was manifested in threeways: photographs of the window immediately after flight,scans of the AATS field of view (FOV) across the sun duringflight, and erratic, elevatedOD spectra acquired in flight.
The entrance window photographs taken immediately af-ter selected early flights showed irregular patches of frost thathad formed on the inside surface of the window. The frostpatches were located toward the middle of most of the open-ings in the foil heater that is mounted on the inner surface ofthe window. Each of these openings forms an entrance portfor one of the AATS-14 channels. Different frost patcheshad different shapes, covering different portions of the portsand even leaving some ports frost-free. This frost forma-tion pattern provided evidence that the water vapor source ofthe frost was the interior of the science detector head, thatthe vapor diffused from the interior toward the cold windowsurface, and that frost formed at the coldest points – thosefarthest from the foil heater hole edges. Different frost patchshapes indicate different degrees of thermal contact betweenthe foil heater and the window surface, plus possibly differ-ent vapor availability in different detector channels.
Figure A1 shows FOV scans that support the above deduc-tions. FOV scans are made by moving the pointing directionof AATS-14 across the Sun. We typically use FOV scans totest whether AATS auto-tracking keeps the Sun centered inthe AATS FOV, and to measure the FOV width and the slopeof detector output vs pointing angle in the scan’s central por-tion. (This slope determines the impact of tracking errorson AATS transmission measurements.) The bottom frame ofFig. A1 shows a frost-free scan made during the DC-8 flightof 24 January 2003. It has the appearance of the satisfactoryFOV scans made during our mountain calibrations. That is,the central portion of each channel’s trace is flat to within 2%per degree of tracking angle (i.e., azimuth position), and theautotracking position of each channel (between the tops ofthe straight sloping lines radiating from lower left and right
36 P. Russell et al.: Comparison of aerosol optical depths from aircraft and satellite in SOLVE II
267 268 269 270 271 272 273 274 275 2760
1
2
3
4
5
6
7
8
9
10
Sig
nals
(V)
AATS-14 FOV:F011603.AA Rec:1 Time:11.311-11.328 UT
AATS-14 Azimuth position (deg)
3804531240500520605675354779865940102021381558
272 273 274 275 276 277 278 279 280 2810
1
2
3
4
5
6
7
8
9
10
Sig
nals
(V)
AATS-14 FOV:F012403.AB Rec:1 Time:12.114-12.144 UT
AATS-14 Azimuth position (deg)
3804531240500520605675354779865940102021381558
Figure A1. AATS-14 field-of-view (FOV) scans. Top: Made dur-ing the DC-8 flight of 16 January 2003, showing the effect of win-dow frost on all channels except 1558 and 2138 nm. Bottom: Madeduring the DC-8 flight of 24 January 2003, showing the absence ofwindow frost on all channels.
Atmos. Chem. Phys., 5, 1–37, 2005 www.atmos-chem-phys.org/acp/5/1/
Fig. A1. AATS-14 field-of-view (FOV) scans. Top: Made duringthe DC-8 flight of 16 January 2003, showing the effect of windowfrost on all channels except 1558 and 2138 nm. Bottom: Made dur-ing the DC-8 flight of 24 January 2003, showing the absence ofwindow frost on all channels.
corners of the frame) is centered on the flat central part ofthe scan. From this appearance we judge the bottom frameto show a frost-free scan. The scans in the top frame contrastmarkedly, showing the effect of window frost on all channelsexcept 1558 and 2138 nm. Notice that the channels with frosthave largest signal near a scan edge, with a local minimumtoward the center. This behavior is consistent with the frostpatch locations observed in the window photographs – i.e.,toward the center of port entrances, away from the edges,which are heated by the foil.
FOV scans like those in Fig. A1 constituted one of fourtests we made for window frost on the AATS flights inSOLVE II. We ran in-flight FOV scans and checked for the
Atmos. Chem. Phys., 5, 1311–1339, 2005 www.atmos-chem-phys.org/acp/5/1311/
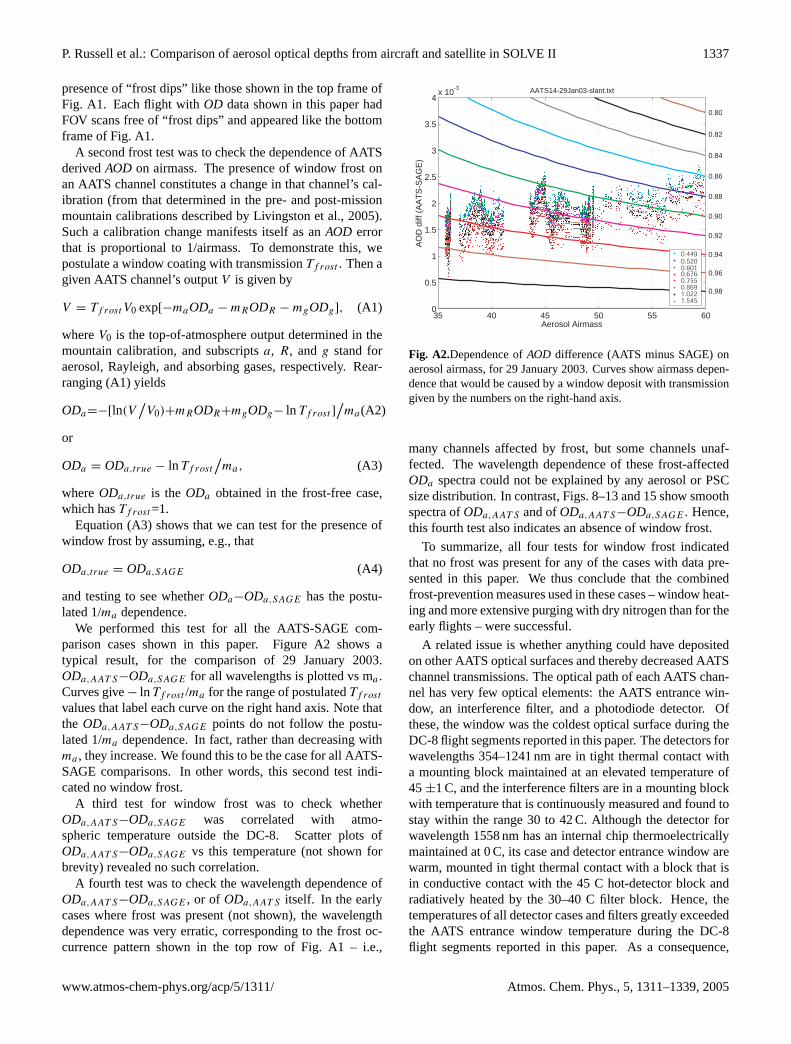
P. Russell et al.: Comparison of aerosol optical depths from aircraft and satellite in SOLVE II 1337
presence of “frost dips” like those shown in the top frame ofFig. A1. Each flight withOD data shown in this paper hadFOV scans free of “frost dips” and appeared like the bottomframe of Fig. A1.
A second frost test was to check the dependence of AATSderivedAOD on airmass. The presence of window frost onan AATS channel constitutes a change in that channel’s cal-ibration (from that determined in the pre- and post-missionmountain calibrations described by Livingston et al., 2005).Such a calibration change manifests itself as anAOD errorthat is proportional to 1/airmass. To demonstrate this, wepostulate a window coating with transmissionTf rost . Then agiven AATS channel’s outputV is given by
V = Tf rostV0 exp[−maODa − mRODR − mgODg], (A1)
whereV0 is the top-of-atmosphere output determined in themountain calibration, and subscriptsa, R, andg stand foraerosol, Rayleigh, and absorbing gases, respectively. Rear-ranging (A1) yields
ODa=−[ln(V/V0)+mRODR+mgODg− ln Tf rost ]
/ma(A2)
or
ODa = ODa,true − ln Tf rost
/ma, (A3)
whereODa,true is theODa obtained in the frost-free case,which hasTf rost=1.
Equation (A3) shows that we can test for the presence ofwindow frost by assuming, e.g., that
ODa,true = ODa,SAGE (A4)
and testing to see whetherODa−ODa,SAGE has the postu-lated 1/ma dependence.
We performed this test for all the AATS-SAGE com-parison cases shown in this paper. Figure A2 shows atypical result, for the comparison of 29 January 2003.ODa,AAT S−ODa,SAGE for all wavelengths is plotted vs ma .Curves give− ln Tf rost /ma for the range of postulatedTf rost
values that label each curve on the right hand axis. Note thatthe ODa,AAT S−ODa,SAGE points do not follow the postu-lated 1/ma dependence. In fact, rather than decreasing withma , they increase. We found this to be the case for all AATS-SAGE comparisons. In other words, this second test indi-cated no window frost.
A third test for window frost was to check whetherODa,AAT S−ODa,SAGE was correlated with atmo-spheric temperature outside the DC-8. Scatter plots ofODa,AAT S−ODa,SAGE vs this temperature (not shown forbrevity) revealed no such correlation.
A fourth test was to check the wavelength dependence ofODa,AAT S−ODa,SAGE , or of ODa,AAT S itself. In the earlycases where frost was present (not shown), the wavelengthdependence was very erratic, corresponding to the frost oc-currence pattern shown in the top row of Fig. A1 – i.e.,
P. Russell et al.: Comparison of aerosol optical depths from aircraft and satellite in SOLVE II 37
35 40 45 50 55 600
0.5
1
1.5
2
2.5
3
3.5
4x 10
-3
Aerosol Airmass
AO
D d
iff (
AA
TS
-SA
GE
)
AATS14-29Jan03-slant.txt
0.80
0.82
0.84
0.86
0.88
0.90
0.92
0.94
0.96
0.98
Figure A2. Dependence ofAOD difference (AATS minus SAGE)on aerosol airmass, for 29 January 2003. Curves show airmass de-pendence that would be caused by a window deposit with transmis-sion given by the numbers on the right-hand axis.
www.atmos-chem-phys.org/acp/5/1/ Atmos. Chem. Phys., 5, 1–37, 2005
Fig. A2.Dependence ofAOD difference (AATS minus SAGE) onaerosol airmass, for 29 January 2003. Curves show airmass depen-dence that would be caused by a window deposit with transmissiongiven by the numbers on the right-hand axis.
many channels affected by frost, but some channels unaf-fected. The wavelength dependence of these frost-affectedODa spectra could not be explained by any aerosol or PSCsize distribution. In contrast, Figs. 8–13 and 15 show smoothspectra ofODa,AAT S and ofODa,AAT S−ODa,SAGE . Hence,this fourth test also indicates an absence of window frost.
To summarize, all four tests for window frost indicatedthat no frost was present for any of the cases with data pre-sented in this paper. We thus conclude that the combinedfrost-prevention measures used in these cases – window heat-ing and more extensive purging with dry nitrogen than for theearly flights – were successful.
A related issue is whether anything could have depositedon other AATS optical surfaces and thereby decreased AATSchannel transmissions. The optical path of each AATS chan-nel has very few optical elements: the AATS entrance win-dow, an interference filter, and a photodiode detector. Ofthese, the window was the coldest optical surface during theDC-8 flight segments reported in this paper. The detectors forwavelengths 354–1241 nm are in tight thermal contact witha mounting block maintained at an elevated temperature of45±1 C, and the interference filters are in a mounting blockwith temperature that is continuously measured and found tostay within the range 30 to 42 C. Although the detector forwavelength 1558 nm has an internal chip thermoelectricallymaintained at 0 C, its case and detector entrance window arewarm, mounted in tight thermal contact with a block that isin conductive contact with the 45 C hot-detector block andradiatively heated by the 30–40 C filter block. Hence, thetemperatures of all detector cases and filters greatly exceededthe AATS entrance window temperature during the DC-8flight segments reported in this paper. As a consequence,
www.atmos-chem-phys.org/acp/5/1311/ Atmos. Chem. Phys., 5, 1311–1339, 2005
1338 P. Russell et al.: Comparison of aerosol optical depths from aircraft and satellite in SOLVE II
any material available to deposit on optical surfaces woulddeposit on the window, not a filter or detector (the only otheroptical elements). Moreover, if one were to postulate a de-posit on an interference filter or detector, it would be revealedby the tests described in this Appendix, especially the plot ofAOD difference vs airmass shown in Fig. A2. As noted, themeasured dependence on airmass is just the opposite of whatwould be caused by a deposit on any surface in the instru-ment optical path.
Acknowledgements.This research was supported by the NationalAeronautics and Space Administration through the Upper At-mosphere Research Program and the Solar Occultation SatelliteScience Team. We appreciate very useful discussions withL. Thomason. We thank L. Lait, M. Schoeberl, and P. Newman forproviding the maps used in Fig. 1.
Edited by: K. S. Carslaw
References
Bodhaine, B. A., Wood, N. B., Dutton, E. G., and Slusser, J. R.: OnRayleigh optical depth calculations, J. Atmos. Ocean. Tech., 16,1854–1861, 1999.
Bucholtz, A.: Rayleigh-scattering calculations for the terrestrial at-mosphere, Appl. Opt., 34, 2765–2773, 1995.
Clough, S. A. and Iacona, M. J.: Line-by-line calculations of atmo-spheric fluxes and cooling rates II: Application to carbon dioxide,ozone, methane, nitrous oxide, and the halocarbons, J. Geophys.Res., 100, 16 519–16 535, 1995.
DeMajistre, R. and Yee, J.-H.: Atmospheric remote sensing using acombined extinctive and refractive stellar occultation technique:2. Inversion method for extinction measurements, J. Geophys.Res., 107, doi:10.1029/2001JD000795, 2002.
Fahey, D. W., Gao, R. S., Carslaw, K. S., et al.: The detection oflarge HNO3-containing particles in the Arctic stratosphere, Sci-ence, 291, 1026–1031, 2001.
Fromm, M., Alfred, J., and Pitts, M.: A unified, long-term, high-latitude stratospheric aerosol and cloud database using SAMII, SAGE II, and POAM II/III data: Algorithm description,database definition, and climatology, J. Geophys. Res., 108,doi:10.1029/2002JD002772, 2003.
Harder, J. W., Brault, J. W., Johnston, P. V., and Mount, G. H.:Temperature dependent NO2 cross sections at high spectral res-olution, J. Geophys. Res., 102, 3861–3879, 1997.
Kneizys, F. X., Abreu, L. W., Anderson, G. P., Chetwynd, J. H.,Shettle, E. P., Berk, A., Bernstein, L. S., Robertson, D. C.,Acharaya, P., Rothmann, L. S., Selby, J. E. A., Gallery, W. O.,and Clough, S. A.: The MODTRAN 2/3 Report and LOWTRAN7 Model, 11 Jan. 1996, Phillips Laboratory, Geophysics Direc-torate PL/GPOS, 29 Randolph Road, Hanscom AFB, MA 01731-3010, 1996.
Kurucz, R. L.: Astrophysical Applications of Powerful NewDatabases, in: Astron. Soc. Pac., edited by: Adelman, S. J.,Wiese, W. L., ASP Conf. Ser. Vol. 78, San Francisco, 205, 1995.
Livingston, J., Schmid, B., Russell, P., Eilers, J., Kolyer, R., Rede-mann, J., Ramirez, S., Yee, J.-H., Trepte, C., Thomason, L., Pitts,M., Avery, M., Randall, C., Lumpe, J., Bevilacqua, R., Bittner,
M., Erbertseder, T., McPeters, R., Shetter, R., Kerr, J., and Lamb,K.: Retrieval of ozone column content from airborne Sun pho-tometer measurements during SOLVE II: Comparison with coin-cident satellite and aircraft measurements, Atmos. Chem. Phys.Discuss., 5, 243–286, 2005,SRef-ID: 1680-7375/acpd/2005-5-243.
McKinney, K. A., Wennberg, P. O., Dhanijala, S., et al.: Trajec-tory studies of large HNO3-containing particles in the Arctic:Evidence for the role of NAT, Geophys. Res. Lett., 31, L05110,doi:10.1029/2003GL018430, 2004.
NASA Langley Research Center, SAGE III algorithm theoreticalbasis document: Solar and lunar algorithm, Rep. LaRC 475-00-108, Vers. 2.1, Hampton, VA, 2002. (Available athttp://eospso.gsfc.nasa.gov.)
Northway, M. J., Gao, R. S., Popp, P. J., et al.: An analysis of largeHNO3-containing particles sampled in the Arctic stratosphereduring the winter of 1999/2000, J. Geophys. Res., 107(D20),8289, doi:10.1029/2001JD001079, 2002.
Randall, C. E., Bevilacqua, R. M., Lumpe, J. D., and Hoppel, K.W.: Validation of POAM III aerosols: comparison to SAGE IIand HALOE, J. Geophys. Res. 106 (D21), 27 525–27 536, 2001.
Rothman, L. S. and Schroeder, J.: Millenium HITRAN Compila-tion, 12th Arm Science Team Meeting Proceedings, St. Peters-burg, Florida, April 8–12, 2002.
Rothman, L. S., Chance, K., Schroeder, J., and Goldman, A.: NewEdition of HITRAN Database, 11th Arm Science Team MeetingProceedings, Atlanta, Georgia, March 19–23, 2001.
Russell, P. B., Livingston, J. M., Dutton, E. G., Pueschel, R. F., Rea-gan, J. A., DeFoor, T. E., Box, M. A., Allen, D., Pilewskie, P.,Herman, B. M., Kinne, S. A., and Hofmann, D. J.: Pinatuboand pre-Pinatubo optical-depth spectra: Mauna Loa measure-ments, comparisons, inferred particle size distributions, radia-tive effects, and relationship to lidar data, J. Geophys. Res., 98,22 969–22 985, 1993.
Schmid, B., Thome, K. J., Demoulin, P., Peter, R., Matzler, C., andSekler, J.: Comparison of modeled and empirical approaches forretrieving columnar water vapor from solar transmittance mea-surements in the 0.94-µm region, J. Geophys. Res., 101, 9345–9358, 1996.
Schmid, B., Michalsky, J. J., Slater, D. W., Barnard, J. C., Hathore,R. N., Liljegren, J. C., Holben, B. N., Eck, T. F., Livingston,J. M., Russell, P. B., Ingold, T., and Slutsker, I.: Comparisonof columnar water-vapor measurements from solar transmittancemethods, Appl. Opt., 40, 1886–1896, 2001.
Shetter, R. E. and Muller, M.: Photolysis frequency measurementsusing actinic flux spectroradiometry during the PEM-Tropicsmission: Instrumentation description and some results, J. Geo-phys. Res., 104, 5647–5661, 1999.
Swartz, W. H., Yee, J.-H., Shetter, R. E., Hall, S. R., Lefer, B. L.,Livingston, J. M., Russell, P. B., Browell, E. V., and Avery, M.A.: Column ozone and aerosol optical properties retrieved fromdirect solar irradiance measurements during SOLVE II, Atmos.Chem. Phys., 5, 611–622, 2005,SRef-ID: 1680-7324/acp/2005-5-611.
Taha, G., Thomason, L. W., Trepte, C., and Chu, W. P.: Valida-tion of SAGE III Data Products Version 3.0, Quadrennial OzoneSymposium, QOS, 1–8 September, 2004, Kos, Greece, Proceed-ings of QOS., 115–116, 2004.
Atmos. Chem. Phys., 5, 1311–1339, 2005 www.atmos-chem-phys.org/acp/5/1311/
P. Russell et al.: Comparison of aerosol optical depths from aircraft and satellite in SOLVE II 1339
Thomason, L. W. and Taha, G.: SAGE III aerosol extinction mea-surements: Initial results, Geophys. Res. Lett., 30, 33 (1-4),2003.
Thomason, L. W., Herman, B. M., and Reagan, J. A.: The effectof atmospheric attenuators with structured vertical distributionson air mass determinations and Langley plot analyses, J. Atmos.Sci., 40, 1851–1854, 1983.
Vervack Jr., R. J., Yee, J.-H., Carbary, J. F., and Morgan,F.: Atmospheric remote sensing using a combined extinc-tive and refractive stellar occultation technique: 3. Inversionmethod for refraction measurements, J. Geophys. Res., 107,doi:10.1029/2001JD000796, 2002.
Yee, J.-H., Vervack Jr., R. J., DeMajistre, R., Morgan, F., Car-bary, J. F., Romick, G. J., Morrison, D., Lloyd, S. A., DeCola,P. L., Paxton, L. J., Anderson, D. E., Krishna Kumar, C.,and Meng, C.-I.: Atmospheric remote sensing using a com-bined extinctive and refractive stellar occultation technique: 1.Overview and proof-of-concept observations, J. Geophys. Res.,107, doi:10.1029/2001JD000794, 2002.
Yee, J.-H., Swartz, W. H., Shetter, R. E., Hall, S. R., Lefer, B. L.,Randall, C. E., Bevilacqua, R. M., Lumpe, J., Pitts, M. C., Za-wodny, J. M., Thomason, L. W., Russell, P. B., Livingston, J. M.,and Schmid, B.: Column composition retrieved from direct solarirradiance measurements during SOLVE II, Quadrennial OzoneSymposium, Kos, Greece, May–June 2004.
www.atmos-chem-phys.org/acp/5/1311/ Atmos. Chem. Phys., 5, 1311–1339, 2005