aerodynamics and aeroelasticity of cable-supported bridges: identification of nonlinear features
TRANSCRIPT

Accep
ted M
anus
cript
Not Cop
yedit
ed
1
Aerodynamics and Aeroelasticity of Cable-Supported
Bridges: Identification of Nonlinear Features
Teng Wu a, Ahsan Kareem b
a Nathaz Modeling Laboratory, University of Notre Dame, Notre Dame, IN, USA,
b Nathaz Modeling Laboratory, University of Notre Dame, Notre Dame, IN, USA,
Abstract: Modern bridge decks exhibit nonlinear behaviour in wind tunnel experiments which has placed
increasing importance on the nonlinear bridge aerodynamics/aeroelasticity considerations for long-span
bridges. In this context, various observed nonlinear phenomena in wind tunnels are discussed and their
identification through high-order spectrum is illustrated.
Journal of Engineering Mechanics. Submitted March 13, 2012; February 26, 2013; posted ahead of print February 28, 2013. doi:10.1061/(ASCE)EM.1943-7889.0000615
Copyright 2013 by the American Society of Civil Engineers
J. Eng. Mech.
Dow
nloa
ded
from
asc
elib
rary
.org
by
UN
IVE
RSI
TY
OF
NO
TR
E D
AM
E o
n 11
/04/
13. C
opyr
ight
ASC
E. F
or p
erso
nal u
se o
nly;
all
righ
ts r
eser
ved.
Accep
ted M
anus
cript
Not Cop
yedit
ed
2
1 INTRODUCTION
The worldwide need to bridge wide river basins, straits and even parts of oceans has led
to spans that are progressively increasing with aerodynamic deck configurations that ex-
hibit aerodynamic/aeroelastic nonlinearities (Chen and Kareem 2003; Diana et al. 2005).
The nonlinear fluid-structure interactions involving flow separation, reattachment around
the deck, 3D wake dynamics and influence of turbulence are critical features that shape
aerodynamic behavior of bridges. Traditionally, it is difficult to delineate the contribu-
tions of linear and nonlinear effects, therefore, the unexplainable observations in bridge
aerodynamics have been often attributed to nonlinear effects (e.g., Dowell and Ilgamov
1988). Recent observations in wind tunnels have highlighted various nonlinear phenome-
na in bridge aerodynamics/aeroelasticity, which can be categorized as: (i). non-
proportional relationship between input and output; (ii). multiple frequencies excited by a
single-frequency; (iii). amplitude dependence of aerodynamic and aeroelastic forces and
(iv). hysteretic feature of aerodynamic/aeroelastic behavior versus the angle of attack.
These features are summarized in the following section.
2 NONLINEAR FEATURES
2.1 Non-proportional relationship between input and output
The non-proportional relationship between amplitudes of input and output is routinely
observed in bridge aerodynamics/aeroelasticity in wind tunnel. In a recent study, related
to the influence of turbulence on the bridge response, it was noted that doubling the am-
plitude of a harmonic fluctuation in the inflow resulted in ten times amplification of the
bridge deck response (Diana et al. 2010). This nonlinear feature will significantly in-
crease the aerodynamic responses as compared to the prediction by the linear theory. Fur-
Journal of Engineering Mechanics. Submitted March 13, 2012; February 26, 2013; posted ahead of print February 28, 2013. doi:10.1061/(ASCE)EM.1943-7889.0000615
Copyright 2013 by the American Society of Civil Engineers
J. Eng. Mech.
Dow
nloa
ded
from
asc
elib
rary
.org
by
UN
IVE
RSI
TY
OF
NO
TR
E D
AM
E o
n 11
/04/
13. C
opyr
ight
ASC
E. F
or p
erso
nal u
se o
nly;
all
righ
ts r
eser
ved.
Accep
ted M
anus
cript
Not Cop
yedit
ed
3
thermore, due to this nonlinear feature, a bridge deck may experience aeroelastic instabil-
ity which the linear theory based scheme may fail to predict (Diana et al. 2010).
2.2 Multiple frequencies excited by a single-frequency
The nonlinear phenomenon related to the excitation of multiple frequencies by a single-
frequency is known to introduce not only superharmonics but also causes harmonic dis-
tortion. Fig. 1 presents experimental data of a typical modern bridge deck. The harmonic
distortion in bridge aerodynamics is shown in Fig. 1 (a), i.e., the input turbulent wind ve-
locity (idealized in terms of harmonic gusts) has only two frequency components at 0.37
Hz and 1.50 Hz. However, the torsional response contains not only response correspond-
ing to 0.37 Hz and 1.50 Hz, resulting from the linear transformation, but also the super-
harmonic components at 0.74 Hz and 1.13 Hz as a consequence of harmonic distortion.
The emergences of superharmonics in bridge aeroelasticity is shown in Fig. 1 (b). The in-
put torsional response has only one frequency component at 1.48 Hz. However, the mo-
tion-induced drag force contains not only the corresponding component at 1.48 Hz, from
the linear transformation, but also the superharmonic component at 2.97 Hz.
This nonlinear feature may result in serious issues concerning bridge aerodynamics
and aeroelasticity, especially if these frequency components generated by superharmonic
(or subharmonic) or harmonic distortion fall at or near one of the modal frequencies of
the bridge deck resulting in response that may not be predicted by conventional linear
theory.
2.3 Amplitude dependence of aerodynamic and aeroelastic forces
The amplitude dependence of aerodynamic and aeroelastic forces is well known in bridge
aerodynamics/aeroelasticity, where the steady-state force coefficients and the aerodynam-
Journal of Engineering Mechanics. Submitted March 13, 2012; February 26, 2013; posted ahead of print February 28, 2013. doi:10.1061/(ASCE)EM.1943-7889.0000615
Copyright 2013 by the American Society of Civil Engineers
J. Eng. Mech.
Dow
nloa
ded
from
asc
elib
rary
.org
by
UN
IVE
RSI
TY
OF
NO
TR
E D
AM
E o
n 11
/04/
13. C
opyr
ight
ASC
E. F
or p
erso
nal u
se o
nly;
all
righ
ts r
eser
ved.
Accep
ted M
anus
cript
Not Cop
yedit
ed
4
ic/aeroelastic transfer functions are dependent on the angle of attack (the angle between
the chord line of bridge deck and the oncoming uniform wind). These features of depend-
ence on the angle of attack can be explained by simple aerodynamic considerations. For
example, dependence of flutter derivatives on the angle of attack is shown in Fig. 2. The
sensitivity of flutter derivatives at different angles of attack has a direct bearing on the
critical flutter wind velocity. At 0o angle of attack the experimental critical flutter wind
velocity of this bridge deck is estimated to be 89 m/s, while it decreases to 76 m/s for -3o
angle of attack. Therefore, estimates based on the zero degree angle of attack may over
predict flutter speed.
2.4 Hysteretic feature of aerodynamic/aeroelastic behavior versus the angle of attack
The hysteretic feature is well known in vortex induced vibration of bluff bodies since it
was initially observed experimentally by Feng (1968). Recently, the hysteretic phenome-
non in the aerodynamic/aeroelastic forces on both the bridge decks and the cables of ca-
ble-stayed bridges has been a cause for concern (Diana et al. 2010; Wu and Kareem
2012a). Typically, the steady-state aerodynamic coefficients are modeled by a nonlinear
polynomial in terms of the angle of attack. However, the hysteretic behavior can be best
described by higher-order (nonlinear) polynomial involving the dynamic angle of attack
(Resulting from turbulence components and deck motions) and its derivative, e.g.,
,,
( , )n
hyst j kl j k
j k
c j k,j k,, ),n
j k)) jj) j k) (1)
where subscript "l" represents "L", "D" or "M", which denotes coefficients related to lift,
drag and pitch, respectively; ,j k is the coefficient corresponding to (j+k)th-order term;
2n is the highest order of the polynomial possible to parsimoniously model hysteretic be-
havior. The actual order of the model depends on the data used for fitting and the identi-
Journal of Engineering Mechanics. Submitted March 13, 2012; February 26, 2013; posted ahead of print February 28, 2013. doi:10.1061/(ASCE)EM.1943-7889.0000615
Copyright 2013 by the American Society of Civil Engineers
J. Eng. Mech.
Dow
nloa
ded
from
asc
elib
rary
.org
by
UN
IVE
RSI
TY
OF
NO
TR
E D
AM
E o
n 11
/04/
13. C
opyr
ight
ASC
E. F
or p
erso
nal u
se o
nly;
all
righ
ts r
eser
ved.
Accep
ted M
anus
cript
Not Cop
yedit
ed
5
fication scheme used. Besides, the contributions of some of the terms in the polynomial
may be negligible which leads to simplified expression. For example, for the lift coeffi-
cient of a stay cable of a cable-stayed bridge, the following model can represent the hys-
teretic behavior:
2 3 40 0,0 1,0 0,1 2,0 1,1 3,0 4,0( , ) ( )hyst
L Lc c 0 0,0 1,0 0,1 2,0 1,1 3,0 4,0L 0 0,0 1,0 0,1 2,0 1,1 3,0 4,00,0 1,0 0,1 2,0 1,1 3,0( 0L, ), 2 3 4) ( ) 2 3 430 0 1 0 0 1 2 0 1 1 3 0 4 00 0 1 0 0 1 2 0 1 1 3 0) ( )0))) 2 330 0 1 0 0 1 2 0 1 1 3 00 0 1 0 0 1 2 0 1 1 3 00 0 1 0 0 1 2 0 1 1 3 0( )0 (2)
where the steady-state coefficient 0( )Lc corresponding to the equilibrium position is
extracted from the constant term in order to emphasize the difference between the steady-
state and the hysteretic cases. A similar model with a third-order polynomial, in the con-
text of a rheological model, has been proposed by Diana et al. (2010) to represent lift co-
efficient of a bridge deck. Fig. 3 presents the hysteretic phenomena observed in the lift
forces acting on a bridge deck and on a typical stay cable based on wind-tunnel studies
together with the numerically fitted model utilizing Moore-Penrose pseudoinverse identi-
fication scheme, which show a good agreement.
The hysteretic behavior that appears in bridge aerodynamics/aeroelasticity suggests
a higher-order memory in the system. Details of the hysteresis phenomenon, common to
many fields, may be found in the literature (e.g., Brilliant 1958). The examples carried
out by the authors indicate that the wind-induced response of a typical modern bridge
deck and a stayed cable is significantly increased by introducing the hysteretic behavior
in the respective response prediction schemes (Wu and Kareem 2012b).
3 TOOLS FOR DETECTION OF NONLINEAR FEATURES
In light of the uncertainties outlined, this section focuses on the higher-order spectrum as
a most effective tool to identify and quantify nonlinearities and its application to bridge
aerodynamics/aeroelasticity.
Journal of Engineering Mechanics. Submitted March 13, 2012; February 26, 2013; posted ahead of print February 28, 2013. doi:10.1061/(ASCE)EM.1943-7889.0000615
Copyright 2013 by the American Society of Civil Engineers
J. Eng. Mech.
Dow
nloa
ded
from
asc
elib
rary
.org
by
UN
IVE
RSI
TY
OF
NO
TR
E D
AM
E o
n 11
/04/
13. C
opyr
ight
ASC
E. F
or p
erso
nal u
se o
nly;
all
righ
ts r
eser
ved.
Accep
ted M
anus
cript
Not Cop
yedit
ed
6
3.1 Higher-order spectrum
The higher-order spectrum is the Fourier transform of the higher-order correlation. It
identifies nonlinear interactions among frequency components and preserves the phase
information, which is generally a more sensitive marker to identify the departure from
linearity as compared to information related to amplitude (Ueda and Dowell 1984). For a
linear system, the second-order information embedded in a power spectrum represents
distribution of energy at different frequencies, which fully characterizes a linear system
in the frequency domain. The normalized value of the cross-power spectrum captures the
phase relation at the same frequency between two different signals. However, for nonlin-
ear system higher-order spectrum is needed because the power spectrum cannot portray
the energy transformation between different frequency components which is a typical
feature of nonlinear systems. Among these higher-order spectra, the bispectrum, the Fou-
rier transform of triple correlation can capture quadratic nonlinearities. Further higher-
order interactions can be tracked by trispectra and beyond, but each additional order adds
significantly to the computational demand and need for added length of data sets (e.g.,
Kim and Powers 1979; Gurley et al. 1996; Tognarelli 1999; Nayfeh et al. 2003; Hajj and
Silva 2004). A bispectrum is easy to visualize since it can be displayed as a three-
dimensional (3-D) plot, whereas, further higher-order spectra can be only viewed in 3-D
by slicing the hyper-dimension at different frequencies.
The auto-bispectrum for a stationary, real-valued, zero-mean signal a(t) can be es-
timated by (e.g., Kim and Powers 1979)
( ) *( ) *( )1 2 1 2 1 2
1
1[ , ] [ ] [ ] [ ]
Nk k k
aaa T T Tk
B f f a f f a f a fN
B f f[ ] (3a)
where ( )[ ]kTa f is the Fourier transform of the kth ensemble of the time series a(t) taken
over a time T and N is the number of these ensembles. The nontrivial value of the bispec-
Journal of Engineering Mechanics. Submitted March 13, 2012; February 26, 2013; posted ahead of print February 28, 2013. doi:10.1061/(ASCE)EM.1943-7889.0000615
Copyright 2013 by the American Society of Civil Engineers
J. Eng. Mech.
Dow
nloa
ded
from
asc
elib
rary
.org
by
UN
IVE
RSI
TY
OF
NO
TR
E D
AM
E o
n 11
/04/
13. C
opyr
ight
ASC
E. F
or p
erso
nal u
se o
nly;
all
righ
ts r
eser
ved.

Accep
ted M
anus
cript
Not Cop
yedit
ed
7
trum could be treated as an indication of quadratic nonlinearity in the system. The nor-
malized auto-bispectrum is given by Eq. (3b) and can be viewed as auto-bicoherence
2( ) *( ) *( )1 2 1 22
2 11 2
2 2( ) ( ) ( )1 2 1 2
1 1
1[ ] [ ] [ ]
[ , ]1 1
[ ] [ ] [ ]
Nk k k
T T Tk
aaa N Nk k k
T T Tk k
a f f a f a fNb f f
a f a f a f fN N
2 ]b f f2 [ (3b)
The higher-order spectrum is generally complex valued and a multi-dimensional
function of frequency, e.g., the bispectrum is a two-dimensional function of frequency.
The magnitude of the auto-bispectrum 1 2[ , ]aaaB f f ]B f f[ is determined by the phase relationship
between the frequency component (f1±f2) and the frequencies component f1 and f2. Usual-
ly, the nontrivial values of higher-order spectrum correspond to the harmonic distortion
which represents a typical nonlinear feature. For example, if the frequency component
(f1±f2) is induced by the two frequency components f1 and f2 through harmonic distortion,
there must be a certain phase relationship between them. As a result, the value of the cor-
responding bispectrum at that frequency combination will be nontrivial. On the contrary,
if the frequency component (f1±f2) is not from harmonic distortion but original input (lin-
ear transformation), the phase relationship between frequency component (f1±f2) and the
frequency components f1 and f2 are random. As a result, the corresponding bispectrum at
that frequency combination will be trivial as it represents an average value of random
quantities.
Analogous to the auto-bispectrum, the cross-bispectrum detects the quadratic nonlin-
earity that may exist between two different signals. The cross-bispectrum and the corre-
sponding cross-bicoherence is given in Eqs. (4a) and (4b), respectively, for two station-
ary, real-valued, zero-mean signals a(t) and b(t).
( ) *( ) *( )1 2 1 2 1 2
1
1[ , ] [ ] [ ] [ ]
Nk k k
baa T T Tk
B f f b f f a f a fN
B f f[ ] (4a)
Journal of Engineering Mechanics. Submitted March 13, 2012; February 26, 2013; posted ahead of print February 28, 2013. doi:10.1061/(ASCE)EM.1943-7889.0000615
Copyright 2013 by the American Society of Civil Engineers
J. Eng. Mech.
Dow
nloa
ded
from
asc
elib
rary
.org
by
UN
IVE
RSI
TY
OF
NO
TR
E D
AM
E o
n 11
/04/
13. C
opyr
ight
ASC
E. F
or p
erso
nal u
se o
nly;
all
righ
ts r
eser
ved.
Accep
ted M
anus
cript
Not Cop
yedit
ed
8
2( ) *( ) *( )1 2 1 22
2 11 2
2 2( ) ( ) ( )1 2 1 2
1 1
1[ ] [ ] [ ]
[ , ]1 1
[ ] [ ] [ ]
Nk k k
T T Tk
baa N Nk k k
T T Tk k
b f f a f a fNb f f
a f a f b f fN N
2 ]b f f2 [ (4b)
3.2 Illustrative example
A simple numerical example is presented to illustrate the contribution of the higher-
order spectrum to the identification of nonlinearity. Considering a harmonic nonlinear
signal
1 1 2 2 3 3
3
1 1 2 2 3 3
1( ) sin( ) sin( ) sin( ) ( )
2
sin( )sin( ) sin( )
a t t t t w t
t t t (5)
where ω1=0.3×2π, ω2=1.0×2π and ω3=ω1+ω2, and w(t) is a small amplitude, zero mean
white noise process. The three phase angles θ1- θ3 for different frequency components are
independent and uniformly distributed random variables. Fig. 4 (a) and (b) show the time
history and the corresponding frequency components of the signal via a Fourier spectrum.
As depicted in Fig. 4 (b), there are five frequency components in this nonlinear time sig-
nal at 0.3 Hz, 0.7 Hz, 1.0 Hz, 1.3 Hz, and 3.9 Hz. In order to test the nonlinear detection
capability of the second-order spectrum, Fig. 5 (a) presents the auto-bicoherence of the
linear part of the harmonic nonlinear signal and Fig. 5 (b) shows the auto-bicoherence of
the linear and quadratic parts of the signal together with their contour plot. Fig 5 (c) pre-
sents the auto-bicoherence of the linear, quadratic and cubic nonlinear parts of the har-
monic nonlinear signal together with their contour plot. As expected, the bicoherence
value of a linear system is trivial as noted in Fig. 5 (a). The noise floor results from the
white noise in this system and from the numerical errors. On the other hand, the product
of harmonic components in the nonlinear signal generates harmonic distortion, i.e., the
Journal of Engineering Mechanics. Submitted March 13, 2012; February 26, 2013; posted ahead of print February 28, 2013. doi:10.1061/(ASCE)EM.1943-7889.0000615
Copyright 2013 by the American Society of Civil Engineers
J. Eng. Mech.
Dow
nloa
ded
from
asc
elib
rary
.org
by
UN
IVE
RSI
TY
OF
NO
TR
E D
AM
E o
n 11
/04/
13. C
opyr
ight
ASC
E. F
or p
erso
nal u
se o
nly;
all
righ
ts r
eser
ved.

Accep
ted M
anus
cript
Not Cop
yedit
ed
9
sum and difference of different frequency components. The bicoherence at frequencies
(ω1, ω2) and (-ω1, ω2) should be nontrivial due to the nonlinear harmonic distortion as in-
dicated in Fig. 5 (b). There are certain phase relationships between frequency components
ω1, ω2 and ω1+ω2, and between ω1, ω2 and ω2-ω1. However, since there is a harmonic
signal component with frequency component ω3= ω1+ω2 that exists in the original signal,
for which the bicoherence value at the frequency combination (ω1, ω2) is trivial, the value
of bicoherence at frequencies (ω1, ω2) should be less than 1 (around 0.5 for this set of pa-
rameters). As shown in Fig. 5 (c) the value around frequency component 3.9 Hz is trivial,
which reaffirms that the second-order spectrum cannot capture cubic nonlinearity. Since
the cubic nonlinear part contains linear transformation of frequency component 1.3 Hz,
the value of bicoherence at (ω1, ω2) should be less than 0.5. It should also be noted that
the frequency components of interest should be smaller than the Nyquist frequency. Be-
sides, due to the symmetric property of the second-order spectrum it suffices to only pre-
sent the result in the first quadrant (e.g., Kim and Powers 1979; Nikias and Petropulu
1993).
3.3 Application to bridge aerodynamics/aeroelasticity
Conventionally, the second-order spectrum technique is utilized to analyze aerodynam-
ic/aeroelastic data obtained in wind tunnels. The auto-/cross-bispectrum and auto-/cross-
bicoherence could be applied to both the pressure signal or the force signal obtained in
wind-tunnel experiments.
Fig. 6 (a) presents the Fourier components of pressure fluctuations on a cable surface
of a cable-stayed bridge being displaced harmonically at 1 Hz. As indicated in this figure,
apart from the 1 Hz (0.9869 Hz) frequency component, there are several other significant
frequency components both in the low frequency and high frequency parts. Fig. 6 (b) pre-
Journal of Engineering Mechanics. Submitted March 13, 2012; February 26, 2013; posted ahead of print February 28, 2013. doi:10.1061/(ASCE)EM.1943-7889.0000615
Copyright 2013 by the American Society of Civil Engineers
J. Eng. Mech.
Dow
nloa
ded
from
asc
elib
rary
.org
by
UN
IVE
RSI
TY
OF
NO
TR
E D
AM
E o
n 11
/04/
13. C
opyr
ight
ASC
E. F
or p
erso
nal u
se o
nly;
all
righ
ts r
eser
ved.
Accep
ted M
anus
cript
Not Cop
yedit
ed
10
sents the corresponding auto-bispectrum. The large spectrum of nontrivial values sug-
gests nonlinear coupling or interaction that exists in this pressure fluctuation signal. For
example, the point at coordinates (0.9869, 0.9869, 22.48) in this figure indicates that at
least part of the value corresponding to the frequency component 1.974 in the Fig. 6 (a)
results from the quadratic self interaction at the frequency component 0.9869. As a result,
it is reasonable to point out that the frequency components lower or higher than the fre-
quency component at 1 Hz partly results from nonlinear interactions among frequencies.
Instead of presenting the contour figure typically used in the literature, Fig. 6 (c) presents
the auto-bicoherence of two frequency components with all the frequencies within the
range of interest, which clearly presents the nonlinear coupling phenomenon among dif-
ferent frequency components. It is noted in this figure, there is a high degree of nonlinear
coupling between 1 Hz or 1.5 Hz components and the frequency region between 0-4 Hz.
After this range, the nonlinear coupling among these frequency components decreases
significantly. There is almost no nonlinear coupling between 1 Hz or 1.5 Hz and the fre-
quency region higher than 8 Hz. Overall, the level of nonlinear coupling of 1.5 Hz with
other frequency components is lower than that of 1 Hz. Fig. 7 presents the second-order
spectrum of an aerodynamic force acting on a typical bridge deck obtain in a wind tunnel.
As mentioned in the preceding, the nontrivial values in the figure indicate nonlinear in-
teractions between the frequency components, suggesting the presence of such interac-
tions in the aerodynamics of bridge decks.
The higher-order spectrum technique is a promising scheme to detect potential exist-
ence of nonlinear behavior and has been extensively used in the areas of turbulence and
offshore mechanics. Furthermore, it is also possible that by combining the information
theory with higher-order spectral analysis, one can further uncover the directionality of
nonlinear energy transfer (e.g., Jamšek et al. 2010). In the case of nonstationarity, the
Journal of Engineering Mechanics. Submitted March 13, 2012; February 26, 2013; posted ahead of print February 28, 2013. doi:10.1061/(ASCE)EM.1943-7889.0000615
Copyright 2013 by the American Society of Civil Engineers
J. Eng. Mech.
Dow
nloa
ded
from
asc
elib
rary
.org
by
UN
IVE
RSI
TY
OF
NO
TR
E D
AM
E o
n 11
/04/
13. C
opyr
ight
ASC
E. F
or p
erso
nal u
se o
nly;
all
righ
ts r
eser
ved.
Accep
ted M
anus
cript
Not Cop
yedit
ed
11
wavelet-based bicoherence could be utilized to detect the intermittent nonlinearities (e.g.,
Gurley et al. 2003; Chabalko et al. 2006).
4 CONCLUDING REMARKS
This note presents several nonlinear phenomena observed in wind tunnels concerning
bridge aerodynamics/aeroelasticity. Analysis techniques have been shown to efficiently
detect these nonlinearities, e.g., the higher-order spectrum scheme for the detection of
quadratic coupling and the Moore-Penrose pseudoinverse scheme, though not detailed
here, for modeling nonlinearities that result from hysteretic aerodynamic/aeroelastic be-
havior. It is highlighted that the higher-order spectrum technique affords delineation of
the linear and nonlinear effects with high fidelity. Accurate modeling of the aerodynam-
ic/aeroelastic force on bridge decks is always a critical issue in ensuring the safety of
long-span bridges. The demonstration of nonlinearities in aerodynamics and aeroelastici-
ty of cable-supported bridges here calls for improved nonlinear modeling capabilities in
this area. The application of quasi-steady theory is a well-known approach applied to
model nonlinearity in bridge aerodynamics that accounts for the "static" nonlinearities.
Accordingly, the amplitude dependent features of bridge aerodynamics/aeroelasticity
could be simulated with a band-superposition or a hybrid formulation scheme (Diana et
al. 1995; Chen and Kareem 2003). In order to take into account the "memory" effects,
i.e., the hysteretic behavior, a rheologic scheme was proposed by Diana et al. (2010),
whereas Wu and Kareem (2011a) developed a higher-order artificial neural network to
improve the hysteretic modeling capability. Another promising scheme for modeling
nonlinear bridge aerodynamics/aeroelasticity is based on Volterra series. As an extension
of Taylor series with memory, it provides an accurate description of the nonlinearity
Journal of Engineering Mechanics. Submitted March 13, 2012; February 26, 2013; posted ahead of print February 28, 2013. doi:10.1061/(ASCE)EM.1943-7889.0000615
Copyright 2013 by the American Society of Civil Engineers
J. Eng. Mech.
Dow
nloa
ded
from
asc
elib
rary
.org
by
UN
IVE
RSI
TY
OF
NO
TR
E D
AM
E o
n 11
/04/
13. C
opyr
ight
ASC
E. F
or p
erso
nal u
se o
nly;
all
righ
ts r
eser
ved.

Accep
ted M
anus
cript
Not Cop
yedit
ed
12
while preserving memory effects absent in the static transformation based on the Taylor
series approach (Wu and Kareem 2011b).
Journal of Engineering Mechanics. Submitted March 13, 2012; February 26, 2013; posted ahead of print February 28, 2013. doi:10.1061/(ASCE)EM.1943-7889.0000615
Copyright 2013 by the American Society of Civil Engineers
J. Eng. Mech.
Dow
nloa
ded
from
asc
elib
rary
.org
by
UN
IVE
RSI
TY
OF
NO
TR
E D
AM
E o
n 11
/04/
13. C
opyr
ight
ASC
E. F
or p
erso
nal u
se o
nly;
all
righ
ts r
eser
ved.
Accep
ted M
anus
cript
Not Cop
yedit
ed
13
5 ACKNOWLEDGEMENTS
The support for this project provided by the NSF Grant # CMMI 09-28282 is gratefully
acknowledged.
6 REFERENCES
[1] Brilliant, M. B., 1958. Theory of the analysis of nonlinear systems. M.I.T., Res. Lab. Elec-
tron., Tech. Rep. 345.
[2] Chabalko, C. C., Ge, Z. and Hajj, M. R., 2006. Analysis tools for the detection of intermit-
tent nonlinear aeroelastic phenomena. Journal of Aircraft, 43 (4), 1082-1088.
[3] Chen, X. and Kareem, A., 2003. Aeroelastic analysis of bridges: effects of turbulence and
aerodynamic nonlinearities. J. Eng. Mech., 129 (8), 885–895.
[4] Diana, G., Falco, M., Bruni, S., Cigada, A., Larose, G. L., Damsgaard, A. and Collina, A.,
1995. Comparisons between wind tunnel tests on a full aeroelastic model of the proposed
bridge over Stretto di Messina and numerical results. Journal of Wind Engineering and In-
dustrial Aerodynamics, 54-55, 101-113.
[5] Diana, G., Bruni, S. and Rocchi, D., 2005. A numerical and experimental investigation on
aerodynamic nonlinearities in bridge response to turbulent wind. In: The Fourth European
and African Conference on Wind Engineering, 1-10, Prague, Czech Republic.
[6] Diana, G., Rocchi, D., Argentini, T. and Muggiasca, S., 2010. Aerodynamic instability of a
bridge deck section model: Linear and nonlinear approach to force modeling. Journal of
Wind Engineering and Industrial Aerodynamics, v 98, n 6-7, 363-374.
[7] Dowell, E. H. and Ilgamov, M., 1988. Studies in nonlinear aeroelasticity. Springer-Verlag,
New York, N. Y..
[8] Feng, C. C., 1968. The measurement of vortex-induced effects in flow past stationary and
oscillating circular and D-section cylinders. MASc thesis. Univ. Br. Columbia, Vancouver.
Journal of Engineering Mechanics. Submitted March 13, 2012; February 26, 2013; posted ahead of print February 28, 2013. doi:10.1061/(ASCE)EM.1943-7889.0000615
Copyright 2013 by the American Society of Civil Engineers
J. Eng. Mech.
Dow
nloa
ded
from
asc
elib
rary
.org
by
UN
IVE
RSI
TY
OF
NO
TR
E D
AM
E o
n 11
/04/
13. C
opyr
ight
ASC
E. F
or p
erso
nal u
se o
nly;
all
righ
ts r
eser
ved.
Accep
ted M
anus
cript
Not Cop
yedit
ed
14
[9] Gurley, K. R., Kareem, A. and Tognarelli, M. A., 1996. Simulation of a Class of Non-
Normal Random Processes. International Journal of Non-Linear Mechanics, Vol. 31 (5),
601-617.
[10] Gurley, K. R., Kijewski, T. and Kareem, A., 2003. First and higher-order correlation detec-
tion using wavelet transforms. Journal of Engineering Mechanics, 129(2), 188-201.
[11] Hajj, M. R. and Silva, W. A., 2004. Nonlinear flutter aspects of the flexible high-speed civil
transport semispan model. Journal of Aircraft, 41, 1202–1208.
[12] Jamšek, J., Paluš, M. and Stefanovska, A., 2010. Detecting couplings between interacting
oscillators with time-varying basic frequencies: Instantaneous wavelet bispectrum and in-
formation theoretic approach. Phys. Rev., E 81, 036207.
[13] Kim, Y. C. and Powers, E. J., 1979. Digital bispectral analysis and its applications to nonlin-
ear wave interactions. IEEE Transactions on Plasma Science, PS-7, 120–131.
[14] Nayfeh, A. H., Owis, F. and Hajj, M. R., 2003. A model for the coupled lift and drag on a
circular cylinder. Proceedings of DETC2003, ASME 19th Biennial Conference on Mechani-
cal Vibration and Noise, Chicago, USA.
[15] Nikias, C. L. and Petropulu, A. P., 1993. Higher-order spectra analysis: a nonlinear signal
processing framework. A Simon & Schuster Company, Englewood Cliffs, New Jersey.
[16] Tognarelli, M. A., 1999. Non-Gaussian Response Statistics of Ocean Structures. Ph.D. the-
sis, University of Notre Dame.
[17] Ueda, T. and Dowell, E. H., 1984. Flutter analysis using nonlinear aerodynamic forces.
Journal of Aircraft, 21, 101–109.
[18] Wu, T. and Kareem, A., 2011a. Modeling hysteretic nonlinear behavior of bridge aerody-
namics via cellular automata nested neural network. J. Wind Eng. Ind. Aerodyn., 99 (4),
378-388.
[19] Wu, T. and Kareem, A., 2011b. Nonlinear modeling of bridge aerodynamics. Proceedings of
the 13th International Conference on Wind Engineering (ICWE13), Amsterdam, the Nether-
land.
Journal of Engineering Mechanics. Submitted March 13, 2012; February 26, 2013; posted ahead of print February 28, 2013. doi:10.1061/(ASCE)EM.1943-7889.0000615
Copyright 2013 by the American Society of Civil Engineers
J. Eng. Mech.
Dow
nloa
ded
from
asc
elib
rary
.org
by
UN
IVE
RSI
TY
OF
NO
TR
E D
AM
E o
n 11
/04/
13. C
opyr
ight
ASC
E. F
or p
erso
nal u
se o
nly;
all
righ
ts r
eser
ved.

Accep
ted M
anus
cript
Not Cop
yedit
ed
15
[20] Wu, T. and Kareem, A., 2012a. On the Excitation Mechanisms of Rain-Wind Induced Vi-
bration of Cables: Unsteady and Hysteretic Nonlinear Features. Journal of Wind Engineer-
ing and Industrial Aerodynamics. Under review.
[21] Wu, T. and Kareem, A., 2012b. Bridge aerodynamics and aeroelasticity: A comparison of
modeling schemes. Journal of Fluids and Structures. Under review.
Journal of Engineering Mechanics. Submitted March 13, 2012; February 26, 2013; posted ahead of print February 28, 2013. doi:10.1061/(ASCE)EM.1943-7889.0000615
Copyright 2013 by the American Society of Civil Engineers
J. Eng. Mech.
Dow
nloa
ded
from
asc
elib
rary
.org
by
UN
IVE
RSI
TY
OF
NO
TR
E D
AM
E o
n 11
/04/
13. C
opyr
ight
ASC
E. F
or p
erso
nal u
se o
nly;
all
righ
ts r
eser
ved.
Accep
ted M
anus
cript
Not Cop
yedit
ed
16
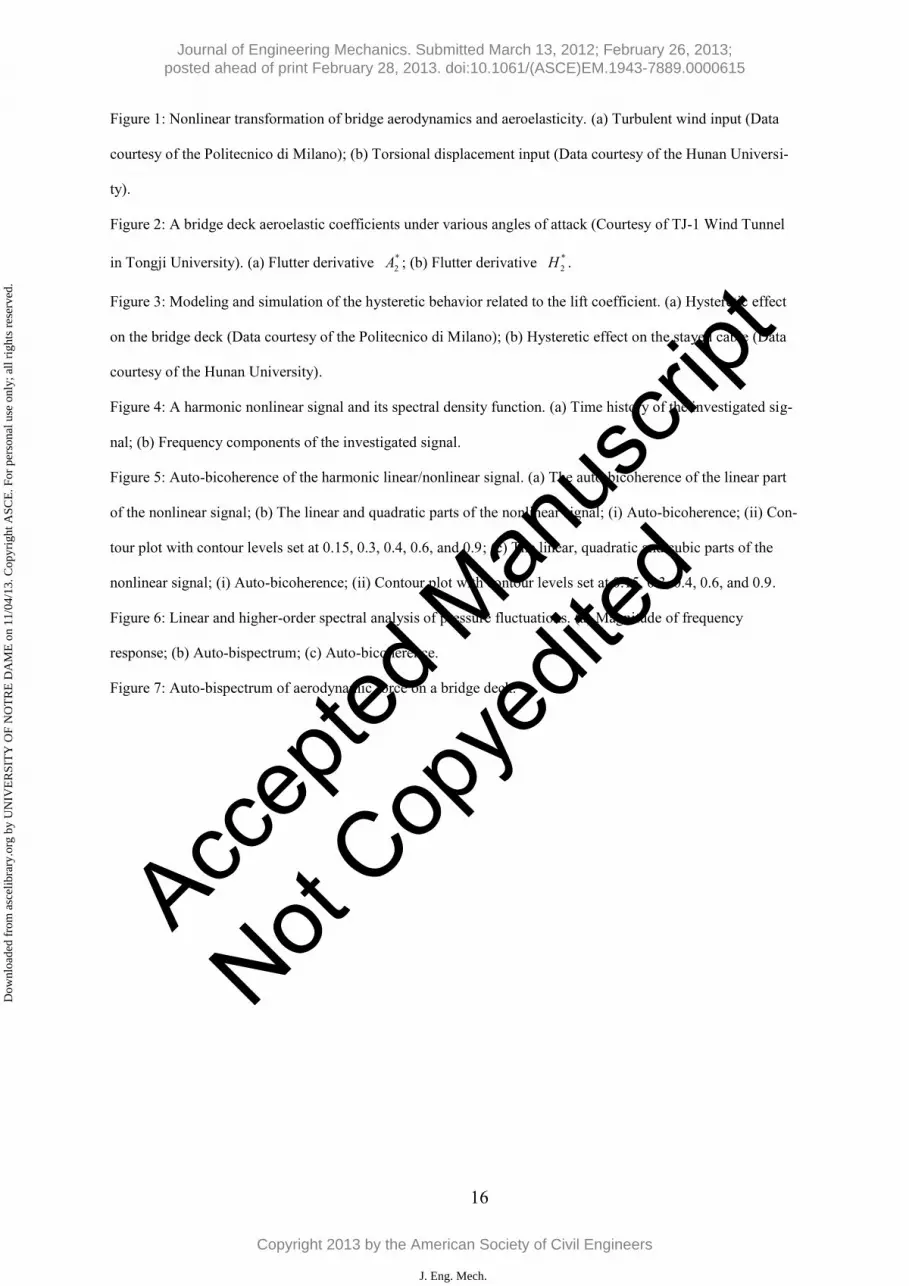
Figure 1: Nonlinear transformation of bridge aerodynamics and aeroelasticity. (a) Turbulent wind input (Data
courtesy of the Politecnico di Milano); (b) Torsional displacement input (Data courtesy of the Hunan Universi-
ty).
Figure 2: A bridge deck aeroelastic coefficients under various angles of attack (Courtesy of TJ-1 Wind Tunnel
in Tongji University). (a) Flutter derivative *2A ; (b) Flutter derivative *
2H .
Figure 3: Modeling and simulation of the hysteretic behavior related to the lift coefficient. (a) Hysteretic effect
on the bridge deck (Data courtesy of the Politecnico di Milano); (b) Hysteretic effect on the stayed cable (Data
courtesy of the Hunan University).
Figure 4: A harmonic nonlinear signal and its spectral density function. (a) Time history of the investigated sig-
nal; (b) Frequency components of the investigated signal.
Figure 5: Auto-bicoherence of the harmonic linear/nonlinear signal. (a) The auto-bicoherence of the linear part
of the nonlinear signal; (b) The linear and quadratic parts of the nonlinear signal; (i) Auto-bicoherence; (ii) Con-
tour plot with contour levels set at 0.15, 0.3, 0.4, 0.6, and 0.9; (c) The linear, quadratic and cubic parts of the
nonlinear signal; (i) Auto-bicoherence; (ii) Contour plot with contour levels set at 0.15, 0.3, 0.4, 0.6, and 0.9.
Figure 6: Linear and higher-order spectral analysis of pressure fluctuations. (a) Magnitude of frequency
response; (b) Auto-bispectrum; (c) Auto-bicoherence.
Figure 7: Auto-bispectrum of aerodynamic force on a bridge deck.
Journal of Engineering Mechanics. Submitted March 13, 2012; February 26, 2013; posted ahead of print February 28, 2013. doi:10.1061/(ASCE)EM.1943-7889.0000615
Copyright 2013 by the American Society of Civil Engineers
J. Eng. Mech.
Dow
nloa
ded
from
asc
elib
rary
.org
by
UN
IVE
RSI
TY
OF
NO
TR
E D
AM
E o
n 11
/04/
13. C
opyr
ight
ASC
E. F
or p
erso
nal u
se o
nly;
all
righ
ts r
eser
ved.
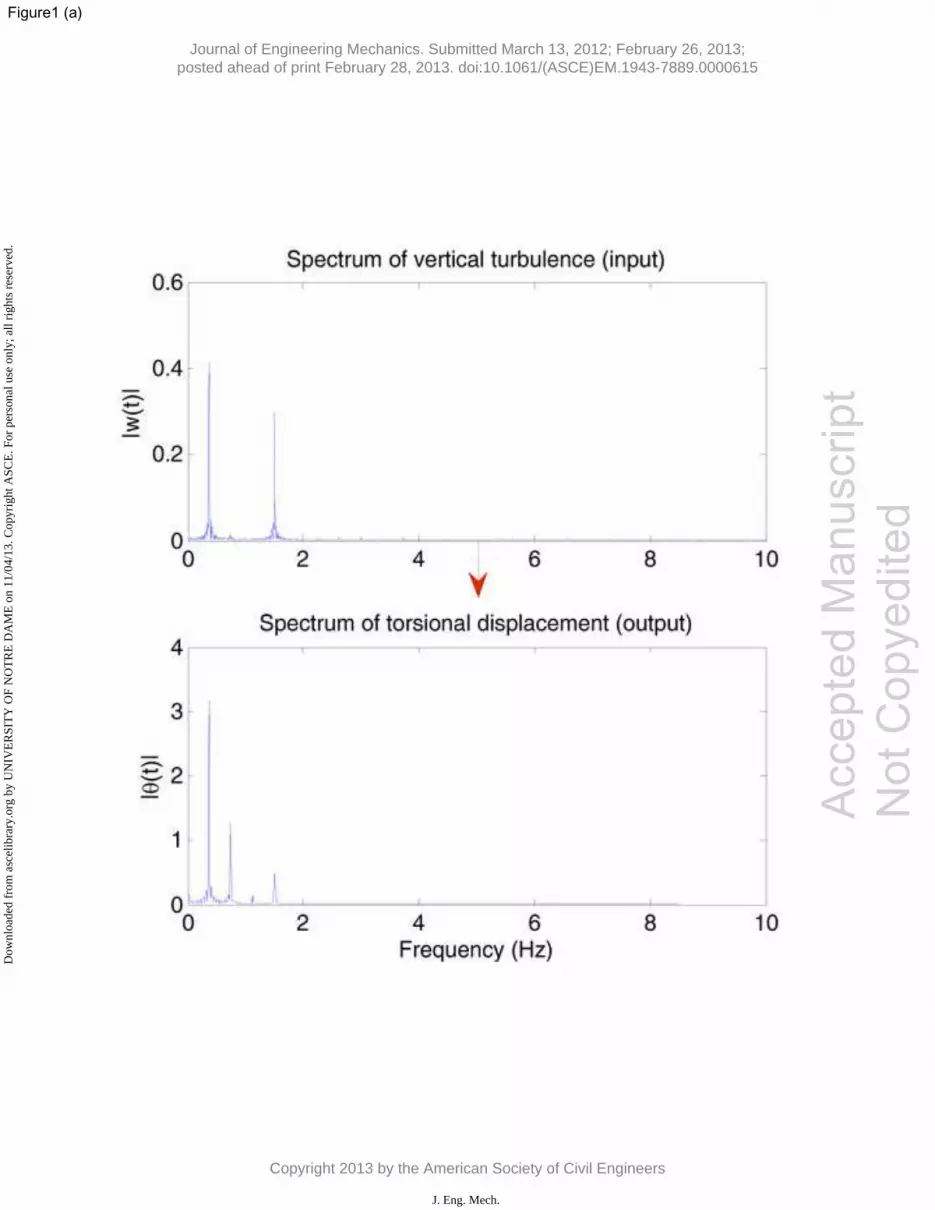
Figure1 (a)
Acc
epte
d M
anus
crip
t N
ot C
opye
dite
d
Journal of Engineering Mechanics. Submitted March 13, 2012; February 26, 2013; posted ahead of print February 28, 2013. doi:10.1061/(ASCE)EM.1943-7889.0000615
Copyright 2013 by the American Society of Civil Engineers
J. Eng. Mech.
Dow
nloa
ded
from
asc
elib
rary
.org
by
UN
IVE
RSI
TY
OF
NO
TR
E D
AM
E o
n 11
/04/
13. C
opyr
ight
ASC
E. F
or p
erso
nal u
se o
nly;
all
righ
ts r
eser
ved.
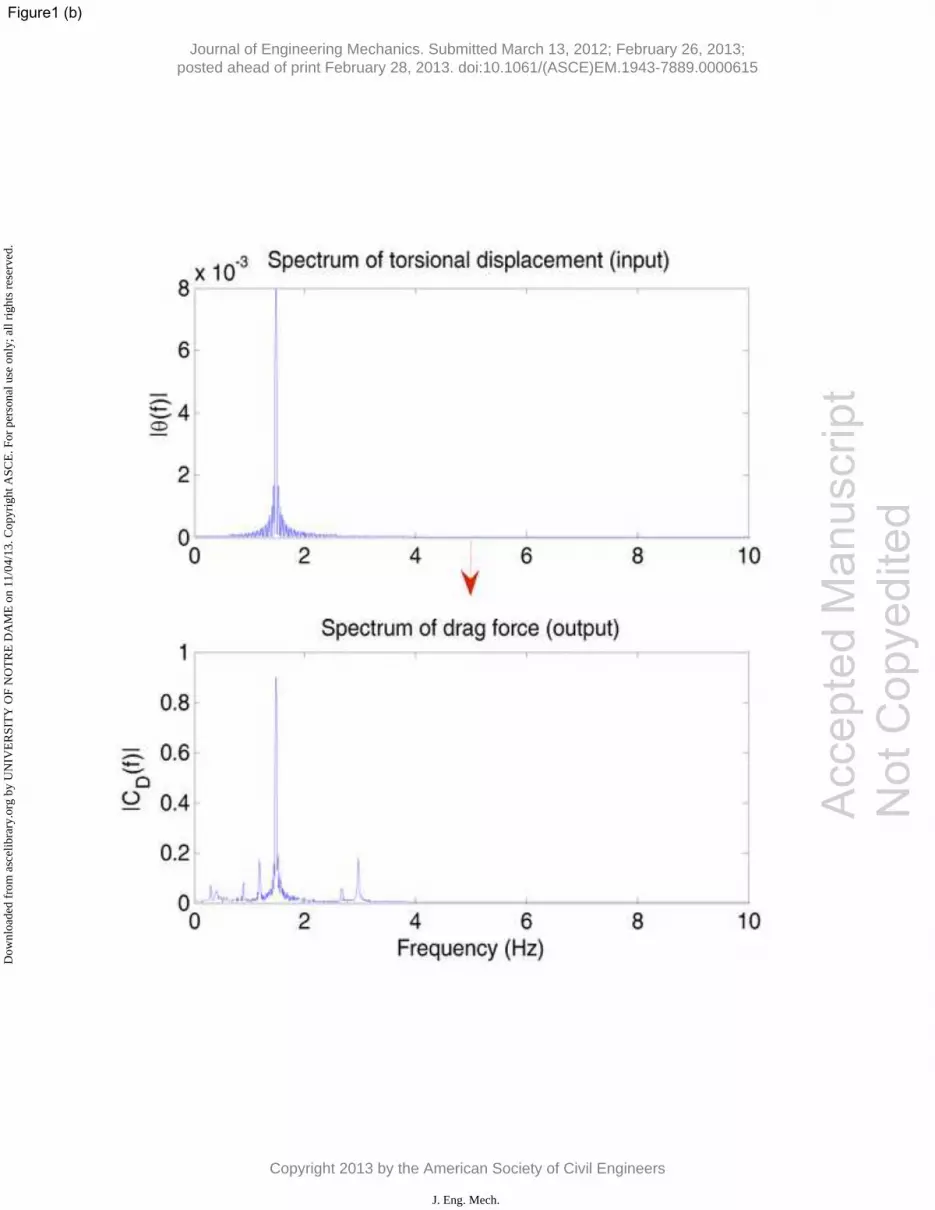
Figure1 (b)
Acc
epte
d M
anus
crip
t N
ot C
opye
dite
d
Journal of Engineering Mechanics. Submitted March 13, 2012; February 26, 2013; posted ahead of print February 28, 2013. doi:10.1061/(ASCE)EM.1943-7889.0000615
Copyright 2013 by the American Society of Civil Engineers
J. Eng. Mech.
Dow
nloa
ded
from
asc
elib
rary
.org
by
UN
IVE
RSI
TY
OF
NO
TR
E D
AM
E o
n 11
/04/
13. C
opyr
ight
ASC
E. F
or p
erso
nal u
se o
nly;
all
righ
ts r
eser
ved.
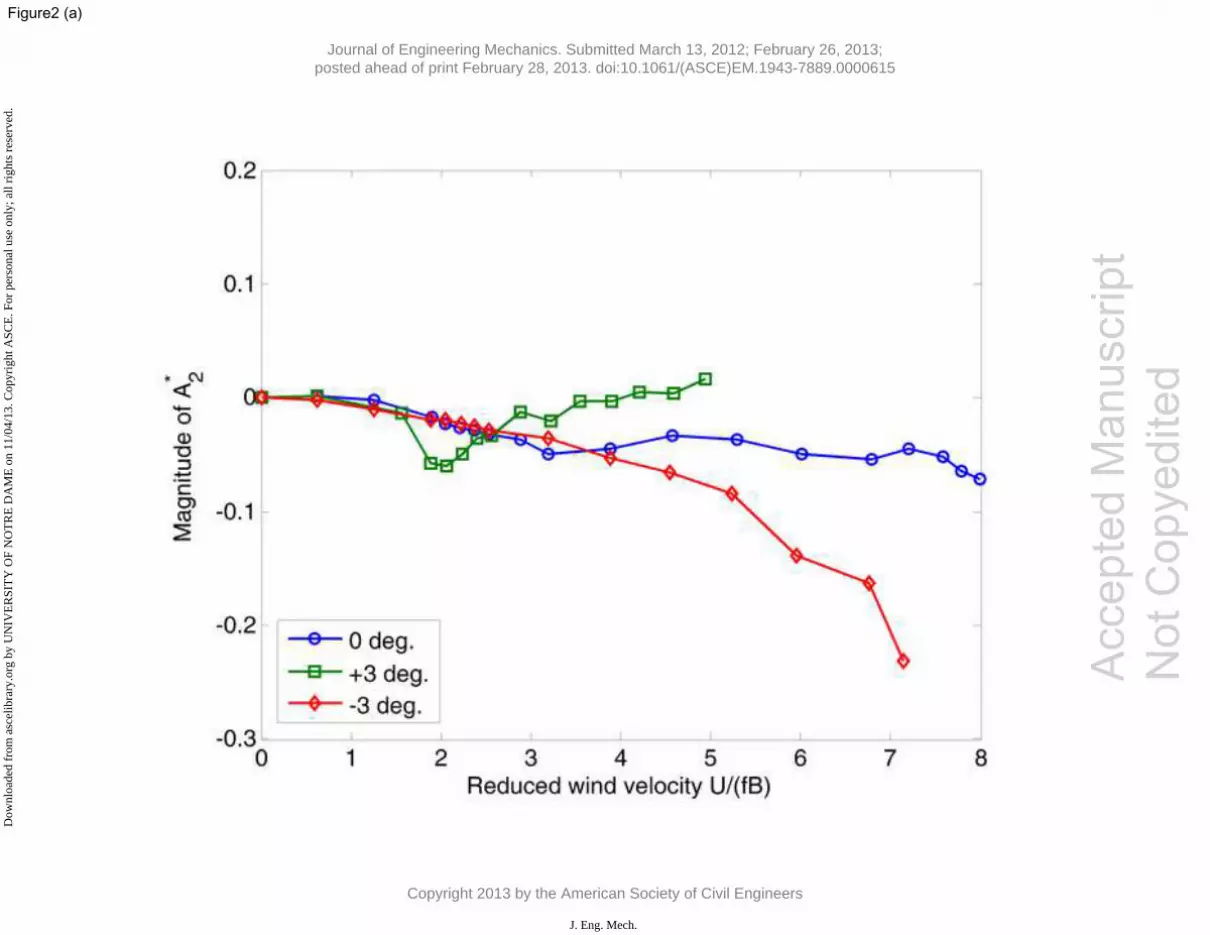
Figure2 (a)
Acc
epte
d M
anus
crip
t N
ot C
opye
dite
d
Journal of Engineering Mechanics. Submitted March 13, 2012; February 26, 2013; posted ahead of print February 28, 2013. doi:10.1061/(ASCE)EM.1943-7889.0000615
Copyright 2013 by the American Society of Civil Engineers
J. Eng. Mech.
Dow
nloa
ded
from
asc
elib
rary
.org
by
UN
IVE
RSI
TY
OF
NO
TR
E D
AM
E o
n 11
/04/
13. C
opyr
ight
ASC
E. F
or p
erso
nal u
se o
nly;
all
righ
ts r
eser
ved.
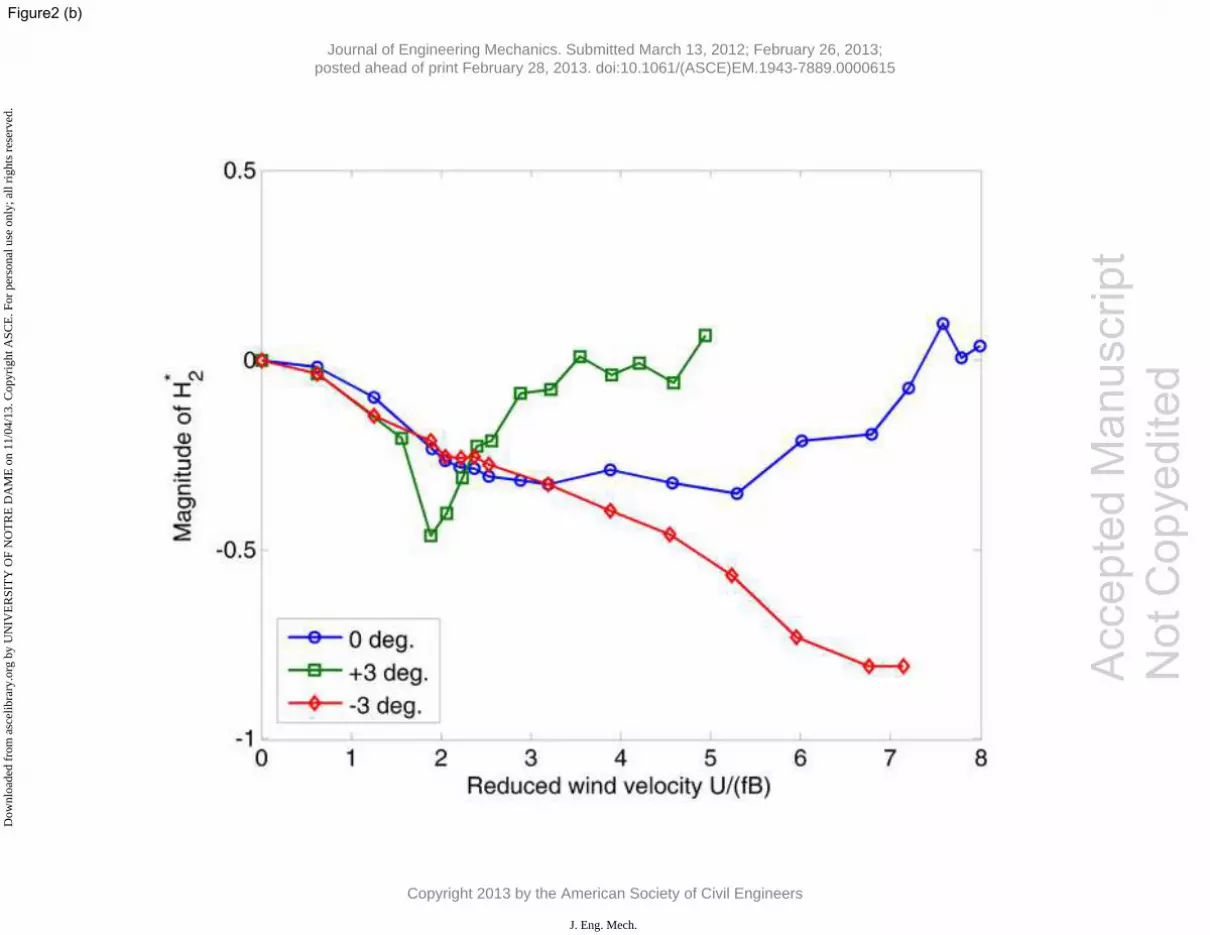
Figure2 (b)
Acc
epte
d M
anus
crip
t N
ot C
opye
dite
d
Journal of Engineering Mechanics. Submitted March 13, 2012; February 26, 2013; posted ahead of print February 28, 2013. doi:10.1061/(ASCE)EM.1943-7889.0000615
Copyright 2013 by the American Society of Civil Engineers
J. Eng. Mech.
Dow
nloa
ded
from
asc
elib
rary
.org
by
UN
IVE
RSI
TY
OF
NO
TR
E D
AM
E o
n 11
/04/
13. C
opyr
ight
ASC
E. F
or p
erso
nal u
se o
nly;
all
righ
ts r
eser
ved.
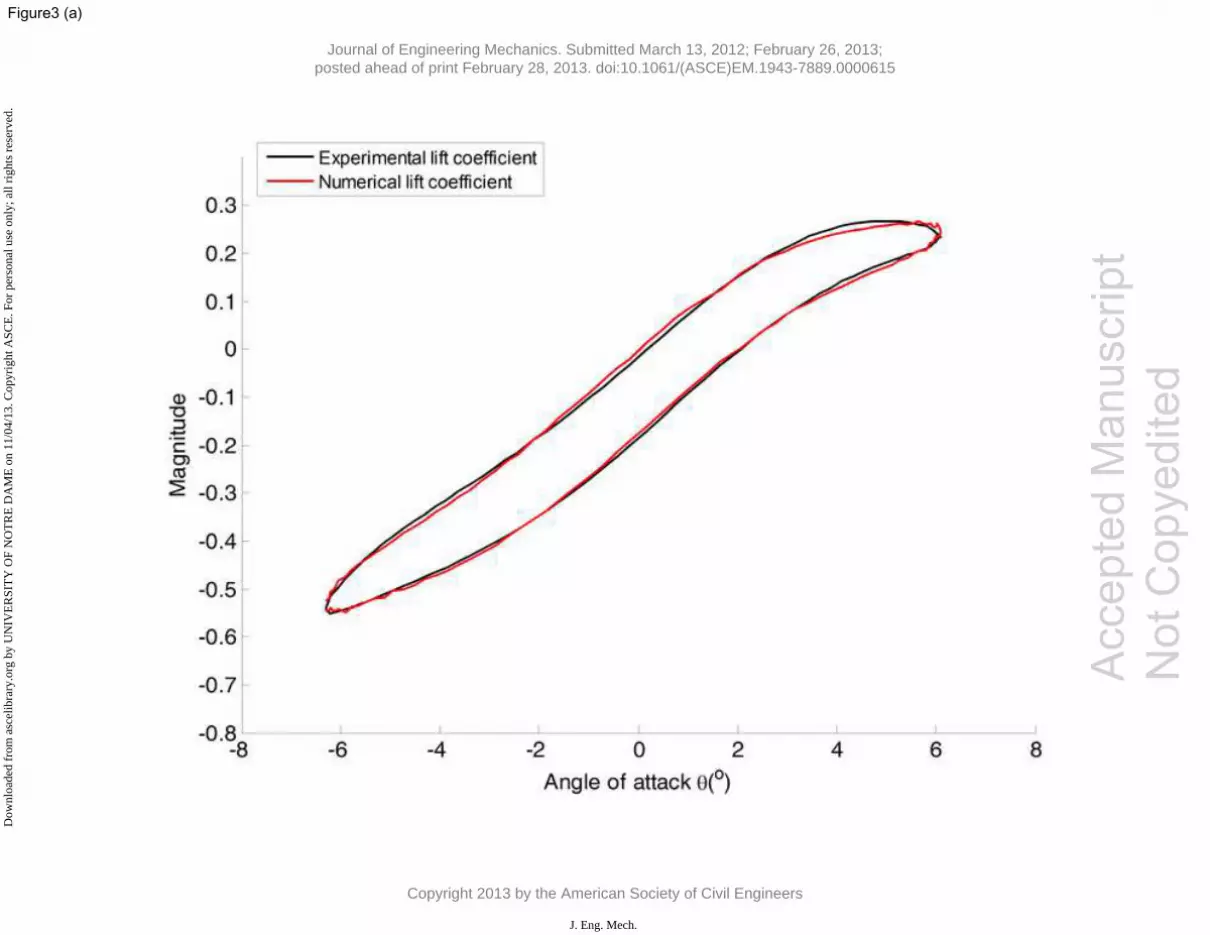
Figure3 (a)
Acc
epte
d M
anus
crip
t N
ot C
opye
dite
d
Journal of Engineering Mechanics. Submitted March 13, 2012; February 26, 2013; posted ahead of print February 28, 2013. doi:10.1061/(ASCE)EM.1943-7889.0000615
Copyright 2013 by the American Society of Civil Engineers
J. Eng. Mech.
Dow
nloa
ded
from
asc
elib
rary
.org
by
UN
IVE
RSI
TY
OF
NO
TR
E D
AM
E o
n 11
/04/
13. C
opyr
ight
ASC
E. F
or p
erso
nal u
se o
nly;
all
righ
ts r
eser
ved.
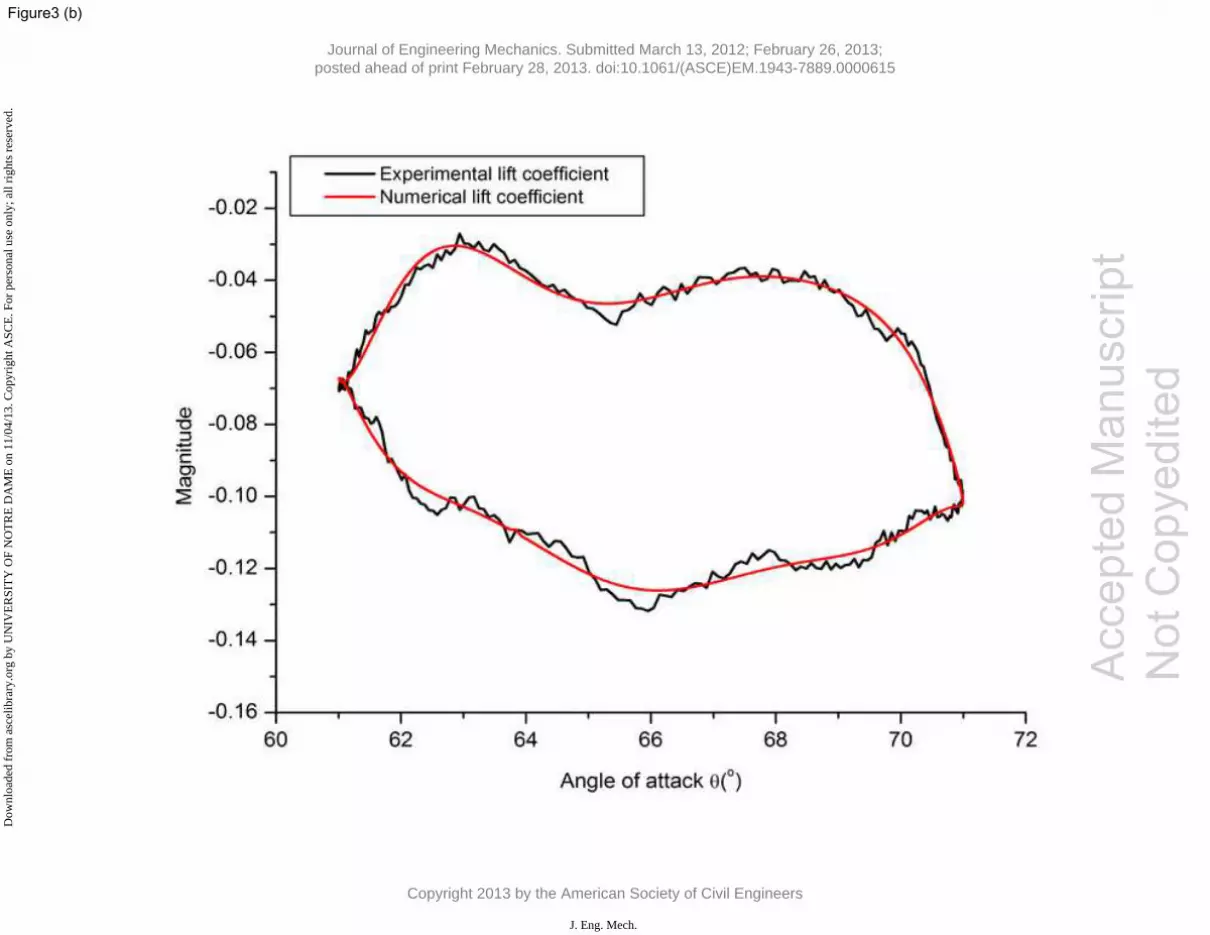
Figure3 (b)
Acc
epte
d M
anus
crip
t N
ot C
opye
dite
d
Journal of Engineering Mechanics. Submitted March 13, 2012; February 26, 2013; posted ahead of print February 28, 2013. doi:10.1061/(ASCE)EM.1943-7889.0000615
Copyright 2013 by the American Society of Civil Engineers
J. Eng. Mech.
Dow
nloa
ded
from
asc
elib
rary
.org
by
UN
IVE
RSI
TY
OF
NO
TR
E D
AM
E o
n 11
/04/
13. C
opyr
ight
ASC
E. F
or p
erso
nal u
se o
nly;
all
righ
ts r
eser
ved.
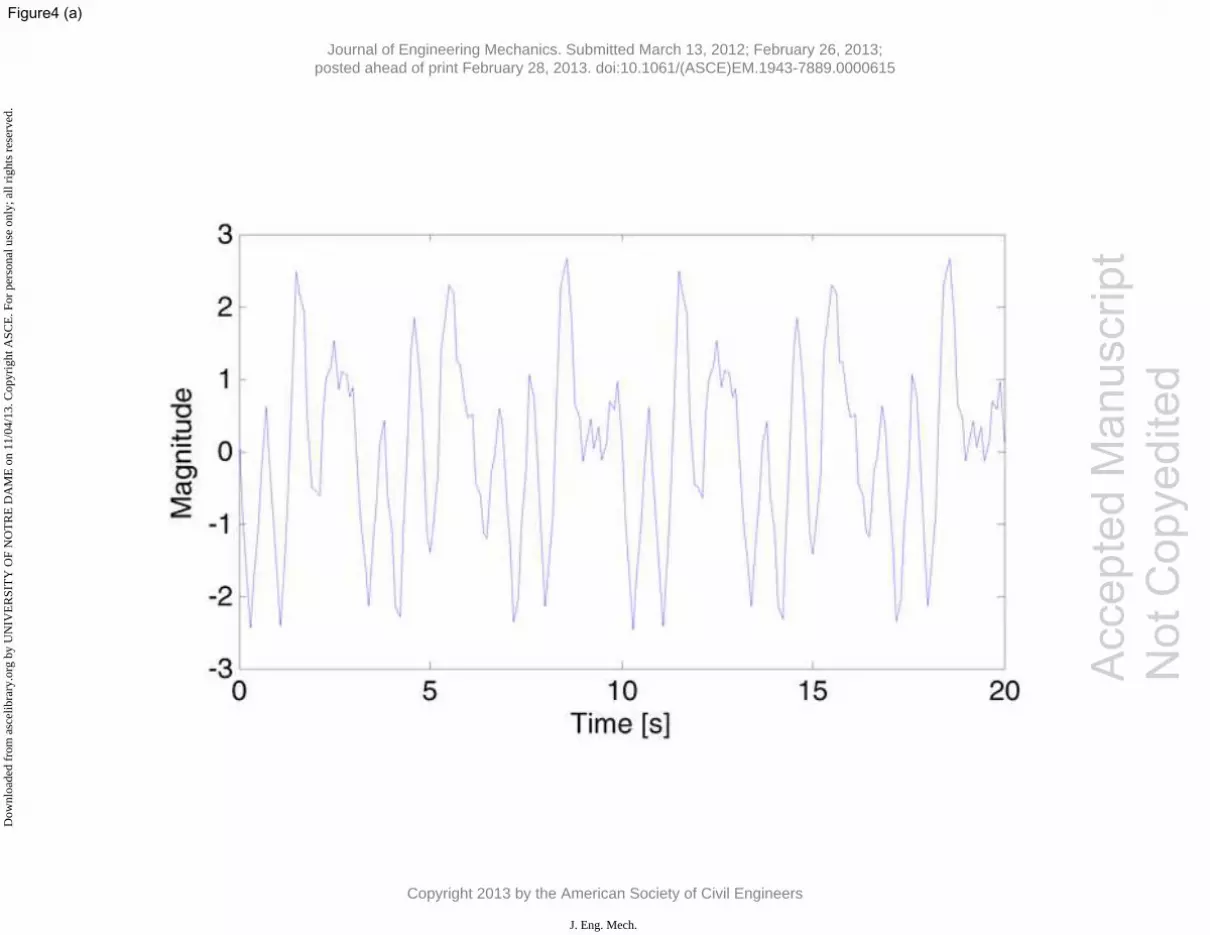
Figure4 (a)
Acc
epte
d M
anus
crip
t N
ot C
opye
dite
d
Journal of Engineering Mechanics. Submitted March 13, 2012; February 26, 2013; posted ahead of print February 28, 2013. doi:10.1061/(ASCE)EM.1943-7889.0000615
Copyright 2013 by the American Society of Civil Engineers
J. Eng. Mech.
Dow
nloa
ded
from
asc
elib
rary
.org
by
UN
IVE
RSI
TY
OF
NO
TR
E D
AM
E o
n 11
/04/
13. C
opyr
ight
ASC
E. F
or p
erso
nal u
se o
nly;
all
righ
ts r
eser
ved.
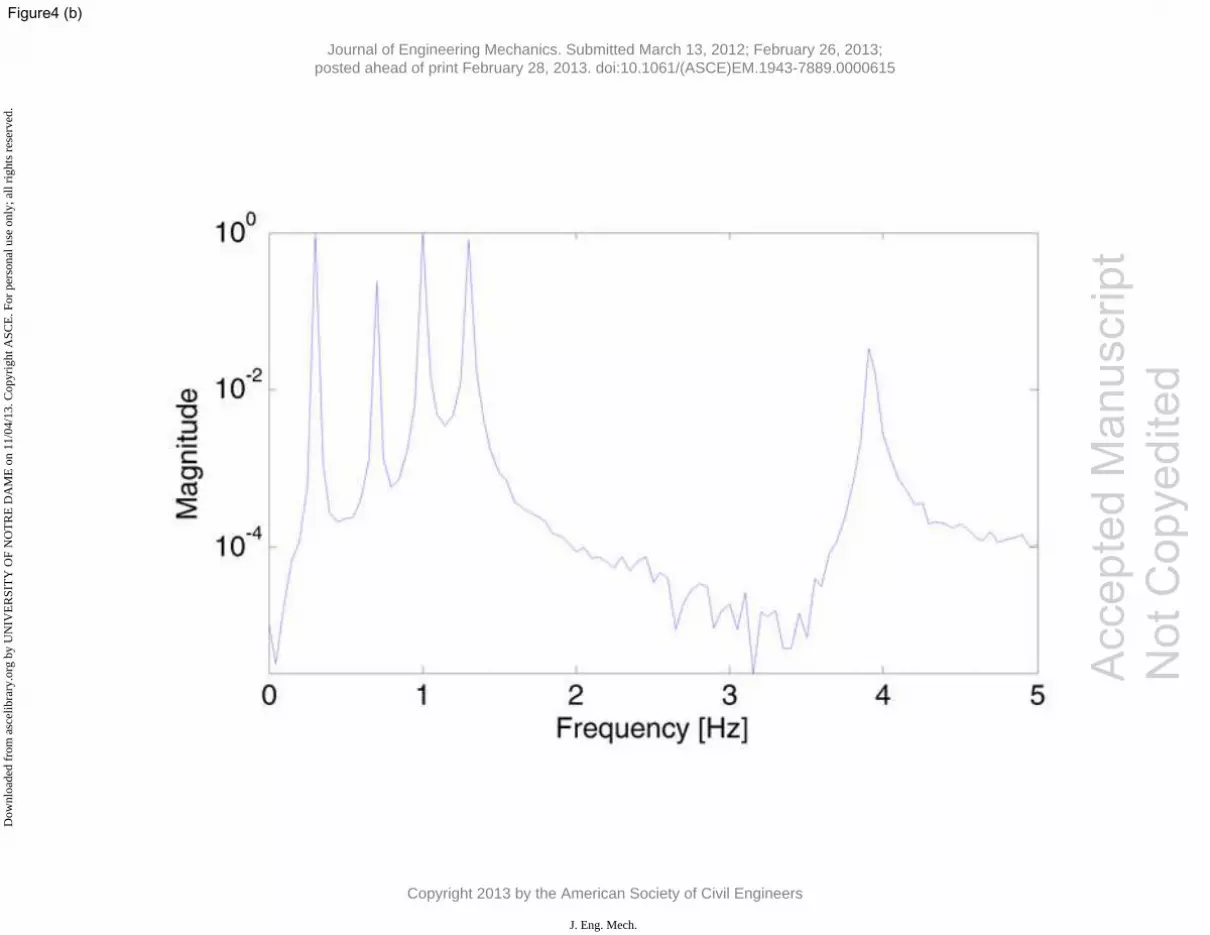
Figure4 (b)
Acc
epte
d M
anus
crip
t N
ot C
opye
dite
d
Journal of Engineering Mechanics. Submitted March 13, 2012; February 26, 2013; posted ahead of print February 28, 2013. doi:10.1061/(ASCE)EM.1943-7889.0000615
Copyright 2013 by the American Society of Civil Engineers
J. Eng. Mech.
Dow
nloa
ded
from
asc
elib
rary
.org
by
UN
IVE
RSI
TY
OF
NO
TR
E D
AM
E o
n 11
/04/
13. C
opyr
ight
ASC
E. F
or p
erso
nal u
se o
nly;
all
righ
ts r
eser
ved.
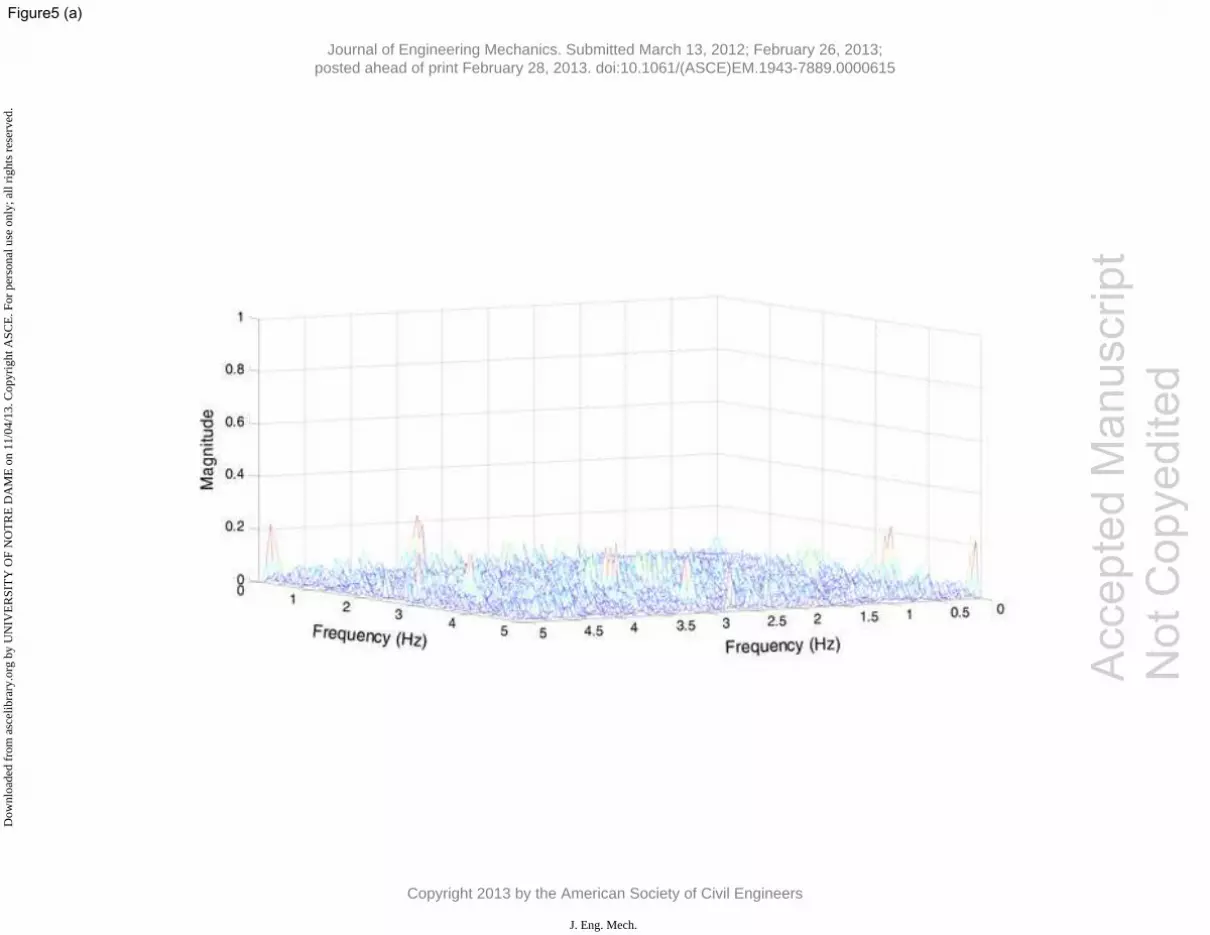
Figure5 (a)
Acc
epte
d M
anus
crip
t N
ot C
opye
dite
d
Journal of Engineering Mechanics. Submitted March 13, 2012; February 26, 2013; posted ahead of print February 28, 2013. doi:10.1061/(ASCE)EM.1943-7889.0000615
Copyright 2013 by the American Society of Civil Engineers
J. Eng. Mech.
Dow
nloa
ded
from
asc
elib
rary
.org
by
UN
IVE
RSI
TY
OF
NO
TR
E D
AM
E o
n 11
/04/
13. C
opyr
ight
ASC
E. F
or p
erso
nal u
se o
nly;
all
righ
ts r
eser
ved.
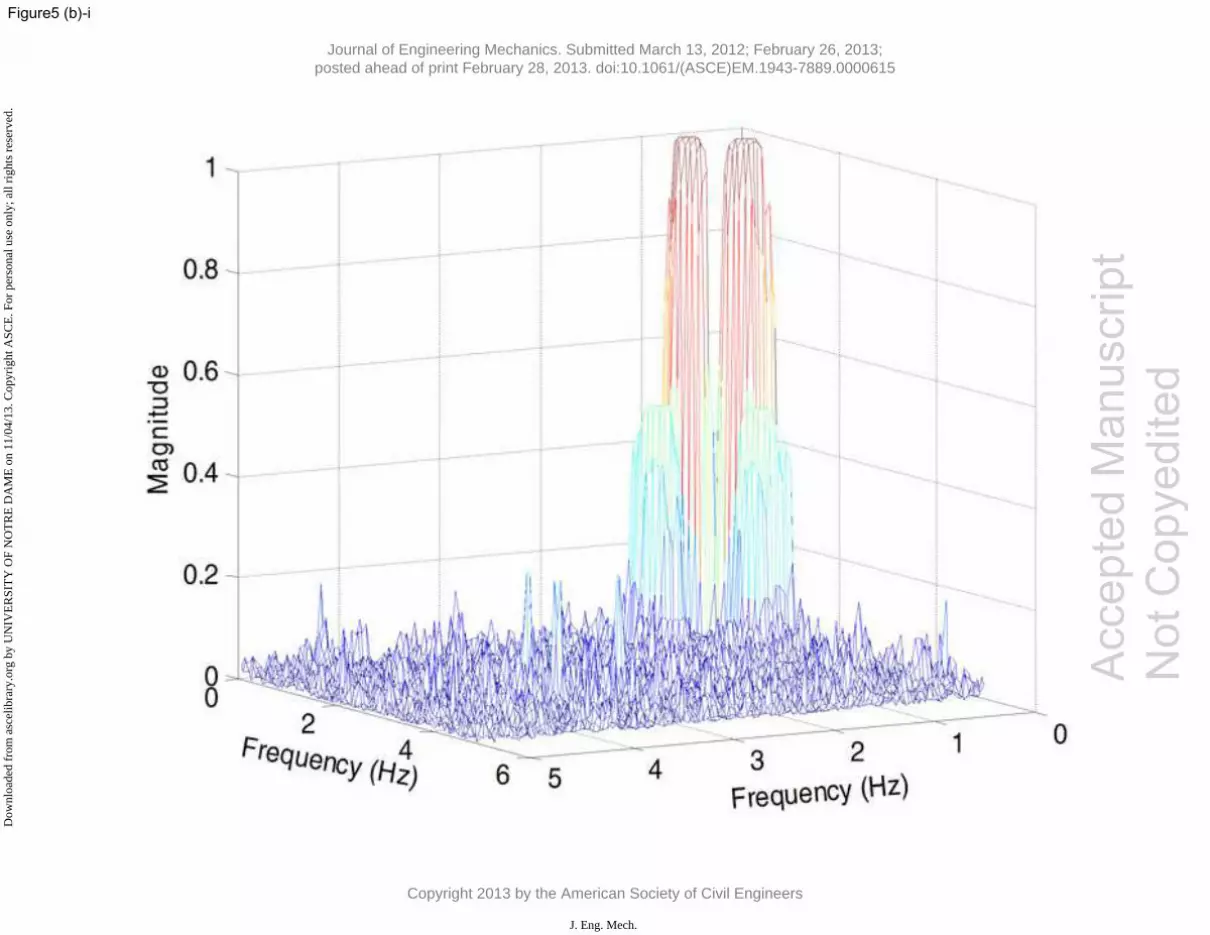
Figure5 (b)-i
Acc
epte
d M
anus
crip
t N
ot C
opye
dite
d
Journal of Engineering Mechanics. Submitted March 13, 2012; February 26, 2013; posted ahead of print February 28, 2013. doi:10.1061/(ASCE)EM.1943-7889.0000615
Copyright 2013 by the American Society of Civil Engineers
J. Eng. Mech.
Dow
nloa
ded
from
asc
elib
rary
.org
by
UN
IVE
RSI
TY
OF
NO
TR
E D
AM
E o
n 11
/04/
13. C
opyr
ight
ASC
E. F
or p
erso
nal u
se o
nly;
all
righ
ts r
eser
ved.
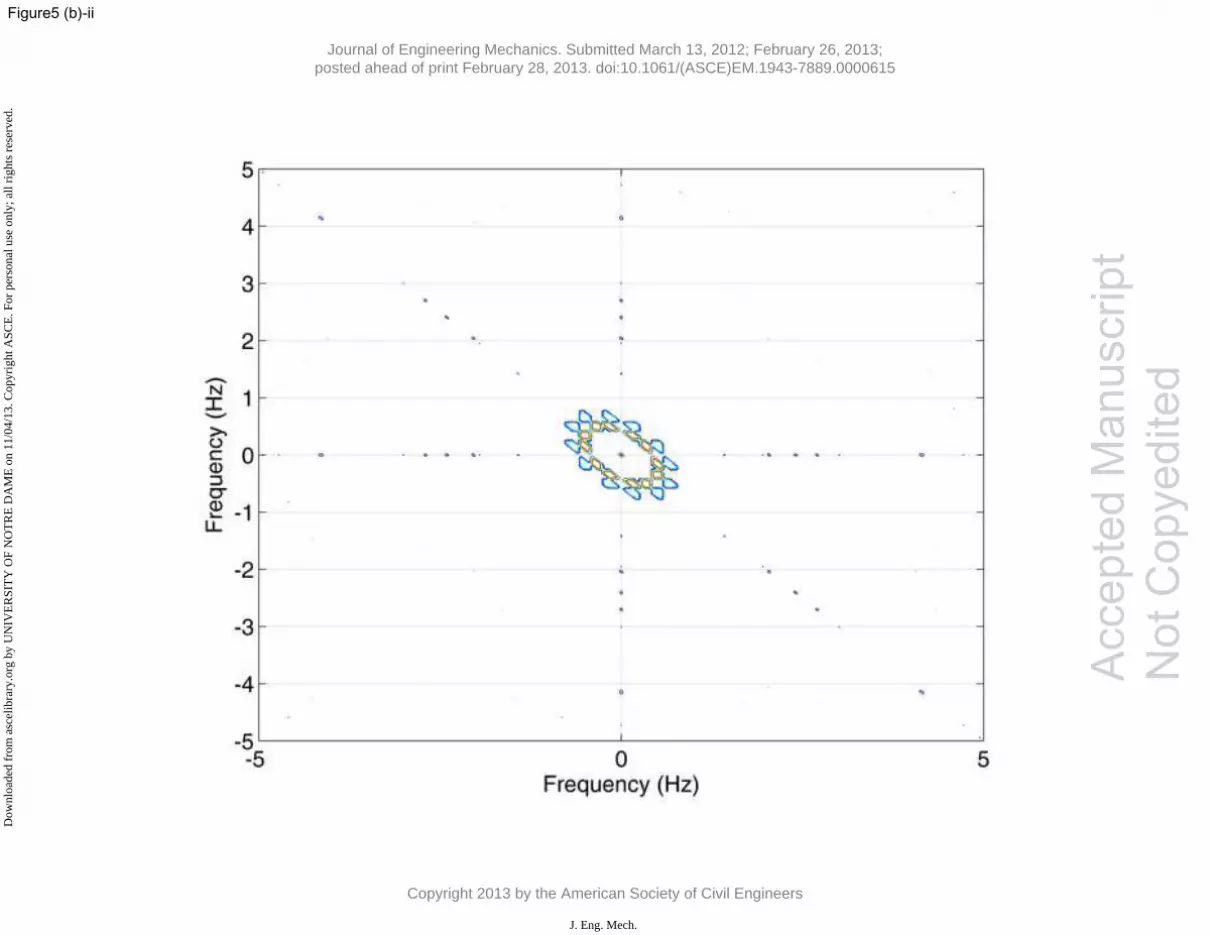
Figure5 (b)-ii
Acc
epte
d M
anus
crip
t N
ot C
opye
dite
d
Journal of Engineering Mechanics. Submitted March 13, 2012; February 26, 2013; posted ahead of print February 28, 2013. doi:10.1061/(ASCE)EM.1943-7889.0000615
Copyright 2013 by the American Society of Civil Engineers
J. Eng. Mech.
Dow
nloa
ded
from
asc
elib
rary
.org
by
UN
IVE
RSI
TY
OF
NO
TR
E D
AM
E o
n 11
/04/
13. C
opyr
ight
ASC
E. F
or p
erso
nal u
se o
nly;
all
righ
ts r
eser
ved.
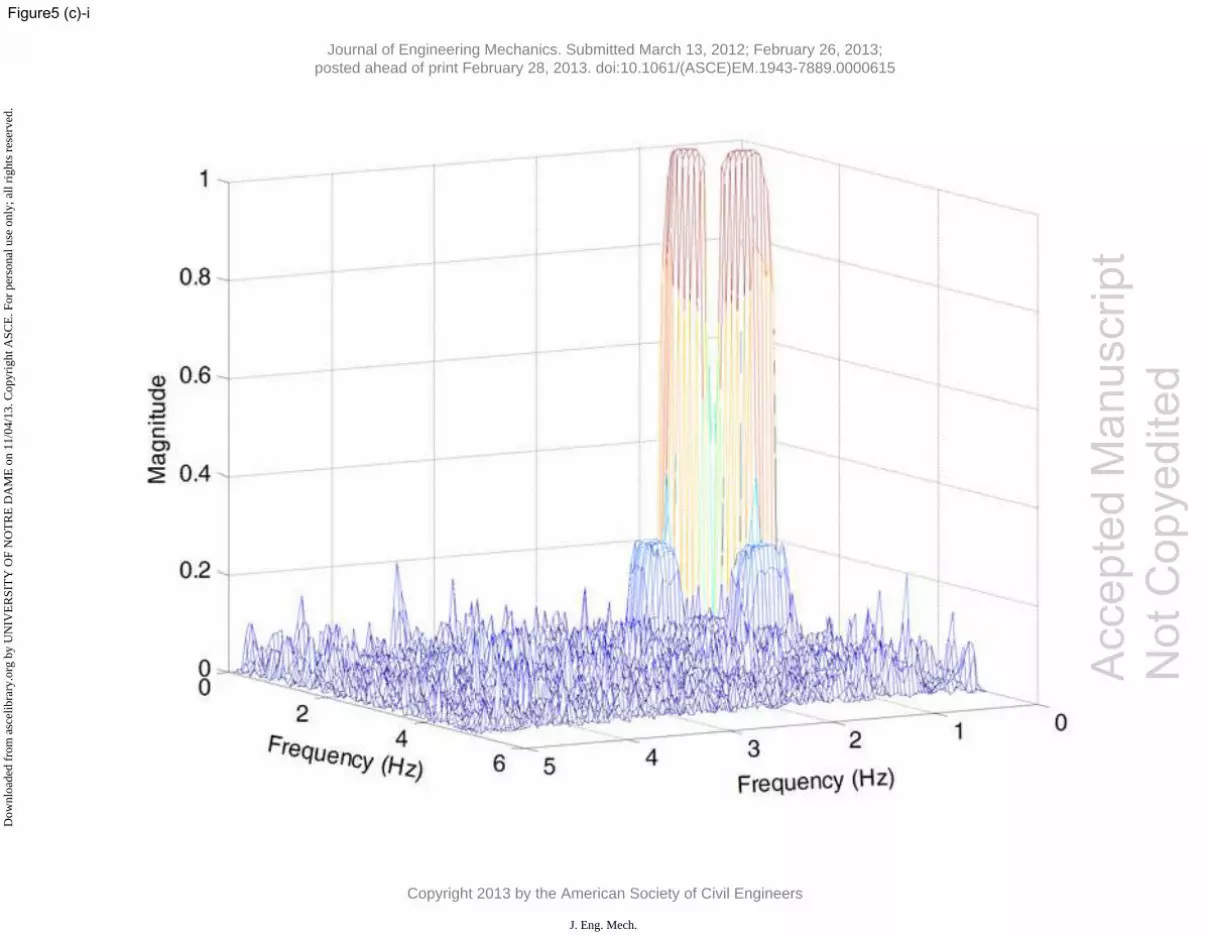
Figure5 (c)-i
Acc
epte
d M
anus
crip
t N
ot C
opye
dite
d
Journal of Engineering Mechanics. Submitted March 13, 2012; February 26, 2013; posted ahead of print February 28, 2013. doi:10.1061/(ASCE)EM.1943-7889.0000615
Copyright 2013 by the American Society of Civil Engineers
J. Eng. Mech.
Dow
nloa
ded
from
asc
elib
rary
.org
by
UN
IVE
RSI
TY
OF
NO
TR
E D
AM
E o
n 11
/04/
13. C
opyr
ight
ASC
E. F
or p
erso
nal u
se o
nly;
all
righ
ts r
eser
ved.
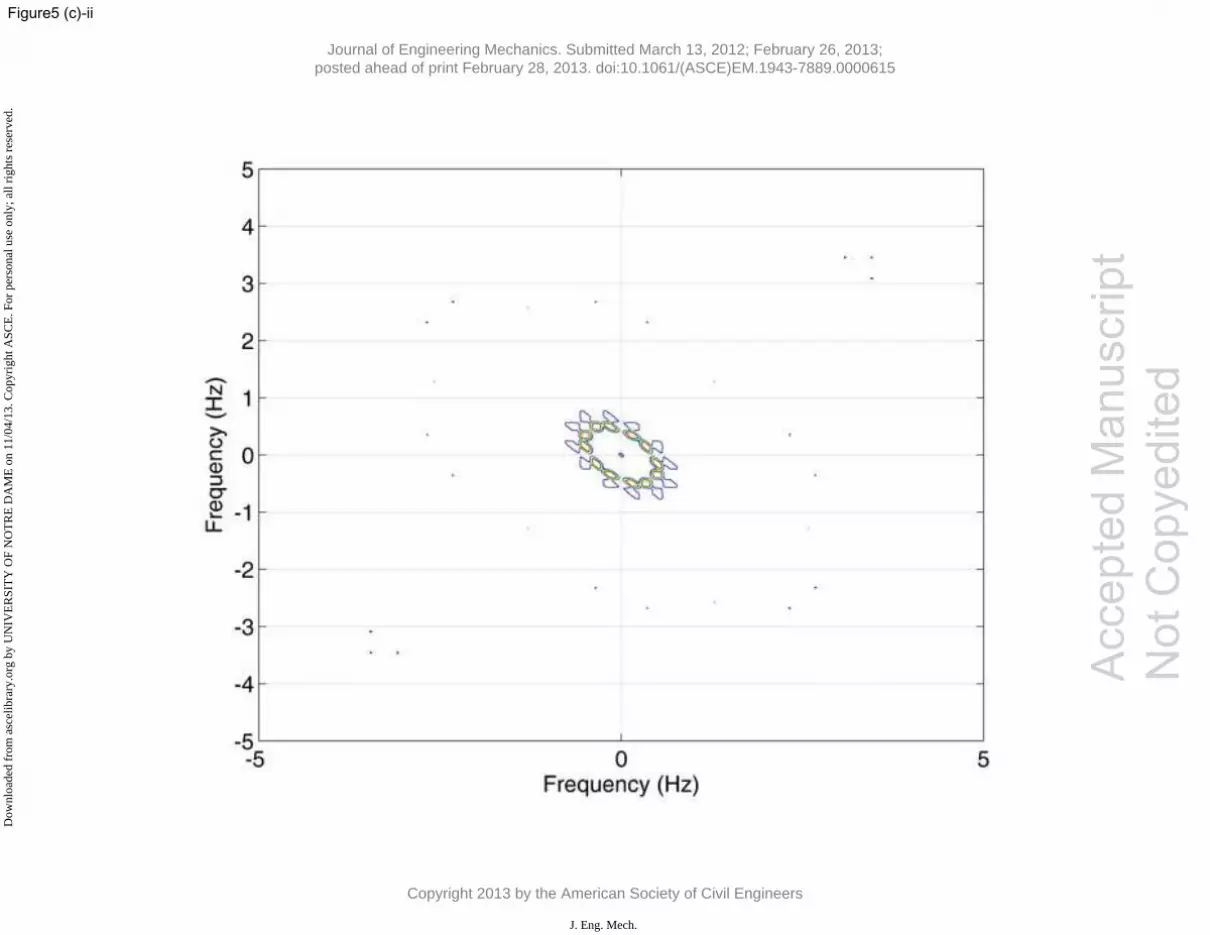
Figure5 (c)-ii
Acc
epte
d M
anus
crip
t N
ot C
opye
dite
d
Journal of Engineering Mechanics. Submitted March 13, 2012; February 26, 2013; posted ahead of print February 28, 2013. doi:10.1061/(ASCE)EM.1943-7889.0000615
Copyright 2013 by the American Society of Civil Engineers
J. Eng. Mech.
Dow
nloa
ded
from
asc
elib
rary
.org
by
UN
IVE
RSI
TY
OF
NO
TR
E D
AM
E o
n 11
/04/
13. C
opyr
ight
ASC
E. F
or p
erso
nal u
se o
nly;
all
righ
ts r
eser
ved.
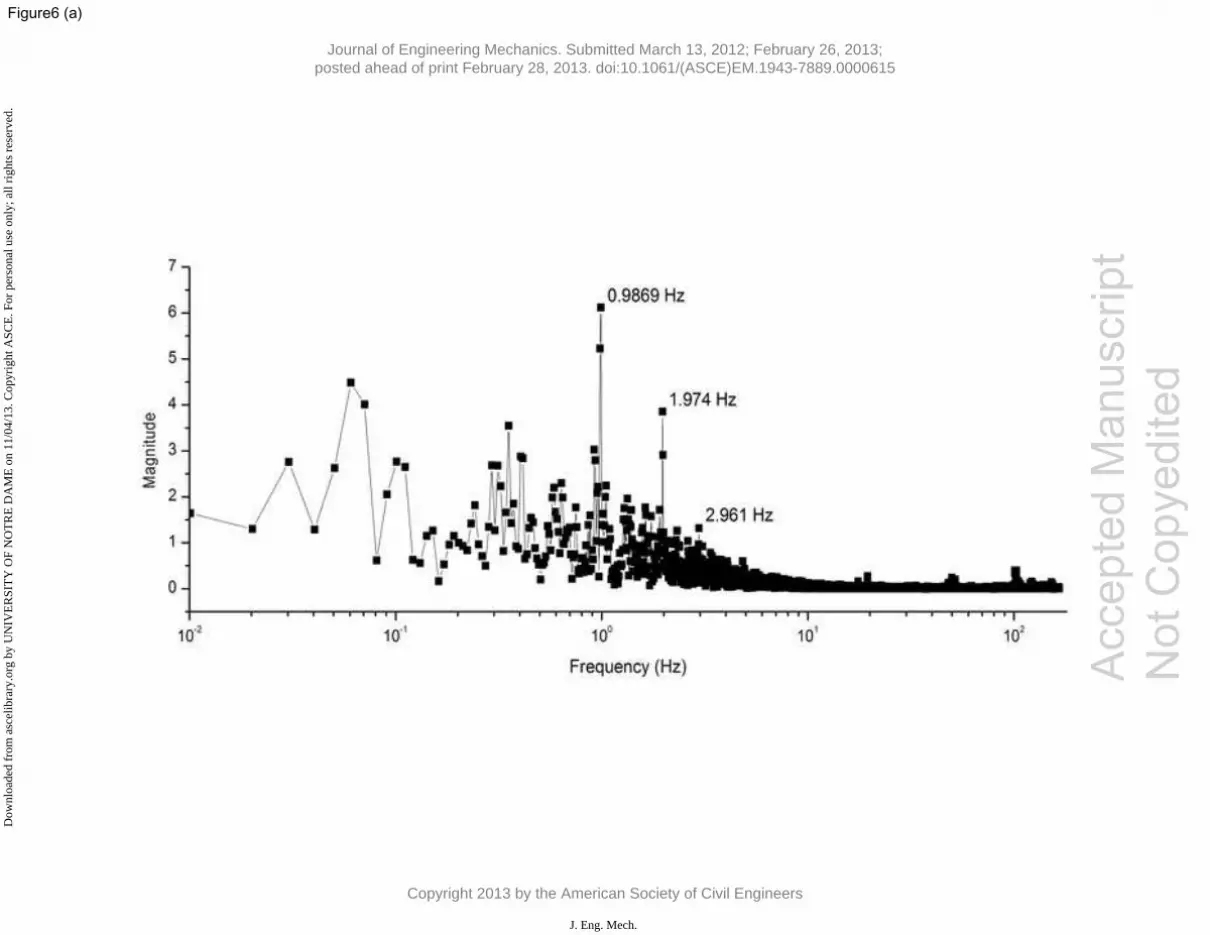
Figure6 (a)
Acc
epte
d M
anus
crip
t N
ot C
opye
dite
d
Journal of Engineering Mechanics. Submitted March 13, 2012; February 26, 2013; posted ahead of print February 28, 2013. doi:10.1061/(ASCE)EM.1943-7889.0000615
Copyright 2013 by the American Society of Civil Engineers
J. Eng. Mech.
Dow
nloa
ded
from
asc
elib
rary
.org
by
UN
IVE
RSI
TY
OF
NO
TR
E D
AM
E o
n 11
/04/
13. C
opyr
ight
ASC
E. F
or p
erso
nal u
se o
nly;
all
righ
ts r
eser
ved.
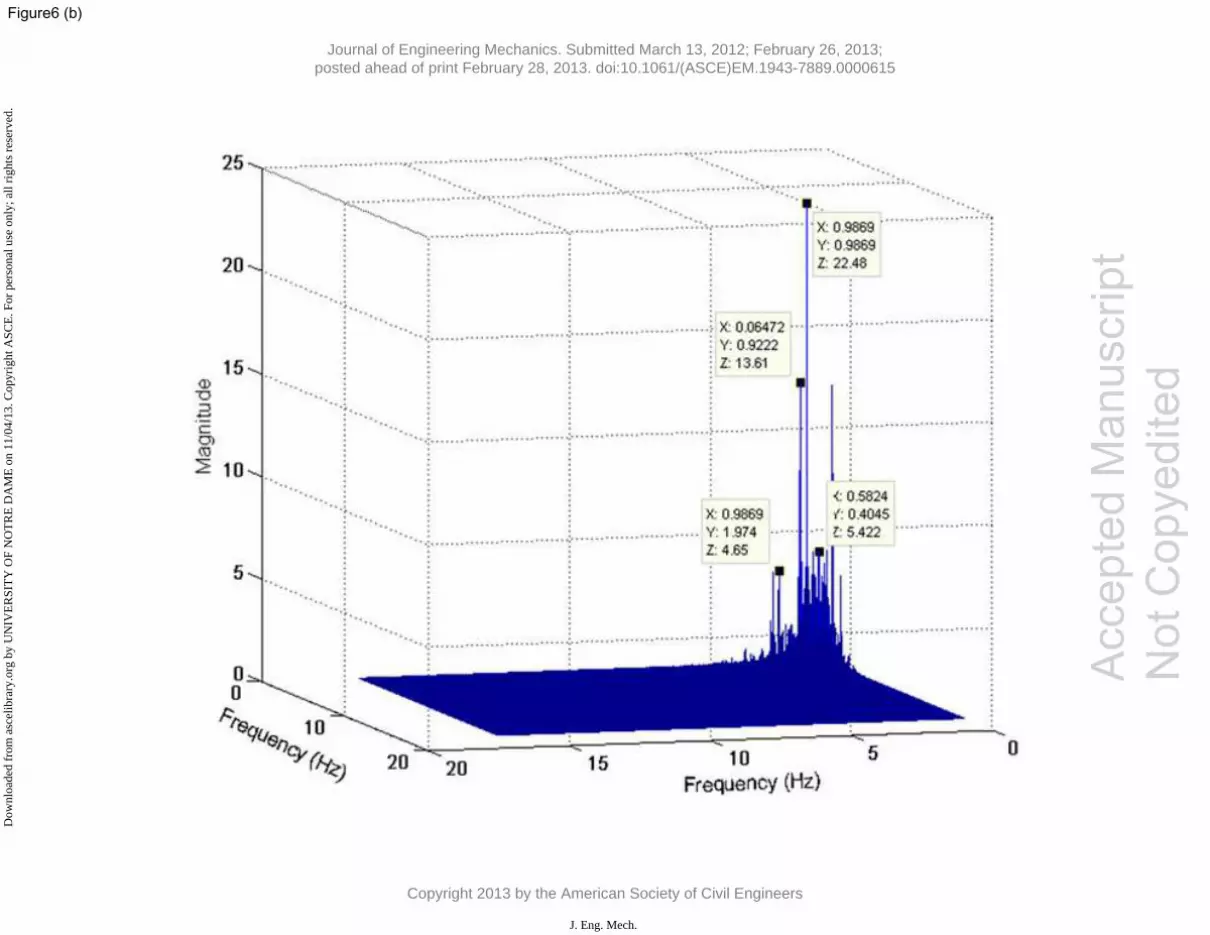
Figure6 (b)
Acc
epte
d M
anus
crip
t N
ot C
opye
dite
d
Journal of Engineering Mechanics. Submitted March 13, 2012; February 26, 2013; posted ahead of print February 28, 2013. doi:10.1061/(ASCE)EM.1943-7889.0000615
Copyright 2013 by the American Society of Civil Engineers
J. Eng. Mech.
Dow
nloa
ded
from
asc
elib
rary
.org
by
UN
IVE
RSI
TY
OF
NO
TR
E D
AM
E o
n 11
/04/
13. C
opyr
ight
ASC
E. F
or p
erso
nal u
se o
nly;
all
righ
ts r
eser
ved.
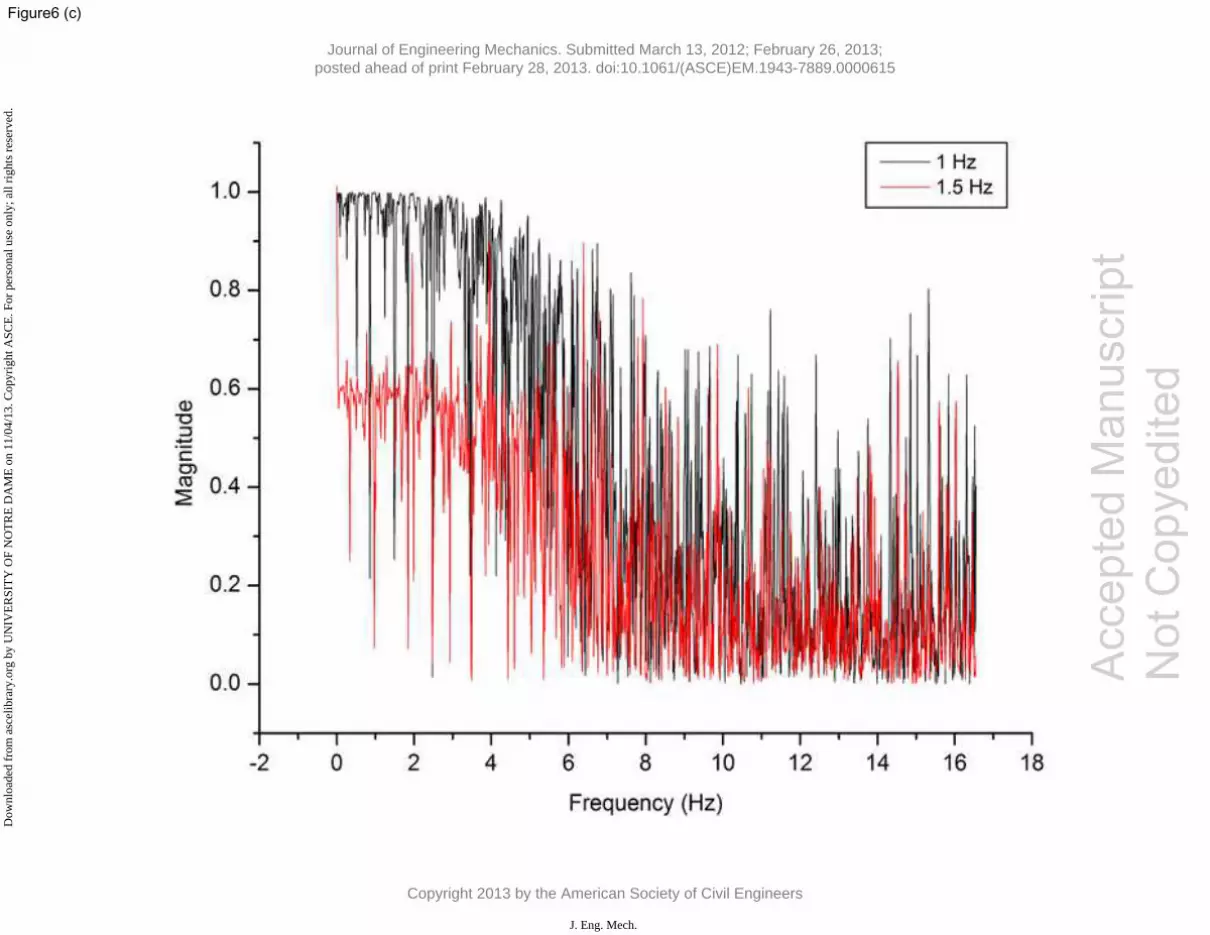
Figure6 (c)
Acc
epte
d M
anus
crip
t N
ot C
opye
dite
d
Journal of Engineering Mechanics. Submitted March 13, 2012; February 26, 2013; posted ahead of print February 28, 2013. doi:10.1061/(ASCE)EM.1943-7889.0000615
Copyright 2013 by the American Society of Civil Engineers
J. Eng. Mech.
Dow
nloa
ded
from
asc
elib
rary
.org
by
UN
IVE
RSI
TY
OF
NO
TR
E D
AM
E o
n 11
/04/
13. C
opyr
ight
ASC
E. F
or p
erso
nal u
se o
nly;
all
righ
ts r
eser
ved.
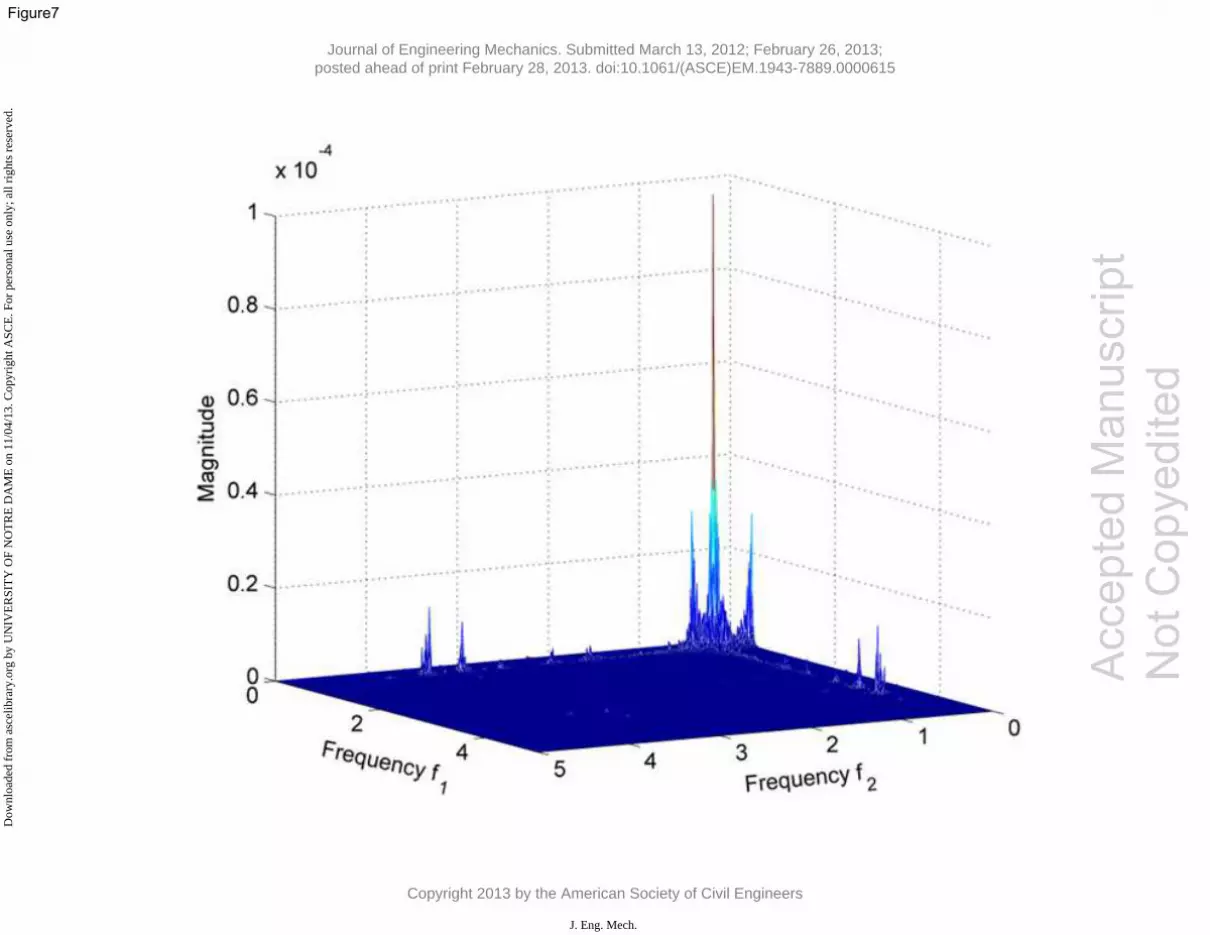
Figure7
Acc
epte
d M
anus
crip
t N
ot C
opye
dite
d
Journal of Engineering Mechanics. Submitted March 13, 2012; February 26, 2013; posted ahead of print February 28, 2013. doi:10.1061/(ASCE)EM.1943-7889.0000615
Copyright 2013 by the American Society of Civil Engineers
J. Eng. Mech.
Dow
nloa
ded
from
asc
elib
rary
.org
by
UN
IVE
RSI
TY
OF
NO
TR
E D
AM
E o
n 11
/04/
13. C
opyr
ight
ASC
E. F
or p
erso
nal u
se o
nly;
all
righ
ts r
eser
ved.