adsorption and wetting in model mesoporous silicas and in
TRANSCRIPT
Seton Hall UniversityeRepository @ Seton HallSeton Hall University Dissertations and Theses(ETDs) Seton Hall University Dissertations and Theses
Spring 5-13-2017
Adsorption and Wetting in Model MesoporousSilicas and in Complex Metal Oxide CatalystsKarthik JayaramanSeton Hall University, [email protected]
Follow this and additional works at: https://scholarship.shu.edu/dissertations
Part of the Materials Chemistry Commons, and the Physical Chemistry Commons
Recommended CitationJayaraman, Karthik, "Adsorption and Wetting in Model Mesoporous Silicas and in Complex Metal Oxide Catalysts" (2017). Seton HallUniversity Dissertations and Theses (ETDs). 2293.https://scholarship.shu.edu/dissertations/2293
Adsorption and Wetting in Model Mesoporous Silicas and in Complex Metal Oxide Catalysts
By:
Karthik Jayaraman
Dissertation submitted to the Department of Chemistry and Biochemistry of Seton Hall University in fulfillment of the requirements for the degree of
Doctor of Philosophy
Spring 2017
South Orange, New Jersey

© 2017 (Karthik Jayaraman)
ii
Dedication (to my well-wishers)
My parents Mr. N. Jayaraman & Mrs. J. Jayam
My wife Ramya
My mentor Frank Tomasella Ph.D. at Bristol Myers Squibb
My brother Ganesh
na coryahāryaṃ na ca rājahāryaṃ na bhrātṛbhājyaṃ na ca bhārakāri |
vyaye kṛte vardhate eva nityaṃ vidyādhanaṃ sarvadhanapradhānam ||
– an Ancient Indian adage.
Not stolen by thieves, not seized by kings, not divided amongst brothers, not heavy to carry. The more you
spend, the more it flourishes always --- the wealth of knowledge is the most important among all kinds of
wealth.
iv
Acknowledgments
I extend my sincere thanks to Professor Alexander Y Fadeev for being my research advisor
and for challenging my thinking, writing and research skills. I also thank him wholeheartedly for
providing me valuable guidance, and encouragement throughout this work. Prof. Fadeev was
always available to provide assistance to comprehend the concepts and techniques to carry out the
research.
I would like to thank Professor Sergiu M Gorun for his willingness to share his research
expertise by being a part of my research (related to phthalocyanines) and dissertation examining
committee. My genuine gratitude goes to Professor Yuri V Kazakevich, Professor David Sabatino
and Professor Stephen P Kelty for being part of my dissertation matriculation committee and
enabling me to progress with my research.
This work has benefitted from discussions with and help from fellow graduate students:
Gabe Graffius, Henry Grau, Edwin Vega and Frank Bernardoni. I would also like to acknowledge
Erik Carrion from Dr. Gorun’s research group for synthesis and isolation of the phthalocyanines.
My profound acknowledgment goes to the Seton Hall University, specifically the Department of
Chemistry and Biochemistry, which has been a great place of learning.
I would like to thank Bristol-Myers Squibb (BMS) Company for supporting my PhD by
providing doctoral fellowship and access to instruments in the lab. I would like to thank Dr. Frank
Tomasella at BMS for fueling my interest in pursuing PhD, for suggesting Seton Hall University
and motivating me periodically to stay on the path to complete the doctoral degree. I would like to
thank Dr. Shasad Sharif at BMS who assisted me immensely to become familiar with much of the
instrumentation or equipment required to perform my experiments.
v
I would like to thank all the teachers in my life who have sown the seed of knowledge in
various academic disciplines. My first chemistry teacher is my beloved father Mr. N. Jayaraman,
a retired chemistry lecturer from a state college in Chennai, India. The first lesson he gave me was
on the different branches of chemistry and how chemistry is present in all ordinary things we come
across everyday. My abundant gratitude goes to my a) undergraduate research advisors: Late Dr.
V. Narayanan, Late Dr. A. Baradarajan and Dr. T. Venkatraman at University of Madras, India, b)
graduate research advisors: Dr. William R Wilcox and Dr. Liya L. Regel at Clarkson University,
Potsdam NY and c) graduate research advisors: Dr. Douglas S English and Dr. Sang Bok Lee at
University of Maryland, College Park, MD for stimulating curiosity and interest in scientific
research at various time points.
I would like to express my appreciation for the constant moral support and encouragement
that I received from my parents, wife, brother & his wife, in-laws and friends during the past years.
Finally, but not perfunctorily, I thank the Almighty for giving me such a great opportunity.
vi
Abstract
The surface of most metal oxides is covered by hydroxyl groups which influence many
surface phenomena such as adsorption and wetting, catalysis and surface reactions. Surface
chemistry of silica is a subject of exhaustive studies owing to a wide variety of practical
applications of silica. In Chapter 1, a brief review of classification, synthesis and characterization
of silica is provided. The hydroxylation of silica surface i.e the number of hydroxyl (-OH) groups
on the surface is of utmost importance for its practical applications. In Chapter 2, a brief
introduction to surface hydration of silica is provided followed by the gas adsorption
measurements and characterization.
Pore wetting is critical to many applications of mesoporous adsorbents, catalysts, and
separation materials. In the work presented in Chapter 3, we employed the combined vapor
adsorption study using nitrogen (77K) and water (293K) isotherms to evaluate the water contact
angles for a series of ordered mesoporous silicas (ex:SBA-15). The proposed method of contact
angle relies on the statistical film thickness (t-curve) of the adsorbed water. There were no t-
curves for water for dehydroxylated or hydrophobic surfaces in literature and we addressed this
issue by measuring t-curves for a series of model surfaces with known and varying silanol
coverage. Using the radius of menisci (( 2 )), statistical film thickness t(H2O) from water
isotherm, and the true radius of pores ( ( 2)), from nitrogen isotherms, the water contact angle
inside pores were calculated. As it was anticipated, the results obtained showed that the silica
pore contact angles were strongly influenced by the number of the surface silanol groups and,
therefore, by the thermal and hydration treatments of silicas.
Phthalocyanines (Pcs) present an interesting class of catalytically active of molecules
with unique spectroscopic, photoelectric, and sometimes magnetic properties. In the work
vii
presented in Chapter 4, we have undertaken a systematic study to explore the possibility of
preparing a supported catalyst material i.e loading fluorinated metal phthalocyanines onto metal
oxide surfaces by two other techniques in addition to solution adsorption. Techniques or
procedures that have been used to immobilize MPcs include: i) physical adsorption (from
solution) onto metal oxide surface, ii) deposition by pore filling and encapsulation and iii)
mesopore entrapment or confinement. The MPcs are loaded on to metal oxides with an aim to: a)
maximize the surface area of the Pcs by distributing it over the support, b) immobilize the Pcs so
that they do not leach into the solution environment, c) improve the thermal stability of the Pcs
and d) attempt to achieve single-site catalysis. All the immobilization techniques were carried out
with F64PcZn as the model MPc, acetone as the immobilization solvent and silica or alumina as
adsorbents (solid support).
An understanding of gas adsorption mechanisms on metal phthalocyanines (MPcs) is
essential for their practical application in biological processes, gas sensing, and catalysis. In this
work, the surface characteristics were probed by performing nitrogen and water adsorption on the
free-form MPcs (without immobilization on solid support) and characterization of their physical
properties. The combined vapor adsorption study (developed in Chapter 3) enabled in
understanding the affinity of Pcs towards water vapor i.e number of water molecules adsorbed per
phthalocyanine molecule was obtained. This information is very relevant towards using Pcs as
catalyst since water vapor is guaranteed to be present in most of the catalytic reaction environment.
viii
Table of Contents
Chapter 1: Classification, Synthesis and Characterization of Silica............ 1
1.1 Introduction to Silica....................................................................................................... 1
1.1.1 Classification based on the crystal structure........................................................... 1
1.1.2 Classification based on dispersity............................................................................ 3
1.1.3 Classification based on surface composition........................................................... 5
1.1.4 Classification based on porosity.............................................................................. 7
1.2 Synthesis of Silica............................................................................................................. 12
1.2.1 Continuous flame hydrolysis of fumed silica........................................................... 13
1.2.2 Sol-gel process of silica gels.................................................................................... 16
1.2.3 Templated Sol-gel process of ordered mesoporous silica........................................ 22
1.3. Characterization of Silica Surface................................................................................. 26
1.3.1 Surface area, pore volume, pore diameter and pore size distribution................... 26
1.3.2 Surface silanols...................................................................................................... 32
Chapter 2: Surface Hydration and Physical Characterization of Silica...... 34
2.1 Introduction...................................................................................................................... 34
2.2 Surface Hydration............................................................................................................ 34
2.2.1 Formation of surface hydroxyls (silanols)............................................................. 34
2.2.2 Type of surface hydroxyls (silanols)...................................................................... 35
2.2.3 Dehydration, dehydroxylation and rehydroxylation of silica................................. 38
2.2.3.1 Dehydration of silica surface..................................................................... 38
2.2.3.2 Dehydroxylation of silica surface.............................................................. 40
2.2.3.3 Rehydroxylation of silica surface............................................................... 43
2.2.4 Infrared studies of the silica surface...................................................................... 43
2.2.5 Quantification of the silanol number by thermogravimetric analysis................... 45
2.3 Gas Adsorption Measurements and Characterization.................................................. 47
2.3.1 Determination of surface area............................................................................... 47
2.3.2 Pore size characterization..................................................................................... 53
2.3.2.1 Capillary condensation, hysteresis and the Kelvin equation..................... 54
ix
2.3.2.2 Pore size distribution, statistical thickness (t) and Kelvin equation............ 60
2.4 Water Adsorption............................................................................................................. 63
2.4.1 Water t-curves................................................................................................ 64
2.4.2 Water Contact Angles..................................................................................... 65
Chapter 3: Water Contact Angles in Silica Mesopores: The Results of Combined Adsorption Study.........................................................................................
67
3.1 Introduction....................................................................................................................... 67
3.2 Experiment........................................................................................................................ 70
3.2.1 Silicas: Preparation, Hydroxylation, Calcination, Silanol determination, and Grafting with TMS..........................................................................................................
70
3.2.2 Nitrogen adsorption isotherms............................................................................... 71
3.2.3 Water adsorption isotherms................................................................................... 72
3.2.4 Contact angles by water......................................................................................... 73
3.3 Results and Discussion..................................................................................................... 73
3.3.1 Structural changes to SBA-15 on exposure to water............................................. 74
3.3.2 Hydrothermal treatment as a means to improve hydrolytic stability of SBA-15..... 78
3.3.3 Radius of pores, Radius of water menisci, and water contact angles..................... 79
3.3.4 SBA-15 freshly made, hydroxylated, and calcined at different temperatures......... 81
3.3.5 SBA-15 with chemically grafted hydrophobic TMS groups................................... 89
3.3.6 Statistical thickness for water adsorption.............................................................. 95
3.3.7 Water adsorbed per silanol group......................................................................... 102
3.4 Conclusions........................................................................................................................ 107
Chapter 4: Fluorinated Metal Phthalocyanine Encapsulated in Metal Oxides.....................................................................................................................................
109
4.1 Introduction....................................................................................................................... 109
4.2 Experiment........................................................................................................................ 114
4.2.1 Chemicals.............................................................................................................. 114
4.2.1 Metal oxides........................................................................................................... 114
4.2.3 Synthesis of perfluorinated phthalocyanines......................................................... 114
4.2.4 Deposition by pore filling...................................................................................... 116
4.2.4.1 Encapsulation procedure........................................................................... 116
x
4.2.5 Mesopore entrapment............................................................................................ 117
4.2.6 Solution adsorption................................................................................................ 118
4.2.7 Solid state characterization.................................................................................... 120
4.2.8 Calculation of phthalocyanine dimensions and theoretical monolayer coverage.. 120
4.2.9 Nitrogen adsorption isotherms............................................................................... 121
4.2.10 Water adsorption isotherms................................................................................. 122
4.2.11 Thermogravimetric Analysis................................................................................ 123
4.3 Results and Discussions.................................................................................................... 123
4.3.1 Surface coverage through various immobilization procedures............................. 124
4.3.2 Solid state UV spectra demonstrating mesopore entrapment................................ 125
4.3.3 Encapsulation as a means to improve thermal stability.......................................... 127
4.3.4 Adsorption measurements on bare fluorinated phthalocyanines............................ 128
4.3.4.1 Nitrogen adsorption measurements........................................................... 129
4.3.4.2 Water adsorption measurements................................................................ 132
4.3.4.3 Nitrogen and Water molecules per MPc.................................................... 134
4.3.5 Adsorption measurements on fluorinated phthalocyanines adsorbed on mesoporous alumina.......................................................................................................
137
4.4 Conclusions........................................................................................................................ 140
References................................................................................................................................ 142
xi
List of Figures
Figure 1. Methods of representing the tetrahedral coordination of oxygen ions with silicon: (a) ball and stick model, (b) solid tetrahedron, (c) skeletal tetrahedron, and (d) space-filling model based on packed sphere.....................................................................................................
2
Figure 2. Cross section of a hypothetical porous material showing various types of pores 1) Open passing 2) Open interconnected 3) Open dead end and 4) Closed pores.............................
5
Figure 3. Shapes of Pores a) Cylindrical b) Slit c) Conical d) Interstices e) Ink Bottle (Spherical)....................................................................................................................................
8
Figure 4. Schematic representation of M41s family of materials................................................. 10 Figure 5. Flowchart depicting the production of Aerosil® fumed silica....................................... 15 Figure 6. Schematic representation of droplet model of particles genesis in the flame................ 15 Figure 7. Specific Surface area as a function of particle diameter............................................... 16 Figure 8a. Mechanism of acid and base catalyzed hydrolysis of silicon alkoxides....................... 20 Figure 8b. Mechanism of acid and base catalyzed condensation of silicon alkoxides.................. 21 Figure 9. Two synthetic strategies of soft templating synthesis of mesoporous materials: (A) cooperative self-assembly; (B) true liquid-crystal templating process.........................................
25
Figure 10. IUPAC classification of sorption isotherms................................................................ 29 Figure 11. The formation of silanol groups on the silica surface: (a) Condensation polymerization (b) rehydroxylation.............................................................................................
35
Figure 12. Type of silanols and siloxane bridges on the surface of amorphous silica. Qn terminology is used in NMR; n indicates the number of bridging oxygens (-O-Si) bonded to the central, silicon (n = 0-4)...............................................................................................................
36 Figure 13. Two types of physically adsorbed water (a) the hydrogen atom in the water molecule is bonded to the oxygen atom of the ≡Si-OH group (b) the oxygen atom in the water molecule is bonded to the hydrogen atom of the ≡Si-OH group...................................................
37 Figure 14. Thermogravimetric analysis of a hydroxylated silica with physically adsorbed water on the surface (mesoporous silica gel) (1) DTG curve, (2) TGA curve................................
39
Figure 15. Silanol as a function of the temperature of pretreatment in vacuo for different samples of silica. The broken lines delimit the range of experimental data (16 samples with different surface area from 11 to 905 m2/g). The sub regions of dehydroxylation are: IIa from 200 to ~400°C, and IIb from 400 to 1100°C.................................................................................
41 Figure 16. Process of dehydration and dehydroxylation.............................................................. 42 Figure 17. Infrared spectrum of Cabosil. (a) original, (b) after degassing at room temperature, (c)after heating to 500°C, (d) after heating to 800°C. ..................................................................
44
Figure 18. Typical thermogram of thermo gravimetric analysis of a silica sample...................... 46 Figure 19. Distribution of the surface groups as a function of the temperature of pretreatment in vacuo (Zhuravlev model-1).......................................................................................................
47
Figure 20. Typical Type II isotherm showing “Point A”and “Point B”. 49 Figure 21. Typical BET plot........................................................................................................ 51 Figure 22. A Type IV isotherm characteristic of mesoporous solids. The corresponding Type II isotherm (dotted line) follows the course ABCN........................................................................
54
Figure 23. Schematic representation of multilayer adsorption, pore condensation and hysteresis in a single cylindrical pore...........................................................................................
56
Figure 24. Relationship between rm of the Kelvin equation and the core radius rc for a cylindrical pore with hemispherical meniscus..............................................................................
57
xii
Figure 25. IUPAC classification of hysteresis loops.................................................................... 58 Figure 26. Capillary condensation in cylindrical pores. (a) Cylinder closed at one end, B. The meniscus is hemispherical during both capillary condensation and capillary evaporation. (b) and (c) Cylinder open at both ends...............................................................................................
59 Figure 27. Statistical thickness of adsorbed film of water as a function of relative pressure on non-porous adsorbents.................................................................................................................
65
Figure 28. Illustration of nitrogen and water adsorption in a cylindrical pore showing wetting and contact angle...........................................................................................................
66
Figure 29. Top: (1-3) - first, second, and sixth consecutive water adsorption isotherms for freshly made SBA-15. (4-6) – first three consecutive water adsorption isotherms for SBA-15 after hydroxylation in liquid water. Bottom: Nitrogen adsorption isotherms for the samples described above...........................................................................................................................
76 Figure 30. Pore size distributions by nitrogen and by water for the SBA-15 silicas with different exposure to water. From top to bottom: freshly made SBA-15 after the first water adsorption cycle; Same silica after four sequential water adsorption cycles; Same silica after hydroxylation in liquid water.......................................................................................................
80 Figure 31. Water contact angles for freshly-made SBA-15 after the first six sequential water adsorption-desorption cycles (Closed symbols). Open symbol – data for three sequential water adsorption-desorption cycles for the hydroxylated SBA-15...............................................
83 Figure 32. Water contact angles (closed symbols, left axis) and surface silanols per sq-nm (stars, right axis) for the hydroxylated SBA-15 silicas calcined at different temperatures.........
85
Figure 33. Water contact angles (closed symbols, left axis) and fraction of surface silanols, from maximum value (triangles, right axis) for the hydroxylated SBA-15 silicas calcined adifferent temperatures..................................................................................................................
87 Figure 34. The adsorption isotherms by nitrogen (77K, open symbols) and by water (293K, closed symbols) for hydroxylated SBA-15 silicas calcined at different temperatures...................
88
Figure 35. Nitrogen (Top) and water (Bottom) adsorption isotherms for series of SBA-15 silicas hydrophobized with TMS. The fraction of surface coverage is shown in the legends. To account for different mass of TMS in the samples, the adsorption was corrected per gram of silica.............................................................................................................................................
92 Figure 36. Water adsorption isotherms (initial parts) for the hydroxylated SBA-15 silicas with different TMS coverage................................................................................................................
93
Figure 37. Water contact angles for the hydroxylated SBA-15 modified with TMS groups. Dashed line contact angles calculated by equation 3-9................................................................
94
Figure 38. The statistical thickness for water adsorption (t-curves): (1) Hydroxylated silica gel, (2) Averaged data for silica gels, quartz, rutile, and zirconium silicate, (3) Hydroxylated silica gel Davisil 1000 (this work) (4) Non porous fumed silica, (5) Averaged for 11 silica gels, (6) Silica gel calcined at 1173K, (7) Silica gel Davisil 1000 calcined at 1273K (this work)........
96 Figure 39.The statistical thickness for water adsorption (t-curves) for hydroxylated silica surfaces........................................................................................................................................
100
Figure 40. The statistical thickness for water adsorption (t-curves) for partially dehydroxylated silica surfaces.....................................................................................................
101
Figure 41. The statistical thickness for water adsorption (t-curves) for fully dehydroxylated silica surfaces...........................................................................................................................
101
xiii
Figure 42. Water adsorption per silanol group for silicas of different degree of hydroxylation. Silica: large pore Davisil 1000, temperature of calcination is shown in the label. Top – initial parts, bottom – full isotherms.......................................................................................................
105Figure 43. Water adsorption per silanol group as a function of number of silanols for silicas of different degree of hydroxylation. Top – at p/po= 0.2, bottom – at p/po= 0.5............................
106
Figure 44. a) Free-base phthalocyanine b) metallophthalocyanine.......................................... 109Figure 45. Structure of porphyrin and phthalocyanine complexes............................................ 110Figure 46. Numbering scheme and labeling of outer-ring positions (α, β) of the phthalocyanine molecule core. Note the 16 C-H bonds present in an unsubstituted molecule...
111
Figure 47. General synthetic scheme for the preparation of fluorinated phthalocyanines........... 115Figure 48. Deposition by pore filling method.............................................................................. 116Figure 49. Encapsulation of F64PcZn deposited silica using colloidal alumina........................... 117Figure 50. Mesopore entrapment of F64PcZn using alumina....................................................... 118Figure 51. Solution adsorption of F64PcZn on mesoporous alumina........................................... 119Figure 52. 3D Space-Filling Model of F64PcZn at the ‘face on’ and ‘edge on’ orientation, demonstrating the difference in cross-section area at for each possible orientation..................
121
Figure 53. Comparison of the reflectance spectra for the entrapment of F64PcZn inside mesoporous alumina and bare alumina (no F64PcZn)...............................................................
126
Figure 54. Mesoporous alumina with entrapped phthalocyanines showing catalytic activity... 127Figure 55. Comparison of the reflected spectra alumina encapsulated F64PcZn (deposited on silica) and non-encapsulated F64PcZn (deposited on silica).................................................
128
Figure 56. Nitrogen adsorption-desorption isotherm of three bare fluorinated Pcs. Inset shows the BET region for surface area calculation.....................................................................
130
Figure 57. Cartoon comparing Pcs as a single molecule or an aggregate. For simplicity a Pc molecule in face on orientation is considered as a sphere..........................................................
131
Figure 58. Water adsorption isotherm of three bare fluorinated Pcs......................................... 132Figure 59. Water adsorption isotherm of three bare fluorinated Pcs in comparison with hydroxylated silica.......................................................................................................................
133
Figure 60. Water adsorption isotherm of bare H16PcZn in comparison with hydroxylated silica, dehydroxylated and hydrophobic silica............................................................................
134
Figure 61. No of water molecules per MPc at various p/p0. No of water molecules at p/po = 0.3 is circled and value provided..................................................................................................
136
Figure 62. Overlay of no of water molecules per F64PcZn and no of nitrogen molecules per F64PcZn at various p/p0. The red dotted lines indicate the monolayer coverage..........................
137
Figure 63. Nitrogen adsorption isotherms on bare mesoporous alumina and F64PcZn adsorbed mesoporous alumina....................................................................................................................
138
Figure 64. Water adsorption isotherms on bare mesoporous alumina and F64PcZn adsorbed mesoporous alumina....................................................................................................................
139
xiv
List of Tables
Table 1. Physical properties of various silicas................................................................................ 5 Table 2. Pores as per IUPAC classification.................................................................................... 7 Table 3. Key milestones in the evolution of ordered mesoporous materials via templating method..............................................................................................................................................
23
Table 4. Pore sizes of ordered mesostructures obtained by various methods................................. 25 Table 5. Classification of adsorbates and adsorbents based on their capacity for non-specific and specific interactions..................................................................................................................
30
Table 6. Surface concentration of the different types of OH groups as a function of pretreatment temperature in vacuo, with the initial state corresponding to the maximum degree of surface hydroxylation (first row).................................................................................................................
42 Table 7. Absorption peaks of various hydroxyl groups.................................................................. 45 Table 8. Values of rp and t at different p/po for nitrogen at 77.4 K................................................. 63 Table 9. Water contact angles and structural parameters for three batches of freshly made SBA-15 & two batches of MCM-41 silicas and for the same silicas after hydroxylation. Values of rp and t at different p/po for nitrogen at 77.4 K..............................................................
77 Table 10. Water contact angles and structural parameters for the hydroxylated SBA-15 silicas calcined at different temperatures...................................................................................................
84
Table 11. Water contact angles and surface composition for the hydroxylated SBA-15 silicas prepared via calcination at different temperatures........................................................................
86
Table 12. Water contact angles and structural parameters for the hydroxylated SBA-15 silica modified with TMS...........................................................................................................................
91
Table 13. Series of silica surfaces with known amount of surface hydroxyls and surface area measure by nitrogen isotherm. Water adsorption was performed on all these surfaces to generate t-curves............................................................................................................................................
97 Table 14. Structural and silanol data for Davisil 1000 hydroxylated and calcined at different temperatures....................................................................................................................................
98
Table 15. Cross-sectional area (ω) and theoretical monolayer coverage (Γmax) for densely packed fully symmetrical zinc phthalocyanines: F16PcZn and F64PcZn..........................................
121
Table 16. Surface coverage of final material obtained by various immobilization techniques. For monolayer coverage of F64PcZn (Face On) cross sectional area is 437 Å2/molecule i.e 0.381 μmol/m2...........................................................................................................................................
125Table 17. Structural parameters of bare Pcs from nitrogen adsorption isotherm. Density was obtained from crystal structure data. Maximum intermolecular distance was obtained for each using 3D space filling model at face on orientation.....................................................................
130Table 18. Calculation of nitrogen and water molecules per MPc. MPcs are considered in face on orientation and equation 4-3 is used to calculate no of adsorbate molecules per MPc...........
135
Table 19. Water contact angles and structural parameters for the bare mesoporous alumina and F64PcZn adsorbed mesoporous alumina..........................................................................................
140
xv
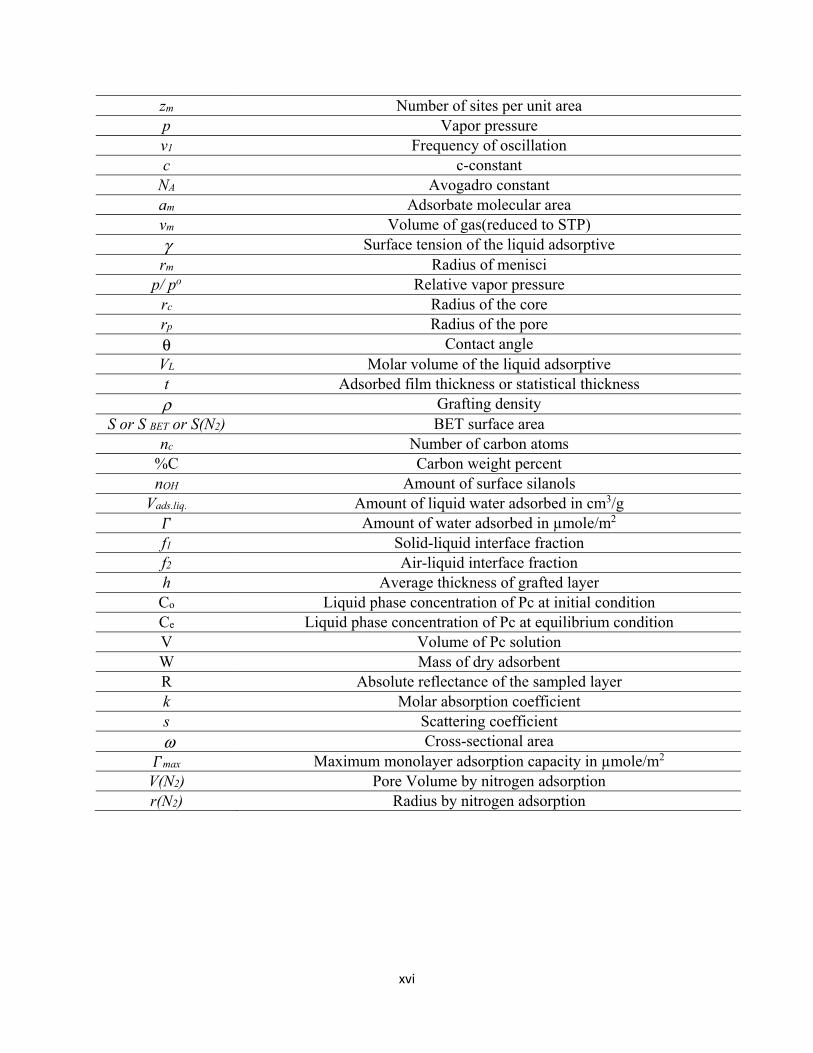
List of Symbols and Abbreviations
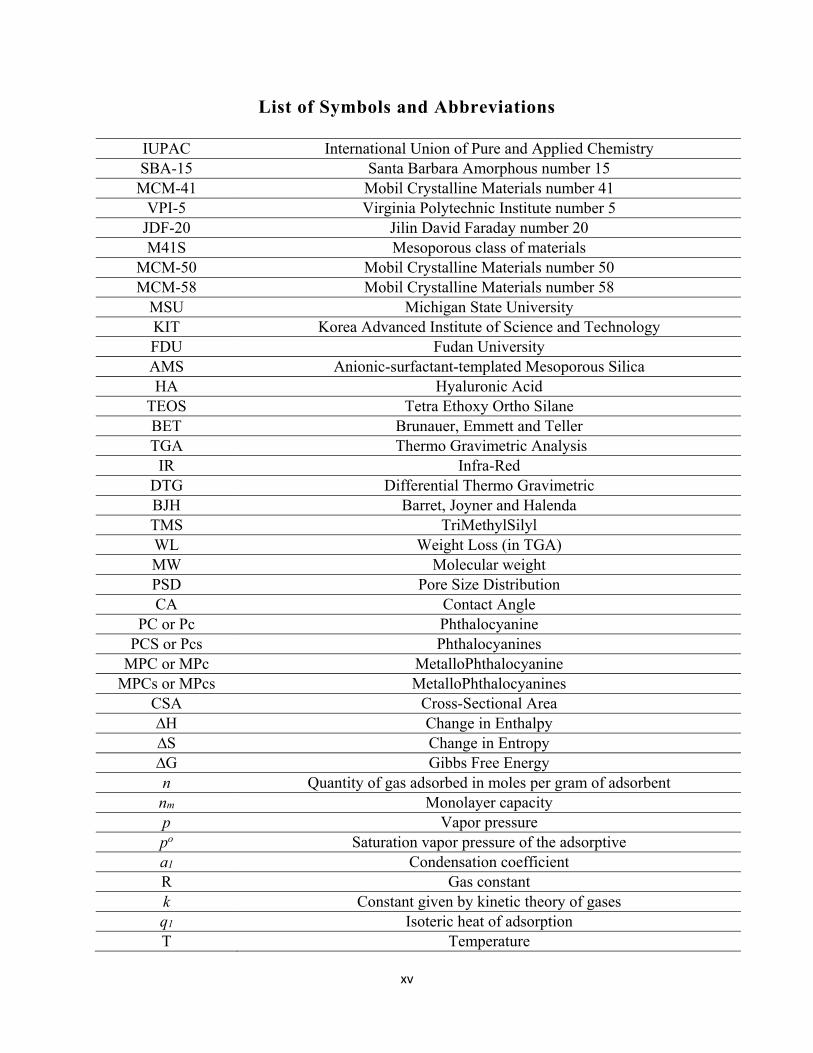
IUPAC International Union of Pure and Applied Chemistry SBA-15 Santa Barbara Amorphous number 15 MCM-41 Mobil Crystalline Materials number 41
VPI-5 Virginia Polytechnic Institute number 5 JDF-20 Jilin David Faraday number 20 M41S Mesoporous class of materials
MCM-50 Mobil Crystalline Materials number 50 MCM-58 Mobil Crystalline Materials number 58
MSU Michigan State University KIT Korea Advanced Institute of Science and Technology FDU Fudan University AMS Anionic-surfactant-templated Mesoporous Silica HA Hyaluronic Acid
TEOS Tetra Ethoxy Ortho Silane BET Brunauer, Emmett and Teller TGA Thermo Gravimetric Analysis
IR Infra-Red DTG Differential Thermo Gravimetric BJH Barret, Joyner and Halenda TMS TriMethylSilyl WL Weight Loss (in TGA) MW Molecular weight PSD Pore Size Distribution CA Contact Angle
PC or Pc Phthalocyanine PCS or Pcs Phthalocyanines
MPC or MPc MetalloPhthalocyanine MPCs or MPcs MetalloPhthalocyanines
CSA Cross-Sectional Area ∆H Change in Enthalpy ∆S Change in Entropy ∆G Gibbs Free Energy n Quantity of gas adsorbed in moles per gram of adsorbent nm Monolayer capacity p Vapor pressure po Saturation vapor pressure of the adsorptive a1 Condensation coefficient R Gas constant k Constant given by kinetic theory of gases q1 Isoteric heat of adsorption T Temperature
xvi
zm Number of sites per unit area p Vapor pressure v1 Frequency of oscillation c c-constant
NA Avogadro constant am Adsorbate molecular area vm Volume of gas(reduced to STP) γ Surface tension of the liquid adsorptive rm Radius of menisci
p/ po Relative vapor pressure rc Radius of the core rp Radius of the pore θ Contact angle VL Molar volume of the liquid adsorptive t Adsorbed film thickness or statistical thickness ρ Grafting density
S or S BET or S(N2) BET surface area nc Number of carbon atoms
%C Carbon weight percent nOH Amount of surface silanols
Vads.liq. Amount of liquid water adsorbed in cm3/g Amount of water adsorbed in µmole/m2
f1 Solid-liquid interface fraction f2 Air-liquid interface fraction h Average thickness of grafted layer Co Liquid phase concentration of Pc at initial condition Ce Liquid phase concentration of Pc at equilibrium condition V Volume of Pc solution W Mass of dry adsorbent R Absolute reflectance of the sampled layer k Molar absorption coefficient s Scattering coefficient
ω Cross-sectional area max Maximum monolayer adsorption capacity in µmole/m2
V(N2) Pore Volume by nitrogen adsorption r(N2) Radius by nitrogen adsorption
1
Chapter 1: Classification, Synthesis and Characterization of Silica
1.1 Introduction to Silica
Silicon dioxide (SiO2) or silica is the most abundant of all the oxide minerals in the earth’s
crust. Besides being the abundant metal oxide, silica is very important to life. The human body
consists of about half gram of silica that promotes the formation and growth of bones, hair and
teeth. The solubility of silica in water is adequate enough to play important roles in many forms
of life. The term silica encompasses silicon dioxide in its natural, synthetic, crystalline or
amorphous and chemically combined forms in which the silicon atom is surrounded by four or six
oxygen atoms1. Solid silica can be classified on the basis of four main attributes namely crystal
structure, dispersity, surface composition and porosity2.
1.1.1 Classification based on the crystal structure
Silica is classified as crystalline or amorphous (non-crystalline). Crystalline silica is found
in nature and also exist as synthetic forms. Quartz, tridymite, cristobalite are three main crystalline
silicas found naturally and each have different polymorphic forms that are stable in different
temperature ranges. The transformation between three silica forms and the vitreous silica glass at
atmospheric pressure is show below:
Keatite, coesite and stishovite are synthetic crystalline silicas with well-ordered structures2-3. The
crystalline form involves a high degree of ordering and the surface area is limited to the external
surface of the crystalline particles. With the exception of stishovite and coesite which has a six
1700°C
1470°C
870°C tridymite vitreous cristobalite quartz
(1-1)
2
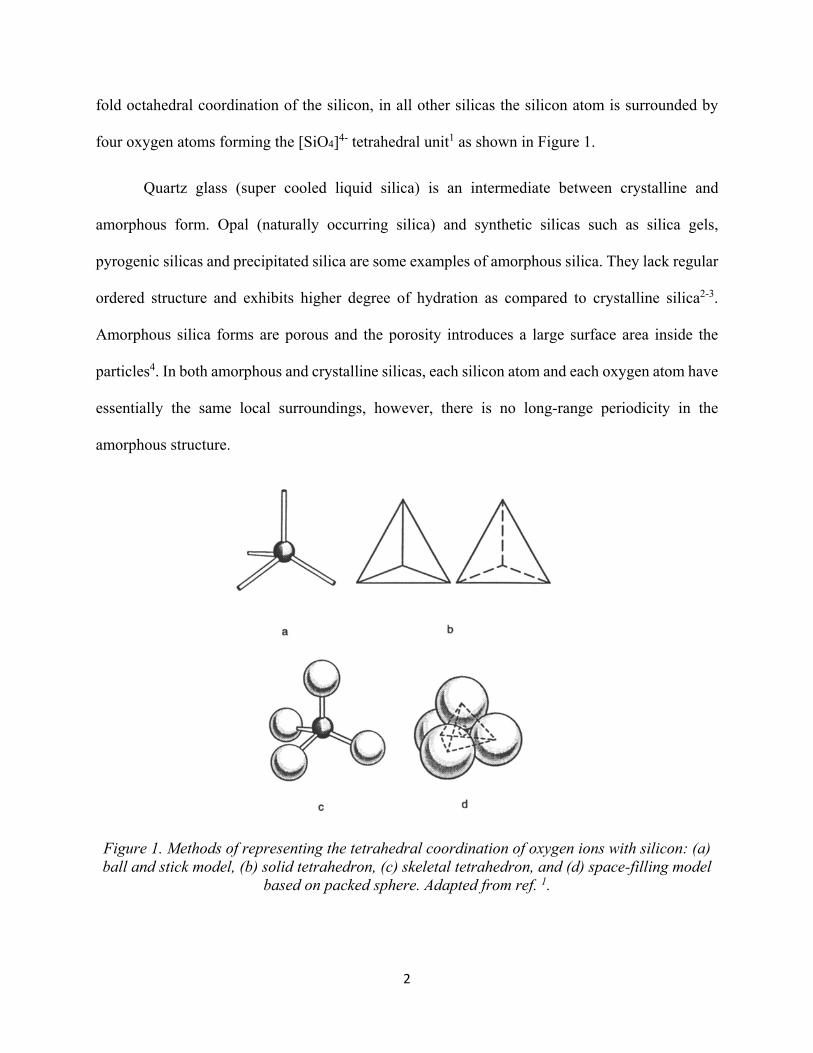
fold octahedral coordination of the silicon, in all other silicas the silicon atom is surrounded by
four oxygen atoms forming the [SiO4]4- tetrahedral unit1 as shown in Figure 1.
Quartz glass (super cooled liquid silica) is an intermediate between crystalline and
amorphous form. Opal (naturally occurring silica) and synthetic silicas such as silica gels,
pyrogenic silicas and precipitated silica are some examples of amorphous silica. They lack regular
ordered structure and exhibits higher degree of hydration as compared to crystalline silica2-3.
Amorphous silica forms are porous and the porosity introduces a large surface area inside the
particles4. In both amorphous and crystalline silicas, each silicon atom and each oxygen atom have
essentially the same local surroundings, however, there is no long-range periodicity in the
amorphous structure.
Figure 1. Methods of representing the tetrahedral coordination of oxygen ions with silicon: (a) ball and stick model, (b) solid tetrahedron, (c) skeletal tetrahedron, and (d) space-filling model
based on packed sphere. Adapted from ref. 1.
3
1.1.2 Classification based on dispersity
Silica can be classified as soluble silica, silica sols, silica gels (hydrogels, xerogels, and
aerogels), precipitated silica and pyrogenic silicas. Soluble silica is a molecular solution of silica
(mainly monosilicic acid at low concentrations) formed when amorphous or crystalline silica
comes in contact with water. It is neutral, hydrophilic, non-ionized and cannot be isolated from
water2-3. Silica sols consists of discrete silica particles that are amorphous, non-porous and
spherical in shape. Silica sols are made by partially neutralizing a dilute solution of soluble silicates
with acid to a pH of 8-9. Under these conditions, polysilicic acids are formed by polycondensation
and grows into colloidal silica particles2-3.The behavior of silica sols is greatly dependent on pH
and a small change in pH converts the sol into a gel or a solution.
Stabilization of silica sols to prevent aggregation, involves understanding of the surface
chemistry of silica and the nature of interaction of silica and water over a wide pH range. If the
silica sols are not stabilized, the dispersed silica particles will aggregate by one of the typical
aggregation processes namely gelling, coagulation, flocculation or coacervation. When the
aggregation happens via the process of gelling, the silica particles are linked to one another leading
to three dimensional packing of silica and finally results in a gelatinous mass called silica gel. The
gel is formed when two silica particles with sufficiently low charges collide with each other to
form siloxane bonds, holding the particles irreversibly bonded. This gel is referred to as hydrogel
or organogel if the continuous liquid phase is water or an organic solvent respectively. The rate of
gel formation depends on pH, particle size, silica concentration, electrolytes, organic liquids and
temperature. For example, the rate of gel formation (in the pH range 3-5) increases with pH and is
proportional to the concentration of hydroxyl ions3. A xerogel is obtained when a gel is dried by
evaporation under normal conditions and a xerogel is reduced in volume by factor of 5 to 10
4
compared to the original wet gel1. The reduction or shrinkage is a result of stresses exerted by
capillary tension in the liquid during drying. An aerogel is obtained when a gel is dried by
evaporation in an autoclave above the critical point of the liquid, so that there is no capillary
pressure leading to minimal or no shrinkage of the gel structure.
Precipitated silicas are obtained from a solution phase such as sodium silicate solution,
fluoride solution, organic liquids and colloidal silica sols by the process of precipitation. The
presence of a coagulant such as sodium ions, ammonium salts, calcium salts, polyvalent metal ions
or organic materials is crucial for silica to precipitate from the solution phase1.
Pyrogenic silicas are made at high temperatures by precipitation of silica from the vapor
phase. They are colloidal dispersion of particles in the gas phase and can be referred to as aerosols.
Pyrogenic silica can be obtained by one of the many processes such as vaporization of SiO2,
oxidation of SiO vapor, oxidation and hydrolysis of SiCl4 vapor or silicon ester vapors, hydrolysis
of SiF4 vapors1, 3. The most commonly used pyrogenic silicas or fumed silicas are made by the
flame hydrolysis process which involves oxidation and hydrolysis of SiCl4 vapors5. Aerosil and
Cab-O-Sil produced by Evonik industries and Cabot Corporation respectively are the most widely
used fumed silicas. The preparation of fumed silica is discussed in detail in the section 1.2. Arc
silicas are made by the reduction of high purity sand and plasma silicas are ultra-fine silica powders
obtained by direct volatilization of sand in a plasma jet.
Among the various silicas discussed above, there is variation in physical properties from
one type to another due to the inherent differences in the process of making these silicas. The size
of the primary particle, density and degree of agglomeration and aggregation decides the porosity
and specific surface area of these silicas. For example, xerogels and aerogels have a porous
5
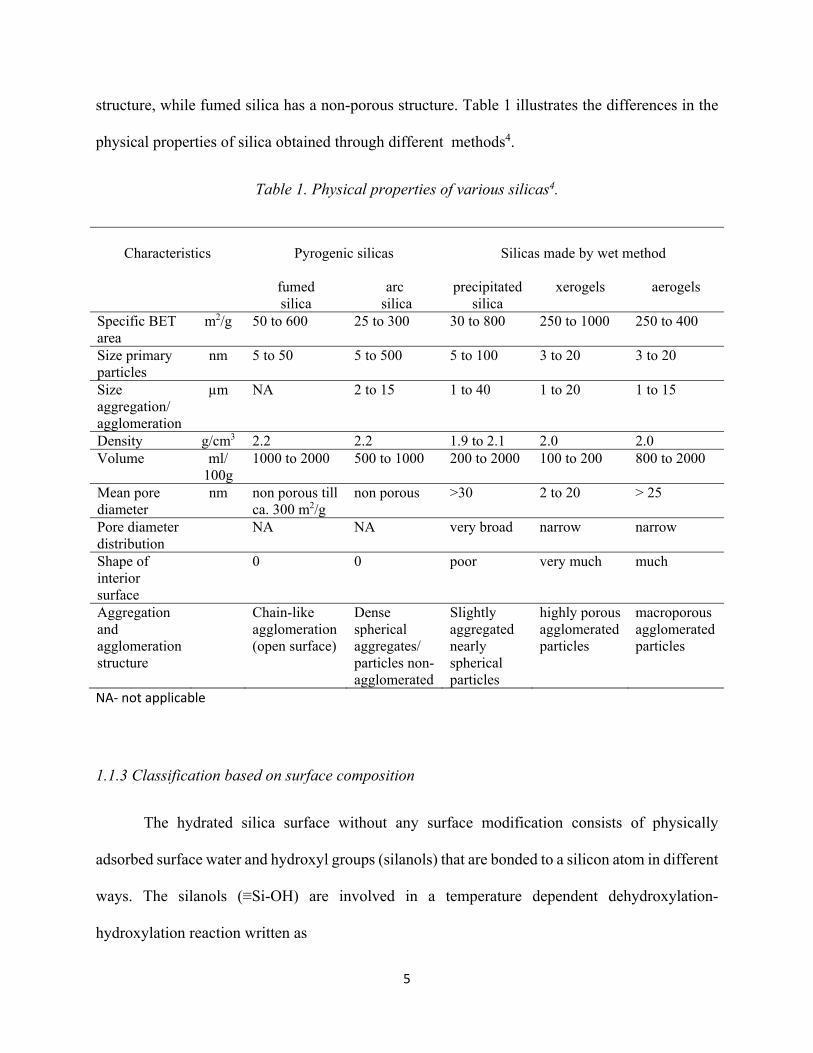
structure, while fumed silica has a non-porous structure. Table 1 illustrates the differences in the
physical properties of silica obtained through different methods4.
Table 1. Physical properties of various silicas4.
Characteristics
Pyrogenic silicas
Silicas made by wet method
fumed silica
arc silica
precipitated silica
xerogels aerogels
Specific BET area
m2/g 50 to 600 25 to 300 30 to 800 250 to 1000 250 to 400
Size primary particles
nm 5 to 50 5 to 500 5 to 100 3 to 20 3 to 20
Size aggregation/ agglomeration
µm NA 2 to 15 1 to 40 1 to 20 1 to 15
Density g/cm3 2.2 2.2 1.9 to 2.1 2.0 2.0 Volume ml/
100g 1000 to 2000 500 to 1000 200 to 2000 100 to 200 800 to 2000
Mean pore diameter
nm non porous till ca. 300 m2/g
non porous >30 2 to 20 > 25
Pore diameter distribution
NA NA very broad narrow narrow
Shape of interior surface
0 0 poor very much much
Aggregation and agglomeration structure
Chain-like agglomeration (open surface)
Dense spherical aggregates/ particles non-agglomerated
Slightly aggregated nearly spherical particles
highly porous agglomerated particles
macroporous agglomerated particles
NA- not applicable
1.1.3 Classification based on surface composition
The hydrated silica surface without any surface modification consists of physically
adsorbed surface water and hydroxyl groups (silanols) that are bonded to a silicon atom in different
ways. The silanols (≡Si-OH) are involved in a temperature dependent dehydroxylation-
hydroxylation reaction written as
6
2 ≡Si-OH ⇌ ≡Si-O-Si≡ + H2O
As dehydroxylation occurs (by heating or annealing), silanols are converted to less polar siloxane
groups (≡Si-O-Si≡). The number and type of surface silanols and surface siloxane groups varies
from silica to silica depending on the synthesis process and post synthesis treatment procedures6.
Based on the surface water, hydroxyl groups and siloxane linkages, silica can be broadly classified
as hydroxylated or partially dehydroxylated or fully dehydroxylated silica. Generally, a completely
hydroxylated silica can be considered as a hydrophilic surface and removal of hydroxyl groups by
the process of dehydroxylation leads to surface with hydrophobic properties. In this research,
chapter 3 is focused on obtaining well defined silica surfaces with various degree of surface
hydroxylation.
Chemical modification of a silica surface is described as covalent bonding of certain
functional groups on to the silica surface as a result of chemical reaction between surface species
and an appropriate surface modifier. Based on the bond by which functional groups are attached
at the surface silicon atoms2, they can be categorized as: (1) ≡Si−O−C≡ (2) ≡Si−C≡ and (3)
≡Si−N=. In the history of silica chemistry, chemical modification is mainly performed to alter the
wettability of silica products depending on the end use. Numerous types of silica are widely used
as adsorbents in liquid chromatography, catalytic bed supports, fillers for polymeric systems, co-
binders in nonstick coatings, enhancers in paper manufacturing processes, stabilizers (for weave
structures) in textiles, as well as dispersant in pigments and fillers, binding agents for molding
materials etc6. Hence, chemical modification of the surface of silica has gained significant
attention in order to meet the technological demands for making several novel silica materials.
(1-2)
7
1.1.4 Classification based on porosity
All solids can be classified in two categories: porous and non-porous solids. Solid silica
with a pore system is defined as porous silica and solid silica without a pore system is non-porous
silica. The presence or absence of a pore system depends on the process used to obtain the silica
material. An assembly of smooth discrete particles or chain like agglomeration of primary silica
particles results in non-porous structures. Fumed silicas such as aerosil are non-porous, possess no
interior surface and specific surface area is simply the external surface of the particles.
Porosity originates when dispersed silicas particles are compacted together. The pore space
is being created by the interstices and voids between the particles. The three measure of a porous
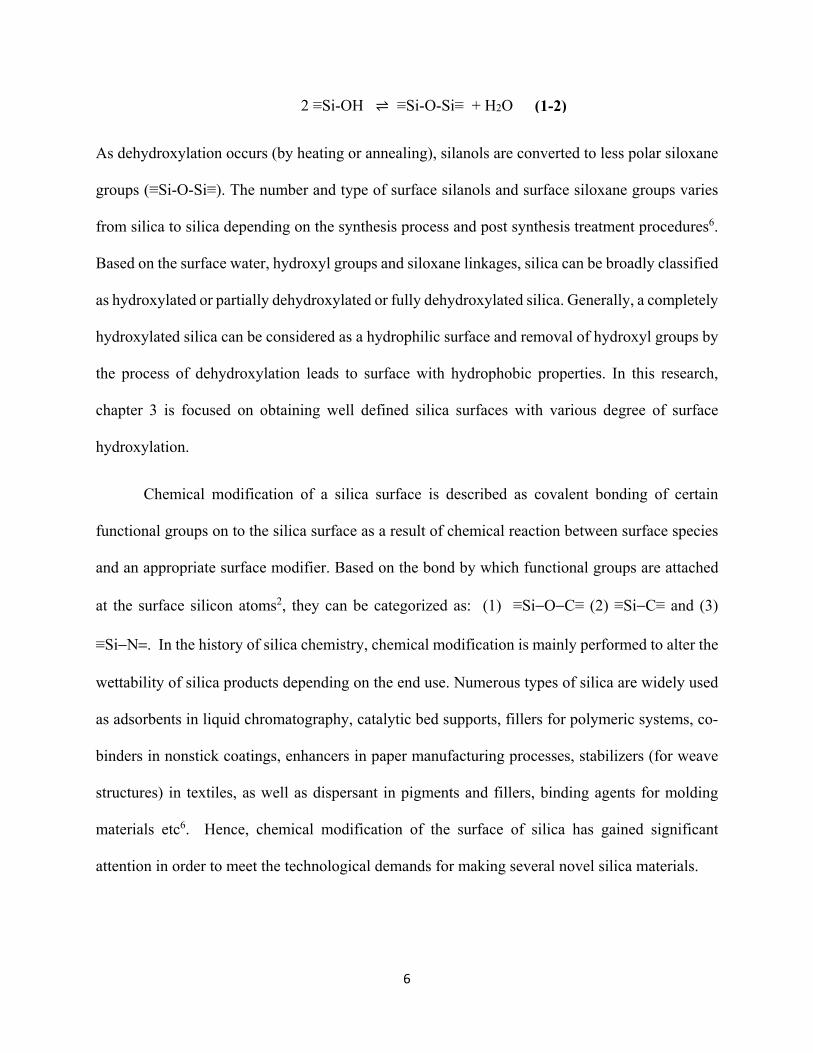
material are surface area, pore size and its distribution and pore volume7. As per IUPAC
classification, pores are classified as below in Table 2.
Table 2. Pores as per IUPAC classification.
Type of Pores Width
Micropores < 2 nm
Mesopores 2- 50 nm
Macropores > 50 nm
Each pore size range corresponds to a characteristic adsorption mechanism and this forms the basis
of this classification. The width would correspond to the diameter in case of the cylindrical pores
and the distance between opposite walls in case of slit pores8. The specific surface area of porous
silica is a combination of both exterior and interior surface with major contribution from the
interior surface.
8
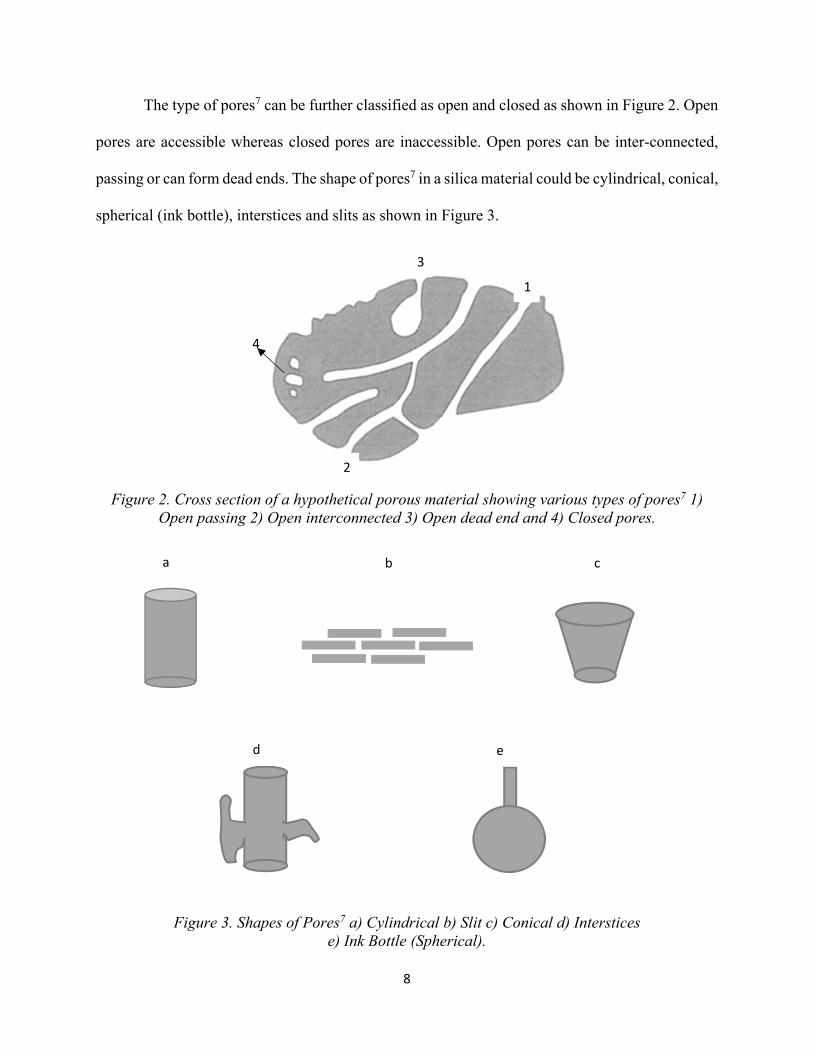
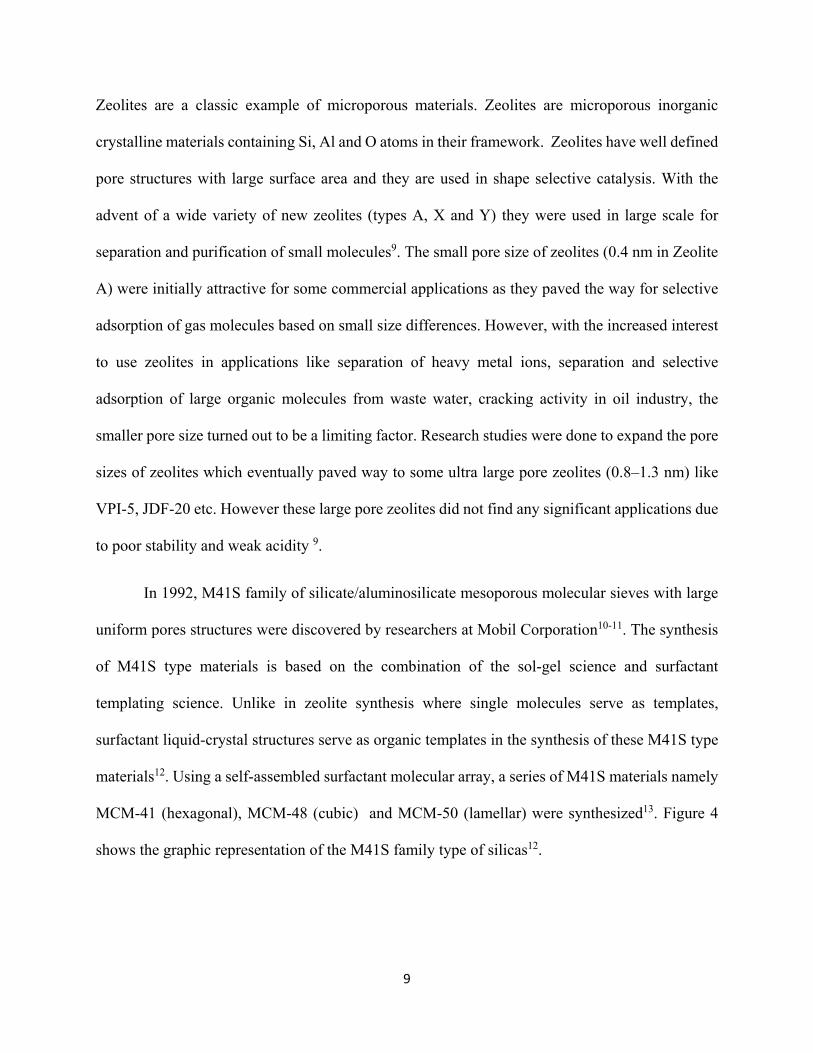
The type of pores7 can be further classified as open and closed as shown in Figure 2. Open
pores are accessible whereas closed pores are inaccessible. Open pores can be inter-connected,
passing or can form dead ends. The shape of pores7 in a silica material could be cylindrical, conical,
spherical (ink bottle), interstices and slits as shown in Figure 3.
Figure 2. Cross section of a hypothetical porous material showing various types of pores7 1) Open passing 2) Open interconnected 3) Open dead end and 4) Closed pores.
Figure 3. Shapes of Pores7 a) Cylindrical b) Slit c) Conical d) Interstices
e) Ink Bottle (Spherical).
a c
d e
b
1
3
2
4
9
Zeolites are a classic example of microporous materials. Zeolites are microporous inorganic
crystalline materials containing Si, Al and O atoms in their framework. Zeolites have well defined
pore structures with large surface area and they are used in shape selective catalysis. With the
advent of a wide variety of new zeolites (types A, X and Y) they were used in large scale for
separation and purification of small molecules9. The small pore size of zeolites (0.4 nm in Zeolite
A) were initially attractive for some commercial applications as they paved the way for selective
adsorption of gas molecules based on small size differences. However, with the increased interest
to use zeolites in applications like separation of heavy metal ions, separation and selective
adsorption of large organic molecules from waste water, cracking activity in oil industry, the
smaller pore size turned out to be a limiting factor. Research studies were done to expand the pore
sizes of zeolites which eventually paved way to some ultra large pore zeolites (0.8–1.3 nm) like
VPI-5, JDF-20 etc. However these large pore zeolites did not find any significant applications due
to poor stability and weak acidity 9.
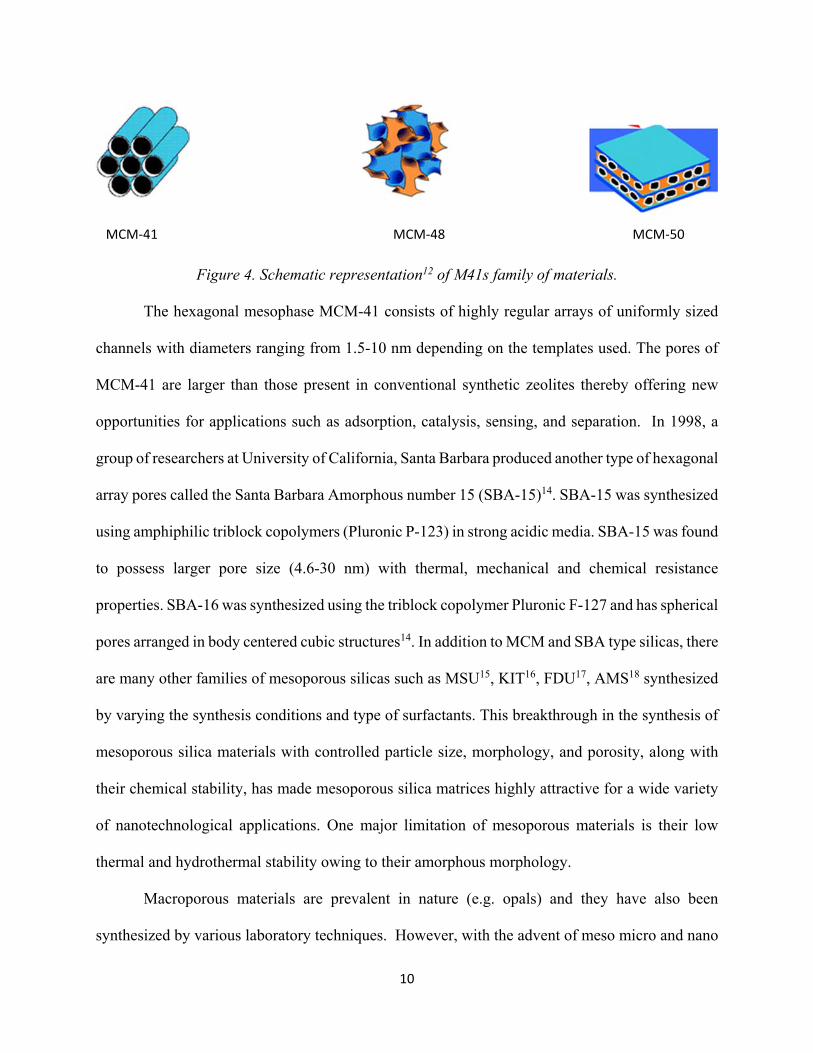
In 1992, M41S family of silicate/aluminosilicate mesoporous molecular sieves with large
uniform pores structures were discovered by researchers at Mobil Corporation10-11. The synthesis
of M41S type materials is based on the combination of the sol-gel science and surfactant
templating science. Unlike in zeolite synthesis where single molecules serve as templates,
surfactant liquid-crystal structures serve as organic templates in the synthesis of these M41S type
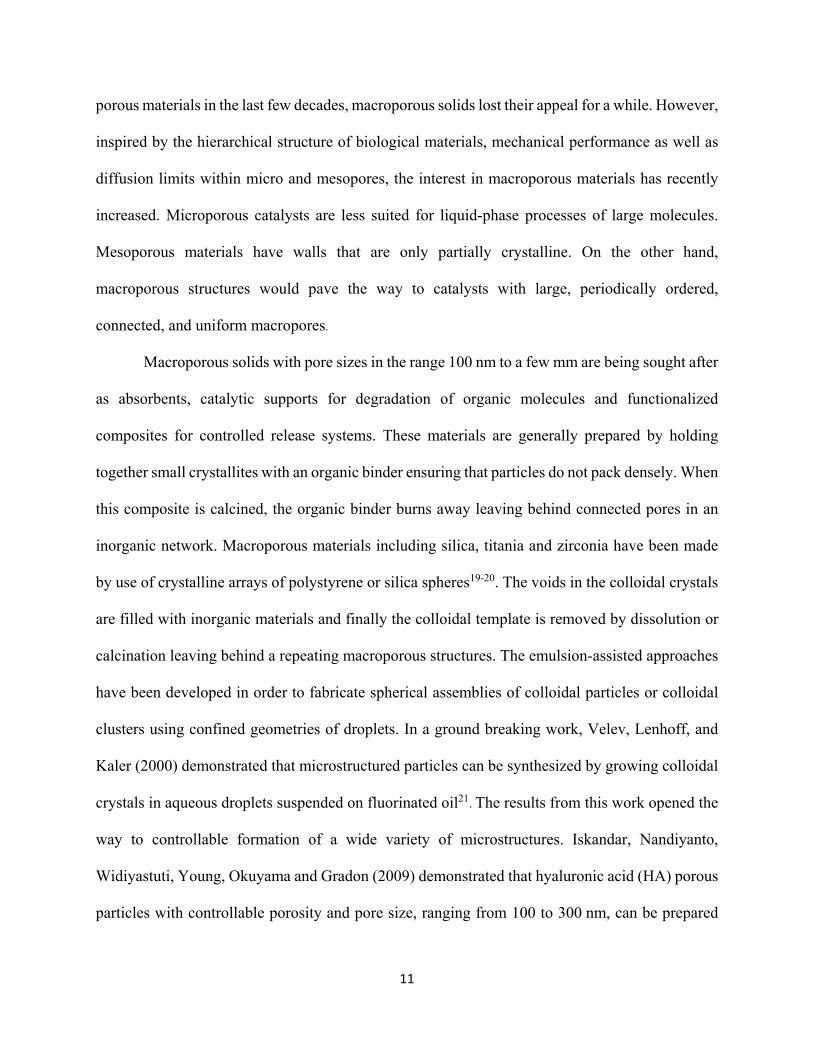
materials12. Using a self-assembled surfactant molecular array, a series of M41S materials namely
MCM-41 (hexagonal), MCM-48 (cubic) and MCM-50 (lamellar) were synthesized13. Figure 4
shows the graphic representation of the M41S family type of silicas12.
10
Figure 4. Schematic representation12 of M41s family of materials.
The hexagonal mesophase MCM-41 consists of highly regular arrays of uniformly sized
channels with diameters ranging from 1.5-10 nm depending on the templates used. The pores of
MCM-41 are larger than those present in conventional synthetic zeolites thereby offering new
opportunities for applications such as adsorption, catalysis, sensing, and separation. In 1998, a
group of researchers at University of California, Santa Barbara produced another type of hexagonal
array pores called the Santa Barbara Amorphous number 15 (SBA-15)14. SBA-15 was synthesized
using amphiphilic triblock copolymers (Pluronic P-123) in strong acidic media. SBA-15 was found
to possess larger pore size (4.6-30 nm) with thermal, mechanical and chemical resistance
properties. SBA-16 was synthesized using the triblock copolymer Pluronic F-127 and has spherical
pores arranged in body centered cubic structures14. In addition to MCM and SBA type silicas, there
are many other families of mesoporous silicas such as MSU15, KIT16, FDU17, AMS18 synthesized
by varying the synthesis conditions and type of surfactants. This breakthrough in the synthesis of
mesoporous silica materials with controlled particle size, morphology, and porosity, along with
their chemical stability, has made mesoporous silica matrices highly attractive for a wide variety
of nanotechnological applications. One major limitation of mesoporous materials is their low
thermal and hydrothermal stability owing to their amorphous morphology.
Macroporous materials are prevalent in nature (e.g. opals) and they have also been
synthesized by various laboratory techniques. However, with the advent of meso micro and nano
MCM-41 MCM-48 MCM-50
11
porous materials in the last few decades, macroporous solids lost their appeal for a while. However,
inspired by the hierarchical structure of biological materials, mechanical performance as well as
diffusion limits within micro and mesopores, the interest in macroporous materials has recently
increased. Microporous catalysts are less suited for liquid-phase processes of large molecules.
Mesoporous materials have walls that are only partially crystalline. On the other hand,
macroporous structures would pave the way to catalysts with large, periodically ordered,
connected, and uniform macropores.
Macroporous solids with pore sizes in the range 100 nm to a few mm are being sought after
as absorbents, catalytic supports for degradation of organic molecules and functionalized
composites for controlled release systems. These materials are generally prepared by holding
together small crystallites with an organic binder ensuring that particles do not pack densely. When
this composite is calcined, the organic binder burns away leaving behind connected pores in an
inorganic network. Macroporous materials including silica, titania and zirconia have been made
by use of crystalline arrays of polystyrene or silica spheres19-20. The voids in the colloidal crystals
are filled with inorganic materials and finally the colloidal template is removed by dissolution or
calcination leaving behind a repeating macroporous structures. The emulsion-assisted approaches
have been developed in order to fabricate spherical assemblies of colloidal particles or colloidal
clusters using confined geometries of droplets. In a ground breaking work, Velev, Lenhoff, and
Kaler (2000) demonstrated that microstructured particles can be synthesized by growing colloidal
crystals in aqueous droplets suspended on fluorinated oil21. The results from this work opened the
way to controllable formation of a wide variety of microstructures. Iskandar, Nandiyanto,
Widiyastuti, Young, Okuyama and Gradon (2009) demonstrated that hyaluronic acid (HA) porous
particles with controllable porosity and pore size, ranging from 100 to 300 nm, can be prepared
12
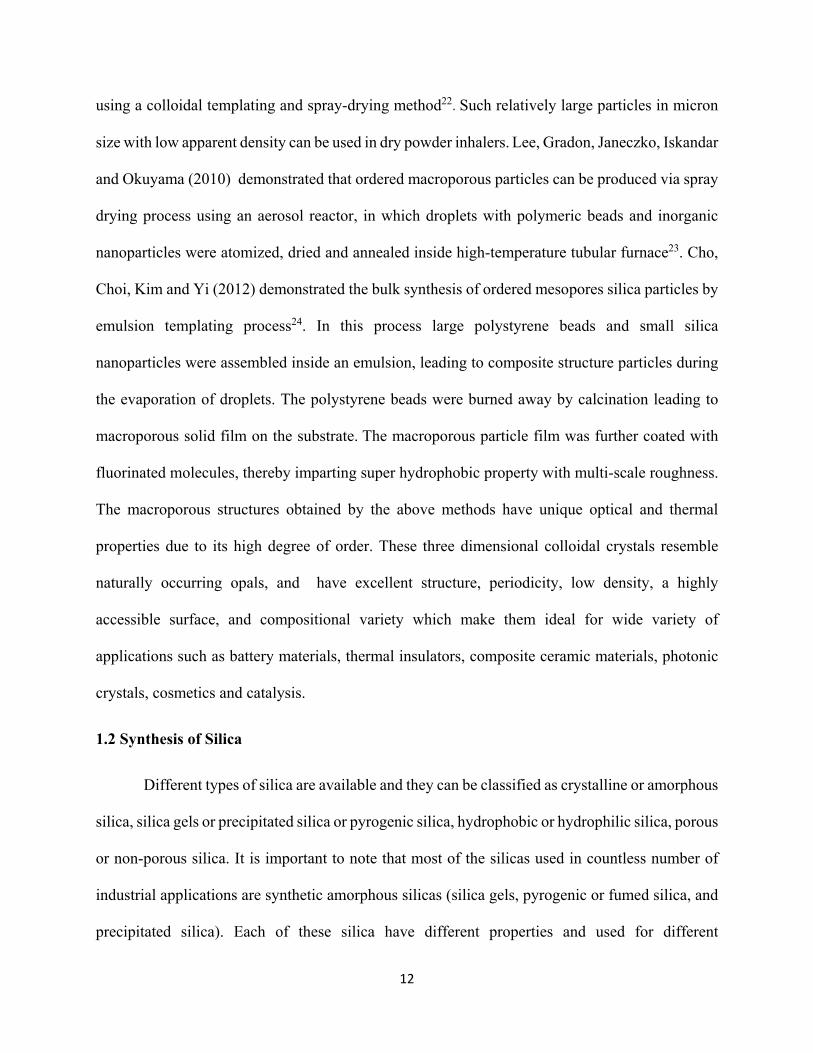
using a colloidal templating and spray-drying method22. Such relatively large particles in micron
size with low apparent density can be used in dry powder inhalers. Lee, Gradon, Janeczko, Iskandar
and Okuyama (2010) demonstrated that ordered macroporous particles can be produced via spray
drying process using an aerosol reactor, in which droplets with polymeric beads and inorganic
nanoparticles were atomized, dried and annealed inside high-temperature tubular furnace23. Cho,
Choi, Kim and Yi (2012) demonstrated the bulk synthesis of ordered mesopores silica particles by
emulsion templating process24. In this process large polystyrene beads and small silica
nanoparticles were assembled inside an emulsion, leading to composite structure particles during
the evaporation of droplets. The polystyrene beads were burned away by calcination leading to
macroporous solid film on the substrate. The macroporous particle film was further coated with
fluorinated molecules, thereby imparting super hydrophobic property with multi-scale roughness.
The macroporous structures obtained by the above methods have unique optical and thermal
properties due to its high degree of order. These three dimensional colloidal crystals resemble
naturally occurring opals, and have excellent structure, periodicity, low density, a highly
accessible surface, and compositional variety which make them ideal for wide variety of
applications such as battery materials, thermal insulators, composite ceramic materials, photonic
crystals, cosmetics and catalysis.
1.2 Synthesis of Silica
Different types of silica are available and they can be classified as crystalline or amorphous
silica, silica gels or precipitated silica or pyrogenic silica, hydrophobic or hydrophilic silica, porous
or non-porous silica. It is important to note that most of the silicas used in countless number of
industrial applications are synthetic amorphous silicas (silica gels, pyrogenic or fumed silica, and
precipitated silica). Each of these silica have different properties and used for different
13
applications, and the differences in the properties mainly arise from the preparation or synthetic
procedures to obtain the silica material. Briefly, the synthetic process can be classified as wet
process for silica gels and thermal or pyrogenic process for fumed silica. The most documented
method for the preparation of silica gels through wet process is the sol-gel process and the heavily
used method for industrial preparation of fumed silica is flame hydrolysis. All the silicas that were
used to understand water adsorption behavior in chapter 3 of this dissertation were prepared either
by sol-gel process or flame hydrolysis. Hence, in the following section, both continuous flame
hydrolysis and sol-gel process will be discussed in detail.
1.2.1 Continuous flame hydrolysis of fumed silica
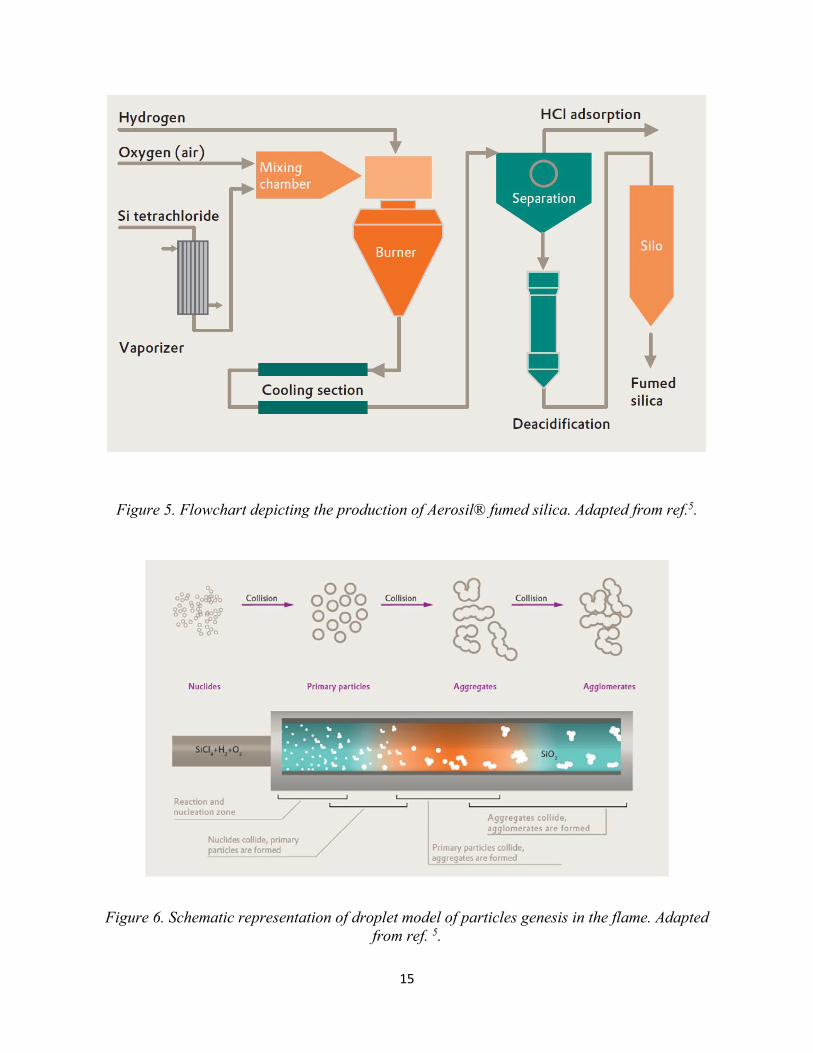
Fumed silicas are obtained by continuous flame hydrolysis of silicon tetrachloride (SiCl4)
i.e burning of SiCl4 in the presence of oxygen and hydrogen under high temperature. SiCl4 is
converted to the gas phase (using vaporizer) separately before it is mixed with oxygen and
hydrogen and fed into the combustion chamber. A hydrogen flame containing SiCl4 burns
continuously inside the reaction chamber. As water gets formed, it reacts spontaneously and
quantitatively with SiCl4 inside the flame producing hydrochloric acid and the desired product
silicon dioxide (SiO2). The chemical reactions are listed below and Figure 5 shows the production
of fumed silica5.
2H2 + O2 → 2H2O
SiCl4 + 2H2O → SiO2 + 4HCl 2H2 + O2 + SiCl4 → SiO2 + 4HCl (1-3)
14
The flame hydrolysis process and eventually the properties of fumed silica can be explained using
the droplet model of particle genesis5 which is schematically illustrated in Figure 6. Some key
points of the droplet model5 is listed below:
1. Reaction gases first pass through the base of the flame and minute droplets (nuclides) of
SiO2 are formed. Droplets collide with one another and merge to form bigger and heavier
droplets. This process continues as long as the flame is hot enough to keep the droplets in
the liquid state.
2. As these bigger droplets enter the relatively cold region of the flame, they partially solidify.
When they collide with each other they do not merge and coalesce completely to form
spherical droplets, instead they partially merge to form aggregates.
3. As they go through the colder parts of the flame, the aggregates become fully solidified.
When these aggregates collide, they are unable to merge, but instead attach to each other
forming agglomerates.
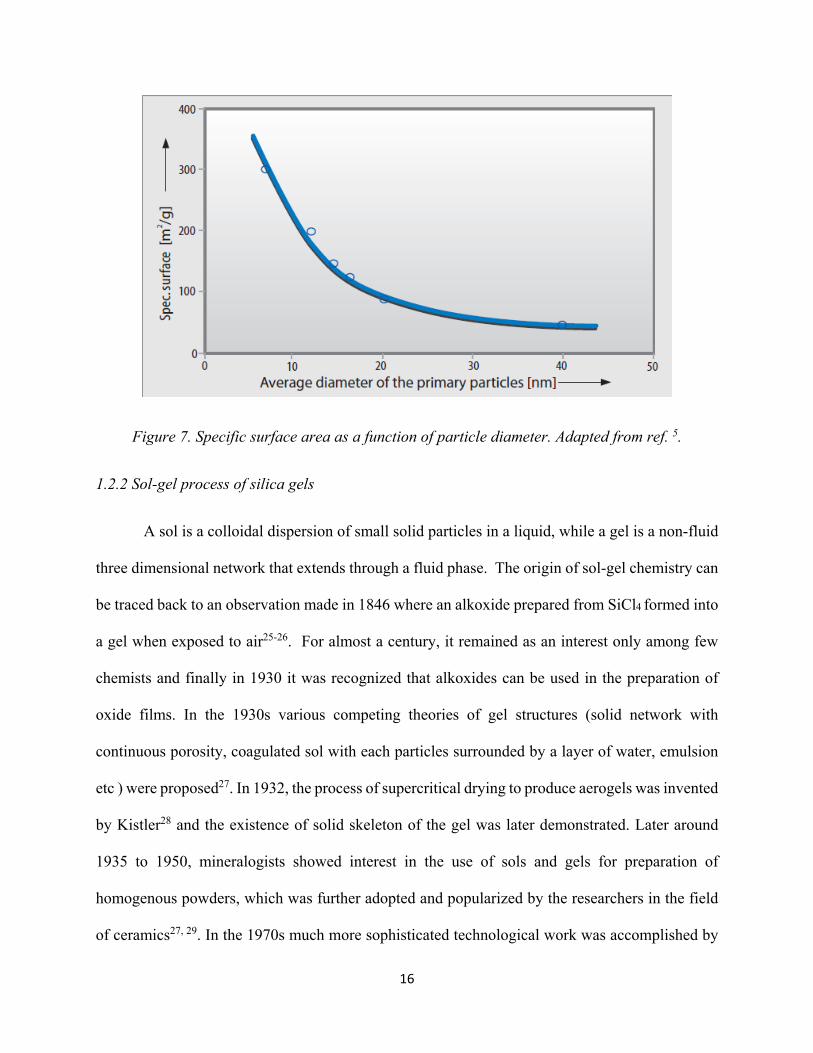
The particle size, particle size distribution, the specific surface and surface properties can be
controlled by varying the concentration of the reactants, the flame temperature, and the residence
(dwell) time of the silica in the combustion chamber. The specific surface increases as the particle
diameter increases and this fundamental correlation is shown in Figure 7. The hydrophilic fumed
silica can be further treated with functional silanes to obtain modified silicas (hydrophobic silicas,
aminated silicas) for various applications.
15
Figure 5. Flowchart depicting the production of Aerosil® fumed silica. Adapted from ref.5.
Figure 6. Schematic representation of droplet model of particles genesis in the flame. Adapted from ref. 5.
16
Figure 7. Specific surface area as a function of particle diameter. Adapted from ref. 5.
1.2.2 Sol-gel process of silica gels
A sol is a colloidal dispersion of small solid particles in a liquid, while a gel is a non-fluid
three dimensional network that extends through a fluid phase. The origin of sol-gel chemistry can
be traced back to an observation made in 1846 where an alkoxide prepared from SiCl4 formed into
a gel when exposed to air25-26. For almost a century, it remained as an interest only among few
chemists and finally in 1930 it was recognized that alkoxides can be used in the preparation of
oxide films. In the 1930s various competing theories of gel structures (solid network with
continuous porosity, coagulated sol with each particles surrounded by a layer of water, emulsion
etc ) were proposed27. In 1932, the process of supercritical drying to produce aerogels was invented
by Kistler28 and the existence of solid skeleton of the gel was later demonstrated. Later around
1935 to 1950, mineralogists showed interest in the use of sols and gels for preparation of
homogenous powders, which was further adopted and popularized by the researchers in the field
of ceramics27, 29. In the 1970s much more sophisticated technological work was accomplished by
17
researchers in the nuclear-fuel industry to prepare small spheres of radioactive oxides to be packed
into fuel cells for reactors27. From the 1970s onward, sol-gel chemistry has been studied and
investigated extensively since it has the ability to produce a solid-state material from a chemically
homogeneous precursor. Additionally sol-gel chemistry enables greater control over particle
morphology and size. The term sol-gel is now used for a diverse range of chemistries involving
materials synthesis and as of April 2016, a Scifinder™ search of the word “sol-gel” yielded
134,230 references.
The sol-gel process describes the number of processes through which a sol undergoes a
sol-gel transition leading to a rigid porous mass. The required precursors, chemistry, mechanisms
involved in the chemistry and the process of making silicate gels are detailed into simple sections
as below:
1. Precursors: In the sol-gel process, the term precursor refers to the starting compound that
consists of a metal or metalloid elements surrounded by various ligands. The precursors for making
metal oxides could be inorganic salts (e.g. Al(NO3)3 for aluminum oxide) or organic compounds
(e.g. Al(OC4H9)3 for aluminum oxide). Metal alkoxides belong to the family of metalorganic
compounds, which have an organic ligand (an alkoxy group) attached to a metal or metalloid atom.
Metal alkoxides are popular precursors owing to their ability to react instantly with water. The
suitability of various alkoxides for sol-gel chemistry heavily depends on; a) Ionic character of the
M-O bond (arising from electronegativity differences) b) electron donating or withdrawing ability
of the alkyl chain on the stability of alkoxy groups26. Although sol-gel science involves solution
chemistry of inorganic precursors (in aqueous solution) and metal alkoxide precursors (in mixed
solvents) of various metals (transition metals such as Ti, V, Zr and Group IIIB metals like B, Al)
the main focus of this section will be on silica gels made from silicon alkoxides. One common
18
example of a sol-gel process related to preparation of silica gel involves the system of
tetraethoxyorthosilane (TEOS, Si(OC2H5)4), ethanol and water. The one phase solution of the
above three component undergoes a sol-gel transition to a rigid two-phase system of solid silica
(SiO2) and solvent-filled pores30.
2. Hydrolysis and Condensation of Alkoxides: The key step to sol-gel process is the series of
hydrolysis and condensation reactions of alkoxides. Hydrolysis and condensation occur almost
simultaneously, in the aqueous alkoxide solution. The sol-gel general reaction scheme can be
understood by the example of silica gel synthesis using the system of tetraalkoxysilanes
(Si(OR)4), ethanol and water. At the functional group level, the following reactions can be used
to understand the sol-gel process. The R in the reaction scheme can be CH3, C2H5, n-C3H7 or n-
C4H9 etc.
a) Hydrolysis: The hydrolysis reaction replaces –OR (alkaoxide) groups with –OH (hydroxyl)
groups. ≡ − + 2 ⇌ ≡ − +
(Hydrolysis)
b) Condensation: Condensation may occur either between two silanols or a silanol and an ethoxy
group to form a siloxane group (Si-O-Si)
≡ − + − ≡ ⇌ ≡ − − ≡ +
(Alcohol condensation)
≡ − + − ≡ ⇌ ≡ − − ≡ + 2
(Water condensation)
(1-4)
(1-5)
(1-6)
19
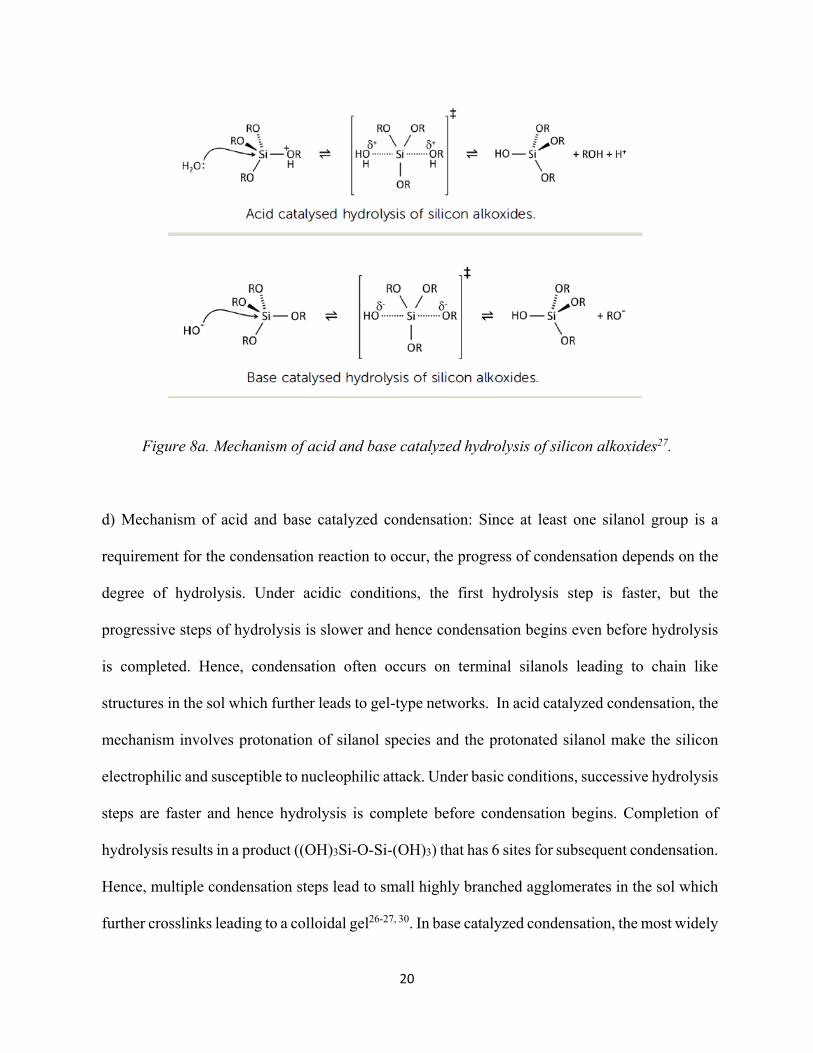
c) Mechanism of acid and base catalyzed hydrolysis: The structure of the resulting gel depends
on the rate of hydrolysis and condensation reactions which in turn depends upon the catalyst
used26, 30. The sol-gel chemistry is driven by acid or base catalyst as neutral reactions are generally
slow. The rate of each hydrolysis step depends on the transition state stability which consecutively
depends on the electron withdrawing or donation power of the –OH versus –OR groups26. In acid
catalyzed reactions, the alkoxide group is protonated in a rapid first step and leads to withdrawal
of electron density from the Si atom. The Si atom becomes more electrophilic and prone to attack
by water. The water molecule attacks the Si, acquires a partial positive charge and weakens the
positive charge of the protonated alkoxide, making the alcohol a better leaving group. The
transition state decays due to the leaving of the alcohol group and inversion of silicon’s
tetrahedron geometry. Under acidic conditions, the hydrolysis rate decreases with each
subsequent hydrolysis step3-4, 26-27. In base catalyzed reactions, water dissociates to produce
nucleophilic hydroxyl anions in a raid first step. The hydroxyl anions attacks the silicon atom and
displaces the OR with inversion of silicon’s tetrahedron geometry. Under basic conditions the
hydrolysis rate increases with each subsequent hydrolysis step. In both acid and base catalyzed
hydrolysis, it is believed that mechanism is affected by both steric and inductive factors. However,
steric factors seems to be more important since Si acquires little charge in the transition state 3-4,
26-27. Figure 8a illustrates the mechanism of acid and base catalyzed hydrolysis. It is to be noted
that the mechanism mentioned here is just one possible pathway for hydrolysis and several other
mechanisms are also proposed in the literature27. Essentially the process of hydrolysis is affected
or governed by the acid or base catalysts, H2O:Si ratio, solvent, steric and inductive factors on the
mechanism of hydrolysis of silicon alkoxides and the reverse reaction esterification.
20
Figure 8a. Mechanism of acid and base catalyzed hydrolysis of silicon alkoxides27.
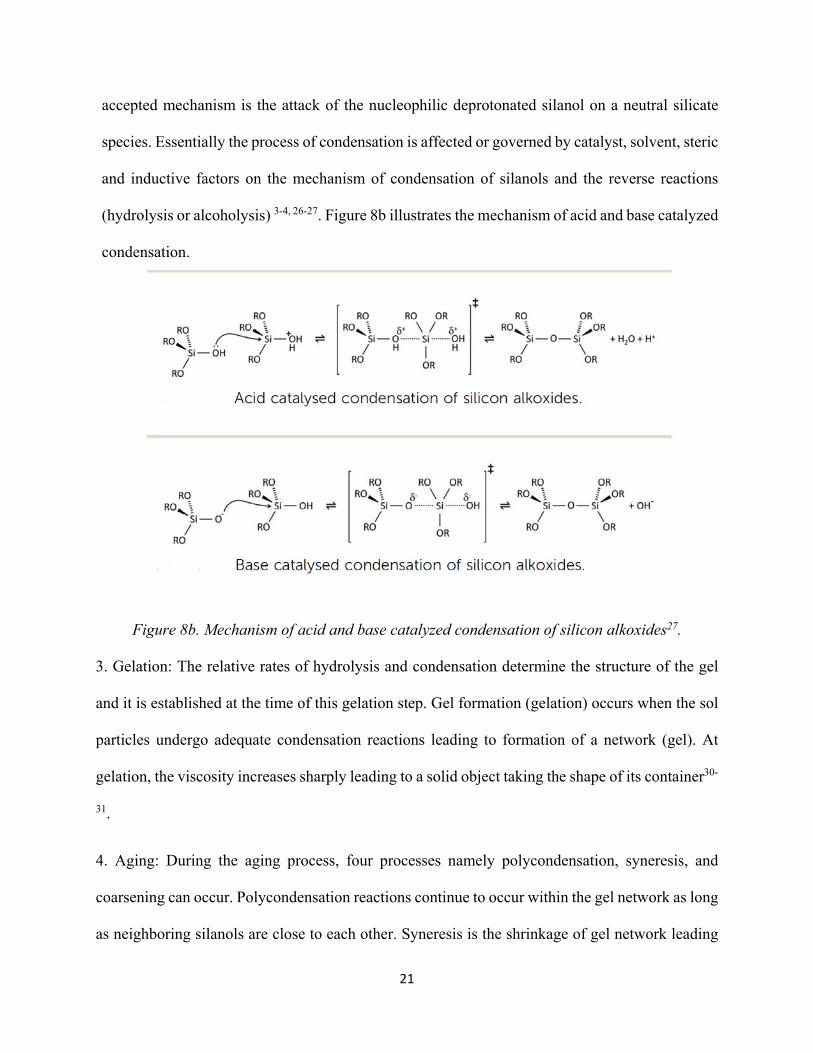
d) Mechanism of acid and base catalyzed condensation: Since at least one silanol group is a
requirement for the condensation reaction to occur, the progress of condensation depends on the
degree of hydrolysis. Under acidic conditions, the first hydrolysis step is faster, but the
progressive steps of hydrolysis is slower and hence condensation begins even before hydrolysis
is completed. Hence, condensation often occurs on terminal silanols leading to chain like
structures in the sol which further leads to gel-type networks. In acid catalyzed condensation, the
mechanism involves protonation of silanol species and the protonated silanol make the silicon
electrophilic and susceptible to nucleophilic attack. Under basic conditions, successive hydrolysis
steps are faster and hence hydrolysis is complete before condensation begins. Completion of
hydrolysis results in a product ((OH)3Si-O-Si-(OH)3) that has 6 sites for subsequent condensation.
Hence, multiple condensation steps lead to small highly branched agglomerates in the sol which
further crosslinks leading to a colloidal gel26-27, 30. In base catalyzed condensation, the most widely
21
accepted mechanism is the attack of the nucleophilic deprotonated silanol on a neutral silicate
species. Essentially the process of condensation is affected or governed by catalyst, solvent, steric
and inductive factors on the mechanism of condensation of silanols and the reverse reactions
(hydrolysis or alcoholysis) 3-4, 26-27. Figure 8b illustrates the mechanism of acid and base catalyzed
condensation.
Figure 8b. Mechanism of acid and base catalyzed condensation of silicon alkoxides27.
3. Gelation: The relative rates of hydrolysis and condensation determine the structure of the gel
and it is established at the time of this gelation step. Gel formation (gelation) occurs when the sol
particles undergo adequate condensation reactions leading to formation of a network (gel). At
gelation, the viscosity increases sharply leading to a solid object taking the shape of its container30-
31.
4. Aging: During the aging process, four processes namely polycondensation, syneresis, and
coarsening can occur. Polycondensation reactions continue to occur within the gel network as long
as neighboring silanols are close to each other. Syneresis is the shrinkage of gel network leading
22
to expulsion of solvent from the pores. The rate of syneresis depends on the composition of the
liquid inside the pores27, 31. The process of shrinking will continue as long as there is flexibility in
the gel. Coarsening is the irreversible decrease in surface area through dissolution and re-
precipitation process.
5. Drying: At first the gel shrinks by the amount equal to the volume of liquid that evaporates
from the structure and the liquid-vapor interface remains at the exterior surface of the body.
Secondly, the gel becomes rigid to shrink and the liquid recedes into the interior resulting in air-
filled pores near the surface and evaporation rate drops. Eventually, the liquid becomes isolated
into pockets and drying proceeds by evaporation of liquid within the gel and diffusion of the vapor
to the outside27, 31.
1.2.3 Templated sol-gel process of ordered mesoporous silica
Zeolites or microporous materials were not able to meet the demands of growing
applications such as adsorption, separation, catalysis, drug delivery photonics, energy storage &
conversion and chemical sensors. However, mesoporous materials with structural capabilities at
the scale of few nanometers and high surface areas shows great potential for the above mentioned
applications. However the mesoporous materials developed since the 1980s were amorphous with
disordered pore systems and broad pore size distributions9, 13, 32-33. The necessity to obtain
mesoporous materials with controllable structures (uniformity within the pore size, shape and
volume) and tunable pore architecture led to the fast expansion of mesoporous materials leveraging
the technical advances in the fields of chemistry, material science and engineering. Besides, the
design and synthesis of novel mesoporous materials with ordered and well-defined pore structure
are important for academic research work. Regardless of the synthetic process to obtain ordered
mesoporous materials, the common element is the use of a ‘template’ to obtain mesoporous
23
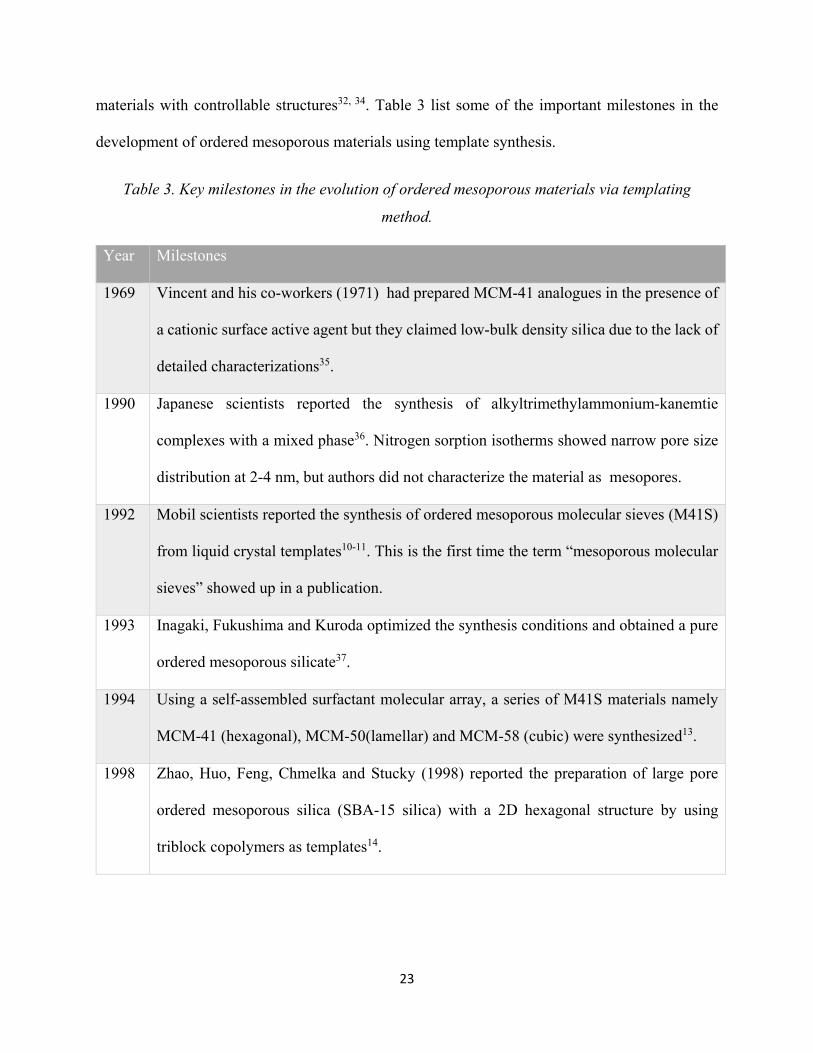
materials with controllable structures32, 34. Table 3 list some of the important milestones in the
development of ordered mesoporous materials using template synthesis.
Table 3. Key milestones in the evolution of ordered mesoporous materials via templating
method.
Year Milestones
1969 Vincent and his co-workers (1971) had prepared MCM-41 analogues in the presence of
a cationic surface active agent but they claimed low-bulk density silica due to the lack of
detailed characterizations35.
1990 Japanese scientists reported the synthesis of alkyltrimethylammonium-kanemtie
complexes with a mixed phase36. Nitrogen sorption isotherms showed narrow pore size
distribution at 2-4 nm, but authors did not characterize the material as mesopores.
1992 Mobil scientists reported the synthesis of ordered mesoporous molecular sieves (M41S)
from liquid crystal templates10-11. This is the first time the term “mesoporous molecular
sieves” showed up in a publication.
1993 Inagaki, Fukushima and Kuroda optimized the synthesis conditions and obtained a pure
ordered mesoporous silicate37.
1994 Using a self-assembled surfactant molecular array, a series of M41S materials namely
MCM-41 (hexagonal), MCM-50(lamellar) and MCM-58 (cubic) were synthesized13.
1998 Zhao, Huo, Feng, Chmelka and Stucky (1998) reported the preparation of large pore
ordered mesoporous silica (SBA-15 silica) with a 2D hexagonal structure by using
triblock copolymers as templates14.
24
The template synthesis involves building a material around some molecule,
macromolecules or liquid crystal. One of the commonly employed templating methods for
mesoporous materials is soft templating method. Soft templating method involves two synthetic
strategies namely a) cooperative self-assembly and b) true liquid crystal templating processes.
As illustrated in Figure 8b, the cooperative self-assembly strategy38 involves the following
steps: i) driven by coulomb forces, covalent bonding or hydrogen bonding, inorganic species
interact with surfactants, polymerize at the interface, crosslink and cooperatively assemble with
the surfactants. ii) As the reaction proceeds, cooperative arrangements between surfactants and the
charge density between inorganic and organic species influence each other leading to varied
compositions of inorganic-organic hybrids. iii) The cooperative assembly process is governed by
the balance of charge density at the surfactant/inorganic interfaces, resulting in phase separation
and reorganization and finally leading to formation of ordered 3-D arrangement with the lowest
energy10, 12, 32, 38.
The term liquid crystal is used to describe the fourth state of matter, which exists between
the liquid and solid phases. Liquid crystals possess both long-range orientation order of solids and
the fluidity and viscosity of liquids. As illustrated in Figure 9, the true liquid crystal templating
process38 involves the following steps: i) formation of semi liquid crystal mesophase micelles from
high concentration surfactants that act as templates. ii) Condensation of inorganic precursors and
confined growth around surfactants leading to ceramic-like frameworks and iii) removal of organic
templates leading to mesoporous frameworks10, 12, 32, 38.
Considering the very fast proliferation of synthetic strategies to obtain ordered mesoporous
materials, it is important to understand the influence of the choice of method and surfactants on
the final mesostructures (pore structure, symmetry, connectivity) and pore sizes of mesoporous
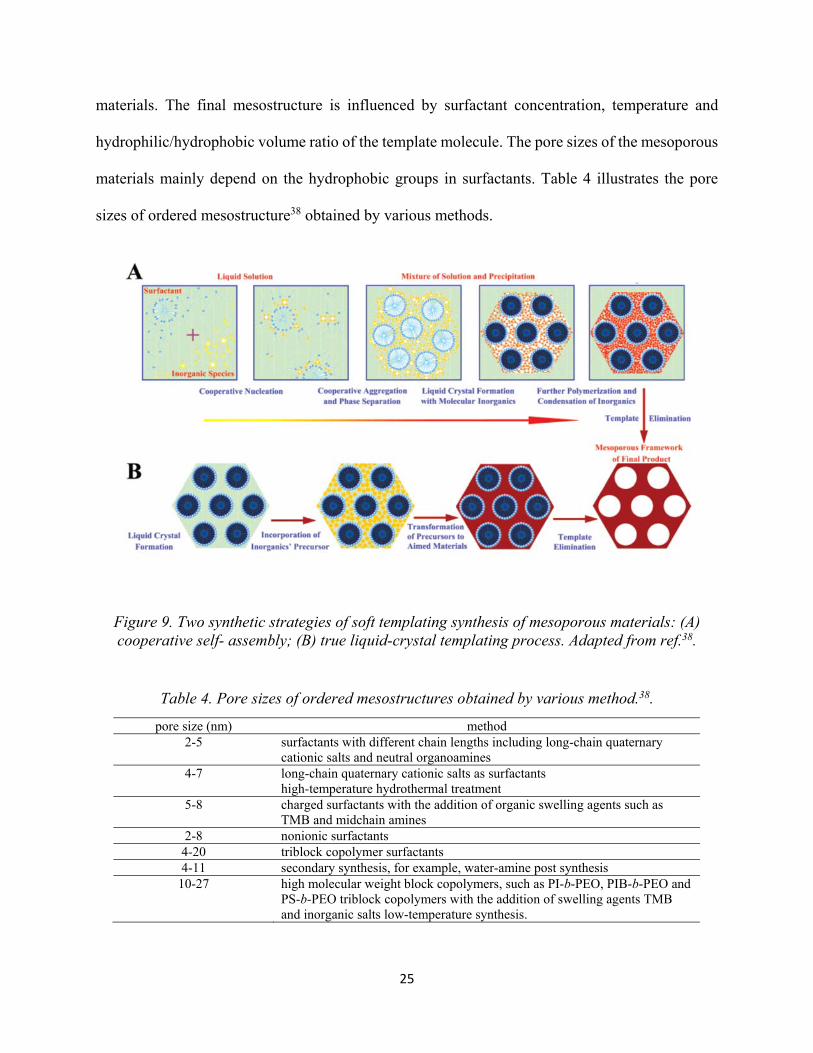
25
materials. The final mesostructure is influenced by surfactant concentration, temperature and
hydrophilic/hydrophobic volume ratio of the template molecule. The pore sizes of the mesoporous
materials mainly depend on the hydrophobic groups in surfactants. Table 4 illustrates the pore
sizes of ordered mesostructure38 obtained by various methods.
Figure 9. Two synthetic strategies of soft templating synthesis of mesoporous materials: (A) cooperative self- assembly; (B) true liquid-crystal templating process. Adapted from ref.38.
Table 4. Pore sizes of ordered mesostructures obtained by various method.38.
pore size (nm) method 2-5 surfactants with different chain lengths including long-chain quaternary
cationic salts and neutral organoamines 4-7 long-chain quaternary cationic salts as surfactants
high-temperature hydrothermal treatment 5-8 charged surfactants with the addition of organic swelling agents such as
TMB and midchain amines 2-8 nonionic surfactants
4-20 triblock copolymer surfactants 4-11 secondary synthesis, for example, water-amine post synthesis
10-27 high molecular weight block copolymers, such as PI-b-PEO, PIB-b-PEO and PS-b-PEO triblock copolymers with the addition of swelling agents TMB and inorganic salts low-temperature synthesis.
26
1.3. Characterization of the Silica Surface
Many of the adsorption, chemical and catalytic properties of a silica material depends on
the surface chemistry and pore geometry of the silica surfaces. Hence, a comprehensive
characterization study of the silica surface includes surface area (m2/g), pore volume (porosity),
pore size distribution (based on pore volume and pore area) and surface silanols is required to
properly define the complex material of interest and to optimize the performance of these silica
materials for many industrial applications33, 39. In this study gas adsorption is used as an
experimental method for surface area, pore volume, pore diameter & pore size characterization of
silica materials and thermogravimetric analysis for obtaining the number of surface silanols. A
brief introduction of the two techniques, namely gas adsorption, and thermogravimetric analysis
is provided. A more detailed description with calculation procedures is presented in Chapter 2.
1.3.1 Surface area, pore volume, pore diameter and pore size distribution
Gas adsorption is a widely used technique for surface area, pore volume, pore diameter and
pore size distribution since it allows assessment of a wide range of pore sizes (0.4 nm to 100 nm)
namely, micropores and mesopores. Surface area and pore volume play complementary roles in
adsorption phenomena and hence measurements of adsorption of gases on a solid surface can be
used to understand the surface area and pore structure of that solid material. Adsorption simply
denotes to the condensation of gases on free surfaces. This includes, the accumulation of molecular
species at the surface rather than in the bulk of a solid or liquid is termed adsorption. The gas is
referred to as the adsorbate and the solid (surface) is referred to as adsorbent.
Adsorption arises due to surface particles of the adsorbent not in the same environment as
the particles inside the bulk. The unbalanced or residual attractive forces on the surface of the
adsorbent are responsible for attracting the adsorbate particles to its surface. The extent of
27
adsorption increases with the increase of surface area per unit mass of the adsorbent at a given
temperature and pressure. During adsorption, there is always a decrease in residual forces of the
surface, i.e there is a decrease in surface energy which appears a heat. Hence, adsorption is always
an exothermic process (∆H is negative). When a gas is adsorbed, the freedom of movement of its
molecules is reduced, i.e there is decrease in entropy (∆S is negative). Hence, adsorption is
accompanied by decreases in enthalpy and entropy of the system. For any process to be
spontaneous, the thermodynamic requirement is that Gibbs energy ∆G (= ∆H-T∆S) should be
negative. In the adsorption process, ∆G can be negative only if ∆H has high negative value since
-T∆S is positive due to negative entropy. In spontaneous adsorption, ∆H is highly negative to begin
with and as the adsorption proceeds ∆H becomes less and less negative until ∆H becomes equal to
T∆S and ∆G becomes zero (equilibrium state is attained).
The adsorption is brought about by the forces acting between solid and gas molecules and
the acting forces can be of two types, namely physical (van der Waals) and chemical, leading to
physisorption and chemisorption respectively. Chemisorption occurs through chemical bonding,
site specific, mostly irreversible and accompanied with heats of adsorption. On the other hand,
physisorption occurs through van der Waals forces, not site specific, reversible and accompanied
with low heats of adsorption. It is to be noted that these two processes (physisorption and
chemisorption) can also occur simultaneously and it is not easy to ascertain the type of adsorption.
However, gas adsorption must be a physisorption process to ensure accurate measurements.
Physisorption is most suitable for surface area determinations and the forces involved in
physisorption van der Waals forces including the long range London dispersion forces and short
range intermolecular repulsion. It is important to note that physisorption is fully reversible,
enabling both the adsorption and desorption process to be studied8, 40.
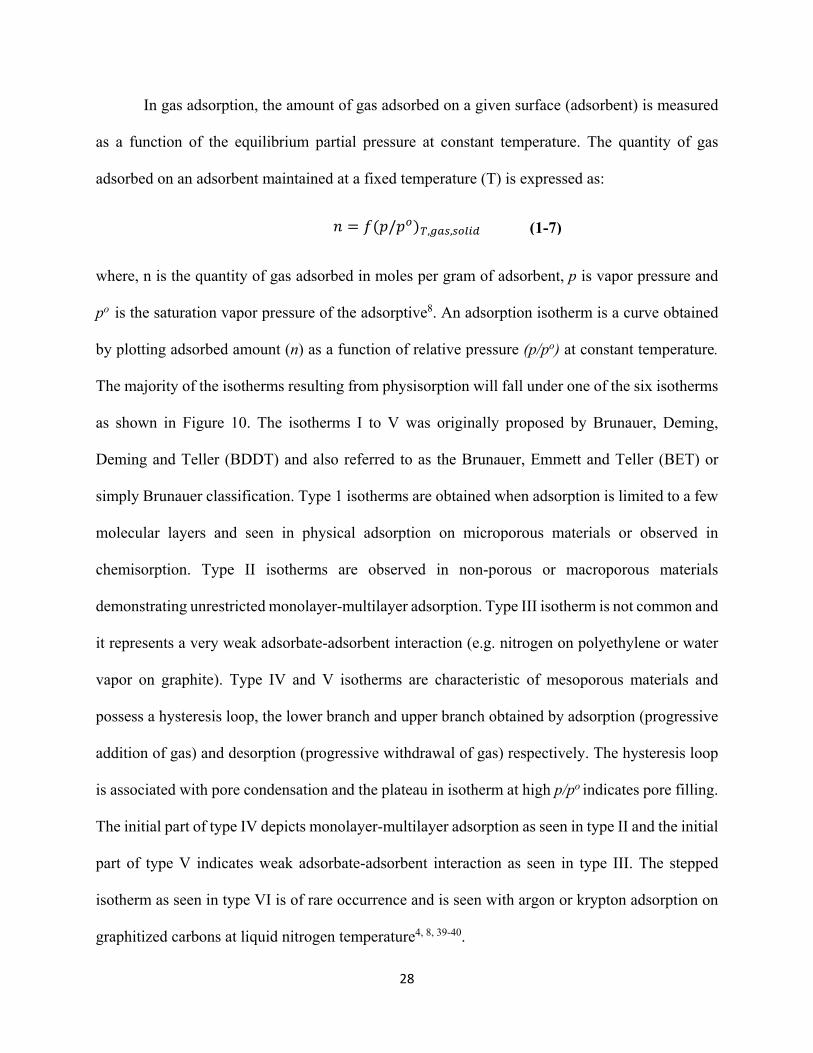
28
In gas adsorption, the amount of gas adsorbed on a given surface (adsorbent) is measured
as a function of the equilibrium partial pressure at constant temperature. The quantity of gas
adsorbed on an adsorbent maintained at a fixed temperature (T) is expressed as:
= ( / ) , ,
where, n is the quantity of gas adsorbed in moles per gram of adsorbent, p is vapor pressure and
po is the saturation vapor pressure of the adsorptive8. An adsorption isotherm is a curve obtained
by plotting adsorbed amount (n) as a function of relative pressure (p/po) at constant temperature.
The majority of the isotherms resulting from physisorption will fall under one of the six isotherms
as shown in Figure 10. The isotherms I to V was originally proposed by Brunauer, Deming,
Deming and Teller (BDDT) and also referred to as the Brunauer, Emmett and Teller (BET) or
simply Brunauer classification. Type 1 isotherms are obtained when adsorption is limited to a few
molecular layers and seen in physical adsorption on microporous materials or observed in
chemisorption. Type II isotherms are observed in non-porous or macroporous materials
demonstrating unrestricted monolayer-multilayer adsorption. Type III isotherm is not common and
it represents a very weak adsorbate-adsorbent interaction (e.g. nitrogen on polyethylene or water
vapor on graphite). Type IV and V isotherms are characteristic of mesoporous materials and
possess a hysteresis loop, the lower branch and upper branch obtained by adsorption (progressive
addition of gas) and desorption (progressive withdrawal of gas) respectively. The hysteresis loop
is associated with pore condensation and the plateau in isotherm at high p/po indicates pore filling.
The initial part of type IV depicts monolayer-multilayer adsorption as seen in type II and the initial
part of type V indicates weak adsorbate-adsorbent interaction as seen in type III. The stepped
isotherm as seen in type VI is of rare occurrence and is seen with argon or krypton adsorption on
graphitized carbons at liquid nitrogen temperature4, 8, 39-40.
(1-7)
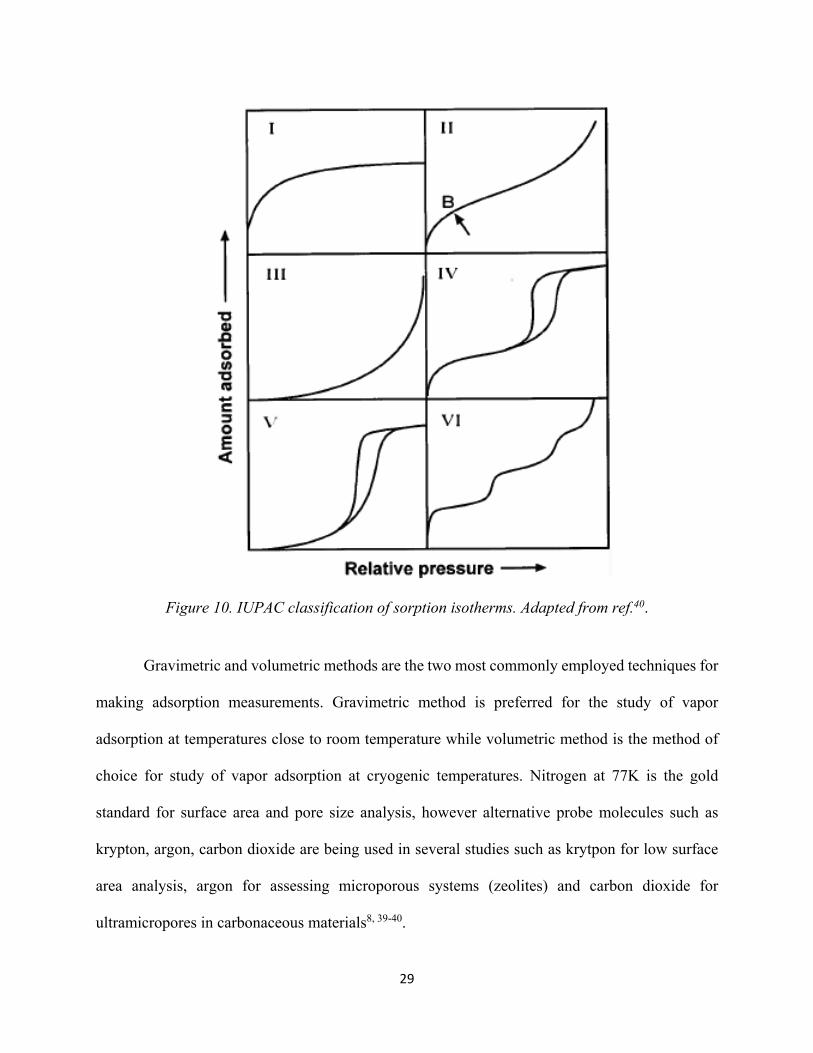
29
Figure 10. IUPAC classification of sorption isotherms. Adapted from ref.40.
Gravimetric and volumetric methods are the two most commonly employed techniques for
making adsorption measurements. Gravimetric method is preferred for the study of vapor
adsorption at temperatures close to room temperature while volumetric method is the method of
choice for study of vapor adsorption at cryogenic temperatures. Nitrogen at 77K is the gold
standard for surface area and pore size analysis, however alternative probe molecules such as
krypton, argon, carbon dioxide are being used in several studies such as krytpon for low surface
area analysis, argon for assessing microporous systems (zeolites) and carbon dioxide for
ultramicropores in carbonaceous materials8, 39-40.
30
While several probe molecules (adsorbates) are being studied and used currently for
characterization of various surfaces, it is important to note that a classification of adsorbents and
adsorbates based on their capacity for non-specific and specific molecular interaction has been
discussed by Kiselev41 as early as 1965. The non-specific interactions (predominantly dispersion
interactions) are universal and exists almost in all cases, while the specific interactions exist
wherever there is concentration of negative or positive charges leading to Coulomb interactions.
As listed in Table 5, Kiselev schematically classified adsorbates and adsorbents based on their
abilities for specific and non-specific interactions.
Table 5. Classification of adsorbates and adsorbents based on their capacity for no-specific and specific interactions41.
groups of adsorbate molecules
types of adsorbents I. Carrying neither
ions, nor active groups (graphitized carbon blacks, BN, surfaces carrying
only saturated groups)
II. Carrying concentrated
positive charges (acid hydroxyls.
exchange cations of small radius)
III. Carrying concentrated
negative charges (ether, nitrile,
carbonyl groups, exchange anions of
small radius) (a) With spherical symmetrical shells or σ-bonds (noble gases, saturated hydrocarbons)
non-specific interactions depending mainly on dispersion forces
(b) With electron density locally concentrated on the peripheries of bonds and links: π-bonds (N2, unsaturated and aromatic hydrocarbons), and lone electron pairs (ethers, ketones, tertiary amines, nitriles, pyridine)
non-specific interactions
non-specific + specific interactions
(c) With positive charges locally concentrated on the peripheries of links (e.g., certain organometallic compounds)
non-specific interactions
non-specific + specific interactions
(d) With functional groups with both electron density and a positive charge concentrated on the peripheries of their individual links (molecules with OH or NH groups)
non-specific interactions
non-specific + specific interactions
31
This research will study the adsorption of nitrogen and water on well-defined dehydroxylated,
partially hydroxylated, and fully hydroxylated silica surfaces. As per the classification in Table 5,
the adsorbates nitrogen and water would fall under the molecules of type b and d respectively. The
dehydroxylated silica would be a non-specific adsorbent (type I), the partially hydroxylated silica
could be a mix of type I & II and the fully hydroxylated silicas would come under type II
adsorbents.
Surface area is an important parameter for optimizing the use of porous materials in many
applications. Nitrogen is the preferred standard adsorptive for determining surface area through
adsorption. A number of theories have been outlined periodically to interpret the isotherm in
quantitative terms, none with complete success. Out of all, the most useful and highly used model
for surface area determination is the Brunauer, Emmett and Teller (BET) theory or model. Details
of the BET model or equation and calculation of surface area from adsorption isotherms using
BET equation is discussed in chapter 2 of this work.
The study of pore structure of any porous solid involves the interpretation of the adsorption
and desorption branches of the full isotherm (Type IV for mesoporous). A characteristic feature of
type IV isotherm is the hysteresis loop and it is attributed to the concept or phenomenon of
capillary condensation that happens within the pores during adsorption process. The theory of
capillary condensation and its quantitative expression Kelvin equation for calculation of pore size
distribution is discussed in Chapter 2 of this thesis.
Nitrogen adsorption–desorption isotherms (77 K) were measured using an Autosorb-1 and
Autosorb IQ analyzer (Quantachrome Instruments, Boynton Beach, FL, USA). The surface area
(using aN2 = 16.2 Å2) was calculated via the Brunauer–Emmett–Teller (BET) method in the range
of relative pressure from 0.05 to 0.25. The cumulative volume of the pores was determined from
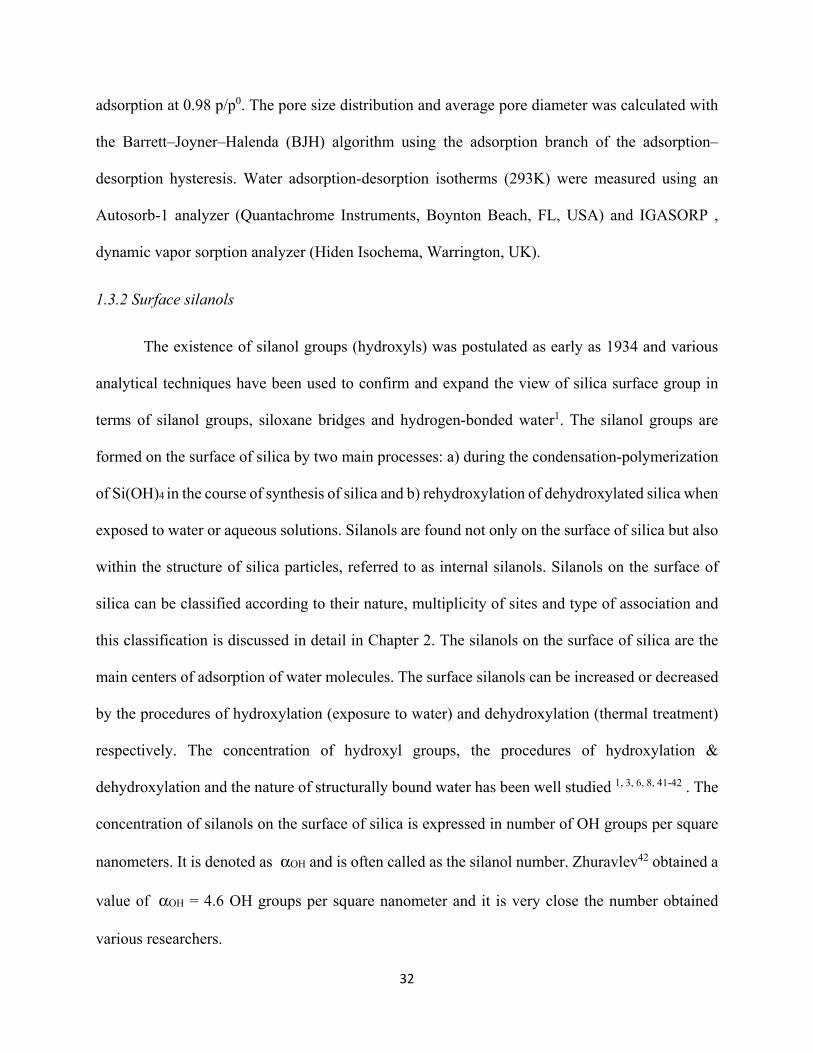
32
adsorption at 0.98 p/p0. The pore size distribution and average pore diameter was calculated with
the Barrett–Joyner–Halenda (BJH) algorithm using the adsorption branch of the adsorption–
desorption hysteresis. Water adsorption-desorption isotherms (293K) were measured using an
Autosorb-1 analyzer (Quantachrome Instruments, Boynton Beach, FL, USA) and IGASORP ,
dynamic vapor sorption analyzer (Hiden Isochema, Warrington, UK).
1.3.2 Surface silanols
The existence of silanol groups (hydroxyls) was postulated as early as 1934 and various
analytical techniques have been used to confirm and expand the view of silica surface group in
terms of silanol groups, siloxane bridges and hydrogen-bonded water1. The silanol groups are
formed on the surface of silica by two main processes: a) during the condensation-polymerization
of Si(OH)4 in the course of synthesis of silica and b) rehydroxylation of dehydroxylated silica when
exposed to water or aqueous solutions. Silanols are found not only on the surface of silica but also
within the structure of silica particles, referred to as internal silanols. Silanols on the surface of
silica can be classified according to their nature, multiplicity of sites and type of association and
this classification is discussed in detail in Chapter 2. The silanols on the surface of silica are the
main centers of adsorption of water molecules. The surface silanols can be increased or decreased
by the procedures of hydroxylation (exposure to water) and dehydroxylation (thermal treatment)
respectively. The concentration of hydroxyl groups, the procedures of hydroxylation &
dehydroxylation and the nature of structurally bound water has been well studied 1, 3, 6, 8, 41-42 . The
concentration of silanols on the surface of silica is expressed in number of OH groups per square
nanometers. It is denoted as αOH and is often called as the silanol number. Zhuravlev42 obtained a
value of αOH = 4.6 OH groups per square nanometer and it is very close the number obtained
various researchers.
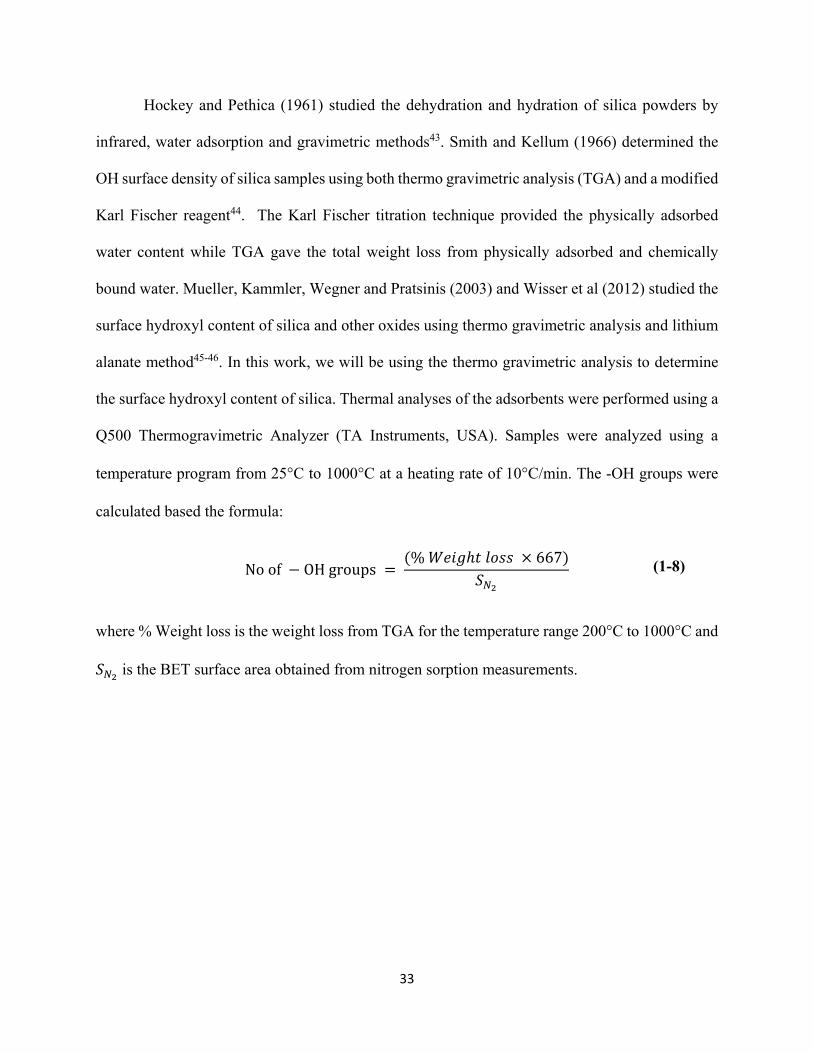
33
Hockey and Pethica (1961) studied the dehydration and hydration of silica powders by
infrared, water adsorption and gravimetric methods43. Smith and Kellum (1966) determined the
OH surface density of silica samples using both thermo gravimetric analysis (TGA) and a modified
Karl Fischer reagent44. The Karl Fischer titration technique provided the physically adsorbed
water content while TGA gave the total weight loss from physically adsorbed and chemically
bound water. Mueller, Kammler, Wegner and Pratsinis (2003) and Wisser et al (2012) studied the
surface hydroxyl content of silica and other oxides using thermo gravimetric analysis and lithium
alanate method45-46. In this work, we will be using the thermo gravimetric analysis to determine
the surface hydroxyl content of silica. Thermal analyses of the adsorbents were performed using a
Q500 Thermogravimetric Analyzer (TA Instruments, USA). Samples were analyzed using a
temperature program from 25°C to 1000°C at a heating rate of 10°C/min. The -OH groups were
calculated based the formula:
No of − OH groups = (% ℎ × 667)
where % Weight loss is the weight loss from TGA for the temperature range 200°C to 1000°C and
is the BET surface area obtained from nitrogen sorption measurements.
(1-8)
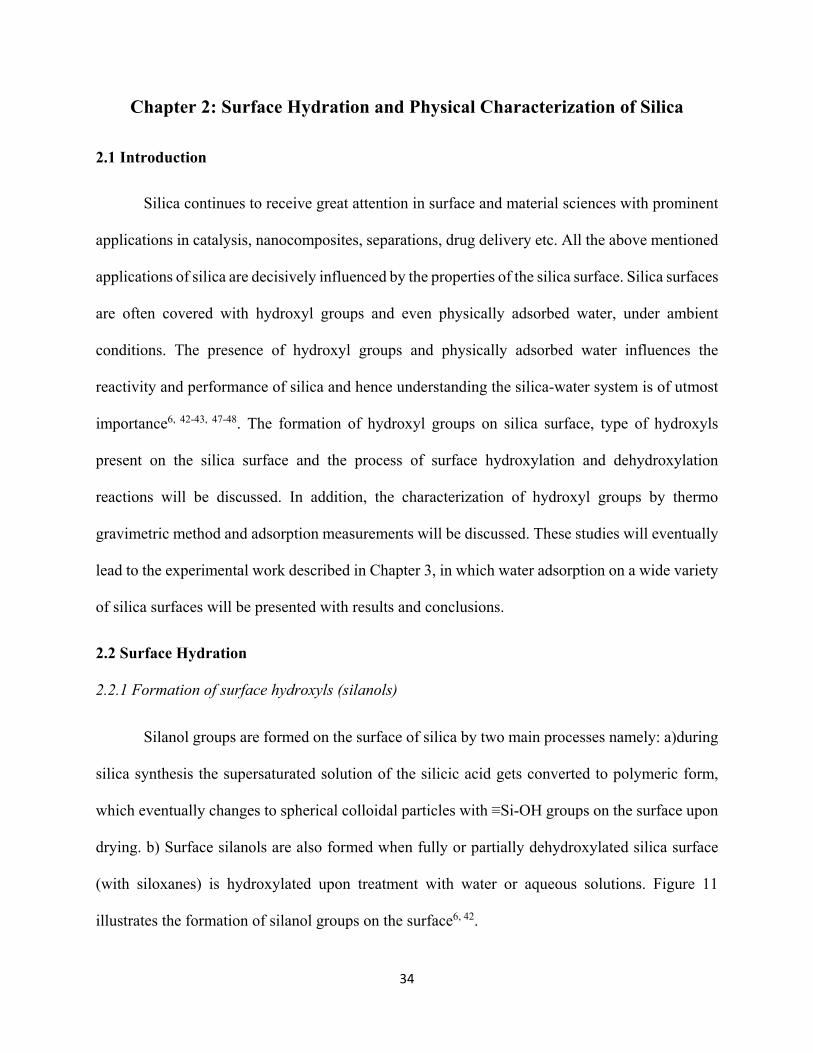
34
Chapter 2: Surface Hydration and Physical Characterization of Silica
2.1 Introduction
Silica continues to receive great attention in surface and material sciences with prominent
applications in catalysis, nanocomposites, separations, drug delivery etc. All the above mentioned
applications of silica are decisively influenced by the properties of the silica surface. Silica surfaces
are often covered with hydroxyl groups and even physically adsorbed water, under ambient
conditions. The presence of hydroxyl groups and physically adsorbed water influences the
reactivity and performance of silica and hence understanding the silica-water system is of utmost
importance6, 42-43, 47-48. The formation of hydroxyl groups on silica surface, type of hydroxyls
present on the silica surface and the process of surface hydroxylation and dehydroxylation
reactions will be discussed. In addition, the characterization of hydroxyl groups by thermo
gravimetric method and adsorption measurements will be discussed. These studies will eventually
lead to the experimental work described in Chapter 3, in which water adsorption on a wide variety
of silica surfaces will be presented with results and conclusions.
2.2 Surface Hydration
2.2.1 Formation of surface hydroxyls (silanols)
Silanol groups are formed on the surface of silica by two main processes namely: a)during
silica synthesis the supersaturated solution of the silicic acid gets converted to polymeric form,
which eventually changes to spherical colloidal particles with ≡Si-OH groups on the surface upon
drying. b) Surface silanols are also formed when fully or partially dehydroxylated silica surface
(with siloxanes) is hydroxylated upon treatment with water or aqueous solutions. Figure 11
illustrates the formation of silanol groups on the surface6, 42.
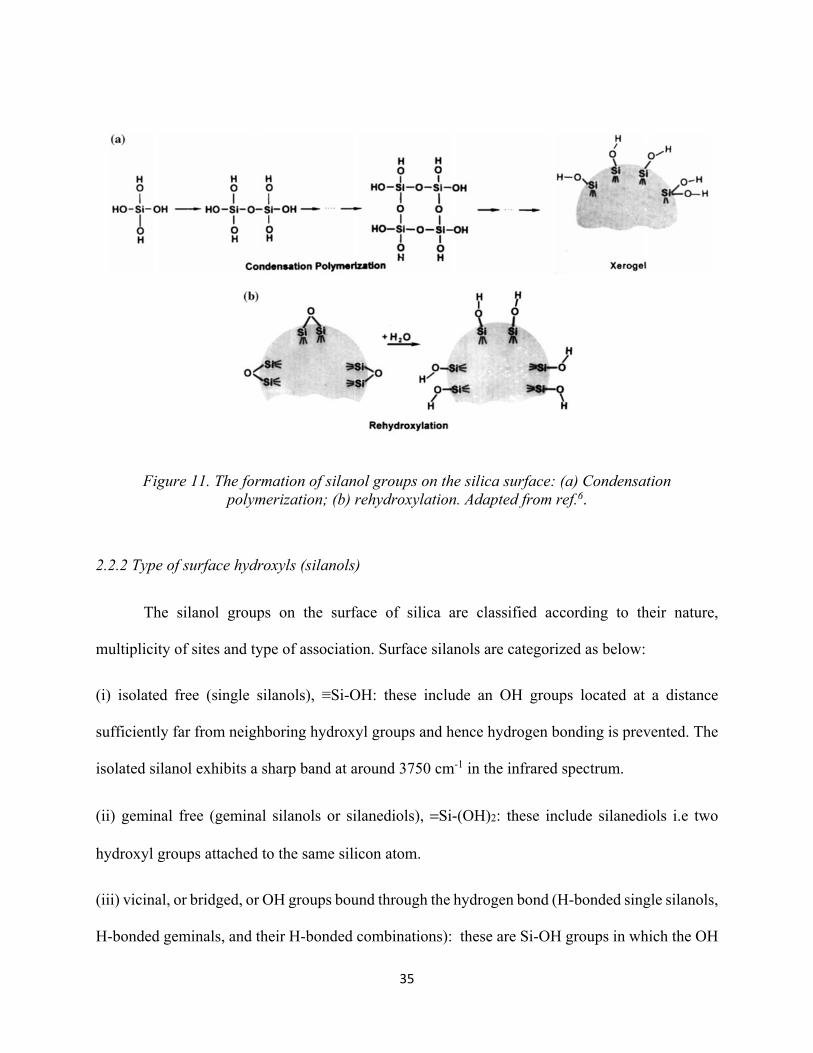
35
Figure 11. The formation of silanol groups on the silica surface: (a) Condensation polymerization; (b) rehydroxylation. Adapted from ref.6.
2.2.2 Type of surface hydroxyls (silanols)
The silanol groups on the surface of silica are classified according to their nature,
multiplicity of sites and type of association. Surface silanols are categorized as below:
(i) isolated free (single silanols), ≡Si-OH: these include an OH groups located at a distance
sufficiently far from neighboring hydroxyl groups and hence hydrogen bonding is prevented. The
isolated silanol exhibits a sharp band at around 3750 cm-1 in the infrared spectrum.
(ii) geminal free (geminal silanols or silanediols), =Si-(OH)2: these include silanediols i.e two
hydroxyl groups attached to the same silicon atom.
(iii) vicinal, or bridged, or OH groups bound through the hydrogen bond (H-bonded single silanols,
H-bonded geminals, and their H-bonded combinations): these are Si-OH groups in which the OH
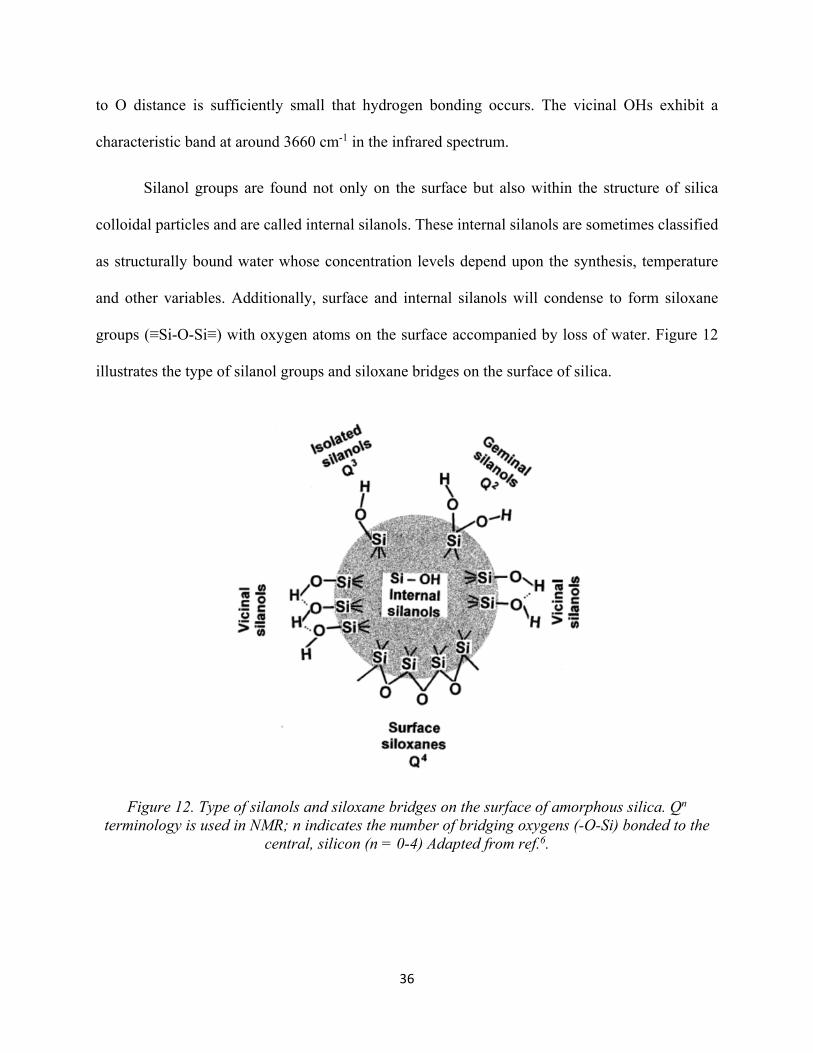
36
to O distance is sufficiently small that hydrogen bonding occurs. The vicinal OHs exhibit a
characteristic band at around 3660 cm-1 in the infrared spectrum.
Silanol groups are found not only on the surface but also within the structure of silica
colloidal particles and are called internal silanols. These internal silanols are sometimes classified
as structurally bound water whose concentration levels depend upon the synthesis, temperature
and other variables. Additionally, surface and internal silanols will condense to form siloxane
groups (≡Si-O-Si≡) with oxygen atoms on the surface accompanied by loss of water. Figure 12
illustrates the type of silanol groups and siloxane bridges on the surface of silica.
Figure 12. Type of silanols and siloxane bridges on the surface of amorphous silica. Qn
terminology is used in NMR; n indicates the number of bridging oxygens (-O-Si) bonded to the central, silicon (n = 0-4) Adapted from ref.6.
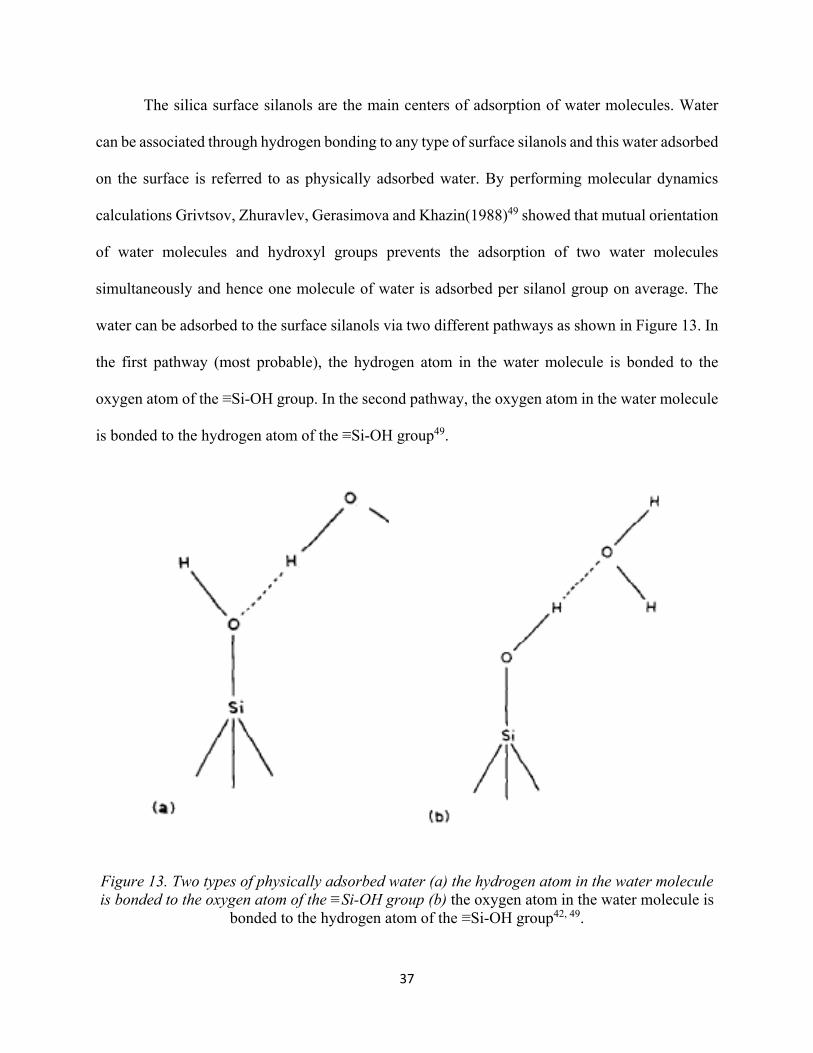
37
The silica surface silanols are the main centers of adsorption of water molecules. Water
can be associated through hydrogen bonding to any type of surface silanols and this water adsorbed
on the surface is referred to as physically adsorbed water. By performing molecular dynamics
calculations Grivtsov, Zhuravlev, Gerasimova and Khazin(1988)49 showed that mutual orientation
of water molecules and hydroxyl groups prevents the adsorption of two water molecules
simultaneously and hence one molecule of water is adsorbed per silanol group on average. The
water can be adsorbed to the surface silanols via two different pathways as shown in Figure 13. In
the first pathway (most probable), the hydrogen atom in the water molecule is bonded to the
oxygen atom of the ≡Si-OH group. In the second pathway, the oxygen atom in the water molecule
is bonded to the hydrogen atom of the ≡Si-OH group49.
Figure 13. Two types of physically adsorbed water (a) the hydrogen atom in the water molecule is bonded to the oxygen atom of the ≡Si-OH group (b) the oxygen atom in the water molecule is
bonded to the hydrogen atom of the ≡Si-OH group42, 49.
38
2.2.3 Dehydration, dehydroxylation and rehydroxylation of silica
The amount of water (physically adsorbed), concentration of surface silanol groups and
siloxanes are all dependent on various factors including but not limited to silica synthesis
conditions, storage conditions (extent of exposure to environment) and specific pretreatment
(thermal heating or hydroxylation) of the silica.. At sufficient concentrations of hydroxyl groups,
the silica surface is hydrophilic and the removal of hydroxyl groups makes the surface
hydrophobic. The scale of hydrophilic or hydrophobicity of surface, chemical reactivity of the
silica surface are all very crucial in deciding the final application of the silica material. Since
surface hydroxyl groups play an active role in determining the applications of silica material, it is
necessary to obtain both qualitative and quantitative information on the surface concentration of
silanol groups. To obtain this information, several silica samples with varying amounts of surface
silanols are required and to obtain such samples, understanding of dehydration, dehyroxylation
and rehydroxylation procedures are very important. It is to be noted that much of the nature of
hydroxyl groups on silica surfaces were obtained earlier by the Infra-Red (IR) spectroscopic
investigations48 and later by thermal gravimetric and titration methods.
2.2.3.1 Dehydration of silica surface
It is important that a distinction is made between surface silanols and physically adsorbed
water and the process of removal of physically adsorbed water from the surface of silica is referred
to as dehydration of silica surface. In the absence of micropores, most of the physically adsorbed
water can be removed by heating up to 120°C but all the surface hydroxyls will be retained
according to Boer and Vleeskens. Lange50 suggested that strongly adsorbed water, especially
retained in micropores can be removed only at 180°C. By combined use of thermogravimetric
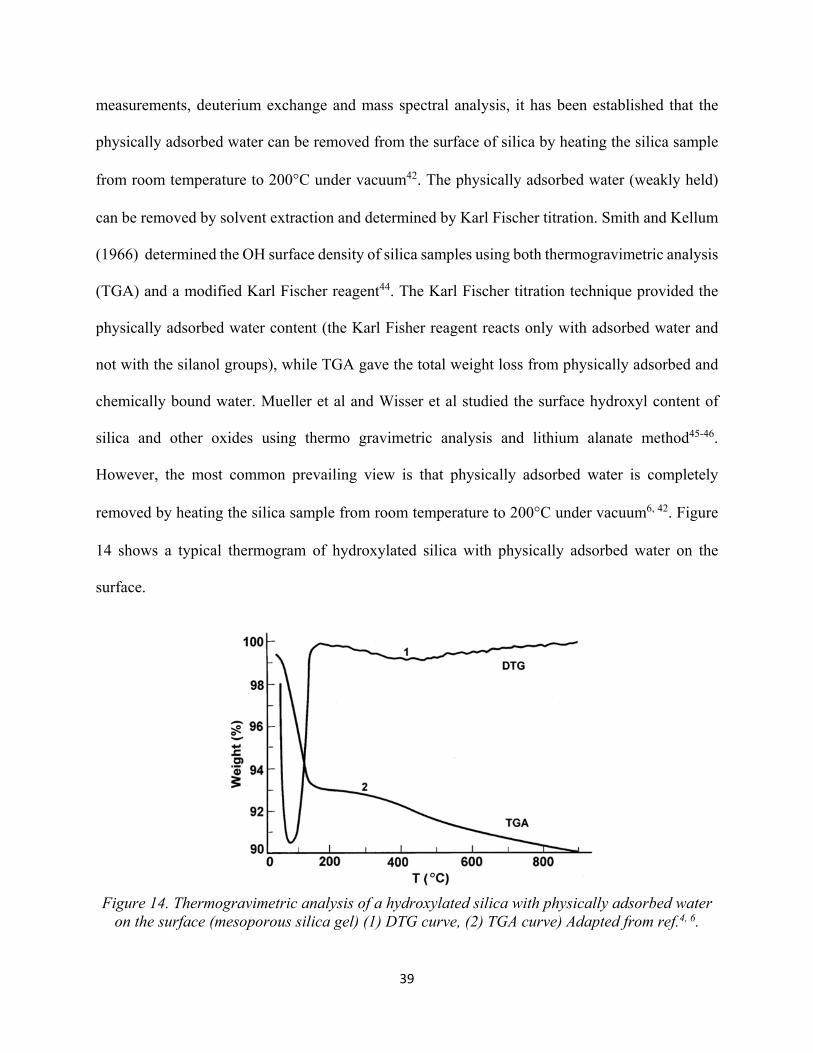
39
measurements, deuterium exchange and mass spectral analysis, it has been established that the
physically adsorbed water can be removed from the surface of silica by heating the silica sample
from room temperature to 200°C under vacuum42. The physically adsorbed water (weakly held)
can be removed by solvent extraction and determined by Karl Fischer titration. Smith and Kellum
(1966) determined the OH surface density of silica samples using both thermogravimetric analysis
(TGA) and a modified Karl Fischer reagent44. The Karl Fischer titration technique provided the
physically adsorbed water content (the Karl Fisher reagent reacts only with adsorbed water and
not with the silanol groups), while TGA gave the total weight loss from physically adsorbed and
chemically bound water. Mueller et al and Wisser et al studied the surface hydroxyl content of
silica and other oxides using thermo gravimetric analysis and lithium alanate method45-46.
However, the most common prevailing view is that physically adsorbed water is completely
removed by heating the silica sample from room temperature to 200°C under vacuum6, 42. Figure
14 shows a typical thermogram of hydroxylated silica with physically adsorbed water on the
surface.
Figure 14. Thermogravimetric analysis of a hydroxylated silica with physically adsorbed water on the surface (mesoporous silica gel) (1) DTG curve, (2) TGA curve) Adapted from ref.4, 6.
40
The profiles of curve 1 (differential thermogravimetric analysis curve (DTG)) and curve 2 (TGA
curve) indicate the loss of physically adsorbed water and is completed around ~150 - 200°C. It is
important to keep in mind that storage conditions contribute the maximum to the physically
adsorbed water. Chemical modification of the surface of silica continue to receive great interest
and hence the physically adsorbed water should be removed in order to obtain reaction with the
surface silanol groups for any type of silica surface modification.
2.2.3.2 Dehydroxylation of silica surface
The dehyroxylation of a silica surface refers to the removal of silanol groups by thermal
pretreatment in vacuo (i.e treating silica at various temperatures). Pretreatment of silica at
temperatures ranging from 200°C to 1100°C leads to various extent of dehydroxylation and the
dehyroxylation is quantified by measuring the number of silanol groups per unit area (silanol
number, αOH) after thermal pretreatment up to a particular temperature. Figure 15 shows silanol
number as a function of pretreatment temperature for different samples of silica with knows surface
area. The total silanol number(αOH, T) decrease considerably in the pretreatment temperature range
of 200 to 400°C and the decrease in αOH becomes notably smaller in the pretreatment temperature
range of 400 to 1100°C. Table 6 lists the different types of silanols that are present after thermal
pretreatment at a particular temperature. It is to be noted that the initial state (temperature treatment
of 180-200°C, i.e after removing only physically adsorbed water) corresponds to the maximum
degree of surface hydroxylation (first row in Table 6). During the transition (thermal treatment)
range of 200 to 400°C, all different types of silanol groups (isolated, geminals, vicinals) are
present. At 400°C, all vicinal groups are gone and only isolated and vicinal groups remain on the
surface. During the transition from 400 to 900°C, isolated silanols and geminals continue to
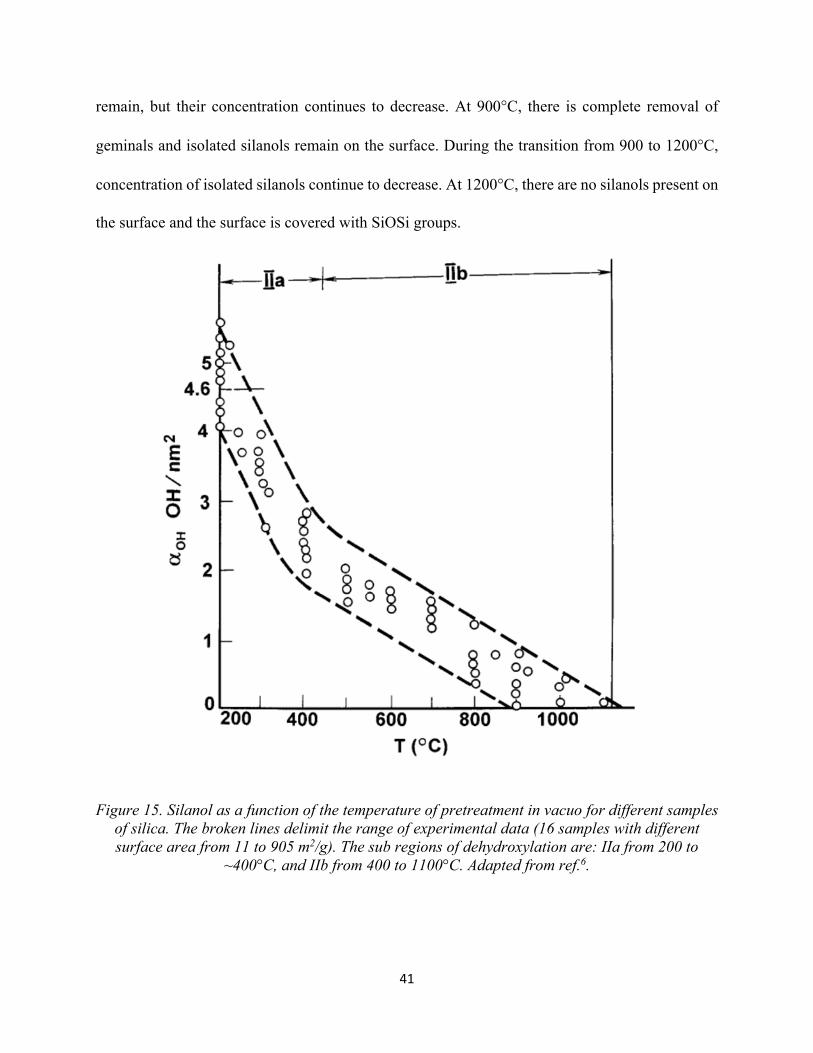
41
remain, but their concentration continues to decrease. At 900°C, there is complete removal of
geminals and isolated silanols remain on the surface. During the transition from 900 to 1200°C,
concentration of isolated silanols continue to decrease. At 1200°C, there are no silanols present on
the surface and the surface is covered with SiOSi groups.
Figure 15. Silanol as a function of the temperature of pretreatment in vacuo for different samples of silica. The broken lines delimit the range of experimental data (16 samples with different surface area from 11 to 905 m2/g). The sub regions of dehydroxylation are: IIa from 200 to
~400°C, and IIb from 400 to 1100°C. Adapted from ref.6.
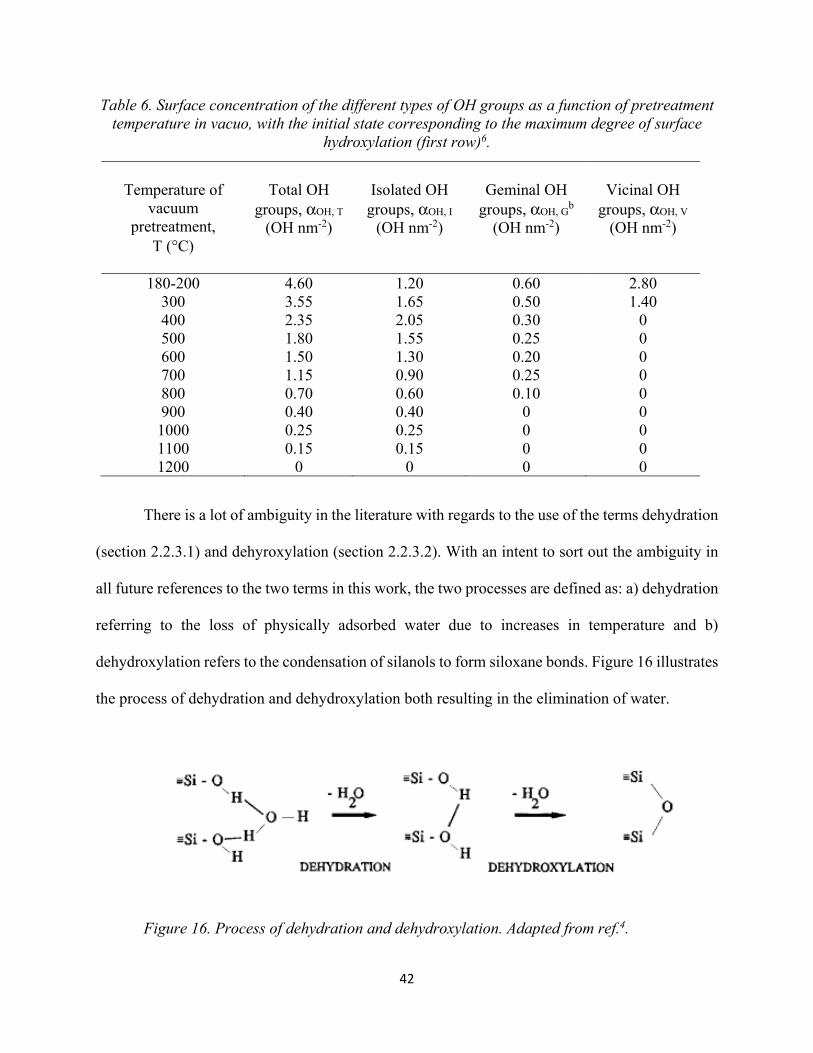
42
Table 6. Surface concentration of the different types of OH groups as a function of pretreatment temperature in vacuo, with the initial state corresponding to the maximum degree of surface
hydroxylation (first row)6.
Temperature of
vacuum pretreatment,
T (°C)
Total OH
groups, αOH, T (OH nm-2)
Isolated OH
groups, αOH, I
(OH nm-2)
Geminal OH
groups, αOH, Gb
(OH nm-2)
Vicinal OH
groups, αOH, V
(OH nm-2)
180-200 4.60 1.20 0.60 2.80 300 3.55 1.65 0.50 1.40 400 2.35 2.05 0.30 0 500 1.80 1.55 0.25 0 600 1.50 1.30 0.20 0 700 1.15 0.90 0.25 0 800 0.70 0.60 0.10 0 900 0.40 0.40 0 0 1000 0.25 0.25 0 0 1100 0.15 0.15 0 0 1200 0 0 0 0
There is a lot of ambiguity in the literature with regards to the use of the terms dehydration
(section 2.2.3.1) and dehyroxylation (section 2.2.3.2). With an intent to sort out the ambiguity in
all future references to the two terms in this work, the two processes are defined as: a) dehydration
referring to the loss of physically adsorbed water due to increases in temperature and b)
dehydroxylation refers to the condensation of silanols to form siloxane bonds. Figure 16 illustrates
the process of dehydration and dehydroxylation both resulting in the elimination of water.
Figure 16. Process of dehydration and dehydroxylation. Adapted from ref.4.
43
2.2.3.3 Rehydroxylation of silica surface
When the dehydroxylated silica surface reacts with water in a vapor or liquid state, silanols
groups are formed again and this process is referred to as rehydroxylation (the term rehydration is
also used). Young51 pointed out that complete rehydroxylation of surface can be achieved for only
surfaces that has been subjected to thermal pretreatment at temperatures below 400°C. The rate of
rehydroxylation is also faster with silica surface subjected to calcination (thermal treatment) less
than 400°C due to the fact that the concentration of siloxane bridges is low and each ≡ − −≡ is surrounded by OH groups. It was also stated that any silica surface that has been subjected
to calcination in the range of 400- 1100°C can only be partially rehydroxylated and the rate of
rehydroxylation is also slower51-52. The rate of rehydroxylation is slower because of the increased
concentration of siloxane bridges (hydrophobic regions) and decreased concentration of -OH
groups. However Agzamkhodzhaev, Zhuravlev, Kiselev and Shengeliya (1969) showed that silica
dehydroxylated in the range of 673-1373K can be completely restored to the maximum
hydroxylated state (4.6 OH groups per nm2) by treating with water at room temperature53. It was
also shown by Agzamkhodzhaev et al53 that the more surface was dehydroxylated, the longer it
took for rehydroxylation and that rehydroxylation can be accelerated by subjecting the silica
surface to hydrothermal treatment at 100°C. The reaction that takes place during rehydroxylation
is the opposite of condensation reaction and involves the breaking of surface siloxane bonds as
shown in Figure 11. It is postulated that rehydration occurs only next to a hydroxyl group and the
hydroxylated area grows in certain areas as the hydration proceeds along the boundary between
hydrophilic (hydroxylated) and hydrophobic (siloxane) regions3.
2.2.4 Infrared studies of the silica surface
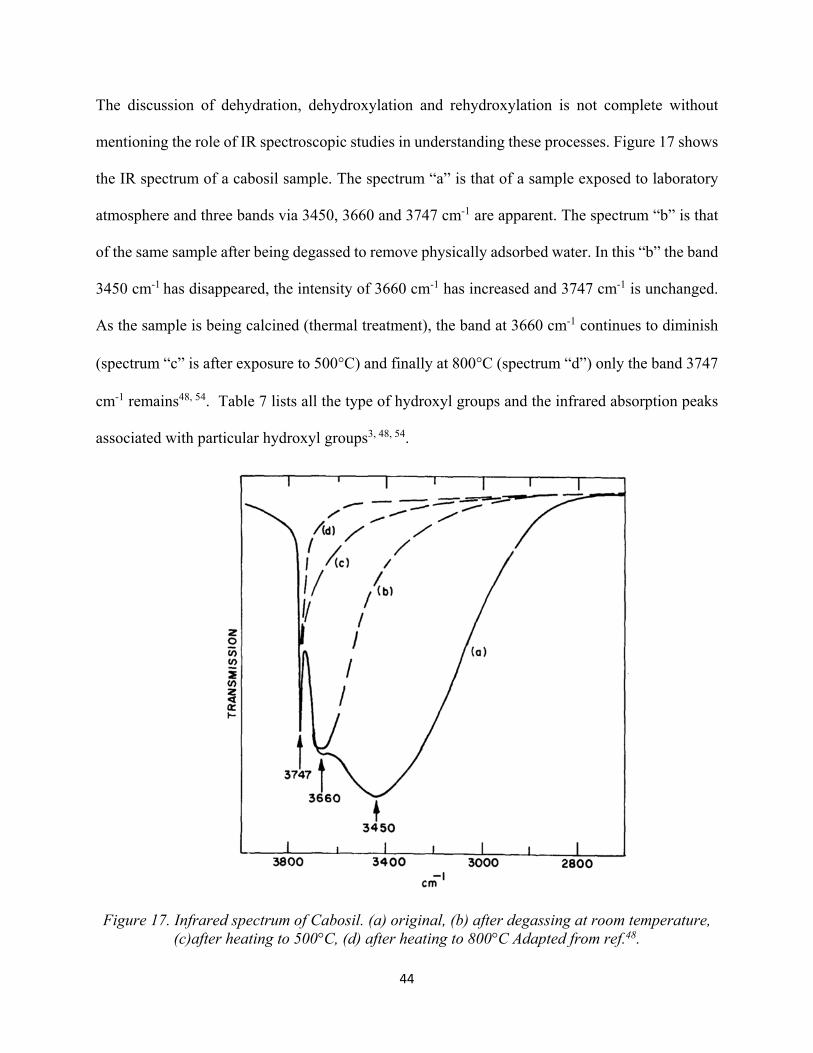
44
The discussion of dehydration, dehydroxylation and rehydroxylation is not complete without
mentioning the role of IR spectroscopic studies in understanding these processes. Figure 17 shows
the IR spectrum of a cabosil sample. The spectrum “a” is that of a sample exposed to laboratory
atmosphere and three bands via 3450, 3660 and 3747 cm-1 are apparent. The spectrum “b” is that
of the same sample after being degassed to remove physically adsorbed water. In this “b” the band
3450 cm-1 has disappeared, the intensity of 3660 cm-1 has increased and 3747 cm-1 is unchanged.
As the sample is being calcined (thermal treatment), the band at 3660 cm-1 continues to diminish
(spectrum “c” is after exposure to 500°C) and finally at 800°C (spectrum “d”) only the band 3747
cm-1 remains48, 54. Table 7 lists all the type of hydroxyl groups and the infrared absorption peaks
associated with particular hydroxyl groups3, 48, 54.
Figure 17. Infrared spectrum of Cabosil. (a) original, (b) after degassing at room temperature, (c)after heating to 500°C, (d) after heating to 800°C Adapted from ref.48.
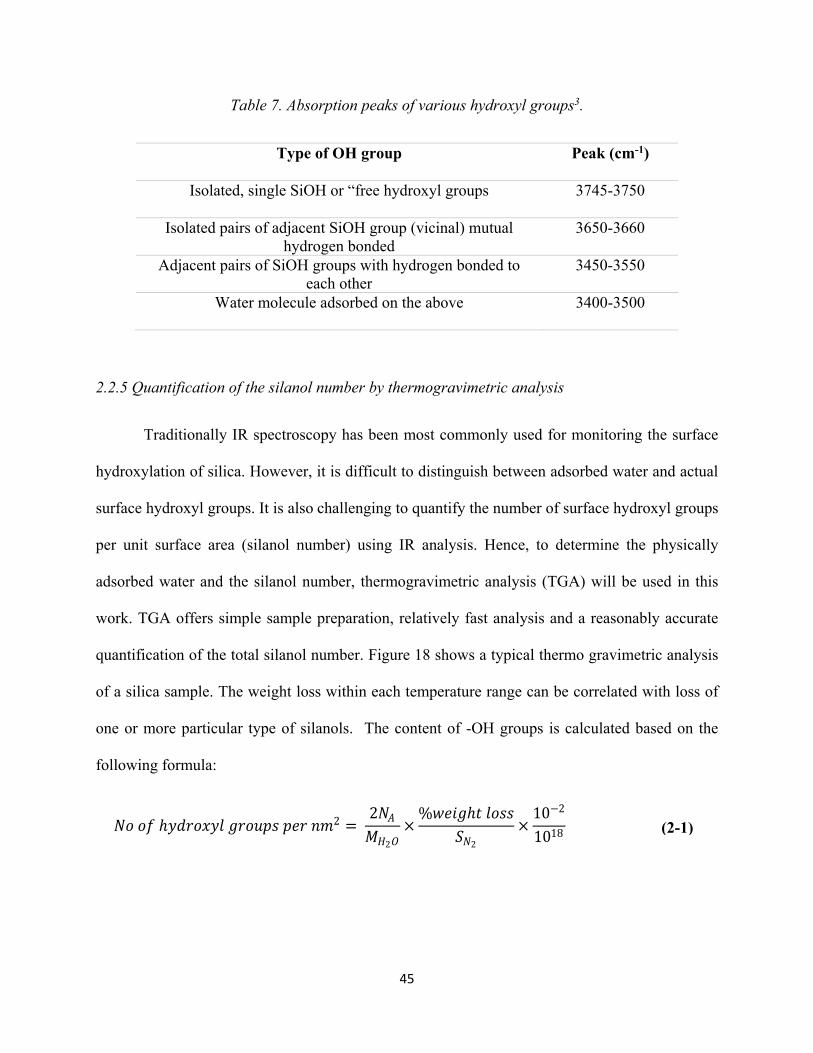
45
Table 7. Absorption peaks of various hydroxyl groups3.
Type of OH group Peak (cm-1)
Isolated, single SiOH or “free hydroxyl groups 3745-3750
Isolated pairs of adjacent SiOH group (vicinal) mutual hydrogen bonded
3650-3660
Adjacent pairs of SiOH groups with hydrogen bonded to each other
3450-3550
Water molecule adsorbed on the above 3400-3500
2.2.5 Quantification of the silanol number by thermogravimetric analysis
Traditionally IR spectroscopy has been most commonly used for monitoring the surface
hydroxylation of silica. However, it is difficult to distinguish between adsorbed water and actual
surface hydroxyl groups. It is also challenging to quantify the number of surface hydroxyl groups
per unit surface area (silanol number) using IR analysis. Hence, to determine the physically
adsorbed water and the silanol number, thermogravimetric analysis (TGA) will be used in this
work. TGA offers simple sample preparation, relatively fast analysis and a reasonably accurate
quantification of the total silanol number. Figure 18 shows a typical thermo gravimetric analysis
of a silica sample. The weight loss within each temperature range can be correlated with loss of
one or more particular type of silanols. The content of -OH groups is calculated based on the
following formula:
ℎ 2 = 22 × % ℎ
2 × 10−21018
(2-1)
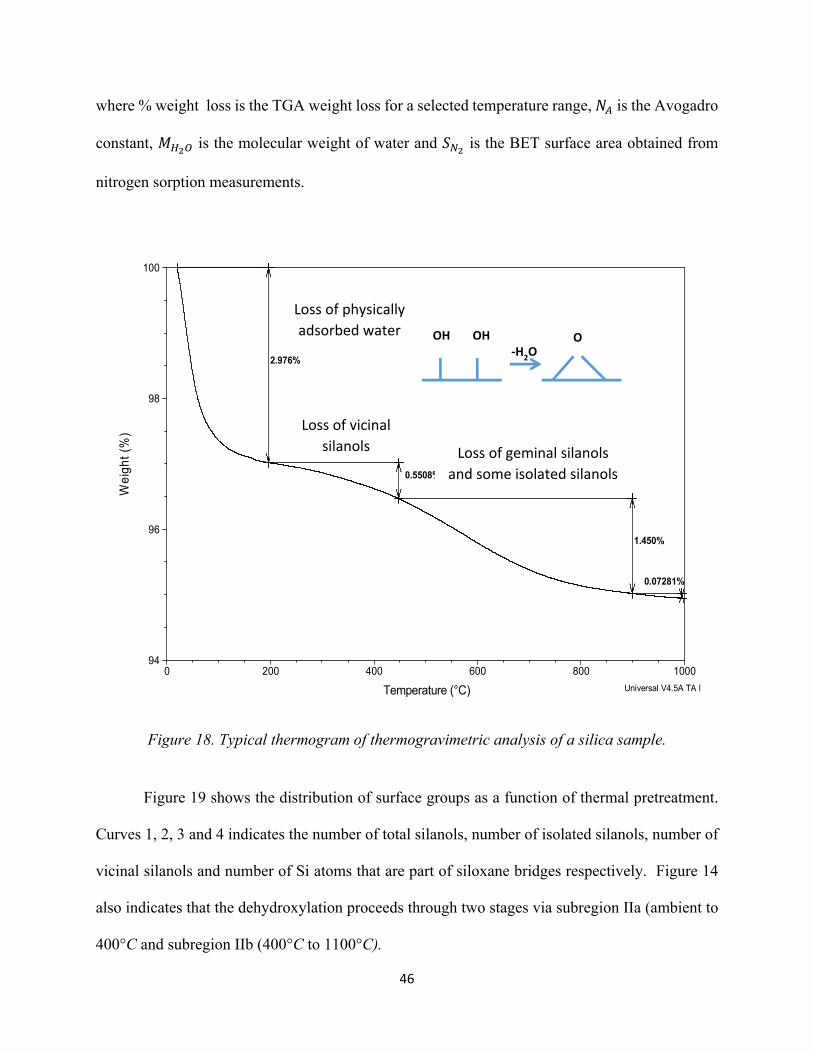
46
where % weight loss is the TGA weight loss for a selected temperature range, is the Avogadro
constant, is the molecular weight of water and is the BET surface area obtained from
nitrogen sorption measurements.
Figure 18. Typical thermogram of thermogravimetric analysis of a silica sample.
Figure 19 shows the distribution of surface groups as a function of thermal pretreatment.
Curves 1, 2, 3 and 4 indicates the number of total silanols, number of isolated silanols, number of
vicinal silanols and number of Si atoms that are part of siloxane bridges respectively. Figure 14
also indicates that the dehydroxylation proceeds through two stages via subregion IIa (ambient to
400°C and subregion IIb (400°C to 1100°C).
2.976%
0.5508%
1.450%
0.07281%
94
96
98
100
We
igh
t (%
)
0 200 400 600 800 1000
Temperature (°C) Universal V4.5A TA I
Loss of physically adsorbed water
Loss of vicinal silanols Loss of geminal silanols
and some isolated silanols
-H2OOHOH O
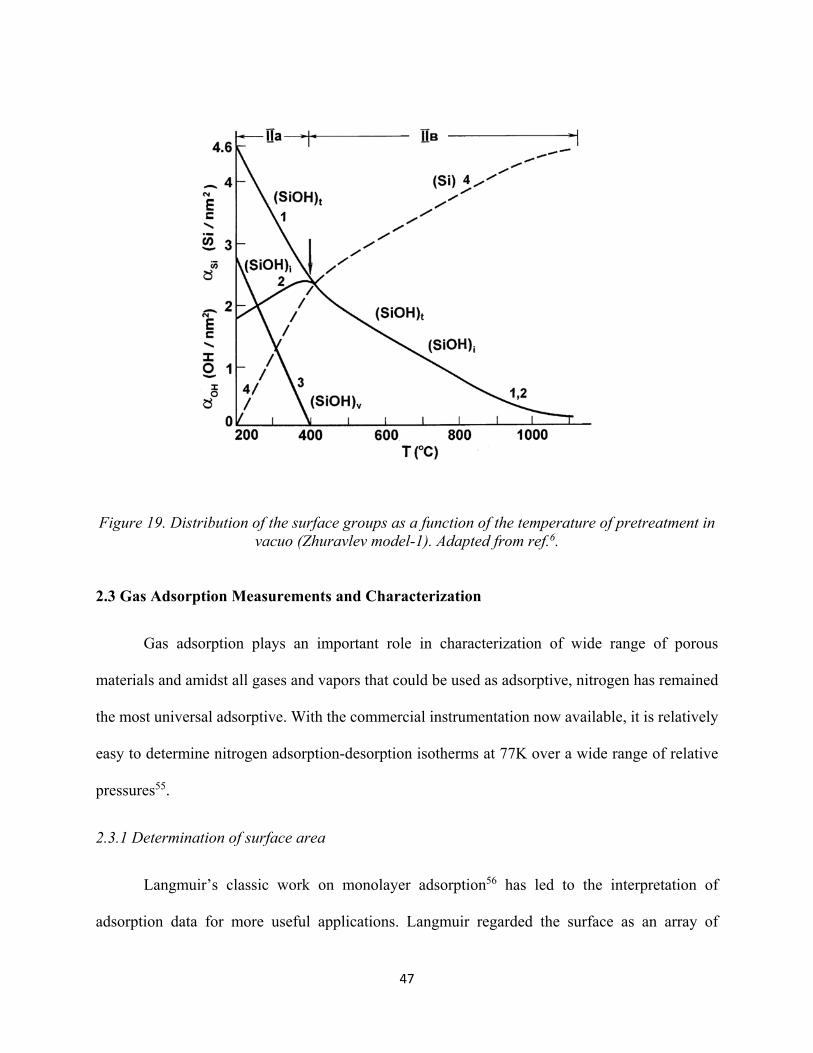
47
Figure 19. Distribution of the surface groups as a function of the temperature of pretreatment in
vacuo (Zhuravlev model-1). Adapted from ref.6. 2.3 Gas Adsorption Measurements and Characterization
Gas adsorption plays an important role in characterization of wide range of porous
materials and amidst all gases and vapors that could be used as adsorptive, nitrogen has remained
the most universal adsorptive. With the commercial instrumentation now available, it is relatively
easy to determine nitrogen adsorption-desorption isotherms at 77K over a wide range of relative
pressures55.
2.3.1 Determination of surface area
Langmuir’s classic work on monolayer adsorption56 has led to the interpretation of
adsorption data for more useful applications. Langmuir regarded the surface as an array of
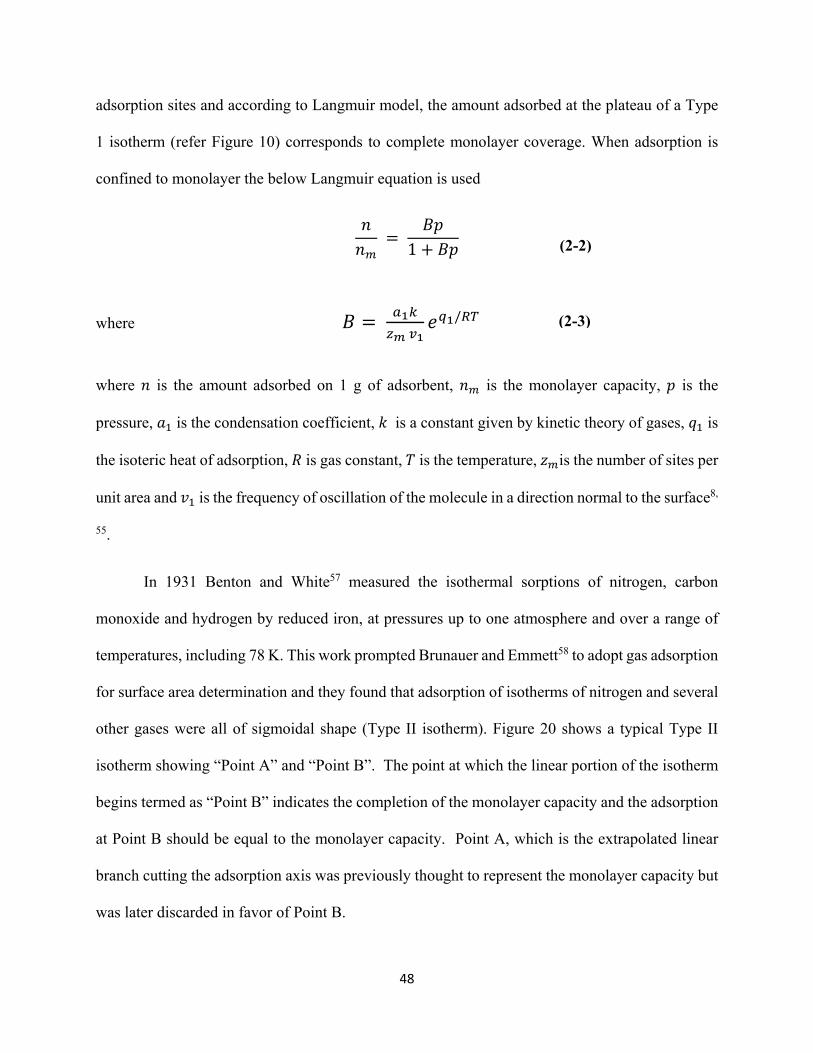
48
adsorption sites and according to Langmuir model, the amount adsorbed at the plateau of a Type
1 isotherm (refer Figure 10) corresponds to complete monolayer coverage. When adsorption is
confined to monolayer the below Langmuir equation is used
= 1 +
where = /
where is the amount adsorbed on 1 g of adsorbent, is the monolayer capacity, is the
pressure, is the condensation coefficient, is a constant given by kinetic theory of gases, is
the isoteric heat of adsorption, is gas constant, is the temperature, is the number of sites per
unit area and is the frequency of oscillation of the molecule in a direction normal to the surface8,
55.
In 1931 Benton and White57 measured the isothermal sorptions of nitrogen, carbon
monoxide and hydrogen by reduced iron, at pressures up to one atmosphere and over a range of
temperatures, including 78 K. This work prompted Brunauer and Emmett58 to adopt gas adsorption
for surface area determination and they found that adsorption of isotherms of nitrogen and several
other gases were all of sigmoidal shape (Type II isotherm). Figure 20 shows a typical Type II
isotherm showing “Point A” and “Point B”. The point at which the linear portion of the isotherm
begins termed as “Point B” indicates the completion of the monolayer capacity and the adsorption
at Point B should be equal to the monolayer capacity. Point A, which is the extrapolated linear
branch cutting the adsorption axis was previously thought to represent the monolayer capacity but
was later discarded in favor of Point B.
(2-2)
(2-3)
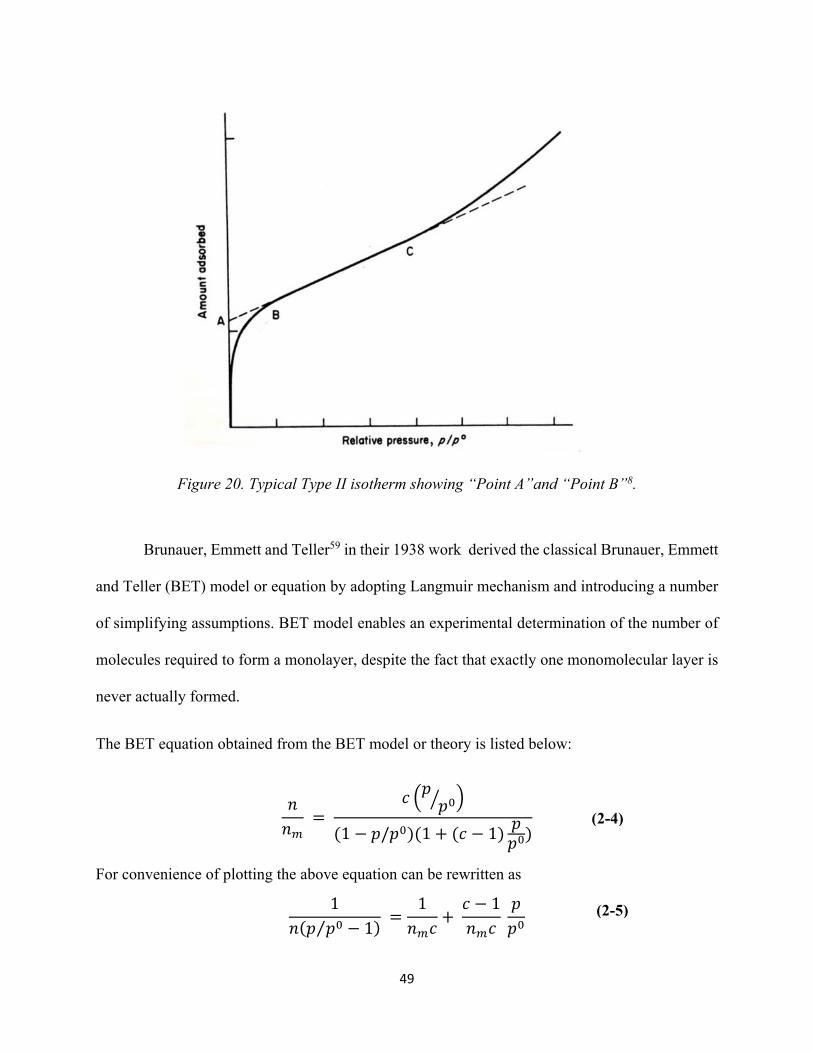
49
Figure 20. Typical Type II isotherm showing “Point A”and “Point B”8.
Brunauer, Emmett and Teller59 in their 1938 work derived the classical Brunauer, Emmett
and Teller (BET) model or equation by adopting Langmuir mechanism and introducing a number
of simplifying assumptions. BET model enables an experimental determination of the number of
molecules required to form a monolayer, despite the fact that exactly one monomolecular layer is
never actually formed.
The BET equation obtained from the BET model or theory is listed below:
= (1 − / )(1 + ( − 1) )
For convenience of plotting the above equation can be rewritten as 1( ⁄ − 1) = 1 + − 1
(2-4)
(2-5)
50
where, is the saturation vapor pressure, c is known as c-constant and given as = ( )⁄
where ( − ) is net heat of adsorption, R is gas constant and T is temperature.
When n/nm is plotted against p/po BET equation provides a curve with the shape of type
II isotherm as long as the value of c is greater than 2. Two major criticisms of the BET model
include: 1) the model assumes all adsorption sites on the surface to be energetically identical (when
in fact most surface are energetically heterogeneous), 2) the model considers only the vertical
interactions (between adsorbent and adsorbate molecules) and ignores the horizontal interactions
(between two neighboring adsorbate molecules). Irrespective of the few assumptions that draw
criticisms, the BET equation is the mostly widely used for determination of surface area of
adsorbents. In the region of relative pressures near completed monolayers (0.05 ≤ p/po ≤ 0.3) the
BET model and experimental isotherms agree very well, leading to a reliable method of surface
area determination. Surface area can be obtained using a single point BET method (only one point
in the isotherm) or multi point BET method (at least 3 points up to 7 points or 11 points) in this
lower p/po region. Figure 21 shows a typical BET (multi point) plot, which is linear plot of
( ⁄ ) against ⁄ as related in equation 2-5. From the BET plot, monolayer capacity nm is
obtained as:
= 1+
where, slope is equal to and intercept is equal to .
(2-6)
(2-7)
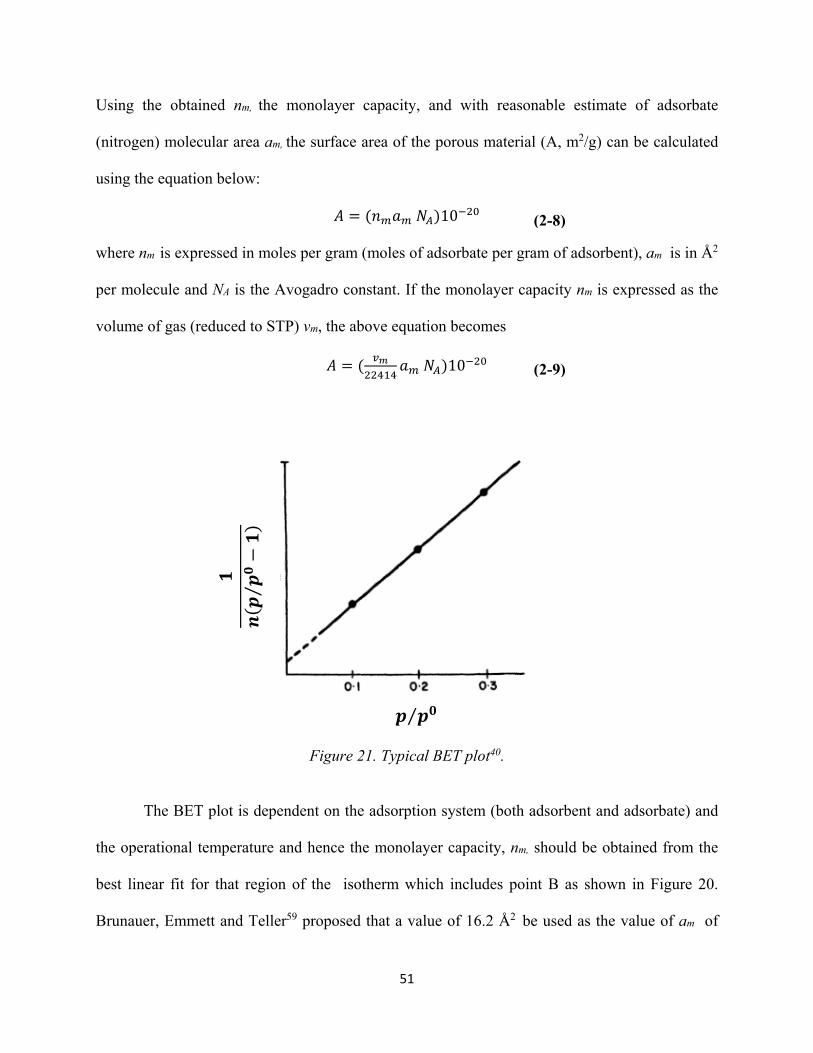
51
Using the obtained nm, the monolayer capacity, and with reasonable estimate of adsorbate
(nitrogen) molecular area am, the surface area of the porous material (A, m2/g) can be calculated
using the equation below: = ( )10
where nm is expressed in moles per gram (moles of adsorbate per gram of adsorbent), am is in Å2
per molecule and NA is the Avogadro constant. If the monolayer capacity nm is expressed as the
volume of gas (reduced to STP) vm, the above equation becomes = ( )10
Figure 21. Typical BET plot40.
The BET plot is dependent on the adsorption system (both adsorbent and adsorbate) and
the operational temperature and hence the monolayer capacity, nm, should be obtained from the
best linear fit for that region of the isotherm which includes point B as shown in Figure 20.
Brunauer, Emmett and Teller59 proposed that a value of 16.2 Å2 be used as the value of am of
(2-8)
(2-9)
(⁄−)
⁄
52
nitrogen independently of the nature of the surface. However the correctness of that value has been
questioned by several researchers3, 8 leading to several studies trying to understand the dependence
of am on the nature of the surface.
Jelinek and Kovats (1994) demonstrated that on highly energetic surfaces, such as surface
hydrated SiO2 or partially dehydrated silica, the orientation of N2 is upright with a cross-sectional
area of 13.5 Å2. For a low energy surface, such as organic modified silicas (C8,C18 modified), a
cross-sectional area of 16.2 Å2 is used because it will lay flat on the surface60. High c-constant
value (which is associated with a sharp point B) indicates strong adsorbent-adsorbate interactions.
Typical c-constant values are in the range of 80-150 for nitrogen at 77 K for well-defined
monolayers on many non-porous and mesoporous adsorbents. To attain a value of am that is
characteristic of an adsorbate, two opposing requirements need to met: a) “c-constant shall be high
enough to ensure adequate separation between monolayer and multilayer formation”8 and b) “c-
constant must be low enough to avoid appreciable localization of the adsorbate”8. With nitrogen,
these two requirements can be met on most of the adsorbents and use of am equal to 16.2 Å2 will
lead to a surface area value that will fall within 20% of the true value.
The monolayer formation occurs by the same mechanism whether the surface is wholly
external (Type II isotherm as in non-porous or macroporous solids, see Figure 10) or is largely
located on the walls of the mesopores (Type IV isotherm as in mesoporous solids, see Figure 10).
Hence, the application of the BET procedure to determine surface area will be the same for non-
porous and mesoporous silica surfaces which were studied in this work. Even when nitrogen
(preferred adsorbate) is being used as an adsorbate, a divergence of at least 10% in the surface area
value must be must be reckoned with. The divergence could be traced to many factors but not
limited to variations in outgassing conditions, variations in temperature of the sample during
53
experiment, inadequate monitoring of the saturation vapor pressure, instrument or apparatus leaks
and the purity of nitrogen used.
2.3.2 Pore size characterization
The use of nitrogen adsorption for pore size analysis is based on the application of the Kelvin
equation. This expression includes a correction for the multilayer thickness on the pore walls and
this approach dates back to late 194061. The first computational procedure was proposed by
Schull61, but the method devised by Barret, Joyner and Halenda (BJH) in 1951 continues to be the
most widely used procedure of deriving the pore size distribution from nitrogen isotherm62. Prior
to pore size characterization of the mesoporous solids, understanding and interpretation of the type
IV isotherm is critical to characterize the pore structure of the mesoporous solids. Figure 22
illustrates the typical type IV isotherm which are often seen with inorganic oxide xerogels and
other porous solids.
In the low-pressure region, both Type IV and Type II isotherm follows the same ABC path,
however, after this point, Type IV begins to deviate upwards taking the path CDE (while Type II
follows CN) until high pressure after which the slope decreases as seen in the path EFG. As the
saturation vapor pressure is reached it will take the path FGH or FGH’. The hysteresis loop is
characteristic of the Type IV and the loop varies from one adsorption system to another. However,
at any given relative pressure, the amount adsorbed along the desorption branch FJD is always
greater than the adsorption branch DEF. According to Zsigmondy, adsorption is limited to thin
layer on the walls along the path ABC of Figure 22, until at D (starting of the hysteresis) capillary
condensation commences in the finest pores. Wider pores get filled progressively as the pressure
increases and at the saturation pressure, entire pore system is full of condensate8, 55, 63-64.
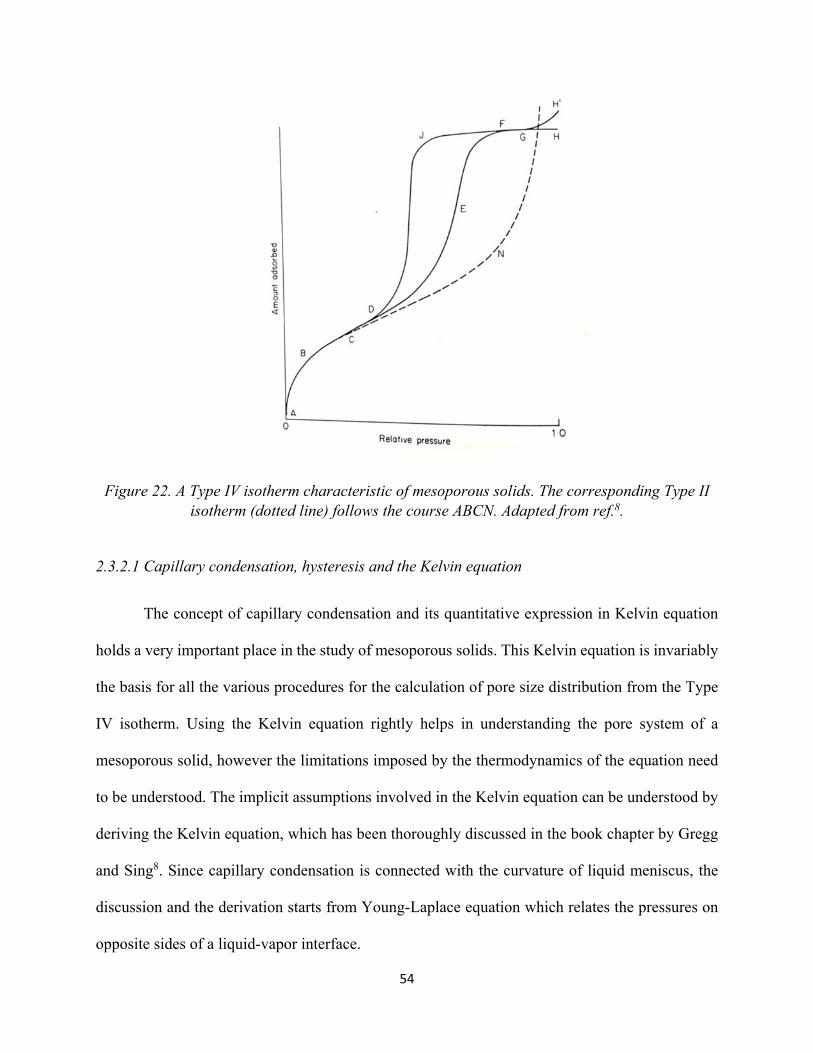
54
Figure 22. A Type IV isotherm characteristic of mesoporous solids. The corresponding Type II isotherm (dotted line) follows the course ABCN. Adapted from ref.8.
2.3.2.1 Capillary condensation, hysteresis and the Kelvin equation
The concept of capillary condensation and its quantitative expression in Kelvin equation
holds a very important place in the study of mesoporous solids. This Kelvin equation is invariably
the basis for all the various procedures for the calculation of pore size distribution from the Type
IV isotherm. Using the Kelvin equation rightly helps in understanding the pore system of a
mesoporous solid, however the limitations imposed by the thermodynamics of the equation need
to be understood. The implicit assumptions involved in the Kelvin equation can be understood by
deriving the Kelvin equation, which has been thoroughly discussed in the book chapter by Gregg
and Sing8. Since capillary condensation is connected with the curvature of liquid meniscus, the
discussion and the derivation starts from Young-Laplace equation which relates the pressures on
opposite sides of a liquid-vapor interface.
55
To provide an interpretation for the hysteresis, Zsigmondy8, 64 put forward the theory of capillary
condensation by making use of the principle established by Thomson63 (later Lord Kelvin) on
thermodynamic grounds. Thomson established that the “equilibrium vapor pressure, p, over a
concave meniscus of liquid, must be less than the saturation vapor pressure, po, at the same
temperature, which implies that a vapor will be able to condense to a liquid in the pores of a solid,
even when its relative pressure is less than unity”8. Thompson’s original equation was further
customized to suit adsorption data and resulted in the “Kelvin equation” which is as follows:
= −
where p/po is the relative pressure of vapor in equilibrium with a meniscus having a radius of
curvature rm, γ is the surface tension of the liquid adsorptive, VL is the molar volume of the liquid
adsorptive, R is gas constant and T is the temperature.
It is to be noted that during the process of capillary condensation during adsorption, the
pore walls are already covered with an adsorbed film, having a thickness t (referred to as statistical
thickness). Hence, the capillary condensation does not happen directly in the pore itself but
somewhat inside the inner core. The process of multilayer adsorption, pore condensation and
hysteresis in a single cylindrical pore is schematically illustrated in Figure 23. At lower relative
pressures, the adsorption process in mesopores is comparable to that on planar surfaces. After
completion of monolayer formation (A) multilayer adsorption (B) commences and continues until
a critical thickness (C) is reached. Capillary condensation then occurs inside the core of the pore
(transition from C to D in the isotherm) and D (plateau region of the isotherm) reflects the state
where the pore is completely filled with liquid and separated from the bulk gas phase by a
hemispherical meniscus. At relative pressures corresponding to E (less than the pore condensation
(2-10)
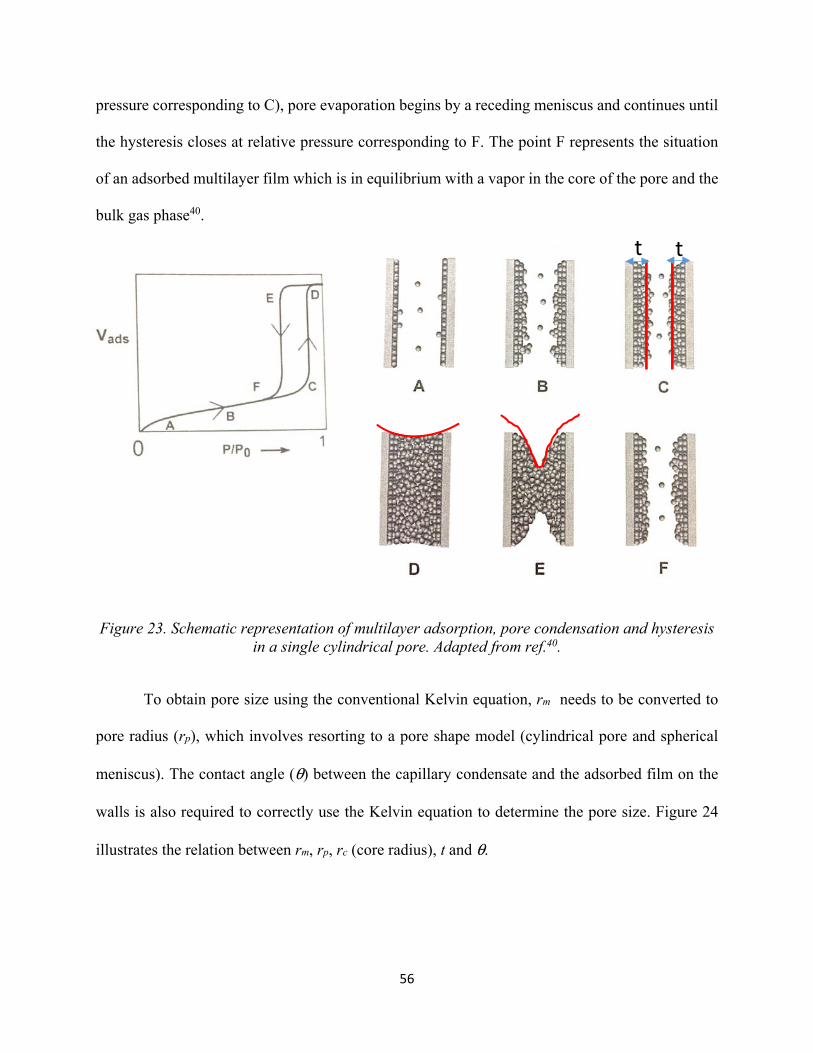
56
pressure corresponding to C), pore evaporation begins by a receding meniscus and continues until
the hysteresis closes at relative pressure corresponding to F. The point F represents the situation
of an adsorbed multilayer film which is in equilibrium with a vapor in the core of the pore and the
bulk gas phase40.
Figure 23. Schematic representation of multilayer adsorption, pore condensation and hysteresis in a single cylindrical pore. Adapted from ref.40.
To obtain pore size using the conventional Kelvin equation, rm needs to be converted to
pore radius (rp), which involves resorting to a pore shape model (cylindrical pore and spherical
meniscus). The contact angle (θ) between the capillary condensate and the adsorbed film on the
walls is also required to correctly use the Kelvin equation to determine the pore size. Figure 24
illustrates the relation between rm, rp, rc (core radius), t and θ.
t t
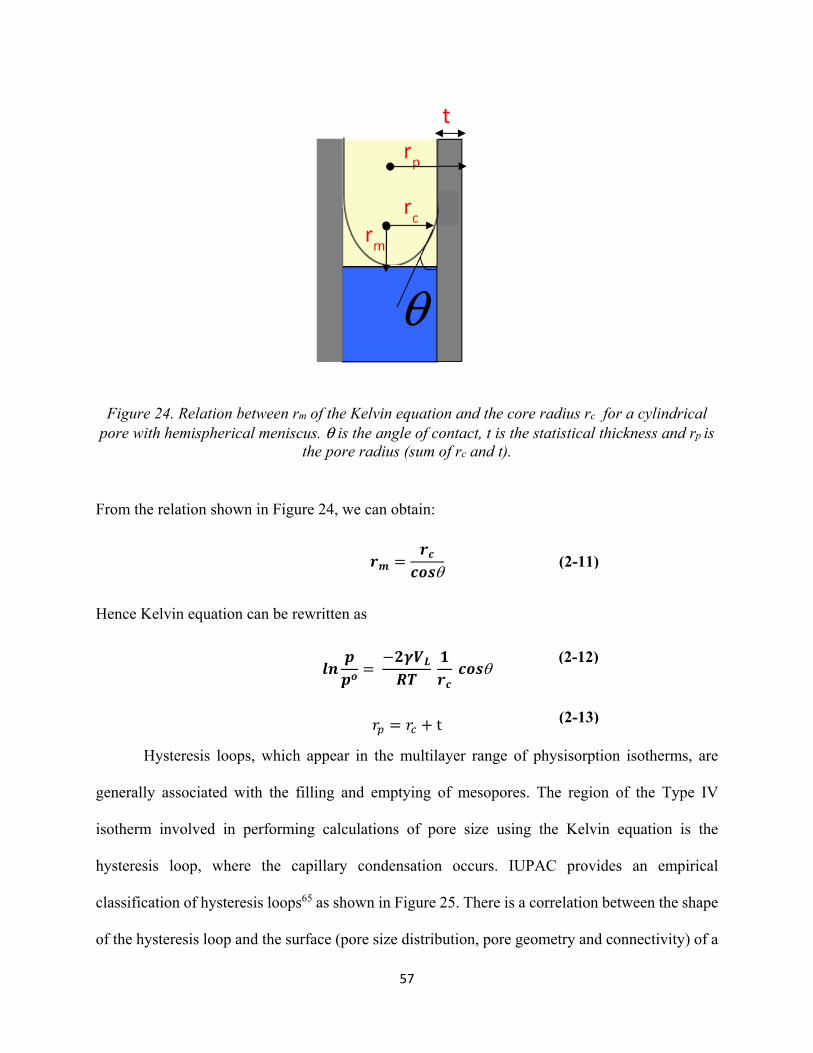
57
Figure 24. Relation between rm of the Kelvin equation and the core radius rc for a cylindrical pore with hemispherical meniscus. θ is the angle of contact, t is the statistical thickness and rp is
the pore radius (sum of rc and t).
From the relation shown in Figure 24, we can obtain:
=
Hence Kelvin equation can be rewritten as
= −
= + t Hysteresis loops, which appear in the multilayer range of physisorption isotherms, are
generally associated with the filling and emptying of mesopores. The region of the Type IV
isotherm involved in performing calculations of pore size using the Kelvin equation is the
hysteresis loop, where the capillary condensation occurs. IUPAC provides an empirical
classification of hysteresis loops65 as shown in Figure 25. There is a correlation between the shape
of the hysteresis loop and the surface (pore size distribution, pore geometry and connectivity) of a
(2-11)
(2-13)
rm
rp
t
rc
θ
(2-12)
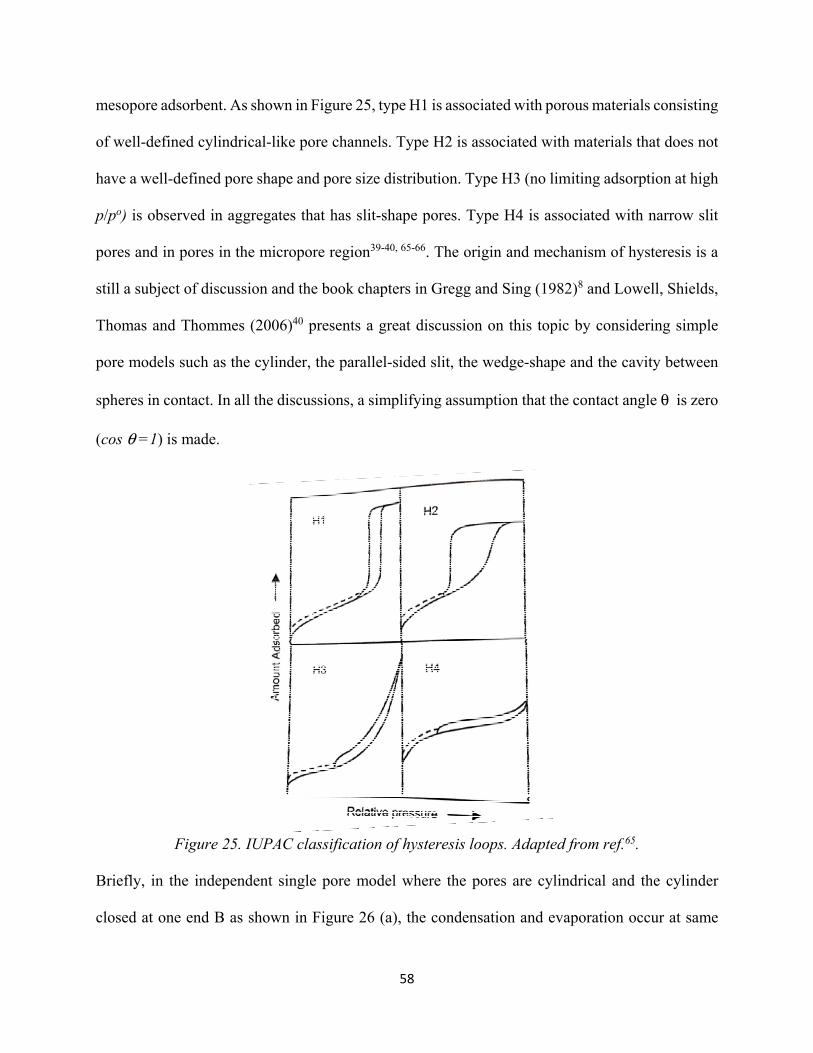
58
mesopore adsorbent. As shown in Figure 25, type H1 is associated with porous materials consisting
of well-defined cylindrical-like pore channels. Type H2 is associated with materials that does not
have a well-defined pore shape and pore size distribution. Type H3 (no limiting adsorption at high
p/po) is observed in aggregates that has slit-shape pores. Type H4 is associated with narrow slit
pores and in pores in the micropore region39-40, 65-66. The origin and mechanism of hysteresis is a
still a subject of discussion and the book chapters in Gregg and Sing (1982)8 and Lowell, Shields,
Thomas and Thommes (2006)40 presents a great discussion on this topic by considering simple
pore models such as the cylinder, the parallel-sided slit, the wedge-shape and the cavity between
spheres in contact. In all the discussions, a simplifying assumption that the contact angle θ is zero
(cos θ =1) is made.
Figure 25. IUPAC classification of hysteresis loops. Adapted from ref.65.
Briefly, in the independent single pore model where the pores are cylindrical and the cylinder
closed at one end B as shown in Figure 26 (a), the condensation and evaporation occur at same
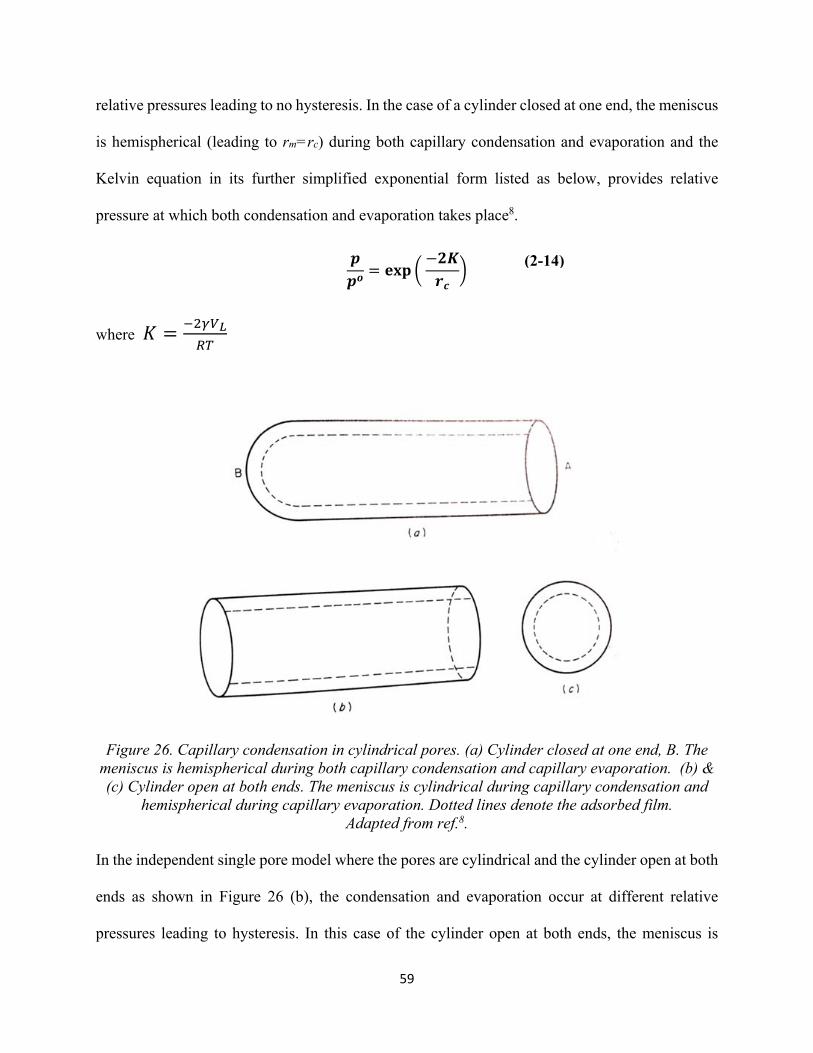
59
relative pressures leading to no hysteresis. In the case of a cylinder closed at one end, the meniscus
is hemispherical (leading to rm=rc) during both capillary condensation and evaporation and the
Kelvin equation in its further simplified exponential form listed as below, provides relative
pressure at which both condensation and evaporation takes place8.
= −
where =
Figure 26. Capillary condensation in cylindrical pores. (a) Cylinder closed at one end, B. The meniscus is hemispherical during both capillary condensation and capillary evaporation. (b) & (c) Cylinder open at both ends. The meniscus is cylindrical during capillary condensation and
hemispherical during capillary evaporation. Dotted lines denote the adsorbed film. Adapted from ref.8.
In the independent single pore model where the pores are cylindrical and the cylinder open at both
ends as shown in Figure 26 (b), the condensation and evaporation occur at different relative
pressures leading to hysteresis. In this case of the cylinder open at both ends, the meniscus is
(2-14)
60
cylindrical (leading to rm=2rc) during capillary condensation and hemispherical ((leading to rm=rc)
during capillary evaporation. The Kelvin equation in its further simplified exponential form listed
as below, provides relative pressure at which condensation and evaporation takes place8. The
values of rc obtained by either using the adsorption branch (using the relative pressure from
condensation) or desorption branch (using the relative pressure from evaporation) should be the
same ideally, but in practice this rarely happens.
= exp −
= exp −2
The value of the contact angle θ (=0) is subject to a great deal of uncertainty. It has to be
kept in mind that in principle the contact angle θ during capillary condensation can differ from
zero (can be anything between 0° and 180°). Presently there exists no means for direct evaluation
of contact angle for a liquid present in a pore having measurements in the mesopore range. Hence
the possible divergence of θ is ignored and θ is assumed as zero in all pore size calculations using
capillary condensation data. This assumption of complete wetting of the pores by liquid nitrogen
(cos θ = 1) is assumed for all practical purposes and this assumption has raised attention from
theoreticians.
It is important to remember that contact angle θ varies according to the thickness t
(statistical thickness) of the adsorbed layer lining the pore walls. Contact angle θ decreases as t
increases and approaches zero when t reaches close to 3 or 4 molecular diameters7-8, 65.
2.3.2.2 Pore size distribution, statistical thickness (t) and Kelvin equation
The computation of mesopore size distribution of a porous solid from the capillary
condensation is valid only if the isotherm is of Type IV. Some of the implicit assumptions that are
(2-15)
(2-16)
61
made in the calculations of pore size distribution are that: (a) the pores are rigid and of a regular
shape (e.g. cylindrical capillaries or parallel-sided slits), (b) micropores are absent, and (c) the size
distribution does not extend continuously from the mesopore into the macropore range7-8, 65. An
important question to be addressed while obtaining pore size distribution is the selection of
adsorption or desorption branch. Mathematically, the procedure used for pore size distribution is
equally valid for both adsorption and desorption branches8. But in practice, the pore size
distribution obtained on different materials by different researchers indicate that the distribution
could have good agreement in some cases and disagreement in other cases as noted in the following
discussion. One such reason for the variability between sorption branches is the effect of pore
networks. i.e for example if pore blocking occurs, the pore size distribution from the desorption
branch will lead to a distorted picture of the pore structure8, 40. The IUPAC classification of
hysteresis loops (Figure 25) could be used as a guidance in determining the choice of sorption
branch for pore size distribution. As an example, for materials (ordered mesoporous systems like
SBA-15) that exhibits H1 type hysteresis loop, the desorption branch would be the best choice for
pore size analysis, while for materials (disordered mesoporous systems) that exhibit H2 or H3 type
hysteresis loops, the adsorption branch would be the best choice39-40, 66. Several mathematical
models8, 40 have been proposed for the calculation of the pore size distribution ad one such
commonly used model or approach is the Barett-Joyner-Halenda (BJH approach). BJH approach
is a procedure for calculating pore size distributions from experimental isotherms using the Kelvin
model of pore filling with applicability only to the mesopore and small macropore size range. It is
also shown that a much more accurate pore size analysis and wider pore size analysis (complete
micro/mesopore size range) is possible with the development and availability of advanced
62
theoretical procedures based on statistical mechanics (e.g., Non-Local Density Functional Theory
(NLDFT)) and molecular simulation39.
While obtaining pore size distribution (expressed as dvp/drp vs rp ), it is very important to
take into consideration the amount adsorbed on the walls and account for the adsorbed film
thickness or statistical thickness(t). By neglecting the adsorbed film thickness t, the results
obtained would be a core size distribution and not pore size distribution. The values of t are derived
from standard nitrogen isotherm using the below equation:
= . Å
The Kelvin equation as expressed in equation 2-14 can be further reduced to = . Å
By using the t and rc values, the pore radius rp can be obtained using equation 2-13. Table
8 illustrates the values of rp and t at different p/po for nitrogen at 77.4 K. The set of values in this
table may be considered as adequate for most practical purposes for nitrogen isotherm on
hydroxylated silica.
(2-17)
(2-18)
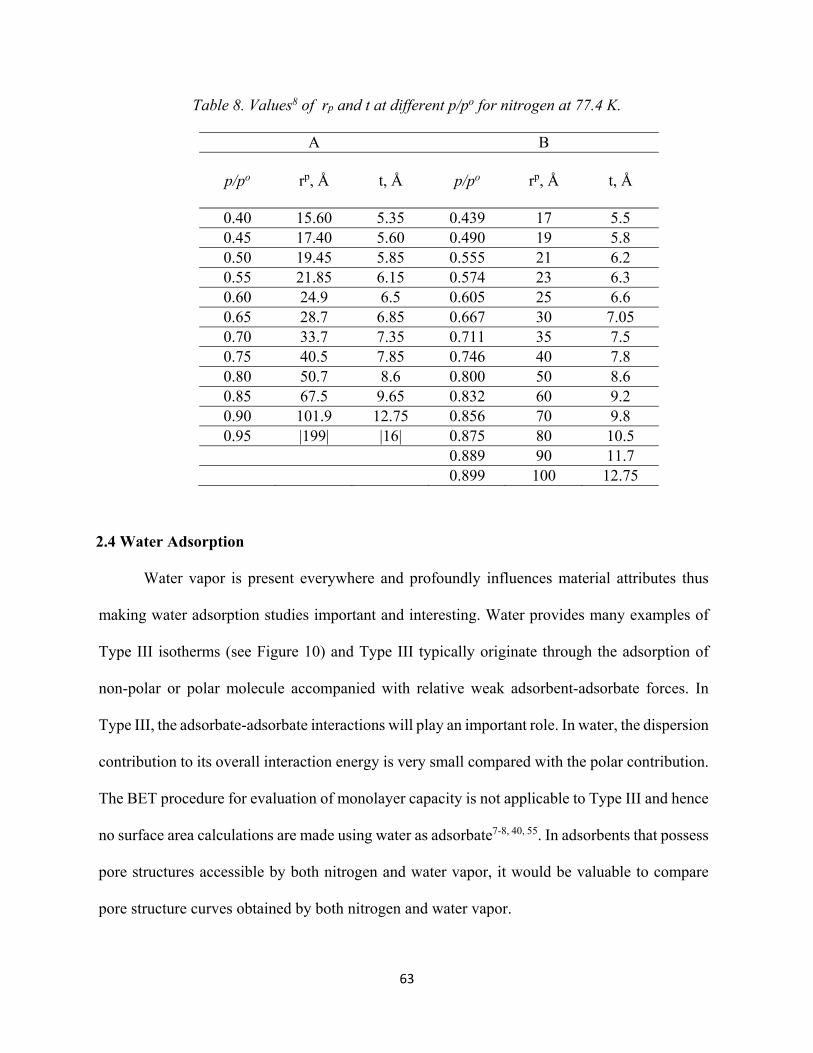
63
Table 8. Values8 of rp and t at different p/po for nitrogen at 77.4 K.
A B
p/po
rp, Å
t, Å
p/po
rp, Å
t, Å
0.40 15.60 5.35 0.439 17 5.5 0.45 17.40 5.60 0.490 19 5.8 0.50 19.45 5.85 0.555 21 6.2 0.55 21.85 6.15 0.574 23 6.3 0.60 24.9 6.5 0.605 25 6.6 0.65 28.7 6.85 0.667 30 7.05 0.70 33.7 7.35 0.711 35 7.5 0.75 40.5 7.85 0.746 40 7.8 0.80 50.7 8.6 0.800 50 8.6 0.85 67.5 9.65 0.832 60 9.2 0.90 101.9 12.75 0.856 70 9.8 0.95 |199| |16| 0.875 80 10.5
0.889 90 11.7 0.899 100 12.75
2.4 Water Adsorption
Water vapor is present everywhere and profoundly influences material attributes thus
making water adsorption studies important and interesting. Water provides many examples of
Type III isotherms (see Figure 10) and Type III typically originate through the adsorption of
non-polar or polar molecule accompanied with relative weak adsorbent-adsorbate forces. In
Type III, the adsorbate-adsorbate interactions will play an important role. In water, the dispersion
contribution to its overall interaction energy is very small compared with the polar contribution.
The BET procedure for evaluation of monolayer capacity is not applicable to Type III and hence
no surface area calculations are made using water as adsorbate7-8, 40, 55. In adsorbents that possess
pore structures accessible by both nitrogen and water vapor, it would be valuable to compare
pore structure curves obtained by both nitrogen and water vapor.
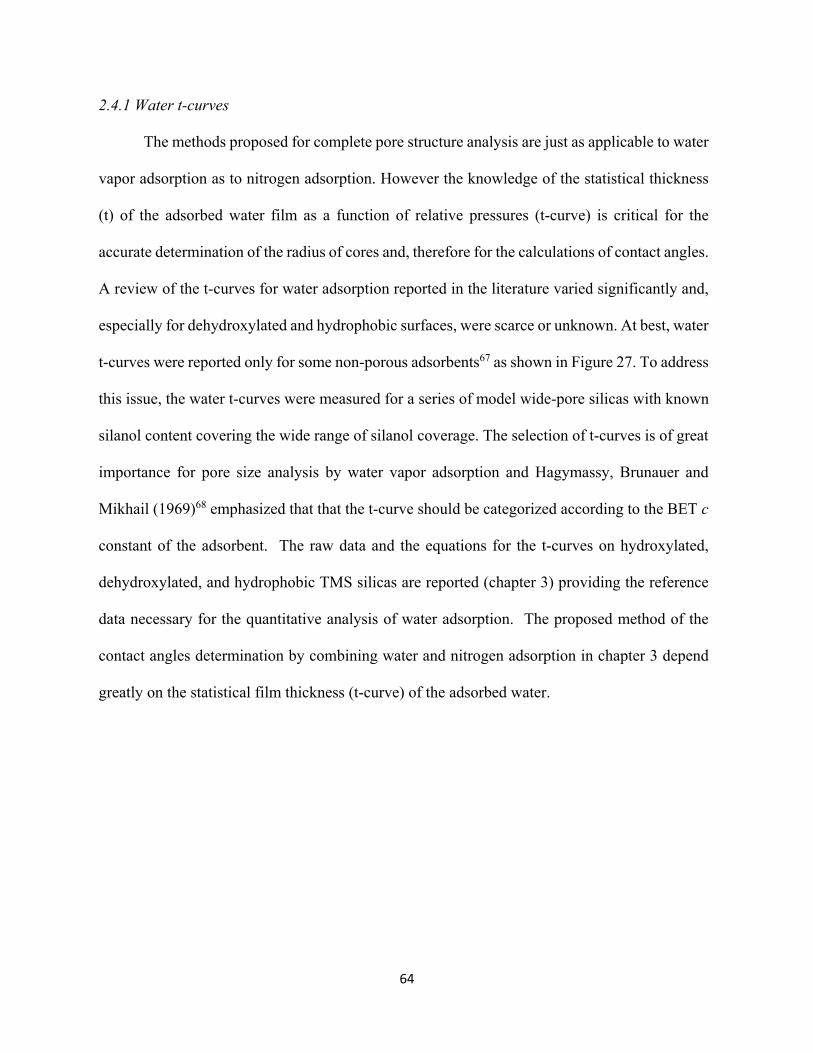
64
2.4.1 Water t-curves
The methods proposed for complete pore structure analysis are just as applicable to water
vapor adsorption as to nitrogen adsorption. However the knowledge of the statistical thickness
(t) of the adsorbed water film as a function of relative pressures (t-curve) is critical for the
accurate determination of the radius of cores and, therefore for the calculations of contact angles.
A review of the t-curves for water adsorption reported in the literature varied significantly and,
especially for dehydroxylated and hydrophobic surfaces, were scarce or unknown. At best, water
t-curves were reported only for some non-porous adsorbents67 as shown in Figure 27. To address
this issue, the water t-curves were measured for a series of model wide-pore silicas with known
silanol content covering the wide range of silanol coverage. The selection of t-curves is of great
importance for pore size analysis by water vapor adsorption and Hagymassy, Brunauer and
Mikhail (1969)68 emphasized that that the t-curve should be categorized according to the BET c
constant of the adsorbent. The raw data and the equations for the t-curves on hydroxylated,
dehydroxylated, and hydrophobic TMS silicas are reported (chapter 3) providing the reference
data necessary for the quantitative analysis of water adsorption. The proposed method of the
contact angles determination by combining water and nitrogen adsorption in chapter 3 depend
greatly on the statistical film thickness (t-curve) of the adsorbed water.
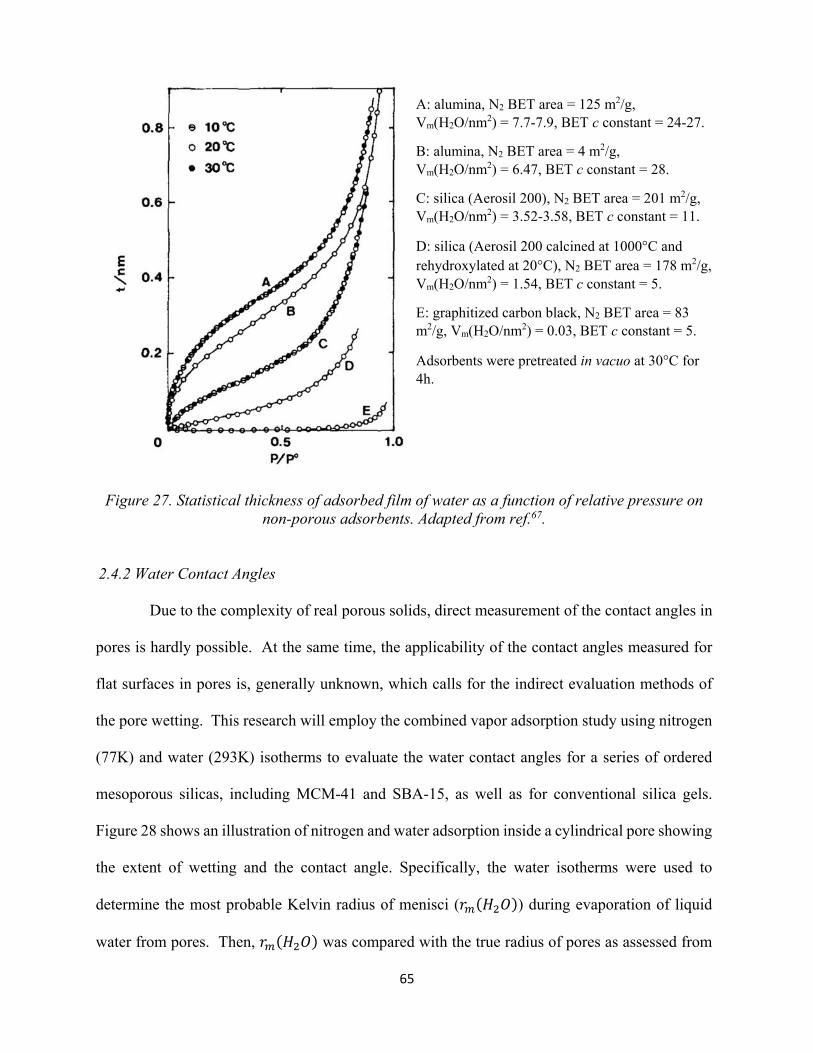
65
A: alumina, N2 BET area = 125 m2/g, Vm(H2O/nm2) = 7.7-7.9, BET c constant = 24-27.
B: alumina, N2 BET area = 4 m2/g, Vm(H2O/nm2) = 6.47, BET c constant = 28.
C: silica (Aerosil 200), N2 BET area = 201 m2/g, Vm(H2O/nm2) = 3.52-3.58, BET c constant = 11.
D: silica (Aerosil 200 calcined at 1000°C and rehydroxylated at 20°C), N2 BET area = 178 m2/g, Vm(H2O/nm2) = 1.54, BET c constant = 5.
E: graphitized carbon black, N2 BET area = 83 m2/g, Vm(H2O/nm2) = 0.03, BET c constant = 5.
Adsorbents were pretreated in vacuo at 30°C for 4h.
Figure 27. Statistical thickness of adsorbed film of water as a function of relative pressure on
non-porous adsorbents. Adapted from ref.67.
2.4.2 Water Contact Angles
Due to the complexity of real porous solids, direct measurement of the contact angles in
pores is hardly possible. At the same time, the applicability of the contact angles measured for
flat surfaces in pores is, generally unknown, which calls for the indirect evaluation methods of
the pore wetting. This research will employ the combined vapor adsorption study using nitrogen
(77K) and water (293K) isotherms to evaluate the water contact angles for a series of ordered
mesoporous silicas, including MCM-41 and SBA-15, as well as for conventional silica gels.
Figure 28 shows an illustration of nitrogen and water adsorption inside a cylindrical pore showing
the extent of wetting and the contact angle. Specifically, the water isotherms were used to
determine the most probable Kelvin radius of menisci ( ( )) during evaporation of liquid
water from pores. Then, ( ) was compared with the true radius of pores as assessed from
66
nitrogen isotherms ( ( )). For incomplete wetting, the radius of meniscus , radius of pore
, and statistical film thickness t(H2O) were related through the known equation below, which
was used to calculate the water contact angles (θ>0) in pores. ( ) − ( ) = ( ) ∙
Figure 28. Illustration of nitrogen and water adsorption in a cylindrical pore showing wetting and contact angle. rc is the radius of the core, rp is the radius of the pore, rm is the evaporating
water meniscus, t(H2O) is the statistical water adsorption thickness, θ is the contact angle.
rm = rc
Cos θ = 1
θ ∼ 0 Complete wetting
Nitrogen on Silica
θ
rc
rm
t(H2O)
Cos θ < 1
θ > 0 Partial wetting
Water on Silica
rm > rc
θ
rc
rm
67
Chapter 3: Water Contact Angles in Silica Mesopores: The Results of
Combined Adsorption Study
3.1 Introduction
Despite the large body of existing research on water adsorption, the deficiencies are
apparent. Present work attempts to fill the voids by establishing the dependence between water
adsorption and total number of hydroxyls. The surface of most metal oxides is covered by hydroxyl
groups which influence many surface phenomena such as adsorption and wetting, catalysis and
surface reactions. Surface chemistry of silica is a subject of exhaustive studies owing to a wide
variety of practical applications of silica6.
The hydroxylation of silica surface i.e the number of hydroxyl (-OH) groups on the surface
is of utmost importance for its practical applications. Several Infra-Red (IR) gravimetric adsorption
studies support that the major adsorption sites on a silica surface are surface hydroxyl groups6, 43,
48, 51. At an adequate number of -OH groups the silica surface is hydrophilic and the -OH groups
act a site of adsorption while interacting with adsorbate (e.g. water). By the process of dehydration
(exposure to high temperature), the -OH groups can be removed and the silica becomes
hydrophobic. The hydroxyl groups can be restored again by the process of rehydration (exposure
to aqueous environment). Using IR and adsorption studies, Young demonstrated that water vapor
physically adsorbs only on the silanol sites for the silica. Young also showed that rehydration
from the vapor phase was completely reversible up to 400°C (673K) and the rehydration of silanol
sites above 400°C (673K) was not completely reversible51.
A range of analytical techniques have been used by material scientists to characterize the
silica surface in terms of hydroxyl groups, surface area and pore structure6, 43-46. Hockey and
68
Pethica (1961) studied the dehydration and rehydration of silica powders by infrared, water
adsorption and gravimetric methods43. Smith and Kellum (1966) determined the OH surface
density of silica samples using both thermo gravimetric analysis (TGA) and a modified Karl
Fischer reagent44. The Karl Fischer titration technique provided the physically adsorbed water
content while TGA gave the total weight loss from physically adsorbed and chemically bound
water. Mueller et al and Wisser et al studied the surface hydroxyl content of silica and other oxides
using thermo gravimetric analysis45-46.
Adsorption methods are sought after for analyzing the porous texture of porous
materials51, 67-70. The most commonly employed adsorption methods are based on adsorption-
desorption isotherms of nitrogen at the boiling point of nitrogen which is 77K. Young determined
the surface area of silicas using nitrogen adsorption data and compared these surface areas with
gravimetric water vapor adsorption data. The surface areas obtained by water vapor adsorption
were only 16% to 25% of the surface area from nitrogen adsorption and hence Young concluded
that major portion of the silica is hydrophobic51. However, it is to be noted that these experiments
were performed on limited non porous silicas.
Use of t curves (graphical comparison of two isotherms obtained from non-porous
reference adsorbent and the porous material under investigation) has been adopted to understand
the surface character of adsorbents. Hagymassay, Brunauer and Mikhail (1969)68 and Naono and
Hakuman (1991)67 previously reported nitrogen and water t curves for various non-porous
adsorbents. Using the above reported standard t curves for water and nitrogen Naono and Hakuman
later characterized a set of porous silica gels69. Naono and Hakuman determined pore size
distribution curves for various adsorbents from the isotherms of both water vapor and nitrogen
gas67, 69. It was shown that when water isotherms were used for analysis of porous structure, pore
69
size distribution can be calculated to a 0.9 - 1.1 nm in pore radius as opposed to only 1.7 nm when
nitrogen isotherms were used. For some adsorbents no hysteresis was seen in the nitrogen isotherm
while a definite hysteresis was seen in water isotherm indicating that capillary condensation of
water vapor takes places in the smaller pores whose radii are less than 1.7nm. This illustrates that
water vapor can see pores that are not seen by nitrogen and hence water vapor isotherms give more
fruitful information of the porous texture69. Even for practical applications, such as using silica
adsorbent as a dehumidifier, it would be more valuable to have the adsorption of water vapor on
silica rather than adsorption of nitrogen on silica.
Water vapor adsorption work performed by Young51 focused only on non-porous silica
and by Naono and Hakuman67, 69 focused only on very limited adsorbents. Previously in the
literature, it was suggested that there exists a universal t-curve and this was independent of the
nature of the sample. Later, this idea was revised and t-curves or t-curves were devised as a
function of the physiochemical and thermodynamical nature of the adsorbent. Hagymassay68 et al
proposed five t-curves in the low pressure region (p/p0 = 0 to 0.5) and two t-curves in the high
pressure region (p/p0 = 0.5 to 0.9). The t-curves were categorized according to a range of values of
the c constant of the BET equation. Raoof, Guilbaud, Van Damme, Porion and Levitz (1998)70
demonstrated that porous t-curve for water coincided with the t-curve of non-porous adsorbents
provided that their BET constants were similar
Most of the t-curves or t-curves available in the literature are based on non-porous
adsorbents and their applicability to porous adsorbents largely depends on the similarity in their
chemical surfaces and pore sizes. For adsorbents with wide pores, the applicability of non-porous
t-curve may be more suitable. However for adsorbents with narrow pores, there is always a
possibility of overlapping surface forces from the pore walls70 and hence the applicability of t-
70
curves measure on non-porous adsorbents can be challenged. The present research work proposes
set of reference water t-curves for a wide variety of porous adsorbents that is primarily based on
the number of surface hydroxyl groups on the adsorbent.
In this work, we report the results of systematic study of the water vapor adsorption (room
temperature) on surfaces of well-defined chemical composition that included fully hydroxylated
silicas, silicas dehydrated at different temperatures, and silicas functionalized through the covalent
attachment of organosilanes.
3.2 Experiment
General Information. All chemicals were purchased from Sigma Aldrich (St. Louis, MO, USA)
except where noted.
3.2.1 Silicas: Preparation, Hydroxylation, Calcination, Silanol determination, and Grafting with TMS.
Bare SBA-15 silicas were prepared following to the procedures published elsewehere14, 71. Three
different batches of SBA-15 were made (under similar conditions), their structural characteristics
determined by the adsorption of nitrogen are given in Table 9. The hydroxylation of silicas was
accomplished by placing ~0.2-0.5 g of silica in ~10 mL liquid water (HPLC grade) in presence of
catalytic amount of acid (H2SO4). The container was sealed and placed in an oven at 100°C for
24 h. After cooling to room temperature, silica was transferred to glass filter, rinsed with excess
of water, and dried at 343K overnight. To reduce silanol population, silicas were calcined at
desired temperature (293K - 1273K ) overnight. To minimize the exposure of the samples, silicas
were placed directly in the adsorption quartz vials. After the calcination, the vial was cooled to
room temperature in a flow of nitrogen and immediately used for the adsorption measurements.
The amount of surface silanol groups (silanol number6) was determined from the TGA weight loss
71
of silicas in the range 473K -1273K°C at a rate of 10°/min (Q500 Thermogravimetric Analyzer,
TA Instruments, USA). The amount of surface silanols was calculated as follows:72
[ ]⁄ = 667 ∗ ⁄
where WL was the TGA weight loss (mass %) at 200-1000°C SN2 was the BET surface area
obtained by nitrogen adsorption.
The TMS (trimethylsilyl)-modified silicas were prepared by the reaction of hydroxylated silicas
with (N,N-dimethyl-amino)-trimethylsilane as described elsewhere71. The progress of the TMS
surface reactions was monitored by the chemical analysis made by Schwarzkopf Microanalytical
Lab. (Woodside, NY). The grafting density of TMS groups [TMS/nm2] was obtained as follows:2
2
5 1
)](%1200[
)(%106
SiOC SCMWn
C ⋅×−⋅
×=ρ
where MW is the molecular weight of the (CH3)3SiO group (89 g/mole), nC = 3, the number of
carbon atoms in the grafted TMS group, SSiO2 is the BET surface area of bare silica by nitrogen
[m2/g], and %C is the carbon weight percent in the sample.
3.2.2 Nitrogen adsorption isotherms
The adsorption-desorption isotherms of nitrogen (77K) were obtained with a Quantachrome
Autosorb-1 analyzer (Boynton Beach, FL, USA) and with a Micromeritics ASAP analyzer
(Norcross, GA, USA). The isotherms were measured over a relative pressure p/po range from
~0.005 to 0.995 and, on average, consisted of 80-130 adsorption-desorption points. Prior to the
adsorption measurements, the silicas were outgassed at 200°C (473K) overnight. The TMS-
modified silicas were outgassed at 100°C to avoid the damage of organic groups. Specific surface
(3-1)
(3-2)
72
areas were calculated via the BET method using the range of relative pressure from ~0.06 to 0.27
and the value for nitrogen cross-section 0.162 nm2. The total pore volume was obtained from the
amount adsorbed at p/p0~0.99. The micropore volume was determined using the t-plot and alpha-
s methods. The pore size distribution and the average (most probable) pore radius ( ) was
calculated by the BJH method from the desorption branch of the isotherm. Complete wetting of
the pores by liquid nitrogen (cos θ = 1) was assumed. All the calculations were performed using
vendor’s software.
3.2.3 Water adsorption isotherms
The adsorption-desorption isotherms of water (293K) were obtained using a Quantachrome
Autosorb-1 analyzer (Boynton Beach, FL, USA). The isotherms were measured over a relative
pressure p/po range from ~0.02 to 0.99 and consisted of 78 adsorption-desorption points. Unless
specified otherwise, silicas were outgassed at 200°C (473K) overnight. The statistical thickness of
the adsorbed water films (t-curves) were determined for the reference silica gel Davisil 1000. Due
to the large pore size (rp~50 nm), capillary condensation of water did not occur (up to p/p0~0.99)
and its contribution to the adsorption was negligible. The thickness of the adsorbed films was
calculated by equation:8
[ ] = 0.001 ∗ . .( 2 )(( )
where Vads.liq. (H2O) is amount of liquid water adsorbed (cm3/g), SBET(N2) surface area of silica
determined by N2 (39 m2/g). In the literature, some of the water adsorption data was reported not
as t-curves, but as the amount of water adsorbed (Γ) expressed in µmole/m2 or #H2O
molecules/nm2 vs. p/p0. To compare the data, the conversion between these units was done as
follows:
(3-3)
73
[ ] = 0.018 ∗ Γ = 0.03 ∗ Γ
3.2.4 Contact angles by water
The distribution of radii of water menisci and the most probable radius rm was calculated
by the BJH method from the desorption branch of the water adsorption isotherms. At the
temperature of the experiment 293K, surface tension of water was 72.8 mJ/m2 and its molar
volume 18.05 cm3/mol, respectively73. Using these parameters, the Kelvin equation was:
( ) = 1.078ln ( )⁄ [ ] The contact angles were calculated by equation 2-19 using the most probable values of rm(H2O)
and rp(N2). The values of statistical thickness t(H2O) were taken at the relative pressure that
corresponded to rm(H2O). The standard error for the determination of cos θ by equation 2-19 was
assessed for two silica samples (hydroxylated SBA-15 and SBA-15 grafted with 25%TMS) from
three separate measurements of water and nitrogen adsorption performed for each sample
respectively. The highest standard error for cos θ (±0.009) was determined for hydroxylated SBA-
15, which was used for all standard error calculations in the text.
3.3 Results and Discussion
The main focus of this work was to evaluate contact angles and surface energy of SBA-
15 silica mesopores using the combined water and nitrogen adsorption isotherms. This task,
however, was complicated by the fact that the pore structure and the surface chemistry of the
freshly made SBA-15 was altered after its exposure to water vapors during the course of the water
adsorption experiment74-76. Thus, as a first point of this work, we began with (1) the evaluation of
(3-4)
(3-5)
74
the changes of the SBA-15 caused by the adsorption of water and (2) the optimization of the
hydrothermal treatment aimed to prepare pure SBA-15 silica stable to water.
3.3.1 Structural changes to SBA-15 on exposure to water
To quantify the changes caused by the adsorption of water, we conducted a series of
sequential water adsorption-desorption cycles, each followed by the nitrogen adsorption
measurements. The representative sequence of water isotherms and the corresponding nitrogen
isotherms are shown in Figure 29. As assessed by nitrogen, the surface area and the pore volume
of SBA-15 showed a notable ~8-10% decrease after the completion of the very first water
adsorption-desorption cycle. The more prolonged exposure of SBA-15 to water vapors resulted
in further reduction of the surface area and the pore volume. Overall, six cycles of water
adsorption-desorption were conducted for the same SBA-15 silica and the reduction in surface
area and pore volume (by nitrogen) was noted after each water cycle, though the magnitude of the
changes was gradually decreasing. In addition to the structural changes observed, the adsorption
of water also lead to the notable changes of the SBA-15 surface, making it more and more
hydrophilic after each completed water adsorption-desorption cycle. Qualitatively, this was
demonstrated by the gradual changes in the shape of the isotherm from the convex, Type V –
typically observed for hydrophobic surfaces to concave, Type IV – indicating polar surfaces with
higher affinity to water8. In agreement with previous works74-75, these changes were attributed to
the reaction of the adsorbed water with the hydrophobic siloxane groups producing hydrophilic
silanols.
Indeed, the radii of the evaporating water menisci used for the calculation of the contact
angles (Table 9) were obtained from the desorption branch of the isotherm. By the time the
desorption began, the SBA-15 silica had been in contact with liquid water condensate for many
75
hours. On average, water adsorption-desorption isotherms were completed in ~70-90 h. We
estimated that at least half of this time was spent on the capillary condensation loop, i.e. when
liquid water condensate was present in pores. It was, therefore, highly possible that the
hydroxylation and surface reconstruction via dissolution/redeposition74-75, 77-80 of silica was taking
place before the system had reached the desorption equilibrium.
SBA-15 silica (as prepared) is inherently hydrophobic and unstable towards water vapor.
The improvement of the surface hydrophilicity for the SBA-15 after the exposure to water was
also demonstrated by the water pore filling at saturation. In the first water adsorption cycle, the
pore volume by water was 0.75 of that by nitrogen. In the second and the third cycles it was 0.78
and 0.80 respectively. We noted, however, that even for the fully hydroxylated hydrophilic silicas
(see Figure 29) the pore volume by water was ~0.85, i.e. notably lower than by nitrogen. Similar
observations regarding the pore volumes differences by nitrogen and by water were also reported80-
81. Authors81, attributed this to the microscopic heterogeneity of the pore surface and the presence
of hydrophobic patches. In the following sections of this work, the hydrophobicity and the
incomplete wetting of pores of these silicas will be further validated and characterized.
.
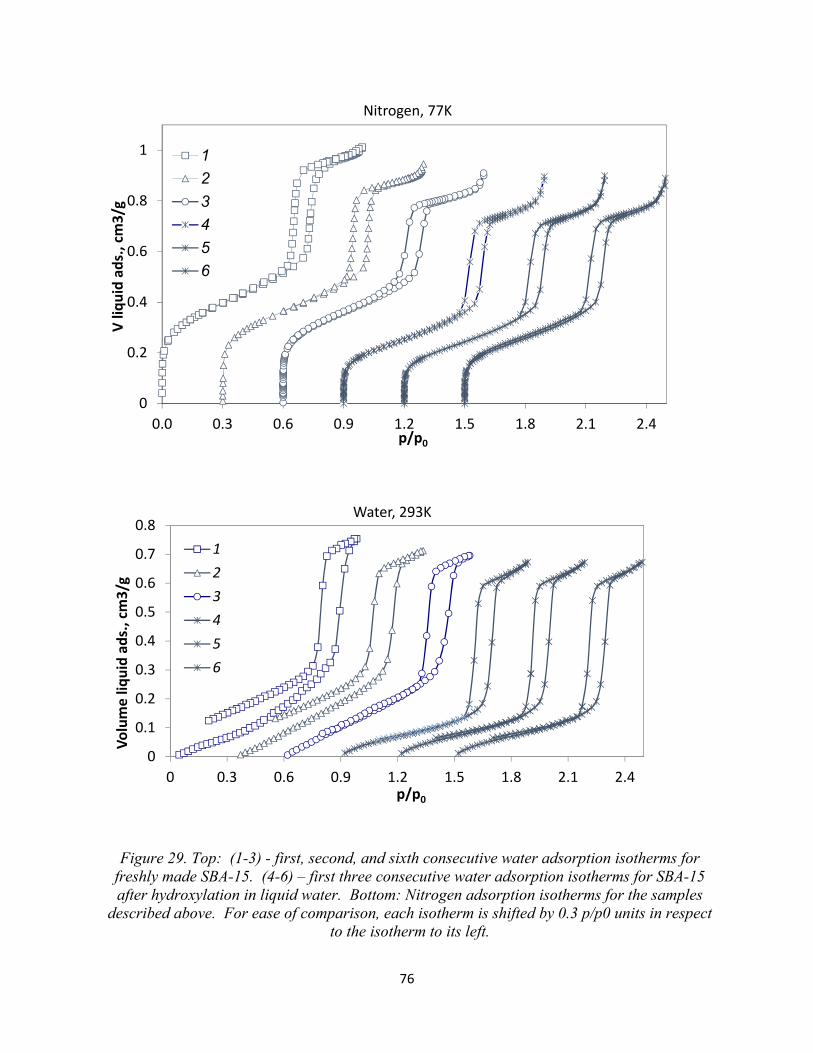
76
Figure 29. Top: (1-3) - first, second, and sixth consecutive water adsorption isotherms for freshly made SBA-15. (4-6) – first three consecutive water adsorption isotherms for SBA-15 after hydroxylation in liquid water. Bottom: Nitrogen adsorption isotherms for the samples
described above. For ease of comparison, each isotherm is shifted by 0.3 p/p0 units in respect to the isotherm to its left.
0
0.2
0.4
0.6
0.8
1
0.0 0.3 0.6 0.9 1.2 1.5 1.8 2.1 2.4
V liq
uid
ads.
, cm
3/g
p/p0
Nitrogen, 77K
123456
0
0.1
0.2
0.3
0.4
0.5
0.6
0.7
0.8
0 0.3 0.6 0.9 1.2 1.5 1.8 2.1 2.4
Volu
me
liqui
d ad
s., c
m3/
g
p/p0
Water, 293K
123456
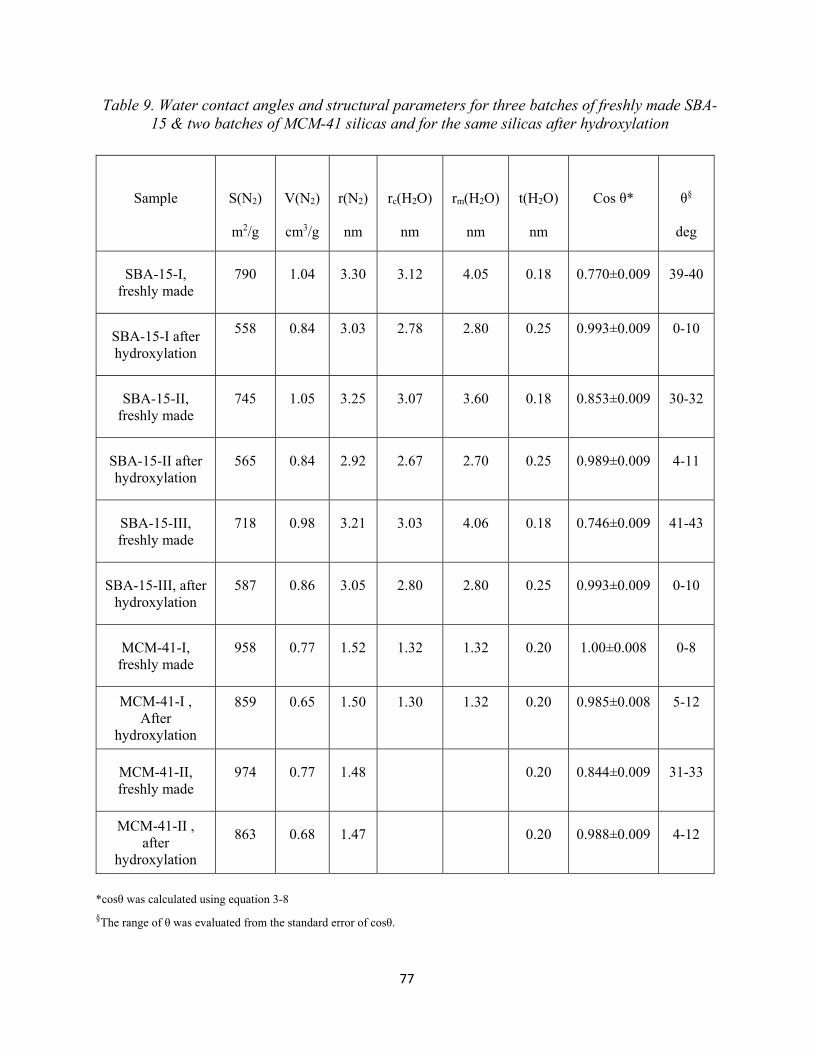
77
Table 9. Water contact angles and structural parameters for three batches of freshly made SBA-15 & two batches of MCM-41 silicas and for the same silicas after hydroxylation
*cosθ was calculated using equation 3-8
§The range of θ was evaluated from the standard error of cosθ.
Sample
S(N2)
m2/g
V(N2)
cm3/g
r(N2)
nm
rc(H2O)
nm
rm(H2O)
nm
t(H2O)
nm
Cos θ*
θ§
deg
SBA-15-I, freshly made
790 1.04 3.30 3.12 4.05 0.18 0.770±0.009 39-40
SBA-15-I after hydroxylation
558 0.84 3.03 2.78 2.80 0.25 0.993±0.009 0-10
SBA-15-II, freshly made
745 1.05 3.25 3.07 3.60 0.18 0.853±0.009 30-32
SBA-15-II after hydroxylation
565 0.84 2.92 2.67 2.70 0.25 0.989±0.009 4-11
SBA-15-III, freshly made
718 0.98 3.21 3.03 4.06 0.18 0.746±0.009 41-43
SBA-15-III, after hydroxylation
587 0.86 3.05 2.80 2.80 0.25 0.993±0.009 0-10
MCM-41-I, freshly made
958 0.77 1.52 1.32 1.32 0.20 1.00±0.008 0-8
MCM-41-I , After
hydroxylation
859 0.65 1.50 1.30 1.32 0.20 0.985±0.008 5-12
MCM-41-II, freshly made
974 0.77 1.48 0.20 0.844±0.009 31-33
MCM-41-II , after
hydroxylation
863 0.68 1.47 0.20 0.988±0.009 4-12
78
3.3.2 Hydrothermal treatment as a means to improve hydrolytic stability of SBA-15
To facilitate the surface hydration and to “complete” the structural changes induced by
water, the SBA-15 silicas were subjected to the hydroxylation, the hydrothermal treatment2,
involving the reaction of silica with liquid water at elevated temperature (373K). Three different
batches of SBA-15 (Table 9) were tested and, on average, the hydroxylation resulted in ~17%
reduction in the pore volume and ~25% reduction in the surface area respectively (Table 9). Also,
while the micropore volume for bare SBA-15 was typically ~0.05 cm3/g, after the hydroxylation
it was down to 0.01 cm3/g or less. Since in presence of the micropores the BET surface area was
overestimated8, the larger relative reduction in the surface area vs. the reduction in pore volumes
was consistent with the disappearance of the micropores.
In the literature, the hydrothermal stability of SBA-15 silicas has been studied extensively.
Although SBA-15 was reported to retained the pore order under severe conditions like prolonged
treatment in boiling water14, and 600oC (873K) steam79 most researchers noted that the pore
structure of freshly prepared SBA-15 showed dramatic changes within the first hours of contact
with water. According to Gouze, Cambedouzou, Parrès-Maynadié and Rébiscoul (2014)78 as soon
as SBA-15 is in contact with water, the silica started to dissolve and re-condense forming an altered
silica layer at the pore surface. The redistribution of silica in the matrix resulted in widening of
the micropores, smoothening the pore walls, and hydroxylation of the surface74-75, 77. The results
of this work confirmed previous findings and demonstrated that the native structure of the freshly
made SBA-15 suffered major changes upon exposure to water vapors at room temperature. These
changes were irreversible as the calcination did not restore the original structure. To conclude this
section, we recommend hydroxylation in liquid water as a simple and effective treatment to obtain
SBA-15 silicas with improved hydrolytic stability and reproducible properties. After the
79
hydroxylation, the SBA-15 silicas showed no changes in pore structure after extended period (over
a year) of storage under ambient humidity, exposure to saturated water vapor, contact with liquid
water, and subsequent hydroxylations. In addition to being hydrolytically stable, the hydroxylated
SBA-15 silicas have high number of silanol groups. The average value of cosines of these angles
(0.991) was less than 1% smaller than the cosine of zero (cos0o=1), the value of water contact
angle attributed to clean fully hydroxylated silica surface3, 82.
3.3.3 Radius of pores, Radius of water menisci, and Water contact angles
As shown in Figure 30, for bare SBA-15 silica the pore size distributions (PSD) by water
was off considerably as compared to the PSD by nitrogen indicating a different type of interaction
by water and nitrogen with the silica surface. Next, while the PSDs by nitrogen were nearly
unchanged, the position of maximums as well as the width of the PSDs by water were strongly
influenced by the exposure of silica to water. After each completed water adsorption-desorption
cycle, the difference between the PSDs by nitrogen and water was diminishing. However, only
for the hydroxylated SBA-15, the PSDs by water and by nitrogen were in close agreement, Figure
30.
This behavior suggested that, unlike nitrogen, water did not completely wet the surface of the
pores. For incomplete wetting (θ>0), the radius of evaporating water meniscus (during the
desorption process) exceeded the radius of the core and were related through the equation8:
( ) = ( ) ∙
The radius of the water cores was obtained from the true pore radius (assessed by nitrogen) and
statistical water adsorption thickness t(H2O):
( ) = ( ) − ( )
(3-6)
(3-7)
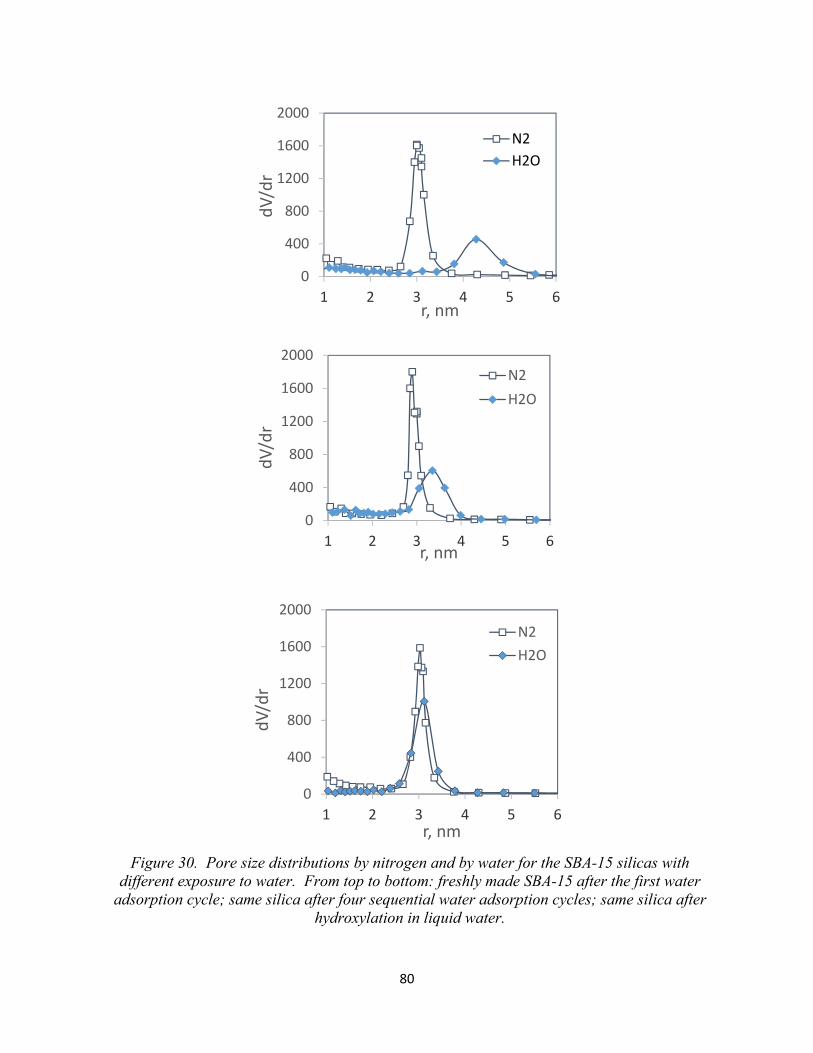
80
Figure 30. Pore size distributions by nitrogen and by water for the SBA-15 silicas with different exposure to water. From top to bottom: freshly made SBA-15 after the first water
adsorption cycle; same silica after four sequential water adsorption cycles; same silica after hydroxylation in liquid water.
0
400
800
1200
1600
2000
1 2 3 4 5 6
dV/d
r
r, nm
N2H2O
0
400
800
1200
1600
2000
1 2 3 4 5 6
dV/d
r
r, nm
N2H2O
0
400
800
1200
1600
2000
1 2 3 4 5 6
dV/d
r
r, nm
N2H2O
81
After combining equations (3-6) and (3-7), the cosines of water contact angles were calculated as:
= ( ) − ( )( )
To obtain the parameters needed for the calculation by equation 3-8, water and nitrogen
adsorption isotherms were measured for each sample. The pore radius ( ) was determined
from the nitrogen isotherms, the radius of water menisci ( ( )) - from the water isotherms
respectively. The statistical water film thickness t(H2O) was obtained from the water adsorption
data collected for reference silicas.
In the following sections, we use the above described method and report the water contact
angles for (1) SBA-15 freshly-made, hydroxylated, and calcined at different temperatures and (2)
hydroxylated SBA-15 silicas that were functionalized with hydrophobic trimethylsilyl groups at
different surface concentrations.
3.3.4 SBA-15 freshly made, hydroxylated, and calcined at different temperatures.
Table 9 summarizes the contact angles and the parameters used for their calculations for
three different batches of freshly made SBA-15 silicas and for the same silicas after the
hydroxylation. The water contact angles for bare, freshly made SBA-15 silicas were in the range
~30-43o, with the average value of 38o, demonstrating fairly hydrophobic surfaces. This was
consistent with the fact that preparation of the SBA-15 included11 calcination at 550oC (823K) in
order to remove the polymer template and open the pore space. Treatment at such high temperature
resulted in substantial reduction of surface silanols (dehydroxylation) rendering surfaces with the
increased amount of non-polar siloxanes at the expense of polar silanols. To assess the
(3-8)
82
contributions of different surface functionalities to wettability, we used the Israelachvili-Gee
equation83:
(1+cosθ)2 = f1(1+cosθ1)2 + f2(1+cosθ2)2
f1 + f2 = 1
We treated SBA-15 surface as a mixture of silanol and siloxane groups. Using the water
contact angle 0° for a silanol surface (θ1) and 44° for a siloxane surface (θ2)82, we found that the
observed average water contact angle of 38o corresponded to a surface mixture of 23% silanols
and 77% siloxanes. The actual number of silanols in these SBA-15 silicas, as evaluated by TGA,
was in the range 1.3-1.4 OH/nm2. This was ~30% from the average value of 4.6 OH/nm2 suggested
for fully hydroxylated silica surface6. The use of the equation 3-9 and 3-10 for the surface
consisting of 30% silanols and 70% siloxanes gave 36o, which was well within the range of the
contact angles obtained from the isotherms.
As we mentioned earlier, the freshly made SBA-15 surface had been altered
(hydroxylated) during the water adsorption experiment, which was also evident by the contact
angles inside the mesopores. Over six sequential water adsorption-desorption cycles the water
contact angles decreased after each cycle and, after the cycle #6, they leveled off ~14±3o,
approaching the values observed for the hydroxylated SBA-15. The data is shown in Figure 31
and Table 9. We noted that these contact angles were not truly equilibrium as they dependent on
the time of contact of silica with water. They should be interpreted as metastable contact angles
characterizing the progression of the hydroxylation process of SBA-15. For SBA-15 hydroxylated
in liquid water, the water contact angles showed a decrease down to 0-11o, indicating silica surface
rich in silanol groups3, 82. The number of silanol groups in the hydroxylated SBA-15 silicas by
TGA averaged around 5 silanols/nm2 indicating fully hydroxylated silica surface. After
(3-9)
(3-10)
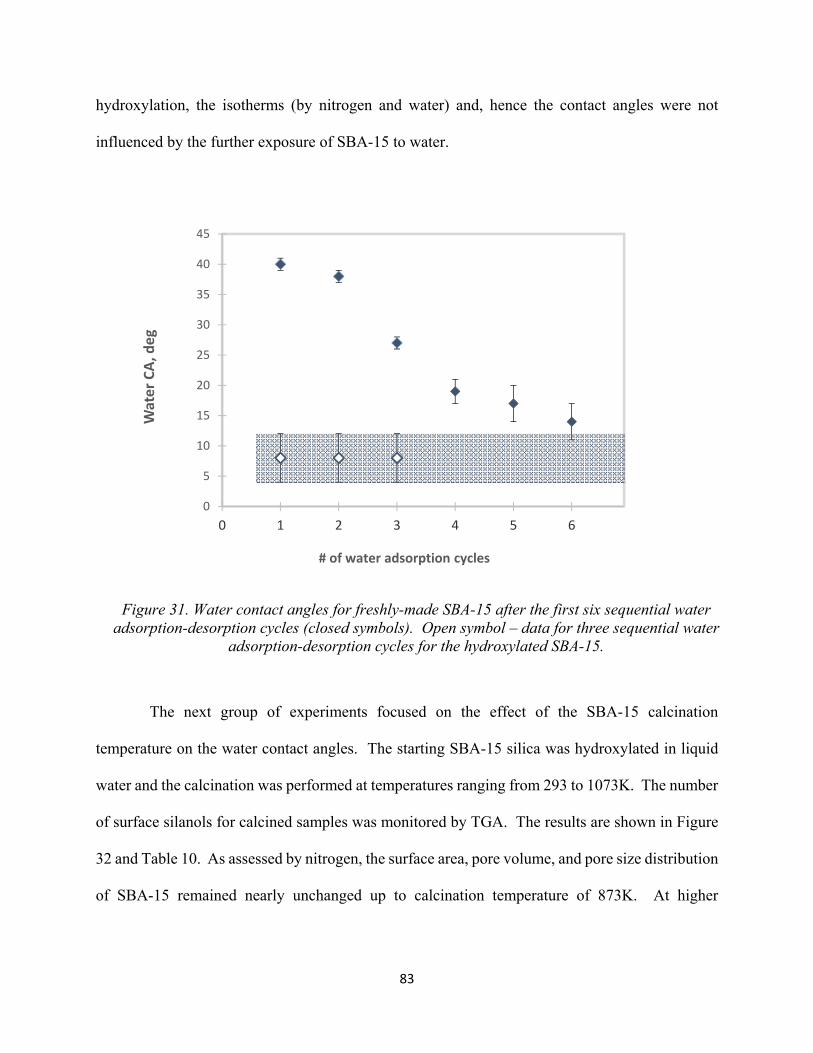
83
hydroxylation, the isotherms (by nitrogen and water) and, hence the contact angles were not
influenced by the further exposure of SBA-15 to water.
Figure 31. Water contact angles for freshly-made SBA-15 after the first six sequential water adsorption-desorption cycles (closed symbols). Open symbol – data for three sequential water
adsorption-desorption cycles for the hydroxylated SBA-15.
The next group of experiments focused on the effect of the SBA-15 calcination
temperature on the water contact angles. The starting SBA-15 silica was hydroxylated in liquid
water and the calcination was performed at temperatures ranging from 293 to 1073K. The number
of surface silanols for calcined samples was monitored by TGA. The results are shown in Figure
32 and Table 10. As assessed by nitrogen, the surface area, pore volume, and pore size distribution
of SBA-15 remained nearly unchanged up to calcination temperature of 873K. At higher
0
5
10
15
20
25
30
35
40
45
0 1 2 3 4 5 6
Wat
er C
A, d
eg
# of water adsorption cycles
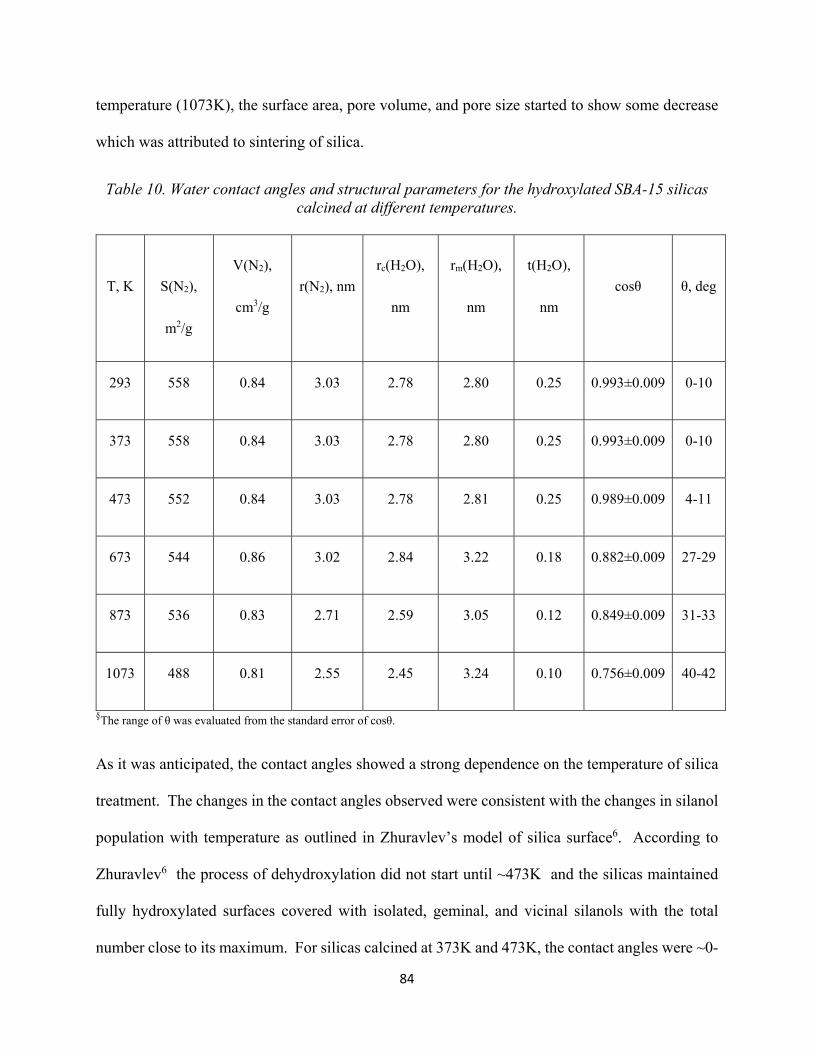
84
temperature (1073K), the surface area, pore volume, and pore size started to show some decrease
which was attributed to sintering of silica.
Table 10. Water contact angles and structural parameters for the hydroxylated SBA-15 silicas calcined at different temperatures.
T, K
S(N2),
m2/g
V(N2),
cm3/g
r(N2), nm
rc(H2O),
nm
rm(H2O),
nm
t(H2O),
nm
cosθ θ, deg
293 558 0.84 3.03 2.78 2.80 0.25 0.993±0.009 0-10
373 558 0.84 3.03 2.78 2.80 0.25 0.993±0.009 0-10
473 552 0.84 3.03 2.78 2.81 0.25 0.989±0.009 4-11
673 544 0.86 3.02 2.84 3.22 0.18 0.882±0.009 27-29
873 536 0.83 2.71 2.59 3.05 0.12 0.849±0.009 31-33
1073 488 0.81 2.55 2.45 3.24 0.10 0.756±0.009 40-42
§The range of θ was evaluated from the standard error of cosθ.
As it was anticipated, the contact angles showed a strong dependence on the temperature of silica
treatment. The changes in the contact angles observed were consistent with the changes in silanol
population with temperature as outlined in Zhuravlev’s model of silica surface6. According to
Zhuravlev6 the process of dehydroxylation did not start until ~473K and the silicas maintained
fully hydroxylated surfaces covered with isolated, geminal, and vicinal silanols with the total
number close to its maximum. For silicas calcined at 373K and 473K, the contact angles were ~0-
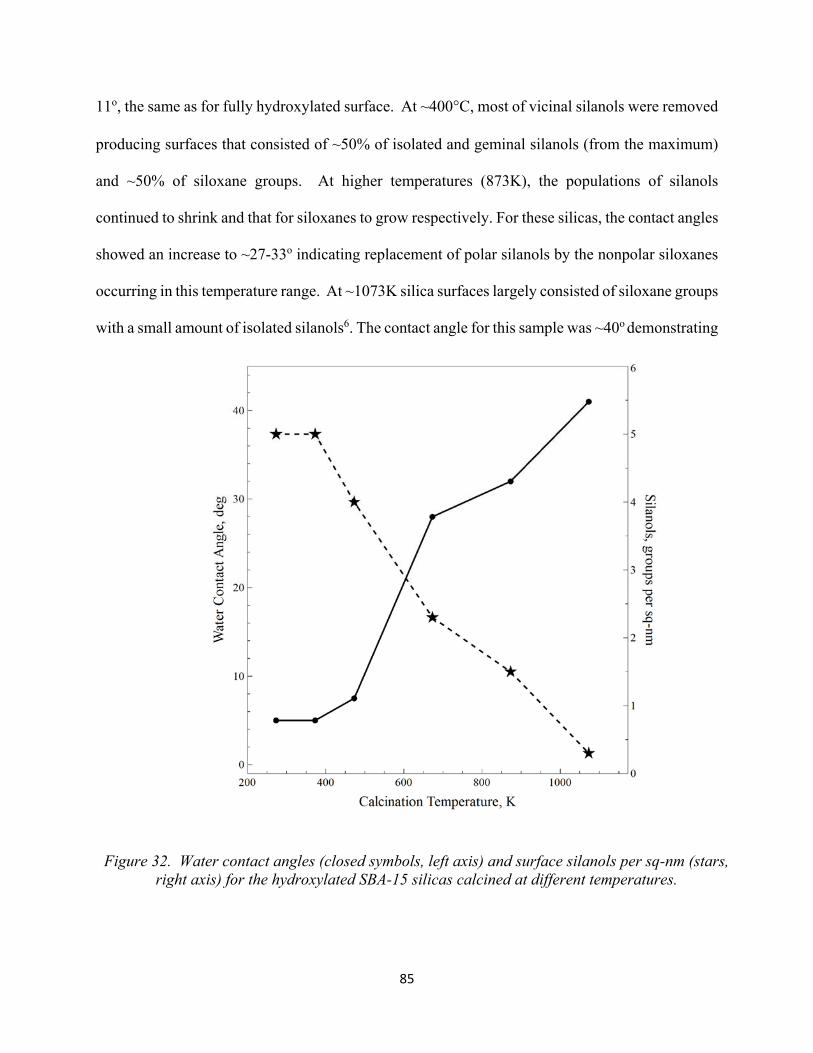
85
11o, the same as for fully hydroxylated surface. At ~400°C, most of vicinal silanols were removed
producing surfaces that consisted of ~50% of isolated and geminal silanols (from the maximum)
and ~50% of siloxane groups. At higher temperatures (873K), the populations of silanols
continued to shrink and that for siloxanes to grow respectively. For these silicas, the contact angles
showed an increase to ~27-33o indicating replacement of polar silanols by the nonpolar siloxanes
occurring in this temperature range. At ~1073K silica surfaces largely consisted of siloxane groups
with a small amount of isolated silanols6. The contact angle for this sample was ~40o demonstrating
Figure 32. Water contact angles (closed symbols, left axis) and surface silanols per sq-nm (stars, right axis) for the hydroxylated SBA-15 silicas calcined at different temperatures.
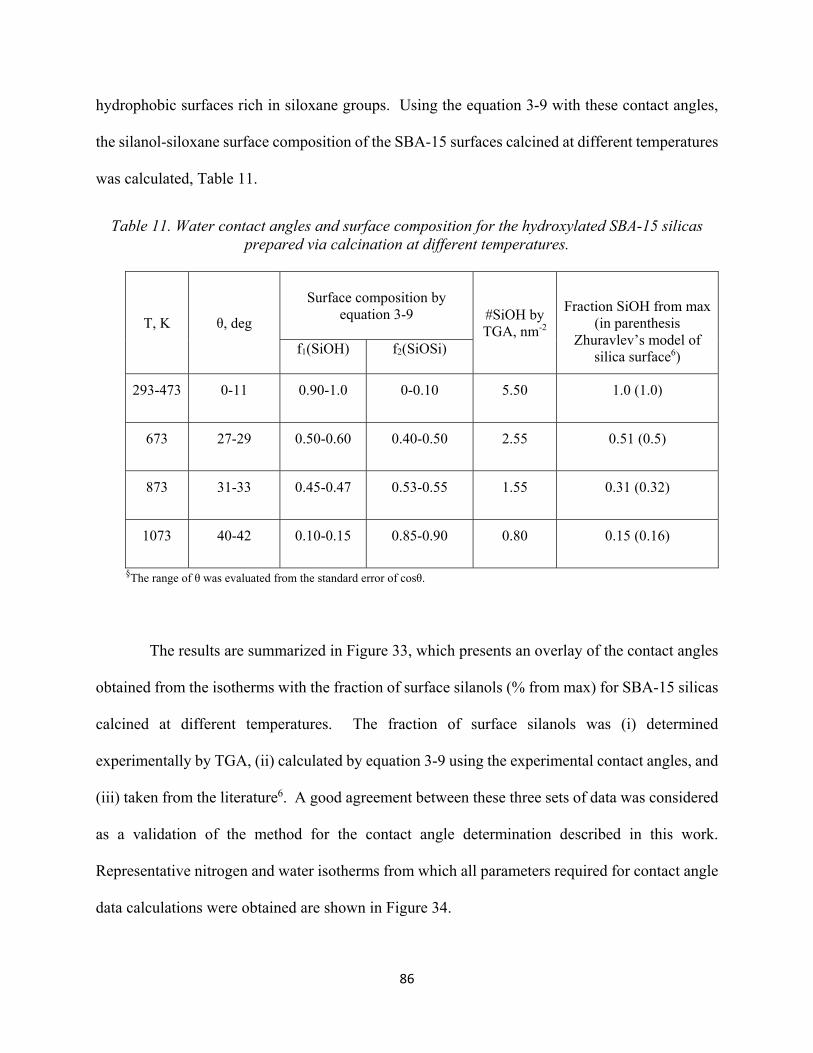
86
hydrophobic surfaces rich in siloxane groups. Using the equation 3-9 with these contact angles,
the silanol-siloxane surface composition of the SBA-15 surfaces calcined at different temperatures
was calculated, Table 11.
Table 11. Water contact angles and surface composition for the hydroxylated SBA-15 silicas prepared via calcination at different temperatures.
T, K θ, deg
Surface composition by
equation 3-9
#SiOH by TGA, nm-2
Fraction SiOH from max
(in parenthesis Zhuravlev’s model of
silica surface6) f1(SiOH) f2(SiOSi)
293-473 0-11 0.90-1.0 0-0.10 5.50 1.0 (1.0)
673 27-29 0.50-0.60 0.40-0.50 2.55 0.51 (0.5)
873 31-33 0.45-0.47 0.53-0.55 1.55 0.31 (0.32)
1073 40-42 0.10-0.15 0.85-0.90 0.80 0.15 (0.16)
§The range of θ was evaluated from the standard error of cosθ.
The results are summarized in Figure 33, which presents an overlay of the contact angles
obtained from the isotherms with the fraction of surface silanols (% from max) for SBA-15 silicas
calcined at different temperatures. The fraction of surface silanols was (i) determined
experimentally by TGA, (ii) calculated by equation 3-9 using the experimental contact angles, and
(iii) taken from the literature6. A good agreement between these three sets of data was considered
as a validation of the method for the contact angle determination described in this work.
Representative nitrogen and water isotherms from which all parameters required for contact angle
data calculations were obtained are shown in Figure 34.
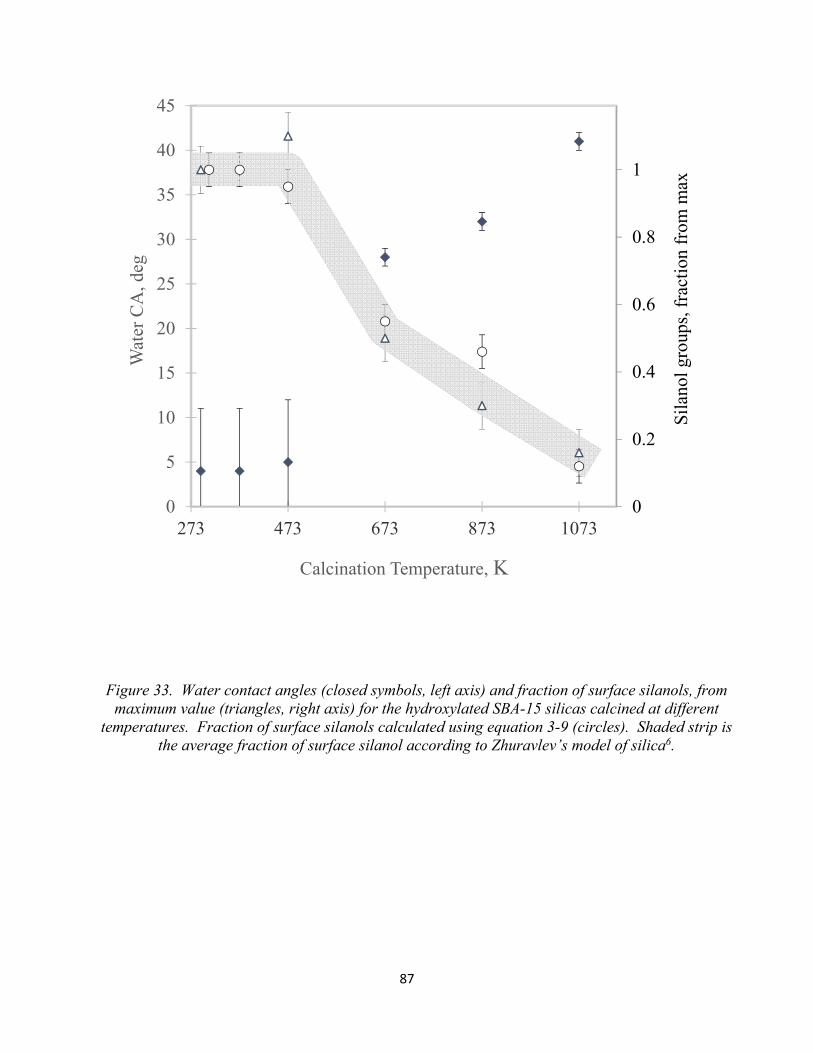
87
Figure 33. Water contact angles (closed symbols, left axis) and fraction of surface silanols, from maximum value (triangles, right axis) for the hydroxylated SBA-15 silicas calcined at different
temperatures. Fraction of surface silanols calculated using equation 3-9 (circles). Shaded strip is the average fraction of surface silanol according to Zhuravlev’s model of silica6.
0
0.2
0.4
0.6
0.8
1
0
5
10
15
20
25
30
35
40
45
273 473 673 873 1073
Sil
anol
gro
ups,
fra
ctio
n fr
om m
ax
Wat
er C
A, d
eg
Calcination Temperature, K
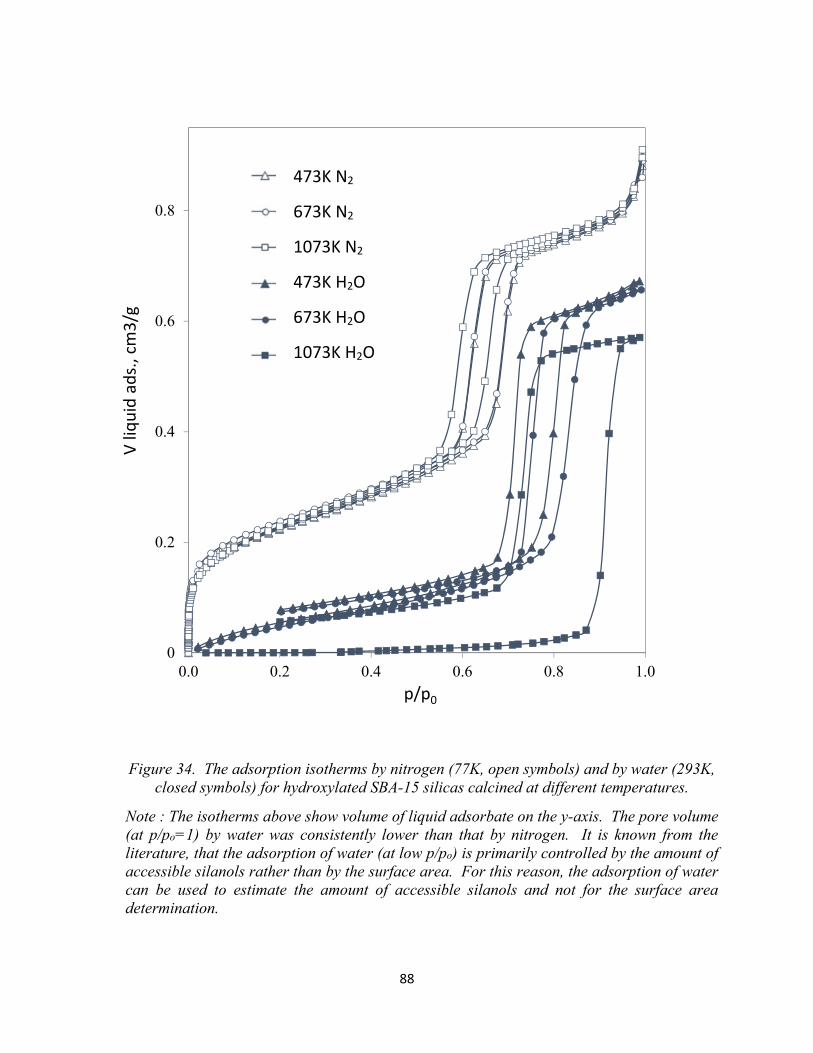
88
Figure 34. The adsorption isotherms by nitrogen (77K, open symbols) and by water (293K, closed symbols) for hydroxylated SBA-15 silicas calcined at different temperatures.
Note : The isotherms above show volume of liquid adsorbate on the y-axis. The pore volume (at p/po=1) by water was consistently lower than that by nitrogen. It is known from the literature, that the adsorption of water (at low p/po) is primarily controlled by the amount of accessible silanols rather than by the surface area. For this reason, the adsorption of water can be used to estimate the amount of accessible silanols and not for the surface area determination.
0
0.2
0.4
0.6
0.8
0.0 0.2 0.4 0.6 0.8 1.0
V liq
uid
ads.
, cm
3/g
p/p0
473K N2
673K N2
1073K N2
473K H2O
673K H2O
1073K H2O
89
3.3.5. SBA-15 with chemically grafted hydrophobic TMS groups
Hydrophobic SBA-15 silicas were prepared via the reaction of (CH3)3SiN(CH3)2 with
hydroxylated SBA-15. As a result of this reaction, polar silanols were replaced (and partially
screened) by the trimethylsilyl (TMS) groups producing hydrophobic surfaces. By using the dilute
solutions of trimethylsilane and limiting the reaction time, a series of silica surfaces with the TMS
surface coverage ranging from 0.31 to 2.88 TMS group/nm2 was prepared. Using the cross-
sectional area of TMS groups84 at 0.35 nm2, these values corresponded to ~11-100% of TMS
surface coverage (by area). The sample characteristics are summarized in Table 12. The nitrogen
and water adsorption isotherms are shown in Figure 35.
As assessed by nitrogen, the uniform mesoporous structure of parental SBA-15 was
preserved, however the pore volume, surface area, and pore size showed a natural decrease with
an increase of the TMS coverage. The decrease in the pore volume and the average pore size was
consistent with the attachment of TMS groups on the surface of the pores. Average thickness (h)
of the TMS grafted layers was calculated from the pore volume decrease (cm3/g, corrected per
gram of silica) and the surface area of bare SBA-15 (m2/g) as follows:
ℎ [ ] = 1000 × ∆ /
The thickness values ranged from 0.1 to 0.39 nm for 11 and 100% TMS surface coverage
respectively. The value 0.39 nm was in a good agreement with the thickness of a single layer of
TMS (0.35 nm) demonstrating closely packed monolayer of TMS groups. The decrease in the
surface area observed for the TMS silicas was less obvious. To a certain degree, the decrease in
the surface area could be attributed to the micropore blockage by the TMS groups. Although the
amount of micropores in the hydroxylated SBA-15 was small by volume (Vµ<0.01 cm3/g), in their
(3-11)
90
presence the surface area of bare silica would be overestimated. Thus, closure of the micropores
would result in an apparent reduction of the surface area of the TMS-modified silicas. As another
possible reason that complicated the analysis of the surface area, we pointed out the uncertainty of
the nitrogen cross-section for the modified surfaces. The value of the cross-sectional area of
nitrogen for the TMS silicas was probably larger than the standard value 0.162 nm2 which was
used for the calculations. On hydrophobic surfaces, the nitrogen cross section is ~20% greater as
the molecules packed more loosely than on silica. So, the use of the same value of the nitrogen
cross-section would result in ~20% underestimation of the surface area of the TMS-silicas.
Unlike nitrogen isotherms, the effect of the TMS surface coverage on the water adsorption
isotherms was dramatic (Figure 35). The overall shape of the isotherm, the presence of the
hysteresis loop and its position, and the total amount of the adsorption was strongly influenced by
the TMS coverage. For silicas with high TMS coverage (77, 85 and 100%), the adsorption of
water was low over the entire range of pressures, the isotherms were pressed down to the x-axis
and no capillary condensation was observed. For the intermediate and low TMS surface coverage
(11, 20, 26, and 50%), the capillary condensation was observed yet the amount of water adsorbed
at the saturation decreased as the surface coverage of the TMS increased. For the 11% TMS silica,
water occupied 72% of the available pore volume (by nitrogen), while for the 50% TMS silica
only 20% of the available pore volume was filled by water at saturation. Even at saturation the
amounts of water adsorbed were below the theoretical monolayer. Using 0.106 nm2 for the water
cross section, the adsorbed amounts at saturation corresponded to ~25-30% of the monolayer
capacity demonstrating high quality hydrophobic surfaces of the pores. Figure 36 shows the initial
parts of the water adsorption isotherms for the hydroxylated SBA-15 silicas with different TMS
coverage.
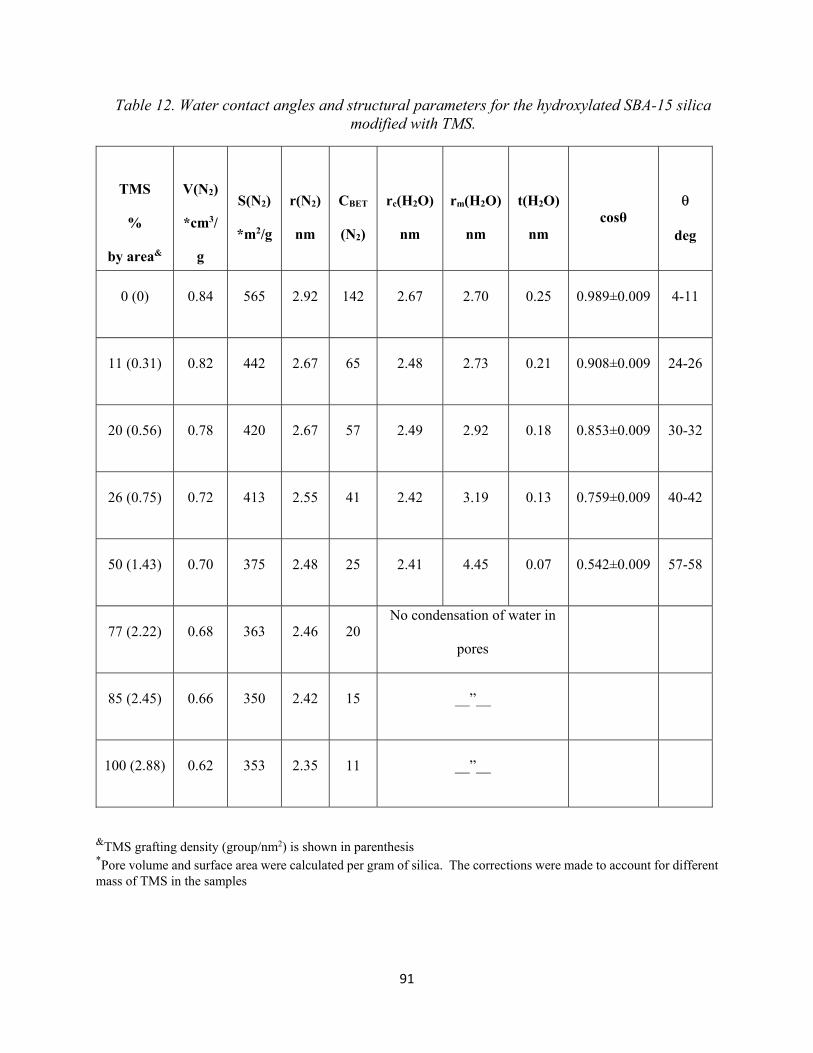
91
Table 12. Water contact angles and structural parameters for the hydroxylated SBA-15 silica modified with TMS.
&TMS grafting density (group/nm2) is shown in parenthesis
*Pore volume and surface area were calculated per gram of silica. The corrections were made to account for different mass of TMS in the samples
TMS
%
by area&
V(N2)
*cm3/
g
S(N2)
*m2/g
r(N2)
nm
CBET
(N2)
rc(H2O)
nm
rm(H2O)
nm
t(H2O)
nm
cosθ
θ
deg
0 (0) 0.84 565 2.92 142 2.67 2.70 0.25 0.989±0.009 4-11
11 (0.31) 0.82 442 2.67 65 2.48 2.73 0.21 0.908±0.009 24-26
20 (0.56) 0.78 420 2.67 57 2.49 2.92 0.18 0.853±0.009 30-32
26 (0.75) 0.72 413 2.55 41 2.42 3.19 0.13 0.759±0.009 40-42
50 (1.43) 0.70 375 2.48 25 2.41 4.45 0.07 0.542±0.009 57-58
77 (2.22) 0.68 363 2.46 20 No condensation of water in
pores
85 (2.45) 0.66 350 2.42 15 __”__
100 (2.88) 0.62 353 2.35 11 __”__
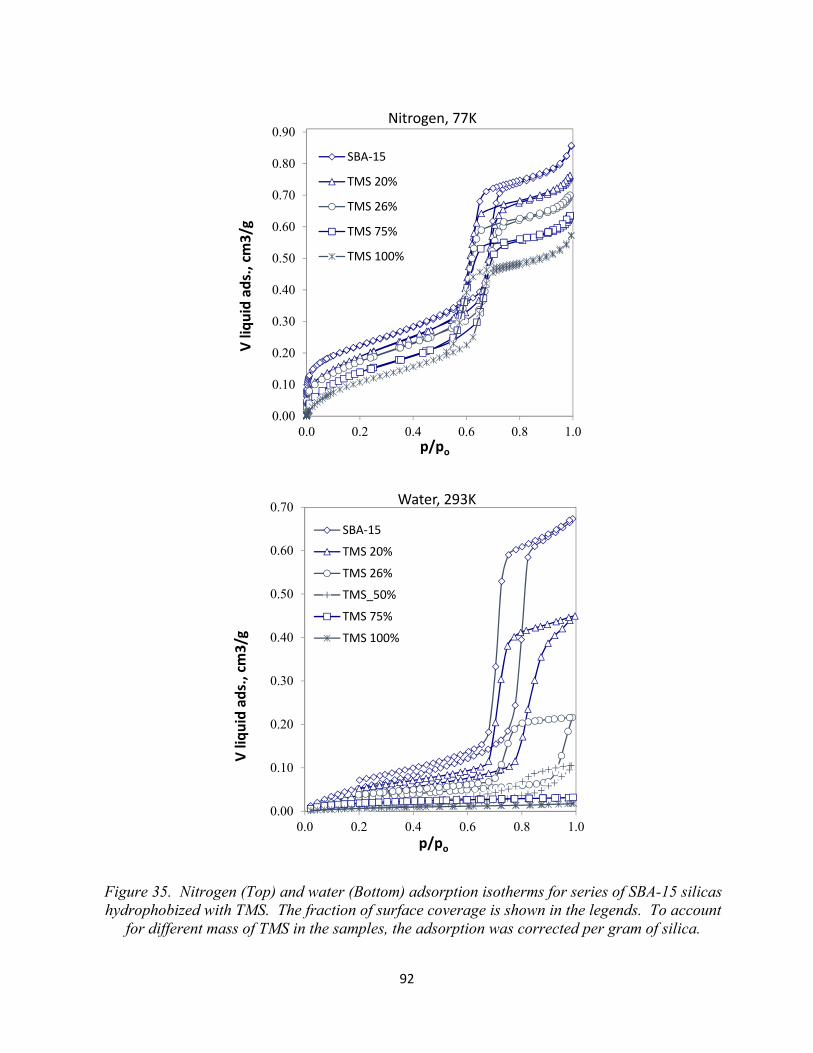
92
Figure 35. Nitrogen (Top) and water (Bottom) adsorption isotherms for series of SBA-15 silicas hydrophobized with TMS. The fraction of surface coverage is shown in the legends. To account
for different mass of TMS in the samples, the adsorption was corrected per gram of silica.
0.00
0.10
0.20
0.30
0.40
0.50
0.60
0.70
0.80
0.90
0.0 0.2 0.4 0.6 0.8 1.0
V liq
uid
ads.
, cm
3/g
p/po
Nitrogen, 77K
SBA-15
TMS 20%
TMS 26%
TMS 75%
TMS 100%
0.00
0.10
0.20
0.30
0.40
0.50
0.60
0.70
0.0 0.2 0.4 0.6 0.8 1.0
V liq
uid
ads.
, cm
3/g
p/po
Water, 293K
SBA-15
TMS 20%
TMS 26%
TMS_50%
TMS 75%
TMS 100%
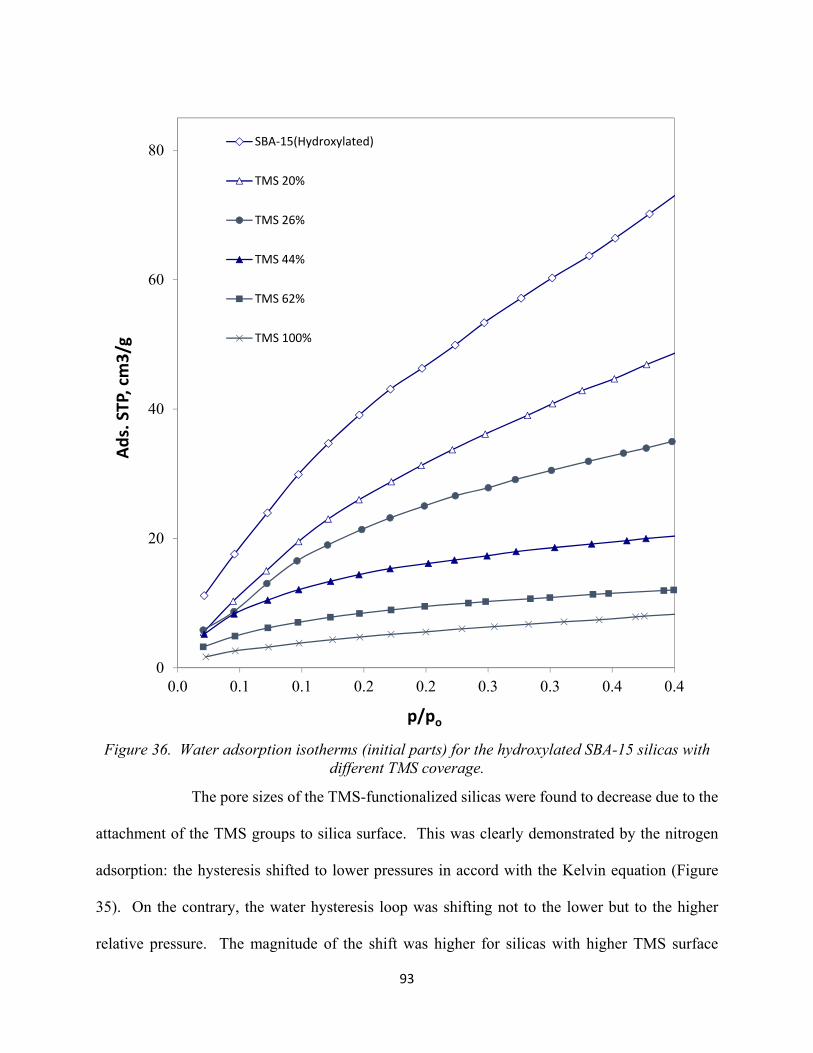
93
Figure 36. Water adsorption isotherms (initial parts) for the hydroxylated SBA-15 silicas with different TMS coverage.
The pore sizes of the TMS-functionalized silicas were found to decrease due to the
attachment of the TMS groups to silica surface. This was clearly demonstrated by the nitrogen
adsorption: the hysteresis shifted to lower pressures in accord with the Kelvin equation (Figure
35). On the contrary, the water hysteresis loop was shifting not to the lower but to the higher
relative pressure. The magnitude of the shift was higher for silicas with higher TMS surface
0
20
40
60
80
0.0 0.1 0.1 0.2 0.2 0.3 0.3 0.4 0.4
Ads.
STP
, cm
3/g
p/po
SBA-15(Hydroxylated)
TMS 20%
TMS 26%
TMS 44%
TMS 62%
TMS 100%
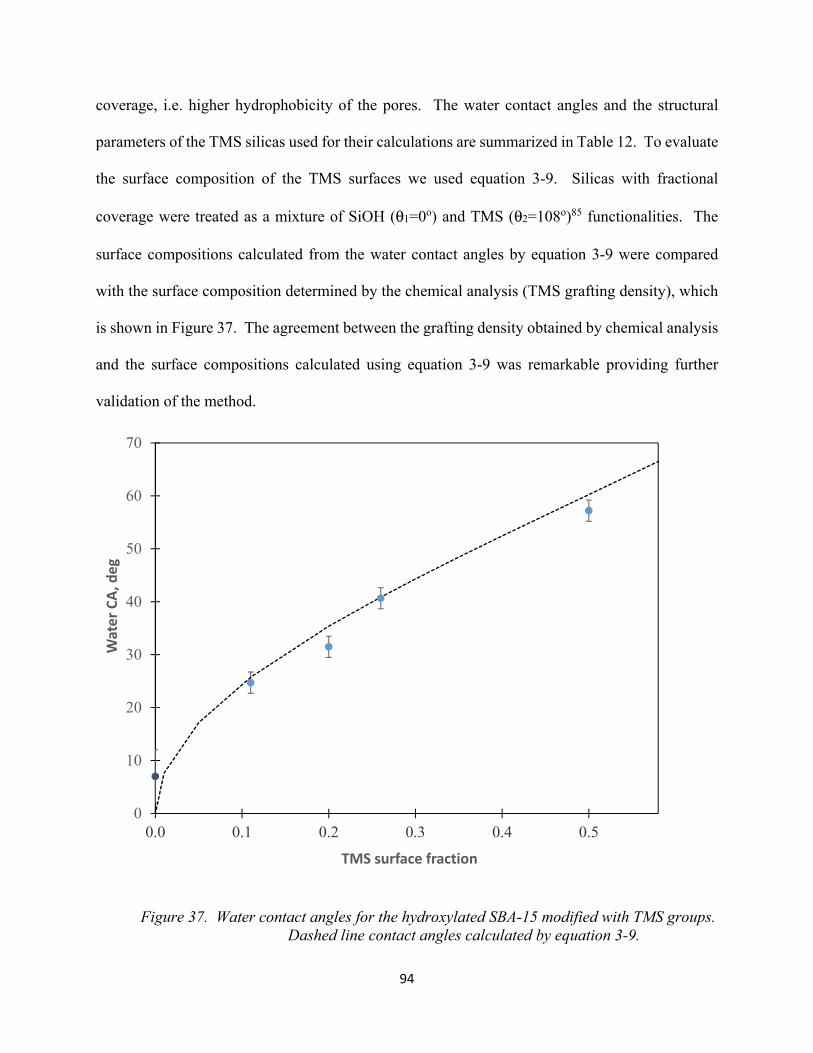
94
coverage, i.e. higher hydrophobicity of the pores. The water contact angles and the structural
parameters of the TMS silicas used for their calculations are summarized in Table 12. To evaluate
the surface composition of the TMS surfaces we used equation 3-9. Silicas with fractional
coverage were treated as a mixture of SiOH (θ1=0o) and TMS (θ2=108o)85 functionalities. The
surface compositions calculated from the water contact angles by equation 3-9 were compared
with the surface composition determined by the chemical analysis (TMS grafting density), which
is shown in Figure 37. The agreement between the grafting density obtained by chemical analysis
and the surface compositions calculated using equation 3-9 was remarkable providing further
validation of the method.
Figure 37. Water contact angles for the hydroxylated SBA-15 modified with TMS groups. Dashed line contact angles calculated by equation 3-9.
0
10
20
30
40
50
60
70
0.0 0.1 0.2 0.3 0.4 0.5
Wat
er C
A, d
eg
TMS surface fraction
95
3.3.6 Statistical thickness for water adsorption.
The knowledge of the statistical thickness of the adsorbed water film as a function of
relative pressures (t-curve) is critical for the accurate determination of the radius of cores
(equation 3-7) and, therefore, for the calculations of contact angles described in this work. In
the literature, the adsorption of water has been studied extensively and a number of water t-
curves have been reported68-69, 86. The representative data is compiled in Figure 38. The water
t-curves show strong dependence to the nature of silica (water born silica gel68, 86 or pyrogenic
fumed silica69) and to its preparation conditions (calcination temperature)86. The data presented
in Figure 38 serves as a good illustration of the great sensitivity of water adsorption to the
surface chemistry of silica, specifically, to the extent of its surface hydroxylation, i.e. the number
of silanol groups. For example, the statistical thickness decreased more than 10-fold passing
from fully hydroxylated silica to dehydroxylated silica prepared by calcination at high
temperatures86. Clearly, for the pore size determination and for the calculations by equation 3-
6 through 3-8, one should use the t-curve obtained for the reference silica with the similar extent
of hydration (silanol number) to the silica under analysis.
Unfortunately, most of the water t-curves available in the literature were reported
without the silanol density data. The authors68 suggested to use the BET c constants as a
measure of intensity of the adsorption interactions and reported several water t-curves for the
adsorbents with different c constants. The use of the BET c constants, however, seems dubious
since the adsorption of water involves strong cooperative interactions (hydrogen bonding) and
hardly fits the BET model. To the best of our knowledge, the t-curves for the surfaces of low
silanol numbers and for the hydrophobic silicas were not available. To investigate further and
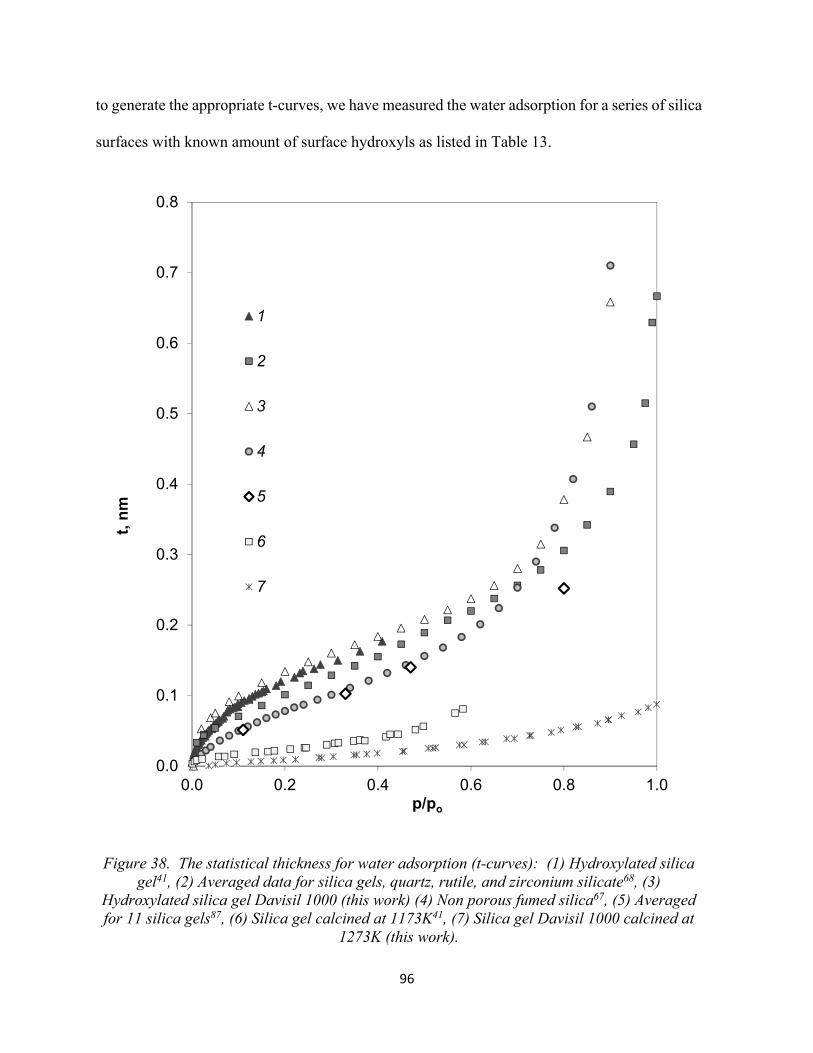
96
to generate the appropriate t-curves, we have measured the water adsorption for a series of silica
surfaces with known amount of surface hydroxyls as listed in Table 13.
Figure 38. The statistical thickness for water adsorption (t-curves): (1) Hydroxylated silica gel41, (2) Averaged data for silica gels, quartz, rutile, and zirconium silicate68, (3)
Hydroxylated silica gel Davisil 1000 (this work) (4) Non porous fumed silica67, (5) Averaged for 11 silica gels87, (6) Silica gel calcined at 1173K41, (7) Silica gel Davisil 1000 calcined at
1273K (this work).
0.0
0.1
0.2
0.3
0.4
0.5
0.6
0.7
0.8
0.0 0.2 0.4 0.6 0.8 1.0
t, nm
p/po
1
2
3
4
5
6
7
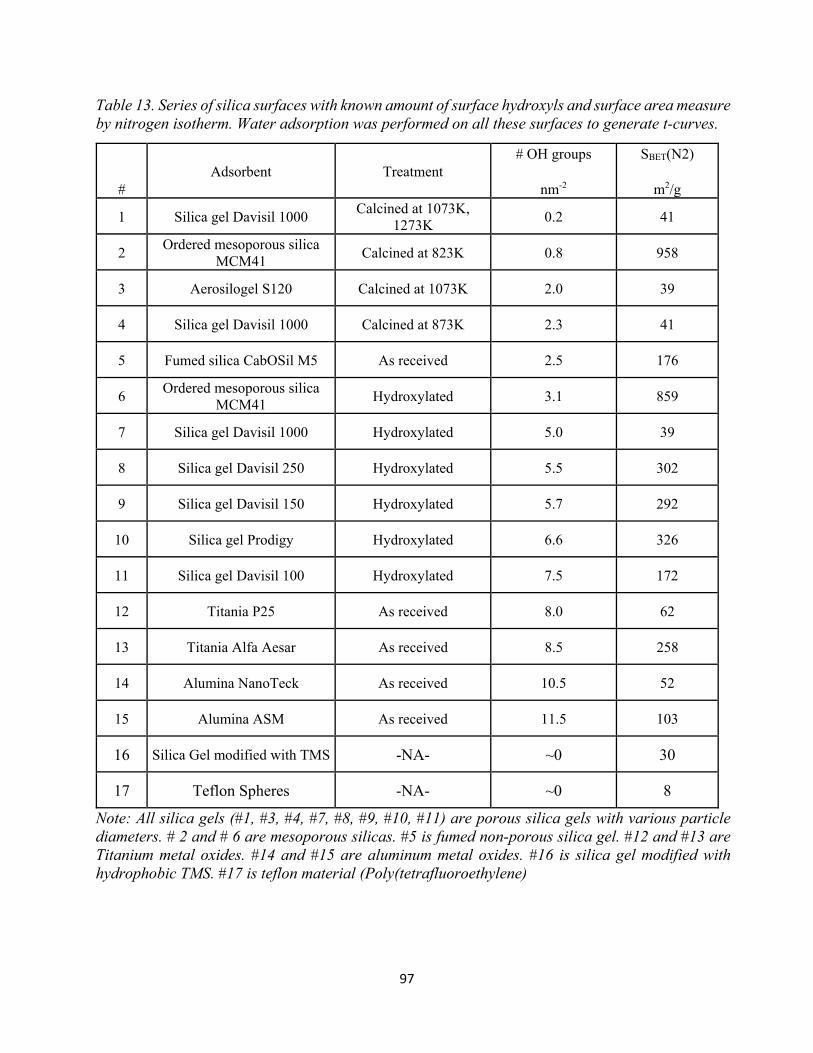
97
Table 13. Series of silica surfaces with known amount of surface hydroxyls and surface area measure by nitrogen isotherm. Water adsorption was performed on all these surfaces to generate t-curves.
# Adsorbent Treatment
# OH groups
nm-2
SBET(N2)
m2/g
1 Silica gel Davisil 1000 Calcined at 1073K,
1273K 0.2 41
2 Ordered mesoporous silica
MCM41 Calcined at 823K 0.8 958
3 Aerosilogel S120 Calcined at 1073K 2.0 39
4 Silica gel Davisil 1000 Calcined at 873K 2.3 41
5 Fumed silica CabOSil M5 As received 2.5 176
6 Ordered mesoporous silica
MCM41 Hydroxylated 3.1 859
7 Silica gel Davisil 1000 Hydroxylated 5.0 39
8 Silica gel Davisil 250 Hydroxylated 5.5 302
9 Silica gel Davisil 150 Hydroxylated 5.7 292
10 Silica gel Prodigy Hydroxylated 6.6 326
11 Silica gel Davisil 100 Hydroxylated 7.5 172
12 Titania P25 As received 8.0 62
13 Titania Alfa Aesar As received 8.5 258
14 Alumina NanoTeck As received 10.5 52
15 Alumina ASM As received 11.5 103
16 Silica Gel modified with TMS -NA- ~0 30
17 Teflon Spheres -NA- ~0 8
Note: All silica gels (#1, #3, #4, #7, #8, #9, #10, #11) are porous silica gels with various particle diameters. # 2 and # 6 are mesoporous silicas. #5 is fumed non-porous silica gel. #12 and #13 are Titanium metal oxides. #14 and #15 are aluminum metal oxides. #16 is silica gel modified with hydrophobic TMS. #17 is teflon material (Poly(tetrafluoroethylene)
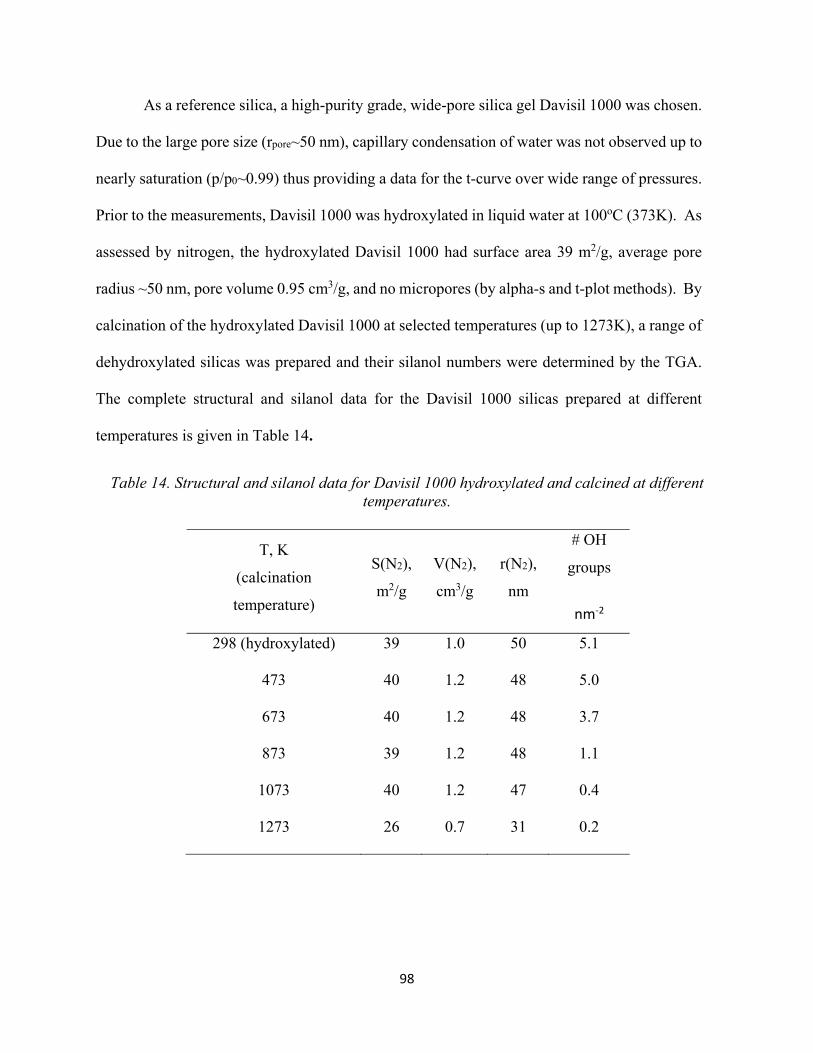
98
As a reference silica, a high-purity grade, wide-pore silica gel Davisil 1000 was chosen.
Due to the large pore size (rpore~50 nm), capillary condensation of water was not observed up to
nearly saturation (p/p0~0.99) thus providing a data for the t-curve over wide range of pressures.
Prior to the measurements, Davisil 1000 was hydroxylated in liquid water at 100oC (373K). As
assessed by nitrogen, the hydroxylated Davisil 1000 had surface area 39 m2/g, average pore
radius ~50 nm, pore volume 0.95 cm3/g, and no micropores (by alpha-s and t-plot methods). By
calcination of the hydroxylated Davisil 1000 at selected temperatures (up to 1273K), a range of
dehydroxylated silicas was prepared and their silanol numbers were determined by the TGA.
The complete structural and silanol data for the Davisil 1000 silicas prepared at different
temperatures is given in Table 14.
Table 14. Structural and silanol data for Davisil 1000 hydroxylated and calcined at different temperatures.
T, K
(calcination
temperature)
S(N2),
m2/g
V(N2),
cm3/g
r(N2),
nm
# OH
groups
nm-2
298 (hydroxylated) 39 1.0 50 5.1
473 40 1.2 48 5.0
673 40 1.2 48 3.7
873 39 1.2 48 1.1
1073 40 1.2 47 0.4
1273 26 0.7 31 0.2
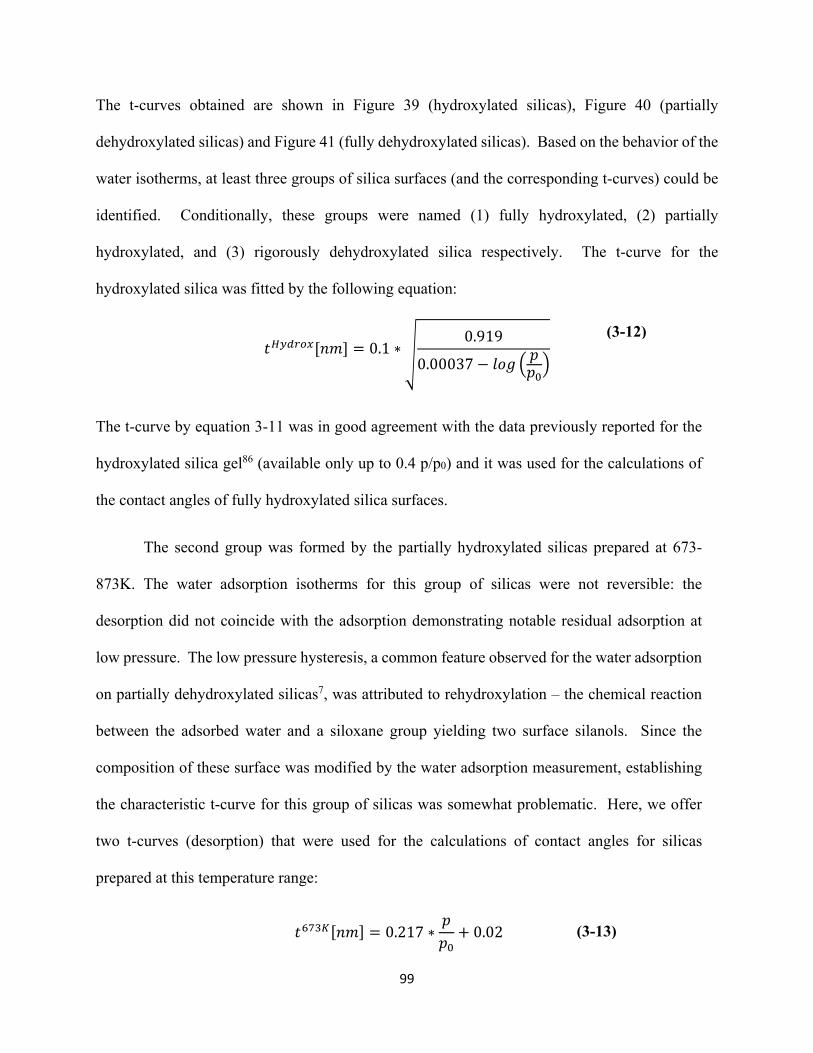
99
The t-curves obtained are shown in Figure 39 (hydroxylated silicas), Figure 40 (partially
dehydroxylated silicas) and Figure 41 (fully dehydroxylated silicas). Based on the behavior of the
water isotherms, at least three groups of silica surfaces (and the corresponding t-curves) could be
identified. Conditionally, these groups were named (1) fully hydroxylated, (2) partially
hydroxylated, and (3) rigorously dehydroxylated silica respectively. The t-curve for the
hydroxylated silica was fitted by the following equation:
[ ] = 0.1 ∗ 0.9190.00037 −
The t-curve by equation 3-11 was in good agreement with the data previously reported for the
hydroxylated silica gel86 (available only up to 0.4 p/p0) and it was used for the calculations of
the contact angles of fully hydroxylated silica surfaces.
The second group was formed by the partially hydroxylated silicas prepared at 673-
873K. The water adsorption isotherms for this group of silicas were not reversible: the
desorption did not coincide with the adsorption demonstrating notable residual adsorption at
low pressure. The low pressure hysteresis, a common feature observed for the water adsorption
on partially dehydroxylated silicas7, was attributed to rehydroxylation – the chemical reaction
between the adsorbed water and a siloxane group yielding two surface silanols. Since the
composition of these surface was modified by the water adsorption measurement, establishing
the characteristic t-curve for this group of silicas was somewhat problematic. Here, we offer
two t-curves (desorption) that were used for the calculations of contact angles for silicas
prepared at this temperature range:
[ ] = 0.217 ∗ + 0.02
(3-12)
(3-13)
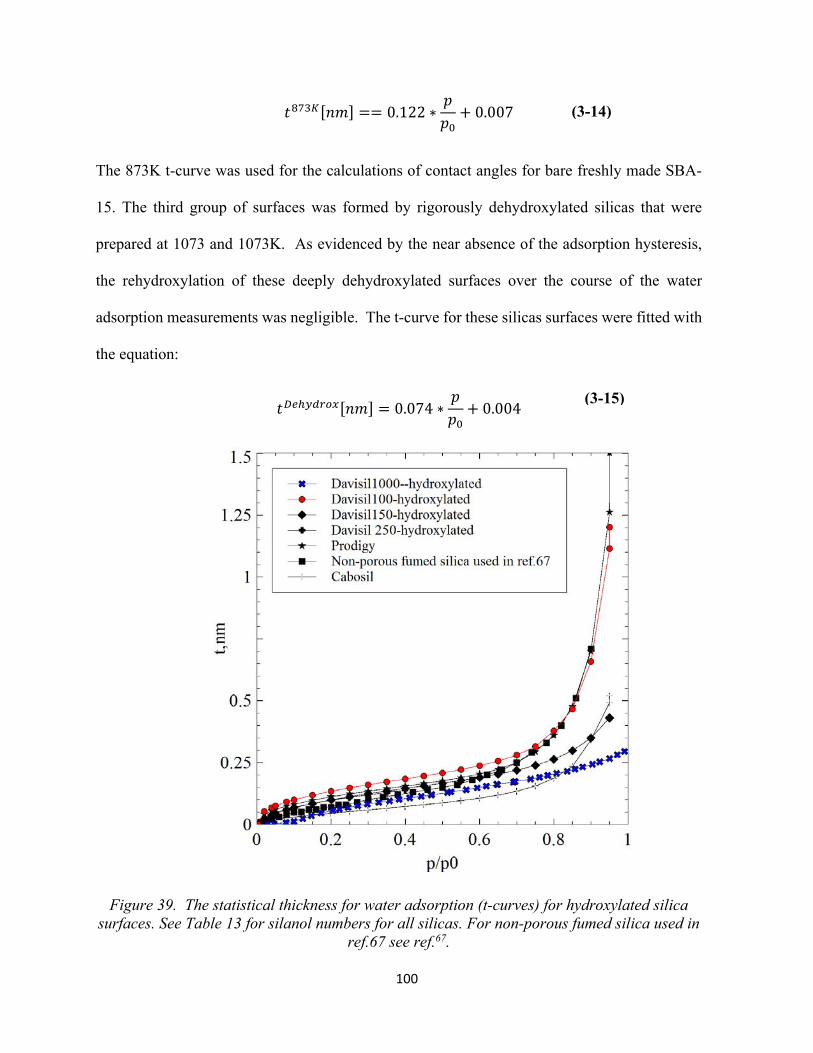
100
[ ] == 0.122 ∗ + 0.007
The 873K t-curve was used for the calculations of contact angles for bare freshly made SBA-
15. The third group of surfaces was formed by rigorously dehydroxylated silicas that were
prepared at 1073 and 1073K. As evidenced by the near absence of the adsorption hysteresis,
the rehydroxylation of these deeply dehydroxylated surfaces over the course of the water
adsorption measurements was negligible. The t-curve for these silicas surfaces were fitted with
the equation:
[ ] = 0.074 ∗ + 0.004
Figure 39. The statistical thickness for water adsorption (t-curves) for hydroxylated silica surfaces. See Table 13 for silanol numbers for all silicas. For non-porous fumed silica used in
ref.67 see ref.67.
(3-14)
(3-15)
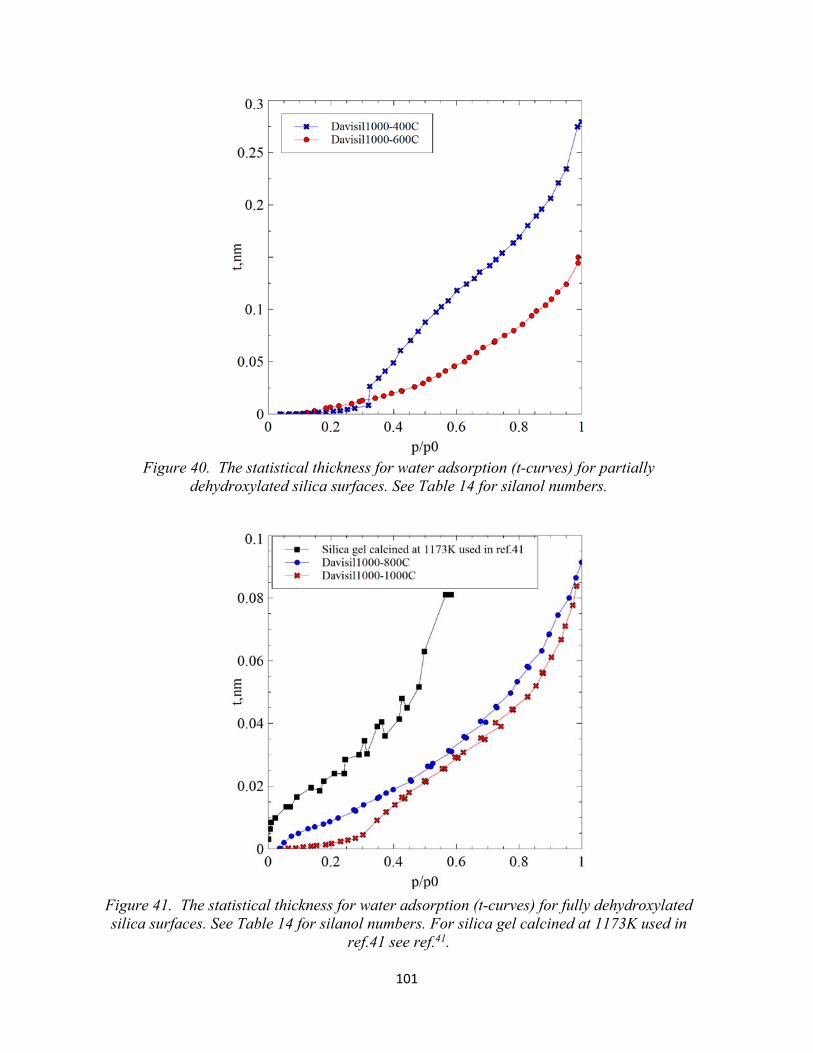
101
Figure 40. The statistical thickness for water adsorption (t-curves) for partially dehydroxylated silica surfaces. See Table 14 for silanol numbers.
Figure 41. The statistical thickness for water adsorption (t-curves) for fully dehydroxylated silica surfaces. See Table 14 for silanol numbers. For silica gel calcined at 1173K used in
ref.41 see ref.41.
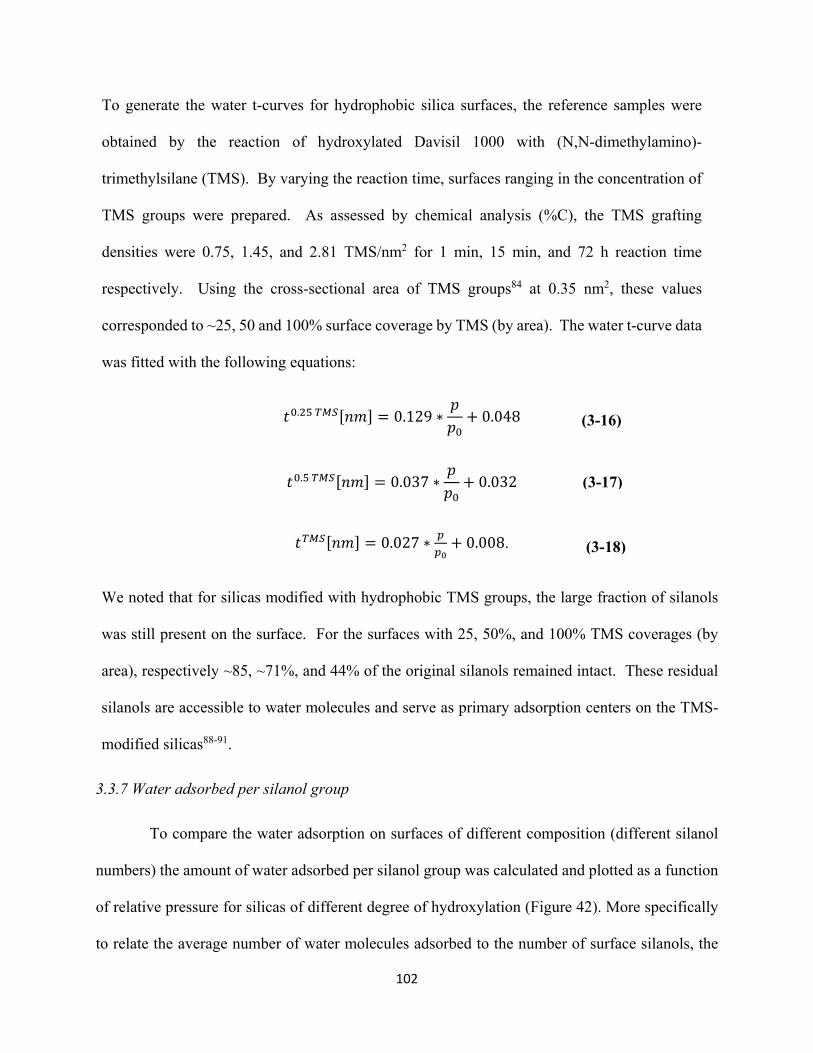
102
To generate the water t-curves for hydrophobic silica surfaces, the reference samples were
obtained by the reaction of hydroxylated Davisil 1000 with (N,N-dimethylamino)-
trimethylsilane (TMS). By varying the reaction time, surfaces ranging in the concentration of
TMS groups were prepared. As assessed by chemical analysis (%C), the TMS grafting
densities were 0.75, 1.45, and 2.81 TMS/nm2 for 1 min, 15 min, and 72 h reaction time
respectively. Using the cross-sectional area of TMS groups84 at 0.35 nm2, these values
corresponded to ~25, 50 and 100% surface coverage by TMS (by area). The water t-curve data
was fitted with the following equations:
. [ ] = 0.129 ∗ + 0.048
. [ ] = 0.037 ∗ + 0.032
[ ] = 0.027 ∗ + 0.008.
We noted that for silicas modified with hydrophobic TMS groups, the large fraction of silanols
was still present on the surface. For the surfaces with 25, 50%, and 100% TMS coverages (by
area), respectively ~85, ~71%, and 44% of the original silanols remained intact. These residual
silanols are accessible to water molecules and serve as primary adsorption centers on the TMS-
modified silicas88-91.
3.3.7 Water adsorbed per silanol group
To compare the water adsorption on surfaces of different composition (different silanol
numbers) the amount of water adsorbed per silanol group was calculated and plotted as a function
of relative pressure for silicas of different degree of hydroxylation (Figure 42). More specifically
to relate the average number of water molecules adsorbed to the number of surface silanols, the
(3-16)
(3-17)
(3-18)
103
adsorbed amounts of water were plotted vs. the number of OH groups present on the surface.
Figure 43 shows these plots for two relative water pressures 0.2 and 0.5 p/po respectively. Figure
43 also includes the data from works8, 41, 67, which was recalculated using the reported silanol
numbers. The results in Figure 43 showed that for hydroxylated, dehydroxylated, and hydrophobic
silicas, the amount of adsorbed water was directly proportional to the number of OH groups present
on the surface. This was remarkable as these plots suggested a simple, approximately linear
relationship between the water adsorption and the silanol number regardless of the nature of the
surface. At relative pressure 0.2 the ratio between the adsorbed water molecules and the silanol
groups was ~1:2, while at 0.5 this ratio was close to 1:1, in agreement with the earlier works8, 67-
68. We point out that these ratios do not reflect the true adsorption stoichiometry, which is more
complicated according to IR and modeling. These ratios, however, may be useful as empirical
rules to evaluate the number of silanols from the water adsorption data or, alternatively, to predict
the amount of water adsorption for a surface with known silanol number. It is important to point
out, however, that the approximately linear relationship between the amount of water adsorbed
and the number of silanols is valid only up to a certain relative pressure, perhaps up to ~0.5 p/po
or so. At higher relative pressures, when the adsorption of water increasingly occur on the
previously adsorbed molecules and involve cooperative hydrogen bonding and clustering, the
adsorption become influenced more by the local environment and spacing between the growing
water clusters than by the number of primary adsorption centers lying underneath (silanols). The
difference in the adsorption behavior at high relative pressures was clearly seen upon comparison
of the water isotherms for TMS-modified silicas. For silicas with low TMS coverage (<25% by
area), the adsorption progressively increased with the relative pressure leading to a multilayer
adsorption and, eventually, capillary condensation of water in pores. For more hydrophobic
104
surfaces (>50% TMS by area), no capillary condensation was observed and the adsorption at high
relative pressures was nearly constant indicating that growth of water clusters was inhibited on
extended hydrophobic surfaces. Considering surface hydrophobicity, it was remarkable however
that the shape of the initial part of the isotherm was convex (Figure 36) indicating positive
interactions between water and the surface, thereby suggesting the presence of the hydrophilic
adsorption centers albeit at a small amount. We believed that the adsorption centers were residual
silanol groups. The water adsorption data suggested that the residual silanols were not fully
screened by the TMS groups and were available to water vapors.
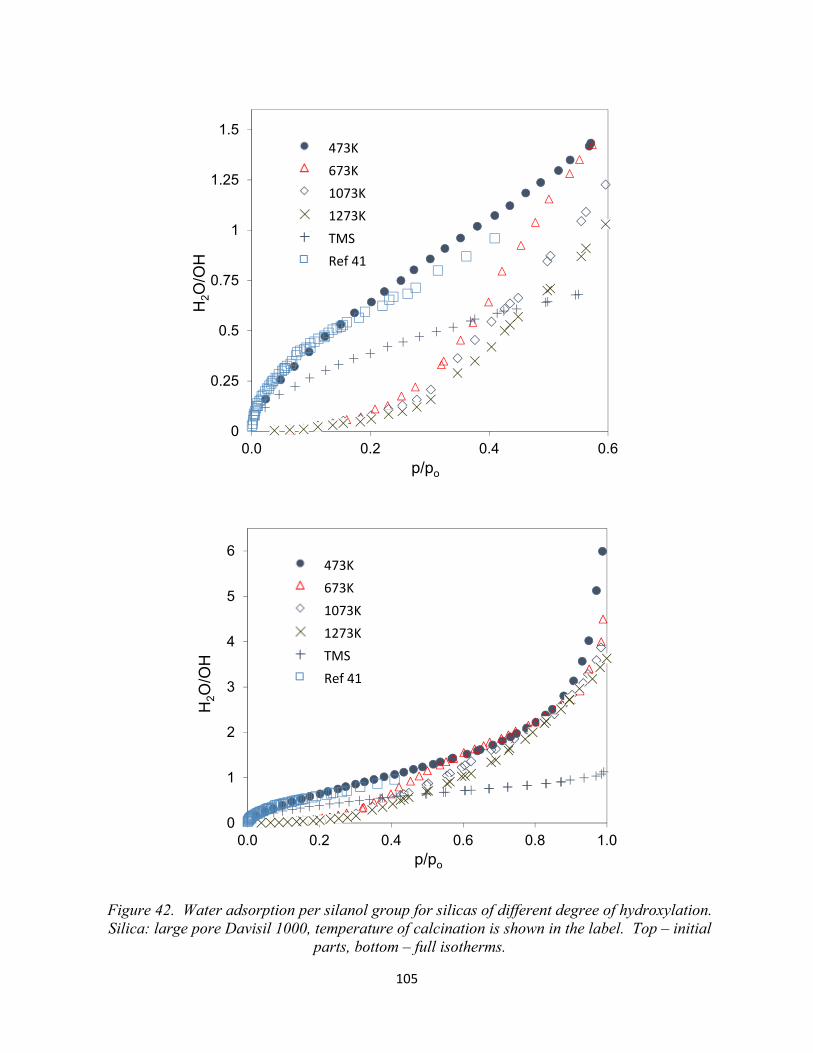
105
Figure 42. Water adsorption per silanol group for silicas of different degree of hydroxylation. Silica: large pore Davisil 1000, temperature of calcination is shown in the label. Top – initial
parts, bottom – full isotherms.
0
0.25
0.5
0.75
1
1.25
1.5
0.0 0.2 0.4 0.6
H2O
/OH
p/po
473K 673K 1073K 1273K TMS Ref 41
0
1
2
3
4
5
6
0.0 0.2 0.4 0.6 0.8 1.0
H2O
/OH
p/po
473K 673K 1073K 1273K TMS Ref 41
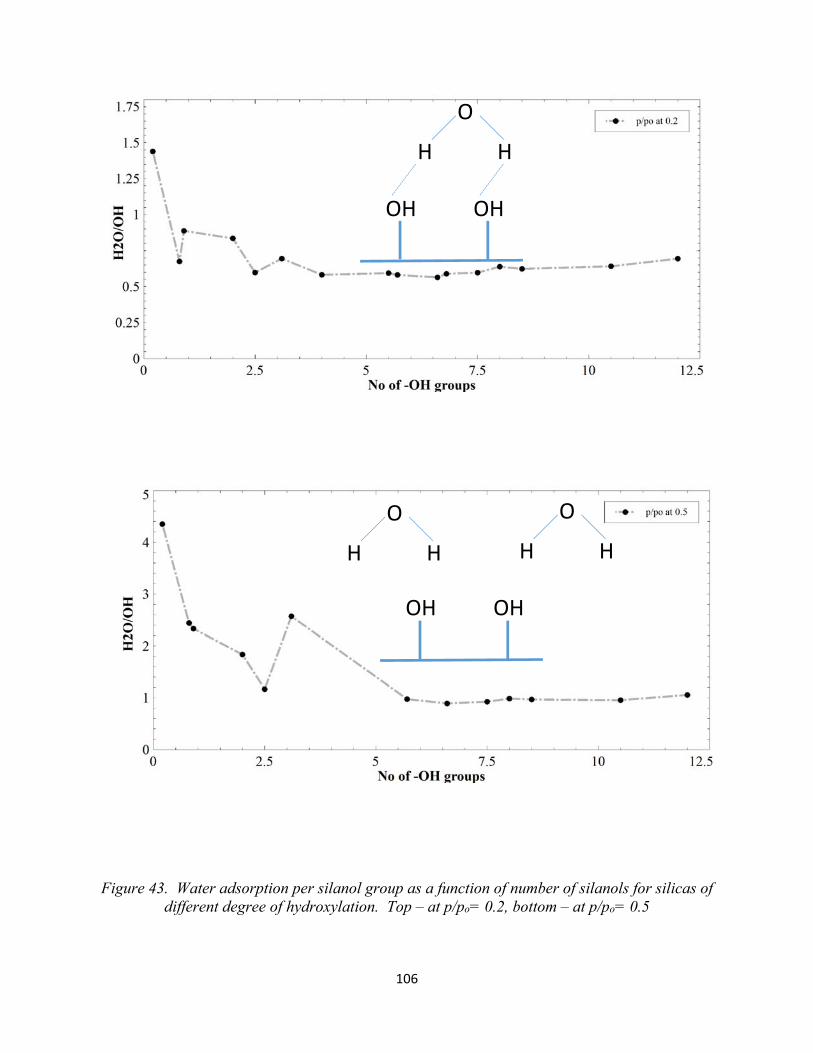
106
Figure 43. Water adsorption per silanol group as a function of number of silanols for silicas of different degree of hydroxylation. Top – at p/po= 0.2, bottom – at p/po= 0.5
OH OH
O
H H
OH OH
O
H H
O
H H
107
3.4 Conclusions
In this work, we employed the combined vapor adsorption study using nitrogen (77K)
and water (293K) isotherms to evaluate the water contact angles for a series of ordered
mesoporous silicas, including MCM-41 and SBA-15, as well as for conventional silica gels.
Specifically, the water isotherms were used to determine the most probable Kelvin radius of
menisci ( ( )) during evaporation of liquid water from pores. Then, ( ) was compared
with the true radius of pores as assessed from nitrogen isotherms ( ( )). For incomplete
wetting, the radius of meniscus, radius of pore, and statistical film thickness t(H2O) were related
through the known equation: ( ) − ( ) = ( ) ∙ , which was used to calculate
the water contact angles (θ>0) in pores.
As it was anticipated, the results obtained showed that the silica pore contact angles were
strongly influenced by the number of the surface silanol groups and, therefore, by the thermal and
hydration treatments of silicas. Freshly made MCM-41 and SBA-15 silicas calcined at 550oC
(standard treatment to remove surfactant from the pores) demonstrated partly dehydroxylated,
moderately hydrophobic surfaces with the water contact angles θ ~30-40o. Exposure of these
silicas to water vapors at room temperature gradually restored the hydroxyl coverage and reduced
the water contact angles down to ~15-20o. However, silicas with fully hydrophilic surfaces
wettable by water were obtained only after the hydroxylation, the hydrothermal treatment by liquid
water at 100oC (373K) for 24 h. Thus hydroxylated silicas showed pore surfaces with water
contact angles θ ~0-12o. The changes in the pore structure of SBA-15 caused by liquid water were
attributed to the dissolution/ redistribution of silica resulting in smoothening the pore walls and
reduction of the micropores74. Depending on the preparation conditions used for the SBA-15
synthesis74, the reflux in water for 4 h showed ~5-20% decrease in the pore volume and ~10-50%
108
decrease in the surface area compared to bare SBA-15, in good agreement with the results reported
here.
Along with the thermal treatment, chemical substitution of silanols was a powerful method
to control the pore wetting. For example, the reactions of SBA-15 with trimethyl-(N,N-
dimethylamino)-silane produced a series of silicas with the increasing pore hydrophobicity as
characterized by the water contact angles 26, 31, 41, and 62o for 10, 35, 50, and 60% of the TMS
surface coverage respectively.
The proposed method of the contact angles determination relies on the statistical film
thickness (t-curve) of the adsorbed water. We noted that the t-curves for water adsorption reported
in the literature varied significantly and, especially for dehydroxylated and hydrophobic surfaces,
were scarce or unknown. To address this issue, the water t-curves were measured for a series of
model wide-pore silicas with known silanol content covering the wide range of silanol coverage.
The raw data and the equations for the t-curves on hydroxylated, dehydroxylated, and hydrophobic
TMS silicas were reported providing the reference data necessary for the quantitative analysis of
water adsorption.
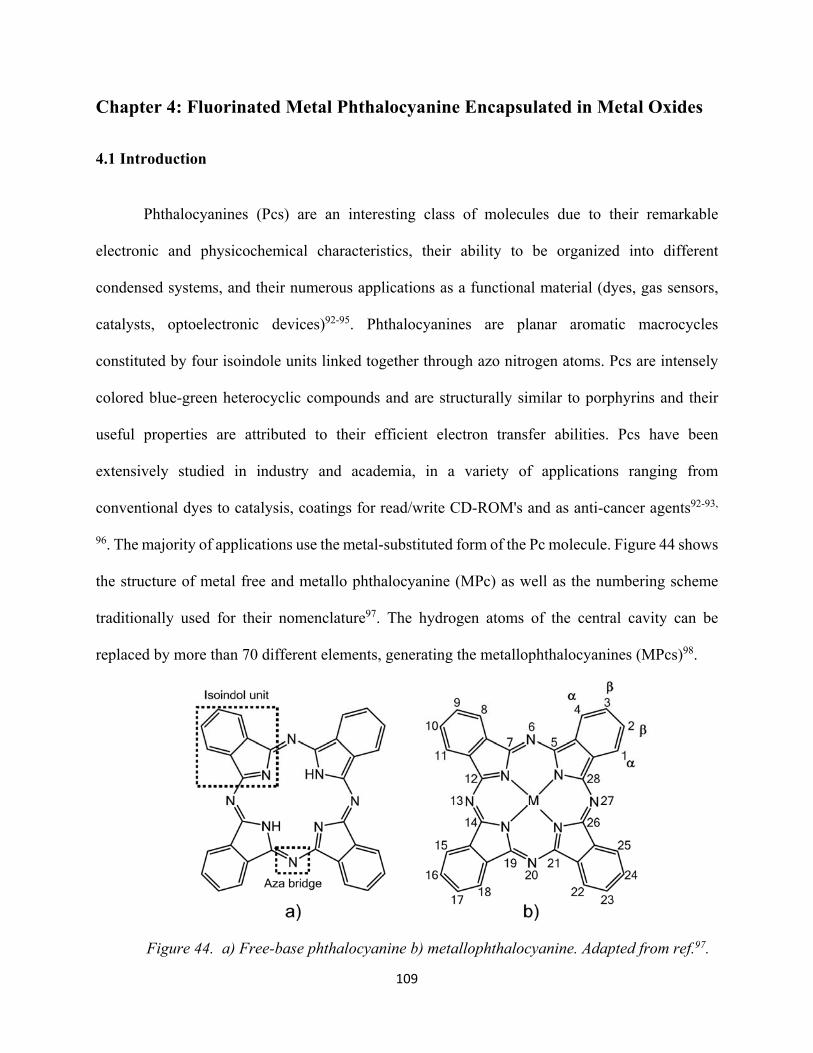
109
Chapter 4: Fluorinated Metal Phthalocyanine Encapsulated in Metal Oxides
4.1 Introduction
Phthalocyanines (Pcs) are an interesting class of molecules due to their remarkable
electronic and physicochemical characteristics, their ability to be organized into different
condensed systems, and their numerous applications as a functional material (dyes, gas sensors,
catalysts, optoelectronic devices)92-95. Phthalocyanines are planar aromatic macrocycles
constituted by four isoindole units linked together through azo nitrogen atoms. Pcs are intensely
colored blue-green heterocyclic compounds and are structurally similar to porphyrins and their
useful properties are attributed to their efficient electron transfer abilities. Pcs have been
extensively studied in industry and academia, in a variety of applications ranging from
conventional dyes to catalysis, coatings for read/write CD-ROM's and as anti-cancer agents92-93,
96. The majority of applications use the metal-substituted form of the Pc molecule. Figure 44 shows
the structure of metal free and metallo phthalocyanine (MPc) as well as the numbering scheme
traditionally used for their nomenclature97. The hydrogen atoms of the central cavity can be
replaced by more than 70 different elements, generating the metallophthalocyanines (MPcs)98.
Figure 44. a) Free-base phthalocyanine b) metallophthalocyanine. Adapted from ref.97.
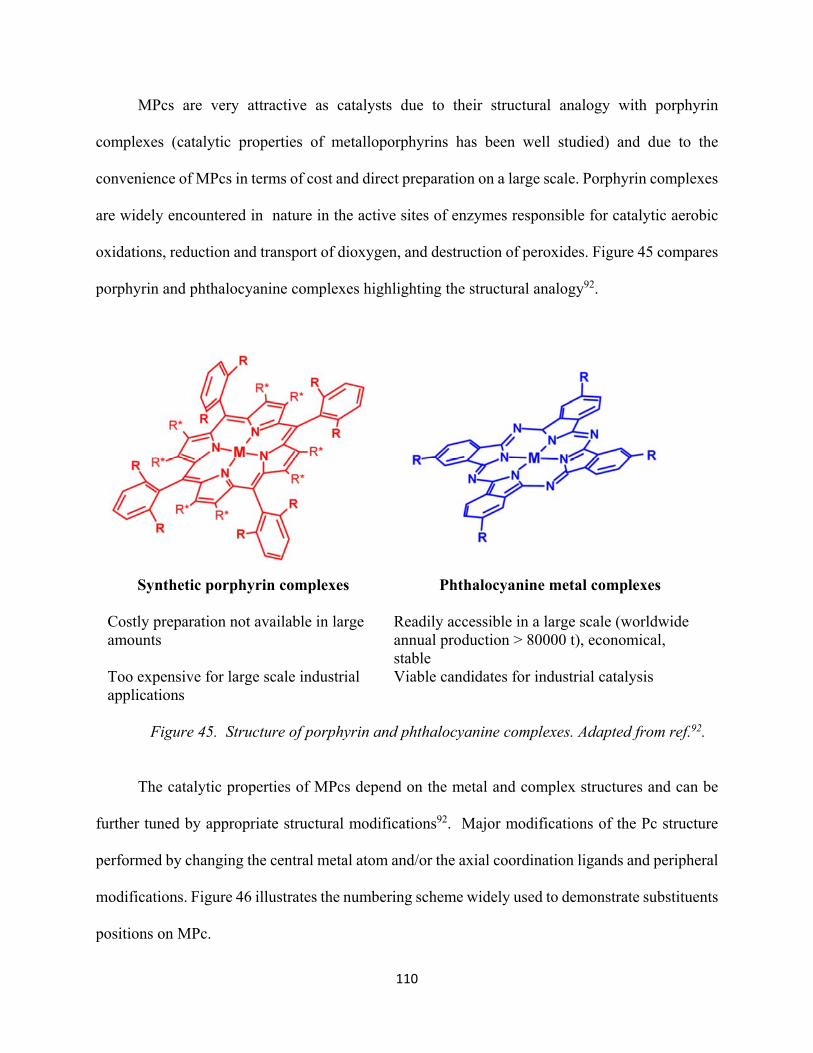
110
MPcs are very attractive as catalysts due to their structural analogy with porphyrin
complexes (catalytic properties of metalloporphyrins has been well studied) and due to the
convenience of MPcs in terms of cost and direct preparation on a large scale. Porphyrin complexes
are widely encountered in nature in the active sites of enzymes responsible for catalytic aerobic
oxidations, reduction and transport of dioxygen, and destruction of peroxides. Figure 45 compares
porphyrin and phthalocyanine complexes highlighting the structural analogy92.
Synthetic porphyrin complexes
Phthalocyanine metal complexes
Costly preparation not available in large amounts
Readily accessible in a large scale (worldwide annual production > 80000 t), economical, stable
Too expensive for large scale industrial applications
Viable candidates for industrial catalysis
Figure 45. Structure of porphyrin and phthalocyanine complexes. Adapted from ref.92.
The catalytic properties of MPcs depend on the metal and complex structures and can be
further tuned by appropriate structural modifications92. Major modifications of the Pc structure
performed by changing the central metal atom and/or the axial coordination ligands and peripheral
modifications. Figure 46 illustrates the numbering scheme widely used to demonstrate substituents
positions on MPc.
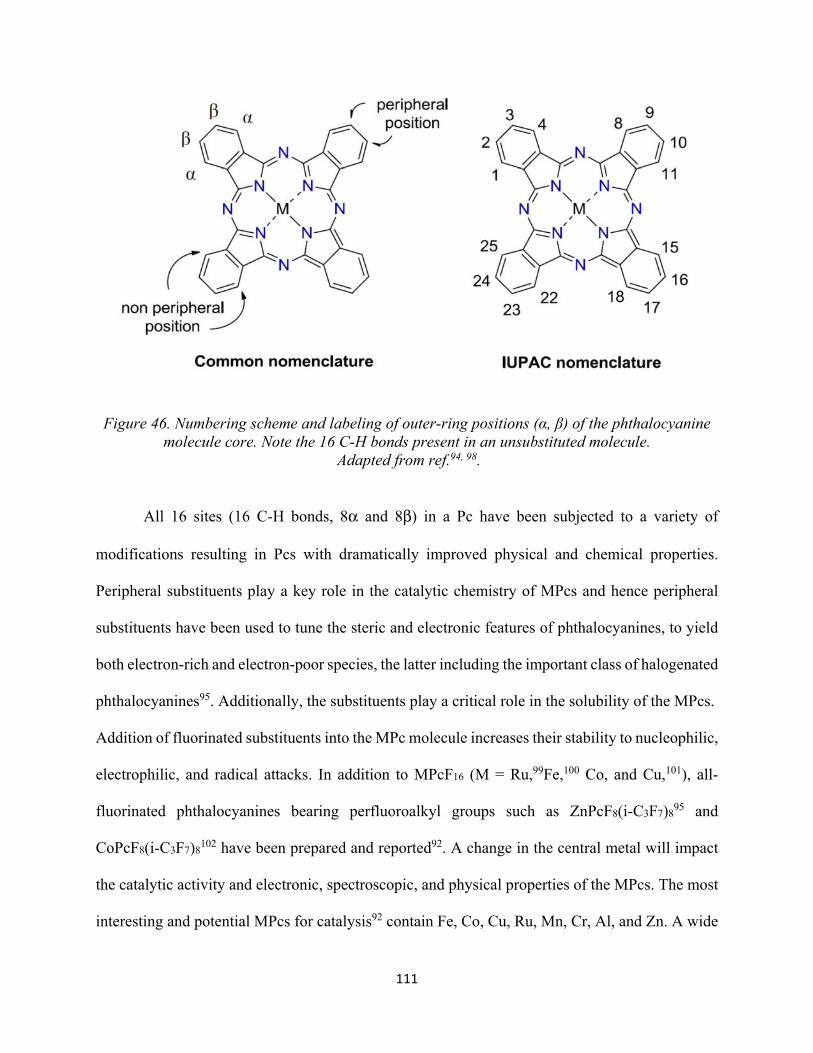
111
Figure 46. Numbering scheme and labeling of outer-ring positions (α, β) of the phthalocyanine molecule core. Note the 16 C-H bonds present in an unsubstituted molecule.
Adapted from ref.94, 98.
All 16 sites (16 C-H bonds, 8α and 8β) in a Pc have been subjected to a variety of
modifications resulting in Pcs with dramatically improved physical and chemical properties.
Peripheral substituents play a key role in the catalytic chemistry of MPcs and hence peripheral
substituents have been used to tune the steric and electronic features of phthalocyanines, to yield
both electron-rich and electron-poor species, the latter including the important class of halogenated
phthalocyanines95. Additionally, the substituents play a critical role in the solubility of the MPcs.
Addition of fluorinated substituents into the MPc molecule increases their stability to nucleophilic,
electrophilic, and radical attacks. In addition to MPcF16 (M = Ru,99Fe,100 Co, and Cu,101), all-
fluorinated phthalocyanines bearing perfluoroalkyl groups such as ZnPcF8(i-C3F7)895 and
CoPcF8(i-C3F7)8102 have been prepared and reported92. A change in the central metal will impact
the catalytic activity and electronic, spectroscopic, and physical properties of the MPcs. The most
interesting and potential MPcs for catalysis92 contain Fe, Co, Cu, Ru, Mn, Cr, Al, and Zn. A wide
112
range of several transformations including reduction, preparation of nitrogen-containing
compounds, and various C−C bond formation reactions can be efficiently catalyzed by MPcs. The
catalytic properties of MPcs can be used in large-scale processes for the preparation of bulk
chemicals and synthesis of elaborated fine chemicals92. The focus of Dr.Gorun and his
collaborators’ work94, 98 has been the replacement of outer-ring hydrogens with fluorine and i-C3F7
groups to increase the relative stability and catalytic activity of MPcs.
Homogeneous catalysts have some attractive properties, such as high selectivity and
accessibility to all catalytically active sites. However, the use of homogeneous catalysts is being
challenged because of inherent problems, such as corrosion, toxicity, difficulty in catalyst handling
and separation from the reaction system, high cost, and the creation of solid waste. A thorough
review of homogenous and heterogeneous catalytic reactions using various MPcs has been
published by Sorokin92. In general, unsubstituted MPcs have been often used as catalysts
(homogeneous) in a variety of reactions. Due to their poor solubility in common organic solvents,
the solubility of these MPcs under reaction conditions has always remained an issue.
One approach is to immobilize the homogeneous catalyst on an insoluble support92, 103,
forming a heterogeneous catalyst. Heterogeneous catalysts are highly preferred due to their easy
separation from the reaction mixture and their reuse for successive reactions provided that catalysts
retain their catalytic properties104. In general organic polymers and inorganic materials are used as
supports for the catalyst molecule. However the stability of the support under reaction conditions,
non-involvement of the support itself in the reaction, capacity of the support to introduce
functionality for covalent anchoring, availability and cost of the support are various considerations.
Porous materials with high surface area e.g., mesoporous silicas generally provide a good catalyst
loading and a possibility to use confinement effects i.e entrapment of the catalyst molecule inside
113
the support. The distribution of the active sites (MPc) on the surface of the adsorbent (solid
support), accessibility to the active site and the state of the adsorbent-MPc complex are heavily
influenced by the method or procedure of preparation of these supported catalysts.
In the thesis completed by Graffius98 a systematic study of the solution adsorption was
performed on several substrates, including : (1) Zinc phthalocyanines with an increasingly
fluorinated periphery and electron deficiency, and (2) F64PcM where the central metal was changed
from Zn to Cu, Co, Ru, Fe, and VO. Adsorption of each series from acetone and methylene chloride
was compared on several unique adsorbents. Solution adsorption of phthalocyanines was
demonstrated as an effective means of producing uniform catalytically active solid surfaces. The
end-goal of the research performed by Graffius98 work was to obtain stable phthalocyanine thin
films for use as recyclable, solid-supported heterogeneous catalysts.
In this effort, we have undertaken a systematic study to explore the possibility of preparing
a supported catalyst material i.e loading fluorinated metal phthalocyanines onto metal oxide
surfaces by two other techniques in addition to solution adsorption demonstrated by Graffius98.
Techniques or procedures that have been used to immobilize MPcs include: i) physical adsorption
(from solution) onto metal oxide surface, ii) deposition by pore filling and encapsulation and iii)
mesopore entrapment or confinement. The MPcs are loaded on to metal oxides with an aim to: a)
maximize the surface area of the Pcs by distributing it over the support, b) immobilize the Pcs so
that they do not leach into the solution environment, c) improve the thermal stability of the Pcs
and d) attempt to achieve single-site catalysis. All the immobilization techniques were carried out
with F64PcZn as the model MPc, acetone as the immobilization solvent and silica or alumina as
adsorbents (solid support).
114
An understanding of gas adsorption mechanisms on metal phthalocyanines (MPcs)105 is
essential for their practical application in biological processes, gas sensing, and catalysis. In this
work, the surface characteristics were probed by performing nitrogen and water adsorption on the
free-form MPcs (without immobilization on solid support) and characterization of their physical
properties. Additionally probing into surface characteristics of MPcs facilitate the understanding
of these complexes interact with or adsorb onto metal oxide pores.
4.2 Experimental
4.2.1 Chemicals
All solvents and chemicals for the synthesis of the phthalocyanines were purchased from
Thermo Fisher Scientific (Waltham, MA). Commercially available phthalocyanines were
purchased from Sigma-Aldrich (St. Louis, MO).
4.2.2 Metal oxides
Davisil 150 Silica (Pore Diameter: 150Å, Pore Volume: 0.5cc/g) was obtained from Grace
(Columbia, MD). The pore structure of Davisil 150 was assessed by nitrogen adsorption (77 K)
using a Quantachrome Autosorb-1 analyzer (Boynton Beach, FL, USA). Colloidal alumina
(Aluminum oxide, 20% in H2O, colloidal dispersion) and mesoporous alumina (activated alumina,
basic, Pore Diameter: 58Å) were obtained from Alfa Aesar (Tewksbury, MA).
4.2.3 Synthesis of perfluorinated phthalocyanines
Synthesis of the perfluorinated phthalonitrile precursor and phthalocyanines was completed by
Erik Carrion from the Gorun research group at Seton Hall using a previously developed procedure
(Figure 47) 94, 96, 106. Briefly, the fluorinated precursor, tetrafluorophthalonitrile, (A) was purchased
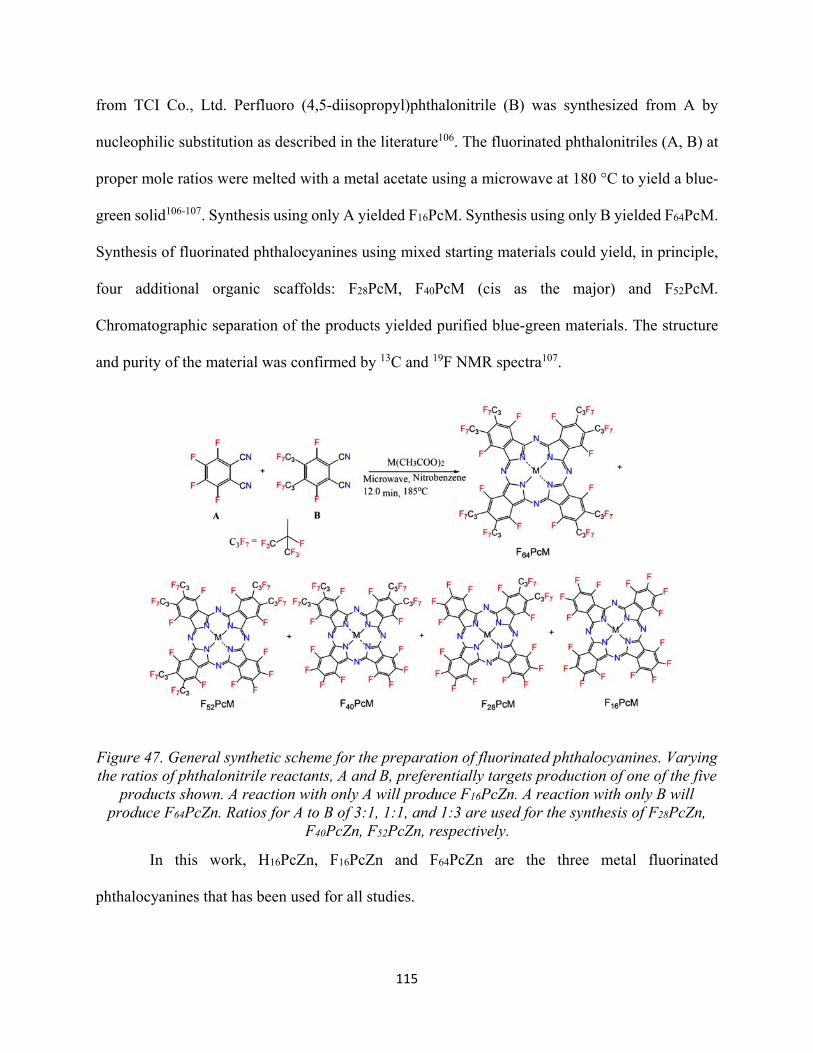
115
from TCI Co., Ltd. Perfluoro (4,5-diisopropyl)phthalonitrile (B) was synthesized from A by
nucleophilic substitution as described in the literature106. The fluorinated phthalonitriles (A, B) at
proper mole ratios were melted with a metal acetate using a microwave at 180 °C to yield a blue-
green solid106-107. Synthesis using only A yielded F16PcM. Synthesis using only B yielded F64PcM.
Synthesis of fluorinated phthalocyanines using mixed starting materials could yield, in principle,
four additional organic scaffolds: F28PcM, F40PcM (cis as the major) and F52PcM.
Chromatographic separation of the products yielded purified blue-green materials. The structure
and purity of the material was confirmed by 13C and 19F NMR spectra107.
Figure 47. General synthetic scheme for the preparation of fluorinated phthalocyanines. Varying the ratios of phthalonitrile reactants, A and B, preferentially targets production of one of the five
products shown. A reaction with only A will produce F16PcZn. A reaction with only B will produce F64PcZn. Ratios for A to B of 3:1, 1:1, and 1:3 are used for the synthesis of F28PcZn,
F40PcZn, F52PcZn, respectively.
In this work, H16PcZn, F16PcZn and F64PcZn are the three metal fluorinated
phthalocyanines that has been used for all studies.
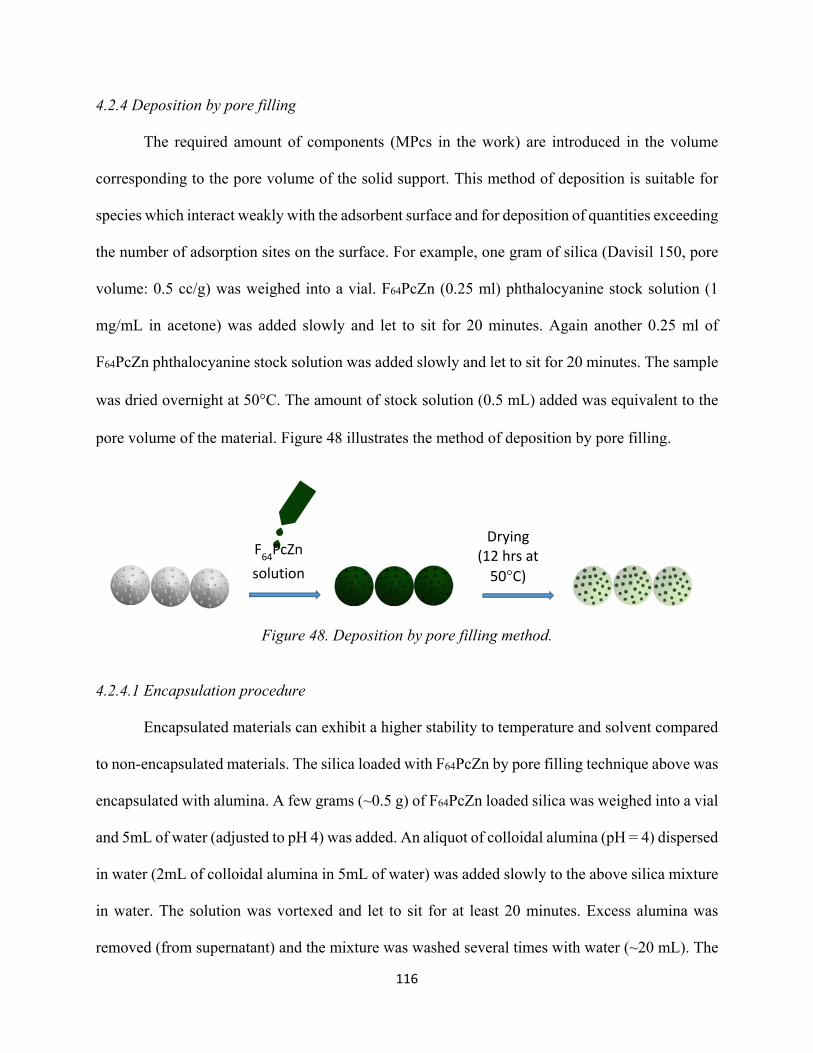
116
4.2.4 Deposition by pore filling
The required amount of components (MPcs in the work) are introduced in the volume
corresponding to the pore volume of the solid support. This method of deposition is suitable for
species which interact weakly with the adsorbent surface and for deposition of quantities exceeding
the number of adsorption sites on the surface. For example, one gram of silica (Davisil 150, pore
volume: 0.5 cc/g) was weighed into a vial. F64PcZn (0.25 ml) phthalocyanine stock solution (1
mg/mL in acetone) was added slowly and let to sit for 20 minutes. Again another 0.25 ml of
F64PcZn phthalocyanine stock solution was added slowly and let to sit for 20 minutes. The sample
was dried overnight at 50°C. The amount of stock solution (0.5 mL) added was equivalent to the
pore volume of the material. Figure 48 illustrates the method of deposition by pore filling.
Figure 48. Deposition by pore filling method.
4.2.4.1 Encapsulation procedure
Encapsulated materials can exhibit a higher stability to temperature and solvent compared
to non-encapsulated materials. The silica loaded with F64PcZn by pore filling technique above was
encapsulated with alumina. A few grams (~0.5 g) of F64PcZn loaded silica was weighed into a vial
and 5mL of water (adjusted to pH 4) was added. An aliquot of colloidal alumina (pH = 4) dispersed
in water (2mL of colloidal alumina in 5mL of water) was added slowly to the above silica mixture
in water. The solution was vortexed and let to sit for at least 20 minutes. Excess alumina was
removed (from supernatant) and the mixture was washed several times with water (~20 mL). The
Drying
(12 hrs at 50°C)
F64PcZn
solution
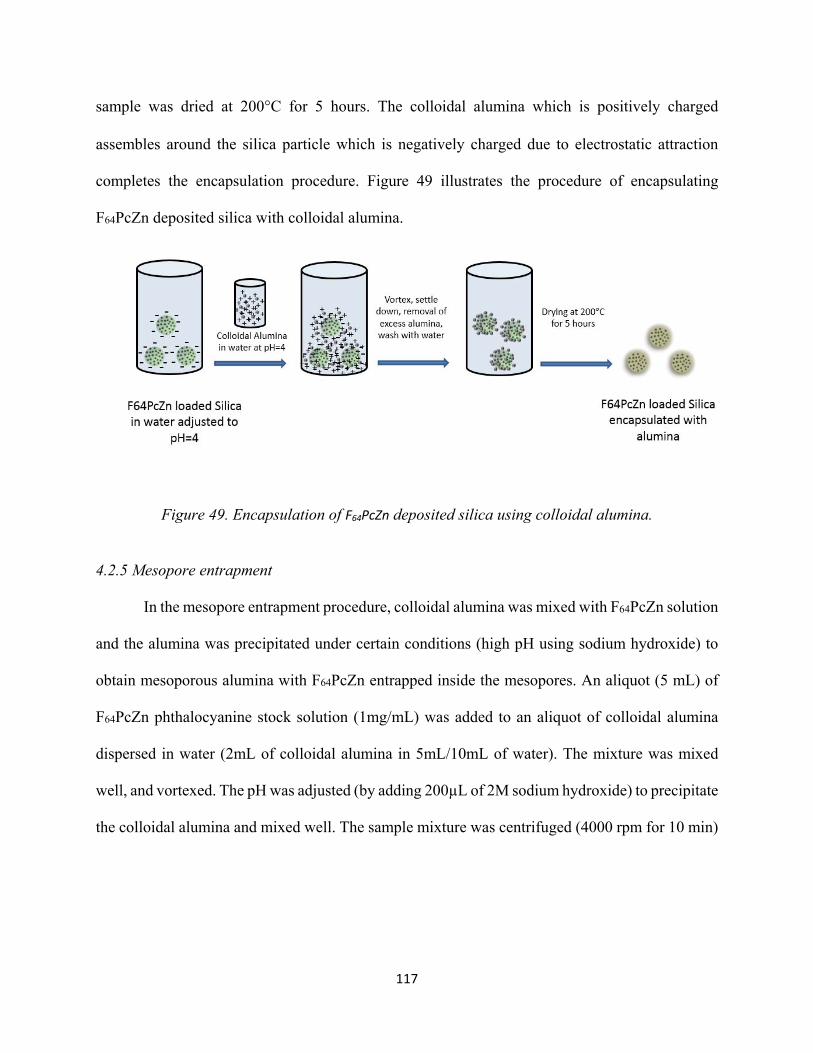
117
sample was dried at 200°C for 5 hours. The colloidal alumina which is positively charged
assembles around the silica particle which is negatively charged due to electrostatic attraction
completes the encapsulation procedure. Figure 49 illustrates the procedure of encapsulating
F64PcZn deposited silica with colloidal alumina.
Figure 49. Encapsulation of F64PcZn deposited silica using colloidal alumina.
4.2.5 Mesopore entrapment
In the mesopore entrapment procedure, colloidal alumina was mixed with F64PcZn solution
and the alumina was precipitated under certain conditions (high pH using sodium hydroxide) to
obtain mesoporous alumina with F64PcZn entrapped inside the mesopores. An aliquot (5 mL) of
F64PcZn phthalocyanine stock solution (1mg/mL) was added to an aliquot of colloidal alumina
dispersed in water (2mL of colloidal alumina in 5mL/10mL of water). The mixture was mixed
well, and vortexed. The pH was adjusted (by adding 200µL of 2M sodium hydroxide) to precipitate
the colloidal alumina and mixed well. The sample mixture was centrifuged (4000 rpm for 10 min)
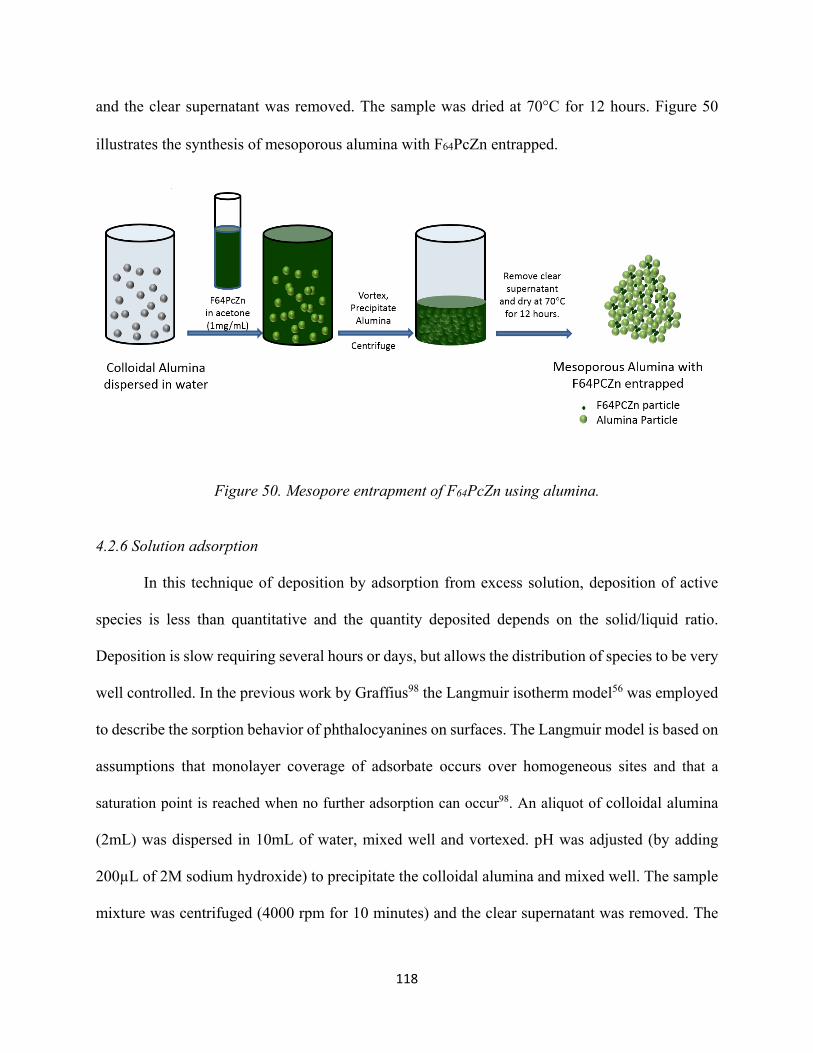
118
and the clear supernatant was removed. The sample was dried at 70°C for 12 hours. Figure 50
illustrates the synthesis of mesoporous alumina with F64PcZn entrapped.
Figure 50. Mesopore entrapment of F64PcZn using alumina.
4.2.6 Solution adsorption
In this technique of deposition by adsorption from excess solution, deposition of active
species is less than quantitative and the quantity deposited depends on the solid/liquid ratio.
Deposition is slow requiring several hours or days, but allows the distribution of species to be very
well controlled. In the previous work by Graffius98 the Langmuir isotherm model56 was employed
to describe the sorption behavior of phthalocyanines on surfaces. The Langmuir model is based on
assumptions that monolayer coverage of adsorbate occurs over homogeneous sites and that a
saturation point is reached when no further adsorption can occur98. An aliquot of colloidal alumina
(2mL) was dispersed in 10mL of water, mixed well and vortexed. pH was adjusted (by adding
200µL of 2M sodium hydroxide) to precipitate the colloidal alumina and mixed well. The sample
mixture was centrifuged (4000 rpm for 10 minutes) and the clear supernatant was removed. The
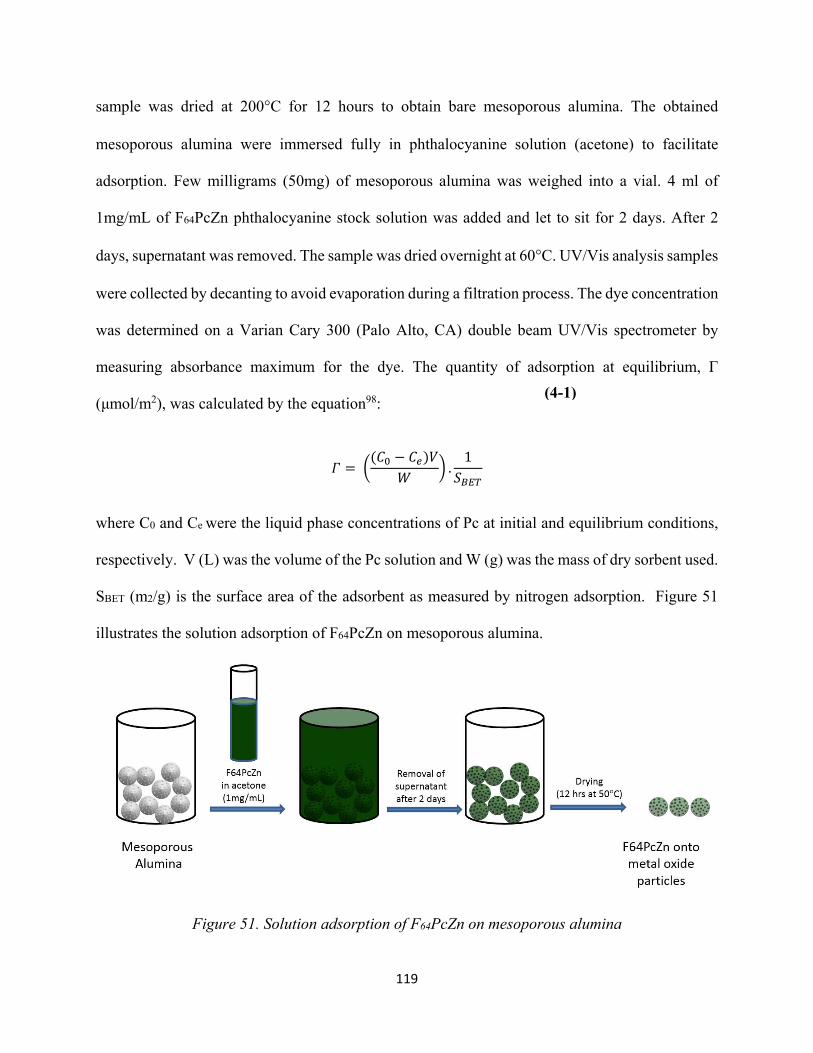
119
sample was dried at 200°C for 12 hours to obtain bare mesoporous alumina. The obtained
mesoporous alumina were immersed fully in phthalocyanine solution (acetone) to facilitate
adsorption. Few milligrams (50mg) of mesoporous alumina was weighed into a vial. 4 ml of
1mg/mL of F64PcZn phthalocyanine stock solution was added and let to sit for 2 days. After 2
days, supernatant was removed. The sample was dried overnight at 60°C. UV/Vis analysis samples
were collected by decanting to avoid evaporation during a filtration process. The dye concentration
was determined on a Varian Cary 300 (Palo Alto, CA) double beam UV/Vis spectrometer by
measuring absorbance maximum for the dye. The quantity of adsorption at equilibrium, Γ
(μmol/m2), was calculated by the equation98:
= ( − ) . 1
where C0 and Ce were the liquid phase concentrations of Pc at initial and equilibrium conditions,
respectively. V (L) was the volume of the Pc solution and W (g) was the mass of dry sorbent used.
SBET (m2/g) is the surface area of the adsorbent as measured by nitrogen adsorption. Figure 51
illustrates the solution adsorption of F64PcZn on mesoporous alumina.
Figure 51. Solution adsorption of F64PcZn on mesoporous alumina
(4-1)
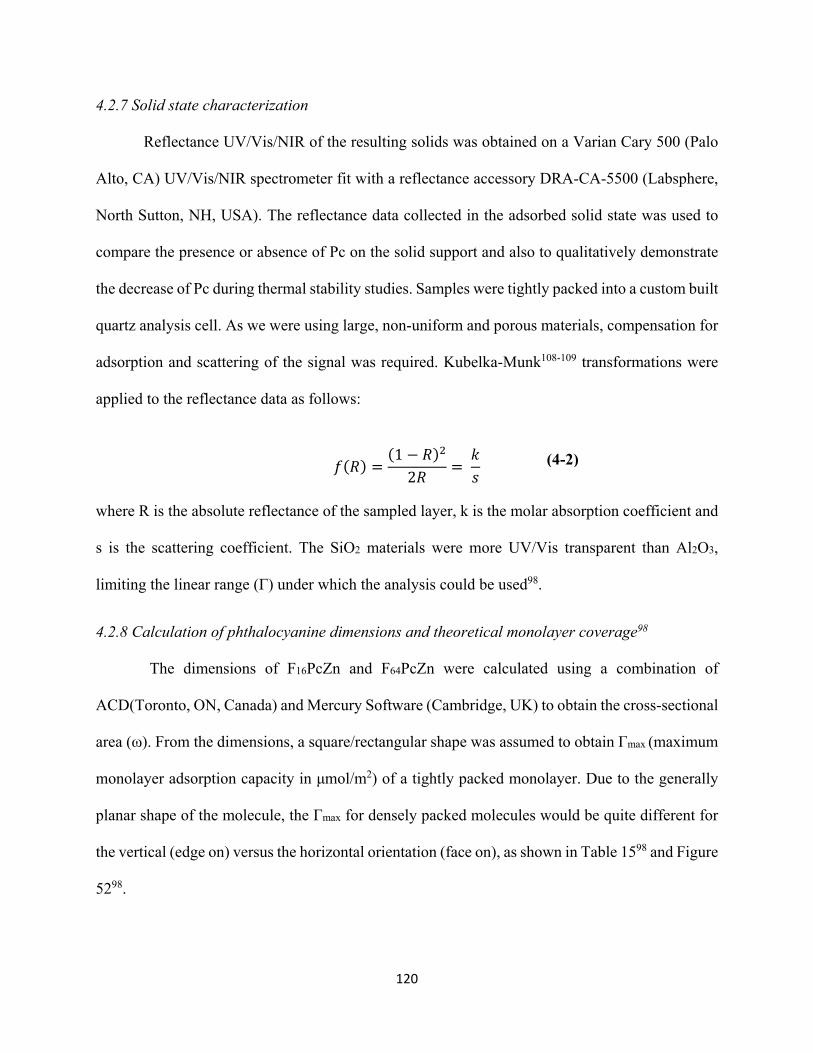
120
4.2.7 Solid state characterization
Reflectance UV/Vis/NIR of the resulting solids was obtained on a Varian Cary 500 (Palo
Alto, CA) UV/Vis/NIR spectrometer fit with a reflectance accessory DRA-CA-5500 (Labsphere,
North Sutton, NH, USA). The reflectance data collected in the adsorbed solid state was used to
compare the presence or absence of Pc on the solid support and also to qualitatively demonstrate
the decrease of Pc during thermal stability studies. Samples were tightly packed into a custom built
quartz analysis cell. As we were using large, non-uniform and porous materials, compensation for
adsorption and scattering of the signal was required. Kubelka-Munk108-109 transformations were
applied to the reflectance data as follows:
( ) = (1 − )2 =
where R is the absolute reflectance of the sampled layer, k is the molar absorption coefficient and
s is the scattering coefficient. The SiO2 materials were more UV/Vis transparent than Al2O3,
limiting the linear range (Γ) under which the analysis could be used98.
4.2.8 Calculation of phthalocyanine dimensions and theoretical monolayer coverage98
The dimensions of F16PcZn and F64PcZn were calculated using a combination of
ACD(Toronto, ON, Canada) and Mercury Software (Cambridge, UK) to obtain the cross-sectional
area (ω). From the dimensions, a square/rectangular shape was assumed to obtain Γmax (maximum
monolayer adsorption capacity in μmol/m2) of a tightly packed monolayer. Due to the generally
planar shape of the molecule, the Γmax for densely packed molecules would be quite different for
the vertical (edge on) versus the horizontal orientation (face on), as shown in Table 1598 and Figure
5298.
(4-2)
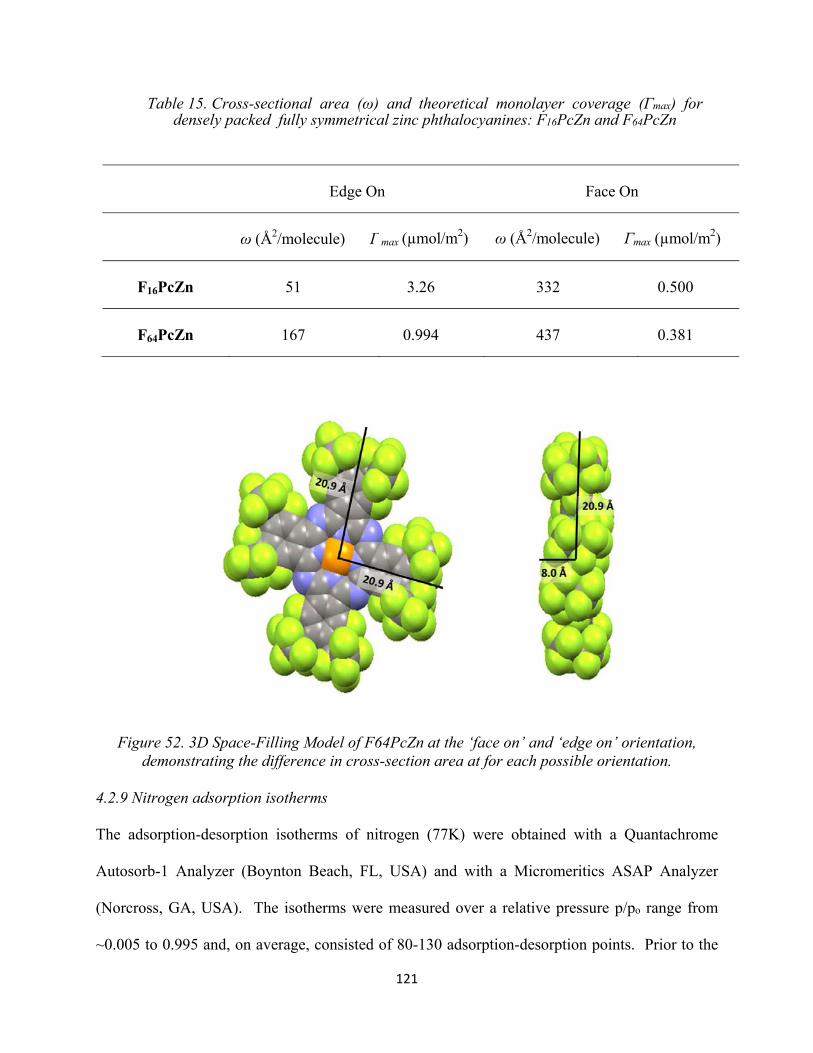
121
Table 15. Cross-sectional area (ω) and theoretical monolayer coverage (Γmax) for densely packed fully symmetrical zinc phthalocyanines: F16PcZn and F64PcZn
Edge On Face On
ω (Å2/molecule) Γmax (µmol/m2) ω (Å2/molecule) Γmax (µmol/m2)
F16PcZn 51 3.26 332 0.500
F64PcZn 167 0.994 437 0.381
Figure 52. 3D Space-Filling Model of F64PcZn at the ‘face on’ and ‘edge on’ orientation, demonstrating the difference in cross-section area at for each possible orientation.
4.2.9 Nitrogen adsorption isotherms
The adsorption-desorption isotherms of nitrogen (77K) were obtained with a Quantachrome
Autosorb-1 Analyzer (Boynton Beach, FL, USA) and with a Micromeritics ASAP Analyzer
(Norcross, GA, USA). The isotherms were measured over a relative pressure p/po range from
~0.005 to 0.995 and, on average, consisted of 80-130 adsorption-desorption points. Prior to the
122
adsorption measurements, the Pcs were outgassed at 200°C overnight. Specific surface areas were
calculated via the BET method using the range of relative pressure from ~0.06 to 0.27 and the
value for nitrogen cross-section 0.162 nm2. The pore size distribution and the average (most
probable) pore radius ( ) was calculated by the BJH method from the desorption branch of the
isotherm. Complete wetting of the pores by liquid nitrogen (cos θ = 1) was assumed. All the
calculations were performed using vendor’s (Quantachrome Instruments) software. The amount
of nitrogen adsorbed (Γ) expressed in µmole/m2 is converted to number of nitrogen molecules per
MPc molecule as per equation (4-3).
= ( Γ ∗ 10 ) ∗ ( ∗ 10 ) ∗
where Γ is amount of nitrogen adsorbed in expressed in µmole/m2, is cross-sectional area of
the MPc molecule in Å2/molecule and is the Avogadro’s constant.
4.2.10 Water adsorption isotherms
The adsorption-desorption isotherms of water (293K) were obtained using a Quantachrome
Autosorb-1 Analyzer (Boynton Beach, FL, USA). The isotherms were measured over a relative
pressure p/po range from ~0.02 to 0.99 and consisted of 78 adsorption-desorption points. Unless
specified otherwise, Pcs were outgassed at 100°C overnight. The thickness of the adsorbed films
was calculated by equation (3-3). The value for water cross-section 0.105 nm2. At the temperature
of the experiment 20°C, surface tension of water was 72.8 mJ/m2 and its molar volume is 18.05
cm3/mol. The contact angles were calculated by equation 2-19 using the most probable values of
rm(H2O) and rp(N2). The amount of water adsorbed (Γ) expressed in µmole/m2 is converted to
number of water molecules per MPc molecule using equation (4-3).
(4-3)
123
4.2.11 Thermogravimetric Analysis
Thermogravimetric analysis (TGA) was performed using a TA Instruments
Thermogravimetric Analyzer operated between room temperature and 1000°C at a heating rate
10°C/min with ambient (air exposure) or a flow of dry nitrogen (20 cm3/min). Stability of the
adsorbed phthalocyanines was assessed by heating materials to set temperatures (200-400°C) and
analyzing the TGA weight loss and solid state spectra.
4.3 Results and Discussions
The Zn containing Pcs have been utilized widely in developing electro and photo catalysts,
thin films, infrared sensors, photovoltaic cells, light-emitting diodes, and field-effect transistors.
The planar Pcs are known to aggregate through π−π interactions, there by hindering solubility and
accessibility to the central metal ion which is believed to be important for catalytic activity.
As demonstrated in the work by Patel94 and references there in the new class of
perfluorometalphthalocyanines (F64PcZn) exhibit enhanced solubility and favorable electronic
structure over planar Pcs. The replacement of sixteen aromatic C-H bonds of planar H16Pc by
aromatic C-F bonds (F16Pc) enhances the thermal stability of Pcs, but did not improve the chemical
stability due to nucleophilic attack94. In the research by Patel94 the aggregation propensity and
chemical stability issues of the thermally stable F16Pc have been eliminated via replacement of
eight peripheral aromatic C-F substituents with bulky aliphatic iso perfluoro groups (i-C3F7)
resulting in F64Pc class. In the work by Graffius98, the solution adsorption and thermal stability of
phthalocyanines: F16PcZn and F64PcZn in addition to other series of MPcs was studied on a variety
of surfaces using acetone and methylene chloride as solvent. Graffius98 reported strong,
irreversible adsorption of these molecules on the surface of Al2O3 and aminated silicas. Graffius98
also indicated that adsorption was dominated by Lewis acid-base interactions between the electron
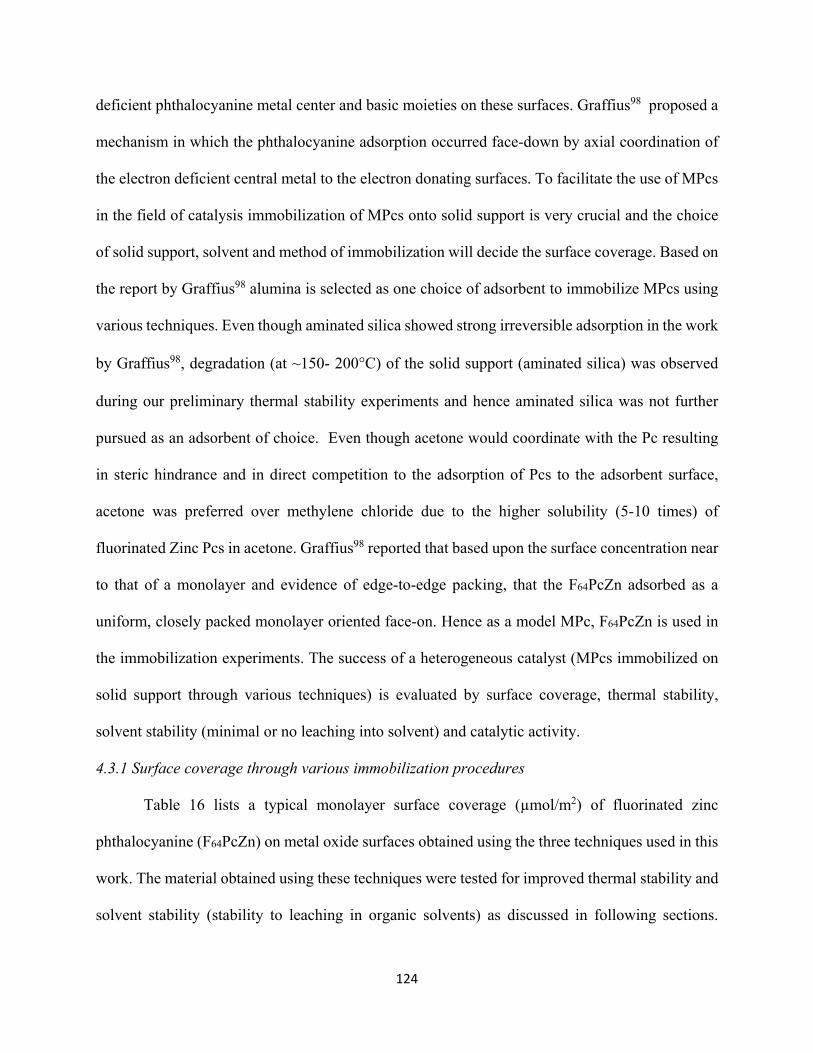
124
deficient phthalocyanine metal center and basic moieties on these surfaces. Graffius98 proposed a
mechanism in which the phthalocyanine adsorption occurred face-down by axial coordination of
the electron deficient central metal to the electron donating surfaces. To facilitate the use of MPcs
in the field of catalysis immobilization of MPcs onto solid support is very crucial and the choice
of solid support, solvent and method of immobilization will decide the surface coverage. Based on
the report by Graffius98 alumina is selected as one choice of adsorbent to immobilize MPcs using
various techniques. Even though aminated silica showed strong irreversible adsorption in the work
by Graffius98, degradation (at ~150- 200°C) of the solid support (aminated silica) was observed
during our preliminary thermal stability experiments and hence aminated silica was not further
pursued as an adsorbent of choice. Even though acetone would coordinate with the Pc resulting
in steric hindrance and in direct competition to the adsorption of Pcs to the adsorbent surface,
acetone was preferred over methylene chloride due to the higher solubility (5-10 times) of
fluorinated Zinc Pcs in acetone. Graffius98 reported that based upon the surface concentration near
to that of a monolayer and evidence of edge-to-edge packing, that the F64PcZn adsorbed as a
uniform, closely packed monolayer oriented face-on. Hence as a model MPc, F64PcZn is used in
the immobilization experiments. The success of a heterogeneous catalyst (MPcs immobilized on
solid support through various techniques) is evaluated by surface coverage, thermal stability,
solvent stability (minimal or no leaching into solvent) and catalytic activity.
4.3.1 Surface coverage through various immobilization procedures
Table 16 lists a typical monolayer surface coverage (µmol/m2) of fluorinated zinc
phthalocyanine (F64PcZn) on metal oxide surfaces obtained using the three techniques used in this
work. The material obtained using these techniques were tested for improved thermal stability and
solvent stability (stability to leaching in organic solvents) as discussed in following sections.
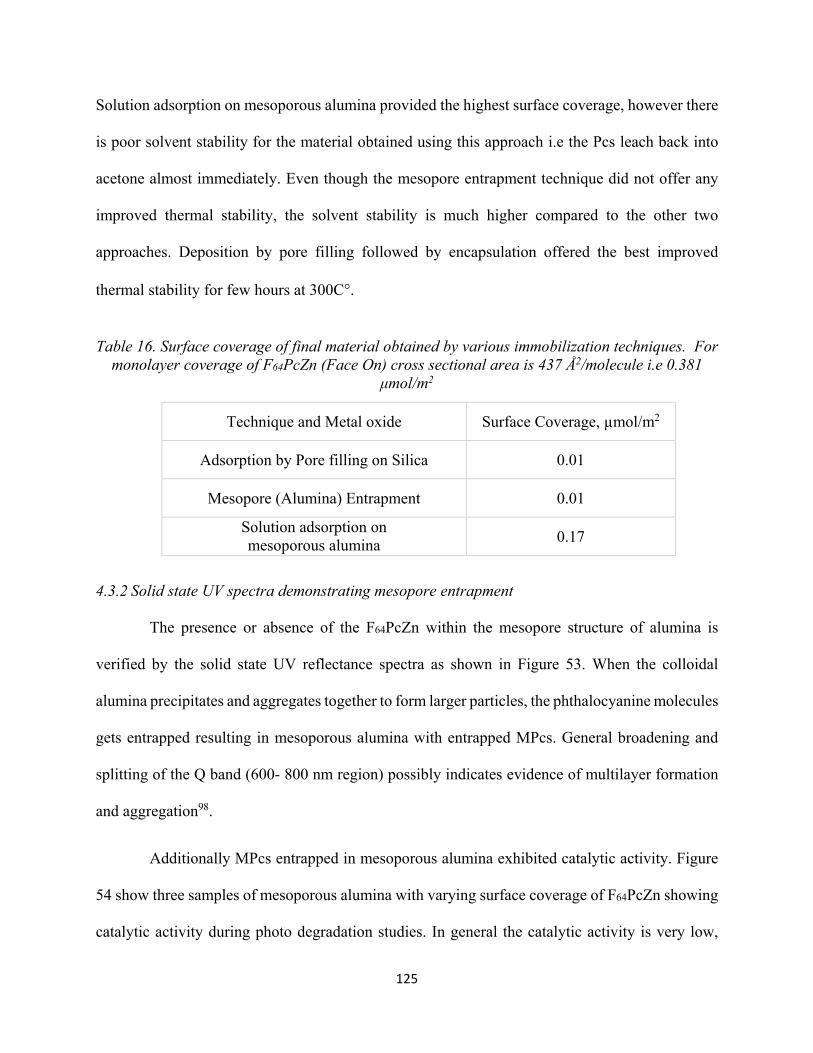
125
Solution adsorption on mesoporous alumina provided the highest surface coverage, however there
is poor solvent stability for the material obtained using this approach i.e the Pcs leach back into
acetone almost immediately. Even though the mesopore entrapment technique did not offer any
improved thermal stability, the solvent stability is much higher compared to the other two
approaches. Deposition by pore filling followed by encapsulation offered the best improved
thermal stability for few hours at 300C°.
Table 16. Surface coverage of final material obtained by various immobilization techniques. For monolayer coverage of F64PcZn (Face On) cross sectional area is 437 Å2/molecule i.e 0.381
μmol/m2
4.3.2 Solid state UV spectra demonstrating mesopore entrapment
The presence or absence of the F64PcZn within the mesopore structure of alumina is
verified by the solid state UV reflectance spectra as shown in Figure 53. When the colloidal
alumina precipitates and aggregates together to form larger particles, the phthalocyanine molecules
gets entrapped resulting in mesoporous alumina with entrapped MPcs. General broadening and
splitting of the Q band (600- 800 nm region) possibly indicates evidence of multilayer formation
and aggregation98.
Additionally MPcs entrapped in mesoporous alumina exhibited catalytic activity. Figure
54 show three samples of mesoporous alumina with varying surface coverage of F64PcZn showing
catalytic activity during photo degradation studies. In general the catalytic activity is very low,
Technique and Metal oxide Surface Coverage, µmol/m2
Adsorption by Pore filling on Silica 0.01
Mesopore (Alumina) Entrapment 0.01
Solution adsorption on mesoporous alumina 0.17
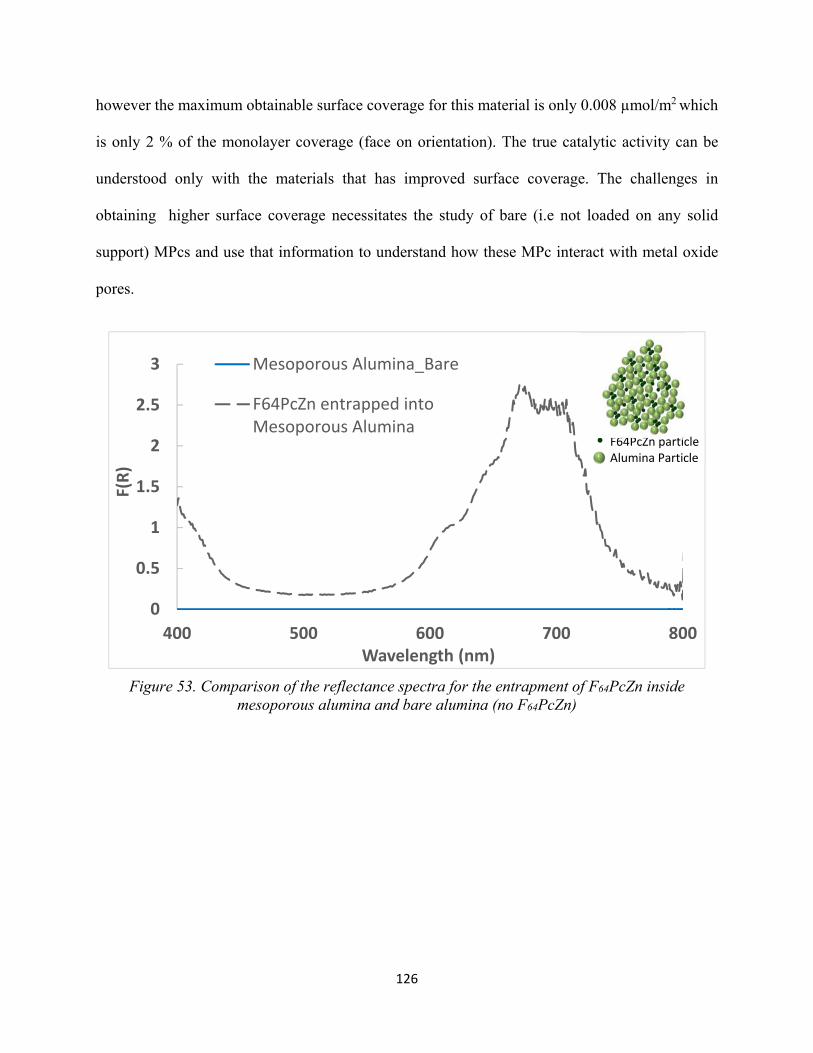
126
however the maximum obtainable surface coverage for this material is only 0.008 µmol/m2 which
is only 2 % of the monolayer coverage (face on orientation). The true catalytic activity can be
understood only with the materials that has improved surface coverage. The challenges in
obtaining higher surface coverage necessitates the study of bare (i.e not loaded on any solid
support) MPcs and use that information to understand how these MPc interact with metal oxide
pores.
Figure 53. Comparison of the reflectance spectra for the entrapment of F64PcZn inside mesoporous alumina and bare alumina (no F64PcZn)
0
0.5
1
1.5
2
2.5
3
400 500 600 700 800
F(R)
Wavelength (nm)
Mesoporous Alumina_Bare
F64PcZn entrapped intoMesoporous Alumina
F64PcZn particle
Alumina Particle
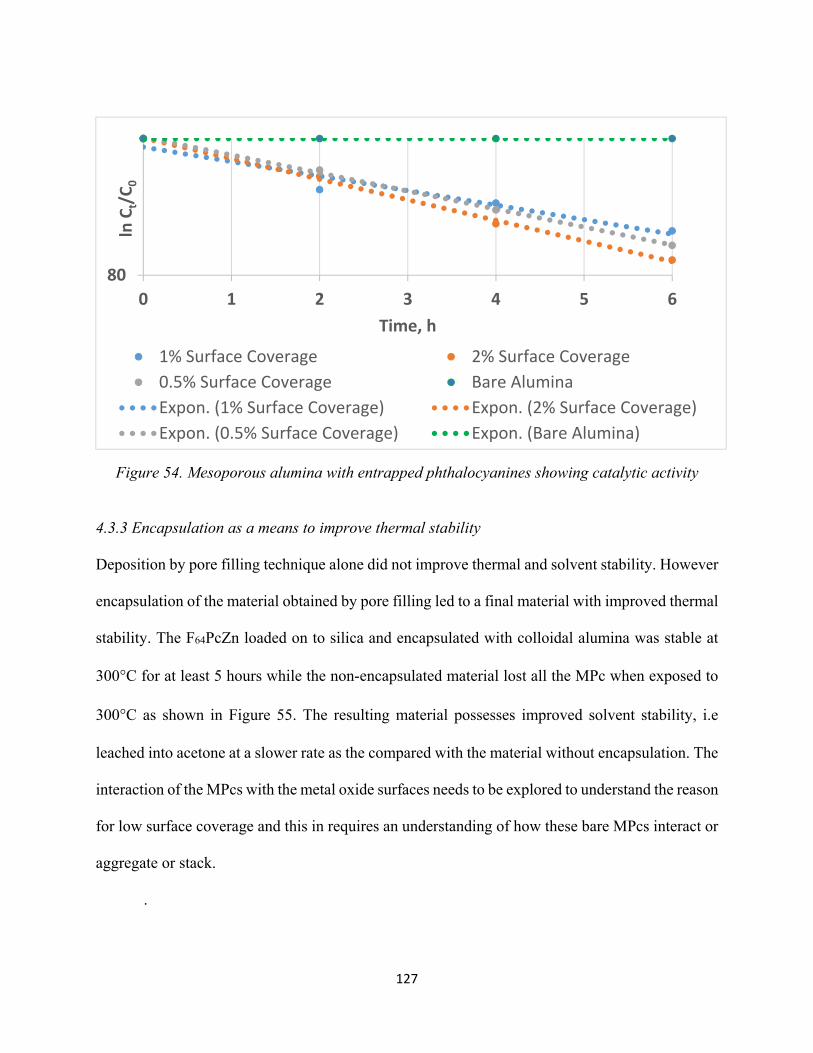
127
Figure 54. Mesoporous alumina with entrapped phthalocyanines showing catalytic activity
4.3.3 Encapsulation as a means to improve thermal stability
Deposition by pore filling technique alone did not improve thermal and solvent stability. However
encapsulation of the material obtained by pore filling led to a final material with improved thermal
stability. The F64PcZn loaded on to silica and encapsulated with colloidal alumina was stable at
300°C for at least 5 hours while the non-encapsulated material lost all the MPc when exposed to
300°C as shown in Figure 55. The resulting material possesses improved solvent stability, i.e
leached into acetone at a slower rate as the compared with the material without encapsulation. The
interaction of the MPcs with the metal oxide surfaces needs to be explored to understand the reason
for low surface coverage and this in requires an understanding of how these bare MPcs interact or
aggregate or stack.
.
800 1 2 3 4 5 6
ln C
t/C 0
Time, h
1% Surface Coverage 2% Surface Coverage0.5% Surface Coverage Bare AluminaExpon. (1% Surface Coverage) Expon. (2% Surface Coverage)Expon. (0.5% Surface Coverage) Expon. (Bare Alumina)
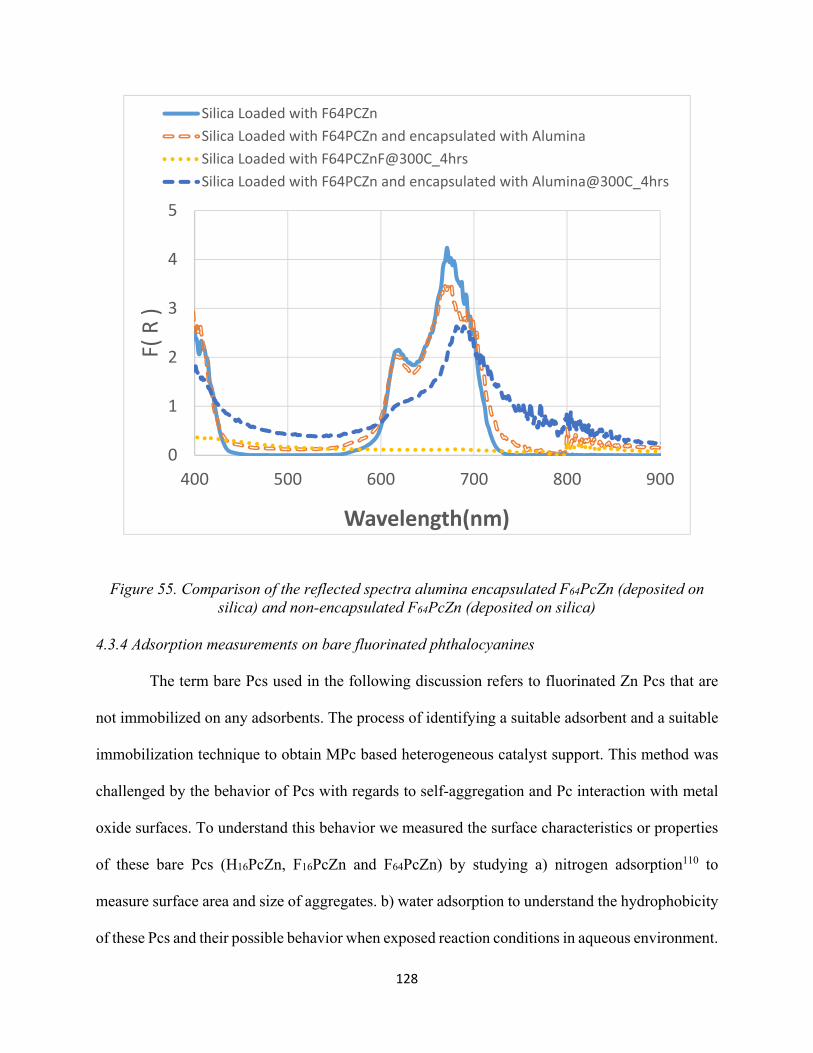
128
Figure 55. Comparison of the reflected spectra alumina encapsulated F64PcZn (deposited on silica) and non-encapsulated F64PcZn (deposited on silica)
4.3.4 Adsorption measurements on bare fluorinated phthalocyanines
The term bare Pcs used in the following discussion refers to fluorinated Zn Pcs that are
not immobilized on any adsorbents. The process of identifying a suitable adsorbent and a suitable
immobilization technique to obtain MPc based heterogeneous catalyst support. This method was
challenged by the behavior of Pcs with regards to self-aggregation and Pc interaction with metal
oxide surfaces. To understand this behavior we measured the surface characteristics or properties
of these bare Pcs (H16PcZn, F16PcZn and F64PcZn) by studying a) nitrogen adsorption110 to
measure surface area and size of aggregates. b) water adsorption to understand the hydrophobicity
of these Pcs and their possible behavior when exposed reaction conditions in aqueous environment.
0
1
2
3
4
5
400 500 600 700 800 900
F( R
)
Wavelength(nm)
Silica Loaded with F64PCZnSilica Loaded with F64PCZn and encapsulated with AluminaSilica Loaded with F64PCZnF@300C_4hrsSilica Loaded with F64PCZn and encapsulated with Alumina@300C_4hrs
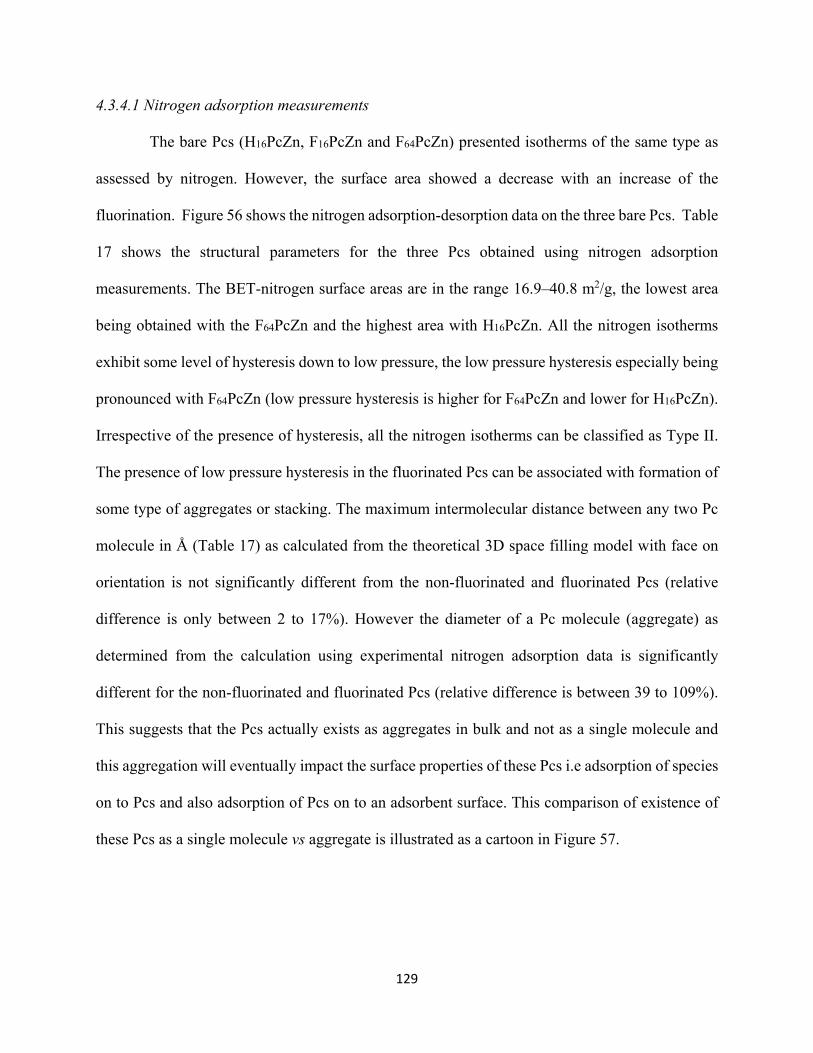
129
4.3.4.1 Nitrogen adsorption measurements
The bare Pcs (H16PcZn, F16PcZn and F64PcZn) presented isotherms of the same type as
assessed by nitrogen. However, the surface area showed a decrease with an increase of the
fluorination. Figure 56 shows the nitrogen adsorption-desorption data on the three bare Pcs. Table
17 shows the structural parameters for the three Pcs obtained using nitrogen adsorption
measurements. The BET-nitrogen surface areas are in the range 16.9–40.8 m2/g, the lowest area
being obtained with the F64PcZn and the highest area with H16PcZn. All the nitrogen isotherms
exhibit some level of hysteresis down to low pressure, the low pressure hysteresis especially being
pronounced with F64PcZn (low pressure hysteresis is higher for F64PcZn and lower for H16PcZn).
Irrespective of the presence of hysteresis, all the nitrogen isotherms can be classified as Type II.
The presence of low pressure hysteresis in the fluorinated Pcs can be associated with formation of
some type of aggregates or stacking. The maximum intermolecular distance between any two Pc
molecule in Å (Table 17) as calculated from the theoretical 3D space filling model with face on
orientation is not significantly different from the non-fluorinated and fluorinated Pcs (relative
difference is only between 2 to 17%). However the diameter of a Pc molecule (aggregate) as
determined from the calculation using experimental nitrogen adsorption data is significantly
different for the non-fluorinated and fluorinated Pcs (relative difference is between 39 to 109%).
This suggests that the Pcs actually exists as aggregates in bulk and not as a single molecule and
this aggregation will eventually impact the surface properties of these Pcs i.e adsorption of species
on to Pcs and also adsorption of Pcs on to an adsorbent surface. This comparison of existence of
these Pcs as a single molecule vs aggregate is illustrated as a cartoon in Figure 57.
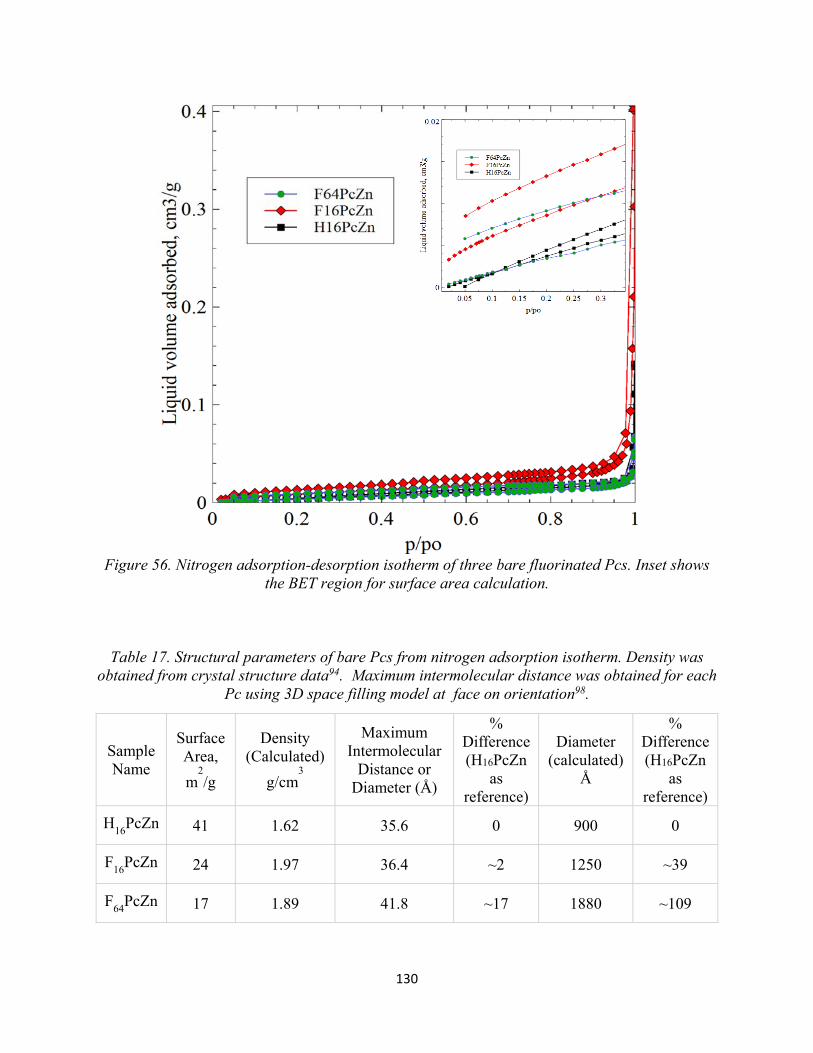
130
Figure 56. Nitrogen adsorption-desorption isotherm of three bare fluorinated Pcs. Inset shows the BET region for surface area calculation.
Table 17. Structural parameters of bare Pcs from nitrogen adsorption isotherm. Density was obtained from crystal structure data94. Maximum intermolecular distance was obtained for each
Pc using 3D space filling model at face on orientation98.
Sample Name
Surface Area,
m2/g
Density (Calculated)
g/cm3
Maximum Intermolecular
Distance or Diameter (Å)
% Difference (H16PcZn
as reference)
Diameter (calculated)
Å
% Difference (H16PcZn
as reference)
H16
PcZn 41 1.62 35.6 0 900 0
F16
PcZn 24 1.97 36.4 ~2 1250 ~39
F64
PcZn 17 1.89 41.8 ~17 1880 ~109
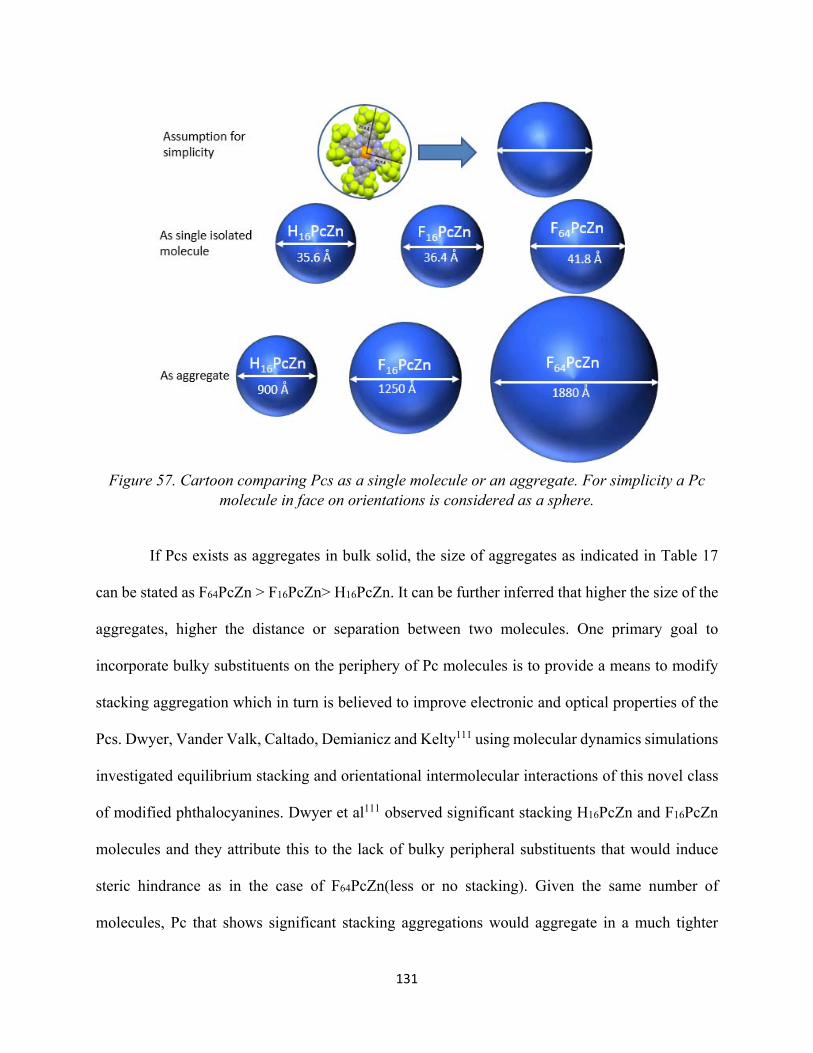
131
Figure 57. Cartoon comparing Pcs as a single molecule or an aggregate. For simplicity a Pc molecule in face on orientations is considered as a sphere.
If Pcs exists as aggregates in bulk solid, the size of aggregates as indicated in Table 17
can be stated as F64PcZn > F16PcZn> H16PcZn. It can be further inferred that higher the size of the
aggregates, higher the distance or separation between two molecules. One primary goal to
incorporate bulky substituents on the periphery of Pc molecules is to provide a means to modify
stacking aggregation which in turn is believed to improve electronic and optical properties of the
Pcs. Dwyer, Vander Valk, Caltado, Demianicz and Kelty111 using molecular dynamics simulations
investigated equilibrium stacking and orientational intermolecular interactions of this novel class
of modified phthalocyanines. Dwyer et al111 observed significant stacking H16PcZn and F16PcZn
molecules and they attribute this to the lack of bulky peripheral substituents that would induce
steric hindrance as in the case of F64PcZn(less or no stacking). Given the same number of
molecules, Pc that shows significant stacking aggregations would aggregate in a much tighter
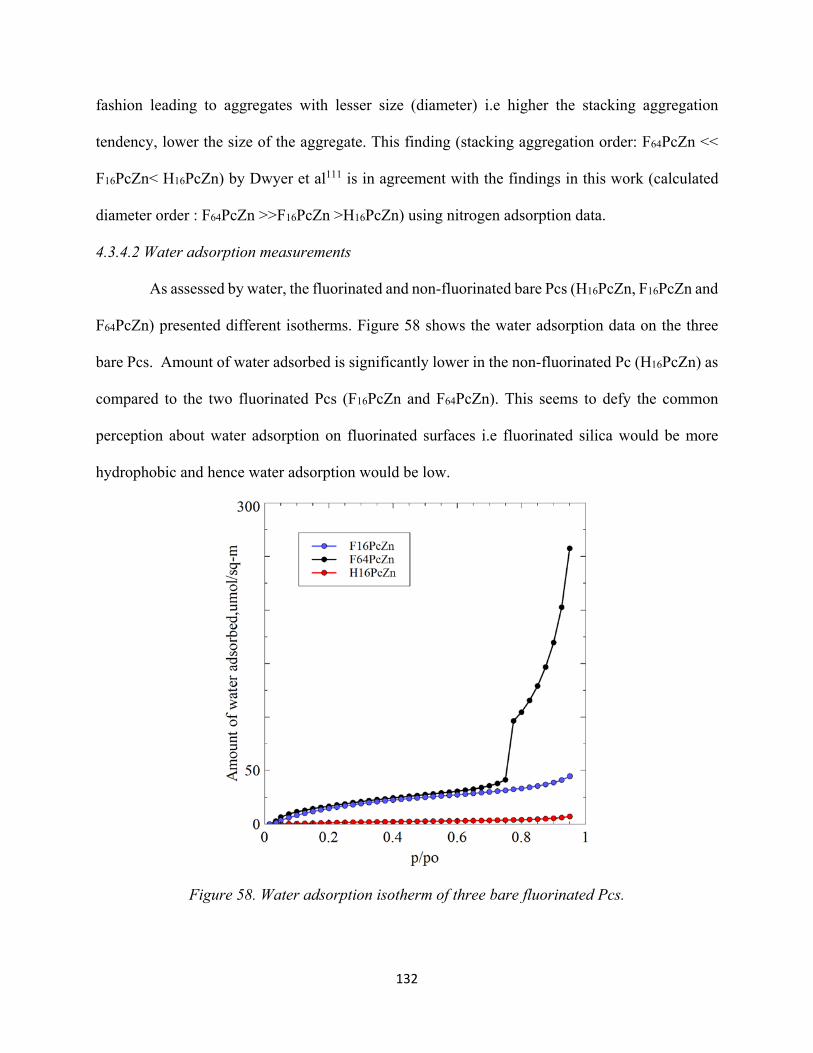
132
fashion leading to aggregates with lesser size (diameter) i.e higher the stacking aggregation
tendency, lower the size of the aggregate. This finding (stacking aggregation order: F64PcZn <<
F16PcZn< H16PcZn) by Dwyer et al111 is in agreement with the findings in this work (calculated
diameter order : F64PcZn >>F16PcZn >H16PcZn) using nitrogen adsorption data.
4.3.4.2 Water adsorption measurements
As assessed by water, the fluorinated and non-fluorinated bare Pcs (H16PcZn, F16PcZn and
F64PcZn) presented different isotherms. Figure 58 shows the water adsorption data on the three
bare Pcs. Amount of water adsorbed is significantly lower in the non-fluorinated Pc (H16PcZn) as
compared to the two fluorinated Pcs (F16PcZn and F64PcZn). This seems to defy the common
perception about water adsorption on fluorinated surfaces i.e fluorinated silica would be more
hydrophobic and hence water adsorption would be low.
Figure 58. Water adsorption isotherm of three bare fluorinated Pcs.
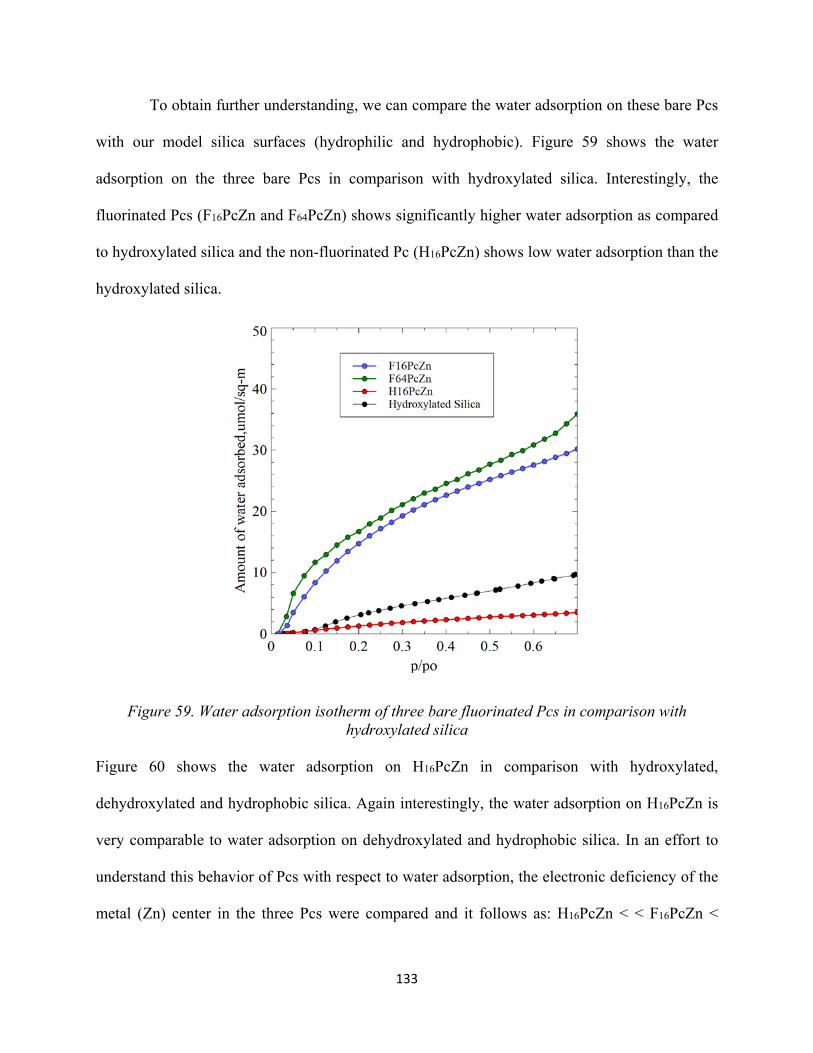
133
To obtain further understanding, we can compare the water adsorption on these bare Pcs
with our model silica surfaces (hydrophilic and hydrophobic). Figure 59 shows the water
adsorption on the three bare Pcs in comparison with hydroxylated silica. Interestingly, the
fluorinated Pcs (F16PcZn and F64PcZn) shows significantly higher water adsorption as compared
to hydroxylated silica and the non-fluorinated Pc (H16PcZn) shows low water adsorption than the
hydroxylated silica.
Figure 59. Water adsorption isotherm of three bare fluorinated Pcs in comparison with hydroxylated silica
Figure 60 shows the water adsorption on H16PcZn in comparison with hydroxylated,
dehydroxylated and hydrophobic silica. Again interestingly, the water adsorption on H16PcZn is
very comparable to water adsorption on dehydroxylated and hydrophobic silica. In an effort to
understand this behavior of Pcs with respect to water adsorption, the electronic deficiency of the
metal (Zn) center in the three Pcs were compared and it follows as: H16PcZn < < F16PcZn <
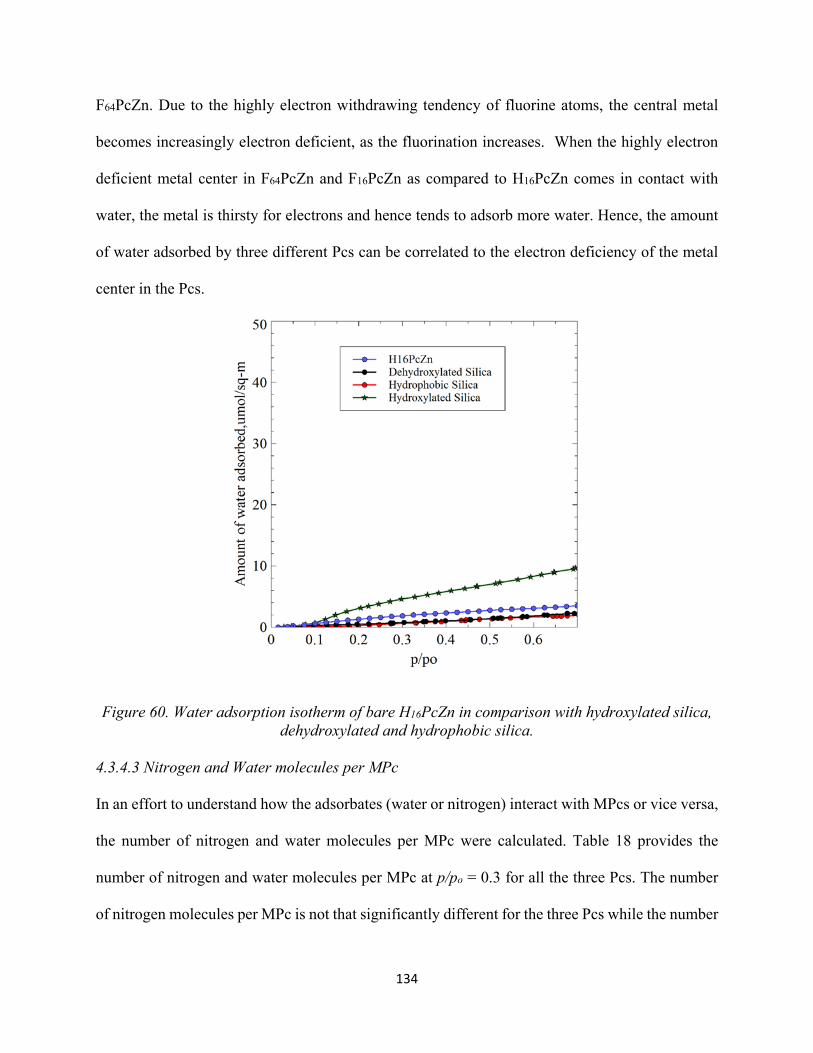
134
F64PcZn. Due to the highly electron withdrawing tendency of fluorine atoms, the central metal
becomes increasingly electron deficient, as the fluorination increases. When the highly electron
deficient metal center in F64PcZn and F16PcZn as compared to H16PcZn comes in contact with
water, the metal is thirsty for electrons and hence tends to adsorb more water. Hence, the amount
of water adsorbed by three different Pcs can be correlated to the electron deficiency of the metal
center in the Pcs.
Figure 60. Water adsorption isotherm of bare H16PcZn in comparison with hydroxylated silica, dehydroxylated and hydrophobic silica.
4.3.4.3 Nitrogen and Water molecules per MPc
In an effort to understand how the adsorbates (water or nitrogen) interact with MPcs or vice versa,
the number of nitrogen and water molecules per MPc were calculated. Table 18 provides the
number of nitrogen and water molecules per MPc at p/po = 0.3 for all the three Pcs. The number
of nitrogen molecules per MPc is not that significantly different for the three Pcs while the number
135
of water molecules per MPc is significantly different for the three Pcs . It would be expected that
with increase in perfluoro groups, hydrophobicity of Pc would increase resulting in decreased
affinity to water. However, the number of water molecules per MPc increases significantly as
fluorination increases (H16PcZn to F16PcZn to F64PcZn). This significant difference in water
molecules per MPc further correlates with the theory that the metal center becomes increasingly
electron deficient with increased fluorination.
Table 18. Calculation of nitrogen and water molecules per MPc. MPcs are considered in face on orientation and equation 4-3 is used to calculate no of adsorbate molecules per MPc.
Sample CSA of MPc (Å2/molecule)
No of water molecules per MPc
(p/po=0.3)
No of nitrogen molecules per MPc
(p/po =0.3)
F64PcZn 437 55 22.5
F16PcZn 332 39 26
H16PcZn 317 3.5 14
Figure 61 shows the number of water molecules per MPc calculated at a range of relative
pressures. In general fluorinated organic materials synthesized for electronic and optoelectronic
applications are perceived to have enhanced hydrophobic properties. However form the water
adsorption studies in this work and in specifically as shown in Figure 61, the number of water
molecules per MPc is higher for heavily fluorinated F64PcZn. This higher adsorption of water by
fluorinated Pcs led us to believe that that fluorinated MPcs are not hydrophobic and in fact they
very much prefer to interact with water molecules through metal centers.
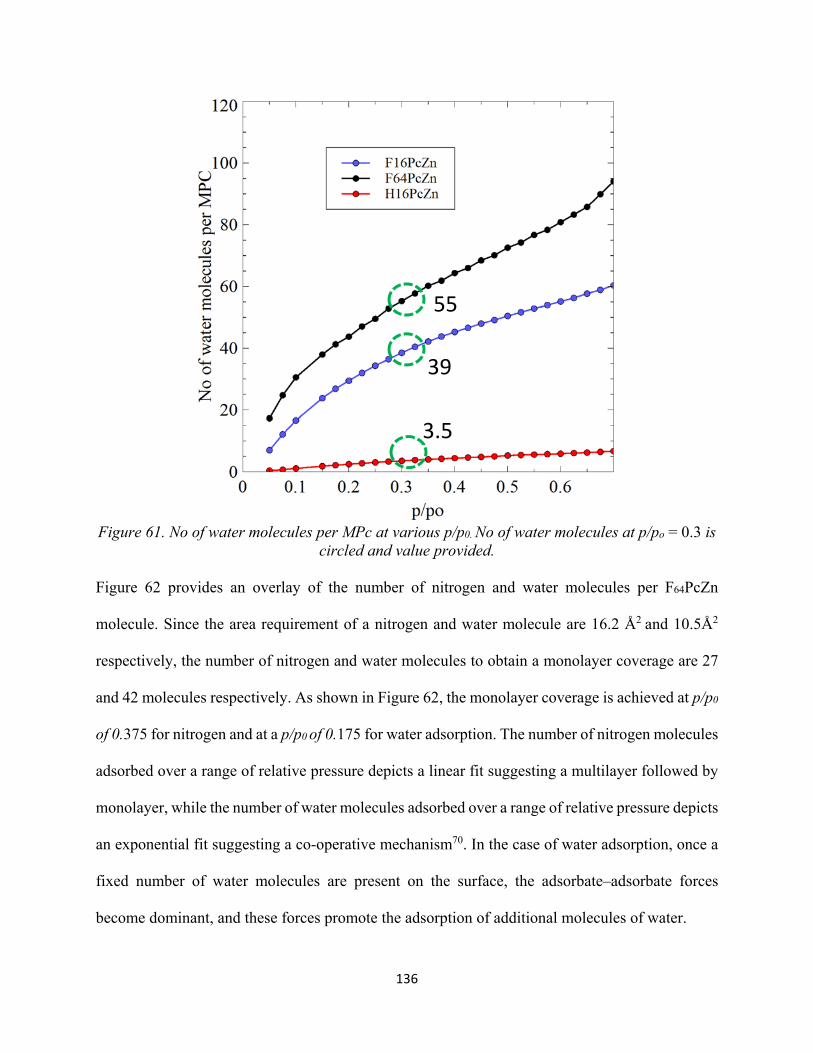
136
Figure 61. No of water molecules per MPc at various p/p0. No of water molecules at p/po = 0.3 is circled and value provided.
Figure 62 provides an overlay of the number of nitrogen and water molecules per F64PcZn
molecule. Since the area requirement of a nitrogen and water molecule are 16.2 Å2 and 10.5Å2
respectively, the number of nitrogen and water molecules to obtain a monolayer coverage are 27
and 42 molecules respectively. As shown in Figure 62, the monolayer coverage is achieved at p/p0
of 0.375 for nitrogen and at a p/p0 of 0.175 for water adsorption. The number of nitrogen molecules
adsorbed over a range of relative pressure depicts a linear fit suggesting a multilayer followed by
monolayer, while the number of water molecules adsorbed over a range of relative pressure depicts
an exponential fit suggesting a co-operative mechanism70. In the case of water adsorption, once a
fixed number of water molecules are present on the surface, the adsorbate–adsorbate forces
become dominant, and these forces promote the adsorption of additional molecules of water.
55
39
3.5
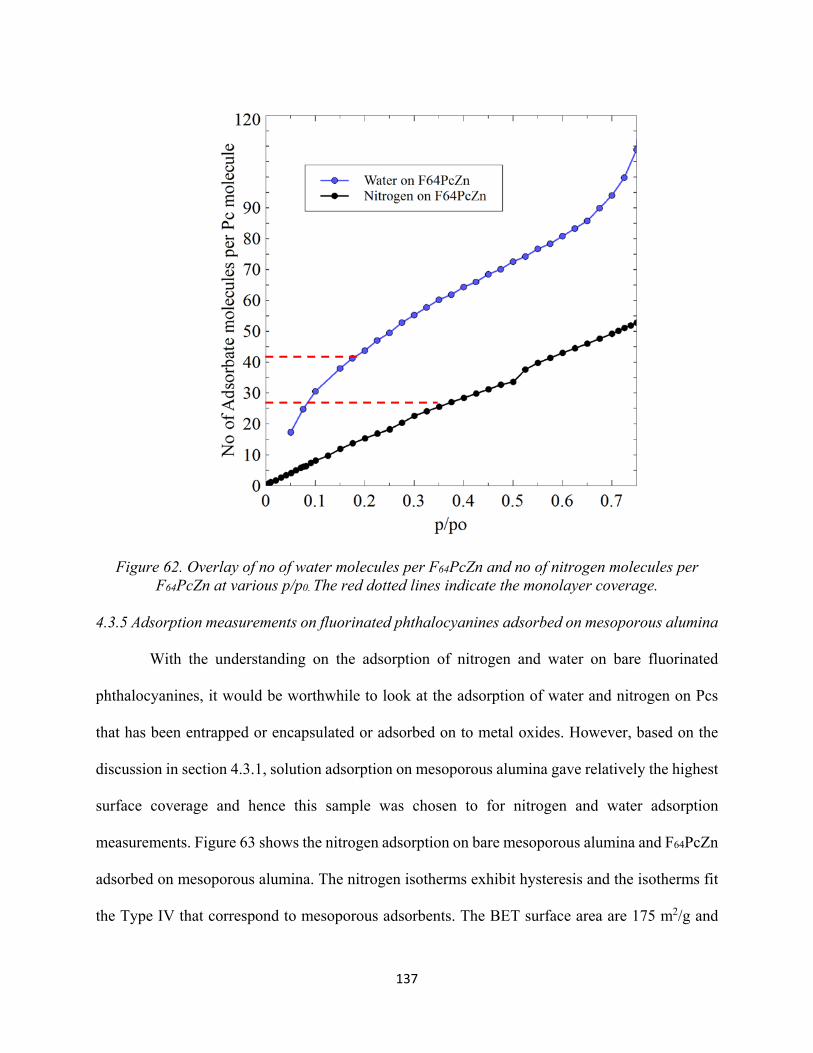
137
Figure 62. Overlay of no of water molecules per F64PcZn and no of nitrogen molecules per F64PcZn at various p/p0. The red dotted lines indicate the monolayer coverage.
4.3.5 Adsorption measurements on fluorinated phthalocyanines adsorbed on mesoporous alumina
With the understanding on the adsorption of nitrogen and water on bare fluorinated
phthalocyanines, it would be worthwhile to look at the adsorption of water and nitrogen on Pcs
that has been entrapped or encapsulated or adsorbed on to metal oxides. However, based on the
discussion in section 4.3.1, solution adsorption on mesoporous alumina gave relatively the highest
surface coverage and hence this sample was chosen to for nitrogen and water adsorption
measurements. Figure 63 shows the nitrogen adsorption on bare mesoporous alumina and F64PcZn
adsorbed on mesoporous alumina. The nitrogen isotherms exhibit hysteresis and the isotherms fit
the Type IV that correspond to mesoporous adsorbents. The BET surface area are 175 m2/g and
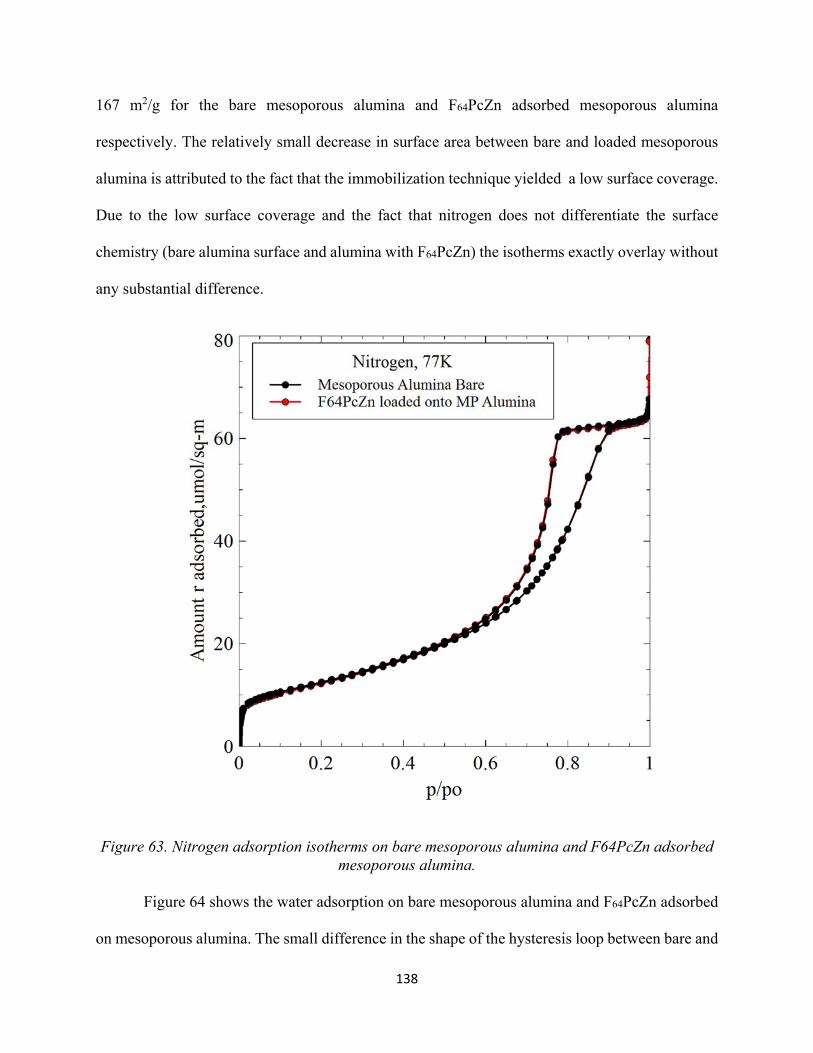
138
167 m2/g for the bare mesoporous alumina and F64PcZn adsorbed mesoporous alumina
respectively. The relatively small decrease in surface area between bare and loaded mesoporous
alumina is attributed to the fact that the immobilization technique yielded a low surface coverage.
Due to the low surface coverage and the fact that nitrogen does not differentiate the surface
chemistry (bare alumina surface and alumina with F64PcZn) the isotherms exactly overlay without
any substantial difference.
Figure 63. Nitrogen adsorption isotherms on bare mesoporous alumina and F64PcZn adsorbed mesoporous alumina.
Figure 64 shows the water adsorption on bare mesoporous alumina and F64PcZn adsorbed
on mesoporous alumina. The small difference in the shape of the hysteresis loop between bare and
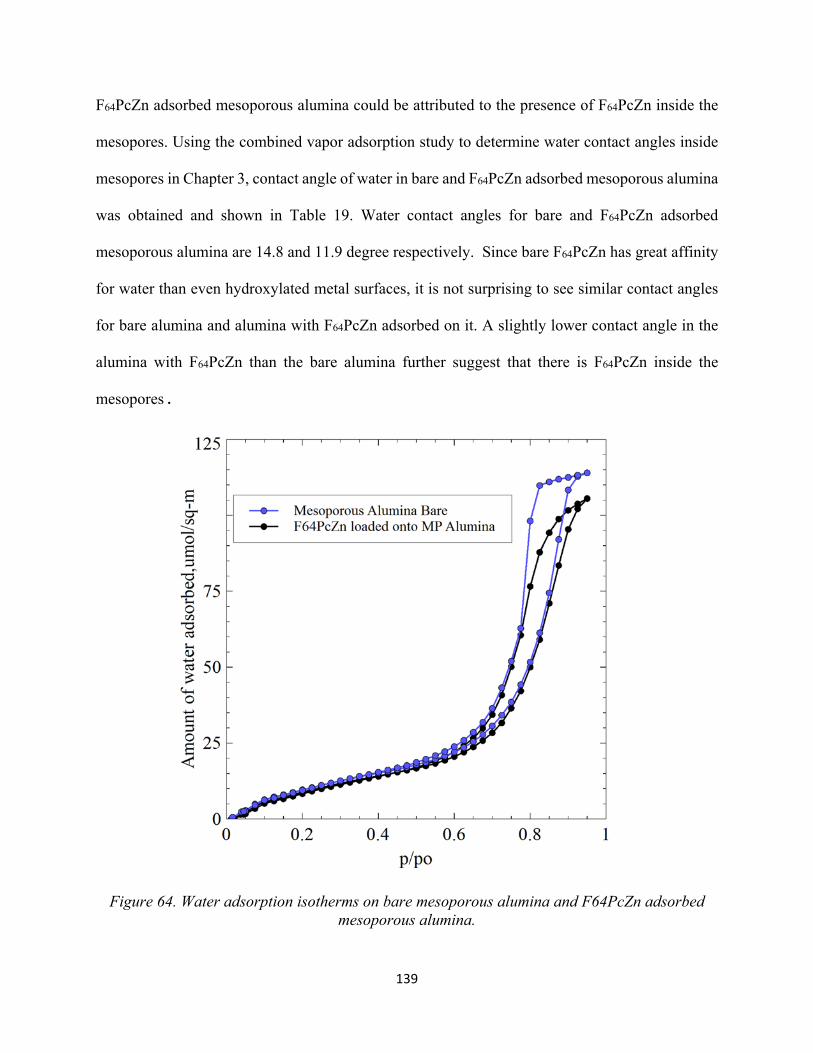
139
F64PcZn adsorbed mesoporous alumina could be attributed to the presence of F64PcZn inside the
mesopores. Using the combined vapor adsorption study to determine water contact angles inside
mesopores in Chapter 3, contact angle of water in bare and F64PcZn adsorbed mesoporous alumina
was obtained and shown in Table 19. Water contact angles for bare and F64PcZn adsorbed
mesoporous alumina are 14.8 and 11.9 degree respectively. Since bare F64PcZn has great affinity
for water than even hydroxylated metal surfaces, it is not surprising to see similar contact angles
for bare alumina and alumina with F64PcZn adsorbed on it. A slightly lower contact angle in the
alumina with F64PcZn than the bare alumina further suggest that there is F64PcZn inside the
mesopores .
Figure 64. Water adsorption isotherms on bare mesoporous alumina and F64PcZn adsorbed mesoporous alumina.
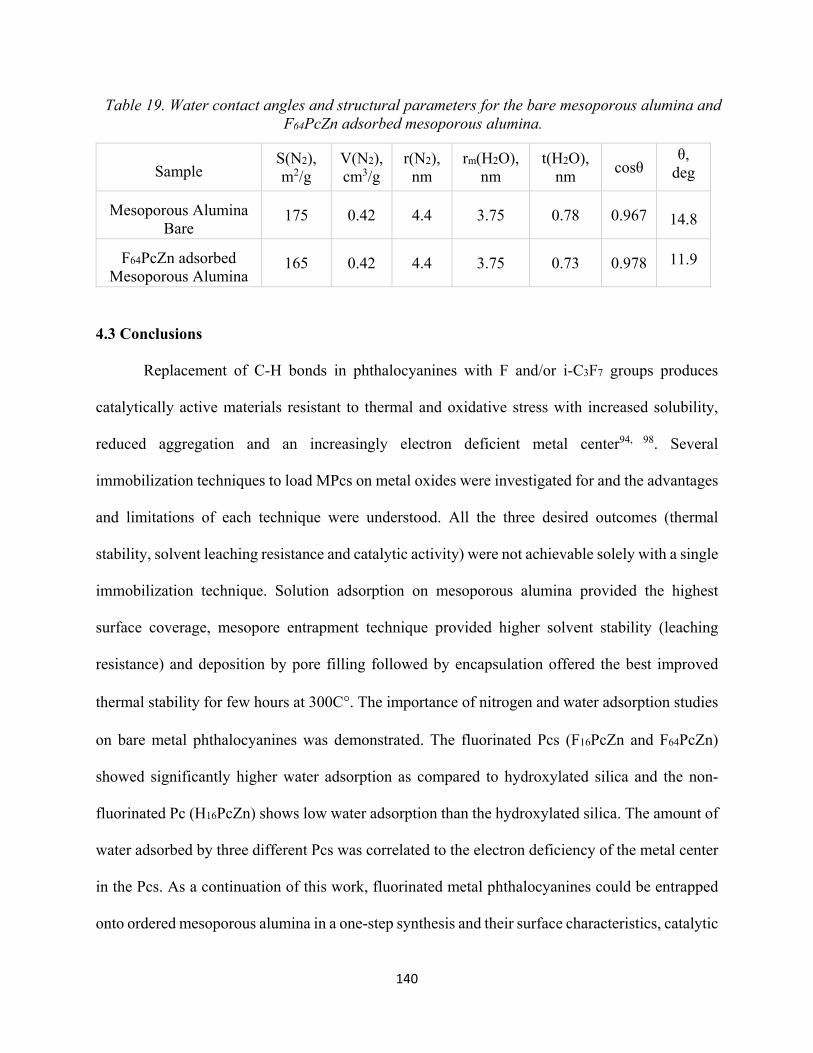
140
Table 19. Water contact angles and structural parameters for the bare mesoporous alumina and F64PcZn adsorbed mesoporous alumina.
Sample S(N2), m2/g
V(N2), cm3/g
r(N2), nm
rm(H2O), nm
t(H2O), nm
cosθ θ,
deg
Mesoporous Alumina Bare
175 0.42 4.4 3.75 0.78 0.967
14.8
F64PcZn adsorbed Mesoporous Alumina
165 0.42 4.4 3.75 0.73 0.978 11.9
4.3 Conclusions
Replacement of C-H bonds in phthalocyanines with F and/or i-C3F7 groups produces
catalytically active materials resistant to thermal and oxidative stress with increased solubility,
reduced aggregation and an increasingly electron deficient metal center94, 98. Several
immobilization techniques to load MPcs on metal oxides were investigated for and the advantages
and limitations of each technique were understood. All the three desired outcomes (thermal
stability, solvent leaching resistance and catalytic activity) were not achievable solely with a single
immobilization technique. Solution adsorption on mesoporous alumina provided the highest
surface coverage, mesopore entrapment technique provided higher solvent stability (leaching
resistance) and deposition by pore filling followed by encapsulation offered the best improved
thermal stability for few hours at 300C°. The importance of nitrogen and water adsorption studies
on bare metal phthalocyanines was demonstrated. The fluorinated Pcs (F16PcZn and F64PcZn)
showed significantly higher water adsorption as compared to hydroxylated silica and the non-
fluorinated Pc (H16PcZn) shows low water adsorption than the hydroxylated silica. The amount of
water adsorbed by three different Pcs was correlated to the electron deficiency of the metal center
in the Pcs. As a continuation of this work, fluorinated metal phthalocyanines could be entrapped
onto ordered mesoporous alumina in a one-step synthesis and their surface characteristics, catalytic

141
activity, thermal stability and solvent stability could be studied. The technique of immobilization
and characterization can be extended to other fluorinated phthalocyanines with different metals-
fluorinated Ru phthalocyanines would be an excellent choice to pursue further studies.
142
References
1. Bergna, H. E., Colloid Chemistry of Silica. In The Colloid Chemistry of Silica, American Chemical Society: 1994; Vol. 234, pp 1-47.
2. K.K.Unger, Chapter 1 General chemistry of silica. In Journal of Chromatography Library, Unger, K. K., Ed. Elsevier: 1979; Vol. Volume 16, pp 1-14.
3. Iler, R. K., The Chemistry of Silica. Wiley-Interscience: New York 1979.
4. Vansant, E. F., Van Der Voort, P, Vrancken K.C., Characterization and chemical modifciation of the silica surface. Studies in Surface Science and Catalysis 1995, 93.
5. AEROSIL® – Fumed Silica. Technical Bulletin, Evonik Industries 2015.
6. Zhuravlev, L. T., The surface chemistry of amorphous silica. Zhuravlev model. Colloids and Surfaces A: Physicochemical and Engineering Aspects 2000, 173 (1–3), 1-38.
7. Rouquerol, F. o.; Rouquerol, J.; Sing, K. S. W., Adsorption by Powders and Porous Solids : Principles, Methodology, and Applications. Academic Press: San Diego, 1999.
8. S.J.Gregg; K.S.W.Sing, Adsorption, Surface Area and Porosity. Academic Press, London 1982.
9. ALOthman, Z., A Review: Fundamental Aspects of Silicate Mesoporous Materials. Materials 2012, 5 (12), 2874.
10. Beck, J. S.; Vartuli, J. C.; Roth, W. J.; Leonowicz, M. E.; Kresge, C. T.; Schmitt, K. D.; Chu, C. T. W.; Olson, D. H.; Sheppard, E. W.; McCullen, S. B.; Higgins, J. B.; Schlenker, J. L., A new family of mesoporous molecular sieves prepared with liquid crystal templates. Journal of the American Chemical Society 1992, 114 (27), 10834-10843.
11. Kresge, C. T.; Leonowicz, M. E.; Roth, W. J.; Vartuli, J. C.; Beck, J. S., Ordered mesoporous molecular sieves synthesized by a liquid-crystal template mechanism. Nature 1992, 359 (6397), 710-712.
12. Vartuli, J. C.; Schmitt, K. D.; Kresge, C. T.; Roth, W. J.; Leonowicz, M. E.; McCullen, S. B.; Hellring, S. D.; Beck, J. S.; Schlenker, J. L., Effect of Surfactant/Silica Molar Ratios on the Formation of Mesoporous Molecular Sieves: Inorganic Mimicry of Surfactant Liquid-Crystal Phases and Mechanistic Implications. Chemistry of Materials 1994, 6 (12), 2317-2326.
13. Thomas, F. D.; Wielsaw, J. R.; James, C. V., Mesoporous Materials. In Dekker Encyclopedia of Nanoscience and Nanotechnology, Second Edition, Taylor & Francis: 2009; Vol. null, pp 2029-2043.
14. Zhao, D.; Huo, Q.; Feng, J.; Chmelka, B. F.; Stucky, G. D., Nonionic Triblock and Star Diblock Copolymer and Oligomeric Surfactant Syntheses of Highly Ordered, Hydrothermally
143
Stable, Mesoporous Silica Structures. Journal of the American Chemical Society 1998, 120 (24), 6024-6036.
15. Bagshaw, S. A.; Prouzet, E.; Pinnavaia, T. J., Templating of Mesoporous Molecular Sieves by Nonionic Polyethylene Oxide Surfactants. Science 1995, 269 (5228), 1242-1244.
16. Jun, S.; Ryoo, R., Aluminum Impregnation into Mesoporous Silica Molecular Sieves for Catalytic Application to Friedel–Crafts Alkylation. Journal of Catalysis 2000, 195 (2), 237-243.
17. Yu, C.; Yu, Y.; Zhao, D., Highly ordered large caged cubic mesoporous silica structures templated by triblock PEO-PBO-PEO copolymer. Chemical Communications 2000, (7), 575-576.
18. Che, S.; Garcia-Bennett, A. E.; Yokoi, T.; Sakamoto, K.; Kunieda, H.; Terasaki, O.; Tatsumi, T., A novel anionic surfactant templating route for synthesizing mesoporous silica with unique structure. Nat Mater 2003, 2 (12), 801-805.
19. Kulinowski, K. M.; Jiang, P.; Vaswani, H.; Colvin, V. L., Porous Metals from Colloidal Templates. Advanced Materials 2000, 12 (11), 833-838.
20. Xia, Y.; Gates, B.; Yin, Y.; Lu, Y., Monodispersed Colloidal Spheres: Old Materials with New Applications. Advanced Materials 2000, 12 (10), 693-713.
21. Velev, O. D.; Lenhoff, A. M.; Kaler, E. W., A Class of Microstructured Particles Through Colloidal Crystallization. Science 2000, 287 (5461), 2240-2243.
22. Iskandar, F.; Nandiyanto, A. B. D.; Widiyastuti, W.; Young, L. S.; Okuyama, K.; Gradon, L., Production of morphology-controllable porous hyaluronic acid particles using a spray-drying method. Acta Biomaterialia 2009, 5 (4), 1027-1034.
23. Lee, S. Y.; Gradon, L.; Janeczko, S.; Iskandar, F.; Okuyama, K., Formation of Highly Ordered Nanostructures by Drying Micrometer Colloidal Droplets. ACS Nano 2010, 4 (8), 4717-4724.
24. Cho, Y.-S.; Choi, S.-Y.; Kim, Y.-K.; Yi, G.-R., Bulk synthesis of ordered macroporous silica particles for superhydrophobic coatings. Journal of Colloid and Interface Science 2012, 386 (1), 88-98.
25. Ebelmen, Untersuchungen über die Verbindungen der Borsäure und Kieselsäure mit Aether. Justus Liebigs Annalen der Chemie 1846, 57 (3), 319-355.
26. Danks, A. E.; Hall, S. R.; Schnepp, Z., The evolution of 'sol-gel' chemistry as a technique for materials synthesis. Materials Horizons 2016, 3 (2), 91-112.
27. Brinker, C. J.; Scherer, G. W., Sol-gel Science: The Physics and Chemistry of Sol-gel Processing. Academic Press: 1990.
144
28. Kistler, S. S., Coherent Expanded-Aerogels. The Journal of Physical Chemistry 1931, 36 (1), 52-64.
29. Roy, R., Aids in Hydrothermal Experimentation: II, Methods of Making Mixtures for Both “Dry” and “Wet” Phase Equilibrium Studies. Journal of the American Ceramic Society 1956, 39 (4), 145-146.
30. Buckley, A. M.; Greenblatt, M., The Sol-Gel Preparation of Silica Gels. Journal of Chemical Education 1994, 71 (7), 599.
31. Hench, L. L.; West, J. K., The sol-gel process. Chemical Reviews 1990, 90 (1), 33-72.
32. Li, W.; Zhao, D., An overview of the synthesis of ordered mesoporous materials. Chemical Communications 2013, 49 (10), 943-946.
33. Perego, C.; Millini, R., Porous materials in catalysis: challenges for mesoporous materials. Chemical Society Reviews 2013, 42 (9), 3956-3976.
34. Davis, M. E., Ordered porous materials for emerging applications. Nature 2002, 417 (6891), 813-821.
35. Vincent, C.; E, R. J.; D, V. C., Process for producing low-bulk density silica. Google Patents: 1971.
36. T.Yanagisawa; T.Shimizu; K.Juroda; C.Kato, The Preparation of Alkyltrimethylammonium–Kaneinite Complexes and Their Conversion to Microporous Materials Bull.Chem.Soc 1990, 63 (4), 988.
37. Inagaki, S.; Fukushima, Y.; Kuroda, K., Synthesis of highly ordered mesoporous materials from a layered polysilicate. Journal of the Chemical Society, Chemical Communications 1993, (8), 680-682.
38. Wan, Y.; Zhao, On the Controllable Soft-Templating Approach to Mesoporous Silicates. Chemical Reviews 2007, 107 (7), 2821-2860.
39. Thommes, M., Physical Adsorption Characterization of Nanoporous Materials. Chemie Ingenieur Technik 2010, 82 (7), 1059-1073.
40. Lowell, S.; Shields, J. E.; Thomas, M. A.; Thommes, M., Characterization of Porous Solids and Powders: Surface Area, Pore Size and Density. Springer Netherlands: 2006.
41. Kiselev, A. V., Non-specific and specific interactions of molecules of different electronic structures with solid surfaces. Discussions of the Faraday Society 1965, 40 (0), 205-218.
42. Zhuravlev, L. T., Surface characterization of amorphous silica—a review of work from the former USSR. Colloids and Surfaces A: Physicochemical and Engineering Aspects 1993, 74 (1), 71-90.
145
43. Hockey, J. A.; Pethica, B. A., Surface hydration of silicas. Transactions of the Faraday Society 1961, 57 (0), 2247-2262.
44. Smith, R. C.; Kellum, G. E., Modified Karl Fischer Titration for Determination of Water in Presence of Silanol and Other Interfering Materials. Analytical Chemistry 1966, 38 (1), 67-72.
45. Mueller, R.; Kammler, H. K.; Wegner, K.; Pratsinis, S. E., OH Surface Density of SiO2 and TiO2 by Thermogravimetric Analysis. Langmuir 2003, 19 (1), 160-165.
46. Wisser, F. M.; Abele, M.; Gasthauer, M.; Müller, K.; Moszner, N.; Kickelbick, G., Detection of surface silanol groups on pristine and functionalized silica mixed oxides and zirconia. Journal of Colloid and Interface Science 2012, 374 (1), 77-82.
47. Yang, J.; Wang, E. G., Reaction of water on silica surfaces. Current Opinion in Solid State and Materials Science 2006, 10 (1), 33-39.
48. Hair, M. L., Hydroxyl groups on silica surface. Journal of Non-Crystalline Solids 1975, 19, 299-309.
49. Grivtsov, A. G.; Zhuravlev, L. T.; Gerasimova, G. A.; Khazin, L. G., Molecular dynamics of water: Adsorption of water on β-tridymite. Journal of Colloid and Interface Science 1988, 126 (2), 397-407.
50. Lange, K. R., The characterization of molecular water on silica surfaces. Journal of Colloid Science 1965, 20 (3), 231-240.
51. Young, G. J., Interaction of water vapor with silica surfaces. Journal of Colloid Science 1958, 13 (1), 67-85.
52. Young, G. J.; Bursh, T. P., Immersion calorimetry studies of the interaction of water with silica surfaces. Journal of Colloid Science 1960, 15 (4), 361-369.
53. Agzamkhodzhaev, A. A.; Zhuravlev, L. T.; Kiselev, A. V.; Shengeliya, K. Y., Concentration of hydroxyl groups on the surface and in the volume of silicas. Bulletin of the Academy of Sciences of the USSR, Division of chemical science 1969, 18 (10), 1968-1973.
54. Hair, M. L., Infrared spectroscopy in surface chemistry. Dekker: New York, 1967.
55. Sing, K., The use of nitrogen adsorption for the characterisation of porous materials. Colloids and Surfaces A: Physicochemical and Engineering Aspects 2001, 187–188, 3-9.
56. Langmuir, I., THE CONSTITUTION AND FUNDAMENTAL PROPERTIES OF SOLIDS AND LIQUIDS. PART I. SOLIDS. Journal of the American Chemical Society 1916, 38 (11), 2221-2295.
57. Benton, A. F.; White, T. A., THE SORPTION OF GASES BY IRON. Journal of the American Chemical Society 1932, 54 (5), 1820-1830.
146
58. Brunauer, S.; Emmett, P. H., The Use of Low Temperature van der Waals Adsorption Isotherms in Determining the Surface Areas of Various Adsorbents. Journal of the American Chemical Society 1937, 59 (12), 2682-2689.
59. Brunauer, S.; Emmett, P. H.; Teller, E., Adsorption of Gases in Multimolecular Layers. Journal of the American Chemical Society 1938, 60 (2), 309-319.
60. Jelinek, L.; sz. Kovats, E., True Surface Areas from Nitrogen Adsorption Experiments. Langmuir 1994, 10 (11), 4225-4231.
61. Schull, C. G., The Determination of Pore Size Distribution from Gas Adsorption Data. Journal of the American Chemical Society 1948, 70 (4), 1405-1410.
62. Barrett, E. P.; Joyner, L. G.; Halenda, P. P., The Determination of Pore Volume and Area Distributions in Porous Substances. I. Computations from Nitrogen Isotherms. Journal of the American Chemical Society 1951, 73 (1), 373-380.
63. kelvin), W. T. T. L., On the Equilibrium of Vapour at a Curved Surface of Liquid. Phil. Mag. 1871, 42, 448.
64. Zsigmondy, A., Structure of Gelatinous Silicic Acid. Theory of Dehydration. Zeitschrift fuer Anorganische Chemie 1911, 71, 356-77.
65. Sing, K. S. W., Reporting physisorption data for gas/solid systems with special reference to the determination of surface area and porosity (Recommendations 1984). In Pure and Applied Chemistry, 1985; Vol. 57, p 603.
66. Thommes, M.; Morell, J.; Cychosz, K. A.; Fröba, M., Combining Nitrogen, Argon, and Water Adsorption for Advanced Characterization of Ordered Mesoporous Carbons (CMKs) and Periodic Mesoporous Organosilicas (PMOs). Langmuir 2013, 29 (48), 14893-14902.
67. Naono, H.; Hakuman, M., Analysis of adsorption isotherms of water vapor for nonporous and porous adsorbents. Journal of Colloid and Interface Science 1991, 145 (2), 405-412.
68. Hagymassy, J.; Brunauer, S.; Mikhail, R. S., Pore structure analysis by water vapor adsorption. Journal of Colloid and Interface Science 1969, 29 (3), 485-491.
69. Naono, H.; Hakuman, M., Analysis of Porous Texture by Means of Water Vapor Adsorption Isotherm with Particular Attention to Lower Limit of Hysteresis Loop. Journal of Colloid and Interface Science 1993, 158 (1), 19-26.
70. Raoof, A.; Guilbaud, J.-P.; Van Damme, H.; Porion, P.; Levitz, P., Analysis of the Multilayer Thickness Relationship for Water Vapor and Nitrogen Adsorption. Journal of Colloid and Interface Science 1998, 206 (1), 1-9.
71. Bernardoni, F.; Fadeev, A. Y., Adsorption and wetting characterization of hydrophobic SBA-15 silicas. Journal of Colloid and Interface Science 2011, 356 (2), 690-698.
147
72. Kozlova, S. A.; Kirik, S. D., Post-synthetic activation of silanol covering in the mesostructured silicate materials МСМ-41 and SBA-15. Microporous and Mesoporous Materials 2010, 133 (1–3), 124-133.
73. Haynes, W. M.; Lide, D. R.; Bruno, T. J., CRC handbook of chemistry and physics : a ready-reference book of chemical and physical data. 2015.
74. Galarneau, A.; Nader, M.; Guenneau, F.; Di Renzo, F.; Gedeon, A., Understanding the Stability in Water of Mesoporous SBA-15 and MCM-41. The Journal of Physical Chemistry C 2007, 111 (23), 8268-8277.
75. Pollock, R. A.; Gor, G. Y.; Walsh, B. R.; Fry, J.; Ghampson, I. T.; Melnichenko, Y. B.; Kaiser, H.; DeSisto, W. J.; Wheeler, M. C.; Frederick, B. G., Role of Liquid vs Vapor Water in the Hydrothermal Degradation of SBA-15. The Journal of Physical Chemistry C 2012, 116 (43), 22802-22814.
76. Erko, M.; Wallacher, D.; Findenegg, G. H.; Paris, O., Repeated sorption of water in SBA-15 investigated by means of in situ small-angle x-ray scattering. Journal of Physics: Condensed Matter 2012, 24 (28), 284112.
77. Celer, E. B.; Kruk, M.; Zuzek, Y.; Jaroniec, M., Hydrothermal stability of SBA-15 and related ordered mesoporous silicas with plugged pores. Journal of Materials Chemistry 2006, 16 (27), 2824-2833.
78. Gouze, B.; Cambedouzou, J.; Parrès-Maynadié, S.; Rébiscoul, D., How hexagonal mesoporous silica evolves in water on short and long term: Role of pore size and silica wall porosity. Microporous and Mesoporous Materials 2014, 183, 168-176.
79. Zhang, F.; Yan, Y.; Yang, H.; Meng, Y.; Yu, C.; Tu, B.; Zhao, D., Understanding Effect of Wall Structure on the Hydrothermal Stability of Mesostructured Silica SBA-15. The Journal of Physical Chemistry B 2005, 109 (18), 8723-8732.
80. Ribeiro Carrott, M. M. L.; Estêvão Candeias, A. J.; Carrott, P. J. M.; Unger, K. K., Evaluation of the Stability of Pure Silica MCM-41 toward Water Vapor. Langmuir 1999, 15 (26), 8895-8901.
81. Kocherbitov, V.; Alfredsson, V., Hydration of MCM-41 Studied by Sorption Calorimetry. The Journal of Physical Chemistry C 2007, 111 (35), 12906-12913.
82. Lamb, R. N.; Furlong, D. N., Controlled wettability of quartz surfaces. Journal of the Chemical Society, Faraday Transactions 1: Physical Chemistry in Condensed Phases 1982, 78 (1), 61-73.
83. Israelachvili, J. N.; Gee, M. L., Contact angles on chemically heterogeneous surfaces. Langmuir 1989, 5 (1), 288-289.
148
84. Sindorf, D. W.; Maciel, G. E., Cross-polarization magic-angle-spinning silicon-29 nuclear magnetic resonance study of silica gel using trimethylsilane bonding as a probe of surface geometry and reactivity. The Journal of Physical Chemistry 1982, 86 (26), 5208-5219.
85. Fadeev, A. Y., Hydrophobic Monolayer Surfaces: Synthesis and Wettability. In Encyclopedia of Surface and Colloid Science, Third Edition, CRC Press: 2015; pp 3120-3140.
86. Dzhigit, O. M. K., A.V.; Muttik, G.G., Heat of Adsorption of Water Vapor on Silica Gel with Hydrated and Dehydrated Surface. Colloid J. 1961, 23, 553-562.
87. Collins, K. E.; de Camargo, V. R.; Dimiras, A. B.; Menezes, D. T. C.; da Silva, P. A.; Collins, C. H., Physisorbed water layer formation on fully hydroxylated mesoporous silicas. Journal of Colloid and Interface Science 2005, 291 (2), 353-360.
88. Takei, T.; Yamazaki, A.; Watanabe, T.; Chikazawa, M., Water Adsorption Properties on Porous Silica Glass Surface Modified by Trimethylsilyl Groups. Journal of Colloid and Interface Science 1997, 188 (2), 409-414.
89. Klier, K.; Shen, J. H.; Zettlemoyer, A. C., Water on silica and silicate surfaces. I. Partially hydrophobic silicas. The Journal of Physical Chemistry 1973, 77 (11), 1458-1465.
90. Zettlemoyer, A. C.; Hsing, H. H., Water on silica and silicate surfaces. III. Hexamethyldisilazane-treated silica surfaces. Journal of Colloid and Interface Science 1976, 55 (3), 637-644.
91. Zettlemoyer, A. C.; Hsing, H. H., Water on organosilane-treated silica surfaces. Journal of Colloid and Interface Science 1977, 58 (2), 263-274.
92. Sorokin, A. B., Phthalocyanine Metal Complexes in Catalysis. Chemical Reviews 2013, 113 (10), 8152-8191.
93. Moons, H.; Loas, A.; Gorun, S. M.; Van Doorslaer, S., Photoreduction and light-induced triplet-state formation in a single-site fluoroalkylated zinc phthalocyanine. Dalton Transactions 2014, 43 (40), 14942-14948.
94. Patel, H. H. Fluorinated Metallo Phthalocyanines for Chemical and Biological Catalysis. Seton Hall University, Seton Hall University Dissertations and Theses (ETDs), 2015.
95. Bench, B. A.; Beveridge, A.; Sharman, W. M.; Diebold, G. J.; van Lier, J. E.; Gorun, S. M., Introduction of Bulky Perfluoroalkyl Groups at the Periphery of Zinc Perfluorophthalocyanine: Chemical, Structural, Electronic, and Preliminary Photophysical and Biological Effects. Angewandte Chemie International Edition 2002, 41 (5), 747-750.
96. Patel, P.; Patel, H. H.; Borland, E.; Gorun, S. M.; Sabatino, D., Chemically robust fluoroalkyl phthalocyanine-oligonucleotide bioconjugates and their GRP78 oncogene photocleavage activity. Chemical Communications 2014, 50 (48), 6309-6311.
149
97. Ganivet, C. R. Novel Single Molecule Magnets and Photosensitizers for Molecular Photovoltaics based on Customized Phthalocyanines Universidad Autónoma de Madrid, Universidad Autónoma de Madrid, 2015.
98. Graffius, G. C. Functionalization of Metal Oxide Surfaces through Chemical Reactions and Physical Adsorption. Seton Hall University, Seton Hall University Dissertations and Theses (ETDs), 2016.
99. Christendat, D.; David, M.-A.; Morin, S.; Lever, A. B. P.; Kadish, K. M.; Shao, J., Synthesis and characterization of highly soluble hexadecachloro- and hexadecafluorophthalocyanine ruthenium(II) complexes. Journal of Porphyrins and Phthalocyanines 2005, 09 (09), 626-636.
100. Gabrielov, A. G.; Balkus, K. J.; Bell, S. L.; Bedioui, F.; Devynck, J., Faujasite-type zeolites modified with iron perfluorophthalocyanines: Synthesis and characterization. Microporous Materials 1994, 2 (2), 119-126.
101. Balkus, K. J.; Gabrielov, A. G.; Bell, S. L.; Bedioui, F.; Roue, L.; Devynck, J., Zeolite encapsulated cobalt(II) and copper(II) perfluorophthalocyanines. Synthesis and characterization. Inorganic Chemistry 1994, 33 (1), 67-72.
102. Bench, B. A.; Brennessel, W. W.; Lee, H.-J.; Gorun, S. M., Synthesis and Structure of a Biconcave Cobalt Perfluorophthalocyanine and Its Catalysis of Novel Oxidative Carbon–Phosphorus Bonds Formation by Using Air. Angewandte Chemie 2002, 114 (5), 776-780.
103. Ernst, S.; Selle, M., Immobilization and catalytic properties of perfluorinated ruthenium phthalocyanine complexes in MCM-41-type molecular sieves. Microporous and Mesoporous Materials 1999, 27 (2–3), 355-363.
104. Haber, J.; Block, J. H.; Delmon, B., Manual of methods and procedures for catalyst characterization (Technical Report). In Pure and Applied Chemistry, 1995; Vol. 67, p 1257.
105. Wright, J. D., Gas adsorption on phthalocyanines and its effects on electrical properties. Progress in Surface Science 1989, 31 (1), 1-60.
106. Gorun, S. M.; Bench, B. A.; Carpenter, G.; Beggs, M. W.; Mague, J. T.; Ensley, H. E., Synthesis and structural characterization of non-planar perfluoro phthalonitriles. Journal of Fluorine Chemistry 1998, 91 (1), 37-40.
107. Gorun, S. M. L., A. I.; Griswold, K.; Lapok, L.; Patel, H. H.; Gerdes, R. SYSTEM AND METHOD FOR FLUOROALKYLATED FLUOROPHTHALOCYANINES WITH AGGREGATING PROPERTIES AND CATALYTIC DRIVEN PATHWAY FOR OXIDIZING THIOLS 10.05.2012, 2012.
108. Kubelka, P., Zeitschrift fur Technische Physik 1931, 593-601.
109. Džimbeg-Malčić, V.; Barbarić-Mikočević, Ž.; Itrić, K., Kubelka-Munk theory in describing optical properties of paper (I). Tehnički vjesnik 2011, 18 (1), 117-124.

150
110. Mather, R. R.; Sing, K. S. W., Surface properties of organic pigments. Journal of Colloid and Interface Science 1977, 60 (1), 60-66.
111. Dwyer, P. J.; Vander Valk, R. J.; Caltaldo, V.; Demianicz, D.; Kelty, S. P., All-Atom CHARMM Force Field and Bulk Properties of Perfluorozinc Phthalocyanines. The Journal of Physical Chemistry A 2014, 118 (49), 11583-11590.