activate technology & media outlook 2020 - wall street journal
TRANSCRIPT

www.activate.com
ACTIVATE TECHNOLOGY & MEDIA OUTLOOK 2020
www.activate.com 2
Welcome to Activate Consulting’s Technology and Media Outlook 2020
Each year, as part of the Wall Street Journal’s WSJ TECH LIVE, our team analyzes some of the most important consumer trends, technology innovations, and industry dynamics to predict what’s going to happen next and next after that.
2020 promises to be a pivotal year for everyone in the dynamic tech and media ecosystem.
We’ve taken a deep dive into many of the forces that will reshape the industry next year and for years to come: the splintering of social networks, the race for the last mile in eCommerce, the streaming video wars, sports gambling’s explosive growth, the next wave of video gaming, and the changing world of digital marketplaces. There is also an extensive evaluation of music, podcasting, esports, emerging sports, the networked body, and digital consumer financial services. In addition, we analyze the phenomenon of ‘Super Users’ who will be increasingly important to every company in the industry. Finally, we assess the connectivity technologies that will unlock the next wave of technology and media growth.
As a firm, our work begins with the most important person in technology and media: The User. Understanding how people use technology and media experiences is the foundation of our thinking. You’ll see extensive analysis of consumers’ time, preferences, habits, and spending based on Activate’s proprietary analysis and large-scale consumer research.
We know you’ll find the results both provocative and useful, and look forward to a lively discussion.
Let’s see where technology and media are headed in 2020!
The Activate Consulting Team
www.activate.com 3
$300 Billion Global Internet and Media Growth Dollars by 2023 4
Consumer Attention: 12:40 Hours of Technology & Media Per Day 9
Super Users: The Imperative for Technology & Media Companies 13
Social Splinter: The Social Media World Expands 27
eCommerce: Shrinking the Divide Between Physical and Digital Shopping 41
Digital Marketplaces: New Inventory, Price, Transparency, Ease of Use 60
Video Gaming: The Next Streaming Battlefront 71
Esports: Sport of the Future 84
Video: Streaming Stacking, Battleground Households 94
Sports Betting: The Next Big Financial Trading Market 117
Sports: More Viewing, Emerging Sports, Better Fan Experiences 129
Music: The Discovery Challenge 138
Podcasting: New Listening Experiences and Explosive Growth 146
The Networked Body: Quantified and Connected Human 159
Digital Consumer Finance: Next Generation Services Go Mainstream 169
Connectivity: Enabling the Next Wave of Technology and Media Growth 182
PAGECONTENTS

www.activate.com 4
PAGE
$300 Billion Global Internet and Media Growth Dollars by 2023 4
Consumer Attention: 12:40 Hours of Technology & Media Per Day 9
Super Users: The Imperative for Technology & Media Companies 13
Social Splinter: The Social Media World Expands 27
eCommerce: Shrinking the Divide Between Physical and Digital Shopping 41
Digital Marketplaces: New Inventory, Price, Transparency, Ease of Use 60
Video Gaming: The Next Streaming Battlefront 71
Esports: Sport of the Future 84
Video: Streaming Stacking, Battleground Households 94
Sports Betting: The Next Big Financial Trading Market 117
Sports: More Viewing, Emerging Sports, Better Fan Experiences 129
Music: The Discovery Challenge 138
Podcasting: New Listening Experiences and Explosive Growth 146
The Networked Body: Quantified and Connected Human 159
Digital Consumer Finance: Next Generation Services Go Mainstream 169
Connectivity: Enabling the Next Wave of Technology and Media Growth 182
CONTENTS
CONSUMER SPEND
2019E 2023E
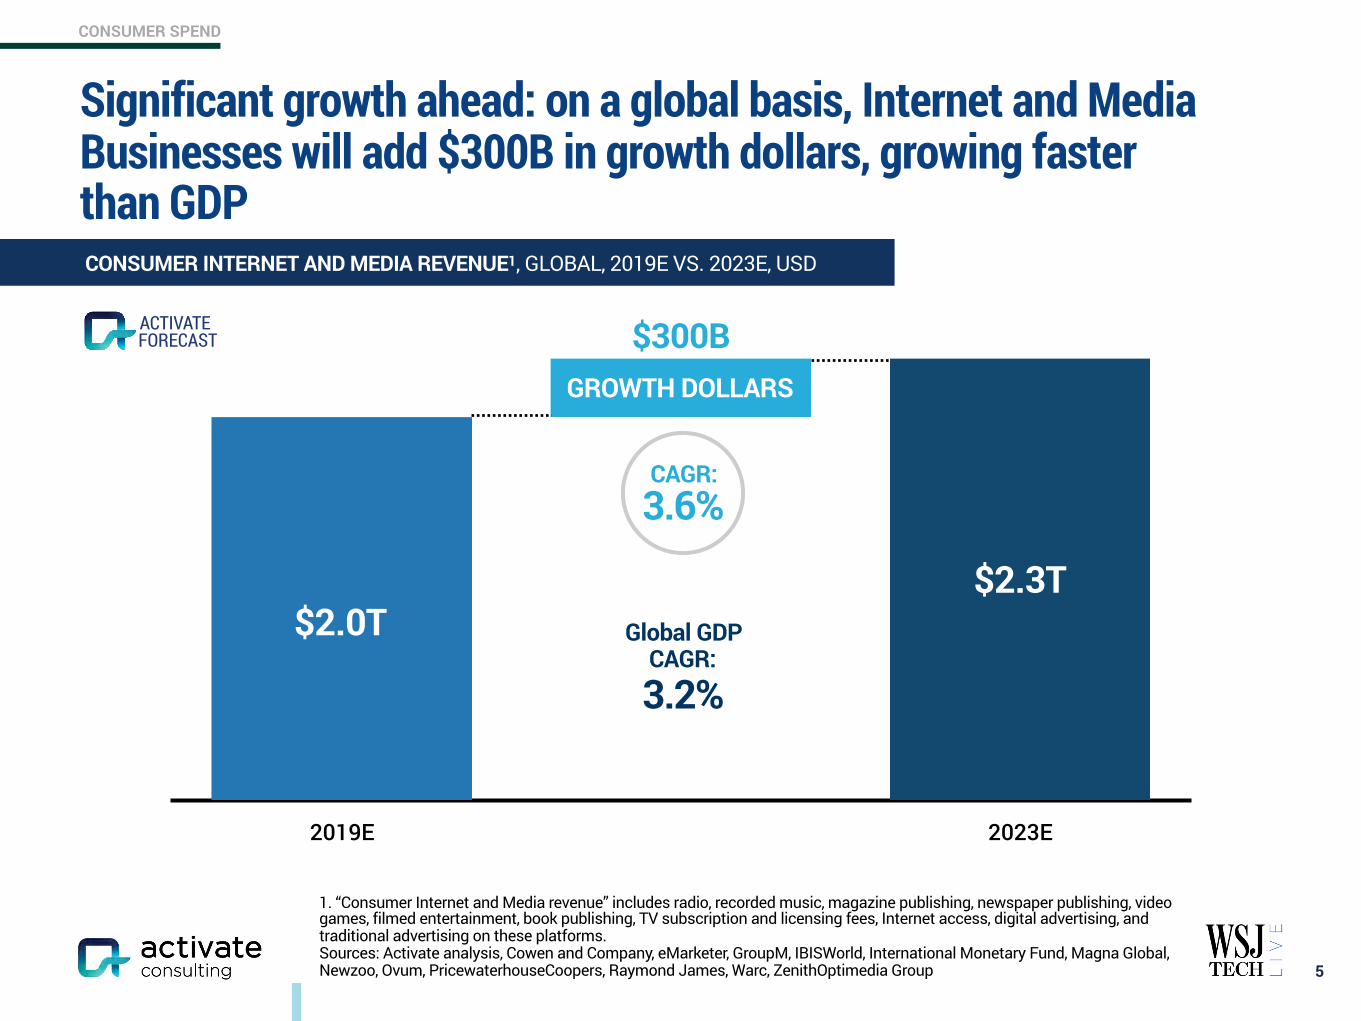
Significant growth ahead: on a global basis, Internet and Media Businesses will add $300B in growth dollars, growing faster than GDP
5
CONSUMER INTERNET AND MEDIA REVENUE1, GLOBAL, 2019E VS. 2023E, USD
1. “Consumer Internet and Media revenue” includes radio, recorded music, magazine publishing, newspaper publishing, video games, filmed entertainment, book publishing, TV subscription and licensing fees, Internet access, digital advertising, and traditional advertising on these platforms. Sources: Activate analysis, Cowen and Company, eMarketer, GroupM, IBISWorld, International Monetary Fund, Magna Global, Newzoo, Ovum, PricewaterhouseCoopers, Raymond James, Warc, ZenithOptimedia Group
$2.0T$2.3T
GROWTH DOLLARS
CAGR: 3.6%
$300B
Global GDP CAGR:
3.2%
FORECASTACTIVATE
CONSUMER SPEND
2019E 2023E
224.5%211.4%
199.8%
Ad revenue
Internet access3
Paid content2
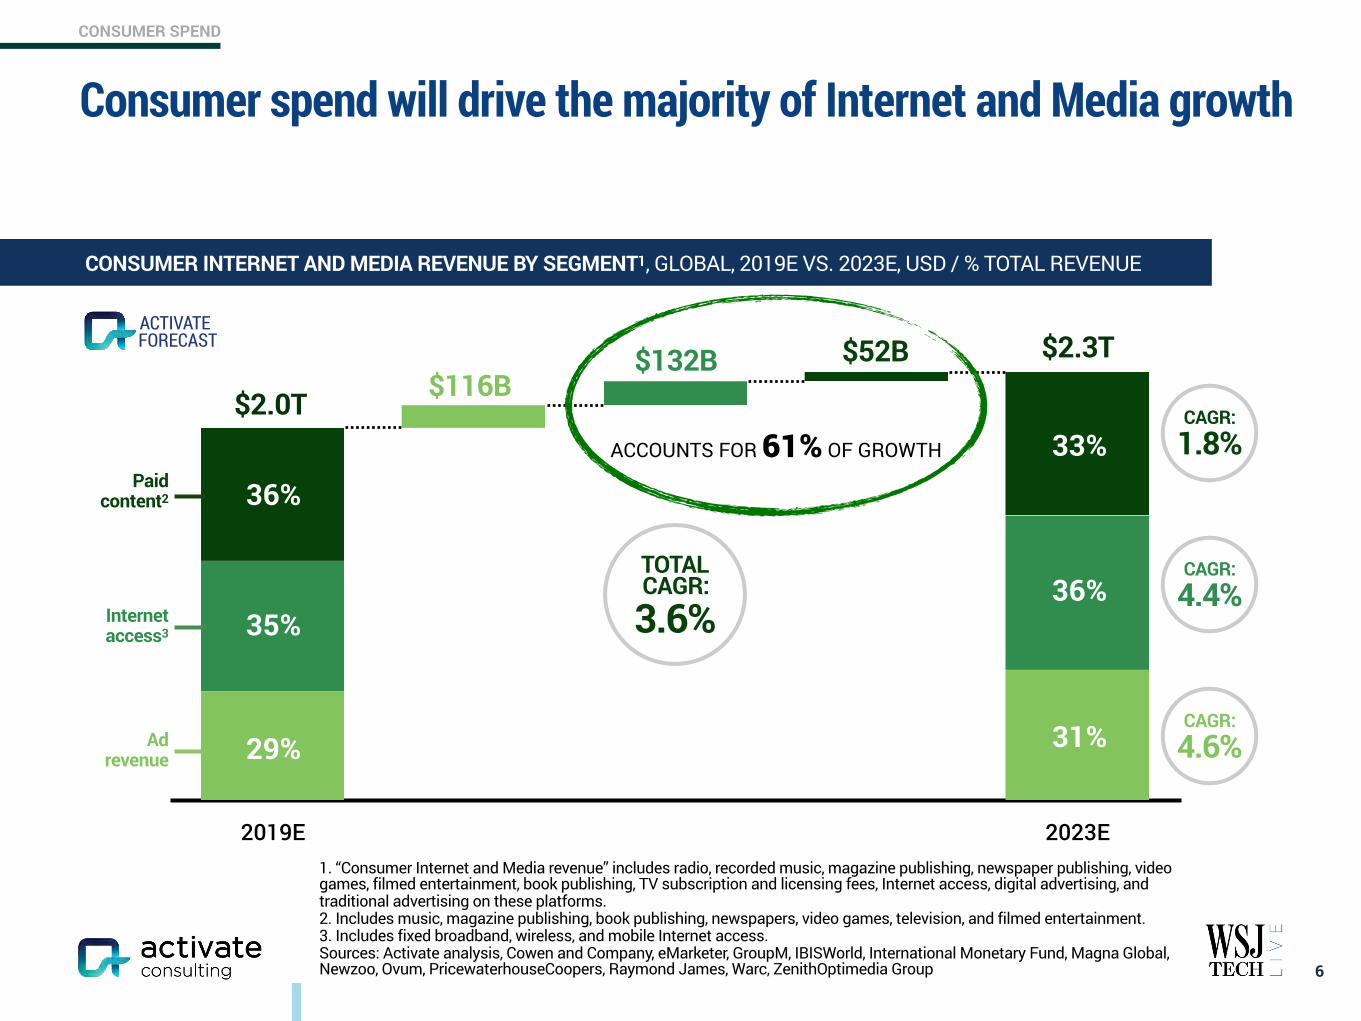
Consumer spend will drive the majority of Internet and Media growth
6
CONSUMER INTERNET AND MEDIA REVENUE BY SEGMENT1, GLOBAL, 2019E VS. 2023E, USD / % TOTAL REVENUE
1. “Consumer Internet and Media revenue” includes radio, recorded music, magazine publishing, newspaper publishing, video games, filmed entertainment, book publishing, TV subscription and licensing fees, Internet access, digital advertising, and traditional advertising on these platforms. 2. Includes music, magazine publishing, book publishing, newspapers, video games, television, and filmed entertainment. 3. Includes fixed broadband, wireless, and mobile Internet access. Sources: Activate analysis, Cowen and Company, eMarketer, GroupM, IBISWorld, International Monetary Fund, Magna Global, Newzoo, Ovum, PricewaterhouseCoopers, Raymond James, Warc, ZenithOptimedia Group
36%
29%
35%
33%
31%
36%
$2.0T$132B
$116B$52B $2.3T
CAGR: 1.8%
CAGR: 4.4%
CAGR: 4.6%
ACCOUNTS FOR 61% OF GROWTH
FORECASTACTIVATE
TOTAL CAGR: 3.6%
CONSUMER SPEND
Subscriptionrevenue
Singletransactions
2019E 2023E
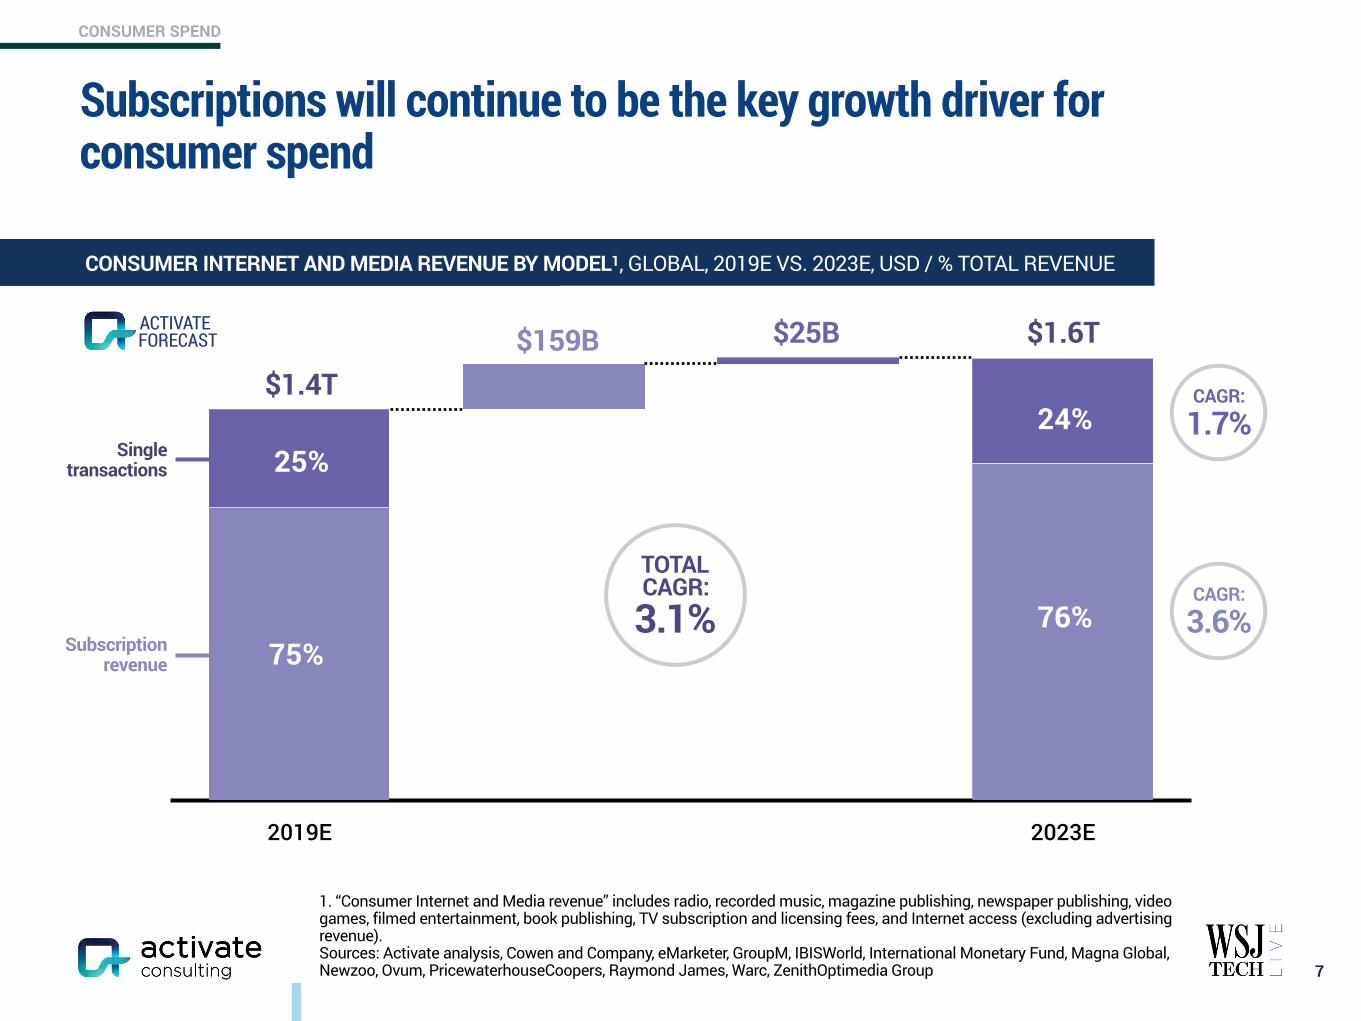
Subscriptions will continue to be the key growth driver for consumer spend
7
CONSUMER INTERNET AND MEDIA REVENUE BY MODEL1, GLOBAL, 2019E VS. 2023E, USD / % TOTAL REVENUE
1. “Consumer Internet and Media revenue” includes radio, recorded music, magazine publishing, newspaper publishing, video games, filmed entertainment, book publishing, TV subscription and licensing fees, and Internet access (excluding advertising revenue). Sources: Activate analysis, Cowen and Company, eMarketer, GroupM, IBISWorld, International Monetary Fund, Magna Global, Newzoo, Ovum, PricewaterhouseCoopers, Raymond James, Warc, ZenithOptimedia Group
25%
75%
24%
76%CAGR:
3.6%
CAGR:
1.7%$1.4T
$159B $25B $1.6TFORECASTACTIVATE
TOTAL CAGR: 3.1%
CONSUMER SPEND
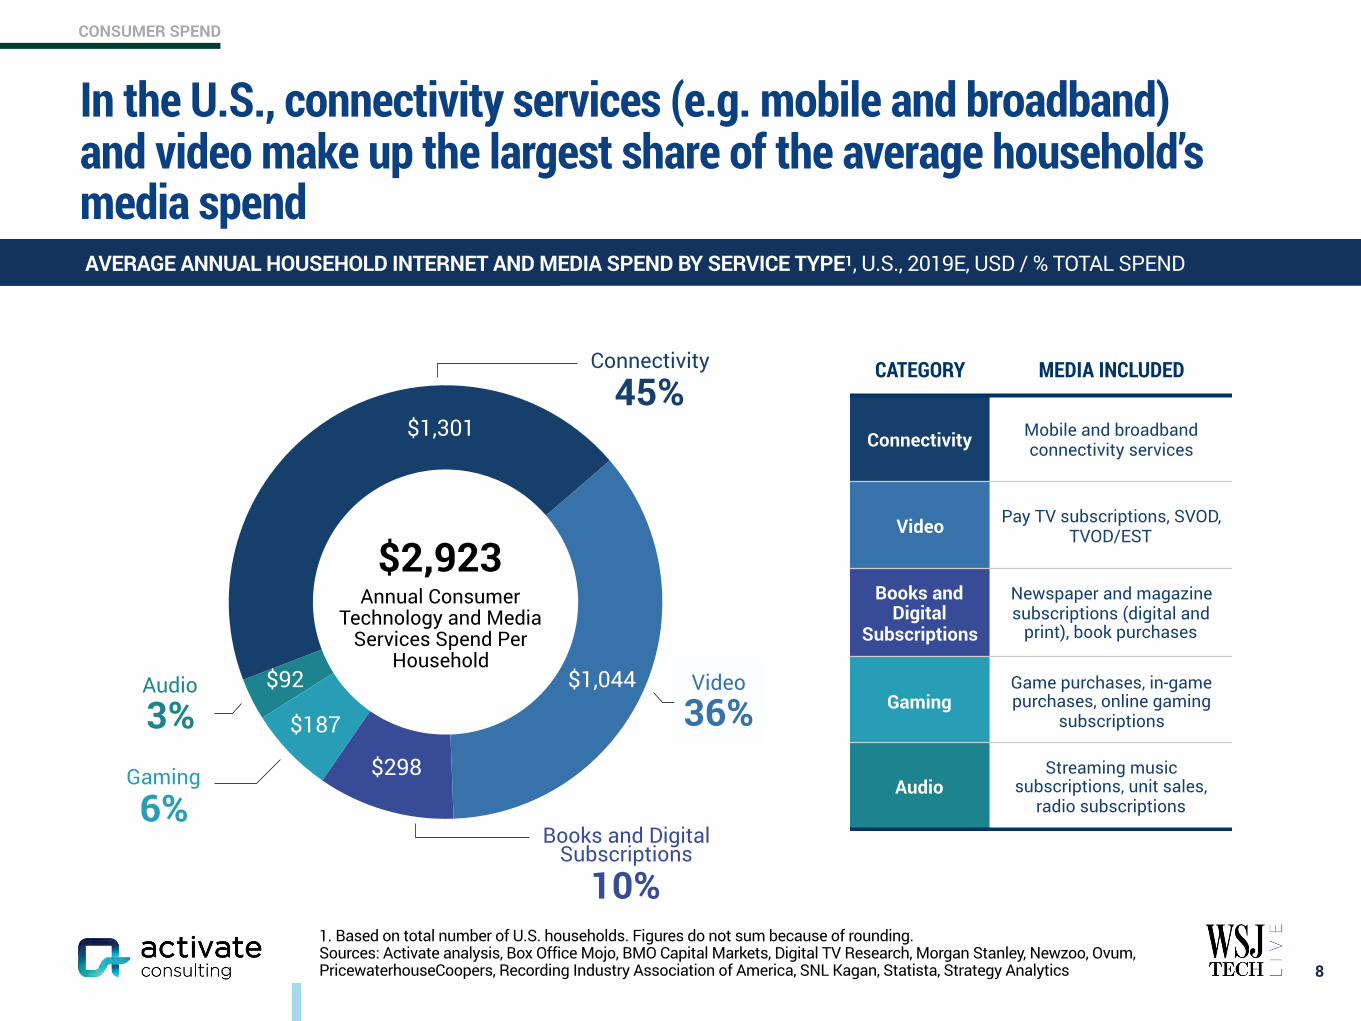
In the U.S., connectivity services (e.g. mobile and broadband) and video make up the largest share of the average household’s media spend
8
AVERAGE ANNUAL HOUSEHOLD INTERNET AND MEDIA SPEND BY SERVICE TYPE1, U.S., 2019E, USD / % TOTAL SPEND
1. Based on total number of U.S. households. Figures do not sum because of rounding. Sources: Activate analysis, Box Office Mojo, BMO Capital Markets, Digital TV Research, Morgan Stanley, Newzoo, Ovum, PricewaterhouseCoopers, Recording Industry Association of America, SNL Kagan, Statista, Strategy Analytics
Audio3%
Gaming6%
Video36%
$2,923 Annual Consumer
Technology and Media Services Spend Per
Household
$1,301
$1,044$92
$298
$187
CATEGORY MEDIA INCLUDED
Connectivity Mobile and broadband connectivity services
Video Pay TV subscriptions, SVOD, TVOD/EST
Books and Digital
Subscriptions
Newspaper and magazine subscriptions (digital and
print), book purchases
GamingGame purchases, in-game purchases, online gaming
subscriptions
AudioStreaming music
subscriptions, unit sales, radio subscriptions
Video
36%Audio
3%Gaming
6%
Connectivity
45%
Books and Digital Subscriptions
10%
www.activate.com 9
PAGE
$300 Billion Global Internet and Media Growth Dollars by 2023 4
Consumer Attention: 12:40 Hours of Technology & Media Per Day 9
Super Users: The Imperative for Technology & Media Companies 13
Social Splinter: The Social Media World Expands 27
eCommerce: Shrinking the Divide Between Physical and Digital Shopping 41
Digital Marketplaces: New Inventory, Price, Transparency, Ease of Use 60
Video Gaming: The Next Streaming Battlefront 71
Esports: Sport of the Future 84
Video: Streaming Stacking, Battleground Households 94
Sports Betting: The Next Big Financial Trading Market 117
Sports: More Viewing, Emerging Sports, Better Fan Experiences 129
Music: The Discovery Challenge 138
Podcasting: New Listening Experiences and Explosive Growth 146
The Networked Body: Quantified and Connected Human 159
Digital Consumer Finance: Next Generation Services Go Mainstream 169
Connectivity: Enabling the Next Wave of Technology and Media Growth 182
CONTENTS
CONSUMER ATTENTION
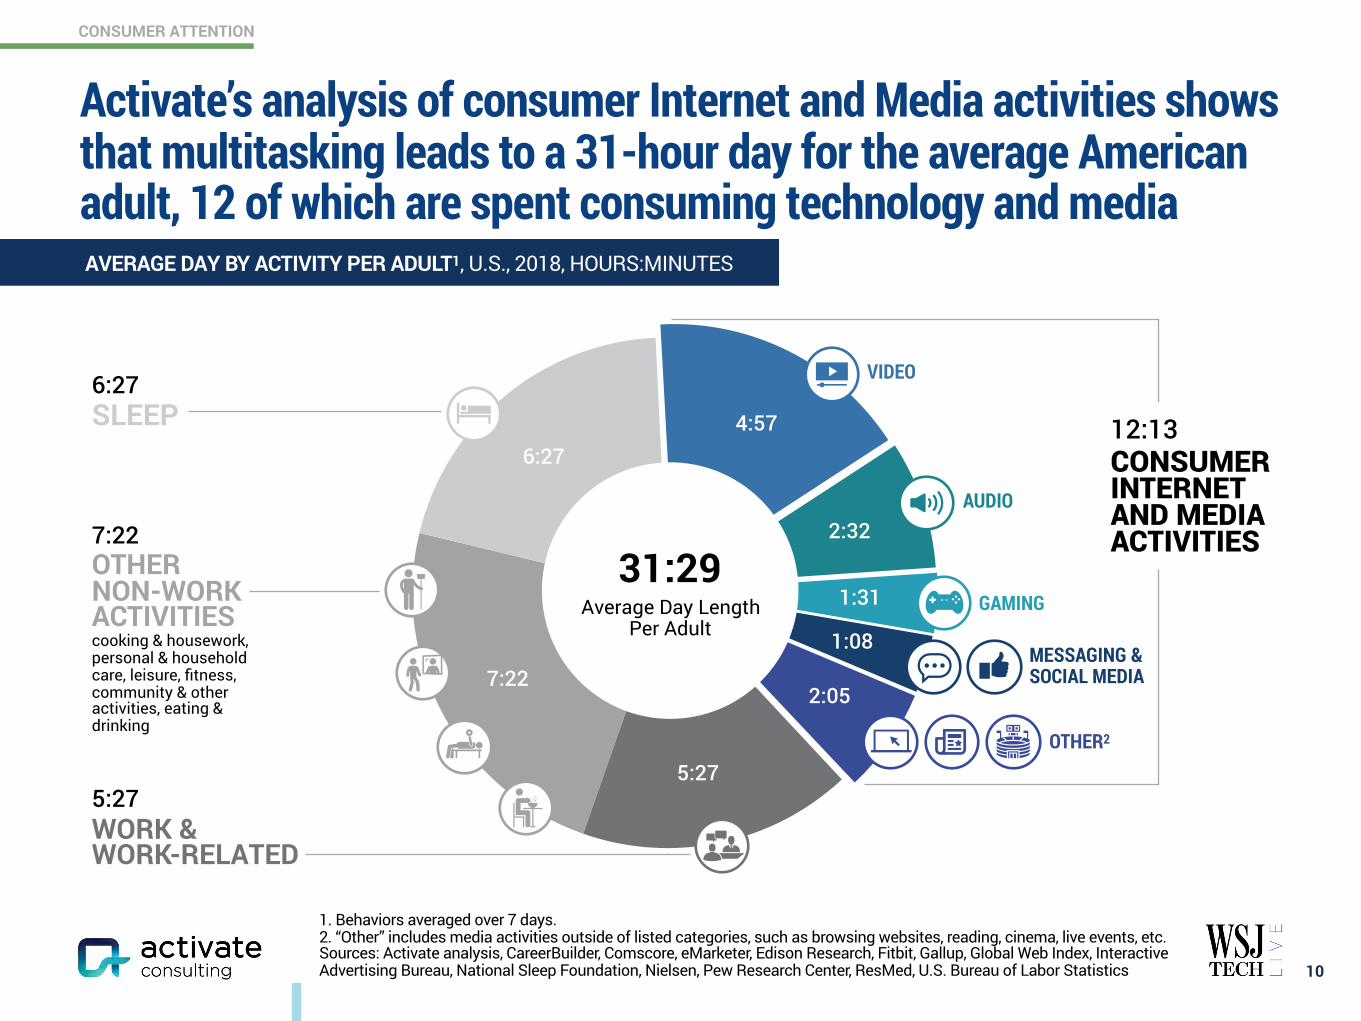
Activate’s analysis of consumer Internet and Media activities shows that multitasking leads to a 31-hour day for the average American adult, 12 of which are spent consuming technology and media
10
AVERAGE DAY BY ACTIVITY PER ADULT1, U.S., 2018, HOURS:MINUTES
6:27 SLEEP
7:22 OTHER NON-WORK ACTIVITIES cooking & housework, personal & household care, leisure, fitness, community & other activities, eating & drinking
5:27 WORK & WORK-RELATED
5:27
7:22
6:274:57
2:32
1:31
1:08
2:05
12:13 CONSUMER INTERNET AND MEDIA ACTIVITIES
VIDEO
AUDIO
GAMING
MESSAGING & SOCIAL MEDIA
OTHER2
1. Behaviors averaged over 7 days. 2. “Other” includes media activities outside of listed categories, such as browsing websites, reading, cinema, live events, etc. Sources: Activate analysis, CareerBuilder, Comscore, eMarketer, Edison Research, Fitbit, Gallup, Global Web Index, Interactive Advertising Bureau, National Sleep Foundation, Nielsen, Pew Research Center, ResMed, U.S. Bureau of Labor Statistics
31:29 Average Day Length
Per Adult
CONSUMER ATTENTION
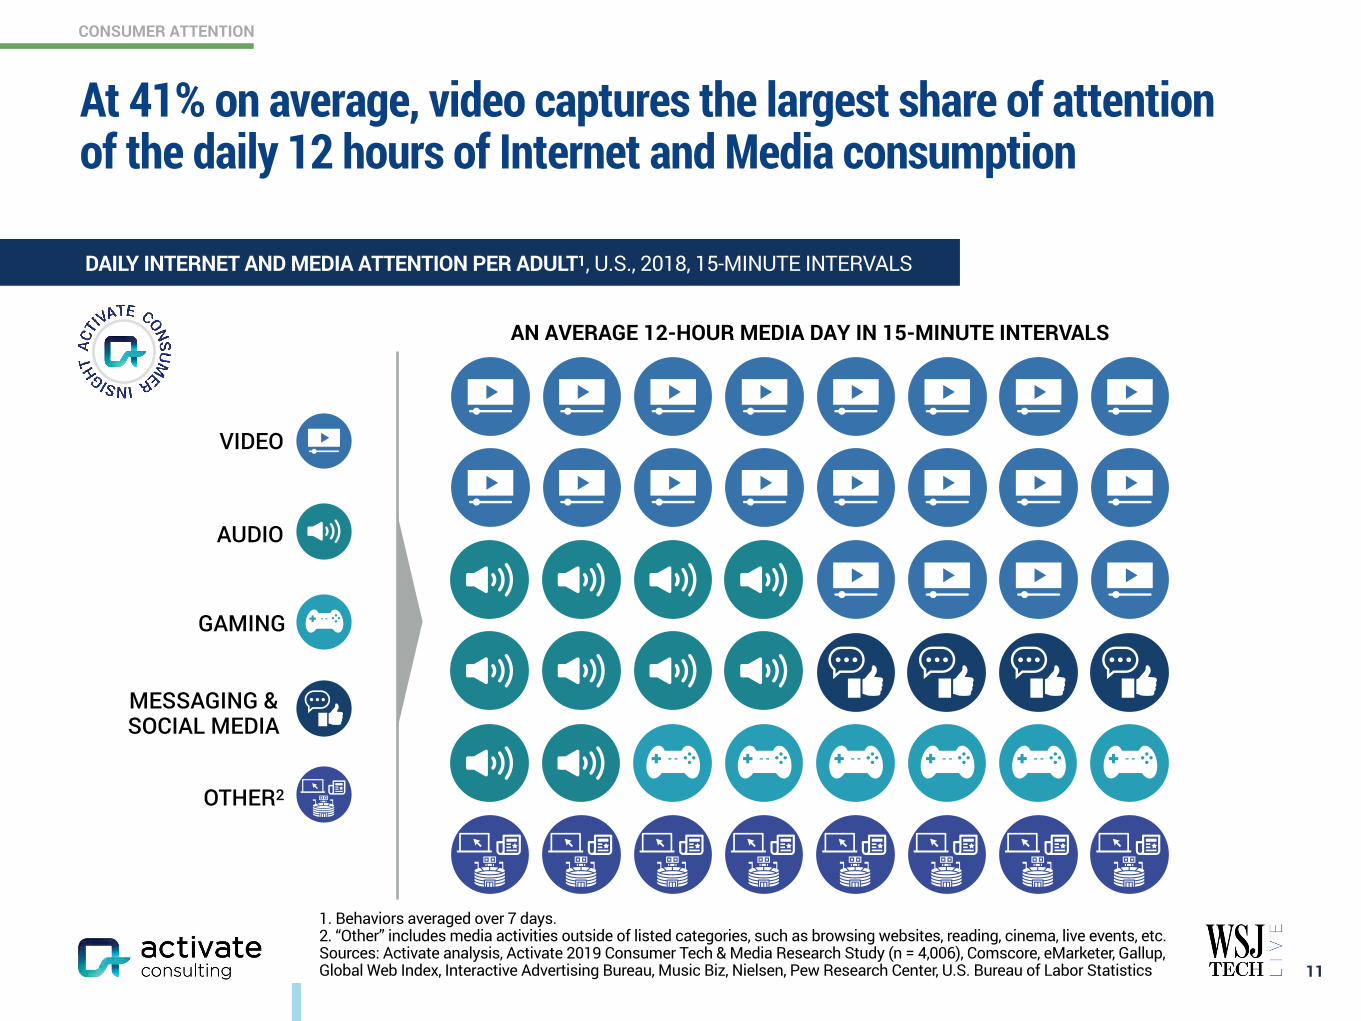
At 41% on average, video captures the largest share of attention of the daily 12 hours of Internet and Media consumption
11
DAILY INTERNET AND MEDIA ATTENTION PER ADULT1, U.S., 2018, 15-MINUTE INTERVALS
A TYPICAL 12:13-HOUR MEDIA DAY: 48 X 15-MINUTE INTERVALS
VIDEO
MESSAGING & SOCIAL MEDIA
GAMING
OTHER2
AUDIO
1. Behaviors averaged over 7 days. 2. “Other” includes media activities outside of listed categories, such as browsing websites, reading, cinema, live events, etc. Sources: Activate analysis, Activate 2019 Consumer Tech & Media Research Study (n = 4,006), Comscore, eMarketer, Gallup, Global Web Index, Interactive Advertising Bureau, Music Biz, Nielsen, Pew Research Center, U.S. Bureau of Labor Statistics
AN AVERAGE 12-HOUR MEDIA DAY IN 15-MINUTE INTERVALS
CONSUMER ATTENTION
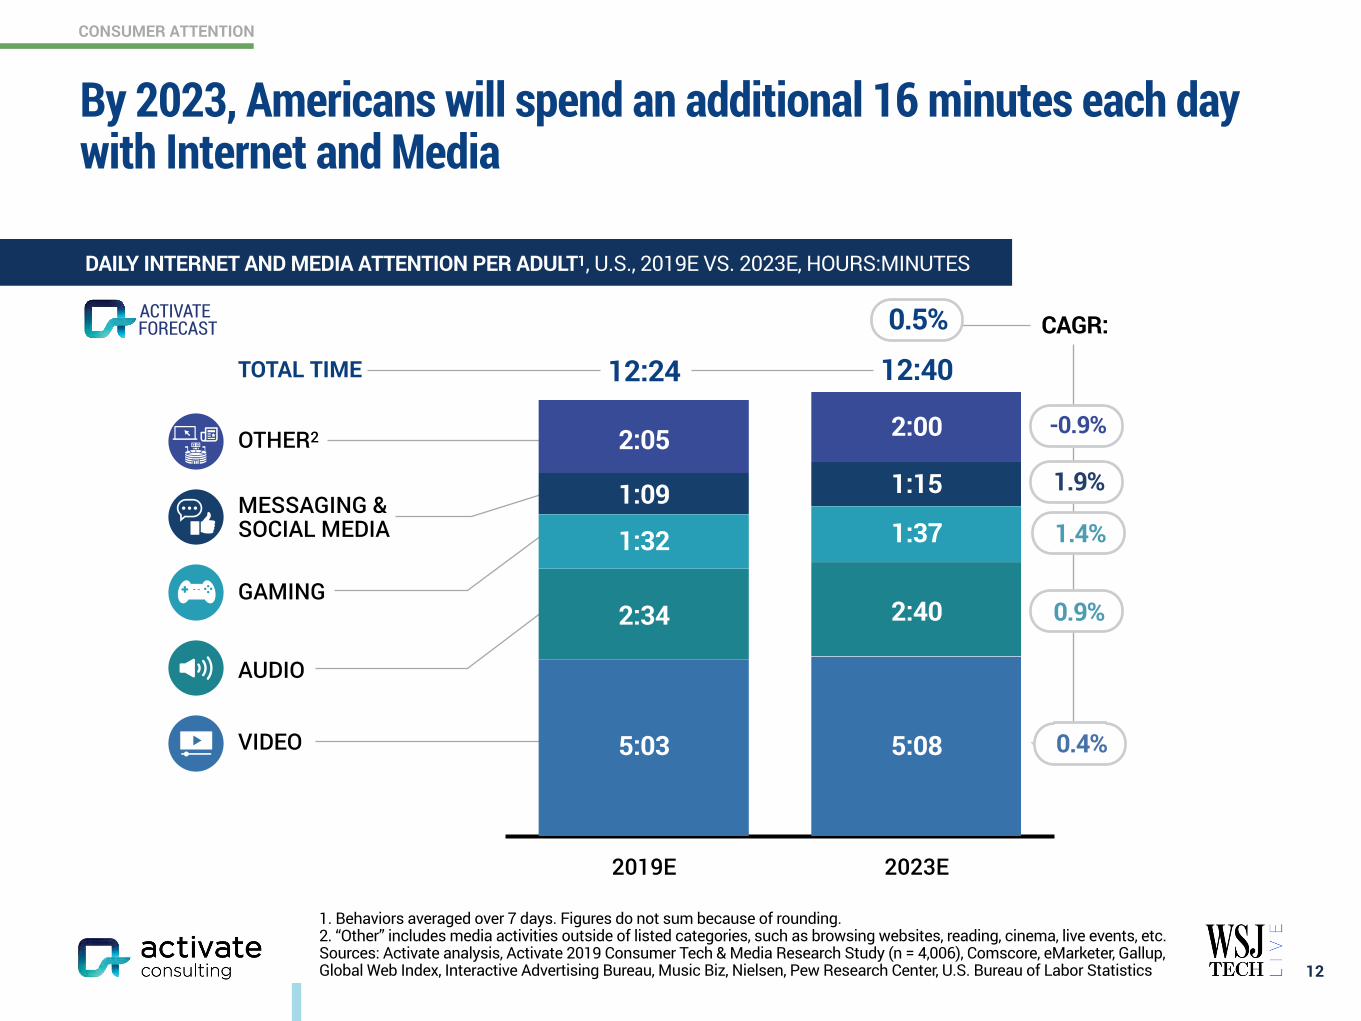
By 2023, Americans will spend an additional 16 minutes each day with Internet and Media
12
DAILY INTERNET AND MEDIA ATTENTION PER ADULT1, U.S., 2019E VS. 2023E, HOURS:MINUTES
1. Behaviors averaged over 7 days. Figures do not sum because of rounding. 2. “Other” includes media activities outside of listed categories, such as browsing websites, reading, cinema, live events, etc. Sources: Activate analysis, Activate 2019 Consumer Tech & Media Research Study (n = 4,006), Comscore, eMarketer, Gallup, Global Web Index, Interactive Advertising Bureau, Music Biz, Nielsen, Pew Research Center, U.S. Bureau of Labor Statistics
2019E 2023E
12:24 12:40
5:03
FORECASTACTIVATE
2:34
1:32
1:09
2:05
5:08
2:40
1:37
1:15
2:00
VIDEO
MESSAGING & SOCIAL MEDIA
GAMING
OTHER2
AUDIO
TOTAL TIME
CAGR:0.5%
-0.9%
1.9%
1.4%
0.9%
0.4%
www.activate.com 13
PAGE
$300 Billion Global Internet and Media Growth Dollars by 2023 4
Consumer Attention: 12:40 Hours of Technology & Media Per Day 9
Super Users: The Imperative for Technology & Media Companies 13
Social Splinter: The Social Media World Expands 27
eCommerce: Shrinking the Divide Between Physical and Digital Shopping 41
Digital Marketplaces: New Inventory, Price, Transparency, Ease of Use 60
Video Gaming: The Next Streaming Battlefront 71
Esports: Sport of the Future 84
Video: Streaming Stacking, Battleground Households 94
Sports Betting: The Next Big Financial Trading Market 117
Sports: More Viewing, Emerging Sports, Better Fan Experiences 129
Music: The Discovery Challenge 138
Podcasting: New Listening Experiences and Explosive Growth 146
The Networked Body: Quantified and Connected Human 159
Digital Consumer Finance: Next Generation Services Go Mainstream 169
Connectivity: Enabling the Next Wave of Technology and Media Growth 182
CONTENTS
SUPER USERS
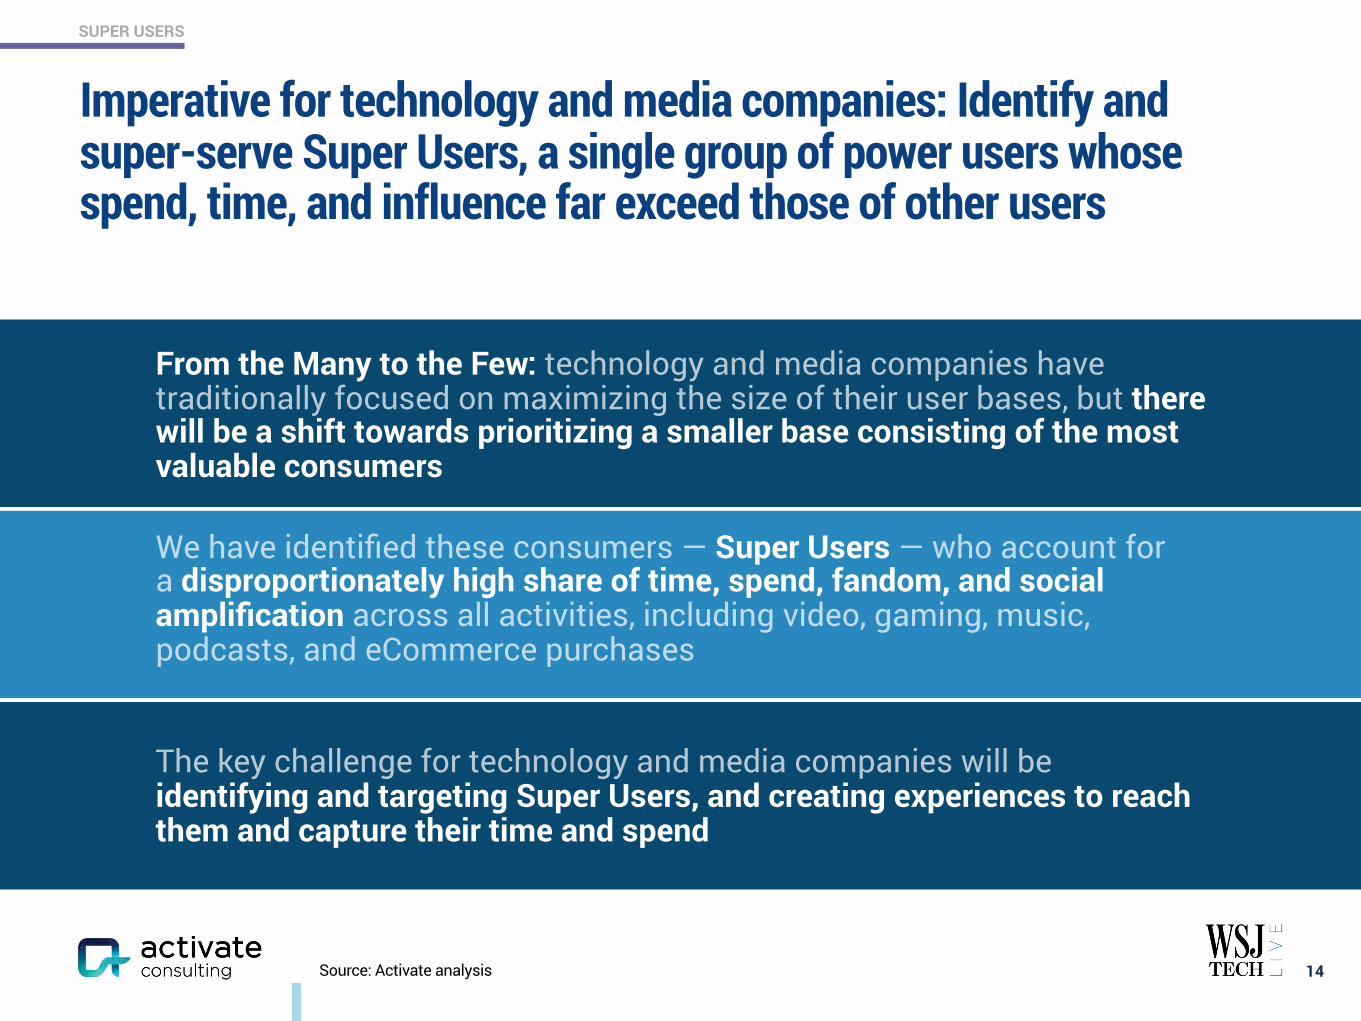
Imperative for technology and media companies: Identify and super-serve Super Users, a single group of power users whose spend, time, and influence far exceed those of other users
14Source: Activate analysis
We have identified these consumers — Super Users — who account for a disproportionately high share of time, spend, fandom, and social amplification across all activities, including video, gaming, music, podcasts, and eCommerce purchases
From the Many to the Few: technology and media companies have traditionally focused on maximizing the size of their user bases, but there will be a shift towards prioritizing a smaller base consisting of the most valuable consumers
The key challenge for technology and media companies will be identifying and targeting Super Users, and creating experiences to reach them and capture their time and spend
SUPER USERS
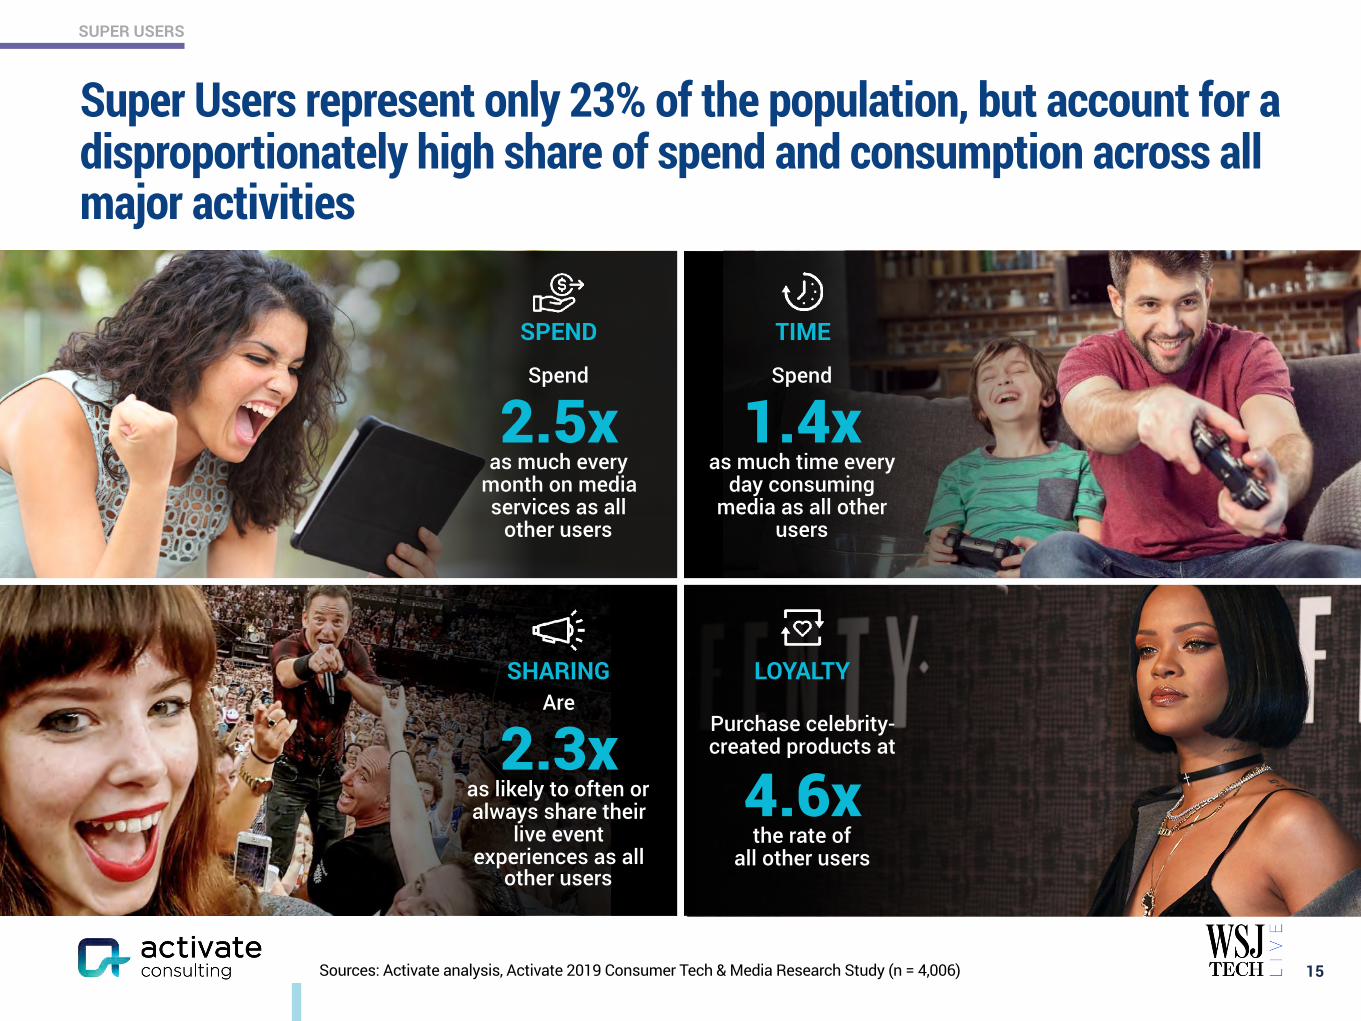
Super Users represent only 23% of the population, but account for a disproportionately high share of spend and consumption across all major activities
15Sources: Activate analysis, Activate 2019 Consumer Tech & Media Research Study (n = 4,006)
Spend
1.4x as much time every
day consuming media as all other
users
TIME
Spend
2.5x as much every
month on media services as all
other users
SPEND
Purchase celebrity-created products at
4.6x the rate of
all other users
LOYALTYSHARINGAre
2.3x as likely to often or always share their
live event experiences as all
other users
SUPER USERS
77%
23%SUPER USERS
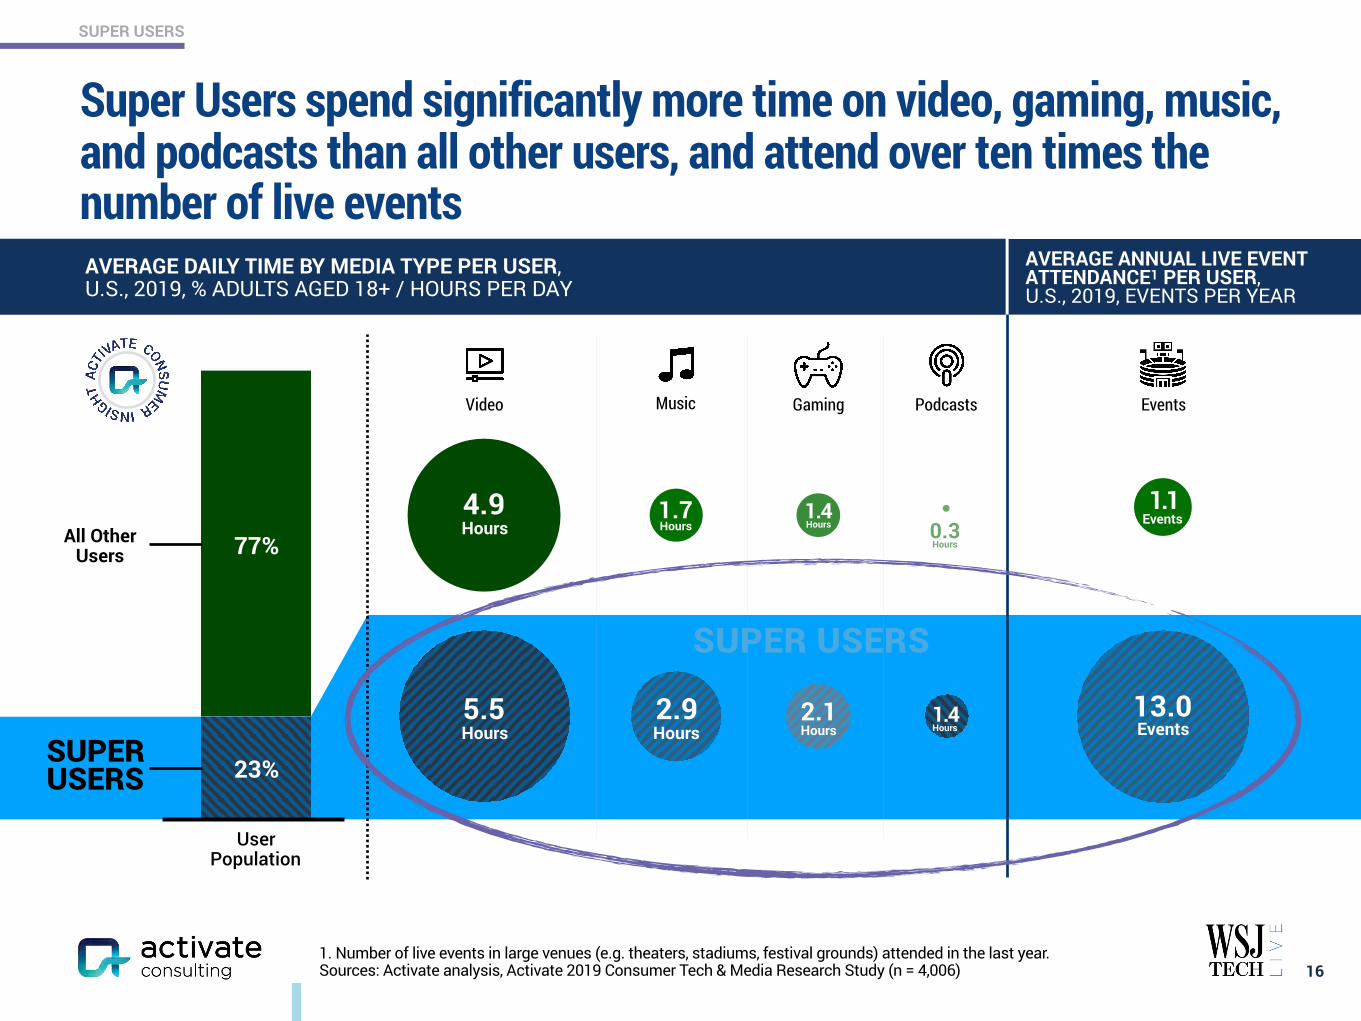
Super Users spend significantly more time on video, gaming, music, and podcasts than all other users, and attend over ten times the number of live events
161. Number of live events in large venues (e.g. theaters, stadiums, festival grounds) attended in the last year. Sources: Activate analysis, Activate 2019 Consumer Tech & Media Research Study (n = 4,006)
AVERAGE DAILY TIME BY MEDIA TYPE PER USER, U.S., 2019, % ADULTS AGED 18+ / HOURS PER DAY
AVERAGE ANNUAL LIVE EVENT ATTENDANCE1 PER USER, U.S., 2019, EVENTS PER YEAR
Video Music Gaming Podcasts Events
5.5 Hours
2.9 Hours
2.1 Hours
1.4 Hours
13.0 Events
4.9 Hours
1.7 Hours
1.4 Hours 0.3
Hours
1.1 Events
User Population
All OtherUsers
SUPER USERS
SUPER USERS
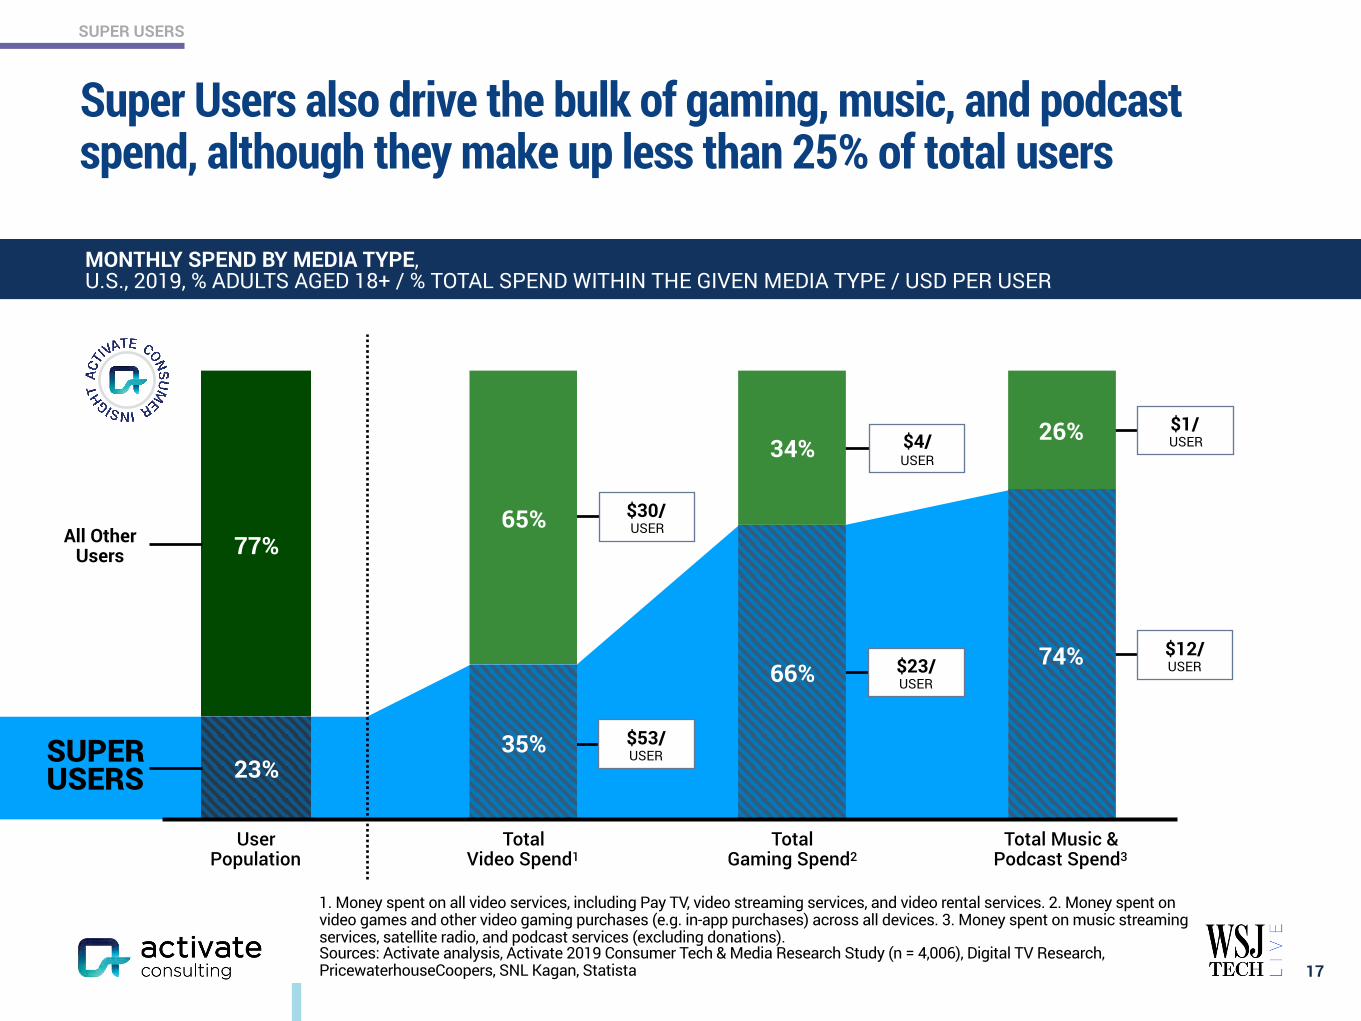
Super Users also drive the bulk of gaming, music, and podcast spend, although they make up less than 25% of total users
17
ROBOTO BOLD 16PT, ROBOTO REGULAR 16 PT
1. Money spent on all video services, including Pay TV, video streaming services, and video rental services. 2. Money spent on video games and other video gaming purchases (e.g. in-app purchases) across all devices. 3. Money spent on music streaming services, satellite radio, and podcast services (excluding donations). Sources: Activate analysis, Activate 2019 Consumer Tech & Media Research Study (n = 4,006), Digital TV Research, PricewaterhouseCoopers, SNL Kagan, Statista
MONTHLY SPEND BY MEDIA TYPE, U.S., 2019, % ADULTS AGED 18+ / % TOTAL SPEND WITHIN THE GIVEN MEDIA TYPE / USD PER USER
$30/ USER
$53/ USER
$1/ USER
$12/ USER
77%
23%SUPER USERS
All OtherUsers
$4/ USER
$23/ USER
User Population
Total Video Spend1
Total Gaming Spend2
Total Music & Podcast Spend3
26%34%
65%
74%66%
35%
SUPER USERS
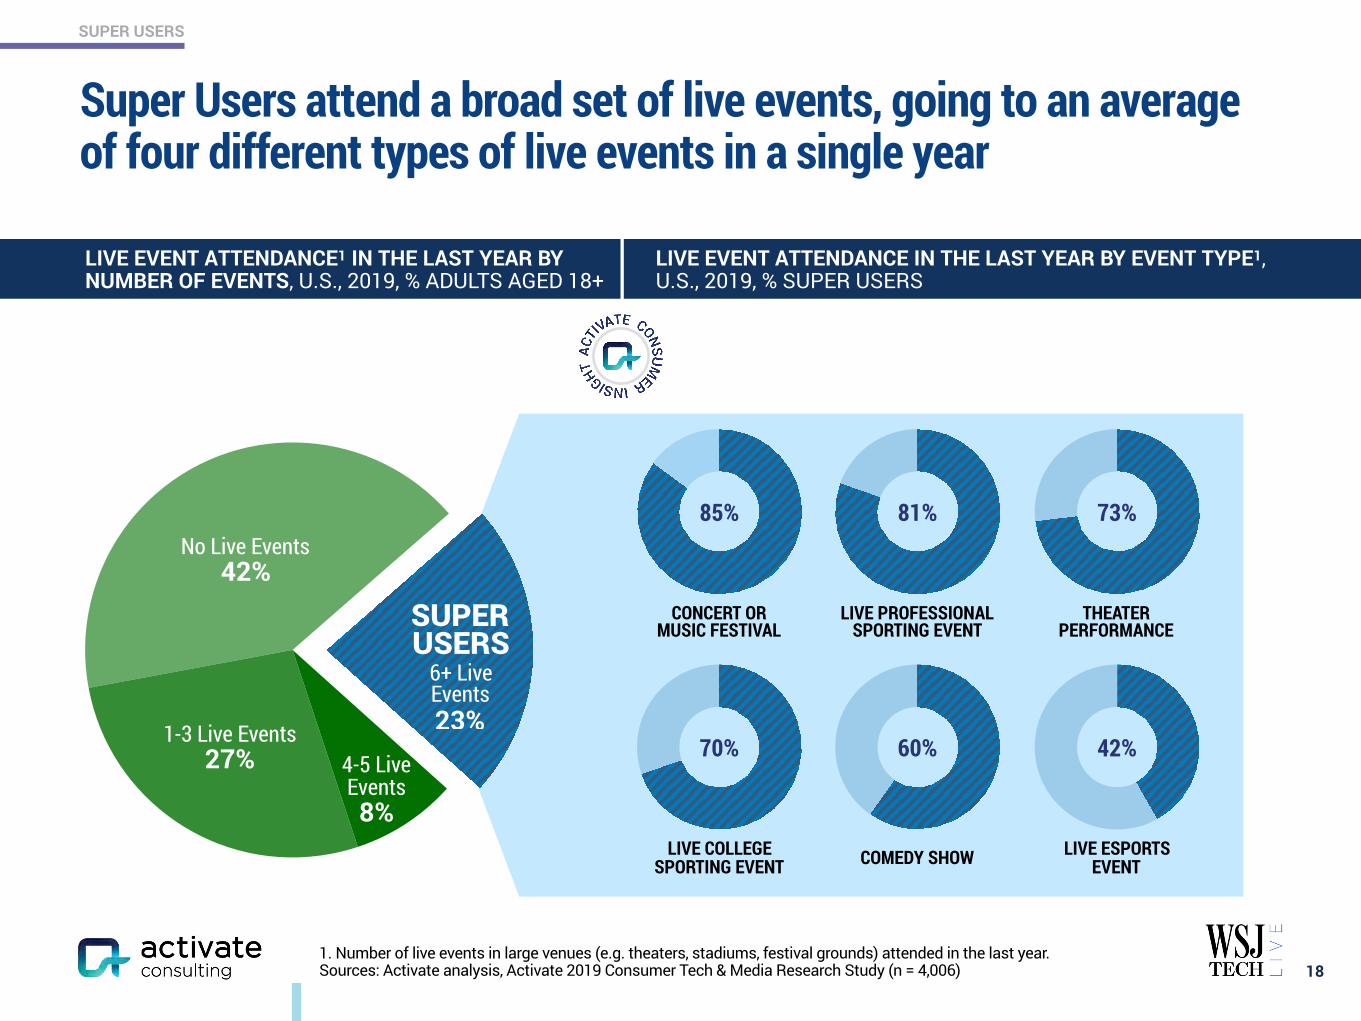
Super Users attend a broad set of live events, going to an average of four different types of live events in a single year
18
ROBOTO BOLD 16PT, ROBOTO REGULAR 16 PT
1. Number of live events in large venues (e.g. theaters, stadiums, festival grounds) attended in the last year. Sources: Activate analysis, Activate 2019 Consumer Tech & Media Research Study (n = 4,006)
LIVE EVENT ATTENDANCE1 IN THE LAST YEAR BY NUMBER OF EVENTS, U.S., 2019, % ADULTS AGED 18+
1-3 Live Events 27%
6+ Live Events 23%
No Live Events 42%
CONCERT OR MUSIC FESTIVAL
85%
THEATER PERFORMANCE
81%
COMEDY SHOW
73%
LIVE PROFESSIONAL SPORTING EVENT
70%
LIVE COLLEGE SPORTING EVENT
60%
LIVE ESPORTS EVENT
42%
LIVE EVENT ATTENDANCE IN THE LAST YEAR BY EVENT TYPE1, U.S., 2019, % SUPER USERS
4-5 Live Events 8%
SUPER USERS

SUPER USERS
Super Users are younger, more affluent, and more educated
19Sources: Activate analysis, Activate 2019 Consumer Tech & Media Research Study (n = 4,006)
Aged 18-34
Has a household income of $100K or greater
Currently enrolled as a student in a higher education institution
(Associate’s program or higher)
Holds a college degree(Associate’s degree or higher)
46%
19%
13%
24%
72%
53%
34%
40%
Super Users All Other Users
USER DEMOGRAPHICS, U.S., 2019, % ADULTS AGED 18+
SUPER USERS
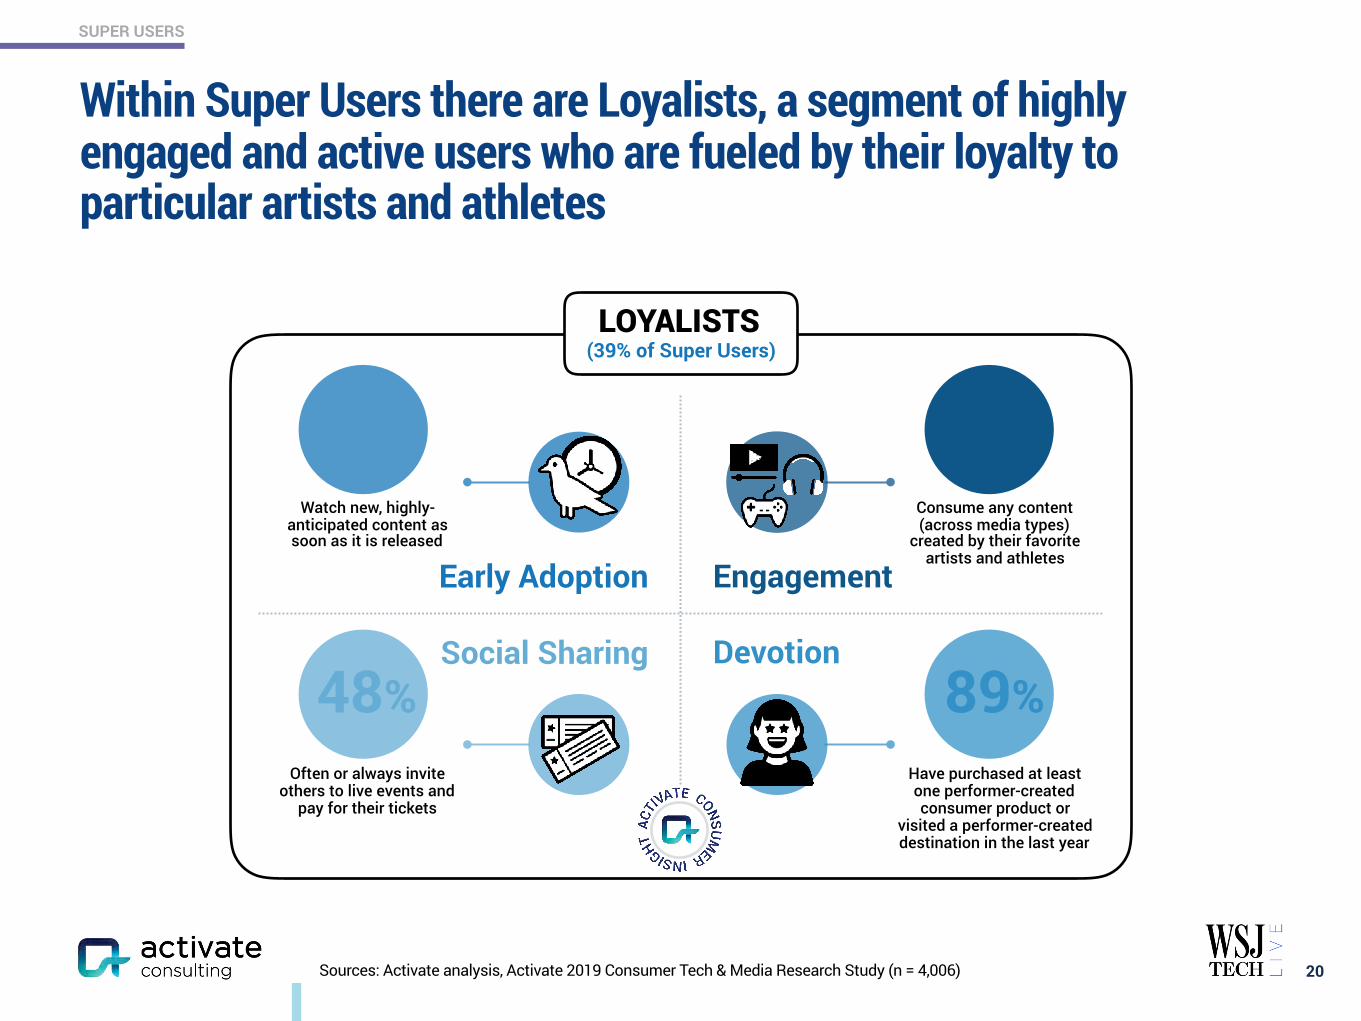
Within Super Users there are Loyalists, a segment of highly engaged and active users who are fueled by their loyalty to particular artists and athletes
20Sources: Activate analysis, Activate 2019 Consumer Tech & Media Research Study (n = 4,006)
Early Adoption Engagement
Social Sharing Devotion
LOYALISTS (39% of Super Users)
89%
77%
48%
63%
Have purchased at least one performer-created consumer product or
visited a performer-created destination in the last year
Consume any content (across media types)
created by their favorite artists and athletes
Often or always invite others to live events and
pay for their tickets
Watch new, highly-anticipated content as soon as it is released
SUPER USERS
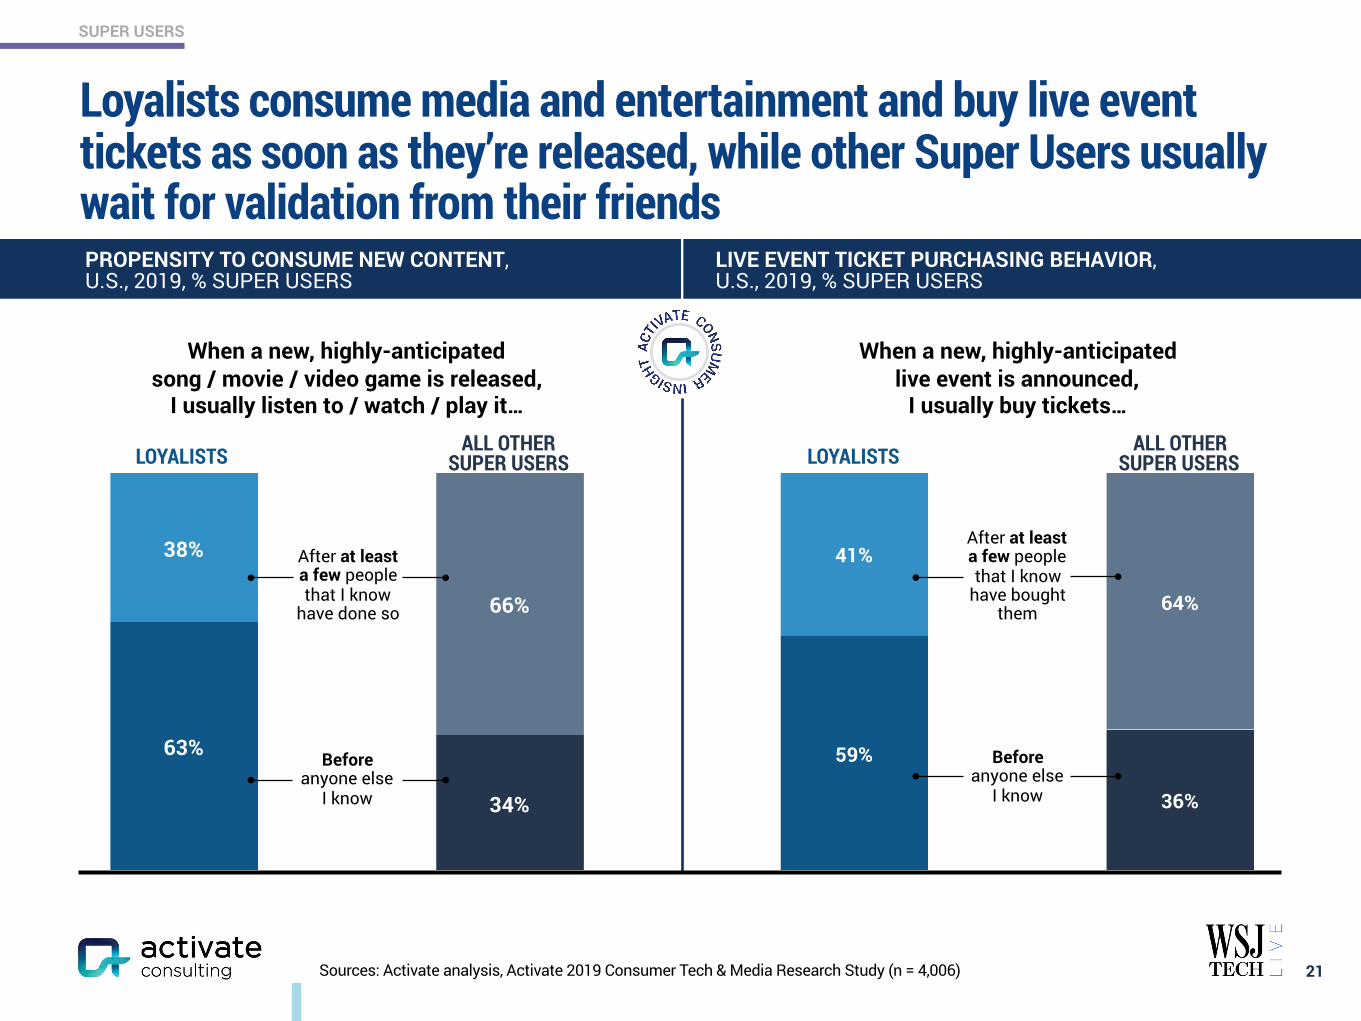
66%
34%
38%
63%
Loyalists consume media and entertainment and buy live event tickets as soon as they’re released, while other Super Users usually wait for validation from their friends
21Sources: Activate analysis, Activate 2019 Consumer Tech & Media Research Study (n = 4,006)
PROPENSITY TO CONSUME NEW CONTENT, U.S., 2019, % SUPER USERS
When a new, highly-anticipated song / movie / video game is released,
I usually listen to / watch / play it…
Before anyone else
I know
After at least a few people that I know
have done so
ALL OTHER SUPER USERSLOYALISTS
When a new, highly-anticipated live event is announced,
I usually buy tickets…
LIVE EVENT TICKET PURCHASING BEHAVIOR, U.S., 2019, % SUPER USERS
64%
36%
41%
59% Before anyone else
I know
After at least a few people that I know
have bought them
ALL OTHER SUPER USERSLOYALISTS
SUPER USERS
22Sources: Activate analysis, Activate 2019 Consumer Tech & Media Research Study (n = 4,006)
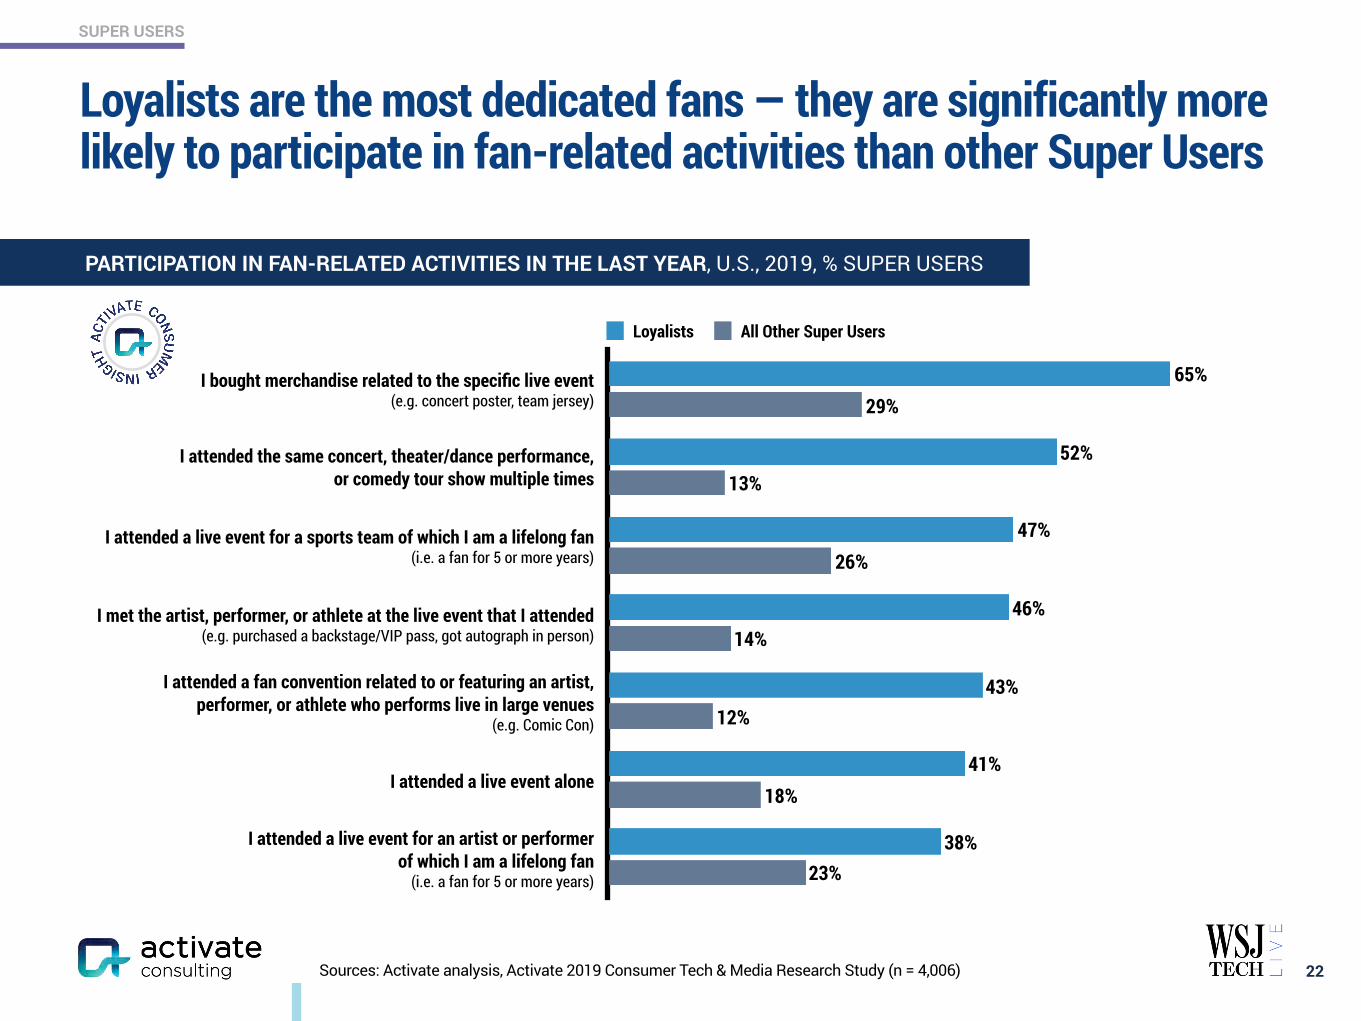
23%
18%
12%
14%
26%
13%
29%
38%
41%
43%
46%
47%
52%
65%
Loyalists All Other Super Users
I bought merchandise related to the specific live event (e.g. concert poster, team jersey)
I attended the same concert, theater/dance performance, or comedy tour show multiple times
I attended a live event for a sports team of which I am a lifelong fan (i.e. a fan for 5 or more years)
I met the artist, performer, or athlete at the live event that I attended (e.g. purchased a backstage/VIP pass, got autograph in person)
I attended a fan convention related to or featuring an artist, performer, or athlete who performs live in large venues
(e.g. Comic Con)
I attended a live event alone
I attended a live event for an artist or performer of which I am a lifelong fan
(i.e. a fan for 5 or more years)
PARTICIPATION IN FAN-RELATED ACTIVITIES IN THE LAST YEAR, U.S., 2019, % SUPER USERS
Loyalists are the most dedicated fans — they are significantly more likely to participate in fan-related activities than other Super Users
SUPER USERS
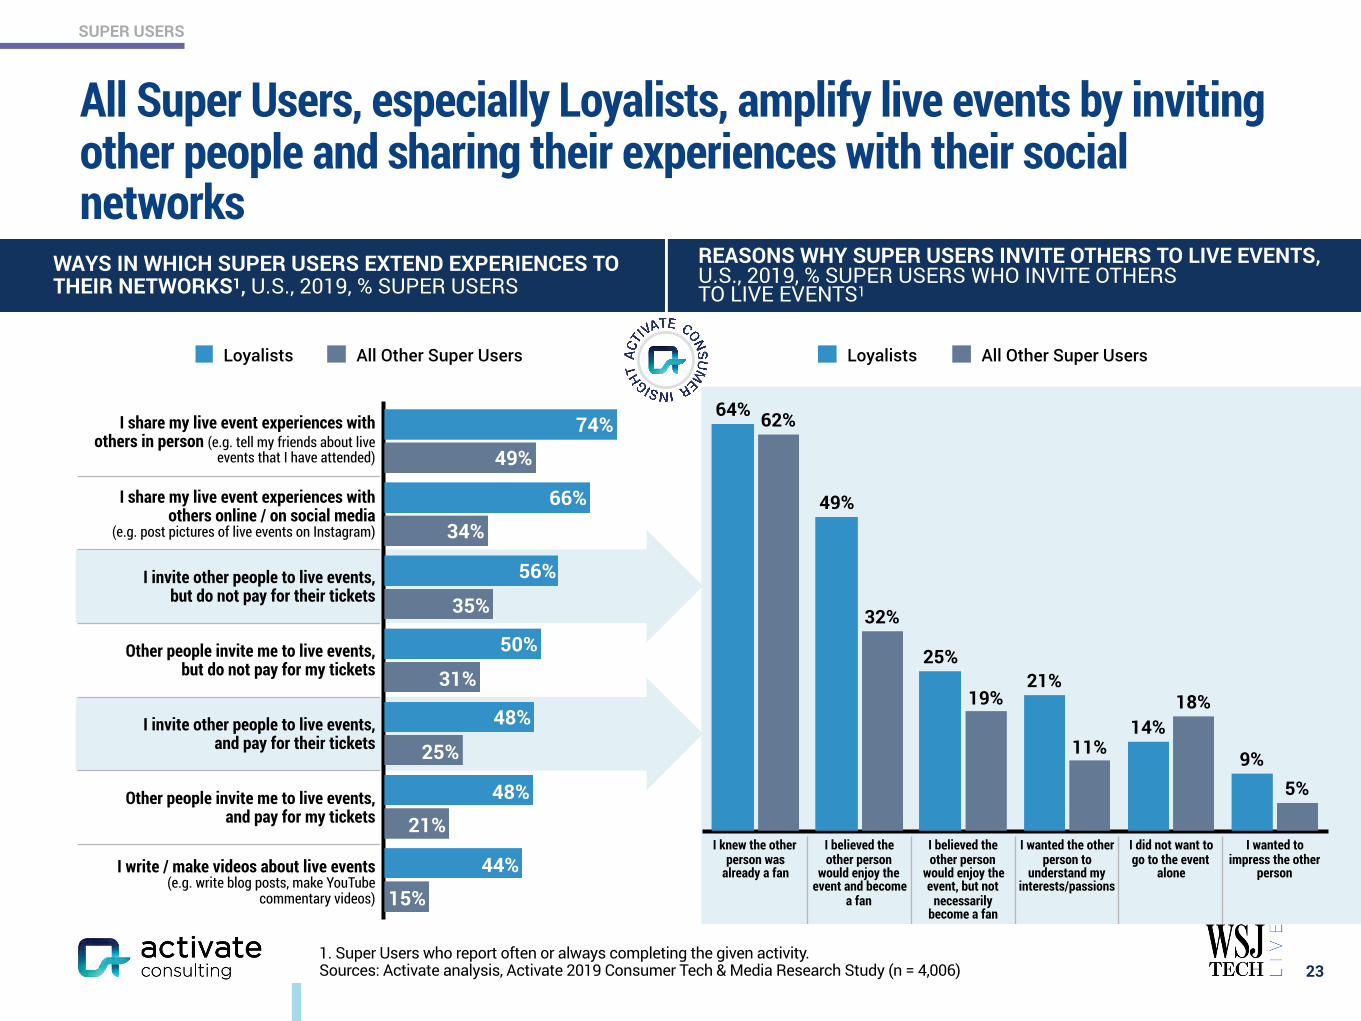
All Super Users, especially Loyalists, amplify live events by inviting other people and sharing their experiences with their social networks
231. Super Users who report often or always completing the given activity. Sources: Activate analysis, Activate 2019 Consumer Tech & Media Research Study (n = 4,006)
15%
21%
25%
31%
35%
34%
49%
44%
48%
48%
50%
56%
66%
74%
Loyalists All Other Super Users
5%
18%
11%
19%
32%
62%
9%
14%
21%25%
49%
64%
Loyalists All Other Super Users
WAYS IN WHICH SUPER USERS EXTEND EXPERIENCES TO THEIR NETWORKS1, U.S., 2019, % SUPER USERS
REASONS WHY SUPER USERS INVITE OTHERS TO LIVE EVENTS, U.S., 2019, % SUPER USERS WHO INVITE OTHERS TO LIVE EVENTS1
I share my live event experiences with others in person (e.g. tell my friends about live
events that I have attended)
I share my live event experiences with others online / on social media
(e.g. post pictures of live events on Instagram)
I invite other people to live events, but do not pay for their tickets
Other people invite me to live events, but do not pay for my tickets
I invite other people to live events, and pay for their tickets
Other people invite me to live events, and pay for my tickets
I write / make videos about live events (e.g. write blog posts, make YouTube
commentary videos)
I knew the other person was
already a fan
I believed the other person
would enjoy the event and become
a fan
I believed the other person
would enjoy the event, but not
necessarily become a fan
I wanted the other person to
understand my interests/passions
I did not want to go to the event
alone
I wanted to impress the other
person
SUPER USERS
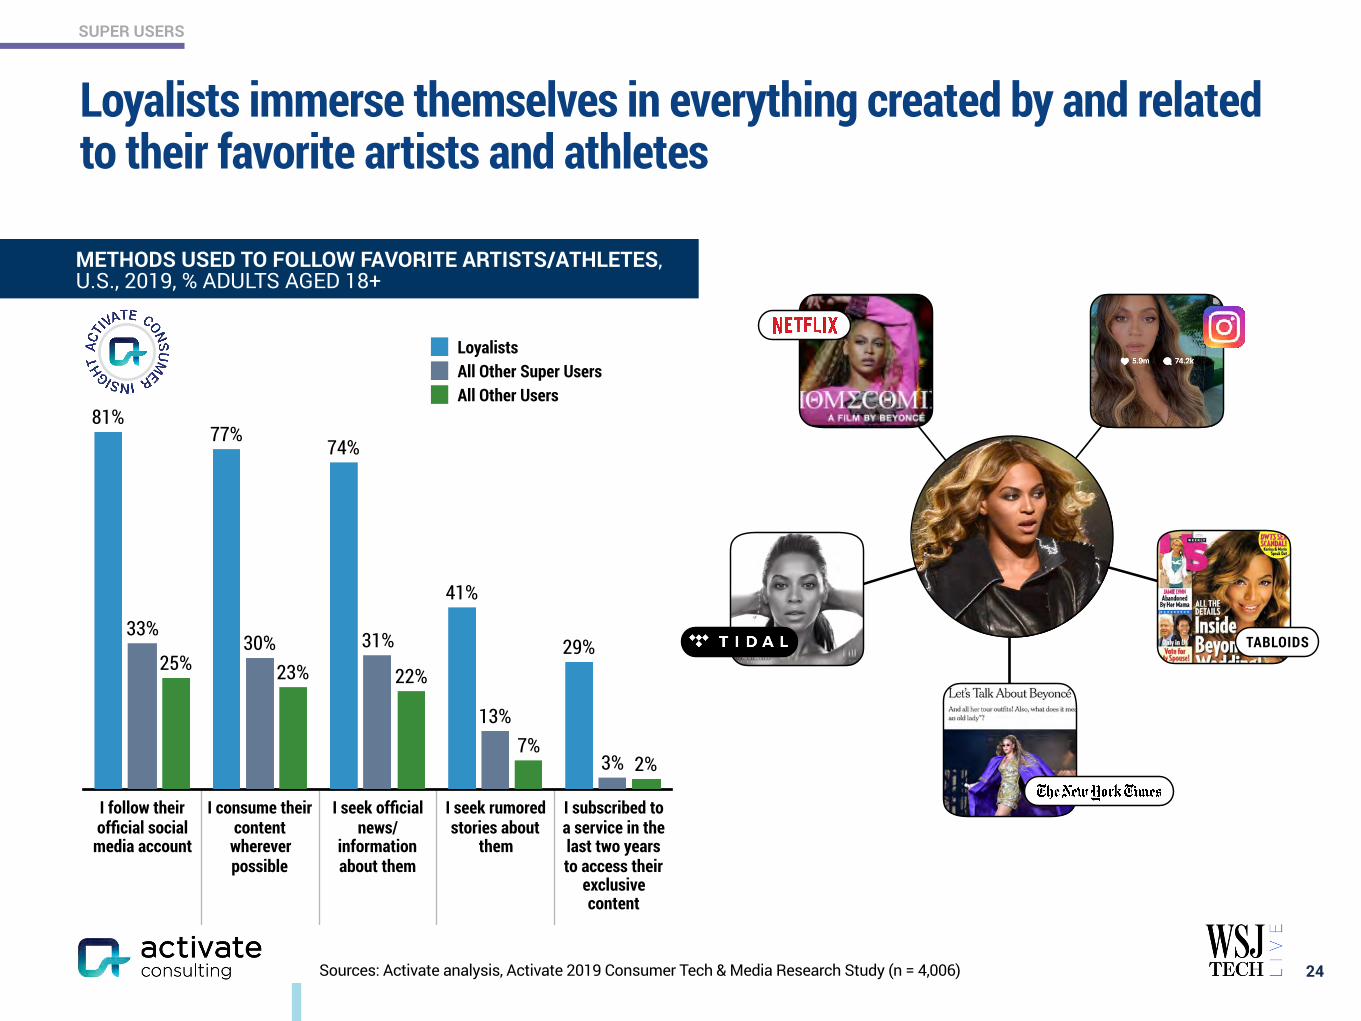
Loyalists immerse themselves in everything created by and related to their favorite artists and athletes
24Sources: Activate analysis, Activate 2019 Consumer Tech & Media Research Study (n = 4,006)
METHODS USED TO FOLLOW FAVORITE ARTISTS/ATHLETES, U.S., 2019, % ADULTS AGED 18+
I follow their official social
media account
I consume their content
wherever possible
I seek official news/
information about them
I seek rumored stories about
them
I subscribed to a service in the last two years to access their
exclusive content
TABLOIDS
2%7%
22%23%25%
3%
13%
31%30%33%
29%
41%
74%77%
81%
LoyalistsAll Other Super UsersAll Other Users
SUPER USERS
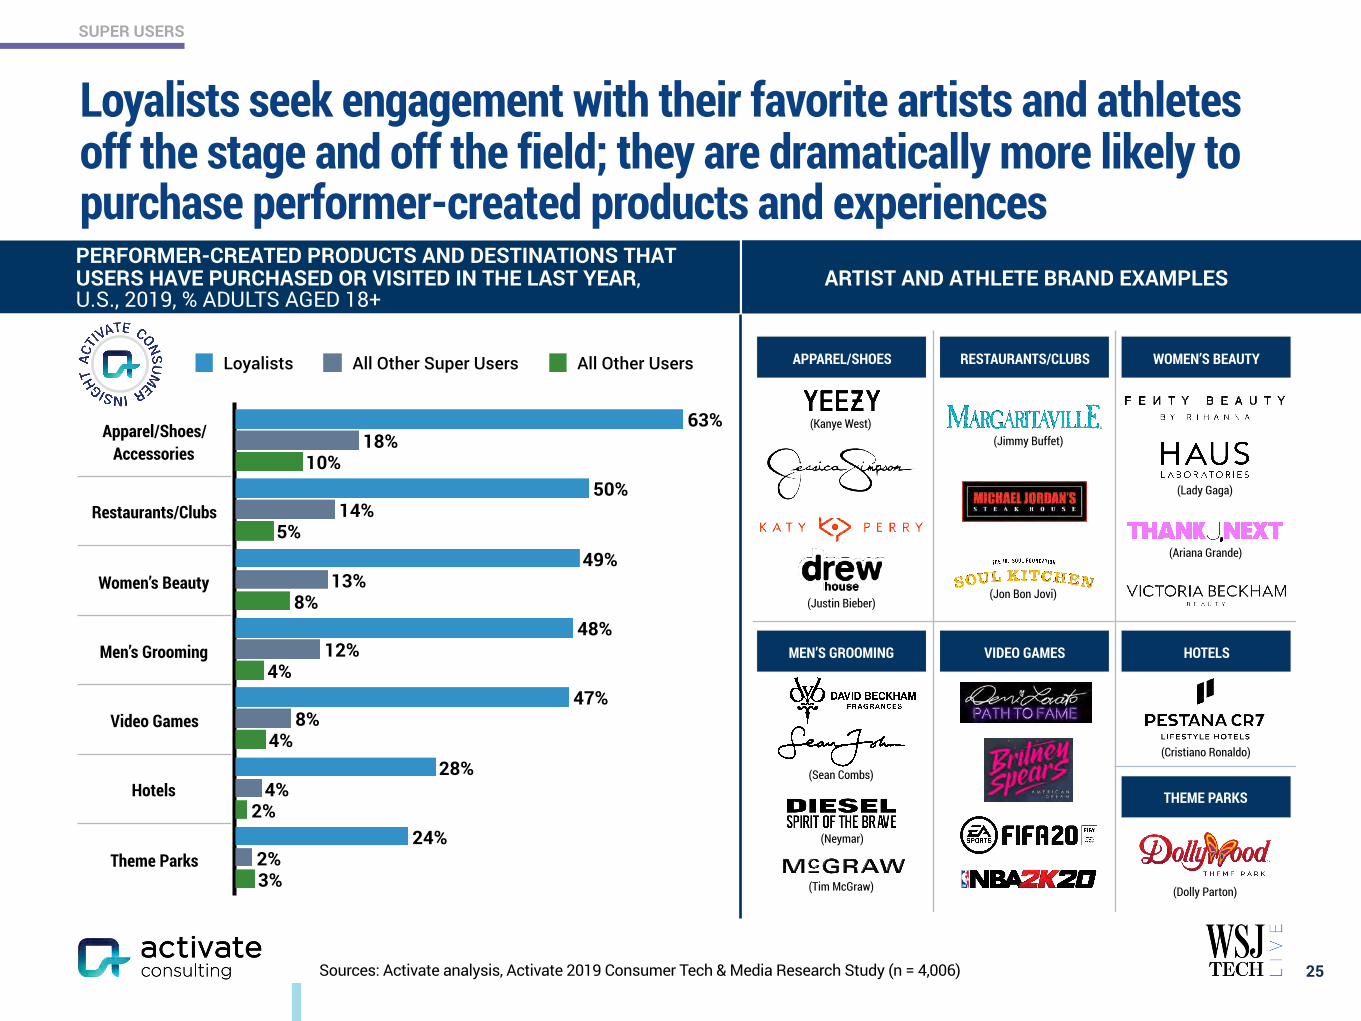
Loyalists seek engagement with their favorite artists and athletes off the stage and off the field; they are dramatically more likely to purchase performer-created products and experiences
25
3%
2%
4%
4%
8%
5%
10%
2%
4%
8%
12%
13%
14%
18%
24%
28%
47%
48%
49%
50%
63%
Loyalists All Other Super Users All Other Users
PERFORMER-CREATED PRODUCTS AND DESTINATIONS THAT USERS HAVE PURCHASED OR VISITED IN THE LAST YEAR, U.S., 2019, % ADULTS AGED 18+
ARTIST AND ATHLETE BRAND EXAMPLES
Apparel/Shoes/ Accessories
Restaurants/Clubs
Women’s Beauty
Men’s Grooming
Video Games
Hotels
Theme Parks
WOMEN’S BEAUTY
MEN’S GROOMING
APPAREL/SHOES
VIDEO GAMES
RESTAURANTS/CLUBS
HOTELS
THEME PARKS
(Kanye West)(Jimmy Buffet)
(Jon Bon Jovi)
(Lady Gaga)
(Ariana Grande)
(Sean Combs)
(Neymar)
(Justin Bieber)
(Tim McGraw)
Sources: Activate analysis, Activate 2019 Consumer Tech & Media Research Study (n = 4,006)
(Cristiano Ronaldo)
(Dolly Parton)
SUPER USERS
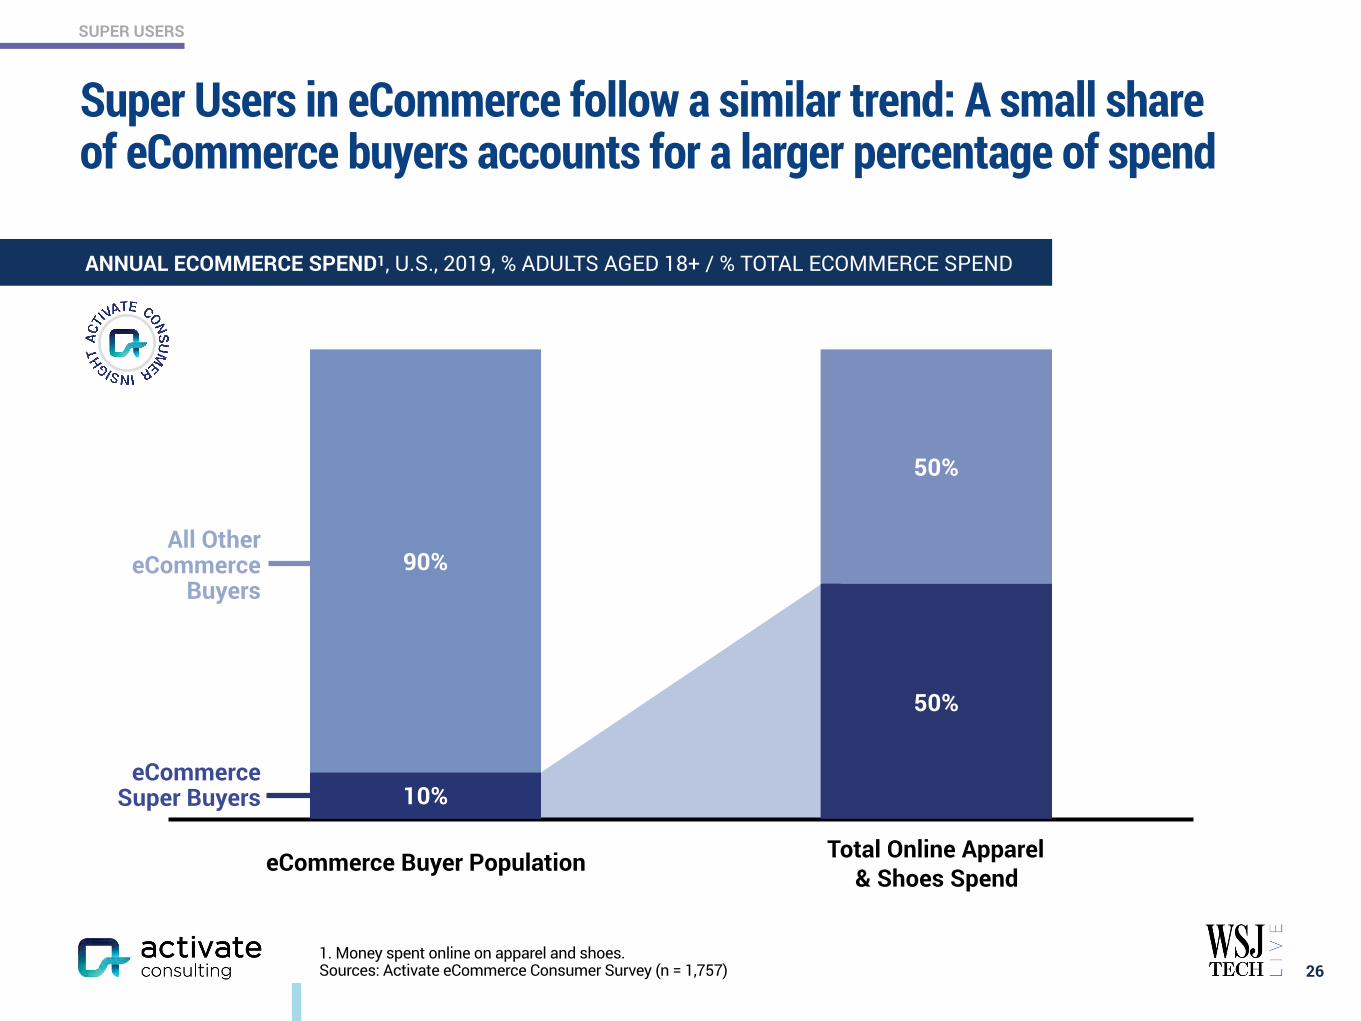
90%
10%
50%
50%
Super Users in eCommerce follow a similar trend: A small share of eCommerce buyers accounts for a larger percentage of spend
261. Money spent online on apparel and shoes. Sources: Activate eCommerce Consumer Survey (n = 1,757)
eCommerce Buyer Population Total Online Apparel & Shoes Spend
eCommerce Super Buyers
All Other eCommerce
Buyers
ANNUAL ECOMMERCE SPEND1, U.S., 2019, % ADULTS AGED 18+ / % TOTAL ECOMMERCE SPEND
www.activate.com 27
PAGE
$300 Billion Global Internet and Media Growth Dollars by 2023 4
Consumer Attention: 12:40 Hours of Technology & Media Per Day 9
Super Users: The Imperative for Technology & Media Companies 13
Social Splinter: The Social Media World Expands 27
eCommerce: Shrinking the Divide Between Physical and Digital Shopping 41
Digital Marketplaces: New Inventory, Price, Transparency, Ease of Use 60
Video Gaming: The Next Streaming Battlefront 71
Esports: Sport of the Future 84
Video: Streaming Stacking, Battleground Households 94
Sports Betting: The Next Big Financial Trading Market 117
Sports: More Viewing, Emerging Sports, Better Fan Experiences 129
Music: The Discovery Challenge 138
Podcasting: New Listening Experiences and Explosive Growth 146
The Networked Body: Quantified and Connected Human 159
Digital Consumer Finance: Next Generation Services Go Mainstream 169
Connectivity: Enabling the Next Wave of Technology and Media Growth 182
CONTENTS
SOCIAL SPLINTER
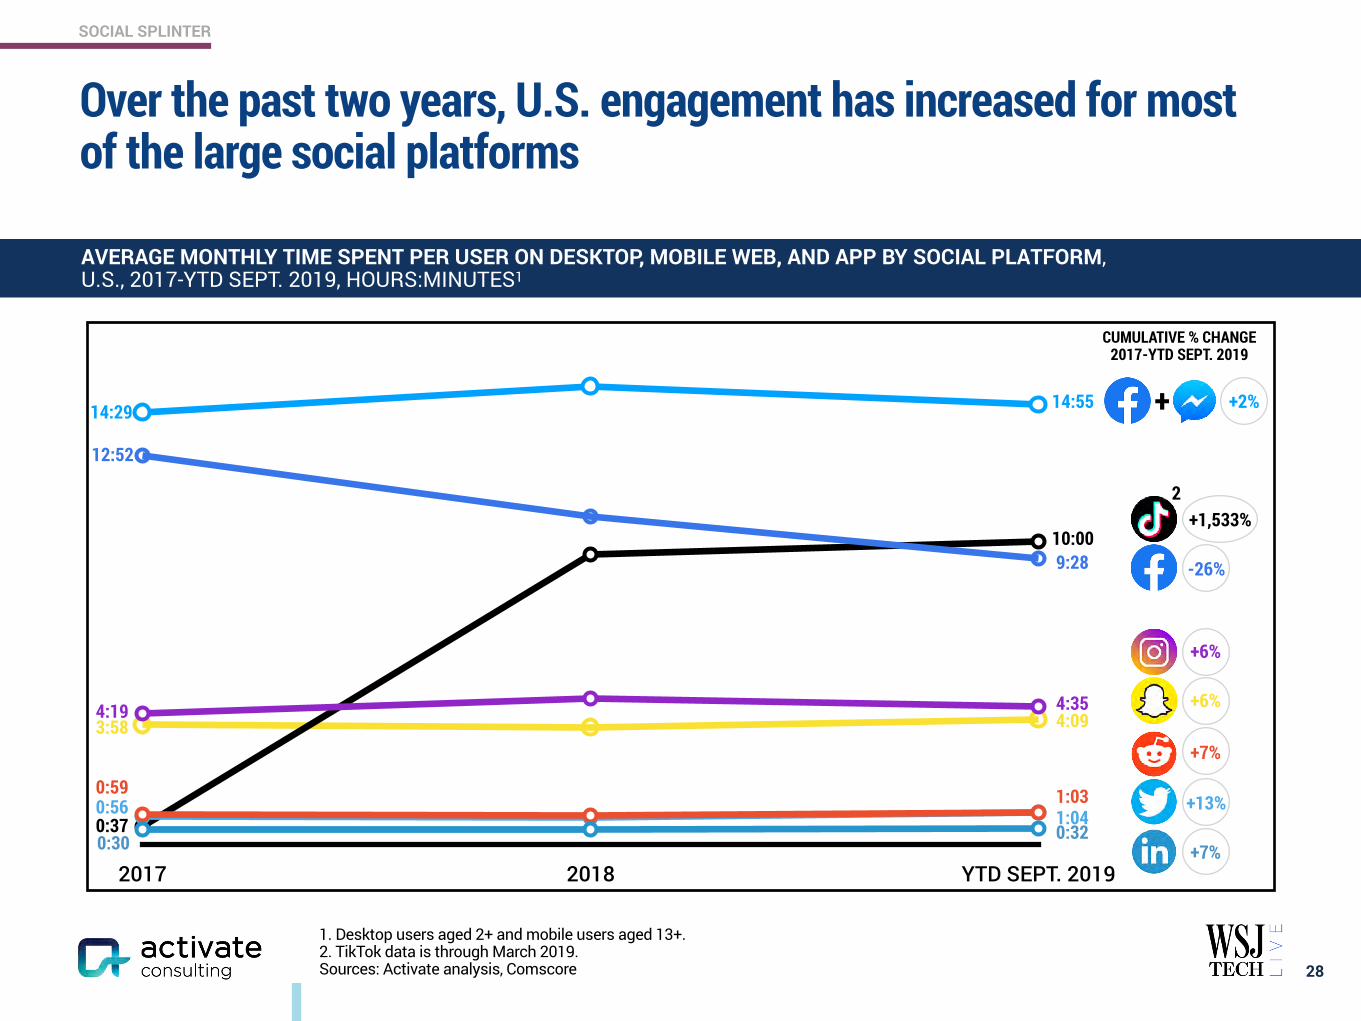
1. Desktop users aged 2+ and mobile users aged 13+. 2. TikTok data is through March 2019. Sources: Activate analysis, Comscore
Over the past two years, U.S. engagement has increased for most of the large social platforms
28
2017 2018 YTD SEPT. 2019
AVERAGE MONTHLY TIME SPENT PER USER ON DESKTOP, MOBILE WEB, AND APP BY SOCIAL PLATFORM, U.S., 2017-YTD SEPT. 2019, HOURS:MINUTES1
12:52
9:28
4:19 4:35
0:591:041:03
0:30 0:32
-26%
+6%
+7%
+13%
+7%
0:56
+1,533%10:00
0:37
+6%3:58 4:09
14:29 14:55 +2%+
CUMULATIVE % CHANGE 2017-YTD SEPT. 2019
2
SOCIAL SPLINTER
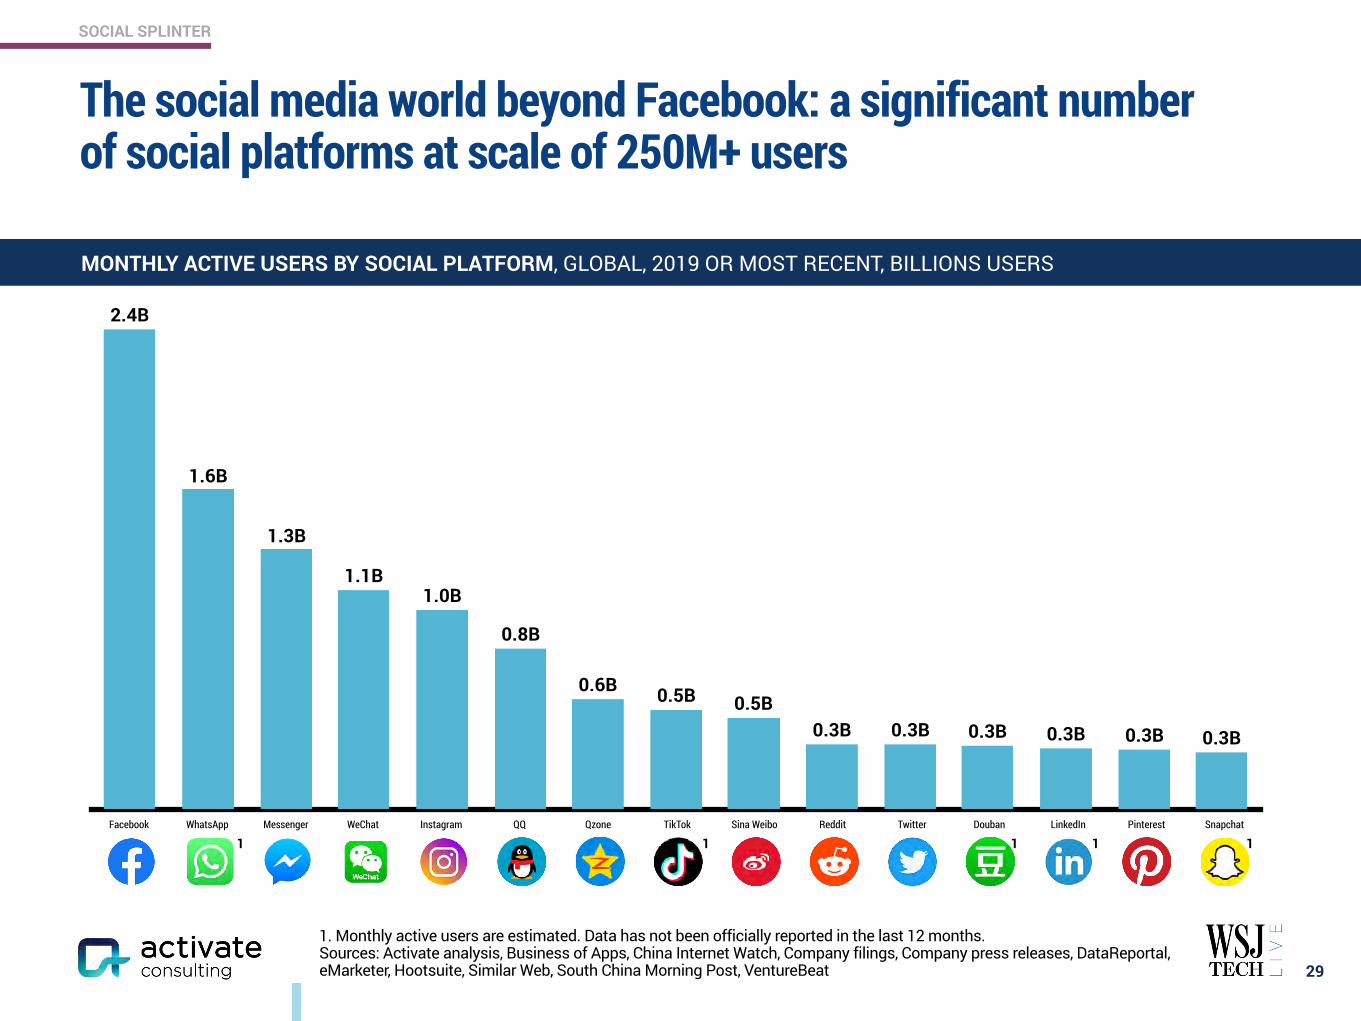
The social media world beyond Facebook: a significant number of social platforms at scale of 250M+ users
29
MONTHLY ACTIVE USERS BY SOCIAL PLATFORM, GLOBAL, 2019 OR MOST RECENT, BILLIONS USERS
QQ Qzone TikTok Sina Weibo Reddit Twitter Douban LinkedIn SnapchatPinterest
0.3B0.3B0.3B0.3B0.3B0.3B0.5B0.5B0.6B
0.8B
1.0B1.1B
1.3B
1.6B
2.4B
InstagramMessenger WeChatWhatsAppFacebook
111
1. Monthly active users are estimated. Data has not been officially reported in the last 12 months. Sources: Activate analysis, Business of Apps, China Internet Watch, Company filings, Company press releases, DataReportal, eMarketer, Hootsuite, Similar Web, South China Morning Post, VentureBeat
1 1
SOCIAL SPLINTER
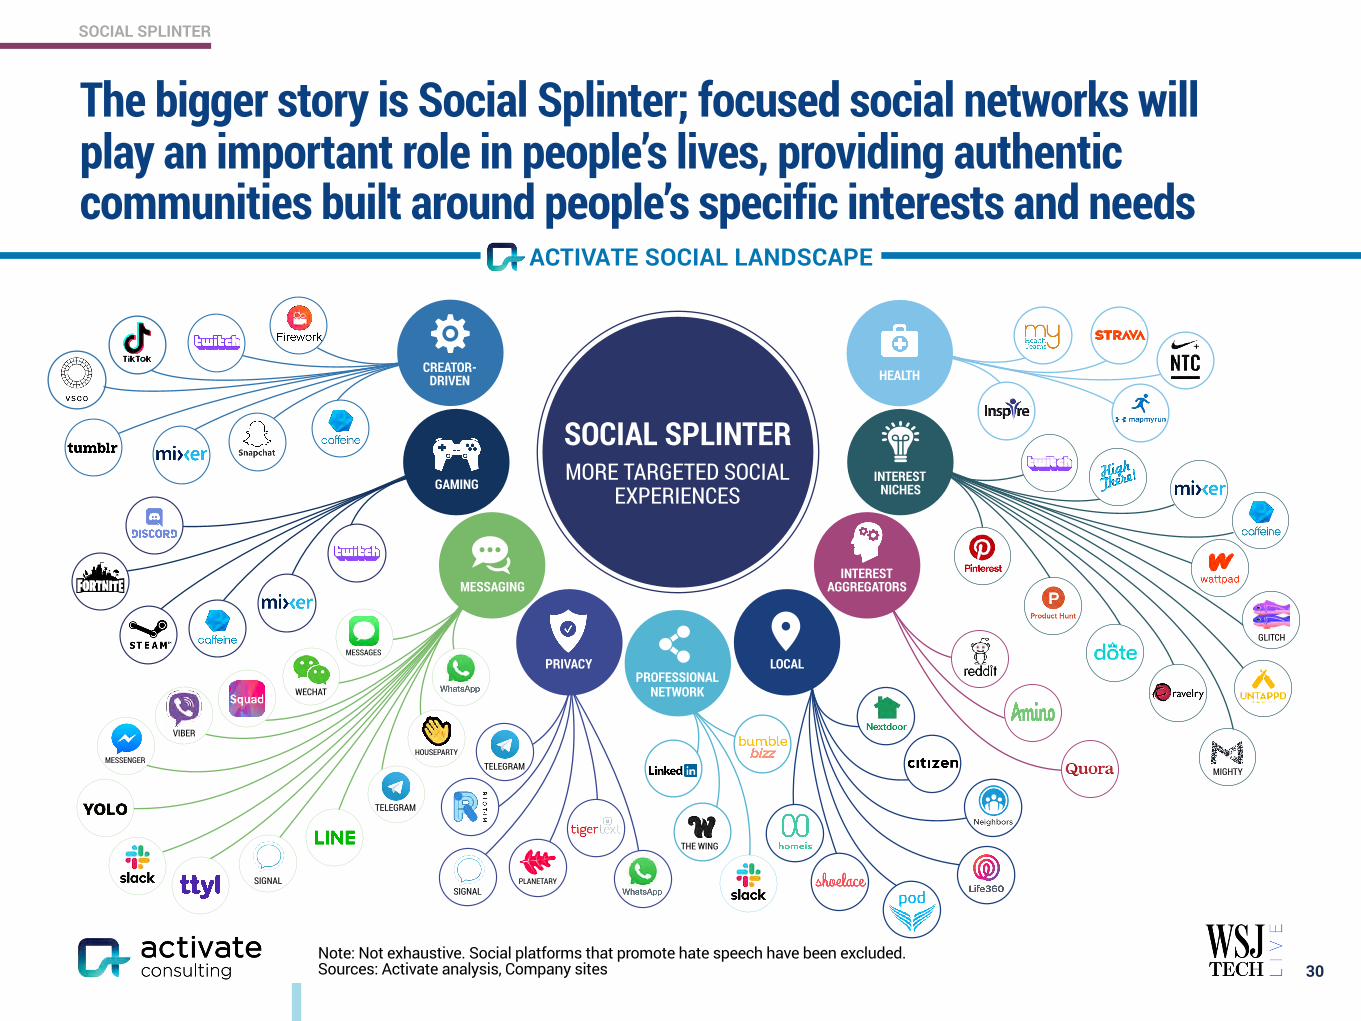
The bigger story is Social Splinter; focused social networks will play an important role in people’s lives, providing authentic communities built around people’s specific interests and needs
30
CITIZEN
NEIGHB
ORS
Life 360CITIZEN
SOCIAL SPLINTER MORE TARGETED SOCIAL
EXPERIENCES
HEALTH
INTEREST NICHES
INTEREST AGGREGATORS
LOCAL
PROFESSIONAL NETWORK
CREATOR- DRIVEN
MESSAGING
PRIVACY
GAMING
SIGNAL
MESSAGES
TELEGRAM
VIBER
MESSENGERMIGHTY
GLITCH
THE WING
SIGNALPLANETARY
Note: Not exhaustive. Social platforms that promote hate speech have been excluded. Sources: Activate analysis, Company sites
CITIZEN
TELEGRAMHOUSEPARTY
CITIZEN
ACTIVATE SOCIAL LANDSCAPE
SOCIAL SPLINTER
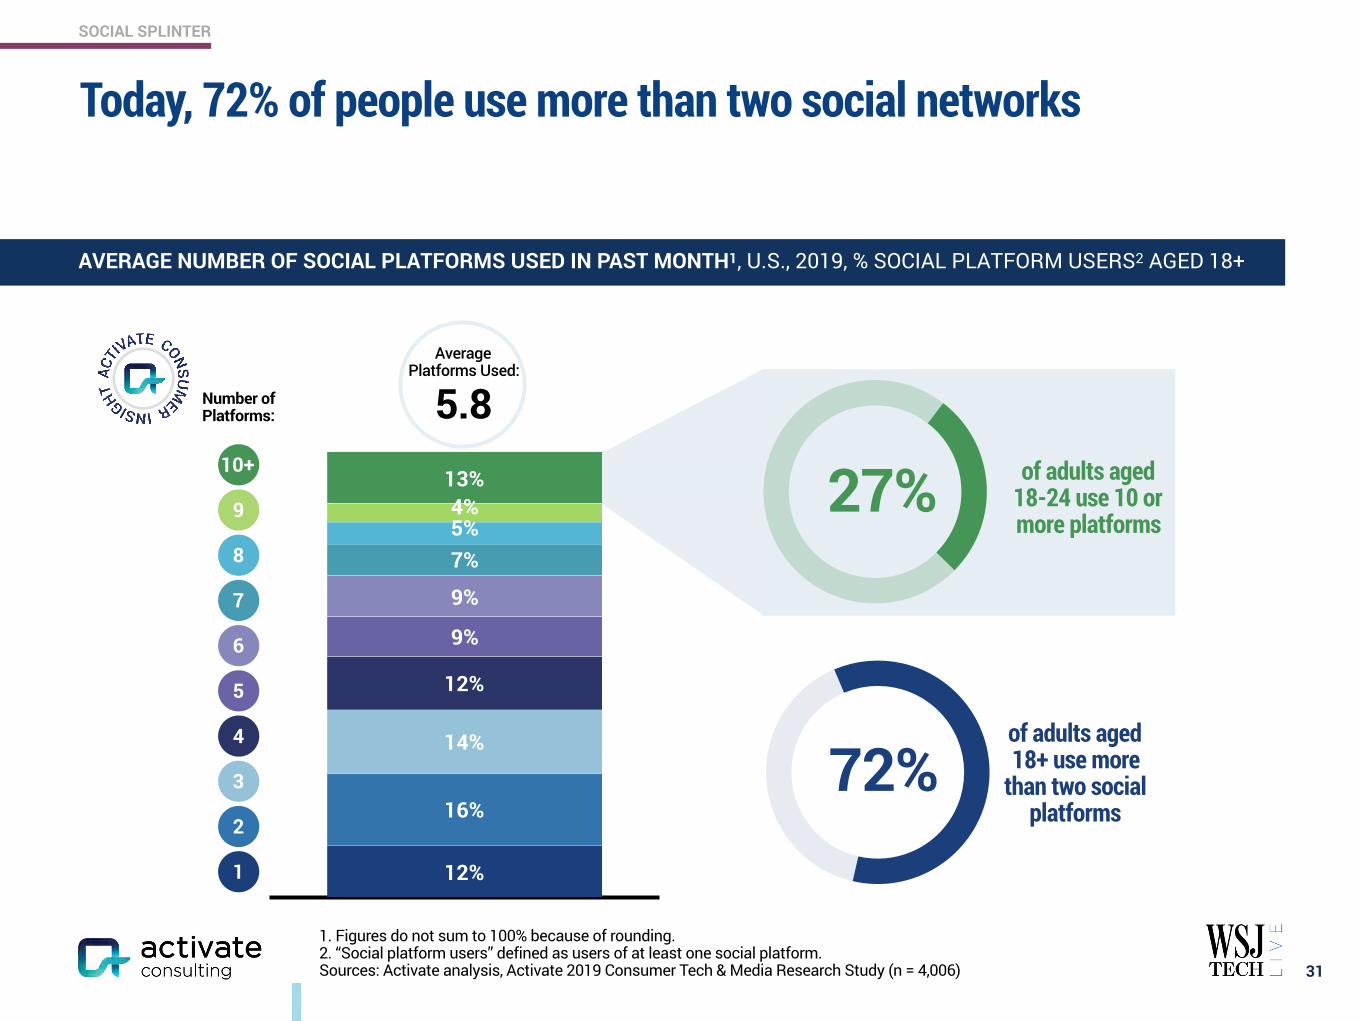
72%of adults aged 18+ use more
than two social platforms
27% of adults aged 18-24 use 10 or more platforms
13%4%5%7%
9%
9%
12%
14%
16%
12%
1. Figures do not sum to 100% because of rounding. 2. “Social platform users” defined as users of at least one social platform. Sources: Activate analysis, Activate 2019 Consumer Tech & Media Research Study (n = 4,006)
Today, 72% of people use more than two social networks
31
AVERAGE NUMBER OF SOCIAL PLATFORMS USED IN PAST MONTH1, U.S., 2019, % SOCIAL PLATFORM USERS2 AGED 18+
Average Platforms Used:
5.810+
9
8
7
6
5
4
3
2
1
Number of Platforms:
SOCIAL SPLINTER
2019 2023E
Sources: Activate analysis, Activate 2016 Consumer Tech & Media Research Study (n = 4,000), Activate 2017 Consumer Tech & Media Research Study (n = 4,047), Activate 2018 Consumer Tech & Media Research Study (n = 4,000), Activate 2019 Consumer Tech & Media Research Study (n = 4,006), Digital TV Research, Hulu, Netflix
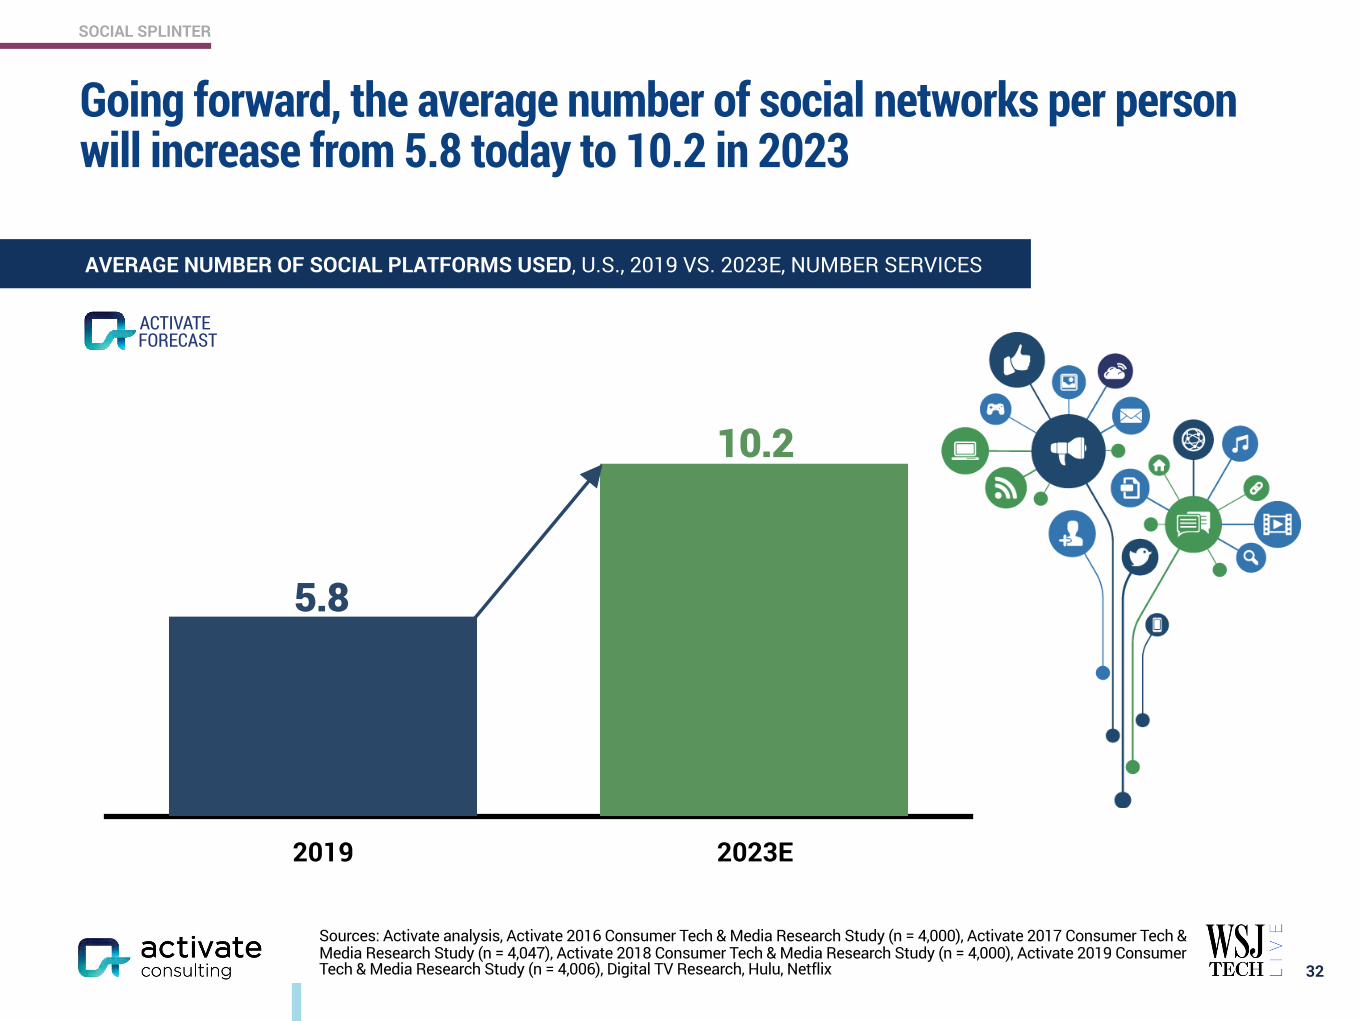
Going forward, the average number of social networks per person will increase from 5.8 today to 10.2 in 2023
32
AVERAGE NUMBER OF SOCIAL PLATFORMS USED, U.S., 2019 VS. 2023E, NUMBER SERVICES
5.8
10.2
FORECASTACTIVATE

SOCIAL SPLINTER
TFUE SHROUD MYTH
7.1M 7.0M 5.4M
RIOTGAMES DAKOTAZ TIMTHETATMAN
4.2M 4.1M 4.1M
LOREN GRAY BABY ARIEL KRISTEN HANCHER
34.0M 29.8M 23.0M
ZACH KING RIYAZ ALY JACOB SARTORIUS
22.8M 21.9M 21.1M
Sources: Activate analysis, Activate 2019 Consumer Tech & Media Research Study (n = 4,006), Business Insider, Company sites, Social Blade
Creator-driven networks have reached scale
33
USERS OF TWITCH AND TIKTOK, U.S., 2019, % ADULTS AGED 18+
28%
25%
48%
18-24 25+
6%
21%
18-24 25+
9%
26%
Creator-driven platforms have significant usage among Gen Z
CREATOR-DRIVEN GAMING PRIVACY PROFESSIONAL NETWORK LOCAL INTEREST AGGREGATORS INTEREST NICHES HEALTH
TOP INFLUENCERS ON TWITCH AND TIKTOK, GLOBAL, OCT. 2019, MILLIONS FOLLOWERS
SOCIAL SPLINTER
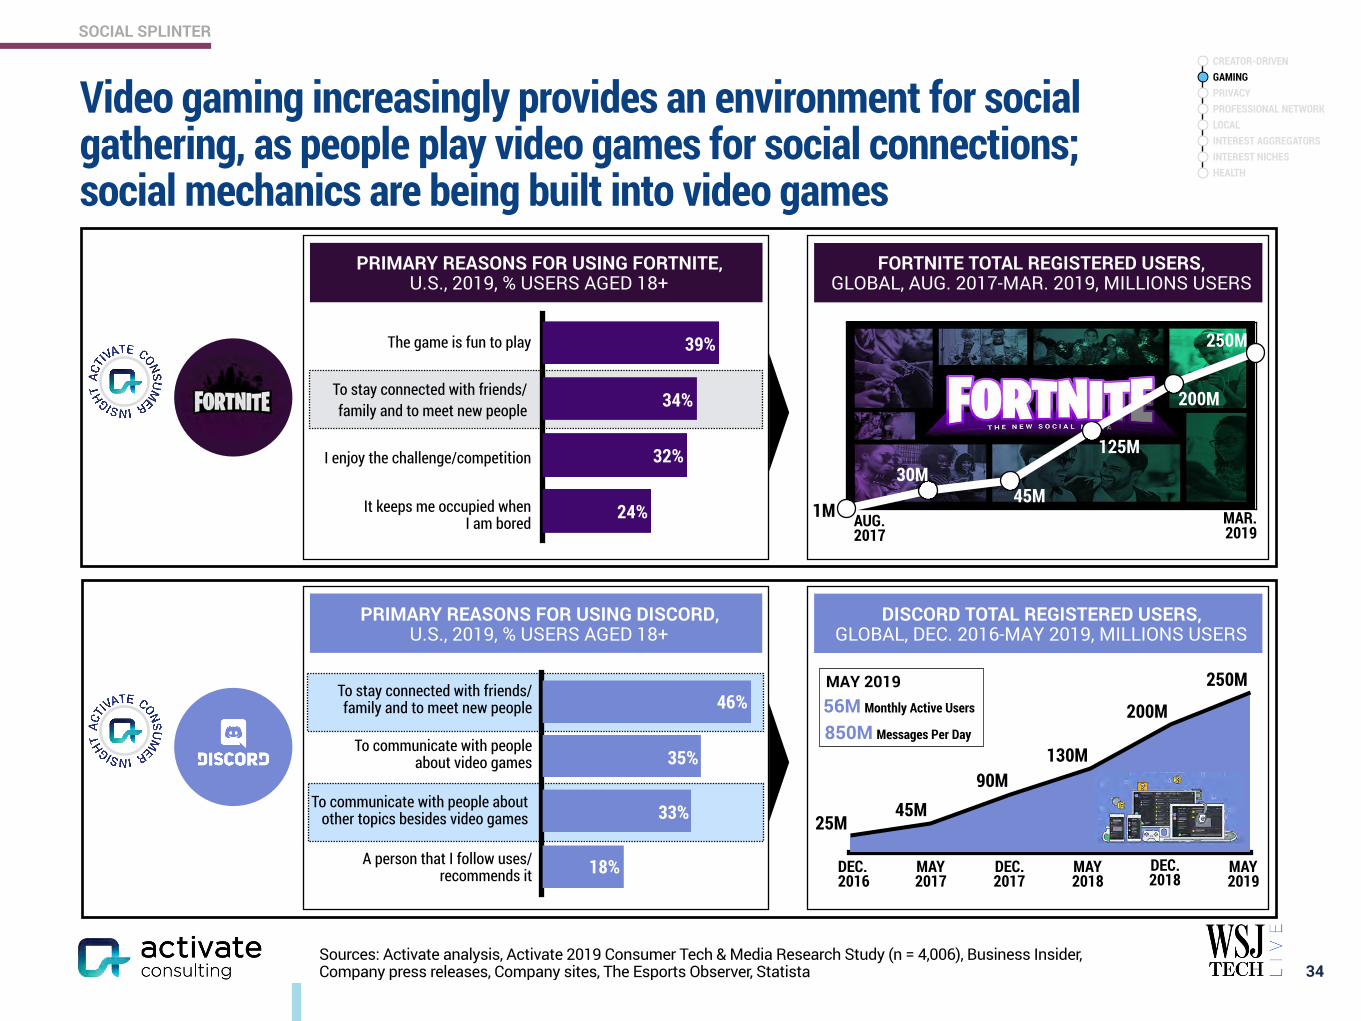
PRIMARY REASONS FOR USING DISCORD, U.S., 2019, % USERS AGED 18+
DISCORD TOTAL REGISTERED USERS, GLOBAL, DEC. 2016-MAY 2019, MILLIONS USERS
24%
32%
34%
39%The game is fun to play
To stay connected with friends/family and to meet new people
I enjoy the challenge/competition
It keeps me occupied when I am bored
Sources: Activate analysis, Activate 2019 Consumer Tech & Media Research Study (n = 4,006), Business Insider, Company press releases, Company sites, The Esports Observer, Statista
Video gaming increasingly provides an environment for social gathering, as people play video games for social connections; social mechanics are being built into video games
34
25M45M
90M130M
200M
250M
DEC.2016
MAY 2017
DEC.2017
MAY 2018
DEC.2018
MAY 2019
MAY 2019
1M AUG.2017
MAR. 2019
30M45M
125M
200M
250M
PRIMARY REASONS FOR USING FORTNITE, U.S., 2019, % USERS AGED 18+
FORTNITE TOTAL REGISTERED USERS, GLOBAL, AUG. 2017-MAR. 2019, MILLIONS USERS
18%
33%
35%
46%To stay connected with friends/ family and to meet new people
To communicate with people about video games
To communicate with people about other topics besides video games
A person that I follow uses/ recommends it
56M Monthly Active Users
850M Messages Per Day
CREATOR-DRIVEN GAMING PRIVACY PROFESSIONAL NETWORK LOCAL INTEREST AGGREGATORS INTEREST NICHES HEALTH
SOCIAL SPLINTER
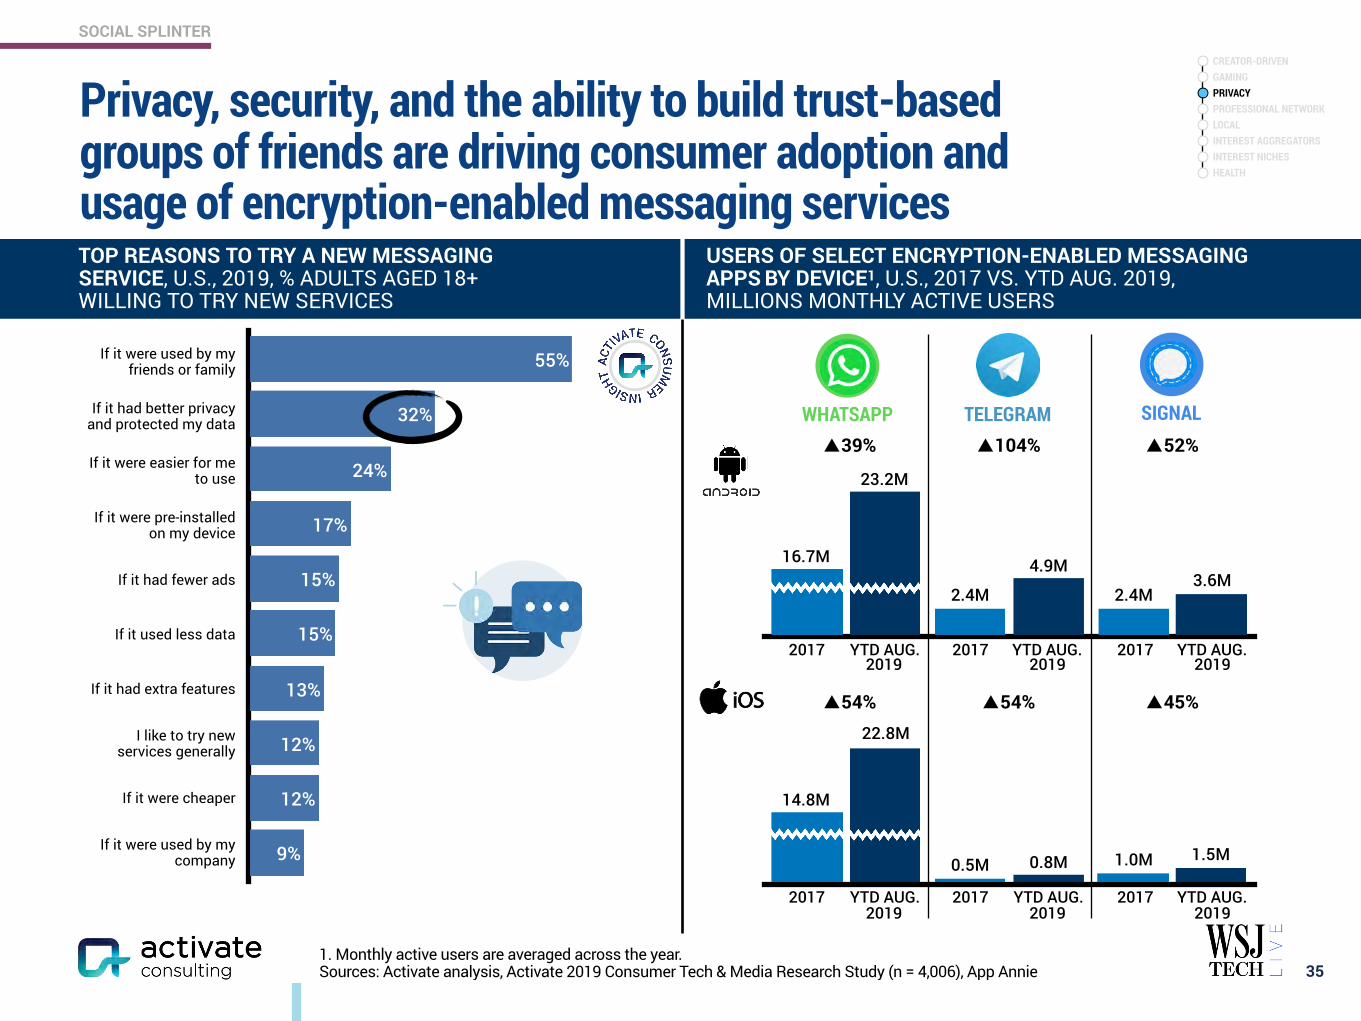
9%
12%
12%
13%
15%
15%
17%
24%
32%
55%
1. Monthly active users are averaged across the year. Sources: Activate analysis, Activate 2019 Consumer Tech & Media Research Study (n = 4,006), App Annie
Privacy, security, and the ability to build trust-based groups of friends are driving consumer adoption and usage of encryption-enabled messaging services
35
USERS OF SELECT ENCRYPTION-ENABLED MESSAGING APPS BY DEVICE1, U.S., 2017 VS. YTD AUG. 2019, MILLIONS MONTHLY ACTIVE USERS
TELEGRAM SIGNAL
TOP REASONS TO TRY A NEW MESSAGING SERVICE, U.S., 2019, % ADULTS AGED 18+ WILLING TO TRY NEW SERVICES
WHATSAPP ▲39% ▲104% ▲52%
▲54% ▲54% ▲45%
3.6M4.9M
12.2M
2.4M2.4M
5.7M
23.2M
16.7M
2017 YTD AUG. 2019
1.5M0.8M
12.8M
1.0M0.5M
6.8M
22.8M
14.8M
If it were used by my friends or family
If it had better privacy and protected my data
If it were easier for me to use
If it were pre-installed on my device
If it had fewer ads
If it used less data
If it had extra features
I like to try new services generally
If it were cheaper
If it were used by my company
2017 YTD AUG. 2019
2017 YTD AUG. 2019
2017 YTD AUG. 2019
2017 YTD AUG. 2019
2017 YTD AUG. 2019
CREATOR-DRIVEN GAMING PRIVACY PROFESSIONAL NETWORK LOCAL INTEREST AGGREGATORS INTEREST NICHES HEALTH
SOCIAL SPLINTER
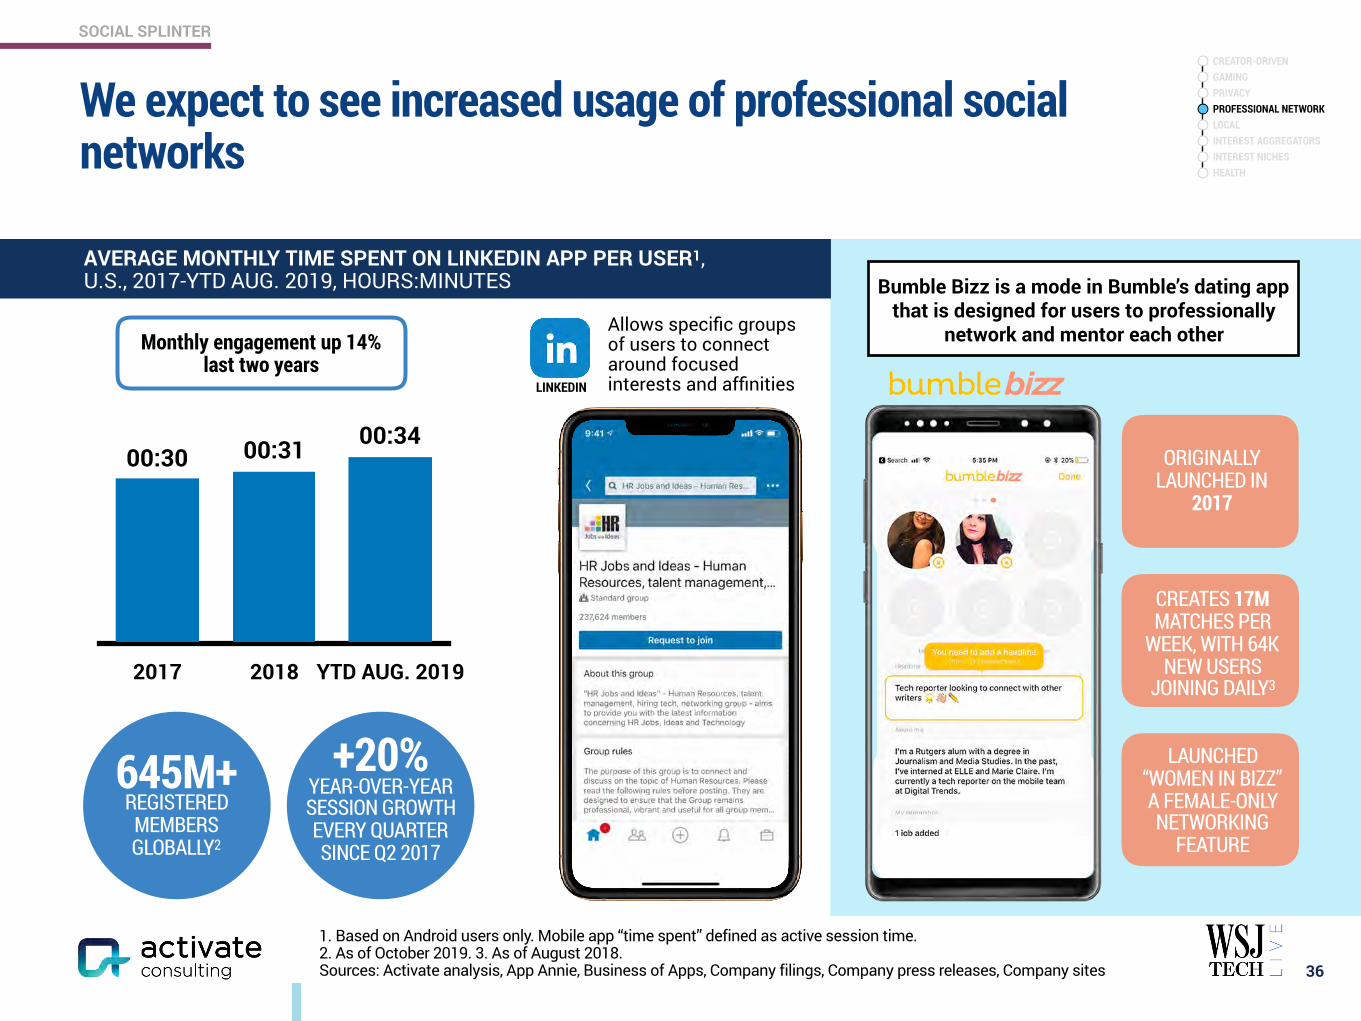
We expect to see increased usage of professional social networks
36
2017 2018 YTD AUG. 2019
343130
645M+ REGISTERED
MEMBERS GLOBALLY2
Allows specific groups of users to connect around focused interests and affinitiesLINKEDIN
Bumble Bizz is a mode in Bumble’s dating app that is designed for users to professionally
network and mentor each other
AVERAGE MONTHLY TIME SPENT ON LINKEDIN APP PER USER1, U.S., 2017-YTD AUG. 2019, HOURS:MINUTES
ORIGINALLY LAUNCHED IN
2017
CREATES 17M MATCHES PER
WEEK, WITH 64K NEW USERS
JOINING DAILY3
LAUNCHED “WOMEN IN BIZZ” A FEMALE-ONLY NETWORKING
FEATURE
+20% YEAR-OVER-YEAR SESSION GROWTH EVERY QUARTER SINCE Q2 2017
Monthly engagement up 14% last two years
1. Based on Android users only. Mobile app “time spent” defined as active session time. 2. As of October 2019. 3. As of August 2018. Sources: Activate analysis, App Annie, Business of Apps, Company filings, Company press releases, Company sites
00:30 00:31 00:34
CREATOR-DRIVEN GAMING PRIVACY PROFESSIONAL NETWORK LOCAL INTEREST AGGREGATORS INTEREST NICHES HEALTH
SOCIAL SPLINTER
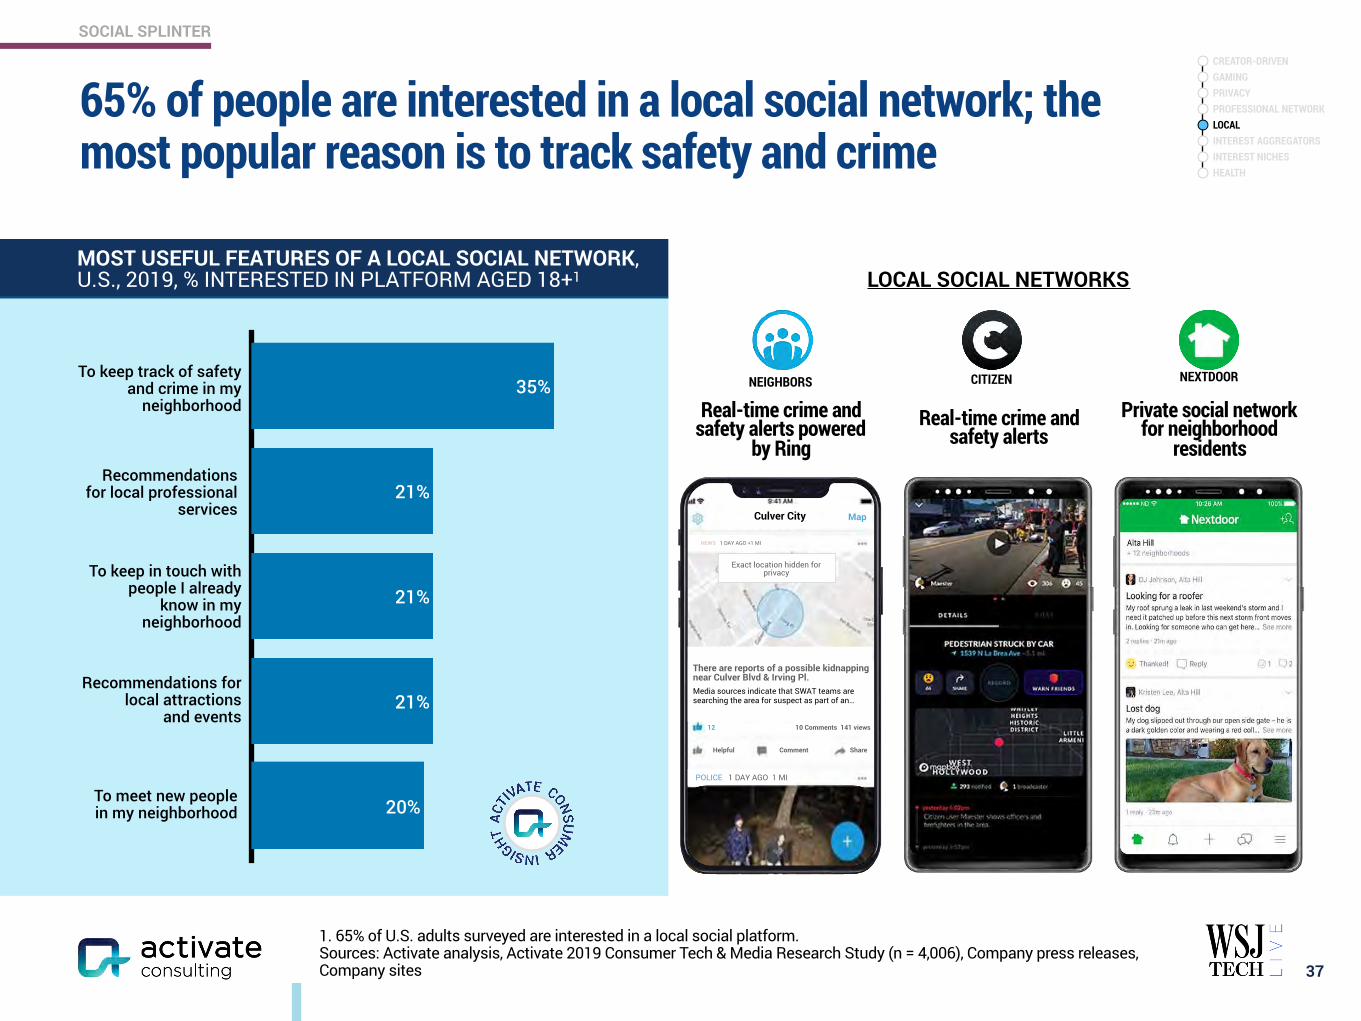
65% of people are interested in a local social network; the most popular reason is to track safety and crime
37
20%
21%
21%
21%
35%To keep track of safety
and crime in my neighborhood
Recommendations for local professional
services
To keep in touch with people I already
know in my neighborhood
Recommendations for local attractions
and events
To meet new people in my neighborhood
Real-time crime and safety alerts
Private social network for neighborhood
residents
Real-time crime and safety alerts powered
by Ring
NEIGHBORS CITIZEN NEXTDOOR
Culver City Map
Exact location hidden for privacy
NEWS 1 DAY AGO +1 MI
There are reports of a possible kidnapping near Culver Blvd & Irving Pl. Media sources indicate that SWAT teams are searching the area for suspect as part of an…
Helpful Comment Share
10 Comments 141 views12
POLICE 1 DAY AGO 1 MI
LOCAL SOCIAL NETWORKSMOST USEFUL FEATURES OF A LOCAL SOCIAL NETWORK, U.S., 2019, % INTERESTED IN PLATFORM AGED 18+1
1. 65% of U.S. adults surveyed are interested in a local social platform. Sources: Activate analysis, Activate 2019 Consumer Tech & Media Research Study (n = 4,006), Company press releases, Company sites
CREATOR-DRIVEN GAMING PRIVACY PROFESSIONAL NETWORK LOCAL INTEREST AGGREGATORS INTEREST NICHES HEALTH
SOCIAL SPLINTER
Sources: Activate analysis, App Annie, Company press releases, Company sites, TechCrunch
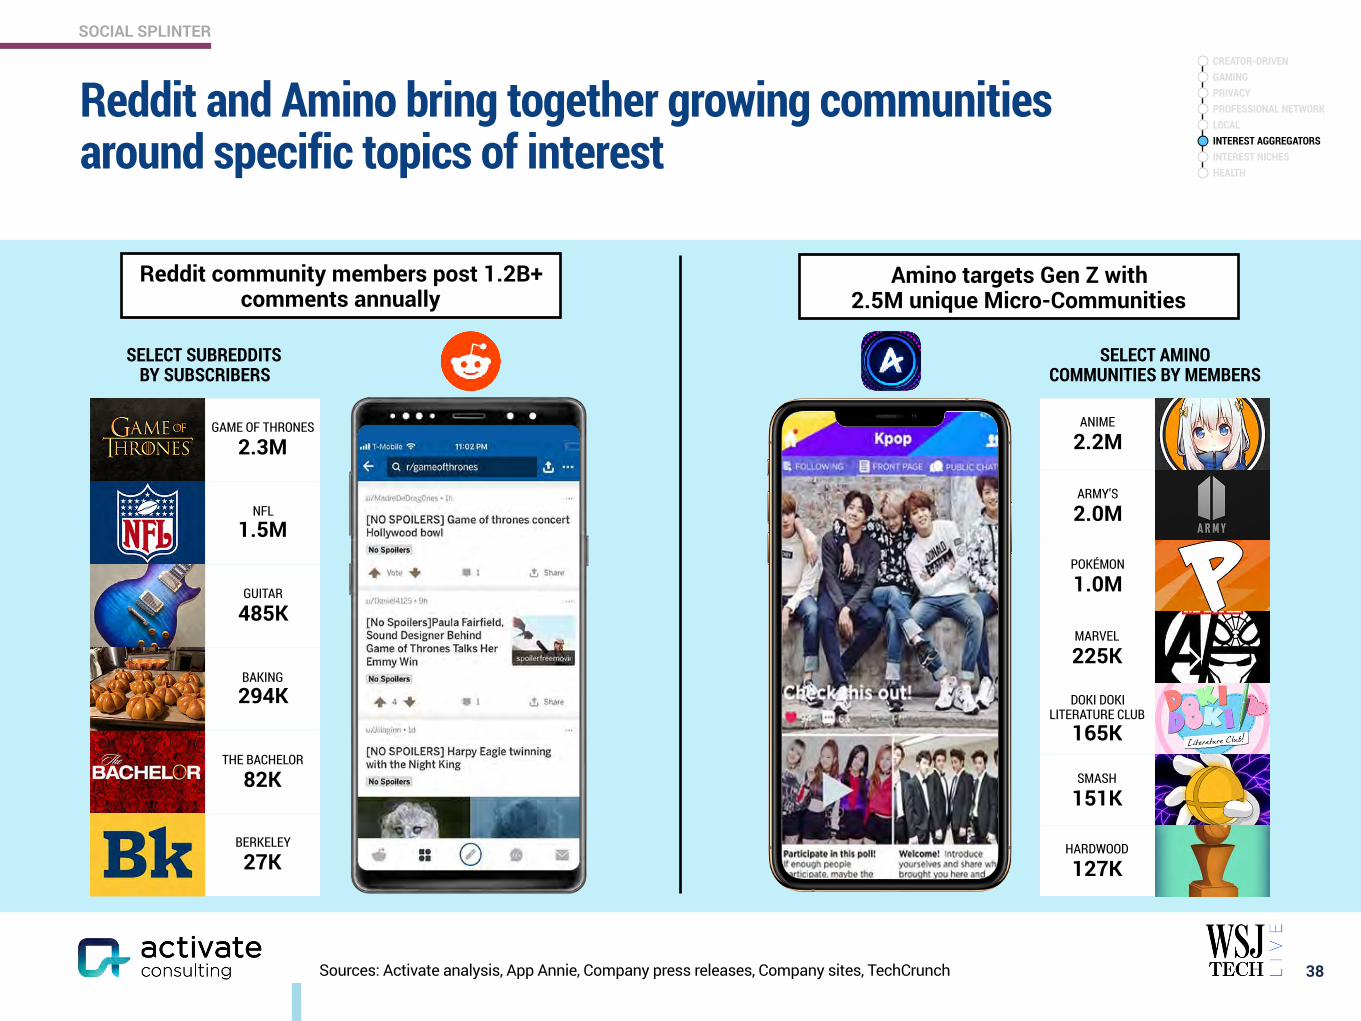
Reddit and Amino bring together growing communities around specific topics of interest
38
SELECT AMINO COMMUNITIES BY MEMBERS
ANIME
2.2M
ARMY’S
2.0M
POKÉMON
1.0M
MARVEL
225K
DOKI DOKI LITERATURE CLUB
165K
SMASH
151K
HARDWOOD
127K
Amino targets Gen Z with 2.5M unique Micro-Communities
SELECT SUBREDDITS BY SUBSCRIBERS
GAME OF THRONES
2.3M
NFL 1.5M
GUITAR
485K
BAKING 294K
THE BACHELOR
82K
BERKELEY
27K
Reddit community members post 1.2B+ comments annually
CREATOR-DRIVEN GAMING PRIVACY PROFESSIONAL NETWORK LOCAL INTEREST AGGREGATORS INTEREST NICHES HEALTH
SOCIAL SPLINTER
Source: Activate analysis
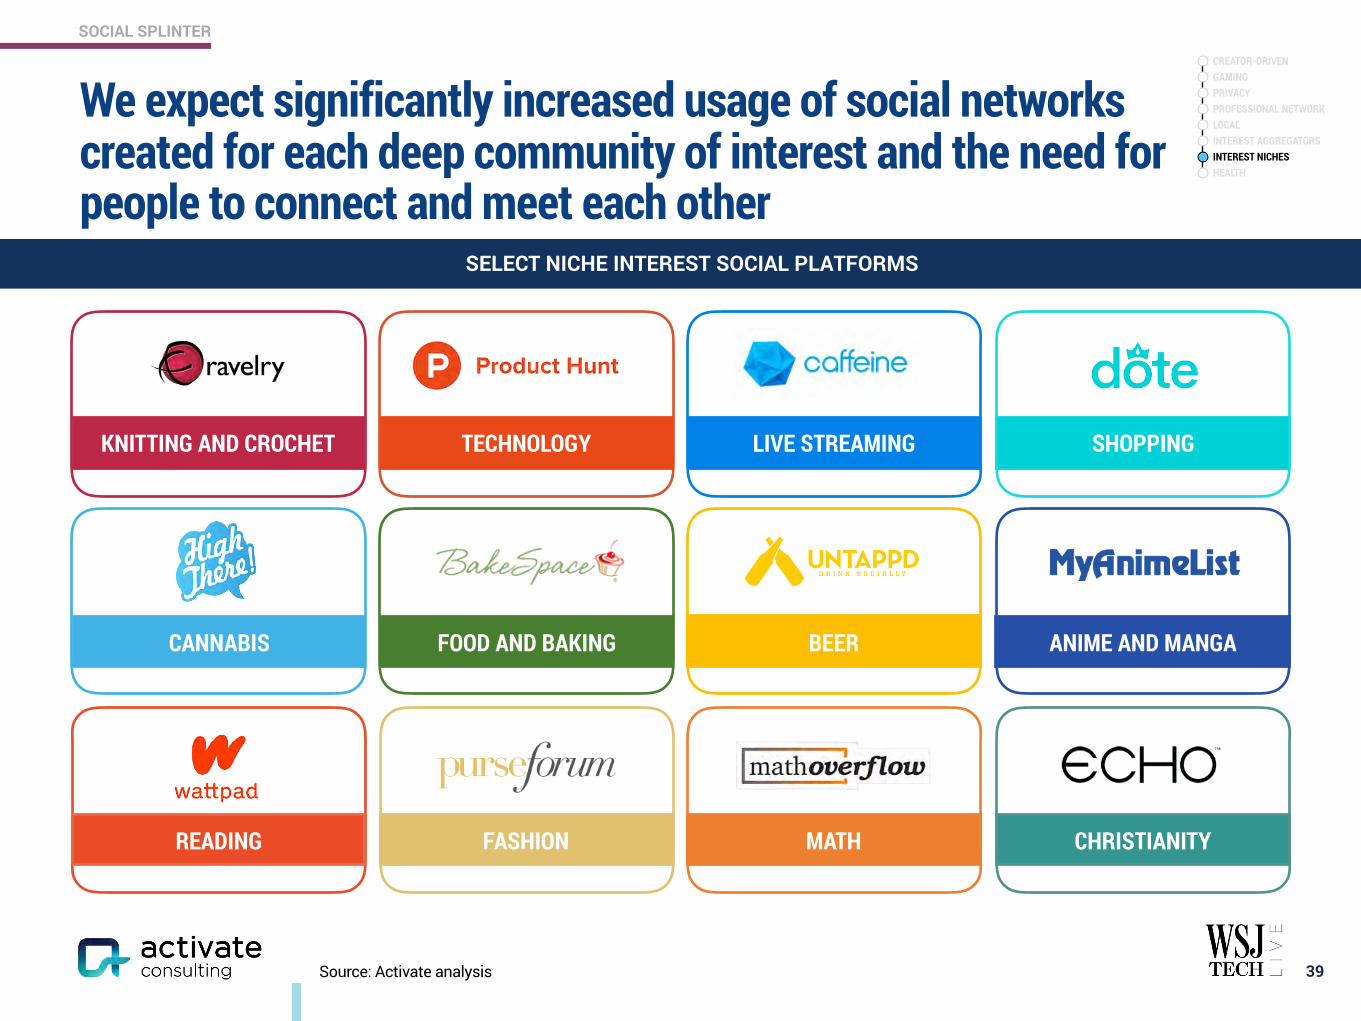
We expect significantly increased usage of social networks created for each deep community of interest and the need for people to connect and meet each other
39
KNITTING AND CROCHET TECHNOLOGY SHOPPING
CANNABIS
SELECT NICHE INTEREST SOCIAL PLATFORMS
ANIME AND MANGA FOOD AND BAKING BEER
LIVE STREAMING
READING CHRISTIANITYFASHION MATH
CREATOR-DRIVEN GAMING PRIVACY PROFESSIONAL NETWORK LOCAL INTEREST AGGREGATORS INTEREST NICHES HEALTH
SOCIAL SPLINTER
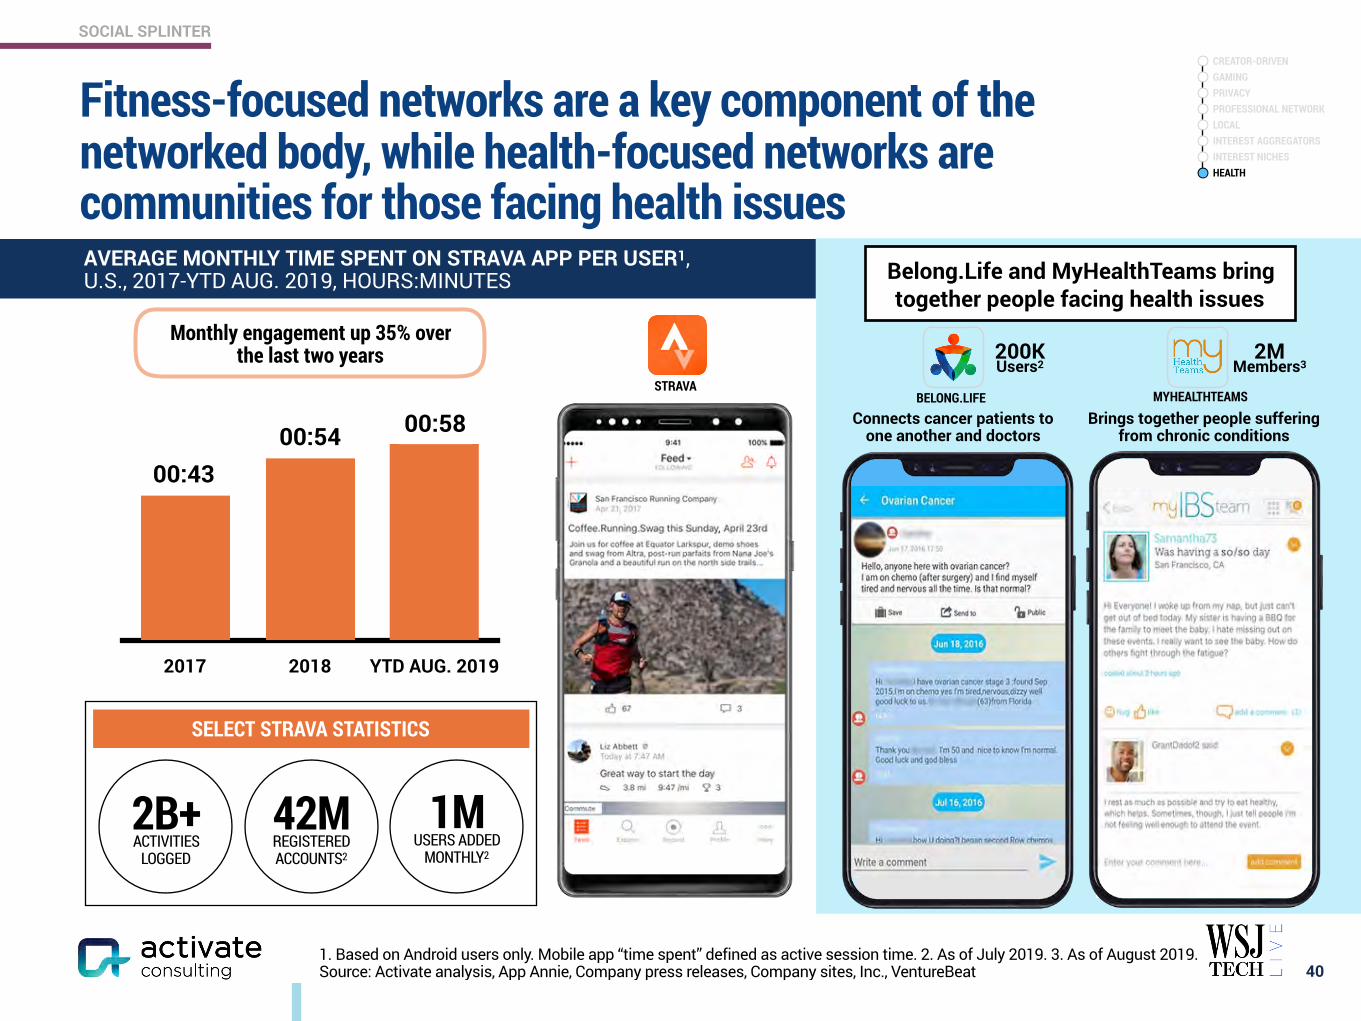
Fitness-focused networks are a key component of the networked body, while health-focused networks are communities for those facing health issues
40
2017 2018 YTD AUG. 2019
5854
43
SELECT STRAVA STATISTICS
Connects cancer patients to one another and doctors
Brings together people suffering from chronic conditions
STRAVA
2B+ ACTIVITIES
LOGGED
42M REGISTERED ACCOUNTS2
1M USERS ADDED
MONTHLY2
BELONG.LIFE MYHEALTHTEAMS
Belong.Life and MyHealthTeams bring together people facing health issues
AVERAGE MONTHLY TIME SPENT ON STRAVA APP PER USER1, U.S., 2017-YTD AUG. 2019, HOURS:MINUTES
200K Users2
2M Members3
Monthly engagement up 35% over the last two years
1. Based on Android users only. Mobile app “time spent” defined as active session time. 2. As of July 2019. 3. As of August 2019. Source: Activate analysis, App Annie, Company press releases, Company sites, Inc., VentureBeat
00:4300:54 00:58
CREATOR-DRIVEN GAMING PRIVACY PROFESSIONAL NETWORK LOCAL INTEREST AGGREGATORS INTEREST NICHES HEALTH
www.activate.com 41
PAGE
$300 Billion Global Internet and Media Growth Dollars by 2023 4
Consumer Attention: 12:40 Hours of Technology & Media Per Day 9
Super Users: The Imperative for Technology & Media Companies 13
Social Splinter: The Social Media World Expands 27
eCommerce: Shrinking the Divide Between Physical and Digital Shopping 41
Digital Marketplaces: New Inventory, Price, Transparency, Ease of Use 60
Video Gaming: The Next Streaming Battlefront 71
Esports: Sport of the Future 84
Video: Streaming Stacking, Battleground Households 94
Sports Betting: The Next Big Financial Trading Market 117
Sports: More Viewing, Emerging Sports, Better Fan Experiences 129
Music: The Discovery Challenge 138
Podcasting: New Listening Experiences and Explosive Growth 146
The Networked Body: Quantified and Connected Human 159
Digital Consumer Finance: Next Generation Services Go Mainstream 169
Connectivity: Enabling the Next Wave of Technology and Media Growth 182
CONTENTS
ECOMMERCE
1. Excluding travel and tickets. Sources: Activate analysis, 451 Research, eMarketer 42
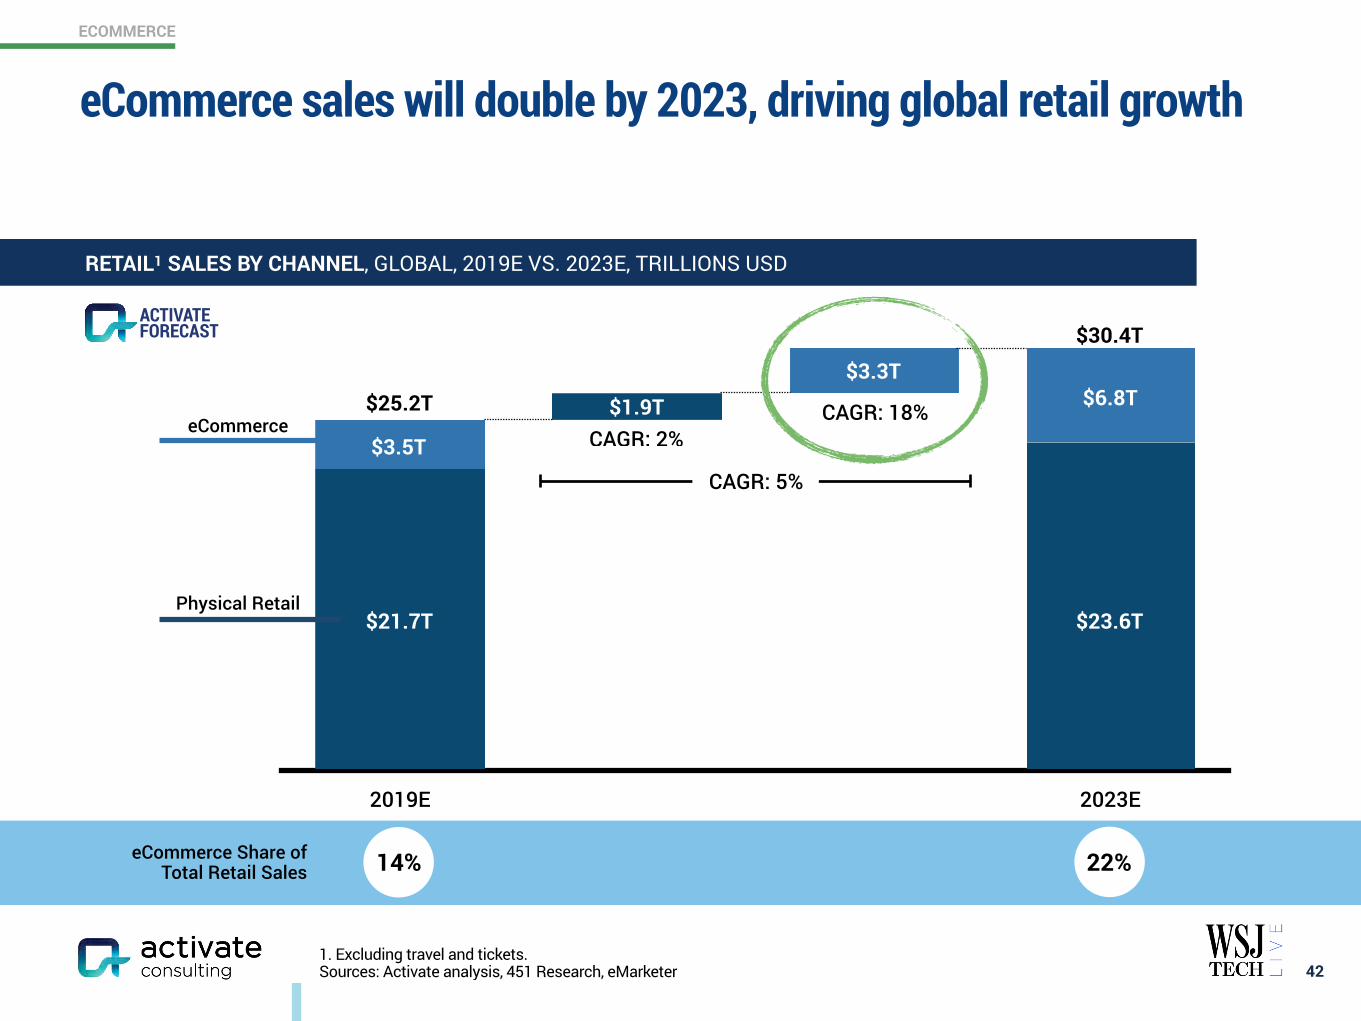
RETAIL1 SALES BY CHANNEL, GLOBAL, 2019E VS. 2023E, TRILLIONS USD
2019E 2023E
$27$25$25.2T CAGR: 18%
$30.4T
CAGR: 2%
eCommerce Share of Total Retail Sales 14% 22%
CAGR: 5%
FORECASTACTIVATE
eCommerce
Physical Retail
$1.9T
$21.7T $23.6T
$3.5T
$3.3T$6.8T
eCommerce sales will double by 2023, driving global retail growth

ECOMMERCE
1. Figures do not sum to 100% because of rounding. 2. Updated from 2017 estimate to reflect the company’s reported financial results. 3. Each company accounts for approximately 1%. 4. Each company accounts for less than 1%. Sources: Activate analysis, China Internet Watch, Company filings, Company press releases, Company sites, Digital Commerce 360, eMarketer, Forbes, GeekWire, Internet Retailer, Marketplace Pulse, Retail Dive, TechCrunch, UBS 43
16%
13% 10%2
8%
3%2%
2%4
Rest of the Web38%
PINDUODUO
7%3
2018 TOTAL GLOBAL ONLINE GMV: $2.9T
ONLINE GROSS MERCHANDISE VOLUME (GMV)1, GLOBAL, 2018, % TOTAL GMV
Today, the bulk of online global transaction volume is concentrated across the top 20 eCommerce companies
ECOMMERCE
Sources: Activate analysis, China Internet Watch, Company filings, Company press releases, Company sites, Digital Commerce 360, eMarketer, Forbes, GeekWire, Internet Retailer, Marketplace Pulse, Retail Dive, TechCrunch, UBS 44
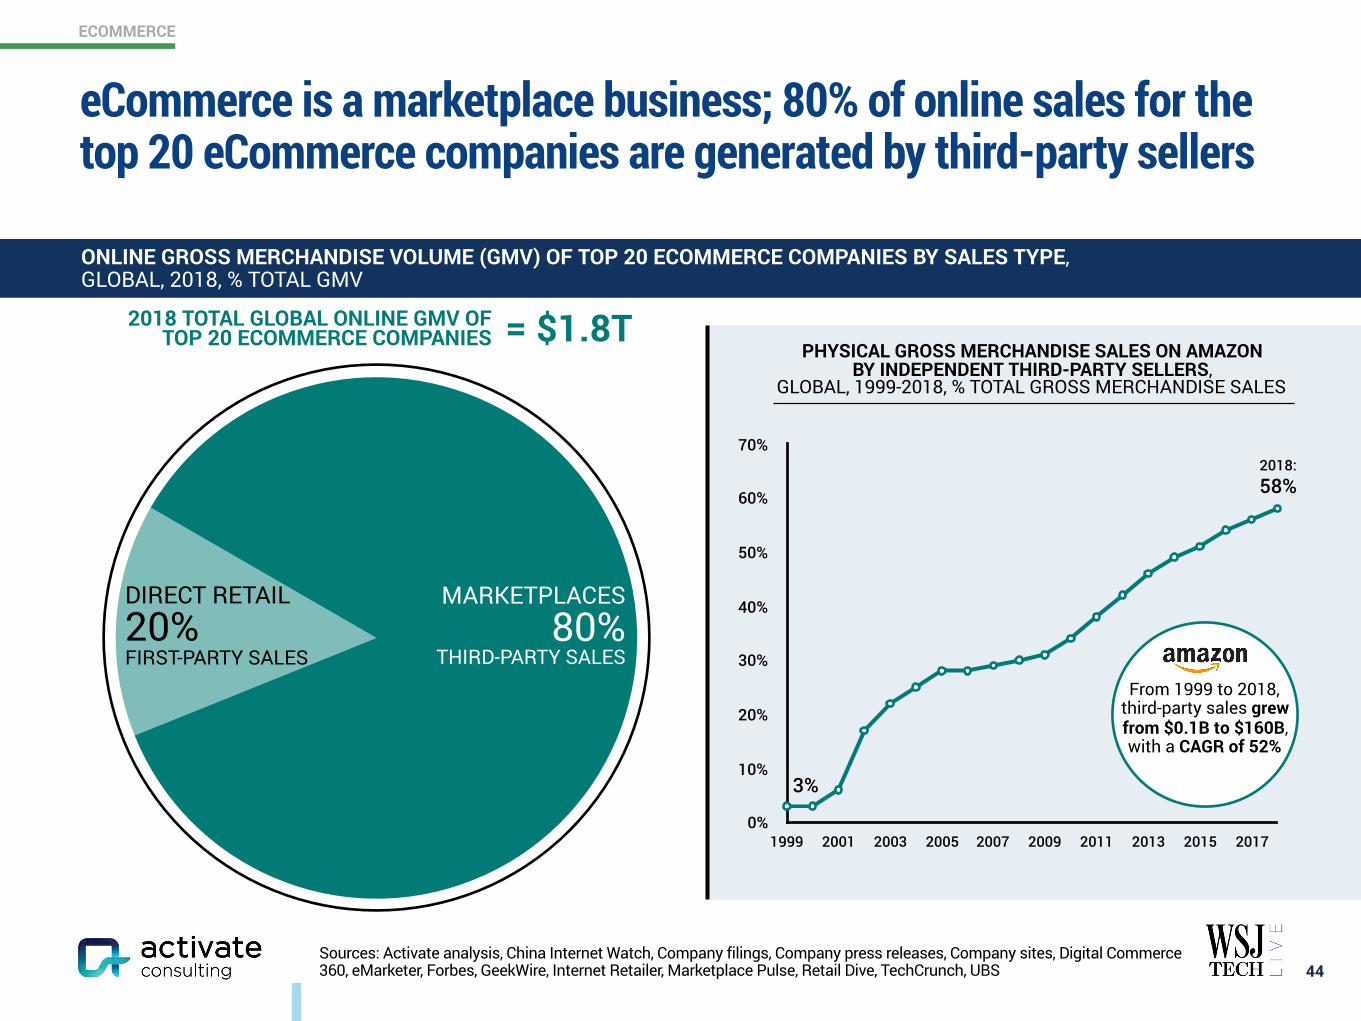
ONLINE GROSS MERCHANDISE VOLUME (GMV) OF TOP 20 ECOMMERCE COMPANIES BY SALES TYPE, GLOBAL, 2018, % TOTAL GMV
0%
10%
20%
30%
40%
50%
60%
70%
1999 2001 2003 2005 2007 2009 2011 2013 2015 2017
PHYSICAL GROSS MERCHANDISE SALES ON AMAZON BY INDEPENDENT THIRD-PARTY SELLERS,
GLOBAL, 1999-2018, % TOTAL GROSS MERCHANDISE SALES
From 1999 to 2018, third-party sales grew from $0.1B to $160B, with a CAGR of 52%
58%
3%
FIRST-PARTY SALES THIRD-PARTY SALES80%
MARKETPLACESDIRECT RETAIL20%
2018:
2018 TOTAL GLOBAL ONLINE GMV OF TOP 20 ECOMMERCE COMPANIES = $1.8T
eCommerce is a marketplace business; 80% of online sales for the top 20 eCommerce companies are generated by third-party sellers
ECOMMERCE
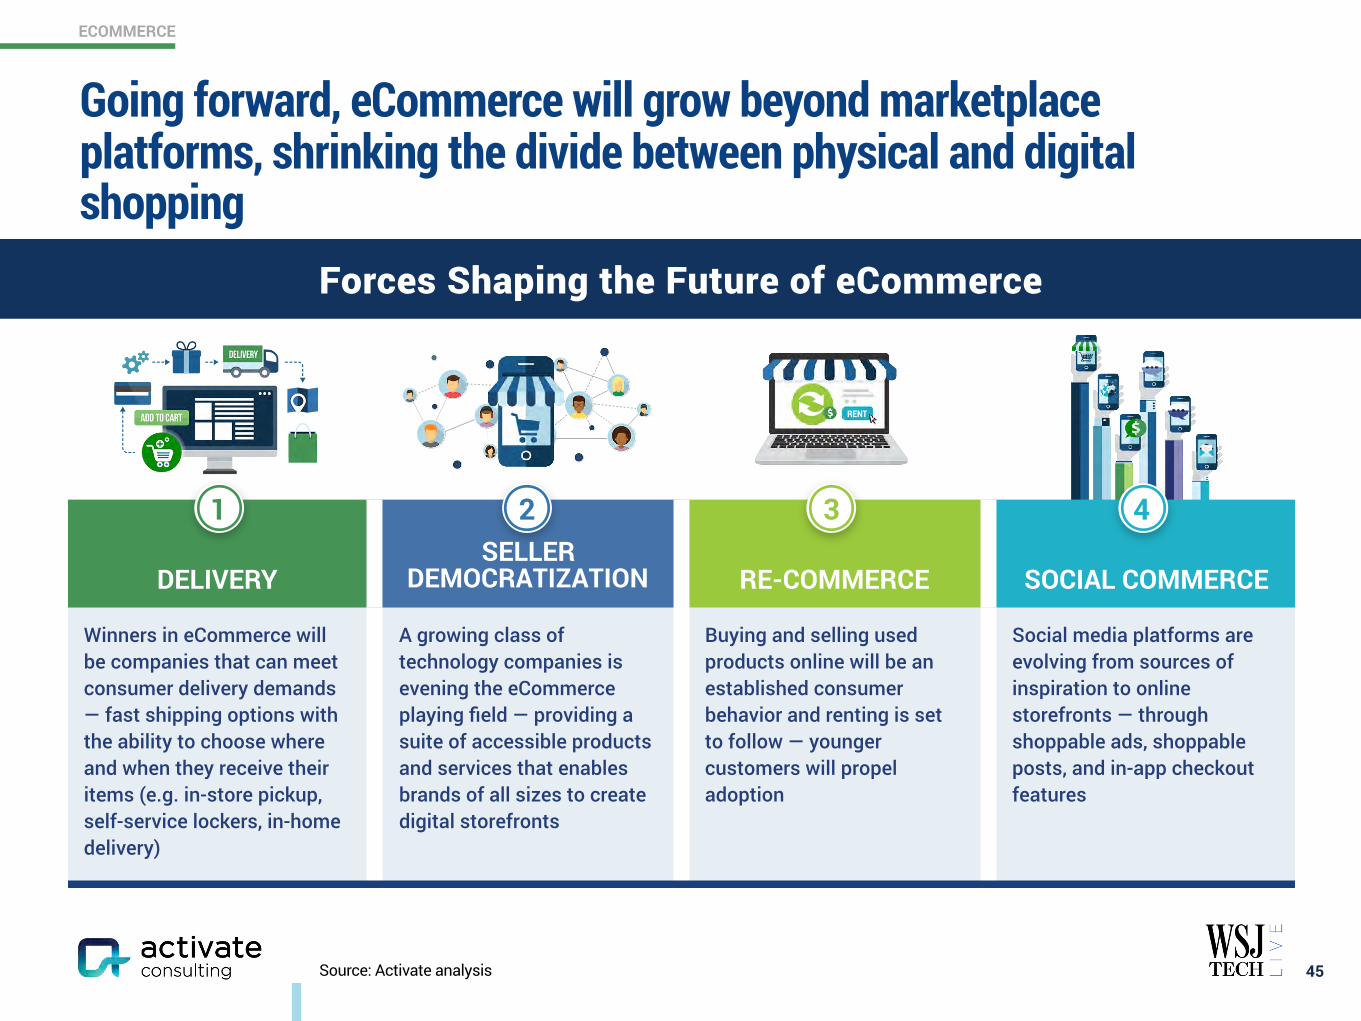
DELIVERYSELLER
DEMOCRATIZATION RE-COMMERCE SOCIAL COMMERCE
Winners in eCommerce will be companies that can meet consumer delivery demands — fast shipping options with the ability to choose where and when they receive their items (e.g. in-store pickup, self-service lockers, in-home delivery)
A growing class of technology companies is evening the eCommerce playing field — providing a suite of accessible products and services that enables brands of all sizes to create digital storefronts
Buying and selling used products online will be an established consumer behavior and renting is set to follow — younger customers will propel adoption
Social media platforms are evolving from sources of inspiration to online storefronts — through shoppable ads, shoppable posts, and in-app checkout features
Source: Activate analysis 45
Forces Shaping the Future of eCommerce
RENT
1 2 3 4
Going forward, eCommerce will grow beyond marketplace platforms, shrinking the divide between physical and digital shopping
ECOMMERCE
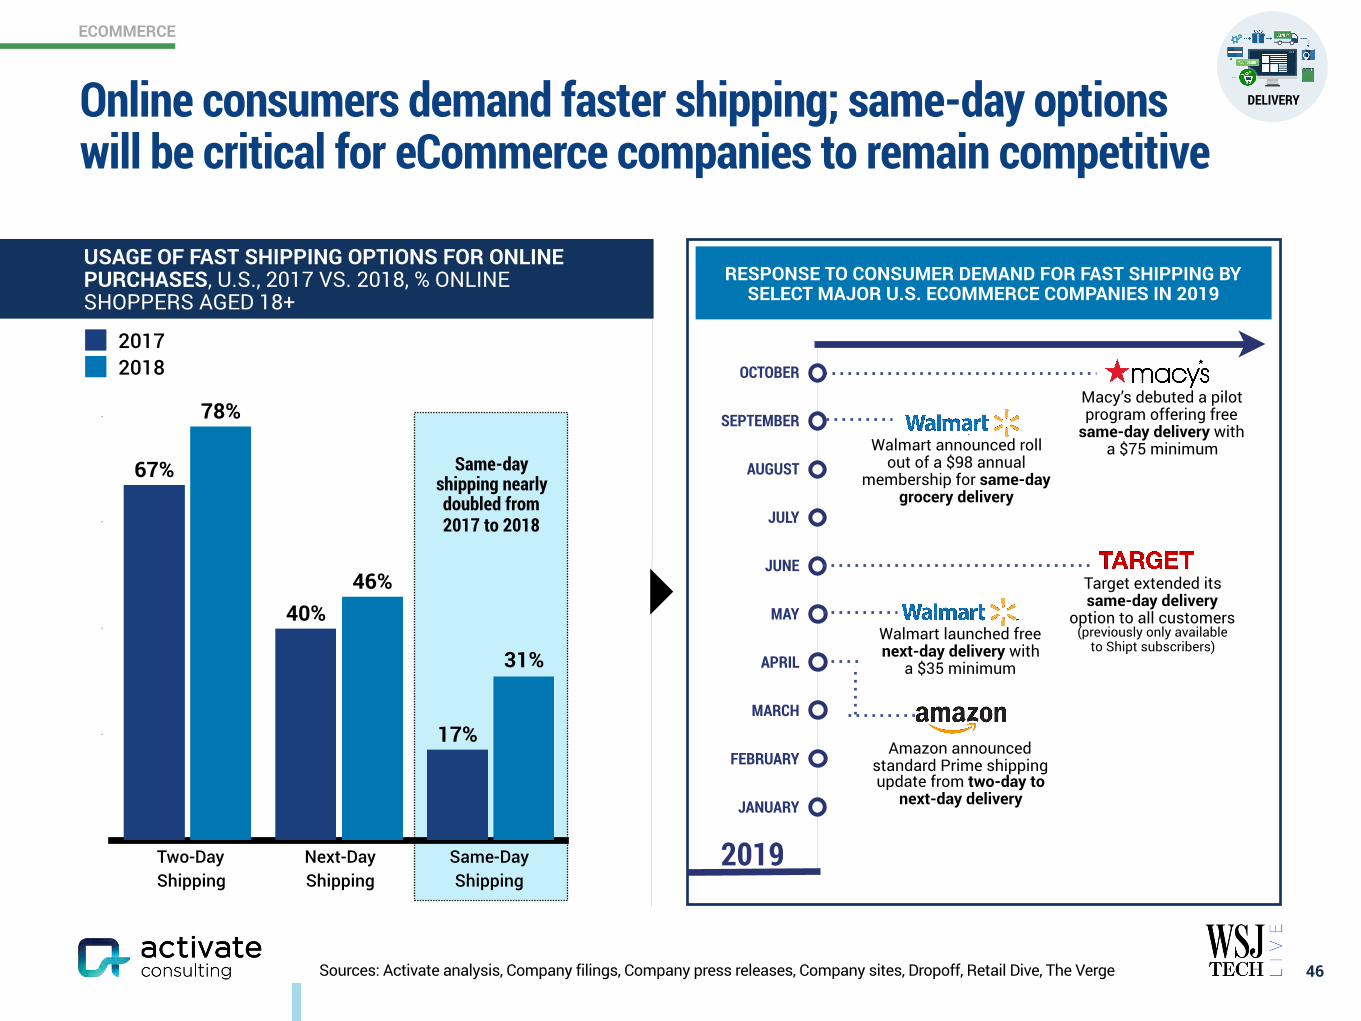
Sources: Activate analysis, Company filings, Company press releases, Company sites, Dropoff, Retail Dive, The Verge 46
0.2
0.4
0.6
0.8
31%
46%
78%
17%
40%
67%
20172018
USAGE OF FAST SHIPPING OPTIONS FOR ONLINE PURCHASES, U.S., 2017 VS. 2018, % ONLINE SHOPPERS AGED 18+
RESPONSE TO CONSUMER DEMAND FOR FAST SHIPPING BY SELECT MAJOR U.S. ECOMMERCE COMPANIES IN 2019
Same-day shipping nearly doubled from 2017 to 2018
2019
Amazon announced standard Prime shipping update from two-day to
next-day delivery
APRIL
Walmart launched free next-day delivery with
a $35 minimum
MAY
Target extended itssame-day delivery
option to all customers (previously only available
to Shipt subscribers)
JUNE
JULY
AUGUSTWalmart announced roll
out of a $98 annual membership for same-day
grocery delivery
Macy’s debuted a pilot program offering free
same-day delivery with a $75 minimum
SEPTEMBER
MARCH
FEBRUARY
JANUARY
Two-Day Shipping
Next-Day Shipping
Same-Day Shipping
DELIVERY
OCTOBER
Online consumers demand faster shipping; same-day options will be critical for eCommerce companies to remain competitive

ECOMMERCE
1. Includes Apple, Best Buy, Costco, The Home Depot, Kohl’s, Macy’s, Nordstrom, Old Navy, Target, and Walmart. Sources: Activate analysis, Business Insider, Company press releases, Company sites, Rakuten Intelligence, Retail Dive
PICK-UP AND DELIVERY OPTIONS AT SELECT MAJOR U.S. ECOMMERCE COMPANIES
In-Store DesignatedPick-Up Counter
introduced in 2010
In-Store Locker
rolled out in 2018
Curbside Pick-Updebuted in 2017
Self-Service Locker at Third-Party Location (e.g. convenience store, mall,
apartment complex lobby) launched in 2011
In-Home/In-Fridge Delivery is currently piloting in
select cities
4747
2017 2018 YTD FEB. 2019
33%
27%
22%
BUY ONLINE, PICK UP IN-STORE SALES AMONG SELECT MAJOR ECOMMERCE COMPANIES1,
U.S., 2017-YTD FEB. 2019, % TOTAL ONLINE SALES
DELIVERYAlternative delivery and pick-up options will expand to meet shoppers’ needs
ECOMMERCE
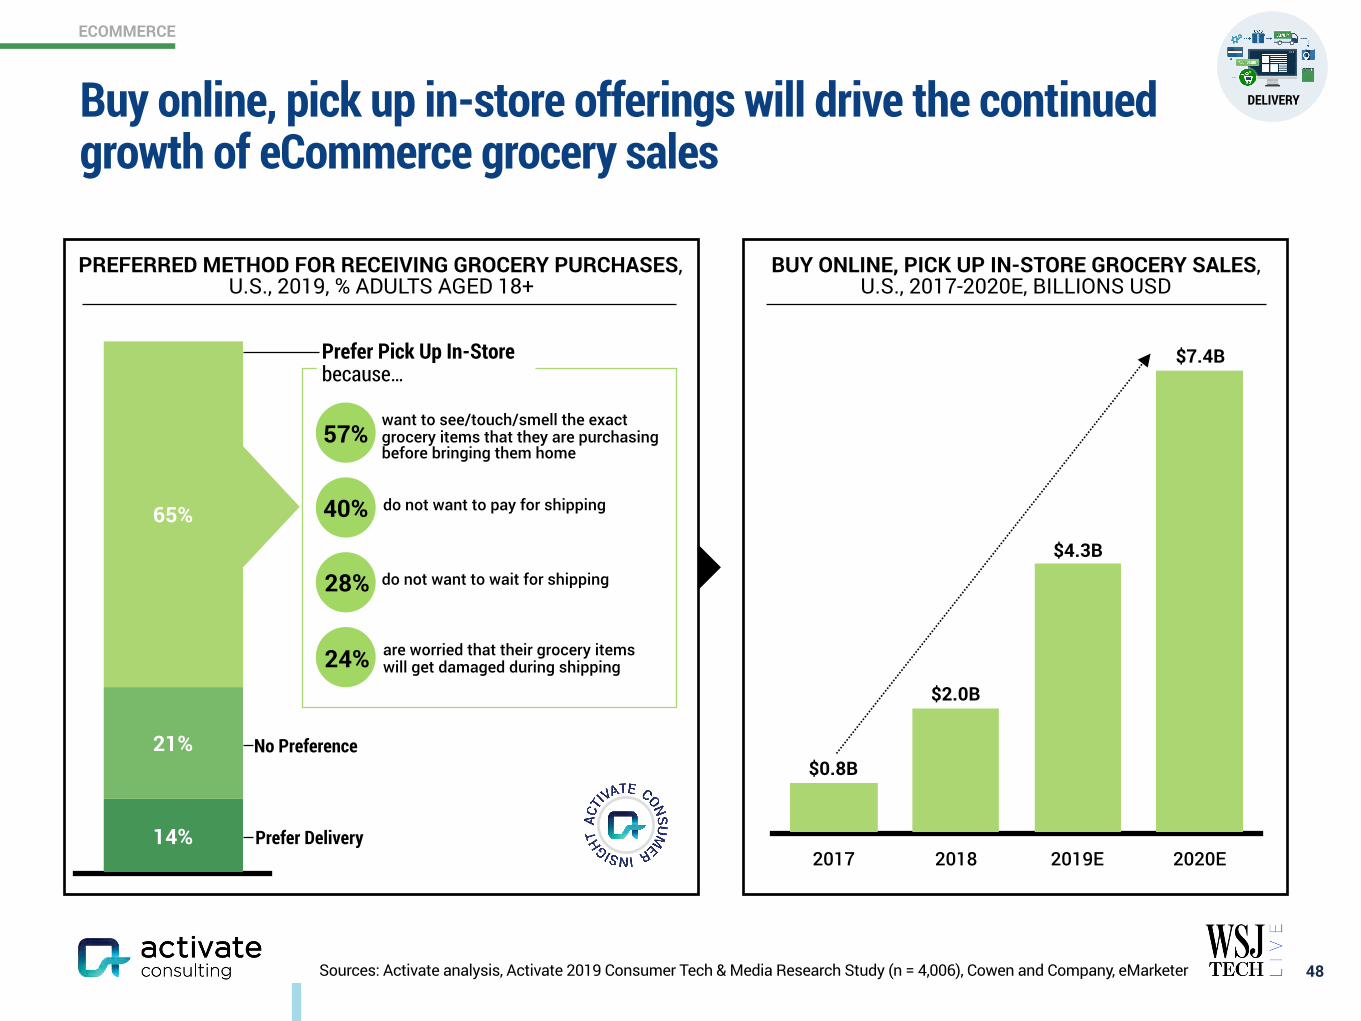
Sources: Activate analysis, Activate 2019 Consumer Tech & Media Research Study (n = 4,006), Cowen and Company, eMarketer 48
PREFERRED METHOD FOR RECEIVING GROCERY PURCHASES, U.S., 2019, % ADULTS AGED 18+
65%
21%
14% Prefer Delivery
No Preference
BUY ONLINE, PICK UP IN-STORE GROCERY SALES, U.S., 2017-2020E, BILLIONS USD
2017 2018 2019E 2020E
$7.4B
$4.3B
$2.0B
$0.8B
want to see/touch/smell the exact grocery items that they are purchasing before bringing them home
do not want to pay for shipping
do not want to wait for shipping
are worried that their grocery items will get damaged during shipping
57%
40%
28%
24%
Prefer Pick Up In-Store because…
DELIVERYBuy online, pick up in-store offerings will drive the continued growth of eCommerce grocery sales
ECOMMERCE
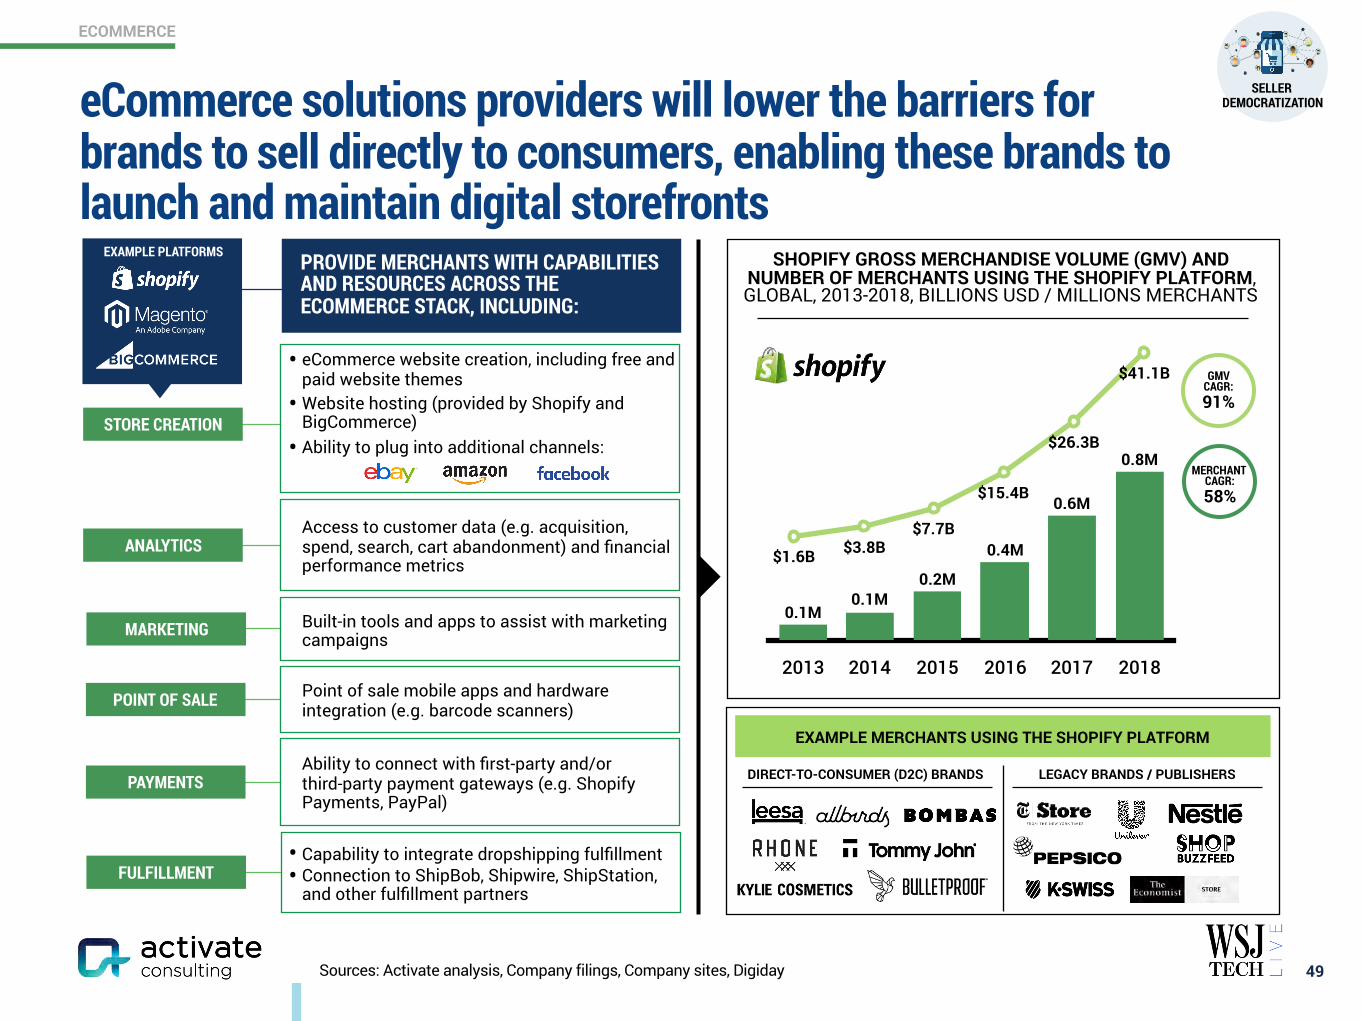
Sources: Activate analysis, Company filings, Company sites, Digiday
• Capability to integrate dropshipping fulfillment • Connection to ShipBob, Shipwire, ShipStation,
and other fulfillment partners
SHOPIFY GROSS MERCHANDISE VOLUME (GMV) AND NUMBER OF MERCHANTS USING THE SHOPIFY PLATFORM, GLOBAL, 2013-2018, BILLIONS USD / MILLIONS MERCHANTS
$1.6B $3.8B$7.7B
$15.4B
$26.3B
$41.1B
2013 2014 2015 2016 2017 2018
0.8M
0.6M
0.4M
0.2M0.1M
0.1M
GMV CAGR: 91%
MERCHANT CAGR: 58%
EXAMPLE MERCHANTS USING THE SHOPIFY PLATFORM
DIRECT-TO-CONSUMER (D2C) BRANDS LEGACY BRANDS / PUBLISHERS
• eCommerce website creation, including free and paid website themes
• Website hosting (provided by Shopify and BigCommerce)
• Ability to plug into additional channels:
Point of sale mobile apps and hardware integration (e.g. barcode scanners)
Built-in tools and apps to assist with marketing campaigns
Ability to connect with first-party and/or third-party payment gateways (e.g. Shopify Payments, PayPal)
POINT OF SALE
STORE CREATION
FULFILLMENT
MARKETING
PAYMENTS
ANALYTICSAccess to customer data (e.g. acquisition, spend, search, cart abandonment) and financial performance metrics
PROVIDE MERCHANTS WITH CAPABILITIES AND RESOURCES ACROSS THE ECOMMERCE STACK, INCLUDING:
SELLERDEMOCRATIZATION
49
EXAMPLE PLATFORMS
eCommerce solutions providers will lower the barriers for brands to sell directly to consumers, enabling these brands to launch and maintain digital storefronts
ECOMMERCE
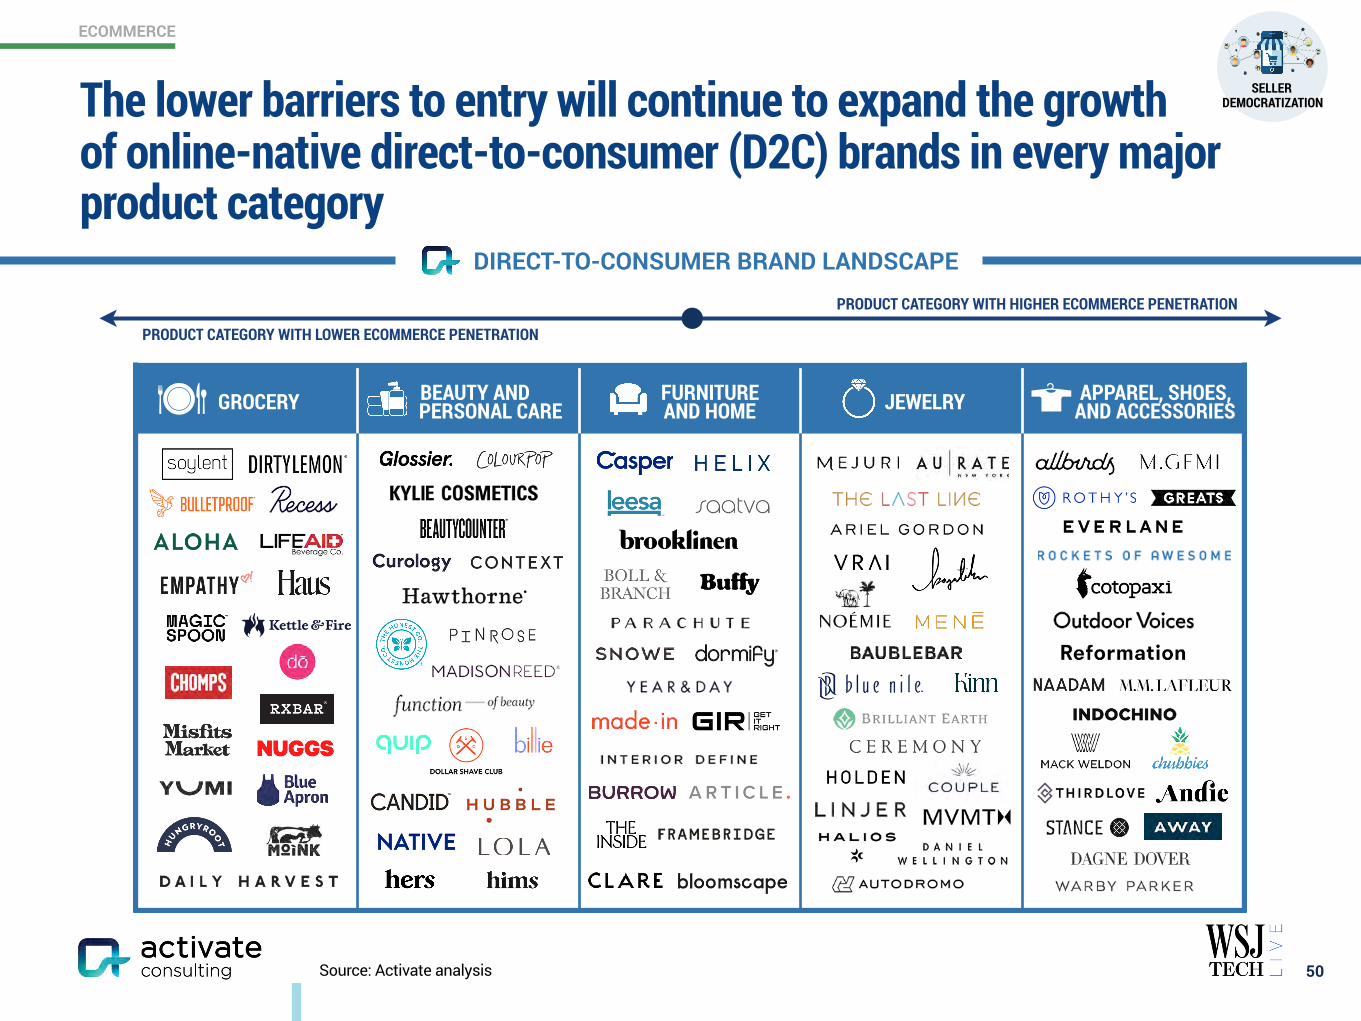
GROCERY BEAUTY AND PERSONAL CARE
FURNITURE AND HOME JEWELRY APPAREL, SHOES,
AND ACCESSORIES
Source: Activate analysis 50
PRODUCT CATEGORY WITH LOWER ECOMMERCE PENETRATION
PRODUCT CATEGORY WITH HIGHER ECOMMERCE PENETRATION
DIRECT-TO-CONSUMER BRAND LANDSCAPE
The lower barriers to entry will continue to expand the growth of online-native direct-to-consumer (D2C) brands in every major product category
SELLERDEMOCRATIZATION
ECOMMERCE
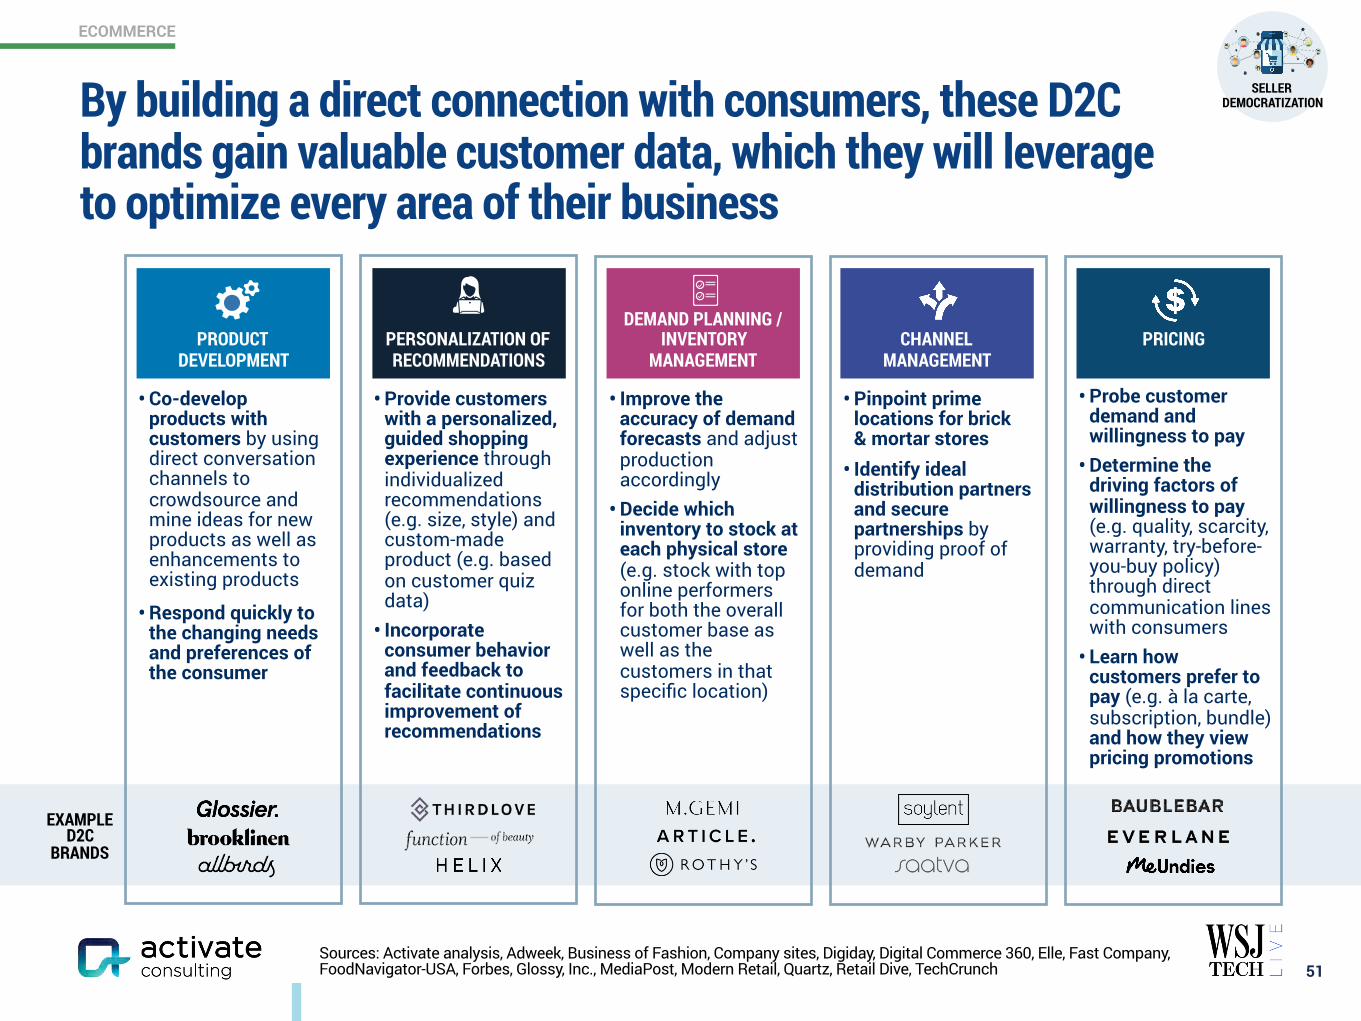
• Improve the accuracy of demand forecasts and adjust production accordingly
• Decide which inventory to stock at each physical store (e.g. stock with top online performers for both the overall customer base as well as the customers in that specific location)
• Probe customer demand and willingness to pay
• Determine the driving factors of willingness to pay (e.g. quality, scarcity, warranty, try-before-you-buy policy) through direct communication lines with consumers
• Learn how customers prefer to pay (e.g. à la carte, subscription, bundle) and how they view pricing promotions
• Provide customers with a personalized, guided shopping experience through individualized recommendations (e.g. size, style) and custom-made product (e.g. based on customer quiz data)
• Incorporate consumer behavior and feedback to facilitate continuous improvement of recommendations
• Co-develop products with customers by using direct conversation channels to crowdsource and mine ideas for new products as well as enhancements to existing products
• Respond quickly to the changing needs and preferences of the consumer
Sources: Activate analysis, Adweek, Business of Fashion, Company sites, Digiday, Digital Commerce 360, Elle, Fast Company, FoodNavigator-USA, Forbes, Glossy, Inc., MediaPost, Modern Retail, Quartz, Retail Dive, TechCrunch 51
EXAMPLE D2C
BRANDS
• Pinpoint prime locations for brick & mortar stores
• Identify ideal distribution partners and secure partnerships by providing proof of demand
PRODUCT DEVELOPMENT
PERSONALIZATION OF RECOMMENDATIONS
DEMAND PLANNING / INVENTORY
MANAGEMENTCHANNEL
MANAGEMENTPRICING
By building a direct connection with consumers, these D2C brands gain valuable customer data, which they will leverage to optimize every area of their business
SELLERDEMOCRATIZATION
ECOMMERCE
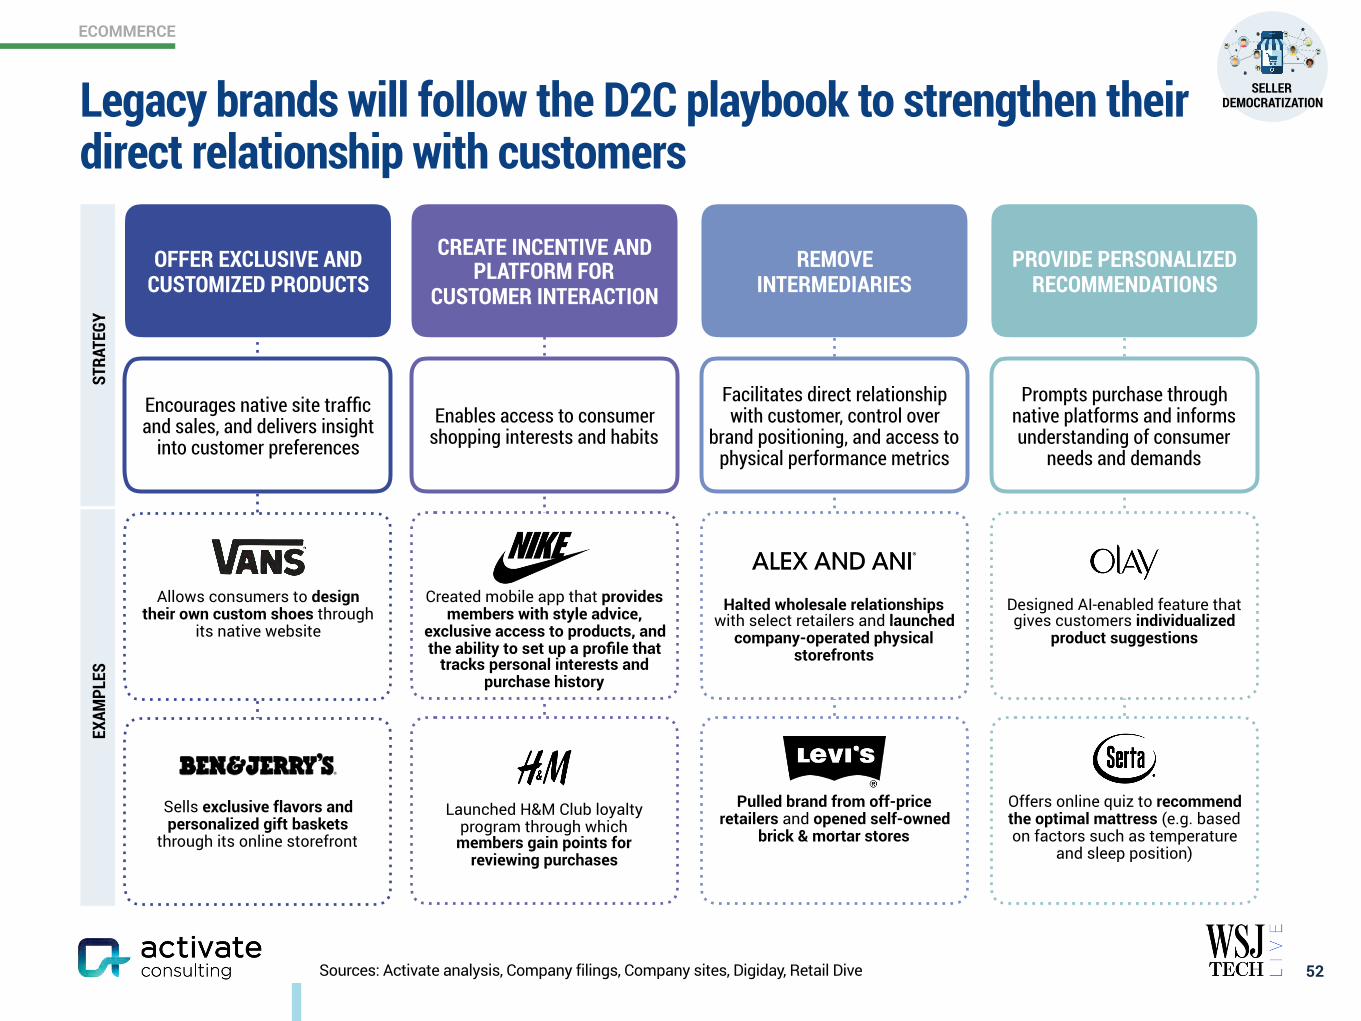
Sells exclusive flavors and personalized gift baskets
through its online storefront
52Sources: Activate analysis, Company filings, Company sites, Digiday, Retail Dive
REMOVEINTERMEDIARIES
Facilitates direct relationship with customer, control over
brand positioning, and access to physical performance metrics
Pulled brand from off-price retailers and opened self-owned
brick & mortar stores
Halted wholesale relationships with select retailers and launched
company-operated physical storefronts
PROVIDE PERSONALIZED RECOMMENDATIONS
Prompts purchase through native platforms and informs understanding of consumer
needs and demands
Offers online quiz to recommend the optimal mattress (e.g. based on factors such as temperature
and sleep position)
Designed AI-enabled feature that gives customers individualized
product suggestions
Allows consumers to design their own custom shoes through
its native website
OFFER EXCLUSIVE AND CUSTOMIZED PRODUCTS
Encourages native site traffic and sales, and delivers insight
into customer preferences
CREATE INCENTIVE AND PLATFORM FOR
CUSTOMER INTERACTION
Launched H&M Club loyalty program through which
members gain points for reviewing purchases
Created mobile app that provides members with style advice,
exclusive access to products, and the ability to set up a profile that
tracks personal interests and purchase history
Enables access to consumer shopping interests and habits
STRA
TEGY
EXAM
PLES
Legacy brands will follow the D2C playbook to strengthen their direct relationship with customers
SELLERDEMOCRATIZATION
ECOMMERCE
Sources: Activate analysis, Activate 2019 Consumer Tech & Media Research Study (n = 4,006) 53
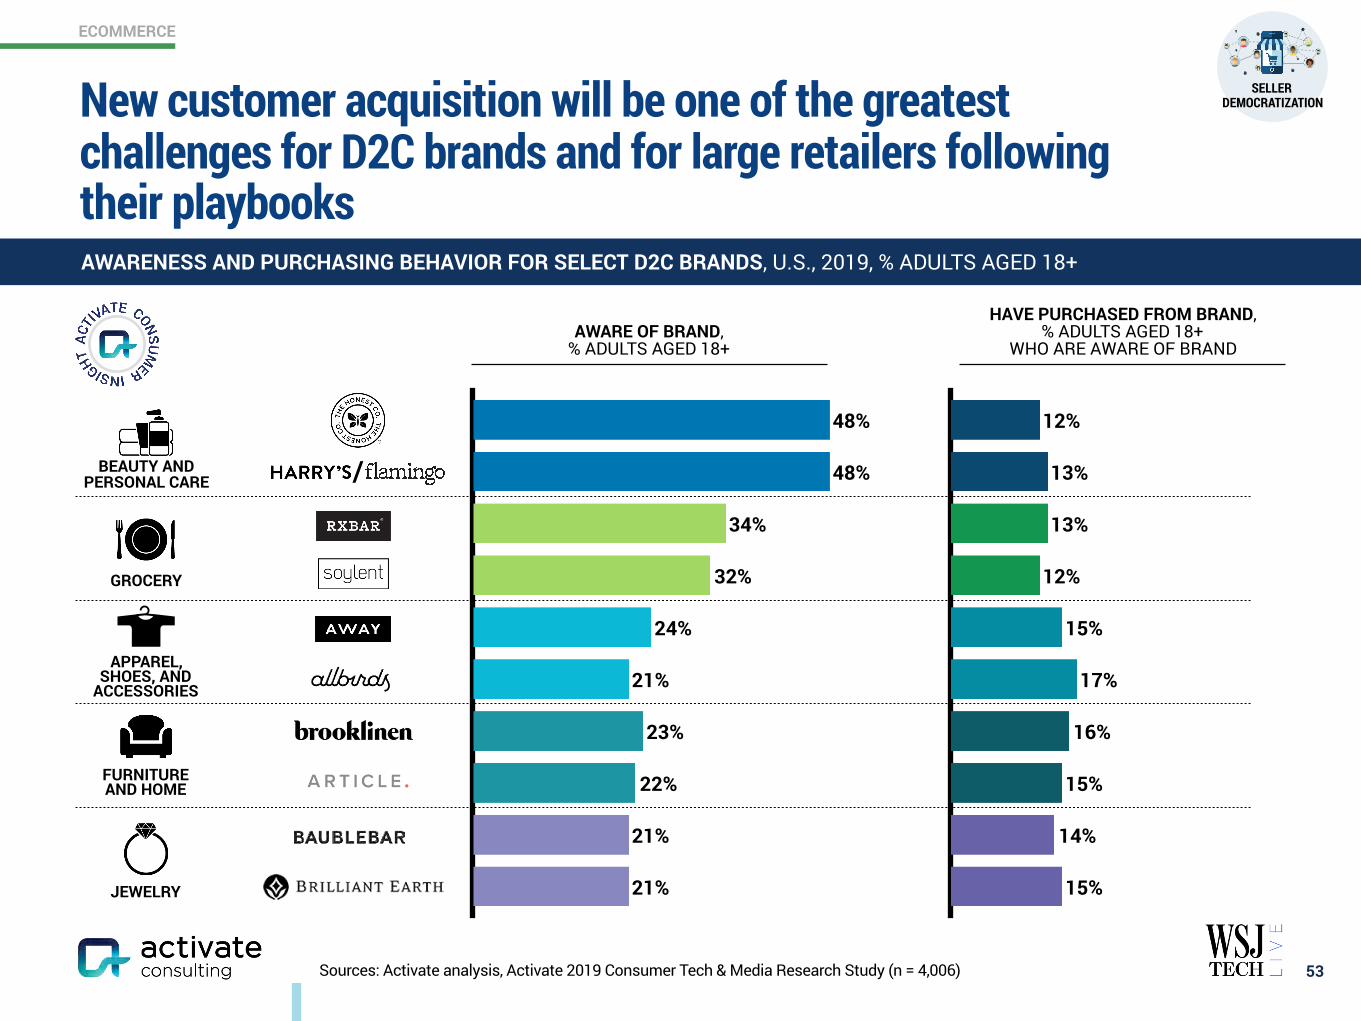
AWARENESS AND PURCHASING BEHAVIOR FOR SELECT D2C BRANDS, U.S., 2019, % ADULTS AGED 18+
JEWELRY
FURNITURE AND HOME
GROCERY
BEAUTY AND PERSONAL CARE
APPAREL, SHOES, AND
ACCESSORIES
21%
21%
22%
23%
21%
24%
32%
34%
48%
48%
15%
14%
15%
16%
17%
15%
12%
13%
13%
12%
/
AWARE OF BRAND, % ADULTS AGED 18+
HAVE PURCHASED FROM BRAND, % ADULTS AGED 18+
WHO ARE AWARE OF BRAND
New customer acquisition will be one of the greatest challenges for D2C brands and for large retailers following their playbooks
SELLERDEMOCRATIZATION
ECOMMERCE
Sources: Activate analysis, Activate 2019 Consumer Tech & Media Research Study (n = 4,006), Company press releases, Company sites 54
RE-COMMERCE
RENT
EXAMPLE ONLINERESALE
PLATFORMS
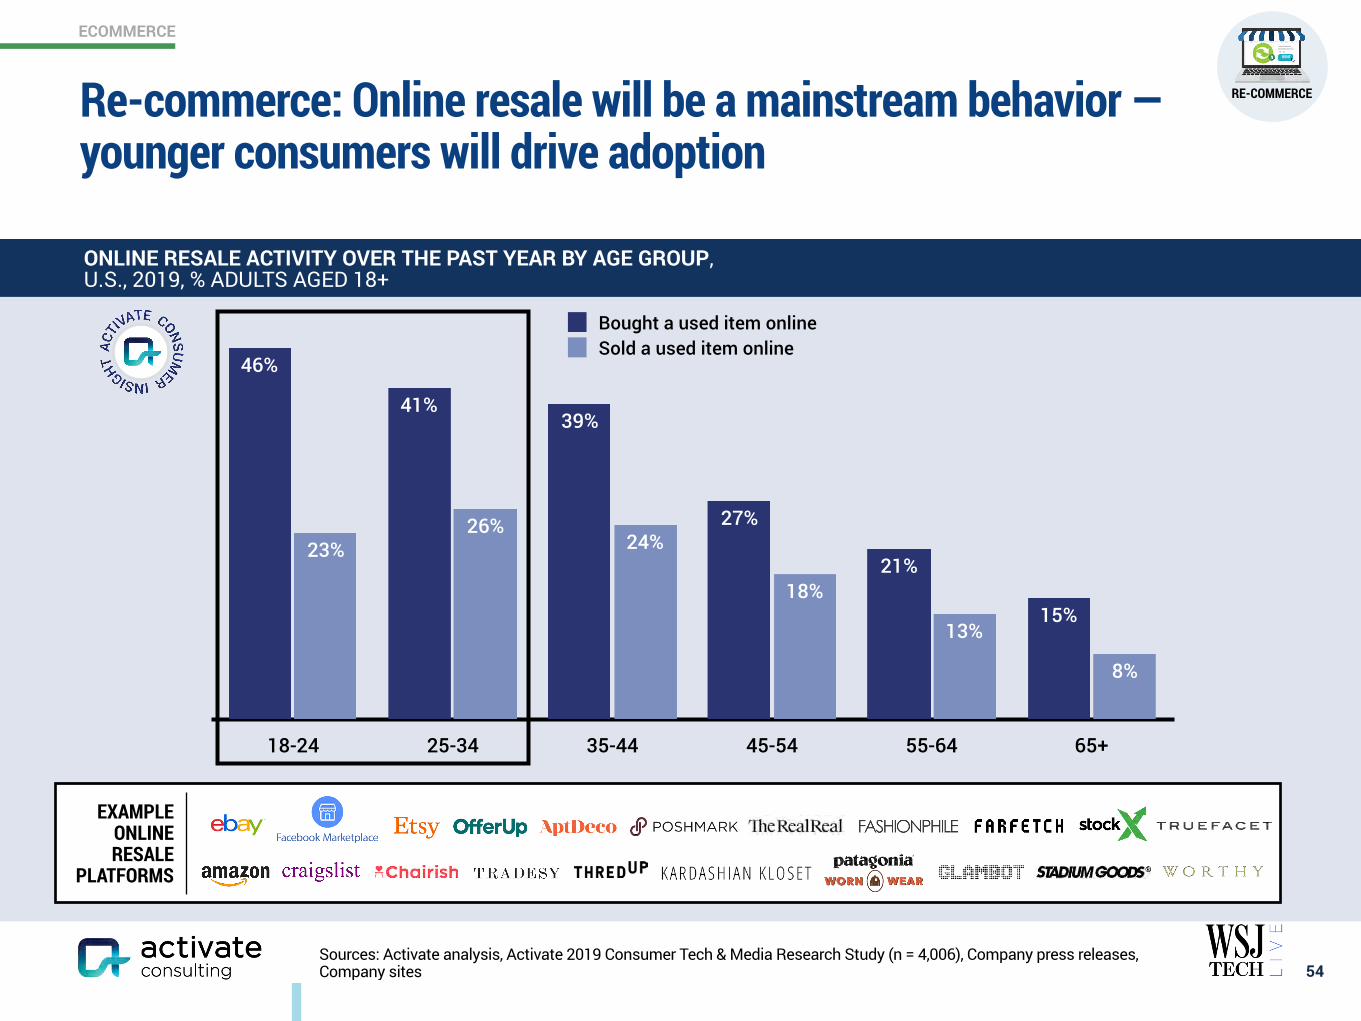
ONLINE RESALE ACTIVITY OVER THE PAST YEAR BY AGE GROUP, U.S., 2019, % ADULTS AGED 18+
18-24 25-34 35-44 45-54 55-64 65+
8%
13%
18%
24%26%
23%
15%
21%
27%
39%41%
46%
Bought a used item onlineSold a used item online
Re-commerce: Online resale will be a mainstream behavior — younger consumers will drive adoption
ECOMMERCE
Sources: Activate analysis, Activate 2019 Consumer Tech & Media Research Study (n = 4,006), Company press releases, Company sites
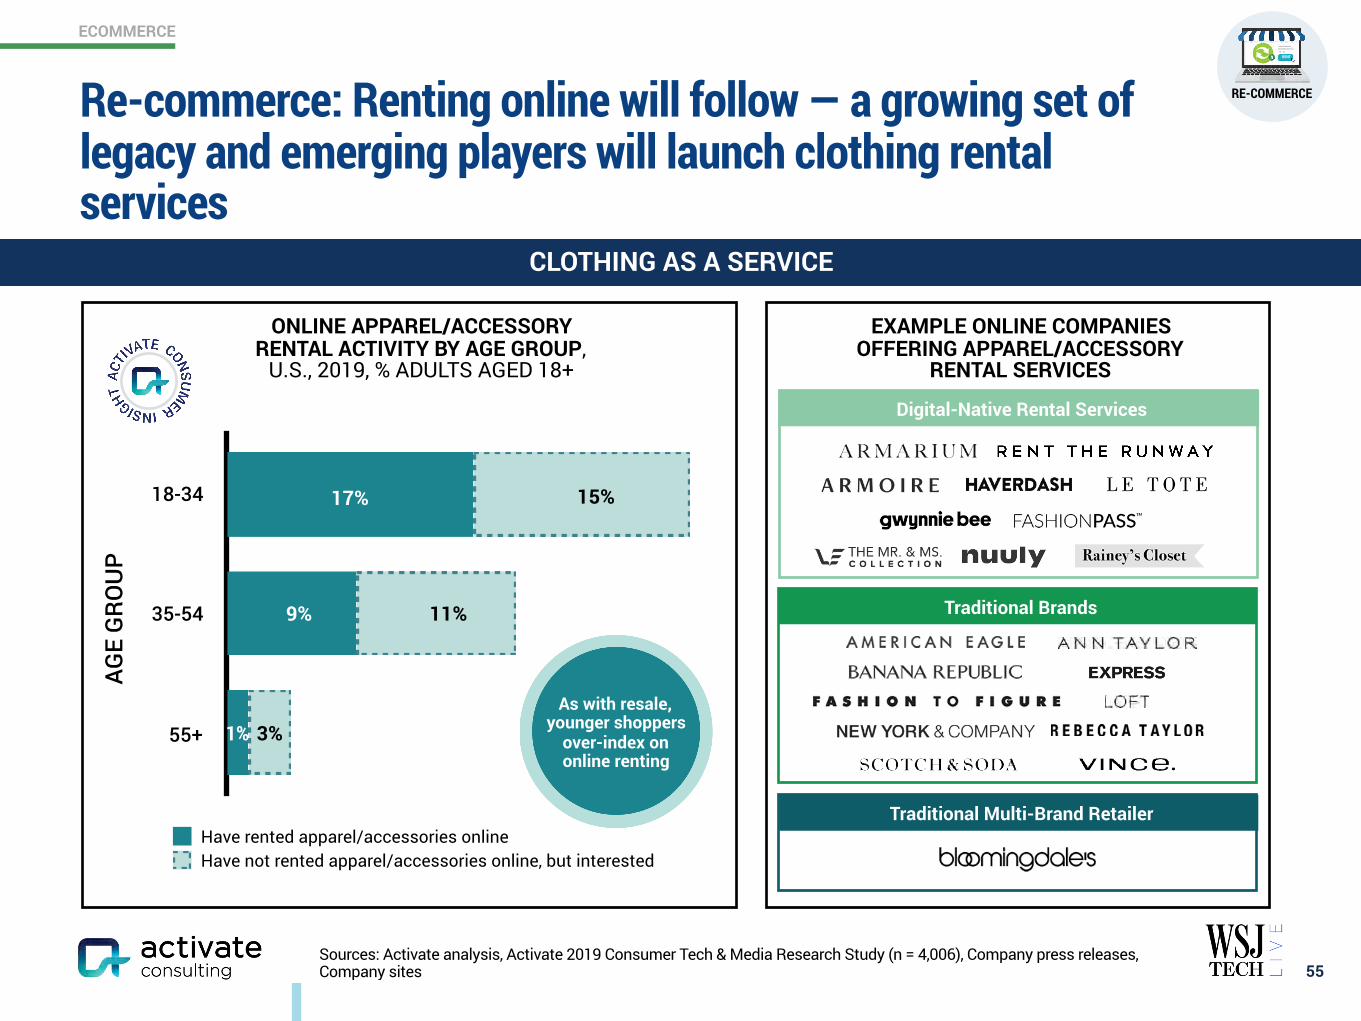
Re-commerce: Renting online will follow — a growing set of legacy and emerging players will launch clothing rental services
55
ONLINE APPAREL/ACCESSORY RENTAL ACTIVITY BY AGE GROUP,
U.S., 2019, % ADULTS AGED 18+
CLOTHING AS A SERVICE
18-34
35-54
55+
Have rented apparel/accessories onlineHave not rented apparel/accessories online, but interested
AGE
GRO
UP
EXAMPLE ONLINE COMPANIES OFFERING APPAREL/ACCESSORY
RENTAL SERVICES
Digital-Native Rental Services
Traditional Brands
Traditional Multi-Brand Retailer
As with resale, younger shoppers
over-index on online renting
15%
11%
3%
9%
17%
1%
RE-COMMERCE
RENT
ECOMMERCE
Sources: Activate analysis, Adobe Digital Insights, Company social media accounts, eMarketer
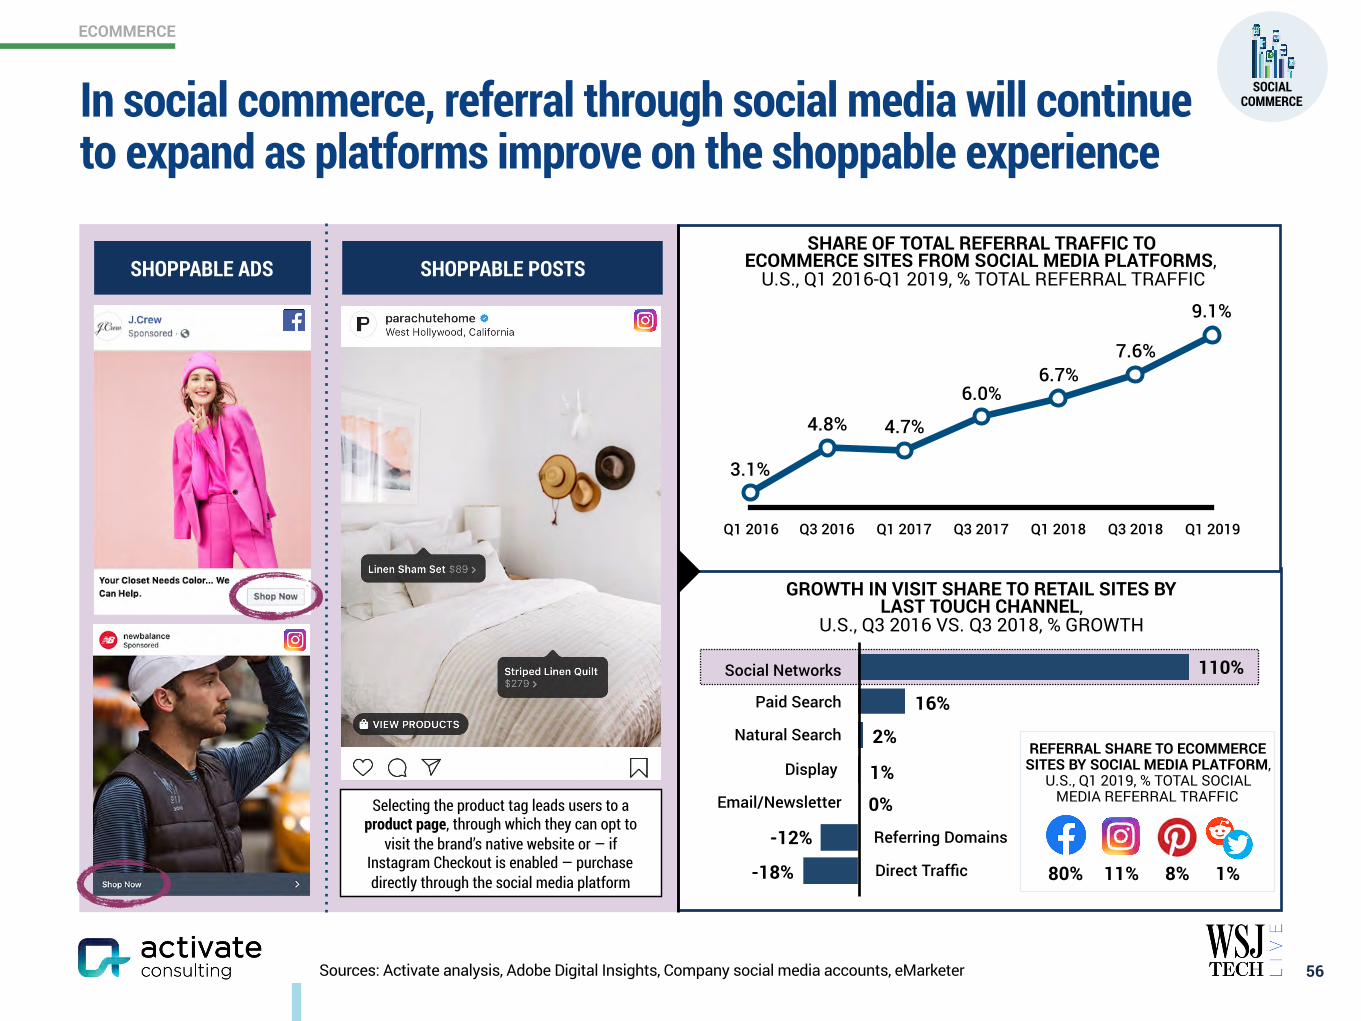
In social commerce, referral through social media will continue to expand as platforms improve on the shoppable experience
Q1 2016 Q3 2016 Q1 2017 Q3 2017 Q1 2018 Q3 2018 Q1 2019
3.1%
4.8% 4.7%
6.0%6.7%
7.6%
9.1%
REFERRAL SHARE TO ECOMMERCE SITES BY SOCIAL MEDIA PLATFORM,
U.S., Q1 2019, % TOTAL SOCIAL MEDIA REFERRAL TRAFFIC
GROWTH IN VISIT SHARE TO RETAIL SITES BY LAST TOUCH CHANNEL,
U.S., Q3 2016 VS. Q3 2018, % GROWTH
SHARE OF TOTAL REFERRAL TRAFFIC TO ECOMMERCE SITES FROM SOCIAL MEDIA PLATFORMS,
U.S., Q1 2016-Q1 2019, % TOTAL REFERRAL TRAFFIC
80% 11% 8%
110%
16%
2%
1%
-12%
-18%
Social Networks
Paid Search
Natural Search
Display
Email/Newsletter
Referring Domains
Direct Traffic
0%Selecting the product tag leads users to a product page, through which they can opt to
visit the brand’s native website or — if Instagram Checkout is enabled — purchase directly through the social media platform
SOCIAL COMMERCE
56
SHOPPABLE POSTSSHOPPABLE ADS
1%
ECOMMERCE
Sources: Activate Analysis, Business Insider, Company sites, Company social media accounts, Forbes, Marketing Land
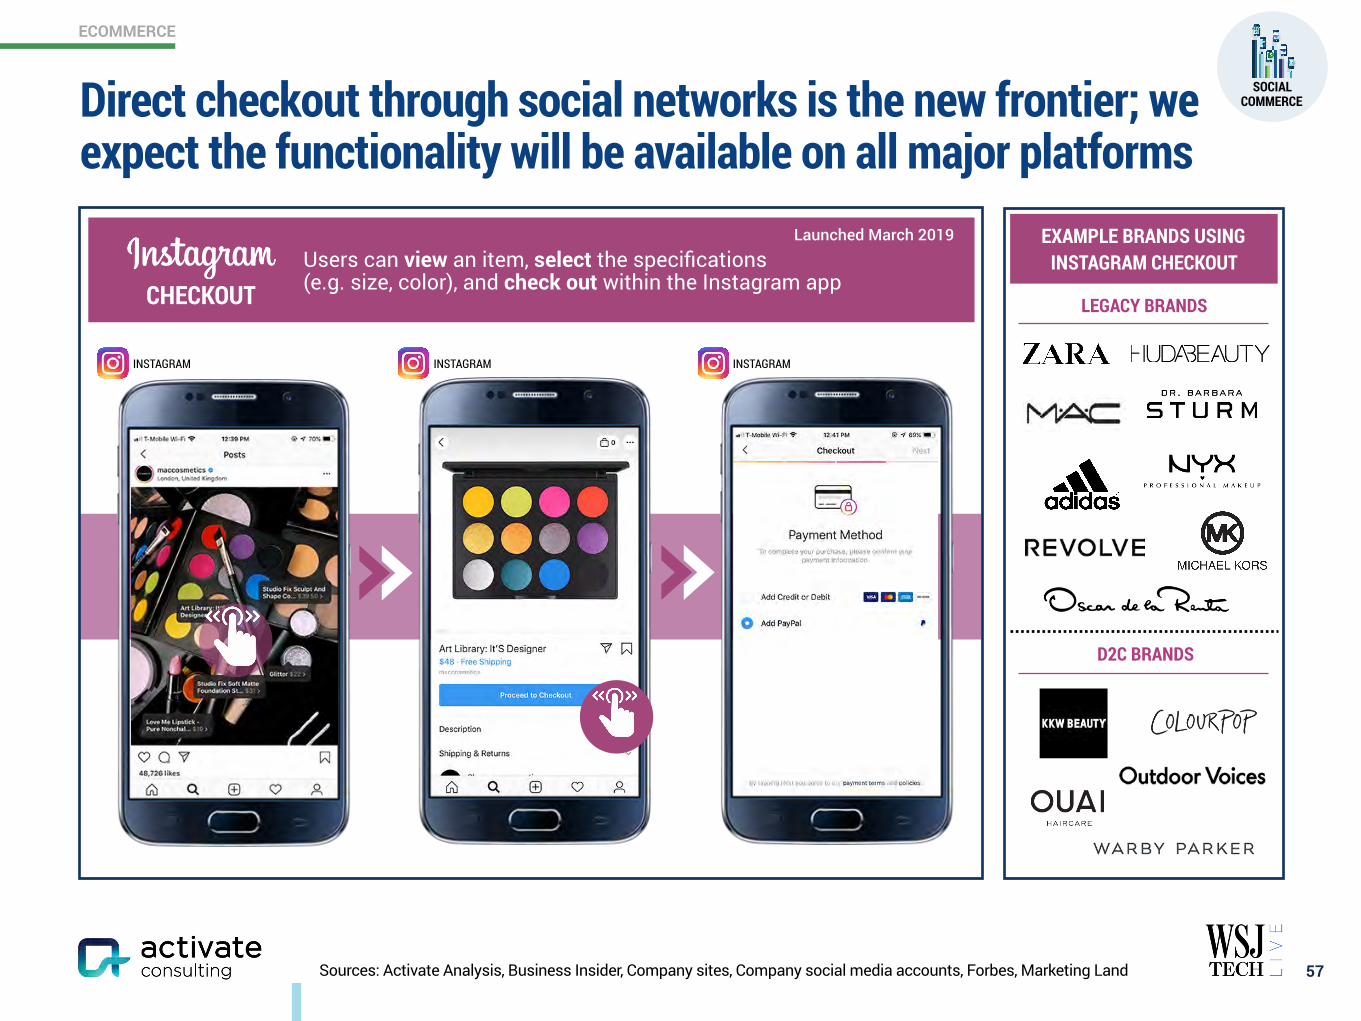
Direct checkout through social networks is the new frontier; we expect the functionality will be available on all major platforms
57
SOCIAL COMMERCE
EXAMPLE BRANDS USING INSTAGRAM CHECKOUT
D2C BRANDS
LEGACY BRANDS
Users can view an item, select the specifications (e.g. size, color), and check out within the Instagram app
Launched March 2019
INSTAGRAM INSTAGRAM INSTAGRAM
CHECKOUT
ECOMMERCE
Sources: Activate analysis, Adweek, Business of Fashion, CNBC, Company press releases, Company sites, Company social media accounts, Digital Commerce 360
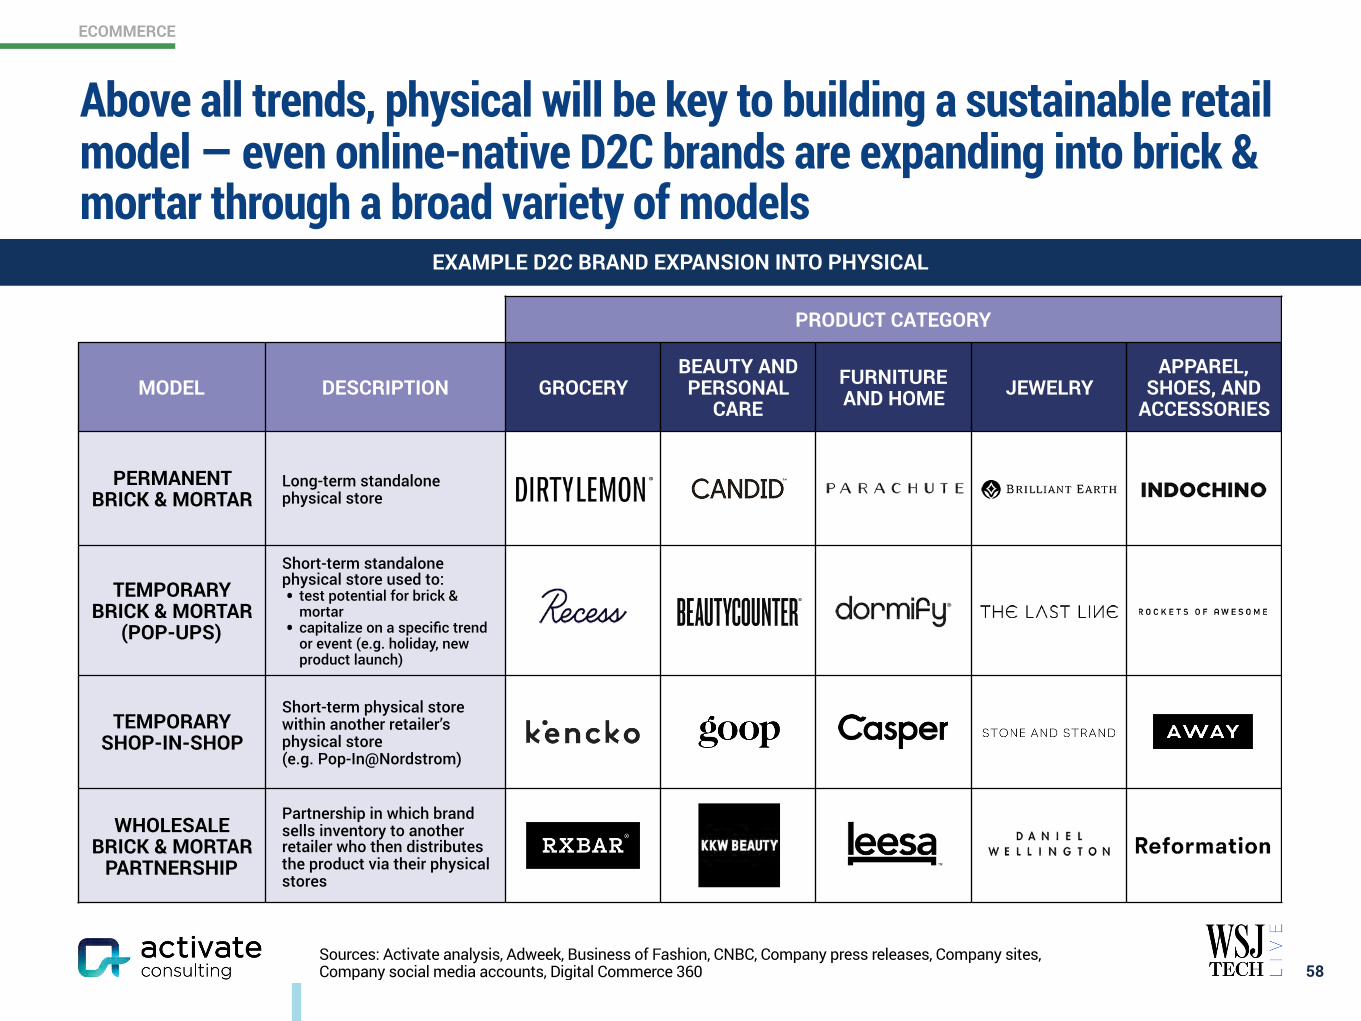
Above all trends, physical will be key to building a sustainable retail model — even online-native D2C brands are expanding into brick & mortar through a broad variety of models
58
EXAMPLE D2C BRAND EXPANSION INTO PHYSICAL
PRODUCT CATEGORY
MODEL DESCRIPTION GROCERYBEAUTY AND PERSONAL
CAREFURNITURE AND HOME JEWELRY
APPAREL, SHOES, AND
ACCESSORIES
PERMANENT BRICK & MORTAR
Long-term standalone physical store
TEMPORARY BRICK & MORTAR
(POP-UPS)
Short-term standalone physical store used to: • test potential for brick &
mortar • capitalize on a specific trend
or event (e.g. holiday, new product launch)
TEMPORARY SHOP-IN-SHOP
Short-term physical store within another retailer’s physical store (e.g. Pop-In@Nordstrom)
WHOLESALE BRICK & MORTAR
PARTNERSHIP
Partnership in which brand sells inventory to another retailer who then distributes the product via their physical stores

ECOMMERCE
Sources: Activate analysis, Company filings, Company press releases, Company sites, Digiday, Essential Retail, Fast Company, Glossy, The New Food Economy, TechCrunch
As eCommerce evolves, physical will evolve with it, creating new retail concepts and technology to enhance the in-store experience
59
Electronic Shelf Labels
• Best Buy has installed electronic shelf labels to synchronize pricing across digital and physical channels
• The Home Depot uses electronic shelf labels in its appliance department to incorporate customer reviews and item specifications
Mobile Integration
• The Kroger app enables shoppers to create shopping lists, view purchase history, and locate items in-store
• The Nike app’s In-Store Mode allows customers to book fitting rooms, request items to try on, and scan QR codes on mannequins to identify the modeled products
Scanning Robots
• Walmart has rolled out shelf-scanning robots to identify low stock levels, incorrect price listings, missing labels, and misplaced items
• Stop & Shop has debuted robotic assistants to monitor for potential hazards (e.g. broken or spilled item), stockouts, and pricing issues
Augmented Reality / Virtual Reality
• Sephora has launched Virtual Artists, an augmented reality trial tool
• Neiman Marcus has installed smart mirrors for customers to virtually try on items
EXAMPLE RETAILERS LEVERAGING TECHNOLOGY TO ENHANCE IN-STORE EXPERIENCE
The new wave of retail concepts will include a set of brick & mortar stores hosting an ever-rotating curation of primarily online-native D2C brands
These retailers provide emerging brands with a low-risk avenue to test physical, offering:
• Short-term leases • Swift shop launch • Shop design and staffing teams • Complete and transparent access to performance metrics • Collaborative event space (e.g. for classes, art exhibits,
launch parties, speaker series)
NEXT GENERATION RETAIL MODEL
Neighborhood Goods has a restaurant and social space that
hosts events (e.g. panels, workshops) to build community
Showfields features an immersive theater and art experience through which shoppers are invited to test
and interact with all products
EXAMPLES
www.activate.com 60
PAGE
$300 Billion Global Internet and Media Growth Dollars by 2023 4
Consumer Attention: 12:40 Hours of Technology & Media Per Day 9
Super Users: The Imperative for Technology & Media Companies 13
Social Splinter: The Social Media World Expands 27
eCommerce: Shrinking the Divide Between Physical and Digital Shopping 41
Digital Marketplaces: New Inventory, Price, Transparency, Ease of Use 60
Video Gaming: The Next Streaming Battlefront 71
Esports: Sport of the Future 84
Video: Streaming Stacking, Battleground Households 94
Sports Betting: The Next Big Financial Trading Market 117
Sports: More Viewing, Emerging Sports, Better Fan Experiences 129
Music: The Discovery Challenge 138
Podcasting: New Listening Experiences and Explosive Growth 146
The Networked Body: Quantified and Connected Human 159
Digital Consumer Finance: Next Generation Services Go Mainstream 169
Connectivity: Enabling the Next Wave of Technology and Media Growth 182
CONTENTS
DIGITAL MARKETPLACES
Sources: Activate analysis, Company sites
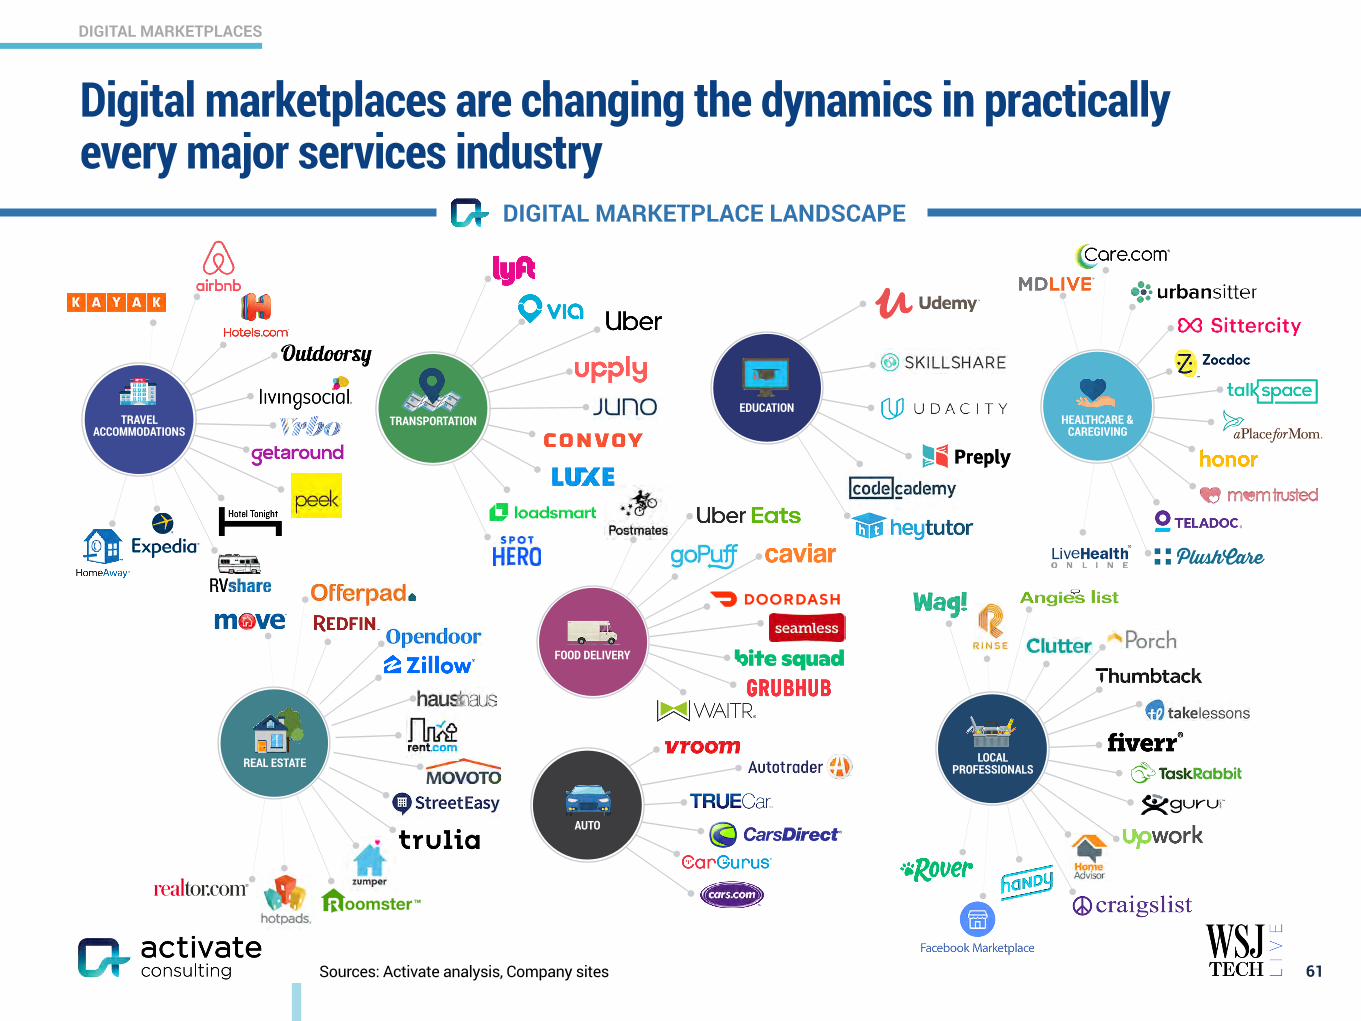
Digital marketplaces are changing the dynamics in practically every major services industry
61
DIGITAL MARKETPLACE LANDSCAPE
TRAVEL ACCOMMODATIONS
HEALTHCARE & CAREGIVING
LOCAL PROFESSIONALS
FOOD DELIVERY
TRANSPORTATIONEDUCATION
AUTO
REAL ESTATE
DIGITAL MARKETPLACES
1. Numbers reflect maximum MUV in the trailing 12 months. Measured across app, desktop, and mobile web. Sources: Activate analysis, Comscore
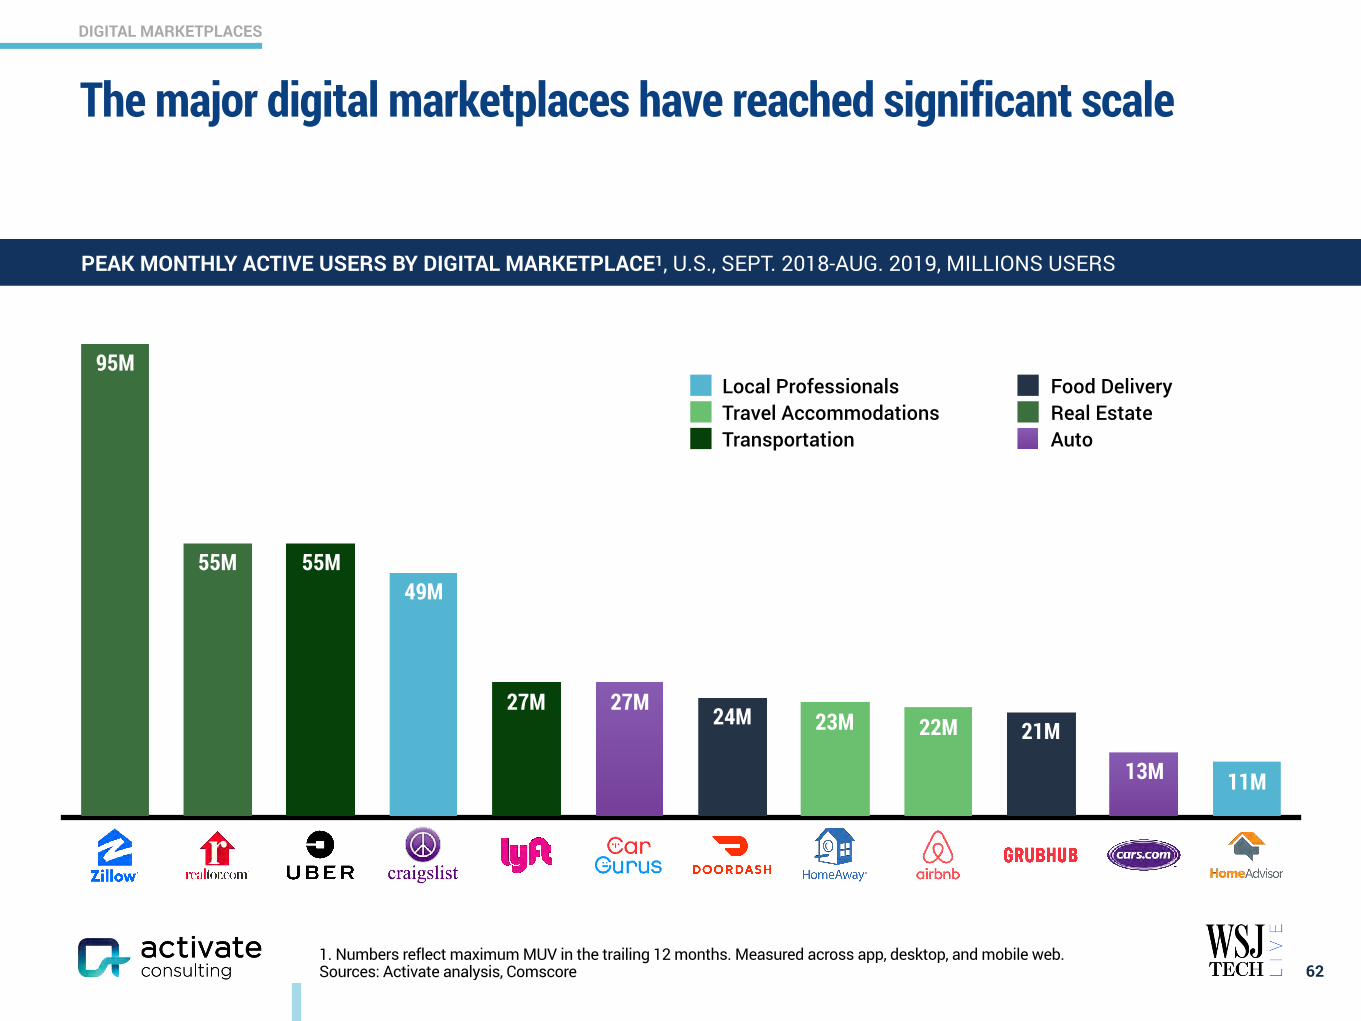
The major digital marketplaces have reached significant scale
62
PEAK MONTHLY ACTIVE USERS BY DIGITAL MARKETPLACE1, U.S., SEPT. 2018-AUG. 2019, MILLIONS USERS
13M
27M27M
55M55M
95M
22M23M 21M24M
11M
49M
Local Professionals Food DeliveryTravel Accommodations Real EstateTransportation Auto
DIGITAL MARKETPLACES
1. Usage asked for targeted set of major marketplaces in each vertical, including the major marketplaces listed and others. Marketplaces defined as major if they ranked highly in either monthly website traffic or app downloads within their segments. Sources: Activate analysis, Activate 2019 Consumer Tech & Media Research Study (n = 4,006)
Local Professionals Food Delivery Travel Accommodations Real Estate Transportation Healthcare &
Caregiving
Example Services Offered
Find/book freelancers for creative, technical,
and/or professional services
Order food on-demand for immediate/
same-day delivery
Find/book lodging, vehicle rental, and/or
vacation activities
Find home/apartment to buy/rent for at least 1 year
Find/book black cars and/or rideshares
Find/book visits with medical
professionals and/or caregivers
Major Marketplaces
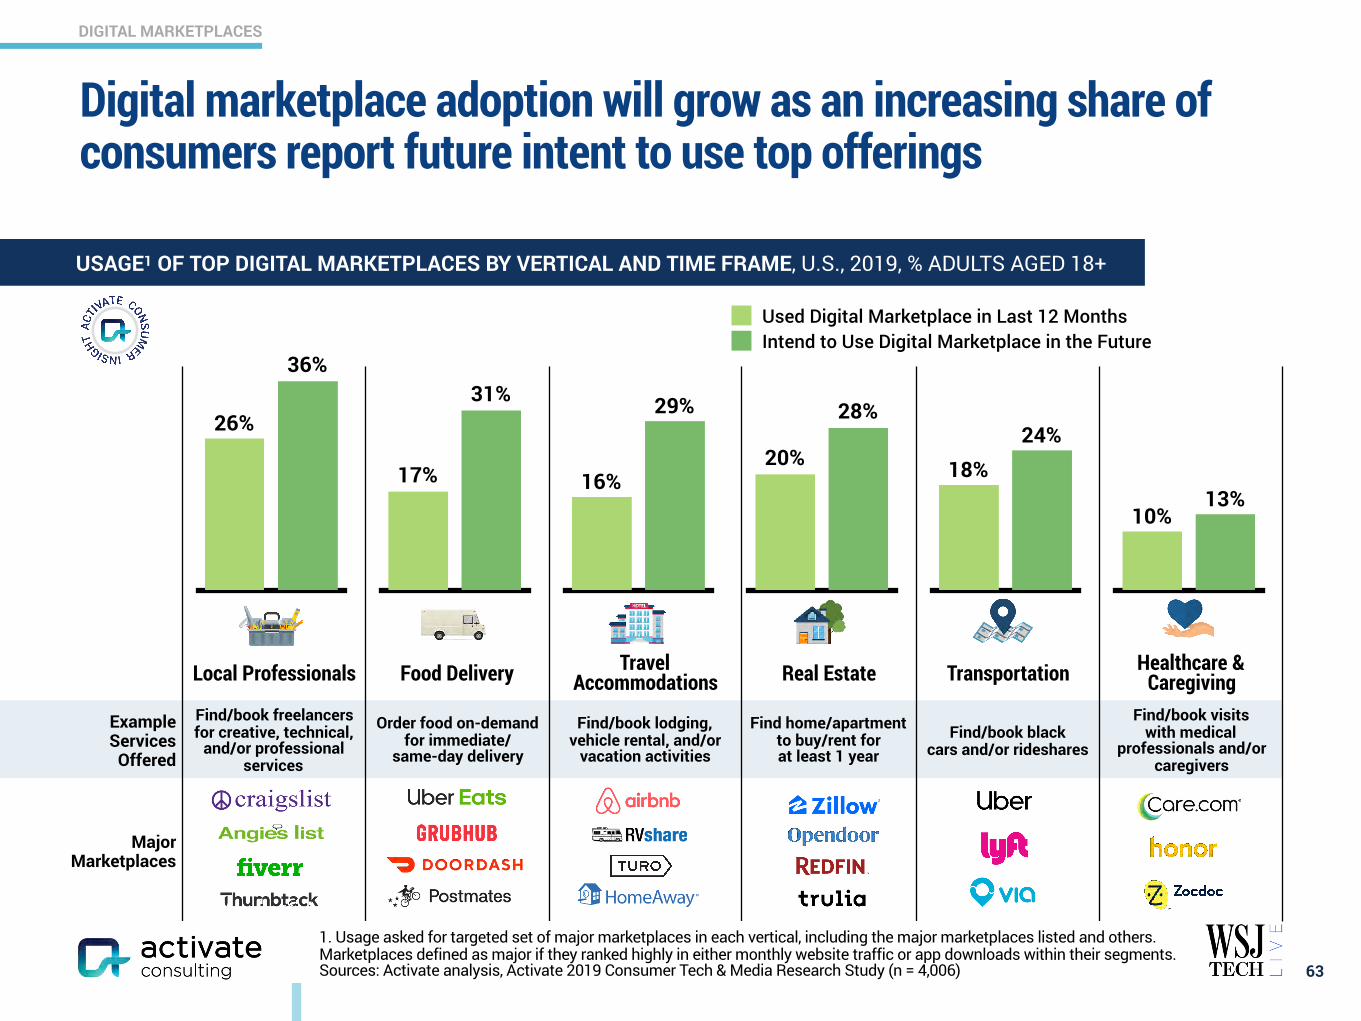
Digital marketplace adoption will grow as an increasing share of consumers report future intent to use top offerings
63
28%
20%
Used Digital Marketplace in Last 12 MonthsIntend to Use Digital Marketplace in the Future
29%
16%
36%
26%31%
17%
24%18%
13%10%
USAGE1 OF TOP DIGITAL MARKETPLACES BY VERTICAL AND TIME FRAME, U.S., 2019, % ADULTS AGED 18+

DIGITAL MARKETPLACES
1. 2018 growth for the global Travel and Tourism Sector as defined by the World Travel and Tourism Council. 2. Only includes Expedia online travel agency revenue. 3. 2015-2018 CAGR for combined Couriers, Messengers, and Local Delivery U.S. Census Bureau Sector and U.S. restaurant delivery sales. 4. Also includes London revenue. 5. 2013-2018 CAGR for the Real Estate and Rental and Leasing U.S. Census Bureau Sector. 6. 2013-2018 CAGR for the Taxi and Limousine U.S. Census Bureau Sector. 7. Also includes Canada revenue. 8. 2013-2018 CAGR for the Healthcare and Social Assistance U.S. Census Bureau Sector. Sources: Activate analysis, Company filings, IBISWorld, Morgan Stanley, U.S. Census Bureau, World Travel and Tourism Council
Digital marketplaces are driving faster growth than the service industries they serve
TRAVEL ACCOMMODATIONS
Global 2018
Revenue
Global 2017-2018
Growth
$3.6B ▲40%VERTICAL GROWTH1
$1.2B ▲29%
$8.8B ▲11%
$14.5B ▲15%
FOOD DELIVERYU.S. 2018
Revenue
U.S. 2017-2018
Growth
$780M ▲150%VERTICAL GROWTH3
$1.0B4 ▲47%
$69.3M ▲202%
64
SERVICE MARKETPLACE MODEL Connecting individual buyers with sellers, eliminating the need for intermediaries
REAL ESTATE
U.S. 2018
Revenue
U.S. 2017-2018
Growth
$1.3B ▲24%VERTICAL GROWTH5
$487M ▲32%
TRANSPORTATION
U.S. 2018
Revenue
U.S. 2017-2018
Growth
$5.1B ▲34%VERTICAL GROWTH6
$2.2B7 ▲100%
HEALTHCARE & CAREGIVING
U.S. 2018
Revenue
U.S. 2017-2018
Growth
$173M ▲10%
VERTICAL GROWTH8
2 ▲4%
▲6%
▲4%
▲3%
▲3%
DIGITAL MARKETPLACES
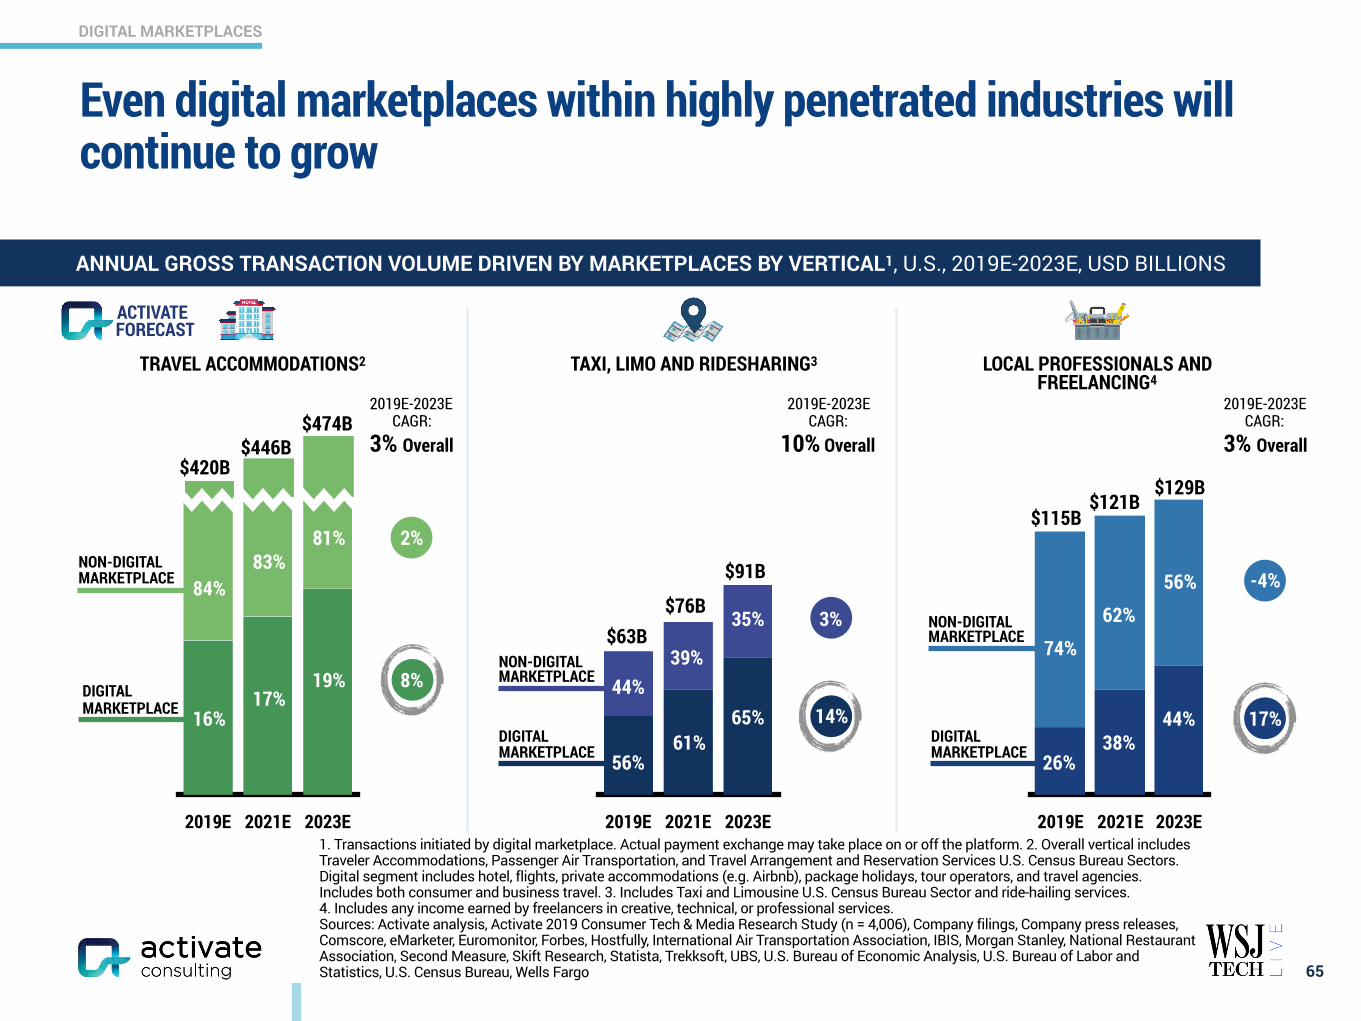
2019E 2021E 2023E
65
ANNUAL GROSS TRANSACTION VOLUME DRIVEN BY MARKETPLACES BY VERTICAL1, U.S., 2019E-2023E, USD BILLIONS
2019E 2021E 2023E
LOCAL PROFESSIONALS AND FREELANCING4
TRAVEL ACCOMMODATIONS2
$420B$446B
$474B
$115B$121B
$129B
16%
74%
62%
56%
17%19%
81%83%
84%
2%
8%
26%38%
44%
-4%
17%
2019E-2023E CAGR:
3% Overall
2019E-2023E CAGR:
3% Overall
DIGITAL MARKETPLACE
NON-DIGITAL MARKETPLACE
DIGITAL MARKETPLACE
NON-DIGITAL MARKETPLACE
1. Transactions initiated by digital marketplace. Actual payment exchange may take place on or off the platform. 2. Overall vertical includes Traveler Accommodations, Passenger Air Transportation, and Travel Arrangement and Reservation Services U.S. Census Bureau Sectors. Digital segment includes hotel, flights, private accommodations (e.g. Airbnb), package holidays, tour operators, and travel agencies. Includes both consumer and business travel. 3. Includes Taxi and Limousine U.S. Census Bureau Sector and ride-hailing services. 4. Includes any income earned by freelancers in creative, technical, or professional services. Sources: Activate analysis, Activate 2019 Consumer Tech & Media Research Study (n = 4,006), Company filings, Company press releases, Comscore, eMarketer, Euromonitor, Forbes, Hostfully, International Air Transportation Association, IBIS, Morgan Stanley, National Restaurant Association, Second Measure, Skift Research, Statista, Trekksoft, UBS, U.S. Bureau of Economic Analysis, U.S. Bureau of Labor and Statistics, U.S. Census Bureau, Wells Fargo
2019E 2021E 2023E
TAXI, LIMO AND RIDESHARING3
DIGITAL MARKETPLACE
NON-DIGITAL MARKETPLACE
$63B$76B
$91B
2019E-2023E CAGR:
10% Overall
14%
56%
44%39%
61%
35%
65%
3%
FORECASTACTIVATE
Even digital marketplaces within highly penetrated industries will continue to grow
DIGITAL MARKETPLACES
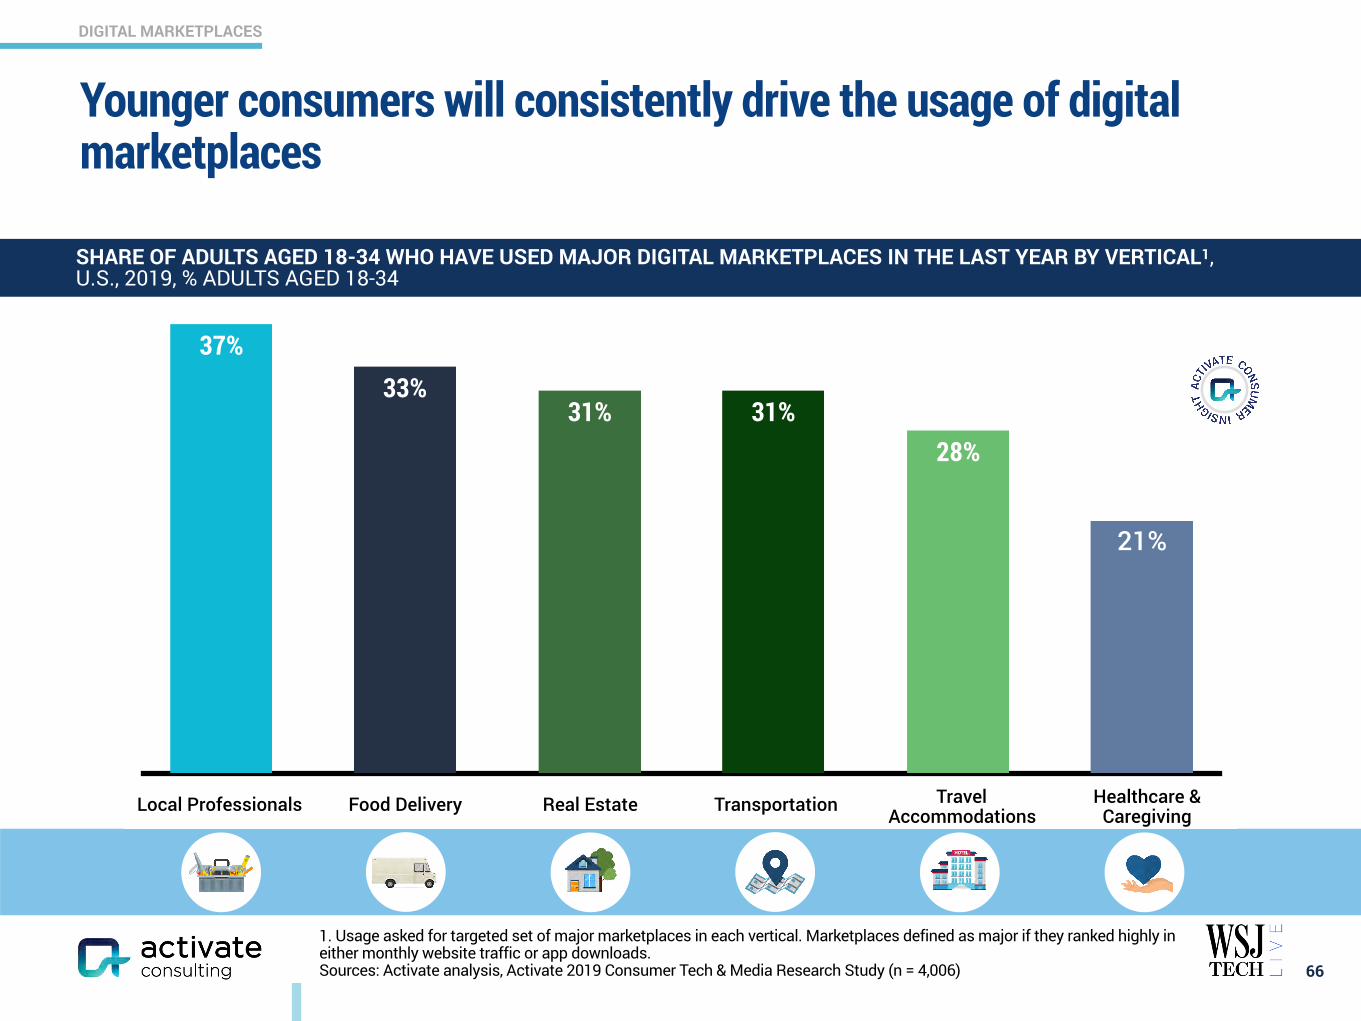
Younger consumers will consistently drive the usage of digital marketplaces
66
21%
28%31%31%
33%37%
SHARE OF ADULTS AGED 18-34 WHO HAVE USED MAJOR DIGITAL MARKETPLACES IN THE LAST YEAR BY VERTICAL1, U.S., 2019, % ADULTS AGED 18-34
1. Usage asked for targeted set of major marketplaces in each vertical. Marketplaces defined as major if they ranked highly in either monthly website traffic or app downloads. Sources: Activate analysis, Activate 2019 Consumer Tech & Media Research Study (n = 4,006)
Local Professionals Food Delivery Real Estate Transportation Travel Accommodations
Healthcare & Caregiving
DIGITAL MARKETPLACES
Sources: Activate analysis, Activate 2019 Consumer Tech & Media Research Study (n = 4,006)
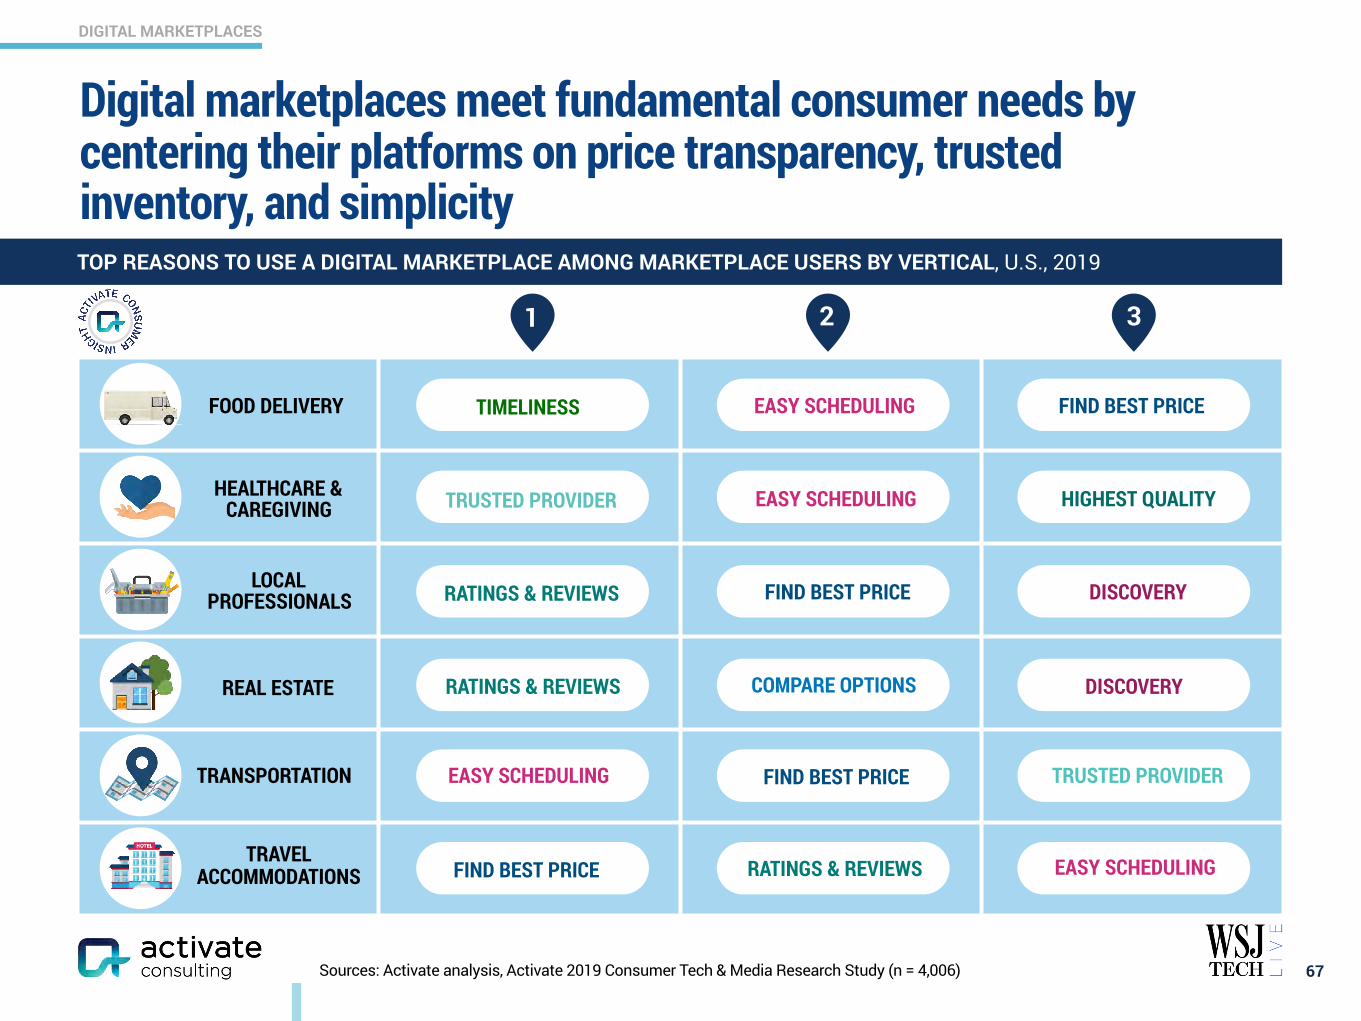
Digital marketplaces meet fundamental consumer needs by centering their platforms on price transparency, trusted inventory, and simplicity
67
TOP REASONS TO USE A DIGITAL MARKETPLACE AMONG MARKETPLACE USERS BY VERTICAL, U.S., 2019
REAL ESTATE
TRAVEL ACCOMMODATIONS
HEALTHCARE & CAREGIVING
LOCAL PROFESSIONALS
FOOD DELIVERY
TRANSPORTATION
RATINGS & REVIEWS
TIMELINESS EASY SCHEDULING FIND BEST PRICE
FIND BEST PRICE TRUSTED PROVIDER
FIND BEST PRICE RATINGS & REVIEWS EASY SCHEDULING
TRUSTED PROVIDER EASY SCHEDULING HIGHEST QUALITY
RATINGS & REVIEWS COMPARE OPTIONS DISCOVERY
FIND BEST PRICE DISCOVERY
1 2 3
EASY SCHEDULING
DIGITAL MARKETPLACES
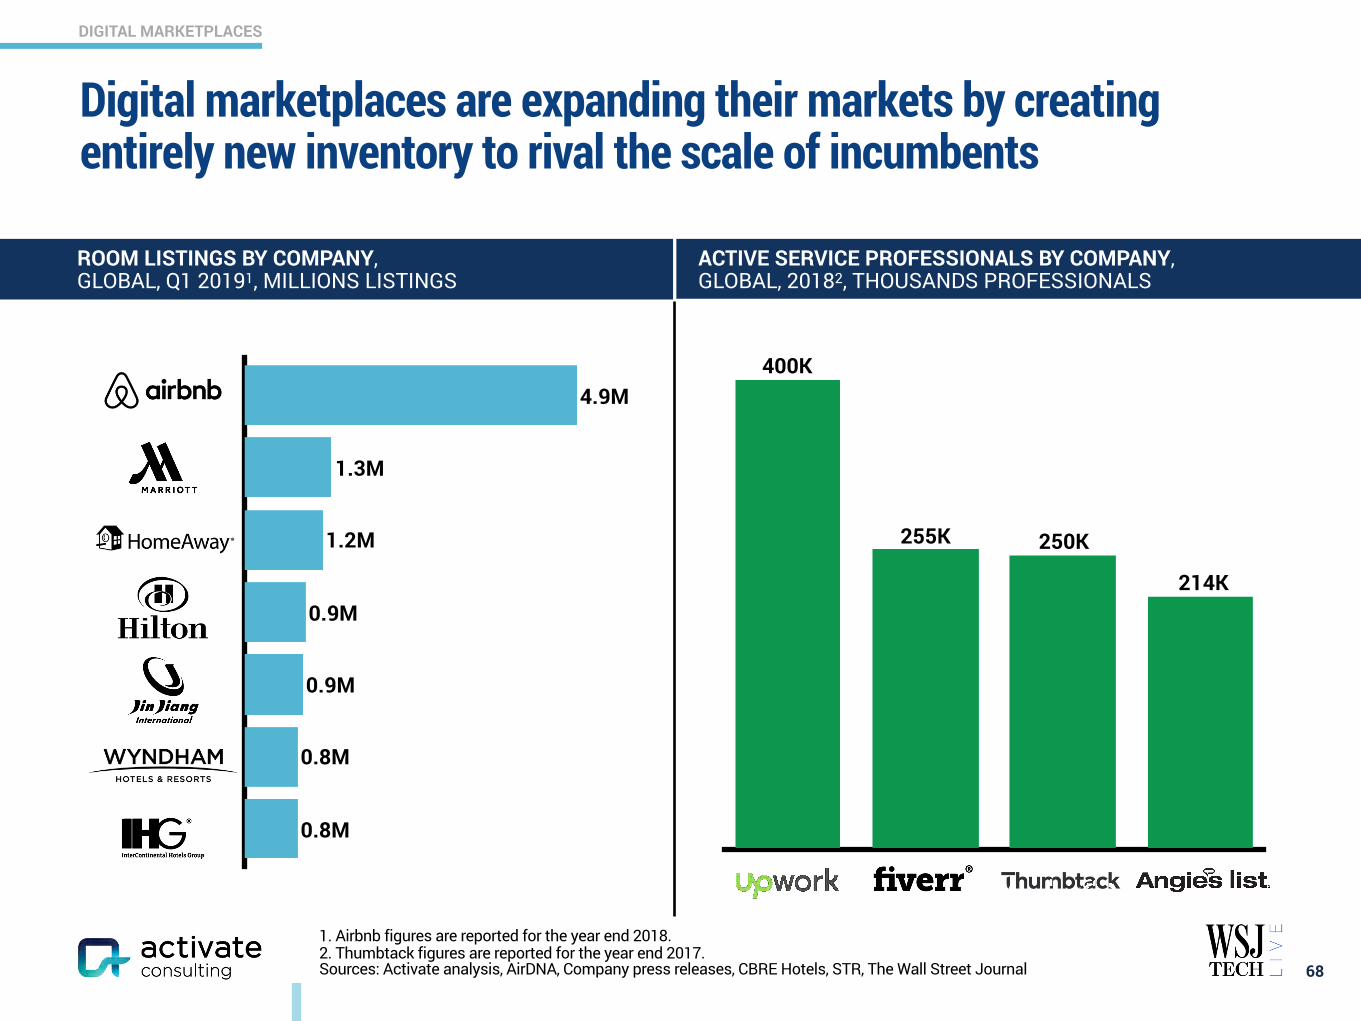
0.8M
0.8M
0.9M
0.9M
1.2M
1.3M
4.9M
1. Airbnb figures are reported for the year end 2018. 2. Thumbtack figures are reported for the year end 2017. Sources: Activate analysis, AirDNA, Company press releases, CBRE Hotels, STR, The Wall Street Journal
Digital marketplaces are expanding their markets by creating entirely new inventory to rival the scale of incumbents
68
400K
255K
214K
250K
ROOM LISTINGS BY COMPANY, GLOBAL, Q1 20191, MILLIONS LISTINGS
ACTIVE SERVICE PROFESSIONALS BY COMPANY, GLOBAL, 20182, THOUSANDS PROFESSIONALS

DIGITAL MARKETPLACES
1. “Marketplace user” defined as individual who has used a digital marketplace within last 12 months. Figures do not sum because of rounding. Sources: Activate analysis, Activate 2019 Consumer Tech & Media Research Study (n = 4,006)
Once consumers use a digital marketplace in one vertical, they will use marketplaces in other verticals as well
69
NUMBER OF VERTICALS IN WHICH DIGITAL MARKETPLACES USED, U.S., 2019, % MARKETPLACE USERS AGED 18+1
MARKETPLACE USERS USE MARKETPLACE BUSINESSES IN 3+ VERTICALS
1 out of 3
43%
1 VERTICAL 2 VERTICALS 3 VERTICALS 4 VERTICALS 5 VERTICALS 6 VERTICALS
21% 10% 4% 4% 17%
REAL ESTATE TRAVEL ACCOMMODATIONS
LOCAL PROFESSIONALSFOOD DELIVERY TRANSPORTATIONHEALTHCARE &
CAREGIVINGVERTICALS EVALUATED
DIGITAL MARKETPLACES
1. Among those who have not used a marketplace in the vertical in the last 12 months. Excludes those who are not familiar with the marketplaces in that vertical. Excludes those who do not use a service in this vertical. Easier ability to schedule and ability to communicate more with provider excluded because of lack of consumer interest. Sources: Activate analysis, Activate 2019 Consumer Tech & Media Research Study (n = 4,006)
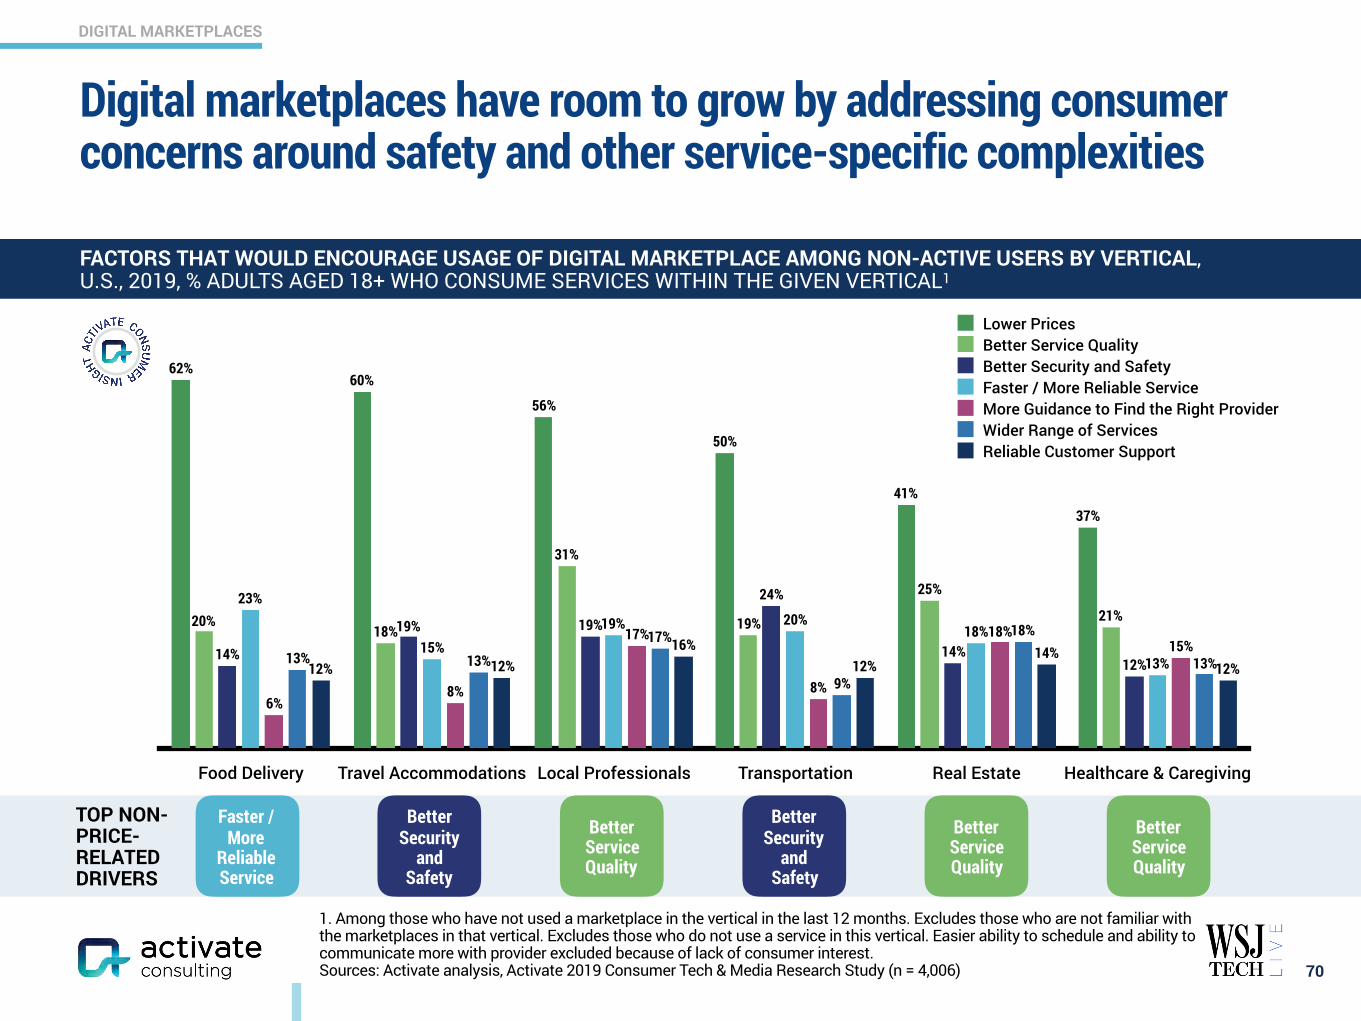
Digital marketplaces have room to grow by addressing consumer concerns around safety and other service-specific complexities
70
FACTORS THAT WOULD ENCOURAGE USAGE OF DIGITAL MARKETPLACE AMONG NON-ACTIVE USERS BY VERTICAL, U.S., 2019, % ADULTS AGED 18+ WHO CONSUME SERVICES WITHIN THE GIVEN VERTICAL1
Food Delivery Travel Accommodations Local Professionals Transportation Real Estate Healthcare & Caregiving
12%14%
12%16%
12%12% 13%
18%
9%
17%13%13%
15%18%
8%
17%
8%6%
13%
18%20%19%
15%
23%
12%14%
24%
19%19%
14%
21%
25%
19%
31%
18%20%
37%41%
50%
56%
60%62%
Lower PricesBetter Service QualityBetter Security and SafetyFaster / More Reliable ServiceMore Guidance to Find the Right ProviderWider Range of ServicesReliable Customer Support
TOP NON-PRICE-RELATED DRIVERS
Better Service Quality
Faster / More
Reliable Service
Better Security
and Safety
Better Security
and Safety
Better Service Quality
Better Service Quality
www.activate.com 71
PAGE
$300 Billion Global Internet and Media Growth Dollars by 2023 4
Consumer Attention: 12:40 Hours of Technology & Media Per Day 9
Super Users: The Imperative for Technology & Media Companies 13
Social Splinter: The Social Media World Expands 27
eCommerce: Shrinking the Divide Between Physical and Digital Shopping 41
Digital Marketplaces: New Inventory, Price, Transparency, Ease of Use 60
Video Gaming: The Next Streaming Battlefront 71
Esports: Sport of the Future 84
Video: Streaming Stacking, Battleground Households 94
Sports Betting: The Next Big Financial Trading Market 117
Sports: More Viewing, Emerging Sports, Better Fan Experiences 129
Music: The Discovery Challenge 138
Podcasting: New Listening Experiences and Explosive Growth 146
The Networked Body: Quantified and Connected Human 159
Digital Consumer Finance: Next Generation Services Go Mainstream 169
Connectivity: Enabling the Next Wave of Technology and Media Growth 182
CONTENTS
VIDEO GAMING
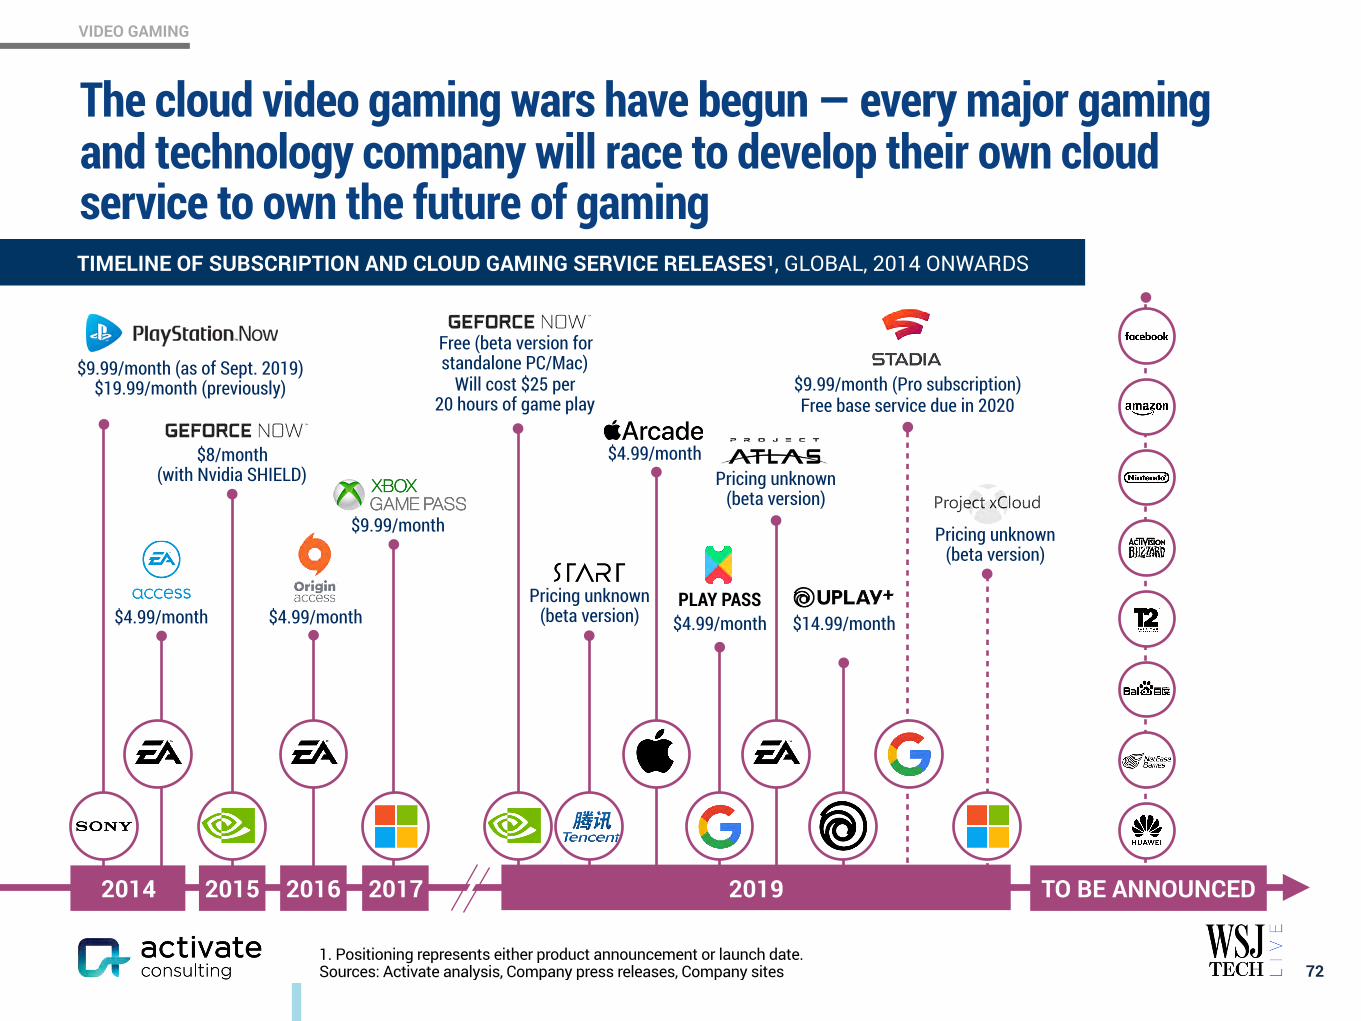
The cloud video gaming wars have begun — every major gaming and technology company will race to develop their own cloud service to own the future of gaming
721. Positioning represents either product announcement or launch date. Sources: Activate analysis, Company press releases, Company sites
TIMELINE OF SUBSCRIPTION AND CLOUD GAMING SERVICE RELEASES1, GLOBAL, 2014 ONWARDS
Pricing unknown (beta version)
2015 2019
$9.99/month (Pro subscription) Free base service due in 2020
$4.99/monthPricing unknown
(beta version)
Free (beta version for standalone PC/Mac)
Will cost $25 per 20 hours of game play
$14.99/month
$9.99/month (as of Sept. 2019) $19.99/month (previously)
PLAY PASS
$8/month (with Nvidia SHIELD)
2014 2016 2017
$9.99/month
$4.99/month
TO BE ANNOUNCED
$4.99/month $4.99/month
Pricing unknown (beta version)

VIDEO GAMING
Gaming will increasingly shift to multi-platform playing — a platform-convergent experience will cultivate Super User behaviors and drive growth
73
GAMER OVERLAP BY GAMING DEVICES USED1, U.S., 2019, % GAMERS AGED 18+
GAMER BREAKDOWN BY MULTI-PLATFORM BEHAVIOR, U.S., 2019, % GAMERS AGED 18+ / USD
10%
18%
24%
4%
18%18%
7%
Mobile
ConsolePC
(-10% YoY)
(+8% YoY)
(+9% YoY)
(+5% YoY)
(-7% YoY)(-2% YoY)
(-5% YoY)
64% Multi-
Platform Gamers2
36% Single-
Platform Gamers
Average Monthly Gaming Spend
$17
$13
1. Values do not sum to 100% because of rounding. Analysis examines console (excluding handheld consoles), PC, and mobile (including tablets). 2. Includes any gamers that play across 2 or more devices. Sources: Activate analysis, Activate 2018 Consumer Tech & Media Research Study (n = 4,000), Activate 2019 Consumer Tech & Media Research Study (n = 4,006)
Multi-platform gamers spend
50% more time
watching gaming video content compared to
single-platform gamers
VIDEO GAMING
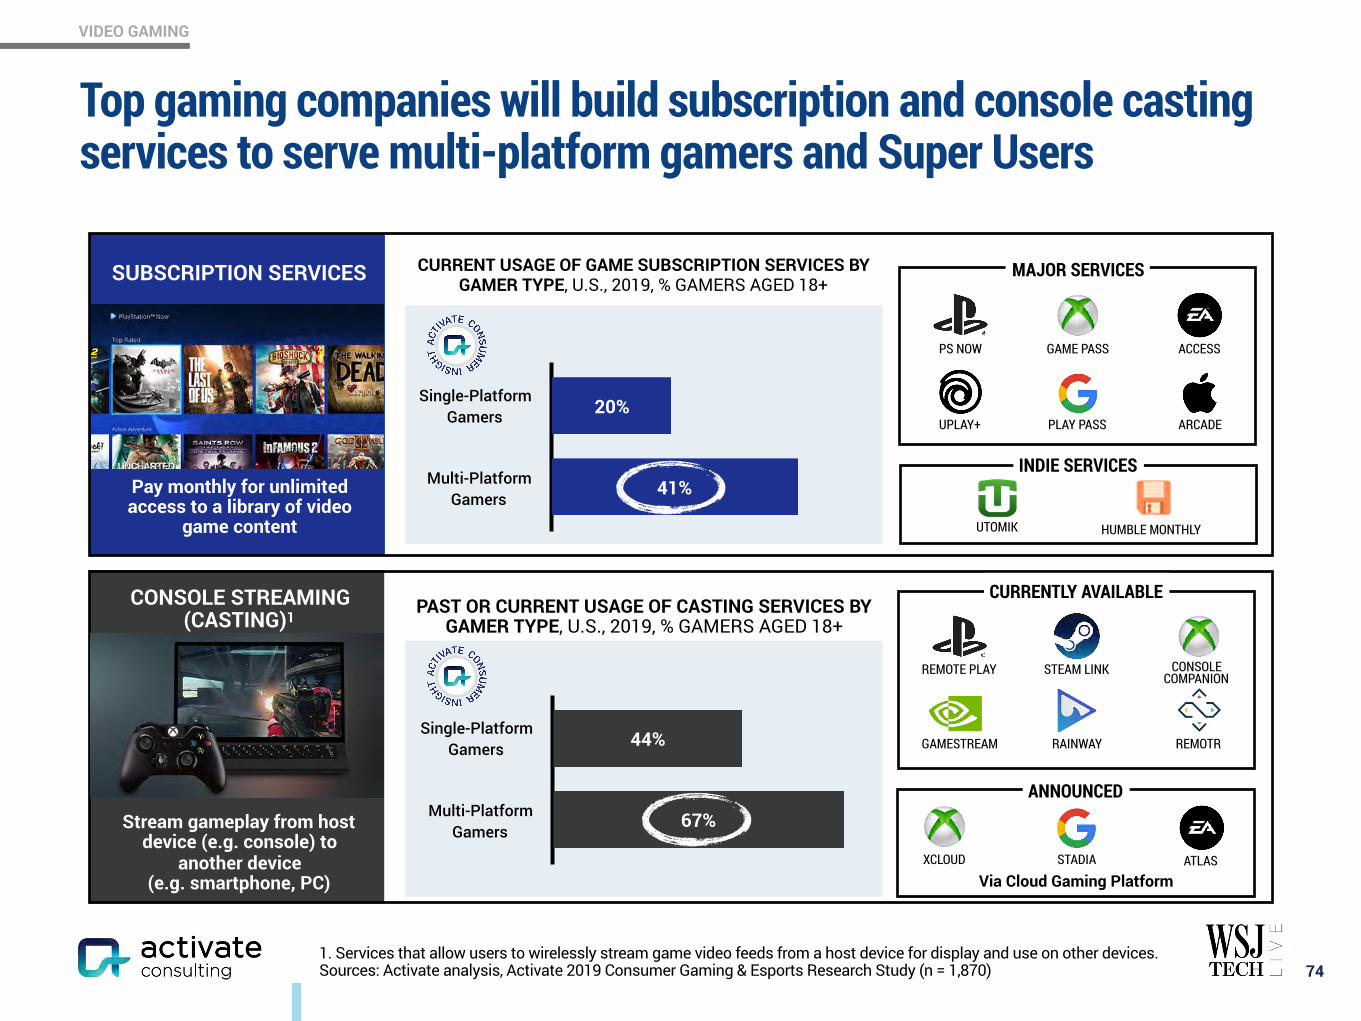
Top gaming companies will build subscription and console casting services to serve multi-platform gamers and Super Users
74
SUBSCRIPTION SERVICES
PS NOW GAME PASS
UPLAY+
ACCESS
MAJOR SERVICES
INDIE SERVICES
PLAY PASS ARCADE
UTOMIK HUMBLE MONTHLY
Pay monthly for unlimited access to a library of video
game content
Stream gameplay from host device (e.g. console) to
another device (e.g. smartphone, PC)
CONSOLE STREAMING (CASTING)1
ANNOUNCED
CURRENTLY AVAILABLE
Via Cloud Gaming PlatformXCLOUD STADIA ATLAS
REMOTE PLAY STEAM LINK CONSOLE COMPANION
GAMESTREAM RAINWAY REMOTR
Single-PlatformGamers
Multi-Platform Gamers
41%
20%
Single-PlatformGamers
Multi-Platform Gamers
67%
44%
1. Services that allow users to wirelessly stream game video feeds from a host device for display and use on other devices. Sources: Activate analysis, Activate 2019 Consumer Gaming & Esports Research Study (n = 1,870)
CURRENT USAGE OF GAME SUBSCRIPTION SERVICES BY GAMER TYPE, U.S., 2019, % GAMERS AGED 18+
PAST OR CURRENT USAGE OF CASTING SERVICES BY GAMER TYPE, U.S., 2019, % GAMERS AGED 18+

VIDEO GAMING
75
ENABLER IMPACT RATIONALE
SUBSCRIPTION SERVICES
Centralized discovery and lower cost of
switching between titles
• Services from console providers, technology companies, and gaming publishers will create a single point of discovery and encourage gamers to play more titles
• Gaming time spend will increase relative to other media formats
CONNECTIVITY
Premium titles and multiplayer gameplay
available across all devices at high quality
• Increased availability of high-speed networks provides the ability for gameplay to be streamed at high-quality from any location
• Gamers will be able to compete across platforms, a model that the Battle Royale genre has already pioneered
CLOUD COMPUTING TECHNOLOGY Controller hardware
that can support gameplay without need for high-performance
console or PC
• Streaming technology will bring gaming PCs and consoles into the cloud, distributing games through low-cost hardware (e.g. streaming devices)
Source: Activate analysis
The winning cloud gaming services will be enabled by subscription access, improved connectivity, and cloud technology
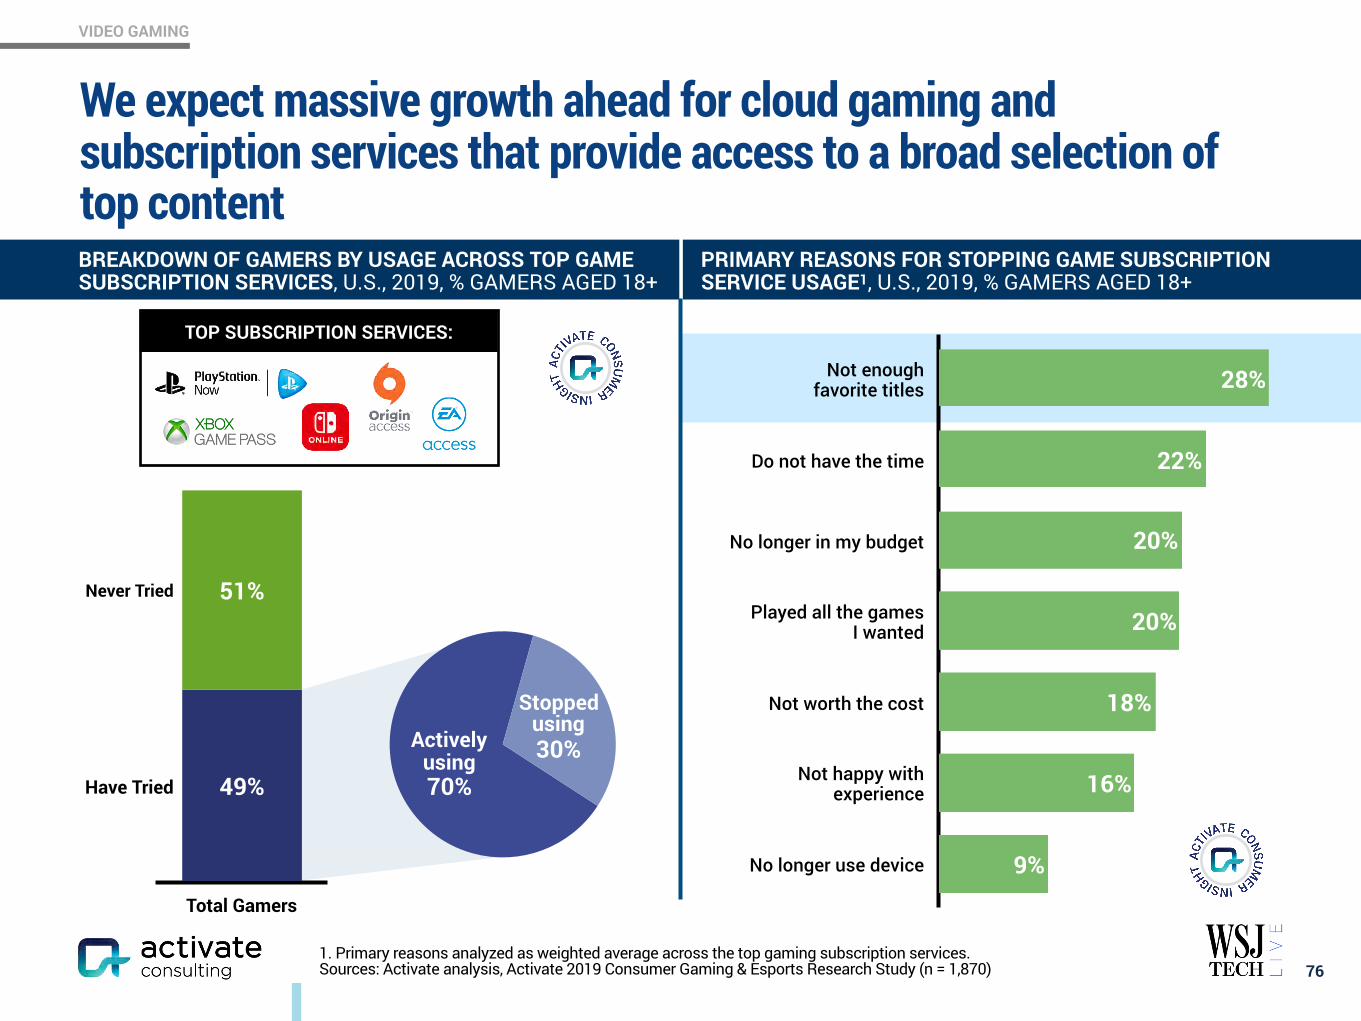
VIDEO GAMING
1. Primary reasons analyzed as weighted average across the top gaming subscription services. Sources: Activate analysis, Activate 2019 Consumer Gaming & Esports Research Study (n = 1,870)
We expect massive growth ahead for cloud gaming and subscription services that provide access to a broad selection of top content
76
BREAKDOWN OF GAMERS BY USAGE ACROSS TOP GAME SUBSCRIPTION SERVICES, U.S., 2019, % GAMERS AGED 18+
PRIMARY REASONS FOR STOPPING GAME SUBSCRIPTION SERVICE USAGE1, U.S., 2019, % GAMERS AGED 18+
9%
16%
18%
20%
20%
22%
28%
TOP SUBSCRIPTION SERVICES:
51%
49%
Never Tried
Have Tried
Total Gamers
Actively using 70%
Stopped using 30%
Not enough favorite titles
Do not have the time
No longer in my budget
Played all the games I wanted
Not worth the cost
Not happy with experience
No longer use device
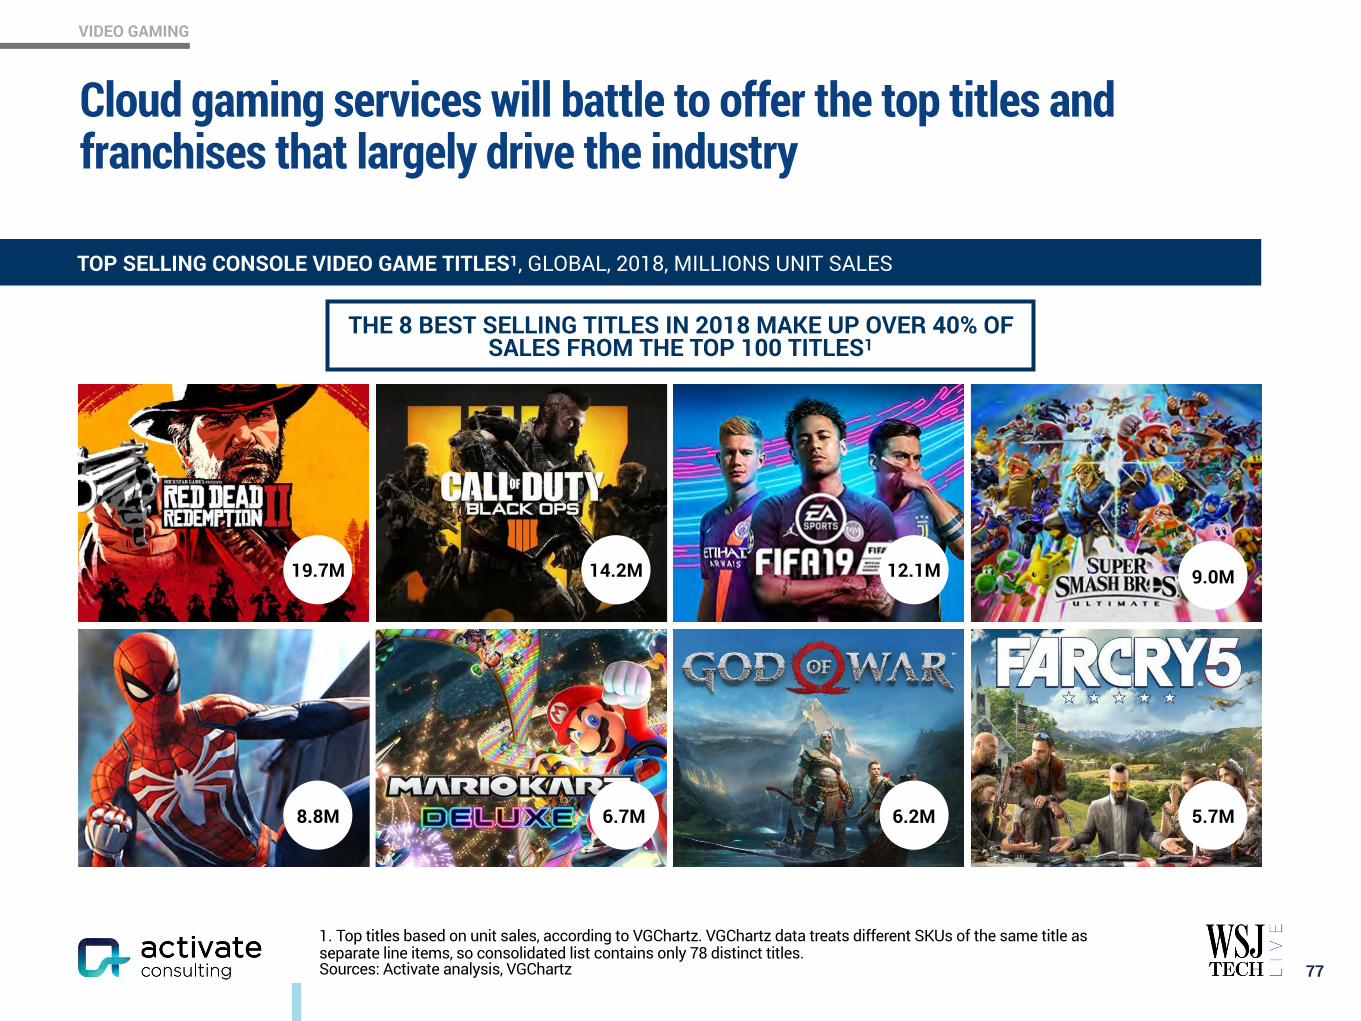
VIDEO GAMING
Cloud gaming services will battle to offer the top titles and franchises that largely drive the industry
77
TOP SELLING CONSOLE VIDEO GAME TITLES1, GLOBAL, 2018, MILLIONS UNIT SALES
THE 8 BEST SELLING TITLES IN 2018 MAKE UP OVER 40% OF SALES FROM THE TOP 100 TITLES1
14.2M 12.1M19.7M 9.0M
5.7M6.2M6.7M8.8M
1. Top titles based on unit sales, according to VGChartz. VGChartz data treats different SKUs of the same title as separate line items, so consolidated list contains only 78 distinct titles.Sources: Activate analysis, VGChartz
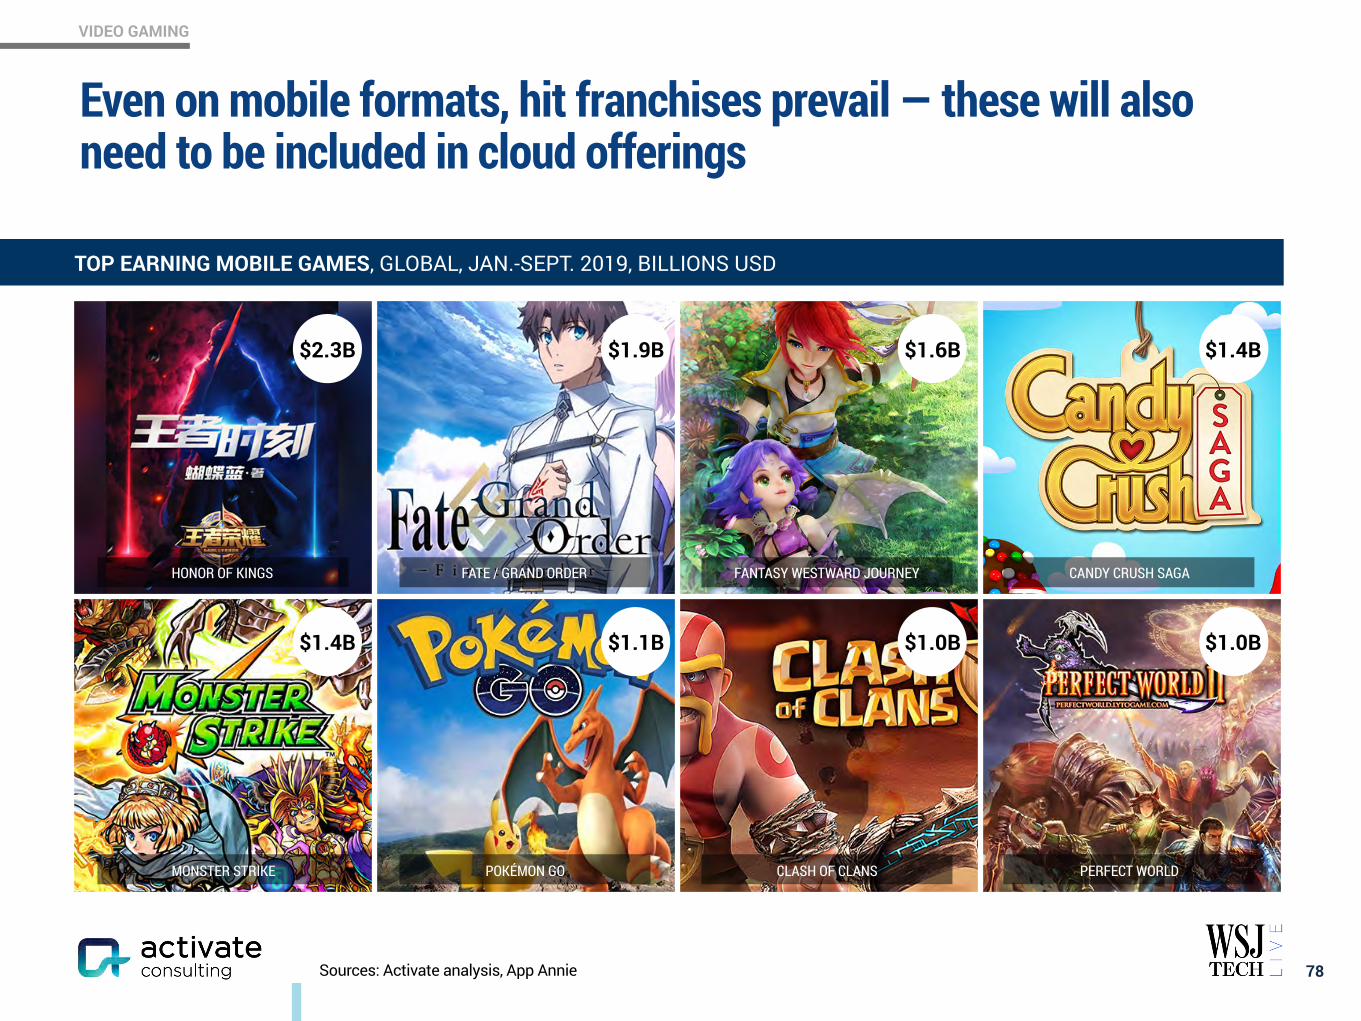
VIDEO GAMING
Even on mobile formats, hit franchises prevail — these will also need to be included in cloud offerings
78
$1.6B
$1.0B
$1.9B
$1.1B $1.0B
$1.4B
HONOR OF KINGS
$2.3B
FATE / GRAND ORDER FANTASY WESTWARD JOURNEY CANDY CRUSH SAGA
MONSTER STRIKE
$1.4B
POKÉMON GO CLASH OF CLANS PERFECT WORLD
Sources: Activate analysis, App Annie
TOP EARNING MOBILE GAMES, GLOBAL, JAN.-SEPT. 2019, BILLIONS USD
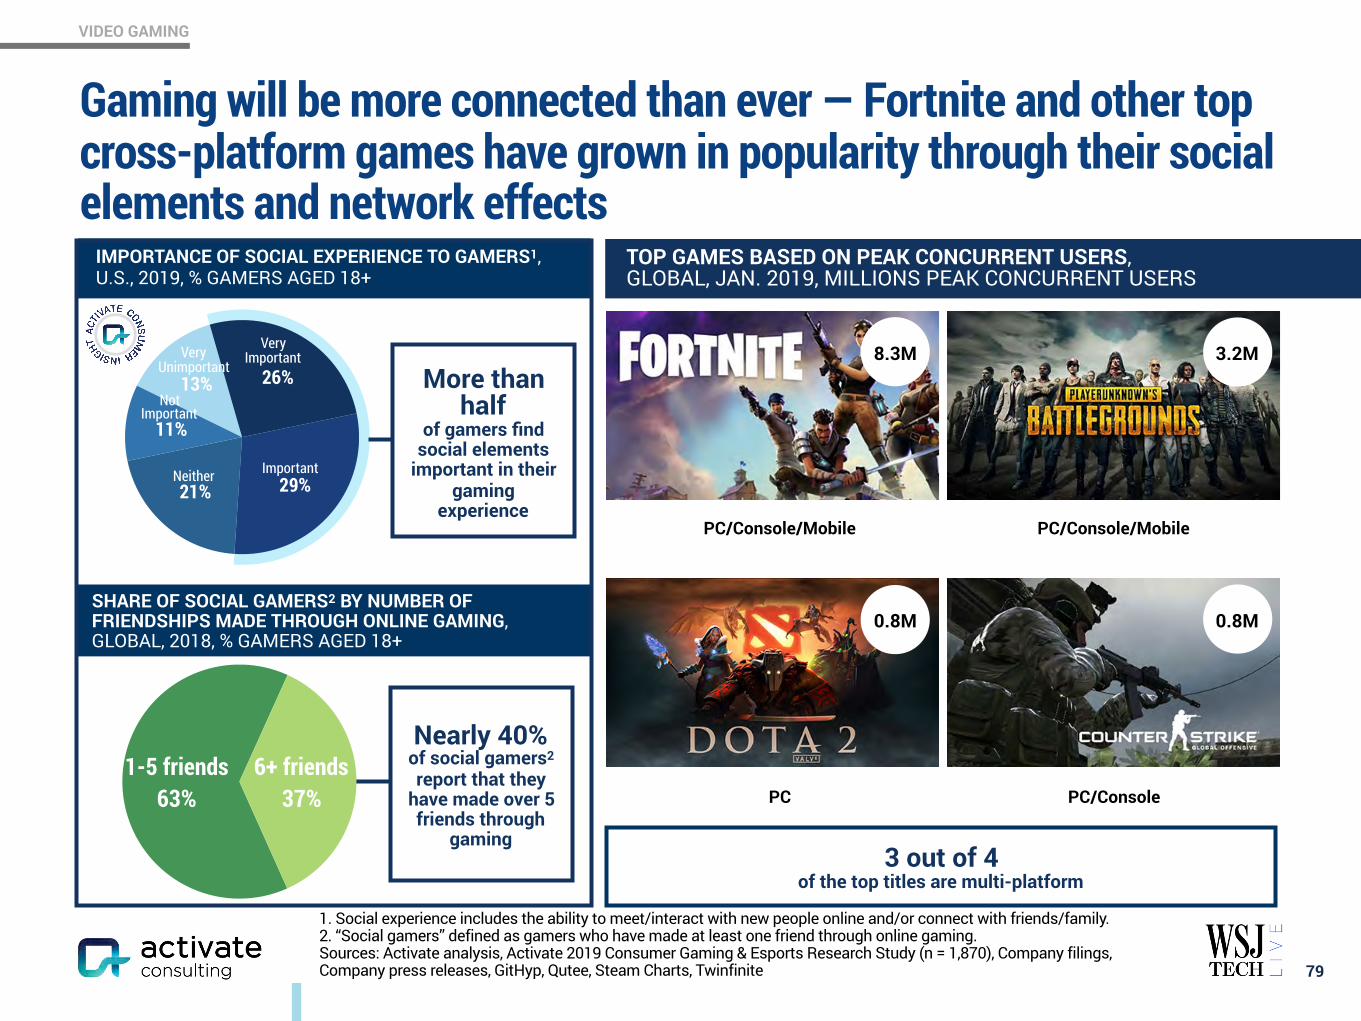
VIDEO GAMING
Gaming will be more connected than ever — Fortnite and other top cross-platform games have grown in popularity through their social elements and network effects
79
13%
11%
21% 29%
26%
Very Important
ImportantNeither
Not Important
Very Unimportant
TOP GAMES BASED ON PEAK CONCURRENT USERS,GLOBAL, JAN. 2019, MILLIONS PEAK CONCURRENT USERS
3.2M
0.8M
8.3M
0.8M
3 out of 4 of the top titles are multi-platform
IMPORTANCE OF SOCIAL EXPERIENCE TO GAMERS1, U.S., 2019, % GAMERS AGED 18+
More than half
of gamers find social elements
important in their gaming
experience
SHARE OF SOCIAL GAMERS2 BY NUMBER OF FRIENDSHIPS MADE THROUGH ONLINE GAMING, GLOBAL, 2018, % GAMERS AGED 18+
Nearly 40% of social gamers2 report that they
have made over 5 friends through
gaming
1-5 friends63%
6+ friends37%
PC/Console/Mobile
PC/ConsolePC
PC/Console/Mobile
1. Social experience includes the ability to meet/interact with new people online and/or connect with friends/family. 2. “Social gamers” defined as gamers who have made at least one friend through online gaming. Sources: Activate analysis, Activate 2019 Consumer Gaming & Esports Research Study (n = 1,870), Company filings, Company press releases, GitHyp, Qutee, Steam Charts, Twinfinite
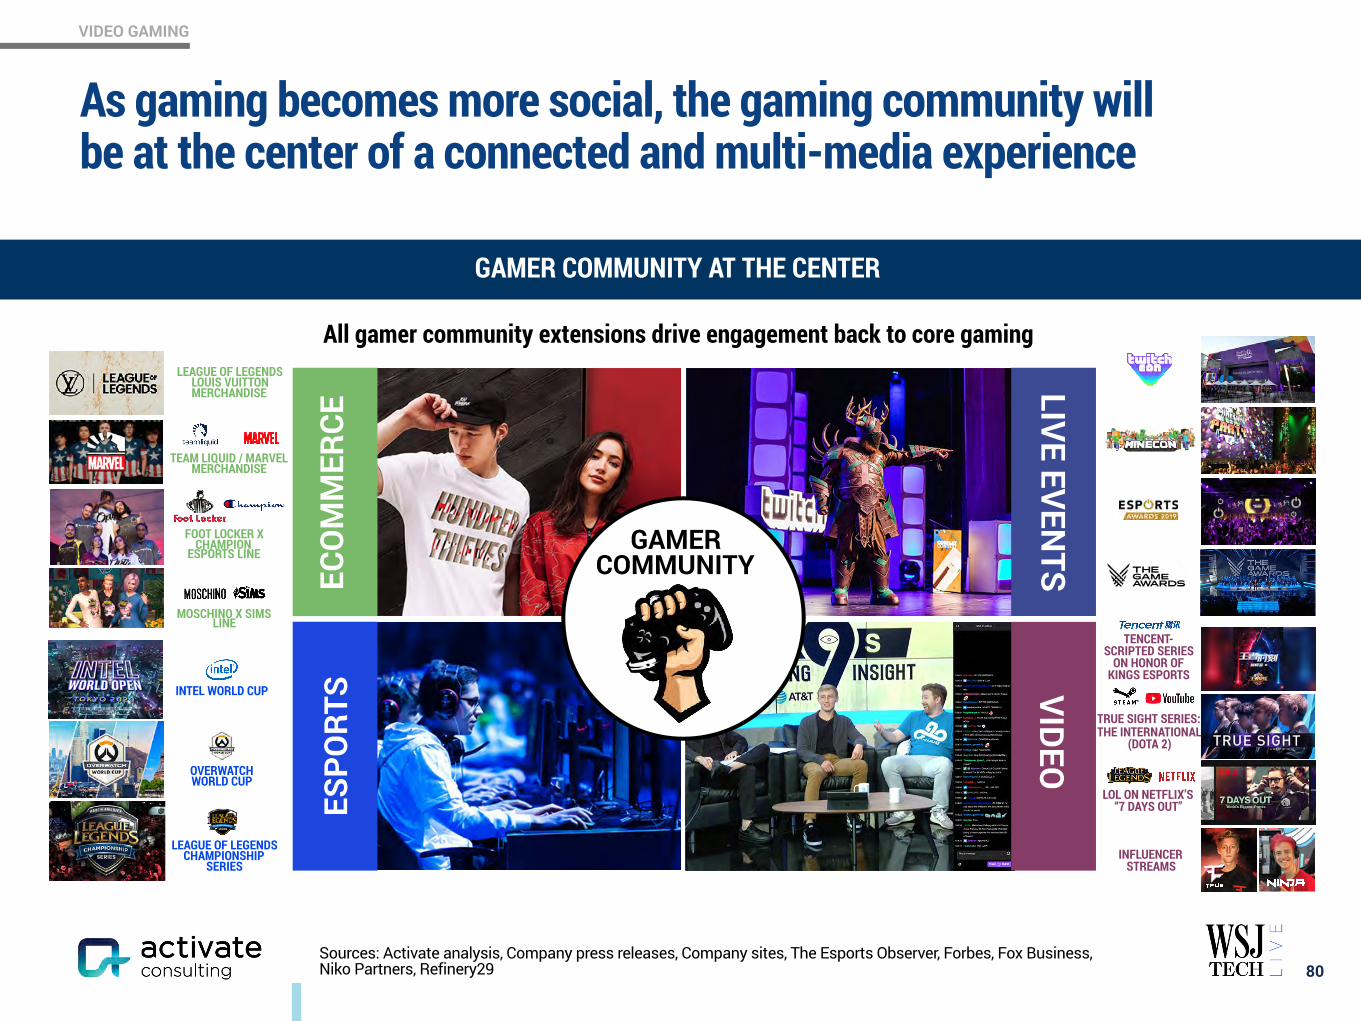
VIDEO GAMING
LIVE EVENTS
INFLUENCER STREAMS
TENCENT-SCRIPTED SERIES
ON HONOR OF KINGS ESPORTS
As gaming becomes more social, the gaming community will be at the center of a connected and multi-media experience
80
All gamer community extensions drive engagement back to core gaming
GAMER COMMUNITY AT THE CENTER
ECO
MM
ERCE
ESPO
RTS
LEAGUE OF LEGENDS LOUIS VUITTON MERCHANDISE
TEAM LIQUID / MARVEL MERCHANDISE
FOOT LOCKER X CHAMPION
ESPORTS LINE
MOSCHINO X SIMS LINE
LOL ON NETFLIX’S “7 DAYS OUT”
TRUE SIGHT SERIES: THE INTERNATIONAL
(DOTA 2)
INTEL WORLD CUP
GAMER COMMUNITY
OVERWATCH WORLD CUP
LEAGUE OF LEGENDS CHAMPIONSHIP
SERIES
VIDEO
Sources: Activate analysis, Company press releases, Company sites, The Esports Observer, Forbes, Fox Business, Niko Partners, Refinery29
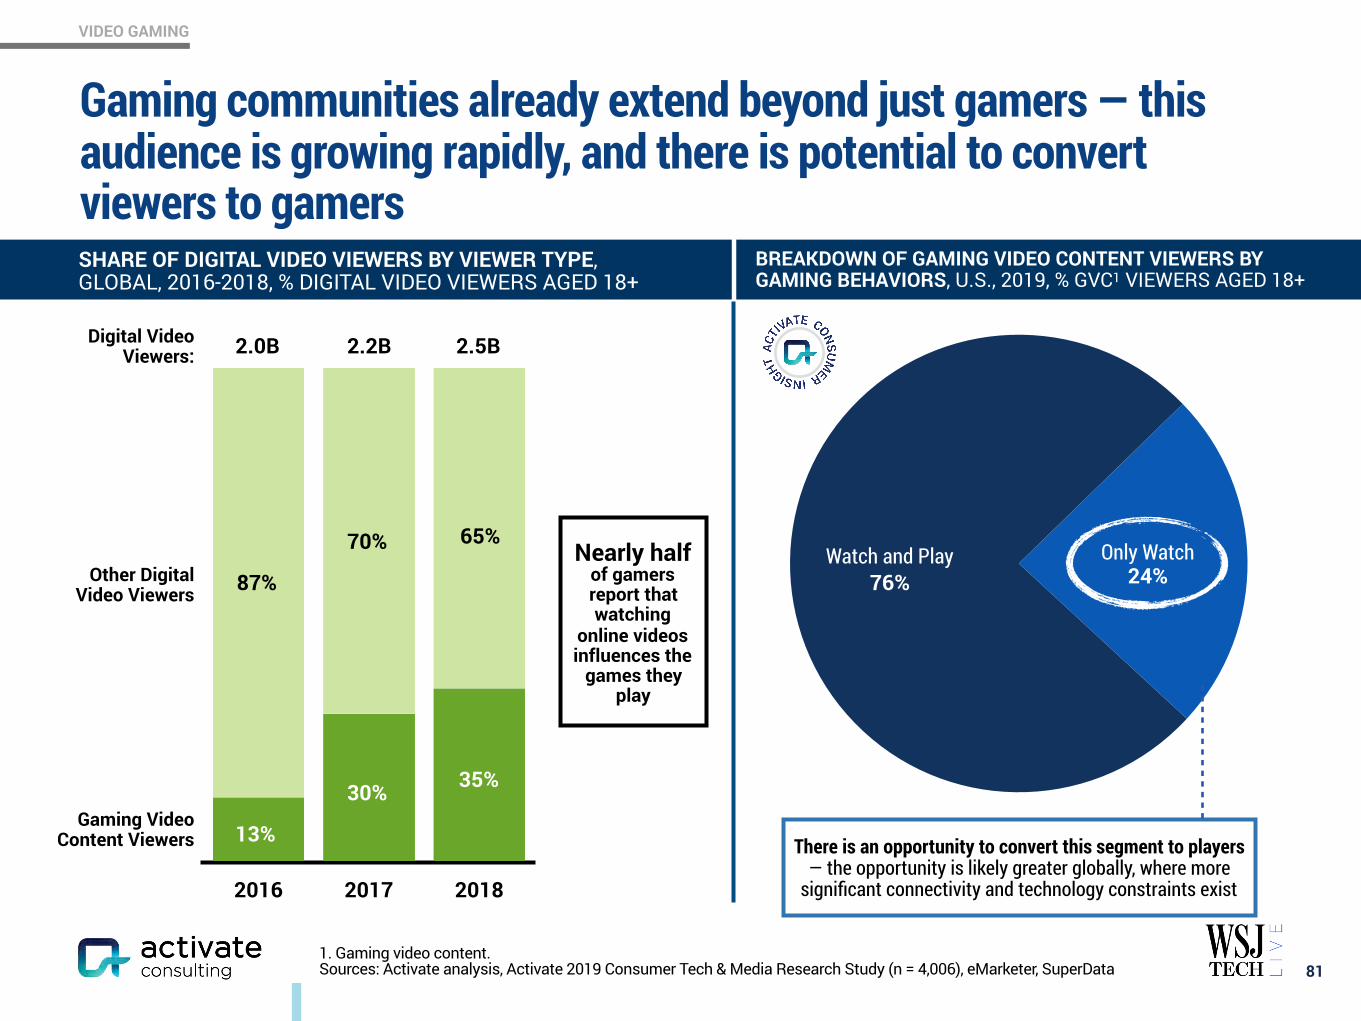
VIDEO GAMING
Gaming communities already extend beyond just gamers — this audience is growing rapidly, and there is potential to convert viewers to gamers
81
SHARE OF DIGITAL VIDEO VIEWERS BY VIEWER TYPE,GLOBAL, 2016-2018, % DIGITAL VIDEO VIEWERS AGED 18+
BREAKDOWN OF GAMING VIDEO CONTENT VIEWERS BY GAMING BEHAVIORS, U.S., 2019, % GVC1 VIEWERS AGED 18+
Other Digital Video Viewers
Gaming Video Content Viewers
2016 2017 2018
13%
87%
30%
70%
35%
65%
2.5B2.2B2.0B
Nearly half of gamers report that watching
online videos influences the
games they play
Digital Video Viewers:
Watch and Play76%
Only Watch24%
There is an opportunity to convert this segment to players — the opportunity is likely greater globally, where more
significant connectivity and technology constraints exist
1. Gaming video content. Sources: Activate analysis, Activate 2019 Consumer Tech & Media Research Study (n = 4,006), eMarketer, SuperData
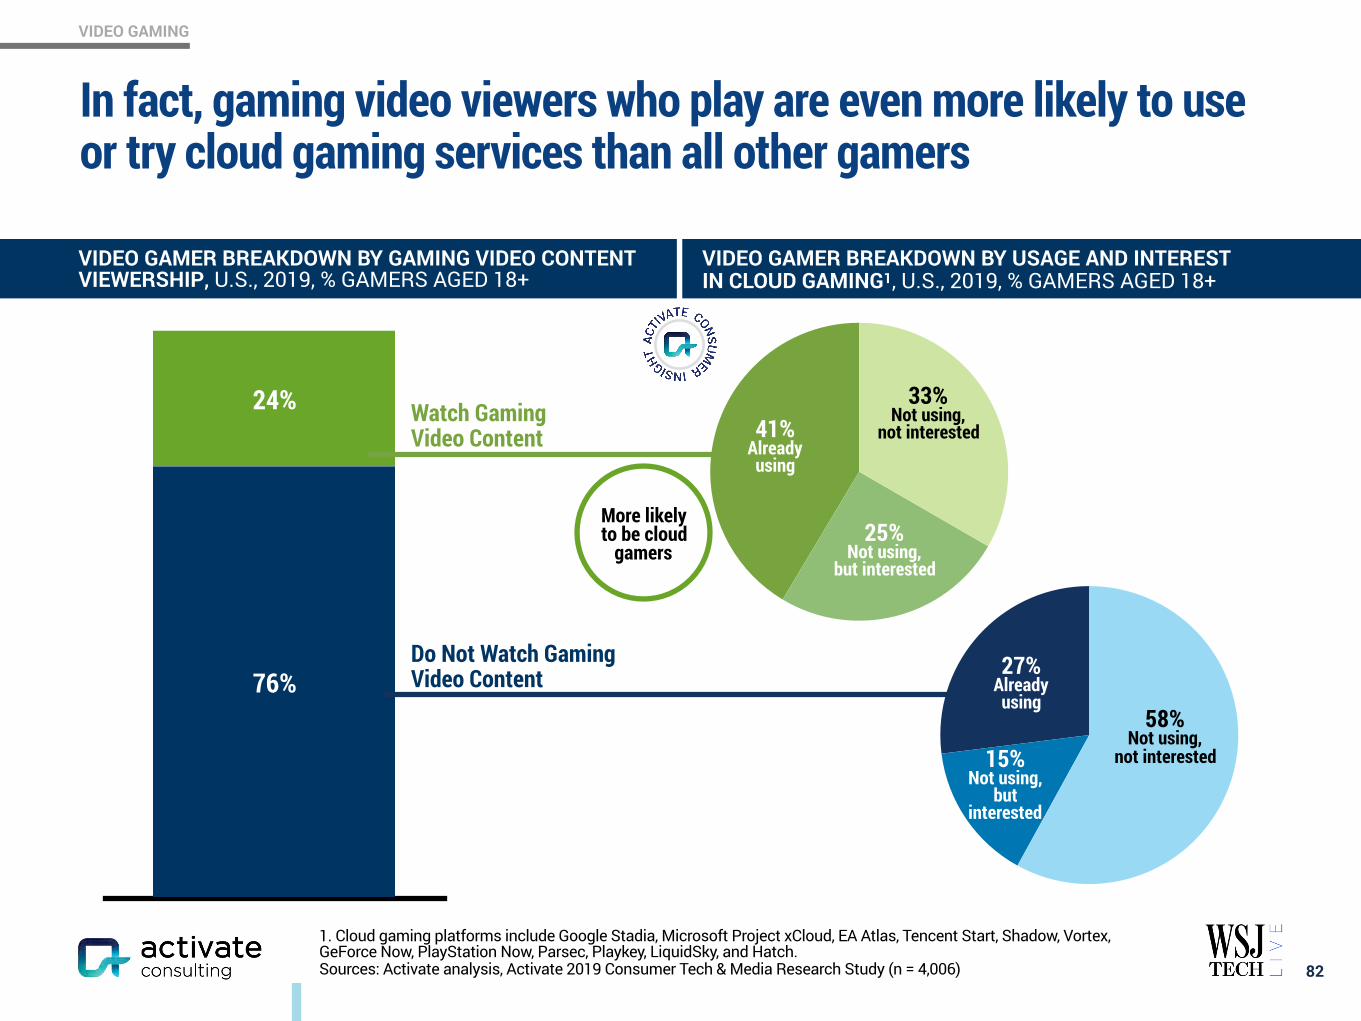
VIDEO GAMING
In fact, gaming video viewers who play are even more likely to use or try cloud gaming services than all other gamers
82
24%
76%
VIDEO GAMER BREAKDOWN BY GAMING VIDEO CONTENT VIEWERSHIP, U.S., 2019, % GAMERS AGED 18+
Watch Gaming Video Content
Do Not Watch Gaming Video Content
VIDEO GAMER BREAKDOWN BY USAGE AND INTEREST IN CLOUD GAMING1, U.S., 2019, % GAMERS AGED 18+
25% Not using,
but interested
41% Already using
33% Not using,
not interested
15% Not using,
but interested
27% Already using
58% Not using,
not interested
More likely to be cloud
gamers
1. Cloud gaming platforms include Google Stadia, Microsoft Project xCloud, EA Atlas, Tencent Start, Shadow, Vortex, GeForce Now, PlayStation Now, Parsec, Playkey, LiquidSky, and Hatch. Sources: Activate analysis, Activate 2019 Consumer Tech & Media Research Study (n = 4,006)
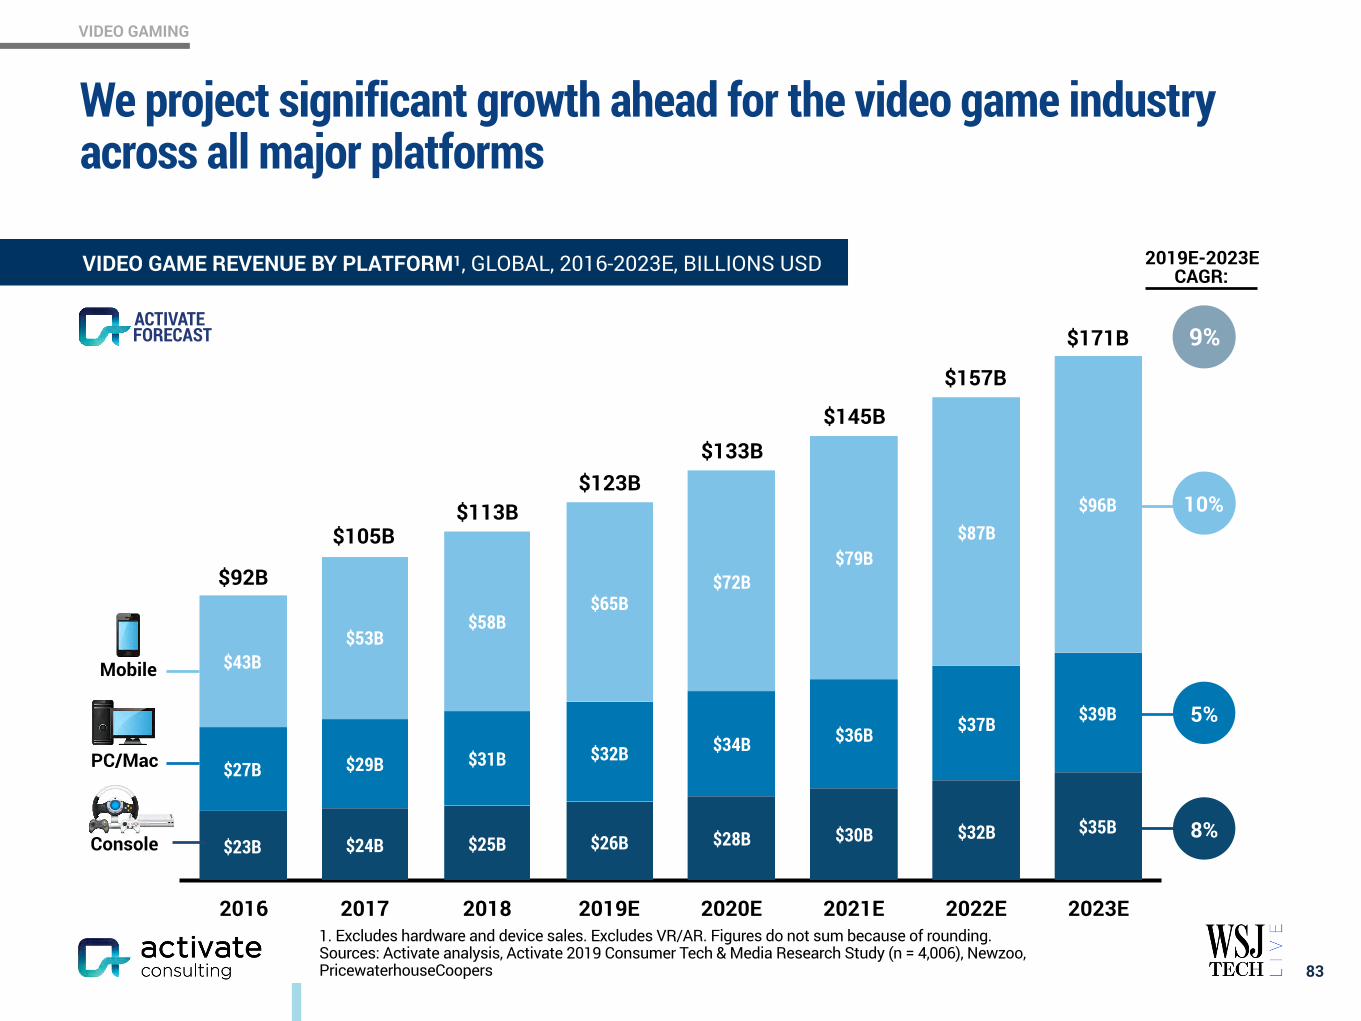
VIDEO GAMING
We project significant growth ahead for the video game industry across all major platforms
83
2016 2017 2018 2019E 2020E 2021E 2022E 2023E
$96B$87B
$79B$72B
$65B$58B
$53B$43B
$39B$37B$36B$34B$32B$31B$29B$27B
$35B$32B$30B$28B$26B$25B$24B$23BConsole
PC/Mac
Mobile
10%
5%
8%
2019E-2023E CAGR:VIDEO GAME REVENUE BY PLATFORM1, GLOBAL, 2016-2023E, BILLIONS USD
$105B
$92B
$113B
$133B$145B
$157B
$171B
$123B
FORECASTACTIVATE
9%
1. Excludes hardware and device sales. Excludes VR/AR. Figures do not sum because of rounding. Sources: Activate analysis, Activate 2019 Consumer Tech & Media Research Study (n = 4,006), Newzoo, PricewaterhouseCoopers
www.activate.com 84
PAGE
$300 Billion Global Internet and Media Growth Dollars by 2023 4
Consumer Attention: 12:40 Hours of Technology & Media Per Day 9
Super Users: The Imperative for Technology & Media Companies 13
Social Splinter: The Social Media World Expands 27
eCommerce: Shrinking the Divide Between Physical and Digital Shopping 41
Digital Marketplaces: New Inventory, Price, Transparency, Ease of Use 60
Video Gaming: The Next Streaming Battlefront 71
Esports: Sport of the Future 84
Video: Streaming Stacking, Battleground Households 94
Sports Betting: The Next Big Financial Trading Market 117
Sports: More Viewing, Emerging Sports, Better Fan Experiences 129
Music: The Discovery Challenge 138
Podcasting: New Listening Experiences and Explosive Growth 146
The Networked Body: Quantified and Connected Human 159
Digital Consumer Finance: Next Generation Services Go Mainstream 169
Connectivity: Enabling the Next Wave of Technology and Media Growth 182
CONTENTS
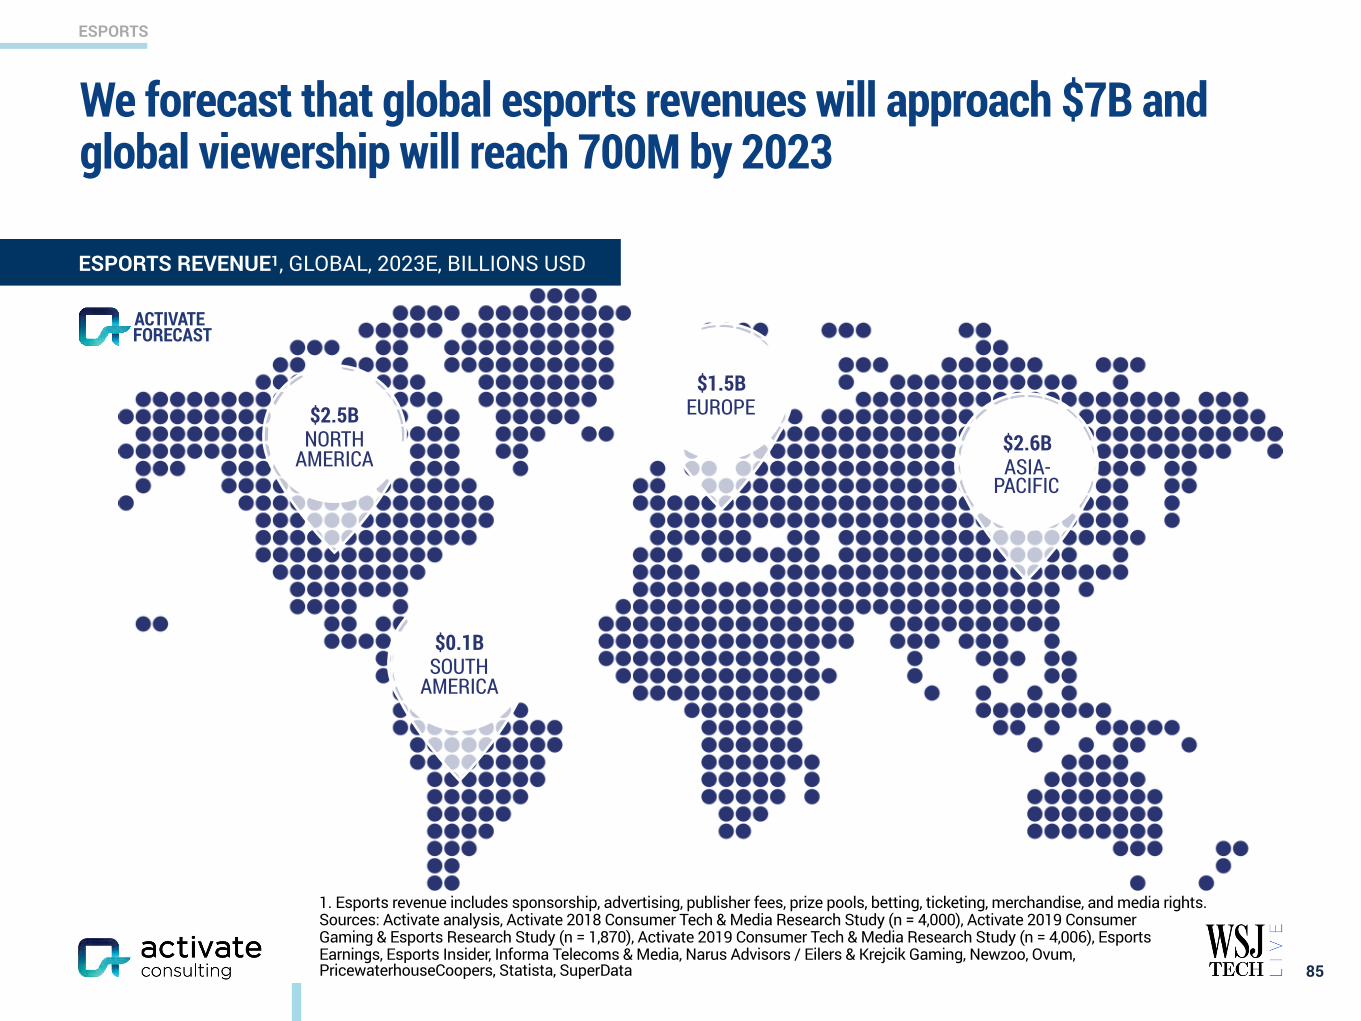
ESPORTS
We forecast that global esports revenues will approach $7B and global viewership will reach 700M by 2023
85
ESPORTS REVENUE1, GLOBAL, 2023E, BILLIONS USD
FORECASTACTIVATE
$2.5B NORTH
AMERICA
$1.5B EUROPE
$2.6B ASIA-
PACIFIC
$0.1B SOUTH
AMERICA
1. Esports revenue includes sponsorship, advertising, publisher fees, prize pools, betting, ticketing, merchandise, and media rights. Sources: Activate analysis, Activate 2018 Consumer Tech & Media Research Study (n = 4,000), Activate 2019 Consumer Gaming & Esports Research Study (n = 1,870), Activate 2019 Consumer Tech & Media Research Study (n = 4,006), Esports Earnings, Esports Insider, Informa Telecoms & Media, Narus Advisors / Eilers & Krejcik Gaming, Newzoo, Ovum, PricewaterhouseCoopers, Statista, SuperData
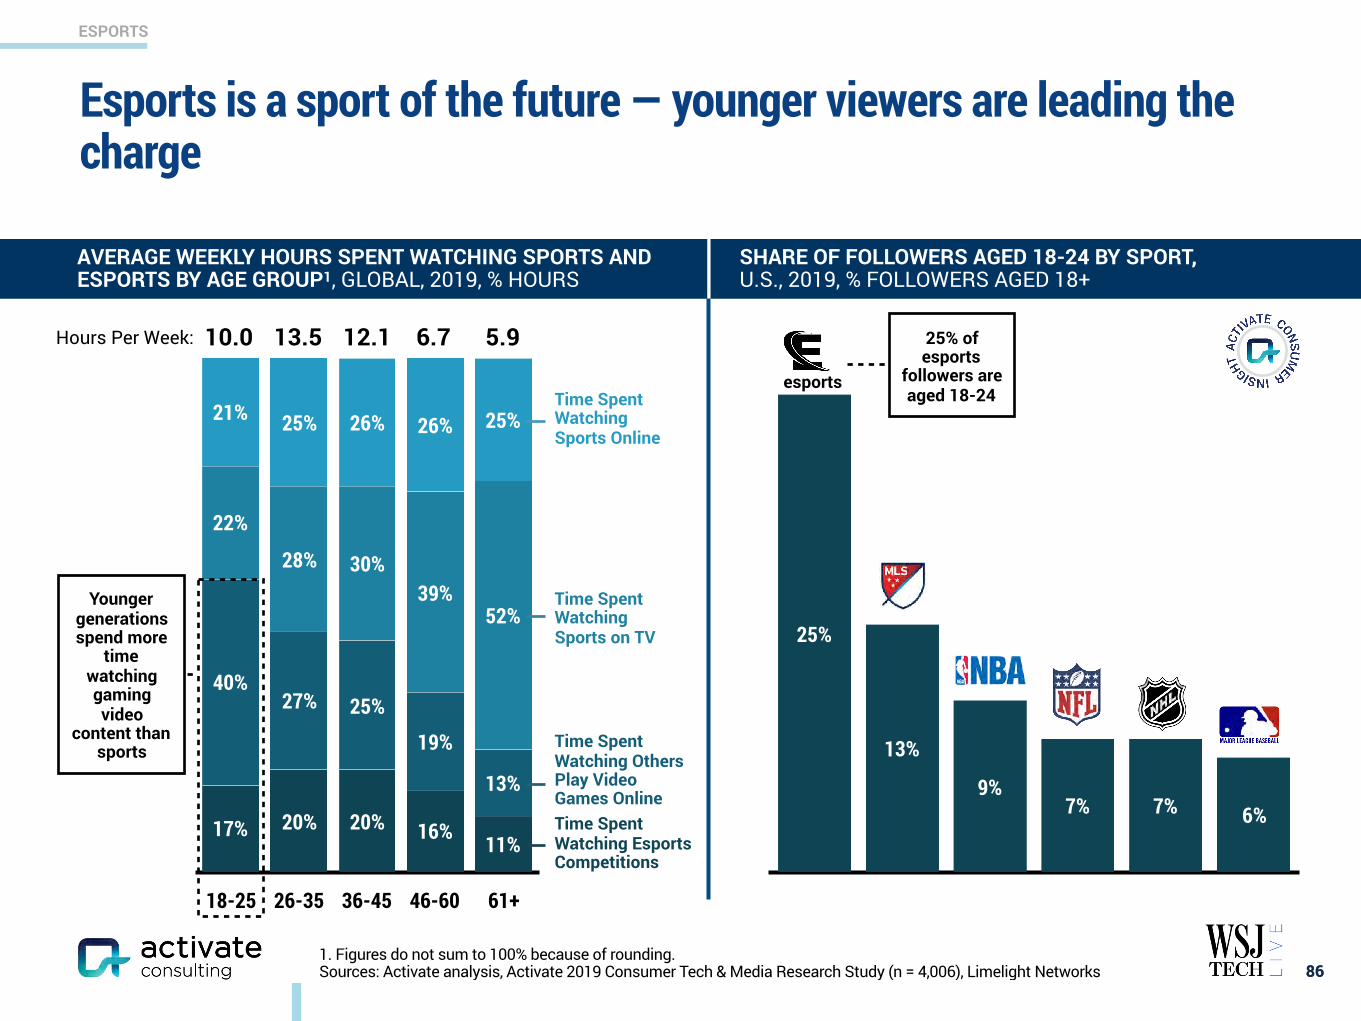
ESPORTS
86
SHARE OF FOLLOWERS AGED 18-24 BY SPORT, U.S., 2019, % FOLLOWERS AGED 18+
18-25 26-35 36-45 46-60 61+
25%26%26%25%21%
52%39%
30%28%
22%
13%
19%
25%27%40%
11%16%20%20%17% Time Spent Watching Esports Competitions
Time Spent Watching Others Play Video Games Online
Time Spent Watching Sports on TV
Time Spent Watching Sports Online
Younger generations spend more
time watching gaming video
content than sports
10.0Hours Per Week: 13.5 12.1 6.7 5.9
AVERAGE WEEKLY HOURS SPENT WATCHING SPORTS AND ESPORTS BY AGE GROUP1, GLOBAL, 2019, % HOURS
86
6%7%7%9%
13%
25%
1. Figures do not sum to 100% because of rounding. Sources: Activate analysis, Activate 2019 Consumer Tech & Media Research Study (n = 4,006), Limelight Networks
Esports is a sport of the future — younger viewers are leading the charge
25% of esports
followers are aged 18-24
esports

ESPORTS
Watching games that I enjoy playing
Following a game series
Watching exciting
gameplay
Following a team or player
Watching with others
Betting on the outcome
Participating in fantasy
10%14%
23%28%
45%48%
62%
87
72% of esports viewers also watch general
gaming video content
81% of esports viewers already play video
games
Sources: Activate analysis, Activate 2019 Consumer Gaming & Esports Research Study (n = 1,870), Activate 2019 Consumer Tech & Media Research Study (n = 4,006)
Esports fans are highly likely to also play video games and watch general gaming video content
PRIMARY REASONS FOR WATCHING ESPORTS, U.S., 2019, % ESPORTS VIEWERS AGED 18+
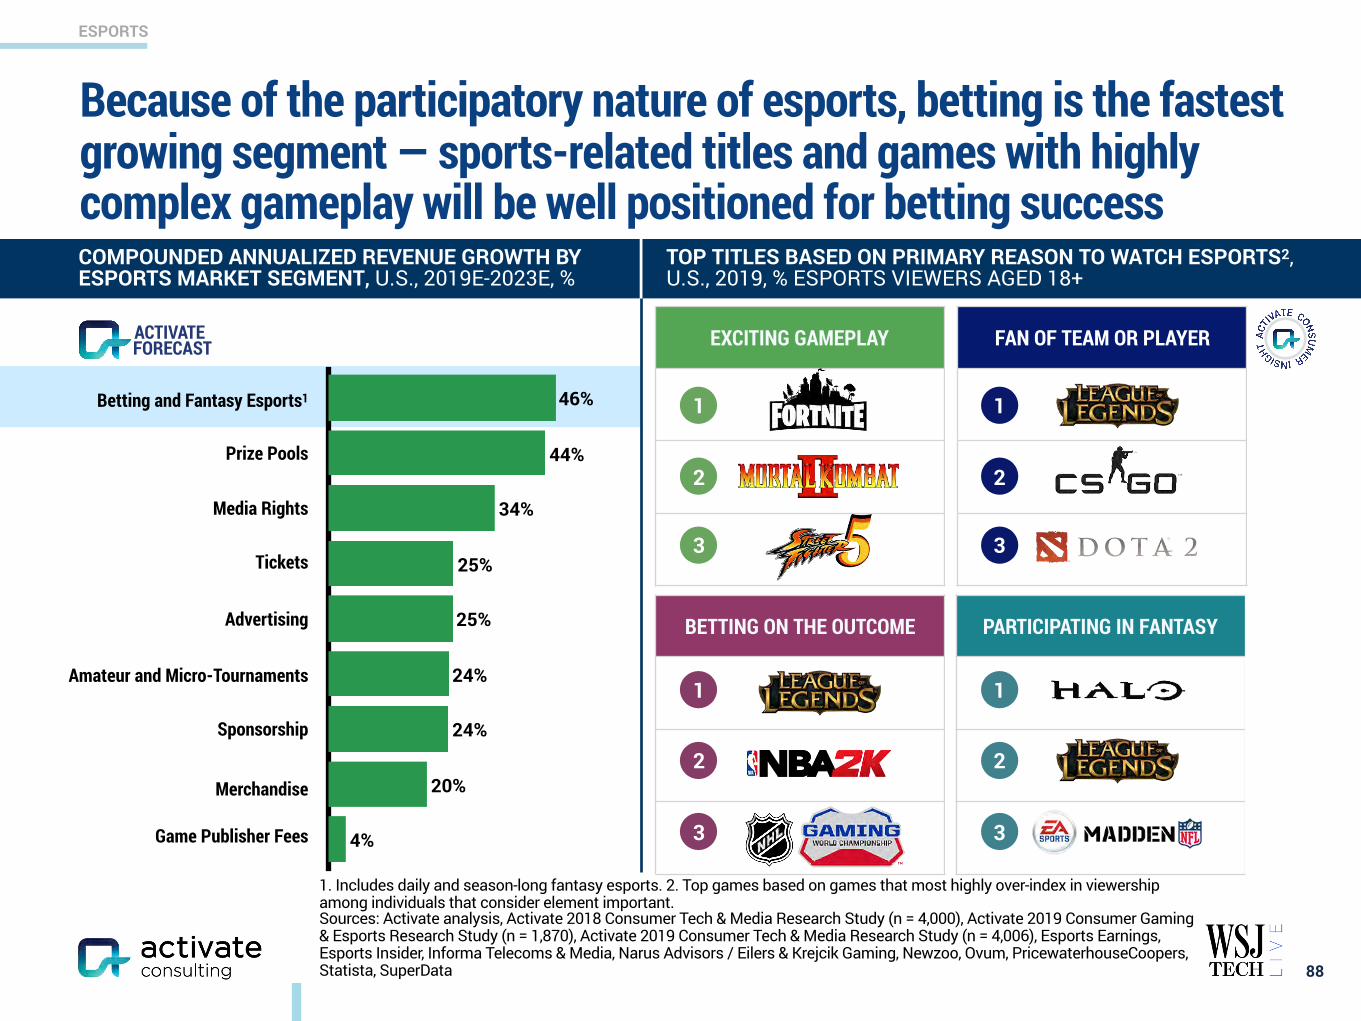
ESPORTS
FAN OF TEAM OR PLAYER
1. Includes daily and season-long fantasy esports. 2. Top games based on games that most highly over-index in viewership among individuals that consider element important. Sources: Activate analysis, Activate 2018 Consumer Tech & Media Research Study (n = 4,000), Activate 2019 Consumer Gaming & Esports Research Study (n = 1,870), Activate 2019 Consumer Tech & Media Research Study (n = 4,006), Esports Earnings, Esports Insider, Informa Telecoms & Media, Narus Advisors / Eilers & Krejcik Gaming, Newzoo, Ovum, PricewaterhouseCoopers, Statista, SuperData
PARTICIPATING IN FANTASYBETTING ON THE OUTCOME
EXCITING GAMEPLAY
88
4%
20%
24%
24%
25%
25%
34%
44%
46%
FORECASTACTIVATE
1
2
3
1
2
3
1
2
3
1
2
3
COMPOUNDED ANNUALIZED REVENUE GROWTH BY ESPORTS MARKET SEGMENT, U.S., 2019E-2023E, %
TOP TITLES BASED ON PRIMARY REASON TO WATCH ESPORTS2, U.S., 2019, % ESPORTS VIEWERS AGED 18+
Betting and Fantasy Esports1
Prize Pools
Media Rights
Tickets
Advertising
Amateur and Micro-Tournaments
Sponsorship
Merchandise
Game Publisher Fees
Because of the participatory nature of esports, betting is the fastest growing segment — sports-related titles and games with highly complex gameplay will be well positioned for betting success
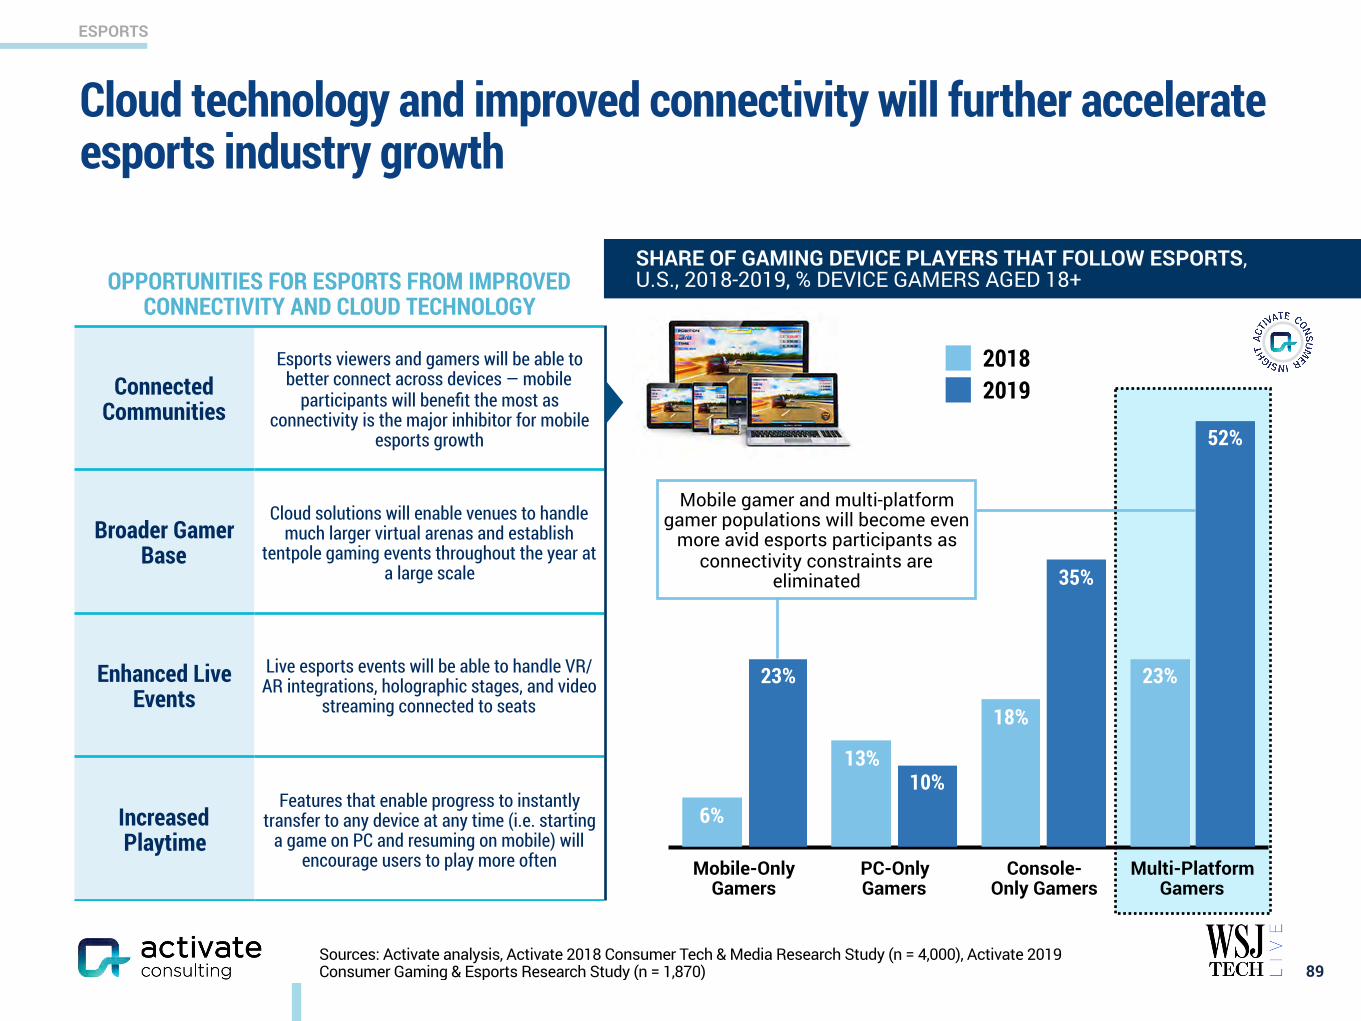
ESPORTS
89
SHARE OF GAMING DEVICE PLAYERS THAT FOLLOW ESPORTS, U.S., 2018-2019, % DEVICE GAMERS AGED 18+
52%
35%
10%
23% 23%
18%
13%
6%
20182019
Mobile-Only Gamers
PC-Only Gamers
Console-Only Gamers
Multi-Platform Gamers
Mobile gamer and multi-platform gamer populations will become even
more avid esports participants as connectivity constraints are
eliminated
OPPORTUNITIES FOR ESPORTS FROM IMPROVED CONNECTIVITY AND CLOUD TECHNOLOGY
Connected Communities
Esports viewers and gamers will be able to better connect across devices — mobile
participants will benefit the most as connectivity is the major inhibitor for mobile
esports growth
Broader Gamer Base
Cloud solutions will enable venues to handle much larger virtual arenas and establish
tentpole gaming events throughout the year at a large scale
Enhanced Live Events
Live esports events will be able to handle VR/AR integrations, holographic stages, and video
streaming connected to seats
Increased Playtime
Features that enable progress to instantly transfer to any device at any time (i.e. starting
a game on PC and resuming on mobile) will encourage users to play more often
Sources: Activate analysis, Activate 2018 Consumer Tech & Media Research Study (n = 4,000), Activate 2019 Consumer Gaming & Esports Research Study (n = 1,870)
Cloud technology and improved connectivity will further accelerate esports industry growth
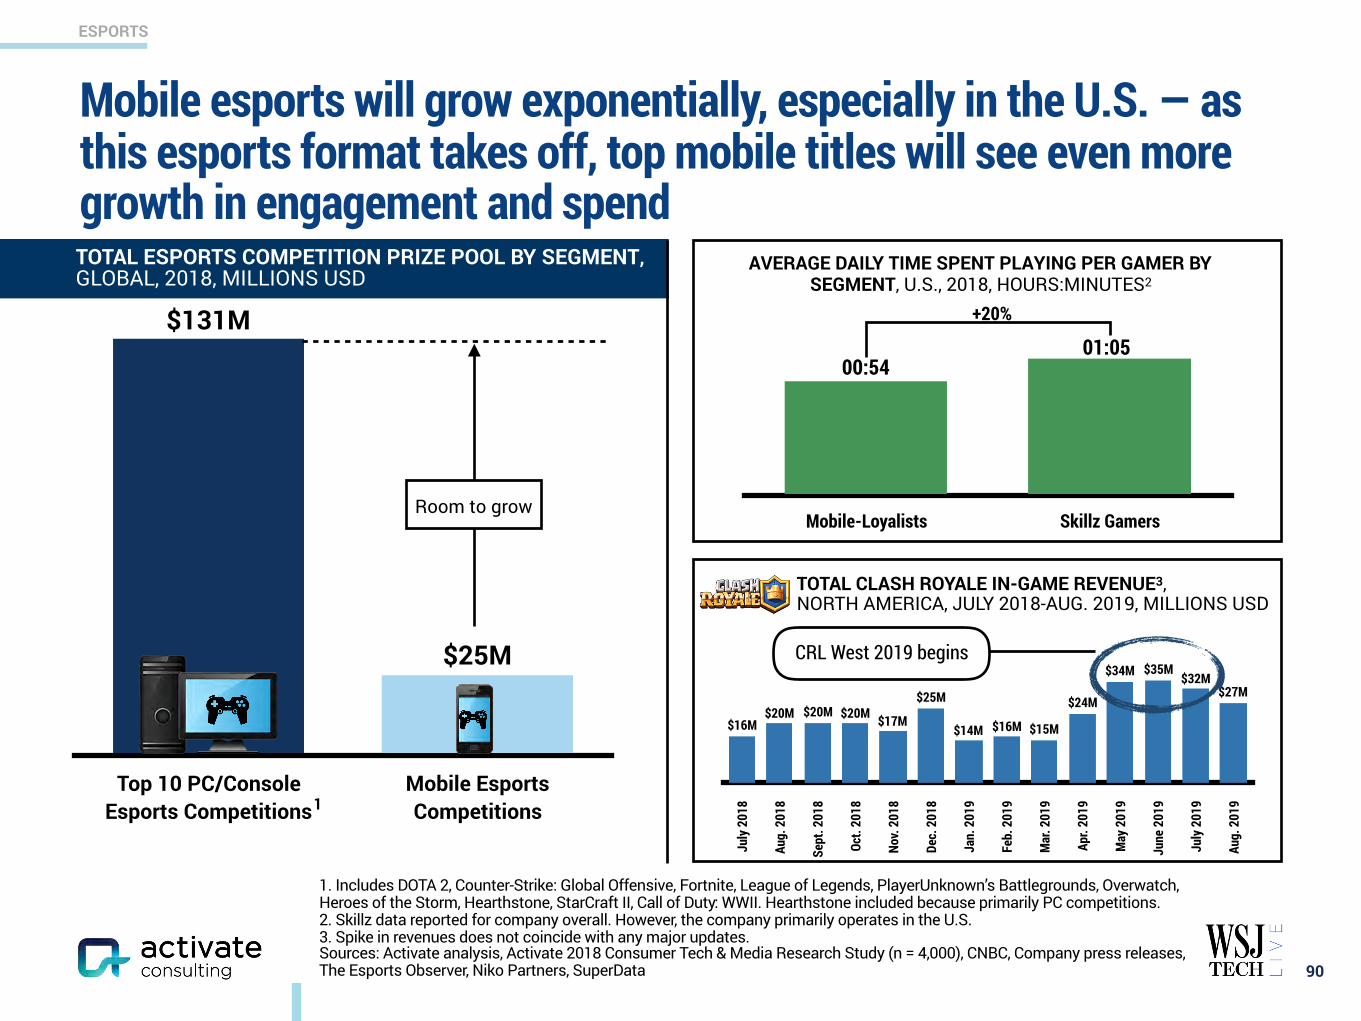
ESPORTS
Mobile esports will grow exponentially, especially in the U.S. — as this esports format takes off, top mobile titles will see even more growth in engagement and spend
90
TOTAL ESPORTS COMPETITION PRIZE POOL BY SEGMENT, GLOBAL, 2018, MILLIONS USD
TOTAL CLASH ROYALE IN-GAME REVENUE3, NORTH AMERICA, JULY 2018-AUG. 2019, MILLIONS USD
AVERAGE DAILY TIME SPENT PLAYING PER GAMER BY SEGMENT, U.S., 2018, HOURS:MINUTES2
July
201
8
Aug.
201
8
Sept
. 201
8
Oct.
2018
Nov.
2018
Dec.
201
8
Jan.
201
9
Feb.
201
9
Mar
. 201
9
Apr.
2019
May
201
9
June
201
9
July
201
9
Aug.
201
9
$27M$32M
$35M$34M
$24M
$15M$16M$14M
$25M
$17M$20M$20M$20M$16M
CRL West 2019 begins
1
Mobile-Loyalists Skillz Gamers
01:0500:54
+20%
1. Includes DOTA 2, Counter-Strike: Global Offensive, Fortnite, League of Legends, PlayerUnknown’s Battlegrounds, Overwatch, Heroes of the Storm, Hearthstone, StarCraft II, Call of Duty: WWII. Hearthstone included because primarily PC competitions. 2. Skillz data reported for company overall. However, the company primarily operates in the U.S. 3. Spike in revenues does not coincide with any major updates. Sources: Activate analysis, Activate 2018 Consumer Tech & Media Research Study (n = 4,000), CNBC, Company press releases, The Esports Observer, Niko Partners, SuperData
Top 10 PC/Console Esports Competitions
Mobile Esports Competitions
$25M
$131M
Room to grow
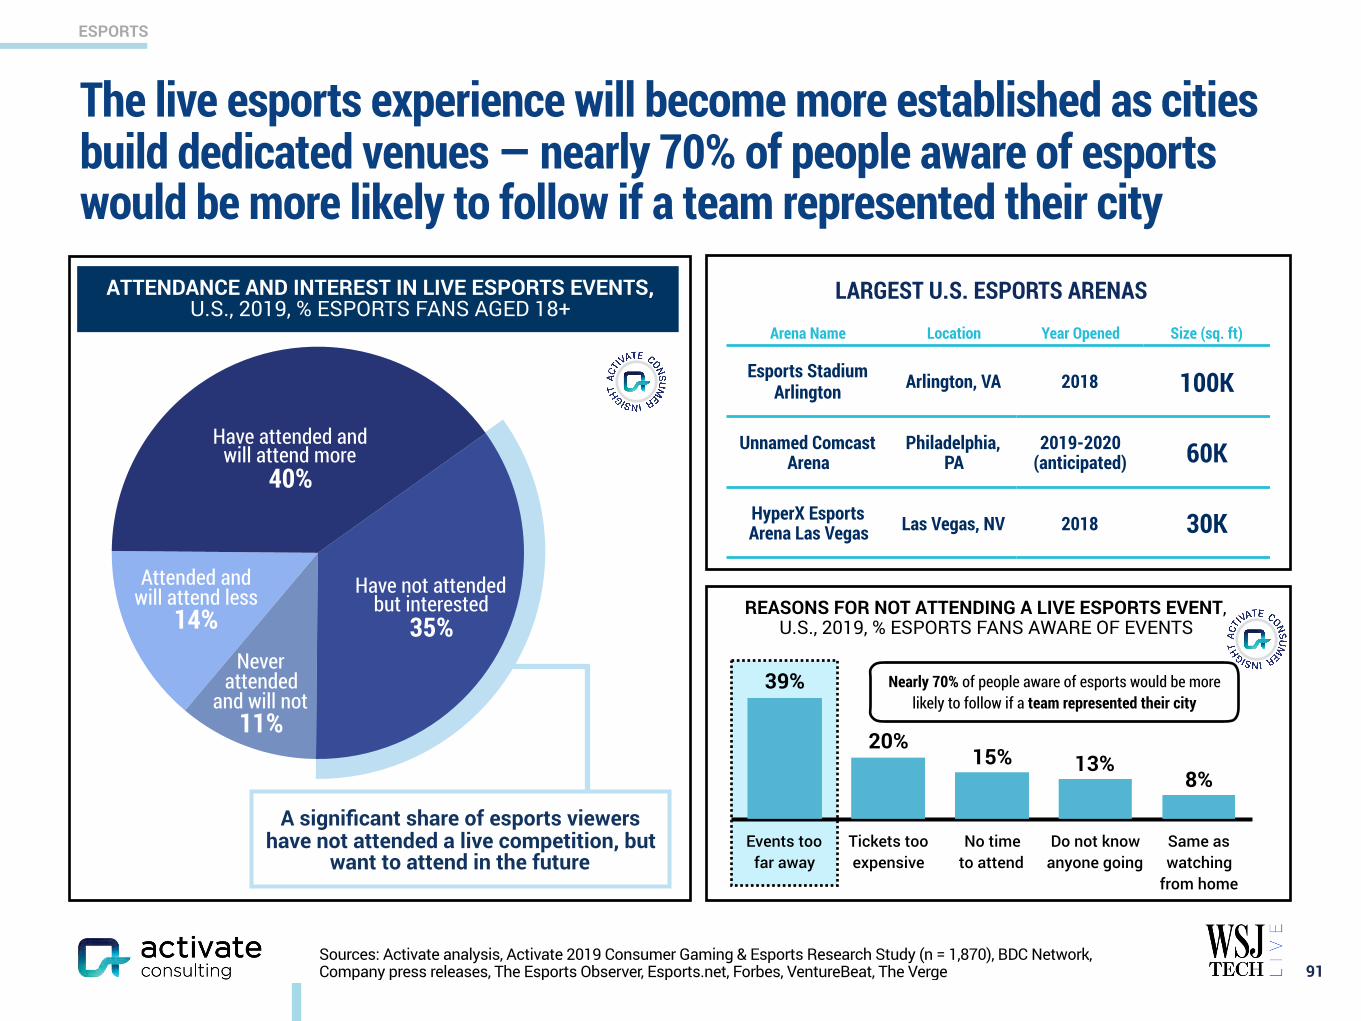
ESPORTS
Have attended and will attend more
40%
Have not attended but interested
35%
Attended and will attend less
14%Never
attended and will not
11%
The live esports experience will become more established as cities build dedicated venues — nearly 70% of people aware of esports would be more likely to follow if a team represented their city
91
ATTENDANCE AND INTEREST IN LIVE ESPORTS EVENTS, U.S., 2019, % ESPORTS FANS AGED 18+
Arena Name Location Year Opened Size (sq. ft)
Esports Stadium Arlington Arlington, VA 2018 100K
Unnamed Comcast Arena
Philadelphia, PA
2019-2020 (anticipated) 60K
HyperX Esports Arena Las Vegas Las Vegas, NV 2018 30K
LARGEST U.S. ESPORTS ARENAS
Events too far away
Tickets too expensive
No time to attend
Do not know anyone going
Same as watching
from home
8%13%15%
20%
39%
REASONS FOR NOT ATTENDING A LIVE ESPORTS EVENT, U.S., 2019, % ESPORTS FANS AWARE OF EVENTS
Nearly 70% of people aware of esports would be more likely to follow if a team represented their city
A significant share of esports viewers have not attended a live competition, but
want to attend in the future
Sources: Activate analysis, Activate 2019 Consumer Gaming & Esports Research Study (n = 1,870), BDC Network, Company press releases, The Esports Observer, Esports.net, Forbes, VentureBeat, The Verge
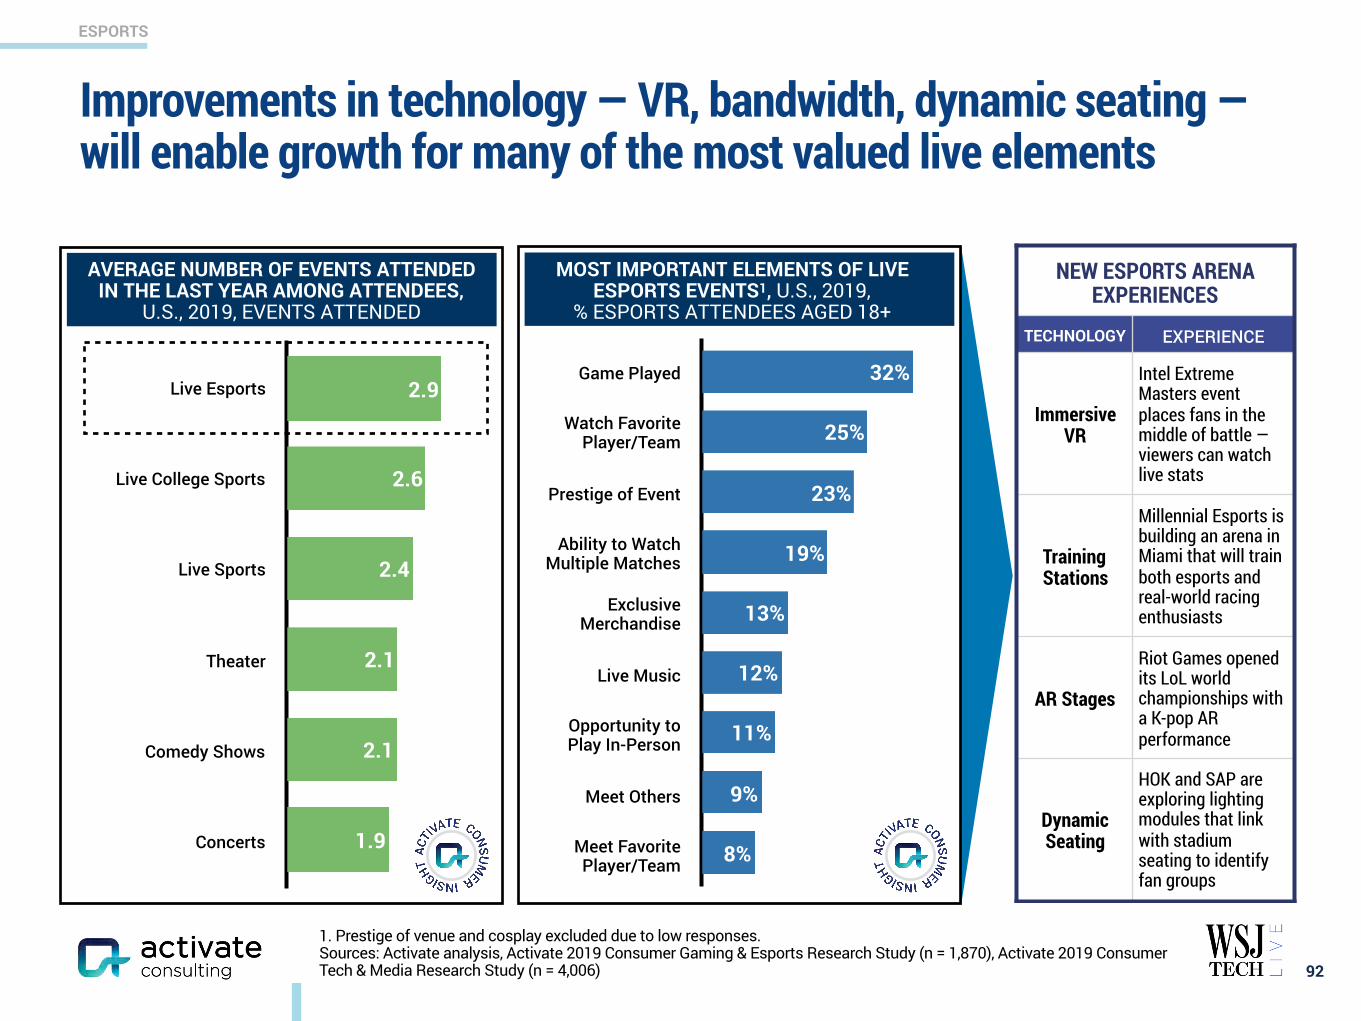
ESPORTS
1. Prestige of venue and cosplay excluded due to low responses. Sources: Activate analysis, Activate 2019 Consumer Gaming & Esports Research Study (n = 1,870), Activate 2019 Consumer Tech & Media Research Study (n = 4,006)
Improvements in technology — VR, bandwidth, dynamic seating — will enable growth for many of the most valued live elements
92
NEW ESPORTS ARENA EXPERIENCES
TECHNOLOGY EXPERIENCE
Immersive VR
Intel Extreme Masters event places fans in the middle of battle — viewers can watch live stats
Training Stations
Millennial Esports is building an arena in Miami that will train both esports and real-world racing enthusiasts
AR Stages
Riot Games opened its LoL world championships with a K-pop AR performance
Dynamic Seating
HOK and SAP are exploring lighting modules that link with stadium seating to identify fan groups
MOST IMPORTANT ELEMENTS OF LIVE ESPORTS EVENTS1, U.S., 2019,
% ESPORTS ATTENDEES AGED 18+
AVERAGE NUMBER OF EVENTS ATTENDED IN THE LAST YEAR AMONG ATTENDEES,
U.S., 2019, EVENTS ATTENDED
Live Esports
Live College Sports
Live Sports
Theater
Comedy Shows
Concerts 1.9
2.1
2.1
2.4
2.6
2.9
8%
9%
11%
12%
13%
19%
23%
25%
32%Game Played
Watch Favorite Player/Team
Prestige of Event
Ability to Watch Multiple Matches
Exclusive Merchandise
Live Music
Opportunity to Play In-Person
Meet Others
Meet Favorite Player/Team
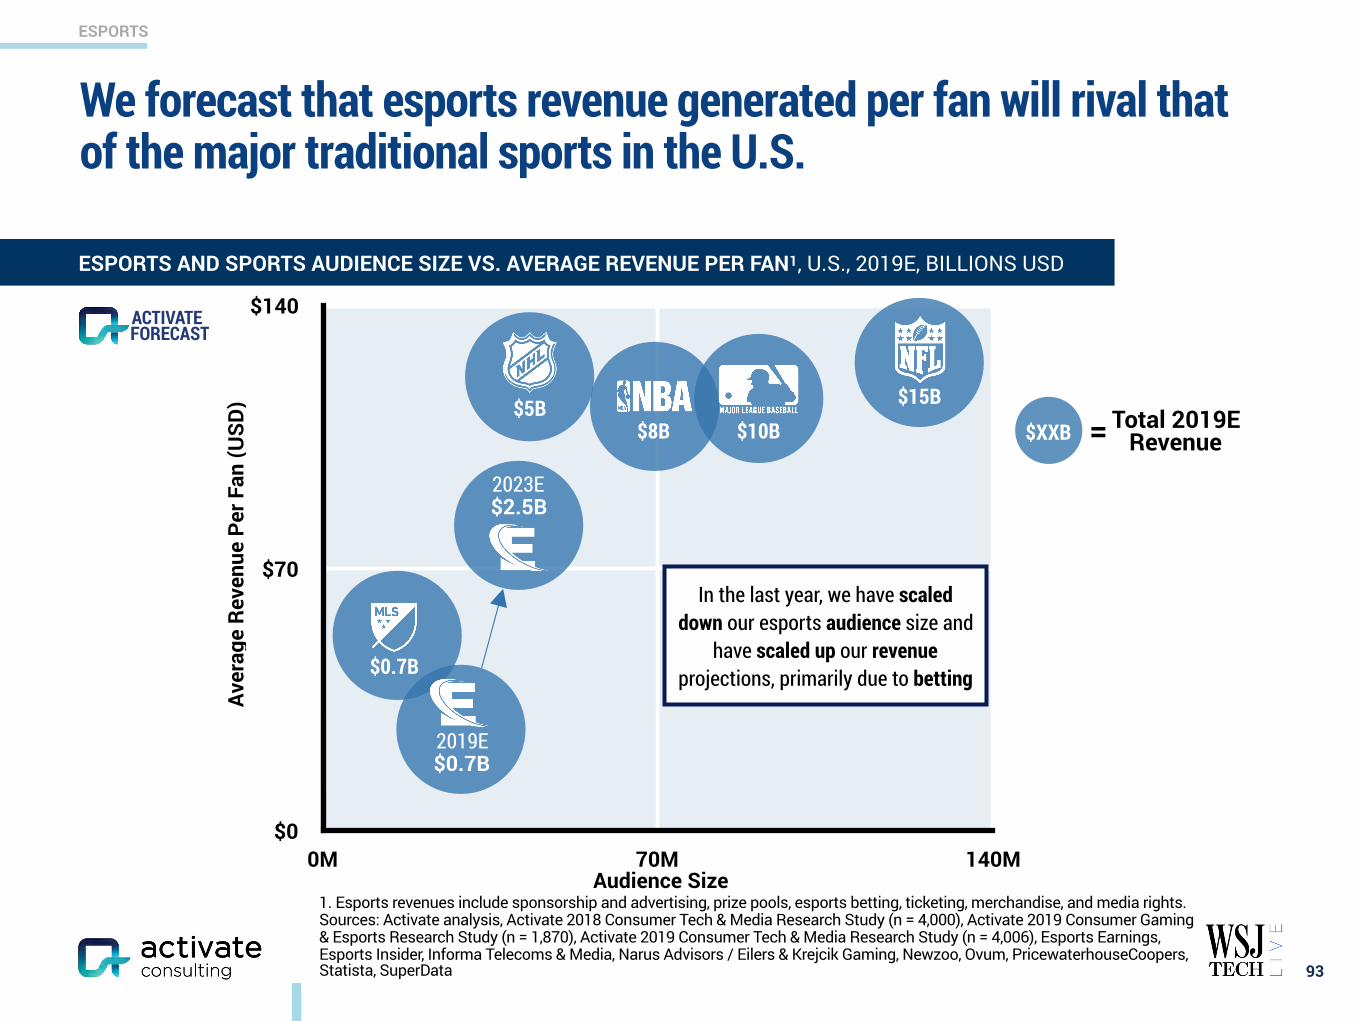
ESPORTS
1. Esports revenues include sponsorship and advertising, prize pools, esports betting, ticketing, merchandise, and media rights. Sources: Activate analysis, Activate 2018 Consumer Tech & Media Research Study (n = 4,000), Activate 2019 Consumer Gaming & Esports Research Study (n = 1,870), Activate 2019 Consumer Tech & Media Research Study (n = 4,006), Esports Earnings, Esports Insider, Informa Telecoms & Media, Narus Advisors / Eilers & Krejcik Gaming, Newzoo, Ovum, PricewaterhouseCoopers, Statista, SuperData
We forecast that esports revenue generated per fan will rival that of the major traditional sports in the U.S.
93
ESPORTS AND SPORTS AUDIENCE SIZE VS. AVERAGE REVENUE PER FAN1, U.S., 2019E, BILLIONS USD
Audience Size
$0
$70
$140
0M 70M 140M
Aver
age
Reve
nue
Per F
an (U
SD)
FORECASTACTIVATE
2023E$2.5B
$15B$5B
$0.7B
$8B $10B
2019E$0.7B
In the last year, we have scaled down our esports audience size and
have scaled up our revenue projections, primarily due to betting
$XXB = Total 2019E Revenue
www.activate.com 94
PAGE
$300 Billion Global Internet and Media Growth Dollars by 2023 4
Consumer Attention: 12:40 Hours of Technology & Media Per Day 9
Super Users: The Imperative for Technology & Media Companies 13
Social Splinter: The Social Media World Expands 27
eCommerce: Shrinking the Divide Between Physical and Digital Shopping 41
Digital Marketplaces: New Inventory, Price, Transparency, Ease of Use 60
Video Gaming: The Next Streaming Battlefront 71
Esports: Sport of the Future 84
Video: Streaming Stacking, Battleground Households 94
Sports Betting: The Next Big Financial Trading Market 117
Sports: More Viewing, Emerging Sports, Better Fan Experiences 129
Music: The Discovery Challenge 138
Podcasting: New Listening Experiences and Explosive Growth 146
The Networked Body: Quantified and Connected Human 159
Digital Consumer Finance: Next Generation Services Go Mainstream 169
Connectivity: Enabling the Next Wave of Technology and Media Growth 182
CONTENTS
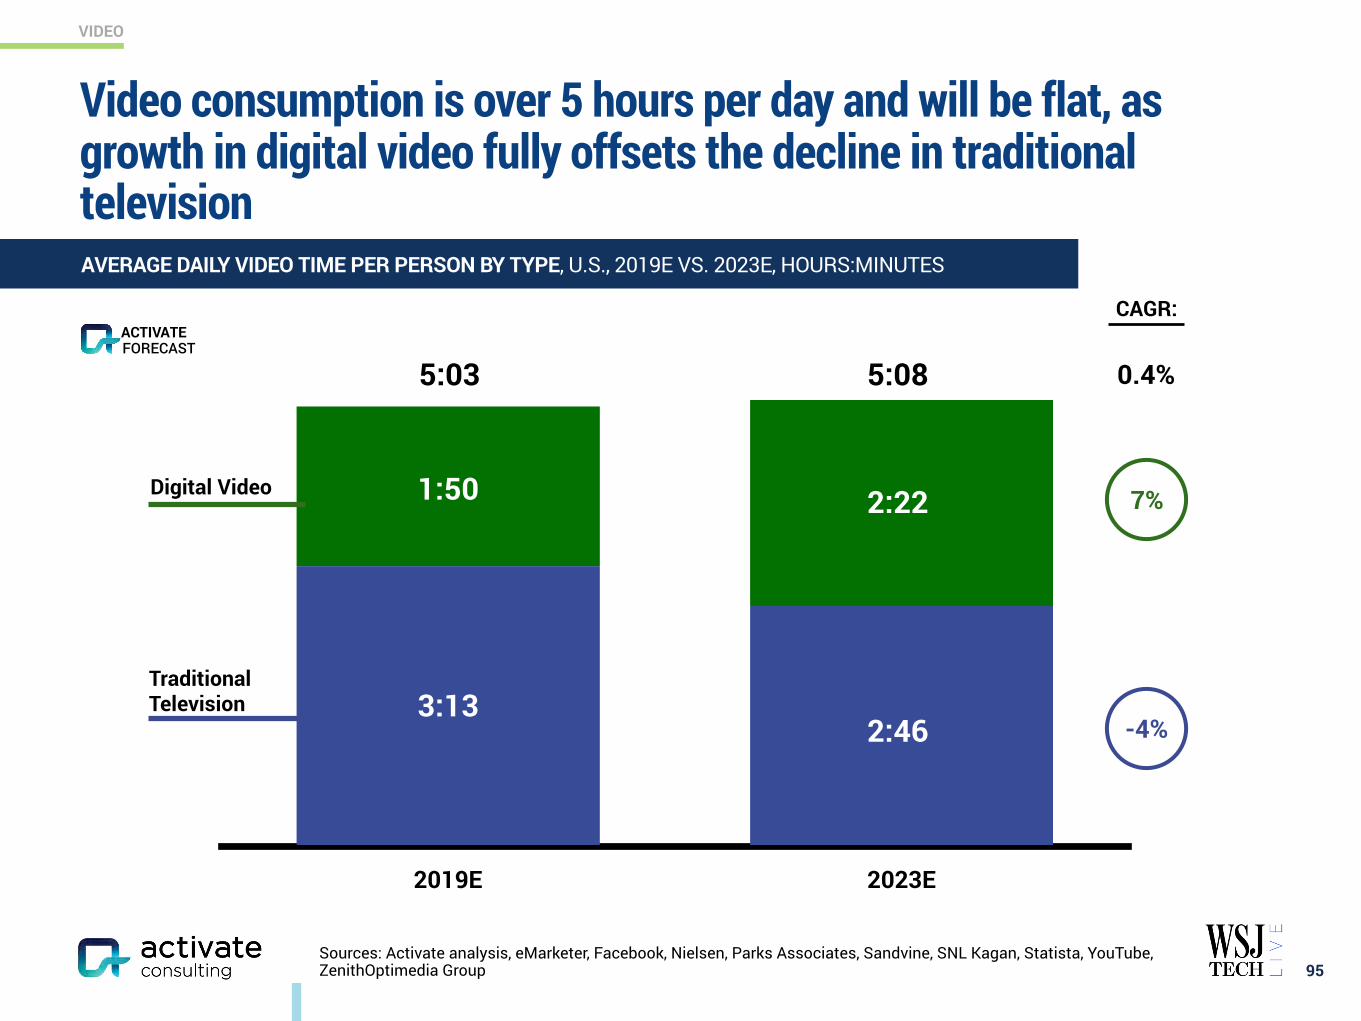
VIDEO
0.4%
Sources: Activate analysis, eMarketer, Facebook, Nielsen, Parks Associates, Sandvine, SNL Kagan, Statista, YouTube, ZenithOptimedia Group
Video consumption is over 5 hours per day and will be flat, as growth in digital video fully offsets the decline in traditional television
95
2019E 2023E
FORECASTACTIVATE
AVERAGE DAILY VIDEO TIME PER PERSON BY TYPE, U.S., 2019E VS. 2023E, HOURS:MINUTES
Traditional Television
Digital Video
3:132:46
2:221:50
5:03 5:08
CAGR:
-4%
7%
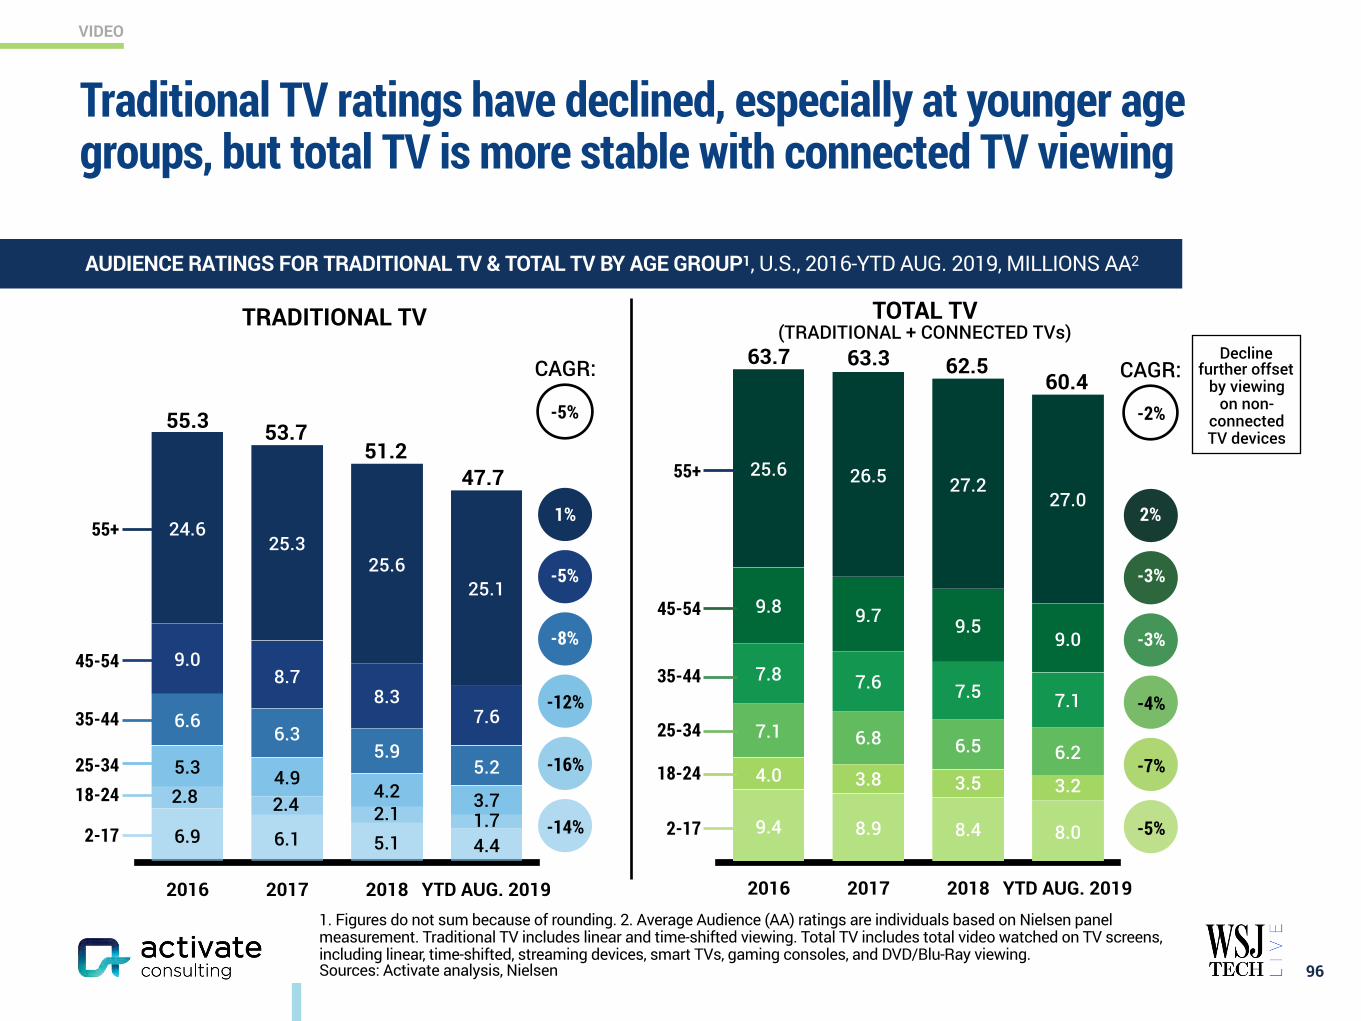
VIDEO
1. Figures do not sum because of rounding. 2. Average Audience (AA) ratings are individuals based on Nielsen panel measurement. Traditional TV includes linear and time-shifted viewing. Total TV includes total video watched on TV screens, including linear, time-shifted, streaming devices, smart TVs, gaming consoles, and DVD/Blu-Ray viewing. Sources: Activate analysis, Nielsen
2016 2017 2018 YTD AUG. 2019
27.027.226.525.6
9.09.59.79.8
7.17.57.67.8
6.26.56.87.1
3.23.53.84.0
8.08.48.99.4
Traditional TV ratings have declined, especially at younger age groups, but total TV is more stable with connected TV viewing
96
AUDIENCE RATINGS FOR TRADITIONAL TV & TOTAL TV BY AGE GROUP1, U.S., 2016-YTD AUG. 2019, MILLIONS AA2
2016 2017 2018 YTD AUG. 2019
25.125.6
25.324.6
7.68.3
8.79.0
5.25.9
6.36.6
3.74.24.95.3
4.45.16.16.9
55+
TRADITIONAL TV TOTAL TV (TRADITIONAL + CONNECTED TVs)
45-54
35-44
25-3418-24
2-17
55.3 53.751.2
47.7
63.7 63.3 62.560.4CAGR:
-14%
-16%
-12%
-8%
-5%
1%
-5%
2.8 2.4 2.1 1.7
55+
45-54
35-44
25-34
18-24
2-17
CAGR:
-5%
-7%
-4%
-3%
-3%
2%
-2%
Decline further offset
by viewing on non-
connected TV devices
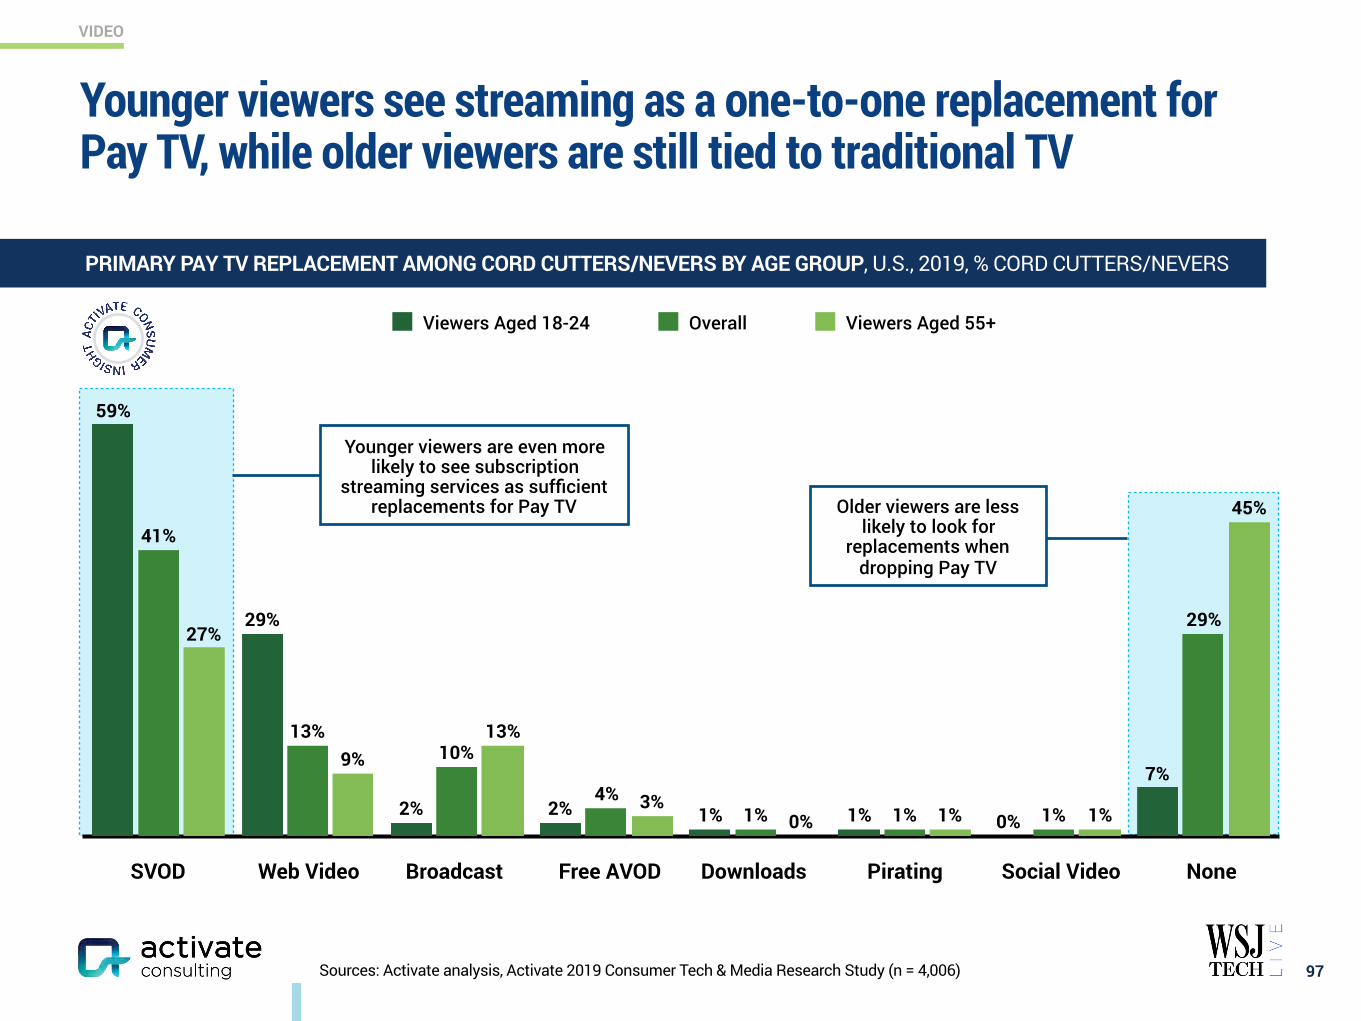
VIDEO
Sources: Activate analysis, Activate 2019 Consumer Tech & Media Research Study (n = 4,006)
Older viewers are less likely to look for
replacements when dropping Pay TV
45%
1%1%0%3%
13%9%
27%29%
1%1%1%4%
10%13%
41%
7%
0%1%1%2%2%
29%
59%
Viewers Aged 18-24 Overall Viewers Aged 55+
Younger viewers see streaming as a one-to-one replacement for Pay TV, while older viewers are still tied to traditional TV
97
Younger viewers are even more likely to see subscription
streaming services as sufficient replacements for Pay TV
SVOD BroadcastWeb Video DownloadsFree AVOD NonePirating Social Video
PRIMARY PAY TV REPLACEMENT AMONG CORD CUTTERS/NEVERS BY AGE GROUP, U.S., 2019, % CORD CUTTERS/NEVERS
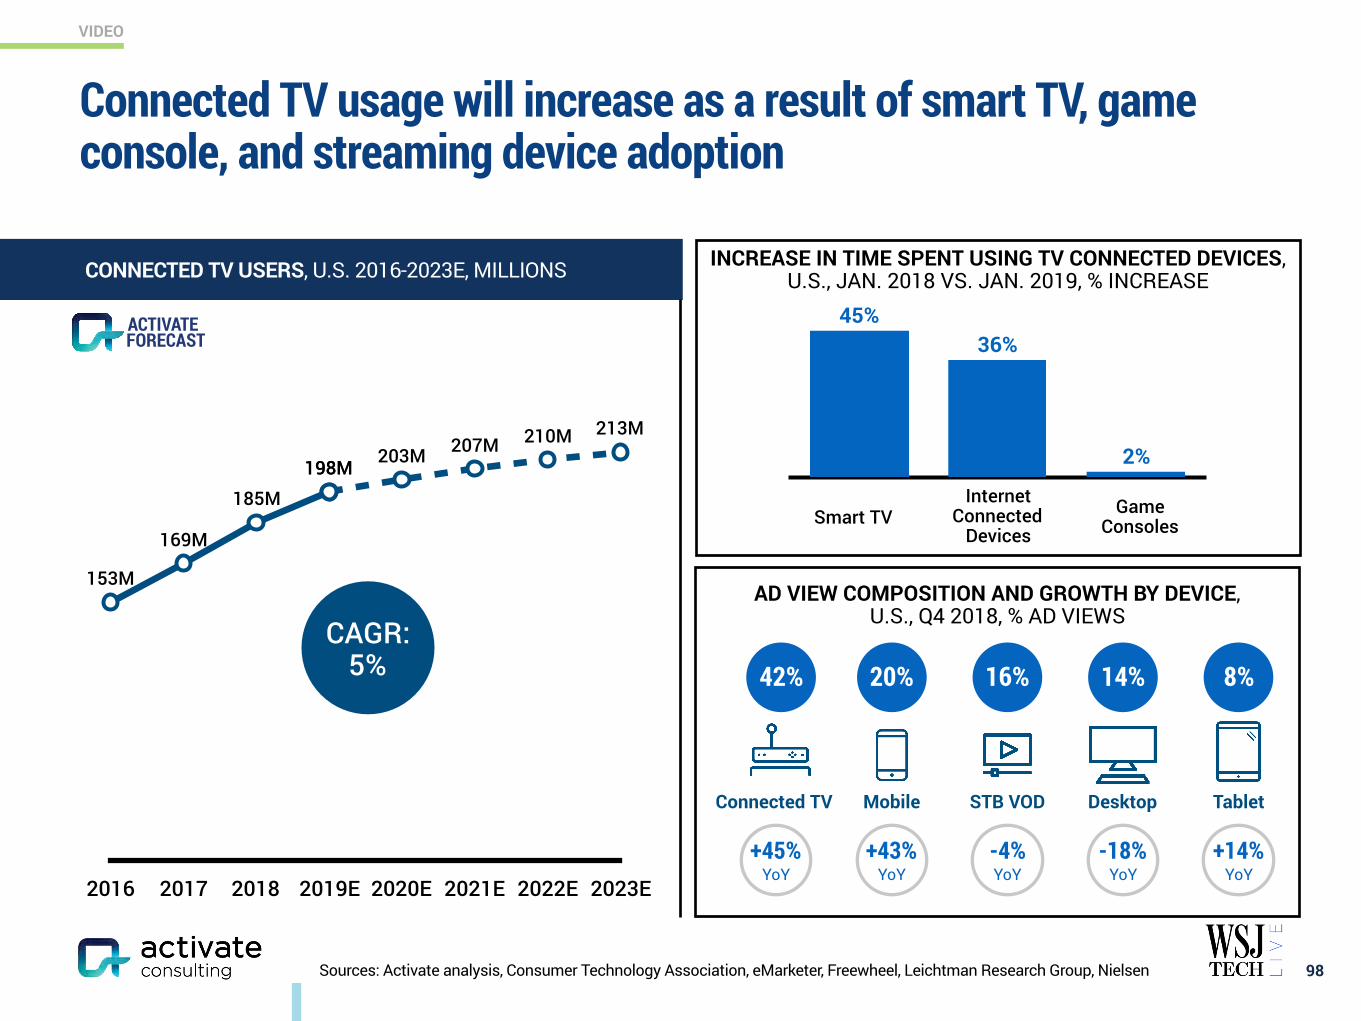
VIDEO
Sources: Activate analysis, Consumer Technology Association, eMarketer, Freewheel, Leichtman Research Group, Nielsen
Connected TV usage will increase as a result of smart TV, game console, and streaming device adoption
98
2016 2017 2018 2019E 2020E 2021E 2022E 2023E
153M
169M
185M198M198M 203M 207M 210M 213M
CONNECTED TV USERS, U.S. 2016-2023E, MILLIONS
CAGR: 5%
FORECASTACTIVATE
2%
36%45%
Smart TVInternet
Connected Devices
Game Consoles
Connected TV Mobile STB VOD Desktop Tablet
42% 20% 16% 14% 8%
+45%YoY
AD VIEW COMPOSITION AND GROWTH BY DEVICE, U.S., Q4 2018, % AD VIEWS
+43%YoY
-4% YoY
-18% YoY
+14%YoY
INCREASE IN TIME SPENT USING TV CONNECTED DEVICES, U.S., JAN. 2018 VS. JAN. 2019, % INCREASE
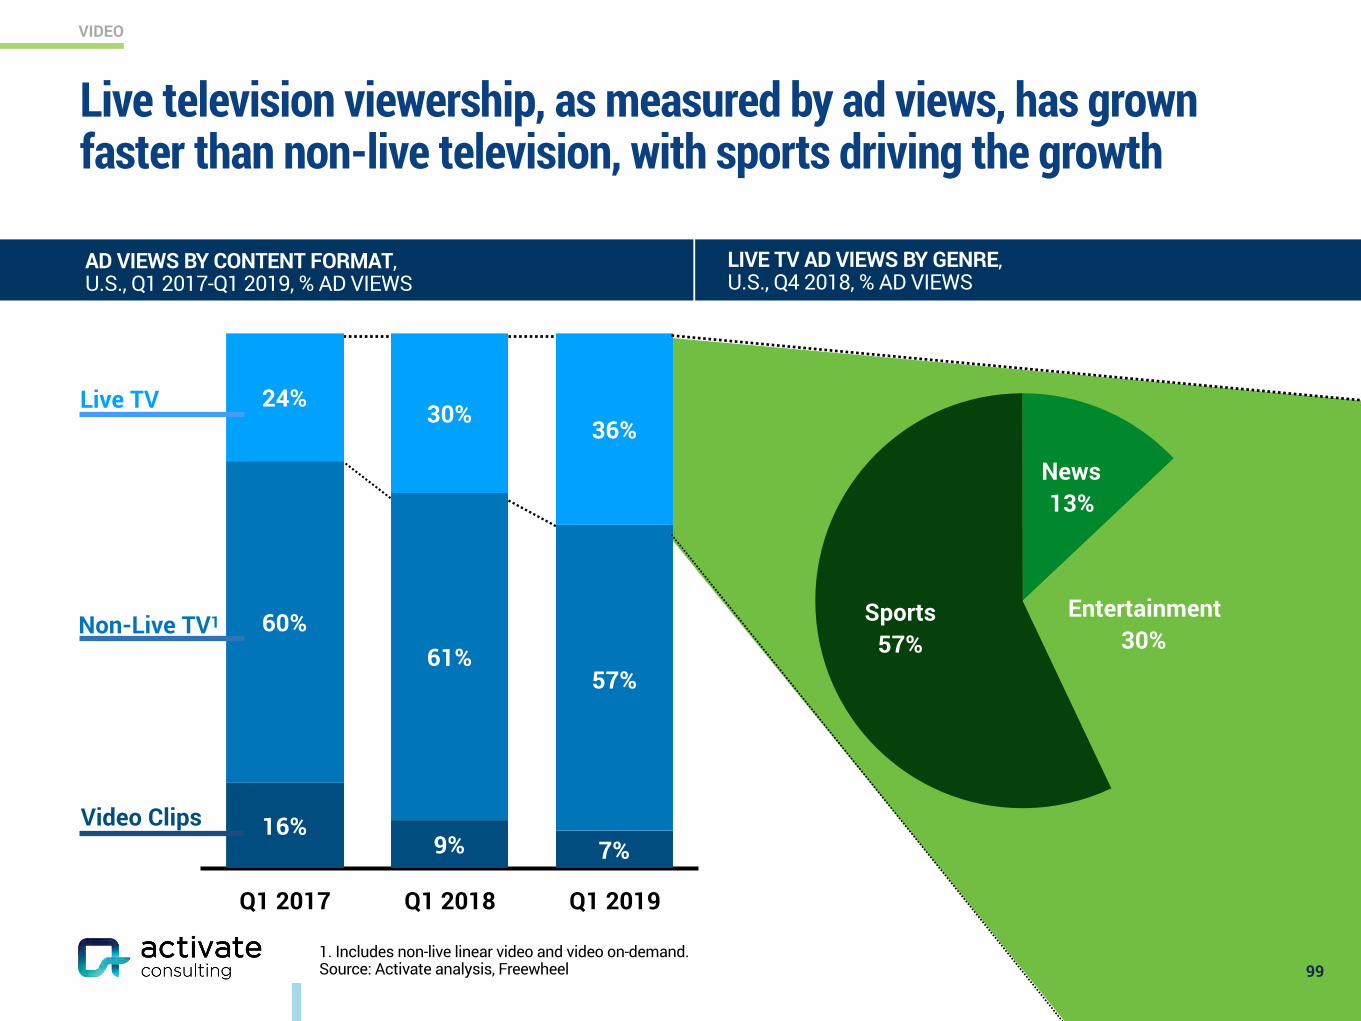
VIDEO
Live television viewership, as measured by ad views, has grown faster than non-live television, with sports driving the growth
99
AD VIEWS BY CONTENT FORMAT, U.S., Q1 2017-Q1 2019, % AD VIEWS
LIVE TV AD VIEWS BY GENRE, U.S., Q4 2018, % AD VIEWS
Live TV
Video Clips
Q1 2017 Q1 2018 Q1 2019
36%30%
24%
57%61%
60%
7%9%16%
Non-Live TV1
News13%
Sports57%
Entertainment30%
1. Includes non-live linear video and video on-demand. Source: Activate analysis, Freewheel
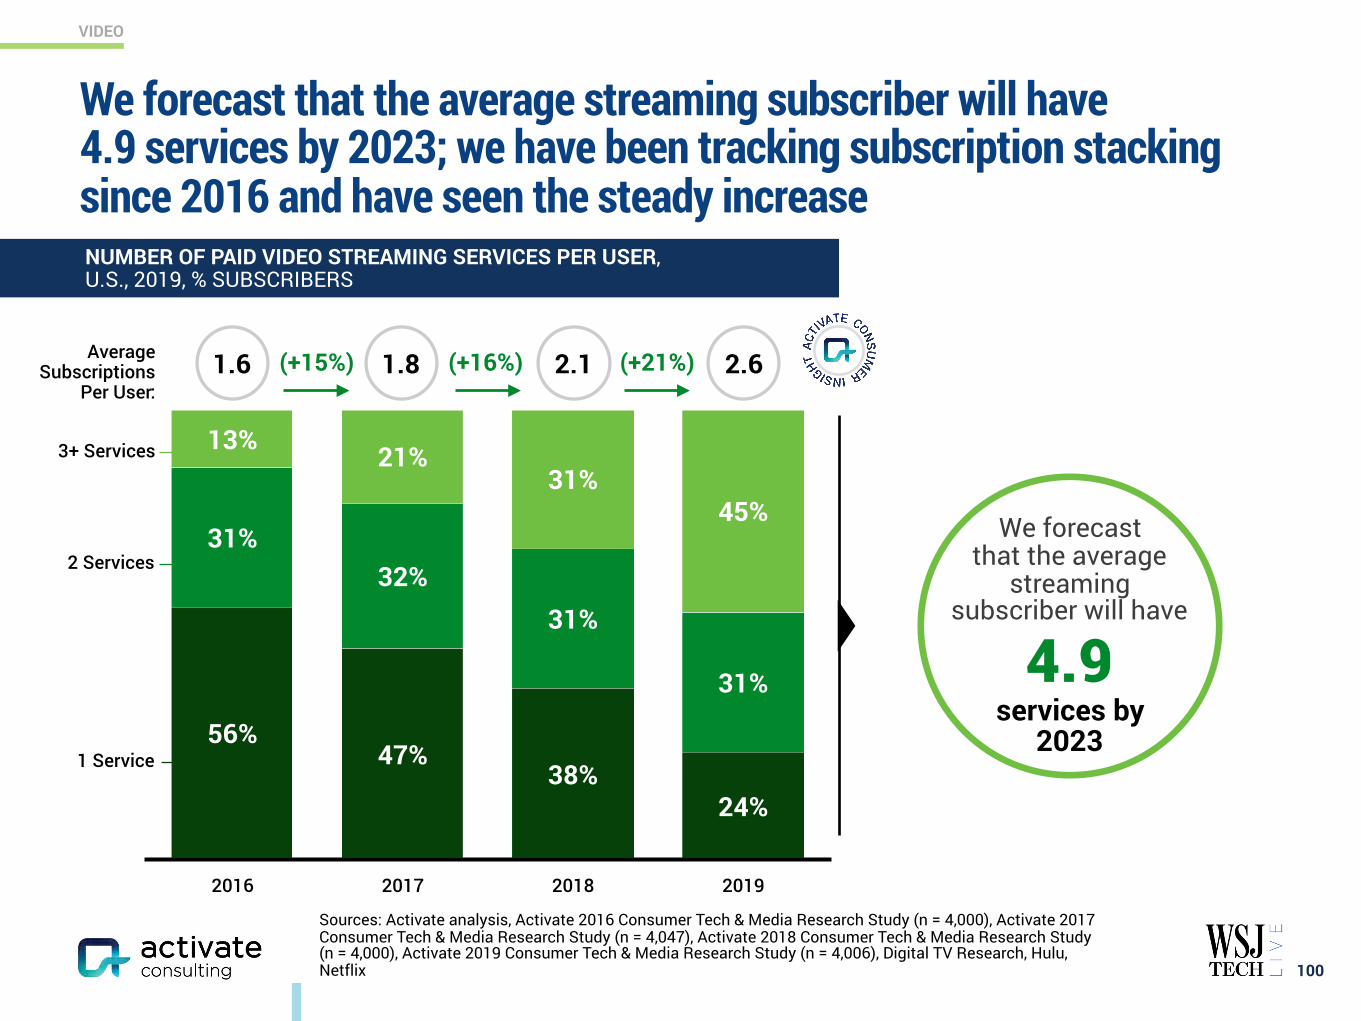
VIDEO
Sources: Activate analysis, Activate 2016 Consumer Tech & Media Research Study (n = 4,000), Activate 2017 Consumer Tech & Media Research Study (n = 4,047), Activate 2018 Consumer Tech & Media Research Study (n = 4,000), Activate 2019 Consumer Tech & Media Research Study (n = 4,006), Digital TV Research, Hulu, Netflix 100
NUMBER OF PAID VIDEO STREAMING SERVICES PER USER, U.S., 2019, % SUBSCRIBERS
2016 2017 2018 2019
45%31%
21%13%
31%
31%32%
31%
24%38%
47%56%
1 Service
2 Services
2.1
3+ Services
Average Subscriptions
Per User:1.81.6 (+15%) (+16%) (+21%) 2.6
We forecast that the average streaming subscriber will have 4.9 services by 2023; we have been tracking subscription stacking since 2016 and have seen the steady increase
We forecast
that the average streaming
subscriber will have
4.9 services by
2023
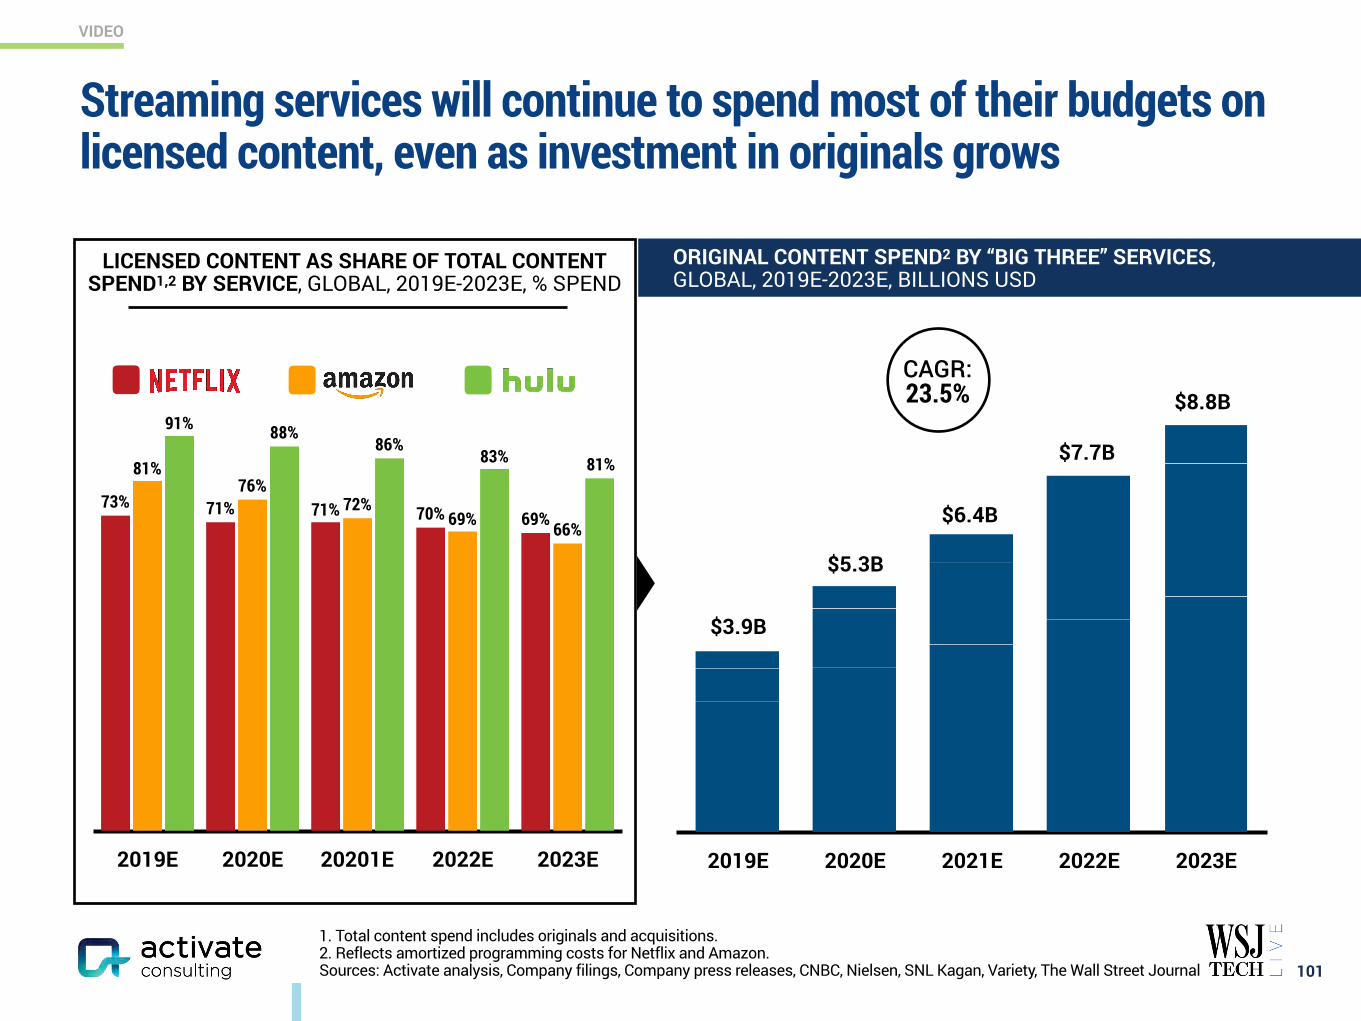
VIDEO
1. Total content spend includes originals and acquisitions. 2. Reflects amortized programming costs for Netflix and Amazon. Sources: Activate analysis, Company filings, Company press releases, CNBC, Nielsen, SNL Kagan, Variety, The Wall Street Journal
Streaming services will continue to spend most of their budgets on licensed content, even as investment in originals grows
101
LICENSED CONTENT AS SHARE OF TOTAL CONTENT SPEND1,2 BY SERVICE, GLOBAL, 2019E-2023E, % SPEND
2019E 2020E 20201E 2022E 2023E
81%83%86%
88%91%
66%69%72%
76%81%
69%70%71%71%73%
2019E 2020E 2021E 2022E 2023E
$3.9B
$5.3B
$6.4B
$7.7B
$8.8BCAGR:23.5%
ORIGINAL CONTENT SPEND2 BY “BIG THREE” SERVICES, GLOBAL, 2019E-2023E, BILLIONS USD
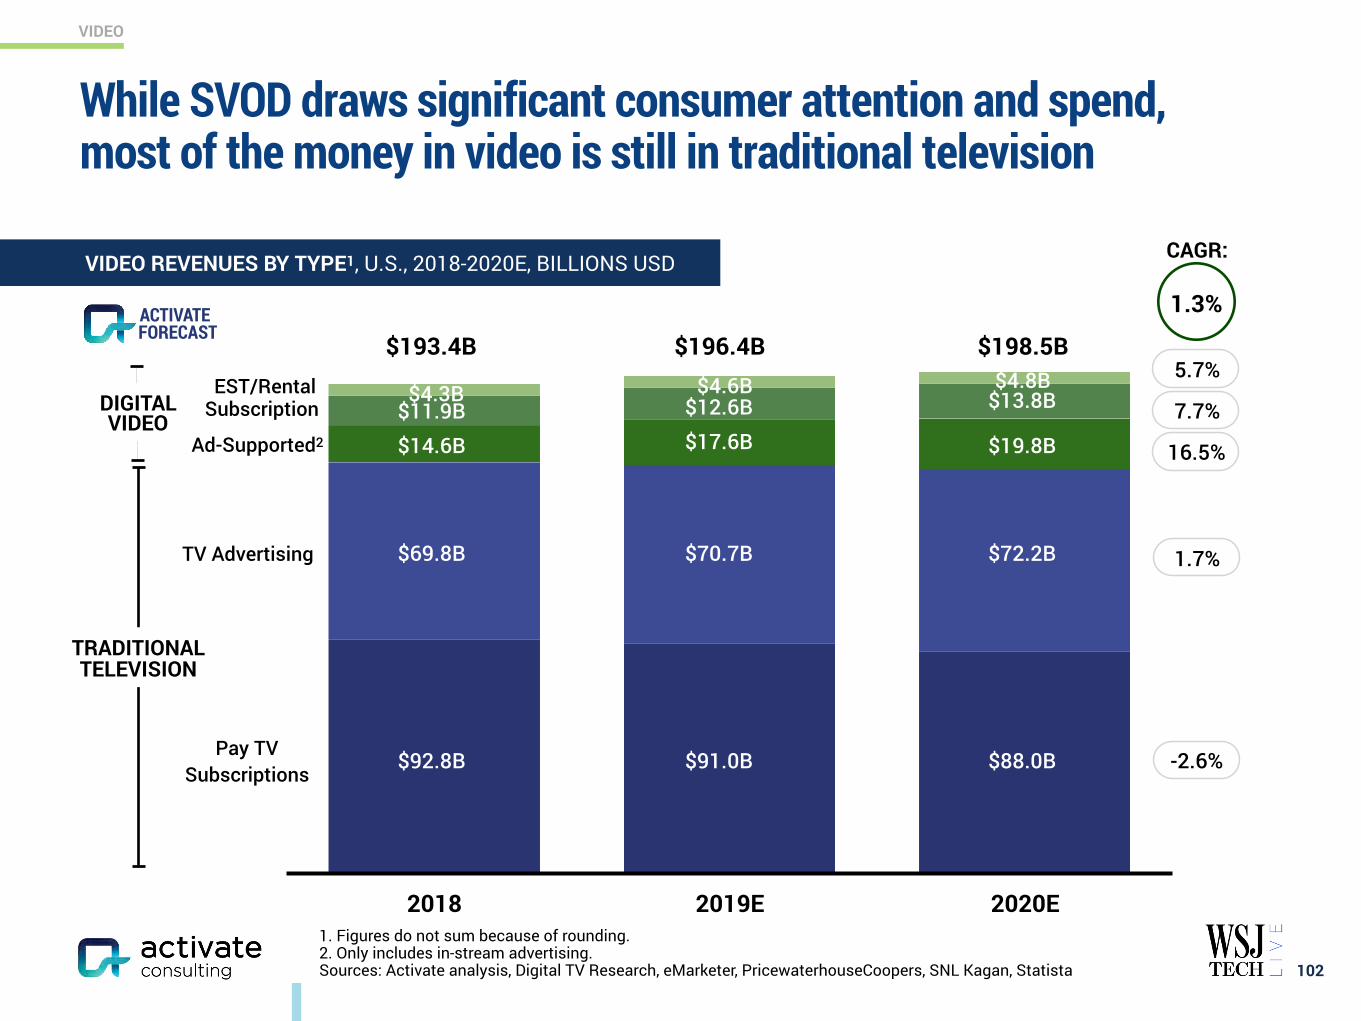
VIDEO
While SVOD draws significant consumer attention and spend, most of the money in video is still in traditional television
102
FORECASTACTIVATE
1. Figures do not sum because of rounding. 2. Only includes in-stream advertising. Sources: Activate analysis, Digital TV Research, eMarketer, PricewaterhouseCoopers, SNL Kagan, Statista
2018 2019E 2020E
Pay TV Subscriptions
TV Advertising
Ad-Supported2
SubscriptionEST/Rental
TRADITIONAL TELEVISION
DIGITAL VIDEO
$88.0B
$72.2B
$19.8B
$13.8B$4.8B
$91.0B
$70.7B
$17.6B$12.6B
$4.6B
$92.8B
$69.8B
$14.6B$11.9B
$4.3B
$198.5B$196.4B$193.4B
1.3%
CAGR:
5.7%
7.7%
16.5%
1.7%
-2.6%
VIDEO REVENUES BY TYPE1, U.S., 2018-2020E, BILLIONS USD
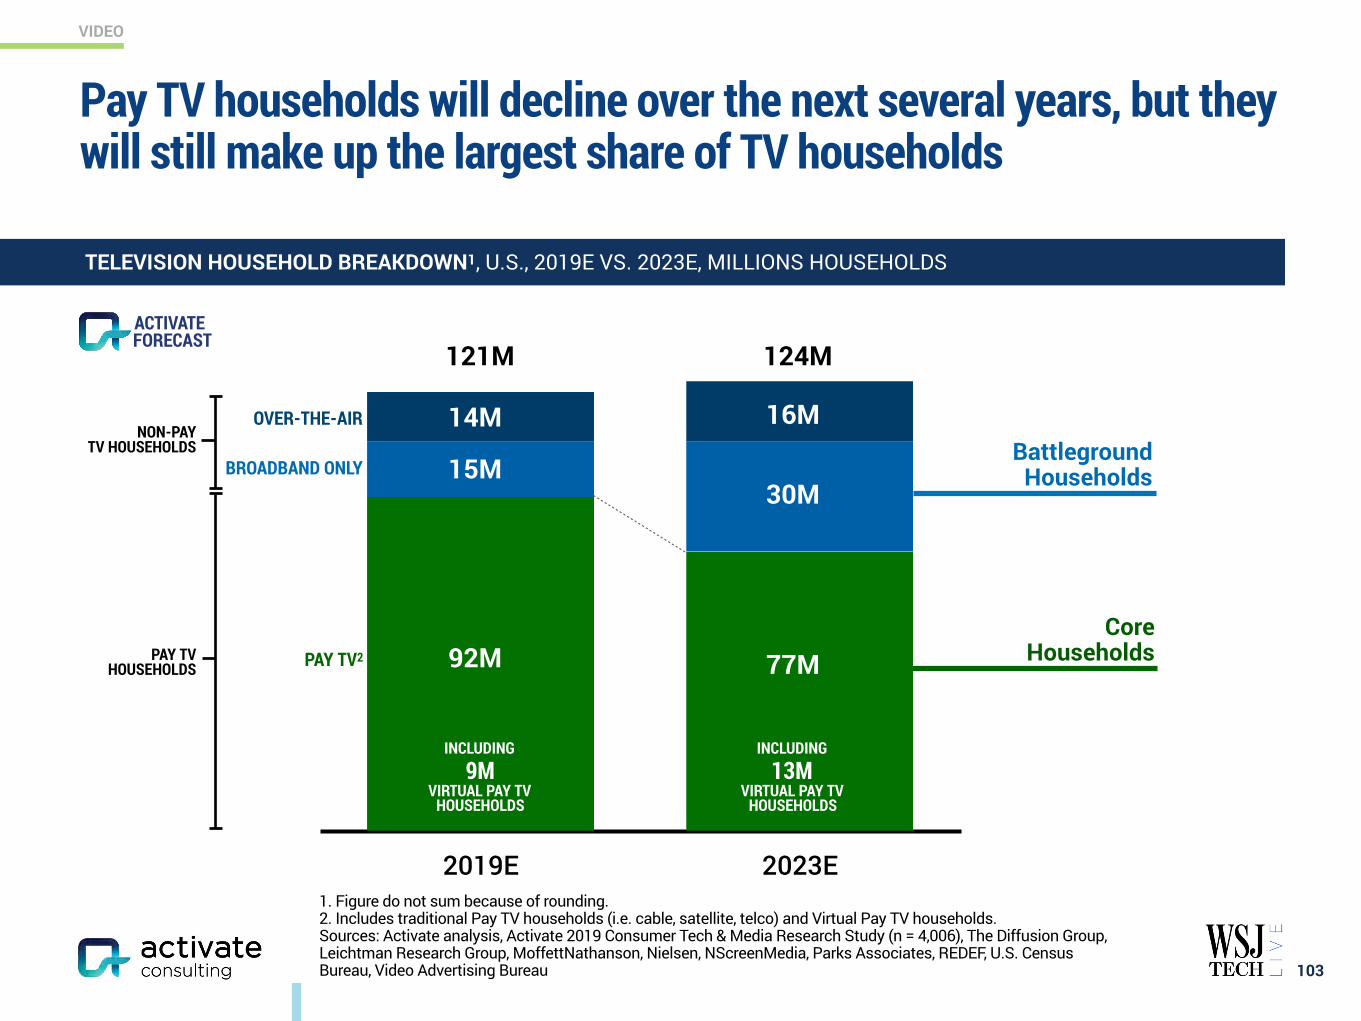
VIDEO
1. Figure do not sum because of rounding. 2. Includes traditional Pay TV households (i.e. cable, satellite, telco) and Virtual Pay TV households. Sources: Activate analysis, Activate 2019 Consumer Tech & Media Research Study (n = 4,006), The Diffusion Group, Leichtman Research Group, MoffettNathanson, Nielsen, NScreenMedia, Parks Associates, REDEF, U.S. Census Bureau, Video Advertising Bureau
Pay TV households will decline over the next several years, but they will still make up the largest share of TV households
103
2019E 2023E
92M 77M
15M30M
14M 16M
121M 124M
PAY TV HOUSEHOLDS
NON-PAY TV HOUSEHOLDS
BROADBAND ONLY
OVER-THE-AIR
PAY TV2
FORECASTACTIVATE
Battleground Households
Core Households
TELEVISION HOUSEHOLD BREAKDOWN1, U.S., 2019E VS. 2023E, MILLIONS HOUSEHOLDS
INCLUDING 9M
VIRTUAL PAY TV HOUSEHOLDS
INCLUDING 13M
VIRTUAL PAY TV HOUSEHOLDS
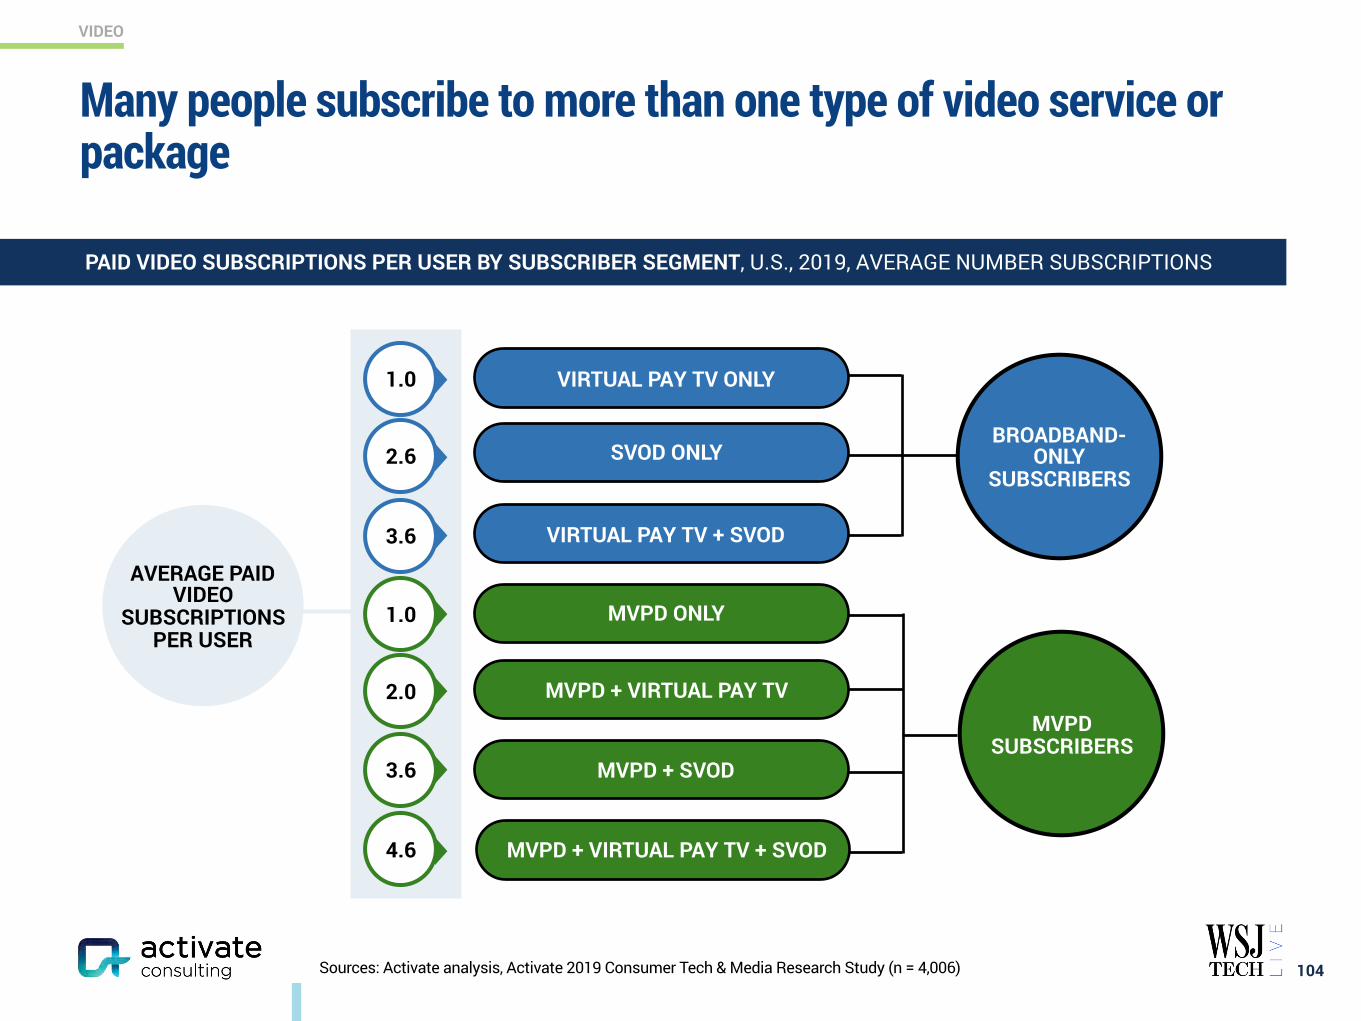
VIDEO
Sources: Activate analysis, Activate 2019 Consumer Tech & Media Research Study (n = 4,006)
Many people subscribe to more than one type of video service or package
104
PAID VIDEO SUBSCRIPTIONS PER USER BY SUBSCRIBER SEGMENT, U.S., 2019, AVERAGE NUMBER SUBSCRIPTIONS
BROADBAND-ONLY
SUBSCRIBERS
MVPD SUBSCRIBERS
AVERAGE PAID VIDEO
SUBSCRIPTIONS PER USER
MVPD ONLY
MVPD + VIRTUAL PAY TV
MVPD + SVOD
MVPD + VIRTUAL PAY TV + SVOD
1.0
2.0
3.6
4.6
VIRTUAL PAY TV ONLY
SVOD ONLY
VIRTUAL PAY TV + SVOD
1.0
2.6
3.6
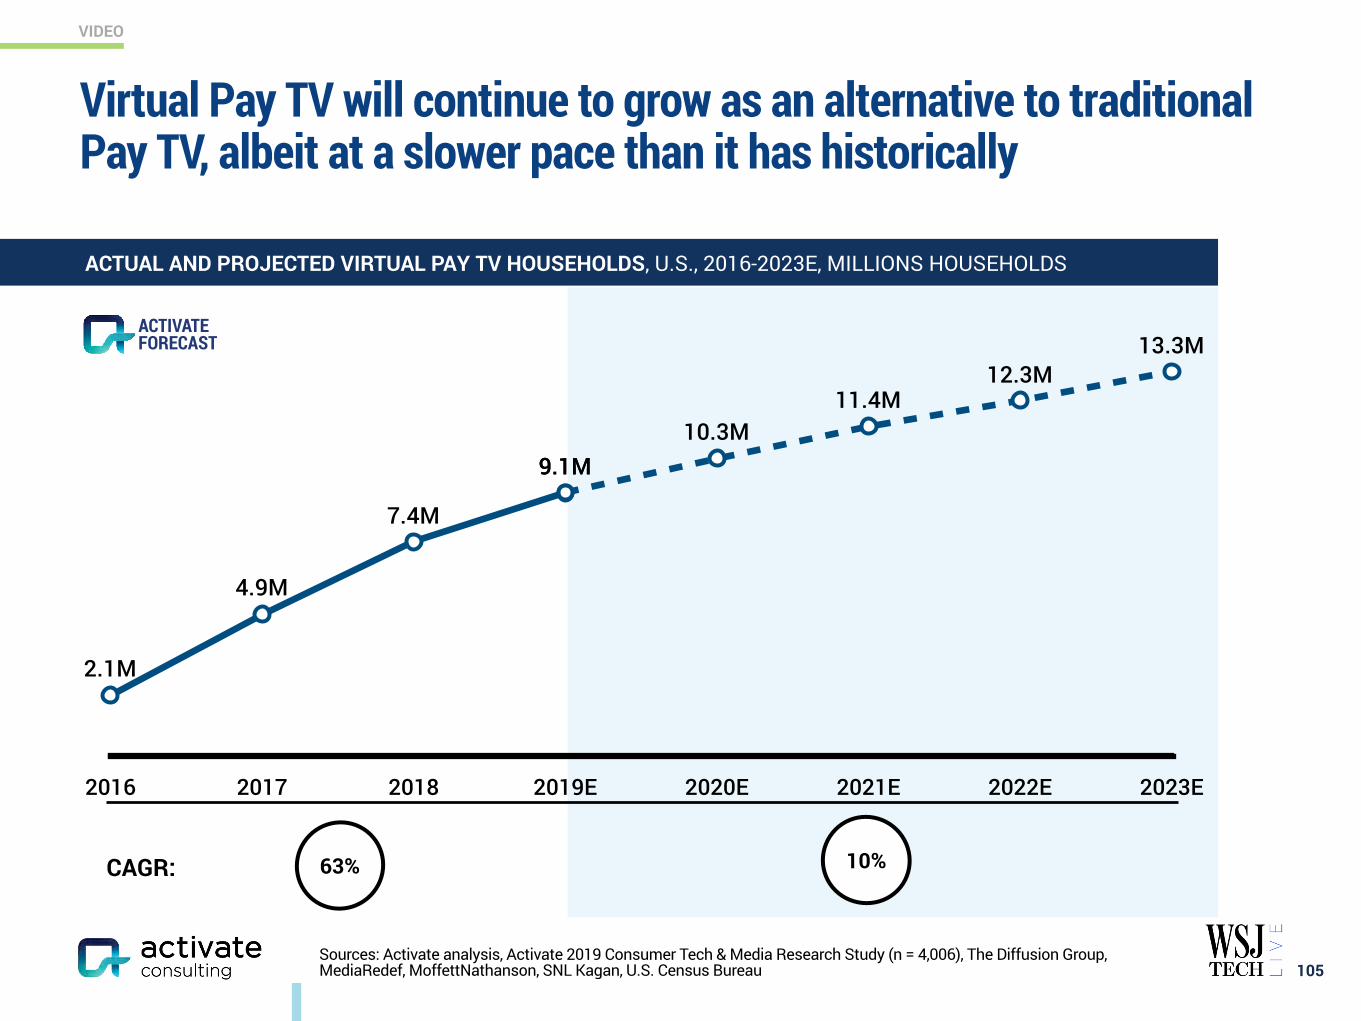
VIDEO
Sources: Activate analysis, Activate 2019 Consumer Tech & Media Research Study (n = 4,006), The Diffusion Group, MediaRedef, MoffettNathanson, SNL Kagan, U.S. Census Bureau
Virtual Pay TV will continue to grow as an alternative to traditional Pay TV, albeit at a slower pace than it has historically
105
FORECASTACTIVATE
2016 2017 2018 2019E 2020E 2021E 2022E 2023E
9.1M10.3M
11.4M12.3M
13.3M
2.1M
4.9M
7.4M
9.1M
ACTUAL AND PROJECTED VIRTUAL PAY TV HOUSEHOLDS, U.S., 2016-2023E, MILLIONS HOUSEHOLDS
63% 10%CAGR:
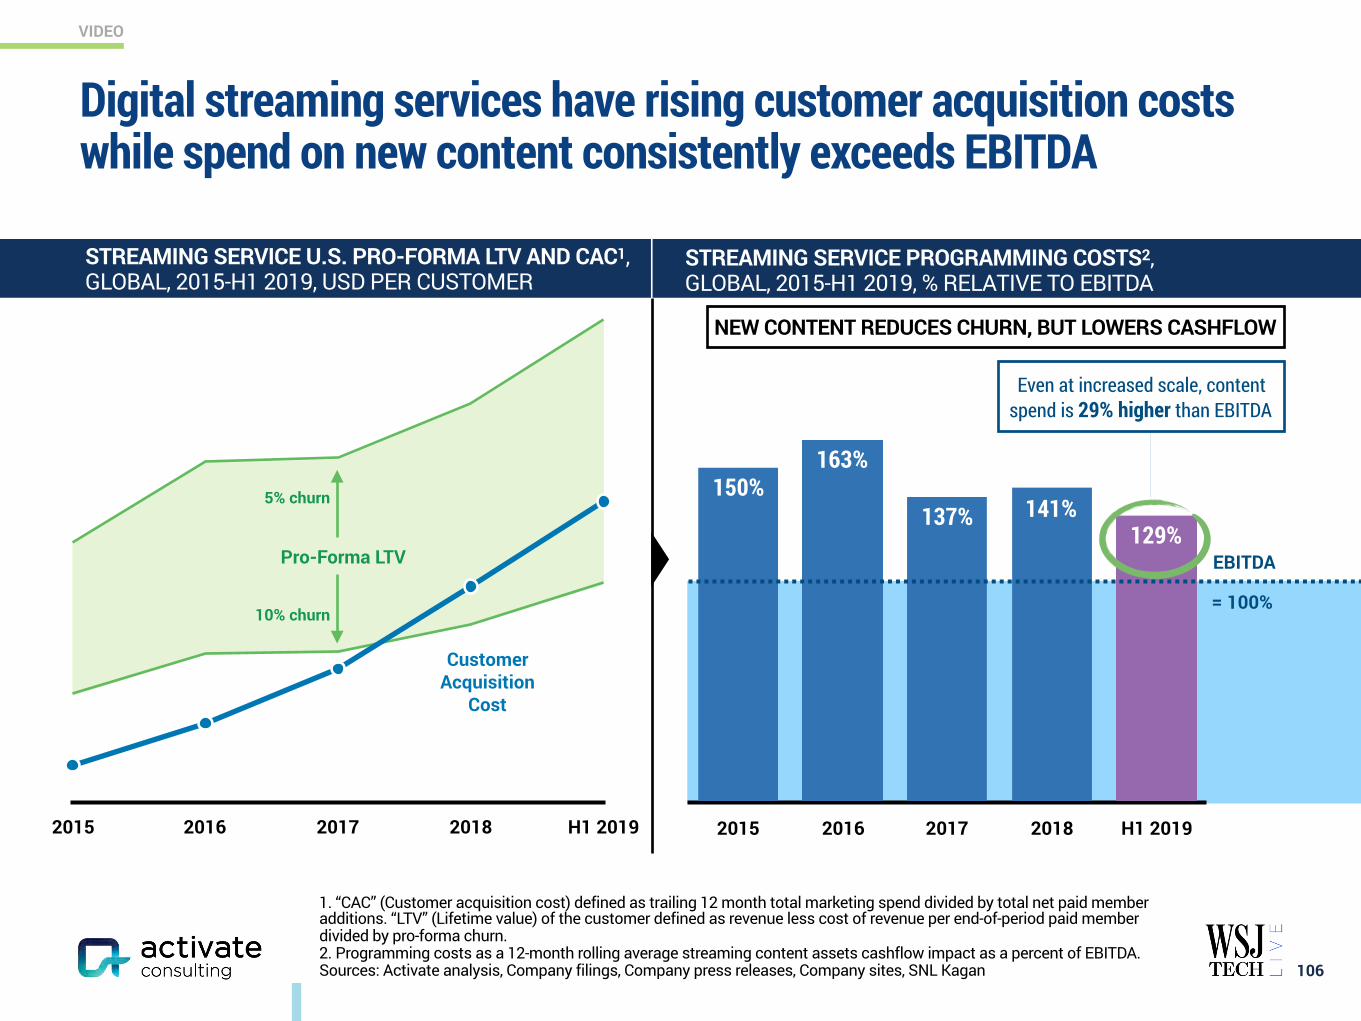
VIDEO
2015 2016 2017 2018 H1 2019
Digital streaming services have rising customer acquisition costs while spend on new content consistently exceeds EBITDA
106
1. “CAC” (Customer acquisition cost) defined as trailing 12 month total marketing spend divided by total net paid member additions. “LTV” (Lifetime value) of the customer defined as revenue less cost of revenue per end-of-period paid member divided by pro-forma churn. 2. Programming costs as a 12-month rolling average streaming content assets cashflow impact as a percent of EBITDA. Sources: Activate analysis, Company filings, Company press releases, Company sites, SNL Kagan
Pro-Forma LTV
10% churn
5% churn
Customer Acquisition
Cost
STREAMING SERVICE PROGRAMMING COSTS2, GLOBAL, 2015-H1 2019, % RELATIVE TO EBITDA
NEW CONTENT REDUCES CHURN, BUT LOWERS CASHFLOW
STREAMING SERVICE U.S. PRO-FORMA LTV AND CAC1, GLOBAL, 2015-H1 2019, USD PER CUSTOMER
EBITDA
2015 2016 2017 2018 H1 2019
129%141%137%
163%150%
Even at increased scale, content spend is 29% higher than EBITDA
= 100%
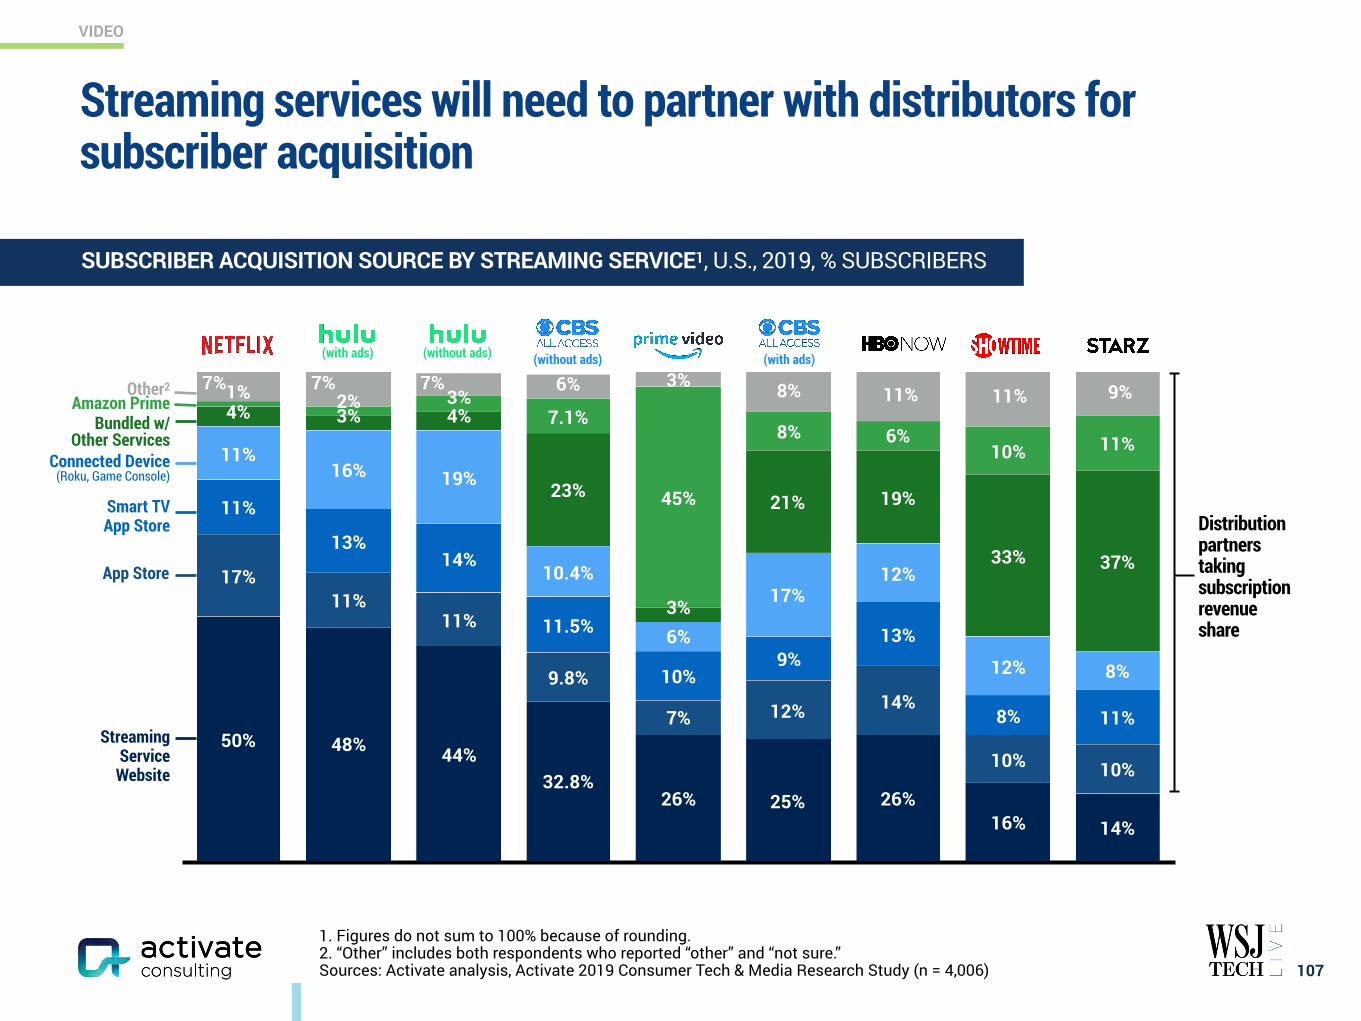
VIDEO
1. Figures do not sum to 100% because of rounding. 2. “Other” includes both respondents who reported “other” and “not sure.” Sources: Activate analysis, Activate 2019 Consumer Tech & Media Research Study (n = 4,006)
11%10%6%8%
45%
7.1%3%2%1%
37%33%
19%21%
3%
23%
4%3%4%
8%12%
12%17%
6%
10.4%
19%16%11%
11%8%
13%9%
10%
11.5%
14%13%
11%
10%10%
14%12%7%
9.8%
11%11%
17%
14%16%26%25%26%
32.8%44%48%50%
Streaming services will need to partner with distributors for subscriber acquisition
107
Streaming Service Website
App Store
Bundled w/Other Services
Amazon Prime
Distribution partners taking subscription revenue share
Other2
Smart TV App Store
Connected Device (Roku, Game Console)
(with ads) (without ads) (without ads) (with ads)
SUBSCRIBER ACQUISITION SOURCE BY STREAMING SERVICE1, U.S., 2019, % SUBSCRIBERS
7% 7% 7% 6% 3%11%8% 11% 9%
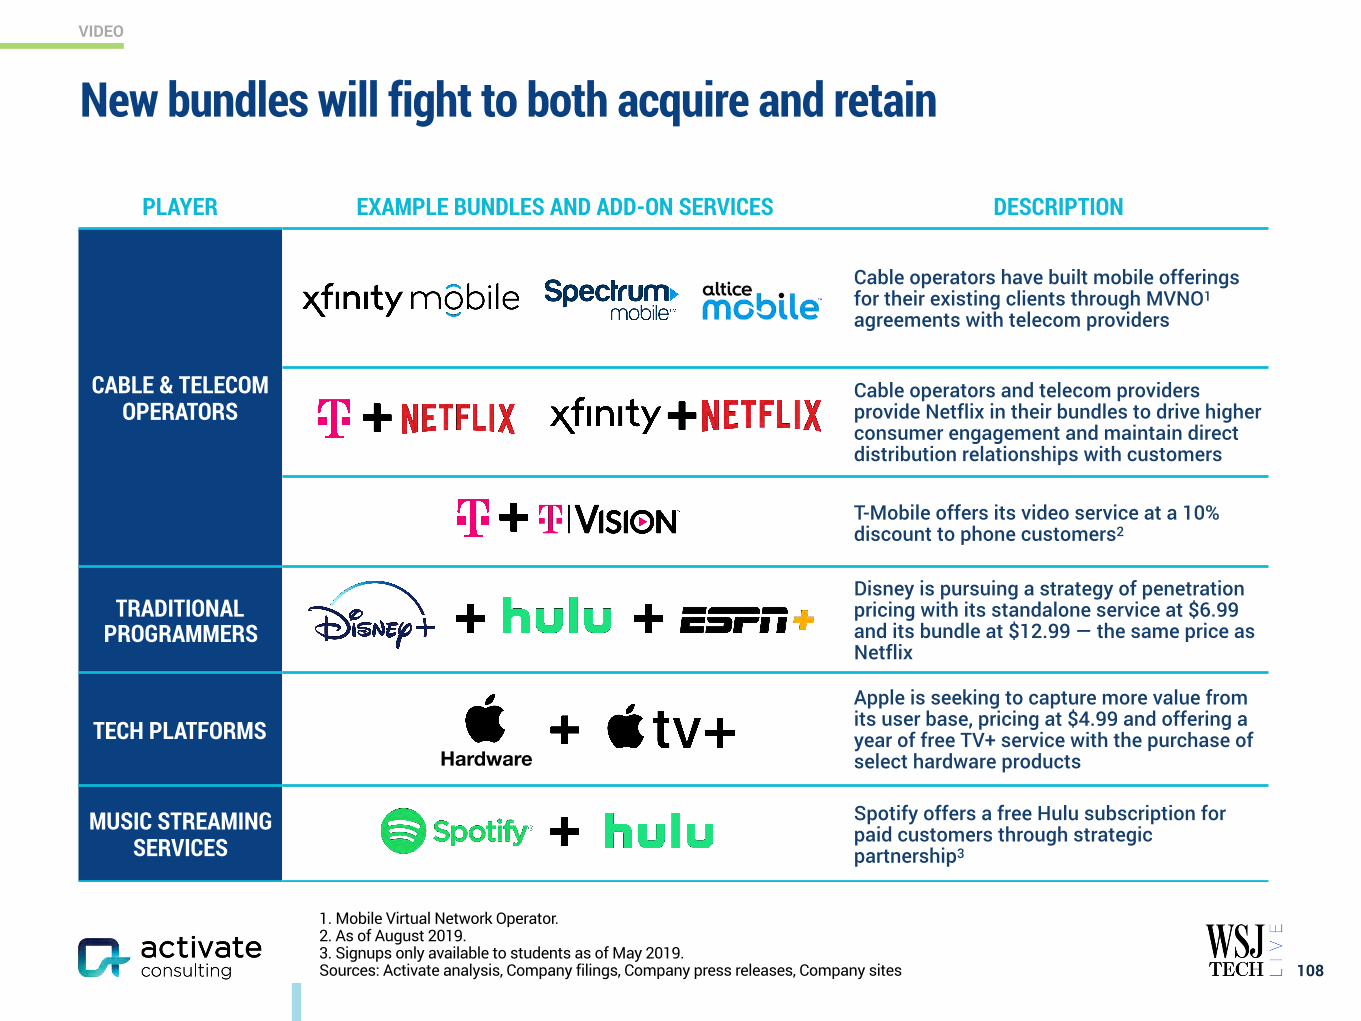
VIDEO
1. Mobile Virtual Network Operator. 2. As of August 2019. 3. Signups only available to students as of May 2019. Sources: Activate analysis, Company filings, Company press releases, Company sites
New bundles will fight to both acquire and retain
108
PLAYER EXAMPLE BUNDLES AND ADD-ON SERVICES DESCRIPTION
CABLE & TELECOM OPERATORS
Cable operators have built mobile offerings for their existing clients through MVNO1 agreements with telecom providers
Cable operators and telecom providers provide Netflix in their bundles to drive higher consumer engagement and maintain direct distribution relationships with customers
T-Mobile offers its video service at a 10% discount to phone customers2
TRADITIONAL PROGRAMMERS
Disney is pursuing a strategy of penetration pricing with its standalone service at $6.99 and its bundle at $12.99 — the same price as Netflix
TECH PLATFORMSApple is seeking to capture more value from its user base, pricing at $4.99 and offering a year of free TV+ service with the purchase of select hardware products
MUSIC STREAMING SERVICES
Spotify offers a free Hulu subscription for paid customers through strategic partnership3
Hardware
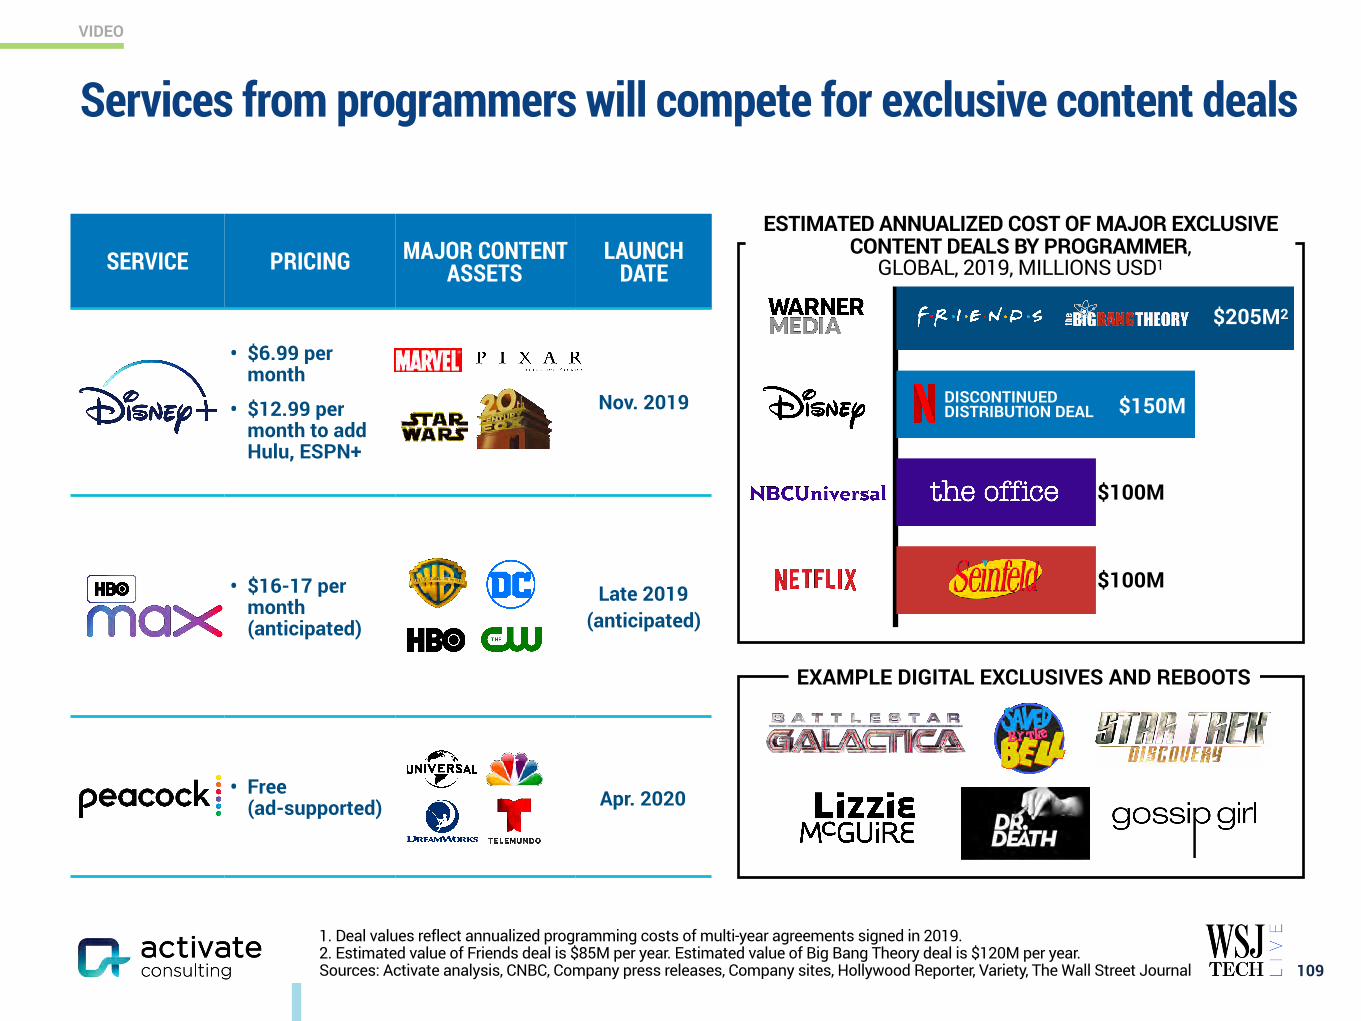
VIDEO
1. Deal values reflect annualized programming costs of multi-year agreements signed in 2019. 2. Estimated value of Friends deal is $85M per year. Estimated value of Big Bang Theory deal is $120M per year. Sources: Activate analysis, CNBC, Company press releases, Company sites, Hollywood Reporter, Variety, The Wall Street Journal
Services from programmers will compete for exclusive content deals
109
SERVICE PRICING MAJOR CONTENT ASSETS
LAUNCH DATE
• $6.99 per month
• $12.99 per month to add Hulu, ESPN+
Nov. 2019
• $16-17 per month (anticipated)
Late 2019 (anticipated)
• Free(ad-supported) Apr. 2020
EXAMPLE DIGITAL EXCLUSIVES AND REBOOTS
ESTIMATED ANNUALIZED COST OF MAJOR EXCLUSIVE CONTENT DEALS BY PROGRAMMER,
GLOBAL, 2019, MILLIONS USD1
DISCONTINUED DISTRIBUTION DEAL
$100M
$100M
$150M
$205M2
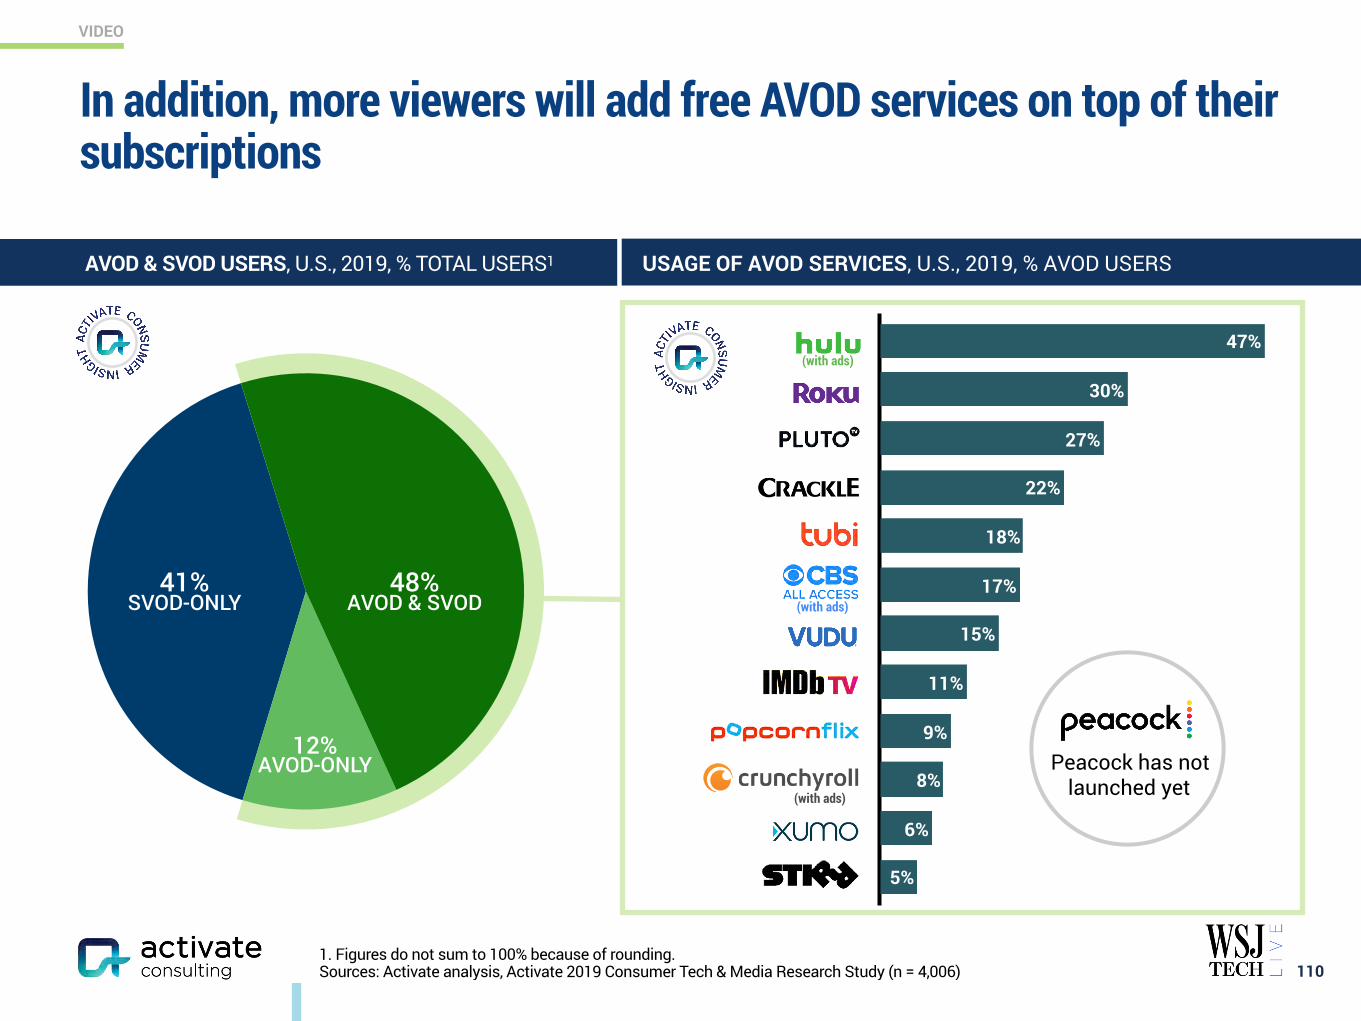
VIDEO
1. Figures do not sum to 100% because of rounding. Sources: Activate analysis, Activate 2019 Consumer Tech & Media Research Study (n = 4,006)
In addition, more viewers will add free AVOD services on top of their subscriptions
110
12% AVOD-ONLY
41% SVOD-ONLY
48% AVOD & SVOD
5%
6%
8%
9%
11%
15%
17%
18%
22%
27%
30%
47%
AVOD & SVOD USERS, U.S., 2019, % TOTAL USERS1 USAGE OF AVOD SERVICES, U.S., 2019, % AVOD USERS
(with ads)
(with ads)
(with ads)
Peacock has not launched yet
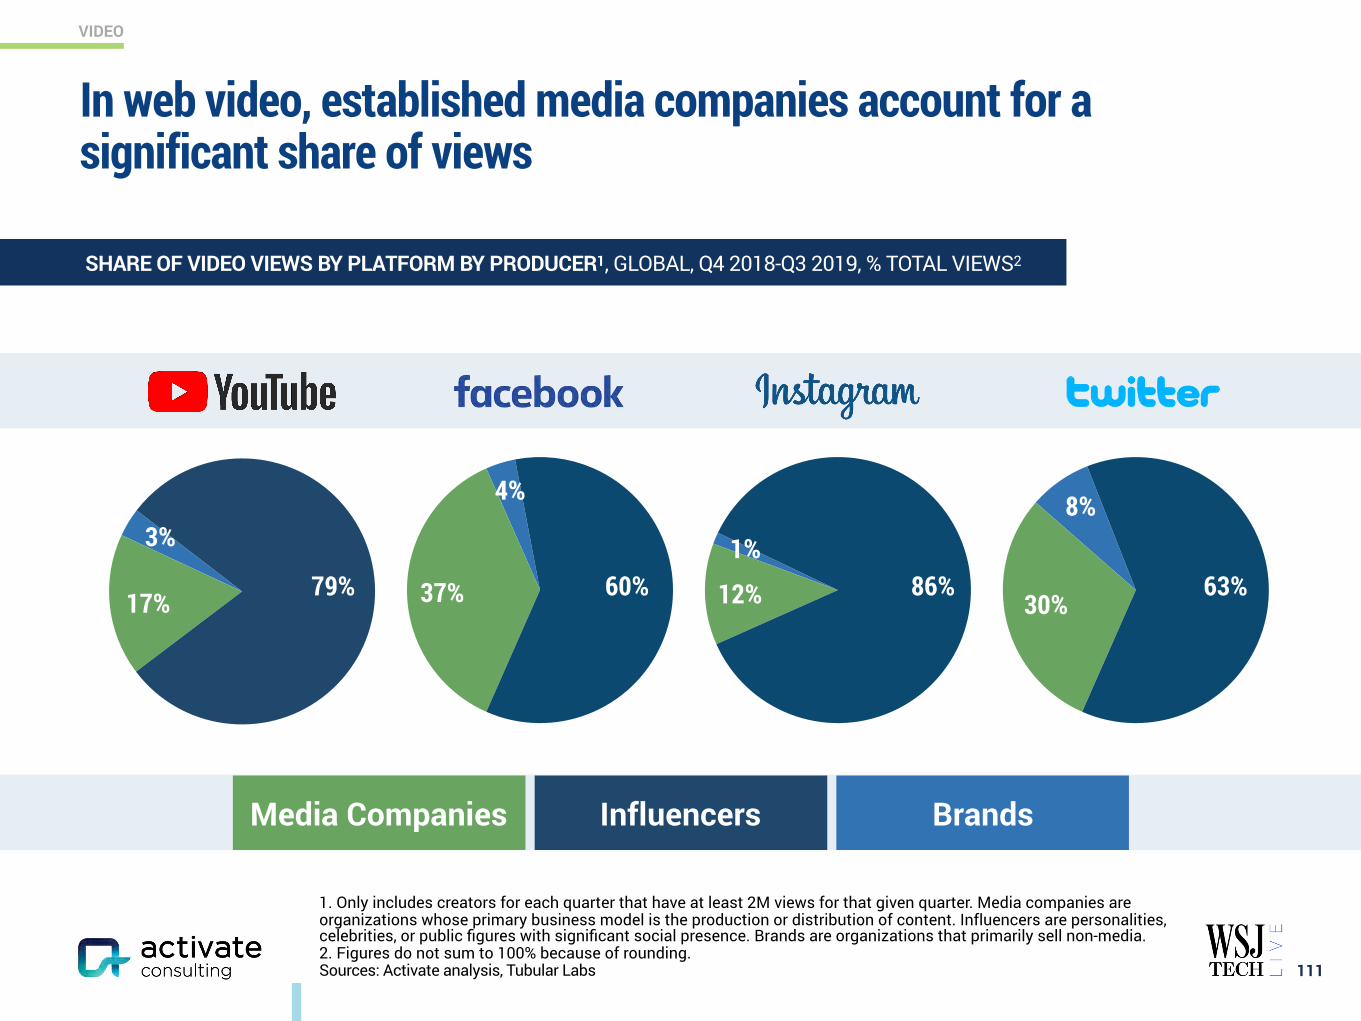
VIDEO
1. Only includes creators for each quarter that have at least 2M views for that given quarter. Media companies are organizations whose primary business model is the production or distribution of content. Influencers are personalities, celebrities, or public figures with significant social presence. Brands are organizations that primarily sell non-media. 2. Figures do not sum to 100% because of rounding. Sources: Activate analysis, Tubular Labs
In web video, established media companies account for a significant share of views
111
SHARE OF VIDEO VIEWS BY PLATFORM BY PRODUCER1, GLOBAL, Q4 2018-Q3 2019, % TOTAL VIEWS2
79%17%
3%
60%37%
4%
86%12%
1%63%
30%
8%
InfluencersMedia Companies Brands
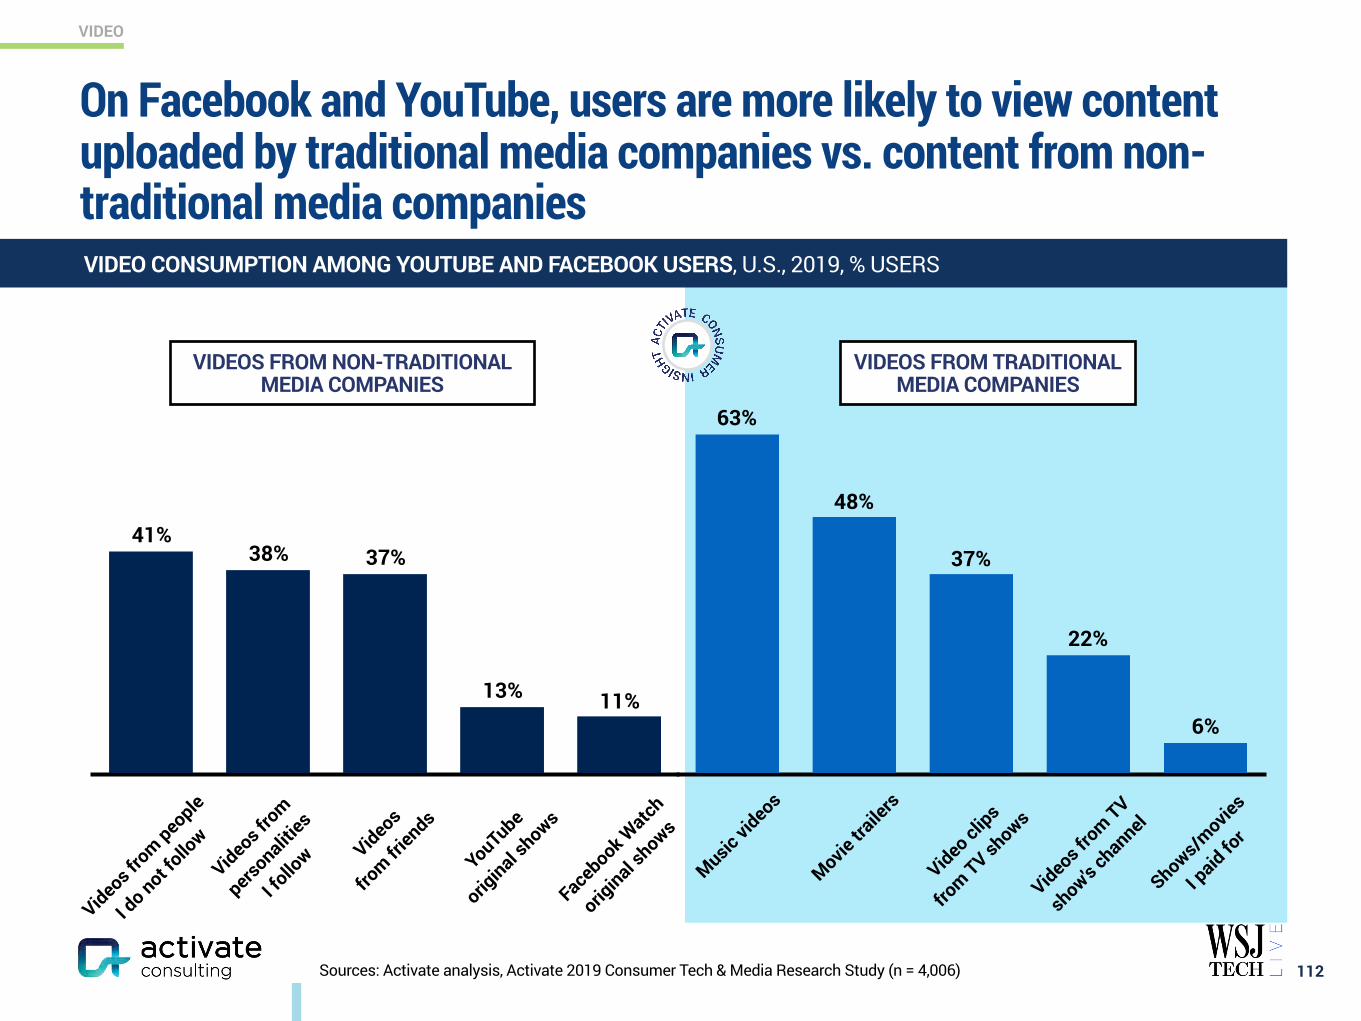
VIDEO
Sources: Activate analysis, Activate 2019 Consumer Tech & Media Research Study (n = 4,006)
On Facebook and YouTube, users are more likely to view content uploaded by traditional media companies vs. content from non-traditional media companies
112
Videos from people
I do not f
ollow
Videos from
personaliti
es
I follo
w Videos
from fr
iends
YouTube
original s
hows
Facebook W
atch
original s
hows
11%13%
37%38%41%
Music vi
deos
Movie tr
ailers
Video clips
from TV sh
ows
Videos from TV
show's c
hannel
Shows/movie
s
I paid fo
r
6%
22%
37%
48%
63%
VIDEOS FROM NON-TRADITIONAL MEDIA COMPANIES
VIDEOS FROM TRADITIONAL MEDIA COMPANIES
VIDEO CONSUMPTION AMONG YOUTUBE AND FACEBOOK USERS, U.S., 2019, % USERS

VIDEO
1. Excludes general interest and live streaming. Figures do not sum to 100% because of rounding. Sources: Activate analysis, Tubular Labs
Genre viewing varies significantly by web video platform
113
15%18%17%16%
11%
27%
17%
7%
20%
24%46%
20%
6%13%
6%
24%
Entertainment
Gaming
Kids Entertainment
Music & Dance
News & Politics
People & Blogs
Sports
Other
MOST VIEWED GENRES BY PLATFORM, GLOBAL, Q4 2018-Q3 2019, % TOTAL VIEWS1
0.3%
0.2%
4%3%
17%
7%
3%
18%
9%
1%
1%
3%0.5%
5%14%
26%

VIDEO
Sources: Activate analysis, Tubular Labs
Multi-platform success is rare among influencers — no top 10 creator is in another platform’s top 10
114
TOP 10 INFLUENCERS BY PLATFORM, U.S., OCT. 2017-SEPT. 2019, MILLIONS TOTAL VIEWS
RANK
1 Like Nastya Vlog 12,603 Marcelo Tinelli 3,578 Cardi B 3,226 BANGTANTV 927
2 Vlad and Nikita 9,976 Jay Shetty 3,511 BestVines BVIRAL 2,506 Donald J. Trump 735
3 Kids Diana Show 9,974 Voompla 3,083 therock 2,305 Free Memes Kids 546
4 Ryan ToysReview 7,712 Platano 3,070 Lele Pons 1,896 Quenlin Blackwell 523
5 Toys and Colors 7,473 Love Is Part Of Life 2,928 Huda Beauty 1,831 Lil Nas X 444
6 Canal KondZilla 7,000 Công Lý 2,801 Will Smith 1,759 UnusualVideos 416
7 Boram Tube Vlog 6,649 BigDawsTv 2,545 @DOG 1,646 Aaron Rupar 393
8 Shemaroo Filmi Gaane 6,312 Ben Phillips 2,379 Lambe Turah 1,644 Brother Nature 377
9 Luccas Neto - Luccas Toon 5,297 Gãy TV 2,079 snoopdogg 1,643 Physics & Astronomy
Zone 374
10 Stacy Toys 5,038 Nas Daily 2,022 Couples! 1,617 Red Dead 2 367
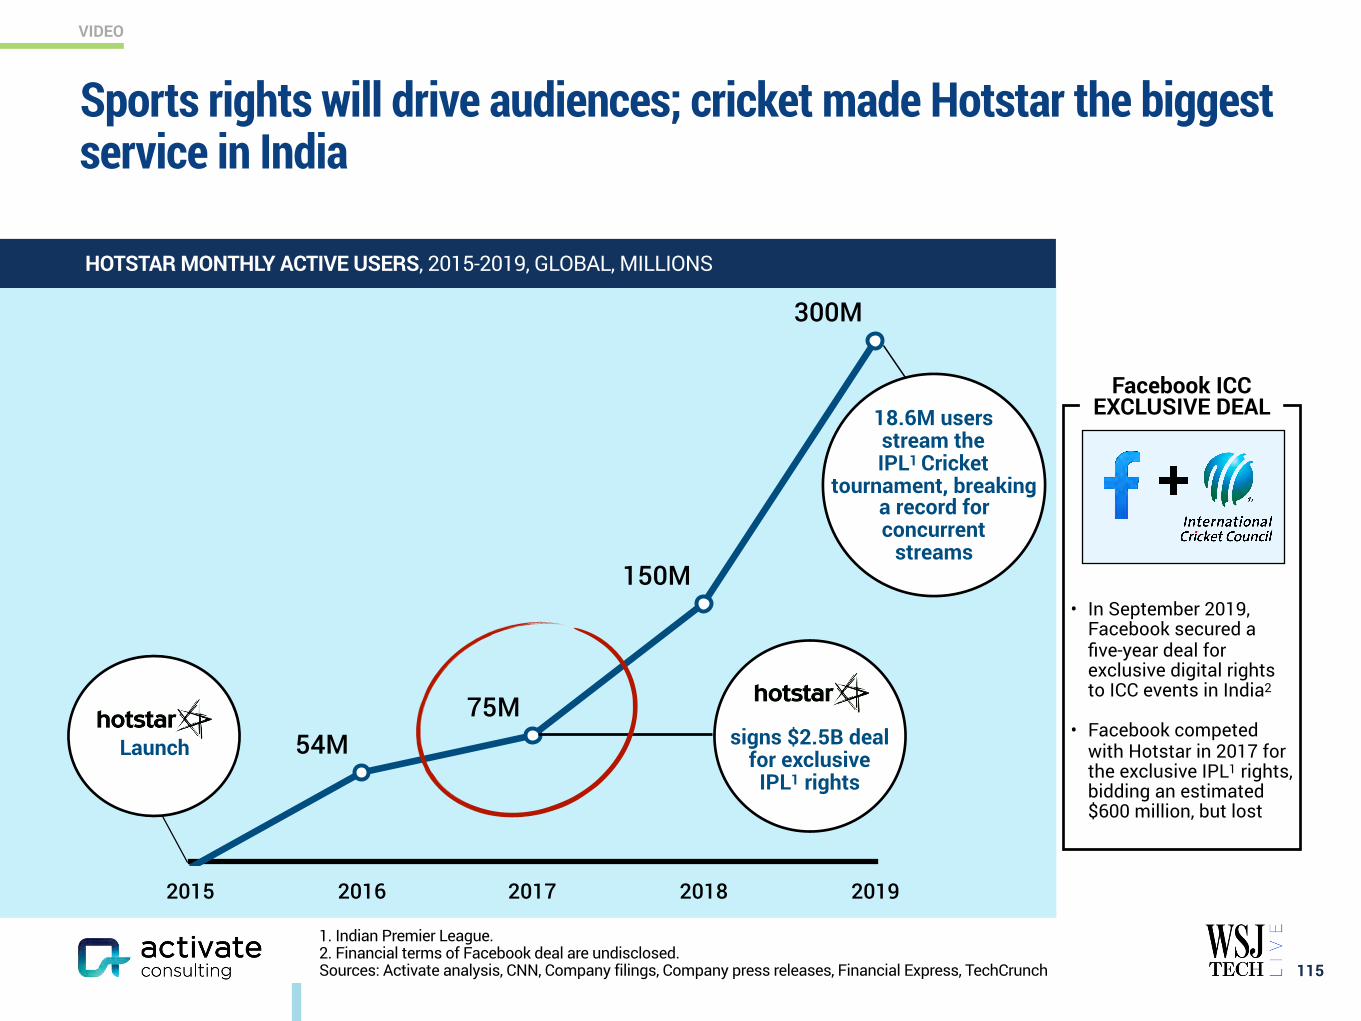
VIDEO
• In September 2019, Facebook secured a five-year deal for exclusive digital rights to ICC events in India2
• Facebook competed with Hotstar in 2017 for the exclusive IPL1 rights, bidding an estimated $600 million, but lost
1. Indian Premier League. 2. Financial terms of Facebook deal are undisclosed. Sources: Activate analysis, CNN, Company filings, Company press releases, Financial Express, TechCrunch
Sports rights will drive audiences; cricket made Hotstar the biggest service in India
115
2015 2016 2017 2018 2019
54M75M
150M
300M
signs $2.5B deal for exclusive
IPL1 rights
18.6M users stream the IPL1 Cricket
tournament, breaking a record for concurrent
streams
Launch
Facebook ICC EXCLUSIVE DEAL
HOTSTAR MONTHLY ACTIVE USERS, 2015-2019, GLOBAL, MILLIONS
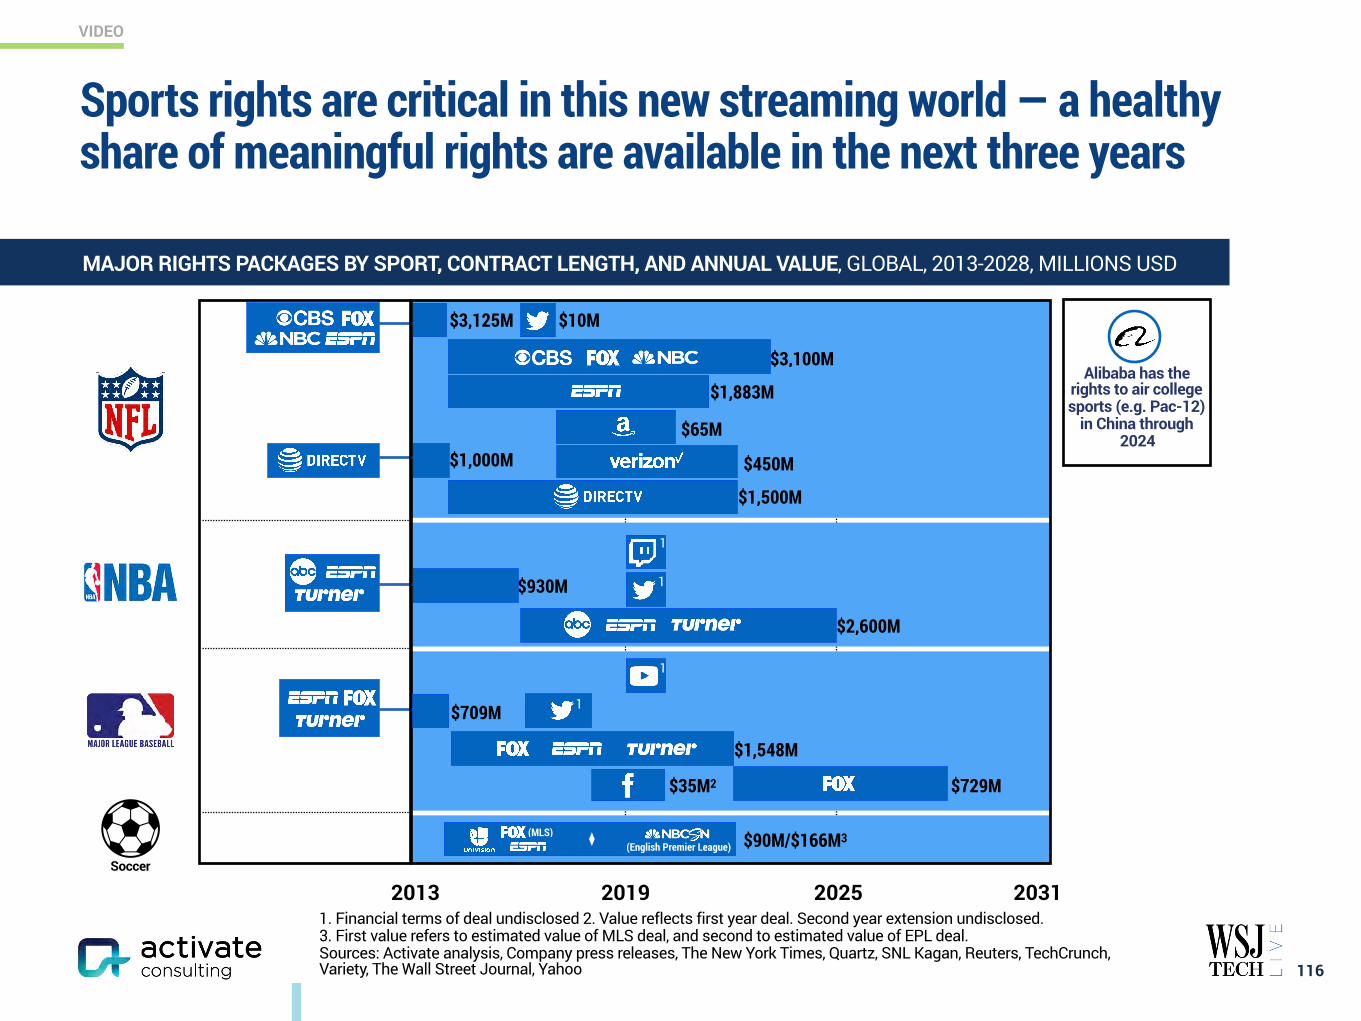
VIDEO
1. Financial terms of deal undisclosed 2. Value reflects first year deal. Second year extension undisclosed. 3. First value refers to estimated value of MLS deal, and second to estimated value of EPL deal. Sources: Activate analysis, Company press releases, The New York Times, Quartz, SNL Kagan, Reuters, TechCrunch, Variety, The Wall Street Journal, Yahoo
Sports rights are critical in this new streaming world — a healthy share of meaningful rights are available in the next three years
116
Alibaba has the rights to air college sports (e.g. Pac-12)
in China through 2024
$709M
$1,548M
$930M
$3,125M
$1,883M
$3,100M
$10M
$65M
Soccer
$35M2
$90M/$166M3(English Premier League)
1
(MLS)
$2,600M
$450M
1
1
2013 2019 2025 2031
$729M
1
$1,500M
$1,000M
MAJOR RIGHTS PACKAGES BY SPORT, CONTRACT LENGTH, AND ANNUAL VALUE, GLOBAL, 2013-2028, MILLIONS USD
www.activate.com 117
PAGE
$300 Billion Global Internet and Media Growth Dollars by 2023 4
Consumer Attention: 12:40 Hours of Technology & Media Per Day 9
Super Users: The Imperative for Technology & Media Companies 13
Social Splinter: The Social Media World Expands 27
eCommerce: Shrinking the Divide Between Physical and Digital Shopping 41
Digital Marketplaces: New Inventory, Price, Transparency, Ease of Use 60
Video Gaming: The Next Streaming Battlefront 71
Esports: Sport of the Future 84
Video: Streaming Stacking, Battleground Households 94
Sports Betting: The Next Big Financial Trading Market 117
Sports: More Viewing, Emerging Sports, Better Fan Experiences 129
Music: The Discovery Challenge 138
Podcasting: New Listening Experiences and Explosive Growth 146
The Networked Body: Quantified and Connected Human 159
Digital Consumer Finance: Next Generation Services Go Mainstream 169
Connectivity: Enabling the Next Wave of Technology and Media Growth 182
CONTENTS
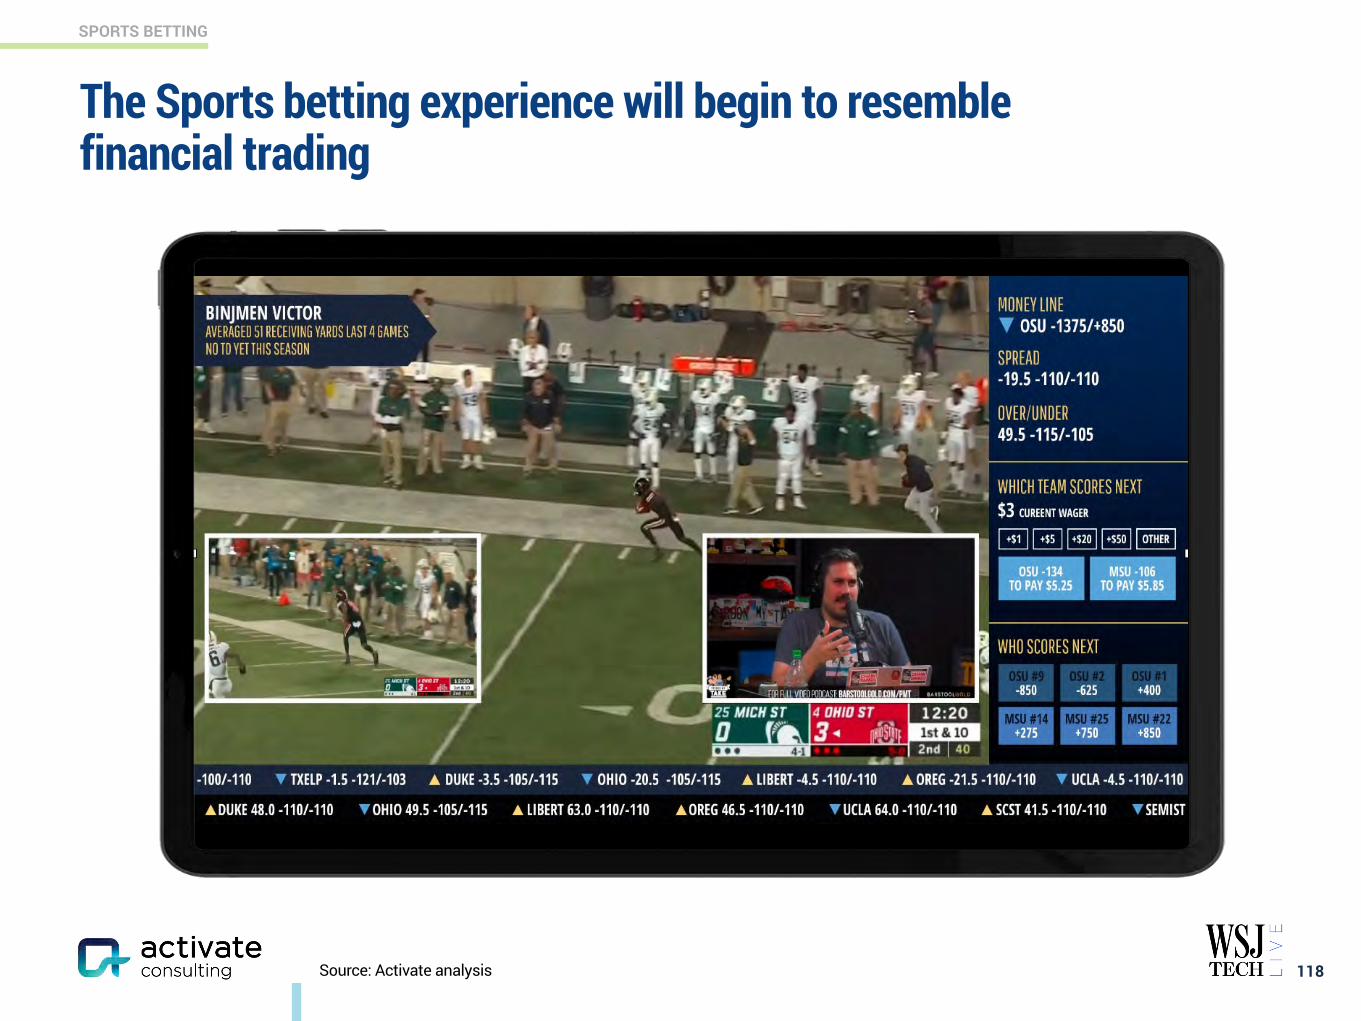
118
SPORTS BETTING
Source: Activate analysis
The Sports betting experience will begin to resemble financial trading
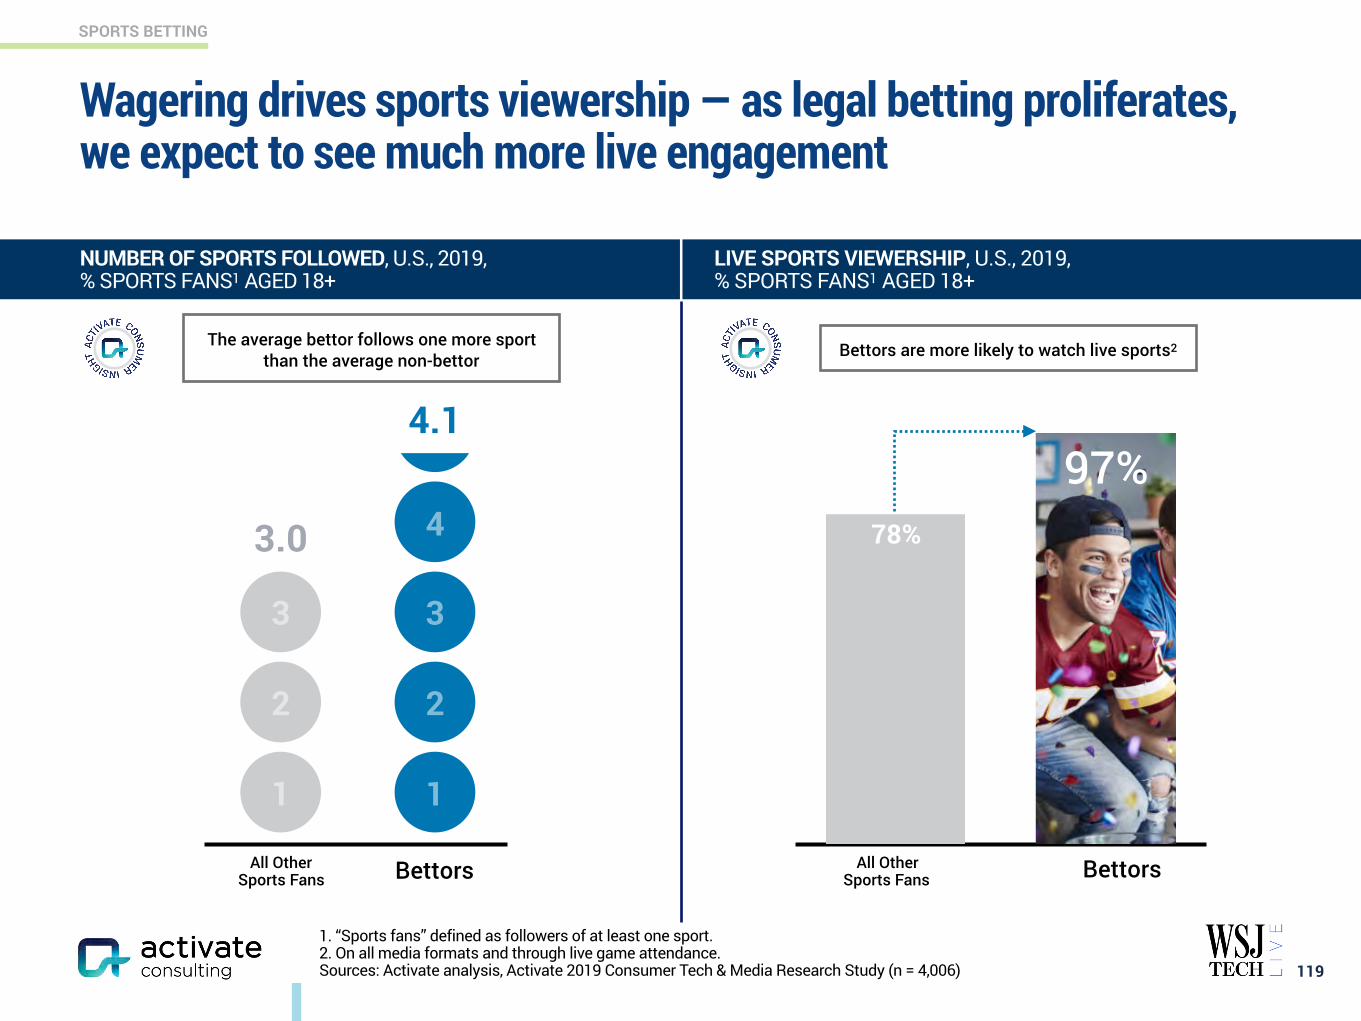
SPORTS BETTING
119
Wagering drives sports viewership — as legal betting proliferates, we expect to see much more live engagement
NUMBER OF SPORTS FOLLOWED, U.S., 2019, % SPORTS FANS1 AGED 18+
LIVE SPORTS VIEWERSHIP, U.S., 2019, % SPORTS FANS1 AGED 18+
Bettors are more likely to watch live sports2
1
2
3
1
2
3
4
All Other Sports Fans Bettors
3.0
4.197%
78%
All Other Sports Fans Bettors
The average bettor follows one more sport than the average non-bettor
1. “Sports fans” defined as followers of at least one sport. 2. On all media formats and through live game attendance. Sources: Activate analysis, Activate 2019 Consumer Tech & Media Research Study (n = 4,006)
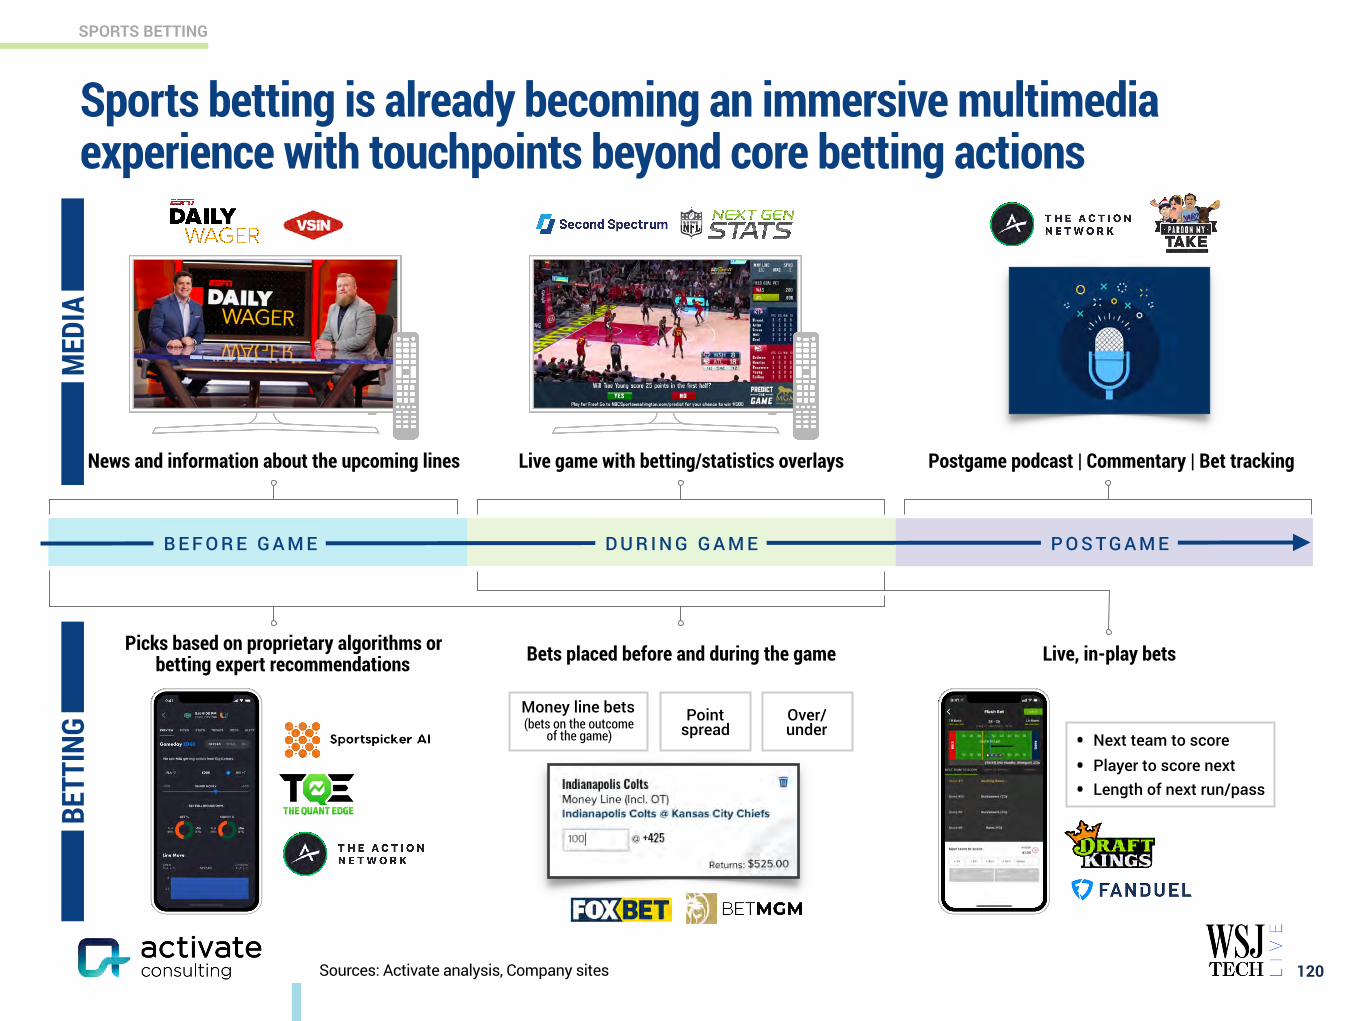
SPORTS BETTING
120
Sports betting is already becoming an immersive multimedia experience with touchpoints beyond core betting actions
Live game with betting/statistics overlays
Picks based on proprietary algorithms or betting expert recommendations
Postgame podcast | Commentary | Bet tracking
Live, in-play bets
News and information about the upcoming lines
Bets placed before and during the game
B E F O R E G A M E D U R I N G G A M E P O S T G A M E
• Next team to score
• Player to score next
• Length of next run/pass
Money line bets (bets on the outcome
of the game) Point
spreadOver/under
MED
IABE
TTIN
G
Sources: Activate analysis, Company sites
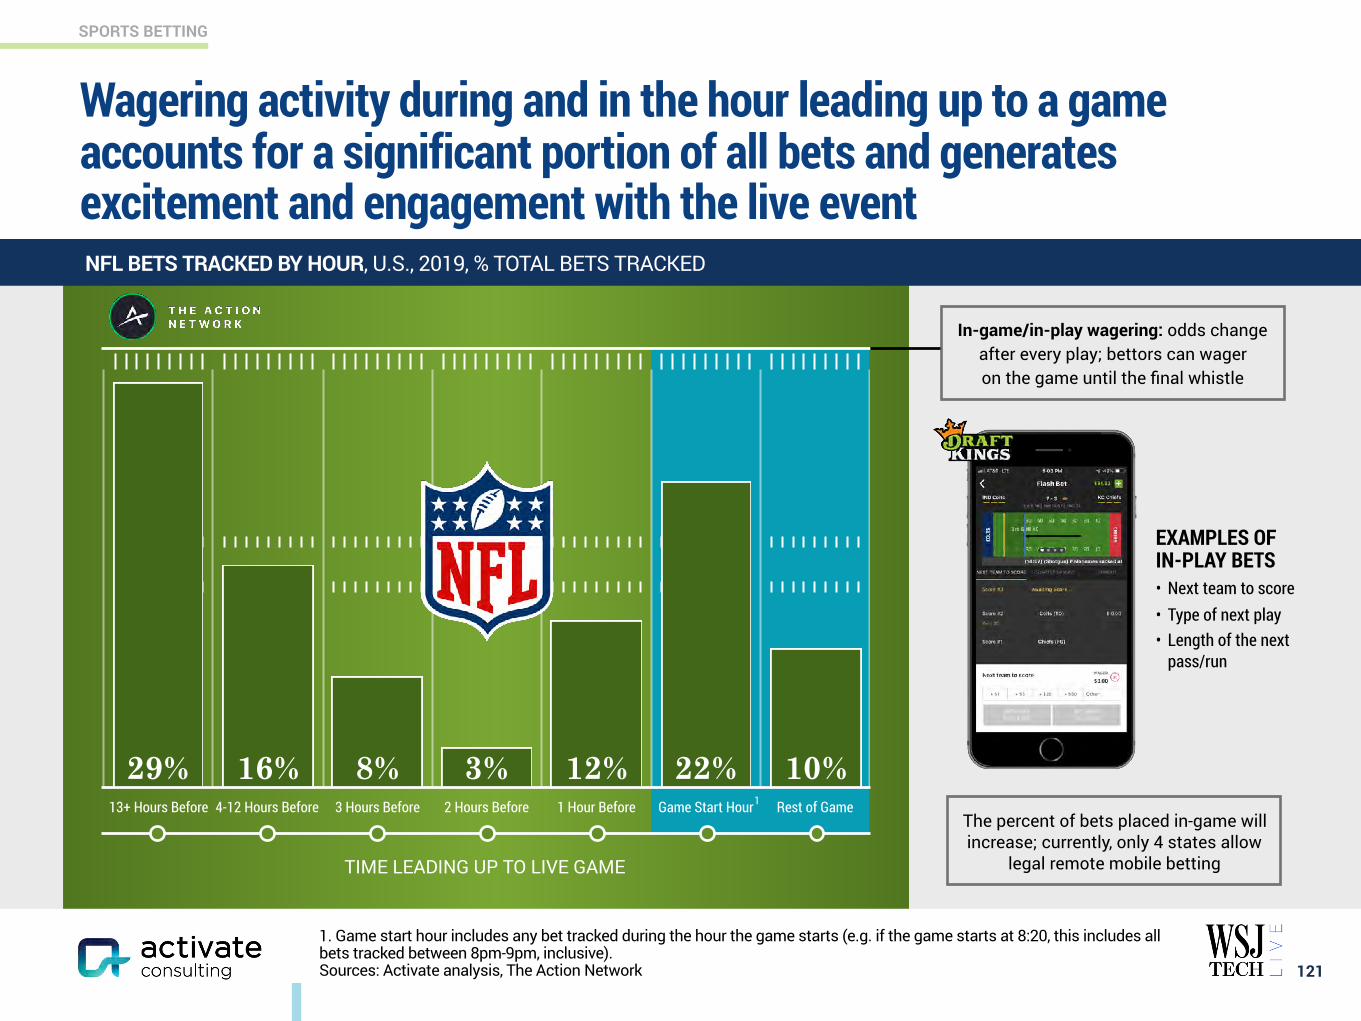
SPORTS BETTING
121
Wagering activity during and in the hour leading up to a game accounts for a significant portion of all bets and generates excitement and engagement with the live eventNFL BETS TRACKED BY HOUR, U.S., 2019, % TOTAL BETS TRACKED
13+ Hours Before 4-12 Hours Before 3 Hours Before 2 Hours Before 1 Hour Before Game Start Hour Rest of Game
10%22%12%3%8%16%29%
In-game/in-play wagering: odds change after every play; bettors can wager on the game until the final whistle
1
The percent of bets placed in-game will increase; currently, only 4 states allow
legal remote mobile betting TIME LEADING UP TO LIVE GAME
EXAMPLES OF IN-PLAY BETS • Next team to score • Type of next play • Length of the next
pass/run
1. Game start hour includes any bet tracked during the hour the game starts (e.g. if the game starts at 8:20, this includes all bets tracked between 8pm-9pm, inclusive). Sources: Activate analysis, The Action Network
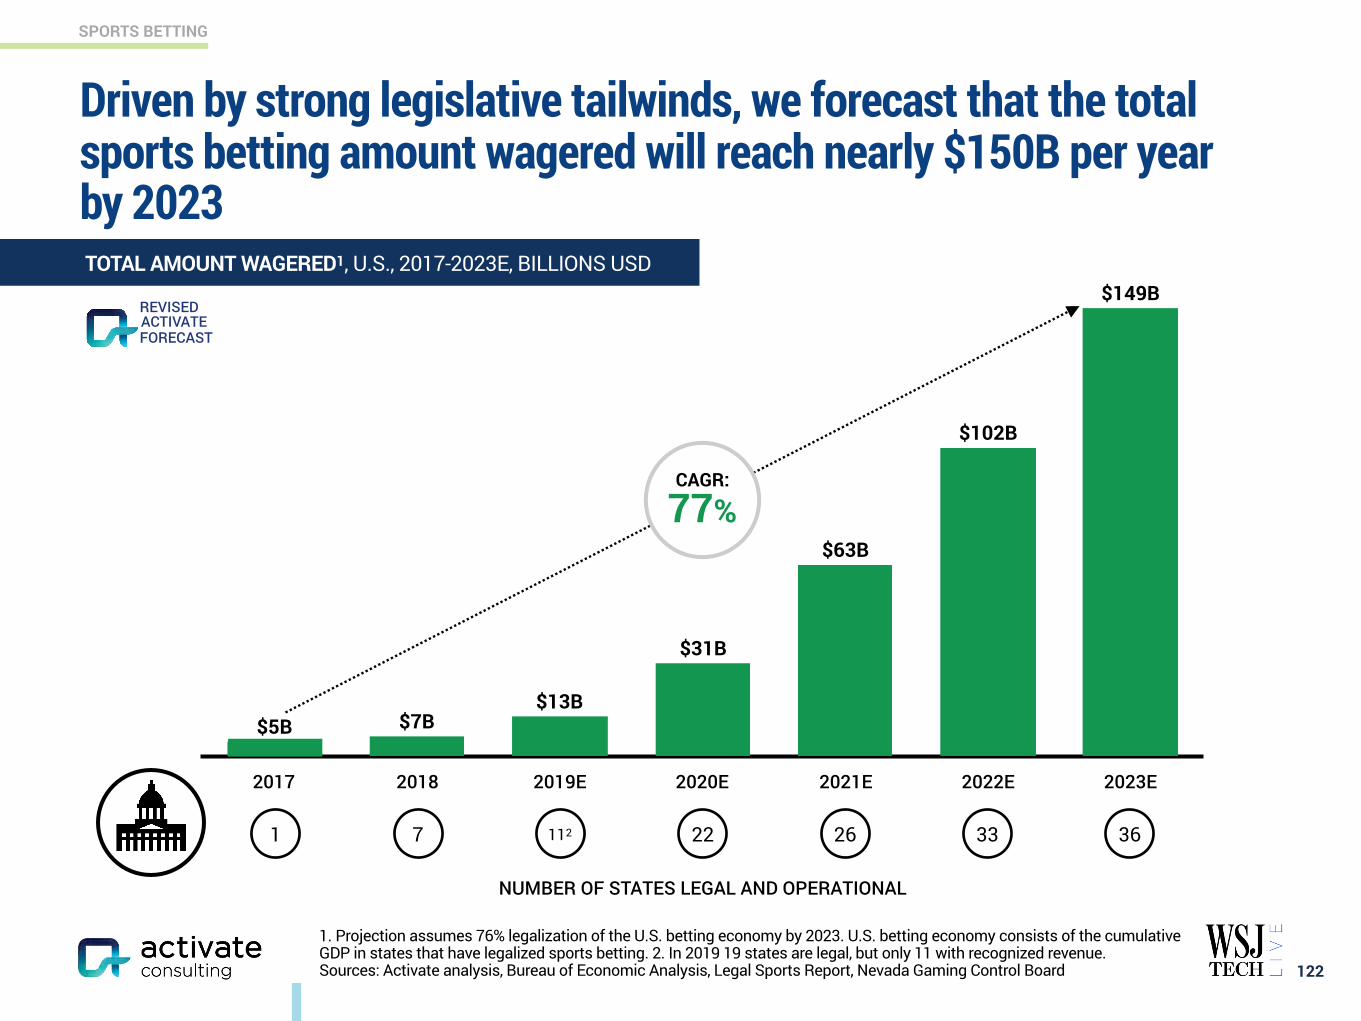
SPORTS BETTING
122
Driven by strong legislative tailwinds, we forecast that the total sports betting amount wagered will reach nearly $150B per year by 2023TOTAL AMOUNT WAGERED1, U.S., 2017-2023E, BILLIONS USD
FORECASTACTIVATE
2017 2018 2019E 2020E 2021E 2022E 2023E
$149B
$102B
$63B
$31B
$13B$7B$5B
CAGR:
77%
REVISED
1. Projection assumes 76% legalization of the U.S. betting economy by 2023. U.S. betting economy consists of the cumulative GDP in states that have legalized sports betting. 2. In 2019 19 states are legal, but only 11 with recognized revenue. Sources: Activate analysis, Bureau of Economic Analysis, Legal Sports Report, Nevada Gaming Control Board
1
NUMBER OF STATES LEGAL AND OPERATIONAL
7 112 22 26 33 36
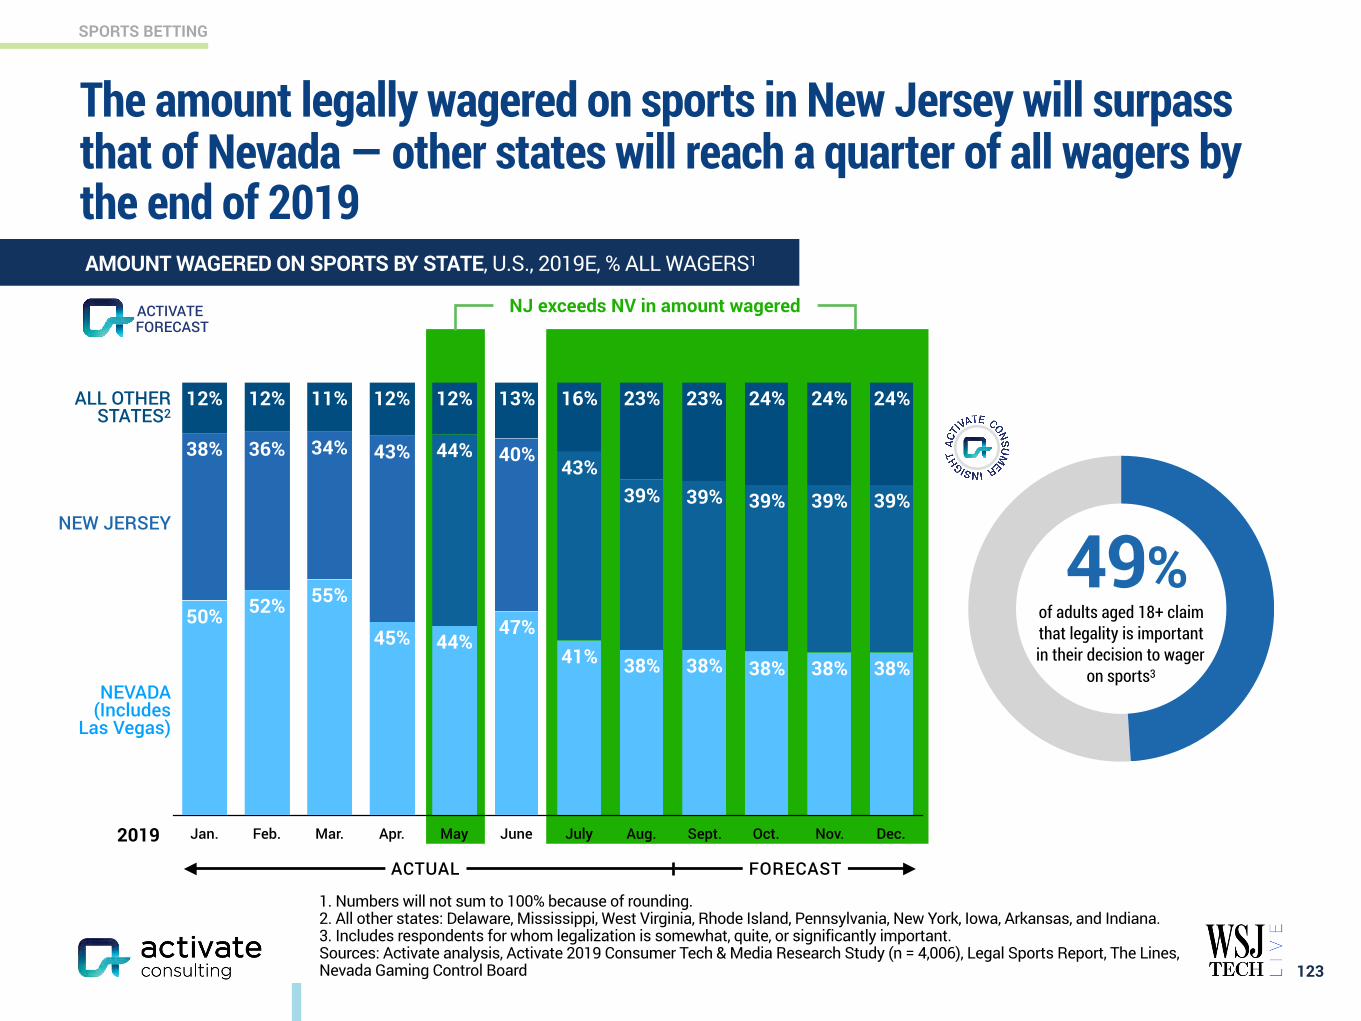
SPORTS BETTING
123
The amount legally wagered on sports in New Jersey will surpass that of Nevada — other states will reach a quarter of all wagers by the end of 2019
Jan. Feb. Mar. Apr. May June July Aug. Sept. Oct. Nov. Dec.
24%24%24%23%23%16%13%12%12%11%12%12%
39%39%39%39%39%43%
40%44%43%34%36%38%
38%38%38%38%38%41%47%
44%45%
55%52%50%
AMOUNT WAGERED ON SPORTS BY STATE, U.S., 2019E, % ALL WAGERS1
FORECASTACTIVATE
49%of adults aged 18+ claim that legality is important in their decision to wager
on sports3
NEVADA (Includes
Las Vegas)
NEW JERSEY
ALL OTHER STATES2
NJ exceeds NV in amount wagered
ACTUAL FORECAST
2019
1. Numbers will not sum to 100% because of rounding. 2. All other states: Delaware, Mississippi, West Virginia, Rhode Island, Pennsylvania, New York, Iowa, Arkansas, and Indiana. 3. Includes respondents for whom legalization is somewhat, quite, or significantly important. Sources: Activate analysis, Activate 2019 Consumer Tech & Media Research Study (n = 4,006), Legal Sports Report, The Lines, Nevada Gaming Control Board
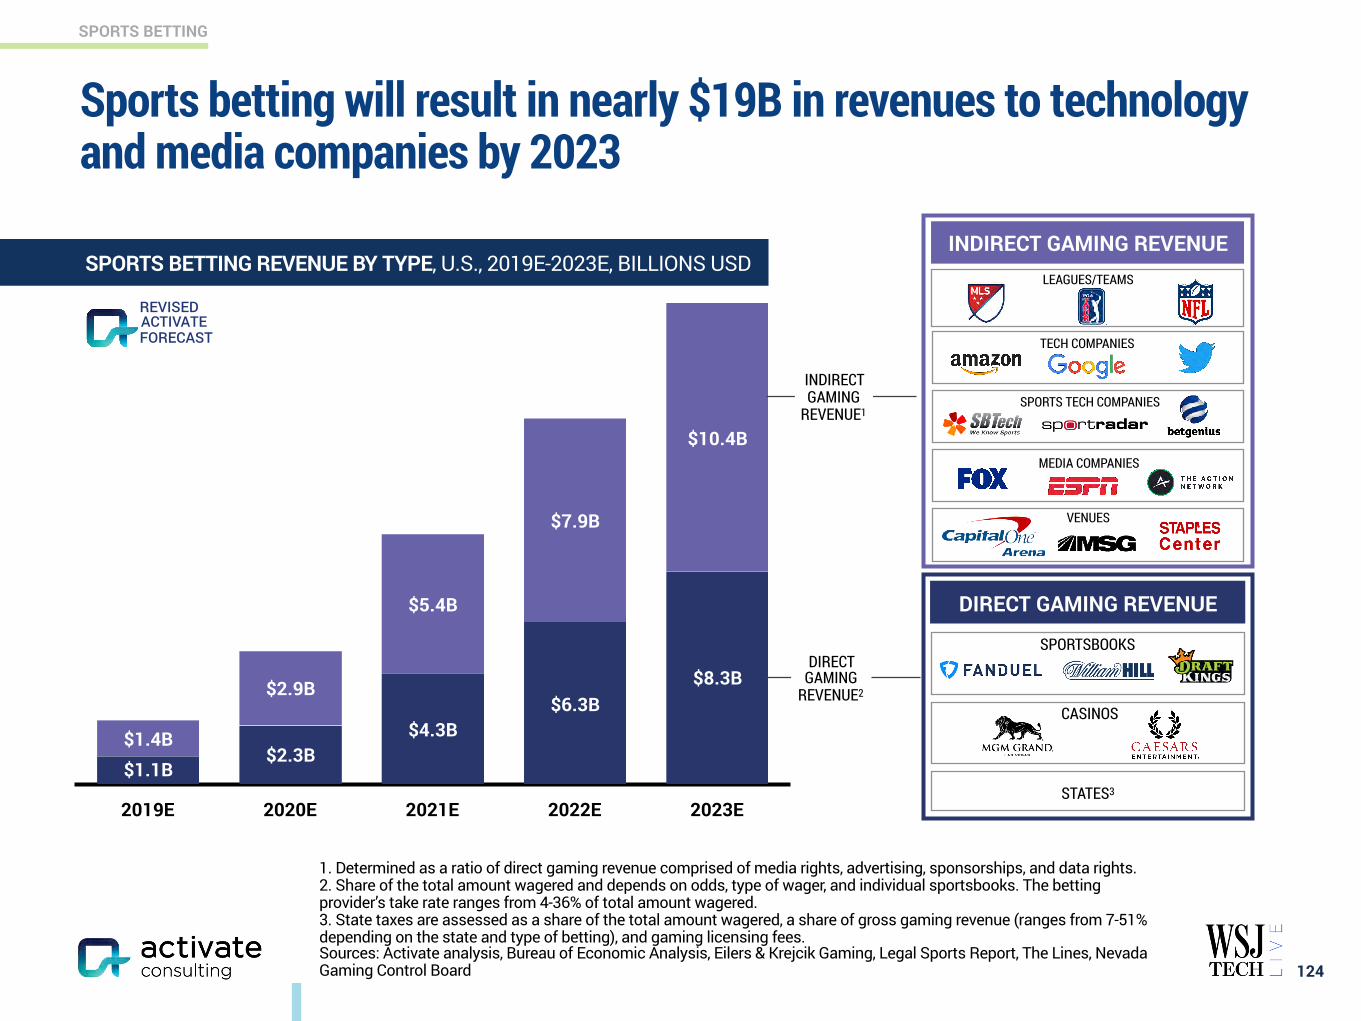
SPORTS BETTING
124
Sports betting will result in nearly $19B in revenues to technology and media companies by 2023
INDIRECT GAMING REVENUESPORTS BETTING REVENUE BY TYPE, U.S., 2019E-2023E, BILLIONS USD
2019E 2020E 2021E 2022E 2023E
$10.4B
$7.9B
$5.4B
$2.9B
$1.4B
$8.3B$6.3B
$4.3B$2.3B
$1.1B
DIRECT GAMING REVENUE
LEAGUES/TEAMS
TECH COMPANIES
MEDIA COMPANIES
VENUES
SPORTSBOOKS
CASINOS
STATES3
INDIRECT GAMING
REVENUE1
DIRECT GAMING
REVENUE2
SPORTS TECH COMPANIES
1. Determined as a ratio of direct gaming revenue comprised of media rights, advertising, sponsorships, and data rights. 2. Share of the total amount wagered and depends on odds, type of wager, and individual sportsbooks. The betting provider’s take rate ranges from 4-36% of total amount wagered. 3. State taxes are assessed as a share of the total amount wagered, a share of gross gaming revenue (ranges from 7-51% depending on the state and type of betting), and gaming licensing fees. Sources: Activate analysis, Bureau of Economic Analysis, Eilers & Krejcik Gaming, Legal Sports Report, The Lines, Nevada Gaming Control Board
FORECASTACTIVATEREVISED
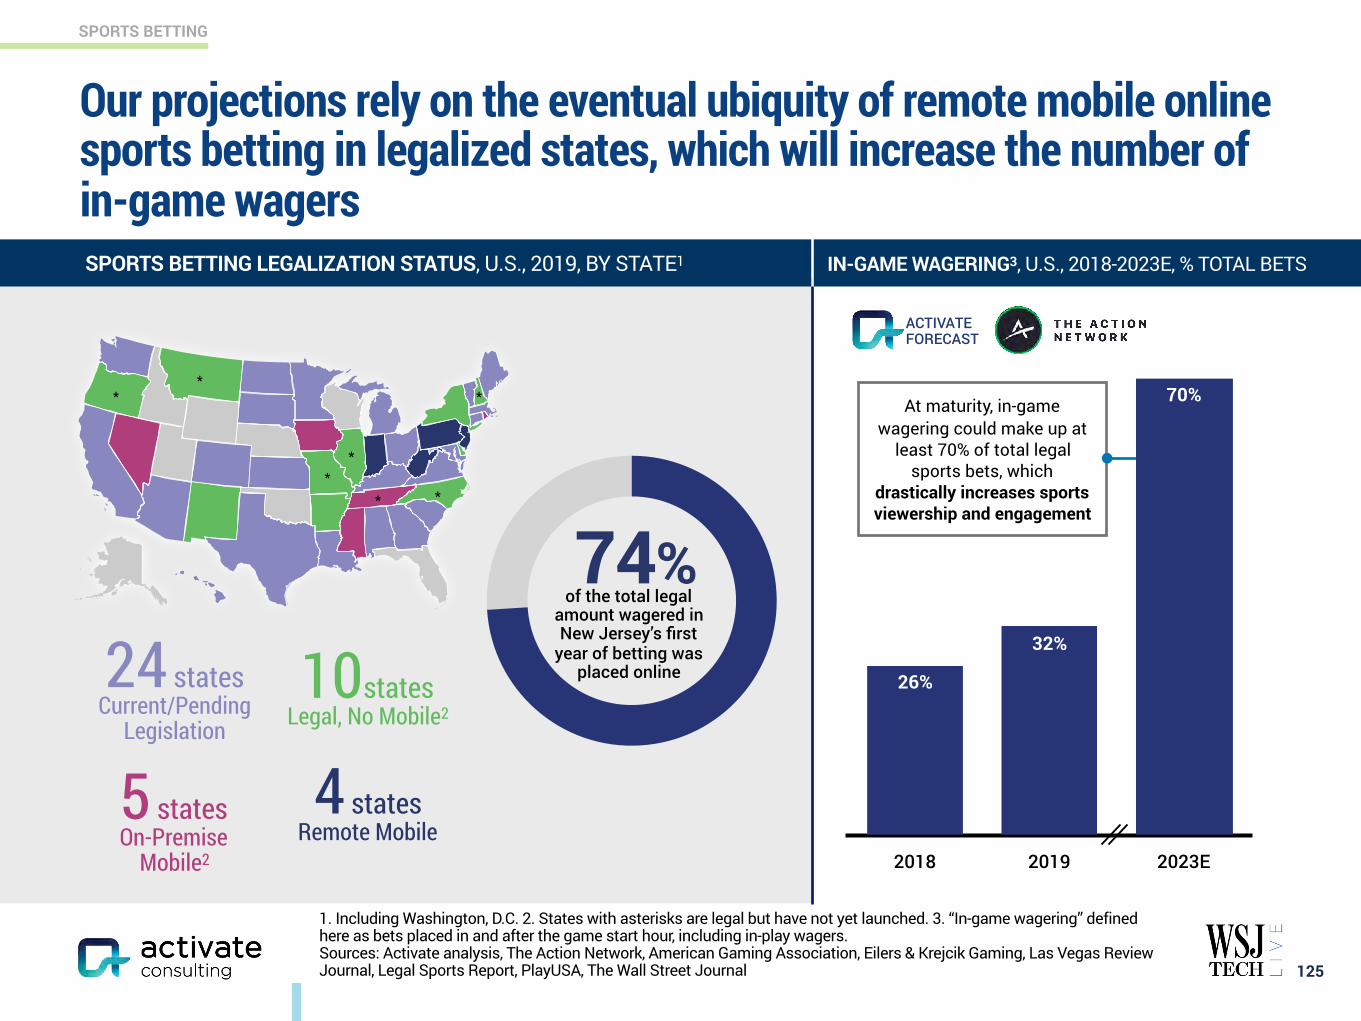
SPORTS BETTING
125
Our projections rely on the eventual ubiquity of remote mobile online sports betting in legalized states, which will increase the number ofin-game wagers
At maturity, in-game wagering could make up at
least 70% of total legal sports bets, which
drastically increases sports viewership and engagement
SPORTS BETTING LEGALIZATION STATUS, U.S., 2019, BY STATE1 IN-GAME WAGERING3, U.S., 2018-2023E, % TOTAL BETS
74%of the total legal
amount wagered in New Jersey’s first
year of betting was placed online
FORECASTACTIVATE
24 states Current/Pending
Legislation
10 states Legal, No Mobile2
5 states On-Premise
Mobile2
4 states Remote Mobile
**
**
* *
*
1. Including Washington, D.C. 2. States with asterisks are legal but have not yet launched. 3. “In-game wagering” defined here as bets placed in and after the game start hour, including in-play wagers. Sources: Activate analysis, The Action Network, American Gaming Association, Eilers & Krejcik Gaming, Las Vegas Review Journal, Legal Sports Report, PlayUSA, The Wall Street Journal
2018 2019 2023E
70%
32%
26%
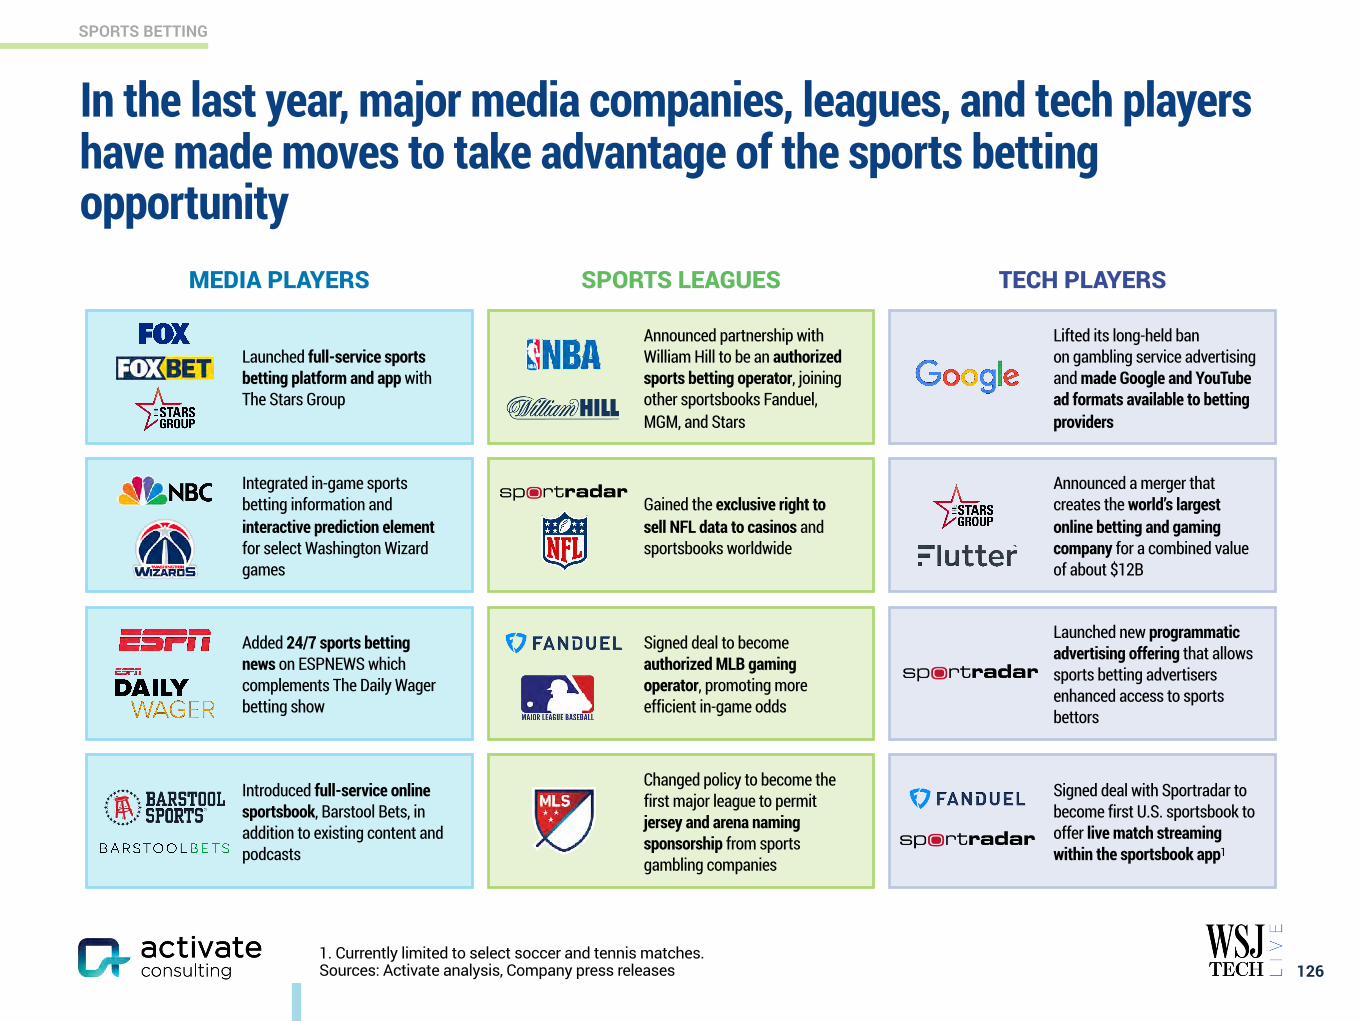
SPORTS BETTING
126
In the last year, major media companies, leagues, and tech players have made moves to take advantage of the sports betting opportunity
MEDIA PLAYERS SPORTS LEAGUES TECH PLAYERS
Lifted its long-held ban on gambling service advertising and made Google and YouTube ad formats available to betting providers
Announced a merger that creates the world’s largest online betting and gaming company for a combined value of about $12B
Launched new programmatic advertising offering that allows sports betting advertisers enhanced access to sports bettors
Launched full-service sports betting platform and app with The Stars Group
Integrated in-game sports betting information and interactive prediction element for select Washington Wizard games
Changed policy to become the first major league to permit jersey and arena naming sponsorship from sports gambling companies
Introduced full-service online sportsbook, Barstool Bets, in addition to existing content and podcasts
Added 24/7 sports betting news on ESPNEWS which complements The Daily Wager betting show
Signed deal with Sportradar to become first U.S. sportsbook to offer live match streaming within the sportsbook app1
Gained the exclusive right to sell NFL data to casinos and sportsbooks worldwide
Signed deal to become authorized MLB gaming operator, promoting more efficient in-game odds
Announced partnership with William Hill to be an authorized sports betting operator, joining other sportsbooks Fanduel, MGM, and Stars
1. Currently limited to select soccer and tennis matches. Sources: Activate analysis, Company press releases
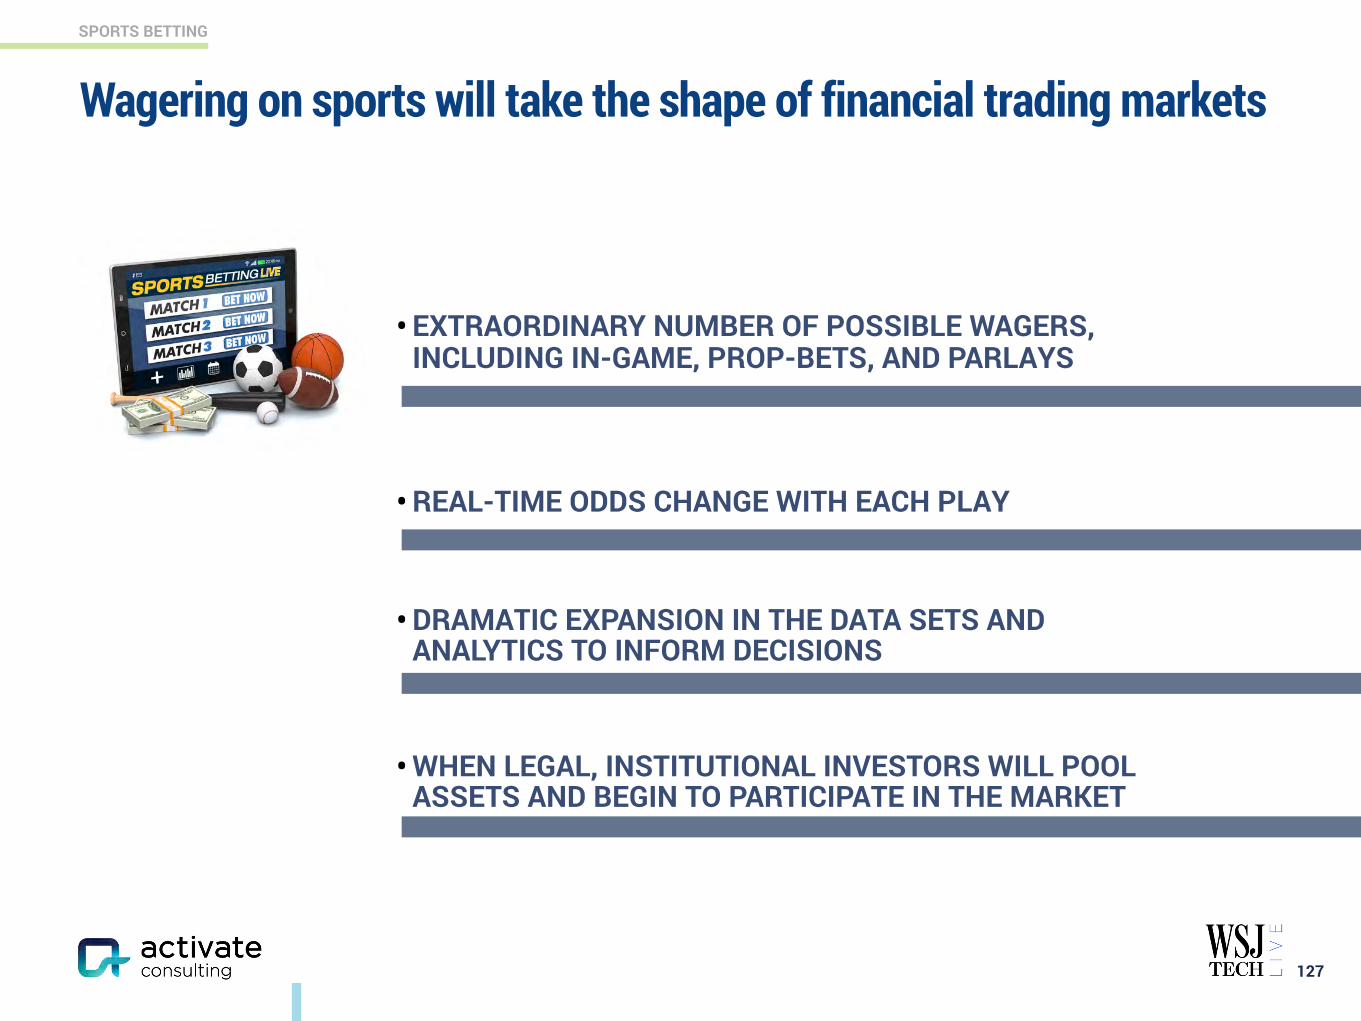
SPORTS BETTING
Wagering on sports will take the shape of financial trading markets
127
• EXTRAORDINARY NUMBER OF POSSIBLE WAGERS, INCLUDING IN-GAME, PROP-BETS, AND PARLAYS
• REAL-TIME ODDS CHANGE WITH EACH PLAY
• DRAMATIC EXPANSION IN THE DATA SETS AND ANALYTICS TO INFORM DECISIONS
• WHEN LEGAL, INSTITUTIONAL INVESTORS WILL POOL ASSETS AND BEGIN TO PARTICIPATE IN THE MARKET
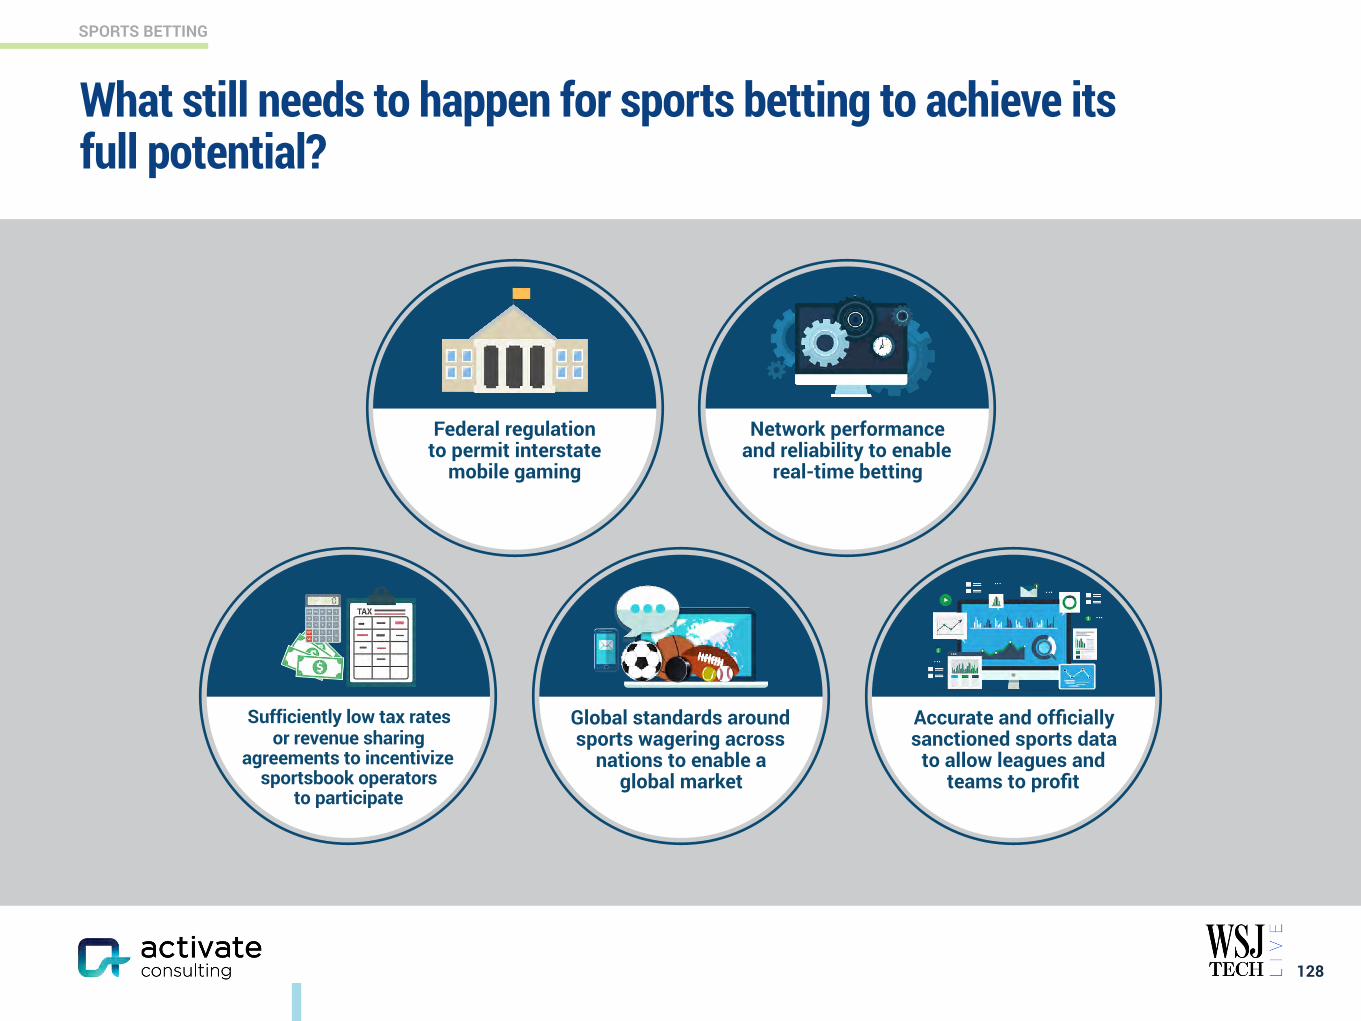
SPORTS BETTING
128
What still needs to happen for sports betting to achieve its full potential?
Federal regulation to permit interstate
mobile gaming
Network performance and reliability to enable
real-time betting
Sufficiently low tax rates or revenue sharing
agreements to incentivize sportsbook operators
to participate
Global standards around sports wagering across
nations to enable a global market
Accurate and officially sanctioned sports data
to allow leagues and teams to profit
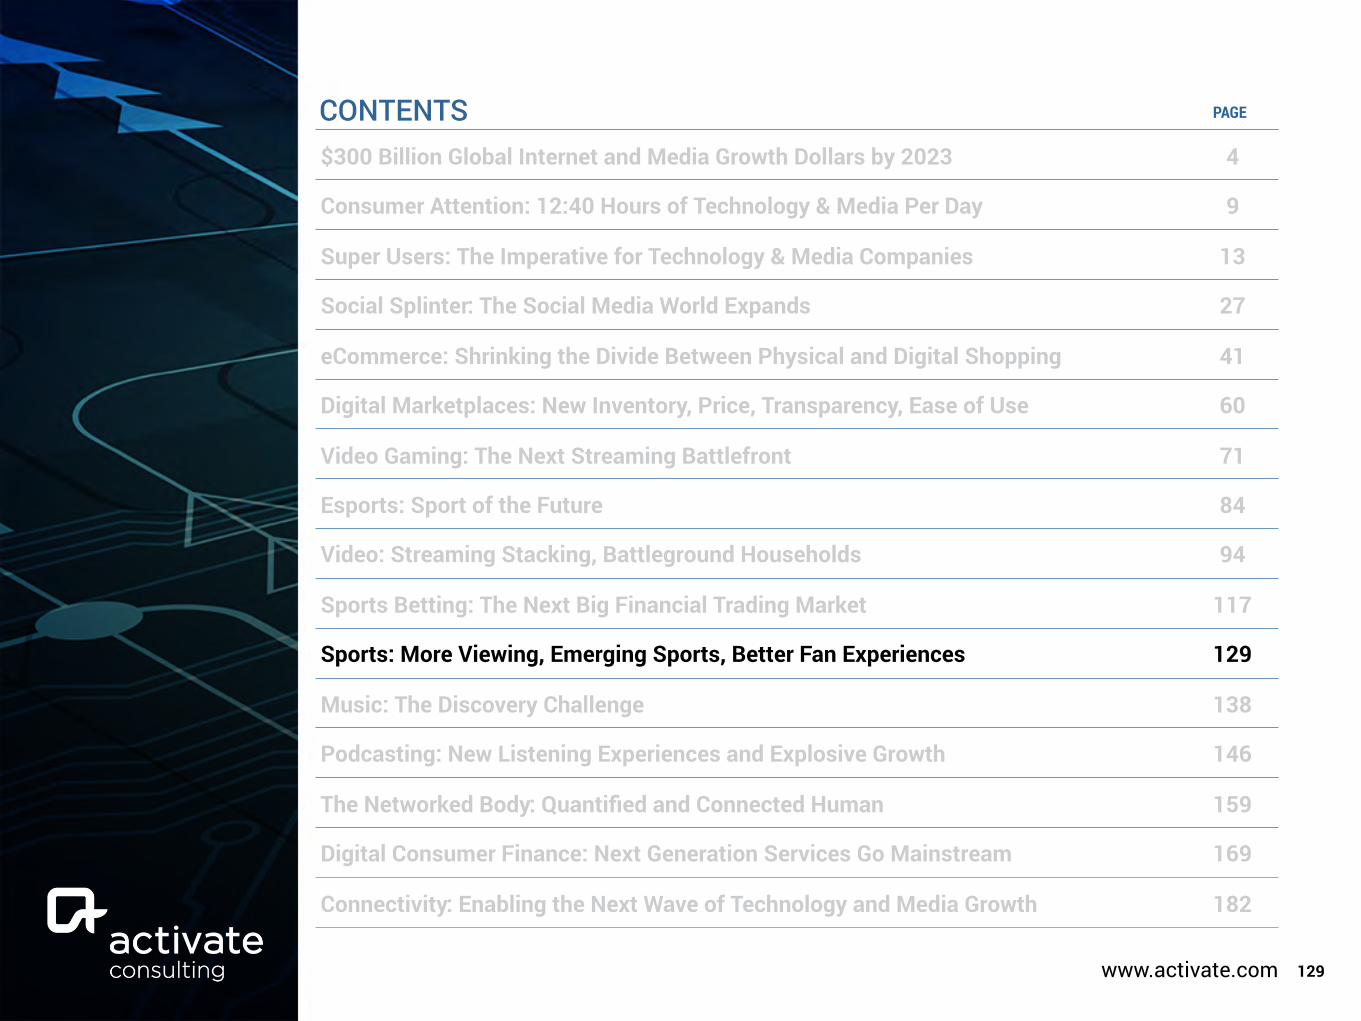
www.activate.com 129
PAGE
$300 Billion Global Internet and Media Growth Dollars by 2023 4
Consumer Attention: 12:40 Hours of Technology & Media Per Day 9
Super Users: The Imperative for Technology & Media Companies 13
Social Splinter: The Social Media World Expands 27
eCommerce: Shrinking the Divide Between Physical and Digital Shopping 41
Digital Marketplaces: New Inventory, Price, Transparency, Ease of Use 60
Video Gaming: The Next Streaming Battlefront 71
Esports: Sport of the Future 84
Video: Streaming Stacking, Battleground Households 94
Sports Betting: The Next Big Financial Trading Market 117
Sports: More Viewing, Emerging Sports, Better Fan Experiences 129
Music: The Discovery Challenge 138
Podcasting: New Listening Experiences and Explosive Growth 146
The Networked Body: Quantified and Connected Human 159
Digital Consumer Finance: Next Generation Services Go Mainstream 169
Connectivity: Enabling the Next Wave of Technology and Media Growth 182
CONTENTS
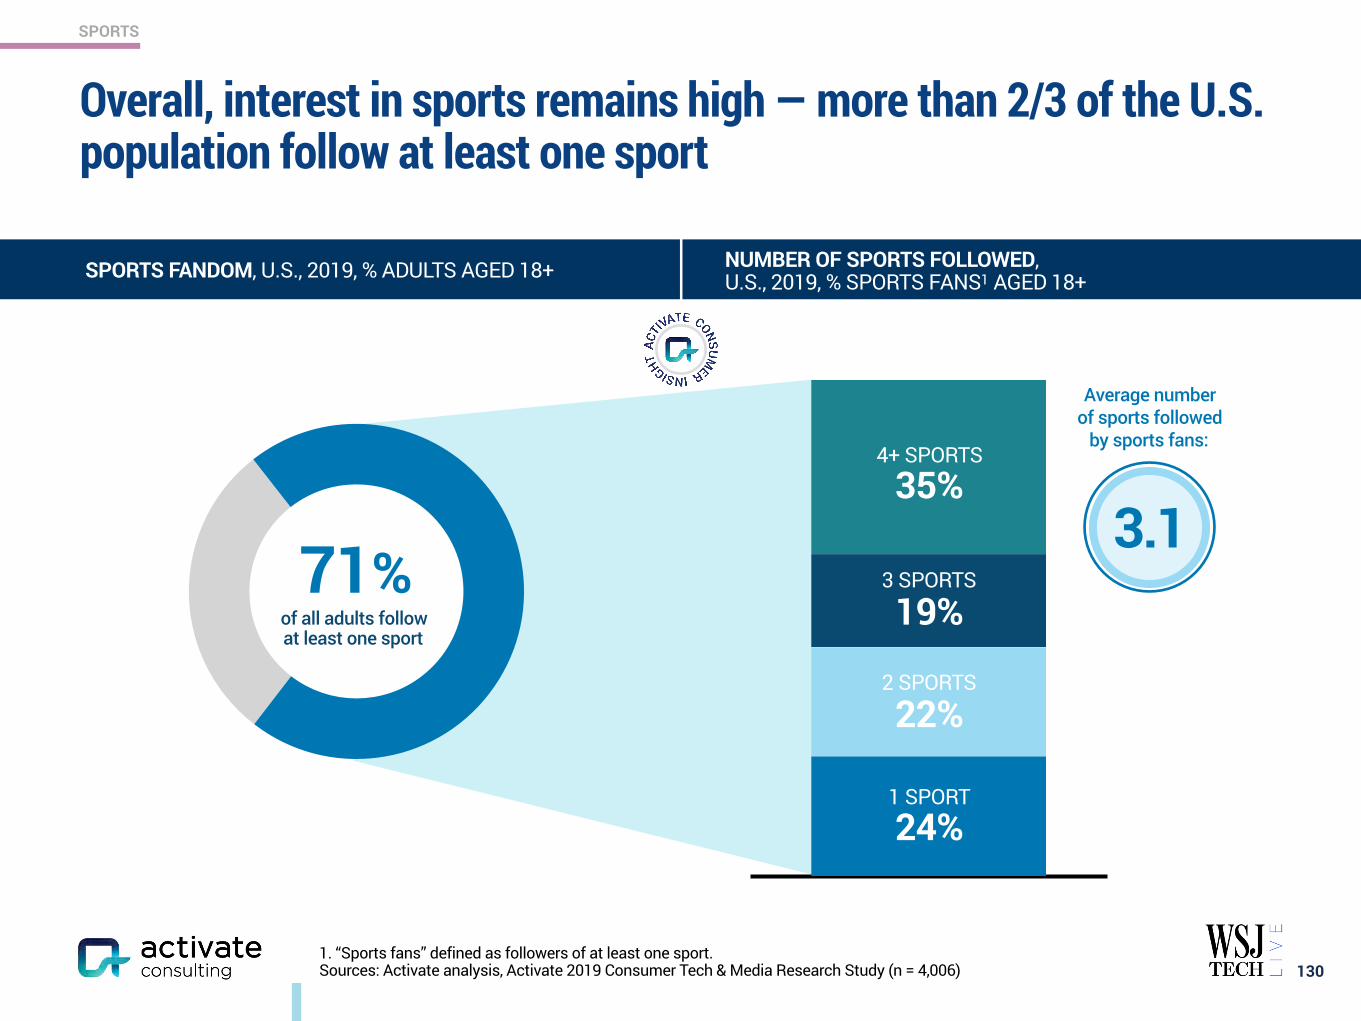
SPORTS
Overall, interest in sports remains high — more than 2/3 of the U.S. population follow at least one sport
130
SPORTS FANDOM, U.S., 2019, % ADULTS AGED 18+
1. “Sports fans” defined as followers of at least one sport. Sources: Activate analysis, Activate 2019 Consumer Tech & Media Research Study (n = 4,006)
NUMBER OF SPORTS FOLLOWED, U.S., 2019, % SPORTS FANS1 AGED 18+
Average number of sports followed
by sports fans:
71%of all adults follow at least one sport
4+ SPORTS
35%
3 SPORTS
19%
2 SPORTS
22%
1 SPORT
24%
3.1
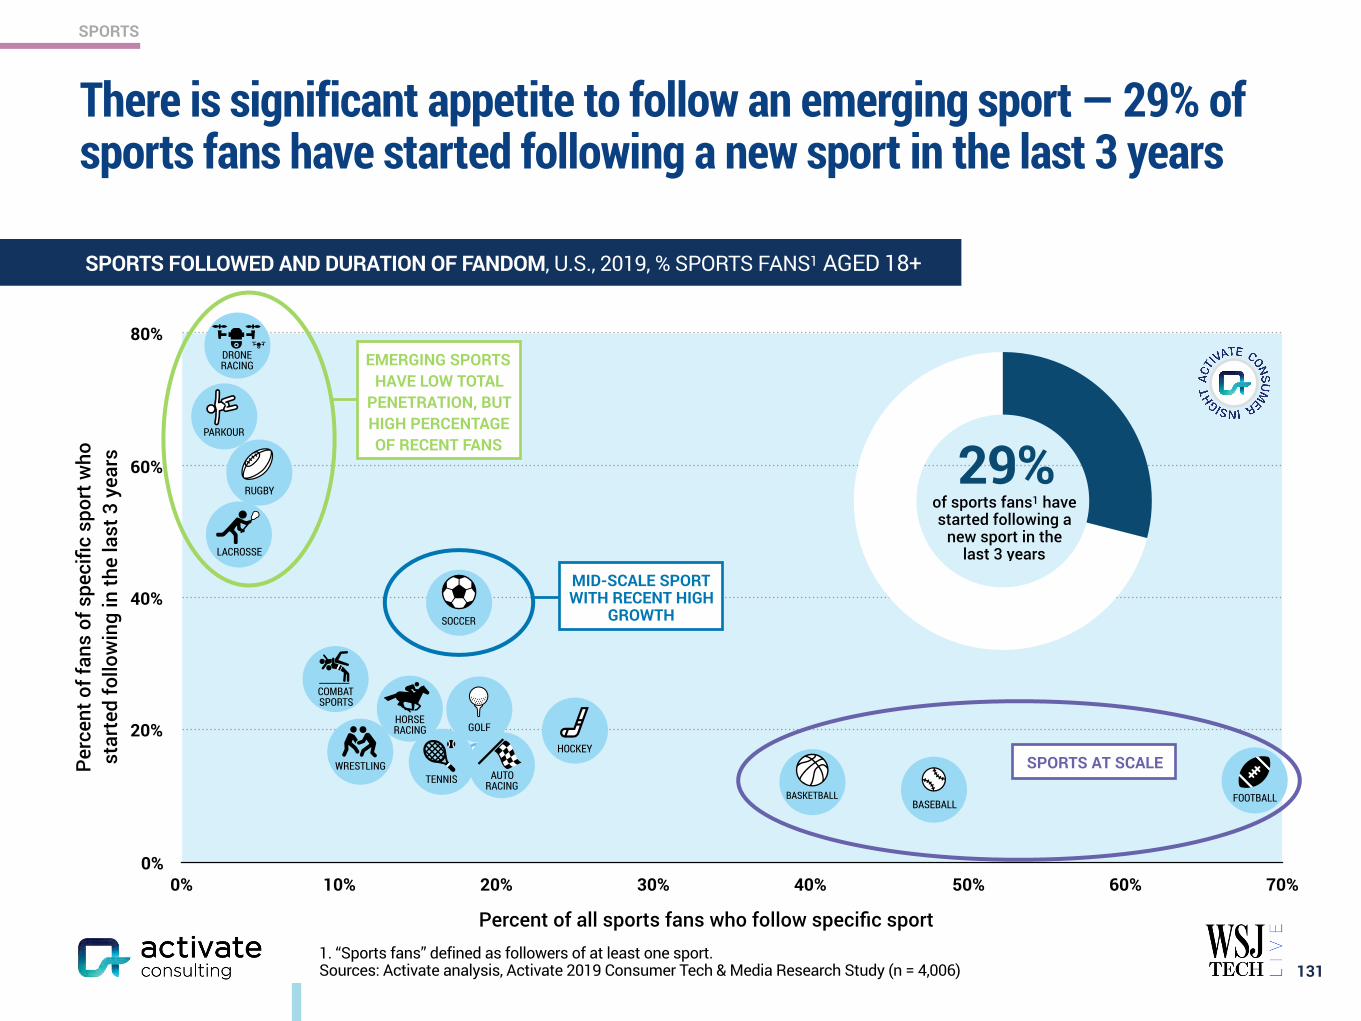
SPORTS
1. “Sports fans” defined as followers of at least one sport. Sources: Activate analysis, Activate 2019 Consumer Tech & Media Research Study (n = 4,006)
There is significant appetite to follow an emerging sport — 29% of sports fans have started following a new sport in the last 3 years
131
SPORTS FOLLOWED AND DURATION OF FANDOM, U.S., 2019, % SPORTS FANS1 AGED 18+
Perc
ent o
f fan
s of
spe
cific
spo
rt w
ho
star
ted
follo
win
g in
the
last
3 y
ears
Percent of all sports fans who follow specific sport
0%
20%
40%
60%
80%
0% 10% 20% 30% 40% 50% 60% 70%
of sports fans1 have started following a
new sport in thelast 3 years
29%
SOCCER
DRONE RACING
PARKOUR
RUGBY
LACROSSE
BASEBALLBASKETBALL FOOTBALL
COMBAT SPORTS
TENNISWRESTLING
AUTO RACING
HOCKEY
HORSE RACING GOLF
EMERGING SPORTS HAVE LOW TOTAL
PENETRATION, BUT HIGH PERCENTAGE OF RECENT FANS
MID-SCALE SPORT WITH RECENT HIGH
GROWTH
SPORTS AT SCALE
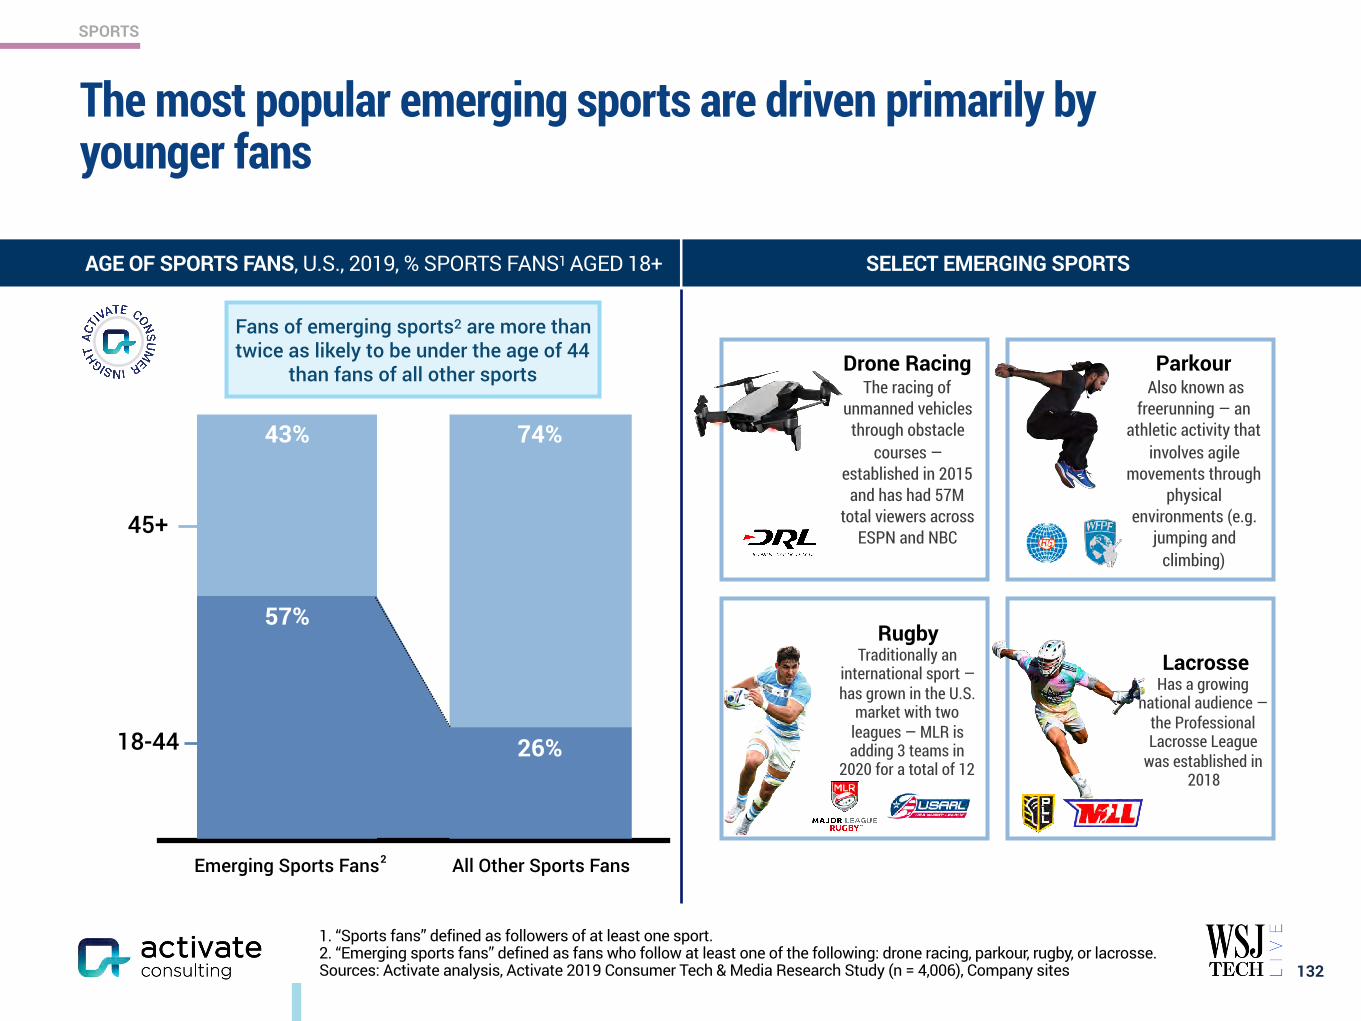
SPORTS
Emerging Sports Fans All Other Sports Fans
74%43%
26%
57%
The most popular emerging sports are driven primarily by younger fans
132
AGE OF SPORTS FANS, U.S., 2019, % SPORTS FANS1 AGED 18+
1. “Sports fans” defined as followers of at least one sport. 2. “Emerging sports fans” defined as fans who follow at least one of the following: drone racing, parkour, rugby, or lacrosse. Sources: Activate analysis, Activate 2019 Consumer Tech & Media Research Study (n = 4,006), Company sites
SELECT EMERGING SPORTS
Drone Racing The racing of
unmanned vehicles through obstacle
courses — established in 2015
and has had 57M total viewers across
ESPN and NBC
18-44
45+
Parkour Also known as
freerunning — an athletic activity that
involves agile movements through
physical environments (e.g.
jumping and climbing)
Lacrosse Has a growing
national audience — the Professional Lacrosse League
was established in 2018
Rugby Traditionally an
international sport —has grown in the U.S.
market with two leagues — MLR is adding 3 teams in
2020 for a total of 12
Fans of emerging sports2 are more than twice as likely to be under the age of 44
than fans of all other sports
2

SPORTS
1. “Sports fans” defined as followers of at least one sport. 2. Top 4 traditional sports are football, basketball, baseball, and hockey. Sources: Activate analysis, Activate 2019 Consumer Tech & Media Research Study (n = 4,006), Company sites
To reach this younger audience, major media channels are carrying emerging sports, and in many cases have secured brand sponsorships
133
FOLLOWING OF NON-TOP 4 U.S. SPORTS, U.S., 2019, % SPORTS FANS1 AGED 18+
SPORT LEAGUE / GOVERNING BODY MEDIA COVERAGE MAJOR SPONSORS/PARTNERS
Bull Riding
Climbing
Cornhole
Drone Racing
Lacrosse
Parkour N/A
Rugby
Spikeball
66%of sports fans follow a sport that is not in
the top 42
2018
American Cornhole League 2017 – 2020
2012 – 2028
2019 2019 2016
2018 2017
2019 (PLL)
2019 2020
2024E
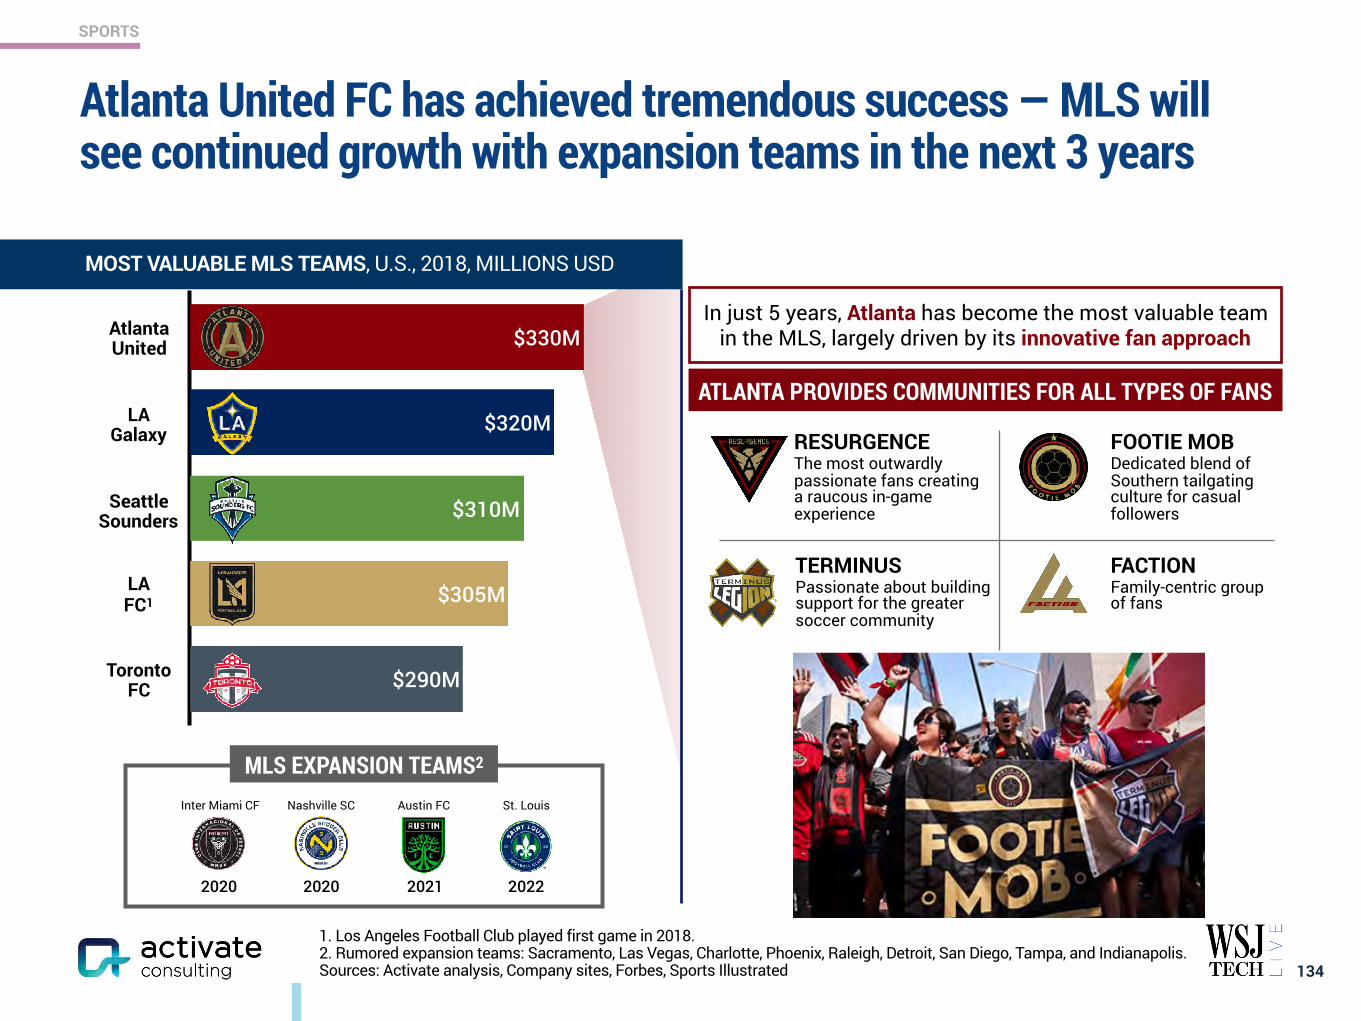
SPORTS
Atlanta United FC has achieved tremendous success — MLS will see continued growth with expansion teams in the next 3 years
134
MOST VALUABLE MLS TEAMS, U.S., 2018, MILLIONS USD
1. Los Angeles Football Club played first game in 2018. 2. Rumored expansion teams: Sacramento, Las Vegas, Charlotte, Phoenix, Raleigh, Detroit, San Diego, Tampa, and Indianapolis. Sources: Activate analysis, Company sites, Forbes, Sports Illustrated
RESURGENCE The most outwardly passionate fans creating a raucous in-game experience
FOOTIE MOB Dedicated blend of Southern tailgating culture for casual followers
TERMINUS Passionate about building support for the greater soccer community
FACTION Family-centric group of fans
ATLANTA PROVIDES COMMUNITIES FOR ALL TYPES OF FANS
$290M
$305M
$310M
$320M
$330MIn just 5 years, Atlanta has become the most valuable team
in the MLS, largely driven by its innovative fan approachAtlanta United
LA Galaxy
Seattle Sounders
LA FC1
Toronto FC
MLS EXPANSION TEAMS2
2020 2020 2021 2022
Inter Miami CF Nashville SC Austin FC St. Louis
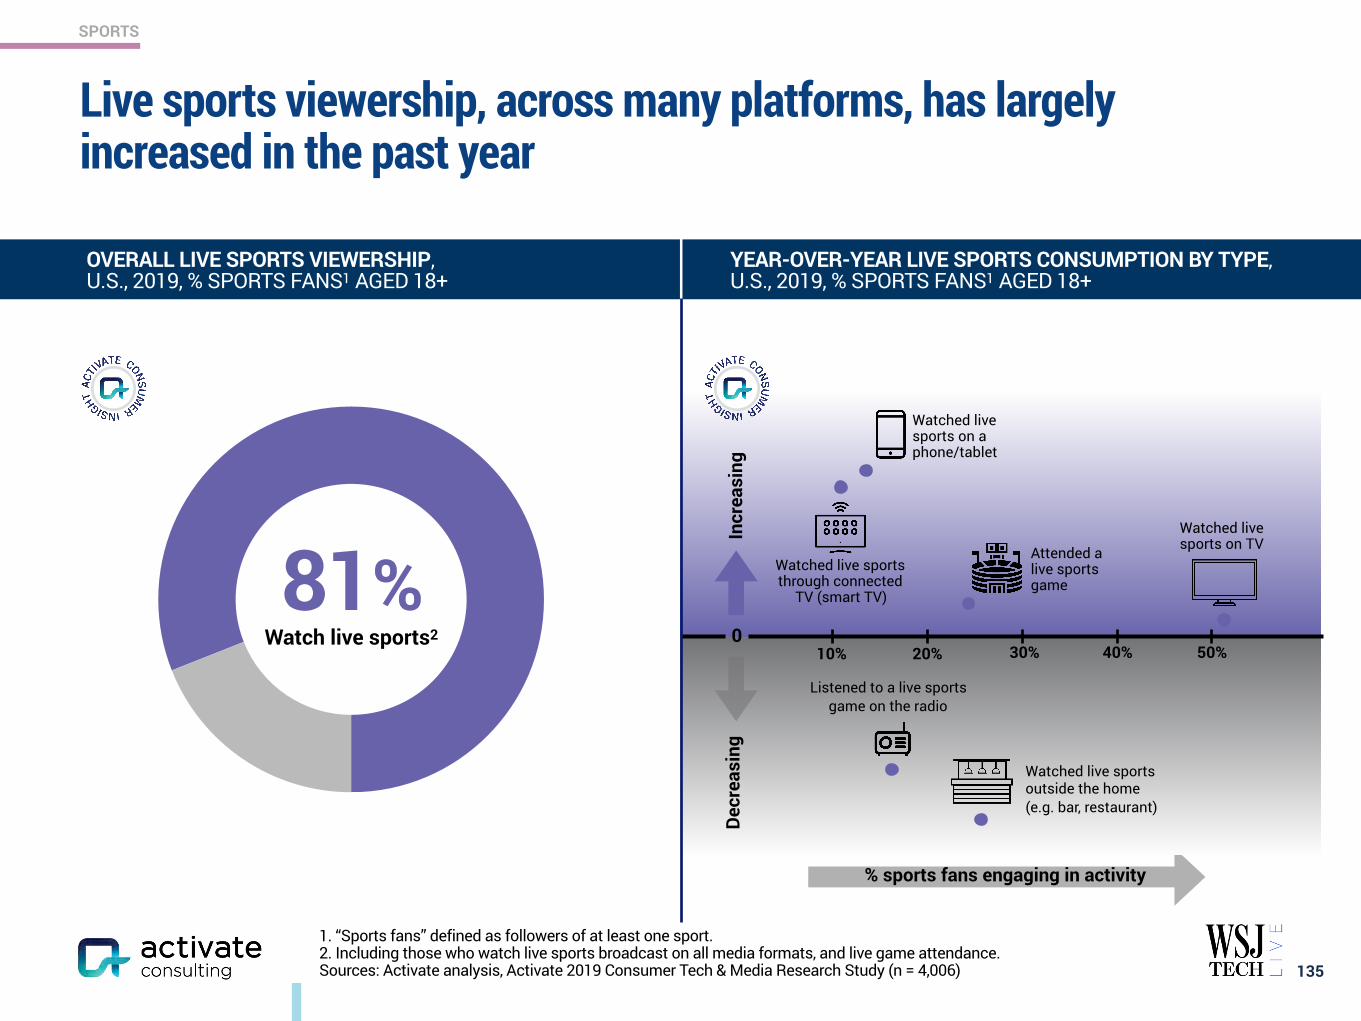
SPORTS
Live sports viewership, across many platforms, has largely increased in the past year
135
1. “Sports fans” defined as followers of at least one sport. 2. Including those who watch live sports broadcast on all media formats, and live game attendance. Sources: Activate analysis, Activate 2019 Consumer Tech & Media Research Study (n = 4,006)
OVERALL LIVE SPORTS VIEWERSHIP, U.S., 2019, % SPORTS FANS1 AGED 18+
YEAR-OVER-YEAR LIVE SPORTS CONSUMPTION BY TYPE, U.S., 2019, % SPORTS FANS1 AGED 18+
81% Watch live sports2
% sports fans engaging in activity
Attended a live sports game
Watched live sports on TV
Watched live sports through connected
TV (smart TV)
Watched live sports on a phone/tablet
Watched live sports outside the home (e.g. bar, restaurant)
Listened to a live sports game on the radio
Incr
easi
ngDe
crea
sing
010% 20% 30% 40% 50%
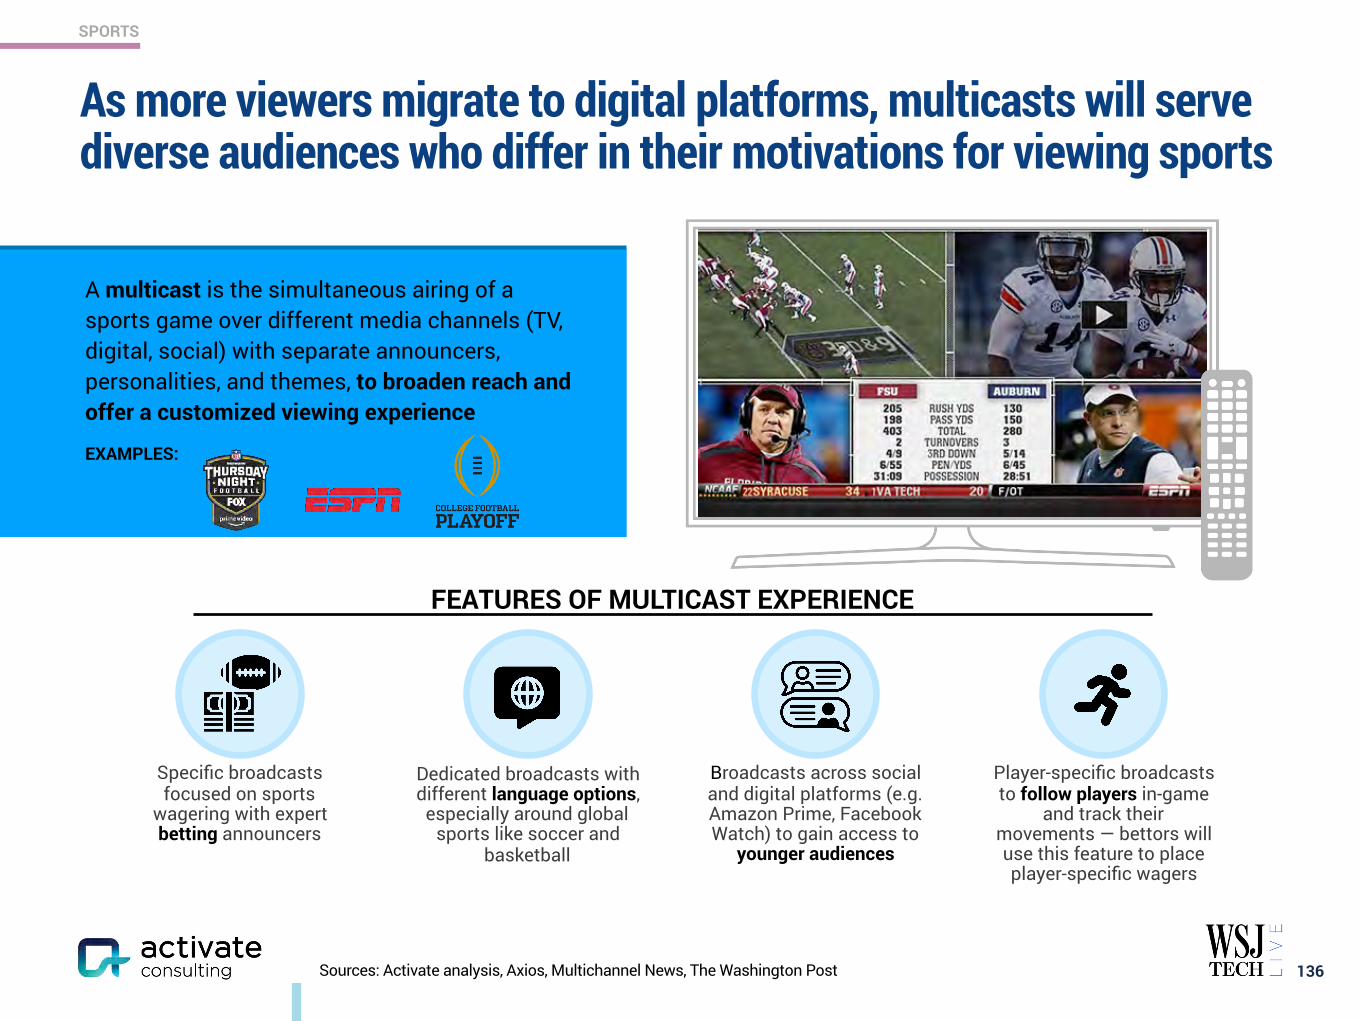
SPORTS
Sources: Activate analysis, Axios, Multichannel News, The Washington Post
Specific broadcasts focused on sports
wagering with expert betting announcers
As more viewers migrate to digital platforms, multicasts will serve diverse audiences who differ in their motivations for viewing sports
136
A multicast is the simultaneous airing of a sports game over different media channels (TV, digital, social) with separate announcers, personalities, and themes, to broaden reach and offer a customized viewing experience
Dedicated broadcasts with different language options,
especially around global sports like soccer and
basketball
Broadcasts across social and digital platforms (e.g. Amazon Prime, Facebook Watch) to gain access to
younger audiences
Player-specific broadcasts to follow players in-game
and track their movements — bettors will use this feature to place player-specific wagers
FEATURES OF MULTICAST EXPERIENCE
EXAMPLES:

SPORTS
1. Powered by AWS. 2. Leagues are asking sports betting operators to pay up to 1.5% of net profits for official league data and feeds. Sources: Activate analysis, Company sites, Harvard Business Review
Next Gen Stats1 uses chips embedded into player jerseys/equipment and historic data to capture:
• Expected catch rate • Expected yards after catch • Completion probability • Fastest sacks
Statistics will improve team decision-making, enhance the fan experience, and enable in-game wagering
137
Improved game day decision-making through enhanced performance data
Personalized games and higher viewer engagement through data visualization
and augmented reality
Informed in-play wagering through superior stats and data insights2
Fan ExperienceTeams and Player Decision-Making In-Game Wagering
Second Spectrum enabled capabilities:
• Statistics data overlays • Data visualization • Streaming video interactive apps • Augmented reality
TAKEAWAYS
Statistics offered through Stat Cast1:
• Arm strength • Catch probability • Distance needed • Sprint speed • Exit velocity
www.activate.com 138
PAGE
$300 Billion Global Internet and Media Growth Dollars by 2023 4
Consumer Attention: 12:40 Hours of Technology & Media Per Day 9
Super Users: The Imperative for Technology & Media Companies 13
Social Splinter: The Social Media World Expands 27
eCommerce: Shrinking the Divide Between Physical and Digital Shopping 41
Digital Marketplaces: New Inventory, Price, Transparency, Ease of Use 60
Video Gaming: The Next Streaming Battlefront 71
Esports: Sport of the Future 84
Video: Streaming Stacking, Battleground Households 94
Sports Betting: The Next Big Financial Trading Market 117
Sports: More Viewing, Emerging Sports, Better Fan Experiences 129
Music: The Discovery Challenge 138
Podcasting: New Listening Experiences and Explosive Growth 146
The Networked Body: Quantified and Connected Human 159
Digital Consumer Finance: Next Generation Services Go Mainstream 169
Connectivity: Enabling the Next Wave of Technology and Media Growth 182
CONTENTS
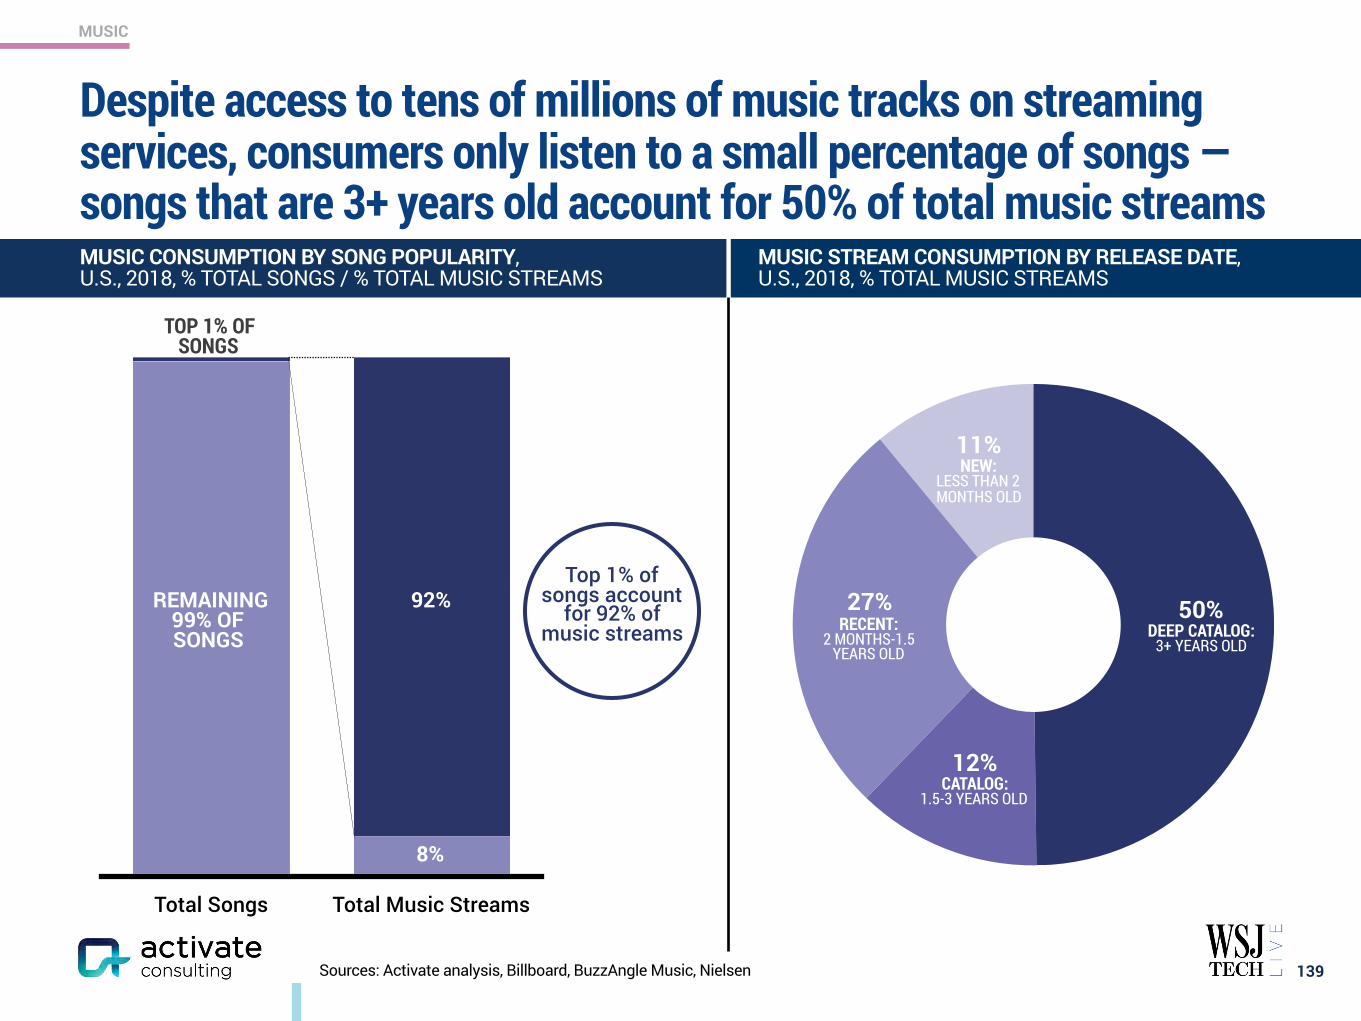
MUSIC
Despite access to tens of millions of music tracks on streaming services, consumers only listen to a small percentage of songs — songs that are 3+ years old account for 50% of total music streams
139Sources: Activate analysis, Billboard, BuzzAngle Music, Nielsen
Total Songs Total Music Streams
MUSIC CONSUMPTION BY SONG POPULARITY, U.S., 2018, % TOTAL SONGS / % TOTAL MUSIC STREAMS
8%
REMAINING 99% OF SONGS
TOP 1% OF SONGS
MUSIC STREAM CONSUMPTION BY RELEASE DATE, U.S., 2018, % TOTAL MUSIC STREAMS
50% DEEP CATALOG:
3+ YEARS OLD
12% CATALOG:
1.5-3 YEARS OLD
27% RECENT:
2 MONTHS-1.5 YEARS OLD
11% NEW:
LESS THAN 2 MONTHS OLD
92%Top 1% of
songs account for 92% of
music streams
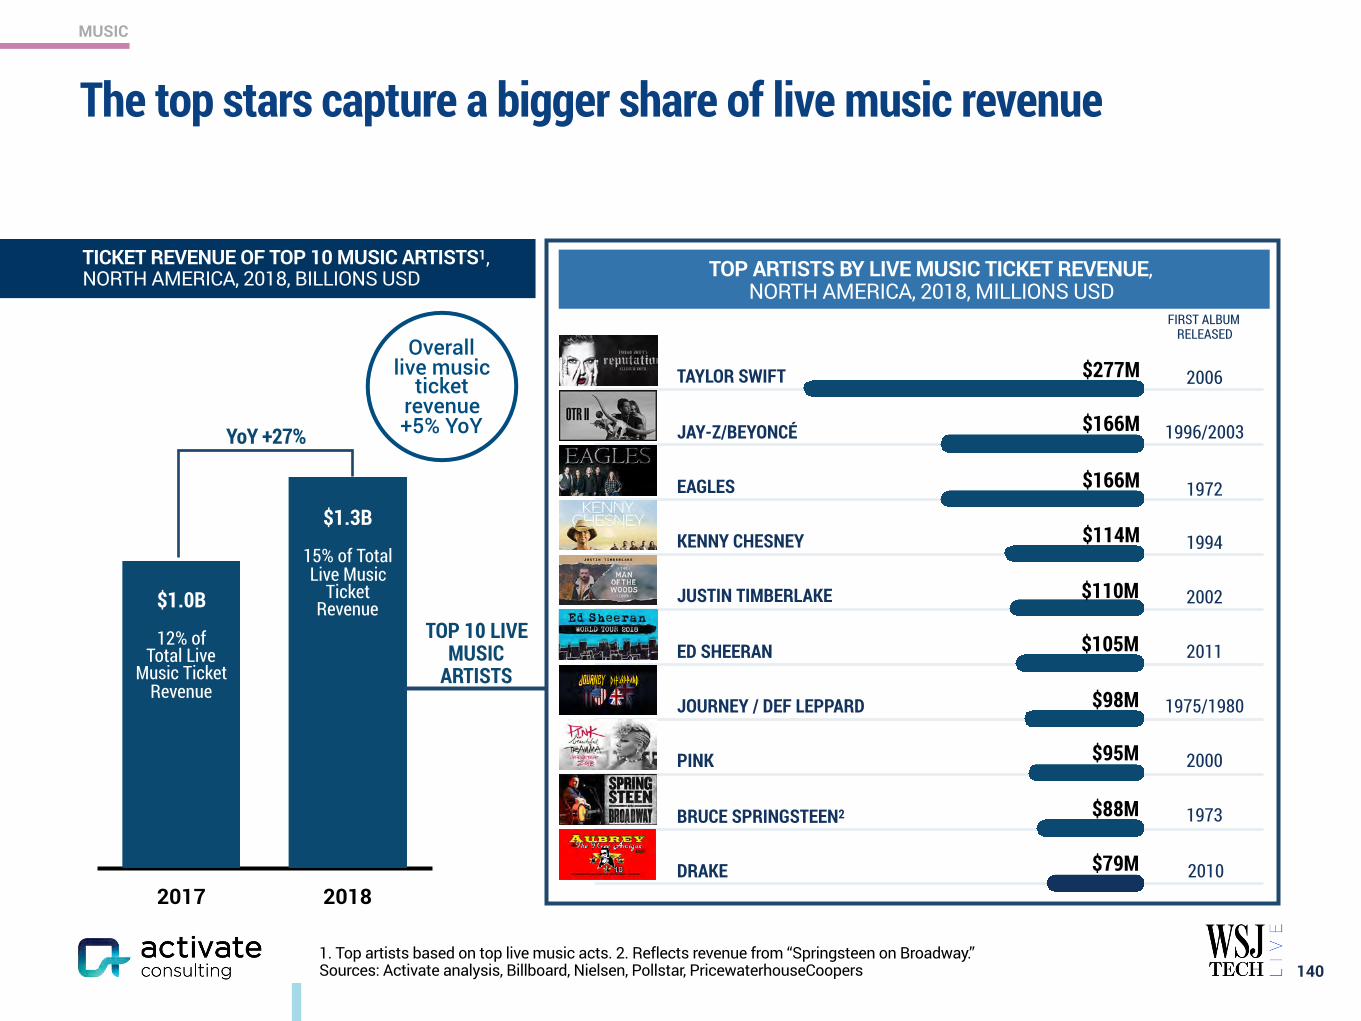
MUSIC
TAYLOR SWIFT
JAY-Z/BEYONCÉ
EAGLES
KENNY CHESNEY
JUSTIN TIMBERLAKE
ED SHEERAN
JOURNEY / DEF LEPPARD
PINK
BRUCE SPRINGSTEEN2
DRAKE
TOP 10 LIVE MUSIC
ARTISTS
$277M
$166M
$166M
$114M
The top stars capture a bigger share of live music revenue
1401. Top artists based on top live music acts. 2. Reflects revenue from “Springsteen on Broadway.” Sources: Activate analysis, Billboard, Nielsen, Pollstar, PricewaterhouseCoopers
2017 2018
TOP ARTISTS BY LIVE MUSIC TICKET REVENUE, NORTH AMERICA, 2018, MILLIONS USD
$110M
$105M
$98M
$95M
$88M
$79M
FIRST ALBUM RELEASED
2006
1996/2003
1972
1994
2002
2011
1975/1980
2000
1973
2010
Overall live music
ticket revenue +5% YoY
$1.0B
12% of Total Live
Music Ticket Revenue
$1.3B
15% of Total Live Music
Ticket Revenue
YoY +27%
TICKET REVENUE OF TOP 10 MUSIC ARTISTS1, NORTH AMERICA, 2018, BILLIONS USD
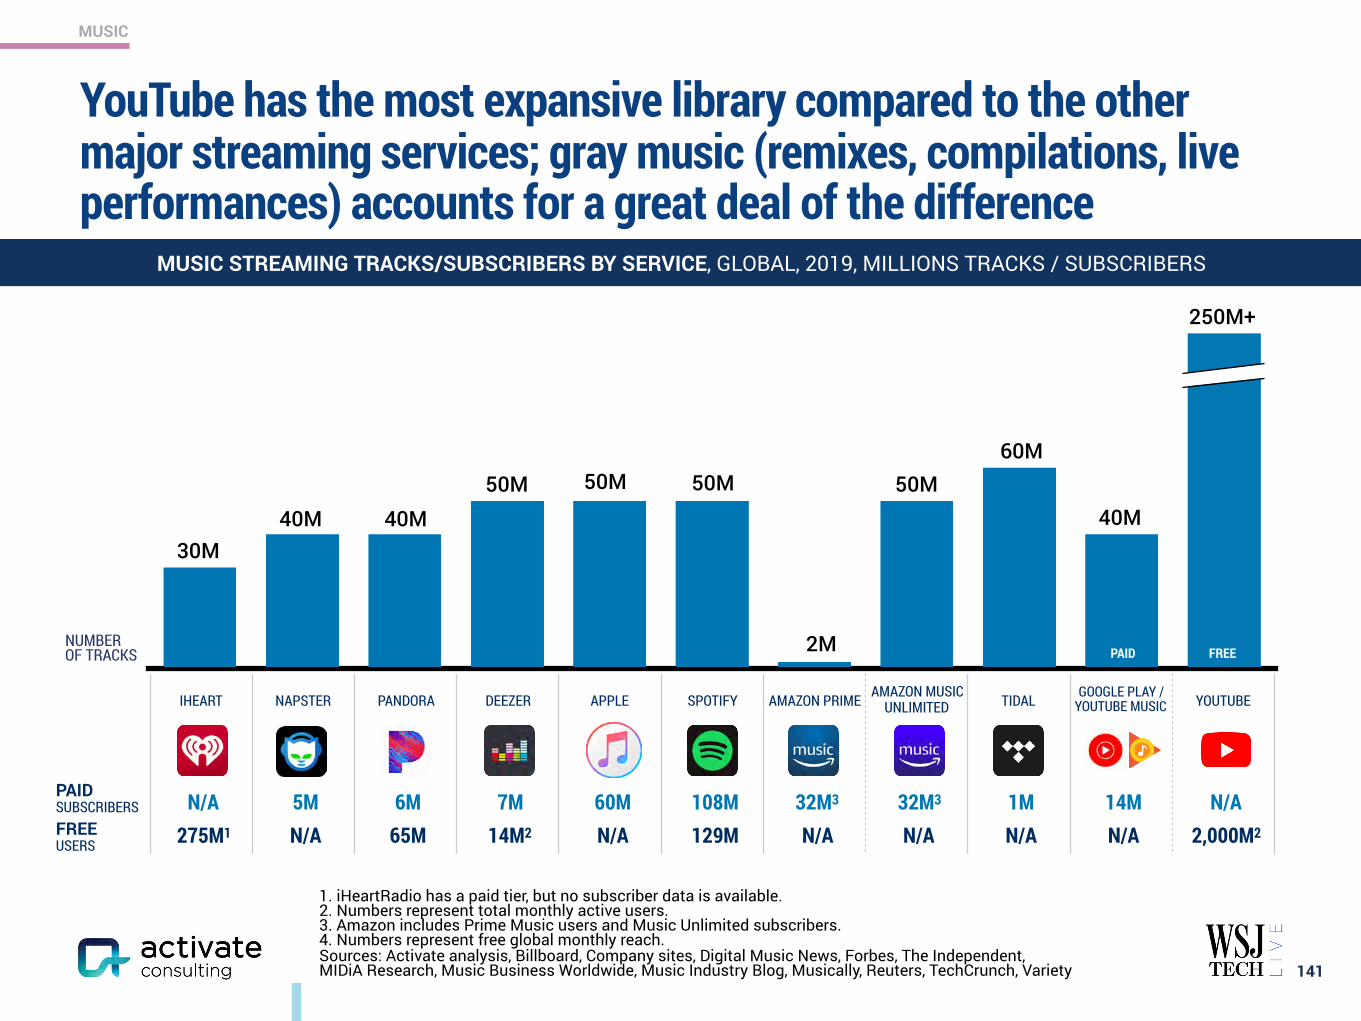
MUSIC
YouTube has the most expansive library compared to the other major streaming services; gray music (remixes, compilations, live performances) accounts for a great deal of the difference
141
PAID
40M
60M50M50M 50M50M
40M
2M
40M30M
IHEART NAPSTER PANDORA DEEZER APPLE SPOTIFY AMAZON PRIME AMAZON MUSIC UNLIMITED TIDAL GOOGLE PLAY /
YOUTUBE MUSIC YOUTUBE
PAID SUBSCRIBERS N/A 5M 6M 7M 60M 108M 32M3 32M3 1M 14M N/AFREE USERS 275M1 N/A 65M 14M2 N/A 129M N/A N/A N/A N/A 2,000M2
PAID FREENUMBEROF TRACKS
250M+
1. iHeartRadio has a paid tier, but no subscriber data is available. 2. Numbers represent total monthly active users. 3. Amazon includes Prime Music users and Music Unlimited subscribers. 4. Numbers represent free global monthly reach. Sources: Activate analysis, Billboard, Company sites, Digital Music News, Forbes, The Independent,MIDiA Research, Music Business Worldwide, Music Industry Blog, Musically, Reuters, TechCrunch, Variety
MUSIC STREAMING TRACKS/SUBSCRIBERS BY SERVICE, GLOBAL, 2019, MILLIONS TRACKS / SUBSCRIBERS
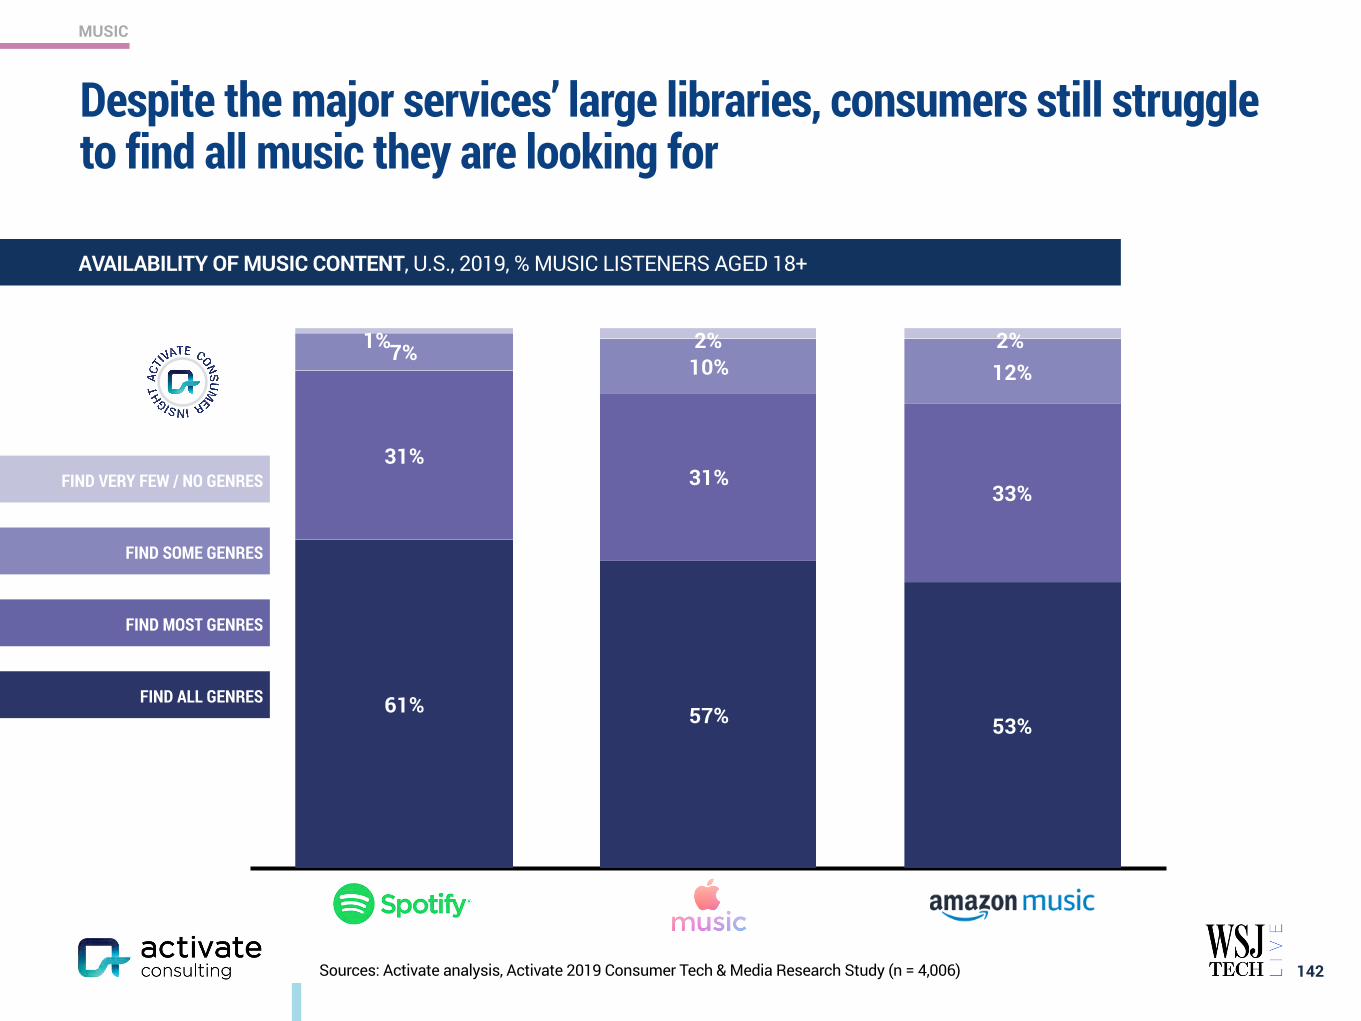
MUSIC
12%10%7%
33%31%
31%
53%57%61%
Despite the major services’ large libraries, consumers still struggle to find all music they are looking for
142Sources: Activate analysis, Activate 2019 Consumer Tech & Media Research Study (n = 4,006)
1% 2% 2%
FIND ALL GENRES
FIND MOST GENRES
FIND SOME GENRES
FIND VERY FEW / NO GENRES
AVAILABILITY OF MUSIC CONTENT, U.S., 2019, % MUSIC LISTENERS AGED 18+

MUSIC
1 Service 39%
None23%
44%
1 Service 39%
2 Services 23%
3 Services 12%
4+ Services 9%
No Services1
17%
Consumers are putting together their own music bundles to meet their needs — YouTube is the most used service
143
4%
5%
6%
7%
10%
13%
20%
21%
22%
42%2 MUSIC SERVICES ON
AVERAGE PER LISTENER
TOP 10 MUSIC SERVICES USED, U.S., 2019, % MUSIC LISTENERS AGED 18+
Free
With Prime
Paid
Outside of Prime
1. “No services” includes those who only listen through terrestrial radio, CDs, vinyl, etc. Sources: Activate analysis, Activate 2019 Consumer Tech & Media Research Study (n = 4,006)
NUMBER OF SERVICES USED TO LISTEN TO MUSIC, U.S., 2019, % MUSIC LISTENERS AGED 18+
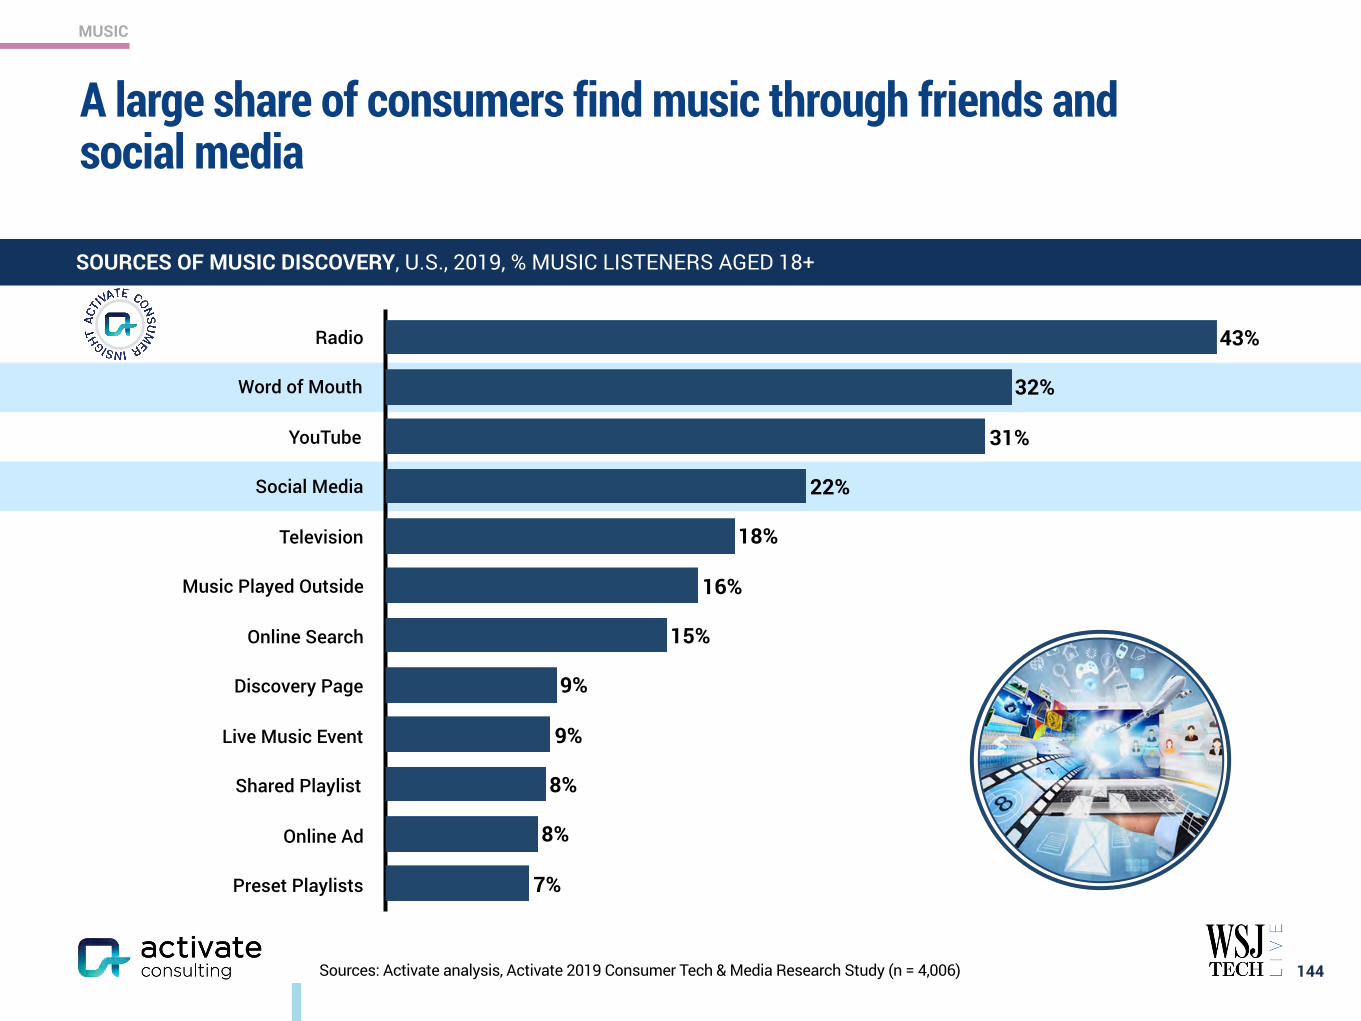
MUSIC
A large share of consumers find music through friends and social media
144Sources: Activate analysis, Activate 2019 Consumer Tech & Media Research Study (n = 4,006)
Radio
Word of Mouth
YouTube
Social Media
Television
Music Played Outside
Online Search
Discovery Page
Live Music Event
Shared Playlist
Online Ad
Preset Playlists 7%
8%
8%
9%
9%
15%
16%
18%
22%
31%
32%
43%
SOURCES OF MUSIC DISCOVERY, U.S., 2019, % MUSIC LISTENERS AGED 18+
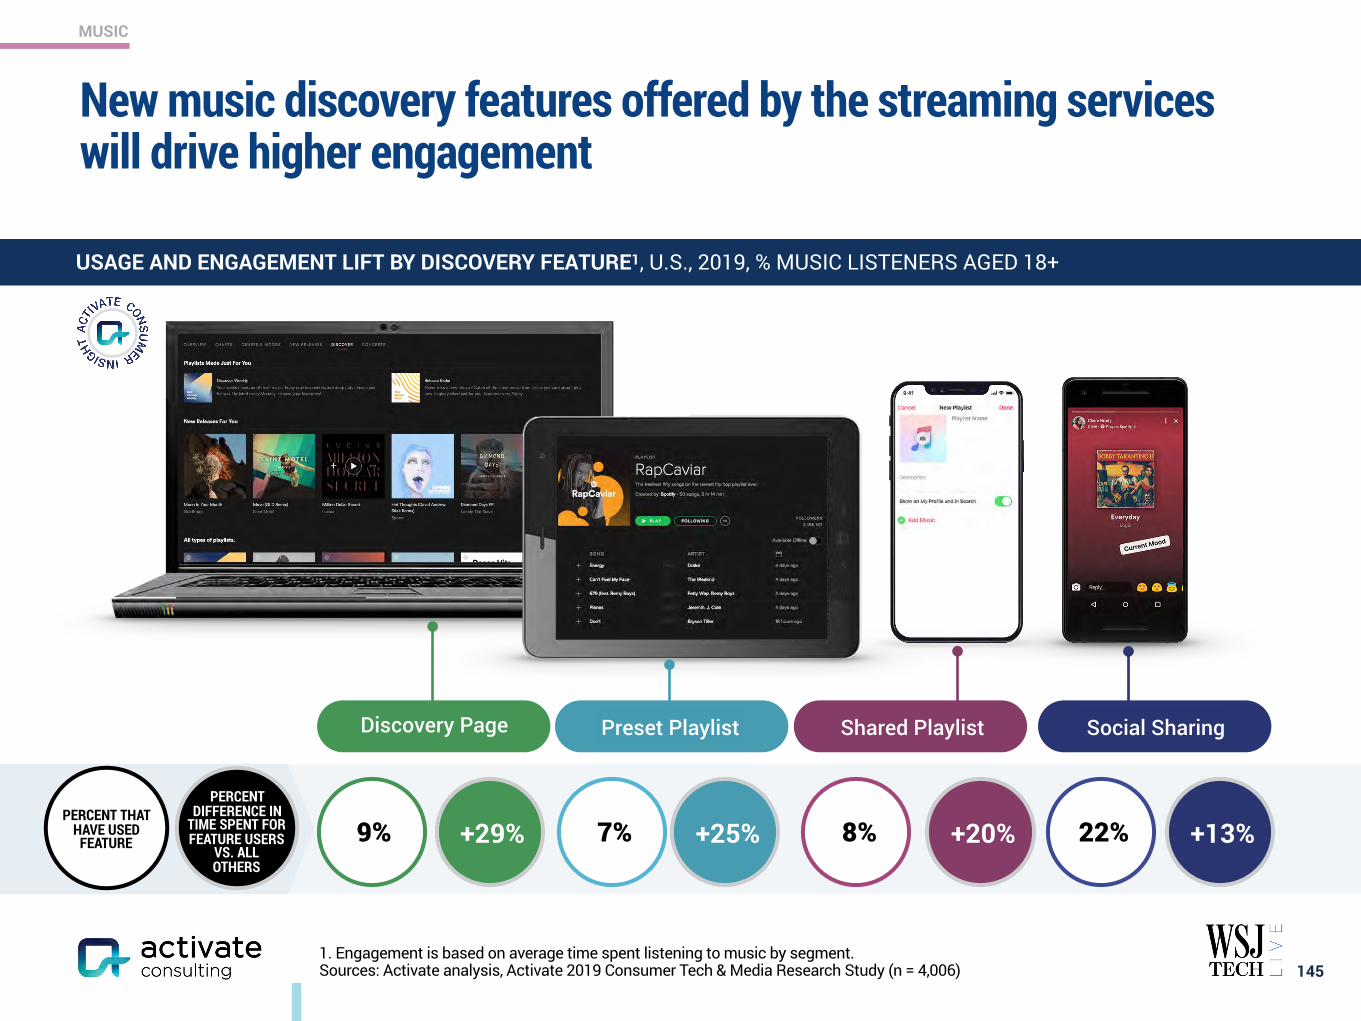
MUSIC
+29% +25% +20% +13%
New music discovery features offered by the streaming services will drive higher engagement
1451. Engagement is based on average time spent listening to music by segment. Sources: Activate analysis, Activate 2019 Consumer Tech & Media Research Study (n = 4,006)
9% 8% 22%7%
Discovery Page Preset Playlist Shared Playlist Social Sharing
USAGE AND ENGAGEMENT LIFT BY DISCOVERY FEATURE1, U.S., 2019, % MUSIC LISTENERS AGED 18+
PERCENT DIFFERENCE IN
TIME SPENT FOR FEATURE USERS
VS. ALL OTHERS
PERCENT THAT HAVE USED
FEATURE
www.activate.com 146
PAGE
$300 Billion Global Internet and Media Growth Dollars by 2023 4
Consumer Attention: 12:40 Hours of Technology & Media Per Day 9
Super Users: The Imperative for Technology & Media Companies 13
Social Splinter: The Social Media World Expands 27
eCommerce: Shrinking the Divide Between Physical and Digital Shopping 41
Digital Marketplaces: New Inventory, Price, Transparency, Ease of Use 60
Video Gaming: The Next Streaming Battlefront 71
Esports: Sport of the Future 84
Video: Streaming Stacking, Battleground Households 94
Sports Betting: The Next Big Financial Trading Market 117
Sports: More Viewing, Emerging Sports, Better Fan Experiences 129
Music: The Discovery Challenge 138
Podcasting: New Listening Experiences and Explosive Growth 146
The Networked Body: Quantified and Connected Human 159
Digital Consumer Finance: Next Generation Services Go Mainstream 169
Connectivity: Enabling the Next Wave of Technology and Media Growth 182
CONTENTS
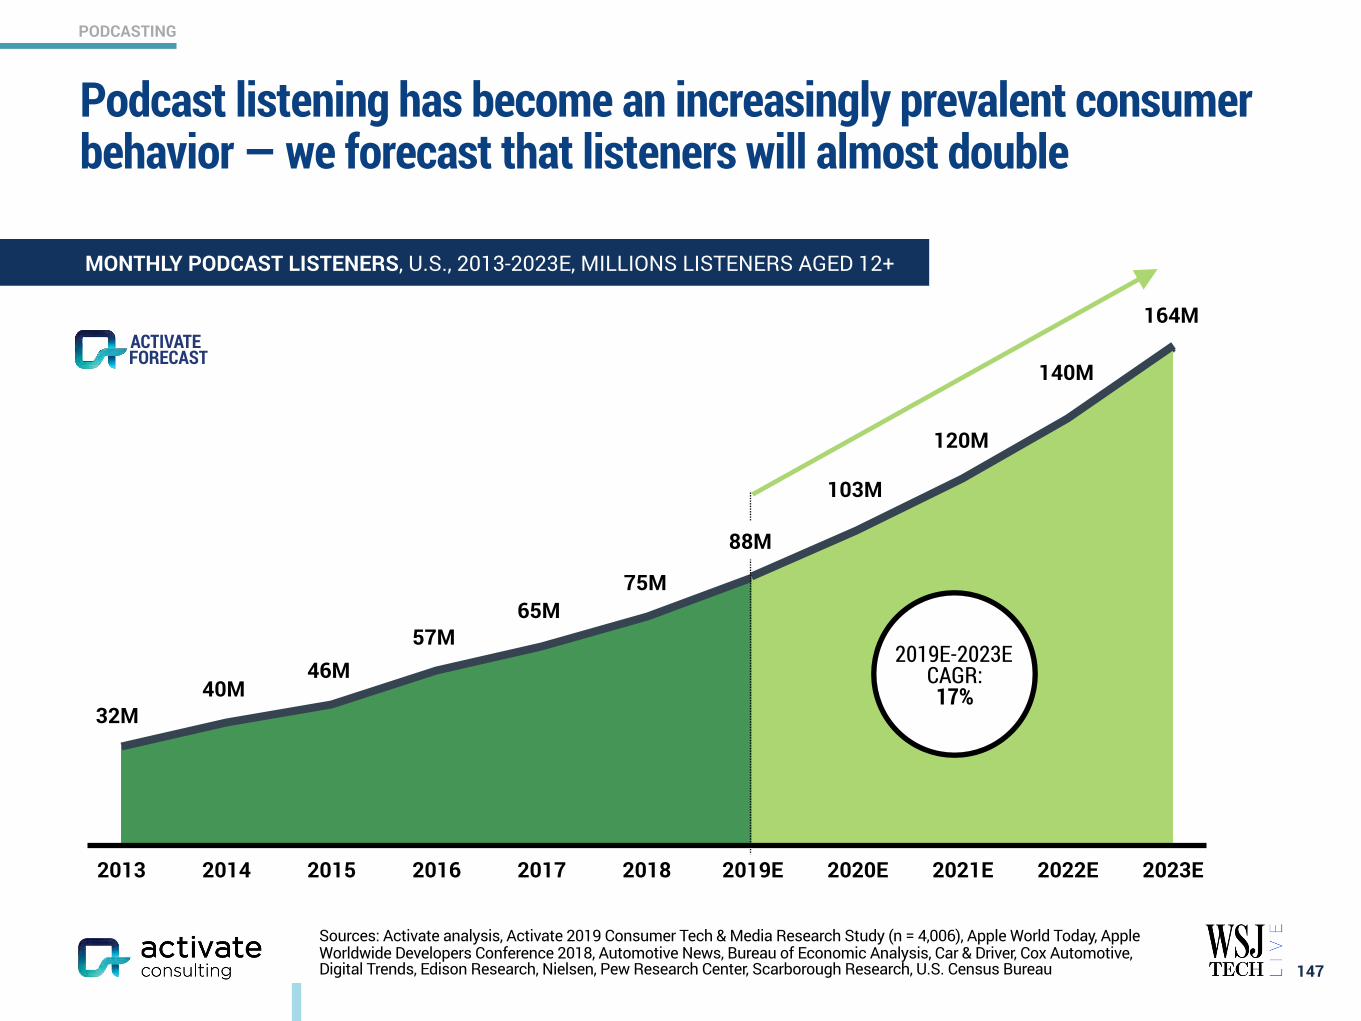
PODCASTING
Podcast listening has become an increasingly prevalent consumer behavior — we forecast that listeners will almost double
147
MONTHLY PODCAST LISTENERS, U.S., 2013-2023E, MILLIONS LISTENERS AGED 12+
2013 2014 2015 2016 2017 2018 2019E 2020E 2021E 2022E 2023E
126M
FORECASTACTIVATE
2019E-2023E CAGR: 17%
32M40M
46M57M
65M75M
103M
120M
140M
164M
88M
Sources: Activate analysis, Activate 2019 Consumer Tech & Media Research Study (n = 4,006), Apple World Today, Apple Worldwide Developers Conference 2018, Automotive News, Bureau of Economic Analysis, Car & Driver, Cox Automotive, Digital Trends, Edison Research, Nielsen, Pew Research Center, Scarborough Research, U.S. Census Bureau

PODCASTING
TRADITIONAL MEDIA COMPANIES EXTENDING THEIR REACH AND
TESTING NEW FORMATS
DIGITAL-FIRST MEDIA COMPANIES RUNNING PODCAST-FOCUSED
DIVISION
AUDIO-NATIVE PLATFORMS TARGETING NICHE MARKETS
PODCAST-NATIVE PLATFORMS LOOKING TO EXPAND COVERAGE
NON-MEDIA COMPANIES AIMING TO DRIVE ENGAGEMENT
WITH THEIR CUSTOMERS
1. As of June 2019. Sources: Activate analysis, Apple Worldwide Developers Conference 2018, Chartable, Edison Research, Foundation Digital, Podcast Insights
There is an explosion of podcasts from a broad set of creators, both media professionals and amateurs
148
ACTIVE PODCASTS AVAILABLE ON ITUNES, GLOBAL, 2015 VS. 20191, THOUSANDS
2015 2019
750K
60K
12.5x
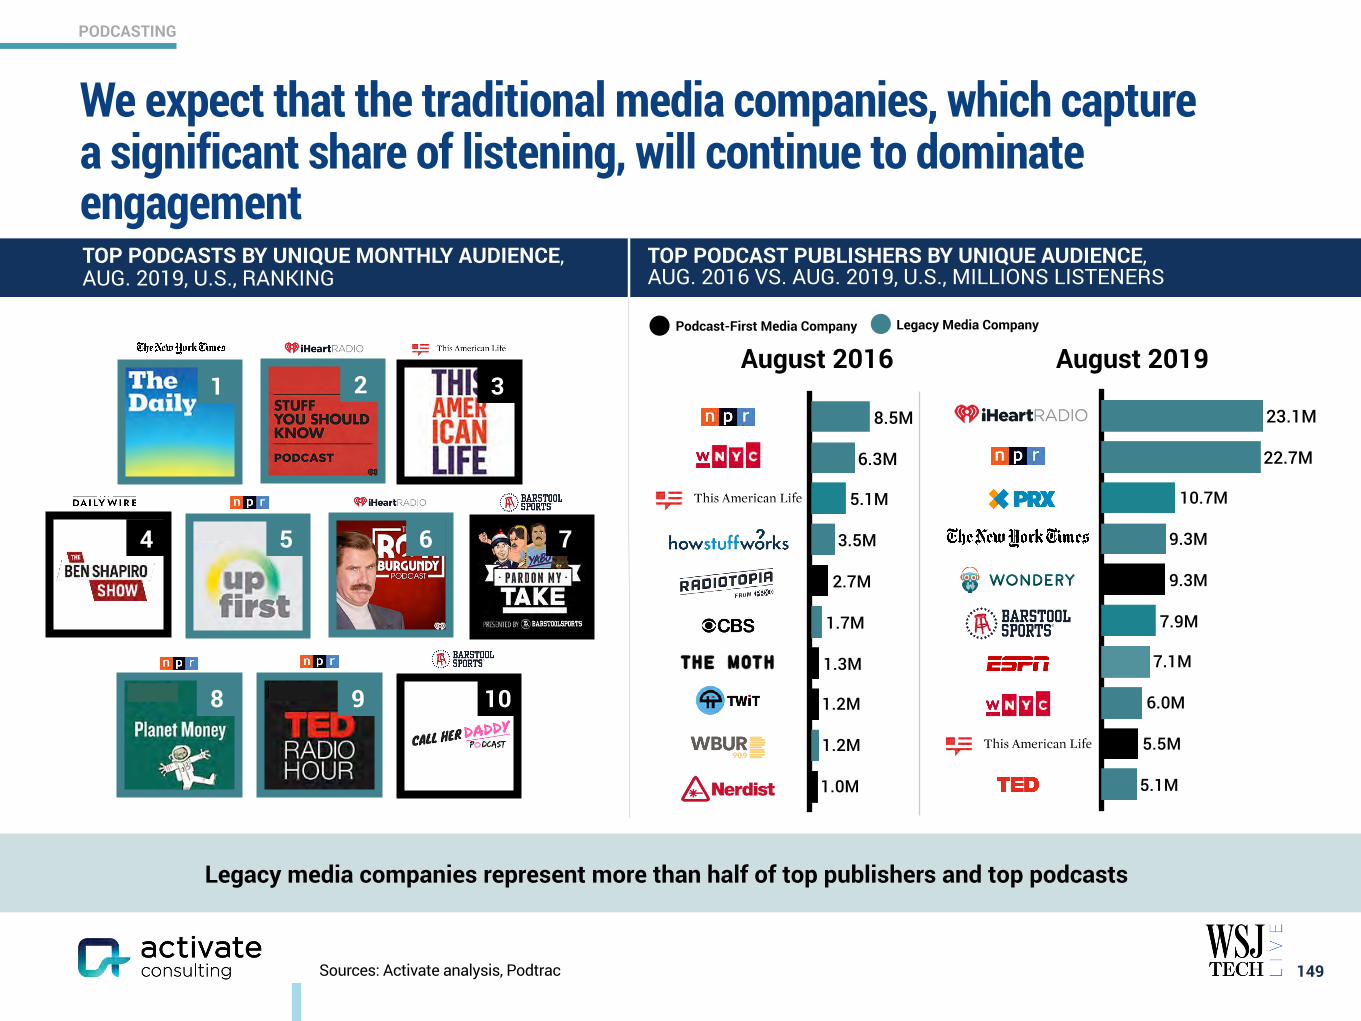
PODCASTING
1.0M
1.2M
1.2M
1.3M
1.7M
2.7M
3.5M
5.1M
6.3M
8.5M
Sources: Activate analysis, Podtrac
We expect that the traditional media companies, which capture a significant share of listening, will continue to dominate engagement
149
TOP PODCAST PUBLISHERS BY UNIQUE AUDIENCE, AUG. 2016 VS. AUG. 2019, U.S., MILLIONS LISTENERS
TOP PODCASTS BY UNIQUE MONTHLY AUDIENCE, AUG. 2019, U.S., RANKING
Legacy media companies represent more than half of top publishers and top podcasts
5.1M
5.5M
6.0M
7.1M
7.9M
9.3M
9.3M
10.7M
22.7M
23.1M
Legacy Media CompanyPodcast-First Media Company
1
9
3
8
2
4 5 6 7
10
August 2016 August 2019
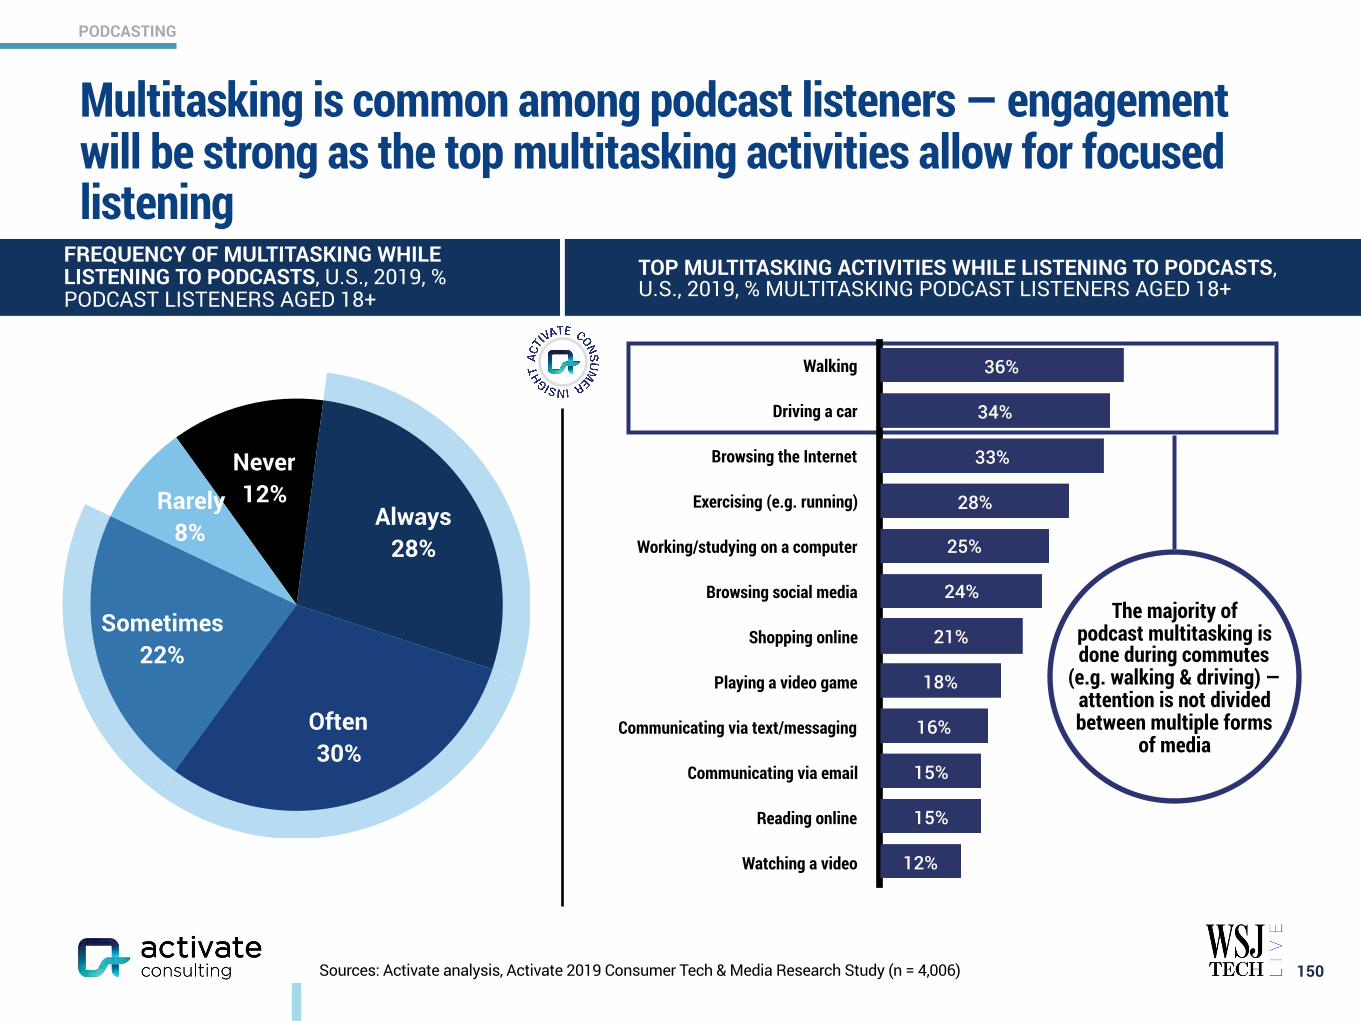
PODCASTING
Sources: Activate analysis, Activate 2019 Consumer Tech & Media Research Study (n = 4,006)
Multitasking is common among podcast listeners — engagement will be strong as the top multitasking activities allow for focused listening
150
Walking
Driving a car
Browsing the Internet
Exercising (e.g. running)
Working/studying on a computer
Browsing social media
Shopping online
Playing a video game
Communicating via text/messaging
Communicating via email
Reading online
Watching a video 12%
15%
15%
16%
18%
21%
24%
25%
28%
33%
34%
36%
TOP MULTITASKING ACTIVITIES WHILE LISTENING TO PODCASTS, U.S., 2019, % MULTITASKING PODCAST LISTENERS AGED 18+
FREQUENCY OF MULTITASKING WHILE LISTENING TO PODCASTS, U.S., 2019, % PODCAST LISTENERS AGED 18+
The majority of podcast multitasking is done during commutes
(e.g. walking & driving) — attention is not divided between multiple forms
of media
Never12%Rarely
8%
Sometimes22%
Often30%
Always28%
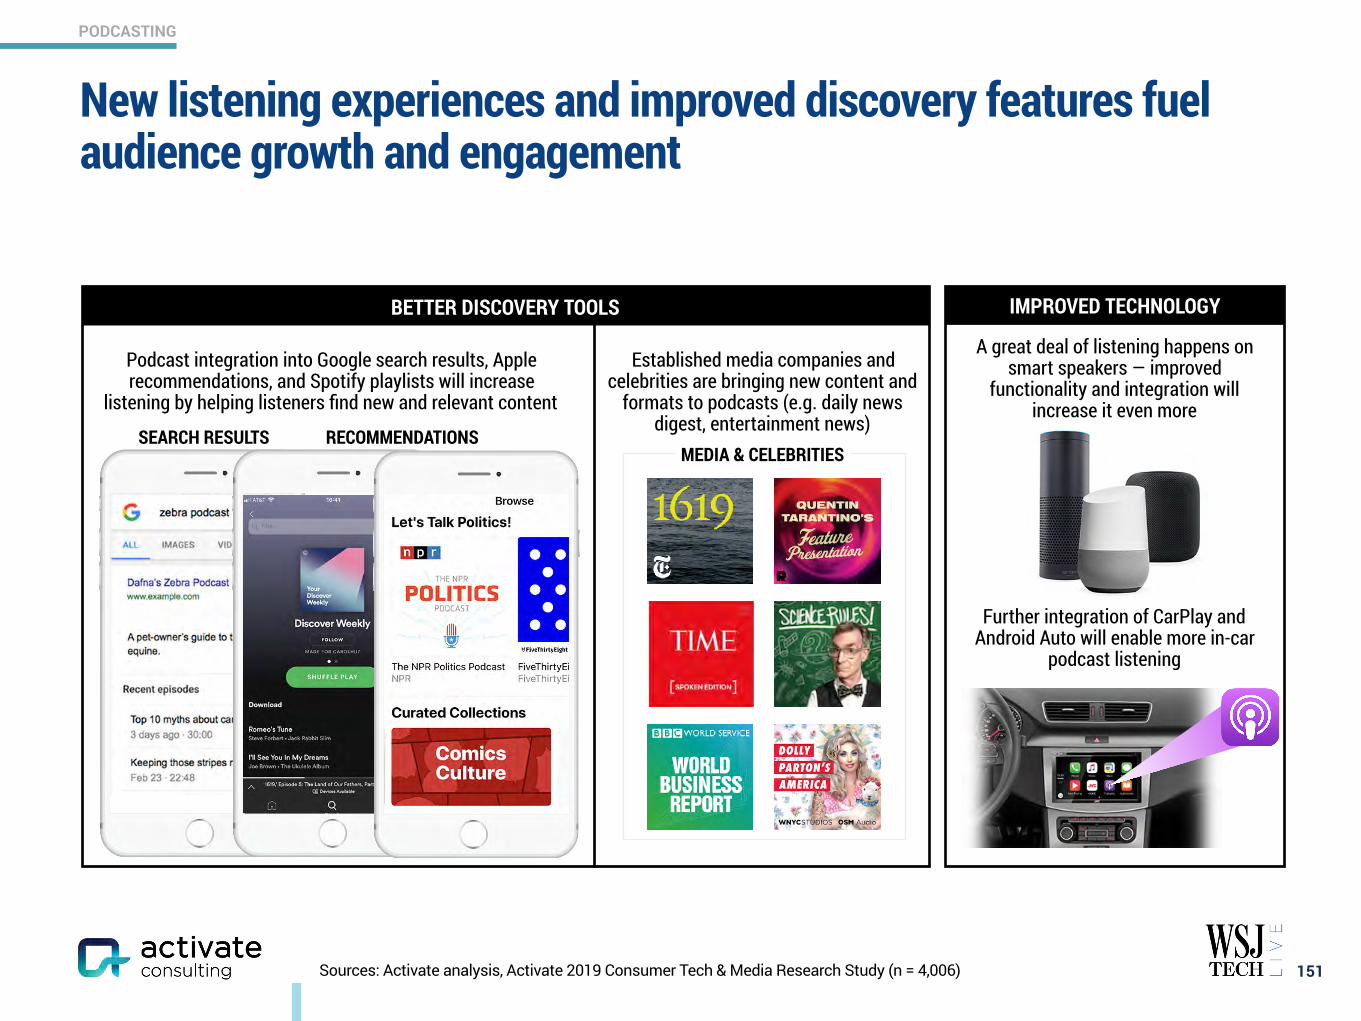
PODCASTING
RECOMMENDATIONS
Sources: Activate analysis, Activate 2019 Consumer Tech & Media Research Study (n = 4,006)
New listening experiences and improved discovery features fuel audience growth and engagement
151
Established media companies and celebrities are bringing new content and
formats to podcasts (e.g. daily news digest, entertainment news)
BETTER DISCOVERY TOOLS IMPROVED TECHNOLOGY
A great deal of listening happens on smart speakers — improved
functionality and integration will increase it even more
SEARCH RESULTS
Further integration of CarPlay and Android Auto will enable more in-car
podcast listening
MEDIA & CELEBRITIES
Podcast integration into Google search results, Apple recommendations, and Spotify playlists will increase
listening by helping listeners find new and relevant content
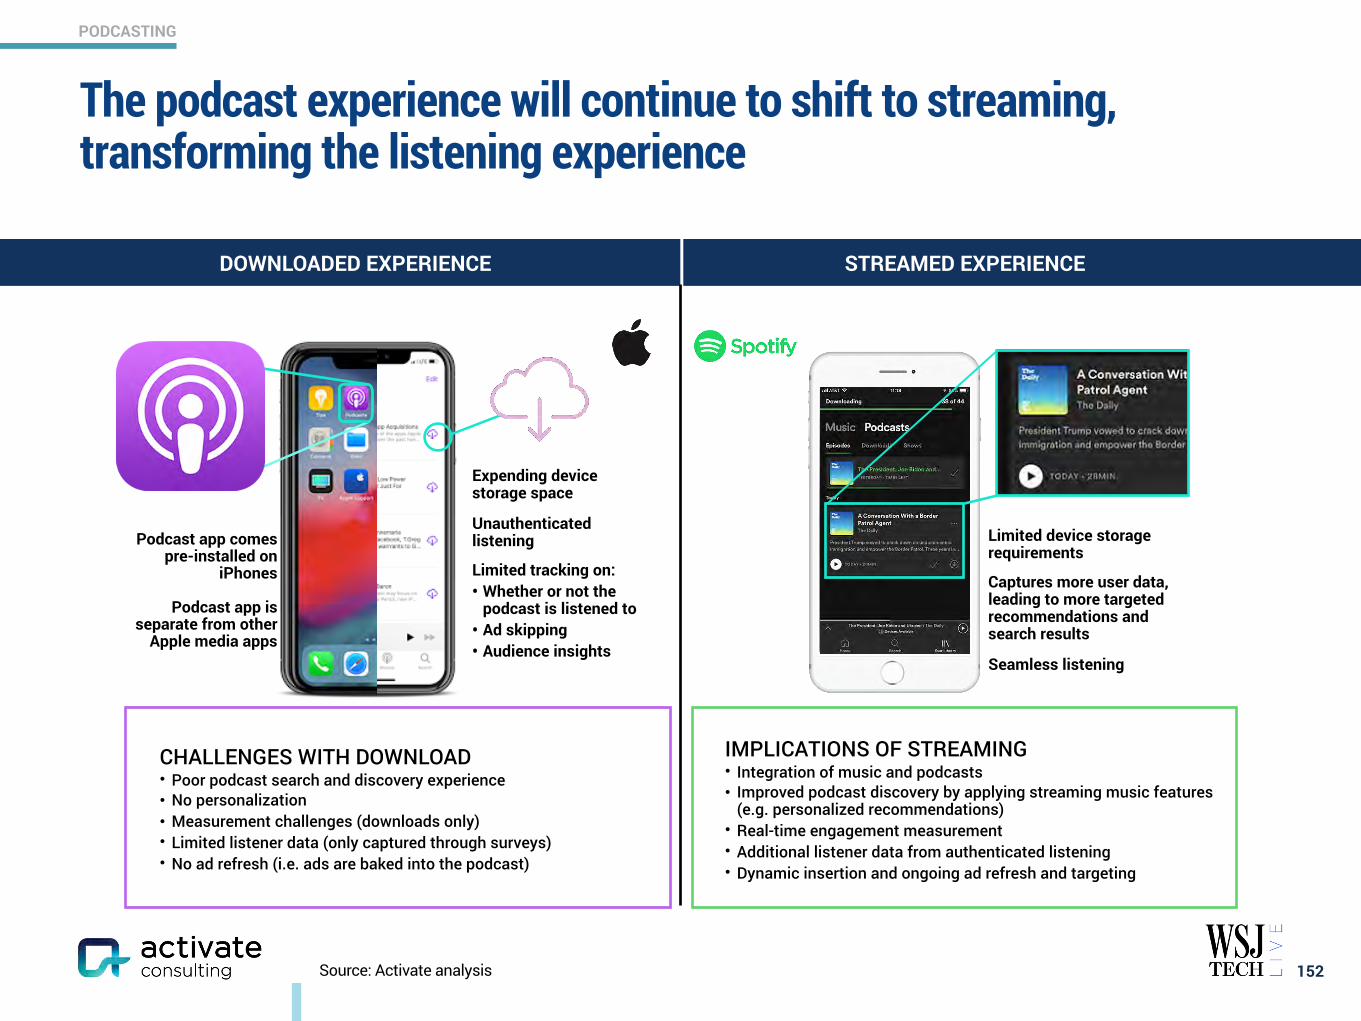
PODCASTING
Source: Activate analysis
The podcast experience will continue to shift to streaming, transforming the listening experience
152
Podcast app comes pre-installed on
iPhones
Podcast app is separate from other
Apple media apps
Expending device storage space
Unauthenticated listening
Limited tracking on: • Whether or not the
podcast is listened to • Ad skipping • Audience insights
Limited device storage requirements
Captures more user data, leading to more targeted recommendations and search results
Seamless listening
STREAMED EXPERIENCEDOWNLOADED EXPERIENCE
CHALLENGES WITH DOWNLOAD • Poor podcast search and discovery experience • No personalization • Measurement challenges (downloads only) • Limited listener data (only captured through surveys) • No ad refresh (i.e. ads are baked into the podcast)
IMPLICATIONS OF STREAMING • Integration of music and podcasts • Improved podcast discovery by applying streaming music features
(e.g. personalized recommendations) • Real-time engagement measurement • Additional listener data from authenticated listening • Dynamic insertion and ongoing ad refresh and targeting
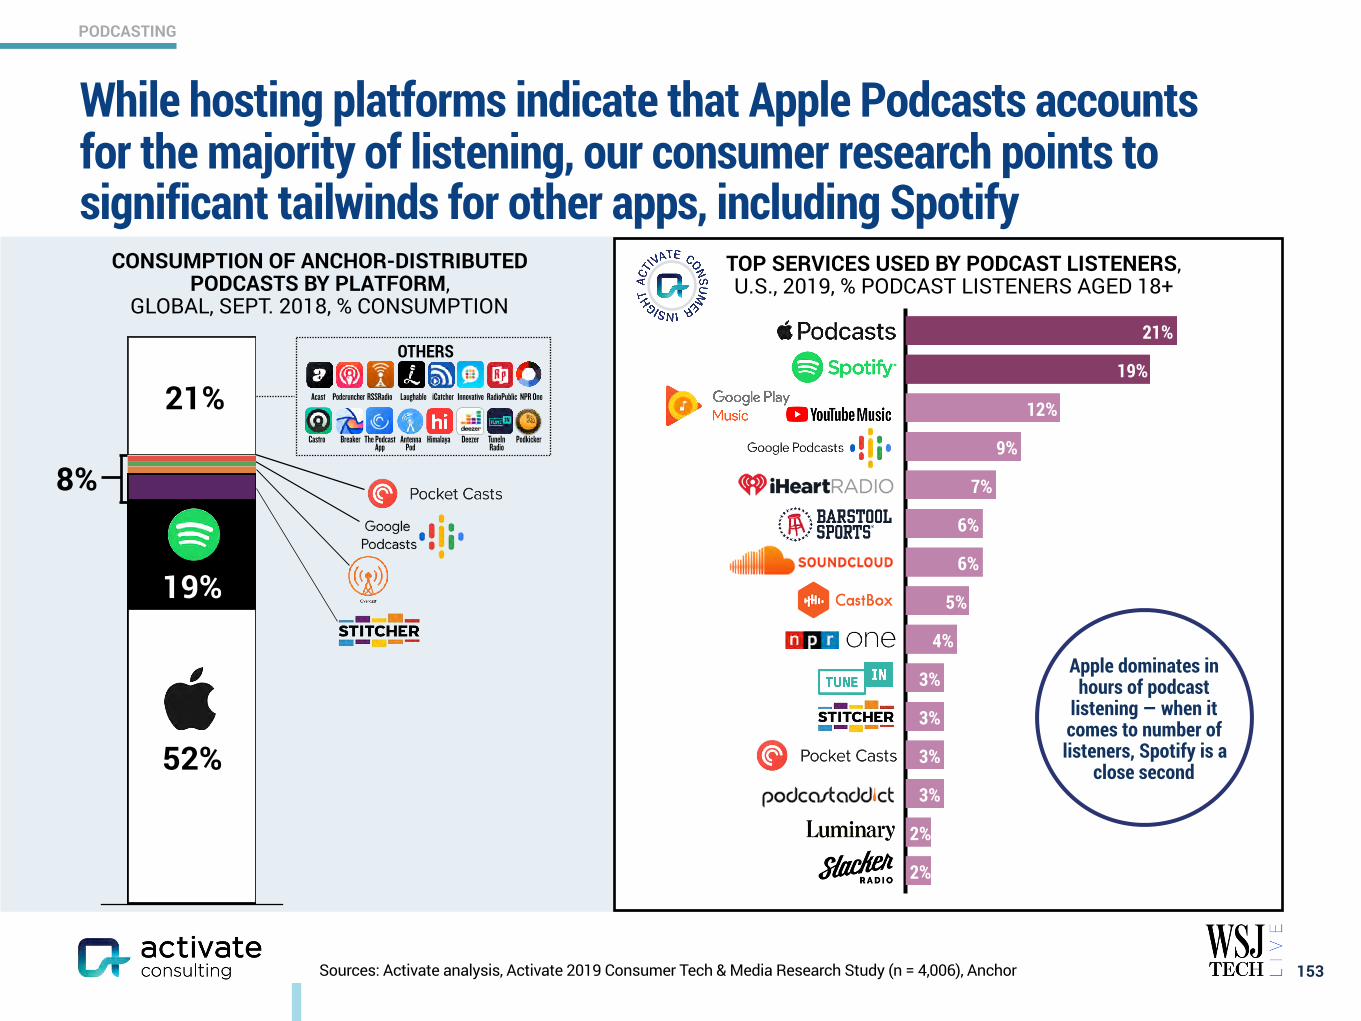
PODCASTING
19%
21%
2%
2%
3%
3%
3%
3%
4%
5%
6%
6%
7%
9%
12%
Sources: Activate analysis, Activate 2019 Consumer Tech & Media Research Study (n = 4,006), Anchor 153
While hosting platforms indicate that Apple Podcasts accounts for the majority of listening, our consumer research points to significant tailwinds for other apps, including Spotify
TOP SERVICES USED BY PODCAST LISTENERS, U.S., 2019, % PODCAST LISTENERS AGED 18+
CONSUMPTION OF ANCHOR-DISTRIBUTED PODCASTS BY PLATFORM,
GLOBAL, SEPT. 2018, % CONSUMPTION
0.21
19%
52%
21%OTHERS
Acast Innovative
TuneIn Radio
The Podcast App
PodkickerBreaker AntennaPod
Deezer
RSSRadio RadioPublic
Castro
iCatcher
Himalaya
Podcruncher Laughable NPR One
Apple dominates in hours of podcast
listening — when it comes to number of listeners, Spotify is a
close second
8%
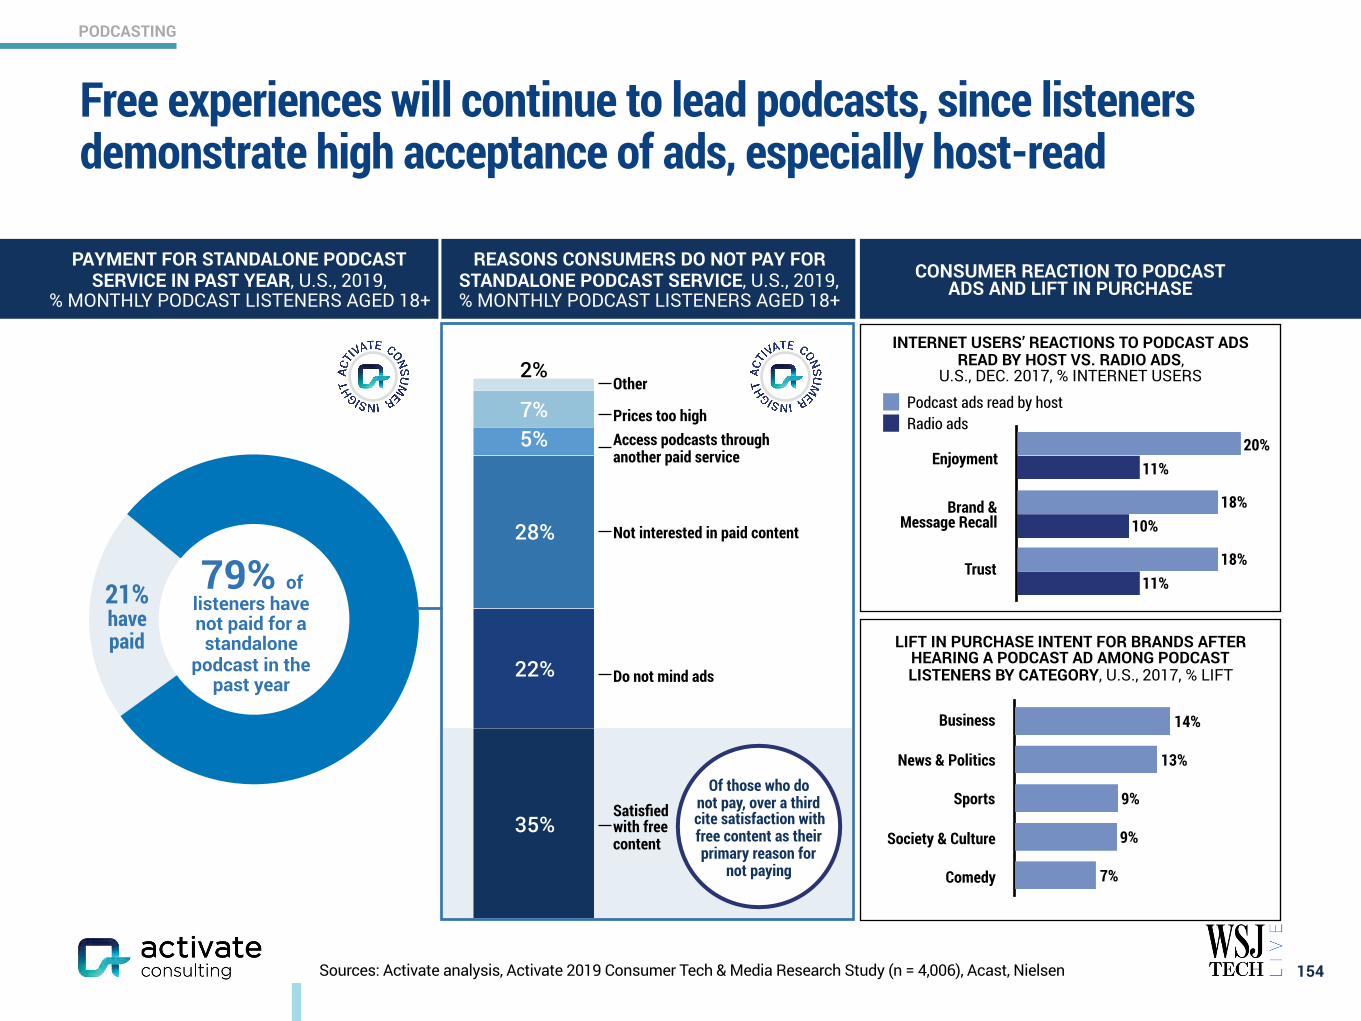
PODCASTING
Sources: Activate analysis, Activate 2019 Consumer Tech & Media Research Study (n = 4,006), Acast, Nielsen
Free experiences will continue to lead podcasts, since listeners demonstrate high acceptance of ads, especially host-read
154
79% of listeners have not paid for a
standalone podcast in the
past year
REASONS CONSUMERS DO NOT PAY FOR STANDALONE PODCAST SERVICE, U.S., 2019, % MONTHLY PODCAST LISTENERS AGED 18+
PAYMENT FOR STANDALONE PODCAST SERVICE IN PAST YEAR, U.S., 2019,
% MONTHLY PODCAST LISTENERS AGED 18+
21% have paid
7%5%
28%
22%
35%
Other
Prices too highAccess podcasts throughanother paid service
Not interested in paid content
Do not mind ads
Satisfied with free content
2%
Of those who do not pay, over a third cite satisfaction with free content as their primary reason for
not paying
INTERNET USERS’ REACTIONS TO PODCAST ADS READ BY HOST VS. RADIO ADS,
U.S., DEC. 2017, % INTERNET USERS
11%
10%
11%
18%
18%
20%
Podcast ads read by hostRadio ads
LIFT IN PURCHASE INTENT FOR BRANDS AFTER HEARING A PODCAST AD AMONG PODCAST LISTENERS BY CATEGORY, U.S., 2017, % LIFT
Business
News & Politics
Sports
Society & Culture
Comedy 7%
9%
9%
13%
14%
Trust
Brand & Message Recall
Enjoyment
CONSUMER REACTION TO PODCAST ADS AND LIFT IN PURCHASE
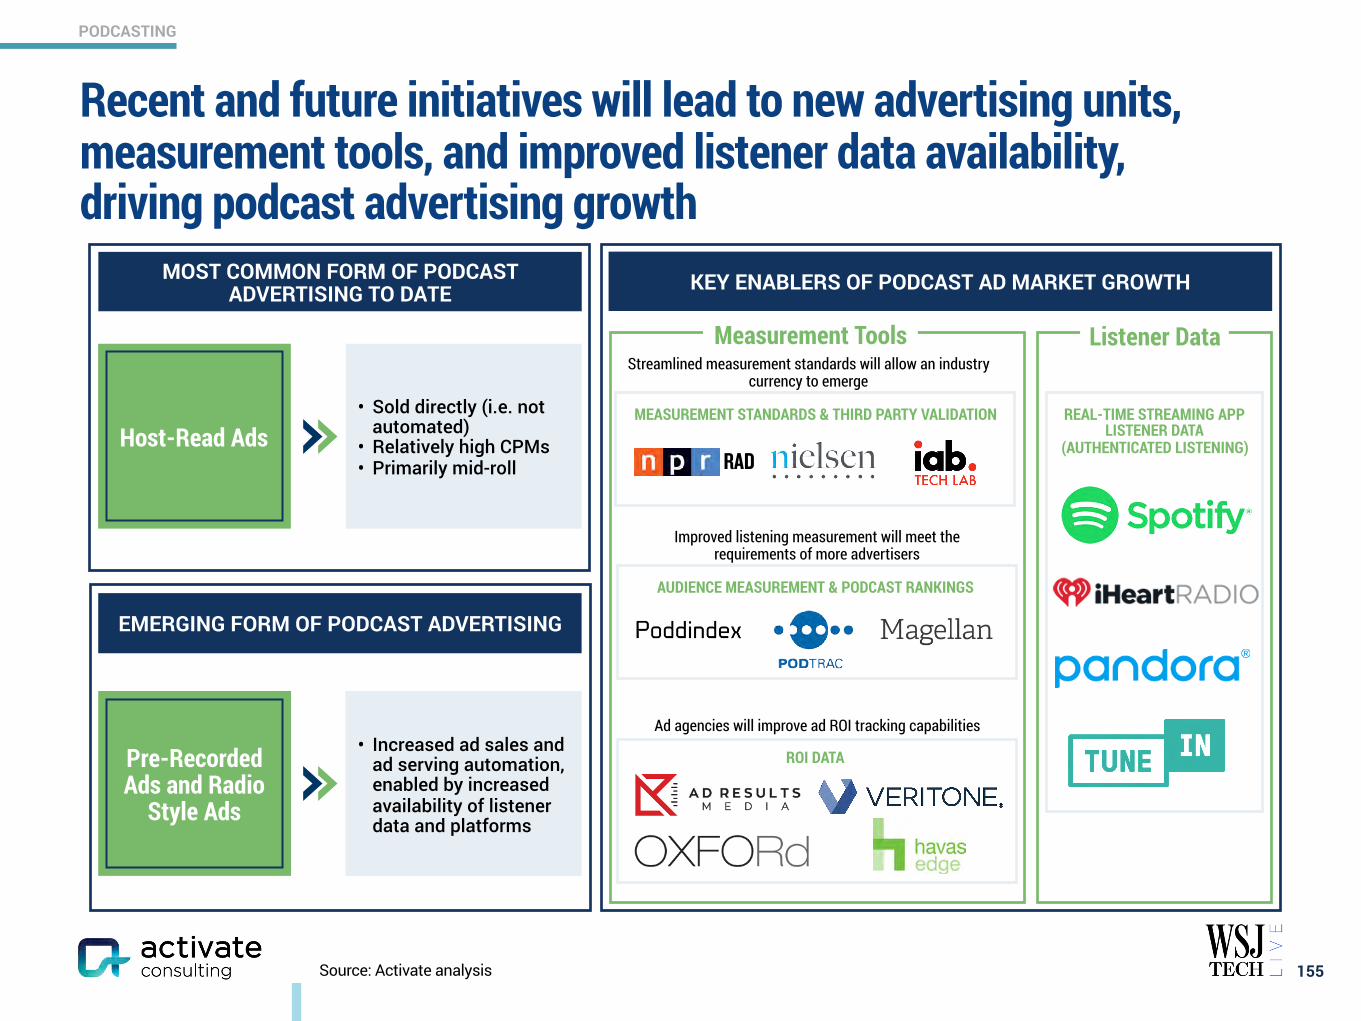
PODCASTING
Source: Activate analysis
Recent and future initiatives will lead to new advertising units, measurement tools, and improved listener data availability, driving podcast advertising growth
155
REAL-TIME STREAMING APP LISTENER DATA
(AUTHENTICATED LISTENING)
ROI DATA
MEASUREMENT STANDARDS & THIRD PARTY VALIDATION
AUDIENCE MEASUREMENT & PODCAST RANKINGS
Improved listening measurement will meet the requirements of more advertisers
Ad agencies will improve ad ROI tracking capabilities
RAD
MOST COMMON FORM OF PODCAST ADVERTISING TO DATE
EMERGING FORM OF PODCAST ADVERTISING
Host-Read Ads• Sold directly (i.e. not
automated) • Relatively high CPMs • Primarily mid-roll
Pre-Recorded Ads and Radio
Style Ads
• Increased ad sales and ad serving automation, enabled by increased availability of listener data and platforms
Measurement Tools Listener Data
KEY ENABLERS OF PODCAST AD MARKET GROWTH
Streamlined measurement standards will allow an industry currency to emerge
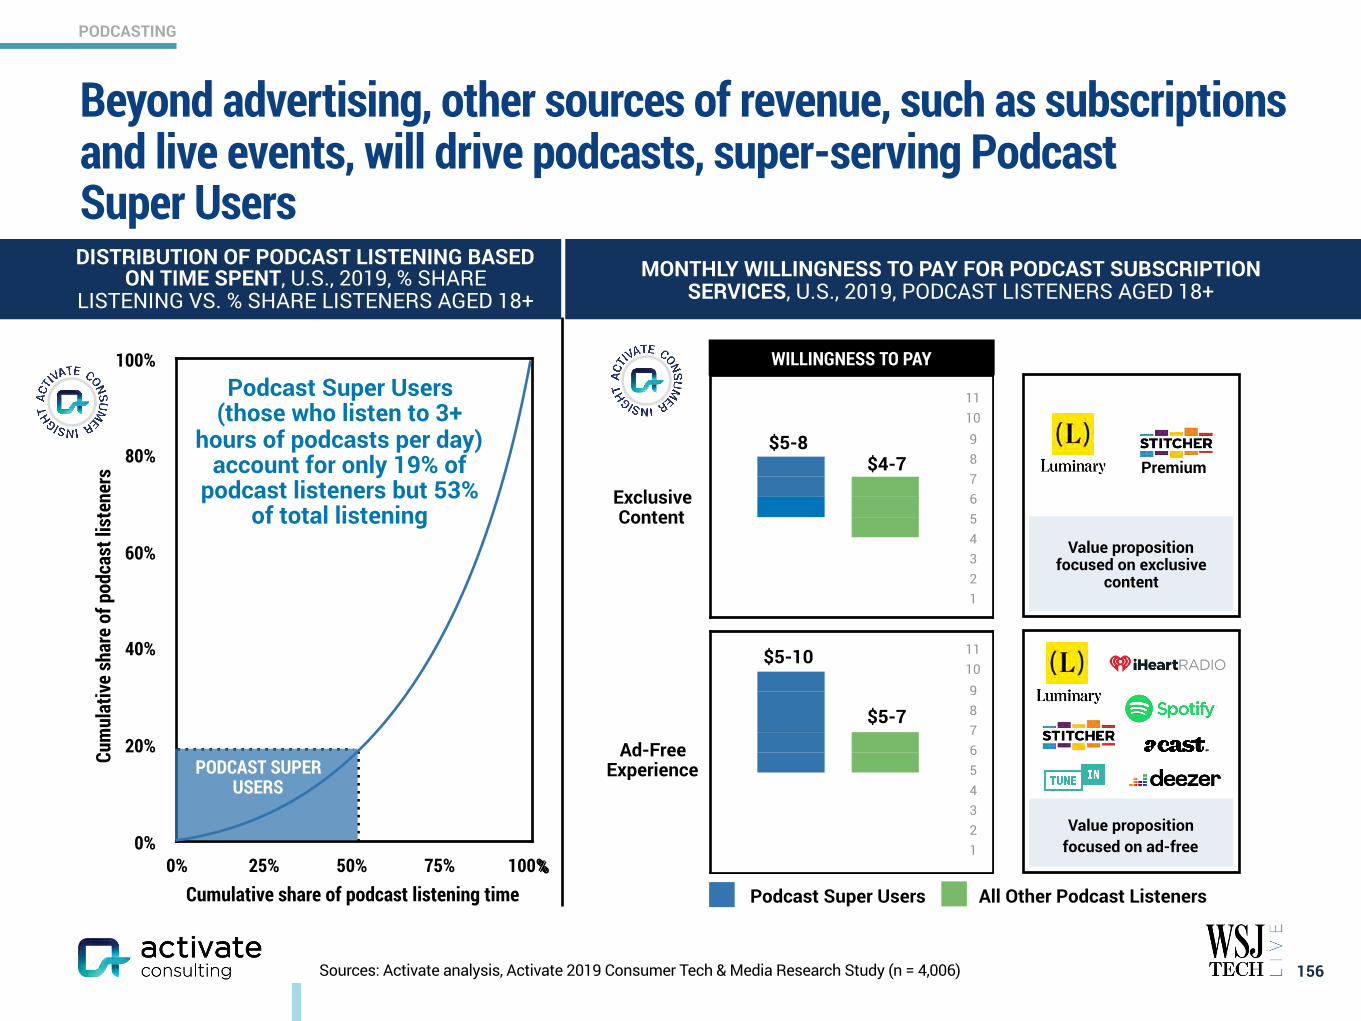
PODCASTING
0%
20%
40%
60%
80%
100%
0% 25% 50% 75% 100%
Sources: Activate analysis, Activate 2019 Consumer Tech & Media Research Study (n = 4,006)
Beyond advertising, other sources of revenue, such as subscriptions and live events, will drive podcasts, super-serving Podcast Super Users
156
Cum
ulat
ive
shar
e of
pod
cast
list
ener
s
Cumulative share of podcast listening time
Podcast Super Users (those who listen to 3+
hours of podcasts per day) account for only 19% of
podcast listeners but 53% of total listening
MONTHLY WILLINGNESS TO PAY FOR PODCAST SUBSCRIPTION SERVICES, U.S., 2019, PODCAST LISTENERS AGED 18+
DISTRIBUTION OF PODCAST LISTENING BASED ON TIME SPENT, U.S., 2019, % SHARE
LISTENING VS. % SHARE LISTENERS AGED 18+
Exclusive Content
Ad-Free Experience
Value proposition focused on ad-free
0
0
Podcast Super Users All Other Podcast Listeners
WILLINGNESS TO PAY
$5-10
$5-7
$5-8$4-7
PODCAST SUPER USERS
%
1110987654321
1110987654321
Value proposition focused on exclusive
content
Premium
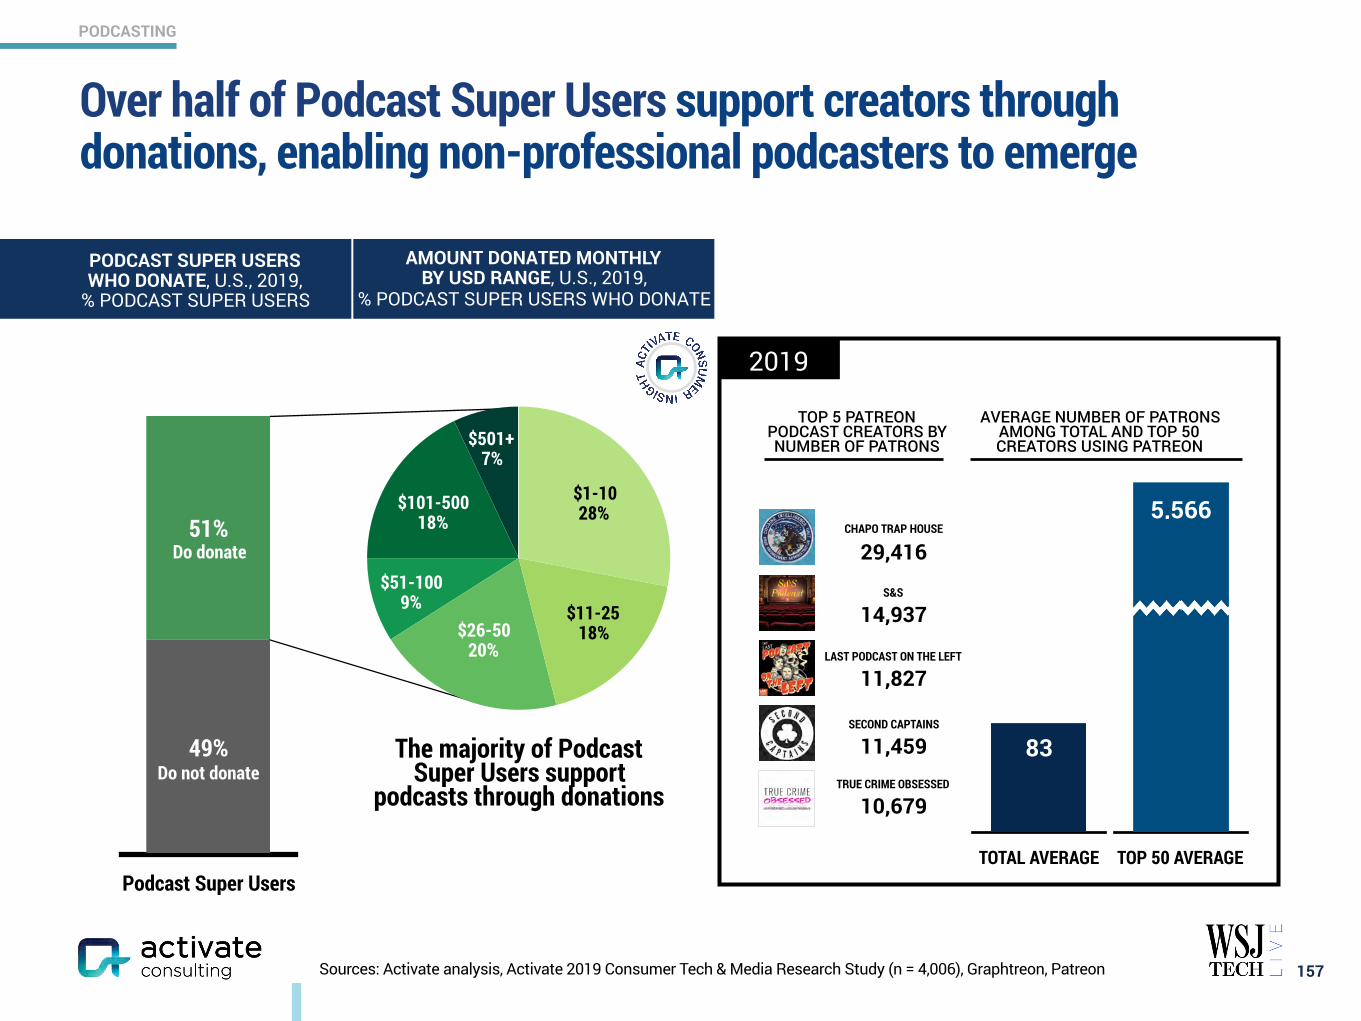
PODCASTING
Sources: Activate analysis, Activate 2019 Consumer Tech & Media Research Study (n = 4,006), Graphtreon, Patreon
Over half of Podcast Super Users support creators through donations, enabling non-professional podcasters to emerge
157
The majority of Podcast Super Users support
podcasts through donations
Podcast Super Users
51%
49%
AMOUNT DONATED MONTHLY BY USD RANGE, U.S., 2019,
% PODCAST SUPER USERS WHO DONATE
Do donate
Do not donate
$1-10 28%
$11-25 18%$26-50
20%
$51-100 9%
$101-500 18%
$501+ 7%
29,416CHAPO TRAP HOUSE
S&S
14,937
LAST PODCAST ON THE LEFT
11,827
SECOND CAPTAINS
11,459
TOP 50 AVERAGE
5,566
TOTAL AVERAGE
83
TOP 5 PATREON PODCAST CREATORS BY NUMBER OF PATRONS
AVERAGE NUMBER OF PATRONS AMONG TOTAL AND TOP 50 CREATORS USING PATREON
TRUE CRIME OBSESSED
10,679
2019
PODCAST SUPER USERS WHO DONATE, U.S., 2019,
% PODCAST SUPER USERS
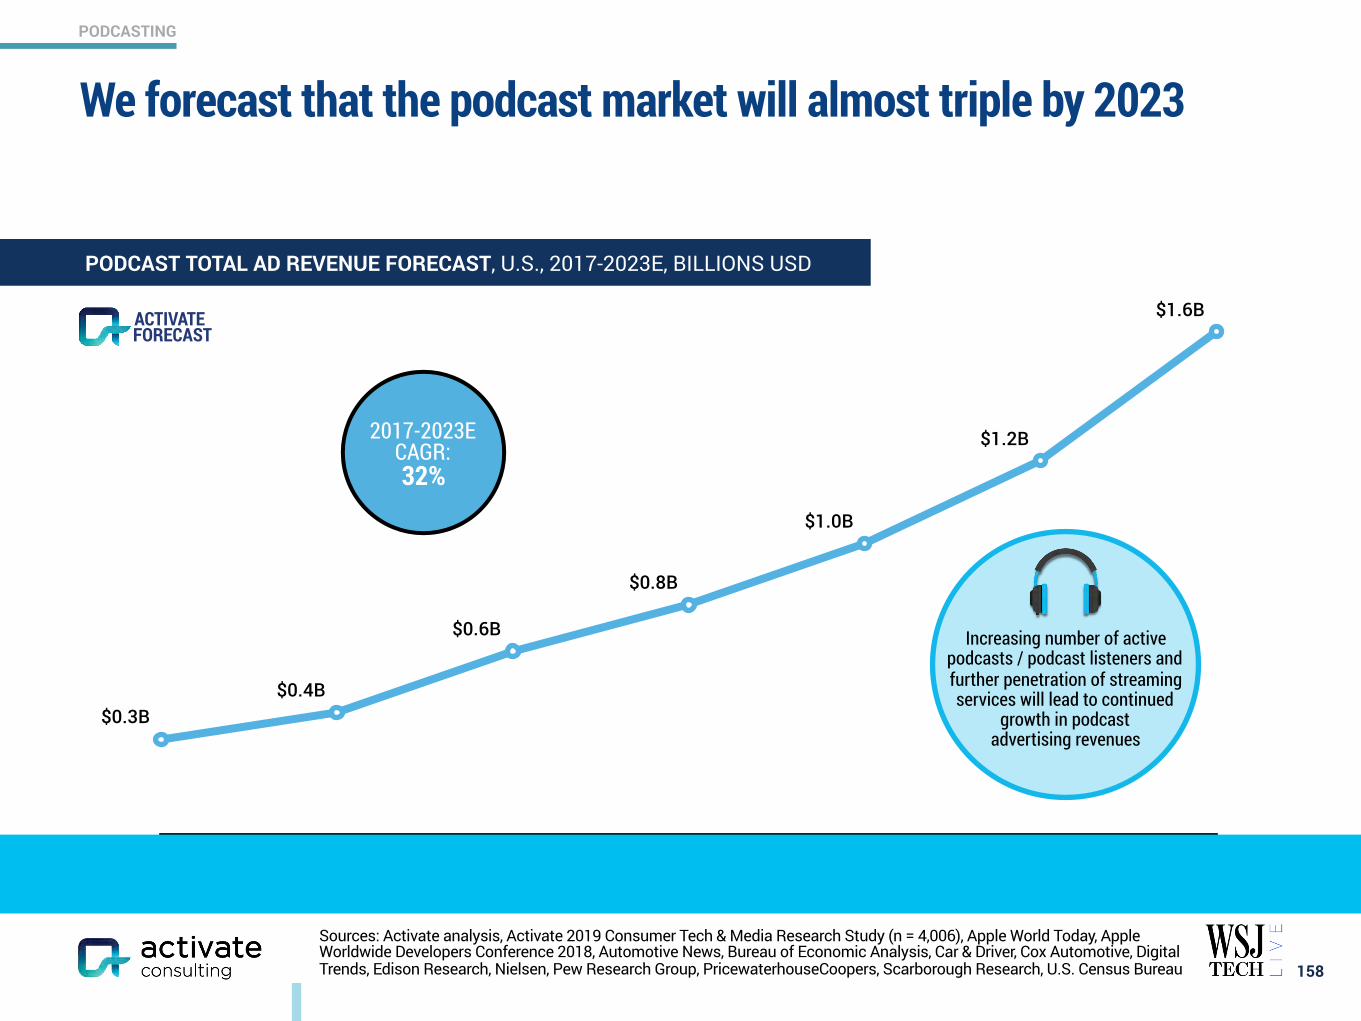
PODCASTING
2017 2018 2019E 2020E 2021E 2022E 2023E
$0.3B$0.4B
$0.6B
$0.8B
$1.0B
$1.2B
$1.6B
We forecast that the podcast market will almost triple by 2023
158
FORECASTACTIVATE
Increasing number of active podcasts / podcast listeners and further penetration of streaming services will lead to continued
growth in podcast advertising revenues
PODCAST TOTAL AD REVENUE FORECAST, U.S., 2017-2023E, BILLIONS USD
Sources: Activate analysis, Activate 2019 Consumer Tech & Media Research Study (n = 4,006), Apple World Today, Apple Worldwide Developers Conference 2018, Automotive News, Bureau of Economic Analysis, Car & Driver, Cox Automotive, Digital Trends, Edison Research, Nielsen, Pew Research Group, PricewaterhouseCoopers, Scarborough Research, U.S. Census Bureau
2017-2023E CAGR: 32%

www.activate.com 159
PAGE
$300 Billion Global Internet and Media Growth Dollars by 2023 4
Consumer Attention: 12:40 Hours of Technology & Media Per Day 9
Super Users: The Imperative for Technology & Media Companies 13
Social Splinter: The Social Media World Expands 27
eCommerce: Shrinking the Divide Between Physical and Digital Shopping 41
Digital Marketplaces: New Inventory, Price, Transparency, Ease of Use 60
Video Gaming: The Next Streaming Battlefront 71
Esports: Sport of the Future 84
Video: Streaming Stacking, Battleground Households 94
Sports Betting: The Next Big Financial Trading Market 117
Sports: More Viewing, Emerging Sports, Better Fan Experiences 129
Music: The Discovery Challenge 138
Podcasting: New Listening Experiences and Explosive Growth 146
The Networked Body: Quantified and Connected Human 159
Digital Consumer Finance: Next Generation Services Go Mainstream 169
Connectivity: Enabling the Next Wave of Technology and Media Growth 182
CONTENTS
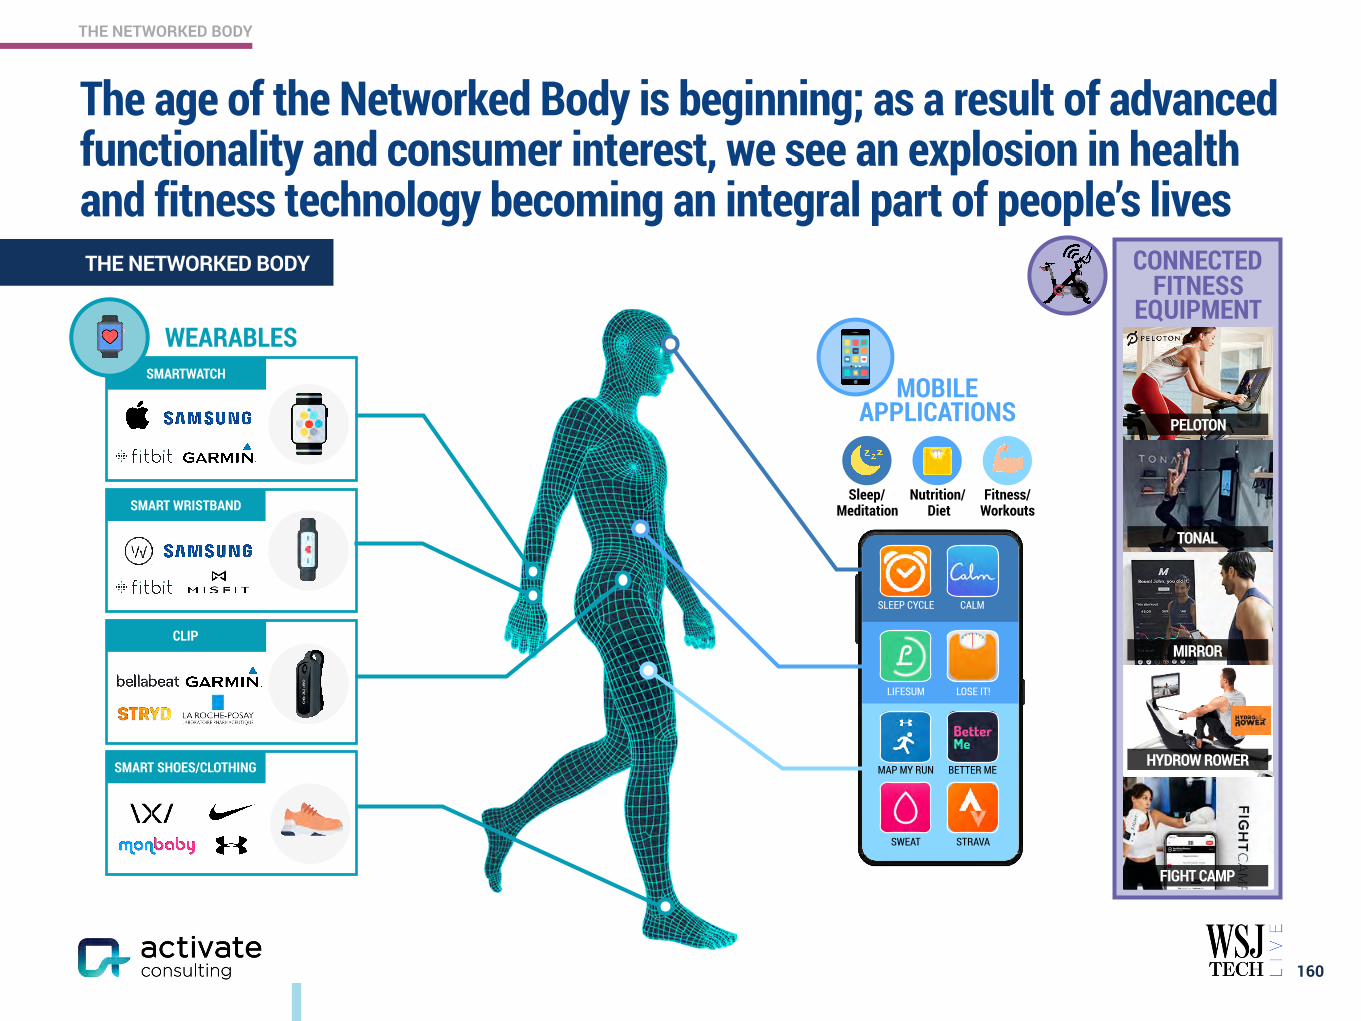
THE NETWORKED BODY
160
THE NETWORKED BODY
WEARABLES
MOBILE APPLICATIONS
SMARTWATCH
SMART WRISTBAND
CLIP
SMART SHOES/CLOTHING
Sleep/Meditation
Nutrition/ Diet
Fitness/Workouts
SLEEP CYCLE CALM
LIFESUM LOSE IT!
MAP MY RUN BETTER ME
SWEAT STRAVA
CONNECTEDFITNESS
EQUIPMENT
PELOTON
TONAL
HYDROW ROWER
FIGHT CAMP
MIRROR
The age of the Networked Body is beginning; as a result of advanced functionality and consumer interest, we see an explosion in health and fitness technology becoming an integral part of people’s lives
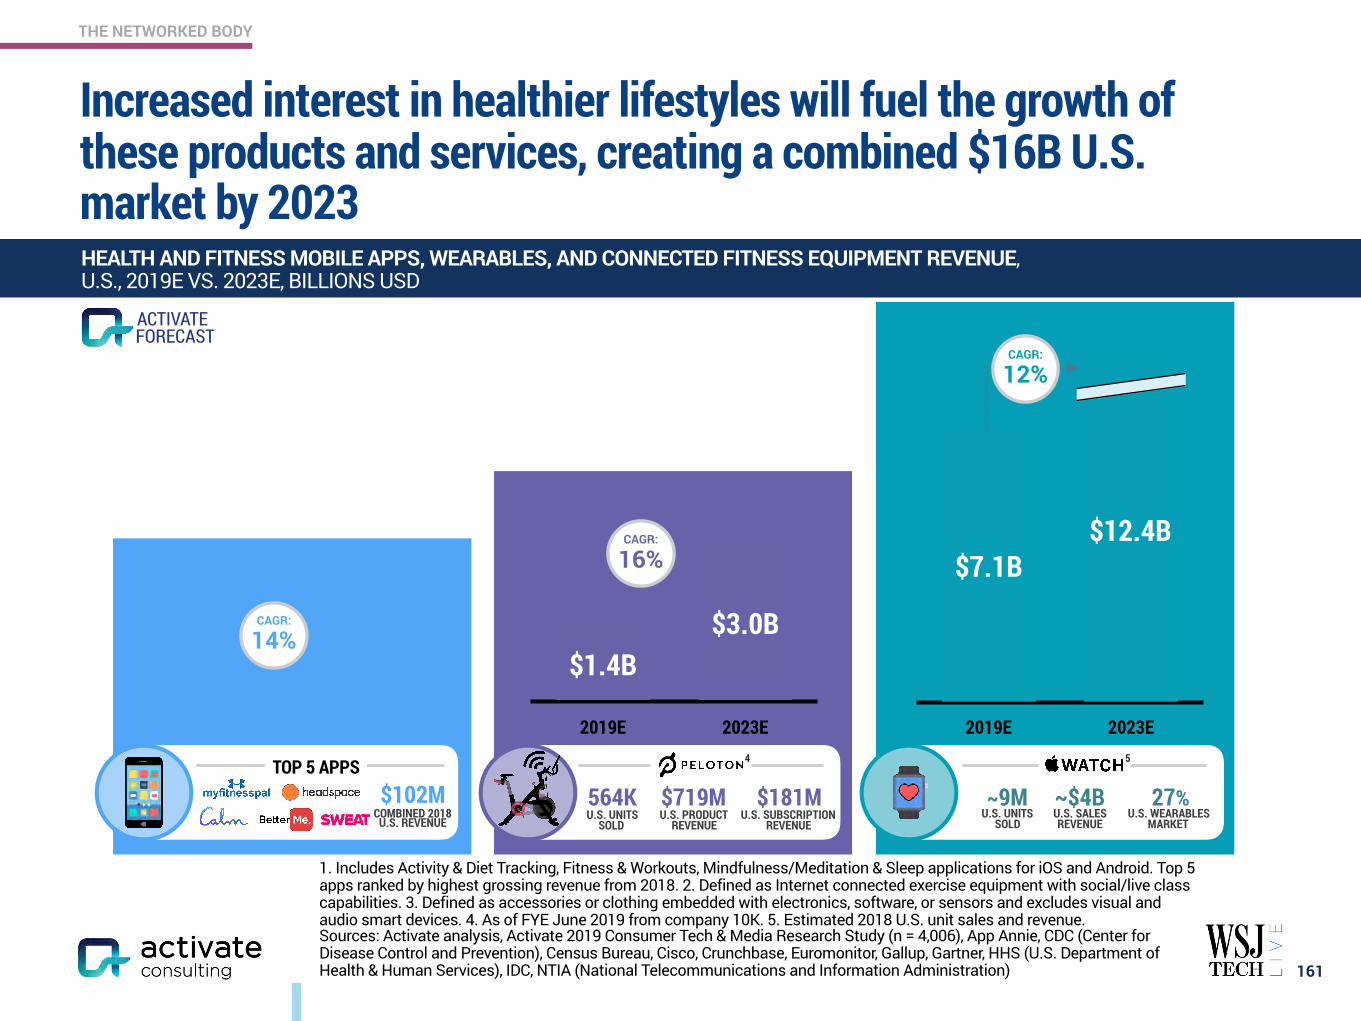
THE NETWORKED BODY
Increased interest in healthier lifestyles will fuel the growth of these products and services, creating a combined $16B U.S. market by 2023
161
HEALTH AND FITNESS MOBILE APPS, WEARABLES, AND CONNECTED FITNESS EQUIPMENT REVENUE, U.S., 2019E VS. 2023E, BILLIONS USD
1. Includes Activity & Diet Tracking, Fitness & Workouts, Mindfulness/Meditation & Sleep applications for iOS and Android. Top 5 apps ranked by highest grossing revenue from 2018. 2. Defined as Internet connected exercise equipment with social/live class capabilities. 3. Defined as accessories or clothing embedded with electronics, software, or sensors and excludes visual and audio smart devices. 4. As of FYE June 2019 from company 10K. 5. Estimated 2018 U.S. unit sales and revenue. Sources: Activate analysis, Activate 2019 Consumer Tech & Media Research Study (n = 4,006), App Annie, CDC (Center for Disease Control and Prevention), Census Bureau, Cisco, Crunchbase, Euromonitor, Gallup, Gartner, HHS (U.S. Department of Health & Human Services), IDC, NTIA (National Telecommunications and Information Administration)
FORECASTACTIVATE
2019E 2023E 2019E 2023E
$12.4B$7.1BMOBILE APPS1
WEARABLES3
CAGR:
12%
2019E 2023E
$3.0B$1.4B
CAGR:
16%
$0.4B$0.8B
CAGR:
14%
~9M U.S. UNITS
SOLD
~$4B U.S. SALES REVENUE
27% U.S. WEARABLES
MARKET
564K U.S. UNITS
SOLD
$719M U.S. PRODUCT
REVENUE
$181M U.S. SUBSCRIPTION
REVENUE
TOP 5 APPS$102M
COMBINED 2018 U.S. REVENUE
54
CONNECTED FITNESS EQUIPMENT2
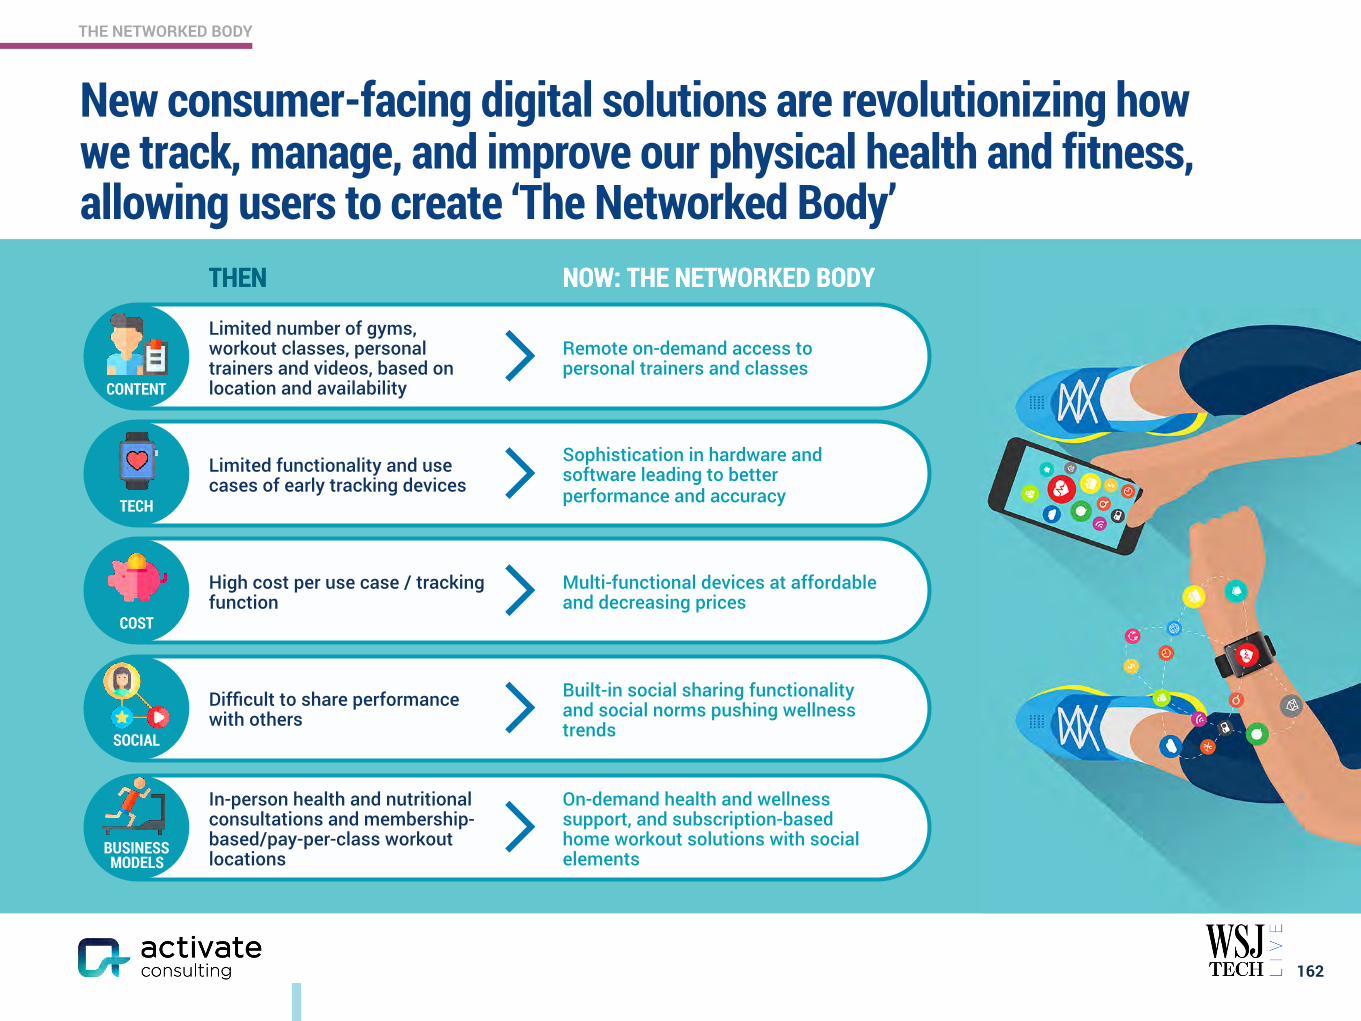
THE NETWORKED BODY
New consumer-facing digital solutions are revolutionizing how we track, manage, and improve our physical health and fitness, allowing users to create ‘The Networked Body’
162
THEN NOW: THE NETWORKED BODY
SOCIAL
THEN NOW: THE NETWORKED BODY
Limited number of gyms, workout classes, personal trainers and videos, based on location and availability
Remote on-demand access to personal trainers and classes
CONTENT
Limited functionality and use cases of early tracking devices
Sophistication in hardware and software leading to better performance and accuracyTECH
High cost per use case / tracking function
Multi-functional devices at affordable and decreasing prices
COST
Difficult to share performance with others
Built-in social sharing functionality and social norms pushing wellness trendsSOCIAL
In-person health and nutritional consultations and membership-based/pay-per-class workout locations
On-demand health and wellness support, and subscription-based home workout solutions with social elementsBUSINESS
MODELS
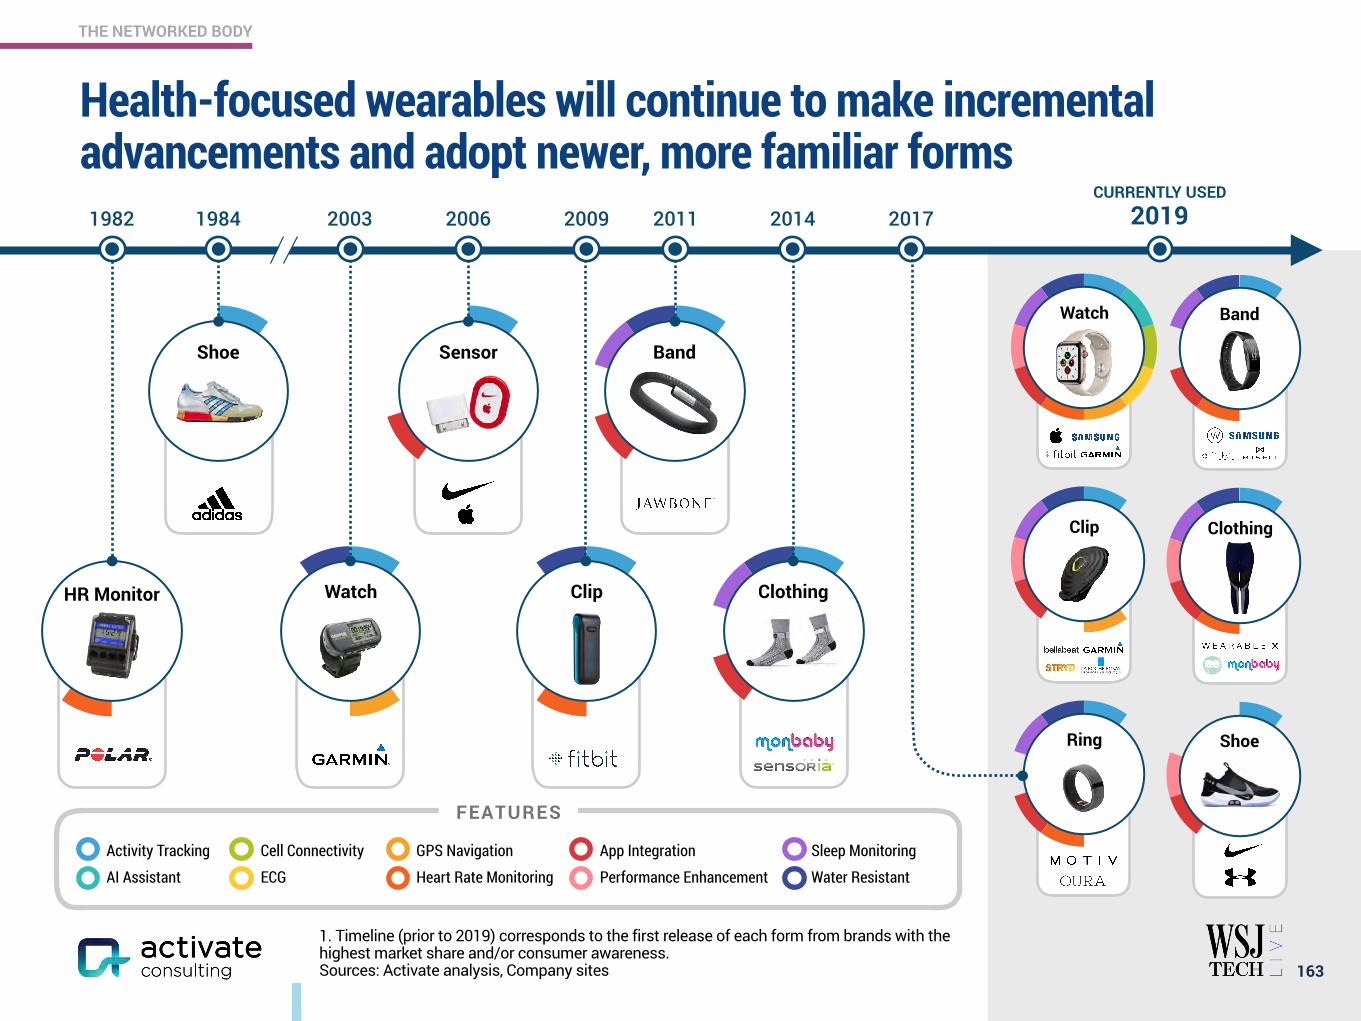
THE NETWORKED BODY
Health-focused wearables will continue to make incremental advancements and adopt newer, more familiar forms
FEATURES
163
1. Timeline (prior to 2019) corresponds to the first release of each form from brands with the highest market share and/or consumer awareness. Sources: Activate analysis, Company sites
• Activity Tracking
• AI Assistant • Cell Connectivity
• ECG • GPS Navigation
• Heart Rate Monitoring • App Integration
• Performance Enhancement • Sleep Monitoring
• Water Resistant
Shoe
1984 2017CURRENTLY USED
2019
HR Monitor
1982 2011
Clip
2009
Watch
2003
Sensor
2006 2014
Clothing
Band
Watch Band
Clip Clothing
Ring Shoe
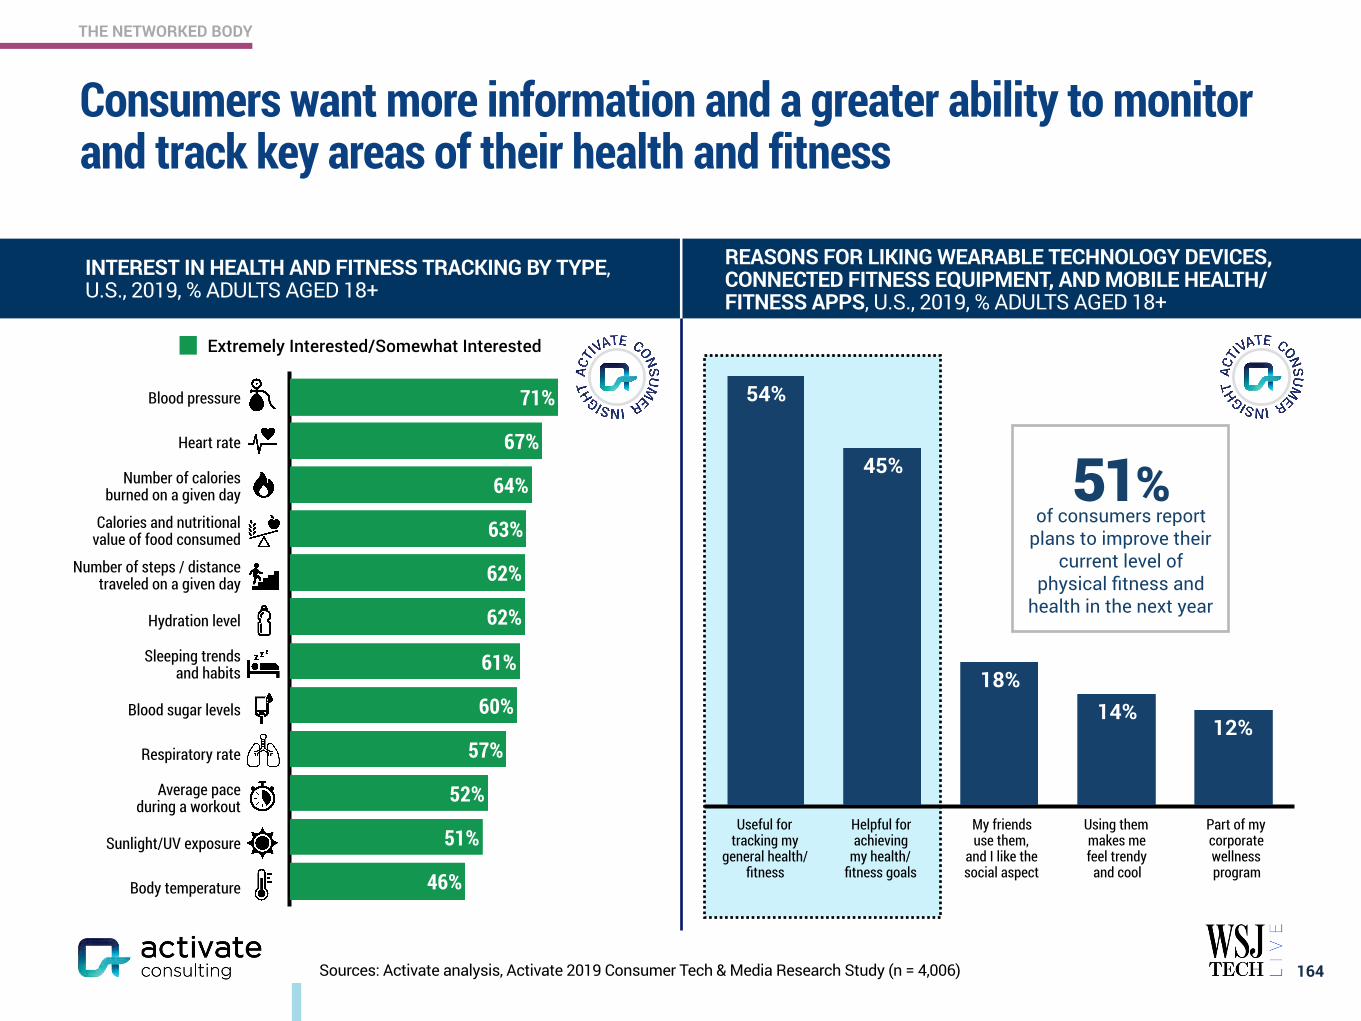
THE NETWORKED BODY
Consumers want more information and a greater ability to monitor and track key areas of their health and fitness
164
INTEREST IN HEALTH AND FITNESS TRACKING BY TYPE, U.S., 2019, % ADULTS AGED 18+
Sources: Activate analysis, Activate 2019 Consumer Tech & Media Research Study (n = 4,006)
REASONS FOR LIKING WEARABLE TECHNOLOGY DEVICES, CONNECTED FITNESS EQUIPMENT, AND MOBILE HEALTH/FITNESS APPS, U.S., 2019, % ADULTS AGED 18+
12%14%
18%
45%
54%
Useful for tracking my
general health/ fitness
Using them makes me feel trendy
and cool
My friends use them,
and I like the social aspect
Helpful for achieving
my health/fitness goals
Part of my corporate wellness program
51% of consumers report
plans to improve their current level of
physical fitness and health in the next year
Blood pressure
Heart rate
Number of calories burned on a given day
Calories and nutritional value of food consumed
Number of steps / distance traveled on a given day
Hydration level
Sleeping trends and habits
Blood sugar levels
Respiratory rate
Average pace during a workout
Sunlight/UV exposure
Body temperature 46%
51%
52%
57%
60%
61%
62%
62%
63%
64%
67%
71%
Extremely Interested/Somewhat Interested
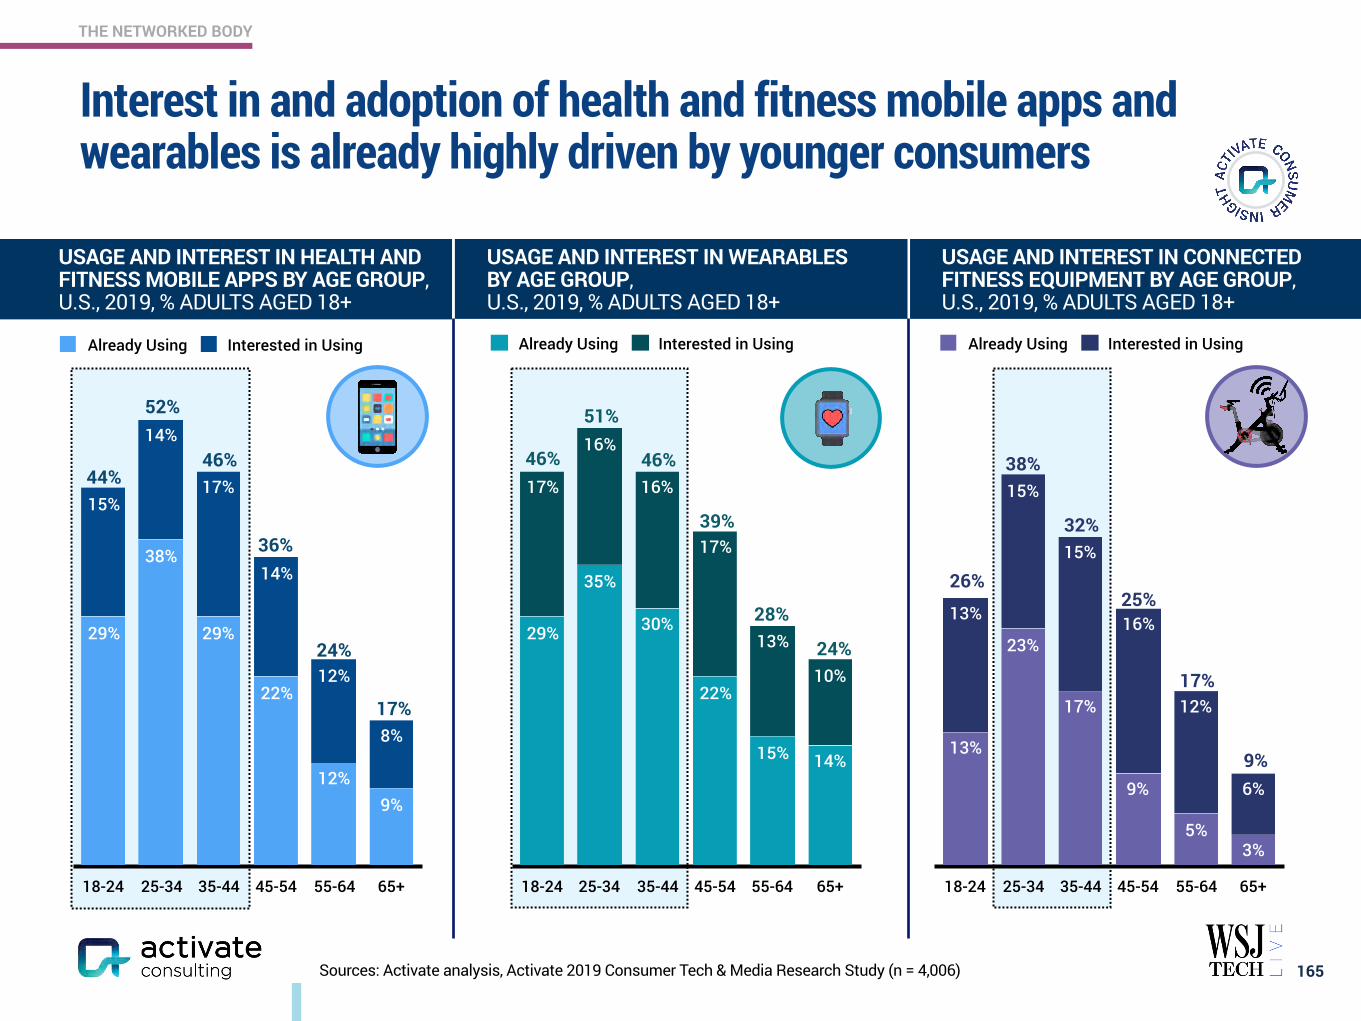
THE NETWORKED BODY
Interest in and adoption of health and fitness mobile apps and wearables is already highly driven by younger consumers
165
USAGE AND INTEREST IN HEALTH AND FITNESS MOBILE APPS BY AGE GROUP, U.S., 2019, % ADULTS AGED 18+
USAGE AND INTEREST IN WEARABLES BY AGE GROUP, U.S., 2019, % ADULTS AGED 18+
USAGE AND INTEREST IN CONNECTED FITNESS EQUIPMENT BY AGE GROUP, U.S., 2019, % ADULTS AGED 18+
Mob Wear ConnSources: Activate analysis, Activate 2019 Consumer Tech & Media Research Study (n = 4,006)
18-24 25-34 35-44 45-54 55-64 65+
8%
12%
14%
17%
14%
15%
9%12%
22%
29%
38%
29%
Already Using Interested in Using
44%
52%
46%
36%
24%
17%
18-24 25-34 35-44 45-54 55-64 65+
10%
13%
17%
16%
16%
17%
14%15%
22%
30%
35%
29%
Already Using Interested in Using
46%
51%
46%
39%
28%
24%
18-24 25-34 35-44 45-54 55-64 65+
6%
12%
16%
15%
15%
13%
3%5%
9%
17%
23%
13%
Already Using Interested in Using
26%
38%
32%
25%
17%
9%
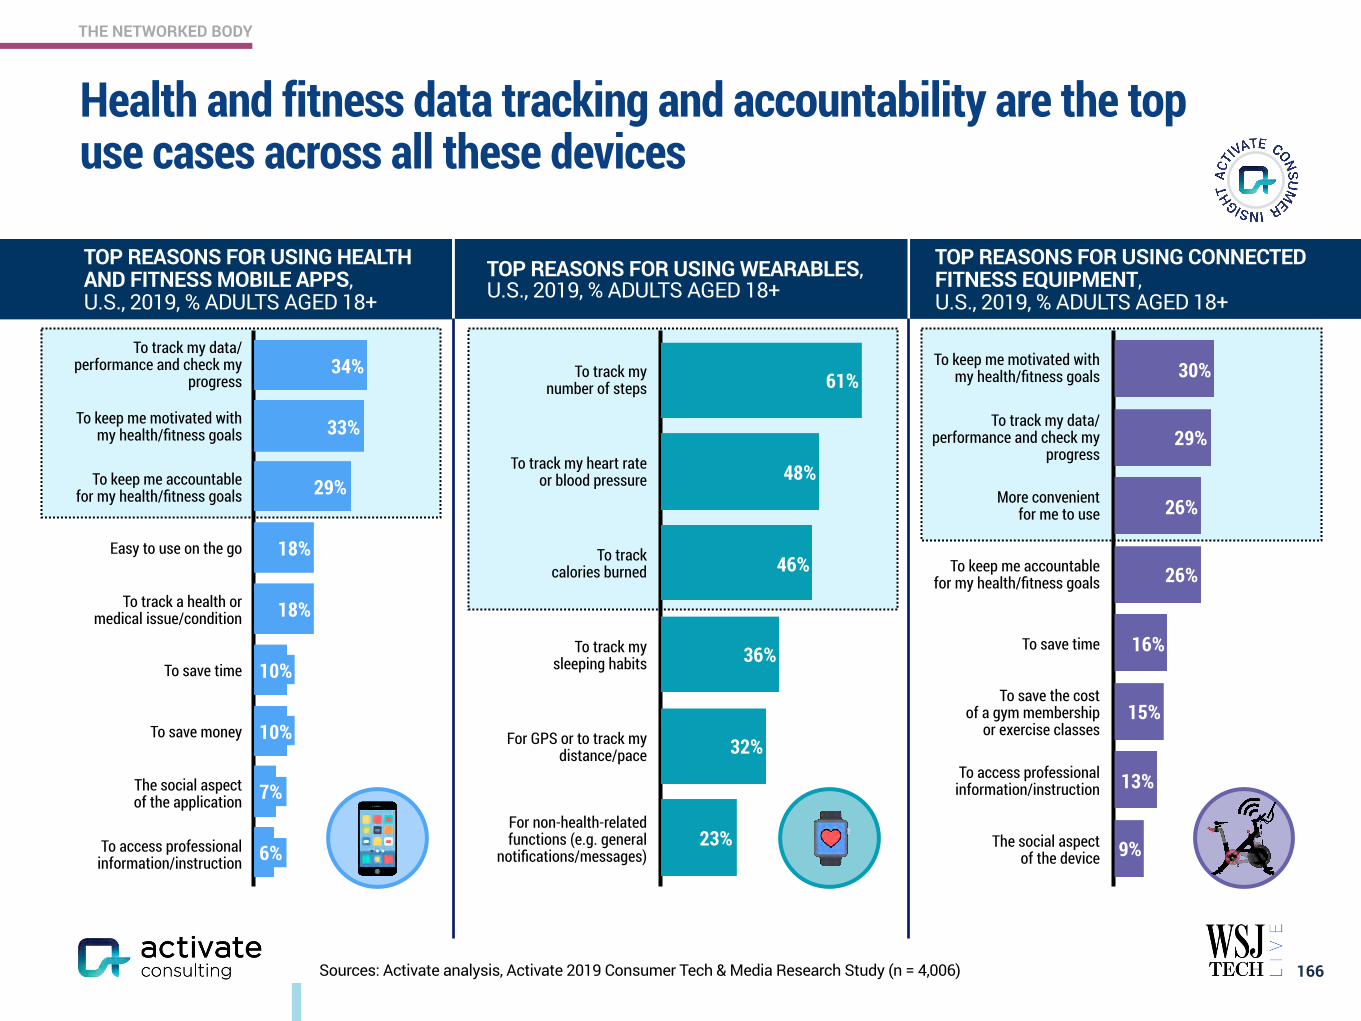
THE NETWORKED BODY
6%
7%
10%
10%
18%
18%
29%
33%
34%
Health and fitness data tracking and accountability are the top use cases across all these devices
166
TOP REASONS FOR USING HEALTH AND FITNESS MOBILE APPS, U.S., 2019, % ADULTS AGED 18+
TOP REASONS FOR USING WEARABLES, U.S., 2019, % ADULTS AGED 18+
TOP REASONS FOR USING CONNECTED FITNESS EQUIPMENT, U.S., 2019, % ADULTS AGED 18+
To track my data/performance and check my
progress
To keep me motivated with my health/fitness goals
To keep me accountable for my health/fitness goals
Easy to use on the go
To track a health or medical issue/condition
To save time
To save money
The social aspect of the application
To access professional information/instruction
23%
32%
36%
46%
48%
61%To track my number of steps
To track my heart rate or blood pressure
To track calories burned
To track my sleeping habits
For GPS or to track my distance/pace
For non-health-related functions (e.g. general
notifications/messages) 9%
13%
15%
16%
26%
26%
29%
30%To keep me motivated with my health/fitness goals
To track my data/performance and check my
progress
More convenient for me to use
To keep me accountable for my health/fitness goals
To save time
To save the cost of a gym membership
or exercise classes
To access professional information/instruction
The social aspect of the device
10%
10%
7%
6%
Sources: Activate analysis, Activate 2019 Consumer Tech & Media Research Study (n = 4,006)
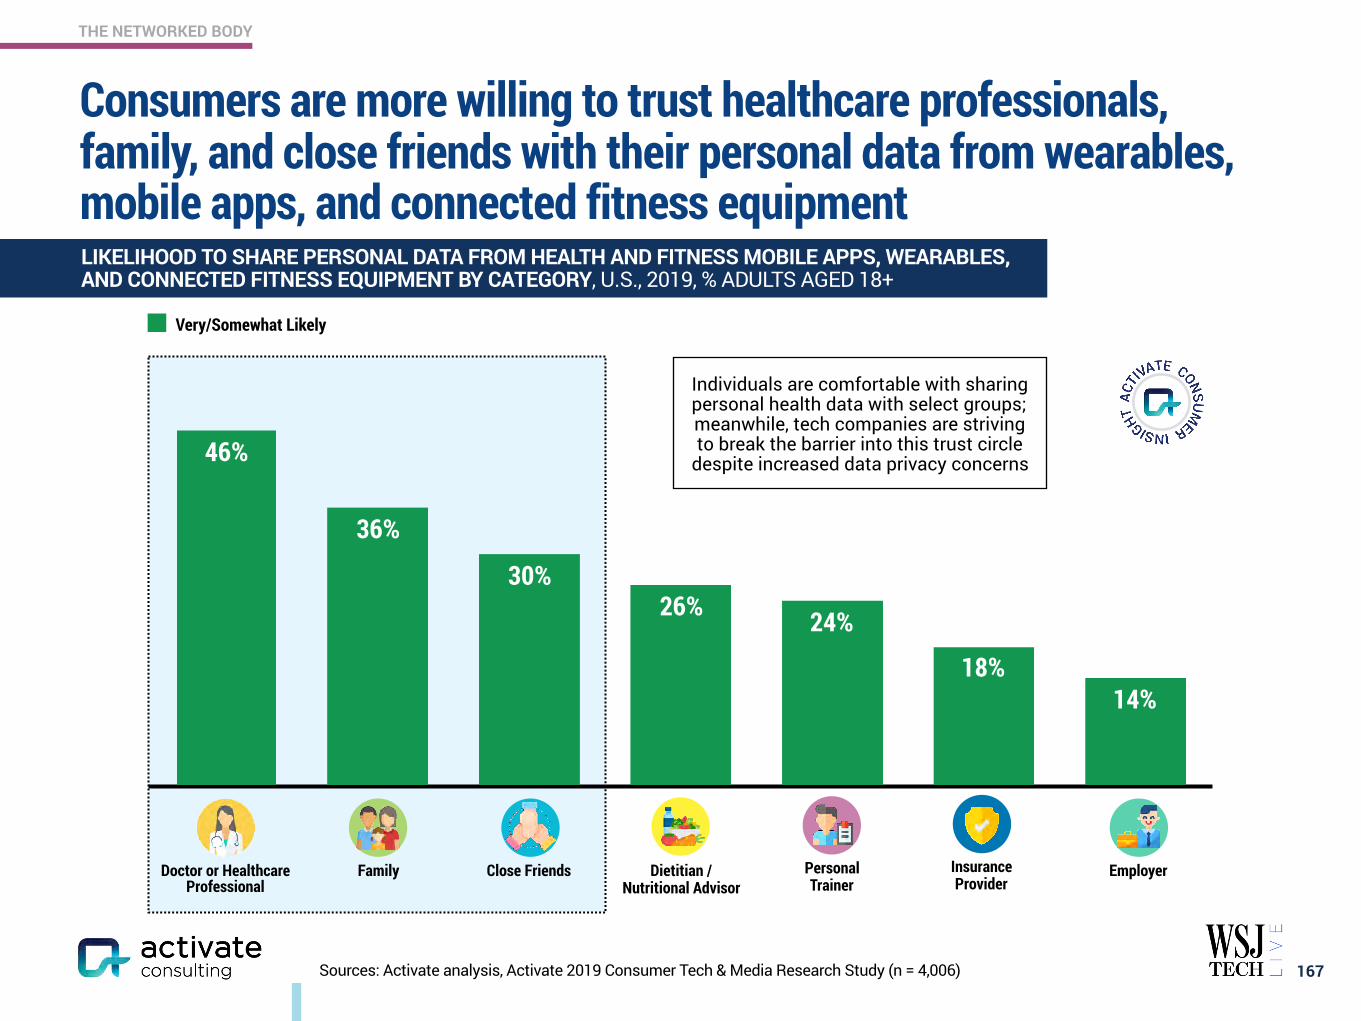
THE NETWORKED BODY
Consumers are more willing to trust healthcare professionals, family, and close friends with their personal data from wearables, mobile apps, and connected fitness equipment
167
LIKELIHOOD TO SHARE PERSONAL DATA FROM HEALTH AND FITNESS MOBILE APPS, WEARABLES, AND CONNECTED FITNESS EQUIPMENT BY CATEGORY, U.S., 2019, % ADULTS AGED 18+
14%18%
24%26%30%
36%
46%
Very/Somewhat Likely
Doctor or Healthcare Professional
Family Close Friends Personal Trainer
Dietitian / Nutritional Advisor
Insurance Provider
Employer
Sources: Activate analysis, Activate 2019 Consumer Tech & Media Research Study (n = 4,006)
Individuals are comfortable with sharing personal health data with select groups; meanwhile, tech companies are striving to break the barrier into this trust circle
despite increased data privacy concerns
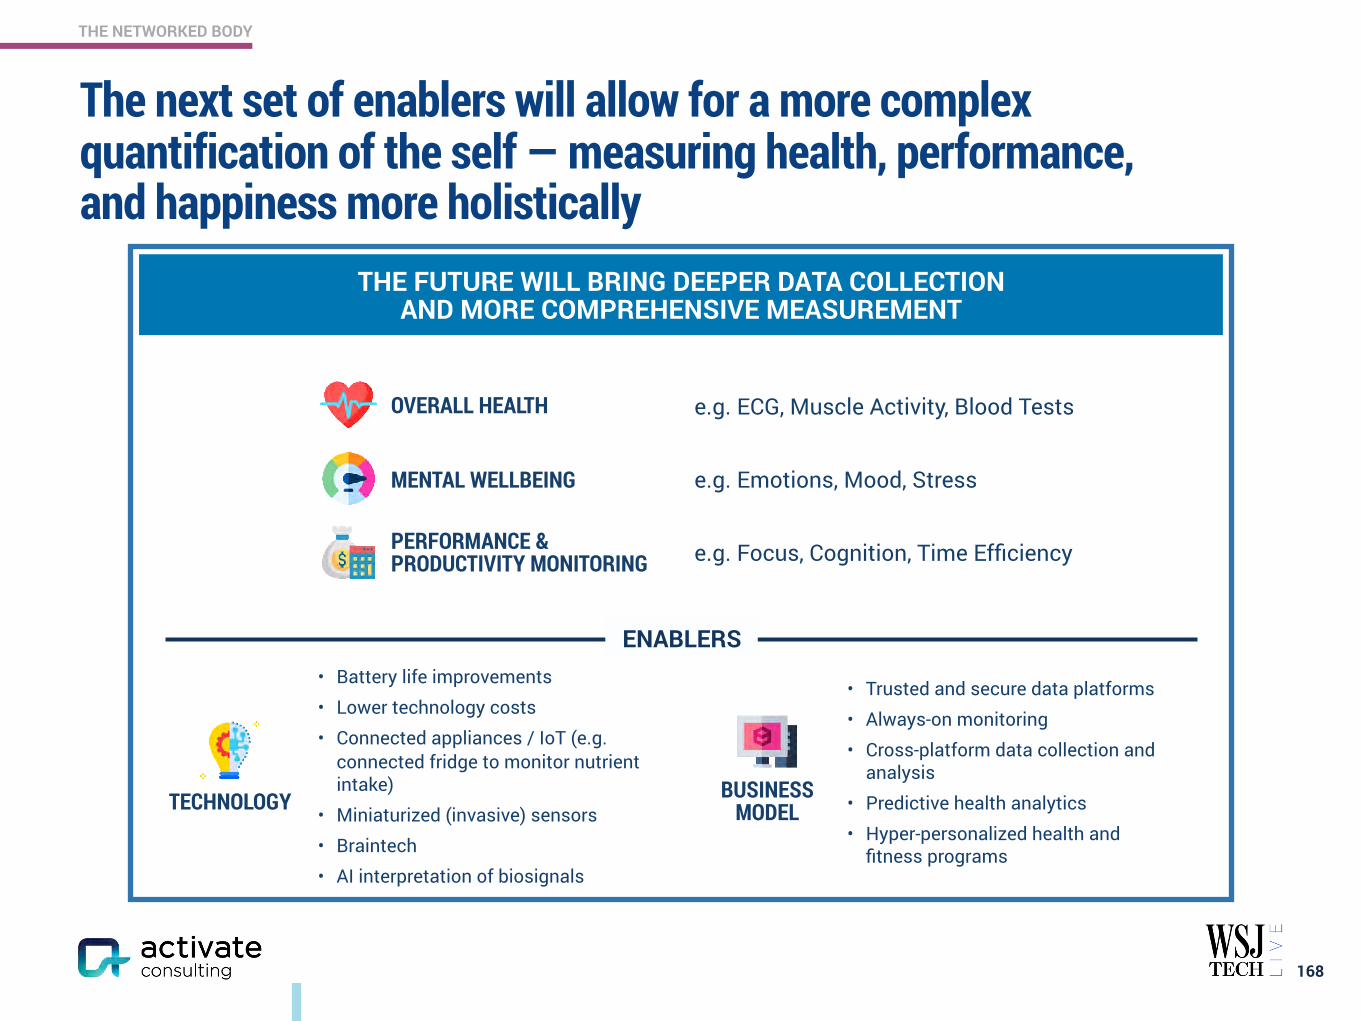
THE NETWORKED BODY
The next set of enablers will allow for a more complex quantification of the self — measuring health, performance, and happiness more holistically
168
THE FUTURE WILL BRING DEEPER DATA COLLECTION AND MORE COMPREHENSIVE MEASUREMENT
OVERALL HEALTH
MENTAL WELLBEING
PERFORMANCE & PRODUCTIVITY MONITORING
e.g. ECG, Muscle Activity, Blood Tests
e.g. Emotions, Mood, Stress
e.g. Focus, Cognition, Time Efficiency
• Battery life improvements • Lower technology costs • Connected appliances / IoT (e.g.
connected fridge to monitor nutrient intake)
• Miniaturized (invasive) sensors • Braintech • AI interpretation of biosignals
• Trusted and secure data platforms • Always-on monitoring • Cross-platform data collection and
analysis • Predictive health analytics • Hyper-personalized health and
fitness programs
ENABLERS
TECHNOLOGY BUSINESS MODEL
www.activate.com 169
PAGE
$300 Billion Global Internet and Media Growth Dollars by 2023 4
Consumer Attention: 12:40 Hours of Technology & Media Per Day 9
Super Users: The Imperative for Technology & Media Companies 13
Social Splinter: The Social Media World Expands 27
eCommerce: Shrinking the Divide Between Physical and Digital Shopping 41
Digital Marketplaces: New Inventory, Price, Transparency, Ease of Use 60
Video Gaming: The Next Streaming Battlefront 71
Esports: Sport of the Future 84
Video: Streaming Stacking, Battleground Households 94
Sports Betting: The Next Big Financial Trading Market 117
Sports: More Viewing, Emerging Sports, Better Fan Experiences 129
Music: The Discovery Challenge 138
Podcasting: New Listening Experiences and Explosive Growth 146
The Networked Body: Quantified and Connected Human 159
Digital Consumer Finance: Next Generation Services Go Mainstream 169
Connectivity: Enabling the Next Wave of Technology and Media Growth 182
CONTENTS
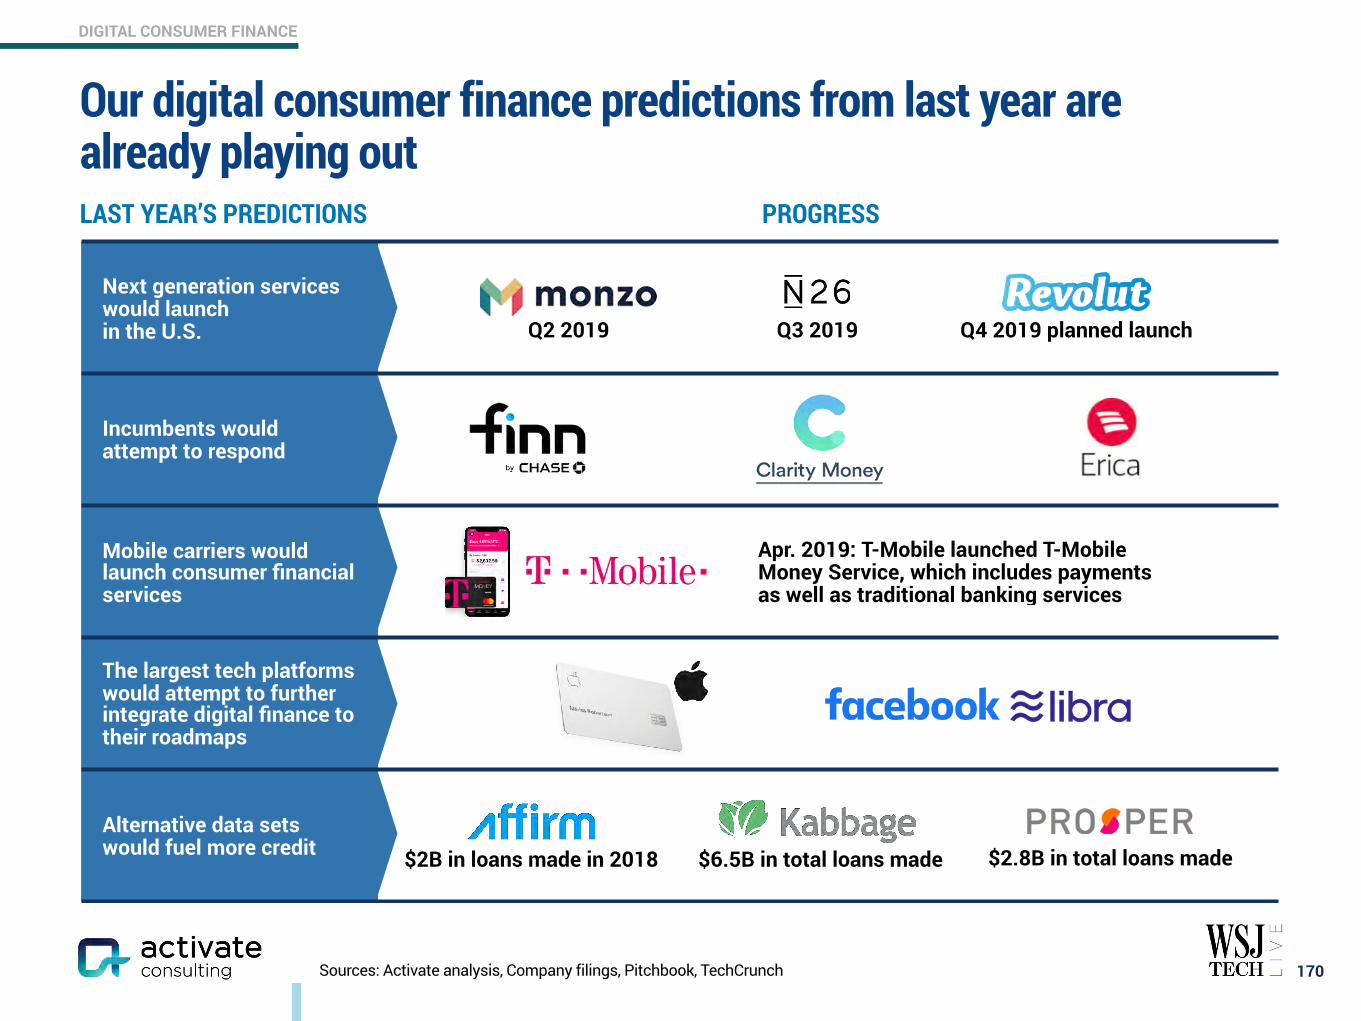
DIGITAL CONSUMER FINANCE
Sources: Activate analysis, Company filings, Pitchbook, TechCrunch 170
Next generation services would launch in the U.S.
Incumbents would attempt to respond
Mobile carriers would launch consumer financial services
The largest tech platforms would attempt to further integrate digital finance to their roadmaps
Alternative data sets would fuel more credit $6.5B in total loans made$2B in loans made in 2018 $2.8B in total loans made
Apr. 2019: T-Mobile launched T-Mobile Money Service, which includes payments as well as traditional banking services
Q4 2019 planned launchQ3 2019Q2 2019
LAST YEAR’S PREDICTIONS PROGRESS
Our digital consumer finance predictions from last year are already playing out
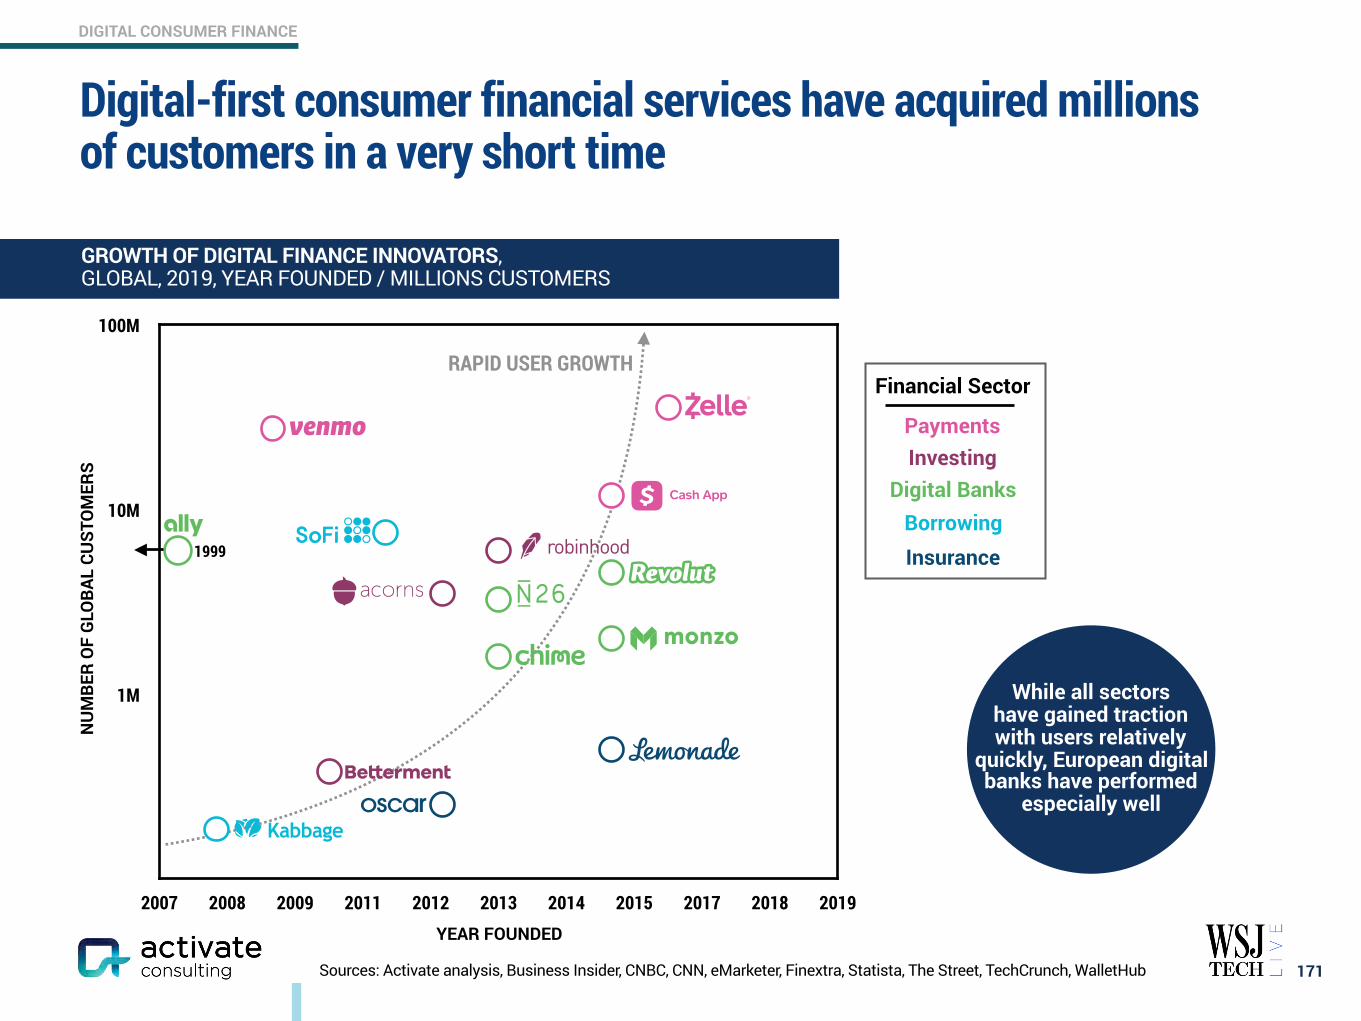
DIGITAL CONSUMER FINANCE
0.1M
1M
10M
100M
2007 2008 2009 2011 2012 2013 2014 2015 2017 2018 2019
Digital-first consumer financial services have acquired millions of customers in a very short time
171
GROWTH OF DIGITAL FINANCE INNOVATORS, GLOBAL, 2019, YEAR FOUNDED / MILLIONS CUSTOMERS
Sources: Activate analysis, Business Insider, CNBC, CNN, eMarketer, Finextra, Statista, The Street, TechCrunch, WalletHub
Payments
Digital BanksBorrowingInsurance
Investing
Financial Sector
YEAR FOUNDED
NU
MBE
R O
F G
LOBA
L CU
STO
MER
S
1999
While all sectors have gained traction with users relatively
quickly, European digital banks have performed
especially well
RAPID USER GROWTH

DIGITAL CONSUMER FINANCE
12%12%15%16%
74%
11%12%13%13%
70%
2018 2019
Our research shows that adoption of all types of digital-first financial services has grown over the last year
172
ROBOTO BOLD 16PT, ROBOTO REGULAR 16 PTADOPTION OF DIGITAL FINANCE PRODUCTS BY PRODUCT TYPE, U.S., 2018 VS. 2019, % ADULTS AGED 18+
Payments1 Banking Investing Money Management
Borrowing
1. “Payments” includes people who use peer-to-peer payment products, point-of-sale payment products, online payment products, and any combination thereof. Sources: Activate analysis, Activate 2018 Consumer Tech & Media Research Study (n = 4,000), Activate 2019 Consumer Tech & Media Research Study (n = 4,006)
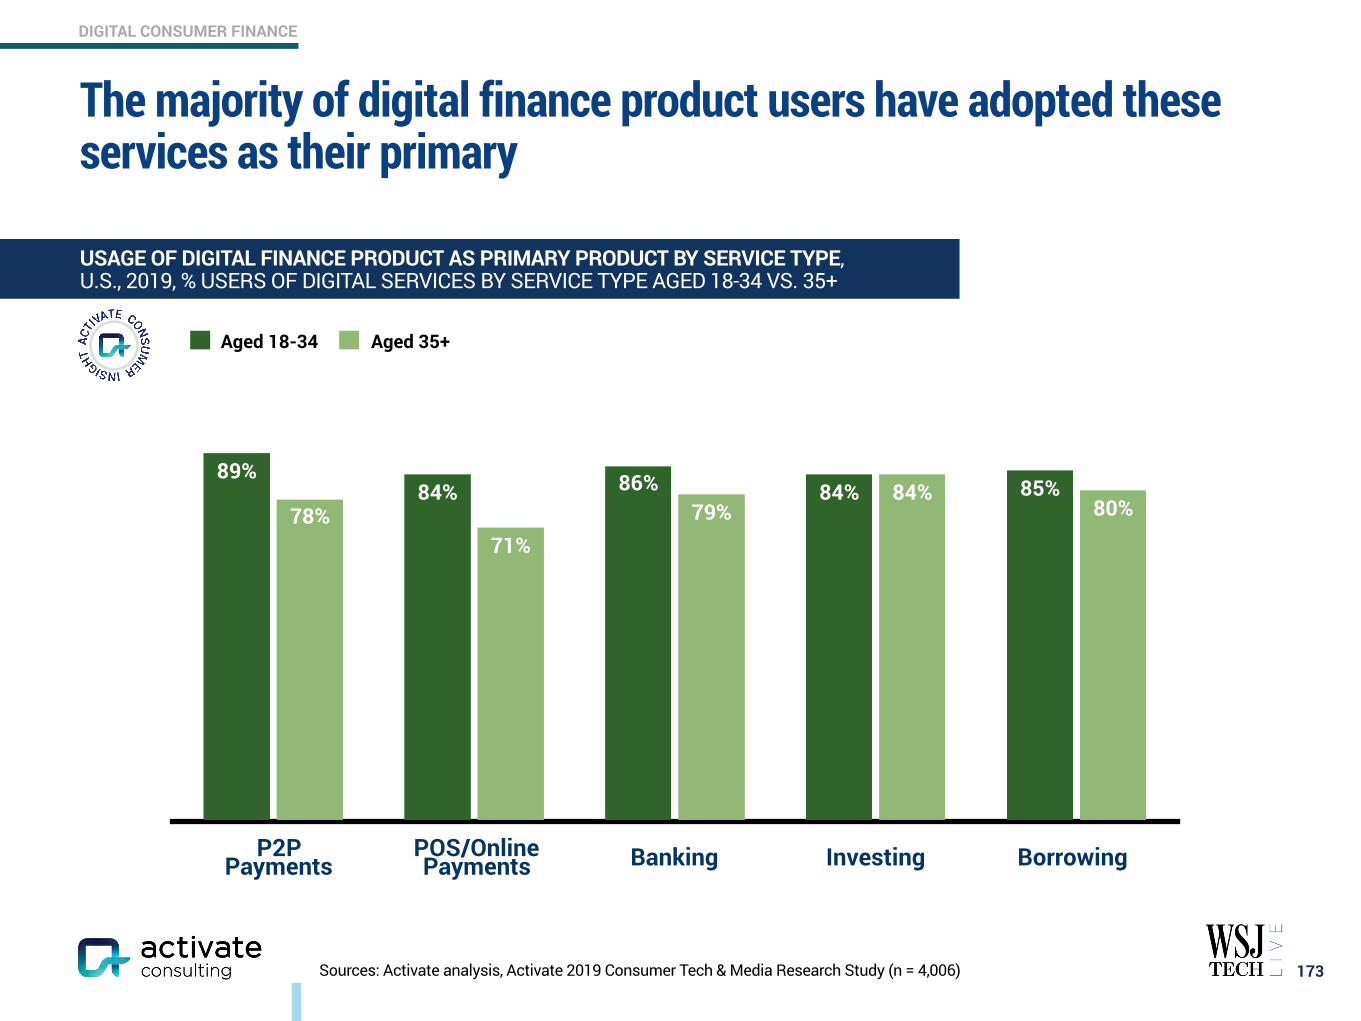
DIGITAL CONSUMER FINANCE
80%84%
79%71%
78%85%84%86%84%
89%
Aged 18-34 Aged 35+
173
USAGE OF DIGITAL FINANCE PRODUCT AS PRIMARY PRODUCT BY SERVICE TYPE, U.S., 2019, % USERS OF DIGITAL SERVICES BY SERVICE TYPE AGED 18-34 VS. 35+
Sources: Activate analysis, Activate 2019 Consumer Tech & Media Research Study (n = 4,006)
P2P Payments
POS/Online Payments Banking Investing Borrowing
The majority of digital finance product users have adopted these services as their primary
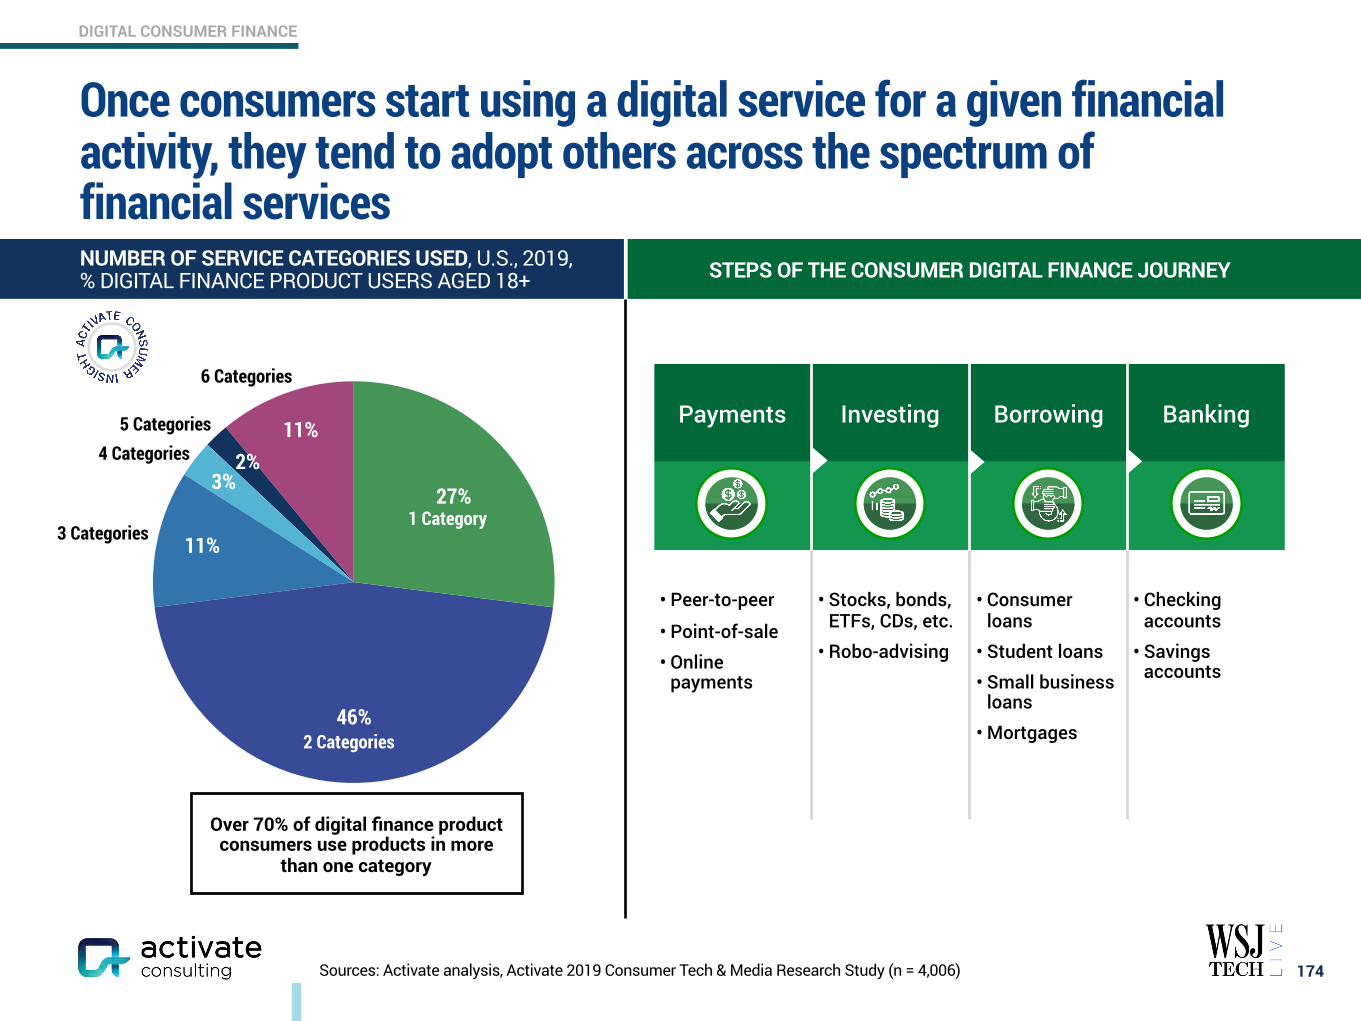
DIGITAL CONSUMER FINANCE
Once consumers start using a digital service for a given financial activity, they tend to adopt others across the spectrum of financial services
174
ROBOTO BOLD 16PT, ROBOTO REGULAR 16 PT
Sources: Activate analysis, Activate 2019 Consumer Tech & Media Research Study (n = 4,006)
Over 70% of digital finance product consumers use products in more
than one category
STEPS OF THE CONSUMER DIGITAL FINANCE JOURNEY
3 Categories
4 Categories5 Categories
6 Categories
1 Category
2 Categories
11%2%
3%
11%
46%
27%
NUMBER OF SERVICE CATEGORIES USED, U.S., 2019, % DIGITAL FINANCE PRODUCT USERS AGED 18+
Payments Investing Borrowing Banking
• Peer-to-peer
• Point-of-sale • Online
payments
• Stocks, bonds, ETFs, CDs, etc.
• Robo-advising
• Consumer loans
• Student loans • Small business
loans • Mortgages
• Checking accounts
• Savings accounts
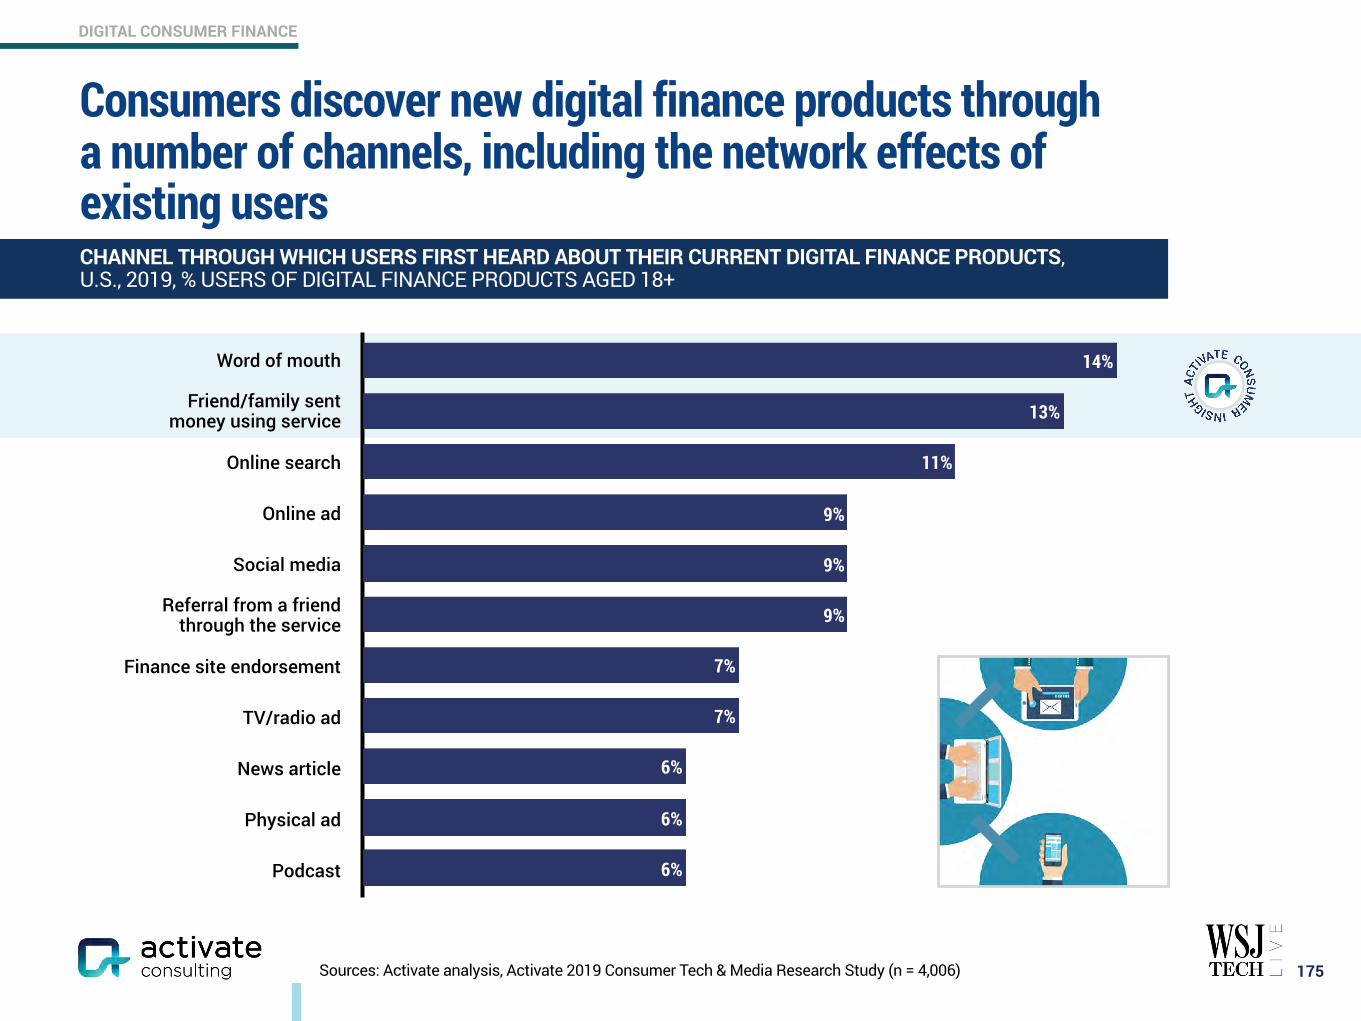
DIGITAL CONSUMER FINANCE
Consumers discover new digital finance products through a number of channels, including the network effects of existing users
175
CHANNEL THROUGH WHICH USERS FIRST HEARD ABOUT THEIR CURRENT DIGITAL FINANCE PRODUCTS, U.S., 2019, % USERS OF DIGITAL FINANCE PRODUCTS AGED 18+
6%
6%
6%
7%
7%
9%
9%
9%
11%
13%
14%Word of mouth
Friend/family sent money using service
Online search
Online ad
Social media
Referral from a friend through the service
Finance site endorsement
TV/radio ad
News article
Physical ad
Podcast
Sources: Activate analysis, Activate 2019 Consumer Tech & Media Research Study (n = 4,006)
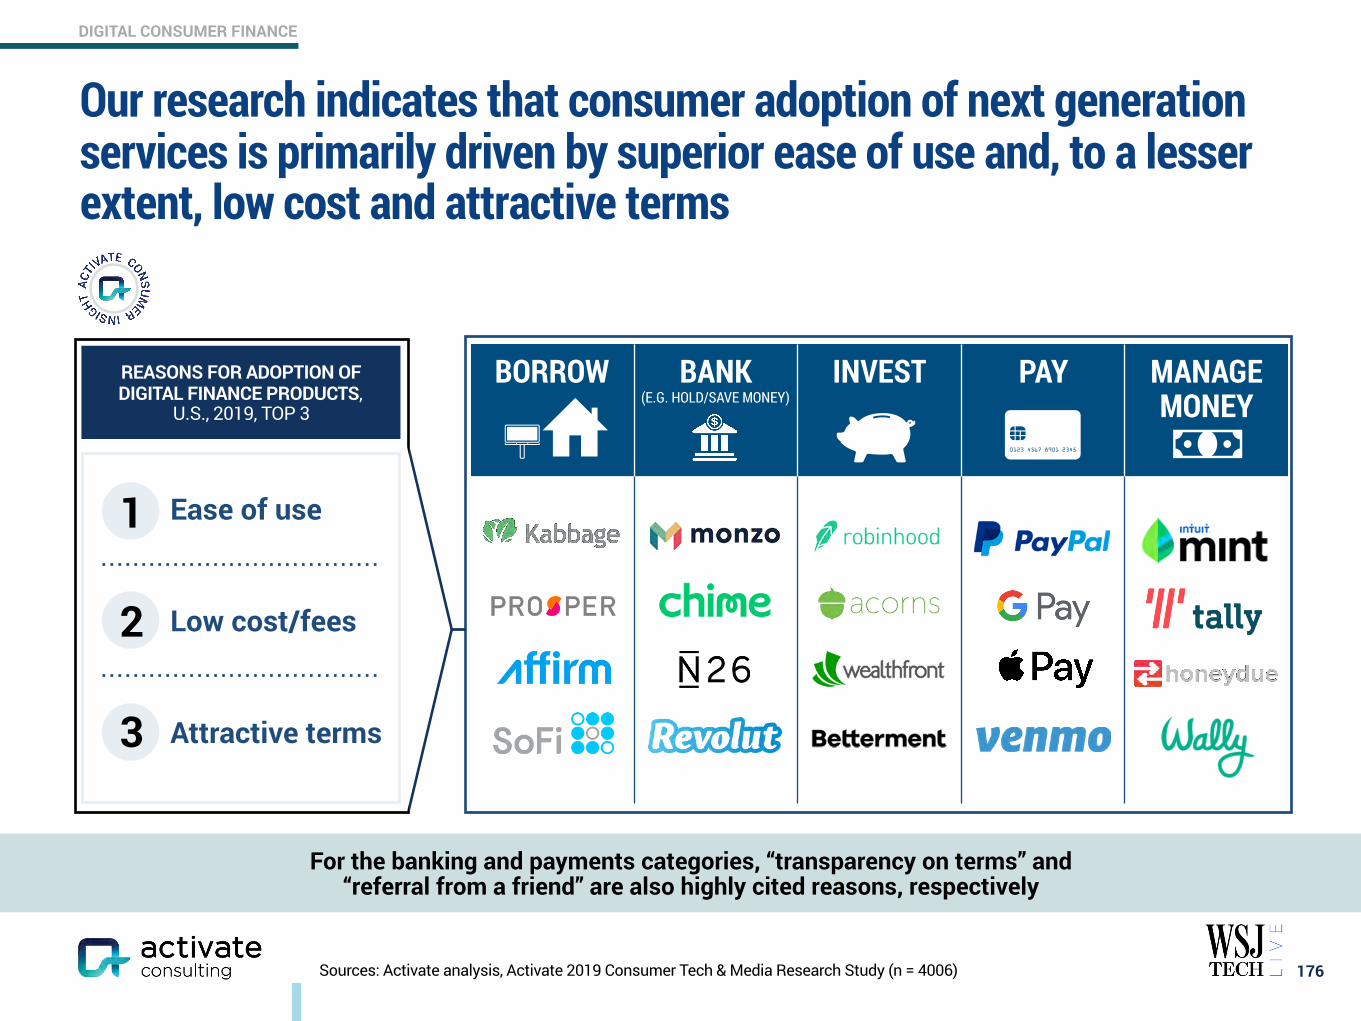
DIGITAL CONSUMER FINANCE
176Sources: Activate analysis, Activate 2019 Consumer Tech & Media Research Study (n = 4006)
BORROW BANK (E.G. HOLD/SAVE MONEY)
INVEST PAY MANAGE MONEY
Ease of use
Low cost/fees
Attractive terms
REASONS FOR ADOPTION OF DIGITAL FINANCE PRODUCTS,
U.S., 2019, TOP 3
Our research indicates that consumer adoption of next generation services is primarily driven by superior ease of use and, to a lesser extent, low cost and attractive terms
For the banking and payments categories, “transparency on terms” and “referral from a friend” are also highly cited reasons, respectively
1
2
3
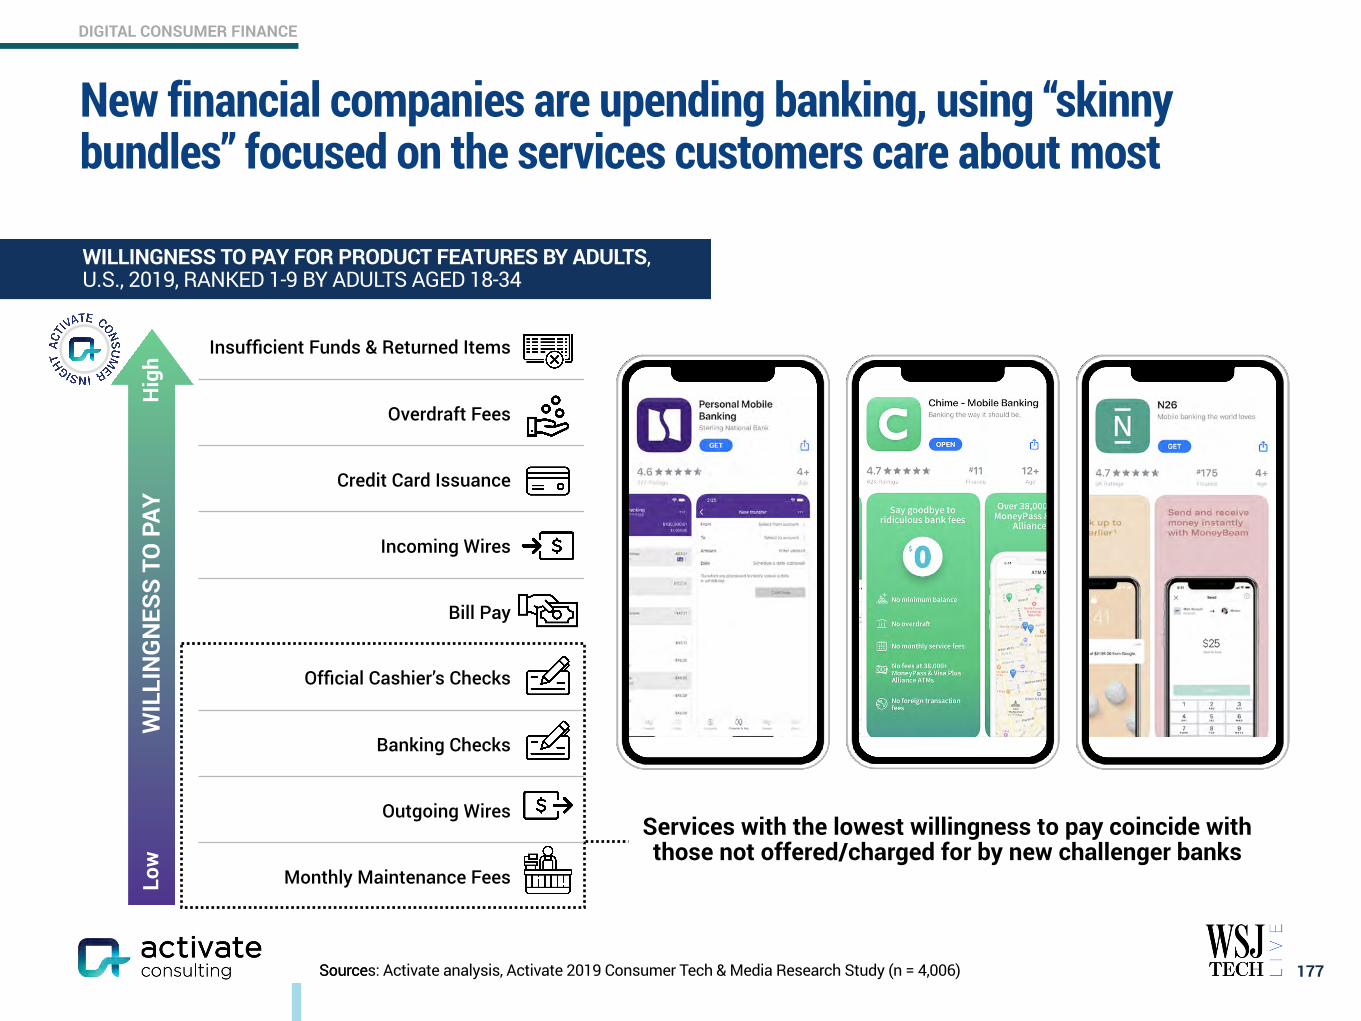
DIGITAL CONSUMER FINANCE
New financial companies are upending banking, using “skinny bundles” focused on the services customers care about most
177SourceSources: Activate analysis, Activate 2019 Consumer Tech & Media Research Study (n = 4,006)
Services with the lowest willingness to pay coincide with those not offered/charged for by new challenger banks
Insufficient Funds & Returned Items
Overdraft Fees
Credit Card Issuance
Incoming Wires
Bill Pay
Official Cashier’s Checks
Banking Checks
Outgoing Wires
Monthly Maintenance Fees
WILLINGNESS TO PAY FOR PRODUCT FEATURES BY ADULTS, U.S., 2019, RANKED 1-9 BY ADULTS AGED 18-34
WIL
LIN
GN
ESS
TO P
AYH
igh
Low

DIGITAL CONSUMER FINANCE
178
NUMBER OF FINTECH UNICORNS AGAINST ALL DOLLARS INVESTED IN DIGITAL FINANCE STARTUPS ACROSS VC, PE, & M&A, U.S., 2010-2019, BILLIONS USD / NUMBER OF FINTECH UNICORNS
Note: “HENRY” is an acronym for High Earners, Not Rich Yet. Sources: Activate analysis, CB Insights, Crunchbase
2010 2011 2012 2013 2014 2015 2016 2017 2018 2019
$68B
$53B
$24B
$42B$41B
$25B
$14B$11B$8B$6B
00
00
0$68B
2
4
4
8
8
EARLY EXAMPLES OF CAMPAIGN / CUSTOMER ACQUISITION
Numbers above bars correspond to the number of digital finance startups that
became unicorns in that year
Investment money flowing into digital finance services will fuel their growth, and allow them to target large pools of consumers beyond HENRYs
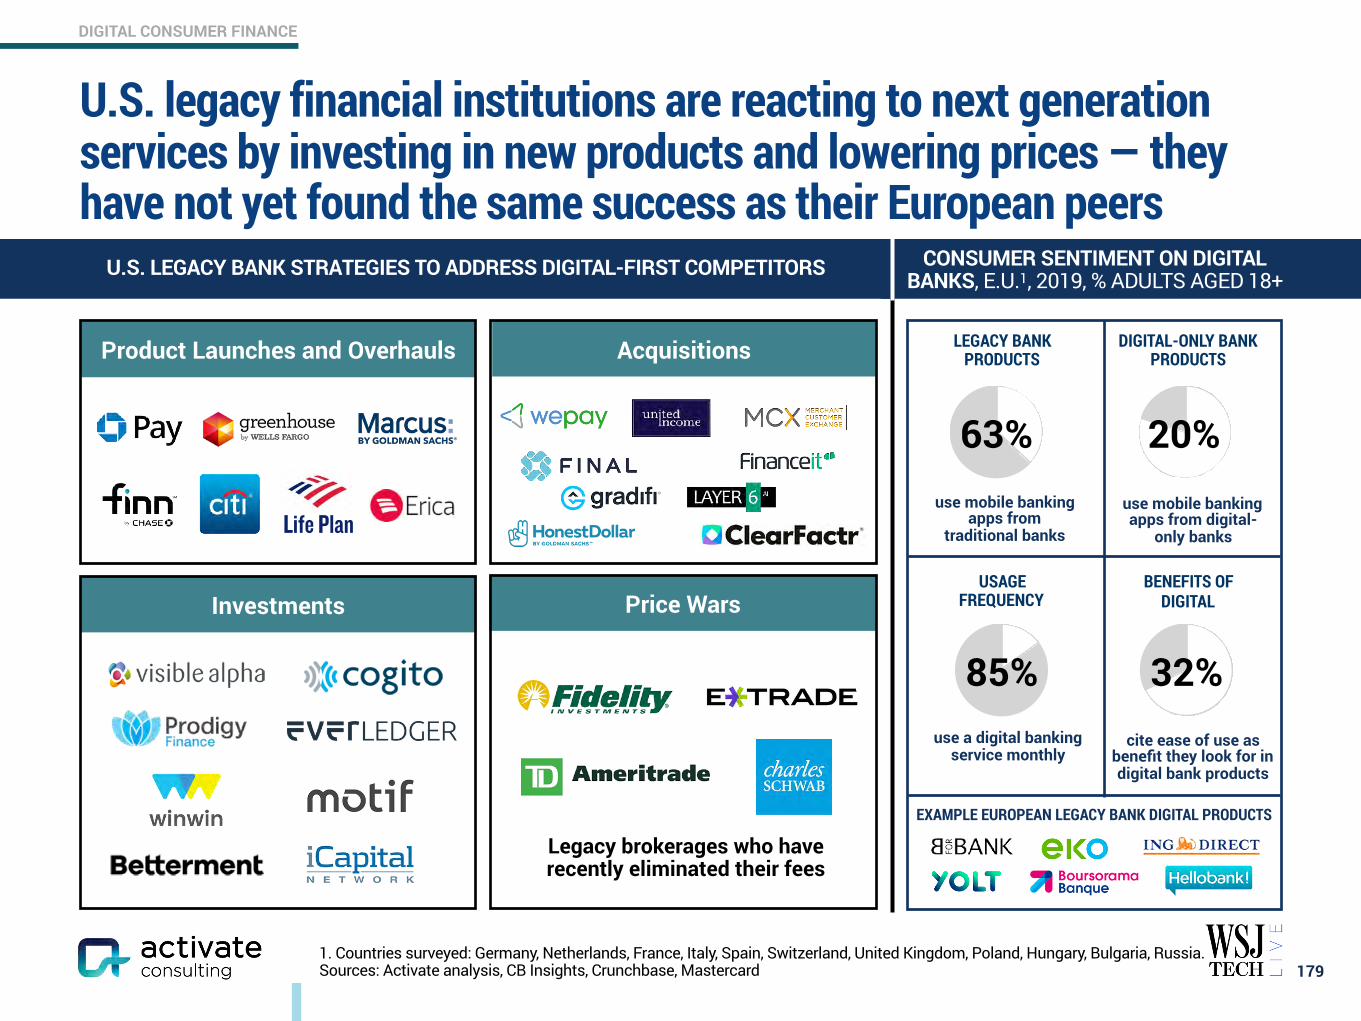
DIGITAL CONSUMER FINANCE
Product Launches and Overhauls Acquisitions
Investments Price Wars
U.S. legacy financial institutions are reacting to next generation services by investing in new products and lowering prices — they have not yet found the same success as their European peers
179
U.S. LEGACY BANK STRATEGIES TO ADDRESS DIGITAL-FIRST COMPETITORS
Legacy brokerages who have recently eliminated their fees
CONSUMER SENTIMENT ON DIGITAL BANKS, E.U.1, 2019, % ADULTS AGED 18+
Life Plan
use a digital banking service monthly
85%
EXAMPLE EUROPEAN LEGACY BANK DIGITAL PRODUCTS
32%cite ease of use as
benefit they look for in digital bank products
20%use mobile banking apps from digital-
only banks
USAGE FREQUENCY
DIGITAL-ONLY BANK PRODUCTS
BENEFITS OF DIGITAL
LEGACY BANK PRODUCTS
63%use mobile banking
apps from traditional banks
1. Countries surveyed: Germany, Netherlands, France, Italy, Spain, Switzerland, United Kingdom, Poland, Hungary, Bulgaria, Russia. Sources: Activate analysis, CB Insights, Crunchbase, Mastercard
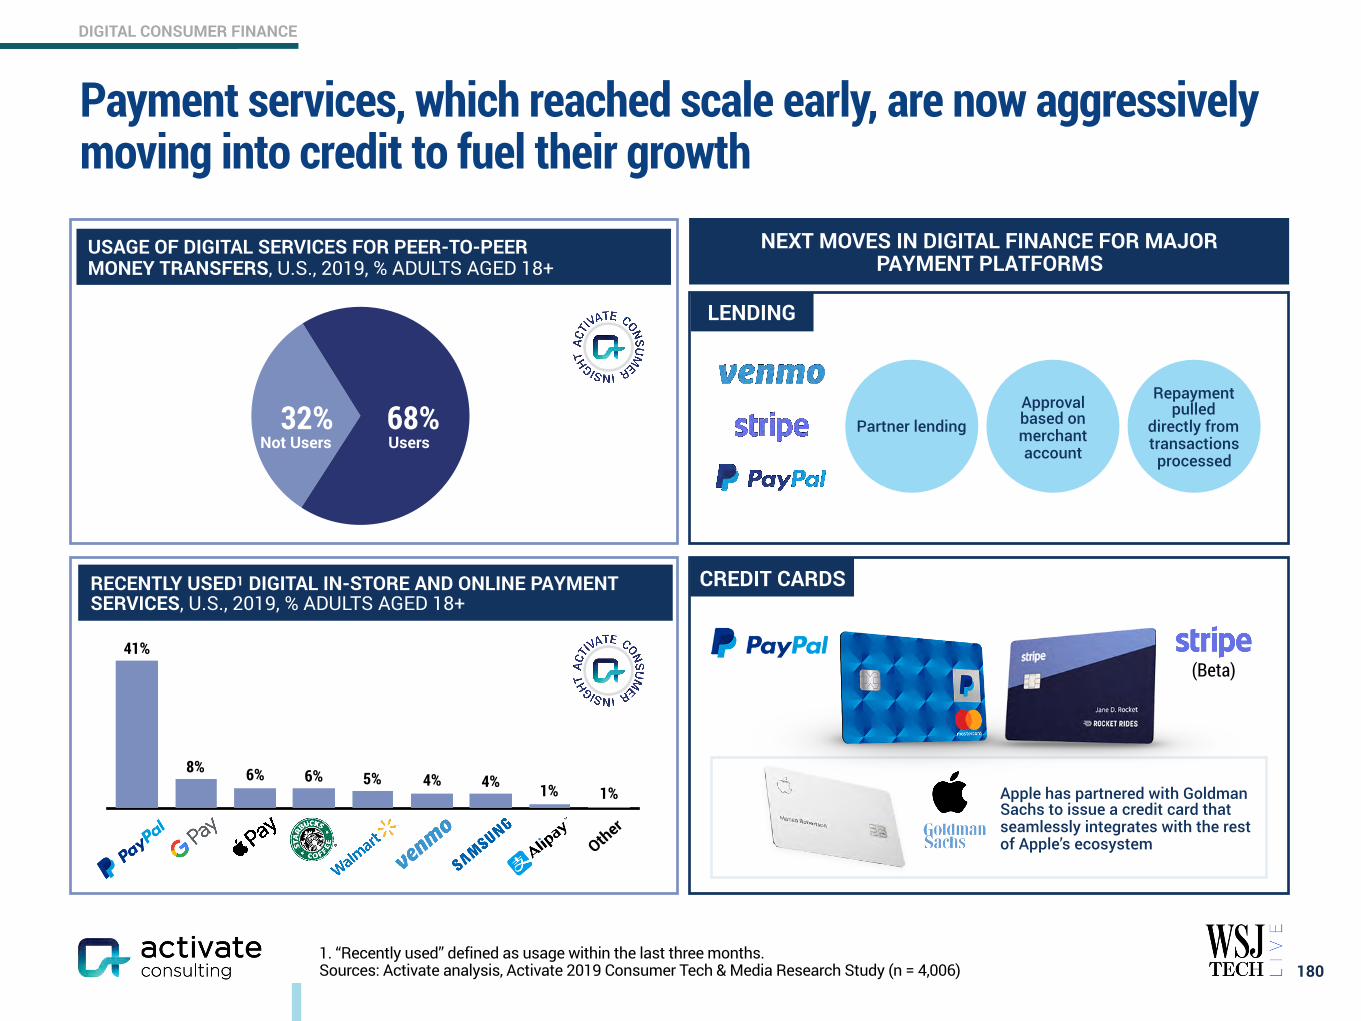
DIGITAL CONSUMER FINANCE
Approval based on merchant account
Partner lending
Repayment pulled
directly from transactions
processed
Payment services, which reached scale early, are now aggressively moving into credit to fuel their growth
1801. “Recently used” defined as usage within the last three months. Sources: Activate analysis, Activate 2019 Consumer Tech & Media Research Study (n = 4,006)
NEXT MOVES IN DIGITAL FINANCE FOR MAJOR PAYMENT PLATFORMS
(Beta)
LENDING
Apple has partnered with Goldman Sachs to issue a credit card that seamlessly integrates with the rest of Apple’s ecosystem
CREDIT CARDS
32% 68%
USAGE OF DIGITAL SERVICES FOR PEER-TO-PEER MONEY TRANSFERS, U.S., 2019, % ADULTS AGED 18+
RECENTLY USED1 DIGITAL IN-STORE AND ONLINE PAYMENT SERVICES, U.S., 2019, % ADULTS AGED 18+
1%1%4%4%5%6%6%8%
41%
Other
Not Users Users
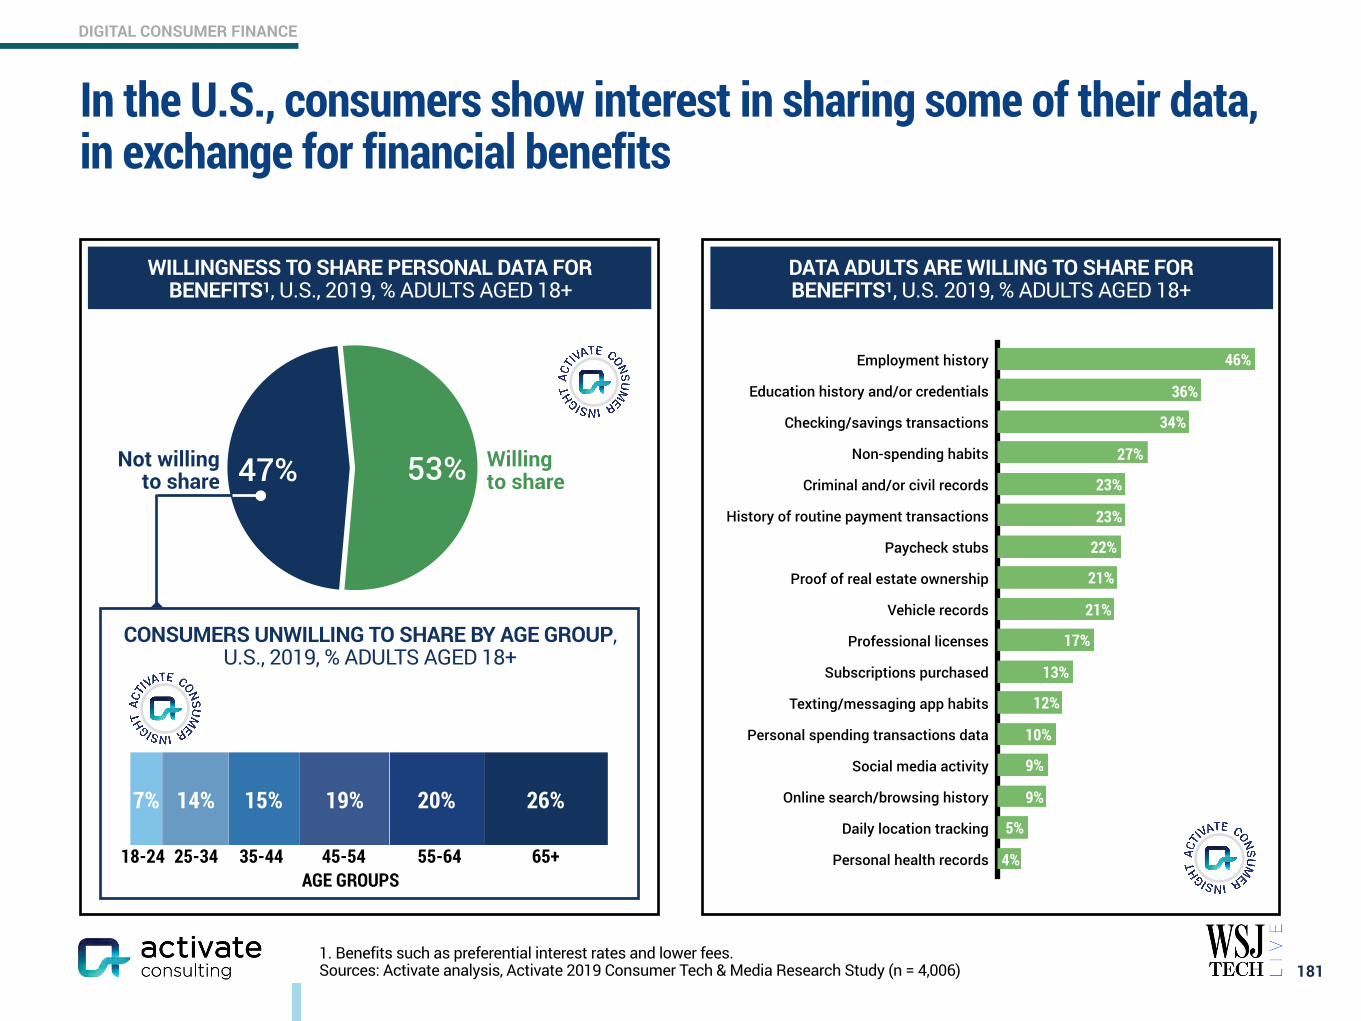
DIGITAL CONSUMER FINANCE
In the U.S., consumers show interest in sharing some of their data, in exchange for financial benefits
DATA ADULTS ARE WILLING TO SHARE FOR BENEFITS1, U.S. 2019, % ADULTS AGED 18+
1811. Benefits such as preferential interest rates and lower fees. Sources: Activate analysis, Activate 2019 Consumer Tech & Media Research Study (n = 4,006)
4%
5%
9%
9%
10%
12%
13%
17%
21%
21%
22%
23%
23%
27%
34%
36%
46%
WILLINGNESS TO SHARE PERSONAL DATA FOR BENEFITS1, U.S., 2019, % ADULTS AGED 18+
53%47%
26%20%19%15%14%7%
Employment history
Education history and/or credentials
Checking/savings transactions
Non-spending habits
Criminal and/or civil records
History of routine payment transactions
Paycheck stubs
Proof of real estate ownership
Vehicle records
Professional licenses
Subscriptions purchased
Texting/messaging app habits
Personal spending transactions data
Social media activity
Online search/browsing history
Daily location tracking
Personal health records
Willing to share
Not willingto share
18-24 25-34 35-44 45-54 55-64 65+AGE GROUPS
CONSUMERS UNWILLING TO SHARE BY AGE GROUP, U.S., 2019, % ADULTS AGED 18+
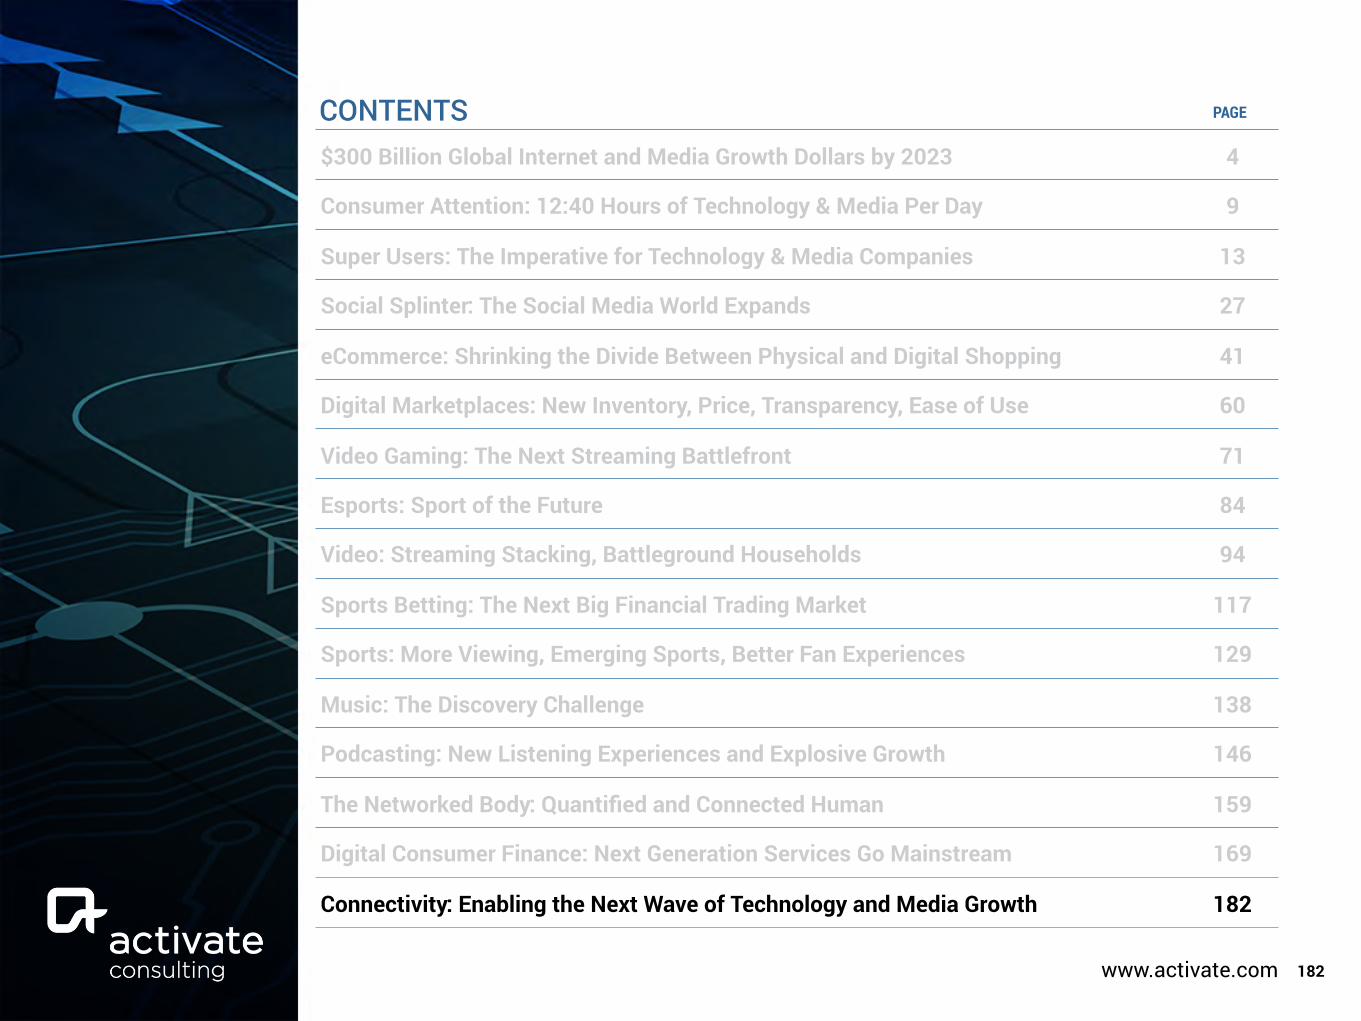
www.activate.com 182
PAGE
$300 Billion Global Internet and Media Growth Dollars by 2023 4
Consumer Attention: 12:40 Hours of Technology & Media Per Day 9
Super Users: The Imperative for Technology & Media Companies 13
Social Splinter: The Social Media World Expands 27
eCommerce: Shrinking the Divide Between Physical and Digital Shopping 41
Digital Marketplaces: New Inventory, Price, Transparency, Ease of Use 60
Video Gaming: The Next Streaming Battlefront 71
Esports: Sport of the Future 84
Video: Streaming Stacking, Battleground Households 94
Sports Betting: The Next Big Financial Trading Market 117
Sports: More Viewing, Emerging Sports, Better Fan Experiences 129
Music: The Discovery Challenge 138
Podcasting: New Listening Experiences and Explosive Growth 146
The Networked Body: Quantified and Connected Human 159
Digital Consumer Finance: Next Generation Services Go Mainstream 169
Connectivity: Enabling the Next Wave of Technology and Media Growth 182
CONTENTS
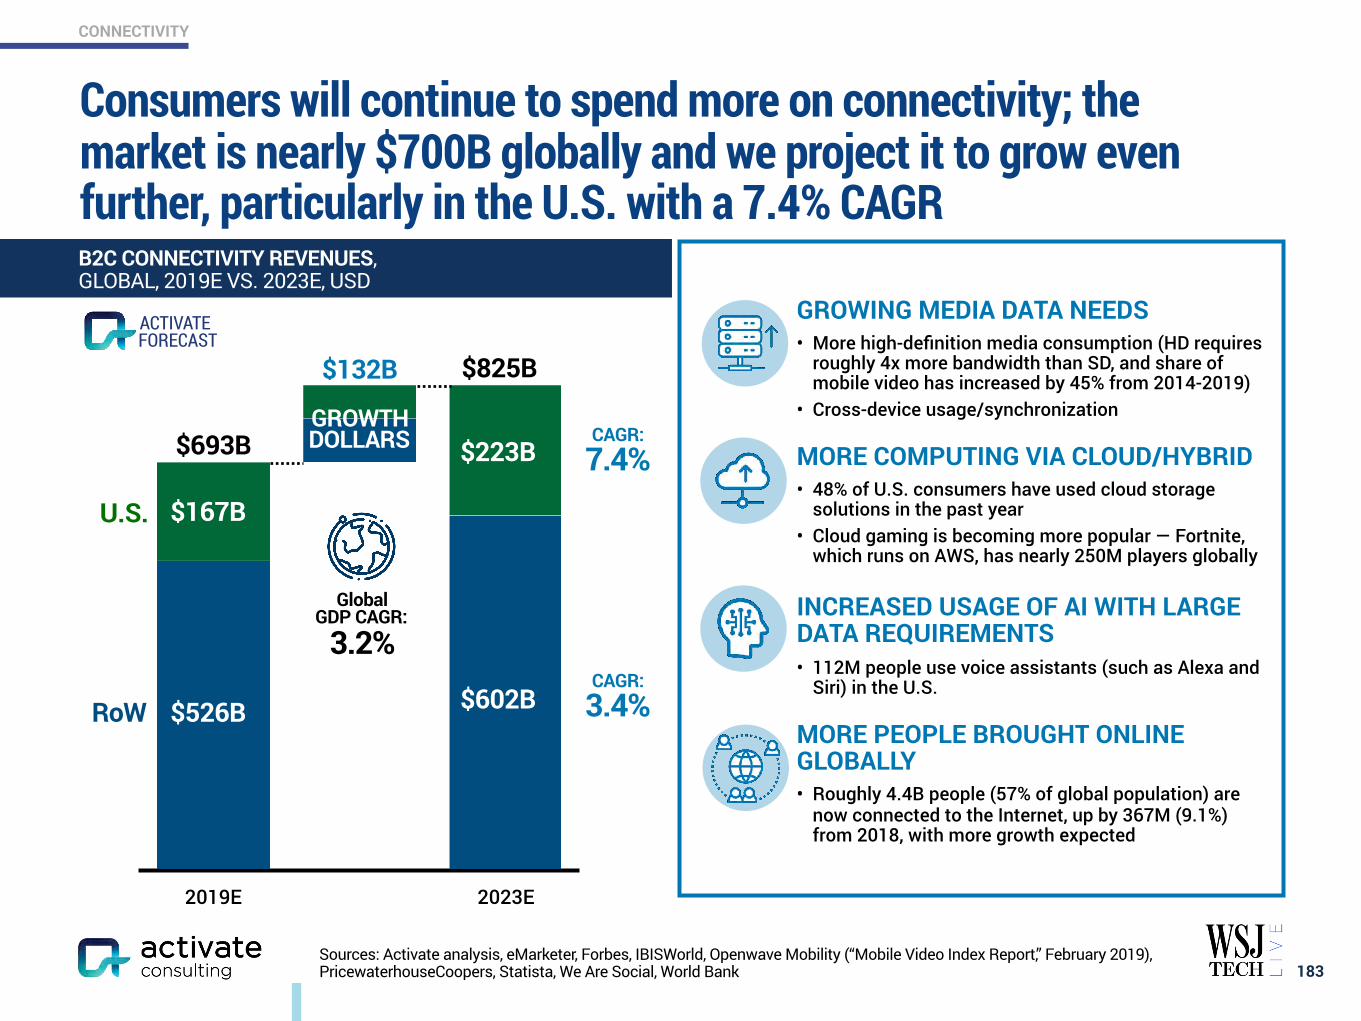
CONNECTIVITY
GROWING MEDIA DATA NEEDS • More high-definition media consumption (HD requires
roughly 4x more bandwidth than SD, and share of mobile video has increased by 45% from 2014-2019)
• Cross-device usage/synchronization
MORE COMPUTING VIA CLOUD/HYBRID • 48% of U.S. consumers have used cloud storage
solutions in the past year • Cloud gaming is becoming more popular — Fortnite,
which runs on AWS, has nearly 250M players globally
INCREASED USAGE OF AI WITH LARGE DATA REQUIREMENTS • 112M people use voice assistants (such as Alexa and
Siri) in the U.S.
MORE PEOPLE BROUGHT ONLINE GLOBALLY • Roughly 4.4B people (57% of global population) are
now connected to the Internet, up by 367M (9.1%) from 2018, with more growth expected
2019E 2023E
Sources: Activate analysis, eMarketer, Forbes, IBISWorld, Openwave Mobility (“Mobile Video Index Report,” February 2019), PricewaterhouseCoopers, Statista, We Are Social, World Bank
Consumers will continue to spend more on connectivity; the market is nearly $700B globally and we project it to grow even further, particularly in the U.S. with a 7.4% CAGR
183
B2C CONNECTIVITY REVENUES, GLOBAL, 2019E VS. 2023E, USD
Global GDP CAGR: 3.2%
$693B
$825B
GROWTH DOLLARS CAGR:
7.4%
$132B
U.S.
RoW
$167B
$526B
$223B
$602BCAGR: 3.4%
FORECASTACTIVATE
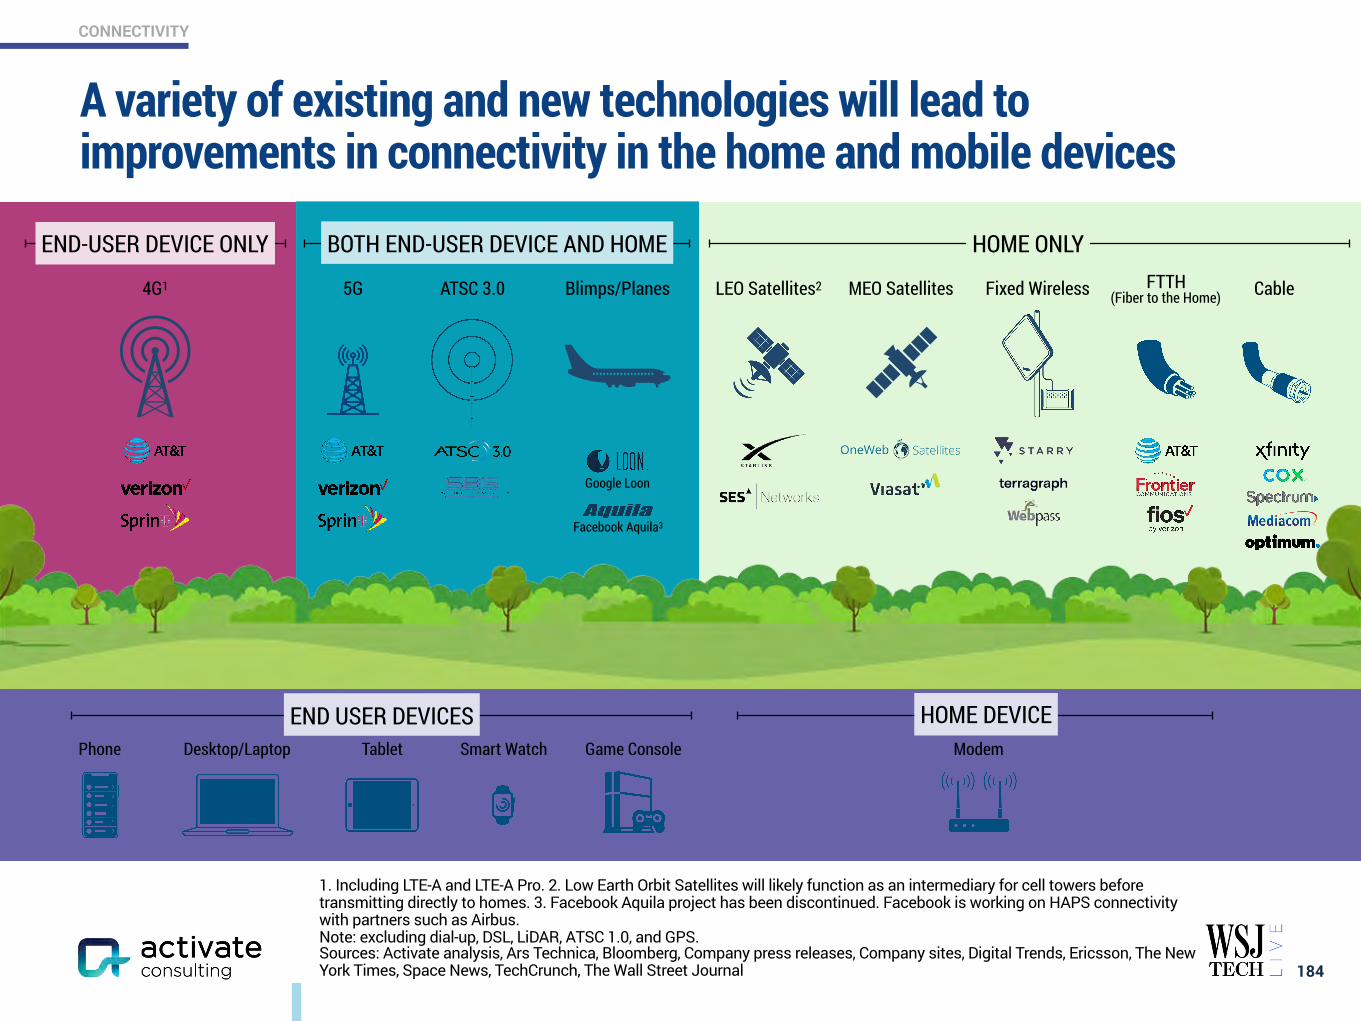
A variety of existing and new technologies will lead to improvements in connectivity in the home and mobile devices
184
CONNECTIVITY
1. Including LTE-A and LTE-A Pro. 2. Low Earth Orbit Satellites will likely function as an intermediary for cell towers before transmitting directly to homes. 3. Facebook Aquila project has been discontinued. Facebook is working on HAPS connectivity with partners such as Airbus. Note: excluding dial-up, DSL, LiDAR, ATSC 1.0, and GPS. Sources: Activate analysis, Ars Technica, Bloomberg, Company press releases, Company sites, Digital Trends, Ericsson, The New York Times, Space News, TechCrunch, The Wall Street Journal
LEO Satellites2Blimps/Planes MEO Satellites
END-USER DEVICE ONLY BOTH END-USER DEVICE AND HOME HOME ONLY
5G4G1 ATSC 3.0 CableFixed Wireless FTTH (Fiber to the Home)
Phone Desktop/Laptop Tablet Smart Watch ModemGame Console
END USER DEVICES
Google Loon
Facebook Aquila3
HOME DEVICE
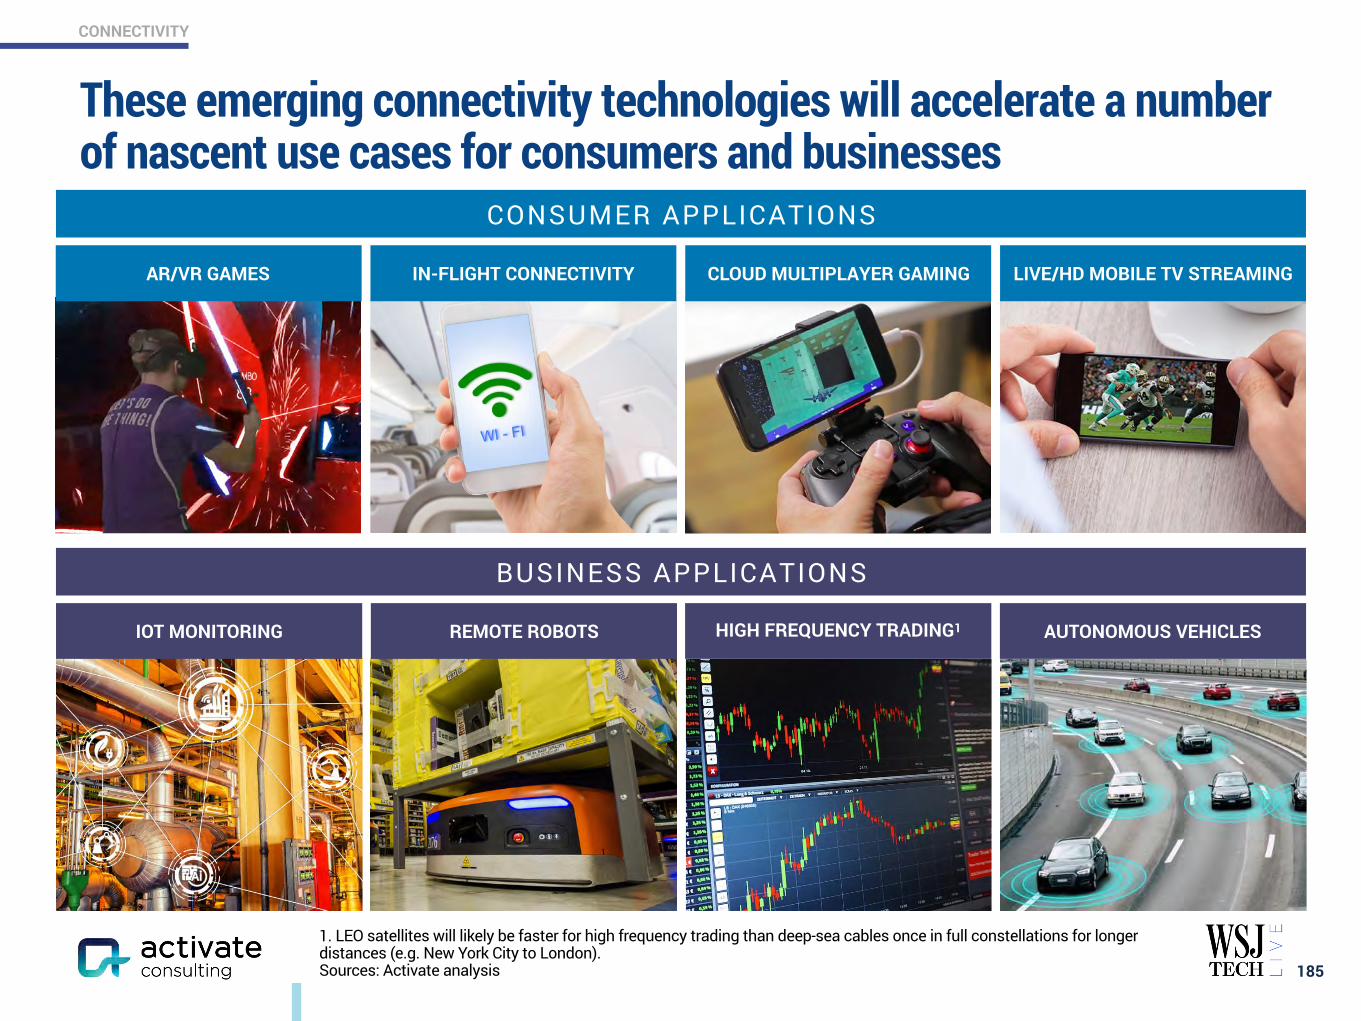
CONNECTIVITY
1. LEO satellites will likely be faster for high frequency trading than deep-sea cables once in full constellations for longer distances (e.g. New York City to London). Sources: Activate analysis
These emerging connectivity technologies will accelerate a number of nascent use cases for consumers and businesses
185
CONSUMER APPLICATIONS
BUSINESS APPLICATIONS
AUTONOMOUS VEHICLESHIGH FREQUENCY TRADING1REMOTE ROBOTSIOT MONITORING
IN-FLIGHT CONNECTIVITY LIVE/HD MOBILE TV STREAMINGCLOUD MULTIPLAYER GAMINGAR/VR GAMES
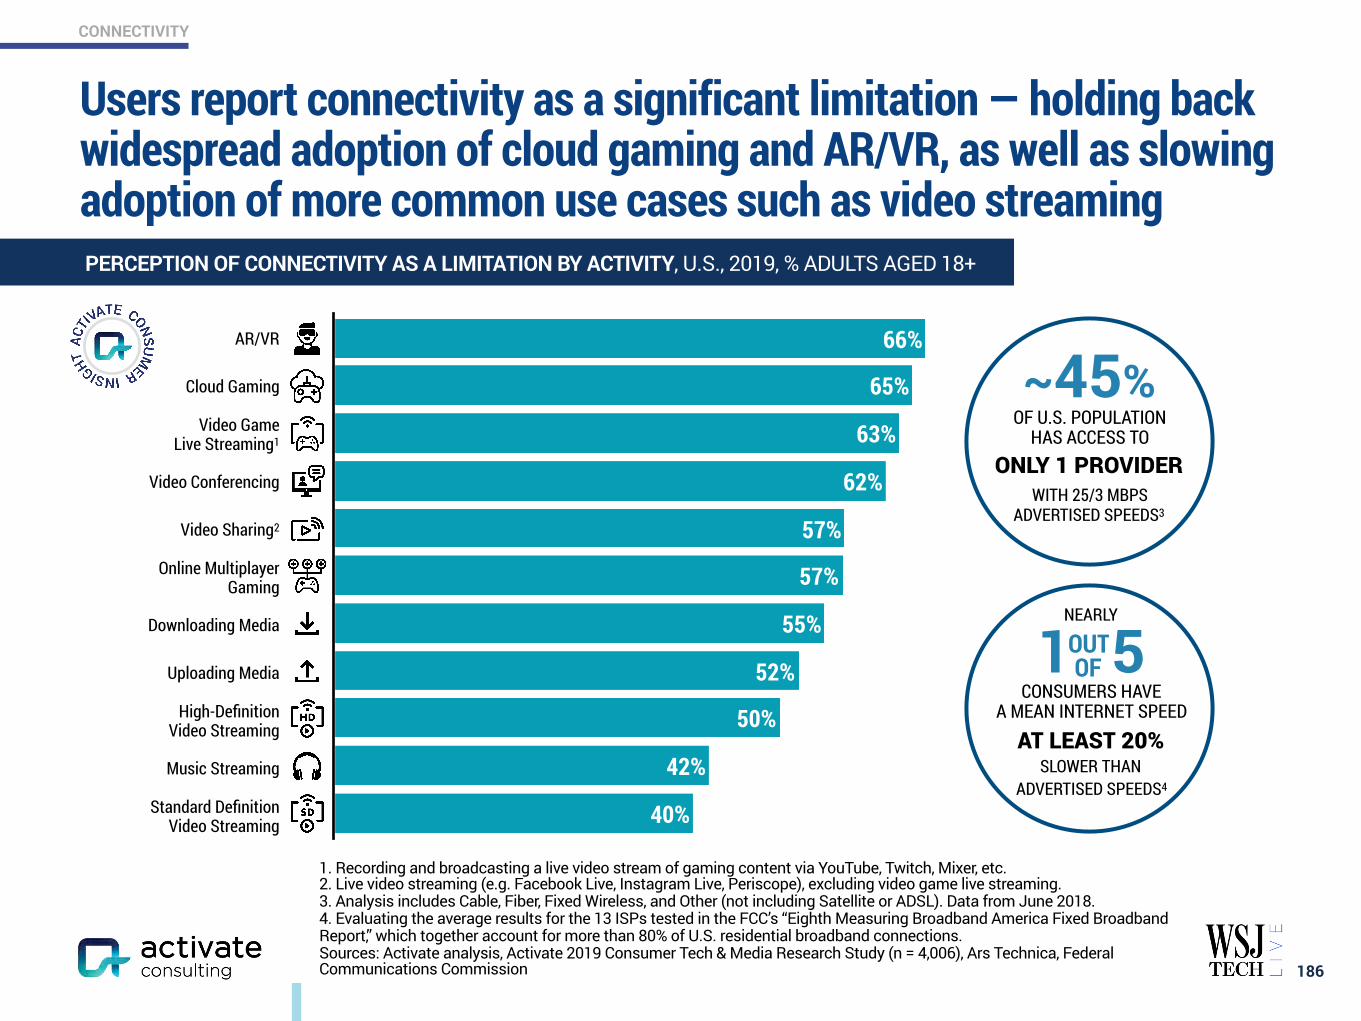
Users report connectivity as a significant limitation — holding back widespread adoption of cloud gaming and AR/VR, as well as slowing adoption of more common use cases such as video streaming
186
PERCEPTION OF CONNECTIVITY AS A LIMITATION BY ACTIVITY, U.S., 2019, % ADULTS AGED 18+
CONNECTIVITY
1. Recording and broadcasting a live video stream of gaming content via YouTube, Twitch, Mixer, etc. 2. Live video streaming (e.g. Facebook Live, Instagram Live, Periscope), excluding video game live streaming. 3. Analysis includes Cable, Fiber, Fixed Wireless, and Other (not including Satellite or ADSL). Data from June 2018. 4. Evaluating the average results for the 13 ISPs tested in the FCC’s “Eighth Measuring Broadband America Fixed Broadband Report,” which together account for more than 80% of U.S. residential broadband connections. Sources: Activate analysis, Activate 2019 Consumer Tech & Media Research Study (n = 4,006), Ars Technica, Federal Communications Commission
40%
42%
50%
52%
55%
57%
57%
62%
63%
65%
66%AR/VR
Cloud Gaming
Video Game Live Streaming1
Video Conferencing
Video Sharing2
Online Multiplayer Gaming
Downloading Media
Uploading Media
High-Definition Video Streaming
Music Streaming
Standard Definition Video Streaming
~45% OF U.S. POPULATION
HAS ACCESS TO ONLY 1 PROVIDER
WITH 25/3 MBPS ADVERTISED SPEEDS3
NEARLY
1 5 CONSUMERS HAVE
A MEAN INTERNET SPEED AT LEAST 20%
SLOWER THAN ADVERTISED SPEEDS4
OUT OF
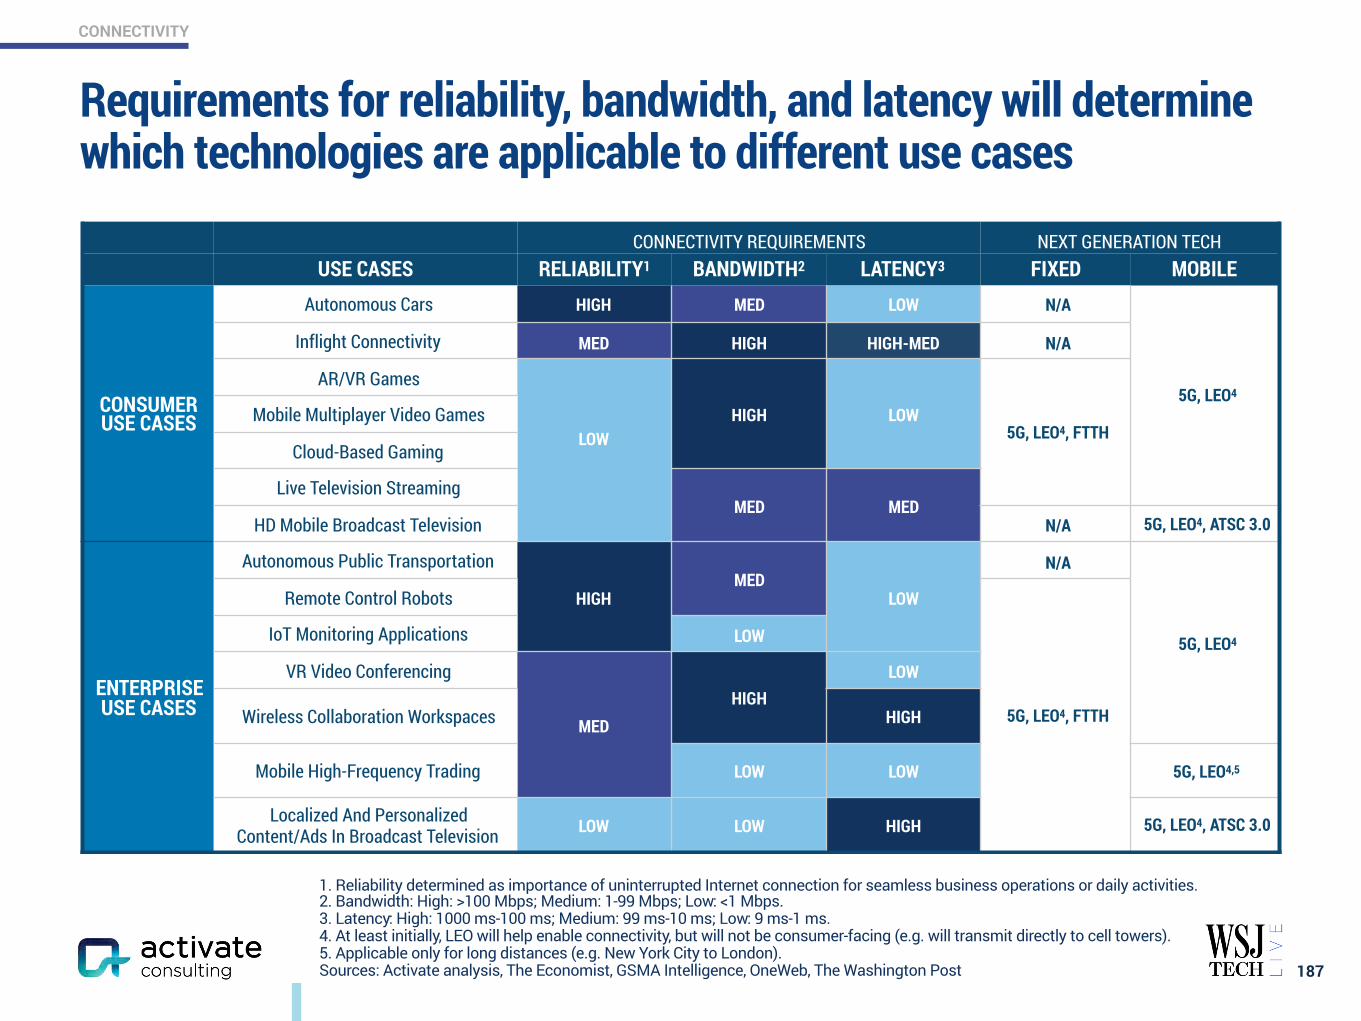
CONNECTIVITY
Requirements for reliability, bandwidth, and latency will determine which technologies are applicable to different use cases
187
CONNECTIVITY REQUIREMENTS NEXT GENERATION TECHUSE CASES RELIABILITY1 BANDWIDTH2 LATENCY3 FIXED MOBILE
CONSUMER USE CASES
Autonomous Cars HIGH MED LOW N/A
5G, LEO4
Inflight Connectivity MED HIGH HIGH-MED N/A
AR/VR Games
LOW HIGH LOW
5G, LEO4, FTTHMobile Multiplayer Video Games
Cloud-Based Gaming
Live Television StreamingMED MED
HD Mobile Broadcast Television N/A 5G, LEO4, ATSC 3.0
ENTERPRISE USE CASES
Autonomous Public Transportation
HIGH MED
LOW
N/A
5G, LEO4
Remote Control Robots
5G, LEO4, FTTH
IoT Monitoring Applications LOW
VR Video Conferencing
MEDHIGH
LOW
Wireless Collaboration Workspaces HIGH
Mobile High-Frequency Trading LOW LOW 5G, LEO4,5
Localized And Personalized Content/Ads In Broadcast Television LOW LOW HIGH 5G, LEO4, ATSC 3.0
1. Reliability determined as importance of uninterrupted Internet connection for seamless business operations or daily activities. 2. Bandwidth: High: >100 Mbps; Medium: 1-99 Mbps; Low: <1 Mbps. 3. Latency: High: 1000 ms-100 ms; Medium: 99 ms-10 ms; Low: 9 ms-1 ms. 4. At least initially, LEO will help enable connectivity, but will not be consumer-facing (e.g. will transmit directly to cell towers). 5. Applicable only for long distances (e.g. New York City to London). Sources: Activate analysis, The Economist, GSMA Intelligence, OneWeb, The Washington Post
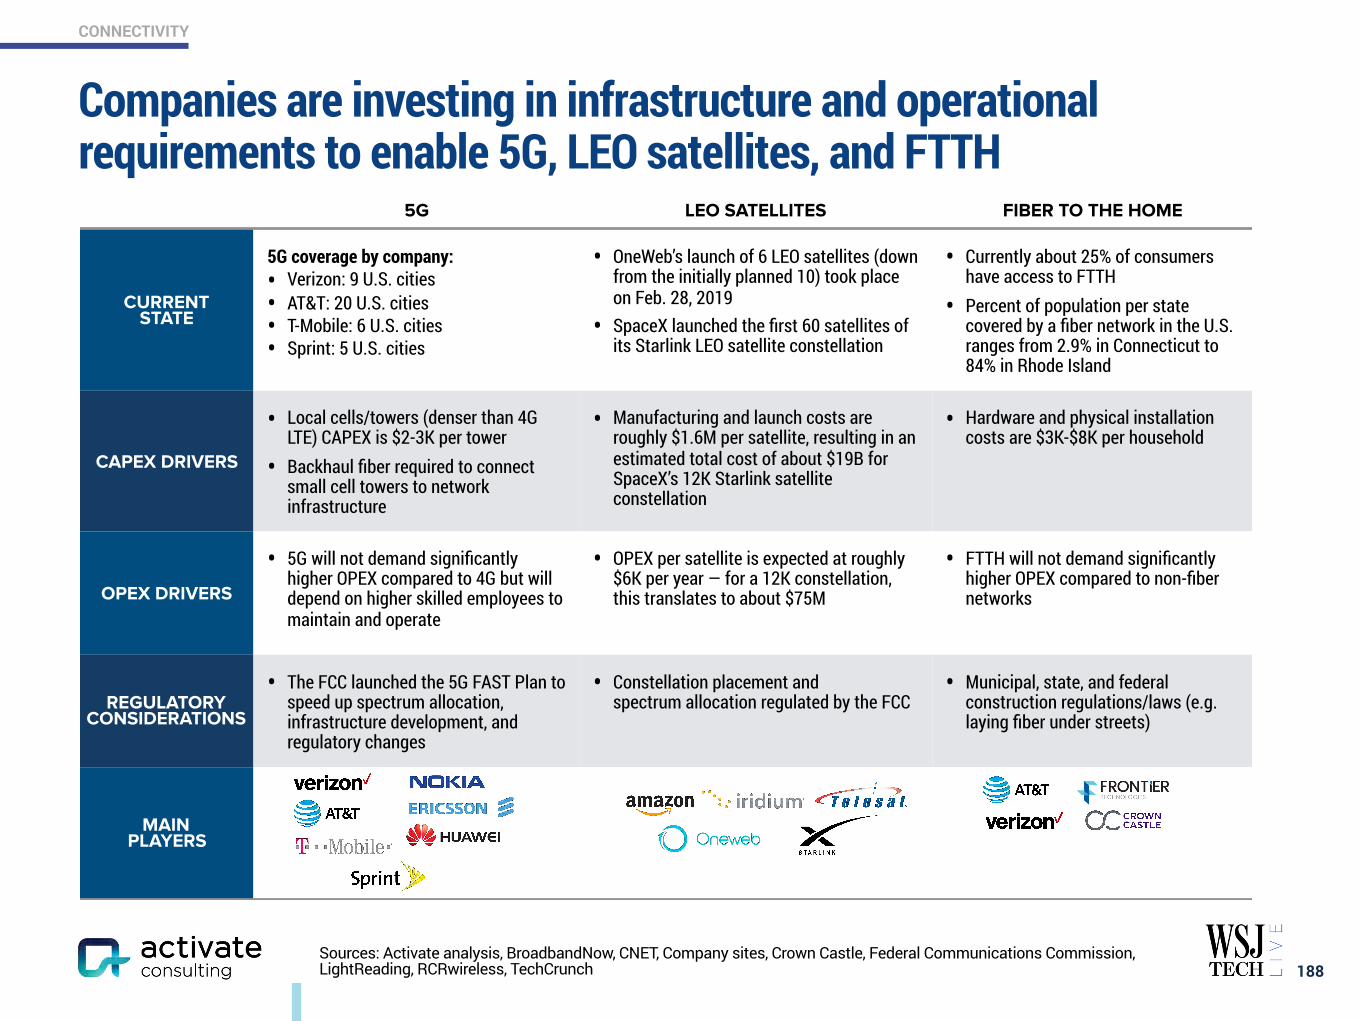
CONNECTIVITY
5G LEO SATELLITES FIBER TO THE HOME
CURRENT STATE
5G coverage by company: • Verizon: 9 U.S. cities • AT&T: 20 U.S. cities • T-Mobile: 6 U.S. cities • Sprint: 5 U.S. cities
• OneWeb’s launch of 6 LEO satellites (down from the initially planned 10) took place on Feb. 28, 2019
• SpaceX launched the first 60 satellites of its Starlink LEO satellite constellation
• Currently about 25% of consumers have access to FTTH
• Percent of population per state covered by a fiber network in the U.S. ranges from 2.9% in Connecticut to 84% in Rhode Island
CAPEX DRIVERS
• Local cells/towers (denser than 4G LTE) CAPEX is $2-3K per tower
• Backhaul fiber required to connect small cell towers to network infrastructure
• Manufacturing and launch costs are roughly $1.6M per satellite, resulting in an estimated total cost of about $19B for SpaceX’s 12K Starlink satellite constellation
• Hardware and physical installation costs are $3K-$8K per household
OPEX DRIVERS
• 5G will not demand significantly higher OPEX compared to 4G but will depend on higher skilled employees to maintain and operate
• OPEX per satellite is expected at roughly $6K per year — for a 12K constellation, this translates to about $75M
• FTTH will not demand significantly higher OPEX compared to non-fiber networks
REGULATORY CONSIDERATIONS
• The FCC launched the 5G FAST Plan to speed up spectrum allocation, infrastructure development, and regulatory changes
• Constellation placement and spectrum allocation regulated by the FCC
• Municipal, state, and federal construction regulations/laws (e.g. laying fiber under streets)
MAIN PLAYERS
Companies are investing in infrastructure and operational requirements to enable 5G, LEO satellites, and FTTH
188Sources: Activate analysis, BroadbandNow, CNET, Company sites, Crown Castle, Federal Communications Commission, LightReading, RCRwireless, TechCrunch
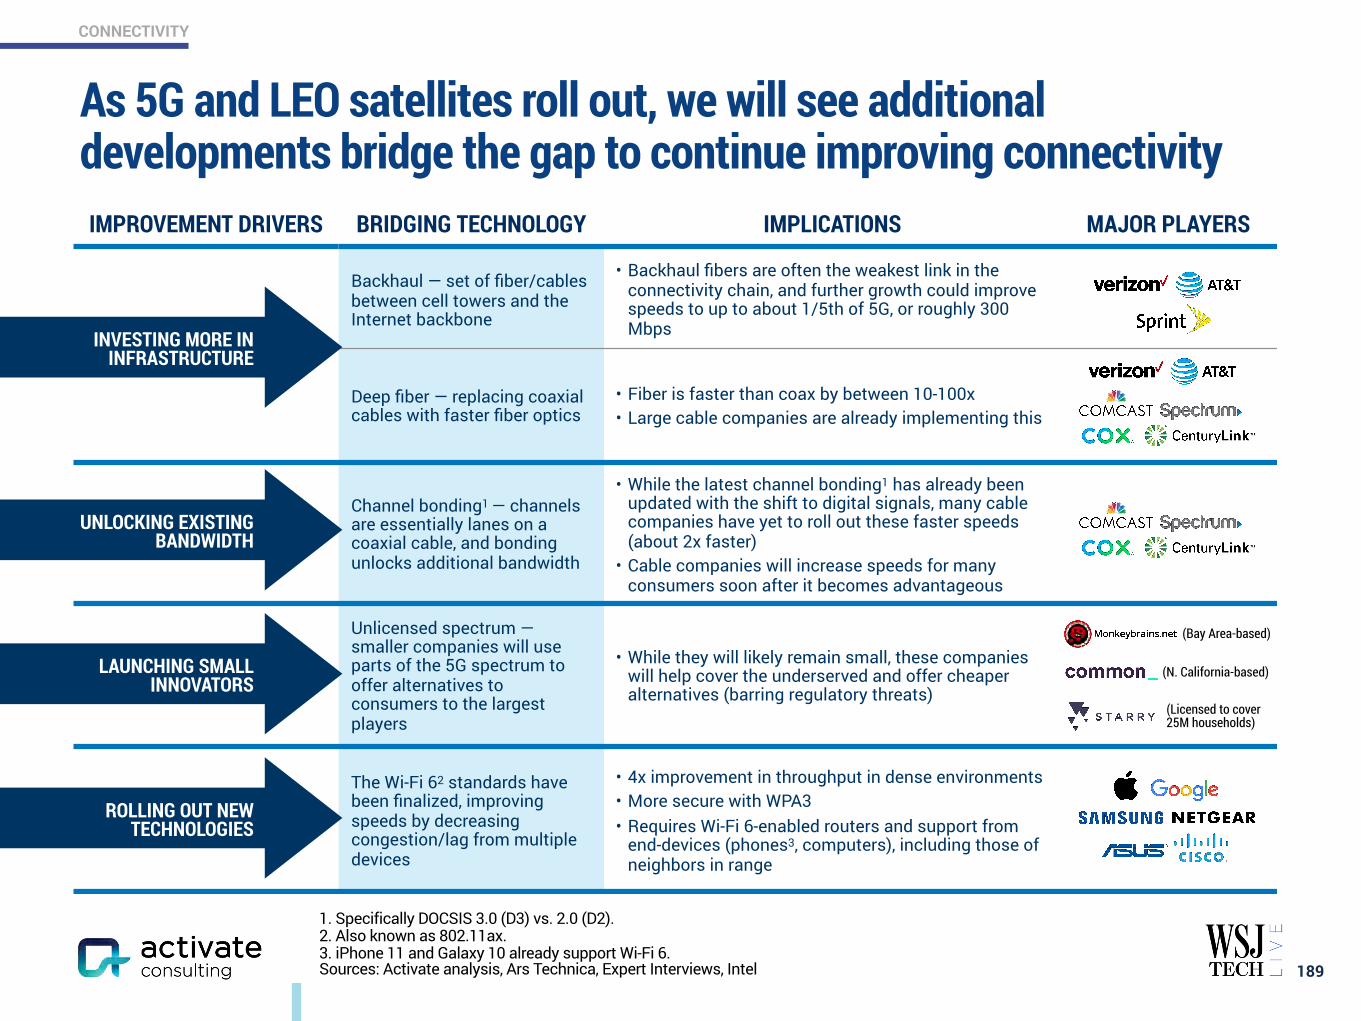
CONNECTIVITY
1. Specifically DOCSIS 3.0 (D3) vs. 2.0 (D2). 2. Also known as 802.11ax. 3. iPhone 11 and Galaxy 10 already support Wi-Fi 6. Sources: Activate analysis, Ars Technica, Expert Interviews, Intel
As 5G and LEO satellites roll out, we will see additional developments bridge the gap to continue improving connectivity
189
IMPROVEMENT DRIVERS BRIDGING TECHNOLOGY IMPLICATIONS MAJOR PLAYERS
Backhaul — set of fiber/cables between cell towers and the Internet backbone
• Backhaul fibers are often the weakest link in the connectivity chain, and further growth could improve speeds to up to about 1/5th of 5G, or roughly 300 Mbps
Deep fiber — replacing coaxial cables with faster fiber optics
• Fiber is faster than coax by between 10-100x • Large cable companies are already implementing this
Channel bonding1 — channels are essentially lanes on a coaxial cable, and bonding unlocks additional bandwidth
• While the latest channel bonding1 has already been updated with the shift to digital signals, many cable companies have yet to roll out these faster speeds (about 2x faster)
• Cable companies will increase speeds for many consumers soon after it becomes advantageous
Unlicensed spectrum — smaller companies will use parts of the 5G spectrum to offer alternatives to consumers to the largest players
• While they will likely remain small, these companies will help cover the underserved and offer cheaper alternatives (barring regulatory threats)
The Wi-Fi 62 standards have been finalized, improving speeds by decreasing congestion/lag from multiple devices
• 4x improvement in throughput in dense environments • More secure with WPA3 • Requires Wi-Fi 6-enabled routers and support from
end-devices (phones3, computers), including those of neighbors in range
INVESTING MORE IN INFRASTRUCTURE
UNLOCKING EXISTING BANDWIDTH
LAUNCHING SMALL INNOVATORS
ROLLING OUT NEW TECHNOLOGIES
(Bay Area-based)
(N. California-based)
(Licensed to cover 25M households)
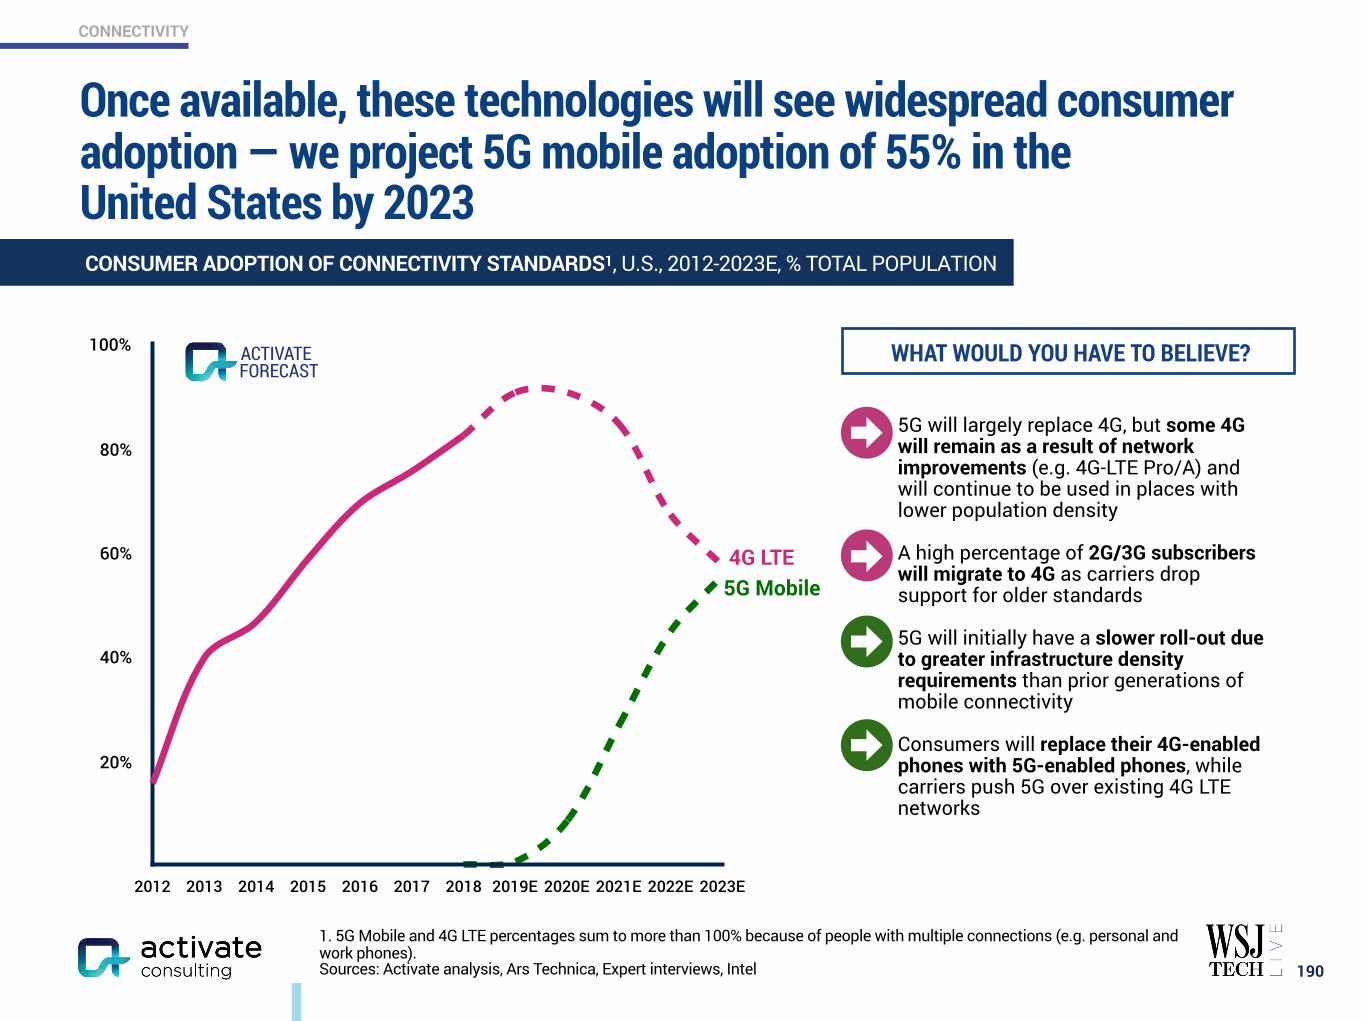
CONNECTIVITY
1. 5G Mobile and 4G LTE percentages sum to more than 100% because of people with multiple connections (e.g. personal and work phones). Sources: Activate analysis, Ars Technica, Expert interviews, Intel
20%
40%
60%
80%
100%
2012 2013 2014 2015 2016 2017 2018 2019E 2020E 2021E 2022E 2023E
Once available, these technologies will see widespread consumer adoption — we project 5G mobile adoption of 55% in the United States by 2023
190
WHAT WOULD YOU HAVE TO BELIEVE?
• 5G will largely replace 4G, but some 4G will remain as a result of network improvements (e.g. 4G-LTE Pro/A) and will continue to be used in places with lower population density
• A high percentage of 2G/3G subscribers will migrate to 4G as carriers drop support for older standards
• 5G will initially have a slower roll-out due to greater infrastructure density requirements than prior generations of mobile connectivity
• Consumers will replace their 4G-enabled phones with 5G-enabled phones, while carriers push 5G over existing 4G LTE networks
5G Mobile4G LTE
FORECASTACTIVATE
CONSUMER ADOPTION OF CONNECTIVITY STANDARDS1, U.S., 2012-2023E, % TOTAL POPULATION
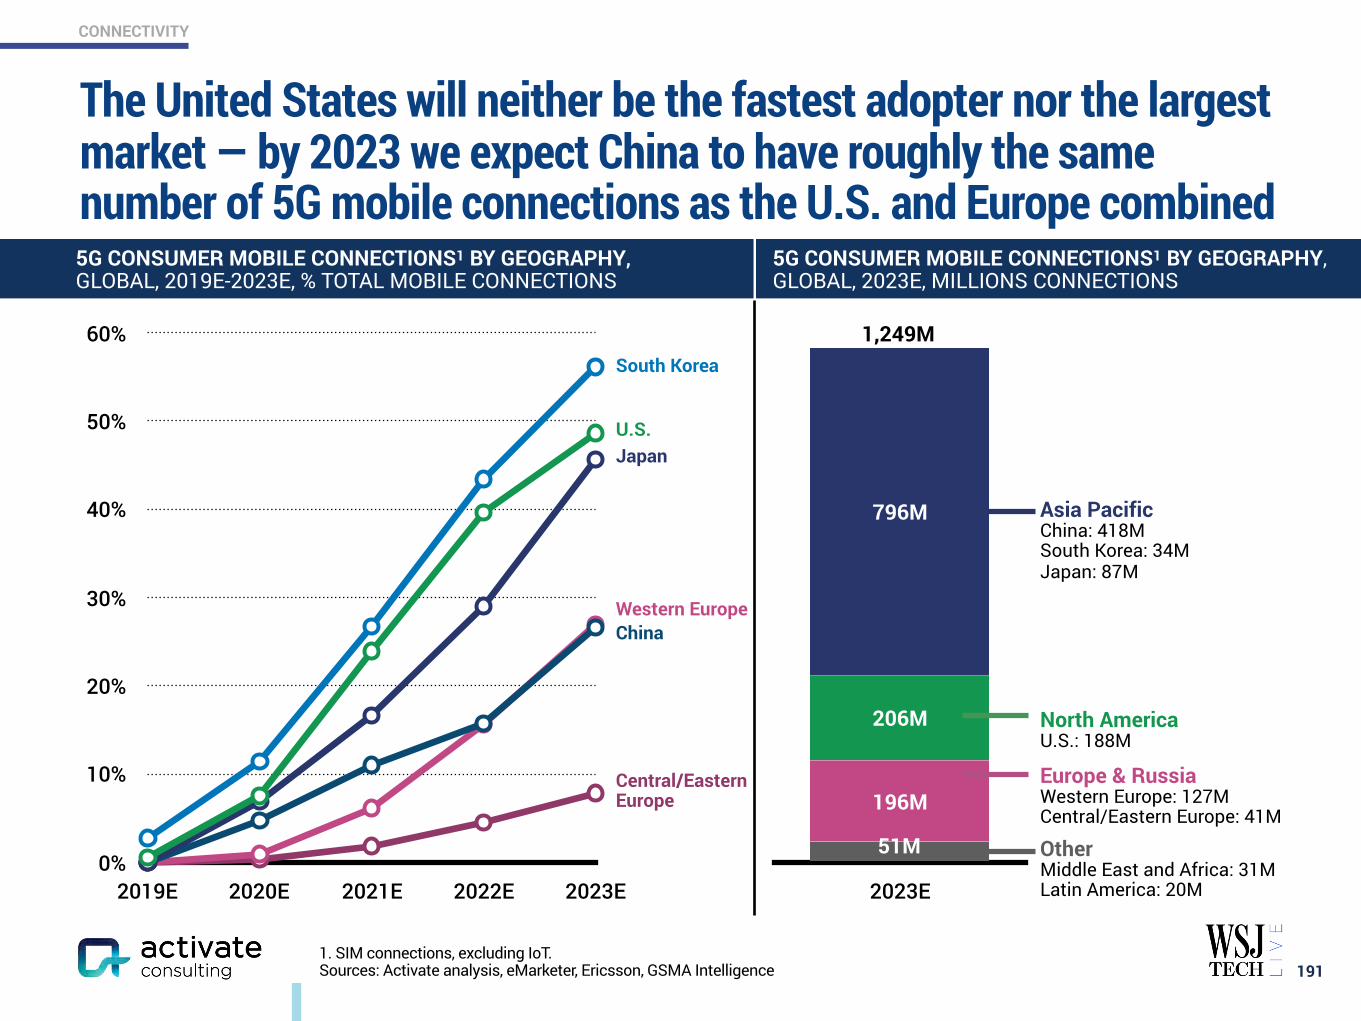
CONNECTIVITY
1. SIM connections, excluding IoT. Sources: Activate analysis, eMarketer, Ericsson, GSMA Intelligence
The United States will neither be the fastest adopter nor the largest market — by 2023 we expect China to have roughly the same number of 5G mobile connections as the U.S. and Europe combined
191
2023E
796M
206M
196M
51M0%
10%
20%
30%
40%
50%
60%
2019E 2020E 2021E 2022E 2023E
South Korea
JapanU.S.
Western EuropeChina
Central/Eastern Europe
1,249M
Asia Pacific China: 418M South Korea: 34M Japan: 87M
North America U.S.: 188M
Europe & Russia Western Europe: 127M Central/Eastern Europe: 41M
Other Middle East and Africa: 31M Latin America: 20M
5G CONSUMER MOBILE CONNECTIONS1 BY GEOGRAPHY, GLOBAL, 2023E, MILLIONS CONNECTIONS
5G CONSUMER MOBILE CONNECTIONS1 BY GEOGRAPHY, GLOBAL, 2019E-2023E, % TOTAL MOBILE CONNECTIONS
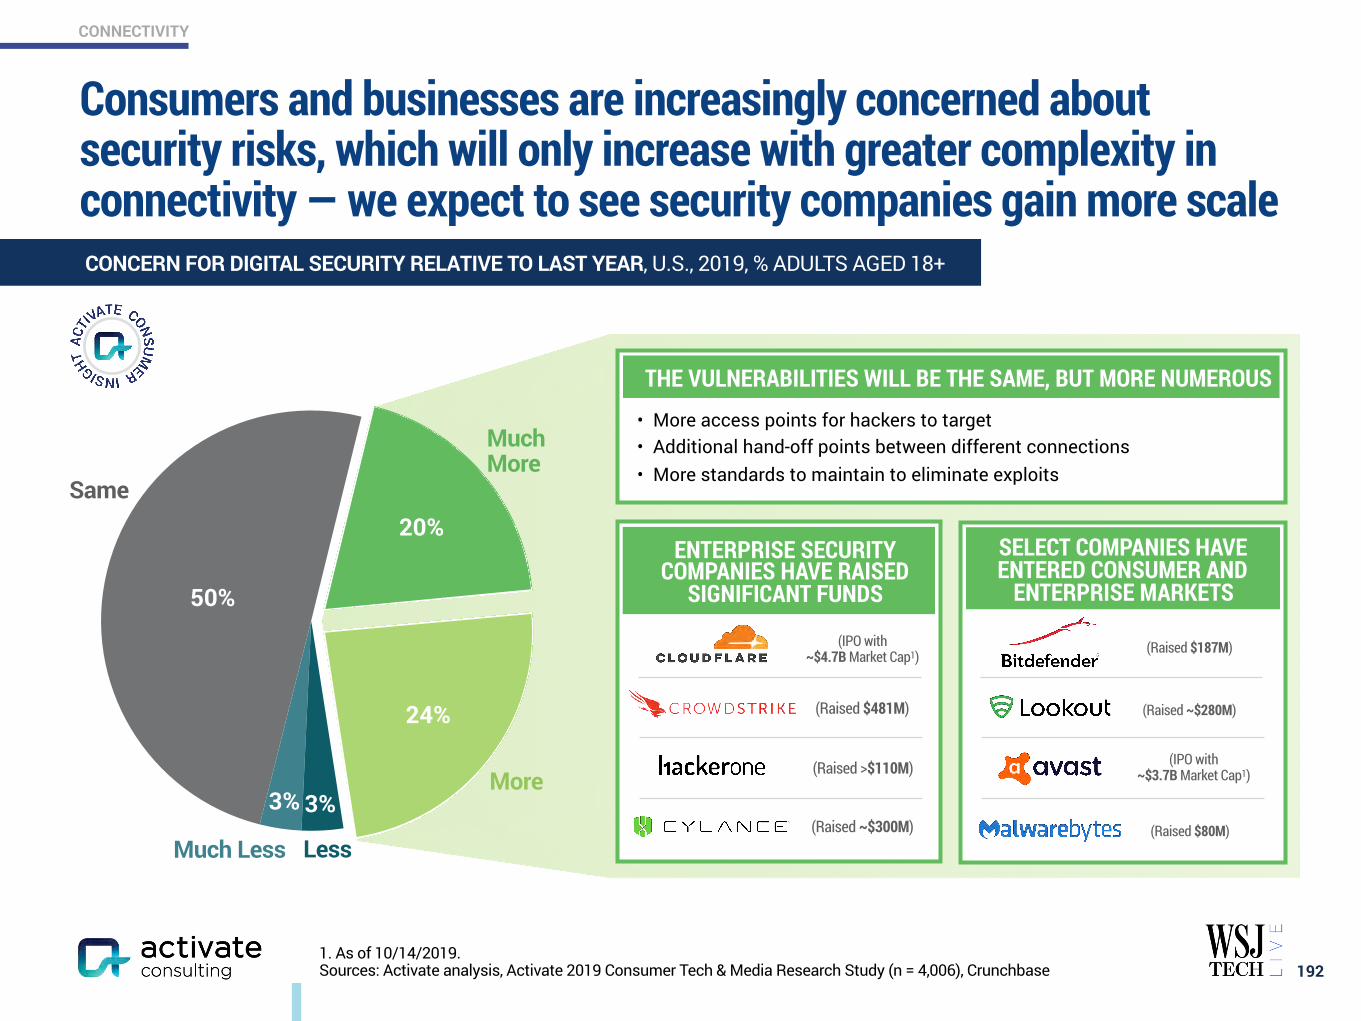
Consumers and businesses are increasingly concerned about security risks, which will only increase with greater complexity in connectivity — we expect to see security companies gain more scale
192
CONCERN FOR DIGITAL SECURITY RELATIVE TO LAST YEAR, U.S., 2019, % ADULTS AGED 18+
CONNECTIVITY
1. As of 10/14/2019. Sources: Activate analysis, Activate 2019 Consumer Tech & Media Research Study (n = 4,006), Crunchbase
• More access points for hackers to target • Additional hand-off points between different connections • More standards to maintain to eliminate exploits
24%
20%
50%
3% 3%
Much More
More
Same
Much Less Less
(Raised >$110M)
(Raised ~$300M)
THE VULNERABILITIES WILL BE THE SAME, BUT MORE NUMEROUS
ENTERPRISE SECURITY COMPANIES HAVE RAISED
SIGNIFICANT FUNDS
SELECT COMPANIES HAVE ENTERED CONSUMER AND
ENTERPRISE MARKETS
(Raised $187M)
(Raised $481M) (Raised ~$280M)
(IPO with ~$3.7B Market Cap1)
(Raised $80M)
(IPO with ~$4.7B Market Cap1)
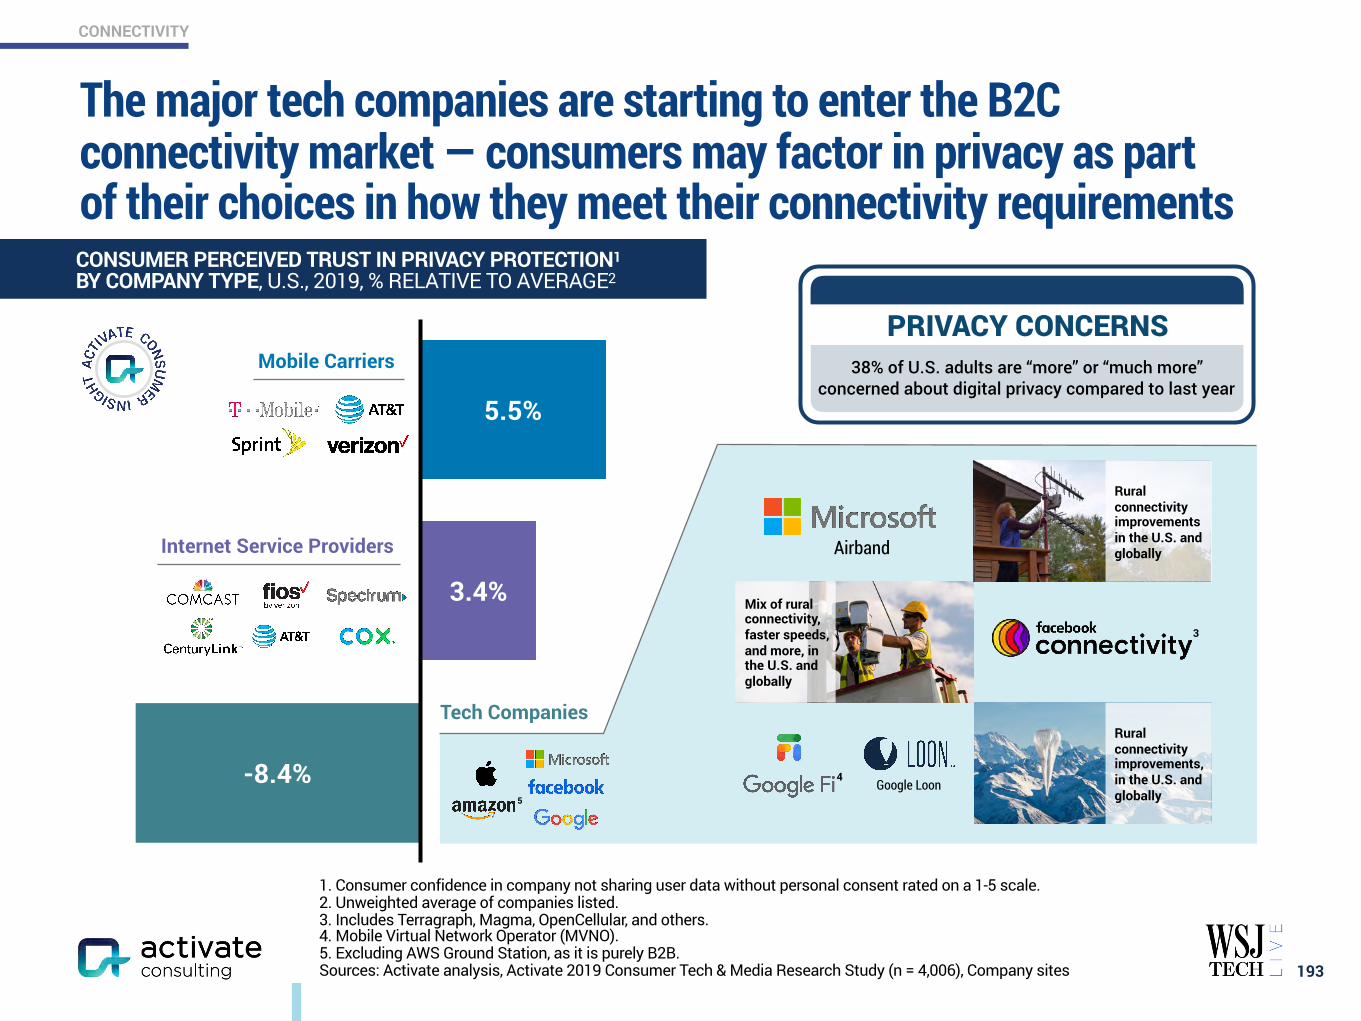
The major tech companies are starting to enter the B2C connectivity market — consumers may factor in privacy as part of their choices in how they meet their connectivity requirements
193
CONNECTIVITY
CONSUMER PERCEIVED TRUST IN PRIVACY PROTECTION1
BY COMPANY TYPE, U.S., 2019, % RELATIVE TO AVERAGE2
1. Consumer confidence in company not sharing user data without personal consent rated on a 1-5 scale. 2. Unweighted average of companies listed. 3. Includes Terragraph, Magma, OpenCellular, and others. 4. Mobile Virtual Network Operator (MVNO). 5. Excluding AWS Ground Station, as it is purely B2B. Sources: Activate analysis, Activate 2019 Consumer Tech & Media Research Study (n = 4,006), Company sites
-8.4%
3.4%
5.5%
Tech Companies
Internet Service Providers
Mobile Carriers
5
38% of U.S. adults are “more” or “much more” concerned about digital privacy compared to last year
PRIVACY CONCERNS
3
Google Loon
Airband
4
Rural connectivity improvements in the U.S. and globally
Mix of rural connectivity, faster speeds, and more, in the U.S. and globally
Rural connectivity improvements, in the U.S. and globally
Activate Data Partners for Technology & Media Outlook 2020
194
ACTIVATE DATA PARTNERS

Michael J. Wolf Seref Turkmenoglu Chris Walters Sri Narasimhan Samuel Studnia Edward Doueihi Donovan Rose Ellis Bowen David Howard Allison Flanders Joshua Marksberry Mitch Gainer Cigdem Binal Rohun Reddy Marlee Melendy Mark Manley Brian Flaxman
CREATED BY THE ACTIVATE CONSULTING TEAM:
Zach Remsen Yuxiao Zhang Devang Bhatt Daniel Reshef Kyle Kroeger Lily Silva Kyler Meehan Tyler Davis Karinya Ghiara Phoebe Gould Joe Sileo Cory Goldenthal Annik Wolf Frank Noto Denise Shea Stephen Corsello Al Rotches
Activate growth. Own the future.
Technology. Internet. Media. Entertainment. These are the industries we’ve shaped, but the future is where we live.
Activate Consulting helps technology and media companies drive revenue growth, identify new strategic opportunities, and position their businesses for the future.
As the leading management consulting firm for these industries, we know what success looks like because we’ve helped our clients achieve it in the key areas that will impact their top and bottom lines:
Together, we can help you grow faster than the market and smarter than the competition.
• Go-to-Market strategy • Digital strategy • Building new digital businesses • Strategic due diligence • M&A-led growth
• Strategy • Customer acquisition • Pricing optimization • Marketing effectiveness • Salesforce activation
www.activate.comNEW YORK 11 Madison Square North New York, NY 10010 212 316 4444
SAN FRANCISCO 2 Bryant Street, Suite 100 San Francisco, CA 94105 415 385 3725 [email protected]