acoustically and electrically evoked contralateral suppression of otoacoustic emissions in guinea...
TRANSCRIPT

Acoustically and electrically evoked contralateral suppression ofotoacoustic emissions in guinea pigs
J. Popelar a;*, J. Valvoda b, J. Syka a
a Institute of Experimental Medicine, Academy of Sciences, V|denska 1083, 142 20 Prague 4, Czech Republicb ENT Clinic, 1st Medical Faculty, Charles University, Prague, Czech Republic
Received 7 October 1998; received in revised form 30 April 1999; accepted 11 May 1999
Abstract
It is generally accepted that stimulation of the efferent auditory system results in changes of cochlear activity. A simple method ofactivating the olivocochlear pathway by contralateral electrical stimulation of the round window (ES-RW) was used in this studywith the aim of comparing the efficacy of acoustically and/or electrically evoked contralateral suppression. The suppression oftransient evoked otoacoustic emissions (TEOAEs) and distortion product otoacoustic emissions (DPOAEs) was elicited bycontralateral acoustic stimulation (AS) (61 dB SPL continuous white noise), and/or by electrical stimulation of an electrodeimplanted at the contralateral round window (monopolar rectangular pulses 0.1 ms, repetition rate 300 Hz, intensity 50^100 WA) in12 guinea pigs. The average value of contralateral suppression of TEOAEs amounted to 1.04 þ 0.48 dB for acoustic stimulation and0.97 þ 0.53 dB for round window electrical stimulation. The simultaneous presentation of both acoustic and electrical stimulationhad only a slight additive effect and resulted in 1.27 þ 0.79 dB diminution of TEOAEs. The suppression of DPOAEs duringcontralateral acoustic and electrical stimulation was evident mainly at low and middle frequencies (1^4 kHz). In two guinea pigs themaximum DPOAE suppression was present at high frequencies. The average values of contralateral suppression measured atindividual f2 frequencies of DPOAEs were similar to those calculated from 1/4 octave power spectrum analysis of the TEOAEs inhalf of the animals. The results demonstrated that contralateral ES-RW had a similar suppressive effect on TEOAEs and DPOAEsas did contralateral AS and simultaneous AS+(ES-RW). The results of spectral analysis suggested that both modes of contralateralstimulation excited similar sensory cochlear elements and induce comparable suppression of both TEOAEs and DPOAEs. ß 1999Elsevier Science B.V. All rights reserved.
Key words: Evoked otoacoustic emission; Contralateral suppression; Acoustic stimulation; Electrical stimulation; Guinea pig
1. Introduction
The recording of evoked otoacoustic emissions(EOAEs) is a very reliable and simple method for eval-uating peripheral hearing function and for detectingvarious cochlear dysfunctions. Since many papershave demonstrated comparable results in humans anddi¡erent animal species, the evaluation of EOAEs inanimals can be used as a model for the human EOAEs.In guinea pigs, the ¢rst reports on transient evokedotoacoustic emission (TEOAE) and distortion productotoacoustic emission (DPOAE) recordings were pub-
lished by Mountain (1980) and Zwicker and Manley(1981). Later, the individual types of OAEs werestudied in guinea pigs by Avan et al. (1990, 1995);Puel and Rebillard (1990); Ohyama et al. (1991);Ueda et al. (1992) and others.
It is known that the cochlear or neural activity re-corded in the ipsilateral ear can be modulated by stim-ulation of the contralateral ear. Except for cochlearmicrophonics, which are enhanced after stimulation ofthe e¡erent ¢bers (Fex, 1959), contralateral stimulationhas resulted in a depression of all other potentials. Thise¡ect, which is called contralateral suppression (CS), ispresumed to be mediated by the e¡erent system, mainlyby the crossed medial olivocochlear bundle (Gi¡ordand Guinan, 1987; Guinan and Gi¡ord, 1988a,b).These ¢bers originate in the vicinity of the medial oli-
0378-5955 / 99 / $ ^ see front matter ß 1999 Elsevier Science B.V. All rights reserved.PII: S 0 3 7 8 - 5 9 5 5 ( 9 9 ) 0 0 0 9 1 - X
* Corresponding author. Tel. : +420 (2) 475 2689;Fax: +420 (2) 475 2787; E-mail: [email protected]
HEARES 3269 20-8-99
Hearing Research 135 (1999) 61^70

vary nuclei and innervate the basal pole of outer haircells (OHC). The motile properties of OHC, describedfor example by Brownell et al. (1985) and Zenner et al.(1990), are responsible for active electromechanicalprocesses in the cochlea, and they can change the coch-lear micromechanics during contralateral stimulation(Mountain, 1980; Siegel and Kim, 1982; Davis, 1983).CS was demonstrated in experimental animals as wellas in humans using recording of di¡erent types ofEOAEs. This research is oriented to evaluate hearingfunction under pathological conditions (Collet et al.,1989) or for diagnosis of di¡erent brainstem lesions(Prasher et al., 1994).
Contralateral suppression in experimental animalscan be evoked not only by acoustic stimulation butalso by electrical stimulation of the e¡erent ¢bers.This is usually performed by direct AC stimulation ofthe olivocochlear nerve ¢bers at the £oor of the fourthventricle. Under deep anesthesia the electrode is usuallyadvanced to the stimulation point according to stereo-taxic coordinates. This method requires much experi-ence and skill. In addition, the use of anesthesia a¡ectsboth central and peripheral neural processes, which canin£uence ongoing a¡erent activity and the function ofthe medial olivocochlear system (Cazals and Huang,1996; Lima da Costa et al., 1997). In 1983, Rajanand Johnstone reported a technique for activating e¡er-ent nerve ¢bers to the cochlea by electrical stimulationat the round window. Such electrical stimulation causeda reduction in the amplitude of the compound actionpotential (CAP) recorded in the contralateral ear inanesthetized and paralyzed guinea pigs. Electrical stim-ulation of the round window (RW) may be performedalso in awake or lightly anesthetized guinea pigs withimplanted electrodes (Popelar and Syka, 1993; Sykaand Popelar, 1994). Electrode implantation at the RWin an anesthetized animal (using the modi¢ed methodof Aran and Erre, 1979) is routine and simple surgery.After a week recovery, electrical stimulation with theimplanted RW electrode can be performed in awakeor lightly sedated animals, and measurements in oneanimal can be repeated as often as necessary. In thisstudy the CS of TEOAEs and DPOAEs was studied inlightly sedated guinea pigs. It has been shown previ-ously that CS increases with increasing intensity ofthe contralateral sound stimulus (Puel and Rebillard,1990; Hood et al., 1996). However, the maximal soundintensity is limited by binaural crosstalk. In contrast toacoustic stimulation, the RW electrical stimulation canstimulate the majority of auditory nerve ¢bers and elec-tric current does not spread to the opposite ear. Themaximal electric current is limited only by the occur-rence of muscle twitches. The aims of this work were:(i) to assess the e¡ect of electrical stimulation of thecontralateral RW on EOAEs; (ii) to compare the e¡ect
of di¡erent modes of stimulation, i.e. electrical stimula-tion with a pulse train and continuous white-noiseacoustic stimulation; (iii) to evaluate the e¡ect of CSon TEOAEs and DPOAEs in frequency bands (by eval-uating the 1/4 octave power spectrum of the TEOAEsand DPOAEs); (iv) to ¢nd out if simultaneous acousticand electrical contralateral stimulation elicits a greatersuppressive e¡ect than each stimulation alone. The dif-ference in the e¡ect of stimulation would indicate thatdi¡erent parts of the e¡erent system may be involved.
2. Materials and methods
Experiments were performed on 12 pigmented guineapigs weighing 250^300 g. Animals were anesthetizedwith an intramuscular injection of 33 mg/kg of ket-amine (Narkamon 5%, Spofa) and 6.6 mg/kg of xyla-zine (Rompun 2%, Bayer). A te£on-coated platinum-iridium ball electrode was implanted at the round win-dow of the left ear. The reference electrode was ¢xed inthe neck muscles. The electrodes were soldered to thepins of a connector mounted to the vertex of the skullby small screws and acrylic resin. The correct positionof electrodes was checked by recording the click-evokedCAP.
Measurements were performed in an anechoic andsound-attenuated chamber. The testing of animals wasstarted at least 10 days after surgery. Awake guineapigs were put in a holding box, which allowed thewhole head to be free. Head movements were restrictedonly by a sliding ring placed over the nose. TEOAEsand DPOAEs were recorded using an ILO 92 otoacous-tic emission analyzer using the H-probe designed forneonate ears. A plastic adapter was ¢tted over theprobe in order to seal it into the external ear canal.To minimize head movement, guinea pigs were slightlysedated by an intramuscular injection of 0.1 ml of xyl-azine before the test session.
TEOAEs were elicited by non-linear clicks of 40 Wsduration and an level of 65^75 dB peak equivalent SPL(pSPL). Recordings were made using the non-linear ac-quisition mode, so that the response was averaged from260 stimulus repetitions. The time window for click-evoked TEOAE processing was set between 1.5 and10.5 ms. The starting time, 1.5 ms after the click onset,was con¢rmed in post-mortem measurements to be asu¤cient interval for avoiding stimulus artifacts (seebelow). The cubic 2f13f2 DPOAEs were recorded innine of 12 guinea pigs using two primary tones, f1
and f2 (ratio f2/f1 = 1.22), presented with two head-phones, with either equi-level stimuli or with an L2 levelfor f2 that was 5^10 dB less than L1. In ¢ve guinea pigs,DP-grams (the function of DPOAE level on increasingstimulus frequency, four points per octave) were re-
HEARES 3269 20-8-99
J. Popelar et al. / Hearing Research 135 (1999) 61^7062
corded at stimulus levels of 40^70 dB SPL. Since post-mortem measurements (see below) revealed thatDPOAEs elicited by 65^70 dB SPL primaries persistedseveral minutes after the animal's death, CS was testedwith f1 and f2 primary tone levels of L1/L2 = 60/60, 60/55, 60/50, 55/45 or 50/45 dB SPL.
The suppression of EOAEs was tested by stimulationof the contralateral ear with continuous white noise(WN) at 61 dB SPL, generated with a Hewlett Packard(33120A) waveform generator and ampli¢ed andshaped with an electronic tone switch. WN was deliv-ered to the ear by a piezoelectric stimulator coupled tothe outer ear canal via a 7 cm long silastic tube (outerdiameter 5 mm, inner diameter 3 mm). The end of thesilastic tube was ¢xed in the entrance to the outer earcanal by Histoacryl S glue. The stimulating sound sys-tem was calibrated in an arti¢cial ear (adopted for theimpedance of the guinea pig ear canal) with a Bru«el andKjaer (4134) 1/2 inch microphone. In order to calibratethe sound system more precisely, 10 guinea pigs werelightly anesthetized with 0.1^0.2 ml of a ketamine-xyla-zine mixture (ratio 2:1). The sound pressure level andthe frequency spectrum of the white noise near the tym-panic membrane were measured with the calibratedprobe connected to a miniature Knowles microphone(BT-1751). The main part of the WN measured in theouter ear canal near the tympanic membrane was local-ized in the frequency range 1.5^14 kHz. Spectrumcurves in all animals were very similar; the maximumdi¡erences among individual guinea pigs did not exceed5 dB for frequencies up to 9 kHz and 10 dB for thefrequency range 9^14 kHz. The measurement of thefrequency spectra after repeated re¢xation of the stim-ulating tube in the outer ear canal also displayed verystable results (Popelar et al., 1996).
Electrical stimulation of the contralateral RW wasperformed with a continuous train of monopolar rec-tangular pulses (pulse width 100 Ws, repetition rate 300Hz), generated by an optically coupled constant currentsource. The electrical current was increased until the¢rst detectable muscle twitches were observed. Then,the electrical current for stimulation was set at 50^100WA which was at least 10% lower than the maximumvalue.
2.1. Experimental protocol
The guinea pig was sedated by an i.m. injection ofxylazine at a dose of 20 mg/kg body weight and ¢xed inthe testing box. The sedation was usually e¡ective for1 h, which was enough time to perform all recordings.The ILO H-probe was inserted into the tested ear canal(usually the right ear) and a silastic tube connected tothe piezoelectric sound source was ¢xed by acrylic glueinto the contralateral outer ear canal (usually the left
ear). This ¢xation prevented the disconnection of thestimulating tube during small head movements, butthe silastic tube was easy to remove at the end of themeasuring session. In each experiment, the normalcochlear function of the guinea pig and the correct ¢x-ation of the stimulating silastic tube in the outer earwere tested by measuring the threshold of the CAP toWN bursts (2 ms duration). The CAP was ampli¢ed10 000 times and ¢ltered from 10 Hz to 10 kHz, andthe signal was processed with a CED 1401 intelligentinterface connected to a PC using Signal software(Cambridge Electronic Design). The threshold to WNbursts was 15^20 dB SPL. Thus, the intensity of WNstimulation to the contralateral ear was 41^46 dB abovehearing threshold, which was enough to prevent con-tralateral crosstalk (Popelar et al., 1994).
2.2. TEOAE recordings
At ¢rst, the control click-evoked TEOAE was re-corded. Then the emissions were measured during con-tralateral acoustic stimulation (AS) with WN, duringcontralateral RW electrical stimulation (ES-RW) andduring simultaneous acoustic and electrical stimulation(AS+(ES-RW)). At the end of these measurements asecond control TEOAE recording was obtained. Inmost experimental sessions the animals were quiet,and the TEOAE responses in the ¢rst and second con-trol recordings did not vary by more than 0.1^0.2 dB. Ifthe variation in control measurements was larger, theTEOAE recordings were repeated after re¢xing themeasuring probe or after an additional dose of the sed-ative.
2.3. DPOAE recordings
Similarly as TEOAE, a control DPOAE (DP-gram)was recorded ¢rst followed by measurements during ASwith WN, during ES-RW and during AS+(ES-RW).The recording session ended with a second controlDPOAE recording.
2.4. Post-mortem measurements
To ensure the biological origin of recorded emissions,the TEOAEs and DPOAEs were recorded in four guin-ea pigs after an overdose of pentobarbital (100 mg i.p.).The heart rate was checked by ECG recording with asubcutaneous needle electrode; the respiration rate wascontrolled visually. Several minutes after the pentobar-bital injection (2^5 min) respiration was stopped com-pletely and the heart rate frequency gradually decreasedfrom the original frequency of about 180 beats/min toabout one half or one third. In this time interval, asshown in Fig. 1b, the TEOAEs measured from 1.5^10.5
HEARES 3269 20-8-99
J. Popelar et al. / Hearing Research 135 (1999) 61^70 63

ms disappeared completely. The heart beat stopped 10^15 min after the pentobarbital injection. In the TEOAErecording evoked by a click larger than 75 dB pSPL andwith response processing started 1 ms after the clickonset, as shown in Fig. 1c, a small response (1^2 dBSPL) was still detectable 20^30 min after the pentobar-bital injection. The TEOAE residual response, whichappeared at low frequencies only, probably re£ectedpassive ringing in the ear canal. According to theseresults, a 1.5^10.5 ms window setting and click of lessthan 75 dB pSPL for TEOAE testing were chosen asstandard testing parameters.
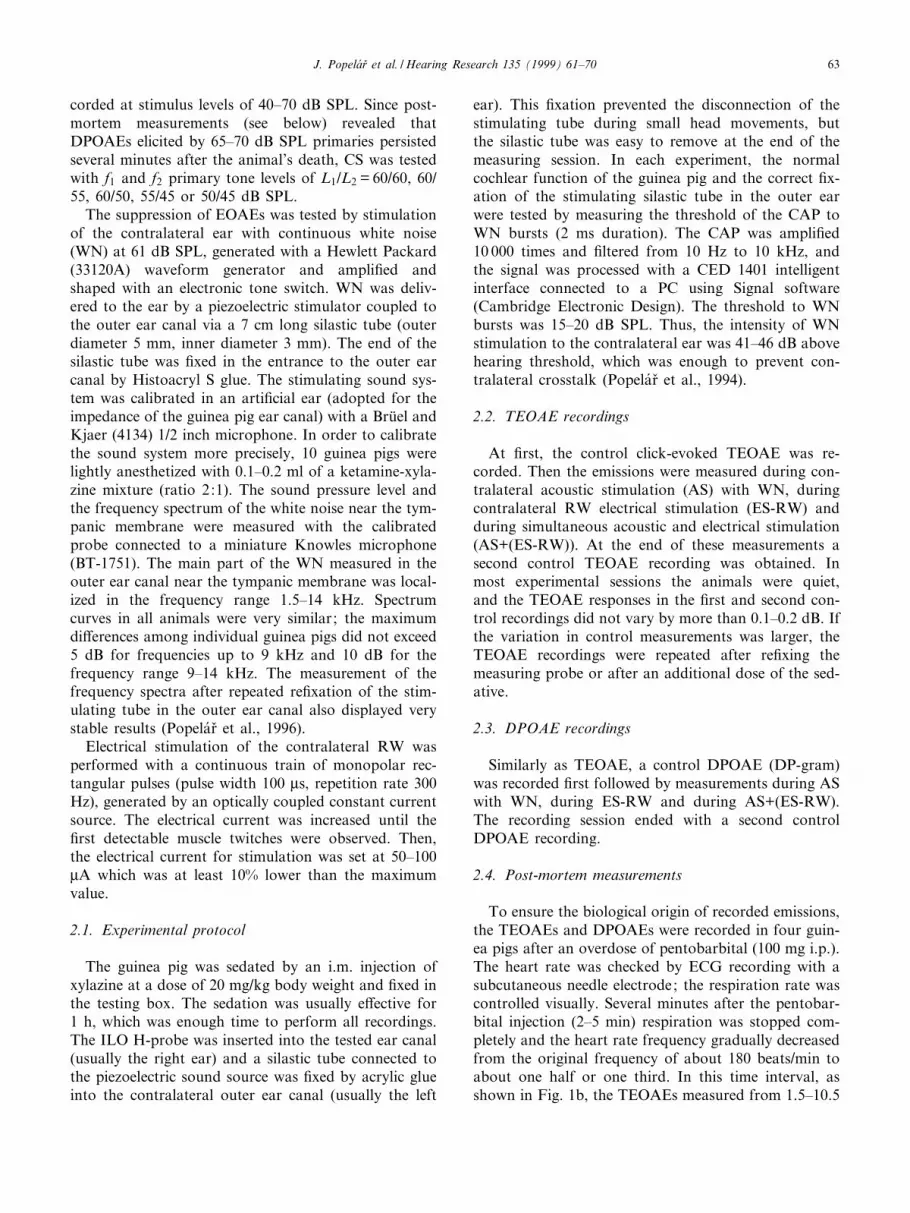
The DPOAEs were measured with primary tonesranging between 45 and 70 dB SPL. The DPOAEsevoked by primaries of 60 dB SPL or less, as shownin Fig. 2a, disappeared only a few minutes after thepentobarbital injection. The response evoked by pri-mary tones of 65^70 dB SPL slowly and gradually de-creased during several tens of minutes after the pento-barbital injection (as illustrated in Fig. 2b). In twoanimals, a residual DPOAE at high stimulus levelswas detected even 90 min after the pentobarbital injec-tion. To avoid the passive response, the DPOAEs weretested with primary-tone levels at 60 dB SPL or less.
2.5. Statistical evaluation of data
The statistical signi¢cance of di¡erences between con-trol TEOAE response and TEOAE responses measuredduring AS, ES-RW and AS+(ES-RW) was tested bypaired t-test at 5% signi¢cance level. The paired t-testwas also used to test the di¡erences between TEOAEand DPOAE levels at individual frequency bands in the1/4 octave power spectrum analysis under control re-cording and during individual modes of contralateralstimulation.
The care and use of animals reported on in this studywere approved by the Ethics Committee of the Instituteof Experimental Medicine and followed the guidelinesof the Declaration of Helsinki.
3. Results
3.1. TEOAEs
TEOAEs were regularly recorded in all tested guineapigs. The duration of transient response varied between3 and 5 ms. Usually two prominent peaks in the fre-quency range 0.8^1.4 kHz and 2.8^4.8 kHz were iden-ti¢ed in the click-evoked response. In some animals, athird smaller peak around 1.7 kHz was also detected.The overall response of TEOAEs ranged between 1 and15 dB SPL. No spontaneous emission was detected inthis experimental group of guinea pigs.
The overall TEOAE responses recorded during con-tralateral AS, ES-RW or AS+(ES-RW) stimulationwere in all guinea pigs smaller than the control record-ing. The di¡erence between control measurements andrecording during contralateral stimulation is referred toas the value of CS. The values of CS to acoustic (d AS),electrical (d ES-RW) and combined stimulations (dAS+(ES-RW)) in individual animals are shown in Fig.3a. The values of CS ranged between 0.3 and 2.4 dB inindividual guinea pigs and they were not correlated
Fig. 1. Click-evoked TEOAEs and the FFT spectra measured inone guinea pig (ME 6) under control conditions (a), 1 min after thei.p. injection of 100 mg of pentobarbital (b) and 35 min post-injec-tion (c). Click level was 70 dB pSPL in (a) and (b) and 76.5 dBpSPL in (c). The starting time for TEOAE processing after the clickonset was set at 1.5 ms in (a) and (b) and at 1 ms in (c). Blackarea in the FFT spectra represents noise level, gray area is a re-sponse.
HEARES 3269 20-8-99
J. Popelar et al. / Hearing Research 135 (1999) 61^7064
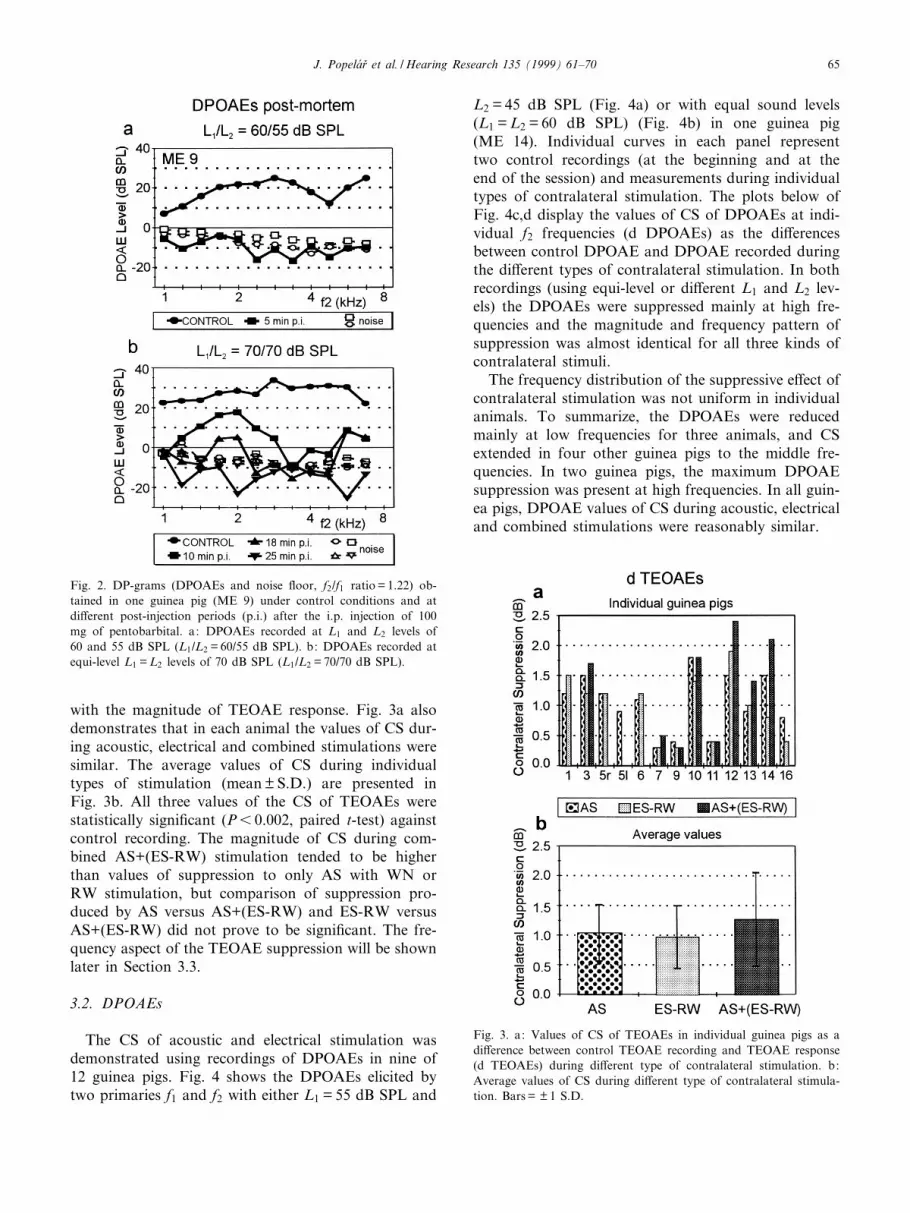
with the magnitude of TEOAE response. Fig. 3a alsodemonstrates that in each animal the values of CS dur-ing acoustic, electrical and combined stimulations weresimilar. The average values of CS during individualtypes of stimulation (mean þ S.D.) are presented inFig. 3b. All three values of the CS of TEOAEs werestatistically signi¢cant (P6 0.002, paired t-test) againstcontrol recording. The magnitude of CS during com-bined AS+(ES-RW) stimulation tended to be higherthan values of suppression to only AS with WN orRW stimulation, but comparison of suppression pro-duced by AS versus AS+(ES-RW) and ES-RW versusAS+(ES-RW) did not prove to be signi¢cant. The fre-quency aspect of the TEOAE suppression will be shownlater in Section 3.3.
3.2. DPOAEs
The CS of acoustic and electrical stimulation wasdemonstrated using recordings of DPOAEs in nine of12 guinea pigs. Fig. 4 shows the DPOAEs elicited bytwo primaries f1 and f2 with either L1 = 55 dB SPL and
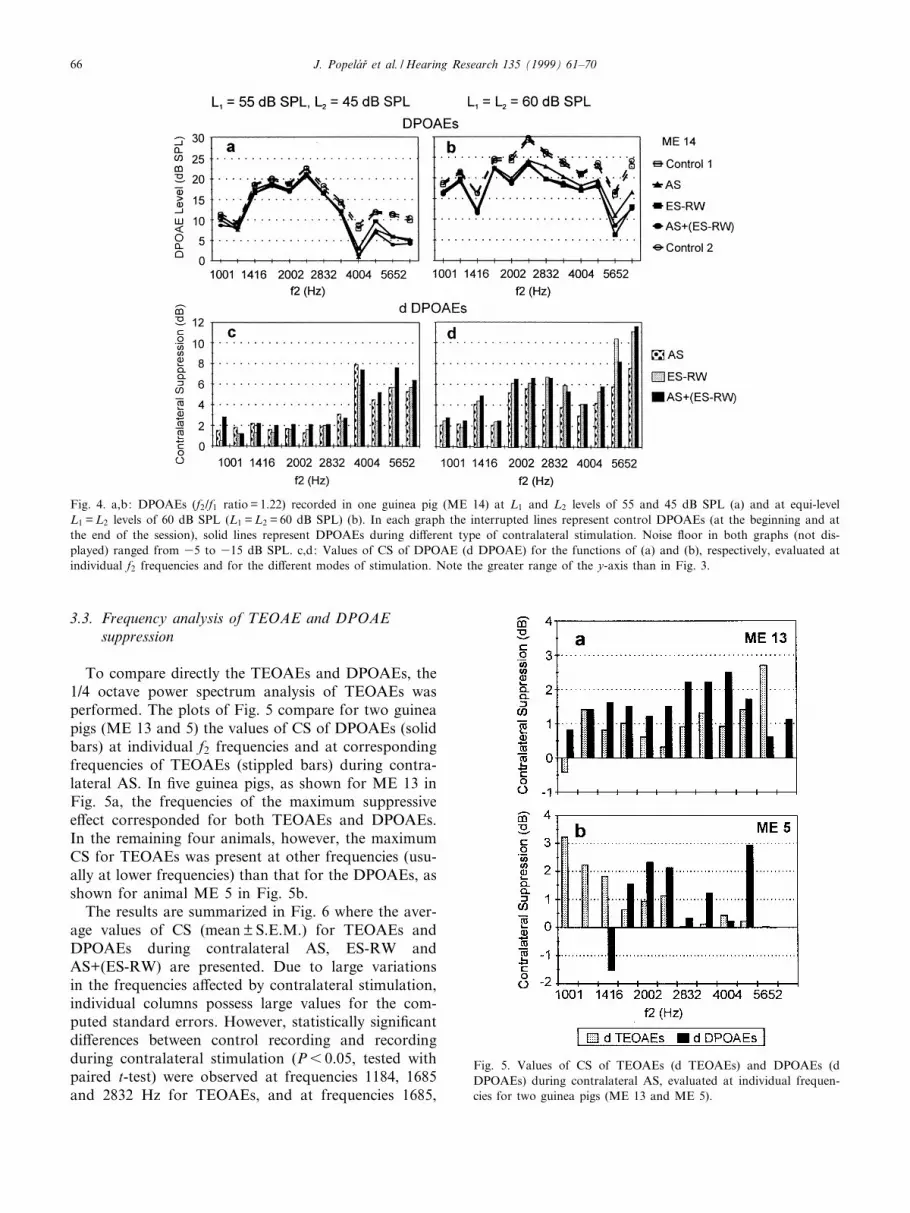
L2 = 45 dB SPL (Fig. 4a) or with equal sound levels(L1 = L2 = 60 dB SPL) (Fig. 4b) in one guinea pig(ME 14). Individual curves in each panel representtwo control recordings (at the beginning and at theend of the session) and measurements during individualtypes of contralateral stimulation. The plots below ofFig. 4c,d display the values of CS of DPOAEs at indi-vidual f2 frequencies (d DPOAEs) as the di¡erencesbetween control DPOAE and DPOAE recorded duringthe di¡erent types of contralateral stimulation. In bothrecordings (using equi-level or di¡erent L1 and L2 lev-els) the DPOAEs were suppressed mainly at high fre-quencies and the magnitude and frequency pattern ofsuppression was almost identical for all three kinds ofcontralateral stimuli.
The frequency distribution of the suppressive e¡ect ofcontralateral stimulation was not uniform in individualanimals. To summarize, the DPOAEs were reducedmainly at low frequencies for three animals, and CSextended in four other guinea pigs to the middle fre-quencies. In two guinea pigs, the maximum DPOAEsuppression was present at high frequencies. In all guin-ea pigs, DPOAE values of CS during acoustic, electricaland combined stimulations were reasonably similar.
Fig. 3. a: Values of CS of TEOAEs in individual guinea pigs as adi¡erence between control TEOAE recording and TEOAE response(d TEOAEs) during di¡erent type of contralateral stimulation. b:Average values of CS during di¡erent type of contralateral stimula-tion. Bars = þ 1 S.D.
Fig. 2. DP-grams (DPOAEs and noise £oor, f2/f1 ratio = 1.22) ob-tained in one guinea pig (ME 9) under control conditions and atdi¡erent post-injection periods (p.i.) after the i.p. injection of 100mg of pentobarbital. a: DPOAEs recorded at L1 and L2 levels of60 and 55 dB SPL (L1/L2 = 60/55 dB SPL). b: DPOAEs recorded atequi-level L1 = L2 levels of 70 dB SPL (L1/L2 = 70/70 dB SPL).
HEARES 3269 20-8-99
J. Popelar et al. / Hearing Research 135 (1999) 61^70 65
3.3. Frequency analysis of TEOAE and DPOAEsuppression
To compare directly the TEOAEs and DPOAEs, the1/4 octave power spectrum analysis of TEOAEs wasperformed. The plots of Fig. 5 compare for two guineapigs (ME 13 and 5) the values of CS of DPOAEs (solidbars) at individual f2 frequencies and at correspondingfrequencies of TEOAEs (stippled bars) during contra-lateral AS. In ¢ve guinea pigs, as shown for ME 13 inFig. 5a, the frequencies of the maximum suppressivee¡ect corresponded for both TEOAEs and DPOAEs.In the remaining four animals, however, the maximumCS for TEOAEs was present at other frequencies (usu-ally at lower frequencies) than that for the DPOAEs, asshown for animal ME 5 in Fig. 5b.
The results are summarized in Fig. 6 where the aver-age values of CS (mean þ S.E.M.) for TEOAEs andDPOAEs during contralateral AS, ES-RW andAS+(ES-RW) are presented. Due to large variationsin the frequencies a¡ected by contralateral stimulation,individual columns possess large values for the com-puted standard errors. However, statistically signi¢cantdi¡erences between control recording and recordingduring contralateral stimulation (P6 0.05, tested withpaired t-test) were observed at frequencies 1184, 1685and 2832 Hz for TEOAEs, and at frequencies 1685,
Fig. 5. Values of CS of TEOAEs (d TEOAEs) and DPOAEs (dDPOAEs) during contralateral AS, evaluated at individual frequen-cies for two guinea pigs (ME 13 and ME 5).
Fig. 4. a,b: DPOAEs (f2/f1 ratio = 1.22) recorded in one guinea pig (ME 14) at L1 and L2 levels of 55 and 45 dB SPL (a) and at equi-levelL1 = L2 levels of 60 dB SPL (L1 = L2 = 60 dB SPL) (b). In each graph the interrupted lines represent control DPOAEs (at the beginning and atthe end of the session), solid lines represent DPOAEs during di¡erent type of contralateral stimulation. Noise £oor in both graphs (not dis-played) ranged from 35 to 315 dB SPL. c,d: Values of CS of DPOAE (d DPOAE) for the functions of (a) and (b), respectively, evaluated atindividual f2 frequencies and for the di¡erent modes of stimulation. Note the greater range of the y-axis than in Fig. 3.
HEARES 3269 20-8-99
J. Popelar et al. / Hearing Research 135 (1999) 61^7066

2002, 3369 and 4004 Hz for DPOAEs. The emissions atthese frequencies that were signi¢cantly a¡ected weresuppressed during all three kinds of contralateral stim-ulation. However, the emissions at other intermediatefrequencies were signi¢cantly suppressed by only one ortwo types of contralateral stimulation. Thus, the maine¡ect of CS was localized in the frequency range 1184^2832 Hz for TEOAEs and 1685^4004 Hz using DPOAErecordings.
4. Discussion
4.1. Comparison with human data
The basic data of TEOAEs with respect to the shapeof the response, duration or frequency spectrum ob-served in the guinea pigs of the present study are con-sistent with the results of other authors (Ueda et al.,1992; Avan et al., 1995; Khvoles et al., 1996). The largespread of response values in the range of 1^15 dB isalso comparable with human data (Kemp, 1978). Sincethe latency and duration of TEOAEs in guinea pigs areshorter in comparison with humans, recording param-eters need to be modi¢ed from those used for emissionrecording in humans. For example, Avan and co-work-
ers (1995) used as the starting time for the post-clickprocessing 1 ms, whereas Khvoles and co-workers(1996) used 1.1 ms. Based on the post-mortem measure-ments described here, a 1 ms starting time for process-ing the TEOAs at the higher stimulus levels exceeding75 dB pSPL produced a small residual response, prob-ably re£ecting a passive ringing in the ear canal, thatpersisted several minutes after the animal's death. Tak-ing these data into account, TEOAE processing in ourexperiments was begun 1.5 ms after click onset. In sev-eral guinea pigs, TEOAEs were also measured with astarting time of 2.5 ms (as used routinely for TEOAErecording in humans). However, even though theTEOAE response was smaller than in the case of the1.5 ms starting time, the value of CS was similar in bothcases. Thus it seems possible that mainly the later com-ponents of the TEOAE are suppressed by contralateralstimulation (as shown by Berlin et al., 1993).
In the case of DPOAEs the recording parameters alsoneeded to be slightly modi¢ed in comparison with thosetypically used in humans, namely with respect to stim-ulus levels. The present post-mortem recordings demon-strated that stimulus levels exceeding 65^70 dB SPLevoked a passive response that persisted several tensof minutes after the guinea pig's death. Therefore, pri-mary tone levels were set at 60 dB SPL or less. It hasbeen established previously that the levels of the 2f13f2
DPOAE shows a variability of 10ö20 dB depending onthe relationship of the frequencies and levels of the twoprimaries (see for review: Probst et al., 1991). At higherf2/f1 ratios (around 1.2), as used in the present study (f2/f1 = 1.22), the contribution from f2 intensity is largerthan that from f1 at the overlap region on the basilarmembrane (Brown and Gaskill, 1990; Gaskill andBrown, 1990). Thus, to equalize the intensity contribu-tions from f1 and f2 primaries, Wiederhold et al. (1986)recommended setting a higher level for L1 than for L2
in the ear canal. Although the values of CS of DPOAEevoked by di¡erent L1 and L2 combinations were notsystematically investigated in the present experiments,the results with the equi-level and di¡erent-level L1
and L2 parameters did not show any systematic ten-dency.
4.2. Comparison with animal data
The CS values found in this study correspond tosimilar values obtained by other authors using contra-lateral acoustic stimulation or direct electrical stimula-tion of the e¡erent nerve ¢bers at the £oor of the fourthventricle. A magnitude of 1^5 dB of CS was reportedfor the CAP (Liberman, 1989; Smith et al., 1994) orDPOAE (Mountain, 1980; Siegel and Kim, 1982; Pueland Rebillard, 1990) in guinea pigs or cats. The largespread of individual CS values in this study was prob-
Fig. 6. Average values of CS for TEOAEs (d TEOAEs) (a) andDPOAEs (d DPOAEs) (b) evaluated at individual frequencies.Bars = þ 1 S.E.M.
HEARES 3269 20-8-99
J. Popelar et al. / Hearing Research 135 (1999) 61^70 67

ably caused by interindividual variations since repeatedmeasures of EOAEs in the same guinea pig gave similarresults. We also suppose that CS values in individualanimals were not in£uenced signi¢cantly by anesthesiasince the animals were only lightly anesthetized by xyl-azine which has been shown to have only slight e¡ecton the CS (Lima da Costa et al., 1997). The resultsdemonstrated that contralateral RW-ES had a similarsuppressive e¡ect on TEOAEs and DPOAEs as didcontralateral acoustic stimulation. Rajan and Johnstone(1983) measured the CS of click-evoked CAP with apulse train of di¡erent ES parameters applied to thecontralateral RW. They obtained a 0.53 dB reductionwith an ES current of 200 WA and a 4.06 dB reductionwith an ES current of 400 WA (with a 300 ms shocktrain and a repetition pulse frequency of 260 Hz). Be-cause a di¡erent stimulus strategy (continuous train ofpulses) was used here, a reduction of both types ofEOAEs with lower ES intensities, i.e. 50^100 WA, wasobserved.
4.3. Comparison of individual types of CS
In several animals the contralateral WN stimulationproduced a smaller suppressive e¡ect than did ES-RW.It was shown previously that the CS value increaseswith the stimulus level (Puel and Rebillard, 1990;Hood et al., 1996). To prevent acoustic crosstalk, it ispossible that the WN intensity was not set high enoughto evoke the maximal suppressive e¡ect (for example,Puel and Rebillard (1990) used 100 dB SPL of contra-lateral noise). Another reason may be some variationsin hearing threshold and the ¢xation of the stimulatingtube in the outer ear in individual animals (although thecorrect ¢xation of the stimulator was checked by re-cording CAP). In contrast to AS, the stimulating cur-rent for ES-RW was adjusted as high as possible (only10% lower than the threshold for evoking muscle orpinna twitches). The combination of both kinds of stim-ulation had only a slight additive e¡ect that was notsigni¢cantly di¡erent from AS or ES-RW alone. Theseresults demonstrated that AS or ES-RW of maximumpossible levels produces the maximal suppressive e¡ect,which cannot be increased by a simultaneous combina-tion of both kinds of stimulation.
This study provides evidence that two di¡erent stim-uli, such as continuous WN and a train of electricalpulses, have a similar e¡ect on OAEs with respect tothe frequencies at which the maximum suppressive ef-fect is present. This result is not surprising since Veuilletet al. (1991) have shown in human that contralateraltransient sound (non-¢ltered clicks) had a similar sup-pressive e¡ect on TEOAEs as did contralateral WN.Previously, our laboratory (Syka and Popelar, 1994)demonstrated that RW electrical stimulation of the in-
tact cochlea evokes a so-called electrophonic e¡ect andthat the threshold to electrical stimuli resembled thehearing threshold. Thus, ES with rectangular pulsescan stimulate a similar population of auditory nerve¢bers as acoustic stimulation with WN. Puel and Re-billard (1990) demonstrated that DPOAEs in guineapigs were suppressed by contralateral WN almostequally throughout the entire frequency range. Also,Norman and Thornton (1993) showed that the suppres-sion of click-evoked TEOAEs in human was spreadthroughout the frequency range of the emissions, withlimited frequency speci¢city. On the other hand, Chery-Croze et al. (1993) and Moulin et al. (1993) demon-strated in human that the maximal suppressive e¡ectof contralateral sound was restricted to low frequenciesup to 2^3 kHz. In the majority of our measurements,the OAEs were suppressed almost throughout thewhole frequency range, with the largest e¡ect at lowand middle frequencies. In several animals, however,the TEOAEs were suppressed at lower frequenciesthan were DPOAEs. This di¡erence can be explainedby the di¡erent mechanisms generating both kinds ofOAE. Using TEOAE recordings, only frequencies thatare present in the spectrum of the stimulating click canbe recorded in the ear canal by an emission analyzer,whereas the 2f13f2 DPOAEs are evoked by two tonesof di¡erent frequencies. The generally accepted hypoth-esis is that the site of generation of the DPOAE islocated in the region of the basilar membrane stimu-lated by both primaries (see for review: Probst et al.,1991). Thus, it is important to ¢nd the frequency atwhich the changes in DPOAEs can be compared withthose of other physiological measurements. This fre-quency is usually suggested as f1 (Brown and Gaskill,1990; Gaskill and Brown, 1990), f2 (Kemp and Brown,1984), 2f13f2 or the geometric mean of f1 and f2
(��������������f 1Uf 2
p) (Lonsbury-Martin et al., 1987). Since the f2
frequency was demonstrated by Puel et al. (1995) to bethe best frequency corresponding to the maximum audi-tory brainstem threshold shift and the maximumDPOAE reduction after noise exposure, the presentDPOAE data was illustrated as a function of the f2
frequency.The results of this study showed that a simple meth-
od such as ES through a RW-implanted electrode canbe as e¤cient as contralateral acoustic stimulation orelectrical stimulation of the olivocochlear nerve ¢bers atthe £oor of the fourth ventricle. In addition, RW stim-ulation can be performed in awake or lightly sedatedanimals, thus avoiding the negative e¡ects of anesthe-sia. These experiments were performed on normal guin-ea pigs, but it would be of interest to apply ES-RW toanimals with destroyed or damaged hair cells on thecontralateral side. Previously, it has been shown thatES-RW evokes an excitatory response in the auditory
HEARES 3269 20-8-99
J. Popelar et al. / Hearing Research 135 (1999) 61^7068

system with di¡erent mechanisms of response genera-tion in intact and deaf animals (Popelar and Syka,1993; Syka and Popelar, 1994).
Acknowledgements
This work was supported by Grant 4747-3 of theMinistry of Health of the Czech Republic and by Grant309/97/0830 of the Grant Agency of the Czech Repub-lic.
References
Aran, J.-M., Erre, J.-P., 1979. Long-term recording of cochleo-neuralpotentials in the guinea pig. In: Beagley, H.A. (Ed.), TechnicalBasis of Auditory Investigations. Oxford University Press, Lon-don, pp. 233^261.
Avan, P., Loth, D., Menguy, C., Teyssou, M., 1990. Evoked oto-acoustic emissions in guinea pig: Basic characteristics. Hear.Res. 44, 151^160.
Avan, P., Bon¢ls, P., Loth, D., Elbez, M., Erminy, M., 1995. Tran-sient-evoked otoacoustic emissions and high-frequency acoustictrauma in the guinea pig. J. Acoust. Soc. Am. 97, 3012^3020.
Berlin, C.I., Hood, L.J., Wen, H., Szabo, P., Cecola, R.P., Rigby, P.,Jackson, D.F., 1993. Contralateral suppression of non-linear click-evoked otoacoustic emissions. Hear. Res. 71, 1^11.
Brown, A.M., Gaskill, S.A., 1990. Measurement of the distortionproducts reveals underlying similarities between human and rodentmechanical responses. J. Acoust. Soc. Am. 88, 840^849.
Brownell, W.E., Bader, C.R., Bertrand, D., de Ribaupierre, Y., 1985.Evoked mechanical responses of isolated cochlear outer hair cells.Science 227, 194^196.
Cazals, Y., Huang, Z.W., 1996. Average spectrum of cochlear activ-ity: A possible synchronized ¢ring, its olivo-cochlear feedback andalterations under anesthesia. Hear. Res. 101, 81^92.
Chery-Croze, S., Moulin, A., Collet, L., 1993. E¡ect of contralateralsound stimulation on the distortion product 2f13f2 in humans:Evidence of a frequency speci¢city. Hear. Res. 68, 53^58.
Collet, L., Disant, F., Morgon, A., 1989. E¡et de l'age sur les oto-emissions acoustiques. Rev. Laryngol. Otol. Rhinol. Bord. 110,67^68.
Davis, H., 1983. An active process in cochlear mechanics. Hear. Res.9, 79^90.
Fex, J., 1959. Augmentation of cochlear microphonic by stimulationof e¡erent ¢bers to the cochlea. Acta Otolaryngol. 50, 540^541.
Gaskill, S.A., Brown, A.M., 1990. The behavior of the distortionproduct, 2f13f2 from human ear and its relation to auditory sen-sitivity. J. Acoust. Soc. Am. 88, 821^839.
Gi¡ord, M.L., Guinan, J.J.Jr., 1987. E¡ects of electrical stimulationof medial olivocochlear neurons on ipsilateral and contralateralcochlear responses. Hear. Res. 29, 179^194.
Guinan, J.J., Jr., Gi¡ord, M.L., 1988a. E¡ects of electrical stimulationof e¡erent olivocochlear neurons on cat auditory-nerve ¢bers.I. Rate-level functions. Hear. Res. 33, 97^114.
Guinan, J.J., Jr., Gi¡ord, M.L., 1988b. E¡ects of electrical stimula-tion of e¡erent olivocochlear neurons on cat auditory-nerve ¢bers.III. Tuning curves and thresholds at CF. Hear. Res. 37, 29^46.
Hood, L.J., Berlin, C.I., Hurley, A., Cecola, R.P., Bell, B., 1996.Contralateral suppression of transient-evoked otoacoustic emis-sions in humans: Intensity e¡ects. Hear. Res. 101, 113^118.
Kemp, D.T., 1978. Stimulated acoustic emissions from within thehuman auditory system. J. Acoust. Soc. Am. 64, 1386^1391.
Kemp, D.T., Brown, A.M., 1984. Ear canal acoustic and round win-dow electrical correlates of 2f13f2 distortion generated in thecochlea. Hear. Res. 13, 39^46.
Khvoles, R., Freeman, S., Sohmer, H., 1996. Transient evoked oto-acoustic emissions can be recorded in the rat. Hear. Res. 97, 120^126.
Liberman, M.C., 1989. Rapid assessment of sound-evoked olivococh-lear feedback: Suppression of compound action potentials by con-tralateral sound. Hear. Res. 38, 47^56.
Lima da Costa, D., Erre, J.P., Charlet de Sauvage, R., Popelar, J.,Aran, J.-M., 1997. Bioelectrical cochlear noise and its contralateralsuppression: Relation to background activity of the eight nerveand e¡ects of sedation and anesthesia. Exp. Brain Res. 116, 259^269.
Lonsbury-Martin, B.L., Martin, G.K., Probst, R., Coats, A.C., 1987.Acoustic distortion products in rabbit ear canal. I. Basic featuresand physiological vulnerability. Hear. Res. 28, 173^189.
Moulin, A., Collet, L., Duclaux, R., 1993. Contralateral auditorystimulation alters acoustic distortion products in humans. Hear.Res. 65, 193^210.
Mountain, D.C., 1980. Changes in endolymphatic potential andcrossed olivocochlear bundle stimulation alter cochlear mechanics.Science 210, 71^72.
Norman, N., Thornton, A.R.D., 1993. Frequency analysis of the con-tralateral suppression of evoked otoacoustic emissions by narrow-band noise. Br. J. Audiol. 27, 281^289.
Ohyama, K., Wada, H., Kobayashi, T., Takasaka, T., 1991. Sponta-neous otoacoustic emissions in the guinea pig. Hear. Res. 56, 111^121.
Popelar, J., Syka, J., 1993. Middle latency responses to electrical stim-ulation of the auditory nerve in unanaesthetized guinea pigs. Hear.Res. 67, 69^74.
Popelar, J., Erre, J.P., Aran, J.-M., Cazals, Y., 1994. Plastic changesin ipsi-contralateral di¡erences of auditory cortex and inferiorcolliculus evoked potentials after injury to one ear in the adultguinea pig. Hear. Res. 72, 125^134.
Popelar, J., Lima da Costa, D., Erre, J.P., Avan, P., Aran, J.-M.,1996. Contralateral suppression of the ensemble background ac-tivity of the auditory nerve in awake guinea pigs: E¡ects of gen-tamicin. Audit. Neurosci. 3, 425^433.
Prasher, D., Ryan, S., Luxon, L., 1994. Contralateral suppression oftransiently evoked otoacoustic emissions and neuro-otology. Br. J.Audiol. 28, 247^254.
Probst, R., Lonsbury-Martin, B.L., Martin, G.K., 1991. A review ofotoacoustic emissions. J. Acoust. Soc. Am. 89, 2027^2067.
Puel, J.L., Rebillard, G., 1990. E¡ect of contralateral sound stim-ulation on the distortion product 2f13f2 : Evidence that themedial e¡erent system is involved. J. Acoust. Soc. Am. 76,1713^1720.
Puel, J.L., Durrieu, J.Ph., Rebillard, G., Vidal, D., Assie, R., Uziel,A., 1995. Comparison between auditory brainstem responses anddistortion products otoacoustic emissions after temporary thresh-old shift in guinea pig. Acta Acust. 3, 75^82.
Rajan, R., Johnstone, B.M., 1983. E¡erent e¡ects elicited by electricalstimulation at the round window of the guinea pig. Hear. Res. 12,405^417.
Siegel, J.H., Kim, D.O., 1982. E¡erent neural control of cochlearmechanics? Olivocochlear bundle stimulation a¡ects biomechani-cal nonlinearity. Hear. Res. 6, 171^182.
Smith, D.W., Erre, J.-P., Aran, J.-M., 1994. Rapid, reversible elimi-nation of medial olivocochlear function following single injectionof gentamicin in the guinea pig. Brain Res. 652, 243^248.
Syka, J., Popelar, J., 1994. Modulation of thresholds to acoustical and
HEARES 3269 20-8-99
J. Popelar et al. / Hearing Research 135 (1999) 61^70 69

electrical stimulation of the intact ear in guinea pig by furosemideand noise. Hear. Res. 75, 1^10.
Ueda, H., Hattori, T., Sawaki, M., Niwa, H., Yanagita, N., 1992. Thee¡ect of furosemide on evoked otoacoustic emissions in guineapigs. Hear. Res. 62, 199^205.
Veuillet, E., Collet, L., Duclaux, R., 1991. E¡ect of contralateralacoustic stimulation on active cochlear micromechanical proper-ties in human subjects: Dependence on stimulus variables. J. Neu-rophysiol. 65, 724^735.
Wiederhold, M.L., Mahoney, J.W., Kellogg, D.L., 1986. Acousticoverstimulation reduces 2f13f2 cochlear emissions at all levels in
the cat. In: Allen, J.B., Hall, J.L., Hubbard, A., Neely, S.T.,Tubis, A. (Eds.), Peripheral Auditory Mechanisms. Springer,New York, pp. 3223329.
Zenner, H.P., Reuter, G., Plinkert, P.K., Gitter, A.H., 1990. Fast andslow motility of outer hair cells in vitro and in situ. In: Grandori,F., Cianfrone, G., Kemp, D. (Eds.). Cochlear Mechanisms andOtoacoustic Emissions. Advances in Audiology, Vol. 7. S. Karger,Basel, pp. 35341.
Zwicker, E., Manley, G., 1981. Acoustical responses and suppression-period patterns in guinea pigs. Hear. Res. 4, 43^52.
HEARES 3269 20-8-99
J. Popelar et al. / Hearing Research 135 (1999) 61^7070