sensitivity of free radicals production in acoustically driven bubble to the ultrasonic frequency...
TRANSCRIPT
Ultrasonics Sonochemistry 22 (2015) 41–50
Contents lists available at ScienceDirect
Ultrasonics Sonochemistry
journal homepage: www.elsevier .com/locate /u l tson
Sensitivity of free radicals production in acoustically driven bubbleto the ultrasonic frequency and nature of dissolved gases
http://dx.doi.org/10.1016/j.ultsonch.2014.07.0111350-4177/� 2014 Elsevier B.V. All rights reserved.
⇑ Corresponding author at: Department of Chemical Engineering, Faculty ofPharmaceutical Engineering Process, University of Constantine 3, 25000 Constan-tine, Algeria. Tel./fax: +213 (0)38876560.
E-mail address: [email protected] (S. Merouani).
Slimane Merouani a,b,⇑, Oualid Hamdaoui a, Yacine Rezgui c, Miloud Guemini c
a Laboratory of Environmental Engineering, Department of Process Engineering, Faculty of Engineering, Badji Mokhtar – Annaba University, P.O. Box 12, 23000 Annaba, Algeriab Department of Chemical Engineering, Faculty of Pharmaceutical Engineering Process, University of Constantine 3, 25000 Constantine, Algeriac Laboratory of Applied Chemistry and Materials Technology, University of Oum El-Bouaghi, P.O. Box 358, 04000 Oum El Bouaghi, Algeria
a r t i c l e i n f o a b s t r a c t
Article history:Received 26 April 2014Received in revised form 16 July 2014Accepted 16 July 2014Available online 25 July 2014
Keywords:Single-bubble sonochemistryComputer simulationsUltrasonic frequencySaturating gas�OH radical
Central events of ultrasonic action are the bubbles of cavitation that can be considered as poweredmicroreactors within which high-energy chemistry occurs. This work presents the results of a compre-hensive numerical assessment of frequency and saturating gases effects on single bubble sonochemistry.Computer simulations of chemical reactions occurring inside a bubble oscillating in liquid waterirradiated by an ultrasonic wave have been performed for a wide range of ultrasonic frequencies(213–1100 kHz) under different saturating gases (O2, air, N2 and H2). For O2 and H2 bubbles, reactionsmechanism consisting in 25 reversible chemical reactions were proposed for studying the internalbubble-chemistry whereas 73 reversible reactions were taken into account for air and N2 bubbles. Thenumerical simulations have indicated that radicals such as �OH, H�, HO2
� and O are created in the bubbleduring the strong collapse. In all cases, hydroxyl radical (�OH) is the main oxidant created in the bubble.The production rate of the oxidants decreases as the driving ultrasonic frequency increases. Theproduction rate of �OH radical followed the order O2 > air > N2 > H2 and the order becomes more remark-able at higher ultrasonic frequencies. The effect of ultrasonic frequency on single bubble sonochemistrywas attributed to its significant impact on the cavitation process whereas the effects of gases wereattributed to the nature of the chemistry produced in the bubble at the strong collapse. It was concludedthat, in addition to the gas solubility, the nature of the internal bubble chemistry is another parameter ofa paramount importance that controls the overall sonochemical activity in aqueous solutions.
� 2014 Elsevier B.V. All rights reserved.
1. Introduction
The chemical effects of ultrasound (sonochemistry) originatefrom acoustic cavitation, that is, ultrasound-induced formation,growth and violent collapse of microbubbles in a liquid medium[1]. The rapid collapse of cavitation bubbles is nearly adiabatic,rendering each individual bubble a microreactor, inside whichtemperatures of the order of 5000 K and pressures of hundreds ofatmospheres have been shown to exist [2,3]. As a results, watervapor entrapped inside a bubble is dissociated into H� and �OH rad-icals, and with other species present, various other reactive speciessuch as HO2
� , O and H2O2 may form [4]. Parallel reaction pathwaysexist where volatile solutes may evaporate into the bubble and bepyrolysed by the high core temperatures [4]. The radical species
produced can recombine, react with other gaseous species presentin the cavity or diffuse out of the bubble into the surroundingliquid to serve as oxidants [5]. All chemical reactions promotedby ultrasound are known as sonochemical reactions. Under certainconditions, bubble collapse is also accompanied by the emission oflight, called sonoluminescence, originating from the hot core of thebubble during the final stages of collapse [6,7].
A number of factors influence sonochemical activity (radicals’production) and luminescence intensity. These include frequencyof ultrasound, dissolved gas, acoustic power, bulk liquid tempera-ture, etc. [8–17]. Among all these parameters, the ultrasonic fre-quency and the nature of the dissolved gases have shownspectacular effects. The frequency of ultrasound has a significantimpact on the critical size of the bubble (resonance size), whichdecreases as ultrasound frequency increases [18,19] and the lowerfrequency ultrasound would produce more violent collapse leadingto higher localized temperatures and pressures in the bubble.However, recent published papers [8–10,14,15] have suggest ahigher sonochemical activity at higher frequency. As a general idea,

Nomenclature
Af (Ar) pre-exponential factor of the forward (reverse) reaction,[(cm3 mol�1 s�1) for two body reaction and (cm6
mol�2 s�1) for three body reaction]bf (br) temperature exponent of the forward (reverse) reactionc speed of sound in the liquid medium, (m s�1)Eaf (Ear) activation energy of the forward (reverse) reaction
(cal mol�1)f frequency of ultrasonic wave (Hz)Ia acoustic intensity of ultrasonic irradiation (W m�2)kf9 (kr) forward (reverse) reaction constant, [(cm3 mol�1 s�1)
for two body reaction and (cm6 mol�2 s�1) for threebody reaction]
p pressure inside a bubble (Pa)pmax maximum pressure inside a bubble (Pa)p1 ambient static pressure (Pa)PA amplitude of the acoustic pressure (Pa)Pv vapor pressure of water (Pa)Pg0 initial gas pressure (Pa)R radius of the bubble (m)
Rmax maximum radius of the bubble (m)R0 ambient bubble radius (m)t time (s)T temperature inside a bubble (K)Tmax maximum temperature inside a bubble (K)T1 bulk liquid temperature (K)xi solubility (in mole fraction) of the gas i in wateryH2O mole fraction of water vapor trapped at the collapse
Greek letters
c specific heat ratio (cp/cv) of the gas mixturer surface tension of liquid water (N m�1)q density of liquid water (kg m�3)k gas thermal conductivity (W m�2 K)sc collapse time of the bubble (s)sexp expansion time of the bubble (s)
42 S. Merouani et al. / Ultrasonics Sonochemistry 22 (2015) 41–50
a gas with high polytropic index (c = cp/cv) and low thermal con-ductivity converts more energy upon collapse and gives a greatersonochemical effect than one with low polytropic index. However,recent investigations [12–14,16,17] showed that polyatomic gasescan provide a more sonochemical activity than monatomic gasesbecause gases such as oxygen can provide additional sources forthe production of active species through the self thermal dissocia-tion inside a bubble and, thus, can compensate for the lower inter-nal cavitation temperatures. On the other hand, Okitsu et al. [20]showed experimental evidence that the bubble temperatureinduced by high frequency ultrasound is almost the same amongdifferent gases and the overall chemical efficiency is in proportionto the gas solubility, which would be closely related to the numberof active bubbles. Therefore, the mechanism of saturating gasesand ultrasound frequency on the sonochemical activity remainedpoorly understood. This is in fact because the effects of these twoparameters are not well established in microscopic scale (scale ofsingle bubble). In this paper, the results of a comprehensivenumerical assessment of frequency and saturating gases effectson sonochemical activity of single cavitation bubble weredescribed. The numerical simulations of the bubble oscillationand chemical reactions therein have been performed for variousultrasonic frequencies (in the range of 213–1100 kHz) under differ-ent saturating gases (O2, air, N2 and H2). The employed model com-bines the dynamic of bubble collapse in acoustic field with thechemical kinetics of single cavitating bubble.
2. Model and computational methods
The theoretical model used in the present numerical simula-tions has been fully described in our previous works [21–24].The following is a brief description of the model.
2.1. Bubble dynamics model
A gas and vapor filled spherical bubble isolated in water oscil-lates under the action of a sinusoidal sound wave. The temperatureand pressure in the bubble are assumed spatially uniform and thegas content of the bubble behaves as an ideal gas [25]. The radialdynamics of the bubble is described by the Keller–Miksis equation
that includes first order terms in the Mach number M ¼ _R=c[26,27]:
1� R�
c
� �R R��þ 3
2 1� R�
3c
� �R�
2 ¼ 1qL
1þ R�
c
� �p� p1 � 2r
R � 4l R�
Rþ PA sinð2pftÞh i
þ RqLc
ddt p� p1 � 2r
R � 4l R�
Rþ PA sinð2pftÞh i
ð1Þ
in this equation dots denote time derivatives (d/dt), R is the radiusof the bubble, c is the speed of sound in the liquid, qL is the densityof the liquid, r is the surface tension, l is the liquid viscosity, p isthe pressure inside the bubble, p1 is the ambient static pressure,PA is the acoustic amplitude and f is the sound frequency. The acous-tic amplitude PA is correlated with the acoustic intensity Ia, orpower per unit area, as PA = (2IaqLc)1/2 [28].
The expansion of the bubble is assumed as isothermal and itstotal compression is considered as adiabatic [29]. These assump-tions, which are widely accepted since the lifetime of an oscillationat high frequency is relatively short with a very rapidly occurringcollapse event, were pointed out by Yasui et al. [30] using a moredetailed model. We also assume that the vapor pressure in thebubble remains constant during the bubble expansion phase andthere is no gas diffusion during expansion and no mass and heattransfer of any kind during collapse. We note here that Storeyand Szeri [31] demonstrated that the inclusion of mass transferon the bubble dynamics has practically no effect on the maximumbubble temperature attained in the bubble at the collapse whenthe compression ratio of the bubble (Rmax/Rmin) is less than 20(Rmax is the maximum radius of the bubble and Rmin is the mini-mum bubble radius at the collapse). This level of Rmax/Rmin wasnever attained in the present numerical study (see Table 4).Therefore, in order to reduce computational parameters, thecurrent model takes, as input, initial bubble vapor content andneglects mass and heat transfer during bubble expansion andcollapse.
Because of the above assumptions, the pressure and tempera-ture inside the bubble at any instant during adiabatic phase canbe calculated from the bubble size as
p ¼ Pv þ Pg0R0
Rmax
� �3" #
Rmax
R
� �3c
ð2Þ
S. Merouani et al. / Ultrasonics Sonochemistry 22 (2015) 41–50 43
T ¼ T1Rmax
R
� �3ðc�1Þ
ð3Þ
where Pv is the vapor pressure, Pg0 = p1 + (2r/R0) � Pv is the gaspressure in the bubble at its ambient state (R = R0), R0 is the ambientbubble radius, T1 is the bulk liquid temperature and c is the ratio ofspecific heats capacities (cp/cv) of the gas/vapor mixture, given as
c ¼XK
k¼1
ykck ð4Þ
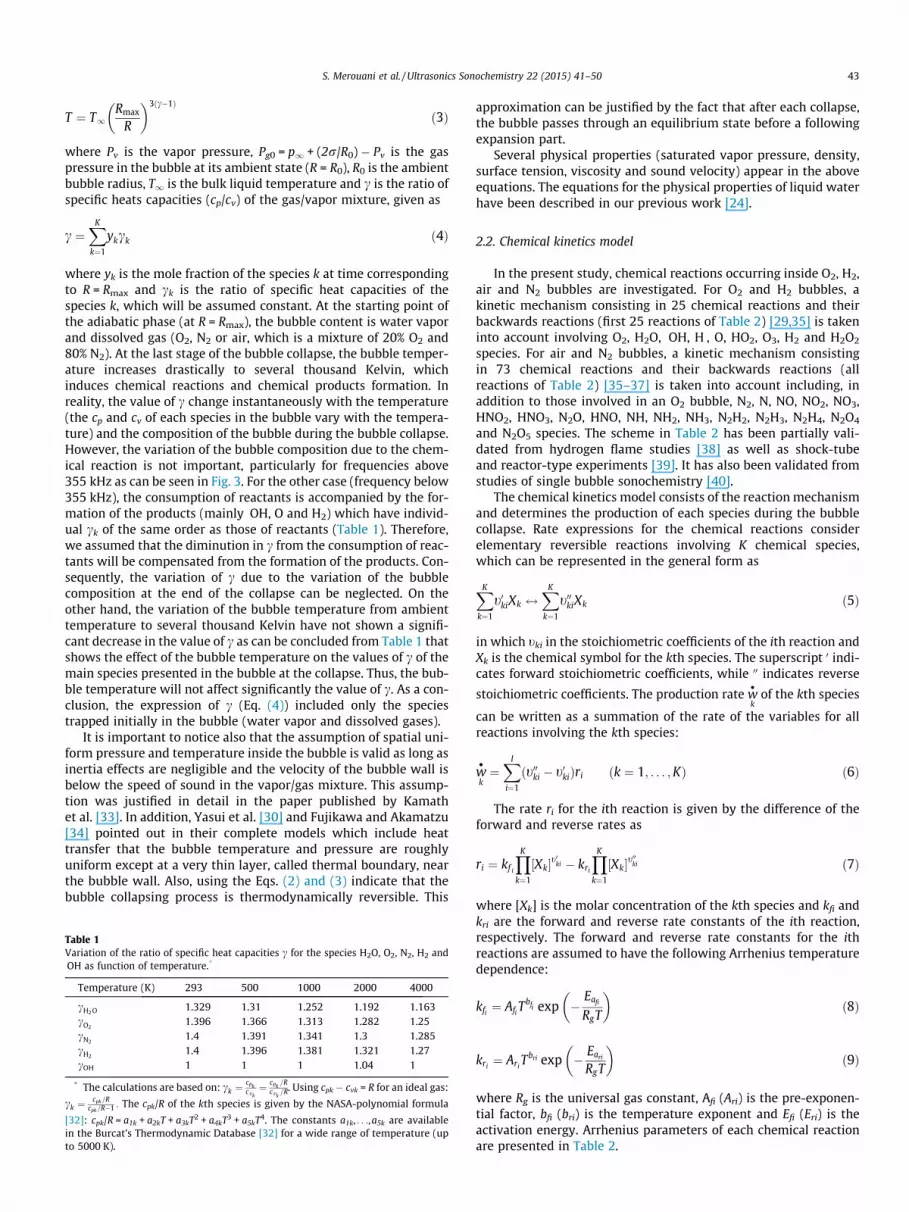
where yk is the mole fraction of the species k at time correspondingto R = Rmax and ck is the ratio of specific heat capacities of thespecies k, which will be assumed constant. At the starting point ofthe adiabatic phase (at R = Rmax), the bubble content is water vaporand dissolved gas (O2, N2 or air, which is a mixture of 20% O2 and80% N2). At the last stage of the bubble collapse, the bubble temper-ature increases drastically to several thousand Kelvin, whichinduces chemical reactions and chemical products formation. Inreality, the value of c change instantaneously with the temperature(the cp and cv of each species in the bubble vary with the tempera-ture) and the composition of the bubble during the bubble collapse.However, the variation of the bubble composition due to the chem-ical reaction is not important, particularly for frequencies above355 kHz as can be seen in Fig. 3. For the other case (frequency below355 kHz), the consumption of reactants is accompanied by the for-mation of the products (mainly �OH, O and H2) which have individ-ual ck of the same order as those of reactants (Table 1). Therefore,we assumed that the diminution in c from the consumption of reac-tants will be compensated from the formation of the products. Con-sequently, the variation of c due to the variation of the bubblecomposition at the end of the collapse can be neglected. On theother hand, the variation of the bubble temperature from ambienttemperature to several thousand Kelvin have not shown a signifi-cant decrease in the value of c as can be concluded from Table 1 thatshows the effect of the bubble temperature on the values of c of themain species presented in the bubble at the collapse. Thus, the bub-ble temperature will not affect significantly the value of c. As a con-clusion, the expression of c (Eq. (4)) included only the speciestrapped initially in the bubble (water vapor and dissolved gases).
It is important to notice also that the assumption of spatial uni-form pressure and temperature inside the bubble is valid as long asinertia effects are negligible and the velocity of the bubble wall isbelow the speed of sound in the vapor/gas mixture. This assump-tion was justified in detail in the paper published by Kamathet al. [33]. In addition, Yasui et al. [30] and Fujikawa and Akamatzu[34] pointed out in their complete models which include heattransfer that the bubble temperature and pressure are roughlyuniform except at a very thin layer, called thermal boundary, nearthe bubble wall. Also, using the Eqs. (2) and (3) indicate that thebubble collapsing process is thermodynamically reversible. This
Table 1Variation of the ratio of specific heat capacities c for the species H2O, O2, N2, H2 and�OH as function of temperature.*
Temperature (K) 293 500 1000 2000 4000
cH2 O 1.329 1.31 1.252 1.192 1.163cO2
1.396 1.366 1.313 1.282 1.25cN2
1.4 1.391 1.341 1.3 1.285cH2
1.4 1.396 1.381 1.321 1.27c�OH 1 1 1 1.04 1
* The calculations are based on: ck ¼cpkcvk¼ cpk
=Rcvk
=R. Using cpk � cvk = R for an ideal gas:
ck ¼cpk=R
cpk=R�1 : The cpk/R of the kth species is given by the NASA-polynomial formula
[32]: cpk/R = a1k + a2kT + a3kT2 + a4kT3 + a5kT4. The constants a1k, . . .,a5k are availablein the Burcat’s Thermodynamic Database [32] for a wide range of temperature (upto 5000 K).
approximation can be justified by the fact that after each collapse,the bubble passes through an equilibrium state before a followingexpansion part.
Several physical properties (saturated vapor pressure, density,surface tension, viscosity and sound velocity) appear in the aboveequations. The equations for the physical properties of liquid waterhave been described in our previous work [24].
2.2. Chemical kinetics model
In the present study, chemical reactions occurring inside O2, H2,air and N2 bubbles are investigated. For O2 and H2 bubbles, akinetic mechanism consisting in 25 chemical reactions and theirbackwards reactions (first 25 reactions of Table 2) [29,35] is takeninto account involving O2, H2O, �OH, H�, O, HO2
� , O3, H2 and H2O2
species. For air and N2 bubbles, a kinetic mechanism consistingin 73 chemical reactions and their backwards reactions (allreactions of Table 2) [35–37] is taken into account including, inaddition to those involved in an O2 bubble, N2, N, NO, NO2, NO3,HNO2, HNO3, N2O, HNO, NH, NH2, NH3, N2H2, N2H3, N2H4, N2O4
and N2O5 species. The scheme in Table 2 has been partially vali-dated from hydrogen flame studies [38] as well as shock-tubeand reactor-type experiments [39]. It has also been validated fromstudies of single bubble sonochemistry [40].
The chemical kinetics model consists of the reaction mechanismand determines the production of each species during the bubblecollapse. Rate expressions for the chemical reactions considerelementary reversible reactions involving K chemical species,which can be represented in the general form as
XK
k¼1
t0kiXk $XK
k¼1
t00kiXk ð5Þ
in which tki in the stoichiometric coefficients of the ith reaction andXk is the chemical symbol for the kth species. The superscript 0 indi-cates forward stoichiometric coefficients, while 00 indicates reverse
stoichiometric coefficients. The production rate w�
kof the kth species
can be written as a summation of the rate of the variables for allreactions involving the kth species:
w�
k¼XI
i¼1
ðt00ki � t0kiÞri ðk ¼ 1; . . . ;KÞ ð6Þ
The rate ri for the ith reaction is given by the difference of theforward and reverse rates as
ri ¼ kf i
YK
k¼1
Xk½ �t0ki � kri
YK
k¼1
Xk½ �t00ki ð7Þ
where [Xk] is the molar concentration of the kth species and kfi andkri are the forward and reverse rate constants of the ith reaction,respectively. The forward and reverse rate constants for the ithreactions are assumed to have the following Arrhenius temperaturedependence:
kfi ¼ Afi Tbfi exp �
Eafi
RgT
� �ð8Þ
kri¼ Ari
Tbri exp � Eari
RgT
� �ð9Þ
where Rg is the universal gas constant, Afi (Ari) is the pre-exponen-tial factor, bfi (bri) is the temperature exponent and Efi (Eri) is theactivation energy. Arrhenius parameters of each chemical reactionare presented in Table 2.
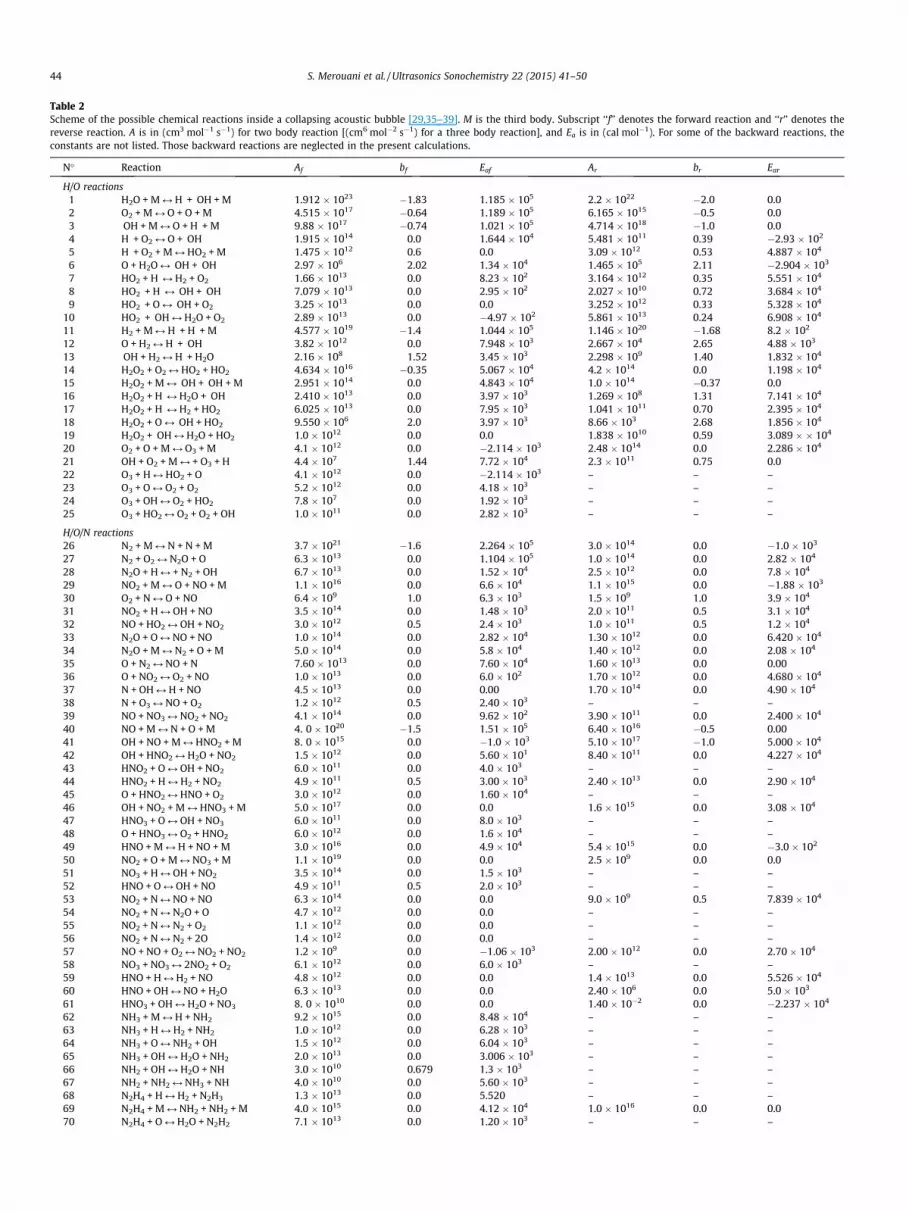
Table 2Scheme of the possible chemical reactions inside a collapsing acoustic bubble [29,35–39]. M is the third body. Subscript ‘‘f’’ denotes the forward reaction and ‘‘r’’ denotes thereverse reaction. A is in (cm3 mol�1 s�1) for two body reaction [(cm6 mol�2 s�1) for a three body reaction], and Ea is in (cal mol�1). For some of the backward reactions, theconstants are not listed. Those backward reactions are neglected in the present calculations.
N� Reaction Af bf Eaf Ar br Ear
H/O reactions1 H2O + M M H� + �OH + M 1.912 � 1023 �1.83 1.185 � 105 2.2 � 1022 �2.0 0.02 O2 + M M O + O + M 4.515 � 1017 �0.64 1.189 � 105 6.165 � 1015 �0.5 0.03 �OH + M M O + H� + M 9.88 � 1017 �0.74 1.021 � 105 4.714 � 1018 �1.0 0.04 H� + O2 M O + �OH 1.915 � 1014 0.0 1.644 � 104 5.481 � 1011 0.39 �2.93 � 102
5 H� + O2 + M M HO2� + M 1.475 � 1012 0.6 0.0 3.09 � 1012 0.53 4.887 � 104
6 O + H2O M�OH + �OH 2.97 � 106 2.02 1.34 � 104 1.465 � 105 2.11 �2.904 � 103
7 HO2� + H�M H2 + O2 1.66 � 1013 0.0 8.23 � 102 3.164 � 1012 0.35 5.551 � 104
8 HO2� + H�M �OH + �OH 7.079 � 1013 0.0 2.95 � 102 2.027 � 1010 0.72 3.684 � 104
9 HO2� + O M
�OH + O2 3.25 � 1013 0.0 0.0 3.252 � 1012 0.33 5.328 � 104
10 HO2� + �OH M H2O + O2 2.89 � 1013 0.0 �4.97 � 102 5.861 � 1013 0.24 6.908 � 104
11 H2 + M M H� + H� + M 4.577 � 1019 �1.4 1.044 � 105 1.146 � 1020 �1.68 8.2 � 102
12 O + H2 M H� + �OH 3.82 � 1012 0.0 7.948 � 103 2.667 � 104 2.65 4.88 � 103
13 �OH + H2 M H� + H2O 2.16 � 108 1.52 3.45 � 103 2.298 � 109 1.40 1.832 � 104
14 H2O2 + O2 M HO2� + HO2
� 4.634 � 1016 �0.35 5.067 � 104 4.2 � 1014 0.0 1.198 � 104
15 H2O2 + M M�OH + �OH + M 2.951 � 1014 0.0 4.843 � 104 1.0 � 1014 �0.37 0.0
16 H2O2 + H�M H2O + �OH 2.410 � 1013 0.0 3.97 � 103 1.269 � 108 1.31 7.141 � 104
17 H2O2 + H�M H2 + HO2� 6.025 � 1013 0.0 7.95 � 103 1.041 � 1011 0.70 2.395 � 104
18 H2O2 + O M�OH + HO2
� 9.550 � 106 2.0 3.97 � 103 8.66 � 103 2.68 1.856 � 104
19 H2O2 + �OH M H2O + HO2� 1.0 � 1012 0.0 0.0 1.838 � 1010 0.59 3.089 � � 104
20 O2 + O + M M O3 + M 4.1 � 1012 0.0 �2.114 � 103 2.48 � 1014 0.0 2.286 � 104
21 OH + O2 + M M + O3 + H 4.4 � 107 1.44 7.72 � 104 2.3 � 1011 0.75 0.022 O3 + H M HO2 + O 4.1 � 1012 0.0 �2.114 � 103 – – –23 O3 + O M O2 + O2 5.2 � 1012 0.0 4.18 � 103 – – –24 O3 + OH M O2 + HO2 7.8 � 107 0.0 1.92 � 103 – – –25 O3 + HO2 M O2 + O2 + OH 1.0 � 1011 0.0 2.82 � 103 – – –
H/O/N reactions26 N2 + M M N + N + M 3.7 � 1021 �1.6 2.264 � 105 3.0 � 1014 0.0 �1.0 � 103
27 N2 + O2 M N2O + O 6.3 � 1013 0.0 1.104 � 105 1.0 � 1014 0.0 2.82 � 104
28 N2O + H M + N2 + OH 6.7 � 1013 0.0 1.52 � 104 2.5 � 1012 0.0 7.8 � 104
29 NO2 + M M O + NO + M 1.1 � 1016 0.0 6.6 � 104 1.1 � 1015 0.0 �1.88 � 103
30 O2 + N M O + NO 6.4 � 109 1.0 6.3 � 103 1.5 � 109 1.0 3.9 � 104
31 NO2 + H M OH + NO 3.5 � 1014 0.0 1.48 � 103 2.0 � 1011 0.5 3.1 � 104
32 NO + HO2 M OH + NO2 3.0 � 1012 0.5 2.4 � 103 1.0 � 1011 0.5 1.2 � 104
33 N2O + O M NO + NO 1.0 � 1014 0.0 2.82 � 104 1.30 � 1012 0.0 6.420 � 104
34 N2O + M M N2 + O + M 5.0 � 1014 0.0 5.8 � 104 1.40 � 1012 0.0 2.08 � 104
35 O + N2 M NO + N 7.60 � 1013 0.0 7.60 � 104 1.60 � 1013 0.0 0.0036 O + NO2 M O2 + NO 1.0 � 1013 0.0 6.0 � 102 1.70 � 1012 0.0 4.680 � 104
37 N + OH M H + NO 4.5 � 1013 0.0 0.00 1.70 � 1014 0.0 4.90 � 104
38 N + O3 M NO + O2 1.2 � 1012 0.5 2.40 � 103 – – –39 NO + NO3 M NO2 + NO2 4.1 � 1014 0.0 9.62 � 102 3.90 � 1011 0.0 2.400 � 104
40 NO + M M N + O + M 4. 0 � 1020 �1.5 1.51 � 105 6.40 � 1016 �0.5 0.0041 OH + NO + M M HNO2 + M 8. 0 � 1015 0.0 �1.0 � 103 5.10 � 1017 �1.0 5.000 � 104
42 OH + HNO2 M H2O + NO2 1.5 � 1012 0.0 5.60 � 101 8.40 � 1011 0.0 4.227 � 104
43 HNO2 + O M OH + NO2 6.0 � 1011 0.0 4.0 � 103 – – –44 HNO2 + H M H2 + NO2 4.9 � 1011 0.5 3.00 � 103 2.40 � 1013 0.0 2.90 � 104
45 O + HNO2 M HNO + O2 3.0 � 1012 0.0 1.60 � 104 – – –46 OH + NO2 + M M HNO3 + M 5.0 � 1017 0.0 0.0 1.6 � 1015 0.0 3.08 � 104
47 HNO3 + O M OH + NO3 6.0 � 1011 0.0 8.0 � 103 – – –48 O + HNO3 M O2 + HNO2 6.0 � 1012 0.0 1.6 � 104 – – –49 HNO + M M H + NO + M 3.0 � 1016 0.0 4.9 � 104 5.4 � 1015 0.0 �3.0 � 102
50 NO2 + O + M M NO3 + M 1.1 � 1019 0.0 0.0 2.5 � 109 0.0 0.051 NO3 + H M OH + NO2 3.5 � 1014 0.0 1.5 � 103 – – –52 HNO + O M OH + NO 4.9 � 1011 0.5 2.0 � 103 – – –53 NO2 + N M NO + NO 6.3 � 1014 0.0 0.0 9.0 � 109 0.5 7.839 � 104
54 NO2 + N M N2O + O 4.7 � 1012 0.0 0.0 – – –55 NO2 + N M N2 + O2 1.1 � 1012 0.0 0.0 – – –56 NO2 + N M N2 + 2O 1.4 � 1012 0.0 0.0 – – –57 NO + NO + O2 M NO2 + NO2 1.2 � 109 0.0 �1.06 � 103 2.00 � 1012 0.0 2.70 � 104
58 NO3 + NO3 M 2NO2 + O2 6.1 � 1012 0.0 6.0 � 103 – – –59 HNO + H M H2 + NO 4.8 � 1012 0.0 0.0 1.4 � 1013 0.0 5.526 � 104
60 HNO + OH M NO + H2O 6.3 � 1013 0.0 0.0 2.40 � 106 0.0 5.0 � 103
61 HNO3 + OH M H2O + NO3 8. 0 � 1010 0.0 0.0 1.40 � 10�2 0.0 �2.237 � 104
62 NH3 + M M H + NH2 9.2 � 1015 0.0 8.48 � 104 – – –63 NH3 + H M H2 + NH2 1.0 � 1012 0.0 6.28 � 103 – – –64 NH3 + O M NH2 + OH 1.5 � 1012 0.0 6.04 � 103 – – –65 NH3 + OH M H2O + NH2 2.0 � 1013 0.0 3.006 � 103 – – –66 NH2 + OH M H2O + NH 3.0 � 1010 0.679 1.3 � 103 – – –67 NH2 + NH2 M NH3 + NH 4.0 � 1010 0.0 5.60 � 103 – – –68 N2H4 + H M H2 + N2H3 1.3 � 1013 0.0 5.520 – – –69 N2H4 + M M NH2 + NH2 + M 4.0 � 1015 0.0 4.12 � 104 1.0 � 1016 0.0 0.070 N2H4 + O M H2O + N2H2 7.1 � 1013 0.0 1.20 � 103 – – –
44 S. Merouani et al. / Ultrasonics Sonochemistry 22 (2015) 41–50

Table 2 (continued)
N� Reaction Af bf Eaf Ar br Ear
71 N2H4 + NH2 M NH3 + N2H3 1.0 � 1013 0.0 5.6 � 103 3.3 � 106 0.0 0.072 N2O4 + M M NO2 + NO2 + M 1.8 � 1017 0.0 1.11 � 104 1.7 � 1013 0.0 1.72 � 103
73 N2O5 + M M NO2 + NO3 + M 1.3 � 1019 0.0 1.944 � 104 2.0 � 1017 0.0 �9.62 � 102
Table 3Selected values of the ambient radius (R0) for active bubbles as function of frequencyof ultrasound, selected according to experimental data.
Frequency (kHz) Ambient bubble radius, R0 (lm) Refs.
213 3.9 [18]355 3.2 [18]515 3 [44]647 2.9 [18]875 2.7 [18]
1000 2 [18]1100 1.4 [45]
-1
0
1
2
3
0 1 2 3 4 5
Liqu
id p
ress
ure
(atm
)
Time (µs)
213 kHz355 kHz515 kHz1000 kHz
(a)
0
1
2
3
4
0 1 2 3 4 5
R/R
0
Time (µs)
213 kHz355 kHz515 kHz1000 kHz
(b)
Fig. 1. Liquid pressure (a) and R/R0 (b) versus time curves for one acoustic cycle atvarious ultrasonic frequencies (conditions: ambient bubble radius: Table 3; acousticintensity: 1 W cm�2; bulk liquid temperature: 20 �C; static pressure: 1 atm). Theliquid pressure in (a) is the sum of the acoustic pressure �PA sin 2pft and the staticpressure P1.
-200
-150
-100
-50
0
50
100
0 1 2 3 4 5
Velo
city
of t
he b
ubbl
e w
all (
m s
-1)
Time (µs)
1000 kHz
515 kHz
355 kHz
213 kHz
Fig. 2. Bubble wall velocity as function of time during the oscillation of the bubblefor different ultrasonic frequencies, for the same conditions as in Fig. 1.
S. Merouani et al. / Ultrasonics Sonochemistry 22 (2015) 41–50 45
2.3. Procedure of the numerical simulation
The simulation of the reactions system (Table 2) occurring inthe bubble starts at the beginning of the adiabatic phase (time cor-responding to Rmax). The input parameters of the reactions systemare the composition of the bubble on water vapor and gas at this
point, the temperature and pressure profiles in the bubble duringadiabatic phase and the collapse time. All these parameters wereobtained by solving the dynamics equation (Eq. (1)). The bubbletemperature increases during the adiabatic phase, the reaction sys-tem evolves and radicals start to form by thermal dissociation ofH2O and gas molecules in the bubble. Thus, the composition ofthe bubble for all species expected to be present was determinedat any temperature during the collapse phase. The simulation ofthe reactions system was stopped after the end of the bubble col-lapse. It should be also noticed that the effect of the chemical reac-tion (heat of reaction) occurring in the cavity on the bubbledynamics is known to be not significant [31,41]. The dynamics out-put results, thus, will not greatly affected by the chemical reac-tions. This effect is not taken into account in the presentnumerical investigation.
3. Results and discussion
According to the experimental and theoretical data [18,19,42,43], it is now well known that the ambient radius (R0) for atypical active bubble depends on the experimentally controllableparameters such as the driving ultrasonic frequency. The range ofambient bubble radius for a typical active bubble is rather narrowaccording to the experimental observations and in this range thereexists an ambient radius at which the most activity is localized[18]. The ambient bubble radius at which the activity is localizedis called mean ambient bubble radius. The mean ambient bubbleradius decreases considerably as the ultrasonic frequency increasesin the range 213–1100 kHz according to the experimental observa-tions [18]. The present study tries to use the same frequencies atwhich the mean ambient bubble radii (R0) were determined

46 S. Merouani et al. / Ultrasonics Sonochemistry 22 (2015) 41–50
experimentally. The ambient bubble radius (R0) in the presentnumerical simulations has been assumed as the mean ambientbubble radius. The selected values of R0 with respect to the ultra-sonic frequency are presented in Table 3.
3.1. Bubble dynamics and chemical bubble yield
In Fig. 1(a) and (b), the calculated results of the liquid pressureand the R/R0 ratio for one acoustic cycle are shown for ultrasonicfrequencies of 213, 355, 515 and 1000 kHz when the acousticintensity is 1 W cm�2. The time axes in Fig. 1(a) and (b) are identi-cal. The liquid pressure applied on the bubble is the sum of theacoustic pressure and the static pressure. In all cases, the bubblestarts from an ambient radius of R0 which is the radius at whichthe bubble is in static mechanical equilibrium with the externalstatic pressure (typically 1 atm). It was seen that the bubble ini-tially expands during the rarefaction phase of ultrasound wave,reaches a maximum at the beginning of the compression phase
0
500
1000
1500
2000
2500
3000
3500
4000
4500
5000
0.0001
0.001
0.01
0.1
1
10
100
3.51 3.517 3.524 3.531 3.538 3.545
Bub
ble
Tem
pera
ture
(K)
Num
ber o
f mol
es×××1
015
Time (s)
Number of molesBubble temperature
H O
O
HO •
H O
(a)
•OH
O
O3
H
0
500
1000
1500
2000
2500
3000
0.0001
0.001
0.01
0.1
1
10
100
1000
1.56 1.5657 1.5714 1.5771 1.5828
Bub
ble
tem
pera
ture
(K)
Num
ber o
f mol
es× 1
017
Time (s)
Number of molesBubble temperature
•OHO
H•
HO •(c) H O
H
O3
H O
O1
10
20
Fig. 3. Evolution of the reaction systems inside a bubble as function of time at arounconditions as in Fig. 1. (a) 213 kHz, (b) 355 kHz, (c) 515 kHz and (d) 1000 kHz. Horizonscale. The dominant oxidant created in all cases is �OH radical.
and then quickly collapses during the compression phase of ultra-sound wave. The minimum bubble radius, which indicates the endof the bubble collapse, is attained when the liquid pressure is ataround of its maximum value (2.72 atm) during the compressionphase. Fig. 1 clearly shows that the bubble dynamics is stronglyaffected by the ultrasonic frequency. From the first view, it wasnoticed that the maximum bubble radius and the bubble lifetimedecrease as the frequency increases.
The velocity of the bubble wall during oscillation, especially atthe collapse, is a very important parameter that gives an idea aboutthe quality of implosion. Fig. 2 shows the behavior of the bubblewall speed as function of time for the same conditions as inFig. 1. Insignificant changes of the bubble wall velocity areobserved during the expansion phase and the first stage of the col-lapse. However, the bubble wall velocity increases suddenly duringthe final stage of the bubble collapse up to 178, 118, 78 and48 m s�1 for respectively 213, 355, 515 and 1000 kHz. These highspeeds of the bubble implosion yield stronger collapses, which
0
500
1000
1500
2000
2500
3000
3500
4000
0.0001
0.001
0.01
0.1
1
10
100
2.168 2.1722 2.1764 2.1806 2.1848 2.189
Bub
ble
tem
pera
ture
(K)
Num
ber o
f mol
es× × 1
016
Time (s)
Number of moles
Bubble temperature
H O
O
•OH
O
H
HO •
H O
(b)O3
H
0
200
400
600
800
1000
1200
1400
1600
1800
2000
0.0001
0.001
0.01
0.1
1
10
100
1000
10000
00000
00000
0.815 0.8195 0.824 0.8285 0.833
Bub
ble
tem
pera
ture
(K)
Num
ber o
f mol
es×1
0
Time (s)
Number of molesBubble temperature
•OH
O
H•
(d)
HO •
H O
H
O3
H O
O
d the end of the bubble collapse for various ultrasonic frequencies, for the sametal axes are presented for only �0.015 ls. Principal vertical axes are in logarithmic
0.0
0.0
0.0
0.0
0.0
0.0
0.0
0.0
0.0
0.0
0.0
0.0
0 200 400 600 800 1000 1200
Prod
uctio
n ra
te o
f •• O
H (m
ole
s-1)
Ultrasonic frequency (kHz)
O
air
N
H
10-12
10-11
10-13
10-17
10-8
10-14
10-15
0-16
10-10
10-18
10-19
10-9
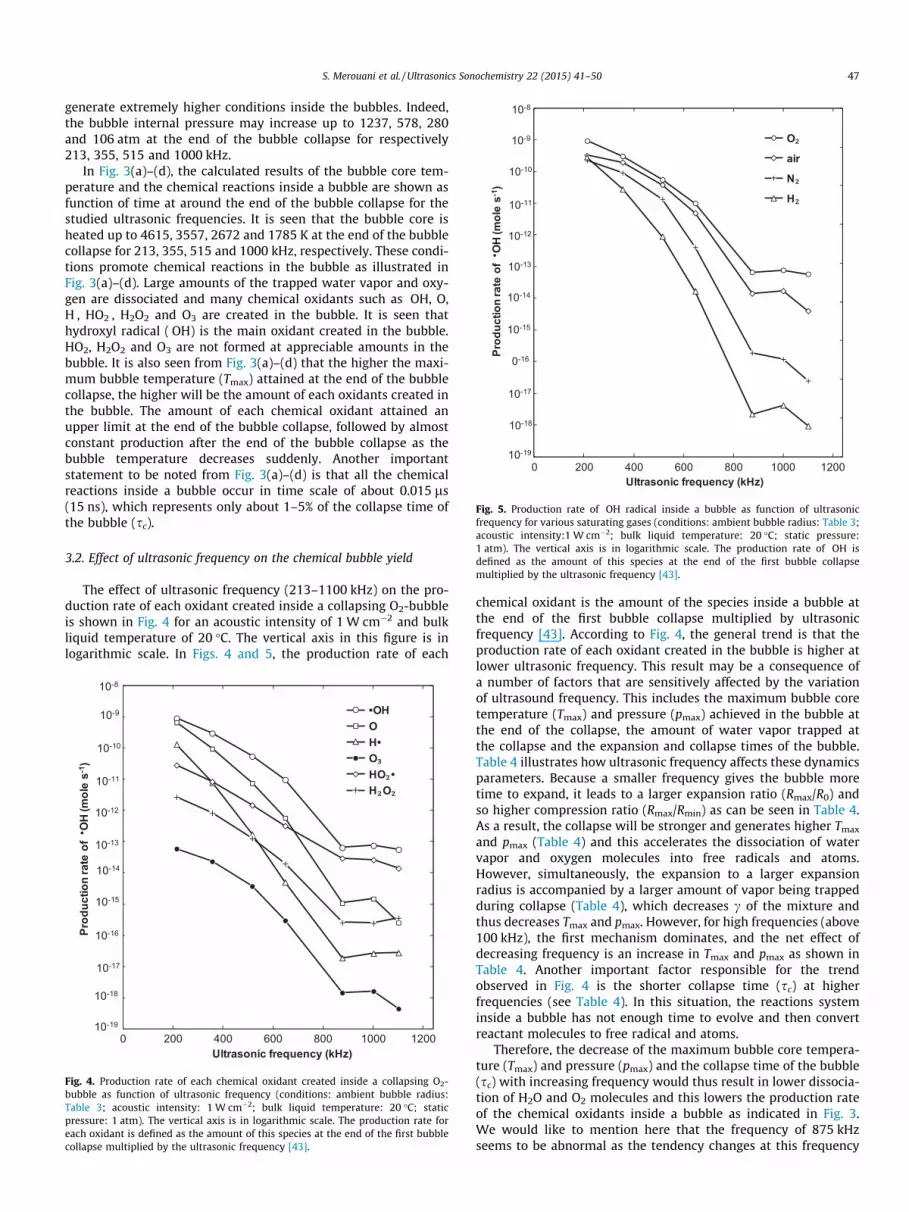
Fig. 5. Production rate of �OH radical inside a bubble as function of ultrasonicfrequency for various saturating gases (conditions: ambient bubble radius: Table 3;acoustic intensity:1 W cm�2; bulk liquid temperature: 20 �C; static pressure:1 atm). The vertical axis is in logarithmic scale. The production rate of �OH isdefined as the amount of this species at the end of the first bubble collapsemultiplied by the ultrasonic frequency [43].
S. Merouani et al. / Ultrasonics Sonochemistry 22 (2015) 41–50 47
generate extremely higher conditions inside the bubbles. Indeed,the bubble internal pressure may increase up to 1237, 578, 280and 106 atm at the end of the bubble collapse for respectively213, 355, 515 and 1000 kHz.
In Fig. 3(a)–(d), the calculated results of the bubble core tem-perature and the chemical reactions inside a bubble are shown asfunction of time at around the end of the bubble collapse for thestudied ultrasonic frequencies. It is seen that the bubble core isheated up to 4615, 3557, 2672 and 1785 K at the end of the bubblecollapse for 213, 355, 515 and 1000 kHz, respectively. These condi-tions promote chemical reactions in the bubble as illustrated inFig. 3(a)–(d). Large amounts of the trapped water vapor and oxy-gen are dissociated and many chemical oxidants such as �OH, O,H�, HO2
�, H2O2 and O3 are created in the bubble. It is seen thathydroxyl radical (�OH) is the main oxidant created in the bubble.HO2
� , H2O2 and O3 are not formed at appreciable amounts in thebubble. It is also seen from Fig. 3(a)–(d) that the higher the maxi-mum bubble temperature (Tmax) attained at the end of the bubblecollapse, the higher will be the amount of each oxidants created inthe bubble. The amount of each chemical oxidant attained anupper limit at the end of the bubble collapse, followed by almostconstant production after the end of the bubble collapse as thebubble temperature decreases suddenly. Another importantstatement to be noted from Fig. 3(a)–(d) is that all the chemicalreactions inside a bubble occur in time scale of about 0.015 ls(15 ns), which represents only about 1–5% of the collapse time ofthe bubble (sc).
3.2. Effect of ultrasonic frequency on the chemical bubble yield
The effect of ultrasonic frequency (213–1100 kHz) on the pro-duction rate of each oxidant created inside a collapsing O2-bubbleis shown in Fig. 4 for an acoustic intensity of 1 W cm�2 and bulkliquid temperature of 20 �C. The vertical axis in this figure is inlogarithmic scale. In Figs. 4 and 5, the production rate of each
1E-19
1E-18
1E-17
1E-16
1E-15
1E-14
1E-13
1E-12
1E-11
1E-10
1E-09
1E-08
0 200 400 600 800 1000 1200
Prod
uctio
n ra
te o
f •• O
H (m
ole
s-1)
Ultrasonic frequency (kHz)
•OH OH•OHO •H O
10-12
10-11
10-13
10-17
10-8
10-9
10-14
10-15
10-16
10-10
10-18
10-19
Fig. 4. Production rate of each chemical oxidant created inside a collapsing O2-bubble as function of ultrasonic frequency (conditions: ambient bubble radius:Table 3; acoustic intensity: 1 W cm�2; bulk liquid temperature: 20 �C; staticpressure: 1 atm). The vertical axis is in logarithmic scale. The production rate foreach oxidant is defined as the amount of this species at the end of the first bubblecollapse multiplied by the ultrasonic frequency [43].
chemical oxidant is the amount of the species inside a bubble atthe end of the first bubble collapse multiplied by ultrasonicfrequency [43]. According to Fig. 4, the general trend is that theproduction rate of each oxidant created in the bubble is higher atlower ultrasonic frequency. This result may be a consequence ofa number of factors that are sensitively affected by the variationof ultrasound frequency. This includes the maximum bubble coretemperature (Tmax) and pressure (pmax) achieved in the bubble atthe end of the collapse, the amount of water vapor trapped atthe collapse and the expansion and collapse times of the bubble.Table 4 illustrates how ultrasonic frequency affects these dynamicsparameters. Because a smaller frequency gives the bubble moretime to expand, it leads to a larger expansion ratio (Rmax/R0) andso higher compression ratio (Rmax/Rmin) as can be seen in Table 4.As a result, the collapse will be stronger and generates higher Tmax
and pmax (Table 4) and this accelerates the dissociation of watervapor and oxygen molecules into free radicals and atoms.However, simultaneously, the expansion to a larger expansionradius is accompanied by a larger amount of vapor being trappedduring collapse (Table 4), which decreases c of the mixture andthus decreases Tmax and pmax. However, for high frequencies (above100 kHz), the first mechanism dominates, and the net effect ofdecreasing frequency is an increase in Tmax and pmax as shown inTable 4. Another important factor responsible for the trendobserved in Fig. 4 is the shorter collapse time (sc) at higherfrequencies (see Table 4). In this situation, the reactions systeminside a bubble has not enough time to evolve and then convertreactant molecules to free radical and atoms.
Therefore, the decrease of the maximum bubble core tempera-ture (Tmax) and pressure (pmax) and the collapse time of the bubble(sc) with increasing frequency would thus result in lower dissocia-tion of H2O and O2 molecules and this lowers the production rateof the chemical oxidants inside a bubble as indicated in Fig. 3.We would like to mention here that the frequency of 875 kHzseems to be abnormal as the tendency changes at this frequency

Table 4Evolutions of the bubble dynamics parameters as function of ultrasonic frequency. (sexp) is the expansion time of the bubble, (Rmax/R0) is the expansion ratio of the bubble, (Rmax/Rmin) is the compression ratio of the bubble, Tmax and pmax are, respectively, the maximum bubble temperature and pressure reached in the bubble at the end of the collapse, yH2 O
is the mole fraction of water vapor trapped at the collapse and (sc) is the collapse time of the bubble.
Frequency sexp (ls) Rmax/R0 Rmax/Rmin Tmax (K) Pmax (atm) yH2 O sc (ls)
213 2.609 3.808 11.871 4615.96 1237.41 0.482 0.930355 1.583 3.049 8.677 3557.72 578.03 0.310 0.603515 1.117 2.532 6.494 2672.59 280.18 0.202 0.462647 0.907 2.272 5.397 2190.47 173.92 0.153 0.398875 0.687 2.008 4.281 1687.38 94.29 0.108 0.328
1000 0.575 2.107 4.434 1758.88 106.61 0.111 0.251100 0.486 2.231 4.384 1734.7 101.08 0.111 0.201
48 S. Merouani et al. / Ultrasonics Sonochemistry 22 (2015) 41–50
(Figs. 4 and 5). This result is theoretically logical as the maximumbubble temperature present a minimum at this point as shown inTable 4. Practically, we attribute this phenomenon to an error inthe experimental value of R0 at 875 kHz (2.7 lm). According tothe procedure presented in Ref. [19], the value of R0 at 875 kHzshould be near 2 lm, which yield a maximum bubble temperatureof 1970 K. This temperature is lower than that of 647 kHz (2190 K)and higher than that of 1000 kHz (1758 K), which will yield anormal tendency in Figs. 4 and 5. In the numerical simulations,we retained the experimental value of 2.7 lm.
After knowing the effects of frequency on single bubble yield,we will discuss briefly its effects on the sonochemical activity inaqueous solution. Some experimental reports [8,9,15,16,46]showed the existence of an optimum frequency between 200 and1000 kHz that maximize the overall sonochemical activity. A thislevel, we say that aqueous solution is a multibubble system andthe overall sonochemical activity in multibubble system is notrelated only to the single bubble event, but also to the number ofbubbles and other phenomena (i.e., bubbles coalescence). Thenumber of bubbles formed in the cavitating medium is stronglyaffected by the applied ultrasonic frequency. Generally, thenumber of bubbles increases as the applied frequency increases[11,21]. Therefore, the chance of existing of an optimum frequencybetween 200 and 1000 kHz for the production of the oxidants inaqueous solution is possible as the sonochemical activity inindividual bubble decreases with increasing frequency in thisinterval whereas the number of bubbles increases with increasingfrequency. However, in the absence of exact information about thebubble population, any theoretical decision about the existing ofan optimum frequency is not possible to make.
3.3. Effect of the nature of dissolved gas on the chemical bubble yield
Numerical simulations of chemical reactions occurring in thebubble during implosion have been performed for different satu-rating gases including O2, air, N2 and H2. In all cases, the numericalcalculations showed that �OH radical is the main powerful oxidantcreated in the bubble. The production rate of hydroxyl radical (�OH)will thus used in the following for comparison.
In Fig. 5, the effects of the selected dissolved gases (O2, air, N2
and H2) on the production rate of �OH radical in the bubble areshown for various ultrasonic frequencies. The same general trendof decreasing production rate of �OH radical with increasingfrequency is observed for all the saturating gases. From Fig. 5, itis clearly appeared that the effect of saturating gases on theproduction rate of �OH radical follows the order O2 > air > N2 > H2.The other trend to be noted from Fig. 5 is that the effect of saturat-ing gases on the production rate of �OH radical becomes moreremarkable at higher ultrasonic frequencies.
In the literature, several experimental reports [12,13,17,47,48]conducted at different frequencies in the range of 300–1000 kHzshowed that the sonochemical production of H2O2 and the
degradation of various non-volatile organic contaminants in aque-ous solutions followed the order O2 > air > N2 > H2. Therefore, theobtained results in this study for single bubble sonochemistry thatis consistent qualitatively with the experimental results, shouldexplain with arguments the effects of saturating gases on the sono-chemical activity.
In general, dissolved gases affect the single bubble sonochemis-try through two aspect: (i) gas with higher polytropic ratio c(c = cp/cv) can create higher maximum temperature (Tmax) at thecollapse, which enhances the dissociation of water vapor mole-cules trapped in the bubble at the collapse; (ii) gases with lowthermal conductivities (k) can reduce the heat dissipation, thusfacilitating the increase in collapse temperature (Tmax) and enhanc-ing sonochemical activity. In this study, all employed gases havethe same polytropic ratio (c = 1.41) and O2, N2 and air have thesame thermal conductivity (k = 0.026 W m�2 K�1 [49]). Therefore,the intensity of the bubble implosion will be identical for all theemployed gases and the maximum bubble temperature (Tmax)achieved at the collapse is the same. The values of Tmax withrespect to frequency are the same as those of Table 4. It should alsobe noted here that Okitsu et al. [20] showed experimentally thatthe bubble temperature is not affected by the gas conductivity.Excluding the effects of gases on the maximum bubble tempera-ture (Tmax) achieved at the collapse, the observed effects of saturat-ing gases on single bubble sonochemistry (Fig. 5) are thusassociated only to the nature of the reactants trapped in the bubbleat the collapse (O2/H2O, O2/N2/H2O, N2/H2O, H2/H2O) which affectsdirectly the internal bubble-chemistry. Using the chemical kineticsanalysis, some explanation can be made. In the case of O2 and H2
bubbles, �OH radical was consumed mainly though the followingreactions: �OH + H�M O + H2 and �OH + H2 M H + H2O. In the caseof air and N2 bubbles, an additional reaction involved NO speciescontributed significantly in the consumption of �OH radical.This reaction is NO + �OH + M M HNO2 + M. On the other hand,NO was formed mainly through NO2 + M M O + NO + M andN2 + O M NO + N. Consequently, the higher the concentration ofN2 in the bubble, the higher will be the concentration of NO andthis accelerates the consumption rate of �OH radical thought thereaction NO + �OH + M M HNO2 + M. Therefore, it is not surprisingthat between O2, air and N2, the production rate of �OH radical fol-lows the order O2 > air > N2 as the concentration of N2 decreases inthe same order. The inhibiting effect of oxidizing nitrogen (NO)toward the production of the oxidants inside an air bubble havebeen previously reported by Yasui et al. [50]. Between H2 and othergases, the problem is treated in similar manner. The higher theconcentration of H2 in the bubble, the higher will be the scavengingrate of �OH radical thought the reaction �OH + H2 M H� + H2O. Thus,it is very logical that hydrogen occupied the last class in the orderO2 > air > N2 > H2 as the concentration of hydrogen is the highest inthe case of hydrogen bubble.
Knowledge the order of saturating gases on single bubblesonochemistry allows the discussion of their effects in aqueous

S. Merouani et al. / Ultrasonics Sonochemistry 22 (2015) 41–50 49
solutions (multibubble systems). In this case, the solubility of thegas is an important factor because it control the number ofcollapsing bubbles and the higher the gas solubility, the higher willbe the number of bubbles formed in the reactor. The solubilities (inmole fraction) of the gases treated in the present numerical studyare [51]: xO2 = 2.517 � 10�5, xair = 1.524 � 10�5, xN2 = 1.276 � 10�5,xH2 = 1.457 � 10�5. Therefore, the order of the solubility followsO2 > air > H2 > N2. This order constitutes a fort indication that theoverall sonochemical activity in aqueous solutions is not controlledby the gas solubility alone, as pointed by Okutso et al. [20], but alsoby the nature of the internal bubble chemistry because H2 have ahigh solubility than N2 but it yielded the lower overall sonochem-ical activity (see Ref. [48]). This is in a fact because H2 yielded thelowest activity in the scale of single bubble (Fig. 5). Consequently,in addition to the gas solubility, the nature of the internal bubblechemistry is another parameter of a paramount importance thatcontrols the overall sonochemical activity of ultrasound in aqueoussolutions.
4. Conclusion
In this work, results from a comprehensive numericalassessment of frequency and gas effects on sonochemical activityof single bubble have been described. The numerical simulationsof the bubble oscillations and chemical reactions therein have beenperformed for various ultrasonic frequencies (in the range of213–1100 kHz) under different saturating gases (O2, air, N2 andH2). The results of this study provide a detailed informations aboutthe gas and frequency mechanisms on single bubble sonochemis-try, which will help in understanding their effects in aqueoussolutions. The effect of ultrasonic frequency on single bubblesonochemistry was attributed to its significant impact on thecavitation process whereas the effect of gases was attributed tothe nature of the combustion chemistry occurred in the bubble(Ar/H2O, O2/H2O, H2/H2O. . .). It is concluded that the nature ofthe bubble chemistry is an additional parameter that controls theoverall sonochemical activity of ultrasound in aqueous solutions.The understanding of the frequency effect on sonochemical activityin aqueous solutions needs the knowledge of the number ofbubbles created in the liquid. However, in absence of sufficientlyinformation about the number of bubbles created in the sonicatingmedium, any theoretical decision about the effect of frequency onthe overall sonochemical activity of ultrasound in aqueoussolutions is not possible to make.
Acknowledgments
The financial support by the Ministry of Higher Education andScientific Research of Algeria (Project No. J0101120120098) isgreatly acknowledged.
References
[1] K.S. Suslick, Y. Didenko, M.M. Fang, T. Hyeon, K.J. Kolbeck, W.B. McNamara,M.M. Mdleleni, M.M. Wong, Acoustic cavitation and its chemicalconsequences, Philos. Trans. R. Soc. A: Math. Phys. Eng. Sci. 357 (1999) 335–353.
[2] K.S. Suslick, D.A. Hammerton, R.E.J. Cline, Sonochemical hotspot, J. Am. Chem.Soc. 108 (1986) 5641–5642.
[3] K.S. Suslick, D.J. Flannigan, Inside a collapsing bubble: sonoluminescence andthe conditions during cavitation, Annu. Rev. Phys. Chem. 59 (2008) 659–683.
[4] T. Leong, M. Ashokkumar, S. Kentish, The fundamentals of power ultrasound–areview, Acoust. Aust. 39 (2011) 54–63.
[5] Y.G. Adewuyi, Sonochemistry: environmental science and engineeringapplications, Ind. Eng. Chem. Res. 40 (2001) 4681–4715.
[6] S.J. Putterman, K.R. Weninger, Sonoluminescence: how bubbles turn soundinto light, Annu. Rev. Fluid Mech. 32 (2000) 445–476.
[7] F.R. Young, Sonoluminescence, CRC Press, Boca Raton, Florida, 2005.
[8] M. Capocelli, E. Joyce, A. Lancia, T.J. Mason, D. Musmarra, M. Prisciandaro,Sonochemical degradation of estradiols: incidence of ultrasonic frequency,Chem. Eng. J. 210 (2012) 9–17.
[9] M. Dukkanci, M. Vinatoru, T.J. Maison, Sonochemical treatment of orange IIusing ultrasound at range of frequencies and powers, J. Adv. Oxid. Technol. 15(2012) 277–283.
[10] T.J. Mason, A.J. Cobley, J.E. Graves, D. Morgan, New evidence for the inversedependence of mechanical and chemical effects on the frequency ofultrasound, Ultrason. Sonochem. 18 (2011) 226–230.
[11] P. Kanthale, F. Ashokkumar, F. Grieser, Sonoluminescence, sonochemistry(H2O2 yield) and bubble dynamics: frequency and power effects, Ultrason.Sonochem. 15 (2008) 143–150.
[12] F. Méndez-Arriaga, R.A. Torres, C. Pétrier, S. Esplugas, J. Gimenez, C. Pulgarin,Ultrasonic treatment of water contaminated with ibuprofen, Water Res. 42(2008) 4243–4248.
[13] R.A. Torres, C. Pétrier, E. Combet, M. Carrier, C. Pulgarin, Ultrasonic cavitationapplied to the treatment of bisphenol A. Effect of sonochemical parametersand analysis of BPA by-products, Ultrason. Sonochem. 15 (2008) 605–611.
[14] Y. Jiang, C. Petrier, T.D. Waite, Sonolysis of 4-chlorophenol in aqueous solution:effects of substrate concentration, aqueous temperature and ultrasonicfrequency, Ultrason. Sonochem. 13 (2006) 415–422.
[15] S. Koda, T. Kimura, T. Kondo, H. Mitome, A standard method to calibratesonochemical efficiency of an individual reaction system, Ultrason. Sonochem.10 (2003) 149–156.
[16] M.A. Beckett, I. Hua, Impact of ultrasonic frequency on aqueoussonoluminescence and sonochemistry, J. Phys. Chem. A 105 (2001) 3796–3802.
[17] E.L. Mead, R.G. Sutherland, R.E. Verrall, The effects of ultrasound on water inthe presence of dissolved gases, Can. J. Chem. 54 (1976) 1114–1120.
[18] A. Brotchie, F. Grieser, M. Ashokkumar, Effect of power and frequency onbubble-size distributions in acoustic cavitation, Phys. Rev. Lett. 102 (2009)084302-1–084302-4.
[19] S. Merouani, O. Hamdaoui, Y. Rezgui, M. Guemini, Effects of ultrasoundfrequency and acoustic amplitude on the size of sonochemically activebubbles-theoretical study, Ultrason. Sonochem. 20 (2013) 815–819.
[20] K. Okitsu, T. Suzuki, N. Takenaka, H. Bandow, R. Nishimura, Y. Maeda, Acousticmultibubble cavitation in water: a new aspect of the effect of a rare gasatmosphere on bubble temperature and its relevance to sonochemistry, J.Phys. Chem. B 110 (2006) 20081–20084.
[22] S. Merouani, O. Hamdaoui, Y. Rezgui, M. Guemini, Theoretical estimation of thetemperature and pressure within collapsing acoustical bubbles, Ultrason.Sonochem. 21 (2014) 53–59.
[23] S. Merouani, O. Hamdaoui, Y. Rezgui, M. Guemini, Energy analysis duringacoustic bubble oscillations: relationship between bubble energy andsonochemical parameters, Ultrasonics 54 (2014) 227–232.
[24] S. Merouani, O. Hamdaoui, Y. Rezgui, M. Guemini, Computer simulation ofchemical reactions occurring in collapsing acoustical bubble: dependence offree radicals production on operational conditions, Res. Chem. Intermed.(2013), http://dx.doi.org/10.1007/s11164-013-1240-y.
[25] L.A. Crum, The polytrophic exponent of gas contained within air bubblespulsating in a liquid, J. Acoust. Soc. Am. 73 (1983) 116–120.
[26] J.B. Keller, I.I. Kolodner, Damping of underwater explosion bubble oscillations,J. Appl. Phys. 27 (1956) 1152–1161.
[27] J.B. Keller, M.J. Miksis, Bubble oscillations of large amplitude, J. Acoust. Soc.Am. 68 (1980) 628–633.
[28] T.G. Leighton, The Acoustic Bubble, Academic Press, London, UK, 1994.[29] A.J. Colussi, L.K. Weavers, M.R. Hoffmann, Chemical bubble dynamics and
quantitative sonochemistry, J. Phys. Chem. A 102 (1998) 6927–6934.[30] K. Yasui, Effect of non-equilibrium evaporation and condensation on bubble
dynamics near the sonoluminescence threshold, Ultrasonics 36 (1998)575–580.
[31] B.D. Storey, A.J. Szeri, Water vapor, sonoluminescence and sonochemistry,Proc. R. Soc. London, Sect. A 456 (2000) 1685–1709.
[32] Burcat’s Thermodynamical Database, ftp://ftp.technion.ac.il/pub/supported/aetdd/thermodyna- mics/; also available from; http://garfield.chem.elte.hu/Burcat/burcat.html.
[33] V. Kamath, A. Prosperetti, F.N. Egolfopoulos, A theoretical study ofsonoluminescence, J. Acoust. Soc. Am. 94 (1993) 248–260.
[34] S. Fujikawa, T. Akamatsu, Effects of the non-equilibrium condensation ofvapour on the pressure wave produced by the collapse of a bubble in a liquid, J.Fluid Mech. 97 (1980) 481–512.
[35] K. Yasui, T. Tuziuti, Y. Iida, H. Mitome, Theoretical study of the ambient-pressure dependence of sonochemical reactions, J. Chem. Phys. 119 (2003)346–356.
[36] K. Yasui, A new formulation of bubble dynamics for sonoluminescence (Ph.D.thesis), Waseda University, Japan, 1996.
[37] R. Toegel, D. Loshe, Phase diagrams for sonoluminescing bubbles, acomparison between experiment and theory, J. Chem. Phys. 118 (2003)1863–1875.
[38] M.O. Conaire, H.J. Curran, J.M. Simmie, W.J. Pitz, C.K. Westbrook, Acomprehensive modeling study of hydrogen oxidation, Int. J. Chem. Kinet. 36(2004) 603–622.
[39] M.A. Mueller, T.J. Kim, R.A. Yetter, F.L. Dryer, Flow reactor studies and kineticmodeling of the H2/O2 reaction, Int. J. Chem. Kinet. 31 (1999) 113–125.
[40] K. Yasui, T. Tuziuti, M. Sivakumar, Y. Iida, Theoretical study of single bubblesonochemistry, J. Chem. Phys. 120 (2005) 224706-1–224706-12.
50 S. Merouani et al. / Ultrasonics Sonochemistry 22 (2015) 41–50
[41] G. Hauke, D. Fuster, C. Dopazo, Dynamic of a single cavitating and reactingbubble, Phys. Rev. E 75 (2007) 066310-1–066310-14.
[42] S. Labouret, J. Frohly, Distribution en tailles des bulles d’un champ de cavitationultrasonore, 10ème Congrès Français d’Acoustique, Lyon, 2010. Available from:<http://hal.archives-ouvertes.fr/docs/00/55/11/51/PDF/000441.pdf>.
[43] K. Yasui, T. Tuziuti, J. Lee, T. Kozuka, A. Towada, The range of ambient radius foran active bubble in sonoluminescence and sonochemical reactions, J. Chem.Phys. 128 (2008) 184705-1–184705-12.
[44] J. Lee, M. Ashokkumar, S. Kentish, F. Grieser, Determination of the sizedistribution of sonoluminescence bubbles in a pulsed acoustic field, J. Am.Chem. Soc. 127 (2005) 16810–16811.
[45] W.-S. Chen, T.J. Matula, L.A. Crum, The disappearance of ultrasound contrastbubbles: observations of bubble dissolution and cavitation nucleation,Ultrasound Med. Biol. 28 (2002) 793–803.
[46] G. Mark, A. Tauber, R. Laupert, H.-P. Schechmann, D. Schulz, A. Mues, C. VonSonntag, OH-radical formation by ultrasound in aqueous solution. Part II.Terephthalate and Fricke dosimetry and the influence of various conditions onthe sonolytic yield, Utrason. Sonochem. 5 (1998) 41–52.
[47] Y.-Q. Gao, N.-Y. Gao, Y. Deng, J.-s. Gu, Y.-L. Gu, D. Zhang, Factor affectingsonolytic degradation of sulfamethazine in water, Ultrason. Sonochem. 20(2013) 1401–1407.
[48] E.J. Hart, A. Henglein, Sonochemistry of aqueous solutions: H2–O2 combustionin cavitation bubbles, J. Phys. Chem. 91 (1987) 3654–3656.
[49] C.F. Beaton, G.F. Hewitt, Physical Property Data for the Design Engineer,Hemisphere Publishing Corporation, New York, 1989.
[50] K. Yasui, T. Tuziuti, Y. Iida, Optimum bubble temperature for the sonochemicalproduction of oxidants, Ultrasonics 42 (2004) 579–584.
[51] P.G.T. Fogg, W. Gerrard, Solubility of Gases in Liquids, John Wiley & Sons Ltd.,Chichester, UK, 1991.
Further reading
[21] S. Merouani, O. Hamdaoui, Y. Rezgui, M. Guemini, Theoretical procedure forthe characterization of acoustic cavitation bubbles, Acta Acust. United Acust.(2014), accepted manuscript.