accurate measurement of the electro-optic coefficients: application to linbo3
TRANSCRIPT
REVIEW OF SCIENTIFIC INSTRUMENTS VOLUME 71, NUMBER 4 APRIL 2000
Accurate measurements of the electro-optic coefficients and birefringencechanges using an external modulation signal
M. Ailleriea)
Laboratoire Materiaux Optiques a` Proprietes Spe´cifiques, Centre Lorrain d’Optique et d’Electronique desSolides, Universite´ de Metz and Supelec, 57070 Metz Cedex 3, France
F. AbdiLaboratoire Materiaux Optiques a` Proprietes Spe´cifiques, Centre Lorrain d’Optique et d’Electronique desSolides, Universite´ de Metz and Supelec, 57070 Metz Cedex 3, and Laboratoire Signaux Syste`mes etComposants, Faculte´ des Sciences and Techniques, Fe`s-Saı¨ss, B.P. 2202, Maroc, France
M. D. FontanaLaboratoire Materiaux Optiques a` Proprietes Spe´cifiques, Centre Lorrain d’Optique et d’Electronique desSolides, Universite´ de Metz and Supelec, 57070 Metz Cedex 3, France
N. TheofanousDepartment of Informatics, Optoelectronics Group, University of Athens, Panepistimiopolis-Ktiria TYPA,Athens 15784, Greece
E. AbarkanLaboratoire Signaux Syste`mes et Composants, Faculte´ des Sciences and Techniques, Fe`s-Saı¨ss, B.P. 2202,Maroc, France
~Received 19 October 1999; accepted for publication 3 December 1999!
We propose a new method to measure within a high accuracy both the electro-optic properties andthe birefringence changes in bulk crystals. This technique is based upon the frequency doublingelectro-optic modulation~FDEOM! method in which an external modulator is inserted in theexperimental Se´narmont setup. We present a complete analysis of the optical response of aSenarmont setup within Jones formulation. The FDEOM method possesses as main advantages ahigh accuracy and sensitivity in the measurements due to a direct determination of the electricfield-induced phase retardation in the crystal under study. The measurements are recorded with anadjustment of the shape of the output beam at a frequency double the frequency of the ac appliedvoltage. The external modulation version of this method allows us to perform measurements with ahigher modulation depth and to avoid any additional dynamical perturbation in the electro-opticcrystal under study. Therefore, even small values of the electro-optic coefficients can be accuratelymeasured. Moreover, the new method is able to measure with a high accuracy the variations of thebirefringence in any crystal, even if it does not present an electro-optic effect. Some significativeresults in LiNbO3 point out the large advantages of the method. ©2000 American Institute ofPhysics.@S0034-6748~00!04803-6#
ifin
seenletu
msrshao
s theamesary
s,ngof
are
u-n
aw-tual
onma
I. INTRODUCTION
Different methods can be used for electro-optic~EO!characterization of bulk samples with some specparticularities.1 With respect to the optical setup, we caclass these methods in two families. The first family is baon a one beam setup~Senarmont arrangement by exampl!where the EO effect induces a phase retardation betweetwo principal components of the polarization in the sampThe second family is concerned with the two-beam se~Michelson interferometer for example!, where the EO effectinduces a phase shift in the beam passing through the saunder study with respect to the reference beam. Thankhigher output amplitude variation, the methods of the fifamily usually give more precise and accurate results tthose provided by interferometric measurements. As a c
a!Author to whom correspondence should be addressed; [email protected]
1620034-6748/2000/71(4)/1627/8/$17.00
Downloaded 10 Nov 2003 to 130.120.96.9. Redistribution subject to A
c
d
the.p
pletotnn-
sequence, the one beam setup is preferred as long adetermination of an effective EO coefficient occurring inmodulating configuration is concerned. Nevertheless in soconfigurations, interferometric measurements are necesto measure an individual component of the EO tensor.2 Now,it is well known that, among the various EO techniquedynamic ~or ac! modulation methods, based on measurithe ac component of the output signal, offer a numberadvantages when compared with static~or dc! methods espe-cially when methods based on null-detection techniquesinvolved.3
With the aim of coupling the advantages of ac EO modlation methods with those of ellipsometric null-detectiotechniques, while reducing as much as possible their drbacks, a new sensitive method was proposed by the acauthors and successfully achieved.4,5 This method, referredto as the frequency-doubling electro-optic modulati~FDEOM! method is located in a typical Se´narmont con-il:
7 © 2000 American Institute of Physics
IP license or copyright, see http://ojps.aip.org/rsio/rsicr.jsp
for
1628 Rev. Sci. Instrum., Vol. 71, No. 4, April 2000 Aillerie et al.
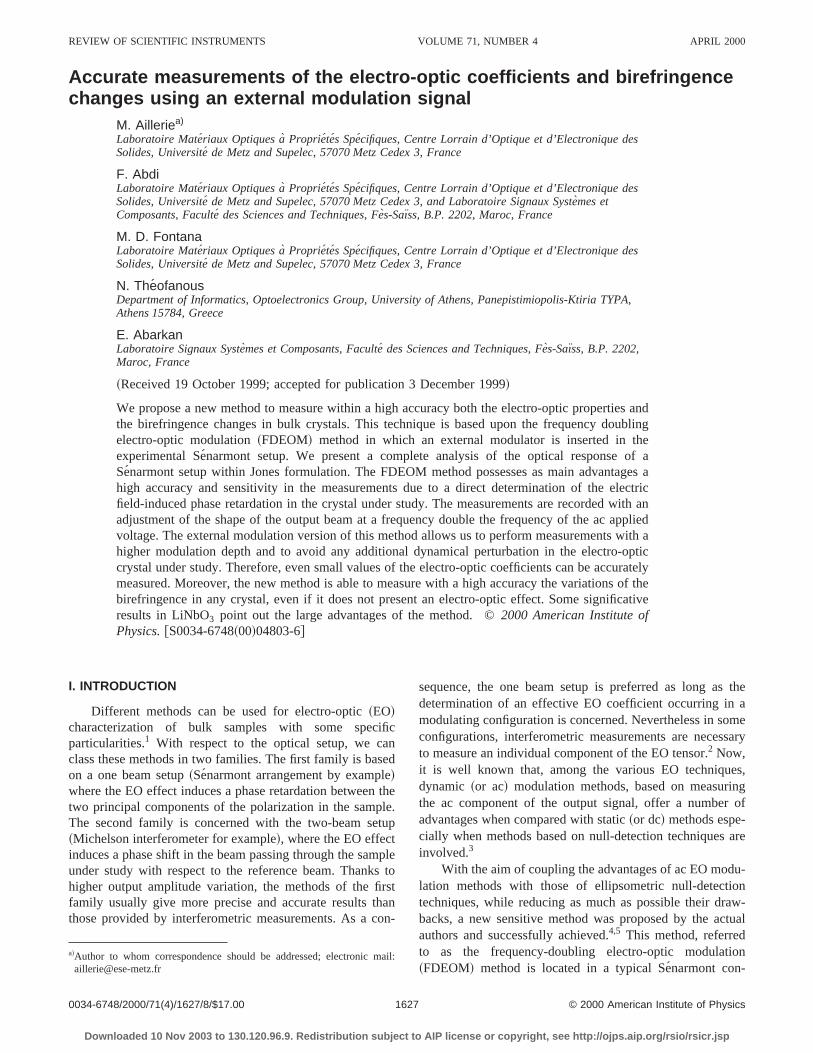
FIG. 1. Optical arrangement and plate orientationsthe basic FDEOM method.
tio
ve
dvibupeictaen
isEhiar
cfieernE
M
ththbm
ob
ge-
in-theto
ut
ix
by
y
figuration system having its sample under an ac modulavoltage, the setting of the analyzer~at the null or extinctionposition! for which a characteristic double-frequency waform appears at the photodetected output.
Surprisingly, the main limitation of the FDEOM methois not related to the optical arrangement, or to the sensitiof the photodetection system or else to the sample itselfis due to the limited performances of the power voltage sply. The main source of error in the FDEOM method arisfrom the precision in the dc induced phase retardation whshould be as large as possible. But especially for cryswith a small EO effect or sample with a small ratio betwelength ~along the beam direction! over thickness~along thevoltage direction!, the satisfactory implementation of thmethod, which yields an accurate determination of thecoefficient, needs an ac power supply that can support abias dc voltage. Actually, the commercial power supplieslimited to some hundred zero-to-peak ac volts~typically lessthan 250 Vz-p!, which corresponds to the limitation of the dbias voltage. To solve this problem, we propose a modiFDEOM method that differs from the original one, in thseparation of the ac modulation signal induced by an extemodulator inserted in the experimental setup, from the dceffect, induced in the sample under study. This methodreferred to as the external modulation version of the FDEOmethod.
The article is devoted to the general expression oftransmission factor in both techniques. For this, we useformulation in terms of the polarization states proposedJones.6 We illustrate the advantages of the new method copared with the usual FDEOM technique, from the datatained in LiNbO3 crystals.
Downloaded 10 Nov 2003 to 130.120.96.9. Redistribution subject to A
n
tyut-
shls
Oghe
d
alOis
eey--
II. THE FDEOM METHOD
The FDEOM method employs as its structural arranment, a P.S.C.A. modulator5 set in a typical Se´narmont con-figuration as depicted in Fig. 1, with the sampleS under testinserted between a linear polarizerP and a quarter-waveplateC ~C for compensator! followed by an analyzerA. Thevibration direction of the polarizerP and the principal axesof thel/4 plate are set, respectively, ata andu to the natural~without field! birefringence axesOx andOy of the sampleS. The vibration direction of the analyzerA is, however, freeto be rotated and positioned at an azimuthal angleb, mea-sured with respect to the fast axisOx of the sample. First, wewill express the transmission of such a setup.
Hereafter we discard the absolute phase retardationtroduced by the different plates of the setup because onlyrelative phase shift is driven by the EO effect. Accordingthe Jones formalism,6 the relationship between the outpstate of polarization and the input one is given by
S Ax8
Ay8D 5PbQuJ0PaS Ax
AyD , ~1!
wherePa , Pb , andQu are, respectively, the transfer matrof the polarizer, the analyzer, and the quarter wave plateJ0
those of the sample under test defined in that formalism
J05S e2 iG/2 0
0 eiG/2D ~2!
with G the total~differential! phase retardation introduced bthe sample andQu defined by
Qu5S cos2 u expS 2 ip
4 D1sin2 u expS ip
4 D cosu sinuFexpS 2 ip
4 D2expS ip
4 D Gcosu sinuFexpS 2 i
p
4 D2expS ip
4 D G sin2 u expS 2 ip
4 D1cos2 u expS ip
4 D D . ~3!
IP license or copyright, see http://ojps.aip.org/rsio/rsicr.jsp
-
-
tiole
h
ealu
ll
-
ipa-
sid-
t.entzi-
ared
ndis
tal-
-
rda-e
1629Rev. Sci. Instrum., Vol. 71, No. 4, April 2000 Electro-optic coefficient
By replacing each term of Eq.~1! by its Jones representation, we obtain
S Ax8
Ay8D 5S cos2 b sinb cosb
sinb cosb sin2 b DQuS e2 iG/2 0
0 eiG/2D3S cos2 a sina cosa
sina cosa sin2 a D S Ax
AyD . ~4!
After simplifications and normalization of the input amplitudes, this equation becomes
S Ax8
Ay8D 5S p1 p2
p3 p4D S cosa
sina D ~5!
with
p15cosb cosu cos~b2u!expF2 i S G
21
p
4 D G1cosb sinu sin~b2u!expF2 i S G
22
p
4 D G ,p25cosb sinu cos~b2u!expF i S G
22
p
4 D G2cosb cosu sin~b2u!expF i S G
21
p
4 D G ,~6!
p35sinb cosu cos~b2u!expF2 i S G
21
p
4 D G1sinb sinu sin~b2u!expF2 i S G
22
p
4 D G ,p45sinb sinu cos~b2u!expF i S G
22
p
4 D G2sinb cosu sin~b2u!expF i S G
21
p
4 D G .When we neglect the overall losses due to absorp
and reflection of the different plates, including the sampthe observed intensity of the transmitted beamI at the outputof the setup is the modulus of the complex amplitude of ligand is proportional to the input intensityI 0 . The theoreticalexpression of the optical transmissionT5I /I 0 is found to be
T5 12$11cos 2u cos 2a cos 2~b2u!1sin 2a@cos 2~b
2u!sin 2u cosG1sin 2~b2u!sinG#%. ~7!
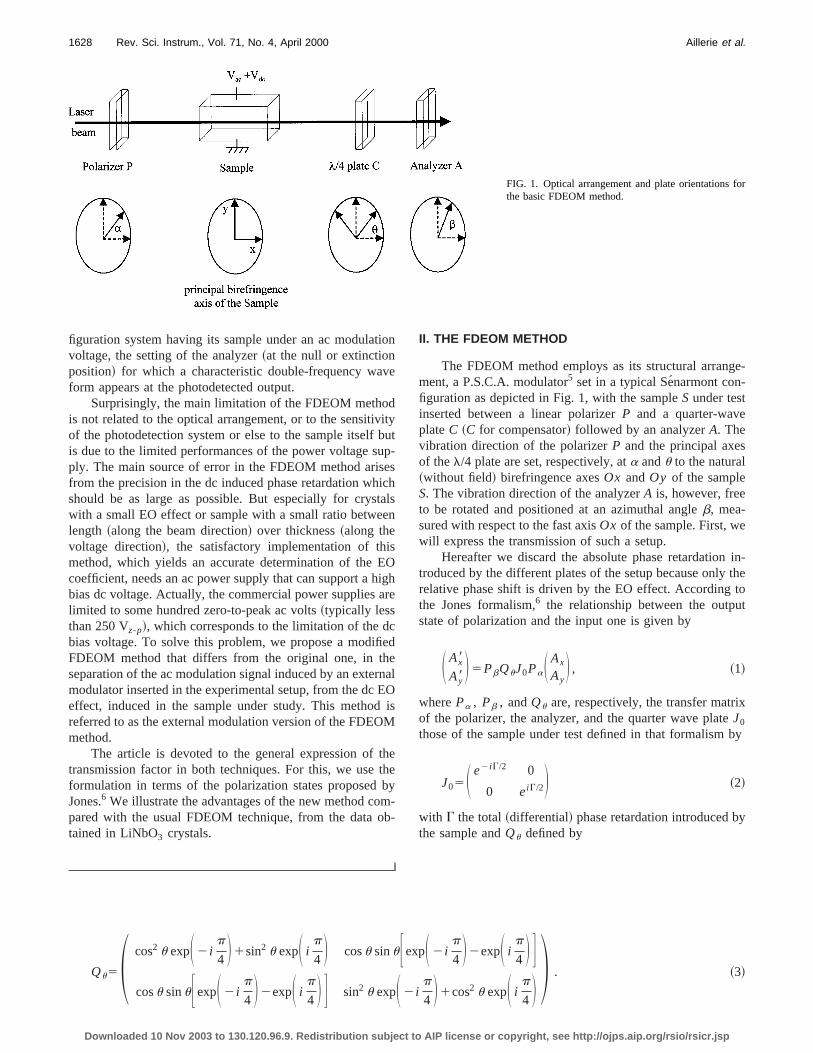
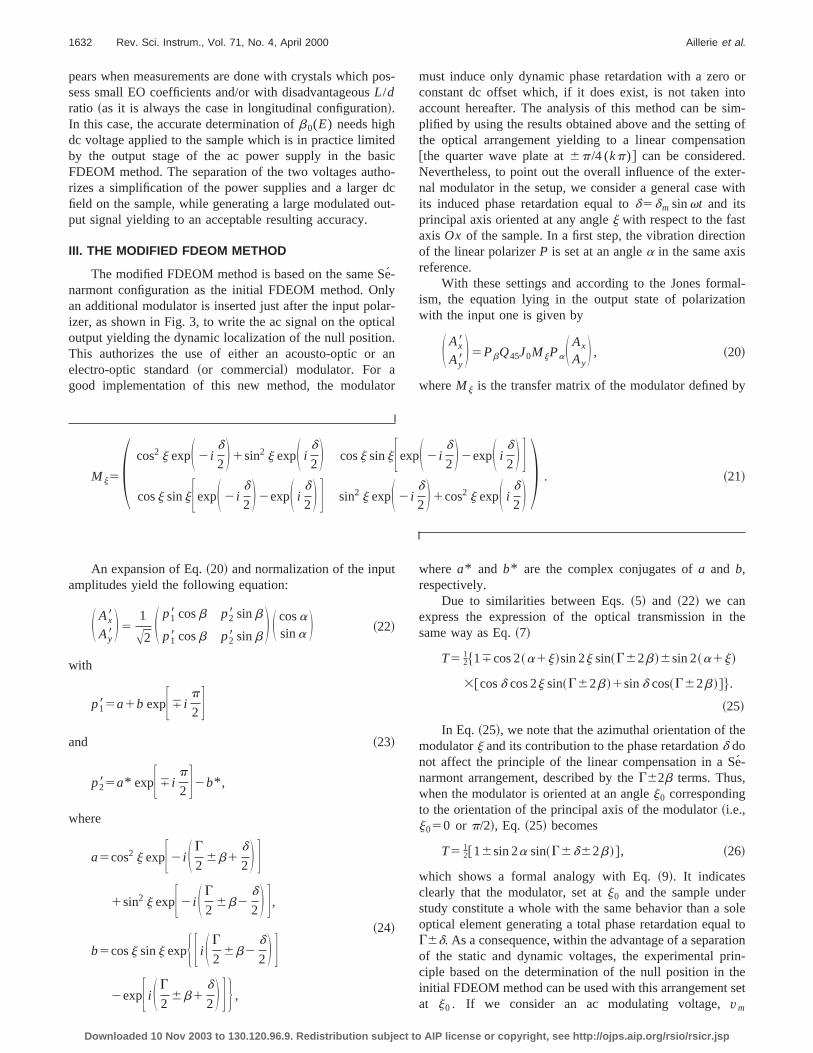
The plots of the behaviors of the optical transmissionT,defined by Eq.~7!, as a function ofG and b for differentvalues ofu whena5p/4 are reported in Fig. 2. Figures 2~a!,2~b! and 2~c! point out that foru5@0,p/4@, a variation inG iscompensated by a variation inb. These figures show that thachievement of compensation depends on the absolute vof u. For u5p/4, as shown in Fig. 2~d!, the relation betweenG andb becomes linear withdG/db5a.
The Senarmont system under consideration is generaset to obtain this linear compensation ofG by the analyzerrotation. Whatever the anglea is, we can also find the par
Downloaded 10 Nov 2003 to 130.120.96.9. Redistribution subject to A
n,
t
es
y
ticular value of u0 , which ensures the linear relationshbetweenG andb by the derivation of the transmission eqution T, Eq. ~7! with respect tob. We obtain
sin 2a$cosG sin 2~b2u0!@2 sin 2u02a#
1sinG cos 2~b2u0!@a sin 2u022#%
1cos 2a cos 2u0 sin 2~b2u0!50. ~8!
The solution of this equation is given bya52 so that theangle of thel/4 plate is given byu056p/4 (kp) andG562b. Finally, the optical transmissionT of the Senar-mont compensator when the linear compensation is conered, is given by
T5 12@16sin 2a sin~G62b!#. ~9!
The optimum value fora is given in Eq.~9! when sin 2a561 corresponding toa56p/4 (kp) so thatT is expressedas
T5 12@16sin~G62b!#. ~10!
Equation~10! is the basic formula3 for the determinationof the phase shiftG leading to the electro-optic coefficienusing an optical bench setting in the Se´narmont compensatorA characteristic operating position of the optical arrangemgiven T50 is achieved when the analyzer is set at an amuthal angle
b5b0561
2 Fp2 1GG1kp, k50,61,62,... . ~11!
Generally, when the EO sample exhibits the line~Pockels! EO effect, its total birefringence can be expressas
Dn5Dn~0!1Dn~E!, ~12!
whereDn(0) is the natural or spontaneous birefringence aDn(E) is the field-induced birefringence, which if small,given by
Dn~E!5n3rE
2~13!
with r denotes the effective EO coefficient of the crysunder the orientation considered andn the appropriate natural refractive index of the crystal.
E is the result of a dc testing voltage, that meansVdc inseries with an ac modulating voltage,vm5Um sinvmt ap-plied onto the sample by taking into account thatE5V/d~where d is the electrode spacing!. Under these considerations, the total phase retardationG of the sample with thewell known relation G5(2pL/l0)Dn ~L is the samplelength along the light path andl0 is the light wavelength invacuum! will be modulated according to
G5G81Gm sinvmt, ~14!
where the second term corresponds to the dynamic retation and whereG8 is the total static retardation equal to thsum
G85G~0!1Gdc. ~15!
IP license or copyright, see http://ojps.aip.org/rsio/rsicr.jsp
1630 Rev. Sci. Instrum., Vol. 71, No. 4, April 2000 Aillerie et al.
FIG. 2. Optical transmissionT vs G andb for a5p/4 represented for different azimuthal orientationsu of thel/4 plate:~a! u50, ~b! u50.2p/4, ~c! u50.6p/4,~d! u5p/4. The linear compensation can be achieved only in this last configuration.
Downloaded 10 Nov 2003 to 130.120.96.9. Redistribution subject to AIP license or copyright, see http://ojps.aip.org/rsio/rsicr.jsp
cr
enrrb
hee
l
befgi-e
ini
hthnt
am-
ec-emion.lowis-
hastalsa
riza-al-ta-
EO
-nse-
thecaltheofhen
edo-epa-geula-edhey toap-
1631Rev. Sci. Instrum., Vol. 71, No. 4, April 2000 Electro-optic coefficient
In Eqs. ~14! and ~15!, G~0! is the natural retardation@G(0)5(2pL/l0)Dn(0)# andGdc is the dc bias retardation~due to the testing voltageVdc! given by
Gdc5S r
ADVdc ~16!
andGm is the amplitude of the ac retardation component~dueto the modulating voltagevm! given by
Gm5S r
ADUm . ~17!
In the above equations,A is the sample characteristiconstant depending on the crystal size dimensions andfractive indices; it is expressed as
A5l0d
pn3L. ~18!
In the case of an analyzer setting atb0 defined in Eq.~11!, the amplitude of the fundamental frequency componof the transmitted intensity beam vanishes and the cosponding amplitude of the second-harmonic componentcomes maximum and equal to
I 2m5I 0
2
Gm2
4. ~19!
Then, the determination of the phase retardationG8, re-sulting from natural and/or induced birefringence of tsample, and thereupon the EO coefficients, needs the msurement of the azimuthb0 at the frequency doubling nulposition and then applying Eq.~16! solved forG8.
The frequency doubling null position can accuratelylocated by observing the appearance and the shape ooutput wave formU2m8 on an oscilloscope screen, resultinfrom the amplification ofI 2m by a photodetecting and possbly a band pass filter system. Due to the direct measuremof the dc electric field induced retardation by Eq.~16! and asdeveloped in Ref. 5 the FDEOM method can offer ancreased sensitivity and improved accuracy compared wthe usual intensity measurement methods. Especially, wthe sample under study exhibits a large EO coefficient inconsidered configuration, or a small characteristic constaA
Downloaded 10 Nov 2003 to 130.120.96.9. Redistribution subject to A
e-
te-e-
a-
the
nt
-thene
due by example to an advantageous ratioL/d @see Eq.~18!#the overall response of the optical setup allows a largeplitude of I 2m and thus the response appears with a largev2m8in comparison to the amplitude of the transmitted optoeltronic noise. Indeed,b0 corresponds to the location of thnull position where the dc transmitted intensity is minimuor equal to zero, which leads to an extensive noise reductFor such crystals, one can apply to the sample only aamplitude of the ac voltage sufficient to induce a clear dcrimination of the observedv2m8 , which yields an acceptableresulting accuracy in theb0 location. In addition, due to thefavorable sample optogeometric properties, a largeGdc canbe induced by the applied voltageVdc and the overall accu-racy in the determination ofr is thus increased. The FDEOMmethod implemented in an appropriate automated systembeen suitably used for EO measurements in different crysas KDP, BaTiO3 , LiNbO3,..., .7–9 These crystals possesshigh number of advantages as far as their EO charactetion is concerned. Their growths are perfectly masteredlowing us to produce large samples with possible advangeous ratioL/d ~L/d possibly equals 10! when transverseconfiguration is used. In addition they possess quite largecoefficients in the magnitude of 10 pm/V.
Two main limitations in EO measurements~especially intransverse configuration! arise from the photorefractive effect and the weakness of the domain structure. As a coquence, a lot of precautions have to be taken concerningsense and the amplitude of the applied voltage. A critiexperimental situation occurs when the compensation ofnatural birefringence is achieved by the azimuthal locationthe analyzer at the null position and, as a consequence, wthe amplitude of the ac applied voltageUm is higher than thedc oneVdc. In some materials with low coercitive field, thvoltage can thus induce a reversal of the ferroelectricmains. To prevent this phenomenon, it is necessary to srate the two voltages by the application of the sole dc voltaonto the sample and the ac voltage onto an external modtor inserted in the setup. This limitation leads to a modifiversion of the FDEOM method, which is hereafter called texternal modulation version. In addition, another necessitmeasure EO coefficients with an external ac modulation
ford.
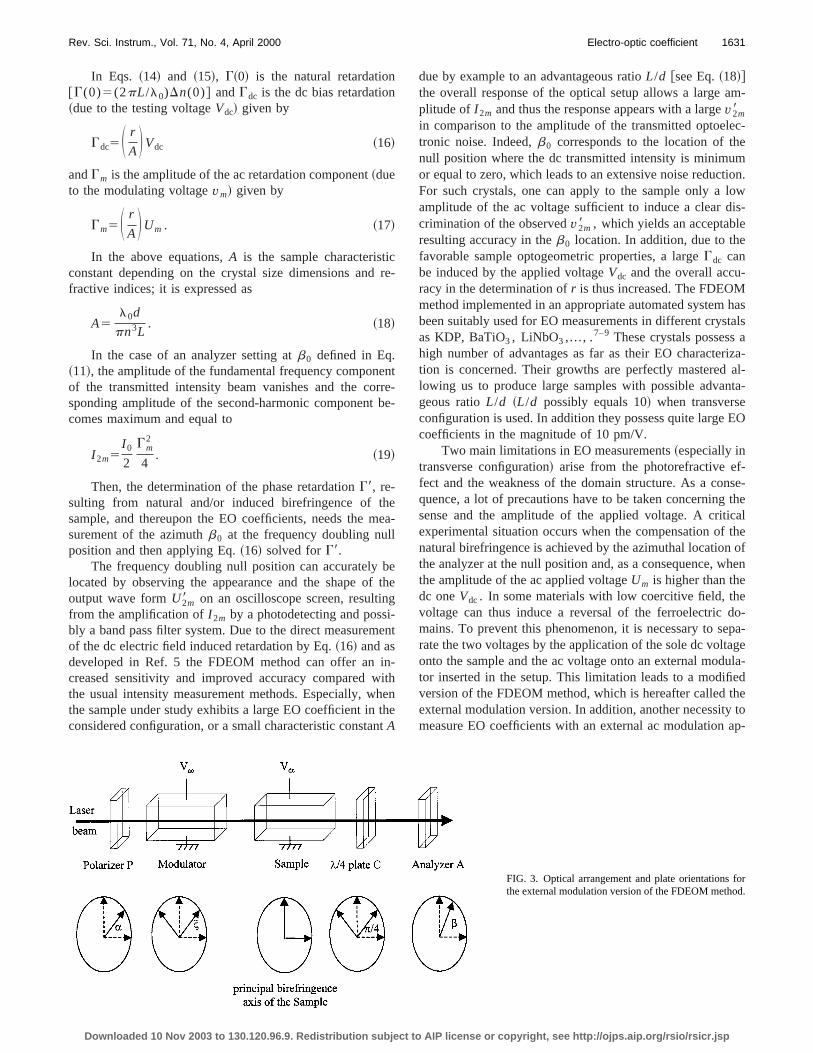
FIG. 3. Optical arrangement and plate orientationsthe external modulation version of the FDEOM metho
IP license or copyright, see http://ojps.aip.org/rsio/rsicr.jsp
po
n
edshodu
Sly
larcan.a
to
ortoim-of
ion.er-with
tn
al-on
y
1632 Rev. Sci. Instrum., Vol. 71, No. 4, April 2000 Aillerie et al.
pears when measurements are done with crystals whichsess small EO coefficients and/or with disadvantageousL/dratio ~as it is always the case in longitudinal configuratio!.In this case, the accurate determination ofb0(E) needs highdc voltage applied to the sample which is in practice limitby the output stage of the ac power supply in the baFDEOM method. The separation of the two voltages autrizes a simplification of the power supplies and a largerfield on the sample, while generating a large modulated oput signal yielding to an acceptable resulting accuracy.
III. THE MODIFIED FDEOM METHOD
The modified FDEOM method is based on the same´-narmont configuration as the initial FDEOM method. Onan additional modulator is inserted just after the input poizer, as shown in Fig. 3, to write the ac signal on the optioutput yielding the dynamic localization of the null positioThis authorizes the use of either an acousto-optic orelectro-optic standard~or commercial! modulator. For agood implementation of this new method, the modula
t
Downloaded 10 Nov 2003 to 130.120.96.9. Redistribution subject to A
s-
ic-ct-
e
-l
n
r
must induce only dynamic phase retardation with a zeroconstant dc offset which, if it does exist, is not taken inaccount hereafter. The analysis of this method can be splified by using the results obtained above and the settingthe optical arrangement yielding to a linear compensat@the quarter wave plate at6p/4 (kp)# can be consideredNevertheless, to point out the overall influence of the extnal modulator in the setup, we consider a general caseits induced phase retardation equal tod5dm sinvt and itsprincipal axis oriented at any anglej with respect to the fasaxis Ox of the sample. In a first step, the vibration directioof the linear polarizerP is set at an anglea in the same axisreference.
With these settings and according to the Jones formism, the equation lying in the output state of polarizatiwith the input one is given by
S Ax8
Ay8D 5PbQ45J0M jPaS Ax
AyD , ~20!
whereM j is the transfer matrix of the modulator defined b
M j5S cos2 j expS 2 id
2D1sin2 j expS id
2D cosj sinjFexpS 2 id
2D2expS id
2D Gcosj sinjFexpS 2 i
d
2D2expS id
2D G sin2 j expS 2 id
2D1cos2 j expS id
2D D . ~21!
the
e
e
role
al totion
rin-heset
An expansion of Eq.~20! and normalization of the inpuamplitudes yield the following equation:
S Ax8
Ay8D 5
1
A2S p18 cosb p28 sinb
p18 cosb p28 sinbD S cosa
sina D ~22!
with
p185a1b expF7 ip
2 Gand ~23!
p285a* expF7 ip
2 G2b* ,
where
a5cos2 j expF2 i S G
26b1
d
2D G1sin2 j expF2 i S G
26b2
d
2D G ,~24!
b5cosj sinj expH F i S G
26b2
d
2D G2expF i S G
26b1
d
2D G J ,
where a* and b* are the complex conjugates ofa and b,respectively.
Due to similarities between Eqs.~5! and ~22! we canexpress the expression of the optical transmission insame way as Eq.~7!
T5 12$17cos 2~a1j!sin 2j sin~G62b!6sin 2~a1j!
3@cosd cos 2j sin~G62b!1sind cos~G62b!#%.
~25!
In Eq. ~25!, we note that the azimuthal orientation of thmodulatorj and its contribution to the phase retardationd donot affect the principle of the linear compensation in a S´-narmont arrangement, described by theG62b terms. Thus,when the modulator is oriented at an anglej0 correspondingto the orientation of the principal axis of the modulator~i.e.,j050 or p/2!, Eq. ~25! becomes
T5 12@16sin 2a sin~G6d62b!#, ~26!
which shows a formal analogy with Eq.~9!. It indicatesclearly that the modulator, set atj0 and the sample undestudy constitute a whole with the same behavior than a soptical element generating a total phase retardation equG6d. As a consequence, within the advantage of a separaof the static and dynamic voltages, the experimental pciple based on the determination of the null position in tinitial FDEOM method can be used with this arrangementat j0 . If we consider an ac modulating voltage,vm
IP license or copyright, see http://ojps.aip.org/rsio/rsicr.jsp
re
heo
ee
rca
th
e
nedt
an
nemthn
cs
nsis,
ewve
the
eeda-an
ially
and
-t to
to
1633Rev. Sci. Instrum., Vol. 71, No. 4, April 2000 Electro-optic coefficient
5Umsinvmt applied onto the modulator, the total phasetardation of the setup, Eq.~14!, will be modulated accordingto
G5G81dm sinvmt, ~27!
with G8 defined by Eq.~15!.For a general orientation of the modulator and of t
input beam polarization, i.e., for any azimuthal orientationthe modulator and polarizer,j and a, the amplitude of thesecond-harmonic component of the ac modulating voltagthe null position, Eq.~19! obtained by adjustment of thanalyzer, is rewritten as
I 2m5I 0
2
dm2
4cos 2j sin 2~a1j!. ~28!
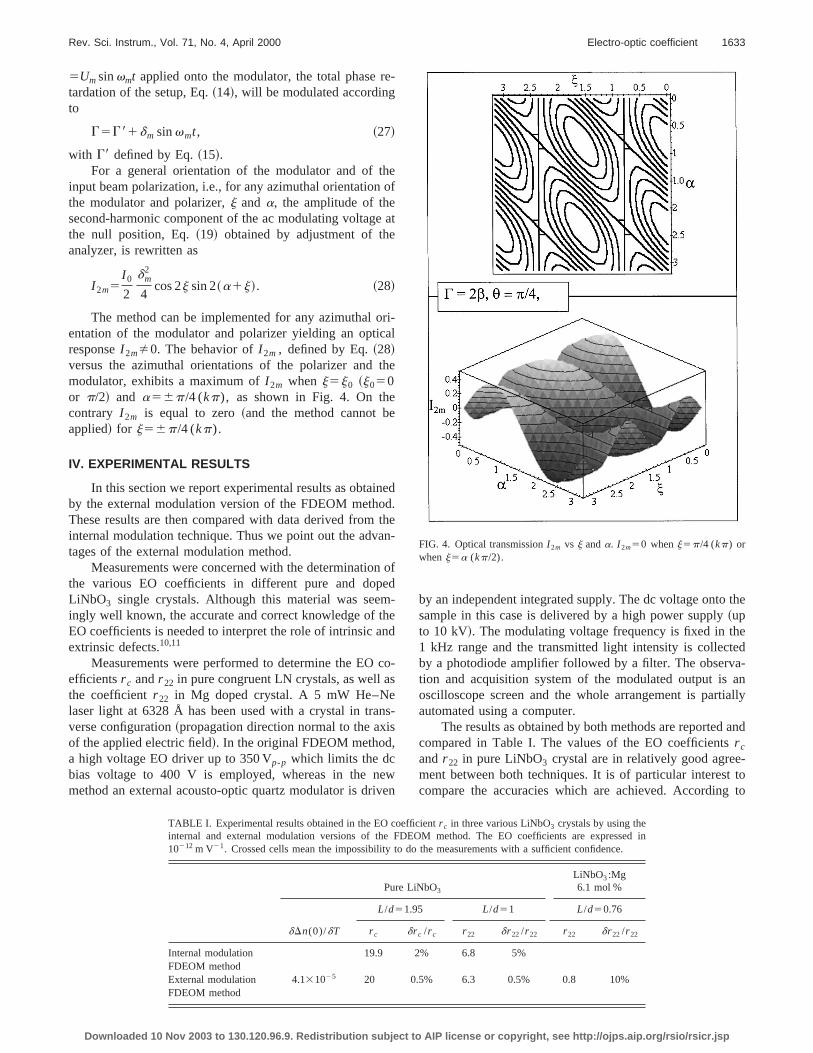
The method can be implemented for any azimuthal oentation of the modulator and polarizer yielding an optiresponseI 2mÞ0. The behavior ofI 2m , defined by Eq.~28!versus the azimuthal orientations of the polarizer andmodulator, exhibits a maximum ofI 2m when j5j0 ~j050or p/2! and a56p/4 (kp), as shown in Fig. 4. On thecontrary I 2m is equal to zero~and the method cannot bapplied! for j56p/4 (kp).
IV. EXPERIMENTAL RESULTS
In this section we report experimental results as obtaiby the external modulation version of the FDEOM methoThese results are then compared with data derived frominternal modulation technique. Thus we point out the advtages of the external modulation method.
Measurements were concerned with the determinatiothe various EO coefficients in different pure and dopLiNbO3 single crystals. Although this material was seeingly well known, the accurate and correct knowledge ofEO coefficients is needed to interpret the role of intrinsic aextrinsic defects.10,11
Measurements were performed to determine the EOefficientsr c andr 22 in pure congruent LN crystals, as well athe coefficientr 22 in Mg doped crystal. A 5 mW He–Nelaser light at 6328 Å has been used with a crystal in traverse configuration~propagation direction normal to the axof the applied electric field!. In the original FDEOM methoda high voltage EO driver up to 350 Vp-p which limits the dcbias voltage to 400 V is employed, whereas in the nmethod an external acousto-optic quartz modulator is dri
Downloaded 10 Nov 2003 to 130.120.96.9. Redistribution subject to A
-
f
at
i-l
e
d.he-
ofd-ed
o-
-
n
by an independent integrated supply. The dc voltage ontosample in this case is delivered by a high power supply~upto 10 kV!. The modulating voltage frequency is fixed in th1 kHz range and the transmitted light intensity is collectby a photodiode amplifier followed by a filter. The observtion and acquisition system of the modulated output isoscilloscope screen and the whole arrangement is partautomated using a computer.
The results as obtained by both methods are reportedcompared in Table I. The values of the EO coefficientsr c
and r 22 in pure LiNbO3 crystal are in relatively good agreement between both techniques. It is of particular interescompare the accuracies which are achieved. According
FIG. 4. Optical transmissionI 2m vs j anda. I 2m50 whenj5p/4 (kp) orwhenj5a (kp/2).
sed in.
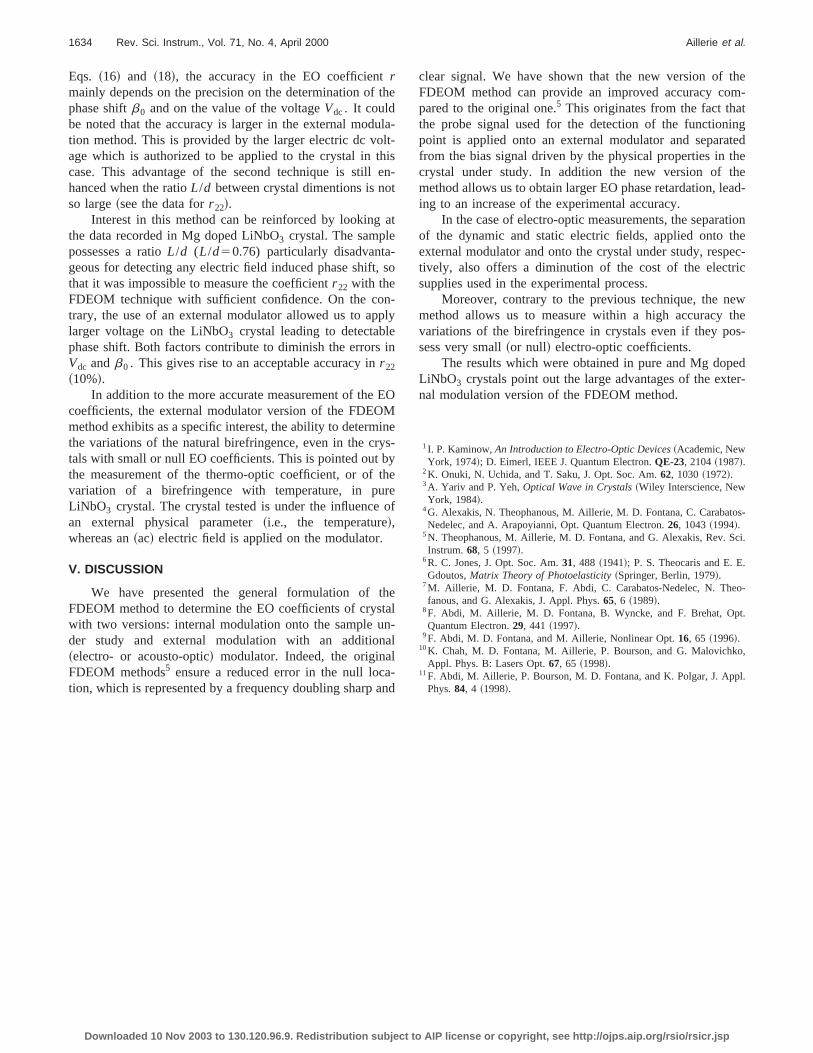
TABLE I. Experimental results obtained in the EO coefficientr c in three various LiNbO3 crystals by using theinternal and external modulation versions of the FDEOM method. The EO coefficients are expres10212 m V21. Crossed cells mean the impossibility to do the measurements with a sufficient confidence
Pure LiNbO3
LiNbO3:Mg6.1 mol %
dDn(0)/dT
L/d51.95 L/d51 L/d50.76
r c dr c /r c r 22 dr 22 /r 22 r 22 dr 22 /r 22
Internal modulationFDEOM method
19.9 2% 6.8 5%
External modulationFDEOM method
4.131025 20 0.5% 6.3 0.5% 0.8 10%
IP license or copyright, see http://ojps.aip.org/rsio/rsicr.jsp
th
ullthiet
a
-, s
npe
i
EMinysy
threo
thtanala-an
them-tingted
thehead-
tionheec-
ic
ewthes-
edter-
os-
ci.
.
o-
t.
o,
l.
1634 Rev. Sci. Instrum., Vol. 71, No. 4, April 2000 Aillerie et al.
Eqs. ~16! and ~18!, the accuracy in the EO coefficientrmainly depends on the precision on the determination ofphase shiftb0 and on the value of the voltageVdc. It couldbe noted that the accuracy is larger in the external modtion method. This is provided by the larger electric dc voage which is authorized to be applied to the crystal in tcase. This advantage of the second technique is stillhanced when the ratioL/d between crystal dimentions is noso large~see the data forr 22!.
Interest in this method can be reinforced by lookingthe data recorded in Mg doped LiNbO3 crystal. The samplepossesses a ratioL/d (L/d50.76) particularly disadvantageous for detecting any electric field induced phase shiftthat it was impossible to measure the coefficientr 22 with theFDEOM technique with sufficient confidence. On the cotrary, the use of an external modulator allowed us to aplarger voltage on the LiNbO3 crystal leading to detectablphase shift. Both factors contribute to diminish the errorsVdc andb0 . This gives rise to an acceptable accuracy inr 22
~10%!.In addition to the more accurate measurement of the
coefficients, the external modulator version of the FDEOmethod exhibits as a specific interest, the ability to determthe variations of the natural birefringence, even in the crtals with small or null EO coefficients. This is pointed out bthe measurement of the thermo-optic coefficient, or ofvariation of a birefringence with temperature, in puLiNbO3 crystal. The crystal tested is under the influencean external physical parameter~i.e., the temperature!,whereas an~ac! electric field is applied on the modulator.
V. DISCUSSION
We have presented the general formulation ofFDEOM method to determine the EO coefficients of cryswith two versions: internal modulation onto the sample uder study and external modulation with an addition~electro- or acousto-optic! modulator. Indeed, the originaFDEOM methods5 ensure a reduced error in the null loction, which is represented by a frequency doubling sharp
Downloaded 10 Nov 2003 to 130.120.96.9. Redistribution subject to A
e
a--sn-
t
o
-ly
n
O
e-
e
f
el-l
d
clear signal. We have shown that the new version ofFDEOM method can provide an improved accuracy copared to the original one.5 This originates from the fact thathe probe signal used for the detection of the functionpoint is applied onto an external modulator and separafrom the bias signal driven by the physical properties incrystal under study. In addition the new version of tmethod allows us to obtain larger EO phase retardation, leing to an increase of the experimental accuracy.
In the case of electro-optic measurements, the separaof the dynamic and static electric fields, applied onto texternal modulator and onto the crystal under study, resptively, also offers a diminution of the cost of the electrsupplies used in the experimental process.
Moreover, contrary to the previous technique, the nmethod allows us to measure within a high accuracyvariations of the birefringence in crystals even if they posess very small~or null! electro-optic coefficients.
The results which were obtained in pure and Mg dopLiNbO3 crystals point out the large advantages of the exnal modulation version of the FDEOM method.
1I. P. Kaminow,An Introduction to Electro-Optic Devices~Academic, NewYork, 1974!; D. Eimerl, IEEE J. Quantum Electron.QE-23, 2104~1987!.
2K. Onuki, N. Uchida, and T. Saku, J. Opt. Soc. Am.62, 1030~1972!.3A. Yariv and P. Yeh,Optical Wave in Crystals~Wiley Interscience, NewYork, 1984!.
4G. Alexakis, N. Theophanous, M. Aillerie, M. D. Fontana, C. CarabatNedelec, and A. Arapoyianni, Opt. Quantum Electron.26, 1043~1994!.
5N. Theophanous, M. Aillerie, M. D. Fontana, and G. Alexakis, Rev. SInstrum.68, 5 ~1997!.
6R. C. Jones, J. Opt. Soc. Am.31, 488 ~1941!; P. S. Theocaris and E. EGdoutos,Matrix Theory of Photoelasticity~Springer, Berlin, 1979!.
7M. Aillerie, M. D. Fontana, F. Abdi, C. Carabatos-Nedelec, N. Thefanous, and G. Alexakis, J. Appl. Phys.65, 6 ~1989!.
8F. Abdi, M. Aillerie, M. D. Fontana, B. Wyncke, and F. Brehat, OpQuantum Electron.29, 441 ~1997!.
9F. Abdi, M. D. Fontana, and M. Aillerie, Nonlinear Opt.16, 65 ~1996!.10K. Chah, M. D. Fontana, M. Aillerie, P. Bourson, and G. Malovichk
Appl. Phys. B: Lasers Opt.67, 65 ~1998!.11F. Abdi, M. Aillerie, P. Bourson, M. D. Fontana, and K. Polgar, J. App
Phys.84, 4 ~1998!.
IP license or copyright, see http://ojps.aip.org/rsio/rsicr.jsp