accounting for taste heterogeneity in purchase channel intention modeling: an example from northern...
TRANSCRIPT

* Corresponding author, T: +1 530 220-5508, [email protected] † T: +1 530 752-7062, F: + 1 530 752-7872, [email protected]
Accounting for Taste Heterogeneity in Purchase Channel Intention Modeling:
An Example from Northern California for Book
Purchases
Wei (Laura) Tang1,*
Patricia L. Mokhtarian1,†
1University of California, Davis, Institute of Transportation Studies,
One Shields Avenue, Davis, CA 95616, U.S.A.
Received 14 January 2009, revised version received 13 July 2009, accepted 1 October 2009
Abstract
This study uses latent class modeling (LCM) to explore the effects of channel-
specific perceptions, along with other variables, on purchase channel intention.
Using data on book purchases collected from an Internet-based survey of two
university towns in Northern California, we develop a latent class model with two
segments (final N=373). Age turns out to be the only observed determinant of class
membership, and in the intention model, the mostly-younger segment is more cost-
sensitive and the mostly-older segment appears to be more convenience-sensitive.
The results clearly demonstrate the effects on purchase intention of channel-
specific perceptions, purchase experience, context and sociodemographics.
Comparing the LCM to the unsegmented model and to models deterministically
segmented on age indicates that the LCM is slightly better from the statistical
perspective, but arguably weaker from the conceptual perspective. However, a
model that interacts age with the explanatory variables in the conventional
unsegmented model outperforms all the others (though not overwhelmingly so),
including the LCM. Thus, our results suggest that using LCM as an initial stage in
model exploration allows us to more intelligently specify a model where the taste
heterogeneity is (potentially) specified deterministically in the end, which often
yields a more parsimonious model, and may in fact fit the data better.
Keywords: Internet/online shopping, store shopping, taste heterogeneity, latent
class model, market segmentation
Journal of Choice Modelling, 2(2), pp 148-172
www.jocm.org.uk

Tang, W. and Mokhtarian, P. L., Journal of Choice Modelling, 2(2), pp. 148-172
149
1 Introduction
As an alternative channel to traditional store shopping, Internet shopping has been
steadily increasing for the last decade. According to US Census Bureau data1, Internet-
based retail sales in the US constituted about 1.0% of total retail sales2 in 2001 and
1.9% of total retail sales in 2004. By 2006, online retail, at $100.1 billion, accounted
for 2.6% of total retail sales. Online purchases of the product type of particular interest
to the present study are also increasing. Specifically, the percentage of retail spending
on books, music, and videos that takes place online has nearly doubled in five years,
from 7.7% in 2001 to 14.6% in 20063. It is predicted that online retail sales (excluding
travel) will reach $184.4 billion in 2008, rising to $271.1 billion in 20114. Compared
to traditional store shopping, the steadily rising trend of online retail sales and the
confident predictions of how intensively online shopping (also known as e-shopping)
will be adopted in the future make it increasingly important to understand more about
the circumstances under which it is adopted, and its potential impacts on other
activities, such as travel.
Although many studies of e-shopping intention have appeared in the marketing
research literature, most of them have at least one of two deficiencies: (1) they tend to
focus only on the perceptions of the internet (e.g. Ahn et al. 2004), or at best a directly
comparative judgment of the internet relative to stores (e.g. Farag et al. 2006)5; and
(2) the perceptions are typically gathered without regard to product type, which can
yield vague or inconsistent results since it may overstate or understate consumers‟ e-
shopping intention and fail to identify explanatory variables that are important to some
product types but not others. With respect to these issues, in this study, we separately
capture people‟s perceptions of Internet and store (as well as catalog, which is not
included in the present paper). In addition, we explicitly focus on a specific product
category: book/CD/DVD/videotape (henceforth “book”).
Besides the improvements in the above two respects, this paper offers two other
distinctive contributions. (1) We examine a rich set of explanatory variables, including
general shopping-related attitudes, channel-specific perceptions, shopping experience,
Internet usage and sociodemographics. Although subsets of most of these variables
have been used in one or another study, the combined availability of all of them is
virtually unique. (2) We explore the development of latent class models (LCMs, where
1 Source: http://www.census.gov/compendia/statab/tables/08s1015.pdf and
http://www.census.gov/compendia/statab/tables/08s1022.pdf, accessed Dec. 1, 2008. 2 Excluding food service.
3 Table 1022, http://www.census.gov/compendia/statab/tables/08s1022.pdf, accessed Dec. 1, 2008.
4 http://www.census.gov/compendia/ statab/tables/08s1021.pdf, accessed Dec. 1, 2008.
5 In principle, for discrete choice models such as those we are exploring here, “only differences
in utility in matter” (Train 2009, p. 19), and in fact, in this study we only analyze perception
differences even though we measured perceptions separately for each channel. In general,
however: (1) Understanding individual channel perceptions is also of interest in its own right.
If a perception difference between channels is zero, it matters whether both perceptions are
highly positive, or both are highly negative: in the latter case, there is the opportunity for one
channel to gain a competitive advantage by improving how it is perceived on that dimension.
(2) The empirical existence of alternative-specific coefficients testifies that the same
explanatory variable can be weighted differently in a utility function depending on the
alternative with which it is associated (as we are finding to be the case for further e-shopping
modeling work in progress). Testing this possibility is precluded if the variable is only
measured in “difference” or relative form, not separately for each channel.

Tang, W. and Mokhtarian, P. L., Journal of Choice Modelling, 2(2), pp. 148-172
150
the “M” can refer to “model” or “modeling”, depending on the context) of intended
purchase channel. LCM postulates the existence of different market segments, which
place different importance weights on the variables explaining choice. The segment
membership of a given person is not known (hence, “latent”), but can be predicted on
the basis of a separate class membership model, with explanatory variables of its own.
The choice6 model is estimated simultaneously with the class membership model, and
the classes are defined specifically so as to best discriminate between different market
segments with respect to the choice in question. Thus, LCM is theoretically superior to
the conventional deterministic two-stage market segmentation approach, in which
cluster analysis (or some other deterministic rule) is first applied to identify different
segments (but where the resulting segments may not be the best segments with respect
to the choice of interest), and then discrete choice models are estimated for each
segment separately. To investigate whether LCM is also superior from a practical
standpoint, we will conduct a partial comparison of the two approaches. In addition,
we will use the LCM results to improve the unsegmented conventional model, and
compare those two models.
The organization of the paper is as follows. The next section briefly reviews
previous related research. The subsequent section describes data collection, the survey
contents and variables used in this study. We then introduce the methodology we used
and explain the model results, followed by comparisons of our best LCM with five
deterministically-segmented choice models and an unsegmented model with interac-
tion terms. The last section offers some concluding remarks and future research
directions.
2 Literature Review
Numerous studies have analyzed e-shopping intention in the past decade. Many
different methodologies have been used to conduct the research, such as discriminant
analysis (Phau and Poon 2000), ANOVA and t-tests (Van den Poel and Leunis 1999),
regression (Liao and Cheung 2001; Belanger et al. 2002), structural equation modeling
(SEM) (Shim et al. 2001; Chen and Tan 2004), and binary logit (BL) modeling (Van
den Poel and Buckinx 2005). However, we are not aware of other applications of
LCM to e-shopping intention so far.
As early as 1968, Haley pointed out that “the benefits which people are seeking in
consuming a given product are the basic reasons for the existence of true market
segments” (p. 31). Three years later, Darden and Reynolds (1971) found significant
differences with respect to consumers‟ shopping orientations, supporting Stone‟s
(1954) classification of shoppers as economic, personalizing, ethical or apathetic.
These studies suggested the necessity of considering shopper segments “by their
preferences for the alternative benefits they obtain from shopping” (Tauber 1972, p.
49). Mokhtarian (2004) also advocated that when modeling e-shopping adoption
behavior as affected by a variety of factors, we should “seek to identify segments of
the population that have distinct [tastes] among those factors” (p. 263). As a tool for
market segmentation, the latent class model has been used extensively in the
marketing research literature (Greene 2003; Louviere et al. 2005), and to a lesser
extent in the transportation field out of which this study arose (Walker and Li 2007).
6 Although there is a difference between a revealed choice and a stated intention, in this paper
we will often use the word “choice” interchangeably with “intention”, in view of the fact that
the choice of interest to this study is the choice of intended purchase channel.

Tang, W. and Mokhtarian, P. L., Journal of Choice Modelling, 2(2), pp. 148-172
151
In the remainder of this section, we briefly review selected studies from each field in
turn.
In the context of seeking latent predisposition segments with respect to retail
store format (e.g. hypermarket, supermarket, and local discount store) selection,
Gonzalez-Benito (2004) found that various segments exist. He assumed a discrete
probability distribution for response parameters (just as the semi-parametric LCM
approach does), based on the conclusion from the study of Chintagunta et al. (1991)
that segmenting the population by a family of response parameters (corresponding to
the coefficients of the segmentation variables of our study) is more suitable than
relying on a prior distribution assumption (as mixed logit modeling does). Bhatnagar
and Ghose (2004) segmented a sample of national survey data collected online, based
on respondents‟ perceptions of the benefits and risks of Internet shopping. The LCM
approach was used to identify the latent segments and the results largely supported
their hypotheses that the importance placed on the two dimensions of risk (product
risk vs. security risk) vary across segments (specifically, they hypothesized that the
importance of product risk would decrease with age and Internet experience and that
of security risk would decrease with education).
With respect to travel/activity-oriented studies, Bhat (1997) applied an
endogenous segmentation approach to model mode choice on a Canadian intercity
travel dataset (N=3593); the multinomial-logit based Expectation-Maximization
algorithm was used in his study. The results show that the endogenous segmentation
model fits the data best and yields more reasonable and interpretable results compared
to other approaches (i.e. refined utility function specification models and limited-
dimensional exogenous segmentation models). Greene and Hensher (2003) proposed a
semi-parametric extension of the multinomial logit (MNL) model (based on the latent
class formulation), and then compared it with the fully parametric mixed logit model.
The comparison was performed in an application to the choice of long distance car
travel by three road types in New Zealand, and the results revealed both merits and
limitations of both models. The LCM frees the researcher from the necessity of
making possibly unwarranted distributional assumptions about the population hetero-
geneity, but can only accommodate a finite (small) number of segments, while the
mixed logit model (MLM) allows infinite variability in individuals‟ unobserved
heterogeneity. Thus to some degree the flexibility of the MLM specification offsets
the distributional assumptions required, and the study did not certify either approach
as unambiguously preferred.
Kemperman and Timmermans (2006) used diary data from 803 residents living in
the Eindhoven region in the Netherlands to identify their leisure activity patterns and
in turn to analyze the relationship between leisure activity participation and character-
istics of the built environment, controlling for sociodemographic characteristics. Four
latent segments were identified: low frequency recreational users, traditionalists, urban
cultural participants and club recreationers. Besides sociodemographic characteristics
(gender and education level), the degree of urbanization and green space accessibility
were also found significant to segment discrimination.
Walker and Li (2007) conducted latent class choice modeling on stated prefer-
ence data obtained from a household activity and travel behavior survey (conducted in
Portland, Oregon in 1994), to represent the effect of heterogeneous lifestyles on resi-
dential location choice. Their final model segmented the population into three latent
classes, which they referred to as suburban dwellers, urban dwellers and transit-riders
(in terms of their attitudinal orientations). Their research provided a behavioral model
for understanding the relationship of lifestyle and residential location selection, and

Tang, W. and Mokhtarian, P. L., Journal of Choice Modelling, 2(2), pp. 148-172
152
also demonstrated the potential of LCM in “uncovering discrete heterogeneity of
lifestyle preferences” (p. 21).
These studies demonstrate that the LCM approach has been used in many appli-
cations. They provide basic knowledge and help us understand the fundamental model
structure and application, as well as in which contexts it is suitable to be used. Our
approach is similar to the studies of Bhat (1997) and Walker and Li (2007), but we use
a totally different dataset to model different variables of interest in the e-shopping
behavior context.
3 Data and Variables
3.1 Data collection
The data used in this study were collected from an Internet-based survey of Northern
California residents (see Ory and Mokhtarian 2007 for more details). The purpose of
the study is to identify potential population segments and then to investigate e-
shopping behavior for each segment by analyzing relationships among the measured
variables, rather than to report descriptive statistics of the sample distributions and
expect them to reflect the corresponding population. Accordingly, the representa-
tiveness of the sample is not our primary concern, because the conditional relation-
ships of interest can be reliably measured even if the sample is not strictly represent-
tative (Babbie 1998; Brownstone 1998).
To maximize the computer literacy and knowledge of e-shopping in the sample,
two university communities were selected as study sites: Santa Clara and Davis. Some
8,000 recruitment letters were mailed in June 2006 to randomly-selected households in
those two cities. Approximately 6,500 letters apparently reached their intended
addressee and around 1,000 respondents went to the website to complete the survey.
Overall, the response rate was 16%, which we considered quite good for an Internet
survey of this length (117 web pages; the paper version has 19 pages) and complexity.
Typical response rates for mail-out/mail-back surveys of the general population are
10-40% (Babbie 1998). We presume the higher end of that range to be unlikely for a
survey as long as ours, with the additional barrier of being administered over the
Internet.
After eliminating surveys with incomplete responses on important questions and
filling very small amounts of missing data with category-specific means, a working
sample of 967 cases containing relatively complete data was established. Because the
catalog channel was not well-represented in the sample, we focused this study on the
individual‟s purchase intention between store and Internet. Accordingly, we excluded
64 catalog-related cases, leaving 903 cases. Among those, 450 cases involved a recent
book purchase and 453 involved a clothing purchase. Considering that the impact of
variables influencing purchase channel intention may substantially vary for different
product types, it is reasonable to estimate purchase behavior on the book and clothing
subsamples separately. In this empirical study, we only analyze the 450 book cases
(although the final model has only 373 cases due to missing data on variables included
in the model).
Table 1 presents a few major characteristics of the sample, including sample
statistics for the variables significant in the final model. A respondent who is average

Tang, W. and Mokhtarian, P. L., Journal of Choice Modelling, 2(2), pp. 148-172
153
Table 1. Selected Characteristics of the Sample (book cases)
Characteristic (sample sizes) N (%)
Total number of cases 450
Number of females (446) 214 (48.0)
Average age (years) (440) 45.4
Average educational level a
(450) 5.81
Annual household income (433)
Less than $15,000
$15,000 to $29,999
$30,000 to $49,999
$50,000 to $74,999
$75,000 to $124,999
$125,000 or more
22 (4.9)
29 (6.4)
61 (13.6)
100 (22.2)
129 (28.7)
92 (20.4)
Home internet access b
(450)
Low speed
Broadband
Work internet access b
(446)
Low speed
Broadband
92 (20.4)
366 (81.3)
20 (4.5)
366 (82.1)
Mean (s.d.)
Shopping attitudinal factors
Post-purchase satisfaction c
Convenience c
0.825 (1.745)
-1.589 (1.582)
Purchase experiences
Activeness of searching d
Context-specific cost difference e
2.660 (0.670)
0.130 (0.731) a 1=Some grade school or high school; 2=High school diploma or equivalent; 3=Some college
or technical school; 4=Two-year college associates degree; 5=Four-year college/technical
school degree; 6=Some graduate school; 7=Completed graduate degree(s). b Categories are not mutually exclusive.
c Difference between channel-specific perceptions: store factor score minus Internet factor
score. d 1=I had not previously thought about buying such an item – I just came across it; 2=I had
previously thought about buying such an item if I found it, but I was not actively looking for it
on this occasion; 3=I was actively looking for such an item on this occasion. e A qualitative measure of the perceived cost difference between store and Internet with respect
to the recent purchase; a higher value means the store channel costs more (-1=store is cheaper;
0=about the same price; 1=store is more expensive).
on all traits would be middle-aged (45), slightly more likely to be male (52%) than
female (48%), and have education beyond a four-year college or technical school
degree. About 70 percent of the households have annual incomes higher than $50,000.
More than four-fifths of the respondents have broadband Internet access either at work
or at home. The attitudinal factor scores are discussed when those variables are
introduced in Section 3.2.2.
3.2 Variables
The survey started with a welcome question, followed by seven parts asking questions
related to general and channel-specific shopping attitudes, previous general purchasing

Tang, W. and Mokhtarian, P. L., Journal of Choice Modelling, 2(2), pp. 148-172
154
experience by channel and a specific recent purchase, shopping frequency for specific
product types, usage of the Internet, and sociodemographics. A more detailed descrip-
tion is presented below.
As mentioned above, some portions of the survey focus on a specific product type
– either book or clothing. We chose these two relatively low-cost and frequently-
purchased product categories to ensure the presence of sufficient recent purchase
occasions in the sample. Each respondent answered detailed questions with respect to
a recent purchase (referred to as the “key purchase”) of one of the two product types,
which could have been bought over the Internet or in a store.
3.2.1 Dependent variable
Although the survey obtains information for a number of potential dependent variables
of interest, this study analyzes people‟s intended shopping channel for a future
purchase similar to the recent one for which the detailed information had just been
obtained. The dependent variable is created from the survey question which asks “If
you were going to make a similar purchase today, how would you do so?”, with four
possible response options: “In a store”, “Over the internet”, “Through a catalog” and
“Other (please specify)”. In the current study we concentrate on the first two channels:
store and Internet. As a result, our dependent variable is binary.
3.2.2 Explanatory variables
Developed from an extensive literature review (Cao and Mokhtarian 2005), the
explanatory variables measured by the survey fall into five main categories, each
described below.
General shopping-related attitudes: In Part A, the survey presented a series of 42
general shopping-related statements, with responses ordered on a 5-point scale from
“strongly disagree” (1) to “strongly agree” (5). Common factor analysis was used to
extract 13 (obliquely-rotated) factors (see Mokhtarian et al. 2009 for the detailed
results), and standardized scores on these 13 factors were included as potential
explanatory variables. Table 2 presents the strongly-loading statements for each factor.
While some of these factors (e.g. impulse-buying, materialism, shopping enjoyment)
could apply about equally well to either shopping channel (and were developed
primarily for models of shopping frequency), many of them (e.g. pro-technology, pro-
environmental, caution, time consciousness, trustingness, pro-exercise and store
enjoyment) could differentially affect individuals‟ shopping channel intentions.
Purchase experiences: In survey Part C, several questions related to the key
purchase were asked, such as how much money was spent, how the item was obtained,
the purchase location, and the availability of alternative channels for that specific
purchase. All these are possibly relevant explanatory variables giving important
information on why the particular channel was adopted. Obviously, whether the
experience is satisfying or not could play a very important role with respect to the next
purchase intention.
Channel-specific attitudes: In survey Part D, respondents were asked to agree or
disagree (on a five-point scale) with 28 channel-specific statements, assuming they
were to make a purchase similar to the one discussed in Part C. To reduce the burden

Tang, W. and Mokhtarian, P. L., Journal of Choice Modelling, 2(2), pp. 148-172
155
on the respondents, they were asked to complete such a set of statements for two of the
three main shopping channels (store, Internet, and catalog) – the channel chosen for
the key purchase, and one alternative. Store was always assumed to be an alternative,
so most (927) respondents completed the store-Internet pair, with the remainder (40)
reporting for store and catalog (38 for clothing and 2 for book). As mentioned earlier,
these 40 cases, together with 24 whose future intended purchase channel was either
catalog or missing, were excluded from the present analysis.
Common factor analysis was also conducted for this set of statements. The
statements were pooled across channel and factor-analyzed to find eight underlying
dimensions, as shown in Table 2. Standardized scores on the final extracted factors
will help us examine how attitudes differ by channel and product type. And they can
serve as a useful complement to the general (Part A) shopping attitudes, allowing us to
model e-shopping behavior from a more specific and concrete perspective. Channel-
specific attitudes such as “post-purchase satisfaction”, “cost savings”, “convenience”
and “enjoyment” are all likely to affect people‟s intention for a future similar pur-
chase. In this study, these variables are represented in the model as differences
between the store and Internet scores on each factor.
Use of Internet and communication technology: In Part F, the survey asked some
general questions about the respondents‟ usage of the Internet, as well as other
communication technologies. The information captured in this part reflects the
individual‟s overall computer-use pattern, which can help to explain the propensity to
choose the Internet shopping channel in particular.
Sociodemographic characteristics: Part G of the survey captured an extensive list
of sociodemographic variables such as gender, age, employment status (part time or
full time), available work arrangements, and educational background, as well as
household information such as household income, household size, number of clothing
and book stores near home and work, and so on.
4 LCM Methodology and Model Results
4.1 LCM methodology
The purpose of the study is to model shopping channel intention for a “future similar
purchase” of a book, identifying and accounting for taste heterogeneity. LCM, which
(as described in the Introduction) allows model coefficients to differ by latent
segment, is one increasingly popular way of doing so. In LCM, the probability that
person n chooses alternative i (Pn(i)) can be expressed as the product of the
(unconditional) probability of belonging to a given latent class g (Png) and the
corresponding conditional response probability for choosing the alternative given that
the person belongs to that class (Pn|g(i|n g)), summed over classes (Magidson and
Vermunt 2003): |( ) ( )Pn g n g ngP i P i n g .

Tang, W. and Mokhtarian, P. L., Journal of Choice Modelling, 2(2), pp. 148-172
156
Table 2. General Attitudes and Channel-specific Perceptual Factors
Factor Survey Statement (Loading)
General Attitudes/Personality Traits/Values Factors a b
Pro-credit card Credit cards encourage unnecessary spending (-0.573); I prefer to pay for things by cash rather than credit card (-0.514).
Pro-environmental We should raise the price of gasoline to reduce congestion and air pollution (0.605); To improve air quality, I am willing to pay a little more to use a
hybrid or other clean-fuel vehicle (0.556); Shopping travel creates only a negligible amount of pollution (-0.447); A lot of product packaging is
wasteful (0.388); Whenever possible, I prefer to walk or bike rather than drive (0.354).
Pro-exercise I follow a regular physical exercise routine (0.562); Whenever possible, I prefer to walk or bike rather than drive (0.540).
Impulse buying I generally stick to my shopping lists (-0.586); When it comes to buying things, I‟m pretty spontaneous (0.565); I like a routine (-0.289); If I got a lot
of money unexpectedly, I would probably spend more of it than I saved (0.273).
Caution “Better safe than sorry” describes my decision-making style (0.634); Taking risks fits my personality (-0.509); I like a routine (0.319); I am generally
cautious about accepting new ideas (0.316); I prefer to see other people using new products before I consider getting them myself (0.265).
Materialism For me, a lot of the fun of having something nice is showing it off (0.604); I would/do enjoy having a lot of expensive things (0.495); Buying things
cheers me up (0.363); My lifestyle is relatively simple, in terms of material goods (-0.302).
Price consciousness It‟s too much trouble to find or take advantage of sales and special offers (-0.648); It‟s important to me to get the lowest prices when I buy things
(0.604).
Time consciousness I‟m often in a hurry to be somewhere else when I‟m shopping (0.580); I‟m too busy to shop as often or as long as I‟d like (0.425).
Trend-setting I often introduce new trends to my friends (0.604); I like to track the development of new technology (0.392).
Trustingness People are generally trustworthy (0.469); I tend to be cautious with strangers (-0.408); I enjoy the social interactions shopping provides (0.343).
Store enjoyment Even if I don‟t end up buying anything, I still enjoy going to stores and browsing (0.769); I like to stroll through shopping areas (0.752); Shopping
helps me relax (0.586); Shopping is fun (0.529); For me, shopping is sometimes an excuse to get out of the house or workplace (0.427); Shopping is
usually a chore for me (-0.389); Buying things cheers me up (0.293); Shopping is too physically tiring to be enjoyable (-0.285).
Shopping enjoyment Shopping is too physically tiring to be enjoyable (-0.440); Shopping is usually a chore for me (-0.408); My lifestyle is relatively simple, in terms of
material goods (-0.309); “Variety is the spice of life” (-0.267).
Pro-technology Computers are more frustrating than they are fun (-0.735); The internet makes my life more interesting (0.582); I like to track the development of
new technology (0.478); Technology brings at least as many problems as it does solutions (-0.444).

Tang, W. and Mokhtarian, P. L., Journal of Choice Modelling, 2(2), pp. 148-172
157
Table 2 (continued)
Channel-specific Perceptual Factors c
Convenience
When it comes to buying books/CDs/DVDs/videotapes, I can find anything I want in stores (0.640); A lot of times, products I want are unavailable in
stores (-0.636); The product information I need is easy to find in stores (0.615); Stores are open whenever I want to shop (0.518); When shopping in
stores, it is easy to check the availability of products (0.475); The stores I want/need to shop at are conveniently located (0.447); All things
considered, buying in stores saves me time (0.413); I often find shopping in stores to be frustrating (-0.345).
Product risk
I‟m concerned that a product I purchase in a store will not perform as expected (e.g. quality, etc.) (0.469); When shopping in stores, I am able to
experience products before buying, to the extent that I want to (-0.374); I am concerned that unfamiliar stores will fail to meet my expectations
(0.334).
Enjoyment Shopping in stores is boring (-0.768); I enjoy shopping in stores (0.760); I often find shopping in stores to be frustrating (-0.407); With respect to
buying books/CDs/DVDs/videotapes, I am always on the lookout for a new store to check out (0.323).
Financial/identity risk It is risky to release credit card information to stores (0.838); I am uncomfortable about providing personal information to stores (0.627).
Efficiency/inertia
I value stores that allow me to fulfill many of my shopping needs in just one location (0.449); When it comes to books/CDs/DVDs/videotapes, I have
a strong preference for shopping at one or a few particular stores (0.414); When shopping in stores, I am able to experience products before buying,
to the extent that I want to (0.322).
Cost saving All things considered, buying in stores saves me money (0.760); Considering taxes and other costs, books/CDs/DVDs/videotapes are usually more
expensive when purchased in stores (-0.753).
Store brand independence I prefer to shop at independent stores rather than national chains (0.561); With respect to buying books/CDs/DVDs/videotapes, I am always on the
lookout for a new store to check out (0.389).
Post-purchase satisfaction
I often have to wait too long for a store to obtain the product I want to purchase (-0.594); Stores typically provide poor after-purchase customer
service (-0.559); If necessary, it is easy to return a product purchased at a store (0.486); When shopping in stores, I am able to immediately obtain the
products I purchase (0.412); It is difficult to compare products at stores (-0.316).
a Adapted from Mokhtarian et al. (2009). Based on oblique rotation of the common factor analysis solution (Rummel 1970). b Pattern matrix loadings, reflecting the contribution each factor makes to the variance of each observed variable (higher-magnitude loadings reflecting a greater association
between variable and factor). Only loadings greater than 0.25 in magnitude are displayed. c Pattern matrix loadings greater than 0.30 in magnitude are displayed.

Tang, W. and Mokhtarian, P. L., Journal of Choice Modelling, 2(2), pp. 148-172
158
Accordingly, estimating a LCM involves two components: (1) modeling class mem-
bership (ngP ) as a function of segmentation variables, that is, variables considered
likely to impact the importance given to variables affecting the discrete responses; and
(2) simultaneously modeling the discrete choice behavior | ( )n gP i n g for each latent
class (market segment) separately, using utility maximization theory (UMT) as the
basis for the individual‟s response. As mentioned earlier, which individual belongs in
which class is unknown (although the expected segment sizes in the sample can be
determined through summing across the sample the predicted probabilities of indi-
viduals belonging to each class). Researchers can, however, explore the nature of each
segment through analyzing (1) the segment membership model, (2) the segment-
specific coefficients of the discrete response model, and (3) the expected character-
istics of each segment (using the function given in Section 4.2).
4.2 Model results
It is conventional practice to start from a single-segment model (that is, a conventional
pooled discrete choice model) and then keep adding one more segment at a time. To
obtain the optimal number of segments, we compare model statistics such as the
Akaike Information Criterion (AIC), the Bayesian Information Criterion (BIC), and
the Consistent Akaike Information Criterion (CAIC) (Akaike 1974; Bhat 1997;
Walker and Li 2007). In this exploratory study, we were unable to find an appropriate
model with more than two segments. All of the three- and four-segment models we
attempted resulted in either too many segments (based on the p-values of 1 for all the
choice model variables of one or more segments), or computation failures due to a
singular variance-covariance matrix.
Table 3 summarizes our two-class LCM results for purchase channel intention,
with the same results obtained from both the software packages of Limdep 9.0/Nlogit
4.0 (Greene 2007) and Mplus 5.1 (Muthén and Muthén 1998-2007). A number of
different specifications were tested, drawing from the variety of possible explanatory
variables available in the data. However, insignificant variables were excluded from
the final model, and only the remaining, significant, variables are shown in the table
and discussed below. Due to missing data on significant variables, the final sample
size is 373 cases; the expected segment shares are 48% (180) and 52% (193). The 2
value (Ben-Akiva and Lerman 1985) of the LCM is 0.365 (with the equally-likely
pooled model as base), which is considered quite acceptable in the context of disag-
gregate discrete choice models. The BL model on the unsegmented (pooled) sample
with the same choice model explanatory variables yields a 2 of 0.319. For compari-
son, the 2 of the market share (constant-term-only) model on the pooled sample is
only 0.015, since the intention shares are relatively balanced (store 43%; internet
57%). The relevant chi-squared test shows that the latent segmentation model is
significantly better than the model on the pooled data (p = 0.001).
In lieu of reporting elasticities (which were not available as an option in the LCM
modules of Limdep/Nlogit nor Mplus), we (as endorsed by Miller 2005 for logistic
regression models) report the coefficients obtained when all explanatory variables are
standardized (as well as the conventional unstandardized coefficients), which, similar
to elasticities (and analogous to the standardized coefficients in regression), serves the
purpose of making the coefficients independent of the scale of the explanatory
variables.
Tang, W. and Mokhtarian, P. L., Journal of Choice Modelling, 2(2), pp. 148-172
159
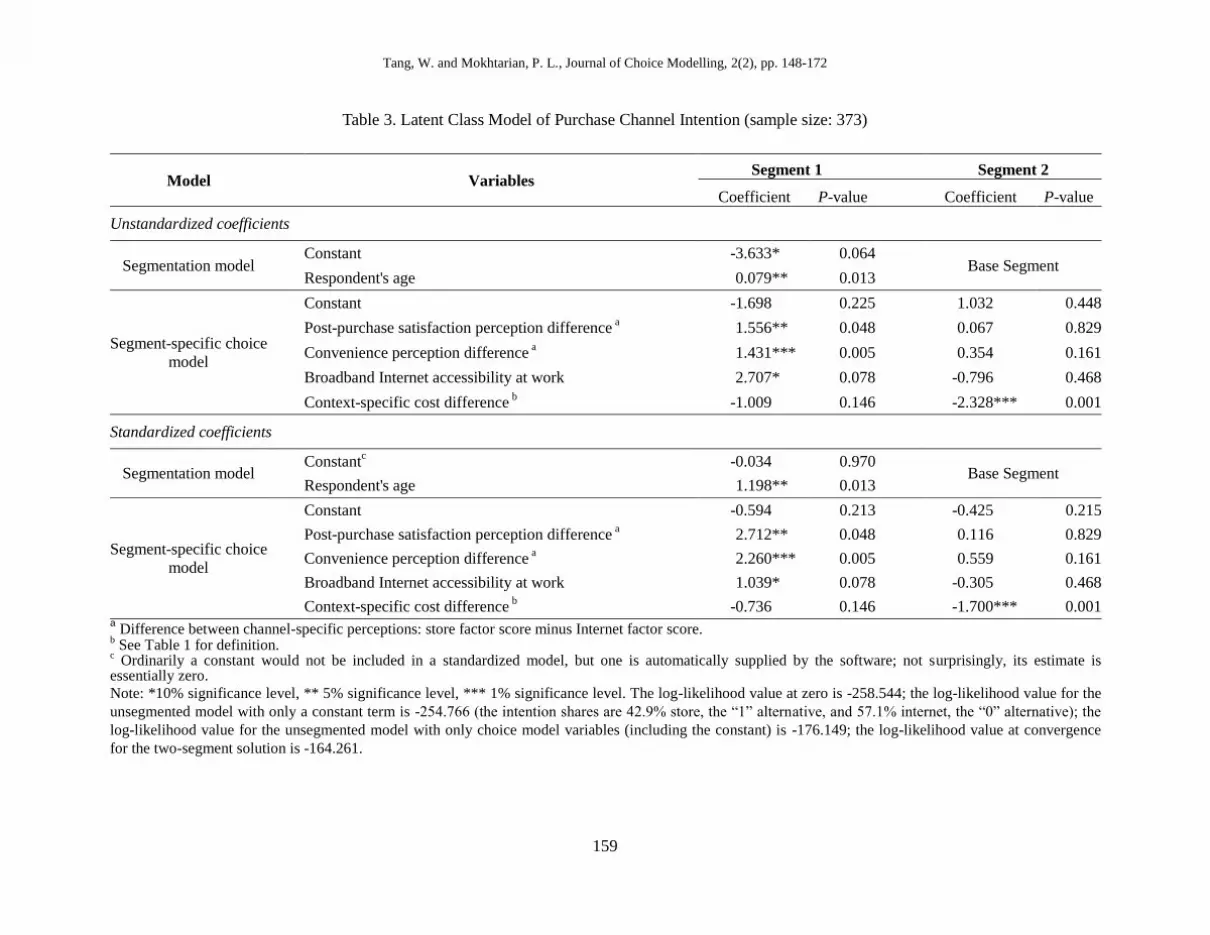
Table 3. Latent Class Model of Purchase Channel Intention (sample size: 373)
Model
Variables Segment 1 Segment 2
Coefficient P-value Coefficient P-value
Unstandardized coefficients
Segmentation model Constant -3.633 * 0.064
Base Segment Respondent's age 0.079 ** 0.013
Segment-specific choice
model
Constant -1.698 0.225 1.032 0.448
Post-purchase satisfaction perception difference a 1.556 ** 0.048 0.067 0.829
Convenience perception difference a 1.431 *** 0.005 0.354 0.161
Broadband Internet accessibility at work 2.707 * 0.078 -0.796 0.468
Context-specific cost difference b -1.009 0.146 -2.328 *** 0.001
Standardized coefficients
Segmentation model Constant
c -0.034 0.970
Base Segment Respondent's age 1.198 ** 0.013
Segment-specific choice
model
Constant -0.594 0.213 -0.425 0.215
Post-purchase satisfaction perception difference a 2.712 ** 0.048 0.116 0.829
Convenience perception difference a 2.260 *** 0.005 0.559 0.161
Broadband Internet accessibility at work 1.039 * 0.078 -0.305 0.468
Context-specific cost difference b -0.736 0.146 -1.700 *** 0.001
a Difference between channel-specific perceptions: store factor score minus Internet factor score.
b See Table 1 for definition.
c Ordinarily a constant would not be included in a standardized model, but one is automatically supplied by the software; not surprisingly, its estimate is
essentially zero.
Note: *10% significance level, ** 5% significance level, *** 1% significance level. The log-likelihood value at zero is -258.544; the log-likelihood value for the
unsegmented model with only a constant term is -254.766 (the intention shares are 42.9% store, the “1” alternative, and 57.1% internet, the “0” alternative); the
log-likelihood value for the unsegmented model with only choice model variables (including the constant) is -176.149; the log-likelihood value at convergence
for the two-segment solution is -164.261.

Tang, W. and Mokhtarian, P. L., Journal of Choice Modelling, 2(2), pp. 148-172
160
Turning to the model interpretation, only one segmentation variable (besides the
constant term) is significant for the membership model, that is, the respondent‟s age.
Its positive coefficient indicates that older respondents are more likely to belong to
Segment 1. Candidly, we expected a more “interesting” class membership model.
Specifically, we expected some general shopping-related attitudes to be significant, in
keeping with the recognition that class membership variables constitute moderators of
the coefficients of the choice model, and that moderators are likely to be fairly stable
individual traits (Wu and Zumbo 2008). It is quite possible, however, that age is
serving as a single marker for a complex bundle of traits associated with age in a non-
straightforward way. For example, age is significantly correlated with employment
status (0.49), with Internet usage diversity (-0.52), with the time consciousness factor
(-0.18), with income (0.17), and with some other variables. Thus, although none of
those variables was individually significant in the class membership model, it could be
that age is representing a non-linear combination of them (and others) that is
significant. And from a practical standpoint, it is certainly convenient for age to be the
only segmentation variable, not only because having only one variable keeps the
model relatively simple, but also because that particular variable is easy to forecast,
and constitutes a clear-cut basis on which to target marketing messages. Accordingly,
what in this case is a necessity, is also a virtue.
At the suggestion of a reviewer, to further explore the effects of the segmentation
variable (i.e. age) on class membership, we tried creating three dummy variables for
different age groups (i.e. for age “younger than 40”, “between 40 and 60, including
40” and “60 or older”), and then interacted age with two of those three dummy
variables in the class membership model. This, in effect, created a piecewise-linear
function for the coefficient, reflecting that the marginal impact on the probability of
class membership of being another year older might differ depending on one's age
group. However, this approach did not improve the model.
With respect to the choice model component of the LCM, four variables (besides
the constant term) were significant: two channel-specific perceptions (post-purchase
satisfaction and convenience), one purchase experience variable (context-specific cost
difference) and one Internet usage variable (broadband Internet accessibility at work).
Each of these variables is significant to only one of the two segments, indicating that
the LCM has identified two classes that have almost completely distinct tastes – at
least as far as the variables observed in this study are concerned.
As mentioned in Section 3.2.2, channel-specific perceptions are represented in the
model by differences between store and Internet factor scores. Not surprisingly, the
more positively store is perceived relative to the Internet on post-purchase satisfaction
and convenience, the more likely store is to be the intended channel for the next
purchase. However, while these variables are strongly significant for Segment 1, the
older group (respectively the first- and second-most important variables in the model
for that segment, based on the standardized coefficients), they are quite insignificant
for the younger segment. Similarly, the dummy variable representing broadband
Internet accessibility at work is also significant for the older segment but not the
younger one. The positive sign (indicating that those who have broadband Internet
access at work are more likely to intend to purchase in a store) seems counterintuitive
because (particularly for the book product type) we would expect ease of access to the
Internet to support intentions to buy online. However, we believe that (for the older
segment particularly) it may be a marker for individuals holding a largely sedentary
desk job, who, to the extent they associate shopping with the work environment,
would prefer store shopping (e.g. during the lunch hour) for exercise and a change of

Tang, W. and Mokhtarian, P. L., Journal of Choice Modelling, 2(2), pp. 148-172
161
scenery. Especially, considering the higher age of Segment 1, they may possibly prefer
physical store shopping as a pleasant way to get more exercise.
The context-specific cost difference variable is the only variable significant in the
choice model for Segment 2 (and, not surprisingly then, by far the most important
variable according to the standardized coefficients). A higher value of this variable
indicates that store was perceived to be more expensive than Internet for the specific
purchase made recently. As a result, it is natural that people with higher values of this
variable are more likely to intend the more economical channel – Internet – for their
next purchase.
The picture that emerges from the distinctive variables significant to each seg-
ment is that Segment 1 places a higher value on convenience (including concerns
about the potential hassle of customer service and/or returns if the item purchased is
not satisfactory), whereas Segment 2 is mainly concerned about cost. It is not sur-
prising that these heterogeneous tastes are closely associated with age – older people
will tend to have higher incomes and more time pressure, whereas younger people
may tend to have more time than money.
4.3 Additional interpretation of the segments
To better understand the respective natures of the two segments, it is useful to com-
pute their (estimated) expected values on a number of attributes of interest. For a given
attribute x, this is done using the formula n ng n
g
n ng
P xx
P. That is, we compute the
weighted average value of attribute x for segment g, where the weights are the proba-
bilities that each case in the sample belongs to segment g.
Table 4 lists the expected values of the significant variables in the final LCM
model, together with several other important variables. We see, for example, that the
mean age of people in Segment 1 is 52.6 years, while that of Segment 2 is 38.3 years.
Both segments perceive store to be superior to the Internet on post-purchase satis-
faction; interestingly, Segment 2‟s perception of that difference is even more positive
than that of Segment 1, but that variable is not significant to Segment 2‟s intention.
Conversely, both segments perceive the Internet to be superior to stores on conveni-
ence; Segment 2 favors the Internet on that dimension even more strongly than Seg-
ment 1, but again, that variable is not significant to Segment 2. These results illustrate
the obvious (but occasionally neglected) point that finding one alternative to be superi-
or to another on a given characteristic is only relevant if that characteristic is important
to choice. This is all the more critical when a given characteristic is important to some
market segments but not others.
Several variables support our interpretation of Segment 1 as being more time-
pressured and less money-sensitive than Segment 2, and also less Internet-savvy. For
example, people in Segment 1 tend to be less price conscious (-0.170) than those in
Segment 2 (-0.024). Segment 1 has somewhat higher education and income than
Segment 2 (consistent with their age differences). People in Segment 1 on average use
the Internet for fewer types of functions (5.48 vs. 7.09), which also makes sense in
view of the age difference between the segments, and further, less often have broad-
band Internet access at work (78% vs. 90%). On the other hand, on average there is
little difference between the segments (at least, as measured by the statements shown
in Table 2) with respect to their time consciousness and attitudes toward exercise.

Tang, W. and Mokhtarian, P. L., Journal of Choice Modelling, 2(2), pp. 148-172
162
Table 4. Average Characteristics of the Segments
Variables
Attribute Means
Segment 1 (48.3%) Segment 2 (51.7%)
Segment-specific choice
model variables
Post-purchase satisfaction perception difference a 0.817 0.898
Convenience perception difference a -1.392 -1.757
Broadband Internet accessibility at work (dummy variable) 0.779 0.901
Context-specific cost difference b 0.118 0.144
Segmentation model variable Respondent's age (years) 52.571 38.313
Dependent variable Intended channel for future book purchase (1=store; 0=internet) 0.445 0.414
Other important variables
Chosen channel for the recent book purchase 0.558 0.516
Store enjoyment factor c
-0.158 -0.051
Price consciousness factor c
-0.170 -0.024
Time consciousness factor -0.058 0.058
Pro-exercise factor -0.013 0.028
Cost saving factor a, c
-1.068 -1.362
Activeness of searching b
2.670 2.645
Internet usage diversity d
5.478 7.086
Education level b 5.908 5.759
Annual household income e 4.612 4.316
a Difference between channel-specific perceptions: store factor score minus Internet factor score.
b See Table 1 for definition.
c The means for both segments can have the same sign because the factor scores were standardized across the entire sample, including the clothing-purchase
segment not analyzed in this study. Thus, for example, both segments of book purchasers analyzed here have lower store enjoyment scores, on average, than do
the clothing purchasers in the rest of the sample. d Index variable created by summing the 14 binary variables indicating usage of the Internet for “Email”, “Instant messaging”, “Audio conversations”, “Video
conversations”, “Chat rooms”, “Viewing blogs/bulletin boards”, “Blogging”, “Making own website”, “Internet radio or television”, “Banking/paying bills”,
“Selling goods”, “Personal networking”, “Job search” and “Collaborative professional work”. e Categories numbered 1 through 6 correspond to those in Table 1.

Tang, W. and Mokhtarian, P. L., Journal of Choice Modelling, 2(2), pp. 148-172
163
However, given the central tendencies of the variables shown in Table 4, the taste dif-
ferences that do exist between the segments do not overwhelmingly favor one channel
over the other. For Segment 1, for example, there is a clear tradeoff: the importance of
the post-purchase satisfaction factor tends to favor store, but the importance of the
convenience factor tends to favor the Internet. For Segment 2, the perceived cost dif-
ference between the two channels is the only significant observed variable, but its
value does not always favor the Internet. Overall, people in Segment 1 are more likely
than those in Segment 2 to have chosen store for their recent book purchase (56% vs.
52%), and to intend to make a similar future purchase in a store (45% vs. 41%) – but
only marginally so7.
5 Comparison of LCM with Deterministic Approaches to
Treating Taste Heterogeneity
5.1 Deterministic market segmentation
As mentioned in the Introduction, LCM is theoretically superior to the conventional
deterministic two-stage market segmentation approach, because in LCM the choice
model is estimated simultaneously with the class membership model, and the classes
are defined specifically so as to best discriminate between different market segments
with respect to choice. As a result, we expect LCM to give us models that have better
goodness-of-fit (GOF) and interpretability. However, it is relevant to wonder how
large the improvement from using LCM is in practical terms, and in particular whether
it is sufficiently large to justify the increased complexity of implementation. Accor-
dingly, in this section we conduct a limited comparison of the two approaches. That is,
we restrict the deterministic segmentation to using the same class membership variable
identified by the LCM, namely age.
For this initial comparison, we divided the sample into two segments based on
age. To reflect the fact that the best cutpoint for the two segments would not be known
in advance, we prepared five different segmentations, using different segment shares.
Specifically, the second segment (i.e. those who tend to be younger) contains 10 per-
cent, 24 percent, 50 percent, 73 percent and 90 percent of the total number of cases
respectively, corresponding to highest ages of 26, 31, 45, 55, and 63. The second and
fourth segmentations are slightly irregular (with Segment 2 shares originally planned
to be 25 and 75 percent, respectively), to avoid placing people of the same age into
different segments. The cutpoint of 45 for the third (50-50) segmentation also corres-
ponds both to the age beyond which the LCM first predicts a higher probability of
belonging to Segment 1, and to the weighted average of the two mean ages of the
latent segments (38.3 and 52.6), where the weights are the expected segment sizes.
Thus, if one took the results of the LCM and subsequently deterministically assigned
each case to its highest-probability segment (as seems to be done astonishingly often,
despite the practice being “opposed to the meaning of probabilities and the purpose of
specifying choice probabilities”; Train 2009, p. 69), the 50-50 segmentation would
result.
7 Due to the essentially choice-based nature of the sampled channel choices, the specific shares
presented here should not be taken as representative of the population shares; it is the
comparison between Segments 1 and 2 that is relevant.
Tang, W. and Mokhtarian, P. L., Journal of Choice Modelling, 2(2), pp. 148-172
164
The overall comparisons of the LCM, the pooled model, and the five determinis-
tically-segmented (DS) choice models are shown in Table 5. For deterministically seg-
mented choice models, overall log-likelihoods are equal to the sum of the correspond-
ding log-likelihoods of each segment (Ben-Akiva and Lerman 1985), and thus all
models have the same log-likelihood for the equally-likely model (-258.544). As ex-
pected, the LCM has the highest log-likelihood at convergence (-164.261), with all the
DS model final log-likelihoods falling below -168. Interestingly, among the DS
models, DS1 and DS2 (with the smallest shares of younger people) are little better
than the pooled model, while at the other extreme, just peeling off the oldest 10% of
cases into a separate segment yields the best DS model (DS5) among those tested, one
that is almost as good as the LCM (specifically, the LCM final log-likelihood is only
2.4% higher, -164.261 vs. -168.377, and the adjusted 2 is only 2.6% higher, 0.318 vs.
0.310). On the other hand, the fit of the “naïve” 50-50 split model (DS3) is essentially
identical to that of DS5, while that of DS4 is worse than either.
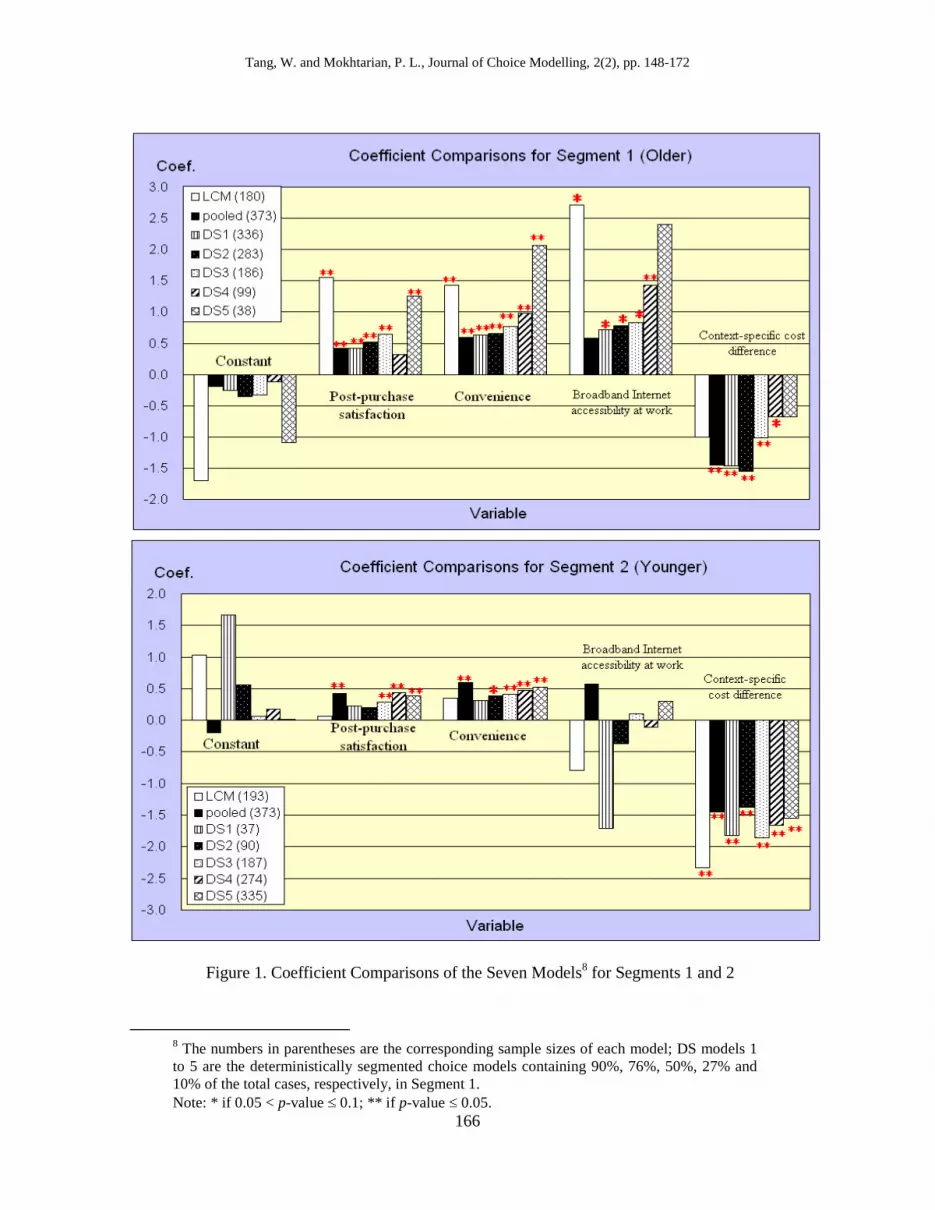
Given the foregoing discussion, and especially the similar fits of DS3 and DS5, it
is natural to want to compare the (choice model) coefficients estimated from the LCM,
pooled, and five DS models. Figure 1 charts the coefficients for each segment. The
results are interesting. The coefficients of Segment 1 for the DS models generally get
closer to those of the LCM as the size of Segment 1 (the older segment) decreases (i.e.
going from DS1 to DS5), suggesting that the oldest slice of Segment 1 dominates the
estimation of its coefficients for the LCM. On the other hand, for DS1 – DS4, the
context-specific cost difference variable is significant for Segment 1, whereas it is not
significant in the LCM (nor in DS5). For DS1 – DS3, in fact, all four explanatory vari-
ables are significant for Segment 1, so that an analyst might well consider any of those
models to be preferable to the LCM (for which one of those four variables, the cost
difference, is not significant) on conceptual grounds, if just viewing these results. In
any case, however, it is worth noting that although the fits of DS3 and DS5 are essen-
tially equal as mentioned above, their Segment 1 coefficients are not.
The situation for Segment 2 is somewhat different. The coefficients are generally
more stable across the DS models, with the exception of those for broadband Internet
accessibility, which are never significant. In particular (with that same exception), the
coefficients for DS3 and DS5 are quite similar, with those of DS3 being somewhat
closer to those of the LCM. Here, the DS coefficients for post-purchase satisfaction (in
models DS3-DS5) and convenience (DS2-DS5) are significant for Segment 2 although
the LCM coefficients for the same variables are not.
Looking across both segments, then, it appears that the naïve, 50-50, segmen-
tation produces a model which for Segment 2 is rather close to that of the LCM (but
with two additional, conceptually relevant, variables achieving statistical significance),
and for Segment 1 is arguably better (since one additional conceptually relevant vari-
able is significant). The slight statistical edge gained by the LCM is due to its ability to
use all cases in the estimation of the coefficients for both latent class segments, which
of course is desirable when class membership is unknown a priori.
Thus, while LCM is the theoretically superior model, at least in this particular
application its GOF is not substantially higher than that of models involving deter-
ministic segmentation on the same variable, and its conceptual relevance is arguably
somewhat weaker. However, this comparison presupposes that the “right” segmen-
tation variable is known in advance, and also involves just one segmentation variable.
For LCMs in which more than one variable is significant in the class membership
model, it would be far less clear how to find the best deterministic

Tang, W. and Mokhtarian, P. L., Journal of Choice Modelling, 2(2), pp. 148-172
165
Table 5. Goodness-of-Fit Comparison of the Models
Segment Log(beta) Log(EL) No. of Parameters 2
2
No. of Cases
LCM -164.261 -258.544 12 0.365 0.318 Seg. 1: expected 180; Seg. 2: expected 193.
Pooled model -176.149 -258.544 5 0.319 0.299 373
DS Model 1 1 -158.227 -232.897 5
0.325 0.287 336
2 -16.228 -25.646 5 37
DS Model 2 1 -127.411 -196.161 5
0.329 0.290 283
2 -46.166 -62.383 5 90
DS Model 3 1 -82.912 -128.925 5
0.348 0.310 186
2 -85.559 -129.619 5 187
DS Model 4 1 -45.510 -68.622 5
0.343 0.305 99
2 -124.282 -189.922 5 274
DS Model 5 1 -10.949 -26.340 5
0.349 0.310 38
2 -157.428 -232.204 5 335
Notes:
(1) The log-likelihood increases of the LCM compared to the pooled and the five DS models are: 6.7%, 5.8%, 5.4%, 2.5%, 3.3% and 2.4%, respectively.
(2) The rho-square and adjusted rho-square for DS models 1 to 5 were computed using formulas for deterministically-segmented choice models (Ben-Akiva and
Lerman 1985).
Tang, W. and Mokhtarian, P. L., Journal of Choice Modelling, 2(2), pp. 148-172
166
Figure 1. Coefficient Comparisons of the Seven Models8 for Segments 1 and 2
8 The numbers in parentheses are the corresponding sample sizes of each model; DS models 1
to 5 are the deterministically segmented choice models containing 90%, 76%, 50%, 27% and
10% of the total cases, respectively, in Segment 1.
Note: * if 0.05 < p-value 0.1; ** if p-value 0.05.

Tang, W. and Mokhtarian, P. L., Journal of Choice Modelling, 2(2), pp. 148-172
167
segmentation using the same variables, even aside from the issue of knowing what
variables were best for segmenting in the first place.
5.2 Unsegmented model with interaction terms
Given that LCM is not strongly superior to the deterministic market segmentation
approach in this instance, a reviewer‟s comment led us to try using the LCM results to
improve the BL model on the pooled data. Specifically, we interacted the age variable
(i.e. the only segmentation variable identified by the LCM) with the choice model ex-
planatory variables (allowing both the original variables and the corresponding new
interaction variables to enter the model, if both were significant), to create a new BL
model on the pooled data. This has the effect of allowing the coefficient of an original
variable such as the cost difference (“cost_D”) to be a linear function of age, rather
than purely a single constant as in the conventional pooled model:
C cost_D + A*C (age* cost_D) = ( C + A*C age) cost_D.
In this case, it is not clear a priori which model will be superior: if the effect of cost_D
on choice does change more or less continuously (and linearly) with age, the interact-
tion terms approach could be better; if the effect of cost_D on choice is more or less
constant within latent segment, the LCM approach could be better. Scarpa et al. (2003)
conducted a comparison similar to ours, and found that in their application LCM was
not substantially better than the conventional BL representation via interaction vari-
ables (final log likelihoods are -1238 vs. -1289).
Table 6 summarizes the original BL model (model 1, identical to the pooled
model referred to by Table 5) and the new BL-with-interaction-terms model (model
2). Model 1 contains the same four variables (besides the constant term) as the choice
model of the LCM, with consistent signs and similar explanations to those described
in Section 4.2. However, in model 2, the first three variables are replaced by their
corresponding interaction terms, with the positive signs indicating that the marginal
effect of each variable on the utility difference (between store and Internet) increases
linearly with age. For example, the marginal effect on utility of post-purchase satis-
faction ranges from 0.180 for the youngest person in our sample (18 years old), to
0.869 for the oldest (87). For the final variable, context-specific cost difference, both
the original variable and its interaction term counterpart are significant. The latter two
variables have the nice interpretation that the total impact on utility of changing
cost_D by one unit is equal to (-2.670 + 0.0269 age). This value remains negative (as
expected) for ages up to 99 (i.e. beyond the range of ages found in our sample), but
indicates that the sensitivity to cost steadily diminishes the older one gets. This is
consistent with the LCM result showing that the older segment was less money-
sensitive than the younger one, but allows that taste heterogeneity to be expressed in a
different way.

Tang, W. and Mokhtarian, P. L., Journal of Choice Modelling, 2(2), pp. 148-172
168
Table 6. Comparison of Binary Logit Models with and without Interaction Terms
Variable Name
Model 1
(w/o interaction terms)
Variable Name
Model 2
(with interaction terms)
Coefficient P-value Coefficient
(value when age = 18, 87)d
P-value
Constant -0.191 0.583 Constant -0.327 0.292
Post-purchase satisfaction perception difference a 0.424 0.000 Age * pps_D
c 0.0100 (0.180, 0.869) 0.000
Convenience perception difference a 0.594 0.000 Age * convenience_D
c 0.0129 (0.232, 1.123) 0.000
Broadband Internet accessibility at work 0.575 0.122 Age * bbw c 0.0145 (0.261, 1.262) 0.041
Context-specific cost difference b -1.453 0.000 Age * cost_D
c 0.0269 (0.485, 2.343) 0.064
Context-specific cost difference b -2.670 0.000
Valid number of cases, N 373 373
Final log-likelihood, LL(b) -176.149 -168.396
Log–likelihood for equally-likely (EL) model, LL(0) -258.544 -258.544
Number of estimated parameters 5 6
ρ2 0.319 0.349
Adjusted ρ2 0.299 0.325
a See Table 3 for definition.
b See Table 1 for definition.
c We abbreviate the variable names to fit the table size; they correspond to the names which are in the 1
st column for the same row.
d The lowest and highest ages in the sample.
Note: the adjusted ρ2 test for these two non-nested models shows that model 2 is significantly better than model 1, with a p-value of 0.00007.

Tang, W. and Mokhtarian, P. L., Journal of Choice Modelling, 2(2), pp. 148-172
169
Which way is better? The ρ2 GOF measure is still higher for the LCM (0.365) than for
the interaction-terms model (0.349), but requires six more parameters to achieve it.
The adjusted ρ2 measure, which penalizes for lack of parsimony, is actually higher for
the interaction-terms model (0.325) than for the LCM (0.318). The adjusted ρ2
test for
non-nested models cannot be performed in this case9, but it can be argued on the
grounds of parsimony, simplicity, and the numerically better adjusted ρ2 that the inter-
action-terms model is superior in this instance.
6 Conclusions
This study modeled shopping channel intention (store versus Internet) with respect to
a future purchase of a book/CD/DVD/videotape, using a sample (final N=373) of
residents of two university towns (Santa Clara and Davis) in Northern California, with
particular attention to shopping attitudinal factors and the taste heterogeneity of the
population. In view of the targeted (and choice-based) nature of the sample, we do not
claim that our models per se are necessarily representative of a broader population.
However, it is possible that the multivariate relationships between variables, as ex-
pressed by the models, are more generalizable than the univariate distributions of
those variables are (Babbie 1998; Brownstone 1998). In any case, the methodology is
generally applicable, and our specific empirical results are of interest in that Internet-
literate residents of university communities may serve as harbingers of future adoption
in the population as a whole.
Our original expectation was that our best model would be the latent class model
(LCM), and it was only a question of whether it was empirically enough better than
more conventional deterministic market segmentation models to justify the added con-
ceptual complexity. Instead, we found the LCM playing a different role: rather than
being the apex of the model-building process, it became more of a signpost along the
way. Specifically, development of the class membership component of the LCM
pointed toward an improvement in the specification of the unsegmented model (i.e. the
inclusion of interaction terms) whose outcome turned out to be superior to that of the
LCM.
Latent class modeling is still a powerful tool, in that it can help identify the set of
variables that best addresses the taste heterogeneity relevant to the choice at hand; in
that respect it can replace a great deal of ad hoc stumbling around to develop the
“best” deterministic segments. But then rather than stopping there, the LCM results
can point toward improving an unsegmented (or deterministically-segmented) model.
Two reasons to expect results even better than LCM from this process are that (1) an
unsegmented model with interaction terms (such as our best model turned out to be)
could be considerably more parsimonious than a LCM, which has a full set of choice
model coefficients for each segment, plus segment membership model coefficients for
each class except the base; and (2) the LCM (in its standard form) assumes constant
9 Under the null hypothesis that the model with the lower adjusted ρ
2 is the true model (model
1), then the probability of finding a model with an adjusted ρ2 more than z points greater is
bounded by the expression 1/22 2
2 1 2 1Pr[ ] 2 ln , 0z Nz J K K z
(Ben-Akiva and Lerman 1985). In our case, with z=0.007 (the difference in adjusted ρ2s be-
tween the two models), N = 373, J = 2, K2 = 6, and K1 = 12, the argument of the square root
function in this expression becomes -2.380. In such cases, the test cannot be performed, as is
implicitly remarked in Ben-Akiva and Swait (1984).

Tang, W. and Mokhtarian, P. L., Journal of Choice Modelling, 2(2), pp. 148-172
170
choice model coefficients within segment, which may or may not be the best reflection
of reality in any given application. It is possible to allow the choice model coefficients
of the LCM to be randomly-distributed (i.e. constituting a mixed logit model within an
LCM) – an extension we leave for future analysis of these data – but even that
complex structure may not represent reality better than coefficients of an unsegmented
model that are simple functions of variables explaining taste heterogeneity (linear
functions of age, in the present case).
Our empirical results can be summarized as follows. The single variable age of-
fers a valuable means of delineating taste heterogeneity in this application context, re-
vealing (in the LCM) two segments with substantively different tastes, or (in the
pooled model with interaction terms) coefficients whose magnitudes are intensified or
diminished with age. In general, the impacts of post-purchase satisfaction, conveni-
ence, and work-based broadband Internet accessibility increase with age, while the
sensitivity to cost decreases. These are generally logical results, suggesting that money
is more critical to the young, while convenience and time are more important to older
shoppers. We speculate that age may be an efficient marker for the complex impacts
of a bundle of variables with which it is correlated (e.g. employment status (+), Inter-
net usage diversity (–), time consciousness (–), and income (+)).
Several directions for future research with these data are indicated. Beginning
with the context studied here (channel intention for book purchases), we can continue
to refine the model specifications, for example by allowing continuously-distributed
coefficients within latent class as mentioned above. Using the same book subsample,
we can also explore people‟s (past) shopping channel adoption instead of (future)
intention, and then compare the results to those obtained here, to identify variables sig-
nificant to choice but not intention, and conversely. In addition, parallel intention and
adoption models will be developed for the clothing subsample as well, enabling the
identification of factors relevant to channel choice for one product type but not the
other. In each of these cases, we will continue to explore the role of LCM in identi-
fying taste heterogeneity, and compare the models resulting from that approach to
those obtained from deterministic segmentation and unsegmented models with inter-
action terms
Acknowledgements
Data collection was funded by the University of California Transportation Center; the
present analysis is funded by the UC Davis Sustainable Transportation Center. The
authors wish to thank Xinyu Cao, who participated heavily in the early stages of the
survey design; Susan Handy, who provided helpful input on the survey design and ad-
ministration; Tara Puzin, who collected and organized Census statistics on the study
areas; and David Ory, who finalized the survey design, conducted the data collection
and initial data cleaning activities, and performed the factor analysis on the general
attitudes/personality traits/values. The comments of two anonymous reviewers im-
proved this paper: we especially thank them for the suggestion leading to our discov-
ery of the unsegmented model with interaction terms.
References
Akaike, H., 1974, A new look at the statistical identification model. IEEE
Transactions on Automatic Control, 19(6), 716-723.

Tang, W. and Mokhtarian, P. L., Journal of Choice Modelling, 2(2), pp. 148-172
171
Ahn, T., Ryu, S. and Han, I., 2004, The impact of the online and offline features on
the user acceptance of internet shopping malls. Electronic Commerce Research
and Applications, 3(4), 405-420.
Babbie, E., 1998, The Practice of Social Research, 8th edition. Belmont, CA:
Wadsworth Pub. Co.
Belanger, F., Hiller, J. S., and Smith, W. J., 2002, Trustworthiness in electronic
commerce: The role of privacy, security, and site attributes. Journal of Strategic
Information Systems, 11, 245-270.
Ben-Akiva, M. and Lerman, S. R., 1985, Discrete Choice Analysis: Theory and
Application to Travel Demand. Cambridge, Massachusetts: MIT Press.
Ben-Akiva, M. and Swait, J., 1984, The Akaike likelihood ratio index. Working paper.
Department of Civil Emgineering, MIT, Cambridge, Mass.
Bhat, C. R., 1997, An endogenous segmentation mode choice model with an
application to intercity travel. Transportation Science, 31(1), 34-48.
Bhatnagar, A. and Ghose, S., 2004, Segmenting consumers based on the benefits and
risks of Internet shopping. Journal of Business Research, 57, 1352-1360.
Brownstone, D., 1998, Multiple imputation methodology for missing data, non-
random response, and panel attrition. Chapter 18 in Tommy Garling, Thomas
Laitila, and Kerstin Westin, eds. Theoretical Foundations of Travel Choice
Modeling. Amsterdam: Elsevier, 421-449. Available at
http://www.its.uci.edu/its/publications/papers/ITS/UCI-ITS-WP-97-4.pdf.
Cao, X. and Mokhtarian, P. L., 2005, The Intended and Actual Adoption of Online
Purchasing: A Brief Review of Recent Literature. Research Report No. UCD-ITS-
RR-05-07, Institute of Transportation Studies, University of California, Davis. A-
vailable at http://www.its.ucdavis.edu/publications/2005/UCD-ITS-RR-05-07.pdf.
Chen, L. and Tan, J., 2004, Technology adaptation in e-commerce: Key determinants
of virtual stores acceptance. European Management Journal, 22(1), 74-86.
Chintagunta, P. K., Jain, D. C. and Vilcassim, N. J., 1991, Investigating heterogeneity
in brand preferences in logit models for panel data. Journal of Marketing
Research, 28(4), 417-428.
Darden, W. R. and Reynolds, F. D., 1971, Shopping orientations and product usage
rates. Journal of Marketing Research, 8(4), 505-508.
Farag, S., Krizek, K. J. and Dijst, M., 2006, E-shopping and its relationship with in-
store shopping: Empirical evidence from the Netherlands and the USA. Transport
Reviews, 26(1), 43-61.
Gonzalez-Benito, O., 2004, Random effects choice models: Seeking latent predisposi-
tion segments in the context of retail store format selection. Omega, 32, 167-177.
Greene, W. H., 2003, Econometric Analysis, 5th edition. Englewood Cliffs, New
Jersey: Prentice Hall,.
Greene, W. H. and Hensher, D. A., 2003, A latent class model for discrete choice
analysis: contrasts with mixed logit. Transportation Research Part B, 37(8), 681-
698.
Greene, W. H., 2007, NLOGIT Version 4.0 Reference Guide. Econometric Software,
Inc.
Haley, R. I., 1968, Benefit segmentation: A decision-oriented research tool. Journal of
Marketing, 32(3), 30-35.
Kemperman, A. and Timmermans, H., 2006, Latent class analysis of leisure activity
patterns: Segments and their covariates. Paper 07-0484 on the CD-ROM of the
86th Annual Meeting of the Transportation Research Board, January, Washington
DC.

Tang, W. and Mokhtarian, P. L., Journal of Choice Modelling, 2(2), pp. 148-172
172
Liao, Z. and Cheung, M. T., 2001. Internet-based e-shopping and consumer attitudes:
An empirical study. Information & Management, 38, 299-306.
Louviere, J., Train, K., Ben-Akiva, M., Bhat, C. R., Brownstone, D., Cameron, T. A.,
Carson, R. T., Deshazo, J. R., Fiebig, D., Greene, W. H., Hensher, D. A. and
Waldman, D., 2005, Recent progress on endogeneity in choice modeling.
Marketing Letters, 16(3–4), 255–265.
Magidson, J. and Vermunt, J. K., 2003, Latent class models. Statistical Innovations
Inc. Available at http://www.statisticalinnovations.com/articles/sage11.pdf,
accessed April 8, 2007.
Miller, J. E., 2005, The Chicago Guide to Writing about Multivariate Analysis.
Chicago, IL: University of Chicago Press.
Mokhtarian, P. L., 2004, A conceptual analysis of the transportation impacts of B2C e-
commerce. Transportation, 31, 257–284.
Mokhtarian, P. L., Ory, D. T. and Cao, X., 2009, Shopping-related attitudes: A factor
and cluster analysis of northern California shoppers. Environment and Planning B,
36(2), 204-228.
Muthén, L. K. and Muthén, B. O., 1998-2007, Mplus User‟s Guide. Fifth Edition. Los
Angeles, CA: Muthén and Muthén.
Ory, D. T. and Mokhtarian, P. L., 2007, Description of a Northern California Shop-
ping Survey Data Collection Effort. University of California, Davis, Institute of
Transportation Studies, Research Report No. UCD-ITS-RR-07-03, March, avail-
able at http://pubs.its.ucdavis.edu/publication_detail.php?id=1071.
Phau, I. and Poon, S. M., 2000, Factors influencing the types of products and services
purchased over internet. Internet Research: Electronic Networking Applications
and Policy, 10(2), 102-113.
Rummel, R. J., 1970, Applied Factor Analysis. Evanston, IL: Northwestern University
Press.
Scarpa, R., Drucker, A. G., Anderson, S., Ferraes-Ehuan, N., Gomez, V., Risopatron
C. R. and Rubio-Leonel, O., 2003, Valuing genetic resources in peasant econo-
mies: the case of „hairless‟ creole pigs in Yucatan. Ecological Economics, 45,
427–443.
Shim, S., Eastlick, M. A., Lotz, S. L. and Warrington, P., 2001, An online prepurchase
intentions model: The role of intention to search. Journal of Retailing, 77, 397-
416.
Stone, G. P., 1954, City shoppers and urban identification: Observations on the social
psychology of city life. The American Journal of Sociology, 60(1), 36-45.
Tauber, E., 1972, Why do people shop? Journal of Marketing, 36, 46-49.
Train, K., 2009, Discrete Choice Methods with Simulation, 2nd
ed. Cambridge, UK:
Cambridge University Press.
Van den Poel, D. and Leunis, J., 1999, Consumer acceptance of the Internet as a
channel of distribution. Journal of Business Research, 45, 249-256.
Van den Poel, D. and Buckinx, W., 2005, Predicting online-purchasing behavior.
European Journal of Operational Research, 166(2), 557-575.
Walker, J. L. and Li, J., 2007, Latent lifestyle preferences and household location
decisions. Journal of Geographical Systems, 9(1), 77-101.
Wu, A. D. and Zumbo, B. D., 2008, Understanding and using mediators and
moderators. Social Indicators Research, 87, 367-392.