access to health care and disparities in colorectal cancer survival in texas
TRANSCRIPT
Health & Place ] (]]]]) ]]]–]]]
Contents lists available at SciVerse ScienceDirect
Health & Place
1353-82
doi:10.1
n Corr
Departm
Drive, T
E-m
yl10@tx1 Te2 Te3 Te
Pleas(201
journal homepage: www.elsevier.com/locate/healthplace
Access to healthcare and disparities in colorectal cancer survival in Texas
Neng Wan a,1, F. Benjamin Zhan a,b,n, Yongmei Lu a,2, John P. Tiefenbacher c,3
a Texas Center for Geographic Information Science, Department of Geography, Texas State University, San Marcos, 601 University Drive, TX 78666, USAb Wuhan University, School of Resource and Environmental Science, Wuhan, Hubei 430079, Chinac The James and Marilyn Lovell Center for Environmental Geography and Hazards Research, Department of Geography, Texas State University,
San Marcos, 601 University Drive, TX 78666, USA
a r t i c l e i n f o
Article history:
Received 4 May 2011
Received in revised form
14 October 2011
Accepted 23 October 2011
Keywords:
Cancer
Colorectal cancer
Disparity
Spatial access
GIS
Health
92/$ - see front matter & 2011 Elsevier Ltd. A
016/j.healthplace.2011.10.007
esponding author at: Texas Center for Geog
ent of Geography, Texas State University,
X 78666, USA. Tel.: þ1 512 245 8846; fax: þ
ail addresses: [email protected] (N. Wan), zha
state.edu (Y. Lu), [email protected] (J.P. Tiefen
l.: þ1 512 245 2170; fax: þ1 512 245 8353.
l.: þ1 512 245 1337; fax: þ1 512 245 8353.
l.: þ1 512 245 8327; fax: þ1 512 245 8353.
e cite this article as: Wan, N., et al.1), doi:10.1016/j.healthplace.2011.10
a b s t r a c t
This paper reports a study examining the association between colorectal cancer (CRC) survival and
access to healthcare in Texas using data from the Texas cancer registry. We geo-referenced the data to
the census tract level and used an enhanced 2-step floating catchment area method and factor analysis
to estimate people’s spatial and non-spatial access to healthcare. In addition, Cox proportional hazard
regression was employed to assess the influence of different factors on CRC survival, and a spatial scan
statistic was used to investigate the geographic disparity of CRC survival and the influence of access
to healthcare. The analyses revealed that Hispanics, non-Hispanic blacks, and residents from several
regions in Texas were more likely to die from CRC than others. Disadvantaged population groups based
on factors rather than spatial access had an increased risk of CRC-specific mortality. Spatial access to
oncologists has a significant association with CRC survival in non-urban areas but not in urban areas.
Geographic disparities of CRC survival were largely influenced by factors rather than spatial access to
healthcare.
& 2011 Elsevier Ltd. All rights reserved.
1. Introduction
Colorectal cancer (CRC) is a common and deadly disease. In theUnited States, CRC was estimated to account for 142,570 new casesand 51,370 new deaths in 2010 (American Cancer Society (ACS),2010). The probability of surviving CRC differs significantly amongpopulation groups in the United States. Researchers have reportedsubstantial disparities of CRC survival in relation to neighborhoodor individual level socioeconomic status (SES), race/ethnicity, andgeographic location, suggesting that racial/ethnic minorities (e.g.,African Americans and Hispanics), individuals from groups with lowSES, and individuals in some geographic regions systematicallyexperience lower survival rates than others (Clegg et al., 2002;McDavid et al., 2003; Jemal et al., 2004; Du et al., 2007; Huang et al.,2007b; Le et al., 2008; Henry et al., 2009).
Stage at the first time of diagnosis is a primary determinant ofCRC survival, as early-stage CRC patients could attain a five-yearsurvival rate of 90%, which is much higher than the 10% five-year
ll rights reserved.
raphic Information Science,
San Marcos, 601 University
1 512 245 8353.
[email protected] (F.B. Zhan),
bacher).
, Access to healthcare and d.007
survival rate for patients diagnosed at a distant stage (ACS, 2005).The high CRC-specific mortality rate among disadvantaged socialgroups has been largely attributed to a high proportion of late-stage CRC cases in these groups (Govindarajan et al., 2003; Dimouet al., 2009).
In addition to stage at diagnosis, access to treatment services isalso believed to influence cancer outcomes, as high-quality andtimely treatment can extend a patient’s life and lower the chanceof dying from cancer (McDavid et al., 2003; Siminoff and Ross,2005; Le et al., 2008; Dai, 2010; Tian et al., 2010; Kuo et al., 2011).Access to medical services can be influenced by spatial andnon-spatial factors, with spatial access largely determined by geo-graphic characteristics (i.e., location and distance) of the demandingpopulation and related medical services and non-spatial accessdetermined by individual and/or community socio-cultural factors(e.g., affluence, education, language fluency) (Aday and Andersen,1974).
The goal of this study is to investigate how spatial access tocancer treatment services, along with non-spatial access factors,influences CRC survival based on data geo-referenced at thecensus tract level in Texas. Spatial access to medical servicesrepresents the basis for healthcare use because it provides thephysical prerequisite for using the services (Guagliardo, 2004;Luo, 2004). Associations between CRC survival and spatial accessto CRC services have been well established internationally. Forexample, Dejardin et al. (2008) analyzed the impact of travelingdistance to cancer treatment on colon cancer survival in two
isparities in colorectal cancer survival in Texas. Health & Place

N. Wan et al. / Health & Place ] (]]]]) ]]]–]]]2
French areas. Their analysis revealed a positive associationbetween road distance to the nearest care center and the riskof dying from colon cancer after adjusting for other importantfactors. In a comprehensive study of cancer survival in NewZealand, Haynes et al. (2008) found that CRC patients livingfarther from cancer centers experienced significantly lowerchances of survival. These studies suggest that, despite the criticalrole of socio-cultural factors and quality of medical treatment,geographic factors exert an important influence on CRC survival.
However, few studies have been conducted in the United Statesto investigate how spatial access to cancer treatment servicesinfluences CRC survival. The majority of previous studies focusedon the impacts of socio-cultural factors (e.g., SES and insurancestatus) on CRC survival (McDavid et al., 2003; Kirsner et al., 2006; Duet al., 2007). While most of these studies confirmed the associationsbetween socio-cultural factors and CRC survival, few have investi-gated whether spatial factors (e.g., distance and location) could helpexplain these disparities. Other studies have examined the influenceof treatment delivery (Gomez et al., 2007; Le et al., 2008), but noattempts were made to investigate how the use of treatment wasinfluenced by patients’ spatial access to the services.
In this study, a GIS method was used to measure individuals’spatial access to cancer services and a factor analysis wasconducted to estimate non-spatial factors that influence serviceutilization and CRC outcomes. The study assesses the impacts ofspatial and non-spatial factors on CRC survival in various rural/urban settings. This study is the first to examine the role of spatialaccess factors on CRC survival in the United States. The resultsprovide insights about the importance of access to medical care,and hence give useful information that may be used to enhancepractices in the allocation of medical resources.
2. Data and methodology
2.1. CRC survival data
Individual CRC incidence data for Texas from January 1, 1995through December 31, 2003 were obtained from the Texas CancerRegistry (TCR). The TCR is maintains the most comprehensivecancer databases in Texas with a case-ascertaining rate greaterthan 98.3% (Risser et al., 2009). The TCR uses a passive follow-upapproach to ascertain the vital status of cancer patients but alsolinks its cancer registry information with the Texas vital statisticsdata, the National Death Index data, and the Social Security DeathIndex data. CRC incidence was determined based on the Interna-tional Classification of Diseases, 9th revision (ICD-9) (codes:153.0–154.1), and 10th Revision (ICD-10) (codes: C18-C20).CRC-specific mortality was determined based on the standarddefinition of the Surveillance Epidemiology and End Result (SEER)cause-specific death classification. The use and analysis of theTexas CRC incidence database has been reviewed and approvedby the Institutional Review Board (IRB) of the Texas Departmentof State Health Services (DSHS).
According to the CRC data, 72,738 Texans were diagnosed witha first primary tumor in the colon or rectum during the studyperiod. Descriptive characteristics of each CRC case included apatient’s age, sex, race/ethnicity (i.e., non-Hispanic white, non-Hispanic black, Hispanic, Asian, or Native American), stage atdiagnosis, residential address, date of last contact, vital status(deceased or alive) at last contact, cause of death (if deceased),and date of death (if deceased). The patient follow-up period wasfrom January 1, 1995, through March 1, 2010.
The geographic locations of CRC patients were determined usingthe Geocoding module of ArcGIS, version 9.3 (Environmental Serviceand Research Institute (ESRI), 2009) with the census 2000 street file
Please cite this article as: Wan, N., et al., Access to healthcare and d(2011), doi:10.1016/j.healthplace.2011.10.007
(US Census Bureau, 2001a) as reference data. The geocodingsuccessfully matched 65,212 (89.7%) patients to street locations.Addresses that could not be geocoded were addresses with postaloffice box numbers and addresses with incomplete information thatmakes the geocoding of an address not possible. The unmatchedcases were excluded from the analysis. Multiple t-tests revealed nosignificant difference between the matched and the unmatchedcases by sex (p¼0.89), age (p¼0.92), stage at diagnosis (p¼0.97),and race/ethnicity (p¼0.54).
Categorization of stage at diagnosis in the original CRC data wasbased on the SEER classification of either in-situ, localized, regional,or distant stages. For cases with multiple primary CRC tumors, onlythe most distant stage was used in this study. Cases with missingstage information (N¼8478) were excluded from some subsequentanalyses because stage at diagnosis was the main factor used inthese analyses. The unstaged cases and study cases were similar toeach other in the distributions by sex (p¼0.82), age (p¼0.98), race/ethnicity (p¼0.42), rurality (p¼0.79), spatial access to oncologists(p¼0.62), and non-spatial access to healthcare services (p¼0.76).
CRC-specific survival is the measure used to reflect survivalrate in this study. Cancer specific survival (or cause-specificmortality) is a ‘‘net survival measure representing survival of aspecific cause of death in the absence of other causes of death’’(National Cancer Institute (NCI), 2010). It is the most usefulapproach for analyzing cancer disparities and has been adoptedby NCI as a ‘‘policy-based statistic’’ (NCI, 2010). Both long-termand five-year CRC-specific survival data were analyzed in thisstudy. For the long-term survival analysis, the survival time (inmonths) of a patient was measured from the date of CRCdiagnosis and was censored at the date on which the case waslost to follow-up, the date the case died from other causes, or thelast day of the follow-up (which was March 1, 2010), whicheveroccurred first. Censoring is a common challenge for survivalanalysis when the time of cause-specific mortality is unavailablefor some cases; these cases will therefore be labeled as ‘censored’in the analysis. For the five-year survival analysis, the survivaltime (in months) of a patient was measured from the date of CRCdiagnosis and was censored at the date on which the case was lostto follow-up, the date the case died from other causes, or the lastday of the five-year period starting from the date of diagnosis,whichever occurred first.
2.2. Service locations of oncologists
The office locations of oncologists were used as proxies for thelocations of cancer treatment services in this study. A database oflicensed oncologists practicing in the state of Texas in 2000 wasacquired from the Health Professional Resource Center of TexasDSHS, the most comprehensive health professional informationcollection system in Texas. According to the data, there were 205oncologists practicing at 121 addresses in Texas in 2000. All ofthese oncologists had postgraduate medical education and hadbeen practicing medicine, and been involved in research and/orteaching. The ArcGIS 9.3 geocoding tool successfully matched 204oncologists to 120 locations based on their primary practicingaddresses.
2.3. Measuring spatial access to oncologist services
Spatial access to oncologists was determined based on census-tract boundaries using an enhanced 2-step floating catchmentarea (E2SFCA) method. This approach has an advantage in that itcan capture complex interactions between population demandand medical service availability, as well as the geographic loca-tions of patient populations and medical sites (Luo and Qi, 2009).The E2SFCA method works in two steps. First, it ‘‘draws’’ a
isparities in colorectal cancer survival in Texas. Health & Place
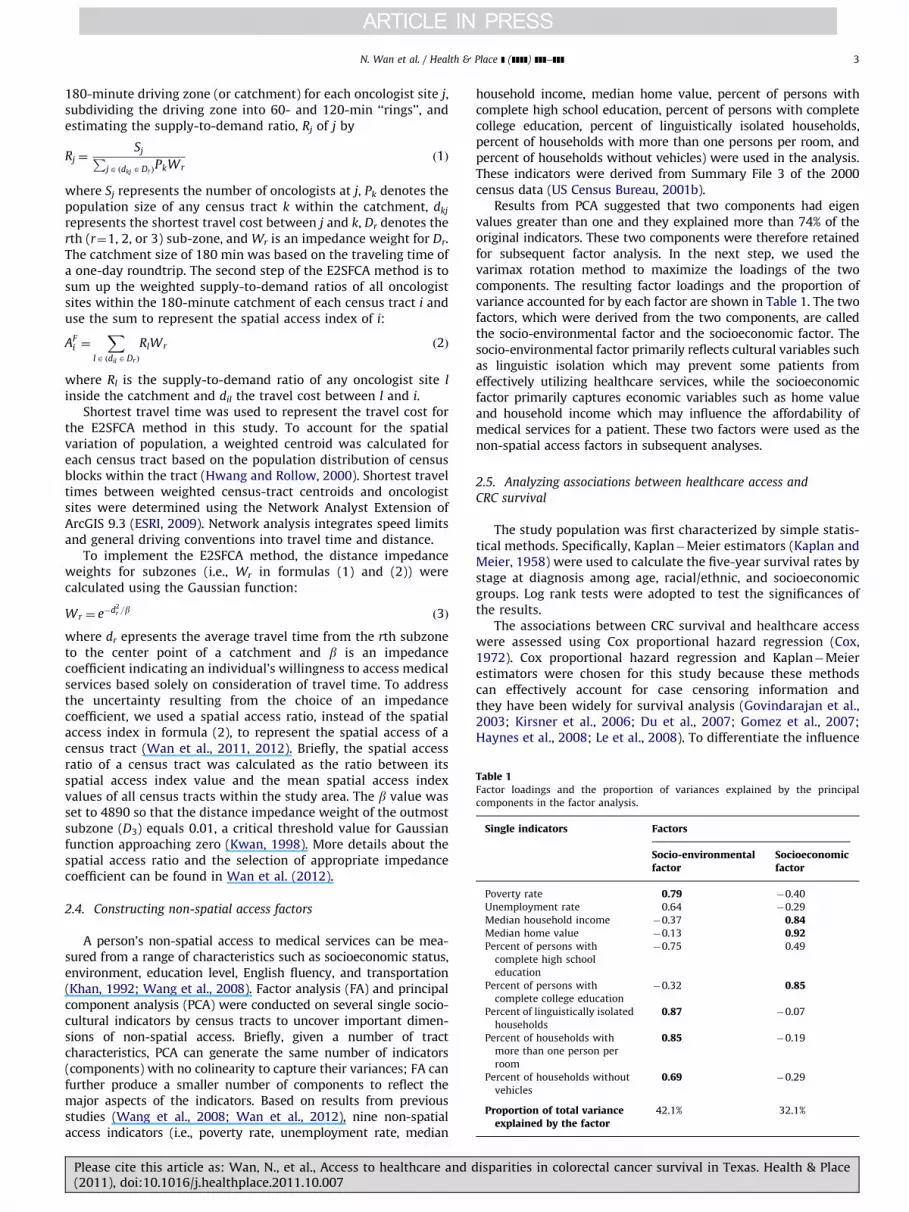
Table 1Factor loadings and the proportion of variances explained by the principal
components in the factor analysis.
Single indicators Factors
Socio-environmentalfactor
Socioeconomicfactor
Poverty rate 0.79 �0.40
Unemployment rate 0.64 �0.29
Median household income �0.37 0.84Median home value �0.13 0.92Percent of persons with
complete high school
education
�0.75 0.49
Percent of persons with
complete college education
�0.32 0.85
Percent of linguistically isolated
households
0.87 �0.07
Percent of households with
more than one person per
room
0.85 �0.19
Percent of households without
vehicles
0.69 �0.29
Proportion of total varianceexplained by the factor
42.1% 32.1%
N. Wan et al. / Health & Place ] (]]]]) ]]]–]]] 3
180-minute driving zone (or catchment) for each oncologist site j,subdividing the driving zone into 60- and 120-min ‘‘rings’’, andestimating the supply-to-demand ratio, Rj of j by
Rj ¼SjP
jA ðdkj ADr ÞPkWr
ð1Þ
where Sj represents the number of oncologists at j, Pk denotes thepopulation size of any census tract k within the catchment, dkj
represents the shortest travel cost between j and k, Dr denotes therth (r¼1, 2, or 3) sub-zone, and Wr is an impedance weight for Dr.The catchment size of 180 min was based on the traveling time ofa one-day roundtrip. The second step of the E2SFCA method is tosum up the weighted supply-to-demand ratios of all oncologistsites within the 180-minute catchment of each census tract i anduse the sum to represent the spatial access index of i:
AFi ¼
X
lA ðdil ADr Þ
RlWr ð2Þ
where Rl is the supply-to-demand ratio of any oncologist site l
inside the catchment and dil the travel cost between l and i.Shortest travel time was used to represent the travel cost for
the E2SFCA method in this study. To account for the spatialvariation of population, a weighted centroid was calculated foreach census tract based on the population distribution of censusblocks within the tract (Hwang and Rollow, 2000). Shortest traveltimes between weighted census-tract centroids and oncologistsites were determined using the Network Analyst Extension ofArcGIS 9.3 (ESRI, 2009). Network analysis integrates speed limitsand general driving conventions into travel time and distance.
To implement the E2SFCA method, the distance impedanceweights for subzones (i.e., Wr in formulas (1) and (2)) werecalculated using the Gaussian function:
Wr ¼ e�d2r =b ð3Þ
where dr epresents the average travel time from the rth subzoneto the center point of a catchment and b is an impedancecoefficient indicating an individual’s willingness to access medicalservices based solely on consideration of travel time. To addressthe uncertainty resulting from the choice of an impedancecoefficient, we used a spatial access ratio, instead of the spatialaccess index in formula (2), to represent the spatial access of acensus tract (Wan et al., 2011, 2012). Briefly, the spatial accessratio of a census tract was calculated as the ratio between itsspatial access index value and the mean spatial access indexvalues of all census tracts within the study area. The b value wasset to 4890 so that the distance impedance weight of the outmostsubzone (D3) equals 0.01, a critical threshold value for Gaussianfunction approaching zero (Kwan, 1998). More details about thespatial access ratio and the selection of appropriate impedancecoefficient can be found in Wan et al. (2012).
2.4. Constructing non-spatial access factors
A person’s non-spatial access to medical services can be mea-sured from a range of characteristics such as socioeconomic status,environment, education level, English fluency, and transportation(Khan, 1992; Wang et al., 2008). Factor analysis (FA) and principalcomponent analysis (PCA) were conducted on several single socio-cultural indicators by census tracts to uncover important dimen-sions of non-spatial access. Briefly, given a number of tractcharacteristics, PCA can generate the same number of indicators(components) with no colinearity to capture their variances; FA canfurther produce a smaller number of components to reflect themajor aspects of the indicators. Based on results from previousstudies (Wang et al., 2008; Wan et al., 2012), nine non-spatialaccess indicators (i.e., poverty rate, unemployment rate, median
Please cite this article as: Wan, N., et al., Access to healthcare and d(2011), doi:10.1016/j.healthplace.2011.10.007
household income, median home value, percent of persons withcomplete high school education, percent of persons with completecollege education, percent of linguistically isolated households,percent of households with more than one persons per room, andpercent of households without vehicles) were used in the analysis.These indicators were derived from Summary File 3 of the 2000census data (US Census Bureau, 2001b).
Results from PCA suggested that two components had eigenvalues greater than one and they explained more than 74% of theoriginal indicators. These two components were therefore retainedfor subsequent factor analysis. In the next step, we used thevarimax rotation method to maximize the loadings of the twocomponents. The resulting factor loadings and the proportion ofvariance accounted for by each factor are shown in Table 1. The twofactors, which were derived from the two components, are calledthe socio-environmental factor and the socioeconomic factor. Thesocio-environmental factor primarily reflects cultural variables suchas linguistic isolation which may prevent some patients fromeffectively utilizing healthcare services, while the socioeconomicfactor primarily captures economic variables such as home valueand household income which may influence the affordability ofmedical services for a patient. These two factors were used as thenon-spatial access factors in subsequent analyses.
2.5. Analyzing associations between healthcare access and
CRC survival
The study population was first characterized by simple statis-tical methods. Specifically, Kaplan�Meier estimators (Kaplan andMeier, 1958) were used to calculate the five-year survival rates bystage at diagnosis among age, racial/ethnic, and socioeconomicgroups. Log rank tests were adopted to test the significances ofthe results.
The associations between CRC survival and healthcare accesswere assessed using Cox proportional hazard regression (Cox,1972). Cox proportional hazard regression and Kaplan�Meierestimators were chosen for this study because these methodscan effectively account for case censoring information andthey have been widely for survival analysis (Govindarajan et al.,2003; Kirsner et al., 2006; Du et al., 2007; Gomez et al., 2007;Haynes et al., 2008; Le et al., 2008). To differentiate the influence
isparities in colorectal cancer survival in Texas. Health & Place

N. Wan et al. / Health & Place ] (]]]]) ]]]–]]]4
of urban/rural settings, the analysis was implemented for allareas, urban areas, and non-urban areas, respectively. Theurban/non-urban status of census tracts was based on the RuralUrban Commuting Area (RUCA) classification (Hart, 2006), whichintegrates the census urban/rural information and the work-commuting data to differentiate the rurality of geographic units.
We did not use more detailed rurality categories because ofthe small numbers of CRC cases in some areas. For each setting,the analysis consisted of three steps. The first step estimated age-,sex- and stage-adjusted hazard ratios (HRs) of five-year CRCsurvival by race/ethnicity and each of the healthcare accessindices (Model I). The second step incorporated age, sex, stageat diagnosis, race/ethnicity, and the non-spatial access factor intothe model (Model II). The third step integrated spatial access tooncologists with all of the factors of Model II into the regression(Model III). The change of the HRs for each factor was examined toassess the relative importance of each factor for CRC survivaldisparity among urban and rural patients. The Kaplan�Meierestimations and the Cox hazard proportional hazard regressionswere accomplished with SPSS, version 17.0 (SPSS Inc., 2009).
2.6. Analyzing the influence of healthcare access on geographic
disparities of CRC survival
The spatial scan statistic (exponential model) (Huang et al.,2007a) was used to detect geographic disparities of CRC survivalin Texas. Based on the assumption that survival times follow anexponential model, the mean survival times of cases withina moving circular kernel (yin) are compared to those outsidethe kernel (yout) to determine ‘‘hot’’ or ‘‘cold’’ spots of survival.Therefore, the null hypothesis is H0: yin¼yout and the alternativecan be either Ha: yinoyout or Hb: yin4yout, depending onwhether the researcher wants to identify high- or low-risk areas.This method uses a Monte Carlo permutation approach to test thestatistical significance of ‘‘hot’’ or ‘‘cold’’ spots and to allowfor multiple testing (Huang et al., 2007a). Since the goal is todetect areas with significantly different survival times, both Haand Hb were tested. The kernel size was set to range from twocases to one half of the case population. The spatial scan statisticanalyses were accomplished using SaTScan, version 9.0 (Kulldorff,1997).
Four spatial scan statistic models were employed to identifyareas with significantly longer or shorter CRC-specific survivalrates, while sequentially adjusting for important covariates usingan exponential model (Huang et al., 2007a). Specifically, the firstmodel (Model a) used sex- and age-adjusted survival times. Thesecond model (Model b) adjusted for sex, age, and stage atdiagnosis. The covariates adjusted in the third model (Model c)involved all factors of the second model plus race/ethnicity. Thefourth model (Model d) included all factors of the third modelplus the non-spatial access factor. The covariate adjustmentsfollowed the procedures of Huang et al. (2007a) using MATLAB,version 7.0 (Mathworks, 2010).
Areas with significantly longer or shorter survival times afterthe covariate adjustments were mapped using ArcGIS 9.3 (ESRI,2009). Relevant indicators such as the number of cases, theobserved/expected (O/E) ratio of CRC mortality as determinedby SaTScan, the racial/ethnic distribution, and the population-averaged non-spatial access factor were reported and comparedbetween the high- and low-risk areas. It is worth noting thatSaTScan calculates expected mortality cases as the ones whoseactual survival or censoring times are shorter than the meansurvival time. Therefore, the O/E ratio as mentioned in this studyis different from the standard O/E mortality or incidence ratiosused in other studies.
Please cite this article as: Wan, N., et al., Access to healthcare and d(2011), doi:10.1016/j.healthplace.2011.10.007
3. Results
3.1. Descriptive results
Among the 56,734 CRC cases that meet the study criteria,41,265 (72.7%) were non-Hispanic whites, 8081 (14.2%) wereHispanics, 6595 (11.6%) were non-Hispanic blacks, 757 (1.3%)were Asians, and 36 (0.1%) were native Americans. The mean ageat diagnosis for all these cases was 67. The numbers of in-situ,localized, regional, and distant stage cases were 3151 (5.6%),19,901 (35.1%), 23,555 (41.5%), and 10,127 (17.8%), respectively.Urban dwellers (N¼43,969) comprised 77.5% of the cases. Thepatient follow-up process determined that 18,836 (33.2%) caseshad died from CRC as of March 1, 2010. The rest were rightcensored, that is, censored after the date of first diagnosis.
Table 2 lists the five-year survival rates categorized by differ-ent factors. As can be seen in Table 2, the risk of five-yearCRC-specific mortality is associated with stage at diagnosis, age,race/ethnicity, and access to healthcare services. Non-Hispanicwhites had a significantly higher five-year survival rate than otherracial/ethnic groups. Patients with different spatial and non-spatial access to healthcare services also differed significantly inthe five-year survival rate. In addition, the rate of five-yearsurvival ranged from as high as 97.1% (i.e., patients younger than50) for in-situ stage groups to as low as 5.1% (i.e., patients olderthan 80) for distant stage groups.
Table 2 also lists the five-year survival rates by variouscharacteristics for the unstaged cases. In general, the five-yearsurvival rate of the unstaged cases was slightly higher than that ofthe staged cases. This difference is more obvious for the threeaccessibility factors. However, the rates for unstaged cases weregenerally between those of the localized stage and the regionalstage, suggesting a similar stage-distribution to the staged cases.
3.2. Access to healthcare in Texas
Geographic patterns of spatial access to oncologists and thesocioeconomic factor across Texas are shown in Figs. 1 and 2, whichare interpolated based on values at the census tract level. The socio-environmental factor was not mapped because, according to apreliminary regression analysis, it was not significantly associatedwith CRC survival for either urban or non-urban CRC patients inTexas after adjusting for age and sex. As shown in Fig. 1, Texanshave unequal spatial access to oncologists, as residents of majormetropolitan areas (i.e., Houston, Dallas, Austin, and Lubbock) havethe greatest spatial access and people from non-metropolitan areashad limited spatial access. The southwestern part of Texas had theleast spatial access to oncologists compared to other parts of thestate. There was also an uneven distribution of non-spatial access tohealthcare in Texas, as the southwestern part of the state haddisadvantaged non-spatial access to healthcare compared to therest of the state (Fig. 2).
3.3. Results of regression analysis
Table 3 shows the HRs and the 95% confident intervals (CIs) ofthe Cox proportional regressions. Asians and Native Americanswere excluded from the regression analyses because of theirrelatively smaller numbers. The socio-environmental factor wasnot used in the regression analysis because a preliminary analysissuggested that the socio-environmental factor was not significantafter adjusting for age and sex. Age, sex and stage-adjustedregression indicates that non-Hispanic black (HR: 1.33, 95%CI: 1.28�1.39) and Hispanic (HR: 1.16, 95% CI: 1.11�1.21) CRCpatients had significantly higher risks of five-year CRC-specificmortality than non-Hispanic white patients. Patients with the
isparities in colorectal cancer survival in Texas. Health & Place
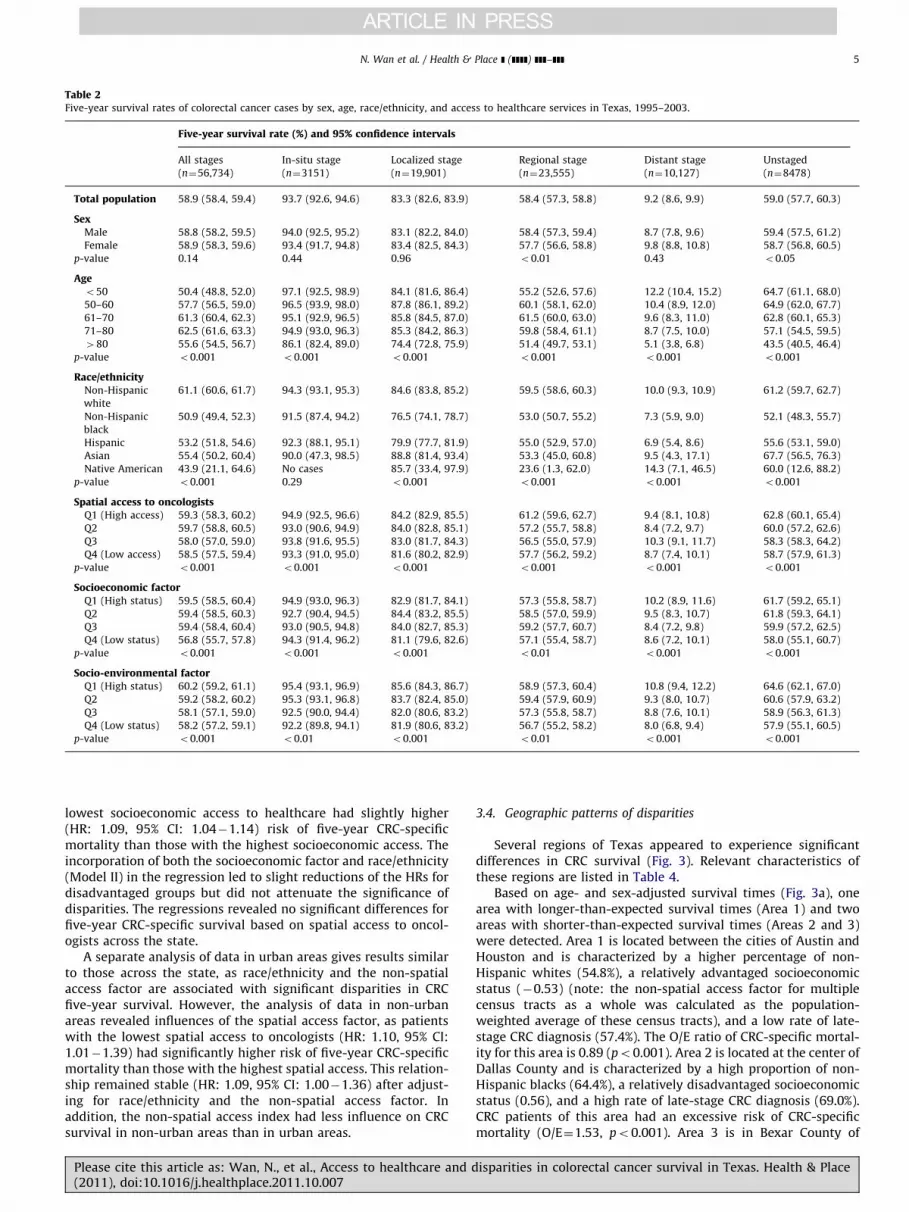
Table 2Five-year survival rates of colorectal cancer cases by sex, age, race/ethnicity, and access to healthcare services in Texas, 1995–2003.
Five-year survival rate (%) and 95% confidence intervals
All stages
(n¼56,734)
In-situ stage
(n¼3151)
Localized stage
(n¼19,901)
Regional stage
(n¼23,555)
Distant stage
(n¼10,127)
Unstaged
(n¼8478)
Total population 58.9 (58.4, 59.4) 93.7 (92.6, 94.6) 83.3 (82.6, 83.9) 58.4 (57.3, 58.8) 9.2 (8.6, 9.9) 59.0 (57.7, 60.3)
SexMale 58.8 (58.2, 59.5) 94.0 (92.5, 95.2) 83.1 (82.2, 84.0) 58.4 (57.3, 59.4) 8.7 (7.8, 9.6) 59.4 (57.5, 61.2)
Female 58.9 (58.3, 59.6) 93.4 (91.7, 94.8) 83.4 (82.5, 84.3) 57.7 (56.6, 58.8) 9.8 (8.8, 10.8) 58.7 (56.8, 60.5)
p-value 0.14 0.44 0.96 o0.01 0.43 o0.05
Ageo50 50.4 (48.8, 52.0) 97.1 (92.5, 98.9) 84.1 (81.6, 86.4) 55.2 (52.6, 57.6) 12.2 (10.4, 15.2) 64.7 (61.1, 68.0)
50–60 57.7 (56.5, 59.0) 96.5 (93.9, 98.0) 87.8 (86.1, 89.2) 60.1 (58.1, 62.0) 10.4 (8.9, 12.0) 64.9 (62.0, 67.7)
61–70 61.3 (60.4, 62.3) 95.1 (92.9, 96.5) 85.8 (84.5, 87.0) 61.5 (60.0, 63.0) 9.6 (8.3, 11.0) 62.8 (60.1, 65.3)
71–80 62.5 (61.6, 63.3) 94.9 (93.0, 96.3) 85.3 (84.2, 86.3) 59.8 (58.4, 61.1) 8.7 (7.5, 10.0) 57.1 (54.5, 59.5)
480 55.6 (54.5, 56.7) 86.1 (82.4, 89.0) 74.4 (72.8, 75.9) 51.4 (49.7, 53.1) 5.1 (3.8, 6.8) 43.5 (40.5, 46.4)
p-value o0.001 o0.001 o0.001 o0.001 o0.001 o0.001
Race/ethnicityNon-Hispanic
white
61.1 (60.6, 61.7) 94.3 (93.1, 95.3) 84.6 (83.8, 85.2) 59.5 (58.6, 60.3) 10.0 (9.3, 10.9) 61.2 (59.7, 62.7)
Non-Hispanic
black
50.9 (49.4, 52.3) 91.5 (87.4, 94.2) 76.5 (74.1, 78.7) 53.0 (50.7, 55.2) 7.3 (5.9, 9.0) 52.1 (48.3, 55.7)
Hispanic 53.2 (51.8, 54.6) 92.3 (88.1, 95.1) 79.9 (77.7, 81.9) 55.0 (52.9, 57.0) 6.9 (5.4, 8.6) 55.6 (53.1, 59.0)
Asian 55.4 (50.2, 60.4) 90.0 (47.3, 98.5) 88.8 (81.4, 93.4) 53.3 (45.0, 60.8) 9.5 (4.3, 17.1) 67.7 (56.5, 76.3)
Native American 43.9 (21.1, 64.6) No cases 85.7 (33.4, 97.9) 23.6 (1.3, 62.0) 14.3 (7.1, 46.5) 60.0 (12.6, 88.2)
p-value o0.001 0.29 o0.001 o0.001 o0.001 o0.001
Spatial access to oncologistsQ1 (High access) 59.3 (58.3, 60.2) 94.9 (92.5, 96.6) 84.2 (82.9, 85.5) 61.2 (59.6, 62.7) 9.4 (8.1, 10.8) 62.8 (60.1, 65.4)
Q2 59.7 (58.8, 60.5) 93.0 (90.6, 94.9) 84.0 (82.8, 85.1) 57.2 (55.7, 58.8) 8.4 (7.2, 9.7) 60.0 (57.2, 62.6)
Q3 58.0 (57.0, 59.0) 93.8 (91.6, 95.5) 83.0 (81.7, 84.3) 56.5 (55.0, 57.9) 10.3 (9.1, 11.7) 58.3 (58.3, 64.2)
Q4 (Low access) 58.5 (57.5, 59.4) 93.3 (91.0, 95.0) 81.6 (80.2, 82.9) 57.7 (56.2, 59.2) 8.7 (7.4, 10.1) 58.7 (57.9, 61.3)
p-value o0.001 o0.001 o0.001 o0.001 o0.001 o0.001
Socioeconomic factorQ1 (High status) 59.5 (58.5, 60.4) 94.9 (93.0, 96.3) 82.9 (81.7, 84.1) 57.3 (55.8, 58.7) 10.2 (8.9, 11.6) 61.7 (59.2, 65.1)
Q2 59.4 (58.5, 60.3) 92.7 (90.4, 94.5) 84.4 (83.2, 85.5) 58.5 (57.0, 59.9) 9.5 (8.3, 10.7) 61.8 (59.3, 64.1)
Q3 59.4 (58.4, 60.4) 93.0 (90.5, 94.8) 84.0 (82.7, 85.3) 59.2 (57.7, 60.7) 8.4 (7.2, 9.8) 59.9 (57.2, 62.5)
Q4 (Low status) 56.8 (55.7, 57.8) 94.3 (91.4, 96.2) 81.1 (79.6, 82.6) 57.1 (55.4, 58.7) 8.6 (7.2, 10.1) 58.0 (55.1, 60.7)
p-value o0.001 o0.001 o0.001 o0.01 o0.001 o0.001
Socio-environmental factorQ1 (High status) 60.2 (59.2, 61.1) 95.4 (93.1, 96.9) 85.6 (84.3, 86.7) 58.9 (57.3, 60.4) 10.8 (9.4, 12.2) 64.6 (62.1, 67.0)
Q2 59.2 (58.2, 60.2) 95.3 (93.1, 96.8) 83.7 (82.4, 85.0) 59.4 (57.9, 60.9) 9.3 (8.0, 10.7) 60.6 (57.9, 63.2)
Q3 58.1 (57.1, 59.0) 92.5 (90.0, 94.4) 82.0 (80.6, 83.2) 57.3 (55.8, 58.7) 8.8 (7.6, 10.1) 58.9 (56.3, 61.3)
Q4 (Low status) 58.2 (57.2, 59.1) 92.2 (89.8, 94.1) 81.9 (80.6, 83.2) 56.7 (55.2, 58.2) 8.0 (6.8, 9.4) 57.9 (55.1, 60.5)
p-value o0.001 o0.01 o0.001 o0.01 o0.001 o0.001
N. Wan et al. / Health & Place ] (]]]]) ]]]–]]] 5
lowest socioeconomic access to healthcare had slightly higher(HR: 1.09, 95% CI: 1.04�1.14) risk of five-year CRC-specificmortality than those with the highest socioeconomic access. Theincorporation of both the socioeconomic factor and race/ethnicity(Model II) in the regression led to slight reductions of the HRs fordisadvantaged groups but did not attenuate the significance ofdisparities. The regressions revealed no significant differences forfive-year CRC-specific survival based on spatial access to oncol-ogists across the state.
A separate analysis of data in urban areas gives results similarto those across the state, as race/ethnicity and the non-spatialaccess factor are associated with significant disparities in CRCfive-year survival. However, the analysis of data in non-urbanareas revealed influences of the spatial access factor, as patientswith the lowest spatial access to oncologists (HR: 1.10, 95% CI:1.01�1.39) had significantly higher risk of five-year CRC-specificmortality than those with the highest spatial access. This relation-ship remained stable (HR: 1.09, 95% CI: 1.00�1.36) after adjust-ing for race/ethnicity and the non-spatial access factor. Inaddition, the non-spatial access index had less influence on CRCsurvival in non-urban areas than in urban areas.
Please cite this article as: Wan, N., et al., Access to healthcare and d(2011), doi:10.1016/j.healthplace.2011.10.007
3.4. Geographic patterns of disparities
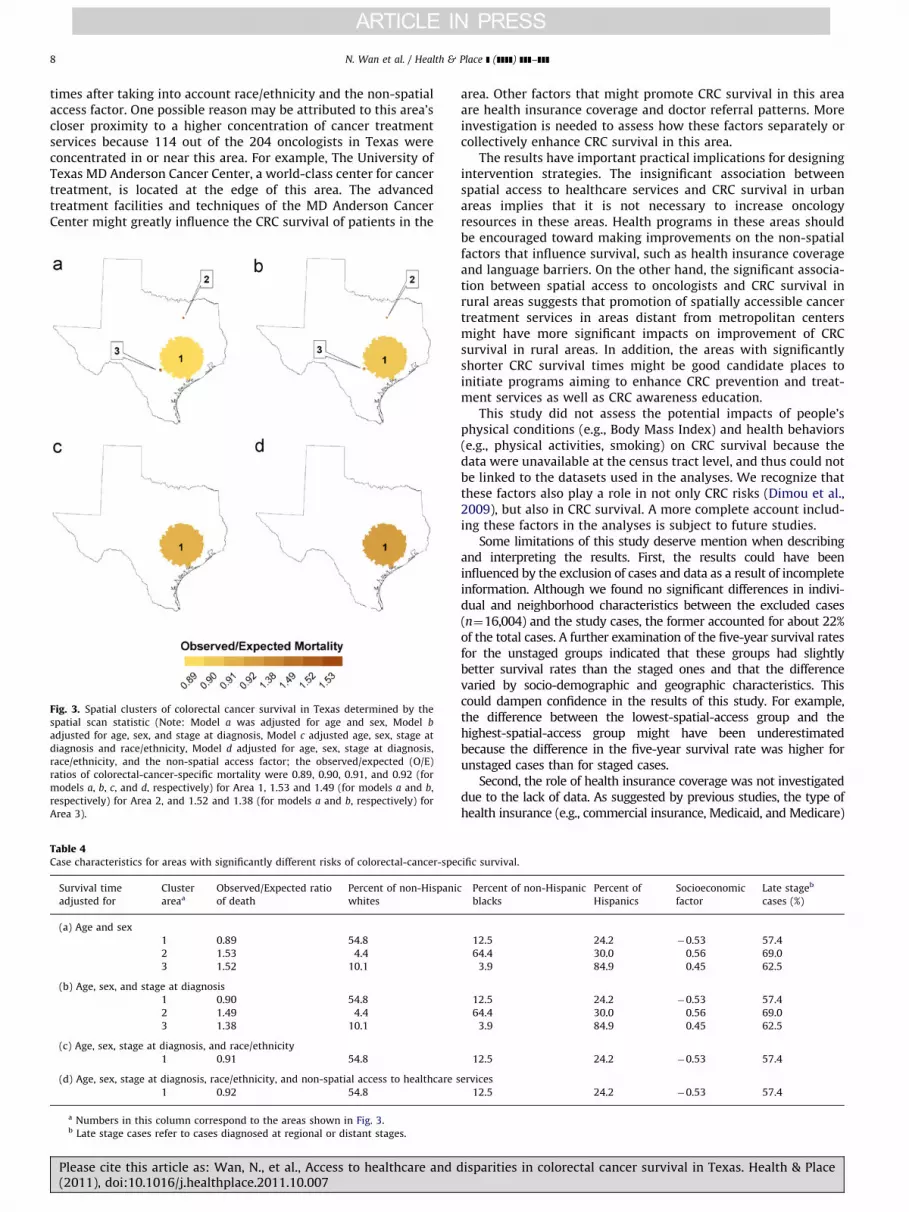
Several regions of Texas appeared to experience significantdifferences in CRC survival (Fig. 3). Relevant characteristics ofthese regions are listed in Table 4.
Based on age- and sex-adjusted survival times (Fig. 3a), onearea with longer-than-expected survival times (Area 1) and twoareas with shorter-than-expected survival times (Areas 2 and 3)were detected. Area 1 is located between the cities of Austin andHouston and is characterized by a higher percentage of non-Hispanic whites (54.8%), a relatively advantaged socioeconomicstatus (�0.53) (note: the non-spatial access factor for multiplecensus tracts as a whole was calculated as the population-weighted average of these census tracts), and a low rate of late-stage CRC diagnosis (57.4%). The O/E ratio of CRC-specific mortal-ity for this area is 0.89 (po0.001). Area 2 is located at the center ofDallas County and is characterized by a high proportion of non-Hispanic blacks (64.4%), a relatively disadvantaged socioeconomicstatus (0.56), and a high rate of late-stage CRC diagnosis (69.0%).CRC patients of this area had an excessive risk of CRC-specificmortality (O/E¼1.53, po0.001). Area 3 is in Bexar County of
isparities in colorectal cancer survival in Texas. Health & Place
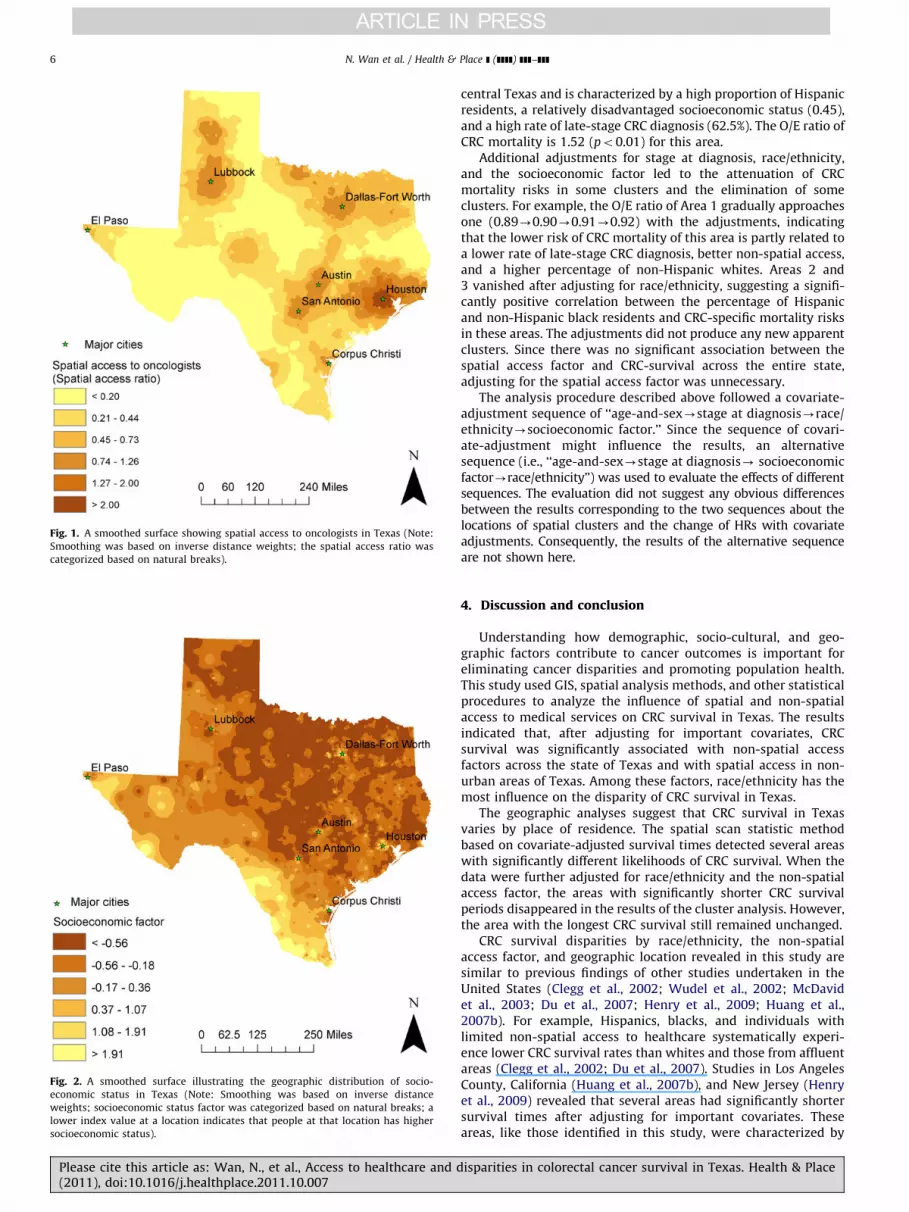
Fig. 1. A smoothed surface showing spatial access to oncologists in Texas (Note:
Smoothing was based on inverse distance weights; the spatial access ratio was
categorized based on natural breaks).
Fig. 2. A smoothed surface illustrating the geographic distribution of socio-
economic status in Texas (Note: Smoothing was based on inverse distance
weights; socioeconomic status factor was categorized based on natural breaks; a
lower index value at a location indicates that people at that location has higher
socioeconomic status).
N. Wan et al. / Health & Place ] (]]]]) ]]]–]]]6
Please cite this article as: Wan, N., et al., Access to healthcare and d(2011), doi:10.1016/j.healthplace.2011.10.007
central Texas and is characterized by a high proportion of Hispanicresidents, a relatively disadvantaged socioeconomic status (0.45),and a high rate of late-stage CRC diagnosis (62.5%). The O/E ratio ofCRC mortality is 1.52 (po0.01) for this area.
Additional adjustments for stage at diagnosis, race/ethnicity,and the socioeconomic factor led to the attenuation of CRCmortality risks in some clusters and the elimination of someclusters. For example, the O/E ratio of Area 1 gradually approachesone (0.89-0.90-0.91-0.92) with the adjustments, indicatingthat the lower risk of CRC mortality of this area is partly related toa lower rate of late-stage CRC diagnosis, better non-spatial access,and a higher percentage of non-Hispanic whites. Areas 2 and3 vanished after adjusting for race/ethnicity, suggesting a signifi-cantly positive correlation between the percentage of Hispanicand non-Hispanic black residents and CRC-specific mortality risksin these areas. The adjustments did not produce any new apparentclusters. Since there was no significant association between thespatial access factor and CRC-survival across the entire state,adjusting for the spatial access factor was unnecessary.
The analysis procedure described above followed a covariate-adjustment sequence of ‘‘age-and-sex-stage at diagnosis-race/ethnicity-socioeconomic factor.’’ Since the sequence of covari-ate-adjustment might influence the results, an alternativesequence (i.e., ‘‘age-and-sex-stage at diagnosis- socioeconomicfactor-race/ethnicity’’) was used to evaluate the effects of differentsequences. The evaluation did not suggest any obvious differencesbetween the results corresponding to the two sequences about thelocations of spatial clusters and the change of HRs with covariateadjustments. Consequently, the results of the alternative sequenceare not shown here.
4. Discussion and conclusion
Understanding how demographic, socio-cultural, and geo-graphic factors contribute to cancer outcomes is important foreliminating cancer disparities and promoting population health.This study used GIS, spatial analysis methods, and other statisticalprocedures to analyze the influence of spatial and non-spatialaccess to medical services on CRC survival in Texas. The resultsindicated that, after adjusting for important covariates, CRCsurvival was significantly associated with non-spatial accessfactors across the state of Texas and with spatial access in non-urban areas of Texas. Among these factors, race/ethnicity has themost influence on the disparity of CRC survival in Texas.
The geographic analyses suggest that CRC survival in Texasvaries by place of residence. The spatial scan statistic methodbased on covariate-adjusted survival times detected several areaswith significantly different likelihoods of CRC survival. When thedata were further adjusted for race/ethnicity and the non-spatialaccess factor, the areas with significantly shorter CRC survivalperiods disappeared in the results of the cluster analysis. However,the area with the longest CRC survival still remained unchanged.
CRC survival disparities by race/ethnicity, the non-spatialaccess factor, and geographic location revealed in this study aresimilar to previous findings of other studies undertaken in theUnited States (Clegg et al., 2002; Wudel et al., 2002; McDavidet al., 2003; Du et al., 2007; Henry et al., 2009; Huang et al.,2007b). For example, Hispanics, blacks, and individuals withlimited non-spatial access to healthcare systematically experi-ence lower CRC survival rates than whites and those from affluentareas (Clegg et al., 2002; Du et al., 2007). Studies in Los AngelesCounty, California (Huang et al., 2007b), and New Jersey (Henryet al., 2009) revealed that several areas had significantly shortersurvival times after adjusting for important covariates. Theseareas, like those identified in this study, were characterized by
isparities in colorectal cancer survival in Texas. Health & Place
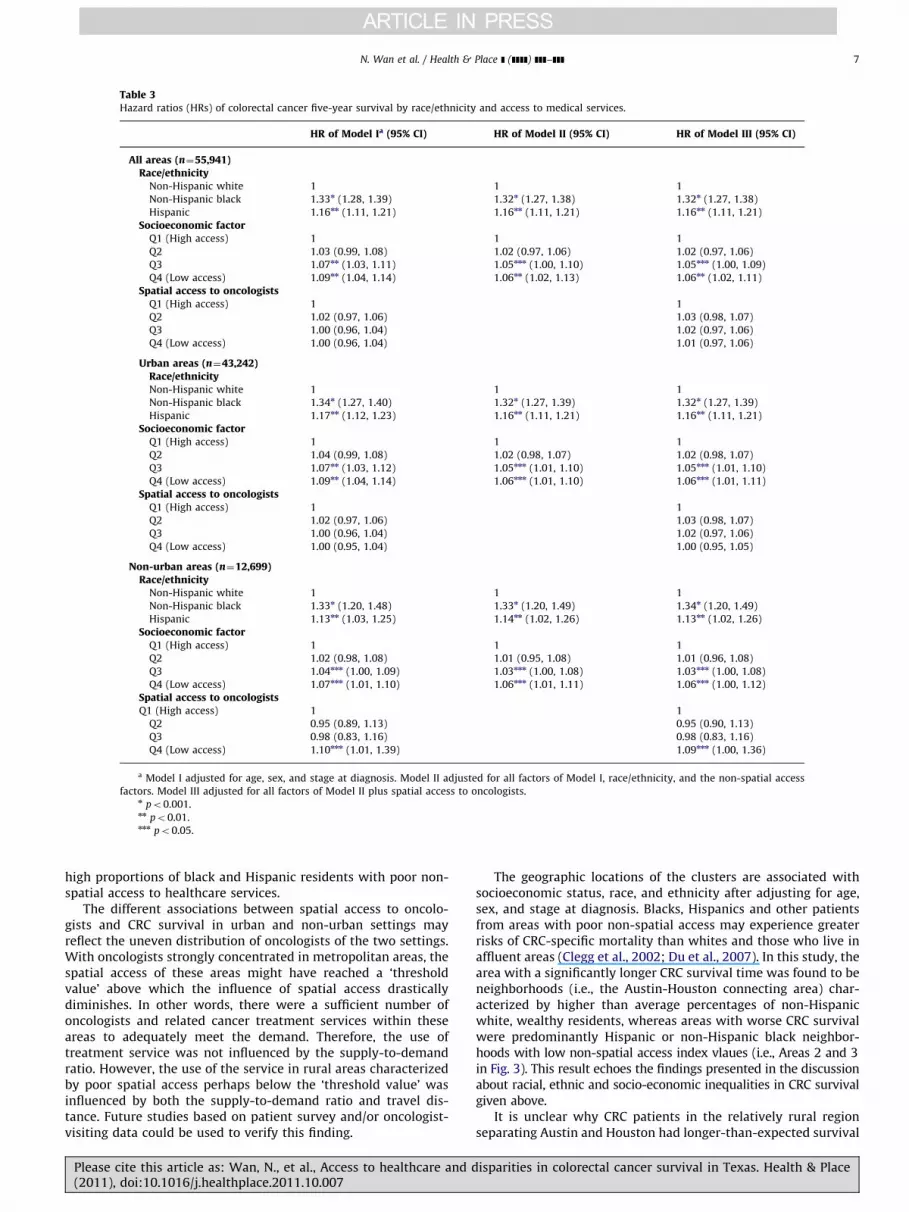
Table 3Hazard ratios (HRs) of colorectal cancer five-year survival by race/ethnicity and access to medical services.
HR of Model Ia (95% CI) HR of Model II (95% CI) HR of Model III (95% CI)
All areas (n¼55,941)Race/ethnicity
Non-Hispanic white 1 1 1
Non-Hispanic black 1.33n (1.28, 1.39) 1.32n (1.27, 1.38) 1.32n (1.27, 1.38)
Hispanic 1.16nn (1.11, 1.21) 1.16nn (1.11, 1.21) 1.16nn (1.11, 1.21)
Socioeconomic factorQ1 (High access) 1 1 1
Q2 1.03 (0.99, 1.08) 1.02 (0.97, 1.06) 1.02 (0.97, 1.06)
Q3 1.07nn (1.03, 1.11) 1.05nnn (1.00, 1.10) 1.05nnn (1.00, 1.09)
Q4 (Low access) 1.09nn (1.04, 1.14) 1.06nn (1.02, 1.13) 1.06nn (1.02, 1.11)
Spatial access to oncologistsQ1 (High access) 1 1
Q2 1.02 (0.97, 1.06) 1.03 (0.98, 1.07)
Q3 1.00 (0.96, 1.04) 1.02 (0.97, 1.06)
Q4 (Low access) 1.00 (0.96, 1.04) 1.01 (0.97, 1.06)
Urban areas (n¼43,242)Race/ethnicityNon-Hispanic white 1 1 1
Non-Hispanic black 1.34n (1.27, 1.40) 1.32n (1.27, 1.39) 1.32n (1.27, 1.39)
Hispanic 1.17nn (1.12, 1.23) 1.16nn (1.11, 1.21) 1.16nn (1.11, 1.21)
Socioeconomic factorQ1 (High access) 1 1 1
Q2 1.04 (0.99, 1.08) 1.02 (0.98, 1.07) 1.02 (0.98, 1.07)
Q3 1.07nn (1.03, 1.12) 1.05nnn (1.01, 1.10) 1.05nnn (1.01, 1.10)
Q4 (Low access) 1.09nn (1.04, 1.14) 1.06nnn (1.01, 1.10) 1.06nnn (1.01, 1.11)
Spatial access to oncologistsQ1 (High access) 1 1
Q2 1.02 (0.97, 1.06) 1.03 (0.98, 1.07)
Q3 1.00 (0.96, 1.04) 1.02 (0.97, 1.06)
Q4 (Low access) 1.00 (0.95, 1.04) 1.00 (0.95, 1.05)
Non-urban areas (n¼12,699)Race/ethnicity
Non-Hispanic white 1 1 1
Non-Hispanic black 1.33n (1.20, 1.48) 1.33n (1.20, 1.49) 1.34n (1.20, 1.49)
Hispanic 1.13nn (1.03, 1.25) 1.14nn (1.02, 1.26) 1.13nn (1.02, 1.26)
Socioeconomic factorQ1 (High access) 1 1 1
Q2 1.02 (0.98, 1.08) 1.01 (0.95, 1.08) 1.01 (0.96, 1.08)
Q3 1.04nnn (1.00, 1.09) 1.03nnn (1.00, 1.08) 1.03nnn (1.00, 1.08)
Q4 (Low access) 1.07nnn (1.01, 1.10) 1.06nnn (1.01, 1.11) 1.06nnn (1.00, 1.12)
Spatial access to oncologistsQ1 (High access) 1 1
Q2 0.95 (0.89, 1.13) 0.95 (0.90, 1.13)
Q3 0.98 (0.83, 1.16) 0.98 (0.83, 1.16)
Q4 (Low access) 1.10nnn (1.01, 1.39) 1.09nnn (1.00, 1.36)
a Model I adjusted for age, sex, and stage at diagnosis. Model II adjusted for all factors of Model I, race/ethnicity, and the non-spatial access
factors. Model III adjusted for all factors of Model II plus spatial access to oncologists.n po0.001.nn po0.01.nnn po0.05.
N. Wan et al. / Health & Place ] (]]]]) ]]]–]]] 7
high proportions of black and Hispanic residents with poor non-spatial access to healthcare services.
The different associations between spatial access to oncolo-gists and CRC survival in urban and non-urban settings mayreflect the uneven distribution of oncologists of the two settings.With oncologists strongly concentrated in metropolitan areas, thespatial access of these areas might have reached a ‘thresholdvalue’ above which the influence of spatial access drasticallydiminishes. In other words, there were a sufficient number ofoncologists and related cancer treatment services within theseareas to adequately meet the demand. Therefore, the use oftreatment service was not influenced by the supply-to-demandratio. However, the use of the service in rural areas characterizedby poor spatial access perhaps below the ‘threshold value’ wasinfluenced by both the supply-to-demand ratio and travel dis-tance. Future studies based on patient survey and/or oncologist-visiting data could be used to verify this finding.
Please cite this article as: Wan, N., et al., Access to healthcare and d(2011), doi:10.1016/j.healthplace.2011.10.007
The geographic locations of the clusters are associated withsocioeconomic status, race, and ethnicity after adjusting for age,sex, and stage at diagnosis. Blacks, Hispanics and other patientsfrom areas with poor non-spatial access may experience greaterrisks of CRC-specific mortality than whites and those who live inaffluent areas (Clegg et al., 2002; Du et al., 2007). In this study, thearea with a significantly longer CRC survival time was found to beneighborhoods (i.e., the Austin-Houston connecting area) char-acterized by higher than average percentages of non-Hispanicwhite, wealthy residents, whereas areas with worse CRC survivalwere predominantly Hispanic or non-Hispanic black neighbor-hoods with low non-spatial access index vlaues (i.e., Areas 2 and 3in Fig. 3). This result echoes the findings presented in the discussionabout racial, ethnic and socio-economic inequalities in CRC survivalgiven above.
It is unclear why CRC patients in the relatively rural regionseparating Austin and Houston had longer-than-expected survival
isparities in colorectal cancer survival in Texas. Health & Place
N. Wan et al. / Health & Place ] (]]]]) ]]]–]]]8
times after taking into account race/ethnicity and the non-spatialaccess factor. One possible reason may be attributed to this area’scloser proximity to a higher concentration of cancer treatmentservices because 114 out of the 204 oncologists in Texas wereconcentrated in or near this area. For example, The University ofTexas MD Anderson Cancer Center, a world-class center for cancertreatment, is located at the edge of this area. The advancedtreatment facilities and techniques of the MD Anderson CancerCenter might greatly influence the CRC survival of patients in the
Fig. 3. Spatial clusters of colorectal cancer survival in Texas determined by the
spatial scan statistic (Note: Model a was adjusted for age and sex, Model b
adjusted for age, sex, and stage at diagnosis, Model c adjusted age, sex, stage at
diagnosis and race/ethnicity, Model d adjusted for age, sex, stage at diagnosis,
race/ethnicity, and the non-spatial access factor; the observed/expected (O/E)
ratios of colorectal-cancer-specific mortality were 0.89, 0.90, 0.91, and 0.92 (for
models a, b, c, and d, respectively) for Area 1, 1.53 and 1.49 (for models a and b,
respectively) for Area 2, and 1.52 and 1.38 (for models a and b, respectively) for
Area 3).
Table 4Case characteristics for areas with significantly different risks of colorectal-cancer-spe
Survival time
adjusted for
Cluster
areaa
Observed/Expected ratio
of death
Percent of non-Hispani
whites
(a) Age and sex
1 0.89 54.8
2 1.53 4.4
3 1.52 10.1
(b) Age, sex, and stage at diagnosis
1 0.90 54.8
2 1.49 4.4
3 1.38 10.1
(c) Age, sex, stage at diagnosis, and race/ethnicity
1 0.91 54.8
(d) Age, sex, stage at diagnosis, race/ethnicity, and non-spatial access to healthcare s
1 0.92 54.8
a Numbers in this column correspond to the areas shown in Fig. 3.b Late stage cases refer to cases diagnosed at regional or distant stages.
Please cite this article as: Wan, N., et al., Access to healthcare and d(2011), doi:10.1016/j.healthplace.2011.10.007
area. Other factors that might promote CRC survival in this areaare health insurance coverage and doctor referral patterns. Moreinvestigation is needed to assess how these factors separately orcollectively enhance CRC survival in this area.
The results have important practical implications for designingintervention strategies. The insignificant association betweenspatial access to healthcare services and CRC survival in urbanareas implies that it is not necessary to increase oncologyresources in these areas. Health programs in these areas shouldbe encouraged toward making improvements on the non-spatialfactors that influence survival, such as health insurance coverageand language barriers. On the other hand, the significant associa-tion between spatial access to oncologists and CRC survival inrural areas suggests that promotion of spatially accessible cancertreatment services in areas distant from metropolitan centersmight have more significant impacts on improvement of CRCsurvival in rural areas. In addition, the areas with significantlyshorter CRC survival times might be good candidate places toinitiate programs aiming to enhance CRC prevention and treat-ment services as well as CRC awareness education.
This study did not assess the potential impacts of people’sphysical conditions (e.g., Body Mass Index) and health behaviors(e.g., physical activities, smoking) on CRC survival because thedata were unavailable at the census tract level, and thus could notbe linked to the datasets used in the analyses. We recognize thatthese factors also play a role in not only CRC risks (Dimou et al.,2009), but also in CRC survival. A more complete account includ-ing these factors in the analyses is subject to future studies.
Some limitations of this study deserve mention when describingand interpreting the results. First, the results could have beeninfluenced by the exclusion of cases and data as a result of incompleteinformation. Although we found no significant differences in indivi-dual and neighborhood characteristics between the excluded cases(n¼16,004) and the study cases, the former accounted for about 22%of the total cases. A further examination of the five-year survival ratesfor the unstaged groups indicated that these groups had slightlybetter survival rates than the staged ones and that the differencevaried by socio-demographic and geographic characteristics. Thiscould dampen confidence in the results of this study. For example,the difference between the lowest-spatial-access group and thehighest-spatial-access group might have been underestimatedbecause the difference in the five-year survival rate was higher forunstaged cases than for staged cases.
Second, the role of health insurance coverage was not investigateddue to the lack of data. As suggested by previous studies, the type ofhealth insurance (e.g., commercial insurance, Medicaid, and Medicare)
cific survival.
c Percent of non-Hispanic
blacks
Percent of
Hispanics
Socioeconomic
factor
Late stageb
cases (%)
12.5 24.2 �0.53 57.4
64.4 30.0 0.56 69.0
3.9 84.9 0.45 62.5
12.5 24.2 �0.53 57.4
64.4 30.0 0.56 69.0
3.9 84.9 0.45 62.5
12.5 24.2 �0.53 57.4
ervices
12.5 24.2 �0.53 57.4
isparities in colorectal cancer survival in Texas. Health & Place

N. Wan et al. / Health & Place ] (]]]]) ]]]–]]] 9
and the deductibles they carry may influence the quality of thetreatment delivered and, consequently, the survival time of the patient(McDavid et al., 2003; Du et al., 2007). Previous studies thatconsidered individual level health insurance information were pri-marily based on national samples (e.g., the SEER data), Medicaid orMedicare enrollment data, or hospital treatment records. Similarinformation was not available in the Texas cancer registry datasetsfor this study.
Third, we did not examine the all-cause survival of CRC, whichmeans other competing risks of mortality were ignored in theanalysis. This may further limit the usefulness of the results. Inaddition, SaTScan uses circles to define cluster shapes. Realclusters may not be circular in size, and the circular shapes ofthe clusters presented in Fig. 3 should not give the false impres-sion that the geographic boundaries of clusters are circular.
Despite these limitations, this research is the first studyconducted in the U.S. to examine the independent roles of spatialand non-spatial accesses to medical services in CRC survival.Results regarding disparities in terms of race/ethnicity, geo-graphic location, and access to healthcare services can help usbetter understand how these factors determine CRC survival. It ishoped that these results would be useful in the development ofprograms aiming at reducing cancer disparities.
Acknowledgment
This article is based on one chapter of Neng Wan’s dissertationcompleted at Texas State University-San Marcos under F. Benja-min Zhan’s supervision. Part of this article was written whileBenjamin Zhan was visiting Wuhan University as a Chang JiangScholar Guest Chair Professor. Support from the Chang JiangScholars Award Program and Wuhan University is greatly appre-ciated. The authors wish to thank Sara McLafferty, two anon-ymous referees, and the editor for their helpful suggestionsduring the review process. The Texas Department of State HealthServices provided the cancer registry data and health professionaldata used in this study.
References
Aday, L., Andersen, R., 1974. A framework for the study of access to medical care.Health Services Research 9 (3), 208–220.
American Cancer Society, 2005. Cancer Facts & Figures 2005. American CancerSociety, Atlanta.
American Cancer Society, 2010. Cancer Facts & Figures 2010. American CancerSociety, Atlanta.
Clegg, L.X., Li, F.P., Hankey, B.G., Chu, K., Edwards, B.K., 2002. Cancer survivalamong US whites and minorities—A SEER (Surveillance, Epidemiology, andEnd Results) program population-based study. Archives of Internal Medicine162 (17), 1985–1993.
Cox, D.R., 1972. Regression models and life-tables. Journal of the Royal StatisticsSociety Series B 34 (2), 187–220.
Dai, D., 2010. Black residential segregation, disparities in spatial access to healthcare facilities, and late-stage breast cancer diagnosis in metropolitan Detroit.Health & Place 16 (5), 1038–1052.
Dejardin, O., Bouvier, A.M., Faivre, J., Boutreux, S., De Pouvourville, G., Launoy, G.,2008. Access to care, socioeconomic deprivation and colon cancer survival.Alimentary Pharmacology & Therapeutics 27 (10), 940–949.
Dimou, A., Syrigos, K.N., Saif, M.W., 2009. Disparities in colorectal cancer inAfrican-Americans vs. Whites: before and after diagnosis. World Journal ofGastroenterology 15 (30), 3734–3743.
Du, X.L., Fang, S., Vernon, S.W., El-Serag, H., Shih, Y.T., Davila, J., Rasmus, M.L., 2007.Racial disparities and socioeconomic status in association with survival in alarge population-based cohort of elderly patients with colon cancer. Cancer110 (3), 660–669.
Environmental Systems Research Institute (ESRI), 2009. ArcGIS, vol. 9.3, Redlands, CA.Gomez, S.L., O’Malley, C.D., Stroup, A., Shema, S.J., Satariano, W.A., 2007. Long-
itudinal, population-based study of racial/ethnic differences in colorectal
Please cite this article as: Wan, N., et al., Access to healthcare and d(2011), doi:10.1016/j.healthplace.2011.10.007
cancer survival: impact of neighborhood socioeconomic status, treatmentand comorbidity. BMC Cancer 7, 19.
Govindarajan, R., Shah, R.V., Erkman, L.G., Hutchins, L.F., 2003. Racial differences inthe outcome of patients with colorectal carcinoma. Cancer 97 (2), 493–498.
Guagliardo, M.F., 2004. Spatial accessibility of primary care: concept, methods andchallenges. International Journal of Health Geographics 3, 3.
Hart, G., 2006. Rural�urban commuting areas codes, version, 2.0. /http://depts.washington.edu/uwruca/S and /http://www.doh.wa.gov/data/Guidelines/RuralUrban1.htmS Accessed on 18 May 2010.
Haynes, R., Pearce, J., Barnett, R., 2008. Cancer survival in New Zealand: ethnic,social and geographical inequalities. Social Science & Medicine 67 (6),928–937.
Henry, K.A., Niu, X.L., Boscoe, F.P., 2009. Geographic disparities in colorectal cancersurvival. International Journal of Health Geographics 8, 13.
Huang, L., Kulldorff, M., Gregorio, D., 2007a. A spatial scan statistic for survivaldata. Biometrics 63 (1), 109–118.
Huang, L., Pickle, L.W., Stinchcomb, D., Feuer, E.J., 2007b. Detection of spatialclusters—application to cancer survival as a continuous outcome. Epidemiol-ogy 18 (1), 73–87.
Hwang, H.L., Rollow, J., 2000. Data processing procedures and methodology forestimating trip distances for the 1995 American Travel Survey (ATS), ORNL/TM-2000/141. Oak Ridge National Laboratory, Oak Ridge, TN.
Jemal, A., Clegg, L.X., Ward, E., Ries, L.A.G., Wu, X.C., Jamison, P.M., Wingo, P.A.,Howe, H.L., Anderson, R.N., Edwards, B.K., 2004. Annual report to the nation onthe status of cancer, 1975�2001, with a special feature regarding survival.Cancer 101 (1), 3–27.
Kaplan, E.L., Meier, P., 1958. Nonparametric estimation from incomplete observa-tions. Journal of American Statistical Association 53 (282), 457–481.
Khan, A., 1992. An integrated approach to measuring potential spatial access tohealth care services. Socio-Economic Planning Sciences 26 (4), 275–287.
Kirsner, R.S., Ma, F.C., Fleming, L., Federman, D.G., Trapido, E., Duncan, R.,Wilkinson, J.D., 2006. The effect of Medicare health care delivery systems onsurvival for patients with breast and colorectal cancer. Cancer EpidemiologyBiomarkers & Prevention 15 (4), 769–773.
Kulldorff, M., 1997. A spatial scan statistic. Communications in Statistics—Theoryand Methods 26 (6), 1481–1496.
Kuo, T., Mobley, L., Anselin, L., 2011. Geographic disparities in late-stage breastcancer diagnosis in California. Health & Place 17 (1), 327–334.
Kwan, M.P., 1998. Space-time and integral measures of individual accessibility: acomparative analysis using a point-based framework. Geographical Analysis30 (3), 191–216.
Le, H., Ziogas, A., Lipkin, S.M., Zell, J.A., 2008. Effects of socioeconomic status andtreatment disparities in colorectal cancer survival. Cancer EpidemiologyBiomarkers & Prevention 17 (8), 1950–1962.
Luo, W., 2004. Using a GIS-based floating catchment method to assess areas withshortage of physicians. Health & Place 10 (1), 1–11.
Luo, W., Qi, Y., 2009. An enhanced two-step floating catchment area (E2SFCA)method for measuring spatial accessibility to primary care physicians. Health& Place 15 (4), 1100–1107.
Mathworks, Inc., 2010. MATLAB, V.2010a, Natick, MA.McDavid, K., Tucker, T.C., Sloggett, A., Coleman, M.P., 2003. Cancer survival in
Kentucky and health insurance coverage. Archives of Internal Medicine 163(18), 2135–2144.
National Cancer Institute (NCI), 2010. Statistical Research & Applications Branch,Measures of Cancer Survival. /http://srab.cancer.gov/survival/measures.htmlS.Accessed on 05/30/2010.
Risser, D.R., Williams, M.A., Mokry, B., Betts, P., Miller, E.A., 2009. Cancer Incidence& Mortality in Texas, 2001–2005 Austin, Texas: Texas Department of StateHealth Services.
Siminoff, L.A., Ross, L., 2005. Access and equity to cancer care in the USA: a reviewand assessment. Postgraduate Medical Journal 81 (961), 674–679.
SPSS Inc, 2009. SPSS for Windows. Version 17.0. SPSS Inc, Chicago.Tian, N., Wilson, J.G., Zhan, F.B., 2010. Female breast cancer mortality clusters
within racial groups in the United States. Health & place 16, 209–218.US Census Bureau, 2001a. Census 2000 TIGER/Line Files Texas. US Census Bureau,
Washington, DC.US Census Bureau, 2001b. Census 2000 Summary File 3 (SF3) Texas. US Census
Bureau, Washington, DC.Wan, N., Zhan, F.B., Cai, Z., 2011. Socioeconomic disparity in prostate cancer
mortality and the impact of geographic scale. Southern Medical Journal 104(8), 553–559.
Wan, N., Zhan, F.B., Zou, B., Chow, T., 2012. A relative spatial access assessmentapproach for analyzing potential spatial access to colorectal cancer services inTexas. Applied Geography 32 (2), 291–299.
Wang, F.H., McLafferty, S., Escamilla, V., Luo, L., 2008. Late-stage breast cancerdiagnosis and health care access in Illinois. Professional Geographer 60 (1),54–69.
Wudel, L.J., Chapman, W.C., Shyr, Y., Davidson, M., Jeyakumar, A., Rogers, S.O.,Allos, T., Stain, S.C., 2002. Disparate outcomes in patients with colorectalcancer—effect of race on long-term survival. Archives of Surgery 137 (5),550–554.
isparities in colorectal cancer survival in Texas. Health & Place