a unified model for yeast transcript definition
TRANSCRIPT

10.1101/gr.164327.113Access the most recent version at doi: published online October 29, 2013Genome Res.
Carl G. de Boer, Harm van Bakel, Kyle Tsui, et al. A unified model for yeast transcript definition
Material
Supplemental
http://genome.cshlp.org/content/suppl/2013/11/11/gr.164327.113.DC1.html
P<P
Published online October 29, 2013 in advance of the print journal.
Open Access
Open Access option.Genome ResearchFreely available online through the
License
Commons Creative
.http://creativecommons.org/licenses/by/3.0
License (Attribution 3.0 Unported), as described at , is available under a Creative CommonsGenome ResearchThis article, published in
ServiceEmail Alerting
click here.top right corner of the article or
Receive free email alerts when new articles cite this article - sign up in the box at the
object identifier (DOIs) and date of initial publication. by PubMed from initial publication. Citations to Advance online articles must include the digital publication). Advance online articles are citable and establish publication priority; they are indexedappeared in the paper journal (edited, typeset versions may be posted when available prior to final Advance online articles have been peer reviewed and accepted for publication but have not yet
http://genome.cshlp.org/subscriptionsgo to: Genome Research To subscribe to
© 2014 de Boer et al.; Published by Cold Spring Harbor Laboratory Press
Cold Spring Harbor Laboratory Press on December 4, 2013 - Published by genome.cshlp.orgDownloaded from Cold Spring Harbor Laboratory Press on December 4, 2013 - Published by genome.cshlp.orgDownloaded from

Method
A unified model for yeast transcript definitionCarl G. de Boer,1 Harm van Bakel,2 Kyle Tsui,3 Joyce Li,2 Quaid D. Morris,1,2
Corey Nislow,1,2 Jack F. Greenblatt,1,2 and Timothy R. Hughes1,2,4
1Department of Molecular Genetics, 2Banting and Best Department of Medical Research and Donnelly Centre for Cellular and
Biomolecular Research, 3Department of Pharmaceutical Sciences, University of Toronto, Toronto, Ontario, M5S 3E1, Canada
Identifying genes in the genomic context is central to a cell’s ability to interpret the genome. Yet, in general, the signalsused to define eukaryotic genes are poorly described. Here, we derived simple classifiers that identify where transcriptionwill initiate and terminate using nucleic acid sequence features detectable by the yeast cell, which we integrate intoa Unified Model (UM) that models transcription as a whole. The cis-elements that denote where transcription initiatesfunction primarily through nucleosome depletion, and, using a synthetic promoter system, we show that most of theseelements are sufficient to initiate transcription in vivo. Hrp1 binding sites are the major characteristic of terminators; thesebinding sites are often clustered in terminator regions and can terminate transcription bidirectionally. The UM predictsglobal transcript structure by modeling transcription of the genome using a hidden Markov model whose emissions are theoutputs of the initiation and termination classifiers. We validated the novel predictions of the UM with available RNA-seqdata and tested it further by directly comparing the transcript structure predicted by the model to the transcriptiongenerated by the cell for synthetic DNA segments of random design. We show that the UM identifies transcription startsites more accurately than the initiation classifier alone, indicating that the relative arrangement of promoter and ter-minator elements influences their function. Our model presents a concrete description of how the cell defines transcriptunits, explains the existence of nongenic transcripts, and provides insight into genome evolution.
[Supplemental material is available for this article.]
Identification of the cellular mechanisms that define gene struc-
ture has been a long-standing problem in molecular biology: It is of
interest not only for the study of transcription and its regulation,
but also for understanding how new genes arise (Carvunis et al.
2012), creating synthetic regulatory elements (Blount et al. 2012),
and explaining the many types of ‘‘cryptic’’ transcripts (Xu et al.
2009; Yassour et al. 2010). While much is known about individual
elements that function in eukaryotic transcription initiation and
termination (see below), to our knowledge it has not been sys-
tematically explored which elements are critical on a genome-wide
basis, what proportion of all transcription these elements can ac-
count for, and how they work together across entire chromosomes.
For example, sequences that can function as promoters in some
contexts may be disabled by transcription originating from an
upstream or antisense promoter via repressive changes in the
chromatin environment (Kaplan et al. 2003; Houseley et al. 2008;
Bumgarner et al. 2009) or transcriptional interference (Mazo et al.
2007). Interactions in cis are also clearly important for transcrip-
tional terminators, since a sequence can only be used to terminate
a transcript if it is first transcribed. Moreover, the existence of
physical connections between the 59 and 39 ends of genes that
depend on proper 39 end formation (Ansari and Hampsey 2005;
Tan-Wong et al. 2012) suggests the existence of a feedback mech-
anism between terminators and promoters.
In eukaryotes, protein-coding genes are transcribed by RNA
polymerase II (Pol II), which is loaded onto the promoter region via
the general transcription factors (GTFs) (Juven-Gershon et al. 2008).
However, the GTFs generally lack sequence specificity. In yeast, the
only clear exception is the TATA-binding protein (TBP; encoded by
the gene SPT15), which recognizes the TATA box. Although there
appear to be TATA-like elements bound by Spt15 in most
promoters (Rhee and Pugh 2012), only a minority have a canonical
TATA box (Basehoar et al. 2004), and TATA boxes and TATA-like
sequences also occur elsewhere in the genome. Motif matches for
many yeast sequence-specific transcription factors (TFs) are
enriched in promoters (Lee et al. 2007; Erb and van Nimwegen
2011), but it is not clear that they are sufficient to define
transcription start sites (TSSs), as their activity is often dependent
on other features of the promoter (Iyer and Struhl 1995; Sharon
et al. 2012). Moreover, most yeast promoters have multiple TSSs,
varying within a range of ;26 bp (Pelechano et al. 2013). The exact
start site appears to be controlled by the sequence surrounding the
site (Chen and Struhl 1985; Hahn et al. 1985; Nagawa and Fink
1985) and has a consensus of YR (where Y = pyrimidine and
R = purine) (Zhang and Dietrich 2005) which is likely recognized
by TFIIB and/or Pol II (Pinto et al. 1992; Li et al. 1994; Bushnell
et al. 2004).
In many eukaryotes, including yeast, a distinguishing feature
of promoters is the presence of a nucleosome-depleted region
(NDR) immediately upstream of the TSS (Yuan et al. 2005; Lee et al.
2007). Yeast promoters often contain a high A/T content and poly-
dA:dT tracts, which inherently inhibit nucleosome formation (Iyer
and Struhl 1995; Yuan et al. 2005; Kaplan et al. 2009; Tillo and
Hughes 2009). Many promoters also contain binding sites for
general regulatory factors (GRFs), including Rap1, Reb1, and Abf1
(Harbison et al. 2004), which cause nucleosome depletion in vivo
where bound (Yu and Morse 1999; Yarragudi et al. 2004; Badis et al.
2008; Hartley and Madhani 2009; Kaplan et al. 2009; Ganapathi
et al. 2011). However, none of these features are present in all
� 2014 de Boer et al. This article, published in Genome Research, is availableunder a Creative Commons License (Attribution 3.0 Unported), as described athttp://creativecommons.org/licenses/by/3.0.
4Corresponding authorE-mail [email protected] published online before print. Article, supplemental material, and pub-lication date are at http://www.genome.org/cgi/doi/10.1101/gr.164327.113.Freely available online through the Genome Research Open Access option.
24:000–000 Published by Cold Spring Harbor Laboratory Press; ISSN 1088-9051/14; www.genome.org Genome Research 1www.genome.org
Cold Spring Harbor Laboratory Press on December 4, 2013 - Published by genome.cshlp.orgDownloaded from

promoters, and some occur outside of known promoters. More-
over, promoter definition is complicated by the fact that transcript
initiation occurs bidirectionally in many promoter regions, with
cryptic unstable transcripts (CUTs) produced by transcription in
the antisense orientation (Neil et al. 2009; Xu et al. 2009). Pro-
moters can further be regulated in cis by transcription over the
promoter region, which results in transcriptional interference or
histone modification (Kaplan et al. 2003; Martens et al. 2004; Mazo
et al. 2007).
Termination of coding transcripts in yeast (and other eu-
karyotes) occurs when a cleavage and polyadenylation (CPA) site is
recognized, mRNA cleavage occurs, and a polyadenine tail is
added, producing a mature mRNA. Cleavage tends to occur over
a range of about 36 bases and prefers to occur at (C/G)AA motifs
(Pelechano et al. 2013), which may be recognized by the 39 en-
donuclease Ysh1 (Mandel et al. 2006; Garas et al. 2008). Following
cleavage, the nascent mRNA no longer has a 59 m7G cap and be-
comes a substrate for 59!39 exonucleases that degrade the nascent
RNA, leading to destabilization of the Pol II/RNA association and
termination of transcription (Connelly and Manley 1988; Kim
et al. 2004; West et al. 2004). CPA sites have been previously de-
scribed as comprising several relatively simple motifs that are
bound and recognized by the sequence-specific RNA-binding
protein (RBP) components of the cleavage machinery. In yeast,
these include the AU-rich efficiency element, bound by Hrp1
(Kessler et al. 1997; Chen and Hyman 1998), the A-rich positioning
element, bound by Rna15 (Gross and Moore 2001), and several
U-rich elements surrounding the cleavage site (likely bound by
Yth1 and/or Cft1 [also known as Yhh1]) (Barabino et al. 1997;
Dichtl et al. 2002; Tacahashi et al. 2003). In addition to mRNAs,
Pol II synthesizes several types of noncoding transcripts, including
snRNAs, snoRNAs, and CUTs, which have independent termina-
tion mechanisms (Jacquier 2009). For example, the RBPs Nab3 and
Nrd1 recognize sequences present in RNAs and are important in
the maturation of snoRNAs (Jacquier 2009) and the labeling of
CUTs as TRAMP/exosome substrates (Wyers et al. 2005; Arigo et al.
2006). The CUT termination pathway provides a nonproductive
termination mechanism for Pol II transcripts, as the resulting
transcripts are immediately degraded.
Despite this extensive literature describing the sequences
and factors involved, there has been no global examination of
which features are critical to yeast gene identity, and therefore,
the problem of how yeast (or any other eukaryote) delineates
transcription units remains an open question. Many programs to
identify genes in genomic DNA exist (e.g., Burge and Karlin 1997;
Alexandersson et al. 2003; Solovyev and Shahmuradov 2003;
Majoros et al. 2004), but these generally rely on sequence features
unlikely to be used in the process of transcription, including se-
quence conservation and open reading frames (ORFs). Attempts
to identify promoters (Prestridge 1995; Megraw et al. 2009) and
CPA sites (Graber et al. 2002; Cheng et al. 2006) using mecha-
nistic features, such as TF and RBP specificities, have met with
varying success. To our knowledge, no study has taken an in-
tegrated approach to model the entire process of transcript defi-
nition or has tested the predictions of the model in vivo. Several
groups have used synthetic promoter systems to assay the ex-
pression levels of pools of constructs (e.g., Gertz et al. 2009;
Raveh-Sadka et al. 2012; Sharon et al. 2012). However, these
studies aimed to measure how TF binding sites (TFBSs) or nucle-
osome positioning sequences affect expression level and so used
a basal promoter sequence into which individual sequence ele-
ments were inserted or deleted. To our knowledge, no study has
directly tested what sequences are necessary to generate a func-
tional promoter in vivo.
Here, we have created a computer model that can explain
genome-wide yeast transcript structure and is supported by mul-
tiple lines of experimental validation. The model is underpinned
by classifiers that mimic the choices the cell makes when initiating
and terminating transcripts. These classifiers indicate that the
transcription of most yeast genes can be explained by relatively few
features and reveal which trans-acting factors are most influential
and which cis-elements help to define individual genes. Despite
the fact that we did not incorporate CUTs into the training pro-
cedure, our model predicts bidirectional transcription from uni-
directional promoters, indicating that the same sequence features
generally drive transcript initiation for both mRNAs and CUTs and
that CUTs are an inherent, and possibly unavoidable, feature of
yeast promoters. Our model indicates that yeast CPA sites are also
generally bidirectional, suggesting that convergent genes use the
same termination elements. We combined these classifiers into
a unified model that can predict where transcription will initiate
more accurately than the initiation classifier alone, indicating that
the relative arrangement of promoter and terminator elements in
cis is a likely mechanism for orienting promoters. We go on to
verify the predictions of the model using both existing data and
experiments of our own design. This is the first model that de-
scribes how a eukaryotic cell defines transcript structure genome
wide.
Results
Models of transcription initiation and termination
We first sought to ask how well we could explain the specific rec-
ognition of yeast promoters and CPA sites by cellular factors, using
the known sequence features associated with these elements. This
question can be framed as a computational classification problem,
in which algorithms seek to classify input sequences as positives
(e.g., promoter) or negatives (e.g., nonpromoter) on the basis of
features in the sequences (e.g., TF motif scores at specific posi-
tions). We refer to the two resulting classifiers as the ‘‘initiation’’
and ‘‘termination’’ classifiers because they identify the regions
where transcriptional units initiate (promoters) and terminate
(CPA sites).
Because we wanted the models to mimic cellular mecha-
nisms, we restricted the input features to those that can be re-
alistically sensed by nuclear factors, including predicted TF bind-
ing sites, nucleosome-excluding sequences, and DNA structural
features, as well as the binding sites for RBPs and nucleotide con-
tent for genomic regions encompassing transcripts (since NTP
concentrations can affect Pol II elongation rates) (Fig. 1A; Mason
and Struhl 2005). For both RBPs and TFs, binding sites were pre-
dicted using motif models, rather than measured in vivo binding
sites (i.e., ChIP data). We created an index of promoter and CPA
sites of ORF-containing genes, using RNA-seq and tiling array data
(see Supplemental Methods), which we used as positive examples.
For the initiation classifier, we used nonpromoter sequences se-
lected throughout the genome as negatives. For the termination
classifier, we used sequences within transcripts as negatives (see
Supplemental Methods). In order to calculate features, we sub-
divided these sequences into bins to reflect known or potential
location preferences for specific features relative to TSS or CPA sites
(see Supplemental Table 1; Supplemental Methods) and calculated
a single score (e.g., a TF motif score) for each feature within each
2 Genome Researchwww.genome.org
de Boer et al.
Cold Spring Harbor Laboratory Press on December 4, 2013 - Published by genome.cshlp.orgDownloaded from

bin. This binning procedure limits the resolution of the classifiers,
since they cannot identify the exact locations of features within
bins, but it has two major advantages. First, it accounts for the fact
that most yeast promoters and terminators use a range of initiation
and cleavage sites (see Supplemental Fig. 1A,B; Pelechano et al.
2013). Second, it greatly reduces the number of features consid-
ered. A full list of the features initially included in each classifier is
available in Supplemental Tables 2 and 3.
We created our classifiers using Random Forests (Breiman
2001), an approach that is capable of capturing nonlinear re-
lationships between the features and classes, such as cooperative
interactions among TFs (see Supplemental Methods). To produce
positive examples for the two classifiers, we first identified TSSs
and CPA sites for protein-coding genes. We defined TSSs using
those observed in Lipson et al. (2009) and CPA sites using RNA-seq
reads containing poly(A) sequences (see Supplemental Methods;
Nagalakshmi et al. 2008). This yielded 5010 genes with both TSS
and CPA sites. We scored the initiation classifier features in six
bins, as shown in Figure 1A, for 600 bp surrounding the TSS (from
�500 to +100, relative to the TSS). We obtained negative examples
by dividing nonpromoter portions of the genome into overlapp-
ing 600-bp windows, yielding 72,276 negative examples. For the
termination classifier, we scored features in three 50-base bins
encompassing 150 bases surrounding the CPA site (from �75 to
+75, relative to the CPA site) (see Fig. 1A). We derived negative
examples by dividing sense ORFs into overlapping 150-bp seg-
ments, yielding 155,093 negative exam-
ples. A complete description of the se-
quence selection rules is given in the
Supplemental Methods. We split the ge-
nome into two halves (chromosomes 1–8
and 9–16), using half to train the classi-
fiers and leaving the other half of the
genome for testing the model. Within
each training half, we created eight ran-
dom forests, each training on seven
chromosomes and withholding one chro-
mosome for model refinement. The pre-
dictions from the eight forests were then
averaged to produce a classification score
for the test data. Figure 1B (and Supple-
mental Fig. 2) shows the performance of
the classifiers in segregating the positives
from negatives in the test data.
To minimize overfitting of the
models, remove redundant features, and
make the models easier to interpret, we
sought to reduce the number of included
features. We did this by iteratively re-
building the model, adding one feature at
a time, with features sorted by decreasing
‘‘importance’’ (as defined by the random
forests algorithm), and retaining only
those that appreciably improved the
performance of the model measured on
the ‘‘refinement’’ data (see Supplemental
Methods). This feature reduction pro-
cedure only slightly decreased the per-
formance of each classifier on the ‘‘test’’
data, while greatly reducing the numbers
of features (Fig. 1B; Supplemental Fig. 2).
A striking result of this procedure is that
the two classifiers are dominated by
a small number of critical feature types:
We retained a total of 15 features for the
initiation classifier and four features for
the termination classifier (Fig. 1A; Sup-
plemental Fig. 3). We also found that,
using these reduced feature sets, a linear
model (logistic regression) performed
only marginally worse than the Random
Forests model (AUROC of 0.901 vs. 0.908
for initiation, and 0.946 vs. 0.952 for ter-
mination), indicating that there are few
important nonlinear feature interactions.
Figure 1. Design, refinement, and performance of the classifiers. (A) Classifier pipeline. Training andtest examples were generated by calculating the relevant features (rounded boxes) using the DNAsequence of the example. The features were calculated over the bins shown in the colored boxes. At thebottom of the colored boxes, the components of the minimal feature sets are shown. Feature colorsrepresent the feature type, including transcription factors (TF), general transcription factors (GTF), basecontent (%NT), or RNA-binding proteins (RBP). (B) ROC curves representing initiation and terminationclassifiers with either all features tested or the minimal feature sets, derived from the test data. The liney = x represents the curve expected by random classification.
A unified model for yeast transcript definition
Genome Research 3www.genome.org
Cold Spring Harbor Laboratory Press on December 4, 2013 - Published by genome.cshlp.orgDownloaded from

Indeed, the important trans-acting factors tend to bind distinct sets
of promoters (Supplemental Fig. 3E), consistent with independent
function.
The initiation classifier was largely dependent (14/15 fea-
tures) on six main types of features: binding sites for the GRFs
Reb1, Abf1, and Rap1; binding sites for Rsc3 (a putative GRF and
component of the RSC complex) (Badis et al. 2008); DNA structural
features and poly(A) tracts (which correlate with G/C content and
presumably serve to deplete nucleosomes, and so are hereafter
described collectively as ‘‘G/C content’’ features); and TATA boxes
(Fig. 1A). A classifier with this reduced feature set has an AUROC
only 2.6% lower than one containing all 1698 features (AUROC =
0.908 vs. 0.934) (Fig. 1B), suggesting that these signals are re-
sponsible for establishing the identity of the vast majority of yeast
promoters.
The termination classifier was reduced to only two feature
types (Fig. 1A): G/C content and Hrp1 binding sites. Together,
these confer an AUROC of 0.952 on the test data, only slightly
lower than that obtained when all 147 features are included
(AUROC = 0.968). We initially included A- and U-rich motifs to
capture the canonical sequence specificities of the other CPA fac-
tors (Barabino et al. 1997; Gross and Moore 2001; Dichtl et al.
2002; Tacahashi et al. 2003), but these were not selected by the
above procedure. This result might be explained by several possi-
bilities: The sequence preferences of these factors may be better
captured by base content than by the motifs; the motifs may not
accurately capture the specificities of the factors; or the factors may
not strongly impact cleavage site selection. G/C content can also
impact nucleosome occupancy, which appears low at terminators,
although the significance of this observation is unknown (Chung
et al. 2010; Fan et al. 2010; Allan et al. 2012; Brogaard et al. 2012).
Strikingly, Hrp1 binding sites in terminator regions are often
flanked by additional TA repeats that tend to remain in phase (Fig.
2A). Hrp1 can occupy two directly adjacent TA(3) motifs (Perez-
Canadillas 2006). However, the overall pattern of Hrp1 motif oc-
currence in terminator regions is inconsistent with cooperative
binding (Supplemental Methods), so this pattern may simply re-
flect the fact that each additional TA di-nucleotide creates another
potential Hrp1 binding site.
We next asked how well the classifiers identify the TSS and
CPA sites on a per-base level. Despite the low intrinsic resolution of
the predictors (;70 bp for the initiation classifier and ;50 bp for
the termination classifier, due to the bin sizes), the majority of
bases used as TSSs/CPA sites in promoter/terminator regions
(Pelechano et al. 2013) lie near the center of these peaks (Supple-
mental Fig. 1C,D). Moreover, searching for the initiator (CA) and
the cleavage site ([G/C]AA) motifs within the peaks often identifies
the exact TSS or CPA site (Supplemental Fig. 1E,F; see Supplemental
Methods), consistent with earlier observations that the exact
transcript start and end bases are determined by local sequence
cues, following identification of the general regions for transcript
initiation (Hahn et al. 1985; Nagawa and Fink 1985) and termi-
nation (Russo et al. 1991).
Both promoters and CPA sites are bidirectional
Strikingly, the key features for both the classifiers contain little
strand specificity. The most important features of the initiation
classifier (GRF sites and G/C content/poly[A] sequences) are thought
to function through their role in NDR formation (Iyer and Struhl
1995; Yu and Morse 1999; Lee et al. 2007; Badis et al. 2008; Kaplan
et al. 2009; Tillo and Hughes 2009) and so should function
bidirectionally, since NDRs have no orientation. Indeed, for the
initiation classifier, the predictions for the forward and reverse
strands in the test set are highly correlated (Pearson R » 0.5), and
the correlation is maximal when the DNA strands are offset by
�208 bp, relative to the forward strand. Thus, the initiation
classifier predicts that many promoters initiate transcripts in
either orientation. Indeed, the average distance between the
predicted sense and antisense TSSs (212 bp) is consistent with
bidirectional initiation observed in vivo (Neil et al. 2009).
Both the Hrp1 motif and G/C content are symmetric, and
correspondingly, the termination classifier’s predictions are also
highly correlated between the forward and reverse DNA strands
(Pearson R » 0.8 when offset by 90 bp), suggesting that the same
cleavage signals can operate in either orientation. In fact, 42%
of convergent genes have only one optimal Hrp1 site between
them. Further, RNA-seq reads containing poly(A) sequences
(Nagalakshmi et al. 2008) indicate that a substantial fraction of
CPA sites terminate transcripts in both orientations, that this is
especially common for CPA sites between convergent genes, and
that the distance between cleavage sites on either strand is con-
sistent with the same cleavage signals being used to terminate both
transcripts (Fig. 2B).
Promoter-defining elements drive transcription in vivo
To our knowledge, our classifiers represent the first rigorous dem-
onstration that the few features highlighted can account for the
identity of most yeast gene structures. We next sought experi-
mental evidence that the features are necessary and sufficient in
Figure 2. Properties of terminators. (A) Base content surrounding the3457 optimal nonoverlapping Hrp1 binding sites in terminator regions(#150 bp upstream of CPA site). Colors indicate the base at the corre-sponding position, from 25 bp upstream of to 25 bp downstream from themotif match. (B) Alignment of RNA-seq reads corresponding to poly(A)sites (Nagalakshmi et al. 2008) on both DNA strands for convergentintergenic regions (Conv.) and elsewhere in the genome (Else.). Data arealigned to sense poly(A) sites and include all poly(A) sites in the genomewith at least two reads. The data represent the average read count of allaligned loci and are smoothed over a 5-bp window.
de Boer et al.
4 Genome Researchwww.genome.org
Cold Spring Harbor Laboratory Press on December 4, 2013 - Published by genome.cshlp.orgDownloaded from

vivo. We began by examining published expression data sets cor-
responding to mutations in the key trans-acting factors: Abf1,
Reb1, Rap1, Rsc3, and Spt15 (TBP) (Alper et al. 2006; Badis et al.
2008). For a given DNA sequence, our model provides a score for
how ‘‘promoter-like’’ a sequence is (from 0 to 1). We considered
a gene’s promoter to depend on a factor if leaving out the corre-
sponding feature reduced the promoter’s score by at least 0.1. In
general, the expression of genes whose promoters are predicted to
depend on a factor changes significantly more in the correspond-
ing mutant (by rank sum test) (see Supplemental Methods; Sup-
plemental Fig. 4). This finding demonstrates that the initiation
classifier can identify the set of genes controlled by the predicted
promoter-defining factors. Consistent with the notion that there is
little interaction between promoter-defining features, motif scores
for the individual TFs perturbed in each experiment predict the
genes affected nearly as well as the initiation classifier (Supple-
mental Fig. 4).
We next tested whether these cis-elements are sufficient to
initiate gene expression in vivo using a combinatorial library of
promoter constructs driving GFP, embedded in a context that oth-
erwise has no promoter-like properties. These constructs encom-
passed the parts of the promoter most critical to the model (from
�150 to +80 relative to the TSS). We designed the sequences in three
different sections (Fig. 3A) encompassing four of the bins used in
the model (one of the sections encompassed two bins). The
designed sequences were selected computationally from a large
excess of randomly generated sequences of varying G/C content,
with or without sites for Abf1, Reb1, Rap1, Rsc3, or Spt15 ran-
domly placed within the regions in which they are relevant to the
model. Some of the sequences are predicted to form functional
promoters by virtue of their G/C content alone. For each frag-
ment containing a TFBS, we synthesized a fragment that is
identical except that the TFBS was disrupted at several key bases.
We used conventional oligonucleotide synthesis followed by
pooled ligations to create a library of promoters from these pro-
moter fragments that theoretically contained 86,688 distinct
sequences. We assayed the relative activity of each promoter
in yeast by using cell sorting and sequencing to estimate the
Figure 3. Construction and analysis of the combinatorial promoter library. (A) Synthetic double-stranded promoter fragments with complementaryoverhangs were ligated together to yield full-length promoters, which were then cloned into a GFP expression vector. We used flow cytometry andsequencing to measure the expression level of each promoter (see Methods). (B) Point-density scatter plot showing the correlation between the initiationscore and the expression level (as described in Methods, log-scale). Darkness corresponds to point density. Horizontal and vertical lines indicate theexpression level and initiation score thresholds for considering sequences ‘‘expressed’’ and a ‘‘predicted promoter,’’ respectively. (C–G) Identical to B butdivided into promoters containing (C ) Reb1, (D) Abf1, (E ) Rap1, and (F) Rsc3 binding sites in the�150:�80 bin, and (G) the TATA box in the�80:�50 bin.(H–J ) Point-density scatter plots showing the expression level of promoters that are identical except for the presence or absence of functional (H) Rap1,(I ) Rsc3, or ( J ) Spt15 (TBP) binding sites. The line y = x marks the point at which expression is identical between the two promoters, regardless of thebinding site’s presence. The other GRFs (Abf1 and Reb1) are similar to Rap1 (H ).
A unified model for yeast transcript definition
Genome Research 5www.genome.org
Cold Spring Harbor Laboratory Press on December 4, 2013 - Published by genome.cshlp.orgDownloaded from
expression level of each promoter, similar to a procedure used pre-
viously (see Methods and Supplemental Methods for details; Sharon
et al. 2012), yielding sufficient data to estimate the expression level
of 48,928 different promoters.
We obtained a strong and significant correlation between initi-
ation score (a number between 0 and 1) and GFP expression level
(Spearman R = 0.64, i.e., 41% [R2] of variance in ranks explained
P » 0) (Fig. 3B), indicating that the features of the promoter
model are sufficient for promoter function. At an optimal
threshold (promoter score = 0.37, GFP expression level = 2.69),
the promoter classifier achieves a true positive rate of 73%, with
a false positive rate of only 21%. Promoters containing Rap1,
Reb1, and Abf1 binding sites, to which the model assigns high
scores, are nearly always expressed (expression > 2.69) (Fig. 3C–E),
and the expression level is consistently higher than promoters that
are identical except for disruption of the binding site (e.g., Fig. 3H).
The impact of Rsc3 sites and the TATA box appear weaker; many
promoters containing these elements are neither expressed nor
predicted to be functional promoters (Fig. 3F,G). Nonetheless,
comparison of GFP levels from the promoters that are identical
except for the presence and absence of Rsc3 or TATA
elements showed that these elements have a positive impact on
promoter function (Fig. 3I,J). Overall, the model explains
a considerable amount of the variation in GFP expression; the
additional diversity in expression may be due to experimental
variability as well as the presence of TFBSs that affect gene ex-
pression level, but not promoter identity, and so were not consid-
ered in our analysis.
A unified model improves computational gene identification
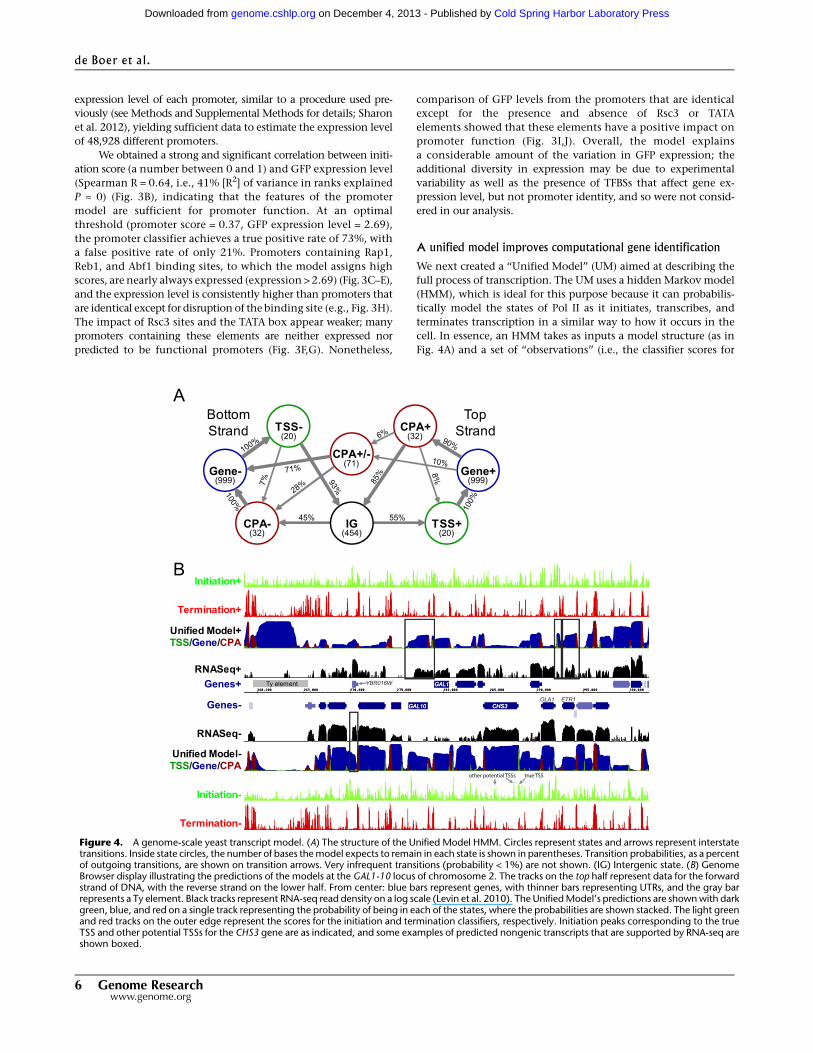
We next created a ‘‘Unified Model’’ (UM) aimed at describing the
full process of transcription. The UM uses a hidden Markov model
(HMM), which is ideal for this purpose because it can probabilis-
tically model the states of Pol II as it initiates, transcribes, and
terminates transcription in a similar way to how it occurs in the
cell. In essence, an HMM takes as inputs a model structure (as in
Fig. 4A) and a set of ‘‘observations’’ (i.e., the classifier scores for
Figure 4. A genome-scale yeast transcript model. (A) The structure of the Unified Model HMM. Circles represent states and arrows represent interstatetransitions. Inside state circles, the number of bases the model expects to remain in each state is shown in parentheses. Transition probabilities, as a percentof outgoing transitions, are shown on transition arrows. Very infrequent transitions (probability < 1%) are not shown. (IG) Intergenic state. (B) GenomeBrowser display illustrating the predictions of the models at the GAL1-10 locus of chromosome 2. The tracks on the top half represent data for the forwardstrand of DNA, with the reverse strand on the lower half. From center: blue bars represent genes, with thinner bars representing UTRs, and the gray barrepresents a Ty element. Black tracks represent RNA-seq read density on a log scale (Levin et al. 2010). The Unified Model’s predictions are shown with darkgreen, blue, and red on a single track representing the probability of being in each of the states, where the probabilities are shown stacked. The light greenand red tracks on the outer edge represent the scores for the initiation and termination classifiers, respectively. Initiation peaks corresponding to the trueTSS and other potential TSSs for the CHS3 gene are as indicated, and some examples of predicted nongenic transcripts that are supported by RNA-seq areshown boxed.
de Boer et al.
6 Genome Researchwww.genome.org
Cold Spring Harbor Laboratory Press on December 4, 2013 - Published by genome.cshlp.orgDownloaded from

each base of a chromosome) and outputs the probability of the
model being in each state at each base (i.e., chromosome-wide
transcript structures). The model structure includes parameters
describing the probability distributions of the observations in each
state (i.e., the distributions of the classifier scores within each of
the states shown in Fig. 4A), as well as the probability distribution
of transitions between states (e.g., the probability of going from
intergenic to TSS+). Since there are eight different states and four
different observations (two classifiers for both DNA strands) (Fig.
4A), the model requires 32 (8 3 4) means and 32 (8 3 4) variances
for observations, as well as 64 (8 3 8) different transition proba-
bilities (40 of which are zero, since not all state transitions are
allowed, e.g., Gene+ directly to Gene�). To ensure that the model is
symmetric, such that the predicted transcript structure will be
identical for a chromosome sequence and its reverse complement
(since a chromosome’s strand labels are arbitrarily assigned), we
used the same means and variances for equivalent states between
the (+) and (�) strands and ensured that the transition probabilities
were symmetrical, resulting in a total of 56 nonzero parameters
(see Supplemental Tables 4, 5).
The UM states correspond to TSSs, transcript bodies (‘‘Gene’’),
and CPA sites on the forward and reverse strands, as well as a state
corresponding to bidirectional transcript termination and a state
for intergenic DNA (Fig. 4A). The model considers transcription in
both orientations simultaneously, scanning in only one direction.
The order of the states for transcripts on the reverse strand is thus
reversed relative to the forward strand, e.g., while the TSS is fol-
lowed by a gene on the forward strand, the TSS is followed by an
intergenic region on the reverse strand. Because TSS and CPA sites
typically cover a range of bases (Pelechano et al. 2013), we repre-
sented TSS and CPA sites as states that can span multiple bases. As
a result, we could not use our original transcript map (the one used
to train the initiation and termination classifiers) to derive the UM
parameters because it has only a single base for each TSS and CPA
site and so does not capture the actual range of bases used for these
sites or the transitions between these and the other model states.
Further, these annotations excluded many cellular RNAs, in-
cluding ORF-containing genes for which we did not have TSS/CPA
site estimates.
To overcome these limitations, we defined a new transcript
map that could be used in deriving the HMM parameters. In our
initial analyses (data not shown), the model outputs (i.e., the
predicted transcript structures) were surprisingly sensitive to the
choice of parameters and the transcript maps from which they
were derived. Ultimately, we derived the parameters using a tran-
script map that divided the genome into the eight HMM states
based on multiple types of RNA-seq data (Nagalakshmi et al. 2008;
Lipson et al. 2009; Levin et al. 2010; Ozsolak et al. 2010) (see
Supplemental Methods and Supplemental Fig. 5 for details). We
also found that the performance of the UM could be substantially
improved by tuning the observation means (i.e., the expected
classifier score in each state) to maximize the correlation of the
probability of being a transcript (as predicted by the UM) to the
expression levels in the training data, measured by RNA-seq on
a per-base level (see Supplemental Methods for details; Levin et al.
2010). We speculate that this process may compensate for errors or
omissions in the initial transcript map. It is also possible that some
aspects of transcription are not captured well by the binary state
annotations in our transcript map. Here we present results for the
UM trained on chromosomes 9–16 and tested on chromosomes
1–8 using scores from initiation and termination classifiers trained
on chromosomes 9–16 (ensuring neither UM nor classifiers had
seen these chromosomes previously). Similar model parameters
and performance were attained by swapping the training and test
data.
Given the classifier scores for an entire chromosome, the UM
outputs the probability of being in each state at every base. The
probability corresponds to the posterior marginals of the HMM
states. An example of our UM predictions at the GAL1-10 locus
(and surrounding region), located on chromosome 2, is shown in
Figure 4B. There is generally a good correspondence between gene
annotations and the transcript predictions (and the exceptions are
informative; see below). The UM robustly predicts TSSs, CPAs, and
transcripts of known genes: Figure 5A shows ROC analysis, and
Supplemental Figure 6 shows the same data as precision-recall
curves. The overall sensitivity (recall) of detecting transcripts on
a base-by-base level is 76.6% (P » 0), and the precision is 76.9% (P <
10�299, taken as predicted transcribed bases that are within 100 bp
of a known transcript) (see Supplemental Methods). For compari-
son, random guessing with a probability of 42.1% (the proportion
of the genome encompassed by a transcript on a given strand)
would yield precision and recall values of 42.1%. TSSs and CPAs are
much more sparse than transcripts, yet the ROC and precision-
recall analyses indicate that the UM is also adept at identifying
these elements (Fig. 5A; Supplemental Fig. 6). We did not expect
the UM to achieve perfect classification in this analysis because it is
penalized for predicting any transcript that is absent from our gene
annotations, even if these transcripts exist in the cell (see below).
Further, if the UM predicts an antisense over a sense transcript, it is
penalized twice in this analysis: Predicting the antisense transcript
yields false positives, and missing the sense transcript yields false
negatives.
The UM also allowed us to ask whether the interaction of
sequence features along the chromosome is important to their
function in vivo. If so, the UM would be expected to be better at
identifying TSSs than the initiation classifier alone. Indeed, the
UM is much better than the initiation classifier at distinguishing
true TSSs from bases that are within ORFs (AUROC = 0.925 vs.
0.863, representing nearly a halving of the error rate) (Fig. 5B),
indicating that the relative arrangement of promoter and CPA sites
on the chromosome has an important influence on the usage of
the individual elements and that this context-dependence is being
modeled by the UM. Manual examination of the UM and the
classifier outputs confirm that the HMM often identifies the cor-
rect TSS for a given gene even when the initiation classifier iden-
tifies other, often stronger, potential TSSs nearby, suggesting that
this context-dependence is being incorporated in the UM. CHS3 in
Figure 4B is one such example (indicated with arrows).
We next investigated the nongenic transcripts predicted by
the model. Transposons and sn/snoRNAs, although not consid-
ered as known transcripts in the analyses above, are also generated
by Pol II (Lesage and Todeschini 2005; Richard and Manley 2009).
These elements encompass 2.95% of predicted transcribed inter-
genic bases, and overall 71.3% of the bases of these elements are
predicted to be transcribed, despite these elements being absent
from the classifier training data (P < 10�7). Remaining in-
consistencies between the model and the annotated transcripts
are split approximately evenly between predicting transcription
on the wrong strand (15.3% of predicted transcribed bases)
and predicting transcripts in intergenic regions (>100 bases from
ORF-containing transcripts; 11.7% of predicted transcribed bases).
Figure 4B contains several such instances. In addition to capturing
most of the known genes, the model identifies a known antisense
transcript of GAL10 (Houseley et al. 2008), transcripts antisense to
A unified model for yeast transcript definition
Genome Research 7www.genome.org
Cold Spring Harbor Laboratory Press on December 4, 2013 - Published by genome.cshlp.orgDownloaded from

ETR1 and YBR016W, and a short intergenic transcript between
ETR1 and OLA1. Notably, all are also observed in the RNA-seq data.
In order to determine more globally whether there was evi-
dence to support the existence of transcripts that do not corre-
spond to known features, we compared the UM’s predictions to
available RNA-seq data. Among the transcripts predicted antisense
to known genes, 23.5% of bases are supported by strand-specific
RNA-seq reads (Lipson et al. 2009) (compared with 8.5% expected
by chance; P » 0), and 39.0% of intergenic bases that are predicted
to be transcribed are supported by the same RNA-seq data (com-
pared with 25.6% expected by chance; P » 0). Finally, examining
complete transcript predictions that do not overlap known fea-
tures (see Supplemental Methods), we find that available RNA-seq
(Levin et al. 2010) and NET-seq (Churchman and Weissman 2011)
data show that the predicted TSSs and CPA sites of nongenic
transcripts appear in aggregate to be largely correct (Supplemental
Fig. 7). These comparisons demonstrate that the model is captur-
ing many real nongenic transcripts and suggest that these tran-
scripts are produced by the same mechanisms that produce con-
ventional Pol II transcripts.
Transcripts produced from randomly generated DNAsequences
An intriguing feature of our classifiers and the UM is that the critical
sequence features are relatively simple and would therefore be
expected to arise in random sequence at a relatively high frequency.
For example, the binding sites for Reb1, Abf1, and Rap1 have only 7,
7, and 9 critical bases, respectively, and tolerate some degeneracy;
thus, binding sites for at least one of these factors should appear
approximately every 2 kb in a randomly generated sequence. Hrp1
binding sites, with a six-base optimal binding site, appear even more
frequently—roughly once every kb in the A/T-rich yeast genome.
Thus, relatively long transcripts should be produced with some
frequency even from a randomly generated DNA sequence.
To confirm that such transcripts do arise and are consistent
with the predictions of the UM, we assayed transcription in vivo
from synthetic DNA fragments that were integrated into the yeast
genome. We tested four 6-kb fragments, each composed of two
tandem 3-kb DNA fragments, denoted A1B1, A1B2, A2B1, and
A2B2. These fragments contained randomly generated sequences
with a G/C content similar to that of the yeast genome (38%), into
which we randomly inserted binding sites for Rap1, Abf1, Rsc3,
Reb1, and Spt15, to reduce the amount of DNA to be synthesized
(see Supplemental Methods). The 3-kb fragments we synthesized
contained an average of 3.75 Spt15, 2.25 Abf1, 0.75 Reb1, 0.25
Rap1, and 3.25 Rsc3 consensus binding sites each, which is only
slightly more than the number expected in completely random
sequences of the same length (2.56, 0.99, 0.24, 0.24, and 1.2
binding sites, respectively). We did not intentionally add CPA sites
because they appear very frequently in randomly generated DNA
sequences. We integrated these constructs into the genome and
assayed expression using a custom tiling array.
The expression data shown in Figure 6 and Supplemental
Figure 8 illustrate that all four fragments produce a diverse set of
transcripts whose expression levels span three orders of magni-
tude. The UM predicts the majority of transcript species correctly.
There are several instances of promoters that initiate transcripts
bidirectionally (A1-a/A1-b, B1-a/B1-b, B2-b/B2-c), as well as nu-
merous instances of convergent transcripts that appear to termi-
nate at the same bidirectional CPA site (B1-b/B1-c, B2-a/B2-b, A2-c/
B1-a, B2-c/kan-R). Of the 12 easily distinguished transcripts, nine
are robustly predicted by the UM (A1-a, A1-b, A2-b, B1-a, B1-b,
B2-a, B2-b, B2-c, kan-R). There are several examples where tran-
scripts are generated on both DNA strands. These cases are difficult
for the UM to predict because it has no states representing tran-
scripts on both strands; nonetheless, in both instances of over-
lapping transcripts (A2-a/A2-b and kan and transcripts generated
antisense to kan), the model is uncertain and partially predicts
transcripts on both strands. In other cases, it is uncertain which
strand is transcribed when the data support the transcription of
only one strand under the condition tested (A1-c, B1-a, B2-c). Of
the easily distinguished transcripts, our model achieves a precision
and a recall of 0.69, on a transcript-by-transcript basis, allowing
a 200-base offset for TSS and CPA sites. Because the model is in-
capable of simultaneously predicting both of the overlapping
Figure 5. Performance of the UM. (A) ROC curves illustrating how well the UM predicts TSSs, transcripts, and CPA sites, when classifying the positive andnegative examples for the initiation and termination classifiers, as well as ORFs/transcripts and nontranscript bases. (B) ROC curve comparing the ability ofboth the UM and initiation classifier to distinguish between TSSs and bases that are part of nondubious ORFs. The line y = x represents the curve expectedby random classification.
de Boer et al.
8 Genome Researchwww.genome.org
Cold Spring Harbor Laboratory Press on December 4, 2013 - Published by genome.cshlp.orgDownloaded from

transcripts A2-a and A2-b, the theoretical maximum is a precision
and recall of 0.92. By simulating random guessing for the positions
and strands of transcripts, but assuming the number and sizes of
transcripts are known, the upper bound of what is expected by
chance is a precision and recall of about 0.029. Altogether, these
results demonstrate that transcripts can arise from a pseudorandom
sequence at a predictable frequency.
DiscussionThe modeling and experimental validation presented here indicate
that the majority of mRNA transcript definition in Saccharomyces
cerevisiae is relatively simple, and that transcription occurs as
a probabilistic process that can be faithfully captured in a hidden
Markov model. Both the models and the experimental data de-
scribed here indicate that, rather than simply being a property of
promoters, promoters are defined by the presence of an NDR,
resulting from sequences that inherently inhibit nucleosome for-
mation, such as G/C content and poly(A) sequences, or binding
sites for a small number of chromatin-modifying TFs, mainly GRFs.
Most of the features originally tested in the initiation classifier
correspond to motifs for other TFs, and so the slight loss in the
initiation classifier’s performance when reducing the number of
features (Fig. 1B) may be explained by less frequent utilization of
other mechanisms, such as the ability of arrays of TFBSs to exclude
nucleosomes and promote transcription (Pettersson and Schaffner
1990; Adams and Workman 1995; Miller and Widom 2003; Bai
et al. 2011). However, the fact that a linear model performed as well
as Random Forests suggests that the major promoter-defining
elements do not work cooperatively.
Importantly, our model captures the interactions between
these features in cis: The fact that the UM is more accurate at
identifying promoters than the initiation classifier alone indicates
that promoter selection can be influenced by cleavage site usage
and the relative arrangement of these elements on the chromo-
some (Fig. 5B). Although previous studies have characterized
potential mechanisms for these types of cis interactions in the
regulation of specific genes, our model suggests that they are of
widespread importance. One possible mechanism for this in-
fluence is through gene looping, which is a physical connection
between the 59 and 39 ends of genes dependent on proper 39 end
formation (Ansari and Hampsey 2005; Tan-Wong et al. 2012).
Following pioneering rounds of transcription from all promoter-
like sequences, successful CPA events may reinforce the ‘‘correct’’
transcript choice (Fig. 7). Previous studies have also established
that transcription can influence the function of nearby elements
by transcriptional interference (Mazo et al. 2007) and repressive
changes in the chromatin environment of the downstream pro-
moter (Kaplan et al. 2003). These mechanisms would force pro-
moters to compete with one another in cis, with factors such as
initiation frequency, epigenetic state, and gene loop formation
determining which promoter becomes dominant (Fig. 7). Given
this model, we would expect that under conditions where an up-
stream promoter is inactivated, downstream promoters could be-
come active as repressive transcription from the upstream pro-
moter stops. Indeed, we can find many potential examples of this
phenomenon (Supplemental Fig. 9). Thus, while few TFBSs con-
tributed to the initiation classifier, they could help determine which
among competing promoters is dominant, since the relative acti-
vation levels of promoters near each other can influence which
transcripts are produced in the neighborhood. Such a mechanism
may also explain why it is beneficial to incorporate expression levels
in training the UM parameters: Their inclusion indirectly informs
the model about the global transcriptional state of the cell.
The initiation classifier explains the presence of many non-
coding transcripts. Previously reported cryptic transcripts, in-
cluding CUTs, SUTs, and antisense transcripts (Xu et al. 2009;
Yassour et al. 2010), are all, on average, associated with promoter-
like sequences at the 59 end (Supplemental Fig. 10). Many of these
transcripts initiate from bidirectional promoters (Neil et al. 2009;
Xu et al. 2009). In our analysis, the correlation between the initi-
ation classifier’s predictions for the forward and reverse DNA
strands is only about 0.5, suggesting that there is some asymmetry
incorporated into the promoter itself; indeed, the distribution of
the critical promoter-defining features is only partly symmetric
(Fig. 1A). It is possible that either the arrangement or orientation of
binding sites for some of the other ;200 TFs in S. cerevisiae help to
make initiation more efficient in one direction. The base content
of the nascent transcript could also be a contributor to asymmet-
rical transcript initiation from bidirectional promoters. We found
that the ratio of As to Ts is important in the first 100 transcribed
bases, which could help to control the efficiency of Pol II promoter
release, since elongation rate can be affected by nucleotide content
(Mason and Struhl 2005).
Figure 6. Predicted transcript structure and measured expression of two of the four randomly generated 6-kb fragments. Tracks as in Figure 4, exceptthat ‘‘Expression’’ was measured using custom Agilent tiling arrays. The construct names are indicated in the center, and discernible transcripts are labeledalong the tiling array data. A1B1 and A2B2 constructs are shown in Supplemental Figure 8 and show very similar results.
A unified model for yeast transcript definition
Genome Research 9www.genome.org
Cold Spring Harbor Laboratory Press on December 4, 2013 - Published by genome.cshlp.orgDownloaded from

The termination classifier is both remarkably accurate (Fig.
1B) and very simple, depending on only base content and Hrp1
sites. Historically, the Hrp1 binding site was thought to control
the efficiency of downstream cleavage, while selection of the site
of cleavage was determined by the positioning element (Guo and
Sherman 1996). Our model is partly consistent with this view and
further suggests that the general location of cleavage is de-
termined primarily by Hrp1-binding, with a minor but significant
contribution by A/T-content to cleavage site identity. The palin-
dromic nature of the features favored by the termination classifier
strongly supports the bidirectional nature of yeast cleavage sites.
It has previously been shown that some yeast terminators can
stimulate cleavage and polyadenylation in either orientation
(Peterson and Myers 1993; Egli et al. 1997; Aranda et al. 1998) and
that the 39 ends of convergent yeast genes frequently overlap
(Nagalakshmi et al. 2008; Ozsolak et al. 2010). We provide evi-
dence that the same cis elements are generally used to stimulate
transcript termination in either orientation. In fact, our UM
predicts that over 40% of convergent genes have overlapping
terminator regions (see Supplemental Methods). Such a mecha-
nism could have a role in preventing transcriptional interference
between adjacent genes by minimizing overlapping transcription
and could also contribute to genome compaction.
The simplicity of our model means that gene structures can
easily be designed and should arise spontaneously in evolution.
Yeast is a prevalent system in synthetic biology (e.g., Khalil et al.
2012; Wei et al. 2012; Westfall et al. 2012). However, most of the
promoter and terminator sequences currently in use are based on
native sequences and so have the potential to recombine (Blount
et al. 2012). Our model provides a guide with which these elements
can be designed de novo. The simplicity of these elements also
means that they can easily arise over evolutionary time. For pro-
moters, all that is fundamentally required is the gradual expansion
of A/T-rich tracts and/or addition of binding sites for the five TFs
that dominate the model. Indeed, promoter-like sequences will
occur in randomly generated DNA sequences at a rate of ;1/kb (see
Supplemental Methods). Since a given promoter-sized sequence is
likely to contain multiple TFBSs purely by chance (there are, on
average, 27 perfect TFBSs per kilobase of random DNA drawn from
the yeast base composition, using the YeTFaSCo expert-curated
motifs [de Boer and Hughes 2012]), then a newly emerged pro-
moter will likely already be regulated in some way. The fact that
functional variants can arise frequently at random could explain
both the relatively high evolutionary rates in cis-regulatory se-
quence (Kellis et al. 2003; Weirauch and Hughes 2010) and de
novo gene birth. Creating new genes from essentially random
DNA was thought to be very unlikely (Jacob 1977), but several
recent studies have shown that it may be more common than
previously thought (Levine et al. 2006; Cai et al. 2008; Carvunis
et al. 2012). Consistent with this, our UM predicts that 66% of
bases in randomly generated DNA sequences will be transcribed on
one strand or another. One model for the origin of new genes in-
volves first generating a stable transcript, then acquiring coding
potential, and finally acquiring a function (Cai et al. 2008). How-
ever, until now, it was unclear how simple it is to generate stable
transcriptional units from essentially random intergenic DNA.
MethodsSupporting data and model predictions are available on ourwebsite (http://hugheslab.ccbr.utoronto.ca/supplementary-data/transcription_model/). Additional methodological descriptionsare available in the Supplemental Methods and Analysis.
Creating the initiation and termination classifiers
For the initiation classifier, features included the YeTFaSCo data-base’s Expert-Curated set of TF motifs (version 1.00) (de Boer andHughes 2012), nucleosome-excluding sequences, and DNA struc-tural features (Supplemental Table 2). The termination classifierused a set of RBP motifs, as well as various counts of base compo-sition (Supplemental Table 3). The initiation classifier also in-cluded these features but only for the 100 bases after the TSS. De-tails on how we calculated each feature for each bin are available inSupplemental Methods.
We divided each chromosome into positive and negative ex-amples for each classifier, where the initiation classifiercompared examples of promoters to nonpromoter sequences, andthe termination classifier compared the CPA sites of genes to genebodies. We trained the classifiers on examples from half of theyeast chromosomes, and within these eight chromosomes, we leftone chromosome out for evaluation of performance and optimi-zation of the models. For each chromosome left out, we made fourreplicate forests, each with 50 trees. Thus, each classifier consistedof 1600 decision trees and was trained on half the genome.
Creation and analysis of the combinatorial promoter library
We designed several hundred promoter segments encompassingthe most important feature bins of the initiation classifier. We
Figure 7. Gene definition model. (A) In the absence of transcription, theDNA forms nucleosomes except where prevented by bound TFs (such asthe GRFs) or by the DNA structure. (B) Transcription begins indiscrimi-nately from nucleosome-free regions in proportion to the efficiency of pre-initiation complex (PIC) formation. Promoters compete with one another incis through the act of transcription. (C ) An equilibrium is reached wheresome promoters are active and others are repressed. Successful cleavageand polyadenylation reinforces the promoter choice. (D) If a nucleosome-free region is destroyed (for instance, through loss of GRF binding), it is nolonger competent for initiating transcription. Downstream promoters arethen de-repressed, become active, and a new equilibrium is reached.
de Boer et al.
10 Genome Researchwww.genome.org
Cold Spring Harbor Laboratory Press on December 4, 2013 - Published by genome.cshlp.orgDownloaded from

generated random DNA sequences, embedded TFBSs within each,and scored them by the initiation classifier in every possiblecombination. We selected those sequences that had relatively highinitiation scores in multiple contexts for synthesis, and designedcorresponding control sequences which were identical, but withthe added TFBS perturbed. We also designed high and low G/Ccontent promoter segments that either score highly or lowly, butinto which we did not specifically add TFBSs. TFBSs were generatedby sampling from the position frequency matrix of the corre-sponding factor using the frequencies as weights. The segmentshad 43, 48, and 41 different sequences in the �150:�80, �80:TSS,and TSS:+80 positions, respectively, and these had complementaryoverhangs at either end that ensured the segments would combinein the desired order and would yield, in theory, 86,688 differentpromoters.
We ordered the promoter parts as single-stranded oligonu-cleotides from Sigma-Aldrich. To generate double-stranded pro-moter parts, we phosphorylated and annealed the forward andreverse strands for each sequence. We then pooled and ligatedthese double-stranded promoter segments in bulk, purified andcloned the resulting promoters into an expression vector con-taining GFP, and transformed them into E. coli. We then isolatedthe resulting library and transformed it into yeast cells. We sortedthe pooled yeast library by flow cytometry into six fluorescencebins and grew the sorted cells overnight. We then isolated DNAand amplified, barcoded, and sequenced the promoter DNA todetermine the proportion of each promoter in each bin. We cal-culated the expression level of each promoter by weighting theprobability of each promoter ending up in each bin by the averagefluorescence of the bin.
Data accessThe data from this study have been submitted to the NCBI GeneExpression Omnibus (GEO; http://www.ncbi.nlm.nih.gov/geo/)under accession numbers GSE47004 and GSE48860. Supplementaland unprocessed data are also available at the author’s website:http://hugheslab.ccbr.utoronto.ca/supplementary-data/transcription_model/.
AcknowledgmentsWe thank Debashish Ray, Kate Cook, Hong Zheng, and Ying Wufor the Hrp1 RNA-compete data, Annie Bang for assistance with theflow cytometry, and Alan Moses for helpful discussions and feed-back on the manuscript. This work was supported by grants fromthe CIHR to T.R.H. (MOP-49451 and MOP-77721) as well as theOntario Graduate Scholarship Program (C.G.D.) and the NSERCPostgraduate Scholarship Program (C.G.D.).
References
Adams CC, Workman JL. 1995. Binding of disparate transcriptional
activators to nucleosomal DNA is inherently cooperative. Mol Cell Biol
15: 1405–1421.Alexandersson M, Cawley S, Pachter L. 2003. SLAM: Cross-species gene
finding and alignment with a generalized pair hidden Markov model.
Genome Res 13: 496–502.Allan J, Fraser RM, Owen-Hughes T, Keszenman-Pereyra D. 2012.
Micrococcal nuclease does not substantially bias nucleosome mapping.
J Mol Biol 417: 152–164.Alper H, Moxley J, Nevoigt E, Fink GR, Stephanopoulos G. 2006.
Engineering yeast transcription machinery for improved ethanol
tolerance and production. Science 314: 1565–1568.Ansari A, Hampsey M. 2005. A role for the CPF 39-end processing machinery
in RNAP II-dependent gene looping. Genes Dev 19: 2969–2978.
Aranda A, Perez-Ortin JE, Moore C, del Olmo M. 1998. The yeast FBP1poly(A) signal functions in both orientations and overlaps with a genepromoter. Nucleic Acids Res 26: 4588–4596.
Arigo JT, Eyler DE, Carroll KL, Corden JL. 2006. Termination of crypticunstable transcripts is directed by yeast RNA-binding proteins Nrd1 andNab3. Mol Cell 23: 841–851.
Badis G, Chan ET, van Bakel H, Pena-Castillo L, Tillo D, Tsui K, Carlson CD,Gossett AJ, Hasinoff MJ, Warren CL, et al. 2008. A library of yeasttranscription factor motifs reveals a widespread function for Rsc3 intargeting nucleosome exclusion at promoters. Mol Cell 32: 878–887.
Bai L, Ondracka A, Cross FR. 2011. Multiple sequence-specific factors generatethe nucleosome-depleted region on CLN2 promoter. Mol Cell 42: 465–476.
Barabino SM, Hubner W, Jenny A, Minvielle-Sebastia L, Keller W. 1997. The30-kD subunit of mammalian cleavage and polyadenylation specificityfactor and its yeast homolog are RNA-binding zinc finger proteins. GenesDev 11: 1703–1716.
Basehoar AD, Zanton SJ, Pugh BF. 2004. Identification and distinctregulation of yeast TATA box-containing genes. Cell 116: 699–709.
Blount BA, Weenink T, Ellis T. 2012. Construction of synthetic regulatorynetworks in yeast. FEBS Lett 586: 2112–2121.
Breiman L. 2001. Random forests. Mach Learn 45: 5–32.Brogaard K, Xi L, Wang JP, Widom J. 2012. A map of nucleosome positions in
yeast at base-pair resolution. Nature 486: 496–501.Bumgarner SL, Dowell RD, Grisafi P, Gifford DK, Fink GR. 2009. Toggle
involving cis-interfering noncoding RNAs controls variegated geneexpression in yeast. Proc Natl Acad Sci 106: 18321–18326.
Burge C, Karlin S. 1997. Prediction of complete gene structures in humangenomic DNA. J Mol Biol 268: 78–94.
Bushnell DA, Westover KD, Davis RE, Kornberg RD. 2004. Structural basis oftranscription: An RNA polymerase II-TFIIB cocrystal at 4.5 Angstroms.Science 303: 983–988.
Cai J, Zhao R, Jiang H, Wang W. 2008. De novo origination of a new protein-coding gene in Saccharomyces cerevisiae. Genetics 179: 487–496.
Carvunis AR, Rolland T, Wapinski I, Calderwood MA, Yildirim MA, SimonisN, Charloteaux B, Hidalgo CA, Barbette J, Santhanam B, et al. 2012.Proto-genes and de novo gene birth. Nature 487: 370–374.
Chen S, Hyman LE. 1998. A specific RNA-protein interaction at yeastpolyadenylation efficiency elements. Nucleic Acids Res 26: 4965–4974.
Chen W, Struhl K. 1985. Yeast mRNA initiation sites are determinedprimarily by specific sequences, not by the distance from the TATAelement. EMBO J 4: 3273–3280.
Cheng Y, Miura RM, Tian B. 2006. Prediction of mRNA polyadenylation sitesby support vector machine. Bioinformatics 22: 2320–2325.
Chung HR, Dunkel I, Heise F, Linke C, Krobitsch S, Ehrenhofer-Murray AE,Sperling SR, Vingron M. 2010. The effect of micrococcal nucleasedigestion on nucleosome positioning data. PLoS ONE 5: e15754.
Churchman LS, Weissman JS. 2011. Nascent transcript sequencingvisualizes transcription at nucleotide resolution. Nature 469: 368–373.
Connelly S, Manley JL. 1988. A functional mRNA polyadenylation signal isrequired for transcription termination by RNA polymerase II. Genes Dev2: 440–452.
de Boer CG, Hughes TR. 2012. YeTFaSCo: A database of evaluated yeasttranscription factor sequence specificities. Nucleic Acids Res 40: D169–D179.
Dichtl B, Blank D, Sadowski M, Hubner W, Weiser S, Keller W. 2002. Yhh1p/Cft1p directly links poly(A) site recognition and RNA polymerase IItranscription termination. EMBO J 21: 4125–4135.
Egli CM, Duvel K, Trabesinger-Ruf N, Irniger S, Braus GH. 1997. Sequencerequirements of the bidirectional yeast TRP4 mRNA 39-end formationsignal. Nucleic Acids Res 25: 417–422.
Erb I, van Nimwegen E. 2011. Transcription factor binding site positioningin yeast: Proximal promoter motifs characterize TATA-less promoters.PLoS ONE 6: e24279.
Fan X, Moqtaderi Z, Jin Y, Zhang Y, Liu XS, Struhl K. 2010. Nucleosomedepletion at yeast terminators is not intrinsic and can occur bya transcriptional mechanism linked to 39-end formation. Proc Natl AcadSci 107: 17945–17950.
Ganapathi M, Palumbo MJ, Ansari SA, He Q, Tsui K, Nislow C, Morse RH.2011. Extensive role of the general regulatory factors, Abf1 and Rap1, indetermining genome-wide chromatin structure in budding yeast.Nucleic Acids Res 39: 2032–2044.
Garas M, Dichtl B, Keller W. 2008. The role of the putative 39 end processingendonuclease Ysh1p in mRNA and snoRNA synthesis. RNA 14: 2671–2684.
Gertz J, Siggia ED, Cohen BA. 2009. Analysis of combinatorial cis-regulationin synthetic and genomic promoters. Nature 457: 215–218.
Graber JH, McAllister GD, Smith TF. 2002. Probabilistic prediction ofSaccharomyces cerevisiae mRNA 39-processing sites. Nucleic Acids Res 30:1851–1858.
A unified model for yeast transcript definition
Genome Research 11www.genome.org
Cold Spring Harbor Laboratory Press on December 4, 2013 - Published by genome.cshlp.orgDownloaded from
Gross S, Moore CL. 2001. Rna15 interaction with the A-rich yeastpolyadenylation signal is an essential step in mRNA 39-end formation.Mol Cell Biol 21: 8045–8055.
Guo Z, Sherman F. 1996. 39-end-forming signals of yeast mRNA. TrendsBiochem Sci 21: 477–481.
Hahn S, Hoar ET, Guarente L. 1985. Each of three ‘‘TATA elements’’ specifiesa subset of the transcription initiation sites at the CYC-1 promoter ofSaccharomyces cerevisiae. Proc Natl Acad Sci 82: 8562–8566.
Harbison CT, Gordon DB, Lee TI, Rinaldi NJ, Macisaac KD, Danford TW,Hannett NM, Tagne JB, Reynolds DB, Yoo J, et al. 2004.Transcriptional regulatory code of a eukaryotic genome. Nature 431:99–104.
Hartley PD, Madhani HD. 2009. Mechanisms that specify promoternucleosome location and identity. Cell 137: 445–458.
Houseley J, Rubbi L, Grunstein M, Tollervey D, Vogelauer M. 2008. A ncRNAmodulates histone modification and mRNA induction in the yeast GALgene cluster. Mol Cell 32: 685–695.
Iyer V, Struhl K. 1995. Poly(dA:dT), a ubiquitous promoter element thatstimulates transcription via its intrinsic DNA structure. EMBO J 14:2570–2579.
Jacob F. 1977. Evolution and tinkering. Science 196: 1161–1166.Jacquier A. 2009. The complex eukaryotic transcriptome: Unexpected
pervasive transcription and novel small RNAs. Nat Rev Genet 10: 833–844.
Juven-Gershon T, Hsu JY, Theisen JW, Kadonaga JT. 2008. The RNApolymerase II core promoter - the gateway to transcription. Curr OpinCell Biol 20: 253–259.
Kaplan CD, Laprade L, Winston F. 2003. Transcription elongation factorsrepress transcription initiation from cryptic sites. Science 301: 1096–1099.
Kaplan N, Moore IK, Fondufe-Mittendorf Y, Gossett AJ, Tillo D, Field Y,LeProust EM, Hughes TR, Lieb JD, Widom J, et al. 2009. The DNA-encoded nucleosome organization of a eukaryotic genome. Nature 458:362–366.
Kellis M, Patterson N, Endrizzi M, Birren B, Lander ES. 2003. Sequencing andcomparison of yeast species to identify genes and regulatory elements.Nature 423: 241–254.
Kessler MM, Henry MF, Shen E, Zhao J, Gross S, Silver PA, Moore CL. 1997.Hrp1, a sequence-specific RNA-binding protein that shuttles betweenthe nucleus and the cytoplasm, is required for mRNA 39-end formationin yeast. Genes Dev 11: 2545–2556.
Khalil AS, Lu TK, Bashor CJ, Ramirez CL, Pyenson NC, Joung JK, Collins JJ.2012. A synthetic biology framework for programming eukaryotictranscription functions. Cell 150: 647–658.
Kim M, Krogan NJ, Vasiljeva L, Rando OJ, Nedea E, Greenblatt JF, BuratowskiS. 2004. The yeast Rat1 exonuclease promotes transcription terminationby RNA polymerase II. Nature 432: 517–522.
Lee W, Tillo D, Bray N, Morse RH, Davis RW, Hughes TR, Nislow C. 2007. Ahigh-resolution atlas of nucleosome occupancy in yeast. Nat Genet 39:1235–1244.
Lesage P, Todeschini AL. 2005. Happy together: The life and times of Tyretrotransposons and their hosts. Cytogenet Genome Res 110: 70–90.
Levin JZ, Yassour M, Adiconis X, Nusbaum C, Thompson DA, Friedman N,Gnirke A, Regev A. 2010. Comprehensive comparative analysis ofstrand-specific RNA sequencing methods. Nat Methods 7: 709–715.
Levine MT, Jones CD, Kern AD, Lindfors HA, Begun DJ. 2006. Novel genesderived from noncoding DNA in Drosophila melanogaster are frequentlyX-linked and exhibit testis-biased expression. Proc Natl Acad Sci 103:9935–9939.
Li Y, Flanagan PM, Tschochner H, Kornberg RD. 1994. RNA polymerase IIinitiation factor interactions and transcription start site selection.Science 263: 805–807.
Lipson D, Raz T, Kieu A, Jones DR, Giladi E, Thayer E, Thompson JF, LetovskyS, Milos P, Causey M. 2009. Quantification of the yeast transcriptome bysingle-molecule sequencing. Nat Biotechnol 27: 652–658.
Majoros WH, Pertea M, Salzberg SL. 2004. TigrScan and GlimmerHMM: Twoopen source ab initio eukaryotic gene-finders. Bioinformatics 20: 2878–2879.
Mandel CR, Kaneko S, Zhang H, Gebauer D, Vethantham V, Manley JL, TongL. 2006. Polyadenylation factor CPSF-73 is the pre-mRNA 39-end-processing endonuclease. Nature 444: 953–956.
Martens JA, Laprade L, Winston F. 2004. Intergenic transcription is requiredto repress the Saccharomyces cerevisiae SER3 gene. Nature 429: 571–574.
Mason PB, Struhl K. 2005. Distinction and relationship betweenelongation rate and processivity of RNA polymerase II in vivo. Mol Cell17: 831–840.
Mazo A, Hodgson JW, Petruk S, Sedkov Y, Brock HW. 2007. Transcriptionalinterference: An unexpected layer of complexity in gene regulation.J Cell Sci 120: 2755–2761.
Megraw M, Pereira F, Jensen ST, Ohler U, Hatzigeorgiou AG. 2009. Atranscription factor affinity-based code for mammalian transcriptioninitiation. Genome Res 19: 644–656.
Miller JA, Widom J. 2003. Collaborative competition mechanism for geneactivation in vivo. Mol Cell Biol 23: 1623–1632.
Nagalakshmi U, Wang Z, Waern K, Shou C, Raha D, Gerstein M, Snyder M.2008. The transcriptional landscape of the yeast genome defined byRNA sequencing. Science 320: 1344–1349.
Nagawa F, Fink GR. 1985. The relationship between the ‘‘TATA’’ sequenceand transcription initiation sites at the HIS4 gene of Saccharomycescerevisiae. Proc Natl Acad Sci 82: 8557–8561.
Neil H, Malabat C, d’Aubenton-Carafa Y, Xu Z, Steinmetz LM, Jacquier A.2009. Widespread bidirectional promoters are the major source ofcryptic transcripts in yeast. Nature 457: 1038–1042.
Ozsolak F, Kapranov P, Foissac S, Kim SW, Fishilevich E, Monaghan AP, JohnB, Milos PM. 2010. Comprehensive polyadenylation site maps in yeastand human reveal pervasive alternative polyadenylation. Cell 143:1018–1029.
Pelechano V, Wei W, Steinmetz LM. 2013. Extensive transcriptionalheterogeneity revealed by isoform profiling. Nature 497: 127–131.
Perez-Canadillas JM. 2006. Grabbing the message: Structural basis of mRNA39UTR recognition by Hrp1. EMBO J 25: 3167–3178.
Peterson JA, Myers AM. 1993. Functional analysis of mRNA 39 endformation signals in the convergent and overlapping transcription unitsof the S. cerevisiae genes RHO1 and MRP2. Nucleic Acids Res 21: 5500–5508.
Pettersson M, Schaffner W. 1990. Synergistic activation of transcription bymultiple binding sites for NF-k B even in absence of co-operative factorbinding to DNA. J Mol Biol 214: 373–380.
Pinto I, Ware DE, Hampsey M. 1992. The yeast SUA7 gene encodesa homolog of human transcription factor TFIIB and is required fornormal start site selection in vivo. Cell 68: 977–988.
Prestridge DS. 1995. Predicting Pol II promoter sequences usingtranscription factor binding sites. J Mol Biol 249: 923–932.
Raveh-Sadka T, Levo M, Shabi U, Shany B, Keren L, Lotan-Pompan M, ZeeviD, Sharon E, Weinberger A, Segal E. 2012. Manipulating nucleosomedisfavoring sequences allows fine-tune regulation of gene expression inyeast. Nat Genet 44: 743–750.
Rhee HS, Pugh BF. 2012. Genome-wide structure and organization ofeukaryotic pre-initiation complexes. Nature 483: 295–301.
Richard P, Manley JL. 2009. Transcription termination by nuclear RNApolymerases. Genes Dev 23: 1247–1269.
Russo P, Li WZ, Hampsey DM, Zaret KS, Sherman F. 1991. Distinct cis-actingsignals enhance 39 endpoint formation of CYC1 mRNA in the yeastSaccharomyces cerevisiae. EMBO J 10: 563–571.
Sharon E, Kalma Y, Sharp A, Raveh-Sadka T, Levo M, Zeevi D, Keren L,Yakhini Z, Weinberger A, Segal E. 2012. Inferring gene regulatory logicfrom high-throughput measurements of thousands of systematicallydesigned promoters. Nat Biotechnol 30: 521–530.
Solovyev VV, Shahmuradov IA. 2003. PromH: Promoters identificationusing orthologous genomic sequences. Nucleic Acids Res 31: 3540–3545.
Tacahashi Y, Helmling S, Moore CL. 2003. Functional dissection of the zincfinger and flanking domains of the Yth1 cleavage/polyadenylationfactor. Nucleic Acids Res 31: 1744–1752.
Tan-Wong SM, Zaugg JB, Camblong J, Xu Z, Zhang DW, Mischo HE, AnsariAZ, Luscombe NM, Steinmetz LM, Proudfoot NJ. 2012. Gene loopsenhance transcriptional directionality. Science 338: 671–675.
Tillo D, Hughes TR. 2009. G+C content dominates intrinsic nucleosomeoccupancy. BMC Bioinformatics 10: 442.
Wei P, Wong WW, Park JS, Corcoran EE, Peisajovich SG, Onuffer JJ, Weiss A,Lim WA. 2012. Bacterial virulence proteins as tools to rewire kinasepathways in yeast and immune cells. Nature 488: 384–388.
Weirauch MT, Hughes TR. 2010. Conserved expression without conservedregulatory sequence: The more things change, the more they stay thesame. Trends Genet 26: 66–74.
West S, Gromak N, Proudfoot NJ. 2004. Human 59! 39 exonuclease Xrn2promotes transcription termination at co-transcriptional cleavage sites.Nature 432: 522–525.
Westfall PJ, Pitera DJ, Lenihan JR, Eng D, Woolard FX, Regentin R,Horning T, Tsuruta H, Melis DJ, Owens A, et al. 2012. Production ofamorphadiene in yeast, and its conversion to dihydroartemisinic acid,precursor to the antimalarial agent artemisinin. Proc Natl Acad Sci 109:E111–E118.
Wyers F, Rougemaille M, Badis G, Rousselle JC, Dufour ME, Boulay J,Regnault B, Devaux F, Namane A, Seraphin B, et al. 2005. Cryptic pol IItranscripts are degraded by a nuclear quality control pathway involvinga new poly(A) polymerase. Cell 121: 725–737.
Xu Z, Wei W, Gagneur J, Perocchi F, Clauder-Munster S, Camblong J,Guffanti E, Stutz F, Huber W, Steinmetz LM. 2009. Bidirectionalpromoters generate pervasive transcription in yeast. Nature 457:1033–1037.
de Boer et al.
12 Genome Researchwww.genome.org
Cold Spring Harbor Laboratory Press on December 4, 2013 - Published by genome.cshlp.orgDownloaded from

Yarragudi A, Miyake T, Li R, Morse RH. 2004. Comparison of ABF1 and RAP1in chromatin opening and transactivator potentiation in the buddingyeast Saccharomyces cerevisiae. Mol Cell Biol 24: 9152–9164.
Yassour M, Pfiffner J, Levin JZ, Adiconis X, Gnirke A, Nusbaum C,Thompson D-A, Friedman N, Regev A. 2010. Strand-specific RNAsequencing reveals extensive regulated long antisense transcripts thatare conserved across yeast species. Genome Biol 11: R87.
Yu L, Morse RH. 1999. Chromatin opening and transactivator potentiationby RAP1 in Saccharomyces cerevisiae. Mol Cell Biol 19: 5279–5288.
Yuan GC, Liu YJ, Dion MF, Slack MD, Wu LF, Altschuler SJ, Rando OJ. 2005.Genome-scale identification of nucleosome positions in S. cerevisiae.Science 309: 626–630.
Zhang Z, Dietrich FS. 2005. Mapping of transcription start sites inSaccharomyces cerevisiae using 59 SAGE. Nucleic Acids Res 33: 2838–2851.
Received July 31, 2013; accepted in revised form October 28, 2013.
A unified model for yeast transcript definition
Genome Research 13www.genome.org
Cold Spring Harbor Laboratory Press on December 4, 2013 - Published by genome.cshlp.orgDownloaded from