a study on the influence of tire speed and pressure ... - mdpi
TRANSCRIPT
Article
A Study on the Influence of Tire Speed and Pressureon Measurement Parameters Obtained fromHigh-Speed Tire Uniformity Testing
Meng Du 1,2, Pengfei Sun 1,3,*, Shuiting Zhou 1,2, Hongwu Huang 1,3 and Jie Zhu 4
1 Collaborative Innovation Center for R&D of Coach and Special Vehicle, Xiamen University of Technology,Xiamen 361024, China; [email protected] (M.D.); [email protected] (S.Z.);[email protected] (H.H.)
2 School of Mechanical & Automotive Engineering, Xiamen University of Technology, Xiamen 361024, China3 School of Aerospace Engineering, Xiamen University, Xiamen 361102, China4 Testing Center, Wanli Tire Co., Ltd., Guangzhou 510940, China; [email protected]* Correspondence: [email protected]
Received: 15 July 2020; Accepted: 18 August 2020; Published: 8 September 2020�����������������
Abstract: In order to improve the test conditions of the tire uniformity test and the effect of the speedand tire pressure on the uniformity parameters, the uniformity test of the tire under different speedsand tire pressure was carried out by a high-speed uniformity test machine, and the experimental datawere analyzed and fitted by the regression analysis method. This paper introduces the definition ofuniformity and the uniformity parameters of automotive tires; the working principle of a high-speeduniformity testing machine is briefly described, a mathematical model of the uniformity testingmachine is established, and the signal acquisition process of the tire uniformity parameters and thecalculation method of the uniformity parameters are described. The test result indicates: As thespeed increases, the radial force fluctuation, lateral force fluctuation, tangential force fluctuation,and turning torque fluctuation of the tire increase, and the positive torque fluctuation first increasesand then decreases; with the increase of tire pressure, the radial force fluctuation and the tangentialforce fluctuation of the tire increase, and the lateral force fluctuation, the turning torque fluctuation,and the returning moment fluctuation are all reduced. Compared to the low speed uniformity test,the high speed uniformity test can better reflect the uniformity of the tire, reducing the speed of thevehicle can reduce the radial runout and lateral sway of the tire; increasing the tire pressure canreduce the left and right swing of the vehicle.
Keywords: speed; pressure; high-speed uniformity testing; uniformity parameters
1. Introduction
With the rapid development of the automotive industry, the performance of cars in the past nolonger meets the needs of drivers in the present; vehicles are constantly improving in their handlingand comfort. As the only part of the vehicle in contact with the road surface, the performance of thetires directly affects the performance of the whole vehicle. Therefore, the automotive industry paysattention to and cooperates with the tire industry as part of its efforts to improve the performance ofvehicles, so that vehicle stability and comfort are further enhanced.
A tire will deform irregularly when driven at high speed, resulting in fluctuations in radial,lateral, and tangential forces, reflecting variation in the circumferential forces of the tire, known as tirenonuniformity. Due to the unevenness of the tire, the forces acting on the rotating shaft during therolling process cause the vehicle to vibrate, which reduces the maneuverability, ride, and comfort ofthe car, and can seriously damage some of the car’s components. Tire uniformity testing is a major
Vehicles 2020, 2, 559–573; doi:10.3390/vehicles2030031 www.mdpi.com/journal/vehicles
Vehicles 2020, 2 560
part of tire quality testing. For newly produced tires, uniformity testing is required to make sure thatthe actual measurement uniformity parameter error is within the allowable tolerance range, ensuringthe tire quality assurance during use [1]. The high-speed uniformity testing machine is a device thatdetects the fluctuation of the circumferential forces of the tire by driving a drum to rotate the tire andapplying a certain load to the tire and can accurately measure the tire uniformity parameters, therebybeing able to characterize the performance of the vehicle.
The high-speed uniformity testing machine is a semi-automatic testing device for measuring tiresunder different speeds, loads, and pressures. The uniformity parameters of the test include radial forcefluctuation, lateral force fluctuation, tangential force fluctuation, radial force harmonics, lateral forcesharmonics, tangential force harmonics, positive torque fluctuations, rollover torque fluctuations, tapereffects, and angle effects [2]. According to the measured test data, not only can the quality of the tire bejudged, but also the performance of the tire can be improved by using the uniformity parameters toimprove the performance of the vehicle.
In the past, many scholars mostly used the low-speed uniformity testing machine to study theuniformity parameters of tires, and used it as the standard for tire quality evaluation [3]. At present,the speed of vehicles on the highway is about 120 km/h, and the test results of the low-speed uniformitytester cannot accurately reflect the forces of the tire when it is rolling at high speed; some parametersthat are neglected in the low-speed uniformity test may be important reference factors in high-speeduniformity tests, such as tangential force fluctuations, positive-torque fluctuations, and roll-overtorque fluctuations. The accuracy of the sensors of the low-speed uniformity tester does not meetthe test requirements of these parameters, and does not fully reflect the uniformity characteristicsof the tires; these parameters can be used to characterize the uniformity of the tires at high speed.In a tire uniformity test, there are many factors that affect the unevenness of the tire, such as speed,load, and pressure, which should be examined in order to study the change of forces and momentswhen the tire is rolling at high speed. In this paper, a high-speed uniformity tester is used to measure thechange of forces and moments of a tire under different speeds and different pressures, and the influenceof speed and pressure on tire uniformity parameters is analyzed. Additionally, the relationship betweentire uniformity parameters and vehicle performance is briefly described, providing a reference forimproving the production level of tires and vehicle design.
2. Tire Uniformity
2.1. Tire Uniformity Definition
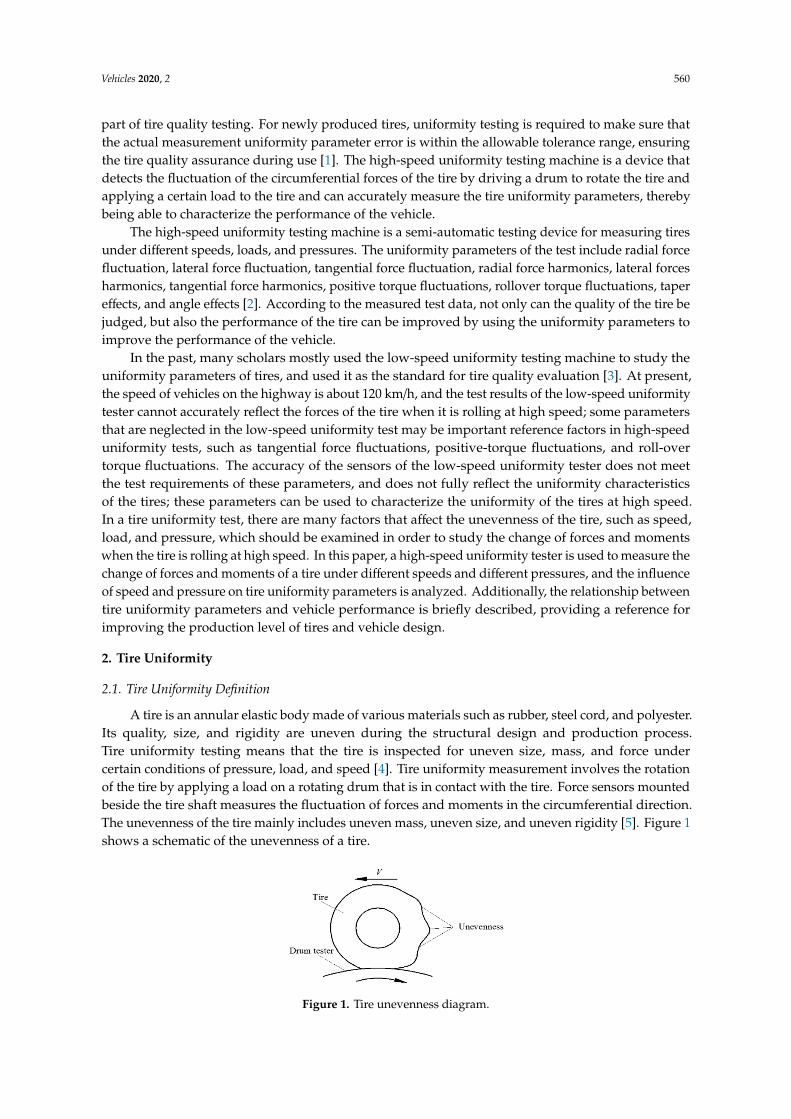
A tire is an annular elastic body made of various materials such as rubber, steel cord, and polyester.Its quality, size, and rigidity are uneven during the structural design and production process.Tire uniformity testing means that the tire is inspected for uneven size, mass, and force undercertain conditions of pressure, load, and speed [4]. Tire uniformity measurement involves the rotationof the tire by applying a load on a rotating drum that is in contact with the tire. Force sensors mountedbeside the tire shaft measures the fluctuation of forces and moments in the circumferential direction.The unevenness of the tire mainly includes uneven mass, uneven size, and uneven rigidity [5]. Figure 1shows a schematic of the unevenness of a tire.
Vehicles 2020, 2, FOR PEER REVIEW 2 of 14
part of tire quality testing. For newly produced tires, uniformity testing is required to make sure that the actual measurement uniformity parameter error is within the allowable tolerance range, ensuring the tire quality assurance during use [1]. The high-speed uniformity testing machine is a device that detects the fluctuation of the circumferential forces of the tire by driving a drum to rotate the tire and applying a certain load to the tire and can accurately measure the tire uniformity parameters, thereby being able to characterize the performance of the vehicle.
The high-speed uniformity testing machine is a semi-automatic testing device for measuring tires under different speeds, loads, and pressures. The uniformity parameters of the test include radial force fluctuation, lateral force fluctuation, tangential force fluctuation, radial force harmonics, lateral forces harmonics, tangential force harmonics, positive torque fluctuations, rollover torque fluctuations, taper effects, and angle effects [2]. According to the measured test data, not only can the quality of the tire be judged, but also the performance of the tire can be improved by using the uniformity parameters to improve the performance of the vehicle.
In the past, many scholars mostly used the low-speed uniformity testing machine to study the uniformity parameters of tires, and used it as the standard for tire quality evaluation [3]. At present, the speed of vehicles on the highway is about 120 km/h, and the test results of the low-speed uniformity tester cannot accurately reflect the forces of the tire when it is rolling at high speed; some parameters that are neglected in the low-speed uniformity test may be important reference factors in high-speed uniformity tests, such as tangential force fluctuations, positive-torque fluctuations, and roll-over torque fluctuations. The accuracy of the sensors of the low-speed uniformity tester does not meet the test requirements of these parameters, and does not fully reflect the uniformity characteristics of the tires; these parameters can be used to characterize the uniformity of the tires at high speed. In a tire uniformity test, there are many factors that affect the unevenness of the tire, such as speed, load, and pressure, which should be examined in order to study the change of forces and moments when the tire is rolling at high speed. In this paper, a high-speed uniformity tester is used to measure the change of forces and moments of a tire under different speeds and different pressures, and the influence of speed and pressure on tire uniformity parameters is analyzed. Additionally, the relationship between tire uniformity parameters and vehicle performance is briefly described, providing a reference for improving the production level of tires and vehicle design.
2. Tire Uniformity
2.1. Tire Uniformity Definition
A tire is an annular elastic body made of various materials such as rubber, steel cord, and polyester. Its quality, size, and rigidity are uneven during the structural design and production process. Tire uniformity testing means that the tire is inspected for uneven size, mass, and force under certain conditions of pressure, load, and speed [4]. Tire uniformity measurement involves the rotation of the tire by applying a load on a rotating drum that is in contact with the tire. Force sensors mounted beside the tire shaft measures the fluctuation of forces and moments in the circumferential direction. The unevenness of the tire mainly includes uneven mass, uneven size, and uneven rigidity [5]. Figure 1 shows a schematic of the unevenness of a tire.
Figure 1. Tire unevenness diagram. Figure 1. Tire unevenness diagram.
Vehicles 2020, 2 561
When a vehicle is running, uneven mass will result in dynamic and static imbalances, causingthe tires to generate undulating forces and moments when rotating. The magnitudes of the forces arerelated to mass imbalance, shape imbalance, and stiffness imbalance. Unbalanced forces in the planeof rotation produce radial, tangential, and lateral excitation forces. Uneven and asymmetrical massdistribution about the rotating shaft causes a coupling imbalance, which produces a rotational momenton the wheel, which is expressed as a returning moment and a turning moment of the frequencychange when the wheel rotates [6]. For uneven tire mass, a weight can be added to the rim to reducethe impact on vehicle performance.
A tire is an elastomer that can be characterized by a radial spring in the circumferential direction,and unevenness in stiffness may occur in the circumferential direction, mainly manifested as fluctuationsin circumferential direction force, taper effect force, and angle effect force [7]. Uneven size will causeradial runout and lateral runout, and the tire will be polygonal in the process of rolling, instead ofcircular. It can affect the vibration or sway of the vehicle when riding.
2.2. Definition of Tire Uniformity Parameters
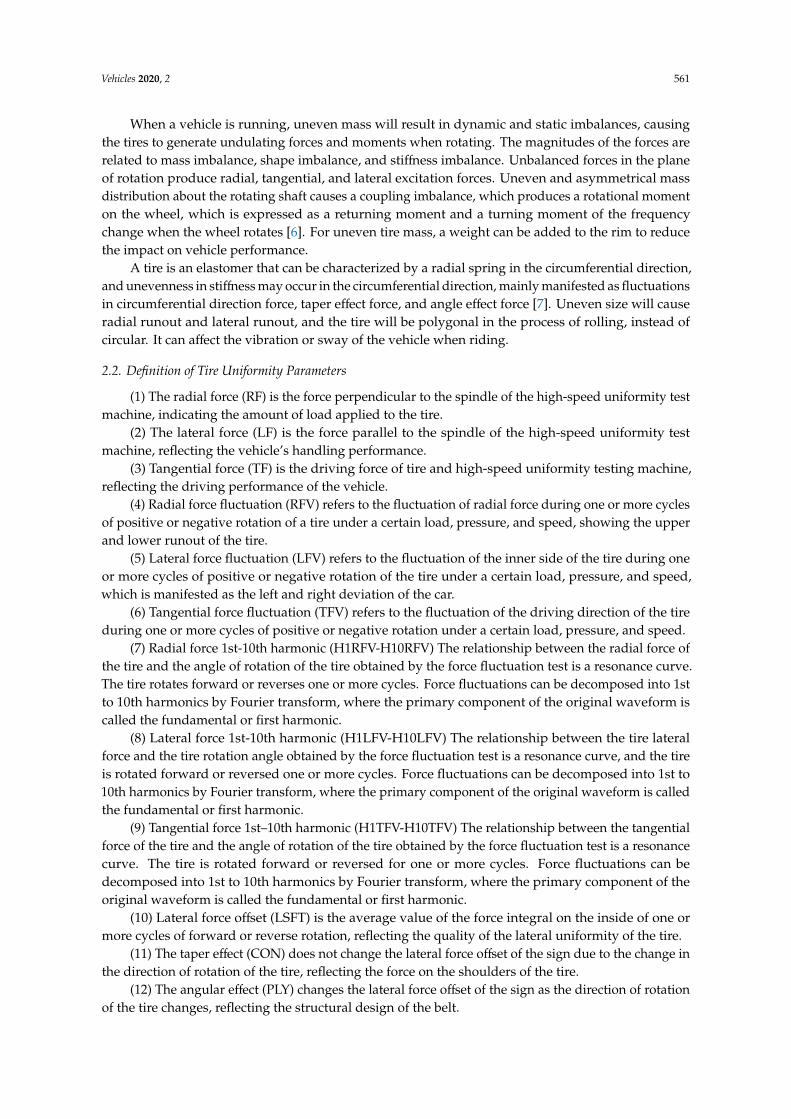
(1) The radial force (RF) is the force perpendicular to the spindle of the high-speed uniformity testmachine, indicating the amount of load applied to the tire.
(2) The lateral force (LF) is the force parallel to the spindle of the high-speed uniformity testmachine, reflecting the vehicle’s handling performance.
(3) Tangential force (TF) is the driving force of tire and high-speed uniformity testing machine,reflecting the driving performance of the vehicle.
(4) Radial force fluctuation (RFV) refers to the fluctuation of radial force during one or more cyclesof positive or negative rotation of a tire under a certain load, pressure, and speed, showing the upperand lower runout of the tire.
(5) Lateral force fluctuation (LFV) refers to the fluctuation of the inner side of the tire during oneor more cycles of positive or negative rotation of the tire under a certain load, pressure, and speed,which is manifested as the left and right deviation of the car.
(6) Tangential force fluctuation (TFV) refers to the fluctuation of the driving direction of the tireduring one or more cycles of positive or negative rotation under a certain load, pressure, and speed.
(7) Radial force 1st-10th harmonic (H1RFV-H10RFV) The relationship between the radial force ofthe tire and the angle of rotation of the tire obtained by the force fluctuation test is a resonance curve.The tire rotates forward or reverses one or more cycles. Force fluctuations can be decomposed into 1stto 10th harmonics by Fourier transform, where the primary component of the original waveform iscalled the fundamental or first harmonic.
(8) Lateral force 1st-10th harmonic (H1LFV-H10LFV) The relationship between the tire lateralforce and the tire rotation angle obtained by the force fluctuation test is a resonance curve, and the tireis rotated forward or reversed one or more cycles. Force fluctuations can be decomposed into 1st to10th harmonics by Fourier transform, where the primary component of the original waveform is calledthe fundamental or first harmonic.
(9) Tangential force 1st–10th harmonic (H1TFV-H10TFV) The relationship between the tangentialforce of the tire and the angle of rotation of the tire obtained by the force fluctuation test is a resonancecurve. The tire is rotated forward or reversed for one or more cycles. Force fluctuations can bedecomposed into 1st to 10th harmonics by Fourier transform, where the primary component of theoriginal waveform is called the fundamental or first harmonic.
(10) Lateral force offset (LSFT) is the average value of the force integral on the inside of one ormore cycles of forward or reverse rotation, reflecting the quality of the lateral uniformity of the tire.
(11) The taper effect (CON) does not change the lateral force offset of the sign due to the change inthe direction of rotation of the tire, reflecting the force on the shoulders of the tire.
(12) The angular effect (PLY) changes the lateral force offset of the sign as the direction of rotationof the tire changes, reflecting the structural design of the belt.
Vehicles 2020, 2 562
(13) Torque fluctuation (SATV) is the fluctuation of the restoring torque to restore the steeringwheel to the straight driving position relative to the reference value.
(14) Flip torque fluctuation (OTTV) is the fluctuation of the rolling moment in the tire straight linedirection from the reference value.
Figure 2 shows the partial uniformity parameter.
Vehicles 2020, 2, FOR PEER REVIEW 4 of 14
(14) Flip torque fluctuation (OTTV) is the fluctuation of the rolling moment in the tire straight line direction from the reference value.
Figure 2 shows the partial uniformity parameter.
Figure 2. RF, LF and TF schematic.
3. High-Speed Uniformity Testing Machine
3.1. Working Principle of the High-Speed Uniformity Testing Machine
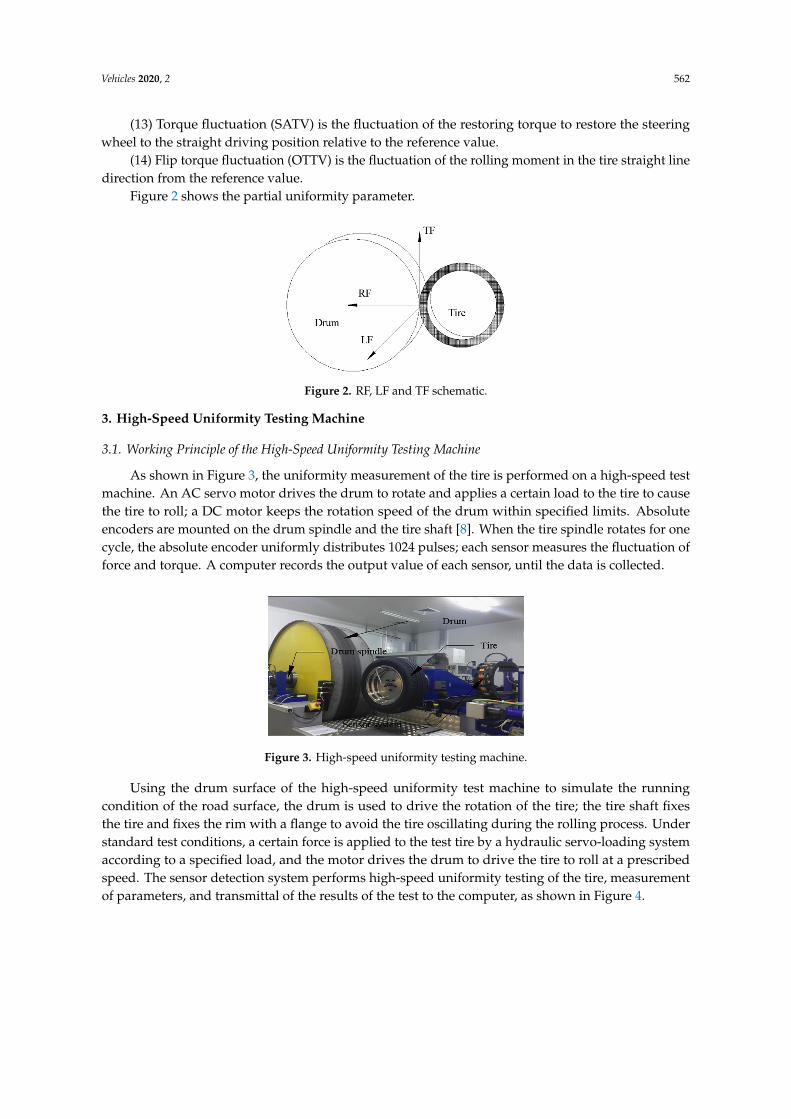
As shown in Figure 3, the uniformity measurement of the tire is performed on a high-speed test machine. An AC servo motor drives the drum to rotate and applies a certain load to the tire to cause the tire to roll; a DC motor keeps the rotation speed of the drum within specified limits. Absolute encoders are mounted on the drum spindle and the tire shaft [8]. When the tire spindle rotates for one cycle, the absolute encoder uniformly distributes 1024 pulses; each sensor measures the fluctuation of force and torque. A computer records the output value of each sensor, until the data is collected.
Figure 3. High-speed uniformity testing machine.
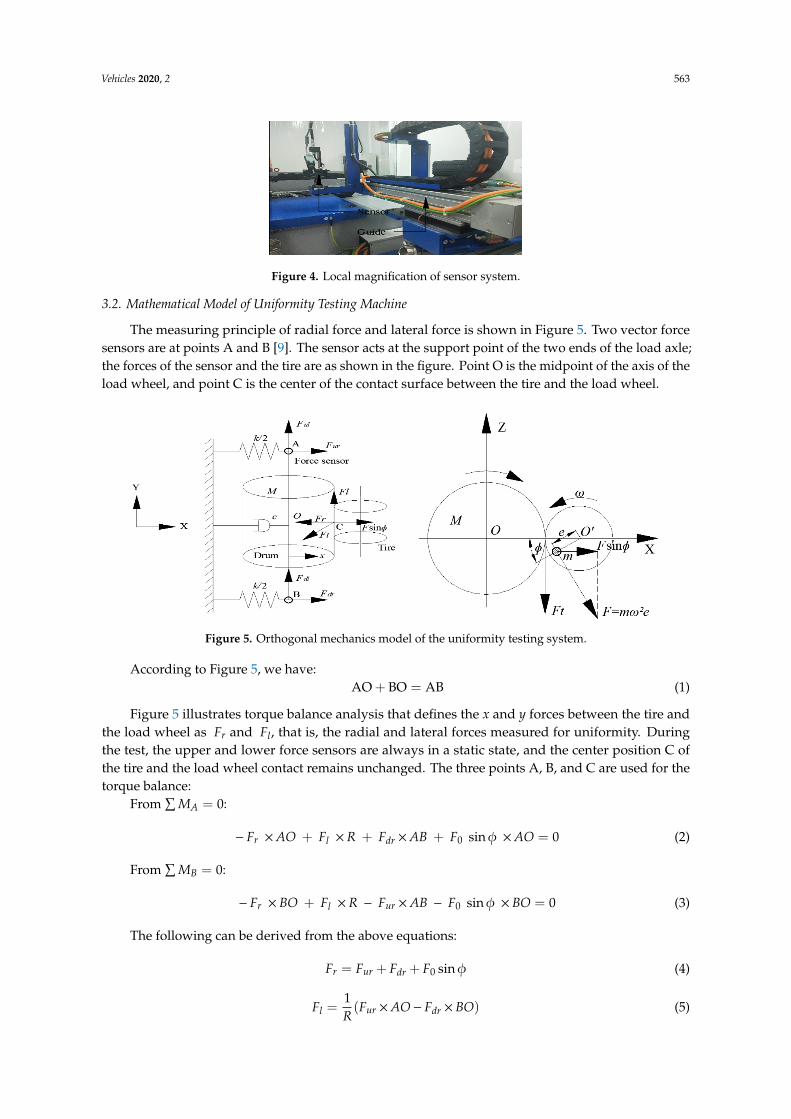
Using the drum surface of the high-speed uniformity test machine to simulate the running condition of the road surface, the drum is used to drive the rotation of the tire; the tire shaft fixes the tire and fixes the rim with a flange to avoid the tire oscillating during the rolling process. Under standard test conditions, a certain force is applied to the test tire by a hydraulic servo-loading system according to a specified load, and the motor drives the drum to drive the tire to roll at a prescribed speed. The sensor detection system performs high-speed uniformity testing of the tire, measurement of parameters, and transmittal of the results of the test to the computer, as shown in Figure 4.
Figure 4. Local magnification of sensor system.
Figure 2. RF, LF and TF schematic.
3. High-Speed Uniformity Testing Machine
3.1. Working Principle of the High-Speed Uniformity Testing Machine
As shown in Figure 3, the uniformity measurement of the tire is performed on a high-speed testmachine. An AC servo motor drives the drum to rotate and applies a certain load to the tire to causethe tire to roll; a DC motor keeps the rotation speed of the drum within specified limits. Absoluteencoders are mounted on the drum spindle and the tire shaft [8]. When the tire spindle rotates for onecycle, the absolute encoder uniformly distributes 1024 pulses; each sensor measures the fluctuation offorce and torque. A computer records the output value of each sensor, until the data is collected.
Vehicles 2020, 2, FOR PEER REVIEW 4 of 14
(14) Flip torque fluctuation (OTTV) is the fluctuation of the rolling moment in the tire straight line direction from the reference value.
Figure 2 shows the partial uniformity parameter.
Figure 2. RF, LF and TF schematic.
3. High-Speed Uniformity Testing Machine
3.1. Working Principle of the High-Speed Uniformity Testing Machine
As shown in Figure 3, the uniformity measurement of the tire is performed on a high-speed test machine. An AC servo motor drives the drum to rotate and applies a certain load to the tire to cause the tire to roll; a DC motor keeps the rotation speed of the drum within specified limits. Absolute encoders are mounted on the drum spindle and the tire shaft [8]. When the tire spindle rotates for one cycle, the absolute encoder uniformly distributes 1024 pulses; each sensor measures the fluctuation of force and torque. A computer records the output value of each sensor, until the data is collected.
Figure 3. High-speed uniformity testing machine.
Using the drum surface of the high-speed uniformity test machine to simulate the running condition of the road surface, the drum is used to drive the rotation of the tire; the tire shaft fixes the tire and fixes the rim with a flange to avoid the tire oscillating during the rolling process. Under standard test conditions, a certain force is applied to the test tire by a hydraulic servo-loading system according to a specified load, and the motor drives the drum to drive the tire to roll at a prescribed speed. The sensor detection system performs high-speed uniformity testing of the tire, measurement of parameters, and transmittal of the results of the test to the computer, as shown in Figure 4.
Figure 4. Local magnification of sensor system.
Figure 3. High-speed uniformity testing machine.
Using the drum surface of the high-speed uniformity test machine to simulate the runningcondition of the road surface, the drum is used to drive the rotation of the tire; the tire shaft fixesthe tire and fixes the rim with a flange to avoid the tire oscillating during the rolling process. Understandard test conditions, a certain force is applied to the test tire by a hydraulic servo-loading systemaccording to a specified load, and the motor drives the drum to drive the tire to roll at a prescribedspeed. The sensor detection system performs high-speed uniformity testing of the tire, measurementof parameters, and transmittal of the results of the test to the computer, as shown in Figure 4.
Vehicles 2020, 2 563
Vehicles 2020, 2, FOR PEER REVIEW 4 of 14
(14) Flip torque fluctuation (OTTV) is the fluctuation of the rolling moment in the tire straight line direction from the reference value.
Figure 2 shows the partial uniformity parameter.
Figure 2. RF, LF and TF schematic.
3. High-Speed Uniformity Testing Machine
3.1. Working Principle of the High-Speed Uniformity Testing Machine
As shown in Figure 3, the uniformity measurement of the tire is performed on a high-speed test machine. An AC servo motor drives the drum to rotate and applies a certain load to the tire to cause the tire to roll; a DC motor keeps the rotation speed of the drum within specified limits. Absolute encoders are mounted on the drum spindle and the tire shaft [8]. When the tire spindle rotates for one cycle, the absolute encoder uniformly distributes 1024 pulses; each sensor measures the fluctuation of force and torque. A computer records the output value of each sensor, until the data is collected.
Figure 3. High-speed uniformity testing machine.
Using the drum surface of the high-speed uniformity test machine to simulate the running condition of the road surface, the drum is used to drive the rotation of the tire; the tire shaft fixes the tire and fixes the rim with a flange to avoid the tire oscillating during the rolling process. Under standard test conditions, a certain force is applied to the test tire by a hydraulic servo-loading system according to a specified load, and the motor drives the drum to drive the tire to roll at a prescribed speed. The sensor detection system performs high-speed uniformity testing of the tire, measurement of parameters, and transmittal of the results of the test to the computer, as shown in Figure 4.
Figure 4. Local magnification of sensor system. Figure 4. Local magnification of sensor system.
3.2. Mathematical Model of Uniformity Testing Machine
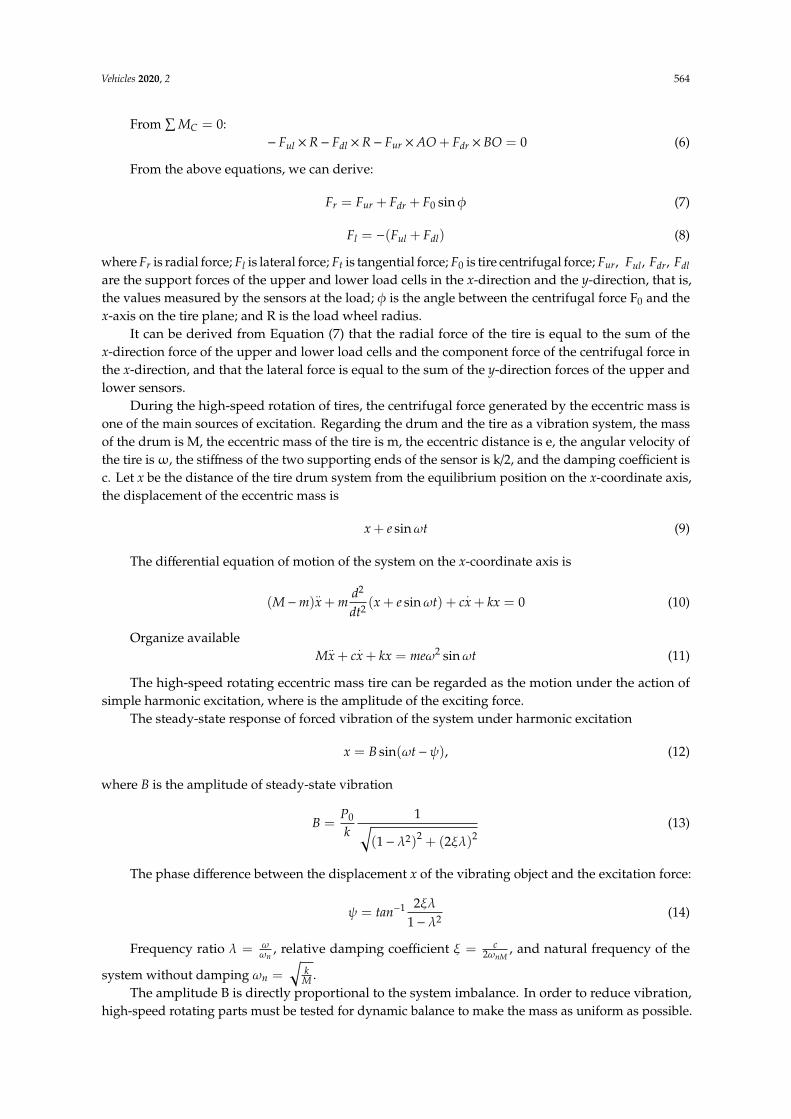
The measuring principle of radial force and lateral force is shown in Figure 5. Two vector forcesensors are at points A and B [9]. The sensor acts at the support point of the two ends of the load axle;the forces of the sensor and the tire are as shown in the figure. Point O is the midpoint of the axis of theload wheel, and point C is the center of the contact surface between the tire and the load wheel.
Vehicles 2020, 2, FOR PEER REVIEW 5 of 14
3.2. Mathematical Model of Uniformity Testing Machine
The measuring principle of radial force and lateral force is shown in Figure 5. Two vector force sensors are at points A and B [9]. The sensor acts at the support point of the two ends of the load axle; the forces of the sensor and the tire are as shown in the figure. Point O is the midpoint of the axis of the load wheel, and point C is the center of the contact surface between the tire and the load wheel.
Figure 5. Orthogonal mechanics model of the uniformity testing system.
According to Figure 5, we have: AO + BO = AB (1)
Figure 5 illustrates torque balance analysis that defines the x and y forces between the tire and the load wheel as 𝐹 and 𝐹 , that is, the radial and lateral forces measured for uniformity. During the test, the upper and lower force sensors are always in a static state, and the center position C of the tire and the load wheel contact remains unchanged. The three points A, B, and C are used for the torque balance:
From ∑ 𝑀 = 0: −𝐹 × 𝐴𝑂 + 𝐹 × 𝑅 + 𝐹 × 𝐴𝐵 + 𝐹 sin 𝜙 × 𝐴𝑂 = 0 (2)
From ∑ 𝑀 = 0: −𝐹 × 𝐵𝑂 + 𝐹 × 𝑅 − 𝐹 × 𝐴𝐵 − 𝐹 sin 𝜙 × 𝐵𝑂 = 0 (3)
The following can be derived from the above equations: 𝐹 = 𝐹 + 𝐹 + 𝐹 sin 𝜙 (4)
𝐹 = 1𝑅 (𝐹 × 𝐴𝑂 − 𝐹 × 𝐵𝑂) (5)
From ∑ 𝑀 = 0: −𝐹 × 𝑅 − 𝐹 × 𝑅 − 𝐹 × 𝐴𝑂 + 𝐹 × 𝐵𝑂 = 0 (6)
From the above equations, we can derive: 𝐹 = 𝐹 + 𝐹 + 𝐹 sin 𝜙 (7) 𝐹 = −(𝐹 + 𝐹 ) (8)
where 𝐹 is radial force; 𝐹 is lateral force; 𝐹 is tangential force; 𝐹 is tire centrifugal force; 𝐹 ,𝐹 , 𝐹 , 𝐹 are the support forces of the upper and lower load cells in the x-direction and the y-direction, that is, the values measured by the sensors at the load; 𝜙 is the angle between the centrifugal force F0 and the x-axis on the tire plane; and R is the load wheel radius.
Figure 5. Orthogonal mechanics model of the uniformity testing system.
According to Figure 5, we have:AO + BO = AB (1)
Figure 5 illustrates torque balance analysis that defines the x and y forces between the tire andthe load wheel as Fr and Fl, that is, the radial and lateral forces measured for uniformity. Duringthe test, the upper and lower force sensors are always in a static state, and the center position C ofthe tire and the load wheel contact remains unchanged. The three points A, B, and C are used for thetorque balance:
From∑
MA = 0:
− Fr ×AO + Fl ×R + Fdr ×AB + F0 sinφ ×AO = 0 (2)
From∑
MB = 0:
− Fr × BO + Fl ×R − Fur ×AB − F0 sinφ × BO = 0 (3)
The following can be derived from the above equations:
Fr = Fur + Fdr + F0 sinφ (4)
Fl =1R(Fur ×AO− Fdr × BO) (5)
Vehicles 2020, 2 564
From∑
MC = 0:− Ful ×R− Fdl ×R− Fur ×AO + Fdr × BO = 0 (6)
From the above equations, we can derive:
Fr = Fur + Fdr + F0 sinφ (7)
Fl = −(Ful + Fdl) (8)
where Fr is radial force; Fl is lateral force; Ft is tangential force; F0 is tire centrifugal force; Fur, Ful, Fdr, Fdlare the support forces of the upper and lower load cells in the x-direction and the y-direction, that is,the values measured by the sensors at the load; φ is the angle between the centrifugal force F0 and thex-axis on the tire plane; and R is the load wheel radius.
It can be derived from Equation (7) that the radial force of the tire is equal to the sum of thex-direction force of the upper and lower load cells and the component force of the centrifugal force inthe x-direction, and that the lateral force is equal to the sum of the y-direction forces of the upper andlower sensors.
During the high-speed rotation of tires, the centrifugal force generated by the eccentric mass isone of the main sources of excitation. Regarding the drum and the tire as a vibration system, the massof the drum is M, the eccentric mass of the tire is m, the eccentric distance is e, the angular velocity ofthe tire isω, the stiffness of the two supporting ends of the sensor is k/2, and the damping coefficient isc. Let x be the distance of the tire drum system from the equilibrium position on the x-coordinate axis,the displacement of the eccentric mass is
x + e sinωt (9)
The differential equation of motion of the system on the x-coordinate axis is
(M−m)..x + m
d2
dt2 (x + e sinωt) + c.x + kx = 0 (10)
Organize availableM
..x + c
.x + kx = meω2 sinωt (11)
The high-speed rotating eccentric mass tire can be regarded as the motion under the action ofsimple harmonic excitation, where is the amplitude of the exciting force.
The steady-state response of forced vibration of the system under harmonic excitation
x = B sin(ωt−ψ), (12)
where B is the amplitude of steady-state vibration
B =P0
k1√
(1− λ2)2 + (2ξλ)2(13)
The phase difference between the displacement x of the vibrating object and the excitation force:
ψ = tan−1 2ξλ1− λ2 (14)
Frequency ratio λ = ωωn
, relative damping coefficient ξ = c2ωnM
, and natural frequency of the
system without damping ωn =√
kM .
The amplitude B is directly proportional to the system imbalance. In order to reduce vibration,high-speed rotating parts must be tested for dynamic balance to make the mass as uniform as possible.
Vehicles 2020, 2 565
When the unbalance of the system cannot be compensated, if the frequency of the excitation force,that is λ = 1, the angular velocity of the motor rotor is close to the natural frequency of the system, thatis, the system will have the strongest vibration, that is, resonance. At this time, the motor speed is calledcritical speed, and output power is called limit power. The resonance phenomenon has a great impacton the performance and life of mechanical equipment and structures, and even directly causes damageto components or the entire mechanical equipment. When the system is in resonance, the maximumamplitude is inversely proportional to the damping. This provides a measure of vibration reduction intheory. In order to avoid the occurrence of resonance, in the design, the power of the motor shouldbe avoided as the limit power, or the motor speed should be kept away from the critical speed ofthe system.
3.3. Uniformity Parameter Signal Acquisition
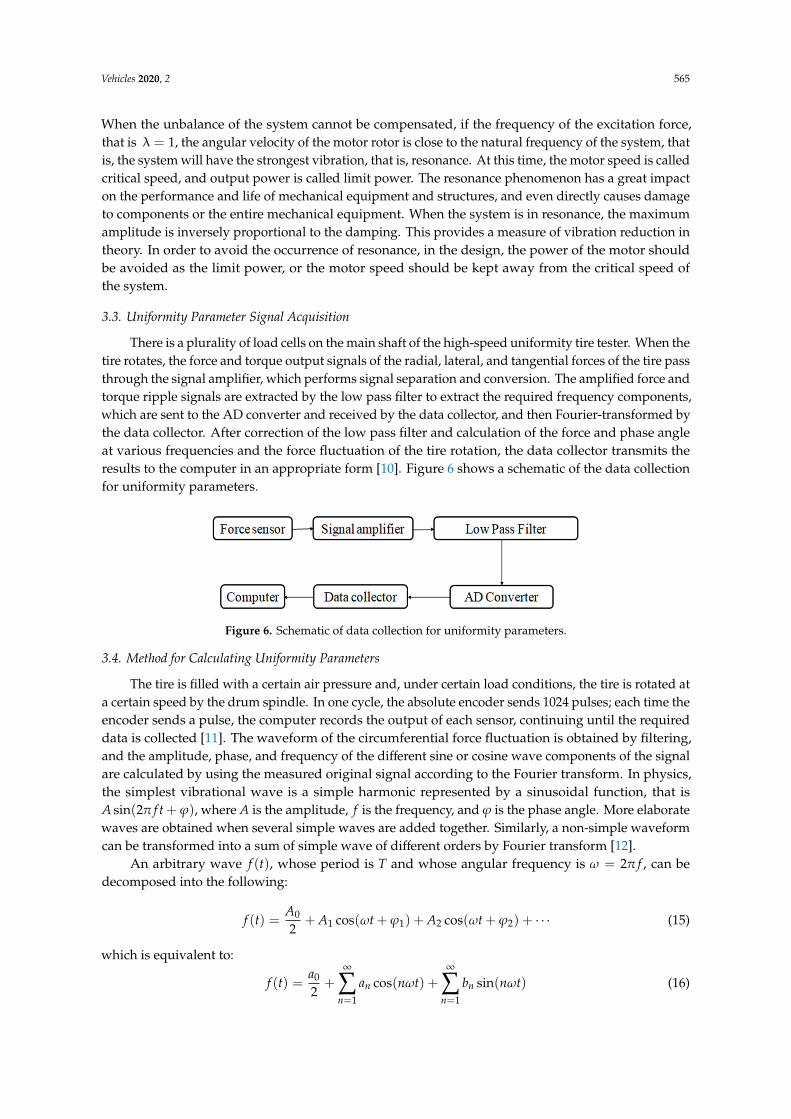
There is a plurality of load cells on the main shaft of the high-speed uniformity tire tester. When thetire rotates, the force and torque output signals of the radial, lateral, and tangential forces of the tire passthrough the signal amplifier, which performs signal separation and conversion. The amplified force andtorque ripple signals are extracted by the low pass filter to extract the required frequency components,which are sent to the AD converter and received by the data collector, and then Fourier-transformed bythe data collector. After correction of the low pass filter and calculation of the force and phase angleat various frequencies and the force fluctuation of the tire rotation, the data collector transmits theresults to the computer in an appropriate form [10]. Figure 6 shows a schematic of the data collectionfor uniformity parameters.
Vehicles 2020, 2, FOR PEER REVIEW 7 of 14
frequency components, which are sent to the AD converter and received by the data collector, and then Fourier-transformed by the data collector. After correction of the low pass filter and calculation of the force and phase angle at various frequencies and the force fluctuation of the tire rotation, the data collector transmits the results to the computer in an appropriate form [10]. Figure 6 shows a schematic of the data collection for uniformity parameters.
Figure 6. Schematic of data collection for uniformity parameters.
3.4. Method for Calculating Uniformity Parameters
The tire is filled with a certain air pressure and, under certain load conditions, the tire is rotated at a certain speed by the drum spindle. In one cycle, the absolute encoder sends 1024 pulses; each time the encoder sends a pulse, the computer records the output of each sensor, continuing until the required data is collected [11]. The waveform of the circumferential force fluctuation is obtained by filtering, and the amplitude, phase, and frequency of the different sine or cosine wave components of the signal are calculated by using the measured original signal according to the Fourier transform. In physics, the simplest vibrational wave is a simple harmonic represented by a sinusoidal function, that is 𝐴 sin(2𝜋𝑓𝑡 + 𝜑), where 𝐴 is the amplitude, 𝑓 is the frequency, and 𝜑 is the phase angle. More elaborate waves are obtained when several simple waves are added together. Similarly, a non-simple waveform can be transformed into a sum of simple wave of different orders by Fourier transform [12].
An arbitrary wave 𝑓(𝑡), whose period is 𝑇 and whose angular frequency is 𝜔 = 2𝜋𝑓, can be decomposed into the following: 𝑓(𝑡) = 𝐴2 + 𝐴 cos(𝜔𝑡 + 𝜑 ) + 𝐴 cos(𝜔𝑡 + 𝜑 ) + ⋯ (15)
which is equivalent to:
𝑓(𝑡) = 𝑎2 + 𝑎 cos(𝑛𝜔𝑡) + 𝑏 sin(𝑛𝜔𝑡) (16)
From the orthogonal relationship of the sine and cosine functions, the Fourier coefficients can be obtained:
𝑎 = 2𝑇 𝑓(𝑡) cos(𝑛𝜔𝑡)𝑑𝑡, 𝑛 = 0,1,2 (17)
𝑏 = 2𝑇 𝑓(𝑡) sin(𝑛𝜔𝑡)𝑑𝑡, 𝑛 = 1,2 (18)
Combine the above formulas: 𝑓(𝑡) = 𝐴2 + 𝐴 cos(𝜔𝑡 + 𝜑 ) + 𝐴 cos(2𝜔𝑡 + 𝜑 ) + ⋯ (19)
which is equivalent to: 𝑓(𝑡) = + ∑ 𝐴 cos(𝑛𝜔𝑡 + 𝜑 ) (20)
Figure 6. Schematic of data collection for uniformity parameters.
3.4. Method for Calculating Uniformity Parameters
The tire is filled with a certain air pressure and, under certain load conditions, the tire is rotated ata certain speed by the drum spindle. In one cycle, the absolute encoder sends 1024 pulses; each time theencoder sends a pulse, the computer records the output of each sensor, continuing until the requireddata is collected [11]. The waveform of the circumferential force fluctuation is obtained by filtering,and the amplitude, phase, and frequency of the different sine or cosine wave components of the signalare calculated by using the measured original signal according to the Fourier transform. In physics,the simplest vibrational wave is a simple harmonic represented by a sinusoidal function, that isA sin(2π f t + ϕ), where A is the amplitude, f is the frequency, and ϕ is the phase angle. More elaboratewaves are obtained when several simple waves are added together. Similarly, a non-simple waveformcan be transformed into a sum of simple wave of different orders by Fourier transform [12].
An arbitrary wave f (t), whose period is T and whose angular frequency is ω = 2π f , can bedecomposed into the following:
f (t) =A0
2+ A1 cos(ωt + ϕ1) + A2 cos(ωt + ϕ2) + · · · (15)
which is equivalent to:
f (t) =a0
2+∞∑
n=1
an cos(nωt) +∞∑
n=1
bn sin(nωt) (16)
Vehicles 2020, 2 566
From the orthogonal relationship of the sine and cosine functions, the Fourier coefficients canbe obtained:
an =2T
∫ T2
−T2
f (t) cos(nωt)dt, n = 0, 1, 2 (17)
bn =2T
∫ T2
−T2
f (t) sin(nωt)dt, n = 1, 2 (18)
Combine the above formulas:
f (t) =A0
2+ A1 cos(ωt + ϕ1) + A2 cos(2ωt + ϕ2) + · · · (19)
which is equivalent to:
f (t) =A0
2+∞∑
n=1
An cos(nωt + ϕn) (20)
where A0 = a0, An =√
a2n + b2
n, ϕn = −arctan(
bnan
). A0
2 is the DC component of f (t), f0 = 1T is the
baseband frequency, An cos(nωt + ϕn) is the nth harmonic of f (t), An is the amplitude, and ϕn is theinitial phase angle of the nth harmonic. When the signal is analyzed and processed, the signal canbe decomposed into superposed harmonics according to the Fourier transform, and the amplitudeand phase angle of each harmonic are respectively obtained. According to the transformed result,the harmonics of the positive and negative directions of the radial force, the lateral force, and thetraction force can be known.
When calculating the lateral force offset LSTF, we assume that the lateral force forward offset isLSTFcw, and the lateral force reversal offset is LSTFccw; thus:
LSTFcw =1
kn
kn∑i=1
LF f (cw, i) (21)
LSTFccw =1
kn
kn∑i=1
LF f (ccw, i) (22)
CON = 0.5× (LSTFcw + LSTFccw) (23)
PLS = 0.5× (LSTFcw − LSTFccw) (24)
According to the above formulas, the numerical values of the tire uniformity parameters can beobtained, so that the quality of the tire can be evaluated, the amplitude of the force value fluctuationcan be determined, and the tire manufacturing process can be improved, providing a basis for tirecompanies to improve tire uniformity and improve the performance of vehicles in the automotivedesign department [13].
4. High-Speed Uniformity Test and Analysis of Tires
Before the tire uniformity test, it is necessary to define the load, pressure, and speed of thetire, and apply a certain load to the tire according to the use of the tire and the production processrequirements. A test was undertaken to simulate the load of a vehicle when measuring the uniformityof a tire with a mass of 75 kg; the tire size used was 205/55R16. The tire load was set to 4221 N, 70% ofthe specified maximum load, which is expressed as the average value of the load received by thetire during one rotation. According to the demands of use, the tire is filled with a certain inflationpressure; the pressures used in this paper were 0.16 MPa, 0.20 MPa, and 0.24 MPa, expressed as theinternal pressure of the tire that is fed back through the barometer during the test. According to thecorresponding control system of the high-speed uniformity testing machine, the inflation pressure of
Vehicles 2020, 2 567
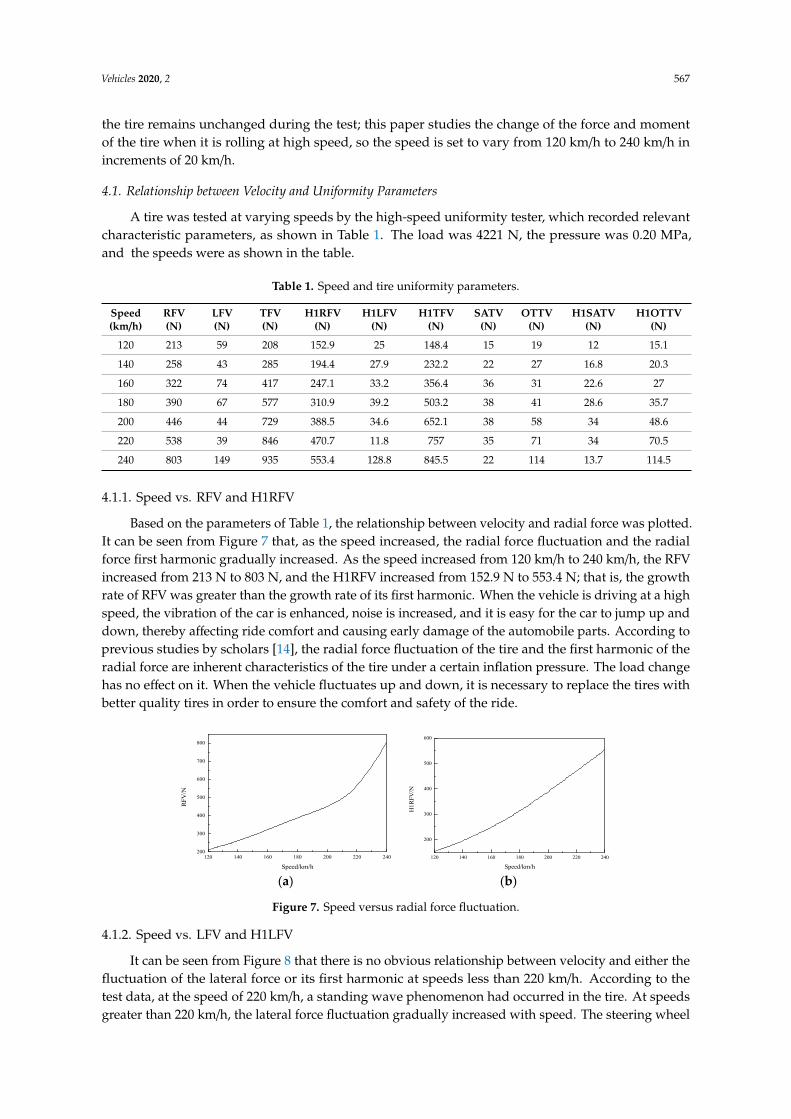
the tire remains unchanged during the test; this paper studies the change of the force and momentof the tire when it is rolling at high speed, so the speed is set to vary from 120 km/h to 240 km/h inincrements of 20 km/h.
4.1. Relationship between Velocity and Uniformity Parameters
A tire was tested at varying speeds by the high-speed uniformity tester, which recorded relevantcharacteristic parameters, as shown in Table 1. The load was 4221 N, the pressure was 0.20 MPa,and the speeds were as shown in the table.
Table 1. Speed and tire uniformity parameters.
Speed(km/h)
RFV(N)
LFV(N)
TFV(N)
H1RFV(N)
H1LFV(N)
H1TFV(N)
SATV(N)
OTTV(N)
H1SATV(N)
H1OTTV(N)
120 213 59 208 152.9 25 148.4 15 19 12 15.1
140 258 43 285 194.4 27.9 232.2 22 27 16.8 20.3
160 322 74 417 247.1 33.2 356.4 36 31 22.6 27
180 390 67 577 310.9 39.2 503.2 38 41 28.6 35.7
200 446 44 729 388.5 34.6 652.1 38 58 34 48.6
220 538 39 846 470.7 11.8 757 35 71 34 70.5
240 803 149 935 553.4 128.8 845.5 22 114 13.7 114.5
4.1.1. Speed vs. RFV and H1RFV
Based on the parameters of Table 1, the relationship between velocity and radial force was plotted.It can be seen from Figure 7 that, as the speed increased, the radial force fluctuation and the radialforce first harmonic gradually increased. As the speed increased from 120 km/h to 240 km/h, the RFVincreased from 213 N to 803 N, and the H1RFV increased from 152.9 N to 553.4 N; that is, the growthrate of RFV was greater than the growth rate of its first harmonic. When the vehicle is driving at a highspeed, the vibration of the car is enhanced, noise is increased, and it is easy for the car to jump up anddown, thereby affecting ride comfort and causing early damage of the automobile parts. According toprevious studies by scholars [14], the radial force fluctuation of the tire and the first harmonic of theradial force are inherent characteristics of the tire under a certain inflation pressure. The load changehas no effect on it. When the vehicle fluctuates up and down, it is necessary to replace the tires withbetter quality tires in order to ensure the comfort and safety of the ride.
Vehicles 2020, 2, FOR PEER REVIEW 9 of 14
Table 1. Speed and tire uniformity parameters.
Speed (km/h)
RFV (N)
LFV (N)
TFV (N)
H1RFV (N)
H1LFV (N)
H1TFV (N)
SATV (N)
OTTV (N)
H1SATV (N)
H1OTTV (N)
120 213 59 208 152.9 25 148.4 15 19 12 15.1 140 258 43 285 194.4 27.9 232.2 22 27 16.8 20.3 160 322 74 417 247.1 33.2 356.4 36 31 22.6 27 180 390 67 577 310.9 39.2 503.2 38 41 28.6 35.7 200 446 44 729 388.5 34.6 652.1 38 58 34 48.6 220 538 39 846 470.7 11.8 757 35 71 34 70.5 240 803 149 935 553.4 128.8 845.5 22 114 13.7 114.5
4.1.1. Speed vs. RFV and H1RFV
Based on the parameters of Table 1, the relationship between velocity and radial force was plotted. It can be seen from Figure 7 that, as the speed increased, the radial force fluctuation and the radial force first harmonic gradually increased. As the speed increased from 120 km/h to 240 km/h, the RFV increased from 213 N to 803 N, and the H1RFV increased from 152.9 N to 553.4 N; that is, the growth rate of RFV was greater than the growth rate of its first harmonic. When the vehicle is driving at a high speed, the vibration of the car is enhanced, noise is increased, and it is easy for the car to jump up and down, thereby affecting ride comfort and causing early damage of the automobile parts. According to previous studies by scholars [14], the radial force fluctuation of the tire and the first harmonic of the radial force are inherent characteristics of the tire under a certain inflation pressure. The load change has no effect on it. When the vehicle fluctuates up and down, it is necessary to replace the tires with better quality tires in order to ensure the comfort and safety of the ride.
(a) (b)
Figure 7. Speed versus radial force fluctuation.
4.1.2. Speed vs. LFV and H1LFV
It can be seen from Figure 8 that there is no obvious relationship between velocity and either the fluctuation of the lateral force or its first harmonic at speeds less than 220 km/h. According to the test data, at the speed of 220 km/h, a standing wave phenomenon had occurred in the tire. At speeds greater than 220 km/h, the lateral force fluctuation gradually increased with speed. The steering wheel of the car at high speed is easy to swing, which should enhance stability during driving and help avoid traffic accidents.
(a) (b)
Figure 8. Speed versus lateral force fluctuation.
120 140 160 180 200 220 240200
300
400
500
600
700
800
RFV
/N
Speed/km/h120 140 160 180 200 220 240
200
300
400
500
600
H1R
FV/N
Speed/km/h
120 140 160 180 200 220 24040
60
80
100
120
140
LFV
/N
Speed/km/h120 140 160 180 200 220 240
20
40
60
80
100
120
H1L
FV/N
Speed/km/h
Figure 7. Speed versus radial force fluctuation.
4.1.2. Speed vs. LFV and H1LFV
It can be seen from Figure 8 that there is no obvious relationship between velocity and either thefluctuation of the lateral force or its first harmonic at speeds less than 220 km/h. According to thetest data, at the speed of 220 km/h, a standing wave phenomenon had occurred in the tire. At speedsgreater than 220 km/h, the lateral force fluctuation gradually increased with speed. The steering wheel
Vehicles 2020, 2 568
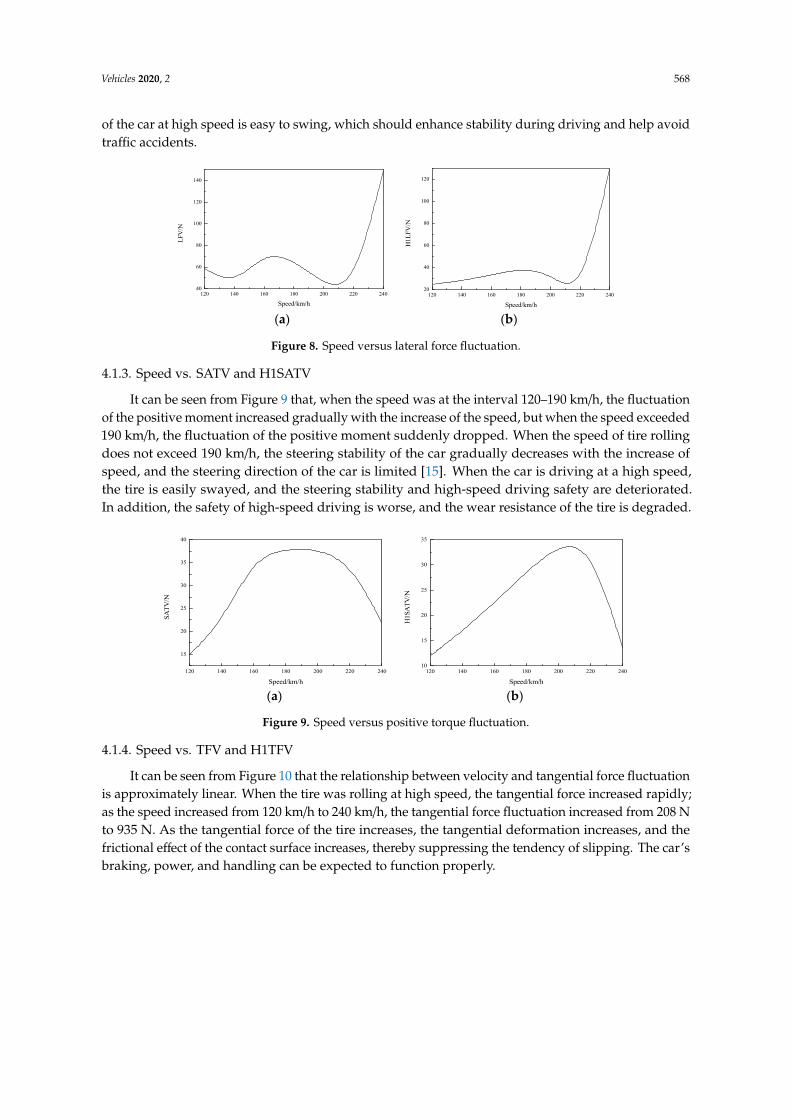
of the car at high speed is easy to swing, which should enhance stability during driving and help avoidtraffic accidents.
Vehicles 2020, 2, FOR PEER REVIEW 9 of 14
Table 1. Speed and tire uniformity parameters.
Speed (km/h)
RFV (N)
LFV (N)
TFV (N)
H1RFV (N)
H1LFV (N)
H1TFV (N)
SATV (N)
OTTV (N)
H1SATV (N)
H1OTTV (N)
120 213 59 208 152.9 25 148.4 15 19 12 15.1 140 258 43 285 194.4 27.9 232.2 22 27 16.8 20.3 160 322 74 417 247.1 33.2 356.4 36 31 22.6 27 180 390 67 577 310.9 39.2 503.2 38 41 28.6 35.7 200 446 44 729 388.5 34.6 652.1 38 58 34 48.6 220 538 39 846 470.7 11.8 757 35 71 34 70.5 240 803 149 935 553.4 128.8 845.5 22 114 13.7 114.5
4.1.1. Speed vs. RFV and H1RFV
Based on the parameters of Table 1, the relationship between velocity and radial force was plotted. It can be seen from Figure 7 that, as the speed increased, the radial force fluctuation and the radial force first harmonic gradually increased. As the speed increased from 120 km/h to 240 km/h, the RFV increased from 213 N to 803 N, and the H1RFV increased from 152.9 N to 553.4 N; that is, the growth rate of RFV was greater than the growth rate of its first harmonic. When the vehicle is driving at a high speed, the vibration of the car is enhanced, noise is increased, and it is easy for the car to jump up and down, thereby affecting ride comfort and causing early damage of the automobile parts. According to previous studies by scholars [14], the radial force fluctuation of the tire and the first harmonic of the radial force are inherent characteristics of the tire under a certain inflation pressure. The load change has no effect on it. When the vehicle fluctuates up and down, it is necessary to replace the tires with better quality tires in order to ensure the comfort and safety of the ride.
(a) (b)
Figure 7. Speed versus radial force fluctuation.
4.1.2. Speed vs. LFV and H1LFV
It can be seen from Figure 8 that there is no obvious relationship between velocity and either the fluctuation of the lateral force or its first harmonic at speeds less than 220 km/h. According to the test data, at the speed of 220 km/h, a standing wave phenomenon had occurred in the tire. At speeds greater than 220 km/h, the lateral force fluctuation gradually increased with speed. The steering wheel of the car at high speed is easy to swing, which should enhance stability during driving and help avoid traffic accidents.
(a) (b)
Figure 8. Speed versus lateral force fluctuation.
120 140 160 180 200 220 240200
300
400
500
600
700
800
RFV
/N
Speed/km/h120 140 160 180 200 220 240
200
300
400
500
600
H1R
FV/N
Speed/km/h
120 140 160 180 200 220 24040
60
80
100
120
140LF
V/N
Speed/km/h120 140 160 180 200 220 240
20
40
60
80
100
120
H1L
FV/N
Speed/km/h
Figure 8. Speed versus lateral force fluctuation.
4.1.3. Speed vs. SATV and H1SATV
It can be seen from Figure 9 that, when the speed was at the interval 120–190 km/h, the fluctuationof the positive moment increased gradually with the increase of the speed, but when the speed exceeded190 km/h, the fluctuation of the positive moment suddenly dropped. When the speed of tire rollingdoes not exceed 190 km/h, the steering stability of the car gradually decreases with the increase ofspeed, and the steering direction of the car is limited [15]. When the car is driving at a high speed,the tire is easily swayed, and the steering stability and high-speed driving safety are deteriorated.In addition, the safety of high-speed driving is worse, and the wear resistance of the tire is degraded.
Vehicles 2020, 2, FOR PEER REVIEW 10 of 14
4.1.3. Speed vs. SATV and H1SATV
It can be seen from Figure 9 that, when the speed was at the interval 120–190 km/h, the fluctuation of the positive moment increased gradually with the increase of the speed, but when the speed exceeded 190 km/h, the fluctuation of the positive moment suddenly dropped. When the speed of tire rolling does not exceed 190 km/h, the steering stability of the car gradually decreases with the increase of speed, and the steering direction of the car is limited [15]. When the car is driving at a high speed, the tire is easily swayed, and the steering stability and high-speed driving safety are deteriorated. In addition, the safety of high-speed driving is worse, and the wear resistance of the tire is degraded.
(a) (b)
Figure 9. Speed versus positive torque fluctuation.
4.1.4. Speed vs. TFV and H1TFV
It can be seen from Figure 10 that the relationship between velocity and tangential force fluctuation is approximately linear. When the tire was rolling at high speed, the tangential force increased rapidly; as the speed increased from 120 km/h to 240 km/h, the tangential force fluctuation increased from 208 N to 935 N. As the tangential force of the tire increases, the tangential deformation increases, and the frictional effect of the contact surface increases, thereby suppressing the tendency of slipping. The car’s braking, power, and handling can be expected to function properly.
(a) (b)
Figure 10. Speed versus tangential force fluctuation.
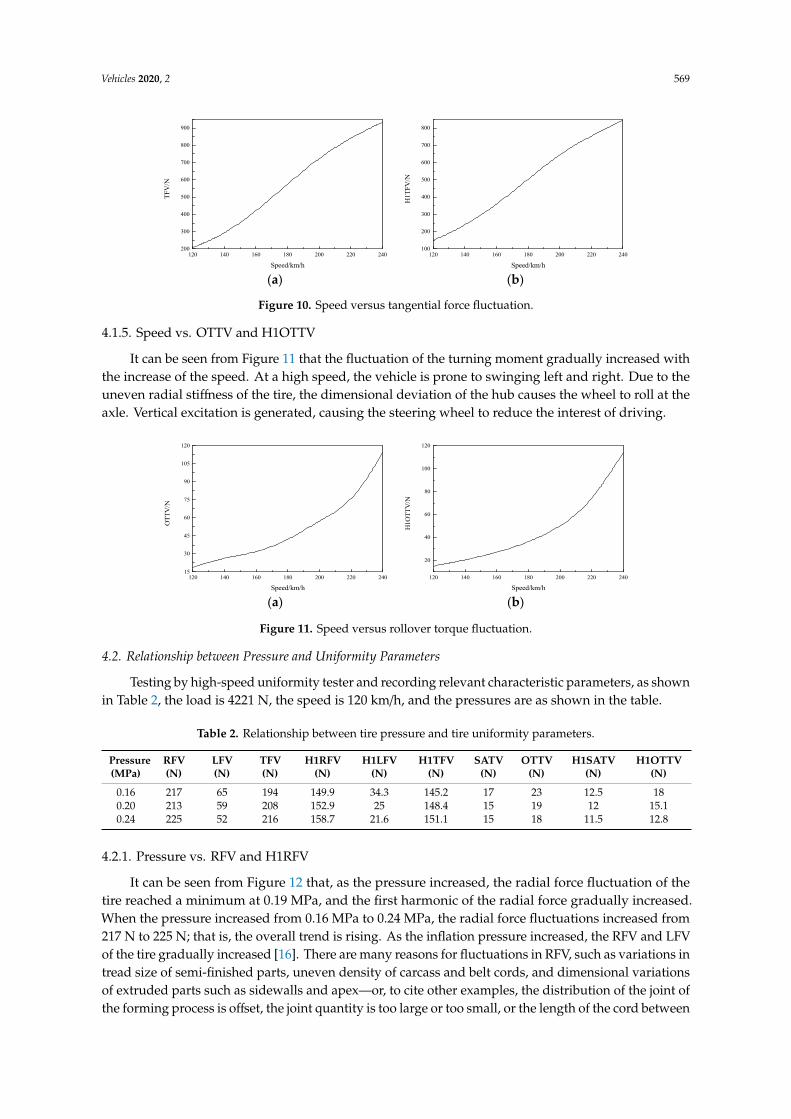
4.1.5. Speed vs. OTTV and H1OTTV
It can be seen from Figure 11 that the fluctuation of the turning moment gradually increased with the increase of the speed. At a high speed, the vehicle is prone to swinging left and right. Due to the uneven radial stiffness of the tire, the dimensional deviation of the hub causes the wheel to roll at the axle. Vertical excitation is generated, causing the steering wheel to reduce the interest of driving.
120 140 160 180 200 220 240
15
20
25
30
35
40
SATV
/N
Speed/km/h120 140 160 180 200 220 240
10
15
20
25
30
35
H1S
ATV
/N
Speed/km/h
120 140 160 180 200 220 240200
300
400
500
600
700
800
900
TFV
/N
Speed/km/h120 140 160 180 200 220 240
100
200
300
400
500
600
700
800
H1T
FV/N
Speed/km/h
Figure 9. Speed versus positive torque fluctuation.
4.1.4. Speed vs. TFV and H1TFV
It can be seen from Figure 10 that the relationship between velocity and tangential force fluctuationis approximately linear. When the tire was rolling at high speed, the tangential force increased rapidly;as the speed increased from 120 km/h to 240 km/h, the tangential force fluctuation increased from 208 Nto 935 N. As the tangential force of the tire increases, the tangential deformation increases, and thefrictional effect of the contact surface increases, thereby suppressing the tendency of slipping. The car’sbraking, power, and handling can be expected to function properly.
Vehicles 2020, 2 569
Vehicles 2020, 2, FOR PEER REVIEW 10 of 14
4.1.3. Speed vs. SATV and H1SATV
It can be seen from Figure 9 that, when the speed was at the interval 120–190 km/h, the fluctuation of the positive moment increased gradually with the increase of the speed, but when the speed exceeded 190 km/h, the fluctuation of the positive moment suddenly dropped. When the speed of tire rolling does not exceed 190 km/h, the steering stability of the car gradually decreases with the increase of speed, and the steering direction of the car is limited [15]. When the car is driving at a high speed, the tire is easily swayed, and the steering stability and high-speed driving safety are deteriorated. In addition, the safety of high-speed driving is worse, and the wear resistance of the tire is degraded.
(a) (b)
Figure 9. Speed versus positive torque fluctuation.
4.1.4. Speed vs. TFV and H1TFV
It can be seen from Figure 10 that the relationship between velocity and tangential force fluctuation is approximately linear. When the tire was rolling at high speed, the tangential force increased rapidly; as the speed increased from 120 km/h to 240 km/h, the tangential force fluctuation increased from 208 N to 935 N. As the tangential force of the tire increases, the tangential deformation increases, and the frictional effect of the contact surface increases, thereby suppressing the tendency of slipping. The car’s braking, power, and handling can be expected to function properly.
(a) (b)
Figure 10. Speed versus tangential force fluctuation.
4.1.5. Speed vs. OTTV and H1OTTV
It can be seen from Figure 11 that the fluctuation of the turning moment gradually increased with the increase of the speed. At a high speed, the vehicle is prone to swinging left and right. Due to the uneven radial stiffness of the tire, the dimensional deviation of the hub causes the wheel to roll at the axle. Vertical excitation is generated, causing the steering wheel to reduce the interest of driving.
120 140 160 180 200 220 240
15
20
25
30
35
40
SATV
/N
Speed/km/h120 140 160 180 200 220 240
10
15
20
25
30
35
H1S
ATV
/N
Speed/km/h
120 140 160 180 200 220 240200
300
400
500
600
700
800
900
TFV
/N
Speed/km/h120 140 160 180 200 220 240
100
200
300
400
500
600
700
800
H1T
FV/N
Speed/km/h
Figure 10. Speed versus tangential force fluctuation.
4.1.5. Speed vs. OTTV and H1OTTV
It can be seen from Figure 11 that the fluctuation of the turning moment gradually increased withthe increase of the speed. At a high speed, the vehicle is prone to swinging left and right. Due to theuneven radial stiffness of the tire, the dimensional deviation of the hub causes the wheel to roll at theaxle. Vertical excitation is generated, causing the steering wheel to reduce the interest of driving.Vehicles 2020, 2, FOR PEER REVIEW 11 of 14
(a) (b)
Figure 11. Speed versus rollover torque fluctuation.
4.2. Relationship between Pressure and Uniformity Parameters
Testing by high-speed uniformity tester and recording relevant characteristic parameters, as shown in Table 2, the load is 4221 N, the speed is 120 km/h, and the pressures are as shown in the table.
Table 2. Relationship between tire pressure and tire uniformity parameters.
Pressure (MPa)
RFV (N)
LFV (N)
TFV (N)
H1RFV (N)
H1LFV (N)
H1TFV (N)
SATV (N)
OTTV (N)
H1SATV (N)
H1OTTV (N)
0.16 217 65 194 149.9 34.3 145.2 17 23 12.5 18 0.20 213 59 208 152.9 25 148.4 15 19 12 15.1 0.24 225 52 216 158.7 21.6 151.1 15 18 11.5 12.8
4.2.1. Pressure vs. RFV and H1RFV
It can be seen from Figure 12 that, as the pressure increased, the radial force fluctuation of the tire reached a minimum at 0.19 MPa, and the first harmonic of the radial force gradually increased. When the pressure increased from 0.16 MPa to 0.24 MPa, the radial force fluctuations increased from 217 N to 225 N; that is, the overall trend is rising. As the inflation pressure increased, the RFV and LFV of the tire gradually increased [16]. There are many reasons for fluctuations in RFV, such as variations in tread size of semi-finished parts, uneven density of carcass and belt cords, and dimensional variations of extruded parts such as sidewalls and apex—or, to cite other examples, the distribution of the joint of the forming process is offset, the joint quantity is too large or too small, or the length of the cord between the two beads is different, the blank of the vulcanization process is not centered with the vulcanization mold, the degree of vulcanization in the circumferential direction of the tire is not uniform, or the fillet storage deformation [17].
(a) (b)
Figure 12. Relationship between pressure and radial force fluctuation.
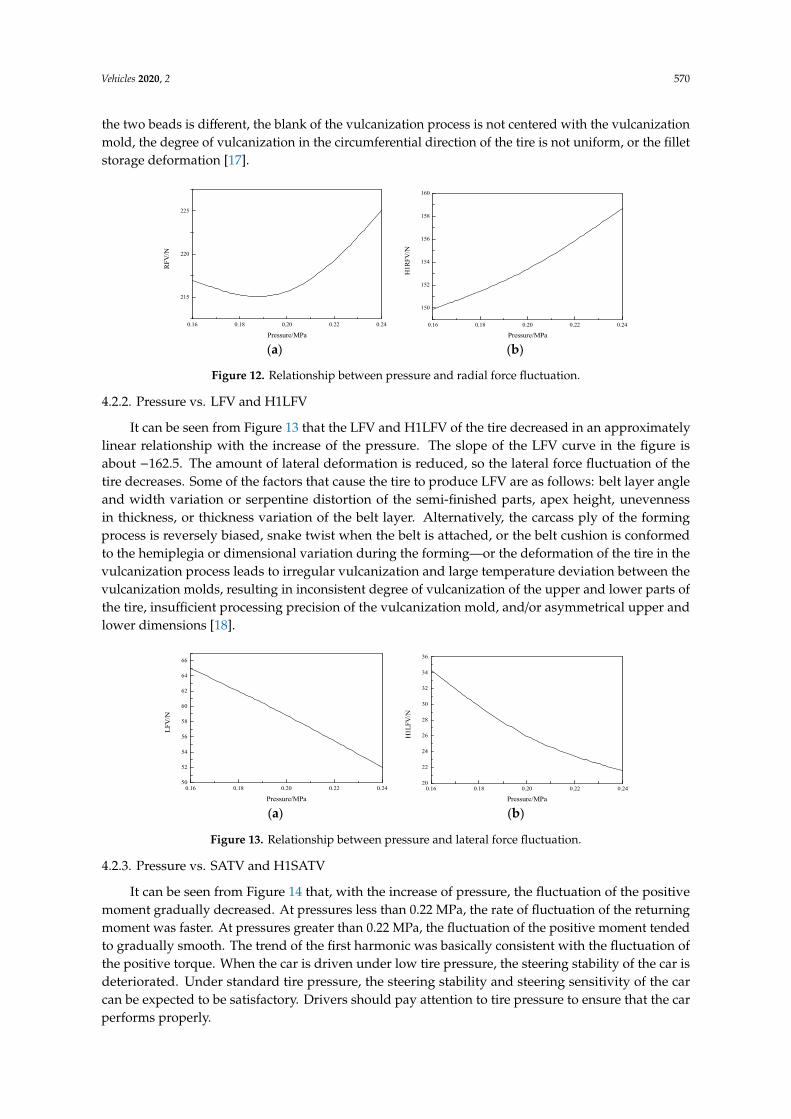
4.2.2. Pressure vs. LFV and H1LFV
It can be seen from Figure 13 that the LFV and H1LFV of the tire decreased in an approximately linear relationship with the increase of the pressure. The slope of the LFV curve in the figure is about
120 140 160 180 200 220 24015
30
45
60
75
90
105
120
OTT
V/N
Speed/km/h120 140 160 180 200 220 240
20
40
60
80
100
120
H1O
TTV
/N
Speed/km/h
0.16 0.18 0.20 0.22 0.24
215
220
225
RFV
/N
Pressure/MPa0.16 0.18 0.20 0.22 0.24
150
152
154
156
158
160
H1R
FV/N
Pressure/MPa
Figure 11. Speed versus rollover torque fluctuation.
4.2. Relationship between Pressure and Uniformity Parameters
Testing by high-speed uniformity tester and recording relevant characteristic parameters, as shownin Table 2, the load is 4221 N, the speed is 120 km/h, and the pressures are as shown in the table.
Table 2. Relationship between tire pressure and tire uniformity parameters.
Pressure(MPa)
RFV(N)
LFV(N)
TFV(N)
H1RFV(N)
H1LFV(N)
H1TFV(N)
SATV(N)
OTTV(N)
H1SATV(N)
H1OTTV(N)
0.16 217 65 194 149.9 34.3 145.2 17 23 12.5 180.20 213 59 208 152.9 25 148.4 15 19 12 15.10.24 225 52 216 158.7 21.6 151.1 15 18 11.5 12.8
4.2.1. Pressure vs. RFV and H1RFV
It can be seen from Figure 12 that, as the pressure increased, the radial force fluctuation of thetire reached a minimum at 0.19 MPa, and the first harmonic of the radial force gradually increased.When the pressure increased from 0.16 MPa to 0.24 MPa, the radial force fluctuations increased from217 N to 225 N; that is, the overall trend is rising. As the inflation pressure increased, the RFV and LFVof the tire gradually increased [16]. There are many reasons for fluctuations in RFV, such as variations intread size of semi-finished parts, uneven density of carcass and belt cords, and dimensional variationsof extruded parts such as sidewalls and apex—or, to cite other examples, the distribution of the joint ofthe forming process is offset, the joint quantity is too large or too small, or the length of the cord between
Vehicles 2020, 2 570
the two beads is different, the blank of the vulcanization process is not centered with the vulcanizationmold, the degree of vulcanization in the circumferential direction of the tire is not uniform, or the filletstorage deformation [17].
Vehicles 2020, 2, FOR PEER REVIEW 11 of 14
(a) (b)
Figure 11. Speed versus rollover torque fluctuation.
4.2. Relationship between Pressure and Uniformity Parameters
Testing by high-speed uniformity tester and recording relevant characteristic parameters, as shown in Table 2, the load is 4221 N, the speed is 120 km/h, and the pressures are as shown in the table.
Table 2. Relationship between tire pressure and tire uniformity parameters.
Pressure (MPa)
RFV (N)
LFV (N)
TFV (N)
H1RFV (N)
H1LFV (N)
H1TFV (N)
SATV (N)
OTTV (N)
H1SATV (N)
H1OTTV (N)
0.16 217 65 194 149.9 34.3 145.2 17 23 12.5 18 0.20 213 59 208 152.9 25 148.4 15 19 12 15.1 0.24 225 52 216 158.7 21.6 151.1 15 18 11.5 12.8
4.2.1. Pressure vs. RFV and H1RFV
It can be seen from Figure 12 that, as the pressure increased, the radial force fluctuation of the tire reached a minimum at 0.19 MPa, and the first harmonic of the radial force gradually increased. When the pressure increased from 0.16 MPa to 0.24 MPa, the radial force fluctuations increased from 217 N to 225 N; that is, the overall trend is rising. As the inflation pressure increased, the RFV and LFV of the tire gradually increased [16]. There are many reasons for fluctuations in RFV, such as variations in tread size of semi-finished parts, uneven density of carcass and belt cords, and dimensional variations of extruded parts such as sidewalls and apex—or, to cite other examples, the distribution of the joint of the forming process is offset, the joint quantity is too large or too small, or the length of the cord between the two beads is different, the blank of the vulcanization process is not centered with the vulcanization mold, the degree of vulcanization in the circumferential direction of the tire is not uniform, or the fillet storage deformation [17].
(a) (b)
Figure 12. Relationship between pressure and radial force fluctuation.
4.2.2. Pressure vs. LFV and H1LFV
It can be seen from Figure 13 that the LFV and H1LFV of the tire decreased in an approximately linear relationship with the increase of the pressure. The slope of the LFV curve in the figure is about
120 140 160 180 200 220 24015
30
45
60
75
90
105
120
OTT
V/N
Speed/km/h120 140 160 180 200 220 240
20
40
60
80
100
120
H1O
TTV
/N
Speed/km/h
0.16 0.18 0.20 0.22 0.24
215
220
225
RFV
/N
Pressure/MPa0.16 0.18 0.20 0.22 0.24
150
152
154
156
158
160
H1R
FV/N
Pressure/MPa
Figure 12. Relationship between pressure and radial force fluctuation.
4.2.2. Pressure vs. LFV and H1LFV
It can be seen from Figure 13 that the LFV and H1LFV of the tire decreased in an approximatelylinear relationship with the increase of the pressure. The slope of the LFV curve in the figure isabout −162.5. The amount of lateral deformation is reduced, so the lateral force fluctuation of thetire decreases. Some of the factors that cause the tire to produce LFV are as follows: belt layer angleand width variation or serpentine distortion of the semi-finished parts, apex height, unevennessin thickness, or thickness variation of the belt layer. Alternatively, the carcass ply of the formingprocess is reversely biased, snake twist when the belt is attached, or the belt cushion is conformedto the hemiplegia or dimensional variation during the forming—or the deformation of the tire in thevulcanization process leads to irregular vulcanization and large temperature deviation between thevulcanization molds, resulting in inconsistent degree of vulcanization of the upper and lower parts ofthe tire, insufficient processing precision of the vulcanization mold, and/or asymmetrical upper andlower dimensions [18].
Vehicles 2020, 2, FOR PEER REVIEW 12 of 14
−162.5. The amount of lateral deformation is reduced, so the lateral force fluctuation of the tire decreases. Some of the factors that cause the tire to produce LFV are as follows: belt layer angle and width variation or serpentine distortion of the semi-finished parts, apex height, unevenness in thickness, or thickness variation of the belt layer. Alternatively, the carcass ply of the forming process is reversely biased, snake twist when the belt is attached, or the belt cushion is conformed to the hemiplegia or dimensional variation during the forming—or the deformation of the tire in the vulcanization process leads to irregular vulcanization and large temperature deviation between the vulcanization molds, resulting in inconsistent degree of vulcanization of the upper and lower parts of the tire, insufficient processing precision of the vulcanization mold, and/or asymmetrical upper and lower dimensions [18].
(a) (b)
Figure 13. Relationship between pressure and lateral force fluctuation.
4.2.3. Pressure vs. SATV and H1SATV
It can be seen from Figure 14 that, with the increase of pressure, the fluctuation of the positive moment gradually decreased. At pressures less than 0.22 MPa, the rate of fluctuation of the returning moment was faster. At pressures greater than 0.22 MPa, the fluctuation of the positive moment tended to gradually smooth. The trend of the first harmonic was basically consistent with the fluctuation of the positive torque. When the car is driven under low tire pressure, the steering stability of the car is deteriorated. Under standard tire pressure, the steering stability and steering sensitivity of the car can be expected to be satisfactory. Drivers should pay attention to tire pressure to ensure that the car performs properly.
(a) (b)
Figure 14. Relationship between pressure and positive torque fluctuation.
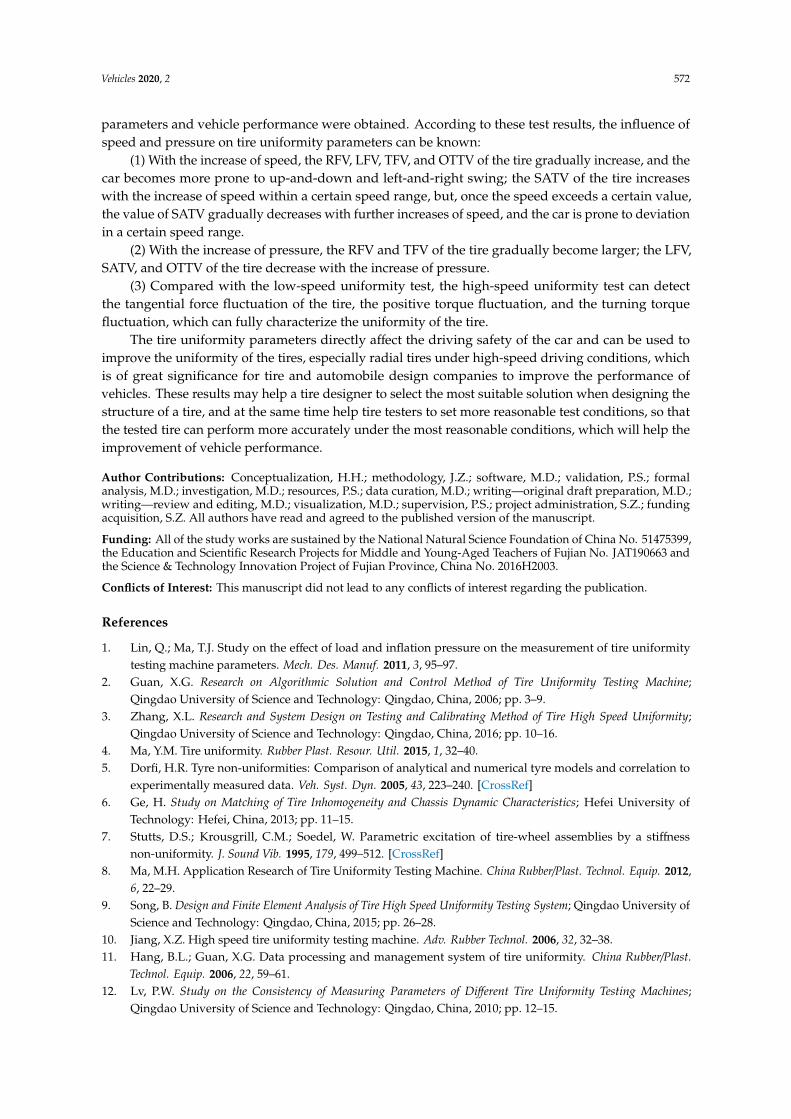
4.2.4. Pressure vs. TFV and H1TFV
It can be seen from Figure 15 that, under certain speed conditions, the tangential force fluctuation of the tire increased with the increase of the pressure, which affects the ride comfort of the car.
0.16 0.18 0.20 0.22 0.2450
52
54
56
58
60
62
64
66
LFV
/N
Pressure/MPa0.16 0.18 0.20 0.22 0.24
20
22
24
26
28
30
32
34
36
H1L
FV/N
Pressure/MPa
0.16 0.18 0.20 0.22 0.24
15.0
15.5
16.0
16.5
17.0
SATV
/N
Pressure/MPa0.16 0.18 0.20 0.22 0.24
11.4
11.6
11.8
12.0
12.2
12.4
12.6
H1S
ATV
/N
Pressure/MPa
Figure 13. Relationship between pressure and lateral force fluctuation.
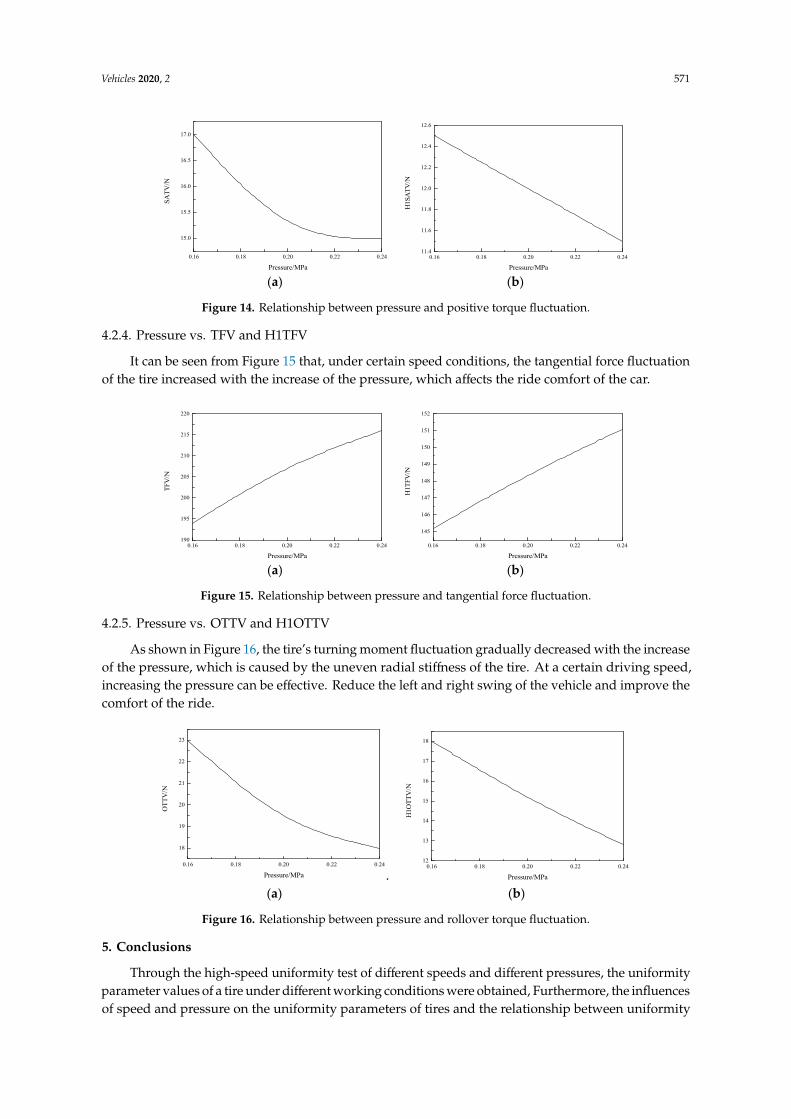
4.2.3. Pressure vs. SATV and H1SATV
It can be seen from Figure 14 that, with the increase of pressure, the fluctuation of the positivemoment gradually decreased. At pressures less than 0.22 MPa, the rate of fluctuation of the returningmoment was faster. At pressures greater than 0.22 MPa, the fluctuation of the positive moment tendedto gradually smooth. The trend of the first harmonic was basically consistent with the fluctuation ofthe positive torque. When the car is driven under low tire pressure, the steering stability of the car isdeteriorated. Under standard tire pressure, the steering stability and steering sensitivity of the carcan be expected to be satisfactory. Drivers should pay attention to tire pressure to ensure that the carperforms properly.
Vehicles 2020, 2 571
Vehicles 2020, 2, FOR PEER REVIEW 12 of 14
−162.5. The amount of lateral deformation is reduced, so the lateral force fluctuation of the tire decreases. Some of the factors that cause the tire to produce LFV are as follows: belt layer angle and width variation or serpentine distortion of the semi-finished parts, apex height, unevenness in thickness, or thickness variation of the belt layer. Alternatively, the carcass ply of the forming process is reversely biased, snake twist when the belt is attached, or the belt cushion is conformed to the hemiplegia or dimensional variation during the forming—or the deformation of the tire in the vulcanization process leads to irregular vulcanization and large temperature deviation between the vulcanization molds, resulting in inconsistent degree of vulcanization of the upper and lower parts of the tire, insufficient processing precision of the vulcanization mold, and/or asymmetrical upper and lower dimensions [18].
(a) (b)
Figure 13. Relationship between pressure and lateral force fluctuation.
4.2.3. Pressure vs. SATV and H1SATV
It can be seen from Figure 14 that, with the increase of pressure, the fluctuation of the positive moment gradually decreased. At pressures less than 0.22 MPa, the rate of fluctuation of the returning moment was faster. At pressures greater than 0.22 MPa, the fluctuation of the positive moment tended to gradually smooth. The trend of the first harmonic was basically consistent with the fluctuation of the positive torque. When the car is driven under low tire pressure, the steering stability of the car is deteriorated. Under standard tire pressure, the steering stability and steering sensitivity of the car can be expected to be satisfactory. Drivers should pay attention to tire pressure to ensure that the car performs properly.
(a) (b)
Figure 14. Relationship between pressure and positive torque fluctuation.
4.2.4. Pressure vs. TFV and H1TFV
It can be seen from Figure 15 that, under certain speed conditions, the tangential force fluctuation of the tire increased with the increase of the pressure, which affects the ride comfort of the car.
0.16 0.18 0.20 0.22 0.2450
52
54
56
58
60
62
64
66
LFV
/N
Pressure/MPa0.16 0.18 0.20 0.22 0.24
20
22
24
26
28
30
32
34
36
H1L
FV/N
Pressure/MPa
0.16 0.18 0.20 0.22 0.24
15.0
15.5
16.0
16.5
17.0
SATV
/N
Pressure/MPa0.16 0.18 0.20 0.22 0.24
11.4
11.6
11.8
12.0
12.2
12.4
12.6
H1S
ATV
/N
Pressure/MPa
Figure 14. Relationship between pressure and positive torque fluctuation.
4.2.4. Pressure vs. TFV and H1TFV
It can be seen from Figure 15 that, under certain speed conditions, the tangential force fluctuationof the tire increased with the increase of the pressure, which affects the ride comfort of the car.Vehicles 2020, 2, FOR PEER REVIEW 13 of 14
(a) (b)
Figure 15. Relationship between pressure and tangential force fluctuation.
4.2.5. Pressure vs. OTTV and H1OTTV
As shown in Figure 16, the tire’s turning moment fluctuation gradually decreased with the increase of the pressure, which is caused by the uneven radial stiffness of the tire. At a certain driving speed, increasing the pressure can be effective. Reduce the left and right swing of the vehicle and improve the comfort of the ride.
. (a) (b)
Figure 16. Relationship between pressure and rollover torque fluctuation.
5. Conclusions
Through the high-speed uniformity test of different speeds and different pressures, the uniformity parameter values of a tire under different working conditions were obtained, Furthermore, the influences of speed and pressure on the uniformity parameters of tires and the relationship between uniformity parameters and vehicle performance were obtained. According to these test results, the influence of speed and pressure on tire uniformity parameters can be known:
(1) With the increase of speed, the RFV, LFV, TFV, and OTTV of the tire gradually increase, and the car becomes more prone to up-and-down and left-and-right swing; the SATV of the tire increases with the increase of speed within a certain speed range, but, once the speed exceeds a certain value, the value of SATV gradually decreases with further increases of speed, and the car is prone to deviation in a certain speed range.
(2) With the increase of pressure, the RFV and TFV of the tire gradually become larger; the LFV, SATV, and OTTV of the tire decrease with the increase of pressure.
(3) Compared with the low-speed uniformity test, the high-speed uniformity test can detect the tangential force fluctuation of the tire, the positive torque fluctuation, and the turning torque fluctuation, which can fully characterize the uniformity of the tire.
The tire uniformity parameters directly affect the driving safety of the car and can be used to improve the uniformity of the tires, especially radial tires under high-speed driving conditions, which is of great significance for tire and automobile design companies to improve the performance of vehicles. These results may help a tire designer to select the most suitable solution when designing the structure of a tire, and at the same time help tire testers to set more reasonable test conditions, so
0.16 0.18 0.20 0.22 0.24190
195
200
205
210
215
220
TFV
/N
Pressure/MPa0.16 0.18 0.20 0.22 0.24
145
146
147
148
149
150
151
152H
1TFV
/N
Pressure/MPa
0.16 0.18 0.20 0.22 0.24
18
19
20
21
22
23
OTT
V/N
Pressure/MPa0.16 0.18 0.20 0.22 0.24
12
13
14
15
16
17
18
H1O
TTV
/N
Pressure/MPa
Figure 15. Relationship between pressure and tangential force fluctuation.
4.2.5. Pressure vs. OTTV and H1OTTV
As shown in Figure 16, the tire’s turning moment fluctuation gradually decreased with the increaseof the pressure, which is caused by the uneven radial stiffness of the tire. At a certain driving speed,increasing the pressure can be effective. Reduce the left and right swing of the vehicle and improve thecomfort of the ride.
Vehicles 2020, 2, FOR PEER REVIEW 13 of 14
(a) (b)
Figure 15. Relationship between pressure and tangential force fluctuation.
4.2.5. Pressure vs. OTTV and H1OTTV
As shown in Figure 16, the tire’s turning moment fluctuation gradually decreased with the increase of the pressure, which is caused by the uneven radial stiffness of the tire. At a certain driving speed, increasing the pressure can be effective. Reduce the left and right swing of the vehicle and improve the comfort of the ride.
. (a) (b)
Figure 16. Relationship between pressure and rollover torque fluctuation.
5. Conclusions
Through the high-speed uniformity test of different speeds and different pressures, the uniformity parameter values of a tire under different working conditions were obtained, Furthermore, the influences of speed and pressure on the uniformity parameters of tires and the relationship between uniformity parameters and vehicle performance were obtained. According to these test results, the influence of speed and pressure on tire uniformity parameters can be known:
(1) With the increase of speed, the RFV, LFV, TFV, and OTTV of the tire gradually increase, and the car becomes more prone to up-and-down and left-and-right swing; the SATV of the tire increases with the increase of speed within a certain speed range, but, once the speed exceeds a certain value, the value of SATV gradually decreases with further increases of speed, and the car is prone to deviation in a certain speed range.
(2) With the increase of pressure, the RFV and TFV of the tire gradually become larger; the LFV, SATV, and OTTV of the tire decrease with the increase of pressure.
(3) Compared with the low-speed uniformity test, the high-speed uniformity test can detect the tangential force fluctuation of the tire, the positive torque fluctuation, and the turning torque fluctuation, which can fully characterize the uniformity of the tire.
The tire uniformity parameters directly affect the driving safety of the car and can be used to improve the uniformity of the tires, especially radial tires under high-speed driving conditions, which is of great significance for tire and automobile design companies to improve the performance of vehicles. These results may help a tire designer to select the most suitable solution when designing the structure of a tire, and at the same time help tire testers to set more reasonable test conditions, so
0.16 0.18 0.20 0.22 0.24190
195
200
205
210
215
220
TFV
/N
Pressure/MPa0.16 0.18 0.20 0.22 0.24
145
146
147
148
149
150
151
152H
1TFV
/N
Pressure/MPa
0.16 0.18 0.20 0.22 0.24
18
19
20
21
22
23
OTT
V/N
Pressure/MPa0.16 0.18 0.20 0.22 0.24
12
13
14
15
16
17
18
H1O
TTV
/N
Pressure/MPa
Figure 16. Relationship between pressure and rollover torque fluctuation.
5. Conclusions
Through the high-speed uniformity test of different speeds and different pressures, the uniformityparameter values of a tire under different working conditions were obtained, Furthermore, the influencesof speed and pressure on the uniformity parameters of tires and the relationship between uniformity
Vehicles 2020, 2 572
parameters and vehicle performance were obtained. According to these test results, the influence ofspeed and pressure on tire uniformity parameters can be known:
(1) With the increase of speed, the RFV, LFV, TFV, and OTTV of the tire gradually increase, and thecar becomes more prone to up-and-down and left-and-right swing; the SATV of the tire increaseswith the increase of speed within a certain speed range, but, once the speed exceeds a certain value,the value of SATV gradually decreases with further increases of speed, and the car is prone to deviationin a certain speed range.
(2) With the increase of pressure, the RFV and TFV of the tire gradually become larger; the LFV,SATV, and OTTV of the tire decrease with the increase of pressure.
(3) Compared with the low-speed uniformity test, the high-speed uniformity test can detectthe tangential force fluctuation of the tire, the positive torque fluctuation, and the turning torquefluctuation, which can fully characterize the uniformity of the tire.
The tire uniformity parameters directly affect the driving safety of the car and can be used toimprove the uniformity of the tires, especially radial tires under high-speed driving conditions, whichis of great significance for tire and automobile design companies to improve the performance ofvehicles. These results may help a tire designer to select the most suitable solution when designing thestructure of a tire, and at the same time help tire testers to set more reasonable test conditions, so thatthe tested tire can perform more accurately under the most reasonable conditions, which will help theimprovement of vehicle performance.
Author Contributions: Conceptualization, H.H.; methodology, J.Z.; software, M.D.; validation, P.S.; formalanalysis, M.D.; investigation, M.D.; resources, P.S.; data curation, M.D.; writing—original draft preparation, M.D.;writing—review and editing, M.D.; visualization, M.D.; supervision, P.S.; project administration, S.Z.; fundingacquisition, S.Z. All authors have read and agreed to the published version of the manuscript.
Funding: All of the study works are sustained by the National Natural Science Foundation of China No. 51475399,the Education and Scientific Research Projects for Middle and Young-Aged Teachers of Fujian No. JAT190663 andthe Science & Technology Innovation Project of Fujian Province, China No. 2016H2003.
Conflicts of Interest: This manuscript did not lead to any conflicts of interest regarding the publication.
References
1. Lin, Q.; Ma, T.J. Study on the effect of load and inflation pressure on the measurement of tire uniformitytesting machine parameters. Mech. Des. Manuf. 2011, 3, 95–97.
2. Guan, X.G. Research on Algorithmic Solution and Control Method of Tire Uniformity Testing Machine;Qingdao University of Science and Technology: Qingdao, China, 2006; pp. 3–9.
3. Zhang, X.L. Research and System Design on Testing and Calibrating Method of Tire High Speed Uniformity;Qingdao University of Science and Technology: Qingdao, China, 2016; pp. 10–16.
4. Ma, Y.M. Tire uniformity. Rubber Plast. Resour. Util. 2015, 1, 32–40.5. Dorfi, H.R. Tyre non-uniformities: Comparison of analytical and numerical tyre models and correlation to
experimentally measured data. Veh. Syst. Dyn. 2005, 43, 223–240. [CrossRef]6. Ge, H. Study on Matching of Tire Inhomogeneity and Chassis Dynamic Characteristics; Hefei University of
Technology: Hefei, China, 2013; pp. 11–15.7. Stutts, D.S.; Krousgrill, C.M.; Soedel, W. Parametric excitation of tire-wheel assemblies by a stiffness
non-uniformity. J. Sound Vib. 1995, 179, 499–512. [CrossRef]8. Ma, M.H. Application Research of Tire Uniformity Testing Machine. China Rubber/Plast. Technol. Equip. 2012,
6, 22–29.9. Song, B. Design and Finite Element Analysis of Tire High Speed Uniformity Testing System; Qingdao University of
Science and Technology: Qingdao, China, 2015; pp. 26–28.10. Jiang, X.Z. High speed tire uniformity testing machine. Adv. Rubber Technol. 2006, 32, 32–38.11. Hang, B.L.; Guan, X.G. Data processing and management system of tire uniformity. China Rubber/Plast.
Technol. Equip. 2006, 22, 59–61.12. Lv, P.W. Study on the Consistency of Measuring Parameters of Different Tire Uniformity Testing Machines;
Qingdao University of Science and Technology: Qingdao, China, 2010; pp. 12–15.
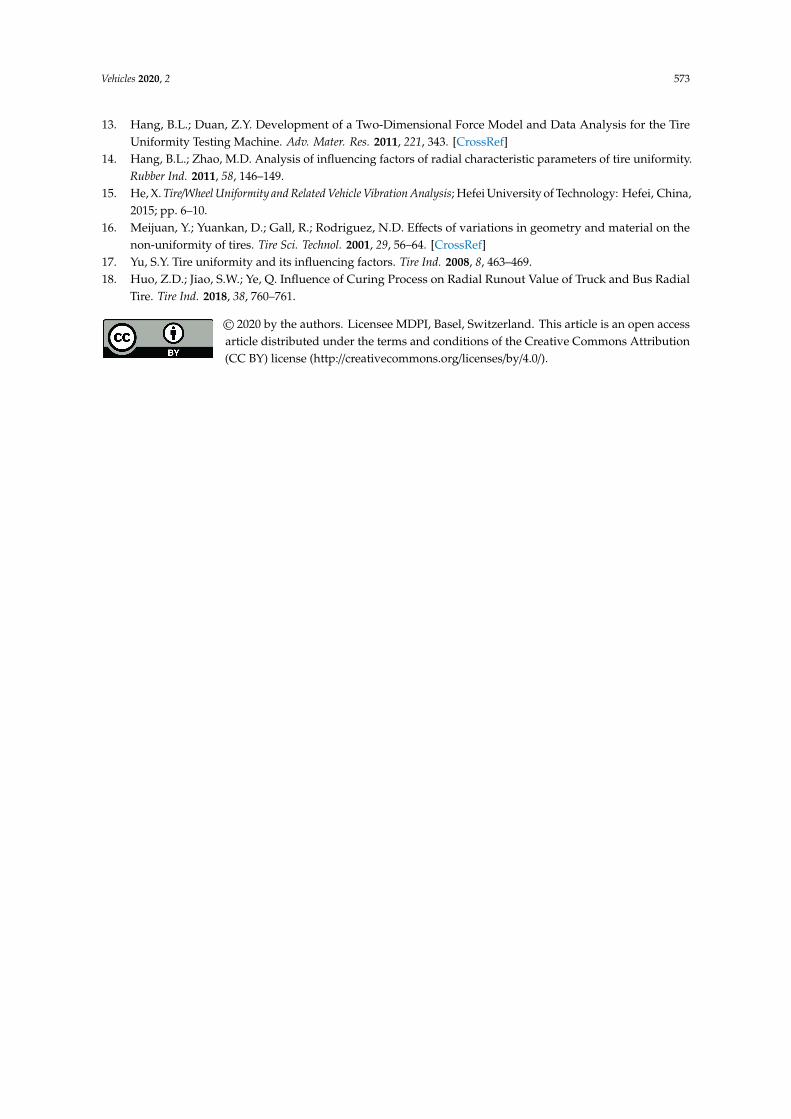
Vehicles 2020, 2 573
13. Hang, B.L.; Duan, Z.Y. Development of a Two-Dimensional Force Model and Data Analysis for the TireUniformity Testing Machine. Adv. Mater. Res. 2011, 221, 343. [CrossRef]
14. Hang, B.L.; Zhao, M.D. Analysis of influencing factors of radial characteristic parameters of tire uniformity.Rubber Ind. 2011, 58, 146–149.
15. He, X. Tire/Wheel Uniformity and Related Vehicle Vibration Analysis; Hefei University of Technology: Hefei, China,2015; pp. 6–10.
16. Meijuan, Y.; Yuankan, D.; Gall, R.; Rodriguez, N.D. Effects of variations in geometry and material on thenon-uniformity of tires. Tire Sci. Technol. 2001, 29, 56–64. [CrossRef]
17. Yu, S.Y. Tire uniformity and its influencing factors. Tire Ind. 2008, 8, 463–469.18. Huo, Z.D.; Jiao, S.W.; Ye, Q. Influence of Curing Process on Radial Runout Value of Truck and Bus Radial
Tire. Tire Ind. 2018, 38, 760–761.
© 2020 by the authors. Licensee MDPI, Basel, Switzerland. This article is an open accessarticle distributed under the terms and conditions of the Creative Commons Attribution(CC BY) license (http://creativecommons.org/licenses/by/4.0/).