a study of evaluation criterias for renewable energy resources using frequency analysis through spss...
TRANSCRIPT

Journal of International Academic Research for Multidisciplinary
ISSN 2320 -5083
A Scholarly, Peer Reviewed, Monthly, Open Access, Online Research Journal
Impact Factor – 1.393
VOLUME 1 ISSUE 10 NOVEMBER 2013
A GLOBAL SOCIETY FOR MULTIDISCIPLINARY RESEARCH
www.jiarm.com
A GREEN PUBLISHING HOUSE

Editorial Board Dr. Kari Jabbour, Ph.D Curriculum Developer, American College of Technology, Missouri, USA.
Er.Chandramohan, M.S System Specialist - OGP ABB Australia Pvt. Ltd., Australia.
Dr. S.K. Singh Chief Scientist Advanced Materials Technology Department Institute of Minerals & Materials Technology Bhubaneswar, India
Dr. Jake M. Laguador Director, Research and Statistics Center, Lyceum of the Philippines University, Philippines. Prof. Dr. Sharath Babu, LLM Ph.D Dean. Faculty of Law, Karnatak University Dharwad, Karnataka, India
Dr.S.M Kadri, MBBS, MPH/ICHD, FFP Fellow, Public Health Foundation of India Epidemiologist Division of Epidemiology and Public Health, Kashmir, India
Dr.Bhumika Talwar, BDS Research Officer State Institute of Health & Family Welfare Jaipur, India
Dr. Tej Pratap Mall Ph.D Head, Postgraduate Department of Botany, Kisan P.G. College, Bahraich, India.
Dr. Arup Kanti Konar, Ph.D Associate Professor of Economics Achhruram, Memorial College, SKB University, Jhalda,Purulia, West Bengal. India
Dr. S.Raja Ph.D Research Associate, Madras Research Center of CMFR , Indian Council of Agricultural Research, Chennai, India
Dr. Vijay Pithadia, Ph.D, Director - Sri Aurobindo Institute of Management Rajkot, India.
Er. R. Bhuvanewari Devi M. Tech, MCIHT Highway Engineer, Infrastructure, Ramboll, Abu Dhabi, UAE Sanda Maican, Ph.D. Senior Researcher, Department of Ecology, Taxonomy and Nature Conservation Institute of Biology of the Romanian Academy, Bucharest, Romania Dr. Reynalda B. Garcia Professor, Graduate School & College of Education, Arts and Sciences Lyceum of the Philippines University Philippines Dr.Damarla Bala Venkata Ramana Senior Scientist Central Research Institute for Dryland Agriculture (CRIDA) Hyderabad, A.P, India PROF. Dr.S.V.Kshirsagar, M.B.B.S,M.S Head - Department of Anatomy, Bidar Institute of Medical Sciences, Karnataka, India. Dr Asifa Nazir, M.B.B.S, MD, Assistant Professor, Dept of Microbiology Government Medical College, Srinagar, India. Dr.AmitaPuri, Ph.D Officiating Principal Army Inst. Of Education New Delhi, India Dr. Shobana Nelasco Ph.D Associate Professor, Fellow of Indian Council of Social Science Research (On Deputation}, Department of Economics, Bharathidasan University, Trichirappalli. India M. Suresh Kumar, PHD Assistant Manager, Godrej Security Solution, India. Dr.T.Chandrasekarayya,Ph.D Assistant Professor, Dept Of Population Studies & Social Work, S.V.University, Tirupati, India.

JOURNAL OF INTERNATIONAL ACADEMIC RESEARCH FOR MULT IDISCIPLINARY Impact Factor 1.393, ISSN: 2320-5083, Volume 1, Issue 10, November 2013
350 www.jiarm.com
A STUDY OF EVALUATION CRITERIAS FOR RENEWABLE ENERG Y RESOURCES USING FREQUENCY ANALYSIS THROUGH SPSS SOFTWARE
DARSH BELANI*
ASHISH H. MAKWANA** JAYESHKUMAR PITRODA***
*Final year M.E. C. E. & M., B.V.M. Engineering College, Vallabh Vidyanagar, Gujarat, India **Final year M.E. C. E. & M., B.V.M. Engineering College, Vallabh Vidyanagar, Gujarat, India
***Assistant Professor & Research Scholar, Dept. of Civil Engineering, B.V.M. Engineering College, Vallabh Vidyanagar, Gujarat, India
ABSTRACT The energy requirements of the world including India are growing at an alarming rate
and the power demand has been running ahead of supply. Nowadays it is also widely
recognized that the fossil fuels (i.e., coal, petroleum and natural gas) and other conventional
resources, presently being used for generation of electrical energy, may not be either
sufficient or suitable to keep pace with ever increasing demand of the electrical energy of the
world. It also causes pollution, which is likely to be more severe in the future. The recent
severe energy crisis has also forced the world to develop new and alternative methods of
power generation, which could not be adopted so far due to various reasons. The non-
conventional methods of power generation may be such as solar cells, fuel cells, thermo-
electric generator, solar power generation, wind power generation, geothermal energy
generation, tidal power generation etc. As there are many energy related crisis curbing the
growth of our nation. So in current study efforts are made to carry out study whether
Renewable Energy should be adopted or not. Various criteria like Nuclear Energy Safety,
Non-Renewable resources’ Pollution problem, Sustainable Development, Agricultural
Development, adoption to various easily available Renewable Resources, etc. are taken into
consideration. Thus, in this study efforts are made to consider each class of people so that
opinion regarding adoption of Renewable Energy will not get biased approach.
So, during this study various parameters regarding renewable energy are being identified and
converted into questionnaire to carry out surveys from the society, which will be the best
judge for renewable energy’s adoption. Software like Microsoft Excel & SPSS Statistics 17.0
(Statistical Package for the Social Sciences) are adopted to evaluate the responses collected
from the people by frequency distribution analysis.
KEYWORDS: Energy Crisis, Renewable Energy, SPSS, Frequency Distribution Analysis INTRODUCTION
With the increasing demand for energy and growing depletion of resources for energy
generation, a global movement towards production of renewable energy (RE) is being
JOURNAL OF INTERNATIONAL ACADEMIC RESEARCH FOR MULT IDISCIPLINARY Impact Factor 1.393, ISSN: 2320-5083, Volume 1, Issue 10, November 2013
351 www.jiarm.com
thought. Renewable Energy is generated from resources which are renewable or which may
last forever like sunlight, wind, rain, tide, geothermal heat etc. Fossil fuels- the non-
renewable resources take millions of years to form, and reserves are getting depleted much
faster than the new ones being formed.
In recent years, India has emerged as one of the leading destinations for investors
from developed countries. India is now the eleventh largest economy in the world, fourth in
terms of purchasing power. It is poised to make tremendous economic strides over the next
ten years, with significant development already in the planning stages. Considered an
"emerging economy," increasing GDP is driving the demand for additional electrical energy,
as well as transportation fuels. India is a nation of extremes.
The development and deployment of renewable energy, products, and services in India is
driven by the need to
Decrease dependence on energy imports
Sustain accelerated deployment of renewable energy system and devices
Expand cost-effective energy supply
Augment energy supply to remote and deficient areas to provide normative
consumption levels to all sections of the population across the country
And finally, switch fuels through new and renewable energy system/device
deployment.
The objective of the present study is mentioned below:
To study whether Renewable Energy Resources should be adopted or not.
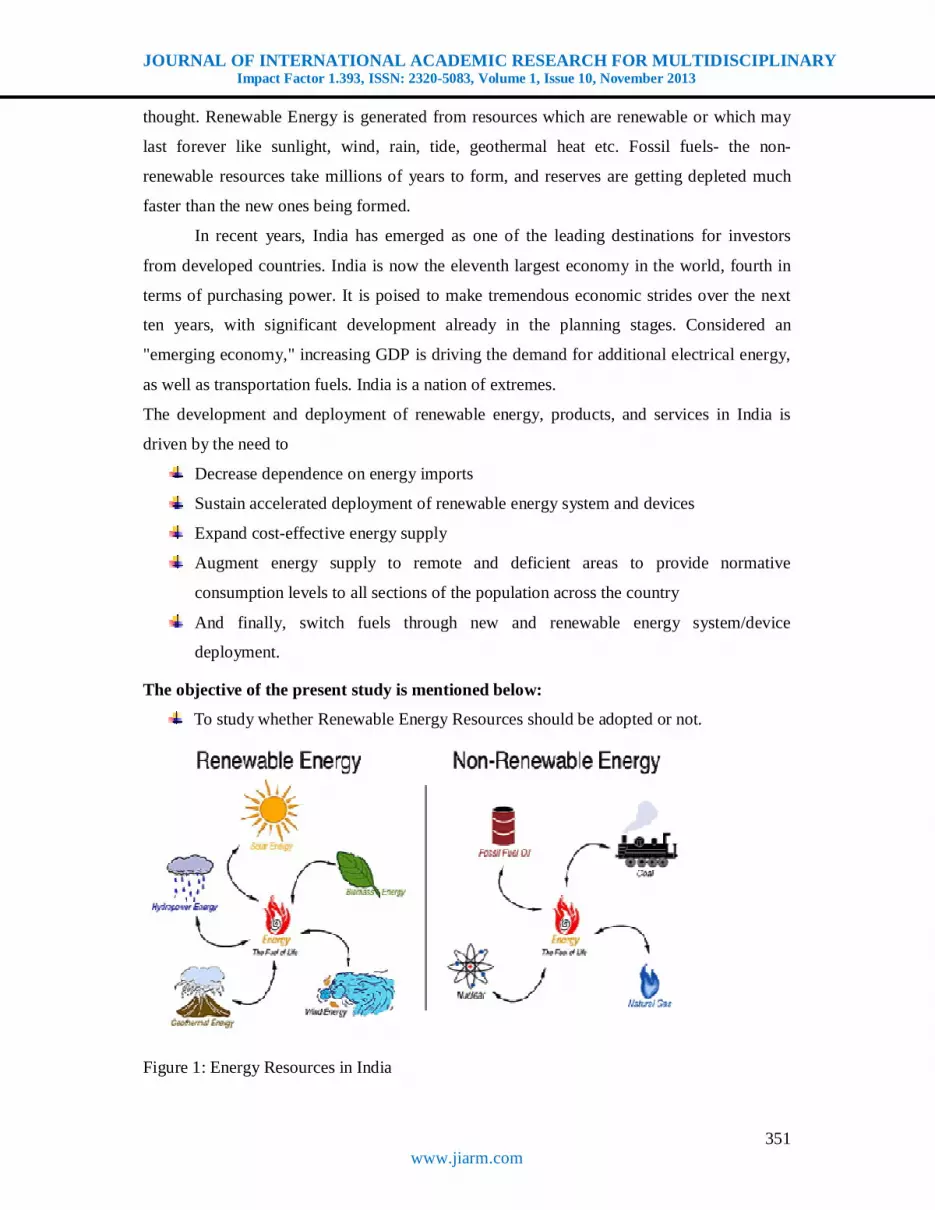
Figure 1: Energy Resources in India
JOURNAL OF INTERNATIONAL ACADEMIC RESEARCH FOR MULT IDISCIPLINARY Impact Factor 1.393, ISSN: 2320-5083, Volume 1, Issue 10, November 2013
352 www.jiarm.com
RENEWABLE ENERGY SOURCES IN INDIA
India was the first country in the world to set up a ministry of non-conventional
energy resources, in early 1980s. India's cumulative Grid interactive or Grid Tied Renewable
Energy Capacity (excluding Large Hydro) has reached 26.9GW, of which 68.9% comes from
wind, while solar power (SPV) contributed nearly 4.59% of the Renewable Energy installed
capacity in India. Renewable energy in India comes under the purview of the Ministry of
New and Renewable Energy.
Source Total Installed Capacity (MW) Wind Power 19,779.15
Solar Power (SPV) 1,968.84 Small Hydro Power 3,711.75
Biomass Power 1,264.80 Bagasse Cogeneration 2,337.43
Waste to Power 99.08 Total 29,161.05
Solar power
There are two basic categories of technologies that convert sunlight into useful forms of
energy, First, solar photovoltaic (PV) modules convert sunlight directly in to electricity.
Second, solar thermal power systems use focused solar radiation to produces team, which is
then used to turn a turbine producing electricity. India is densely populated and has high solar
insolation, an ideal combination for using solar power in India. Much of the country does not
have an electrical grid, so one of the first applications of solar power has been for water
pumping, to begin replacing India's four to five million diesel powered water pumps, each
consuming about 3.5 kilowatts, and off-grid lighting. Some large projects have been
proposed, and a 35,000 km² area of the Thar Desert has been set aside for solar power
projects, sufficient to generate 700 to 2,100 gigawatts.
Wind power
Wind has considerable potential as a global clean energy source, being both widely available,
though diffuse, and producing no pollution during power generation. The development of
wind power in India began in the 1990s, and has significantly increased in the last few years.
Although a relative newcomer to the wind industry compared with Denmark or the US,
domestic policy support for wind power has led India to become the country with the fifth
largest installed wind power capacity in the world. As of December 2010 the installed
capacity of wind power in India was 13,065.37 MW, mainly spread across Tamil Nadu
(4132.72 MW), Maharashtra (1837.85 MW), Karnataka (1184.45 MW), Rajasthan (670.97
JOURNAL OF INTERNATIONAL ACADEMIC RESEARCH FOR MULT IDISCIPLINARY Impact Factor 1.393, ISSN: 2320-5083, Volume 1, Issue 10, November 2013
353 www.jiarm.com
MW), Gujarat (1432.71 MW), Andhra Pradesh (122.45 MW), Madhya Pradesh (187.69
MW), Kerala (23.00 MW), West Bengal (1.10 MW), other states (3.20 MW). Wind power
accounts for 6% of India's total installed power capacity.
Biomass Energy
Biomass is the term used for all organic material originating from plants (including algae),
trees and crops and is essentially the collection and storage of the sun’s energy through
photosynthesis. Biomass energy, or Bioenergy, is the conversion of biomass into useful forms
of energy such as heat, electricity and liquid fuels.
Hydropower
Hydropower is the largest renewable resource used for electricity. It plays an essential role in
many regions of the world with more than 150 countries generating hydroelectric power.
Small, mini and micro hydro plants (usually defined as plants less than 10 MW, 2 MW
and100kW, respectively) also play a key role in many countries like India for rural
electrification.
Geothermal Energy
Geothermal energy, the natural heat within the earth, arises from the ancient heat remaining
in the Earth's core, from friction where continental plates slide beneath each other, and from
the decay of radioactive elements that occur naturally in small amounts in all rocks. The
amount of geothermal energy is enormous. Scientists estimate that just 1 percent of the heat
contained in just the uppermost 10 kilometers of the earth’s crust is equivalent to 500 times
the energy contained in all of the earth's oil and gas resources. Yet, despite the fact that this
heat is present in practically inexhaustible quantities, it is unevenly distributed, seldom
concentrated and often at depths too great to be exploited industrially and economically.
DESIGN OF QUESTIONNAIRES
QUESTIONS
1. Do you know what renewable energy is?
2. How important do you think it is to improve the energy efficiency of your home?
3. Please evaluate the importance of promoting the use of renewable energy sources.
4. Can renewable energy solutions lead to a fairer distribution of the World's richest?
5. Will Renewable Energy solve Demand-Supply gap?
6. Is nuclear energy safe?
7. Are you able to pay for increase in Power Tariff, due to shortage of resources?

JOURNAL OF INTERNATIONAL ACADEMIC RESEARCH FOR MULT IDISCIPLINARY Impact Factor 1.393, ISSN: 2320-5083, Volume 1, Issue 10, November 2013
354 www.jiarm.com
8. If there was a grant available, would it encourage you to improve the energy
efficiency of your home?
9. What is your hot water source?
10. How much energy saving lights bulbs & tubes? (Compact Fluorescent Lamps [CFLs]
& T5_T3 light tubes)?
11. What do you use for cooking?
12. Would you consider the application of Solar Panels to utilize solar energy in power
generation for your Household power needs?
13. How much will renewable energy solutions be able to help free us from depending on
the use of petroleum and other fossil fuels?
14. Are you considering these Sustainable Infrastructure resources for the growth of our
country as our country has great scope for such developments??
15. Isn’t renewable energy a better platform for Agricultural Development?
16. How would you consider the development of regions like Kutch by Wind Power
Generation practices?
17. Will Renewable Energy provide better access of electricity to rural regions?
18. What percentage of the global energy consumption do you think we should manage to
provide using renewable energy sources within the next 30 years?
DATA ANALYSIS & DATA INTERPRETATION
Various Parameters that affect on Renewable Energy Resources is found out by preparing a
survey questionnaire.
Data analysis is done in Microsoft Excel and Statistical Package for the Social Sciences
(SPSS Statistics 17.0) software.
Different regions of Gujarat state are considered in this study for survey based analysis, such
as Ahmedabad, Gandhinagar, Nadiad, Anand, Vadodara, Surat.
FREQUENCY DISTRIBUTION
A frequency distribution is a table that divides a set of data into a suitable number of
classes, showing also the number of items belonging to each class. Properties of frequency
distribution relating to their shape are best exhibited through the use of graph. The most
common form of graphical presentation of a frequency distribution is the histogram. The
histogram of a frequency distribution is constructed of adjacent rectangles; the heights of the
rectangles represent the class frequencies and the bases of the rectangles extend between
successive classes boundaries.

JOURNAL OF INTERNATIONAL ACADEMIC RESEARCH FOR MULT IDISCIPLINARY Impact Factor 1.393, ISSN: 2320-5083, Volume 1, Issue 10, November 2013
355 www.jiarm.com
TABLE: 2 FREQUENCY TABLE
Sr.
No.
Variables Frequency (%)
Max. Min.
1. Do you know what renewable energy is? 26.7 (1) 13.3(2 & 5)
2. How important do you think it is to improve the energy efficiency
of your home?
36.7 (3) 3.3 (1)
3. Please evaluate the importance of promoting the use of renewable
energy sources.
43.3 (4) 5.0 (2)
4. Can renewable energy solutions lead to a fairer distribution of the
World's richest?
40.0 (4) 1.7 (2)
5. Will Renewable Energy solve Demand-Supply gap? 53.3 (3) 16.7 (4)
6. Is nuclear energy safe? 48.3 (3) 25.0 (4)
7. Are you able to pay for increase in Power Tariff, due to shortage
of resources?
76.7 (3) 3.3 (1)
8. If there was a grant available, would it encourage you to improve
the energy efficiency of your home?
55.0 (3) 11.7 (5)
9. What is your hot water source? 38.3 (2) 18.3 (1& 4)
10. How much energy saving lights bulbs & tubes? (Compact
Fluorescent Lamps [CFLs] & T5_T3 light tubes)?
38.3 (4) 1.7 (1)
11. What do you use for cooking? 55.0 (2) 6.7 (3)
12. Would you consider the application of Solar Panels to utilize solar
energy in power generation for your Household power needs?
83.3 (3) 16.7 (4)
13. How much will renewable energy solutions be able to help free us
from depending on the use of petroleum and other fossil fuels?
70.0 (4) 11.7 (3)
14. Are you considering these Sustainable Infrastructure resources for
the growth of our country as our country has great scope for such
developments??
43.3 (3) 15.0 (4)
15. Isn’t renewable energy a better platform for Agricultural
Development?
46.7 (1) 1.7 (4)
16. How would you consider the development of regions like Kutch
by Wind Power Generation practices?
55.0 (3) 20.0 (2)
17. Will Renewable Energy provide better access of electricity to
rural regions?
53.3 (2) 1.7 (3)
18. What percentage of the global energy consumption do you think
we should manage to provide using renewable energy sources
within the next 30 years?
45.0 (2) 13.3 (1)
JOURNAL OF INTERNATIONAL ACADEMIC RESEARCH FOR MULT IDISCIPLINARY Impact Factor 1.393, ISSN: 2320-5083, Volume 1, Issue 10, November 2013
356 www.jiarm.com
ANALYSIS OF FREQUENCIES
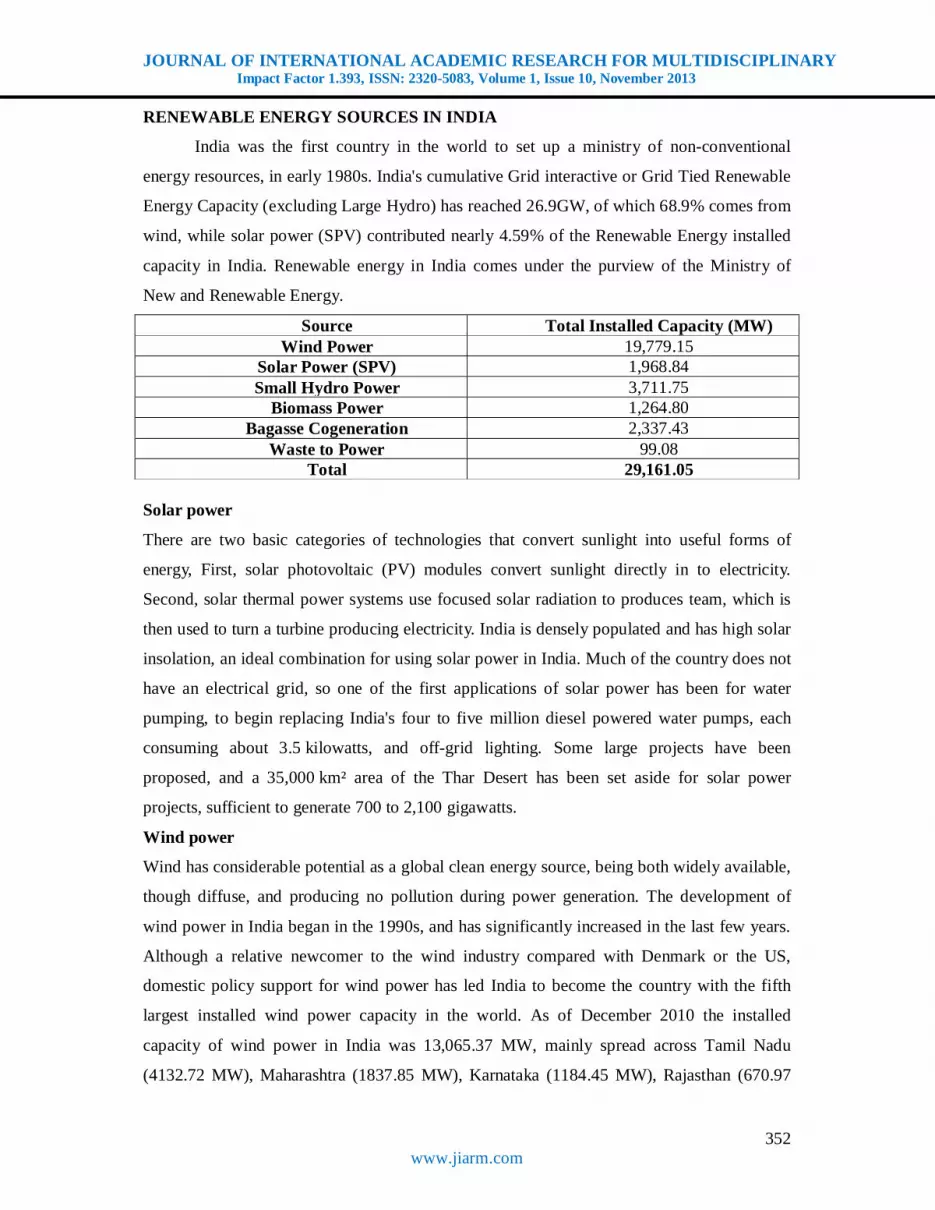
Figure 2: Aware or Not?
1. Yes, very much 2. No 3. Not much 4. To a limited extent 5. Can’t Say As per figure 2, the Frequency Distribution Histogram shows that people are mostly aware about renewable energy.
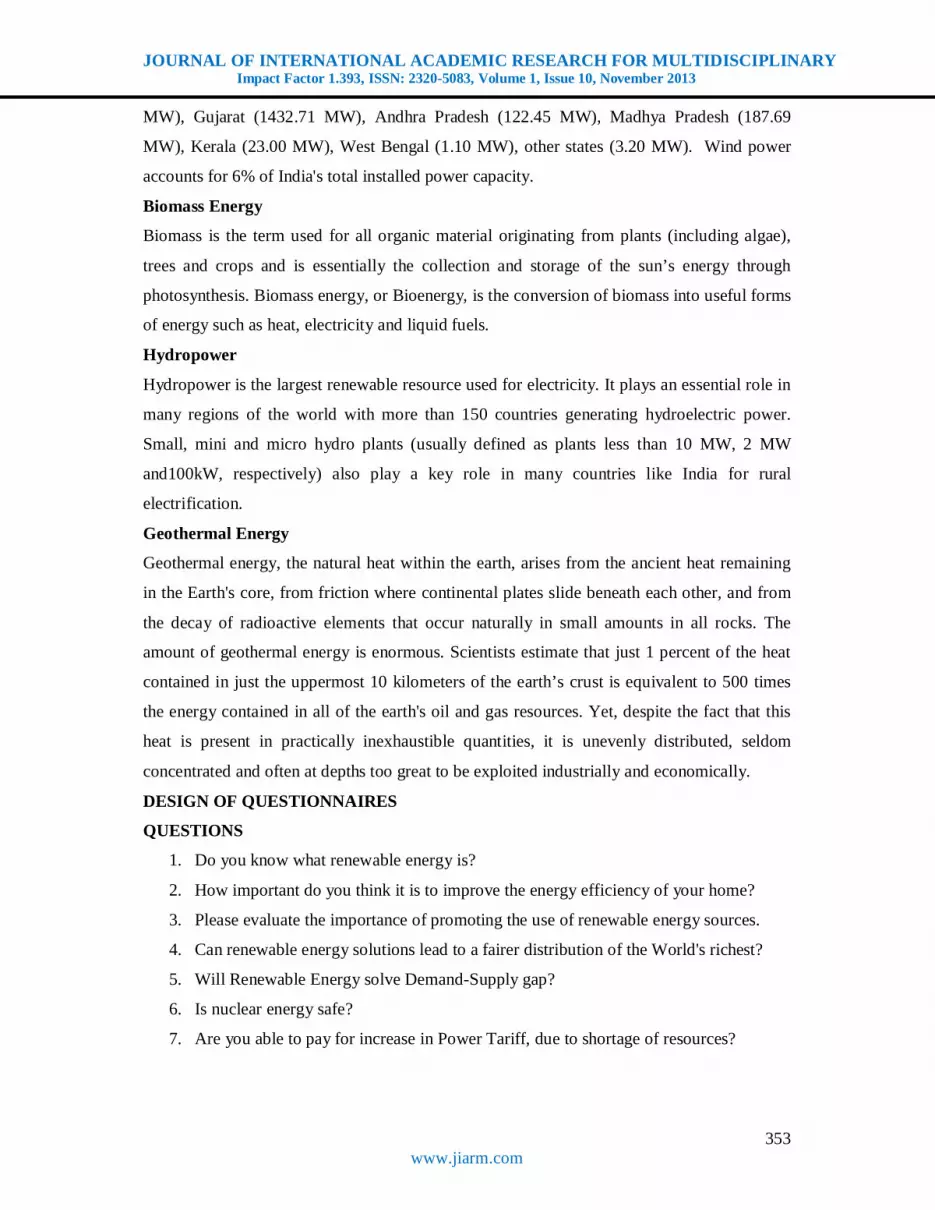
Figure 3: Energy Efficiency at Home 1. Unimportant 2. Important 3. Very important 4. Quite important 5. Can’t Say
As per figure 3, the Frequency Distribution Histogram shows that people are very much concerned about energy consumption at their home.

JOURNAL OF INTERNATIONAL ACADEMIC RESEARCH FOR MULT IDISCIPLINARY Impact Factor 1.393, ISSN: 2320-5083, Volume 1, Issue 10, November 2013
357 www.jiarm.com
Figure 4: Importance of Renewable Energy
1. Important 2. Not important 3. Very important 4. Quite important 5. Can’t Say As per figure 4, the Frequency Distribution Histogram shows that people are giving quite importance to renewable energy.
Figure 5: Can R.E. Differentiate any Countries Richness
1. Yes, very much 2. No 3. Not much 4. To a limited extent 5. Can’t Say As per figure 5, the Frequency Distribution Histogram shows that Renewable Energy can differentiate any countries Richness up to some extent.

JOURNAL OF INTERNATIONAL ACADEMIC RESEARCH FOR MULT IDISCIPLINARY Impact Factor 1.393, ISSN: 2320-5083, Volume 1, Issue 10, November 2013
358 www.jiarm.com
Figure 6: Solution to Demand – Supply Gap
1. Yes, very much 2. No 3. To a limited extent 4. Can’t Say As per figure 6, the Frequency Distribution Histogram shows that Renewable Energy can solve Demand-Supply Gap up to a limited extent.
Figure 7: Is Nuclear Energy Safe?
1. Yes 2. No 3. To a limited extent 4. Can’t Say As per figure 7, the Frequency Distribution Histogram shows that people are not considering Nuclear Energy a safe option for Energy Generation, may be due to its vulnerability during Natural Disaster & subsequently safety of people in vicinity.

JOURNAL OF INTERNATIONAL ACADEMIC RESEARCH FOR MULT IDISCIPLINARY Impact Factor 1.393, ISSN: 2320-5083, Volume 1, Issue 10, November 2013
359 www.jiarm.com
Figure 8: Able to Pay Increase in Power Tariff
1. Yes 2. No 3. To a limited extent 4. Can’t Say As per figure 8, the Frequency Distribution Histogram shows that people are able to pay increase in power tariff. But, some are not able to pay increase in power tariff, which can be curbed by adoption of renewable energy.
Figure 9: Adopt or Not if Grant is Available
1. Yes 2. No 3. Up to some extent 4. Don’t know 5. Can’t Say As per figure 9, the Frequency Distribution Histogram shows that people can afford to renewable energy up to some uses like Solar Awnings, Solar Chargers, etc.at their home, if the grant is available.
JOURNAL OF INTERNATIONAL ACADEMIC RESEARCH FOR MULT IDISCIPLINARY Impact Factor 1.393, ISSN: 2320-5083, Volume 1, Issue 10, November 2013
360 www.jiarm.com
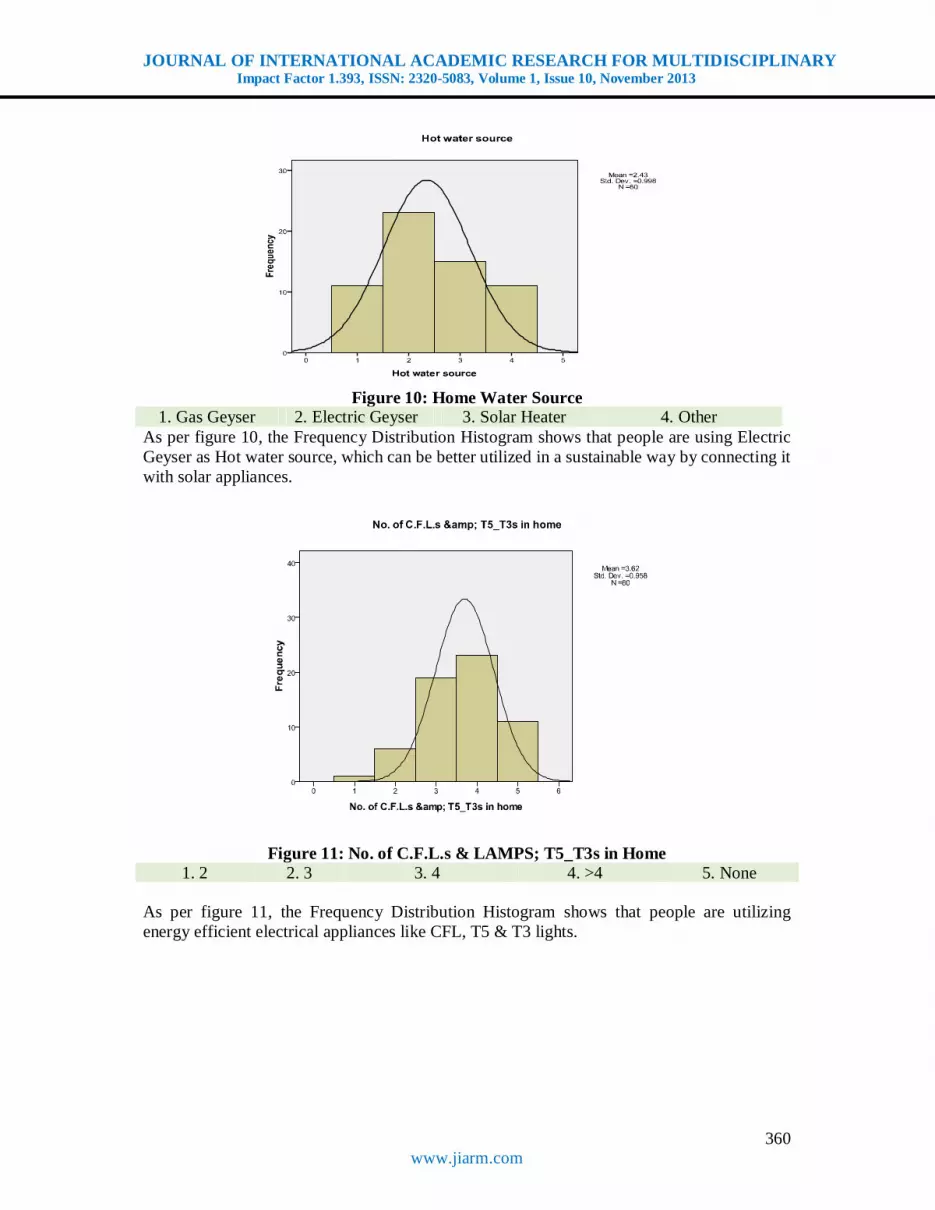
Figure 10: Home Water Source
1. Gas Geyser 2. Electric Geyser 3. Solar Heater 4. Other As per figure 10, the Frequency Distribution Histogram shows that people are using Electric Geyser as Hot water source, which can be better utilized in a sustainable way by connecting it with solar appliances.
Figure 11: No. of C.F.L.s & LAMPS; T5_T3s in Home 1. 2 2. 3 3. 4 4. >4 5. None
As per figure 11, the Frequency Distribution Histogram shows that people are utilizing energy efficient electrical appliances like CFL, T5 & T3 lights.

JOURNAL OF INTERNATIONAL ACADEMIC RESEARCH FOR MULT IDISCIPLINARY Impact Factor 1.393, ISSN: 2320-5083, Volume 1, Issue 10, November 2013
361 www.jiarm.com
Figure 12: Cooking Source 1. Electricity 2. Gas 3. Solid Fuel 4. Solar Cooker with combination of above
As per figure 12, the Frequency Distribution Histogram shows that people are utilizing Gas as a source of cooking, but some are utilizing Solar Cooker with a combination of the other resource. They are also showing interest in adoption of Solar Cooker.
Figure 13: Application of Solar Panels in Your Home
1. Yes 2. No 3. To a limited extent 4. Can’t Say As per figure 13, the Frequency Distribution Histogram shows that people are considering the application of solar panels in their home up to a limited extent.

JOURNAL OF INTERNATIONAL ACADEMIC RESEARCH FOR MULT IDISCIPLINARY Impact Factor 1.393, ISSN: 2320-5083, Volume 1, Issue 10, November 2013
362 www.jiarm.com
Figure 14: Reduction in Dependence on Other Energy Sources
1. Yes, very much 2. No 3. Not much 4. To a limited extent 5. Can’t Say As per figure 14, the Frequency Distribution Histogram shows that renewable resources reduce the dependence on other energy resources like coal, etc. for energy generation.
Figure 15: Scope of Sustainable Infrastructure in Our Country
1. Yes 2. No 3. To a limited extent 4. Can’t Say As per figure 15, the Frequency Distribution Histogram shows that people are considering renewable energy as a source of sustainable development in our country.

JOURNAL OF INTERNATIONAL ACADEMIC RESEARCH FOR MULT IDISCIPLINARY Impact Factor 1.393, ISSN: 2320-5083, Volume 1, Issue 10, November 2013
363 www.jiarm.com
Figure 16: Agricultural Development possible or not?
1. Yes 2. No 3. To a limited extent 4. Can’t Say As per figure 16, the Frequency Distribution Histogram shows that Renewable Energy providesbest alternative for Agricultural Development as it can provide 24*7 energy supply
Figure 17: Rate Development of Regions like Kutch by Wind Power Applications
1. Good 2. Very Good 3. Excellent 4. Worst 5. Can’t Say As per figure 17, the Frequency Distribution Histogram shows that people are considering development of the region like Kutch as an excellent opportunity of development of such region which is emerging as the best place for utilization of natural resources.

JOURNAL OF INTERNATIONAL ACADEMIC RESEARCH FOR MULT IDISCIPLINARY Impact Factor 1.393, ISSN: 2320-5083, Volume 1, Issue 10, November 2013
364 www.jiarm.com
Figure 18: Better Access to Electricity by Rural Regions
1. Yes 2. No 3. To a limited extent 4. Can’t Say As per figure 18, the Frequency Distribution Histogram shows that renewable energy will play an important role in development of Rural India by providing 24*7 electricity and all kinds of thing.
Figure 19: % of Adoption in the World Expected
1. 10 - 30% 2. 30 - 50% 3. 50% - 70% 4. Above 70% 5. Can’t Say As per figure 19, the Frequency Distribution Histogram shows that researches are expected to develop around 30-50% of total energy by Renewable Energy in next 30 years.

JOURNAL OF INTERNATIONAL ACADEMIC RESEARCH FOR MULT IDISCIPLINARY Impact Factor 1.393, ISSN: 2320-5083, Volume 1, Issue 10, November 2013
365 www.jiarm.com
CONCLUSIONS
Following conclusions are drawn from the frequency distribution analysis:
1. Most of people are aware about the Renewable energy resources & they had shown
very positive response towards its acceptance.
2. People think that it is very important to improve the energy efficiency at home, first
and its importance of promoting the use of renewable energy sources are quite
important.
3. Renewable energy solution can lead to a fairer distribution of the world’s richest, too.
Because it is simultaneously weighing up its environment’s sustainability.
4. Renewable energy solutions can solve demand-supply gap to a limited extent. Such
kind a energy source depends on natural resources, thus leads to considerable
reduction in demand-supply gap by generating considerable energy.
5. Users are able to pay for increase in power tariff, due to shortage of resources. But,
there is a limit of acceptance for such kind a matter. It also depends on the economic
class of people, too. Because in India, there the cost of implementing renewable
power sources’ appliances is still on higher side.
6. If there will be a grant available, it would encourage users to improve the energy
efficiency.
7. People mostly use natural gas for cooking. Hence, by utilization of Solar Cooker will
reduce the requirement of natural gas for cooking.
8. They would also consider the application of Solar Panels to utilize solar energy in
power generation for household power needs which will ultimately reduce the burden
of supply-demand gap.
9. Renewable energy solution will be able to help free us from depending on the use of
petroleum and other fossil fuels.
10. Such kind a Sustainable Infrastructure resources are considered to be the most
favourable option, too for the economic growth of our country.
11. Renewable energy will provide a better platform for agricultural development in rural
India, as it will ensure farmer the cheaper power options, elimination of power cuts,
his dependency on power from Government, etc. Thus, better Renewable Energy
System can provide 24*7 power supply to farmer which will ultimately increases
yields from his farm, too.

JOURNAL OF INTERNATIONAL ACADEMIC RESEARCH FOR MULT IDISCIPLINARY Impact Factor 1.393, ISSN: 2320-5083, Volume 1, Issue 10, November 2013
366 www.jiarm.com
12. People appreciate excellent development of regions like Kutch, Gujarat, India by
Wind Power Generation practices and would also like to develop their regions in the
same way.
13. Renewable energy will provide better access of electricity to rural regions which will
enhance the communication channel between Urban India and Rural India.
14. So, the companies producing Renewable Energy based products have great scope in Gujarat state of India.
REFERENCES
1. Ashish H. Makwana, Prof. Jayeshkumar Pitroda (2013), “A Study on Region wise Price Variation of Construction Raw Materials using Frequency Analysis through SPSS Software” International Journal of Engineering Trends and Technology (IJETT), ISSN: 2231-5381, Volume-4, Issue-7, July 2013/3233-3242
2. Hitesh D. Bambhava, Prof. Jayeshkumar Pitroda, Prof. Jaydev J. Bhavsar (2013), “A Comparative Study on Bamboo Scaffolding And Metal Scaffolding in Construction Industry Using Statistical Methods”, International Journal of Engineering Trends and Technology (IJETT) – Volume 4, Issue 6, June 2013, Pg.2330-2337.
3. http://en.wikipedia.org/wiki/Renewable_energy_in_India 4. P. Ganesh Prabhu, D. Ambika, “Study on Behaviour of Workers in Construction
Industry to Improve Production Efficiency”, International Journal of Civil, Structural, Environmental and Infrastructure Engineering Research and Development (IJCSEIERD), ISSN 2249-6866 Vol. 3, Issue 1, Mar 2013, 59-66, © TJPRC Pvt. Ltd.
5. Richard A Johnson, “Miller & Freund’s Probability and Statistics for Engineers”, Seventh Edition, Prentice-Hall of India Private Limited, New Delhi-110 001, 2005