a structural vector autoregressive (svar) model for the hungarian labour market
TRANSCRIPT
Mnb WoRking papeRS
2010/11
Zoltán M. Jakab–Éva kaponya
a Structural vector autoregressive (SvaR) Model for the Hungarian labour market

a Structural vector autoregressive (SvaR) Model for the Hungarian labour market
november 2010
This paper contains research conducted within the Wage Dynamics Network (WDN). The WDN is a research network consisting of economists from the European Central Bank (ECB) and the national central banks (NCBs) of the EU countries. The WDN aims at studying in depth the features and sources of wage and labour cost dynamics and their implications for monetary policy. The specific objectives of the network are: i) identifying the sources and features of wage and labour cost dynamics that are most relevant for monetary policy and ii) clarifying the relationship between wages, labour costs and prices both at the firm and macroeconomic level. The Hungarian research projects conducted within the WDN are published either in the MNB Working Paper series or as MNB Occasional Paper. Some of the studies are also available as ECB Working Paper.
Published by the Ma gyar Nem ze ti Bank
Sza bad ság tér 8–9, H–1850 Bu da pest
http://www.mnb.hu
ISSN 1585 5600 (online)
The MNB Working Paper series includes studies that are aimed to be of in te rest to the academic community, as well as
researchers in central banks and elsewhere. Start ing from 9/2005, articles undergo a refereeing process, and their
publication is supervised by an editorial board.
The purpose of publishing the Working Paper series is to stimulate comments and suggestions to the work prepared
within the Ma gyar Nem ze ti Bank. Citations should refer to a Ma gyar Nem ze ti Bank Working Paper. The views
expressed are those of the authors and do not necessarily reflect the official view of the Bank.
MNB Working Papers 2010/11
a Structural vector autoregressive (SvaR) Model for the Hungarian labour market*
(A magyar munkaerôpiac egy strukturális vektor-autoregresszív [SVAR] modellje)
Written by: Zoltán M. Jakab**–Éva Kaponya***
* We are grateful to Gábor Kátay, István Kónya and Balázs Vonnák for their valuable comments and suggestions and to Zoltán Reppa for his essential technical support. All views expressed here are those of the authors and do not necessarily reflect the official view of the Office of Fiscal Council and that of the Magyar Nemzeti Bank.
** Office of Fiscal Council, Republic of Hungary (Director for Macroeconomic Analysis).*** Magyar Nemzeti Bank (the central bank of Hungary), (Economist, Monetary Strategy and Economic Analysis).
Abstract � 5
Introduction� � 6
1Themodelwithsignrestrictions � 7
1.1�Data�used� 7
1.2��Methodology� � 7
2Results� � 9
2.1��Impulse�responses�� � 9
2.2��Comparison�with�other�DSGE�models� � 12
3HistoricalanalysisonthedrivingforcesoftheHungarianlabourmarket�� 14
3.1��Employment,�real�wages�and�output� � 14
3.2��Inflation�and�interest�rate� � 15
3.3��Comparison�of�historical�decompositions�in�DSGE�models� � 15
Conclusions� � 16
References� � 17
Appendix� � 18
Appendix�A� � 18
Appendix�B� � 19
Appendix�C� � 22
Appendix�D� � 24
MNB WORKING PAPERS • 2010/1 3MNB WORKING PAPERS • 2010/11
Contents

MNB WORKING PAPERS • 2010/11 5
This paper presents a Structural Vector Autoregressive (SVAR) model with particular attention to the Hungarian labour market. The identification of structural shocks is based on sign restrictions. We identify four structural shocks: a labour supply, an aggregate supply, an aggregate demand and a monetary policy shock. It is worth emphasising that a negative labour supply shock cannot be distinguished from minimum wage hikes in this model. Impulse response analysis shows that after an aggregate supply shock, real wages react more persistently and to a greater extent than prices. In addition, aggregate supply and monetary policy shocks induce relatively strong reactions on the real side of the economy. Unlike in estimated DSGE models for Hungary, we found a positive response of employment with respect to monetary policy shock. All impulse responses are estimated to be less persistent than in the SVAR model estimated using eurozone data pointing to a more flexible Hungarian economy. Our impulse responses are closer to the DSGE model of Jakab and Világi (2008) and Baksa, Benk and Jakab (2009) than to the model of Jakab and Kónya (2009) which describes a relatively rigid labour market. Historical decomposition exercises revealed the presence of positive labour supply shocks between 2003 and 2006. The other important factor in explaining employment was aggregate supply shock. Neither monetary nor aggregate demand shocks contributed significantly to employment fluctuations.
JEL: C11, C32, E24, J01.Keywords: Bayesian, VAR, employment, inflation, wage, labour economics.
Jelen tanulmányban a magyar munkaerőpiac egy strukturális vektor-autoregresszív (SVAR) modelljét mutatjuk be. A négy strukturális sokkot – úgymint munkakínálati, aggregált keresleti, aggregált kínálati és monetáris politikai sokk – az előjelmeg-kötés módszerével becsültük meg. Megjegyzendő, hogy modellünkben a negatív munkakínálati sokk nem választható külön a minimálbér-emelések sokkjától. Az impulzus válaszfüggvények alapján elmondható, hogy az aggregált kínálati sokk esetében a reálbérek nagyobb mértékben és perzisztensebben reagálnak, mint az árak. Emellett, mind az aggregált kínálati, mind a monetáris politikai sokknak jelentős reálgazdasági hatása van. Az eddigi Magyarországra becsült DSGE-modellekkel ellentét-ben keretrendszerünkben a monetáris lazítás a foglalkoztatás emelkedését vonja maga után. Az eurozóna eredményeivel összevetve, az impulzus válaszfüggvények kisebb perzisztenciát mutatnak, ami a magyar gazdaság nagyobb fokú rugalmassá-gára utalhat. A hazai irodalom körében eredményeink a Jakab–Világi (2008), illetve a Baksa–Benk–Jakab (2009) által becsült modellekhez esnek közelebb, semmint a relatíve rigidebb munkaerőpiacot leíró Jakab–Kónya (2009) modellhez. A foglalkoz-tatás alakulásában a historikus dekompozíció alapján 2003 és 2006 között nagymértékű pozitív munkakínálati sokk játszott szerepet. Másik jelentős tényezőjeként az aggregált kínálat sokk jelölhető meg. Mindeközben sem a monetáris politikai, sem az aggregált keresleti sokk nem járult hozzá számottevően ezen változó alakulásához.
Abstract
Összefoglalás
MNB WORKING PAPERS • 2010/116
In this paper we estimate a Structural Vector Autoregressive Model (SVAR) for Hungary with particular respect to labour market behaviour. As presented in our paper, different empirical analyses of the labour market produce ambiguous and sometimes contradictory results. These results were often based on relatively complex restrictions. Former models dealing with labour market issues either contain predetermined restrictions which strongly affect the outcome – for example, the scope of empirical questions to be answered is quite narrow – or micro-based estimates which are not able to reflect problems arising at the macro level.
The behaviour of labour market variables at the macro level was so far analysed by relatively large structural models for Hungary. Except for the DSGE model with search-and-matching frictions by Jakab and Kónya (2009), other models, such as Jakab and Világi (2008) or Baksa, Benk and Jakab (2009) or the macroeconomic model of the central bank of Hungary (Benk et al., 2006) were used for general purposes and not specifically to understand labour market. In addition, empirical macro evidence using time series techniques (e.g. Vonnák, 2007) focused more on monetary transmission instead of labour market behaviour. In this paper, we try to fill this knowledge gap by estimating a time series model.
In order to arrive at a more balanced view we opted for a model with the least number of theoretical restrictions, thus giving more emphasis to time series properties of the data. In our view, using a limited number of structural restrictions can help in choosing between different models. In addition, our model is also able to deal (or estimate) the effects of the three major minimum wage increases in Hungary. So far, empirical evidence on this topic was rather limited.
Our agnostic approach – namely, estimating a relatively small VAR model with limited number of restrictions – has the advantage that it can serve as a baseline which structural models should be compared to. We applied sign restrictions analogous to Peersman and Straub (2004) in order to identify four structural shocks: labour supply, aggregate supply, aggregate demand and monetary policy shock. Due to the similar identification strategy, our results are comparable to those of Peersman and Straub (2004).
The rest of this paper is structured as follows. The first section describes the specification of the model. Section 2 deals with impulse response analysis. Then in Section 3 we present the historical shock decompositions. Finally, Section 4 offers some conclusions.
Introduction
MNB WORKING PAPERS • 2010/11 7
Our analysis is based on a Structural Vector Autoregressive (SVAR) approach. This means that we intend to take an agnostic view on data. First, we estimate a reduced form VAR and then identify the economically meaningful shocks with a Bayesian sign-restriction approach advocated by Uhlig (2005).
We specified a model with five variables (core inflation, real wages, employment, value added, three-month benchmark interest rate) with four shocks identified from the possible five – namely labour supply (LS), aggregate supply (AS), aggregate demand (AD) and monetary policy (MP) shock. The remaining shock is referred to “non-defined” (or “nan”) shock in the followings.1
1.1DATAUSED
All data used are in levels and seasonally adjusted without any filtering or trend removal. Series are quarterly with a sample period 1995 Q1–2008 Q4.
In the case of inflation we used the underlying core inflation instead of CPI. The indicator excludes the items with high price volatility – such as unprocessed food, fuel, energy – administered prices, as well as the effect of changes in indirect taxes on the remaining components.
Employment data refers to the private sector and is based on institutional statistics, which originates from companies’ reports about the number of employees. Companies with a headcount of more than 50 are obliged to report to the Central Statistical Office (CSO) both the number of employees as well as costs related to hiring (wages, taxes, etc). The employment data for firms with more than 5 but less than 50 employees are measured with representative sampling.
Regarding private sector earnings, there is only one available source of statistics, namely the institutional wage and employment survey launched by the Hungarian CSO. However, due to several measures affecting the labour market, the data contains certain distorting factors which should be eliminated or handled somehow in order to assess the real underlying process of wage development. The legislative measures – such as minimum wage hikes, the rise in social security contribution – were not filtered out in advance. Because of the high-scaled uncertainty, we did not extract the effect of possible whitening in wage indices followed by the changed regulations aimed the reduction of black economy.2 On the contrary, we handled the changed seasonality of bonus payments. The timing of payments is mainly influenced by tax-optimizing considerations, thus the re-arrangement between two consecutive months could be observed – and corrected – at some points. The effect and treating of minimum wage hikes will be discussed later. During the estimations we used gross real wages for the private sector – filtering out the mentioned timing effects – deflated by the above described core inflation.
Output is measured as private sector value added (excluding the agricultural sector) calculated by national accounts. Interest rate is the 3-month benchmark rate.
For further specifications estimated see Appendix A.
1.2METHoDology
By estimating the reduced form model we used the variables up to the second lags. The optimal lag length was implied by standard Bayesian information criteria. Even with 2 lags some higher order autocorrelation remained in the residuals, but we
1��Given� the� sign� restrictions� applied� for� the� four� economically� meaningful� and� supposed� to� be� investigated� shocks,� the� fifth� one� could� not� be� identified� as� one�particular�set�of�restrictions.�Labour�market�and�aggregate�supply�shocks,�as�well�as�aggregate�demand�and�monetary�policy�shocks�pair-wise�exclude�the�possibility�to�determine�another�shock�based�on�the�same�three�restrictions.�Therefore,�the�sings�of�impulse�responses�may�differ�in�terms�of�non�restricted�variables�in�case�of�each�draw�of�the�simulation.
2��About�the�possible�whitening�of�wages�took�place�in�Hungary�see�Eppich,�Gy.�and�Sz.�Lőrincz�(2007):�“Three�methods�to�estimate�the�whitening-related�distortion�of�the�wage�statistics”,�MNB Occasional Papers�66.
1Themodelwithsignrestrictions
MAGYAR NEMZETI BANK
MNB WORKING PAPERS • 2010/118
did not involve more lags. The reason for this was that such a VAR would require the estimation of lots of additional parameters and due to our short sample size this would generate significant loss in the power of the estimation.
The second step of the estimation is to identify structural shocks. The method follows that of Uhlig (2005). The logic is to find a decomposition of the variance-covariance matrix such that the shocks become orthogonal. There are several orthogonal decompositions of the reduced form variance-covariance matrix, but it can be shown that if we find a decomposition for which our a priori restrictions on the sign of impulse responses hold, then there exists a rotation matrix which transforms our shock-space to another one. Hence, by generating a large enough number of random rotation matrices one can approximate the distribution of impulse responses and variance decompositions for which the sign restrictions hold.
The applied sign restrictions are based on Peersman and Straub (2004) which used a minimal number of restrictions, including only those which are also consistent with real business cycle and sticky price theories. Because of the high-level similarities between the two models, the results are easily comparable to those of Peersman and Straub (2004), which we will discuss in the next section.
In practice, we draw three random matrices. First, we draw a random matrix from the reduced form parameter matrix with elements of asymptotic normal distribution with mean and variance equal to the estimated ones. Second, again an asymptotically normally distributed matrix around the estimated variance-covariance matrix is applied. Thus, we draw a uniformly distributed rotation matrix.3 After these, we calculate the impulse responses and keep them if all restrictions are satisfied. We repeated this until we arrived at one hundred satisfactory impulse responses.
Here we have to note that labour supply shock may also include the effect of minimum wage hikes. The restrictions applied are just as valid for a possible negative labour supply shock as an act of minimum wage hike. On the one hand, due to restrictions imposed this shock could be perceived as a classical labour supply shock – i.e. higher activity is reflected in higher employment, which makes value added grow and forces real wages to decline. On the other hand we can think of it as an exogenous wage shock, like a statutory minimum wage hike – which took place several times in Hungary. Elevated wages force firms to hire less or dismiss employees and, as a consequence, output falls. Hence this identification scheme does not enable us to fully disentangle these two economically very different shocks. During the analyses we have to keep in mind that the results referring to labour supply shocks might be a combination of classical labour supply shock and other measures affecting minimum wages.
By choosing the best model from the sub-specifications introduced in Appendix A, we weighted the significance of impulse responses and the fit of unconditional model forecast. We preferred the reviewed model by this criterion.
3��For�more�details�about�Haar�distribution�see�Reppa�(2009).
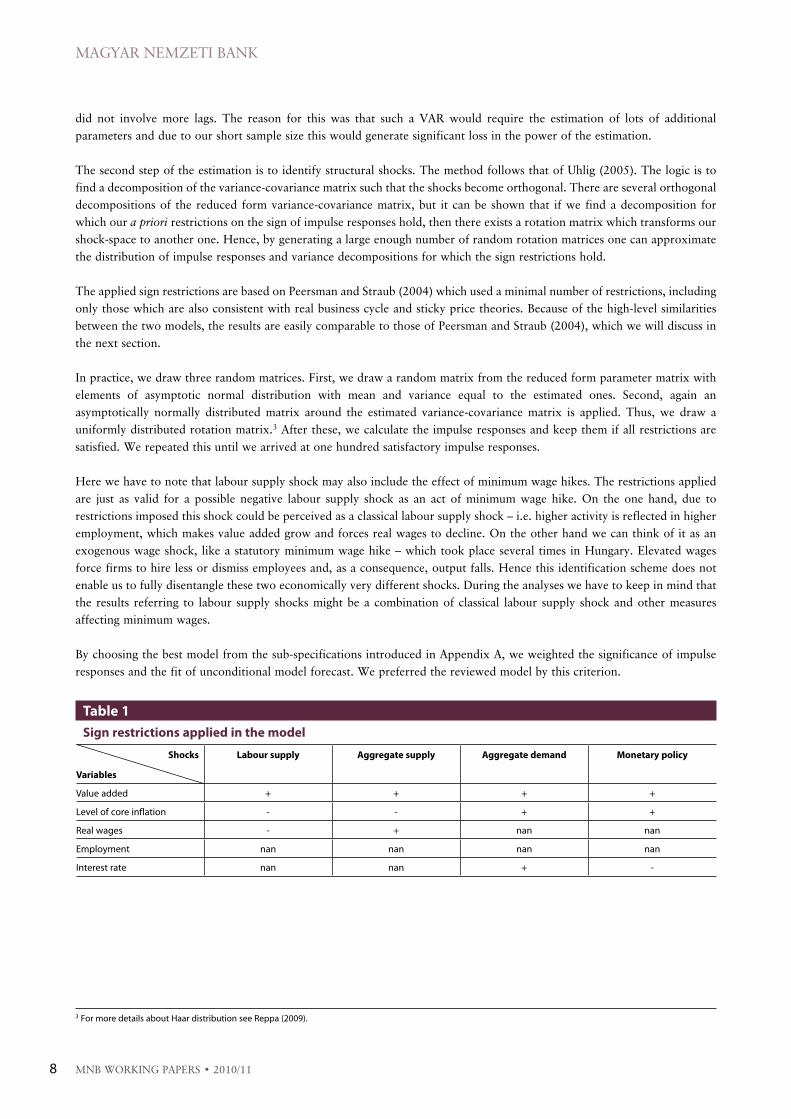
Shocks
Variables
laboursupply Aggregatesupply Aggregatedemand Monetarypolicy
Value�added + + + +
Level�of�core�inflation - - + +
Real�wages - + nan nan
Employment nan nan nan nan
Interest�rate nan nan + -
Table1 Signrestrictionsappliedinthemodel
MNB WORKING PAPERS • 2010/11 9
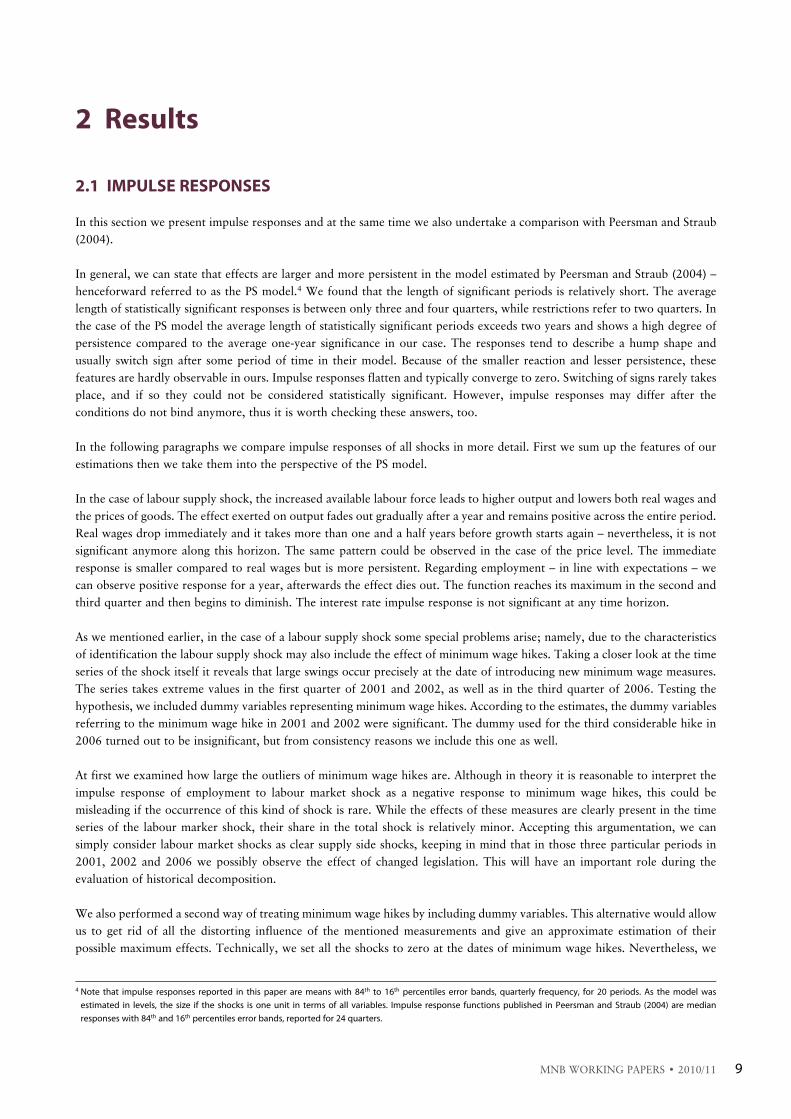
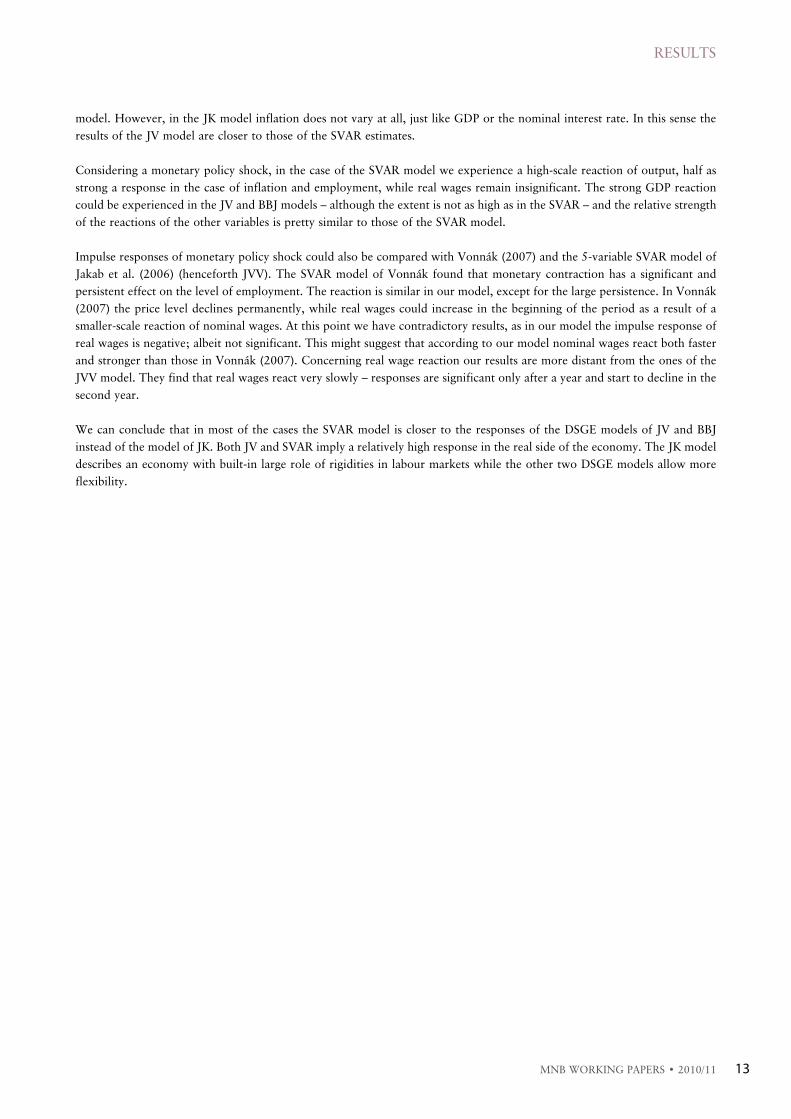
2.1IMpUlSERESponSES
In this section we present impulse responses and at the same time we also undertake a comparison with Peersman and Straub (2004).
In general, we can state that effects are larger and more persistent in the model estimated by Peersman and Straub (2004) – henceforward referred to as the PS model.4 We found that the length of significant periods is relatively short. The average length of statistically significant responses is between only three and four quarters, while restrictions refer to two quarters. In the case of the PS model the average length of statistically significant periods exceeds two years and shows a high degree of persistence compared to the average one-year significance in our case. The responses tend to describe a hump shape and usually switch sign after some period of time in their model. Because of the smaller reaction and lesser persistence, these features are hardly observable in ours. Impulse responses flatten and typically converge to zero. Switching of signs rarely takes place, and if so they could not be considered statistically significant. However, impulse responses may differ after the conditions do not bind anymore, thus it is worth checking these answers, too.
In the following paragraphs we compare impulse responses of all shocks in more detail. First we sum up the features of our estimations then we take them into the perspective of the PS model.
In the case of labour supply shock, the increased available labour force leads to higher output and lowers both real wages and the prices of goods. The effect exerted on output fades out gradually after a year and remains positive across the entire period. Real wages drop immediately and it takes more than one and a half years before growth starts again – nevertheless, it is not significant anymore along this horizon. The same pattern could be observed in the case of the price level. The immediate response is smaller compared to real wages but is more persistent. Regarding employment – in line with expectations – we can observe positive response for a year, afterwards the effect dies out. The function reaches its maximum in the second and third quarter and then begins to diminish. The interest rate impulse response is not significant at any time horizon.
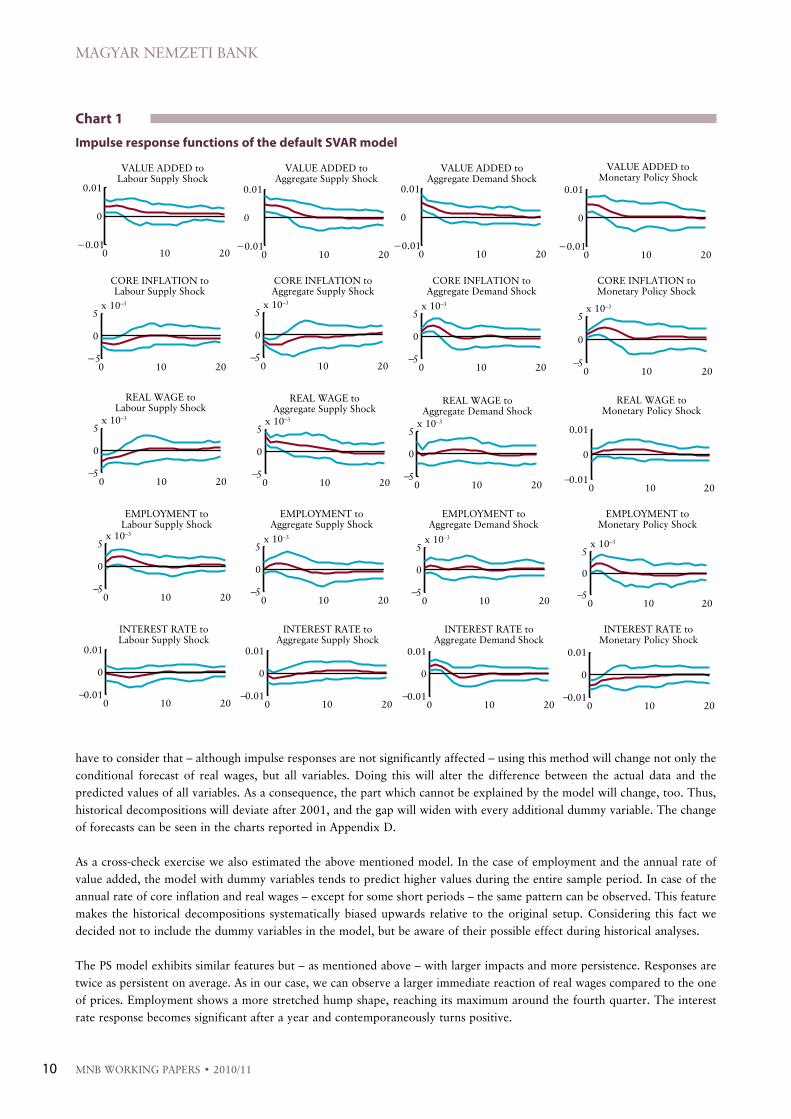
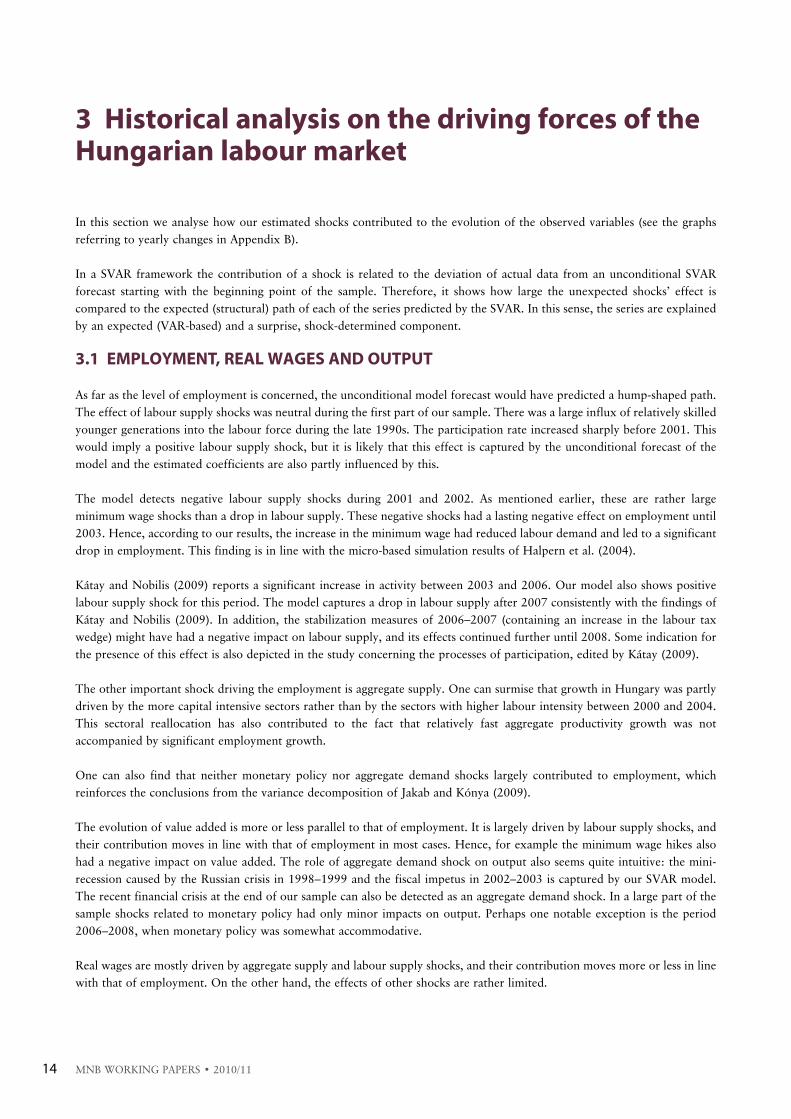
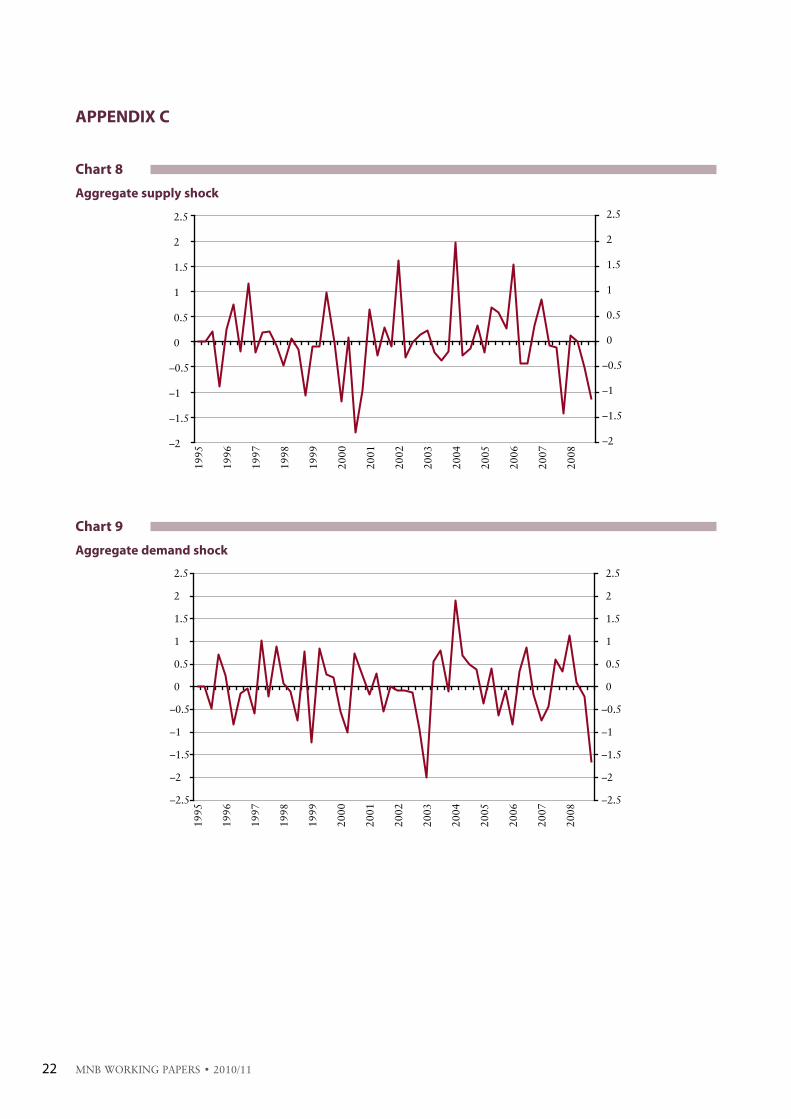
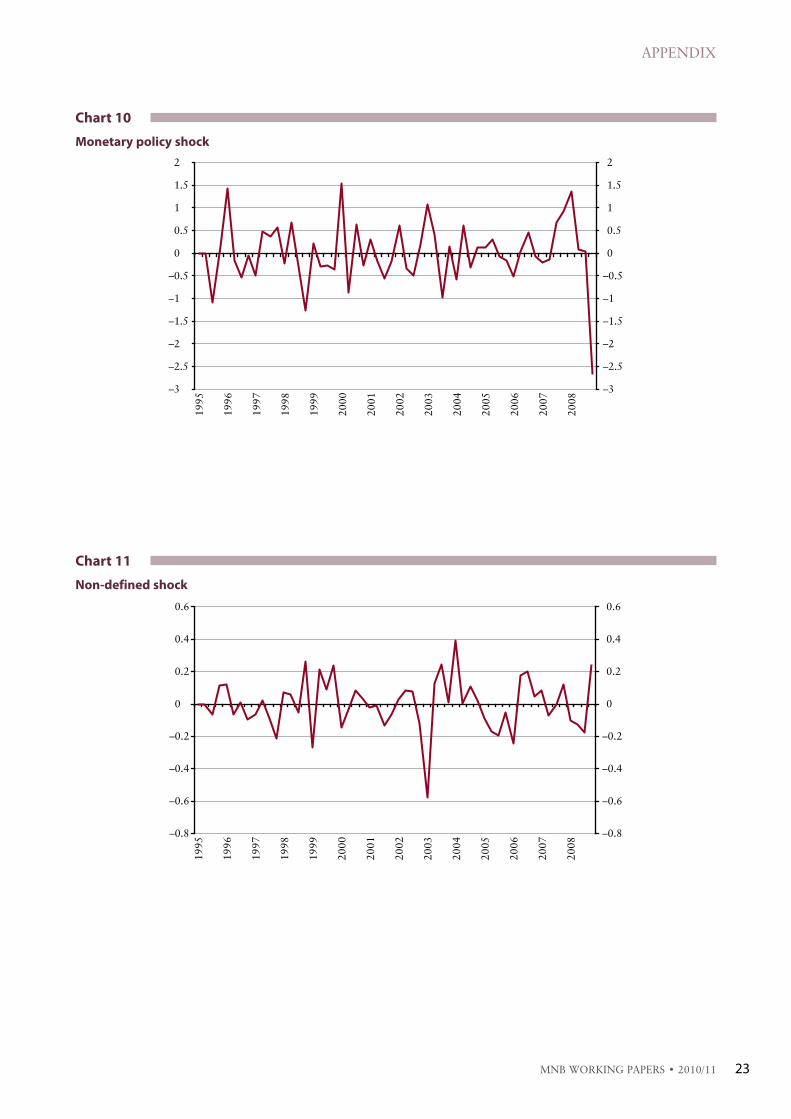
As we mentioned earlier, in the case of a labour supply shock some special problems arise; namely, due to the characteristics of identification the labour supply shock may also include the effect of minimum wage hikes. Taking a closer look at the time series of the shock itself it reveals that large swings occur precisely at the date of introducing new minimum wage measures. The series takes extreme values in the first quarter of 2001 and 2002, as well as in the third quarter of 2006. Testing the hypothesis, we included dummy variables representing minimum wage hikes. According to the estimates, the dummy variables referring to the minimum wage hike in 2001 and 2002 were significant. The dummy used for the third considerable hike in 2006 turned out to be insignificant, but from consistency reasons we include this one as well.
At first we examined how large the outliers of minimum wage hikes are. Although in theory it is reasonable to interpret the impulse response of employment to labour market shock as a negative response to minimum wage hikes, this could be misleading if the occurrence of this kind of shock is rare. While the effects of these measures are clearly present in the time series of the labour marker shock, their share in the total shock is relatively minor. Accepting this argumentation, we can simply consider labour market shocks as clear supply side shocks, keeping in mind that in those three particular periods in 2001, 2002 and 2006 we possibly observe the effect of changed legislation. This will have an important role during the evaluation of historical decomposition.
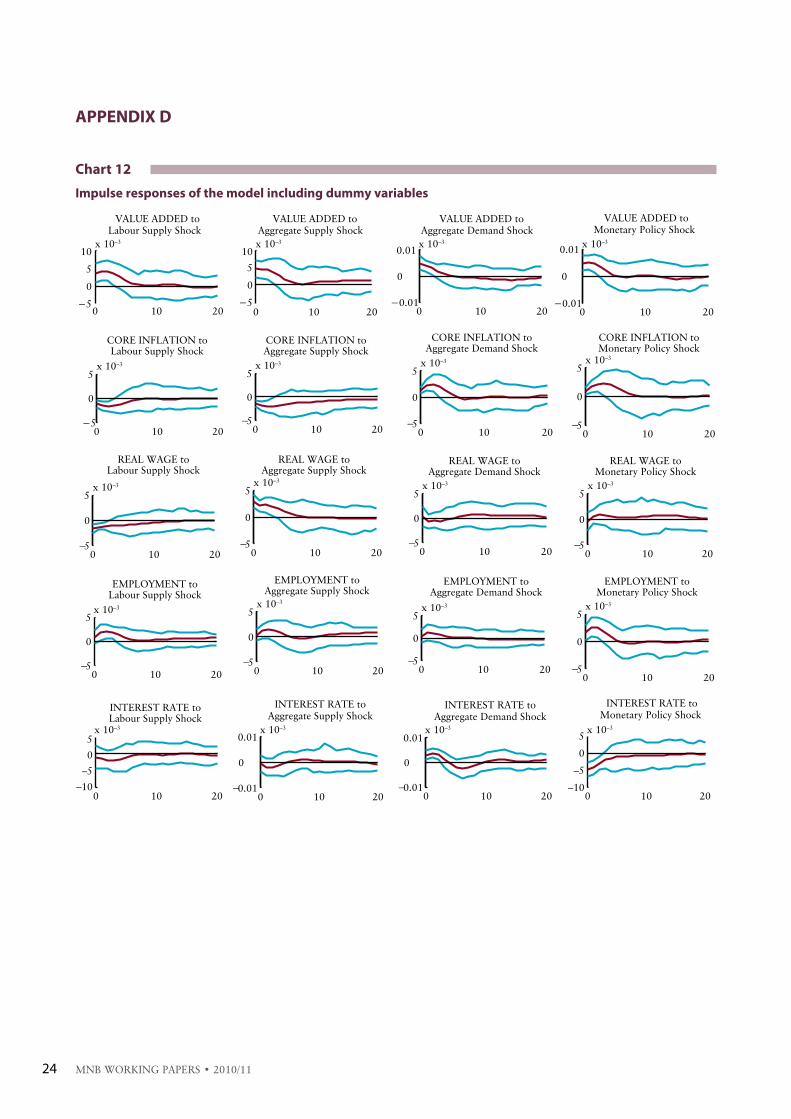
We also performed a second way of treating minimum wage hikes by including dummy variables. This alternative would allow us to get rid of all the distorting influence of the mentioned measurements and give an approximate estimation of their possible maximum effects. Technically, we set all the shocks to zero at the dates of minimum wage hikes. Nevertheless, we
4��Note� that� impulse� responses� reported� in� this� paper� are� means� with� 84th� to� 16th� percentiles� error� bands,� quarterly� frequency,� for� 20� periods.� As� the� model� was�estimated� in� levels,� the� size� if� the� shocks� is� one� unit� in� terms� of� all� variables.� Impulse� response� functions� published� in� Peersman� and� Straub� (2004)� are� median�responses�with�84th�and�16th�percentiles�error�bands,�reported�for�24�quarters.�
2Results
MAGYAR NEMZETI BANK
MNB WORKING PAPERS • 2010/1110
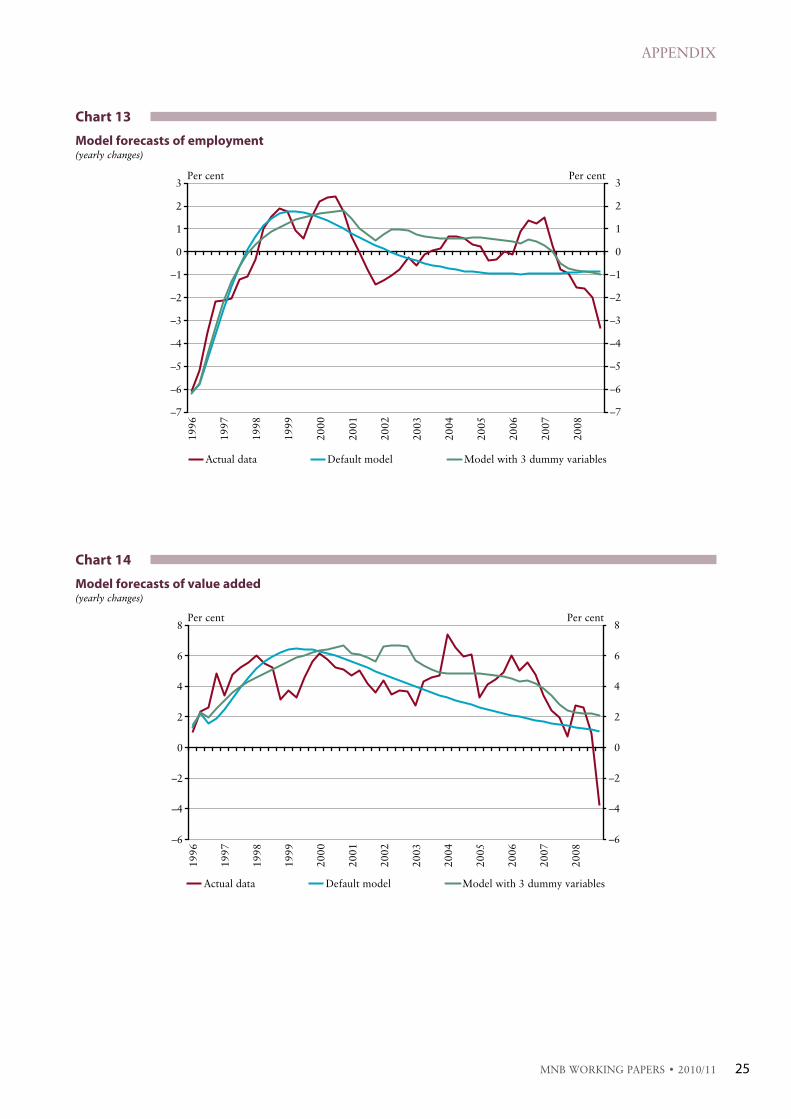
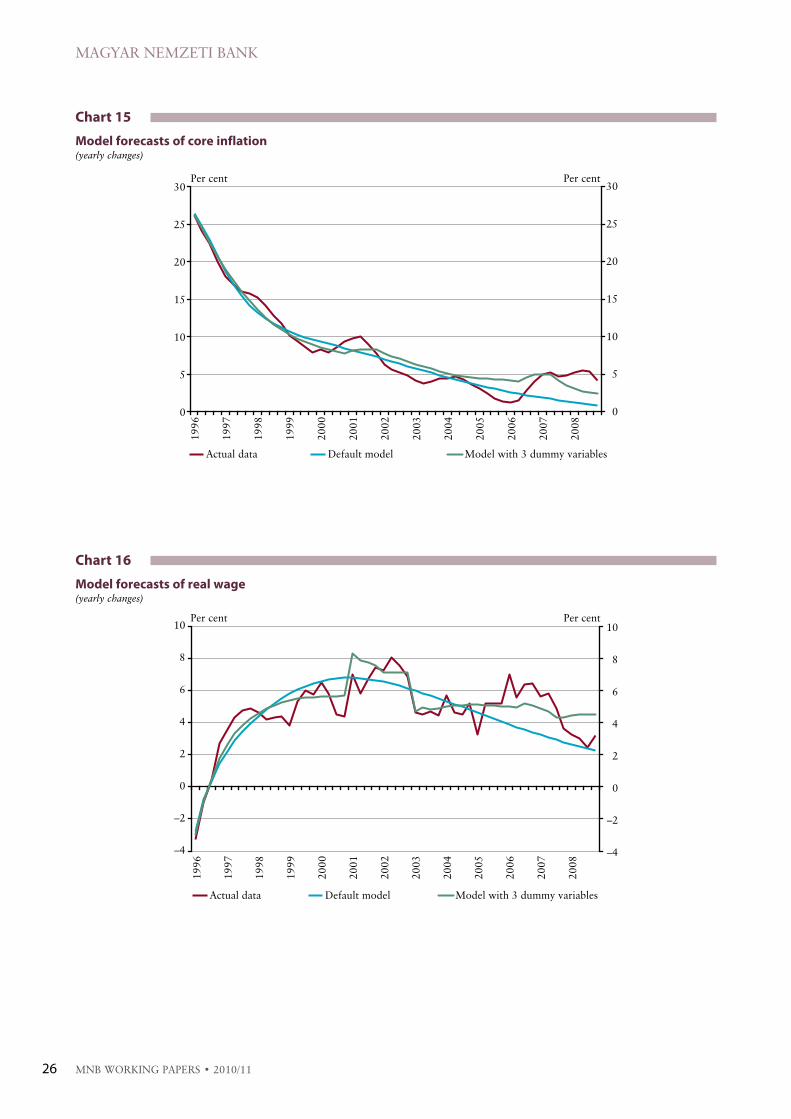
have to consider that – although impulse responses are not significantly affected – using this method will change not only the conditional forecast of real wages, but all variables. Doing this will alter the difference between the actual data and the predicted values of all variables. As a consequence, the part which cannot be explained by the model will change, too. Thus, historical decompositions will deviate after 2001, and the gap will widen with every additional dummy variable. The change of forecasts can be seen in the charts reported in Appendix D.
As a cross-check exercise we also estimated the above mentioned model. In the case of employment and the annual rate of value added, the model with dummy variables tends to predict higher values during the entire sample period. In case of the annual rate of core inflation and real wages – except for some short periods – the same pattern can be observed. This feature makes the historical decompositions systematically biased upwards relative to the original setup. Considering this fact we decided not to include the dummy variables in the model, but be aware of their possible effect during historical analyses.
The PS model exhibits similar features but – as mentioned above – with larger impacts and more persistence. Responses are twice as persistent on average. As in our case, we can observe a larger immediate reaction of real wages compared to the one of prices. Employment shows a more stretched hump shape, reaching its maximum around the fourth quarter. The interest rate response becomes significant after a year and contemporaneously turns positive.
Chart1
ImpulseresponsefunctionsofthedefaultSVARmodel
0 10 20−0.01
0
0.01
VALUE ADDED toLabour Supply Shock
0 10 20−0.01
VALUE ADDED toAggregate Supply Shock
0 10 20−0.01
0
0.01
VALUE ADDED toAggregate Demand Shock
0 10 20−0.01
0
0.01
VALUE ADDED toMonetary Policy Shock
0 10 20−5
0
5x 10⁻³
CORE INFLATION toLabour Supply Shock
0 10 20−5
0
5x 10⁻³
CORE INFLATION toAggregate Supply Shock
0 10 20−5
0
5x 10⁻³
CORE INFLATION toAggregate Demand Shock
0 10 20−5
0
5x 10⁻³
CORE INFLATION toMonetary Policy Shock
0 10 20−5
0
5x 10⁻³
REAL WAGE toLabour Supply Shock
0 10 20−5
0
5x 10⁻³
REAL WAGE toAggregate Supply Shock
0 10 20−5
0
5x 10⁻³
REAL WAGE toAggregate Demand Shock
0 10 20−0.01
0
0.01
REAL WAGE toMonetary Policy Shock
0 10 20−5
0
5x 10⁻³
EMPLOYMENT toLabour Supply Shock
0 10 20−5
0
5x 10⁻³
EMPLOYMENT toAggregate Supply Shock
0 10 20−5
0
5x 10⁻³
EMPLOYMENT toAggregate Demand Shock
0 10 20−5
0
5x 10⁻³
EMPLOYMENT toMonetary Policy Shock
0 10 20−0.01
0
0.01
INTEREST RATE toLabour Supply Shock
0 10 20−0.01
0
0.01
INTEREST RATE toAggregate Supply Shock
0 10 20−0.01
0
0.01
INTEREST RATE toAggregate Demand Shock
0 10 20−0.01
0
0.01
INTEREST RATE toMonetary Policy Shock
MNB WORKING PAPERS • 2010/11 11
RESULTS
The aggregate supply shock – referred to as technology shock in Peersman and Straub (2004) – is defined as a rise in output and real wages, but not in prices. According to our estimates responses are significant in a year horizon and gradually converge to zero. The reaction of real wages is higher and more persistent than that of the price level. While the remaining unrestricted variables are not significant, they move in the expected direction. Employment grows while the interest rate declines in the beginning then switches its sign after one and a half years.
The major difference with the results of the PS model concerns the response function of the price level. In that model it becomes positive after two years and grows steadily throughout the remaining period. This feature does not show in our model; the price level response converges to zero after a year and remains there. They found that employment has a significant response for three years, the effect reaching its maximum around the eighth quarter. In contrast, we experienced that this impact is not significant at all. The situation is similar in the case of interest rate: the PS model shows a significant – positive – response after a year, while in our model it is completely insignificant.
While the sign restrictions hold aggregate demand and monetary policy shocks both raise value added and lower inflation, they are different in terms of interest rate policy. In the case of an aggregate demand shock the monetary authority will react to the elevated price level with an interest rate hike, while during a monetary policy shock the central bank lowers the interest rate intentionally to give some boost to the economy.
According to our estimations, output reaches its maximum immediately and then gradually convergences to zero. The price level shows a certain hump shape, peaking in the second-third quarter. Real wages and employment do not react significantly at all. The interest rate shows a significant response in a year’s horizon.
Major differences relative to the PS model occur in the responses of the price level and employment. While in our model the price level forms a hump shape and after the peak the effect fades out relatively fast, in the PS model prices increase more and more rapidly at the beginning and then grow at a constant rate. Employment reacts positively in the PS model, but only for a year. We found this relationship insignificant. Regarding interest rate policy, the impulse response of PS suggests that it is decreasingly restrictive for two years. Unfortunately, in our model the interest rate reaction is significant only for the periods when restrictions hold.
Turning to the monetary policy shock we experienced that it affects output only in the short run. In contrast, the price level shows the largest persistence in this particular case. The reaction of real wages turned out to be statistically insignificant. Employment, however, reacts relatively sensitively – the extent is comparable with that of a labour market shock. The interest rate path gradually converges back to zero.
Chart2
labourmarketshocks–withandwithoutdummyvariables
–2.5
–2
–1.5
–1
–0.5
0
0.5
1
1.5
1995
1996
1997
1998
1999
2000
2001
2002
2003
2004
2005
2006
2007
2008
–2.5
–2
–1.5
–1
–0.5
0
0.5
1
1.5
Default model Model with 3 dummy variables
MAGYAR NEMZETI BANK
MNB WORKING PAPERS • 2010/1112
The results of Peersman and Straub (2004) are similar with output, employment and prices – apart from the extent of persistence. The interest rate response shows a significant correction after a year, which is not observed in our model at all.
To sum up, we can conclude that, as the number of restrictions is relatively high, the results concerning the signs of the responses are not surprising. A less favourable feature of our model is that impulse response functions converge back to zero pretty fast; moreover, after a horizon of one year they become insignificant. If we compare our results with those of Peersman and Straub (2004) we find that impulse responses have similar shapes, but they are considerably smaller and less persistent. Employment turned out to be significant only in the case of labour supply and monetary policy shocks, while in the PS model it always shows significant responses. The patterns of interest rate responses differ in these two particular cases, too. Generally speaking, we do not get contradictory results, but because of the relatively short period of significance the conclusions of our model are less powerful than those of Peersman and Straub (2004).
At this point we have to note that sample size is quite different in the two cases. While in the Peersman and Straub (2004) study the number of observations is 84, in our case it was only 56. Apart from this, the results described above could be explained by at least two theories.
First, we can suspect from the less persistent reactions that the Hungarian economy is more flexible than that of the euro area. Second, we can conclude that the data contain less information in case of Hungary. The large part of insignificant periods and small-scale reactions suggest that linkages are not particularly strong. In fact, the data itself suffer various kinds of measurement errors. Wage statistics are especially sensitive to regulations and tax-optimizing considerations which are hardly controllable.
2.2CoMpARISonwITHoTHERDSgEMoDElS
In this section we carry out a short comparison of our SVAR model’s impulse response functions and those of three small, open economy DSGE models focusing on the Hungarian economy. The first one is the model of Jakab and Világi (JV); the second is the Jakab and Kónya model (JK), which is augmented with search-and-matching frictions on the labour market side. The third one is based on Baksa, Benk and Jakab (2009) (henceforth BBJ), a one-sector DSGE model with fiscal policy.5 During this exercise we identify the main similarities and differences among the four models.
In the case of a positive productivity shock in every model value added begins to rise and the effect fades out gradually, while price level and nominal interest rate decline. As a result of the applied restrictions, in the SVAR model real wages rise immediately and converge back to zero slowly. The three DSGE models give different reactions. While in the JV and the BBJ models the impulse response function shows a massive hump shape with a maximum effect at one or one and a half years, the JK model implies at first some drop in the level of real wages and then a gradual increase after a year’s horizon. Moreover, all DSGE models find that employment reacts negatively to a positive productivity shock, which is in line with Galí (1999) and in contrast to standard real business cycle (RBC) models and points to the strong role of nominal rigidities. Nevertheless, our SVAR model found an impulse response closer to the RBC view.
Aggregate demand shocks raise output and inflation in all models.6 Nevertheless, real wages behave quite differently. In the SVAR model the reaction is almost zero and insignificant. In the JK model they increase and their reaction is strong compared to either the SVAR or the other two DSGE models. The interest rate response is the contrary. The reaction is much stronger with the JV and BBJ model, while in JK it hardly reacts. In the case of this shock we cannot decide which model is closer to the concerned SVAR model.
The labour market and minimum wage shock can be interpreted as the ‘outside option’ shock in the JK model and the ‘wage mark-up’ shock in the model of JV and BBJ. The responses are rather different again. In the SVAR model a one unit rise in the minimum wage exerts a similar but somewhat lesser effect on the price level and reduces value added. Employment reacts significantly for a year and forms a hump shape. The JK model shows a higher reaction of real wages than the JV and the BBJ
5��The� model� can� be� downloaded� from� the� website� of� the� Office� of� the� Fiscal� Council,� Republic� of� Hungary� (http://www.mkkt.hu/download/000/137/dsge_fiscal_council_of_rep_hungary.mod).
6��For�simplicity,�aggregate�demand�shock�is�represented�as�a�government�spending�shock�in�the�three�DSGE�models.
MNB WORKING PAPERS • 2010/11 13
RESULTS
model. However, in the JK model inflation does not vary at all, just like GDP or the nominal interest rate. In this sense the results of the JV model are closer to those of the SVAR estimates.
Considering a monetary policy shock, in the case of the SVAR model we experience a high-scale reaction of output, half as strong a response in the case of inflation and employment, while real wages remain insignificant. The strong GDP reaction could be experienced in the JV and BBJ models – although the extent is not as high as in the SVAR – and the relative strength of the reactions of the other variables is pretty similar to those of the SVAR model.
Impulse responses of monetary policy shock could also be compared with Vonnák (2007) and the 5-variable SVAR model of Jakab et al. (2006) (henceforth JVV). The SVAR model of Vonnák found that monetary contraction has a significant and persistent effect on the level of employment. The reaction is similar in our model, except for the large persistence. In Vonnák (2007) the price level declines permanently, while real wages could increase in the beginning of the period as a result of a smaller-scale reaction of nominal wages. At this point we have contradictory results, as in our model the impulse response of real wages is negative; albeit not significant. This might suggest that according to our model nominal wages react both faster and stronger than those in Vonnák (2007). Concerning real wage reaction our results are more distant from the ones of the JVV model. They find that real wages react very slowly – responses are significant only after a year and start to decline in the second year.
We can conclude that in most of the cases the SVAR model is closer to the responses of the DSGE models of JV and BBJ instead of the model of JK. Both JV and SVAR imply a relatively high response in the real side of the economy. The JK model describes an economy with built-in large role of rigidities in labour markets while the other two DSGE models allow more flexibility.
MNB WORKING PAPERS • 2010/1114
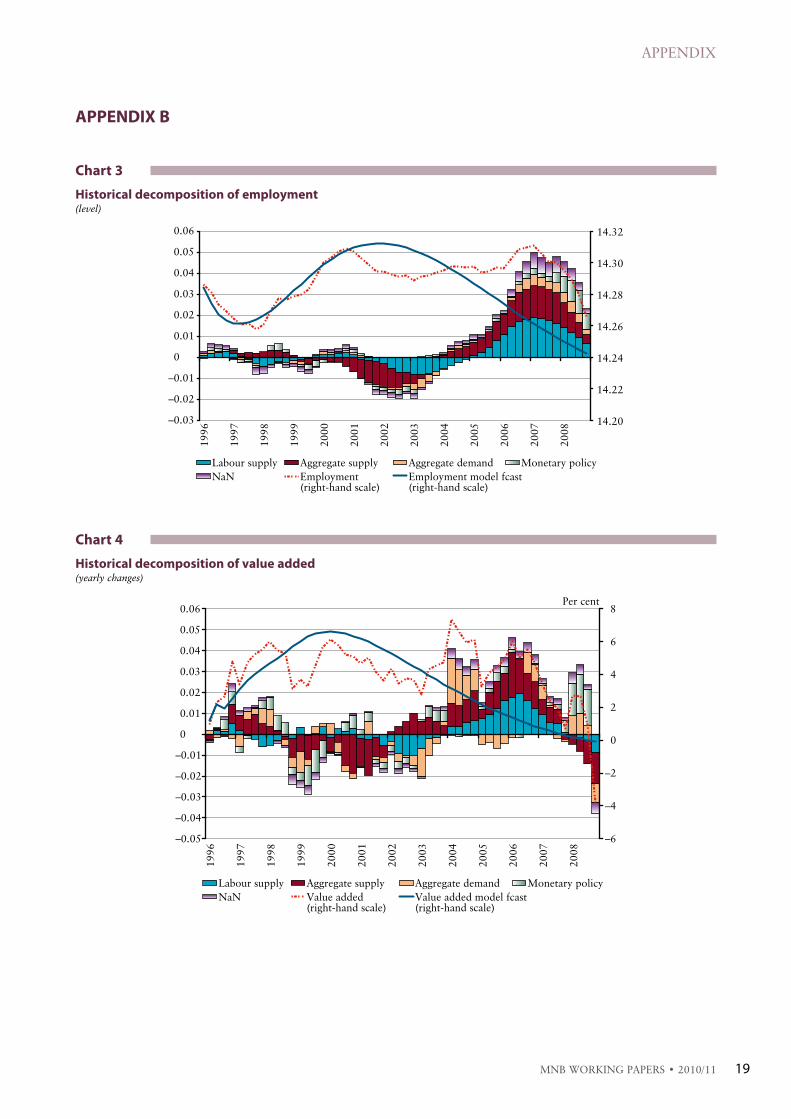
In this section we analyse how our estimated shocks contributed to the evolution of the observed variables (see the graphs referring to yearly changes in Appendix B).
In a SVAR framework the contribution of a shock is related to the deviation of actual data from an unconditional SVAR forecast starting with the beginning point of the sample. Therefore, it shows how large the unexpected shocks’ effect is compared to the expected (structural) path of each of the series predicted by the SVAR. In this sense, the series are explained by an expected (VAR-based) and a surprise, shock-determined component.
3.1EMployMEnT,REAlwAgESAnDoUTpUT
As far as the level of employment is concerned, the unconditional model forecast would have predicted a hump-shaped path. The effect of labour supply shocks was neutral during the first part of our sample. There was a large influx of relatively skilled younger generations into the labour force during the late 1990s. The participation rate increased sharply before 2001. This would imply a positive labour supply shock, but it is likely that this effect is captured by the unconditional forecast of the model and the estimated coefficients are also partly influenced by this.
The model detects negative labour supply shocks during 2001 and 2002. As mentioned earlier, these are rather large minimum wage shocks than a drop in labour supply. These negative shocks had a lasting negative effect on employment until 2003. Hence, according to our results, the increase in the minimum wage had reduced labour demand and led to a significant drop in employment. This finding is in line with the micro-based simulation results of Halpern et al. (2004).
Kátay and Nobilis (2009) reports a significant increase in activity between 2003 and 2006. Our model also shows positive labour supply shock for this period. The model captures a drop in labour supply after 2007 consistently with the findings of Kátay and Nobilis (2009). In addition, the stabilization measures of 2006–2007 (containing an increase in the labour tax wedge) might have had a negative impact on labour supply, and its effects continued further until 2008. Some indication for the presence of this effect is also depicted in the study concerning the processes of participation, edited by Kátay (2009).
The other important shock driving the employment is aggregate supply. One can surmise that growth in Hungary was partly driven by the more capital intensive sectors rather than by the sectors with higher labour intensity between 2000 and 2004. This sectoral reallocation has also contributed to the fact that relatively fast aggregate productivity growth was not accompanied by significant employment growth.
One can also find that neither monetary policy nor aggregate demand shocks largely contributed to employment, which reinforces the conclusions from the variance decomposition of Jakab and Kónya (2009).
The evolution of value added is more or less parallel to that of employment. It is largely driven by labour supply shocks, and their contribution moves in line with that of employment in most cases. Hence, for example the minimum wage hikes also had a negative impact on value added. The role of aggregate demand shock on output also seems quite intuitive: the mini-recession caused by the Russian crisis in 1998–1999 and the fiscal impetus in 2002–2003 is captured by our SVAR model. The recent financial crisis at the end of our sample can also be detected as an aggregate demand shock. In a large part of the sample shocks related to monetary policy had only minor impacts on output. Perhaps one notable exception is the period 2006–2008, when monetary policy was somewhat accommodative.
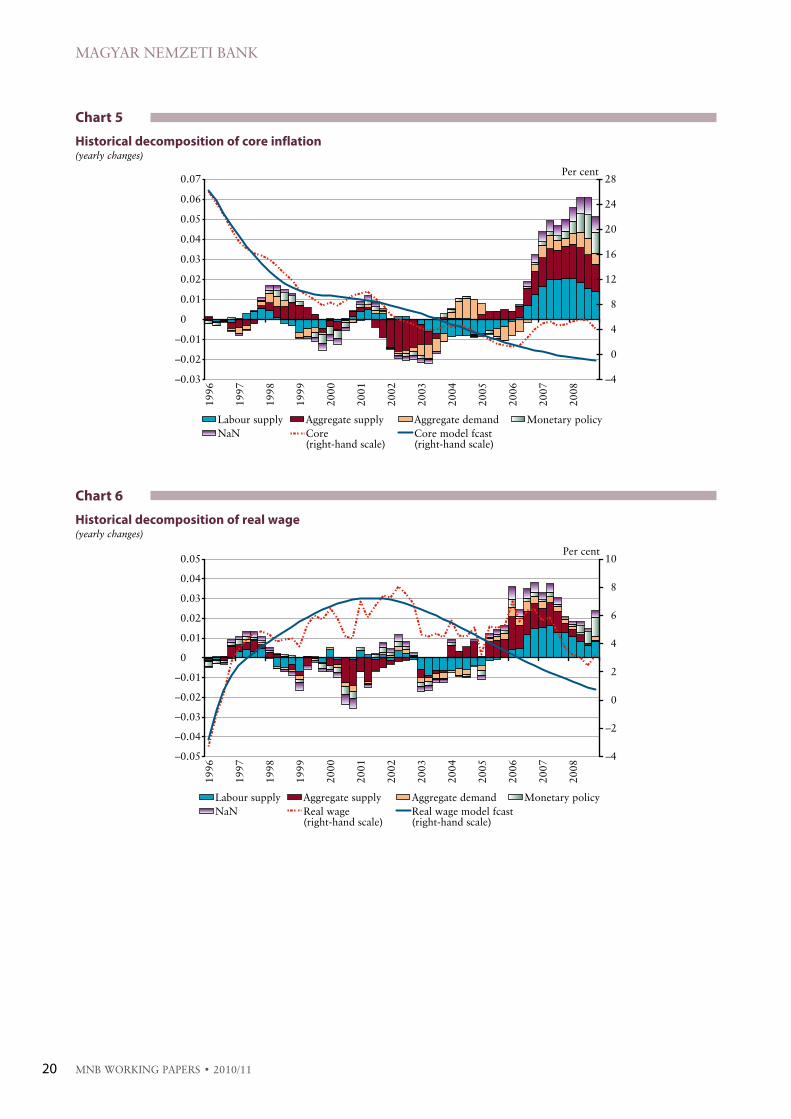
Real wages are mostly driven by aggregate supply and labour supply shocks, and their contribution moves more or less in line with that of employment. On the other hand, the effects of other shocks are rather limited.
3HistoricalanalysisonthedrivingforcesoftheHungarianlabourmarket
MNB WORKING PAPERS • 2010/11 15
HISTORICAL ANALYSIS ON THE DRIVING FORCES OF THE HUNGARIAN LABOUR...
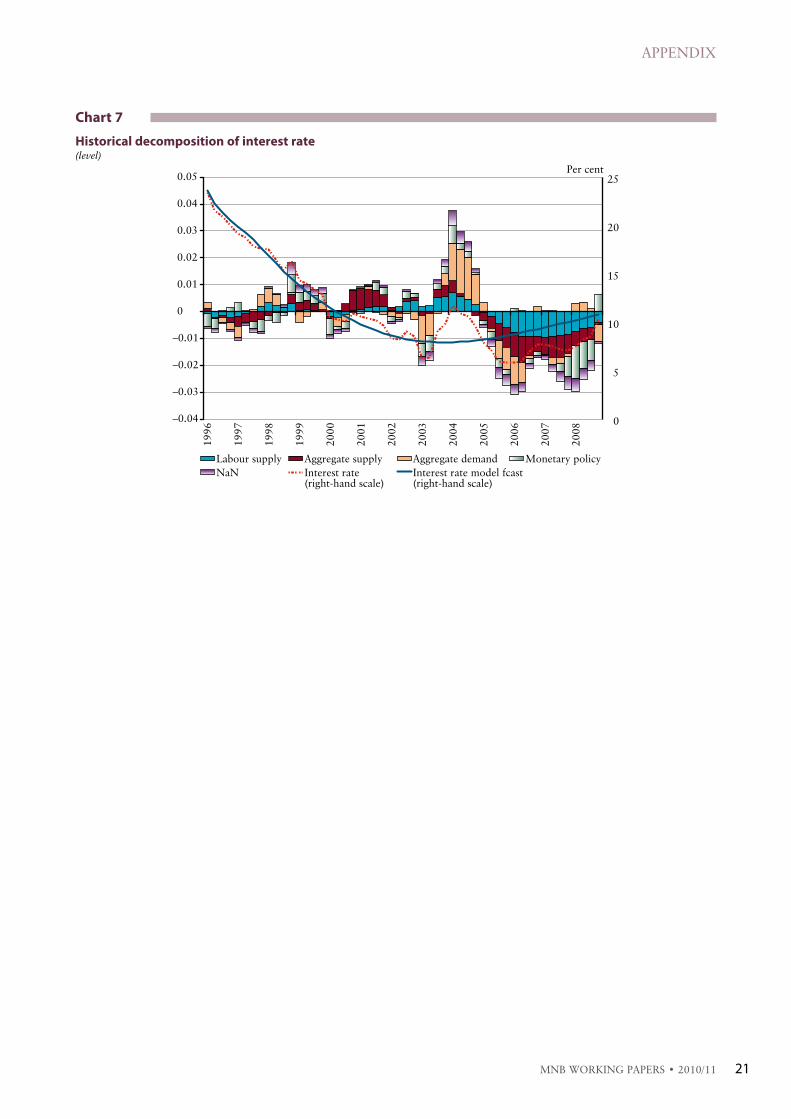
3.2InflATIonAnDInTERESTRATE
Tuning to the shock decomposition of core inflation, one can observe that monetary policy in our model had a relatively small effect on the evolution of core inflation. As with the case of value added, the only exception is the period 2007–2008. This might raise some criticism of our identification, as monetary policy is only identified by the sign of the change in interest rate. However, a change in interest rate can be a reaction to, for example, non-modelled risk premium shocks having the opposite effect on output and inflation compared with a pure monetary shock. Our model is not suitable for disentangling different shocks to interest rates and consequently the monetary shock may be a mixture of counterbalancing effects. This can explain the minor role of this kind of shock.
The significant increase in core inflation after 2006 is captured by aggregate supply shocks and, interestingly, by labour supply shocks. The former seems plausible as one can suspect that second round (indirect) effects of VAT hikes and increased regulated prices, together with food and oil price inflation behave as supply shocks – lowering output and raising prices at the same time.
The interesting observation is that negative labour supply shocks can also account for the increase of core inflation. The role of labour supply shock in the development of core inflation has the same direction as that of employment. The reason lies in the chosen identification scheme. However, what was plausible for the minimum wage hikes in relation to employment, is now a bit puzzling with respect to core inflation. Inflation was lowered by these types of shocks during 2002–2003.
One potential problem arises with the decomposition of inflation. Namely, that there was a gradual disinflation in Hungary as of 1996. Annual core inflation continuously declined from two-digit levels towards lower ones. Moreover, the speed of disinflation was not constant; during 2001–2003 the shift towards an inflation targeting monetary regime from an exchange rate targeting regime was accompanied by swift disinflation. Thus, an unconditional VAR forecast projects disinflation to continue over time and therefore at the end of the sample large positive shocks are required to generate a stable inflation rate. This problem could only be treated by estimating the model using two subsamples or by explicitly taking into account disinflation (exactly this is done by the DSGE models mentioned below). Unfortunately, sample size was not large enough to perform this two-regime procedure.
3.3CoMpARISonofHISToRICAlDECoMpoSITIonSInDSgEMoDElS
We also compare our results to the estimated DSGE model by Baksa, Benk and Jakab (2009) published by the Fiscal Council of the Republic of Hungary.7 It is worth mentioning that the DSGE model decomposes total CPI inflation, while in our model core inflation is analysed; hence the comparison can only be imperfect.
The supply shock’s effect on inflation shows a very similar story to our SVAR. The monetary shock’s role is the same, too. Our SVAR model is more or less similar, though for example in the case of 2002–2006, where the DSGE model shows a negative effect of monetary policy on inflation, our model hardly captures any. This can be partly explained by the incomplete identification of the monetary shock mentioned before, since the monetary shock in the SVAR model is not able to discriminate between aggregate demand, monetary policy and risk premium shocks. For the case of 2007–2008, both models suggest a relatively accommodative monetary policy stance. As far as the labour supply shock is concerned (in the DSGE model we use the wage-mark-up shock for proxies) the DSGE model shows a positive impact on inflation until 2006 and then a negative one. This, however, turns out to be exactly the opposite in our SVAR model. The SVAR model seems to fairly close to the DSGE model as aggregate demand shocks have positive effects in 2007–2008. According to both the SVAR and the DSGE model monetary policy was somewhat accommodative during 2006 and 2008 (i.e. it kept interest rates lower than what the model would suggest). At the end of the sample, the large interest rate hikes as a consequence of financial crisis are clearly captured by our model.
The decomposition of output (private sector value added in SVAR and aggregate GDP in the DSGE model) shows some similarities with respect to the role of aggregate supply shocks, while demand shocks are identified differently. In the SVAR model positive demands shocks dominated the period between 2003–2004, while in the DSGE model the period between 2005–2008 was the one which was accompanied by positive demand shocks.
7��Historical�shock�decomposition�for�both�inflation,�output,�employment�and�wages�is�only�available�for�the�Baksa,�Benk�and�Jakab�(2009)�model.
MNB WORKING PAPERS • 2010/1116
This paper presents a Structural Vector Autoregressive Model (SVAR) for Hungary with special respect to the labour market. The identification of structural shocks was based on sign restrictions similar to Peersman and Straub (2004). Identified shocks were labour supply, aggregate supply, aggregate demand and monetary policy shock.
Impulse response functions are significant for a year on average. However, labour supply shock could be interpreted as a minimum wage hike shock, as well. After a positive aggregate supply shock, real wages react persistently and to a greater extent than prices. Aggregate supply and monetary policy shocks force strong reactions on the real variables. Unlike in DSGE models, positive response of employment is estimated after a positive aggregate supply shock. Surprisingly, employment reacts more sensitively to monetary policy shock than aggregate demand. Concerning a positive labour supply shock, we found a positive response from employment, which contradicts the results of DSGE models estimated for Hungary.
Our estimated impulse response functions show lower level of persistency than in the SVAR model estimated using Eurozone data. This might suggest that Hungarian labour market is more flexible than that of the Eurozone. Our SVAR model’s impulse responses are closer to that of the DSGE model of Jakab and Világi (2008) than to the model of Jakab and Kónya (2009).
In comparison with other SVAR models including real wages and employment with special respect to monetary transmission, results are ambivalent. Monetary policy shock triggers similar employment responses, but the response of real wages contradicts to other SVAR models.
A historical decomposition exercise shows that minimum wage rises in 2001 and 2002 had a significant negative impact on employment and output. Positive labour supply shocks are estimated between 2003 and 2006, which is consistent with the results of Kátay and Nobilis (2009). In addition, fiscal stabilisation in 2006–2007 might have caused a drop in labour supply, as well. The aggregate supply shock was estimated to be the other important driving factor of employment movements. Neither monetary nor aggregate demand shocks contributed largely to employment fluctuations consistently with Jakab and Kónya (2009). Aggregate demand shock’s effect on value-added is more or less in line with the cyclical movements of output.
The increase in core inflation after 2006 is captured by aggregate supply and labour supply shocks. Comparing the historical decomposition of inflation with the DSGE model of Baksa, Benk and Jakab (2009), we found similar role of aggregate supply shock. However, aggregate demand shocks follow different trajectories in the Baksa, Benk and Jakab (2009), model than our SVAR. The reason is that it is possible that part of the effects of the demand shocks in the SVAR model is estimated to be risk premium shock in the other model. Our SVAR model gives a different path for the monetary policy shock than the in the DSGE model. This together with the surprisingly small impact of monetary policy shocks on inflation and output might suggest that our shock identification misses some important channels of monetary transmission (i.e. risk premium shocks). The role of aggregate supply shocks in the SVAR and the DSGE model is similar, though aggregate demand shocks show a different pattern.
Conclusions
MNB WORKING PAPERS • 2010/11 17
BAKSA, D., SZ. BENK AND Z. M. JAKAB (2009): “Does the Fiscal Multiplier Exist”, paper presented at the Annual Conference of the Hungarian Economic Association, (http://media.coauthors.net/konferencia/conferences/1/Baksa_Benk_Jakab_MKE_revised_10_12.pdf).
BENK, SZ., Z. M. JAKAB, M. A. KOVÁCS, B. PÁRKÁNYI, Z. REPPA AND G. VADAS (2006): “The Hungarian Quarterly Projection Model (N.E.M.)”, MNB Occassional Papers 60.
EPPICH, GY. AND SZ. LőRINCZ (2007): “Three methods to estimate the whitening-related distortion of the wage statistics”, MNB Occasional Papers 66.
GALÍ, J. (1999): “Technology, Employment, and the Business Cycle: Do Technology Shocks Explain Aggregate Fluctuations?”, The American Economic Review, 89 (1), pp. 249–271.
HALPERN, L., M. KOREN, G. KőRÖSI AND J. VINCZE (2004): “A minimálbér költségvetési hatásai”, Közgazdasági Szemle, LI. évf. 2004. április, pp. 325–345.
JAKAB, Z. M., V. VÁRPALOTAI AND B. VONNÁK (2006): “How does monetary policy affect aggregate demand? A multimodel approach for Hungary”, in: Monetary Transmission in Hungary (2006), Magyar Nemzeti Bank.
JAKAB, Z. M. AND I. KÓNYA (2009): “An open economy DSGE model with search-and-matching frictions: the case of Hungary”, MNB Working Papers 2009/10.
JAKAB, Z. M. AND B. VILÁGI (2008): “An Estimated DSGE Model of the Hungarian Economy”, MNB Working Papers 2008/9.
KÁTAY, G. (ed., 2009): “Az alacsony aktivitás és foglalkoztatottság okai és következményei Magyarországon”, MNB-tanulmányok 79.
KÁTAY, G. AND B. NOBILIS (2009): “Driving Forces Behind Changes in the Aggregate Labour Force Participation in Hungary”, MNB Working Papers 2009/5.
PEERSMAN, G. AND L. STRAUB (2004): “Technology shocks and robust sign restrictions in a euro area SVAR”, Working Paper Series 373, European Central Bank.
REPPA, Z. (2009): “A joint macroeconomic-yield curve model for Hungary”, MNB Working Papers 2009/1.
UHLIG, H. (2005): “What are the effects of monetary policy on output? Results from an agnostic identification procedure”, Journal of Monetary Economics, 52 (2), pp. 381–419.
VONNÁK, B. (2007): “The Hungarian Monetary Transmission Mechanism: an Assessment”, MNB Working Papers 2007/3.
References
MNB WORKING PAPERS • 2010/1118
AppEnDIxA
Because of the comparability to Peersman and Straub (2004) we applied the sign restrictions published in their paper. However, during the research phase we used different specifications of the core model in terms of variables and the scope of the data. As in the original model, we tried to include working hours instead of employment. In this case we faced several source of difficulties. First, working hours for the entire sample period are only available for physical workers in the manufacturing sector. Time series for private sector starts at Q1 2001. Second, the data has very poor quality. Seasonal adjustment seems to be oversensitive to the model applied. The reason behind this could be that seasonality and related working day effects are pretty strong compared to the signals, thus most of the variations are captured by the seasonal factors. The volatility of the remaining part – the seasonally adjusted series – is especially low, therefore less informative.
Alternative specifications were estimated, such as participation instead of private sector employment, real labour costs instead of real gross wages, CPI instead of core inflation and we made an attempt to substitute institutional statistics with the Labour Force Survey (LFS). The LFS follows a rotating panel sample design, in which households remain in the sample for six consecutive quarters, while in every quarter the one sixth of the sample is replaced by new agents. The choice between LFS and institutional employment statistics was influenced by several considerations. On the one hand, LFS handles the problem stemming from informal employment and gives a more plausible view about the processes of demand side of the labour market. On the other hand, there is no option to separate full-time from part-time workers or self-employed therefore it is not possible to have a measure of employment consistent with the wage statistics. Besides, due to the sampling feature of LFS it might suffer from sampling error.
We reproduced all the mentioned alternatives for the manufacturing sector as well, but could not set up a satisfactory specification. In the majority of the cases we were not able to overcome data inconsistency, namely the fact that data do not refer to the same reference group.
All results referred above are available upon request.
Appendix
MNB WORKING PAPERS • 2010/11 19
APPENDIx
AppEnDIxB
Chart3
Historicaldecompositionofemployment(level)
–0.03
–0.02
–0.01
0
0.01
0.02
0.03
0.04
0.05
0.06
1996
1997
1998
1999
2000
2001
2002
2003
2004
2005
2006
2007
2008
14.20
14.22
14.24
14.26
14.28
14.30
14.32
Labour supply Aggregate supply Aggregate demand Monetary policyNaN Employment
(right-hand scale)Employment model fcast(right-hand scale)
Chart4
Historicaldecompositionofvalueadded(yearly changes)
–0.05
–0.04
–0.03
–0.02
–0.01
0
0.01
0.02
0.03
0.04
0.05
0.06
1996
1997
1998
1999
2000
2001
2002
2003
2004
2005
2006
2007
2008
–6
–4
–2
0
2
4
6
8
Labour supply Aggregate supply Aggregate demand Monetary policyNaN Value added
(right-hand scale)Value added model fcast(right-hand scale)
Per cent
MAGYAR NEMZETI BANK
MNB WORKING PAPERS • 2010/1120
Chart5
Historicaldecompositionofcoreinflation(yearly changes)
–0.03
–0.02
–0.01
0
0.01
0.02
0.03
0.04
0.05
0.06
0.07
1996
1997
1998
1999
2000
2001
2002
2003
2004
2005
2006
2007
2008
–4
0
4
8
12
16
20
24
28Per cent
Labour supply Aggregate supply Aggregate demand Monetary policyNaN Core
(right-hand scale)Core model fcast(right-hand scale)
Chart6
Historicaldecompositionofrealwage(yearly changes)
–0.05
–0.04
–0.03
–0.02
–0.01
0
0.01
0.02
0.03
0.04
0.05
1996
1997
1998
1999
2000
2001
2002
2003
2004
2005
2006
2007
2008
–4
–2
0
2
4
6
8
10Per cent
Labour supply Aggregate supply Aggregate demand Monetary policyNaN Real wage
(right-hand scale)Real wage model fcast(right-hand scale)
MNB WORKING PAPERS • 2010/11 21
APPENDIx
Chart7
Historicaldecompositionofinterestrate(level)
–0.04
–0.03
–0.02
–0.01
0
0.01
0.02
0.03
0.04
0.05
1996
1997
1998
1999
2000
2001
2002
2003
2004
2005
2006
2007
2008
0
5
10
15
20
25Per cent
Labour supply Aggregate supply Aggregate demand Monetary policyNaN Interest rate
(right-hand scale)Interest rate model fcast(right-hand scale)
MNB WORKING PAPERS • 2010/1122
AppEnDIxC
Chart8
Aggregatesupplyshock
–2
–1.5
–1
–0.5
0
0.5
1
1.5
2
2.5
1995
1996
1997
1998
1999
2000
2001
2002
2003
2004
2005
2006
2007
2008
–2
–1.5
–1
–0.5
0
0.5
1
1.5
2
2.5
Chart9
Aggregatedemandshock
–2.5
–2
–1.5
–1
–0.5
0
0.5
1
1.5
2
2.5
1995
1996
1997
1998
1999
2000
2001
2002
2003
2004
2005
2006
2007
2008
–2.5
–2
–1.5
–1
–0.5
0
0.5
1
1.5
2
2.5
MNB WORKING PAPERS • 2010/11 23
APPENDIx
Chart11
non-definedshock
Chart10
Monetarypolicyshock
–3
–2.5
–2
–1.5
–1
–0.5
0
0.5
1
1.5
2
1995
1996
1997
1998
1999
2000
2001
2002
2003
2004
2005
2006
2007
2008
–3
–2.5
–2
–1.5
–1
–0.5
0
0.5
1
1.5
2
–0.8
–0.6
–0.4
–0.2
0
0.2
0.4
0.6
1995
1996
1997
1998
1999
2000
2001
2002
2003
2004
2005
2006
2007
2008
–0.8
–0.6
–0.4
–0.2
0
0.2
0.4
0.6
MNB WORKING PAPERS • 2010/1124
AppEnDIxD
Chart12
Impulseresponsesofthemodelincludingdummyvariables
0 10 20−5
0
10
5
−5
0
10
5
VALUE ADDED toLabour Supply Shock
0 10 20
VALUE ADDED toAggregate Supply Shock
0 10 20−0.01
0
0.01
VALUE ADDED toAggregate Demand Shock
0 10 20−0.01
0
0.01
VALUE ADDED toMonetary Policy Shock
0 10 20−5
0
5x 10⁻³
CORE INFLATION toLabour Supply Shock
0 10 20−5
0
5x 10⁻³
CORE INFLATION toAggregate Supply Shock
0 10 20−5
0
5x 10⁻³
CORE INFLATION toAggregate Demand Shock
0 10 20−5
0
5x 10⁻³
CORE INFLATION toMonetary Policy Shock
0 10 20−5
0
5x 10⁻³
REAL WAGE toLabour Supply Shock
0 10 20−5
0
5x 10⁻³
REAL WAGE toAggregate Supply Shock
0 10 20−5
0
5x 10⁻³
REAL WAGE toAggregate Demand Shock
0 10 20−5
0
5x 10⁻³
REAL WAGE toMonetary Policy Shock
0 10 20−5
0
5
x 10–3 x 10–3 x 10–3 x 10–3
EMPLOYMENT toLabour Supply Shock
0 10 20−5
0
5x 10–3
x 10–3
EMPLOYMENT toAggregate Supply Shock
0 10 20−5
0
5x 10⁻³
EMPLOYMENT toAggregate Demand Shock
0 10 20−5
0
5x 10⁻³
EMPLOYMENT toMonetary Policy Shock
INTEREST RATE to INTEREST RATE to INTEREST RATE to
0 10 20–10
0
–5
5
INTEREST RATE toLabour Supply Shock
0 10 20−0.01
0
0.01
Aggregate Supply Shock
0 10 20−0.01
0
0.01
Aggregate Demand Shock
0 10 20–10
0
–5
5
Monetary Policy Shock
x 10–3 x 10–3 x 10–3 x 10⁻³
MNB WORKING PAPERS • 2010/11 25
APPENDIx
Chart13
Modelforecastsofemployment(yearly changes)
–7
–6
–5
–4
–3
–2
–1
0
1
2
319
96
1997
1998
1999
2000
2001
2002
2003
2004
2005
2006
2007
2008
–7
–6
–5
–4
–3
–2
–1
0
1
2
3
Actual data Default model Model with 3 dummy variables
Per cent Per cent
Chart14
Modelforecastsofvalueadded(yearly changes)
–6
–4
–2
0
2
4
6
8
1996
1997
1998
1999
2000
2001
2002
2003
2004
2005
2006
2007
2008
–6
–4
–2
0
2
4
6
8Per cent Per cent
Actual data Default model Model with 3 dummy variables
MAGYAR NEMZETI BANK
MNB WORKING PAPERS • 2010/1126
Chart15
Modelforecastsofcoreinflation(yearly changes)
0
5
10
15
20
25
3019
96
1997
1998
1999
2000
2001
2002
2003
2004
2005
2006
2007
2008
0
5
10
15
20
25
30Per cent Per cent
Actual data Default model Model with 3 dummy variables
Chart16
Modelforecastsofrealwage(yearly changes)
–4
–2
0
2
4
6
8
10
1996
1997
1998
1999
2000
2001
2002
2003
2004
2005
2006
2007
2008
–4
–2
0
2
4
6
8
10
Actual data Default model Model with 3 dummy variables
Per cent Per cent

MNB Working Papers 2010/11A Structural Vector Autoregressive (SVAR) Model for the Hungarian labour market
Print: D-PlusH–1037 Budapest, Csillaghegyi út 19–21.