a stacking fault energy perspective into the uniaxial tensile deformation behavior and...
TRANSCRIPT

1 23
Metallurgical and MaterialsTransactions A ISSN 1073-5623 Metall and Mat Trans ADOI 10.1007/s11661-013-2175-z
A Stacking Fault Energy Perspective intothe Uniaxial Tensile Deformation Behaviorand Microstructure of a Cr-Mn AusteniticSteel
H. Barman, A. S. Hamada, T. Sahu,B. Mahato, J. Talonen, S. K. Shee,P. Sahu, D. A. Porter & L. P. Karjalainen

1 23
Your article is protected by copyright
and all rights are held exclusively by The
Minerals, Metals & Materials Society and ASM
International. This e-offprint is for personal
use only and shall not be self-archived in
electronic repositories. If you wish to self-
archive your article, please use the accepted
manuscript version for posting on your own
website. You may further deposit the accepted
manuscript version in any repository,
provided it is only made publicly available 12
months after official publication or later and
provided acknowledgement is given to the
original source of publication and a link is
inserted to the published article on Springer's
website. The link must be accompanied by
the following text: "The final publication is
available at link.springer.com”.

A Stacking Fault Energy Perspective into the Uniaxial TensileDeformation Behavior and Microstructure of a Cr-Mn AusteniticSteel
H. BARMAN, A.S. HAMADA, T. SAHU, B. MAHATO, J. TALONEN, S.K. SHEE,P. SAHU, D.A. PORTER, and L.P. KARJALAINEN
A Cr-Mn austenitic steel was tensile strained in the temperature range 273 K(0 �C) £ T £ 473 K (200 �C), to improve the understanding on the role of stacking fault energy(SFE) on the deformation behavior, associated microstructure, and mechanical properties oflow-SFE alloys. The failed specimens were studied using X-ray diffraction, electron backscatterdiffraction, and transmission electron microscopy. The SFE of the steel was estimated to varybetween ~ 10 to 40 mJ/m2 at the lowest and highest deformation temperatures, respectively. Atthe ambient temperatures, the deformation involved martensite transformation (i.e., the TRIPeffect), moderate deformation-induced twinning, and extended dislocations with wide stackingfaults (SFs). The corresponding SF probability of austenite was very high (~10�2). Deformationtwinning was most prevalent at 323 K (50 �C), also resulting in the highest uniform elongationat this temperature. Above 323 K (50 �C), the TRIP effect was suppressed and the incidence oftwinning decreased due to increasing SFE. At elevated temperatures, fine nano-sized SF ribbonswere observed and the SF probability decreased by an order (~10�3). High dislocation densities(~1015 m�2) in austenite were estimated in the entire deformation temperature range. Disloca-tions had an increasingly screw character up to 323 K (50 �C), thereafter becoming mainly edge.The estimated dislocation and twin densities were found to explain approximately the measuredflow stress on the basis of the Taylor equation.
DOI: 10.1007/s11661-013-2175-z� The Minerals, Metals & Materials Society and ASM International 2014
I. INTRODUCTION
THE low-cost 200 series of the Cr-Mn austeniticsteels containing 5 to 9 pct Mn are based on thesubstitution of Ni in the 300 series with Mn and theinterstitial elements C and N to stabilize the austeniticstructure (fcc). The 200 series of steels typically have alow stacking fault energy (SFE) ~16 mJ/m2 at roomtemperature[1,2] and they are metastable, so that strain-induced martensite formation occurs during deforma-tion.[3] SFE is one of the most important parameters
governing the transformation and deformation behaviorin such metastable steels. Low SFE also promotesmechanical twinning which is an important deformationmechanism enhancing strain hardening by retardingdislocation glide. Consequently, there are two mecha-nisms affecting the strain hardening behavior of thesesteels, i.e., cfcc ! c
0Twinnedfcc (TWIP effect) and cfcc ! a0bcc
or cfcc ! ehcp ! a0bcc martensitic transformation (TRIPeffect).According to Allain et al.,[4] in high-Mn steels,
SFE £ 18 mJ/m2 favors the TRIP effect,[5] while theTWIP effect is observed for: 12 mJ/m2<SFE<35 mJ/m2.Saeed-Akbari et al.[5] suggested that SFE of 20 mJ/m2
should be taken as the upper limit for the appearance ofthe TRIP effect. It is generally agreed that withincreasing SFE of austenite, the deformation modegradually changes from deformation-induced martensitetransformation (DIMT) to deformation twinning andfinally to dislocation slip.[6,7] It is well known that thetest temperature influences the SFE significantly andthus can also be expected to be crucial in controlling thedeformation mode of the alloys concerned.Compared to Cr-Ni steels, there is relatively little
literature concerning the deformation behavior of 200series steels.[3,8–10] Previously,[11] we have observed thatat 193 K (�80 �C), the uniaxial tensile deformation ofthe type 201L austenitic steel at a low strain rateinvolves a massive TRIP effect. Hamada et al.[12]
reported that the maximum ductility in type 201L steel
H. BARMAN, Graduate Student, and P. SAHU, AssistantProfessor, are with the Department of Physics, Jadavpur University,Kolkata 700 032, India. Contact e-mail: [email protected],[email protected] A.S. HAMADA, Researcher, formerly withthe Metallurgical and Materials Engineering Department, Faculty ofPetroleum & Mining Engineering, Suez Canal University, Box 43721,Suez, Egypt, is now with the Centre for Advanced Steels Research,University of Oulu, Box 4200, 90014 Oulu, Finland. T. SAHU,Assistant Professor, is with the Department of Physics, RamanandaCollege, Bishnupur 722 122, West Bengal, India. B. MAHATO,Technical Officer, is with the Materials Science and TechnologyDivision, National Metallurgical Laboratory, Jamshedpur 831 007,India. J. TALONEN, Director, Corporate R&D, is with the Out-okumpu Oyj, P.O. Box 140, 02201 Espoo, Finland. S.K. SHEE,Assistant Professor, is with the Department of Physics, MidnaporeCollege, Midnapore 721 101, West Bengal, India. D.A. PORTER,Professor and Head, and L.P. KARJALAINEN, Emeritus Professor,are with the Centre for Advanced Steels Research, University of Oulu.
Manuscript submitted August 23, 2013.
METALLURGICAL AND MATERIALS TRANSACTIONS A
Author's personal copy
in tensile testing is observed at around 323 K (50 �C)while mechanical twinning was most prominent. Hence,in a quest to understand the deformation behavior ofthese steels at slightly elevated temperatures, when theSFE of the steel becomes higher, we have investigatedthe low strain rate tensile deformation behavior of aCr-Mn austenitic steel over a range of test temperatures.
Various line and planar defect parameters describingthe deformed microstructure can be estimated from theuse of direct methods like transmission electron micro-scopy (TEM) and electron backscatter diffraction(EBSD) or indirectly with X-ray diffraction (XRD),utilizing either the Warren–Averbach method[13] or theRietveld method.[14] These methods can complementeach other to provide meaningful information about themicrostructure and the deformation accommodation,which directly influence the mechanical properties.Previously, we observed that the deformed microstruc-tures of such low-SFE steels are quite heterogeneous innature and also possess very complex defect struc-tures[11] and thereby not withstanding the lower statis-tics of conventional direct methods (TEM and EBSD),the investigations of the deformed microstructures bythese methods are often very difficult.
Hence, in the present study, we adopt the XRDpattern analyses, which in spite of being indirect innature offers a better statistics to interpret the temper-ature-dependent kinetics of stress-induced martensitetransformation, the evolution of dislocation density andcharacter by calculation of dislocation contrast fac-tors,[15] the densities of planar defects, and determina-tion of the SFE. Grain boundary analysis by EBSDfollowing the coincidence site lattice (CSL) method andTEM studies were also carried out to obtain some directinformation about the deformation microstructures tosubstantiate the findings of the X-ray analyses. Inaddition, the influence of temperature and SFE on thedeformation mode and its role in the plastic flowbehavior are discussed. This is fundamental to animproved understanding of the contributions of thevarious deformation mechanisms in low-SFE alloys andto the establishment of the relationship between micro-structure and mechanical properties of this kind ofcommercial steel.
II. EXPERIMENTAL
The type 201L Cr-Mn austenitic steel used in thepresent work was supplied by Outokumpu Stainless Oy,TornioWorks, Finland as a 1-mm-thick sheet in the cold-rolled, annealed, pickled, and skin-passed condition. Thechemical composition of the steel is presented in Table I.Uniaxial tensile tests were carried out until failure with alow strain rate of 10�4 s�1 in a Zwick Z 100 tensilemachine (Zwick Roell, GmbH) at temperatures (T):
273 K, 293 K (0 �C, 20 �C) (room temperature, RT),323 K, 423 K, and 473 K (50 �C, 150 �C, and 200 �C).The low strain rate was selected to minimize the effect ofadiabatic heating that might have untoward effects on theSFEof the studied steel. Standard 20-mm-wide tensile testspecimens with a gauge length of 80 mm were used in allthe tensile tests.To assess the deformation microstructure under
different straining conditions, the uniformly deformedgauge regions of fractured tensile specimens wereinvestigated at room temperature using XRD, EBSD,and TEM. XRD data acquisition was carried out usingCu Ka radiation in a powder diffractometer (Siemens-D500) equipped with a secondary beam monochroma-tor. The step scan mode with a preset holding time of 5to 10 s at each 0.01 deg step in the range 40deg £ 2h £100 deg was used to improve the countingstatistics and yield data suitable for stable refinement.[16]
A field-emission gun scanning electron microscope(FEG-SEM Carl Zeiss Ultra plus) operating at 20 kVand equipped with an EBSD device (Oxford HKL) wasemployed for obtaining phase maps and band contrastimages. The EBSD specimens were obtained by mechan-ical polishing down to 1 lm using a diamond suspensionfollowed by chemical polishing for about 20 minutesusing a 0.05 lm colloidal suspension of silica. The TEMmicrostructures were obtained from a Philips CM20TEM operating at 200 kV and the thin foils wereprepared using a twin-jet TENUPOL-5 electrolytic pol-isher. The electrolyte contained 10 vol pct perchloricacid and 90 pct acetic acid.
III. THEORETICAL FORMULATIONSAND METHODS OF ANALYSIS
A. Structure and Microstructure Refinement by theRietveld Method
The XRD patterns were subjected to Rietveld anal-yses, using the MAUD program,[17] to interpret thestructural and microstructural features of the deformedtensile specimens and the kinetics of DIMT in thetemperature range 273 K (0 �C) £ T £ 473 K (200 �C).Instrumental broadening of the diffractometer[18] wasdetermined using a specially prepared silicon standardsample assumed to have no size and strain broaden-ing.[19] The crystallite size and the microstrain valueswere evaluated from the ‘‘size-strain’’ analysis using thePopa model.[20] Any texture-induced variation in inten-sity of Bragg reflections during tensile deformation wasalso considered by carrying out the refinements with thetexture model implemented in the MAUD program,which allows the accurate determination of the phasevolume fractions in the deformed specimens even in thepresence of severe crystallographic texture. Although,the intensity variation of austenite Bragg reflections due
Table I. Chemical Composition of the Cr-Mn Steel in wt pct
Steel C Si Mn Cr Ni Mo Cu N
201L 0.047 0.32 6.74 17.48 3.71 0.05 0.23 0.205
METALLURGICAL AND MATERIALS TRANSACTIONS A
Author's personal copy

to texture was not very significant in the present study.The quality of fitting and reliability of the structural aswell as microstructural parameters can be assessed fromthe criteria of fit parameters,[21] viz. weighted residualerror (Rwp), expected error (Rexp), and goodness of fit(GoF) listed in Table II.
B. Determination of Stacking Fault Probabilityand Stacking Fault Energy
The austenite stacking fault probability (Psf), whichrepresents the fraction of (111) slip planes being affectedby stacking faults (SFs), was estimated for the differentfailed specimens following the Warren’s method[22] offault analysis. Here, the estimation of Psf is accom-plished by the measurements of the angular separationbetween the adjacent pairs of lines of the XRD patternin the faulted specimen and in an unfaulted specimen ofthe same alloy composition. In case of low-SFE steels, itis often very difficult to obtain an annealed referencespecimen, which is free of planar faults. In such low-SFE steels, the stresses due to machining of the XRDspecimen can induce significant planar faults and/or thecfcc ! ehcp transformation. In the present work, weadopted two approaches for determining the Psf asdiscussed below.
First, prior to the XRD measurement, the as-receivedspecimens were electropolished to a surface relief of2 lm that could also eliminate the undesired effect ofstrain broadening and the presence of planar faults onthe surface due to different processing and was regardedas the ‘‘unfaulted’’ specimen. Subsequently, the angulardisplacements (i.e., shifts) of the diffraction lines, D(2h)deg in different broken specimens are measured toestimate the values of Psf according to the Warren’smethod of peak shift analysis.[22] Second, in the absenceof an annealed specimen of the same composition freefrom stacking faults, another novel approach for deter-mining the values of Psf exists, which has been adoptedby several researchers to calculate Psf in differentaustenitic steels[23,24]. In this approach, Bragg’s law iscombined with the Warren’s treatment[22] to determinethe angular position of the faulted austenite diffractionlines as:
2hhkl ¼ 2 arcsink
2dhkl
� �þ 90
ffiffiffi3p
Psf tan hhklp2h20 uþ bð Þ
Xb
ð�ÞL0;
½1�
where, 1h20uþbð Þ
Pb
ð�ÞL0 is a constant specific to each
austenite (hkl) reflection, the values of which areavailable in the literature.[22] dhkl is the faulted interpla-nar spacing of the austenite (hkl) planes, which can be
further written in terms of the faulted austenite latticeparameter (ac) as: dhkl ¼ acffiffiffiffiffiffiffiffiffiffiffiffiffiffi
h2þk2þl2p . Thus, Eq. [1] is a
linear equation of two variables: ac and Psf. Further-more, corresponding to each representative austeniteBragg reflection (hkl) present in the faulted XRDpattern, we can obtain as many independent equationsrepresented by Eq. [1]. Subsequently, the set of linearequations for each Bragg reflection represented byEq. [1] are solved using the linear regression methodto estimate the Psf. The effect of long-range residualstress on the direction-dependent diffraction line shiftswas also considered in the present analyses. Its effect onthe peak shift was insignificant compared to thatinduced by planar faults and hence its contributionwas assumed to be zero in Eq. [1].The determination of SFE from XRD studies neces-
sitates a precise determination of the values of Psf, andthe well-known relation of Schramm and Reed[25] forthe estimation of SFE in austenitic steel is given as:
SFE ¼ 17800e2111� �
L¼50APsf
ðmJ=m2Þ; ½2�
where e2111� �
L¼50A is the mean square microstrain of
the deformed austenite along [111] direction, averagedover the distance of Fourier variable (coherencelength), L = 50 A and is determined from the rootmean square (r.m.s) microstrain distribution. However,the approach of Schramm and Reed[25] is an oversim-plified approach and does not consider the effects ofaustenite dislocation arrangements on the microstraindistribution in the microstructure. It is well establishedthat the anisotropic microstrain broadening is due tothe strain field anisotropy induced by the contrast fac-tor of dislocations.[26] Thus, the accurate determinationof SFE according to XRD pattern analyses shouldalso consider the effect of non-randomness of disloca-tion arrangement, dislocation contrast factor, and dis-location density.[2] Wilkens[27] further suggested thatthe outer cut-off radii of dislocations signifying therange over which the distribution of dislocations israndom should also be considered for describing thevariation of strain field within the dislocation core.Hence, it is imperative to use the Wilkens’ strain func-tion in the presence of dislocation-induced strainbroadening and is given as[26]:
e2L� �
¼ qChklpb
2p
� �2
lnRe
L
� �; ½3�
where b is the magnitude of Burgers vector determinedfrom the Rietveld analysis described in Section III–A,Chkl is the average contrast factors for the differentBragg reflections (hkl), q is the dislocation density, and
Table II. Reliability Parameters in the Rietveld Analysis for Different Specimens
Deformation Temperature [K (�C)] 273 (0) RT (20) 323 (50) 423 (150) 473 (200)
Rwp (pct) 10.3 9.4 7.6 8.5 8.8Rexp (pct) 9.1 8.2 7.1 7.6 7.9GoF = Rwp/Rexp 1.31 1.15 1.07 1.12 1.11
METALLURGICAL AND MATERIALS TRANSACTIONS A
Author's personal copy

Re is the effective outer cut-off radius of the disloca-tions. These parameters can be directly determinedfrom the graphical plots of modified Williamson–Hallequation[11,15] and modified Warren–Averbach proce-dure[11,15] and are also fairly well documented in theliterature. Using Eq. [3] in Eq. [2], the Schramm andReed[25] expression for SFE is modified in terms of dis-location arrangement and density parameters and isgiven as:
SFE ¼ 17800
Psf
b
2p
� �2
qC111p lnRe
L
� �( )ðmJ=m2Þ; ½4�
where C111 is the average contrast factor for theaustenite (111) Bragg reflection.
C. Grain Boundary Character Distribution and TwinningFrequencies of Austenite
The grain boundaries (GBs) of the deformed speci-mens were characterized by the HKL CHANNEL5software of the Oxford Instruments integrated with theEBSD system. EBSD maps were obtained with step sizesof 0.05 to 0.1 lm. The frequencies of primary twins(P
3) and higher-order twins (P
3n, n> 1) were deter-mined by the grain orientation measurements and thesubsequent calculation of the misorientation relation-ship. Deviations from the exact twin relationships wereallowed within the Brandon criterion.[28] To avoidspurious boundaries, misorientations below 5 deg werenot measured and this limit was used for all specimensto achieve consistently quantitative data. The grainboundary misorientations were determined by classify-ing the boundaries with misorientations between 5 and15 deg as low-angle grain boundaries (LAGBs) andthose of misorientation >15 deg as high-angle grainboundaries (HAGBs). Further, to obtain a comparisonwith the frequencies of austenite
P3 boundaries, which
represents the propensity of twinning in a local scale, thetwinning probability (Ptw), representing the twin densityin bulk austenite microstructure, has also been estimatedfollowing the Warren’s model of fault analysis.[22]
IV. INTERPRETATION OF THE DEFORMATIONBEHAVIOR AND MICROSTRUCTURE
A. The Temperature Dependence of Flow StressBehavior
The tensile true stress–true strain curves in thetemperature range 273 K (0 �C) £ T £ 473 K (200 �C)are plotted in Figure 1 and the inset also shows thevariations of tensile and yield strengths (engineeringstress values) of the studied steel with temperature. Thetensile properties of the studied steel are summarized inTable III, which also shows the maximum shear stressvalues at each deformation temperature obtained withthe highest possible Schmid factor value of 0.5. Asexpected, it is observed that the flow stress and the shearstress decrease with increasing temperature. The tensilestrength decreases from 1043 MPa at 273 K (0 �C) to
571 MPa at 473 K (200 �C). It can also be seen that theuniform elongation has a maximum at 323 K (50 �C)(Table III). Further, with increase in testing tempera-ture, the shape of the flow curve changes from sigmoidal(i.e., containing an inflection) at 273 K (0 �C) and RT,to linear at 323 K (50 �C), to parabolic at 423 K and473 K (150 �C and 200 �C). The sigmoidal nature of thestress–strain curve is typical of metastable stainless steeldue to DIMT.[10] The inset of Figure 1 also reveals thatthe dependence of tensile strength on temperature ismore pronounced than that of the yield strength, i.e., thetest temperature has a strong effect on the degree ofstrain hardening.
B. The Martensite Transformation and the Unit CellParameters
The temperature dependence of martensite transfor-mation during uniaxial tension and the correspondingstructural parameters representing the unit cell dimen-sions of austenite and a¢-martensite are determined fromthe analyses of the XRD pattern according to theRietveld crystal structure refinement and are presentedin Table IV for samples strained to uniform elongation.For the considered steel, it was observed thatcfcc ! ehcp ! a0bcc or maybe direct cfcc ! a0bcc DIMTwas very sensitive to the deformation temperature andabout 80 and 50 pct a¢-martensite, and was estimated to
Table III. Tensile Properties of the Steel at DifferentTemperatures
DeformationTemperature[K (�C)]
YieldStrength(MPa)
TensileStrength(MPa)
MaximumShear
Stress (MPa)Elongation
(pct)
273 (0) 464 1043 778 67RT (20) 419 860 680 71323 (50) 372 753 654 73423 (150) 295 602 469 50473 (200) 254 571 370 40
Fig. 1—Flow stress curves at different temperatures. The inset alsoshows the variation of yield strength and tensile strength with tem-perature (Color figure online).
METALLURGICAL AND MATERIALS TRANSACTIONS A
Author's personal copy

form at 273 K (0 �C) and RT, respectively (Table IV).No significant DIMT could be observed during tensiledeformation above RT. However, a trace amount ofe-martensite (~1 pct) was measured in the brokenspecimens after testing at all temperatures up to 423 K(150 �C), with marginally more (~3 pct) in the specimentested at 473 K (200 �C).The precise determination of the austenite lattice
parameter is fundamental to the quantification ofseveral microstructural parameters of the studied steel,namely, SFE, the dislocation densities at different testtemperatures, etc., and is also a measure of the effectivevolume expansion due to the DIMT. According to theRietveld analysis, the austenite lattice parameter revealstwo distinct variations. First, the austenite latticeparameter decreased with decreasing incidence of DIMTat 273 K (0 �C) and RT, and above RT, when DIMTwas suppressed, it increased monotonously until thehighest test temperature of 473 K (200 �C) (Table IV).In contrast, the lattice parameter variation of a¢-mar-tensite follows the opposite trend (Table IV), i.e., itgradually increases with a decrease in the incidence ofDIMT. It was further revealed that, in general, withincrease in deformation temperature, the austenite unitcell volume does not increase significantly as theavailable volume per atom remains almost constant at0.0117 nm3, increasing to 0.0118 nm3 at the highest tem-perature of deformation at 473 K (200 �C) (Table IV).
C. The Deformation Microstructure
1. ‘‘Size-strain’’ analysis in austeniteThe crystallite size and lattice microstrain values of
different constituent phases of the present steel duringtensile deformation at various temperatures wereobtained for different crystallographic [hkl] directionsfollowing the ‘‘size-strain’’ analysis of the Rietveldalgorithm[14] and the modified Warren–Averbach ana-lysis.[15] Each of these two methods has certain limita-tions and advantages. Warren–Averbach analysis[15] is aphenomenological approach, with better reliability butis not preferred in cases of severe peak overlap and/orfor large strains that deviate from a Gaussian straindistribution.The influence of deformation temperature on the
crystallite size and r.m.s. microstrain within the austen-ite microstructure estimated according to the Popamodel[19] is shown in Figure 2, for the prominentcrystallographic directions. Figure 2(a) reveals thatexcept for the [111], the crystallite size values exhibitsmall anisotropy and a weak dependence on thedeformation temperature and the values increase veryslowly as the deformation temperature increases, whilethe anisotropy along [111] is relatively high and also thesize value along this direction increases more rapidlywith increase in deformation temperature. On the otherhand, moderate values (~10�3) of austenite lattice strainwere also obtained, revealing small anisotropy exceptalong the [200] direction, which incidentally was thehighest lattice strain direction. However, the dependenceof lattice strain on the deformation temperature isapproximately identical along all directions as it initially
Table
IV.
StructuralParametersObtained
from
RietveldAnalysisforDifferentTem
peratures
Deform
ation
Tem
perature
[K(�C)]
Austenite(fcc)
a¢-M
artensite
(bcc)
Relative
Volume
Change
V0 a0�V0 c
ðÞ
V0 c
±
(0.56)(pct)
Lattice
Parameter
(ac)
(A)
±(0.0004to
0.0006)
UnitCell
VolumeðV
cÞ(nm
3)
Available
Volume
per
Atom
V0 c
��
(nm
3)
Vol.fraction
±(1
to3)pct
LatticeParameter
(aa0)(A
)±
(0.0003to
0.0007)
UnitCell
VolumeðV
a0Þ
(nm
3)
Available
Volume
per
Atom
V0 a0
(nm
3)
Vol.fraction
±(1
to2)pct
273(0)
3.6063
0.0469
0.0117
19
2.8884
0.0241
0.0121
80
3.42
RT
(20)
3.6037
0.0468
0.0117
49
2.8955
0.0243
0.0122
50
4.27
323(50)
3.6049
0.0468
0.0117
97
——
——
—423(150)
3.6065
0.0469
0.0117
96
——
——
—473(200)
3.6092
0.0471
0.0118
96
——
——
—
METALLURGICAL AND MATERIALS TRANSACTIONS A
Author's personal copy

decreases up to 323 K (50 �C), thereafter, remainsnearly constant until deformation at 423 K (150 �C),and finally decrease further at 473 K (200 �C)(Figure 2(b)).
It is often observed that due to the anisotropy ofelastic constants along different crystallographic direc-tions, the size and strain values in the deformed steelmicrostructures are seldom isotropic. Therefore, thereported size and lattice strain values are derived fromthe Rietveld microstructure refinement,[14] an alternativeapproach to Warren–Averbach method[13] that com-prises various anisotropic [hkl] dependent line broaden-ing models. The anisotropy of austenite size and strainvalues indicate that not all the grains are plasticallydeformed in the same way, although the nature of grainsresponse to deformation is nearly the same along all themajor crystallographic directions. A significant obser-vation in Figure 2(b) is that the initial slopes of thelattice strain curves become nearly zero at intermediatestages of deformation, which finally changes its sign at473 K (200 �C). Likewise, the natures of dependence ofcrystallite size on temperature were also in agreement tothat of the lattice strain as: a lattice with smaller strainvalues is expected to correspond to a larger dimension ofcoherently scattering domain size i.e., crystallite size.
2. Stacking fault analysisThe SF analysis was performed to estimate the effect
of deformation temperatures on Psf and thereby on SFEvalues in the austenite microstructure according to the
(a)
(b)
Fig. 2—The variation of: (a) crystallite size and (b) r.m.s micro-strain, along different crystallographic directions in austenite withtemperature (Color figure online).
Table
V.
StackingFaultRelatedMicrostructuralParametersatDifferentTem
peratures
Deform
ation
Tem
perature
[K(�C)]
WithAnnealedStandard
Ref.[22]
WithoutAnnealedStandard
(from
Eq.[1])
Psf
9103
±(0.0001to
0.0008)
SFE
(mJ/m
2)
±(0.54to
2.32)
Critical
ShearStressðs
cÞ
(MPa)
Psf
9103
±(0.0001to
0.001)
SFE
(mJ/m
2)
±(0.65to
3.75)
CriticalShear
Stressðs
cÞ(
MPa)
273(0)
20.60
10.63
170
16.22
11.60
182
RT
(20)
19.10
13.20
207
15.50
15.84
248
323(50)
9.60
15.08
236
6.84
17.21
270
423(150)
4.96
36.35
569
4.41
34.61
542
473(200)
3.35
40.39
633
2.92
40.04
627
METALLURGICAL AND MATERIALS TRANSACTIONS A
Author's personal copy

Warren’s method,[22] as described in Section III–B. Theresults of the SF analyses are presented in Table V. TheSF analyses according to the two approaches describedin Section III–B reveal that both the approaches providecomparable Psf values in austenite for specimensdeformed at different temperatures, although the valuesare slightly higher in case of ‘‘peak-shift analyses’’ i.e.,the first approach in Section III–B, wherein the electro-polished as-received specimen was used as an annealedstandard and assumed to be free of SFs (Table V).
The observed differences in the Psf values obtainedaccording to both the approaches may be attributed tothe different underlying principles of two methods; viz.different lattice parameter values are assumed foradjacent pairs of lines, (111) and (200) in ‘‘peak-shiftanalyses,’’ whereas in the second approach, the samelattice parameter values were assumed for all the fivemajor diffraction lines of austenite. It can be observedfrom Table V that the low deformation temperature of273 K (0 �C) results in very high density of SFs(Psf ~ 10�2) within the austenite, but the density rapidlydecreases with rising deformation temperature and iseven lower by more than an order of magnitude(Psf ~ 10�3) between 323 K and 473 K (50 �C and200 �C). Similar high Psf values have been obtained inthe austenite microstructure of the same Cr-Mn austen-itic steel deformed at 193 K (�80 �C) as well as in othermetastable austenitic steels.[11,29,30] The presence ofrandomly distributed intrinsic SFs in an fcc structurecan be recognized in its representative diffractionpattern by a decrease of the maximum intensities ofthe (111) and (200) reflections.[22] Furthermore, thePaterson theory[31] suggests that in the presence ofintrinsic SFs, the fcc (111) line is shifted to higherdiffraction angles and the (200) reflection shifts to thelower diffraction angles.
In the present steel, the contribution of austeniteplanar faults on the diffraction pattern of specimendeformed at 273 K (0 �C) is demonstrated in Figure 3for a selected angular range, showing the quality ofrefinement that could be achieved without consideringthe planar faults and also showing the actual refinementthat includes them. A closer look at Figure 3(a) enablesus to make some important observations that are inagreement with the Warren’s model.[22] In austenitemicrostructure, we can see that besides the mismatchbetween the observed and calculated intensities ofadjacent pair of the (111) and (200) Bragg reflections,their angular positions are also distinctly shifted to thehigher and lower diffraction angles, respectively, whichare shown in the XRD pattern using continuous arrows(Figure 3(a)). Furthermore, the dashed arrows in Fig-ure 3(a) also indicate the expected angular positions ofthe (111) and (200) austenite Bragg reflections in theabsence of any planar faults in that microstructure. Theangular separation between the two different types ofarrows in Figure 3(a) and their opposite positionsindicate a very significant peak shift which can only beinduced by the presence of significant number of SFsand is also in agreement with the Paterson theory.[31]
From Figure 3(b), we can see that for the present steel,the Warren’s model[22] can sufficiently model the con-
tribution of SFs within the austenite microstructureduring the Rietveld microstructure refinement.
3. Dislocation character analysisThe parameters relevant to the dislocation analyses
are presented in Table VI. The parameter q signifies thecharacter of dislocations existing within the respectivemicrostructure at different temperatures and is esti-mated from a linear fitting of the squared form of themodified Williamson–Hall equation.[11,15] The dimen-sionless quantity M ¼ Re
ffiffiffiqp
in Table VI further rep-resents the dislocation arrangement parameter forvarying deformation temperatures. It should be men-tioned that in specimen deformed at 273 K (0 �C), thehigh-angle side of the austenite (111) reflection wasmasked by the simultaneous presence of (110) reflectionof a¢-martensite in approximately the same angularrange of 2h and, therefore, the determination of theFWHM of austenite (111) reflection and its tail was notstraightforward. Thus, in order to determine theFWHM of the austenite (111) Bragg reflection, wedeconvoluted the diffraction pattern fitted according tothe Rietveld method to extract the individual overlappeddiffraction lines and subsequently applied the modifiedWilliamson–Hall equation.[11] The deconvoluted patternis presented in Figure 4 for the relevant angular range asa guide for the readers.As the present steel has a low SFE at low tempera-
tures, the creation of numerous SFs are expected due to
(a)
(b)
Fig. 3—Effect of austenite planar faults on the quality of Rietveldrefinement in the XRD pattern of specimen deformed at 273 K(0 �C): (a) fitting without considering the Warren’s model (b) fittingwith the Warren’s model. A selected angular range is presented andthe solid arrows in (a) mark the observed Bragg reflections, while thedashed arrows in (a) mark the expected angular positions of therespective Bragg reflections in the absence of any planar faults. Thedifference curves of fitting are plotted at the bottom of the XRDpatterns and are also in the same scale (Color figure online).
METALLURGICAL AND MATERIALS TRANSACTIONS A
Author's personal copy

the movement ofac
6 112h i Shockley partial dislocationson the close-packed (111) planes of austenite. However,in the present study, the austenite dislocation characterand density determination were carried out for theac
2 110h i perfect dislocations. The theoretical values of qin austenite for pure edge and screw dislocations are1.71 and 2.46, respectively, whereas the correspondingvalues are 1.2 and 2.8, respectively, for a¢-martensite.[11]
The values of q for austenite are further used to evaluatethe fractions of edge fcðedgeÞ
and screw dislocations
fcðscrewÞ
in austenite microstructure for the present steelaccording to our previous work[11] and also presented inTable VI.
For the present steel, the value of q in the as-receivedspecimen is 1.92, signifying that the dislocation charac-ter is mixed.[11] In the deformation temperature regimeto 273 K to 323 K (0 �C to 50 �C), q for austenite grad-ually increases over the range 1.94 to 2.25 (Table VI),suggesting that the dislocation character graduallychanges to increasingly screw type and at 323 K(50 �C), it is predominantly screw in nature, about 72pct of screw dislocations (Table VI). On the other hand,
this analysis indicates that as the deformation temper-ature is increased to 423 K and 473 K (150 �C and200 �C), the austenite dislocation character changes toedge type and the austenite perfect dislocations wereestimated to be essentially edge in character (Table VI).The low-temperature interrupted uniaxial tensile defor-mation of the same steel at 193 K (�80 �C) revealed thatthe austenite dislocation character gradually changes topredominantly edge with increasing deformation.[11] Inthe literature, no report exists about the character ofdislocations in low-SFE Cr-Mn austenitic steels tested atvarying deformation temperatures. However, for Type304 steel, which is also a low-SFE steel, Shintani andMurata[32] reported that the dislocation character in theaustenite gradually changes from screw to edge typewith increasing cold-rolling deformation at room tem-perature and that the dislocations in a¢-martensite arescrew type.
4. Dislocation density analysisThe dislocation density values for the representative
microstructures are listed in Table VI. As seen fromTable VI, the estimated dislocation density values forsamples strained to fracture (at the uniform elongationzone) are quite high (~1015 m�2) in the austenite.However, in the a¢-martensite, which only appearsduring deformation temperatures 273 K (0 �C) andRT, the dislocation density values are even highercompared to those in the austenite, although the orderof magnitude remains the same (~1015 m�2). Shintaniand Murata[32] also made similar observationson relative dislocation densities in the austenite anda¢-martensite during deformation of Type 304 steel. Aninteresting detail in the variation of austenite dislocationdensity is that the values increase until RT deformationand thereafter the dislocation density decreases contin-uously as the deformation temperature is increased until473 K (200 �C) (Table VI).We estimated high values of Re (Table VI), the
effective outer cut-off radius of dislocations, whichdescribes the variation of strain field between thedislocations. The value of Re in the as-received specimenwas very large ~479 nm and represented a nearlyrandom distribution of non-interacting dislocationswithin the undeformed austenite.[11] However, the effectof tensile straining significantly lowered the Re values
Fig. 4—Selected angular range of the 273 K (0 �C) deformed speci-men’s X-ray diffractogram showing the deconvolution of austenite-(111) Bragg reflection for application in modified Williamson–Hallequation, as described in Ref. [11]. The residue of fitting is alsodrawn in the same scale and plotted at the bottom of the diffracto-gram (Color figure online).
Table VI. Dislocation Density and Character Parameters at Different Temperatures
DeformationTemperature [K (�C)]
Austenite (fcc) a¢-Martensite (bcc)
273 (0) RT (20) 323 (50) 423 (150) 473 (200) 273 (0) RT (20) 323 (50) 423 (150) 473 (200)
Dislocation Density,(q) 9 10�15 m�2
9.29 11.56 7.54 5.60 4.10 15.96 27.54 — — —
Dislocation CharacterParameter, (q)
1.94 1.99 2.25 1.72 1.72 2.57 2.78 — — —
Outer Cut-Off Radii ofDislocation, Reð Þ nm
31 27 44 41 45 72 72 — — —
Dislocation arrangementparameter, M ¼ Re
ffiffiffiqp 2.98 2.88 3.84 3.05 2.89 9.09 11.98 — — —
fcðedgeÞ 0.69 0.63 0.28 0.99 0.99 — — — — —fcðscrewÞ 0.31 0.37 0.72 0.01 0.01 — — — — —
METALLURGICAL AND MATERIALS TRANSACTIONS A
Author's personal copy

compared to the undeformed austenite so that they varyfrom 27 to 45 nm at different temperatures (Table VI).This indicates that the tensile deformation had theeffect of establishing a weak interaction among theaustenite dislocations. From the Re values in Table VI,it is imperative that the nature of dislocation inter-action in austenite did not change significantly in thehigher regime of the deformation temperature. As thea¢-martensite was not present above RT, no inferencescan be made regarding the nature of the dislocations.
5. Twinning AnalysisThe results relevant to the twinning analyses by both
X-ray and EBSD methods are presented in Table VII. Itis reported that the as-received microstructure of thissteel consists of negligible twins.[11] The Warren’smethod[22] of fault analysis estimated moderate valuesof twinning in the austenite deformed at 273 K (0 �C),with values Ptw � 0.013, and they even increase for RTdeformation and reach maximum at 323 K (50 �C)
Fig. 5—EBSD phase maps of different deformed specimens with CSL boundaries at: (a) 273 K (0 �C), (b) 323 K (50 �C), (c) 423 K (150 �C), (d)473 K (200 �C). The R3 boundaries are shown in green, e-martensite (yellow) and a¢-martensite (red) (Color figure online).
Fig. 6—The frequencies of CSL boundaries in austenite at differenttemperatures (Color figure online).
Table VII. Deformation Twinning Parameters at Different Temperatures
Deformation Temperature [K (�C)] 273 (0) RT (20) 323 (50) 423 (150) 473 (200)
Ptw 9 103 ± (0.0008 to 0.002) 13.73 (1.37 pct) 22.55 (2.25 pct) 35.75 (3.75 pct) 8.72 (0.87 pct) 4.68 (0.47 pct)R3 (pct) 3.37 6.10 8.41 4.40 2.55
METALLURGICAL AND MATERIALS TRANSACTIONS A
Author's personal copy
corresponding to the value Ptw � 0.035, i.e., almost athreefold increase in the austenite twin density. How-ever, at higher deformation temperatures [i.e., at 423 Kand 473 K (150 �C and 200 �C)], the twinning tendencyof austenite decreases significantly and a low value ofPtw could be observed. The values in percentages arealso shown in Table VII for all the deformation tem-peratures.
Table VII also shows the deformation twinning fre-quencies of austenite obtained according to the CSLmethod revealing the existence of deformation twins.Some selected typical EBSD maps are presented inFigure 5, which shows numerous deformation twinboundaries, whose occurrences are initially moderate,reaching a maximum at 323 K (50 �C) and graduallydecreasing at higher temperatures. Further, we alsopresent the frequencies of the primary twins (
P3) and
higher-order twins (P
3n, n> 1) with varying deforma-tion temperature in Figure 6. We only report the GBswith
P3 to
P29 that are considered as low
P(or
special boundaries) and random boundaries are thosehaving
Pbeyond 29 and are omitted. It can be readily
seen from Table VII and Figure 6 that the nature ofvariation of CSL boundaries remains invariant withdeformation temperature and
P3 boundary is the
dominant CSL boundary in the GBCD, whose incidencegradually increases from 3.37 pct at 273 K (0 �C)deformation and attains the maximum of 8.41 pct at323 K (50 �C) deformation and thereafter its frequencyagain decreases to 2.55 pct at the highest deformationtemperature of 473 K (200 �C). These results are ingood agreement with that observed according to theXRD treatment. Although, the values were somewhathigher in the EBSD approach and are plausibly due tolocal nature of investigation, which although beingdirect in nature offers lower statistics than the X-raymethod.
V. DISCUSSION
A. Temperature Dependence of MartensiteTransformation and the Flow Stress Behavior
The low-SFE austenitic steels are generally metastableand prone to martensite transformation during defor-mation, especially at low temperatures. In such steels,the expected martensitic transformation iscfcc ! ehcp ! a0bcc, even though direct transformationfrom cfcc ! a0bcc has also been reported.[33,34] For aCr-Mn-Ni type steel, Kovalev et al.[10] indicated thatdeformation twinning and cfcc ! a0bcc transformationare possible in this steel. From thermodynamic calcula-tions, they further suggested that the temperatures
Mc!a0
d , Mcþc
0Twinning
!a0
d and Tc!c
0Twinning
d (the highest tempera-ture for occurrence of mechanical twinning) for this kindof steel are 353 K, 373 K, and 523 K (80 �C, 100 �C,and 250 �C), respectively. The maximum deformationtwinning tendency was predicted around 373 K (100 �C)and was proposed to improve the uniform elongation.[10]
It should be mentioned that the temperatures suggestedby Kovalev et al.[10] should only be taken as indicative as
the present steel had about 0.2 wt pct of nitrogencompared to 0.03 pct in the said report and hence it isreasonable to expect more austenite stabilization in the
present steel and the Mc!a0
d should come down furtherfrom 353 K (80 �C). In the present study, the amount ofDIMT decreases significantly with increasing testingtemperature and above RT no DIMT could beobserved. It is well known that temperature stronglyinfluences the SFE such that increasing the temperaturealso increases the SFE. Hence, the DIMT is not favoredduring mechanical deformation at temperatures above
Mc!a0
d .The highest tensile strength of the present steel was at
273 K (0 �C) (Table III and Figure 1) and attributableto the high strain hardening arising from massive TRIPeffect (~80 pct cfcc ! a0bcc DIMT in Table IV) occurring.Interestingly, at RT and 323 K (50 �C), although theyield and tensile strength decrease, the elongation valuesincrease significantly compared to at 273 K (0 �C) andattaining the maximum at 323 K (50 �C) (Table III).Such anomalies in the flow stress behavior of theCr-Mn-Ni steels are also reported by Wittig et al.[9]
and Kovalev et al.[10] at temperatures around RT andslightly elevated temperatures. To explain this, it isexpected that a¢-martensite laths, wide SFs and twinscan efficiently act as obstacles to dislocation glide andcan delay the progress of local necking and thereby areresponsible for the observed high strain hardening andgood elongation. Hence, in the present study, thedeformation modes prominent until RT are expectedto be: reduced dislocation glide, cfcc ! a0bcc transforma-tion and deformation twinning, while at 323 K (50 �C)the cfcc ! a0bcc transformation is suppressed and defor-mation twinning is very prominent. On the other hand,at elevated temperatures, i.e., even higher SFE, disloca-tion tangles and/or cell structures are expected (dis-cussed in Section V–E) due to increased dislocationglide and in the absence of a¢-martensite, wide SFs andsignificant deformation twinning, reduced uniform elon-gation is reasonable as was observed at 423 K and473 K (150 �C and 200 �C) (Table III).
B. Martensite Transformation and the Unit CellDimensions
In our earlier study on the same steel deformed at193 K (�80 �C),[11] we found that the austenite latticeparameter increases with the progress of DIMT andsimilar phenomenon was also observed in the presentstudy, i.e., until RT, with increase in temperature, theextent of cfcc ! a0bcc transformation decreases and sodoes the austenite lattice parameter. It is well knownthat the cfcc ! a0bcc martensitic transformation is real-ized through a massive homogeneous transformationstrain (Bain strain) that is responsible for volumeexpansion of the crystal. At low temperatures, whenwe have significant a¢-martensite contents at highstrains, the expanding austenite lattice due to Bainstrain would affect an increase in its lattice parameterand may also lead to compressive stress in the trans-formed region that may slightly offset the net volume
METALLURGICAL AND MATERIALS TRANSACTIONS A
Author's personal copy

expansion and consequently the a¢-martensite unit cellcan experience a kind of compressive stress. Hence, wecan expect a decrease in the lattice parameters ofa¢-martensite, as long as there is some significantamount of the retained austenite.
Alongside, a low test temperature of 273 K (0 �C) willlead to normal contraction of the crystal due to reducedthermal vibrations of atoms compared to that at theambient and elevated temperatures. These two simulta-neous processes i.e., the expansion due to Bain strainand thermal contraction of the crystal occurring duringa low temperature tests are competing in nature.However, at RT, the opposite contribution due tothermal contraction of the crystal ceases to exist. It isreported that the volume change during the austen-ite fi martensite transformation can be calculated as4.64 � 0.53 9 (pct C), i.e., the volume change is depen-dent on the carbon content of the steel.[35] The presentsteel had a C content of 0.047 pct and thus thecalculated volume expansion should be about 4.62 pct.From Table IV, we can observe that at 273 K (0 �C)deformation, the estimated relative volume expansionwas 3.42 pct, i.e., ~3 pct, which is significantly lowerthan 4.62 pct as predicted in Reference 35. At RT, thereshould not be any thermal contraction of the crystal andthe relative volume was estimated to be 4.27 pct(Table IV), a value well within the accuracy limit ofthe present analyses and which agrees well with resultsin Reference 35.
C. Stacking Faults in Austenite and the Stacking FaultEnergy
It is well known that under a stress-free condition, thewidth of the SF is dependent on the energy of the faultitself, the SFE of the material under consideration. Thewidth of the SF is also directly dependent on theexternal stress. From the X-ray analysis viewpoint, thereis a relation between SFE and Psf. The estimated valuesfor Psf were further used to determine the SFEs of thepresent steel at different deformation temperaturesaccording to the Schramm and Reed equation[25] mod-ified by the Wilkens’ strain function,[26] as described inSection III–B. It can be seen from Table V that thevalue of Psf obtained by both the approaches describedin Section III–B lead to comparable values of the SFEas a function of the deformation temperature. At thelow temperature of 273 K (0 �C), the SFE is low~10 mJ/m2, at RT it is still low ~15 mJ/m2, but itgradually increases with increasing temperature up to~40 mJ/m2 at 473 K (200 �C). Hence, this temperaturedependence of the SFE for the present steel is inreasonable agreement with the model of Curtze et al.,[2]
who suggested an increase in SFE of ~10 mJ/m2/373 K(100 �C) for this kind of steel.
The SFE directly affects the width of the SFs underthe influence of external stress and hence to ourreckoning, the interpretation of deformation mecha-nisms remains incomplete without determining thewidth of the austenite SFs as a function of externalshear stress at different temperatures. Further, weconjectured in Section V–A that besides other factors,
the presence of wide SFs within austenite might alsoimpede the dislocation glide at temperatures around RTand contribute toward the elongation of the steel at suchtemperatures and hence we investigate if the widening ofSFs is tenable in the present steel at low deformationtemperatures. The following relation as suggested byByun[36] was used to determine the width (w) of theaustenite SFs at different deformation temperatures as afunction of the external resolved shear stress ðsÞ as:
w ¼ Gb2
p 2� SFE� sb sin h2 � sin h1j jð Þ cos h1 cos h2ð
þ sin h1 sin h21� m
�; ½5�
where b ¼ acffiffi6p is the absolute value of Burgers vector of
the Shockley partials, G = 77.4 GPa is the shear mod-ulus of the steel and reasonably assumed to remainconstant over the deformation temperature range273 K to 473 K (0 �C to 200 �C), h1 and h2 are theangles between the Burgers vectors of the leading andtrailing partials and assumed as �30 and +30 deg,respectively, and m is the Poisson’s ratio taken as 0.3.The resolved shear stress values were calculated assum-ing the highest possible value of Schmid factor as 0.5.The results of the calculations according to Eq. [5] arepresented in Figure 7 and they show the variation inwidth of the SFs in the austenite with external shearstress for different SFE values in the deformation tem-perature range. Eq. [5] further indicates that for a par-ticular SFE value, above a critical shear stress scð Þ, thewidth of the SFs diverge in most favorably orientatedslip system, whose value is given by the followingequation:
sc ¼2� SFE
b½6�
The SFE values estimated according to Eq. [4](described in Section III–B) were further used in Eq.[6]to determine the sc values for the SFs to diverge,whose values for different temperatures are presented in
Fig. 7—The variation of austenite stacking fault widths with externalstress at different SFE (Color figure online).
METALLURGICAL AND MATERIALS TRANSACTIONS A
Author's personal copy

Table V alongside the Psf and SFE values. It can be seenfrom Table V that in comparison to the maximum shearstress values in Table III, the values are distinctly loweruntil 323 K (50 �C) and they become significantly higher(~ 600 MPa) at 423 K and 473 K (150 �C and 200 �C).The implication of this observation is that duringstraining at temperatures up to 323 K (50 �C), the flowstress and the corresponding shear stress on the spec-imen are well above the sc values required for wideningof the SFs to infinity. Consequently, we can say that upto a SFE of ~15 to 17 mJ/m2, the overlapping ofwidened SFs due to external stress (uniaxial tension) isfavorable.
In other words, if Byun’s calculations[36] are repeatedfor the present steel, then Figure 7 and Table V predictthat until 323 K (50 �C) we should observe wide SFswithin austenite that can act as effective obstacles todislocation glide. However, Figure 7 and Table V fur-ther indicate that at the higher deformation tempera-tures [423 K and 473 K (150 �C and 200 �C)], wideoverlapping SFs would require very high critical shearstress values (i.e., sc) that could not be attained at flowstress values ~950 MPa, which the steel can sustain atthose temperatures (see Figure 1). Thus, at such elevatedtemperatures, we expect fine SF ribbons within austenitethat might not provide any efficient impediment to thedislocation glide.
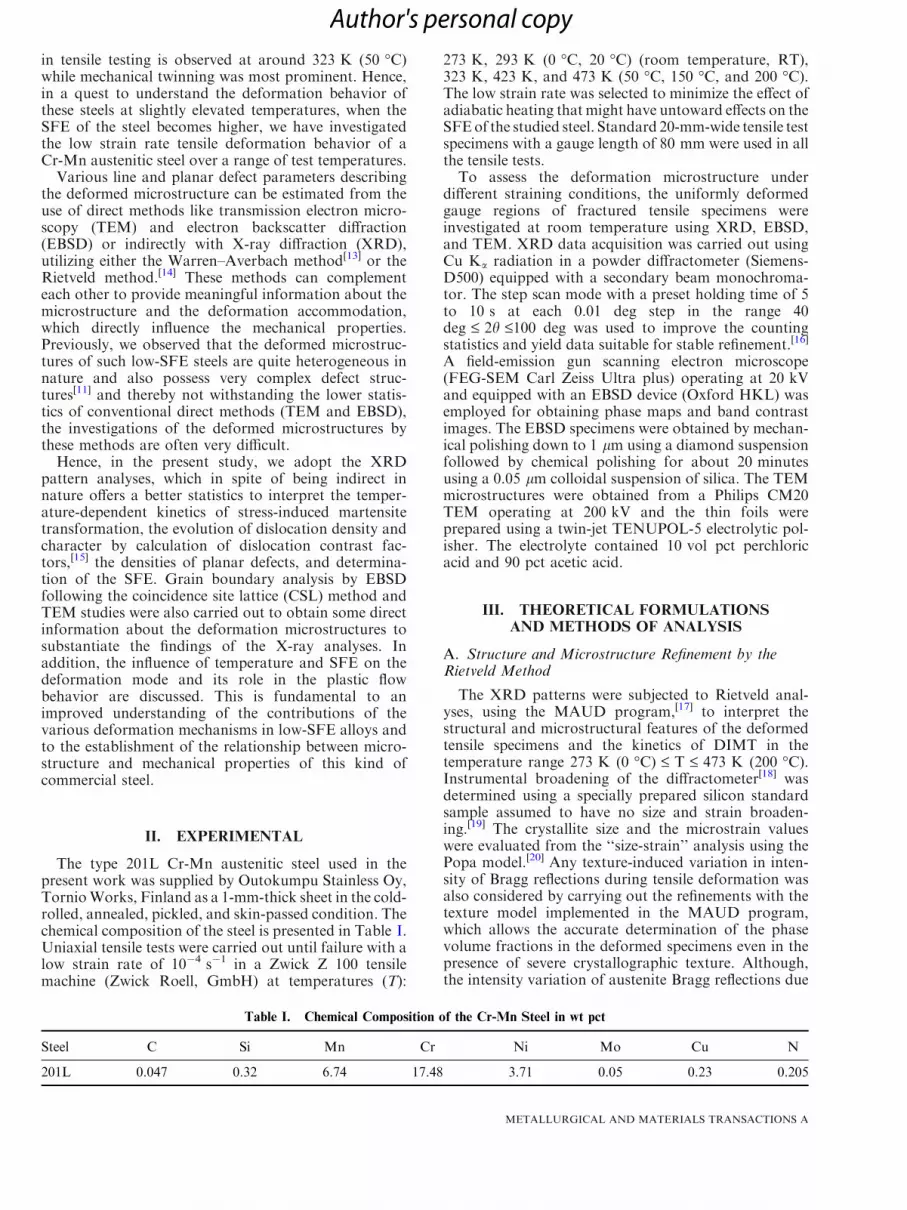
In agreement to this, typical TEM bright-field (BF)microstructures presented in Figures 8(a) and (b) alsoconfirm the presence of few wide intersecting SFs withinaustenite during uniaxial loading at 273 K (0 �C) andRT, in good agreement with the Eq. [5] suggested byByun.[36] In contrast, the BF microstructures of thespecimens tensile deformed at 423 K and 473 K (150 �Cand 200 �C) presented in Figure 9 reveal the existence ofinnumerous perfect dislocations and fine SF ribbons inthe austenite microstructure. Alongside, it should alsobe mentioned that a single isolated SF is an intrinsic SF,which when arranged next to each other on everyalternate (111) austenite plane in a non-localized mannerresults in the presence of hcp e-martensite. In the presentstudy, as revealed from the BF TEM micrographs inFigures 8 and 9, the localized nature of non-intersect-
ing and few intersecting SFs at various deformationtemperatures has the implication of non-existence ofsignificant hcp e-martensite in these specimens.Obviously, it should be mentioned that the above
analyses involve several sources of uncertainties like theXRD method of SFE calculation requires precisedetermination of the Psf values, and Velterop et al.[37]
criticized the Warren’s method for often underestimat-ing the Psf values. However, there are also reports thatthe Warren’s method[22] can successfully model thecontribution of planar faults (SFs and twins) until thelimit of about 0.9 pct of SFs and 10 pct of twinfaulting,[38] which is significantly higher than the densityof planar faults observed in the present study. Thus, itcan be assumed that the Warren’s treatment[22] of planarfaults should be valid here. Further, all the XRDmeasurements were carried out at RT and in principle,the temperature effect on SFs due to the variation ofSFE should be reversible for an undeformed micro-structure. However, a specimen deformed at an elevatedtemperature in the plastic region and subsequentlybrought back to RT represents an irreversible processand the deformation information in such case ispreserved within the specimen unless a suitable heattreatment is given. Also, according to the thermody-namically calculated model, the SFE is considered as anintrinsic material property, which does not depend ondislocations and dislocation arrangements. Whereas, forreal crystals, the dislocation interaction on the SFshould also be taken into account[2] and was consideredin the calculation by the Wilkens’ strain function (Eq. [3]in Section III–B). Nevertheless, despite the above uncer-tainties in SFE determination by XRD analyses, thepresent study showed a good correlation with thetemperature model of SFE for this class of steel[2] andthe deformation behavior in the studied temperatureregion.
D. Temperature Dependence of Deformation Twinning inAustenite
The presence of deformation twinning within themicrostructure does not contribute to a significant peak
Fig. 8—TEM bright-field micrographs revealing wide intersecting and parallel stacking faults in austenite at temperatures: (a) 273 K (0 �C) and(b) RT 293 K (20 �C).
METALLURGICAL AND MATERIALS TRANSACTIONS A
Author's personal copy
shift in the XRD pattern, but it lowers the maximumintensity and increases the asymmetric broadening of(111) and (200) Bragg reflections. To explain theoccurrence of twinning in austenite of the present steelwe recall that in low-SFE fcc metals, a deformation twinis created by an extrinsic SF that changes the stackingorder from ABCABCABC to ABCACBCA. Meyerset al.[39] suggested that the twinning stress is insensitiveto temperature and is strongly dependent on the strainrate and a lower strain rate significantly reduces thetwinning stress. However, there are enough debates onthis issue.[40–42] In this work, we also use a very lowstrain rate (10�4 s�1) and the considered steel had a lowSFE in the lower regime of the deformation temperatureand thus a low critical twinning stress, scð Þtwin, isexpected at lower deformation temperatures, whichshould favor the formation of deformation twins inaustenite at least in this temperature regime.
For coarse-grained metals and alloys, twinning isinitiated by pre-existing dislocation configurationswhich dissociate into multilayered SF structures thatform a twin nucleus. The glide of Shockley partialdislocations i.e., twinning dislocations with Burgersvector, btwinj j ¼ ac
6 112h i, on successive austenite (111)planes creates multilayered SFs that could then producea twin. Also, the critical stress to nucleate a twin can bedetermined from the stress required to operate a twinsource. It has been shown that the critical twinningstress only depends on the intrinsic SFE of the metal andthe phenomenological relation is of the formscð Þtwin� K�SFE
btwin, where K is a fitting parameter.[43] Thus,
lower deformation temperatures also lower the SFE andthe critical twinning stress of the present steel and mayfavor the dissociation of the perfect dislocations intopartial dislocations and SFs that can finally produce adeformation twin within austenite. In contrast, at 423 Kand 473 K (150 �C and 200 �C) deformations the SFEof the steel is significantly high (~40 mJ/m2), whichrequires sufficient higher scð Þtwin values for the occur-rence of deformation twins and might be quite unfa-vorable. The absence of
P9 and
P27 boundaries in the
CSL distribution of austenite in Figure 6 should also bementioned, indicating that the twins within austenite
seem to be coherent twins. Thus to sum up, for thepresent steel, deformation by twinning is more signifi-cant until 323 K (50 �C), but thereafter, its role becomesquite insignificant.
E. Evolution of Dislocation Density and Characteristicsin Austenite
The dislocation arrangement parameter M ¼ Reffiffiffiqp
is a measure of the strength of the dipole character ofdislocations,[26] i.e., the statistical distribution of dislo-cations. It is well known that the dislocation arrange-ment is a strong or weak dipole in nature depending onif M is smaller or greater than unity, respectively. Wecan see from Table VI that the M values correspondingto the dislocations in austenite remain more or lessconstant in the range of ~3, i.e., the dislocations withinthe studied deformation temperature regime represent aweak non-interacting dipole character, but a relativelystronger dipole character can be expected as comparedto the austenite of the same steel deformed at 193 K(�80 �C), wherein the M values were in the range of 4 to6.[11] In general, for most deformed metallic materialshaving high SFE, M decreases to around unity becausedislocations tend to form a cell structure in strongcorrelation. This phenomenon is not always expected inlow-SFE materials because such materials favor planarslip during deformation.For the present steel, the dislocation character in the
as-received specimen was mixed and the deformationbehavior at 193 K (�80 �C) indicated that the edgedislocations dominate the austenite microstructure atlarge strains.[11] However, in the present study, thetemperature dependence of dislocation character showsthat it is increasingly screw until 323 K (50 �C) andthereafter at 423 K and 473 K (150 �C and 200 �C), itagain transforms into almost complete edge populationof dislocations (fcðedgeÞ � 1) (Table VI). We try toexplain this considering the stress required for disloca-tion rearrangement that is inversely proportional to theSFE.[44] Hence, until 323 K (50 �C), as long as the SFEof this steel remains between 10 and 15 mJ/m2, disloca-tion rearrangement via cross slip may not be quite
Fig. 9—TEM bright-field micrographs revealing the perfect dislocations and fine stacking fault ribbons in austenite at temperatures: (a) 423 K(150 �C) and (b) 473 K (200 �C).
METALLURGICAL AND MATERIALS TRANSACTIONS A
Author's personal copy

favorable since it involves a higher stress and thethreshold might not be reached until we deform thesteel at relatively higher temperatures of 423 K and473 K (150 �C and 200 �C). Likewise, since cross slipmight be unfavorable in the studied steel up to 323 K(50 �C), the accumulation of prefect screw dislocationswithin austenite seems quite plausible until such tem-peratures, while at higher deformation temperatures[423 K and 473 K (150 �C and 200 �C)], when the SFEis significantly higher (35 to 40 mJ/m2), such screwdislocations may cross slip. Hence the screws havingopposite Burgers vector can subsequently be annihilatedthat will leave a dislocation arrangement predominantlyedge in nature, i.e., fcðedgeÞ � 1 and consequently, somedecrease in the dislocation density value is reasonable, aswas also observed in the present study (Table VI).
To support this, it is well established that theformation of dislocation cells requires cross slip tooccur and the TEM BF microstructures presented inFigure 10(a) demonstrate the development of incom-plete dislocation cell structure within austenite at 423 K(150 �C), which becomes more distinct at 473 K(200 �C) (Figure 10(b)). Additionally, we should alsomention that a significantly higher external stress caninduce the dislocation cross slip even at lower SFEvalues (i.e., at lower temperatures) and as the presentsteel had a tensile strength of about ~1.4 GPa at 193 K(�80 �C),[11] i.e., about 40 pct higher strength than at273 K (0 �C), and the screw dislocations might cross slipunder the influence of such stress. This can explain theobservation of a nearly complete edge population ofdislocations in the deformed austenite even at a lowtemperature of 193 K (�80 �C).[11]
Furthermore, to interpret the role of dislocationcharacter, interaction, and densities on the mechanicalproperties, we recall that the relationship between theflow stress and the dislocation density is fairly describedby the Taylor equation:
r ¼ T0Gbaq1=2; ½7�
where r, T¢, G, b, a, and q represent the flow stress,Taylor factor, shear modulus, the Burgers vector,dislocation interaction constant, and dislocation density
of the studied steel. For the present steel, it wasreasonably assumed that the value of T¢ and G remainsconstant over the deformation temperature range of 0 to200 �C.We show the variation of the flow stress of the present
steel at different temperatures with the square root ofdislocation density in Figure 11 and it reveals some veryinteresting features. First, if we assume that even in thepresence of significant a¢-martensite (e.g., 273 K (0 �C)deformed specimen) the flow stress values of the presentsteel are determined by the austenite dislocation densi-ties, then the linearity of Taylor equation is notmaintained in the low-temperature region and we get avery poor linear fitting (plotted using a dashed line) andalso marked in red in Figure 11. However, if we assumethat at low deformation temperature [i.e., 273 K (0 �C)],when we have less abundance of austenite, the plasticflow behavior of the steel is dominated by thea¢-martensite dislocation densities; while at other defor-
Fig. 11—The variation of flow stress with square root of dislocationdensities at different temperatures and its linear fitting according toEq. [7]. The dashed line is a fitting of Eq. [7] obtained with contribu-tion from austenite dislocation density at 273 K (0 �C), while thecontinuous line gives the same fitting with contribution from a¢-mar-tensite dislocation density at 273 K (0 �C). The red ellipse and blackarrows indicate the significant scatters of the respective points fromeach linear fit (Color figure online).
Fig. 10—Perfect dislocation structures in austenite: (a) incomplete cell at 423 K (150 �C), (b) prominent cell at 473 K (200 �C).
METALLURGICAL AND MATERIALS TRANSACTIONS A
Author's personal copy
mation temperatures (i.e., RT and above) when there issubstantial austenite to accommodate the defor-mation, the plastic flow behavior is dominated by theaustenite, then we get an improved linear fitting to theTaylor equation (shown in Figure 11 using a con-tinuous line) in the studied temperature range 273 K(0 �C) £ T £ 473 K (200 �C), along with some addi-tional observations, described below.
We can clearly see that the two points correspondingto 273 K and 323 K (0 �C and 50 �C) show a hugeopposite scatter, indicative of deviation from the linearTaylor equation. Onyuna et al.[45] suggested that fordual-phase steels, the plastic behavior of the steel isdominated by the austenite until a moderate presence ofabout 10 to 20 pct of a¢-martensite. For higher amount ofa¢-martensite, the deformation is controlled by martens-ite and failure is promoted, as the plastic flow isrestricted. Now, this appears to be a legible assumptionthat austenite being the softer phase can accommodatemajority of deformation when it has a significantpresence, while for lower abundances of austenite, thedeformation should be carried by the a¢-martensite. Butin the present steel, the scatters at 273 K and 323 K (0 �Cand 50 �C) certainly indicate the presence of othersignificant deformation mechanisms alongside disloca-tion hardening, namely, very high TRIP effect anddeformation twining, respectively, whose contributionmust be included in the strain hardening behavior.
As to our knowledge, until now no model is availablethat relates the dislocation interaction constant a in theTaylor equation to the dislocation arrangement param-eter, M, introduced by Wilkens.[26] However, notwith-standing the contribution from deformation twinning at323 K (50 �C), the approximate linearity of the Taylorequation suggests that the dislocation interaction withinaustenite remains more or less invariant at least fromRT to 473 K (200 �C) and then from the ‘‘dislocationcharacter analysis’’ (Section IV–C–3), we also estimatedthat for all deformation temperatures, the M parameteris ~3 (Table VI). In other words, the M values obtainedfrom X-ray analyses also substantiate the findings of theTaylor equation that the dislocation interaction withinaustenite does not change appreciably during the latterstage of the deformation. For a cold-deformed Type 304steel, Shintani and Murata[32] suggested that the strainhardening in austenite is derived from the pinning ofedge dislocations, which also holds for the present steelat intermediate and higher deformation temperature,when we have complete austenitic structure. However,at 273 K (0 �C), the fraction of austenite decreased veryrapidly with increasing strain so that its contributionalmost ceases at fracture and the high final flow stressmust be attributed to high degree of strain-inducedmartensite transformation causing strain hardening ofthe a¢-martensite.
VI. SUMMARY AND CONCLUSIONS
The deformed microstructure of a Cr-Mn austeniticsteel was studied after the low strain rate tensile tests inthe temperature range 273 K (0 �C) £ T £ 473 K
(200 �C). The increase in the test temperature signifi-cantly raises the SFE of the steel as estimated by XRDpattern analyses. The SFE values had distinct effects onthe deformation behavior of the steel and manifest thefollowing important features about the deformed micro-structure:
� Up to SFEs ~ 15 mJ/m2, i.e., at RT, deformation ofaustenite is accompanied by cfcc ! a0bcc transforma-tion, widening of SFs, and deformation twinning.Higher SFEs suppress the cfcc ! a0bcc transformationand maximum occurrence of deformation twinningwas observed at 323 K (50 �C), which also providedthe highest uniform elongation (~73 pct). At higherSFEs corresponding to higher temperatures [423 Kand 473 K (150 �C and 200 �C)], dislocation glide isdominant so that dislocation cell structures developand uniform elongation decreases (~40 to 50 pct).
� At ambient temperatures, up to SFE ~ 15 mJ/m2,wide SFs were formed; while at elevated tempera-tures, in the instance of higher values of SFE, lowtensile stress, and high critical shear stress valuesprevent the widening of SFs and is responsible forfine SF ribbons and low values of Psf.
� At 273 K (0 �C) and RT, very high density of SFs(Psf ~ 10�2) was observed to be formed within theaustenite, which then decreases rapidly and becomeslower by more than an order of magnitude(Psf ~ 10�3) at higher deformation temperatures.Twinning also contributes to deformation up to323 K (50 �C), which increases the incidence ofhigh-angle
P3 boundaries until such temperature
and its frequency decrease thereafter.� Dislocation character in austenite were estimated tobe increasingly screw type with rise in deformationtemperature until 323 K (50 �C), then becomingmainly edge at still higher temperatures. However,dislocations were weakly interacting and this waspractically invariant at elevated temperatures.
� High dislocation density values (~1015 m�2) werecalculated for the austenite strained until the uni-form elongation. There is a moderate decrease in thedislocation density at elevated temperatures. In thepresence of significant TRIP effect and deformationtwinning, the dislocation density values do not showaccurate correlation with the flow stress of the steelpredicted by the Taylor equation.
ACKNOWLEDGMENTS
The financial support from the Finnish Funding Agen-cy for Technology and Innovation (Tekes) in the Lightand Efficient Solutions program (in the project Pro-duction and Properties of Breakthrough Materials) ofthe Finnish Metals and Engineering Competence Clus-ter (FIMECC Ltd.) is gratefully acknowledged. Theauthors would also like to thank Outokumpu Oyj forproviding the experimental material.
METALLURGICAL AND MATERIALS TRANSACTIONS A
Author's personal copy

REFERENCES1. R.P.R. Kumtubarao: Int. Mater. Rev., 1989, vol. 34, pp. 69–86.2. S. Curtze, V.-T.Kuokkala,A.Oikari, J. Talonen, andH.Hanninen:
Acta Mater., 2011, vol. 59, pp. 1068–76.3. M. Pozuelo, J.E. Wittig, J.A. Jimenez, and G. Frommeyer: Metall.
Mater. Trans. A, 2009, vol. 40A, pp. 1826–34.4. S. Allain, J.-P. Chateau, O. Bouaziz, S. Migot, N. Guelton:Mater.
Sci. Eng. A, 2004, vols. 387–389, pp. 158–162.5. A. Saeed-Akbari, L. Mosecker, A. Schwedt, and W. Bleck:Metall.
Mater. Trans. A, 2012, vol. 43A, pp. 1688–1704.6. G.B. Olson and M. Cohen: Metall. Trans., 1976, vol. 7A,
pp. 1897–1904.7. L. Remy and A. Pineau: Mater. Sci. Eng., 1976, vol. 28, pp. 99–
107.8. T.-H. Lee, E. Shin, C.-S. Oh, H.-Y. Ha, and S.-J. Kim: Acta
Mater., 2010, vol. 58, pp. 3173–86.9. J.E. Wittig, M. Pozuelo, J.A. Jimenez, and G. Frommeyer: Steel
Res. Int., 2009, vol. 80, pp. 66–70.10. A. Kovalev, A. Jahn, A. Weiß, and P.R. Scheller: Steel Res. Int.,
2011, vol. 82, pp. 45–50.11. P. Sahu, S.K. Shee, A.S. Hamada, L. Rovatti, T. Sahu, B. Mahato,
S. Ghosh Chowdhury, D.A. Porter, and L.P. Karjalainen: ActaMater., 2012, vol. 60, pp. 6907–19.
12. A.S. Hamada, L.P. Karjalainen, R.D.K. Misra, and J. Talonen:Mater. Sci. Eng. A, 2013, vol. 559, pp. 336–44.
13. B.E. Warren and B.L. Averbach: J. Appl. Phys., 1950, vol. 21,pp. 595–99.
14. H.M. Rietveld: J. Appl. Cryst., 1969, vol. 2, pp. 65–71.15. T. Ungar, S. Ott, P. Sanders, A. Borbely, and J.R. Weertman:
Acta Mater., 1998, vol. 46, pp. 3693–99.16. R.J. Hill: in The Rietveld Method, Chapter 5, R.A. Young, ed.,
IUCr, Oxford University Press, Oxford, 1993.17. L. Lutterotti: Materials Analysis Using Diffraction, version 2.33,
2011, http://www.ing.unitn.it/~maud/.18. G. Caglioti, A. Paoletti, and F.P. Ricci: Nucl. Inst. Methods, 1958,
vol. 35, pp. 223–28.19. J.G.M. Van Berkum, G.J.M. Sprong, T.H. de Keijser, R. Delhez,
and E.J. Sonneveld: Powder Diffr., 1995, vol. 10, pp. 129–39.20. N.C. Popa: J. Appl. Cryst., 1998, vol. 31, pp. 176–80.21. E. Prince: in The Rietveld Method, Chapter 3, R.A. Young, ed.,
IUCr, Oxford University Press, Oxford, 1993.22. B.E. Warren: X ray Diffraction, Addison-Wesley, Reading, 1969.
23. J. Talonen and H. Hanninen: Acta Mater., 2007, vol. 55, pp. 6108–18.
24. B.X. Huang, X.D. Huang, L. Wang, and Y.H. Rong: Metall.Mater. Trans. A, 2008, vol. 39A, pp. 717–24.
25. R.E. Schramm and R.P. Reed: Metall. Trans. A, 1975, vol. 6A,pp. 1345–51.
26. M. Wilkens: Phys. Status Solidi, 1970, vol. 2, pp. 359–70.27. M. Wilkens: in Fundamental Aspects of Dislocation Theory, J.A.
Simmons, R. de Wit, and R. Bullougs, eds., NBS Spl Pub, II: 317,US Department of Commerce, Wasington, DC, 1970, p. 1195.
28. D.G. Brandon: Acta Metall., 1966, vol. 14, pp. 1479–84.29. X.D. Wang, B.X. Huang, Y.H. Rong, and L. Wang: J. Appl.
Phys., 2007, vol. 101, pp. 093511–15.30. S. Martin, C. Ullrich, D. Simek, U. Martin, and D. Rafaja: J.
Appl. Cryst., 2011, vol. 44, pp. 779–87.31. M.S. Paterson: J. Appl. Phys., 1952, vol. 23, pp. 805–11.32. T. Shintani and Y. Murata: Acta Mater., 2011, vol. 59, pp. 4314–
22.33. G.B. Olson and M. Azrin: Metall. Trans. A, 1978, vol. 9A,
pp. 713–21.34. G.L. Huang, D.K. Matlock, and G. Krauss: Metall. Trans. A,
1989, vol. 20A, pp. 1239–46.35. G.E. Totten: in Chapter 6, Steel Heat Treatment: Metallurgy and
Technologies, 2nd ed., Taylor and Francis, Boca Raton, 2007.36. T.S. Byun: Acta Mater., 2003, vol. 51, pp. 3063–71.37. L. Velterop, R. Delhez, T.H. de Keijser, E.J. Mittemeijer, and D.
Reefman: J. Appl. Cryst., 2000, vol. 33, pp. 296–306.38. P.J. Schields, N. Dunwoody, M. Mamak, C. Gendron, and S.
Bates: Adv. X-ray Anal., 2007, vol. 53, pp. 162–68.39. M.A. Meyers, O. Vohringer, and V.A. Lubarda: Acta Mater.,
2001, vol. 49, pp. 4025–39.40. R.L. Bell and R.W. Cahn: Proc. R. Soc. Lond. A, 1957, vol. 239,
pp. 494–521.41. J.A. Venables: in Deformation Twinning, R.E. Reed-Hill, J.P.
Hirth, and H.C. Rogers, eds., Gordon & Breach, New York, 1964.42. R.E. Reed-Hill: Inhomogeneity of Plastic Deformation, ASM,
Metals Park, OH, 1973.43. S. Miura, J. Takamura, and N. Narita: Suppl. Trans. Jpn. Inst.
Met., 1968, vol. 9, pp. 555–61.44. W. Puschl: Prog. Mater Sci., 2002, vol. 47, pp. 415–61.45. M. Onyuna, H. Oettel, U. Martin, and A. Weiß: Adv. Eng. Mater.,
2004, vol. 6, pp. 529–35.
METALLURGICAL AND MATERIALS TRANSACTIONS A
Author's personal copy