a review of vessel extraction techniques and algorithms
TRANSCRIPT
A Review of Vessel Extraction Techniques and
Algorithms
Cemil Kirbas and Francis K.H. Quek
Vision Interfaces and Systems Laboratory (VISLab)
Department of Computer Science and Engineering
Wright State University, Dayton, Ohio
November 2002
Abstract
Vessel segmentation algorithms are the critical components of circulatory blood vessel
analysis systems. We present a survey of vessel extraction techniques and algorithms. We put
the various vessel extraction approaches and techniques in perspective by means of a classi-
fication of the existing research. While we have mainly targeted the extraction of blood ves-
sels, neurosvascular structure in particular, we have also reviewed some of the segmentation
methods for the tubular objects that show similar characteristics to vessels. We have divided
vessel segmentation algorithms and techniques into six main categories: (1) pattern recog-
nition techniques, (2) model-based approaches, (3) tracking-based approaches, (4) artificial
intelligence-based approaches, (5) neural network-based approaches, and (6) miscellaneous
tube-like object detection approaches. Some of these categories are further divided into sub-
categories. We have also created tables to compare the papers in each category against such
criteria as dimensionality, input type, pre-processing, user interaction, and result type.
Keywords: Vessel extraction, medical imaging, X-ray angiography (XRA), magnetic resonance
angiography (MRA)
1 Introduction
With the advances in imaging technology, diagnostic imaging has become an indispensable tool
in medicine today. X-ray angiography (XRA), magnetic resonance angiography (MRA), magnetic
resonance imaging (MRI), computed tomography (CT), and other imaging modalities are heavily
used in clinical practice. Such images provide complementary information about the patient. While
increased size and volume in medical images required the automation of the diagnosis process, the
latest advances in computer technology and reduced costs have made it possible to develop such
systems.
Blood vessel delineation on medical images forms an essential step in solving several practi-
cal applications such as diagnosis of the vessels (e.g. stenosis or malformations) and registration
of patient images obtained at different times. Vessel segmentation algorithms are the key com-
ponents of automated radiological diagnostic systems. Segmentation methods vary depending on
the imaging modality, application domain, method being automatic or semi-automatic, and other
specific factors. There is no single segmentation method that can extract vasculature from every
medical image modality. While some methods employ pure intensity-based pattern recognition
techniques such as thresholding followed by connected component analysis [1], [2], some other
methods apply explicit vessel models to extract the vessel contours [3], [4], and [5]. Depending on
the image quality and the general image artifacts such as noise, some segmentation methods may
require image preprocessing prior to the segmentation algorithm [6], [7]. On the other hand, some
methods apply post-processing to overcome the problems arising from over segmentation.
We divide vessel segmentation algorithms and techniques into six main categories: (1) pattern
recognition techniques, (2) model-based approaches, (3) tracking-based approaches, (4) artificial
intelligence-based approaches, (5) neural network-based approaches, and (6) miscellaneous tube-
like object detection approaches. Pattern recognition techniques are further divided into seven
categories: (1) multi-scale approaches, (2) skeleton-based approaches, (3) region growing ap-
proaches, (4) ridge-based approaches, (5) differential geometry-based approaches, (6) matching
filters approaches, and (7) mathematical morphology schemes. Model-based approaches are also
further divided into four categories: (1) deformable models, (2) parametric models, (3) template
matching approaches, and (4) generalized cylinders approaches. Although we divide segmentation
methods in different categories, sometimes multiple techniques are used together to solve different
segmentation problems. We, therefore, cross-listed the methods that fall into multiple segmenta-
tion category. Such methods are reviewed in one section and mentioned in the other section with a
pointer referencing to the section in which it is reviewed.
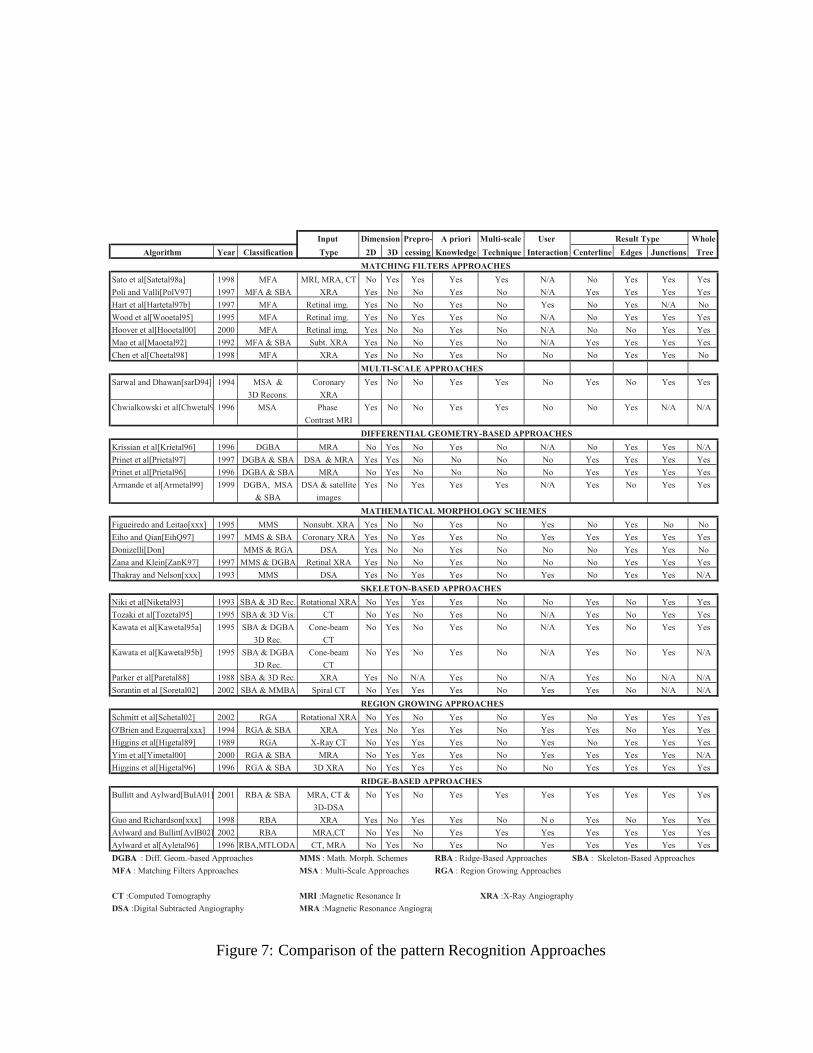
This paper provides a survey of current vessel segmentation methods. We have tried to cover
both early and recent literature related to vessel segmentation algorithms and techniques. After
a short introduction to each segmentation method category, papers fall in that category are sum-
marized briefly. We aim to give a quick summary of the papers and refer interested readers to
references for additional information. At the end of each section, we provide a table and compare
the methods reviewed in that section. The comparison includes segmentation method category,
input image type such as XRA, MRA, MRI, CT, etc., dimensionality, use of a priori knowledge,
whether the method employs multi-scale technique, user interaction requirement, result type such
as centerline, vessel edges, and junctions, and whether the method segments the whole vessels tree
or not.
Interested readers are referred to several surveys on medical image segmentation and analysis
in general for further reading [8], [9], [10], [11], and [12].
This paper is organized as follows. In Section 2, pattern recognition techniques are defined and
reviewed. Model-based approaches are discussed in Section 3. In Section 4, we review tracking-
based approaches. Methods based on artificial intelligence are discussed in Section 5. In Section
6, neural network-based methods are reviewed. In Section 7, algorithms that are not particularly
designed to extract vessels but deal with extraction of tubular objects are discussed. Finally, we
conclude with discussion on the issues related to vessel extraction and its applications in Section
8.
2 Pattern Recognition Techniques
Pattern recognition techniques deal with the automatic detection or classification of objects or fea-
tures. Humans are very well adapted to carry out pattern recognition tasks. Some of the pattern
recognition techniques are the adaption of humans’ pattern recognition ability to the computer
systems. In the vessel extraction domain, pattern recognition techniques is concerned with the
detection of vessel structures and the vessel features automatically. We divide pattern recogni-
tion techniques into seven categories: (1) multi-scale approaches, (2) skeleton-based (centerline
detection) approaches, (3) region growing approaches, (4) ridge-based approaches, (5) differential
Geometry-based approaches, (6) matching filters approaches, and (7) mathematical morphology
schemes. In the next sections, each category is discussed and the literature related to each category
is reviewed.
2.1 Multi-scale Approaches
Multi-scale approaches perform segmentation task on different image resolutions. The main ad-
vantage of this technique is the increased processing speed. Major structures, which are the large
vessels in our application domain, are extracted at low resolution images while fine structures are
extracted at high resolution. Another advantage is the increased robustness. After segmenting the
strong structures at the low resolution, weak structures, such as branches, in the neighborhood of
already segmented structures can be segmented at higher resolution.
Sarwal and Dhawan [13] reconstruct 3D coronary arteries from three views by matching branch
points in each view. Their method is based on simplex method-based linear programming and
relaxation-based consistent labeling. To improve the robustness of the matcher, matching process
is performed at three different resolutions. The stronger vessel tree branches are extracted at high
resolution while the weaker branches are extracted at lower scale. The result of the extracted vessel
tree is then used to perform 3D reconstruction.
Chwialkowski et al [14] accomplish segmentation of blood vessels using multiresolution anal-
ysis based on wavelet transform. Their work aims at automated qualitative analysis of arterial flow
using velocity-sensitive, phase contrast MR images. The segmentation process is applied to the
magnitude image and the velocity information from the phase difference image is integrated on the
resulting vessel area to get the blood flow measurement. Vessel boundaries are localized by em-
ploying a multivariate scoring criterion to minimize the effect of imaging artifacts such as partial
volume averaging and flow turbulence.
This method can also be classified as a contour detection approach.
The works of Summers and Bhalerao [15] described in section 3.3, Huang and Stockman [16]
described in section 7, and Armande et al [17] described in section 2.3 employ a multi-scale ap-
proach and can also be listed in this section.
2.2 Skeleton-Based (Centerline Detection) Approaches
Skeleton-based methods extract blood vessel centerlines. The vessel tree is, then, created by con-
necting these centerlines. Different approaches are used to extract the centerline structure. Ap-
plying thresholding and then object connectivity, thresholding followed by thinning procedure,
and extraction based on graph description are some of these approaches. The resulting centerline
structure is used to create 3D reconstruction of the vessel tree in some applications.
Niki et al [2] describe their 3D blood vessel reconstruction and analysis method. Vessel recon-
struction is achieved on short scan cone-beam filtered backpropagation reconstruction algorithm
based on Gulberg and Zeng’s work [18]. A 3D thresholding and 3D object connectivity procedure
are applied to the resulting reconstructed images for the visualization and analysis process. A 3D
graph description of blood vessels is used to represent the vessel anatomical structure.
Tozaki et al [19] extract bronchus and blood vessels from thin slice CT images of the lung for
3D visualization and analysis purposes. As a first step, a threshold is used to segment the images.
Then, blood vessels and bronchus are differentiated by using their anatomical characters such as
the bronchus contain air inside. Finally, a 3D thinning algorithm is applied to extract the centerline
of the blood vessels. The resulting centerline structure is used to analyze and classify the blood
vessels. Their work helps in early detection of tumors of lung cancer patients.
Kawata et al [20] describe their approach for analyzing blood vessel structures and detecting
blood vessel diseases from cone-beam CT images. X-ray digital angiograms are collected using
the rotational angiography system. 3D image reconstruction is performed by a short scan cone-
beam filtered backprojection algorithm due to short injection time of the contrast medium. First
a graph description procedure extracts the curvilinear centerline structures of the vessel tree using
thresholding, elimination of the small connected components, and 3D fusion processes. Then,
a 3D surface representation procedure extracts the characteristics of convex and concave shapes
on blood vessel surface. The algorithm is run a set of real patient images with abdominal blood
vessels, two aneurysms and a stenosis, and the results are shown.
Kawata et al [21] describe their method of blood vessels disease detection based on high reso-
lution 3D vessel images obtained by cone-beam CT. This method has two major component. First,
the graph description procedure extracts a graph description of vessel centerlines from the blood
vessel image. Second, surface representation procedure extracts concave and convex shapes on
blood vessels using curvature. These shapes are used to represent aneurysms and stenoses on the
blood vessels. The surfaces of the blood vessels are represented by curvatures which are invari-
ant to arbitrary translations and rotations. Surface characteristics such as Gaussian (K) and mean
(H) curvatures, minimal and maximum principal directions, surface normal direction, magnitude
of curvature, and surface types using signs of K and H can be obtained easily from the surface
representation using curvatures.
Since blood vessels’ surfaces are represented using curvatures, this work can also be classified as
a differential geometry-based approach listed in section 2.5.
Parker et al [22] gives a theoretical review of 3D reconstruction algorithm of vascular networks
from X-ray projection images. The algorithm has two steps. First, segmenting the centerline posi-
tions and densimetric profiles of artery candidates from each projection image. Second, combining
multiple view information gathered in step one into one 3D artery representation in an iterative
fashion. Their work utilizes intrinsic vascular bed properties, e.g. connectivity, density, lumen
dimensions, etc, in the reconstruction process.
Sorantin et al [23] uses a 3D skeletonization method in the assessment of tracheal stenoses on
spiral CT images. The method consists of five steps. First, segmentation of the laryngo-tracheal
tract (LTT) is achieved based on fuzzy connectedness. The user supplies a seed point. Then, the
system extracts LTT as a single object. Due to partial volume effect, there are uncertain boundary
point. This problem is solved by employing a 3D dilation process. After the LTT boundaries are
outlined, the segmented binary 3D volume is converted into cubic voxels by linear interpolation. In
the second step, 3D thinning operation is applied to the resulting 3D volume from the previous step.
Third, LLT medial axis is separated from the extracted skeleton using a shortest path searching
algorithm. This step requires the user to mark begin end end points on the central path. Fourth,
segmented LTT medial axis, which is represented by a sequence of vectors from starting point to
the end point, is smoothed. Finally, LTT cross-sectional profile along the medial axis is calculated.
They created a graphical user interface (GUI) for the interactive assessment of the laryngo-tracheal
stenoses (LTS) on the 3D cross-sectional charts created.
The technique is reported as “highly accurate and precise” based on the phantom studies.
The works of Poli and Valli [24] reviewed in section 2.6, Mao et al [25] reviewed in section 2.6,
Prinet et al [26], [27] reviewed in section 2.5, Eiho and Qian [28] reviewed in section 2.7, O’Brien
and Ezquerra [29] reviewed in section 2.4, Yim et al [30] reviewed in section 2.4, Higgins et al [1]
reviewed in section 2.4, and Armande et al [17] described in section 2.3 can also be classified as a
skeleton-based approach due to the skeleton detection in the segmentation process.
2.3 Ridge-Based Approaches
Ridge-based methods treats grayscale images as a height map in which intensity ridges are the
approximation to the central skeleton of the tubular objects. Thus, a 2D image can be viewed as
a 3D surface, image intensity forming the third dimension. If we look at the height map, we will
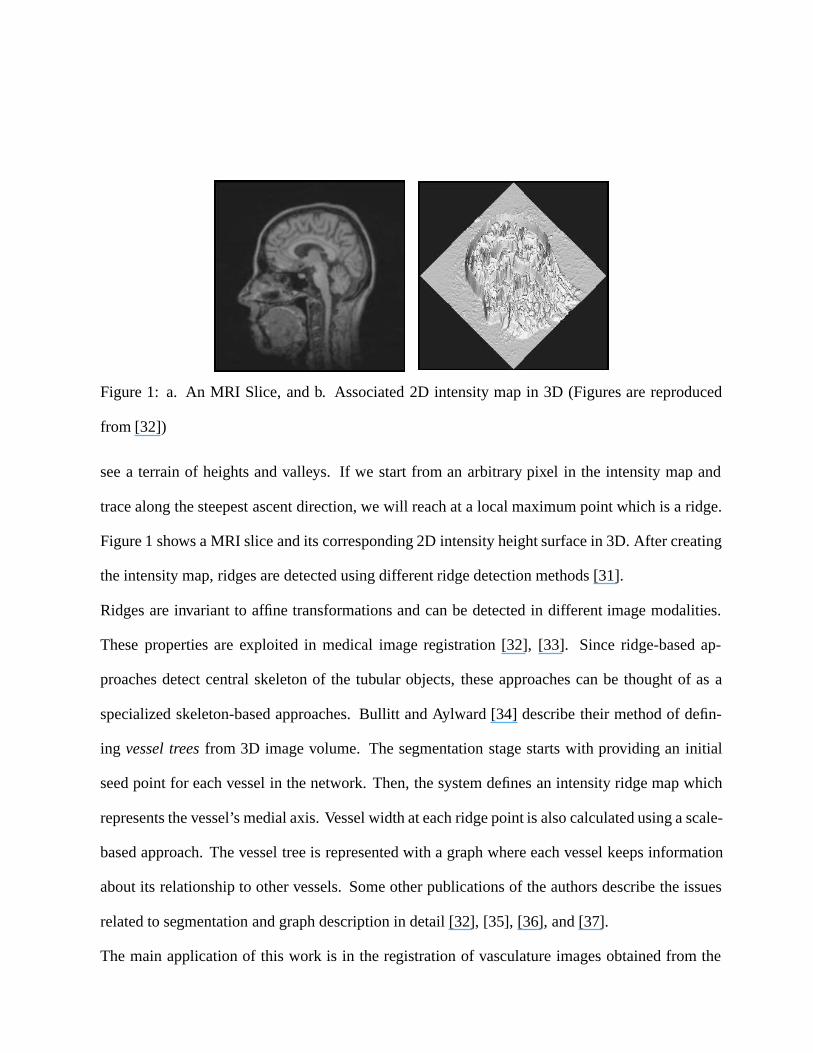
Figure 1: a. An MRI Slice, and b. Associated 2D intensity map in 3D (Figures are reproduced
from [32])
see a terrain of heights and valleys. If we start from an arbitrary pixel in the intensity map and
trace along the steepest ascent direction, we will reach at a local maximum point which is a ridge.
Figure 1 shows a MRI slice and its corresponding 2D intensity height surface in 3D. After creating
the intensity map, ridges are detected using different ridge detection methods [31].
Ridges are invariant to affine transformations and can be detected in different image modalities.
These properties are exploited in medical image registration [32], [33]. Since ridge-based ap-
proaches detect central skeleton of the tubular objects, these approaches can be thought of as a
specialized skeleton-based approaches. Bullitt and Aylward [34] describe their method of defin-
ing vessel trees from 3D image volume. The segmentation stage starts with providing an initial
seed point for each vessel in the network. Then, the system defines an intensity ridge map which
represents the vessel’s medial axis. Vessel width at each ridge point is also calculated using a scale-
based approach. The vessel tree is represented with a graph where each vessel keeps information
about its relationship to other vessels. Some other publications of the authors describe the issues
related to segmentation and graph description in detail [32], [35], [36], and [37].
The main application of this work is in the registration of vasculature images obtained from the
same patient at different times. Registration of vasculature images obtained at different times will
allow the experts to observe the changes and the location of these changes over time.
Guo and Richardson [6] propose a ridge extraction method that treats digitized angiograms as
height maps and the centerlines of the vessels as ridges in the map. The image is first balanced
by a median filter and then smoothed by a non-linear diffusion method, anisotropic smoothing,
as the preprocessing step. Then, a region of interest (ROI) is selected by adaptive thresholding
method. This process cuts the cost of the ridge extraction process as well as reduces the false ridges
introduced by the image noise. Next, the ridge detection process is applied to extract the vessel
centerlines. Finally, The candidate vessel centerlines are connected together from the extracted
ridges using a curve relaxation process.
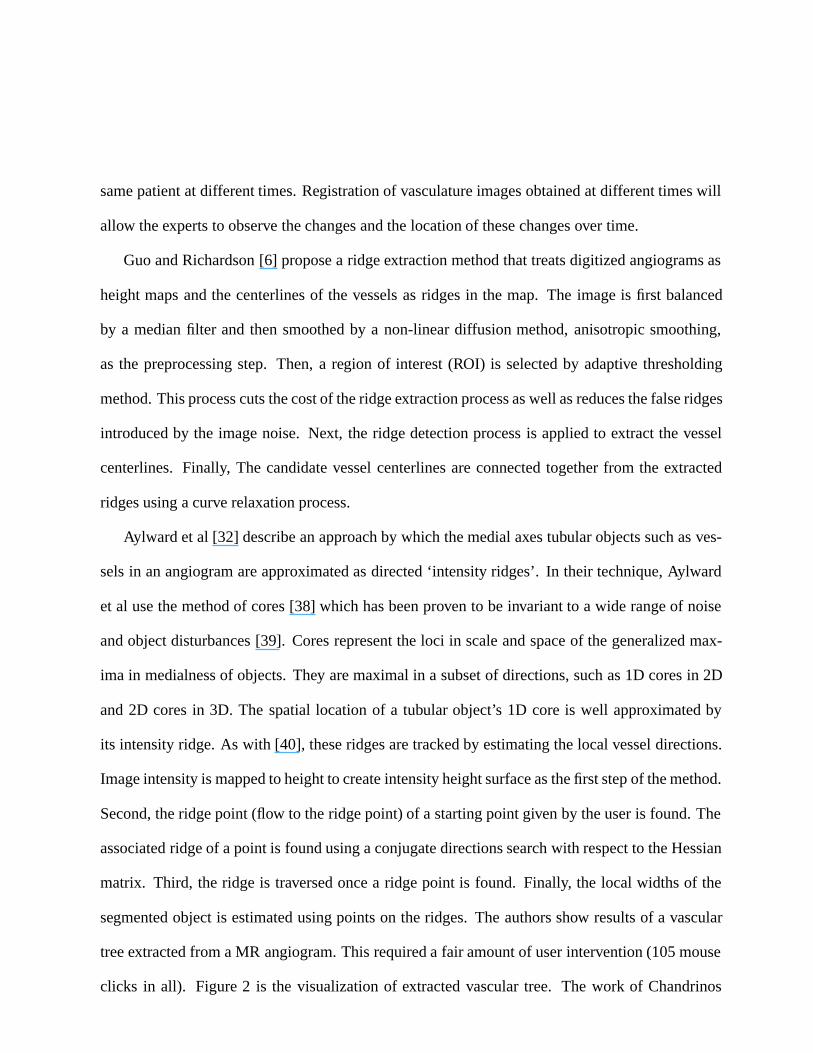
Aylward et al [32] describe an approach by which the medial axes tubular objects such as ves-
sels in an angiogram are approximated as directed ‘intensity ridges’. In their technique, Aylward
et al use the method of cores [38] which has been proven to be invariant to a wide range of noise
and object disturbances [39]. Cores represent the loci in scale and space of the generalized max-
ima in medialness of objects. They are maximal in a subset of directions, such as 1D cores in 2D
and 2D cores in 3D. The spatial location of a tubular object’s 1D core is well approximated by
its intensity ridge. As with [40], these ridges are tracked by estimating the local vessel directions.
Image intensity is mapped to height to create intensity height surface as the first step of the method.
Second, the ridge point (flow to the ridge point) of a starting point given by the user is found. The
associated ridge of a point is found using a conjugate directions search with respect to the Hessian
matrix. Third, the ridge is traversed once a ridge point is found. Finally, the local widths of the
segmented object is estimated using points on the ridges. The authors show results of a vascular
tree extracted from a MR angiogram. This required a fair amount of user intervention (105 mouse
clicks in all). Figure 2 is the visualization of extracted vascular tree. The work of Chandrinos
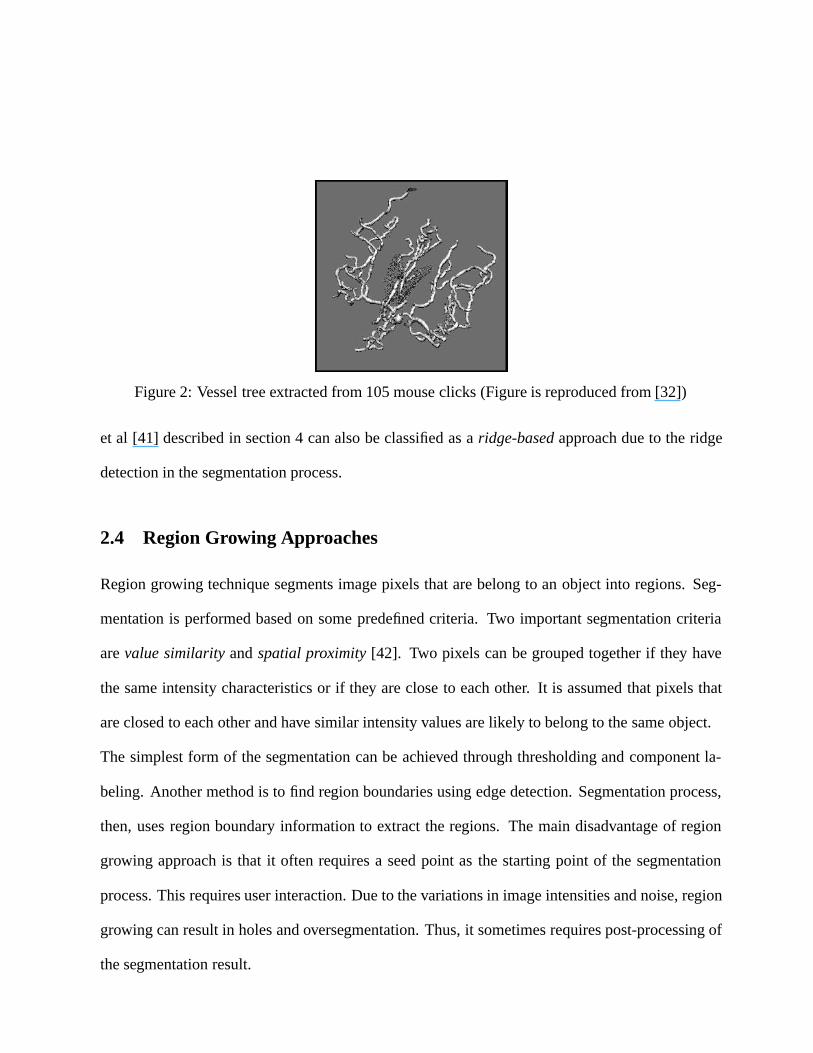
Figure 2: Vessel tree extracted from 105 mouse clicks (Figure is reproduced from [32])
et al [41] described in section 4 can also be classified as a ridge-based approach due to the ridge
detection in the segmentation process.
2.4 Region Growing Approaches
Region growing technique segments image pixels that are belong to an object into regions. Seg-
mentation is performed based on some predefined criteria. Two important segmentation criteria
are value similarity and spatial proximity [42]. Two pixels can be grouped together if they have
the same intensity characteristics or if they are close to each other. It is assumed that pixels that
are closed to each other and have similar intensity values are likely to belong to the same object.
The simplest form of the segmentation can be achieved through thresholding and component la-
beling. Another method is to find region boundaries using edge detection. Segmentation process,
then, uses region boundary information to extract the regions. The main disadvantage of region
growing approach is that it often requires a seed point as the starting point of the segmentation
process. This requires user interaction. Due to the variations in image intensities and noise, region
growing can result in holes and oversegmentation. Thus, it sometimes requires post-processing of
the segmentation result.
Schmitt et al [43] combine thresholding with region growing technique to segment vessel tree
in 3D in their work of determination of the contrast agent propagation in 3D rotational XRA image
volumes. The optimal threshold is determined experimentally. After the segmentation, propagation
information is mapped from the 2D projections to the 3D image data set created by the rotational
XRA.
O’Brien and Ezquerra [29] develop a method to automatically segment coronary vessels in an-
giograms based on temporal, spatial, and structural constraints. The algorithm starts with a low
pass filtering applied to the image as preprocessing. Then, initial segmentation process starts with
the user selecting a seed point. The system starts a region growing process to extract the initial
approximation to the vessel structure from the selected seed point. After extracting initial vessel
structure, a skeletonizing process starts to extract the centerlines of the structure by employing a
balloon test as follows. A disk is expanded, starting from the pixel to tested, outward until some
pixel is encountered which is not part of the extracted region. This case is called a hit. If a hit
occurs on opposite sides with the same distance, then this point is picked as a centerline. After the
skeletonizing process, undetected vessel segments are located by a spatial expansion algorithm. At
this stage, images are divided into two categories: areas which contain vessels and areas which
do not contain. However, there is no spatial or temporal connectivity information exists in the
detected sub-regions. This information is extracted by applying an acceptance and rejection test to
these areas using graph theory. Figure 3 shows the result of their method applied to an angiogram
image.
Due to the extraction of the centerlines, this work can also be classified as a skeleton-based ap-
proach listed in section 2.2. Higgins et al [1] describe their automatic arterial tree extraction
algorithm from 3D coronary angiograms. These angiograms are obtained high-resolution X-ray
CT scanner known as 3D Dynamic Spatial Reconstructor (DSR). Their algorithm is a combination
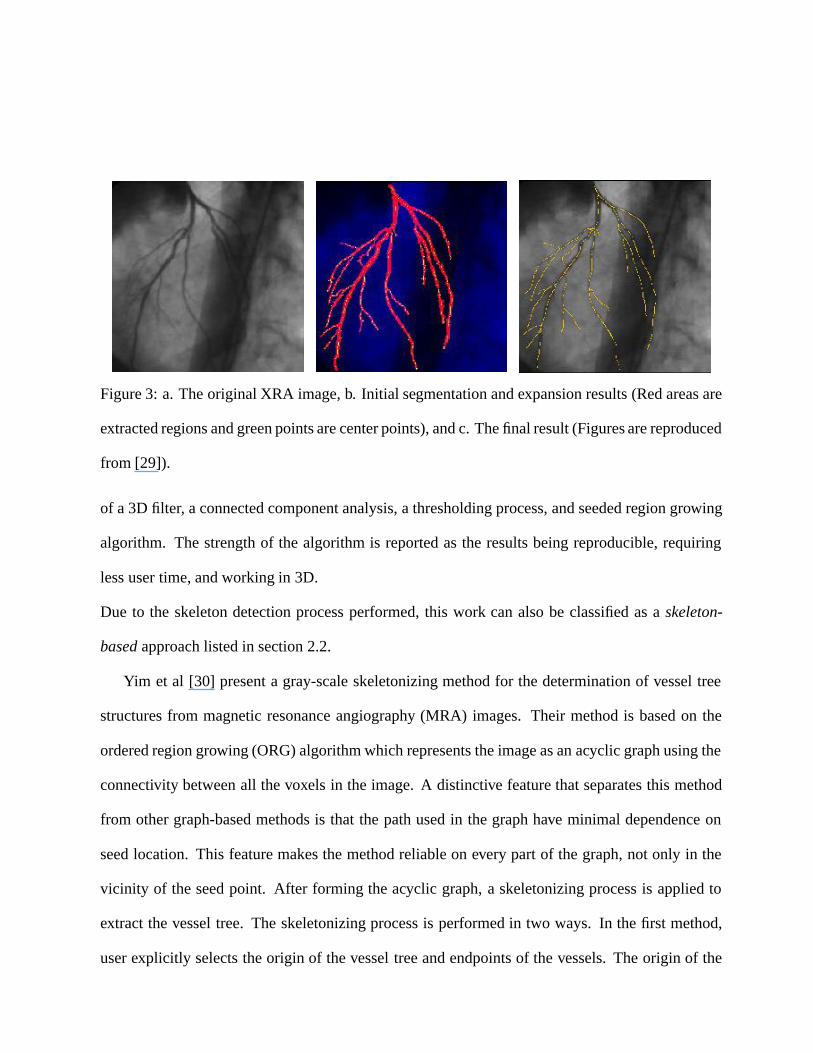
Figure 3: a. The original XRA image, b. Initial segmentation and expansion results (Red areas are
extracted regions and green points are center points), and c. The final result (Figures are reproduced
from [29]).
of a 3D filter, a connected component analysis, a thresholding process, and seeded region growing
algorithm. The strength of the algorithm is reported as the results being reproducible, requiring
less user time, and working in 3D.
Due to the skeleton detection process performed, this work can also be classified as a skeleton-
based approach listed in section 2.2.
Yim et al [30] present a gray-scale skeletonizing method for the determination of vessel tree
structures from magnetic resonance angiography (MRA) images. Their method is based on the
ordered region growing (ORG) algorithm which represents the image as an acyclic graph using the
connectivity between all the voxels in the image. A distinctive feature that separates this method
from other graph-based methods is that the path used in the graph have minimal dependence on
seed location. This feature makes the method reliable on every part of the graph, not only in the
vicinity of the seed point. After forming the acyclic graph, a skeletonizing process is applied to
extract the vessel tree. The skeletonizing process is performed in two ways. In the first method,
user explicitly selects the origin of the vessel tree and endpoints of the vessels. The origin of the
vessel tree serves as the seed point of the graph used. Then, vessel segments are extracted by
tracing the path from each endpoint to the origin of the graph. The second method is a pruning
process based on the branch length. It requires the user to supply the seed point and two parameters
that describe the desired topology of the vessel tree. The method retains the vessel segments which
has the length, distance from the termination point to the origin, more than the specified length and
discards the others. The ORG method resolves the ambiguities in the vessel tree branching due to
vessel overlap by incorporating a priori knowledge about the bifurcation spacing.
Due to the skeletonization process applied to extract vessel tree, this work can also be classified as
a skeleton-based approach listed in section 2.2.
Higgins et al [44] develop a system for extracting, analyzing, and visualizing coronary arteries
form high- resolution 3D angiograms. The system consists of three tools. The Artery Extractor
tool extracts arterial tree and central axes of the important coronary arteries. The Artery Display
tool displays the extracted structure and allows user to perform some measurements on the struc-
ture. Finally, the Tree Trace tool allows user to manually correct irregularities in the automatically
generated results of the Artery Extractor. As a first step in arterial tree extraction process, a 3D
image filter is applied to reduce the noise and artifact effects Second, a thresholding operation is
performed to isolate large and very bright regions. These regions form the core seed regions of
the arterial tree. Third, an iterative 3D seeded region growing algorithm is employed to build up
the arterial tree from the seed regions. Finally, a cavity filling process is applied to add the cav-
ities missed during seeded region growing process. The result of this operation is a solid grown
arterial tree. After the arterial tree is extracted an axes generation process is employed to get the
arterial tree skeleton. The steps of this process is as follows: First, the large aortic root is removed
to leave the arterial tree branches. Second, 3D skeleton of all branches is computed using an it-
erative skeletonization process that uses 26-connectivity. Third, the skeletal components of short
branches ,which are useless, are pruned. Finally, the remaining skeletal components are combined
into line segments. The system is tested on different sets of animal image volumes and the results
are reported.
The work of Donizelli [45] reviewed in section 2.7 can be classified as a region growing ap-
proach due to the binary region growing algorithm applied.
2.5 Differential Geometry-Based Approaches
Differential geometry-based method treats images as hypersurfaces and extracts features of the
images using the curvature and the crest lines of the surface. The crest points of the hyper-surface
correspond to the center lines of the vessel structure. The 2D and 3D images are treated in a similar
way. They only differ in their mathematical formulation. A 2D image is modelled as a surface in
3D space and a 3D image is modelled as a 4D hypersurface.
In differential geometry a 3D surface can be described by two principal curvatures, called maxi-
mum and minimum curvatures, and by their corresponding directions, called principal directions.
These are orthogonal. These features are also invariant under affine transformations and therefore
are used in medical image registration widely. The principal curvatures correspond to the eigenval-
ues of the Weingarten matrix and the principal directions are the eigenvectors. Crest points, which
are the intrinsic properties of the surfaces, are the local maxima of the maximum curvature on the
hypersurface. Center-lines can be obtained by linking the crest-points.
You can find a good introduction to differential geometry in Decarmo [46] and Koenderink [47].
Krissian et al [48] describe their Directional Anisotropic Diffusion method derived from Gaus-
sian convolution to reduce the noise in the image. Their method, which is a more general form of
the work of Perona and Malik [49], is based on the differentiation of the diffusion in the direction
of the gradient and in the directions of the minimum and the maximum curvature. Directional
Anisotropic Diffusion reduces the noise in the image without introducing blurring. The algorithm
is applied to a set of phantom images containing torus with different radii and a set of real im-
ages of vessels. A comparison of the results of the anisotropic diffusion and Gaussian convolution
method is given.
Prinet et al [27] propose a multidimensional vessel extraction method using crest lines. The
method treats vessel images as parametric surfaces and extracts features of the images using the
curvature and the crest lines of the surface. When linked together, the crest points form the center
lines of the vessels. The result of the algorithm applied to angiograms, 2D Digital Subtraction
Angiography (DSA), Magnetic Resonance Angiography (MRA), and 3D synthetic data is reported.
Due to the centerline detection performed, this work can also be classified as a skeleton-based
approach listed in section 2.2.
Prinet et al [26] describe the framework of their thin network extraction algorithm from volu-
metric images. The method uses differential geometry of the surfaces and treats 3D image volume
as a hyper surface of 4D. The fact that the crest points of the hyper-surface correspond to the center
line of the thin network in the volume image is utilized in the technique. A cylindrical mathemati-
cal model is used to represent the vessels. The vessel network is extracted by detecting the extrema
of the maximal curvatures, i.e., the crest points. The technique requires no a priori knowledge on
the shape of the network and is entirely automatic. Due to the centerline detection performed, this
work can also be classified as a skeleton-based approach listed in section 2.2.
Armande et al [17] extract thin nets using a multi-scale approach. Their method exploits the
differential properties of the image surface. They characterize thin nets as crest lines of the image
surface. To overcome the problem faced in extraction of the thin nets having different width, they
employ a multi-scale approach. Their method consists of three main stages. First, the extrema
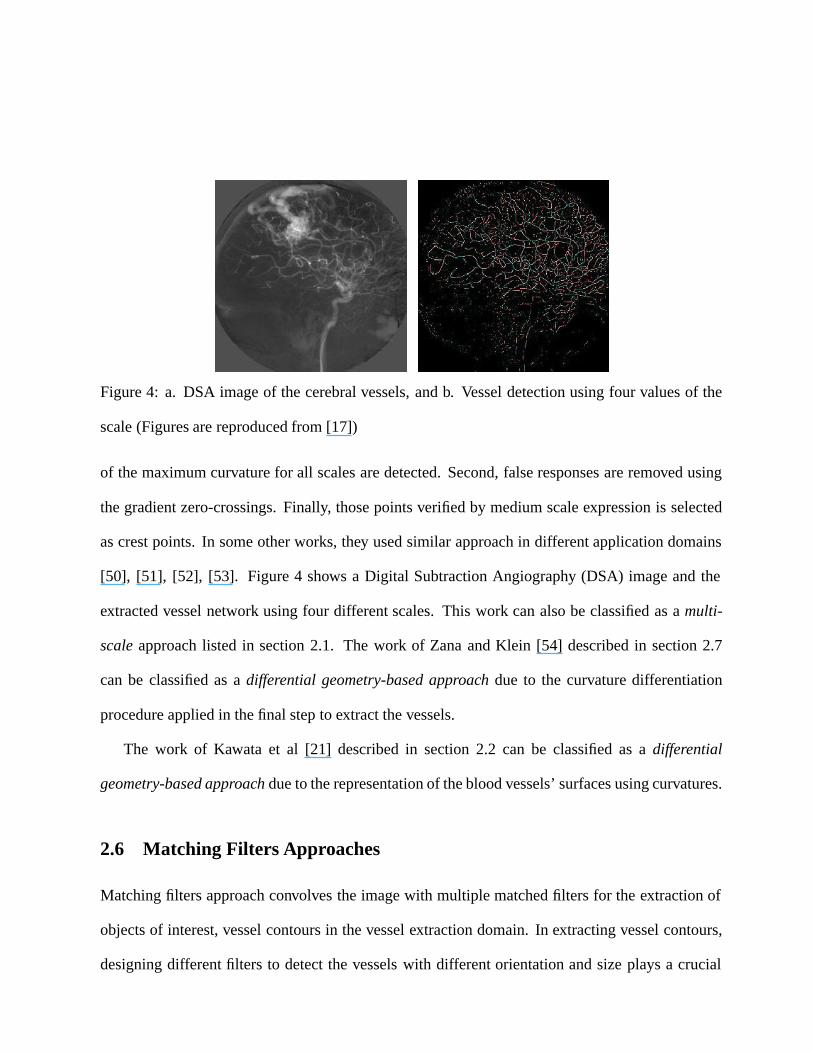
Figure 4: a. DSA image of the cerebral vessels, and b. Vessel detection using four values of the
scale (Figures are reproduced from [17])
of the maximum curvature for all scales are detected. Second, false responses are removed using
the gradient zero-crossings. Finally, those points verified by medium scale expression is selected
as crest points. In some other works, they used similar approach in different application domains
[50], [51], [52], [53]. Figure 4 shows a Digital Subtraction Angiography (DSA) image and the
extracted vessel network using four different scales. This work can also be classified as a multi-
scale approach listed in section 2.1. The work of Zana and Klein [54] described in section 2.7
can be classified as a differential geometry-based approach due to the curvature differentiation
procedure applied in the final step to extract the vessels.
The work of Kawata et al [21] described in section 2.2 can be classified as a differential
geometry-based approach due to the representation of the blood vessels’ surfaces using curvatures.
2.6 Matching Filters Approaches
Matching filters approach convolves the image with multiple matched filters for the extraction of
objects of interest, vessel contours in the vessel extraction domain. In extracting vessel contours,
designing different filters to detect the vessels with different orientation and size plays a crucial
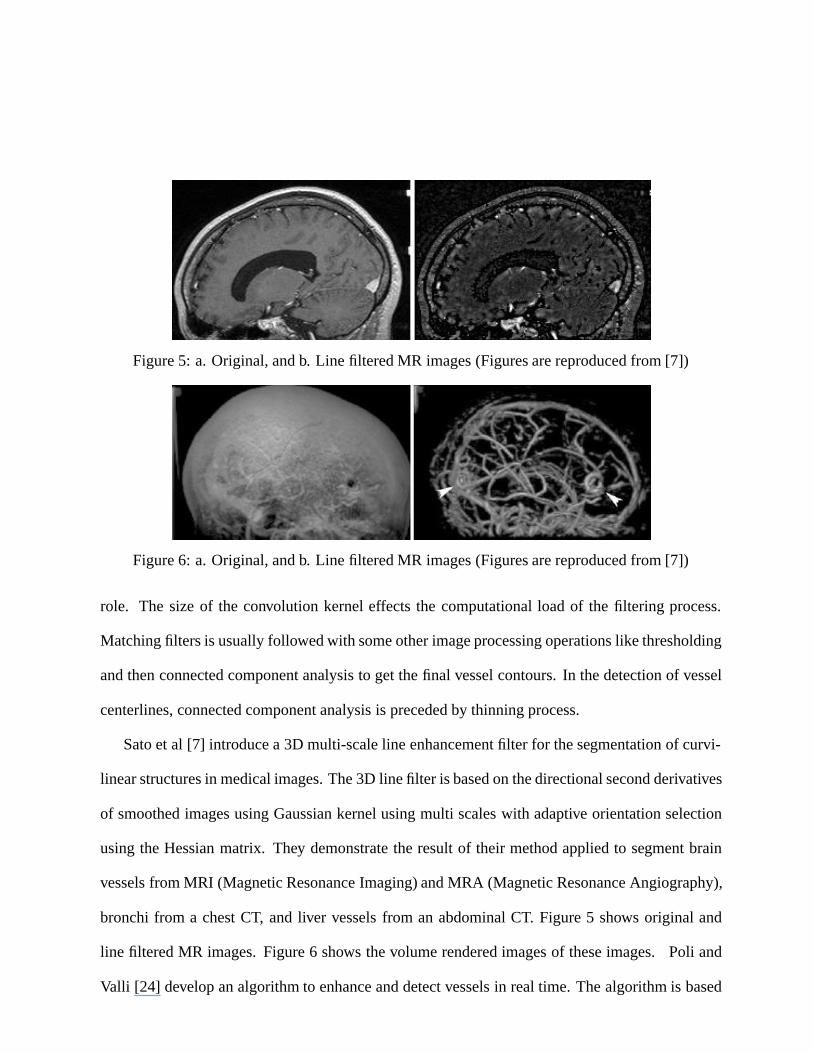
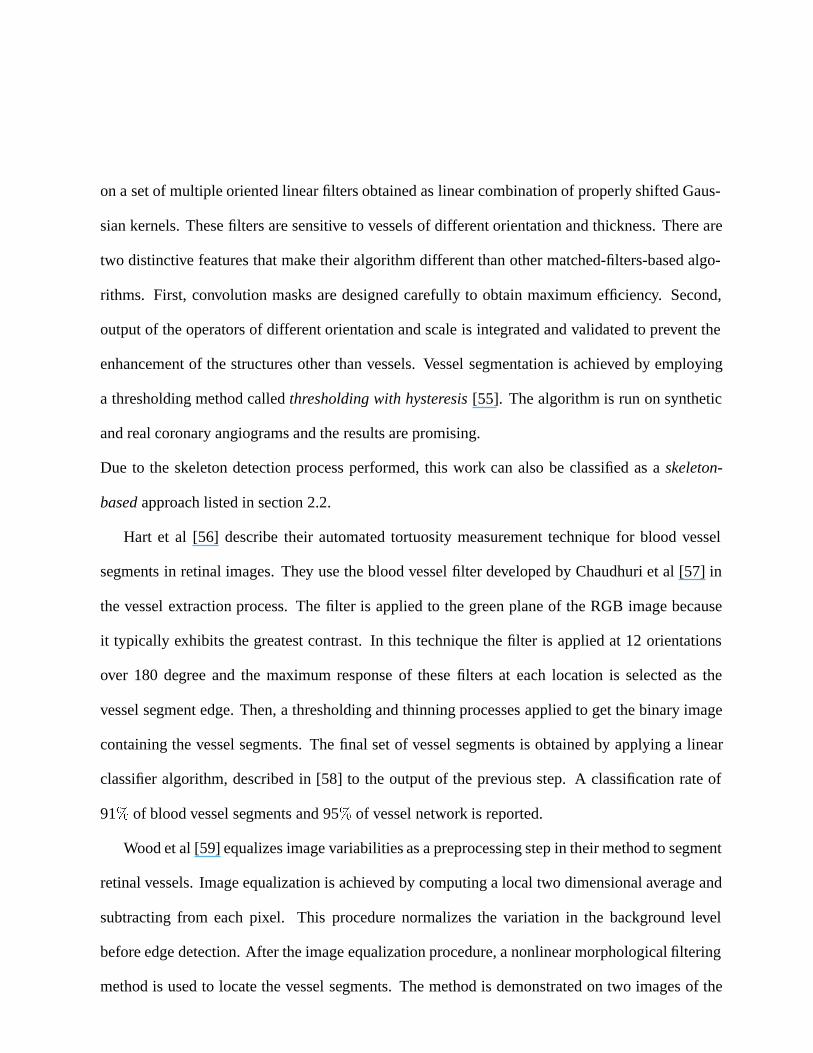
Figure 5: a. Original, and b. Line filtered MR images (Figures are reproduced from [7])
Figure 6: a. Original, and b. Line filtered MR images (Figures are reproduced from [7])
role. The size of the convolution kernel effects the computational load of the filtering process.
Matching filters is usually followed with some other image processing operations like thresholding
and then connected component analysis to get the final vessel contours. In the detection of vessel
centerlines, connected component analysis is preceded by thinning process.
Sato et al [7] introduce a 3D multi-scale line enhancement filter for the segmentation of curvi-
linear structures in medical images. The 3D line filter is based on the directional second derivatives
of smoothed images using Gaussian kernel using multi scales with adaptive orientation selection
using the Hessian matrix. They demonstrate the result of their method applied to segment brain
vessels from MRI (Magnetic Resonance Imaging) and MRA (Magnetic Resonance Angiography),
bronchi from a chest CT, and liver vessels from an abdominal CT. Figure 5 shows original and
line filtered MR images. Figure 6 shows the volume rendered images of these images. Poli and
Valli [24] develop an algorithm to enhance and detect vessels in real time. The algorithm is based
on a set of multiple oriented linear filters obtained as linear combination of properly shifted Gaus-
sian kernels. These filters are sensitive to vessels of different orientation and thickness. There are
two distinctive features that make their algorithm different than other matched-filters-based algo-
rithms. First, convolution masks are designed carefully to obtain maximum efficiency. Second,
output of the operators of different orientation and scale is integrated and validated to prevent the
enhancement of the structures other than vessels. Vessel segmentation is achieved by employing
a thresholding method called thresholding with hysteresis [55]. The algorithm is run on synthetic
and real coronary angiograms and the results are promising.
Due to the skeleton detection process performed, this work can also be classified as a skeleton-
based approach listed in section 2.2.
Hart et al [56] describe their automated tortuosity measurement technique for blood vessel
segments in retinal images. They use the blood vessel filter developed by Chaudhuri et al [57] in
the vessel extraction process. The filter is applied to the green plane of the RGB image because
it typically exhibits the greatest contrast. In this technique the filter is applied at 12 orientations
over 180 degree and the maximum response of these filters at each location is selected as the
vessel segment edge. Then, a thresholding and thinning processes applied to get the binary image
containing the vessel segments. The final set of vessel segments is obtained by applying a linear
classifier algorithm, described in [58] to the output of the previous step. A classification rate of
91% of blood vessel segments and 95% of vessel network is reported.
Wood et al [59] equalizes image variabilities as a preprocessing step in their method to segment
retinal vessels. Image equalization is achieved by computing a local two dimensional average and
subtracting from each pixel. This procedure normalizes the variation in the background level
before edge detection. After the image equalization procedure, a nonlinear morphological filtering
method is used to locate the vessel segments. The method is demonstrated on two images of the

same patient taken at different times. Two images are thresholded resulting two binary images from
which the vessel structures are extracted. The resulting coordinate system is used to register the
images and to remove the interference from the vessel structure for the analysis of the underlying
retinal nerve fiber layer (RNFL).
Mao et al [25] describe their algorithm to extract structural features in digital subtraction an-
giograms. The algorithm is based on the visual perception modeling which states that the relevant
parts of objects in noisy scenes are usually grouped together. The visual perception modeling is
realized by grouping together the segments that belong to the main branches and eliminating oth-
ers. The structural feature extraction algorithm constructs a saliency map by grouping the salient
structures or curves iteratively. The centerlines and contours obtained from the structural feature
extraction algorithm is, then, used to refine the extraction process. The problem with this algorithm
is that it does not successfully solve all the 2D ambiguities such as crossing or forking situations.
This method is aimed to detect the vascular structures from two X-ray projections for 3D recon-
struction of vascular network.
Due to the centerline detection performed, this work can also be classified as a skeleton-based
approach listed in section 2.2.
Hoover et al [60] describe their approach that combines local and region-based properties to
segment blood vessels in retinal images. The method examines the image of a matched filter
response (MFR), developed by Chaudhuri et al [57], in pieces and applies thresholding using a
probing technique. The probing technique classifies pixels in an area of the MFR as vessels and
non-vessels by iteratively decreasing the threshold. At each iteration, the probe examines the
region-based attributes of the pixels in the tested area and segments the pixels classified as vessels.
Pixels that are not classified as vessel from probes are recycled for further probing. A unique
feature of this method is that each pixel is classified using local and region-based properties. The
method is evaluated using hand-labeled images and tested against basic thresholding of MFR. As
much as 15 times reduction of false positives over the basic MFR and up to 75% true positive rate
has been reported.
Chen et al [61] develop a method to segment lines, especially intersections ( X-junctions)
and branches (T-junctions), in multiple orientation using orientation space filtering technique. The
unique feature of this method is that image is represented what is called orientation space by adding
orientation axis to the abscissa and the ordinate of the image. The orientation space representation
is then treated as continuous variable to which Gabor filters, used to represent lines at multiple
orientations, can be tuned. After representing orientation space, multiple orientation line detection
is achieved by thresholding 3D images of the orientation space and then detecting the connected
components in the resulting image. Selecting suitable bandwidth for the Gabor filter is an important
issue that effects the sensitivity of the filters to the lines. If the orientation bandwidth is small, the
orientation selectivity is high. On the other hand, the response of a line having a high degree of
curvature is small which means the sensitivity of the line is low. This feature requires a trade-
off between sensitivity and selectivity for optimum multiple orientation line segmentation. The
method is tested on synthesized and real biomedical images and the results are discussed.
The work of Goldbaum et al [62] reviewed in section 2.6 can be classified as a matching filters
approach due to the rotated matched filters used in the segmentation process.
The work of Thirion et al [63] reviewed in section 7 can be classified as a matching filters
approach due to the bank of filters used in the segmentation process.
The work of Huang and Stockman [16] reviewed in section 7 can be classified as a matching
filters approach due to the optimal filters used in the segmentation process.
The works of Klein et al [4] and [5] reviewed in section 3.1.1 can be classified as a matching
filters approach due to the bank of orientation specific S-Gabor filter pairs used.
2.7 Mathematical Morphology Schemes
Morphology relates to the study of object forms or shapes. It facilitates the segmentation and
search for object of interest by filing holes and eliminating unwanted segments. Morphological
operators apply structuring elements to images. In general morphological operators are applied to
binary images but there are extensions to the gray-level images. Dilation and erosion are the two
main morphological operations. Dilation expands objects, fills holes, and connect disjoint regions.
Erosion shrinks objects by eroding the boundaries. Dilation and erosion operations are performed
by sliding a structuring element on the image.
Closing and opening are two other often used operations. They are combinations of dilation and
erosion operations. Closing is dilation followed by erosion operation. It is used to fill holes and
small gaps. Opening is erosion followed by dilation and used to eliminate small structures.
Two algorithms that are used in medical image segmentation and related to mathematical mor-
phology are top hat transformation and watershed transformation [64]. A good introduction to
morphological operators can be found in [65] and [42].
Figueiredo and Leitao [66] describe their nonsmoothing approach in estimating vessel contours
in angiograms. Their technique has two key features. First, it does not smooth the image to
avoid the distortions introduced by smoothing. Second, it does not assume a constant background
which makes the technique well suited for the unsubtracted angiograms. Under the assumptions of
aforementioned features, edge detection is achieved by adapting a morphological (nonlinear) gray
scale edge operator. Linear operators, such as matched filters or derivative-based schemes, would
not work under the assumptions mentioned above. All local maxima, for each vessel cross section,
of the morphological edge detector are considered as candidates to edge points. Then dynamic
programming is used to find the minimum cost path among the candidates by selecting a pair for
each cross section. Continuity and intensity terms are used used as adapted costs in the process of
selecting of candidate edge points.
Eiho and Qian [28] propose a method based on pure morphological operators for the detec-
tion of coronary artery tree on the cineangiograms. The steps in the method are as follows. First, a
”Top-hat operator”, which is able to detect the local elevations on arbitrary backgrounds, is applied
to enhance the shape of the vessels. Second, morphological erosion followed by half-thresholding
operations are applied to remove the areas except the coronary artery area. Then, a starting point on
the artery tree is selected by the operator. After that, the system extracts whole tree using neighbor
checking according to the average gray scale levels between them. Third, the extracted artery tree
is skeletonized by the thinning operation. Finally, the edges are extracted by applying watershed
transformation on the binary image obtained from a dilation operation on the binary skeleton from
the previous operation. This method requires very little user interaction which is picking only one
point on the artery tree for the extraction process.
Due to the skeletonization of artery tree, this work can also be classified as a skeleton-based ap-
proach listed in section 2.2.
Donizelli [45] combines mathematical morphology and region growing algorithms to segment
large vessels from digital subtracted angiography images. In the first step of the algorithm, the
mathematical ”top-hat” algorithm, which is a morphological filter well suited to extract line-like
structures of a certain size and contrast, is applied to extract large vessels. Then, a binary region
growing algorithm is applied to get rid of some residual shorter capillaries and background noise
artifacts. After the region growing algorithm is applied, regions smaller than a given threshold
are deleted. This leaves the region of the largest vessels. The author implemented three other
classical and morphological algorithms, multiphase analysis process (MRAP) [67], region split-
ting approach (RSBA) [68], and morphological-thresholding (ROSE) [69], and compared with his
method.
Due to the binary region growing algorithm employed, this work can also be classified as a region
growing approach listed in section 2.4.
Zana and Klein [54] present a vessel segmentation algorithm from retinal angiography images
based on mathematical morphology and linear processing. A unique feature of the algorithm is that
it uses a geometric model of all possible undesirable patterns that could be confused with vessels
in order to separate vessels from them. As a first step, all bright round peaks are extracted that
allows microaneurisms to be segmented from the angiograms of diabetic patients. The strength
of the algorithm comes from the combination of mathematical morphology and differential op-
erators in the segmentation process. Linear bright shapes and basic features are extracted using
mathematical morphology operators and differential shape properties like curvature are computed
using a laplacian filter. Vessels are extracted using curvature differentiation in the final step. The
algorithm is tested on a set of retinal angiograms and the results are reported.
Due to the curvature differentiation procedure applied to extract vessels in the final stage of the
method, this work can also be classified as a differential geometry-based approach listed in section
2.5.
Thakray and Nelson [69] describe an approach which extracts vascular segments using a set of
8 morphological operators, each of which represents an oriented vessel segment (in 8 orientations).
The system also applies an adaptive thresholding scheme to extract the vascular segments from the
intensity image. The system was used to extract vessel segments in a capillary angiogram of mice,
and does not extract the vascular interconnection structure. It appears that the range of vessel
widths the system handles is limited by the setting of the 8 morphological operators.
2.8 3D Reconstruction of Vessels
The works of Sarwal and Dhawan [13] in section 2.1, Niki et al [2] in section 2.2, Kawata et al
[20] in section 2.2, Kawata et al [21] in section 2.2, and Parker et al [22] in section 2.2 are related
to 3D reconstruction of the vessels.
3 Model-Based Approaches
In model-based approaches, explicit vessel models are applied to extract the vasculature. We divide
model-based approaches into four categories: (1) Deformable models, (2) Parametric models, (3)
Template matching, and (4) Generalized cylinders. In the next sections, each category is discussed
and the techniques in each category are reviewed.
3.1 Deformable Models
We divide deformable models into two categories: parametric deformable models and geometric
deformable models. These categories are discusses in detail in the next sections.
A survey on Deformable Models in medical image analysis is published by McInerney and
Terzopoulos [8]. Xu, Pham, and Prince published a book chapter on medical image segmentation
using deformable models [70] and another book chapter on current methods in medical image
segmentation [71] which includes a section on deformable models.
3.1.1 Parametric Deformable Models - Active Contours (Snakes)
Deformable models are model-based techniques employed for finding object contours using para-
metric curves that deform under the influence of internal and external forces. First introduced by
Input Dimension Prepro- A priori Multi-scale User Result Type Whole
Algorithm Year Classification Type 2D 3D cessing Knowledge Technique Interaction Centerline Edges Junctions Tree
MATCHING FILTERS APPROACHES
Sato et al[Satetal98a] 1998 MFA MRI, MRA, CT No Yes Yes Yes Yes N/A No Yes Yes Yes
Poli and Valli[PolV97] 1997 MFA & SBA XRA Yes No No Yes No N/A Yes Yes Yes Yes
Hart et al[Hartetal97b] 1997 MFA Retinal img. Yes No No Yes No Yes No Yes N/A No
Wood et al[Wooetal95] 1995 MFA Retinal img. Yes No Yes Yes No N/A No Yes Yes Yes
Hoover et al[Hooetal00] 2000 MFA Retinal img. Yes No No Yes No N/A No No Yes Yes
Mao et al[Maoetal92] 1992 MFA & SBA Subt. XRA Yes No No Yes No N/A Yes Yes Yes Yes
Chen et al[Cheetal98] 1998 MFA XRA Yes No No Yes No No No Yes Yes No
MULTI-SCALE APPROACHES
Sarwal and Dhawan[sarD94] 1994 MSA & Coronary Yes No No Yes Yes No Yes No Yes Yes
3D Recons. XRA
Chwialkowski et al[Chwetal9 1996 MSA Phase Yes No No Yes Yes No No Yes N/A N/A
Contrast MRI
DIFFERENTIAL GEOMETRY-BASED APPROACHES
Krissian et al[Krietal96] 1996 DGBA MRA No Yes No Yes No N/A No Yes Yes N/A
Prinet et al[Prietal97] 1997 DGBA & SBA DSA & MRA Yes Yes No No No No Yes Yes Yes Yes
Prinet et al[Prietal96] 1996 DGBA & SBA MRA No Yes No No No No Yes Yes Yes Yes
Armande et al[Armetal99] 1999 DGBA, MSA DSA & satellite Yes No Yes Yes Yes N/A Yes No Yes Yes
& SBA images
MATHEMATICAL MORPHOLOGY SCHEMES
Figueiredo and Leitao[xxx] 1995 MMS Nonsubt. XRA Yes No No Yes No Yes No Yes No No
Eiho and Qian[EihQ97] 1997 MMS & SBA Coronary XRA Yes No Yes Yes No Yes Yes Yes Yes Yes
Donizelli[Don] MMS & RGA DSA Yes No No Yes No No No Yes Yes No
Zana and Klein[ZanK97] 1997 MMS & DGBA Retinal XRA Yes No No Yes No No No Yes Yes Yes
Thakray and Nelson[xxx] 1993 MMS DSA Yes No Yes Yes No Yes No Yes Yes N/A
SKELETON-BASED APPROACHES
Niki et al[Niketal93] 1993 SBA & 3D Rec. Rotational XRA No Yes Yes Yes No No Yes No Yes Yes
Tozaki et al[Tozetal95] 1995 SBA & 3D Vis. CT No Yes No Yes No N/A Yes No Yes Yes
Kawata et al[Kawetal95a] 1995 SBA & DGBA Cone-beam No Yes No Yes No N/A Yes No Yes Yes
3D Rec. CT
Kawata et al[Kawetal95b] 1995 SBA & DGBA Cone-beam No Yes No Yes No N/A Yes No Yes N/A
3D Rec. CT
Parker et al[Paretal88] 1988 SBA & 3D Rec. XRA Yes No N/A Yes No N/A Yes No N/A N/A
Sorantin et al [Soretal02] 2002 SBA & MMBA Spiral CT No Yes Yes Yes No Yes Yes No N/A N/A
REGION GROWING APPROACHES
Schmitt et al[Schetal02] 2002 RGA Rotational XRA No Yes No Yes No Yes No Yes Yes Yes
O'Brien and Ezquerra[xxx] 1994 RGA & SBA XRA Yes No Yes Yes No Yes Yes No Yes Yes
Higgins et al[Higetal89] 1989 RGA X-Ray CT No Yes Yes Yes No Yes No Yes Yes Yes
Yim et al[Yimetal00] 2000 RGA & SBA MRA No Yes Yes Yes No Yes Yes Yes Yes N/A
Higgins et al[Higetal96] 1996 RGA & SBA 3D XRA No Yes Yes Yes No No Yes Yes Yes Yes
RIDGE-BASED APPROACHES
Bullitt and Aylward[BulA01] 2001 RBA & SBA MRA, CT & No Yes No Yes Yes Yes Yes Yes Yes Yes
3D-DSA
Guo and Richardson[xxx] 1998 RBA XRA Yes No Yes Yes No N o Yes No Yes Yes
Aylward and Bullitt[AylB02] 2002 RBA MRA,CT No Yes No Yes Yes Yes Yes Yes Yes Yes
Aylward et al[Ayletal96] 1996 RBA,MTLODA CT, MRA No Yes No Yes No Yes Yes Yes Yes Yes
DGBA : Diff. Geom.-based Approaches MMS : Math. Morph. Schemes RBA : Ridge-Based Approaches SBA : Skeleton-Based Approaches
MFA : Matching Filters Approaches MSA : Multi-Scale Approaches RGA : Region Growing Approaches
CT :Computed Tomography XRA :X-Ray Angiography
DSA :Digital Subtracted Angiography MRA :Magnetic Resonance Angiograp
MRI :Magnetic Resonance Im
Figure 7: Comparison of the pattern Recognition Approaches
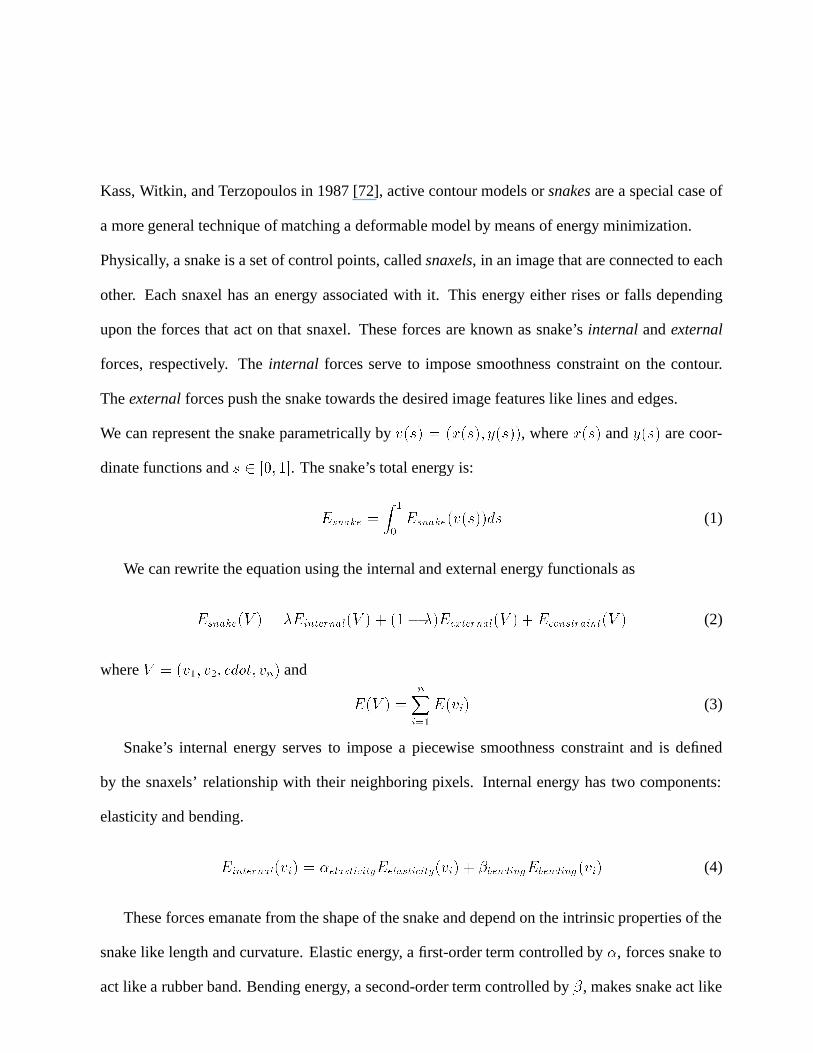
Kass, Witkin, and Terzopoulos in 1987 [72], active contour models or snakes are a special case of
a more general technique of matching a deformable model by means of energy minimization.
Physically, a snake is a set of control points, called snaxels, in an image that are connected to each
other. Each snaxel has an energy associated with it. This energy either rises or falls depending
upon the forces that act on that snaxel. These forces are known as snake’s internal and external
forces, respectively. The internal forces serve to impose smoothness constraint on the contour.
The external forces push the snake towards the desired image features like lines and edges.
We can represent the snake parametrically by v(s) = (x(s); y(s)), where x(s) and y(s) are coor-
dinate functions and s 2 [0; 1]. The snake’s total energy is:
Esnake =Z
1
0
Esnake(v(s))ds (1)
We can rewrite the equation using the internal and external energy functionals as
Esnake(V ) = �Einternal(V ) + (1� �)Eexternal(V ) + Econstraint(V ) (2)
where V = (v1; v2; cdot; vn) and
E(V ) =nX
i=1
E(vi) (3)
Snake’s internal energy serves to impose a piecewise smoothness constraint and is defined
by the snaxels’ relationship with their neighboring pixels. Internal energy has two components:
elasticity and bending.
Einternal(vi) = �elasticityEelasticity(vi) + �bendingEbending(vi) (4)
These forces emanate from the shape of the snake and depend on the intrinsic properties of the
snake like length and curvature. Elastic energy, a first-order term controlled by �, forces snake to
act like a rubber band. Bending energy, a second-order term controlled by �, makes snake act like

a thin plate. The behavior of the snake can be controlled by adjusting the weights � and �. By
setting � to zero, we can make snake second-order discontinuous and develop a corner.
External energy attracts the snake to salient image features. It has two components: line energy
and edge energy.
Eexternal(vi) = lineEline(vi) + edgeEedge(vi) (5)
The simplest line functional is the image intensity itself.
Eline = I(x; y) (6)
We can attract the snake to dark lines or light lines simply by adjusting the sign of the line weight.
Edge energy is determined by the target image’s gradient. We can set edge functional to
Eedge = �(kIr(x; y)k)2 (7)
This edge energy will attract snake to image contours with large gradients. External energy
is essential to halt snake minimization. Without sufficient external force, the internal energy will
make the snake shrink down to a single pixel.
The main advantage of the deformable models are the ability to generate smooth parametric curves
or surfaces. The smoothness constraint imposed by elasticity energy provides robustness to the
noise. The main disadvantage is that usually it requires user interaction for the initialization of the
snake. It also requires initial parameters given by the user. Automatic snake initialization is a hot
ongoing research topic [73] and [74].
Molina et al [3] use 3D snakes to reconstruct 3D catheter paths from biplane angiograms. In the
image preprocessing step, geometric distortions in both images introduced by the X-ray projections
of the vessels are corrected. This correction is achieved by finding and matching markers affixed
to the input screens of both image intensifiers. After geometric correction of the images, a ridge
detector is applied to segment the catheter in both images. The 3D snake used in this method
is represented by B-splines and is initialized interactively. Using a snake facilitates the merging
information from both projections simultaneously during the energy minimization process.
Rueckert et al [75] use deformable models in tracking of the aorta in cardiovascular MR images.
The system tracks the shape of the aorta in a cardiac cycle to study compliance which is a measure
of elasticity of an artery and defined as the ratio of volume change per pressure change between
contraction and expansion of the aorta. The location and diameter of the aorta is roughly estimated
by using a multiscale medial response function accompanied with a priori knowledge about the
circular shape of the aorta as an initial segmentation step. In the next step, the estimate obtained
from step one is refined using an energy minimizing Geometrically Deformable Model (GDM).
The result of the previous step is used to initialize the GDM. Their work introduces two new
aspects the the classical GDM. First, a Markov-Random Field (MRF) framework is introduced.
The system uses Simulated Annealing (SA) and Iterated Conditions Modes (ICM) to minimize
the energy of the snakes in the MRF framework. Second, GDM is represented by a spline-based
representation which is C2 continuous and has the advantage of computing the curvature from
analytical model easily.
Kozerke et al [76] use a modified definition of the active contour models in their technique
to automatically segment vessels in cine phase contrast flow measurements. The method requires
the user to select the vessel of interest in an arbitrary image frame by a mouse click. Then the
system finds the phase image at the phase corresponding to the early systolic acceleration of blood
flow as the starting frame. This is to ensure robust segmentation of the first image frame. In this
frame blood flow is expected to be unidirectional. The steps in this process is as follows: First,
each phase frame is convolved with a Gaussian mask to reduce noise. Then, all pixels of each
frame that exceed half of the maximum phase as found within a circular mask around the vessel
center are detected. Next, isolated pixels are removed and the holes are filled using connectivity
information. Finally, the first phase image in time with an area of half of the maximum found
overall is selected. In the sequential processing of the remaining frames, segmented contours of
previous frame, which is temporally neighboring the current frame, is used as a model for the
approximation of the contour in the current frame in case of missing or distorted edge features.
The method uses phase image, in addition to the magnitude image, to handle image distortions.
Rueckert and Burger [77] combine stochastic and probabilistic relaxation techniques in their
adaptive snake model for the segmentation of vessels in cine MR images. It is assumed that the
shape variation between successive time frames is relatively low. Based on this assumption, the
method uses a Simulated Annealing (SA) stochastic relaxation technique to find the global energy
minimum in the adaptive snake used to segment the vessel in the first frame. The subsequent frames
are segmented using a fast probabilistic relaxation technique, called Iterated Conditional Method
(ICM). The segmentation results from previous time frames are used to initialize the snakes in the
following frames. The adaptive snake used is modeled as a 1D Markov Random Field (MRF) and
it is similar to the concept of Geometrical Deformable Models (GDMs) developed by Miller [78].
The method is tested with a volume of 16 frames, 256x256 MR images that cover the whole heart
cycle. It is reported that the ascending as well as the descending aorta have been located correctly.
Geiger et al [79] propose a method for detecting, tracking, and matching deformable contours.
The method is based on the dynamic programming (DP) but it is non-iterative and guaranteed
to find the global minimum. Detection algorithm creates a list of uncertainty points for each
point selected by the user. Then, a search window is created from two consecutive lists. Next,
the dynamic programming algorithm is applied to find he optimal contour passing through these
lists. Deformable model is obtained after considering all possible contours and deformations.
Since dynamic programming is slow and memory intensive, a multiscale approach is used to speed
up the processing at the expense of losing the guaranteed optimality. In the process of tracking
contours in consecutive frames, the contour obtained in the previous frame is sampled at high
curvature points and these points form the initial points for the next frame. Matching is achieved
through a strategy developed which uses a cost function and some constraints and is also based on
dynamic programming method. The method is applicable to a large spectrum of applications and
the application to medical images is reported in the paper.
Klein et al [4] use orientation specific filters together with B-Spline snakes to identify vascular
features from angiogram images. The method consists of two major components. First, a bank
of orientation specific S-Gabor filter pairs are applied to create an image energy field. Second,
B-Spline snakes, representing the vessels, are employed to obtain centerline and edge features.
Dynamic programming is used to optimize the B-spline snakes and find the least energy contour.
The method is applied to a number of angiogram images, including pre and post-angioplasty coro-
nary angiograms, and the result is reported in the paper.
Due to the bank of orientation specific S-Gabor filter pairs used, this work can also be classified as
a matching filters approach listed in section 2.6.
McInerney and Terzopoulos [80] describe Affine Cell Decomposition-based (ACD-based) de-
formable surfaces and show the potential use of these models in extraction of complex structures
from medical image volumes. Topologically deformable ACD-based models, called T-snakes and
T-surfaces, are parametric models that embed deformable models in an ACD framework to ex-
tract very complex structures. 2D deformable models known as topologically adaptable snakes,
T-snakes, are introduced in [81]. Combining the ACD framework with deformable models allows
the models to overcome the limitations of classical deformable models while keeping the tradi-
tional properties. A T-surface is defined as a closed oriented triangular mesh. The vertices of the
triangles act as a dynamic particle system where the particles are connected by discrete springs.
As the T-surface moves under the influence of internal and external energy forces, the model is
reparameterized with a new set of triangles and nodes computed from the intersection points of the
model with the superposed grid. Reparameterization of the model at every step allows the model
to topologically transfer and adapt itself to more complex structures. The model is run on different
image modalities and the results are reported.
Klein, Lee, and Amini [5] describe an approach to extract vessels from X-ray angiograms
using deformable spline models (snakes). In their approach, the user provides an initial estimate
of the location of the vascular entity, and the system refines the estimate by deforming a snake
to minimize some energy function. They use a B-spline model in their snake implementation.
The energy function defines such constraints as the smoothness or coherence of the contour, the
closeness the contour is to image edge pixels, and the compactness of the boundary. They use a
Gabor filter to determine the image (or edge) energy term to attract the snake. The approach is
most suitable for the accurate extraction of vascular segments. The amount of user interaction and
computation required makes it impractical for extracting entire vascular structures.
Due to the bank of orientation specific S-Gabor filter pairs used, this work can also be classified as
a matching filters approach listed in section 2.6.
Luo et al [82] design a new snake model that overcomes the problems associated to tradi-
tional snakes. Some of these problems are contour initialization, internal parameter setting and
the limitations in the capture range of the external energy. The new snake model has new internal
and external energy and they are treated equally. The new internal energy maintains the smooth-
ness without any shrinking side effects on the contour. This is accomplished by computing “just
enough” smooth force to overcome the image force. The new external energy combines both edge
and region information. This feature of the external energy reduces the effects of contour initial-
ization. The model was tested on both synthetic and real gray-level images and the results were
reported to be encouraging.
Rueckert and Burger [83] develop a new technique to shape-based tracking and analysis of car-
diac MR images based on geometrically deformable templates (GDT). The GDT model uses bend-
ing energy term, in addition to image energy terms of classic deformable templates, to restrict the
template to specific shapes. Any deformation of the template from its equilibrium shape requires
this bending energy. The algorithm has two main steps: First, the size, position, and orientation
of the object is determined by affine transformations (scaling, translation, and rotation) using only
image energy. Second, the shape is approximated by non-rigid deformations of the deformable
template. The total energy of the template is minimized using a global optimization technique,
Simulated Annealing (SA). The results of the algorithm applied to both MR cine sequences of the
aorta and myocardium are reported.
Sarry and Boire [84] propose a computer vision-based approach to track coronary arteries in
biplane digital subtraction angiogram images. They use a 3D contour model based on 3D Fourier
shape descriptors and new constraints inferred from epipolar geometry. The 3D Fourier descriptors
are obtained from the 2D descriptors of the projected contour coordinates. A 3D parametrically
deformable model is, then, employed to in 3D tracking of the artery contours. The 3D tracking
method developed is compared to classical 3D contour tracking method which consists of inde-
pendent 2D tracking in each projection planes and 3D reconstruction using the epipolar geometry
constraints. The model is reported to deal with calibration imperfections and to show higher con-
vergence rate and accuracy than the general 3D tracking method.
Toledo et al [85] combine a probabilistic principal component analysis (PPCA) technique with
a statistical snake technique for tracking non-rigid elongated structures. Probabilistic PCA tech-
nique is used to construct statistical image feature descriptions while snakes are used for global
segmentation and tracking the objects. The statistical snake learns and tracks image features using
statistical learning techniques. A likelihood map, used by statistical snake, is created from a train-
ing set of object profiles using the Probabilistic PCA technique. Each point in the map is assigned
a probability measure to belong to the learned feature category. The likelihood map is extended,
by applying an extended local coherence detection to the coherent direction field, to give priority
to parallel coherent structures. The likelihood map is used to define a probabilistic potential field
of the snake. The statistic snake deforms itself to maximize the overall probability of detecting
learned image features.
Hu et al [86] present a method based on global and local deformable physical models to extract
vessel boundaries from MR cine phase-contrast images. The method uses a circular global model
which fits the shape of the vessel cross-section boundary in the MR cine phase-contrast images.
The global model allows the method to detect vessel position and size changes in the time sequence
of the phase-contrast images. Deformations on the global circular model is achieved through a
local model. The local model, with variable stiffness parameters, locates the contour on the edge
point locations where edge features are strong while keeping the contour smooth at the locations
where edges are missing. Edge segments are extracted using directional gradient information in
the algorithm. The algorithm was run on a set of over 500 MR cine phase-contrast image of the
aorta from 20 patients and the results were reported to be very successful.
The work of Mayer et al [87] reviewed in section 7 can be classified in this section due the
ribbon-snakes used.
The work of Thackray and Nelson [69] described earlier in section 2.7 may be thought of as
model-based in that the 8 morphological operators are essentially explicit oriented vessel models.
The work of Hunter et al [88] reviewed in section 6 can be classified as parametric deformable
model due to the Knowledge-guided Snakes used in the extraction process.
The work of Parwin et al [89] reviewed in section 7 can be classified in this section due the
deformed contour used.
The work of O’Donnell et al [90] reviewed in section 3.4 can also be classified as a parametric
deformable model approach due to the deformable surface used.
The work of Kompatsiaris et al [91] reviewed in section 7 can also be classified as a parametric
deformable model approach due to the active snakes used in refinement process of the detected
stent.
3.1.2 Geometric Deformable Models and Front Propagation Methods
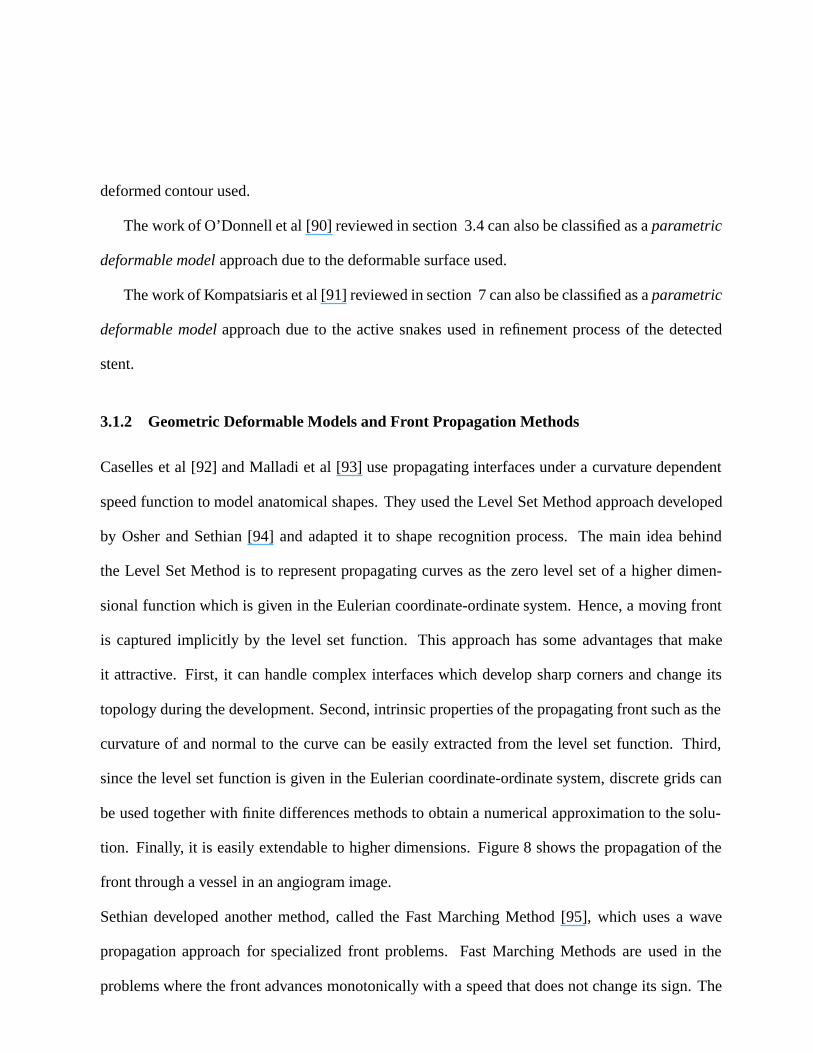
Caselles et al [92] and Malladi et al [93] use propagating interfaces under a curvature dependent
speed function to model anatomical shapes. They used the Level Set Method approach developed
by Osher and Sethian [94] and adapted it to shape recognition process. The main idea behind
the Level Set Method is to represent propagating curves as the zero level set of a higher dimen-
sional function which is given in the Eulerian coordinate-ordinate system. Hence, a moving front
is captured implicitly by the level set function. This approach has some advantages that make
it attractive. First, it can handle complex interfaces which develop sharp corners and change its
topology during the development. Second, intrinsic properties of the propagating front such as the
curvature of and normal to the curve can be easily extracted from the level set function. Third,
since the level set function is given in the Eulerian coordinate-ordinate system, discrete grids can
be used together with finite differences methods to obtain a numerical approximation to the solu-
tion. Finally, it is easily extendable to higher dimensions. Figure 8 shows the propagation of the
front through a vessel in an angiogram image.
Sethian developed another method, called the Fast Marching Method [95], which uses a wave
propagation approach for specialized front problems. Fast Marching Methods are used in the
problems where the front advances monotonically with a speed that does not change its sign. The
IInitialization After 60 iterations
After 200 iterations
After 391 iterationsAfter 275 iterations
After 123 iterations
Figure 8: Propagation of interface through a vessel in XRA image (Figures are reproduced from
[93])
Fast Marching Method’s advantage over the Level Set Methods is that it is more computationally
efficient.
A good book on the Level Set Methods and Fast Marching Methods is written by Sethian [96].
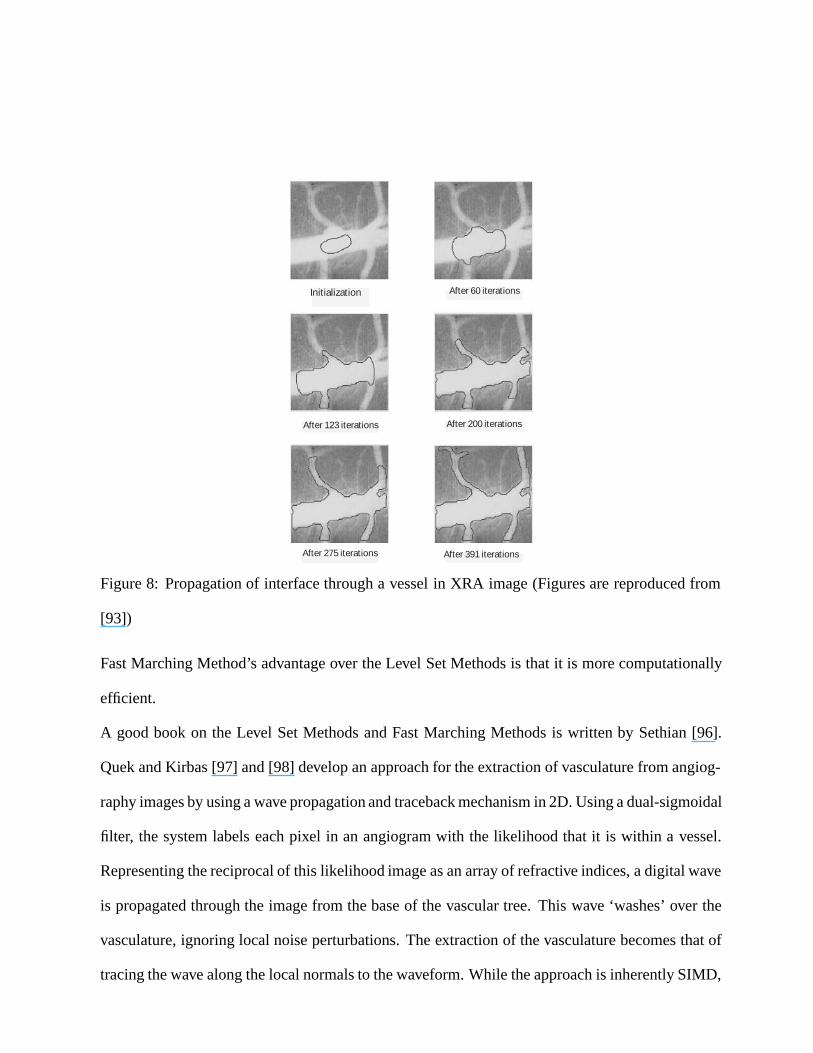
Quek and Kirbas [97] and [98] develop an approach for the extraction of vasculature from angiog-
raphy images by using a wave propagation and traceback mechanism in 2D. Using a dual-sigmoidal
filter, the system labels each pixel in an angiogram with the likelihood that it is within a vessel.
Representing the reciprocal of this likelihood image as an array of refractive indices, a digital wave
is propagated through the image from the base of the vascular tree. This wave ‘washes’ over the
vasculature, ignoring local noise perturbations. The extraction of the vasculature becomes that of
tracing the wave along the local normals to the waveform. While the approach is inherently SIMD,
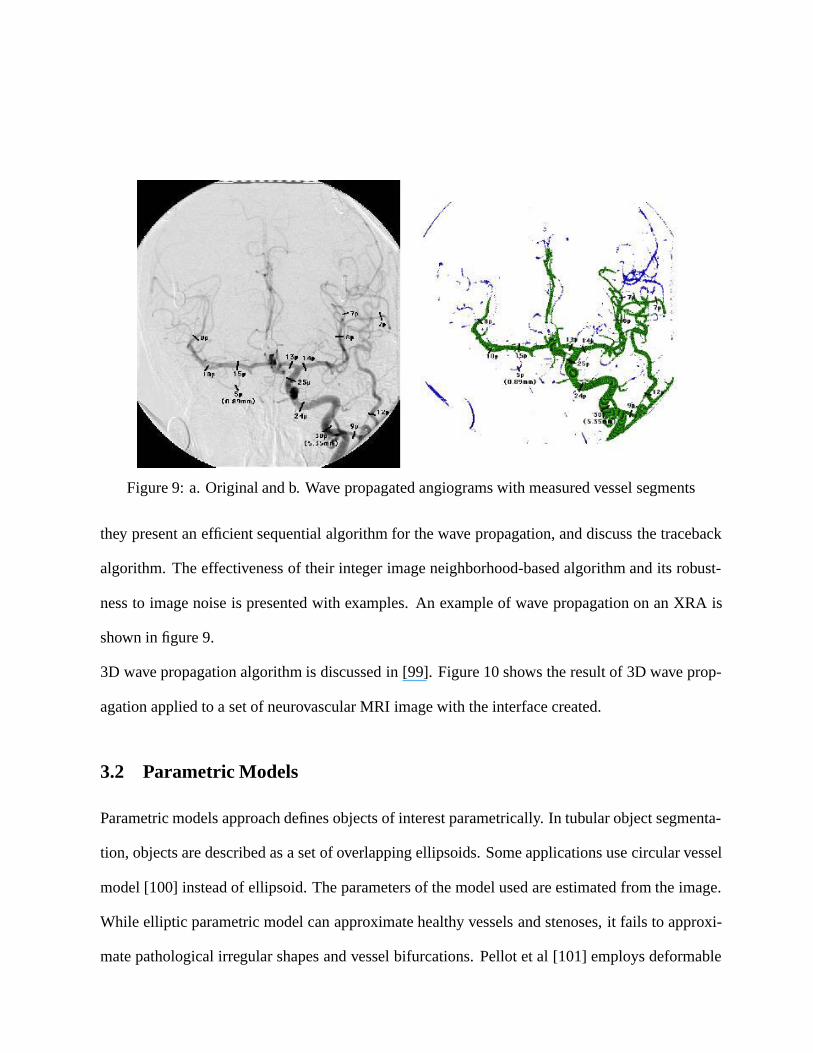
Figure 9: a. Original and b. Wave propagated angiograms with measured vessel segments
they present an efficient sequential algorithm for the wave propagation, and discuss the traceback
algorithm. The effectiveness of their integer image neighborhood-based algorithm and its robust-
ness to image noise is presented with examples. An example of wave propagation on an XRA is
shown in figure 9.
3D wave propagation algorithm is discussed in [99]. Figure 10 shows the result of 3D wave prop-
agation applied to a set of neurovascular MRI image with the interface created.
3.2 Parametric Models
Parametric models approach defines objects of interest parametrically. In tubular object segmenta-
tion, objects are described as a set of overlapping ellipsoids. Some applications use circular vessel
model [100] instead of ellipsoid. The parameters of the model used are estimated from the image.
While elliptic parametric model can approximate healthy vessels and stenoses, it fails to approxi-
mate pathological irregular shapes and vessel bifurcations. Pellot et al [101] employs deformable
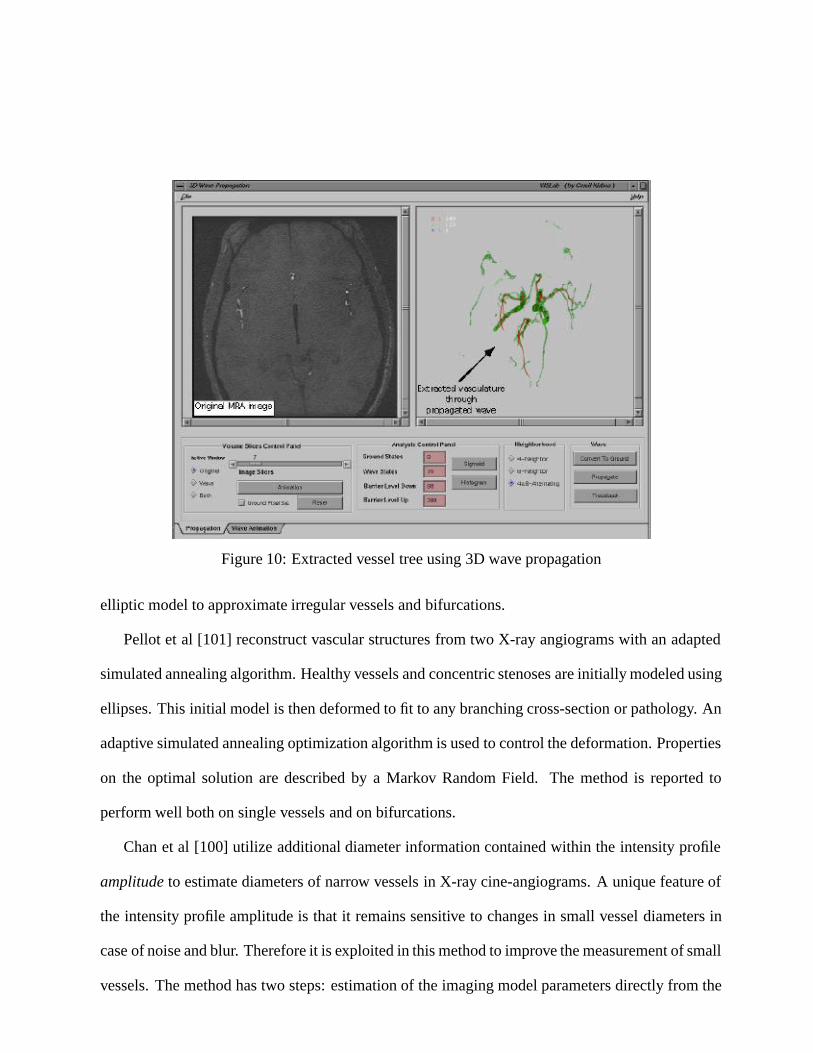
Figure 10: Extracted vessel tree using 3D wave propagation
elliptic model to approximate irregular vessels and bifurcations.
Pellot et al [101] reconstruct vascular structures from two X-ray angiograms with an adapted
simulated annealing algorithm. Healthy vessels and concentric stenoses are initially modeled using
ellipses. This initial model is then deformed to fit to any branching cross-section or pathology. An
adaptive simulated annealing optimization algorithm is used to control the deformation. Properties
on the optimal solution are described by a Markov Random Field. The method is reported to
perform well both on single vessels and on bifurcations.
Chan et al [100] utilize additional diameter information contained within the intensity profile
amplitude to estimate diameters of narrow vessels in X-ray cine-angiograms. A unique feature of
the intensity profile amplitude is that it remains sensitive to changes in small vessel diameters in
case of noise and blur. Therefore it is exploited in this method to improve the measurement of small
vessels. The method has two steps: estimation of the imaging model parameters directly from the
images and estimation of the diameters from these parameters. The first step has three components
to achieve imaging model parameters: a circular vessel model, a nonlinear imaging model, and a
parameter estimation. The second step employs a maximum likelihood (ML) estimation technique
with amplitude information incorporated. It is reported that the model successfully estimate the
diameters in the range of 0.4 mm to 4.0 mm.
Krissian et al [102] develop a multiscale model to extract and reconstruct 3D vessels from
medical images. The model is an extension of their previous work [103] and [104]. It is based
on previous work,[105], [106], [38], [107], [108], [109], and [110], on multi-scale detection with
some modifications. The method uses a new response function which measures the contours of the
vessels around the centerlines. It consists of three main steps. First, the multiscale responses from
discrete set of scales is computed. Second, the local extrema in multiscale response is extracted.
Finally, the skeleton of the local extrema is created and the result is visualized. A cylindrical vessel
model is utilized in the first step to interpret the eigenvalues of the Hessian matrix and to choose a
good normalization parameter. The initial tests of the method gives promising results, with some
local problems at vessel junctions and tangent vessels. Figure 11 shows some of the results of their
work. An extension of this work, with a new response function, is reported in [111].
Bors and Pitas [112] use a pattern classification-based approach for 3D object segmentation
and modeling in volumetric images. The objects are considered as a stack of overlapping ellip-
soids whose parameters are found using the normalized first and second order moments. The
segmentation process is based on the geometrical model and graylevel statistics of the images. The
center of the ellipsoids are estimated using an extended Hough Transform algorithm in 3D space.
The method employs a radial Basis Function (RBF) network classifier in modeling the 3D structure
and graylevel statistics. In the RBF classifier, each unit corresponds to an ellipsoid. The learning
of the RBF network is based on the �-Trimmed Mean algorithm [113]. The algorithm is run on a
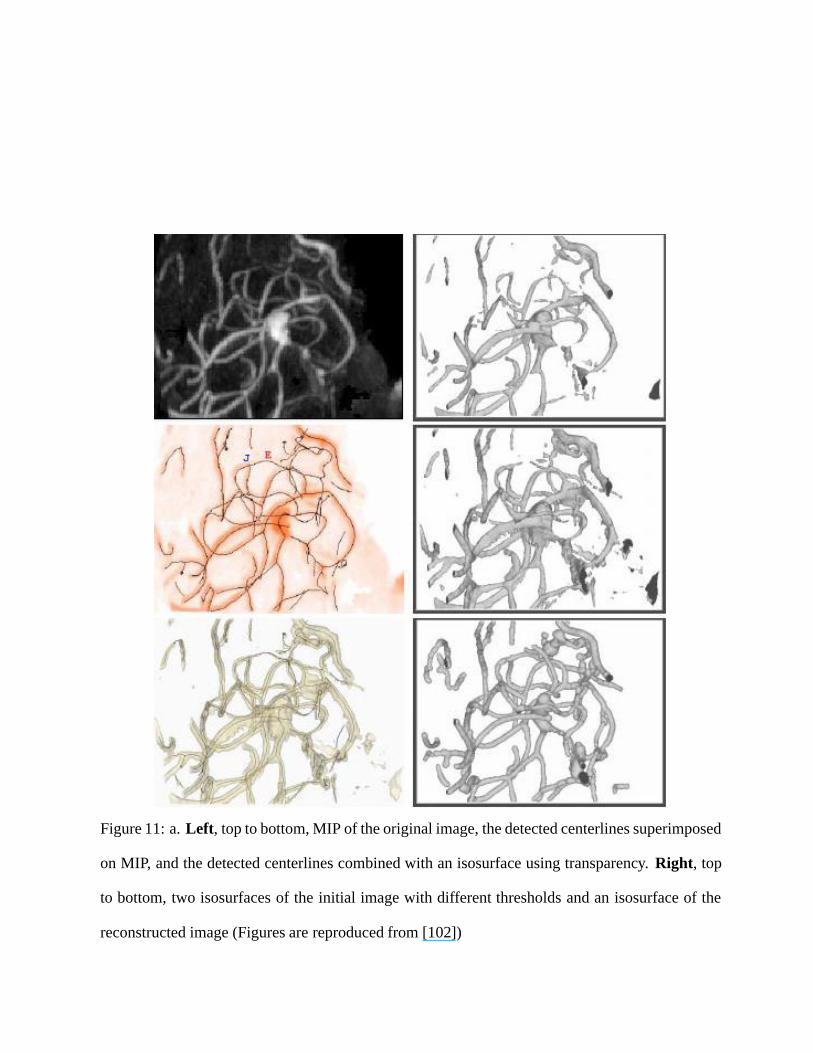
Figure 11: a. Left, top to bottom, MIP of the original image, the detected centerlines superimposed
on MIP, and the detected centerlines combined with an isosurface using transparency. Right, top
to bottom, two isosurfaces of the initial image with different thresholds and an isosurface of the
reconstructed image (Figures are reproduced from [102])
set of tooth pulpal blood vessel microscopy images and the results are presented.
3.3 Template Matching
Template matching tries to recognize a structure model (template) in an image. The method uses
the template as a context, which is a priori model. Thus, it is a contextual method and a top-down
approach. In arterial extraction applications, the arterial tree template is usually represented in
the form of a series of nodes connected in segments. This template is then deformed to fit the
structures in the scene optimally. Stochastic deformation process described by a Hidden Markov
Model (HMM) [114] is a method to achieve template deformation as described in [115], [116].
Dynamic programming is an effective method employed in recognition process [115].
Petrocelli et al [115] describe their method of structure recognition in unsubtracted digital
angiograms. Their method, the Deformable Template Matcher is a combination of a priori knowl-
edge of the arterial tree in the form of mathematical templates and a stochastic deformation process
described by a hidden Markov model. The structure model (template) is a set of connected nodes
and their structural designations. The arterial tree from an image is extracted by deforming the
structure model and calculating the likelihood estimate of the deformation. Their method uses
dynamic programming technique in the recognition process.
Summers and Bhalerao [15] implement a model based multi-resolution technique for the seg-
mentation of magnetic resonance angiograms (MRA). The technique is based on octree represen-
tation. Therefore, the image data is first expanded in an octree representation using averaging on
the combined set of velocity component images. Image blocks, that pass the confidence test for
the occupancy probability and coherence test for adjacency, form the segmented tree. The system
estimates features like flow direction, vessel axis, diameter, and velocity from the segmented image
blocks using the local pressure gradient. The model is tested in extraction of vessels from MRA
images and in calculation of pressure gradients in a model stenosis.
Due to the multi-scale approach used, we can list work under the multi-scale approaches listed in
section 2.1.
Van der Weide et al [117] localize paramagnetic markers to localize intravascular devices in
MR images. The aim is to support the MR-guided vascular interventions. Their method has two
main steps. First, marker candidates, which are local minima (“blobs”), in the image are detected
using both Laplacian image and winding number image. Winding number image [118] is used
to topologically classify different singular points such as local minima and local maxima points.
Second, the intravascular device is identified by a matching process of the detected marker pattern
to the known template of the device. The results of an animal experiment is discussed and 95% of
success rate is stated in phantom experiments.
Petrocelli et al [116] present their method, based on a Gauss-Markov model,to recognize three
dimensional vessel structures from bi-plane angiogram images. A unique feature of the system
comes from its ability to extract structures from unprocessed standard digital angiograms without
any preprocessing. The system, named Deformable Template Matcher (DTM), utilizes a priori
knowledge of the arterial tree encoded as mathematical templates. An arterial tree template is
represented in the form of a series of nodes connected in segments. This template is created by
a cardiologist using an interactive mouse-driven program. This template is then deformed with a
stochastic deformation process described by a Hidden Markov Model (HMM) to fit the unknown
scene in the image using local image information. The template is considered to fit the scene when
the best of the state transition is found. Since the system is working in 3D, the deformation process
is performed in space and backprojected onto two planes used. It requires a good model of the
global structure and computational complexity to extract entire vascular structure.
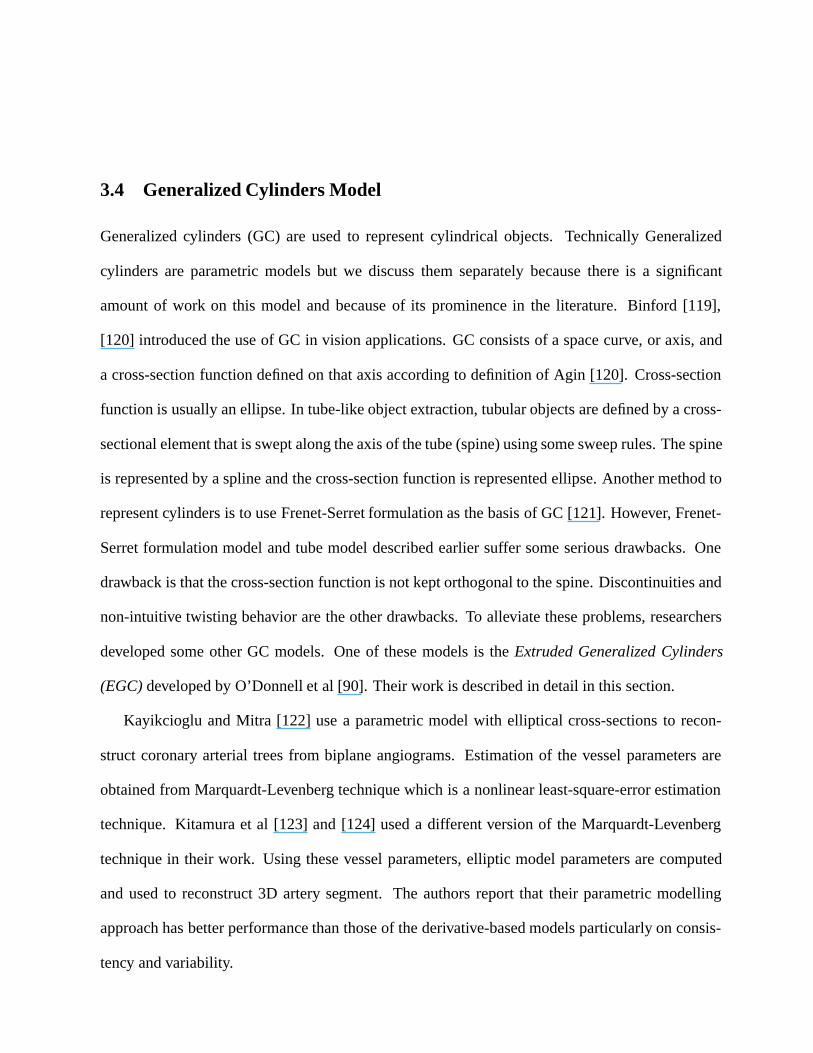
3.4 Generalized Cylinders Model
Generalized cylinders (GC) are used to represent cylindrical objects. Technically Generalized
cylinders are parametric models but we discuss them separately because there is a significant
amount of work on this model and because of its prominence in the literature. Binford [119],
[120] introduced the use of GC in vision applications. GC consists of a space curve, or axis, and
a cross-section function defined on that axis according to definition of Agin [120]. Cross-section
function is usually an ellipse. In tube-like object extraction, tubular objects are defined by a cross-
sectional element that is swept along the axis of the tube (spine) using some sweep rules. The spine
is represented by a spline and the cross-section function is represented ellipse. Another method to
represent cylinders is to use Frenet-Serret formulation as the basis of GC [121]. However, Frenet-
Serret formulation model and tube model described earlier suffer some serious drawbacks. One
drawback is that the cross-section function is not kept orthogonal to the spine. Discontinuities and
non-intuitive twisting behavior are the other drawbacks. To alleviate these problems, researchers
developed some other GC models. One of these models is the Extruded Generalized Cylinders
(EGC) developed by O’Donnell et al [90]. Their work is described in detail in this section.
Kayikcioglu and Mitra [122] use a parametric model with elliptical cross-sections to recon-
struct coronary arterial trees from biplane angiograms. Estimation of the vessel parameters are
obtained from Marquardt-Levenberg technique which is a nonlinear least-square-error estimation
technique. Kitamura et al [123] and [124] used a different version of the Marquardt-Levenberg
technique in their work. Using these vessel parameters, elliptic model parameters are computed
and used to reconstruct 3D artery segment. The authors report that their parametric modelling
approach has better performance than those of the derivative-based models particularly on consis-
tency and variability.
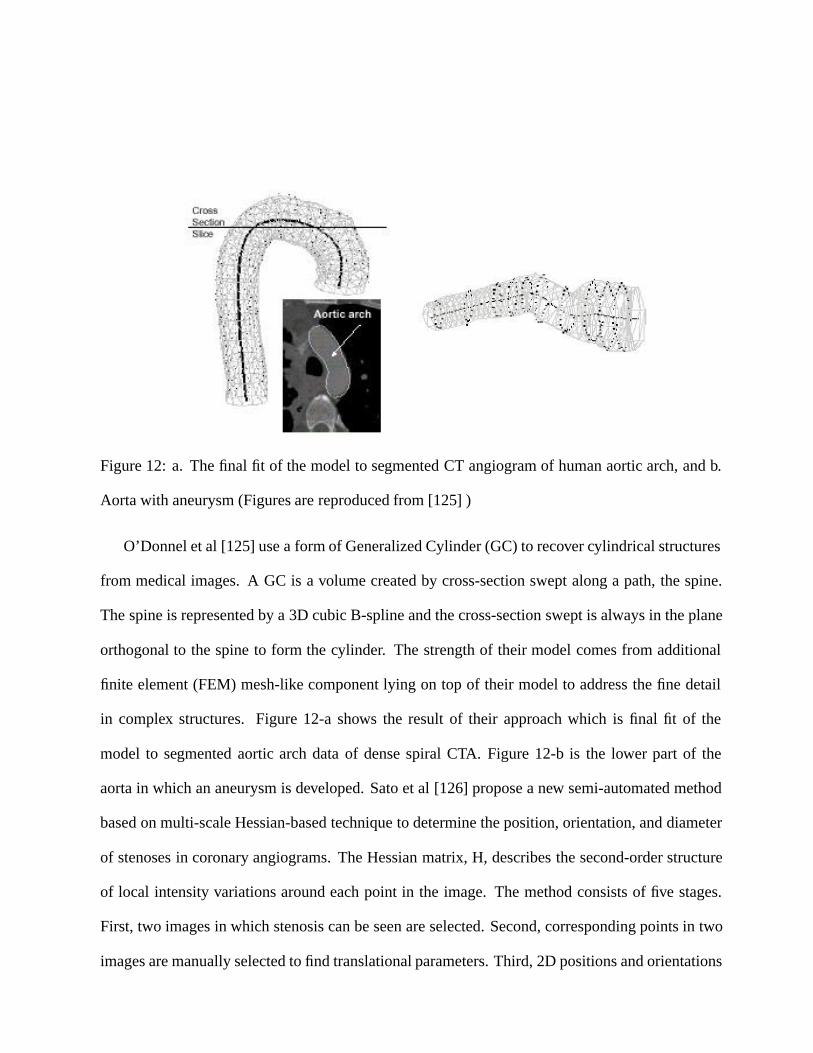
Figure 12: a. The final fit of the model to segmented CT angiogram of human aortic arch, and b.
Aorta with aneurysm (Figures are reproduced from [125] )
O’Donnel et al [125] use a form of Generalized Cylinder (GC) to recover cylindrical structures
from medical images. A GC is a volume created by cross-section swept along a path, the spine.
The spine is represented by a 3D cubic B-spline and the cross-section swept is always in the plane
orthogonal to the spine to form the cylinder. The strength of their model comes from additional
finite element (FEM) mesh-like component lying on top of their model to address the fine detail
in complex structures. Figure 12-a shows the result of their approach which is final fit of the
model to segmented aortic arch data of dense spiral CTA. Figure 12-b is the lower part of the
aorta in which an aneurysm is developed. Sato et al [126] propose a new semi-automated method
based on multi-scale Hessian-based technique to determine the position, orientation, and diameter
of stenoses in coronary angiograms. The Hessian matrix, H, describes the second-order structure
of local intensity variations around each point in the image. The method consists of five stages.
First, two images in which stenosis can be seen are selected. Second, corresponding points in two
images are manually selected to find translational parameters. Third, 2D positions and orientations
of the stenosis in two images are estimated. Fourth, 3D position and orientation of the stenosis are
calculated based on the principle of binocular stereo. The stenosis orientation is determined from
Hessian matrix at each point. Finally, the vessel of interest with stenosis and any peripheral vessels
which may be overlap the stenosis are specified manually.
Their method utilizes scale-dependency to formulate the diameter estimation and therefore reduces
user interaction. Another advantage of the method is that the orientation and diameter are viewed
as a continuous 2D function and estimated directly from local intensity structures. This eliminates
the necessity of obtaining intermediate representations such as left and right vessel borders which
requires the computation of second derivatives. They develop a user interface and show the result
of their method on synthetic and real images.
Puig [127] describes her cerebral blood vessel modeling technique with a good imaging, mod-
eling, and visualization review in her report. She proposes a hybrid model for the blood vessel
representation scheme. The model stores symbolic information of the topology, such as branching
and irregularities, like stenoses and aneurysms, as well as volume and surface information. The
model uses graph representation associated with surface and volume information. Reconstruction
of the symbolic model is achieved by extracting the Discrete Medial Axis (DMAT), described in
[128], based on a seed strategy that begins with a voxel of the medial axis and a main direction as-
sociated at the voxel. Each voxel is classified according to the projections of its wave and the graph
is constructed incrementally. Associated surface model is created using Generalized Cylinders and
volume model is created using run-length encoding.
Fessler and Macovski [129] develop an object-based method for reconstructing arterial trees
from a few projection images. The method uses an elliptical model of generalized cylinders to
approximate arterial cross-sections. By incorporating a priori knowledge of the structure of arter-
ies, the problem of reconstruction turns into an object estimation problem. The method employs a
nonparametric optimality criterion that attempts to capture arterial smoothness incorporated in the
system as a priori knowledge. The method has been applied to three data sets and the results are
summarized in the paper.
O’Donnell et al [90] introduce a new deformable model, extruded generalized cylinder (EGC),
for object segmentation. The paper discusses the drawbacks of the existing generalized cylinder
(GC) models and gives the rationale for their new model. The EGC model allows a non-planar
spine and overcomes the problems caused by inflection points and spine torsion. The model has
some properties that make it useful when there is no a priori curvature information about the object
to be recovered. One of these properties is the ability to describe cylinders with locally straight as
well as curved spines. Another property is that the model has intuitive twisting behavior given by
twisting parameters. If the user desires a twist, she can get it easily. The EGC model is further
extended to include local surface deformations. The algorithm is applied to presegmented carotid
artery data and the result is presented.
This work can also be classified as a parametric deformable model approach listed in section 3.1.1
due to the deformable surface used.
Kayikcioglu and Mitra [130] analyze the shapes and calculate the areas of coronary arterial
cross-sections from biplane angiograms using an elliptical model. The model uses ideal intensity
distributions of an elliptical cross section of coronary artery to find the shape and area information.
The method is tested on computer generated and real arterial data and the results are presented.
The work of Huang and Stockman [16] reviewed in section 7 can be listed in this section since
they are using generalized cylinders to extract tubular structures in 2D intensity images.
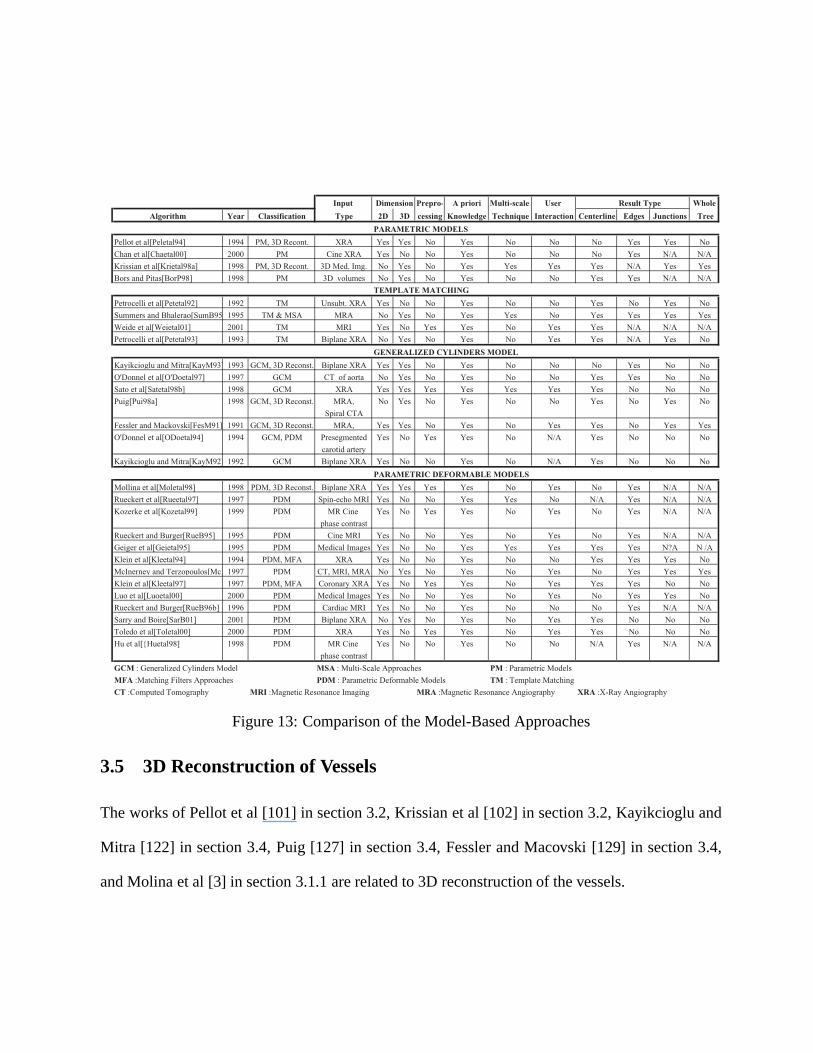
Input Dimension Prepro- A priori Multi-scale User Result Type Whole
Algorithm Year Classification Type 2D 3D cessing Knowledge Technique Interaction Centerline Edges Junctions Tree
PARAMETRIC MODELS
Pellot et al[Peletal94] 1994 PM, 3D Recont. XRA Yes Yes No Yes No No No Yes Yes No
Chan et al[Chaetal00] 2000 PM Cine XRA Yes No No Yes No No No Yes N/A N/A
Krissian et al[Krietal98a] 1998 PM, 3D Recont. 3D Med. Img. No Yes No Yes Yes Yes Yes N/A Yes Yes
Bors and Pitas[BorP98] 1998 PM 3D volumes No Yes No Yes No No Yes Yes N/A N/A
TEMPLATE MATCHING
Petrocelli et al[Petetal92] 1992 TM Unsubt. XRA Yes No No Yes No No Yes No Yes No
Summers and Bhalerao[SumB95 1995 TM & MSA MRA No Yes No Yes Yes No Yes Yes Yes Yes
Weide et al[Weietal01] 2001 TM MRI Yes No Yes Yes No Yes Yes N/A N/A N/A
Petrocelli et al[Petetal93] 1993 TM Biplane XRA No Yes No Yes No Yes Yes N/A Yes No
GENERALIZED CYLINDERS MODEL
Kayikcioglu and Mitra[KayM93] 1993 GCM, 3D Reconst. Biplane XRA Yes Yes No Yes No No No Yes No No
O'Donnel et al[O'Doetal97] 1997 GCM CT of aorta No Yes No Yes No No Yes Yes No No
Sato et al[Satetal98b] 1998 GCM XRA Yes Yes Yes Yes Yes Yes Yes No No No
Puig[Pui98a] 1998 GCM, 3D Reconst. MRA, No Yes No Yes No No Yes No Yes No
Spiral CTA
Fessler and Mackovski[FesM91] 1991 GCM, 3D Reconst. MRA, Yes Yes No Yes No Yes Yes No Yes Yes
O'Donnel et al[ODoetal94] 1994 GCM, PDM Presegmented Yes No Yes Yes No N/A Yes No No No
carotid artery
Kayikcioglu and Mitra[KayM92] 1992 GCM Biplane XRA Yes No No Yes No N/A Yes No No No
PARAMETRIC DEFORMABLE MODELS
Mollina et al[Moletal98] 1998 PDM, 3D Reconst. Biplane XRA Yes Yes Yes Yes No Yes No Yes N/A N/A
Rueckert et al[Rueetal97] 1997 PDM Spin-echo MRI Yes No No Yes Yes No N/A Yes N/A N/A
Kozerke et al[Kozetal99] 1999 PDM MR Cine Yes No Yes Yes No Yes No Yes N/A N/A
phase contrast
Rueckert and Burger[RueB95] 1995 PDM Cine MRI Yes No No Yes No Yes No Yes N/A N/A
Geiger et al[Geietal95] 1995 PDM Medical Images Yes No No Yes Yes Yes Yes Yes N?A N /A
Klein et al[Kleetal94] 1994 PDM, MFA XRA Yes No No Yes No No Yes Yes Yes No
McInerney and Terzopoulos[McI 1997 PDM CT, MRI, MRA No Yes No Yes No Yes No Yes Yes Yes
Klein et al[Kleetal97] 1997 PDM, MFA Coronary XRA Yes No Yes Yes No Yes Yes Yes No No
Luo et al[Luoetal00] 2000 PDM Medical Images Yes No No Yes No Yes No Yes Yes No
Rueckert and Burger[RueB96b] 1996 PDM Cardiac MRI Yes No No Yes No No No Yes N/A N/A
Sarry and Boire[SarB01] 2001 PDM Biplane XRA No Yes No Yes No Yes Yes No No No
Toledo et al[Toletal00] 2000 PDM XRA Yes No Yes Yes No Yes Yes No No No
Hu et al[{Huetal98] 1998 PDM MR Cine Yes No No Yes No No N/A Yes N/A N/A
phase contrast
GCM : Generalized Cylinders Model MSA : Multi-Scale Approaches PM : Parametric Models
MFA :Matching Filters Approaches PDM : Parametric Deformable Models TM : Template Matching
CT :Computed Tomography MRI :Magnetic Resonance Imaging MRA :Magnetic Resonance Angiography XRA :X-Ray Angiography
Figure 13: Comparison of the Model-Based Approaches
3.5 3D Reconstruction of Vessels
The works of Pellot et al [101] in section 3.2, Krissian et al [102] in section 3.2, Kayikcioglu and
Mitra [122] in section 3.4, Puig [127] in section 3.4, Fessler and Macovski [129] in section 3.4,
and Molina et al [3] in section 3.1.1 are related to 3D reconstruction of the vessels.
4 Tracking-Based Approaches
Tracking-based approaches apply local operators on a focus known to be a vessel and track it.
On the other hand, patter recognition approaches apply local operators to the whole image. Ves-
sel tracking approaches, starting from an initial point, detect vessel centerlines or boundaries by
analyzing the pixels orthogonal to the tracking direction. Different methods are employed in deter-
mining vessel contours or centerlines. Edge detection operation followed by sequential tracing by
incorporating connectivity information is a straightforward approach. Aylward et al [32] utilize in-
tensity ridges to approximate the medial axes of tubular objects such as vessels. Some applications
achieve sequential contour tracing by incorporating the features, such as the vessel central point,
the searching direction, and the search range, detected from previous step into the next step [131].
The initial values of the features are supplied by the user. Fuzzy clustering is another approach
to identify vessel segments [132]. It uses linguistic descriptions like “vessel” and “nonvessel” to
track vessels in retinal angiogram images. After the initial segmentation of the pixels into different
regions, a fuzzy tracking algorithm is applied to each candidate vessel region. False candidate
vessels are rejected by the algorithm within two or three iterations. Some methods utilize a model
in the tracking process and incrementally segment the vessels. [133] utilizes a circular template in
the initial segmentation of coronary artery tree.
A more sophisticated approach on vessel tracking is the use of graph representation [134]. The
segmentation process is, then, reduced to finding the optimum path in a graph representation of the
image.
One disadvantage of the vessel tracking approaches is that they are not fully automatic. They often
requires user intervention for selecting starting and end points.
Tolias and Panas [132] develop a fuzzy C-means (FCM) clustering algorithm that uses linguis-
tic descriptions like “vessel” and “nonvessel” to track fundus vessels in retinal angiogram images.
Their algorithm uses only (fuzzy) image intensity information and makes no assumptions for the
shape of the vessels sought. First, optic nerve which is a salient image region in fundus images
is detected and used as the starting point of the algorithm. Next, the bounding circle of the optic
nerve is found. Then, the points in the bounding circle are segmented as vessel and nonvessel us-
ing a Fuzzy C-Means algorithm (FCM). Each segmented region which contains more than 3 vessel
points is considered as a candidate starting points of a vessel. Finally, a fuzzy vessel tracking al-
gorithm is applied to each candidate vessel. False candidate vessels are rejected by the algorithm
within two or three iterations. An attractive feature of the algorithm is that it does not utilize any
edge information to locate the exact location of the vessels and this reduces the effects of noise in
the tracking procedure.
Hart and Holley [135] develop an automated coronary artery tracking system, which incorpo-
rates information within subsections of the image for stable tracking, in unsubtracted angiograms.
The system iteratively operates on image blocks using a first order predictive scheme. Features
obtained, such as vessel width and direction, from one image block (n), are input to the next image
block (n+1) as initial information. Then, the system selects an appropriate image block size for
an optimum width and direction for the next processing step. The seed direction, seed width and
starting point of the first image block is given by the user. This algorithm is relatively slow due
to calculation being done on whole image blocks but faster than some tracking algorithms that use
global image structures since it uses only local information in each image block. The system has
problems in tracking arteries at bifurcations and sharp changes in vessel width.
Park et al [136] describe their work of extracting features and profiling narrow blood vessels
in Digital Subtracted Angiograms (DSA). Their system applies maximum-likelihood (ML) esti-
mation on adjacent pixels for boundary detection and an adaptive tracking algorithm based on the
direction field. The algorithm detects the position of centerlines as direction vectors and adaptively
tracks entire vessel’s direction field. A median filter is used in the preprocessing step to improve
the image quality.
Quek et al [137] and [138] propose a model to interpret Neurovascular XRA images inter-
actively. This attentionally-based interactive model, AIM, exploits human interaction as part of
the solution. AIM posits two channels of interaction: context (”what to look for”), and focus-of-
attention (”where to look”) as the locus of spatial information exchange between the user and the
machine. In an AIM system, the user specifies a context (e.g. a carotid vessel) and directs the
attentional spotlight to focus machine processing. AIM involves the user with the computer as in-
tegral partner and facilitates varying degrees of human intervention in the process. A hierarchy of
context abstractions permits the system to function more autonomously (doing high-level tasks like
extracting an arterial vessel) in routine interpretation, and to require more user intervention (e.g.
locating arterial wall boundaries) as the image complexity increases. This feature lets the medical
professional have ultimate control and confidence in the system. The system employs several edge
detection algorithms, e.g. Canny and Sobel, for the extraction of vessel boundaries.
Haris et al [133] combine a recursive sequential tracking algorithm and morphological tools of
homotopy modification and watersheds to automatically extract coronary arteries from angiogram
images. The initial segmentation of skeleton and borders of the coronary artery tree is achieved
through an artery tracking method based on circular template analysis. The result of this process is
an approximation of coronary tree skeleton along with estimates of the artery width at each point.
Then, by using the skeleton from the initial segmentation, an artery segment tree is constructed.
Finally, the morphological tools of homotopy modification and watershed transform are used to
analyze each artery segment for the accurate border extraction. Authors of the paper admit that the
system has problem in extracting complete coronary tree.
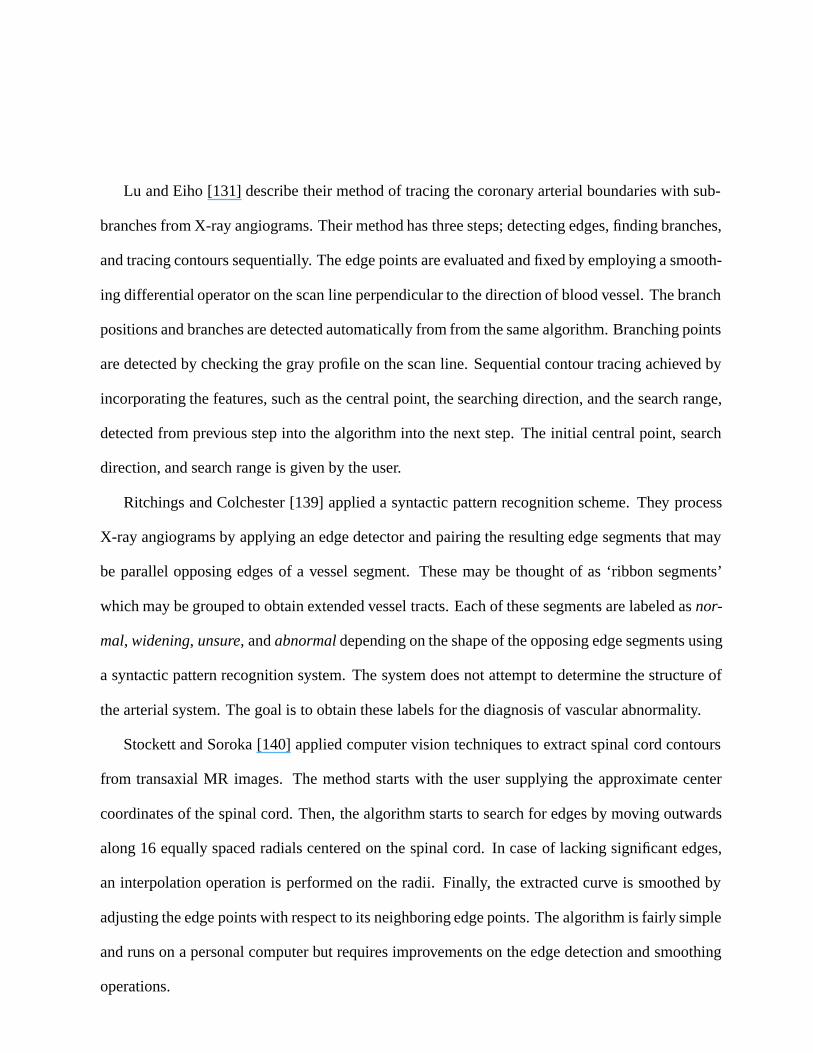
Lu and Eiho [131] describe their method of tracing the coronary arterial boundaries with sub-
branches from X-ray angiograms. Their method has three steps; detecting edges, finding branches,
and tracing contours sequentially. The edge points are evaluated and fixed by employing a smooth-
ing differential operator on the scan line perpendicular to the direction of blood vessel. The branch
positions and branches are detected automatically from from the same algorithm. Branching points
are detected by checking the gray profile on the scan line. Sequential contour tracing achieved by
incorporating the features, such as the central point, the searching direction, and the search range,
detected from previous step into the algorithm into the next step. The initial central point, search
direction, and search range is given by the user.
Ritchings and Colchester [139] applied a syntactic pattern recognition scheme. They process
X-ray angiograms by applying an edge detector and pairing the resulting edge segments that may
be parallel opposing edges of a vessel segment. These may be thought of as ‘ribbon segments’
which may be grouped to obtain extended vessel tracts. Each of these segments are labeled as nor-
mal, widening, unsure, and abnormal depending on the shape of the opposing edge segments using
a syntactic pattern recognition system. The system does not attempt to determine the structure of
the arterial system. The goal is to obtain these labels for the diagnosis of vascular abnormality.
Stockett and Soroka [140] applied computer vision techniques to extract spinal cord contours
from transaxial MR images. The method starts with the user supplying the approximate center
coordinates of the spinal cord. Then, the algorithm starts to search for edges by moving outwards
along 16 equally spaced radials centered on the spinal cord. In case of lacking significant edges,
an interpolation operation is performed on the radii. Finally, the extracted curve is smoothed by
adjusting the edge points with respect to its neighboring edge points. The algorithm is fairly simple
and runs on a personal computer but requires improvements on the edge detection and smoothing
operations.
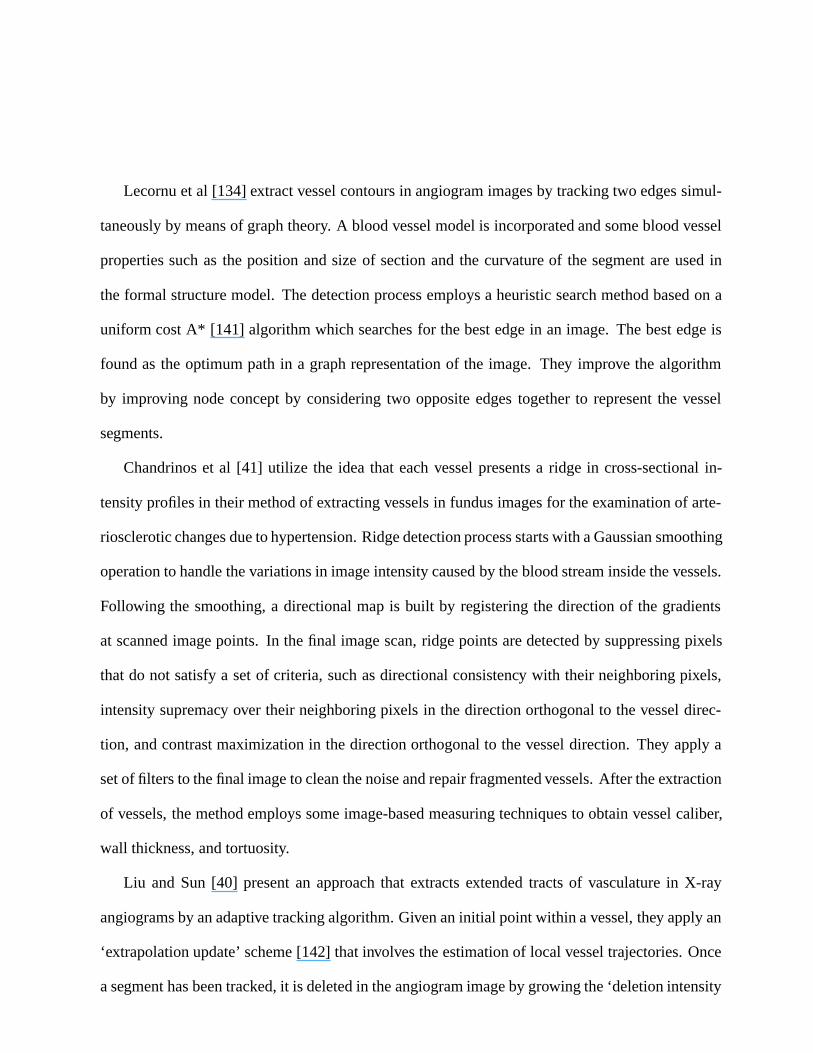
Lecornu et al [134] extract vessel contours in angiogram images by tracking two edges simul-
taneously by means of graph theory. A blood vessel model is incorporated and some blood vessel
properties such as the position and size of section and the curvature of the segment are used in
the formal structure model. The detection process employs a heuristic search method based on a
uniform cost A* [141] algorithm which searches for the best edge in an image. The best edge is
found as the optimum path in a graph representation of the image. They improve the algorithm
by improving node concept by considering two opposite edges together to represent the vessel
segments.
Chandrinos et al [41] utilize the idea that each vessel presents a ridge in cross-sectional in-
tensity profiles in their method of extracting vessels in fundus images for the examination of arte-
riosclerotic changes due to hypertension. Ridge detection process starts with a Gaussian smoothing
operation to handle the variations in image intensity caused by the blood stream inside the vessels.
Following the smoothing, a directional map is built by registering the direction of the gradients
at scanned image points. In the final image scan, ridge points are detected by suppressing pixels
that do not satisfy a set of criteria, such as directional consistency with their neighboring pixels,
intensity supremacy over their neighboring pixels in the direction orthogonal to the vessel direc-
tion, and contrast maximization in the direction orthogonal to the vessel direction. They apply a
set of filters to the final image to clean the noise and repair fragmented vessels. After the extraction
of vessels, the method employs some image-based measuring techniques to obtain vessel caliber,
wall thickness, and tortuosity.
Liu and Sun [40] present an approach that extracts extended tracts of vasculature in X-ray
angiograms by an adaptive tracking algorithm. Given an initial point within a vessel, they apply an
‘extrapolation update’ scheme [142] that involves the estimation of local vessel trajectories. Once
a segment has been tracked, it is deleted in the angiogram image by growing the ‘deletion intensity
value’ over the grey levels representing the vessel. This procedure is performed recursively to
extract the vascular tree. This algorithm requires the user to specify vessel starting points, and
does not appear extensible to 3D extraction.
Haris et al [143] develop an interactive semi-automated method to extract vascular networks
in angiograms. The method starts with a smoothing process based on adaptive smoothing using
anisotropic diffusion which preserves the image structure. Second, smoothed image gradient is
calculated using the partial derivatives of the Gaussian filter. Third, the watershed transform pro-
cess is applied to the smoothed image gradient magnitude calculated in the previous step. This
process results in an initial partition image with many small homogeneous regions. Then, the re-
sulting partition image is input to a fast region merging process. In the final step, vessel regions
are extracted by a simple point-and-click interactive process. The segmented vascular network is
represented by the Region Adjacency Graph which provides spatial relationship information about
the vessels in the network. The current version of the method works in 2D and it is reported that
the smoothing algorithm used oversmooths the thin vessels.
Shen and Johnson [144] combine conventional manual segmentation approach with a bimodal
thresholding algorithm to develop a semi-automatic image segmentation tool. In the manual seg-
mentation, user gives control points of a cubic spline for each section and the system fits appro-
priate spline to these points. The automatic segmentation part applies a bimodal thresholding to
the local window in the image given by the user. The algorithm starts with getting a starting point
from the user. Second, an edge detection and contour following methods are applied to find region
boundaries. Only a small piece is segmented at a time. Bimodal thresholding algorithm is used
to determine the boundary segments in the local region. In the third stage of the algorithm, user
feedback is required. User can correct any segmented contour. Finally, algorithm continues to find
the next segment. This approach works only in 2D images.
Zhou et al [145] develop a method to detect and quantify retinopathy in digital retinal an-
giograms. Their method relies on a matched filtering approach which uses a priori knowledge
about retinal vessel properties. The tracking algorithm is an adaptive iterating procedure and mod-
els the vessel profile using Gaussian function. The algorithm also utilizes spatial continuity prop-
erties of the vessel segments to improve computational performance in regions where the vessel
segments are relatively straight. This method requires the user to identify beginning and ending
search points and first vessel direction manually.
Stevenson et al [146] propose a system by which the user locates vessel bifurcations and ves-
sels are tracked between these bifurcations. The uniqueness of their work is that they use these
vessel segments extracted from two different X-ray viewpoints to estimate the 3D structure of the
vasculature. The first stage of the algorithm gets bifurcation points in the first view and their corre-
sponding points in the second view from user. Second, centerlines of the vessels are tracked using
local maxima. Third, centerlines are smoothed and corrected. Fourth, 3D coordinates of centerline
points in real space are calculated using transformation matrices. Fifth, the next pair of images
are loaded and the points marked in the previous frame are detected using statistical correlation
technique. Algorithm repeats step 2 through 5 until the last frame.
5 Artificial Intelligence-Based Approaches
Artificial Intelligence-based approaches utilize knowledge to guide the segmentation process and
to delineate vessel structures. Different types of knowledge are employed in different systems from
various sources. One knowledge source is the properties of the image acquisition technique, such
as cine-angiography, digital subtraction angiography (DSA), computer tomography (CT), mag-
netic resonance imaging (MRI), and magnetic resonance angiography (MRA). Some applications
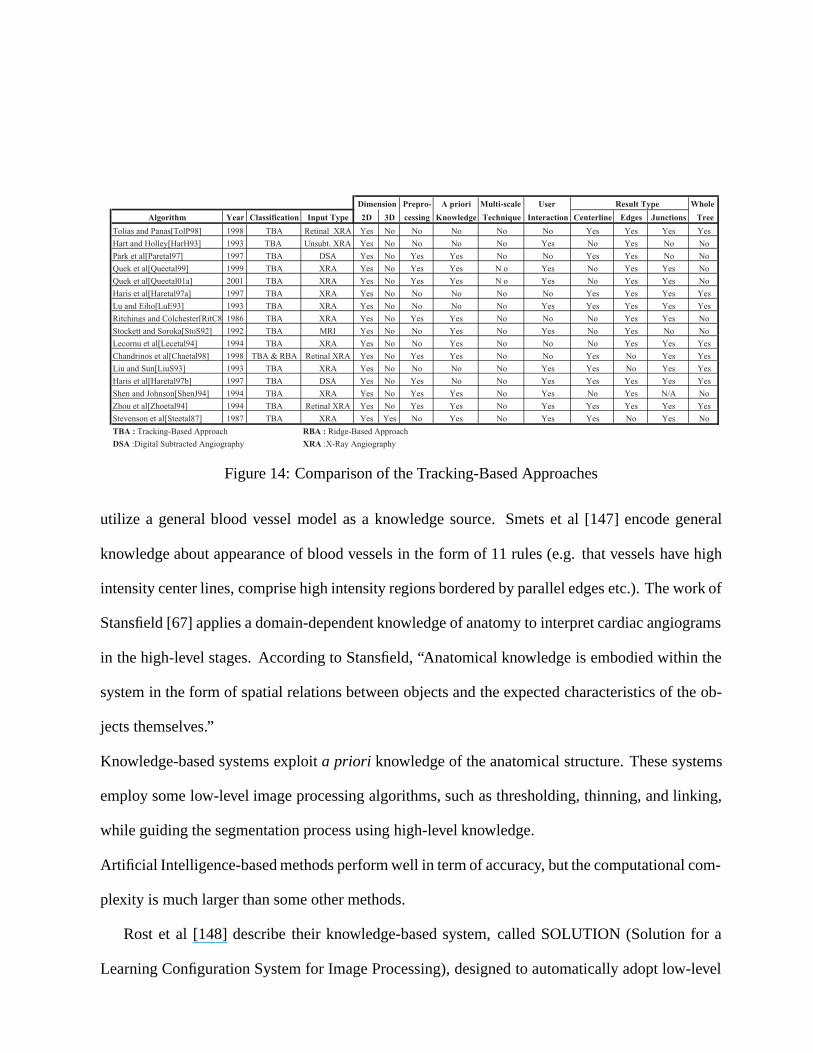
Dimension Prepro- A priori Multi-scale User Result Type Whole
Algorithm Year Classification Input Type 2D 3D cessing Knowledge Technique Interaction Centerline Edges Junctions Tree
Tolias and Panas[TolP98] 1998 TBA Retinal XRA Yes No No No No No Yes Yes Yes Yes
Hart and Holley[HarH93] 1993 TBA Unsubt. XRA Yes No No No No Yes No Yes No No
Park et al[Paretal97] 1997 TBA DSA Yes No Yes Yes No No Yes Yes No No
Quek et al[Queetal99] 1999 TBA XRA Yes No Yes Yes N o Yes No Yes Yes No
Quek et al[Queetal01a] 2001 TBA XRA Yes No Yes Yes N o Yes No Yes Yes No
Haris et al[Haretal97a] 1997 TBA XRA Yes No No No No No Yes Yes Yes Yes
Lu and Eiho[LuE93] 1993 TBA XRA Yes No No No No Yes Yes Yes Yes Yes
Ritchings and Colchester[RitC8 1986 TBA XRA Yes No Yes Yes No No No Yes Yes No
Stockett and Soroka[StoS92] 1992 TBA MRI Yes No No Yes No Yes No Yes No No
Lecornu et al[Lecetal94] 1994 TBA XRA Yes No No Yes No No No Yes Yes Yes
Chandrinos et al[Chaetal98] 1998 TBA & RBA Retinal XRA Yes No Yes Yes No No Yes No Yes Yes
Liu and Sun[LiuS93] 1993 TBA XRA Yes No No No No Yes Yes No Yes Yes
Haris et al[Haretal97b] 1997 TBA DSA Yes No Yes No No Yes Yes Yes Yes Yes
Shen and Johnson[ShenJ94] 1994 TBA XRA Yes No Yes Yes No Yes No Yes N/A No
Zhou et al[Zhoetal94] 1994 TBA Retinal XRA Yes No Yes Yes No Yes Yes Yes Yes Yes
Stevenson et al[Steetal87] 1987 TBA XRA Yes Yes No Yes No Yes Yes No Yes No
TBA : Tracking-Based Approach RBA : Ridge-Based Approach
DSA :Digital Subtracted Angiography XRA :X-Ray Angiography
Figure 14: Comparison of the Tracking-Based Approaches
utilize a general blood vessel model as a knowledge source. Smets et al [147] encode general
knowledge about appearance of blood vessels in the form of 11 rules (e.g. that vessels have high
intensity center lines, comprise high intensity regions bordered by parallel edges etc.). The work of
Stansfield [67] applies a domain-dependent knowledge of anatomy to interpret cardiac angiograms
in the high-level stages. According to Stansfield, “Anatomical knowledge is embodied within the
system in the form of spatial relations between objects and the expected characteristics of the ob-
jects themselves.”
Knowledge-based systems exploit a priori knowledge of the anatomical structure. These systems
employ some low-level image processing algorithms, such as thresholding, thinning, and linking,
while guiding the segmentation process using high-level knowledge.
Artificial Intelligence-based methods perform well in term of accuracy, but the computational com-
plexity is much larger than some other methods.
Rost et al [148] describe their knowledge-based system, called SOLUTION (Solution for a
Learning Configuration System for Image Processing), designed to automatically adopt low-level
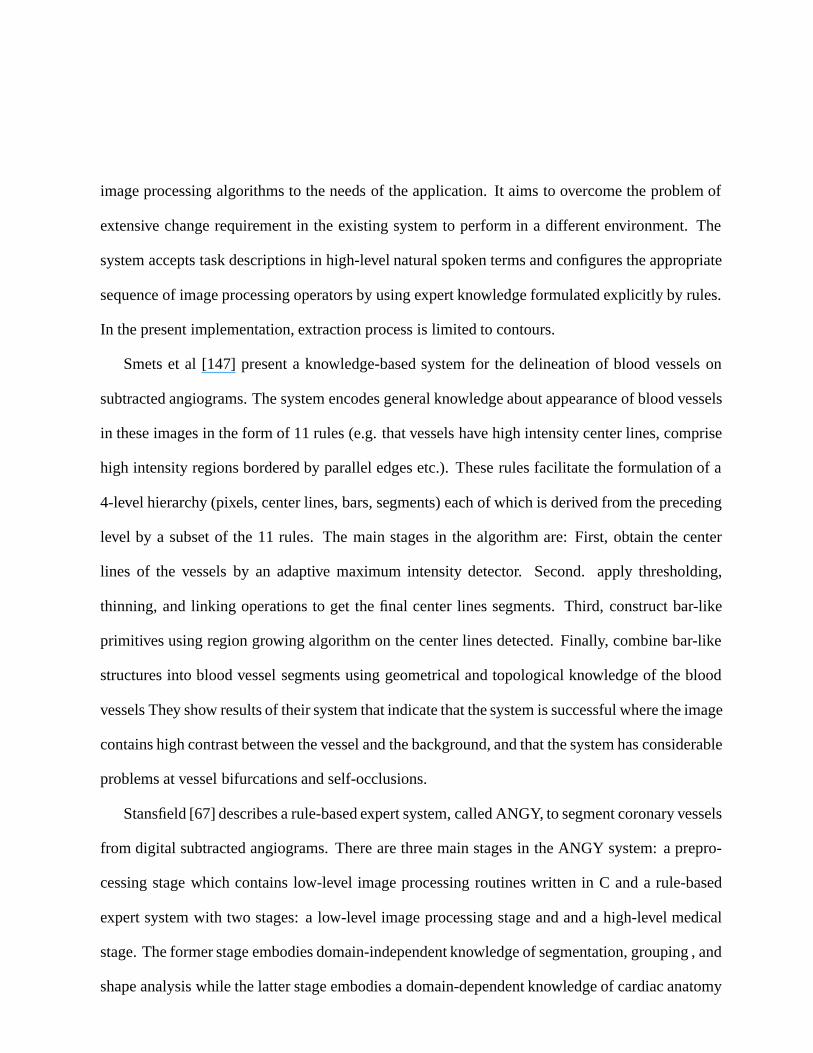
image processing algorithms to the needs of the application. It aims to overcome the problem of
extensive change requirement in the existing system to perform in a different environment. The
system accepts task descriptions in high-level natural spoken terms and configures the appropriate
sequence of image processing operators by using expert knowledge formulated explicitly by rules.
In the present implementation, extraction process is limited to contours.
Smets et al [147] present a knowledge-based system for the delineation of blood vessels on
subtracted angiograms. The system encodes general knowledge about appearance of blood vessels
in these images in the form of 11 rules (e.g. that vessels have high intensity center lines, comprise
high intensity regions bordered by parallel edges etc.). These rules facilitate the formulation of a
4-level hierarchy (pixels, center lines, bars, segments) each of which is derived from the preceding
level by a subset of the 11 rules. The main stages in the algorithm are: First, obtain the center
lines of the vessels by an adaptive maximum intensity detector. Second. apply thresholding,
thinning, and linking operations to get the final center lines segments. Third, construct bar-like
primitives using region growing algorithm on the center lines detected. Finally, combine bar-like
structures into blood vessel segments using geometrical and topological knowledge of the blood
vessels They show results of their system that indicate that the system is successful where the image
contains high contrast between the vessel and the background, and that the system has considerable
problems at vessel bifurcations and self-occlusions.
Stansfield [67] describes a rule-based expert system, called ANGY, to segment coronary vessels
from digital subtracted angiograms. There are three main stages in the ANGY system: a prepro-
cessing stage which contains low-level image processing routines written in C and a rule-based
expert system with two stages: a low-level image processing stage and and a high-level medical
stage. The former stage embodies domain-independent knowledge of segmentation, grouping , and
shape analysis while the latter stage embodies a domain-dependent knowledge of cardiac anatomy
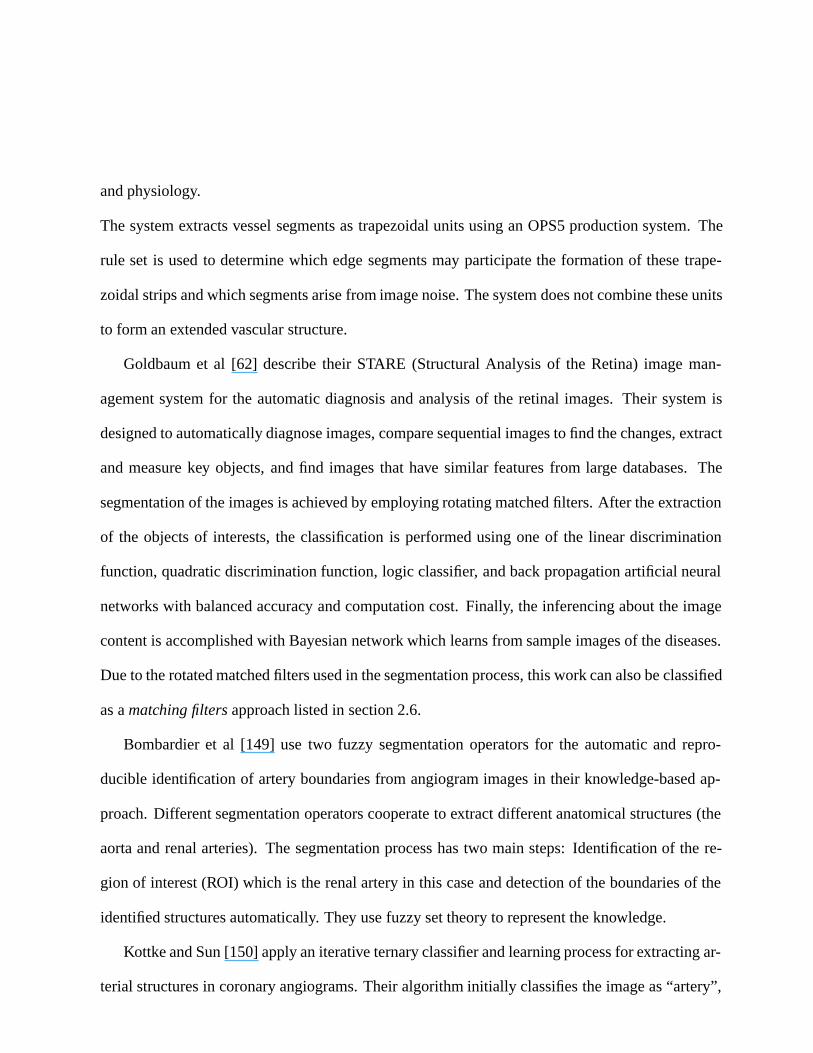
and physiology.
The system extracts vessel segments as trapezoidal units using an OPS5 production system. The
rule set is used to determine which edge segments may participate the formation of these trape-
zoidal strips and which segments arise from image noise. The system does not combine these units
to form an extended vascular structure.
Goldbaum et al [62] describe their STARE (Structural Analysis of the Retina) image man-
agement system for the automatic diagnosis and analysis of the retinal images. Their system is
designed to automatically diagnose images, compare sequential images to find the changes, extract
and measure key objects, and find images that have similar features from large databases. The
segmentation of the images is achieved by employing rotating matched filters. After the extraction
of the objects of interests, the classification is performed using one of the linear discrimination
function, quadratic discrimination function, logic classifier, and back propagation artificial neural
networks with balanced accuracy and computation cost. Finally, the inferencing about the image
content is accomplished with Bayesian network which learns from sample images of the diseases.
Due to the rotated matched filters used in the segmentation process, this work can also be classified
as a matching filters approach listed in section 2.6.
Bombardier et al [149] use two fuzzy segmentation operators for the automatic and repro-
ducible identification of artery boundaries from angiogram images in their knowledge-based ap-
proach. Different segmentation operators cooperate to extract different anatomical structures (the
aorta and renal arteries). The segmentation process has two main steps: Identification of the re-
gion of interest (ROI) which is the renal artery in this case and detection of the boundaries of the
identified structures automatically. They use fuzzy set theory to represent the knowledge.
Kottke and Sun [150] apply an iterative ternary classifier and learning process for extracting ar-
terial structures in coronary angiograms. Their algorithm initially classifies the image as “artery”,
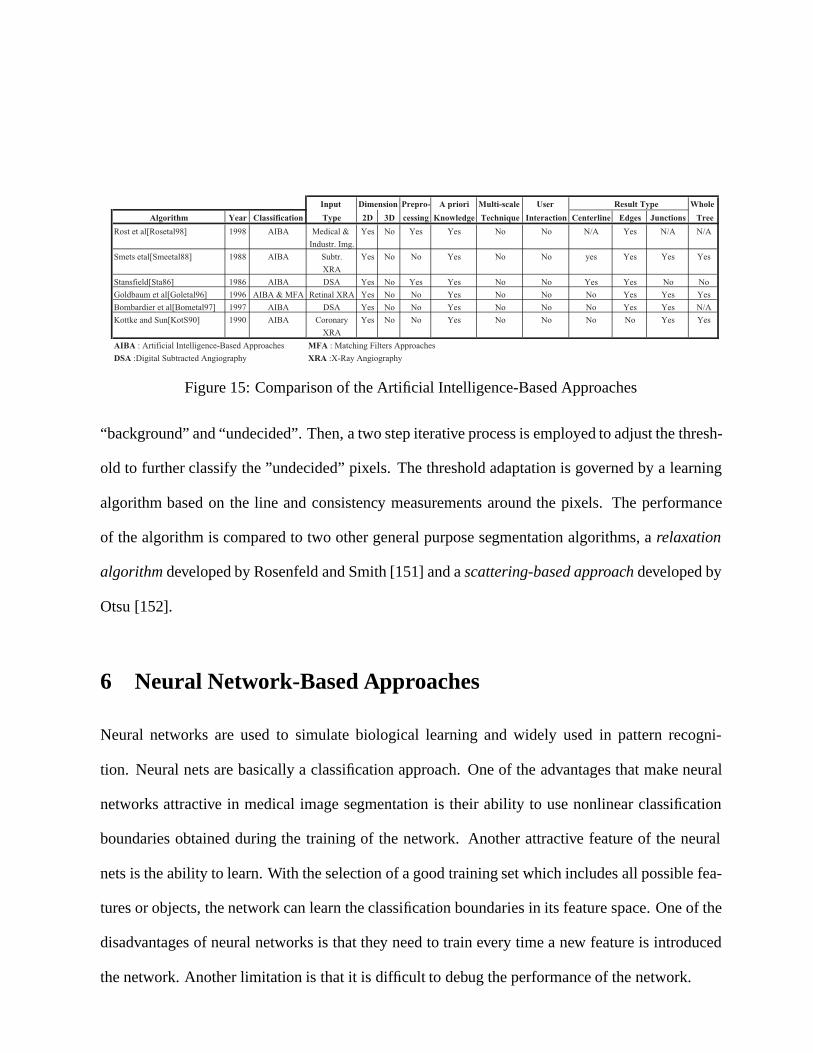
Input Dimension Prepro- A priori Multi-scale User Result Type Whole
Algorithm Year Classification Type 2D 3D cessing Knowledge Technique Interaction Centerline Edges Junctions Tree
Rost et al[Rosetal98] 1998 AIBA Medical & Yes No Yes Yes No No N/A Yes N/A N/A
Industr. Img.
Smets etal[Smeetal88] 1988 AIBA Subtr. Yes No No Yes No No yes Yes Yes Yes
XRA
Stansfield[Sta86] 1986 AIBA DSA Yes No Yes Yes No No Yes Yes No No
Goldbaum et al[Goletal96] 1996 AIBA & MFA Retinal XRA Yes No No Yes No No No Yes Yes Yes
Bombardier et al[Bometal97] 1997 AIBA DSA Yes No No Yes No No No Yes Yes N/A
Kottke and Sun[KotS90] 1990 AIBA Coronary Yes No No Yes No No No No Yes Yes
XRA
AIBA : Artificial Intelligence-Based Approaches MFA : Matching Filters Approaches
DSA :Digital Subtracted Angiography XRA :X-Ray Angiography
Figure 15: Comparison of the Artificial Intelligence-Based Approaches
“background” and “undecided”. Then, a two step iterative process is employed to adjust the thresh-
old to further classify the ”undecided” pixels. The threshold adaptation is governed by a learning
algorithm based on the line and consistency measurements around the pixels. The performance
of the algorithm is compared to two other general purpose segmentation algorithms, a relaxation
algorithm developed by Rosenfeld and Smith [151] and a scattering-based approach developed by
Otsu [152].
6 Neural Network-Based Approaches
Neural networks are used to simulate biological learning and widely used in pattern recogni-
tion. Neural nets are basically a classification approach. One of the advantages that make neural
networks attractive in medical image segmentation is their ability to use nonlinear classification
boundaries obtained during the training of the network. Another attractive feature of the neural
nets is the ability to learn. With the selection of a good training set which includes all possible fea-
tures or objects, the network can learn the classification boundaries in its feature space. One of the
disadvantages of neural networks is that they need to train every time a new feature is introduced
the network. Another limitation is that it is difficult to debug the performance of the network.
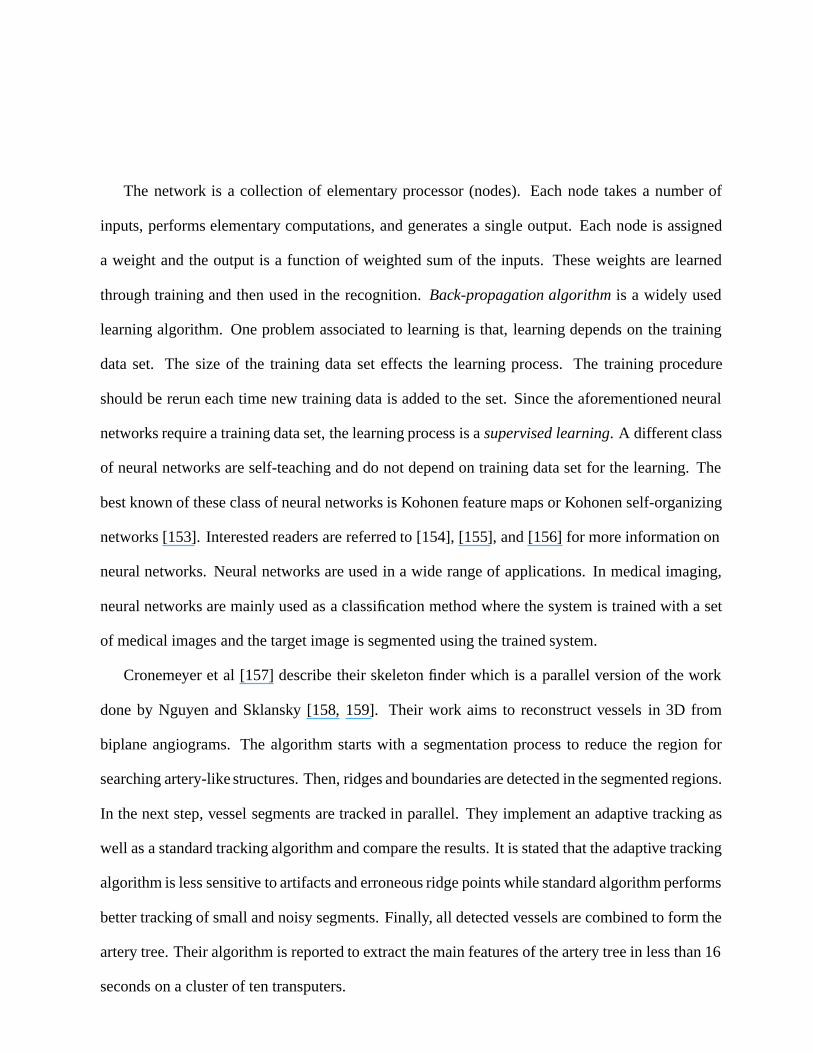
The network is a collection of elementary processor (nodes). Each node takes a number of
inputs, performs elementary computations, and generates a single output. Each node is assigned
a weight and the output is a function of weighted sum of the inputs. These weights are learned
through training and then used in the recognition. Back-propagation algorithm is a widely used
learning algorithm. One problem associated to learning is that, learning depends on the training
data set. The size of the training data set effects the learning process. The training procedure
should be rerun each time new training data is added to the set. Since the aforementioned neural
networks require a training data set, the learning process is a supervised learning. A different class
of neural networks are self-teaching and do not depend on training data set for the learning. The
best known of these class of neural networks is Kohonen feature maps or Kohonen self-organizing
networks [153]. Interested readers are referred to [154], [155], and [156] for more information on
neural networks. Neural networks are used in a wide range of applications. In medical imaging,
neural networks are mainly used as a classification method where the system is trained with a set
of medical images and the target image is segmented using the trained system.
Cronemeyer et al [157] describe their skeleton finder which is a parallel version of the work
done by Nguyen and Sklansky [158, 159]. Their work aims to reconstruct vessels in 3D from
biplane angiograms. The algorithm starts with a segmentation process to reduce the region for
searching artery-like structures. Then, ridges and boundaries are detected in the segmented regions.
In the next step, vessel segments are tracked in parallel. They implement an adaptive tracking as
well as a standard tracking algorithm and compare the results. It is stated that the adaptive tracking
algorithm is less sensitive to artifacts and erroneous ridge points while standard algorithm performs
better tracking of small and noisy segments. Finally, all detected vessels are combined to form the
artery tree. Their algorithm is reported to extract the main features of the artery tree in less than 16
seconds on a cluster of ten transputers.
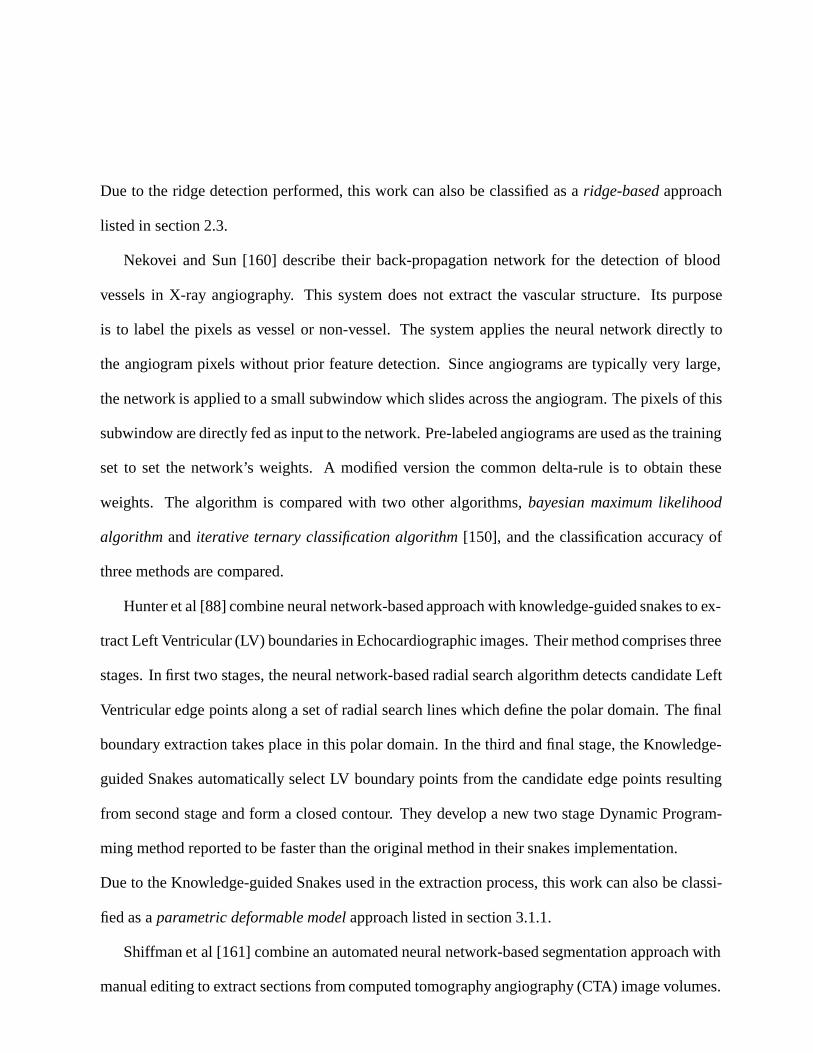
Due to the ridge detection performed, this work can also be classified as a ridge-based approach
listed in section 2.3.
Nekovei and Sun [160] describe their back-propagation network for the detection of blood
vessels in X-ray angiography. This system does not extract the vascular structure. Its purpose
is to label the pixels as vessel or non-vessel. The system applies the neural network directly to
the angiogram pixels without prior feature detection. Since angiograms are typically very large,
the network is applied to a small subwindow which slides across the angiogram. The pixels of this
subwindow are directly fed as input to the network. Pre-labeled angiograms are used as the training
set to set the network’s weights. A modified version the common delta-rule is to obtain these
weights. The algorithm is compared with two other algorithms, bayesian maximum likelihood
algorithm and iterative ternary classification algorithm [150], and the classification accuracy of
three methods are compared.
Hunter et al [88] combine neural network-based approach with knowledge-guided snakes to ex-
tract Left Ventricular (LV) boundaries in Echocardiographic images. Their method comprises three
stages. In first two stages, the neural network-based radial search algorithm detects candidate Left
Ventricular edge points along a set of radial search lines which define the polar domain. The final
boundary extraction takes place in this polar domain. In the third and final stage, the Knowledge-
guided Snakes automatically select LV boundary points from the candidate edge points resulting
from second stage and form a closed contour. They develop a new two stage Dynamic Program-
ming method reported to be faster than the original method in their snakes implementation.
Due to the Knowledge-guided Snakes used in the extraction process, this work can also be classi-
fied as a parametric deformable model approach listed in section 3.1.1.
Shiffman et al [161] combine an automated neural network-based segmentation approach with
manual editing to extract sections from computed tomography angiography (CTA) image volumes.
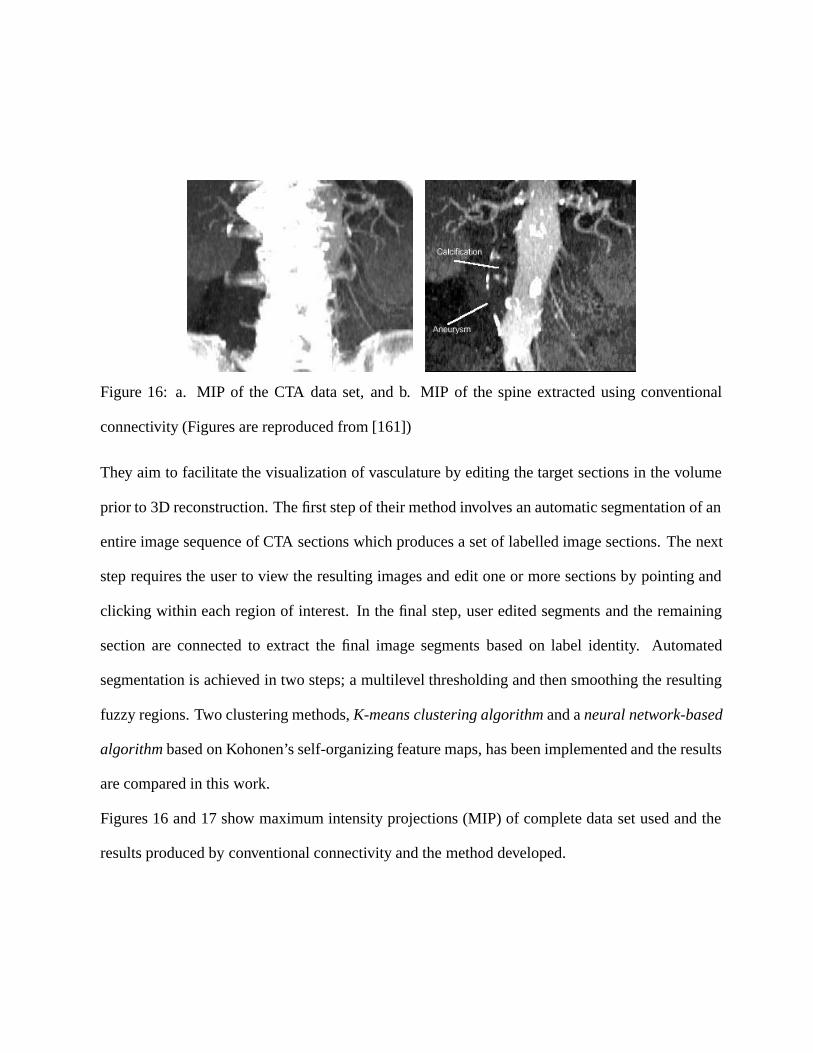
Figure 16: a. MIP of the CTA data set, and b. MIP of the spine extracted using conventional
connectivity (Figures are reproduced from [161])
They aim to facilitate the visualization of vasculature by editing the target sections in the volume
prior to 3D reconstruction. The first step of their method involves an automatic segmentation of an
entire image sequence of CTA sections which produces a set of labelled image sections. The next
step requires the user to view the resulting images and edit one or more sections by pointing and
clicking within each region of interest. In the final step, user edited segments and the remaining
section are connected to extract the final image segments based on label identity. Automated
segmentation is achieved in two steps; a multilevel thresholding and then smoothing the resulting
fuzzy regions. Two clustering methods, K-means clustering algorithm and a neural network-based
algorithm based on Kohonen’s self-organizing feature maps, has been implemented and the results
are compared in this work.
Figures 16 and 17 show maximum intensity projections (MIP) of complete data set used and the
results produced by conventional connectivity and the method developed.
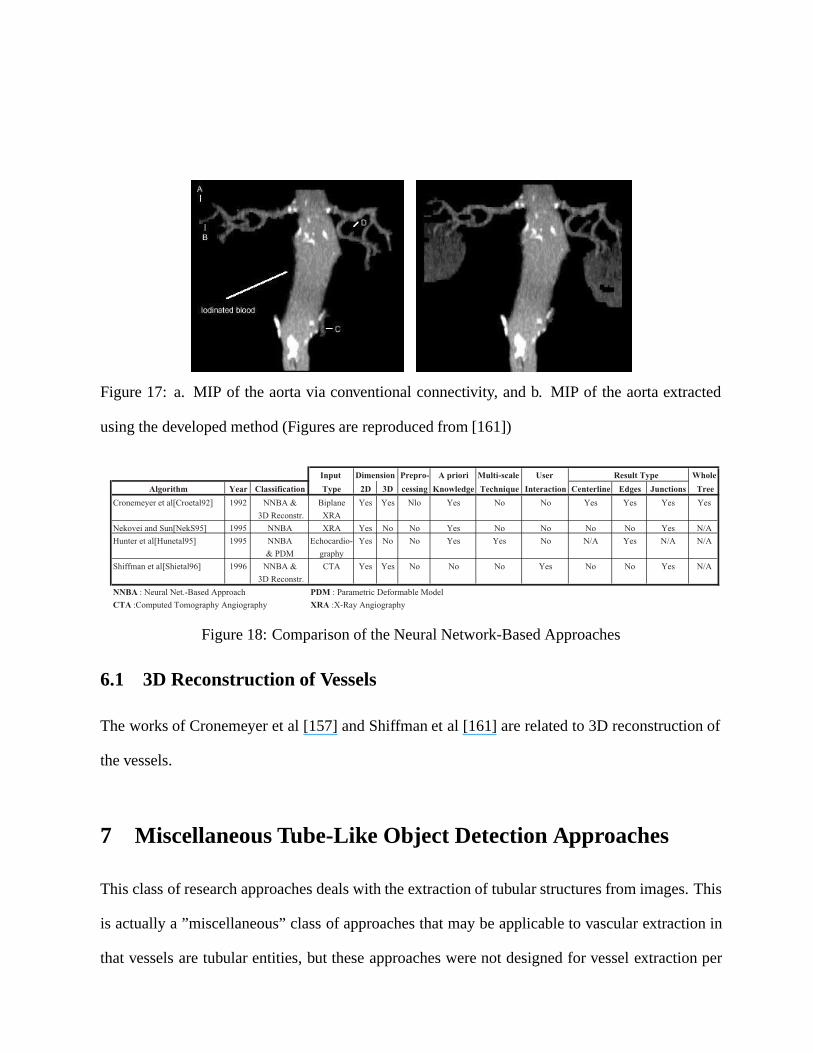
Figure 17: a. MIP of the aorta via conventional connectivity, and b. MIP of the aorta extracted
using the developed method (Figures are reproduced from [161])
Input Dimension Prepro- A priori Multi-scale User Result Type Whole
Algorithm Year Classification Type 2D 3D cessing Knowledge Technique Interaction Centerline Edges Junctions Tree
Cronemeyer et al[Croetal92] 1992 NNBA & Biplane Yes Yes Nlo Yes No No Yes Yes Yes Yes
3D Reconstr. XRA
Nekovei and Sun[NekS95] 1995 NNBA XRA Yes No No Yes No No No No Yes N/A
Hunter et al[Hunetal95] 1995 NNBA Echocardio- Yes No No Yes Yes No N/A Yes N/A N/A
& PDM graphy
Shiffman et al[Shietal96] 1996 NNBA & CTA Yes Yes No No No Yes No No Yes N/A
3D Reconstr.
NNBA : Neural Net.-Based Approach PDM : Parametric Deformable Model
CTA :Computed Tomography Angiography XRA :X-Ray Angiography
Figure 18: Comparison of the Neural Network-Based Approaches
6.1 3D Reconstruction of Vessels
The works of Cronemeyer et al [157] and Shiffman et al [161] are related to 3D reconstruction of
the vessels.
7 Miscellaneous Tube-Like Object Detection Approaches
This class of research approaches deals with the extraction of tubular structures from images. This
is actually a ”miscellaneous” class of approaches that may be applicable to vascular extraction in
that vessels are tubular entities, but these approaches were not designed for vessel extraction per
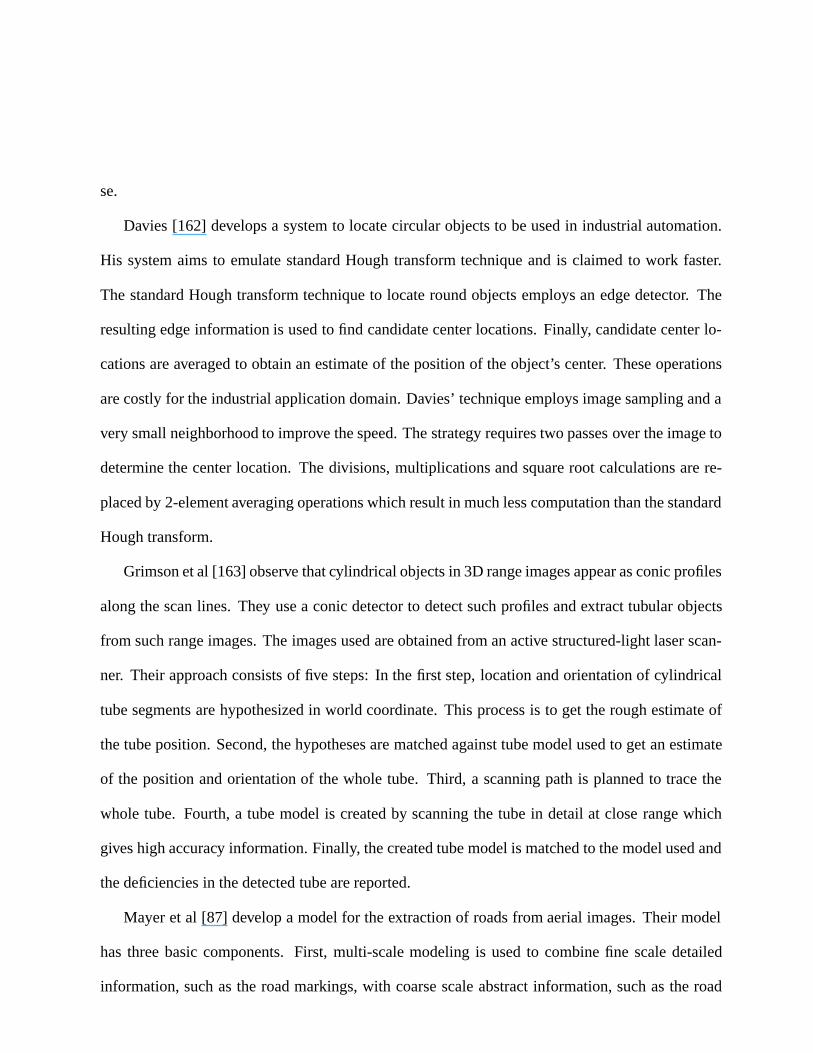
se.
Davies [162] develops a system to locate circular objects to be used in industrial automation.
His system aims to emulate standard Hough transform technique and is claimed to work faster.
The standard Hough transform technique to locate round objects employs an edge detector. The
resulting edge information is used to find candidate center locations. Finally, candidate center lo-
cations are averaged to obtain an estimate of the position of the object’s center. These operations
are costly for the industrial application domain. Davies’ technique employs image sampling and a
very small neighborhood to improve the speed. The strategy requires two passes over the image to
determine the center location. The divisions, multiplications and square root calculations are re-
placed by 2-element averaging operations which result in much less computation than the standard
Hough transform.
Grimson et al [163] observe that cylindrical objects in 3D range images appear as conic profiles
along the scan lines. They use a conic detector to detect such profiles and extract tubular objects
from such range images. The images used are obtained from an active structured-light laser scan-
ner. Their approach consists of five steps: In the first step, location and orientation of cylindrical
tube segments are hypothesized in world coordinate. This process is to get the rough estimate of
the tube position. Second, the hypotheses are matched against tube model used to get an estimate
of the position and orientation of the whole tube. Third, a scanning path is planned to trace the
whole tube. Fourth, a tube model is created by scanning the tube in detail at close range which
gives high accuracy information. Finally, the created tube model is matched to the model used and
the deficiencies in the detected tube are reported.
Mayer et al [87] develop a model for the extraction of roads from aerial images. Their model
has three basic components. First, multi-scale modeling is used to combine fine scale detailed
information, such as the road markings, with coarse scale abstract information, such as the road
Figure 19: Extracted roads from an aerial image (Figure is reproduced from [87])
network. Second, context information in the form of relations to other objects such as buildings
and trees is exploited to extend the model. Using context information facilitates the extraction
process to focus on the target objects. Third, ribbon-snakes are used to extract roads in fine scales.
Using ribbon-snakes is reported to help the extraction of the roads occluded by shadows cast by
building and trees in the image. Figure 19 shows extracted roads in an aerial image.
Due to the ribbon-snakes used, this work can also be classified as a parametric deformable model
listed in section 3.1.1. This work is also a multi-scale approach listed in section 2.1.
Kompatsiaris et al [91] develop a method to detect the boundaries of stents in angiographic
images. Their method first constructs a training set using perspective projection of various defor-
mations of the 3D wireframe model of the stent. The initial detection of the stent in the image is
accomplished by using the training set for deriving a multivariate Gaussion density estimate based
on eigenspace decomposition using Principal Component Analysis (PCA). Then, a maximum like-
lihood estimation framework is formulated to extract the stent. In the final stage of the algorithm, a
2D active contour model (snake) is used to refine the detected stent. The initialization of the snake
is accomplished by an iterative technique considering the geometry of the stent.
This work can also be classified as a parametric deformable model listed in section 3.1.1 due to
the active snakes used in refining the detected stent.
Thirion et al [63] incorporate some high level constraints, such as conceptual application con-
straints and user input and feedback, to overcome some of the drawbacks that traditional image
segmentation methods face in uncontrolled and complex environments. Their system aims to seg-
ment pipelines in industrial images. They try to handle the challenges due to shading, highlights,
and textual variations by fusing physics-based vision, edge and texture analysis, probabilistic learn-
ing, and the graph-cut formalism methods. The parameters of the physics-based model of the color
and highlights of the pipes are learned from a set of training windows selected by the user from
the input images. In the next step, a bank of filters to detect features like color/highlight, contour,
shading/anisotropy, etc., are applied to the image. A probabilistic graph which describes the image
is built from the output of the previous step. Finally, segmentation is performed by using graph cut
method. Segmentation can be improved through user feedback into the graph.
This work can also be classified as a matching filters approach listed in section 2.6 due to the bank
of filters used in segmentation process.
Huang and Stockman [16] describe a system that uses generalized cylinders to extract tubular
structures in 2D intensity images. The system combines contour-based and shading-based methods
and uses a 3D tube model. These cylinders are defined by a cross-sectional element that is swept
along the axis of the tube using some sweep rules. There are two main stages in the algorithm: local
recognition stage and global recognition stage. The first step in the local recognition stage is the
detection of reliable contour primitives. These primitives provide constraints for the localization
of the tubes. Next, optimal filters are generated dynamically and matched against the data in
order to verify the shading property of the tubes under detection. In the global recognition stage,
locally verified tubes from the first stage are used as seeds and are swept along the axis of the tube
using some sweep rule using best fit constraint. The key issue is to control the smoothness of the
sweeping. [16] shows results of this algorithm applied to the extraction of tree roots.
This work can also be classified as a generalized cylinders model listed in section 3.4 due to the
generalized cylinders model used. We can also put this work under the matching filters approach
listed in section 2.6 due to the matched filters used in the segmentation process.
Parwin et al [89] develop a technique for detection, tracking, and representation of tubular
objects in images. In this technique, at the macro level, geometric properties are used to local-
ize and to track the objects and at the micro level, high and low-level constraints are used to
model the detection and tracking the subsystems. In the object detection process, perceptually
significant features from the image are extracted and used as high-level cues in refining the object
boundaries. The result of their approach is shown by an implementation that detects and tracks
DNA molecules obtained through epi-fluorescence microscopy. High-level cues in the application
domain are ribbon-like structures defined by a collection of substructures called “U-shapes” and
anti-parallel segments. These isolated segments are grouped with respect to the object model in
terms of a bounding polygon. This global representation is then refined using local pixel activities.
Dynamic programming is employed in the refinement process. The refined contour is projected
and updated in every consecutive frame to track the object in a time sequence of images. The sys-
tem also provides an axis of symmetry representation of object for subsequent scientific analysis.
This system has some limitations. First, the detection subsystem is dependent on the correct com-
putation of local symmetries. The system is unable to probe the image further and to infer addi-
tional missing local symmetries. Next, the tracking subsystem assumes that the normal lines to the
smooth polygon intersect the actual boundary of the object. The system has difficulty with rapidly
deforming objects. Finally, shape representation is based on finding the end points of the object
which are hypothesized by the curvature peaks along the contour. Due to the noise, these peaks
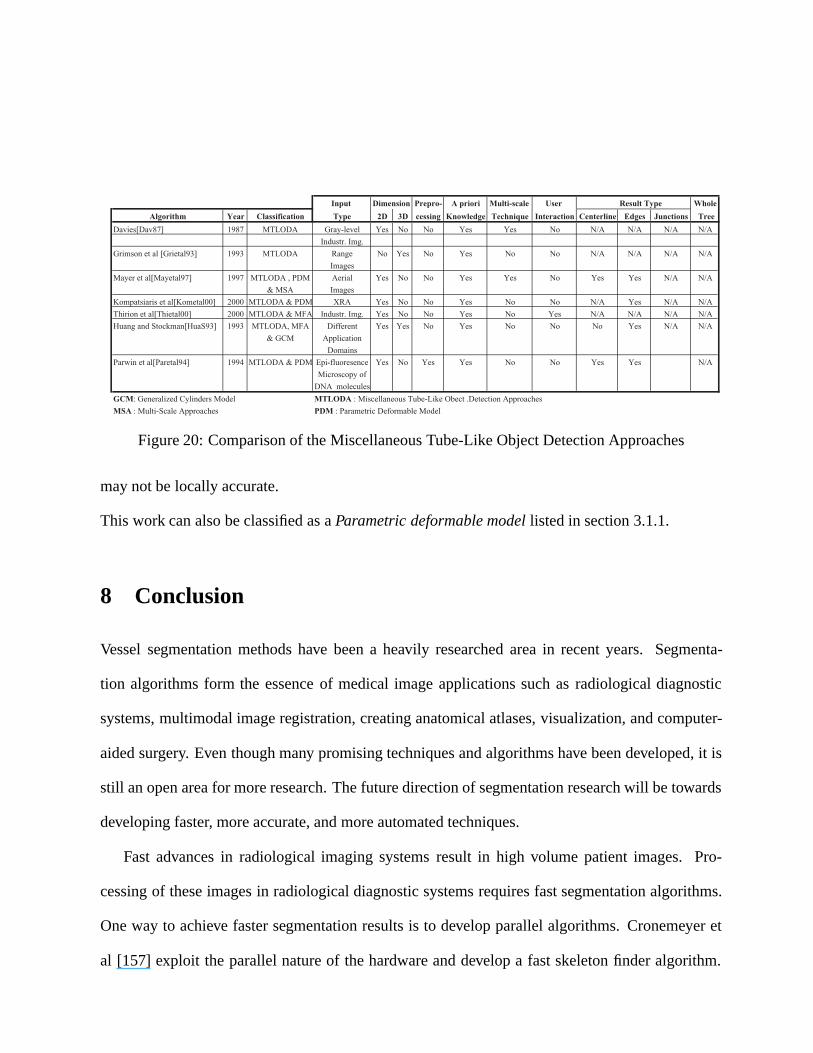
Input Dimension Prepro- A priori Multi-scale User Result Type Whole
Algorithm Year Classification Type 2D 3D cessing Knowledge Technique Interaction Centerline Edges Junctions Tree
Davies[Dav87] 1987 MTLODA Gray-level Yes No No Yes Yes No N/A N/A N/A N/A
Industr. Img.
Grimson et al [Grietal93] 1993 MTLODA Range No Yes No Yes No No N/A N/A N/A N/A
Images
Mayer et al[Mayetal97] 1997 MTLODA , PDM Aerial Yes No No Yes Yes No Yes Yes N/A N/A
& MSA Images
Kompatsiaris et al[Kometal00] 2000 MTLODA & PDM XRA Yes No No Yes No No N/A Yes N/A N/A
Thirion et al[Thietal00] 2000 MTLODA & MFA Industr. Img. Yes No No Yes No Yes N/A N/A N/A N/A
Huang and Stockman[HuaS93] 1993 MTLODA, MFA Different Yes Yes No Yes No No No Yes N/A N/A
& GCM Application
Domains
Parwin et al[Paretal94] 1994 MTLODA & PDM Epi-fluoresence Yes No Yes Yes No No Yes Yes N/A
Microscopy of
DNA molecules
GCM: Generalized Cylinders Model MTLODA : Miscellaneous Tube-Like Obect .Detection Approaches
MSA : Multi-Scale Approaches PDM : Parametric Deformable Model
Figure 20: Comparison of the Miscellaneous Tube-Like Object Detection Approaches
may not be locally accurate.
This work can also be classified as a Parametric deformable model listed in section 3.1.1.
8 Conclusion
Vessel segmentation methods have been a heavily researched area in recent years. Segmenta-
tion algorithms form the essence of medical image applications such as radiological diagnostic
systems, multimodal image registration, creating anatomical atlases, visualization, and computer-
aided surgery. Even though many promising techniques and algorithms have been developed, it is
still an open area for more research. The future direction of segmentation research will be towards
developing faster, more accurate, and more automated techniques.
Fast advances in radiological imaging systems result in high volume patient images. Pro-
cessing of these images in radiological diagnostic systems requires fast segmentation algorithms.
One way to achieve faster segmentation results is to develop parallel algorithms. Cronemeyer et
al [157] exploit the parallel nature of the hardware and develop a fast skeleton finder algorithm.
Neural network-based approaches are also achieve faster segmentation due to the parallel nature
citeNekS95, [88]. Another approach to achieve faster segmentation is to employ multiscale pro-
cessing technique. In multi-scale image processing technique, major structures are extracted using
low resolution images while fine structures are extracted using high resolution images. Some of
the methods that employ multiscale processing technique are reviewed in previous sections [13],
[14], [15], [16], [17].
Accuracy of the segmentation technique is a crucial criteria due to the nature of the work. Ac-
curacy of the segmentation process is essential to achieve more precise and repeatable radiological
diagnostic systems. Accuracy can be improved by incorporating a priori information on vessel
anatomy and let high level knowledge guide the segmentation algorithm.
Expert knowledge and guidence is essential in segmentation systems. Thus, it is not expected
that the vessel segmentation systems will replace the experts. On the other hand, shear volume of
the medical image data requires more automatic segmentation systems with less user interaction to
reduce the work load of the experts.
This paper provides a survey of current vessel segmentation methods. We have tried to cover
both early and recent all literature related to vessel segmentation algorithms and techniques. Our
aim was to introduce the current segmentation techniques. This paper is intended to give the
practitioner a framework for the existing research and to introduce interested parties to the panoply
of vessel segmentation literature.
References
[1] W. E. Higgins, W. J. T. Spyra, E. L. Ritman, Y. Kim, and F. A. Spelman, “Automatic
extraction of the arterial tree from 3-d angiograms”, in IEEE Conf. Eng. in Medicine and
Bio., vol. 2, pp. 563–564, 1989.
[2] N. Niki, Y. Kawata, H. Satoh, and T. Kumazaki, “3d imaging of blood vessels using x-ray
rotational angiographic system”, IEEE Med. Imaging Conf., vol. 3, pp. 1873–1877, 1993.
[3] C. Molina, G. Prause, P. Radeva, and M. Sonka, “3-d catheter path reconstruction from
biplane angiograms”, in SPIE, vol. 3338, pp. 504–512, 1998.
[4] A. Klein, T.K. Egglin, J.S. Pollak, F. Lee, and A. Amini, “Identifying vascular features
with orientation specific filters and b-spline snakes”, in IEEE Computers in Cardiology, pp.
113–116, 1994.
[5] A.K. Klein, F. Lee, and A.A. Amini, “Quantitative coronary angiography with deformable
spline models”, IEEE Trans. on Med. Img., vol. 16, pp. 468–482, October 1997.
[6] D. Guo and P. Richardson, “Automatic vessel extraction from angiogram images”, IEEE
Computers in Cardiology, vol. 25, pp. 441–444, 1998.
[7] Y. Sato, S. Nakajima, N. Shiraga, H. Atsumi, S. Yoshida, T. Koller, G. Gerig, and R. Kiki-
nis, “3d multi-scale line filter for segmentation and visialization of curvilinear structures in
medical images”, IEEE Medical Image Analysis, vol. 2, pp. 143–168, June 1998.
[8] T. McInerney and D. Terzopoulos, “Deformable models in medical image analysis: A
survey”, IEEE Medical Image Analysis, vol. 1, pp. 91–108, 1996.
[9] Q. Chen, K.W. Stock, P.V. Prasad, and H. Hatabu, “Fast magnetic resonance imaging tech-
niques”, European J. of Radio., vol. 29, pp. 90–100, February 1999.
[10] N. Ayache, “Medical computer vision, virtual reality and robotics”, Image Vis. Comp., vol.
13, pp. 295–313, 1994.
[11] J. S. Duncan and N. Ayache, “Medical image analysis: Progress over two decades and the
challenges ahead”, PAMI, vol. 22, pp. 85–105, January 2000.
[12] L.P. Clarke, R.P. Velthuizen, M.A. Camacho, J.J. Heine, M. Vaidyanathan, L.O. Hall, and
R.W. Thatcher, “Mri segmentation: methods and applications”, Magne. Reson. Imaging,
vol. 13, pp. 343–368, 1995.
[13] A. Sarwal and A.P. Dhawan, “3-d reconstruction of coronary arteries”, in IEEE Conf. Eng.
in Medicine and Bio., vol. 1, pp. 504–505, 1994.
[14] M.P. Chwialkowski, Y.M. Ibrahim, F.L. Hong, and R.M. Peshock, “A method for fully
automated quantitative analysis of arterial flow using flow-sensitized mr images”, Comp.
Med. Imaging and Graphics, vol. 20, pp. 365–378, 1996.
[15] P.E. Summers and A.H. Bhalerao, “Derivation of pressure gradients from magnetic reso-
nance angiography using multi-resolution segmentation”, in Proceedings of International
Conference on Image Processing and its Applications, pp. 404–408, 1995.
[16] Q. Huang and G.C. Stockman, “Generalized tube model: Recognizing 3d elongated objects
from 2d intensity images”, in Proc. of the IEEE Conf. on CVPR, pp. 104–109, 1993.
[17] N. Armande, P. Montesinos, and O. Monga, “Thin nets extraction using multi-scale ap-
proach”, Computer Vision and Image Understanding, vol. 73, pp. 248–257, 1999.
[18] G.T. Gullberg and G.L. Zeng, “A cone-beam filtered backpropagation reconstruction al-
gorithm for cardiac single photon emission computed tomography”, IEEE Trans. on Med.
Img., vol. MI-11, pp. 91–101, 1992.
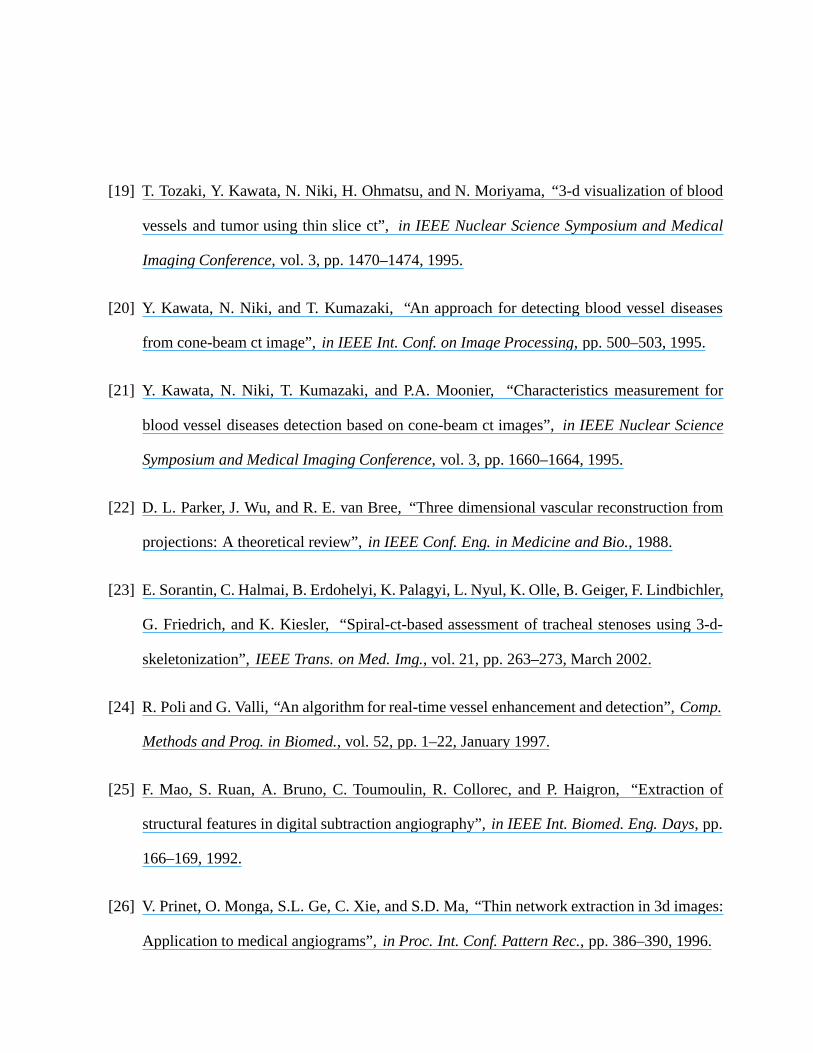
[19] T. Tozaki, Y. Kawata, N. Niki, H. Ohmatsu, and N. Moriyama, “3-d visualization of blood
vessels and tumor using thin slice ct”, in IEEE Nuclear Science Symposium and Medical
Imaging Conference, vol. 3, pp. 1470–1474, 1995.
[20] Y. Kawata, N. Niki, and T. Kumazaki, “An approach for detecting blood vessel diseases
from cone-beam ct image”, in IEEE Int. Conf. on Image Processing, pp. 500–503, 1995.
[21] Y. Kawata, N. Niki, T. Kumazaki, and P.A. Moonier, “Characteristics measurement for
blood vessel diseases detection based on cone-beam ct images”, in IEEE Nuclear Science
Symposium and Medical Imaging Conference, vol. 3, pp. 1660–1664, 1995.
[22] D. L. Parker, J. Wu, and R. E. van Bree, “Three dimensional vascular reconstruction from
projections: A theoretical review”, in IEEE Conf. Eng. in Medicine and Bio., 1988.
[23] E. Sorantin, C. Halmai, B. Erdohelyi, K. Palagyi, L. Nyul, K. Olle, B. Geiger, F. Lindbichler,
G. Friedrich, and K. Kiesler, “Spiral-ct-based assessment of tracheal stenoses using 3-d-
skeletonization”, IEEE Trans. on Med. Img., vol. 21, pp. 263–273, March 2002.
[24] R. Poli and G. Valli, “An algorithm for real-time vessel enhancement and detection”, Comp.
Methods and Prog. in Biomed., vol. 52, pp. 1–22, January 1997.
[25] F. Mao, S. Ruan, A. Bruno, C. Toumoulin, R. Collorec, and P. Haigron, “Extraction of
structural features in digital subtraction angiography”, in IEEE Int. Biomed. Eng. Days, pp.
166–169, 1992.
[26] V. Prinet, O. Monga, S.L. Ge, C. Xie, and S.D. Ma, “Thin network extraction in 3d images:
Application to medical angiograms”, in Proc. Int. Conf. Pattern Rec., pp. 386–390, 1996.
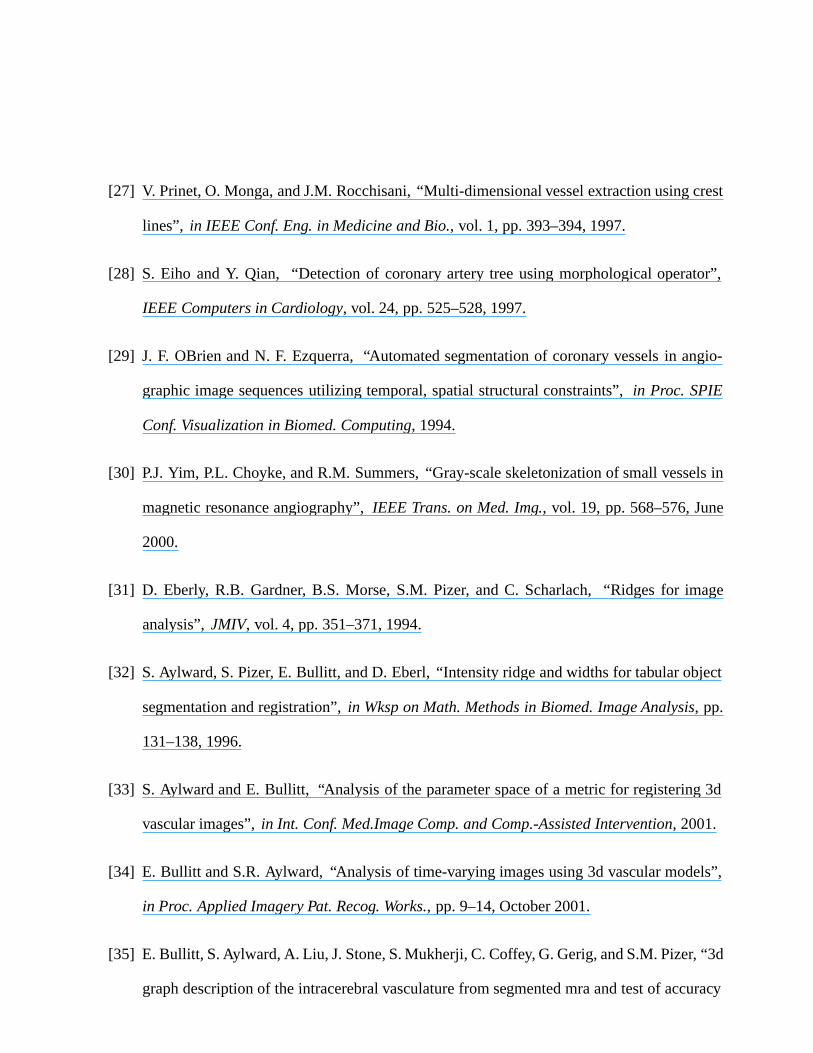
[27] V. Prinet, O. Monga, and J.M. Rocchisani, “Multi-dimensional vessel extraction using crest
lines”, in IEEE Conf. Eng. in Medicine and Bio., vol. 1, pp. 393–394, 1997.
[28] S. Eiho and Y. Qian, “Detection of coronary artery tree using morphological operator”,
IEEE Computers in Cardiology, vol. 24, pp. 525–528, 1997.
[29] J. F. OBrien and N. F. Ezquerra, “Automated segmentation of coronary vessels in angio-
graphic image sequences utilizing temporal, spatial structural constraints”, in Proc. SPIE
Conf. Visualization in Biomed. Computing, 1994.
[30] P.J. Yim, P.L. Choyke, and R.M. Summers, “Gray-scale skeletonization of small vessels in
magnetic resonance angiography”, IEEE Trans. on Med. Img., vol. 19, pp. 568–576, June
2000.
[31] D. Eberly, R.B. Gardner, B.S. Morse, S.M. Pizer, and C. Scharlach, “Ridges for image
analysis”, JMIV, vol. 4, pp. 351–371, 1994.
[32] S. Aylward, S. Pizer, E. Bullitt, and D. Eberl, “Intensity ridge and widths for tabular object
segmentation and registration”, in Wksp on Math. Methods in Biomed. Image Analysis, pp.
131–138, 1996.
[33] S. Aylward and E. Bullitt, “Analysis of the parameter space of a metric for registering 3d
vascular images”, in Int. Conf. Med.Image Comp. and Comp.-Assisted Intervention, 2001.
[34] E. Bullitt and S.R. Aylward, “Analysis of time-varying images using 3d vascular models”,
in Proc. Applied Imagery Pat. Recog. Works., pp. 9–14, October 2001.
[35] E. Bullitt, S. Aylward, A. Liu, J. Stone, S. Mukherji, C. Coffey, G. Gerig, and S.M. Pizer, “3d
graph description of the intracerebral vasculature from segmented mra and test of accuracy
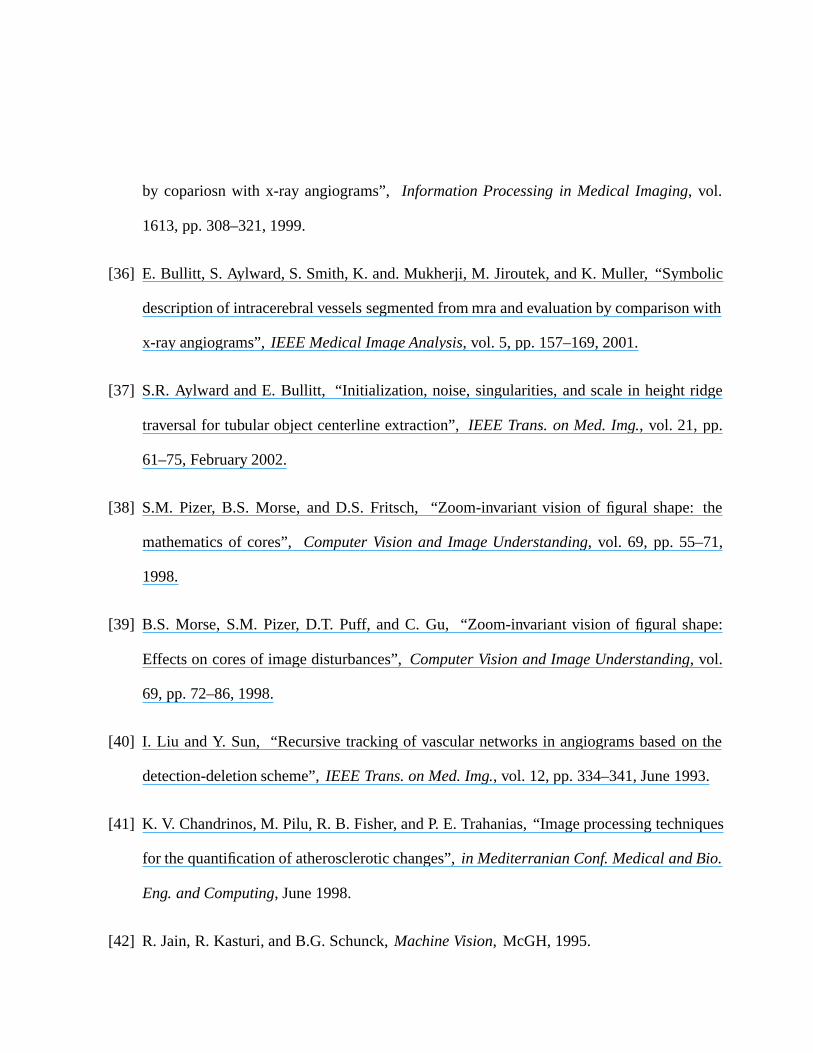
by copariosn with x-ray angiograms”, Information Processing in Medical Imaging, vol.
1613, pp. 308–321, 1999.
[36] E. Bullitt, S. Aylward, S. Smith, K. and. Mukherji, M. Jiroutek, and K. Muller, “Symbolic
description of intracerebral vessels segmented from mra and evaluation by comparison with
x-ray angiograms”, IEEE Medical Image Analysis, vol. 5, pp. 157–169, 2001.
[37] S.R. Aylward and E. Bullitt, “Initialization, noise, singularities, and scale in height ridge
traversal for tubular object centerline extraction”, IEEE Trans. on Med. Img., vol. 21, pp.
61–75, February 2002.
[38] S.M. Pizer, B.S. Morse, and D.S. Fritsch, “Zoom-invariant vision of figural shape: the
mathematics of cores”, Computer Vision and Image Understanding, vol. 69, pp. 55–71,
1998.
[39] B.S. Morse, S.M. Pizer, D.T. Puff, and C. Gu, “Zoom-invariant vision of figural shape:
Effects on cores of image disturbances”, Computer Vision and Image Understanding, vol.
69, pp. 72–86, 1998.
[40] I. Liu and Y. Sun, “Recursive tracking of vascular networks in angiograms based on the
detection-deletion scheme”, IEEE Trans. on Med. Img., vol. 12, pp. 334–341, June 1993.
[41] K. V. Chandrinos, M. Pilu, R. B. Fisher, and P. E. Trahanias, “Image processing techniques
for the quantification of atherosclerotic changes”, in Mediterranian Conf. Medical and Bio.
Eng. and Computing, June 1998.
[42] R. Jain, R. Kasturi, and B.G. Schunck, Machine Vision, McGH, 1995.
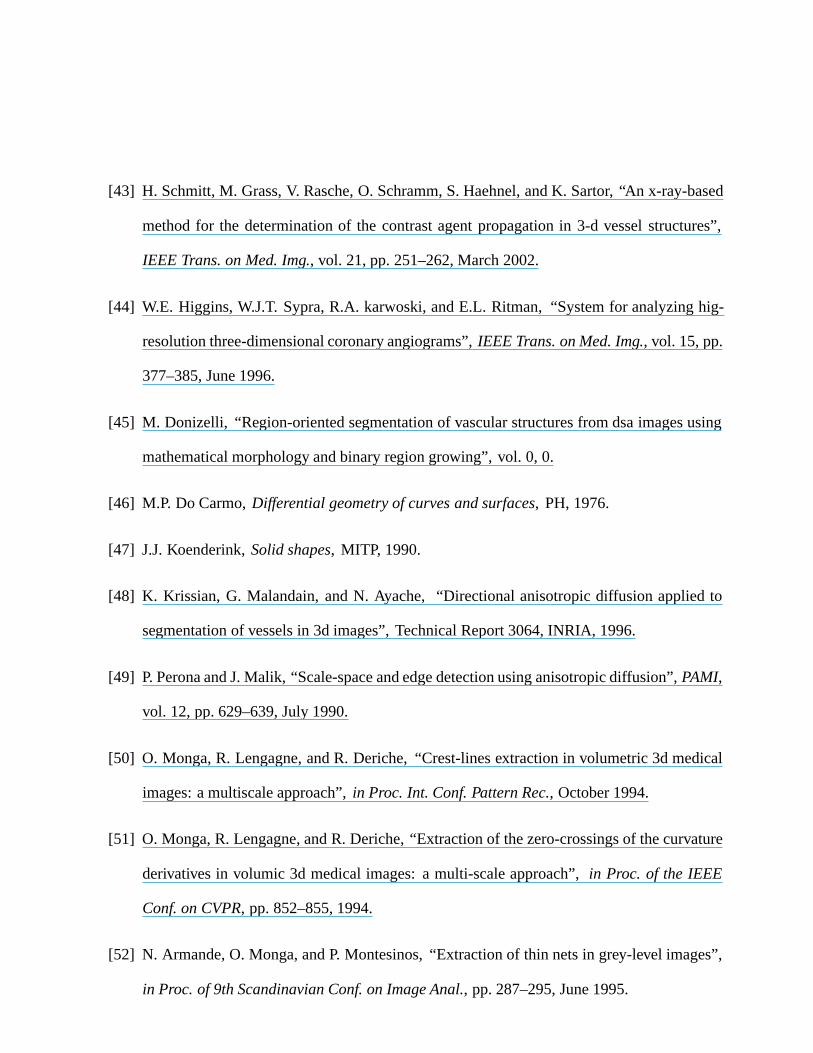
[43] H. Schmitt, M. Grass, V. Rasche, O. Schramm, S. Haehnel, and K. Sartor, “An x-ray-based
method for the determination of the contrast agent propagation in 3-d vessel structures”,
IEEE Trans. on Med. Img., vol. 21, pp. 251–262, March 2002.
[44] W.E. Higgins, W.J.T. Sypra, R.A. karwoski, and E.L. Ritman, “System for analyzing hig-
resolution three-dimensional coronary angiograms”, IEEE Trans. on Med. Img., vol. 15, pp.
377–385, June 1996.
[45] M. Donizelli, “Region-oriented segmentation of vascular structures from dsa images using
mathematical morphology and binary region growing”, vol. 0, 0.
[46] M.P. Do Carmo, Differential geometry of curves and surfaces, PH, 1976.
[47] J.J. Koenderink, Solid shapes, MITP, 1990.
[48] K. Krissian, G. Malandain, and N. Ayache, “Directional anisotropic diffusion applied to
segmentation of vessels in 3d images”, Technical Report 3064, INRIA, 1996.
[49] P. Perona and J. Malik, “Scale-space and edge detection using anisotropic diffusion”, PAMI,
vol. 12, pp. 629–639, July 1990.
[50] O. Monga, R. Lengagne, and R. Deriche, “Crest-lines extraction in volumetric 3d medical
images: a multiscale approach”, in Proc. Int. Conf. Pattern Rec., October 1994.
[51] O. Monga, R. Lengagne, and R. Deriche, “Extraction of the zero-crossings of the curvature
derivatives in volumic 3d medical images: a multi-scale approach”, in Proc. of the IEEE
Conf. on CVPR, pp. 852–855, 1994.
[52] N. Armande, O. Monga, and P. Montesinos, “Extraction of thin nets in grey-level images”,
in Proc. of 9th Scandinavian Conf. on Image Anal., pp. 287–295, June 1995.
[53] O. Monga, N. Armande, and P. Montesinos, “Thin nets and crest lines: Application to
satellite data and medical images”, Computer Vision and Image Understanding, vol. 66,
1997.
[54] F. Zana and J.C. Klein, “Robust segmentation of vessels from retinal angiography”, in IEEE
International Conference on Digital Signal Processing, vol. 2, pp. 1087–1090, 1997.
[55] J.F. Canny, “Finding edges and lines in images”, Technical Report 720, MITAIL, 1983.
[56] W. E. Hart, M. Goldbaum, B. Cote, P. Kube, and M. R. Nelson, “Automated measurement
of retinal vascular tortuosity”, in Proc AMIA Fall Conference, 1997.
[57] S.C. Chaudhuri, N. Katz, M. Nelson, and M. Goldbaum, “Detection of blood vessels in
retinal images using two dimensional blood vessel filters”, IEEE Trans. on Med. Img., vol.
8, September 1989.
[58] B. Cote, W.E. Hart, M. Goldbaum, P. Kube, and M.R. Nelson, “Classifiction of blood
vessels in images of the ocular fundus”, Technical Report CS94-350, UCSD, 1994.
[59] S.L. Wood, G. Qu, and L.W. Roloff, “Detection and labeling of retinal vessels for longi-
tidunal studies”, in IEEE Int. Conf. on Image Processing, vol. 3, pp. 164–167, 1995.
[60] A. Hoover, V. Kouznetsova, and M. Goldbaum, “Locating blood vessels in retinal images
by piecewise threshold probing of a matched filter response”, IEEE Trans. on Med. Img.,
vol. 19, pp. 203–210, March 2000.
[61] J. Chen, Y. Sato, and S. Tamura, “Orientation space filtering for multiple orientation line
segmentation”, in Proc. of the IEEE Conf. on CVPR, pp. 311–317, 1998.
[62] M. Goldbaum, S. Moezzi, A. Taylor, S. Chatterjee, J. Boyd, E. Hunter, and R. Jain, “Auto-
mated diagnosis and image understanding with object extraction, object classification, and
inferencing in retinal images”, in IEEE Int. Conf. on Image Processing, 1996.
[63] B. Thirion, B. Bascle, V. ramesh, and N. Navab, “Fusion of color, shading and boundary
infomation for factory pipe segmentation”, in Proc. of the IEEE Conf. on CVPR, vol. 2, pp.
349–356, June 2000.
[64] M. Sonka and R. Hlavac, V. Boyle, Image Processing, Analysis, and Machine Vision, PWS
Publishing, 1999.
[65] S.E. Umbaugh, Computer Vision and Machine Processing, PHPTR, 1998.
[66] M.T. Figueiredo and J.M.N. Leitao, “A nonsmoothing approach to the estimation of vessel
contours in angiograms”, IEEE Trans. on Med. Img., vol. 14, pp. 162–172, March 1995.
[67] S.A. Stansfiled, “Angy: A rule-based expert system for automatic segmentation of coronory
vessels from digital subtracted angiograms”, PAMI, vol. 8, pp. 188–199, March 1986.
[68] D.P. Kottke and Y. Sun, “Region splitting of medical images based upon bimodality analy-
sis”, in IEEE Eng. Conf. in Medicine and Bio., vol. 12, pp. 154–155, 1990.
[69] B.D. Thackray and A.C. Nelson, “Semi-automatic segmentation of vascular network images
using a rotating structuring element (rose) with mathematical morphology and dual feature
thresholding”, IEEE Trans. on Med. Img., vol. 12, pp. 385–392, September 1993.
[70] C. Xu, D.L. Pham, and J.L. Prince, Medical Image Segmentation Using Deformable Models,
chapter 3, pp. 129–174, SPIE Press, 2000.
[71] D.L. Pham, C. Xu, and J.L. Prince, Current Methods in Medical Image Segmentation, vol. 2,
pp. 315–338, 2000.
[72] M. Kass, A. Witkin, and D. Terzoopoulos, “Snakes: Active contour models”, Int. J. of
Comp. Vision, vol. 1, pp. 321–331, 1988.
[73] V. Caselles, F. Catte, T. Coll, and F. Dibos, “A geometric model for active contours”,
Numeriche Mathematik, vol. 66, pp. 1–31, 1993.
[74] C. Xu and J.L. Prince, “Snakes, shapes, and gradient vector flow”, IEEE Trans. on Image
Proces., vol. 7, pp. 359–369, 1998.
[75] D. Rueckert, P. Burger, S. M. Forbat, R. D. Mohiaddin, and G. Z. Yang, “Automatic tracking
of the aorta in cardiovascular mr images using deformable models”, IEEE Trans. on Med.
Img., vol. 16, pp. 581–590, October 1997.
[76] S. Kozerke, R. Botnar, S. Oyre, M. B. Scheidegger, E.M. Pedersen, and P. Boesinger, “Auto-
matic vessel segmentation using active contours in cine phase contrast flow measurements”,
J. of Mag. Res. Imaging, vol. 10, pp. 41–51, July 1999.
[77] D. Rueckert and P. Burger, “Contour fitting using stochastic and probabilistic relaxation for
cine mr images”, in Computer Assisted Radiology, pp. 137–142, June 1995.
[78] J.V. Miller, D.E. Breen, W.E. Lorensen, R.M. O’Bara, and M.J. Wozny, “Geometrically
deformed models: A method for extracting closed geometric models from volume data”,
CG, vol. 25, pp. 217–226, July 1991.
[79] D. Geiger, A. Gupta, L.A. Costa, and J. Vlontzos, “Dynamic programming for detecting,
tracking, and matching deformable contours”, PAMI, vol. 17, pp. 294–302, 1995.
[80] T. McInerney and D. Terzopoulos, “Medical image segmentation using topologically adapt-
able surfaces”, in Conf. Comp. Vision, Vir. Reality and Robotics in Medicine and Robotics,
vol. 1205, pp. 23–32, 1997.
[81] T. McInerney and D. Terzopoulos, “Topologically adaptable snakes”, in Int. Conf. on Comp.
Vision, pp. 840–845, June 1995.
[82] D. Koozekanani, K. Boyer, and C. Roberts, “Robust snake model”, in Proc. of the IEEE
Conf. on CVPR, vol. 1, pp. 452–457, 2000.
[83] D. Rueckert and P. Burger, “Shape-based tracking and analysis of the aorta in cardiac mr
images using geometrically defornable templates”, in Computer Assisted Radiology, June
1996.
[84] L. Sarry and J.Y. Boire, “Three-dimensional tracking of coronary arteries from biplane
angiographic sequences using parametrically deformable moodels”, IEEE Trans. on Med.
Img., vol. 20, pp. 1341–1351, December 2001.
[85] R. Toledo, X. Orriols, X. Binefa, P. Raveda, J. Vitria, and J. J. Villanueva, “Tracking elon-
gated structures using statistical snakes”, in Proc. of the IEEE Conf. on CVPR, pp. 157–162,
June 2000.
[86] Y.L. Hu, W.J. Rogers, D.A. Coast, C.M. Kramer, and N. Reichek, “Vessel boundary extrac-
tion based on a global and local deformable physical model with variable stiffness”, Magne.
Reson. Imaging, vol. 16, pp. 943–951, 1998.
[87] H. Mayer, I. Laptev, A. Baumgartner, and C. Steger, “Automatic road extraction based on
multi-scale modeling, context, and snakes”, IEEE Trans. on Med. Img., vol. 32, pp. 47–56,
1997.
[88] I.A. Hunter, J.J. Soraghan, and T. McDonagh, “Fully automatic left ventricular boundary
extraction in echocardiographic images”, in IEEE Computers in Cardiology, pp. 741–744,
1995.
[89] B. A. Parvin, C. Penf, W. Johnston, and F. M. Maestre, “Tracking of tubular objects for
scientific applications”, in Proc. of the IEEE Conf. on CVPR, pp. 295–301, 1994.
[90] T. ODonnell, T. E. Boult, X. Fang, and A. Gupta, “The extruded generalized cylinder: A
deformable model for object recovery”, in Proc. of the IEEE Conf. on CVPR, pp. 174–181,
1994.
[91] I. Kompatsiaris, D. Tzovaras, and M. Koutkias, V.a nd Strintzis, “Deformable boundary
detection of stents in angiographic images”, IEEE Trans. on Med. Img., vol. 19, pp. 652–
662, June 2000.
[92] V. Caselles, F. Catte, T. Coll, and F. Dibos, “A geometric model for active contours in image
processing”, NM, vol. 66, pp. 1–32, 1993.
[93] R. Malladi, J. A. Sethian, and B. C. Vemuri, “Shape modeling with front propagation: A
level set approach”, PAMI, vol. 17, pp. 158–175, February 1995.
[94] S. Osher and J. A. Sethian, “Fronts propagating with curvature dependent speed: Algorithms
based on hamilton-jacobi formulation”, JCP, vol. 79, pp. 12–49, 1988.
[95] J. A. Sethian, “A fast marching level set method for monotinically advancing fronts”, in
NAS, vol. 93, pp. 1591–1595, 1996.
[96] J.A. Sethian, Level Set Methods and Fast Marching Methods:Evolving Interfaces in
Computational Geometry, Fluid Mechanics, Computer Vision, and Material Science,
UK:Cambridge University Press, 1999.
[97] F. Quek and C. Kirbas, “Vessel extraction in medical images by wave propagation and
traceback”, IEEE Trans. on Med. Img., vol. 20, pp. 117–131, February 2001.
[98] F. Quek, C. Kirbas, and X. Gong, “Simulated wave propagation and traceback in vascular
extraction”, in Proc. IEEE Med. Imaging and Augmented Reality Conf., pp. 229–234, June
2001.
[99] C. Kirbas and F. Quek, “3d wave propagation and traceback in vascular extraction”, in
IEEE Eng. in Medicine and Bio. and Biomed. Eng. Soc., October 2002.
[100] R.C. Chan, W.C. Karl, and R.S. Lees, “A new model-based technique for enhanced small-
vessel measurements in x-ray cine-angiograms”, IEEE Trans. on Med. Img., vol. 19, pp.
243–255, March 2000.
[101] C. Pellot, A. Herment, and M. Sigelle, “A 3d reconstruction of vascular structures from two
x-ray angiograms using an adapted simulated annealing algorithm”, IEEE Trans. on Med.
Img., vol. 13, pp. 48–60, March 1994.
[102] K. Krissian, G. Malandain, and N. Ayache, “Model-based multiscale detection and recon-
struction of 3d vessels”, Technical Report 3442, INRIA, 1998.
[103] K. Krissian, G. Malandain, N. Ayache, R. Vaillant, and Y. Trousset, “Model-based multi-
scale detection of 3d vessels”, Proc. of the IEEE Conf. on CVPR, pp. 722–727, June 1998.
[104] K. Krissian, G. Malandain, N. Ayache, R. Vaillant, and Y. Trousset, “Model-based multi-
scale detection of 3d vessels”, in Proc. IEEE Workshop Biomed. Image Anal., pp. 202–208,
1998.
[105] T. M. Koller, G. gerig, G. Szekely, and D. Dettwiler, “Multiscale detection of curvilinear
structures in 2d and 3d image data”, in Int. Conf. on Comp. Vision, pp. 864–869, 1995.
[106] C. Lorenz, I. C. Carse, T. M. Buzug, C. Fassnacht, and J. Weese, “Multi-scale line seg-
mentation with automatic estimation of width, contrast and tangential direction in 2d and 3d
medical images”, in Joint Conf. Comp. Vision, Vir. Reality and Robotics in Medicine and
Robotics, and Comp.-Assisted Surgery, pp. 213–222, March 1997.
[107] D.S. Fritsch, S.M. Pizer, B.S. Morse, D.H. Eberly, and A. Liu, “The multiscale medial axis
and its applications in image registration”, Pattern Rec. Let., vol. 15, pp. 445–452, 1994.
[108] D.S. Fritsch, D.H. Eberly, S.M. Pizer, and M.J. McAuliffe, “Simulated cores and their
application in medical imaging”, Information Processing in Medical Imaging, pp. 365–368,
1995.
[109] T. Lindeberg, Scale-Space theory in Computer Vision, Kluwer Academic Publishers, Dor-
drecht, Netherlands, 1994.
[110] T. Lindeberg, “Edge detection and ridge detection with automatic scale selection”, in Proc.
of the IEEE Conf. on CVPR, p. 465, June 1996.
[111] K. Krissian, G. Malandain, N. Ayache, R. Vaillant, and Y. Trousset, “Model based detection
of tubular structures in 3d images”, Technical Report 3736, INRIA, 1999.
[112] A. G. Bors and I. Pitas, “Object segmentation and modeling in volumetric images”, in Proc.
Wksp on Non-Linear Model Based Image Analysis, pp. 295–300, July 1998.
[113] I. Pitas and A.N. Venetsanopoulos, Nonlinear Digital Filters: principles and applications,
Kluver Academic, Norwell, MA, 1990.
[114] L.R. Rabiner, “A tutorial on hidden markov models and selected applications in speech
recognition”, vol. 77, pp. 257–286, 1989.
[115] R.R. Petrocelli, J. Elion, and K. M. Manbeck, “A new method for structure recognition in
unsubtracted digital angiograms”, in IEEE Computers in Cardiology, pp. 207–210, 1992.
[116] R.R. Petrocelli, K.M. Manbeck, and J.L. Elion, “Three dimensional structure recognition in
digital angiograms using gauss-markov methods”, in IEEE Computers in Cardiology, pp.
101–104, 1993.
[117] R. van der Weide, C.J.G. Bakker, and M.A. Viergever, “Localization of intravascular devices
with paramagnetic markers in mr images”, IEEE Trans. on Med. Img., vol. 20, pp. 1061–
1071, October 2001.
[118] S.N. Kalitzin, B.M. ter haar Romaney, A.H. Salden, P.F.M. nacken, and M.A. Viergever,
“Topological numbers and singularities in scalar images: Scale-space evolution properties”,
J. of Math. Imaging and Vis., vol. 9, pp. 253–269, 1998.
[119] T. Binford, “Visual perception by computer”, in IEEE Conf. on Sys. and Controls, 1971.
[120] G. Agin and T. Binford, “Computer description of curved objects”, IEEE Trans. on Comp.,
vol. C-25, pp. 439–449, April 1976.
[121] M. Zerroug and R. Nevatia, “Quasi-invariant properties and 3-d shape recovery of non-
constant generalized cylinders”, in Proc. of the IEEE Conf. on CVPR, pp. 96–103, 1993.
[122] T. Kayikcioglu and S. Mitra, “A new method for estimating dimensions and 3-d reconstruc-
tion of coronary arterial trees from biplane angiograms”, in IEEE Comp.-Based Med. Sys.,
pp. 153–158, 1993.
[123] K. Kitamura, J.M. Tobis, and J. Sklansky, “Biplane analysis of atheromatous coronary
arteries”, in Proc. Int. Conf. Pattern Rec., vol. 2, pp. 1277–1281, 1988.
[124] K. Kitamura, J.M. Tobis, and J. Sklansky, “Estimating the 3-d skeletons and transverse
areas of coronary arteries from biplane angiograms”, IEEE Trans. on Med. Img., vol. 7, pp.
173–187, September 1988.
[125] T. O’Donnell, A. Gupta, and T. Boult, “A new model for the recovery of cylindrical struc-
tures from medical image data”, in Joint Conf. Comp. Vision, Vir. Reality and Robotics in
Medicine and Robotics, and Comp.-Assisted Surgery, pp. 223–232, 1997.
[126] Y. Sato, T. Araki, M. Hanayama, H. Naito, and S. Tamura, “A viewpoint determination sys-
tem for stenosis diagnosis and quantification in coronary angiographic image acquisition”,
IEEE Trans. on Med. Img., vol. 17, pp. 121–137, February 1998.
[127] P.A. Puig, “Cerebral blood vessels modeling”, Technical Report LSI-98-21-R, PICS, 1998.
[128] P.A. Puig, “Discrete medial axis transform for discrete objects”, Technical Report LSI-98-
20-R, PICS, 1998.
[129] J. A. Fessler and A. Macovski, “Object-based 3-d reconstruction of arterial trees from
magnetic resonance angiograms”, IEEE Trans. on Med. Img., vol. 10, pp. 25–39, March
1991.
[130] T. Kayikcioglu and S. Mitra, “Unique determination of shape and area of coronary arterial
cross-section from biplane angiograms”, in IEEE Comp.-Based Med. Sys., pp. 596–603,
1992.
[131] S. Lu and S. Eiho, “Automatic detection of the coronary arterial contours with sub-branches
from an x-ray angiogram”, in IEEE Computers in Cardiology, pp. 575–578, 1993.
[132] Y. Tolias and S.M. Panas, “A fuzzy vessel tracking algorithm for retinal images based on
fuzzy clustering”, IEEE Trans. on Med. Img., vol. 17, pp. 263–273, April 1998.
[133] K. Haris, S. N. Efstratiadis, N. Maglaveras, J. Gourassas, C. Pappas, and G. Louridas, “Au-
tomated coronary artey extraction using watersheds”, IEEE Computers in Cardiology, vol.
24, pp. 741–744, 1997.
[134] L. Lecornu, C. Roux, and J.J. Jacq, “Extraction of vessel contours in angiograms by simul-
taneous tracking of the two edges”, in IEEE Conf. Eng. in Medicine and Bio., vol. 1, pp.
678–679, 1994.
[135] M. Hart and L. Holley, “A method of automated coronary artey tracking in unsubtracted
angiograms”, in IEEE Computers in Cardiology, pp. 93–96, 1993.
[136] S. Park, J. Lee, J. Koo, O. Kwon, and S. Hong, “Adaptive tracking algorithm based on
direction field using ml estimation in angiogram”, in IEEE Conference on Speech and
Image Technologies for Computing and Telecommunications, vol. 2, pp. 671–675, 1997.
[137] F. Quek, C. Kirbas, and F. Charbel, “Aim:attentionally-based interaction model for the
interpretation of vascular angiograph”, IEEE Tran. on Inf. Tech. in Biomed., vol. 3, pp.
139–150, June 1999.
[138] F. Quek, C. Kirbas, and F. Charbel, “Aim: An attentionally-based system for the interpre-
tation of angiography”, in Proc. IEEE Med. Imaging and Augmented Reality Conf., pp.
168–173, June 2001.
[139] R.T. Ritchings and A.C.F. Colchester, “Detection of abnomalities on carotid angiograms”,
Pattern Rec. Let., vol. 4, pp. 367–374, October 1986.
[140] M.H. Stockett and B.I. Soroka, “Extracting spinal cord contours from transaxial mr images
using computer vision techniques”, in IEEE Comp.-Based Med. Sys., pp. 1–8, 1992.
[141] A. martelli, “An application of heuristic search methods to edge and contour detection”, in
Comm. ACM, vol. 19, pp. 73–83, 1976.
[142] Y. Sun, “Automated identification of vessel contours in coronary arteriograms by an adaptive
tracking algorithm”, IEEE Trans. on Med. Img., vol. 8, pp. 78–88, 1989.
[143] K. Haris, S.N. Efstratiadis, N. Maglaveras, and C. Pappas, “Semi-automatic extraction of
vascular networks in angiograms”, in IEEE Conf. Eng. in Medicine and Bio., pp. 1067–
1068, 1997.
[144] H. Shen and C. R. Johnson, “Semi-automatic image segmentation: A bimodal thresholding
approach”, Technical Report UUCS-94-019, Un. of Utah, Dept. of Comp. Science, 1994.
[145] L. Zhou, M.S. Rzeszotarski, L.J. Singerman, and J.M. Chokreff, “The detection and quan-
tification of retinopathy using digital angiograms”, IEEE Trans. on Med. Img., vol. 13, pp.
619–626, December 1994.
[146] D.J. Stevenson, “Working towards the automatic detection of blood vessels in x-ray an-
giograms”, Pattern Rec. Let., vol. 6, pp. 107–112, July 1987.
[147] C. Smets, G. Verbeeck, P. Suetens, and A. Oosterlinck, “A knowledge-based system for
the delineation of blood vessels on subtraction angiograms”, Pattern Rec. Let., vol. 8, pp.
113–121, September 1988.
[148] U. Rost, H. Munkel, and C.-E. Liedtke, “A knowledge based system for the configuration of
image processing algorithms”, Fachtagung Informations und Mikrosystem Technik, March
1998.
[149] V. Bombardier, M.C. Jaluent, A. Bubel, and J. Bremont, “Cooperation of two fuzzy seg-
mentation operators for digital subtracted angiograms analysis”, in IEEE Conference on
Fuzzy Systems, vol. 2, pp. 1057–1062, 1997.
[150] D.P. Kottke and Y. Sun, “Segmentation of coronary arteriograms by iterative ternary class-
sification”, IEEE Trans. on Biomed. Engr., vol. 37, pp. 778–785, August 1990.
[151] A. Rosenfeld and R. Smith, “Thresholding using relaxation”, PAMI, vol. 3, pp. 598–606,
1981.
[152] N. Otsu, “A threshold selection method from gray-level histograms”, IEEE Trans. on Sys.,
Man, and Cybernetics, vol. 9, pp. 62–66, 1979.
[153] T. Kohonen, Self-organizing Maps, Springer Verlag, 1995.
[154] B.D. Ripley, Pattern Recognition and Neural Networks, Cambridge Un. Press, 1996.
[155] J.W. Clak, “Neural network modelling”, Physics in Med. and Bio., vol. 36, pp. 1259–1317,
1991.
[156] S. Haykin, Neural networks: a comprehensive foundation, Mcmillan College, New York,
1994.
[157] J. Cronemeyer, G. Heising, and R. Orglmeister, “A fast skeleton finder for parallel hard-
ware”, in IEEE Computers in Cardiology, pp. 23–26, 1992.
[158] T. Nguyen and J. Sklansky, “A fast skeleton finder for coronary arteries”, in Proc. Int. Conf.
Pattern Rec., pp. 481–483, 1986.
[159] T. Nguyen and J. Sklansky, “Computing the skeleton of coronary arteries in cinean-
giograms”, Comp. and Biomed. Res., vol. 19, pp. 428–444, 1986.
[160] R. Nekovei and Y. Sun, “Back-propagation network and its configuration for blood vessel
detection in angiograms”, IEEE Trans. on Neural Nets, vol. 6, pp. 64–72, January 1995.
[161] S. Shiffman, G. D. Rubin, and S. Napel, Semiautomated editing of computed tomography
sections for visualization of vasculature, vol. 2707, SPIE, 1996.
[162] E.R. Davies, “A high speed algorithm for circular object detection”, Pattern Rec. Let., vol.
6, pp. 323–333, December 1987.
[163] W.E.L. Grimson, T. Lozano-Perez, N. Nobel, and S.J. White, “An automatic tube inspection
system that finds cylinders in range data”, in Proc. of the IEEE Conf. on CVPR, pp. 446–452,
1993.