a novel safety assessment strategy applied to non-selective extracts
TRANSCRIPT
A novel safety assessment strategy applied to non-selective extractsSander Koster a,1, Winfried Leeman a,*, Elwin Verheij a, Ellen Dutman a, Leo van Stee b,Lene Munch Nielsen c, Stefan Ronsmans d, Hub Noteborn e, Lisette Krul a
a TNO, Zeist, The Netherlandsb TNO Triskelion, Zeist, The Netherlandsc Chr. Hansen, Hørsholm, Denmarkd Coca-Cola Services, Brussels, Belgiume The Netherlands Food and Consumer Product Safety Authority (NVWA), Utrecht, The Netherlands
A R T I C L E I N F O
Article history:Received 7 July 2014Accepted 7 March 2015Available online 16 March 2015
Keywords:Non-selective extractSafetyComplex mixture safety assessmentstrategyThreshold of toxicological concernTTCProcessing
A B S T R A C T
A main challenge in food safety research is to demonstrate that processing of foodstuffs does not leadto the formation of substances for which the safety upon consumption might be questioned. This is es-pecially so since food is a complex matrix in which the analytical detection of substances, and consequentrisk assessment thereof, is difficult to determine. Here, a pragmatic novel safety assessment strategy isapplied to the production of non-selective extracts (NSEs), used for different purposes in food such asfor colouring purposes, which are complex food mixtures prepared from reference juices. The ComplexMixture Safety Assessment Strategy (CoMSAS) is an exposure driven approach enabling to efficiently assessthe safety of the NSE by focussing on newly formed substances or substances that may increase in ex-posure during the processing of the NSE. CoMSAS enables to distinguish toxicologically relevant fromtoxicologically less relevant substances, when related to their respective levels of exposure. This will reducethe amount of work needed for identification, characterisation and safety assessment of unknown sub-stances detected at low concentration, without the need for toxicity testing using animal studies. In thispaper, the CoMSAS approach has been applied for elderberry and pumpkin NSEs used for food colouringpurposes.
© 2015 Elsevier Ltd. All rights reserved.
1. Introduction
Most food products are chemically complex food matrices (CCFM)with a high percentage of unknown substances. The safety assess-ment of CCFM usually is very time-consuming, expensive since itmay involve animal studies, and may require the full compositionof the food to be determined. Furthermore, each of the chemicalconstituents requires a risk assessment whereas the intake of thoseconstituents is often relatively low, making the necessity for a full
risk assessment of these substances questionable. Innovations inmore efficient safety assessment strategies, which are less demand-ing for animal studies, will not occur if traditional approaches ofrisk assessment remain the standard. The development of new riskassessment strategies is however of high importance for industry,as well as food safety authorities and other governmental bodies,in order to assure the safety of CCFM in the most efficient and ef-fective way.
TNO has developed an approach, the Complex Mixture Safety As-sessment Strategy (CoMSAS), which is considered a more pragmaticapproach compared to traditional approaches. The basis of CoMSASis the decision tree based approach of the Threshold of Toxicologi-cal Concern (TTC) concept (Cheeseman et al., 1999; Kroes et al., 2004;Rulis, 1989). The theoretical concept of CoMSAS has been de-scribed for the assessment of chemically complex mixtures by Rennenet al. (2011) and proven for the evaluation of non-intentionally addedsubstances (NIAS) in carton food contact materials (Koster et al., 2014),whereas the relevance of combined low dose exposure is dis-cussed by Leeman et al. (2013). CoMSAS has several advantages. First,the approach may require less effort for identification from an an-alytical chemistry point-of-view. Principally, only substances presentin the CCFM to which the exposure is above 90 μg/day have to beidentified under certain conditions. Second, by performing specific
Abbreviations: CCFM, chemically complex food matrices; CoMSAS, ComplexMixture Safety Assessment Strategy; DCHP, dicyclohexylphthalate; DCM,dichloromethane; DFB, difluorobiphenyl; DNFCS, Dutch National Food Consump-tion Survey; EFSA, European Food Safety Authority; EN, non-selective extract ofelderberry; ER, elderberry reference juice; GC, gas chromatograph; MSTFA, N-methyl-N-(trimethylsilyl)trifluoroacetamide; NIAS, non-intentionally added substances; NSE,non-selective extracts; PN, non-selective extract of pumpkin; PR, pumpkin refer-ence juice; SPE, solid phase extraction; SPME, solid phase microextraction; TFAA,trifluoroacetylanthracene; TTC, threshold of toxicological concern; VCF, volatile com-pounds in foods database.
* Corresponding author. TNO, Utrechtseweg 48, 3704HE Zeist, The Netherlands.Tel.: +31888661533.
E-mail address: [email protected] (W. Leeman).1 Current address: Nestlé Research Centre, Lausanne, Switzerland.
http://dx.doi.org/10.1016/j.fct.2015.03.0100278-6915/© 2015 Elsevier Ltd. All rights reserved.
Food and Chemical Toxicology 80 (2015) 163–181
Contents lists available at ScienceDirect
Food and Chemical Toxicology
journal homepage: www.elsevier.com/ locate / foodchemtox
analytical screenings and bioassays, the presence of constituents ofhigh toxicological concern in the CCFM can easily be covered. As afirst proof-of-concept, CoMSAS was successfully applied for the safetyevaluation of migrants from food packaging materials into food. Thisconcerned a large number of constituents migrating at relativelylow levels, resulting in a low consumer exposure to these constitu-ents (Koster et al., 2014). As a next step, the proof-of-concept ofCoMSAS is demonstrated for the safety assessment of food prod-ucts or ingredients thereof which are considered to be chemicallycomplex. Besides the scientific challenge to adapt the approach, e.g.development of analytical methods for this application, it is also im-portant to demonstrate that the CoMSAS approach can be used fora broad range of CCFM and can provide sufficient information forregulatory approval of food products in an efficient way.
The present paper describes the application of CoMSAS to foodproducts in which exposure to substances is higher compared tothe relatively low exposure to migrants from food packaging ma-terial as described in Koster et al. (2014). Non-selective extracts (NSE)are selected as illustrative for this purpose. The reasons to use NSEsto proof the concept of CoMSAS is that they consist of a broad spec-trum of known and unknown substances and are present in relativelylow amounts in food, but at higher exposure levels than migrantsfrom food packaging materials.
NSEs have been obtained from the edible part of food like fruitsor vegetables in order to be used for colouring purposes withoutpurification of the pigments. For industry, NSEs are importantbecause they are considered as foods or food ingredients withcolouring benefit that can be added to food products in many dif-ferent food categories. For the current case two NSEs derived frompumpkin and from elderberry respectively were selected.
From a regulatory perspective, colouring foodstuffs obtained bynon-selective extraction are considered as foods or food ingredi-ents with colouring properties, but are not considered to be foodadditives. Specific EU legislation for non-selective extraction ofcolouring foodstuffs, and assessment of the safety thereof, is cur-rently not available. However guidance notes on the classificationof food extracts with colouring properties has been officially pub-lished in the EU (http://ec.europa.eu/food/food/fAEF/additives/guidance_en.htm).
NSEs are obtained from food products with a long history of safeuse. Therefore, it is considered sufficient to focus on newly formedsubstances during manufacturing of the NSE or to substances thatmay have increased in concentration due to manufacturing, in orderto underpin the safety of the NSE. For this reason CoMSAS is appliedcomparing the raw reference juice, obtained after some commonproduction steps of the fruits, to the final NSE obtained afterprocessing.
1.1. Complex Mixture Safety Assessment Strategy (CoMSAS )
The CoMSAS approach was described in detail in Rennen et al.(2011) and Koster et al. (2014) and is therefore only described brieflyhere.
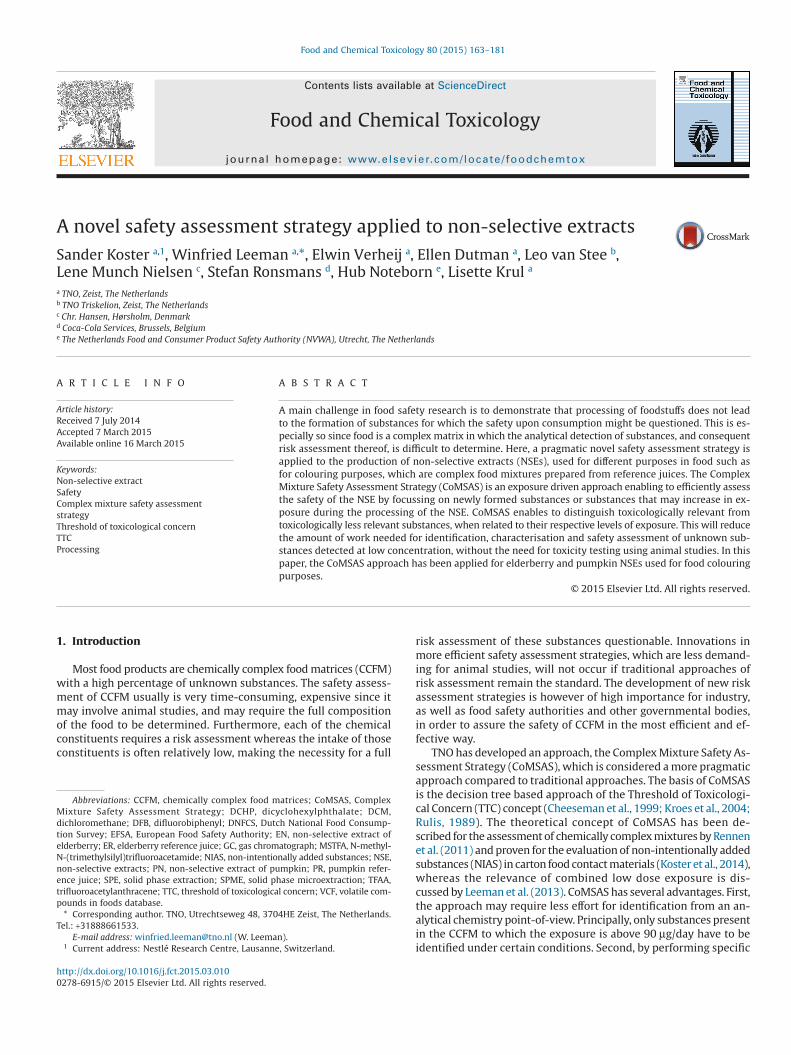
In Fig. 1 the step-wise approach of CoMSAS is described to assessthe safety of the NSEs by focussing on newly formed substances/increased amounts of substances due to the manufacturing process,amongst which is the introduction of, e.g. migrants, as a result ofthe filtering process. CoMSAS is based on the exclusion of the pres-ence of specific groups of substances above their health risk level,using target analytical techniques, following the Kroes et al. (2004)decision tree and modifications as proposed by Munro et al. (2008).Also the recent conclusions of the EFSA opinion on the TTC concept(EFSA, 2012) are taken into account.
1.1.1. Step 1: General screening for migrating substances exceeding90 μg/day
In order to provide the risk assessor with information on thechemical composition of the reference juices and the NSEs, non-target analytical screening techniques (so-called forest-of-peaksscreening) can be applied. These screening approaches should detectas many substances as possibly present in the samples or an extractthereof. The spectra of the reference juice can then be comparedto the NSE spectra to determine newly formed or substances presentat a substantially higher level, indicating that a higher exposure islikely to occur. The exposure to the substances in the samples is de-termined by combining information about the consumption of thefood products to which the NSEs are (intended to be) added, theconcentrations of the substances in the NSEs and the result from
Fig. 1. Complex mixtures safety assessment strategy (CoMSAS).
164 S. Koster et al.f/Food and Chemical Toxicology 80 (2015) 163–181
these analytical screening experiments. It should be noted that atechnique which is able to detect all substances in a chemicallycomplex food mixture does not exist (and may also depend on thefood matrix), since many of these substances are endogenous innature, or may have an unknown origin. The techniques used shouldtherefore be able to detect substances with a wide variety of physical/chemical properties. A number of complementary analyticaltechniques, each covering a different spectrum of physical/chemicalproperties, were applied to detect as many substances in the samplesas possible.
The exposure threshold at which the analytical screening shouldbe performed is set at the threshold for Cramer class III sub-stances corresponding to 90 μg/day (Kroes et al., 2004). This thresholdmay only be used for the safety assessment if a number of (groupsof) substances of relatively high toxicity, including substances forwhich a thresholds below 90 μg/day applies, or substances ex-cluded by the TTC concept are determined not to be formed duringthe manufacturing of the NSEs (see step 2 and step 3) (Koster et al.,2011; Kroes et al., 2004; Rennen et al., 2011).
For the evaluation of substances present in NSEs and the refer-ence juices, the following techniques were used:
• Solid phase microextraction (SPME) GC-MS for volatilesubstances;
• Liquid–liquid extraction GC-MS for semi-volatile substances;• Solid phase extraction (SPE) GC-MS for semi-volatile substances;• Derivatisation of non-volatile substances to make these sub-
stances amenable (more volatile) to analysis by GC-MS (forexample Koek et al., 2006 and Bradley et al., 2008);
• LC-MS for non-volatile substances.
With the exception of LC-MS, a screening using the techniquesabove will result in a semi-quantitative estimate of the concentra-tion of substances in the NSE or reference juice from which exposurecan be calculated. More details on the possibilities and limitationsof the analytical techniques used, including the sensitivity of thedetectors to be used, are described in Koster et al. (2014).
Depending on the complexity of the chromatograms generatedand the number of substances that are newly formed or signifi-cantly increased to an estimated exposure above 90 μg/day, it shouldbe decided whether it is efficient to proceed with steps 2–5. Thisneeds to be evaluated on a case-by-case basis.
1.1.2. Step 2: Covering known highly toxic substances and substancesthat are excluded from the TTC concept
The exposure threshold of 90 μg/day can only be used to assessthe safety of the NSE if the presence of specific classes of sub-stances with high toxicity can be covered when formed in themanufacturing process to produce the NSEs. Also, a few classes ofsubstances like proteins, for which insufficient toxicological data wereavailable to be covered by the TTC concept, should be taken intoaccount; see also Rennen et al. (2011) and Koster et al. (2011). Also,expert judgement may be used (i.e. no analytical screening) in caseinformation is available or is generally known that the specific classesof substances are unlikely to be formed during the manufacturingprocess of NSEs (e.g. heavy metals which should comply with reg-ulatory limits already for the reference juice). When one of thesecategories of substances is found to be formed in the processing toproduce the NSEs, the responsible substance in the NSE should beidentified and a substance specific risk assessment should be per-formed. This can be done using targeted analytical techniques (e.g.a high resolution GC-MS method for determination of dioxins). Theclasses substances concerned are (Kroes et al., 2004):
• Aflatoxin-like substances;• N-Nitroso substances;
• Azoxy substances;• Polyhalogenated dibenzo-p-dioxins, -dibenzofurans and
-biphenyls;• Steroids;• Non-essential metals (Hg, Cd, Pb, etc.);• High molecular weight substances;• Organophosphates and carbamates (derived from pesticides).
1.1.3. Step 3: Covering substances with genotoxic potencyThe exposure threshold of 90 μg/day can only be used to assess
the safety of the NSE if for the NSE it is demonstrated that sub-stances with (a structural alert for) genotoxic potential are notdetected or at least below a threshold of 0.15 μg/day. Exposure togenotoxic substances at these low levels is within the TTC conceptconsidered to be associated with an acceptable risk for human health(Benigni et al., 2008; Kroes et al., 2004; Rennen et al., 2011). Thepotential presence of substances with a genotoxic potential can becovered using bioassays capable of identification of a genotoxichazard, or via a substance specific safety assessment which showsthat an acceptable risk is related to the exposure level concerned.It should be noted, however, that for a lot of botanical products itis known that positive in vitro genotoxicity data are published. Ifthe NSE concerns a botanical product for which this applies, a com-parison of the genotoxic response as found in a bioassay betweenthe reference juice and the NSE may give indications of the pres-ence of new substances with a genotoxic potential, taking intoaccount also a concentration or dilution factor for the NSE. More-over, when all analytical data indicate that no new substances areformed as result of the process concerned, the NSE is containingthe same substances as the reference juice, indicating that next tothe reference juice the NSE is also to be considered safe forconsumption.
Since an approach to demonstrate the presence of structural alertsin CCFM does not exist (Koster et al., 2014), a biological assay is usedin this paper as a pragmatic approach to cover the presence of sub-stances with genotoxic potency in the samples. Traditional assayssuch as the AMES and mouse lymphoma assay were not devel-oped for testing CCFM, but instead were developed and validatedfor relatively pure substances. Therefore the sensitivity of these testsconcerning the expected low concentrations of potential presenceof genotoxic substances in CCFM cannot be addressed also for thetraditional assays. Moreover, for most traditional assays more thana single test should be used to cover the two endpoints of rele-vance in mutagenicity (gene mutations and chromosomeaberrations). Therefore the traditional (OECD guideline) genotoxicitystudies are considered less suited for screening purposes. State-of-the-art conventional (in vitro) assays or alternative assays such asthe BlueScreen HC assay (Hughes et al., 2012) may therefore be con-sidered instead. The BlueScreen HC assay is based on a human cellline and is sensitive for the three classic genotoxic endpoints, genemutations, clastogenicity and aneugenicity, and is used as an indi-cator of genotoxic hazard in high-throughput screening for early-stage drug discovery (Simpson et al., 2012).
If an additional positive genotoxic response is recorded com-pared to the reference juice, it will remain unknown which substancepresent in the samples actually cause this positive effect. In suchcases, the constituents of the samples may be fractionated. Testingof the separate fractions in the genotoxicity assay will help in theprocess to identify the substance(s) in the samples that causethe genotoxic response. Given the high throughput nature of theBlueScreen HC assay, this assay may be very helpful for this purpose.
1.1.4. Step 4: Safety assessmentIf a substance that is newly formed during the NSE manufac-
turing process is detected and belongs to one of the categoriesdescribed by steps 2 and 3, a substance specific safety assessment
165S. Koster et al.f/Food and Chemical Toxicology 80 (2015) 163–181
should be performed unless the exposure to this substance is cal-culated to be below the level mentioned in relevant legislation. Thesafety assessment for the rest of the substances in the NSEs can beperformed using the CoMSAS approach. If the safety assessment in-dicates that a risk for human health is absent or negligible or if theresponsible substance can be eliminated from the NSE, the NSE isconsidered safe for consumption.
Only newly formed substances and substances that increase inconcentration upon manufacturing of the NSEs and that exceed theexposure threshold of 90 μg/day (step 1) should be identified andsubmitted to a substance specific risk assessment. If a newly formedsubstance and substance that increases in concentration upon manu-facturing can be classified as a Cramer class I substance, the exposurethreshold can be increased from 90 μg/day to 1800 μg/day. In casein public literature no relevant toxicological information is avail-able for the substance or for a good read-across candidate thereof,or in case the estimated exposure is above a substance specific TTCthreshold (e.g. being a Cramer class I substance), toxicity testing toidentify the hazard of the substance may be needed to assess itssafety. Moreover, background exposure should be taken into accountif possible.
1.1.5. Step 5: AllergenicityProteins are excluded from the TTC approach since proteins can
be a source of sensitisation after which allergenic reactions may occurfor which insufficient data are available. Therefore, it should be ex-cluded that new proteins/allergens may be introduced or formedfrom proteins that are present in the raw materials upon manu-facturing of the NSEs.
2. Materials and methods
2.1. Chemicals and materials
All reagents and solvents were of analytical grade unless mentioned other-wise. N-methyl-N-trimethylsilyl(trifluoroacetamide) (MSTFA) was obtained fromAlltech Applied Sciences BV (Breda, The Netherlands). Octanol, heptanol, decanal,octanal, alanine-d4, 4,4-difluorobiphenyl (DFB), citric acid-d4, dicyclohexylphthalate(DCHP) were obtained from Sigma-Aldrich (Zwijndrecht, The Netherlands). Ribose13C5 was obtained from Cambridge Isotopes (Tewksbury, MA, USA), andtrifluoroacetylanthracene (TFAA) and Ethoxyamine.HCl from Acros Organics (Geel,Belgium).
2.2. NSE preparation from reference juices and main composition
Pumpkin reference juice (PR) was obtained using regular juice processing stepsincluding mechanical extraction, pasteurisation, centrifugation, concentration andstandardisation. All reference juices were checked for colour strength and shade, pH,brix (amount of dissolved dry matter), density, flow behaviour and microbiologi-cal quality.
To prepare the NSE of pumpkin (PN) from PR, PR was pasteurised at 75 °C for15 minutes followed by a filtration step with a 250 micron filter and final packag-ing. Both PR and PN are cloudy liquids. No additives are used upon preparation. Theend product PN was compared with PR throughout this document. The main com-position of PN and PR is presented in Table 1.
Elderberry reference juice (ER) was obtained using regular juice processing stepsincluding mechanical extraction, pasteurisation, centrifugation, concentration andstandardisation. All raw materials were checked for colour strength and shade, pH,brix, density, microbiological quality, dry extract, sludge and turbidity.
To prepare the NSE of elderberry (EN) from ER, ER was homogenised (mixed).After standardisation to reach a specific colour strength, the juice was pasteurisedat 96 °C for 30 seconds followed by a filtration step with a 100 micron filter andfinal packaging.
Both ER and EN are dark red coloured liquids. As was performed for PN and PR,EN was compared to ER throughout this document.
2.3. Composition elderberry and pumpkin
The Danish food composition database (Danish, 2013) and the volatile com-pounds in foods (VCF) database (VCF, 2013) were consulted for the main compositionof pumpkin and elderberry. The VCF database is a continually updated database, whichcontains information on published volatile compounds which have been found innatural (processed) food products. The main composition of pumpkin and elder-berry is presented in Table 1. It is assumed that the composition of PR and ER areequivalent to that of pumpkin and elderberry, respectively.
3. Methods
3.1. Analytical screening methods (step 1 of CoMSAS)
3.1.1. Volatile substances; SPME GC-MSThree mL of PR, PN, ER and EN were mixed with 6 mL saturated NaCl solution
in 20 mL headspace vials. 90 μL internal standard fluorobenzene was added to PRand PN. This was 130 μL for ER and EN. Fluorobenzene was dissolved in acetone at43 mg/mL. All SPME experiments were performed in duplicate. Headspace vials with3 mL Milli-Q water and 6 mL saturated NaCl were included in the sequence as pro-cedural blank.
The samples were analysed with a 6890 gas chromatograph (GC) coupled to a5973 mass spectrometer (Agilent Technologies). Headspace was sampled using aCombi PAL auto sampler (CTC Analytics, Switzerland) equipped with an SPME fibreassembly (Supelco Stableflex 50/30 μm DVB/CAR/PDMS, Sigma-Aldrich, Zwijndrecht,The Netherlands) and injected into a 30 m × 0.25 mm I.D. × 1 μm df AT-5ms Heliflexcolumn (Alltech B.V., Breda, The Netherlands). Extraction of the headspace was per-formed for 20 and 60 minutes at 50 °C. The GC was equipped with a split/splitlessinjector and cryo cooling. Oven temperature program: 0 °C (1 min)–10 °C/min to 320 °C(2 min). Split/splitless injector temperature: 250 °C. Helium at 1.5 mL/min was usedas carrier gas in constant flow mode. MS detection was performed with electronionisation (70 eV) in full-scan mode (m/z 15–800). MS temperatures were: trans-fer line 325 °C; ion source 230 °C; quadruple at 150 °C.
3.1.2. Semi-volatile substances; liquid–liquid extraction GC-MSSamples were first made alkaline, then extracted and the remaining aqueous
fraction was then acidified and extracted again. One set of samples was extractedwith hexane, the other set with dichloromethane (DCM). Before extraction, thesamples were diluted 40 times (v/v) with Milli-Q water. Subsequently the samples(dissolved in acetone) were spiked with octanol and decanal at 90 μg/day (expo-sure threshold). A set of non-spiked samples was also included to investigate naturaloccurrence of the spiked compounds. All samples were then made alkaline to pH = 11with a 50% (w/w) solution of sodium hydroxide in water. An 18 mL aliquot of eachsample was then extracted three times with 8, 4, and 4 mL in 40-mL screw cap vialswith either hexane or DCM at room temperature. A Laboshake orbital shaker at200 rpm was used for 15 min in each extraction step and the samples were thencentrifuged at 1500 rpm to obtain good phase separation. The organic phases of thethree steps were separated with a pipette and collected in a single tube for eachsample. After the last extraction, the remaining aqueous phase of the samples wasspiked with heptanol and hexanal at 90 μg/day and acidified with 95% sulphuric acid,and the entire liquid–liquid extraction procedure was repeated. The organic phasesof these three acidic extractions were also collected in a single tube. Anhydrous sodiumsulphate was added to all extracts to absorb any traces of water in the extracts.
Samples were analysed with a 6890 gas chromatograph (Agilent Technologies)coupled to a Pegasus III mass spectrometer (Leco Instruments, Monchengladbach,Germany). 1 μL of sample was injected in splitless mode into a 30 m × 0.25 mmI.D. × 0.25 μm df Supelco SLB-5ms column (Sigma-Aldrich) using a CIS-4 PTVinjector (Gerstel) with baffled liner. PTV temperature program: 40 °C (0.05 min)–480 °C/min to 250 °C (12 min). Oven temperature program: 40 °C (1 min)–10 °C/min to 320 °C (15 min).
Helium at 1.5 mL/min was used as carrier gas in constant flow mode. MS de-tection was performed with electron ionisation (70 eV) and spectra were recordedover the m/z 45–550 range. MS temperatures were: transfer line 300 °C; ion source280 °C.
All sample preparation and analysis was performed in duplicate. A proceduralblank (Milli-Q) was included in the sample work-up.
Table 1Main composition of pumpkin and elderberry.
Sample + abbreviation Water% (w/w)
Sugar% (w/w)
Protein% (w/w)
Fibres% (w/w)
Ash% (w/w)
Brixa
% (w/w)
Pumpkin 40 37 4 2 NA 59–61Elderberry 42 54 2 NA 1.6 NA
a Measure for dissolved dry matter.
166 S. Koster et al.f/Food and Chemical Toxicology 80 (2015) 163–181
3.1.3. Semi-volatile substances; SPE GC-MSExtractions were performed with Oasis HLB 3 cc 60 mg solid phase extraction
(SPE) cartridges (Waters) that were first conditioned with 6 mL DCM, then 6 mL meth-anol followed by 6 mL Milli-Q water. Before extraction, the samples were diluted40 times (v/v) with Milli-Q water. Subsequently, the samples were spiked with octanoland decanal (dissolved in acetone). 1 mL of diluted sample was loaded on the column,and after washing with 1 mL of Milli-Q water, the cartridge was dried under vacuumfor 2 hours. The cartridges were then extracted with 1 mL of DCM and anhydroussodium sulphate was added to remove traces of water. All sample preparation andanalysis was performed in duplicate. A procedural blank (Milli-Q water) was in-cluded in the sample work-up.
3.1.4. Non/semi-volatile substances; with derivatisation GC-MSThe samples were too viscous for the derivatisation procedure and were there-
fore diluted four times with Milli-Q water before further sample treatment. The dilutedsamples were further diluted 10, 25, 100 and 250 times with Milli-Q, resulting in atotal dilution of 40, 100, 400 and 1000 times. From each of the diluted samples, 200 μLwas transferred into a PTFE vial and the internal standard Ribose 13C5 in Milli-Q wasadded. The samples were freeze dried (the standard Ribose 13C5 was added to checkthe freeze drying procedure) and derivatised as follows: 10 μL of a 250 ng/μL solu-tion containing Alanin-D4 and citric acid D4 was added. These internal standardswere also derivatised and served as control for the derivatisation procedure. Another10 μL of a 250 ng/μL solution containing 9-(trifluoracetyl)anthracene (TFAA) anddicyclohexylphthalic acid (DCHP) was added. These internal standards were notderivatised and served as control for the dilution and injection volume. 10 μL of adifluorobiphenyl (DFB) solution was added at a level that corresponds to90 μg/day (exposure threshold). 30 μL ethoxyamine.HCl (56 mg/ml pyridine) wasadded. The sample was mixed for 90 minutes at 40 °C. 90 μL N-methyl-N-(trimethylsilyl)trifluoroacetamide derivatisation agent was added. Silylation wasperformed for 50 minutes at 40 °C. The sample was centrifuged at 3500 rpm for 20minutes followed by analysis with GC-MS.
The samples were analysed with a 6890 gas chromatograph coupled to a 5973mass spectrometer (Agilent technologies, Santa Clara). 1 μL of sample was injectedin splitless mode into a 30 m × 0.25 mm I.D. × 0.25 μm df HP-5MS column (Agilent)using a CIS-4 PTV injector (Gerstel) with baffled liner. PTV temperature program:70 °C (0.6 min)–120 °C/min to 300 °C (58 min). Oven temperature program: 70 °C(2 min)–6 °C/min to 325 °C (15.5 min). Helium at 1.7 mL/min was used as carrier gasin constant flow mode. MS detection was performed with electron ionisation (70 eV)in full-scan mode (m/z 15–800). MS temperatures were: transfer line 325 °C; ion source250 °C; quadruple at 200 °C. All sample preparation and analysis was performed induplicate. A procedural blank (Milli-Q water) was included in the sample work-up.
3.1.5. LC-MSAll samples were diluted ten times (by weight) with Milli-Q water to make the
samples less viscous for easier handling in the sample treatment. The samples werefurther diluted 10 times (by volume) with Milli-Q water followed by a centrifuga-tion step for 10 minutes at 14,000 rpm. To 1 mL diluted sample, 10 μL of an internalstandard mix was added. The concentration of the internal standards in the mix was143 μg/mL dexamethasone, 140 μg/mL tyrosine D3, 142 μg/mL Leucine-Enkephalin,139 μg/mL C6-carnitine D3, 137 μg/mL C10-carnitine D3, 145 μg/mL 6-aminohexanoicacid, 143 μg/mL 8-aminooctanoic acid and 146 μg/mL 12-aminododecanoic acid inMilli-Q.
The samples were analysed with a Thermo UPLC system operated with a QExactive Hybrid Quadruple-Orbitrap mass spectrometer. Total runtime was 19 minutes.
• Acquity UPLC HSS T3, 100 × 2.1 mm, 1.8 μm (Waters, 186003539).• Flow 0.5 mL/min.• Eluens A = 0.1% formic acid in Milli-Q water.• Eluens B = 0.1 % formic acid in acetonitrile.• Gradient: t0 100% A, 0% B
t1 100% A, 0% Bt10 50% A, 50% Bt12.5 0% A, 100% Bt15 0% A, 100% Bt15.5 100% A, 0% Bt19 100% A, 0% B.
The mass spectrometer was operated in polarity switching mode (alternatingpositive and negative ESI in one LC-MS run).
3.1.6. Assessment of the exposure to PN and ENThe exposure to the substances in the samples is determined by combining in-
formation about the consumption of the food products to which the NSEs are(intended to be) added (see exposure assessment section in Results and discus-sion), the concentrations of the NSEs in these products and the result from theseanalytical screening experiments as described above. Consumption data from theDutch food consumption database (DNFCS) was used for the exposure assessmentof PN and EN. The exposure was estimated using the aggregated food consump-tion data for the total population (RIVM, 2011). Consequently, the “two highest model”from the EFSA is applied to calculate the exposure, which takes into account notonly high intake amongst users of the products but also market share of the producer.
3.2. Covering high toxic and TTC excluded substances (step 2 of CoMSAS)
According to the CoMSAS approach as described by Rennen et al. (2011), Kosteret al. (2011), and Koster et al. (2014), the formation of highly toxic substances andTTC excluded substances should be covered for the NSEs compared to the refer-ence juices. For the current cases, for all the categories of substances in step 2 thisexclusion has been performed based upon expert judgement.
3.3. Genotoxicity assay; BlueScreen HC (step 3 of CoMSAS)
A 96-well format BlueScreen HC luminescence reporter assay was performedon all samples. The experiment was performed in the absence and presence of met-abolic activation (S9-mix) as described by Hughes et al. (2012) and Koster et al. (2014).A dilution series of all samples was added to the wells of a black-walled, clear-bottomed, sterile 96-well micro plate. The dilution series was obtained by dilutingthe samples 10 times with Milli-Q followed by sterile filtering over a 0.45 micronfilter. The samples were further diluted on-plate to obtain a test concentration withthe cells of 4, 2, 1, 0.5, 0.25, 0.125, 0.063 and 0.031% (v/v). To each well 75 μL of theGADD45a-GLuc cells suspended in assay medium (Gentronix Ltd.) was added at aconcentration of 2 × 10⁶ cells/mL to yield a starting cell density of 1 × 10⁶ cells/mLand a final incubation volume of 150 μL.
In the presence of metabolic activation, 10% S9-mix was present in the final culturemedium of each well, equivalent to 1% S9 fraction (Moltox, Boone, NC). Positive andnegative controls (including medium control) were run simultaneously with the di-lution series. In the absence of metabolic activation the micro plate was sealed witha breath-easy membrane (Sigma-Aldrich) and incubated at 37 °C in a humidified at-mosphere (5% CO2) for 48 h. In the presence of metabolic activation the cells wereexposed for 4 hours, followed by a two times wash in Dulbecco’s phosphate-buffered saline (D-PBS) to remove S9. The remaining cells were resuspended inprewarmed medium (Gentronix Ltd.) for a further 43–45 h incubation. A Tecan In-finite F500 plate reader (Tecan Benelux BVBA, Giessen, The Netherlands), fitted withan injector syringe system, was used to measure luminescence (genotoxicity output).Prior to the measurement, 50 μL of the substrate coelenterazine was injected intoa well where after luminescence data were collected. This was repeated for eachindividual well of the micro plate. Fluorescence (cytotoxicity output) was mea-sured after the addition of 12.5 μM TO (in Triton-X100 in D-PBS) to each well at anexcitation wavelength of 485 nm and an emission wavelength of 535 nm.
4. Results and discussion
4.1. Results of step 1: general screening for substances exceeding90 μg/day
4.1.1. Exposure assessmentExposure assessment is necessary to be able to perform the an-
alytical screening experiments at the right concentration. Theexposure assessment is therefore performed first followed by theanalytical screening.
4.1.1.1. Pumpkin. The supplier of PN (and PR) provided informa-tion on the food groups in which the PN is used and in whichconcentration (provided in percentages). This information issummarised in Table 2.
For all foods consumed and listed in the DNFCS 2007–2010, itwas identified whether or not they belong to one of the food groupsindicated in Table 2. For these groups, individual food products areselected based on their ability to contain the NSE of pumpkin. Forexample: plain yoghurt was not included, since pumpkin gives anorange colour and therefore would not be used in plain yoghurt.The mean food product group intake of the four food groups was
Table 2Food groups and concentration levels in which pumpkin NSE (PN) is used.
Foods Concentration(% = gram/100 gram)
Ice cream 0.7–1.0%Yoghurt Approx. 0.25–0.35%Carbonated soft drinks 0.005–0.045%Candiesa 0.02–1.0%
a Concentration levels for candies are assumed to equal to the levels as used forthe elderberry assessment.
167S. Koster et al.f/Food and Chemical Toxicology 80 (2015) 163–181
calculated for the Dutch total population (Table 3) and users only(Table 4), using RIVM (2011).
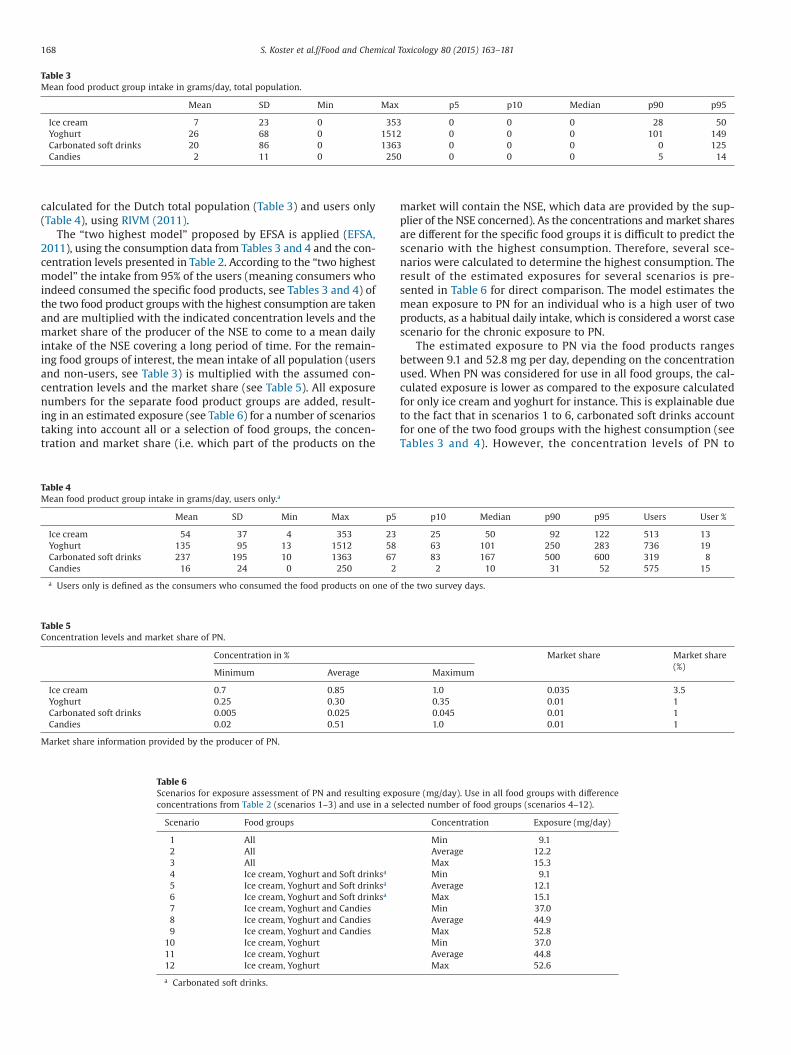
The “two highest model” proposed by EFSA is applied (EFSA,2011), using the consumption data from Tables 3 and 4 and the con-centration levels presented in Table 2. According to the “two highestmodel” the intake from 95% of the users (meaning consumers whoindeed consumed the specific food products, see Tables 3 and 4) ofthe two food product groups with the highest consumption are takenand are multiplied with the indicated concentration levels and themarket share of the producer of the NSE to come to a mean dailyintake of the NSE covering a long period of time. For the remain-ing food groups of interest, the mean intake of all population (usersand non-users, see Table 3) is multiplied with the assumed con-centration levels and the market share (see Table 5). All exposurenumbers for the separate food product groups are added, result-ing in an estimated exposure (see Table 6) for a number of scenariostaking into account all or a selection of food groups, the concen-tration and market share (i.e. which part of the products on the
market will contain the NSE, which data are provided by the sup-plier of the NSE concerned). As the concentrations and market sharesare different for the specific food groups it is difficult to predict thescenario with the highest consumption. Therefore, several sce-narios were calculated to determine the highest consumption. Theresult of the estimated exposures for several scenarios is pre-sented in Table 6 for direct comparison. The model estimates themean exposure to PN for an individual who is a high user of twoproducts, as a habitual daily intake, which is considered a worst casescenario for the chronic exposure to PN.
The estimated exposure to PN via the food products rangesbetween 9.1 and 52.8 mg per day, depending on the concentrationused. When PN was considered for use in all food groups, the cal-culated exposure is lower as compared to the exposure calculatedfor only ice cream and yoghurt for instance. This is explainable dueto the fact that in scenarios 1 to 6, carbonated soft drinks accountfor one of the two food groups with the highest consumption (seeTables 3 and 4). However, the concentration levels of PN to
Table 3Mean food product group intake in grams/day, total population.
Mean SD Min Max p5 p10 Median p90 p95
Ice cream 7 23 0 353 0 0 0 28 50Yoghurt 26 68 0 1512 0 0 0 101 149Carbonated soft drinks 20 86 0 1363 0 0 0 0 125Candies 2 11 0 250 0 0 0 5 14
Table 4Mean food product group intake in grams/day, users only.a
Mean SD Min Max p5 p10 Median p90 p95 Users User %
Ice cream 54 37 4 353 23 25 50 92 122 513 13Yoghurt 135 95 13 1512 58 63 101 250 283 736 19Carbonated soft drinks 237 195 10 1363 67 83 167 500 600 319 8Candies 16 24 0 250 2 2 10 31 52 575 15
a Users only is defined as the consumers who consumed the food products on one of the two survey days.
Table 5Concentration levels and market share of PN.
Concentration in % Market share Market share(%)
Minimum Average Maximum
Ice cream 0.7 0.85 1.0 0.035 3.5Yoghurt 0.25 0.30 0.35 0.01 1Carbonated soft drinks 0.005 0.025 0.045 0.01 1Candies 0.02 0.51 1.0 0.01 1
Market share information provided by the producer of PN.
Table 6Scenarios for exposure assessment of PN and resulting exposure (mg/day). Use in all food groups with differenceconcentrations from Table 2 (scenarios 1–3) and use in a selected number of food groups (scenarios 4–12).
Scenario Food groups Concentration Exposure (mg/day)
1 All Min 9.12 All Average 12.23 All Max 15.34 Ice cream, Yoghurt and Soft drinksa Min 9.15 Ice cream, Yoghurt and Soft drinksa Average 12.16 Ice cream, Yoghurt and Soft drinksa Max 15.17 Ice cream, Yoghurt and Candies Min 37.08 Ice cream, Yoghurt and Candies Average 44.99 Ice cream, Yoghurt and Candies Max 52.8
10 Ice cream, Yoghurt Min 37.011 Ice cream, Yoghurt Average 44.812 Ice cream, Yoghurt Max 52.6
a Carbonated soft drinks.
168 S. Koster et al.f/Food and Chemical Toxicology 80 (2015) 163–181
carbonated soft drinks is lower as compared to the concentrationlevels added to the other food groups, resulting in a lower esti-mated exposure.
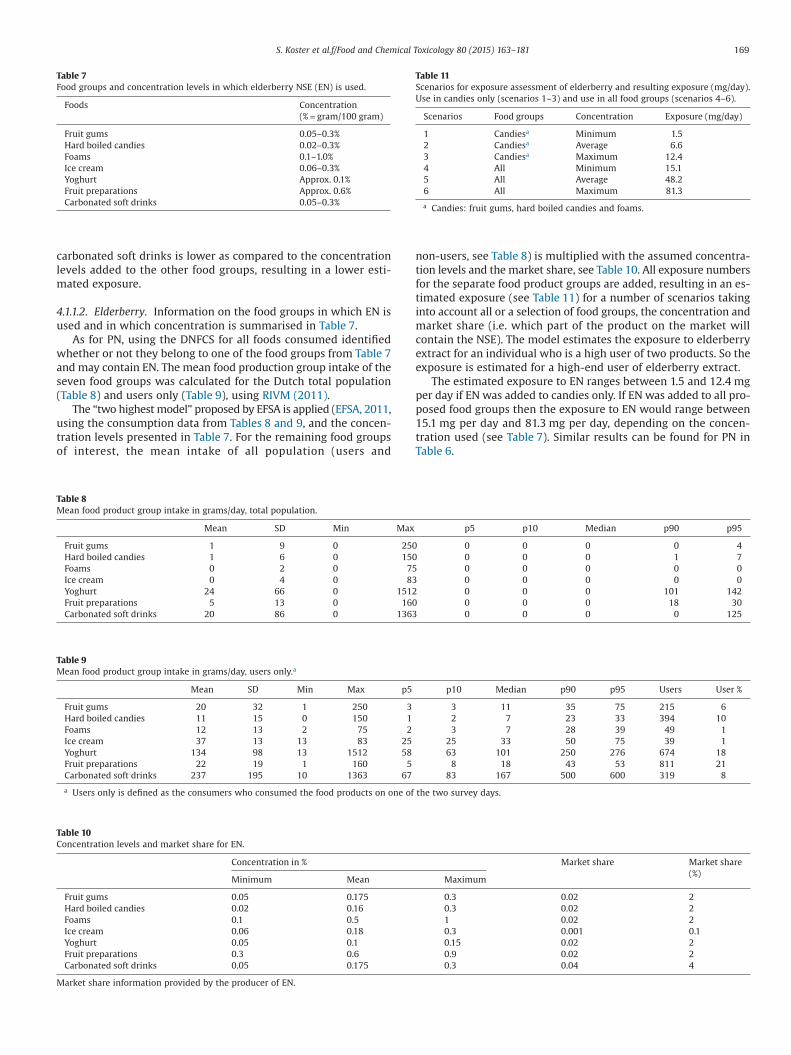
4.1.1.2. Elderberry. Information on the food groups in which EN isused and in which concentration is summarised in Table 7.
As for PN, using the DNFCS for all foods consumed identifiedwhether or not they belong to one of the food groups from Table 7and may contain EN. The mean food production group intake of theseven food groups was calculated for the Dutch total population(Table 8) and users only (Table 9), using RIVM (2011).
The “two highest model” proposed by EFSA is applied (EFSA, 2011,using the consumption data from Tables 8 and 9, and the concen-tration levels presented in Table 7. For the remaining food groupsof interest, the mean intake of all population (users and
non-users, see Table 8) is multiplied with the assumed concentra-tion levels and the market share, see Table 10. All exposure numbersfor the separate food product groups are added, resulting in an es-timated exposure (see Table 11) for a number of scenarios takinginto account all or a selection of food groups, the concentration andmarket share (i.e. which part of the product on the market willcontain the NSE). The model estimates the exposure to elderberryextract for an individual who is a high user of two products. So theexposure is estimated for a high-end user of elderberry extract.
The estimated exposure to EN ranges between 1.5 and 12.4 mgper day if EN was added to candies only. If EN was added to all pro-posed food groups then the exposure to EN would range between15.1 mg per day and 81.3 mg per day, depending on the concen-tration used (see Table 7). Similar results can be found for PN inTable 6.
Table 7Food groups and concentration levels in which elderberry NSE (EN) is used.
Foods Concentration(% = gram/100 gram)
Fruit gums 0.05–0.3%Hard boiled candies 0.02–0.3%Foams 0.1–1.0%Ice cream 0.06–0.3%Yoghurt Approx. 0.1%Fruit preparations Approx. 0.6%Carbonated soft drinks 0.05–0.3%
Table 8Mean food product group intake in grams/day, total population.
Mean SD Min Max p5 p10 Median p90 p95
Fruit gums 1 9 0 250 0 0 0 0 4Hard boiled candies 1 6 0 150 0 0 0 1 7Foams 0 2 0 75 0 0 0 0 0Ice cream 0 4 0 83 0 0 0 0 0Yoghurt 24 66 0 1512 0 0 0 101 142Fruit preparations 5 13 0 160 0 0 0 18 30Carbonated soft drinks 20 86 0 1363 0 0 0 0 125
Table 9Mean food product group intake in grams/day, users only.a
Mean SD Min Max p5 p10 Median p90 p95 Users User %
Fruit gums 20 32 1 250 3 3 11 35 75 215 6Hard boiled candies 11 15 0 150 1 2 7 23 33 394 10Foams 12 13 2 75 2 3 7 28 39 49 1Ice cream 37 13 13 83 25 25 33 50 75 39 1Yoghurt 134 98 13 1512 58 63 101 250 276 674 18Fruit preparations 22 19 1 160 5 8 18 43 53 811 21Carbonated soft drinks 237 195 10 1363 67 83 167 500 600 319 8
a Users only is defined as the consumers who consumed the food products on one of the two survey days.
Table 10Concentration levels and market share for EN.
Concentration in % Market share Market share(%)
Minimum Mean Maximum
Fruit gums 0.05 0.175 0.3 0.02 2Hard boiled candies 0.02 0.16 0.3 0.02 2Foams 0.1 0.5 1 0.02 2Ice cream 0.06 0.18 0.3 0.001 0.1Yoghurt 0.05 0.1 0.15 0.02 2Fruit preparations 0.3 0.6 0.9 0.02 2Carbonated soft drinks 0.05 0.175 0.3 0.04 4
Market share information provided by the producer of EN.
Table 11Scenarios for exposure assessment of elderberry and resulting exposure (mg/day).Use in candies only (scenarios 1–3) and use in all food groups (scenarios 4–6).
Scenarios Food groups Concentration Exposure (mg/day)
1 Candiesa Minimum 1.52 Candiesa Average 6.63 Candiesa Maximum 12.44 All Minimum 15.15 All Average 48.26 All Maximum 81.3
a Candies: fruit gums, hard boiled candies and foams.
169S. Koster et al.f/Food and Chemical Toxicology 80 (2015) 163–181
4.1.1.3. Discussion level of exposure. In this exposure assessmentseveral assumptions are made. There are three main sources thatdetermine the level of exposure: the concentration of the NSE inthe food, the consumption of the food, and the food market share.In this case the DNFCS data were used to determine the consump-tion of the food in which the NSE is used. Information on theconcentration range used in foods and the market share were ob-tained from the supplier of the NSEs and from the supplier ofproducts containing NSEs. Reportedly, the market share numbersused in this assessment are a result of a search (from Mintel) in fourcountries (UK, Belgium, The Netherlands, and Germany), indicat-ing new products to be launched on the market. The words“elderberry” and “pumpkin” were included in the search query. Itis not known from this search whether elderberry and pumpkin areused as colouring agent, for flavouring, blending or otherwise.
Within the market share figures, assumptions were included tocome to a realistic figure amongst which:
• Most searches include theUK, Germany, Belgium and The Neth-erlands. Use of NSE is relatively new, but countries such as theUK and Germany are considered to have a higher market shareregarding use of NSE compared to, e.g. The Netherlands;
• Elderberry and pumpkin NSEs are often used in blends with otherNSEs due to relatively high price and different performance inapplications compared to other NSE;
• Most red shaded yoghurt is coloured with colours comparableto NSE. If elderberry is used as NSE for these products it will prob-ably only be as a blend. As most of the red shaded yoghurt is“strawberry”, the number is adjusted to 2% for elderberry;
• Vanilla ice cream is considered as the most important type ofice cream, followed by strawberry, chocolate and pistachio. Thoseice creams do not contain the NSEs as evaluated. It was there-fore estimated that the market share for PN and EN in ice creamis up to 0.1%;
• Sugar and confectionary are often sold in bags consisting of mixedcandies with different colours. The exposure estimate is con-sidered for the red part of one candy box and then again it wasassumed that PN and EN are normally used in a blend;
• The amount of NSE is assumed to be less than 10% of the globalmarket share for natural and synthetic colours used in food.
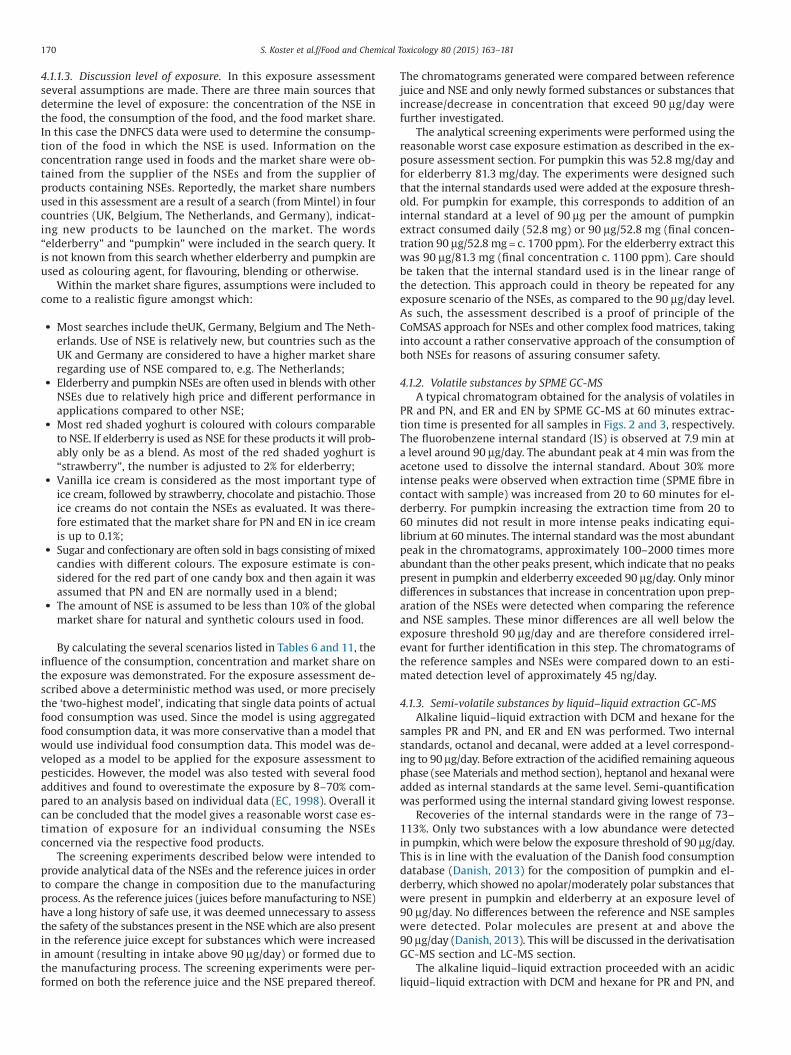
By calculating the several scenarios listed in Tables 6 and 11, theinfluence of the consumption, concentration and market share onthe exposure was demonstrated. For the exposure assessment de-scribed above a deterministic method was used, or more preciselythe ‘two-highest model’, indicating that single data points of actualfood consumption was used. Since the model is using aggregatedfood consumption data, it was more conservative than a model thatwould use individual food consumption data. This model was de-veloped as a model to be applied for the exposure assessment topesticides. However, the model was also tested with several foodadditives and found to overestimate the exposure by 8–70% com-pared to an analysis based on individual data (EC, 1998). Overall itcan be concluded that the model gives a reasonable worst case es-timation of exposure for an individual consuming the NSEsconcerned via the respective food products.
The screening experiments described below were intended toprovide analytical data of the NSEs and the reference juices in orderto compare the change in composition due to the manufacturingprocess. As the reference juices (juices before manufacturing to NSE)have a long history of safe use, it was deemed unnecessary to assessthe safety of the substances present in the NSE which are also presentin the reference juice except for substances which were increasedin amount (resulting in intake above 90 μg/day) or formed due tothe manufacturing process. The screening experiments were per-formed on both the reference juice and the NSE prepared thereof.
The chromatograms generated were compared between referencejuice and NSE and only newly formed substances or substances thatincrease/decrease in concentration that exceed 90 μg/day werefurther investigated.
The analytical screening experiments were performed using thereasonable worst case exposure estimation as described in the ex-posure assessment section. For pumpkin this was 52.8 mg/day andfor elderberry 81.3 mg/day. The experiments were designed suchthat the internal standards used were added at the exposure thresh-old. For pumpkin for example, this corresponds to addition of aninternal standard at a level of 90 μg per the amount of pumpkinextract consumed daily (52.8 mg) or 90 μg/52.8 mg (final concen-tration 90 μg/52.8 mg = c. 1700 ppm). For the elderberry extract thiswas 90 μg/81.3 mg (final concentration c. 1100 ppm). Care shouldbe taken that the internal standard used is in the linear range ofthe detection. This approach could in theory be repeated for anyexposure scenario of the NSEs, as compared to the 90 μg/day level.As such, the assessment described is a proof of principle of theCoMSAS approach for NSEs and other complex food matrices, takinginto account a rather conservative approach of the consumption ofboth NSEs for reasons of assuring consumer safety.
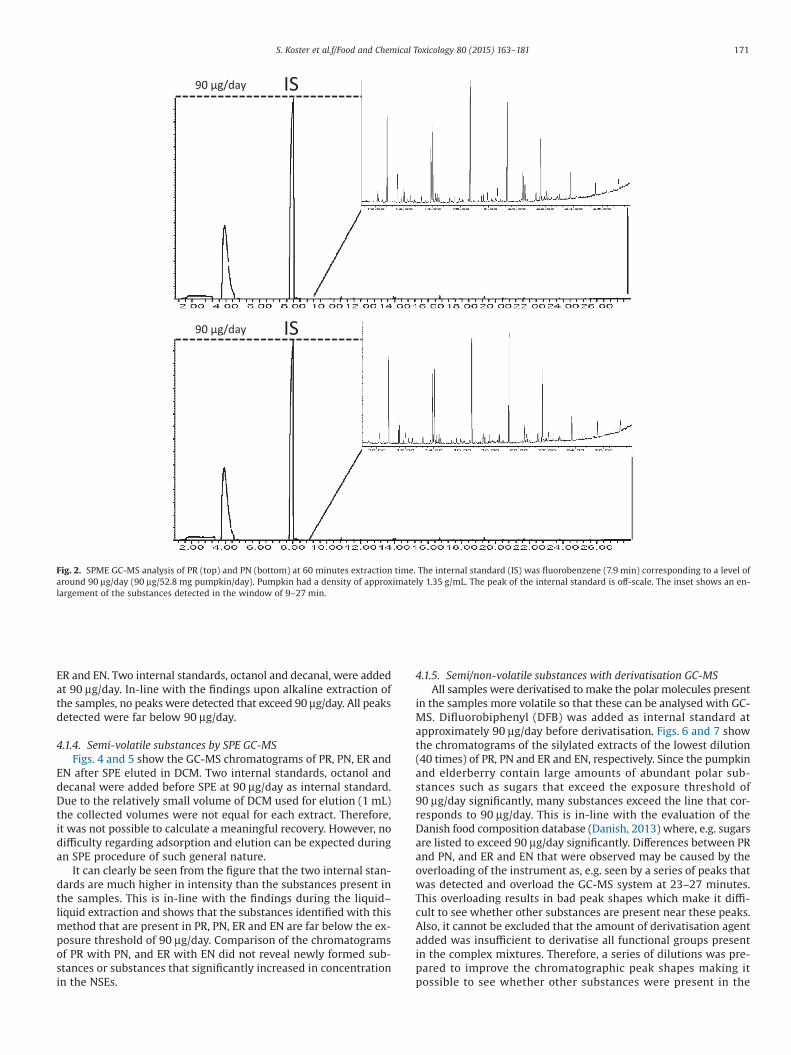
4.1.2. Volatile substances by SPME GC-MSA typical chromatogram obtained for the analysis of volatiles in
PR and PN, and ER and EN by SPME GC-MS at 60 minutes extrac-tion time is presented for all samples in Figs. 2 and 3, respectively.The fluorobenzene internal standard (IS) is observed at 7.9 min ata level around 90 μg/day. The abundant peak at 4 min was from theacetone used to dissolve the internal standard. About 30% moreintense peaks were observed when extraction time (SPME fibre incontact with sample) was increased from 20 to 60 minutes for el-derberry. For pumpkin increasing the extraction time from 20 to60 minutes did not result in more intense peaks indicating equi-librium at 60 minutes. The internal standard was the most abundantpeak in the chromatograms, approximately 100–2000 times moreabundant than the other peaks present, which indicate that no peakspresent in pumpkin and elderberry exceeded 90 μg/day. Only minordifferences in substances that increase in concentration upon prep-aration of the NSEs were detected when comparing the referenceand NSE samples. These minor differences are all well below theexposure threshold 90 μg/day and are therefore considered irrel-evant for further identification in this step. The chromatograms ofthe reference samples and NSEs were compared down to an esti-mated detection level of approximately 45 ng/day.
4.1.3. Semi-volatile substances by liquid–liquid extraction GC-MSAlkaline liquid–liquid extraction with DCM and hexane for the
samples PR and PN, and ER and EN was performed. Two internalstandards, octanol and decanal, were added at a level correspond-ing to 90 μg/day. Before extraction of the acidified remaining aqueousphase (see Materials and method section), heptanol and hexanal wereadded as internal standards at the same level. Semi-quantificationwas performed using the internal standard giving lowest response.
Recoveries of the internal standards were in the range of 73–113%. Only two substances with a low abundance were detectedin pumpkin, which were below the exposure threshold of 90 μg/day.This is in line with the evaluation of the Danish food consumptiondatabase (Danish, 2013) for the composition of pumpkin and el-derberry, which showed no apolar/moderately polar substances thatwere present in pumpkin and elderberry at an exposure level of90 μg/day. No differences between the reference and NSE sampleswere detected. Polar molecules are present at and above the90 μg/day (Danish, 2013). This will be discussed in the derivatisationGC-MS section and LC-MS section.
The alkaline liquid–liquid extraction proceeded with an acidicliquid–liquid extraction with DCM and hexane for PR and PN, and
170 S. Koster et al.f/Food and Chemical Toxicology 80 (2015) 163–181
ER and EN. Two internal standards, octanol and decanal, were addedat 90 μg/day. In-line with the findings upon alkaline extraction ofthe samples, no peaks were detected that exceed 90 μg/day. All peaksdetected were far below 90 μg/day.
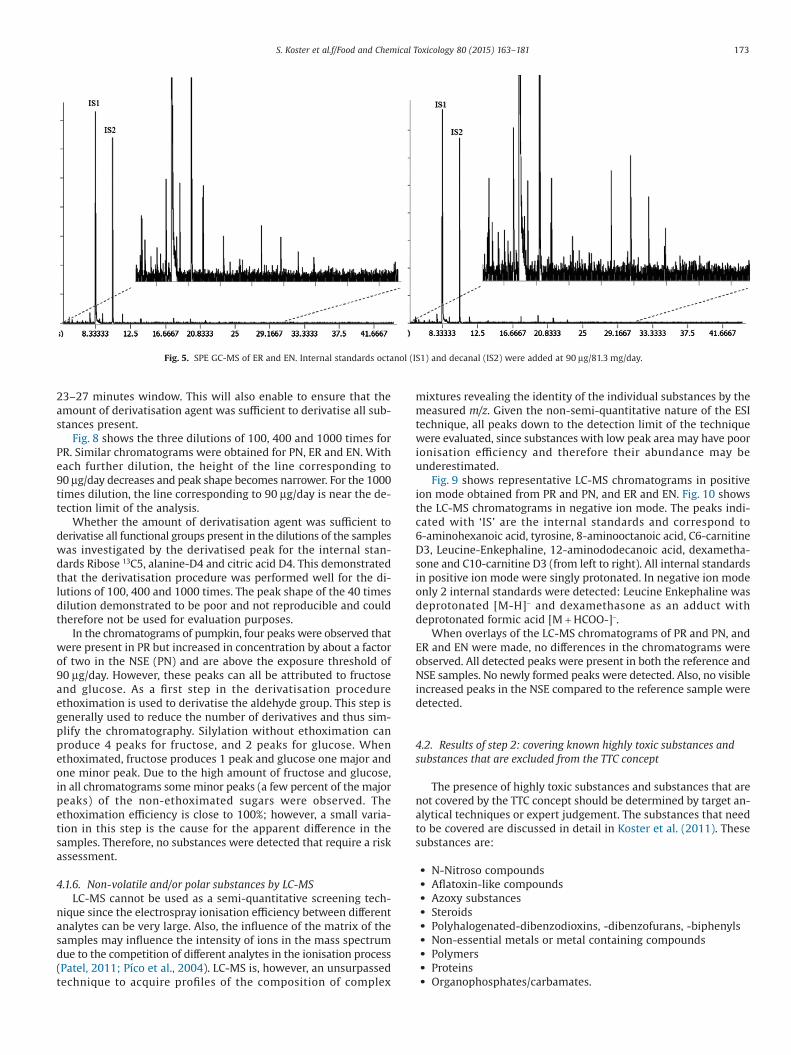
4.1.4. Semi-volatile substances by SPE GC-MSFigs. 4 and 5 show the GC-MS chromatograms of PR, PN, ER and
EN after SPE eluted in DCM. Two internal standards, octanol anddecanal were added before SPE at 90 μg/day as internal standard.Due to the relatively small volume of DCM used for elution (1 mL)the collected volumes were not equal for each extract. Therefore,it was not possible to calculate a meaningful recovery. However, nodifficulty regarding adsorption and elution can be expected duringan SPE procedure of such general nature.
It can clearly be seen from the figure that the two internal stan-dards are much higher in intensity than the substances present inthe samples. This is in-line with the findings during the liquid–liquid extraction and shows that the substances identified with thismethod that are present in PR, PN, ER and EN are far below the ex-posure threshold of 90 μg/day. Comparison of the chromatogramsof PR with PN, and ER with EN did not reveal newly formed sub-stances or substances that significantly increased in concentrationin the NSEs.
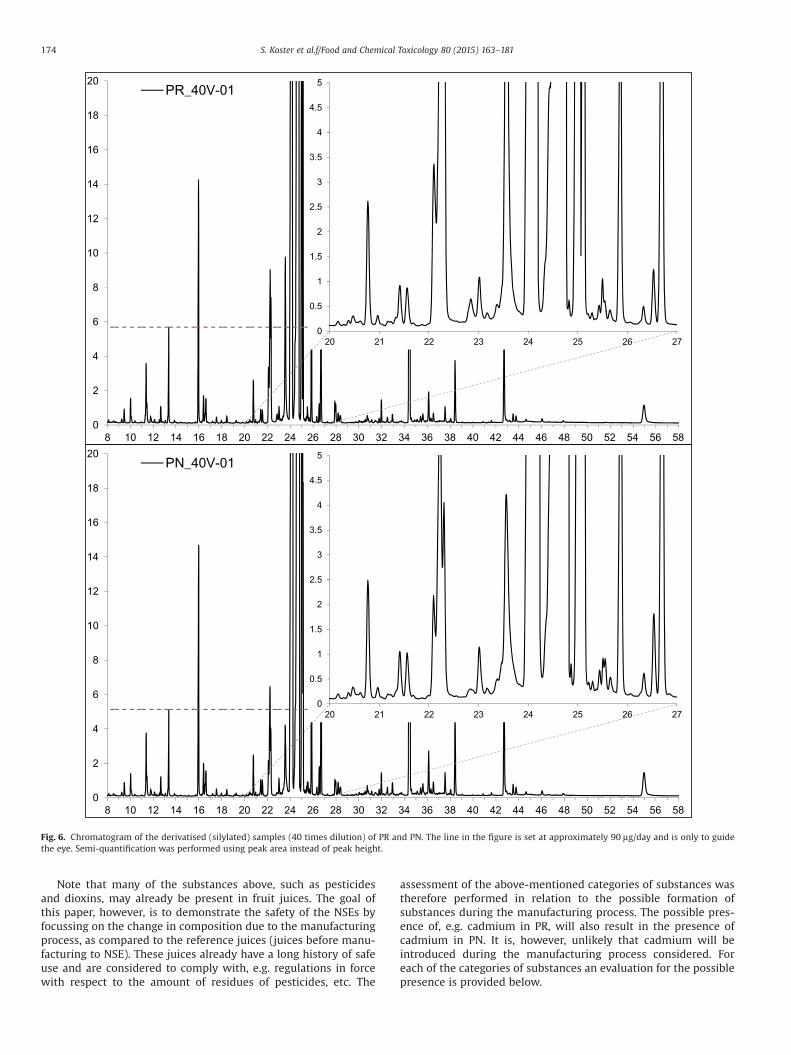
4.1.5. Semi/non-volatile substances with derivatisation GC-MSAll samples were derivatised to make the polar molecules present
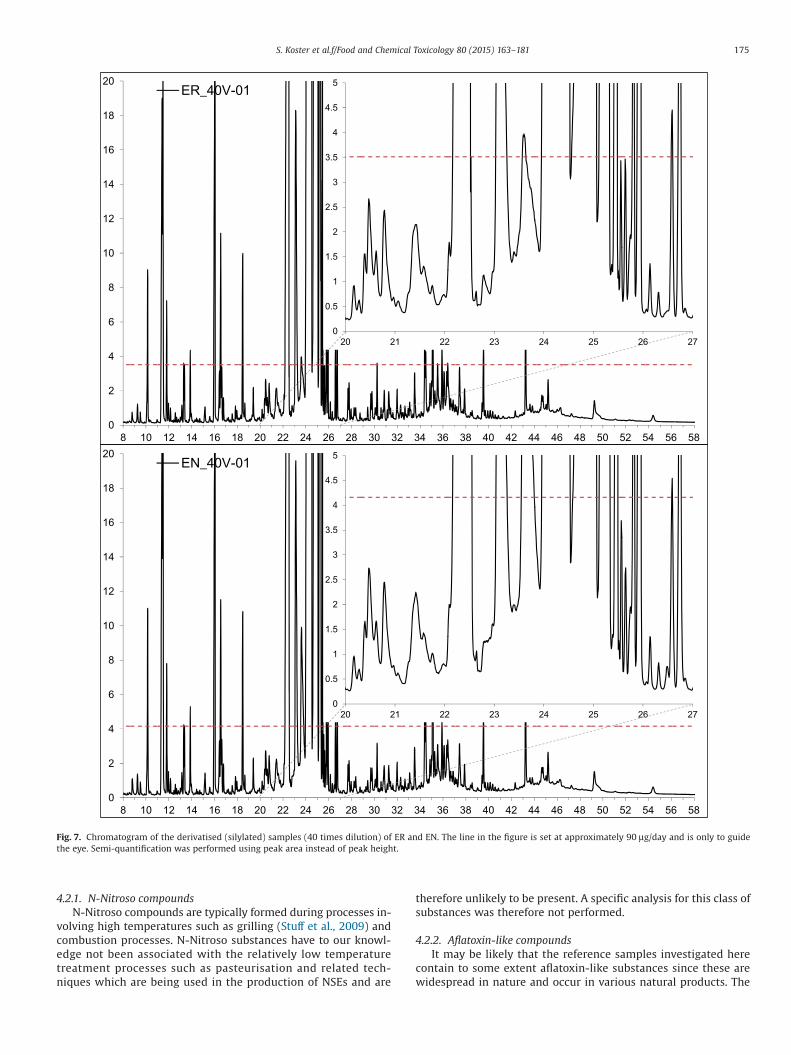
in the samples more volatile so that these can be analysed with GC-MS. Difluorobiphenyl (DFB) was added as internal standard atapproximately 90 μg/day before derivatisation. Figs. 6 and 7 showthe chromatograms of the silylated extracts of the lowest dilution(40 times) of PR, PN and ER and EN, respectively. Since the pumpkinand elderberry contain large amounts of abundant polar sub-stances such as sugars that exceed the exposure threshold of90 μg/day significantly, many substances exceed the line that cor-responds to 90 μg/day. This is in-line with the evaluation of theDanish food composition database (Danish, 2013) where, e.g. sugarsare listed to exceed 90 μg/day significantly. Differences between PRand PN, and ER and EN that were observed may be caused by theoverloading of the instrument as, e.g. seen by a series of peaks thatwas detected and overload the GC-MS system at 23–27 minutes.This overloading results in bad peak shapes which make it diffi-cult to see whether other substances are present near these peaks.Also, it cannot be excluded that the amount of derivatisation agentadded was insufficient to derivatise all functional groups presentin the complex mixtures. Therefore, a series of dilutions was pre-pared to improve the chromatographic peak shapes making itpossible to see whether other substances were present in the
IS
IS
90 µg/day
90 µg/day
Fig. 2. SPME GC-MS analysis of PR (top) and PN (bottom) at 60 minutes extraction time. The internal standard (IS) was fluorobenzene (7.9 min) corresponding to a level ofaround 90 μg/day (90 μg/52.8 mg pumpkin/day). Pumpkin had a density of approximately 1.35 g/mL. The peak of the internal standard is off-scale. The inset shows an en-largement of the substances detected in the window of 9–27 min.
171S. Koster et al.f/Food and Chemical Toxicology 80 (2015) 163–181
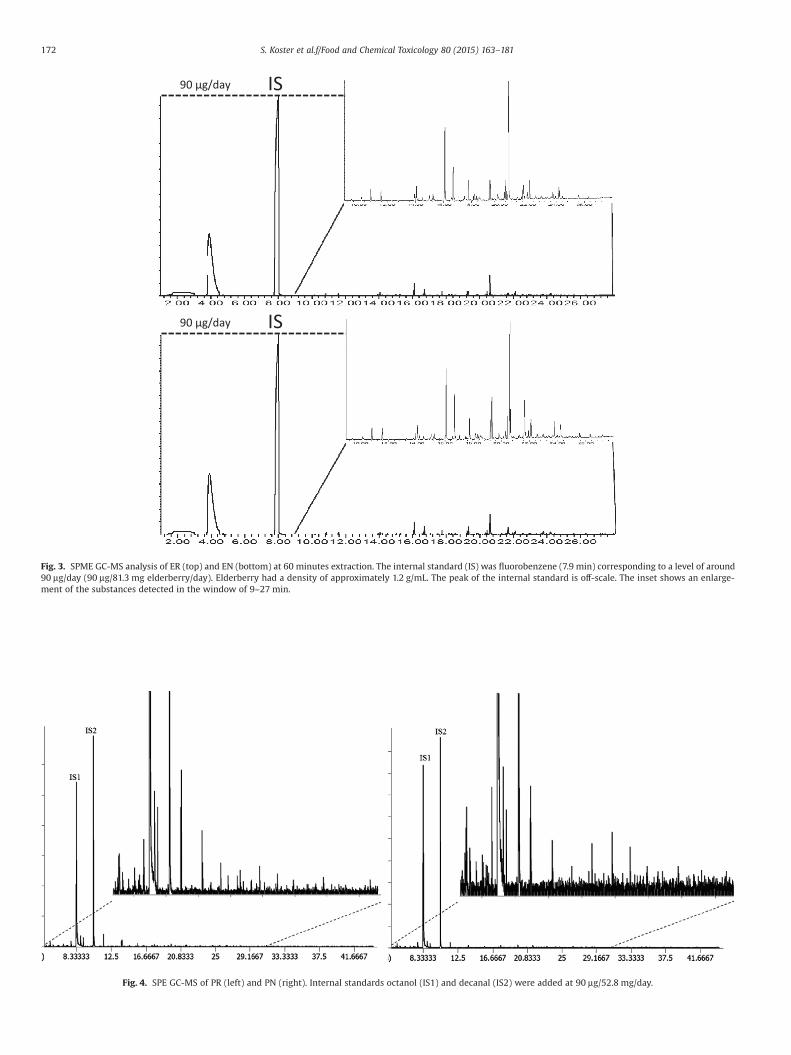
IS90 µg/day
IS90 µg/day
Fig. 3. SPME GC-MS analysis of ER (top) and EN (bottom) at 60 minutes extraction. The internal standard (IS) was fluorobenzene (7.9 min) corresponding to a level of around90 μg/day (90 μg/81.3 mg elderberry/day). Elderberry had a density of approximately 1.2 g/mL. The peak of the internal standard is off-scale. The inset shows an enlarge-ment of the substances detected in the window of 9–27 min.
Fig. 4. SPE GC-MS of PR (left) and PN (right). Internal standards octanol (IS1) and decanal (IS2) were added at 90 μg/52.8 mg/day.
172 S. Koster et al.f/Food and Chemical Toxicology 80 (2015) 163–181
23–27 minutes window. This will also enable to ensure that theamount of derivatisation agent was sufficient to derivatise all sub-stances present.
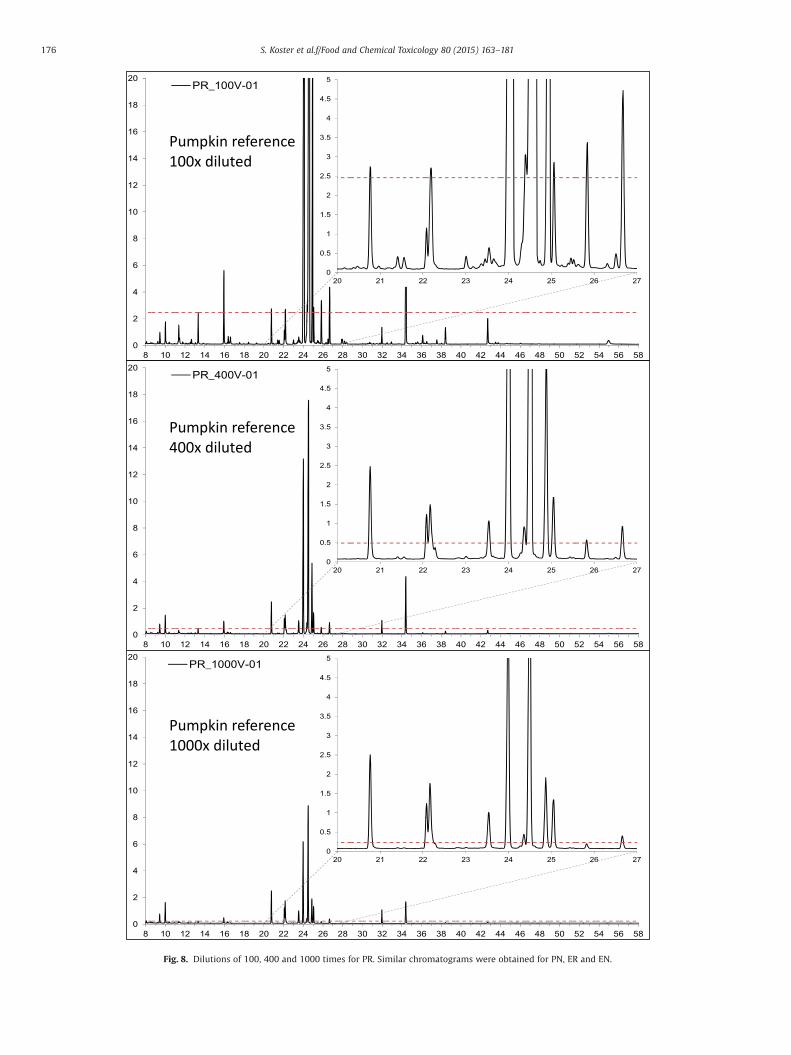
Fig. 8 shows the three dilutions of 100, 400 and 1000 times forPR. Similar chromatograms were obtained for PN, ER and EN. Witheach further dilution, the height of the line corresponding to90 μg/day decreases and peak shape becomes narrower. For the 1000times dilution, the line corresponding to 90 μg/day is near the de-tection limit of the analysis.
Whether the amount of derivatisation agent was sufficient toderivatise all functional groups present in the dilutions of the sampleswas investigated by the derivatised peak for the internal stan-dards Ribose 13C5, alanine-D4 and citric acid D4. This demonstratedthat the derivatisation procedure was performed well for the di-lutions of 100, 400 and 1000 times. The peak shape of the 40 timesdilution demonstrated to be poor and not reproducible and couldtherefore not be used for evaluation purposes.
In the chromatograms of pumpkin, four peaks were observed thatwere present in PR but increased in concentration by about a factorof two in the NSE (PN) and are above the exposure threshold of90 μg/day. However, these peaks can all be attributed to fructoseand glucose. As a first step in the derivatisation procedureethoximation is used to derivatise the aldehyde group. This step isgenerally used to reduce the number of derivatives and thus sim-plify the chromatography. Silylation without ethoximation canproduce 4 peaks for fructose, and 2 peaks for glucose. Whenethoximated, fructose produces 1 peak and glucose one major andone minor peak. Due to the high amount of fructose and glucose,in all chromatograms some minor peaks (a few percent of the majorpeaks) of the non-ethoximated sugars were observed. Theethoximation efficiency is close to 100%; however, a small varia-tion in this step is the cause for the apparent difference in thesamples. Therefore, no substances were detected that require a riskassessment.
4.1.6. Non-volatile and/or polar substances by LC-MSLC-MS cannot be used as a semi-quantitative screening tech-
nique since the electrospray ionisation efficiency between differentanalytes can be very large. Also, the influence of the matrix of thesamples may influence the intensity of ions in the mass spectrumdue to the competition of different analytes in the ionisation process(Patel, 2011; Píco et al., 2004). LC-MS is, however, an unsurpassedtechnique to acquire profiles of the composition of complex
mixtures revealing the identity of the individual substances by themeasured m/z. Given the non-semi-quantitative nature of the ESItechnique, all peaks down to the detection limit of the techniquewere evaluated, since substances with low peak area may have poorionisation efficiency and therefore their abundance may beunderestimated.
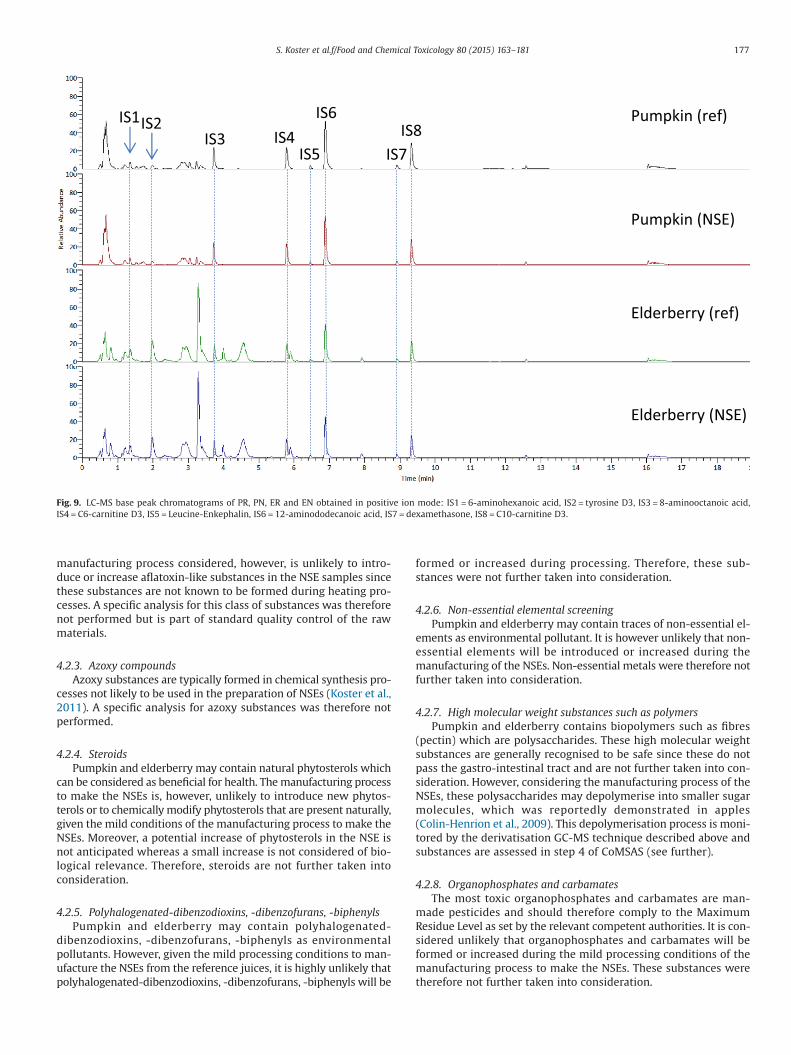
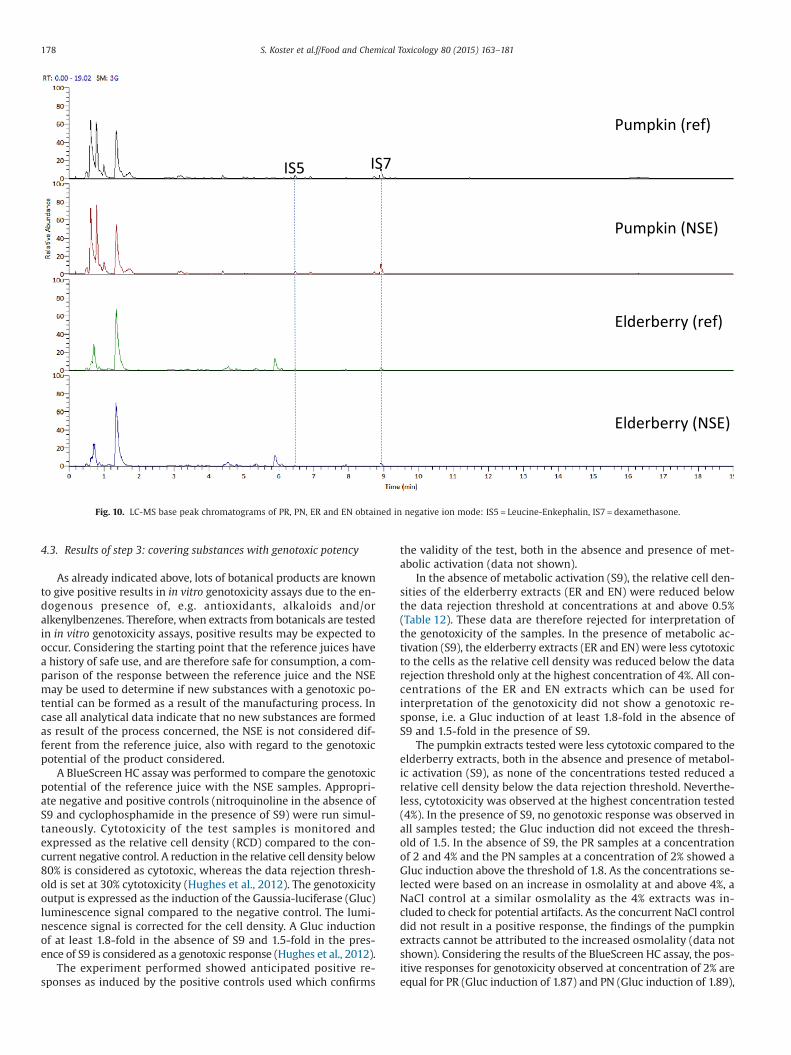
Fig. 9 shows representative LC-MS chromatograms in positiveion mode obtained from PR and PN, and ER and EN. Fig. 10 showsthe LC-MS chromatograms in negative ion mode. The peaks indi-cated with ‘IS’ are the internal standards and correspond to6-aminohexanoic acid, tyrosine, 8-aminooctanoic acid, C6-carnitineD3, Leucine-Enkephaline, 12-aminododecanoic acid, dexametha-sone and C10-carnitine D3 (from left to right). All internal standardsin positive ion mode were singly protonated. In negative ion modeonly 2 internal standards were detected: Leucine Enkephaline wasdeprotonated [M-H]− and dexamethasone as an adduct withdeprotonated formic acid [M + HCOO-]−.
When overlays of the LC-MS chromatograms of PR and PN, andER and EN were made, no differences in the chromatograms wereobserved. All detected peaks were present in both the reference andNSE samples. No newly formed peaks were detected. Also, no visibleincreased peaks in the NSE compared to the reference sample weredetected.
4.2. Results of step 2: covering known highly toxic substances andsubstances that are excluded from the TTC concept
The presence of highly toxic substances and substances that arenot covered by the TTC concept should be determined by target an-alytical techniques or expert judgement. The substances that needto be covered are discussed in detail in Koster et al. (2011). Thesesubstances are:
• N-Nitroso compounds• Aflatoxin-like compounds• Azoxy substances• Steroids• Polyhalogenated-dibenzodioxins, -dibenzofurans, -biphenyls• Non-essential metals or metal containing compounds• Polymers• Proteins• Organophosphates/carbamates.
Fig. 5. SPE GC-MS of ER and EN. Internal standards octanol (IS1) and decanal (IS2) were added at 90 μg/81.3 mg/day.
173S. Koster et al.f/Food and Chemical Toxicology 80 (2015) 163–181
Note that many of the substances above, such as pesticidesand dioxins, may already be present in fruit juices. The goal ofthis paper, however, is to demonstrate the safety of the NSEs byfocussing on the change in composition due to the manufacturingprocess, as compared to the reference juices (juices before manu-facturing to NSE). These juices already have a long history of safeuse and are considered to comply with, e.g. regulations in forcewith respect to the amount of residues of pesticides, etc. The
assessment of the above-mentioned categories of substances wastherefore performed in relation to the possible formation ofsubstances during the manufacturing process. The possible pres-ence of, e.g. cadmium in PR, will also result in the presence ofcadmium in PN. It is, however, unlikely that cadmium will beintroduced during the manufacturing process considered. Foreach of the categories of substances an evaluation for the possiblepresence is provided below.
0
2
4
6
8
10
12
14
16
18
20
8 10 12 14 16 18 20 22 24 26 28 30 32 34 36 38 40 42 44 46 48 50 52 54 56 58
PR_40V-01
0
0.5
1
1.5
2
2.5
3
3.5
4
4.5
5
20 21 22 23 24 25 26 27
0
2
4
6
8
10
12
14
16
18
20
8 10 12 14 16 18 20 22 24 26 28 30 32 34 36 38 40 42 44 46 48 50 52 54 56 58
PN_40V-01
0
0.5
1
1.5
2
2.5
3
3.5
4
4.5
5
20 21 22 23 24 25 26 27
Fig. 6. Chromatogram of the derivatised (silylated) samples (40 times dilution) of PR and PN. The line in the figure is set at approximately 90 μg/day and is only to guidethe eye. Semi-quantification was performed using peak area instead of peak height.
174 S. Koster et al.f/Food and Chemical Toxicology 80 (2015) 163–181
4.2.1. N-Nitroso compoundsN-Nitroso compounds are typically formed during processes in-
volving high temperatures such as grilling (Stuff et al., 2009) andcombustion processes. N-Nitroso substances have to our knowl-edge not been associated with the relatively low temperaturetreatment processes such as pasteurisation and related tech-niques which are being used in the production of NSEs and are
therefore unlikely to be present. A specific analysis for this class ofsubstances was therefore not performed.
4.2.2. Aflatoxin-like compoundsIt may be likely that the reference samples investigated here
contain to some extent aflatoxin-like substances since these arewidespread in nature and occur in various natural products. The
0
2
4
6
8
10
12
14
16
18
20
8 10 12 14 16 18 20 22 24 26 28 30 32 34 36 38 40 42 44 46 48 50 52 54 56 58
ER_40V-01
0
0.5
1
1.5
2
2.5
3
3.5
4
4.5
5
20 21 22 23 24 25 26 27
0
2
4
6
8
10
12
14
16
18
20
8 10 12 14 16 18 20 22 24 26 28 30 32 34 36 38 40 42 44 46 48 50 52 54 56 58
EN_40V-01
0
0.5
1
1.5
2
2.5
3
3.5
4
4.5
5
20 21 22 23 24 25 26 27
Fig. 7. Chromatogram of the derivatised (silylated) samples (40 times dilution) of ER and EN. The line in the figure is set at approximately 90 μg/day and is only to guidethe eye. Semi-quantification was performed using peak area instead of peak height.
175S. Koster et al.f/Food and Chemical Toxicology 80 (2015) 163–181
0
2
4
6
8
10
12
14
16
18
20
8 10 12 14 16 18 20 22 24 26 28 30 32 34 36 38 40 42 44 46 48 50 52 54 56 58
PR_100V-01
0
0.5
1
1.5
2
2.5
3
3.5
4
4.5
5
20 21 22 23 24 25 26 27
0
2
4
6
8
10
12
14
16
18
20
8 10 12 14 16 18 20 22 24 26 28 30 32 34 36 38 40 42 44 46 48 50 52 54 56 58
PR_400V-01
0
0.5
1
1.5
2
2.5
3
3.5
4
4.5
5
20 21 22 23 24 25 26 27
0
2
4
6
8
10
12
14
16
18
20
8 10 12 14 16 18 20 22 24 26 28 30 32 34 36 38 40 42 44 46 48 50 52 54 56 58
PR_1000V-01
0
0.5
1
1.5
2
2.5
3
3.5
4
4.5
5
20 21 22 23 24 25 26 27
Pumpkin reference100x diluted
Pumpkin reference400x diluted
Pumpkin reference1000x diluted
Fig. 8. Dilutions of 100, 400 and 1000 times for PR. Similar chromatograms were obtained for PN, ER and EN.
176 S. Koster et al.f/Food and Chemical Toxicology 80 (2015) 163–181
manufacturing process considered, however, is unlikely to intro-duce or increase aflatoxin-like substances in the NSE samples sincethese substances are not known to be formed during heating pro-cesses. A specific analysis for this class of substances was thereforenot performed but is part of standard quality control of the rawmaterials.
4.2.3. Azoxy compoundsAzoxy substances are typically formed in chemical synthesis pro-
cesses not likely to be used in the preparation of NSEs (Koster et al.,2011). A specific analysis for azoxy substances was therefore notperformed.
4.2.4. SteroidsPumpkin and elderberry may contain natural phytosterols which
can be considered as beneficial for health. The manufacturing processto make the NSEs is, however, unlikely to introduce new phytos-terols or to chemically modify phytosterols that are present naturally,given the mild conditions of the manufacturing process to make theNSEs. Moreover, a potential increase of phytosterols in the NSE isnot anticipated whereas a small increase is not considered of bio-logical relevance. Therefore, steroids are not further taken intoconsideration.
4.2.5. Polyhalogenated-dibenzodioxins, -dibenzofurans, -biphenylsPumpkin and elderberry may contain polyhalogenated-
dibenzodioxins, -dibenzofurans, -biphenyls as environmentalpollutants. However, given the mild processing conditions to man-ufacture the NSEs from the reference juices, it is highly unlikely thatpolyhalogenated-dibenzodioxins, -dibenzofurans, -biphenyls will be
formed or increased during processing. Therefore, these sub-stances were not further taken into consideration.
4.2.6. Non-essential elemental screeningPumpkin and elderberry may contain traces of non-essential el-
ements as environmental pollutant. It is however unlikely that non-essential elements will be introduced or increased during themanufacturing of the NSEs. Non-essential metals were therefore notfurther taken into consideration.
4.2.7. High molecular weight substances such as polymersPumpkin and elderberry contains biopolymers such as fibres
(pectin) which are polysaccharides. These high molecular weightsubstances are generally recognised to be safe since these do notpass the gastro-intestinal tract and are not further taken into con-sideration. However, considering the manufacturing process of theNSEs, these polysaccharides may depolymerise into smaller sugarmolecules, which was reportedly demonstrated in apples(Colin-Henrion et al., 2009). This depolymerisation process is moni-tored by the derivatisation GC-MS technique described above andsubstances are assessed in step 4 of CoMSAS (see further).
4.2.8. Organophosphates and carbamatesThe most toxic organophosphates and carbamates are man-
made pesticides and should therefore comply to the MaximumResidue Level as set by the relevant competent authorities. It is con-sidered unlikely that organophosphates and carbamates will beformed or increased during the mild processing conditions of themanufacturing process to make the NSEs. These substances weretherefore not further taken into consideration.
Pumpkin (ref)
Pumpkin (NSE)
Elderberry (ref)
Elderberry (NSE)
IS8IS7
IS6
IS5IS4IS3
IS2IS1
Fig. 9. LC-MS base peak chromatograms of PR, PN, ER and EN obtained in positive ion mode: IS1 = 6-aminohexanoic acid, IS2 = tyrosine D3, IS3 = 8-aminooctanoic acid,IS4 = C6-carnitine D3, IS5 = Leucine-Enkephalin, IS6 = 12-aminododecanoic acid, IS7 = dexamethasone, IS8 = C10-carnitine D3.
177S. Koster et al.f/Food and Chemical Toxicology 80 (2015) 163–181
4.3. Results of step 3: covering substances with genotoxic potency
As already indicated above, lots of botanical products are knownto give positive results in in vitro genotoxicity assays due to the en-dogenous presence of, e.g. antioxidants, alkaloids and/oralkenylbenzenes. Therefore, when extracts from botanicals are testedin in vitro genotoxicity assays, positive results may be expected tooccur. Considering the starting point that the reference juices havea history of safe use, and are therefore safe for consumption, a com-parison of the response between the reference juice and the NSEmay be used to determine if new substances with a genotoxic po-tential can be formed as a result of the manufacturing process. Incase all analytical data indicate that no new substances are formedas result of the process concerned, the NSE is not considered dif-ferent from the reference juice, also with regard to the genotoxicpotential of the product considered.
A BlueScreen HC assay was performed to compare the genotoxicpotential of the reference juice with the NSE samples. Appropri-ate negative and positive controls (nitroquinoline in the absence ofS9 and cyclophosphamide in the presence of S9) were run simul-taneously. Cytotoxicity of the test samples is monitored andexpressed as the relative cell density (RCD) compared to the con-current negative control. A reduction in the relative cell density below80% is considered as cytotoxic, whereas the data rejection thresh-old is set at 30% cytotoxicity (Hughes et al., 2012). The genotoxicityoutput is expressed as the induction of the Gaussia-luciferase (Gluc)luminescence signal compared to the negative control. The lumi-nescence signal is corrected for the cell density. A Gluc inductionof at least 1.8-fold in the absence of S9 and 1.5-fold in the pres-ence of S9 is considered as a genotoxic response (Hughes et al., 2012).
The experiment performed showed anticipated positive re-sponses as induced by the positive controls used which confirms
the validity of the test, both in the absence and presence of met-abolic activation (data not shown).
In the absence of metabolic activation (S9), the relative cell den-sities of the elderberry extracts (ER and EN) were reduced belowthe data rejection threshold at concentrations at and above 0.5%(Table 12). These data are therefore rejected for interpretation ofthe genotoxicity of the samples. In the presence of metabolic ac-tivation (S9), the elderberry extracts (ER and EN) were less cytotoxicto the cells as the relative cell density was reduced below the datarejection threshold only at the highest concentration of 4%. All con-centrations of the ER and EN extracts which can be used forinterpretation of the genotoxicity did not show a genotoxic re-sponse, i.e. a Gluc induction of at least 1.8-fold in the absence ofS9 and 1.5-fold in the presence of S9.
The pumpkin extracts tested were less cytotoxic compared to theelderberry extracts, both in the absence and presence of metabol-ic activation (S9), as none of the concentrations tested reduced arelative cell density below the data rejection threshold. Neverthe-less, cytotoxicity was observed at the highest concentration tested(4%). In the presence of S9, no genotoxic response was observed inall samples tested; the Gluc induction did not exceed the thresh-old of 1.5. In the absence of S9, the PR samples at a concentrationof 2 and 4% and the PN samples at a concentration of 2% showed aGluc induction above the threshold of 1.8. As the concentrations se-lected were based on an increase in osmolality at and above 4%, aNaCl control at a similar osmolality as the 4% extracts was in-cluded to check for potential artifacts. As the concurrent NaCl controldid not result in a positive response, the findings of the pumpkinextracts cannot be attributed to the increased osmolality (data notshown). Considering the results of the BlueScreen HC assay, the pos-itive responses for genotoxicity observed at concentration of 2% areequal for PR (Gluc induction of 1.87) and PN (Gluc induction of 1.89),
Pumpkin (ref)
Pumpkin (NSE)
Elderberry (ref)
Elderberry (NSE)
IS7IS5
Fig. 10. LC-MS base peak chromatograms of PR, PN, ER and EN obtained in negative ion mode: IS5 = Leucine-Enkephalin, IS7 = dexamethasone.
178 S. Koster et al.f/Food and Chemical Toxicology 80 (2015) 163–181
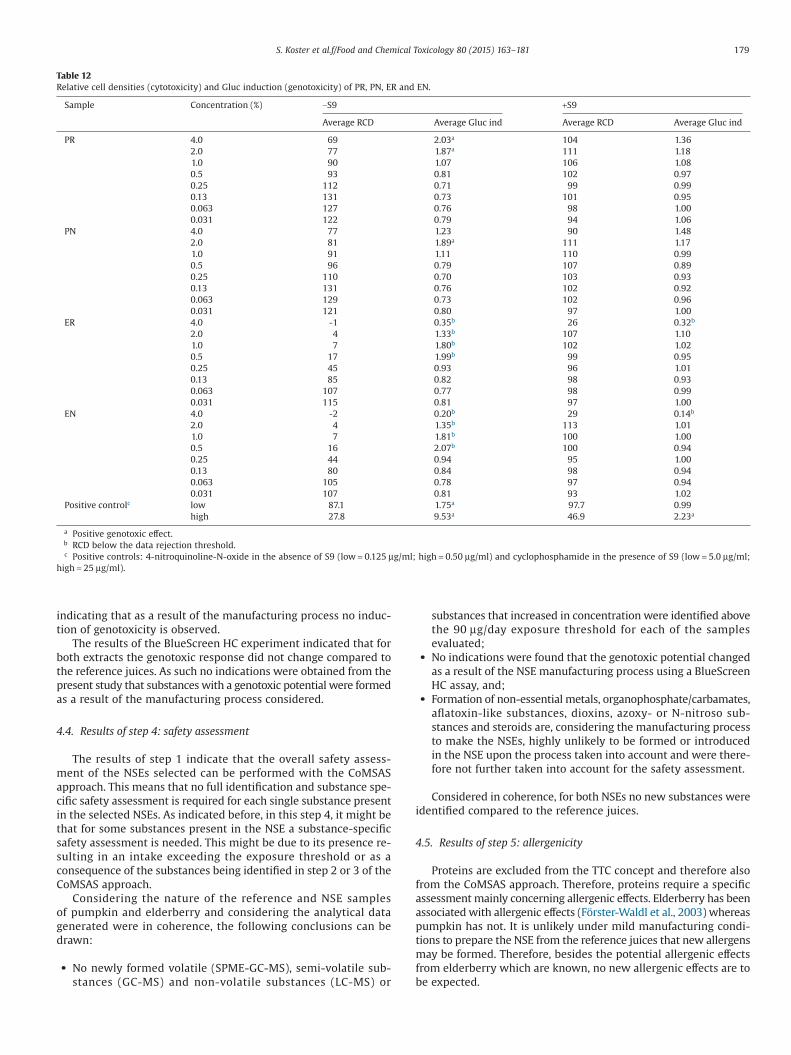
indicating that as a result of the manufacturing process no induc-tion of genotoxicity is observed.
The results of the BlueScreen HC experiment indicated that forboth extracts the genotoxic response did not change compared tothe reference juices. As such no indications were obtained from thepresent study that substances with a genotoxic potential were formedas a result of the manufacturing process considered.
4.4. Results of step 4: safety assessment
The results of step 1 indicate that the overall safety assess-ment of the NSEs selected can be performed with the CoMSASapproach. This means that no full identification and substance spe-cific safety assessment is required for each single substance presentin the selected NSEs. As indicated before, in this step 4, it might bethat for some substances present in the NSE a substance-specificsafety assessment is needed. This might be due to its presence re-sulting in an intake exceeding the exposure threshold or as aconsequence of the substances being identified in step 2 or 3 of theCoMSAS approach.
Considering the nature of the reference and NSE samplesof pumpkin and elderberry and considering the analytical datagenerated were in coherence, the following conclusions can bedrawn:
• No newly formed volatile (SPME-GC-MS), semi-volatile sub-stances (GC-MS) and non-volatile substances (LC-MS) or
substances that increased in concentration were identified abovethe 90 μg/day exposure threshold for each of the samplesevaluated;
• No indications were found that the genotoxic potential changedas a result of the NSE manufacturing process using a BlueScreenHC assay, and;
• Formation of non-essential metals, organophosphate/carbamates,aflatoxin-like substances, dioxins, azoxy- or N-nitroso sub-stances and steroids are, considering the manufacturing processto make the NSEs, highly unlikely to be formed or introducedin the NSE upon the process taken into account and were there-fore not further taken into account for the safety assessment.
Considered in coherence, for both NSEs no new substances wereidentified compared to the reference juices.
4.5. Results of step 5: allergenicity
Proteins are excluded from the TTC concept and therefore alsofrom the CoMSAS approach. Therefore, proteins require a specificassessment mainly concerning allergenic effects. Elderberry has beenassociated with allergenic effects (Förster-Waldl et al., 2003) whereaspumpkin has not. It is unlikely under mild manufacturing condi-tions to prepare the NSE from the reference juices that new allergensmay be formed. Therefore, besides the potential allergenic effectsfrom elderberry which are known, no new allergenic effects are tobe expected.
Table 12Relative cell densities (cytotoxicity) and Gluc induction (genotoxicity) of PR, PN, ER and EN.
Sample Concentration (%) −S9 +S9
Average RCD Average Gluc ind Average RCD Average Gluc ind
PR 4.0 69 2.03a 104 1.362.0 77 1.87a 111 1.181.0 90 1.07 106 1.080.5 93 0.81 102 0.970.25 112 0.71 99 0.990.13 131 0.73 101 0.950.063 127 0.76 98 1.000.031 122 0.79 94 1.06
PN 4.0 77 1.23 90 1.482.0 81 1.89a 111 1.171.0 91 1.11 110 0.990.5 96 0.79 107 0.890.25 110 0.70 103 0.930.13 131 0.76 102 0.920.063 129 0.73 102 0.960.031 121 0.80 97 1.00
ER 4.0 -1 0.35b 26 0.32b
2.0 4 1.33b 107 1.101.0 7 1.80b 102 1.020.5 17 1.99b 99 0.950.25 45 0.93 96 1.010.13 85 0.82 98 0.930.063 107 0.77 98 0.990.031 115 0.81 97 1.00
EN 4.0 -2 0.20b 29 0.14b
2.0 4 1.35b 113 1.011.0 7 1.81b 100 1.000.5 16 2.07b 100 0.940.25 44 0.94 95 1.000.13 80 0.84 98 0.940.063 105 0.78 97 0.940.031 107 0.81 93 1.02
Positive controlc low 87.1 1.75a 97.7 0.99high 27.8 9.53a 46.9 2.23a
a Positive genotoxic effect.b RCD below the data rejection threshold.c Positive controls: 4-nitroquinoline-N-oxide in the absence of S9 (low = 0.125 μg/ml; high = 0.50 μg/ml) and cyclophosphamide in the presence of S9 (low = 5.0 μg/ml;
high = 25 μg/ml).
179S. Koster et al.f/Food and Chemical Toxicology 80 (2015) 163–181
5. Conclusion
In this paper a pragmatic approach to determine the safety ofthe manufacturing process of NSEs, prepared from reference juiceswith a history of safe use, is taken into account. As NSEs frompumpkin and elderberry were considered to be bringing colour tothe food they are being applied in, the exposure assessment wasspecifically focussed on this use. Other sources of exposure topumpkin and elderberry products were therefore not considered.The approach covers the safety of new substances formed during,as well as an increase of substances due to the manufacturingprocess. As indicated, highly toxic classes of substances might bepresent in NSEs and reference juices which should be covered bya targeted analytical approach. It should be noted, however, that pro-ducers of NSEs and juices are mostly aware of the possible presenceof these substances, whereas for some substances producers are evenlegally obliged to monitor for the presence thereof.
To fully assess the safety of CCFM, traditionally a detailed ana-lytical study is necessary, including identification and quantificationof all of the substances. Subsequently, a substance specific safetyassessment should be performed for all individual substances presentwhereas the safety of the CCFM as a whole should also be as-sessed. In case of data gaps in the hazard assessment, this approachmight easily result in additional (animal) toxicity testing. This iscostly, time-consuming and may require the use of laboratoryanimals. The present paper describes how the Complex MixturesSafety Assessment Strategy (CoMSAS) can be applied to evaluate thesafety of NSEs in a pragmatic way. Previously, it has been demon-strated that CoMSAS can efficiently be applied for the safetyassessment of food packaging materials (Koster et al., 2014). Withthe selection of NSEs it was the goal to demonstrate the applica-bility and increase in efficiency of the safety assessment of foodproducts.
The present data show that the amount of work for theanalytical chemist and risk assessor may be significantly reducedwhen applying this approach. No full identification and quantifi-cation of the substances is needed below a certain intake leveland therefore most of the substances don’t require a substance-specific safety assessment. Only those substances that exceed atoxicologically relevant daily intake of 90 μg/day, as previouslydescribed by the TTC concept (Kroes et al., 2004; Rennen et al.,2011), need to undergo a substance-specific safety assessment.This toxicologically relevant daily intake of 90 μg/day may changein the future if new information becomes available. Recently, are-evaluation of the Munro dataset underlying the TTC thresholdswas published by Leeman et al. (2014). This re-evaluation re-vealed that in case organohalogens can be excluded, in additionto the CoMSAS strategy, the toxicologically relevant daily intakecan be increased to a level of 240 μg/day. Moreover, it should benoted that in case many substances are present in a food matrixexceeding the exposure threshold, the approach becomes lesspragmatic or might not even be desirable to follow. However, thiscan easily be decided after step 1 of the CoMSAS approach, whichis a step that traditionally also should be followed to characterisethe substances present in the NSE. Moreover, it is important thatthe presence of highly toxic substances and substances excludedfrom the TTC principle are covered to an extent that a health riskis not to be expected as a result of exposure to the CCFM (steps 2and 3). In case such substances are found in step 2 and/or step 3,the approach might still be pragmatic if the substance responsiblecan be identified. That substance should than be assessed using asubstance-specific assessment (in step 4) and/or eliminated fromthe CCFM.
When applying the CoMSAS approach to determine the safetyof the production of non-selective extracts (NSEs), the following con-clusions were drawn:
• No newly formed volatile, semi-volatile substances and non-volatile substances could be detected;
• No substances were identified which exceed the 90 μg/dayexposure threshold for each of the samples evaluated;
• No change of the overall genotoxic potential was observed com-pared to the reference material, and;
• Non-essential metals, organophosphate/carbamates, aflatoxin-like substances, dioxins, azoxy- or N-nitroso substances andsteroids are, considering the manufacturing process to make theNSEs, highly unlikely to be formed, introduced or increased inthe NSE upon the process taken into account and were there-fore not further taken into account for the safety assessment.
Taking into account these data, the homogenisation,pasteurisation and filtration applied in the manufacturing processfor elderberry and pumpkin NSEs from reference juice did not in-dicate the introduction or increase of substances of concern whencompared to the reference juice, which has a history of safe use.Moreover, based on the analytical data retrieved, no indications wereobtained for a condensation of the concentration of the NSE com-pared to the reference product. Therefore, the evaluated NSEs areconsidered safe for consumption.
In this paper it was demonstrated that CoMSAS allows assess-ing the safety of a chemically complex food product like NSEs in apragmatic and efficient way. The applicability of the approach canbe decided upon in a few days by performing step 1 and, if con-sidered suitable, safety assessment with this approach is faster andcheaper compared to the traditional safety assessment approach.Also, it prevents unnecessary (animal) toxicity testing. The ap-proach also allows to easily identify possible hazardous substancesin a short notice, which might help in new product selection andoptimisation.
Conflict of interest
This work was commissioned by the Food Safety Program Man-agement of TNO. The work was financially supported by KnowledgeProgram funding by the Dutch Ministry of Economic Affairs, Chr.Hansen, Denmark and Coca-Cola Services, Belgium. Chr. Hansen,Denmark and Coca-Cola Services, Belgium, were involved in pro-viding non-selective extracts used for the present work. TheNetherlands Food and Consumer Product Safety Authority (NVWA)was involved as stakeholder. All authors declare that there are noconflicts of interest.
Transparency document
The Transparency document associated with this article can befound in the online version.
Acknowledgements
Ajan Verhoef, Roel Engel, Suryati Sunarto, Joyce Bezemer, EllySpies-Faber, Sandra Steegman, Yvonne Schouten and Marleen Roding-Bolleboom from TNO Triskelion are acknowledged for their analyticalcontribution to this paper. Frédérique van Acker and Michèle vanden Wijngaard from TNO Triskelion are acknowledged for their workon the BlueScreen HC assay.
References
Benigni, R., Bossa, C., Jeliazkova, N., Netzeva, T., Worth, A. 2008. The Benigni/Bossarulebase for mutagenicity and carcinogenicity, a module of toxtree(EUR23241EN-2008).
180 S. Koster et al.f/Food and Chemical Toxicology 80 (2015) 163–181
Bradley, E.L., Honkalampi-Hämäläinen, U., Weber, A., Andersson, M.A., Bertaud, F.,Castle, L., et al., 2008. The BIOSAFEPAPER project for in vitro toxicity assessments:preparation, detailed chemical characterisation and testing of extracts from paperand board samples. Food Chem. Toxicol. 46, 2498–2509.
Cheeseman, M.A., Machuga, E.J., Bailey, A.B., 1999. A tiered approach to thresholdof regulation. Food Chem. Toxicol. 37, 387–412.
Colin-Henrion, M., Mehinagic, E., Renard, C.M.G.C., Richomme, P., Jourjon, F., 2009.From apple to applesauce: processing effects on dietary fibres and cell wallpolysaccharides. Food Chem. 117, 254–260.
Danish Food Composition Databank, 2013. <http://www.foodcomp.dk/v7/fcdb_default.asp> (accessed 13.09.13).
EC (European Commission), 1998. Report on methodologies for the monitoring offood additive intake across the European Union. (Final report submitted by theTask Co-ordinator 16 January 1998). Reports of a Working Group on ScientificCo-operation on Questions Relating to Food. Task 4.2. SCOOP/INT/ REPORT/2.Brussels: European Commission Directorate General III Industry.
EFSA, 2011. Use of the EFSA comprehensive European food consumption databasein exposure assessment. EFSA J. 9 (3), 2097.
EFSA, 2012. Scientific opinion on exploring options for providing advice about possiblehuman health risks based on the concept of Threshold of Toxicological Concern(TTC). EFSA J. 10 (7), 2750.
Förster-Waldl, E., Marchetti, M., Schöll, I., Focke, M., Radauer, C., Kinaciyan, T., et al.,2003. Type I allergy to elderberry (Sambucus nigra) is elicited by a 33.2 kDaallergen with significant homology to ribosomal inactivating proteins. Clin. Exp.Allergy 33, 1703–1710.
Hughes, C., Rabinowitz, A., Tate, M., Birrell, L., Allsup, J., Billinton, N., et al., 2012.Development of a high-throughput Gaussia luciferase reporter assay for theactivation of the GADD45a gene by mutagens, promutagens, clastogens, andaneugens. J. Biomol. Screen. 17 (10), 1302–1315.
Koek, M.M., Muilwijk, B., van der Werf, M.J., Hankemeier, T., 2006. Microbialmetabolomics with gas chromatography/mass spectrometry. Anal. Chem. 78,1272–1281.
Koster, S., Boobis, A.R., Cubberley, R., Hollnagel, H.M., Richling, E., Wildemann, T.,et al., 2011. Application of the TTC concept to unknown substances found inanalysis of foods. Food Chem. Toxicol. 49, 1643–1660.
Koster, S., Rennen, M., Leeman, W., Houben, G., Muilwijk, B., van Acker, F., et al., 2014.A novel safety assessment strategy for non-intentionally added substances (NIAS)
in carton food contact materials. Food Addit. Contam. Part A Chem. Anal. ControlExpo. Risk Assess. 31, 422–443.
Kroes, R., Renwick, A.G., Cheeseman, M., Kleiner, J., Mangelsdorf, I., Piersma, A., et al.,2004. Structure-based thresholds of toxicological concern (TTC): guidance forapplication to substances present at low levels in the diet. Food Chem. Toxicol.42 (1), 65–83.
Leeman, W.R., Krul, L., Houben, G.F., 2013. Complex mixtures: relevance of combinedexposure to substances at low dose levels. Food Chem. Toxicol. 58, 141–148.
Leeman, W.R., Krul, L., Houben, G.F., 2014. Reevaluation of the Munro dataset to derivemore specific TTC thresholds. Regul. Toxicol. Pharmacol. 69, 273–278.
Munro, I.C., Renwick, A.G., Danielewska-Nikiel, B., 2008. The Threshold of ToxicologicalConcern (TTC) in risk assessment. Toxicol. Lett. 180, 151–156.
Patel, D., 2011. Matrix effect in a view of LC-MS/MS: an overview. Int. J. Pharm. Bio.Sci. 2 (1), 559–564.
Píco, Y., Blasco, C., Font, G., 2004. Environmental and food applications of LC-tandemmass spectrometry in pesticide-residue analysis: an overview. Mass Spectrom.Rev. 23 (1), 45–85.
Rennen, M.A.J., Koster, S., Krul, C.A.M., Houben, G.F., 2011. Application of the thresholdof toxicological concern (TTC) concept to the safety assessment of chemicallycomplex food matrices. Food Chem. Toxicol. 49 (4), 933–940.
RIVM, 2011. National Institute for Public Health and the Environment, Dutch NationalFood Consumption Survey 2007–2010, report number 3500500006/2011.
Rulis, A., 1989. Establishing a threshold of regulation. In: Bonin, J., Stevenson, D. (Eds.),Risk Assessment in Setting National Priorities. Plenum., New York, pp. 271–278.
Simpson, K., Bevan, N., Hastwell, P., Eidam, P., Shah, P., Gogo, E., et al., 2012. TheBlueScreen-384 assay as an indicator of genotoxic hazard potential in early-stagedrug discovery. J. Biomol. Screen. 18 (4), 441–452.
Stuff, J.E., Goh, E.T., Barrera, S.L., Bondy, M.L., Forman, M.R., 2009. Construction ofan N-nitroso database for assessing dietary intake. J. Food Composit. Anal. 22,S42–S47.
VCF, 2013. VCF volatile compounds in food: database. Nijssen, L.M.; Ingen-Visscher,C.A. van; Donders, J.J.H. (Eds.). – Version 14.1 – Zeist, The Netherlands: TNOTriskelion, 1963–2013. <http://www.vcf-online.nl/VcfHome.cfm> (accessed05.09.13).
181S. Koster et al.f/Food and Chemical Toxicology 80 (2015) 163–181