a new standard dna damage (sdd) data format - arxiv
TRANSCRIPT
RADIATION RESEARCH 191, 76–92 (2019)0033-7587/19 $15.00�2019 by Radiation Research Society.All rights of reproduction in any form reserved.DOI: 10.1667/RR15209.1
A New Standard DNA Damage (SDD) Data Format
J. Schuemann,a,1 A. L. McNamara,a J. W. Warmenhoven,b N. T. Henthorn,b K. J. Kirkby,b M. J. Merchant,b,1 S.Ingram,b H. Paganetti,a K. D. Held,a J. Ramos-Mendez,c B. Faddegon,c J. Perl,d D. T. Goodhead,e I. Plante,f H.
Rabus,g,h H. Nettelbeck,g,h W. Friedland,h,i P. Kundrat,i A. Ottolenghi,j G. Baiocco,h,j S. Barbieri,h,j M. Dingfelder,k S.Incerti,l,m C. Villagrasa,h,n M. Bueno,n M. A. Bernal,o S. Guatelli,p D. Sakata,p J. M. C. Brown,q Z. Francis,r I.
Kyriakou,s N. Lampe,l F. Ballarini,j,t M. P. Carante,j,t M. Davıdkova,u V. Stepan,u X. Jia,v F. A. Cucinotta,w R. Schulte,x
R. D. Stewart,y D. J. Carlson,z S. Galer,aa Z. Kuncic,bb S. Lacombe,cc J. Milligan,dd S. H. Cho,ee G. Sawakuchi,ee T.Inaniwa,ff T. Sato,gg W. Li,i,hh A. V. Solov’yov,ii E. Surdutovich,jj M. Durante,kk K. M. Prisell and S. J. McMahonll,1
a Department of Radiation Oncology, Massachusetts General Hospital and Harvard Medical School, Boston, Massachusetts; b Division of CancerSciences, The University of Manchester, Manchester, United Kingdom; c Department of Radiation Oncology, University of California San
Francisco, San Francisco, California; d SLAC National Accelerator Laboratory, Menlo Park, California; e Medical Research Council, Harwell,United Kingdom; f KBRwyle, Houston, Texas; g Physikalisch-Technische Bundesanstalt (PTB), Braunschweig, Germany; h Task Group 6.2‘‘Computational Micro- and Nanodosimetry’’, European Radiation Dosimetry Group e.V., Neuherberg, Germany; i Institute of Radiation
Protection, Helmholtz Zentrum Munchen - German Research Center for Environmental Health, Neuherberg, Germany; j Physics Department,University of Pavia, Pavia, Italy; k Department of Physics, East Carolina University, Greenville, North Carolina; l CNRS, IN2P3, CENBG, UMR5797, F-33170 Gradignan, France; m University of Bordeaux, CENBG, UMR 5797, F-33170 Gradignan, France; n Institut de Radioprotection et
Surete Nucleaire, F-92262 Fontenay aux Roses Cedex, France; o Applied Physics Department, Gleb Wataghin Institute of Physics, State Universityof Campinas, Campinas, SP, Brazil; p Centre for Medical Radiation Physics, University of Wollongong, Wollongong, NSW, Australia;
q Department of Radiation Science and Technology, Delft University of Technology, Delft, The Netherlands; r Department of Physics, Faculty ofScience, Saint Joseph University, Beirut, Lebanon; s Medical Physics Laboratory, University of Ioannina Medical School, Ioannina, Greece;t Italian National Institute of Nuclear Physics, Section of Pavia, I-27100 Pavia, Italy; u Department of Radiation Dosimetry, Nuclear Physics
Institute of the CAS, Rez, Czech Republic; v Department of Radiation Oncology, University of Texas Southwestern Medical Center, Dallas, Texas;w Health Physics and Diagnostic Sciences, University of Nevada Las Vegas, Las Vegas, Nevada; x Division of Biomedical Engineering Sciences,School of Medicine, Loma Linda University, Loma Linda, California; y Department of Radiation Oncology, University of Washington, Seattle,
Washington; z Department of Therapeutic Radiology, Yale University School of Medicine, New Haven, Connecticut; aa Medical Radiation ScienceGroup, National Physical Laboratory, Teddington, United Kingdom; bb School of Physics, University of Sydney, Sydney, NSW, Australia; cc Institut
des Sciences Moleculaires d’Orsay (UMR 8214) University Paris-Sud, CNRS, University Paris-Saclay, 91405 Orsay Cedex, France; dd Retired;ee Department of Radiation Physics and Imaging Physics, The University of Texas MD Anderson Cancer Center, Houston, Texas; ff Department ofAccelerator and Medical Physics, National Institute of Radiological Sciences, Chiba, Japan; gg Japan Atomic Energy Agency, Nuclear Science and
Engineering Center, Tokai 319-1196, Japan; hh Task Group 7.7 ‘‘Internal Micro- and Nanodosimetry’’, European Radiation Dosimetry Groupe.V., Neuherberg, Germany; ii MBN Research Center, 60438 Frankfurt am Main, Germany; jj Department of Physics, Oakland University,
Rochester, Michigan; kk GSI Helmholtzzentrum fur Schwerionenforschung, Biophysics Department, Darmstadt, Germany; ll Centre for CancerResearch and Cell Biology, Queens University Belfast, Belfast, United Kingdom
Schuemann, J., McNamara, A. L., Warmenhoven, J. W.,Henthorn, N. T., Kirkby, K. J., Merchant, M. J., Ingram, S.,Paganetti, H., Held, K. D., Ramos-Mendez, J., Faddegon, B.,Perl, J., Goodhead, D. T., Plante, I., Rabus, H., Nettelbeck,H., Friedland, W., Kundrat, P., Ottolenghi, A., Baiocco, G.,Barbieri, S., Dingfelder, M., Incerti, S., Villagrasa, C., Bueno,M., Bernal, M. A., Guatelli, S., Sakata, D., Brown, J. M. C.,Francis, Z., Kyriakou, I., Lampe, N., Ballarini, F., Carante,M. P., Davıdkova, M., Stepan, V., Jia, X., Cucinotta, F. A.,Schulte, R., Stewart, R. D., Carlson, D. J., Galer, S., Kuncic,Z., Lacombe, S., Milligan, J., Cho, S. H., Sawakuchi, G.,Inaniwa, T., Sato, T., Li, W., Solov’yov, A. V., Surdutovich,E., Durante, M., Prise, K. M. and McMahon, S. J. A New
Standard DNA Damage (SDD) Data Format. Radiat. Res.191, 76–92 (2019).
Our understanding of radiation-induced cellular damagehas greatly improved over the past few decades. Despite thisprogress, there are still many obstacles to fully understandhow radiation interacts with biologically relevant cellularcomponents, such as DNA, to cause observable end pointssuch as cell killing. Damage in DNA is identified as a majorroute of cell killing. One hurdle when modeling biologicaleffects is the difficulty in directly comparing resultsgenerated by members of different research groups. MultipleMonte Carlo codes have been developed to simulate damageinduction at the DNA scale, while at the same time variousgroups have developed models that describe DNA repairprocesses with varying levels of detail. These repair modelsare intrinsically linked to the damage model employed intheir development, making it difficult to disentangle system-atic effects in either part of the modeling chain. Thesemodeling chains typically consist of track-structure MonteCarlo simulations of the physical interactions creating direct
1 Address for correspondence: Massachusetts General Hospital andHarvard Medical School Radiation Oncology, Room 3206, 125Nashua St., Boston, MA 02114; email: [email protected], [email protected] or [email protected].
76
damages to DNA, followed by simulations of the productionand initial reactions of chemical species causing so-called‘‘indirect’’ damages. After the induction of DNA damage,DNA repair models combine the simulated damage patternswith biological models to determine the biological conse-quences of the damage. To date, the effect of the environment,such as molecular oxygen (normoxic vs. hypoxic), has beenpoorly considered. We propose a new standard DNA damage(SDD) data format to unify the interface between thesimulation of damage induction in DNA and the biologicalmodeling of DNA repair processes, and introduce the effect ofthe environment (molecular oxygen or other compounds) as aflexible parameter. Such a standard greatly facilitates inter-model comparisons, providing an ideal environment to teaseout model assumptions and identify persistent, underlyingmechanisms. Through inter-model comparisons, this unifiedstandard has the potential to greatly advance our under-standing of the underlying mechanisms of radiation-inducedDNA damage and the resulting observable biological effectswhen radiation parameters and/or environmental conditionschange. � 2019 by Radiation Research Society
INTRODUCTION
Cellular responses to radiation damage have been studied
for many decades, showing the dependency of DNAdamage on the delivered dose, the delivery timeframe and
the radiation particle type and energy. Numerous modelshave been developed to explain these responses across arange of end points, including DNA damage, mutations,
micronuclei formation, chromosome aberrations and cellsurvival. Many of these are phenomenological macroscopic
models, and simply relate cellular end points to thedelivered dose and empirical parameters expressing cell
sensitivity, which can depend on the cell line, irradiationconditions and radiation quality. Such phenomenological
approaches can capture the overall population-based trendsin cell survival that are necessary to describe the effects of
radiation therapy, or to estimate effects of exposure toenvironmental or space radiation. The most commonexample is the linear quadratic (LQ) cell survival model,
which is widely used both experimentally and clinically. Tomore systematically include the observed dependence of
cell survival on the ionization pattern of the radiationmodality, i.e., the particle type and energy, various models
have been proposed that explicitly include additionalphysical properties to describe effects relative to a reference
radiation. Some models consider the linear energy transfer(LET) (1–4) or other properties related to the structure of the
primary irradiating particles and the tracks of surroundingsecondary particles (the track structure) in the cell survival
calculation, such as the local effect model (5) and themicrodosimetric kinetic model (6). The latter two modelsare used clinically in carbon therapy (7–10). However, these
models are also primarily phenomenological and their
parameters are dependent on fitting to a selected data set,rather than being based on more fundamental radiobiology.
To advance the field towards more individualizedtherapies we must study the underlying biological mecha-nisms of cellular response to radiation and develop effectivemulti-scale models of radiation action that combine physics,chemistry and biology. Efforts to model cell response havefocused on damages to the nuclear DNA, which has longbeen established as the primary radiation target determiningcell viability. The response of cells to radiation has beenshown to correlate with the pattern of energy depositionswithin the nucleus; this correlation is attributed to theresulting differences in patterns and types of DNA damage.
Several decades ago, the first studies using Monte Carlosimulations were performed to link the track structure ofdifferent radiation modalities with DNA geometries and theprobability of damage induction (11–22). These studiesrepresent the first attempts to apply track-structure MonteCarlo simulations, to mechanistically understand howradiation energy depositions lead to DNA damage. In anideal scenario, one would use track-structure simulations ofthe incident radiation to simulate the physical interactions asa means of obtaining nanometer-scale energy depositionsand ionizations in accurate geometric models of the cellsand their sub-components (nucleus and DNA). After thephysical interactions, the resulting radiolysis products andother ionized molecules react in a physicochemical stage,which is followed by migration of the chemical species. Atthis stage chemical species can react with each other, bescavenged inside the cells or react with components of thecell, such as the DNA. The simulation finishes bydetermining the direct (caused by physical interactions)and indirect (caused by chemical reactions) damages toDNA. Finally, the DNA damage patterns can be used inmechanistic models of DNA repair kinetics to calculate cellviability, accounting for the damage complexity, along withproperties of the cell and the surrounding environment, suchas repair deficiencies, cell cycle and oxygenation.
In recent years, several major developments have led to asurge in attempts to mechanistically describe DNA damageand repair kinetics (23–47). An increase in the computa-tional power of standard computers has enabled thesimulation of particle tracks in DNA fragments and evenwhole nuclei (48–53). This has been accompanied byimprovements in imaging techniques for studying theresponses of cells to ionizing radiation, providing anabundance of data showing the importance of repairpathways and their effect on cell viability. Currently,several Monte Carlo simulation codes exist that can providethe nanoscale track structure of particles passing through amedium, which is typically simulated as water but morerecently also includes DNA nucleotide material (23, 54–60).Codes like Geant4-DNA (23, 61), KURBUC (62), PAR-TRAC (60), MC4 (63), RITRACK (57), TRAX (64) andTOPAS-nBio (65) are used by various groups to simulatethe track structure of different types of radiation and then
A NEW STANDARD FOR DNA DAMAGE 77
score the resulting initial damages to a cell nucleus. One caneven go further down in scale and use a molecular dynamicsapproach such as in the MBN Explorer (66) to model theinteractions between molecules. Increasing the simulationdetail increases the complexity and makes simulationscomputationally more expensive. Thus, researchers oftenapply a multi-scale approach, using macroscopic simula-tions to capture realistic radiation fields for radiation therapyor mixed-field exposures, and switching to the cell-scalesimulations of particle tracks scoring DNA damages inselected cells. This approach can be achieved using acommon simulation framework [e.g., Geant4/Geant4-DNA,TOPAS/TOPAS-nBio (67), or the multiscale approach (68–70)], or with the ad hoc coupling of different transport andtrack-structure codes [e.g., PHITS and PARTRAC (71)].
Each of these codes includes models of DNA structureswithin the nucleus or cell that are used to obtain the initialpatterns of DNA damage. Most of these codes also includethe first chemical reactions, i.e., the physicochemicalgeneration of radiolysis products and their subsequentdiffusion and interaction (72–77). Thus, these Monte Carlocodes can provide estimates of DNA damages induced bothdirectly (from the initial particle track) and indirectly (fromchemical reactions). While these codes frequently differ intheir underlying assumptions, have slightly differentimplementations of particle transport and physics handlingand have developed their own data structure and damagepattern definitions, complicating inter-code comparisons ofdamage induction, most track-structure codes predictreasonably similar yields of double-strand breaks (DSBs),in part because the number of DSBs is often used as areference dataset.
To fully elucidate the effect of DNA damage inductionand repair on cell survival, chromosome aberrations,mutations or other end points of interest, the simulatedpatterns of damage along the DNA strands, as well as theircomplexity, must then be combined with models thatdescribe the mechanisms of DNA repair (78). Variousgroups are working on models to describe these DNA repairkinetics, and to better understand the dependencies ofpredicted end points on uncertainties and assumptions madein each part of this modeling chain, a direct comparisonbetween models and simulation results from differentgroups would be immensely useful. However, because ofthe differences in damage model outputs and dependenciesamong different damage and repair models, these compar-isons are arduous and complex. Repair modeling approach-es typically either use an assumed (often random)distribution of damage or are designed specifically tointerface with one of the available track-structure codes inan ad hoc fashion (30, 31, 37, 38, 79–83). While typicallybased on similar principles, these models often employdifferent approaches and make different assumptions aboutthe underlying repair processes. Inter-comparison betweenrepair models is often complicated by their close links withunderlying damage models, which introduces implicit
assumptions and dependencies that may not be apparenton simple inspection (84). Providing a common interfacewould offer much more flexibility and scope to testingdifferent combinations of models, and comparing implicitassumptions and uncertainties.
In addition, there can be important differences amongcommunities in the way DNA damages are defined.Examples include differences in what constitutes a single-strand break (SSB) or a DSB and how they are categorizedinto different lesion complexities; what factors are consid-ered when describing the nuclear environment; or at whattime point the damages are recorded (85). Providing astandard data format that all groups can refer to will help tohighlight these differences among the groups and disci-plines and provide a platform with which to reconcile them.
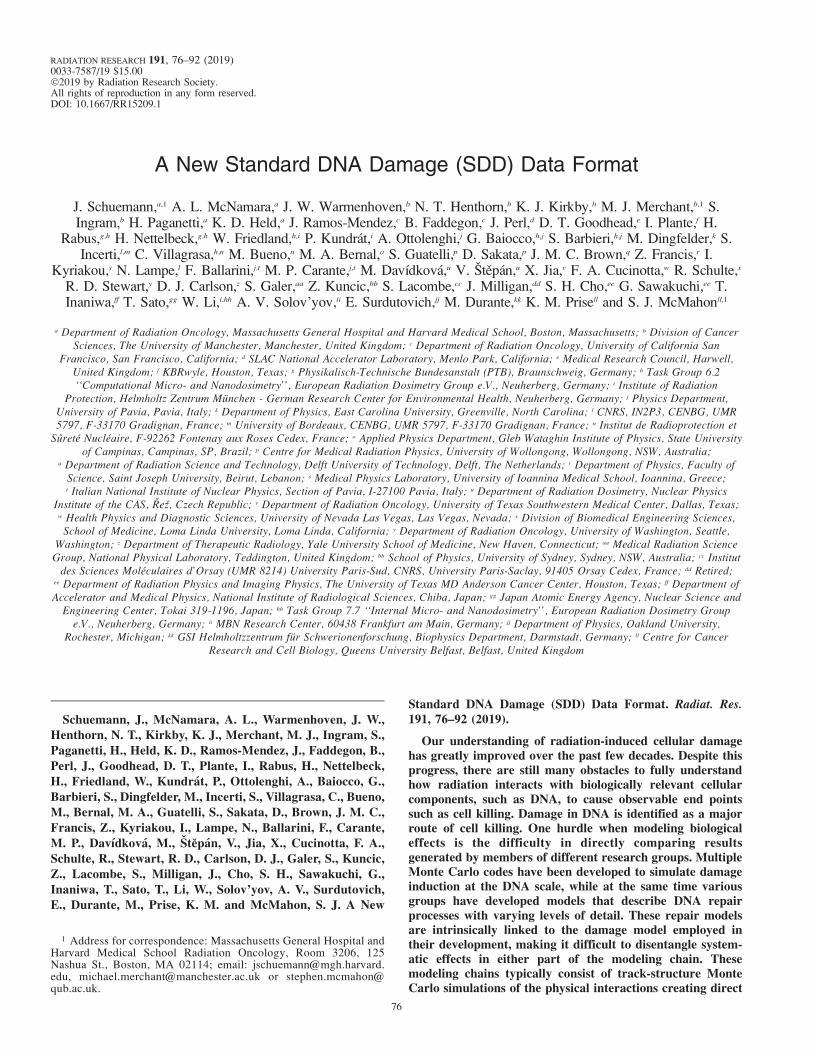
Here, we propose such a new ‘‘Standard for DNADamage’’ (SDD) to facilitate cross-comparisons among thevarious track-structure Monte Carlo codes and theirimplementations of first chemical reactions within the cellnucleus, and to link these to mechanistic models of cellrepair and the kinetics of DNA damage repair. Theproposed standard data format, shown in Fig. 1, providesa new method for cross-code comparisons and promotescollaborations among groups by promoting sharing of DNAdamage patterns at selected stages in time, i.e., after theinitial energy depositions (direct damages) or after thechemical stage (including indirect damages), as input tocalculate the biological end point(s) of interest. Bydeveloping a standard data format that various codes canwrite or read, we provide the means to not only compare theresults of different codes and models, but also investigatethe influence of each model assumption and cross-validatebetween models. Testing the dependencies of variousobservable outcomes on model parameters and theirimplementation in different models can help us to determinewhich parts of the models are most sensitive and whichparts have only a minor effect on the outcome. Incombination with new experimental data of repair process-es, in particular with higher temporal or spatial resolutionfrom new microscopy technologies, this can further help totest the models at various stages along the repair processand identify key experiments to advance the field ofradiation biology research.
This standard is primarily designed to collect nucleardamage information for eukaryotic cells after radiationdamage. However, one can also apply the standard to othersources of DNA damage, e.g., from chemotherapeuticdrugs, or to any other organism with DNA, such asbacterial/viral DNA damage (86, 87). In that case, some ofthe cell-specific information listed in the standard may beomitted. We indicate in some fields where bacterial/viralinformation can be used instead. While non-nucleardamages can also result in cells becoming nonviable, theproposed standard focuses on the main pathway of celldamage, i.e., damage to the DNA, to provide a compact andeasily transferable format.
78 SCHUEMANN ET AL.
THE NEW STANDARD FOR DNA DAMAGE
The data format for the proposed SDD is based on theformat of a typical tuple, i.e., a finite ordered list orsequence of elements. The file format for each damagespecification consists of two sections combined in one filethat should have the suffix ‘‘.sdd’’, for example Filename.sdd. The two sections are:
1. Header Section: A header consisting of a series offactors common to all damage sites in the data block.
2. Data Section: A series of fields defining individualdamage sites within the modeled volume.
Our method intends to offer a standard suitable toaccommodate a wide range of underlying simulations andDNA repair model designs. To achieve this, the headerrequires some basic information about the recorded damagepatterns for automated read-in of standardized data, while atthe same time providing free text sections to expand on thedetails of the simulation tools. For wide-spread readability,SDD-files employ a comma-separated value format in theheader section with each field ending with a semicolon. Forthe data section, values are separated by a comma orforward-slash and a semicolon is used to indicate a newfield. These are the only field separators. Spaces and newlines should be ignored by SDD readers. However, forbetter readability, we strongly recommend starting a newline for each field.
SDD files are written entirely as plain text (UTF-8encoding). Due to the variable size of the damagedefinitions and the sparsity of the data even for radiationexposures of several Gy, a binary format for the data sectionis considered unnecessary.
Website and Updates
The SDD data format anticipates that with increasing usecases, numbering schemes will need to be expanded todefine additional details or options in some fields. To keepthe numbering scheme unique and continue to allow usersto share their SDD files without ambiguity, we recommendthat requests for new numbering schemes be submitted tothe SDD collaboration (represented by the authors of thisarticle, headed by the groups at Massachusetts GeneralHospital/Harvard Medical School, University of Manchesterand Queen’s University Belfast) following the steps detailedon the SDD collaboration website: http://standard-for-dna-damage.readthedocs.org/. Each new specification for fieldsin the header or data block will be assigned a specifiednumber and documentation about all fields will be providedand updated.
Header Section
The header provides information defining the conditionscommon to all entries in the Data Section. The structure ofthe header is presented in Table 1. The header is designed tooffer comprehensive information for a large variety ofpossible damage simulations. A side-effect of this flexibilityis that many simulations may not be able to fill all headerfields. However, we strongly recommend including allinformation available. To ensure reproducibility whensharing SDD files, the header contains information on themodeled geometry as well as the irradiation that caused theDNA damage. While the design of the SDD format and thedescription below is focused on radiation-induced damage,the data structure is flexible enough to allow scoring ofother sources of DNA damage, e.g., from chemotherapeutic
FIG. 1. Illustration of the header and data structure of the proposed Standard for DNA Damage (SDD). Theinformation common to all recorded damages is indicated in the header and the information relevant to eachdamage is indicated in the data section of the SDD file.
A NEW STANDARD FOR DNA DAMAGE 79
drugs. In that case, some of the fields in the header have no
value provided and the damage induction may be described
in the additional information fields.
Comments can be added to provide additional informa-
tion on the irradiation, simulation or modeling details. They
should be denoted by a block of text, e.g., a new line,
starting and ending with #. Any text between these
characters should be ignored by the reader codes. Comment
lines can be inserted anywhere in the header.
Description of header fields. The header consists of 27
fields, each ending with a semicolon. For better readability,
each field can be started on a new line, although this is not
required per se. Table 1 summarizes the proposed fields and
their format and additional details for each field are
provided below. Each field starts with a string including
the ‘‘value’’ tag in the table followed by a comma followed
by the types defined in Table 1. If the information for any
field is not available, the value string and the field-ending
semicolon should still be included in the header. Accord-
ingly, free text sections should not include semicolons
except to end the field.
Field 1, SDD version. The SDD version number allows
tracking future modifications of the file structure and
enables automatic transformation of the information in the
header and data after such modifications. The version
detailed here is SDDv1.0. Thus, the first field should read:
‘‘SDD version, SDDv1.0;’’.
Field 2, Software. Here the program name and version
number that were used to obtain the DNA damage are
described. This can be anything from a simple random
sampling function to a combination of dedicated Monte
Carlo codes. Due to the free text format, additional
information about the software such as an access link
(URL) to the software, if available, can be added.
Field 3, Author. Here, the corresponding author of the
simulations is indicated, to allow for communication about
the data provided; the date of the file creation is also
indicated. The recommended minimum information is
name, email address and date (separated by a comma).
Additional references to publications relevant to the
simulations can be listed here. The recommended format
is: First author (et al.), title, journal, edition, page, year,
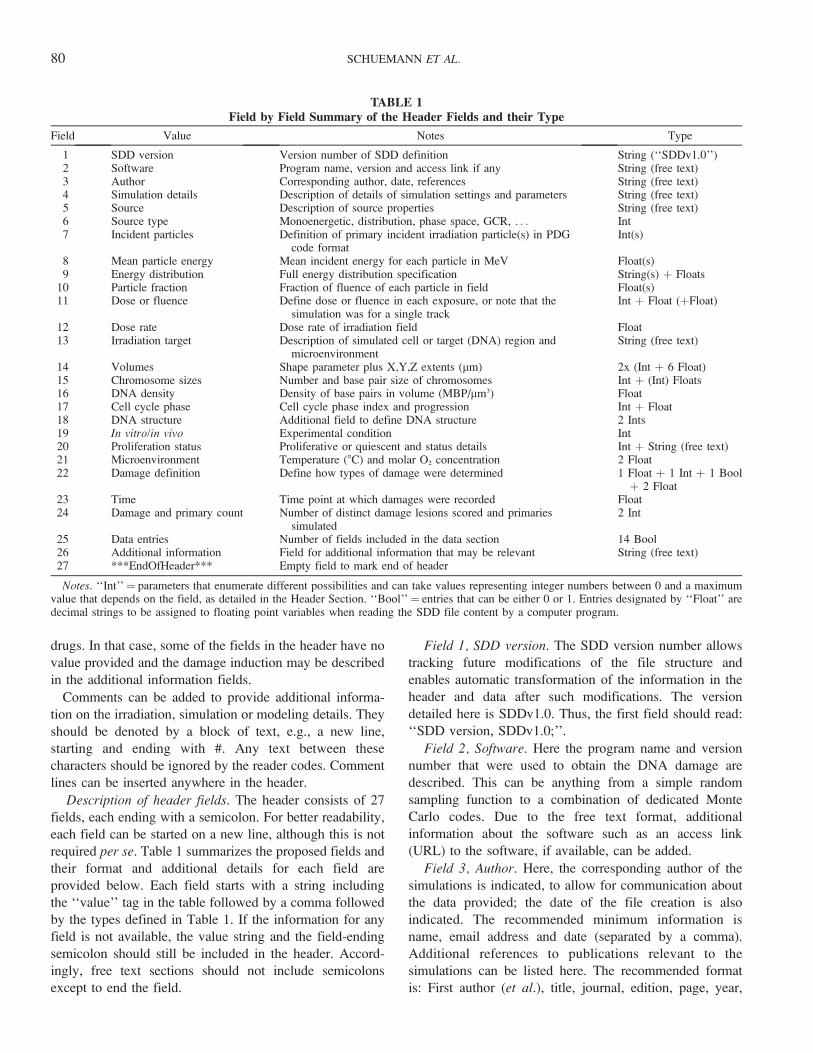
TABLE 1Field by Field Summary of the Header Fields and their Type
Field Value Notes Type
1 SDD version Version number of SDD definition String (‘‘SDDv1.0’’)2 Software Program name, version and access link if any String (free text)3 Author Corresponding author, date, references String (free text)4 Simulation details Description of details of simulation settings and parameters String (free text)5 Source Description of source properties String (free text)6 Source type Monoenergetic, distribution, phase space, GCR, . . . Int7 Incident particles Definition of primary incident irradiation particle(s) in PDG
code formatInt(s)
8 Mean particle energy Mean incident energy for each particle in MeV Float(s)9 Energy distribution Full energy distribution specification String(s) þ Floats
10 Particle fraction Fraction of fluence of each particle in field Float(s)11 Dose or fluence Define dose or fluence in each exposure, or note that the
simulation was for a single trackInt þ Float (þFloat)
12 Dose rate Dose rate of irradiation field Float13 Irradiation target Description of simulated cell or target (DNA) region and
microenvironmentString (free text)
14 Volumes Shape parameter plus X,Y,Z extents (lm) 2x (Int þ 6 Float)15 Chromosome sizes Number and base pair size of chromosomes Int þ (Int) Floats16 DNA density Density of base pairs in volume (MBP/lm3) Float17 Cell cycle phase Cell cycle phase index and progression Int þ Float18 DNA structure Additional field to define DNA structure 2 Ints19 In vitro/in vivo Experimental condition Int20 Proliferation status Proliferative or quiescent and status details Int þ String (free text)21 Microenvironment Temperature (8C) and molar O2 concentration 2 Float22 Damage definition Define how types of damage were determined 1 Float þ 1 Int þ 1 Bool
þ 2 Float23 Time Time point at which damages were recorded Float24 Damage and primary count Number of distinct damage lesions scored and primaries
simulated2 Int
25 Data entries Number of fields included in the data section 14 Bool26 Additional information Field for additional information that may be relevant String (free text)27 ***EndOfHeader*** Empty field to mark end of header
Notes. ‘‘Int’’¼ parameters that enumerate different possibilities and can take values representing integer numbers between 0 and a maximumvalue that depends on the field, as detailed in the Header Section. ‘‘Bool’’¼ entries that can be either 0 or 1. Entries designated by ‘‘Float’’ aredecimal strings to be assigned to floating point variables when reading the SDD file content by a computer program.
80 SCHUEMANN ET AL.
DOI. If multiple references are included, each referenceshould be separated by a forward-slash.
Field 4, Simulation details: Free text is entered todescribe simulation details, ideally providing sufficientinformation to potentially produce a similar simulationsetup. For example, this field should include informationabout the physics settings, e.g., which secondary particlesare included in the simulations with their respective energycut-off or the names of the cross-section models, whererelevant. Also, specifications of the world and transportmedia corresponding to the interaction cross-section models(e.g., liquid water, vapor water, DNA-like material) can besupplied.
Field 5, Source. Free text is entered to describe theparticle source used for the simulation. Particularly forscenarios that include multiple-particle irradiations, usephase spaces or other functional forms such as galacticcosmic rays (GCR), this field can be used to add referencesdescribing the source, following the structure of field 3, orto provide the URL of a website that defines the source.Additional information relevant to the source that is notcovered by the structured data in fields 6–12 should also beadded here. Each piece of information should be separatedby a comma.
Field 6, Source type. Given as an integer, this provides afirst overview of the incident particle source, identified as:1. single or multiple monoenergetic particles; 2. single ormultiple particles with energy distributions; 3. a phase spacesource; or 4. GCRs. For cases 3 and 4, the source should bedescribed in field 5, or users may need to contact the author(field 3) for full source definitions. In addition, for these twooptions, fields 7–10 may be insufficient and can be leftblank; however, if these fields can be used to (roughly)describe the particle distributions, we suggest adding theinformation. Suggestions for additional options can besubmitted to the collaboration website.
Field 7, Incident particles. In this field, the radiationtype(s) of the incident particle(s) is defined, using theparticle specification by the Particle Data Group (PDG) (88)to provide flexibility and a comprehensive handling of allknown particle types, including (charged) ions and excitedstates of ions. The radiation source can be an external beamor radionuclides. Each incident particle type can be fullydescribed by a single PDG code (integer). This field lists allincident particle types in the same order that further sourcedefinitions should be provided in subsequent fields. Eachparticle type is separated by a comma. Resulting chemicalspecies, using for example PubChem IDs, are not includedat this point, since chemical species typically are created asa result of the irradiation, i.e., from the primary particle.
Field 8, Mean particle energy. Here the mean incidentparticle energy, in units of MeV, is listed as a single float foreach particle type listed in field 7 following the same order.
Field 9, Energy distribution. This field further specifiesthe energy distribution of each incident particle in the sameorder as listed in field 7. For monoenergetic beams
(indicated in field 6), this field should take the form ‘‘M,0’’ for each particle defined in field 7. For other beams, theexpected format is a letter specifying distribution (‘‘G’’ forGaussian, ‘‘B’’ for bifurcated Gaussian) followed by acomma and a series of forward-slash separated distributionparameters. The mean, l, is given by field 8. Valuesrequired are the variance (G), and left and right variance(B). This field should define one set of parameters for eachparticle type, using comma separation. For other sourceformats such user defined distributions or distributions fromdata tables or for radionuclides, the spectrum should bedefined either using these functions or the free text section(field 5), where a link (URL) to a website can be included.Alternatively, users may need to contact the author (field 3),or submit suggestions for additional options of functionalforms to be included to the collaboration website.
Field 10, Particle fraction. Here the fraction of thefluence, represented by each particle type, is defined, as asingle comma-separated number per particle type (definedin field 7, same order).
Field 11, Dose or fluence. This field contains, first, aninteger specifying whether each field in the data block is fora single-track irradiation (0), a delivered dose (1) or afluence (2). For the latter two options, the second entry is afloat given in Gy for dose, or particles per lm2 for fluence.A third value can be added to provide the standard deviationof the mean averaged dose or fluence for multipleexposures. For a single track, the field reduces to ‘‘Doseor Fluence, 0;’’.
Field 12, Dose rate. In this field, dose rate in Gy/min islisted. This field provides an easy distinction between spaceradiation and other low-dose radiation scenarios that can betreated as separate events per incident particle, radiationtherapy treatments (in the order of 1 Gy/min), and high-dose-rate deliveries including FLASH therapy and micro-beam or grid therapy (.300 Gy/min) (44, 89–92).
Field 13, Irradiation target. This field contains free textproviding a detailed description of the irradiation target: thecell type, size, cell cycle stage and other properties relevantto the damage induction; size of the nucleus or sub-nuclearregion simulated; other geometrical features like mitochon-dria; and the potential presence of additional factors, such asnanoparticles for radioenhancement or chemotherapeuticdrugs. In case of bacterial/viral or mitochondria irradiations,their DNA content can be defined here. Similar to the freetext field for the source (field 5), this field should containinformation that is not captured by the structured data infields 14–21.
Field 14, Volumes. This field defines the extent of thesimulation volume (i.e., the simulated world), and therelevant scoring volume using two sets of comma-separatedlists of an integer and six floats. For both volumes, theinteger defines the shape of the bounding volume, such asthe cell, as either a box (0), an ellipsoid (1) or a cylinder (2);other volume shapes can be added by submitting a requestto the SDD collaboration website to extend the SDD by
A NEW STANDARD FOR DNA DAMAGE 81
assigning higher value integers. The shape definition isfollowed by three floats in the order X, Y, then Z,specifying the bounds of the volume in lm. For a box, thevalues are given in half lengths, i.e., from (þX,þY,þZ) to(–X,–Y,–Z); for an ellipsoid, the floats define the half axesof the ellipsoid along each of these three axes, i.e., for thespecial case of a spherical bounding volume, X, Y, Z areidentical; for a cylinder, X and Y define the half axes of theellipsoid along these axes, and Z defines the half length ofthe cylinder extent (from þZ to –Z). The bounding boxthereby also defines the origin of the coordinate system asthe center of the bounding box (i.e., the center of thenucleus or cell). The second group of three floats definesEuler rotations, /, h, w, respectively, to allow orienting thetarget in space according to the simulation setup.
The second set of volume definitions (int þ 6 floats)follows the same rules as above and defines the scoringvolume, e.g., the nucleus. If both volumes are identical,only one has to be defined.
Field 15, Chromosome sizes. This field lists the numberN of chromosomes in the nucleus (or in bacteria/virus),followed by N floats for the size of the chromosome inmega base pairs (MBPs). The order of chromosomes listedhere should be consistent with the chromosome ID used infield 3 of the data block. Each chromosome should be listed,i.e., a total of 46 for a normal human cell. This allows forthe inclusion of cells with missing or multiploid chromo-somes. Optionally, if only N is provided, the chromosomesare assumed to be uniform in size based on the densitystored in field 15.
Field 16, DNA density. The field describes the density ofthe DNA base pairs (BPs) in the scoring volume in units ofMBPs per lm3 as a single float value. Here the averagedensity over the entire scoring volume is considered, i.e., anaverage of heterochromatin and euchromatin regions if bothare present.
Field 17, Cell cycle phase. The field defines the cell cycleand the progression through the phase using an integer and afloat. The integer defines the cell cycle numerically as G0
(1), G1 (2), S (3), G2 (4) and M (5). Progression through aphase can be denoted by providing an additional (comma-separated) float with value between 0 and 1. For example,‘‘3, 0.7;’’ indicates a cell 70% of the way through S phase.This optional float is included to allow more granularinclusion of asynchronous cell populations.
For simulations without a specific cell cycle phase, thevalue can be set to 0. The cell cycle phase is important todetermine the presence of sister chromatids. It furtherinfluences the number of chromosome BPs listed in field14; for cells in (late) S or G2, the number of BPs in achromosome should only be one half the total number ofBPs, as they are repeated and identified by their chromatidnumber (CR) in field 3 of the data block.
It should be noted that the DNA damage format isdesigned assuming that each file records responses in asingle defined cell type at a particular point in the cell cycle.
However, in in vitro or in vivo experiments or clinicaltreatment, the cell population being exposed is typicallyheterogeneous, with only features such as the compositionof the cell population being available, e.g., what fraction ofcells are in a given cell cycle phase. Thus, to fully describebiological experiments, it may be necessary to assemble arepresentative cell population from simulations of differentcell cycle stages into a population-level response, with eachparticular condition stored as an individual SDD file. Onecan then represent any mixture of cell populations by anadequate assembly of SDD files/scenarios.
Field 18, DNA structure. Here, the DNA structure isdefined, by two comma-separated integers. The first integerdefines the arrangement of DNA as: whole nucleus (0), aheterochromatin region (1), euchromatin region (2), a mixed(heterochromatin and euchromatin) region (3), single DNAfiber (4), DNA wrapped around a single histone (5), DNAplasmid (6) or a simple circular (7) or straight (8) DNAsection. Details about higher order DNA assumptions canbe added as descriptions in fields 4 or 24, for example byproviding the URL of a website or by referring the reader tothe author (field 3).
To facilitate cross-code comparisons, options for special-ly defined geometries are also available. The currentlydefined reference geometries are a straight DNA section(100), a circular DNA plasmid (101) and a chromatin fiber(102). For exact definitions of these geometries, please referto the SDD website. The second integer indicates ‘‘naked’’(0) or wet (1) DNA. Additional values can be added anddescribed by submitting a request to the SDD collaborationwebsite.
Field 19, In vitro/in vivo. This field describes theexperimental conditions that are simulated. This field isimportant for both the geometry setup and for consider-ations of biological response. The condition is defined bytwo comma-separated integers. The first integer defines ifthe simulations refer to in vitro (0) or in vivo (1) conditions.The second integer further explains the conditions; it shouldbe 0 for in vivo experiments, (1) for monolayers of cells, (2)for cell suspensions, (3) for 3D-grown tissue models.Additional conditions can be added by submitting requeststo the website.
Field 20, Proliferation status. This field contains theinteger variable to determine the proliferation state of thecell(s) as quiescent (0) or proliferating (1). A secondoptional string (free text) can be added to describe the statusof the scenario, including environmental cues such as serumstarvation and innate states like stemness.
Field 21, Microenvironment. This field contains twofloats. The first value defines the temperature in degreesCelsius, the second the molar oxygen (O2) concentration inthe volume in molarity (M). If no values are provided, astandard room temperature of 258C and normoxic condi-tions are assumed. Other relevant concentrations such asthat of various scavengers should be defined in the free textformat of field 13; they are not included due to the wide
82 SCHUEMANN ET AL.
range of potential scavenging agents. Potential additionalfractions or other microenvironment factors can be added bysending a request for expanding the number of parametersgiven in this field to the SDD collaboration website.
Field 22, Damage definition. This field defines howdamage is scored and accumulated into distinct damagesites in the data block. It consists of a list of the followingvalues, using comma separation:
1. Integer to define if damages were recorded as thoseresulting from direct effects only (0) or includingchemistry (1). Other types are not currently explicitlyincluded but can be defined by sending a correspondingrequest to the SDD collaboration website.
2. A Boolean flag to define if the following numbers arelisted in number of BPs (0) or in nm (1).
3. This value sets the distance in BPs or nm betweenbackbone lesions that are considered DSBs (float).
4. If this value is set to –1, it indicates that base lesions arenot scored. Non-negative values mean that damages tothe bases add to the damage complexity and are stored inthe data block. In that case, all base damages betweenbackbone damages that form a DSB are stored. Thisvalue then determines the distance (in BP or nm) beyondthe outer backbone damages where base damages arealso stored in the same site (float).
5. Low energy threshold to induce a strand break (or basedamage) in eV (float).
6. Optional field to define a linear probability function fordamage induction as used in PARTRAC, with theprobability p(E , A) ¼ 0, p(E . B) ¼ 1, and linearlyincreasing probability from 0 to 1 in the interval from Ato B, where A is defined by the 5th value in field 22, andB is given in this field in eV (float). Note: This field will
influence the full break specification in the data part of
the standard, as demonstrated also in Fig. 2. Fields 22.1,
22.5 and 22.6 influence which interactions are scored as
damages, and fields 22.3 and 22.4 determine the
distances between and around damages that are clustered
in a single break record. However, together with the
chromosome position (fields 3 and 4 in the data block),
the data block can be post-processed to yield new break
clustering using different distances as desired.
An example of field 22 would look like: ‘‘Damage
Definition, 0, 0, 10, 3, 17.5;’’ translating to: Only counting
lesions from direct track interactions, distances are defined
in number of BPs, a distance of 10 BP to call two opposite
strand SSBs a DSB, base damages are considered, grouping
base damages up to 3 BPs on either side of backbone
damages in a single site, and only interactions depositing at
least 17.5 eV are counted as lesions.
Field 23, Time. This specifies the total simulation time
for each primary particle, that is, the time from when the
source particle was created to the time at which the
chemistry simulation ends, i.e., when the damage was
recorded, in nanoseconds. For simulations that only
consider direct (physics) interactions, this value should be
set to 0.
Field 24, Damage and primary count. The first integer
records the number of distinct damage lesions scored as a
single integer and should be identical to the number of fields
in the data block divided by the number of fields per
damage site (sum of ‘‘true’’ values of field 25). The second
integer is a counter of how many primary particles were
simulated. This value is important to count particles that did
not cause any damage to the DNA to accurately represent
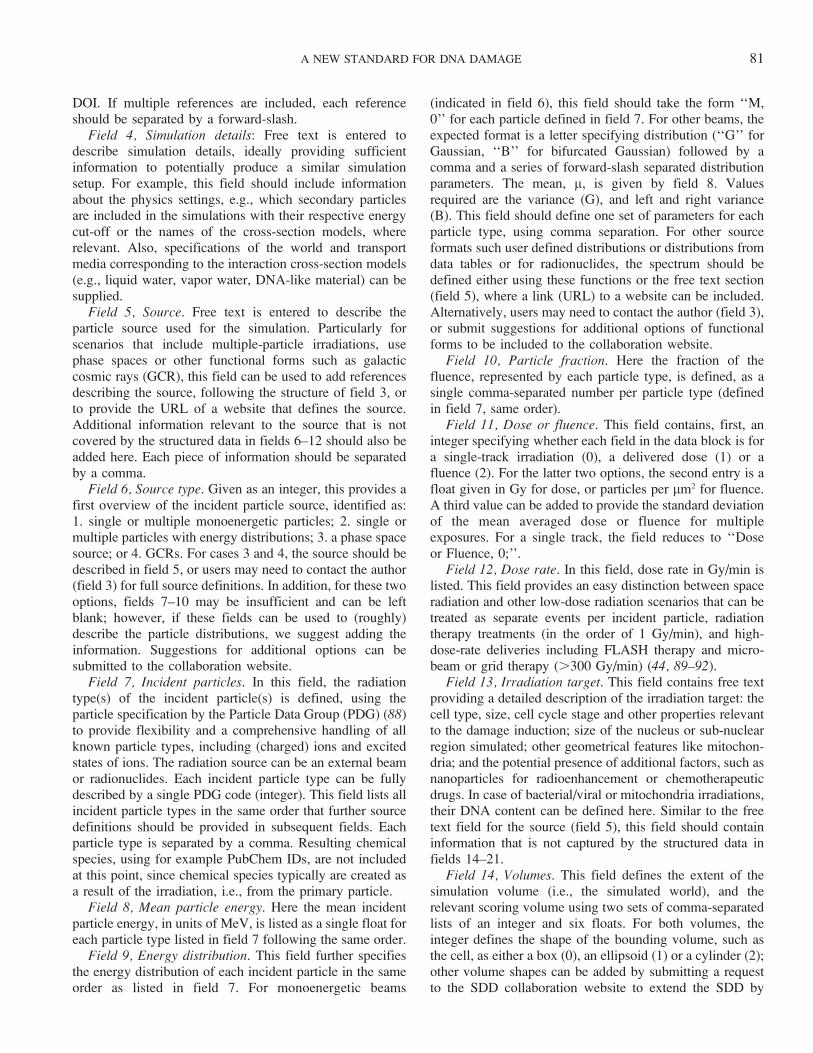
FIG. 2. Example of a single DSB recorded with a 10-BP maximum backbone separation. The upper sectionscores damages if base lesions are counted with a BP separation of up to three BPs as defined in the header field22.4, scoring three entries in the data block, indicated by the solid arrows. The entries in field 6 would be: a DSB‘‘1, 2, 1;’’ a BD ‘‘1, 0, 0;’’ and SSB ‘‘2, 1, 0;’’ If base damages are neglected (lower section), the same damagepattern will be scored as two separate damages: a DSB ‘‘0, 2, 1;’’ and a SSB ‘‘0, 1, 0;’’. The dashed linesdemonstrate the separations considered for grouping; red indicates the distances that are larger than the cutoff.
A NEW STANDARD FOR DNA DAMAGE 83
the probability of interactions and avoid overestimation ofdamage induction.
Field 25, Data entries. This field contains an array of 14comma-separated Booleans to indicate which fields of thedata block are filled. This field facilitates SDD-readerinterfaces.
Field 26, Additional information. Allows for additionalcomments about the simulation that may be relevant for thescored damages. This can, for example, include furtherdetails on the physics settings, simulated geometries,material compositions, the source, potential scavengerconcentrations in the cell or other descriptions of thesimulation or irradiated target that may be helpful to betterunderstand the simulations or improve the biologicalmodeling.
This field can also be used to define new user-specifiedvalues for any field in the header or data block. However,we strongly recommend submitting a request to update thestandard with such new settings to the SDD collaborationwebsite (http://standard-for-dna-damage.readthedocs.org/)so that the new settings can be officially included in thestandard to ensure that all users use the same uniquelydefined values.
Field 27, ***EndOfHeader***. This is an empty field,used to denote the end of the header and beginning of maintext. This field ends the header with: ‘‘***EndOf-Header***;’’.
Data Section
The data block is recorded in text (UTF-8) format. Eachdamage site is stored as a group of up to 14 fields, eachcontaining a series of comma- and/or forward-slash-separated fields to define the structure of the damage. Each
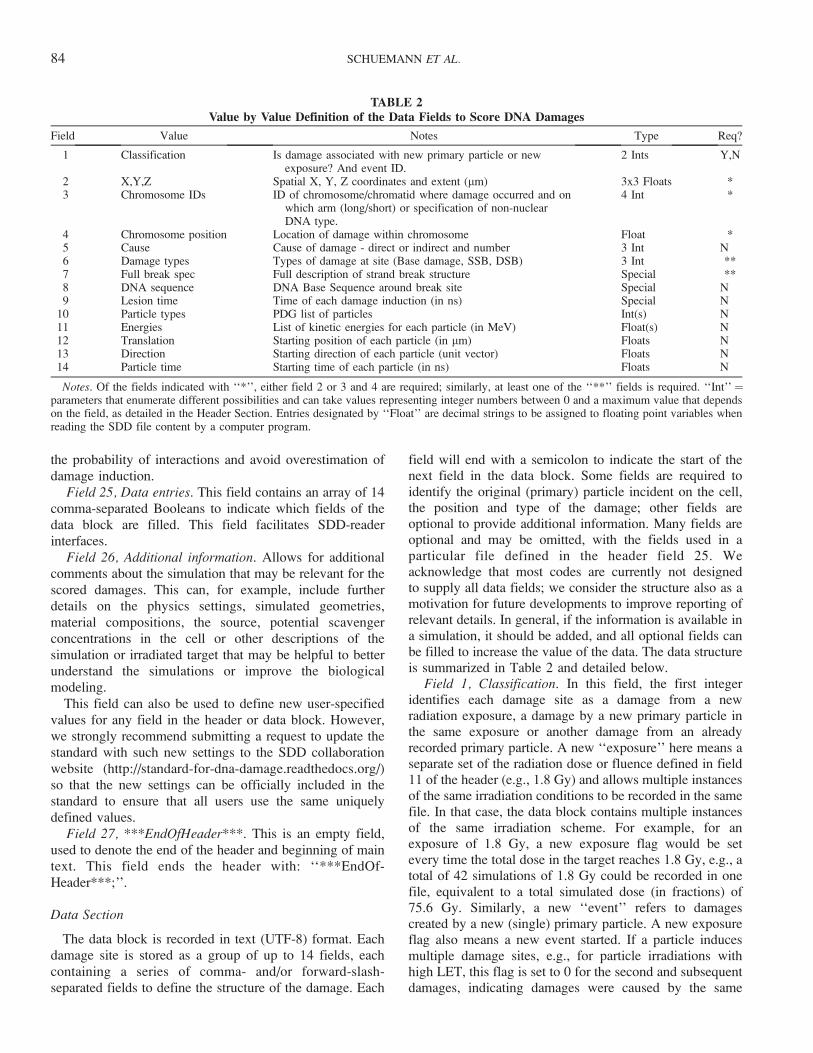
field will end with a semicolon to indicate the start of thenext field in the data block. Some fields are required toidentify the original (primary) particle incident on the cell,the position and type of the damage; other fields areoptional to provide additional information. Many fields areoptional and may be omitted, with the fields used in aparticular file defined in the header field 25. Weacknowledge that most codes are currently not designedto supply all data fields; we consider the structure also as amotivation for future developments to improve reporting ofrelevant details. In general, if the information is available ina simulation, it should be added, and all optional fields canbe filled to increase the value of the data. The data structureis summarized in Table 2 and detailed below.
Field 1, Classification. In this field, the first integeridentifies each damage site as a damage from a newradiation exposure, a damage by a new primary particle inthe same exposure or another damage from an alreadyrecorded primary particle. A new ‘‘exposure’’ here means aseparate set of the radiation dose or fluence defined in field11 of the header (e.g., 1.8 Gy) and allows multiple instancesof the same irradiation conditions to be recorded in the samefile. In that case, the data block contains multiple instancesof the same irradiation scheme. For example, for anexposure of 1.8 Gy, a new exposure flag would be setevery time the total dose in the target reaches 1.8 Gy, e.g., atotal of 42 simulations of 1.8 Gy could be recorded in onefile, equivalent to a total simulated dose (in fractions) of75.6 Gy. Similarly, a new ‘‘event’’ refers to damagescreated by a new (single) primary particle. A new exposureflag also means a new event started. If a particle inducesmultiple damage sites, e.g., for particle irradiations withhigh LET, this flag is set to 0 for the second and subsequentdamages, indicating damages were caused by the same
TABLE 2Value by Value Definition of the Data Fields to Score DNA Damages
Field Value Notes Type Req?
1 Classification Is damage associated with new primary particle or newexposure? And event ID.
2 Ints Y,N
2 X,Y,Z Spatial X, Y, Z coordinates and extent (lm) 3x3 Floats *3 Chromosome IDs ID of chromosome/chromatid where damage occurred and on
which arm (long/short) or specification of non-nuclearDNA type.
4 Int *
4 Chromosome position Location of damage within chromosome Float *5 Cause Cause of damage - direct or indirect and number 3 Int N6 Damage types Types of damage at site (Base damage, SSB, DSB) 3 Int **7 Full break spec Full description of strand break structure Special **8 DNA sequence DNA Base Sequence around break site Special N9 Lesion time Time of each damage induction (in ns) Special N
10 Particle types PDG list of particles Int(s) N11 Energies List of kinetic energies for each particle (in MeV) Float(s) N12 Translation Starting position of each particle (in lm) Floats N13 Direction Starting direction of each particle (unit vector) Floats N14 Particle time Starting time of each particle (in ns) Floats N
Notes. Of the fields indicated with ‘‘*’’, either field 2 or 3 and 4 are required; similarly, at least one of the ‘‘**’’ fields is required. ‘‘Int’’ ¼parameters that enumerate different possibilities and can take values representing integer numbers between 0 and a maximum value that dependson the field, as detailed in the Header Section. Entries designated by ‘‘Float’’ are decimal strings to be assigned to floating point variables whenreading the SDD file content by a computer program.
84 SCHUEMANN ET AL.
single particle. The first value of this field is defined by aninteger as follows:
0: for a damage caused by the same primary particle as theprevious row;
1: for a damage caused by a new primary particle within thesame (user defined) exposure; and
2: for a damage which represents the start of a new exposure(which is also necessarily a new primary particle).
The second integer is optional and offers a place to addthe event ID, i.e., the number of the primary particle thatwas simulated, typically counting from 0 or 1 for each
exposure.
Field 2, X, Y, Z (*). This field defines the spatial positionX, Y, Z of the center and extent of each recorded damage,using coordinates within the bounding box specified by
field 14 in the header. The first three values define positionsspecified as three comma-separated values with unit lm. Allsubsequent fields are optional but should be included ifavailable. The second set of three comma-separated values
defines the maximal position value in X, in Y and in Z andthe last three comma-separated values list the minimalvalues of X, Y, Z, respectively, together defining a box thatencompasses the damage. Each 3-tuple of values is
separated by a forward-slash; for example, field 2 couldread ‘‘0.002, 0, 1.2 / 0.004, 0.002, 1.122 / 0.001, –0.001,1.117;’’.
*Either field 2 or fields 3 and 4 (Chromosome IDs and
Position) must be provided. While both should be listed ifpossible, the option to define either acknowledges the factthat, depending on the code, not all information may beavailable.
Field 3, Chromosome IDs (*). This field stores the
identity of the chromatid where the damage occurs. Theentry consists of four integers. The first integer defines the‘‘DNA structure’’ as unspecified (0), hetero- (1) oreuchromatin (2) regions of nuclear DNA, a free DNA
fragment (3) or mitochondrial/bacterial/viral DNA (4). Inthe case of nuclear DNA, the next three integers are thechromosome and chromatid number and indication of long/
short arm. The values are stored, comma-separated, as ‘‘CH,CR, CA;’’ where CH is the chromosome number, CR is thechromatid number and CA is the arm of the chromosome[short (0) or long (1)]. CR is specified as 1 for unduplicated
chromosomes, and 1 or 2 to identify the two chromatids inthe duplicated chromosome in later S and G2 (and early M)phases. For example, ‘‘12, 1, 1;’’ corresponds to the longarm of chromatid 1 on chromosome 12. Chromosome
numbering is assumed to follow the order listed in headerfield 15. For cells without a specified cell phase or cells inG0 or G1 phase, the chromatid number CR is always 1. Incases where the CA information of short versus long arm is
not available, the last number may be left empty.
*Either this value together with field 4 or the X, Y, Zinformation (field 2) is required.
Field 4, Chromosome position (*). This field indicatesthe damage position along the chromosome’s geneticlength. This value is defined as the distance along thechromosome from the start of the short (p) arm towards theend of the long (q) arm. It can be stored either as a valuebetween 0 and 1 (excluding 1) giving the fractional distancealong the chromosome at which the break occurs, or, if thevalue is greater than or equal to 1, as the distance in BPsfrom the beginning of the short arm (p) to the damage site.In case of non-nuclear DNA, such as DNA fragments ormitochondrial, bacterial or viral DNA, the fraction simplyrefers to the size of DNA segment provided in the header or,if the value is greater than 1, the BP number along thedefined DNA.
*Either this value together with field 3 or the X, Y, Zinformation (field 2) is required.
Field 5, Cause (optional). Offers a flag to identify thecause of the induced damage and a counter for how manydamages were caused by direct or indirect events. The firstinteger classifies the damage type; currently included areoptions to identify whether the damage is a result of directphysical interactions (0), indirect interactions, i.e., the resultof the propagation of any chemical species and afterreactions with the DNA (1), caused by a combination ofdirect and indirect interactions (2), or caused by chargemigration (3). Additional options can be included accordingto the needs of other codes, e.g., to represent damagesinduced by concomitant drug-based therapies. If additionalvalues of this specifier are needed, a request to update thestandard should be submitted to the SDD collaborationwebsite. The second and third integers provide counters forthe number of direct and indirect damages at the site,respectively.
Additional information about the damages, e.g., whichdamage was induced by which process, and morespecification of the indirect damages (e.g., fixation byOH, stabilization of R8 by O2 or O2
–) can be recorded infield 7.
Field 6, Damage types (**). This field provides a high-level specification of the type of damage present at a givensite in terms of base damages, backbone (single strand) andDSBs (defined as exactly two single-strand damages withinthe separations defined in the header), or a combination ofthese. This classification can be seen as a numericaldescription of many other damage classification metrics(21, 93), effectively grouping these damages into broadercategories according to the expected biological severity ofthe damage. Damages separated by less than the minimumdistance of BPs defined by the damage definition in theheader (field 22.4) are scored in a single data block, i.e.,they are considered to be a single cluster of damages. Repaircodes can either convert these clusters to a lesion or use theinformation in field 7 (if provided) to define lesions. Anexample of how lesions are grouped based on theinformation provided by field 22 in the header is shownin Fig. 2.
A NEW STANDARD FOR DNA DAMAGE 85
The damages are stored as three comma-separatedintegers: the first integer lists the number of base damages;the second integer is the total number of single backbonebreaks, including those contributing to the formation of aDSB; and the final number is a binary (0 or 1) indicating thepresence of a DSB, i.e., if lesions occurred on bothbackbones within the BP range defined in the header. Forexample, ‘‘3, 2, 1;’’ would represent a damaged DNA siteconsisting of three (3) base damages with two (2) backbonedamages that are on opposing strands within the BP limitand thus are counted as a DSB (1). Additional examples arelisted in Fig. 4.
**Either field 6 or 7 are mandatory, but if available, thefull damage structure should always be included, asdiscussed below, to provide more details of the breakstructure. This field is intended to provide a high-levelsummary and support models that do not calculate the fullstructure of individual breaks and rather rely on numbers ofSSBs and DSBs and their distribution.
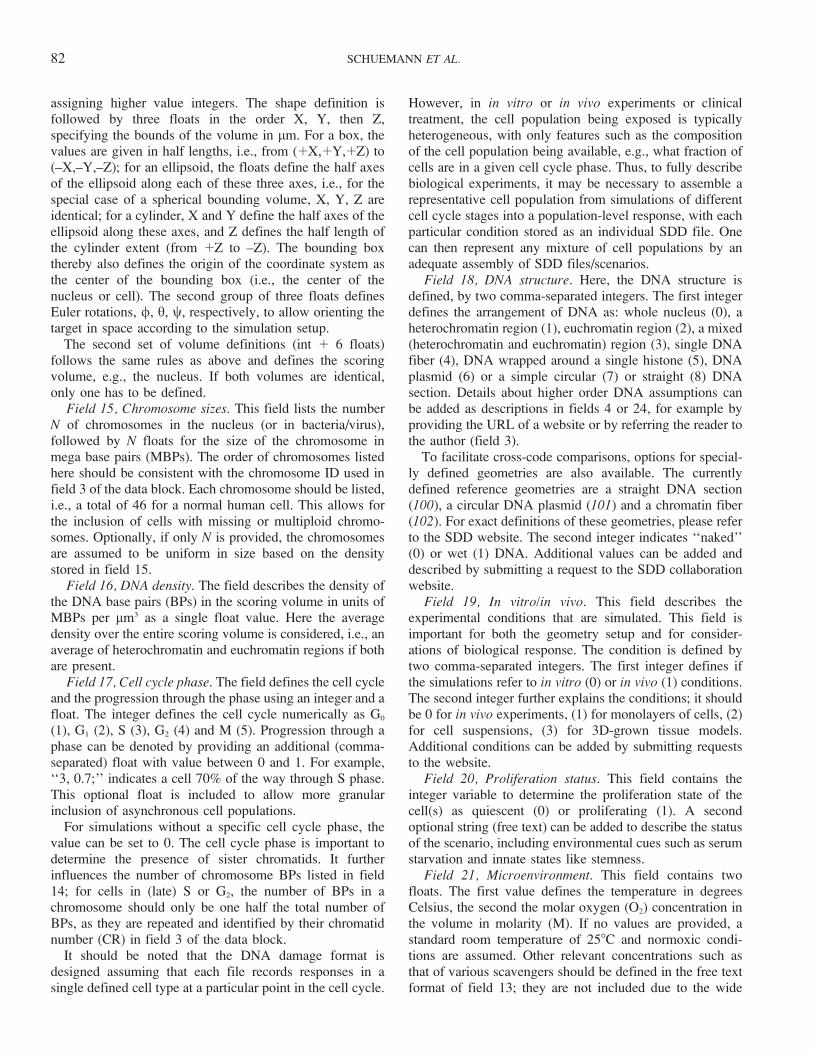
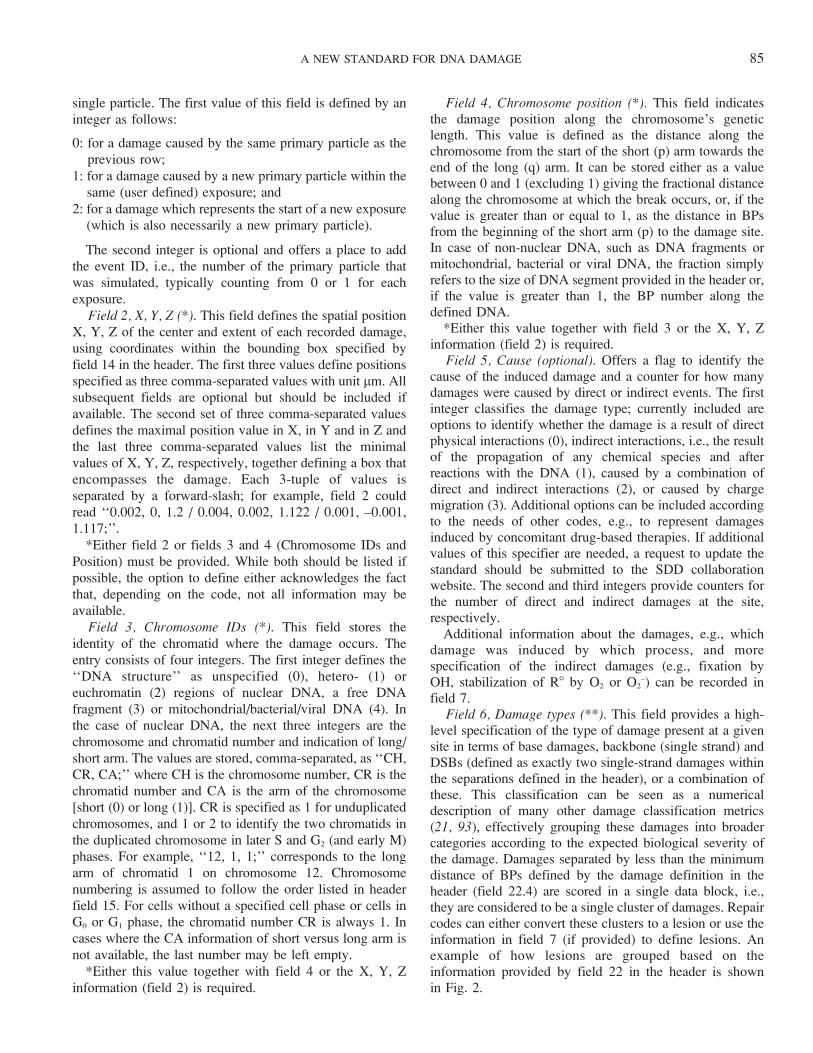
Field 7, Full break spec (**). This field allows for a fullspecification of the structure of the damage. We apply afour-strand structure, using a 4 3 N array, with the rowsconsisting of the backbone (row 1) and bases (row 2) of the50 to 30 strand, and the bases (row 3) and backbone (row 4)of the 30 to 50 strand. The base positions (columns) arealigned reading from the short arm (p) towards the long arm(q), beginning from base 1, which is defined as the firstinvolved alteration at the position corresponding to field 4(if provided). Thus, increasing columns for strand 1correspond to the 50 to 30 direction and the 30 to 50 onstrand 2. The design of the data structure is shown in Fig. 3,with blue fields corresponding to the backbones and lightorange to the base pair fields.
All unmarked sites are assumed to be unaffected, whiledamaged sites (strand or base damages) are markednumerically.
Strand damages are indicated as 1 for point breaks on astrand from direct effects, 2 for lesions (losses orattachments) from a single indirect damage, 3 for multipledamages to the same base pair strand from two or moredirect or indirect interactions. In addition, 0 can be used toindicate nondamage-inducing interactions, i.e., events thatare below the damage induction threshold. Also, 4þ can beused for adducts or other modifications, according to thesource program, e.g., to define additional details such as thetype of indirect reaction that occurred. This may be relevantto account for differences in repair likelihood for different
types of reactions from radiolysis such as dehydrogenation,OH addition or deoxyribose damage. All additionalnumbering schemes should be submitted to and detailedon the collaboration webpage to ensure a unique numberingscheme.
Base damages are indicated in the same manner as strandbreaks, with 1 for point losses from direct effects, 2 forlesions (losses or attachments) from indirect effects, and 3for multiple damages from direct or indirect damages. 0 canbe used to indicate nondamage-inducing interactions.Again, all additional suggested numbering schemes shouldbe submitted to and detailed on the collaboration webpageto ensure a unique numbering scheme.
The damages are recorded in a comma-separated list of:Strand (row), Base pair (column), Damage type, with eachdamage separated by the delimiter ‘‘/’’. Damage events arerecorded by row, beginning with the 50 to 30 backbone, thenits accompanying bases, then the 30 to 50 bases, then finallytheir backbone. Within each row, damages are thenrecorded in the 50 to 30 direction.
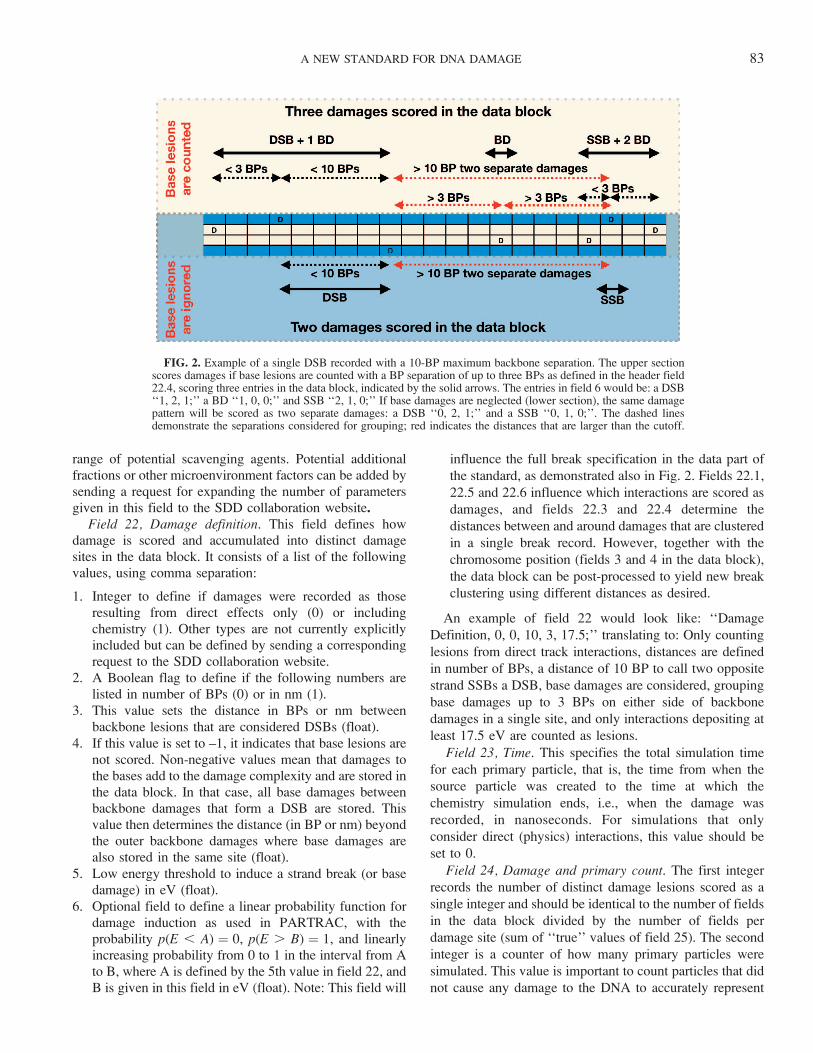
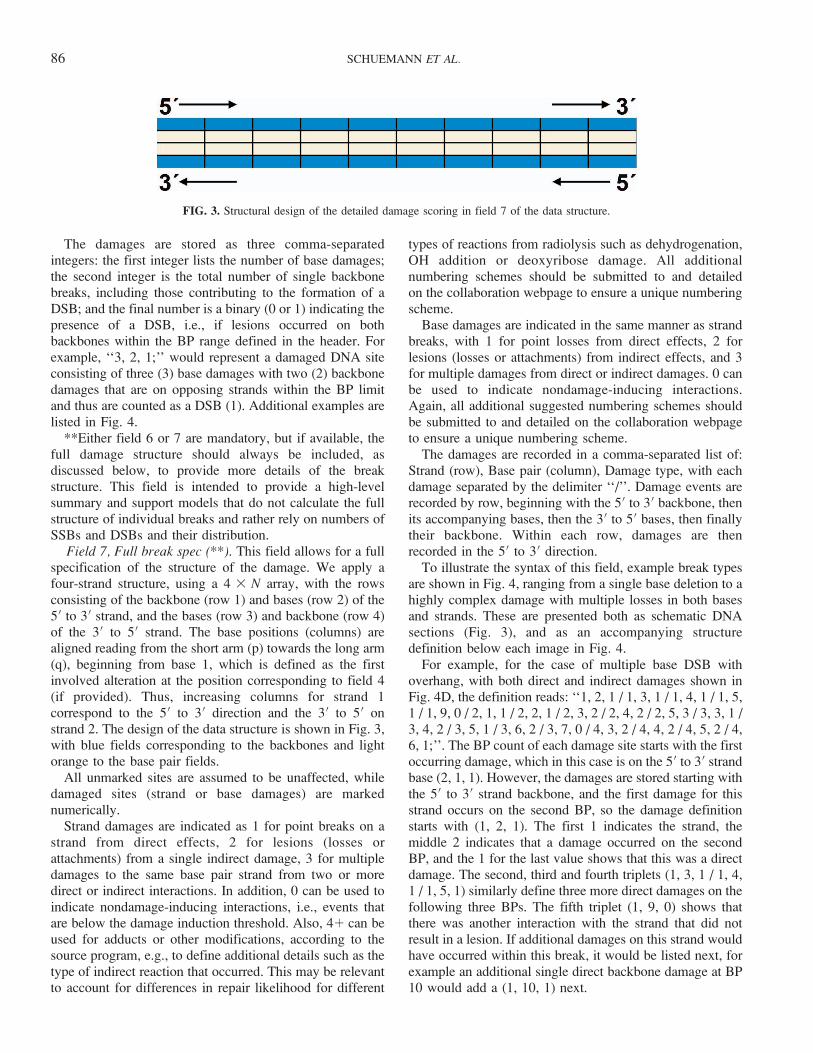
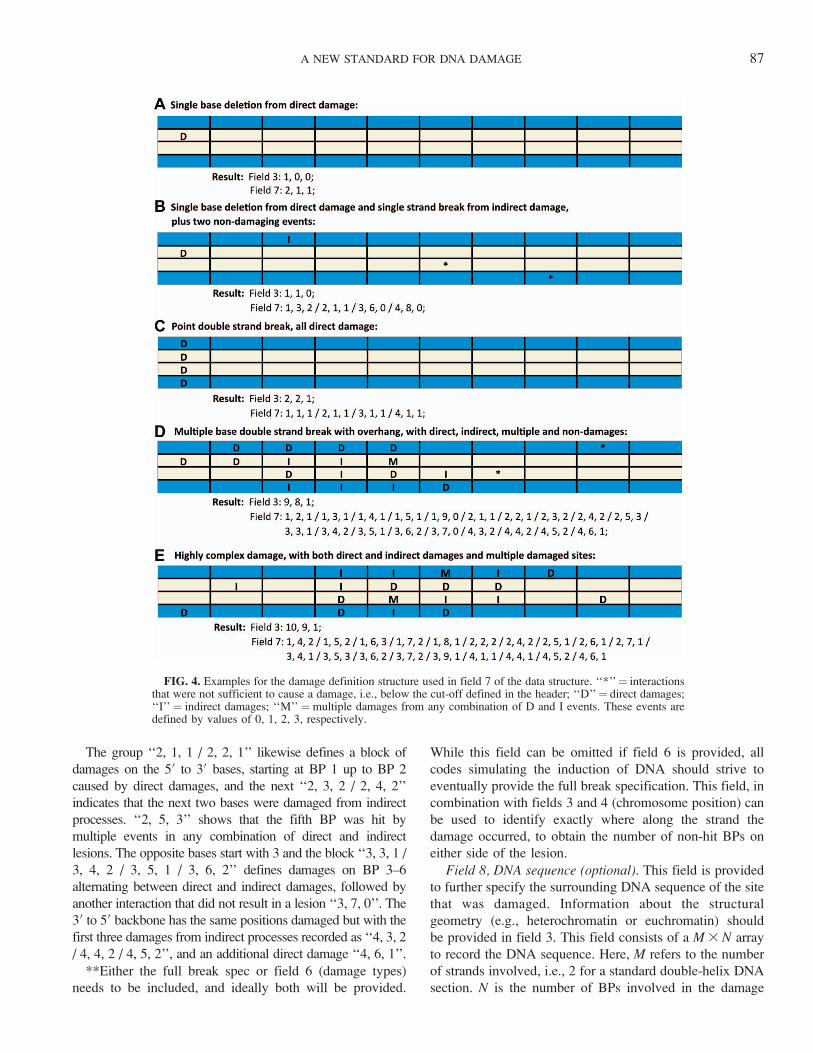
To illustrate the syntax of this field, example break typesare shown in Fig. 4, ranging from a single base deletion to ahighly complex damage with multiple losses in both basesand strands. These are presented both as schematic DNAsections (Fig. 3), and as an accompanying structuredefinition below each image in Fig. 4.
For example, for the case of multiple base DSB withoverhang, with both direct and indirect damages shown inFig. 4D, the definition reads: ‘‘1, 2, 1 / 1, 3, 1 / 1, 4, 1 / 1, 5,1 / 1, 9, 0 / 2, 1, 1 / 2, 2, 1 / 2, 3, 2 / 2, 4, 2 / 2, 5, 3 / 3, 3, 1 /3, 4, 2 / 3, 5, 1 / 3, 6, 2 / 3, 7, 0 / 4, 3, 2 / 4, 4, 2 / 4, 5, 2 / 4,6, 1;’’. The BP count of each damage site starts with the firstoccurring damage, which in this case is on the 50 to 30 strandbase (2, 1, 1). However, the damages are stored starting withthe 50 to 30 strand backbone, and the first damage for thisstrand occurs on the second BP, so the damage definitionstarts with (1, 2, 1). The first 1 indicates the strand, themiddle 2 indicates that a damage occurred on the secondBP, and the 1 for the last value shows that this was a directdamage. The second, third and fourth triplets (1, 3, 1 / 1, 4,1 / 1, 5, 1) similarly define three more direct damages on thefollowing three BPs. The fifth triplet (1, 9, 0) shows thatthere was another interaction with the strand that did notresult in a lesion. If additional damages on this strand wouldhave occurred within this break, it would be listed next, forexample an additional single direct backbone damage at BP10 would add a (1, 10, 1) next.
FIG. 3. Structural design of the detailed damage scoring in field 7 of the data structure.
86 SCHUEMANN ET AL.
The group ‘‘2, 1, 1 / 2, 2, 1’’ likewise defines a block of
damages on the 50 to 30 bases, starting at BP 1 up to BP 2
caused by direct damages, and the next ‘‘2, 3, 2 / 2, 4, 2’’
indicates that the next two bases were damaged from indirect
processes. ‘‘2, 5, 3’’ shows that the fifth BP was hit by
multiple events in any combination of direct and indirect
lesions. The opposite bases start with 3 and the block ‘‘3, 3, 1 /
3, 4, 2 / 3, 5, 1 / 3, 6, 2’’ defines damages on BP 3–6
alternating between direct and indirect damages, followed by
another interaction that did not result in a lesion ‘‘3, 7, 0’’. The
30 to 50 backbone has the same positions damaged but with the
first three damages from indirect processes recorded as ‘‘4, 3, 2
/ 4, 4, 2 / 4, 5, 2’’, and an additional direct damage ‘‘4, 6, 1’’.
**Either the full break spec or field 6 (damage types)
needs to be included, and ideally both will be provided.
While this field can be omitted if field 6 is provided, all
codes simulating the induction of DNA should strive to
eventually provide the full break specification. This field, in
combination with fields 3 and 4 (chromosome position) can
be used to identify exactly where along the strand the
damage occurred, to obtain the number of non-hit BPs on
either side of the lesion.
Field 8, DNA sequence (optional). This field is provided
to further specify the surrounding DNA sequence of the site
that was damaged. Information about the structural
geometry (e.g., heterochromatin or euchromatin) should
be provided in field 3. This field consists of a M 3 N array
to record the DNA sequence. Here, M refers to the number
of strands involved, i.e., 2 for a standard double-helix DNA
section. N is the number of BPs involved in the damage
FIG. 4. Examples for the damage definition structure used in field 7 of the data structure. ‘‘*’’¼ interactionsthat were not sufficient to cause a damage, i.e., below the cut-off defined in the header; ‘‘D’’¼ direct damages;‘‘I’’¼ indirect damages; ‘‘M’’¼multiple damages from any combination of D and I events. These events aredefined by values of 0, 1, 2, 3, respectively.
A NEW STANDARD FOR DNA DAMAGE 87
definition; for the example in Fig. 4C it would be 1, for Fig.4E it would be 9. For a double helix without mismatched ormodified bases, the array can also be reduced to a 1 3 Narray without loss of information.
For models incorporating the actual physical structure ofindividual bases, the DNA sequence along the strand can beincluded in this field. The design uses the same layout as thebreak structures above, beginning from the 50 end at theposition of the first damage. Bases are written in sequencefor the 50 to 30 strand, stored as strings of integer values,with bases denoted as: Missing¼0, A¼1, C¼2, T¼3, G¼4.Backbones are not specified in these data.
This field is kept optional since most codes do not yetconsider the DNA sequence. However, evidence exists thatspecific types of individual lesions formed by ionizingradiation differ for A, G, T and C (94). There is alsoevidence in the literature that the larger-scale base sequencecan have an effect on the types and quantities of individuallesions created by irradiation, and on how this is repaired(95, 96). An example of this latter effect would be holemigration along a DNA molecule. These effects aregenerally not yet considered in most current Monte CarloDNA damage models, although the RADAMOL code (75)offers an option to include charge migration. Such
migrations have potentially important implications formodeling of DNA repair.
Field 9, Lesion time (optional). This field is provided toadd a time for each induced damage in nanoseconds startingfrom the first recorded damage, using the same order as in
field 7. If only a single value is given here, that is assumedto be the time at which the whole damage site enters thesimulation. The values are recorded, separated by ‘‘/’’. Forexample, for the case shown in Fig. 4B denoted as (1, 3, 2 /2, 1, 1 / 3, 6, 0 / 4, 8, 0;), the time structure could be ‘‘2.1 / 0/ 0.0000008 / 0.000001’’. This translates to an event with aninitial direct damage (on 2, 1, 1), a direct base and a directbackbone damage below the break threshold 0.8 and 1 fslater (3, 6, 0) and (4, 8, 0), respectively, and an indirectdamage 2.1 ns after the first break (1, 3, 2).
The remaining fields, discussed below, are optional fieldsto describe the primary particles from the irradiation sourcethat actually caused the recorded damage by itself, throughsecondary particles or chemical reactions. The primariesshould be defined in the Header Section.
Field 10, Particle types (optional). Field 10 defines theparticle type for each involved source particle using comma-separated integers (PDG values). For single-particle-typeirradiations, this field is already defined by header field 7and can be omitted.
Field 11, Energies (optional). This field containscorresponding initial particle energies of the particlesdefined above, in MeV, one comma-separated entry perparticle defined in field 10. Similar to field 10, formonoenergetic irradiations, this field is already defined inheader field 8.
Field 12, Translation (optional). This field contains thethree vectors (X, Y, Z) of the starting points of the particles,in lm, relative to the center of the world volume, stored as acomma-separated list of one 3-tuple for each particle, witheach value within the 3-tuple separated using ‘‘/’’.
Field 13, Direction (optional). This field contains Eulerrotation angles (/, h, w) for the above particles followingthe same style as for the translations to define theirdirection. A rotation of 0/0/0 is defined as having theparticles propagate along the þZ direction.
Field 14, Particle time (optional). This field contains alist of comma-separated floats giving the start time in ns ofeach particle defined in field 10 with t ¼ 0 defined as thetime when a new exposure starts (see field 1 and headerfield 11). This may be particularly important for very low-dose-rate exposures such as those from GCRs.
Dissemination and Repository
We have set up a website (https://standard-for-dna-damage.readthedocs.org/), where the standard is document-ed and to which new requests for enumeration schemes canbe submitted. In addition, we provide a link to our GitHubrepository, which offers selected example codes andprovides a place to share SDD files. Such a repository willbe useful for modelers who do not have the resources toperform their own full damage simulations, and to test(new) damage models against other (published) models thatprovided data here. This repository also includes a code togenerate random damage distributions in the SDD formatand example SDD files. (See Appendix for further details).
DISCUSSION
The outlined standardized data format for DNA damages(SDD) is intended to provide the basis for cross-disciplinaryinvestigations of DNA damage induction and ensuingkinetics of DNA repair mechanisms. By standardizing therecording format of the distribution of damages and theirstructural pattern for single cells and nuclei, we anticipatecreating synergies among various developments in model-ing cellular response to DNA damage.
The standard has been developed in anticipation of severalfuture developments in the field. For example, modeling ofthe initial chemical reactions is becoming increasinglycommon, allowing for inclusion of more sophisticated effectssuch as the potential production of additional reactive speciesinduced by shock waves from high-LET ions (97) orneutralization effects of Auger emitters (98). With anincreased range of chemical reactions simulated, repairmechanisms and accuracy can be adjusted depending onthe particular indirect effect classes of DNA damage.Similarly, radiation therapy is often only one of the deliveredtreatment modalities, combined with chemotherapy orimmunotherapy. Modeling of multi-modality treatments isan emerging field, and good-quality input data from each
88 SCHUEMANN ET AL.
modality is essential. The effects of other treatments can bepartially included in the SDD by adding DNA damages fromdrugs. For therapeutics that inhibit certain repair pathwaysthe biological models will have to be adjusted, with the SDDproviding detailed DNA damage maps.
While the nucleus is the primary target in radiationtherapy, the standard is flexible enough to also be used todescribe damages to mitochondrial DNA or DNA in virusesor bacteria (in a separate file). However, for these casesmany of the optional fields in the SDD may not be relevant.The SDD has been designed to allow a high level offlexibility. Many of the entries are optional and are onlyincluded to encourage the user to think about the conceptsand, if possible, include these details as they may becomeuseful for repair kinetics.
Overall, we anticipate that the SDD data format willgreatly reduce the burden of sharing analysis tools and thus,facilitate the formation of new collaborations. Usingstandardized data will allow researchers to test thepredictions from different models simply by feeding theSDD data to another code. The standard already is (or willsoon be) supported by the following codes: DaMaRiS (39),gMicroMC, MC4 (63), MCDS (27, 79), PARTRAC (60),PHITS (99), RADAMOL (75, 100), RITRACK (57) andTOPAS-nBio (65), as well as by users of Geant4-DNA (23,61). By providing a clearly defined standard and examplecodes of scorers for some of the models, we hope thisencourages other existing and newly developed codes tooffer interfaces to the SDD data format for use as a scorer oras damage distribution input for repair models.
CONCLUSION
We have developed a new Standard DNA Damage dataformat. The SDD has been designed to interface at the pointwhere physics and chemistry simulations, at the DNA scale,meet biological modeling efforts. With this standard, wehope to provide modelers with a new tool to test their modeldesign and dependencies on underlying physics properties.In combination with the supported collaboration website,the SDD offers access to the most accurate availabledamage simulations and provides a platform for inter-codecomparisons of the underlying track-structure Monte Carlosimulation codes and their assumptions in the description ofphysics, chemistry and the geometrical arrangement ofDNA. This standard will play a significant role in advancingour understanding of DNA response to radiation insults bycreating the basis for a wide-spread interdisciplinarycollaborative effort.
APPENDIX
Example SDD Files
With many detailed options of scoring the DNA damage in the SDD
format, we believe it is helpful to illustrate the format with example SDD
files. We have created two files using the McMahon Empirical Model
version 0.3 to generate DNA damages for an irradiation of a cell to 1 Gy
with a 0.975-MeV monoenergetic proton beam. The two files use identical
irradiation setups, but the first (DNA Damage Proton0.975 MeV 1 Gy
full.txt) fills all available scoring blocks (see header field ‘‘Data entries’’),
including records of the full damage definition of data field 7. The second
file (DNA Damage Proton0.975 MeV 1 Gy minimal.txt) showcases an
SDD file that only fills a minimum of 3 of the 14 data sections.
Nevertheless, even the minimal data format offers useful information
about the frequencies of various damage types. Links to additional
examples and example codes to produce SDD files can be found on the
SDD website (http://standard-for-dna-damage.readthedocs.org).
ACKNOWLEDGMENTS
We acknowledge support from the STFC-funded Global Challenge
Networkþ in Advanced Radiotherapy Multi-Scale Monte Carlo Modeling
for Radiotherapy Sandpit (no. ST/N002423/1 to JS, ALM, JWW, NTH,
KK, MJM and SJM). We also acknowledge support from the NIH/NCI
[grant no. R01CA187003 (‘‘TOPAS-nBio: a Monte Carlo tool for
radiation biology research’’) to JS] and NASA contract NNJ15HK11 to IP.
Received: August 14, 2018; accepted: October 9, 2018; published online:
November 8, 2018
REFERENCES
1. McNamara AL, Schuemann J, Paganetti H. A phenomenologicalrelative biological effectiveness (RBE) model for proton therapybased on all published in vitro cell survival data. Phys Med Biol2015; 60:8399–416.
2. Wedenberg M, Lind BK, Hardemark B. A model for the relativebiological effectiveness of protons: the tissue specific parameteralpha/beta of photons is a predictor for the sensitivity to LETchanges. Acta Oncol 2013; 52:580–8.
3. Carabe-Fernandez A, Dale RG, Jones B. The incorporation of theconcept of minimum RBE (RBEmin) into the linear-quadraticmodel and the potential for improved radiobiological analysis ofhigh-LET treatments. Int J Radiat Biol 2009; 83:27–39.
4. Wilkens JJ, Oelfke U. A phenomenological model for the relativebiological effectiveness in therapeutic proton beams. Phys MedBiol 2004; 49:2811–25.
5. Elsasser T, Kramer M, Scholz M. Accuracy of the local effectmodel for the prediction of biologic effects of carbon ion beamsin vitro and in vivo. Int J Radiat Oncol Biol Phys 2008; 71:866–72.
6. Hawkins RB. A statistical theory of cell killing by radiation ofvarying linear energy transfer. Radiat Res 1994; 140:366–74.
7. Inaniwa T, Kanematsu N, Matsufuji N, Kanai T, Shirai T, NodaK, et al. Reformulation of a clinical-dose system for carbon-ionradiotherapy treatment planning at the National Institute ofRadiological Sciences, Japan. Phys Med Biol; 2015; 60:3271–86.
8. Inaniwa T, Furukawa T, Kase Y, Matsufuji N, Toshito T,Matsumoto Y, et al. Treatment planning for a scanned carbonbeam with a modified microdosimetric kinetic model. Phys MedBiol 2010 28; 55:6721–37.
9. Kramer M, Scholz M. Treatment planning for heavy-ionradiotherapy: calculation and optimization of biologicallyeffective dose. Phys Med Biol 2000; 45:3319–30.
10. Bolst D, Tran LT, Chartier L, Prokopovich DA, Pogossov A,Guatelli S, et al. RBE study using solid state microdosimetry inheavy ion therapy. Radiat Meas 2017; 106:512–8.
11. Goodhead DT, Charlton DE. Analysis of high-LET radiationeffects in terms of local energy deposition. Radiat Prot Dosimetry1985; 13:253–8.
12. Goodhead DT, Charlton DE, Wilson WE, Paretzke HG. Currentbiophysical approaches to the understanding of biological effectsof radiation in terms of local energy deposition. In: Schraube H,
A NEW STANDARD FOR DNA DAMAGE 89
Burger G, Booz JJ, editors. Proceedings. Fifth Symposium ofNeutron Dosimetry, 17–21 September 1984, Munich/Neuher-berg. Luxembourg: Commission of the European Communities;1984. p. 57–68.
13. Goodhead DT, Brenner DJ. Estimation of a single property oflow LET radiations which correlates with biological effective-ness. Phys Med Biol 2000; 28:485–92.
14. Charlton DE, Humm JL. A method of calculating initial DNAstrand breakage following the decay of incorporated 125I. Int JRadiat Biol Relat Stud Phys Chem Med 1988; 53:353–65.
15. Goodhead DT, Nikjoo H. Track structure analysis of ultrasoft X-rays compared to high- and low-LET radiations. Int J Radiat Biol1989; 55:513–29.
16. Nikjoo H, Goodhead DT, Charlton DE, Paretzke HG. Energydeposition in small cylindrical targets by ultrasoft x-rays. PhysMed Biol 1989; 34:691–705.
17. Charlton DE, Nikjoo H, Humm JL. Calculation of initial yields ofsingle- and double-strand breaks in cell nuclei from electrons,protons and alpha particles. Int J Radiat Biol 1989; 56:1–19.
18. Paretzke HG. Physical events in the track structure of heavy ionsand their relation to alterations of biomolecules. Adv Space Res1989; 9:15–20.
19. Pomplun E. A New DNA target model for track structurecalculations and its first application to I-125 auger electrons. Int JRadiat Biol 1991; 59:625–42.
20. Terrissol M, Pomplun E. Computer simulation of DNA-incorporated 125I auger cascades and of the associated radiationchemistry in aqueous solution. Radiat Prot Dosimetry 1994;52:177–81.
21. Nikjoo H, O’Neill P, Goodhead DT, Terrissol M. Computationalmodelling of low-energy electron-induced DNA damage by earlyphysical and chemical events. Int J Radiat Biol 1997; 71:467–83.
22. Friedland W, Jacob P, Paretzke HG, Stork T. Monte Carlosimulation of the production of short DNA fragments by low-linear energy transfer radiation using higher-order DNA models.Radiat Res 1998; 150:170.
23. Bernal MA, Bordage MC, Brown JMC, Davidkova M, Delage E,Bitar El Z, et al. Track structure modeling in liquid water: Areview of the Geant4-DNA very low energy extension of theGeant4 Monte Carlo simulation toolkit. Phys Med 2015; 31:861–74.
24. Tello JJ, Incerti S, Francis Z, Tran H, Bernal MA. Numericalinsight into the Dual Radiation Action Theory. Phys Med 2017;43:120–6.
25. Tello Cajiao JJ, Carante MP, Bernal Rodriguez MA, Ballarini F.Proximity effects in chromosome aberration induction by low-LET ionizing radiation. DNA Repair (Amst) 2017; 58:38–46.
26. Stewart RD, Streitmatter SW, Argento DC, Kirkby C, GoorleyJT, Moffitt G, et al. Rapid MCNP simulation of DNA doublestrand break (DSB) relative biological effectiveness (RBE) forphotons, neutrons, and light ions. Phys Med Biol; 2015;60:8249–74.
27. Stewart RD, Yu VK, Georgakilas AG, Koumenis C, Park JH,Carlson DJ. Effects of radiation quality and oxygen on clusteredDNA lesions and cell death. Radiat Res 2011; 176:587–602.
28. Semenenko VA, Stewart RD. Fast Monte Carlo simulation ofDNA damage formed by electrons and light ions. Phys Med Biol2006; 51:1693–706.
29. Semenenko VA, Stewart RD. A fast Monte Carlo algorithm tosimulate the spectrum of DNA damages formed by ionizingradiation. Radiat Res 2004; 161:451–7.
30. Frese MC, Yu VK, Stewart RD, Carlson DJ. A mechanism-basedapproach to predict the relative biological effectiveness of protonsand carbon ions in radiation therapy. Int J Radiat Oncol Biol Phys2012; 83:442–50.
31. Kamp F, Cabal G, Mairani A, Parodi K, Wilkens JJ, Carlson DJ.Fast biological modeling for voxel-based heavy ion treatment
planning using the mechanistic repair-misrepair-fixation modeland nuclear fragment spectra. Int J Radiat Oncol Biol Phys 2015;93:557–68.
32. Ballarini F, Carante MP. Chromosome aberrations and cell deathby ionizing radiation: Evolution of a biophysical model. RadiatPhys Chem 2016; 128:18–25.
33. Carante MP, Aime C, Cajiao JJT, Ballarini F. BIANCA, abiophysical model of cell survival and chromosome damage byprotons, C-ions and He-ions at energies and doses used inhadrontherapy. Phys Med Biol 2018; 63:075007.
34. Li Y, Cucinotta FA. Modeling non-homologous end joining. JTheor Biol 2011; 283:122–35.
35. Li Y, Reynolds P, O’Neill P, Cucinotta FA. Modeling damagecomplexity-dependent non-homologous end-joining repair path-way. PLoS One 2014; 9:e85816.
36. McMahon SJ, Butterworth KT, McGarry CK, Trainor C,O’Sullivan JM, Hounsell AR, et al. A computational model ofcellular response to modulated radiation fields. Int J Radiat OncolBiol Phys 2012; 84:250–6.
37. McMahon SJ, McNamara AL, Schuemann J, Paganetti H, PriseKM. A general mechanistic model enables predictions of thebiological effectiveness of different qualities of radiation. Sci Rep2017; 7:688.
38. Henthorn NT, Warmenhoven JW, Sotiropoulos M, Mackay RI,Kirkby NF, Kirkby KJ, et al. In silico non-homologous endjoining following ion induced DNA double strand breaks predictsthat repair fidelity depends on break density. Sci Rep 2018;8:2654.
39. Henthorn NT, Warmenhoven JW, Sotiropoulos M, Mackay RI,Kirkby KJ, Merchant MJ. Nanodosimetric simulation of direction-induced dna damage using different chromatin geometrymodels. Radiat Res 2017; 188:770–83.
40. Lampe N, Karamitros M, Breton V, Brown JMC, Kyriakou I,Sakata D, et al. Mechanistic DNA damage simulations in Geant4-DNA part 1: A parameter study in a simplified geometry. PhysMed 2018; 48:135–145.
41. McMahon SJ, Schuemann J, Paganetti H, Prise KM. Mechanisticmodelling of DNA repair and cellular survival followingradiation-induced DNA damage. Sci Rep 2016; 6:33290.
42. Ballarini F, Altieri S, Bortolussi S, Carante M, Giroletti E, ProttiN. The role of DNA cluster damage and chromosome aberrationsin radiation-induced cell killing: a theoretical approach. RadiatProt Dosimetry 2015; 166:75–9.
43. Carante MP, Ballarini F. Modelling cell death for cancerhadrontherapy. AIMS Biophys 2017; 4:465–90.
44. Testa A, Ballarini F, Giesen U, Gil OM, Carante MP, Tello J, etal. Analysis of radiation-induced chromosomal aberrations on acell-by-cell basis after alpha-particle microbeam irradiation:experimental data and simulations. Radiat Res 2018; 189:597–604.
45. Tommasino F, Friedrich T, Scholz U, Taucher-Scholz G, DuranteM, Scholz M. A DNA double-strand break kinetic rejoiningmodel based on the local effect model. Radiat Res 2013;180:524–38.
46. Tommasino F, Friedrich T, Scholz U, Taucher-Scholz G, DuranteM, Scholz M. Application of the local effect model to predictDNA double-strand break rejoining after photon and high-LETirradiation. Radiat Prot Dosimetry 2015; 166:66–70.
47. Tommasino F, Friedrich T, Jakob B, Meyer B, Durante M,Scholz M. Induction and processing of the radiation-inducedgamma-H2AX signal and its link to the underlying pattern ofDSB: a combined experimental and modelling study. PLoS One2015; 10:e0129416.
48. Friedland W, Li WB, Jacob P, Paretzke HG. Simulation of exondeletion mutations induced by low-LET radiation at the HPRTlocus. Radiat Res 2001; 155:703–15.
49. Ponomarev AL, Costes SV, Cucinotta FA. Stochastic properties
90 SCHUEMANN ET AL.
of radiation-induced DSB: DSB distributions in large scalechromatin loops, the HPRT gene and within the visible volumesof DNA repair foci. Int J Radiat Biol 2008; 84:916–29.
50. Meylan S, Vimont U, Incerti S, Clairand I, Villagrasa C. Geant4-DNA simulations using complex DNA geometries generated bythe DnaFabric tool. Comput Phys Commun 2016; 204:159–69.
51. Bueno M, Schulte R, Meylan S, Villagrasa C. Influence of thegeometrical detail in the description of DNA and the scoringmethod of ionization clustering on nanodosimetric parameters oftrack structure: a Monte Carlo study using Geant4-DNA. PhysMed Biol 2015; 60:8583–99.
52. Santos Dos M, Villagrasa C, Clairand I, Incerti S. Influence of theDNA density on the number of clustered damages created byprotons of different energies. Nucl Instrum Methods Phys Res B2013; 298:47–54.
53. Nikjoo H, Girard P. A model of the cell nucleus for DNA damagecalculations. Int J Radiat Biol 2012; 88:87–97.
54. Nikjoo H, Uehara S, Emfietzoglou D, Cucinotta FA. Track-structure codes in radiation research. Radiat Meas 2006;41:1052–74.
55. Meylan S, Incerti S, Karamitros M, Tang N, Bueno M, Clairand I,et al. Simulation of early DNA damage after the irradiation of afibroblast cell nucleus using Geant4-DNA. Sci Rep 2017;7:11923.
56. Bug MU, Yong Baek W, Rabus H, Villagrasa C, Meylan S,Rosenfeld AB. An electron-impact cross section data set (10 eV–1 keV) of DNA constituents based on consistent experimentaldata: A requisite for Monte Carlo simulations. Radiat Phys Chem2017; 130:459–79.
57. Plante I, Cucinotta, FA. Monte-Carlo simulation of particlediffusion in various geometries and application to chemistry andbiology. In: Theory and Applications of Monte Carlo Simula-tions. InTech; 2013.
58. Plante I, Cucinotta FA. Binary-Encounter-Bethe ionisation crosssections for simulation of DNA damage by the direct effect ofionising radiation. Radiat Prot Dosimetry 2015; 166:19–23.
59. Friedland W, Dingfelder M, Kundrat P, Jacob P. Track structures,DNA targets and radiation effects in the biophysical Monte Carlosimulation code PARTRAC. Mutat Res 2011; 711:28–40.
60. Friedland W, Schmitt E, Kundrat P, Dingfelder M, Baiocco G,Barbieri S, et al. Comprehensive track-structure based evaluationof DNA damage by light ions from radiotherapy-relevantenergies down to stopping. Sci Rep 2017; 7:45161.
61. Incerti S, Ivanchenko A, Karamitros M, Mantero A, Moretto P,Tran HN, et al. Comparison of GEANT4 very low energy crosssection models with experimental data in water. Med Phys 2010;37:4692–708.
62. Nikjoo H, Emfietzoglou D, Liamsuwan T, Taleei R, Liljequist D,Uehara S. Radiation track, DNA damage and response-a review.Rep Prog Phys 2016; 79:116601.
63. Emfietzoglou D, Papamichael G, Nikjoo H. Monte Carlo electrontrack structure calculations in liquid water using a new modeldielectric response function. Radiat Res 2017; 188:355–68.
64. Walzlein C, Kramer M, Scifoni E, Durante M. Low-energyelectron transport in non-uniform media. Nucl Instrum MethodsPhys Res B 2014; 320:75–82.
65. McNamara A, Geng C, Turner R, Mendez JR, Perl J, Held K, etal. Validation of the radiobiology toolkit TOPAS-nBio in simpleDNA geometries. Phys Med 2017; 33:207–15.
66. Solov’yov IA, Yakubovich AV, Nikolaev PV, Volkovets I,Solov’yov AV. MesoBioNano Explorer–a universal program formultiscale computer simulations of complex molecular structureand dynamics. J Comput Chem 2012; 33:2412–39.
67. Sung W, Ye S-J, McNamara AL, McMahon SJ, Hainfeld J, ShinJ, et al. Dependence of gold nanoparticle radiosensitization oncell geometry. Nanoscale 2017; 9:5843–53.
68. Solov’yov AV, Surdutovich E, Scifoni E, Mishustin I, Greiner W.
Physics of ion beam cancer therapy: a multiscale approach. PhysRev E Stat Nonlin Soft Matter Phys 2009; 79:011909.
69. Surdutovich E, Solov’yov AV. Multiscale approach to thephysics of radiation damage with ions. Eur Phys J D 2014;68:353.
70. Verkhovtsev A, Surdutovich E, Solov’yov AV. Multiscaleapproach predictions for biological outcomes in ion-beam cancertherapy. Sci Rep 2016; 6:27654.
71. Baiocco G, Barbieri S, Babini G, Morini J, Alloni D, FriedlandW, et al. The origin of neutron biological effectiveness as afunction of energy. Sci Rep 2016; 6:34033.
72. Karamitros M, Luan S, Bernal MA, Allison J, Baldacchino G,Davidkova M, et al. Diffusion-controlled reactions modeling inGeant4-DNA. J Comput Phys 2014; 274:841–82.
73. Plante I, Devroye L. Considerations for the independent reactiontimes and step-by-step methods for radiation chemistry simula-tions. Radiat Phys Chem 2017; 139:157–72.
74. Incerti S, Douglass M, Penfold S, Guatelli S, Bezak E. Review ofGeant4-DNA applications for micro and nanoscale simulations.Phys Med 2016; 32:1187–200.
75. Stepan V, Davıdkova M. RADAMOL tool: Role of radiationquality and charge transfer in damage distribution along DNAoligomer. Eur Phys J D 2014; 68:409.
76. Boscolo D, Kramer M, Durante M, Fuss MC, Scifoni E. TRAX-CHEM: A pre-chemical and chemical stage extension of theparticle track structure code TRAX in water targets. Chem PhysLett 2018; 698:11–8.
77. Ramos-Mendez J, Perl J, Schuemann J, McNamara A, PaganettiH, Faddegon B. Monte Carlo simulation of chemistry followingradiolysis with TOPAS-nBio. Phys Med Biol 2018; 63:105014.
78. Nikjoo H, Taleei R, Liamsuwan T, Liljequist D, Emfietzoglou D.Perspectives in radiation biophysics: From radiation trackstructure simulation to mechanistic models of DNA damageand repair. Radiat Phys Chem; 2016; 128:3–10.
79. Carlson DJ, Stewart RD, Semenenko VA, Sandison GA.Combined use of Monte Carlo DNA damage simulations anddeterministic repair models to examine putative mechanisms ofcell killing. Radiat Res 2008; 169:447–59.
80. Taleei R, Nikjoo H. The non-homologous end-joining (NHEJ)pathway for the repair of DNA double-strand breaks: I. Amathematical model. Radiat Res 2013; 179:530–9.
81. Taleei R, Girard PM, Sankaranarayanan K, Nikjoo H. The non-homologous end-joining (NHEJ) mathematical model for therepair of double-strand breaks: II. Application to damage inducedby ultrasoft X rays and low-energy electrons. Radiat Res 2013;179:540–8.
82. Semenenko VA, Stewart RD, Ackerman EJ. Monte Carlosimulation of base and nucleotide excision repair of clusteredDNA damage sites. I. Model properties and predicted trends.Radiat Res 2005; 164:180–93.
83. Semenenko VA, Stewart RD. Monte Carlo simulation of base andnucleotide excision repair of clustered DNA damage sites. II.Comparisons of model predictions to measured data. Radiat Res2005; 164:194–201.
84. Georgakilas AG, O’Neill P, Stewart RD. Induction and repair ofclustered DNA lesions: what do we know so far? Radiat Res2013; 180:100–9.
85. Adams GE, Jameson DG. Time effects in molecular radiationBiology. Radiat Environ Biophys 1980; 17:95–113.
86. Lampe N, Karamitros M, Breton V, Brown JMC, Sakata D,Sarramia D, et al. Mechanistic DNA damage simulations inGeant4-DNA Part 2: Electron and proton damage in a bacterialcell. Phys Med 2018; 48:146–55.
87. Shuryak I, Brenner DJ. Effects of radiation quality on interactionsbetween oxidative stress, protein and DNA damage in Deino-coccus radiodurans. Radiat Environ Biophys 2010; 49:693–703.
A NEW STANDARD FOR DNA DAMAGE 91
88. Tanabashi M, (Particle Data Group). The review of particlephysics. Phys Rev D 2018; 98. (http://pdg.lbl.gov/)
89. Favaudon V, Fouillade C, Vozenin M-C. Ultrahigh dose-rate,‘‘flash’’ irradiation minimizes the side-effects of radiotherapy.Cancer Radiother 2015; 19:526–31.
90. Favaudon V, Caplier L, Monceau V, Pouzoulet F, Sayarath M,Fouillade C, et al. Ultrahigh dose-rate FLASH irradiationincreases the differential response between normal and tumortissue in mice. Sci Transl Med 2014; 6:245ra93.
91. Meyer J, Stewart RD, Smith D, Eagle J, Lee E, Cao N, et al.Biological and dosimetric characterisation of spatially fraction-ated proton minibeams. Phys Med Biol 2017; 62:9260–81.
92. Incerti S, Barberet P, Villeneuve R, Aguer P, Gontier E,Michelet-Habchi C, et al. Simulation of cellular irradiation withthe CENBG microbeam line using GEANT4. IEEE Trans NuclSci 2004; 51:1395–401.
93. Nikjoo H, O’Neill P, Wilson WE, Goodhead DT. Computationalapproach for determining the spectrum of DNA damage inducedby ionizing radiation. Radiat Res 2001; 156:577–83.
94. Teoule R. Radiation-induced DNA damage and its repair. Int JRadiat Biol Relat Stud Phys Chem Med 2009; 51:573–89.
95. Gu J, Lu H, Tsai AG, Schwarz K, Lieber MR. Single-strandedDNA ligation and XLF-stimulated incompatible DNA endligation by the XRCC4-DNA ligase IV complex: influence ofterminal DNA sequence. Nucleic Acids Res 2007; 35:5755–62.
96. Audebert M, Salles B, Calsou P. Effect of double-strand breakDNA sequence on the PARP-1 NHEJ pathway. BiochemBiophys Res Commun 2008; 369:982–8.
97. Surdutovich E, Solov’yov AV. Shock wave initiated by an ionpassing through liquid water. Phys Rev E Stat Nonlin Soft MatterPhys 2010; 82:051915.
98. Li WB, Friedland W, Jacob P, Panyutin IG, Paretzke HG.Simulation of 125 I decay in a synthetic oligodeoxynucleotidewith normal and distorted geometry and the role of radiation andnon-radiation actions. Radiat Environ Biophys 2004; 43:23–33.
99. Sato T, Iwamoto Y, Hashimoto S, Ogawa T, Furuta T, Abe S-I, etal. Features of Particle and Heavy Ion Transport code System(PHITS) version 3.02. J Nucl Sci Technol 2018; 55:684–90.
100. Stepan V, Davıdkova M. Understanding radiation damage onsub-cellular scale using RADAMOL simulation tool. Radiat PhysChem 2016; 128:11–7.
92 SCHUEMANN ET AL.