a network-centric approach for access and interface selection in heterogeneous wireless environments
TRANSCRIPT

INTERNATIONAL JOURNAL OF COMMUNICATION SYSTEMSInt. J. Commun. Syst. 2008; 21:469–488Published online 18 September 2007 in Wiley InterScience (www.interscience.wiley.com). DOI: 10.1002/dac.903
A network-centric approach for access and interface selectionin heterogeneous wireless environments
George Koundourakis∗,†, Dimitrios I. Axiotis, Michael Argyropoulosand Michael Theologou
Telecommunications Laboratory, School of Electrical and Computer Engineering, National Technical Universityof Athens, 9 Heroon Polytechneiou Street, Zografou 15773, Athens, Greece
SUMMARY
In this paper, we introduce a network-based approach for access and interface selection (AIS) in thecontext of resource management in heterogeneous wireless environments (UMTS, WLAN and DVB-T). We focus on the optimization of resource utilization, while ensuring acceptable quality of service(QoS) provision to the end users. Our objective is to optimally manage the overall system resources andminimize the possibility of QoS handovers (non-mobility handovers). The adopted architecture appliesto typical heterogeneous environments and network entities (Access Routers) are enhanced with extrafunctionalities. We propose an AIS algorithm that exploits the multihoming concept and globally managesnetwork resources at both radio access and IP backbone networks. The algorithm can estimate near-optimalsolutions in real time and we also introduce a novel triggering policy. We present simulation results oftypical scenarios that demonstrate the advantages of our approach. System performance metrics, derivedfrom the simulations, show minimum degradations in high load and congestion situations. Copyright q2007 John Wiley & Sons, Ltd.
Received 3 October 2006; Revised 11 May 2007; Accepted 13 July 2007
KEY WORDS: access and interface selection algorithm; heterogeneous networks; multihoming
1. INTRODUCTION
The evolution of wireless communications led to heterogeneous network environments, wherevarious access technologies, such as cellular (2G, 2.5G, 3G), WLAN (IEEE 802.11x), DigitalVideo Broadcasting (Terrestrial—DVB-T, Handheld—DVB-H) and broadband (IEEE 802.16) are(or will be) simultaneously available to the mobile user. Multimode terminals (mobile phones,Personal Digital Assistants (PDAs), laptops) incorporating multiple radio access interfaces are
∗Correspondence to: George Koundourakis, Telecommunications Laboratory, School of Electrical and ComputerEngineering, National Technical University of Athens, 9 Heroon Polytechneiou Street, Zografou 15773, Athens,Greece.
†E-mail: [email protected]
Copyright q 2007 John Wiley & Sons, Ltd.

470 G. KOUNDOURAKIS ET AL.
currently available in the market and a variety of novel services are emerging in the heterogeneousenvironment [1]. Despite the lack of uniformity in network characteristics (coverage, service capa-bilities and compatibilities, security, power consumption, bandwidth, delay), the aforementionedradio access interfaces, through interworking mechanisms [2], can serve the user applications inthe most efficient way. Via deployment in hierarchical layers, heterogeneous networks providebetter coverage (e.g. radiocoverage gaps in 3G can be served by WLAN) and capacity with respectto a non-interworking scenario [2]. This concept is referred to as Always Best Connected (ABC)[3] and enables users to remain seamlessly connected in a way that best suits the quality of service(QoS) constraints of the services in use.
The coexistence and interworking of wireless technologies presupposes that network operatorsand service providers can collaborate in order to provide the optimum QoS to the end users.This issue requires considerable effort, as additional management mechanisms must be added tokey components of the involved networks. Various solutions of network and service managementsystems have been proposed and developed, especially in the context of Information SocietyTechnologies projects (e.g. [4–6]). The common point of most approaches is an IP-based backbonearchitecture. The robustness of IP, in conjunction with the high compatibility with the majorityof access networks, makes it the most suitable protocol for the interworking of wireless systems.The growing demand for typical Internet services (browsing, file transfer, video/audio streaming,etc.) over wireless networks has also led to this direction. Third generation and beyond networksare increasingly specified along the packet switched domain [7], WLANs are inherently built onIP, while the IETF IP/DVB working group [8] extends standards to enable IP traffic over DVB-T.It should be noted that apart from the technical challenges, novel business models that specifyinteractions and revenue flows between different network operators and service providers mustalso be sought.
Returning back to the ABC concept, the notion of ‘best’ can be interpreted in a number ofdifferent factors such as user preferences, device capabilities, network capabilities, applicationQoS constraints and available resources. Most of these factors are contradictory to each other andthe selection of the optimum access technology constitutes a considerable issue. The access networkselection decision involves tradeoffs that depend on several constraints that continuously changeas a function of time (network load and available capacity) or space (available radio coverage).Several researchers proposed solutions that focused on optimizing the usage of a fraction of theoverall factors, while keeping the rest at an acceptable level. Ylitalo et al. [9] focus on an alwayscheapest, for the end user, strategy. A similar approach is presented in [10], where the authors tryto provide the lowest price for non-real-time traffic (e.g. file transfer). An approach based on cost,bandwidth and power consumption is presented in [11]. The authors, in [12, 13], describe the userpreferences by using utility functions. The former approach uses this function when comparingtwo congestion pricing schemes, while the latter considers that users choose a pricing plan. In[14], we analyze an access selection strategy based on utility, cost and available resource functions.This approach is implemented in the context of the IST project CREDO [5]. In [15], the authorsexamine cases where an application is partitionable in flows of different demands, in terms ofdelay and bandwidth. They also consider the possibility of splitting this traffic into more than onepath. Finally, in [16] we introduced a terminal-based approach which focuses on utility functionsthat describe the user preferences and an enhanced user profile.
In this paper we resolve the access and interface selection (AIS) problem from a network-basedperspective. The heterogeneous environment considered includes UMTS, WLAN and DVB-T radioaccess technologies. The main objective is the optimization of the resources utilization in terms of
Copyright q 2007 John Wiley & Sons, Ltd. Int. J. Commun. Syst. 2008; 21:469–488DOI: 10.1002/dac

A NETWORK-CENTRIC APPROACH FOR AIS 471
load balancing across the managed networks and the minimization of QoS handovers (non-mobilityhandovers). In parallel, we ensure acceptable QoS provision and cost to the end users. To thisend, we propose an AIS algorithm, that exploits the multihoming concept, takes into account allpossible constraints and incompatibilities, considers resources at both parts (wireless and wired)and allocates the user services to the appropriate access points (APs) by estimating near-optimalsolutions in real time. Moreover, the novel triggering policy introduced is enhanced with themultihoming concept and avoids unnecessary handovers. All the above features are incorporatedinto a suitable management architecture, which follows a distributed approach, keeping most of eachnetwork particularities. The large-scale validation of our concepts is achieved by NS-2 simulationsby deploying and resolving various scenarios. The simulated scenarios try to demonstrate theability of our approach to detect and handle congestion situations and also avoid excessive networkloading. The rest of the paper is organized as follows. Section 2 presents the adopted heterogeneousarchitecture, including all modules and functionalities needed not only for the access selection butalso for all network management issues. Section 3 analyzes the proposed AIS algorithm. Simulationresults are presented in Section 4, while Section 5 concludes the paper.
2. NETWORK MANAGEMENT—ARCHITECTURE ISSUES
The access selection issue calls for extra functionalities to be defined in some network entities.Therefore, the architecture must accommodate additional operations in the general context ofheterogeneous network management. Figure 1 depicts the adopted architecture, where each networkbubble includes the radio access and the core network (not present for all technologies). It shouldbe noted that the technologies considered in this paper are UMTS (home network), WLAN andDVB-T. The infrastructure of each network remains unmodified, including the APs, an AccessRouter (AR) interfacing with the IP backbone and optionally any other module (e.g. DNS, DHCPservers). The terms AP and AR are generic. AP refers to the point of attachment for the terminalsto every network (Node Bs for UMTS, APs for WLAN and DVB-T transmitters). On the otherhand, AR represents the module that provides the IP interconnection (Gateway GPRS SupportNode—GGSN for UMTS, WLAN Gateway and DVB-T IP Gateway). The coverage capabilitiesof each network differ, hence the number of APs deployed for each technology is not the same(e.g. in actual deployments the geographic coverage of one DVB-T subnet corresponds to severalWLAN subnets).
The ARs are key entities in the heterogeneous network architecture. Apart from the standardgateway operation we have assigned some new functionalities to them:
• Monitoring of the APs either directly by using Simple Network Management Protocol(SNMP) or indirectly by using other technology-specific modules and storing criticalparameters (e.g. load, delays, etc.).
• General network management and resource brokerage functionality, as in [4–6]. The ARsare able to interact through the IP backbone.
• Accepting requests by the terminals and taking decisions about the access selection.• Typical mobile agent functionalities (e.g. Foreign Agent).
In order to provide all the above operations, the ARs must incorporate additional functionalunits. More specifically, apart from the typical functions (e.g. routing), a mobility managementunit is added to the AR and is responsible for establishing and retaining the IP-level link of the
Copyright q 2007 John Wiley & Sons, Ltd. Int. J. Commun. Syst. 2008; 21:469–488DOI: 10.1002/dac

472 G. KOUNDOURAKIS ET AL.
IP Backbone
TerminalTerminal
Network ANetwork B Network C
Access Router
AccessPoint
Access Router Access Router
Figure 1. Heterogeneous network architecture.
terminal. A monitoring and data collection unit is also added for recording the network status bystoring critical parameters per AP and subnet (bandwidth, delay, etc.). Finally, the AR also includesa decision unit, which handles requests from the attached terminals or from other ARs, responsesand queries in cooperating ARs and subsequently takes an AIS decision for each terminal, basedon all gathered information. The mobility and monitoring units do not differ from relative typicalentities (mobility agents, SNMP agents), while the decision unit includes the AIS algorithmexecution described in Section 3.
Distributing the additional operations to the ARs results in extra overhead at these entities, butconstitutes a more flexible architecture in large-scale deployments, in comparison with a centralizedapproach, where all functionalities would remain at the core network. For example, in the case ofan operator adding new subnets to meet increasing user demand for capacity or radio coverage,the additional functionalities introduced by our approach are handled at an AR level. In contrast,if the proposed functionalities were implemented at the core network, the addition of new subnetsshould be carefully examined with respect to the overhead introduced and possible hardwareupgrades in the core network could be necessary. Moreover, a centralized solution should alsoconsider the physical deployment of the core entities (i.e. in which operator’s network should theybe added). Thus, the overhead of the distributed solution, although increased, is unavoidable ifnetwork cooperation is desired, and is definitely lower compared with the corresponding overheadof the centralized approach. Finally, parallel processing schemes allow different operations to beexecuted simultaneously in the same physical unit.
Copyright q 2007 John Wiley & Sons, Ltd. Int. J. Commun. Syst. 2008; 21:469–488DOI: 10.1002/dac

A NETWORK-CENTRIC APPROACH FOR AIS 473
For the overall system management of the heterogeneous network, the critical interactionsamong the involved entities are the inter-AR communication for exchanging management andsignaling data as well as the AR-Terminal communication for general information delivery. Vari-ous network management functions—including the access selection decision—rely on these linksin order to obtain the required data. To this end, relative research has been initiated by theIEEE media-independent handover working group [17]. Moreover, a suitable solution for thisissue is the idea of candidate access router discovery (CARD) [18]. CARD operates in the ter-minals and the ARs and, except for AR discovery, also performs all the needed data exchangebetween ARs and terminals; suitable messages for exchanging the required data are also de-fined [18]. This overhead source—unavoidable in heterogeneous environments—merely affectsthe overall system performance, as the data volume of each message is low (less than 1 kB permessage [18]).
The mobility management aspects of the platform are based on Mobile IP operation [19, 20].All network technologies include mobile agent functionalities, thus all involved terminals areassigned care-of-addresses (CoAs). The key point here is the exploitation of a recently proposedscheme, concerning the mobility management, called multihoming [21, 22]. Multihoming enablesa mobile device to maintain IP-level links with more than one AP of different technologies, andusing them simultaneously for two or more services, or two or more flows of the same service.Consequently, each terminal is assigned more than one CoA. The usage of multihoming modifiesthe treatment of the access selection problem, by giving more alternatives and allowing a terminalapplication (or flow) to be handled independently from the others. Moreover, it adds more reliabilityand redundancy by maintaining more than one active connection, and also reduces the vertical(inter-technology) handover latency.
3. ACCESS AND INTERFACE SELECTION (AIS) ALGORITHM
We followed a network-based and terminal-assisted approach for the AIS. The main goal is theoptimum resource allocation, provided that the minimum QoS constraints and thresholds of theusers are met. The QoS constraints refer to all parameters that affect the services, as obtained bythe users (e.g. video quality, download rate, etc.). Thus, the values of available resources as wellas signal strength are mapped to these parameters and compared with relative thresholds definedby the users.
The algorithm input data comes from three different sources. One source is the user data,including the list of visible APs by the terminal, along with the corresponding signal quality andthe list of requested services. This list contains new services or running services with unacceptableQoS or cost. The second source is network data, containing the AP bandwidth at the wirelessinterface and the delay at the queue of the link between the AR and the IP backbone. Finally,policy decision information is essential in defining the weights of each factor and the QoS andcost thresholds. A part of the weight factors is determined by the user profile and the rest by thenetwork providers.
The output of the algorithm is the allocation of services to APs and terminal interfaces. Eachservice is treated separately (due to multihoming), thus the number of the results is equal tothe number of the services in the request. Furthermore, some constraints have to be considered:service and network compatibilities, trust issues of the selected network providers and the fact thatall services must be allocated with an acceptable QoS. The service and network compatibilities
Copyright q 2007 John Wiley & Sons, Ltd. Int. J. Commun. Syst. 2008; 21:469–488DOI: 10.1002/dac

474 G. KOUNDOURAKIS ET AL.
refer to the grade of the ability of each technology to serve a specific application (e.g. DVB-T is strongly unidirectional and symmetric flows, such as video conference calls, are not fullyserved).
If possible that there is also a second choice available to cater to rapid signal loss cases. Thischoice does not require a specific algorithm and is calculated from the following process: providedall primary service allocations, the most suitable AP, except that currently chosen, is selectedindividually as the back-up solution.
A set of critical parameters of the AIS algorithm are the triggering conditions. Each executionof the whole process requires the collection of data from various entities and it is time andresource consuming. Hence, the avoidance of unnecessary triggers saves resources and also preventsredundant handovers. In this paper we propose the following triggering conditions:
• User initiated (the user desires to start one or more services).• A running service faces QoS degradation for a time interval over a predefined threshold.• A new AP is available and a running service faces unacceptable QoS or cost (no other optionbefore).
The usage of multihoming allows exclusion of the request of all running services that are allocatedon an acceptable level of quality and cost. Otherwise, all services should pass through the sameradio interface and thus all of them should be included in every request. In the current approach,the user terminal is responsible for asking a reselection for an application, i.e. to inform the systemabout cases with QoS degradations and/or high costs. Moreover, the process is not triggered atall, in the following situations, where:
• The user desires to stop a service. In solutions without multihoming, it was possible that thisservice could add a limitation to other applications, so their point of attachment should berecalculated.
• There is a sudden signal loss for a specific radio interface. This case is handled by transferringthe service(s) from the initial selection to their second choice.
• The terminal switches between APs inside the same subnet. Each network executes thesehandovers individually.
The goal of the proposed scheme is to maximize an objective function (OF), specifically formedfor the AIS problem. If we denote a requested service as s, belonging to the total of the services,S and ap, an AP, visible by the terminal, belonging to the total of access points AP, then the OFis given by
OF(∀s ∈ S,∀ap∈AP) = F(s, ap) + OF(∀s′ ∈ S, s′ �= s, ∀ap∈AP) (1)
The value of the OF for s′ represents the allocation of the rest of the services. The service sequenceby which the OF is calculated affects the overall result, because the allocation of an applicationto an AP decreases its available bandwidth. Thus, all possible permutations must be considered.
Function F consists of the quality part Q and the part of providers, costs and policies PT, withtheir corresponding weights (wq + wpt = 1)
F =wq Q + wptPT (2)
Copyright q 2007 John Wiley & Sons, Ltd. Int. J. Commun. Syst. 2008; 21:469–488DOI: 10.1002/dac

A NETWORK-CENTRIC APPROACH FOR AIS 475
Table I. Indicator values’ explanation.
BI DI SQI
0 Lack of resources Unacceptable delay No signal1 Limited resources Significant delay Weak signal2 Adequate resources Acceptable delay Adequate signal3 Abundant resources Practically no delay Strong signal
CCI NPI TTI0 Incompatibility Not cooperating operator No coverage1 High cost, Low QoS Less trusted operator Limited coverage2 Acceptable QoS and cost Cooperating operator Acceptable coverage3 Low cost, High QoS Current operator Perfect coverage
Furthermore, functions Q and PT are analyzed as
Q = wbiBI + wdiDI + wsqiSQI (3)
PT= wcciCCI + wnpiNPI + wttiTTI (4)
Each term in the summations of (3) and (4) represents a specific factor that is calculated asa product of an indicator with its corresponding weight. Note that wbi + wdi + wsqi = 100 andwcci + wnpi + wtti = 100. The weights are defined by the network policies and the user profileand can be dynamically changed according to the network conditions (e.g. in high-load situationsthe quality factor weights are larger than the corresponding values of the cost and policies, whilein low load the opposite stands). The indicators are reduced to the scale 0–3 (0 correspondsto unacceptable and 3 to perfect); hence, they can be added in the same summation. We performeda large number of algorithm executions that have shown that this scale is sufficient to differentiatethe status of the parameters. A wider scale (e.g. 0–10) does not add extra advantages (the decisionsremain the same) and therefore it is not preferred. The following paragraphs provide more detailsabout the indicators:
• BI (bandwidth indicator): Estimates the sufficiency of the resources at the wireless link. Itcalculates the available AP bandwidth with respect to nominal service bit rate ratio (ratio BI).This value is compared with suitably defined thresholds and results in the indicator value(Table I).
• DI (delay indicator): Offers an image of the availability of resources at the wired partof the examined subnet. It is calculated by comparing the delay at the queue of the ARto the backbone link and the delay tolerance of the current service. Again, the relative ratiois calculated (ratio DI) and suitable thresholds provide the indicator value (Table I).
• SQI (signal quality indicator): It is the value of the received signal strength, deriving fromquantization of the raw values with suitable thresholds that depend on each radio accesstechnology. The process is similar to the signal quality indications (bars) for a laptop WLANlink or a mobile phone 3G link.
• CCI (cost and compatibility indicator): Represents the degree of compatibility between aservice and a chosen radio access technology and also an estimation of allocation costaccording to each network capabilities.
Copyright q 2007 John Wiley & Sons, Ltd. Int. J. Commun. Syst. 2008; 21:469–488DOI: 10.1002/dac
476 G. KOUNDOURAKIS ET AL.
START
Data Collection (AP List, ServiceList, Policies…)
Calculation of all ServicesPermutations,maxOF = -1
Any Other Permutation?
Select Next Permutation Item,OF = -1
Any Other Service?
Select Next Service,maxF = -1
Any Other AP?
Select Next AP,Calculation of F
F > maxF ?maxF = FYES
NO
YES
YES
YES
OF = OF + maxFNO
OF > maxOF ?NO
max
OF
= O
F
NO
YES
ENDNO
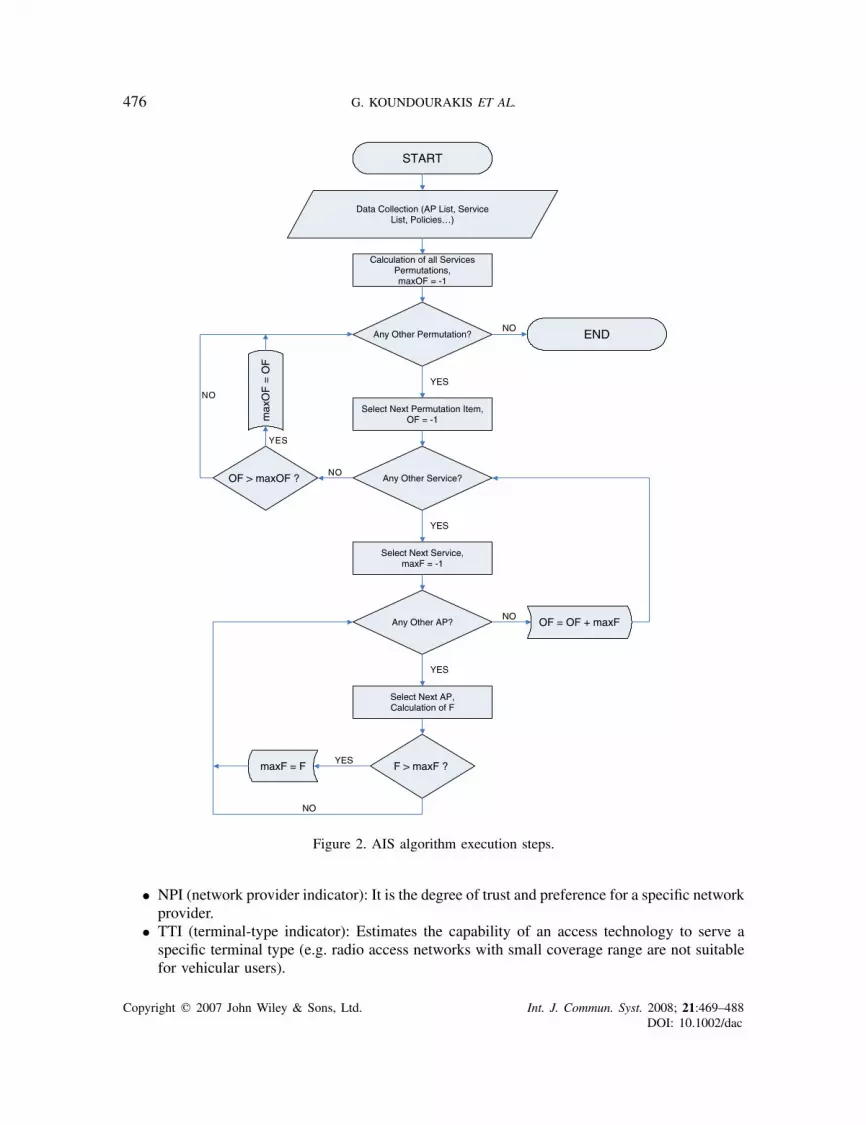
Figure 2. AIS algorithm execution steps.
• NPI (network provider indicator): It is the degree of trust and preference for a specific networkprovider.
• TTI (terminal-type indicator): Estimates the capability of an access technology to serve aspecific terminal type (e.g. radio access networks with small coverage range are not suitablefor vehicular users).
Copyright q 2007 John Wiley & Sons, Ltd. Int. J. Commun. Syst. 2008; 21:469–488DOI: 10.1002/dac
A NETWORK-CENTRIC APPROACH FOR AIS 477
Table I summarizes all the indicator values along with the corresponding meaning. The thresholdshave been chosen after test executions of the algorithm, where the targets were the desired decisions.
The calculation of the values of the OF for each service sequence permutation and for all visibleAPs could be time consuming if the corresponding numbers (services, APs) increase. Thus, insteadof an exhaustive algorithm, we chose a greedy algorithm in order to reduce the complexity andcalculations. If we consider k services in the request and n APs, the calculations required for thegreedy algorithm are k ∗ n ∗ k!, while for the exhaustive one are (n + n2 + n3 + · · · + nk) ∗ k!. Weimplemented the algorithm in C code (Linux environment). Figure 2 depicts in detail the algorithmflow chart. OF stands for the current value of the objective function while maxOF stands for thecurrent maximum value found. Correspondingly, F and max F are the current value and maximumvalue of function F , which refers to a specific service. More precisely, the steps of the algorithmare the following:
1. All required input data (list of services, list of APs, policies and constraints) are collected.2. All possible permutations of the set of services are calculated.3. The first permutation item is selected, i.e. a specific chain of services.4. The first service item is selected.5. For each AP item, the value of function F for the specific service is calculated. The AP
item that maximizes this value (max F) is kept as the temporary optimum.6. The available bandwidth of the selected AP is reduced according to the nominal value of
the current service data rate. Thus, there may be a change in the value of BI.7. Next service item is selected and the procedure returns to step 5. If no other service is
present, it continues to step 8.8. At this point all max F values for all services of the specific permutation are calculated.
Hence, the current OF can be obtained, by adding all these values. If OF >maxOF thisvalue and the set of AP-to-service allocations that construct it are kept as the temporaryoptimum solution.
9. The available bandwidth of all APs (also the BI) obtains the initial value. The nextpermutation item is selected and the procedure returns to step 4. If no other permutation ispresent, it continues to step 10.
10. The current maxOF is the maximum value of the OF and the corresponding allocationscompose the optimum solution.
4. SIMULATION RESULTS
In order to validate the benefits of the AIS algorithm described in Section 3, we have evaluatedvarious scenarios in the context of NS-2 simulations. The simulator version used was ns-2.28(Linux environment) with the suitable UMTS patch and custom DVB-T adaptations (networkentities, propagation model, subnet form, coverage, delay, bandwidth, etc.).
Prior to presenting the results of each scenario, some relative details must be clarified. Thetopology used in the simulations follows the generic architecture presented in Figure 1, i.e.1 UMTS subnet, 1 DVB-T subnet and 1 WLAN subnet. All the users involved are within thecoverage area and are able to interact with any AP of these subnets. The exact number ofusers, user utilization scenarios and number of APs are analyzed in each simulation scenarioindividually.
Copyright q 2007 John Wiley & Sons, Ltd. Int. J. Commun. Syst. 2008; 21:469–488DOI: 10.1002/dac

478 G. KOUNDOURAKIS ET AL.
Table II. Simulated services (parameters and typical values).
WB SA FT VC VS AS
Nominal bandwidth (kbps) 32/64 32/64 64/128 64/128 128/256 32/64Delay tolerance (ms) 1000 1000 4000 200 200 200Mean duration (s) 30 10 30 60 60 120Mean/maximum rate 1/4 1/3 1/2 1/1.1 1/1.1 1/1.1Packet size (bytes) 500 500 1000 500 1000 500Service symmetry (UL-DL) 1-5 1-3 1-20 1-1 1-20 1-20Transport protocol TCP TCP TCP UDP UDP UDP% of Total load 25 5 20 15 30 5
Furthermore, the services used in the context of the simulations are depicted in Table II, alongwith their corresponding features. The values chosen are indicative, according to relevant literature[23] and their usage is clearly for comparison reasons. Various differentiations of these parameterswould affect the simulation results only quantitatively, as the main conclusions do not change. Theabbreviations of the services are explained as follows:
• WB: web browsing (HTTP).• SA: secure applications (HTTPS, SSH, SSL).• FT: file transfer (FTP, SMTP).• VC: video call, video conference.• VS: video streaming.• AS: audio streaming.
The first three categories of services are non-real time as opposed to the rest that are real time.At our simulations, real-time services enjoy higher priority at the simulated AR queues, withrespect to the non-real time that receive normal priority, i.e. in case of queue buffer overflow thenon-real-time packets are dropped at first. This results in larger packet drop probability at thequeue for the non-real-time services in case of congestion. It must be noted that the most preferrednetwork (controlled by the CCI) for FT and WB services is WLAN, for VC and SA is UMTSand DVB-T for VS and AS. Furthermore, all bidirectional services (WB, SA, FT and VC) are notoffered by DVB-T.
Another network performance metric is related to vertical handovers. Several schemes havebeen proposed in the literature [24–26], trying to reduce the latency, packet loss and generallyoptimize the handover procedure. But, in all cases, the handover is time and resources consumingand causes packet duplication. Packet duplication may appear in situations where the user data aresent through both paths for a time interval. In this work, we consider a more generalized definitionfor the packet duplication, taking also into account cases with rerouting (old AP redirects datato the new one); this scheme does not use two network paths, but needs utilization of both AR tobackbone links and thus increases the total system load at the access part.
In order to study the performance of our proposed algorithm, we simulated some representativescenarios. For each scenario, we compare the results of the proposed AIS algorithm (referredhereafter as H1) with an enhanced reference scheme (H2) proposed in the context of the ISTproject CREDO [27]. The reason for choosing this scheme, out of [9–16], for comparison withH1 is the fact that it is a network-based approach, oriented to provide the best QoS to the user.
Copyright q 2007 John Wiley & Sons, Ltd. Int. J. Commun. Syst. 2008; 21:469–488DOI: 10.1002/dac

A NETWORK-CENTRIC APPROACH FOR AIS 479
Figure 3. Topology of scenario A.
Moreover, it is closer to the point of view of the current work. The main differences between H1and H2 are the following:
• H2 does not use multihoming.• H2 considers only the resources at the wireless link.• H2 uses different triggering policy: The algorithm is executed every time a new AP becomesvisible, even in cases where the user does not face any QoS degradation. Furthermore, itis also triggered in case of a service stop if another one is running at the terminal (nomultihoming incorporated).
It should be noted that the use of multihoming, the global management of network resources (bothwireless and AR to backbone) and the triggering policy driven by the optimization of resourceallocation are novel features of scheme H1.
4.1. Scenario A
The topology contains three UMTS Node Bs under the same RNC, four WLAN APs in the samesubnet and one DVB-T AP, all covering the same area (Figure 3). Thus, the total number of APs (n)
is 8(3+ 4+ 1). No background traffic is assumed (users with single-mode terminals and generallyusers who do not adhere to the AIS algorithm) and vertical handover latency is considered to beapproximately 500ms.
A group of 30 users start one service each, with initiation time stamps randomly distributed atthe first 10 s of the simulated scenario. Afterwards, 14 of them start one more service (10–20 s).Hence, 16 users use one service (k = 1) and 14 two (k = 2). Finally, all users gradually stop theirapplications (30–60 s). Method H1 treats every service individually and is not triggered at anyapplication stop. Method H2 reconsiders access selection for all terminal services every time anew application is started. The same happens also for the remaining applications if a service isstopped. For WB and FT applications WLAN is the most preferred network, for SA and VC itis UMTS and for VS and AS it is DVB-T. In cases with more than one service running in theterminal, WLAN is most preferred at H2, as DVB-T is not compatible with bidirectional services
Copyright q 2007 John Wiley & Sons, Ltd. Int. J. Commun. Syst. 2008; 21:469–488DOI: 10.1002/dac

480 G. KOUNDOURAKIS ET AL.
Table III. Scenario A: comparison of H1 and H2 methods.
Comparison point/metric A-H1 A-H2
Algorithm executions 44 58Services involved in the executions 44 72QoS handovers 0 20UMTS load (kbytes) 4003.46 2612.42WLAN load (kbytes) 5373.36 13 240.56DVB-T load (kbytes) 7548.00 1852.00Total load (kbytes) 16 924.82 17 704.98
and UMTS is not suitable for AS and VS applications. Hence, after the initiation of the secondservice in the involved terminals, the already running application must be transferred to WLAN.In contrast, this constraint is not applicable to H1 because the usage of multihoming enables theold service to remain with the initially selected network. This causes extra handovers in the caseof H2 and the traffic to be served mainly via WLAN. All these factors lead to different resultsin H1 and H2, concerning load distribution per network, number of handovers and AIS algorithmtriggers, as summarized in Table III.
It is obvious that H1 excels in algorithm executions and the services involved (less AIS dataexchange), due to the incorporation of multihoming and the novel triggering policy. For the samereasons, it does not require any handover for QoS reasons, while H2 induces 20 handovers. Someof the handovers cause applications to be served sub-optimally, as the other service of the sameterminal may pause some constraints for the chosen network (e.g. to be incompatible with theoptimum AP technology of the other one). Furthermore, H1 results in a smooth traffic distribution,as all access networks are utilized in a uniform manner. On the contrary, H2 causes most of thetraffic to be served by WLAN. The utilization of each radio access network in terms of throughput(kbps) versus time is depicted in Figures 4 and 5, for methods H1 and H2, respectively. It mustalso be clarified that the difference of 780.16 kbytes (17 704.98–16 924.82) in the total load, whichis measured at each subnet’s AR-to-backbone link, is caused by the extra handovers in H2. Duringthe vertical handover execution, both AR-to-backbone links are utilized for the same traffic eitherby route duplication (packets are sent through both routes) or by rerouting (old AR forwardspackets to new AR).
By comparing Figures 4 and 5, we may notice the unequal traffic distribution of method H2among the managed networks (WLAN utilization exceeds 2400 kbps, while DVB-T and UMTSdo not cross the 400 kbps line), in contrast with the uniformity of H1 (Utilization values between600 and 1600 kbps). These remarks are also visible in Table IV, which presents the mean andstandard deviation (STD) values for the utilization of each network. The corresponding values forWLAN, H2 (1765 kbps mean and 951 kbps STD) are quite distinguishable from the rest.
If we consider 4Mbp capacity for the AR-to-backbone link of WLAN, then there is no conges-tion, even with H2, and no QoS downgrade is observed, as depicted in Figure 5. The uniformityin the network utilization leads to a stable operation of the whole system. On the other hand,large differences and variations in the traffic distribution make the system prone to congestion. Inorder to prove that, we generated additional WLAN background traffic (mean 1400 kbps and STD200 kbps) in the same scenario. With this, method H2 leads to further deterioration of the WLANperformance results. The total traffic exceeds, for some time intervals, the link limits and the AR
Copyright q 2007 John Wiley & Sons, Ltd. Int. J. Commun. Syst. 2008; 21:469–488DOI: 10.1002/dac

A NETWORK-CENTRIC APPROACH FOR AIS 481
0
200
400
600
800
1000
1200
1400
1600
1800
0 10 20 30 40 50 60Time (sec)
Th
rou
gh
pu
t (K
bp
s)WLAN Throughput H1
UMTS Throughput H1
DVB Throughput H1
Figure 4. Scenario A: method H1, utilization of access networks.
0
400
800
1200
1600
2000
2400
2800
3200
0 10 20 30 40 50 60Time (sec)
Th
rou
gh
pu
t (K
bp
s)
WLAN Throughput H2
UMTS Throughput H2
DVB Throughput H2
Figure 5. Scenario A: method H2, utilization of access networks.
Table IV. Scenario A: mean and STD throughput values for H1 and H2.
H1 H2
Mean (kbps) STD (kbps) Mean (kbps) STD (kbps)
WLAN 716.45 256.95 1765.41 951.76UMTS 542.84 165.43 354.27 189.76DVB-T 1041.10 486.04 255.45 189.83
queue increases. This traffic volume does not cause queue buffer overflow; hence, no packet dropoccurs, but additional problems appear at the application flows: The FT and WB connections facerate decrease due to the TCP operation and, furthermore, all packets are delayed. As for methodH1, the addition of extra WLAN background traffic does not influence the results, as the total
Copyright q 2007 John Wiley & Sons, Ltd. Int. J. Commun. Syst. 2008; 21:469–488DOI: 10.1002/dac

482 G. KOUNDOURAKIS ET AL.
0
20
40
60
80
100
120
140
0 10 20 30 40 50 60Time (sec)
Dat
a R
ate
(Kb
ps)
H1 Data Rate (FT)
H2 Data Rate (FT)
Figure 6. Scenario A (Extra background traffic): FT service data rate.
0
50
100
150
200
250
300
0 10 20 30 40 50 60Time (sec)
Del
ay (
mse
c)
Figure 7. Scenario A (Extra background traffic): method H2, VC service additional delay.
WLAN utilization does not reach the link capacity. Figure 6 depicts the rate difference for anFT service (H1 and H2 comparison). In the time interval 20–50 s, we observe the aforementionedrate decrease in H2. For H1, the FT achieves a mean data rate of 46.87 kbps (STD= 18.04 kbps),while for H2 the mean throughput is 34.22 kbps (STD= 10.73 kbps). The small increase at the endoccurs because the congestion is relieved after 50 s and TCP tries to balance the total (in terms oftime) mean rate. Moreover, the additional delay (H2 case) that a packet faces at the AR queue isillustrated in Figure 7 for a VC service. Taking into account that VC is a real-time service, delaysover 200ms and large delay variations (jitter) may not comply with the QoS constraints (Table II).
4.2. Scenario B
This scenario aims at examining the ability of H1 to detect and cope with congestion situationsat the access network. The network topology is the same as in scenario A and we assume normal
Copyright q 2007 John Wiley & Sons, Ltd. Int. J. Commun. Syst. 2008; 21:469–488DOI: 10.1002/dac

A NETWORK-CENTRIC APPROACH FOR AIS 483
0
20
40
60
80
100
120
140
0 10 20 30 40 50 60Time (sec)
Dat
a R
ate
(Kb
ps)
H1 Data Rate
H2 Data Rate
Figure 8. Scenario B: VS service data rate.
traffic at UMTS and DVB-T and high background traffic at the WLAN subnet. During the timeinterval of 20–50 s, the mean load in WLAN is considered to be 4400 kbps (STD= 300 kbps).Assuming the same AR-to-backbone capacity (4Mbps), the total traffic exceeds the link limit andpacket loss occurs.
A user starts a VS service of 128 kbps nominal rate at the time stamp of 15 s, i.e. before thecongestion starts (20 s). Initially, both methods suggest WLAN as the optimum network choice.After the WLAN is overloaded, the service faces QoS downgrade and the AIS algorithm is triggeredby the terminal. Due to the extra delay at the AR queue, H1 now selects DVB-T as the optimumaccess network and the corresponding handover is initiated. After the handover is completed, theservice regains its normal quality. In contrast, method H2 is not able to detect the congestion,because it takes only the wireless resources into account. Thus, it reselects WLAN as the bestaccess network and the application continues to face quality degradation.
In Figures 8 and 9 we depict the VS service data rate and the additional queue delay versus time(both H1 and H2). The reaction of H1 is obvious, as the degradations are temporary, as opposedto H2, where the service regains the desired quality (data rate reaches the nominal value and theextra delay is eliminated) only after congestion ceases (50 s). Furthermore, the mean data rate forH1 is 120.71 kbps (STD 18.26 kbps), while for H2 it is 108.23 kbps (STD= 21.45 kbps).
Similar conclusions were obtained in the case where the user starts the service after the beginningof congestion (e.g. at 25 s). Method H2 was again unable to select the appropriate network andthe user faced QoS downgrade. On the other hand, H1 suggested DVB-T as the optimum choicefrom the beginning and the QoS was not downgraded at all.
4.3. Scenario C
The topology of this scenario simulates a city road environment. More specifically, UMTS andDVB-T cover the whole area, but WLAN covers only 100m along the street (Figure 10). Pedestrianswith PDAs and vehicular users (e.g. car PCs) cross into and out of the WLAN hot spot. We assumethat inside the hot spot, WLAN is preferred (concerning CCI) over UMTS due to higher data ratesand also over DVB-T due to better signal quality. When the user is out of the WLAN coverage,FT and VC applications are served through UMTS and VS and AS through DVB-T. WB and SAservices are not considered in this scenario.
Copyright q 2007 John Wiley & Sons, Ltd. Int. J. Commun. Syst. 2008; 21:469–488DOI: 10.1002/dac

484 G. KOUNDOURAKIS ET AL.
0
100
200
300
400
500
600
700
0 10 20 30 40 50 60Time (sec)
Del
ay (
mse
c)H1 Additional Delay
H2 Additional Delay
Figure 9. Scenario B: VS service additional delay.
Figure 10. Topology of scenario C.
After initiating their services (0–10 s), several users move inside the WLAN hotspot (10–15 s).Vehicular users move out in the interval of 20–25 s. All FT and VC applications are served inUMTS with less bandwidth than the nominal. On the other hand, VS and AS applications obtainthe desired quality in DVB-T. Thus, only the users of the first set of services (FT and VC) requestnew AIS in H1. As for H2, new access selection process takes place for all users due to thedifferent trigger policy. The procedures of each method are as follows:
• H1: Users in UMTS ask for new selections. All FT applications are transferred to WLAN,because they are tolerant to handovers and WLAN will provide higher rates. The VC appli-cations, due to their real-time nature, are very sensitive to repeated handovers. Consequently,WLAN is not preferred for the vehicular users, due to its small coverage area, but only for thepedestrians (low mobility). AS and VS remain at DVB-T as no QoS downgrade is observed.Vehicular users with FT services are moved back to UMTS, after crossing out of the hot spot.
• H2: At the beginning, the services of all users are transferred to WLAN. When movingoutside the hot spot, all vehicular user services are transferred back to the initial access
Copyright q 2007 John Wiley & Sons, Ltd. Int. J. Commun. Syst. 2008; 21:469–488DOI: 10.1002/dac

A NETWORK-CENTRIC APPROACH FOR AIS 485
0
20
40
60
80
100
120
140
0 5 10 15 20 25 30 35 40 45 50Time (sec)
Dat
a R
ate
(Kb
ps)
H1 Data Rate
H2 Data Rate
Figure 11. Scenario C: VC service data rate.
0
50
100
150
200
250
300
0 5 10 15 20 25 30 35 40 45 50
H2 Data Rate
H1 Data Rate
Dat
a R
ate
(Kb
ps)
Time (sec)
Figure 12. Scenario C: method H2, VS service data rate.
network. Thus, much more handovers are taking place, causing temporary QoS downgrades,especially when the terminals are moving out of WLAN coverage (rapid signal loss).
Figure 11 illustrates the data rate of a VC service of a vehicular user terminal. Method H1 keepsa low, but acceptable data rate without any variations and handovers (mean service throughput is55.02 kbps and STD is 6.41 kbps). On the other hand, H2 performs two handovers (approximatelyat 12 and 23 s), which lead to a data rate increase for 7–8 s (mean 63.02 kbps and STD 29.87 kbps)but also to two significant drops. Real-time services, such as VC, may not benefit from the short-term throughput increase, because it is accompanied by the aforementioned downgrades, underthe condition that the initially selected AP provides acceptable QoS. Thus, only FT services couldgain any advantages from these handovers, because the temporary downgrades are not visible tothe user and the final result leads to a larger mean rate. Furthermore, for the VS and AS services,the DVB-T to WLAN and WLAN to DVB-T handovers instructed by H2 do not provide any
Copyright q 2007 John Wiley & Sons, Ltd. Int. J. Commun. Syst. 2008; 21:469–488DOI: 10.1002/dac

486 G. KOUNDOURAKIS ET AL.
benefits in terms of data rate compared with H1, which retains them in the DVB-T network.Moreover, they cause two obvious service degradations, as shown in Figure 12 that depicts the bitrate of a VS service (nominal value is 256 kbps) of a vehicular user terminal. When using H1 theservice throughput remains around the nominal value, while H2 does not succeed to maintain thisconstancy. It must be noticed that the second drop is even worse than the first (in both figures).The reason is the rapid WLAN signal loss (not present at the first handover), which further causesdeterioration of the degradation due to the handover.
5. CONCLUSIONS
In this paper we presented a network-based solution for the access selection problem, in the contextof a general management system for heterogeneous environments. Our goal is to select the mostappropriate AP in terms of cost and resources in order to provide an acceptable QoS to the end user.General target is to optimally manage the overall system resources, thus minimizing the possibilityof non-mobility handovers and making the system robust and flexible against congestion situations.Basic key points are the exploitation of multihoming and the triggering policy.
The large-scale validation of the proposed concept has been performed by NS-2 simulations.The simulated scenarios showed the ability of this scheme to detect and cope with congestionsituations and make the overall system prone to overloading cases. It distributes the traffic demandas uniformly as possible among the managed networks and minimizes the probability of QoShandovers (Scenario A). Moreover, it is able to react to every lack of resources, either at thewired or at the wireless part and take appropriate decisions (Scenario B). Finally, it evaluates theinvolved trade-offs between the possible benefits gained by a QoS handover and the correspondingdowngrades caused and act, respectively, as shown in Scenario C.
All the aforementioned simulation scenarios have been performed with typical values withrespect to the service parameters. We should note that the values themselves are not critical soas to affect our conclusions; different but not extreme values could be used without remarkableeffect on the results. For instance, when using different nominal bandwidth/delay tolerance values,only the minimum and maximum values of the throughput/delay would be affected; the overalltendency of the plotted results would still stand. This is also valid when altering the mean servicedurations: the maximum and minimum throughput would be slightly impacted but again the overalltendency of the plots as well as our conclusions would still be valid.
Our approach may also be applied to a similar process involved in the heterogeneous networkmanagement, namely the dynamic redistribution of users and services among the available accesstechnologies. This process requires a core entity that collects the traffic information for all radioaccess networks (users, services, resources) at a specific area and performs a service-to-AP real-location for the whole load demand, in order to achieve better resources utilization. Consequently,the incorporation of our concept could expand current solutions for service reconfiguration aspects[28], which is also our next goal.
ACKNOWLEDGEMENTS
The work described in this article is partially based on the results of IST FP6 Integrated Project DAIDA-LOS (IST-2002-506997). The authors wish to thank the partners of the Daidalos Consortium for theircollaborative work.
Copyright q 2007 John Wiley & Sons, Ltd. Int. J. Commun. Syst. 2008; 21:469–488DOI: 10.1002/dac

A NETWORK-CENTRIC APPROACH FOR AIS 487
REFERENCES
1. Axiotis DI et al. Services in interworking 3G and WLAN environments. IEEE Wireless Communications Magazine2004; 11(5):14–20.
2. Gizawi T, Peppas K, Axiotis DI, Lazarakis F, Protonotarios EN. Interoperability criteria, mechanisms andevaluation of system performance for transparently interoperating WLAN and UMTS-HSDPA networks. IEEENetwork Magazine 2005; 19(4):66–72.
3. Gustafsson E, Jonsson A. Always best connected. IEEE Wireless Communications 2003; 10(1):49–55.4. IST project MONASIDRE (Management Of Networks And Services In a Diversified Radio Environment).
Available at: www.monasidre.com.5. IST project CREDO (Composite Radio for Enhanced Service Delivery during the Olympics). Available at:
www.credo.nal.motlabs.com.6. IST project DAIDALOS (Designing Advanced network Interfaces for the Delivery and Administration of Location
independent, Optimized personal Services). Available at: www.ist-daidalos.org.7. 3GPP Technical Specifications. Available at: www.3gpp.org/specs/numbering.htm.8. IETF (Internet Engineering Task Force). Available at: www.ietf.org, IP over DVB working group9. Ylitalo J, Jokikyyny T, Kauppinen T, Tuominen AJ, Laine J. Dynamic network interface selection in mobile
hosts. Proceedings of the 36th Annual Hawaii International Conference on System Sciences (HICSS ’03), HiltonWaikaloa Village, U.S.A., January 2003; 315–324.
10. Ormond O, Miro-Muntean G, Murphy J. Economic model for cost effective network selection strategy in serviceoriented heterogeneous wireless network environment. Proceedings of the 10th IEEE/IFIP Network Operationsand Management Symposium (NOMS 2006), Vancouver, Canada, April 2006; 1–4.
11. Wang HJ, Katz RH, Giese J. Policy-enabled handoffs across heterogeneous wireless networks. Proceedings of theSecond IEEE Workshop on Mobile Computing Systems and Applications (WMCSA ’99), New Orleans, U.S.A.,February 1999; 51–61.
12. Wang X, Schulzrinne H. An integrated resource negotiation, pricing, and QoS adaptation framework for multimediaapplications. IEEE Journal on Selected Areas in Communications 2000; 18(12):2514–2529.
13. Das S, Lin H, Chatterjee M. An econometric model for resource management in competitive wireless datanetworks. IEEE Network Magazine 2004; 18(6):20–26.
14. Koutsorodi A et al. A management architecture for enabling reconfigurable terminal operation in the B3G/ABCcontext. Tenth WWRF Meeting, New York, U.S.A., October 2003.
15. Xing B, Venkatasubramanian N. Multi-constraint dynamic access selection in always best connected networks.Proceedings of the 2nd Annual International Conference on Mobile and Ubiquitous Systems (MobiQuitous 2005),San Diego, U.S.A., July 2005; 56–64.
16. Adamopoulou E, Demestichas K, Koutsorodi A, Theologou M. Intelligent access network selection inheterogeneous networks—simulation results. Proceedings of the 2nd International Symposium on WirelessCommunication Systems (ISWCS 2005), Siena, Italy, September 2005; 279–283.
17. Media Independent Handover Group. Available at: www.ieee802.org/21.18. Liebsch M, Singh A, Chaskar H, Funato D, Shim E. Candidate access router discovery (CARD). IETF RFC
4066, 2005.19. Perkins C. IP Mobility Support for IPv4. IETF RFC 3344, 2002.20. Johnson D, Perkins C, Arkko J. Mobility support for IPv6. IETF RFC 3775, 2004.21. Wakikawa R, Ernst T, Nagami K, Devarapalli V. Multiple Care-of Addresses Registration. IETF Draft ‘draft-
ietf-monami6-multiplecoa-03’, 2007, work in progress.22. Ahlund C, Zaslavsky A. Multihoming with Mobile IP. Proceedings of the 6th IEEE International Conference on
High Speed Networks and Multimedia Communications (HSNMC ’03), Estoril, Portugal, July 2003; 235–243.23. Clemente M, Velez F. Parameters for Tele-traffic characterization in enhanced UMTS. Proceedings of the 4th
Conference on Telecommunications (ConfTele ’03), Aveiro, Portugal, June 2003; 375–378.24. Perkins CE, Wang KY. Optimized Smooth Handoffs in Mobile IP. Proceedings of the 4th IEEE Symposium on
Computers and Communications (ISCC), Red Sea, Egypt, July 1999; 340–346.25. Cleyn P, Wijngaert N, Cerda L, Blondia C. A smooth handoff scheme using IEEE802.11 triggers—design and
implementation. Computer Networks 2004; 45(3):345–361.26. Pan Y, Lee M, Kim JB, Suda T. An end-to-end multi-path smooth handoff scheme for stream media. IEEE
Journal of Selected Areas of Communications 2004; 22(4):653–663.27. IST project CREDO, Deliverable D4, ‘Architecture of NSMS for optimizing composite radio environments’.
Available at: www.telecom.ntua.gr/∼jaxiot/D4.pdf.
Copyright q 2007 John Wiley & Sons, Ltd. Int. J. Commun. Syst. 2008; 21:469–488DOI: 10.1002/dac

488 G. KOUNDOURAKIS ET AL.
28. Demestichas P, Stavroulaki V, Papadopoulou L, Vasilakos A, Theologou M. Service configuration and trafficdistribution in composite radio environments. IEEE Transactions on Systems, Man and Cybernetics Journal 2003;33(4):69–81.
AUTHORS’ BIOGRAPHIES
Dr George I. Koundourakis was born in Alex/polis, Greece, in 1979. He received adegree in Electrical and Computer Engineering from the National Technical Univer-sity of Athens (NTUA), Greece, in July 2001 and a PhD degree in November 2006.He is a Research Associate at the Telecommunications Laboratory of the Division ofCommunications, Electronics and Information Systems at NTUA. His research interestsinvolve wireless communications, heterogeneous network management and location-based services. He has worked in research projects in the context of the IST framework(IST-MONASIDRE, IST-CREDO and IST-DAIDALOS). George Koundourakis is theauthor of several scientific papers in the areas of mobile communications and is also amember of the Technical Chamber of Greece.
Dr Dimitrios I. Axiotis received a Diploma (1999) in Electrical and Computer Engi-neering, an MSc in Telecommunications (2002) and a PhD degree (2004) in 3G MobileCommunications, all from the Department of Electrical and Computer Engineering,National Technical University of Athens (NTUA), Greece. He is currently a senior re-searcher in the Telecommunications Laboratory (NTUA), coordinating FP6 and nationallyfunded research projects. He is involved in IST-MOTIVE and previously participatedin IST-Daidalos, IST-FITNESS, IST-SATIN and IST-LIAISON. His research interestsinvolve multicarrier CDMA, HAPS-UMTS, TETRA and interoperating HSDPA/WLANnetworks enhanced with MIMO techniques. He has published over 30 papers in refereedconferences and journals. He serves as a reviewer/member of the technical committeefor international journals and conferences. Dr Axiotis is a member of IEEE and theTechnical Chamber of Greece.
Mr Michael G. Argyropoulos holds a bachelor degree in Physics, from the PhysicsDepartment of the Aristotle University of Thessaloniki, Greece. His major domains ofinterest activities have been focused on the telecommunications’ sector applications,especially in satellite transmission, multicasting applications, modern network securityaspects and personalized multimedia content delivery networks. He is a PhD student ofthe National Technical University of Athens (NTUA), Greece, a member of IEEE societyas well as a technical consultant in several Greek companies. He has already worked forOLYMPIC and MAGNET, European research projects, for four Greek research projectsand he is member of European research project MAGNET BEYOND.
Prof. Michael E. Theologou received a degree in Electrical Engineering from PatrasUniversity and his Ph.D. degree from the School of Electrical Engineering and ComputerScience of the National Technical University of Athens (NTUA). Currently, he is aProfessor in the School of Electrical Engineering and Computer Science of NTUA. Hisresearch interests are in the field of Mobile and Personal communications. He has manypublications in the above areas. Dr Theologou is a member of IEEE and the TechnicalChamber of Greece.
Copyright q 2007 John Wiley & Sons, Ltd. Int. J. Commun. Syst. 2008; 21:469–488DOI: 10.1002/dac