a mixed-methods evaluation of health and safety hazards at a scrap metal recycling facility
TRANSCRIPT
Safety Science 51 (2013) 432–440
Contents lists available at SciVerse ScienceDirect
Safety Science
journal homepage: www.elsevier .com/locate /ssc i
A mixed-methods evaluation of health and safety hazards at a scrap metalrecycling facility
Richard L. Neitzel a,⇑, Allison Crollard b, Carlos Dominguez b, Bert Stover b, Noah S. Seixas b
a Risk Science Center, Department of Environmental Health Sciences, School of Public Health, University of Michigan, 1415 Washington Heights, Ann Arbor, MI 48109, United Statesb Department of Environmental and Occupational Health Sciences, School of Public Health, University of Washington, Seattle, WA 98105, United States
a r t i c l e i n f o a b s t r a c t
Article history:Received 15 June 2012Received in revised form 26 August 2012Accepted 28 August 2012Available online 9 October 2012
Keywords:Scrap metal recyclingSafety and healthExposure assessmentIndustrial hygieneObservations
0925-7535/$ - see front matter � 2012 Elsevier Ltd. Ahttp://dx.doi.org/10.1016/j.ssci.2012.08.012
⇑ Corresponding author. Tel.: +1 734 763 2870; faxE-mail address: [email protected] (R.L. Neitzel).
Little work has been done to assess hazardous exposures among scrap metal recycling workers. Thisstudy evaluated safety and health hazards at one scrap metal recycling facility using three methods.The first method was a semi-quantitative hazard observation tool (HOT) used by researchers to ratethe presence and magnitude of exposures for 13 hazards. The second collected self-reported exposureinformation on nine hazards from workers. The third was quantitative industrial hygiene (IH) measure-ments of noise, total particulate, carbon monoxide, and blood lead levels.
We collected 677 HOT observations, collected self-reported exposure information from all 46 workersat the facility, and made over 150 IH measurements among workers in potentially lead-exposed jobs. Allthree methods demonstrated substantial exposures to most of the hazards assessed, and exposures werefound to vary by work area. Workers were found to report higher exposures to a number of hazards, aswell as higher use of controls, when compared to the HOT data. Workers and observations overestimateddust exposures and underestimated noise exposures when compared to IH measurements. Agreementamong five different observers who used the HOT instrument was found to be moderate to substantialacross all hazards and controls.
The results of this study indicate that scrap metal recycling workers at the participating facility werehighly exposed to a variety of occupational hazards, and that additional safety and health measuresare warranted in the scrap metal recycling industry. The HOT instrument developed for this study haspotential for use in evaluating hazards in other industries.
� 2012 Elsevier Ltd. All rights reserved.
1. Introduction
Scrap metal recycling is a large industry in the US, processing 56million tons of scrap iron and steel each year, including 10 milliontons of automobiles, 1.5 million tons of copper, 2.5 million tons ofaluminum, 1.3 million tons of lead, 300,000 tons of zinc and800,000 tons of stainless steel (OSHA, 2008). Detailed employmentdata are not available for the scrap metal recycling industry, butNAICS code 423930, Recyclable Material Merchant Wholesalers,which includes scrap metal recycling workers, employed 117,000US workers in 2012 (BLS, 2012). Scrap metal recycling facilitiesfeature a variety of disparate industrial operations, including:welding and torch cutting; shearing, shredding, processing, andpackaging of ferrous and non-ferrous metals; manual picking andsorting of some materials; movement of bulk materials by craneand fork truck; maintenance; wastewater treatment; and shippingand receiving.
ll rights reserved.
: +1 734 763 8095.
There is a paucity of data on exposures to specific safety andhealth hazards in this industry. However, based on the types ofwork involved, workers have the potential for exposure to ergo-nomic hazards, noise, dusts and fumes, and powerful machinery.In addition to these hazards, the industry relies on a steady streamof incoming scrap metal from industrial operations (which deliverscrap by rail, truck, or barge) and individual scrap peddlers (whodeliver scrap in their personal truck or automobile). The continu-ous inflow of scrap metal results in a heavy volume of vehicletraffic and potentially dangerous pedestrian/vehicle interactions.
The fatality rate for the NAICS code which includes scrap metalrecycling is 18 per 100,000 FTE (BLS, 2011), over five times greaterthan the all-industry average. No detailed data are availablenationally regarding injuries and illnesses in scrap metal recycling,but according to the US Occupational Safety and Health Adminis-tration (OSHA), the most common illnesses experienced in theindustry includes poisoning (e.g., lead, cadmium, nickel), disordersassociated with repeated trauma, skin diseases, and respiratoryconditions associated with contact and/or inhalation of toxicagents (OSHA, 2008). The most common events leading to days
R.L. Neitzel et al. / Safety Science 51 (2013) 432–440 433
away from work involved contact with an object or piece ofequipment; overextension (e.g., sprains, strains, heat burns, cuts,lacerations, and punctures (OSHA, 2008)). Fatalities in this industryare not uncommon; for example, between 2007 and 2009 therewere two fatal incidents at two scrap metal recycling facilities inthe Seattle, WA area alone (Rolp and Pulkkinen, 2007; LandI, 2010).
No national workers’ compensation data exist for this industry,but at the state level, limited claims data are available. In 2006Washington State had 14 metal scrap recyclers in NAICS code423930 employing approximately 1772 workers. Between 2004and 2008, the Washington State Department of Labor and Indus-tries recorded a total of 554 claims from scrap metal dealers andprocessors (WA Risk Class 0604) incurring costs of more than$3.5 million. The average cost for medical and disability paymentswas more than $700,000 per year for an average of 505 FTEemployees, or $1385 per FTE (LandI, 2006).
Better characterization of exposures in the scrap metalrecycling industry is needed to identify and rank hazards, imple-ment exposure controls and risk management interventions, andultimately reduce occupational injuries, illnesses, and fatalities.Exposure assessments can be performed using a number oftechniques, including direct personal quantitative measurements,expert judgment or observations of working conditions, andself-report/. These approaches are typically applied singly inoccupational exposure assessment, and have different strengths.For example, personal quantitative measurements are consideredthe gold standard of exposure assessment to chemicals and phys-ical agents (Nieuwenhuijsen et al., 2006), but are often complexand costly, usually provide only a brief ‘snapshot’ of exposure,and cannot be used to assess safety hazards or injury risks. Expertjudgment and observations are less expensive, can evaluateexposures to chemical and physical hazards as well as safetyand injury risks, and may in some cases effect desired behavioralchanges in observed individuals (Alvero et al., 2008). However,their validity (Cherrie and Schneider, 1999) and sensitivity (Frit-schi et al., 2003) can vary, they typically only provide a snapshotof exposure, and the measures are highly non-specific and requiremany observations or judgements to achieve a statisticallymeaningful assessment. Self-report is sometimes the only feasibleway to assess exposures and accident scenarios that are veryinfrequent, and can be used to integrate exposures of long periodsof time, but self-reported data can be highly susceptible to recalland social desirability biases (Kimberlin and Winterstein, 2008).Comparisons of the results of simultaneous assessments madeusing these disparate methods are needed to identify optimalstrategies for hazard assessments, particularly in dynamic work-places such as scrap metal recycling, where a single methodmay not be sufficient to adequately characterize health and safetyrisks.
The goal of this study was to develop and evaluate a compre-hensive mixed-method assessment of safety and health conditionsat a single scrap metal recycling facility in Washington State. Thethree methods used were: (1) a hazard observation tool (HOT) usedby researchers to rate exposures; (2) worker self-report; and (3)industrial hygiene (IH) measurements. The efforts described herewere part of a larger intervention effort at the cooperating facilitywhich was designed to develop an effective joint labor-manage-ment health and safety committee and to assess the effects of thisintervention on worksite safety and health conditions. Thedevelopment, execution, and evaluate of the training providedare described elsewhere (Crollard et al., 2012), and changes infacility-wide exposures, safety climate and health and safety per-formance resulting from the intervention are described separately(Seixas et al., 2012).
2. Methods
Our assessment focused on safety and health hazards and ergo-nomic stressors. The three different methods we used to assesshazards are described in detail below. All research activities wereapproved by the University of Washington Institutional ReviewBoard. We gave workers at the facility a brief overview of the studydesign and methods during a regularly scheduled safety meeting;interested volunteers then signed an informed consent form andwere enrolled in the study.
2.1. Semi-quantitative hazard observations
The HOT is a 33-item observational tool developed for thisstudy and designed to systematically collect information aboutworkers’ exposures and use of protective equipment for multiplehazards. Information collected in each HOT observation includedobserver, time of day, work area, work activity, and semi-quantita-tive ratings of the magnitude of exposure to 13 hazards. These haz-ards were: falls from height, noise, eye hazards, dusts and fumes,struck by objects, traffic safety, machine guarding, hazardous en-ergy (i.e., lockout/tagout), walking and working surfaces, lacera-tions and abrasions, and a number of ergonomic hazards,including repetitive motion, lifting, and awkward postures. Expo-sures to these hazards were rated as not present, low magnitude(e.g., exposure present, but low injury or accident risk), or highmagnitude (e.g., exposure present, and high injury or accidentrisk). In addition to rating the intensity of these exposures, PPEand exposure controls for these hazards were rated as used, notused, or uncertain.
We programmed the HOT into an electronic form (Visual CEversion 12.0 software, Syware Inc., Cambridge, MA, USA) installedon a handheld device (HP iPaq personal digital assistant, Hew-lett–Packard, Palo Alto, CA, USA). Each item in the HOT had anassociated ‘‘Help’’ screen that provided definitions and examples.The data dictionary provided through this help screen was devel-oped through pre-study site walkthroughs and group review of dif-ferent exposure scenarios and site conditions by the fiveresearchers who conducted observations for this study. The fiveparticipating observers were trained on the tool by conducting anumber of observations as a group on a single day in the field, withdiscussion of differences in results after each observation.
The use of any observational tool by multiple observers intro-duces some degree of inter-observer variability. To evaluate inter-observer agreement, we conducted side-by-side evaluations withpairs of observers. The observers in these observation pairs evalu-ated the same workers at the same points in time and indepen-dently rated their exposure and exposure controls using the HOT.
HOT observations were conducted by researchers walking alonga set observation route through the facility (Fig. 1). Researchersstopped at each observation location and conducted an observa-tion on each worker they could see in all directions, until all work-ers had been observed. An observation of an individual workerevaluated the workers’ working conditions and behaviors at themoment the observation began. In other words, observations didnot integrate workers’ activities over time, but rather representeda moment-in-time snapshot. We chose this approach becausemany activities performed by workers in scrap metal recyclingfacilities change quickly over time, complicating observationsand potentially increasing measurement difficulty and error. Toeliminate the possibility of management retribution, HOT observa-tions did not record the identity of the observed worker. Observa-tions were made in all areas of the facility. These include:
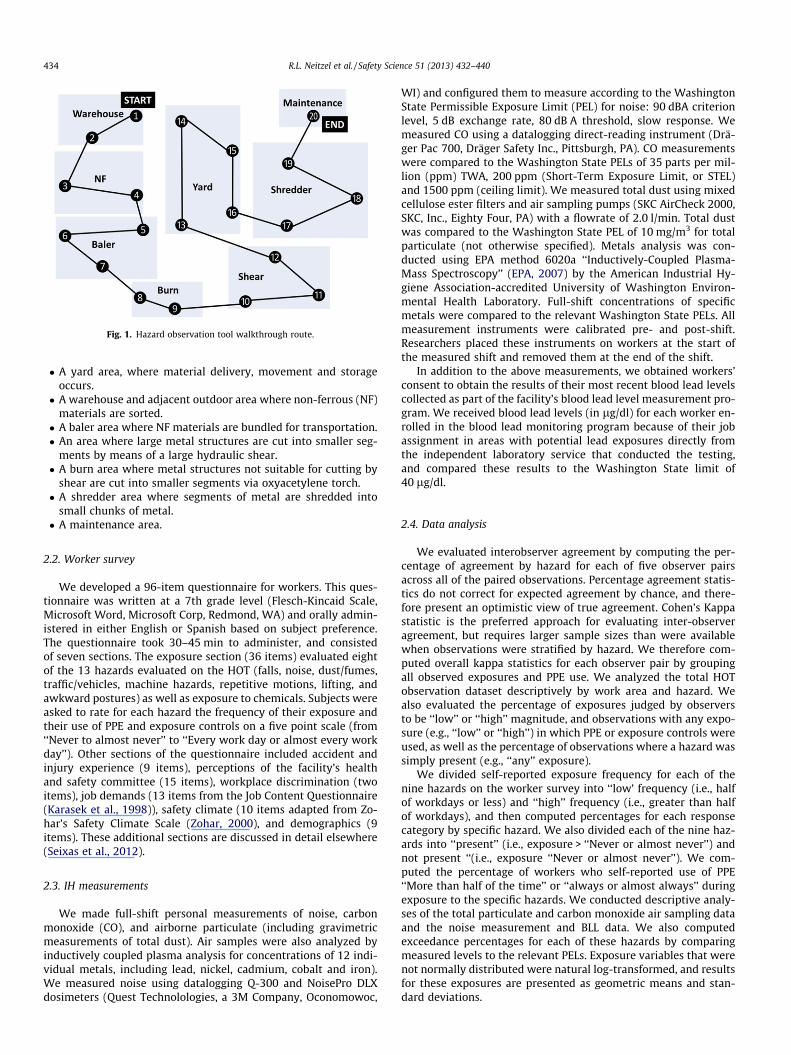
Fig. 1. Hazard observation tool walkthrough route.
434 R.L. Neitzel et al. / Safety Science 51 (2013) 432–440
� A yard area, where material delivery, movement and storageoccurs.� A warehouse and adjacent outdoor area where non-ferrous (NF)
materials are sorted.� A baler area where NF materials are bundled for transportation.� An area where large metal structures are cut into smaller seg-
ments by means of a large hydraulic shear.� A burn area where metal structures not suitable for cutting by
shear are cut into smaller segments via oxyacetylene torch.� A shredder area where segments of metal are shredded into
small chunks of metal.� A maintenance area.
2.2. Worker survey
We developed a 96-item questionnaire for workers. This ques-tionnaire was written at a 7th grade level (Flesch-Kincaid Scale,Microsoft Word, Microsoft Corp, Redmond, WA) and orally admin-istered in either English or Spanish based on subject preference.The questionnaire took 30–45 min to administer, and consistedof seven sections. The exposure section (36 items) evaluated eightof the 13 hazards evaluated on the HOT (falls, noise, dust/fumes,traffic/vehicles, machine hazards, repetitive motions, lifting, andawkward postures) as well as exposure to chemicals. Subjects wereasked to rate for each hazard the frequency of their exposure andtheir use of PPE and exposure controls on a five point scale (from‘‘Never to almost never’’ to ‘‘Every work day or almost every workday’’). Other sections of the questionnaire included accident andinjury experience (9 items), perceptions of the facility’s healthand safety committee (15 items), workplace discrimination (twoitems), job demands (13 items from the Job Content Questionnaire(Karasek et al., 1998)), safety climate (10 items adapted from Zo-har’s Safety Climate Scale (Zohar, 2000), and demographics (9items). These additional sections are discussed in detail elsewhere(Seixas et al., 2012).
2.3. IH measurements
We made full-shift personal measurements of noise, carbonmonoxide (CO), and airborne particulate (including gravimetricmeasurements of total dust). Air samples were also analyzed byinductively coupled plasma analysis for concentrations of 12 indi-vidual metals, including lead, nickel, cadmium, cobalt and iron).We measured noise using datalogging Q-300 and NoisePro DLXdosimeters (Quest Technolologies, a 3M Company, Oconomowoc,
WI) and configured them to measure according to the WashingtonState Permissible Exposure Limit (PEL) for noise: 90 dBA criterionlevel, 5 dB exchange rate, 80 dB A threshold, slow response. Wemeasured CO using a datalogging direct-reading instrument (Drä-ger Pac 700, Dräger Safety Inc., Pittsburgh, PA). CO measurementswere compared to the Washington State PELs of 35 parts per mil-lion (ppm) TWA, 200 ppm (Short-Term Exposure Limit, or STEL)and 1500 ppm (ceiling limit). We measured total dust using mixedcellulose ester filters and air sampling pumps (SKC AirCheck 2000,SKC, Inc., Eighty Four, PA) with a flowrate of 2.0 l/min. Total dustwas compared to the Washington State PEL of 10 mg/m3 for totalparticulate (not otherwise specified). Metals analysis was con-ducted using EPA method 6020a ‘‘Inductively-Coupled Plasma-Mass Spectroscopy’’ (EPA, 2007) by the American Industrial Hy-giene Association-accredited University of Washington Environ-mental Health Laboratory. Full-shift concentrations of specificmetals were compared to the relevant Washington State PELs. Allmeasurement instruments were calibrated pre- and post-shift.Researchers placed these instruments on workers at the start ofthe measured shift and removed them at the end of the shift.
In addition to the above measurements, we obtained workers’consent to obtain the results of their most recent blood lead levelscollected as part of the facility’s blood lead level measurement pro-gram. We received blood lead levels (in lg/dl) for each worker en-rolled in the blood lead monitoring program because of their jobassignment in areas with potential lead exposures directly fromthe independent laboratory service that conducted the testing,and compared these results to the Washington State limit of40 lg/dl.
2.4. Data analysis
We evaluated interobserver agreement by computing the per-centage of agreement by hazard for each of five observer pairsacross all of the paired observations. Percentage agreement statis-tics do not correct for expected agreement by chance, and there-fore present an optimistic view of true agreement. Cohen’s Kappastatistic is the preferred approach for evaluating inter-observeragreement, but requires larger sample sizes than were availablewhen observations were stratified by hazard. We therefore com-puted overall kappa statistics for each observer pair by groupingall observed exposures and PPE use. We analyzed the total HOTobservation dataset descriptively by work area and hazard. Wealso evaluated the percentage of exposures judged by observersto be ‘‘low’’ or ‘‘high’’ magnitude, and observations with any expo-sure (e.g., ‘‘low’’ or ‘‘high’’) in which PPE or exposure controls wereused, as well as the percentage of observations where a hazard wassimply present (e.g., ‘‘any’’ exposure).
We divided self-reported exposure frequency for each of thenine hazards on the worker survey into ‘‘low’ frequency (i.e., halfof workdays or less) and ‘‘high’’ frequency (i.e., greater than halfof workdays), and then computed percentages for each responsecategory by specific hazard. We also divided each of the nine haz-ards into ‘‘present’’ (i.e., exposure > ‘‘Never or almost never’’) andnot present ‘‘(i.e., exposure ‘‘Never or almost never’’). We com-puted the percentage of workers who self-reported use of PPE‘‘More than half of the time’’ or ‘‘always or almost always’’ duringexposure to the specific hazards. We conducted descriptive analy-ses of the total particulate and carbon monoxide air sampling dataand the noise measurement and BLL data. We also computedexceedance percentages for each of these hazards by comparingmeasured levels to the relevant PELs. Exposure variables that werenot normally distributed were natural log-transformed, and resultsfor these exposures are presented as geometric means and stan-dard deviations.
R.L. Neitzel et al. / Safety Science 51 (2013) 432–440 435
Finally, HOT, worker survey, and IH measurement data wereavailable for noise and dusts/fumes. For these two hazards, wecomputed and compared the percentage of ‘‘overexposures’’ (e.g.,‘‘high’’ exposure determined via HOT,’’ ‘‘More than half of the time’’or ‘‘always or almost always’’ exposed via worker self-report, andexposure > PEL for IH measurements) determined by each method.
3. Results
We collected HOT observations, worker survey data, and IHmeasurements at the participating facility in August and Septem-ber, 2010. Forty-six workers (100% of workers at the facility) par-ticipated in the worker surveys. Thirty-four workers completedone or more IH measurements, and blood lead level data wereavailable from 16 workers.
3.1. Hazard observations
A total of 112 paired observations were made by six pairs ofresearchers as part of our interobserver variability evaluation. Eachobservation included assessments of 14 hazards and 14 categoriesof PPE (28 items per observation, total 3136 datapoints). Interob-server agreement for select hazards (eye hazard, traffic hazard,noise, and dust) evaluated using the HOT tool is shown in Table 1.Kappa statistics are presented across all simultaneous observationsof hazards and PPE made by each observer pair; percentage agree-ment statistics are presented for simultaneous observations of spe-cific hazards, where the number of measurements is much smaller.Observer 1 was the primary observer in the study, and collectedthe majority of the observation data. The kappa statistics for allobservations of hazards and PPE use combined were moderate tosubstantial (Landis and Koch, 1977), ranging from 0.45 to 0.89. Per-centage agreement for exposures and PPE use for specific hazardsvaried widely across observer pairs and by hazard, and was gener-ally higher for PPE use than for hazard assessment. For example,agreement varied between 63% and 95% for magnitude of exposureto traffic hazards, but agreement for rating of PPE use for traffichazards was 95–100%. A similar pattern was observed exposuresto dust/fumes and use of respiratory protection. Overall, agree-ment between observers on exposure magnitude was best fornoise and dust, and agreement on use of PPE was best for trafficand dust. Some trends were noted for observer pairs; for example,observers 1 and 4 were highly concordant in their assessments ofall exposures and PPE use, while observers 1 and 5 showed loweragreement.
The presence and magnitude of hazards observed using the HOTtool, as well as observed use of PPE and controls, are shown inTable 2. The interobserver differences described above undoubt-edly have some influence on these HOT results, but this influenceis relatively small given that 78% of observations in Table 2 weremade by observer 1. The most common hazards observed wereawkward posture (present in 77% of observations), noise (71%),
Table 1Interobserver agreement for observed exposure to select hazards and use of personal prot
Observer pair Kappa Percent agreement
All observations Eye hazard
N Exp. n PPE n Exp. PPE
1 and 5 182 0.52 130 0.45 13 69 771 and 4 56 0.82 40 0.89 4 100 751 and 2 350 0.63 250 0.43 25 88 882 and 4 380 0.5 272 0.55 27 80 862 and 3 348 0.67 250 0.53 24 80 823 and 4 238 0.57 170 0.63 17 85 88
and repetitive motion (66%). The hazards where the majority of ob-served exposures were judged to be ‘‘high’’ were working surfacesand lacerations/abrasions. Conversely, exposures were more often‘‘low’’ for traffic/vehicles, repetitive motion, lifting, falls, awkwardpostures, and vibration. Observed exposures to noise, dust/fume,machines, and struck by objects were about evenly split between‘‘low’’ and ‘‘high’’ exposure. PPE or control use during observed‘‘high’’ exposures (Table 1) was >75% for falls, eye hazards, struckby objects, and lacerations/abrasions. However, for dust/fumes,struck by objects, and traffic/vehicles, PPE or controls were usedduring less than 33% of observations.
Not all hazards were observed in all work areas. For example,fall and eye hazards, struck by hazards, machinery hazards, lacer-ation/abrasion hazards and dust/fume exposures were never ob-served in the yard (data not shown). Conversely, in some areas,including maintenance, the baler, the Shear, and the shredder, all13 hazards were observed to be present. Noise, traffic/vehicles,walking/working surfaces, repetitive motions, lifting, and awkwardpostures were observed in all work areas.
3.2. Worker surveys
All 46 participating workers reported on each of the nine haz-ards assessed by self-report (Table 3). Only two hazards (chemicalsand awkward working postures) were commonly reported to be‘‘never or almost never’’ encountered; exposures to the remainingseven hazards were reported by 63% (machine hazards) to 91%(noise, dust/fume, and traffic/vehicle exposure) of workers. Themajority of self-reported exposures to falls, chemicals, traffic/vehi-cles, lifting, and awkward working postures were reported as ‘‘low’’frequency (e.g., occurring on half or less of workdays). The majorityof exposures to noise, dust/fume, traffic/vehicles, and repetitivemotion were reported to be ‘‘high’’ frequency (e.g., occurring onmore than half of workdays). Self-reported PPE use varied widely,with over 70% of workers reporting using hearing protectors morethan half of the time during noise exposure, and only 35% reportinguse of a respirator more than half of the time during exposure todust/fume. Overall, self-reported rates of PPE use for specific haz-ards were low.
Workers in all areas reported ‘‘high’’ exposure frequency foreach hazard, with few exceptions. All areas reported that expo-sures to falls, machine hazards, and lifting hazards occurred with‘‘high’’ frequency. Traffic/vehicle exposures, repetitive motions,and lifting were never reported in the burn area, and awkward pos-tures were never reported in the Warehouse and NF areas.
3.3. IH measurements
Fifty-nine full shift noise measurements were made (Table 4).The mean TWA noise exposure was 81.9 dBA; 19% exceeded thePEL-TWA of 90 dBA (above which noise controls are required),and 57% exceeded 85 dBA (above which workers must be enrolled
ective equipment.
Traffic hazard Noise Dust
n Exp. PPE n Exp. PPE n Exp. PPE
13 77 100 13 85 77 13 88 1004 63 100 5 100 100 5 100 100
25 86 100 25 88 82 25 96 9227 67 95 28 64 79 28 85 9624 94 100 24 77 88 24 92 9617 82 100 17 94 79 17 79 100
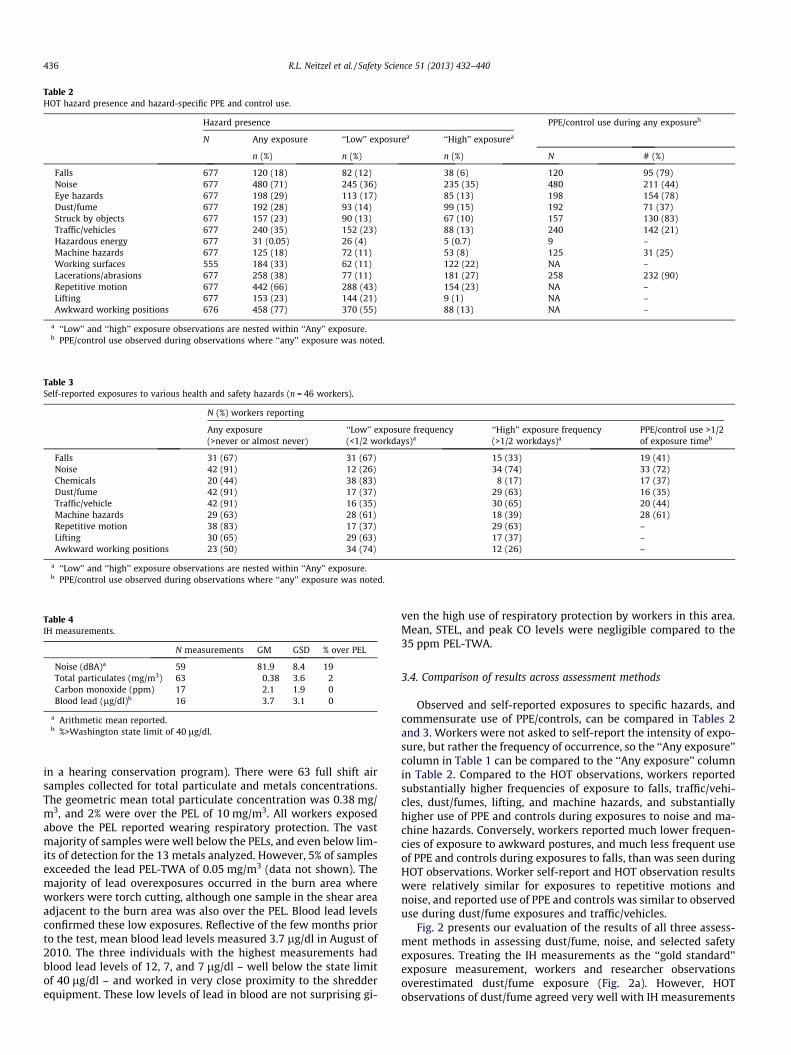
Table 2HOT hazard presence and hazard-specific PPE and control use.
Hazard presence PPE/control use during any exposureb
N Any exposure ‘‘Low’’ exposurea ‘‘High’’ exposurea
n (%) n (%) n (%) N # (%)
Falls 677 120 (18) 82 (12) 38 (6) 120 95 (79)Noise 677 480 (71) 245 (36) 235 (35) 480 211 (44)Eye hazards 677 198 (29) 113 (17) 85 (13) 198 154 (78)Dust/fume 677 192 (28) 93 (14) 99 (15) 192 71 (37)Struck by objects 677 157 (23) 90 (13) 67 (10) 157 130 (83)Traffic/vehicles 677 240 (35) 152 (23) 88 (13) 240 142 (21)Hazardous energy 677 31 (0.05) 26 (4) 5 (0.7) 9 –Machine hazards 677 125 (18) 72 (11) 53 (8) 125 31 (25)Working surfaces 555 184 (33) 62 (11) 122 (22) NA –Lacerations/abrasions 677 258 (38) 77 (11) 181 (27) 258 232 (90)Repetitive motion 677 442 (66) 288 (43) 154 (23) NA –Lifting 677 153 (23) 144 (21) 9 (1) NA –Awkward working positions 676 458 (77) 370 (55) 88 (13) NA –
a ‘‘Low’’ and ‘‘high’’ exposure observations are nested within ‘‘Any’’ exposure.b PPE/control use observed during observations where ‘‘any’’ exposure was noted.
Table 3Self-reported exposures to various health and safety hazards (n = 46 workers).
N (%) workers reporting
Any exposure(>never or almost never)
‘‘Low’’ exposure frequency(<1/2 workdays)a
‘‘High’’ exposure frequency(>1/2 workdays)a
PPE/control use >1/2of exposure timeb
Falls 31 (67) 31 (67) 15 (33) 19 (41)Noise 42 (91) 12 (26) 34 (74) 33 (72)Chemicals 20 (44) 38 (83) 8 (17) 17 (37)Dust/fume 42 (91) 17 (37) 29 (63) 16 (35)Traffic/vehicle 42 (91) 16 (35) 30 (65) 20 (44)Machine hazards 29 (63) 28 (61) 18 (39) 28 (61)Repetitive motion 38 (83) 17 (37) 29 (63) –Lifting 30 (65) 29 (63) 17 (37) –Awkward working positions 23 (50) 34 (74) 12 (26) –
a ‘‘Low’’ and ‘‘high’’ exposure observations are nested within ‘‘Any’’ exposure.b PPE/control use observed during observations where ‘‘any’’ exposure was noted.
Table 4IH measurements.
N measurements GM GSD % over PEL
Noise (dBA)a 59 81.9 8.4 19Total particulates (mg/m3) 63 0.38 3.6 2Carbon monoxide (ppm) 17 2.1 1.9 0Blood lead (lg/dl)b 16 3.7 3.1 0
a Arithmetic mean reported.b %>Washington state limit of 40 lg/dl.
436 R.L. Neitzel et al. / Safety Science 51 (2013) 432–440
in a hearing conservation program). There were 63 full shift airsamples collected for total particulate and metals concentrations.The geometric mean total particulate concentration was 0.38 mg/m3, and 2% were over the PEL of 10 mg/m3. All workers exposedabove the PEL reported wearing respiratory protection. The vastmajority of samples were well below the PELs, and even below lim-its of detection for the 13 metals analyzed. However, 5% of samplesexceeded the lead PEL-TWA of 0.05 mg/m3 (data not shown). Themajority of lead overexposures occurred in the burn area whereworkers were torch cutting, although one sample in the shear areaadjacent to the burn area was also over the PEL. Blood lead levelsconfirmed these low exposures. Reflective of the few months priorto the test, mean blood lead levels measured 3.7 lg/dl in August of2010. The three individuals with the highest measurements hadblood lead levels of 12, 7, and 7 lg/dl – well below the state limitof 40 lg/dl – and worked in very close proximity to the shredderequipment. These low levels of lead in blood are not surprising gi-
ven the high use of respiratory protection by workers in this area.Mean, STEL, and peak CO levels were negligible compared to the35 ppm PEL-TWA.
3.4. Comparison of results across assessment methods
Observed and self-reported exposures to specific hazards, andcommensurate use of PPE/controls, can be compared in Tables 2and 3. Workers were not asked to self-report the intensity of expo-sure, but rather the frequency of occurrence, so the ‘‘Any exposure’’column in Table 1 can be compared to the ‘‘Any exposure’’ columnin Table 2. Compared to the HOT observations, workers reportedsubstantially higher frequencies of exposure to falls, traffic/vehi-cles, dust/fumes, lifting, and machine hazards, and substantiallyhigher use of PPE and controls during exposures to noise and ma-chine hazards. Conversely, workers reported much lower frequen-cies of exposure to awkward postures, and much less frequent useof PPE and controls during exposures to falls, than was seen duringHOT observations. Worker self-report and HOT observation resultswere relatively similar for exposures to repetitive motions andnoise, and reported use of PPE and controls was similar to observeduse during dust/fume exposures and traffic/vehicles.
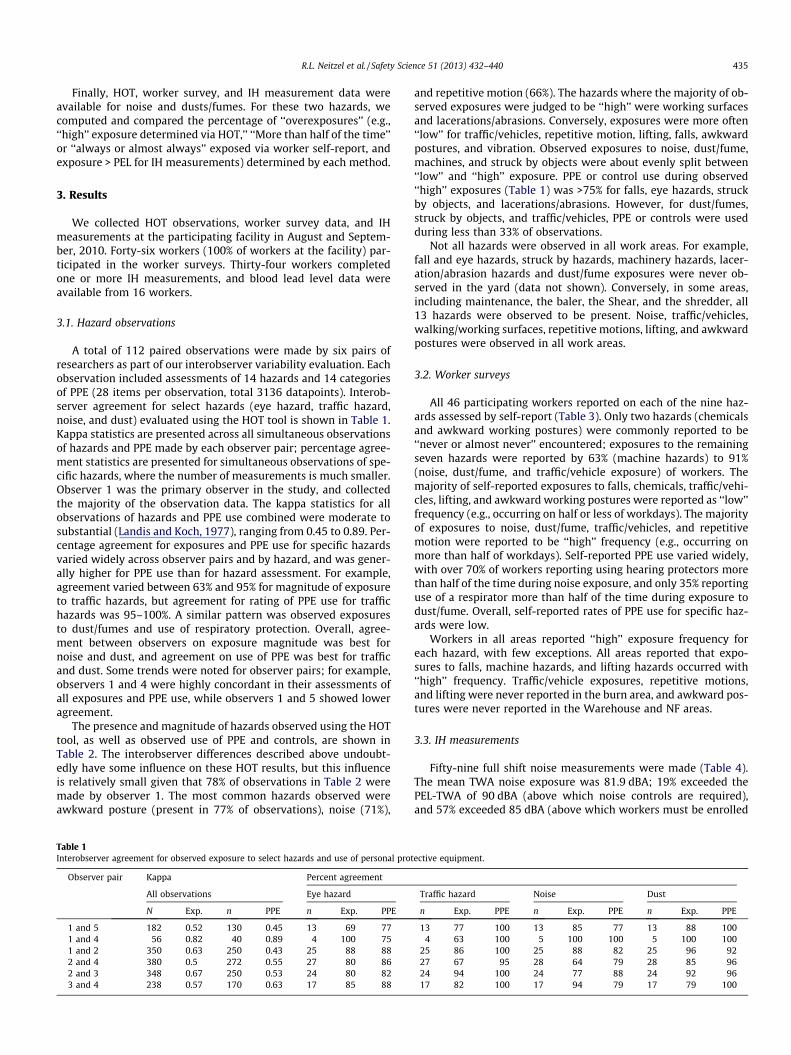
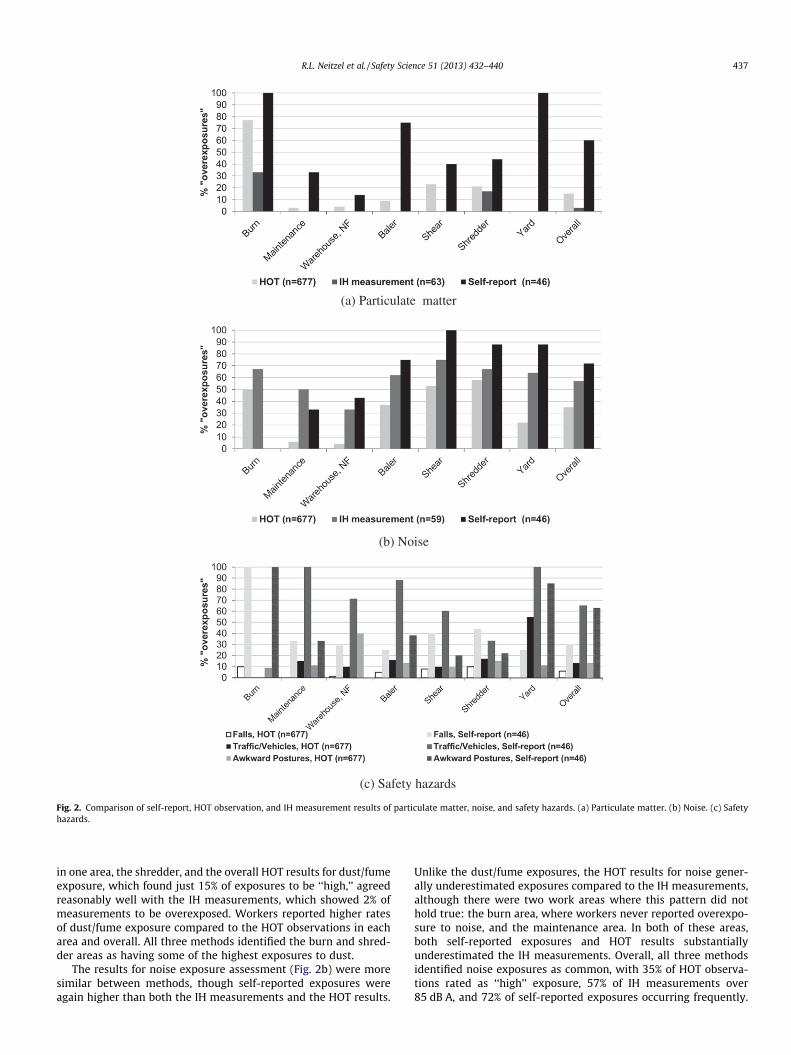
Fig. 2 presents our evaluation of the results of all three assess-ment methods in assessing dust/fume, noise, and selected safetyexposures. Treating the IH measurements as the ‘‘gold standard’’exposure measurement, workers and researcher observationsoverestimated dust/fume exposure (Fig. 2a). However, HOTobservations of dust/fume agreed very well with IH measurements
(b) Noise
(a) Particulate matter
(c) Safety hazards
Fig. 2. Comparison of self-report, HOT observation, and IH measurement results of particulate matter, noise, and safety hazards. (a) Particulate matter. (b) Noise. (c) Safetyhazards.
R.L. Neitzel et al. / Safety Science 51 (2013) 432–440 437
in one area, the shredder, and the overall HOT results for dust/fumeexposure, which found just 15% of exposures to be ‘‘high,’’ agreedreasonably well with the IH measurements, which showed 2% ofmeasurements to be overexposed. Workers reported higher ratesof dust/fume exposure compared to the HOT observations in eacharea and overall. All three methods identified the burn and shred-der areas as having some of the highest exposures to dust.
The results for noise exposure assessment (Fig. 2b) were moresimilar between methods, though self-reported exposures wereagain higher than both the IH measurements and the HOT results.
Unlike the dust/fume exposures, the HOT results for noise gener-ally underestimated exposures compared to the IH measurements,although there were two work areas where this pattern did nothold true: the burn area, where workers never reported overexpo-sure to noise, and the maintenance area. In both of these areas,both self-reported exposures and HOT results substantiallyunderestimated the IH measurements. Overall, all three methodsidentified noise exposures as common, with 35% of HOT observa-tions rated as ‘‘high’’ exposure, 57% of IH measurements over85 dB A, and 72% of self-reported exposures occurring frequently.
438 R.L. Neitzel et al. / Safety Science 51 (2013) 432–440
All three methods identified the Shear, shredder, and baler areas ashaving some of the highest exposures to noise.
Self-report and HOT results for exposures to falls, traffic/vehi-cles, and awkward postures showed substantial variability(Fig. 2c). For each of these hazards, workers reported ‘‘high’’ expo-sures more often than was observed. The differences in self-reported and observed exposures were relatively small for theshredder area, but for most areas – and particularly the burn,maintenance, baler, and yard areas – there was substantial dis-agreement between self-reported and observed exposures. Overall,workers reported ‘‘high’’ exposures to falls, traffic/vehicles, andawkward postures 3–4 times more often than was observed.Workers generally perceived these three exposures to be quitecommon, while researcher observations suggested that ‘‘high’’exposures occurred in less than 15% of observations. Both methodsidentified the yard area as having among the highest exposures tothese hazards, and the estimates of ‘‘high’’ exposures in the Shred-der area were similar for both methods.
4. Discussion
The results of this study indicate that workers at the participat-ing scrap-metal recycling facility are exposed to a wide range ofhazards. The assessment methods used – researcher observationsvia the HOT developed for this study, worker self-report, or IHmeasurements – identified substantial exposures to noise, traffic/vehicles, unsafe working surfaces, lacerations/abrasions, awkwardpostures, and repetitive motions. Use of personal protective equip-ment and exposure controls was generally low. Agreement be-tween different observers using the HOT was moderate tosubstantial when all observations of hazards and use of PPE wereconsidered. Among the two hazards which were assessed by allthree exposure assessment methods, agreement was reasonablygood for noise among all three methods, while workers reportedsubstantially higher exposures to dust compared to the results ofthe other two methods.
Our results are generally consistent with the few previousstudies of health and safety issues in recycling. Workers in a studyof working conditions in a consumer waste recycling facility inSweden (Engkvist, 2010) reported regular exposures to noise, ergo-nomic hazards, falls, lifting, and awkward postures, high use of PPEsuch as gloves and work boots, and lower use of hearing protection,respirators, and eye protection. Workers also reported regularoccurrence of accidents, injuries, and pain related to ergonomichazards. Another study of consumer waste recycling in Quebec(Lavoie and Guertin, 2001) found elevated exposures to airbornebacteria, noise, carbon monoxide (during winter months only)and ergonomic hazards. Other specific types of waste recyclinghave noted elevated exposures to lead in lead acid battery recy-cling (Were et al., 2012) and polybrominated diphenyl ethers inelectronic recycling (Schecter et al., 2009).
The semi-quantitative HOT instrument developed specificallyfor this study was able to successfully differentiate the magnitudeand frequency of hazards at the participating facility. The results ofthe HOT assessment of noise exposures agreed reasonably wellwith the IH measurements of noise; observers rated noise expo-sures as ‘‘high’’ for 35% of observations, while 57% of full-shift mea-surements exceeded 85 dBA, and 19% exceeded 90 dBA. HOTobservations of dust/fume also agreed reasonably well with mea-surements; only 15% of observations were judged to have ‘‘high’’dust/fume exposure, while 2% of air samples indicated exposureconcentrations over 10 mg/m3. Agreement was moderate tosubstantial across all pairs of observers when all hazards and alluse of PPE/controls was considered, but agreement for observedexposures and PPE/control use was lower for specific hazards.
Ratings of PPE use generally showed greater interobserver agree-ment than rating of exposure. This may have been due at least inpart to the binary nature of PPE assessment, compared to theordered categorical approach used for hazard assessment. Agree-ment between observers was lower for PPE for noise (e.g., hearingprotection) and eye hazards (e.g., safety glasses) than other typesof PPE. This is not unexpected, as it is more difficult to accuratelyobserve earplugs (the type of hearing protection most commonlyused on the site) and to differentiate between safety glasses andnormal eyeglasses than it is to observe, for example, the presenceor absence of a high-visibility traffic vest or respirator. The differ-ences in HOT results between observers highlight the need forrevision of the instrument and additional training for observers.
Only a handful of previous studies have used semi-quantitativeor yes/no observation instruments to rate safety and healthhazards in different industries and also evaluated interobserveragreement. In Finland, the TR observational method has been usedon construction sites (Laitinen et al., 1999). This method employsobservers who conduct site walkthroughs and tally the numberof ‘‘correct’’ and ‘‘not correct’’ situations for different safetyhazards. A ‘‘correct’’ observation indicates that appropriate safetysteps were taken for the situation. The TR method rates six condi-tions and hazards, including: use of PPE; scaffolding and ladders;machines and equipment; falls; lighting and electricity; andhousekeeping. To validate the TR method, the error across theobserver-specific safety indices was computed for each site evalu-ated. Over 43,000 measurements were taken by nine observers at305 construction sites as part of this validation effort. The safetyindices were found to have an error of 6–21% across observers,which the authors judged to be ‘‘good enough.’’ Validity was alsoassessed by comparing the site observation results to site safetyperformance measured via reported accidents at each site; higherTR safety indices were found to be strongly inversely correlatedwith accident rates. The error index used in the TR study is some-what analogous to the percent agreement between observers usedhere. However, the two measures cannot be compared directly, asthe measures in the current study were more rigorously controlled,e.g., paired observers rated the same exposure simultaneously,while multiple observers in the TR study rated exposures on eachsite independently.
Another observation-based study was conducted in the US con-struction industry by Seixas et al. (1998). In this study, observersused a checklist to note the presence or absence of hazards andthe degree of protection from the hazard in 323 different observa-tions. Hazards assessed on the 10-item checklist included trips,falls, electrocutions, and trenching cave-ins, vehicle-related inju-ries, and lacerations. Scores for individual hazards, as well as sum-mary scores by site, were computed for each observer. Theindividual and summary scores were able to differentiate risksacross sites and time. Three observers used the instrument to ratethe same work locations on two different sampling days at threesites. While the observers observed the same locations at the sites,observations by different observers did not take place simulta-neously. As with the TR study, the method of evaluation of interob-server agreement was similar but not identical to that used in thecurrent study. Agreement was assessed by comparing observer-specific summary and hazard specific scores for each site via v2
test. Significant differences were found between observers for themajority of hazards observed.
Neitzel and colleagues used a safety observation tool to assessrisk of falls in the aircraft maintenance industry (Neitzel et al.,2008). In this study, a nine-item checklist was developed to evalu-ate different aspects of fall risk and fall protection. The checklistwas used by two observers to rate fall hazards in two aircraft main-tenance facilities, with a total of 1394 observations. As with theprevious studies of construction sites, the observers in this study
R.L. Neitzel et al. / Safety Science 51 (2013) 432–440 439
observed the same work locations, but observations at these loca-tions were made independently. Observed fall hazards were alsocompared to fall hazards which were self-reported by workers inthe facility. Interobserver agreement was compared for frequencyof overall observed noncompliance for fall protection via v2 test.The overall noncompliance ratings of the two observers werefound to be quite similar overall, but the ratings were significantlydifferent for one of the two sites and for all but one type of fall pro-tection. Overall, the results of the studies by Seixas et al. (1998),Laitinen et al. (1999), and Neitzel et al. (2008) demonstrate theutility of observation tools designed to assess workplace safetyand health hazards, but also highlight the importance of consistentand rigorous evaluation of interobserver variability, which can besubstantial for some instruments.
Self-reported exposures in this study indicated that participat-ing workers perceived themselves to be frequently exposed to allof the hazards assessed. Workers also generally reported low useof protective equipment. Use of PPE and controls during more thanhalf of exposure time was reported by 35–72% of workers, depend-ing on the hazard. The generally low reported use of PPE and con-trols suggests little social desirability bias in workers’ responses.Workers’ perceived exposures were in some cases substantiatedby the HOT observations, which documented widespread exposureto most of the hazards assessed. However, compared to the HOT re-sults, workers perceived substantially greater exposures to a num-ber of hazards – particularly to falls, dust/fume, traffic/vehicles,and machine hazards – while simultaneously underreporting theirexposure to awkward postures. They also substantially overreport-ed their use of PPE and controls for noise, and underreported theiruse of fall protection, compared to observed use. When comparedto the IH measurements, self-reported exposures demonstratedeven great discordance. Sixty-three percent of workers reportedfrequent exposure to dust/fume, while only 2% of IH measurementsindicated overexposures, and 91% reported frequent exposure tonoise, while only 57% of IH measurements were over 85 dBA. Con-versely, all three assessment methods identified the burn andshredder areas as those with the highest dust exposures, the Shear,shredder, and baler areas as having the highest dust exposures, andthe yard area as having the greatest exposures to falls, traffic/vehi-cles, and awkward postures.
Taken together, these findings suggest that use of self-reportedexposures in studies of occupational hazards may result in higherestimates of the prevalence of some hazards, although this maybe due at least in part to the longer exposure integration periodcovered by worker self-report and to uncertainty and potential biasin snapshot hazard observations. The concordance in assessmentsof some hazards in specific work areas by the various methods pro-vides evidence of the potential utility of amixed-method approach.The agreement between self-reported and observed exposurescould perhaps be improved by providing workers with detailedexposure definitions. Also, the self-reported exposures here mayhave been influenced by the generally low education level of theworkforce, as well as possible language and cultural barriers.
This study demonstrates the potential utility and limitations ofthe three assessment methods evaluated. The IH measurementsprovided accurate, quantitative measures of exposure which couldbe directly compared to relevant occupational health regulations –but only for the two types of exposure (airborne contaminants andnoise) amenable to quantitative evaluation, and at a substantialsampling cost. Self-reported exposure data collected from workersprovided a much more comprehensive view of hazardous expo-sures at the participating facility, and may be the only feasibleway to collect certain types of data, particularly injury experienceand long-term exposures (e.g., many year) exposures. However, inthis study self-reported data were found to overestimate exposurefrequency for a number of hazards, and to both over- and underre-
port use of PPE and controls, depending on the hazard. Also, whileself-reported surveys are often considered an inexpensive datacollection method, the exposure component of interviews withworkers at this facility took approximately 15 min per worker,caused some disruption to production, and, at this particular work-site, required the assistance of a dual-lingual interviewer, all ofwhich resulted in nontrivial data collection costs. The HOT instru-ment enabled us to assess a broad range of occupational hazards,including some that would be difficult to obtain via self-report(e.g., hazardous energy and working surfaces), and showed reason-ably good agreement overall with IH measurements of noise anddust. Observations were relatively inexpensive, with the primaryexpense being labor costs for the observer. However, interobservervariability must be considered when evaluating the results of suchobservations. A combination of observations and worker self-report can provide a comprehensive picture of health and safetyhazards at a worksite; these data may be supplemented withindustrial hygiene measurements to gain accurate quantitativeestimates of exposures to chemicals and physical hazards and tovalidate observational and self-report data.
Both HOT and self-reported exposures estimated higherexposures to dust/fumes than did the IH measurements of theseexposures. A number of workers alluded to the steam from theshredder as ‘‘dust,’’ and it is possible that clouds of steam fromthe shredder may also have been classified as dust during HOTobservations. The inherent difficulty in visually assessing exposureto dust, which has been demonstrated previously (Nieuwenhuijsenet al., 1997) is evident in the differences between HOT and self-re-ported dust exposure when compared to the IH measurements.Conversely, HOT and self-reported assessments of noise, which isa more easily detectable exposure for which worker self-reporthas previously been shown to correlate well with measuredexposures (Neitzel et al., 2009, 2011; Ising et al., 1997), showedreasonably good agreement with measured full-shift noise levels.
5. Conclusions
The results of this study indicate that workers in the scrap metalrecycling industry have substantial exposures to a wide range ofoccupational hazards, and that additional efforts are needed to re-duce these exposures, particularly in light of the high frequency ofinjuries that we have documented in this industry – about 30% ofworkers reported an injury in the past year (Seixas et al., 2012).Our results, along with those of previous studies (Laitinen et al.,1999; Neitzel et al., 2008; Seixas et al., 1998), demonstrate theutility of observer-based safety and health assessment tools ondynamic, high-hazard worksites. Our use of a systematic walk-through route and a large number of observations made fromconsistent observation stations allowed us to obtain a true sampleof the complex and dynamic working conditions common to scrapmetal recycling; such an approach is critical to obtaining a represen-tative sample of worksite safety and health hazards. Data collectedusing these tools can include substantial interobserver variability,which must be taken into account when designing assessmentcampaigns, but these tools nevertheless represent one way inwhich hazard assessments can be standardized among differentworksites and industries. While this study compared the results ofthree assessment methods – HOT observations, worker self-reports,and IH measurements – to one another, a true validation of the threemethods would involve a comparison of the exposure assessmentsfrom each to accident or injury rates, as was done in the Finnish TRstudy (Laitinen et al., 1999). Assuming that accurate accident orinjury rate data are available, the exposure assessment methodwhich shows the best agreement with these rates is the onewhich should be most predictive of future adverse events.
440 R.L. Neitzel et al. / Safety Science 51 (2013) 432–440
Acknowledgements
This study was funded by the Washington State Department ofLabor and Industries Safety and Health Investment Projects pro-gram, Grant Number 2009ZH00115. The authors are indebted tothe participating facility and workers, without whom this researchwould not have been possible. Additionally, the authors wish toacknowledge Marty Cohen and Marc Beaudreau for their assistancein data management and collection, respectively.
References
Alvero, Alicia M., Rost, Kristen, Austin, John, 2008. The safety observer effect: theeffects of conducting safety observations. J. Saf. Res. 39 (4), 365–373. http://dx.doi.org/10.1016/j.jsr.2008.05.004, <http://www.ncbi.nlm.nih.gov/pubmed/18786423>.
BLS, 2011. Fatal Occupational Injuries, Total Hours Worked, and Rates of FatalOccupational Injuries by Selected Worker Characteristics, Occupations, andIndustries, Civilian Workers, 2010. Washington, DC. <http://www.bls.gov/iif/oshwc/cfoi/cfoi_rates_2010hb.pdf>.
BLS, 2012. Employed Persons by Detailed Industry, Sex, Race, and Hispanic or LatinoEthnicity. Washington, DC. <http://www.bls.gov/cps/cpsaat18.htm>.
Cherrie, J.W., Schneider, T., 1999. Validation of a new method for structuredsubjective assessment of past concentrations. Ann. Occup. Hyg. 43 (4), 235–245.
Crollard, Allison, Neitzel, Richard L., Dominguez, Carlos, Seixas, Noah S., 2012.Training for an Effective Health and Safety Committee in a Small BusinessSetting.
EPA, 2007. Inductively-Coupled Plasma-Mass Spectroscopy. Washington, DC.<http://www.epa.gov/epawaste/hazard/testmethods/sw846/pdfs/6020a.pdf>.
Engkvist, Inga-Lill, 2010. Working conditions at recycling centres in Sweden –physical and psychosocial work environment. Appl. Ergonom. 41 (3), 347–354.http://dx.doi.org/10.1016/j.apergo.2009.06.008, <http://www.ncbi.nlm.nih.gov/pubmed/19643394>.
Fritschi, L., Nadon, L., Benke, G., Lakhani, R., Latreille, B., Parent, M.E., Siemiatycki, J.,2003. Validation of expert assessment of occupational exposures. Am. J. Ind.Med. 43 (5), 519–522. http://dx.doi.org/10.1002/ajim.10208, <http://www.ncbi.nlm.nih.gov/entrez/query.fcgi?cmd=Retrieve&db=PubMed&dopt=Citation&list_uids=12704624>.
Ising, H., Babisch, W., Kruppa, B., Lindthammer, A., Wiens, D., 1997. Subjective worknoise: a major risk factor in myocardial infarction. Soz. Praventivmed. 42 (4),216–222, <http://www.ncbi.nlm.nih.gov/entrez/query.fcgi?cmd=Retrieve&db=PubMed&dopt=Citation&list_uids=9297760>.
Karasek, R., Brisson, C., Kawakami, N., Houtman, I., Bongers, P., Amick, B., 1998. Thejob content questionnaire (JCQ): an instrument for internationally comparativeassessments of psychosocial job characteristics. J. Occup. Health Psychol. 3 (4),322–355, <http://www.ncbi.nlm.nih.gov/pubmed/9805280>.
Kimberlin, Carole L., Winterstein, Almut G., 2008. Validity and reliability ofmeasurement instruments used in research. Am. J. Health-Syst. Pharm. –AJHP: Offic. J. Am. Soc. Health-Syst. Pharm. 65 (23), 2276–2284. http://dx.doi.org/10.2146/ajhp070364, <http://www.ncbi.nlm.nih.gov/pubmed/19020196>.
L&I, W.A., 2006. Scrap Metal Industry in Washington. Retro Market Share Analysison Derived Hours. Tumwater, WA. <http://www.lni.wa.gov/ClaimsIns/Files/Retro/FinInfo/marketshare/2006RetroMarketShareAnalysis.pdf>.
L&I, W.A., 2010. Labor and Industries, Fatality Data Summaries, 2009. Tumwater,WA. <http://www.lni.wa.gov/Safety/Research/Face/Files/ListJuly2009.pdf>.
Laitinen, H., Marjamäki, M., Päivärinta, K., 1999. The validity of the TR safetyobservation method on building construction. Accid. Anal. Prevent. 31 (5), 463–472, <http://www.ncbi.nlm.nih.gov/pubmed/10440543>.
Landis, J.R., Koch, G.G., 1977. The measurement of observer agreement forcategorical data. Biometrics 33 (1), 159–174, <http://www.ncbi.nlm.nih.gov/entrez/query.fcgi?cmd=Retrieve&db=PubMed&dopt=Citation&list_uids=843571>.
Lavoie, J., Guertin, S., 2001. Evaluation of health and safety risks in municipal solidwaste recycling plants. J. Air Waste Manage. Assoc. 51 (3), 352–360, <http://www.ncbi.nlm.nih.gov/pubmed/11266099>.
Neitzel, R., Daniell, W., Sheppard, L., Davies, H., Seixas, N., 2009. Comparison ofperceived and quantitative measures of occupational noise exposure. Ann.Occup. Hyg. 53 (1), 41–54, http://dx.doi.org/men071[pii]10.1093/annhyg/men071 <http://www.ncbi.nlm.nih.gov/entrez/query.fcgi?cmd=Retrieve&db=PubMed&dopt=Citation&list_uids=18984805>.
Neitzel, R., Daniell, W., Sheppard, L., Davies, H., Seixas, N., 2011. Evaluation andcomparison of three exposure assessment techniques. J. Occup. Environ. Hyg. 8(5), 310–323.
Neitzel, Richard L., Seixas, Noah S., Harris, Michael J., Camp, Janice, 2008. Exposureto fall hazards and safety climate in the aircraft maintenance industry. J. Saf.Res. 39 (4), 391–402. http://dx.doi.org/10.1016/j.jsr.2008.02.033, <http://www.ncbi.nlm.nih.gov/pubmed/18786426>.
Nieuwenhuijsen, M.J., Noderer, K.S., Schenker, M.B., 1997. The relation betweensubjective dust exposure estimates and quantitative dust exposuremeasurements in California agriculture. Am. J. Ind. Med. 32 (4), 355–363,<http://www.ncbi.nlm.nih.gov/entrez/query.fcgi?cmd=Retrieve&db=PubMed&dopt=Citation&list_uids=9258389>.
Nieuwenhuijsen, M., Paustenbach, D., Duarte-Davidson, R., 2006. Newdevelopments in exposure assessment: the impact on the practice of healthrisk assessment and epidemiological studies. Environ. Int. 32 (8), 996–1009,http://dx.doi.org/S0160-4120(06)00086-9[pii]10.1016/j.envint.2006.06.015<http://www.ncbi.nlm.nih.gov/entrez/query.fcgi?cmd=Retrieve&db=PubMed&dopt=Citation&list_uids=16875734>.
OSHA, 2008. Guidance for the Identification and Control of Safety and HealthHazards in Metal Scrap Recycling. OHSA 3348-05. Washington, DC.
Rolp, A., Pulkkinen, L., 2007. Man Dies in South Seattle Industrial Accident. SeattlePost-Intelligencer.
Schecter, Arnold, Colacino, Justin A., Robert Harris, T., Shah, Nirav, Brummitt, SharonI., 2009. A newly recognized occupational hazard for US electronic recyclingfacility workers: polybrominated diphenyl ethers. J. Occup. Environ. Med./Am.College Occup. Environ. Med. 51 (4), 435–440. http://dx.doi.org/10.1097/JOM.0b013e31819b8c09, <http://www.ncbi.nlm.nih.gov/pubmed/19322109>.
Seixas, N., Sanders, J., Sheppard, L., Yost, M., 1998. Exposure assessment for acuteinjuries on construction sites: conceptual development and pilot test. Appl.Occup. Environ. Hyg. 13 (5), 304–312.
Seixas, Noah S., Crollard, Allison, Neitzel, Rick, Stover, Bert, Dominguez, Carlos,2012. Intervening at the bottom: can a health and safety committeeintervention influence management commitment? Pol. Pract. Health Saf. 22, 10.
Were, Faridah H., Kamau, Geoffrey N., Shiundu, Paul M., Wafula, Godfrey A., Moturi,Charles M., 2012. Air and blood lead levels in lead acid battery recycling andmanufacturing plants in Kenya. J. Occup. Environ. Hyg. 9 (5), 340–344. http://dx.doi.org/10.1080/15459624.2012.673458, <http://www.ncbi.nlm.nih.gov/pubmed/22512792>.
Zohar, D., 2000. A group-level model of safety climate: testing the effect ofgroup climate on microaccidents in manufacturing jobs. J. Appl. Psychol. 85 (4),587–596, <http://www.ncbi.nlm.nih.gov/entrez/query.fcgi?cmd=Retrieve&db=PubMed&dopt=Citation&list_uids=10948803>.