a midsummer - centre for science and environment
TRANSCRIPT
A MIDSUMMER NIGHTMARE
Decoding the link between comfort, space cooling and energy consumption
in a climate-stressed world
Ever wondered why we keep ACs at 24°C or lower during summers and monsoons when we do not switch on ACs till the temperature rises above mid-30°C at the beginning of the hot season? Do you know how much (and what percentage of) electricity is consumed by ACs? Can you guess how much electricity will be needed to provide the level of cooling enjoyed by a rich American—Indian—to all? Any idea if modern buildings (and city layouts) make it easier to deal with a climate-stressed world? Are you aware that the government differentiates between thermal comfort in air conditioned and naturally ventilated buildings, measuring the former in terms of 'psychology' and the latter in terms of ‘physiology’, perpetuating the mind–body division between classes? Do you know that the peak electricity consumption is big cities (like Delhi) is shifting from mid-afternoon (the hottest period when most people are in offices) to midnight? Can you fathom the ramifications of the answers to these questions?
In this exhaustive report, the first of its kind in the world, Centre for Science and Environment presents before you the Shakespearean tragicomedy of thermal comfort and our response(s) to it.
Centre for Science and Environment41, Tughlakabad Institutional Area, New Delhi 110 062; Phones: 91-11-40616000 Fax: 91-11-29955879; E-mail: [email protected] Website: www.cseindia.org
A M
IDSU
MM
ER
NIG
HTM
AR
E
A Midsummer Nightmare Report Cover 8mm spine.indd 1 11/06/19 3:29 PM
A MIDSUMMER NIGHTMARE
Decoding the link between comfort, space cooling and energy consumption
in a climate-stressed world
thermal comfort report_final.indd 3 06/06/19 2:49 PM
4
Research direction: Anumita Roychowdhury
Author: Avikal Somvanshi
Editor: Arif Ayaz Parrey
Layout: Vijayendra Pratap Singh
Cover and illustrations: Tarique Aziz Laskar
Design: Ajit Bajaj and Sanjit Kumar
Production: Rakesh Shrivastava and Gundhar Das
© 2019 Centre for Science and Environment
ISBN: 978-81-86906-25-5
Material from this publication can be used, but with acknowledgement. Maps are not to scale.
Citation: Avikal Somvanshi 2019, A Midsummer Nightmare: Decoding the link between comfort, space cooling and energy consumption in a climate-stressed world, Centre for Science and Environment, New Delhi
Published byCentre for Science and Environment41, Tughlakabad Institutional AreaNew Delhi 110 062Phones: 91-11-29955124, 29955125, 29953394Fax: 91-11-29955879E-mail: [email protected] Website: www.cseindia.org
Printed at Multi Colour Services, New Delhi
CSE is grateful to Shakti Sustainable Energy Foundation for their support. Shakti Sustainable Energy Foundation works to strengthen the energy security of the country by aiding the design and implementation of policies that encourage energy efficiency, renewable energy and sustainable transport solutions, with an emphasis on sub-sectors with the most energy saving potential. Working together with policy makers, civil society, academia, industry and other partners, the Foundation takes concerted action to help chart out a sustainable energy future for India (www.shaktifoundation.in).Disclaimer: The views and analysis expressed in this report do not necessarily reflect the views of Shakti Sustainable Energy Foundation. The Foundation also does not guarantee the accuracy of any data included in this publication nor does it accept any responsibility for the consequences of its use.
thermal comfort report_final.indd 4 06/06/19 2:49 PM
5
C O N T E N T SEXECUTIVE SUMMARYMuch ado about cooling 07
CHAPTER 1To be or not to be in the comfort zone 27
CHAPTER 2Measure for measure 33
CHAPTER 3Joules to cool 39
CHAPTER 4Comedy of thermal errors 53
CHAPTER 5Taming the technology 67
THE WAY FORWARDDecisions, decisions 83
CASE STUDYHow electricity consumption follows 87 the heat curve
REFERENCES 98
thermal comfort report_final.indd 5 06/06/19 2:49 PM

thermal comfort report_final.indd 6 06/06/19 2:49 PM
7
The Ministry of Environment, Forest and Climate Change (MoEF&CC) launched the India Cooling Action Plan (ICAP)—a 20-year roadmap to address cooling requirements in building, cold chain, transport and
refrigeration sectors—in March 2019. While the plan mostly reinforces energy efficiency and climate targets already set by different sectors and ministries, it is unique in its pioneering attempt to develop adaptive thermal comfort standards for buildings to reduce energy guzzling. However, this revolutionary idea has gone almost unnoticed.
So far energy efficiency policies for the building sector have focused largely making cooling and heating technologies more efficient energy-wise. But an adaptive thermal comfort standard can go much beyond this, opening up new opportunities that, while improving energy efficiency, improve thermal comfort as well.
Much ado about cooling
EXECUTIVE SUMMARY
thermal comfort report_final.indd 7 06/06/19 2:49 PM
8
ICAP has categorically acknowledged that: There is an immense potential to rationalize the rise in requirement of active refrigerant-
based cooling in the country by adoption of passive cooling design strategies across sectors.
Wider proliferation of thermally efficient built spaces that have reduced heat load is required.
This reduced cooling demand because of the use of insulation, shading and enhanced natural
ventilation then needs to be met using energy-efficient and climate-friendly technologies.1
To this end, ICAP has recommended ‘promotion of wider penetration of climate responsive built spaces to bring indoor temperatures within an acceptable thermal comfort band through passive cooling, thus reducing the overall cooling load.’
This idea must immediately get scripted as a regulation so that it does not go off policy and public attention radars. The implication here is a broadening of regulatory ambit, from only quicker uptake of energy-efficient cooling technologies to adoption of passive architectural and bio-climatic options for reducing heat load on buildings and cutting down unnecessary energy-intensive cooling for delivery of comfort for all. Building operations and changes in adaptive behaviour to reduce demand for active cooling are now on the table. Innovative building design can improve indoor comfort and reduce the operational hours of (or, indeed, the need for) mechanical cooling in buildings. This can be a game changer for the way buildings are designed.
Central to this idea is the singular compelling requirement of delivering on the desired or adaptive level of human comfort. But the idea of comfort that will drive cooling demand remains a red herring without much clarity as to how it is expected to be defined for regulatory purposes and innovative practices. What are the optimum thermal comfort conditions that building design and operations
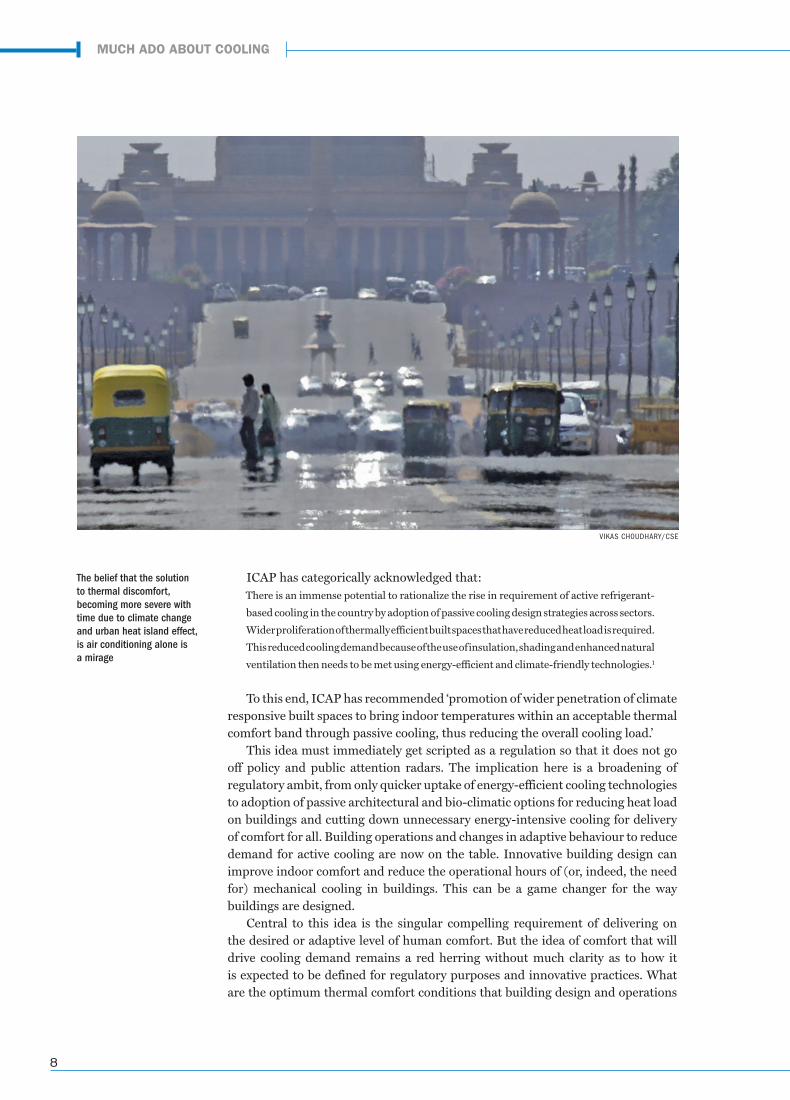
The belief that the solution to thermal discomfort, becoming more severe with time due to climate change and urban heat island effect, is air conditioning alone is a mirage
VIKAS CH0UDHARY/CSE
MUCH ADO ABOUT COOLING
thermal comfort report_final.indd 8 06/06/19 2:49 PM
9
need to achieve in a given climatic condition while reducing the need or severity of mechanical cooling to avert guzzling of electricity? Even though ICAP has proposed adaptive comfort standards, it has not defined the approaches to it. Formulating design standards and guidelines to ensure certain temperature conditions are not breached for most of the year will spur innovation in design and material. This is the key focus of this new debate today.
There are also concerns that current approaches are promoting more active air conditioned cooling by default that stymie promotion of passively cooled buildings. India has the advantage of diverse building approaches and needs to build on its current baseline. On the one hand, there are naturally ventilated buildings that, according to the National Building Code (NBC), do not have any mechanical cooling devices installed and depend entirely on bio-climatic conditions, material and design to improve their level of comfort. On the other hand, there is an increasing trend towards mechanically cooled buildings that can reduce indoor temperature by much more than what is considered optimum. Increasingly, there is growing interest in mixed-mode buildings that combine active and passive cooling and have a greater flexibility in delivering on a range of comfort parameters. New regulatory approaches need to leverage this opportunity.
How do we demystify the concept of comfort and its application as regulatory criteria in designing energy-efficient buildings of varying types in different climatic conditions? How do we use such a definition in regulating air conditioning systems to improve both energy efficiency and sufficiency? How do we understand indoor temperature standards in relation to optimum comfort versus an environmental balance that will work for India? The time has come to seek answers to these questions.
Why comfort and efficiency together?
Increasing heat stress on buildingsThe focus on adaptive thermal comfort will have to be contextualized by the heat map of India, as that will influence the overall cooling demand. Averaged over the country, heat index is increasing at the rate of + 0.56°C per decade and + 0.32°C per decade during summer (March–May) and monsoon (June–September) respectively2 (see Chapter 1: Measure for measure). Spatial distribution of rising heat index indicates greater chances of heat-related illness in India, more prominently in south-eastern coastal regions (Andhra Pradesh, Odisha and Tamil Nadu) during summers and over north-western India (Indo-Gangetic plains and Rajasthan) during the monsoons.
Heat waves in the country have increased manifold in the past two years, according to data put out by the Ministry of Statistics and Programme Implementation. In 2017, there were 14 times the number of heat waves experienced in India in 2016. The numbers for 2018 dropped marginally but are expected to see a drastic spike in 2019 due to the impact of El Niño. An unusual heat wave
How do we demystify the concept of comfort and its application as regulatory criteria in designing energy-efficient buildings in different climatic conditions?
A MIDSUMMER NIGHTMARE
thermal comfort report_final.indd 9 06/06/19 2:49 PM
10
affected Kerala in March 2019, taking weather forecasters by surprise. It killed at least four people and almost 300 people suffered from sun burns.3 Heat waves in India have also intensified because of increase in air pollution and humidity during these periods, especially in urban areas, that worsen the effects of extreme heat on human health.4 The Indian Meteorological Department (IMD) has attributed 40 per cent of all extreme weather-related deaths in 2016 to heat waves—the largest proportion of deaths due to any type of extreme weather event.
Average heat index (see Chapter 2: Measure for Measure) of Delhi, for instance, has consistently been in the danger band during both monsoons and summers since 2016. The most severe heat wave ever recorded in India was in 2016 and it is reflected in the Delhi data as well, with the heat index of the city shooting above 54°C mark (extreme danger) on 51 days during that summer—2017 and 2018 were only marginally better with heat index crossing into the extremely dangerous zone on 32 and 36 days respectively. (Heat index is said to be in the danger band when in the range 41–54°C. During such times, it causes cramps and exhaustion, and there is a possibility of heat strokes with continued physical activity.) Overall, it has been noted that Delhi is not only getting hotter in general but the intensity of the heat conditions is also becoming more severe.
A study by National Institute of Urban Affairs (NIUA) found that the contribution of urban heat island effect will intensify the impact of climate change-induced extreme heat and heat stress in Delhi.5 The study estimates that, currently, urban areas experience, on an average, 2.3 more heat wave days than rural areas every summer. This difference increases to 7.1 in short-term and 13.8 in long-term projections. Similar to this trend, frequency of heat waves for urban areas is also expected to increase from 0.8 each summer to 2.1 and 5.1 in short- and long-term projections.
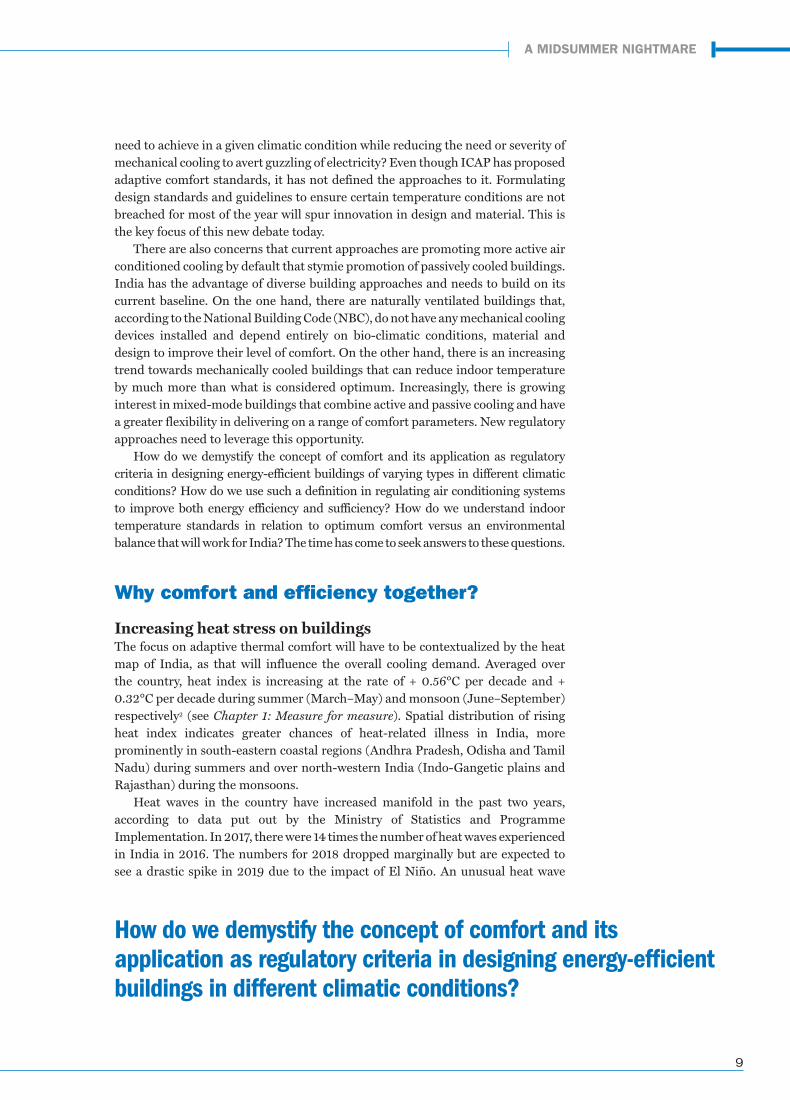
A Harvard University study found that indoor conditions in non-AC buildings during heat waves results in deficits in cognitive functions of young adults
GETTYIMAGES
MUCH ADO ABOUT COOLING
thermal comfort report_final.indd 10 06/06/19 2:49 PM
11
The health impact of these trends cannot be overemphasized. A study of excess mortalities in Asian cities due to the urban heat island effect suggests that mortality increases by 5.8 per cent per 1°C over a temperature threshold of 29°C in Delhi.6
This rate is only 1.8 per cent for Hong Kong owing to better infrastructure to shield its citizens from thermal stress and higher per capita income.
These facts have enormous implications for cooling of buildings. A Harvard University study found that thermally stressed indoor conditions in non-AC buildings during heat waves results in deficits in cognitive functions of young adults.7 It established that the health impacts of indoor thermal conditions during heat waves extend beyond vulnerable populations. It further noted that non-AC buildings designed to retain heat in cold climate exacerbate thermal exposures during heat waves by maintaining elevated indoor temperatures even after ambient temperatures have dropped. This phenomenon of retaining heat can also be observed in poorly designed building in tropical climates found across India. The findings of the study highlight the importance of incorporating sustainable adaptation measures in buildings to preserve educational attainment, economic productivity, and safety in the light of a changing climate.8
Thus, environmental imperatives of climate change imply that if immediate interventions are not made to design buildings for overall comfort, there can be humongous energy and cost penalty from energy guzzling cooling alone.
Environmental heat stress on buildings and, in turn, cities will increase active cooling and energy consumptionThe Lawrence Berkeley National Laboratory (LBNL), in a paper titled The 100 power plant question, has estimated that there is a 40 per cent difference in the afternoon peak demand and 60 per cent difference in the evening peak demand in cities like Delhi because of electricity demand of air conditioners (ACs).
Historically, Delhi is known to have cooler night temperatures with a cool breeze aiding denizens to sleep comfortably even during peak summers. But the nights are getting increasingly warmer; the CSE survey found that the average daily minimum temperature in the month of May in 2018 did not drop below 29°C. This is 3°C warmer than average daily low recorded for the month of May in Delhi during 1971–90. In fact, the ambient temperature in 2018 was consistently above 30°C beyond mid-night in the city. These uncomfortable sleeping conditions have been driving night-time electricity demand. An analysis of the hourly peak electricity demand in the city corroborates the observation that thermal comfort during the night is an issue as people are switching on ACs at home, spiking peak loads around midnight.
Global studies mirror this trend. A comparative analysis of the percentage increase in electricity demand per degree of temperature rise for select countries shows that the hourly, daily or monthly electricity penalty varies between 0.5 per cent and 8.5 per cent with an average value close to 4.6 per cent. The US Energy Information Administration reported that in the average US household, air
IMD has attributed 40 per cent of all extreme weather-related deaths in 2016 to heat waves. This is the largest proportion of deaths due to any extreme weather event
A MIDSUMMER NIGHTMARE
thermal comfort report_final.indd 11 06/06/19 2:49 PM
12
conditioning accounted for 12 per cent of total household energy costs (and 17 per cent of electricity expenditures) at the national level. Some regions use much more air conditioning. In hot and humid regions, air conditioning made up 27 per cent of home energy expenditures, while in the marine region, it made up just 2 per cent of home energy expenditures.
Heat stress and lifestyle changes drive demand for active coolingCSE has estimated that in Delhi 25–30 per cent of annual energy consumption is because of thermal stress. During peak summer, when energy demand soars, it is as much as 50 per cent of the energy consumption. Cooling energy consumption in buildings is likely to double in the next decade and become nearly four times in the next two decades compared to 2017–18 baseline. ICAP has estimated that 60 per cent current space cooling energy consumption is by 10 per cent population. This has already skewed electricity demand. CSE estimates show that if today every household in India runs an AC unit for seven months a year, the total electricity required would be 120 per cent higher than the total electricity produced in the country during 2017–18.
Globally, there are now about 1.6 billion ACs in use, with over half in just two countries—China and the United States.9 They vary enormously in energy efficiency, and keeping them running consumes over 2,000 terawatt hours (TWh) of electricity every year, which is two and a half times the total electricity consumed by all of Africa. Averaged across all countries, space cooling accounted for around 14 per cent of peak demand in 2016. In some regions, such as Middle East and parts of US, space cooling can represent more than 70 per cent of peak residential electrical demand on extremely hot days.10 Countries and cities have been trying to attune their electricity grids and infrastructure to meet the peak demand. This is a wasteful use of resources. Building, maintaining and operating electricity capacity to meet peak demand due to air conditioning is very expensive because it is used only for limited periods, and this drives up its overall costs.
More heat stress from active coolingThere is yet another rebound effect of AC usage. While air conditioning may help reduce mortality due to heat waves, heat reject from ACs increase street temperatures, thereby worsening heat stress on people in the street (a significant portion of informal workforce in India uses streets and sidewalks as their workspace). It also undermines thermal comfort delivery in buildings that don’t have access to ACs.
A study in Tokyo found that waste heat from ACs caused a temperature rise of 1–2°C or more on weekdays in the Tokyo office areas.11 The magnitude of urban heat island effect during weekends and holidays was found to be lesser due to reduced AC use. Another study done in Phoenix, US, found that waste heat released from AC systems increased the mean temperature (measured at a height of two metres from the ground) by more than 1°C at night, inducing increased demand for cooling during night.12
Air conditioning may help reduce mortality due to heat waves, but its reject heat increases street temperatures, worsening
heat stress on people working outdoors
MUCH ADO ABOUT COOLING
thermal comfort report_final.indd 12 06/06/19 2:49 PM
13
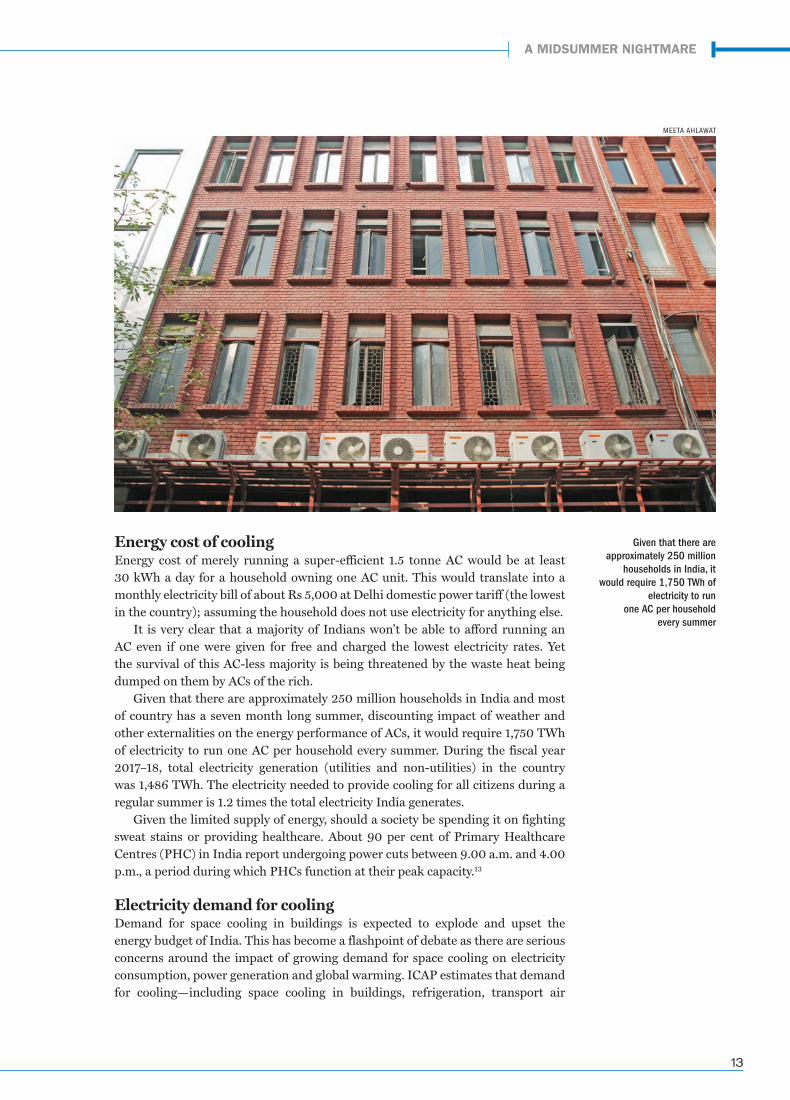
Energy cost of coolingEnergy cost of merely running a super-efficient 1.5 tonne AC would be at least 30 kWh a day for a household owning one AC unit. This would translate into a monthly electricity bill of about Rs 5,000 at Delhi domestic power tariff (the lowest in the country); assuming the household does not use electricity for anything else.
It is very clear that a majority of Indians won’t be able to afford running an AC even if one were given for free and charged the lowest electricity rates. Yet the survival of this AC-less majority is being threatened by the waste heat being dumped on them by ACs of the rich.
Given that there are approximately 250 million households in India and most of country has a seven month long summer, discounting impact of weather and other externalities on the energy performance of ACs, it would require 1,750 TWh of electricity to run one AC per household every summer. During the fiscal year 2017–18, total electricity generation (utilities and non-utilities) in the country was 1,486 TWh. The electricity needed to provide cooling for all citizens during a regular summer is 1.2 times the total electricity India generates.
Given the limited supply of energy, should a society be spending it on fighting sweat stains or providing healthcare. About 90 per cent of Primary Healthcare Centres (PHC) in India report undergoing power cuts between 9.00 a.m. and 4.00 p.m., a period during which PHCs function at their peak capacity.13
Electricity demand for coolingDemand for space cooling in buildings is expected to explode and upset the energy budget of India. This has become a flashpoint of debate as there are serious concerns around the impact of growing demand for space cooling on electricity consumption, power generation and global warming. ICAP estimates that demand for cooling—including space cooling in buildings, refrigeration, transport air
Given that there are approximately 250 million
households in India, it would require 1,750 TWh of
electricity to run one AC per household
every summer
MEETA AHLAWAT
A MIDSUMMER NIGHTMARE
thermal comfort report_final.indd 13 06/06/19 2:50 PM
14
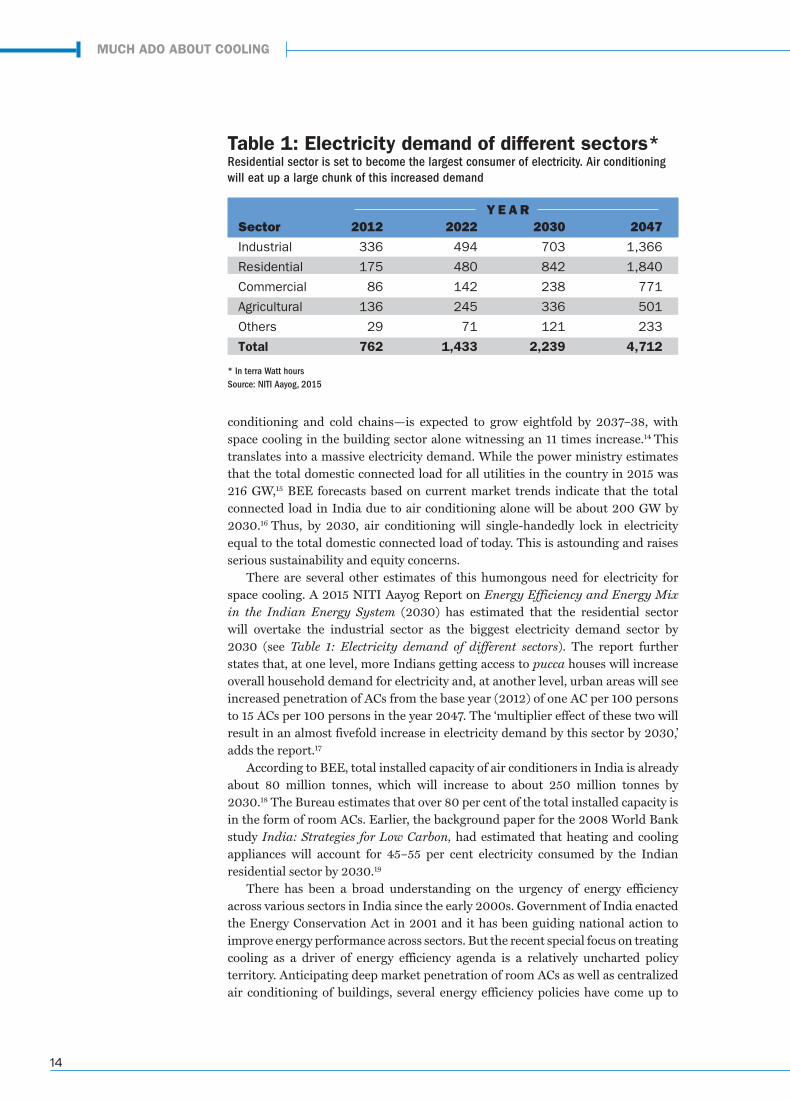
Sector 2012 2022 2030 2047
Industrial 336 494 703 1,366
Residential 175 480 842 1,840
Commercial 86 142 238 771
Agricultural 136 245 336 501
Others 29 71 121 233
Total 762 1,433 2,239 4,712
Table 1: Electricity demand of different sectors*Residential sector is set to become the largest consumer of electricity. Air conditioning will eat up a large chunk of this increased demand
Y E A R
* In terra Watt hoursSource: NITI Aayog, 2015
conditioning and cold chains—is expected to grow eightfold by 2037–38, with space cooling in the building sector alone witnessing an 11 times increase.14 This translates into a massive electricity demand. While the power ministry estimates that the total domestic connected load for all utilities in the country in 2015 was 216 GW,15 BEE forecasts based on current market trends indicate that the total connected load in India due to air conditioning alone will be about 200 GW by 2030.16 Thus, by 2030, air conditioning will single-handedly lock in electricity equal to the total domestic connected load of today. This is astounding and raises serious sustainability and equity concerns.
There are several other estimates of this humongous need for electricity for space cooling. A 2015 NITI Aayog Report on Energy Efficiency and Energy Mix in the Indian Energy System (2030) has estimated that the residential sector will overtake the industrial sector as the biggest electricity demand sector by 2030 (see Table 1: Electricity demand of different sectors). The report further states that, at one level, more Indians getting access to pucca houses will increase overall household demand for electricity and, at another level, urban areas will see increased penetration of ACs from the base year (2012) of one AC per 100 persons to 15 ACs per 100 persons in the year 2047. The ‘multiplier effect of these two will result in an almost fivefold increase in electricity demand by this sector by 2030,’ adds the report.17
According to BEE, total installed capacity of air conditioners in India is already about 80 million tonnes, which will increase to about 250 million tonnes by 2030.18 The Bureau estimates that over 80 per cent of the total installed capacity is in the form of room ACs. Earlier, the background paper for the 2008 World Bank study India: Strategies for Low Carbon, had estimated that heating and cooling appliances will account for 45–55 per cent electricity consumed by the Indian residential sector by 2030.19
There has been a broad understanding on the urgency of energy efficiency across various sectors in India since the early 2000s. Government of India enacted the Energy Conservation Act in 2001 and it has been guiding national action to improve energy performance across sectors. But the recent special focus on treating cooling as a driver of energy efficiency agenda is a relatively uncharted policy territory. Anticipating deep market penetration of room ACs as well as centralized air conditioning of buildings, several energy efficiency policies have come up to
MUCH ADO ABOUT COOLING
thermal comfort report_final.indd 14 06/06/19 2:50 PM
15
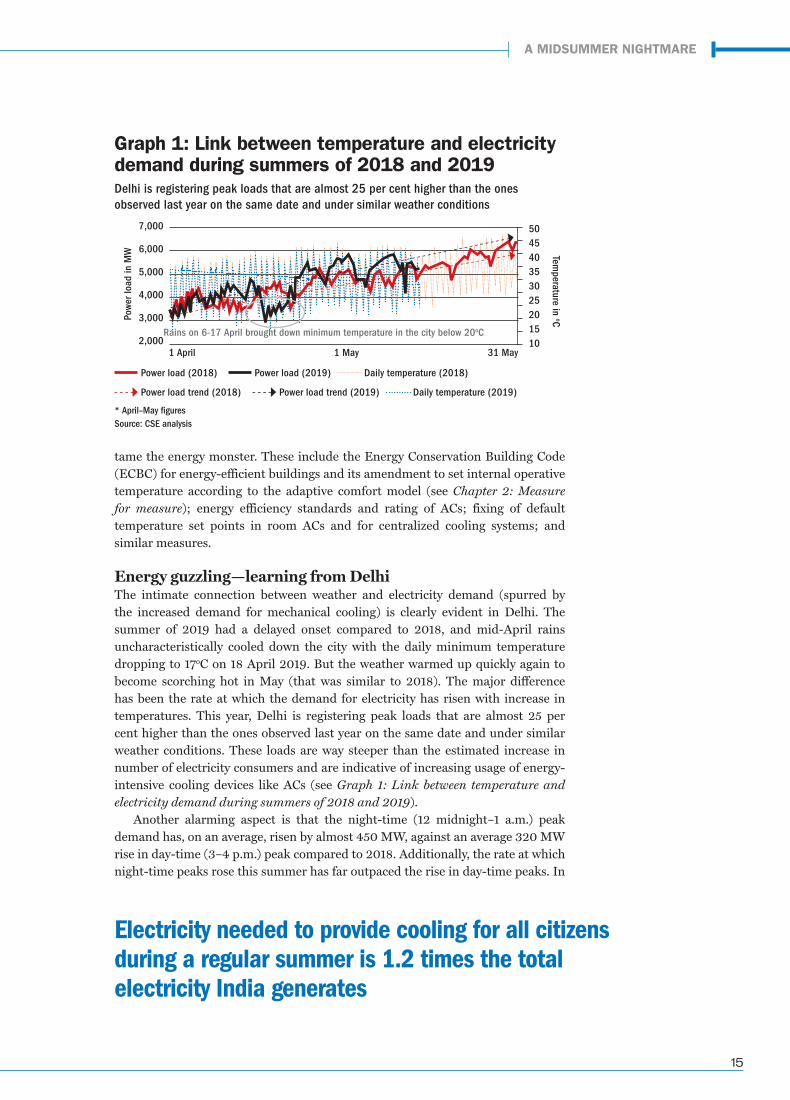
Graph 1: Link between temperature and electricity demand during summers of 2018 and 2019 Delhi is registering peak loads that are almost 25 per cent higher than the ones observed last year on the same date and under similar weather conditions
7,000
6,000
5,000
4,000
3,000
2,0001 April
Daily temperature (2019)Power load trend (2018) Power load trend (2019)
31 May1 May
Rains on 6-17 April brought down minimum temperature in the city below 20oC
504540353025201510
Powe
r loa
d in
MW Tem
perature in oC
tame the energy monster. These include the Energy Conservation Building Code (ECBC) for energy-efficient buildings and its amendment to set internal operative temperature according to the adaptive comfort model (see Chapter 2: Measure for measure); energy efficiency standards and rating of ACs; fixing of default temperature set points in room ACs and for centralized cooling systems; and similar measures.
Energy guzzling—learning from DelhiThe intimate connection between weather and electricity demand (spurred by the increased demand for mechanical cooling) is clearly evident in Delhi. The summer of 2019 had a delayed onset compared to 2018, and mid-April rains uncharacteristically cooled down the city with the daily minimum temperature dropping to 17oC on 18 April 2019. But the weather warmed up quickly again to become scorching hot in May (that was similar to 2018). The major difference has been the rate at which the demand for electricity has risen with increase in temperatures. This year, Delhi is registering peak loads that are almost 25 per cent higher than the ones observed last year on the same date and under similar weather conditions. These loads are way steeper than the estimated increase in number of electricity consumers and are indicative of increasing usage of energy-intensive cooling devices like ACs (see Graph 1: Link between temperature and electricity demand during summers of 2018 and 2019).
Another alarming aspect is that the night-time (12 midnight–1 a.m.) peak demand has, on an average, risen by almost 450 MW, against an average 320 MW rise in day-time (3–4 p.m.) peak compared to 2018. Additionally, the rate at which night-time peaks rose this summer has far outpaced the rise in day-time peaks. In
Electricity needed to provide cooling for all citizens during a regular summer is 1.2 times the total electricity India generates
Power load (2018) Power load (2019) Daily temperature (2018)
* April–May figuresSource: CSE analysis
A MIDSUMMER NIGHTMARE
thermal comfort report_final.indd 15 06/06/19 2:50 PM
16
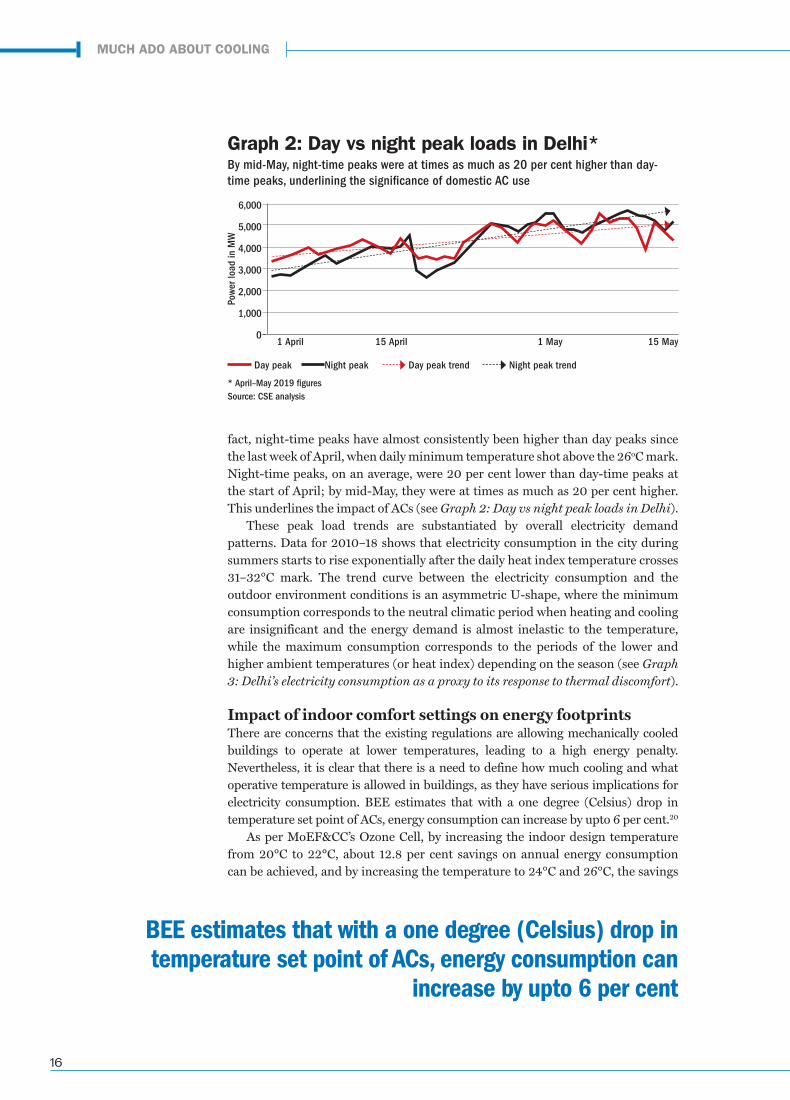
fact, night-time peaks have almost consistently been higher than day peaks since the last week of April, when daily minimum temperature shot above the 26oC mark. Night-time peaks, on an average, were 20 per cent lower than day-time peaks at the start of April; by mid-May, they were at times as much as 20 per cent higher. This underlines the impact of ACs (see Graph 2: Day vs night peak loads in Delhi).
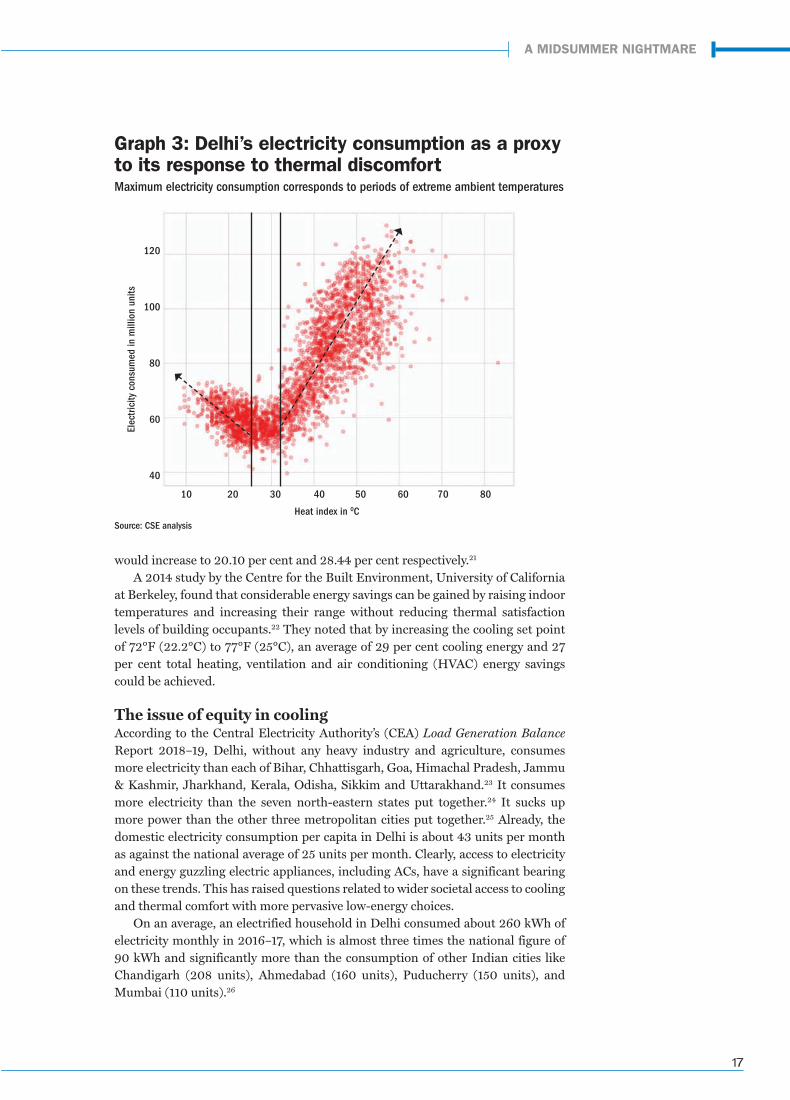
These peak load trends are substantiated by overall electricity demand patterns. Data for 2010–18 shows that electricity consumption in the city during summers starts to rise exponentially after the daily heat index temperature crosses 31–32°C mark. The trend curve between the electricity consumption and the outdoor environment conditions is an asymmetric U-shape, where the minimum consumption corresponds to the neutral climatic period when heating and cooling are insignificant and the energy demand is almost inelastic to the temperature, while the maximum consumption corresponds to the periods of the lower and higher ambient temperatures (or heat index) depending on the season (see Graph 3: Delhi’s electricity consumption as a proxy to its response to thermal discomfort).
Impact of indoor comfort settings on energy footprintsThere are concerns that the existing regulations are allowing mechanically cooled buildings to operate at lower temperatures, leading to a high energy penalty. Nevertheless, it is clear that there is a need to define how much cooling and what operative temperature is allowed in buildings, as they have serious implications for electricity consumption. BEE estimates that with a one degree (Celsius) drop in temperature set point of ACs, energy consumption can increase by upto 6 per cent.20
As per MoEF&CC’s Ozone Cell, by increasing the indoor design temperature from 20°C to 22°C, about 12.8 per cent savings on annual energy consumption can be achieved, and by increasing the temperature to 24°C and 26°C, the savings
BEE estimates that with a one degree (Celsius) drop in temperature set point of ACs, energy consumption can
increase by upto 6 per cent
Graph 2: Day vs night peak loads in Delhi*By mid-May, night-time peaks were at times as much as 20 per cent higher than day-time peaks, underlining the significance of domestic AC use
6,000
5,000
4,000
3,000
2,000
1,000
01 April 15 April 15 May1 May
Powe
r loa
d in
MW
Day peak Day peak trend Night peak trendNight peak
* April–May 2019 figuresSource: CSE analysis
MUCH ADO ABOUT COOLING
thermal comfort report_final.indd 16 06/06/19 2:50 PM
17
would increase to 20.10 per cent and 28.44 per cent respectively.21
A 2014 study by the Centre for the Built Environment, University of California at Berkeley, found that considerable energy savings can be gained by raising indoor temperatures and increasing their range without reducing thermal satisfaction levels of building occupants.22 They noted that by increasing the cooling set point of 72°F (22.2°C) to 77°F (25°C), an average of 29 per cent cooling energy and 27 per cent total heating, ventilation and air conditioning (HVAC) energy savings could be achieved.
The issue of equity in coolingAccording to the Central Electricity Authority’s (CEA) Load Generation BalanceReport 2018–19, Delhi, without any heavy industry and agriculture, consumes more electricity than each of Bihar, Chhattisgarh, Goa, Himachal Pradesh, Jammu & Kashmir, Jharkhand, Kerala, Odisha, Sikkim and Uttarakhand.23 It consumes more electricity than the seven north-eastern states put together.24 It sucks up more power than the other three metropolitan cities put together.25 Already, the domestic electricity consumption per capita in Delhi is about 43 units per month as against the national average of 25 units per month. Clearly, access to electricity and energy guzzling electric appliances, including ACs, have a significant bearing on these trends. This has raised questions related to wider societal access to cooling and thermal comfort with more pervasive low-energy choices.
On an average, an electrified household in Delhi consumed about 260 kWh of electricity monthly in 2016–17, which is almost three times the national figure of 90 kWh and significantly more than the consumption of other Indian cities like Chandigarh (208 units), Ahmedabad (160 units), Puducherry (150 units), and Mumbai (110 units).26
Graph 3: Delhi’s electricity consumption as a proxy to its response to thermal discomfortMaximum electricity consumption corresponds to periods of extreme ambient temperatures
120
100
80
60
40
10 20 30 40 50 60 70 80
Elec
trici
ty c
onsu
med
in m
illio
n un
its
Heat index in 0CSource: CSE analysis
A MIDSUMMER NIGHTMARE
thermal comfort report_final.indd 17 06/06/19 2:50 PM
18
Globally, too, access to cooling is a major socio-economic issue. Of the 2.8 billion people living in the hottest parts of the world, only 8 per cent currently possess ACs, compared to 90 per cent ownership in the United States and Japan. Consumption patterns of electricity consistently bear out this fact. In 2016, cooling made up about 10.5 per cent of energy use in buildings in the United States, followed by Mexico (9.8 per cent), Japan (9.5 per cent), China (9.3 per cent) and Korea (8.5 per cent). Compare this with way hotter (and more humid) India and Indonesia, where only about 3 per cent building energy is spent on cooling.27
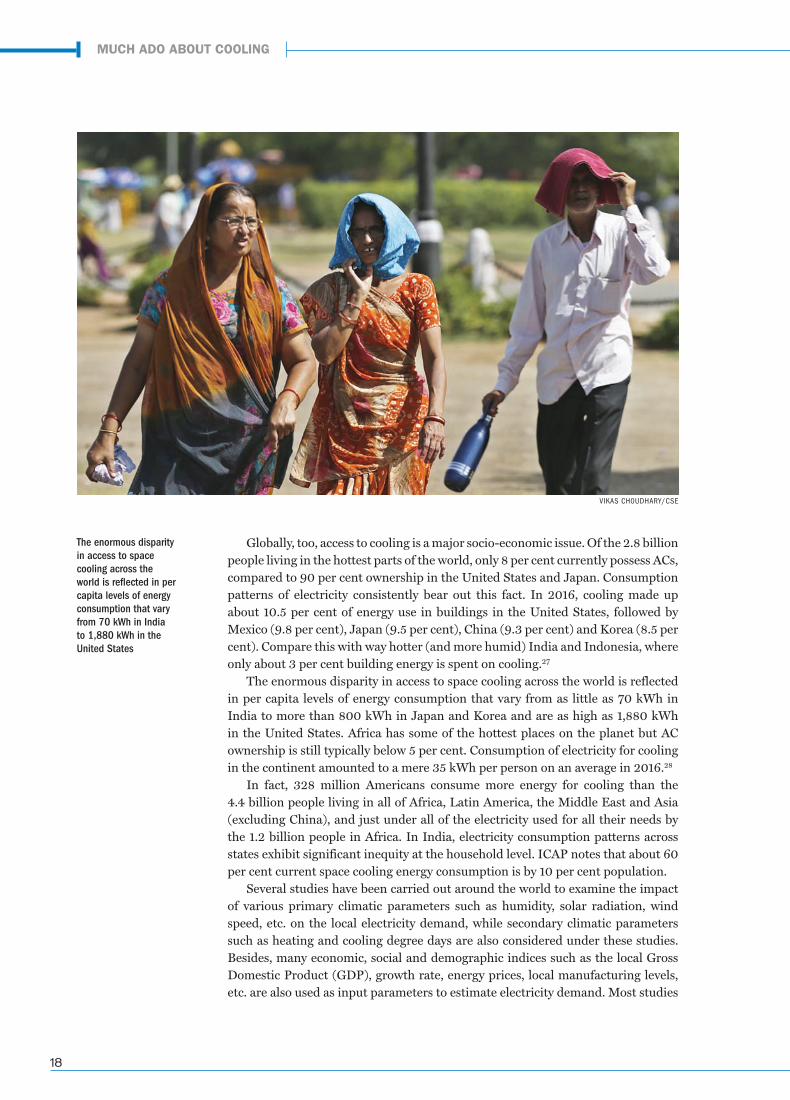
The enormous disparity in access to space cooling across the world is reflected in per capita levels of energy consumption that vary from as little as 70 kWh in India to more than 800 kWh in Japan and Korea and are as high as 1,880 kWh in the United States. Africa has some of the hottest places on the planet but AC ownership is still typically below 5 per cent. Consumption of electricity for cooling in the continent amounted to a mere 35 kWh per person on an average in 2016.28
In fact, 328 million Americans consume more energy for cooling than the 4.4 billion people living in all of Africa, Latin America, the Middle East and Asia (excluding China), and just under all of the electricity used for all their needs by the 1.2 billion people in Africa. In India, electricity consumption patterns across states exhibit significant inequity at the household level. ICAP notes that about 60 per cent current space cooling energy consumption is by 10 per cent population.
Several studies have been carried out around the world to examine the impact of various primary climatic parameters such as humidity, solar radiation, wind speed, etc. on the local electricity demand, while secondary climatic parameters such as heating and cooling degree days are also considered under these studies. Besides, many economic, social and demographic indices such as the local Gross Domestic Product (GDP), growth rate, energy prices, local manufacturing levels, etc. are also used as input parameters to estimate electricity demand. Most studies
The enormous disparity in access to space cooling across the world is reflected in per capita levels of energy consumption that vary from 70 kWh in India to 1,880 kWh in the United States
VIKAS CH0UDHARY/CSE
MUCH ADO ABOUT COOLING
thermal comfort report_final.indd 18 06/06/19 2:50 PM
19
have concluded that among all these parameters, ambient temperature has the highest impact on the variation of the electricity demand.29
Sourcing energy for coolingThe projected increased supply of renewable power will be essential for meeting electricity demand for cooling. A major portion is going to come from solar power. But solar power alone will not be sufficient as the daily pattern of its supply does not always match that of cooling demand, with high cooling demand in many countries lasting well after the sun has gone down.
For instance, in Delhi in May 2018, the daily peak electricity demand was registered around mid-night on 21 days. A typical summer day in Delhi has two peaks, one during the day (driven by commercial activities) and other around midnight (driven by the residential sector). On an average, these two peaks became almost identical in 2018 in terms of consumption. As a result, electricity systems will have to install and maintain large amounts of expensive peak power generation capacity. This implies further investment is dirty power, increasing the overall climate burden of the sector.
Make comfort affordable for allThis discussion has become more important now as India is constructing affordable and low-cost housing at a massive scale, largely on the mixed-mode pattern. Regulations will have to ensure requisite design and material innovation takes place to keep these buildings comfortable for all. Low-cost yet effective solutions will be needed to deliver on the overall comfort condition in affordable housing.
ICAP has recommended thermal comfort strategies for affordable housing projects under the Pradhan Mantri Awas Yojana for the economically weaker section. This is important for the affordable housing sector and low-income housing where the current focus is only on speed and ease of construction, disregarding comfort requirements of the poor.
Comfort delivery through design and system approach is necessary for lower-income groups. Agencies of United Nations have been proposing comfort as a human rights issue. It is not necessary to lower the standard (of thermal comfort) for poor people if design and material solutions are available. It has taken a while to acknowledge this idea. When the original Energy Conservation Building Code (ECBC) was scripted to govern energy efficiency in buildings, formal requirement of passive architectural systems for low-energy solutions to provide thermal comfort in buildings was weak.
The revised version of ECBC has introduced an Energy Performance Index (EPI) score for all designs to be used as a benchmark to track operational energy performance. But there is no mechanism to ensure that building operators continue to maintain EPI score awarded at the completion of the construction.
Another addition to the ECBC is regulating indoor temperature thresholds for heating, ventilation and air conditioning design to prevent heavy energy
UN has proposed comfort as a human right. Why should the standard (of thermal comfort) for poor people be lowered if design and material solutions are available?
A MIDSUMMER NIGHTMARE
thermal comfort report_final.indd 19 06/06/19 2:50 PM

20
penalty. It refers to Indian Adaptive Comfort Model for better energy efficiency in thermal comfort delivery. But it stops short of prohibiting unnecessary cooling or heating of indoors in complete disregard of outdoor weather conditions and realistic thermal comfort expectations of occupants. The new approach should help to address these gaps.
We are face-to-face with an ironic situation. While air conditioned buildings—energy guzzlers that consume even more at lower temperature settings—cannot breach the upper limit of 26°C, naturally ventilated buildings —energy efficient—cannot operate within the prescribed comfort range as they have no means of mechanically cooling down the building. NBC’s current thermal comfort prescriptions, both static and adaptive, discriminate based on building class.
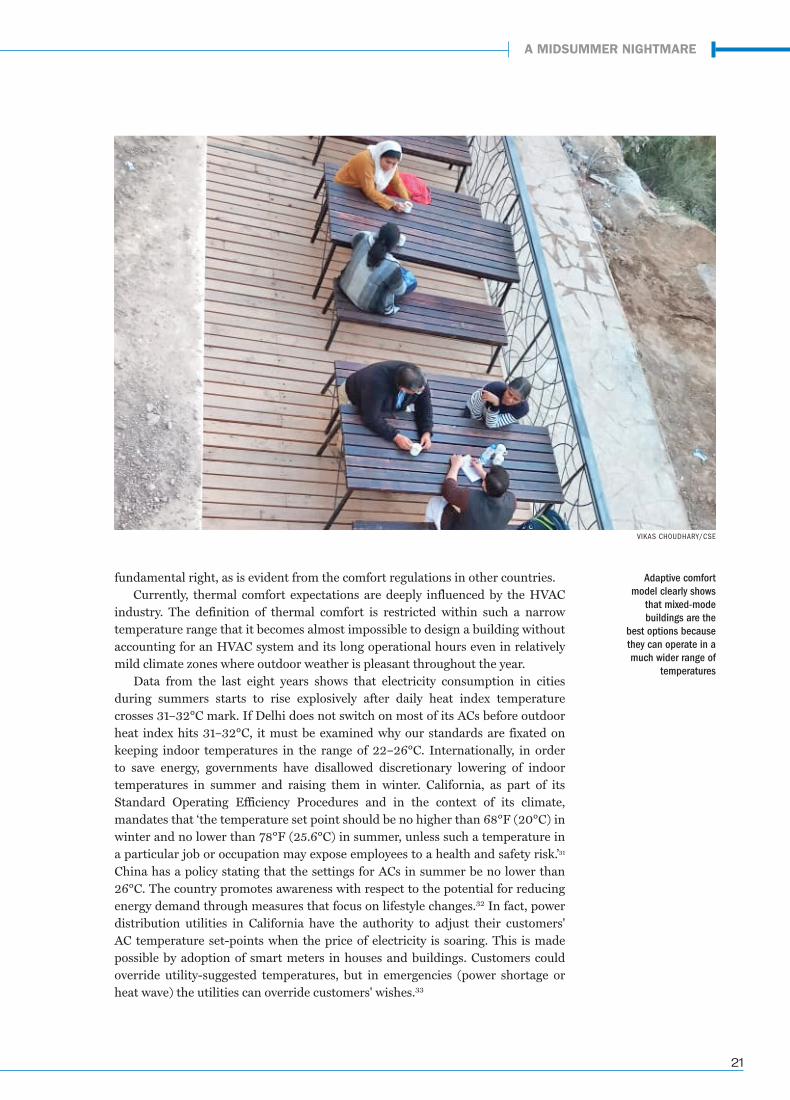
India Adaptive Comfort Model, limited as it may be, clearly shows that mixed-mode buildings are the best options because they can operate in a much wider range of temperatures as people are more adaptive and can flexibly operate their cooling devices according to requirements to achieve greater energy savings. This actually proves that there needs to be greater regulatory focus on promoting mixed-mode buildings. But there seems to be a deliberate push to just modulate the AC thermostat, so to say, based on the Adaptive Comfort Model, and not actually switching off the AC when buildings are able to provide recommended comfort naturally owning to favourable weather conditions.
Define approaches to thermal comfort standardsThe next steps are about defining the strategies and approaches to defining thermal comfort standards as ICAP has asked for. To a great extent, this will leverage the natural advantage of adaptive nature of human body, natural ventilation and passive architectural design while integrating mechanical cooling approaches as needed.
Adaptive comfort means different ranges of temperatures depending on the building typology as expected comfort expectations vary. NBC says:
People living year-round in air conditioned spaces are likely to develop high expectations for
homogeneity and cool temperatures, and may become quite critical if thermal conditions
deviate from the centre of the comfort zone they have come to expect. In contrast, people
who live or work in naturally ventilated buildings have the ability to partially control their
immediate exposure to external thermal conditions (like opening or closing a window) but
the interior thermal conditions are largely in-sync with the prevailing outdoor weather, so
they get accustomed to variable indoor thermal conditions that reflect local patterns of
daily and seasonal climate changes.30
While it is true that thermal expectations in a naturally ventilated or mixed-mode buildings (a combination of active cooling methods and natural ventilation) and fully air conditioned buildings will be different, the public policy imperative is to narrow down the gap between comfort temperature ranges of all buildings. Regulations should not create perverse incentive or legal provisions for overcooling in air conditioned buildings with enormous energy penalty. Overcooling is not a
Regulations should not create perverse incentive or legal provisions for overcooling in air conditioned buildings with
enormous energy penalty
MUCH ADO ABOUT COOLING
thermal comfort report_final.indd 20 06/06/19 2:50 PM
21
fundamental right, as is evident from the comfort regulations in other countries. Currently, thermal comfort expectations are deeply influenced by the HVAC
industry. The definition of thermal comfort is restricted within such a narrow temperature range that it becomes almost impossible to design a building without accounting for an HVAC system and its long operational hours even in relatively mild climate zones where outdoor weather is pleasant throughout the year.
Data from the last eight years shows that electricity consumption in cities during summers starts to rise explosively after daily heat index temperature crosses 31–32°C mark. If Delhi does not switch on most of its ACs before outdoor heat index hits 31–32°C, it must be examined why our standards are fixated on keeping indoor temperatures in the range of 22–26°C. Internationally, in order to save energy, governments have disallowed discretionary lowering of indoor temperatures in summer and raising them in winter. California, as part of its Standard Operating Efficiency Procedures and in the context of its climate, mandates that ‘the temperature set point should be no higher than 68°F (20°C) in winter and no lower than 78°F (25.6°C) in summer, unless such a temperature in a particular job or occupation may expose employees to a health and safety risk.’31
China has a policy stating that the settings for ACs in summer be no lower than 26°C. The country promotes awareness with respect to the potential for reducing energy demand through measures that focus on lifestyle changes.32 In fact, power distribution utilities in California have the authority to adjust their customers' AC temperature set-points when the price of electricity is soaring. This is made possible by adoption of smart meters in houses and buildings. Customers could override utility-suggested temperatures, but in emergencies (power shortage or heat wave) the utilities can override customers' wishes.33
Adaptive comfort model clearly shows
that mixed-mode buildings are the
best options because they can operate in a much wider range of
temperatures
VIKAS CH0UDHARY/CSE
A MIDSUMMER NIGHTMARE
thermal comfort report_final.indd 21 06/06/19 2:50 PM
22
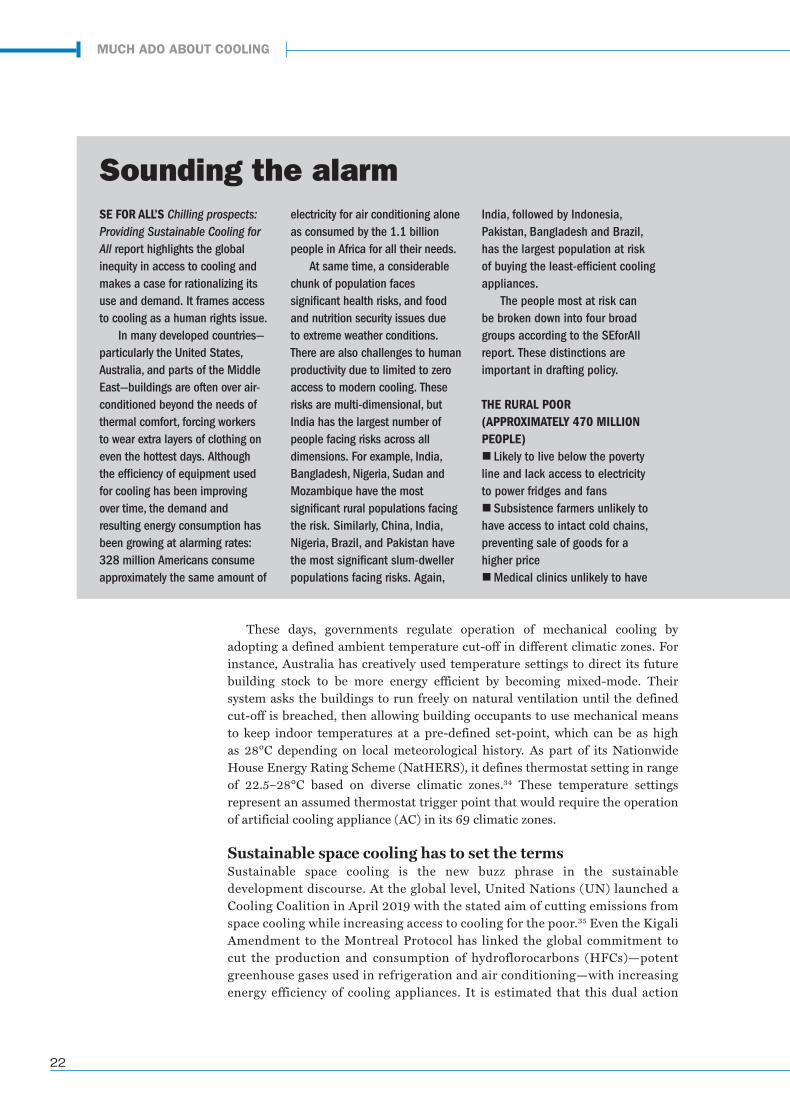
SE FOR ALL’S Chilling prospects: Providing Sustainable Cooling for All report highlights the global inequity in access to cooling and makes a case for rationalizing its use and demand. It frames access to cooling as a human rights issue.
In many developed countries—particularly the United States, Australia, and parts of the Middle East—buildings are often over air-conditioned beyond the needs of thermal comfort, forcing workers to wear extra layers of clothing on even the hottest days. Although the efficiency of equipment used for cooling has been improving over time, the demand and resulting energy consumption has been growing at alarming rates: 328 million Americans consume approximately the same amount of
electricity for air conditioning alone as consumed by the 1.1 billion people in Africa for all their needs.
At same time, a considerable chunk of population faces significant health risks, and food and nutrition security issues due to extreme weather conditions. There are also challenges to human productivity due to limited to zero access to modern cooling. These risks are multi-dimensional, but India has the largest number of people facing risks across all dimensions. For example, India, Bangladesh, Nigeria, Sudan and Mozambique have the most significant rural populations facing the risk. Similarly, China, India, Nigeria, Brazil, and Pakistan have the most significant slum-dweller populations facing risks. Again,
India, followed by Indonesia, Pakistan, Bangladesh and Brazil, has the largest population at risk of buying the least-efficient cooling appliances.
The people most at risk can be broken down into four broad groups according to the SEforAll report. These distinctions are important in drafting policy.
THE RURAL POOR (APPROXIMATELY 470 MILLION PEOPLE) Likely to live below the poverty line and lack access to electricity to power fridges and fans Subsistence farmers unlikely to have access to intact cold chains, preventing sale of goods for a higher priceMedical clinics unlikely to have
Sounding the alarm
These days, governments regulate operation of mechanical cooling by adopting a defined ambient temperature cut-off in different climatic zones. For instance, Australia has creatively used temperature settings to direct its future building stock to be more energy efficient by becoming mixed-mode. Their system asks the buildings to run freely on natural ventilation until the defined cut-off is breached, then allowing building occupants to use mechanical means to keep indoor temperatures at a pre-defined set-point, which can be as high as 28°C depending on local meteorological history. As part of its Nationwide House Energy Rating Scheme (NatHERS), it defines thermostat setting in range of 22.5–28°C based on diverse climatic zones.34 These temperature settings represent an assumed thermostat trigger point that would require the operation of artificial cooling appliance (AC) in its 69 climatic zones.
Sustainable space cooling has to set the termsSustainable space cooling is the new buzz phrase in the sustainable development discourse. At the global level, United Nations (UN) launched a Cooling Coalition in April 2019 with the stated aim of cutting emissions from space cooling while increasing access to cooling for the poor.35 Even the Kigali Amendment to the Montreal Protocol has linked the global commitment to cut the production and consumption of hydroflorocarbons (HFCs)—potent greenhouse gases used in refrigeration and air conditioning—with increasing energy efficiency of cooling appliances. It is estimated that this dual action
MUCH ADO ABOUT COOLING
thermal comfort report_final.indd 22 06/06/19 2:50 PM
23
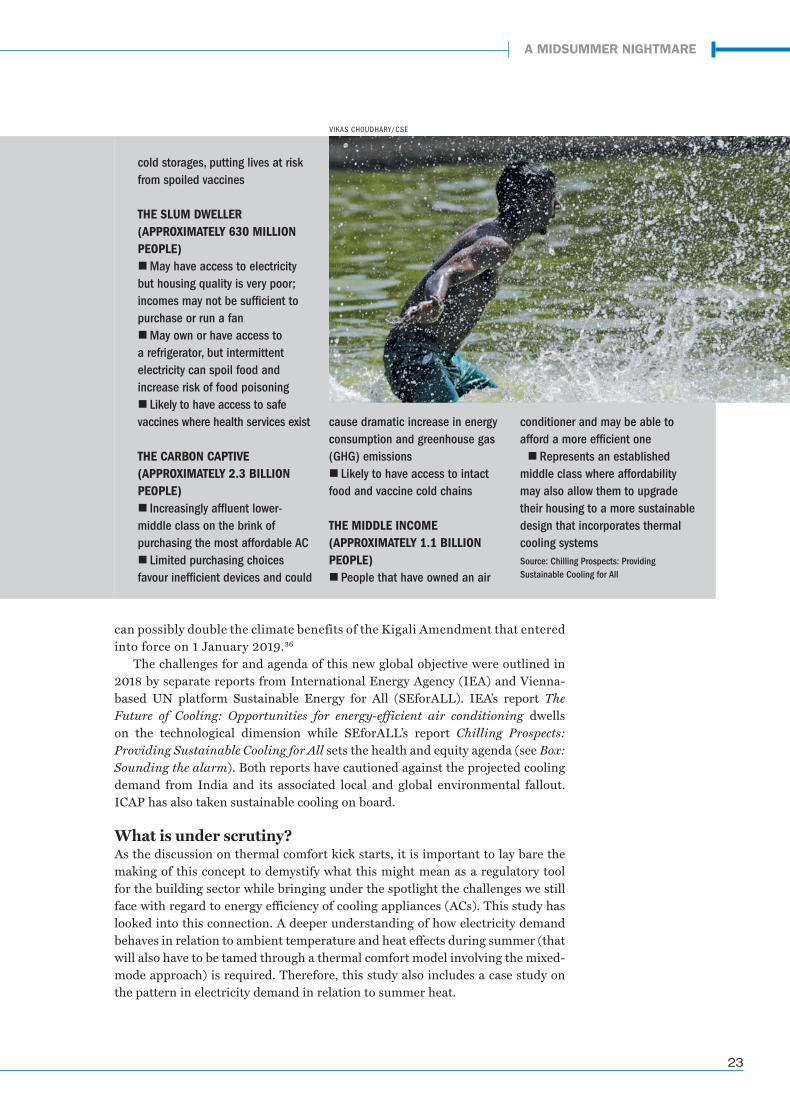
cold storages, putting lives at risk from spoiled vaccines
THE SLUM DWELLER (APPROXIMATELY 630 MILLION PEOPLE)May have access to electricity but housing quality is very poor; incomes may not be sufficient to purchase or run a fanMay own or have access to a refrigerator, but intermittent electricity can spoil food and increase risk of food poisoning Likely to have access to safe vaccines where health services exist
THE CARBON CAPTIVE (APPROXIMATELY 2.3 BILLION PEOPLE) Increasingly affluent lower-middle class on the brink of purchasing the most affordable AC Limited purchasing choices favour inefficient devices and could
cause dramatic increase in energy consumption and greenhouse gas (GHG) emissions Likely to have access to intact food and vaccine cold chains
THE MIDDLE INCOME (APPROXIMATELY 1.1 BILLION PEOPLE) People that have owned an air
conditioner and may be able to afford a more efficient one Represents an established
middle class where affordability may also allow them to upgrade their housing to a more sustainable design that incorporates thermal cooling systems
can possibly double the climate benefits of the Kigali Amendment that entered into force on 1 January 2019.36
The challenges for and agenda of this new global objective were outlined in 2018 by separate reports from International Energy Agency (IEA) and Vienna-based UN platform Sustainable Energy for All (SEforALL). IEA’s report The Future of Cooling: Opportunities for energy-efficient air conditioning dwells on the technological dimension while SEforALL’s report Chilling Prospects: Providing Sustainable Cooling for All sets the health and equity agenda (see Box: Sounding the alarm). Both reports have cautioned against the projected cooling demand from India and its associated local and global environmental fallout. ICAP has also taken sustainable cooling on board.
What is under scrutiny? As the discussion on thermal comfort kick starts, it is important to lay bare the making of this concept to demystify what this might mean as a regulatory tool for the building sector while bringing under the spotlight the challenges we still face with regard to energy efficiency of cooling appliances (ACs). This study has looked into this connection. A deeper understanding of how electricity demand behaves in relation to ambient temperature and heat effects during summer (that will also have to be tamed through a thermal comfort model involving the mixed-mode approach) is required. Therefore, this study also includes a case study on the pattern in electricity demand in relation to summer heat.
VIKAS CH0UDHARY/CSE
A MIDSUMMER NIGHTMARE
Source: Chilling Prospects: Providing Sustainable Cooling for All
thermal comfort report_final.indd 23 06/06/19 2:50 PM
24
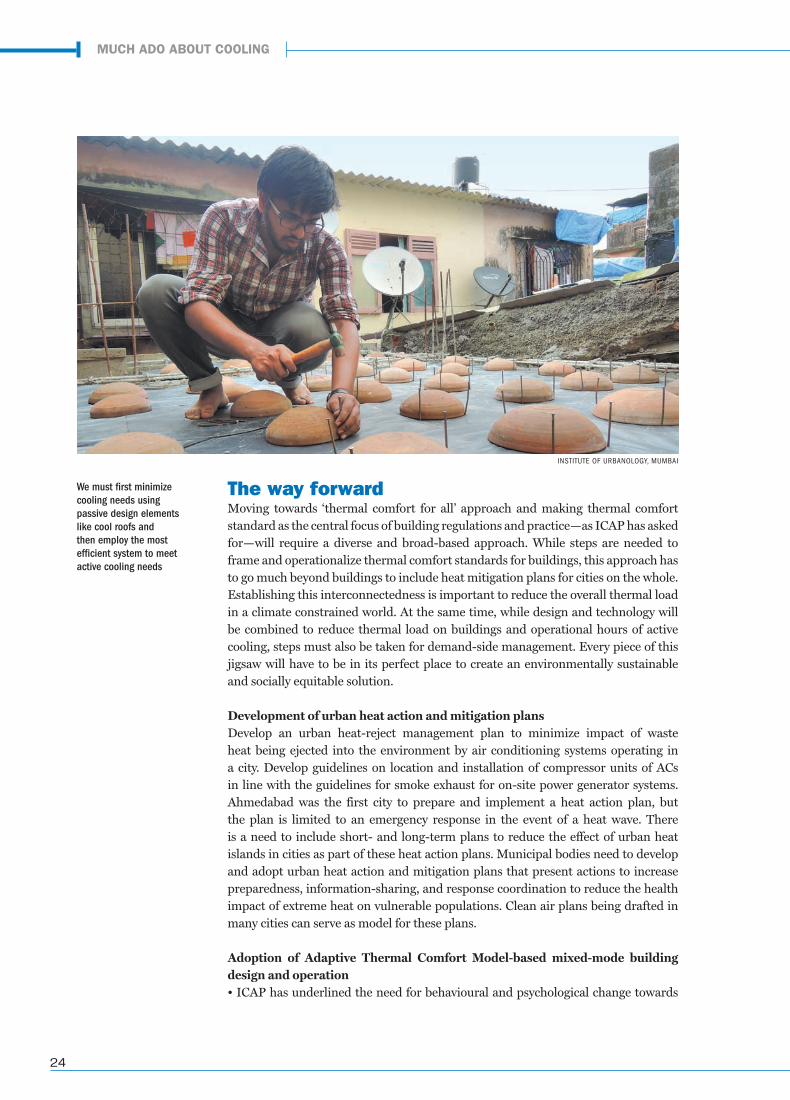
The way forwardMoving towards ‘thermal comfort for all’ approach and making thermal comfort standard as the central focus of building regulations and practice—as ICAP has asked for—will require a diverse and broad-based approach. While steps are needed to frame and operationalize thermal comfort standards for buildings, this approach has to go much beyond buildings to include heat mitigation plans for cities on the whole. Establishing this interconnectedness is important to reduce the overall thermal load in a climate constrained world. At the same time, while design and technology will be combined to reduce thermal load on buildings and operational hours of active cooling, steps must also be taken for demand-side management. Every piece of this jigsaw will have to be in its perfect place to create an environmentally sustainable and socially equitable solution.
Development of urban heat action and mitigation plansDevelop an urban heat-reject management plan to minimize impact of waste heat being ejected into the environment by air conditioning systems operating in a city. Develop guidelines on location and installation of compressor units of ACs in line with the guidelines for smoke exhaust for on-site power generator systems. Ahmedabad was the first city to prepare and implement a heat action plan, but the plan is limited to an emergency response in the event of a heat wave. There is a need to include short- and long-term plans to reduce the effect of urban heat islands in cities as part of these heat action plans. Municipal bodies need to develop and adopt urban heat action and mitigation plans that present actions to increase preparedness, information-sharing, and response coordination to reduce the health impact of extreme heat on vulnerable populations. Clean air plans being drafted in many cities can serve as model for these plans.
Adoption of Adaptive Thermal Comfort Model-based mixed-mode building design and operation• ICAP has underlined the need for behavioural and psychological change towards
We must first minimize cooling needs using passive design elements like cool roofs and then employ the most efficient system to meet active cooling needs
INSTITUTE OF URBANOLOGY, MUMBAI
MUCH ADO ABOUT COOLING
thermal comfort report_final.indd 24 06/06/19 2:50 PM
25
adaptive thermal comfort practices. There is an immediate need to establish adaptive thermal comfort benchmarks for various climatic zones in India, for both domestic and occupational application. The latest version of NBC has introduced an adaptive comfort model but it is limited to office application and agnostic to different climatic zones in India.• There is a misconception regarding the meaning and application of adaptive thermal comfort. It is being confused as a function of building design and operation when it is about human ability to respond to thermal variations in the immediate surrounding and adapt to them, in the process re-configuring what feels thermally comfortable. This is important to understand because ICAP is asking to use the adaptive model to train thermostat setting of an AC when it should be governing when to switch off ACs. • The building codes—ECBC and NBC—need to link design and energy efficiency guidelines with adaptive thermal comfort delivery using practices specific to the Indian climates.• Adopt a Bush Shirt Rule to allow people freedom to dress for comfort at work and for formal engagements.
Adoption of passive design and envelope improvements in all new construction to inherently reduce the need for active space cooling• Institutionalize a holistic and integrated approach for thermally comfortable and energy-efficient building designs for buildings with the mandate to first minimize cooling needs using passive design elements and then employing the most efficient system to meet active cooling needs as a condition under the environment clearance policy.• All buildings need to be designed to provide thermal comfort as set by the adaptive thermal comfort standards. This needs to make use of passive design interventions in a way that limits dependency on active space cooling to a few weeks in a year, if not totally eliminating it. • ECBC and ECBC-R need to be reworked to use thermal comfort as a means to achieve energy efficiency. The reworked codes must be aggressively pushed for widespread adoption and stringent enforcement.• Allocate government funding and support to enable passive cooling design implementation for economically weaker section. This can include viability gap funding for incorporating additional features like cool roofs, insulation, sun-shades, wind-towers, etc. • Meanwhile, mandate provision of sun-shade for all windows and make a provision for installing desert coolers in all new housing. Builders have resorted to providing provision only for ACs in new buildings making it difficult for people to use any other means for cooling.• Run aggressive market awareness campaigns to sensitize both the construction community as well as the end-users towards the multiple benefits of energy-efficient buildings—reduced operational costs, health and comfort, environmental and societal benefits.• Develop an inventory of building materials, listing their energy efficiency, life-cycle environmental cost and thermal comfort performance.
Measures to enhance thermal comfort and reduce operational need for active cooling systems• Retrofit and retro-commission existing buildings to improve their thermal comfort
A MIDSUMMER NIGHTMARE
thermal comfort report_final.indd 25 06/06/19 2:50 PM
26
performance and to reduce their cooling requirements and energy consumption. This should include addition of sun-shades to any exposed glass in the facade, cool roofs and capping of thermostat of building HVAC. • Mandatory minimum indoor temperature settings for summer and maximum indoor temperature setting for winter to reduce cooling and heating requirement, and energy consumption while maintaining a healthy working as well as living environment.
Improvement in star labelling of existing technology to better inform people of the energy costs• Revise Indian Seasonal Energy Efficiency Rating (ISEER) to meet international standard for a number of Minimum Energy Performance Standard (MEPS) tests. Further, rework the climatic data used in ISEER calculations using the summer profile and not the annual profile. Make it separately for all five climate zones in India. • Introduce a new star label that includes climate-based rating information. Mention test conditions on the label as well. • Set the default set point of AC at the same level as the one used in MEPS testing. • Drive widespread adoption of 5-star labelled fans and room air conditioners in new and existing buildings• It has been noted all over the world that room air conditioner manufacturers only invest in development of and innovation in energy-efficient ACs if pushed by upping of MEPS. India should aggressively push up the MEPS.• Make BEE star labelling of ceiling fans mandatory and introduce BEE star labelling for air coolers.
Demand-side management and response programmes for behavioural change • Institutionalize demand-side management programmes with (electricity) distribution companies (DISCOMs) to partly fund thermal performance improvements in existing building stock. • Introduce a behaviour-based energy efficiency programme where households are provided an analysis of their monthly energy bill by DISCOMs in relation to their peers, so that they can compare energy performance.• Promote the use of demand response-enabled cooling technology, real-time power consumption displays in all room ACs and building automation and management systems.• Institutionalize installation of thermal storage with cooling systems and differential power tariffs to minimize peak power requirements.• Put into place a scrappage policy to ensure old ACs are effectively retired.
Building energy data collection and reporting • Institute a practice of making disclosure of energy and cooling demand mandatory for all buildings. This information should be made publicly available for all buildings with a connected load equal to or more than 100 kW.• Make mandatory third-party verification of building energy and cooling demand disclosures for all buildings that have a connected load of 100 kW or higher every five years. • Improve data collection and statistics on energy efficiency indicators and make it part of the Open Government Data Platform put in place by the Government of India.
MUCH ADO ABOUT COOLING
thermal comfort report_final.indd 26 06/06/19 2:50 PM
27
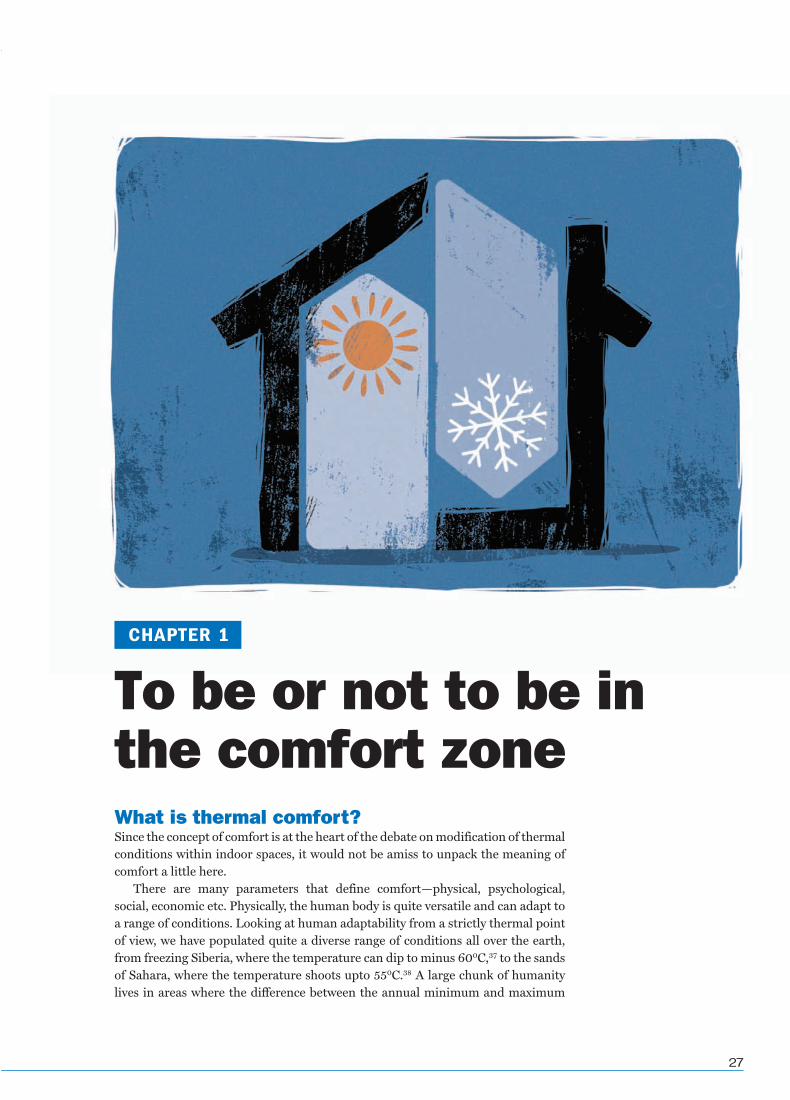
What is thermal comfort?Since the concept of comfort is at the heart of the debate on modification of thermal conditions within indoor spaces, it would not be amiss to unpack the meaning of comfort a little here.
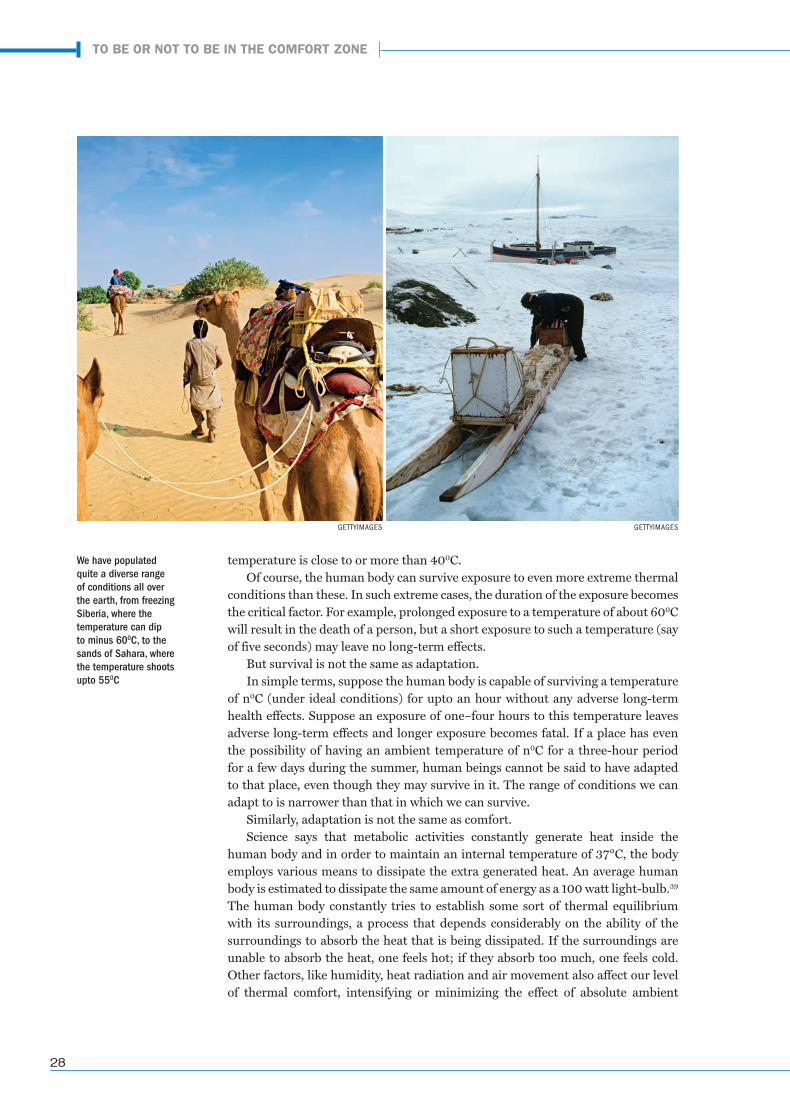
There are many parameters that define comfort—physical, psychological, social, economic etc. Physically, the human body is quite versatile and can adapt to a range of conditions. Looking at human adaptability from a strictly thermal point of view, we have populated quite a diverse range of conditions all over the earth, from freezing Siberia, where the temperature can dip to minus 600C,37 to the sands of Sahara, where the temperature shoots upto 550C.38 A large chunk of humanity lives in areas where the difference between the annual minimum and maximum
To be or not to be in the comfort zone
CHAPTER 1
thermal comfort report_final.indd 27 06/06/19 2:50 PM
28
temperature is close to or more than 400C.Of course, the human body can survive exposure to even more extreme thermal
conditions than these. In such extreme cases, the duration of the exposure becomes the critical factor. For example, prolonged exposure to a temperature of about 600C will result in the death of a person, but a short exposure to such a temperature (say of five seconds) may leave no long-term effects.
But survival is not the same as adaptation.In simple terms, suppose the human body is capable of surviving a temperature
of n0C (under ideal conditions) for upto an hour without any adverse long-term health effects. Suppose an exposure of one–four hours to this temperature leaves adverse long-term effects and longer exposure becomes fatal. If a place has even the possibility of having an ambient temperature of n0C for a three-hour period for a few days during the summer, human beings cannot be said to have adapted to that place, even though they may survive in it. The range of conditions we can adapt to is narrower than that in which we can survive.
Similarly, adaptation is not the same as comfort.Science says that metabolic activities constantly generate heat inside the
human body and in order to maintain an internal temperature of 37°C, the body employs various means to dissipate the extra generated heat. An average human body is estimated to dissipate the same amount of energy as a 100 watt light-bulb.39
The human body constantly tries to establish some sort of thermal equilibrium with its surroundings, a process that depends considerably on the ability of the surroundings to absorb the heat that is being dissipated. If the surroundings are unable to absorb the heat, one feels hot; if they absorb too much, one feels cold. Other factors, like humidity, heat radiation and air movement also affect our level of thermal comfort, intensifying or minimizing the effect of absolute ambient
We have populated quite a diverse range of conditions all over the earth, from freezing Siberia, where the temperature can dip to minus 600C, to the sands of Sahara, where the temperature shoots upto 550C
GETTYIMAGES GETTYIMAGES
TO BE OR NOT TO BE IN THE COMFORT ZONE
thermal comfort report_final.indd 28 06/06/19 2:50 PM
29
temperature on our comfort levels. There is an additional ‘forgiveness factor’ that refers to the human ability to disregard or ignore actual physical discomfort in recognition of the unique nature of our surroundings, like cooking at an open flame. There are numerous permutation and combination of these six variables that are applied to achieve comfort.
The range of conditions under which we would feel comfortable is narrower than that to which we can adapt. This is a crucial point in the context of our present discussion. The idea of comfort transcends the mere physical situation of our body. It is equally, if not more, dependent on psychological, social and economic factors.
Generally speaking, the range of temperatures (taking into account factors like humidity and air movement) in which we feel comfortable is much narrower than the range of temperatures to which our bodies could adapt. People living in regions with colder climates find a lower range of temperatures comfortable while people living in regions with hotter climates find comfort in a higher range (see Figure 1: The conundrum of comfort). For instance, in Sweden, a heat wave is said to occur if the daily maximum temperature crosses 250C for three days running.40 In the US, on the other hand, the number is pegged at 32.20C.41 The IMD has different threshold temperatures for declaring heat waves in the three major geographical regions: Plains (400C), coastal (370C) and hills (300C).42
Similarly, in a particular location, people who have the economic means to modify ambient temperature feel comfortable in a much narrower range of temperatures than people who may not be financially as secure. A prince may find the weather unbearably hot or cold in which a pauper will find no discomfort. This engenders questions of equity and resource allocation, but we will come back to that later. It is also worth pointing out that if this proverbial prince lived in the 18th century—with a posse of servants fanning him day and night in a tent pegged in the middle of a pond with fountains spraying the air with mist—he could not imagine
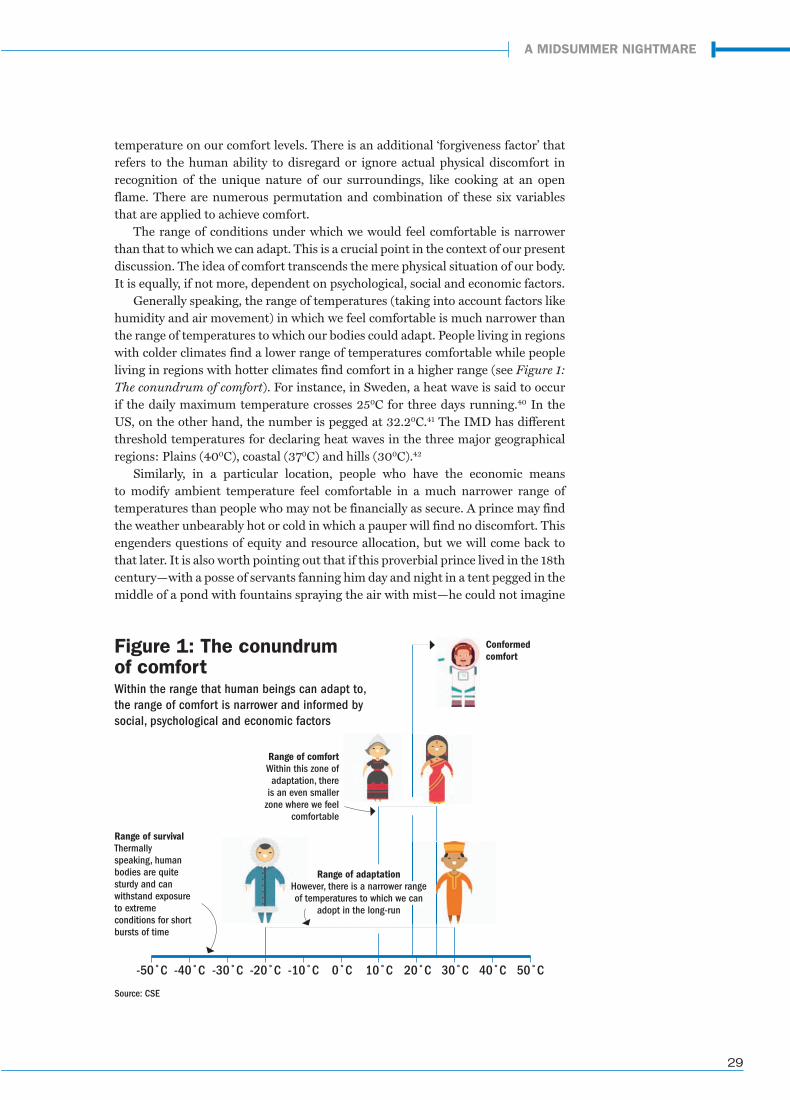
Figure 1: The conundrum of comfortWithin the range that human beings can adapt to, the range of comfort is narrower and informed by social, psychological and economic factors
Range of survivalThermally speaking, human bodies are quite sturdy and can withstand exposure to extreme conditions for short bursts of time
Range of comfortWithin this zone of adaptation, there
is an even smaller zone where we feel
comfortable
Source: CSE
-50˚C 50˚C-40˚C 40˚C-30˚C 30˚C-20˚C 20˚C-10˚C 10˚C0˚C
Conformed comfort
Range of adaptationHowever, there is a narrower range of temperatures to which we can
adopt in the long-run
A MIDSUMMER NIGHTMARE
thermal comfort report_final.indd 29 06/06/19 2:50 PM
30
the kind of thermal comfort which a person of even limited resources can enjoy in the 21st century—an era of centralized cooling and smart homes. Thus, availability of technology too determines our definition of (princely) comfort.
Finally, social norms and mores also modify our perception of comfort. A particular location might have a natural temperature range well within the human adaptability range, and might not require the use of electric fans, but such fans might be seen as a status symbol, and people will have them installed anyway, get used to them, and then feel uncomfortable without them. Thus, cultural and social practices play a part in establishing a notion of thermal comfort. Rio de Janeiro in Brazil and Dhaka in Bangladesh have almost identical climatic and weather conditions, but their response to uncomfortable weather is different due to differing cultural practices. Many a time, the reason for this perception is socio-economic. Poorer people may want to have the same thermal comfort which their richer contemporaries enjoy. In most cases, this aspirational desire translates into a demand for exposure to only an ever narrowing range of temperatures.
Let us look at this issue from another important angle. Since comfort is largely a subjective feeling within the broader range of human adaptability, it is possible for a person used to one range of temperatures to get out of the comfort zone and get used to another range of temperatures. Our bodies adjust to changing weather during the course of a year and adjust to the cooler and hotter (if not the coolest and hottest) periods in different seasons. Similarly, when a person from a cold region migrates to a hot region, they will feel more discomfort in the new location in the beginning than those who have lived there longer, but in time they will adjust to the new climate and become more comfortable. The more the difference in the climate of the two regions, the longer they will take to adjust. We can label this time delay in adjustment as thermal inertia.
Nevertheless, even though mankind as a whole has a huge range of thermal adaptability, people used to the lowest rungs of this thermal scale may not be able to adjust to the highest rungs of temperatures in this scale without it affecting their health and well-being adversely and vice versa. For example, an Eskimo might not be able to adjust to the Saharan climate without adverse effects. The smaller range within the larger range of human adaptability to which a particular person can adjust can be termed the thermal elasticity of that person. Besides the climate a person is used to, individual resilience of a body, gender and age are also factors in determining thermal elasticity.
Then there is issue of thermal sensitivity of a person to physically tolerate non-ideal thermal conditions. Pregnant women, unwell individuals, as well as individuals whose age is below 14 or above 60 are known to exhibit different perceptions of thermal comfort than regular adults.43 Existing literature provides consistent evidence that sensitivity to hot and cold spaces usually decreases from childhood to the age of maturity and then increases with age. There is also some evidence of a gradual reduction in the effectiveness of the body to thermo-regulate itself after the age of 60.
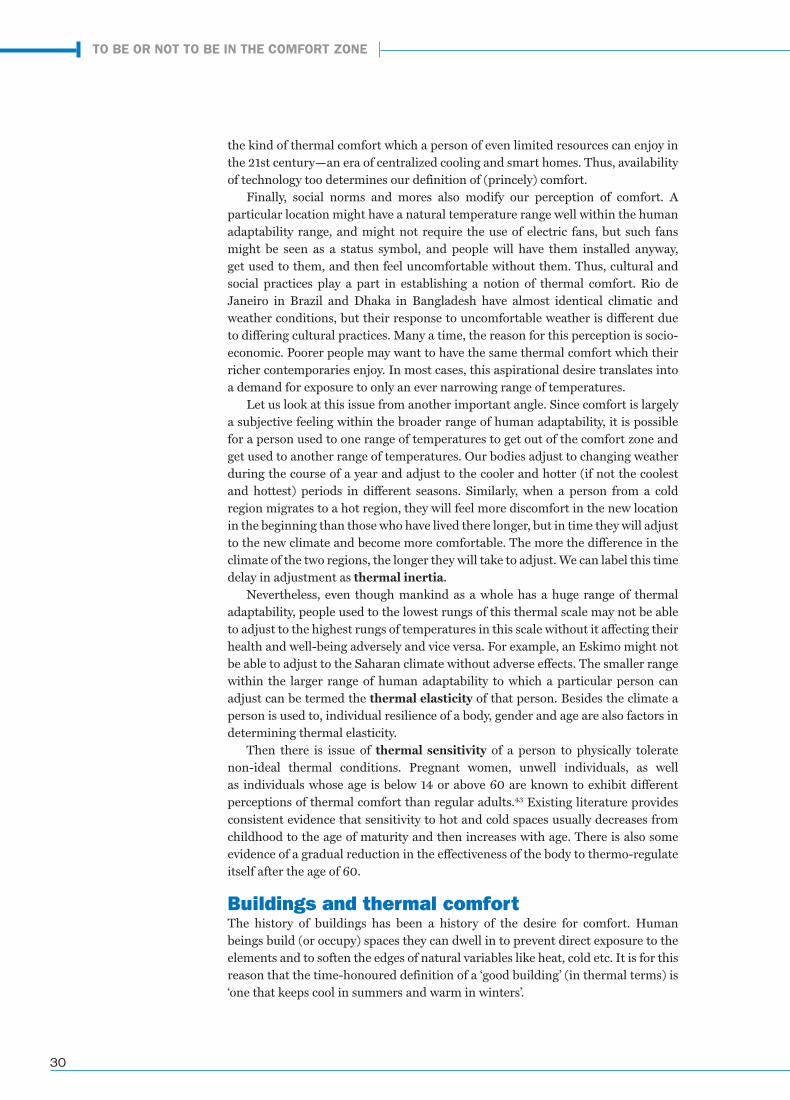
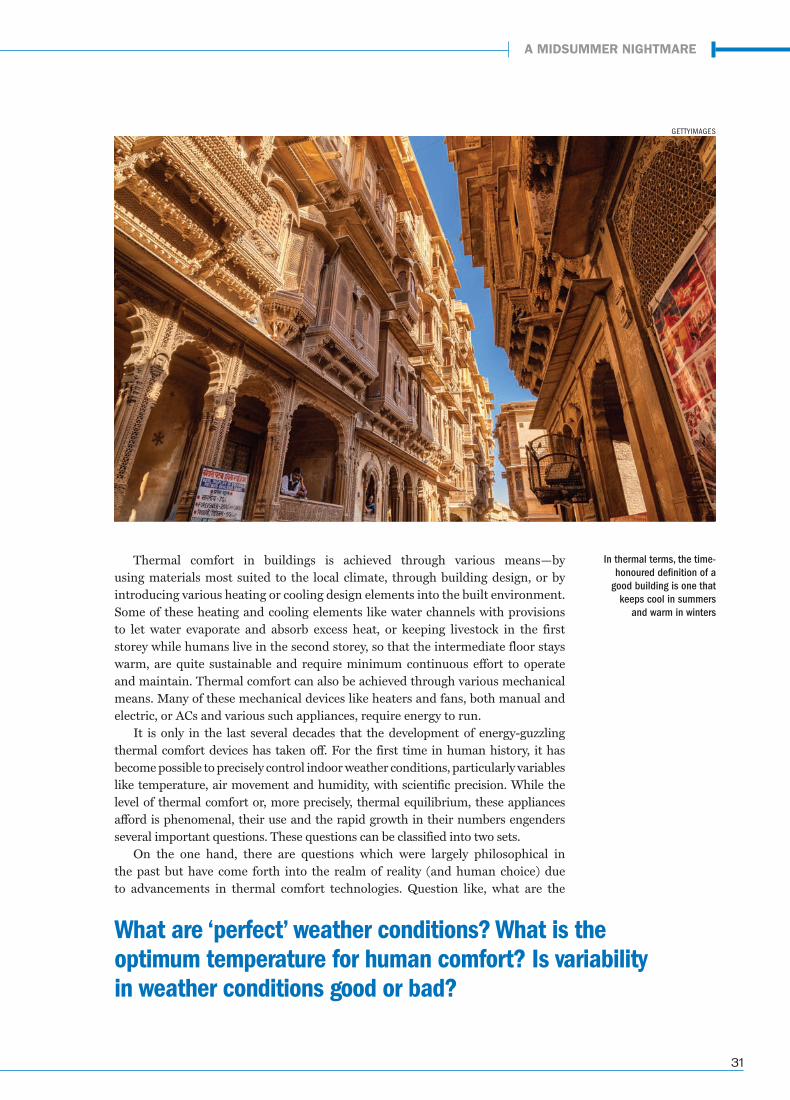
Buildings and thermal comfortThe history of buildings has been a history of the desire for comfort. Human beings build (or occupy) spaces they can dwell in to prevent direct exposure to the elements and to soften the edges of natural variables like heat, cold etc. It is for this reason that the time-honoured definition of a ‘good building’ (in thermal terms) is ‘one that keeps cool in summers and warm in winters’.
TO BE OR NOT TO BE IN THE COMFORT ZONE
thermal comfort report_final.indd 30 06/06/19 2:50 PM
31
Thermal comfort in buildings is achieved through various means—by using materials most suited to the local climate, through building design, or by introducing various heating or cooling design elements into the built environment. Some of these heating and cooling elements like water channels with provisions to let water evaporate and absorb excess heat, or keeping livestock in the first storey while humans live in the second storey, so that the intermediate floor stays warm, are quite sustainable and require minimum continuous effort to operate and maintain. Thermal comfort can also be achieved through various mechanical means. Many of these mechanical devices like heaters and fans, both manual and electric, or ACs and various such appliances, require energy to run.
It is only in the last several decades that the development of energy-guzzling thermal comfort devices has taken off. For the first time in human history, it has become possible to precisely control indoor weather conditions, particularly variables like temperature, air movement and humidity, with scientific precision. While the level of thermal comfort or, more precisely, thermal equilibrium, these appliances afford is phenomenal, their use and the rapid growth in their numbers engenders several important questions. These questions can be classified into two sets.
On the one hand, there are questions which were largely philosophical in the past but have come forth into the realm of reality (and human choice) due to advancements in thermal comfort technologies. Question like, what are the
What are ‘perfect’ weather conditions? What is the optimum temperature for human comfort? Is variability in weather conditions good or bad?
In thermal terms, the time-honoured definition of a
good building is one that keeps cool in summers
and warm in winters
GETTYIMAGES
A MIDSUMMER NIGHTMARE
thermal comfort report_final.indd 31 06/06/19 2:50 PM
32
‘perfect’ weather conditions? What is the optimum temperature for human comfort? Is variability in weather conditions good or bad? Is exposure to a range of temperatures during the day and night, during different seasons and in different regions ideal or should we live in permanently weather-equilibrated conditions?
On the other hand, there are questions linking these philosophical questions with matters of public policy. How much energy is consumed by the thermal comfort sector locally and globally? Where does this energy come from? What are the consequences of producing this energy and routing it to the thermal comfort sector? How much energy will be required to provide thermal comfort for all? What are the effects of climate change on thermal comfort and the resultant energy consumption and how does the energy consumption by the thermal comfort sector, in turn, influence climate change? These questions involve economic, political and environmental issues of energy production and access, equity and sustainability.
TO BE OR NOT TO BE IN THE COMFORT ZONE
thermal comfort report_final.indd 32 06/06/19 2:50 PM
33
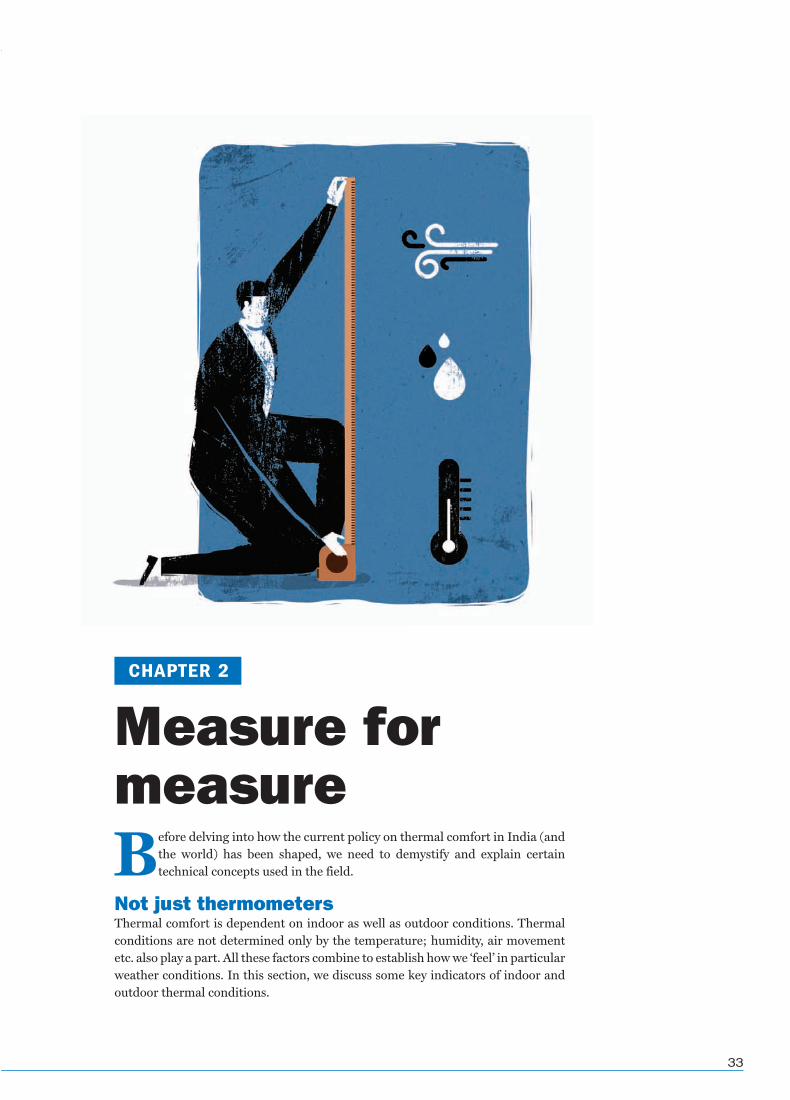
Before delving into how the current policy on thermal comfort in India (and the world) has been shaped, we need to demystify and explain certain technical concepts used in the field.
Not just thermometersThermal comfort is dependent on indoor as well as outdoor conditions. Thermal conditions are not determined only by the temperature; humidity, air movement etc. also play a part. All these factors combine to establish how we ‘feel’ in particular weather conditions. In this section, we discuss some key indicators of indoor and outdoor thermal conditions.
Measure for measure
CHAPTER 2
thermal comfort report_final.indd 33 06/06/19 2:50 PM
34
Outdoors
Heat Index (HI) or humitureIt is an index that combines air temperature and relative humidity in shaded areas to posit a human-perceived equivalent temperature, as how hot it would feel if the humidity were some other value in the shade. The result is also known as the ‘felt air temperature’, ‘apparent temperature’, ‘real feel’ or ‘feels like’. For example, when the temperature is 32°C and relative humidity is at 70 per cent, the heat index is 41°C. At 20 per cent relative humidity, the heat index temperature is equal to the actual air temperature. The formula for calculating heat index temperature varies slightly among countries, taking into account local factors. India has officially not defined a heat index calculation formula. Formulae used in most countries do not account for heat index temperatures of less than 270C.
Wind chillThe term is used to describe what the air temperature feels like on human skin due to a combination of cold temperatures and winds blowing on exposed skin. In simple terms, the colder the air temperature and the higher the wind speeds, the colder it will feel on your skin if you are outside. So even if the temperature remains unchanged, but wind speed increases, it will actually feel colder on your skin. India has officially not defined a wind chill calculation formula.
Wet-bulb globe temperatureA type of apparent temperature used to estimate the effect of temperature, humidity, wind speed (wind chill), and visible and infrared radiation (usually sunlight) on humans. It is used by industrial hygienists, athletes, and the military to determine appropriate exposure levels to extreme temperatures.
Degree daysEssentially, a simplified representation of outside air temperature data. They are widely used in the energy industry for calculations relating to the effect of outside air temperature on building energy consumption. ‘Heating degree days’, or ‘HDD’, are a measure of how much (in degrees Celsius or Fahrenheit), and for how long (in days), the outside air temperature was lower than a specific ‘base temperature’ (or ‘balance point’). They are used in calculations relating to the energy consumption required to heat buildings. ‘Cooling degree days’, or ‘CDD’, are a measure of how much (in degrees Celsius or Fahrenheit), and for how long (in days), the outside air temperature was higher than a specific base temperature. They are used in calculations relating to the energy consumption required to cool buildings. India has not defined any base temperature to facilitate calculation of degree days; therefore, most professionals in India fall back upon the US standard that uses 180C as the base temperature.44 This means that, following the US practice, days with mean temperatures above 180C are seen as requiring cooling by many professionals in India. This is obviously divorced from reality and contrary to the common experience in the country. In most regions of India, hardly anyone would say that they feel hot at temperatures just above 180C.
Indoors
Operative temperatureA uniform temperature of a radiantly black enclosure in which an occupant would
MEASURE FOR MEASURE
thermal comfort report_final.indd 34 06/06/19 2:50 PM
35
exchange the same amount of heat by radiation plus convection as in the actual non-uniform environment. It is the combined effect of the mean radiant temperature and air temperature calculated as an average of the two. It is also known as dry resultant temperature or resultant temperature. It is used for operation of central air conditioning systems. It is also used to define thermal comfort conditions under the Indian Adaptive Comfort Model.
Effective temperatureIt is a measure of the combined effects of air temperature, humidity, air movement, mean radiant temperature, and occupants’ clothing and activity on the sensation of warmth or cold felt by the human body. It is numerically equivalent to the temperature of still air producing similar thermal sensation as produced by a combination of the above six parameters of thermal comfort. It is used under the PMV-PDD models.
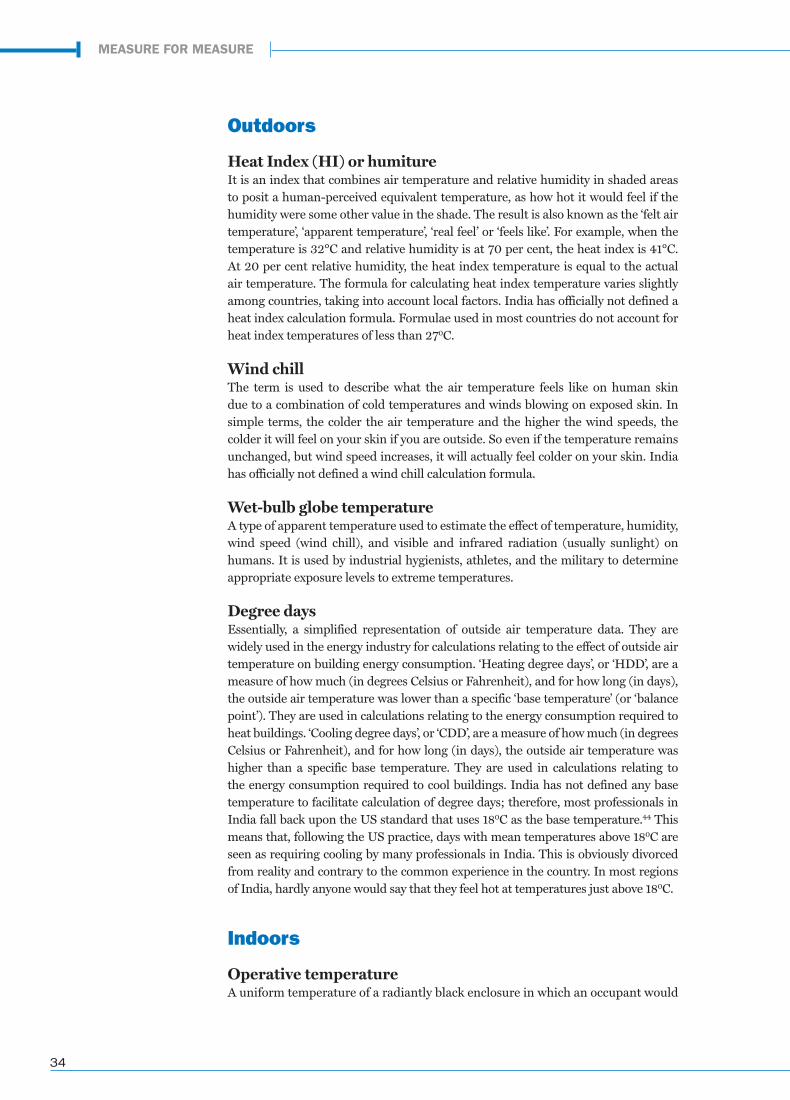
Heat loadIt is the amount of thermal energy that should be removed from an indoor space in order to keep its temperature lower (in the comfort range) than the outside temperature (see Figure 2: Heat load). It depends on the following: a) The thermal energy input from outside, essentially due to solar radiation passing through windows and its effect on the walls and roof, plus the infiltration of (or ventilation with) warm air and leaks of cooled air.b) The thermal energy internally generated, associated with human activities, lighting and operating equipment within the conditioned space.
Total heat load can be estimated fairly accurately by taking into account the building position (latitude) and orientation with regards to the path of the sun; existence of shading (other buildings); material walls and roofs are constructed of;
Figure 2: Heat loadThermal energy that should be removed from an indoor space in order to keep its temperature in the comfort range
Source: CSE
A MIDSUMMER NIGHTMARE
Part of a building's
heat load is generated
internally by human bodies, appliances and
lighting
Part of the heat load is
from the sun, transmitted
through glass windows,
walls and the roof
thermal comfort report_final.indd 35 06/06/19 2:50 PM
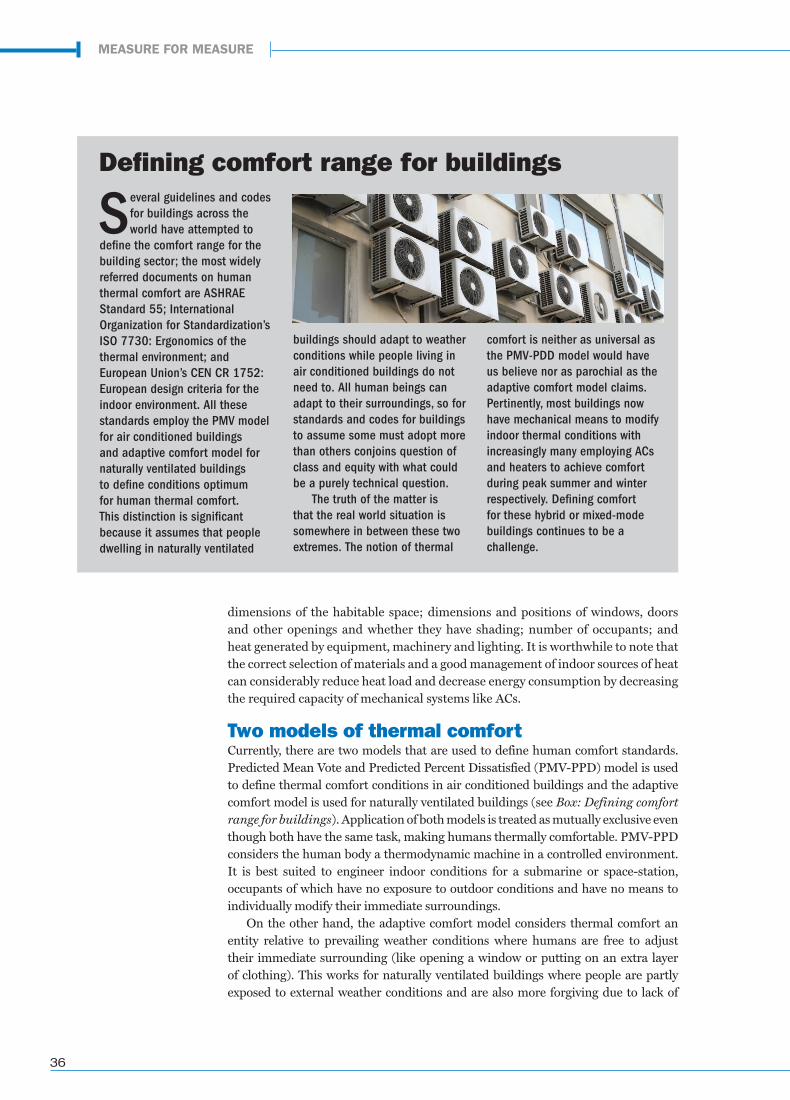
36
dimensions of the habitable space; dimensions and positions of windows, doors and other openings and whether they have shading; number of occupants; and heat generated by equipment, machinery and lighting. It is worthwhile to note that the correct selection of materials and a good management of indoor sources of heat can considerably reduce heat load and decrease energy consumption by decreasing the required capacity of mechanical systems like ACs.
Two models of thermal comfortCurrently, there are two models that are used to define human comfort standards. Predicted Mean Vote and Predicted Percent Dissatisfied (PMV-PPD) model is used to define thermal comfort conditions in air conditioned buildings and the adaptive comfort model is used for naturally ventilated buildings (see Box: Defining comfort range for buildings). Application of both models is treated as mutually exclusive even though both have the same task, making humans thermally comfortable. PMV-PPD considers the human body a thermodynamic machine in a controlled environment. It is best suited to engineer indoor conditions for a submarine or space-station, occupants of which have no exposure to outdoor conditions and have no means to individually modify their immediate surroundings.
On the other hand, the adaptive comfort model considers thermal comfort an entity relative to prevailing weather conditions where humans are free to adjust their immediate surrounding (like opening a window or putting on an extra layer of clothing). This works for naturally ventilated buildings where people are partly exposed to external weather conditions and are also more forgiving due to lack of
Several guidelines and codes for buildings across the world have attempted to
define the comfort range for the building sector; the most widely referred documents on human thermal comfort are ASHRAE Standard 55; International Organization for Standardization’s ISO 7730: Ergonomics of the thermal environment; and European Union’s CEN CR 1752: European design criteria for the indoor environment. All these standards employ the PMV model for air conditioned buildings and adaptive comfort model for naturally ventilated buildings to define conditions optimum for human thermal comfort. This distinction is significant because it assumes that people dwelling in naturally ventilated
buildings should adapt to weather conditions while people living in air conditioned buildings do not need to. All human beings can adapt to their surroundings, so for standards and codes for buildings to assume some must adopt more than others conjoins question of class and equity with what could be a purely technical question.
The truth of the matter is that the real world situation is somewhere in between these two extremes. The notion of thermal
comfort is neither as universal as the PMV-PDD model would have us believe nor as parochial as the adaptive comfort model claims. Pertinently, most buildings now have mechanical means to modify indoor thermal conditions with increasingly many employing ACs and heaters to achieve comfort during peak summer and winter respectively. Defining comfort for these hybrid or mixed-mode buildings continues to be a challenge.
Defining comfort range for buildings
MEASURE FOR MEASURE
thermal comfort report_final.indd 36 06/06/19 2:50 PM
37
means to significantly altering indoor conditions (see Box: India develops Tropical Summer Index).
Predictive Mean VoteDeveloped in 1970 by the Danish professor P.O. Fanger, the Predicted Mean Vote (PMV) model combined human variables of activity and clothing with the environmental variables of air temperature, mean radiant temperature, humidity and relative air velocity to define thermal comfort. It is based on standard thermal comfort surveys that asked subjects about their thermal sensation on a seven-point scale from cold (-3) to hot (+3). PMV was complimented by another equation that calculated the Predicted Percentage of Dissatisfied (PPD). Since individual perceptions of comfort can vary on the basis of health and psychological factors, there is always a large spread of what is deemed comfortable by a population. Therefore, PPD is used to limit the thermal range to ensure that at least 80 per cent occupants are satisfied and would term it ‘comfortable’. The evaluation of the PMV index is not easy, since many of the parameters have to be estimated or require sensing modalities that may not be available. For this reason, both ASHRAE Standard 55 and ISO 7730 have introduced simplified prescription methodologies to define acceptable limits for thermal comfort. ISO 7730’s simplified prescription is to provide an operative temperature of 24.5 ± 1.5°C in summer and 22 ± 2°C in winter.45
These recommendations correspond to zero values of the PMV index (optimum comfort condition), under standard assumptions of the metabolic rate (1.2 metabolic equivalent or met),46 corresponding to sedentary activity, clothing level (0.5 clo in summer and 1 clo in winter),47 relative humidity (60 per cent in summer and 40 per cent in winter) and air velocity corresponding to calm conditions.
Similarly, ASHRAE Standard 55 prescriptions are 23–26°C for summer and 20–23°C for winter.48 Since the PMV model has no relation with the outdoor climatic conditions, the seasonal variation in simplified prescriptions in the standards are function of the assumed change in people’s clothing preference and corresponding insulation between winter and summer. In the real world, most designers and building operators calculate comfort based on the assumption that people wear suits and shoes (formal dressing) year long and there is an average 50 per cent relative humidity. This roughly works out to be 21.5 ± 1.5°C and, for ease of management, buildings are operated throughout the year at this setting.
Adaptive Thermal Comfort ModelThe theory of adaptive thermal comfort developed contemporaneously with PMV-PPD. The model is based on the idea that outdoor climate influences indoor comfort because humans can adapt to different temperatures during different times of the year. The fundamental assumption of the adaptive approach is expressed by the adaptive principle: If a change occurs such as to produce discomfort, people react in ways which tend to restore their comfort. The adaptive hypothesis predicts that contextual factors, such as having access to environmental controls, and past thermal history can influence building occupants' thermal expectations and preferences. ASHRAE Standard 55 introduced the adaptive comfort model in its 2004 revision. The adaptive chart relates indoor comfort temperature to prevailing outdoor temperature and defines zones of 80 per cent and 90 per cent satisfaction.
ASHRAE 55, 2010 Standard introduced the prevailing mean outdoor temperature as the input variable for the adaptive model. It is based on the arithmetic average of the mean daily outdoor temperatures over no fewer than
A MIDSUMMER NIGHTMARE
thermal comfort report_final.indd 37 06/06/19 2:50 PM
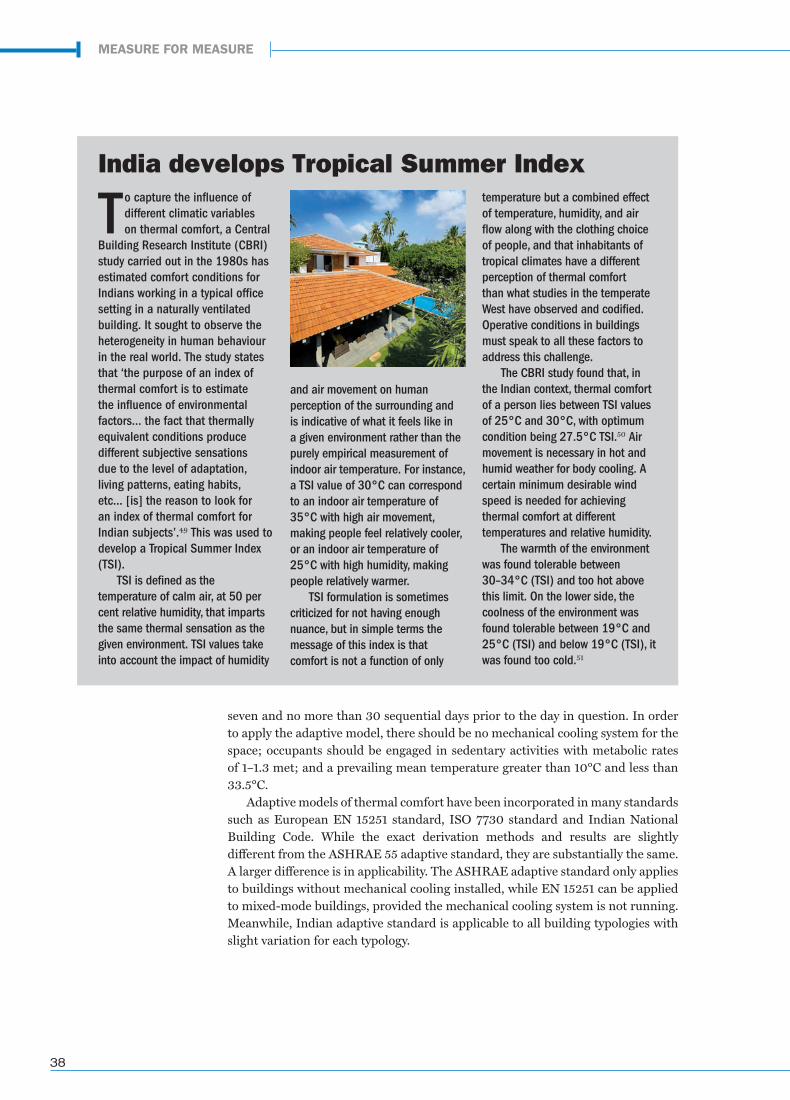
38
seven and no more than 30 sequential days prior to the day in question. In order to apply the adaptive model, there should be no mechanical cooling system for the space; occupants should be engaged in sedentary activities with metabolic rates of 1–1.3 met; and a prevailing mean temperature greater than 10°C and less than 33.5°C.
Adaptive models of thermal comfort have been incorporated in many standards such as European EN 15251 standard, ISO 7730 standard and Indian National Building Code. While the exact derivation methods and results are slightly different from the ASHRAE 55 adaptive standard, they are substantially the same. A larger difference is in applicability. The ASHRAE adaptive standard only applies to buildings without mechanical cooling installed, while EN 15251 can be applied to mixed-mode buildings, provided the mechanical cooling system is not running. Meanwhile, Indian adaptive standard is applicable to all building typologies with slight variation for each typology.
To capture the influence of different climatic variables on thermal comfort, a Central
Building Research Institute (CBRI) study carried out in the 1980s has estimated comfort conditions for Indians working in a typical office setting in a naturally ventilated building. It sought to observe the heterogeneity in human behaviour in the real world. The study states that ‘the purpose of an index of thermal comfort is to estimate the influence of environmental factors… the fact that thermally equivalent conditions produce different subjective sensations due to the level of adaptation, living patterns, eating habits, etc... [is] the reason to look for an index of thermal comfort for Indian subjects’.49 This was used to develop a Tropical Summer Index (TSI).
TSI is defined as the temperature of calm air, at 50 per cent relative humidity, that imparts the same thermal sensation as the given environment. TSI values take into account the impact of humidity
and air movement on human perception of the surrounding and is indicative of what it feels like in a given environment rather than the purely empirical measurement of indoor air temperature. For instance, a TSI value of 30°C can correspond to an indoor air temperature of 35°C with high air movement, making people feel relatively cooler, or an indoor air temperature of 25°C with high humidity, making people relatively warmer.
TSI formulation is sometimes criticized for not having enough nuance, but in simple terms the message of this index is that comfort is not a function of only
temperature but a combined effect of temperature, humidity, and air flow along with the clothing choice of people, and that inhabitants of tropical climates have a different perception of thermal comfort than what studies in the temperate West have observed and codified. Operative conditions in buildings must speak to all these factors to address this challenge.
The CBRI study found that, in the Indian context, thermal comfort of a person lies between TSI values of 25°C and 30°C, with optimum condition being 27.5°C TSI.50 Air movement is necessary in hot and humid weather for body cooling. A certain minimum desirable wind speed is needed for achieving thermal comfort at different temperatures and relative humidity.
The warmth of the environment was found tolerable between 30–34°C (TSI) and too hot above this limit. On the lower side, the coolness of the environment was found tolerable between 19°C and 25°C (TSI) and below 19°C (TSI), it was found too cold.51
India develops Tropical Summer Index
MEASURE FOR MEASURE
thermal comfort report_final.indd 38 06/06/19 2:50 PM
39
In our current discussion, we are concentrating on the use of air conditioning to reduce ambient indoor temperature to a point of comfort. With rising global temperatures due to climate change and an insatiable aspirational desire to
live in lower and lower ambient room temperature conditions, helped along by relentless advertisement campaigns by AC manufacturing and selling industry, the cooling needs of the world have become a severe headache.
But before we dwell any deeper into the challenge of providing thermal comfort, it is important to recognize the overpowering impact of climatic and weather conditions on the expectation of comfort and, in turn, the electricity demand. As climate change becomes more severe, resulting in perceptible changes in average annual mean temperatures and worsening heat island effects in urban centres across India, long-term consequences for cooling and energy demand will be inevitable. It is important to understand these trends.
Joules to cool CHAPTER 3
thermal comfort report_final.indd 39 06/06/19 2:50 PM
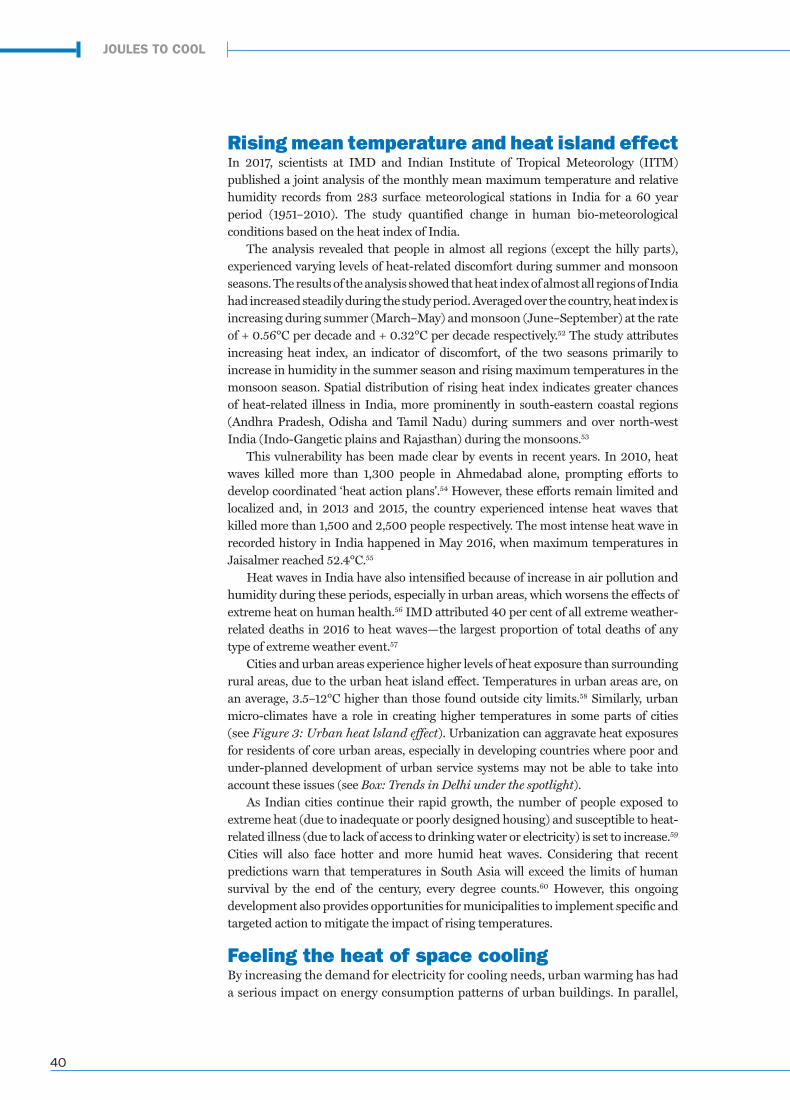
40
Rising mean temperature and heat island effectIn 2017, scientists at IMD and Indian Institute of Tropical Meteorology (IITM) published a joint analysis of the monthly mean maximum temperature and relative humidity records from 283 surface meteorological stations in India for a 60 year period (1951–2010). The study quantified change in human bio-meteorological conditions based on the heat index of India.
The analysis revealed that people in almost all regions (except the hilly parts), experienced varying levels of heat-related discomfort during summer and monsoon seasons. The results of the analysis showed that heat index of almost all regions of India had increased steadily during the study period. Averaged over the country, heat index is increasing during summer (March–May) and monsoon (June–September) at the rate of + 0.56°C per decade and + 0.32°C per decade respectively.52 The study attributes increasing heat index, an indicator of discomfort, of the two seasons primarily to increase in humidity in the summer season and rising maximum temperatures in the monsoon season. Spatial distribution of rising heat index indicates greater chances of heat-related illness in India, more prominently in south-eastern coastal regions (Andhra Pradesh, Odisha and Tamil Nadu) during summers and over north-west India (Indo-Gangetic plains and Rajasthan) during the monsoons.53
This vulnerability has been made clear by events in recent years. In 2010, heat waves killed more than 1,300 people in Ahmedabad alone, prompting efforts to develop coordinated ‘heat action plans'.54 However, these efforts remain limited and localized and, in 2013 and 2015, the country experienced intense heat waves that killed more than 1,500 and 2,500 people respectively. The most intense heat wave in recorded history in India happened in May 2016, when maximum temperatures in Jaisalmer reached 52.4°C.55
Heat waves in India have also intensified because of increase in air pollution and humidity during these periods, especially in urban areas, which worsens the effects of extreme heat on human health.56 IMD attributed 40 per cent of all extreme weather-related deaths in 2016 to heat waves—the largest proportion of total deaths of any type of extreme weather event.57
Cities and urban areas experience higher levels of heat exposure than surrounding rural areas, due to the urban heat island effect. Temperatures in urban areas are, on an average, 3.5–12°C higher than those found outside city limits.58 Similarly, urban micro-climates have a role in creating higher temperatures in some parts of cities (see Figure 3: Urban heat lsland effect). Urbanization can aggravate heat exposures for residents of core urban areas, especially in developing countries where poor and under-planned development of urban service systems may not be able to take into account these issues (see Box: Trends in Delhi under the spotlight).
As Indian cities continue their rapid growth, the number of people exposed to extreme heat (due to inadequate or poorly designed housing) and susceptible to heat-related illness (due to lack of access to drinking water or electricity) is set to increase.59
Cities will also face hotter and more humid heat waves. Considering that recent predictions warn that temperatures in South Asia will exceed the limits of human survival by the end of the century, every degree counts.60 However, this ongoing development also provides opportunities for municipalities to implement specific and targeted action to mitigate the impact of rising temperatures.
Feeling the heat of space coolingBy increasing the demand for electricity for cooling needs, urban warming has had a serious impact on energy consumption patterns of urban buildings. In parallel,
Rural area
Temperature curve
Heat ejected from vehicle exhaust
Heat getting trapped between buildings
Buildingsabsorbing heat
Sub-urban areaUrban area
Heat getting trapped in polluted air
Glass facades reflect heat to surrounding areas as well as pass it to the interiors of the building
Air temperature in cities can be as much as 12°C higher than that in neighbouring, less developed regions
Buildings hinder the flow of cooler air from neighbouring areas into the city
Heat ejected from air conditioners
Pavements and rooftops’ surface temperatures can be 27°C to 50°C hotter than the air
45°C
43°C
39°C
35°C
JOULES TO COOL
thermal comfort report_final.indd 40 06/06/19 2:50 PM
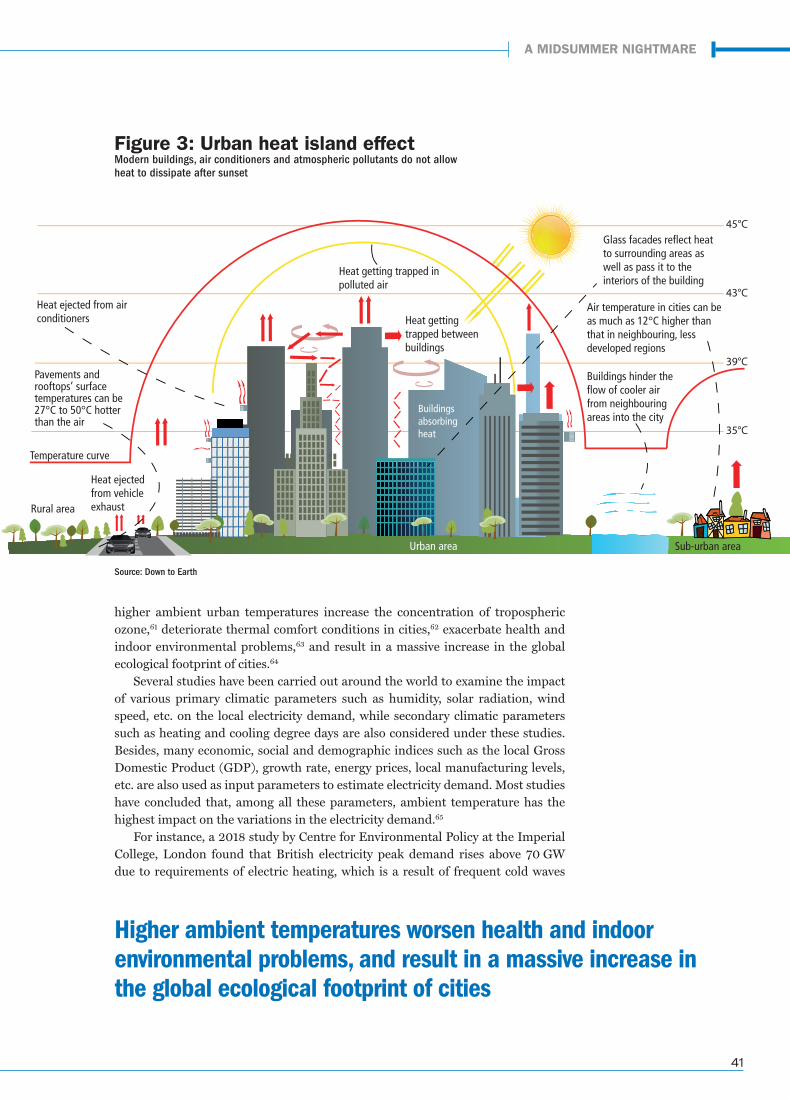
41
higher ambient urban temperatures increase the concentration of tropospheric ozone,61 deteriorate thermal comfort conditions in cities,62 exacerbate health and indoor environmental problems,63 and result in a massive increase in the global ecological footprint of cities.64
Several studies have been carried out around the world to examine the impact of various primary climatic parameters such as humidity, solar radiation, wind speed, etc. on the local electricity demand, while secondary climatic parameters such as heating and cooling degree days are also considered under these studies. Besides, many economic, social and demographic indices such as the local Gross Domestic Product (GDP), growth rate, energy prices, local manufacturing levels, etc. are also used as input parameters to estimate electricity demand. Most studies have concluded that, among all these parameters, ambient temperature has the highest impact on the variations in the electricity demand.65
For instance, a 2018 study by Centre for Environmental Policy at the Imperial College, London found that British electricity peak demand rises above 70 GW due to requirements of electric heating, which is a result of frequent cold waves
Higher ambient temperatures worsen health and indoor environmental problems, and result in a massive increase in the global ecological footprint of cities
Rural area
Temperature curve
Heat ejected from vehicle exhaust
Heat getting trapped between buildings
Buildingsabsorbing heat
Sub-urban areaUrban area
Heat getting trapped in polluted air
Glass facades reflect heat to surrounding areas as well as pass it to the interiors of the building
Air temperature in cities can be as much as 12°C higher than that in neighbouring, less developed regions
Buildings hinder the flow of cooler air from neighbouring areas into the city
Heat ejected from air conditioners
Pavements and rooftops’ surface temperatures can be 27°C to 50°C hotter than the air
45°C
43°C
39°C
35°C
Figure 3: Urban heat island effectModern buildings, air conditioners and atmospheric pollutants do not allow heat to dissipate after sunset
Source: Down to Earth
A MIDSUMMER NIGHTMARE
thermal comfort report_final.indd 41 06/06/19 2:50 PM
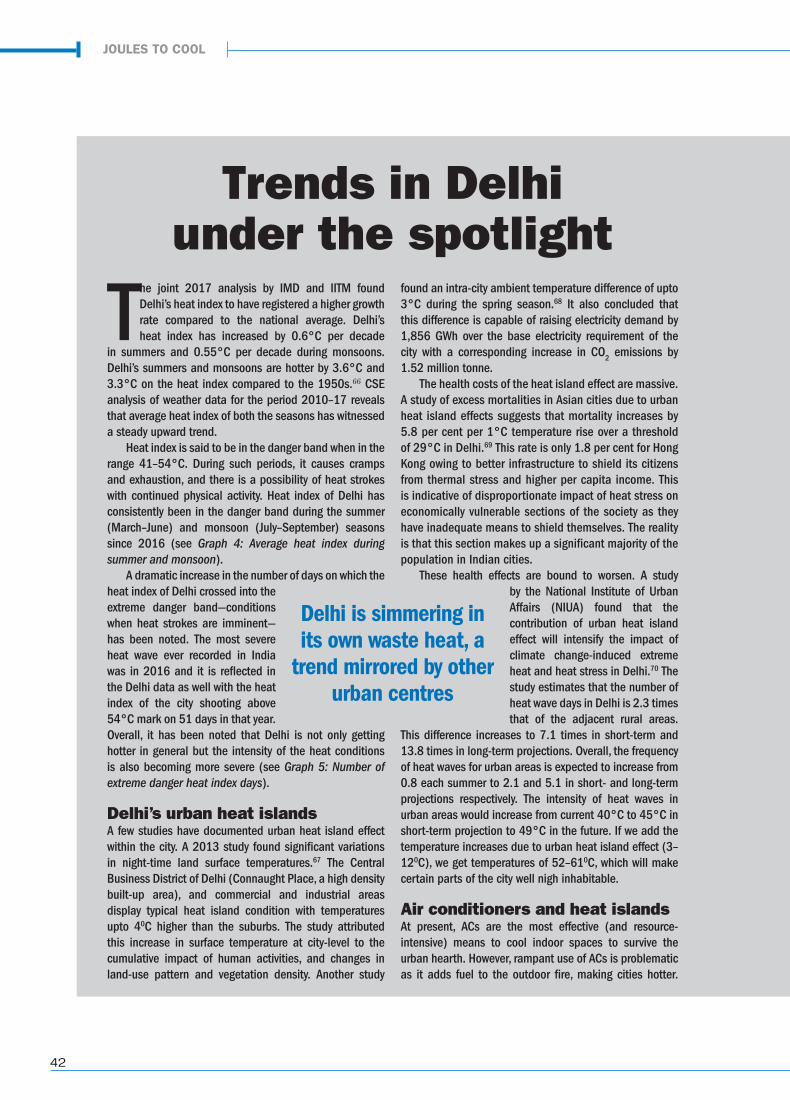
42
The joint 2017 analysis by IMD and IITM found Delhi’s heat index to have registered a higher growth rate compared to the national average. Delhi’s heat index has increased by 0.6°C per decade
in summers and 0.55°C per decade during monsoons. Delhi’s summers and monsoons are hotter by 3.6°C and 3.3°C on the heat index compared to the 1950s.66 CSE analysis of weather data for the period 2010–17 reveals that average heat index of both the seasons has witnessed a steady upward trend.
Heat index is said to be in the danger band when in the range 41–54°C. During such periods, it causes cramps and exhaustion, and there is a possibility of heat strokes with continued physical activity. Heat index of Delhi has consistently been in the danger band during the summer (March–June) and monsoon (July–September) seasons since 2016 (see Graph 4: Average heat index during summer and monsoon).
A dramatic increase in the number of days on which the heat index of Delhi crossed into the extreme danger band—conditions when heat strokes are imminent—has been noted. The most severe heat wave ever recorded in India was in 2016 and it is reflected in the Delhi data as well with the heat index of the city shooting above 54°C mark on 51 days in that year. Overall, it has been noted that Delhi is not only getting hotter in general but the intensity of the heat conditions is also becoming more severe (see Graph 5: Number of extreme danger heat index days).
Delhi’s urban heat islandsA few studies have documented urban heat island effect within the city. A 2013 study found significant variations in night-time land surface temperatures.67 The Central Business District of Delhi (Connaught Place, a high density built-up area), and commercial and industrial areas display typical heat island condition with temperatures upto 40C higher than the suburbs. The study attributed this increase in surface temperature at city-level to the cumulative impact of human activities, and changes in land-use pattern and vegetation density. Another study
found an intra-city ambient temperature difference of upto 3°C during the spring season.68 It also concluded that this difference is capable of raising electricity demand by 1,856 GWh over the base electricity requirement of the city with a corresponding increase in CO2 emissions by 1.52 million tonne.
The health costs of the heat island effect are massive. A study of excess mortalities in Asian cities due to urban heat island effects suggests that mortality increases by 5.8 per cent per 1°C temperature rise over a threshold of 29°C in Delhi.69 This rate is only 1.8 per cent for Hong Kong owing to better infrastructure to shield its citizens from thermal stress and higher per capita income. This is indicative of disproportionate impact of heat stress on economically vulnerable sections of the society as they have inadequate means to shield themselves. The reality is that this section makes up a significant majority of the population in Indian cities.
These health effects are bound to worsen. A study by the National Institute of Urban Affairs (NIUA) found that the contribution of urban heat island effect will intensify the impact of climate change-induced extreme heat and heat stress in Delhi.70 The study estimates that the number of heat wave days in Delhi is 2.3 times that of the adjacent rural areas.
This difference increases to 7.1 times in short-term and 13.8 times in long-term projections. Overall, the frequency of heat waves for urban areas is expected to increase from 0.8 each summer to 2.1 and 5.1 in short- and long-term projections respectively. The intensity of heat waves in urban areas would increase from current 40°C to 45°C in short-term projection to 49°C in the future. If we add the temperature increases due to urban heat island effect (3–120C), we get temperatures of 52–610C, which will make certain parts of the city well nigh inhabitable.
Air conditioners and heat islands At present, ACs are the most effective (and resource-intensive) means to cool indoor spaces to survive the urban hearth. However, rampant use of ACs is problematic as it adds fuel to the outdoor fire, making cities hotter.
Trends in Delhi under the spotlight
Delhi is simmering in its own waste heat, a
trend mirrored by other urban centres
JOULES TO COOL
thermal comfort report_final.indd 42 06/06/19 2:50 PM
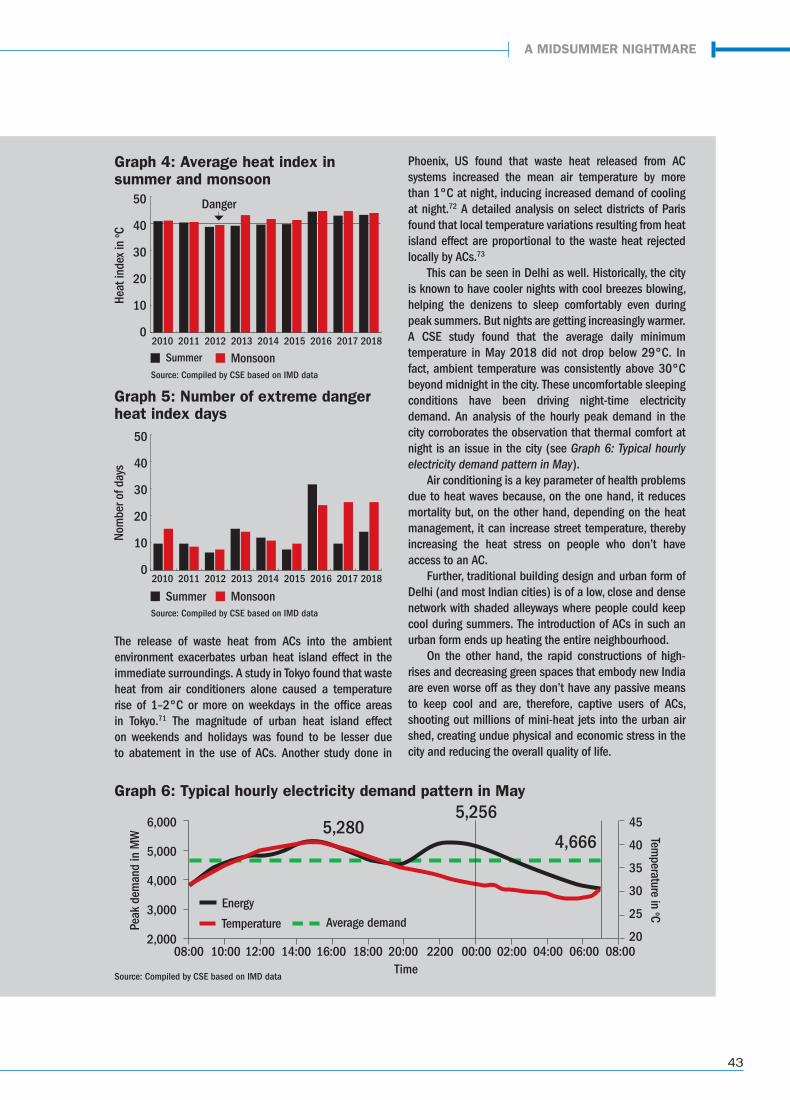
43
The release of waste heat from ACs into the ambient environment exacerbates urban heat island effect in the immediate surroundings. A study in Tokyo found that waste heat from air conditioners alone caused a temperature rise of 1–2°C or more on weekdays in the office areas in Tokyo.71 The magnitude of urban heat island effect on weekends and holidays was found to be lesser due to abatement in the use of ACs. Another study done in
Phoenix, US found that waste heat released from AC systems increased the mean air temperature by more than 1°C at night, inducing increased demand of cooling at night.72 A detailed analysis on select districts of Paris found that local temperature variations resulting from heat island effect are proportional to the waste heat rejected locally by ACs.73
This can be seen in Delhi as well. Historically, the city is known to have cooler nights with cool breezes blowing, helping the denizens to sleep comfortably even during peak summers. But nights are getting increasingly warmer. A CSE study found that the average daily minimum temperature in May 2018 did not drop below 29°C. In fact, ambient temperature was consistently above 30°C beyond midnight in the city. These uncomfortable sleeping conditions have been driving night-time electricity demand. An analysis of the hourly peak demand in the city corroborates the observation that thermal comfort at night is an issue in the city (see Graph 6: Typical hourly electricity demand pattern in May).
Air conditioning is a key parameter of health problems due to heat waves because, on the one hand, it reduces mortality but, on the other hand, depending on the heat management, it can increase street temperature, thereby increasing the heat stress on people who don’t have access to an AC.
Further, traditional building design and urban form of Delhi (and most Indian cities) is of a low, close and dense network with shaded alleyways where people could keep cool during summers. The introduction of ACs in such an urban form ends up heating the entire neighbourhood.
On the other hand, the rapid constructions of high-rises and decreasing green spaces that embody new India are even worse off as they don’t have any passive means to keep cool and are, therefore, captive users of ACs, shooting out millions of mini-heat jets into the urban air shed, creating undue physical and economic stress in the city and reducing the overall quality of life.
6,000
5,000
4,000
3,000
2,00008:00
Energy
Temperature Average demand
Time10:00 12:00 14:00 16:00 18:00 20:00 2200 00:00 02:00 04:00 06:00 08:00
Peak
dem
and
in M
W Temperature in oC
5,2805,256
4,66645
40
35
30
25
20
Graph 6: Typical hourly electricity demand pattern in May
50
40
30
20
10
0
50
40
30
20
10
0
2010 2011 2012 2013 2014 2015 2016 2017 2018
2010 2011 2012 2013 2014 2015 2016 2017 2018
Heat
inde
x in
o CNo
mbe
r of d
ays
Summer
Summer
Monsoon
Danger
Monsoon
Graph 4: Average heat index in summer and monsoon
Graph 5: Number of extreme danger heat index days
Source: Compiled by CSE based on IMD data
Source: Compiled by CSE based on IMD data
Source: Compiled by CSE based on IMD data
A MIDSUMMER NIGHTMARE
thermal comfort report_final.indd 43 06/06/19 2:50 PM
44
in the region and deliberate effort to shift from dirty fuels to electricity to meet space heating needs.74 Another study by the Missouri University of Science and Technology, US found that a one unit increase in heating and cooling degree minutes increases energy use by about 9 per cent and 5 per cent respectively for a conventional house, and 5 per cent and 4 per cent respectively for an energy-efficient house. It also noted that non-temperature variables like solar radiation and humidity affect energy use, where the sensitivity rates for an energy-efficient house are consistently lower than that for a conventional house.75
Increase in the use of air conditioning as a result of rising temperature and improvement in living standards has created and intensified the correlation between electricity demand and the outdoor ambient temperature above the threshold levels. The problem seems to be more significant in zones that require cooling. In fact, a study examining the temperature elasticity of electricity demand for six countries with warm climates (Australia, India, Indonesia, Mexico, Thailand and Venezuela), twenty one countries with mild climates (Austria, Belgium, Denmark, France, Germany, Greece, Hungary, Ireland, Italy, Japan, Korea, Luxembourg, Netherlands, New Zealand, Portugal, South Africa, Spain, Switzerland, Turkey, United Kingdom and United States) and four countries with cold climates (Canada, Finland, Norway and Sweden) concluded that the temperature elasticity for warm countries is close to 1.7 per cent, while for the mild and cold countries is 0.54 per cent and 0.51 per cent respectively.76
A comparative analysis of the percentage increase in electricity demand per degree of temperature rise for select countries shows that the hourly, daily or monthly electricity penalty varies between 0.5 per cent and 8.5 per cent with an average value close to 4.6 per cent. Higher temperature elasticity is reported for some US states because of the very high penetration and use of air conditioning in these areas. The threshold temperatures under which electricity demand starts to increase varies, on an average, it is between 11.7°C and 22°C.77 Higher threshold
ANIRBAN BORAH
JOULES TO COOL
thermal comfort report_final.indd 44 06/06/19 2:50 PM
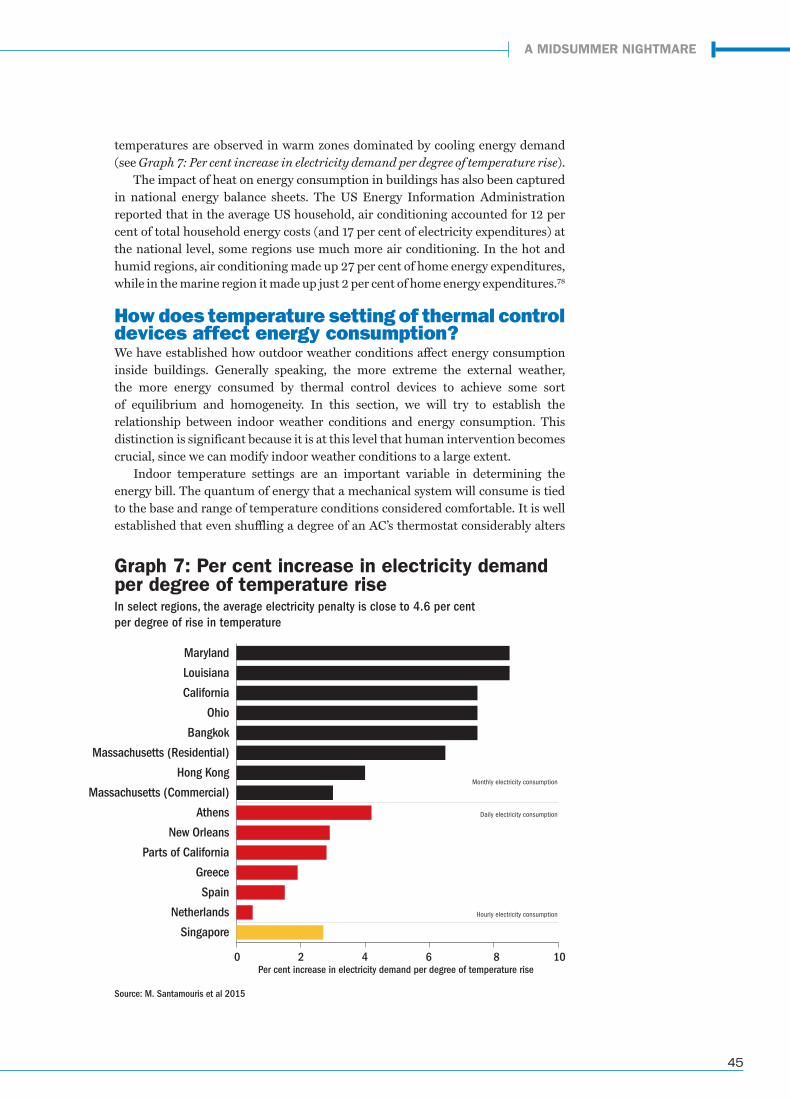
45
temperatures are observed in warm zones dominated by cooling energy demand (see Graph 7: Per cent increase in electricity demand per degree of temperature rise).
The impact of heat on energy consumption in buildings has also been captured in national energy balance sheets. The US Energy Information Administration reported that in the average US household, air conditioning accounted for 12 per cent of total household energy costs (and 17 per cent of electricity expenditures) at the national level, some regions use much more air conditioning. In the hot and humid regions, air conditioning made up 27 per cent of home energy expenditures, while in the marine region it made up just 2 per cent of home energy expenditures.78
How does temperature setting of thermal control devices affect energy consumption?We have established how outdoor weather conditions affect energy consumption inside buildings. Generally speaking, the more extreme the external weather, the more energy consumed by thermal control devices to achieve some sort of equilibrium and homogeneity. In this section, we will try to establish the relationship between indoor weather conditions and energy consumption. This distinction is significant because it is at this level that human intervention becomes crucial, since we can modify indoor weather conditions to a large extent.
Indoor temperature settings are an important variable in determining the energy bill. The quantum of energy that a mechanical system will consume is tied to the base and range of temperature conditions considered comfortable. It is well established that even shuffling a degree of an AC’s thermostat considerably alters
Graph 7: Per cent increase in electricity demand per degree of temperature riseIn select regions, the average electricity penalty is close to 4.6 per cent per degree of rise in temperature
Hourly electricity consumption
Daily electricity consumption
Monthly electricity consumption
Maryland
Louisiana
California
Ohio
Bangkok
Massachusetts (Residential)
Hong Kong
Massachusetts (Commercial)
Athens
New Orleans
Parts of California
Greece
Spain
Netherlands
Singapore
0 2 4 6 8 10Per cent increase in electricity demand per degree of temperature rise
Source: M. Santamouris et al 2015
A MIDSUMMER NIGHTMARE
thermal comfort report_final.indd 45 06/06/19 2:50 PM
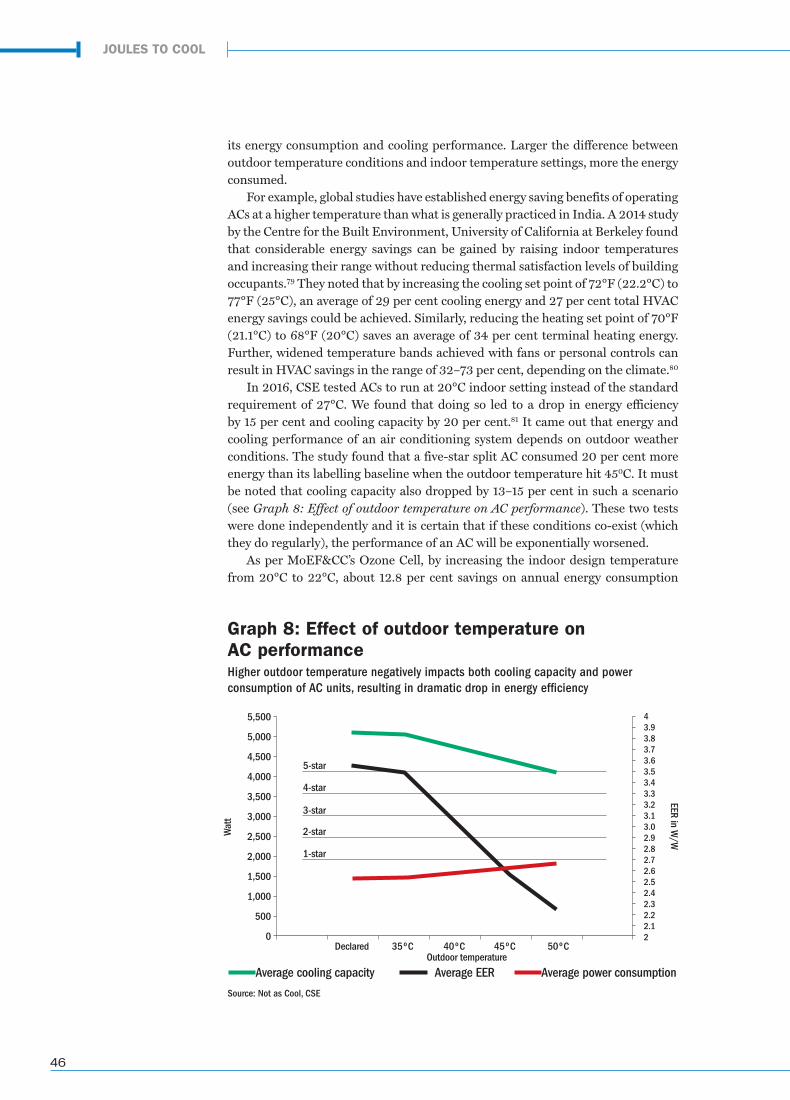
46
its energy consumption and cooling performance. Larger the difference between outdoor temperature conditions and indoor temperature settings, more the energy consumed.
For example, global studies have established energy saving benefits of operating ACs at a higher temperature than what is generally practiced in India. A 2014 study by the Centre for the Built Environment, University of California at Berkeley found that considerable energy savings can be gained by raising indoor temperatures and increasing their range without reducing thermal satisfaction levels of building occupants.79 They noted that by increasing the cooling set point of 72°F (22.2°C) to 77°F (25°C), an average of 29 per cent cooling energy and 27 per cent total HVAC energy savings could be achieved. Similarly, reducing the heating set point of 70°F (21.1°C) to 68°F (20°C) saves an average of 34 per cent terminal heating energy. Further, widened temperature bands achieved with fans or personal controls can result in HVAC savings in the range of 32–73 per cent, depending on the climate.80
In 2016, CSE tested ACs to run at 20°C indoor setting instead of the standard requirement of 27°C. We found that doing so led to a drop in energy efficiency by 15 per cent and cooling capacity by 20 per cent.81 It came out that energy and cooling performance of an air conditioning system depends on outdoor weather conditions. The study found that a five-star split AC consumed 20 per cent more energy than its labelling baseline when the outdoor temperature hit 450C. It must be noted that cooling capacity also dropped by 13–15 per cent in such a scenario (see Graph 8: Effect of outdoor temperature on AC performance). These two tests were done independently and it is certain that if these conditions co-exist (which they do regularly), the performance of an AC will be exponentially worsened.
As per MoEF&CC’s Ozone Cell, by increasing the indoor design temperature from 20°C to 22°C, about 12.8 per cent savings on annual energy consumption
Graph 8: Effect of outdoor temperature on AC performanceHigher outdoor temperature negatively impacts both cooling capacity and power consumption of AC units, resulting in dramatic drop in energy efficiency
Source: Not as Cool, CSE
5,500
5,000
4,500
4,000
3,500
3,000
2,500
2,000
1,500
1,000
500
0Declared 35ºC 40ºC 45ºC 50ºC
43.93.83.73.63.53.43.33.23.13.02.92.82.72.62.52.42.32.22.12
Wat
t
EER in W/W
Average cooling capacity Average power consumptionAverage EEROutdoor temperature
JOULES TO COOL
1-star
2-star
3-star
4-star
5-star
thermal comfort report_final.indd 46 06/06/19 2:50 PM
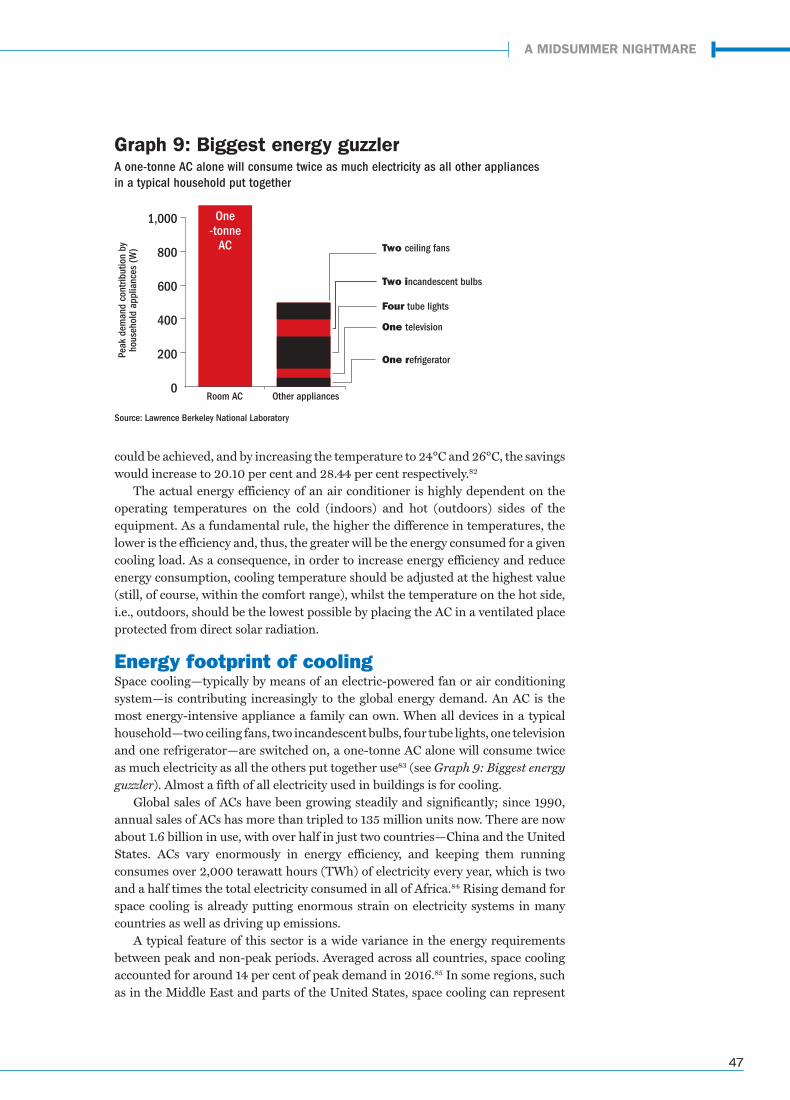
47
could be achieved, and by increasing the temperature to 24°C and 26°C, the savings would increase to 20.10 per cent and 28.44 per cent respectively.82
The actual energy efficiency of an air conditioner is highly dependent on the operating temperatures on the cold (indoors) and hot (outdoors) sides of the equipment. As a fundamental rule, the higher the difference in temperatures, the lower is the efficiency and, thus, the greater will be the energy consumed for a given cooling load. As a consequence, in order to increase energy efficiency and reduce energy consumption, cooling temperature should be adjusted at the highest value (still, of course, within the comfort range), whilst the temperature on the hot side, i.e., outdoors, should be the lowest possible by placing the AC in a ventilated place protected from direct solar radiation.
Energy footprint of coolingSpace cooling—typically by means of an electric-powered fan or air conditioning system—is contributing increasingly to the global energy demand. An AC is the most energy-intensive appliance a family can own. When all devices in a typical household—two ceiling fans, two incandescent bulbs, four tube lights, one television and one refrigerator—are switched on, a one-tonne AC alone will consume twice as much electricity as all the others put together use83 (see Graph 9: Biggest energy guzzler). Almost a fifth of all electricity used in buildings is for cooling.
Global sales of ACs have been growing steadily and significantly; since 1990, annual sales of ACs has more than tripled to 135 million units now. There are now about 1.6 billion in use, with over half in just two countries—China and the United States. ACs vary enormously in energy efficiency, and keeping them running consumes over 2,000 terawatt hours (TWh) of electricity every year, which is two and a half times the total electricity consumed in all of Africa.84 Rising demand for space cooling is already putting enormous strain on electricity systems in many countries as well as driving up emissions.
A typical feature of this sector is a wide variance in the energy requirements between peak and non-peak periods. Averaged across all countries, space cooling accounted for around 14 per cent of peak demand in 2016.85 In some regions, such as in the Middle East and parts of the United States, space cooling can represent
Graph 9: Biggest energy guzzler A one-tonne AC alone will consume twice as much electricity as all other appliances in a typical household put together
1,000
800
600
400
200
0
One refrigerator
One television
Four tube lights
Two incandescent bulbs
Two ceiling fans
Peak
dem
and
cont
ribut
ion
by
hous
ehol
d ap
plia
nces
(W)
Room AC Other appliances
One -tonne
AC
Source: Lawrence Berkeley National Laboratory
A MIDSUMMER NIGHTMARE
thermal comfort report_final.indd 47 06/06/19 2:50 PM
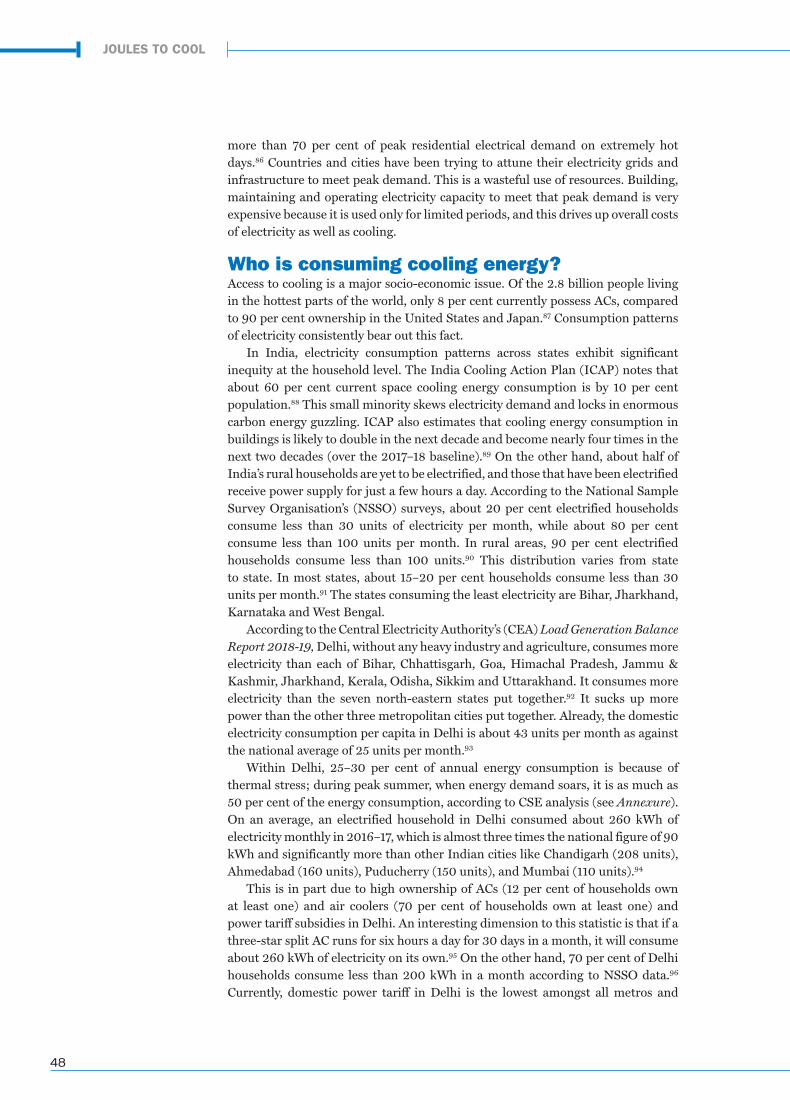
48
more than 70 per cent of peak residential electrical demand on extremely hot days.86 Countries and cities have been trying to attune their electricity grids and infrastructure to meet peak demand. This is a wasteful use of resources. Building, maintaining and operating electricity capacity to meet that peak demand is very expensive because it is used only for limited periods, and this drives up overall costs of electricity as well as cooling.
Who is consuming cooling energy?Access to cooling is a major socio-economic issue. Of the 2.8 billion people living in the hottest parts of the world, only 8 per cent currently possess ACs, compared to 90 per cent ownership in the United States and Japan.87 Consumption patterns of electricity consistently bear out this fact.
In India, electricity consumption patterns across states exhibit significant inequity at the household level. The India Cooling Action Plan (ICAP) notes that about 60 per cent current space cooling energy consumption is by 10 per cent population.88 This small minority skews electricity demand and locks in enormous carbon energy guzzling. ICAP also estimates that cooling energy consumption in buildings is likely to double in the next decade and become nearly four times in the next two decades (over the 2017–18 baseline).89 On the other hand, about half of India’s rural households are yet to be electrified, and those that have been electrified receive power supply for just a few hours a day. According to the National Sample Survey Organisation’s (NSSO) surveys, about 20 per cent electrified households consume less than 30 units of electricity per month, while about 80 per cent consume less than 100 units per month. In rural areas, 90 per cent electrified households consume less than 100 units.90 This distribution varies from state to state. In most states, about 15–20 per cent households consume less than 30 units per month.91 The states consuming the least electricity are Bihar, Jharkhand, Karnataka and West Bengal.
According to the Central Electricity Authority’s (CEA) Load Generation Balance Report 2018-19, Delhi, without any heavy industry and agriculture, consumes more electricity than each of Bihar, Chhattisgarh, Goa, Himachal Pradesh, Jammu & Kashmir, Jharkhand, Kerala, Odisha, Sikkim and Uttarakhand. It consumes more electricity than the seven north-eastern states put together.92 It sucks up more power than the other three metropolitan cities put together. Already, the domestic electricity consumption per capita in Delhi is about 43 units per month as against the national average of 25 units per month.93
Within Delhi, 25–30 per cent of annual energy consumption is because of thermal stress; during peak summer, when energy demand soars, it is as much as 50 per cent of the energy consumption, according to CSE analysis (see Annexure). On an average, an electrified household in Delhi consumed about 260 kWh of electricity monthly in 2016–17, which is almost three times the national figure of 90 kWh and significantly more than other Indian cities like Chandigarh (208 units), Ahmedabad (160 units), Puducherry (150 units), and Mumbai (110 units).94
This is in part due to high ownership of ACs (12 per cent of households own at least one) and air coolers (70 per cent of households own at least one) and power tariff subsidies in Delhi. An interesting dimension to this statistic is that if a three-star split AC runs for six hours a day for 30 days in a month, it will consume about 260 kWh of electricity on its own.95 On the other hand, 70 per cent of Delhi households consume less than 200 kWh in a month according to NSSO data.96
Currently, domestic power tariff in Delhi is the lowest amongst all metros and
JOULES TO COOL
thermal comfort report_final.indd 48 06/06/19 2:50 PM
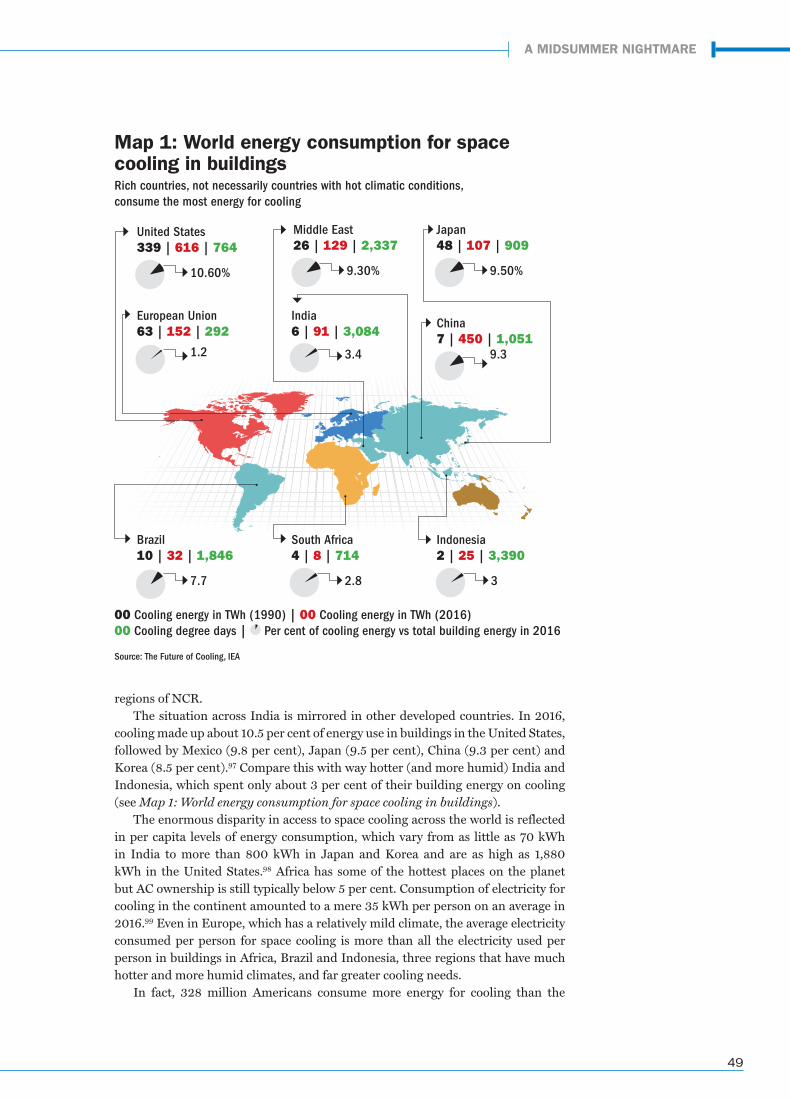
49
regions of NCR.The situation across India is mirrored in other developed countries. In 2016,
cooling made up about 10.5 per cent of energy use in buildings in the United States, followed by Mexico (9.8 per cent), Japan (9.5 per cent), China (9.3 per cent) and Korea (8.5 per cent).97 Compare this with way hotter (and more humid) India and Indonesia, which spent only about 3 per cent of their building energy on cooling (see Map 1: World energy consumption for space cooling in buildings).
The enormous disparity in access to space cooling across the world is reflected in per capita levels of energy consumption, which vary from as little as 70 kWh in India to more than 800 kWh in Japan and Korea and are as high as 1,880 kWh in the United States.98 Africa has some of the hottest places on the planet but AC ownership is still typically below 5 per cent. Consumption of electricity for cooling in the continent amounted to a mere 35 kWh per person on an average in 2016.99 Even in Europe, which has a relatively mild climate, the average electricity consumed per person for space cooling is more than all the electricity used per person in buildings in Africa, Brazil and Indonesia, three regions that have much hotter and more humid climates, and far greater cooling needs.
In fact, 328 million Americans consume more energy for cooling than the
Map 1: World energy consumption for space cooling in buildings Rich countries, not necessarily countries with hot climatic conditions, consume the most energy for cooling
United States339 | 616 | 764
10.60%
India6 | 91 | 3,084
3.4
European Union63 | 152 | 292
1.2
South Africa4 | 8 | 714
2.8 3
Indonesia2 | 25 | 3,390
Japan48 | 107 | 909
9.50%
Middle East26 | 129 | 2,337
9.30%
Brazil10 | 32 | 1,846
7.7
00 Cooling energy in TWh (1990) | 00 Cooling energy in TWh (2016) 00 Cooling degree days | Per cent of cooling energy vs total building energy in 2016
China7 | 450 | 1,051
9.3
Source: The Future of Cooling, IEA
A MIDSUMMER NIGHTMARE
thermal comfort report_final.indd 49 06/06/19 2:50 PM
50
4.4 billion people living in all of Africa, Latin America, the Middle East and Asia (excluding China), and just under all of the electricity used for all their needs by the 1.2 billion people in Africa.100
The hunger for space cooling is siphoning off electricity needed for other purposes, raising concerns about the rural–urban and rich–poor divide on the issue of access to electricity.
Where is energy for cooling going to come from?These trends are likely to continue in a business-as-usual scenario. In India, for example, the share of space cooling in peak electricity load is projected to rise sharply, from 10 per cent today to about 45 per cent in 2050.101 Electricity consumption is only going to grow—and exponentially. Even at the current growth rate, the number of ACs sold in 2030 will be 40 million units.102 CSE estimates that by then electricity consumed by ACs alone (even after accounting for improvements in efficiency) would double to 450 TWh in the domestic and commercial sectors. This is equal to the electricity produced by 65 power plants of 1,000 MW each. It will seriously jeopardize the policy desire to provide ‘electricity to all’, as the projected growth in power production will be gobbled up by the use of ravenous ACs.
Here we are not even talking about the new buzzword of policy advocates—‘cooling for all’. Our analysis reveals that if every household in India runs one AC unit (of the most efficient vintage available in the market) for seven months a year, the total electricity required will be at least 1,750 TWh—120 per cent of the total electricity produced by India in 2017–18. Turns out that ‘cooling for all’ cannot share a room with ‘electricity for all’.
Moreover, AC use during a 24-hour period is not uniform, nor does it match well with solar power production cycle. The Lawrence Berkeley National Laboratory (LBNL), in a paper titled The 100 power plant question, has estimated that there is a 40 per cent difference in the afternoon peak and 60 per cent difference in the evening peak in cities like Delhi because of electricity demand by ACs.103 In other words, these cities would use 40–60 per cent less power if they did not have ACs. The projected increased supply of renewable power will be essential to meet this demand, a major portion of which is going to come from solar power. But it will still not be sufficient, as the daily pattern of solar power supply does not always match that of cooling demand, with high cooling demand in many countries lasting well after the sun has gone down.
For instance, in Delhi in May 2018, the daily peak electricity demand was registered around midnight on 21 days. A typical summer day in Delhi has two peaks, one during the day (driven by commercial activities) and other around midnight (driven by residential sector). On an average, these two peaks have become almost identical in 2018, in terms of consumption. As a result, electricity systems will have to install and maintain huge battery infrastructure for storage of solar power, which will be prohibitively expensive. Alternatively, they will have to install large (and equally
The energy consumption for cooling of 328 million Americans is almost the same as the energy consumed
by 1.2 billion people of Africa for all their needs
JOULES TO COOL
thermal comfort report_final.indd 50 06/06/19 2:50 PM
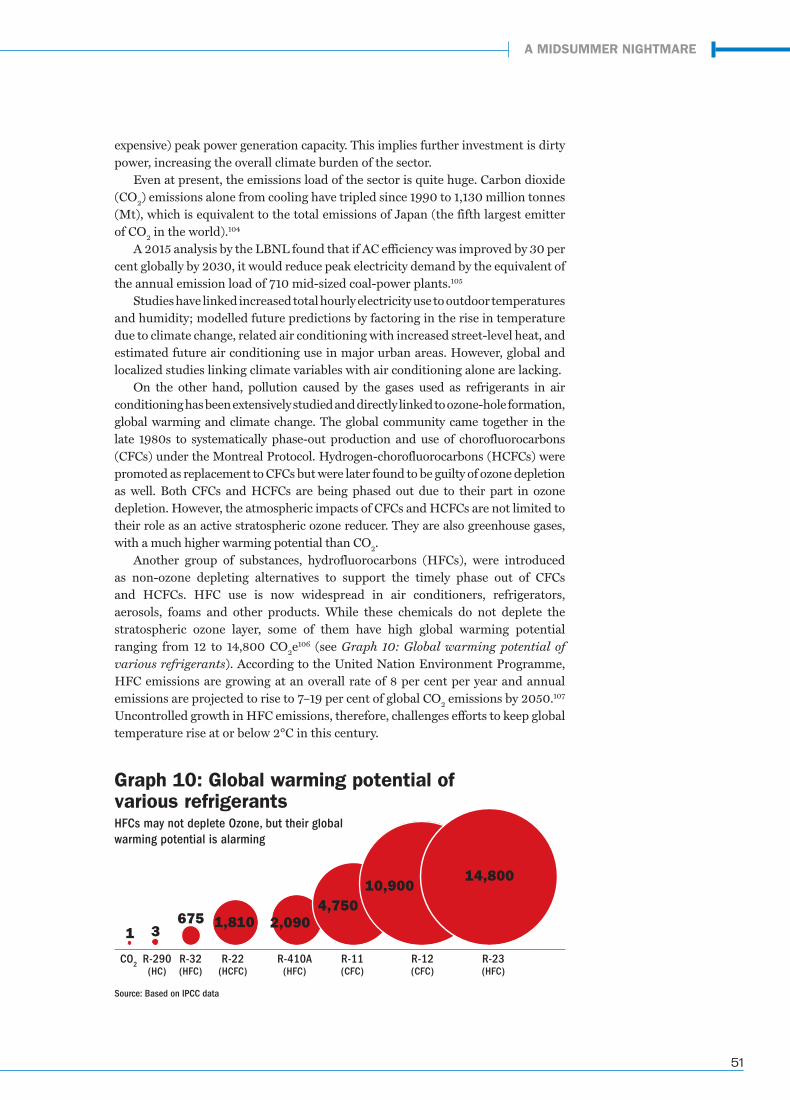
51
expensive) peak power generation capacity. This implies further investment is dirty power, increasing the overall climate burden of the sector.
Even at present, the emissions load of the sector is quite huge. Carbon dioxide (CO2) emissions alone from cooling have tripled since 1990 to 1,130 million tonnes (Mt), which is equivalent to the total emissions of Japan (the fifth largest emitter of CO2 in the world).104
A 2015 analysis by the LBNL found that if AC efficiency was improved by 30 per cent globally by 2030, it would reduce peak electricity demand by the equivalent of the annual emission load of 710 mid-sized coal-power plants.105
Studies have linked increased total hourly electricity use to outdoor temperatures and humidity; modelled future predictions by factoring in the rise in temperature due to climate change, related air conditioning with increased street-level heat, and estimated future air conditioning use in major urban areas. However, global and localized studies linking climate variables with air conditioning alone are lacking.
On the other hand, pollution caused by the gases used as refrigerants in air conditioning has been extensively studied and directly linked to ozone-hole formation, global warming and climate change. The global community came together in the late 1980s to systematically phase-out production and use of chorofluorocarbons (CFCs) under the Montreal Protocol. Hydrogen-chorofluorocarbons (HCFCs) were promoted as replacement to CFCs but were later found to be guilty of ozone depletion as well. Both CFCs and HCFCs are being phased out due to their part in ozone depletion. However, the atmospheric impacts of CFCs and HCFCs are not limited to their role as an active stratospheric ozone reducer. They are also greenhouse gases, with a much higher warming potential than CO2.
Another group of substances, hydrofluorocarbons (HFCs), were introduced as non-ozone depleting alternatives to support the timely phase out of CFCs and HCFCs. HFC use is now widespread in air conditioners, refrigerators, aerosols, foams and other products. While these chemicals do not deplete the stratospheric ozone layer, some of them have high global warming potential ranging from 12 to 14,800 CO2e106 (see Graph 10: Global warming potential of various refrigerants). According to the United Nation Environment Programme, HFC emissions are growing at an overall rate of 8 per cent per year and annual emissions are projected to rise to 7–19 per cent of global CO2 emissions by 2050.107
Uncontrolled growth in HFC emissions, therefore, challenges efforts to keep global temperature rise at or below 2°C in this century.
Graph 10: Global warming potential of various refrigerants HFCs may not deplete Ozone, but their global warming potential is alarming
CO2
1 3675
R-290(HC)
R-32(HFC)
R-22(HCFC)
R-410A(HFC)
R-11(CFC)
R-12(CFC)
R-23(HFC)
1,810 2,0904,750
10,90014,800
Source: Based on IPCC data
A MIDSUMMER NIGHTMARE
thermal comfort report_final.indd 51 06/06/19 2:50 PM
52
Parties to the Montreal Protocol reached an agreement at their 28th Meeting of the Parties on 15 October 2016 in Kigali, Rwanda to phase-down HFCs. Countries agreed to add HFCs to the list of controlled substances, and approved a timeline for their gradual reduction by 80–85 per cent by the late 2040s.108
The first reductions by developed countries are expected to take place in 2019. Developing countries will follow suit with a freeze of HFC consumption levels in 2024 (in 2028 for some nations).
Using alternative and renewable forms of energy and refrigerants on a wide-scale might slow down its climate impact, but turning on an air conditioner will always mean guzzling of resources. The only way to limit the damage is to make as little use of ACs as possible, and utilize only energy-efficient air conditioners when there is no other option.
The other side of the debate is the issue of equity. Air conditioning will remain out of reach for many, even as it increasingly becomes a necessity. In 2014, Public Health England raised concerns that ‘the distribution of cooling systems may reflect socio-economic inequalities unless they are heavily subsidized,’ (even in rich and cooler country like the UK) adding that rising fuel costs could further exacerbate this problem.109 Energy cost of merely running a super-efficient AC would be at minimum 30 kWh a day for a household owning one 1.5 tonne AC unit according to CSE estimate. This would translate into a monthly electricity bill of about Rs 5,000 at Delhi domestic power tariff rates assuming the household doesn’t use electricity for anything else. This amount is equal to the median household income of India, meaning half of all households in India earn less than what it would require to operate the most efficient AC available in the market. Poverty line in India is defined as Rs 1,407 per month for urban India and about 30 per cent Indian population lives below the poverty line.110 It is very clear that a majority of India’s citizenry won’t be able to afford to run ACs even if they were to be given for free and charged the lowest electricity rates (Delhi has the lowest domestic power rate in the country). The survival of this marginalized but huge chunk of population without ACs is being endangered by the waste heat being dumped on them by the ACs of the rich.
Yet another side of the debate is prioritizing the use of energy. Given the limited supply of energy, should a society be spending it on fighting sweat stains or providing healthcare. About 90 per cent of India’s PHCs report undergoing power cuts between 9.00 a.m. and 4.00 p.m., a period during which the PHCs functions at their peak capacity.111 Shouldn’t they get preference in the long queue for electricity?
At the same time, it is important to recognize that as climate change becomes more manifest and with changes in average annual mean temperature and worsening heat island effect in India (and the world), there are long-term consequences for cooling and energy demand. This results in a vicious cycle, where the thermal comfort sector contributes significantly to changing weather and temperature patterns due to climate change that, in turn, create demand for even more unsustainable thermal equilibrium appliances and technologies. It is important to understand these trends, and devise intelligent and equitable strategies to deal with the imminent crisis.
JOULES TO COOL
thermal comfort report_final.indd 52 06/06/19 2:50 PM
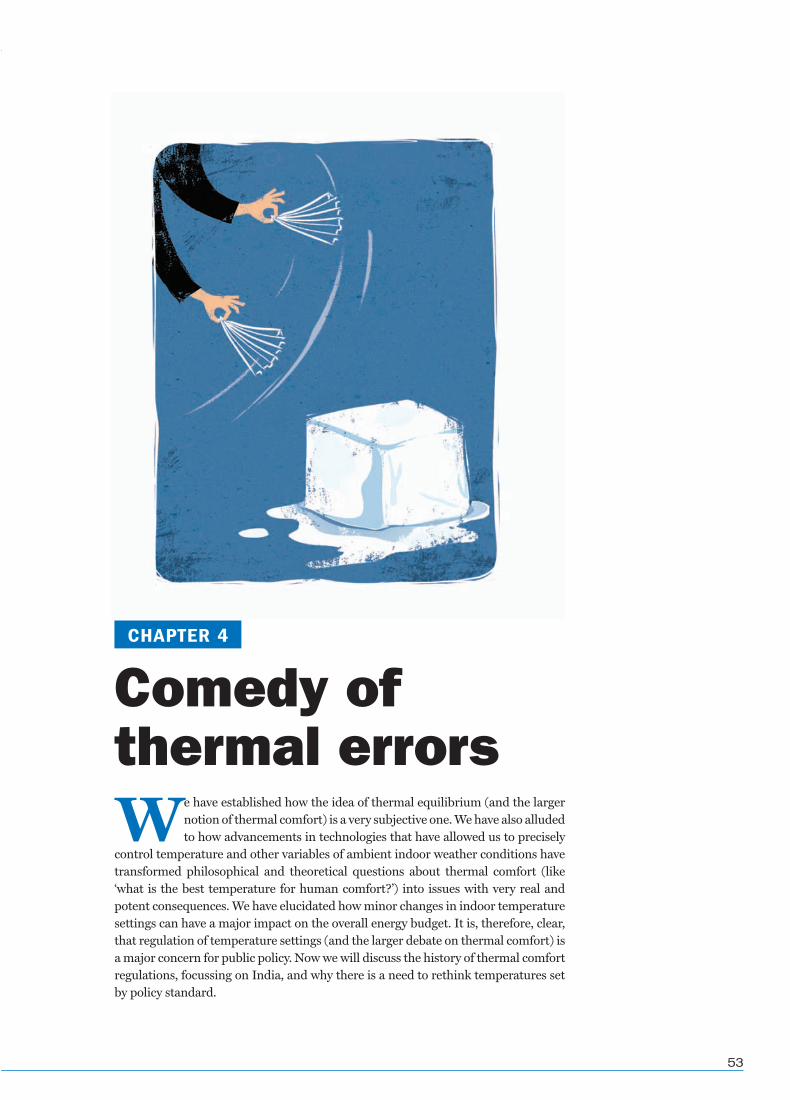
53
We have established how the idea of thermal equilibrium (and the larger notion of thermal comfort) is a very subjective one. We have also alluded to how advancements in technologies that have allowed us to precisely
control temperature and other variables of ambient indoor weather conditions have transformed philosophical and theoretical questions about thermal comfort (like ‘what is the best temperature for human comfort?’) into issues with very real and potent consequences. We have elucidated how minor changes in indoor temperature settings can have a major impact on the overall energy budget. It is, therefore, clear, that regulation of temperature settings (and the larger debate on thermal comfort) is a major concern for public policy. Now we will discuss the history of thermal comfort regulations, focussing on India, and why there is a need to rethink temperatures set by policy standard.
Comedy of thermal errors
CHAPTER 4
thermal comfort report_final.indd 53 06/06/19 2:50 PM
54
Evolution of comfort standards globally With the invention of air-conditioning in the 1910s, indoor weather condition became an engineering problem. Thermal comfort discussions and scientific enquiry vis-à-vis laws of thermodynamics gained momentum by the 1930s. By and by, these led to the creation of ANSI/ASHRAE Standard 55 (Thermal Environmental Conditions for Human Occupancy standards), first published in 1966 by the ASHRAE.
Development of the PMV-PPD model in the 1970s led to revision of ASHRAE Standard 55 in 1974 that made PMV-PPD the tool to define thermal comfort requirements inside buildings. It began as an industry standard but the HVAC industry successfully lobbied to make it legally binding for building construction in the US. Eventually, PMV-PPD catapulted to global application with ISO 7730 (ergonomics of the thermal environment) adopting it in 1984 and CEN CR 1752 (European design criteria for indoor environment) in 1998.
The most bewildering aspect of these legislative nods to the PMV-PPD-based thermal comfort standard was that they assumed universal applicability across building types irrespective of whether they were to be air conditioned or not. This wider application of PMV-PPD can be attributed to vested interest of and its limited understanding by HVAC industry as the scientist community had been clear about its limitations. O.P. Fanger, the developer of PMV-PPD, himself noted in the introduction of his 1970 engineering guide that PMV is exclusively meant for centrally controlled HVAC buildings where occupants have little or no control over their immediate thermal environment.112
There was obviously a conflict of interest as the thermal comfort science and standard were being developed by the HVAC industry itself. Over the years, the standard has gone through various revisions and adjustments have been made in its measurement protocols, but these interventions have almost exclusively been sculpted to serve the interests of the HVAC industry. The definition of thermal comfort was narrowed to such an extent that it became almost impossible to design a
There is a blatant conflict of interest as the thermal comfort science and standards are developed by the HVAC industry itself
GETTYIMAGES
COMEDY OF THERMAL ERRORS
thermal comfort report_final.indd 54 06/06/19 2:50 PM
55
building without having an HVAC system even in relatively mild climatic zones where outdoor weather is pleasant throughout the year.113 Any broadening or exception to the standard would have adversely affected the growth of the HVAC industry.
Repeated criticism of the standard by scientists and practitioners for ignoring adaptive nature of humans and it non-applicability to naturally ventilated buildings prompted ASHRAE to sponsor an extensive study into the issue in the late 1990s. The ASHRAE RP-884 project tasked to ‘examine the adaptive hypothesis and its implications for ASHRAE Standard 55’ submitted its finding in 1998. It was helmed by Richard de Dear of Sydney-based Macquarie University and Gail Schiller Brager of University of California, Berkeley.
The study discovered—if a discovery of such an obvious thing is even possible—that people constantly adapt to their immediate surroundings in both naturally ventilated and air conditioned buildings even though the scale and range of adaptation varies. It concluded that PMV model was being grossly misused, noting:
Fanger was quite clear that his book, and by implication the PMV model at its core, were
intended for application by the HVAC industry in the creation of artificial climates in
controlled spaces. The extrapolation of the model’s scope to all spaces intended for human
occupancy, including those with natural ventilation, was a much later development that
the results in this paper fail to justify… Current standards such as ANSI/ASHRAE 55-1992
and the PMV model prescribe a much too narrow range of conditions in such buildings, are
inappropriate for predicting acceptability, and are unsuitable guides for deciding when and
where HVAC systems are required.114
Dear and Brager proposed drafting a different standard for naturally ventilated buildings as a measure to fix the problem with ASHRAE Standard 55. They also suggested minor adjustment to the then prevalent PVM model. ASHRAE revised their Standard 55 in 2004 to introduce the adaptive comfort model solely meant for naturally ventilated buildings. European EN 15251 and ISO 7730 standards followed the ASHRAE lead and incorporated adaptive models of thermal comfort for naturally ventilated buildings.
While there have been many field studies gathering valuable information from people conducting their activities in everyday environments, including research into the person–environment relationship and the factors that affect thermal comfort in a built environment, studies are still mostly conducted in controlled environments and analyze issues individually. In some situations, thermal comfort cannot be fully explained by the six classic variables (two human and four environmental). There are a number of other factors that influence the sensation of thermal comfort, like cultural and behavioural aspects, age, gender, space layout, possibility of control over the environment, user’s thermal history and individual preferences. Static and homogeneous environments leading to thermal monotony, an expensive solution, previously preferred, is giving way to dynamic environments, in which wider ranges of indoor temperature are preferred and natural ventilation is desired. The use of personalized conditioning systems is probably the best way to increase user
Expensive static environments leading to thermal monotony are giving way to dynamic environments with a range of indoor temperatures and natural ventilation
A MIDSUMMER NIGHTMARE
thermal comfort report_final.indd 55 06/06/19 2:50 PM
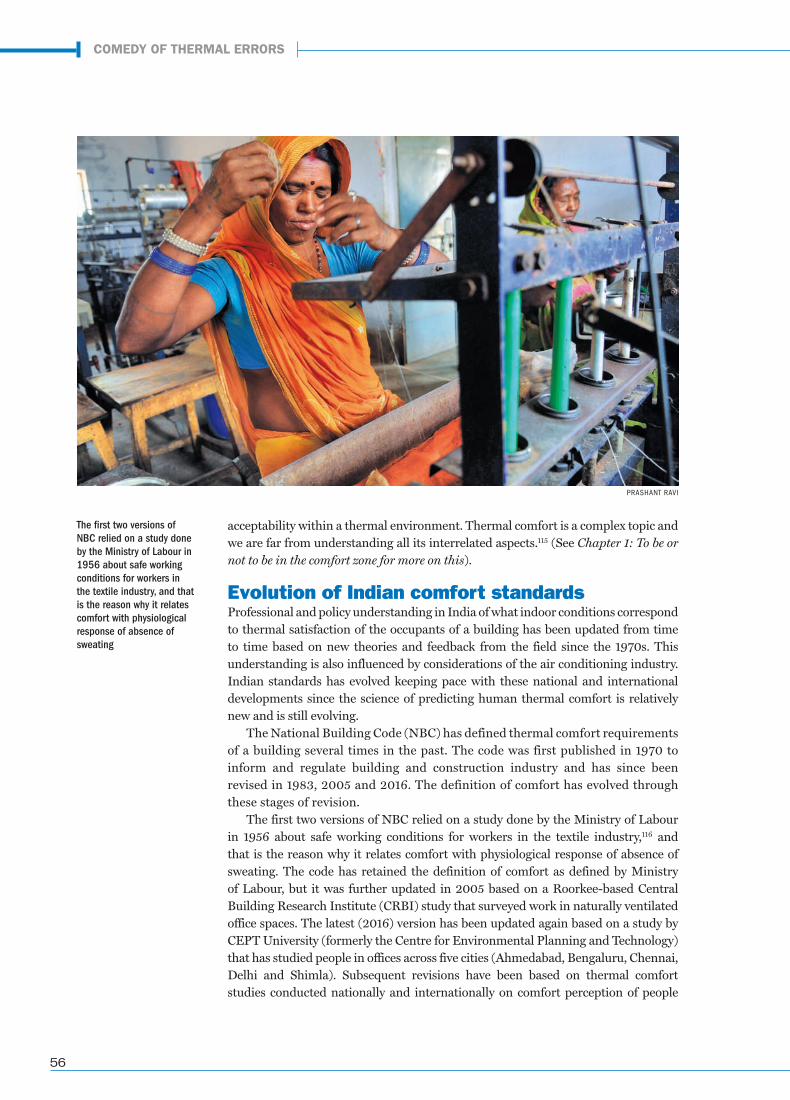
56
acceptability within a thermal environment. Thermal comfort is a complex topic and we are far from understanding all its interrelated aspects.115 (See Chapter 1: To be or not to be in the comfort zone for more on this).
Evolution of Indian comfort standardsProfessional and policy understanding in India of what indoor conditions correspond to thermal satisfaction of the occupants of a building has been updated from time to time based on new theories and feedback from the field since the 1970s. This understanding is also influenced by considerations of the air conditioning industry. Indian standards has evolved keeping pace with these national and international developments since the science of predicting human thermal comfort is relatively new and is still evolving.
The National Building Code (NBC) has defined thermal comfort requirements of a building several times in the past. The code was first published in 1970 to inform and regulate building and construction industry and has since been revised in 1983, 2005 and 2016. The definition of comfort has evolved through these stages of revision.
The first two versions of NBC relied on a study done by the Ministry of Labour in 1956 about safe working conditions for workers in the textile industry,116 and that is the reason why it relates comfort with physiological response of absence of sweating. The code has retained the definition of comfort as defined by Ministry of Labour, but it was further updated in 2005 based on a Roorkee-based Central Building Research Institute (CRBI) study that surveyed work in naturally ventilated office spaces. The latest (2016) version has been updated again based on a study by CEPT University (formerly the Centre for Environmental Planning and Technology) that has studied people in offices across five cities (Ahmedabad, Bengaluru, Chennai, Delhi and Shimla). Subsequent revisions have been based on thermal comfort studies conducted nationally and internationally on comfort perception of people
The first two versions of NBC relied on a study done by the Ministry of Labour in 1956 about safe working conditions for workers in the textile industry, and that is the reason why it relates comfort with physiological response of absence of sweating
PRASHANT RAVI
COMEDY OF THERMAL ERRORS
thermal comfort report_final.indd 56 06/06/19 2:50 PM
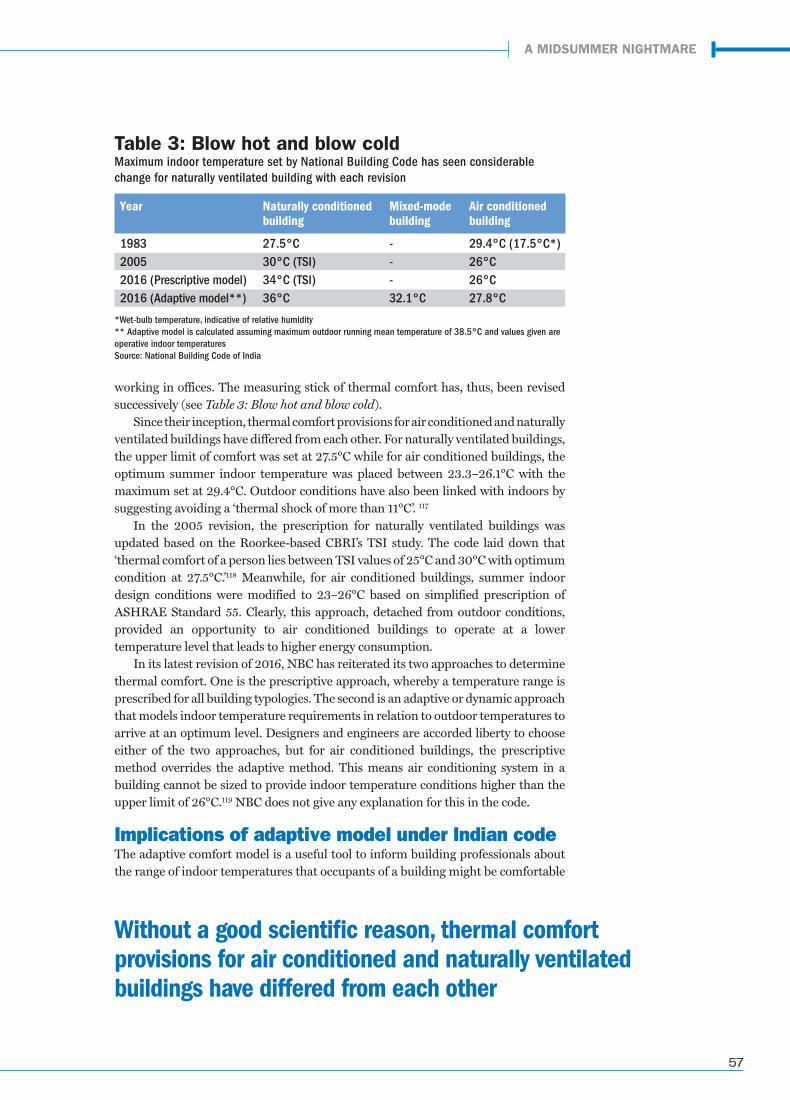
57
working in offices. The measuring stick of thermal comfort has, thus, been revised successively (see Table 3: Blow hot and blow cold).
Since their inception, thermal comfort provisions for air conditioned and naturally ventilated buildings have differed from each other. For naturally ventilated buildings, the upper limit of comfort was set at 27.5°C while for air conditioned buildings, the optimum summer indoor temperature was placed between 23.3–26.1°C with the maximum set at 29.4°C. Outdoor conditions have also been linked with indoors by suggesting avoiding a ‘thermal shock of more than 11°C’. 117
In the 2005 revision, the prescription for naturally ventilated buildings was updated based on the Roorkee-based CBRI’s TSI study. The code laid down that ‘thermal comfort of a person lies between TSI values of 25°C and 30°C with optimum condition at 27.5°C.’118 Meanwhile, for air conditioned buildings, summer indoor design conditions were modified to 23–26°C based on simplified prescription of ASHRAE Standard 55. Clearly, this approach, detached from outdoor conditions, provided an opportunity to air conditioned buildings to operate at a lower temperature level that leads to higher energy consumption.
In its latest revision of 2016, NBC has reiterated its two approaches to determine thermal comfort. One is the prescriptive approach, whereby a temperature range is prescribed for all building typologies. The second is an adaptive or dynamic approach that models indoor temperature requirements in relation to outdoor temperatures to arrive at an optimum level. Designers and engineers are accorded liberty to choose either of the two approaches, but for air conditioned buildings, the prescriptive method overrides the adaptive method. This means air conditioning system in a building cannot be sized to provide indoor temperature conditions higher than the upper limit of 26°C.119 NBC does not give any explanation for this in the code.
Implications of adaptive model under Indian codeThe adaptive comfort model is a useful tool to inform building professionals about the range of indoor temperatures that occupants of a building might be comfortable
Table 3: Blow hot and blow coldMaximum indoor temperature set by National Building Code has seen considerable change for naturally ventilated building with each revision
198320052016 (Prescriptive model)2016 (Adaptive model**)
27.5°C30°C (TSI)34°C (TSI)36°C
---32.1°C
29.4°C (17.5°C*)26°C26°C27.8°C
Year Naturally conditioned building
Mixed-mode building
Air conditioned building
*Wet-bulb temperature, indicative of relative humidity ** Adaptive model is calculated assuming maximum outdoor running mean temperature of 38.5°C and values given are operative indoor temperaturesSource: National Building Code of India
Without a good scientific reason, thermal comfort provisions for air conditioned and naturally ventilated buildings have differed from each other
A MIDSUMMER NIGHTMARE
thermal comfort report_final.indd 57 06/06/19 2:50 PM
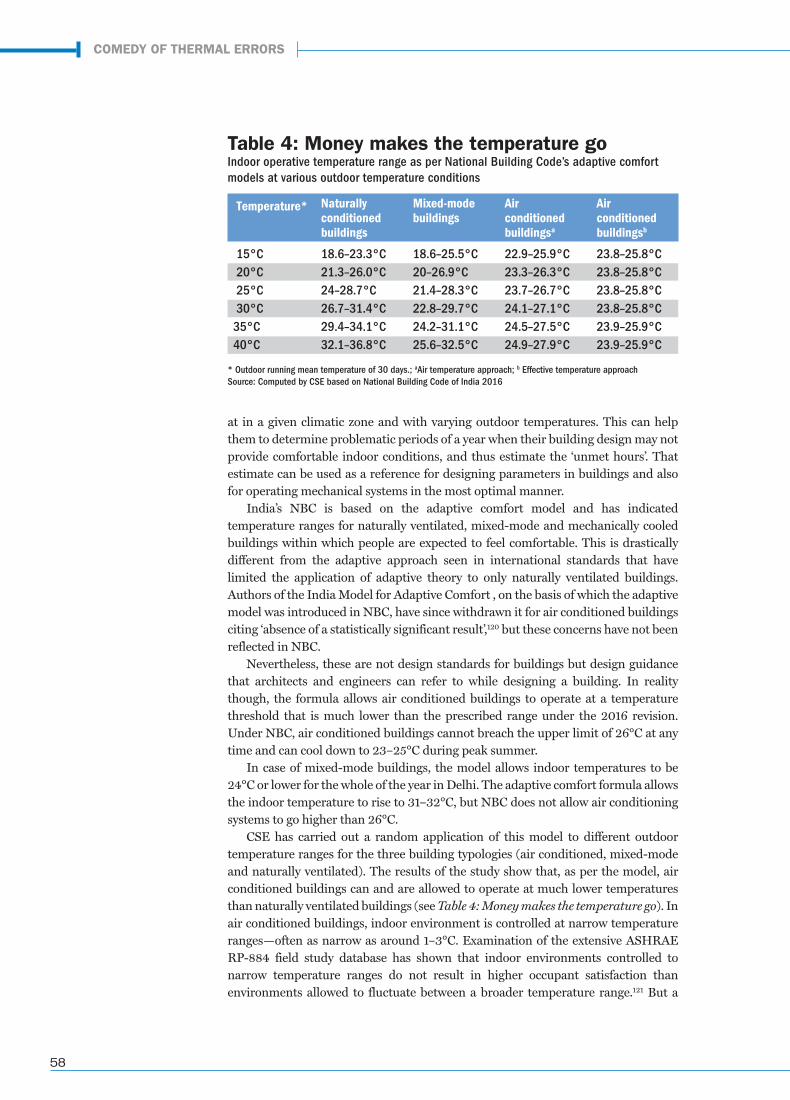
58
at in a given climatic zone and with varying outdoor temperatures. This can help them to determine problematic periods of a year when their building design may not provide comfortable indoor conditions, and thus estimate the ‘unmet hours’. That estimate can be used as a reference for designing parameters in buildings and also for operating mechanical systems in the most optimal manner.
India’s NBC is based on the adaptive comfort model and has indicated temperature ranges for naturally ventilated, mixed-mode and mechanically cooled buildings within which people are expected to feel comfortable. This is drastically different from the adaptive approach seen in international standards that have limited the application of adaptive theory to only naturally ventilated buildings. Authors of the India Model for Adaptive Comfort , on the basis of which the adaptive model was introduced in NBC, have since withdrawn it for air conditioned buildings citing ‘absence of a statistically significant result’,120 but these concerns have not been reflected in NBC.
Nevertheless, these are not design standards for buildings but design guidance that architects and engineers can refer to while designing a building. In reality though, the formula allows air conditioned buildings to operate at a temperature threshold that is much lower than the prescribed range under the 2016 revision. Under NBC, air conditioned buildings cannot breach the upper limit of 26°C at any time and can cool down to 23–25°C during peak summer.
In case of mixed-mode buildings, the model allows indoor temperatures to be 24°C or lower for the whole of the year in Delhi. The adaptive comfort formula allows the indoor temperature to rise to 31–32°C, but NBC does not allow air conditioning systems to go higher than 26°C.
CSE has carried out a random application of this model to different outdoor temperature ranges for the three building typologies (air conditioned, mixed-mode and naturally ventilated). The results of the study show that, as per the model, air conditioned buildings can and are allowed to operate at much lower temperatures than naturally ventilated buildings (see Table 4: Money makes the temperature go). In air conditioned buildings, indoor environment is controlled at narrow temperature ranges—often as narrow as around 1–3°C. Examination of the extensive ASHRAE RP-884 field study database has shown that indoor environments controlled to narrow temperature ranges do not result in higher occupant satisfaction than environments allowed to fluctuate between a broader temperature range.121 But a
Table 4: Money makes the temperature goIndoor operative temperature range as per National Building Code’s adaptive comfort models at various outdoor temperature conditions
15°C 20°C 25°C 30°C35°C40°C
18.6–23.3°C 21.3–26.0°C 24–28.7°C26.7–31.4°C29.4–34.1°C32.1–36.8°C
18.6–25.5°C20–26.9°C21.4–28.3°C22.8–29.7°C24.2–31.1°C25.6–32.5°C
22.9–25.9°C 23.3–26.3°C23.7–26.7°C24.1–27.1°C24.5–27.5°C24.9–27.9°C
23.8–25.8°C23.8–25.8°C23.8–25.8°C23.8–25.8°C23.9–25.9°C23.9–25.9°C
Temperature* Naturally conditioned buildings
Mixed-mode buildings
Air conditioned buildingsa
Air conditioned buildingsb
* Outdoor running mean temperature of 30 days.; aAir temperature approach; b Effective temperature approachSource: Computed by CSE based on National Building Code of India 2016
COMEDY OF THERMAL ERRORS
thermal comfort report_final.indd 58 06/06/19 2:50 PM
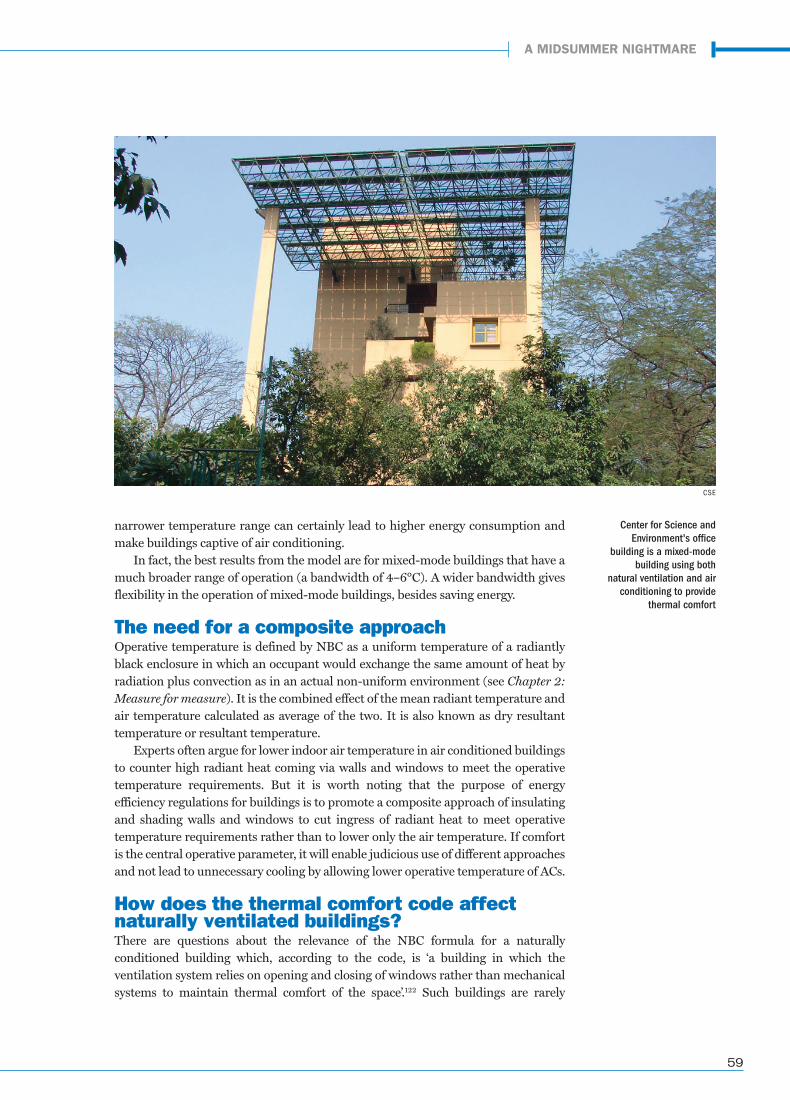
59
narrower temperature range can certainly lead to higher energy consumption and make buildings captive of air conditioning.
In fact, the best results from the model are for mixed-mode buildings that have a much broader range of operation (a bandwidth of 4–6°C). A wider bandwidth gives flexibility in the operation of mixed-mode buildings, besides saving energy.
The need for a composite approachOperative temperature is defined by NBC as a uniform temperature of a radiantly black enclosure in which an occupant would exchange the same amount of heat by radiation plus convection as in an actual non-uniform environment (see Chapter 2: Measure for measure). It is the combined effect of the mean radiant temperature and air temperature calculated as average of the two. It is also known as dry resultant temperature or resultant temperature.
Experts often argue for lower indoor air temperature in air conditioned buildings to counter high radiant heat coming via walls and windows to meet the operative temperature requirements. But it is worth noting that the purpose of energy efficiency regulations for buildings is to promote a composite approach of insulating and shading walls and windows to cut ingress of radiant heat to meet operative temperature requirements rather than to lower only the air temperature. If comfort is the central operative parameter, it will enable judicious use of different approaches and not lead to unnecessary cooling by allowing lower operative temperature of ACs.
How does the thermal comfort code affect naturally ventilated buildings?There are questions about the relevance of the NBC formula for a naturally conditioned building which, according to the code, is ‘a building in which the ventilation system relies on opening and closing of windows rather than mechanical systems to maintain thermal comfort of the space’.122 Such buildings are rarely
Center for Science and Environment's office
building is a mixed-mode building using both
natural ventilation and air conditioning to provide
thermal comfort
CSE
A MIDSUMMER NIGHTMARE
thermal comfort report_final.indd 59 06/06/19 2:50 PM
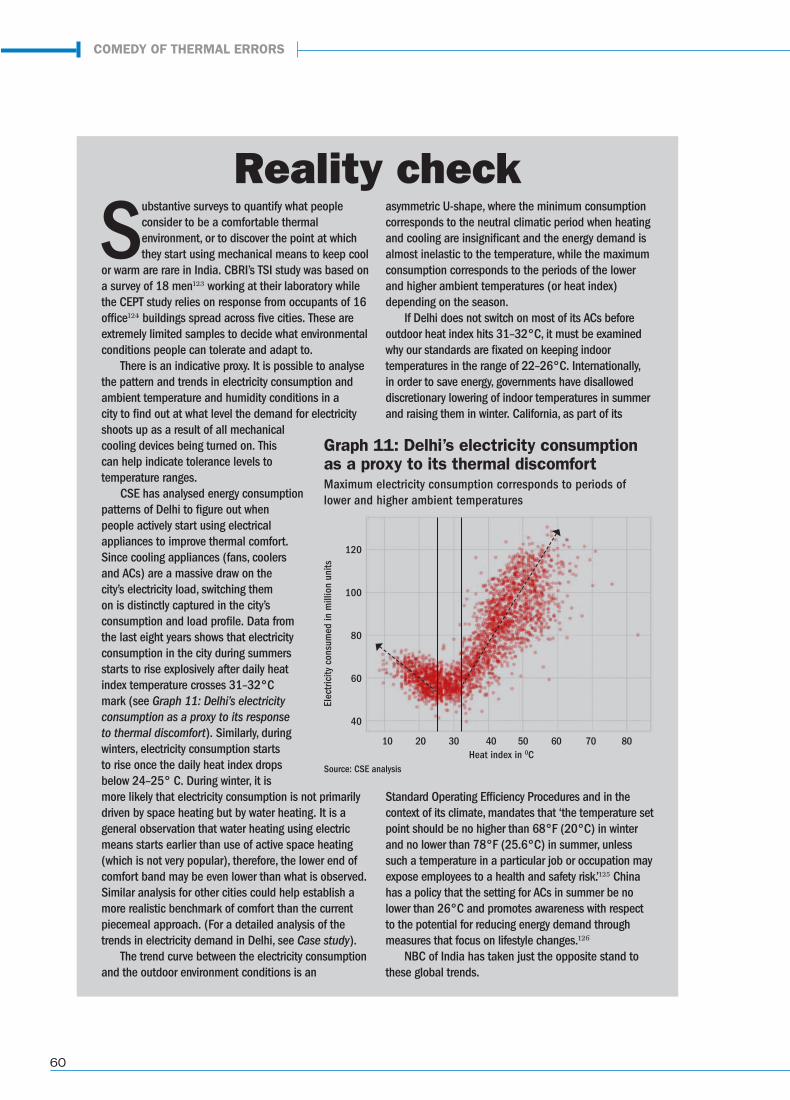
60
Substantive surveys to quantify what people consider to be a comfortable thermal environment, or to discover the point at which they start using mechanical means to keep cool
or warm are rare in India. CBRI’s TSI study was based on a survey of 18 men123 working at their laboratory while the CEPT study relies on response from occupants of 16 office124 buildings spread across five cities. These are extremely limited samples to decide what environmental conditions people can tolerate and adapt to.
There is an indicative proxy. It is possible to analyse the pattern and trends in electricity consumption and ambient temperature and humidity conditions in a city to find out at what level the demand for electricity shoots up as a result of all mechanical cooling devices being turned on. This can help indicate tolerance levels to temperature ranges.
CSE has analysed energy consumption patterns of Delhi to figure out when people actively start using electrical appliances to improve thermal comfort. Since cooling appliances (fans, coolers and ACs) are a massive draw on the city’s electricity load, switching them on is distinctly captured in the city’s consumption and load profile. Data from the last eight years shows that electricity consumption in the city during summers starts to rise explosively after daily heat index temperature crosses 31–32°C mark (see Graph 11: Delhi’s electricity consumption as a proxy to its response to thermal discomfort). Similarly, during winters, electricity consumption starts to rise once the daily heat index drops below 24–25° C. During winter, it is more likely that electricity consumption is not primarily driven by space heating but by water heating. It is a general observation that water heating using electric means starts earlier than use of active space heating (which is not very popular), therefore, the lower end of comfort band may be even lower than what is observed. Similar analysis for other cities could help establish a more realistic benchmark of comfort than the current piecemeal approach. (For a detailed analysis of the trends in electricity demand in Delhi, see Case study).
The trend curve between the electricity consumption and the outdoor environment conditions is an
asymmetric U-shape, where the minimum consumption corresponds to the neutral climatic period when heating and cooling are insignificant and the energy demand is almost inelastic to the temperature, while the maximum consumption corresponds to the periods of the lower and higher ambient temperatures (or heat index) depending on the season.
If Delhi does not switch on most of its ACs before outdoor heat index hits 31–32°C, it must be examined why our standards are fixated on keeping indoor temperatures in the range of 22–26°C. Internationally, in order to save energy, governments have disallowed discretionary lowering of indoor temperatures in summer and raising them in winter. California, as part of its
Standard Operating Efficiency Procedures and in the context of its climate, mandates that ‘the temperature set point should be no higher than 68°F (20°C) in winter and no lower than 78°F (25.6°C) in summer, unless such a temperature in a particular job or occupation may expose employees to a health and safety risk.’125 China has a policy that the setting for ACs in summer be no lower than 26°C and promotes awareness with respect to the potential for reducing energy demand through measures that focus on lifestyle changes.126
NBC of India has taken just the opposite stand to these global trends.
Reality check
Elec
trici
ty c
onsu
med
in m
illio
n un
its
Heat index in 0C
Graph 11: Delhi’s electricity consumption as a proxy to its thermal discomfortMaximum electricity consumption corresponds to periods of lower and higher ambient temperatures
120
100
80
60
40
10 20 30 40 50 60 70 80
Source: CSE analysis
COMEDY OF THERMAL ERRORS
thermal comfort report_final.indd 60 06/06/19 2:50 PM
61
constructed nowadays, though several architects and clients are patronizing bio-climatic buildings. Comfort standards indicating temperature ranges and linked to an index may have little meaning for these buildings. A 30 day running mean temperature of 35°C in Delhi includes days when the mercury hits 46–48°C. It is nearly impossible for such a building to achieve this 14–18°C differential without any mechanical means to comply with the formula. These buildings will have to find innovative ways to ensure comfort.
In fact, survey data generated and used by the CEPT University study for a naturally ventilated building in Ahmedabad shows that its indoor temperature never dropped below 34°C, with the maximum shooting up to 39°C.127 Similarly, a 30 day running mean of 15°C in Delhi marks the coldest portion of the winter with minimum temperatures frequently dropping below the 5°C mark. Under such conditions, maintaining indoor temperatures above 18°C without any mechanical means is impossible. By definition, these buildings have no means to artificially modulate air temperature to comply with a formula recommendation or prescribed standard. But they can innovate in terms of design and material to keep ambient conditions comfortable for the greater part of a year.
At a time when there is a growing obsession with fully air conditioned buildings, NBC’s adaptive comfort range at various outdoor temperature conditions for different building typologies reaffirms the importance of mixed-mode buildings to prevent lock in of excessive active cooling. Mixed-mode buildings allow a wider operative temperature range that provides an opportunity to leverage passive design and natural ventilation. It is, therefore, possible to minimize or reduce operative time of active cooling in buildings.
For whom does the thermal comfort bell toll?NBC has been treating natural ventilation and mechanical ventilation as two separate building services and typologies since its inception. It has defined thermal comfort requirements differently for each of them. For a naturally ventilated building—defined as one without any mechanical cooling system and relying entirely on architectural design, material and climate—NBC describes ‘limits of comfort and heat tolerance’ and a ‘condition of thermal environment under which a person can maintain a body heat balance at normal body temperature and without perceptible sweating’.
For buildings with HVAC systems, NBC asks for ‘design for indoor conditions’ and defines ‘thermal comfort’ as a ‘state of mind which expresses satisfaction with the indoor environment’. This definition attaches importance to psychological (mental) and physiological (physical) factors and discretion of the occupier in determining acceptable thermal comfort conditions.
In 2016, NBC included naturally ventilated, air conditioned and mixed-mode buildings within its adaptive comfort model. The adaptive models for three different building typologies proposed by CEPT University have been incorporated in the NBC as mutually exclusive categories. For naturally ventilated buildings (without
NBC's definition of thermal comfort varies. For naturally ventilated buildings, the emphasis is on the human body; for air conditioned builds, on the mind
A MIDSUMMER NIGHTMARE
thermal comfort report_final.indd 61 06/06/19 2:50 PM
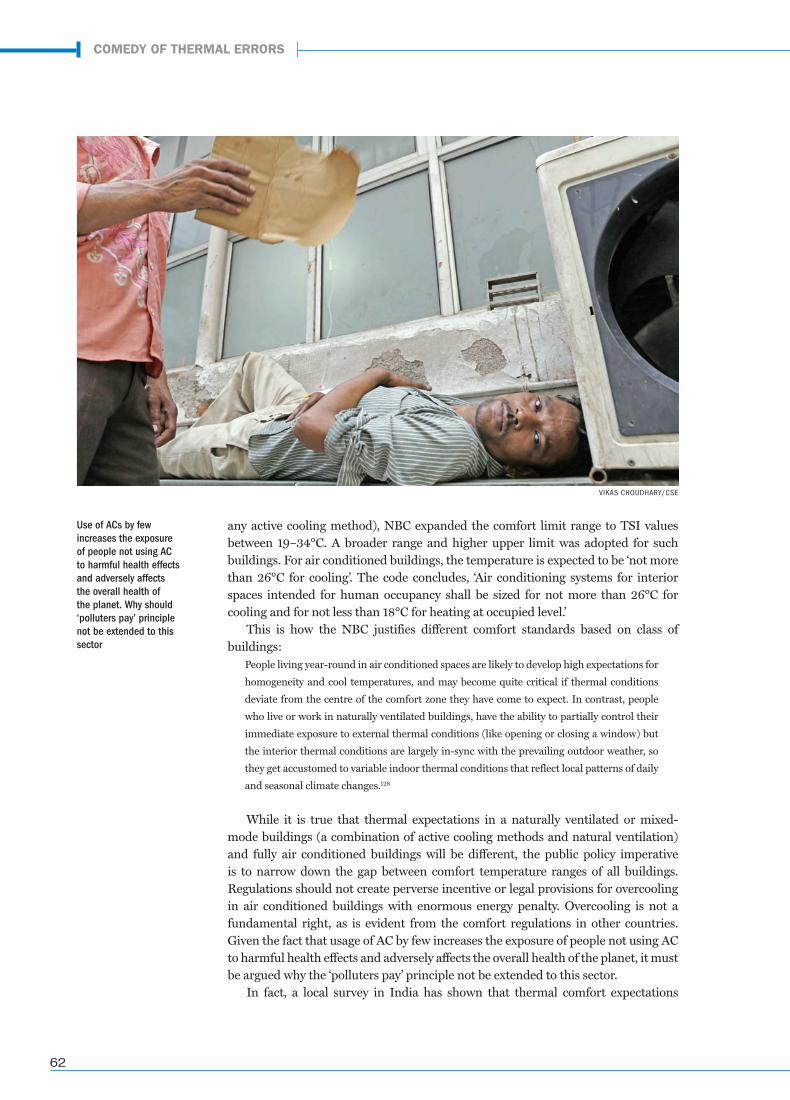
62
any active cooling method), NBC expanded the comfort limit range to TSI values between 19–34°C. A broader range and higher upper limit was adopted for such buildings. For air conditioned buildings, the temperature is expected to be ‘not more than 26°C for cooling’. The code concludes, ‘Air conditioning systems for interior spaces intended for human occupancy shall be sized for not more than 26°C for cooling and for not less than 18°C for heating at occupied level.’
This is how the NBC justifies different comfort standards based on class of buildings:
People living year-round in air conditioned spaces are likely to develop high expectations for
homogeneity and cool temperatures, and may become quite critical if thermal conditions
deviate from the centre of the comfort zone they have come to expect. In contrast, people
who live or work in naturally ventilated buildings, have the ability to partially control their
immediate exposure to external thermal conditions (like opening or closing a window) but
the interior thermal conditions are largely in-sync with the prevailing outdoor weather, so
they get accustomed to variable indoor thermal conditions that reflect local patterns of daily
and seasonal climate changes.128
While it is true that thermal expectations in a naturally ventilated or mixed-mode buildings (a combination of active cooling methods and natural ventilation) and fully air conditioned buildings will be different, the public policy imperative is to narrow down the gap between comfort temperature ranges of all buildings. Regulations should not create perverse incentive or legal provisions for overcooling in air conditioned buildings with enormous energy penalty. Overcooling is not a fundamental right, as is evident from the comfort regulations in other countries. Given the fact that usage of AC by few increases the exposure of people not using AC to harmful health effects and adversely affects the overall health of the planet, it must be argued why the ‘polluters pay’ principle not be extended to this sector.
In fact, a local survey in India has shown that thermal comfort expectations
Use of ACs by few increases the exposure of people not using AC to harmful health effects and adversely affects the overall health of the planet. Why should ‘polluters pay’ principle not be extended to this sector
VIKAS CHOUDHARY/CSE
COMEDY OF THERMAL ERRORS
thermal comfort report_final.indd 62 06/06/19 2:50 PM
63
range more towards warmer conditions—that people in Indian buildings prefer warmer indoors than the prevailing ASHRAE and EN models would suggest, for both naturally ventilated and air conditioned buildings.129 The model that helps to work out the optimum operative indoor temperature in relation to the changing outdoor temperature is based on field surveys by CEPT University in 16 buildings in three seasons and five cities, representative of five Indian climate zones. The models thus developed have a higher base or neutral temperature than used in international standards. This acknowledges the role of local climate in shaping comfort expectations vis-à-vis acclimatization.
India decides to be a 240C societyA partial process towards thermal comfort approach has just begun in India.
For a considerable amount of time, the Indian Energy Conservation Building Code, that was notified in 2007 and revised in 2017, was framed without any temperature set points for designing HVAC systems in buildings. But as we have seen, setting temperature baselines is a crucial aspect of thermal comfort guidelines.
Initial attempts in 2016 to set default temperature setting for ACs faced resistance. Publicly available minutes of a meeting of the BEE held on 6 September 2016 show the HVAC industry’s reluctance to accept such moves.130 In fact, BEE’s proposal of setting default temperature of all ACs at 27°C (which is in line with the testing temperature defined in IS 1391, a standard that prescribes the constructional and performance requirements of non-ducted unitary air conditioners), was contested by the industry. Manufacturers argued that if ACs are programmed with a default set ‘switch on’ temperature, it will lead to discomfort to the user and it will always restart at 27°C instead of the set point preferred by the consumer. The industry suggested that instead a rider be added in the product user manual stating that ‘comfort zone for humans is 24–27°C, hence to conserve electricity and for comfort conditioning, ACs should be used between 24–27°C’.
On 22 June 2018, the Union Ministry of Power issued an advisory asking AC manufacturers and consumers to voluntarily set the default start temperature of AC units at 24°C. It may be noted that according to BEE, most ACs in India are operated at 20–21°C.131 The power ministry hopes to save 20 billion kilowatt hours of electricity in one year if all AC consumers adopt its advisory.
The larger understanding had been that new ACs will by default start running at 24°C unless the setting is changed by the consumer. Right now, manufacturers are free to set default temperatures, with some using 18°C as power-on default, and many users leave it at that, leading to unnecessary cooling and energy guzzling. This, however, is expected not to restrict consumers’ choice of lowering or raising the temperature setting of room ACs if they feel uncomfortable. But there is stronger interest to extend this to centrally air conditioned buildings for a larger effect.
The power ministry had further mentioned that a similar temperature setting should be voluntary adopted for centralized cooling systems in commercial buildings like airports, hotels, shopping malls, official and government buildings (ministries and attached offices, state government, and public sector undertakings etc). This time, the power ministry has the AC industry’s nod. The AC industry has now agreed to temperature set points for refrigeration and air conditioning (RAC) units. But this measure has not been enforced and there is no tracking of it being voluntarily adopted by anyone manufacturer.
The draft India Cooling Action Plan (ICAP) that was released by the Ministry of Environment, Forest and Climate Change (MoEF&CC) on 17 October 2018 has taken
A MIDSUMMER NIGHTMARE
thermal comfort report_final.indd 63 06/06/19 2:50 PM
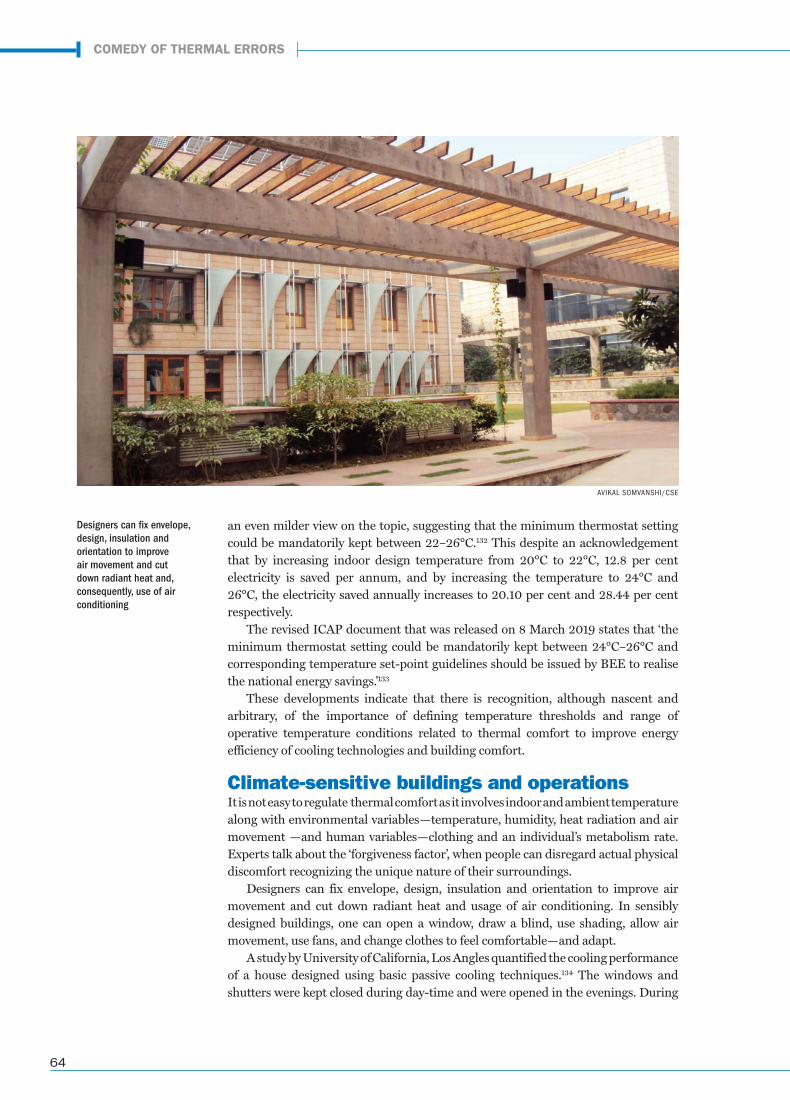
64
an even milder view on the topic, suggesting that the minimum thermostat setting could be mandatorily kept between 22–26°C.132 This despite an acknowledgement that by increasing indoor design temperature from 20°C to 22°C, 12.8 per cent electricity is saved per annum, and by increasing the temperature to 24°C and 26°C, the electricity saved annually increases to 20.10 per cent and 28.44 per cent respectively.
The revised ICAP document that was released on 8 March 2019 states that ‘the minimum thermostat setting could be mandatorily kept between 24°C–26°C and corresponding temperature set-point guidelines should be issued by BEE to realise the national energy savings.’133
These developments indicate that there is recognition, although nascent and arbitrary, of the importance of defining temperature thresholds and range of operative temperature conditions related to thermal comfort to improve energy efficiency of cooling technologies and building comfort.
Climate-sensitive buildings and operationsIt is not easy to regulate thermal comfort as it involves indoor and ambient temperature along with environmental variables—temperature, humidity, heat radiation and air movement —and human variables—clothing and an individual’s metabolism rate. Experts talk about the ‘forgiveness factor’, when people can disregard actual physical discomfort recognizing the unique nature of their surroundings.
Designers can fix envelope, design, insulation and orientation to improve air movement and cut down radiant heat and usage of air conditioning. In sensibly designed buildings, one can open a window, draw a blind, use shading, allow air movement, use fans, and change clothes to feel comfortable—and adapt.
A study by University of California, Los Angles quantified the cooling performance of a house designed using basic passive cooling techniques.134 The windows and shutters were kept closed during day-time and were opened in the evenings. During
Designers can fix envelope, design, insulation and orientation to improve air movement and cut down radiant heat and, consequently, use of air conditioning
AVIKAL SOMVANSHI/CSE
COMEDY OF THERMAL ERRORS
thermal comfort report_final.indd 64 06/06/19 2:50 PM
65
the study, the outdoor maximum temperature rose from 31°C to 33°C, with the minimum hovering around 20°C. The indoor maximums stabilize at temperatures of 25.3–26°C, with indoor minimums of 22–23°C.
A study in Egypt found that bio-climatic building design that uses solar chimneys with passive cooling wind towers can effectively reduce indoor temperature by nearly 8°C compared to outdoor temperature.135 The study also found that building occupants were thermally comfortable with indoor conditions achieved by the bio-climatic design.
In fact, there are many studies from India and the world that have shown reduced operating costs, and better thermal comfort and indoor air quality to be some of the advantages of the application of natural ventilation in buildings. The efficiency of natural ventilation depends on the efficiency and practicability of architectural elements used to maximize ventilation in buildings along with window-to-wall ratio and building orientation to control heat ingress.
Such building systems have always been part of our architectural heritage but are fast disappearing from modern construction practices owing to ill-informed standards that have unknowingly pushed for air conditioned buildings. Bio-climatic buildings provide thermal conditions that are dynamic and wide ranging and align with thermal comfort expectations as understood by the adaptive model.
Now that the idea of adaptive thermal comfort standards has been mooted by ICAP, it needs public support and action. The new plan has asked Bureau of Indian Standards to frame these standards. In its 2016 version, NBC has adopted an adaptive or dynamic approach that models indoor temperature in relation to optimum range of outdoor temperature at which occupiers are expected to feel comfortable. Ranges have been developed separately for naturally ventilated buildings, mixed-mode buildings with different types of cooling systems, and air conditioned buildings.
Supported by the research of Centre for Advanced Research in Building Science and Energy, CEPT University, the importance of mixed-mode buildings is gaining ground. The research has worked out comfort expectation ranges of people using naturally ventilated, mixed-mode buildings and air conditioned buildings that have informed the NBC. For example, when outside mean running temperature condition is 35°C, people in a mixed-mode building can have a comfort range of 24.2–31.1°C; but in an air conditioned building, the comfort range is much narrower—24.5–27.5°C.
Mixed-mode offers more opportunities for adaptive comfort and low-energy solutions. It allows a wider adaptive comfort range and temperature for building operations. It gives people greater control and ability to adjust to indoor climate. People can play around with shade, wind speed and direction to maintain temperatures and comfort conditions. It will make way for low-energy solutions with bio-climatic strategies. Based on passive strategies and design, the sizing of cooling systems can be planned to meet thermal comfort goals. Designers can assess and forecast comfort range of indoor temperature through seasons more deliberately to reduce operational time of air conditioning or the need for it.
Designing regulations for mixed-mode buildingsAt present, there is no explicit regulatory tool in India to promote mixed-mode buildings. It may help to tap into the global learning curve. Globally, governments are now regulating operation of mechanical cooling by adopting a defined ambient temperature cut-off in different climatic zones. Australia, for instance, has creatively used temperature setting to direct its future building stock to be more energy
A MIDSUMMER NIGHTMARE
thermal comfort report_final.indd 65 06/06/19 2:50 PM
66
efficient by becoming mixed-mode. Buildings are asked to run freely on natural ventilation until the defined cut-off is breached, and only then are occupants allowed to use mechanical means to keep indoor temperatures at the defined set-point, which can be as high as 28°C depending on local meteorological history. As part of its Nationwide House Energy Rating Scheme (NatHERS), it defines thermostat setting in range of 22.5–28°C based on diverse climatic zones.136 These temperature settings represent an assumed thermostat trigger point that would require operation of artificial cooling appliance (AC) in its 69 climatic zones.
NatHERS’s guidebooks explains:The cooling thermostat setting varies according to the climate zone to account for the
acclimatization of local residents. It also varies from room-to-room from the summer
neutral cooling temperature of that climate zone to take into account the effect of air
movement, air temperature and humidity level in that space on the occupants' perception
of thermal comfort.137
The Australian scheme of managing thermal comfort according to different climatic conditions in the country via prioritizing passive cooling and bio-climatic design is a good and replicable principle. It strikes a just balance between energy efficiency and thermal (adaptive) comfort, while optimizing climate and health outcomes from buildings, though it might be a challenge to enforce it.
There is a misconception regarding the meaning and application of adaptive comfort. People confuse it as a function of building design and operation when it is about human ability to respond to thermal variations in the immediate surroundings and adapt to them, in the process re-configuring what feels comfortable. This is important to understand because many are trying to use the adaptive model to train thermostat setting of an AC and claiming adoption of this model.There is no need to modulate an AC’s thermostat setting to go down from 26°C during peak summer and to 22°C during spring. We need to switch the AC off and let the natural human ability to adapt work when reasonably milder thermal conditions set in.
An ideal scenario would be to scientifically determine the limit of thermal tolerance for a given climatic zone and set it as the outer limit for acceptable indoor thermal conditions. Architects must be asked to ensure buildings passively maintain indoor thermal conditions within this limit for most of the year. Building operators must be provided artificial means (read ACs) to bring indoor thermal conditions at par with the limits if adverse outdoor conditions force indoor conditions to breach the limit. Once outdoor conditions improve, enabling a building to passively maintain thermal conditions within the limit, building operators must discontinue the use of AC, and let occupants adapt to conditions using means like windows, fans and clothing.
For example, if it is determined that 19°C and 28°C are the thermal tolerance limits for Delhi, and a properly designed building is able to provide these conditions if outdoor conditions are between 10°C to 35°C, using passive cooling design, once outdoor temperature gets hotter, say 40°C, and building indoor conditions rise above 28°C, ACs could be employed to keep indoors at 28°C, not lower. Once the outdoor temperature falls and a building achieves indoor conditions in the range of 19°C–28°C by itself, ACs use should be discontinued. People will not be uncomfortable in this range and it will be within their personal capacity to adapt to seasonal variation. The same logic would apply to winter vis-à-vis space heating.
The matter of comfort standards and setting of a temperature range for energy-efficient design and operation of buildings has been a pressing one and needs to be resolved quickly.
COMEDY OF THERMAL ERRORS
thermal comfort report_final.indd 66 06/06/19 2:50 PM
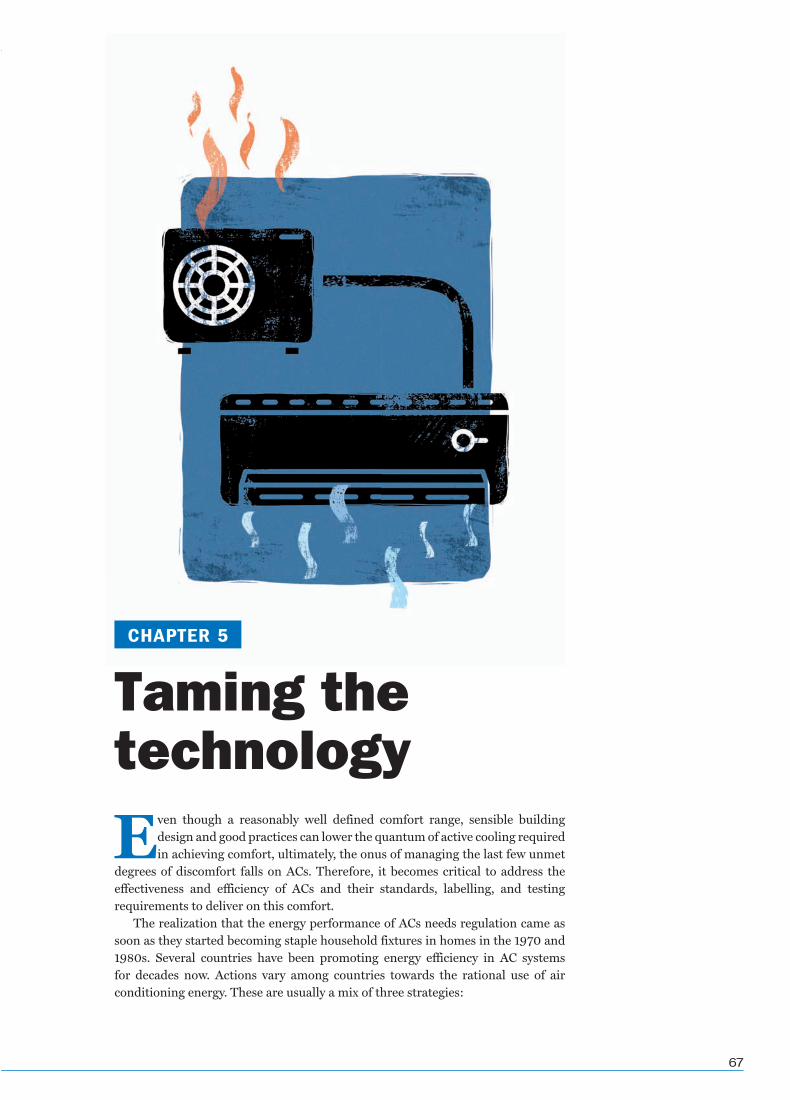
67
Even though a reasonably well defined comfort range, sensible building design and good practices can lower the quantum of active cooling required in achieving comfort, ultimately, the onus of managing the last few unmet
degrees of discomfort falls on ACs. Therefore, it becomes critical to address the effectiveness and efficiency of ACs and their standards, labelling, and testing requirements to deliver on this comfort.
The realization that the energy performance of ACs needs regulation came as soon as they started becoming staple household fixtures in homes in the 1970 and 1980s. Several countries have been promoting energy efficiency in AC systems for decades now. Actions vary among countries towards the rational use of air conditioning energy. These are usually a mix of three strategies:
Taming the technology
CHAPTER 5
thermal comfort report_final.indd 67 06/06/19 2:50 PM
68
The first modern air conditioner was invented in 1902 by Willis Haviland Carrier, an engineer
who began experimenting with the laws of humidity control to solve an application problem at a printing plant in Brooklyn, US. At the Sacekt-Wilhelms Lithographing and Publishing Company, printed copies of magazines were wrinkling due to high humidity in the printing press and a solution to this was needed. Borrowing from the concepts of mechanical refrigeration established during the previous years, Carrier designed a system that sent air through coils filled with cold water, cooling the air while at the same time removing moisture to control room humidity. He was granted a patent for this experiment that he called an ‘apparatus for treating air’. This invention could both humidify and dehumidify air depending on whether the water it made use of was heated or cooled. He continued to work on his equipment to make it even better and more technologically advanced. His new automatic
control system helped to regulate humidity as well as temperature of the air at textile mills.
Carrier began to see that his humidity control, along with air conditioning projects, could be beneficial in many industries. He left his job with Buffalo Forge and started his own company, Carrier Engineering Corporation.
A few years later, in the 1920s, Americans began going to movie theatres regularly and with it came the need for cooling the air in these new indoor public spaces packed with people. The first cooling systems were just modified heating systems. They used refrigeration equipment that sent up cool air through the heating vents. This caused lower floors to be much colder than upper floors.
The main issue that plagued this equipment was the use of ammonia as a coolant. Ammonia was toxic in nature and made operation risky. In 1920, Carrier and his engineers discovered a replacement for ammonia in their cooling system—the much safer coolant dyeline.
They also made units significantly smaller so they could be placed in department stores, office buildings, and railroad cars.
Carrier introduced a new air conditioning system to the public at the Rivoli Theatre located in New York in May of 1922. This system used a centrifugal chiller. It had fewer moving parts and a compressor stage that made it more reliable and cheaper to build than some of the previous air conditioning systems. This new advancement led to the installation of more large-scale ACs throughout the United States.
Frigidaire (the US consumer and commercial home appliances brand originally owned by General Motors), introduced a new split-system room cooler in the US market in 1929. It was small enough for home use and shaped like a radio cabinet. However, the system was heavy, expensive and required a separate, remote-controlled condensing unit. General Electric's Frank Faust improved this design, developing a self-contained room cooler, and
a) Regulation, setting minimum limits of efficiency and similar requirements of performance for ACsb) Financial or fiscal incentives to stimulate users to adopt more efficient air conditioning equipmentc) Targeted information, orienting consumers to buy and use air conditioning systems properly
Today’s ACs, while operating on the same fundamental science as Willis H Carrier’s 1933 system (see Box: History of the cooling box and Box: Present technological senario), have incorporated many advancements in vapour compression, diagnostics and controls, electronic sensors, materials, and energy efficiency. Most of these advancements have been driven by regulatory requirements for energy efficiency. Hence, it becomes critical to design these regulations in a way that keeps pushing the industry towards more innovations. This fact has now been globally recognized with the Kigali Amendment to the Montreal Protocol that legally binds countries to shift from HFCs to ozone- and climate-friendly AC alternatives, and to improve energy efficiency of mechanical cooling systems.
History of the cooling box
TAMING THE TECHNOLOGY
thermal comfort report_final.indd 68 06/06/19 2:50 PM
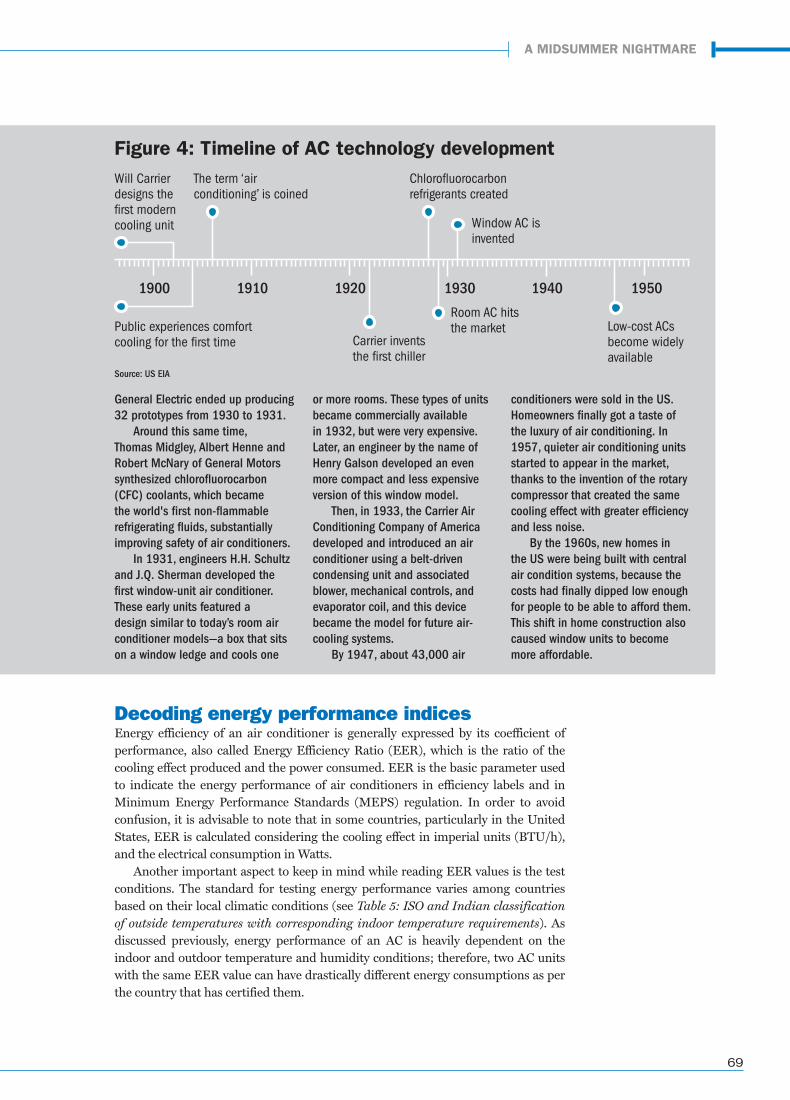
69
Decoding energy performance indices Energy efficiency of an air conditioner is generally expressed by its coefficient of performance, also called Energy Efficiency Ratio (EER), which is the ratio of the cooling effect produced and the power consumed. EER is the basic parameter used to indicate the energy performance of air conditioners in efficiency labels and in Minimum Energy Performance Standards (MEPS) regulation. In order to avoid confusion, it is advisable to note that in some countries, particularly in the United States, EER is calculated considering the cooling effect in imperial units (BTU/h), and the electrical consumption in Watts.
Another important aspect to keep in mind while reading EER values is the test conditions. The standard for testing energy performance varies among countries based on their local climatic conditions (see Table 5: ISO and Indian classification of outside temperatures with corresponding indoor temperature requirements). As discussed previously, energy performance of an AC is heavily dependent on the indoor and outdoor temperature and humidity conditions; therefore, two AC units with the same EER value can have drastically different energy consumptions as per the country that has certified them.
General Electric ended up producing 32 prototypes from 1930 to 1931.
Around this same time, Thomas Midgley, Albert Henne and Robert McNary of General Motors synthesized chlorofluorocarbon (CFC) coolants, which became the world's first non-flammable refrigerating fluids, substantially improving safety of air conditioners.
In 1931, engineers H.H. Schultz and J.Q. Sherman developed the first window-unit air conditioner. These early units featured a design similar to today’s room air conditioner models—a box that sits on a window ledge and cools one
or more rooms. These types of units became commercially available in 1932, but were very expensive. Later, an engineer by the name of Henry Galson developed an even more compact and less expensive version of this window model.
Then, in 1933, the Carrier Air Conditioning Company of America developed and introduced an air conditioner using a belt-driven condensing unit and associated blower, mechanical controls, and evaporator coil, and this device became the model for future air-cooling systems.
By 1947, about 43,000 air
conditioners were sold in the US. Homeowners finally got a taste of the luxury of air conditioning. In 1957, quieter air conditioning units started to appear in the market, thanks to the invention of the rotary compressor that created the same cooling effect with greater efficiency and less noise.
By the 1960s, new homes in the US were being built with central air condition systems, because the costs had finally dipped low enough for people to be able to afford them. This shift in home construction also caused window units to become more affordable.
Figure 4: Timeline of AC technology development
1900 1910 1920 1930 1940 1950
Will Carrier designs the first modern cooling unit
Public experiences comfort cooling for the first time
The term ‘air conditioning’ is coined
Chlorofluorocarbon refrigerants created
Window AC is invented
Carrier invents the first chiller
Low-cost ACs become widely available
Room AC hits the market
Source: US EIA
A MIDSUMMER NIGHTMARE
thermal comfort report_final.indd 69 06/06/19 2:50 PM
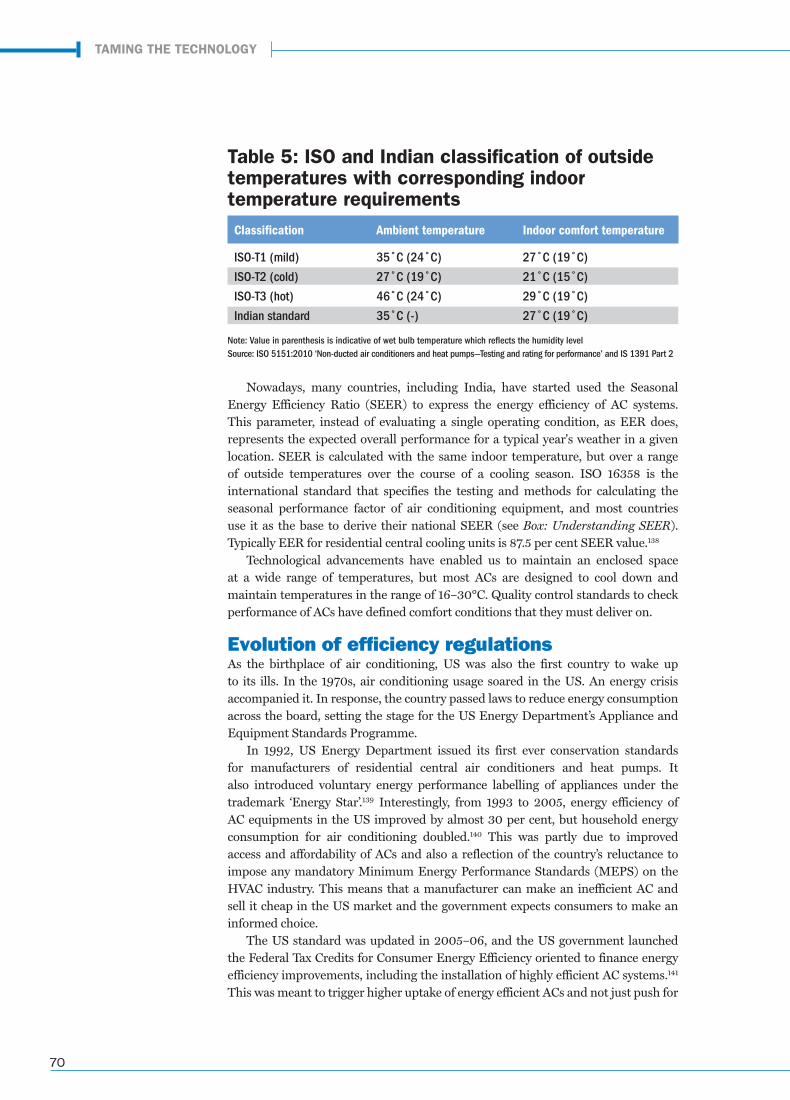
70
Nowadays, many countries, including India, have started used the Seasonal Energy Efficiency Ratio (SEER) to express the energy efficiency of AC systems. This parameter, instead of evaluating a single operating condition, as EER does, represents the expected overall performance for a typical year's weather in a given location. SEER is calculated with the same indoor temperature, but over a range of outside temperatures over the course of a cooling season. ISO 16358 is the international standard that specifies the testing and methods for calculating the seasonal performance factor of air conditioning equipment, and most countries use it as the base to derive their national SEER (see Box: Understanding SEER). Typically EER for residential central cooling units is 87.5 per cent SEER value.138
Technological advancements have enabled us to maintain an enclosed space at a wide range of temperatures, but most ACs are designed to cool down and maintain temperatures in the range of 16–30°C. Quality control standards to check performance of ACs have defined comfort conditions that they must deliver on.
Evolution of efficiency regulationsAs the birthplace of air conditioning, US was also the first country to wake up to its ills. In the 1970s, air conditioning usage soared in the US. An energy crisis accompanied it. In response, the country passed laws to reduce energy consumption across the board, setting the stage for the US Energy Department’s Appliance and Equipment Standards Programme.
In 1992, US Energy Department issued its first ever conservation standards for manufacturers of residential central air conditioners and heat pumps. It also introduced voluntary energy performance labelling of appliances under the trademark ‘Energy Star’.139 Interestingly, from 1993 to 2005, energy efficiency of AC equipments in the US improved by almost 30 per cent, but household energy consumption for air conditioning doubled.140 This was partly due to improved access and affordability of ACs and also a reflection of the country’s reluctance to impose any mandatory Minimum Energy Performance Standards (MEPS) on the HVAC industry. This means that a manufacturer can make an inefficient AC and sell it cheap in the US market and the government expects consumers to make an informed choice.
The US standard was updated in 2005–06, and the US government launched the Federal Tax Credits for Consumer Energy Efficiency oriented to finance energy efficiency improvements, including the installation of highly efficient AC systems.141
This was meant to trigger higher uptake of energy efficient ACs and not just push for
Note: Value in parenthesis is indicative of wet bulb temperature which reflects the humidity level Source: ISO 5151:2010 ‘Non-ducted air conditioners and heat pumps—Testing and rating for performance’ and IS 1391 Part 2
Table 5: ISO and Indian classification of outside temperatures with corresponding indoor temperature requirementsClassification Ambient temperature Indoor comfort temperature
ISO-T1 (mild) 35˚C (24˚C) 27˚C (19˚C)
ISO-T2 (cold) 27˚C (19˚C) 21˚C (15˚C)
ISO-T3 (hot) 46˚C (24˚C) 29˚C (19˚C)
Indian standard 35˚C (-) 27˚C (19˚C)
TAMING THE TECHNOLOGY
thermal comfort report_final.indd 70 06/06/19 2:50 PM
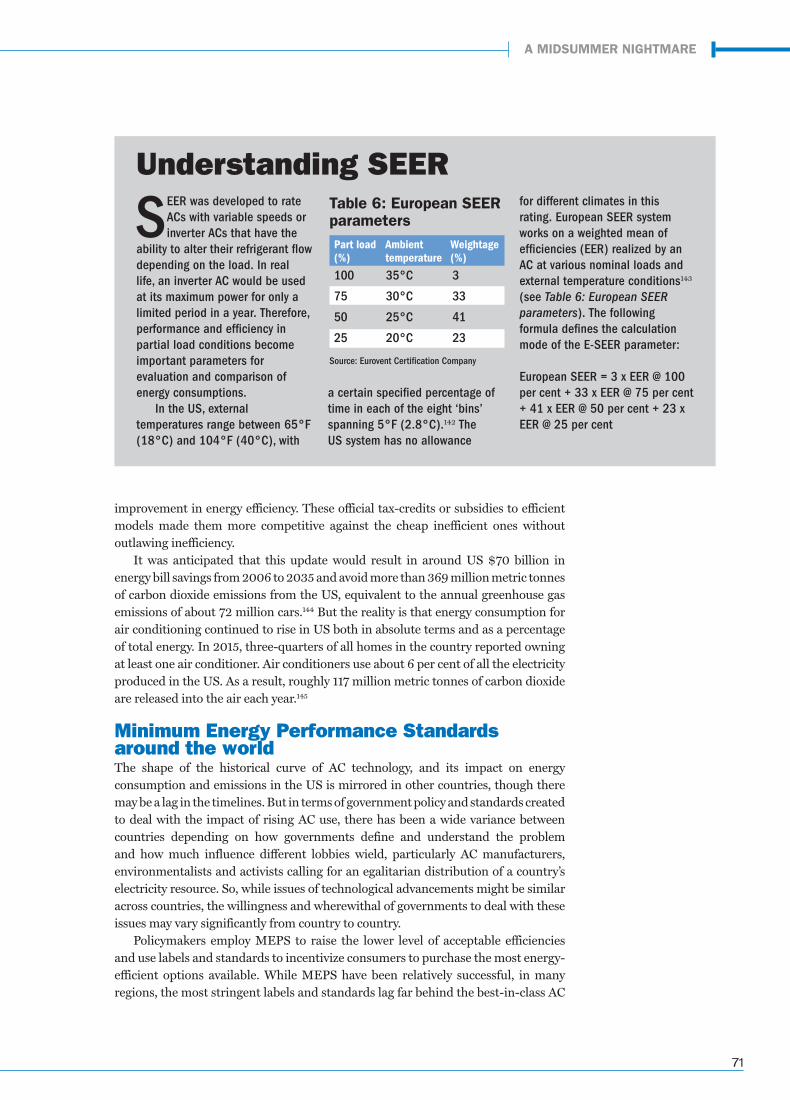
71
improvement in energy efficiency. These official tax-credits or subsidies to efficient models made them more competitive against the cheap inefficient ones without outlawing inefficiency.
It was anticipated that this update would result in around US $70 billion in energy bill savings from 2006 to 2035 and avoid more than 369 million metric tonnes of carbon dioxide emissions from the US, equivalent to the annual greenhouse gas emissions of about 72 million cars.144 But the reality is that energy consumption for air conditioning continued to rise in US both in absolute terms and as a percentage of total energy. In 2015, three-quarters of all homes in the country reported owning at least one air conditioner. Air conditioners use about 6 per cent of all the electricity produced in the US. As a result, roughly 117 million metric tonnes of carbon dioxide are released into the air each year.145
Minimum Energy Performance Standards around the worldThe shape of the historical curve of AC technology, and its impact on energy consumption and emissions in the US is mirrored in other countries, though there may be a lag in the timelines. But in terms of government policy and standards created to deal with the impact of rising AC use, there has been a wide variance between countries depending on how governments define and understand the problem and how much influence different lobbies wield, particularly AC manufacturers, environmentalists and activists calling for an egalitarian distribution of a country’s electricity resource. So, while issues of technological advancements might be similar across countries, the willingness and wherewithal of governments to deal with these issues may vary significantly from country to country.
Policymakers employ MEPS to raise the lower level of acceptable efficiencies and use labels and standards to incentivize consumers to purchase the most energy-efficient options available. While MEPS have been relatively successful, in many regions, the most stringent labels and standards lag far behind the best-in-class AC
SEER was developed to rate ACs with variable speeds or inverter ACs that have the
ability to alter their refrigerant flow depending on the load. In real life, an inverter AC would be used at its maximum power for only a limited period in a year. Therefore, performance and efficiency in partial load conditions become important parameters for evaluation and comparison of energy consumptions.
In the US, external temperatures range between 65°F (18°C) and 104°F (40°C), with
a certain specified percentage of time in each of the eight ‘bins’ spanning 5°F (2.8°C).142 The US system has no allowance
for different climates in this rating. European SEER system works on a weighted mean of efficiencies (EER) realized by an AC at various nominal loads and external temperature conditions143
(see Table 6: European SEER parameters). The following formula defines the calculation mode of the E-SEER parameter:
European SEER = 3 x EER @ 100 per cent + 33 x EER @ 75 per cent + 41 x EER @ 50 per cent + 23 x EER @ 25 per cent
Understanding SEER
100 35°C 3
75 30°C 33
50 25°C 41
25 20°C 23
Part load (%)
Ambient temperature
Weightage (%)
Table 6: European SEER parameters
Source: Eurovent Certification Company
A MIDSUMMER NIGHTMARE
thermal comfort report_final.indd 71 06/06/19 2:50 PM
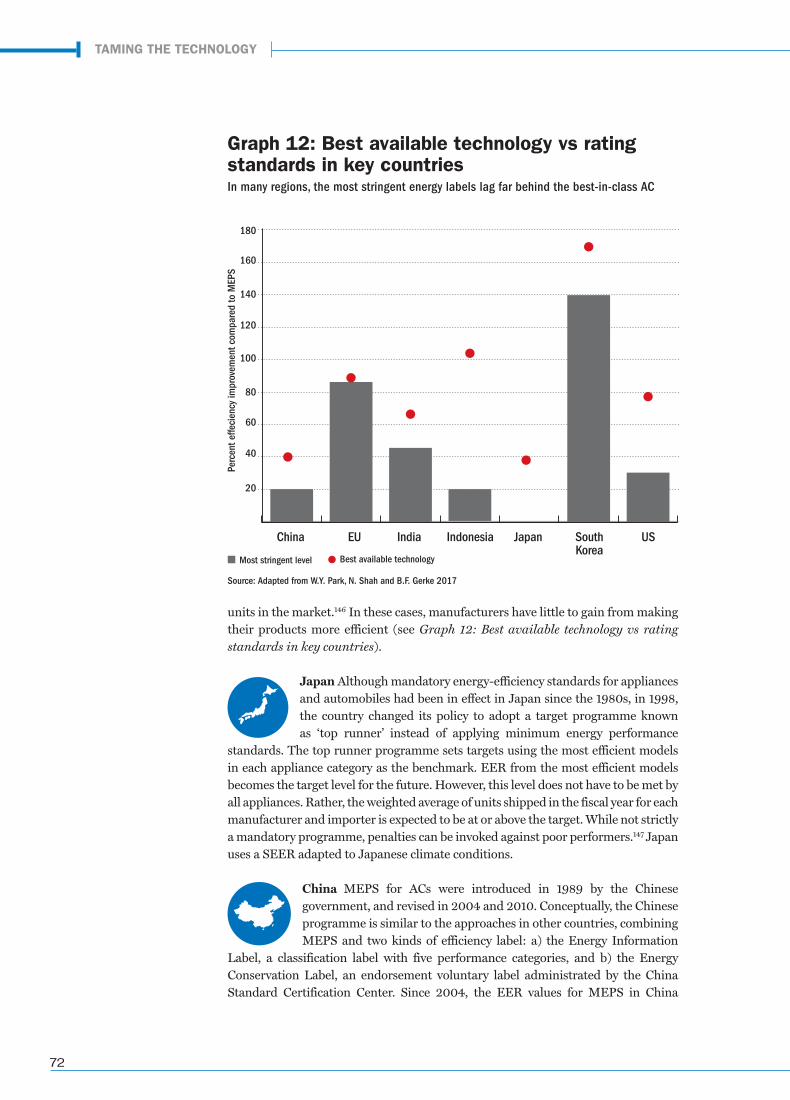
72
units in the market.146 In these cases, manufacturers have little to gain from making their products more efficient (see Graph 12: Best available technology vs rating standards in key countries).
Japan Although mandatory energy-efficiency standards for appliances and automobiles had been in effect in Japan since the 1980s, in 1998, the country changed its policy to adopt a target programme known as ‘top runner’ instead of applying minimum energy performance
standards. The top runner programme sets targets using the most efficient models in each appliance category as the benchmark. EER from the most efficient models becomes the target level for the future. However, this level does not have to be met by all appliances. Rather, the weighted average of units shipped in the fiscal year for each manufacturer and importer is expected to be at or above the target. While not strictly a mandatory programme, penalties can be invoked against poor performers.147 Japan uses a SEER adapted to Japanese climate conditions.
China MEPS for ACs were introduced in 1989 by the Chinese government, and revised in 2004 and 2010. Conceptually, the Chinese programme is similar to the approaches in other countries, combining MEPS and two kinds of efficiency label: a) the Energy Information
Label, a classification label with five performance categories, and b) the Energy Conservation Label, an endorsement voluntary label administrated by the China Standard Certification Center. Since 2004, the EER values for MEPS in China
Graph 12: Best available technology vs rating standards in key countriesIn many regions, the most stringent energy labels lag far behind the best-in-class AC
Source: Adapted from W.Y. Park, N. Shah and B.F. Gerke 2017
20
40
60
80
100
120
140
160
180
China EU India Indonesia Japan SouthKorea
US
Most stringent level Best available technology
Perc
ent e
ffeci
ency
impr
ovem
ent c
ompa
red
to M
EPS
TAMING THE TECHNOLOGY
thermal comfort report_final.indd 72 06/06/19 2:50 PM
73
are being progressively elevated and have become one of the most stringent in the world.148 China uses a SEER adapted to Chinese climatic conditions.
South Korea MEPS were introduced in South Korea in 1992. Mandatory MEPS were established in 2002 and took effect in 2004.149
In 2011, the government announced the Energy Frontier programme, which sets mid-term energy-efficiency goals for key appliances,
including RACs. This standard sets out a two-tier system which includes an MEPS level and a more stringent target level known as Target Energy Performance Standard (TEPS). While the aim of the MEPS is to eliminate the most inefficient models from the market, TEPS are in place to encourage manufacturers to increase the efficiency of their products. Typically, South Korea updates the standards every three to five years and it is common for TEPS to become the new MEPS level.150 Currently, South Korean MEPS levels are among the most stringent levels in the world. South Korea uses a SEER adapted to Korean climate conditions.
ASEAN countries In 2016, ASEAN countries agreed to set a minimum EER by 2020 as mandatory MEPS for all fixed- and variable-speed ACs under the ASEAN Standards Harmonization Initiative for Energy Efficiency (SHINE) programme.151 The ASEAN SHINE programme
focuses on progressively phasing out inefficient ACs and increasing the share of high-efficiency ACs through harmonizing test methods and energy-efficiency standards, including adopting common MEPS requirements, and influencing consumer purchasing decisions. They plan to use ISO as a standard for testing and energy performance index.
Many countries have already mandated MEPS requirements—Philippines152
(1992), Singapore153 (1998), and Thailand154 (2005).
Ghana Ghana has no indigenous AC manufacturers and imports its entire requirement. It was observed that manufacturers were dumping their least-efficient models into Ghana due to lack of any energy efficiency standards in the country. Therefore, in 2005, a
Mandatory Appliance Standards and Labelling programme was launched. Since then, Ghana has been operating a regime under which importers and retailers are required to import and sell only products that meet minimum efficiency and performance standards approved by the Ghana Standards Board. The programme has not had any significant impact on AC stock, rather, it is aimed at new ACs with a minimum efficiency performance (EER = 2.8).155 It also tries to ensure that consumers have the life-cycle cost information needed to select ACs with higher levels of efficiency.
Brazil The Brazilian Labelling Programme was launched in 1985. This programme has the objective of informing consumers about the efficiency of appliances and energy systems, by using the Energy Conservation National Label. The comparison label has been applied
since 1988 to ACs on a voluntary basis. In 1999, an endorsement label called the PROCEL label, reinforcing use of better equipment, started to be applied to window ACs (and was later extended to split ACs in 2004). In 2007 and 2011, minimum values of EER (MEPS) for all ACs sold in Brazil were adopted.156 Brazil has one of the lowest MEPS levels among major economies. The country does not use the SEER
A MIDSUMMER NIGHTMARE
thermal comfort report_final.indd 73 06/06/19 2:50 PM
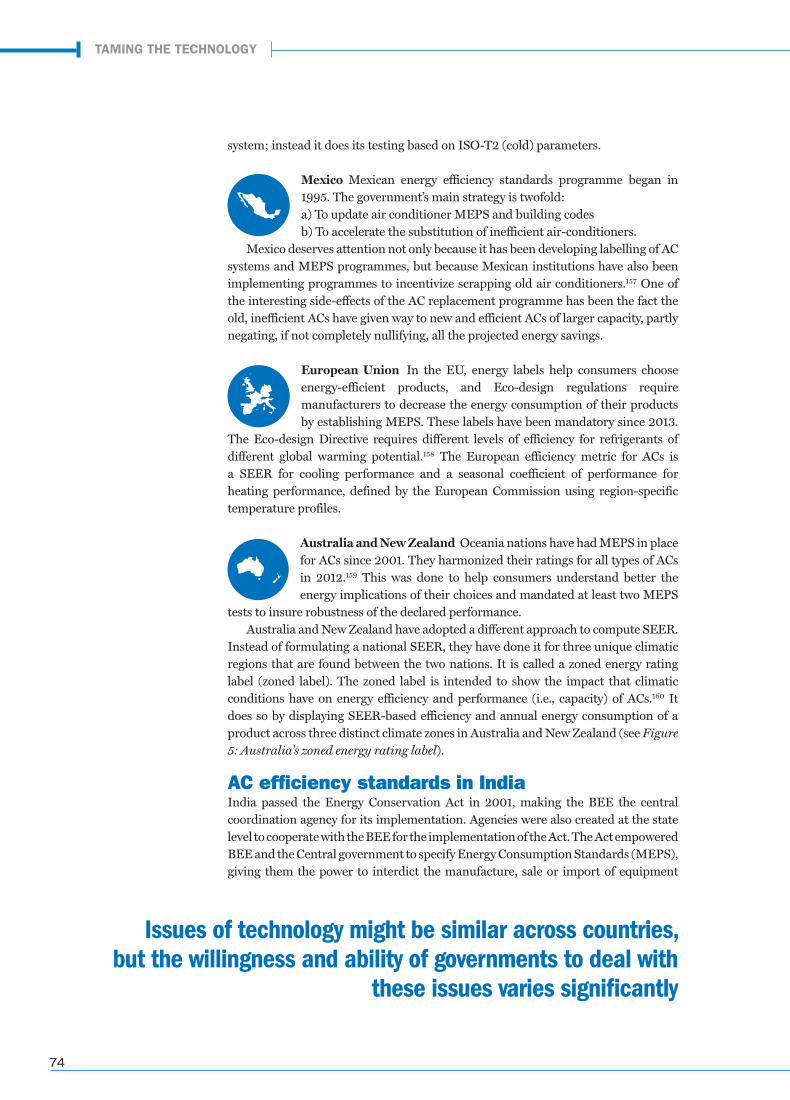
74
system; instead it does its testing based on ISO-T2 (cold) parameters.
Mexico Mexican energy efficiency standards programme began in 1995. The government’s main strategy is twofold: a) To update air conditioner MEPS and building codesb) To accelerate the substitution of inefficient air-conditioners.
Mexico deserves attention not only because it has been developing labelling of AC systems and MEPS programmes, but because Mexican institutions have also been implementing programmes to incentivize scrapping old air conditioners.157 One of the interesting side-effects of the AC replacement programme has been the fact the old, inefficient ACs have given way to new and efficient ACs of larger capacity, partly negating, if not completely nullifying, all the projected energy savings.
European Union In the EU, energy labels help consumers choose energy-efficient products, and Eco-design regulations require manufacturers to decrease the energy consumption of their products by establishing MEPS. These labels have been mandatory since 2013.
The Eco-design Directive requires different levels of efficiency for refrigerants of different global warming potential.158 The European efficiency metric for ACs is a SEER for cooling performance and a seasonal coefficient of performance for heating performance, defined by the European Commission using region-specific temperature profiles.
Australia and New Zealand Oceania nations have had MEPS in place for ACs since 2001. They harmonized their ratings for all types of ACs in 2012.159 This was done to help consumers understand better the energy implications of their choices and mandated at least two MEPS
tests to insure robustness of the declared performance.Australia and New Zealand have adopted a different approach to compute SEER.
Instead of formulating a national SEER, they have done it for three unique climatic regions that are found between the two nations. It is called a zoned energy rating label (zoned label). The zoned label is intended to show the impact that climatic conditions have on energy efficiency and performance (i.e., capacity) of ACs.160 It does so by displaying SEER-based efficiency and annual energy consumption of a product across three distinct climate zones in Australia and New Zealand (see Figure 5: Australia’s zoned energy rating label).
AC efficiency standards in IndiaIndia passed the Energy Conservation Act in 2001, making the BEE the central coordination agency for its implementation. Agencies were also created at the state level to cooperate with the BEE for the implementation of the Act. The Act empowered BEE and the Central government to specify Energy Consumption Standards (MEPS), giving them the power to interdict the manufacture, sale or import of equipment
Issues of technology might be similar across countries, but the willingness and ability of governments to deal with
these issues varies significantly
TAMING THE TECHNOLOGY
thermal comfort report_final.indd 74 06/06/19 2:50 PM
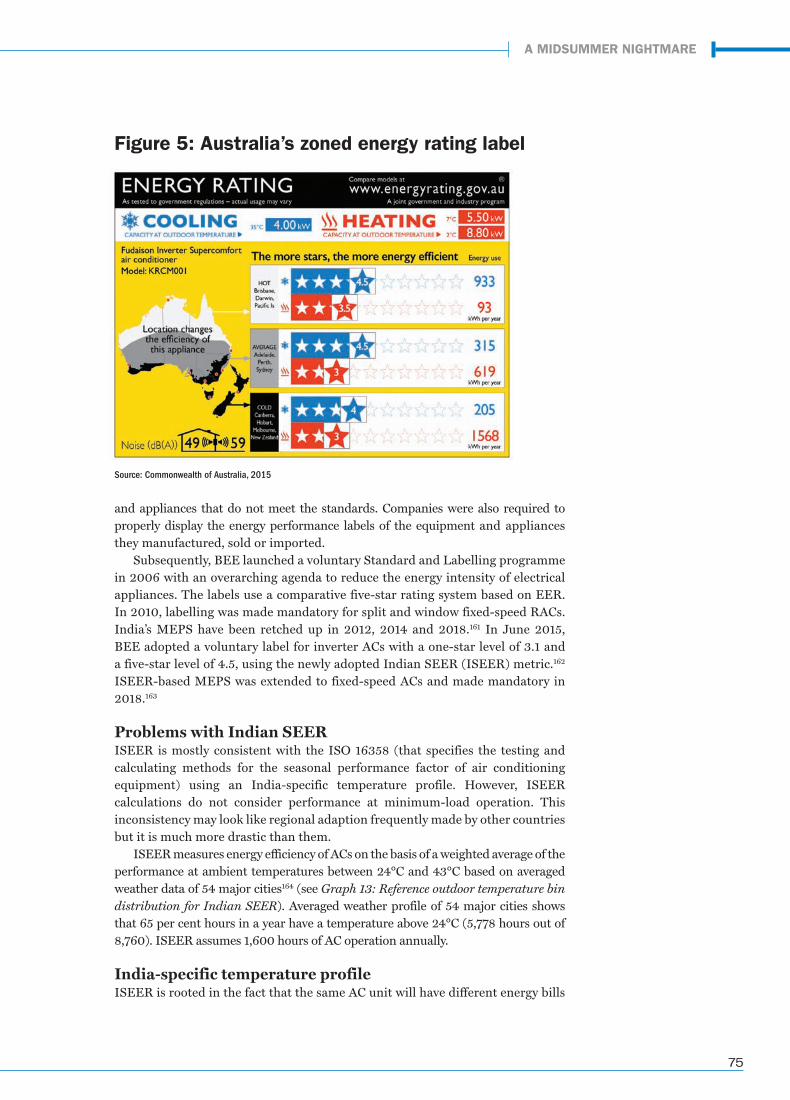
75
and appliances that do not meet the standards. Companies were also required to properly display the energy performance labels of the equipment and appliances they manufactured, sold or imported.
Subsequently, BEE launched a voluntary Standard and Labelling programme in 2006 with an overarching agenda to reduce the energy intensity of electrical appliances. The labels use a comparative five-star rating system based on EER. In 2010, labelling was made mandatory for split and window fixed-speed RACs. India’s MEPS have been retched up in 2012, 2014 and 2018.161 In June 2015, BEE adopted a voluntary label for inverter ACs with a one-star level of 3.1 and a five-star level of 4.5, using the newly adopted Indian SEER (ISEER) metric.162
ISEER-based MEPS was extended to fixed-speed ACs and made mandatory in 2018.163
Problems with Indian SEERISEER is mostly consistent with the ISO 16358 (that specifies the testing and calculating methods for the seasonal performance factor of air conditioning equipment) using an India-specific temperature profile. However, ISEER calculations do not consider performance at minimum-load operation. This inconsistency may look like regional adaption frequently made by other countries but it is much more drastic than them.
ISEER measures energy efficiency of ACs on the basis of a weighted average of the performance at ambient temperatures between 24°C and 43°C based on averaged weather data of 54 major cities164 (see Graph 13: Reference outdoor temperature bin distribution for Indian SEER). Averaged weather profile of 54 major cities shows that 65 per cent hours in a year have a temperature above 24°C (5,778 hours out of 8,760). ISEER assumes 1,600 hours of AC operation annually.
India-specific temperature profileISEER is rooted in the fact that the same AC unit will have different energy bills
Figure 5: Australia’s zoned energy rating label
Source: Commonwealth of Australia, 2015
A MIDSUMMER NIGHTMARE
thermal comfort report_final.indd 75 06/06/19 2:50 PM
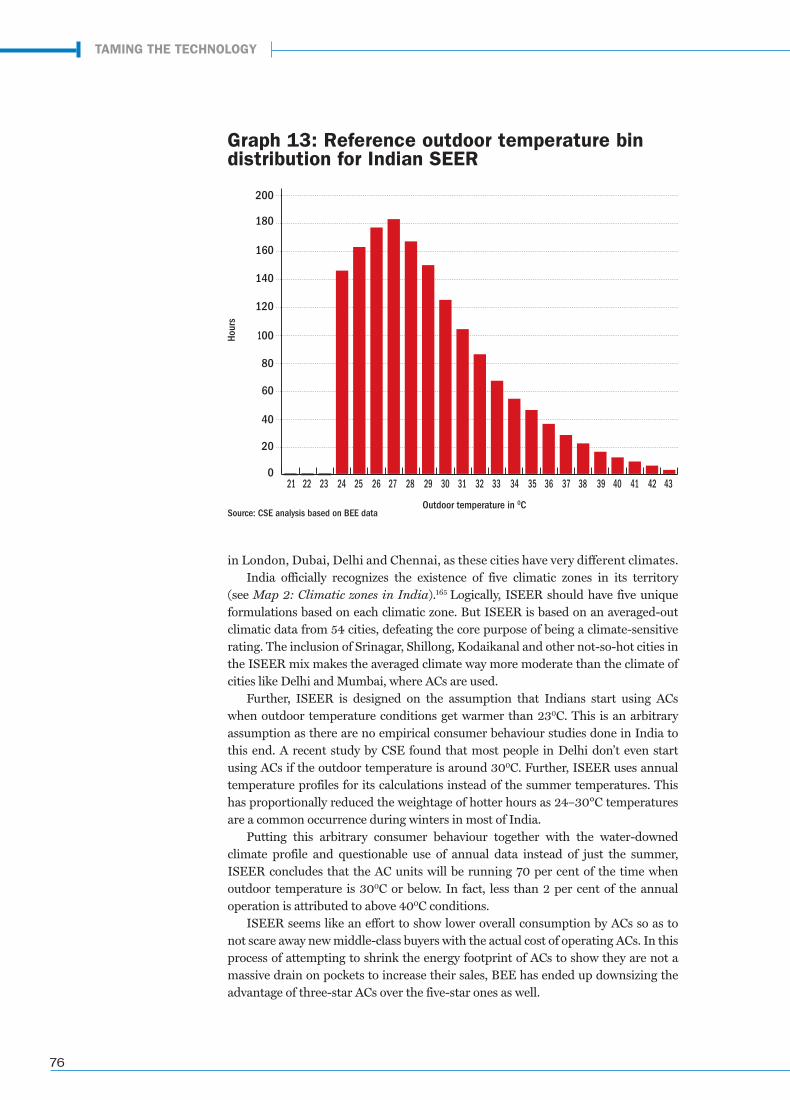
76
in London, Dubai, Delhi and Chennai, as these cities have very different climates.India officially recognizes the existence of five climatic zones in its territory
(see Map 2: Climatic zones in India).165 Logically, ISEER should have five unique formulations based on each climatic zone. But ISEER is based on an averaged-out climatic data from 54 cities, defeating the core purpose of being a climate-sensitive rating. The inclusion of Srinagar, Shillong, Kodaikanal and other not-so-hot cities in the ISEER mix makes the averaged climate way more moderate than the climate of cities like Delhi and Mumbai, where ACs are used.
Further, ISEER is designed on the assumption that Indians start using ACs when outdoor temperature conditions get warmer than 230C. This is an arbitrary assumption as there are no empirical consumer behaviour studies done in India to this end. A recent study by CSE found that most people in Delhi don’t even start using ACs if the outdoor temperature is around 300C. Further, ISEER uses annual temperature profiles for its calculations instead of the summer temperatures. This has proportionally reduced the weightage of hotter hours as 24–30°C temperatures are a common occurrence during winters in most of India.
Putting this arbitrary consumer behaviour together with the water-downed climate profile and questionable use of annual data instead of just the summer, ISEER concludes that the AC units will be running 70 per cent of the time when outdoor temperature is 300C or below. In fact, less than 2 per cent of the annual operation is attributed to above 400C conditions.
ISEER seems like an effort to show lower overall consumption by ACs so as to not scare away new middle-class buyers with the actual cost of operating ACs. In this process of attempting to shrink the energy footprint of ACs to show they are not a massive drain on pockets to increase their sales, BEE has ended up downsizing the advantage of three-star ACs over the five-star ones as well.
200
180
160
140
120
100
80
60
40
20
0 21 22 23 24 25 26 27 28 29 30 31 32 33 34 35 36 37 38 39 40 41 42 43
Outdoor temperature in 0C
Hour
s
Source: CSE analysis based on BEE data
Graph 13: Reference outdoor temperature bin distribution for Indian SEER
TAMING THE TECHNOLOGY
thermal comfort report_final.indd 76 06/06/19 2:50 PM
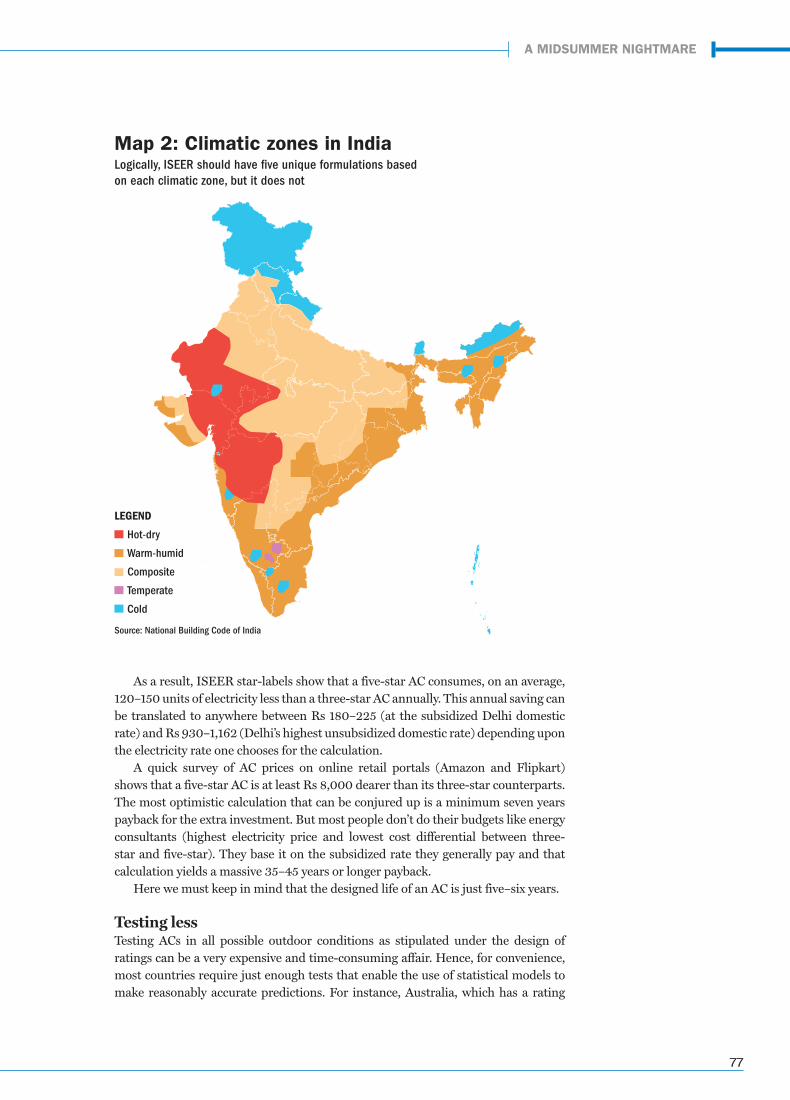
77
As a result, ISEER star-labels show that a five-star AC consumes, on an average, 120–150 units of electricity less than a three-star AC annually. This annual saving can be translated to anywhere between Rs 180–225 (at the subsidized Delhi domestic rate) and Rs 930–1,162 (Delhi’s highest unsubsidized domestic rate) depending upon the electricity rate one chooses for the calculation.
A quick survey of AC prices on online retail portals (Amazon and Flipkart) shows that a five-star AC is at least Rs 8,000 dearer than its three-star counterparts. The most optimistic calculation that can be conjured up is a minimum seven years payback for the extra investment. But most people don’t do their budgets like energy consultants (highest electricity price and lowest cost differential between three-star and five-star). They base it on the subsidized rate they generally pay and that calculation yields a massive 35–45 years or longer payback.
Here we must keep in mind that the designed life of an AC is just five–six years.
Testing lessTesting ACs in all possible outdoor conditions as stipulated under the design of ratings can be a very expensive and time-consuming affair. Hence, for convenience, most countries require just enough tests that enable the use of statistical models to make reasonably accurate predictions. For instance, Australia, which has a rating
Source: National Building Code of India
Map 2: Climatic zones in IndiaLogically, ISEER should have five unique formulations based on each climatic zone, but it does not
LEGEND
Hot-dry
Warm-humid
Composite
Temperate
Cold
A MIDSUMMER NIGHTMARE
thermal comfort report_final.indd 77 06/06/19 2:50 PM
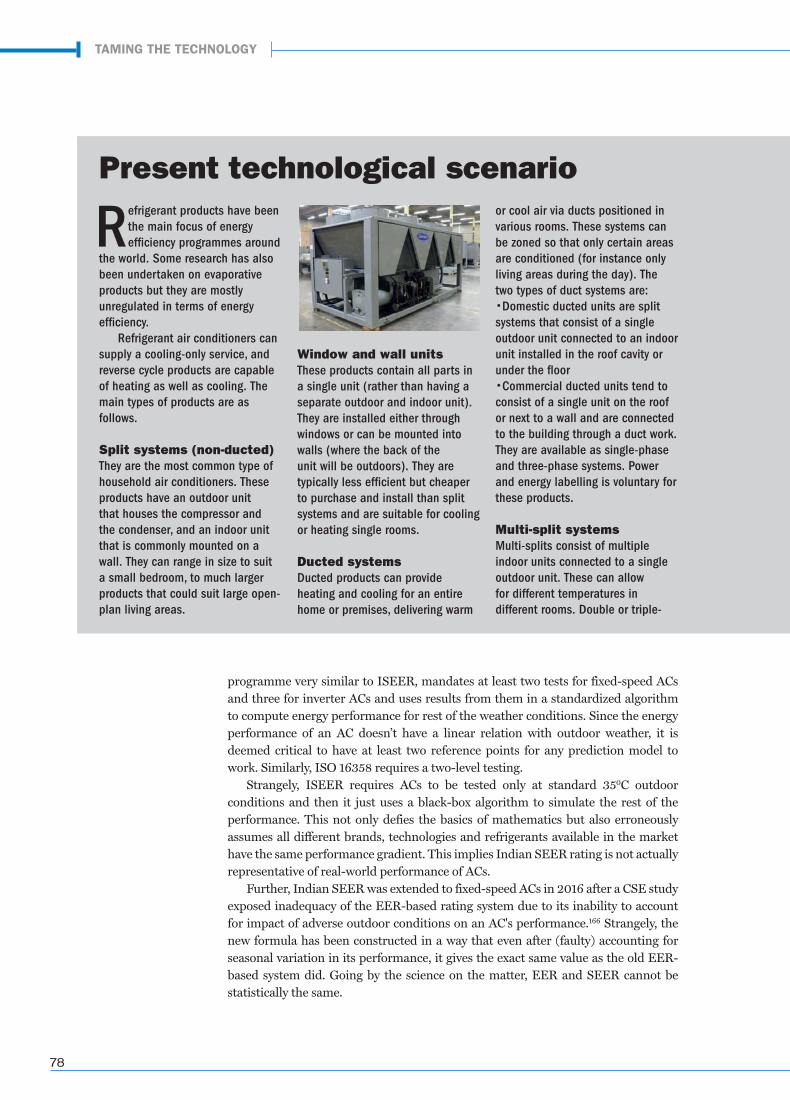
78
programme very similar to ISEER, mandates at least two tests for fixed-speed ACs and three for inverter ACs and uses results from them in a standardized algorithm to compute energy performance for rest of the weather conditions. Since the energy performance of an AC doesn’t have a linear relation with outdoor weather, it is deemed critical to have at least two reference points for any prediction model to work. Similarly, ISO 16358 requires a two-level testing.
Strangely, ISEER requires ACs to be tested only at standard 350C outdoor conditions and then it just uses a black-box algorithm to simulate the rest of the performance. This not only defies the basics of mathematics but also erroneously assumes all different brands, technologies and refrigerants available in the market have the same performance gradient. This implies Indian SEER rating is not actually representative of real-world performance of ACs.
Further, Indian SEER was extended to fixed-speed ACs in 2016 after a CSE study exposed inadequacy of the EER-based rating system due to its inability to account for impact of adverse outdoor conditions on an AC's performance.166 Strangely, the new formula has been constructed in a way that even after (faulty) accounting for seasonal variation in its performance, it gives the exact same value as the old EER-based system did. Going by the science on the matter, EER and SEER cannot be statistically the same.
Refrigerant products have been the main focus of energy efficiency programmes around
the world. Some research has also been undertaken on evaporative products but they are mostly unregulated in terms of energy efficiency.
Refrigerant air conditioners can supply a cooling-only service, and reverse cycle products are capable of heating as well as cooling. The main types of products are as follows.
Split systems (non-ducted)They are the most common type of household air conditioners. These products have an outdoor unit that houses the compressor and the condenser, and an indoor unit that is commonly mounted on a wall. They can range in size to suit a small bedroom, to much larger products that could suit large open-plan living areas.
Window and wall unitsThese products contain all parts in a single unit (rather than having a separate outdoor and indoor unit). They are installed either through windows or can be mounted into walls (where the back of the unit will be outdoors). They are typically less efficient but cheaper to purchase and install than split systems and are suitable for cooling or heating single rooms.
Ducted systemsDucted products can provide heating and cooling for an entire home or premises, delivering warm
or cool air via ducts positioned in various rooms. These systems can be zoned so that only certain areas are conditioned (for instance only living areas during the day). The two types of duct systems are: •Domestic ducted units are split systems that consist of a single outdoor unit connected to an indoor unit installed in the roof cavity or under the floor•Commercial ducted units tend to consist of a single unit on the roof or next to a wall and are connected to the building through a duct work. They are available as single-phase and three-phase systems. Power and energy labelling is voluntary for these products.
Multi-split systemsMulti-splits consist of multiple indoor units connected to a single outdoor unit. These can allow for different temperatures in different rooms. Double or triple-
Present technological scenario
TAMING THE TECHNOLOGY
thermal comfort report_final.indd 78 06/06/19 2:50 PM
79
Comfort conditionsUnder ISEER, comfort conditions are defined as per IS 1391 (which is the Indian standard for the construction and performance requirements of ACs); that is, an indoor temperature of 27˚C and a relative humidity of 50 per cent.167 The operational environment and comfort conditions described in this standard are used to establish and label energy efficiency of every AC sold in India.
In short, the energy efficiency of our ACs is tested and rated on their ability to cool down a space to 27˚C at 50 per cent relative humidity and keep it there. As established earlier, the indoor temperature set-point is one of the primary determinants of an AC’s energy performance, and if the end-user operates the AC at a setting lower than this, the AC is bound to consume more energy than what is printed on its energy efficiency label and rating.
Given this fact, it technically implies that the recommended set-points for ACs need to be aligned with testing temperature for certification. To illustrate this point let us consider the power ministry’s advisory to set default temperature of AC at 24˚C. Logically, this should be the default temperature or setting that the ACs have been rated on and that is placed on their labels. If 240C becomes the default set-point of ACs, the fact will be reflected in the testing protocol so that ACs are also tested at 24oC. Similarly, NBC’s prescription of not sizing any air conditioning above 26˚C sits
split systems are increasingly uncommon configurations that consist of a single outdoor unit and two or three indoor units that cannot be controlled individually.
Portable productsLike window or wall units, portable air conditioners are unitary systems. However, they are contained entirely within the space to be conditioned (i.e., a room) and air is drawn from indoors, cooled and then expelled via a single duct. These products are not currently regulated.
Solar air conditionersMany types of solar air conditioning technologies exist, though most of them are unlikely to be found in the domestic market. These technologies include some of the following.
Adsorption chillers: They use heat (e.g. from solar thermal collectors or waste heat from other processes) to
evaporate water in a vacuum which absorbs heat from its surroundings. Other materials can also be used. These tend to be used alongside large industrial processes to utilize waste heat and are sometimes encountered in commercial buildings as part of a cogeneration or tri-generation system.
Absorption chillers: They use heat (e.g. from solar thermal collectors or waste heat from other processes) to drive the refrigeration cycle. Familiar applications include kerosene- or gas-fired fridges. They are also used as part of cogeneration or tri-generation systems.
Solar desiccant cooling: They use desiccant material to absorb moisture (humidity) from the air to help with cooling. Solar heat is then used to dry the desiccant material in a continuous process.
Solar cooling using ejectors: They
use heat to create a thermally driven compression process. Many researchers (for example, at the Australian National University) are looking at ways of making this process economical for commercial applications.
Regular AC on PV: Normal electrically driven domestic air conditioners of vapour compression cycle that use photovoltaic (PV) panels to provide electricity directly to the air conditioners’ electrically driven compressor. This PV generated electricity offsets the amount of mains electricity that is required.
Regular ACs using solar thermal collectors: Normal electrically driven domestic air conditioners of vapour compression cycle that use solar thermal collectors to add heat to the refrigeration cycle (although some companies claim this process helps remove heat from the refrigeration cycle).
A MIDSUMMER NIGHTMARE
thermal comfort report_final.indd 79 06/06/19 2:50 PM
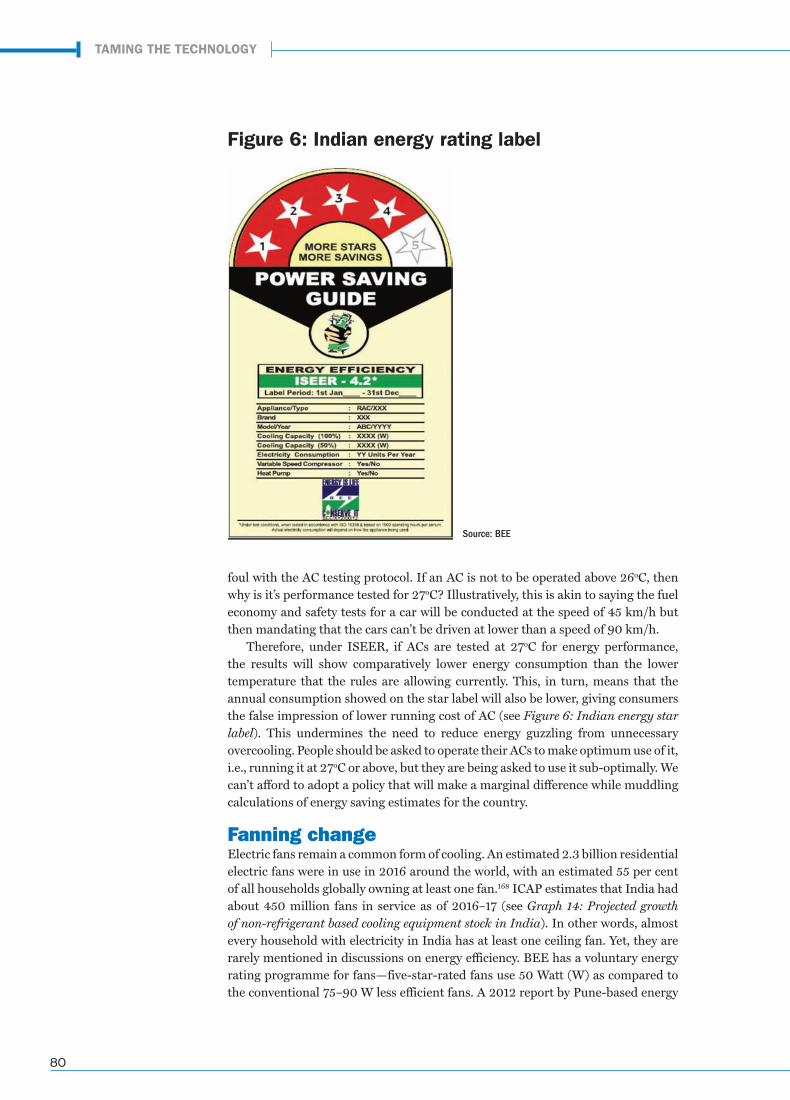
80
foul with the AC testing protocol. If an AC is not to be operated above 26oC, then why is it’s performance tested for 27oC? Illustratively, this is akin to saying the fuel economy and safety tests for a car will be conducted at the speed of 45 km/h but then mandating that the cars can’t be driven at lower than a speed of 90 km/h.
Therefore, under ISEER, if ACs are tested at 27oC for energy performance, the results will show comparatively lower energy consumption than the lower temperature that the rules are allowing currently. This, in turn, means that the annual consumption showed on the star label will also be lower, giving consumers the false impression of lower running cost of AC (see Figure 6: Indian energy star label). This undermines the need to reduce energy guzzling from unnecessary overcooling. People should be asked to operate their ACs to make optimum use of it, i.e., running it at 27oC or above, but they are being asked to use it sub-optimally. We can’t afford to adopt a policy that will make a marginal difference while muddling calculations of energy saving estimates for the country.
Fanning changeElectric fans remain a common form of cooling. An estimated 2.3 billion residential electric fans were in use in 2016 around the world, with an estimated 55 per cent of all households globally owning at least one fan.168 ICAP estimates that India had about 450 million fans in service as of 2016–17 (see Graph 14: Projected growth of non-refrigerant based cooling equipment stock in India). In other words, almost every household with electricity in India has at least one ceiling fan. Yet, they are rarely mentioned in discussions on energy efficiency. BEE has a voluntary energy rating programme for fans—five-star-rated fans use 50 Watt (W) as compared to the conventional 75–90 W less efficient fans. A 2012 report by Pune-based energy
Source: BEE
Figure 6: Indian energy rating label
TAMING THE TECHNOLOGY
thermal comfort report_final.indd 80 06/06/19 2:50 PM
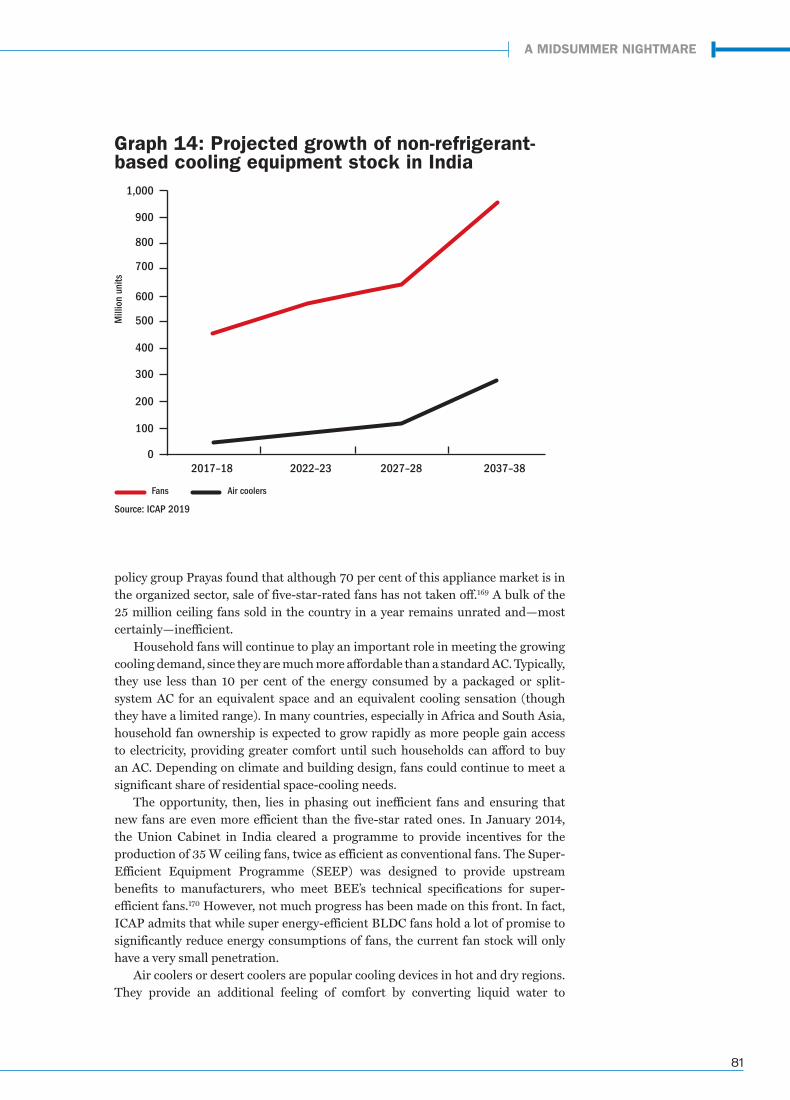
81
policy group Prayas found that although 70 per cent of this appliance market is in the organized sector, sale of five-star-rated fans has not taken off.169 A bulk of the 25 million ceiling fans sold in the country in a year remains unrated and—most certainly—inefficient.
Household fans will continue to play an important role in meeting the growing cooling demand, since they are much more affordable than a standard AC. Typically, they use less than 10 per cent of the energy consumed by a packaged or split-system AC for an equivalent space and an equivalent cooling sensation (though they have a limited range). In many countries, especially in Africa and South Asia, household fan ownership is expected to grow rapidly as more people gain access to electricity, providing greater comfort until such households can afford to buy an AC. Depending on climate and building design, fans could continue to meet a significant share of residential space-cooling needs.
The opportunity, then, lies in phasing out inefficient fans and ensuring that new fans are even more efficient than the five-star rated ones. In January 2014, the Union Cabinet in India cleared a programme to provide incentives for the production of 35 W ceiling fans, twice as efficient as conventional fans. The Super-Efficient Equipment Programme (SEEP) was designed to provide upstream benefits to manufacturers, who meet BEE’s technical specifications for super-efficient fans.170 However, not much progress has been made on this front. In fact, ICAP admits that while super energy-efficient BLDC fans hold a lot of promise to significantly reduce energy consumptions of fans, the current fan stock will only have a very small penetration.
Air coolers or desert coolers are popular cooling devices in hot and dry regions. They provide an additional feeling of comfort by converting liquid water to
A MIDSUMMER NIGHTMARE
1,000
900
800
700
600
500
400
300
200
100
2017–18 2022–23 2027–28 2037–380
Fans Air coolers
Source: ICAP 2019
Mill
ion
units
Graph 14: Projected growth of non-refrigerant-based cooling equipment stock in India
thermal comfort report_final.indd 81 06/06/19 2:50 PM
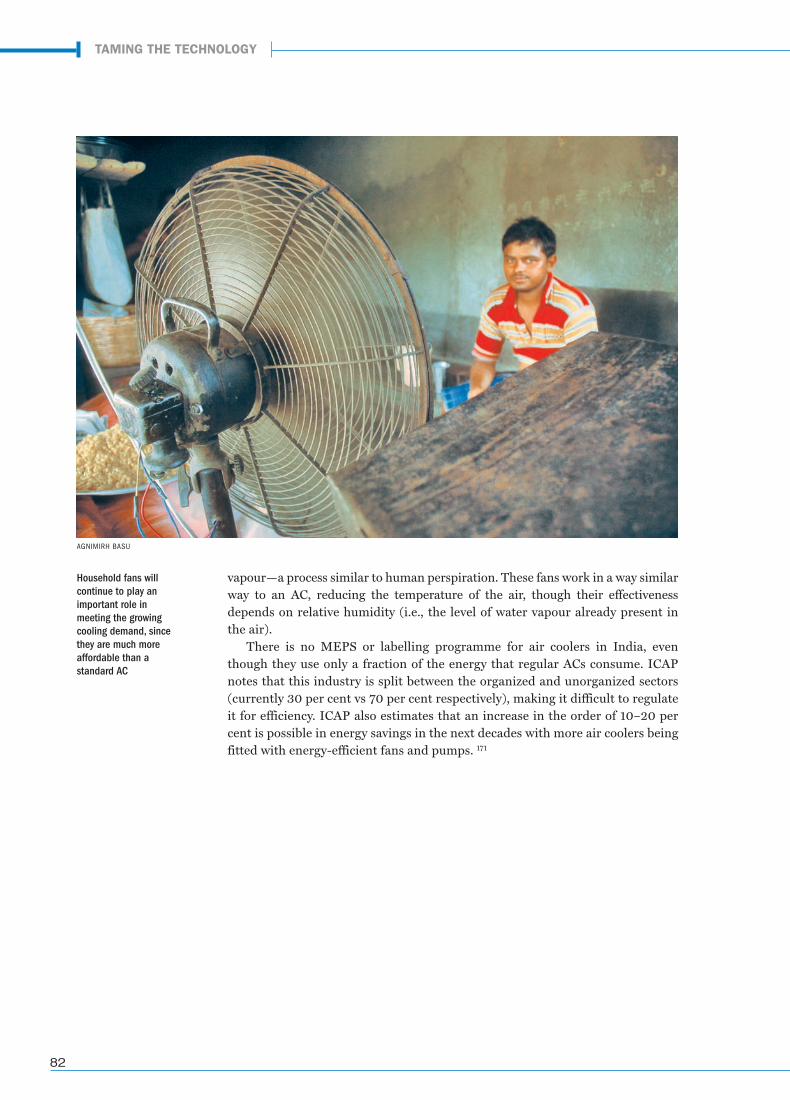
82
vapour—a process similar to human perspiration. These fans work in a way similar way to an AC, reducing the temperature of the air, though their effectiveness depends on relative humidity (i.e., the level of water vapour already present in the air).
There is no MEPS or labelling programme for air coolers in India, even though they use only a fraction of the energy that regular ACs consume. ICAP notes that this industry is split between the organized and unorganized sectors (currently 30 per cent vs 70 per cent respectively), making it difficult to regulate it for efficiency. ICAP also estimates that an increase in the order of 10–20 per cent is possible in energy savings in the next decades with more air coolers being fitted with energy-efficient fans and pumps. 171
TAMING THE TECHNOLOGY
Household fans will continue to play an important role in meeting the growing cooling demand, since they are much more affordable than a standard AC
AGNIMIRH BASU
thermal comfort report_final.indd 82 06/06/19 2:50 PM
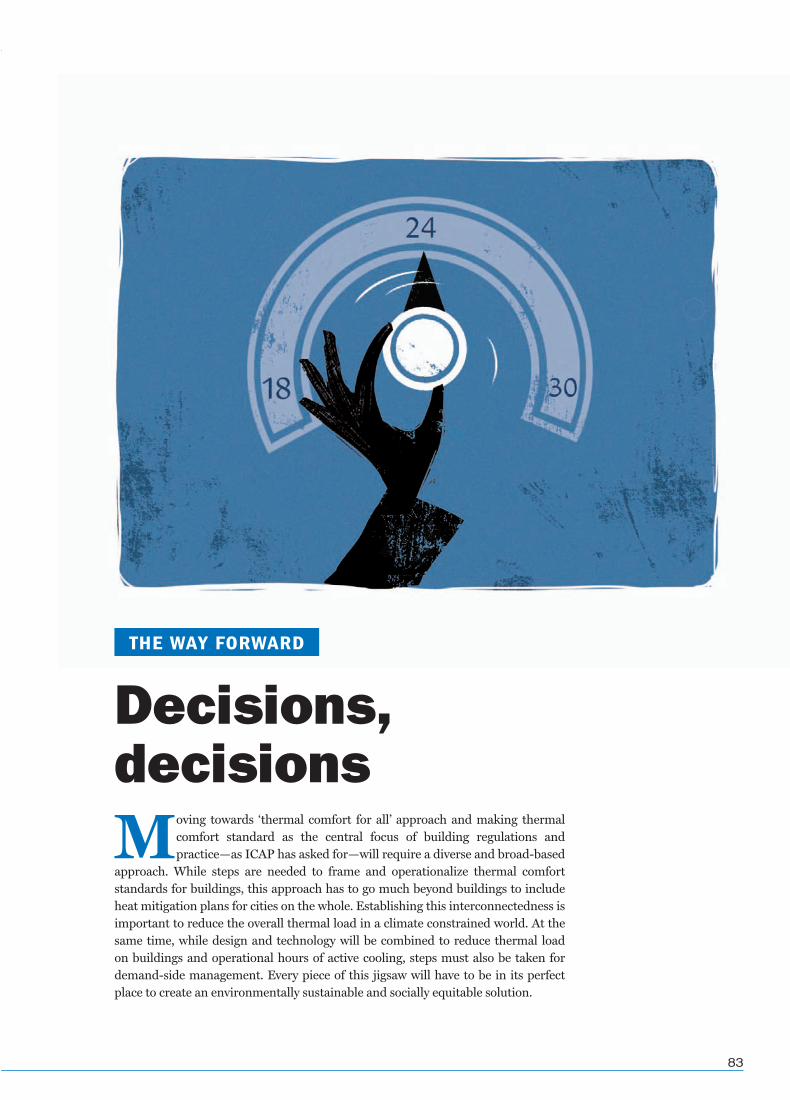
83
Moving towards ‘thermal comfort for all’ approach and making thermal comfort standard as the central focus of building regulations and practice—as ICAP has asked for—will require a diverse and broad-based
approach. While steps are needed to frame and operationalize thermal comfort standards for buildings, this approach has to go much beyond buildings to include heat mitigation plans for cities on the whole. Establishing this interconnectedness is important to reduce the overall thermal load in a climate constrained world. At the same time, while design and technology will be combined to reduce thermal load on buildings and operational hours of active cooling, steps must also be taken for demand-side management. Every piece of this jigsaw will have to be in its perfect place to create an environmentally sustainable and socially equitable solution.
Decisions, decisions
THE WAY FORWARD
thermal comfort report_final.indd 83 06/06/19 2:50 PM
84
Development of urban heat action and mitigation plansDevelop an urban heat-reject management plan to minimize impact of waste heat being ejected into the environment by air conditioning systems operating in a city. Develop guidelines on location and installation of compressor units of ACs in line with the guidelines for smoke exhaust for on-site power generator systems. Ahmedabad was the first city to prepare and implement a heat action plan, but the plan is limited to an emergency response in the event of a heat wave. There is a need to include short- and long-term plans to reduce the effect of urban heat islands in cities as part of these heat action plans. Municipal bodies need to develop and adopt urban heat action and mitigation plans that present actions to increase preparedness, information-sharing, and response coordination to reduce the health impact of extreme heat on vulnerable populations. Clean air plans being drafted in many cities can serve as model for these plans.
Adoption of Adaptive Thermal Comfort Model-based mixed-mode building design and operation• ICAP has underlined the need for behavioural and psychological change towards adaptive thermal comfort practices. There is an immediate need to establish adaptive thermal comfort benchmarks for various climatic zones in India, for both domestic and occupational application. The latest version of NBC has introduced an adaptive comfort model but it is limited to office application and agnostic to different climatic zones in India.• There is a misconception regarding the meaning and application of adaptive thermal comfort. It is being confused as a function of building design and operation when it is about human ability to respond to thermal variations in the immediate surrounding and adapt to them, in the process re-configuring what feels thermally comfortable. This is important to understand because ICAP is asking to use the adaptive model to train thermostat setting of an AC when it should be governing when to switch off ACs. • The building codes—ECBC and NBC—need to link design and energy efficiency guidelines with adaptive thermal comfort delivery using practices specific to the Indian climates.• Adopt a Bush Shirt Rule to allow people freedom to dress for comfort at work and for formal engagements.
Adoption of passive design and envelope improvements in all new construction to inherently reduce the need for active space cooling• Institutionalize a holistic and integrated approach for thermally comfortable and energy-efficient building designs for buildings with the mandate to first minimize cooling needs using passive design elements and then employing the most efficient system to meet active cooling needs as a condition under the environment clearance policy.• All buildings need to be designed to provide thermal comfort as set by the adaptive thermal comfort standards. This needs to make use of passive design interventions in a way that limits dependency on active space cooling to a few weeks in a year, if not totally eliminating it. • ECBC and ECBC-R need to be reworked to use thermal comfort as a means to achieve energy efficiency. The reworked codes must be aggressively pushed for widespread adoption and stringent enforcement.• Allocate government funding and support to enable passive cooling design
THE WAY FORWARD
thermal comfort report_final.indd 84 06/06/19 2:50 PM
85
implementation for economically weaker section. This can include viability gap funding for incorporating additional features like cool roofs, insulation, sun-shades, wind-towers, etc. • Meanwhile, mandate provision of sun-shade for all windows and make a provision for installing desert coolers in all new housing. Builders have resorted to providing provision only for ACs in new buildings making it difficult for people to use any other means for cooling.• Run aggressive market awareness campaigns to sensitize both the construction community as well as the end-users towards the multiple benefits of energy-efficient buildings—reduced operational costs, health and comfort, environmental and societal benefits.• Develop an inventory of building materials, listing their energy efficiency, life-cycle environmental cost and thermal comfort performance.
Measures to enhance thermal comfort and reduce operational need for active cooling systems• Retrofit and retro-commission existing buildings to improve their thermal comfort performance and to reduce their cooling requirements and energy consumption. This should include addition of sun-shades to any exposed glass in the facade, cool roofs and capping of thermostat of building HVAC. • Mandatory minimum indoor temperature settings for summer and maximum indoor temperature setting for winter to reduce thermal requirement, and energy consumption while maintaining a healthy working as well as living environment.
Improvement in star labelling of existing technology to better inform people of the energy costs• Revise ISEER to meet international standard for a number of MEPS tests. Further, rework the climatic data used in ISEER calculations using the summer profile and not the annual profile. Make it separately for all five climate zones in India. • Introduce a new star label that includes climate-based rating information. Mention test conditions on the label as well. • Set the default set point of AC at the same level as the one used in MEPS testing. • Drive widespread adoption of 5-star labelled fans and room air conditioners in new and existing buildings• It has been noted all over the world that room air conditioner manufacturers only invest in development of and innovation in energy-efficient ACs if pushed by upping of MEPS. India should aggressively push up the MEPS.• Make BEE star labelling of ceiling fans mandatory and introduce BEE star labelling for air coolers.
Demand-side management and demand response programmes for behavioural change • Institutionalize demand-side management programmes with DISCOMs to partly fund thermal performance improvements in existing building stock. • Introduce a behaviour-based energy efficiency programme where households are provided an analysis of their monthly energy bill by DISCOMs in relation to their peers, so that they can compare energy performance.• Promote the use of demand response-enabled cooling technology, real-time power consumption displays in all room ACs and building automation and management systems.
A MIDSUMMER NIGHTMARE
thermal comfort report_final.indd 85 06/06/19 2:50 PM
86
• Institutionalize installation of thermal storage with cooling systems and differential power tariffs to minimize peak power requirements.• Put into place a scrappage policy to ensure old ACs are effectively retired.
Building energy data collection and reporting • Institute a practice of making disclosure of energy and cooling demand mandatory for all buildings. This information should be made publicly available for all buildings with a connected load equal to or more than 100 kW.• Make mandatory third-party verification of building energy and cooling demand disclosures for all buildings that have a connected load of 100 kW or higher every five years. • Improve data collection and statistics on energy efficiency indicators and make it part of the Open Government Data Platform put in place by the Government of India.
THE WAY FORWARD
thermal comfort report_final.indd 86 06/06/19 2:50 PM
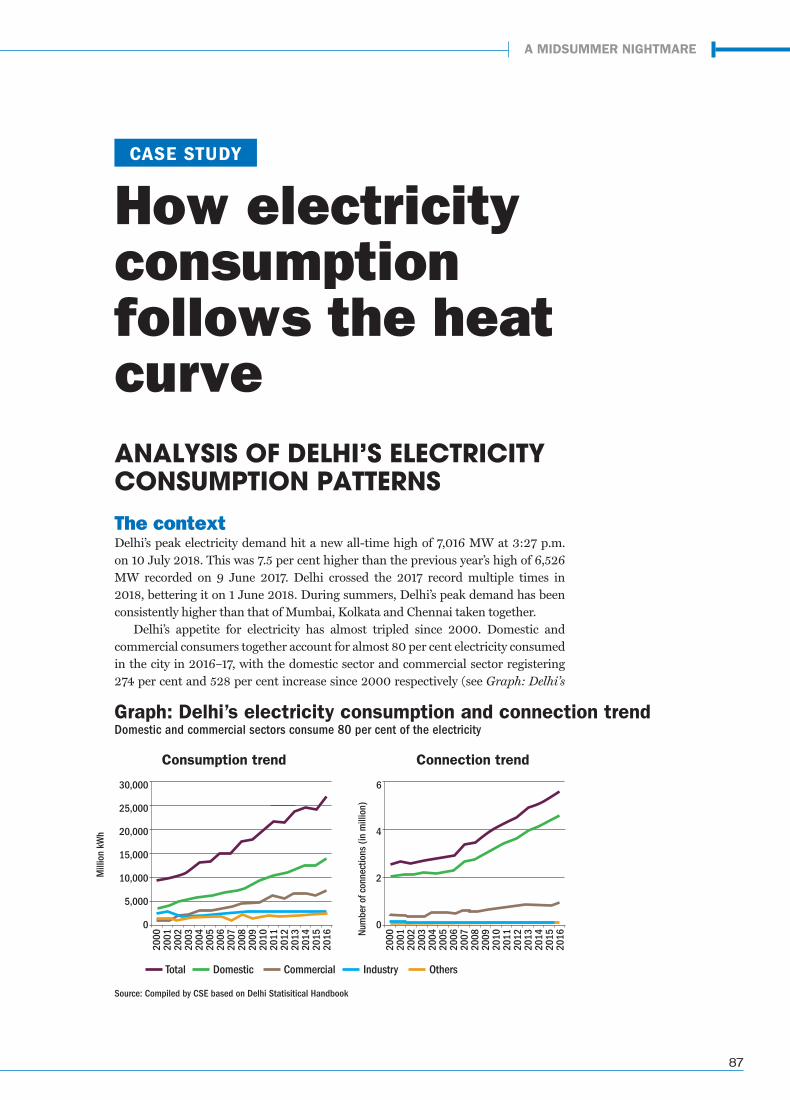
87
A MIDSUMMER NIGHTMARE
The contextDelhi’s peak electricity demand hit a new all-time high of 7,016 MW at 3:27 p.m. on 10 July 2018. This was 7.5 per cent higher than the previous year’s high of 6,526 MW recorded on 9 June 2017. Delhi crossed the 2017 record multiple times in 2018, bettering it on 1 June 2018. During summers, Delhi’s peak demand has been consistently higher than that of Mumbai, Kolkata and Chennai taken together.
Delhi’s appetite for electricity has almost tripled since 2000. Domestic and commercial consumers together account for almost 80 per cent electricity consumed in the city in 2016–17, with the domestic sector and commercial sector registering 274 per cent and 528 per cent increase since 2000 respectively (see Graph: Delhi’s
How electricity consumption follows the heat curveANALYSIS OF DELHI’S ELECTRICITY CONSUMPTION PATTERNS
30,000
25,000
20,000
15,000
10,000
5,000
0
6
4
2
0
2000
2000
2001
2001
2002
2002
2003
2003
2004
2004
2005
2005
2006
2006
2007
2007
2008
2008
2009
2009
2010
2010
2011
2011
2012
2012
2013
2013
2014
2014
2015
2015
2016
2016
Mill
ion
kWh
Num
ber o
f con
nect
ions
(in
mill
ion)
Source: Compiled by CSE based on Delhi Statisitical Handbook
Total Domestic Commercial Industry Others
CASE STUDY
Graph: Delhi’s electricity consumption and connection trendDomestic and commercial sectors consume 80 per cent of the electricity
Consumption trend Connection trend
thermal comfort report_final.indd 87 06/06/19 2:50 PM
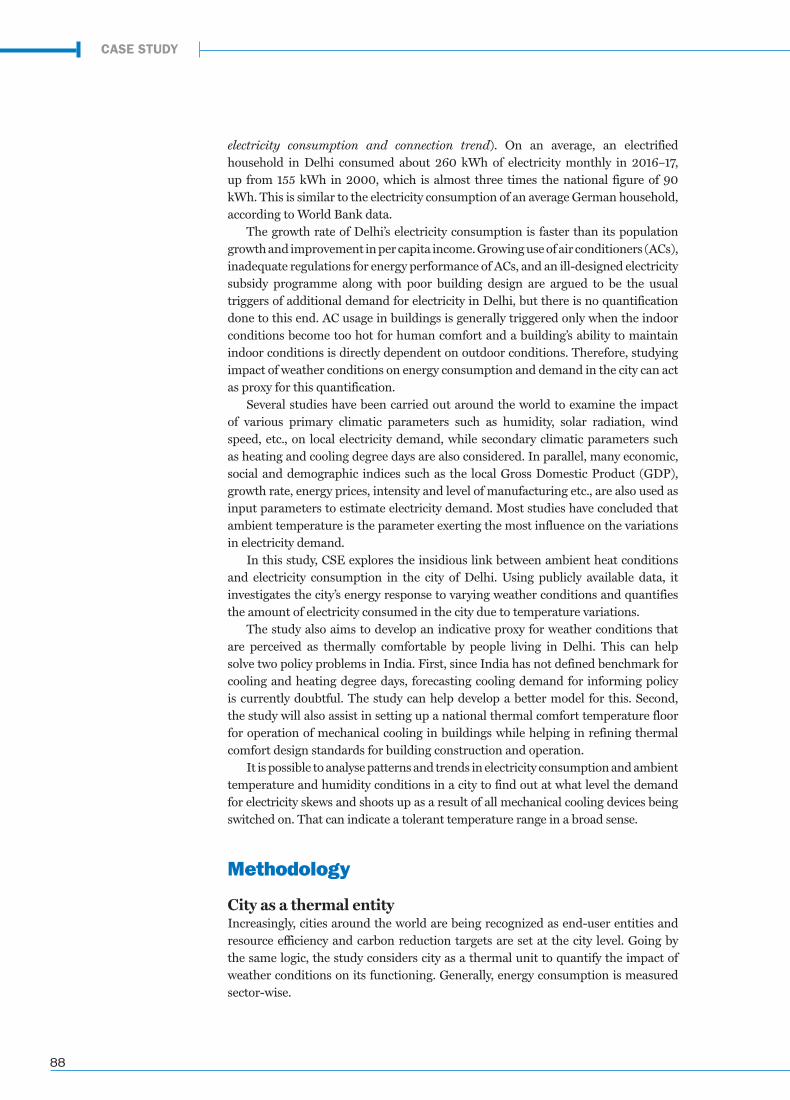
88
electricity consumption and connection trend). On an average, an electrified household in Delhi consumed about 260 kWh of electricity monthly in 2016–17, up from 155 kWh in 2000, which is almost three times the national figure of 90 kWh. This is similar to the electricity consumption of an average German household, according to World Bank data.
The growth rate of Delhi’s electricity consumption is faster than its population growth and improvement in per capita income. Growing use of air conditioners (ACs), inadequate regulations for energy performance of ACs, and an ill-designed electricity subsidy programme along with poor building design are argued to be the usual triggers of additional demand for electricity in Delhi, but there is no quantification done to this end. AC usage in buildings is generally triggered only when the indoor conditions become too hot for human comfort and a building’s ability to maintain indoor conditions is directly dependent on outdoor conditions. Therefore, studying impact of weather conditions on energy consumption and demand in the city can act as proxy for this quantification.
Several studies have been carried out around the world to examine the impact of various primary climatic parameters such as humidity, solar radiation, wind speed, etc., on local electricity demand, while secondary climatic parameters such as heating and cooling degree days are also considered. In parallel, many economic, social and demographic indices such as the local Gross Domestic Product (GDP), growth rate, energy prices, intensity and level of manufacturing etc., are also used as input parameters to estimate electricity demand. Most studies have concluded that ambient temperature is the parameter exerting the most influence on the variations in electricity demand.
In this study, CSE explores the insidious link between ambient heat conditions and electricity consumption in the city of Delhi. Using publicly available data, it investigates the city’s energy response to varying weather conditions and quantifies the amount of electricity consumed in the city due to temperature variations.
The study also aims to develop an indicative proxy for weather conditions that are perceived as thermally comfortable by people living in Delhi. This can help solve two policy problems in India. First, since India has not defined benchmark for cooling and heating degree days, forecasting cooling demand for informing policy is currently doubtful. The study can help develop a better model for this. Second, the study will also assist in setting up a national thermal comfort temperature floor for operation of mechanical cooling in buildings while helping in refining thermal comfort design standards for building construction and operation.
It is possible to analyse patterns and trends in electricity consumption and ambient temperature and humidity conditions in a city to find out at what level the demand for electricity skews and shoots up as a result of all mechanical cooling devices being switched on. That can indicate a tolerant temperature range in a broad sense.
Methodology
City as a thermal entityIncreasingly, cities around the world are being recognized as end-user entities and resource efficiency and carbon reduction targets are set at the city level. Going by the same logic, the study considers city as a thermal unit to quantify the impact of weather conditions on its functioning. Generally, energy consumption is measured sector-wise.
CASE STUDY
thermal comfort report_final.indd 88 06/06/19 2:50 PM
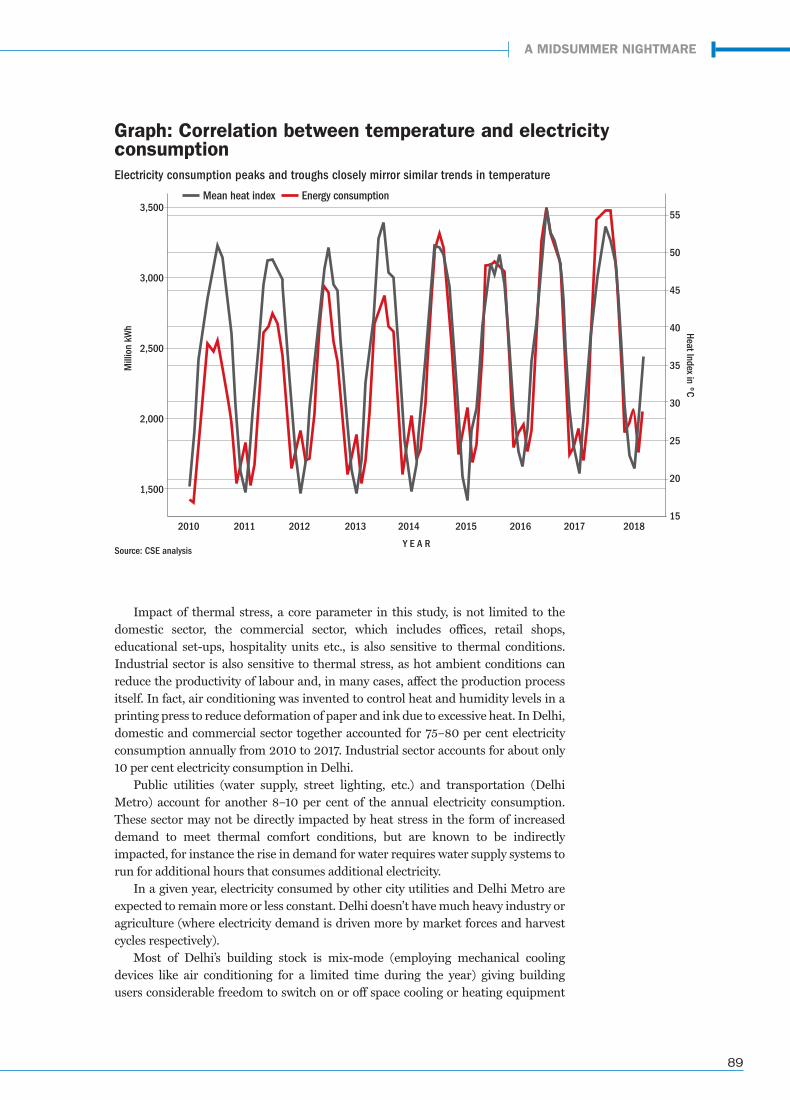
89
Impact of thermal stress, a core parameter in this study, is not limited to the domestic sector, the commercial sector, which includes offices, retail shops, educational set-ups, hospitality units etc., is also sensitive to thermal conditions. Industrial sector is also sensitive to thermal stress, as hot ambient conditions can reduce the productivity of labour and, in many cases, affect the production process itself. In fact, air conditioning was invented to control heat and humidity levels in a printing press to reduce deformation of paper and ink due to excessive heat. In Delhi, domestic and commercial sector together accounted for 75–80 per cent electricity consumption annually from 2010 to 2017. Industrial sector accounts for about only 10 per cent electricity consumption in Delhi.
Public utilities (water supply, street lighting, etc.) and transportation (Delhi Metro) account for another 8–10 per cent of the annual electricity consumption. These sector may not be directly impacted by heat stress in the form of increased demand to meet thermal comfort conditions, but are known to be indirectly impacted, for instance the rise in demand for water requires water supply systems to run for additional hours that consumes additional electricity.
In a given year, electricity consumed by other city utilities and Delhi Metro are expected to remain more or less constant. Delhi doesn’t have much heavy industry or agriculture (where electricity demand is driven more by market forces and harvest cycles respectively).
Most of Delhi’s building stock is mix-mode (employing mechanical cooling devices like air conditioning for a limited time during the year) giving building users considerable freedom to switch on or off space cooling or heating equipment
Graph: Correlation between temperature and electricity consumptionElectricity consumption peaks and troughs closely mirror similar trends in temperature
3,500
3,000
2,500
2,000
1,500
2010 2011 2012 2013 2014 2015 2016 2017 2018
55
50
45
40
35
30
25
20
15
Mill
ion
kWh
Y E A R
Mean heat index Energy consumption
Heat Index in ºC
A MIDSUMMER NIGHTMARE
Source: CSE analysis
thermal comfort report_final.indd 89 06/06/19 2:50 PM
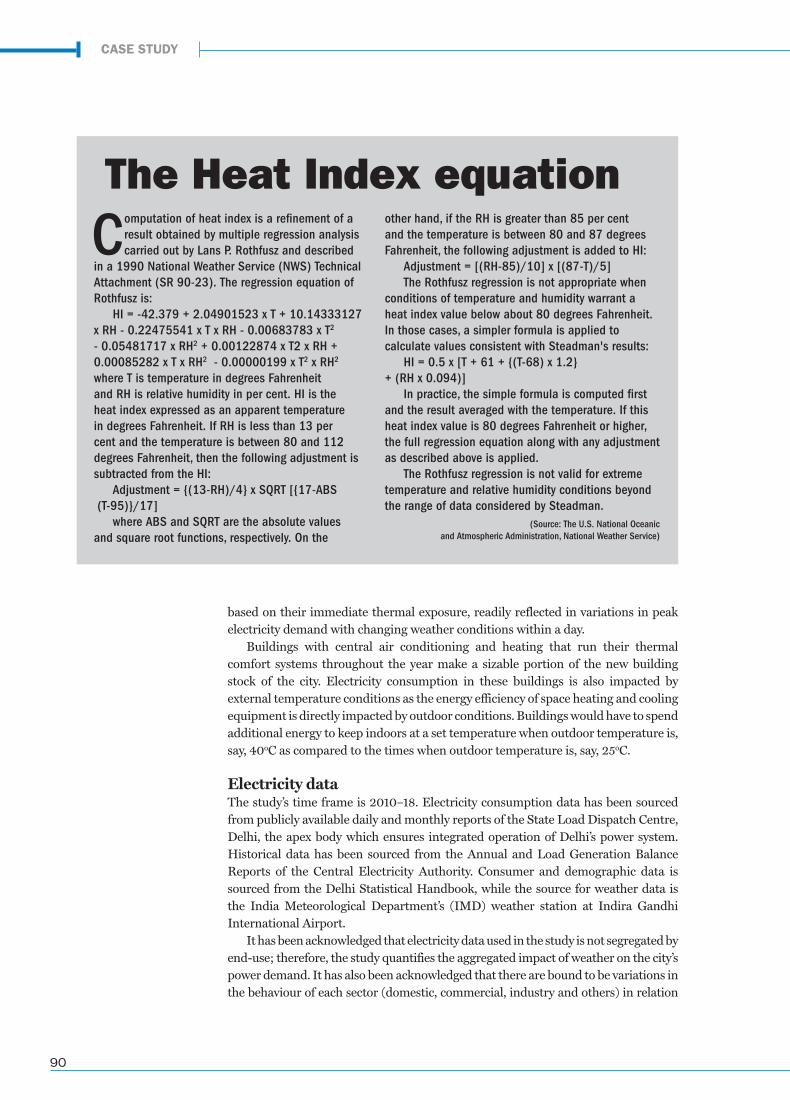
90
based on their immediate thermal exposure, readily reflected in variations in peak electricity demand with changing weather conditions within a day.
Buildings with central air conditioning and heating that run their thermal comfort systems throughout the year make a sizable portion of the new building stock of the city. Electricity consumption in these buildings is also impacted by external temperature conditions as the energy efficiency of space heating and cooling equipment is directly impacted by outdoor conditions. Buildings would have to spend additional energy to keep indoors at a set temperature when outdoor temperature is, say, 40oC as compared to the times when outdoor temperature is, say, 25oC.
Electricity dataThe study’s time frame is 2010–18. Electricity consumption data has been sourced from publicly available daily and monthly reports of the State Load Dispatch Centre, Delhi, the apex body which ensures integrated operation of Delhi’s power system. Historical data has been sourced from the Annual and Load Generation Balance Reports of the Central Electricity Authority. Consumer and demographic data is sourced from the Delhi Statistical Handbook, while the source for weather data is the India Meteorological Department’s (IMD) weather station at Indira Gandhi International Airport.
It has been acknowledged that electricity data used in the study is not segregated by end-use; therefore, the study quantifies the aggregated impact of weather on the city’s power demand. It has also been acknowledged that there are bound to be variations in the behaviour of each sector (domestic, commercial, industry and others) in relation
Computation of heat index is a refinement of a result obtained by multiple regression analysis carried out by Lans P. Rothfusz and described
in a 1990 National Weather Service (NWS) Technical Attachment (SR 90-23). The regression equation of Rothfusz is:
HI = -42.379 + 2.04901523 x T + 10.14333127 x RH - 0.22475541 x T x RH - 0.00683783 x T2 - 0.05481717 x RH2 + 0.00122874 x T2 x RH + 0.00085282 x T x RH2 - 0.00000199 x T2 x RH2
where T is temperature in degrees Fahrenheit and RH is relative humidity in per cent. HI is the heat index expressed as an apparent temperature in degrees Fahrenheit. If RH is less than 13 per cent and the temperature is between 80 and 112 degrees Fahrenheit, then the following adjustment is subtracted from the HI:
Adjustment = {(13-RH)/4} x SQRT [{17-ABS (T-95)}/17]
where ABS and SQRT are the absolute values and square root functions, respectively. On the
other hand, if the RH is greater than 85 per cent and the temperature is between 80 and 87 degrees Fahrenheit, the following adjustment is added to HI:
Adjustment = [(RH-85)/10] x [(87-T)/5]The Rothfusz regression is not appropriate when
conditions of temperature and humidity warrant a heat index value below about 80 degrees Fahrenheit. In those cases, a simpler formula is applied to calculate values consistent with Steadman's results:
HI = 0.5 x [T + 61 + {(T-68) x 1.2} + (RH x 0.094)]
In practice, the simple formula is computed first and the result averaged with the temperature. If this heat index value is 80 degrees Fahrenheit or higher, the full regression equation along with any adjustment as described above is applied.
The Rothfusz regression is not valid for extreme temperature and relative humidity conditions beyond the range of data considered by Steadman.
(Source: The U.S. National Oceanic and Atmospheric Administration, National Weather Service)
The Heat Index equation
CASE STUDY
thermal comfort report_final.indd 90 06/06/19 2:50 PM
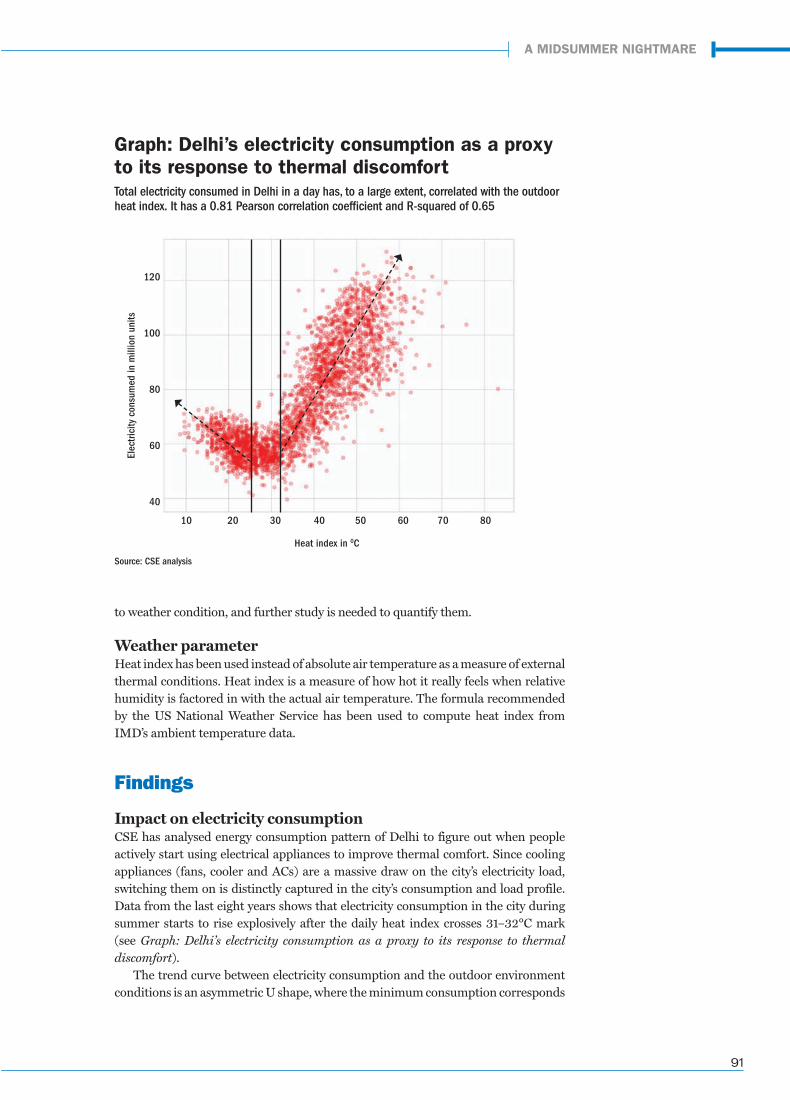
91
to weather condition, and further study is needed to quantify them.
Weather parameterHeat index has been used instead of absolute air temperature as a measure of external thermal conditions. Heat index is a measure of how hot it really feels when relative humidity is factored in with the actual air temperature. The formula recommended by the US National Weather Service has been used to compute heat index from IMD’s ambient temperature data.
Findings
Impact on electricity consumptionCSE has analysed energy consumption pattern of Delhi to figure out when people actively start using electrical appliances to improve thermal comfort. Since cooling appliances (fans, cooler and ACs) are a massive draw on the city’s electricity load, switching them on is distinctly captured in the city’s consumption and load profile. Data from the last eight years shows that electricity consumption in the city during summer starts to rise explosively after the daily heat index crosses 31–32°C mark (see Graph: Delhi’s electricity consumption as a proxy to its response to thermal discomfort).
The trend curve between electricity consumption and the outdoor environment conditions is an asymmetric U shape, where the minimum consumption corresponds
Graph: Delhi’s electricity consumption as a proxy to its response to thermal discomfortTotal electricity consumed in Delhi in a day has, to a large extent, correlated with the outdoor heat index. It has a 0.81 Pearson correlation coefficient and R-squared of 0.65
120
100
80
60
40
10 20 30 40 50 60 70 80
Elec
trici
ty c
onsu
med
in m
illio
n un
its
Heat index in 0C
A MIDSUMMER NIGHTMARE
Source: CSE analysis
thermal comfort report_final.indd 91 06/06/19 2:50 PM
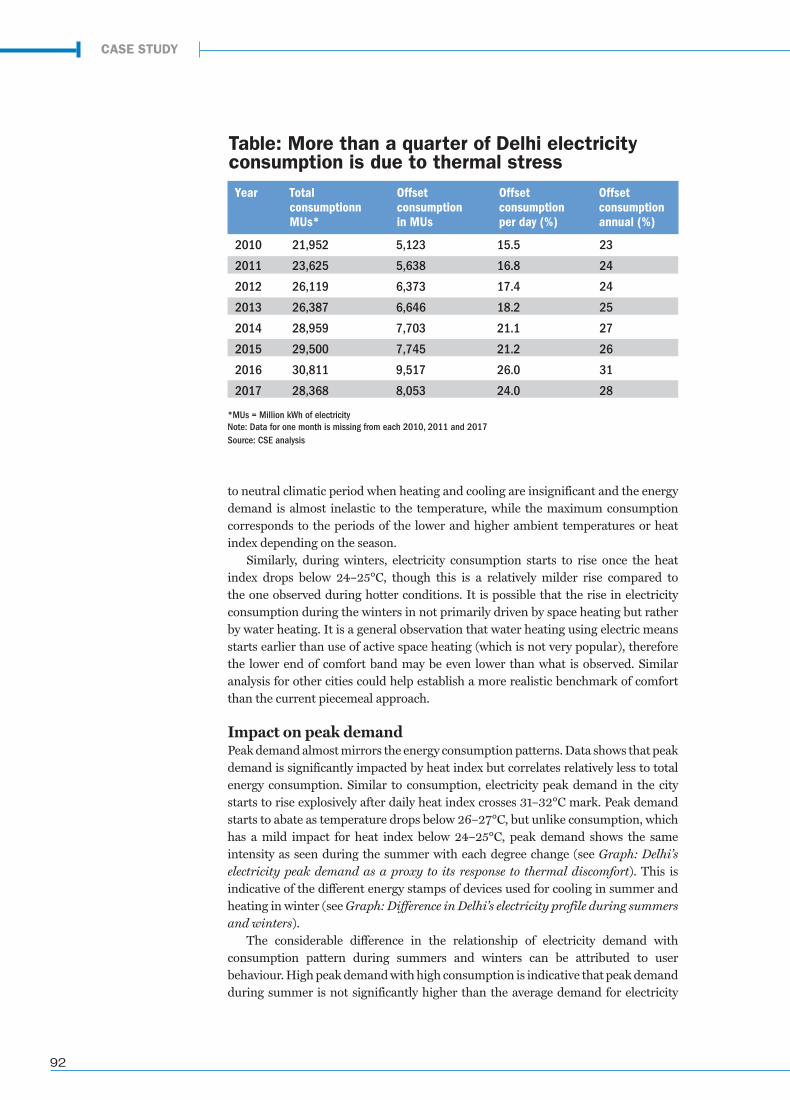
92
to neutral climatic period when heating and cooling are insignificant and the energy demand is almost inelastic to the temperature, while the maximum consumption corresponds to the periods of the lower and higher ambient temperatures or heat index depending on the season.
Similarly, during winters, electricity consumption starts to rise once the heat index drops below 24–25°C, though this is a relatively milder rise compared to the one observed during hotter conditions. It is possible that the rise in electricity consumption during the winters in not primarily driven by space heating but rather by water heating. It is a general observation that water heating using electric means starts earlier than use of active space heating (which is not very popular), therefore the lower end of comfort band may be even lower than what is observed. Similar analysis for other cities could help establish a more realistic benchmark of comfort than the current piecemeal approach.
Impact on peak demandPeak demand almost mirrors the energy consumption patterns. Data shows that peak demand is significantly impacted by heat index but correlates relatively less to total energy consumption. Similar to consumption, electricity peak demand in the city starts to rise explosively after daily heat index crosses 31–32°C mark. Peak demand starts to abate as temperature drops below 26–27°C, but unlike consumption, which has a mild impact for heat index below 24–25°C, peak demand shows the same intensity as seen during the summer with each degree change (see Graph: Delhi’s electricity peak demand as a proxy to its response to thermal discomfort). This is indicative of the different energy stamps of devices used for cooling in summer and heating in winter (see Graph: Difference in Delhi’s electricity profile during summers and winters).
The considerable difference in the relationship of electricity demand with consumption pattern during summers and winters can be attributed to user behaviour. High peak demand with high consumption is indicative that peak demand during summer is not significantly higher than the average demand for electricity
2010 21,952 5,123 15.5 23
2011 23,625 5,638 16.8 24
2012 26,119 6,373 17.4 24
2013 26,387 6,646 18.2 25
2014 28,959 7,703 21.1 27
2015 29,500 7,745 21.2 26
2016 30,811 9,517 26.0 31
2017 28,368 8,053 24.0 28
Year Total consumptionn MUs*
Offset consumption in MUs
Offset consumption per day (%)
Offset consumption annual (%)
Table: More than a quarter of Delhi electricity consumption is due to thermal stress
*MUs = Million kWh of electricityNote: Data for one month is missing from each 2010, 2011 and 2017Source: CSE analysis
CASE STUDY
thermal comfort report_final.indd 92 06/06/19 2:50 PM
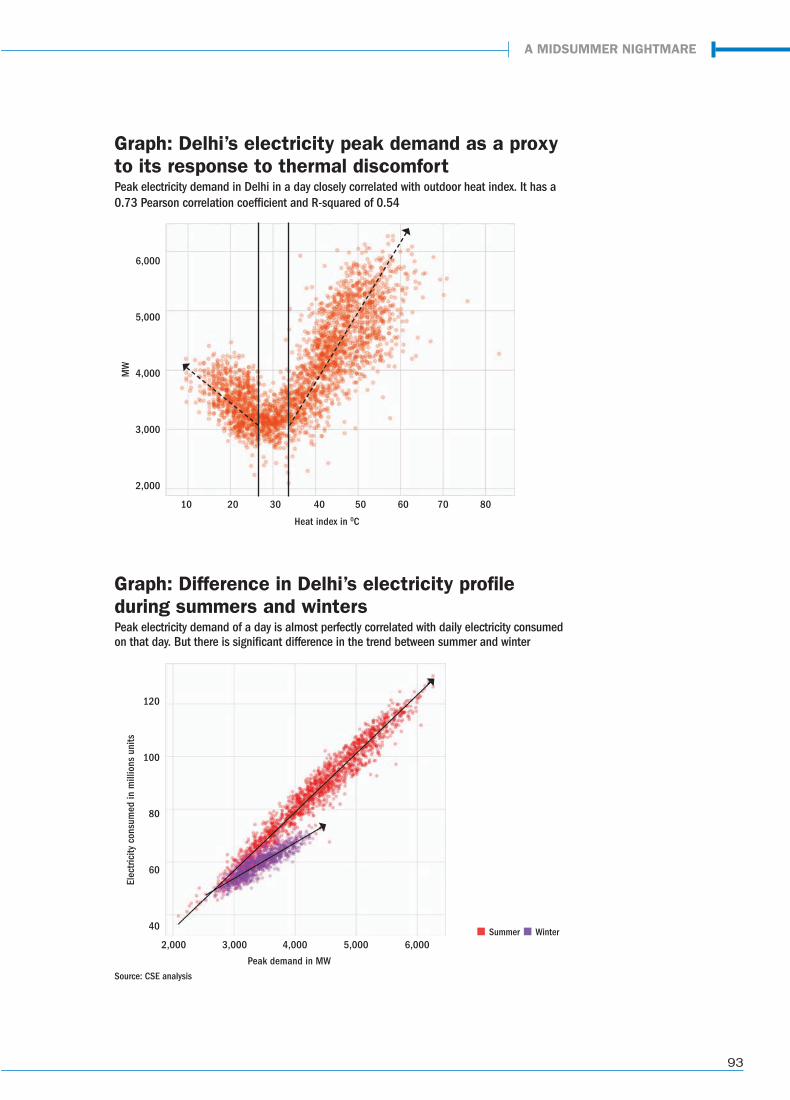
93
A MIDSUMMER NIGHTMARE
Graph: Difference in Delhi’s electricity profile during summers and winters Peak electricity demand of a day is almost perfectly correlated with daily electricity consumed on that day. But there is significant difference in the trend between summer and winter
Graph: Delhi’s electricity peak demand as a proxy to its response to thermal discomfortPeak electricity demand in Delhi in a day closely correlated with outdoor heat index. It has a 0.73 Pearson correlation coefficient and R-squared of 0.54
6,000
5,000
4,000
3,000
2,000
120
100
80
60
40
10 20 30 40 50 60 70 80
2,000 3,000 4,000 5,000 6,000
MW
Elec
trici
ty c
onsu
med
in m
illio
ns u
nits
Heat index in 0C
Peak demand in MWSource: CSE analysis
Summer Winter
thermal comfort report_final.indd 93 06/06/19 2:51 PM
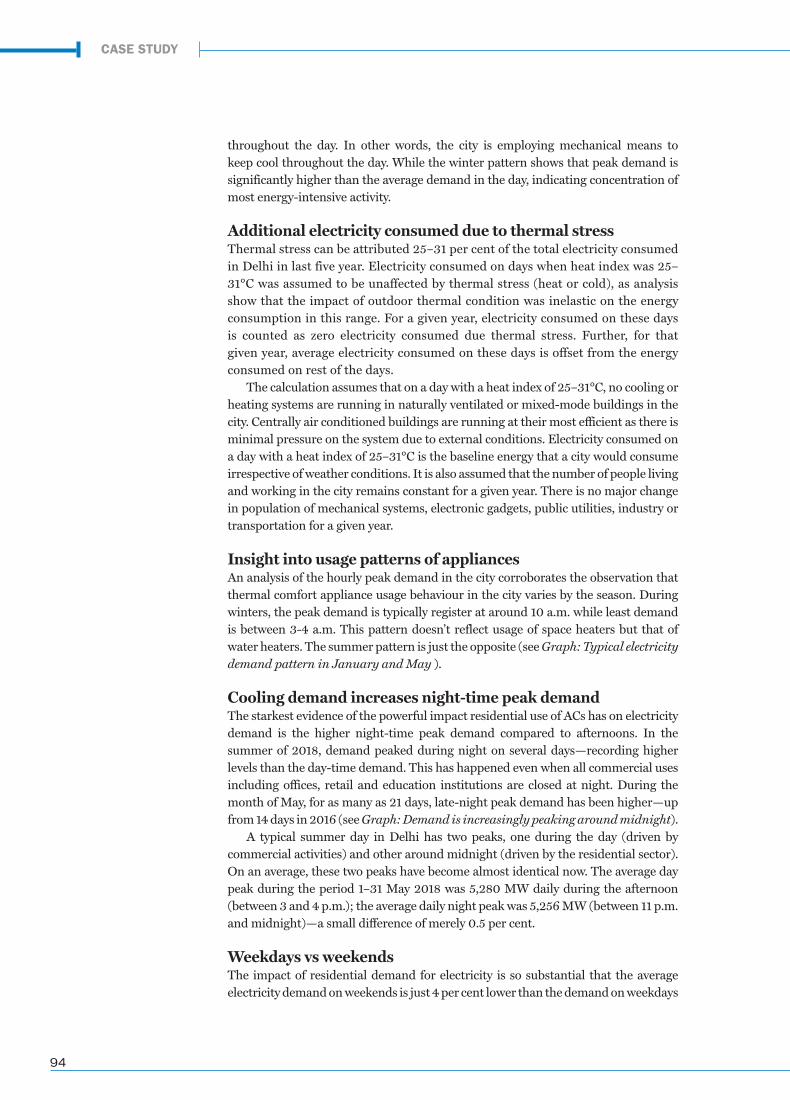
94
throughout the day. In other words, the city is employing mechanical means to keep cool throughout the day. While the winter pattern shows that peak demand is significantly higher than the average demand in the day, indicating concentration of most energy-intensive activity.
Additional electricity consumed due to thermal stressThermal stress can be attributed 25–31 per cent of the total electricity consumed in Delhi in last five year. Electricity consumed on days when heat index was 25–31°C was assumed to be unaffected by thermal stress (heat or cold), as analysis show that the impact of outdoor thermal condition was inelastic on the energy consumption in this range. For a given year, electricity consumed on these days is counted as zero electricity consumed due thermal stress. Further, for that given year, average electricity consumed on these days is offset from the energy consumed on rest of the days.
The calculation assumes that on a day with a heat index of 25–31°C, no cooling or heating systems are running in naturally ventilated or mixed-mode buildings in the city. Centrally air conditioned buildings are running at their most efficient as there is minimal pressure on the system due to external conditions. Electricity consumed on a day with a heat index of 25–31°C is the baseline energy that a city would consume irrespective of weather conditions. It is also assumed that the number of people living and working in the city remains constant for a given year. There is no major change in population of mechanical systems, electronic gadgets, public utilities, industry or transportation for a given year.
Insight into usage patterns of appliancesAn analysis of the hourly peak demand in the city corroborates the observation that thermal comfort appliance usage behaviour in the city varies by the season. During winters, the peak demand is typically register at around 10 a.m. while least demand is between 3-4 a.m. This pattern doesn’t reflect usage of space heaters but that of water heaters. The summer pattern is just the opposite (see Graph: Typical electricity demand pattern in January and May ).
Cooling demand increases night-time peak demandThe starkest evidence of the powerful impact residential use of ACs has on electricity demand is the higher night-time peak demand compared to afternoons. In the summer of 2018, demand peaked during night on several days—recording higher levels than the day-time demand. This has happened even when all commercial uses including offices, retail and education institutions are closed at night. During the month of May, for as many as 21 days, late-night peak demand has been higher—up from 14 days in 2016 (see Graph: Demand is increasingly peaking around midnight).
A typical summer day in Delhi has two peaks, one during the day (driven by commercial activities) and other around midnight (driven by the residential sector). On an average, these two peaks have become almost identical now. The average day peak during the period 1–31 May 2018 was 5,280 MW daily during the afternoon (between 3 and 4 p.m.); the average daily night peak was 5,256 MW (between 11 p.m. and midnight)—a small difference of merely 0.5 per cent.
Weekdays vs weekendsThe impact of residential demand for electricity is so substantial that the average electricity demand on weekends is just 4 per cent lower than the demand on weekdays
CASE STUDY
thermal comfort report_final.indd 94 06/06/19 2:51 PM
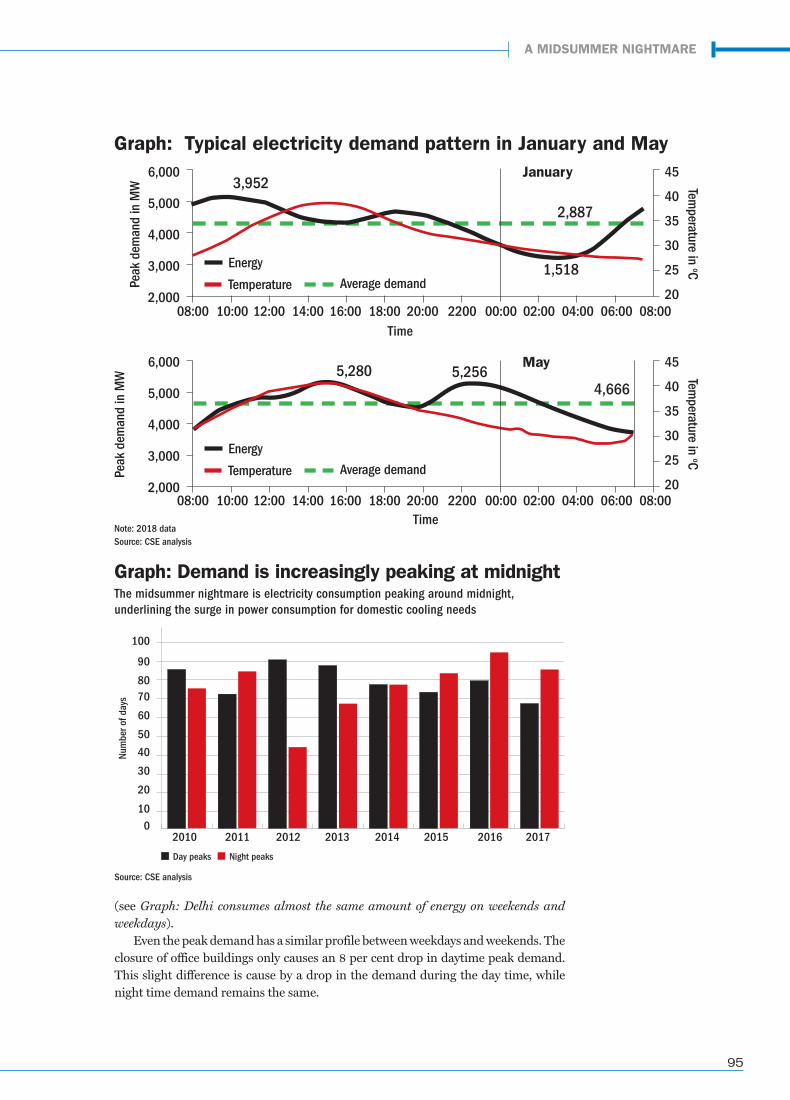
95
(see Graph: Delhi consumes almost the same amount of energy on weekends and weekdays).
Even the peak demand has a similar profile between weekdays and weekends. The closure of office buildings only causes an 8 per cent drop in daytime peak demand. This slight difference is cause by a drop in the demand during the day time, while night time demand remains the same.
Day peaks Night peaks
100
2010 2011 2012 2013 2014 2015 2016 2017
90
8070
60
50
40
30
20
100
Num
ber o
f day
s
Graph: Demand is increasingly peaking at midnightThe midsummer nightmare is electricity consumption peaking around midnight, underlining the surge in power consumption for domestic cooling needs
Source: CSE analysis
6,000
5,000
4,000
3,000
2,00008:00
Energy
Temperature Average demand
Time10:00 12:00 14:00 16:00 18:00 20:00 2200 00:00 02:00 04:00 06:00 08:00
Peak
dem
and
in M
W Temperature in oC
3,952
2,887
1,518
45
40
35
30
25
20
6,000
5,000
4,000
3,000
2,00008:00
Energy
Temperature Average demand
Time10:00 12:00 14:00 16:00 18:00 20:00 2200 00:00 02:00 04:00 06:00 08:00
Peak
dem
and
in M
W Temperature in oC
5,280 5,2564,666
45
40
35
30
25
20
Note: 2018 dataSource: CSE analysis
Graph: Typical electricity demand pattern in January and May
A MIDSUMMER NIGHTMARE
January
May
thermal comfort report_final.indd 95 06/06/19 2:51 PM
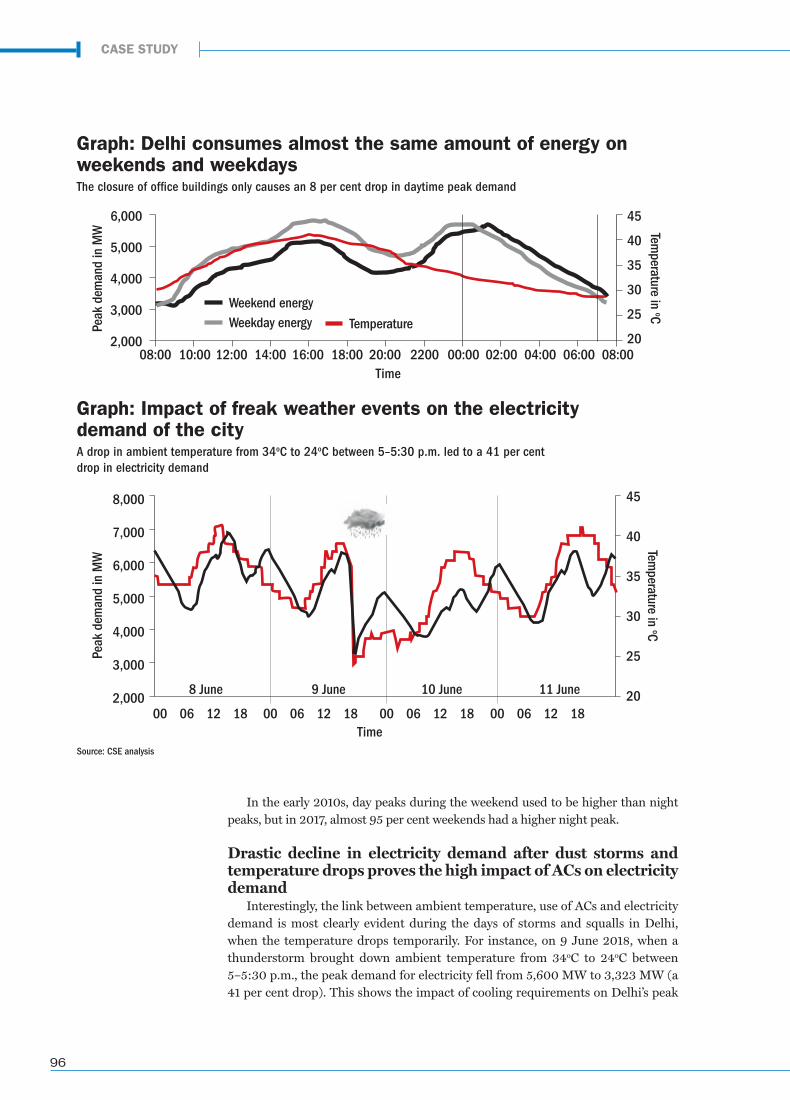
96
In the early 2010s, day peaks during the weekend used to be higher than night peaks, but in 2017, almost 95 per cent weekends had a higher night peak.
Drastic decline in electricity demand after dust storms and temperature drops proves the high impact of ACs on electricity demand
Interestingly, the link between ambient temperature, use of ACs and electricity demand is most clearly evident during the days of storms and squalls in Delhi, when the temperature drops temporarily. For instance, on 9 June 2018, when a thunderstorm brought down ambient temperature from 34oC to 24oC between 5–5:30 p.m., the peak demand for electricity fell from 5,600 MW to 3,323 MW (a 41 per cent drop). This shows the impact of cooling requirements on Delhi’s peak
Graph: Delhi consumes almost the same amount of energy on weekends and weekdaysThe closure of office buildings only causes an 8 per cent drop in daytime peak demand
Graph: Impact of freak weather events on the electricity demand of the cityA drop in ambient temperature from 34oC to 24oC between 5–5:30 p.m. led to a 41 per cent drop in electricity demand
6,000
5,000
4,000
3,000
2,000
8,000
7,000
6,000
5,000
4,000
3,000
2,000
45
40
35
30
25
20
08:00
Weekend energyWeekday energy Temperature
Time
Time
10:00 12:00 14:00 16:00 18:00 20:00 2200 00:00 02:00 04:00 06:00 08:00
Peak
dem
and
in M
WPe
ak d
eman
d in
MW
Temperature in oC
Temperature in oC
45
40
35
30
25
20
Source: CSE analysis
00
8 June 9 June 10 June 11 June
00 00 0006 06 06 0612 12 12 1218 18 18 18
CASE STUDY
thermal comfort report_final.indd 96 06/06/19 2:51 PM

97
energy demand (see Graph: Impact of freak weather events on the electricity demand of the city).
Similarly, there in an average drop of 30 per cent in peak demand between midnight and morning (7–8 a.m.) during summers, this is equivalent to 0.6 million ACs (1.5 tonne cooling capacity with 2.1 energy efficiency ratio) being switched off. This means that, at the most, around 14 per cent households are actively using ACs at night in Delhi. Since, switching off ACs is not the only reason for drop in peak demand, and many households have multiple ACs installed, it can be inferred that AC penetration in Delhi households is certainly not more than 14 per cent.
A MIDSUMMER NIGHTMARE
thermal comfort report_final.indd 97 06/06/19 2:51 PM
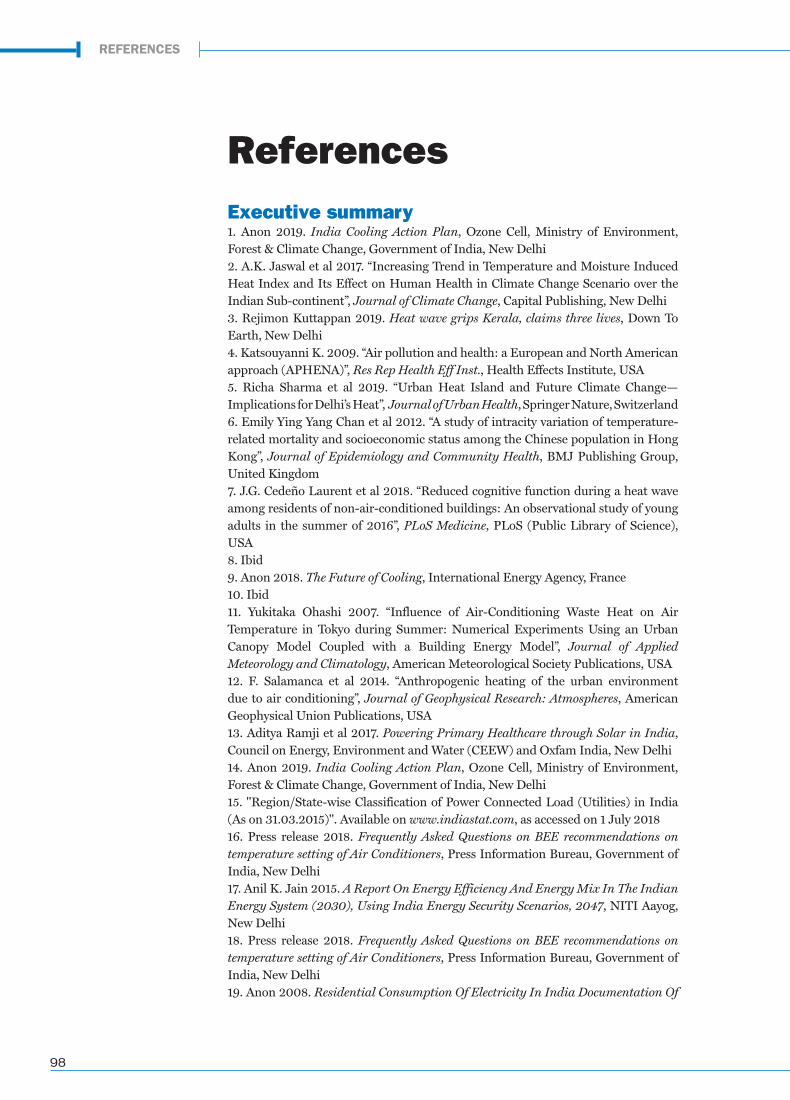
98
Executive summary1. Anon 2019. India Cooling Action Plan, Ozone Cell, Ministry of Environment, Forest & Climate Change, Government of India, New Delhi2. A.K. Jaswal et al 2017. “Increasing Trend in Temperature and Moisture Induced Heat Index and Its Effect on Human Health in Climate Change Scenario over the Indian Sub-continent”, Journal of Climate Change, Capital Publishing, New Delhi3. Rejimon Kuttappan 2019. Heat wave grips Kerala, claims three lives, Down To Earth, New Delhi 4. Katsouyanni K. 2009. “Air pollution and health: a European and North American approach (APHENA)”, Res Rep Health Eff Inst., Health Effects Institute, USA 5. Richa Sharma et al 2019. “Urban Heat Island and Future Climate Change—Implications for Delhi’s Heat”, Journal of Urban Health, Springer Nature, Switzerland6. Emily Ying Yang Chan et al 2012. “A study of intracity variation of temperature-related mortality and socioeconomic status among the Chinese population in Hong Kong”, Journal of Epidemiology and Community Health, BMJ Publishing Group, United Kingdom7. J.G. Cedeño Laurent et al 2018. “Reduced cognitive function during a heat wave among residents of non-air-conditioned buildings: An observational study of young adults in the summer of 2016”, PLoS Medicine, PLoS (Public Library of Science), USA8. Ibid9. Anon 2018. The Future of Cooling, International Energy Agency, France10. Ibid11. Yukitaka Ohashi 2007. “Influence of Air-Conditioning Waste Heat on Air Temperature in Tokyo during Summer: Numerical Experiments Using an Urban Canopy Model Coupled with a Building Energy Model”, Journal of Applied Meteorology and Climatology, American Meteorological Society Publications, USA12. F. Salamanca et al 2014. “Anthropogenic heating of the urban environment due to air conditioning”, Journal of Geophysical Research: Atmospheres, American Geophysical Union Publications, USA13. Aditya Ramji et al 2017. Powering Primary Healthcare through Solar in India, Council on Energy, Environment and Water (CEEW) and Oxfam India, New Delhi14. Anon 2019. India Cooling Action Plan, Ozone Cell, Ministry of Environment, Forest & Climate Change, Government of India, New Delhi15. "Region/State-wise Classification of Power Connected Load (Utilities) in India (As on 31.03.2015)". Available on www.indiastat.com, as accessed on 1 July 2018 16. Press release 2018. Frequently Asked Questions on BEE recommendations on temperature setting of Air Conditioners, Press Information Bureau, Government of India, New Delhi 17. Anil K. Jain 2015. A Report On Energy Efficiency And Energy Mix In The Indian Energy System (2030), Using India Energy Security Scenarios, 2047, NITI Aayog, New Delhi18. Press release 2018. Frequently Asked Questions on BEE recommendations on temperature setting of Air Conditioners, Press Information Bureau, Government of India, New Delhi 19. Anon 2008. Residential Consumption Of Electricity In India Documentation Of
References
REFERENCES
thermal comfort report_final.indd 98 06/06/19 2:51 PM
99
Data And Methodology, The World Bank, New Delhi 20. Press release 2018. Frequently Asked Questions on BEE recommendations on temperature setting of Air Conditioners, Press Information Bureau, Government of India, New Delhi21. Anon 2019. India Cooling Action Plan, Ozone Cell, Ministry of Environment, Forest & Climate Change, Government of India, New Delhi22. Tyler Hoyt 2015. “Extending air temperature setpoints: Simulated energy savings and design considerations for new and retrofit buildings”, Building and Environment, Elsevier Ltd., United Kingdom23. Anon 2018. Load Generation Balance Report 2018-19, Central Electricity Authority, Government of India, New Delhi24. Ibid 25. Ibid 26. Radhika Khosla and Aditya Chunekar 2017. Plugging In: A Collection of Insights on Electricity Use in Indian Homes (Research Report), Centre for Policy Research, New Delhi and Prayas (Energy Group), Pune27. Anon 2018. The Future of Cooling, International Energy Agency, France28. Ibid 29. M. Santamouris et al 2015. “On the impact of urban heat island and global warming on the power demand and electricity consumption of buildings—A review”, Energy and Buildings, Elsevier Ltd., United Kingdom 30. Anon 2016. National Building Code of India 2016, Bureau of Indian Standards, New Delhi31. Anon. Management Memo 09-04: Standard Operating Efficiency Procedures, California Department of General Services, California, USA 32. Anon 2018. Chilling prospects: Providing sustainable cooling for all, Sustainable Energy for All, Vienna, Austria 33. Sharon McNary 2017. Thousands give up control of home thermostats during a heat wave, Southern California Public Radio, California, USA34. "Nationwide House Energy Rating Scheme (NatHERS)". Available at www.nathers.gov.au, as accessed on 3 April 201935. Press release 2019. “Cool Coalition” comes together to save lives, energy and trillions for the global economy, UN Environment, Copenhagen, Denmark 36. Press release 2019. World takes a stand against powerful greenhouse gases with implementation of Kigali Amendment, UN Environment Ozone Secretariat, Nairobi, Kenya
Chapter 137. "Extremes on Earth". Available at https://en.wikipedia.org, as accessed on 3 April 201938. Ibid39. "How much heat per hour do humans dissipate?". Available at https://www.physlink.com/, as accessed on 3 April 2019 40. "Heat Wave". Available at http://www.smhi.se, as accessed on 3 April 2019 41. "Heat Waves". Available at https://www.globalchange.gov/, as accessed on 3 April 2019 42. "Terminologies and Glossary". Available at http://imd.gov.in, as accessed on 3 April 2019 43. Elizabeth G. Hanna and Peter W. Tait 2015. “Limitations to Thermoregulation and Acclimatization Challenge Human Adaptation to Global Warming”, International
A MIDSUMMER NIGHTMARE
thermal comfort report_final.indd 99 06/06/19 2:51 PM
100
Journal for Environmental Research and Public Health, Multidisciplinary Digital Publishing Institute (MDPI), USA
Chapter 244. "What is a degree day?". Available at https://www.eia.gov, as accessed on 3 April 2019 45. Anon 2015. ISO 7730:2005 Ergonomics of the thermal environment -- Analytical determination and interpretation of thermal comfort using calculation of the PMV and PPD indices and local thermal comfort criteria, International Organization for Standardization, Switzerland 46. Metabolic equivalent is expressed as met. At rest, one has resting metabolism or 1 met.47. Clothing insulation is expressed in clo units. The clo has the same dimensions as the R-value used to describe insulation used in residential and commercial construction. The clo value is also similar in magnitude to the R- value. R-value is a measure of thermal resistance of a material.48. Anon 1995. Addendum to Thermal Environmental Conditions for Human Occupancy, American Society Of Heating, Refrigerating and Air-Conditioning Engineers, Inc., USA49. M.R. Sharma and Sharafat Ali 1986. “Tropical summer index—a study of thermal comfort of Indian subjects”, Building and Environment, Elsevier Ltd., United Kingdom 50. Ibid51. Anon 2016. National Building Code of India 2016, Bureau of Indian Standards, Government of India, New Delhi
Chapter 352. A.K. Jaswal et al 2017. “Increasing Trend in Temperature and Moisture Induced Heat Index and Its Effect on Human Health in Climate Change Scenario over the Indian Sub-continent”, Journal of Climate Change, Capital Publishing, New Delhi53. Ibid 54. Omid Mazdiyasni et al 2017. “Increasing probability of mortality during Indian heat waves”, Science Advances, American Association for the Advancement of Science, USA 55. Ibid 56. Katsouyanni K. 2009. “Air pollution and health: a European and North American approach (APHENA)”, Res Rep Health Eff Inst., Health Effects Institute, USA 57. Sushma Guleria and Anil Kumar Gupta 2018. Heat Wave in India Documentation of State of Telangana and Odisha (2016), National Institute of Disaster Management, Government of India, New Delhi58. Wong K. et la 2013. “Review of World Urban Heat Islands: Many Linked to Increased Mortality”, Journal of Energy Resources Technology, The American Society Of Mechanical Engineers, USA 59. G. J. van Oldenborgh et al 2018. “Extreme heat in India and anthropogenic climate change”, Natural Hazards and Earth System Sciences, Copernicus Publications, Germany 60. Eun-Soon Im, Jeremy S. Pal, and Elfatih A. B. Eltahir 2017. “Deadly heat waves projected in the densely populated agricultural regions of South Asia”, Science Advances, American Association for the Advancement of Science, USA61. E. Stathopoulou et al 2008. “On the impact of temperature on tropospheric
REFERENCES
thermal comfort report_final.indd 100 06/06/19 2:51 PM
101
ozone concentration levels in urban environments”, Journal of Earth System Science, Indian Academy of Sciences, Bengaluru62. K. Pantavou et al 2013. “Outdoor thermal sensation of pedestrians in a Mediterranean climate and a comparison with UTCI”, Building and Environment, Elsevier Ltd., United Kingdom 63. A. Sakka et al 2012. “On the thermal performance of low income housing during heat waves”, Energy and Buildings, Elsevier Ltd., United Kingdom 64. M. Santamouris et al 2007. "Estimating the ecological footprint of the heat island effect over Athens”, Climatic Change, Greece, Springer Netherlands, Netherlands 65. M. Santamouris et al 2015. “On the impact of urban heat island and global warming on the power demand and electricity consumption of buildings—A review”, Energy and Buildings, Elsevier Ltd., United Kingdom 66. A.K. Jaswal et al 2017. “Increasing Trend in Temperature and Moisture Induced Heat Index and Its Effect on Human Health in Climate Change Scenario over the Indian Sub-continent”, Journal of Climate Change, Capital Publishing, New Delhi67. Javed Mallick, Atiqur Rahman, and Chander Kumar Singh 2013. “Modeling urban heat islands in heterogeneous land surface and its correlation with impervious surface area by using night-time ASTER satellite data in highly urbanizing city, Delhi-India”, Advances in Space Research, Elsevier Ltd., United Kingdom 68. Neha Yadav et al 2017. “Study of intra-city urban heat island intensity and its influence on atmospheric chemistry and energy consumption in Delhi”, Sustainable Cities and Society, Elsevier Ltd., United Kingdom69. Emily Ying Yang Chan et al 2012. “A study of intracity variation of temperature-relatedmortality and socioeconomic status among the Chinese population in Hong Kong”, Journal of Epidemiology and Community Health, BMJ Publishing Group, United Kingdom70. Richa Sharma et al 2019. “Urban Heat Island and Future Climate Change—Implications for Delhi’s Heat”, Journal of Urban Health, Springer Nature, Switzerland71. Yukitaka Ohashi 2007. “Influence of Air-Conditioning Waste Heat on Air Temperature in Tokyo during Summer: Numerical Experiments Using an Urban Canopy Model Coupled with a Building Energy Model”, Journal of Applied Meteorology and Climatology, American Meteorological Society Publications, USA72. F. Salamanca et al 2014. “Anthropogenic heating of the urban environment due to air conditioning”, Journal of Geophysical Research: Atmospheres, American Geophysical Union Publications, USA73. Brice Tremeac et la 2012. “Influence of air conditioning management on heat island in Paris air street temperatures”, Applied Energy, Elsevier Ltd., United Kingdom74. Iain Staffella and Stefan Pfenninger 2018. “The increasing impact of weather on electricity supply and demand”, Energy, Elsevier Ltd., United Kingdom 75. Mahelet G. Fikrua and Luis Gautier 2015. “The impact of weather variation on energy consumption in residential houses”, Applied Energy, Elsevier Ltd., United Kingdom 76. E. De Cian et al 2007. The Impact of Temperature Change on Energy Demand: A Dynamic Panel Analysis, Fondazione Eni Enrico Mattei, Milano, Italy 77. M. Santamouris et al 2015. “On the impact of urban heat island and global warming on the power demand and electricity consumption of buildings—A review”, Energy and Buildings, Elsevier Ltd., United Kingdom 78. "Air conditioning accounts for about 12% of U.S. home energy expenditures". Available at www.eia.gov, as accessed on 3 April 2019
A MIDSUMMER NIGHTMARE
thermal comfort report_final.indd 101 06/06/19 2:51 PM
102
79. Tyler Hoyt 2015. “Extending air temperature setpoints: Simulated energy savings and design considerations for new and retrofit buildings”, Building and Environment, Elsevier Ltd., United Kingdom80. Ibid81. Avikal Somvanshi and Anumita Roychowdhury 2016. Not As Cool, Centre for Science and Environment, New Delhi82. Anon 2019. India Cooling Action Plan, Ozone Cell, Ministry of Environment, Forest & Climate Change, Government of India, New Delhi83. Amol A. Phadke, Nikit Abhyankar and Nihar Shah 2014. Avoiding 100 New Power Plants by Increasing Efficiency of Room Air Conditioners in India: Opportunities and Challenges, Lawrence Berkeley National Laboratory, USA84. Anon 2018. The Future of Cooling, International Energy Agency, France85. Ibid86. Ibid 87. Ibid88. Anon 2019. India Cooling Action Plan, Ozone Cell, Ministry of Environment, Forest & Climate Change, Government of India, New Delhi 89. Ibid90. Anon 2018. Energy Statistics 2018 (Twenty Fifth Issue), Central Statistics Office, Government of India, New Delhi 91. Radhika Khosla and Aditya Chunekar 2017. Plugging In: A Collection of Insights on Electricity Use in Indian Homes (Research Report), Centre for Policy Research, New Delhi and Prayas (Energy Group), Pune92. Anon 2018. Load Generation Balance Report 2018-19, Central Electricity Authority, New Delhi93. Aditya Chunekar, Sapekshya Varshney and Shantanu Dixit 2016. Residential Electricity Consumption in India: What do we know?, Prayas (Energy Group), Pune94. Radhika Khosla and Aditya Chunekar 2017. Plugging In: A Collection of Insights on Electricity Use in Indian Homes (Research Report), Centre for Policy Research, New Delhi and Prayas (Energy Group), Pune95. Avikal Somvanshi and Anumita Roychowdhury 2018. Power Pangs, Centre for Science and Environment, New Delhi 96. Rahul Tongia 2017. Delhi’s Household Electricity Subsidies: Highly Generous but Inefficient?, Brookings India, New Delhi 97. Anon 2018. The Future of Cooling, International Energy Agency, France 98. Ibid99. Ibid100. Ibid101. Ibid102. Ibid103. Amol A. Phadke, Nikit Abhyankar and Nihar Shah 2014. Avoiding 100 New Power Plants by Increasing Efficiency of Room Air Conditioners in India: Opportunities and Challenges, Lawrence Berkeley National Laboratory, USA104. Anon 2018. The Future of Cooling, International Energy Agency, France105. Nihar Shah et al 2015. Benefits of Leapfrogging to Super efficiency and Low Global Warming Potential Refrigerants in Room Air Conditioning, Lawrence Berkeley National Laboratory, USA106. 'The Montreal Protocol". Available at https://www.unenvironment.org, as accessed on 30 April 2019107. Ibid
REFERENCES
thermal comfort report_final.indd 102 06/06/19 2:51 PM
103
108. Ibid 109. Amy Fleming et al 2018. Heat: the next big inequality issue, Guardian Cities, United Kingdom110. Anon 2014. Report of The Expert Group to Review The Methodology for Measurement of Poverty, Planning Commission of India, Government of India, New Delhi111. Aditya Ramji et al 2017. Powering Primary Healthcare through Solar in India, Council on Energy, Environment and Water (CEEW) and Oxfam India, New Delhi
Chapter 4112. P.O. Fanger 1970. Thermal Comfort, Danish Technical Press, Copenhagen, Denmark113. Richard J. de Dear and Gail Schiller Brager 1998. “Developing an Adaptive Model of Thermal Comfort and Preference”, ASHRAE Transactions 1998, American Society of Heating, Refrigerating and Air-Conditioning Engineers, USA114. Ibid115. Ricardo Forgiarini Ruppa, Natalia Giraldo Vásquez and Roberto Lamberts 2015. “A review of human thermal comfort in the built environment”, Energy and Buildings, Elsevier Ltd., United Kingdom 116. Anon 1983. National Building Code of India 1983, Bureau of Indian Standards, Government of India, New Delhi117. Ibid 118. Anon 2005. National Building Code of India 2005, Bureau of Indian Standards, Government of India, New Delhi 119. Anon 2016. National Building Code of India 2016, Bureau of Indian Standards, Government of India, New Delhi120. Sanyogita Manu et al 2016. “Field studies of thermal comfort across multiple climate zones for the subcontinent: India Model for Adaptive Comfort (IMAC)”, Building and Environment, Elsevier Ltd., United Kingdom121. Richard J. de Dear and Gail Schiller Brager 1998. “Developing an Adaptive Model of Thermal Comfort and Preference”, ASHRAE Transactions 1998, American Society of Heating, Refrigerating and Air-Conditioning Engineers, USA122. Anon 2016. National Building Code of India 2016, Bureau of Indian Standards, Government of India, New Delhi123. M.R. Sharma and Sharafat Ali 1986. “Tropical summer index—a study of thermal comfort of Indian subjects”, Building and Environment, Elsevier Ltd., United Kingdom 124. Sanyogita Manu et al 2016. “Field studies of thermal comfort across multiple climate zones for the subcontinent: India Model for Adaptive Comfort (IMAC)” , Building and Environment, Elsevier Ltd., United Kingdom125. Anon. Management Memo 09-04: Standard Operating Efficiency Procedures, California Department of General Services, California, USA 126. Anon 2018. Chilling prospects: Providing sustainable cooling for all, Sustainable Energy for All, Vienna, Austria 127. Sanyogita Manu et al 2016. “Field studies of thermal comfort across multiple climate zones for the subcontinent: India Model for Adaptive Comfort (IMAC)” , Building and Environment, Elsevier Ltd., United Kingdom128. Anon 2016. National Building Code of India 2016, Bureau of Indian Standards, Government of India, New Delhi129. Sanyogita Manu et al 2016. “Field studies of thermal comfort across multiple
A MIDSUMMER NIGHTMARE
thermal comfort report_final.indd 103 06/06/19 2:51 PM
104
climate zones for the subcontinent: India Model for Adaptive Comfort (IMAC)”, Building and Environment, Elsevier Ltd., United Kingdom 130. Anon 2016. Technical Committee Meeting for Room Air Conditioners Minutes of Meeting dated 6-09-2016, Bureau of Energy Efficiency, Government of India, New Delhi131. Press release 2018. Frequently Asked Questions on BEE recommendations on temperature setting of Air Conditioners, Press Information Bureau, Government of India, New Delhi 132. Anon 2018. Draft India Cooling Action Plan, Ozone Cell, Ministry of Environment, Forest & Climate Change, Government of India, New Delhi 133. Anon 2019. India Cooling Action Plan, Ozone Cell, Ministry of Environment, Forest & Climate Change, Government of India, New Delhi134. Baruch Givoni 2011. “Indoor temperature reduction by passive cooling systems”, Solar Energy, Elsevier Ltd., United Kingdom135. Amr Sayed Hassan Abdallah 2017. “Occupant Comfort and Indoor Temperature Reduction by Using Passive Air Conditioning System With Solar Chimney Concept in Hot Arid Climate”, Procedia Engineering, Elsevier Ltd., United Kingdom136. "Nationwide House Energy Rating Scheme (NatHERS)". Available at www.nathers.gov.au, as accessed on 3 April 2019137. Anon 2012. Nationwide House Energy Rating Scheme (NatHERS) –Software Accreditation Protocol, NatHERS National Administrator, Commonwealth of Australia, Australia
Chapter 5138. Luiz A Horta Nogueira 2013. Measures to promote efficient air conditioning, French Environment and Energy Management Agency, France and World Energy Council, France139. "Explaining Central Air Conditioner & Heat Pump Standards". Available at www.energy.gov, as accessed on 30 April 2019140. Stan Cox 2012. “Cooling a Warming Planet: A Global Air Conditioning Surge”, Yale Environment 360, Yale School of Forestry & Environmental Studies, Yale University, USA141. Luiz A Horta Nogueira 2013. Measures to promote efficient air conditioning, French Environment and Energy Management Agency, France and World Energy Council, France142.Anon 2012. 2008 ANSI/AHRI Standard 210/240 for Performance Rating of Unitary Air-Conditioning & Air-Source Heat Pump Equipment with Addenda 1 and 2, Air Conditioning, Heating, and Refrigeration Institute, USA143. Anon 2016. Annexes to the Commission Regulation (EU) No .../..implementing Directive 2009/125/EC of the European Parliament and of the Council establishing a framework for the setting of ecodesign requirements for energy-related products, with regard to ecodesign requirements for air heating products, cooling products, high temperature process chillers and fan coil units, European Commission, Brussels, Belgium 144. "History of Air Conditioning". Available at www.energy.gov, as accessed on 3 April 2019145. "Air Conditioning". Available at www.energy.gov, as accessed on 3 April 2019146. W.Y. Park, N. Shah, and B.F. Gerke 2017. Assessment of commercially available energy-efficient room air conditioners including models with low global warming potential (GWP) refrigerants, Lawrence Berkeley National Laboratory, USA
REFERENCES
thermal comfort report_final.indd 104 06/06/19 2:51 PM
105
147. Luiz A Horta Nogueira 2013. Measures to promote efficient air conditioning, French Environment and Energy Management Agency, France and World Energy Council, France148. Ibid 149. Energy Consultant 2005. Comparison of International MEPS: Room Air Conditioners, Commonwealth of Australia, Australia150. Anon 2011. Performance Improvements during the First 19 years and a Vision for the Future: Korea’s Energy Standards & Labeling, Ministry of Knowledge Economy, South Korea and Korea Energy Management Corporation, South Korea 151. "ASEAN Regional Policy Roadmap for Harmonization of Energy Performance Standards for Air Conditioners". Available at https://www.aseanshine.org, as accessed on 30 April 2019152. Energy Consultant 2005. Comparison of International MEPS: Room Air Conditioners, Commonwealth of Australia, Australia153. Ibid 154. Luiz A Horta Nogueira 2013. Measures to promote efficient air conditioning, French Environment and Energy Management Agency, France and World Energy Council, France155. Ibid 156. Ibid 157. Ibid 158. "Ecodesign". Available at https://ec.europa.eu, as accessed on 30 April 2019159. "About the E3 Program". Available at http://www.energyrating.gov.au, as accessed on 30 April 2019 160. "Air Conditioners". Available at http://www.energyrating.gov.au, as accessed on 30 April 2019161. Anon 2017. Ministry of Power Notification dated 8 August 2017, The Gazette of India, Government of India, New Delhi162. Anon 2015. Schedule-19: Variable Capacity Air Conditioners, Bureau of Energy Efficiency, Government of India, New Delhi163. Anon 2017. Ministry of Power Notification dated 8 August 2017, The Gazette of India, Government of India, New Delhi164. Anon 2015. Schedule-19: Variable Capacity Air Conditioners, Bureau of Energy Efficiency, Government of India, New Delhi165. Anon 2016. National Building Code of India 2016, Bureau of Indian Standards, Government of India, New Delhi 166. Avikal Somvanshi and Anumita Roychowdhury 2016. Not As Cool, Centre for Science and Environment, New Delhi167. Anon 2015. Schedule-19: Variable Capacity Air Conditioners, Bureau of Energy Efficiency, Government of India, New Delhi 168. Anon 2018. The Future of Cooling, International Energy Agency, France169. Alexander Boegle, Daljit Singh, and Girish Sant 2010. Energy Saving Potential from Indian Households from Appliance Efficiency, Prayas (Energy Group), Pune170. "SEEP". Available at https://beeindia.gov.in, as accessed on 30 April 2019171. Anon 2019. India Cooling Action Plan, Ozone Cell, Ministry of Environment, Forest & Climate Change, Government of India, New Delhi
A MIDSUMMER NIGHTMARE
thermal comfort report_final.indd 105 06/06/19 2:51 PM

thermal comfort report_final.indd 106 06/06/19 2:51 PM

Centre for Science and Environment41, Tughlakabad Institutional Area,
New Delhi-110 062, INDIATel: 91-11-4061 6000Fax: 91-11-2995 5879
Email: [email protected] Website: www.cseindia.org
Centre for Science and EnvironmentCentre for Science and Environment (CSE) is a non-governmental, independent policy research institution based in Delhi that was started in 1980 by the late Anil Agarwal, a leading figure in India’s environment movement.
For more than three decades now, CSE has helped shape policies and build public awareness to bring change in areas of pollution mitigation and public health security, low carbon development, natural resource management and livelihood security to make growth sustainable and inclusive.
CSE’s public advocacy and research efforts have delivered path-breaking results—from championing equity in climate change negotiations, to supporting public transport and sustainable mobility practices in cities (CNG in Delhi), and mobilizing the country through a water literacy programme that catalyzed important policy changes on decentralized water and wastewater management. CSE programmes have achieved important public health outcomes by strengthening regulatory oversight in the use of pesticides and heavy metals, while its innovative industry ratings programme that certifies environment performance, serves as an alternative model of civil society governance to control industrial pollution and resource efficiency in India.
Today, CSE is well recognized for its path-breaking role in capacitating public institutions and regulatory agencies, while its environmental education efforts across a vast network of schools helps build a cadre of knowledgeable, committed environmental actors.
CSE’s brand of knowledge-based activism has won it wide respect for its campaigns, research and publications and it is regarded as among India’s most influential environmental NGOs. Prestigious national and international awards include the 2005 Stockholm Water Prize and the Prince Albert II of Monaco Foundation Water Award in 2008. The annual Global Go To Think Tank Index of the University of Pennsylvania in the US ranked CSE
as the 17th most influential environmental think tank in the world in 2014 and a leading environmental think tank of the developing world.
Such is our footprint.
thermal comfort report_final.indd 107 06/06/19 2:51 PM
A MIDSUMMER NIGHTMARE
Decoding the link between comfort, space cooling and energy consumption
in a climate-stressed world
Ever wondered why we keep ACs at 24°C or lower during summers and monsoons when we do not switch on ACs till the temperature rises above mid-30°C at the beginning of the hot season? Do you know how much (and what percentage of) electricity is consumed by ACs? Can you guess how much electricity will be needed to provide the level of cooling enjoyed by a rich American—Indian—to all? Any idea if modern buildings (and city layouts) make it easier to deal with a climate-stressed world? Are you aware that the government differentiates between thermal comfort in air conditioned and naturally ventilated buildings, measuring the former in terms of 'psychology' and the latter in terms of ‘physiology’, perpetuating the mind–body division between classes? Do you know that the peak electricity consumption is big cities (like Delhi) is shifting from mid-afternoon (the hottest period when most people are in offices) to midnight? Can you fathom the ramifications of the answers to these questions?
In this exhaustive report, the first of its kind in the world, Centre for Science and Environment presents before you the Shakespearean tragicomedy of thermal comfort and our response(s) to it.
Centre for Science and Environment41, Tughlakabad Institutional Area, New Delhi 110 062; Phones: 91-11-40616000 Fax: 91-11-29955879; E-mail: [email protected] Website: www.cseindia.org
A M
IDSU
MM
ER
NIG
HTM
AR
E
A Midsummer Nightmare Report Cover 8mm spine.indd 1 11/06/19 3:29 PM