a hydraulic study on the applicability of flood rating curves
TRANSCRIPT

A hydraulic study on the applicability of floodrating curves
Giuliano Di Baldassarre and Pierluigi Claps
ABSTRACT
Several hydrological studies have shown that river discharge records are affected by significant
uncertainty. This uncertainty is expected to be very high for river flow data referred to flood
events, when the stage–discharge rating curve is extrapolated far beyond the measurement
range. This study examines the standard methodologies for the construction and extrapolation of
rating curves to extreme flow depths and shows the need of proper approaches to reduce the
uncertainty of flood discharge data. To this end, a comprehensive analysis is performed on a
16 km reach of the River Po (Italy) where five hydraulic models (HEC-RAS) were built. The results
of five topographical surveys conducted during the last 50 years are used as geometric input. The
application demonstrates that hydraulically built stage–discharge curves for the five cases differ
only for ordinary flows, so that a common rating curve for flood discharges can be derived. This
result confirms the validity of statistical approaches to the estimation of the so-called ‘flood rating
curve’, a unique stage–discharge curve based on data of contemporaneous annual maxima of
stage and discharge values, which appears insensitive to marginal changes in river geometry.
Key words 9999 cross-sections, flood discharge, hydraulic models, observation uncertainty,
rating curve
INTRODUCTION
Hydrological models often disregard the fact that river flow
data are affected by a significant uncertainty (e.g. Clarke
1999). This is despite the fact that it is well known that river
discharges are almost never directly measured, as opposite to
the water stage. Usually, observed river stage values are
converted into river discharges by means of a stage–discharge
relationship, the so-called rating curve (World Meteorologi-
cal Organisation 1994).
The main sources of uncertainty that affect river dis-
charge data, obtained using the rating curves, are: (1) errors
in the individual stage and discharge measurements;
(2) errors induced by the presence of unsteady flow condi-
tions; and (3) errors induced by the extrapolation of the rating
curve beyond the range of measurements used for its deriva-
tion. Depending on the specific case study, additional sources
of uncertainty can be significant. These include the presence
of relevant backwater effects (caused by downstream con-
fluent tributaries, lakes and regulated reservoirs) and tem-
poral changes in the hydraulic properties governing the
stage–discharge relationship (e.g. scour and fill, vegetation
growth and ice build-up during cold periods).
Concerning the measurement uncertainty (case 1),
Pelletier (1987) reviewed 140 publications and concluded
that the overall uncertainty in a single determination of
river discharge can be more than 8% at the 95% condence
level. More recent studies reported errors around 5–6% (e.g.
Leonard et al. 2000) that could possibly be reduced by using
appropriate discharge measurement techniques (Lintrup
1989; European ISO EN Rule 748 1997).
The errors induced by the presence of unsteady flow
(case 2) can be relevant in very mild river slope conditions,
where the variable energy slope leads to the formation of a
Giuliano Di Baldassarre (corresponding author)Department of Hydroinformatics and Knowledge
Management,UNESCO-IHE Institute for Water Education,Westvest 7,PO Box 3015,2601 DA Delft,The NetherlandsE-mail: [email protected]
Pierluigi ClapsDipartimento di Idraulica,Trasporti ed Infrastrutture Civili,Politecnico di Torino,Torino,Italy
doi: 10.2166/nh.2010.098
10 & IWA Publishing 2011 Hydrology Research 9999 42.1 9999 2011

loop rating curve (Jones 1916; Fread 1975). In order to reduce
this source of uncertainty, a number of authors proposed the
use of artificial neural networks to model the looped rating
curve due to unsteady flow (e.g. Tawfik et al. 1997; Jain &
Chalisgaonkar 2000; Bhattacharya & Solomatine 2005). More
recently, an original approach based on simultaneous stage
measurements at two adjacent cross-sections was introduced
(e.g. Arico et al. 2008; Dottori et al. 2009).Finally, the uncertainty induced by the extrapolation of
the rating curve beyond the measurement range (case 3) can
result in an amplification of the previous uncertainties. Given
the lack of measurements during high flow conditions, indir-
ect and extrapolated discharge measures of flood discharges
turn out to be affected by relevant errors. Many authors
therefore warn not to extrapolate rating curves beyond a
certain range (e.g. Kuczera 1996; Clarke 1999). For instance,
Di Baldassarre & Montanari (2009) performed a quantitative
numerical analysis to estimate the uncertainty of river dis-
charge observations on the River Po (Italy) and showed that
the errors produced by the extrapolation of the rating curve
beyond the range of measurements used for its derivation
were about 14% at the 95% confidence level. They also
showed that this extrapolation uncertainty strongly increases
for increasing values of river discharge.
Nevertheless, river discharge data referred to high flow
conditions are required for many hydrological applications,
such as calibration and validation of rainfall–runoff models,
flood frequency analysis, boundary conditions of flood inun-
dation models, geomorphologic studies and river sediments
management. Thus, the extrapolation of the rating curve
beyond the measurement range is very often a necessity
(Pappenberger et al. 2006) and more efforts are needed to
reduce the errors and uncertainties associated with this
indirect measure. These premises are the main motivations
for the present study.
The standard methodology to derive a rating curve con-
sists of carrying out field campaigns to record contempora-
neous measures of water stage h and river discharge Q. Such
measures allow us to identify discrete points (Q, h) that aresubsequently interpolated through an analytical relationship
that approximates the rating curve. The power-law function is
commonly used in hydrometric practice (Herschy 1978;
Dymond & Christian 1982; ISO 1998):
Q ! a " h# b$ %c $1%
where a, b and c are calibration parameters that are usually
estimated by means of the non-linear least squares method
(e.g. Petersen-Øverleir 2004). Equation (1) is widely used in
river hydraulics and has some physical justifications (Chow
1959; Fenton 2001; Petersen-Øverleir 2005). More recently,
Reitan & Petersen-Øverleir (2008) analyzed the use of power-
law (Equation (1)) segments to cope with stage–discharge
relationships that change at certain flow stages.
Hydrologic measurement standards require a periodic
updating of the rating curve to account for changes that
may occur in the river geometry. These updates produce
annual rating curves that sometimes change considerably
from one year to another. The evaluation of the effects of
these changes in the range of flood discharges is the main
topic of this manuscript. Visual inspection of the ensemble of
annual rating curves (Figure 1) gives an idea of the possible
inaccuracies due to the extrapolation and of the variability in
the low-flow region. Studies conducted by Claps et al. (2003)hypothesize that flow extremes in different years can be
0.01
0.10
1.00
10.00(a) (b)
1 10 100 1000 10000
River Discharge (m3s-1)
Wat
er S
tage
(m
)
1
10
100001000100
River Discharge (m3s-1)
Wat
er S
tage
(m
)
Figure 1 9999 Example of the methodology proposed by Claps et al. (2003): (a) different rating curves (from 1922 to 2004) for a River Po tributary and (b) corresponding flood rating curveinterpolating annual maxima.
11 G. Di Baldassarre and P. Claps 9999 A hydraulic study on the applicability of flood rating curves Hydrology Research 9999 42.1 9999 2011

considered compatible with a unique so-called flood rating
curve, despite changes in river geometry. The flood rating
curve is estimated using only annual maxima of contempora-
neous values of stage and discharge (Figure 1(b)). This
approach (described below) is solely based on a statistical
fitting and is quite practical to apply when data of the section
geometry is lacking. However, appropriate hydraulic justifi-
cation would be required to confirm the above basic assump-
tion that the rating curve tends to be constant in the range of
annual maximum discharges.
Flood rating curve
The empirical estimation of the so-called flood rating curve
(Claps et al. 2003) is based on the assumption that available
annual maximum discharge values can be used to identify a
discharge range in which the rating curve is stable for a given
cross-section. The study is based on data available in pub-
lications of the Italian Hydrological Survey (SII) (Ministero
dei Lavori Pubblici 1937–1970), which contain annual max-
ima of instantaneous discharge (not of secondary peaks) as
well as the annual rating curves. Peak discharges are available
in the publications as determined from extrapolation of the
annual rating curves, even if some expert-judgment adjust-
ment is reported (Figure 1). Given the high variability of the
annual rating curves in the low discharges range, Claps et al.(2003) considered the series of annual extremes and, using
the published stage values, proposed the use of a separated
and hydraulically based rating curve only for those series
(Figure 1). In particular, the flood rating curve is obtained by
parameterizing Equation (1) using the annual extremes data.
This curve allowed the authors to demonstrate the incon-
sistency of some discharge values and to reconstruct
discharge values from stage measurements made in periods
where the annual rating curves were unavailable.
The present study aims to evaluate the validity of the
assumptions made by Claps et al. (2003) and to reduce the
uncertainty of flood data induced by extrapolation of the
rating curve. These objectives are tackled by means of a
hydraulic approach using a set of valuable data on a 16 km
reach of the River Po (Northern Italy). In particular, five
hydraulic models are built using five topographical ground
surveys conducted in 1954, 1968, 1979, 1991 and 2000 as
geometric input. These models are then used to investigate
the hydraulic behaviour of the river reach and, in particular,
to assess the effects of river geometry changes in the stage–
discharge relationships, as described in the following sections.
DATA AND METHODS
Data related to the rating curves and used in the hydraulic
modelling refers to the 16 km reach of the River Po (North-
ern Italy) between Cogozzo and Tagliata (Figure 2). The River
Po is the longest river in Italy and its basin of about
70,000 km2 drains a large part of the Italian alpine region.
In the reach under study, the average bed slope is about
0.02% and the cross-section is formed by a main channel
having a width varying from 200 to 300 m. Two lateral banks
with overall width varying from 2 to 3 km are confined by
continuous artificial levees. The mean annual peak discharge
is equal to around 1000 m3 s–1 and the 100-year flood peak is
Tag
liata
Pie
ve S
alic
eto
Via
dana
Cog
ozzo
10
13
16
19
22
25
28
31(a) (b)
-500 4500 9500 14500X (m)
Z (
m a
sl)
Levee elevationBed elevation
8
12
16
20
24
28
32
0 500 1000 1500 2000 2500
Z (
m a
sl)
Y (m)
1954 1968 1979 1991 2000
Figure 2 9999 Test site: (a) River Po between Cogozzo and Tagliata and (b) cross-section of Viadana surveyed in 1954, 1968, 1979, 1991 and 2000. X represents the river chainage (m), Y thedistance along each cross-section (m) and Z the elevation (m asl).
12 G. Di Baldassarre and P. Claps 9999 A hydraulic study on the applicability of flood rating curves Hydrology Research 9999 42.1 9999 2011

about 12,000 m3 s–1 (Maione et al. 2003). Historical flood
events on the River Po are characterized by flood waves with
a rather long base time (Castellarin et al. 2009).Five different topographical ground surveys of this river
reach, conducted in 1954, 1968, 1979, 1991 and 2000, are
used in this study. The right panel of Figure 2 shows an
internal cross-section surveyed at Viadana. Using the above-
mentioned survey data as geometric input, five different
hydraulic models are built by means of the one-dimensional
(1D) HEC-RAS (Hydrologic Engineering Center River Ana-
lysis System) model code (Hydrologic Engineering Center
2001). HEC-RAS is widely used for flood inundation model-
ling (Horritt & Bates 2002; Pappenberger et al. 2005; Matgen
et al. 2007) and as a hydraulic kernel in hydrological studies
(Young et al. 2009). It is worth noting that a number of studies
showed that, when the hydraulic problem at hand is not
dominated by specific 2D phenomena (e.g. inundation caused
by dam breaches or levee failures), HEC-RAS is rather
suitable for providing an accurate reproduction of the flood
propagation and inundation extent (e.g. Horritt & Bates
2002). Concerning the Po test site, previous studies pointed
out that HEC-RAS provides an accurate reproduction of the
hydraulic behaviour of the River Po (Castellarin et al. 2009;Di Baldassarre et al. 2009).
The topography of the 16 km reach of the River Po is
described by using 4 cross-sections (Figure 2). Despite this
apparently excessive cross-section spacing, the hydraulic
behaviour of this river reach is reasonably well described
because of its regular geometry and very gentle slope. This is
confirmed by indications in the scientific literature (e.g.
Samuels 1995) as well as by the findings of the extensive
numerical analysis performed in this test site (Castellarin
et al. 2009).River discharge at the upstream end and friction slope at
the downstream end define the model boundary conditions.
Concerning the roughness parameters, in order to avoid
subjectivity in separating the main channel from the flood-
plain for each cross-section in the five different topographical
ground surveys, a uniform Manning coefficient for the entire
cross-section (channel and floodplain) is utilized. This
assumption is justified by the findings of previous studies
performed in the same river reach using HEC-RAS (Di
Baldassarre et al. 2009). In particular, Di Baldassarre et al.(2009) manually calibrated a HEC-RAS model using a large
amount of data from the October 2000 flood event. The
calibration exercise showed that the optimal set of parameters
agrees well with the values given in standard tables of
Manning’s coefficients (0.04 m–1/3 s for the channel and
0.09 m–1/3 s for the floodplain; Chow 1959). The same study
demonstrated that parameter compensation, due to Man-
ning’s coefficient decrease in the floodplain and to its increase
in the main channel, allows us to use a uniform Manning’s
coefficient for the whole section (equal to around 0.05 m–1/3 s)
while preserving almost equivalent performance of the
hydraulic model. Consequently, in the present study, direct
stage and discharge measurements are used to evaluate the
model performance with a uniform Manning’s coefficient
equal to 0.05 m–1/3 s. This additional evaluation indicated
that relative errors between observed and simulated water
levels did not exceed 5%.
NUMERICAL STUDY
This study focuses on the extrapolation errors of the steady
rating curve and is made by means of numerical experiments.
It is therefore important to note that, in steady flow condi-
tions for this river reach, it is reasonable to assume the
presence of a one-to-one correspondence between the
water stage and the river discharge. This is due the minor
role played by downstream disturbances and tributaries (e.g.
Franchini et al. 1999; Di Baldassarre & Montanari 2009).
The first numerical experiment is performed to examine
how the river geometry modification affects steady-state rat-
ing curves. The experiment focuses on an internal cross-
section (Viadana, Figure 2) and uses two different geometries
surveyed in 1954 and 1968. Specifically, steady-state simula-
tions with the hydraulic model produces ‘measured’ river
discharges values. This is in a range between 500 m3 s–1
(low flow condition) and 5000 m3 s–1 (ordinary flood condi-
tion), in steps of 500 m3 s–1. The rating curve expressed by
Equation (1) is estimated by interpolating the (Q, h) points.These simulations are run using a uniform Manning’s coeffi-
cient equal to 0.05 m–1/3 s and the least-squares method is
used to estimate the three parameters of Equation (1).
The choice of the mentioned discharge interval reflects
the actual practice to make direct measurements of river
discharge up to ordinary flow conditions (e.g. Franchini
13 G. Di Baldassarre and P. Claps 9999 A hydraulic study on the applicability of flood rating curves Hydrology Research 9999 42.1 9999 2011
et al. 1999). This is obviously due to the fact that measuring
discharge during extreme floods is very difficult (if not
impossible).
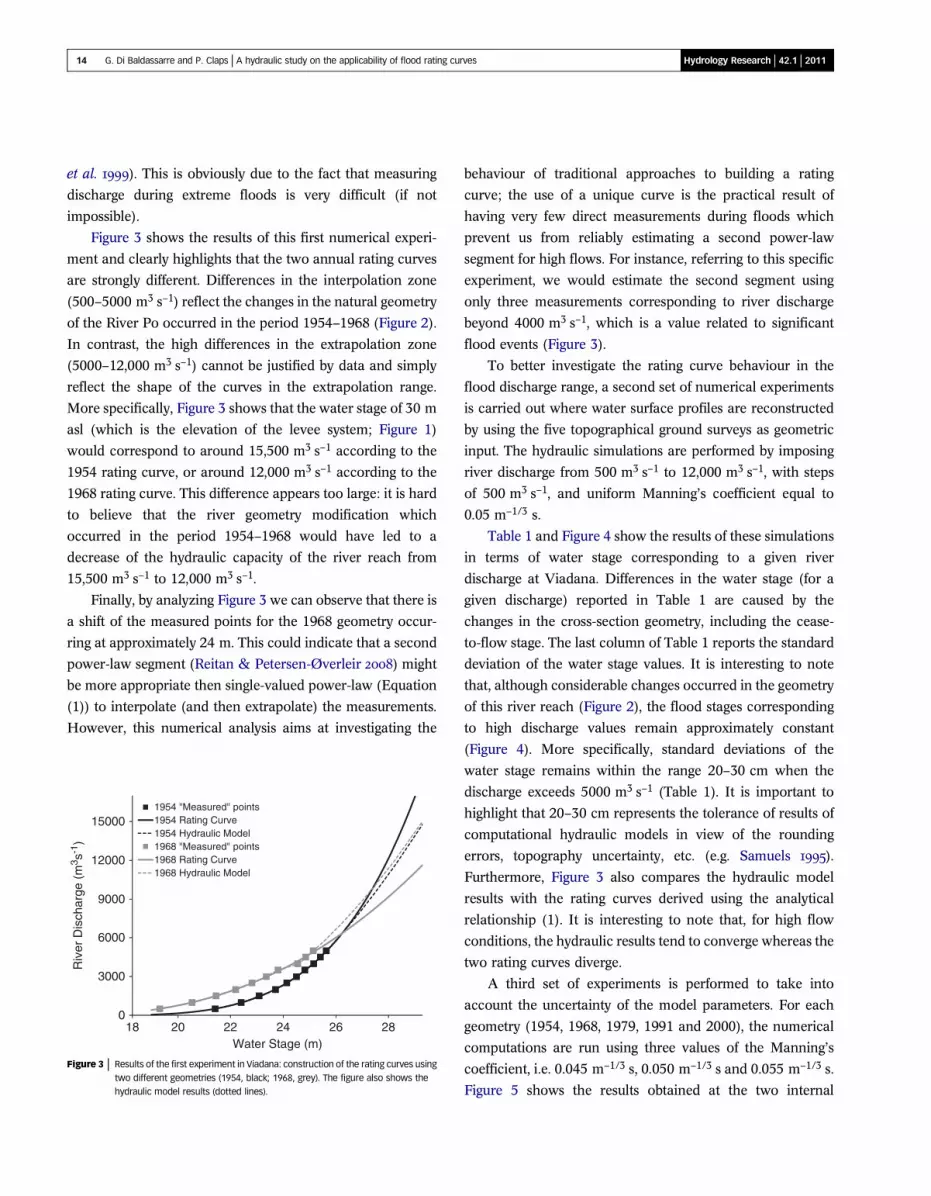
Figure 3 shows the results of this first numerical experi-
ment and clearly highlights that the two annual rating curves
are strongly different. Differences in the interpolation zone
(500–5000 m3 s–1) reflect the changes in the natural geometry
of the River Po occurred in the period 1954–1968 (Figure 2).
In contrast, the high differences in the extrapolation zone
(5000–12,000 m3 s–1) cannot be justified by data and simply
reflect the shape of the curves in the extrapolation range.
More specifically, Figure 3 shows that the water stage of 30 m
asl (which is the elevation of the levee system; Figure 1)
would correspond to around 15,500 m3 s–1 according to the
1954 rating curve, or around 12,000 m3 s–1 according to the
1968 rating curve. This difference appears too large: it is hard
to believe that the river geometry modification which
occurred in the period 1954–1968 would have led to a
decrease of the hydraulic capacity of the river reach from
15,500 m3 s–1 to 12,000 m3 s–1.
Finally, by analyzing Figure 3 we can observe that there is
a shift of the measured points for the 1968 geometry occur-
ring at approximately 24 m. This could indicate that a second
power-law segment (Reitan & Petersen-Øverleir 2008) might
be more appropriate then single-valued power-law (Equation
(1)) to interpolate (and then extrapolate) the measurements.
However, this numerical analysis aims at investigating the
behaviour of traditional approaches to building a rating
curve; the use of a unique curve is the practical result of
having very few direct measurements during floods which
prevent us from reliably estimating a second power-law
segment for high flows. For instance, referring to this specific
experiment, we would estimate the second segment using
only three measurements corresponding to river discharge
beyond 4000 m3 s–1, which is a value related to significant
flood events (Figure 3).
To better investigate the rating curve behaviour in the
flood discharge range, a second set of numerical experiments
is carried out where water surface profiles are reconstructed
by using the five topographical ground surveys as geometric
input. The hydraulic simulations are performed by imposing
river discharge from 500 m3 s–1 to 12,000 m3 s–1, with steps
of 500 m3 s–1, and uniform Manning’s coefficient equal to
0.05 m–1/3 s.
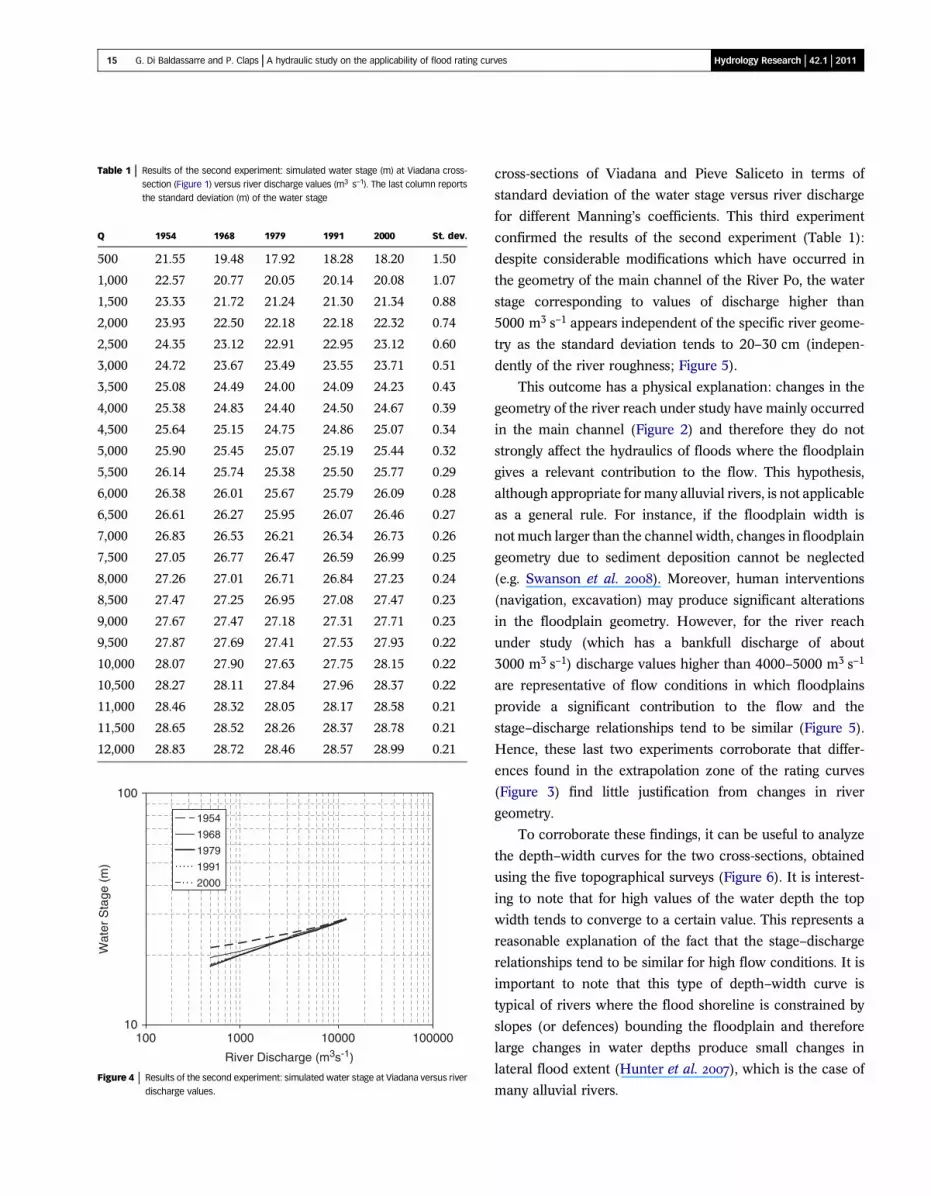
Table 1 and Figure 4 show the results of these simulations
in terms of water stage corresponding to a given river
discharge at Viadana. Differences in the water stage (for a
given discharge) reported in Table 1 are caused by the
changes in the cross-section geometry, including the cease-
to-flow stage. The last column of Table 1 reports the standard
deviation of the water stage values. It is interesting to note
that, although considerable changes occurred in the geometry
of this river reach (Figure 2), the flood stages corresponding
to high discharge values remain approximately constant
(Figure 4). More specifically, standard deviations of the
water stage remains within the range 20–30 cm when the
discharge exceeds 5000 m3 s–1 (Table 1). It is important to
highlight that 20–30 cm represents the tolerance of results of
computational hydraulic models in view of the rounding
errors, topography uncertainty, etc. (e.g. Samuels 1995).
Furthermore, Figure 3 also compares the hydraulic model
results with the rating curves derived using the analytical
relationship (1). It is interesting to note that, for high flow
conditions, the hydraulic results tend to converge whereas the
two rating curves diverge.
A third set of experiments is performed to take into
account the uncertainty of the model parameters. For each
geometry (1954, 1968, 1979, 1991 and 2000), the numerical
computations are run using three values of the Manning’s
coefficient, i.e. 0.045 m–1/3 s, 0.050 m–1/3 s and 0.055 m–1/3 s.
Figure 5 shows the results obtained at the two internal
0
3000
6000
9000
12000
15000
18 20 22 24 26 28
Riv
er D
isch
arge
(m
3 s-1
)
Water Stage (m)
1954 "Measured" points1954 Rating Curve1954 Hydraulic Model1968 "Measured" points1968 Rating Curve1968 Hydraulic Model
Figure 3 9999 Results of the first experiment in Viadana: construction of the rating curves usingtwo different geometries (1954, black; 1968, grey). The figure also shows thehydraulic model results (dotted lines).
14 G. Di Baldassarre and P. Claps 9999 A hydraulic study on the applicability of flood rating curves Hydrology Research 9999 42.1 9999 2011
cross-sections of Viadana and Pieve Saliceto in terms of
standard deviation of the water stage versus river discharge
for different Manning’s coefficients. This third experiment
confirmed the results of the second experiment (Table 1):
despite considerable modifications which have occurred in
the geometry of the main channel of the River Po, the water
stage corresponding to values of discharge higher than
5000 m3 s–1 appears independent of the specific river geome-
try as the standard deviation tends to 20–30 cm (indepen-
dently of the river roughness; Figure 5).
This outcome has a physical explanation: changes in the
geometry of the river reach under study have mainly occurred
in the main channel (Figure 2) and therefore they do not
strongly affect the hydraulics of floods where the floodplain
gives a relevant contribution to the flow. This hypothesis,
although appropriate for many alluvial rivers, is not applicable
as a general rule. For instance, if the floodplain width is
not much larger than the channel width, changes in floodplain
geometry due to sediment deposition cannot be neglected
(e.g. Swanson et al. 2008). Moreover, human interventions
(navigation, excavation) may produce significant alterations
in the floodplain geometry. However, for the river reach
under study (which has a bankfull discharge of about
3000 m3 s–1) discharge values higher than 4000–5000 m3 s–1
are representative of flow conditions in which floodplains
provide a significant contribution to the flow and the
stage–discharge relationships tend to be similar (Figure 5).
Hence, these last two experiments corroborate that differ-
ences found in the extrapolation zone of the rating curves
(Figure 3) find little justification from changes in river
geometry.
To corroborate these findings, it can be useful to analyze
the depth–width curves for the two cross-sections, obtained
using the five topographical surveys (Figure 6). It is interest-
ing to note that for high values of the water depth the top
width tends to converge to a certain value. This represents a
reasonable explanation of the fact that the stage–discharge
relationships tend to be similar for high flow conditions. It is
important to note that this type of depth–width curve is
typical of rivers where the flood shoreline is constrained by
slopes (or defences) bounding the floodplain and therefore
large changes in water depths produce small changes in
lateral flood extent (Hunter et al. 2007), which is the case of
many alluvial rivers.
10
100
100 1000 10000 100000
River Discharge (m3s-1)
Wat
er S
tage
(m
)
19541968197919912000
Figure 4 9999 Results of the second experiment: simulated water stage at Viadana versus riverdischarge values.
Table 1 9999 Results of the second experiment: simulated water stage (m) at Viadana cross-section (Figure 1) versus river discharge values (m3 s–1). The last column reportsthe standard deviation (m) of the water stage
Q 1954 1968 1979 1991 2000 St. dev.
500 21.55 19.48 17.92 18.28 18.20 1.50
1,000 22.57 20.77 20.05 20.14 20.08 1.07
1,500 23.33 21.72 21.24 21.30 21.34 0.88
2,000 23.93 22.50 22.18 22.18 22.32 0.74
2,500 24.35 23.12 22.91 22.95 23.12 0.60
3,000 24.72 23.67 23.49 23.55 23.71 0.51
3,500 25.08 24.49 24.00 24.09 24.23 0.43
4,000 25.38 24.83 24.40 24.50 24.67 0.39
4,500 25.64 25.15 24.75 24.86 25.07 0.34
5,000 25.90 25.45 25.07 25.19 25.44 0.32
5,500 26.14 25.74 25.38 25.50 25.77 0.29
6,000 26.38 26.01 25.67 25.79 26.09 0.28
6,500 26.61 26.27 25.95 26.07 26.46 0.27
7,000 26.83 26.53 26.21 26.34 26.73 0.26
7,500 27.05 26.77 26.47 26.59 26.99 0.25
8,000 27.26 27.01 26.71 26.84 27.23 0.24
8,500 27.47 27.25 26.95 27.08 27.47 0.23
9,000 27.67 27.47 27.18 27.31 27.71 0.23
9,500 27.87 27.69 27.41 27.53 27.93 0.22
10,000 28.07 27.90 27.63 27.75 28.15 0.22
10,500 28.27 28.11 27.84 27.96 28.37 0.22
11,000 28.46 28.32 28.05 28.17 28.58 0.21
11,500 28.65 28.52 28.26 28.37 28.78 0.21
12,000 28.83 28.72 28.46 28.57 28.99 0.21
15 G. Di Baldassarre and P. Claps 9999 A hydraulic study on the applicability of flood rating curves Hydrology Research 9999 42.1 9999 2011

DISCUSSION (UNCERTAINTY ESTIMATION)
The results of the numerical experiments suggest that the
indirect measurement of discharges beyond the measurement
range should rely on a physically based model rather than on
the traditional approach of extrapolating rating curves based
on analytical relationships (as that of Equation (1)). A
hydraulic analysis of the river reach is allowed nowadays by
the broad availability of topographic data and hydraulic
model codes and may help to reduce the uncertainty in
derivation of river discharge measurements, also leading
to more reliable stage–discharge relationships in the
extrapolation zone. A good operational strategy could be to
use the stage–discharge measurements to calibrate a hydrau-
lic model and then to use the model to extrapolate the rating
curve. A hydraulic approach can also potentially include
roughness variations due to changes in the state of the
vegetation, which can be a relevant factor of alteration of
the rating curve (e.g. Di Baldassarre & Montanari 2009).
However, it must be said that the uncertainty of the hydraulic
model, which is calibrated using ordinary flow data and then
used to simulate extremely high flow conditions, cannot be
neglected (Jarret 1987; Kirby 1987; Burnham & Davis 1990).
For instance, a number of studies (e.g. Horritt & Bates 2002;
0
500
1000
1500
2000
2500
3000
(a) (b)
4 7 10 13 16
Wid
th (
m)
Depth (m)
1954 1968 1979 1991 2000 1954 1968 1979 1991 2000
0
500
1000
1500
2000
2500
3000
4 7 10 13 16
Wid
th (
m)
Depth (m)
Figure 6 9999 Depth-width curves at (a) Viadana and (b) Pieve Saliceto.
0.00
0.30
0.60
0.90
1.20
1.50(a) (b)
River Discharge (m3s-1)
Sta
ndar
d D
evia
tion
(m)
n = 0.045n = 0.050n = 0.055
0.00
0.30
0.60
0.90
1.20
1.50
0 3000 6000 9000 12000 0 3000 6000 9000 12000
River Discharge (m3s-1)S
tand
ard
Dev
iatio
n (m
)
n = 0.045n = 0.050n = 0.055
Figure 5 9999 Results of the third experiment: standard deviation of the water stage versus river discharge for three different Manning’s coefficient values at the two internal cross-sections:(a) Viadana and (b) Pieve Saliceto.
16 G. Di Baldassarre and P. Claps 9999 A hydraulic study on the applicability of flood rating curves Hydrology Research 9999 42.1 9999 2011
Romanowicz & Beven 2003; Horritt et al. 2007) have shown
that the effective roughness coefficients may be different
when evaluated for different flow conditions. Thus, the
hydraulic extrapolation of the rating curve is affected by
uncertainty that should be considered and estimated.
A rigorous and statistically consistent analysis of the
uncertainty of the hydraulically derived rating curve is not
an easy task and might be not be computationally feasible.
We therefore set up, as an example, a simple and pragmatic
approach based on the widely used Generalized Likelihood
Uncertainty Estimation (GLUE, Beven & Binley 1992; Pap-
penberger et al. 2006). In this approach the uncertainty of the
hydraulic model is estimated as follows. Firstly, the hydraulic
model is run using uniformly distributed roughness coeffi-
cients in the range 0.04–0.07 m–1/3 s (selected according to
prior knowledge; e.g. Montanari 2007). Secondly, the simula-
tion results are compared to the calibration data (i.e. stage–
discharge measurements) and simulations with a mean
absolute relative error higher than 20% are rejected as non-
behavioural. Thirdly, the computed likelihoods are rescaled
to produce a cumulative sum of 1, and then uncertainty
bounds and the median simulation are derived by following
the standard GLUE methodology (e.g. Montanari 2005).
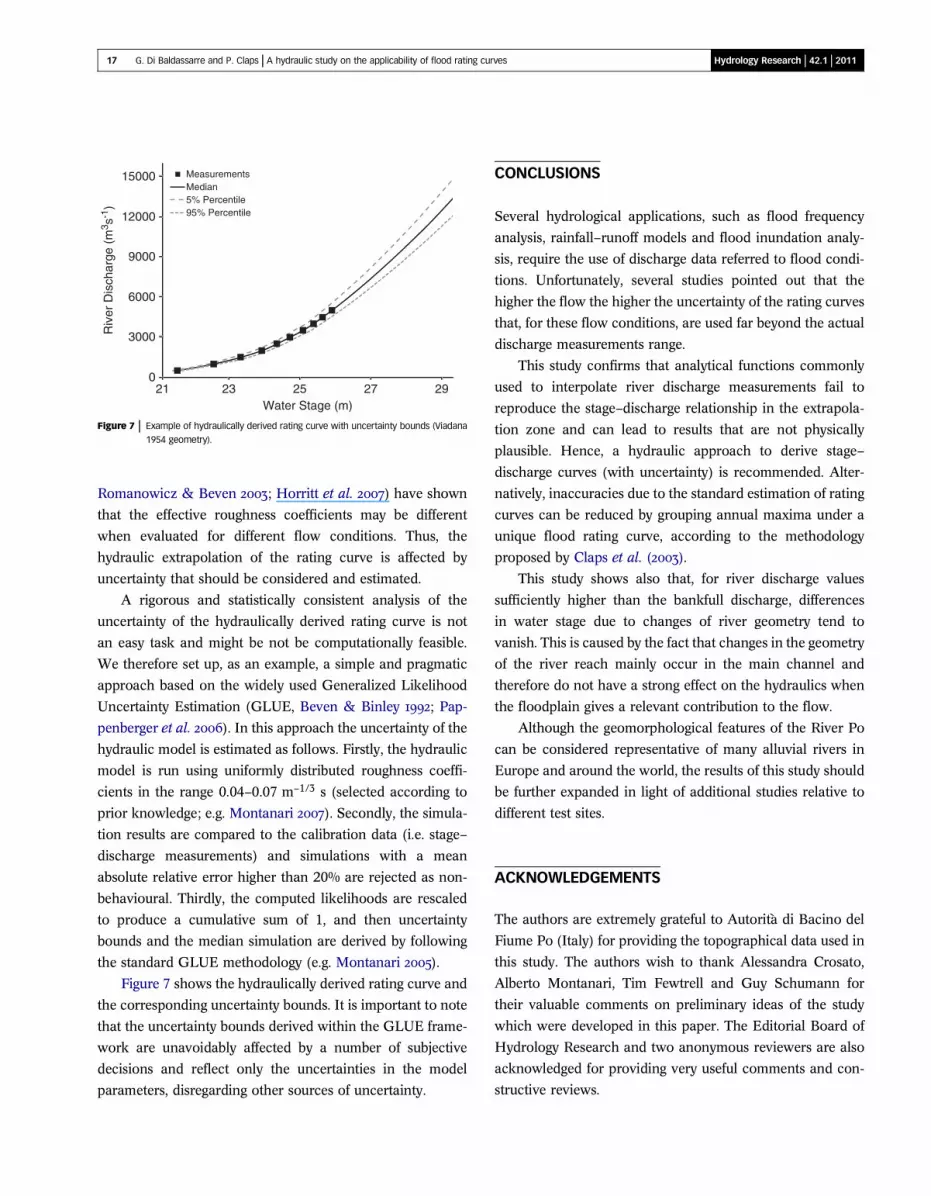
Figure 7 shows the hydraulically derived rating curve and
the corresponding uncertainty bounds. It is important to note
that the uncertainty bounds derived within the GLUE frame-
work are unavoidably affected by a number of subjective
decisions and reflect only the uncertainties in the model
parameters, disregarding other sources of uncertainty.
CONCLUSIONS
Several hydrological applications, such as flood frequency
analysis, rainfall–runoff models and flood inundation analy-
sis, require the use of discharge data referred to flood condi-
tions. Unfortunately, several studies pointed out that the
higher the flow the higher the uncertainty of the rating curves
that, for these flow conditions, are used far beyond the actual
discharge measurements range.
This study confirms that analytical functions commonly
used to interpolate river discharge measurements fail to
reproduce the stage–discharge relationship in the extrapola-
tion zone and can lead to results that are not physically
plausible. Hence, a hydraulic approach to derive stage–
discharge curves (with uncertainty) is recommended. Alter-
natively, inaccuracies due to the standard estimation of rating
curves can be reduced by grouping annual maxima under a
unique flood rating curve, according to the methodology
proposed by Claps et al. (2003).This study shows also that, for river discharge values
sufficiently higher than the bankfull discharge, differences
in water stage due to changes of river geometry tend to
vanish. This is caused by the fact that changes in the geometry
of the river reach mainly occur in the main channel and
therefore do not have a strong effect on the hydraulics when
the floodplain gives a relevant contribution to the flow.
Although the geomorphological features of the River Po
can be considered representative of many alluvial rivers in
Europe and around the world, the results of this study should
be further expanded in light of additional studies relative to
different test sites.
ACKNOWLEDGEMENTS
The authors are extremely grateful to Autorita di Bacino del
Fiume Po (Italy) for providing the topographical data used in
this study. The authors wish to thank Alessandra Crosato,
Alberto Montanari, Tim Fewtrell and Guy Schumann for
their valuable comments on preliminary ideas of the study
which were developed in this paper. The Editorial Board of
Hydrology Research and two anonymous reviewers are also
acknowledged for providing very useful comments and con-
structive reviews.
0
3000
6000
9000
12000
15000
21 23 25 27 29
Riv
er D
isch
arge
(m
3 s-1
)
Water Stage (m)
MeasurementsMedian5% Percentile95% Percentile
Figure 7 9999 Example of hydraulically derived rating curve with uncertainty bounds (Viadana1954 geometry).
17 G. Di Baldassarre and P. Claps 9999 A hydraulic study on the applicability of flood rating curves Hydrology Research 9999 42.1 9999 2011

REFERENCES
Arico, C., Tucciarelli, T., Dottori, F., Martina, M. L. V. & Todini, E. 2008Peak flow measurement in the Arno River by means of unsteady-state water level data analysis. Proc. International Conference onFluvial Hydraulics. (RiverFlow), Cesme-Izmir, Turkey, 3–5September 2008.
Beven, K. J. & Binley, A. M. 1992 The future of distributed models:model calibration and uncertainty prediction. HydrologicalProcesses 6, 279–298.
Bhattacharya B. & Solomatine, D. P. 2005 Neural networks and M%model tress in modelling water level discharge relationships.Neurocomputing 63, 381–396.
Burnham, M. W. & Davis, D. W. 1990 Effects of data errors incomputed steady-flow profiles. Journal of Hydraulic Engineering116, 914–928.
Castellarin, A., Di Baldassarre, G., Bates, P. D. & Brath, A. 2009Optimal cross-section spacing in Preissmann scheme 1D hydro-dynamic models. ASCE Journal of Hydraulic Engineering 135(2),96–105.
Chow, V. T. 1959 Open-channel Hydraulics. McGraw-Hill, New York.Claps, P., Fiorentino, M. & Laio, F. 2003 Scale di deflusso di piena di
corsi d’acqua naturali (in Italian), Atti delle Giornate di Studio suLa difesa idraulica del territorio. Trieste 10–12 September 2003.
Clarke, R. T. 1999 Uncertainty in the estimation of mean annual flooddue to rating-curve indefinition. Journal of Hydrology 222,185–190.
Di Baldassarre, G. & Montanari, A. 2009Uncertainty in river dischargeobservations: a quantitative analysis. Hydrol. Earth Sys. Sci. 13,913–921.
Di Baldassarre, G., Schumann, G. & Bates, P. D. 2009 Near real timesatellite imagery to support and verify timely flood modelling.Hydrological Processes 23(5), 799–803.
Dottori, F., Martina M. L. V. & Todini E. 2009 A dynamic rating curveapproach to indirect discharge measurement. Hydrol. Earth Syst.Sci. 6, 859–896.
Dymond, J. R. & Christian, R. 1982 Accuracy of discharge determinedfrom a rating curve. Hydrological Sciences Journal - Journal desSciences Hydrologiques 27(4), 493–504.
European ISO EN Rule 748 1997 Measurement of liquid flow in openchannels - velocity-area methods, Reference number ISO748:1997 (E), International Standard.
Fenton, J. D. 2001 Rating curves: part 2—representation and approxima-tion. Proceedings of the Conference on Hydraulics in Civil Engi-neering. Institute of Engineer Australia: Hobart; 28–30 November,pp. 319–328.
Franchini, M., Lamberti, P. & Di Giammarco, P. 1999 Rating curveestimation using local stages, upstream discharge data and asimplified hydraulic model. Hydrol. Earth Sys. Sci. 3, 541–548.
Fread, D. L. 1975 Computation of stage-discharge relationship affectedby unsteady flow, Water Resour. Bull. 11(2), 429–442.
Herschy, R. W. 1978 Accuracy in Hydrometry. Wiley, New York,pp. 353–397.
Horritt, M. S. & Bates, P. D. 2002 Evaluation of 1-D and 2-D models forpredicting river flood inundation. Journal of Hydrology 268, 87–99.
Horritt, M. S., Di Baldassarre, G., Bates, P. D. & Brath, A. 2007Comparing the performance of 2-D finite element and finitevolume models of floodplain inundation using airborne SARimagery. Hydrological Processes 21, 2745–2759.
Hunter, N. M., Bates, P. D., Horritt, M. S. & Wilson, M. D. 2007 Simplespatially-distributed models for predicting flood inundation: areview. Geomorphology 90, 208–225.
Hydrologic Engineering Center 2001 Hydraulic Reference Manual.Davis, USA, US Army Corps of Engineers.
ISO (International Standards Organisation) 1998 ISO 1100/2 1998,Stage-discharge Relation. International Standards Organisation,Geneva.
Jain, S. K. & Chalisgaonkar, D. 2000 Setting up stage–discharge usingANN. Journal of Hydrologic Engineering 5, 428–433.
Jarret, R. D. 1987 Errors in slope-area computations of peak dischargesin mountain streams. Journal of Hydrology 96, 53–67.
Jones, B. E. 1916 A Method of Correcting River Discharge for a ChangingStage. U.S. Geological SurveyWater Supply Paper, 375-E, 117–130.
Kirby, W. H. 1987 Linear error analysis of slope-area discharge deter-minations. Journal of Hydrology 96, 125–138.
Kuczera, G. 1996 Correlated rating curve error in flood frequencyinference. Water Resour. Res. 32(7), 2119–2127.
Leonard, J., Mietton, M., Najib, H. & Gourbesville, P. 2000 Rating curvemodelling with Manning’s equation to manage instabilityand improve extrapolation. Hydrological Sciences Journal 45(5),739–750.
Lintrup, M. 1989 A new expression for the uncertainty of a currentmeter discharge measurement. Nordic Hydrology 20(3), 191–200.
Maione, U., Mignosa, P. & Tomirotti, M. 2003 Regional estimationmodel of synthetic design hydrographs. International Journal ofRiver Basin Management 12, 151–163.
Matgen, P., Schumann, G., Henry, J. B., Hoffmann, L. & Pfister L.2007 Integration of SAR derived river inundation areas, high-precision topographic data and flood propagation models: a steptowards effective, near real-time flood management. InternationalJournal of Applied Earth Observation and Geoinformation 9(3),247–263.
Montanari, A. 2005 Large sample behaviors of the generalizedlikelihood uncertainty estimation (GLUE) in assessing the uncer-tainty of rainfall-runoff simulations. Water Resources Research 41,W08406.
Montanari, A. 2007 What do we mean by uncertainty? The need for aconsistent wording about uncertainty assessment in hydrology.Hydrological Processes 21, 841–845.
Pappenberger, F., Beven, K. J., Horritt, M. & Blazkova, S. 2005Uncertainty in the calibration of effective roughness parametersin HEC-RAS using inundation and downstream level observa-tions. Journal of Hydrology 302(1–4), 46–69.
Pappenberger, F., Matgen, P., Beven, K. J., Henry, J. B., Pfister, L. & deFraipont, P. 2006 Influence of uncertain boundary conditions andmodel structure on flood inundation predictions. Advances inWater Resources 29(1430–1449).
Pelletier, M. P. 1987 Uncertainties in the determination of river dis-charge: a literature review. Can. J. Civ. Eng. 15, 834–850.
Petersen-Øverleir, A. 2004 Accounting for heteroscedasticity in ratingcurve estimates. Journal of Hydrology 292, 173–181.
18 G. Di Baldassarre and P. Claps 9999 A hydraulic study on the applicability of flood rating curves Hydrology Research 9999 42.1 9999 2011

Petersen-Øverleir, A. 2005 A Hydraulics Perspective on the Power-lawStage-discharge Rating Curve, NVE report 05-05, NorwegianWater Resources and Energy Directorate, Oslo.
Reitan, T. & Petersen-Averleir, A. 2008 Bayesian methods for fittingmulti-segment stage-discharge rating curves. Stochastic Environ-mental Research and Risk Assessment 23, 627–642.
Romanowicz, R. & Beven, K. 2003 Estimation of flood inundationprobabilities as conditioned on event inundation maps. WaterResources Research 39(3), 1073–1085.
Samuels, P. G. 1995 Uncertainty in flood level prediction. ProceedingsXXVI Biannual Congress of the IAHR. HYDRA2000, ThomasTelford, London.
Swanson, K. M., Watson, E., Aalto, R., Lauer, J. W., Bera, M. T.,Marshall, A., Taylor, M. P., Apte, S. C. & Dietrich, W. E. 2008
Sediment load and floodplain deposition rates: Comparison of theFly and Strickland rivers, Papua New Guinea. J. Geophys. Res.113, F01S03.
Tawfik, M., Ibrahim, A. & Fahmy, H. 1997 Hysteresis sensitive neuralnetwork for modelling rating curves. Journal of Computing in CivilEngineering 11, 206–211.
World Meteorological Organisation 1994 Guide to Hydrological Prac-tice, WMO Pubbl. no. 168.
Young, P. C., Leedal, D., Beven, K. J. C. & Szczypta, C. 2009 Reducedorder emulation of distributed hydraulic models. In: Proceedings15th IFAC Symposium on System Identification SYSID09, StMalo, France. World Meteorological Organisation 1994. Guideto Hydrological Practice, WMO Publ. no. 168.
First received 2 September 2009; accepted in revised form 1 March 2010. Available online December 2010
19 G. Di Baldassarre and P. Claps 9999 A hydraulic study on the applicability of flood rating curves Hydrology Research 9999 42.1 9999 2011