a global survey of university league tables
TRANSCRIPT
epiEducational Policy Institute
Canadian Education Report Series
A World of Difference:
A Global Survey of University League Tables
Alex Usher & Massimo Savino
January 2006
The Educational Policy InstituteThe Educational Policy Institute, Inc. (EPI) is a non-partisan, non-governmental organizationdedicated to policy-based research on educational opportunity for all students. With officesin Washington, DC, Toronto, ON, and Melbourne, Australia, EPI is a collective associationof researchers and policy analysts from around the world dedicated to the mission of enhancingour knowledge of critical barriers facing students and families throughout the educationalpipeline. In addition, EPI has developed extensive partnerships and collaborativearrangements with other leading research and educational organizations, further supportingour mission and ability to conduct policy-relevant research for practical use.
The mission of EPI is to expand educational opportunity for low-income and other historically-underrepresented students through high-level research and analysis. By providing educationalleaders and policymakers with the information required to make prudent programmaticand policy decisions, we believe that the doors of opportunity can be further opened for allstudents, resulting in an increase in the number of students prepared for, enrolled in, andcompleting postsecondary education.
For more information about the Educational Policy Institute, please visit our website at:www.educationalpolicy.org or contact us at:
epiE d u c a t i o n a l P o l i c y I n s t i t u t eVirginia Beach
2401 Seaboard Rd, Suite 104Virginia Beach, VA 23456
(540) 288-2322
Toronto20 Maud Street, Suite 300
Toronto ON M5V 2M5+1 416 848-0215
Melbourne147 Wingrove Street
Fairfield Victoria 3078+61 (0) 419 514 232
email: [email protected]
About the Authors
Alex Usher is the Vice-President of the Educational Policy Institute. Prior to joining theInstitute, he was the Director of Research and Program Development for the CanadaMillennium Scholarship Foundation, where he was in charge of Canada’s largest-everresearch project on access to post-secondary education. He is a native of Winnipeg, Manitoba,and graduate of McGill University and Carleton University. ([email protected])
Massimo Savino is a Research Associate with the Educational Policy Institute’s Torontooffice. He holds a BA in political science from McGill University in Montreal as well as anMSc from the London School of Economics.
Citation:
Usher, A., and Savino, M. (2006). A World of Difference: A Global Survey of University LeagueTables. Toronto, ON: Educational Policy Institute.
www.educationalpolicy.org
A World of Difference:
A Global Survey of
University League Tables
Alex Usher and Massimo Savino
Educational Policy Institute
Educational Policy Institute
Acknowledgements
Thanks are due first and foremost to Jan Sadlak of UNESCO-CEPES and Jamie Merisotis
of the Institute for Higher Education Policy for extending an invitation to one of the
authors to the December 2004 meeting of the International Working Group on
University Ranking Systems in Washington, DC. Thanks are also due to the participants
of that meeting, especially Jesus de Miguel, Hong Shen, David Jobbins and Nian Cai Liu,
all of whom were of considerable assistance in helping us to understand the intricacies
of the various international ranking systems.
Ron Saunders of the Canadian Policy Research Network and Ross Finnie of Queen’s
University are also owed a debt of gratitude for bringing EPI into the world of quality
measurement. Ken Redd provided illuminating advice on undergraduate programs in
the United States and how they might relate to ranking systems there. Tomasz
Bednarczyk translated league tables from Poland. Federica Prato of MIUR in Italy was of
great assistance in deepening our understanding of contemporary issues in Italian
higher education. Long afternoons were profitably and enjoyably spent with Ken
Snowdon discussing the ins and outs and pros and cons of ranking systems.
The paper also benefited considerably from helpful comments from a number of people,
including David Jobbins, Jan Sadlak, Jamie Merisotis and Kim Steele.
Notwithstanding all this generous assistance, any errors or omissions are entirely those
of the authors.
www.educationalpolicy.org 2
Educational Policy Institute
I. Introduction
University rankings or “league tables,” a novelty as recently as 15 years ago, are today a
standard feature in most countries with large higher education systems. They were
originally created over 20 years ago by Bob Morse at the US News and World Report in
order to meet a perceived market need for more transparent, comparative data about
educational institutions. Reviled by critics but popular with parents, copy-cat ranking
systems began popping up all over the world, usually shortly after the introduction of—
or a rapid rise in—tuition fees. Wherever rankings have appeared, they have been met
with a mixture of public enthusiasm and institutional unease. There are now two
institutional ranking projects which compare institutions on a global basis and another
15 or so which compare them on a national basis. There are also innumerable ranking
schemes which look only at particular faculties (e.g., MBA rankings, law and medical
school rankings) or particular qualities of universities (e.g., Yahoo Magazine’s “most
wired” university index, the Journal of Black Higher Education’s Racial Diversity Ranking).
One of the main causes of institutional unease is the tendency of institutional ranking
schemes to use weighted aggregates of indicators to arrive at a single, all-encompassing
quality “score,” which in turn permits institutions to be ranked against one another. By
selecting a particular set of indicators and assigning each a given weight, the authors of
these rankings are imposing a specific definition of quality on the institutions being
ranked. The fact that there may be other legitimate indicators or combinations of
indicators is usually passed over in silence. To the reader, the author’s judgement is in
effect final.
Intriguingly, however, there is absolutely no agreement among the authors of these
indicators as to what indicates quality. The world’s main ranking systems bear little if
any relationship to one another, using very different indicators and weightings to arrive
at a measure of quality. This suggests that the position of certain institutions in their
national rankings is largely a statistical fluke—if another country’s ranking system were
used, a different result might emerge. Yet, that said, certain institutions repeatedly come
at the top of the heap regardless of the system of indicators and weights used.
In this document we discuss 19 university league tables and ranking systems from
around the world. Sixteen of these are “national” league tables collected from ten
countries (Australia, Canada, China, Germany, Hong Kong, Italy, Poland, Spain, the
www.educationalpolicy.org 3
Educational Policy Institute
United Kingdom and the United States); three are “international” or “cross-national”
league tables. Section II provides a more complete description of these league tables and
how they were selected. In Section III, we elaborate on how league tables serve generally
as measurements of or judgements on quality, and how rankings relate to assessments of
educational quality. Specifically, we look at how the choice of indicator and the
weighting attached to each indicator define the nature of “quality.”
In Section IV, we examine how rankings and league tables go about the business of
collecting data on the indicators chosen for their respective systems. It turns out that
strategies for obtaining data differ significantly between ranking systems, largely as a
function of the quality of publicly available data and the sophistication of the chosen
indicators. Following up on this point, in Section V we take a detailed look at the galaxy
of quality indicators used by the existing league tables and ranking systems, according
to a seven-category typology based loosely on the “flow” model of educational quality
first posited by Ross Finnie and Alex Usher (2005).
This information is then synthesized in Section VI through the construction of a “table of
league tables,” in order to make a more direct comparison of indicators and weightings.
In so doing, we note certain regional and national patterns in the implicit definition of
“quality” used by league tables. Section VII explores some of the ramifications of these
regional quality definitions and, in turn, what these ramifications mean in terms of
university positions compared across different league tables. Finally, in Section VIII, we
explore an alternative to the strict “league table” format that is presently the dominant
model for institutional rankings. Conclusions are presented in Section IX.
www.educationalpolicy.org 4
Educational Policy Institute
II. What Are University Rankings and League Tables?
University rankings are lists of certain groupings of institutions (usually, but not always,
within a single national jurisdiction), comparatively ranked according to a common set
of indicators in descending order. With one specific exception, which will be discussed
later (Germany’s CHE/DAAD rankings), university rankings are presented in the
format of a “league table,” much as sports teams in a single league are listed from best to
worst according to the number of wins and losses they have achieved.1
“League tables” are not synonymous with “performance indicators,” although the two
bear more than a passing resemblance to one other. Performance indicators are usually
published by governments or institutions themselves either to show how well an
institution (or a system of institutions) does compared to some kind of benchmark or
simply for the sake of “transparency.” League tables, on the other hand, while similarly
compiled and arranged on the basis of indicators, are designed specifically as a
comparative measure, pitting institutions against each other.
Another notable aspect of league tables is that they are, for the most part, produced by
commercial publishing enterprises. In part, this reflects the fact that rankings share some
characteristics with “consumer guides” to various products. Although rankings are not
guides to specific institutions, the publishers of individual institutional guides may
incorporate rankings data as supplementary material, fleshing out descriptions for the
purpose of providing more information to their readers. Rankings are—at least in
theory—meant to be an “under the hood” look at a complex product. In many cases, the
effort required to collect, collate and analyze the data required to produce the rankings
is so great that their production on anything but a commercial basis is probably
impossible.
1 The term stems from UK-based chart listings that were often compared with Premier League professional soccer or
football standings in England during the 1990s and can now be found in an extremely wide variety of contexts in Britain
today. Examples include the National Health Service’s league tables of hospitals and primary care trusts, the Department
for Education and Skills’ (UK) Achievement and Attainment Tables, Thomson Financial's Debt, Equity and Project
Finance tables, and Transport for London's Bus Performance Tables. The link between rankings and football is taken to its
logical—if absurd—extreme at the website of the Centre for Science and Technology Studies in Bern, Switzerland (English
site at http://adminsrv3.admin.ch/cest/en/), whose rankings take the name “Champions League,” after the prestigious
annual UEFA club competition.
www.educationalpolicy.org 5
Educational Policy Institute
University ranking systems come in two varieties: institutional ranking systems and
sub-institutional ranking systems. They can be conducted either on a national or
international scale. National ranking systems are ones in which all or nearly all of a
country's universities are measured against one another. This was the original university
ranking format—i.e., the type pioneered by the US News and World Report in 1981 and
which has been widely copied in other countries. In most cases, all universities within a
country are compared, although in some cases—notably in Canada (Maclean’s Magazine)
and the United States (US News and World Report)—the country’s universities are
divided up according to certain institutional characteristics and only compared to other
institutions with similar characteristics, in effect creating a group of mini-league tables.
At present, national-level rankings exist in Australia (the Melbourne Institute), Canada
(Maclean’s), China (Wuhan, Guangdong, Education18), Germany (CHE/DAAD rankings),
Hong Kong (Education18), Italy (La Repubblica), Poland (Rzeczpospolita), Spain (Excelencia),
the United Kingdom (the Times, the Guardian, the Financial Times and the Telegraph,
although the latter two have not been published since 2003 and there do not appear to be
plans to re-commence publication of either) and the United States (US News and World
Report and the Washington Monthly). All of these ranking schemes are included in this
report.
Global institutional ranking systems are a new variation on the older idea of national
rankings. There are at present only two of these: the Academic Ranking of World
Universities from Shanghai's Jiao Tong University, first released in 2003, and the World
University Rankings from the Times Higher Education Supplement of Britain (henceforth
THES), first released in November 2004. The first international ranking—albeit not a
global one—was actually done by Asiaweek in 1997, which ranked the continent’s major
universities. However, this was discontinued when Asiaweek ceased publication in 2000.
Again, all three of these ranking schemes are covered in this report.
Beyond institutional rankings, there are also sub-institutional rankings, which compare
specific university units against similar ones at other institutions. These rankings are
usually national in scope and deal with professional schools such as business, law and
medicine. Graduate business schools are also the subject of a number of international
rankings from such organizations as the Economist, the Financial Times, the Wall Street
Journal and Business Week. These types of ranking schemes are not covered in this report,
on the grounds that there are simply too many of them to analyze in detail. However,
www.educationalpolicy.org 6
Educational Policy Institute
we will be examining one variation on the subject-specific ranking system (the
CHE/DAAD rankings) at the conclusion of this document, as it seems to point in a very
interesting direction.
There are also ranking schemes which focus on specific aspects of university activities.
For instance, the Best American Research Universities ranks US institutions specifically on
their research output, as, in a cruder manner, does the Centre for Science and
Technology Studies in Bern, Switzerland, with its international “Champions League”
tables. Similarly, Yahoo Magazine has ranked universities on their “connectivity,” and the
Journal of Black Higher Education has graded them on their ability to integrate students
from different backgrounds in its ethnic diversity rankings. Again, these types of
ranking systems are excluded because their purposes are much more specific and
limited than the general ranking systems which we wish to focus on.
www.educationalpolicy.org 7
Educational Policy Institute
III. How Rankings and League Tables Work
League tables, by their very nature, are meant to boil down the work of entire
institutions into single, comparable, numerical indicators. To some, it is precisely this
which makes league tables illegitimate: the process of turning the work of hundreds or
thousands of people in diverse intellectual enterprises into a single number is often seen
as inherently impossible, demeaning or simply wrong. Nevertheless, in order to
understand league tables and what they do, it is important to understand the way in
which this single number is arrived at. In most (but not quite all) ranking systems, it is a
three-part process: first, data is collected on indicators; second, the data for each
indicator is scored; and, third, the scores from each indicator are weighted and
aggregated.
All rankings systems operate by comparing institutions on a range of indicators. The
number of indicators in a ranking system can vary significantly, from five in the simplest
case (the THES World Rankings) to several dozen in the case of the most complicated (La
Repubblica or Wuhan). Specific areas of institutional activity or types of institutional
output can therefore be compared across institutions, in much the same manner as is
done with performance indicators.
With only a few exceptions (notably, Spain’s Excelencia rankings), league table systems
then take the data on each indicator and turn it into a “score.” Usually, this is done by
giving the institution with the highest score on a particular indicator a perfect mark of
100 and then awarding lower scores to other institutions based on how close they were
to the score of the top institution. For example, if three institutions were being compared
on the basis of graduation rates, and one institution had a rate of 80%, a second had a
rate of 70% and a third a rate of 60%, the first institution’s score would be 100, while the
second’s would be 87.5 (70/80 = .875) and that of the third institution 75 (60/80 = .75).
Once scores have been derived for each indicator, they are weighted. Nearly all league
tables weight their data in a particular manner, giving greater weight to indicators
which are believed to be of greater importance. For example, the rate at which faculty
obtains research grants might be weighted at 5%—an institution with a score of 100 on
this indicator would therefore receive five points towards a total score, while an
institution with a score of 80 would only receive four points. The weighted scores from
all indicators are then tallied to give a unified final score for each institution.
www.educationalpolicy.org 8
Educational Policy Institute
Clearly, the choice of indicators and the weight given to each indicator make an
enormous amount of difference to the final output. Indeed, it is no exaggeration to say
that when publishers advertise their product as a guide to “the best” institutions, it is the
publishers themselves who largely decide the best simply through their choice of
indicators and weightings. In effect, the act of choosing a set of indicators and
weightings imposes a definition of “quality.”
As many previous studies have shown, however, quality in higher education is a highly
contested notion. The question of “which university is the best” may legitimately be
answered in very different ways according to who is asking the question and what this
person is seeking from a university experience. But since most rankings are done for
print-based mass-market publications, there can only be a single “answer” to this
question—that is, the one provided by the specific choice of indicators and weightings
chosen by the publisher. As Eccles (2002) points out, this ‘one-size-fits-all’ approach
usually fails to cater to the interests of non-traditional student populations that may
have different interests in finding an appropriate university, such as international
students, mature applicants, unusual applicants with alternative classifications, part-
time students and non-degree candidates.
Some might see this as indicative of a certain capriciousness in the use of indicators. Yet
this is not necessarily the case: there might be very legitimate reasons for using different
indicators of quality. For instance, if there was a large public or policy consensus in
favour of viewing universities as creators of knowledge, then indicators that measure
such things as publications, citations or patents awarded would be appropriate. If, on
the other hand, it was held that universities are largely about teaching undergraduates,
then indicators which look at graduation rates and the views of undergraduates on the
teaching and the learning environment would take on greater significance. The question,
really, is whether the differences between ranking systems are in fact reflections of
legitimately different points of view or merely of the editors’ preferences. This issue, first
raised by Dill and Soo (2002) in their examination of Canadian, American, Australian
and British ranking systems, will be re-visited in this paper, using a much larger sample
of instruments.
www.educationalpolicy.org 9
Educational Policy Institute
IV. The Evidentiary Basis of League Tables — How Data Is
Collected
A key issue in the preparation of league tables and rankings is the method by which
data is collected. There are basically three sources of data on institutions:
* Survey data. Surveys of the opinions or experiences of various stakeholders can be used
to obtain comparable data on different institutions regarding educational quality.
* Independent third parties. Frequently, government agencies will collect and publish data
on institutions in their jurisdiction, and this can be used as an objective standard by
which to compare institutions. This data is very often financial in nature and is based on
administrative data from grant-making bodies.
* University sources. The most complete and most detailed sources of data on universities
are of course universities themselves, and they are thus potentially a very rich source of
data.
The use of each source of data has pros and cons. Survey data is scientific in the sense
that it records observations accurately, but to the extent that it is used to survey
employers or opinion-makers on the value of degrees from various institutions, critics
might reasonably question the value of such observations, as very few employers or
opinion-makers are likely to have detailed views on or knowledge of every institution
under scrutiny. Surveys of students and recent graduates are similarly denigrated on the
grounds that while they may be able to enunciate their feelings about their own
institution, they have no basis on which to compare their institution with others.
Independent third-party administrative data (usually from governments or grant-
making bodies) is generally considered the “gold standard” of comparative data since it
is, at least theoretically, both accurate and impartial. The problem is that this data is not
(usually) collected for the purpose of compiling league tables but rather as an
administrative by-product of ordinary business. As a result, over-reliance on this source
of data can lead to a situation where indicators are chosen simply on the basis that data
is available rather than because they contribute to a sensible definition of quality—Marc
Chun (2003) has memorably compared this situation to that of a drunk who loses his
keys in the middle of the street but looks for them directly under the streetlight because
www.educationalpolicy.org 10
Educational Policy Institute
the light is better there.
Finally, there is data from universities themselves. In some cases, where important
indicators on quality cannot be obtained via surveys or third parties, the authors of
ranking schemes will address a questionnaire to institutions themselves and ask for
certain pieces of data. The benefit of this approach is that one can—in theory—answer a
number of questions about quality that cannot otherwise be answered. The main
drawback is that there is absolutely no guarantee that institutions will actually report the
data to the ranker on a consistent basis, as all have a clear incentive to manipulate data
in a manner which will benefit them. Indeed, at some institutions in the United States,
there are staff positions within institutional research offices which require the incumbent
to do nothing but provide institutional data to the US News and World Report in a
favourable light.
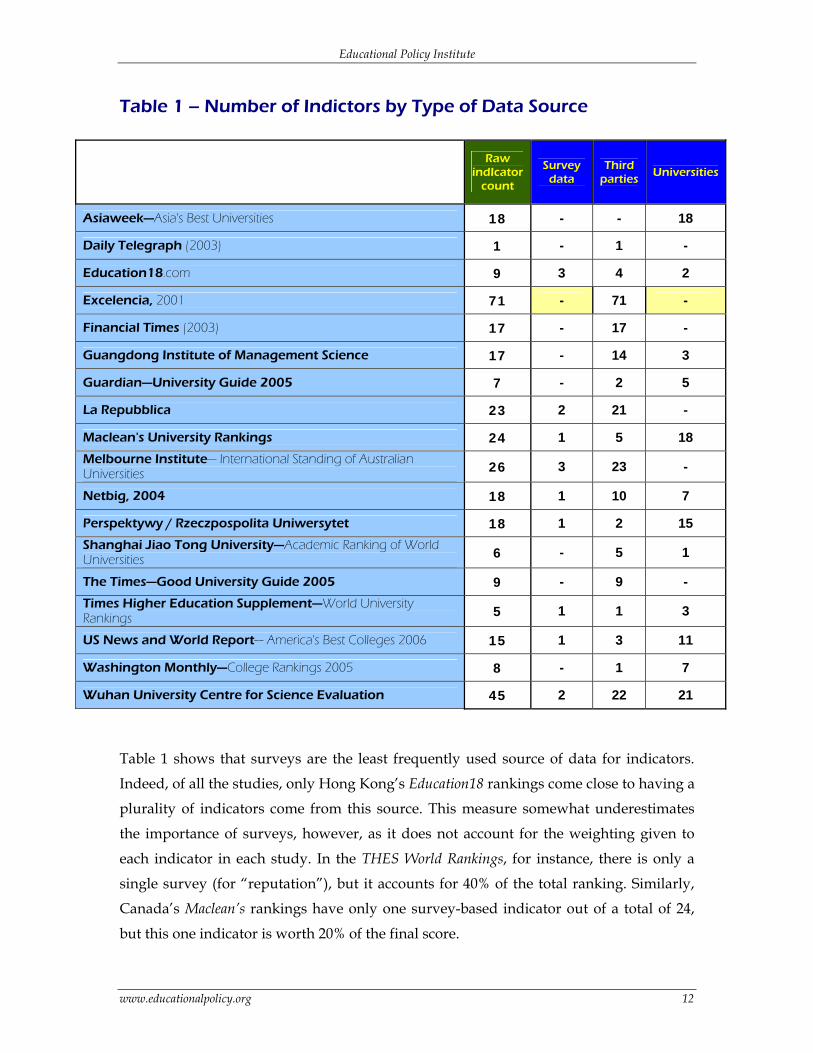
The extent to which each ranking system uses each source of data is shown below in
Table 1.2
2 For more information on how Table 1 was compiled, please see Appendix A.
www.educationalpolicy.org 11
Educational Policy Institute
Table 1 – Number of Indictors by Type of Data Source
Raw
indIcator count
Survey data
Third parties Universities
Asiaweek—Asia's Best Universities 18 - - 18
Daily Telegraph (2003) 1 - 1 -
Education18.com 9 3 4 2
Excelencia, 2001 71 - 71 -
Financial Times (2003) 17 - 17 -
Guangdong Institute of Management Science 17 - 14 3
Guardian—University Guide 2005 7 - 2 5
La Repubblica 23 2 21 -
Maclean's University Rankings 24 1 5 18 Melbourne Institute— International Standing of Australian Universities 26 3 23 -
Netbig, 2004 18 1 10 7
Perspektywy / Rzeczpospolita Uniwersytet 18 1 2 15 Shanghai Jiao Tong University—Academic Ranking of World Universities 6 - 5 1
The Times—Good University Guide 2005 9 - 9 - Times Higher Education Supplement—World University Rankings 5 1 1 3
US News and World Report— America's Best Colleges 2006 15 1 3 11
Washington Monthly—College Rankings 2005 8 - 1 7
Wuhan University Centre for Science Evaluation 45 2 22 21
Table 1 shows that surveys are the least frequently used source of data for indicators.
Indeed, of all the studies, only Hong Kong’s Education18 rankings come close to having a
plurality of indicators come from this source. This measure somewhat underestimates
the importance of surveys, however, as it does not account for the weighting given to
each indicator in each study. In the THES World Rankings, for instance, there is only a
single survey (for “reputation”), but it accounts for 40% of the total ranking. Similarly,
Canada’s Maclean’s rankings have only one survey-based indicator out of a total of 24,
but this one indicator is worth 20% of the final score.
www.educationalpolicy.org 12
Educational Policy Institute
Outside North America, third-party sources are by far the most heavily used sources of
data: indeed, four of the 18 ranking schemes in this study use them exclusively. Of the
remaining 14, third-party sources comprise a plurality of indicators in eight and
university sources form a plurality in six. The predominance of data from universities is
most understandable in the cases of the Asiaweek and THES rankings, as their
international scope significantly reduces the possibility of third-party sources providing
data on a consistent trans-national basis (Shanghai Jiao Tong, the third international study
in this comparison, solved this problem by relying almost exclusively on research output
measures such as scientific publications and citations). In the cases of the US News and
World Report, Washington Monthly, Maclean’s, the Guardian and Rzeczpospolita, the
explanation seems to be that the editors’ definitions of “quality” could not be measured
using government administrative data. This may indicate a failure of government data
collection in these countries, in the sense that information deemed important to quality
measurement is not collected on a consistent and centralized basis; alternatively, it may
indicate that the rankers’ views of what constitutes an indicator of quality is not shared
by governments or the higher education community.
www.educationalpolicy.org 13
Educational Policy Institute
V. What League Tables Measure—A Look at the Indicators
A Framework for Analysis
It should come as no surprise to learn that different ranking systems use very different
indicators in order to obtain a picture of “quality.” In some cases, these differences are
clearly due to differing national standards or practices in the way data is collected or
reported. In some cases, differences in indicators reflect genuine differences in the
definition of “quality;” Shanghai Jiao Tong, for instance, uses research-related indicators
far more than THES; the Washington Monthly has explicitly tried to generate indicators
on “social responsibility” which do not exist in the US News and World Report; and so on.
But the sheer number of individual indicators used in ranking systems worldwide runs
well into the hundreds, making any kind of comparison grid too large to be useful.
In order to look at indicators (and, in a subsequent section, weightings) in a manageable
way, we have tried to categorize them into larger headings, based in part on an existing
model of institutional quality. Finnie and Usher (2005), in their proposal for a system of
measuring quality in post-secondary education, developed a conceptual framework for
quality measurement based on the following four elements:
• Beginning characteristics, which represent the characteristics, attributes and abilities of incoming students as they start their programs.
• Learning inputs, which come in two main types:
o i) resources, both financial and material, available to students and
faculty for educational ends; and o ii) staff, not just in terms of the number of staff, but also the way in
which they are deployed to teach and the learning environment they create, as measured by the amount of contact time students have with their teachers, the kinds of exams they face, and so on (sometimes referred to as “pedagogies”).
• Learning outputs represent the “skill sets” or other attributes of graduates which
culminate from their educational experiences, such as critical thinking, analytic reasoning and technical knowledge. They also include records relating to retention and completion.
www.educationalpolicy.org 14
Educational Policy Institute
• Final outcomes represent the ultimate ends to which the educational system may
contribute, including not only such traditional measures as employment rates and incomes but also any other outcome deemed to be important to individuals and society, such as job satisfaction, an appreciation of the finer things in life and being a “good citizen.”
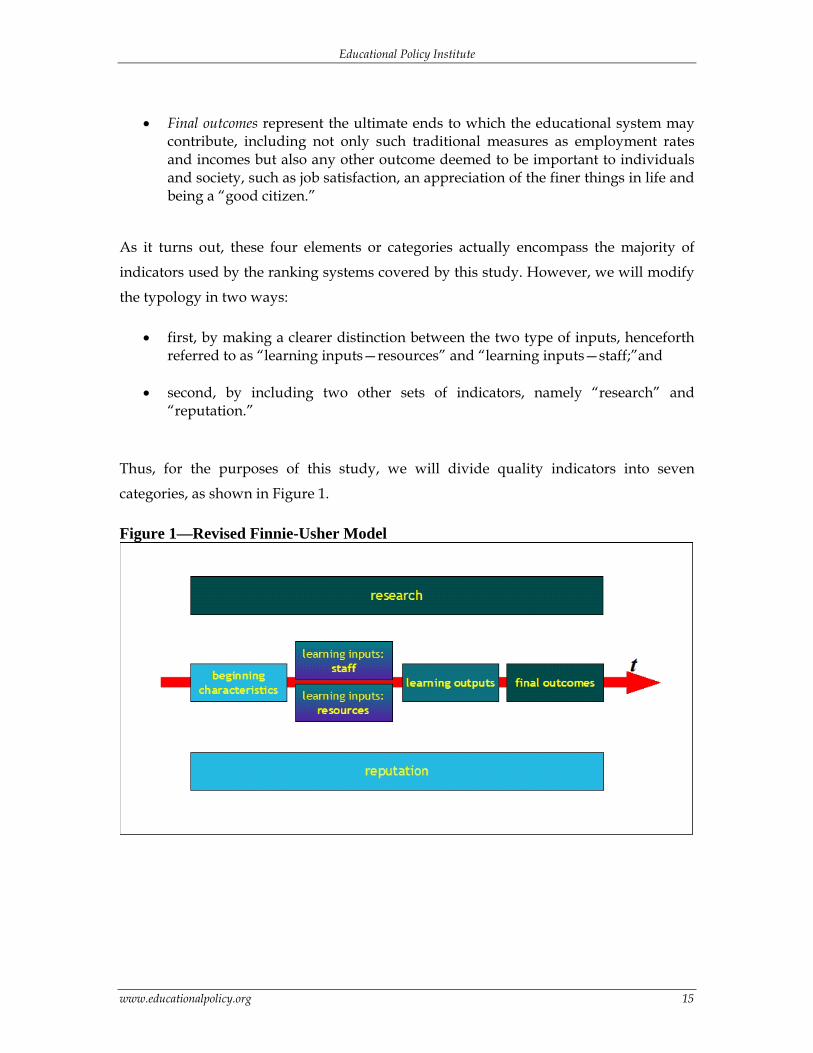
As it turns out, these four elements or categories actually encompass the majority of
indicators used by the ranking systems covered by this study. However, we will modify
the typology in two ways:
• first, by making a clearer distinction between the two type of inputs, henceforth referred to as “learning inputs—resources” and “learning inputs—staff;”and
• second, by including two other sets of indicators, namely “research” and
“reputation.”
Thus, for the purposes of this study, we will divide quality indicators into seven
categories, as shown in Figure 1.
Figure 1—Revised Finnie-Usher Model
www.educationalpolicy.org 15
Educational Policy Institute
A. Indicators of Beginning Characteristics
“Beginning characteristics” refer to any part of the set of characteristics or abilities of
students at the time they begin their studies. Fourteen of the 18 rankings
examined in this study use one or more indicators of the beginning
characteristics of students to arrive at their definition of “quality.” Of these, the
Washington Monthly puts the most emphasis on these factors, with 33% of the
total ranking coming from this class of indicators, but the Guardian, Education18,
Asiaweek and the two other North American surveys also place considerable
emphasis on this category.
There are six main indicators used to determine which institutions have students with
positive “beginning characteristics.”
The most common measure of beginning characteristics is performance on national
standardized tests, with nine surveys using this as a measure. Education18 and the
Guardian put the biggest emphasis on this measure (a weighting of 20%), but it is also
used by the Melbourne Institute (11%), Asiaweek (8.33%), the US News and World Report
(7.5%), Netbig (5.95%), the Financial Times (5%), the Times (3.3%) and Wuhan (0.33%).
Because this data is collected and standardized by national bodies, it has the benefit of
being seen as a relatively impartial method of determining the relative “strength” of the
students entering each institution. Institutions’ results can be scored by showing either
averages or the percentage of entering students meeting a particular standard.
Canada is an exception to this rule, as its main league table producer—Maclean’s—uses
secondary school grades as a means of measuring the “strength” of the student body.
This is a second-best solution made necessary by the absence of any national
standardized test in Canada (or, indeed, of any provincial standardized tests at the end
of secondary school in provinces other than Alberta). The lack of national
standardization makes this an undoubtedly inferior indicator, as there is no guarantee
that an “A” in one jurisdiction is truly equivalent to an “A” in another jurisdiction.
Another measure of the strength of the student body is the percentage of incoming
students receiving (third-party) scholarships, which is worth 11% of the score in the
Wuhan survey. One can also approach the issue by measuring institutional selectivity.
In effect, this method infers the strength of the student body by the proportion of
www.educationalpolicy.org 16
Educational Policy Institute
applicants rejected, the theory being that the higher the number of rejected applicants,
the stronger the remaining students are—an approach forcefully critiqued by Peck
(2003). Normally, this measure is expressed as a straight ratio of acceptances to
applications, but it can also be expressed (as it is in Asiaweek, which, at 8.5% of the total,
puts by far the greatest weight on this measure) as a ratio of enrolments to applications.
Within the US, there is some dispute as to what constitutes an offer of admission and
whether or not late admissions are included, as noted by Ganeshananthan (2003).
Student bodies are often considered to be strong if the school is able to attract a large
number of international or out-of-district students or if they contain people from
diverse ethnic backgrounds. A number of league tables use the international student
indicator (which, like the selectivity indicator, is arguably as much an indicator of
prestige and reputation as it is of student characteristics), although in no case does this
indicator account for more than 5% of the total ranking. Only the Guardian uses ethnic
diversity as a quality indicator, although others—notably the US News and World
Report—display data on this indicator without scoring it for inclusion in the final
ranking. At 8%, the Guardian puts a somewhat larger emphasis on this indicator in
comparison to other league tables which use similar variables.
A very different take on this idea is present in the Washington Monthly, which released its
first set of College Rankings in September 2005. With the declared aim of using an
institution’s commitment to social mobility as a measure of quality, it uses the
percentage of students from low-income backgrounds as an indicator (with percentage of students receiving need-based government (Pell) grants used as a proxy).
Some measures of “beginning characteristics” relate to the nature of students’ “study status.” Two of the Chinese rankings (Netbig and Wuhan) use an indicator based on the
percentage of the student population who are graduate students (arguably, this is a
research ranking, rather than a student one). In Poland’s Rzeczpospolita league table, the
number of graduate students auditing classes is used as an indicator; the assumption is
presumably that if people are auditing then the classes must be very attractive. The
Italian La Repubblica ranks an institution according to the number of part-time students it
has; contrary to prevailing North American views on the undesirability of part-time
study, the Italian rankings see higher numbers of part-time students in a positive light,
as it is evidence that an institution is becoming less rigid in its timetabling and
www.educationalpolicy.org 17
Educational Policy Institute
permitting students to juggle both work and study, something which was nearly
impossible in that country just a few years ago.
The Washington Monthly also has a final category of indicators which reflect students’
beginning characteristics, namely their likelihood of performing community service, as
measured by the percentage of students in the U.S. Peace Corps and Reserve Officer
Training Corps (ROTC) and the percentage of students involved in work-study in the
community.3 Together, these three indicators account for 33% of an institution’s total
ranking.
B. Indicators of Learning Inputs—Staff
Generally, both the quantity and quality of staff are positively correlated with
institutional quality. The problem, of course, is finding useful metrics for each of these
factors, especially if one excludes, as we have done here, measures of research
performance and research intensity, putting them in a separate category.4
The simplest measure is simply the number of faculty, unadjusted for things like size of
student body. Most national league tables, however, prefer to use variations on the
concept of faculty/student ratio. Others try to measure teaching intensity with measures
such as courses per teacher or hours spent in class per student (both in La Repubblica).
These kinds of measures usually account for between 2-5% of the final rankings,
although in some cases (i.e., the Guardian), this figure can be as high as 20%.
Another important way of measuring how faculty resources are deployed is the measure
of average class size, which is used only by Maclean’s and the US News and World Report.
Ostensibly, the reason for measuring class size is to account in some form for the degree
3 Judging by the text that accompanies its rankings, the authors of the Washington Monthly rankings would probably
disagree with the classification of these measures as “beginning characteristics” since they clearly intend them to be a measure of the institution’s commitment to community service, rather the students. Our judgement, however, is that in the end the decision to join the Peace Corps or the ROTC rests with the individual student, and the institution, so far as we can tell, does not play a significant role in the enrolment process. Similarly, although institutions are responsible for allocating work-study money, it is, generally speaking, up to the student who qualifies for work-study to find or create a job on his or her own, whether in the community or on campus. On balance, we feel that these indicators can more accurately be said to reflect the inclinations and decisions of the students rather than those of institutions, and hence belong in the “beginning characteristic” category rather than the “learning inputs—resources” category.
4 Indeed, the dividing line between “Learning Inputs—Staff” and “Research” is a difficult one to enforce, especially with respect to indicators which attempt to look at the quality of staff by measuring research. Our litmus test is as follows: if the indicator refers to a professor’s accomplishments as a researcher (e.g., membership in an academy, some kind of third-party research award), we have included it in the research category rather than the staff category.
www.educationalpolicy.org 18
Educational Policy Institute
of attention devoted to actually teaching students. Despite the fact that important
research (Gilbert 1995) has cast doubt on class size as a proxy for quality at the
institutional level, the use of this indicator appears to be a spillover from the North
American debates on class sizes at the primary and secondary levels (see Krueger,
Hanushek and Rothstein 2000). Regardless of why the indicators are used, they are
extraordinarily important to these two rankings systems, making up 14% and 8% of the
Maclean’s and US News and World Report’s rankings, respectively.
A number of ranking systems try to look at staff qualifications such as the number of
PhDs or tenure-track staff employed (Asiaweek, Netbig, Education18, Maclean’s, the
Washington Monthly5 and the US News and World Report). Maclean’s goes one step further
than other surveys and actually looks at the proportion of classes taught by tenure-track staff. Others (i.e., THES) look at the number of foreign faculty, based on the assumption
that institutions with higher numbers of foreign staff must be “attracting quality.” Still
others (i.e., La Repubblica) look at the age structure of the faculty. Another proxy for
institutional quality is the pay rates for tenured staff, on the assumption that institutions
with higher rates of pay, on average, attract better faculty; this measure has been used
both by the US News and World Report and Asiaweek.
Finally, a number of league tables rank faculty inputs on the basis of standardized third-
party evaluations.6 Education18, the Financial Times, the Times, the Guardian and the US
News and World Report league tables all use some sort of ranking criterion based at least
in part on this indicator or variations thereof.
C. Indicators of Learning Inputs—Resources
Resource inputs—crudely, the amount of current dollars, equipment and books
available to students at an institution—are widely considered an important measure of
quality. Yet despite the apparent simplicity of counting dollars and measuring assets,
5 Only hard sciences and engineering PhDs are considered. No participation from any other subject area counts. 6 Until 1997, the Quality Assessment Agency provided regular Teaching Quality Assessments of each department of each
university. Since that date, the TQA has not been updated in a consistent way (participation was in effect made voluntary in 1997.) Since a number of UK league-table producers relied on this data, the end of the TQA led to a reduction in the number of media organizations releasing league tables, from four papers only a few years ago down to the current two (the Guardian and the Times). Neither the Daily Telegraph nor the Financial Times have issued university league tables at all in the last two years, and there is no indication that either will be updated in the future.
www.educationalpolicy.org 19
Educational Policy Institute
the means by which institutional wealth is measured varies considerably between
ranking systems.
There are a number of revenue-based measures of resources. Maclean’s uses public funding of institutional budgets as a factor in its analysis; conversely, the Financial Times
uses the private funding of institutional budgets as an indicator of quality. Both
Maclean’s (3% of total score) and the US News and World Report (5% of total score) also
measure alumni financial support as a measure of quality.
For reasons that are not entirely clear, league tables tend to favour measures of
expenditures rather than revenues. The Guardian looks at total institutional expenditures as an indicator. Institutional expenditure on student services is used as a
measure of institutional quality by both the Times and Maclean’s (counting for 3.3% and
4.3% of total institutional scores, respectively). Rzezspospolita does not measure student
services expenditures directly, but does measure student services outputs, such as
number of student athletes and number of study clubs, which amounts to more or less
the same thing. Maclean’s also gives out 4.33% of its total score based on institutional expenditures on scholarships and bursaries.
Various aspects of physical infrastructure are also used as measures of institutional
resources, most directly in the case of La Repubblica, which bases 3.17% of its total rank
on the number of lecture spaces at an institution. Rather cryptic measures of “building assets” are also used by two Chinese ranking systems (Netbig and Wuhan). Another type
of physical infrastructure measured is available Internet bandwidth, which was used by
Asiaweek in its now-defunct rankings. Generally speaking, all of these measures are
worth roughly 3% of the total score.
By some distance, the infrastructure indicators most favoured by the compilers of league
tables are library resources. The Maclean’s rankings put perhaps the most emphasis on
this, with 12% of the total quality mark being taken from various types of library
infrastructure measurements (including acquisitions per year, total volumes, average number of volumes per student and yearly library expenditure outside of acquisitions).
Netbig and Education18 also use library volume holdings, while Asiaweek, the Financial
Times and the Times also use measures of library expenditures outside of acquisitions or
computerization of library resources as measures of institutional quality.
www.educationalpolicy.org 20
Educational Policy Institute
One important factor to note is that most ranking systems do not normalize their
resource and infrastructure measures. That is to say, it is raw spending power or simple
size of assets that is usually measured, rather than spending per student/professor or
assets per student/professor. As a result, a number of these rankings systems have in-
built biases towards larger institutions.
D. Indicators of Learning Outputs
Learning outputs—that is, measurements of educational attainment or of
skills/knowledge learned over the course of a baccalaureate degree—should be a basic
indicator of institutional quality. Unfortunately, good means of measuring these
outputs—like the National Survey of Student Engagement (NSSE) and the College Learning
Assessment (CLA)—have only recently become available and, for the most part,
institutions are still keeping their scores secret. Outside of these measures, only a few
very crude indicators are available, which likely explains why learning outputs do not
feature especially prominently in most ranking schemes.
The simplest types of measures of learning outputs are those linked to graduation and
retention rates. The US News and World Report, La Repubblica, Maclean’s, Wuhan,
Guangdong and the Melbourne Institute all use undergraduate graduation rates as proxies
for quality7; the latter three also use rates of graduation from Master’s programs as
indicators. In some cases, the weights on these measures can be very high—in the
Guangdong rankings, graduation rates account for over 50% of the ranking—but in most
cases the weights are 10% or less. Retention rates, commonly meaning the progression
rate of first-year students into second year, are accorded less importance. The US News
and World Report, Maclean’s, the Melbourne Institute and La Repubblica all employ retention
measures as indicators, but none of them are worth more than 4% of total weighting.
Two publications make specific indicators for retention and graduation of international
students: Maclean’s (graduation rates of international students) and the Melbourne
Institute (retention rates of international students). The Washington Monthly looks
specifically at institutional retention rates adjusted for the participation of lower-income
students, and gives higher scores to institutions whose rates significantly exceed their
“predicted” values based on SAT scores and number of Pell Grant recipients; the US 7 Usually, the time-to-graduation is time-delimited, so only those students who graduate in under, for example, six years
are counted on these measures. The Washington Monthly’s measure is designed to serve a slightly different purpose and based on another metric for academic performance using changing graduation rates over time. Please see the section on Beginning Characteristics on p. 18.
www.educationalpolicy.org 21
Educational Policy Institute
News and World Report’s graduation rate performance indicator and the Guardian’s
“value-added” indicator also score institutions on a real vs. predicted basis).
E. Indicators of Final Outcomes
Final outcomes are indications of generalized outcomes for students after graduation.
Finnie and Usher (2005) state that these outcomes are in theory unlimited (e.g.,
happiness, good citizenship), but given the somewhat utilitarian justifications for
education that are currently in fashion (see Wolf 2000), employment outcomes are the
most commonly used measure of final outcomes. These are given particular emphasis by
the Guardian (where employment outcomes are worth 17% of the total score), but are
also used by the Financial Times (6%), the Times (3.3%) and Wuhan (0.6%). The Guardian,
the Financial Times and the Times are, interestingly, not concerned with employment per
se but with “employment in an area relevant to one’s course of studies.” The Guardian,
using data from the Higher Education Statistics Agency (HESA), uses Standard
Occupational Classifications to measure the proportion of graduates in professional or
white-collar jobs; anyone not in such a job is considered not to be working in an area
related to their studies (it is unclear what methodology is used by the Financial Times
and the Times, although we suspect their methods are broadly similar).
The only other measure of final outcomes in use is percentage of graduates returning for
additional education, which is an indicator used by both the Melbourne Institute and the
Financial Times. This is a particularly important indicator for the latter, as it is worth 21%
of the final ranking.
The lack of indicators concerning final outcomes is interesting, since most government-
sponsored performance-indicator regimes around the world are very much concerned
with such measures, especially with respect to employment. Possibly, this indicates that
ranking systems simply do not view education outcomes as relevant measures of
educational quality. Alternatively, it may be the case that they simply have not found a
reliable indicator of outcomes, or that there are reliable indicators but that there is so
little variation between institutions that it makes no sense to rank based on the data.
www.educationalpolicy.org 22
Educational Policy Institute
F. Indicators of Research
Many of the league tables covered in this survey include sections and weightings related
to universities’ research efforts. It is in this field of measurement that we see the greatest
diversity of indicators. Presumably, this is because research inputs and outputs lend
themselves much more easily to measurement and manipulation than other areas of
institutional activity.
Three studies include research staff as part of their ranking scheme: La Repubblica at
9.52%, the Melbourne Institute (4%) and Wuhan (0.78%).
Bibliometrics—that is, the counting of publications and citations—is one commonly
used method of looking at research quality, but it is not universally admired because
different disciplines use different means to communicate major advances in knowledge
(leading scientists invariably produce large numbers of journal articles; leading social
scientists may produce fewer journal articles but instead have one or two long,
important monographs—see Hicks 2004). There is also some concern among non-
English speaking countries that they are penalized in international rankings because so
many of the major journals (notably Science and Nature) are printed in English. However,
the one set of rankings that uses separate indicators to monitor articles published in
English and articles published in another language (the Wuhan rankings) shows that the
two indicators are positively correlated: institutions that have more Chinese publications
are also likely to have more English publications, and vice versa.
Several sets of league tables measure bibliometric citations in various publication
indices. The Shanghai Jiao Tong and the THES rankings both emphasize this category by
giving it a weight of 20% of the final total. Guangdong also monitors other Chinese
universities specifically for citations in engineering publications and weights this at
2.9%. Moreover, it tacks on an additional 10.49% for citations in science-oriented indices
such as the Science Citation Index. The Shanghai Jiao Tong rankings are close behind
Guangdong at 10% for the same category of scientific citations, while the Melbourne
Institute rates science citations at 6.8% and Wuhan at 1.28%. Citations in social science-oriented indices (i.e., the Social Science Citation Index, which does not include the
humanities) are noted in only two league tables: those of Shanghai Jiao Tong (10% of the
final weighting) and the Melbourne Institute (3.2%). Another way of measuring research
www.educationalpolicy.org 23
Educational Policy Institute
impact is to focus specifically on citations in “highly cited” publications.8 These are
given a weighting of 20% by the Shanghai Jiao Tong rankings, 5.4% by Wuhan and 2% by
the Melbourne Institute.
The complement of citations is of course publications. Listing the number of
publications an individual, group, department or whole university releases can act as a
weak substitute for citations—weak because simply publishing a paper or monograph is
no guarantee that the general public or other researchers will even glance at the work.
Guangdong gives an 11.79% weighting to publications in science-oriented indices such as
the Science Citation Index from Thomson-ISI. Similarly, 13.6% of Netbig’s ranking is
based on the same indicator, while the Melbourne Institute weights this at 4% and Wuhan
at 1.46%. Guangdong even has a separate category just for measuring publications in
Science and Nature, although it accords it an almost derisory weighting of .06%. Under
publications in social science-oriented indices, Netbig adds another 8.4% and the
Melbourne Institute 2% to their final totals. For publications in other indices (where the
subject indices are undifferentiated), the weighting is 6.6% for Asiaweek, 5% for
Education18, 4.5% for Guangdong and 1.45% for Wuhan. As for other publications,
Asiaweek was the only set of rankings to include research monographs, weighted at
0.33%.
In countries where there are specific third-party evaluations of research output,
academic quality of research is sometimes used as a research indicator. The Times puts a
very large 30% weight on this indicator, while the Financial Times puts it at 11%.9
Research awards are another handy third-party measurement of quality, as the number
of international and national awards won by faculty and/or graduates is often
considered a useful measure of institutional success. International research awards—
specifically, the number of alumni who have won Nobel Prizes or Fields Medals—are
used as an indicator by Shanghai Jiao Tong and, at 30%, given enormous weight. This
indicator is seen as particularly suspect in some quarters, given that the points are based
on where the recipient went to school rather than on where they are or were on the
8 The definition of “highly cited” has been standardized for the purposes of comparison by Thomson-ISI, suppliers of the
most prominent publication indices.
9 The two English guides use the 2001 Research Assessment Exercise (RAE) results from Britain’s funding councils, which rank each university using a graduated scale from 1 (bottom) to 5 (top). Melbourne’s International Standing paper judges academic research quality through the use of the Essential Science Index for both the hard and soft sciences.
www.educationalpolicy.org 24
Educational Policy Institute
faculty and that some of the Nobellists propping up institutions’ rankings have been
dead for nearly a century. Wuhan uses similar measures, but only accords them a weight
of 1.4%. National research awards are more common as a quality indicator, used by La
Repubblica (9.52%), the Melbourne Institute (8%), Wuhan (7.13%), Netbig (4%) and
Guangdong (1.56%).
Financial indicators of research are also very common. Research budgets as a factor in
the overall assessment of research in universities are covered by the Financial Times (9%),
Netbig (6%) and the Melbourne Institute (3.33%). Wuhan lists a figure of 1.78% allocated
for total amount of research expenditure; unfortunately, it is unclear precisely what this
research expenditure represents or how it is determined, although it is clearly indicated
that it does not represent the total number of grants or projects at a university. Total number of research-based grants and projects is weighted by Education18 at 15% and
Wuhan at 9.31%. Maclean’s devotes 5.5% of its weight to public-source grants for science
and engineering and another 5.5% to those for social sciences and humanities. Similarly,
the Melbourne Institute gives 6% of its overall weight to public-source grants, making no
distinction between areas of study.
In a slightly different vein, Netbig (4.6%) and Wuhan (2.78%) both list the number of research-based chairs per institution. Also, Netbig (8.6%), Wuhan (5.48%) and La
Repubblica (0.95%) all weigh research-based/affiliated research institutions or centres for
studies.
Finally, one can also measure research not simply in terms of the amount of money it
generates but also in terms of the amount of future income it will generate. Both
Guangdong (2.45%) and Wuhan (1.93%) measure the number of patents issued to
universities as a quality indicator.
A final way of measuring an institution’s research intensity is to look at the range of its
course offerings. Asiaweek (3%), Netbig (6.8%) and Wuhan (1.95%) all use the number of doctoral and Master’s programs offered as a proxy for research intensity.
As with physical and financial resources, few if any of the research indicators are
normalized to account for institutional size (either by student or faculty numbers). In the
world of rankings, bigger almost always means better: an institution with 100 faculty
with ten citations apiece will always look worse than an institution with 1001 faculty
www.educationalpolicy.org 25
Educational Policy Institute
with one citation each. To the extent that the raw production of knowledge matters, this
form of measurement is acceptable. To the extent that rankings are meant to show how
well institutions are doing on a like-to-like basis or to show the efficiency of universities,
it is plainly inadequate. This should be of particular concern to Chinese policy-makers,
whose ranking systems are especially reliant on research-based indicators.
G. Indicators of Reputation
The final set of indicators for quality ranking schemes is “reputation and peer
appraisal.” Those rankings systems which use the results of reputation surveys as an
indicator do so as an indirect measure of quality, based on the assumption that the
employers, academics and academic administrators surveyed have opinions of
institutional quality that are informed, up-to-date and impartial. While these
assumptions are clearly open to debate, they nevertheless form an important basis for
many ranking systems. Another reason for using reputation measures is the paucity of
other data available—some countries have few independent measures of teaching
effectiveness, university resources or output, and reputation can thus act as a useful
surrogate. Reputation rankings are often criticized as simply quantifying the common
ignorance of the people being surveyed. However, to the extent that the people being
surveyed hold positions which have the potential to affect large numbers of young
people and whose positions actually require some knowledge of institutional quality
(i.e., officials in charge of graduate admissions, corporate recruiters, etc.), then
reputation rankings make sense because they provide useful information for students
about the perceived value of the degrees that they could obtain from various
universities.
The greatest emphasis on reputation is found in the rankings of Perspektywy in Poland
and the Times, which both accord reputation a weighting of 50% in their overall ranking
scheme. Education18 assigns it almost as much significance, at 40%. The US News and
World Report applies a weight of 25%, followed closely by Asiaweek at 20%. Clustering
tightly just below these league tables are the trio of the Melbourne Institute (17.1%),
Maclean’s (16%) and Netbig (15%). The only other study to include reputation is Wuhan
(11.7%).
www.educationalpolicy.org 26
Educational Policy Institute
How League Tables Construct Quality – Indicator Weightings
Examining Weighting Schemes
The previous section took a detailed look at the individual quality indicators used
around the world. It found a bewildering array of indicators, with no single indicator in
common use around the world. In part, this no doubt reflects differences in the
availability of data in different countries; it also, however, highlights serious differences
in the definition of quality between various ranking systems.
However, rankings are more than a collection of indicators. Crucially, they are an
aggregation of indicators; it is therefore important not to simply examine individual
indicators, but also to see how they are put together and how each ranking system
implicitly defines educational quality through the distribution of its weighting.
Although the apparent differences between ranking systems are substantial, it turns out
that there are some real and intriguing similarities among particular subsets of league
tables.
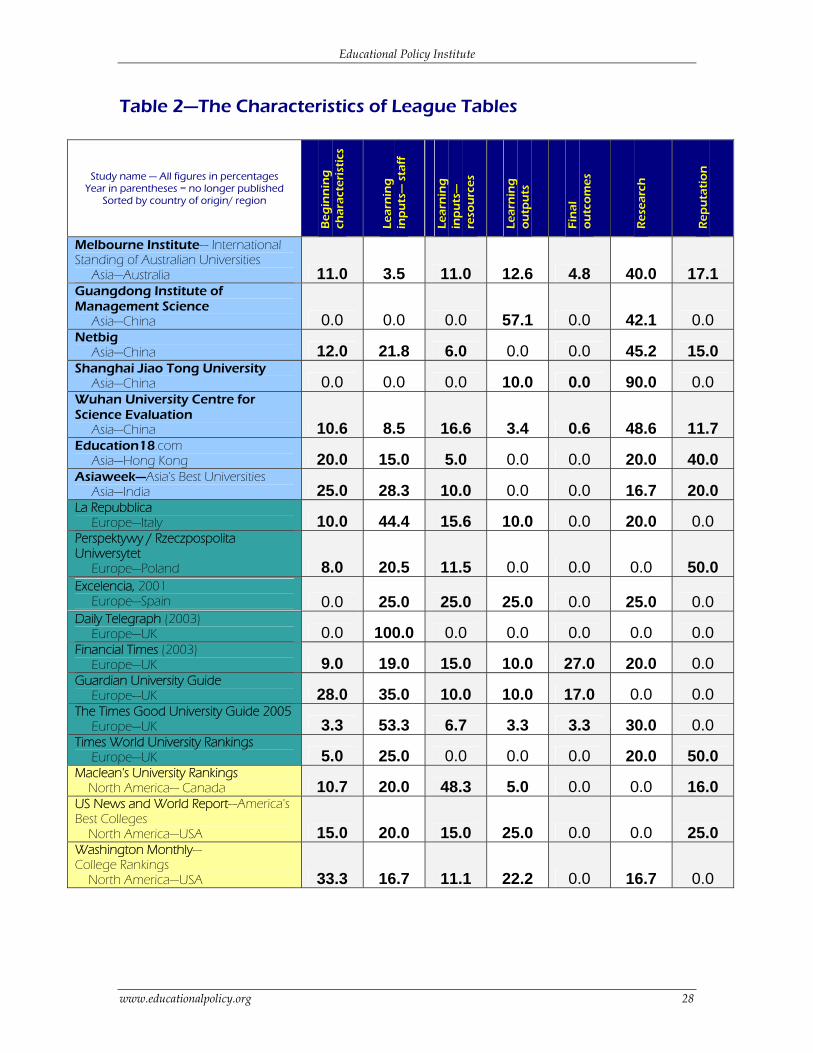
Table 2, below, shows the differences in the indicators and weightings used by different
league table systems. Each row summarizes the distribution of indicator weightings
among the seven categories of indicators described in the previous section and adds up
to 100%. It is obvious from even the most cursory glance at this table that no two ranking
systems are alike and indeed that some have virtually no areas of overlap with one
another.
www.educationalpolicy.org 27
Educational Policy Institute
Table 2—The Characteristics of League Tables
Study name — All figures in percentages Year in parentheses = no longer published
Sorted by country of origin/ region
Beg
inn
ing
ch
arac
teri
stic
s
Lear
nin
g
inp
uts
— s
taff
Lear
nin
g
inp
uts
—
reso
urc
es
Lear
nin
g
ou
tpu
ts
Fin
al
ou
tco
mes
Res
earc
h
Rep
uta
tio
n
Melbourne Institute— International Standing of Australian Universities Asia—Australia 11.0 3.5 11.0 12.6 4.8 40.0 17.1 Guangdong Institute of Management Science Asia—China 0.0 0.0 0.0 57.1 0.0 42.1 0.0 Netbig Asia—China 12.0 21.8 6.0 0.0 0.0 45.2 15.0 Shanghai Jiao Tong University Asia—China 0.0 0.0 0.0 10.0 0.0 90.0 0.0 Wuhan University Centre for Science Evaluation Asia—China 10.6 8.5 16.6 3.4 0.6 48.6 11.7 Education18.com Asia—Hong Kong 20.0 15.0 5.0 0.0 0.0 20.0 40.0 Asiaweek—Asia's Best Universities Asia—India 25.0 28.3 10.0 0.0 0.0 16.7 20.0 La Repubblica Europe—Italy 10.0 44.4 15.6 10.0 0.0 20.0 0.0 Perspektywy / Rzeczpospolita Uniwersytet Europe—Poland 8.0 20.5 11.5 0.0 0.0 0.0 50.0 Excelencia, 2001 Europe—Spain 0.0 25.0 25.0 25.0 0.0 25.0 0.0 Daily Telegraph (2003) Europe—UK 0.0 100.0 0.0 0.0 0.0 0.0 0.0 Financial Times (2003) Europe—UK 9.0 19.0 15.0 10.0 27.0 20.0 0.0 Guardian University Guide Europe—UK 28.0 35.0 10.0 10.0 17.0 0.0 0.0 The Times Good University Guide 2005 Europe—UK 3.3 53.3 6.7 3.3 3.3 30.0 0.0 Times World University Rankings Europe—UK 5.0 25.0 0.0 0.0 0.0 20.0 50.0 Maclean's University Rankings North America— Canada 10.7 20.0 48.3 5.0 0.0 0.0 16.0 US News and World Report—America's Best Colleges North America—USA 15.0 20.0 15.0 25.0 0.0 0.0 25.0 Washington Monthly— College Rankings North America—USA 33.3 16.7 11.1 22.2 0.0 16.7 0.0
www.educationalpolicy.org 28
Educational Policy Institute
Despite the vastly different choices of indicators and weightings evident throughout the
world, certain patterns do appear when the studies are grouped together geographically.
For instance, studies from China—which has four different ranking projects—place
much more weight on research indicators than any other studies in the world. In the
most extreme case—that of Shanghai Jiao Tong University’s Academic Ranking of World
Universities—research performance is worth 90% of the total ranking. This is followed by
Wuhan, where research measures are worth 48.2% of the final ranking, Netbig (45.2%),
and Guangdong (42.1%). As we have seen, much of this weighting comes from counting
papers and citations in bibliometric studies—studies which have a heavy bias towards
the hard sciences. With the exception of Guangdong, which has a major focus on learning
outputs (mostly graduation rates), Chinese systems also put significant emphasis on
institutional reputation. In contrast, comparatively little weight is put on either resource
inputs or on final outcomes. Whether this is because data on these issues is scarce or
because Chinese experts genuinely consider indicators of these types to be unimportant
is an open question.
Other regional patterns are also evident. Rankings of UK universities, for instance,
completely eschew the use of reputation surveys as a means of determining quality
(although THES places a 50% weighting on reputation issues). British league tables also
put a much higher emphasis than league tables elsewhere on measures of staff and staff
quality—on average, they put over 40% of their weighting in this area, as opposed to an
average of just 5% in the rest of the world’s league tables combined.
The two big North American surveys—Maclean’s rankings and America’s Best Colleges by
the US News and World Report—are virtually identical in the distribution of weighting,
except for the fact that the Canadian version puts more weight on resource inputs and
the American version puts more weight on learning output (intriguingly, the general
category weightings of Italy’s La Repubblica rankings are very similar in nature to thsoe
of Maclean’s and the US News and World Report, even though the specific indicators used
are completely different).
Table 2 graphically demonstrates the central premise of this paper: different ranking
systems have very different definitions of quality. The notion of “quality” in higher education
is clearly a very malleable one—some observers wish to look at outputs, while others
focus on inputs. Among both inputs and outputs, there is very little agreement as to
www.educationalpolicy.org 29
Educational Policy Institute
what kinds of inputs and outputs are important. Not only is no single indicator used
across all ranking schemes, no single category of indicators is common either:
remarkably, none of the seven basic categories of indicators are common to all university
ranking systems.
One of the only previous comparative examinations of league tables (Dill and Soo 2004)
concluded, on the basis of an examination of four sets of league tables in four countries,
that international definitions of quality were converging. Our findings, based on a larger
sample, contradict their result. We acknowledge that part of the reason for the
contradiction lies in the fact that we have divided indicators into seven categories
instead of four and hence were always likely to find more variation. Methodological
differences notwithstanding—and we believe our methodology to be the more refined of
the two—the results still conflict. We believe that had Dill and Soo looked at Asian or
international ranking schemes, they too would have seen these differences and revised
their conclusions.
www.educationalpolicy.org 30
Educational Policy Institute
VII. Consistency of Outcomes across League Tables
One might reasonably conclude from the foregoing analysis that measured institutional
quality is not immutable and that an institution’s ranking is largely a function of what
the ranking body chooses to measure. A possible example in support of this proposition
is Queen’s University in Kingston, Canada. In its domestic rankings (Maclean’s), it fares
very well because it attracts good students and is reasonably well-endowed and well-
funded. In international rankings, it fares poorly, even compared to other Canadian
universities, because its small size puts it at a disadvantage in terms of non-normalized
research output measures.
Due to the plethora of ranking systems that have appeared in recent years, one can now
test this proposition directly. In most countries, there are at least three separate rankings
“observations” made by different national and international ranking systems (those of
THES and Shanghai Jiao Tong, plus one or more domestic rankings). In Appendix C, we
show the concordance of ranking measures in five countries for which there are
observations of quality available from multiple ranking systems. Generally speaking,
what we find is that when there are only a few institutions present and they have
multiple observations, the observations are relatively consistent, but when there a large
number of multiple observations, the observations are less consistent. In part, this is a
statistical artefact—variation should increase this way because an increase in the number
of observations naturally increases the scope for variability. But this should not obscure
the point that these concordances also support the proposition that rankings have an
element of capriciousness to them: with a large enough sample, choosing a different set
of indicators does indeed create a different set of ordinal rankings, and the choice and
weighting of indicators is thus a matter of no small concern. The question from the point
of view of this paper is: Does the variation in indicator choice and weighting actually
reflect different national views on what constitutes “quality” in an institution? Or does it
simply reflect the whims and prejudices of the rankings’ authors?
With respect to this question, one should note that, while the observation that rankings
are a function of the specific set of indicators and weightings chosen by the their authors
is true, it is not the whole story. Certain institutions tend to do well regardless of the
www.educationalpolicy.org 31
Educational Policy Institute
indicators and weights used to measure them. As the series of tables in Appendix C
shows, where we can use multiple ranking schemes to look at the relative scores of
institutions in a single country, we find that certain institutions invariably rise to the top:
Oxford and Cambridge in the UK; Harvard, Yale, Princeton, MIT and Stanford in the
US; Peking and Tsinghua in China; and the University of Toronto in Canada. Even using
very different measures, these institutions monopolize the top spots, and it would take a
decidedly perverse set of rankings (and arguably this is a fair description of the
Washington Monthly rankings—the publishers argue that their rankings accurately assess
colleges’ ability to “serve the country” and promote democratic values, not their ability
to provide “post-secondary educational quality”) to move them. In other words,
regardless of the ranking scheme employed, “top universities” are almost always going
to come out as top universities. The variation between rankings occurs lower down the
scale; there, even small changes in methodology can change rankings significantly.
This poses a serious problem for interpretation. If institutional ordinal rankings were
inconsistent across all ranking schemes, it would be easy to dismiss the whole idea of
ranking as some kind of con game, an intellectually worthless exercise designed simply
to sell newspapers or magazines. If institutional ordinal rankings were absolutely
consistent across all ranking schemes, then we might conclude that there are probably
one or two “super” indicators which are driving the overall rankings, with the
remainder of the indicators essentially being amusing “chaff” with which to distract
readers and to create false differentiations. But neither of these scenarios is true—in fact,
what appears to happen is that different ranking schemes provide consistent results for
some institutions and inconsistent ones for others. If we were to describe this in
experimental terms, we might say that when exposing a group of “subjects” (i.e.,
institutions) to different “treatments” (i.e., ranking schemes), most subjects behave as
expected and display different “symptoms” (i.e., ordinal ranking position) when
exposed to different treatments; however, some subjects mysteriously show precisely the
same symptoms regardless of the treatment.
The simplest explanation for this is a surprising one: institutional ranking systems don’t
measure what their authors think they are measuring. Ranking systems’ authors believe
that each indicator is a reasonable proxy for quality and that, suitably aggregated and
weighted, these indicators constitute a plausible, holistic “definition” of quality. What
our results here show is that most indicators are probably epiphenomena of some
www.educationalpolicy.org 32
Educational Policy Institute
underlying quality feature that is not being measured. That is to say, there is actually
some “dark matter” or “X factor” exerting a gravitational pull on all ranking schemes
such that certain institutions or types of institutions (the Harvards, Oxfords and
Tsinghuas of the world) rise to the top regardless of the specific indicators and
weightings used. While an in-depth investigation into the search for an “X factor” is
beyond the scope of this paper, such a search certainly seems deserving of future
research. Our guess, however, is that “age of institution,” “faculty size” and “per-
student expenditure” are probably excellent candidates to be these “X factors.”
www.educationalpolicy.org 33
Educational Policy Institute
VIII. Rankings without League Tables: The CHE/DAAD
Approach
For most of this paper we have been describing league tables—that is, ranking systems
that provide a single integrated score that allows an ordinal ranking of entire
institutions. However, this is not the only possible approach to university rankings.
There is, for instance, no intrinsic reason why indicators must focus solely on
institutions; approaches which look at institutions at lower administrative levels (such as
departments or faculties) are also possible. Neither is there any intrinsic reason why
indicators need to be either weighted or aggregated—they may just as easily be
compared in isolation as together. Indeed, some would argue that this is a better way of
comparing institutions, and that the abandonment of weighting and aggregating would
be a very good step toward shearing ranking schemes of their “one-size-fits-all”
approach.
Apart from the dozens of subject ranking exercises (such as MBA rankings) around the
world, there are two ranking systems which provide comprehensive departmental-level
rankings across entire universities (that is to say, they provide separate rankings for each
discipline). These two are the Guardian (which also synthesizes the data upwards into
institutional rankings, which we have explored in the previous two sections) and the
CHE/DAAD rankings in Germany. The Guardian discipline rankings, which comprise
seven indicators, are also effectively “league tables,” as scores based on weighted
indicators for each discipline allow them to ordinally rank each institution by discipline.
Germany’s CHE/DAAD rankings, on the other hand, are not league tables, and for that
reason are worthy of a closer look.
The CHE/DAAD rankings are issued by the Centre for Higher Education Development,
located in Gütersloh, in the state of North Rhine-Westphalia (in the northeast of the
country), in conjunction with the DAAD (the German Academic Exchange Service,
which serves to assist international students in coming to Germany) and a media partner
(currently Die Zeit, formerly Stern). In terms of data sources, CHE conducts regular
surveys of approximately 130,000 students and 16,000 faculty, covering nearly 250
higher education institutes. The student surveys are very extensive and ask a number of
questions about both student experiences and student satisfaction. The faculty survey is
done in order to generate data for a special indicator known as the “insider’s pick” (the
www.educationalpolicy.org 34
Educational Policy Institute
survey asks professors to name the three institutions in their field of study that they
would recommend to someone as the best places to study). It also has a number of
indicators which use independent sources of data. Roughly two-thirds of the indicators
are survey based (higher than any of the league tables listed in this study), and the
remaining data points all come from third-party sources. The CHE/DAAD rankings do
not make use of university-sourced data.
The CHE/DAAD ranking of German university departments differs from traditional
league tables in two notable ways. First, as noted above, it does not weight or aggregate
individual indicator scores. Each department’s data on each indicator is allowed to stand
independently, and no attempt is made to rank departments on an ordinal scale. CHE
does this because it believes that it is at best meaningless (and at worst actively
misleading) to combine widely disparate indicators into a single overall hierarchy.
This stance presents certain difficulties in presenting data in a printed format. Instead of
a simple ordinal rank, all indicators must be shown for all institutions, which means that
they are somewhat unwieldy and difficult to read. On the other hand, this stance has an
enormous advantage when translated to the World Wide Web (available at
http://www.daad.de/deutschland/studium/hochschulranking/04690.en.html).
Because CHE does not weight the ratings, it is possible for users themselves to in effect
create their own weightings and rankings by selecting a restricted number of indicators
and asking the website’s database to provide comparative institutional information on
that basis.10 In so doing, the CHE/DAAD approach effectively cedes the power of
defining “quality”—which, as we have seen, is one of the key roles arrogated by the
authors of ranking schemes—to consumers of the ranking system (i.e., prospective
university students and their parents or sponsors).
CHE/DAAD’s second unique point is that, even within each indicator, no attempt is
made to assign ordinal ranks. Each institution’s department in a given discipline is
simply classified as being in the “top third,” “middle third” and “bottom third” of all
institutions with respect to that specific indicator. Schools within each of these three
categories are considered qualitatively equal, apparently on the grounds that for many 10 To quote from the DAAD website: “If you are quite certain of what you want and know the criteria that are particularly
important to you, such as library facilities or computer equipment, then try out ‘My Ranking.’ This allows you to select up to five personal criteria from more than 25 choices, to set the order in which these criteria apply, and to weight the criteria to help you find the most suitable university.”
www.educationalpolicy.org 35
Educational Policy Institute
indicators, ordinal rankings are relatively spurious since the actual amount by which
institutions differ from one another on most measures is quite small. While there is
certainly some merit in this observation, this approach does imply concealing data from
the user, in the sense that the CHE knows the specific values associated with each
institution on each indicator but chooses not to reveal it.
www.educationalpolicy.org 36
Educational Policy Institute
IX. Conclusions
Based on this survey of league tables, we can conclude a number of things, notably:
1) There are vast differences between university league tables in terms of what
they measure, how they measure it and how they implicitly define “quality.”
2) Some of these differences appear to be geographic or cultural in nature. There
is notable clustering of certain types of indicators and certain types of data
sources. Whether this reflects genuine differences in opinion about the
definition of what constitutes “quality” in universities or cross-national
differences in the collection and availability of data is unclear, although we
lean towards the former explanation. The lack of common indicators across
countries explains why the large international league tables (Shanghai Jiao
Tong and THES) are so reliant on measures of publication outputs and on
reputational surveys (respectively), as they are the only indicators that do not
rely on governments or institutions to first collect and process the data.
3) Very few league tables do a good job of normalizing their figures for
institutional size or of using a “value-added” approach to measuring
institutions. As a result, they tend to be biased towards larger institutions
and those institutions that have good “inputs” (i.e., more money and more
talented students).
4) Despite major inconsistencies in the methodologies used to rank universities,
there is a surprising level of agreement between ranking systems as to which
universities in a given country are “the best.” To the extent that different
methodologies give differing opinions about the quality of an institution, the
variance between observations grows as one moves down the ordinal
rankings.
5) Although the definition of “quality” is contested, league tables by definition
impose a “one-size-fits-all” approach to the matter; this is precisely why they
are so controversial. As the CHE/DAAD approach shows, however, league
tables are not the only way to approach rankings. Indeed, the spread of the
World Wide Web provides collectors of institutional data with an
opportunity to democratize rankings and put the power of ranking in the
www.educationalpolicy.org 37
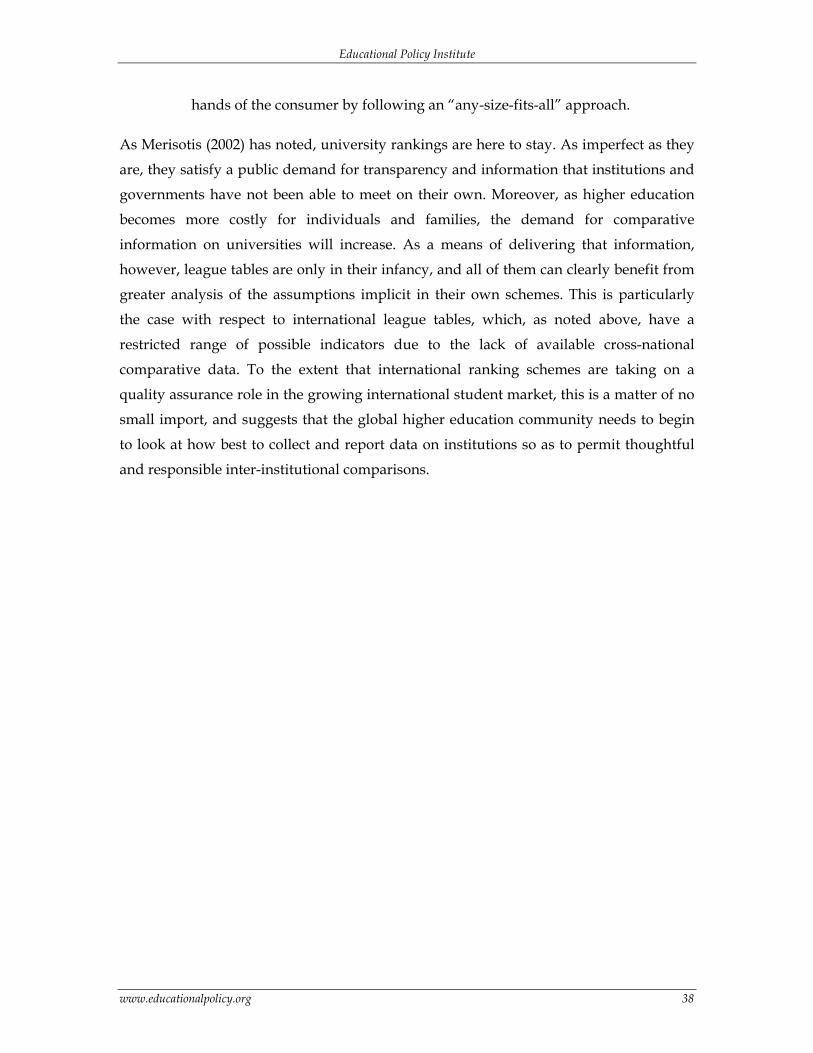
Educational Policy Institute
hands of the consumer by following an “any-size-fits-all” approach.
As Merisotis (2002) has noted, university rankings are here to stay. As imperfect as they
are, they satisfy a public demand for transparency and information that institutions and
governments have not been able to meet on their own. Moreover, as higher education
becomes more costly for individuals and families, the demand for comparative
information on universities will increase. As a means of delivering that information,
however, league tables are only in their infancy, and all of them can clearly benefit from
greater analysis of the assumptions implicit in their own schemes. This is particularly
the case with respect to international league tables, which, as noted above, have a
restricted range of possible indicators due to the lack of available cross-national
comparative data. To the extent that international ranking schemes are taking on a
quality assurance role in the growing international student market, this is a matter of no
small import, and suggests that the global higher education community needs to begin
to look at how best to collect and report data on institutions so as to permit thoughtful
and responsible inter-institutional comparisons.
www.educationalpolicy.org 38
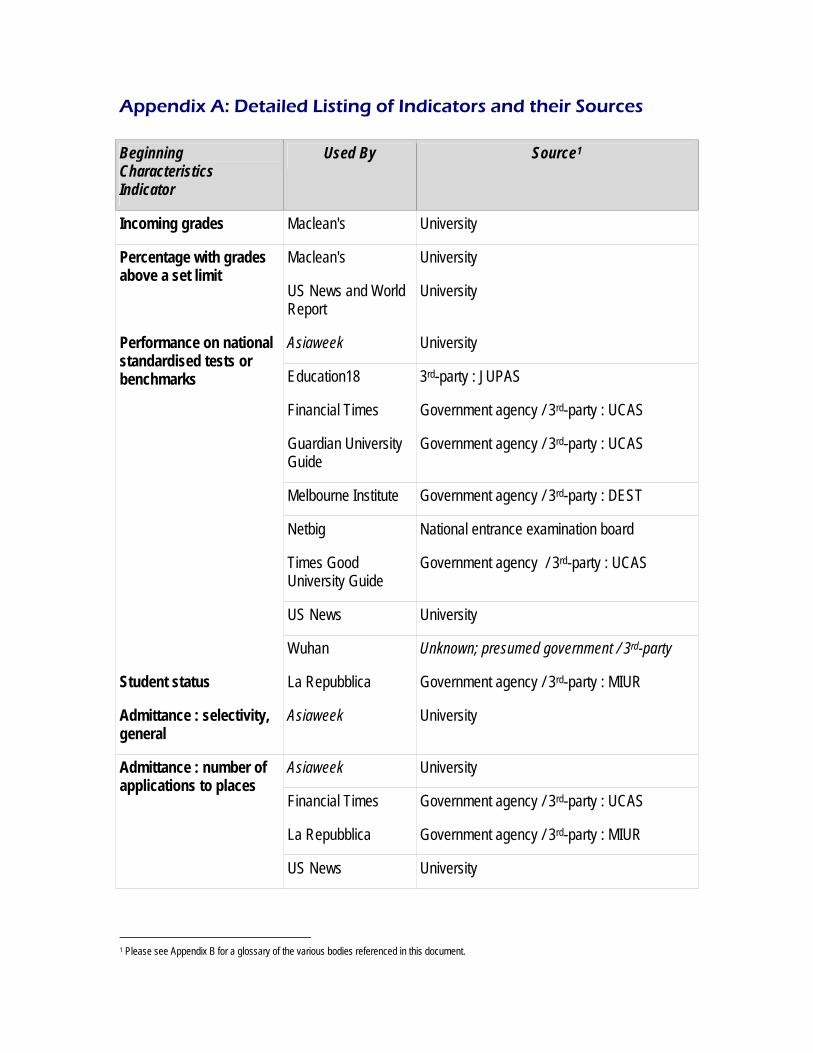
Appendix A: Detailed Listing of Indicators and their Sources
Beginning Characteristics Indicator
Used By Source1
Incoming grades Maclean's University
Maclean's University Percentage with grades above a set limit
US News and World Report
University
Asiaweek University
Education18 3rd-party : JUPAS
Financial Times Government agency / 3rd-party : UCAS
Guardian University Guide
Government agency / 3rd-party : UCAS
Melbourne Institute Government agency / 3rd-party : DEST
Netbig National entrance examination board
Times Good University Guide
Government agency / 3rd-party : UCAS
US News University
Performance on national standardised tests or benchmarks
Wuhan Unknown; presumed government / 3rd-party
Student status La Repubblica Government agency / 3rd-party : MIUR
Admittance : selectivity, general
Asiaweek University
Asiaweek University
Financial Times Government agency / 3rd-party : UCAS
La Repubblica Government agency / 3rd-party : MIUR
Admittance : number of applications to places
US News University
1 Please see Appendix B for a glossary of the various bodies referenced in this document.
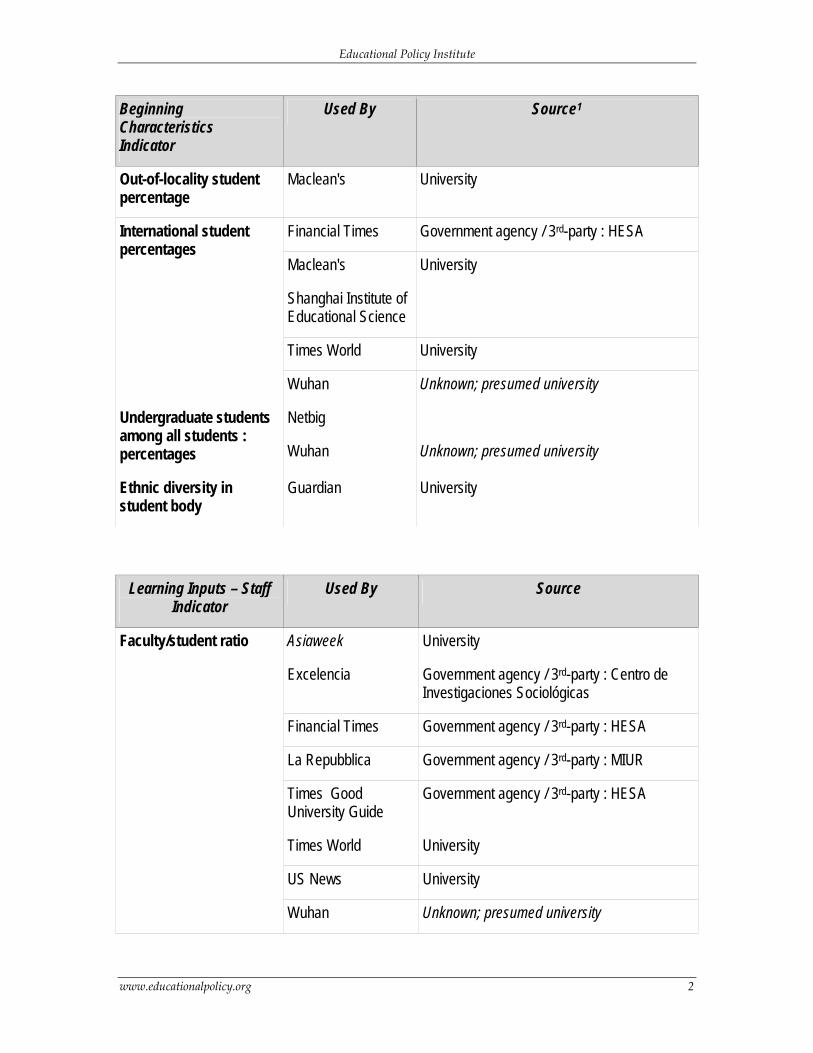
Educational Policy Institute
Beginning Used By Source1
Characteristics Indicator
Out-of-locality student percentage
Maclean's University
Financial Times Government agency / 3rd-party : HESA
Maclean's University
Shanghai Institute of Educational Science
Times World University
International student percentages
Wuhan Unknown; presumed university
Netbig Undergraduate students among all students : percentages Wuhan Unknown; presumed university
Ethnic diversity in student body
Guardian University
Learning Inputs – Staff Indicator
Used By Source
Asiaweek University
Excelencia Government agency / 3rd-party : Centro de Investigaciones Sociológicas
Financial Times Government agency / 3rd-party : HESA
La Repubblica Government agency / 3rd-party : MIUR
Times Good University Guide
Government agency / 3rd-party : HESA
Times World University
US News University
Faculty/student ratio
Wuhan Unknown; presumed university
www.educationalpolicy.org 2
Educational Policy Institute
Learning Inputs – Staff Used By Source Indicator
Social science faculty / student ratio
Melbourne Government agency / 3rd-party : DEST
Science faculty / student ratio
Melbourne Government agency / 3rd-party : DEST
Administrative staff / student ratio
Excelencia Government agency / 3rd-party : Centro de Investigaciones Sociológicas
Guardian Government agency / 3rd-party : HESA Staff /student ratio (regardless of division)
Netbig University ?
Course per teacher La Repubblica Government agency / 3rd-party : MIUR
Per-teacher university spending
Asiaweek University
Asiaweek University Faculty pay rates for tenured staff
US News University
Netbig University?
US News University
Number of full-time / part-time faculty
Wuhan Unknown; presumed university
Faculty with research projects
Wuhan Unknown; presumed university
Maclean's University Class size differentiation
US News University
Classes taught by tenured faculty
Maclean's University
Exchange programmes hosted
La Repubblica Government agency / 3rd-party : AgNaSoc
Number of classes ‘actually taught’
La Repubblica Government agency / 3rd-party : MIUR
% of international faculty (v faculty as a whole)
Times World University
www.educationalpolicy.org 3
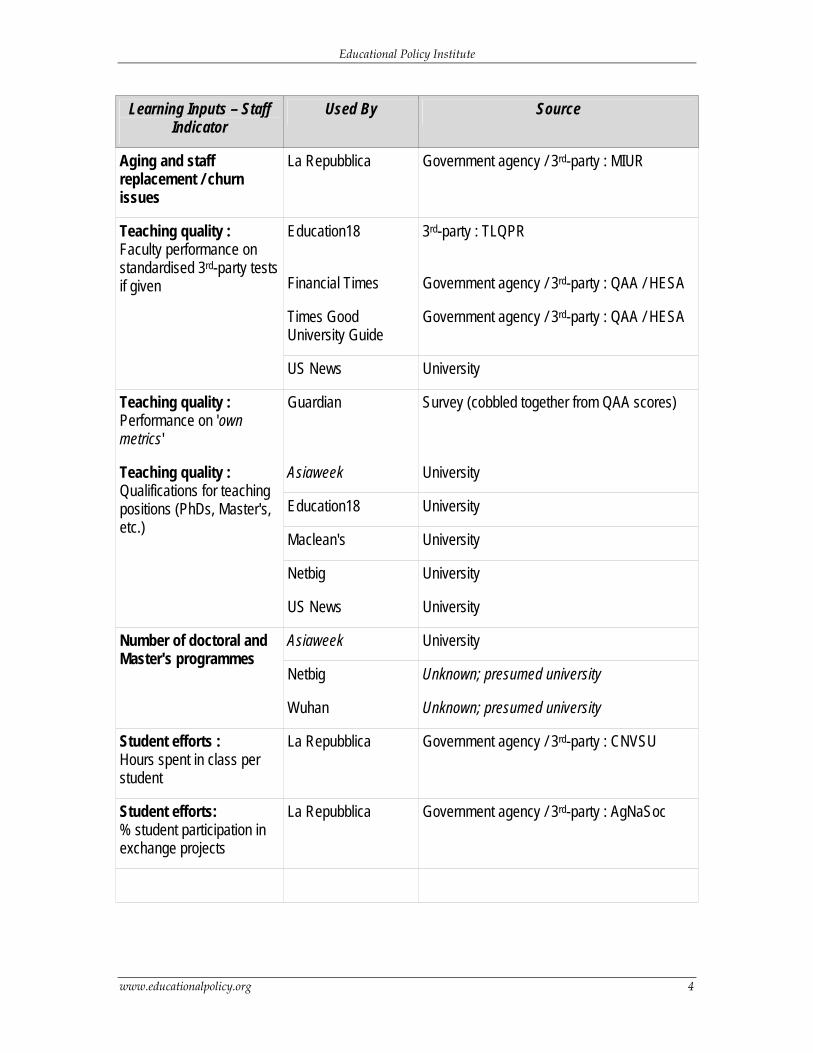
Educational Policy Institute
Learning Inputs – Staff Used By Source Indicator
Aging and staff replacement / churn issues
La Repubblica Government agency / 3rd-party : MIUR
Education18
3rd-party : TLQPR
Financial Times Government agency / 3rd-party : QAA / HESA
Times Good University Guide
Government agency / 3rd-party : QAA / HESA
Teaching quality : Faculty performance on standardised 3rd-party tests if given
US News University
Teaching quality : Performance on 'own metrics'
Guardian Survey (cobbled together from QAA scores)
Asiaweek University
Education18 University
Maclean's University
Netbig University
Teaching quality : Qualifications for teaching positions (PhDs, Master's, etc.)
US News University
Asiaweek University
Netbig Unknown; presumed university
Number of doctoral and Master's programmes
Wuhan Unknown; presumed university
Student efforts : Hours spent in class per student
La Repubblica Government agency / 3rd-party : CNVSU
Student efforts: % student participation in exchange projects
La Repubblica Government agency / 3rd-party : AgNaSoc
www.educationalpolicy.org 4
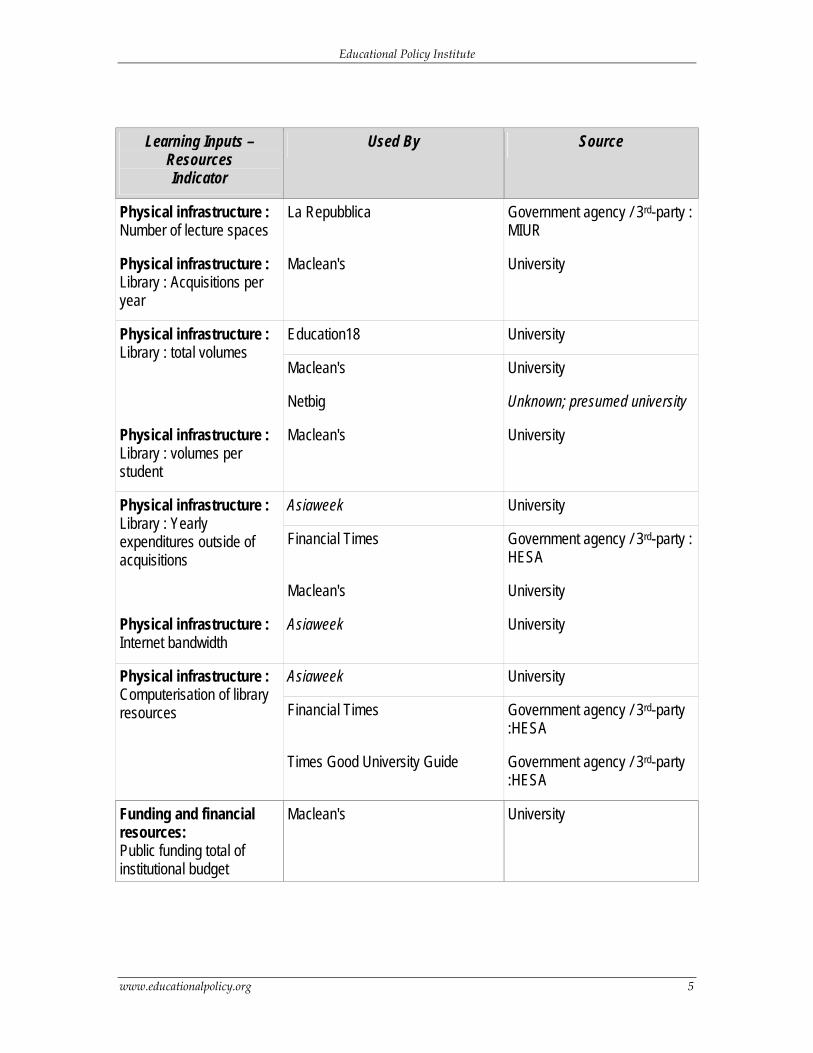
Educational Policy Institute
Learning Inputs – Resources Indicator
Used By Source
Physical infrastructure : Number of lecture spaces
La Repubblica Government agency / 3rd-party : MIUR
Physical infrastructure : Library : Acquisitions per year
Maclean's University
Education18 University
Maclean's University
Physical infrastructure : Library : total volumes
Netbig Unknown; presumed university
Physical infrastructure : Library : volumes per student
Maclean's University
Asiaweek University
Financial Times Government agency / 3rd-party : HESA
Physical infrastructure : Library : Yearly expenditures outside of acquisitions
Maclean's University
Physical infrastructure : Internet bandwidth
Asiaweek University
Asiaweek University
Financial Times Government agency / 3rd-party :HESA
Physical infrastructure : Computerisation of library resources
Times Good University Guide Government agency / 3rd-party :HESA
Funding and financial resources: Public funding total of institutional budget
Maclean's University
www.educationalpolicy.org 5
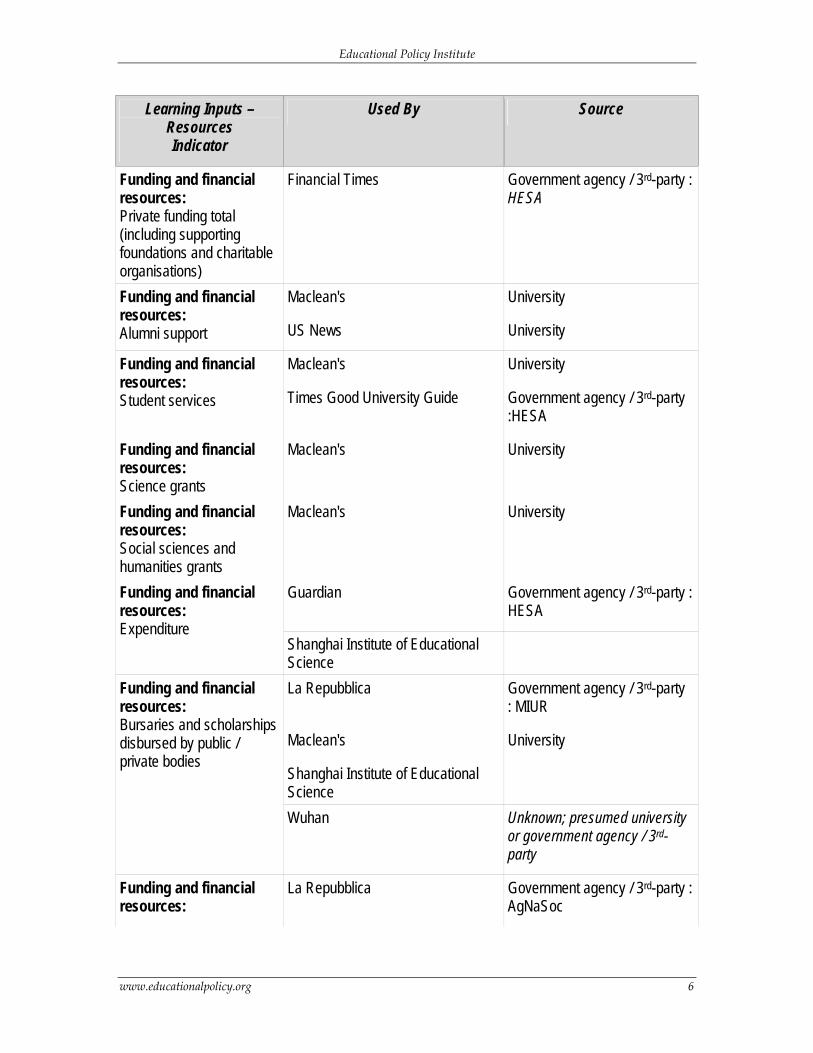
Educational Policy Institute
Learning Inputs – Used By Source Resources Indicator
Funding and financial resources: Private funding total (including supporting foundations and charitable organisations)
Financial Times Government agency / 3rd-party : HESA
Maclean's University Funding and financial resources: Alumni support US News University
Maclean's University Funding and financial resources: Student services Times Good University Guide Government agency / 3rd-party
:HESA
Funding and financial resources: Science grants
Maclean's University
Funding and financial resources: Social sciences and humanities grants
Maclean's University
Guardian Government agency / 3rd-party : HESA
Funding and financial resources: Expenditure
Shanghai Institute of Educational Science
La Repubblica Government agency / 3rd-party : MIUR
Maclean's University
Shanghai Institute of Educational Science
Funding and financial resources: Bursaries and scholarships disbursed by public / private bodies
Wuhan Unknown; presumed university or government agency / 3rd-party
Funding and financial resources:
La Repubblica Government agency / 3rd-party : AgNaSoc
www.educationalpolicy.org 6
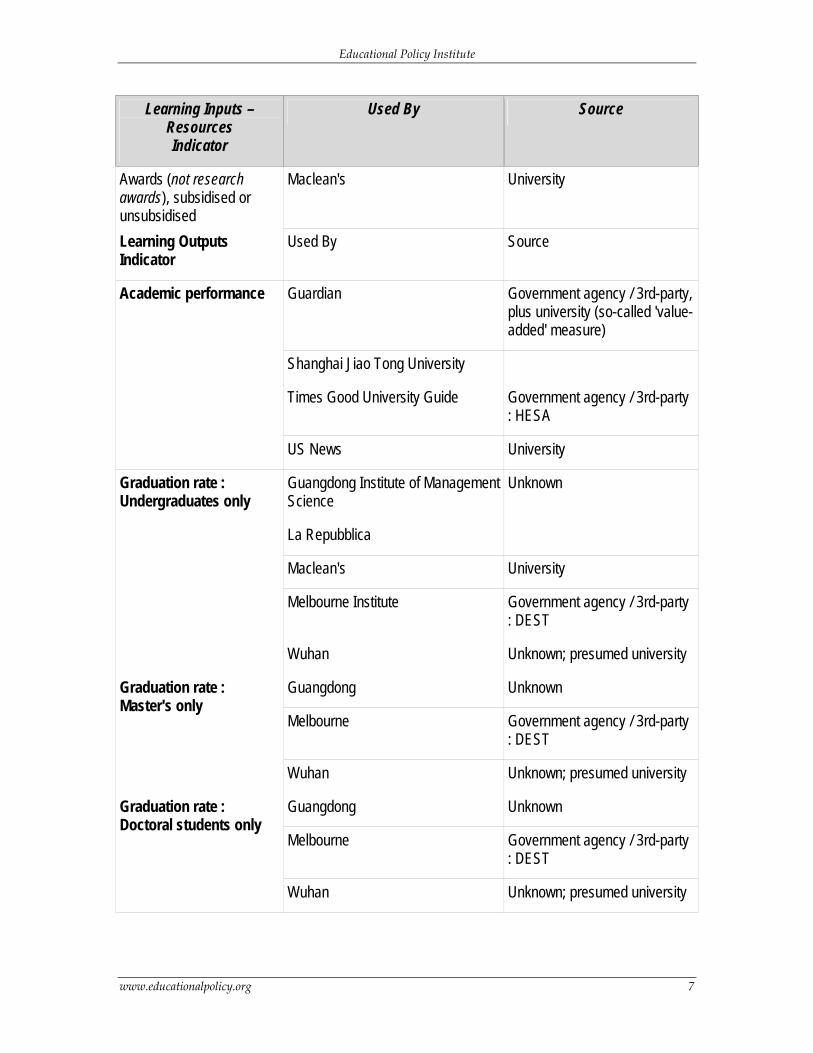
Educational Policy Institute
Learning Inputs – Used By Source Resources Indicator
Awards (not research awards), subsidised or unsubsidised
Maclean's University
Learning Outputs Indicator
Used By Source
Guardian Government agency / 3rd-party, plus university (so-called 'value-added' measure)
Shanghai Jiao Tong University
Times Good University Guide Government agency / 3rd-party : HESA
Academic performance
US News University
Guangdong Institute of Management Science
Unknown
La Repubblica
Maclean's University
Melbourne Institute Government agency / 3rd-party : DEST
Graduation rate : Undergraduates only
Wuhan Unknown; presumed university
Guangdong Unknown
Melbourne Government agency / 3rd-party : DEST
Graduation rate : Master's only
Wuhan Unknown; presumed university
Guangdong Unknown
Melbourne Government agency / 3rd-party : DEST
Graduation rate : Doctoral students only
Wuhan Unknown; presumed university
www.educationalpolicy.org 7
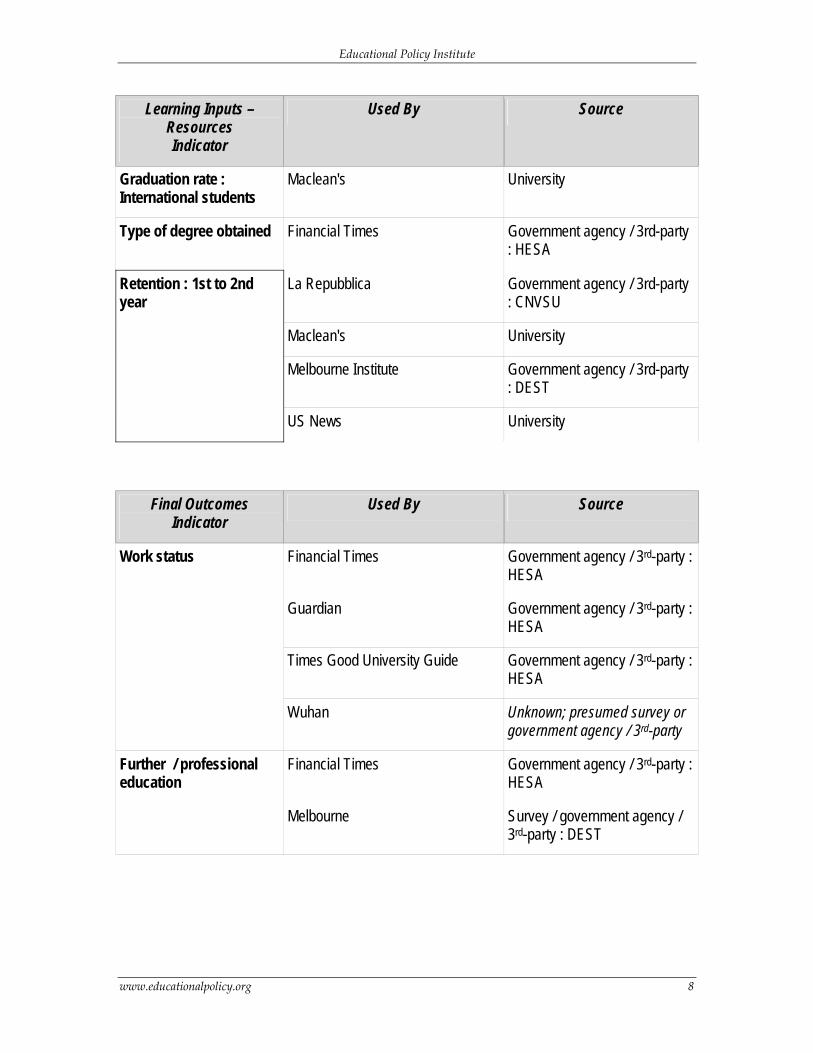
Educational Policy Institute
Learning Inputs – Used By Source Resources Indicator
Graduation rate : International students
Maclean's University
Type of degree obtained Financial Times Government agency / 3rd-party : HESA
Retention : 1st to 2nd year
La Repubblica Government agency / 3rd-party : CNVSU
Maclean's University
Melbourne Institute Government agency / 3rd-party : DEST
US News University
Final Outcomes Indicator
Used By Source
Financial Times Government agency / 3rd-party : HESA
Guardian Government agency / 3rd-party : HESA
Times Good University Guide Government agency / 3rd-party : HESA
Work status
Wuhan Unknown; presumed survey or government agency / 3rd-party
Financial Times Government agency / 3rd-party : HESA
Further / professional education
Melbourne Survey / government agency / 3rd-party : DEST
www.educationalpolicy.org 8
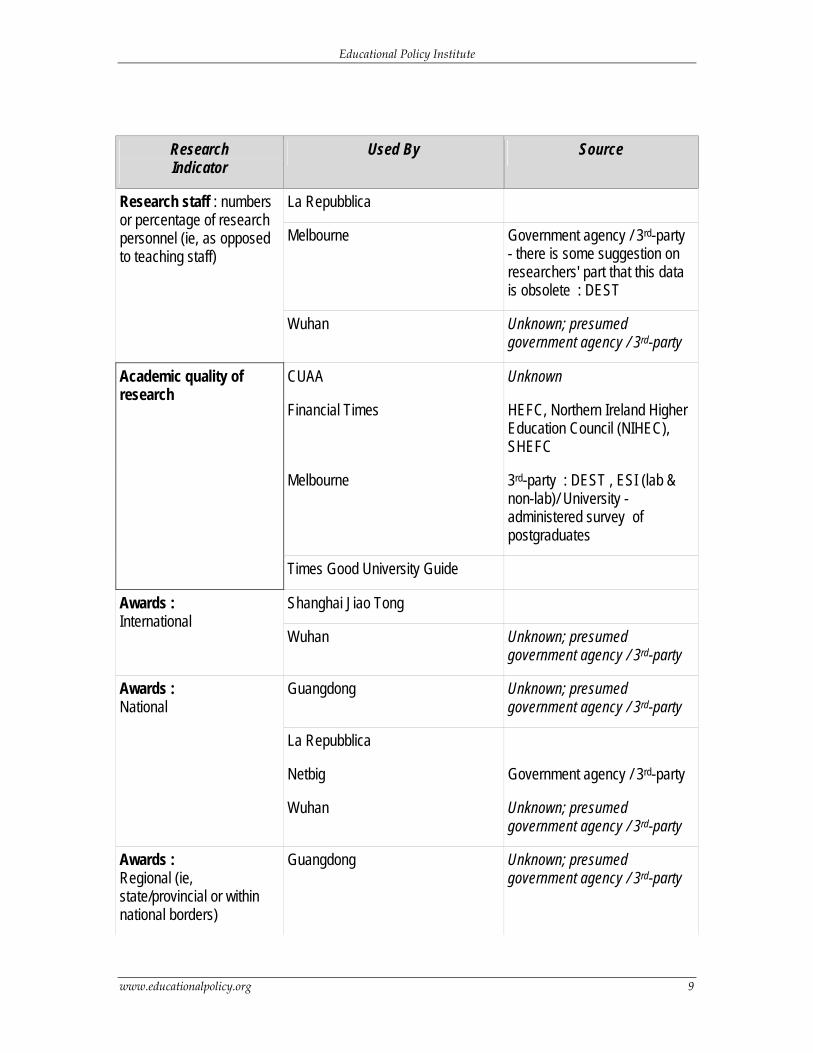
Educational Policy Institute
Research Indicator
Used By Source
La Repubblica
Melbourne Government agency / 3rd-party - there is some suggestion on researchers' part that this data is obsolete : DEST
Research staff : numbers or percentage of research personnel (ie, as opposed to teaching staff)
Wuhan Unknown; presumed government agency / 3rd-party
CUAA Unknown
Financial Times HEFC, Northern Ireland Higher Education Council (NIHEC), SHEFC
Melbourne 3rd-party : DEST , ESI (lab & non-lab)/ University -administered survey of postgraduates
Academic quality of research
Times Good University Guide
Shanghai Jiao Tong Awards : International
Wuhan Unknown; presumed government agency / 3rd-party
Guangdong Unknown; presumed government agency / 3rd-party
La Repubblica
Netbig Government agency / 3rd-party
Awards : National
Wuhan Unknown; presumed government agency / 3rd-party
Awards : Regional (ie, state/provincial or within national borders)
Guangdong Unknown; presumed government agency / 3rd-party
www.educationalpolicy.org 9
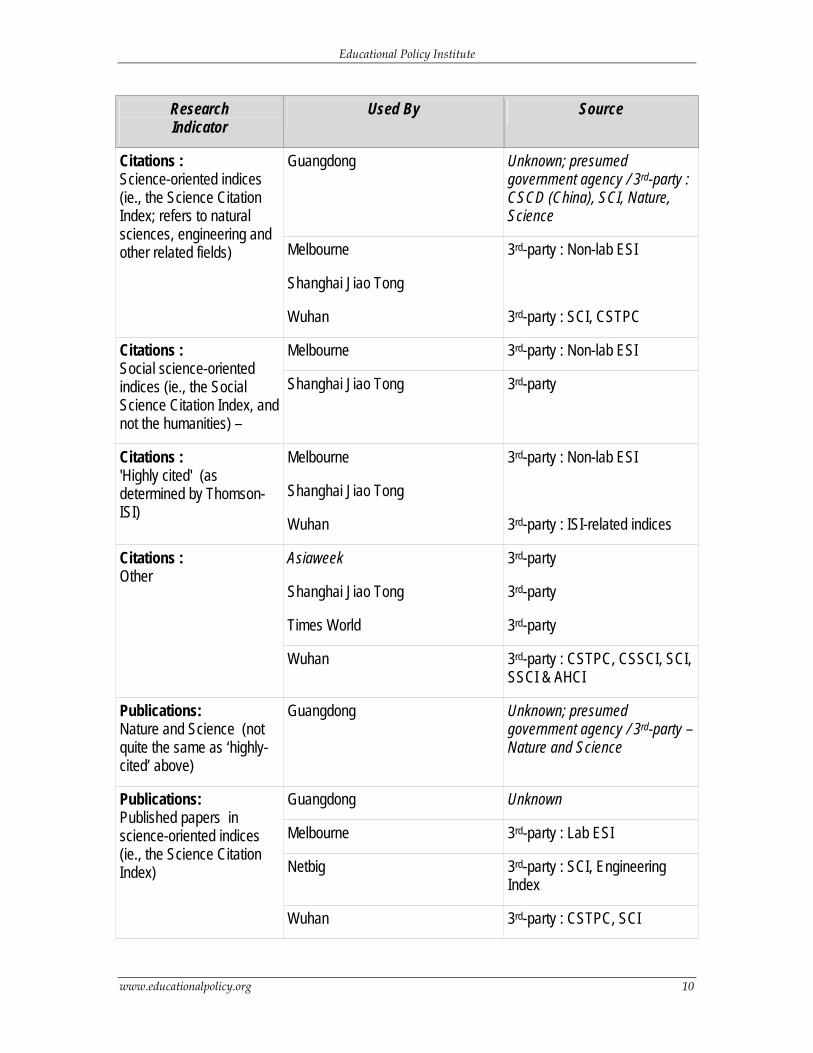
Educational Policy Institute
Research Used By Source Indicator
Guangdong Unknown; presumed government agency / 3rd-party : CSCD (China), SCI, Nature, Science
Melbourne 3rd-party : Non-lab ESI
Shanghai Jiao Tong
Citations : Science-oriented indices (ie., the Science Citation Index; refers to natural sciences, engineering and other related fields)
Wuhan 3rd-party : SCI, CSTPC
Melbourne 3rd-party : Non-lab ESI Citations : Social science-oriented indices (ie., the Social Science Citation Index, and not the humanities) –
Shanghai Jiao Tong 3rd-party
Melbourne 3rd-party : Non-lab ESI
Shanghai Jiao Tong
Citations : 'Highly cited' (as determined by Thomson-ISI)
Wuhan 3rd-party : ISI-related indices
Asiaweek 3rd-party
Shanghai Jiao Tong 3rd-party
Times World 3rd-party
Citations : Other
Wuhan 3rd-party : CSTPC, CSSCI, SCI, SSCI & AHCI
Publications: Nature and Science (not quite the same as ‘highly-cited’ above)
Guangdong Unknown; presumed government agency / 3rd-party – Nature and Science
Guangdong Unknown
Melbourne 3rd-party : Lab ESI
Netbig 3rd-party : SCI, Engineering Index
Publications: Published papers in science-oriented indices (ie., the Science Citation Index)
Wuhan 3rd-party : CSTPC, SCI
www.educationalpolicy.org 10
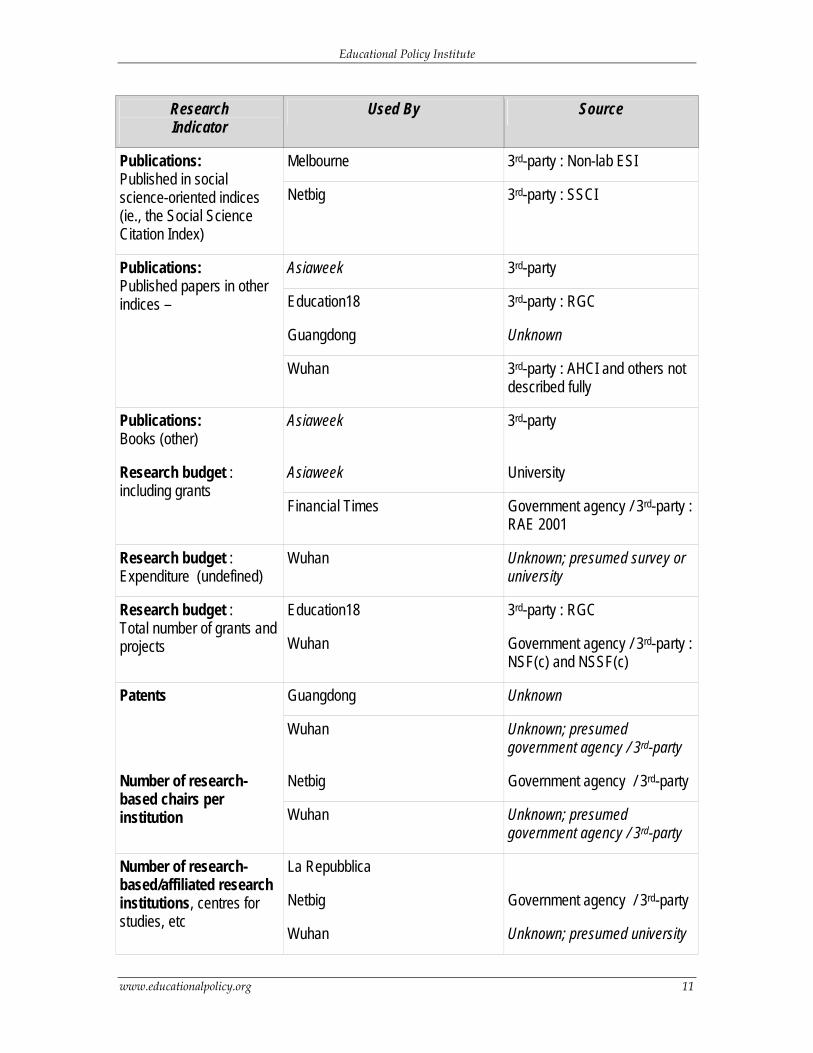
Educational Policy Institute
Research Used By Source Indicator
Melbourne 3rd-party : Non-lab ESI Publications: Published in social science-oriented indices (ie., the Social Science Citation Index)
Netbig 3rd-party : SSCI
Asiaweek 3rd-party
Education18 3rd-party : RGC
Guangdong Unknown
Publications: Published papers in other indices –
Wuhan 3rd-party : AHCI and others not described fully
Publications: Books (other)
Asiaweek 3rd-party
Asiaweek University Research budget : including grants
Financial Times Government agency / 3rd-party : RAE 2001
Research budget : Expenditure (undefined)
Wuhan Unknown; presumed survey or university
Education18 3rd-party : RGC Research budget : Total number of grants and projects Wuhan Government agency / 3rd-party :
NSF(c) and NSSF(c)
Guangdong Unknown Patents
Wuhan Unknown; presumed government agency / 3rd-party
Netbig Government agency / 3rd-party Number of research-based chairs per institution Wuhan Unknown; presumed
government agency / 3rd-party
La Repubblica
Netbig Government agency / 3rd-party
Number of research-based/affiliated research institutions, centres for studies, etc
Wuhan Unknown; presumed university
www.educationalpolicy.org 11
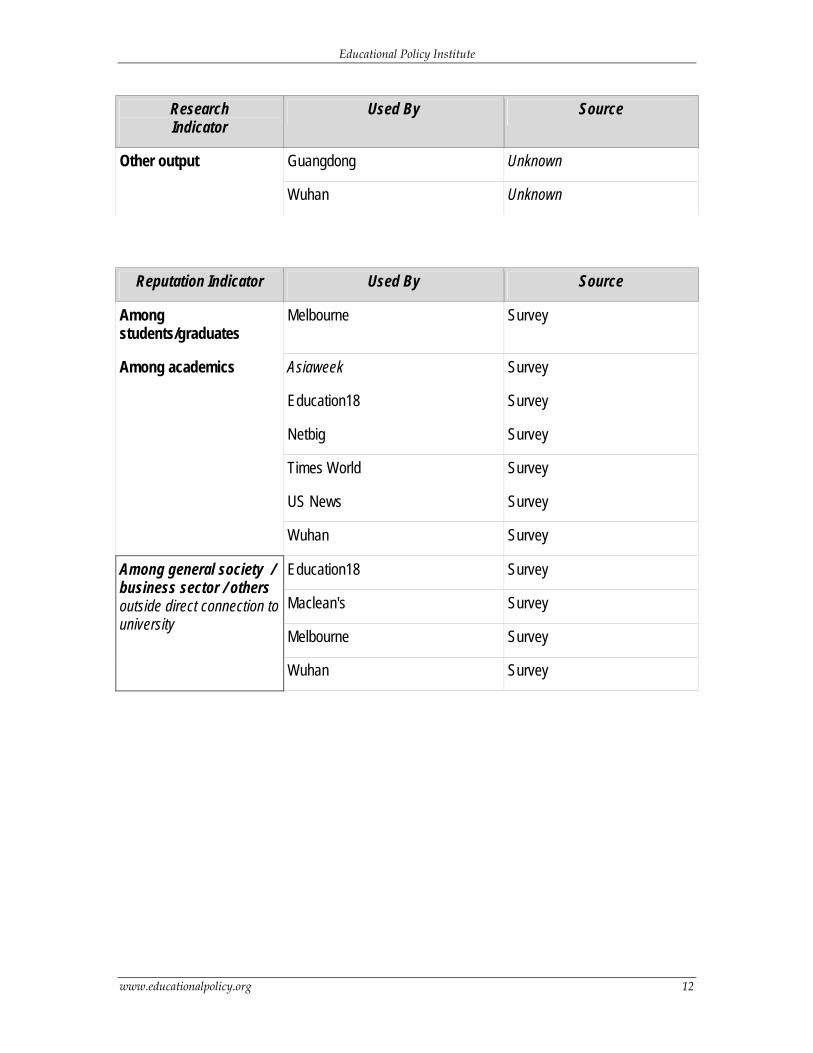
Educational Policy Institute
Research Used By Source Indicator
Guangdong Unknown Other output
Wuhan Unknown
Reputation Indicator Used By Source
Among students/graduates
Melbourne Survey
Asiaweek Survey
Education18 Survey
Netbig Survey
Times World Survey
US News Survey
Among academics
Wuhan Survey
Education18 Survey
Maclean's Survey
Melbourne Survey
Among general society / business sector / others outside direct connection to university
Wuhan Survey
www.educationalpolicy.org 12
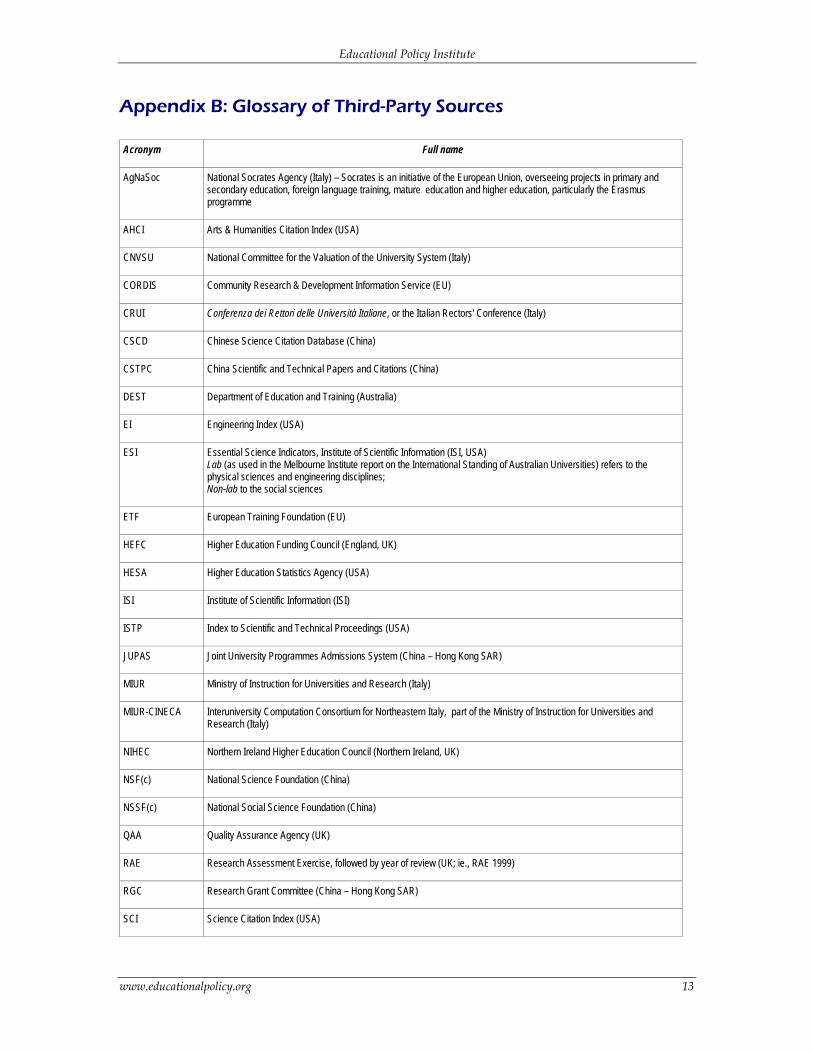
Educational Policy Institute
Appendix B: Glossary of Third-Party Sources
Acronym Full name
AgNaSoc National Socrates Agency (Italy) – Socrates is an initiative of the European Union, overseeing projects in primary and secondary education, foreign language training, mature education and higher education, particularly the Erasmus programme
AHCI Arts & Humanities Citation Index (USA)
CNVSU National Committee for the Valuation of the University System (Italy)
CORDIS Community Research & Development Information Service (EU)
CRUI Conferenza dei Rettori delle Università Italiane, or the Italian Rectors' Conference (Italy)
CSCD Chinese Science Citation Database (China)
CSTPC China Scientific and Technical Papers and Citations (China)
DEST Department of Education and Training (Australia)
EI Engineering Index (USA)
ESI Essential Science Indicators, Institute of Scientific Information (ISI, USA) Lab (as used in the Melbourne Institute report on the International Standing of Australian Universities) refers to the physical sciences and engineering disciplines; Non-lab to the social sciences
ETF European Training Foundation (EU)
HEFC Higher Education Funding Council (England, UK)
HESA Higher Education Statistics Agency (USA)
ISI Institute of Scientific Information (ISI)
ISTP Index to Scientific and Technical Proceedings (USA)
JUPAS Joint University Programmes Admissions System (China – Hong Kong SAR)
MIUR Ministry of Instruction for Universities and Research (Italy)
MIUR-CINECA Interuniversity Computation Consortium for Northeastern Italy, part of the Ministry of Instruction for Universities and Research (Italy)
NIHEC Northern Ireland Higher Education Council (Northern Ireland, UK)
NSF(c) National Science Foundation (China)
NSSF(c) National Social Science Foundation (China)
QAA Quality Assurance Agency (UK)
RAE Research Assessment Exercise, followed by year of review (UK; ie., RAE 1999)
RGC Research Grant Committee (China – Hong Kong SAR)
SCI Science Citation Index (USA)
www.educationalpolicy.org 13
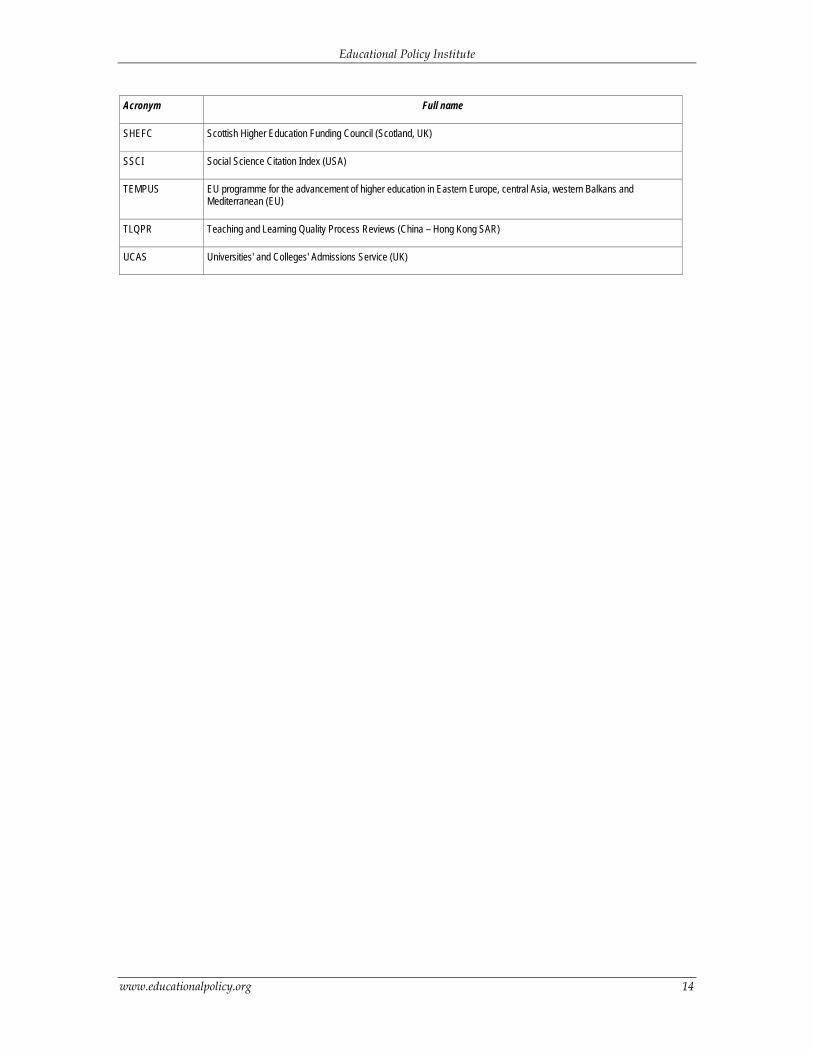
Educational Policy Institute
Acronym Full name
SHEFC Scottish Higher Education Funding Council (Scotland, UK)
SSCI Social Science Citation Index (USA)
TEMPUS EU programme for the advancement of higher education in Eastern Europe, central Asia, western Balkans and Mediterranean (EU)
TLQPR Teaching and Learning Quality Process Reviews (China – Hong Kong SAR)
UCAS Universities' and Colleges' Admissions Service (UK)
www.educationalpolicy.org 14
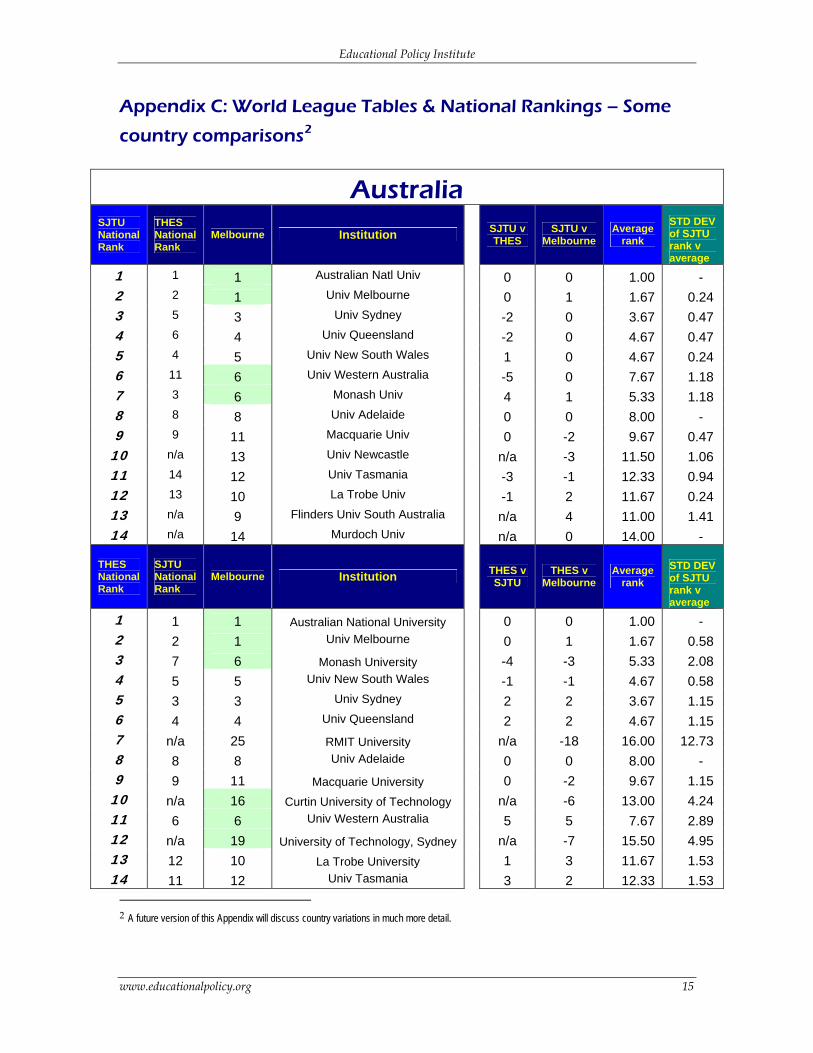
Educational Policy Institute
Appendix C: World League Tables & National Rankings – Some
country comparisons2
Australia SJTU National Rank
THES National Rank
Melbourne Institution
SJTU v THES
SJTU v Melbourne
Average rank
STD DEV of SJTU rank v average
1 1 1 Australian Natl Univ 0 0 1.00 - 2 2 1 Univ Melbourne 0 1 1.67 0.24 3 5 3 Univ Sydney -2 0 3.67 0.47 4 6 4 Univ Queensland -2 0 4.67 0.47 5 4 5 Univ New South Wales 1 0 4.67 0.24 6 11 6 Univ Western Australia -5 0 7.67 1.18 7 3 6 Monash Univ 4 1 5.33 1.18 8 8 8 Univ Adelaide 0 0 8.00 - 9 9 11 Macquarie Univ 0 -2 9.67 0.47
10 n/a 13 Univ Newcastle n/a -3 11.50 1.06 11 14 12 Univ Tasmania -3 -1 12.33 0.94 12 13 10 La Trobe Univ -1 2 11.67 0.24 13 n/a 9 Flinders Univ South Australia n/a 4 11.00 1.41 14 n/a 14 Murdoch Univ n/a 0 14.00 -
THES National Rank
SJTU National Rank
Melbourne Institution
THES v SJTU
THES v Melbourne
Average rank
STD DEV of SJTU rank v average
1 1 1 Australian National University 0 0 1.00 - 2 2 1 Univ Melbourne 0 1 1.67 0.58 3 7 6 Monash University -4 -3 5.33 2.08 4 5 5 Univ New South Wales -1 -1 4.67 0.58 5 3 3 Univ Sydney 2 2 3.67 1.15 6 4 4 Univ Queensland 2 2 4.67 1.15 7 n/a 25 RMIT University n/a -18 16.00 12.73 8 8 8 Univ Adelaide 0 0 8.00 - 9 9 11 Macquarie University 0 -2 9.67 1.15
10 n/a 16 Curtin University of Technology n/a -6 13.00 4.24 11 6 6 Univ Western Australia 5 5 7.67 2.89 12 n/a 19 University of Technology, Sydney n/a -7 15.50 4.95 13 12 10 La Trobe University 1 3 11.67 1.53 14 11 12 Univ Tasmania 3 2 12.33 1.53
2 A future version of this Appendix will discuss country variations in much more detail.
www.educationalpolicy.org 15
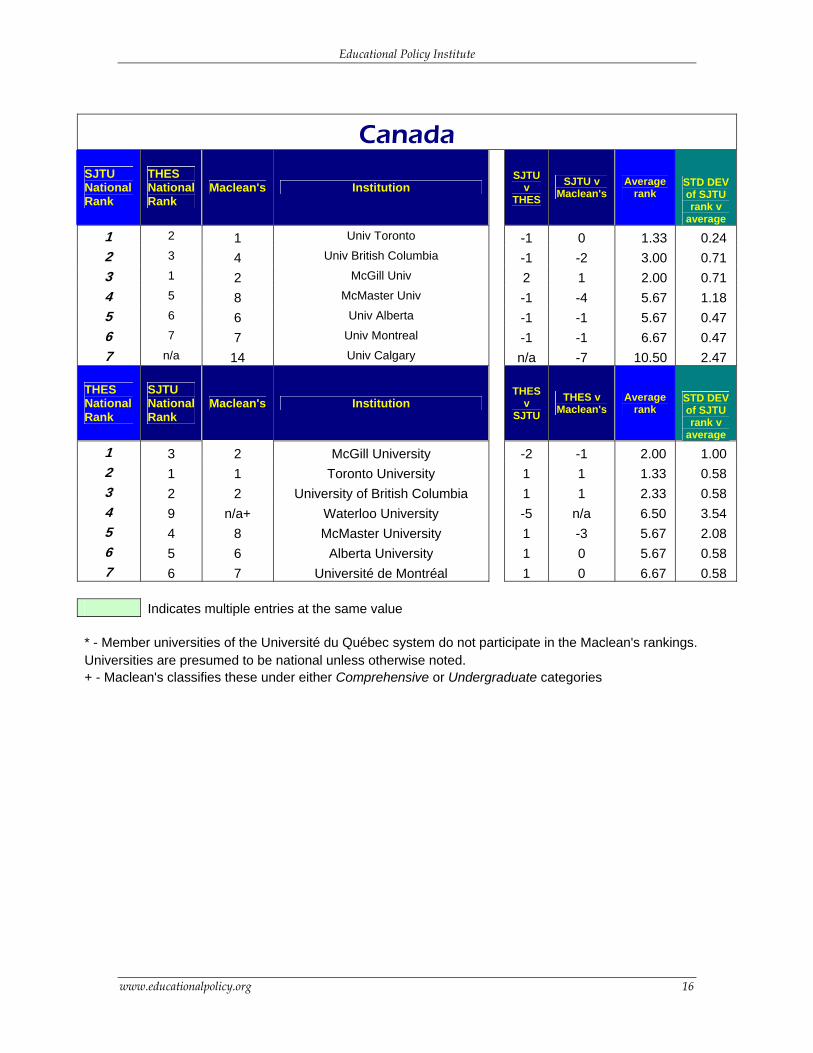
Educational Policy Institute
Canada SJTU National Rank
THES National Rank
Maclean's Institution
SJTU v
THES SJTU v
Maclean's Average
rank STD DEV of SJTU rank v
average
1 2 1 Univ Toronto -1 0 1.33 0.24 2 3 4 Univ British Columbia -1 -2 3.00 0.71 3 1 2 McGill Univ 2 1 2.00 0.71 4 5 8 McMaster Univ -1 -4 5.67 1.18 5 6 6 Univ Alberta -1 -1 5.67 0.47 6 7 7 Univ Montreal -1 -1 6.67 0.47 7 n/a 14 Univ Calgary n/a -7 10.50 2.47
THES National Rank
SJTU National Rank
Maclean's Institution
THES v
SJTU
THES v Maclean's
Average rank
STD DEV of SJTU rank v
average
1 3 2 McGill University -2 -1 2.00 1.00 2 1 1 Toronto University 1 1 1.33 0.58 3 2 2 University of British Columbia 1 1 2.33 0.58 4 9 n/a+ Waterloo University -5 n/a 6.50 3.54 5 4 8 McMaster University 1 -3 5.67 2.08 6 5 6 Alberta University 1 0 5.67 0.58 7 6 7 Université de Montréal 1 0 6.67 0.58
Indicates multiple entries at the same value * - Member universities of the Université du Québec system do not participate in the Maclean's rankings. Universities are presumed to be national unless otherwise noted. + - Maclean's classifies these under either Comprehensive or Undergraduate categories
www.educationalpolicy.org 16
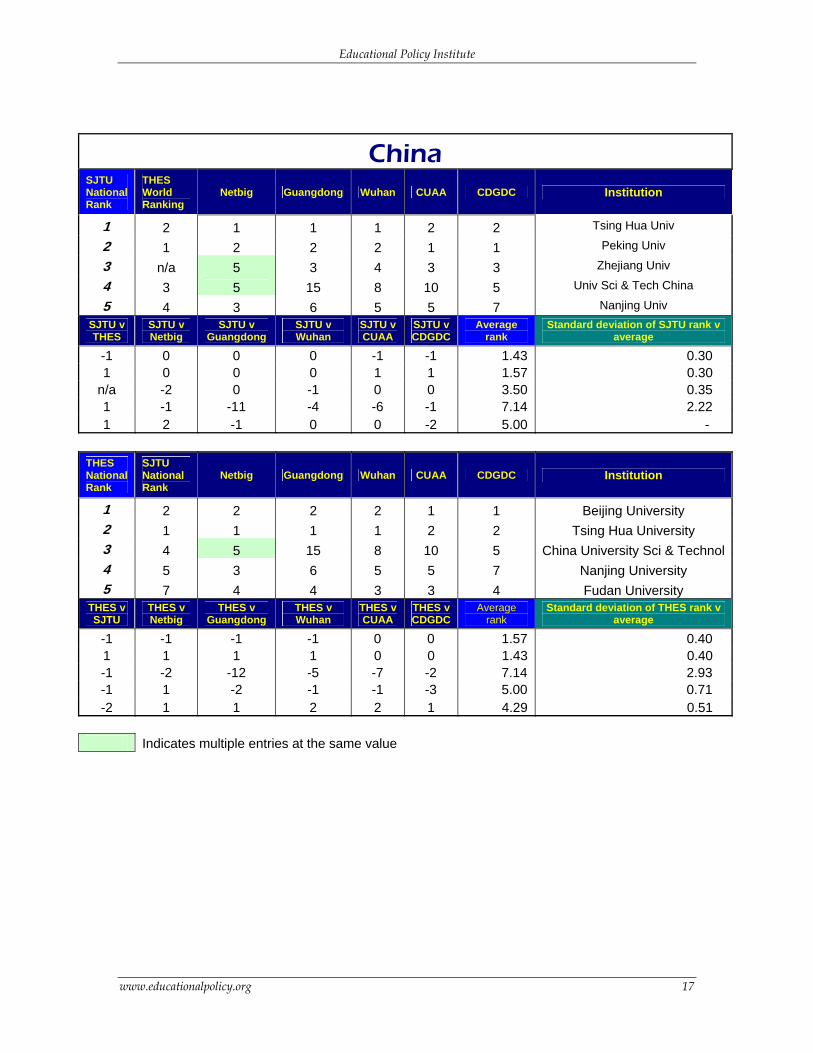
Educational Policy Institute
China SJTU National Rank
THES World Ranking
Netbig Guangdong Wuhan CUAA CDGDC Institution
1 2 1 1 1 2 2 Tsing Hua Univ
2 1 2 2 2 1 1 Peking Univ
3 n/a 5 3 4 3 3 Zhejiang Univ
4 3 5 15 8 10 5 Univ Sci & Tech China
5 4 3 6 5 5 7 Nanjing Univ SJTU v THES
SJTU v Netbig
SJTU v Guangdong
SJTU v Wuhan
SJTU v CUAA
SJTU v CDGDC
Average rank
Standard deviation of SJTU rank v average
-1 0 0 0 -1 -1 1.43 0.30 1 0 0 0 1 1 1.57 0.30
n/a -2 0 -1 0 0 3.50 0.35 1 -1 -11 -4 -6 -1 7.14 2.22 1 2 -1 0 0 -2 5.00 -
THES National Rank
SJTU National Rank
Netbig Guangdong Wuhan CUAA CDGDC Institution
1 2 2 2 2 1 1 Beijing University 2 1 1 1 1 2 2 Tsing Hua University 3 4 5 15 8 10 5 China University Sci & Technol4 5 3 6 5 5 7 Nanjing University 5 7 4 4 3 3 4 Fudan University
THES v SJTU
THES v Netbig
THES v Guangdong
THES v Wuhan
THES v CUAA
THES v CDGDC
Average rank
Standard deviation of THES rank v average
-1 -1 -1 -1 0 0 1.57 0.40 1 1 1 1 0 0 1.43 0.40 -1 -2 -12 -5 -7 -2 7.14 2.93 -1 1 -2 -1 -1 -3 5.00 0.71 -2 1 1 2 2 1 4.29 0.51
Indicates multiple entries at the same value
www.educationalpolicy.org 17
Educational Policy Institute
Global University League Tables - Bibliography
The Atlantic Monthly (2003). ‘Our First College-Admissions Survey’, in the Atlantic
Monthly, November 2003, pp 104-106.
Confessore, Nicholas (2003). ‘What Makes a College Good?’ p 104-105.
Fallows, James (2003). ‘The New College Chaos,’ p 106.
Ganeshananthan, VV (2003). ‘The Late-Decision Program’, p 116.
Mathews, Jay (2003). ‘The Bias Question,’p 130.
Peck, Don (2003). ‘The Selectivity Illusion,’ p 128.
Centrum für Hochschulentwicklung (CHE, Germany: Berghoff, Sonia; Federkeil, Gero; Giebisch, Petra; Hachmeister, Cort-Denis; Siekermann, Meike; Müller-Böling, Detlef), ‘ForschungsUniversitäten 2004’, No 62, 10 February 2005.
Clarke, Marguerite (2002). ‘Some Guidelines for Academic Quality Rankings,’ in Higher
Education in Europe, vol XXVII, no 4, pp 443-459.
Dill, David D & Soo, Maarja (2004). ‘Is There a Global Definition of Academic Quality?
A Cross-National Analysis of University Ranking Systems.’ Chapel Hill, NC: Public
Policy for Academic Quality background paper, University of North Carolina.
Eccles, Charles. ‘The Use of University Rankings in the United Kingdom,’ in Higher
Education in Europe, vol XXVII, no 4, pp 423-432.
The Economist. ’The year of listing differently,’ 24 September 2005, p81.
Education18, Internet URL at http://education18.com/
The Financial Times. Financial Times Universities 2003, 03 May 2003.
Kelly, Jim. ‘Access: A gentle break with elitist traditions: Government opts for a
benign regulatory framework over quotas,’ p 3.
--. ‘Admissions policies: A shining example to the rest: Sheffield has shown how
www.educationalpolicy.org 18
Educational Policy Institute
to build a socially inclusive university and is far ahead of the government’s
agenda,’ p 12.
--. ‘How to read the tables: Large number of criteria provide stability – method
produces important tool for parents and would-be students,’ p 8.
--. ‘London 2nd edition: Fears that £ 3000 top-up fee could be the norm,’ p 7.
--. ‘London 2nd edition: Review to challenge academic attitudes,’ p 7.
--. ‘London 2nd edition – school funding: Headteachers warn of £ 2.5bn black
hole,’ p 7.
--. ‘Top five confirm their long-held positions: But Loughborough breeds
winners and edges towards the elite,’ p 9.
--. ‘Vice-chancellors’ survey: Higher charges seem inevitable – Questionnaire
provides clear indication of how the market will look in 2006 with most
institutions expected to charge an extra £ 3000,’ p 2.
Murray, Sarah. ‘Manchester merger: A marriage of love: The move to combine
was driven by compelling reasons,’ p 11.
Tieman, Ross. ‘Cambridge/MIT: Change of tack alters emphasis - focus is now
on knowledge exchange,’ p 10.
Finnie, Ross & Usher, Alex (2005). Measuring the Quality of Post-secondary Education:
Concepts, Current Practices and a Strategic Plan. Kingston, Ont.: Canadian Policy Research
Networks.
Gladwell, Malcolm. ‘Getting in: the social logic of Ivy League admissions,’ the New
Yorker, 10 October 2005, p80.
The Guardian (Leach, Jimmy, editor; 2004). The Guardian University Guide 2005: What to
study, where to go and how to get there. London: Atlantic Books.
Hicks, Diana (2004) “The Four Literatures of Social Science” in Handbook of Quantitative
Science and Technology Research, e. Henk Moed., Kluwer Academic.
Jobbins, David. ‘The Times/The Times Higher Education Supplement – League Tables
www.educationalpolicy.org 19
Educational Policy Institute
in Britain: An Insider’s View’ in Higher Education in Europe, vol XXVII, no 4, pp 383-388.
Krueger, Alan B. and Hanushek, Eric A (2000). The Class Size Policy Debate, Working
Paper No 121. Washington DC: Economic Policy Institute.
Maclean’s (Johnston, Ann Dowsett, editor; 2005). Maclean’s Guide to Canadian Universities
’05. Toronto: Rogers Publishing Limited.
De Miguel, Jesús M.; Sánchez, Jara D.; & Vaquera, Elizabeth (2004). ‘University
Ranking in Spain: Methods for Evaluating Public and Private Institutions’, Presentation
at UNESCO-CEPES Conference, Washington DC.
Melbourne Institute of Applied Economic and Social Research (Williams, Ross & Van Dyke, Nina; 2004). The International Standing of Australian Universities. Melbourne:
University of Melbourne.
Merisotis, Jamie P (2002a). ‘On the Ranking of Higher Education Institutions’, in Higher
Education in Europe, vol XXVII, no 4, pp 361-363.
Merisotis, Jamie P (2002b). ‘Summary Report of the Invitational Roundtable on
Statistical Indicators for the Quality Assessment of Higher/Tertiary Education
Institutions: Ranking and League Table Methodologies’, in Higher Education in Europe,
vol XXVII, no 4, pp 475-480.
Netbig Chinese rankings. Internet URL at http://www.netbig.com
Le Nouvel Observateur (2003). ‘Universités le palmarès 2003’, Le Nouvel Observateur, 13
March 2003.
Perspektywy 2004 University Rankings. October 2004.
Pike, Gary R (2004). ‘Measuring Quality: A Comparison of US News Rankings and
NSSE Benchmarks,’ in Research in Higher Education, Vol 45 No 2, March 2004, pp 193-208.
The Princeton Review. ‘America’s Best Value Colleges’, Internet URL at
http://www.princetonreview.com
Provan, David & Abercromby, Karen (2000). University League Tables and Rankings: A
Critical Analysis. CHEMS Paper No. 30. London: Commonwealth Higher Education
www.educationalpolicy.org 20
Educational Policy Institute
Management Service (CHEMS), Association of Commonwealth Universities.
Push UK (2004). The Push Guide to Universities in the UK. London: Nelson Thornes,
2004.
La Repubblica (2004), October 2004.
Sebkova, Helena (2002). ‘Accreditation and Quality Assurance in Europe,’ in Higher
Education in Europe, vol XXVII, no 3, pp 239-247.
Siwiński, Waldemar (2002). ‘Perspektywy – Ten Years of Rankings,’ in Higher Education
in Europe, vol XXVII, no 4, pp 399-406.
Der Spiegel (22 November 2004: no. 48). ‘Where Do the Best Study? Elite Students at
German Universities?’ Berlin: Der Spiegel, pp 178-200.
Teixiera, IC; Teixiera, JP; Pile, M; Durão (1997). ‘Classification and Ranking of Higher
Engineering Education Programmes and Institutions: The ICT View’.
Terenzini, Patrick T.; Pascarella, Ernest T. (1994) ‘Living with Myths’ in Change, Jan/Feb
1994, vol 26 issue 1, pp 28-33.
The Times Good University Guide (O’Leary, John; Hindmarsh, Andrew; & Kingston,
Bernard. 2004). The Times Good University Guide 2005. Hammersmith, London: Times
Newspapers Limited.
The Washington Monthly (2005). ‘The Washington Monthly College Guide,’ Volume
37, number 9, September 2005, pp 24-37.
Woźnicki, Jerzy and Morawski, Roman Z (2002). ‘Public and Private Higher Education
Institutions – Joint or Separate Evaluation and Rankings: The Polish Perspective’ in
Higher Education in Europe, vol XXVII, no 4, pp 461-466.
Yonezawa, Akiyoshi; Nakatsui, Izumi; Kobayashi, Tetsuo (2002). ‘University Rankings
in Japan’ in Higher Education in Europe, vol XXVII, no 4, pp 377-382.
www.educationalpolicy.org 21

www.educationalpolicy.org
Copyright 2006