a field comparison of inhalable and thoracic size selective sampling techniques
TRANSCRIPT

A Field Comparison of Inhalable and Thoracic SizeSelective Sampling TechniquesHUGH W. DAVIES*, KAY TESCHKE and PAUL A. DEMERS
Occupational Hygiene Program, University of British Columbia, Vancouver, BC, Canada,V6T 1Z3
We measured inhalable, thoracic, and so-called ``total'' wood dust exposure in British Columbia
lumber mill workers. Particle-size selective sampling was conducted using the GSP and Seven
hole inhalable samplers, the PEM thoracic sampler and the 37-mm closed-face cassette ``total''
sampler. All measurements were full-shift personal samples, obtained from randomly selected
workers. We obtained intersampler comparison data for the following pairs of instruments:
GSP and 37-mm sampler; GSP and seven-hole sampler (SHS); and PEM and 37-mm sampler.
The intersampler measurement ratios were estimated as: GSP/37-mm sampler=4.2; GSP/
SHS=1.7; and PEM/37-mm sampler=1.6. The GSP/37-mm sampler ratio is consistent with
previously reported ®ndings, while PEM/37-mm sampler and GSP/SHS ratios were both larger
than expected. We found that in all comparisons, the measurement ratio had signi®cant
variability that was greatest at low ambient dust concentrations. Although it was not possible to
attribute the source of the variability to speci®c sampler types, we concluded that the GSP
sampler might be susceptible to ``projectile'' particles not normally aspirated, and may be
vulnerable to direct aspiration of dust from accidentally contacted surfaces. The PEM was
designed for environmental monitoring, and it is possible that it is unsuited to the higher
particulate concentrations found in some occupational settings. Disparities among inhalable
sampling techniques such as that between GSP and SHS should be investigated further in light
of the proposed adoption of the inhalable method as an industrial standard. # 1999 British
Occupational Hygiene Society. Published by Elsevier Science Ltd. All rights reserved.
Keywords: occupational exposure; inhalable; thoracic; particulate; wood
INTRODUCTION
In Canada and the United States sampling methods
for occupational exposure to wood dust are usually
gravimetric, and have traditionally utilized ®lters
mounted in 37-mm polystyrene cassettes. While
called a ``total aerosol'' method, the particle size
fraction collected by this technique varies with
device con®guration and ¯ow rate. It is not consist-
ently representative of either the total amount of air-
borne particulate or the fraction that may enter the
respiratory system (Werner et al., 1996). In particu-
lar, it is not considered a reliable method for
measuring particulate with aerodynamic diameters
in the range of 10±100 mm, which are of greatest
concern in the study of diseases of the upper respir-
atory tract such as nasal cancer, a disease associated
with wood dust exposure (Hinds, 1988).
For over a decade the American Conference of
Governmental Industrial Hygienists (ACGIH) has
recommended that particle size selective sampling
techniques be used to measure airborne particulate
(ACGIH, 1985). The ACGIH is currently reviewing
particulate exposures with a view to de®ning appro-
priate fractions and mass concentrations to be
adopted as particle-size selective Threshold Limit
Values (TLVs; ACGIH, 1997). Particle size selective
TLVs have been proposed for the inhalable, thoracic
and respirable fractions. This study is concerned
with only the ®rst two of these. Inhalable dust is
de®ned as the fraction of particulate that may enter
the mouth or nose during breathing, while thoracic
dust is de®ned as the sub-fraction of inhalable par-
ticulate which may penetrate past the larynx. Both
are described by curves relating inhalabilty and de-
position in the respiratory tract to aerodynamic di-
Ann. occup. Hyg., Vol. 43, No. 6, pp. 381±392, 1999# 1999 British Occupational Hygiene Society
Published by Elsevier Science Ltd. All rights reservedPrinted in Great Britain.
0003±4878/99/$20.00+0.00PII: S0003-4878(99)00039-3
*Corresponding author. Tel.: +1 (604) 822-6277; fax: +1(604) 822-4994.
Received 2 September 1998in ®nal form 2 March 1999.
381
by guest on July 13, 2011annhyg.oxfordjournals.org
Dow
nloaded from
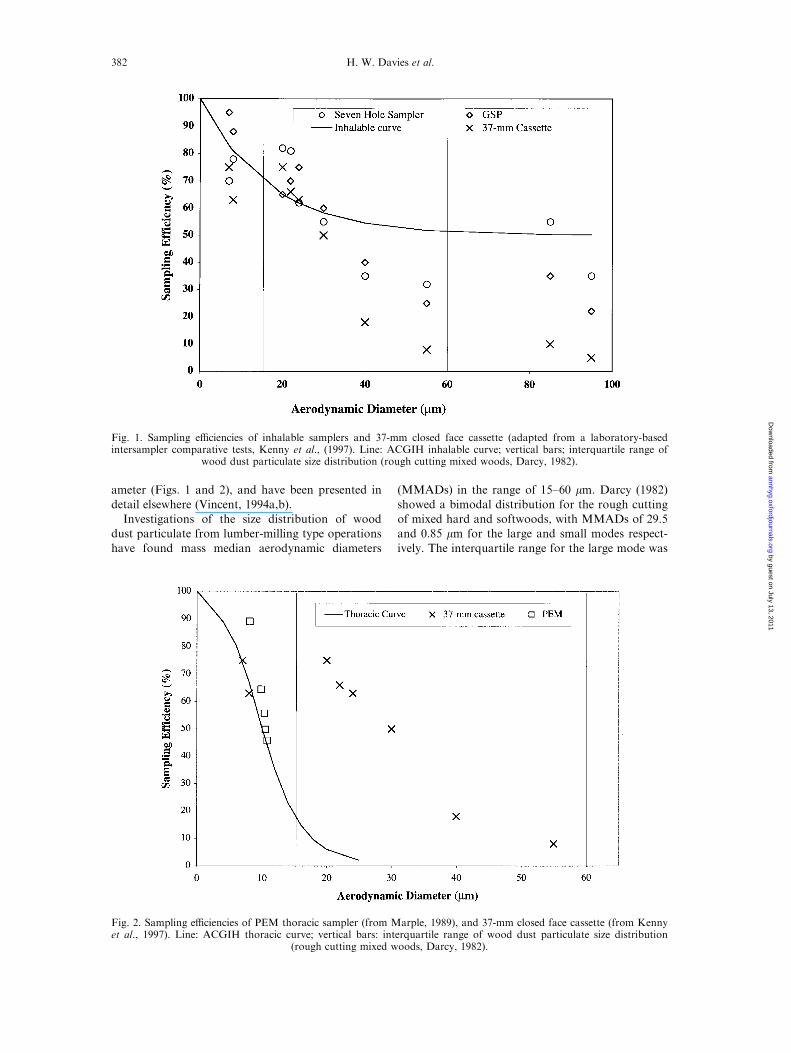
ameter (Figs. 1 and 2), and have been presented in
detail elsewhere (Vincent, 1994a,b).Investigations of the size distribution of wood
dust particulate from lumber-milling type operations
have found mass median aerodynamic diameters
(MMADs) in the range of 15±60 mm. Darcy (1982)
showed a bimodal distribution for the rough cuttingof mixed hard and softwoods, with MMADs of 29.5and 0.85 mm for the large and small modes respect-
ively. The interquartile range for the large mode was
Fig. 1. Sampling e�ciencies of inhalable samplers and 37-mm closed face cassette (adapted from a laboratory-basedintersampler comparative tests, Kenny et al., (1997). Line: ACGIH inhalable curve; vertical bars; interquartile range of
wood dust particulate size distribution (rough cutting mixed woods, Darcy, 1982).
Fig. 2. Sampling e�ciencies of PEM thoracic sampler (from Marple, 1989), and 37-mm closed face cassette (from Kennyet al., 1997). Line: ACGIH thoracic curve; vertical bars: interquartile range of wood dust particulate size distribution
(rough cutting mixed woods, Darcy, 1982).
H. W. Davies et al.382
by guest on July 13, 2011annhyg.oxfordjournals.org
Dow
nloaded from

15±60 mm. Bullock and Laird (1994) reported an
MMAD of 15 mm in sawing of particle- and wafer-
board, and from 3.5 to 20 mm for cleanup jobs.
Pisaniello et al. (1991) reported MMADs of 17±
22 mm for sawing tasks. It is generally concluded
that the major portion of wood dust mass is contrib-
uted by particles >10 mm (Hinds, 1988; Pisaniello et
al., 1991).
We used particle size-selective sampling methods
to obtain 949 personal wood dust exposure measure-
ments as part of an e�ort to assign exposure levels
to a cohort of 26 487 lumber mill workers (Teschke
et al., 1998). Because of the suspected health e�ects
of wood dust on both the upper and lower respirat-
ory tract, exposure to both inhalable and thoracic
particulate was assessed. Assessment of these frac-
tions provides a more accurate understanding of the
true deposition of aerosol in the respiratory system,
which is likely to reduce exposure misclassi®cation
in epidemiologic studies of respiratory disease.
The air monitoring was conducted at four British
Columbia lumber mills. We selected the GSP as our
inhalable sampler because it ranked highly in a
recent review of six commercially available samplers,
giving the most accurate and precise conformation
to the recommended sampling e�ciency standards
(Kenny et al., 1997). Figure 1 shows the sampling
e�ciency curves of the GSP and 37-mm sampler,
and the ACGIH inhalable standard curve.
Thoracic aerosol samples were collected using a
personal PM10 sampler, the PEM. The PEM was
the only commercially available device for personal
sampling of the thoracic fraction. Figure 2 shows
the sampling e�ciency of the PEM and 37-mm sam-
plers. The PEM gives a sharp cut-o� at 10 mm, and
its sampling e�ciency is therefore considered to
only approximate the ACGIH thoracic curve (also
shown).
In an earlier cross-sectional study of a British
Columbia lumber mill (Demers et al., 1999; Teschke
et al., 1999), inhalable samples were collected using
the seven-hole sampler (SHS). The SHS is rec-
ommended by the U.K.'s Health and Safety
Executive for sampling ``total-inhalable'' dust (HSE,
1993), and it had been found by Chung et al. (1987)
and Kenny et al. (1997) to well approximate the
published inhalable particulate sampling e�ciency
standards (Fig. 1).
Publishing comparative ®eld studies has been
encouraged to supplement laboratory work and help
the introduction of size-selective sampling tech-
niques (Kenny et al., 1997; Werner et al., 1996).
Developing ``intersampler ratios'' comparing 37-mm
sampler measurements to particle size selective
measurements is problematic however, because the
intersampler ratio is dependent on the underlying
particulate size distribution and the qualitative hom-
ogeneity of the particulate. For the inhalable frac-
tion, Werner et al. (1996) have suggested ``working''
inhalable to 37-mm sampler ``conversion factors''based on industry type, and ranging from 1.0 to 2.5,derived from studies conducted comparing the IOM
inhalable sampler (Mark and Vincent, 1986) and the37-mm sampler. Exposures and industries studied todate have included nickel production (Tsai et al.,1995), nickel electroplating (Tsai et al., 1996), alumi-
num production (Vincent, 1995), lead smelting(Spear et al., 1997), machining ¯uids in metal work-ing shops (Wilsey et al., 1996), woodworking
(Martin and Zalk, 1998; Vinzents et al., 1995), andwelding (Vinzents et al., 1995). To our knowledge,no comparative studies in occupational settings
using the GSP or SHS inhalable samplers, nor usingthe personal PEM thoracic sample have yet beenpublished.
The purpose of this paper is to present the resultsof analyses used to determine intersampler ratios forwood dust exposure using inhalable and thoracicsamplers with the 37-mm sampler. These were de-
rived using side-by-side data collected under ®eldconditions in four lumber mills. Intersampler ratiosfor GSP to 37-mm sampler, PEM to 37-mm sampler
and GSP to SHS were calculated. Full details of theexposure ®ndings of this study will be published at alater date.
MATERIALS AND METHODS
Sampling headsInhalable exposures were measured using the
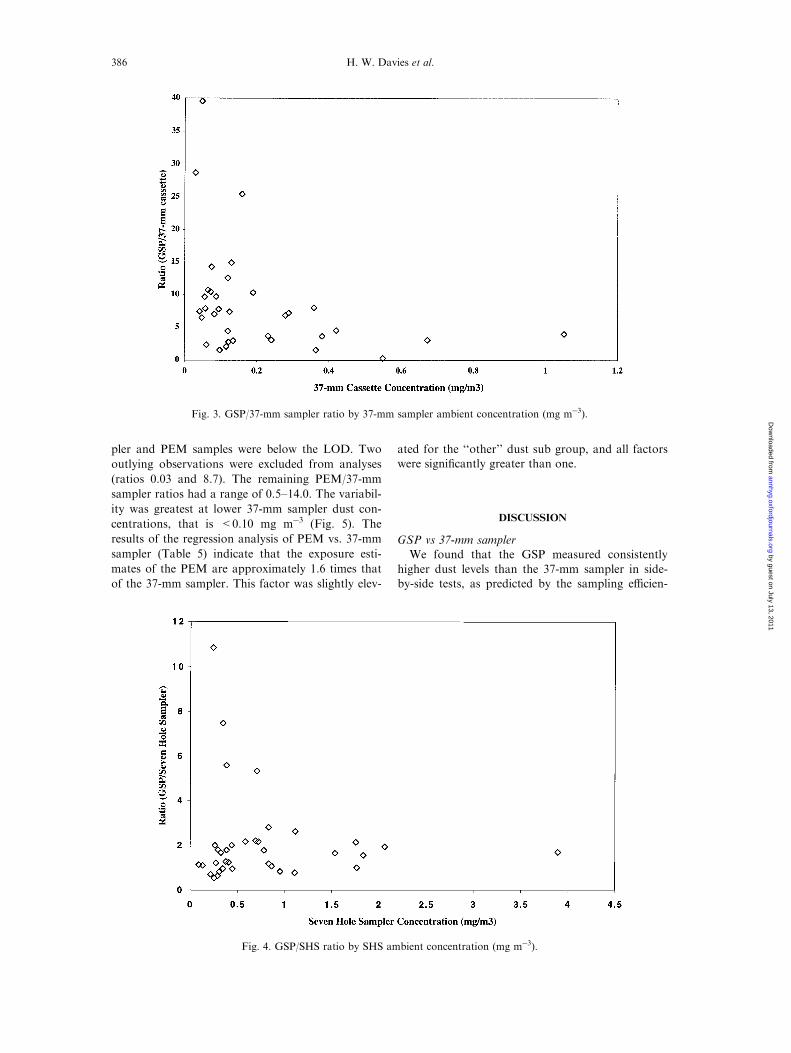
GSP sampler (Deha-Haan & Wittmer GmbH,Friolzheim, Germany) and the SHS (JS-Holdings,Stevenage, U.K.). The GSP is of cast metal con-
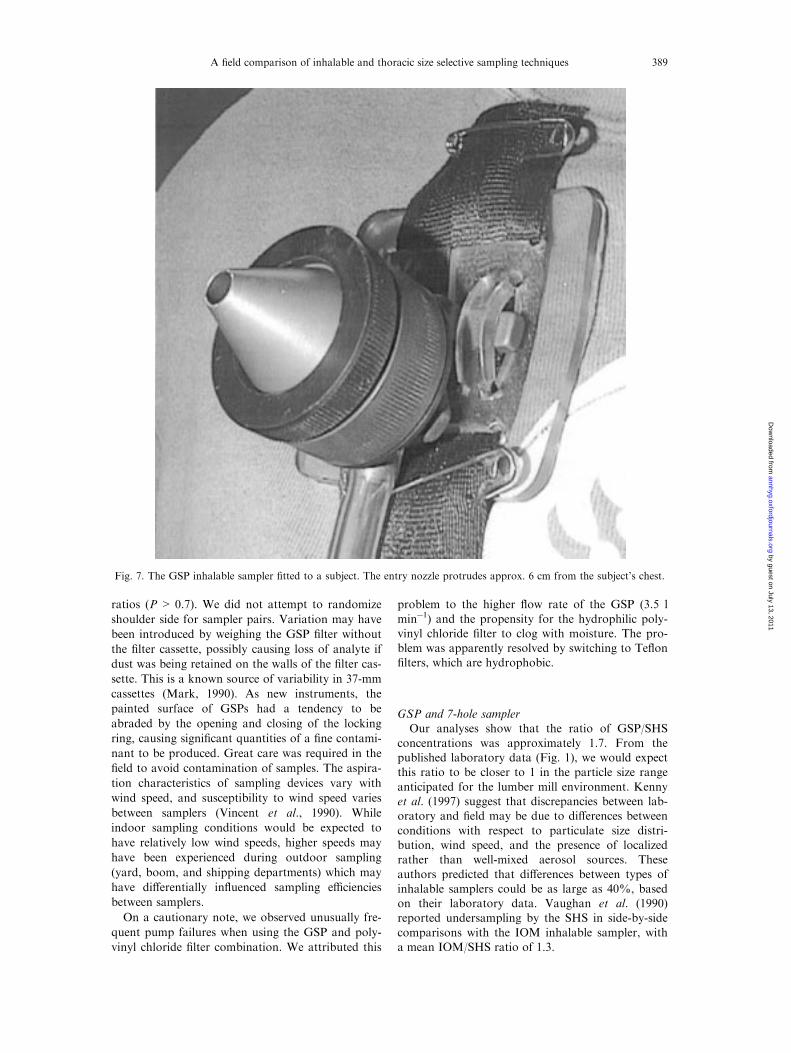
struction, with a conical aluminium inlet. It has asingle 8 mm inlet which faces outward from the sub-ject (Figs. 6 and 7). The SHS is smaller and lighter
than the GSP, constructed of injection-molded plas-tic, with seven 4-mm inlets that face outward fromthe subject (Fig. 6). The thoracic fraction wasmeasured using the personal PEM monitor (MSP
Corp., Minneapolis, MN). The PEM is of aluminumconstruction (Fig. 6). It is a two-stage sampler, the®rst stage being an annular impactor which removes
particulate >10 mm; particulate smaller than 10 mmare collected on ®lter media (Marple et al., 1987).37-mm sampler particulate was measured using a
closed-faced 37-mm cassette (SKC Inc., Eighty-Four, PA).
Filters
The SHS's were ®tted with 25-mm diameter0.45 mm pore size Te¯on ®lters (Costar, U.S.A.).GSPs used 37-mm diameter 5-mm pore size PVC or2-mm pore size Te¯on ®lters (Gelman, U.S.A.). The
PEMs used 37-mm diameter 2-mm pore size Te¯on,either with or without a polyole®n support ring
A ®eld comparison of inhalable and thoracic size selective sampling techniques 383
by guest on July 13, 2011annhyg.oxfordjournals.org
Dow
nloaded from

(Gelman, U.S.A.). The 37-mm polystyrene cassettesused 5-mm pore size polyvinylchloride ®lters.
Aerosol samplingSKC Brand personal sampling pumps (Eight-
Four, PA) were calibrated using a dry piston cali-brator (BIOS, Pompton Plains, NJ) to design ¯owrates 25%: SHS and 37-mm, 2 l minÿ1; GSP, 3.5 l
minÿ1; PEM, 4 l minÿ1. Flow rates in calculationswere averages of pre- and post-sample ¯ow rates.Pairs of pumps were attached to workers' belts, andsampling heads a�xed on the same shoulder in the
worker's breathing zone (in approx. 10% ofsampling tests, sampling heads were positioned ondi�erent shoulders). Samplers were worn for the
workers' full 8±12 h shift, including breaks. Allmeasurements were personal samples.SHS and 37-mm samplers were loaded and
unloaded at our laboratory facilities in Vancouver,BC. GSP ®lters were transported to and from thesampling sites in manufacturer-supplied ®lter car-
riers. The uncapped carrier ®tted directly into theGSP sampling head. PEM samplers were alsoreloaded in the ®eld, with ®lters transported to andfrom the site in 37-mm cassettes. Approximately
every 10th sample (for all types) was a ®eld blank.Filters were removed from GSP ®lter carriers
before weighing. All ®lters were triple weighed pre-
and post-sampling on a Sartorius microbalance(Goettingen, Germany), in an environmentally con-trolled room after ®lters had been desiccated (60 h)
and equilibrated (208C, 50% RH, >48 h). Allsample masses were adjusted by the mean weightchange of ®eld blanks.
Comparison between sampling devices
Every production, yard and maintenance job ateach of the 4 mills was targeted to be sampled atleast once with a GSP device and once with a PEM
device. For the purposes of the comparative tests werandomly selected participants from within the fullgroup, from all possible sampling days, and askedthem to wear side-by-side samplers. Our goal was to
obtain 37-mm cassette side-by-side samples forapprox. 10% of all GSP and PEM samples. Toassist us with the interpretation of the results of the
earlier cross-sectional study, we obtained a series ofGSP vs SHS side-by-side measurements for a further10% of GSP samples.
The exposure measurements were made duringthe period October 1996 to August 1997. The 4 lum-ber mills were all large commercial operations,
employing on average 60 persons per shift in pro-duction and maintenance departments. The millsrepresented both coastal (temperate, wet) and in-terior (cold winter/hot summer, dry) climates. The
mills processed only native softwood species: spruce(Picea spp.), pine (Pinus spp.), hemlock (Tsuga
spp.), Douglas ®r (Psuedotsuega menziesii) andalpine ®r (Abies lasiocarpa). Three of the four millsprocessed kiln-dried lumber in their planer mills in
addition to green wood.
Statistical analysisSample pairs with either sample below the mass
limit of detection (LOD: 37-mm sampler, GSP and
PEM samples, 0.029 mg; SHS samples, 0.070 mg)were excluded from analysis.To simplify the analysis we initially assumed the
underlying particulate distribution was uniform. Aswe discuss later, this may not be the case in thisstudy. Based on this assumption and the physical
basis of the sampling methods (which suggest the re-lationship between sampling methods should be lin-ear), simple linear regression was used to estimate
the intersampler particulate concentration ratio. Weselected either the 37-mm cassette (C37-mm ) or SHSconcentrations (CSHS ) to be the X-axis in our ana-lyses as they represented the ``standards'' to which
we compared newer methods. It was also assumedthat the measuring devices should measure a simul-taneous zero concentration and therefore all re-
gressions were forced through zero.Outliers and observations exerting high leverage
(identi®ed by residual analysis and the Cooks D
statistic) were removed. Residual analyses demon-strated reasonable homoscedasticity in all compari-sons, and therefore no transformation or weightingof variables was required. A t-test was used to com-
pare results of same- and di�erent-shoulder results.All analyses were conducted using STATA Version5 (STATA Corp., College Station, TX).
RESULTS
Table 1 gives a summary of the various sampling
regimes. In the full exposure assessment study, 419GSP and 414 PEM measurements were obtained.Side-by-side tests of GSP and PEM with SHS and37-mm samplers were subsets of these measure-
ments. GSP and PEM subsets have similar geo-metric mean and geometric standard deviation tothe full datasets, suggesting that they are representa-
tive sub-samples. The underlying distributions of allof the GSP, PEM, 37-mm samplers and SHS samplegroups were approximately log normal, with large
variances (GSDs 2.50±3.34).
GSP vs 37-mm samplerForty-two GSP/37-mm sampler paired obser-
vations were initially obtained. Five pairs wereexcluded because one of the pair (all 37-mmsamples) was below the mass LOD. Three outlyingobservations were excluded from analyses (GSP/37-
mm sampler ratios 39.1±200.7). The remainingGSP/37-mm sampler ratios were highly variable
H. W. Davies et al.384
by guest on July 13, 2011annhyg.oxfordjournals.org
Dow
nloaded from
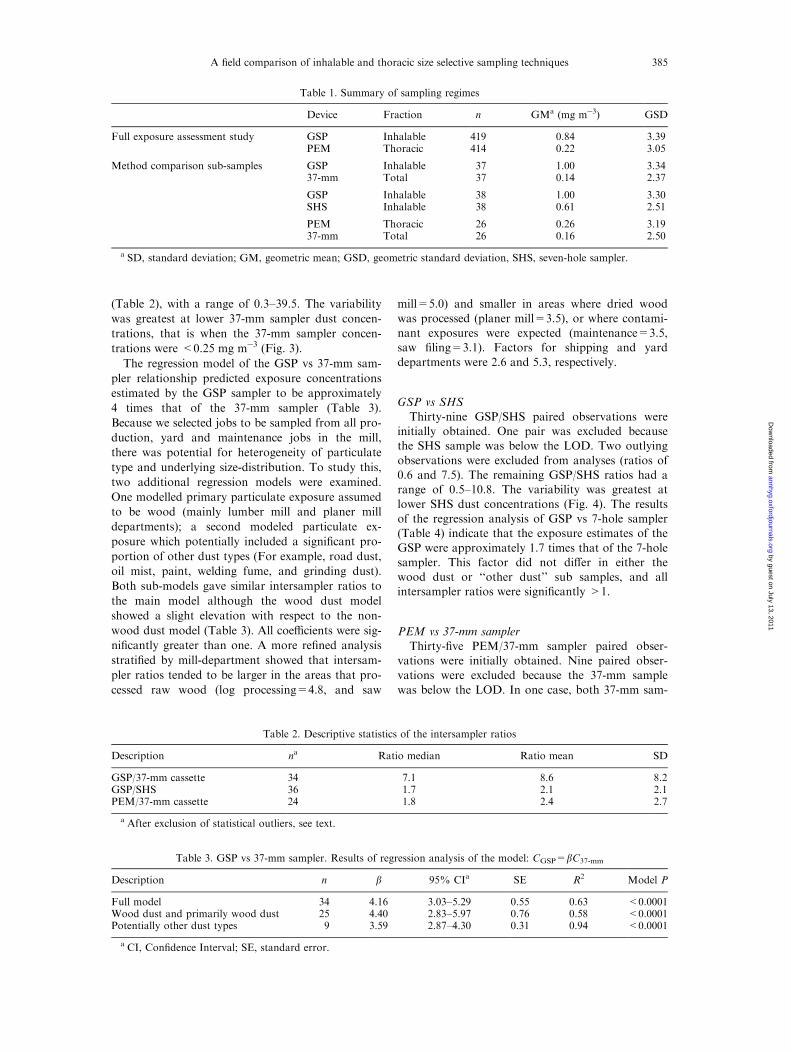
(Table 2), with a range of 0.3±39.5. The variability
was greatest at lower 37-mm sampler dust concen-
trations, that is when the 37-mm sampler concen-
trations were <0.25 mg mÿ3 (Fig. 3).The regression model of the GSP vs 37-mm sam-
pler relationship predicted exposure concentrations
estimated by the GSP sampler to be approximately
4 times that of the 37-mm sampler (Table 3).
Because we selected jobs to be sampled from all pro-
duction, yard and maintenance jobs in the mill,
there was potential for heterogeneity of particulate
type and underlying size-distribution. To study this,
two additional regression models were examined.
One modelled primary particulate exposure assumed
to be wood (mainly lumber mill and planer mill
departments); a second modeled particulate ex-
posure which potentially included a signi®cant pro-
portion of other dust types (For example, road dust,
oil mist, paint, welding fume, and grinding dust).
Both sub-models gave similar intersampler ratios to
the main model although the wood dust model
showed a slight elevation with respect to the non-
wood dust model (Table 3). All coe�cients were sig-
ni®cantly greater than one. A more re®ned analysis
strati®ed by mill-department showed that intersam-
pler ratios tended to be larger in the areas that pro-
cessed raw wood (log processing=4.8, and saw
mill=5.0) and smaller in areas where dried wood
was processed (planer mill=3.5), or where contami-nant exposures were expected (maintenance=3.5,saw ®ling=3.1). Factors for shipping and yard
departments were 2.6 and 5.3, respectively.
GSP vs SHS
Thirty-nine GSP/SHS paired observations wereinitially obtained. One pair was excluded becausethe SHS sample was below the LOD. Two outlying
observations were excluded from analyses (ratios of0.6 and 7.5). The remaining GSP/SHS ratios had arange of 0.5±10.8. The variability was greatest at
lower SHS dust concentrations (Fig. 4). The resultsof the regression analysis of GSP vs 7-hole sampler(Table 4) indicate that the exposure estimates of the
GSP were approximately 1.7 times that of the 7-holesampler. This factor did not di�er in either thewood dust or ``other dust'' sub samples, and allintersampler ratios were signi®cantly >1.
PEM vs 37-mm sampler
Thirty-®ve PEM/37-mm sampler paired obser-vations were initially obtained. Nine paired obser-vations were excluded because the 37-mm sample
was below the LOD. In one case, both 37-mm sam-
Table 1. Summary of sampling regimes
Device Fraction n GMa (mg mÿ3) GSD
Full exposure assessment study GSP Inhalable 419 0.84 3.39PEM Thoracic 414 0.22 3.05
Method comparison sub-samples GSP Inhalable 37 1.00 3.3437-mm Total 37 0.14 2.37
GSP Inhalable 38 1.00 3.30SHS Inhalable 38 0.61 2.51
PEM Thoracic 26 0.26 3.1937-mm Total 26 0.16 2.50
a SD, standard deviation; GM, geometric mean; GSD, geometric standard deviation, SHS, seven-hole sampler.
Table 2. Descriptive statistics of the intersampler ratios
Description na Ratio median Ratio mean SD
GSP/37-mm cassette 34 7.1 8.6 8.2GSP/SHS 36 1.7 2.1 2.1PEM/37-mm cassette 24 1.8 2.4 2.7
a After exclusion of statistical outliers, see text.
Table 3. GSP vs 37-mm sampler. Results of regression analysis of the model: CGSP=bC37-mm
Description n b 95% CIa SE R2 Model P
Full model 34 4.16 3.03±5.29 0.55 0.63 <0.0001Wood dust and primarily wood dust 25 4.40 2.83±5.97 0.76 0.58 <0.0001Potentially other dust types 9 3.59 2.87±4.30 0.31 0.94 <0.0001
a CI, Con®dence Interval; SE, standard error.
A ®eld comparison of inhalable and thoracic size selective sampling techniques 385
by guest on July 13, 2011annhyg.oxfordjournals.org
Dow
nloaded from
pler and PEM samples were below the LOD. Two
outlying observations were excluded from analyses
(ratios 0.03 and 8.7). The remaining PEM/37-mm
sampler ratios had a range of 0.5±14.0. The variabil-
ity was greatest at lower 37-mm sampler dust con-
centrations, that is <0.10 mg mÿ3 (Fig. 5). The
results of the regression analysis of PEM vs. 37-mm
sampler (Table 5) indicate that the exposure esti-
mates of the PEM are approximately 1.6 times that
of the 37-mm sampler. This factor was slightly elev-
ated for the ``other'' dust sub group, and all factorswere signi®cantly greater than one.
DISCUSSION
GSP vs 37-mm samplerWe found that the GSP measured consistently
higher dust levels than the 37-mm sampler in side-by-side tests, as predicted by the sampling e�cien-
Fig. 3. GSP/37-mm sampler ratio by 37-mm sampler ambient concentration (mg mÿ3).
Fig. 4. GSP/SHS ratio by SHS ambient concentration (mg mÿ3).
H. W. Davies et al.386
by guest on July 13, 2011annhyg.oxfordjournals.org
Dow
nloaded from

cies of the two devices in the particle size rangeexpected in a lumber mill environment (Fig. 1). Thisis consistent with the ®ndings of previous inhalable/
37-mm cassette comparative studies (Werner et al.,1996; Martin and Zalk, 1998).The GSP to 37-mm sampler intersampler ratio
was estimated to be approximately 4. Vinzents et al.(1995) reported a ratio of medians of inhalable to37-mm sampler measurement to be slightly less than
2 at two Scandinavian woodworking sites. Martinand Zalk (1998) reported an inhalable/37-mm sam-pler ratio of 2±4 at higher dust concentration levels
(>0.5 mg mÿ3) in their carpentry shop study. Thedi�ering ratios reported might be due to di�erencesin underlying particle size distributions resultingfrom di�ering machining processes and wood
characteristics.GSP/37-mm sampler ratios ranged from 0.23 to
39.5. This broad range may have been due in part to
heterogeneity in underlying particle size distri-butions. Di�erences in particle size distributionscould be attributed to: (i) variability of processes,
for example, planing vs sawing; (ii) variation inwood state, for example, green vs kiln-dried woodor wet vs dry; (iii) variation in factors associated
with site and season, such as species processed, pro-cessing of frozen wood, or rain-dampening of air-borne wood dust; or (iv) variation in particulate
exposure composition within jobs, particularlymaintenance and yard jobs that may be exposed tocontaminating particulate such as oil mist, welding
fume, grinding dust, or road dust. To investigate thee�ect of qualitative di�erences, we analyzed the datagrouped by dust type (for example, primarily woodvs those potentially exposed to other dust types) and
by department. There was a small and non-signi®-cant di�erence by dust type. Departments processinggreen wood showed larger intersampler ratios than
Table 4. GSP vs SHS: results of regression analysis of the model: CGSP=bCSHS
Description n b 95% CI SE R2 Model P
Full model 36 1.75 1.48±2.02 0.13 0.83 <0.0001Wood dust and primarily wood dust 26 1.76 1.42±2.09 0.16 0.82 <0.0001Potentially other dust types 10 1.70 1.30±2.11 0.18 0.91 <0.0001
Fig. 5. PEM/37-mm sampler ratio by 37-mm sampler ambient concentration (mg mÿ3).
Table 5. PEM vs 37-mm sampler: results of regression analysis of the model: CPEM=bC37-mm
Description n b 95% CI SE R2 Model P
Full model 24 1.58 1.25±1.92 0.162 0.81 <0.0001Wood dust and primarily wood dust 19 1.50 1.07±1.93 0.203 0.75 <0.0001Potentially other dust types 5 1.83 1.43±2.24 0.146 0.98 <0.0001
A ®eld comparison of inhalable and thoracic size selective sampling techniques 387
by guest on July 13, 2011annhyg.oxfordjournals.org
Dow
nloaded from
departments where dried wood or contaminant ex-posures were expected. These di�erences were con-
sistent with the predicted underlying particle sizedistribution. We would expect a ratio close to 1 withsmall particle sizes (such as welding fume and ®ne
dried wood dust) where both GSP and 37-mm cas-sette have high sampling e�ciency, with the ratioincreasing as the particle size increases (for example,
coarser wood dust) and the e�ciency of the 37-mmcassette decreases relative to the GSP sampler.However, particle size distributions are unlikely to
account for all of the variability seen in the GSP/37-
mm sampler ratios. Others sources of variabilitymay be associated with characteristics of the individ-ual samplers. As with the more widely used IOM
inhalable sampler, the GSP may be vulnerable to``projectile'' particles which would normally be toolarge to be aspirated (Baron, 1998). Variability in in-
dividual GSP vs 37-mm sampler ratios was greatestat low 37-mm sampler dust concentrations. This isconsistent with loading of the GSP ®lter with projec-
tile particulate, as the ratio would be most sensitiveto projectile loading at low ambient particulate con-centrations. Because the inlet of the GSP projects so
far from the subject's body (approx. 6 cm, Fig. 7), itmay also be susceptible to direct aspiration of
settled particulate from accidentally contacted sur-faces. This would be a problem especially for sub-jects working in cramped and dusty conditions, such
as maintenance workers in the lumber mills. This isa time when accurate exposure measurement is par-ticularly important, as it may be a signi®cant contri-
butor to the individual's overall exposure.Similar ®ndings of increased variability at low
ambient particulate concentration have beenreported by Martin and Zalk (1998), who found
inhalable (IOM sampler) vs 37-mm sampler ratios inthe range of 2±71 when 37-mm sampler dust con-centrations were below 0.5 mg mÿ3, and 1.8±4.1
above 0.5 mg mÿ3.Other sources of variability can be imagined.
Approximately 90% of our intersampler comparison
tests were conducted with the sampling heads physi-cally adjacent on the same shoulder. Vaughan et al.(1990) showed that variability between samples on
di�erent shoulders could be large in comparison tointer-device variability, but we did not see a signi®-cant di�erence between same- and di�erent-shoulder
Fig. 6. Particulate size-selective samplers: clockwise from top left: PEM, 7HS, GSP, 37-mm cassette.
H. W. Davies et al.388
by guest on July 13, 2011annhyg.oxfordjournals.org
Dow
nloaded from
ratios (P > 0.7). We did not attempt to randomize
shoulder side for sampler pairs. Variation may have
been introduced by weighing the GSP ®lter without
the ®lter cassette, possibly causing loss of analyte if
dust was being retained on the walls of the ®lter cas-
sette. This is a known source of variability in 37-mm
cassettes (Mark, 1990). As new instruments, the
painted surface of GSPs had a tendency to be
abraded by the opening and closing of the locking
ring, causing signi®cant quantities of a ®ne contami-
nant to be produced. Great care was required in the
®eld to avoid contamination of samples. The aspira-
tion characteristics of sampling devices vary with
wind speed, and susceptibility to wind speed varies
between samplers (Vincent et al., 1990). While
indoor sampling conditions would be expected to
have relatively low wind speeds, higher speeds may
have been experienced during outdoor sampling
(yard, boom, and shipping departments) which may
have di�erentially in¯uenced sampling e�ciencies
between samplers.
On a cautionary note, we observed unusually fre-
quent pump failures when using the GSP and poly-
vinyl chloride ®lter combination. We attributed this
problem to the higher ¯ow rate of the GSP (3.5 l
minÿ1) and the propensity for the hydrophilic poly-vinyl chloride ®lter to clog with moisture. The pro-blem was apparently resolved by switching to Te¯on®lters, which are hydrophobic.
GSP and 7-hole samplerOur analyses show that the ratio of GSP/SHS
concentrations was approximately 1.7. From thepublished laboratory data (Fig. 1), we would expectthis ratio to be closer to 1 in the particle size range
anticipated for the lumber mill environment. Kennyet al. (1997) suggest that discrepancies between lab-oratory and ®eld may be due to di�erences between
conditions with respect to particulate size distri-bution, wind speed, and the presence of localizedrather than well-mixed aerosol sources. These
authors predicted that di�erences between types ofinhalable samplers could be as large as 40%, basedon their laboratory data. Vaughan et al. (1990)reported undersampling by the SHS in side-by-side
comparisons with the IOM inhalable sampler, witha mean IOM/SHS ratio of 1.3.
Fig. 7. The GSP inhalable sampler ®tted to a subject. The entry nozzle protrudes approx. 6 cm from the subject's chest.
A ®eld comparison of inhalable and thoracic size selective sampling techniques 389
by guest on July 13, 2011annhyg.oxfordjournals.org
Dow
nloaded from
During early sampling e�orts we found the SHSsusceptible to air leakage due to the loosening of thefaceplate (these samples were excluded from ana-
lyses). We resolved this by sealing the plate/basejoint with electrical tape. Despite this, technicalerrors generally seem to have a small e�ect on pre-cision. We calculated pooled coe�cients of variation
from intra-sampler side-by-side tests and foundthem to be 12 and 15% for GSP (n=29 pairs) andSHS (n=21 pairs), respectively. While the SHS tests
were personal samples, the GSP tests were station-ary, and additional methodological issues such assampler positioning may be of importance when
considering precision in personal sampling.A factor of 1.7 between the two inhalable tech-
niques is a concern, and indicates that substantially
di�erent results could be obtained even in the sameambient particulate concentration. We do not knowif this problem is uniquely associated with wood-dust monitoring. The ACGIH (1998) has proposed
new inhalable threshold limit values for wood dustexposure. The lowest proposed limit is 0.5 mg mÿ3
(Western red cedar), which is in the concentration
range giving the highest inter-method variability.Such variability is one of the problems of current``total'' dust sampling which size-selective sampling
was hoped to address.
PEM vs 37-mm samplerThe results indicated a PEM/37-mm sampler ratio
equal to 1.6, much higher than anticipated from therelative sampling e�ciencies of these samplers in therange of particulate size expected in a lumber mill,and given the sharp cut-o� characteristic of the
PEM sampler (Fig. 2). Whether this is due to rela-tive oversampling by the PEM or undersampling bythe 37-mm sampler method is not understood.
The 37-mm sampler is known to be susceptible tosigni®cant wall losses due to static charge, up to40% of 37-mm sampler mass aspirated at 40 mmMMAD (Mark, 1990). It is also possible that thePEM is unsuited to the higher particulate concen-trations found in occupational settings. The PEMhas to date primarily been utilized in environmental
studies, with average concentrations in the order of0.08±0.15 mg mÿ3 (Clayton et al., 1993; Thomas etal., 1993; OÈ zkaynak et al., 1996). Robins et al.
(1997), however, used PEMs in their study of occu-pational exposure to metalworking ¯uids, reportingmean concentrations of 0.13±0.56 mg mÿ3. The pre-
cision of the PEM in the higher concentrationsfound in industrial environments has not, to ourknowledge, been investigated. When individual
PEM/37-mm sampler ratios were plotted againstPEM concentrations, we found a slight positivetrend. This may suggest particle bounce, and over-loading (data not shown). We observed a few
samples in which particulate that had built up onthe impactor spilled over on to the ®lter. The reten-
tion ability of the impactor, and therefore thesampling e�ciency of the samplers, was probablyimpaired before actual spillage occurred, and so
more samples may have been a�ected.Again we found large variability in individual
PEM/37-mm sampler ratios, greatest at low 37-mmsampler dust concentrations. For the PEM this is
unlikely due to the incursion of projectile particles,as particles propelled (as opposed to normally aspi-rated) into the PEM would be expected to be
removed by the impactor. It should be noted thatincluding outliers (excluded in regression analyses)in these analyses did not a�ect the pattern of ratio
variability for any intersampler comparison.
Limitations of the studyA detailed method comparison was not one of the
original objectives of this exposure study, and wedid not obtain adequate sample numbers for strati®-cation across all qualitatively homogenous groupsof interest (for example, jobs or departments).
Ordinary least squares regression, though appropri-ate for a cursory analysis, did not provide a good-®tting model even after exclusion of statistical out-
liers (although the regression coe�cient was stabil-ized, in e�ect removing extreme ratios). Anunderlying assumption of linear regression is that
the independent variable is measured without error.In the case of the comparison of two samplingmethods, it is not always clear which is the referencemethod, and very di�erent regression slopes may be
calculated for the two possible models. Such was thecase in our study. Some authors have addressed thisproblem by using alternate methods, such as the
Deming linear regression analysis that minimizeboth x and y residuals simultaneously, resulting in asingle regression line (Janssen et al., 1998).
Interpretation of our results would have been aidedby having particle size distribution data for thesampling sites.
CONCLUSIONS
In a side-by-side comparison of particle size selec-tive methods in a lumber mill environment, wefound the GSP/37-mm sampler dust ratio to be ap-
proximately 4. This is consistent with previouslyreported results from similar studies, and with theunderlying particle size distribution of wood dust.
We found large variability in individual GSP/37-mm sampler ratios. Factors potentially contributingto this variability were the heterogeneous nature of
the underlying particle size distribution, vulner-ability of the GSP to ``projectile'' particles, variabil-ity in the ambient wind speed, and perhaps lossesdue to electrostatic e�ects in the walls of the 37-mm
sampler. We suspect that the GSP may be also sus-ceptible to direct aspiration of particulate from acci-
H. W. Davies et al.390
by guest on July 13, 2011annhyg.oxfordjournals.org
Dow
nloaded from
dentally contacted surfaces. The highest degree ofvariability occurred at lower concentrations. In acomparison of two types of inhalable sampler, we
found the GSP sampler to oversample relative tothe SHS by a factor of 1.7.Such large degrees of variability both within
GSPs at low concentrations, and between the GSP
and SHS, which have both been categorized as``inhalable samplers'', is a concern. This variabilitymay cause a high degree of uncertainty when com-
paring sampling results to regulatory limits, and inattributing health outcomes to exposure. Assuggested by Martin and Zalk (1998), further study
into sources of variability in inhalable sampling inthe industrial environment are needed.A surprising result was the PEM/37-mm sampler
ratio of 1.6, higher than would have been predictedgiven the small range of particulate aerodynamic di-ameters the PEM device is designed to collect. ThePEM was originally designed for environmental stu-
dies and relatively low aerosol concentrations. It ispossible that the device is unsuited to the higherconcentrations found in some occupational environ-
ments, suggesting further investigation in this areaare needed.We recommend that at least with respect to wood
dust, the adoption of particle size selective samplingbe made cautiously, until there is a better under-standing of the performance of these devices in theindustrial environment. Intersampler ratios or ``con-
version factors'' must be used with extreme care. Assuggested by Werner et al., (1996), these ratiosshould probably be used only to reinterpret individ-
ual sets of exposure data, and homogeneity of theunderlying particle size distribution and the speci®cdevice type used should be taken into account.
AcknowledgementsÐOur thanks to the hundreds of BritishColumbia lumber mill workers who participated in thestudy, and to the corporations who provided sites, andmuch support in kind. This study was funded in part bythe Medical Research Council of Canada.
REFERENCES
ACGIH (1985) Particle Size Selective Sampling in theWorkplace. American Conference of GovernmentalIndustrial Hygienists, Cincinnati, OH.
ACGIH (1997) Threshold Limit Values for ChemicalSubstances and Physical Agents, Biological ExposureIndices. ACGIH, Cincinnati, Ohio.
Baron, P. A. (1998) Personal aerosol sampler design: areview. Appl. Occup. Environ. Hyg 13(5), 313±320.
Bullock, W. H. and Laird, T. L. (1994) A pilot study ofthe particle size distribution of dust in the paper andwood products industry. Am. Ind. Hyg. Assoc. J 55(9),836±840.
Chung, K. Y. K., Ogden, T. L. and Vaughan, N. P.(1987) Wind e�ects on personal dust samplers. J.Aerosol Science 18, 159±174.
Clayton, C. A., Perritt, R. L., Pellizzari, E. D., Thomas,K. W., Whitmore, R. W., Wallace, L. A., OÈ zkaynak, H.
and Spengler, J. (1993) Particle total exposure assess-ment methodology (PTEAM) study: distributions ofaerosol and elemental concentrations in personal, indoorand outdoor air samples in a southern California com-munity. J. Exp. Anal. Environ. Epi 3(2), 227±250.
Darcy, F. J. 1982 Physical characteristics of wood dust.Ph.D. thesis, University of Minnesota.
Demers, P. A., Teschke, K., Kennedy, S. M., Davies, H.W., Bartlett, K. and Leung, V. (1999) Exposure to dust,resin acids, and monoterpenes in softwood lumber mills.Am. Ind. Hyg. Assoc. J (submitted).
HSE (1993) General methods for gravimetric determi-nation of respirable and total inhalable dust. InMethods for the Determination of Hazardous Substances,vol. 14. Health and Safety Executive, UK.
Hinds, W. C. (1988) Basis for particle size-selectivesampling for wood dust. Appl. Ind. Hyg 3(3), 67±72.
Jannsen, N. A. H., Hoek, G., Harssema, H. andBrunekeef, B. (1998) Personal sampling of airborne par-ticles: method performance and data quality. J.Exposure Analysis and Environ. Epidem 8(1), 37±49.
Kenny, L. C., Aitken, R., Chalmers, C., Fabries, J. F.,Gonzalez-Fernandez, E., Kromhout, H., Liden, G.,Mark, D., Reidiger, G. and Prodi, V. (1997) A colla-borative European study of personal inhalable aerosolsampler. Ann. Occup. Hyg 41(2), 135±153.
Mark, D. (1990) The use of dust-collecting cassettes indust samplers. Ann. Occup. Hyg 34(3), 281±291.
Mark, D. and Vincent, J. H. (1986) A new personal sam-pler for airborne total dust in workplaces. Ann. Occup.Hyg 30(1), 89±102.
Marple, V. A. (1989) PEM development, fabrication, evalu-ation and calibration. Report, Research TriangleInstitute. MSP Corporation, Minneapolis, MN.
Marple, V. A., Rubow, K. L., Turner, W. and Spengler, J.D. (1987) Low ¯ow rate sharp cut impactors for indoorair sampling: design and calibration. J. Air Pollut.Control Assoc 37, 1303±1307.
Martin, J. R. and Zalk, D. M. (1998) Comparison of totaldust/inhalable dust sampling methods for the evaluationof airborne wood dust. Appl. Occup. Environ. Hyg13(3), 177±182.
OÈ zkaynak, H., Xue, J., Spengler, J., Wallace, L.,Pellizzari, E. and Jenkins, P. (1996) Personal exposureto airborne particles and metals: results from the par-ticle team study in Riverside California. J. Exposure.Anal. Environ. Epidemiol 6(1), 57±78.
Pisaniello, D. L., Connell, K. E. and Muriale, L. (1991)Wood dust exposure during furniture manufacturingÐresults from an Australian survey and considerations forthreshold development. Am. Ind. Hyg. Assoc. J 52, 485±492.
Robins, T., Seixas, N., Franzblau, A., Abrams, L.,Minick, S., Burge, H. and Schork, M. A. (1997) Acuterespiratory e�ects on workers exposed to metalworking¯uid aerosols in an automotive transmission plant. Am.J. Indust. Med 31, 510±524.
Spear, T. M., Werner, M. A., Bootland, J., Harbour, A.,Murray, E. P., Rossi, R. and Vincent, J. H. (1997)Comparison of methods for personal sampling of inhal-able and 37-mm sampler lead and cadmium-containingaerosols in a primary lead smelter. Am. Ind. Hyg. Assoc.J 58, 893±899.
Teschke, K., Ostry, A., Hertzman, C., Demers, P. A.,Barroetavena, M. C., Davies, H. W., Dimich-Ward, H.,Heacock, H. and Marion, S. (1998) Opportunities for abroader understanding of work and health: multipleuses of an occupational cohort database. CanadianJournal of Public Health 89(2), 132±136.
Teschke, K., Demers, P. A., Davies, H. W., Kennedy, S.M. and Leung, V. (1999) Determinants of exposure to
A ®eld comparison of inhalable and thoracic size selective sampling techniques 391
by guest on July 13, 2011annhyg.oxfordjournals.org
Dow
nloaded from
inhalable particulate, wood dust, resin acids and mono-terpenes in a lumber mill environment. Ann. Occ. Hyg43(4), 247±255.
Thomas, K. W., Pellizzari, E. D., Clayton, A., Whitaker,D. A., Shores, R. C., Spengler, J., OÈ zkaynak, H.,Froelich, S. E. and Wallace, L. A. (1993) Particle totalexposure assessment methodology (PTEAM) 1990study: method performance and data quality for per-sonal, indoor and outdoor monitoring. J. Exp. Anal.Environ. Epidem 3, 203±226.
Tsai, P. J., Vincent, J. H., Wahl, G. and Maldonaldo, G.(1995) Occupational exposure to inhalable and totalaerosol in the primary nickel production industry.Occupational and Environmental Medicine 52,793±799.
Tsai, P. J., Werner, M. A., Vincent, J. H. and Maldonado,G. (1996) Worker exposure to nickel-containing aerosolin two electroplating shops: comparison between inhal-able and total aerosol. Appl. Occup. Environ. Hyg 11(5),484±492.
Vaughan, N. P., Chalmers, C. P. and Botham, R. A.(1990) Field comparison of personal samplers for inhal-able dust. Ann. Occup. Hyg 34, 560±564.
Vincent, J. H. (1994a) Measurement of coarse aerosols inworkplaces: a review. Analyst 119, 13±18.
Vincent, J. H. (1994b) Measurement of ®ne aerosols inworkplaces: a review. Analyst 119, 19±25.
Vincent, J. H. (1995) Progress towards implementation ofnew aerosol industrial hygiene standards, with specialreference to the aluminum industry. The Science of theTotal Environment 163, 3±9.
Vincent, J. H., Mark, D., Miller, B. G., Armbruster, L.and Ogden, T. L. (1990) Aerosol inhalability at higherwindspeeds. J. Aerosol Sci 21, 577±586.
Vinzents, P. S., Thomassen, Y. and Hetland, S. (1995) Amethod for establishing tentative occupational exposurelimits for inhalable dust. Ann. Occup. Hyg 39(6), 795±800.
Werner, M. A., Spear, T. M. and Vincent, J. H. (1996)Investigation into the impact of introducing workplaceaerosol standards based on the inhalable fraction.Analyst 121, 1207±1214.
Wilsey, P. W., Vincent, J. H., Bishop, M. J., Brosseau, L.M. and Greaves, I. A. (1996) Exposures to inhalableand total oil mist aerosol by metal machining shopworkers. Am. Ind. Hyg. J 57, 1149±1153.
H. W. Davies et al.392
by guest on July 13, 2011annhyg.oxfordjournals.org
Dow
nloaded from