a contextual analysis of electoral participation sequences (with françois buton & claire...
TRANSCRIPT
191
Chapter 10A Contextual Analysis of Electoral Participation Sequences
François Buton, Claire Lemercier and Nicolas Mariot
C. Lemercier ( )
Center for the Sociology of Organizations (CSO), CNRS, Paris, France
e-mail: [email protected]
F. Buton
Center for the Political Study of Latin Europe (CEPEL), CNRS, Montpellier, France
N. Mariot
European Center for Sociology and Political Science (CESSP), CNRS, Paris, France
Introduction
This chapter presents the first steps in a collective research program, PAECE, that
aims at qualifying mainstream models in electoral studies by considering electoral
participation not merely as an individual act, but also as the product of social en-
vironments (CEPEL 2009). In order to observe such environments, small spaces
of analysis have been chosen by each research team in PAECE, in the spirit of
ecological analysis. In these French local contexts, it has been possible to use re-
cords of turnout in order to analyze behaviors, not discourses; this difference in
sources is important, as abstention is under-reported in opinion polls and interviews
(Braconnier and Dormagen 2007). We had of course no access to the contents of the
vote, but we know whether registered voters participated in each election, thanks
to signature lists. One of these teams, that of François Buton and Nicolas Mariot,
built a longitudinal dataset: for one polling station, situated in a residential part of
a town in the Paris region, it records 29,756 traces of acts of turnout or abstention,
over three decades (1982–2008) and 44 ballots. It also includes limited but useful
information on voters and especially on their living together in households.
Such a dataset requires some sort of sequence analysis. Of course, it is always
possible to reduce turnout trajectories to one number by computing individual par-
ticipation rates. We have done it and it has produced interesting results. However,
patterns in the trajectories themselves also deserve to be described and interpreted.
We have begun to do so in a paper that has been published in a mainstream journal
in the field (Buton et al. 2012), despite or thanks to its methodological peculiarities.
Interested readers should refer to this paper to learn more about the setting of the
Ph. Blanchard et al. (eds.), Advances in Sequence Analysis: Theory, Method, Applications, Life Course Research and Social Policies 2, DOI 10.1007/978-3-319-04969-4_10,
© Springer New York Heidelberg Dordrecht London 2014
F. Buton et al.192
case study, which we will only briefly sum up here. Our first results are also pre-
sented there. They show an extremely high homogeneity of voting patterns inside
what we call “electorate households”. Registered voters who live together tend to
vote or abstain at the exact same moments. Not taking into account this specific
social dimension of participation thus leads to misinterpret it. This chapter provides
a more methodological reading of the first stages of this research, those that led to
the 2012 paper and those that happened afterward.
The second part presents the ways in which our research design allows us to
contextualize the analysis of electoral participation. This design is replicable and in
no way specific to France; we hope that it will be an inspiration for other research-
ers. The third part sums up our published results on the correlation of participation
behaviors inside households and the correlation between position in the household
and participation. It shows why sequence analysis was essential in producing these
results and how a slightly different, less standard modeling can help to better inter-
pret them. The fourth part opens an even more temporal question: do parents vote
more when their children become potential voters? We show how visualizations
help to tackle this question. The fifth and final part presents tentative results that
differentiate ballots according to the type of election, hence introducing a third type
of contextualization, after the synchronic household context and the diachronic con-
text of individual voting trajectories.
A Contextual Analysis
Electoral studies generally belong to the realm of standard methods considering
a “general linear reality”, in the words of Abbott (2001). Information on voting
behavior is gathered through large-scale surveys of representative samples of non-
related voters. This behavior is explained by more or less standard attributes of
voters, e.g. gender, age, occupation, religion. Voting is seen as a conscious decision,
isolated from social contexts as well as isolated in time: even recent panel studies
have rarely taken more than four ballots into account. Hence, turnout is often con-
sidered as the output of an individual, general tendency that can be, e.g., related to
an interest in politics and correlated with variables such as age or education.
However, pioneering studies taking into account more than one ballot have
abundantly shown that consistent participators and consistent abstainers were a mi-
nority (Lancelot 1968; Subileau and Toinet 1993). Our own data makes this point
even clearer: if we concentrate on the 1,665 voters who were registered for at least
three ballots, we only find 16 % of consistent participators and 7 % of consistent
abstainers, most of the latter being registered eight times or less. Turnout thus has
its patterns: trajectories are rarely plain, but they are not random either—hence the
interest of exploring them.
We study them with hypotheses that are rather different from the standard model.
We consider turnout as an institution, in the sense of something that individuals tend
to take for granted, not to reflexively question: a sort of routine that is collectively
10 A Contextual Analysis of Electoral Participation Sequences 193
performed, in which imitation, acting like other voters, plays an important role.
Participation is not performed by everybody, for abstention happens; but it happens
neither randomly nor necessarily as a product of an individual conscious decision.
In some cases, abstention can also be a routine. This view of electoral participation
calls for a contextualized study, in order to test the importance of various contexts:
do voters act like voters close to them, especially in their own household (social
context)? Do they act as they used to (temporal context)? Do they act like other vot-
ers at the same time, whatever the personal connection (political context)?
Three Contexts of Turnout
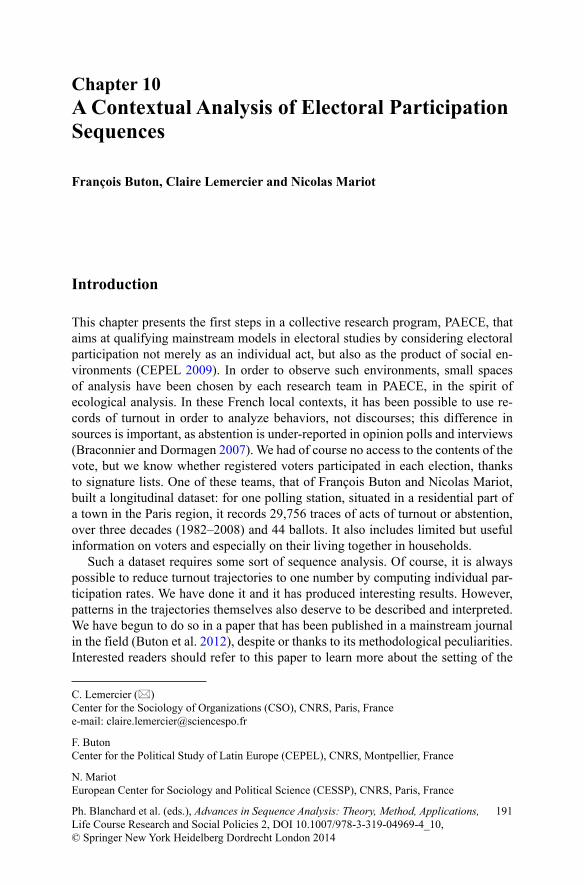
A very simple visualization of our trajectories, provided, like the rest of our analy-
sis, by the R package TraMineR, clearly illustrates this point (Fig. 10.1; for R, see R
Development Core Team 2013). Each line in this index-plot represents a voter, and
lines are sorted according to their pairwise similarity, as defined by a distance that
we will present below. The scarcity of consistent behaviors is visible. There are few
completely black or green lines, describing consistent participators, and almost no
completely orange or gray lines, denoting consistent abstention.
Many trajectories include large white patches: these are associated with ballots
when the voter was not registered in this polling station. He could have been too
)LJ�� ����� A visualization of participation trajectories (index-plots). Sorting based on multi-
dimensional scaling on the optimal matching distance defined below. Participation: Black/Green.
Abstention: Gray/Orange. Not registered: White/White
F. Buton et al.194
young to vote (the minimum age is 18 in France) or deceased at that time, but most
of these non-registrations are related to moves in space. In France, registration is
automatically performed by the administration only for young people who turn 18;
they are then registered at the polling station where they live. When a voter moves
to another place, hence a different polling station, it is up to her to state it and make
a new registration in her new domicile. If she has just moved to our polling station,
her colored line begins at that time; if she has moved from our polling station to
another, it ends.
Patterns in our trajectories are not only created by registration. Vertical orange/
gray lines can be noticed in the dominant green/black landscape: while a majority
of registered voters participated in most ballots, some are characterized by over-
whelming abstention. In addition to these horizontal or vertical lines, a more subtle
pattern is also apparent: there is more green in the lower-right corner, more orange
in the upper-left one. It thus seems that those who became registered voters late in
our period often tended to vote, contrary to those who were only registered in the
early years. What is even more obvious, finally, is that much diversity remains to be
described and explained, apart from these general patterns.
The aim of our research is to provide such a description, which is not an easy
task, if we want to take the timing and not only the aggregate number of acts into
account. In addition, we will consider possible mechanisms that would help to make
sense of this description. They relate to three types of contextualization: social, tem-
poral and political. They will play a prominent role in the next parts of this chapter;
let us briefly list them here.
First, voting does not appear as an individual decision, because people who live
together tend to go, or not to go, to the polling station together. If we group the lines
in Fig. 10.1 according to household, new, very sharp patterns appear that capture a
large part of its diversity. It is our most important result, and taking timing into ac-
count allowed us to better assess it, as we will show in the third part of this chapter.
Secondly, although consistent participators/abstainers are rare, it is reasonable
to think of “participation careers” in which voters more or less consciously build
on their previous actions, acting consistently in one way or another—even if con-
sistency consists in regularly alternating between vote and abstention. In a side
comment, Abbott (2005) clearly stated that in his view, standard electoral studies
were wrong because they underestimated the fact that votes are mostly based on in-
dividual memories (he did not consider our two other types of context). Our dataset
allows this sort of temporal contextualization, although we have not yet focused
our investigations on it. The general idea, here, is to focus on the horizontal lines of
Fig. 10.1. Parts three and four of this chapter will show our first steps in this direc-
tion of a genuine longitudinal study.
Third, each moment in time, here each ballot, also can be considered as a specific
context, in that the registered voters are more or less exposed to the same informa-
tion from the mass media; to the same, narrow or wide, range of political parties,
etc. It means that vertical lines in Fig. 10.1 are not to be ignored. Attributes of the
ballots therefore should also be taken into account in our analysis—a dimension
of context that we will briefly begin to address in part five. While we have not yet
10 A Contextual Analysis of Electoral Participation Sequences 195
brought all these dimensions together in a comprehensive description, let alone a
model, our point is here to show that our research design, simple as it seems, allows
us to tackle all of them.
A Specific Research Design
We chose this design because our background was quite distinct from that of spe-
cialists of electoral studies, which deserves a few comments. First, we learned
quantitative methods in France, a country where specific, more descriptive and of-
ten more contextual methods than in the English-speaking world have been devel-
oped for applications in sociology and history and have become dominant in some
fields—such as, for example, multiple correspondence analysis (Greenacre and
Blasius 1994). Using formal methods in micro case studies that allow researchers to
carefully build their own datasets, including non-standard variables, has been more
routine there than elsewhere (see Lemercier and Zalc (2008) for a handbook and
Mariot and Zalc (2010) for an example). Therefore, many French scholars have read
Andrew Abbott’s methodological work with enthusiasm (Demazière and Jouvenet
forthcoming)—some of them are in fact co-authors of this very book. Secondly, we
share ambiguous disciplinary allocations, somewhere between political science, so-
ciology and history, which is related to the label “socio-histoire” (Buton and Mariot
2009). For present purposes, it translates into an interest in processes and configura-
tions, in the spirit of Norbert Elias, and into the aim of dealing with social science
questions by using “historical” sources, in the sense of traces, longitudinal data and
data that is situated in time and space.
In this context, it was quite normal for the two of us who gathered data to input
them ourselves from the source, during long days in the polling station. It allowed
us to get a better, somewhat ethnographic knowledge both of the place and of the
source, hence to devise better coding schemes and research questions: this type of
data input can be considered as fieldwork. For example, one of the main drawbacks
of our source is the lack of any direct indicator of education, wealth, occupation
or social status. Personally knowing the place allowed us to decide on a coding of
neighborhoods from addresses that offered reasonably defined clusters in terms of
type of housing, hence indirect indications on social status. The specific history
of the polling station also matters for our interpretation: initially a small village,
it was included in the urban planning of the Paris region in the 1970s, and grew
rapidly, with changing occupations, during our period. Finally, inputting very te-
dious data on turnout allows us to observe some of the standard and exceptional
patterns in trajectories, which helped us to better mine a dataset that is at the same
time very simple and very complicated. This research design, although produced,
in our case, by a specific French academic socialization, could easily be adopted by
other researchers. It would probably produce interesting results on electoral partici-
pation. More generally, it could benefit the methodology of sequence analysis by
expanding its application to different types of data.
F. Buton et al.196
Unusual Sequences
Our dataset is indeed peculiar, as compared to what has until now been the bread
and butter of sequence analysis: life-course and/or occupational trajectories, often
gathered from large surveys that do not allow much re-coding of states or covari-
ates. It is not only the political theme that creates this difference, but mainly the fact
that our 1,799 individual trajectories are not statistically, or substantively, indepen-
dent. On the contrary, the very purpose of our case study is to discuss whether simi-
larities between trajectories can be related to ties between individuals, be it because
of direct interactions in political discussions or because of shared exposure to the
same micro-environment. As is classically the case in network analysis, in order
to study such questions we have to forsake the advantages of large representative
samples and turn to an ecological case study.
The problem of boundaries hence becomes complicated. Working on signature
lists led us to concentrate on one polling station that provided us with a large enough
number of trajectories. However, the perimeter of our polling station changed dur-
ing the decades that we study. We chose to concentrate on a fixed perimeter in terms
of addresses, considering all the voters who lived there and those alone. More im-
portantly, as has already been seen in Fig. 10.1, people moved into and away from
the part of town where our polling station was situated: only 9 % of the population
was registered during the whole period, while 10 % was only registered for one
ballot.
To deal with this issue, we had to accept a trade-off between two types of contex-
tualization that we were interested in: on the one hand, that of voters among fellow
voters registered in the same, small place (there were 500–800 simultaneously reg-
istered voters); on the other hand, that of voting acts among past and future voting
acts by the same persons. Following voters from their first registration onwards,
in their successive polling stations, would be completely impractical in terms of
sources, as it would require us to look for records in many different places. Were it
possible, it would certainly help us better understand how previous votes shape later
votes and how this interacts with specific political contexts (prominence of the elec-
tion in the media, number of candidates, etc.) and micro-environments (behavior of
the parents, spouse, neighbors, etc.).
While our dataset is very local, historical and not very large, it is quite different
from those built by Abbott and Hrycak (1990) in an early analysis of historical data,
or by Blanchard (2012) in a study of multi-dimensional mobilization careers. In
both cases, as in ours, the trajectories are those of named individuals who constitute
the whole of a population; each line of the dataset is potentially interesting per se
and in its relationships with others, and individuals are perceived as more than a
collection of variables. We are not studying a representative sample of the French
population. We are attempting a different sort of generalization. Our aim is to find
interesting patterns in data on turnout and covariates and to hypothesize some of
their generative mechanisms; it is these mechanisms that are offered as candidates
for a role in other case studies.
10 A Contextual Analysis of Electoral Participation Sequences 197
This goal is probably shared with Abbott and Blanchard. However, as compared
with their datasets, ours might appear ridiculously simple. We only study three
possible states for each ballot: voting, not voting, not being registered. Although
the third option creates methodological problems, coding, color-coding, etc. seem
trivial in our case. In addition, our short list of variables was entirely built on the
basis of the sex, name, maiden name, address, date and place of birth and date of
first registration of the voter: this was all the information available in our source.
However, our ethnographic approach to data input and our intention of taking
all the dimensions of contextualization seriously led us to consider these admit-
tedly poor data as potentially rich in meaning (as advocated by Rosental (1999) for
similar data on migration). For example, translating our data into a representation
such as that in Fig. 10.1, a more or less standard operation in the non-standard field
of sequence analysis, in fact involves at least two implicit decisions. First, any act
of turnout is the same as the others (the same color, here). This is in fact not self-
evident: voting when most of the population does not, for example, is admittedly a
specific behavior—in the same way as working when most people do not (a prob-
lem which led Lesnard (2010) to devise a specific sequence dissimilarity metric).
We had many discussions on how to take this point into account when computing
individual participation rates; we finally chose flat rates for our 2012 paper and
plain colors for our graphs, but we here present reflections on this topic in part five.
Secondly, time is treated in a peculiar way in our sequences, which are sequences
of ballots. There were sometimes four ballots in an interval of 8 days (two separate
elections on the same days, with the first and second ballots for each), while we had
an interval of 3 years without any ballot from 1989 to 1992. We chose to consider
only one act when two ballots happened on the same day, as almost all voters had
consistent behaviors; but this leaves us with intervals ranging from 1 week to 3
years in calendar time, and with ten separate ballots for 1988–1989. Finally, we
obviously do not know much on how voters considered their own “voting careers”
and their timing, if they did at all. Our homogeneous time scale based on ballots, not
years, is therefore a methodological choice in itself, to be questioned and possibly
changed in future stages of this investigation.
Households as a Context of Participation
This simple way to consider participation trajectories as sequences of 44 successive
states of participation, abstention or non-registration already led us to interesting re-
sults in terms of social contextualization. Had we not used sequence analysis ideas
and software, these results would certainly have been less convincing. However,
the fact that we published them in a mainstream journal has much to do with the
recent evolution, led by TraMineR authors, toward including some forms of tests,
thanks to permutations of data, in sequence analysis. These tests are useful even for
a case study like ours which deals with non-independent trajectories—both as rhe-
torical devices that help to convince specialists in quantitative methods and, more
F. Buton et al.198
importantly, as tools that proved fit to answer our main question: do people who live
together also go and vote together?
In spite of the dominance of the standard models that we briefly sketched above,
a few studies of voting and/or participation had already taken correlations among
couples into account; one of them had even chosen households as a unit of observa-
tion, although with shorter observed trajectories (see e.g. Huckfeldt 1986; Verba
et al. 2005; Braconnier and Dormagen 2007, and especially Johnston et al. 2005).
We confirmed that this dimension should be taken into account in any analysis of
turnout, as the magnitude of correlations in our case was very large. This magnitude
could partly be due to the French schedule of elections, as they always happen on
Sundays, when time spent together by household members is likely to be higher,
on average, then on a standard working day. International comparisons would be
required to test this hypothesis.
In order to assess the correlations among voting trajectories, we defined an “elec-
torate household” as a group of registered voters who live together. Often, but not
always, they are also married couples, or parents and children, or they share other
kinship ties. The residential area that we study mostly includes detached houses,
which helped us to define households on the basis of names, addresses and on-
site observation. It should be noticed that “electorate households” are distinct from
households in that we only consider registered voters. A registered woman with a
foreign partner and young children, for example, would be counted as an “elector-
ate household” of one. This captures ties of co-residence that empirically, in most
cases, are also kinship ties. Ties with kin outside of the household, which arguably
also play a role in electoral participation, could not be observed, and arguably were
very few in the small space that we studied. What we are therefore able to assess
is whether voters who are also coresident, and generally coresident kin, vote at the
same moments. What we are interested in is the very collective character of this
behavior. As in other studies of collective and especially family behavior, we are not
able to determine if it is created by some sort of internal influence (from parents to
children, or vice versa, etc.) or by exposure to a shared micro-environment (on this
alternative, see e.g. Palloni et al. 2001).
Correlations in Several Dimensions of Voting Trajectories
On the basis of this definition, we found a correlation within households in terms of
overall participation rates. We used ANOVA to show its significance. In addition,
a multilevel regression that also included individual attributes such as the date of
birth or that of registration demonstrated that the similarity within households had
a significant, autonomous and very important effect on participation, representing
a majority of the variance. However, this only proves that members of the same
“electorate household” have similar aggregate tendencies to vote or not to vote,
whatever the ballot.
10 A Contextual Analysis of Electoral Participation Sequences 199
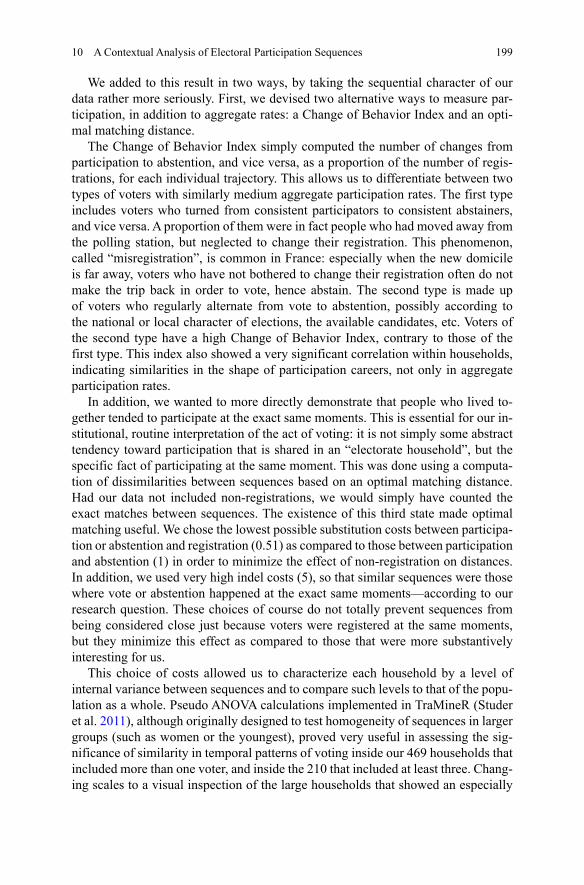
We added to this result in two ways, by taking the sequential character of our
data rather more seriously. First, we devised two alternative ways to measure par-
ticipation, in addition to aggregate rates: a Change of Behavior Index and an opti-
mal matching distance.
The Change of Behavior Index simply computed the number of changes from
participation to abstention, and vice versa, as a proportion of the number of regis-
trations, for each individual trajectory. This allows us to differentiate between two
types of voters with similarly medium aggregate participation rates. The first type
includes voters who turned from consistent participators to consistent abstainers,
and vice versa. A proportion of them were in fact people who had moved away from
the polling station, but neglected to change their registration. This phenomenon,
called “misregistration”, is common in France: especially when the new domicile
is far away, voters who have not bothered to change their registration often do not
make the trip back in order to vote, hence abstain. The second type is made up
of voters who regularly alternate from vote to abstention, possibly according to
the national or local character of elections, the available candidates, etc. Voters of
the second type have a high Change of Behavior Index, contrary to those of the
first type. This index also showed a very significant correlation within households,
indicating similarities in the shape of participation careers, not only in aggregate
participation rates.
In addition, we wanted to more directly demonstrate that people who lived to-
gether tended to participate at the exact same moments. This is essential for our in-
stitutional, routine interpretation of the act of voting: it is not simply some abstract
tendency toward participation that is shared in an “electorate household”, but the
specific fact of participating at the same moment. This was done using a computa-
tion of dissimilarities between sequences based on an optimal matching distance.
Had our data not included non-registrations, we would simply have counted the
exact matches between sequences. The existence of this third state made optimal
matching useful. We chose the lowest possible substitution costs between participa-
tion or abstention and registration (0.51) as compared to those between participation
and abstention (1) in order to minimize the effect of non-registration on distances.
In addition, we used very high indel costs (5), so that similar sequences were those
where vote or abstention happened at the exact same moments—according to our
research question. These choices of course do not totally prevent sequences from
being considered close just because voters were registered at the same moments,
but they minimize this effect as compared to those that were more substantively
interesting for us.
This choice of costs allowed us to characterize each household by a level of
internal variance between sequences and to compare such levels to that of the popu-
lation as a whole. Pseudo ANOVA calculations implemented in TraMineR (Studer
et al. 2011), although originally designed to test homogeneity of sequences in larger
groups (such as women or the youngest), proved very useful in assessing the sig-
nificance of similarity in temporal patterns of voting inside our 469 households that
included more than one voter, and inside the 210 that included at least three. Chang-
ing scales to a visual inspection of the large households that showed an especially
F. Buton et al.200
high or low internal variance helped us to better understand and describe our data.
While tests added strength to our demonstration, such comings and goings between
the population and examples, between numbers and visualizations, helped us to bet-
ter grasp and describe our dataset.
Participation and Position in the Household
After having extended the study of correlations inside households to temporal pat-
terns, we added a second dimension to the literature. Our data allowed us not only
to define the perimeter of “electorate households” but also to assign a position in the
household to each individual. After having tried more complicated coding schemes,
we classified these positions as follows. “Couples” (27 % of individuals) are those
who live as spouses (married or not) with another registered voter, but without any
child registered as potential voter. “Children” (21 %) have at least one “parent”
(22 %) present in their “electorate household”, and vice versa. “Others” (4 %) live
with at least one other registered voter, but do not fall into the previous categories.
Finally, “isolated” voters (26 %) are the only registered voter in their household.
Our hypothesis was that households mattered not only because some sort of
alignment of behaviors happened between their members, but also because they
produced social roles that could influence participation, which would lead to dif-
ferences within households. In our multilevel regression, which also included the
household effect and other individual attributes, with the overall participation index
as the dependent variable, position in the household indeed proved significant, with
a hierarchy from “isolated” (who participated less) to “others”, “children”, “cou-
ples”, and “parents” (who participated more). This effect is not that of age, as some
“children” were older than “couples” and as the date of birth was also included as a
covariate. It hints at a specific type of social integration that seems to affect turnout:
not the existence of social or family ties per se, but that of ties with other registered
voters of the same polling station.
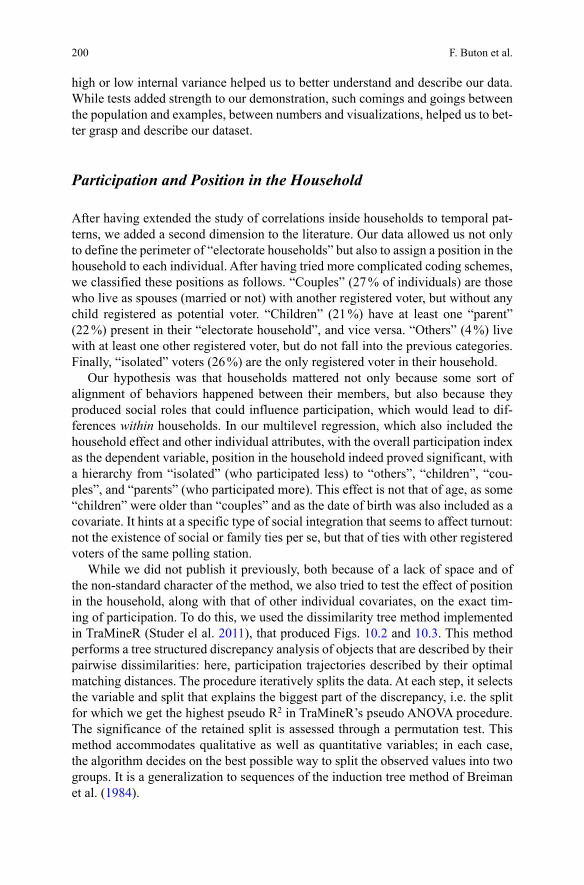
While we did not publish it previously, both because of a lack of space and of
the non-standard character of the method, we also tried to test the effect of position
in the household, along with that of other individual covariates, on the exact tim-
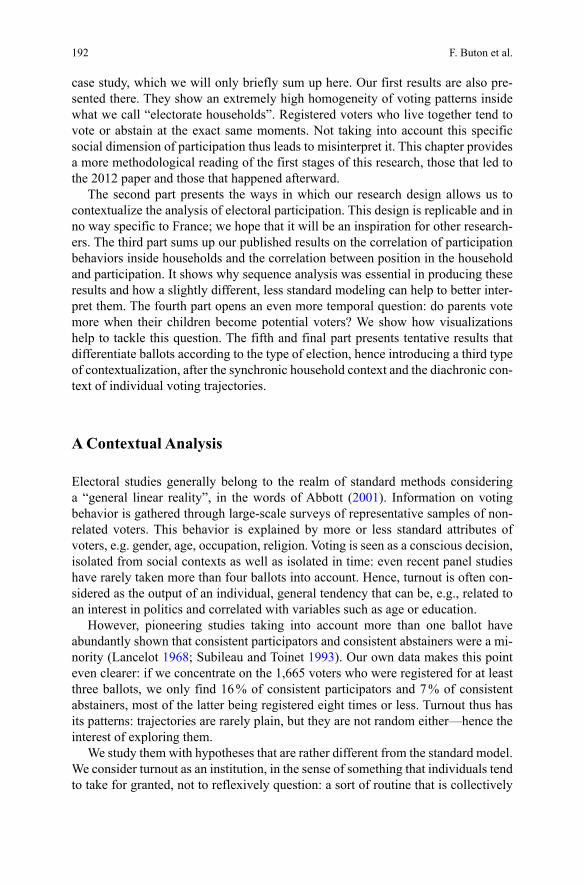
ing of participation. To do this, we used the dissimilarity tree method implemented
in TraMineR (Studer el al. 2011), that produced Figs. 10.2 and 10.3. This method
performs a tree structured discrepancy analysis of objects that are described by their
pairwise dissimilarities: here, participation trajectories described by their optimal
matching distances. The procedure iteratively splits the data. At each step, it selects
the variable and split that explains the biggest part of the discrepancy, i.e. the split
for which we get the highest pseudo R2 in TraMineR’s pseudo ANOVA procedure.
The significance of the retained split is assessed through a permutation test. This
method accommodates qualitative as well as quantitative variables; in each case,
the algorithm decides on the best possible way to split the observed values into two
groups. It is a generalization to sequences of the induction tree method of Breiman
et al. (1984).
10 A Contextual Analysis of Electoral Participation Sequences 201
)LJ�������
Tre
e dia
gra
m b
ased
on a
n o
pti
mal
mat
chin
g d
ista
nce
–in
dex
-plo
ts. C
ovar
iate
s th
at w
ere
incl
uded
but
do n
ot
show
up i
n t
he
resu
lts:
sex
, pla
ce o
f bir
th,
nei
ghborh
ood, an
d d
ista
nce
fro
m a
ddre
ss t
o t
he
poll
ing s
tati
on (
as i
n t
he
mult
ilev
el r
egre
ssio
n i
ncl
uded
in B
uto
n e
t al
. 2012).
Colo
r co
de:
Par
tici
pat
ion:
Blac
k/G
reen
. Abst
enti
on:
Gra
y/O
rang
e. N
ot
regis
tere
d:
Whi
te/W
hite
F. Buton et al.202
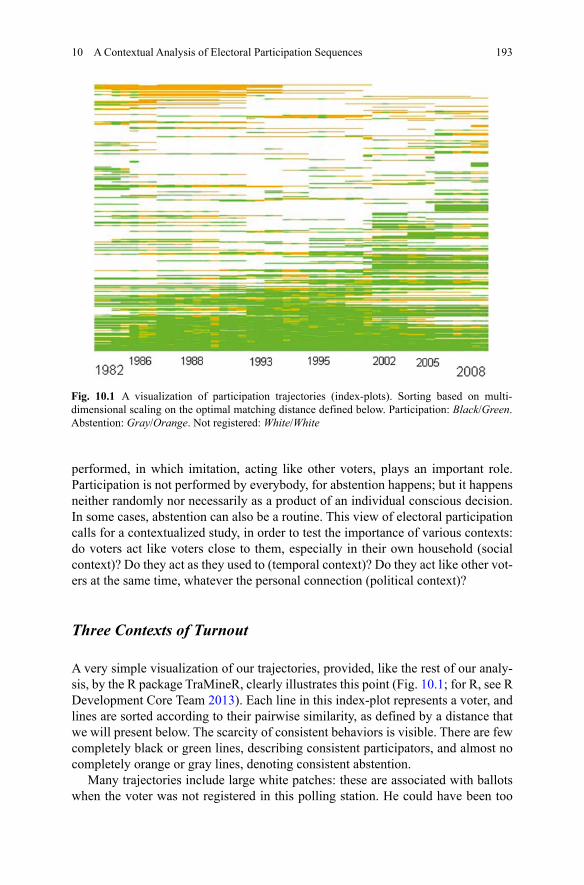
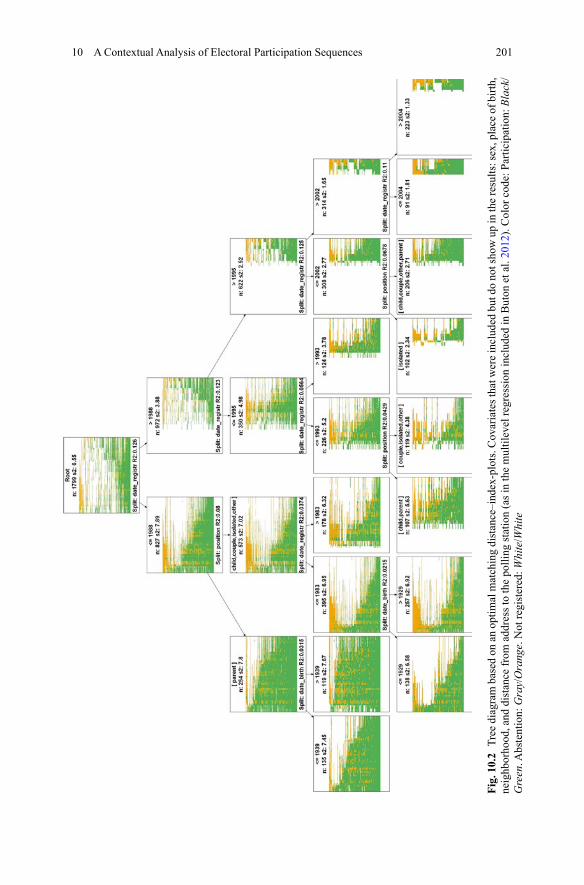
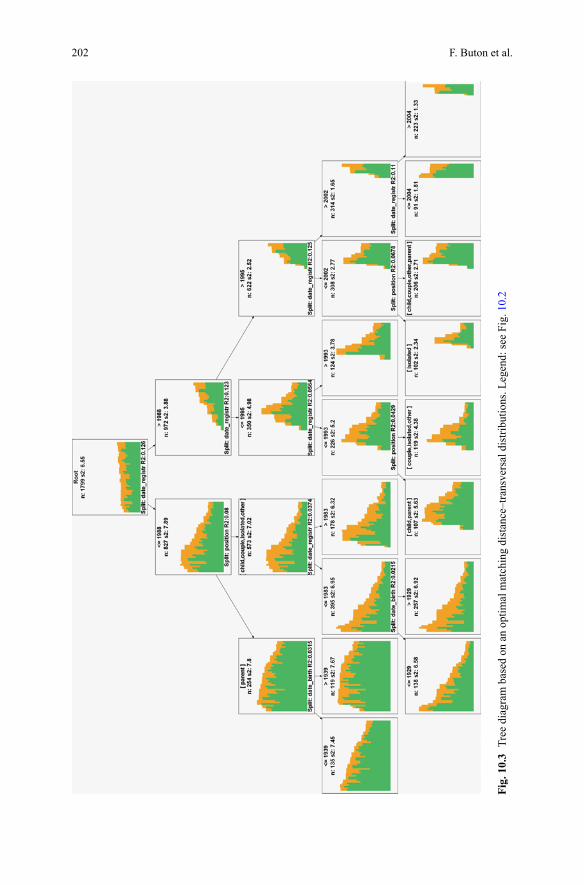
)LJ�������
Tre
e dia
gra
m b
ased
on a
n o
pti
mal
mat
chin
g d
ista
nce
–tr
ansv
ersa
l dis
trib
uti
ons.
Leg
end:
see
Fig
. 10.2
10 A Contextual Analysis of Electoral Participation Sequences 203
This method has important limits in our case. First, due to the large number of
different households, it is not possible to use multilevel modeling, including ho-
mogeneity inside each household along with individual covariates, while we have
shown that it was an important dimension in our data. What we model here is thus
something like a residual: what happens apart from this homogeneity. Secondly,
what drives the model is the search for groups that have the lowest possible internal
variance, in terms of distance between sequences as defined by optimal matching;
despite our choice of costs, it is mostly in terms of date of registration, on the one
hand, and of overall level of participation, on the other hand, that these groups ap-
pear quite visibly homogeneous. However, we can be confident that if something
important sets them apart in terms of exact timing of turnout, it should be taken into
account in the diagram.
This being said, this analysis is helpful to better understand our data in several
ways. First, as compared to regression coefficients, the visualization helps to assess
the magnitude of each variable and especially not to overestimate the homogene-
ity of behaviors among individuals that are similar according to a few significant
covariates. For example, the 254 “parents” who registered before or in 1988 are
quickly singled out by the model; but the internal variance in this group is higher
than that of the total population (due to the fact that generally they were registered
for a long time), and visual inspection reminds us of differences among them. Sec-
ondly, while the prominent part played by the date of registration in this model
is admittedly partly due to the effect of non-registration on distances, what is not
trivial is the way in which the procedure defined classes of dates, with significant
breaks in 1988, then 1995, then 1993 and 2002. It is interesting to use such an
inductive way to build classes, rather than using arbitrary thresholds; the same is
true for dates of birth. Thirdly and more importantly, what a tree diagram does and
a regression does not do is consider and put forward interactions among variables,
not the independent action of those same variables. This is very much in the spirit of
Abbott and of French methodologies, and we consider it an important complement
to our regression.
As regards position in the household, the tree diagram very much validates its
significance. It is the only covariate that appears in this model along with the date of
registration and that of birth: the small effects of the place of birth and distance from
the polling station that we found in the regression on overall participation rates do
not show up in this model on the exact patterns of participation. Trajectories differ
primarily according to the date of first registration, before or after 1988, which first
splits the tree into two branches. For the early registrations, the difference between
“parents” and all the other positions in the household causes the second significant
split. For the later cohorts, it is still the date of registration that is most discriminat-
ing, with successive splits. However, position in the household also appears signifi-
cant in those right-hand branches of the tree, except for voters who were only regis-
tered after 2002. Although its significance is higher for voters who were registered
in 1988 or before, it is present almost everywhere.
While our regression showed a hierarchy of positions in terms of participation,
the tree diagram adds that this hierarchy also applies to the duration of registration:
F. Buton et al.204
“parents” tend both to be registered for a longer time and to vote more than the
others and especially than the “isolated”. Social integration in “electorate house-
holds”, local integration in terms of registration (being registered, and not moving
away) and electoral participation are strongly correlated. Finally, there are slight
differences between branches of the tree in terms of which positions exactly are
different from the others, as regards exact participation patterns. This is food for
thought for our future investigations, for example as regards the difference between
the “isolated” and all members of “electorate households”: this difference is very
strong for registrations happening between 1996 and 2002, but not for the other
groups. Conversely, it is “parents” that are singled out in the first registration cohort.
However, these small differences remain roughly consistent with our continuum of
positions, from “isolated” to “parents”. This intriguing effect of social integration
thus deserves further investigation.
Getting More Sequential: from Couples to Parents
We present here a very preliminary investigation in this respect. It begins with a
critical return to our coding scheme for positions in the “electorate households”. Our
definition of households and positions is static: each individual trajectory is related,
in our database, to a given household, which is deemed to have, for example, four
members; and each individual is assigned a position, e.g. that of “parent”. However,
in the simple case of a couple with two children who became voters during our
period of observation, the number of voters in the household in fact increased from
two to three, then four, while the “couple” became “parents”. However convenient
for a first step of analysis, it is thus somewhat odd to classify trajectories according
to static labels.
In the case of positions in the households, there is a more substantive reason
to take this matter seriously. How come that “parents” vote more than “couples”?
“Couples” may or may not have children; what differentiates them from “parents”,
in our coding scheme, is that the children of “parents” are also registered voters in
the same polling station. Why would this lead to higher participation? Do parents
want or feel compelled to set an example by voting more, once their children are
also registered? Or do “parents” participate more just because this position happens
to be correlated with other variables, without having any specific causal effect? We
have no final answer to this question, which will of course also require comparisons
with other case studies and a more qualitative inquiry. Yet we can begin to tackle it,
thanks to our database and a few visualizations.
What can we learn by observing those “couples” who become “parents” in our
dataset? Before talking about the “effect” of a “variable”, it is important to observe
the individuals who experienced a change in the modality of this variable (Blossfeld
and Rohwer 2002). Here, while it rapidly leads us to manipulate small sub-samples,
it provides food for thought and future testing. Let us consider the sub-sample of
120 “children” in our database who came to be registered after our first date of
10 A Contextual Analysis of Electoral Participation Sequences 205
observation, along with their 215 parents. In fact, we only considered the first child
in each household who was registered: the one who caused his parents to become
“parents” in our coding scheme. We also excluded children who did not have at
least one parent who was registered before them. Let us, in a first stage of investiga-
tion, ignore the fact that among these 215 parents, some are part of the same couple.
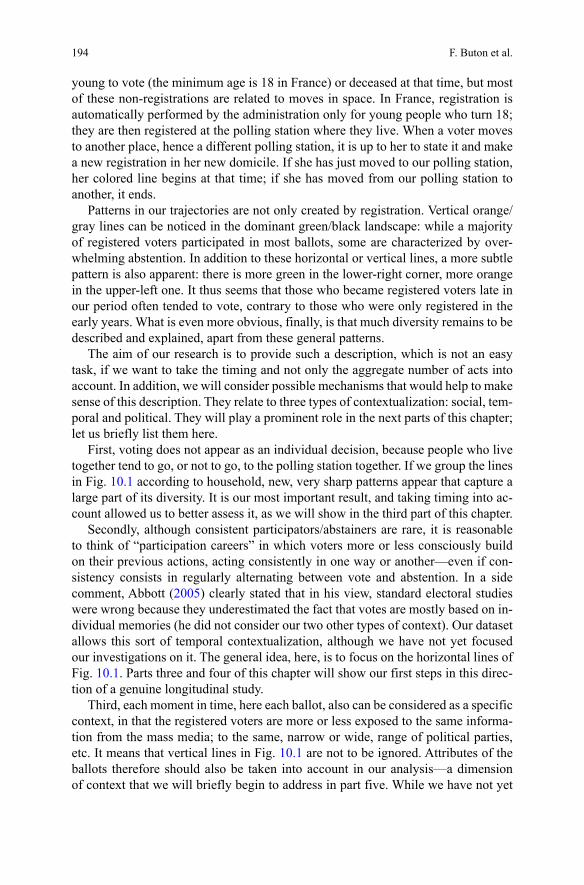
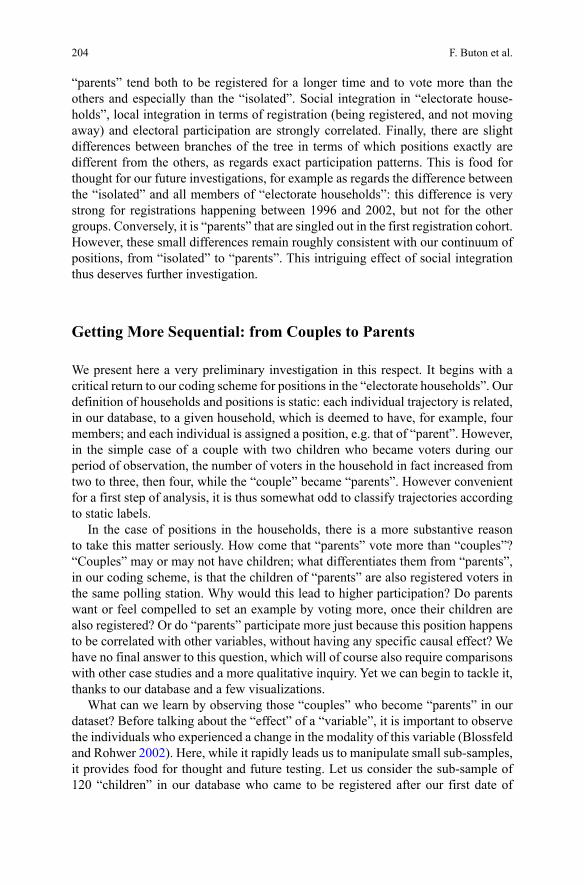
What we did was simply to align an index-plot not on calendar time, but on the
date of an external event: the first ballot when a child of the individual was regis-
tered in the polling station. This apparently simple representation required the use
of the piece of code devised by Denis Colombi and Simon Paye (see their chapter in
this volume on aligning sequences on events). Figures 10.4 and 10.5 therefore have
a quite different timeline from the other figures in this chapter: reading them re-
quires some concentration, but this unusual representation offers new insights. Each
line represents the trajectory of a parent. The ballot in the center of the figure, that
between two close vertical lines (white lines in the black and white figure, bold lines
in the color version), is the ballot when a child of the parent was first registered.
According to our coding scheme, it is the time when a “couple” became “parents”.
This time occurred in various years: there is a calendar time scale for each line, as
the sequence begins in 1982 and ends in 2008, but no common calendar time scale
for the whole graph. Its scale is organized around the first ballot of the child, with
“first ballot minus one, minus two, etc.” on the left half and “first ballot plus one,
plus two, etc.” on the right half. The two additional vertical lines (black lines in
the black and white version, thin lines in the color version) define the seven ballots
before and after the first registration of the child.
)LJ������� Participation patterns of “parents” before and after the first registration of a child. Tra-
jectories sorted according to registration date of the parent. Participation: Black/Green. Absten-
tion: Dark Gray/Orange. Not registered: Light Gray/Gray
F. Buton et al.206
No clear pattern emerges from Fig. 10.4, which is in itself a result: our event is
not a turning point; it apparently does not have any lasting effect on trajectories. Its
one noteworthy impact is transient: for the precise ballot when their first child be-
comes a registered voter, parents tend to vote, whatever their usual behavior. 100 %
of the few who were themselves not registered for the previous ballot participated;
94 % of those who had participated did the same, as well as 71 % of those who had
abstained. The idea of setting a good example, as a kind of strategy of socializa-
tion into the voters’ world, would thus apply. In our institutional understanding of
participation, it would mean that, at a fairly macro level, the thing to do is to vote
for the first ballot of your child. However, what is even more important is that this
only holds true for one ballot: no difference is to be found in mean participation
rates between all ballots before and after the event, or between the seven ballots di-
rectly before and directly after. Alternatively, it is possible that many children only
registered when they and their parents intended to vote for the next ballot–when
they were, in one way or another, especially interested in it. Empirically, ages of
registration are far from always aligned on the minimum age of 18; they are often
much higher. In any case, something interesting happens at the level of households,
not only for children but also for parents, at this time when our “couples” become
“parents”; but this effect does not seem to be enduring. It cannot explain the general
difference in participation between “couples” and “parents”.
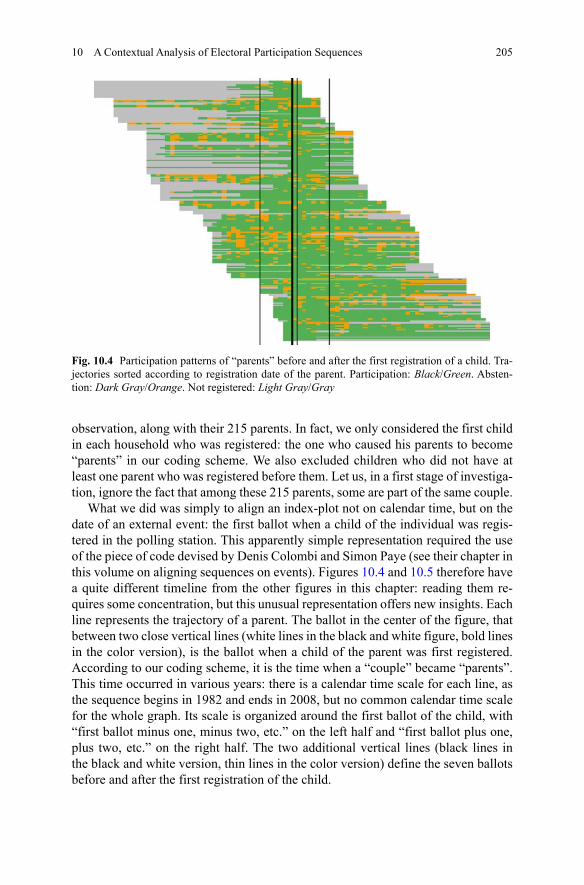
However, careful visual exploration and successive sortings of our small sub-
sample led us to complementary results. We were puzzled by the fact that partici-
pation decreased almost as often as increased when “couples” became “parents”.
The longitudinal study of change seemed to directly contradict our results based on
static labels, thus questioning the very category of “parents”: did they in fact vote
more because this label was correlated with some other, hidden but more important
variable? We therefore visualized differences between trajectories with an increase
in overall mean participation after the event and those with a decrease, in order to
better make sense of the latter (Fig. 10.5).
)LJ�� ����� Participation patterns of “parents” before and after the first registration of a child.
Decrease vs. increase in overall participation rates. The only trajectories considered here are those
that include at least four ballots before and after the event. Trajectories with equal rates before and
after are also excluded. Color code: Participation: Black/Green. Abstention: Dark Gray/Orange.
Not registered: Light Gray/Gray
10 A Contextual Analysis of Electoral Participation Sequences 207
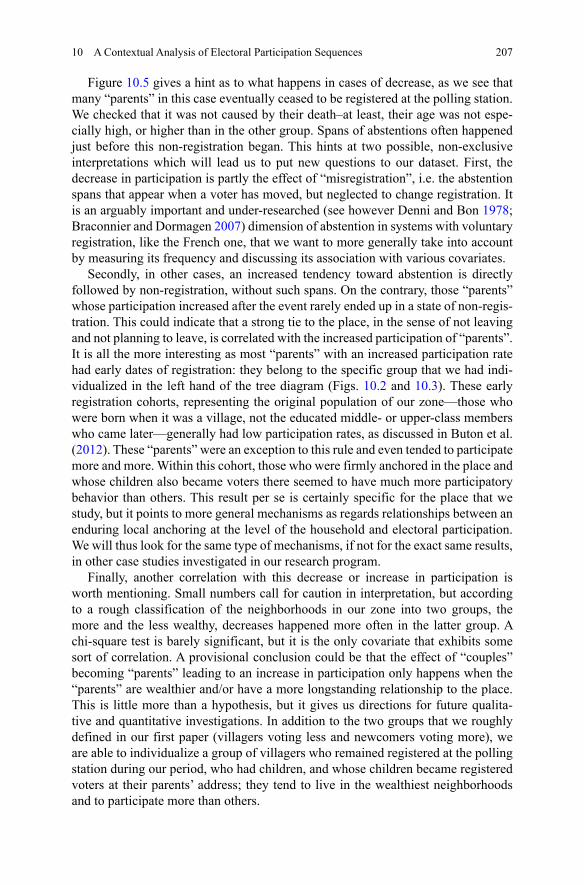
Figure 10.5 gives a hint as to what happens in cases of decrease, as we see that
many “parents” in this case eventually ceased to be registered at the polling station.
We checked that it was not caused by their death–at least, their age was not espe-
cially high, or higher than in the other group. Spans of abstentions often happened
just before this non-registration began. This hints at two possible, non-exclusive
interpretations which will lead us to put new questions to our dataset. First, the
decrease in participation is partly the effect of “misregistration”, i.e. the abstention
spans that appear when a voter has moved, but neglected to change registration. It
is an arguably important and under-researched (see however Denni and Bon 1978;
Braconnier and Dormagen 2007) dimension of abstention in systems with voluntary
registration, like the French one, that we want to more generally take into account
by measuring its frequency and discussing its association with various covariates.
Secondly, in other cases, an increased tendency toward abstention is directly
followed by non-registration, without such spans. On the contrary, those “parents”
whose participation increased after the event rarely ended up in a state of non-regis-
tration. This could indicate that a strong tie to the place, in the sense of not leaving
and not planning to leave, is correlated with the increased participation of “parents”.
It is all the more interesting as most “parents” with an increased participation rate
had early dates of registration: they belong to the specific group that we had indi-
vidualized in the left hand of the tree diagram (Figs. 10.2 and 10.3). These early
registration cohorts, representing the original population of our zone—those who
were born when it was a village, not the educated middle- or upper-class members
who came later—generally had low participation rates, as discussed in Buton et al.
(2012). These “parents” were an exception to this rule and even tended to participate
more and more. Within this cohort, those who were firmly anchored in the place and
whose children also became voters there seemed to have much more participatory
behavior than others. This result per se is certainly specific for the place that we
study, but it points to more general mechanisms as regards relationships between an
enduring local anchoring at the level of the household and electoral participation.
We will thus look for the same type of mechanisms, if not for the exact same results,
in other case studies investigated in our research program.
Finally, another correlation with this decrease or increase in participation is
worth mentioning. Small numbers call for caution in interpretation, but according
to a rough classification of the neighborhoods in our zone into two groups, the
more and the less wealthy, decreases happened more often in the latter group. A
chi-square test is barely significant, but it is the only covariate that exhibits some
sort of correlation. A provisional conclusion could be that the effect of “couples”
becoming “parents” leading to an increase in participation only happens when the
“parents” are wealthier and/or have a more longstanding relationship to the place.
This is little more than a hypothesis, but it gives us directions for future qualita-
tive and quantitative investigations. In addition to the two groups that we roughly
defined in our first paper (villagers voting less and newcomers voting more), we
are able to individualize a group of villagers who remained registered at the polling
station during our period, who had children, and whose children became registered
voters at their parents’ address; they tend to live in the wealthiest neighborhoods
and to participate more than others.
F. Buton et al.208
A Vote is a Vote is a Vote?
Finally, in the same exploratory spirit, we will present reflections on our third type
of contextualization: political contextualization. How can we take into account
types of elections and especially their prominence in the media, i.e. the political
context? All the ballots were considered in the same way, represented with the same
color, etc. in our previous analyses, be they the second ballot of the 2002 presi-
dential election, with vibrant calls to participate in order to minimize the score of
far-right Jean-Marie Le Pen, or the 1988 referendum on self-determination in the
overseas territory of New Caledonia, with a national participation rate of less than
40 % (on participation in France in diverse types of elections, see Héran 2004).
Regarding the act of turnout as one and the same in all cases is debatable: different
mechanisms could be at play in different types of elections, and social and temporal
contexts could especially have different roles.
Our first idea in this respect was to differentiate between local and national
elections. There are no consistent differences in overall turnout rates between the
two categories, as the latter include, along with the presidential elections that are
generally considered the most important events in French political life, referenda
and European elections, which usually generate less turnout. However, reasons to
participate in local and in national elections could be different. It is generally be-
lieved that the latter have more to do with parties and their programs and with
national media, while the former leave more space to face-to-face relationships and
local issues. We therefore wondered whether correlations inside households were as
strong for each type of election. In addition, in our case study, we already found dif-
ferent patterns of participation across cohorts, both in terms of date of birth and date
of registration. We interpreted them as proxies of more general social differences
between inhabitants who had known the place as a village and middle- and upper-
class baby-boomers who had settled later and had, on average, the highest participa-
tion rates. We could expect different behaviors in these two groups as regards local
and national elections.
At the level of overall individual participation rates, there is some correlation
between turnout for local and for national elections in our population; but, with an
R2 of 0.55, there are also many voters who regularly participated in national elec-
tions but not so much in local ones (the reverse case being much scarcer). Linear
regressions with individual covariates as independent variables and the two sepa-
rate participation indices as dependent variables show that the date of birth, place
of birth and distance from the polling station had a significant effect only for local
elections. Counter-intuitively, it is in local elections that the difference in partici-
pation between newcomers and other is most significant, with newcomers voting
more. It calls for a careful study of patterns of turnout for these elections, avoiding
common sense equivalences between local anchorage and interest in local poli-
tics—as already shown by more qualitative studies (Girard 2011). Participation in
national elections is much more difficult to model accurately than that in local elec-
tions—perhaps because it is more correlated with variables that we cannot observe,
such as wealth, occupation, education or political commitment.
10 A Contextual Analysis of Electoral Participation Sequences 209
However, the effect that we are most interested in, that of the position in the
household, is significant in both cases. In addition, ANOVA shows that correlations
inside households are extremely strong and significant in both cases. This legiti-
mizes the definition of trajectories that we have chosen in Buton et al. (2012) and in
the first parts of this chapter. Considering participation trajectories as a whole, in-
cluding a mix of local and national elections, is certainly a simplification and should
not prevent us from studying, for example, the group of voters who participated
more in national elections; however, the effects of cohorts of registration, household
homogeneity and position in the household seem to have been at play whatever the
type of election.
In order to assess this more precisely, we have just begun to analyze the specific
case of presidential elections. Due to the prominence of these elections, it makes
sense—from the point of view of the researcher, and possibly even if we think of
more subjective “voting careers”—to extract our eight presidential ballots, for four
elections, and to study them as specific trajectories (for a similar attempt at a macro
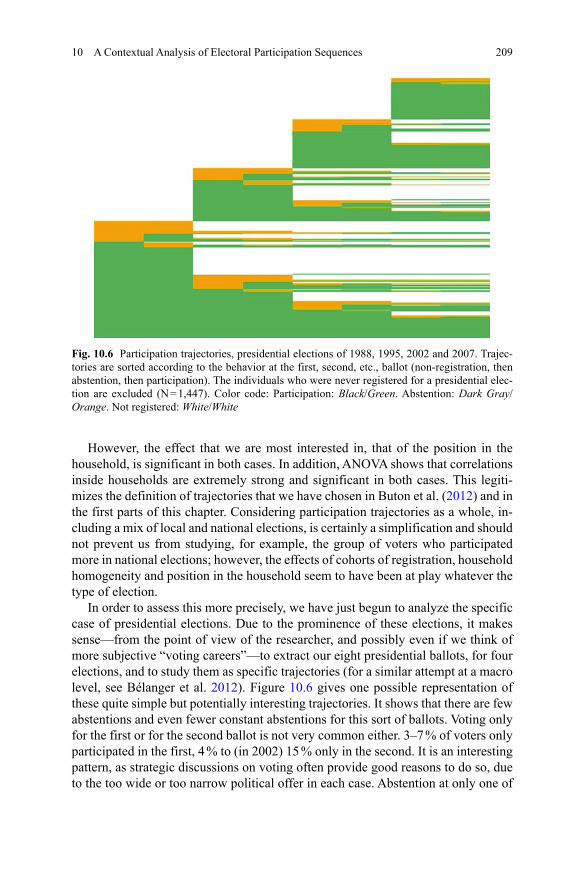
level, see Bélanger et al. 2012). Figure 10.6 gives one possible representation of
these quite simple but potentially interesting trajectories. It shows that there are few
abstentions and even fewer constant abstentions for this sort of ballots. Voting only
for the first or for the second ballot is not very common either. 3–7 % of voters only
participated in the first, 4 % to (in 2002) 15 % only in the second. It is an interesting
pattern, as strategic discussions on voting often provide good reasons to do so, due
to the too wide or too narrow political offer in each case. Abstention at only one of
)LJ������� Participation trajectories, presidential elections of 1988, 1995, 2002 and 2007. Trajec-
tories are sorted according to the behavior at the first, second, etc., ballot (non-registration, then
abstention, then participation). The individuals who were never registered for a presidential elec-
tion are excluded (N = 1,447). Color code: Participation: Black/Green. Abstention: Dark Gray/
Orange. Not registered: White/White
F. Buton et al.210
the two ballots of a presidential elections thus could be thought of as more “politi-
cal”, less “social” than other abstentions (on these concepts, see Subileau and Toinet
1993).
However, if this distinction makes sense, our results show that “political” deci-
sions on turnout are a minority. For 77 % of our population, presidential voting pat-
terns only included a mix of non-registration and participation and, in a few cases,
abstention at the two ballots. In such cases, looking for other contextual effects on
participation, be they social or temporal, is pointless.
We will however focus our further investigations on the other 23 %, those who
sometimes changed behaviors between ballots. This rarely seemed to be a consis-
tent behavior: the specific context of the moment of one election seems to have
been more at play here than individual longstanding preferences or habits begun in
previous elections. 88 voters participated only in the first ballot, only on one occa-
sion, while 19 did it several times without doing the reverse or abstaining for both
ballots; 169 voters participated only in the second ballot, only one time (half of
them in 2002), while only six did it more consistently. If there is some sort of politi-
cal strategy behind such behaviors, it is not independent of the specific context of
each election. What seems much more promising is thus to look into household pat-
terns in presidential election trajectories. A cursory look at them shows that some of
the specific inter-ballot patterns are indeed found consistently in some households,
where we could hypothesize the existence of shared, maybe even collectively dis-
cussed strategies; but there are also cases when voters in the same household have
opposite behaviors for the same election.
The presidential election is seen by many as the case when voters are most likely
to make conscious choices according to political information provided beyond the
borders of their household, due to the wide mass-media coverage. It is therefore
a limiting case for us, as we are primarily interested in the weight of more local
contexts. Our preliminary investigation does not point in the direction of decontex-
tualized and/or purely “political” behaviors. For most voters, voting in a presiden-
tial election mostly appears as a taken-for-granted behavior; for smaller numbers,
abstaining has the same status. One of our next steps will be to focus on household
patterns in presidential election participation and to try to make sense of them, in
order to better understand the minority of non-standard patterns.
Acknowledgments We thank all the participants in the LaCOSA conference for valuable sugges-
tions and Richard Nice for an excellent editing of our English. This research has been funded by
the French National Agency for Research, PAECE program.
References
Abbott, A. (2001). Time matters: On theory and method. Chicago: University of Chicago Press.
Abbott, A. (2005). The historicality of individuals. Social Science History, 29(1), 1–13.
Abbott, A., & Hrycak, A. (1990). Measuring resemblance in sequence data: An optimal matching
analysis of musicians’ careers. American Journal of Sociology, 96(1), 144–185.
10 A Contextual Analysis of Electoral Participation Sequences 211
Bélanger, É, Cautrès, B., Foucault, M., Lewis-Beck, M. S., & Nadeau, R. (2012). Le vote des Fran-
çais de Mitterrand à Sarkozy: 1988-1995-2002-2007. Paris: Presses de Sciences Po.Blanchard, P. (2012). Analyse séquentielle et carrières militantes. Research Report. http://hal.
archives-ouvertes.fr/hal-00476193. Accessed 13 June 2013.Blossfeld, H.-P., & Rohwer, G. (2002). Techniques of event history modeling: New approaches to
causal analysis. Mahwah: Lawrence Erlbaum Associates.Braconnier, C., & Dormagen, J.-Y. (2007). La démocratie de l’abstention. Aux origines de la dé-
mobilisation électorale en milieu populaire. Paris: Gallimard.Breiman, L., Friedman, J. H., Olshen, R. A., & Stone, C. J. (1984). Classification and regression
trees. New York: Chapman & Hall.Buton, F., & Mariot, N. (Eds.). (2009). Pratiques et méthodes de la socio-histoire. Paris: PUF.Buton, F., Lemercier, C., & Mariot, N. (2012). The household effect on electoral participation. A
contextual analysis of voter signatures from a French polling station (1982–2007). Electoral
Studies, 31(2), 434–447.CEPEL. (2009). ANR “PEACE”. http://www.cepel.univ-montp1.fr/spip.php?article231&lang=en.
Accessed 13 June 2013.Demazière, D., & Jouvenet, M. (Eds.). (forthcoming). La sociologie d’Andrew Abbott. Paris: Édi-
tions de l’EHESS.Denni, B., & Bon, F. (1978). Population électorale, population électorale potentielle, population
totale dans la région Rhône-Alpes. Revue française de science politique, 28(6), 1055–1066.Girard, V. (2011). Quelles catégories de classement pour l’analyse localisée de la représentation
politique? Le cas des techniciens élus au sein d’un territoire industriel. Terrains & Travaux,
19, 99–119.Greenacre, M. J., & Blasius, J. (1994). Correspondence analysis in the social sciences: Recent
developments and applications. London: Academic Press.Héran, F. (2004). Voter toujours, parfois… ou jamais. In B. Cautrès & N. Mayer (Eds.), Le nouveau
désordre électoral. Les leçons du 21 avril 2002 (pp. 351–367). Paris: Presses de Sciences Po.Huckfeldt, R. (1986). Politics in context. Assimilation and conflict in urban neighborhoods. New
York: Agathon Press.Johnston, R. J., Jones, K., Propper, C., Sarker, R., Burgess, S., & Bolster, A. (2005). A missing
level in the analyses of British voting behaviour: The household as context as shown by analy-ses of a 1992-1997 longitudinal survey. Electoral Studies, 24(2), 201–225.
Lancelot, A. (1968). L’abstentionnisme électoral en France. Paris: Armand Colin.Lemercier, C., & Zalc, C. (2008). Méthodes quantitatives pour l’historien. Paris: La Découverte.Lesnard, L. (2010). Cost setting in optimal matching to uncover contemporaneous socio-temporal
patterns. Sociological Methods & Research, 38(3), 389–419.Mariot, N., & Zalc, C. (2010). Face à la persécution. 991 Juifs dans la guerre. Paris: Odile Jacob.Palloni, A., Massey, D. S., Ceballos, M., Espinosa, K., & Spittel, M. (2001). Social capital and
international migration: A test using information on family networks. American Journal of
Sociology, 106(5), 1262–1298.R Development Core Team. (2013). R: A language and environment for statistical computing.
Vienna: R Foundation for Statistical Computing.Rosental, P.-A. (1999). Les sentiers invisibles: Espaces, familles et migrations dans la France du
19e siècle. Paris: Éditions de l’EHESS.Studer, M., Ritschard, G., Gabadinho, A., & Müller, N. S. (2011). Discrepancy analysis of state
sequences. Sociological Methods & Research, 40(3), 471–510.Subileau, F., & Toinet, M.-F. (1993). Les chemins de l’abstention. Une comparaison franco-améri-
caine. Paris: La Découverte.Verba, S., Lehman Schlozman, K., & Burns, N. (2005). Family ties. Understanding the intergen-
erational transmission of political participation. In A. S. Zuckerman (Ed.), The social logics
of politics. Personal networks as contexts for political behaviour (pp. 95–114). Philadelphia: Temple University Press.