a comprehensive molecular interaction map for rheumatoid arthritis
TRANSCRIPT

A Comprehensive Molecular Interaction Map forRheumatoid ArthritisGang Wu., Lisha Zhu., Jennifer E. Dent., Christine Nardini*
Group of Clinical Genomic Networks, CAS-MPG Partner Institute for Computational Biology, Shanghai Institutes for Biological Sciences, Chinese Academy of Sciences,
Shanghai, People’s Republic of China
Abstract
Background: Computational biology contributes to a variety of areas related to life sciences and, due to the growing impactof translational medicine - the scientific approach to medicine in tight relation with basic science -, it is becoming animportant player in clinical-related areas. In this study, we use computation methods in order to improve our understandingof the complex interactions that occur between molecules related to Rheumatoid Arthritis (RA).
Methodology: Due to the complexity of the disease and the numerous molecular players involved, we devised a method toconstruct a systemic network of interactions of the processes ongoing in patients affected by RA. The network is based onhigh-throughput data, refined semi-automatically with carefully curated literature-based information. This global networkhas then been topologically analysed, as a whole and tissue-specifically, in order to translate the experimental molecularconnections into topological motifs meaningful in the identification of tissue-specific markers and targets in the diagnosis,and possibly in the therapy, of RA.
Significance: We find that some nodes in the network that prove to be topologically important, in particular AKT2, IL6,MAPK1 and TP53, are also known to be associated with drugs used for the treatment of RA. Importantly, based ontopological consideration, we are also able to suggest CRKL as a novel potentially relevant molecule for the diagnosis ortreatment of RA. This type of finding proves the potential of in silico analyses able to produce highly refined hypotheses,based on vast experimental data, to be tested further and more efficiently. As research on RA is ongoing, the present map isin fieri, despite being -at the moment- a reflection of the state of the art. For this reason we make the network freelyavailable in the standardised and easily exportable .xml CellDesigner format at ‘www.picb.ac.cn/ClinicalGenomicNTW/temp.html’ and ‘www.celldesigner.org’.
Citation: Wu G, Zhu L, Dent JE, Nardini C (2010) A Comprehensive Molecular Interaction Map for Rheumatoid Arthritis. PLoS ONE 5(4): e10137. doi:10.1371/journal.pone.0010137
Editor: Frank Beier, University of Western Ontario, Canada
Received January 11, 2010; Accepted March 15, 2010; Published April 16, 2010
Copyright: � 2010 Wu et al. This is an open-access article distributed under the terms of the Creative Commons Attribution License, which permits unrestricteduse, distribution, and reproduction in any medium, provided the original author and source are credited.
Funding: JED is fully funded by The European Union Science and Technology Fellowship Programme, China. The contracting authority for the Programme is theEuropean commission, reference: EuropeAidl128952/L/ACT/CN, budget line: BGUE-B2009-19.100104-CI-AIDCO, http://www.euchinastf.eu/. The funders had norole in study design, data collection and analysis, decision to publish, or preparation of the manuscript.
Competing Interests: The authors have declared that no competing interests exist.
* E-mail: [email protected]
. These authors contributed equally to this work.
Introduction
Rheumatoid Arthritis (RA) is a complex disease involving a yet
unknown number of genes, and affecting a large number of
organs, tissues and sites across the body. It is affecting
approximately 1% of the population worldwide [1], with this rate
rising for the first time in 40 years, as reported at the American
College of Rheumatology meeting in San Francisco (CA, USA) in
2008. RA is a systemic autoimmune disease causing recruitment
and activation of inflammatory cells, synovial hyperplasia, and
destruction of cartilage and bone. A complete loss of mobility and
functioning can be the final evolution of the disease [2]. Although
RA involves the synovial joints, it presents several systemic features
as, in fact, several other organs are affected including skin, lungs,
kidneys, blood vessels and heart [3–6]. Because of its complexity,
having a broad, systemic perspective on the biological functions
activated and the molecular pathways involved in the disease is of
crucial importance.
In this direction several types of approaches and data platforms
can be used for investigation. Genome-Wide Association studies
(GWAs) scan the whole genome in search of loci susceptible to
carry mutations related to RA (only as a sample of very recent
studies [7–9]). Gene microarray data have contributed greatly to
pathogenesis and to the identification of biomarkers for diagnosis,
to patient stratification and prognostication of RA [10]. Other
studies join the information from these 2 approaches and compare
differentially expressed genes with genome-wide association studies
to better predict candidate susceptibility genes of RA [11].
Furthermore, some signal transduction pathways have also been
identified as being involved in the disease progression and in the
effects of therapies of RA. The TGF-b pathway, for example,
shows broad, constitutive alternation in Rheumatoid Arthritis
Synovial Fibroblasts (RASFs) [12] and the NF-kB pathway has
been inhibited during the anti-TNF-a therapy by etanercept [13].
The signal transduction pathways in RA and some of the
important proteins of these pathways have been identified as drug
PLoS ONE | www.plosone.org 1 April 2010 | Volume 5 | Issue 4 | e10137
targets to treat RA [14–16]. However, due to the complex
interactions of these pathways, treatments that target only one
protein may not be very effective. Besides the relevance of proteins
as targets, a recent study has also shown that miR-155 was up-
regulated during the treatment with TNF-a in RASFs [17]. This
implies that some microRNA may be involved in RA progression.
Due to the complexity of RA, however, the interaction among all
of these molecules and pathways is still obscure. This is highly
relevant in the identification of new therapies, as in fact, some of
the most common drugs used to treat RA, such as MTX
(Methotrexate), can cause liver, lung and kidney damage, as well
as strong immunodepression. To avoid these important side effects
and to develop more specific and useful drugs, the whole structure
of the molecular networks involved in RA needs to be studied and
clarified. The identification and analysis of this complex map
cannot be performed without the help of computational biology.
Hence we present here a comprehensive map for RA that
combines together the molecules and pathways that were so far
found to be associated with RA, based on systemic, high-
throughput data, and made available following the format
suggested by CellDesigner [18], a popular and successful standard
for the exchange of cellular maps [19].
To date, the most abundant source of high-throughput,
systemic, genome-wide data is still represented by microarrays
for gene expression, although soon this may be replaced by more
quantitative information from mRNAs sequencing [20,21]. For
this reason, in order to build a comprehensive map of the
processes ongoing in RA, we chose to construct a molecular map
based on the results of high-throughput analyses. In fact, despite
the growing availability of proteomic data and their promising
applications, the throughput remains lower and limited to a
number of validated targets [22]. In order to give a systemic
description of the relationships among the genes and pathways
known to be involved in RA, we merged the information of all
available papers related to high-throughput experiments (mRNA,
miRNA) on RA ( [11–13,17,23–46]). Using these information and
further data available from the Kyoto Encyclopedia of Genes and
Genomes (KEGG) ‘http://www.genome.jp/kegg/’, we build a
comprehensive cell-level interaction map. Visually, we present this
molecular-interaction map as a gene regulation map and a
protein-protein interaction map, linked by a number of transcrip-
tion factors. We then use network analysis methods to analyse the
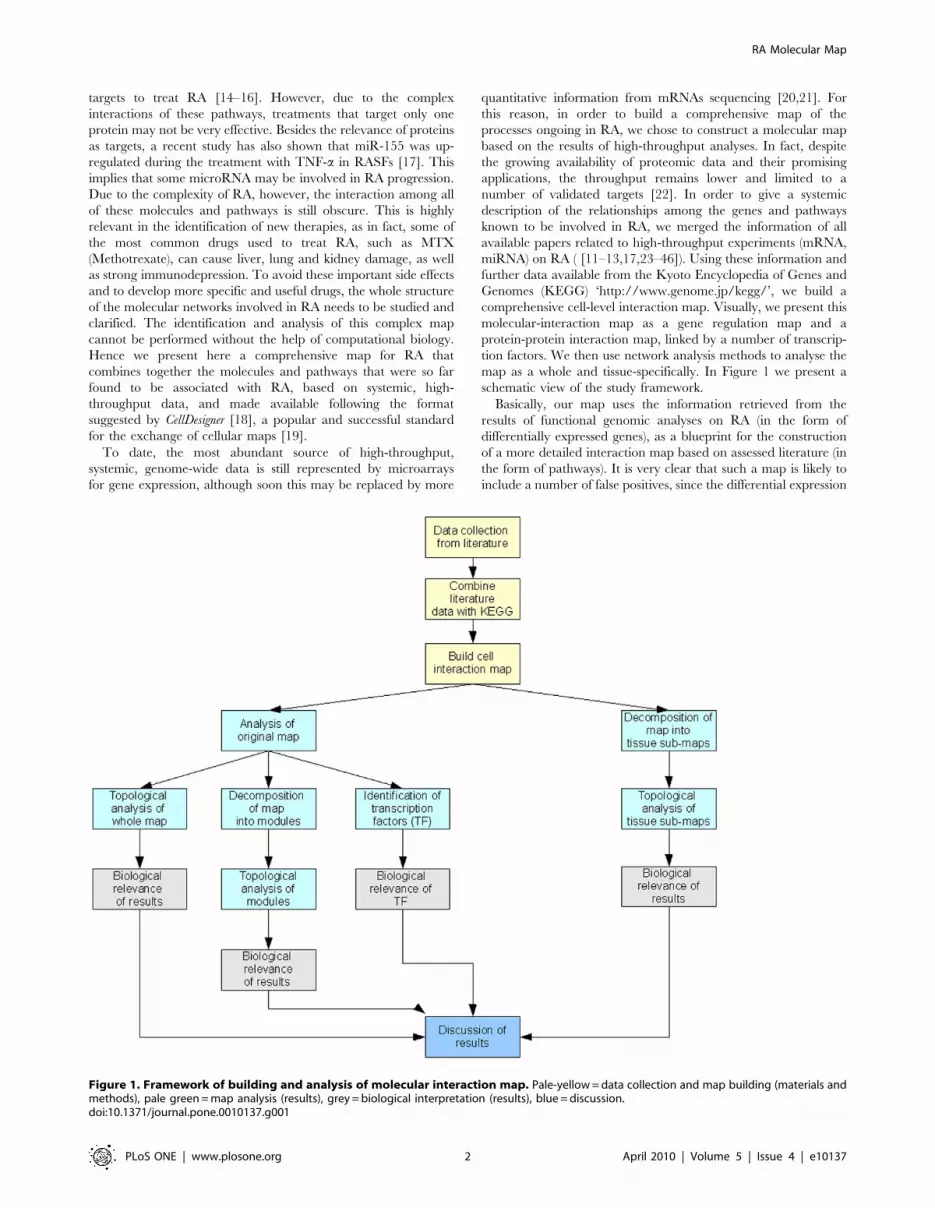
map as a whole and tissue-specifically. In Figure 1 we present a
schematic view of the study framework.
Basically, our map uses the information retrieved from the
results of functional genomic analyses on RA (in the form of
differentially expressed genes), as a blueprint for the construction
of a more detailed interaction map based on assessed literature (in
the form of pathways). It is very clear that such a map is likely to
include a number of false positives, since the differential expression
Figure 1. Framework of building and analysis of molecular interaction map. Pale-yellow = data collection and map building (materials andmethods), pale green = map analysis (results), grey = biological interpretation (results), blue = discussion.doi:10.1371/journal.pone.0010137.g001
RA Molecular Map
PLoS ONE | www.plosone.org 2 April 2010 | Volume 5 | Issue 4 | e10137

of genes may not correspond to the effective presence of the
corresponding protein. However, the additional layer of informa-
tion retrieved from pathways stored in literature shows that the
reconstructed map is able to identify hubs that are known targets
of current RA treatments, and to suggest interesting new targets.
Moreover, one of the preeminent characteristics of in silico
modeling and analysis is to offer ‘cheap’ working hypotheses to
be subsequently tested in vitro and in vivo. In this respect our
analysis highlights the importance of proteins that have already
been identified as relevant in the evolution of RA, giving more
insight into their potential role, and in particular into their ability
to affect neighboring pathways and functions. This type of analysis
indicates potential new markers in the diagnosis and/or
monitoring of RA, that is markers that could be loaded, for
example, on board of point-of-care diagnostic tools, based not only
on genomic (DNA) screens [47], but also on functional genomic
(mRNA) screens [48]. Generally, the mRNAs on which we base
our analysis are identified as relevant under different biological
conditions, such as healthy versus diseased subjects, RA versus
other immune diseases, or comparing subjects before and after
treatment. The experiment samples are also from different tissues,
such as peripheral blood mononuclear cell (PBMC), synovial
fibroblasts and cartilage.
A range of network analysis methods have been successfully
applied in multiple studies in an attempt to understand the
structure of interaction networks, or the effect that single genes or
molecules have on such networks (see [49–53] for example). In the
‘Analysis of Molecular-Interaction Map and Network Modules’
section of this paper we use network analysis methods to
understand the systemic interactions of molecules involved in
RA. We begin by determining the topological parameters of the
network and analysing the structure of the map as a whole. Many
biological networks display scale-free properties [54–58], which
means that they contain fewer nodes that have many connections
to other nodes’ hubs. Targeting hubs enables one to reach several
other nodes in a shorter time frame than would be possible by
targeting nodes at random. On the downside, the presence of hubs
in scale-free networks means that the network can be more easily
destroyed if the hubs are removed. We use the degree distribution,
which describes the number of links per node, to identify hubs and
to determine if the network is scale free (if it is, then the degree
distribution follows a power-law distribution). We then consider
whether the hubs in the molecular-interaction map have known
biological relevance. Further to understanding the structure of the
network through the presence of hubs, we decompose the network
into modules according to its structure. We expect the network to
have a bow tie structure [56], which means that it can be
separated into four components: a central part containing strongly
connected components, an IN component containing nodes from
which the central component can be reached, an OUT
component containing nodes that can be reached from the central
component and a fourth component containing all other nodes.
Within the central component of the bow tie structure, we can
identify topologically relevant cycles of nodes. A cycle in this sense
is a group of nodes that are connected to each other such that the
links between nodes form a cycle containing all nodes. Definition
of cycles in a cell can represent biologically significant features,
such as feedback in the cell, which is an important way for the cell
to regulate different biological mechanisms, such as protein-
protein interactions, gene-regulation or metabolic pathways
[59,60]. We use the relevant cycles and consider the paths
attached to them, thus creating separate modules from the
interaction-network whose core components are a closed cycle.
We then look for biological relevance in these newly defined
modules. We determine if the modules produced show similarities
to biological modules (in the sense that they may act as an
independent sub-system or perform a specific biological function
in the cell) [50]. This module analysis helps one to decompose the
complex network and furthermore identify the pathways involved
in RA. By careful dissection of the pathways, novel therapeutic
interventions designed to block signaling may be developed.
Several potential targets, including MAP kinases and NF-kB, are
already being explored. Analysis of the interaction network
without any amount of decomposition will not give a full
understanding of its structure, which is important for thorough
biological interpretation.
Given that transcription factors have been shown to be potential
drug-targets, and that it has also been shown that it is possible to
modulate some transcription factors through signaling cascades,
our attention is drawn the transcription factors in our network. In
‘The Role of Transcription Factors’ we investigate whether the
transcription factors present in our network also have important
topological properties, in the sense that they link topologically
distinct parts (i.e. different modules) of the network. If this is the
case, then it may be possible to influence the different topologically
important parts of the cell, by concentrating on specific
transcription factors.
Further to analysis of the interaction map as a whole, in section
‘Analysis of Tissue-Specific Networks’ we also present the results of
a tissue-specific analysis. Here we consider whether there are
topological and biological differences in the way in which various
tissue types act within the cell with respect to RA. By assigning a
species tag to each node in the molecular-interaction map, we
produce five tissue-specific sub-maps (Blood Peripheral Blood
Mononuclear Cell (Blood_PBMC), Blood Peripheral Blood
Mononuclear Cell plus Polymorphonuclear leukocytes (Blood_
PBMC_PMN), cartilage, Synovial Fibroblast and synovial Poly-
morphonuclear leukocytes (synovial_PMN)). Of these five sub-
maps, we are only able to achieve meaningful topological results
for three (Blood_PBMC, Synovial Fibroblast and cartilage), due to
the small amount of data used to build the remaining two sub-
maps. For these three larger sub-maps, we pay particular attention
to the identification of hubs by tissue type, and to areas where
there is an overlap between tissue types. The results from this part
of the study enable us to comment on whether there exist tissue
specific markers that could play a role in the diagnosis of RA.
Throughout the analysis, we constantly are required to return to
the literature in order to determine if the topological results have
any biological significance. We present our findings and identify
areas for further research.
Results
The results section can be broken down as shown in Figure 1. In
the first, and largest, section we present the results from the
analysis of the molecular-interaction map as a whole and broken
down into topologically significant modules as previously dis-
cussed. In this first section, we determine the biological relevance
of hubs in the molecular-interaction map as well as in the three
largest modules. We find, on the whole (and particularly for the
molecular-interaction map when it is analysed before any sort of
decomposition), that the hubs in the molecular-interaction map
are already known drug targets. This is consistent with the role of a
hub in a network and is therefore of no surprise. Interestingly,
however, only one of the hubs in the molecular-interaction map is
a transcription factor, implying that the transcription factors that
act as a bridge between the gene-regulatory and the protein-
protein interaction maps, do not directly link a large number of
RA Molecular Map
PLoS ONE | www.plosone.org 3 April 2010 | Volume 5 | Issue 4 | e10137

nodes. The role of hubs, as well as explanation for the biological
significance of each of the modules, is then presented. Next, we
consider the transcription factors present in the molecular-
interaction map and discuss the role of these transcription factors
from a biological point of view. Finally, we present the results from
the tissue-specific analysis.
Figure 2 shows the molecular-interaction map as displayed in
CellDesigner 4.0.1. The map is separated into a protein-protein
interaction (A) and a gene regulation map (B). The two maps are
linked by transcription factors identified from the molecular-
interaction map (discussed below). The resulting map has a total of
273 proteins, which are represented in 348 distinct chemical
species (248 of them are located in the cytoplasm, 44 in the
membrane, 21 in the nucleus, 25 in the outside of the membrane,
4 in the mitochondrion, 1 in the cytosol, 4 in the endoplasm
reticulum, 1 in the golgi apparatus) and 255 reactions and
regulations (among them, 24 protein associations, 3 protein
dissociations, 160 state transitions, 47 transcriptional regulations,
10 protein translations, 7 transportations, 2 known_transition_omitted,
indicating an indirect interaction, and 2 unknown_transitions,
indicating interactions predicted but not validated from literature
[24]). The genes associated with RA distribute almost every
organelle of the cell including Golgi apparatus, endoplasmic
reticulum and mitochondrion.
Analysis of Molecular-Interaction Map and NetworkModules
Molecular-Interaction Map. The systemic network of
interactions was first analysed as a whole and then decomposed
in to topologically significant modules. The map and all
modules are available for public use at ‘http://www.picb.ac.cn/
ClinicalGenomicNTW/temp.html’. The original network, which
has a total of 776 nodes and 886 edges, displays scale-free
properties, as expected from a biological network [56], with the in-
and out-degree distributions having power law exponents of
approximately 2.394 and 2.479 (R2 value of 0.951 and 0.948)
respectively. The network consists of 23 connected components,
with each node having an average of 2.281 neighbours (network
density 0.003). We can therefore conclude that the network is not
well-connected. Analysis of shortest path frequency shows that the
mean shortest path length is approximately 16.042
(variance = 75.80) and network diameter (maximum length of
shortest path) of 48. Using node degree to identify network hubs,
we identify six protein hubs (AKT2, EGFR, IL6, MAPK1,
RAC1,2 and TP53). An example of a protein hub (TP53), and its
connections, is shown in Figure 3.
Biological Relevance of Hubs in the Molecular-
Interaction Map. We describe in this section the biological
properties of the hubs in the whole map. Interestingly, they are all
related to RA therapy.
AKT2 is a putative oncogene encoding a protein belonging to a
subfamily of serine/threonine kinases, containing SH2-like
domains. Itis related to various kinds of antitumor drugs such as
cetuximab, erlotinib, gefitinib and lapatinib. All of these drugs are
associated with the EGFR inhibitor pathway, which plays an
essential role in regulating cell division and death [61]. AKT2 is
the hub of Module 4 and belongs to 20 different pathways (except
hsa04912, 04650, 04810, 04540, 04320 and 04670, see below).
AKT2 is also one of the synovial genomic targets of bucillamine,
Figure 2. Molecular-interaction map for Rheumatoid Arthritis. A = protein-protein interaction map, B = gene regulation map. The two mapsare joined by transcription factors.doi:10.1371/journal.pone.0010137.g002
RA Molecular Map
PLoS ONE | www.plosone.org 4 April 2010 | Volume 5 | Issue 4 | e10137

mostly used as treatment in Japan to reduce pain in RA patients
[45].
EGFR is a transmembrane glycoprotein that is a member of the
protein kinase superfamily. This protein is a receptor for members
of the epidermal growth factor family. EGFR is a cell surface
protein that binds to epidermal growth factor. Binding of the
protein to a ligand induces receptor dimerization and tyrosine
autophosphorylation and leads to cell proliferation. It is associated
with some drugs to treat neoplasms such as canertinib [62],
cetuximab [63] and cisplatin [64,65].
IL6 (interleukin 6) encodes a cytokine that functions in
inflammation and the maturation of B cells. The protein is
primarily produced at sites of acute and chronic inflammation,
where it is secreted into the serum and induces a transcriptional
inflammatory response through IL6a receptor. The functioning of
this gene is implicated in a wide variety of inflammation-associated
disease states, including susceptibility to diabetes mellitus and
systemic juvenile RA. It has been found that the functional
dynamics of IL6 might be crucial for the outcome of etanercept
therapy and the particular role of IL6 in RA is presently
considered in therapeutic interventions that target IL6 or its
receptor [13]. The expression of IL6 is also reduced in RASFs
treated with trichostatin A and ultrasound [26]. IL6 was also
inhibited by SB-203580, a p38 MAPK inhibitor, in IL1B treated
broblast-like synoviocytes (FLS) cells [31]. IL6 had also been
reported to be associated with immunosuppressive effects of
glucocorticoids. Dexamethasone was found to be a potent
inhibitor of IL6 gene in connective tissue-type cells from the
synovium of patients with RA [66]. This was mainly because
dexamethasone can decrease the mRNA stability of IL6 gene [67].
MAPK1 is a member of the MAP kinase family. MAP kinases
act as an integration point for multiple biochemical signals, and
are involved in a wide variety of cellular processes such as
proliferation, differentiation, transcription regulation and devel-
opment. The activation of this kinase requires its phosphorylation
by upstream kinases. Upon activation, this kinase trans-locates to
the nucleus of the stimulated cells, where it phosphorylates nuclear
targets. It is also related to some immune regulative drugs, such as
cetuximab, and drugs used to treat cancers, such as isoproterenol
[68], erlotinib and sorafenib [69].
RAC1 and RAC2 are GTPases which belongs to the RAS
superfamily of small GTP-binding proteins. Members of this
superfamily appear to regulate a diverse array of cellular events,
including the control of cell growth, cytoskeletal reorganization, and
the activation of protein kinases. It has been shown that
Azathioprine-generated 6-Thio-GTP can prevent the development
of an effective immune response via blockade of Vav activity on RAC
proteins [70]. Azathioprine is also a drug used to treat RA [71].
TP53 responds to diverse cellular stresses to regulate target
genes that induce cell cycle arrest, apoptosis, senescence, DNA
repair, or changes in metabolism. It is a DNA-binding protein
containing transcription activation, DNA-binding, and oligomer-
ization domains. TP53 is postulated to bind to a p53-binding site
and activate expression of downstream genes that inhibit growth
and/or invasion, and thus function as a tumor suppressor.
Methotrexate is an antimetabolite and antifolate drug used in
treatment of cancer and autoimmune diseases. It acts by inhibiting
the metabolism of folic acid. In vitro studies have shown that
methotrexate caused single- and double-strand DNA breaks is
associated with TP53 [72–74]. The p53 pathway was also found to
be affected by bucillamine, which, as said above, is mainly used as
a treatment in Japan to reduce pain in RA patients [45].
Network Modules. By considering relevant cycles in the
interaction network (see Materials and Methods), we were able to
Figure 3. Cytoscape view of Module 10, with TP53 hub highlighted (red). n = nucleus, p = phosphorylation, g = gene, r = RNA, ’ = active.doi:10.1371/journal.pone.0010137.g003
RA Molecular Map
PLoS ONE | www.plosone.org 5 April 2010 | Volume 5 | Issue 4 | e10137

decompose the interaction network into 11 network modules
whose core components were represented by such cycles within
the interaction network. A final 12th module was created from
weakly connected components that were disjoint from all other
modules. Table 1 gives the results from a topological analysis of all
modules. Hubs were identified in the three largest modules
(Modules 1,2 and 4) as discussed below.
Module 4 is the largest module with 292 nodes and 334 edges.
It has a density of 0.008 and in- and out-degree distributions that
can be fitted to power-law distributions with exponent values of
2.009 and 2.352 respectively (corresponding R2 values 0.961 and
0.939). Module 4 has six protein hubs: AKT2, MAPK1, EGFR,
CRKL, GNAI3 and FGFR1. Module 2 is the next largest
module, with 173 nodes and 182 edges. The density of Module 2
is 0.012 and its in- and out-degree distributions also have a good
fit to the power-law distribution (R2 values of 0.96 and 0.989),
with exponent values of 2.269 and 3.043 for in- and out-degree
respectively. Module 2 has two protein hubs, namely MAPK14
and IL6. The third largest module, Module 1, has 111 nodes and
120 edges. The density of this module is 0.019. Due to the smaller
number of nodes with high degree, the fit of a power-law to the
degree distributions for Module 1 is less accurate, with R2 values
dropping to 0.843 and 0.862 for in- and out-degree distribution.
Module 1 has only two protein hubs, MAPK8 and the complex
containing RAC1 and RAC2. As the size of other modules
quickly decreases, with approximately half of the modules
containing fewer than 50 nodes, we do not discuss their
topological features here.
Biological Relevance of Hubs in Modules. Module hubs
that are also hubs in the molecular-interaction map (namely AKI1,
MAPK1, EGFR, IL6 and RAC1, RAC2) are not re-discussed in
this section.
FGFR1 (Module 4) is a membrane protein. It is a member of
the fibroblast growth factor receptor (FGFR) family, where amino
acid sequence is highly conserved between members and
throughout evolution. The extracellular portion of the protein
interacts with fibroblast growth factors, setting in motion a cascade
of downstream signals, ultimately influencing mitogenesis and
differentiation. This protein is associated with palifermin, which is
human keratinocyte growth factor used to treat mucositis. GNAI3
(Module 4) is associated with some antidepressants such as
citalopram, fluoxetine, paroxetine and sertraline.
MAPK14 (Module 2) is also a member of the MAP kinase
family, already described above. This kinase is activated by various
environmental stresses and proinflammatory cytokines. The
activation requires its phosphorylation by MAP kinase kinases
(MKKs), or its autophosphorylation triggered by the interaction of
MAP3K7IP1/TAB1 protein with this kinase. The substrates of
this kinase include transcription regulator ATF2, MEF2C, and
MAX, cell cycle regulator CDC25B, and tumor suppressor p53,
which suggest the roles of this kinase in stress related transcription
and cell cycle regulation, as well as in genotoxic stress response.
Since this protein is one of most important members involved in
the RAF/MEK/ERK signaling pathway, MAPK14 is associated
with sorafenib, which is a drug used for the treatment of advanced
renal cell carcinoma (primary kidney cancer) and advanced
hepatocellular carcinoma (primary liver cancer). Sorafenib is a
small molecular inhibitor of Raf kinase, PDGF (platelet-derived
growth factor), VEGF receptor 2 & 3 kinases and c-Kit, the
receptor for stem cell factor. A growing number of drugs target
most of these pathways. The originality of sorafenib lays in its
simultaneous targeting of the Raf/Mek/Erk pathway [69].
MAPK8 (Module 1) is a member of the MAP kinase family (see
above). This kinase is activated by various cell stimuli, and targets
Table 1. Topological Analysis of Modules and Tissue Maps.
Network Node Edge Comp Nei Path Dia Den Din Dout Rin Rout
Main 776 886 23 2.28 16.04 48 0.003 2.39 2.48 0.95 0.95
Mod 1 111 120 1 2.13 10.71 26 0.019 1.6 2.73 0.84 0.86
Mod 2 173 182 1 2.10 15.67 39 0.012 2.269 3.043 0.96 0.99
Mod 3 75 85 1 2.27 5.83 14 0.031 1.714 2.389 0.85 0.92
Mod 4 72 82 1 2.28 5.85 14 0.032 1.664 2.286 0.85 0.81
Mod 5 12 16 1 2.67 3.33 7 0.242 1.063 1.661 0.87 0.75
Mod 6 43 48 1 2.23 3.08 8 0.053 1.664 2.635 0.89 0.95
Mod 7 11 11 1 2 3.32 7 0.2 1.807 1.807 1 1
Mod 8 4 4 1 2 2 3 0.667 na na na na
Mod 9 20 23 1 2.3 2.40 6 0.121 1.07 1.594 0.84 0.88
Mod 10 53 59 1 2.23 4.71 12 0.043 2.175 1.576 0.93 0.88
Mod 11 6 6 1 2 2.2 4 0.4 na na na na
Mod 12 74 49 25 1.32 1.76 4 0.018 2.605 4.492 0.78 1
B_PBMC 450 428 65 1.90 6.09 20 0.004 2.279 2.964 0.97 0.91
B+PMN 3 2 1 1.33 1.33 2 0.667 na na na na
Cart 50 30 21 1.2 2.37 6 0.024 2.634 3.7 0.987 1
SF 301 236 75 1.57 3.98 12 0.005 2.951 4.129 0.97 0.95
S_PMN 16 10 6 1.25 2.36 6 0.083 1.585 na 1 na
Node = Number nodes, Edges = Number edges, Comp = Number of connected components, Nei = Average number of neighbours, Path = Average shortest path,Dia = network diameter, Den = Network Density, Din = In-degree distribution power law exponent, Dout = Out-degree distribution power law exponent, Rin = R2 valuefor in-degree distribution power-law fit, Rout = R2 value for out-degree distribution power-law fit, Main = cell interaction map, Mod = Module, B_PBMC = Blood_PBMC,B+PMN = Blood_PBMC plus PMN, Cart = cartilage, SF = Synovial Fibroblast, S_PMN = Synovial_PMN.doi:10.1371/journal.pone.0010137.t001
RA Molecular Map
PLoS ONE | www.plosone.org 6 April 2010 | Volume 5 | Issue 4 | e10137

specific transcription factors, and thus mediates immediate-early
gene expression in response to cell stimuli. The activation of this
kinase by tumor-necrosis factor alpha (TNF-a) is found to be
required for TNF-a induced apoptosis. This kinase is also involved
in UV-radiation induced apoptosis, which is thought to be related
to cytochrome c-mediated cell death pathway. This protein is
related to many antineoplastic drugs such as cetuximab, erlotinib
and sorafenib [69]. This protein is also a potential target for
therapeutic treatment of metabolic syndrome. MAPK8 activation
in adipose tissue can cause insulin resistance in the liver [75].
Module Analysis. Using DAVID [76] (see Materials and
Methods) and adopting both false discovery rate (FDR) and
Bonferroni (FWER) correction to control the number of false
positives, we were able to perform a pathway analysis on proteins
involved in Modules 1, 2, 3, 4, 6 and 10. A table giving the full set
of results for Modules 1, 2, 3, 6 and 10 is available in the Table S1
(Module 4 is discussed separately below - see also Table 2).
Module 1 contains 56 proteins, of which we obtained
information about 50 proteins (the other 6 proteins were not
enrolled during the process of this DAVID pathway analysis).
Among these 50 proteins, 17 proteins are involved in the Toll-like
receptor signaling pathway, 14 proteins belong to Leukocyte
transendothelial migration and 18 proteins come from the MAPK
signaling pathway. Module 2 contains 80 proteins. Sixty-four of
which were selected in the pathway analysis. Among these 64
proteins, 45 proteins are involved in the Toll-like receptor
signaling pathway, 27 proteins belong to the MAPK signaling
pathway, 16 proteins are associated with apoptosis and 16 proteins
come from cytokine-cytokine receptor interaction. In Module 3,
23 proteins out of 30 proteins have been enrolled in the pathway
analysis. According to the statistical significance, 8 proteins are
related to the Toll-like receptor signaling pathway. Module 4 is the
biggest module, containing 112 proteins. The DAVID pathway
analysis of Module 4 showed 104 proteins distributed among 26
different pathways (see Table 2). In Module 4 there are 43 proteins
from the MAPK signaling pathway, 36 proteins from focal
adhesion, 23 proteins from the ErbB signaling pathway, and some
cancer associated pathways such as leukemia, prostate cancer and
colorectal cancer (Table 2). There are 23 proteins in Module 6, 22
proteins have been selected by the DAVID pathway analysis. Of
these, 13 proteins are involved in the natural killer cell mediated
cytotoxicity, 11 proteins are related to the T-cell receptor signaling
pathway and 10 proteins belong to focal adhesion. In Module 10,
the p53 signaling pathway has been highlighted by the DAVID
pathway analysis, in which 11 proteins have been enrolled.
Most of these pathways have been found to be playing
important roles in RA. For example, the Toll-like receptor
signaling pathway is shared by Modules 1, 2, 3 and 4. The Toll-
like receptors (TLRs) signaling pathways are membrane-bound
receptors which are expressed in innate immune cells, such as
Table 2. Module 4 Pathway.
Pathway Count List Total Bonferroni FDR
hsa04010:MAPK signaling pathway 43 104 5.05E-23 3.15E-22
hsa04510:Focal adhesion 36 104 9.43E-20 5.88E-19
hsa04012:ErbB signaling pathway 23 104 2.40E-15 1.50E-14
hsa05220:Chronic myeloid leukemia 21 104 4.46E-14 2.78E-13
hsa05215:Prostate cancer 22 104 6.69E-14 4.22E-13
hsa04664:Fc epsilon RI signaling pathway 20 104 6.25E-13 3.90E-12
hsa05210:Colorectal cancer 21 104 6.92E-13 4.32E-12
hsa05211:Renal cell carcinoma 19 104 1.52E-12 9.47E-12
hsa05213:Endometrial cancer 16 104 5.26E-11 3.28E-10
hsa05212:Pancreatic cancer 18 104 1.20E-10 7.48E-10
hsa04620:Toll-like receptor signaling pathway 20 104 3.40E-10 2.12E-09
hsa04912:GnRH signaling pathway 19 104 8.54E-10 5.33E-09
hsa05214:Glioma 15 104 1.53E-08 9.53E-08
hsa04650:Natural killer cell mediated cytotoxicity 20 104 2.58E-08 1.61E-07
hsa05223:Non-small cell lung cancer 14 104 2.99E-08 1.87E-07
hsa04910:Insulin signaling pathway 20 104 5.09E-08 3.17E-07
hsa05218:Melanoma 15 104 1.14E-07 7.09E-07
hsa04810:Regulation of actin cytoskeleton 24 104 1.57E-07 9.81E-07
hsa04370:VEGF signaling pathway 15 104 1.70E-07 1.06E-06
hsa05221:Acute myeloid leukemia 13 104 8.77E-07 5.47E-06
hsa04660:T cell receptor signaling pathway 16 104 9.01E-07 5.62E-06
hsa04540:Gap junction 16 104 1.05E-06 6.54E-06
hsa04662:B cell receptor signaling pathway 12 104 0.00007 0.0004
hsa04320:Dorso-ventral axis formation 8 104 0.0007 0.004
hsa04670:Leukocyte transendothelial migration 14 104 0.0008 0.005
hsa04210:Apoptosis 12 104 0.0009 0.006
hsa = homo sapiens, FDR = false discovery rate.doi:10.1371/journal.pone.0010137.t002
RA Molecular Map
PLoS ONE | www.plosone.org 7 April 2010 | Volume 5 | Issue 4 | e10137

macrophages and dendritic cells. TLRs signaling plays an
important role in the activation and direction of the adaptive
immune system by the up-regulation of co-stimulatory molecules
of antigen presenting cells. The activation of the TLRs signaling
pathway can trigger the activation of the MAPK and NF-kB
pathways. Evidence is emerging that certain TLRs play a role in
the pathogenesis of infectious and/or infammatory diseases. For
example TLR4, which has also been mentioned in the tissue map
analysis, is one of the most studied members of TLRs. TLR4 is a
possible receptor for endogenous factors released during tissue
injury and infammation, such as hsp60 [77]. One study has shown
that TLR2 and TLR4 are expressed by RA synovial membrane
cells and are able to up-regulate inflammatory cytokine produc-
tion, which promotes the inflammatory and destructive process in
RA [78]. There is considerable evidence from rodent models that
activation of the TLRs can induce or exacerbate inflammatory
arthritis, and TLR2 deficient animals exhibited a significantly
reduced severity of arthritis [79].
The MAPK signaling pathway has been found to be involved in
Modules 1, 2 and 4. Some of the members of MAPK signaling
pathway have been identified as hubs in the topological analysis.
MAPK is a key signal transduction pathway of inflammation,
which shuttles information about inflammatory stimuli to the cell
nucleus. All the MAPK signaling pathways in these 3 modules are
triggered by IL1B, which is an important mediator of the
inflammatory response and is involved in a variety of cellular
activities, including cell proliferation, differentiation, and apopto-
sis. IL1B is also a hub in the cartilage tissue map (see below). The
MAPK pathway plays an important in the development and
progress of RA. For example, cartilage damage is a hallmark of
RA. It is based on increased proteoglycan loss as well as
attachment and invasion of inflammatory tissue into the cartilage,
which leads to its structural disintegration. Production of matrix
metalloproteinases (MMPs) by synovial tissue appears to be a key
prerequisite for synovial tissue to invade and destroy cartilage.
Synthesis of MMPs is regulated through multiple MAPK families,
suggesting that a blockade of MAPK might have structural benefit
in arthritis [80,81]. Activation of stress kinase pathways ERK,
JNK, and p38 MAPK is a typical feature of chronic synovitis
during RA, and several proinflammatory mediators use the
signaling of these stress kinase pathways [82].
The other pathways are connected to immunity and inflam-
mation, focal adhesion, apoptosis and cancers. Most of the hubs
mentioned above are members of these pathways. For instance,
the p53 pathway has been mentioned in the hubs and
transcription factor analysis. The diversity and complexity of the
pathways involved in these modules confirms that RA is a complex
systemic disease.
The Role of Transcription FactorsWe identify 5 transcription factors in the global interaction
network: FOS, FOXO1, NFAT5, NFKB1 and TP53. These
transcription factors are important because not only do they link
the gene regulation map with the protein-protein map as shown in
Figure 2, but they also link different modules obtained from the
decomposition of the map.
FOS is one of the leucine zipper proteins that can dimerize with
proteins of the JUN family, thereby forming the transcription
factor complex AP-1. As such, the FOS proteins have been
implicated as regulators of cell proliferation, differentiation, and
transformation. In some cases, expression of the FOS gene has also
been associated with apoptotic cell death. Most of the genes
encoding inflammatory cytokines and matrix-degrading MMPs
are under the control of c-Fos/AP-1, and it plays a very important
role in the destruction of arthritic joints [83]. In the decomposition
of the interaction map, FOS appears in Module 2 only and
MAPK14 catalyzes the activation of FOS. FOS links Modules 1, 2
and 4 and MAPK14 also links Modules 1 and 2. Neither however,
are hubs in the large map. FOS is not in a closed cycle. FOS
belongs to Toll-like receptor signaling pathway and the MAPK
signaling pathway in Module 1 and Module 2. In Module 4, FOS
is also involved in T-cell and B-cell receptor signaling pathways.
The Toll-like receptor signaling pathway and MAPK signaling
pathway are also very important pathways in the module pathway
analysis. FOS therefore not only links the modules, but also links
the important pathways of these modules. The T-cell and B-cell
receptor signaling pathway also play an important role in the
immune effect.
FOXO1 belongs to the forkhead family of transcription factors
that are characterized by a distinct forkhead domain. It may play a
role in myogenic growth and differentiation. Unphosphorylated
active FOXO family proteins promote transcription of genes that
regulate cell-cycle progression and survival, including CDKN1B
[84], FASLG and BCL2L11 [85], which also have been listed in
the map. The relationship between FOXO1 and RA has been
studied in [86–88]. All of the aforementioned studies showed that
FOXO1 contributed to the inflammation and bone destruction in
the affected joints of patients with RA. Here, FOXO1 appears in
the largest module, Module 4. It is connected to AKT2 and AKT2
inhibits the phosphorylation of FOXO1. AKT2 is not included in
a strongly connected component in Module 4 but it has second
highest degree in Module 4 and is therefore a hub. AKT2 also
appears in Module 10. Neither AKT2 nor FOXO1 belong to any
cycles in Module 4. FOXO1 only appears in the pathways of
Module 4, it is associated with prostate cancer and insulin
signaling pathway.
NFAT5 is a member of the nuclear factors of the activated T-
cells family of transcription factors. This family plays a central role
in inducible gene transcription during the immune response. In
RA, NFAT5 mRNA is expressed in proliferating RASF but not in
nonproliferating RASF. Furthermore, NFAT5 mRNA is expressed
in RA synovium - but not in normal individuals - as well as at sites
of bone destruction. NFAT5 could therefore be related not only
with proliferation, but also with the activation and invasion of
RASF in vivo [46]. NFAT5 links Modules 1 and 9. Despite the fact
that Module 1 is relatively large (92 nodes), in the global
interaction network NFAT5 has a degree of only 3, so it is not a
highly connected node. In Module 9, it is linked to PTGS2 via
activation of PTGS2, and PPP3CB can active NFAT5. In Module
1, NFAT5 is linked to genes FOS and JUN, which are both
involved in relatively large cycles of genes (the main cycle that
forms Module 1). Module 1 can be decomposed into 7 non-unique
cycles, each cycle containing approximately 20 nodes. FOS
appears in 4 of these cycles and JUN in the other 3. This suggests
that the NFAT5 transcription pathway is closely linked to a small
number of genes that have a potentially high influence on one of
the largest modules, implying that perturbations made here could
potentially affect a larger part of the cell. NFAT5 is not related to
any pathway in the module pathway analysis.
NFKB1 is a transcription regulator that is activated by various
intra- and extra-cellular stimuli such as cytokines, oxidant-free
radicals, ultraviolet irradiation, and bacterial or viral products.
Activated NFKB1 trans-locates into the nucleus and stimulates the
expression of genes involved in a wide variety of biological
functions. Inappropriate activation of NFKB1 has been associated
with a number of inflammatory diseases while persistent inhibition
of NFKB1 leads to inappropriate immune cell development or
delayed cell growth. NFKB1 dependent gene expression in
RA Molecular Map
PLoS ONE | www.plosone.org 8 April 2010 | Volume 5 | Issue 4 | e10137

peripheral leukocytes is highly correlated with RA activity as
measured by DAS28-CRP. Expression of many genes responds
differentially to anti-TNF-a versus MTX, suggesting fundamen-
tally different effects on the NF-kB pathway [89]. NFKB1 links
Modules 1 and 2. In Module 1, NFKB1 and CCL4 work together
to activate the transcription of PTGS2 in the global interaction
map, which forms part of the same cycle as JUN, mentioned
above. In Module 2, NFKB1 is linked to two reactions
(re99:transcription and re40:heterodimer_association). The het-
erodimer_association of NFKBIA and NFKB1 is included in a
large cycle in Module 2. In the global interaction network, genes
that are directly connected to NFKB1 (inclusive) have small degree
(,4) and therefore are not hubs. NFKB1 is related to the Toll-like
receptor signaling pathway and the MAPK signaling pathway in
Module 1. In Module 2, NFKB1 is involved in the apoptosis
pathway as well as the above two pathways. NFKB1 is distributed
among several pathways in Module 4 involving the MAPK
signaling pathway, chronic myeloid leukemia, pancreatic cancer,
the Toll-like receptor signaling pathway, acute myeloid leukemia,
T-cell and B-cell receptor signaling pathway and apoptosis.
TP53 is in Module 10. It is connected to three genes: TP53 in its
active state in the nucleus (through state_transition), TPPP (TPPP
can phosphorylate TP53) and MDM2 (MDM2 can inhibit the
activation of TP53). TP53 has a degree of 10 in both Module 10
and the global interaction network. It does not link two modules in
our analysis, but is the hub of Module 10. Figure 3 shows the
nodes and connections in Module 10, with the TP53 hub
highlighted in red. The biological relevance of TP53 was discussed
in ‘Biological Relevance of Hubs in the Molecular-Interaction
Map’. TP53 only appears in the pathway of Module 10, where it is
the key member of the p53 pathway.
Analysis of Tissue-Specific NetworksThe global interaction map was decomposed in to 5 sub-maps
according to tissue type. The Blood_PBMC_ PMN (PBMC
Peripheral Blood Mononuclear Cell, PMN Polymorphonuclear
leukocytes) and the synovial_PMN sub-networks contain 3 and 16
nodes respectively. We consider these two maps to be too small for
topological analysis.
The Blood_PBMC sub-network of the RA network is the largest
of the 5 tissue-specific networks, with 450 nodes and 428 edges.
This sub-network is sparse, with a network density of 0.004, and
an average number of 1.898 neighbours. Both the in- and out-
degree distributions can be fitted to a power-law, with exponents
of 2.279 and 2.964 (R2: 0.972 and 0.914 respectively), suggesting
the network displays scale-free properties. Figure 4A shows the
out-degree distribution for Blood_PBMC map. Using degree
distribution to find hubs, this network has five protein hubs
(AKT2, RAC1,2, TP53, GNAI3 and CROP) with out-degree
greater than 3. AKT2, RAC1,2 and TP53 are also hubs in the
global interaction network (see above). GNAI3 is a hub of Module
4 as discussed above. CROP is not a drug target.
The Synovial Fibroblast sub-network contains 301 nodes and
236 edges. It is also a sparse network (though slightly less so than
the Blood_PMBC sub-network), with a network density of 0.005.
In- and out-degree distributions have power-law exponents of
2.279 and 4.129 (R2: 0.97 and 0.953 respectively). Figure 4B
shows the out-degree distribution for the Synovial Fibroblast map,
with the power-law fitted to nodes with non-negative degree. The
out-degree distribution gives rise to three protein hubs, namely IL6
and TLR2 and TLR4 (the number of hubs is reduced here due to
the higher power-law exponent), with out-degree greater than 2.
IL6 is discussed above and TLR2 is not a drug target. However,
TLR4 is a member of the Toll-like receptor (TLR) family, which
plays a fundamental role in pathogen recognition and activation of
innate immunity. The TLR family recognises pathogen-associated
molecular patterns (PAMPs) that are expressed on infectious
agents, and mediates the production of cytokines necessary for the
development of effective immunity. TLR4 is the main receptor for
Lipopolysaccharide (LPS) and is most abundantly expressed in
placenta, and in myelomonocytic subpopulation of the leukocytes.
It has been shown that in cells expressing the 299D-399T TLR4,
LPS activated the transcription factor NFkB and increased the
expression of IL6 and TNF-a. These affects were reduced by
pretreatment of the cells with pravastatin or simvastatin [90].
The cartilage network is small, with 50 nodes and 30 edges. The
network density is 0.024. A power-law distribution can be fitted to
the in- and out-degree distributions, with exponents of 2.634 and
3.7 (R2: 0.987 and 1 respectively). See Figure 4C for out-degree
distribution with fitted power-law. This network also has two
protein hubs, IL6 and the complex containing IL12A, TNF, IL1B
and IL6 (out-degree = 2). TNF is a multifunctional proinflamma-
tory cytokine that belongs to the tumor necrosis factor (TNF)
superfamily. This cytokine is mainly secreted by macrophages. It
can bind to, and thus functions through, its receptors
TNFRSF1A/TNFR1 and TNFRSF1B/TNFBR. TNF is involved
in the regulation of a wide spectrum of biological processes
including cell proliferation, differentiation, apoptosis, lipid metab-
olism, and coagulation. This cytokine has been implicated in RA,
insulin resistance and cancers. TNF-blocking strategies are widely
used in the treatment of RA. Three anti-TNF agents are registered
for use in RA: etanercept, infliximab and adalimumab [91,92].
One study has also shown that dexamethasone (DEX) contributed
to the downregulation of MAM-induced IL1B and TNF-a gene
expression [93]. The expression of TNF was inhibited by histone
deacetylase (HDAC) in affected synovial tissue [94]. In addition,
the relationship between TNF and methotrexate in RA has also
been studied [95]. IL1B is a member of the IL1 cytokine family.
This cytokine is produced by activated macrophages as a
proprotein, which is proteolytically processed to its active form
by caspase 1 (CASP1/ICE). IL1B is an important mediator of the
inflammatory response, and is involved in a variety of cellular
activities, including cell proliferation, differentiation, and apopto-
sis. Glucocorticoids, such as DEX, inhibit interleukin IL1B
because DEX markedly decreases the stability of IL1B mRNA.
DEX was also found to be a potent inhibitor of IL1-induced
expression of the IL6 gene in connective tissue-type cells from the
synovium of patients with RA. Inhibition of the formation of
proinflammatory cytokines, including IL1B and TNF, is a
mechanism by which glucocorticoids exert anti-inflammatory
effects. Inhibition by glucocorticoids of the expression of IL1B in
antigen-presenting cells could decrease the capacity of the cells to
stimulate the proliferation of T-lymphocytes. This activity could
explain the immunosuppressive effects of glucocorticoids [66]. It
has been shown that the effect of MTX treated on RA is associated
with the genotype of IL1 gene. IL1RN*3 polymorphism is
associated with active disease in RA patients who do not respond
to methotrexate treatment, while IL1RN*long allele is associated
with the worst responses to methotrexate therapy in RA patients
[96]. IL12A is not a drug target.
Overlap Between Tissue Types. In order to be able to
comment on whether there are significant topological (and hence
potentially biological) differences between tissue types, we
considered those nodes that appear in multiple tissue types. For
all nodes that appeared in two or more tissues, we identified those
nodes that had different topological properties in different tissues
i.e. they are linked to different nodes in different tissues. If these
nodes prove to be both topologically and biologically significant,
RA Molecular Map
PLoS ONE | www.plosone.org 9 April 2010 | Volume 5 | Issue 4 | e10137

RA Molecular Map
PLoS ONE | www.plosone.org 10 April 2010 | Volume 5 | Issue 4 | e10137

we can draw conclusions on the necessity of targeting different
tissues in the diagnosis and treatment of RA. In total, we found 58
nodes present in multiple tissue types (Table 3) - 57 in two different
tissue types, and one node in three different tissue types. Of these,
29 nodes had identical nearest neighbours in both tissue types
(7 isolated nodes) and 29 had different nearest neighbours
in different tissue types. A biological analysis of the nodes and
their corresponding pathways highlighted several important
overlapping nodes as discussed below. A full list of overlapping
nodes is given Table S2 and Table S3.
The interaction between CCNB1 and CDC2 links the
Blood_PBMC map and Synovial Fibrobalst map together.
CCNB1 is a regulatory protein involved in the G2/M phase of
mitosis. CDC2 is a member of the Ser/Thr protein kinase family.
The kinase activity of this protein is controlled by cyclin
accumulation and destruction through the cell cycle. The
phosphorylation and dephosphorylation of CDC2 also play
important regulatory roles in cell cycle control. The complexes
between CCNB1 and CDC2 form the maturation-promoting
factor (MPF), which is essential for G1/S and G2/M phase
transitions of eukaryotic cell cycle [97]. It has been shown in vitro
[98] that in synovial cells, the over-expression of CCNB1 and
CDC2 leads to aberrant mitosis, recognizable by abundant
cytoplasm, large pale nuclei and prominent nucleoli with
karyotypic alteration. These features are all typically found in
synovial cells adjacent to the affected cartilage and bone of the
joint in human RA and experimental animal models of arthritis.
This also confirmed that rheumatoid synovial cells are ‘tumor-like’
in behaviour [99–101]. It should be noted that the cycle
containing CCNB1 (Blood_PBMC) and CDC2 (Synovial Fibro-
blast) is a significant cycle both in the Blood_PBMC and Synovial
Fibroblast tissues. Identification of this cycle could help us to
identify the key regulatory process in the development and
progression of RA.
The complex containing PB_IKK b, PB_IKK c and CHUK, in
the largest component of the Blood_PBMC tissue map, links to the
Synovial Fibroblast tissue map. This node is a NF-kB complex,
which is a key transcription factor involved in the regulation of
immune responses and apoptosis. Both in vivo and in vitro studies
indicate that NF-kB signaling plays an important role in the
development and progress of RA. Patients with RA present
constitutively high serum levels of pre-inflammatory cytokines,
including TNF-a, IL1 and IL6, which are NF-kB target genes,
suggesting activation of this pathway in the course of RA disease.
Some activated NF-kB members such as NFKB1 and RelA were
found in the nuclei of cells from synovial tissue in RA patients,
whereas these transcript factors were not detected in the nuclei of
cells from normal synovial tissues [102]. Furthermore, the
expression of NFKB1 in synovial tissue was highest at the
cartilage-pannus junction, which is a site that is most likely to be
associated with joint erosion [103]. Apart from the increased
concentration of the active NF-kB in synovium, its binding to
DNA was found to be much stronger in RA compared to
osteoarthritis patients [104]. NF-kB is a potential drug target for
the treatment of autoimmune diseases. Indeed, a number of novel
therapeutic strategies that aim at the specific inhibition of key
elements in NF-kB pathway have been developed. For example,
Decoy oligodeoxynucleotides (ODNs), short double stranded
DNAs containing a consensus sequence for the NF-kB binding
sites, specifically block NF-kB binding to the target genes and are
effective in the down-regulation of pro-inflammatory cytokine
gene expression in vitro [105]. Apart from the specific NF-kB-
directed therapies, a variety of drugs used in the conventional
treatment of autoimmune diseases have effects on NF-kB activity.
Glucocorticoiks are an example of commonly used therapeutics
that can modulate the NF-kB pathway through several mecha-
nisms mentioned in [106].
In the tissue map, TLR2 and TLR4 are shared by the
Blood_PBMC tissue map and Synovial Fibroblast tissue map. In
different tissue types, the various TLRs exhibit different patterns of
expression. TLR2 and TLR4 are expressed most abundantly in
peripheral blood leukocytes. TLRs were first suggested to have a
role in RA in response to a pathogen initiating the disease [107].
Expression of TLR2 and TLR4 has been shown to be increased in
the synovial tissue of RA patients compared with healthy donors or
osteoarthritis samples [108,109]. Analysis of synovial tissues of
patients with RA revealed TLR2 expression in the synovial lining
on fibroblasts as well as on macrophages [110]. TLR2 was found
to be up-regulated by TNF-a and inhibited by SB-203580 [31].
Furthermore, evidence for a TLR4 ligand in the serum and
synovial fluid of RA patients has been observed. Serum and
synovial fluid from RA patients stimulated TLR4 expressing CHO
cells to up-regulate CD25, but the serum and synovial fluid from
the healthy donors had no effect on CHO cells. In contrast, the
expression of TLR4 in systemic sclerosis (SSc) and systemic lupus
erythematosus (SLE) is lower than it is in RA. Furthermore, the
serum from SSc and SLE patients cannot stimulate TLR4
expressing CHO cells to up-regulate CD25, which suggests that
TLR4 could be a specific biomarker for RA [111]. TLR4 was also
found to be associated with the response to rituximab, which is
used in the treatment of many lymphomas, leukemias, and some
autoimmune disorders [36]. The LY96 protein appears to be
associated with TLR4 on the cell surface and confers responsive-
ness to lipopolysaccyaride (LPS), thus providing a link between the
receptor and the LPS signaling pathway. So the interaction
between LY96 in synovial tissue and TLR2 or TLR4 in the
PBMC may indicate that the interaction between these two tissues
in RA is mediated by the TLR signaling pathway. Synovial
fibroblasts and macrophages activated by the recognition of
microbial components or endogenous ligands by TLRs up-
regulate the expression of proinflammatory cytokines, chemokines,
and tissue destructive enzymes. In a hypothetical feedback loop,
endogenous TLR ligands generated by the inflammatory processes
may result in chronic stimulation of synovial cells [112].
Figure 4. Out-degree distribution for different tissue types, fitted to power law (red line). A) Blood_PBMC (231:45x{2:964), B) SynovialFibroblast (201:76x{4:129), C) Cartilage (26x{3:7). Nodes with zero degree are not included in the fitting of the power-law.doi:10.1371/journal.pone.0010137.g004
Table 3. Number of nodes shared by different tissue types.
Tissue type B__PBMC B+PMN Cart SF S__PMN
B__PBMC 450 0 6 25 0
B+PMN 0 3 0 3 0
Cart 6 0 50 21 0
SF 25 3 21 301 4
S__PMN 0 0 0 4 16
B_PBMC = Blood_PBMC, B+PMN = Blood_PBMC plus PMN, Cart = Cartilage,SF = Synovial Fibroblast, S_PMN = Synovial_PMN. Some nodes were assigned tomultiple tissue types. Nodes that could not be identified by tissue type werenot included in this part of the analysis.doi:10.1371/journal.pone.0010137.t003
RA Molecular Map
PLoS ONE | www.plosone.org 11 April 2010 | Volume 5 | Issue 4 | e10137

The nodes IL1B, IL1RN, MMP1, MMP3 and TNF that
overlap between synovial and cartilage tissue, as well as the nodes
CCNB1, CDC2, CDK7, CCNH, IKKb, IKKc and CHUK are
all involved in inflammation and immune reactions.
Discussion
In this study we have successfully reconstructed and analysed a
systemic network of interactions of the processes on-going in
patients affected by RA. The network has been analysed
topologically and biologically as a whole and by tissue type. The
topological results show that the network is sparse, with a large
number of connected components and a low number of average
neighbours. Although the network follows a power-law distribu-
tion as expected, the power-law exponents are higher than is
expected of a biological network (typically between 2.0 and 2.4).
This means that the probability of a node having k connections is
slightly lower than expected, resulting in fewer hubs that have a
high degree. The low-density of the network, and the lower
number of hubs with high degree makes the network particularly
robust to change. These results, however, should be interpreted
with some caution as they imply that the number of links in the
network is likely to be less than the number of links that truly exist.
We strongly encourage readers to add to the map where possible.
The analyses should be re-run once significantly more links have
been added. This, however, may take time and the map presented
here can be considered as comprehensive as possible at the time of
study.
In this study, we have also been interested in determining if the
topologically important aspects of the network have biological
significance. Hub proteins often have special biological properties:
they tend to be more essential than non-hub proteins [113] and
they are found to play a central role in modular organisation of the
protein interaction network [114]. Furthermore, hub proteins may
also be evolutionarily conserved to a larger extent than non-hubs
[115]. As a result, hub proteins can be used as targets to design
new drugs. Although not all topologically significant results can be
explained biologically, we have found that many of the hubs
identified are already drug targets for RA. This may be partly
explained by the fact that these proteins and genes are well
referenced and so finding the links associated with these genes is
relatively easy. It is interesting to note that there do exist definite
topological and biological links for the RA network, implying that
the map presented here can be used to further understand how
drugs influence RA at the molecular level. For example, from the
topological analysis alone we can speculate that the ability to affect
the rest of the network by targeting drugs at the hubs is likely to be
reduced by the aforementioned topological characteristics.
One application of the map could be to determine the likely
affect of targeting specific genes in the map, and to understand the
effect that different drugs (that target nodes in the map) have on
the rest of the network. Furthermore, those parts of the map that
were topologically important, but that currently seem to have little
biological relevance should be investigated further. It has been
shown that drug-target proteins have higher connectivity and
quicker communication with each other in a protein-protein
interaction network [116], suggesting that the hubs that seem to
have little biological relevance today may be potential targets for
future research. Through the topological analysis of this RA
network, CRKL has been identified to be a hub of Module 4. As
far as searching Pharmaccogenomics Knowledge Base website
‘http://www.pharmgkb.org/index.jsp/’, we did not find that this
protein has been used as any drug target. CRKL, containing SH2
and SH3 domains, had been shown to activate the RAS and JUN
kinase signaling pathways. Proteins with this kind of domain-
mediated protein-protein interaction are required for the trans-
mission of proliferative signals that are initiated by tyrosine
kinases. Peptidomimetic ligands based on the sequence of target
proteins for SH2 and SH3 domains may represent new
compounds for the therapy of proliferative diseases that are
dependent upon constitutively activated tyrosine kinases [117].
Via the pathway analysis, we also found that CRKL is associated
with a number of pathways, for instance, the MAPK signaling
pathway, chronic myeloid leukemia and the regulation of the actin
cytoskeleton pathways. Most of these pathways are related to the
immune and inflammation reactions. So it is reasonable here to
suggest that CRKL could be an interesting candidate as potential
new drug target for the treatment of RA. This is consistent with
the recommendation in [118].
Topologically speaking, it would seem that perturbations
targeted at specific areas of the network will die out quickly and
changes in concentrations would have to be stronger in order to
reach secondary modules, if at all possible. This occurs because the
average shortest path length in the interaction network is longer
than expected, but as the network is not well-connected and hence
the number of connected nodes is small, the power of this
calculation will not be high for this network. It is also important to
note that although mean path length is used as a measure in
biological networks, the reader should keep in mind that as the
data are scale-free, so there is skewness. Further, in the transition
from CellDesigner v4.0.1 used to draw the map, to Cytoscape [119],
used to analyse the network (see Materials and Methods), reaction
between genes and proteins are transformed from part of a link to
an actual node, this means that the shortest path that can exist
between a gene and a protein that interact is always 2, rather than
1 as may be seen in other interaction networks. It also means that
the number of links for some nodes is reduced as they are forced to
be channeled via such a reaction node. Consequently, the
clustering coefficient, which can be considered in a topological
analysis, cannot be calculated for the network studied here. It is
beyond the scope of this project to correct this but it should be
considered as an area of future research.
With the exception of the cartilage sub-map, the topological
patterns seen in the interaction map as a whole can also be seen in
the tissue sub-maps (see Table 1). For both the Blood_PBMC and
the Synovial Fibroblast map the density is low and the power-law
exponents, particularly for the out-degree distribution, are higher
than is expected for a biological network. From Figure 4, it is clear
that all three sub-maps have few nodes with degree higher than 2,
particularly in the cartilage sub-map (Figure 4C)), which has no
proteins of degree larger than 2. The low number of hubs in the
graphs implies that, from the analysis of these three sub-maps, we
are not able to identify many potential drug target sites within each
tissue type. The higher density in the cartilage sub-map could be
explained by the low number of nodes in the map. It is to be
expected that Blood_PBMC has a higher number of hubs because
there is more data available for blood tissue than other tissue types.
Despite this, there was little topological difference between the
Blood_PBMC and Synovial Fibroblast sub-maps, suggesting that
there is no topological evidence to recommend that targeting one
tissue type over the other is advantageous. However, the different
expression levels of nodes in different tissue types might suggest
otherwise. Although there is a relatively high amount of overlap
between different tissue maps, only some of the overlapping nodes
were shown to be biologically significant. In particular we note the
existence of the CCNB1:CDC2 cycle in the Blood_PBMC and the
Synovial Fibroblast tissues, which could lead to identification of the
key regulatory process in the development and progression of RA if
RA Molecular Map
PLoS ONE | www.plosone.org 12 April 2010 | Volume 5 | Issue 4 | e10137

investigated further. We also note the existence of TLR2 and TLR4
in both Blood_PBMC and Synovial Fibroblast as significant as this
overlap may lead us to conclude that the interaction between the
two tissue types is mediated by the TLR signaling pathway.
We have successfully been able to use network analysis methods
to identify biologically important areas of the network, including
hubs. This supports previously published hypotheses that there is a
relationship between biologically and topologically significant
areas of molecular interaction maps. Without network analysis it
would be impossible to visualize such important nodes or clusters
in such a complex graph as the one studied here. Although the
results presented here can be considered preliminary, they are, to
our knowledge, the first representation of a systematic map for
RA. The molecular interaction map improves our ability to
understand the molecular mechanism involved in RA on the
whole.
Materials and Methods
DataUsing the search terms ‘rheumatoid arthritis AND microarray
AND expression profiling’, an intensive literature search of papers
based on high-throughput RA experiments (mRNA, miRNA) was
done in order to identify genes, proteins and small molecules that
relate to RA. The animal studies of RA and the expression
profiling performed using techniques other than microarray are
deleted. Finally, 28 peer-reviewed articles had been enrolled
[11–13,17,23–46] and combined with data publicly available in
the KEGG database ‘http://www.genome.jp/kegg/’ in order to
further identify genes involved in RA and to aid reconstruction of
gene pathways. A total of 273 proteins, 58 genes, 46 RNAs, 5
simple molecules, 1 ion and 1 antisense RNA involved in RA were
identified using this method. (See Table S4 for a tabulated
summary of the literature.)
Construction of the Molecular-Interaction NetworkUsing the data obtained, the general molecular interaction
network was created in CellDesigner v4.0.1 [18]. Initially, connections
were built among all the molecules (proteins, genes, RNAs, simple
molecules, ions and antisense RNA) presented in the literature
studied. In some cases, detailed regulatory relationships between
different molecules, such as activation, inhibition and phosphoryla-
tion were available, enabling the re-construction of part of the RA
map. In the case where molecules were identified in the literature, but
their interactions not identified (i.e. the nodes are isolated in the RA
map), we searched the KEGG PATHWAY database for missing
connections. Here, every molecule was input as a query term and a
list of different pathways that it is involved in was obtained. For each
pathway map, we were able to obtain information about the
molecule’s neighbours, as well as the relationships among them. If the
neighbours of the queried molecule were also related to RA, then they
were added to the interaction map. Otherwise, this information was
not included. In different pathways, it may occur that the neighbours
of the queried molecule differ. In such cases, each path is treated
independently and included in the map according to the method
described above. Where no interaction information was available
from either the literature or KEGG database, the molecules were
excluded from the map.
The resulting RA map is a directed network between molecules
involved in RA, where each node represents a single molecule and
links between two nodes may represent state transition (the
transition of one node from one state to another state, namely
activation, inhibition or phosphorylation), transcription, transla-
tion or transport. Where the transition occurs in both directions
between two nodes, two directed links (one in each direction) are
used. Other types of links can only occur in one direction.
Network Decomposition and AnalysisThe molecular interaction map was imported into Cytoscape
v2.6.3 for decomposition and topological analysis. Based on work
previously published [120], the network was decomposed, as
described below, into modules using the Cytoscape plugin BiNoM
[121]. It should be noted here that activation or inhibition
between two proteins in Celldesigner is represented as a node in
Cytoscape. These nodes are given ‘re’ as a prefix, followed by an ID
number assigned by the software.
As we expect the graph to have a bow tie structure [56], we first
separate the map in to three sub-maps; namely a central cyclic
part that contains strongly connected components (SCC), an in-
component and an out-component. (All strongly connected
components of the central-cyclic part were extracted using the
standard Tarjan’s algorithm, implemented in BiNoM.) The in-
and out-components contain those parts of the map from which
the central cyclic component can be reached (IN) and those that
can be reached from the central cyclic component (OUT). The
central cyclic part may contain several disjoint strongly connected
components. Since feedback is one of the ways that an organism
uses to regulate different biological networks, we decomposed the
central cyclic part into relevant cycles, where a relevant cycle is
defined as a cycle that is not the sum of shorter cycles [122].
Definition of relevant cycles can provide information about
feedback within the network.
As each cycle is not necessarily unique, we merged those cycles
that shared more than half of their nodes. This produced the core
components for 11 modules that may be of biological, as well as
topological, interest.
Given the core components of the 11 potentially important
modules that we wish to analyse, we reintroduced the nodes (and
components of nodes) that were in the IN and OUT sub-maps.
When each module is merged with the IN and OUT sub-maps,
only the connected parts are kept. Where components were not
disjoint (i.e. were connected to multiple modules), the component
was manually assigned to the module with which the majority of
nodes were connected. If a component was connected to two
different modules by the same number of nodes, it was assigned to
the largest module. The union of all of the modules was then
compared to the original graph to identify those nodes that had
not been assigned to a module. This gave rise to a 12th module
containing 13 connected components and 12 isolated nodes, that
were disjoint from all other modules. The components in this
module appear in the outer-section of the bow tie structure. The
12 modules vary greatly in size, with the number of nodes varying
from 4 to 292 nodes. This implies that the original map has at least
one large cluster of nodes, which is not well connected to other,
smaller clusters. All modules can be downloaded in Cytoscape
format at: ‘www.picb.ac.cn/ClinicalGenomicNTW/temp.html’.
Once the network had successfully been decomposed, we used the
Cytoscape plugin, NetworkAnalyzer [123], to run a topological analysis
on each of the 12 modules. The topological properties that we
consider to be of most biological interest here are given in Table 1.
If the networks that we analyse are scale-free (i.e. they fit a
power-law distribution), then their topology should be determined
by a few highly connected nodes (hubs), that link the rest of the
less-connected nodes to the system. Biologically speaking, nodes
that can be identified as hubs in a network may lead us to be able
to more readily identify important pathways in this complex
network. We use both the in- and out-degree to identify hubs in
the original map as well as in the larger of the 12 modules.
RA Molecular Map
PLoS ONE | www.plosone.org 13 April 2010 | Volume 5 | Issue 4 | e10137

Biological Interpretation. We analysed the outputs from the
topological analyses in order to determine if there was any biological
significance in the topological results, in particular we use the
Pharmaccogenomics Knowledge Base website ‘http://www.
pharmgkb.org/index.jsp/’ and corresponding literature to determine
if the nodes that were identified as being topologically important are
also associated with drugs that are used to treat RA. Furthermore, we
use DAVID (The Database for Annotation, Visualization and
Integrated Discovery, [76]) ‘http://david.abcc.ncifcrf.gov/home.
jsp’, which provides a comprehensive set of functional annotation
tools for investigators to understand biological meaning behind large
list of genes, to obtain KEGG pathway information of Module 1,
Module 2, Module 3, Module 4, Module 6 and Module 10. The
remaining five modules are too small to be able to obtain meaningful
results. In the analysis, we control at the 0.01 level the number of false
positives using two statistics: False Detection Rate (FDR) and
Bonferroni correction (FWER).
Supporting Information
Table S1
Found at: doi:10.1371/journal.pone.0010137.s001 (0.05 MB
PDF)
Table S2
Found at: doi:10.1371/journal.pone.0010137.s002 (0.03 MB
PDF)
Table S3
Found at: doi:10.1371/journal.pone.0010137.s003 (0.03 MB
PDF)
Table S4
Found at: doi:10.1371/journal.pone.0010137.s004 (0.04 MB
PDF)
Acknowledgments
The authors would like to thank Prof. Nan Shen, Director of the Shanghai
Institute of Rheumatology Renji Hospital, JiaoTong University School of
Medicine, Shanghai China, for his important feedback.
Author Contributions
Conceived and designed the experiments: CN. Analyzed the data: GW LZ
JED. Wrote the paper: GW JED CN.
References
1. Alamanos Y, Voulgari PV, Drosos AA (2006) Incidence and prevalence ofrheumatoid arthritis, based on the 1987 american college of rheumatology
criteria: a systematic review. Semin Arthritis Rheum 36: 182–188.
2. Schneider M, Manabile E, Tikly M (2008) Social aspects of living with
rheumatoid arthritis: a qualitative descriptive study in soweto, south africa - alow resource context. Health Qual Life Outcomes 6: 54–54.
3. Giladi H, Sukenik S, Flusser D, Liel-Cohen N, Applebaum A, et al. (2008) A
rare case of enterobacter endocarditis superimposed on a mitral valverheumatoid nodule. J Clin Rheumatol 14: 97–100.
4. Carl HD, Swoboda B (2008) [effectiveness of arthroscopic synovectomy in
rheumatoid arthritis]. Z Rheumatol 67: 485–490.
5. Meltzer EB, Noble PW (2008) Idiopathic pulmonary fibrosis. Orphanet J RareDis 3: 8–8.
6. Levin J, Werth VP (2006) Skin disorders with arthritis. Best Pract Res Clin
Rheumatol 20: 809–826.
7. Eyre S, Hinks A, Flynn E, Martin P, Wilson AG, et al. (2009) Confirmation ofassociation of the rel locus with rheumatoid arthritis susceptibility in the uk
population. Ann Rheum Dis.
8. van der Linden MP, Feitsma AL, le Cessie S, Kern M, Olsson LM, et al. (2009)Association of a single-nucleotide polymorphism in cd40 with the rate of joint
destruction in rheumatoid arthritis. Arthritis Rheum 60: 2242–2247.
9. Wu CC, Shete S, Chen WV, Peng B, Lee AT, et al. (2009) Detection of disease-associated deletions in case-control studies using snp genotypes with application
to rheumatoid arthritis. Hum Genet 126: 303–315.
10. van Baarsen LG, Bos CL, van der Pouw Kraan TC, Verweij CL (2009)
Transcription profiling of rheumatic diseases. Arthritis Res Ther 11: 207–207.
11. Toonen EJ, Barrera P, Radstake TR, van Riel PL, Scheffer H, et al. (2008)
Gene expression profiling in rheumatoid arthritis: current concepts and future
directions. Ann Rheum Dis 67: 1663–1669.
12. Pohlers D, Beyer A, Koczan D, Wilhelm T, Thiesen HJ, et al. (2007)Constitutive upregulation of the transforming growth factor-beta pathway in
rheumatoid arthritis synovial fibroblasts. Arthritis Res Ther 9.
13. Koczan D, Drynda S, Hecker M, Drynda A, Guthke R, et al. (2008) Moleculardiscrimination of responders and nonresponders to anti-tnf alpha therapy in
rheumatoid arthritis by etanercept. Arthritis Res Ther 10.
14. Hammaker D, Sweeney S, Firestein GS (2003) Signal transduction networks inrheumatoid arthritis. Ann Rheum Dis 62 Suppl 2: 86–89.
15. Sweeney SE, Firestein GS (2004) Signal transduction in rheumatoid arthritis.
Curr Opin Rheumatol 16: 231–237.
16. Morel J, Berenbaum F (2004) Signal transduction pathways: new targets fortreating rheumatoid arthritis. Joint Bone Spine 71: 503–510.
17. Stanczyk J, Pedrioli DM, Brentano F, Sanchez-Pernaute O, Kolling C, et al.
(2008) Altered expression of microrna in synovial fibroblasts and synovial tissuein rheumatoid arthritis. Arthritis Rheum 58: 1001–1009.
18. Funahashi A, Morohashi M, Kitano H, Tanimura N (2003) Celldesigner: a
process diagram editor for gene-regulatory and biochemical networks.
BIOSILICO 1: 159–162.
19. Klipp E, Liebermeister W, Helbig A, Kowald A, Schaber J (2007) Systems
biology standards?the community speaks. Nature Biotechnology. pp 390–391.
20. Holt RA, Jones SJ (2008) The new paradigm of flow cell sequencing. Genome
Res 18: 839–846.
21. Wang Z, Gerstein M, Snyder M (2009) Rna-seq: a revolutionary tool for
transcriptomics. Nat Rev Genet 10: 57–63.
22. Lea P, Keystone E, Mudumba S, Kahama A, Ding SF, et al. (2009) Advantages
of multiplex proteomics in clinical immunology : The case of rheumatoidarthritis: Novel igxplex: Planar microarray diagnosis. Clin Rev Allergy
Immunol.
23. Sha N, Vannucci M, Brown PJ, Trower MK, Amphlett G, et al. (2003) Geneselection in arthritis classification with large-scale microarray expression
profiles. Comp Funct Genomics 4: 171–181.
24. Arranz A, Gutierrez-Canas I, Carrion M, Juarranz Y, Pablos JL, et al. (2008)
Vip reverses the expression profiling of tlr4-stimulated signaling pathway inrheumatoid arthritis synovial fibroblasts. Mol Immunol 45: 3065–3073.
25. Sekiguchi N, Kawauchi S, Furuya T, Inaba N, Matsuda K, et al. (2008)
Messenger ribonucleic acid expression profile in peripheral blood cells from rapatients following treatment with an anti-tnf-alpha monoclonal antibody,
infliximab. Rheumatology (Oxford) 47: 780–788.
26. Nakamura C, Matsushita I, Kosaka E, Kondo T, Kimura T (2008) Anti-
arthritic effects of combined treatment with histone deacetylase inhibitor andlow-intensity ultrasound in the presence of microbubbles in human rheumatoid
synovial cells. Rheumatology (Oxford) 47: 418–424.
27. Qingchun H, Runyue H, LiGang J, Yongliang C, Song W, et al. (2008)
Comparison of the expression profile of apoptosis-associated genes in
rheumatoid arthritis and osteoarthritis. Rheumatol Int 28: 697–701.
28. Andreas K, Lubke C, Haupl T, Dehne T, Morawietz L, et al. (2008) Key
regulatory molecules of cartilage destruction in rheumatoid arthritis: an in vitrostudy. Arthritis Res Ther 10.
29. Auer J, Blass M, Schulze-Koops H, Russwurm S, Nagel T, et al. (2007)Expression and regulation of ccl18 in synovial fluid neutrophils of patients with
rheumatoid arthritis. Arthritis Res Ther 9.
30. Timmer TC, Baltus B, Vondenhoff M, Huizinga TW, Tak PP, et al. (2007)Inflammation and ectopic lymphoid structures in rheumatoid arthritis synovial
tissues dissected by genomics technology: identification of the interleukin-7signaling pathway in tissues with lymphoid neogenesis. Arthritis Rheum 56:
2492–2502.
31. Zer C, Sachs G, Shin JM (2007) Identification of genomic targets downstream
of p38 mitogen-activated protein kinase pathway mediating tumor necrosis
factor-alpha signaling. Physiol Genomics 31: 343–351.
32. Galligan CL, Baig E, Bykerk V, Keystone EC, Fish EN (2007) Distinctive gene
expression signatures in rheumatoid arthritis synovial tissue fibroblast cells:correlates with disease activity. Genes Immun 8: 480–491.
33. Devauchelle V, Marion S, Cagnard N, Mistou S, Falgarone G, et al. (2004)Dna microarray allows molecular profiling of rheumatoid arthritis and
identification of pathophysiological targets. Genes Immun 5: 597–608.
34. Lindberg J, af Klint E, Catrina AI, Nilsson P, Klareskog L, et al. (2006) Effectof infliximab on mrna expression profiles in synovial tissue of rheumatoid
arthritis patients. Arthritis Res Ther 8.
35. Lequerre T, Gauthier-Jauneau AC, Bansard C, Derambure C, Hiron M, et al.
(2006) Gene profiling in white blood cells predicts infliximab responsiveness inrheumatoid arthritis. Arthritis Res Ther 8.
36. Julia A, Barcelo M, Erra A, Palacio C, Marsal S (2009) Identification ofcandidate genes for rituximab response in rheumatoid arthritis patients by
RA Molecular Map
PLoS ONE | www.plosone.org 14 April 2010 | Volume 5 | Issue 4 | e10137

microarray expression profiling in blood cells. Pharmacogenomics 10:1697–1708.
37. Olsen N, Sokka T, Seehorn CL, Kraft B, Maas K, et al. (2004) A gene
expression signature for recent onset rheumatoid arthritis in peripheral bloodmononuclear cells. Ann Rheum Dis 63: 1387–1392.
38. Lequerre T, Bansard C, Vittecoq O, Derambure C, Hiron M, et al. (2009)Early and long-standing rheumatoid arthritis: distinct molecular signatures
identified by gene-expression profiling in synovia. Arthritis Res Ther 11.
39. Alsaleh G, Suffert G, Semaan N, Juncker T, Frenzel L, et al. (2009) Bruton’styrosine kinase is involved in mir-346-related regulation of il-18 release by
lipopolysaccharide-activated rheumatoid fibroblast-like synoviocytes.J Immunol 182: 5088–5097.
40. Junta CM, Sandrin-Garcia P, Fachin-Saltoratto AL, Mello SS, Oliveira RD,
et al. (2009) Differential gene expression of peripheral blood mononuclear cellsfrom rheumatoid arthritis patients may discriminate immunogenetic, patho-
genic and treatment features. Immunology 127: 365–372.
41. Edwards CJ, Feldman JL, Beech J, Shields KM, Stover JA, et al. (2007)
Molecular profile of peripheral blood mononuclear cells from patients with
rheumatoid arthritis. Mol Med 13: 40–58.
42. Silva GL, Junta CM, Mello SS, Garcia PS, Rassi DM, et al. (2007) Profiling
meta-analysis reveals primarily gene coexpression concordance betweensystemic lupus erythematosus and rheumatoid arthritis. Ann N Y Acad Sci
1110: 33–46.
43. van der Pouw Kraan T, Wijbrandts C, van Baarsen L, Rustenburg F, Baggen J,et al. (2008) Responsiveness to anti-tumour necrosis factor {alpha} therapy is
related to pre-treatment tissue inflammation levels in rheumatoid arthritispatients. British Medical Journal 67: 563.
44. Van der Pouw Kraan T, van Gaalen F, Kasperkovitz P, Verbeet N, Smeets T,
et al. (2003) Rheumatoid arthritis is a heterogeneous disease. Arthritis Rheum48: 2132–2145.
45. Oki K, Tsuji F, Ohashi K, Kageyama M, Aono H, et al. (2009) The
investigation of synovial genomic targets of bucillamine with microarraytechnique. Inflamm Res 58: 571–584.
46. Teixeira VH, Olaso R, Martin-Magniette ML, Lasbleiz S, Jacq L, et al. (2009)Transcriptome analysis describing new immunity and defense genes in
peripheral blood mononuclear cells of rheumatoid arthritis patients. PLoS
One 4.
47. Kalatzis FG, Giannakeas N, Exarchos TP, Lorenzelli L, Adami A, et al. (2009)
Developing a genomic-based point-of-care diagnostic system for rheumatoidarthritis and multiple sclerosis. Conf Proc IEEE Eng Med Biol Soc 1: 827–830.
48. Ziober AF, Patel KR, Alawi F, Gimotty P, Weber RS, et al. (2006)
Identification of a gene signature for rapid screening of oral squamous cellcarcinoma. Clin Cancer Res 12: 5960–5971.
49. Alberghina L, Hofer T, Vanoni M (2009) Molecular networks and system-levelproperties. Journal of Biotechnology.
50. Barrenas F, Chavali S, Holme P, Mobini R, Benson M (2009) Network
properties of complex human disease genes identified through genome-wideassociation studies. PLoS ONE 4: e8090.
51. Sengupta U, Ukil S, Dimitrova N, Agrawal S (2009) Expression-based networkbiology identifies alteration in key regulatory pathways of type 2 diabetes and
associated risk/complications. PLoS ONE 4: e8100.
52. Lu R, Markowetz F, Unwin RD, Leek JT, Airoldi EM, et al. (2009) Systems-level dynamic analyses of fate change in murine embryonic stem cells. Nature
462: 358–362.
53. Eschrich S, Zhang H, Zhao H, Boulware D, Lee JH, et al. (2009) Systemsbiology modeling of the radiation sensitivity network: A biomarker discovery
platform. International Journal of Radiation Oncology Biology Physics 75:497–505.
54. Reka A (2005) Scale-free networks in cell biology. J Cell Sci 118: 4947–4957.
55. Jeong H, Tombor B, Albert R, Oltvai ZN, Barabasi AL (2000) The large-scaleorganization of metabolic networks. Nature 407: 651–654.
56. Newman MEJ, Barabasi AL, Watts DJ, eds (2006) The Structure andDynamics of Networks Princeton University Press.
57. Barabasi AL (2009) Scale-free networks: A decade and beyond. Science 325:
412–413.
58. Vallabhajosyula RR, Chakravarti D, Lutfeali S, Ray A, Raval A (2009)
Identifying hubs in protein interaction networks. PLoS ONE 4: e5344+.
59. JACOB F, PERRIN D, SANCHEZ C, MONOD J (1960) [operon: a group ofgenes with the expression coordinated by an operator.]. C R Hebd Seances
Acad Sci 250: 1727–1729.
60. Brandman O, Meyer T (2008) Feedback loops shape cellular signals in space
and time. Science 322: 390–395.
61. Klein TE, Chang JT, Cho MK, Easton KL, Fergerson R, et al. (2001)Integrating genotype and phenotype information: an overview of the pharmgkb
project. pharmacogenetics research network and knowledge base.Pharmacogenomics J 1: 167–170.
62. Murakami M, Sasaki T, Yamasaki S, Kuwahara K, Miyata H, et al. (2004)
Induction of apoptosis by ionizing radiation and ci-1033 in hucct-1 cells.Biochem Biophys Res Commun 319: 114–119.
63. Pander J, Gelderblom H, Guchelaar HJ (2007) Pharmacogenetics of egfr andvegf inhibition. Drug Discov Today 12: 1054–1060.
64. Glaysher S, Yiannakis D, Gabriel FG, Johnson P, Polak ME, et al. (2009)
Resistance gene expression determines the in vitro chemosensitivity of non-small cell lung cancer (nsclc). BMC Cancer 9: 300–300.
65. Ji L, Roth JA (2008) Tumor suppressor fus1 signaling pathway. J Thorac Oncol
3: 327–330.
66. Amano Y, Lee SW, Allison AC (1993) Inhibition by glucocorticoids of theformation of interleukin-1 alpha, interleukin-1 beta, and interleukin-6:
mediation by decreased mrna stability. Mol Pharmacol 43: 176–182.
67. Tobler A, Meier R, Seitz M, Dewald B, Baggiolini M, et al. (1992)Glucocorticoids downregulate gene expression of gm-csf, nap-1/il-8, and il-6,
but not of m-csf in human fibroblasts. Blood 79: 45–51.
68. Huang J, Sun Y, Huang XY (2004) Distinct roles for src tyrosine kinase in
beta2-adrenergic receptor signaling to mapk and in receptor internalization.J Biol Chem 279: 21637–21642.
69. Wilhelm SM, Carter C, Tang L, Wilkie D, McNabola A, et al. (2004) Bay 43-
9006 exhibits broad spectrum oral antitumor activity and targets the raf/mek/erk pathway and receptor tyrosine kinases involved in tumor progression and
angiogenesis. Cancer Res 64: 7099–7109.
70. Poppe D, Tiede I, Fritz G, Becker C, Bartsch B, et al. (2006) Azathioprine
suppresses ezrin-radixin-moesin-dependent t cell-apc conjugation throughinhibition of vav guanosine exchange activity on rac proteins. J Immunol
176: 640–651.
71. Black AJ, McLeod HL, Capell HA, Powrie RH, Matowe LK, et al. (1998)Thiopurine methyltransferase genotype predicts therapy-limiting severe toxicity
from azathioprine. Ann Intern Med 129: 716–718.
72. Li JC, Kaminskas E (1984) Accumulation of dna strand breaks and
methotrexate cytotoxicity. Proc Natl Acad Sci U S A 81: 5694–5698.
73. Lorico A, Toffoli G, Boiocchi M, Erba E, Broggini M, et al. (1988)Accumulation of dna strand breaks in cells exposed to methotrexate or n10-
propargyl-5,8-dideazafolic acid. Cancer Res 48: 2036–2041.
74. Nelson WG, Kastan MB (1994) Dna strand breaks: the dna templatealterations that trigger p53-dependent dna damage response pathways. Mol
Cell Biol 14: 1815–1823.
75. Sabio G, Das M, Mora A, Zhang Z, Jun JY, et al. (2008) A stress signaling
pathway in adipose tissue regulates hepatic insulin resistance. Science 322:1539–1543.
76. Huang daW, Sherman BT, Lempicki RA (2009) Systematic and integrative
analysis of large gene lists using david bioinformatics resources. Nat Protoc 4:44–57.
77. Ohashi K, Burkart V, Flohe S, Kolb H (2000) Cutting edge: heat shock protein
60 is a putative endogenous ligand of the toll-like receptor-4 complex.J Immunol 164: 558–561.
78. Sacre SM, Andreakos E, Kiriakidis S, Amjadi P, Lundberg A, et al. (2007) Thetoll-like receptor adaptor proteins myd88 and mal/tirap contribute to the
inflammatory and destructive processes in a human model of rheumatoidarthritis. Am J Pathol 170: 518–525.
79. Joosten LA, Koenders MI, Smeets RL, Heuvelmans-Jacobs M, Helsen MM,
et al. (2003) Toll-like receptor 2 pathway drives streptococcal cell wall-inducedjoint inflammation: critical role of myeloid differentiation factor 88. J Immunol
171: 6145–6153.
80. Liacini A, Sylvester J, Li WQ, Huang W, Dehnade F, et al. (2003) Induction of
matrix metalloproteinase-13 gene expression by tnf-alpha is mediated by mapkinases, ap-1, and nf-kappab transcription factors in articular chondrocytes.
Exp Cell Res 288: 208–217.
81. Suzuki M, Tetsuka T, Yoshida S, Watanabe N, Kobayashi M, et al. (2000) Therole of p38 mitogen-activated protein kinase in il-6 and il-8 production from the
tnf-alpha- or il-1beta-stimulated rheumatoid synovial fibroblasts. FEBS Lett
465: 23–27.
82. Schett G, Tohidast-Akrad M, Smolen JS, Schmid BJ, Steiner CW, et al. (2000)Activation, differential localization, and regulation of the stress-activated
protein kinases, extracellular signal-regulated kinase, c-jun n-terminal kinase,and p38 mitogen-activated protein kinase, in synovial tissue and cells in
rheumatoid arthritis. Arthritis Rheum 43: 2501–2512.
83. Shiozawa S, Tsumiyama K (2009) Pathogenesis of rheumatoid arthritis and c-
fos/ap-1. Cell Cycle 8: 1539–1543.
84. Dijkers PF, Medema RH, Pals C, Banerji L, Thomas NS, et al. (2000)Forkhead transcription factor fkhr-l1 modulates cytokine-dependent transcrip-
tional regulation of p27(kip1). Mol Cell Biol 20: 9138–9148.
85. Dijkers PF, Medema RH, Lammers JW, Koenderman L, Coffer PJ (2000)Expression of the pro-apoptotic bcl-2 family member bim is regulated by the
forkhead transcription factor fkhr-l1. Curr Biol 10: 1201–1204.
86. Ludikhuize J, de Launay D, Groot D, Smeets TJ, Vinkenoog M, et al. (2007)
Inhibition of forkhead box class o family member transcription factors inrheumatoid synovial tissue. Arthritis Rheum 56: 2180–2191.
87. Kuo CC, Lin SC (2007) Altered foxo1 transcript levels in peripheral blood
mononuclear cells of systemic lupus erythematosus and rheumatoid arthritispatients. Mol Med 13: 561–566.
88. Singh K, Colmegna I, He X, Weyand CM, Goronzy JJ (2008) Synoviocyte
stimulation by the lfa-1-intercellular adhesion molecule-2-ezrin-akt pathway in
rheumatoid arthritis. J Immunol 180: 1971–1978.
89. Parker A, Izmailova ES, Narang J, Badola S, Le T, et al. (2007) Peripheralblood expression of nuclear factor-kappab-regulated genes is associated with
rheumatoid arthritis disease activity and responds differentially to anti-tumornecrosis factor-alpha versus methotrexate. J Rheumatol 34: 1817–1822.
90. Hodgkinson CP, Ye S (2008) Statins inhibit toll-like receptor 4-mediated
lipopolysaccharide signaling and cytokine expression. Pharmacogenet Geno-
mics 18: 803–813.
RA Molecular Map
PLoS ONE | www.plosone.org 15 April 2010 | Volume 5 | Issue 4 | e10137

91. Coenen MJ, Toonen EJ, Scheffer H, Radstake TR, Barrera P, et al. (2007)
Pharmacogenetics of anti-tnf treatment in patients with rheumatoid arthritis.Pharmacogenomics 8: 761–773.
92. Kooloos WM, de Jong DJ, Huizinga TW, Guchelaar HJ (2007) Potential role
of pharmacogenetics in anti-tnf treatment of rheumatoid arthritis and crohn’sdisease. Drug Discov Today 12: 125–131.
93. Mehindate K, al Daccak R, Rink L, Mecheri S, Hebert J, et al. (1994)Modulation of mycoplasma arthritidis-derived superantigen-induced cytokine
gene expression by dexamethasone and interleukin-4. Infect Immun 62:
4716–4721.94. Nishida K, Komiyama T, Miyazawa S, Shen ZN, Furumatsu T, et al. (2004)
Histone deacetylase inhibitor suppression of autoantibody-mediated arthritis inmice via regulation of p16ink4a and p21(waf1/cip1) expression. Arthritis
Rheum 50: 3365–3376.95. Lacroix BD, Lovern MR, Stockis A, Sargentini-Maier ML, Karlsson MO, et al.
(2009) A pharmacodynamic markov mixed-effects model for determining the
effect of exposure to certolizumab pegol on the acr20 score in patients withrheumatoid arthritis. Clin Pharmacol Ther 86: 387–395.
96. Tolusso B, Pietrapertosa D, Morelli A, De Santis M, Gremese E, et al. (2006) Il-1b and il-1rn gene polymorphisms in rheumatoid arthritis: relationship with
protein plasma levels and response to therapy. Pharmacogenomics 7: 683–695.
97. Nurse P (1990) Universal control mechanism regulating onset of m-phase.Nature 344: 503–508.
98. Kawasaki H, Komai K, Nakamura M, Yamamoto E, Ouyang Z, et al. (2003)Human wee1 kinase is directly transactivated by and increased in association
with c-fos/ap-1: rheumatoid synovial cells overexpressing these genes go intoaberrant mitosis. Oncogene 22: 6839–6844.
99. Shiozawa S, Shiozawa K, Fujita T (1983) Morphologic observations in the
early phase of the cartilage-pannus junction. light and electron microscopicstudies of active cellular pannus. Arthritis Rheum 26: 472–478.
100. Fassbender HG (1984) Is pannus a residue of inflammation? Arthritis Rheum27: 956–957.
101. Fassbender HG (1998) What destroys the joint in rheumatoid arthritis? Arch
Orthop Trauma Surg 117: 2–7.102. Handel ML, McMorrow LB, Gravallese EM (1995) Nuclear factor-kappa b in
rheumatoid synovium. localization of p50 and p65. Arthritis Rheum 38:1762–1770.
103. Benito MJ, Murphy E, Murphy EP, van den Berg WB, FitzGerald O, et al.(2004) Increased synovial tissue nf-kappa b1 expression at sites adjacent to the
cartilage-pannus junction in rheumatoid arthritis. Arthritis Rheum 50:
1781–1787.104. Han Z, Boyle DL, Manning AM, Firestein GS (1998) Ap-1 and nf-kappab
regulation in rheumatoid arthritis and murine collagen-induced arthritis.Autoimmunity 28: 197–208.
105. Atreya I, Atreya R, Neurath M (2008) NF-kappaB in inflammatory bowel
disease. J Intern Med 263: 591–596.106. De Bosscher K, Berghe V, et al. (2003) The interplay between the
glucocorticoid receptor and nuclear factor-{kappa} B or activator protein-1:molecular mechanisms for gene repression. Endocrine reviews 24: 488.
107. van der Heijden IM, Wilbrink B, Tchetverikov I, Schrijver IA, Schouls LM,
et al. (2000) Presence of bacterial dna and bacterial peptidoglycans in joints of
patients with rheumatoid arthritis and other arthritides. Arthritis Rheum 43:
593–598.
108. Radstake TR, Roelofs MF, Jenniskens YM, Oppers-Walgreen B, van Riel PL,
et al. (2004) Expression of toll-like receptors 2 and 4 in rheumatoid synovial
tissue and regulation by proinflammatory cytokines interleukin-12 and
interleukin-18 via interferon-gamma. Arthritis Rheum 50: 3856–3865.
109. Brentano F, Schorr O, Gay RE, Gay S, Kyburz D (2005) Rna released from
necrotic synovial fluid cells activates rheumatoid arthritis synovial fibroblasts
via toll-like receptor 3. Arthritis Rheum 52: 2656–2665.
110. Seibl R, Birchler T, Loeliger S, Hossle JP, Gay RE, et al. (2003) Expression and
regulation of toll-like receptor 2 in rheumatoid arthritis synovium. Am J Pathol
162: 1221–1227.
111. Roelofs MF, Joosten LA, Abdollahi-Roodsaz S, van Lieshout AW, Sprong T,
et al. (2005) The expression of toll-like receptors 3 and 7 in rheumatoid arthritis
synovium is increased and costimulation of toll-like receptors 3, 4, and 7/8
results in synergistic cytokine production by dendritic cells. Arthritis Rheum 52:
2313–2322.
112. Brentano F, Kyburz D, Schorr O, Gay R, Gay S (2005) The role of toll-like
receptor signalling in the pathogenesis of arthritis. Cell Immunol 233: 90–96.
113. Jeong H, Mason SP, Barabasi AL, Oltvai ZN (2001) Lethality and centrality in
protein networks. Nature 411: 41–42.
114. Albert R, Jeong H, Barabasi AL (2000) Error and attack tolerance of complex
networks. Nature 406: 378–382.
115. Wuchty S, Almaas E (2005) Peeling the yeast protein network. Proteomics 5:
444–449.
116. Zhu M, Gao L, Li X, Liu Z (2009) Identifying drug-target proteins based on
network features. Sci China C Life Sci 52: 398–404.
117. Smithgall TE (1995) Sh2 and sh3 domains: potential targets for anti-cancer
drug design. J Pharmacol Toxicol Methods 34: 125–132.
118. Birge RB, Kalodimos C, Inagaki F, Tanaka S (2009) Crk and crkl adaptor
proteins: networks for physiological and pathological signaling. Cell Commun
Signal 7: 13–13.
119. Shannon P, Markiel A, Ozier O, Baliga NS, Wang JT, et al. (2003) Cytoscape:
A Software Environment for Integrated Models of Biomolecular Interaction
Networks. Genome Research 13: 2498–2504.
120. Calzone L, Gelay A, Zinovyev A, Radvanyl F, Barillot E (2008) A
comprehensive modular map of molecular interactions in rb/e2f pathway.
Mol Syst Biol 4.
121. Zinovyev A, Viara E, Calzone L, Barillot E (2008) BiNoM: a Cytoscape plugin
for manipulating and analyzing biological networks. Bioinformatics 24:
876–877.
122. Vismara P (1997) Union of all the minimum cycle bases of a graph. URL
http://citeseerx.ist.psu.edu/viewdoc/summary?doi = 10.1.1.47.3674.
123. Assenov Y, Ramirez F, Schelhorn SE, Lengauer T, Albrecht M (2008)
Computing topological parameters of biological networks. Bioinformatics 24:
282–284.
RA Molecular Map
PLoS ONE | www.plosone.org 16 April 2010 | Volume 5 | Issue 4 | e10137