a comparison of nutrient availability indices along an ombrotrophic–minerotrophic gradient in...
TRANSCRIPT

DIVISION S-10—WETLAND SOILS
A Comparison of Nutrient Availability Indices Along an Ombrotrophic–MinerotrophicGradient in Minnesota Wetlands
Scott D. Bridgham,* Karen Updegraff, and John Pastor
ABSTRACT thought of as the rate of replenishment or the buffercapacity of the dissolved inorganic nutrient pool. How-Despite the importance of nutrient availability in determining eco-ever, measurement of nutrient supply rates is a difficultsystem structure and function, it is difficult to quantify in an absolute
sense because of the complexity of nutrient cycles and methodological endeavor, as they are determined by the relative sizeslimitations. Others have compared nutrient availability indices for of the labile, organic, and recalcitrant inorganic poolsupland soils, but few comparative studies have been done in organic in the soil, and rates of transformation and transfersoils. Objectives of this study were, (i) to determine if N and P among the pools (Stevenson, 1986; Binkley and Hart,availability change in a predictable manner across an ombrotrophic– 1989). Furthermore, the importance of particular poolsminerotrophic gradient in 16 wetlands in northern Minnesota, and and transformations varies among nutrients. Environ-(ii) to compare various laboratory and field indices of soil nutrient
mental controls over all of these factors must also beavailability in a diverse group of organic soils. Ombrotrophic wetlandsconsidered. Any particular method of determining nu-receive only atmospheric inputs of ions, while minerotrophic wetlandstrient availability only measures one to several of thesealso receive groundwater or overland water inputs. We comparedpools and fluxes and the pools are often operationallythe following nutrient availability indices: 2- and 59-wk laboratory
mineralization potentials, labile P and N pools determined from a defined, so any measure of nutrient availability must bekinetic mineralization model, total and extractable soil N and P pools, considered an index (Binkley and Hart, 1989; Binkleyplant N and P concentrations, and H–OH and HCO2
3 charged resins. and Vitousek, 1989). In addition, field studies have largeMost indices indicated that N availability increases along the ombro- amounts of temporal and spatial variability, which istrophic–minerotrophic gradient, and correlations among indices were usually poorly quantified.generally good, suggesting that they can be used somewhat inter- Researchers are typically interested in (and often de-changeably. Resins indicated a predominance of NO3–N availability
fine) nutrient availability in terms of plant growth; how-during the growing season and NH4–N availability during the winter,ever, plant growth is a response to soil nutrient availabil-and most indices indicated an increasing importance of nitrification inity and is, at best, an indirect measure of it. Nutrientmore minerotrophic wetlands. In contrast, P indices gave contrastingsupply rates and nutrient limitation of plants may varyresults across the gradient and were generally poorly correlated; how-
ever, the majority of the methods suggested that P availability is in complex ways in natural communities because of in-higher in minerotrophic swamp forests or beaver meadows, and that herent physiological limitations in the capacity of plantsP availability is low in bogs and fens. We suggest that current methods adapted to low nutrient environments to respond toof determining P availability may be inadequate in highly diverse increases in nutrient supply (Chapin et al., 1986; Pastororganic soils. Plant nutrient concentrations did not show clear relation- and Bridgham, 1999; Aerts and Chapin, 2000). Thus,ships with soil nutrient indices, particularly for N, which probably nutrient supply rates and nutrient limitation of plantreflects the complicated relationship between soil nutrient availability
growth may give contradictory results.and plant response in natural wetlands.Despite our inability to definitively quantify nutrient
availability, several studies have measured nutrient gra-dients across natural community assemblages (e.g., Pas-Despite the importance of nutrient availability intor et al., 1984; Hart and Firestone, 1989; Giblin et al.,determining ecosystem structure and function, it1991; Bridgham and Richardson, 1993). These studiesis difficult to quantify in an absolute sense because ofhave often improved our understanding of the spatialthe complexity of nutrient cycles and methodologicalcontrols over plant community structure and productiv-limitations. Dissolved inorganic nutrient pool sizes inity. However, the methods employed by these studiessoil are typically orders of magnitude less than annualmay be limited in their ability to characterize changesplant uptake and must be continually replenished fromin nutrient dynamics across sites with widely varyingother labile pools to maintain soil fertility (Binkley andsoil characteristics.Hart, 1989). Thus, nutrient availability is most profitably
In this study, we focused on how nutrient availabilityvaries among wetlands that occur along an ombro-
S. Bridgham, Dep. of Biological Sciences, Univ. of Notre Dame, P.O. trophic–minerotrophic gradient. This gradient is a basicBox 369, Notre Dame, IN 46556-0369; K. Updegraff, Dep. of Foreststructuring paradigm in wetlands with organic soilsResources, Univ. of Minnesota, St. Paul, MN 55108; J. Pastor, Natural(Bridgham et al., 1996). Ombrotrophic wetlands areResources Research Institute, 5013 Miller Trunk Highway, Duluth,
MN 55811 and Dep. of Biology, Univ. of Minnesota, Duluth, MN those that receive all their water and associated ions via55811. Received 22 Jul. 1999. *Corresponding author (bridgham.1@ the atmosphere, usually because of a deep accumulationnd.edu).
of soil organic matter causing hydrologic isolation fromgroundwater inputs. This results in low soil pH and veryPublished in Soil Sci. Soc. Am. J. 65:259–269 (2001).
259

260 SOIL SCI. SOC. AM. J., VOL. 65, JANUARY–FEBRUARY 2001
Table 1. Total soil N content, initial 0.01 M CaCl2-extractable N, potential N mineralization at 2 and 59 wk, and labile N (No) pool from16 Minnesota wetlands across an ombrotrophic-minerotrophic gradient. Mean 6 (SE). Numbers with different letters within a columnshow significant differences among sites (P , 0.05). Data were previously published in Bridgham et al. (1998) and are included herefor comparison to other nutrient availability indices.
Initial CaCl2-extractable N 2 wk mineralization 59 wk mineralization Labile N Pool (No)
Site n† Total soil N NH4-N NO3-N Aerobic Anaerobic Aerobic Anaerobic Nitrification‡ Aerobic Anaerobic
mg N cm23 ug N cm23 % mg N g21 total NBog 5 0.51 (0.05)c 0.50 (0.14)d 0.03 (0.03)b 8.0 (2.5)b 11.8 (3.7)c 62.8 (8.2)de 23.8 (3.8)d 1.9 (1.4)d 79 (18)a 35 (5)aAcidic fen 2 0.29 (0.04)d 0.96 (0.43)cd 0.04 (0.01)b 6.6 (1.0)b 5.5 (0.4)d 33.9 (4.9)e 13.9 (2.2)d 17.4 (13.5)c 79 (22)a 31 (1)aIntermediate
fen 2 2.17 (0.32)b 2.11 (0.08)bc 0.07 (0.07)b 6.4 (0.5)b 10.5 (2.4)c 78.9 (15.0)cd 63.4 (11.0)c 30.3 (17.9)c 14§a 7 (0)aCedar
swamp 3 2.25 (0.27)b 5.64 (0.96)a 0.06 (0.01)b 6.9 (2.8)b 24.8 (0.5)b 107.0 (12.7)c 86.8 (12.5)c 64.9 (25.9)b 42§a 23 (2)aTamarack
swamp 2 2.34 (0.32)b 6.31 (2.33)a 0.04 (0.02)b 9.8 (3.6)b 27.0 (3.8)b 155.5 (5.4)b 118.0 (18.3)b 76.0 (18.2)ab 6§a 23 (0)aMeadow 2 3.50 (0.24)a 3.19 (1.27)b 3.50 (1.20)a 18.4 (5.3)a 45.1 (16.3)a 276.2 (73.3)a 263.6 (89.3)a 98.3 (28.3)a 21 (13)a 46 (20)a
† Number of replicate sites within a community type, with 5 cores taken per site.‡ Percentage nitrification in aerobic 59-wk mineralization experiment.§ Kinetic model did not converge for all sites, n 5 1. Standard error could not be calculated.
high organic matter content, along with other associated term laboratory nutrient and C mineralization poten-tials for these wetlands and found that N mineralizationchemical and physical soil properties (Bridgham et al.,
2000). In contrast, minerotrophic wetlands also have rates were greater in more minerotrophic wetlands, butthat P mineralization changed in complex ways acrossinputs of surface or groundwater that usually impart a
higher soil pH and ash content. There are also distinct the gradient (Bridgham et al., 1998). However, environ-mental conditions vary widely among the wetlands, andchanges in plant community structure along this gradi-
ent (Glaser, 1987; Vitt and Chee, 1990; Gorham and long incubations probably cause artifacts such aschanges in microbial community structure. Thus, we willJanssens, 1992). Although fundamentally a hydrology
gradient, it has generally been assumed that the ombro- determine if in situ measurements of nutrient availabil-ity show similar changes along the ombrotrophic–trophic–minerotrophic gradient is coincident with a nu-
trient availability gradient, with ombrotrophic wetlands minerotrophic gradient. Second, we ask the more meth-odological question of whether a large variety ofbeing nutrient deficient and minerotrophic sites being
relatively nutrient rich (Bridgham et al., 1996). How- commonly used indices of soil nutrient availability givecomparable results in a diverse set of organic soils, de-ever, the few studies that have examined this assumption
have generally found that nutrient availability does not spite the fact that each index measures a somewhatdifferent pool or rate (Binkley and Hart, 1989; Binkleyvary in a simple way along this gradient (Waughman,
1980; Verhoeven et al., 1990; Vitt and Chee, 1990; Brid- and Vitousek, 1989). We compared in situ soil nutrientavailability as measured by anion–cation exchange res-gham et al., 1998; Aerts et al., 1999; Bedford et al.,
1999). Furthermore, results have varied among these ins and nutrient concentrations in foliage reported inthis paper with extractable and total soil nutrient pools,studies, and it is unclear to what extent this has been
because of the different methods employed. cumulative nutrients mineralized over 2 and 59 wk, andthe labile N and P pools (No and Po, respectively) fromThe objectives of this study are twofold. First, we
examine how in situ N and P soil availability and nutrient previously published data taken from the same sites(Bridgham et al., 1998). This previously published dataconcentrations in foliage change in 16 wetlands that
occur across an ombrotrophic–minerotrophic gradient are presented in Tables 1 and 2 to allow for a directcomparison between methods.in northern Minnesota. We previously compared long–
Table 2. Total soil P content, initial acid-fluoride extractable P, initial 0.01 M CaCl2-extractable P, potential P mineralization at 2 and59 wk, and labile P (Po) pool from 16 Minnesota wetlands across an ombrotrophic-minerotrophic gradient. Mean 6 (SE). Numberswith different letters within a column show significant differences among sites (P , 0.05). Data were previously published in Bridghamet al. (1998) and are included here for comparison to other nutrient availability indices.
Initial acid- 2-wk mineralization 59-wk mineralization Labile P Pool (Po)fluoride Initial CaCl2-
Site n† Total soil P extractable P extractable P Aerobic Anaerobic Aerobic Anaerobic Aerobic Anaerobic
mg P cm23 ug P cm23 mg P g21 total PBog 5 0.024 (0.004)d 0.122 (0.023)d 0.245 (0.111)ab 0.34 (0.17)ab 4.14 (0.97)a 5.72 (1.23)a 6.44 (1.14)b 150 (50)‡a 247 (20)aAcidic fen 2 0.012 (0.002)e 0.347 (0.308)cd 0.400 (0.242)a 0.45 (0.24)a 0.87 (0.61)c 2.00 (1.31)b 1.63 (0.73)c 98 (62)a 110 (34)bIntermediate fen 2 0.067 (0.009)c 0.157 (0.047)d 0.071 (0.002)b 0.04 (0.01)c 0.10 (0.02)d 0.70 (0.36)c 1.15 (0.38)c 8 (4)a 11 (8)bCedar swamp 3 0.091 (0.011)bc 0.338 (0.123)bc 0.315 (0.143)a 0.31 (0.21)ab 2.81 (0.77)b 3.22 (1.36)b 7.88 (3.25)b 9 (3)§a 80 (23)bTamarack swamp 2 0.098 (0.019)b 0.788 (0.563)b 0.213 (0.028)ab 0.10 (0.01)bc 4.99 (0.45)a 2.80 (1.66)b 10.76 (2.43)a 6¶a 95 (35)bMeadow 2 0.272 (0.000)a 1.224 (0.318)a 0.425 (0.236)a 0.95 (0.12)a 0.49 (0.04)cd 2.15 (0.05)b 6.55 (1.98)b 6 (0)a 23 (15)b
† Number of replicate sites within a community type, with 5 cores taken per site.‡ Kinetic model did not converge for all sites, n 5 4.§ Kinetic model did not converge for all sites, n 5 2.¶ Kinetic model did not converge for all sites, n 5 1. Standard error could not be calculated.

BRIDGHAM ET AL: NUTRIENT INDICES IN PEATLANDS 261
in 0.5 M HCO23 . Upon retrieval from the field, ≈3 g dry massMATERIALS AND METHODS
of resin was extracted twice in 0.5 M HCl and passed throughStudy Sites a Whatman #1 filter (Whatman Chemical Separation, Inc.,
Clifton, NJ).We sampled 16 different wetland sites in northern Minne-The H–OH resins (Rexyn I-300, Fisher Scientific, Pitts-sota located between 468 and 498 N that are representative of
burgh, PA) came appropriately charged. Upon retrieval fromthe ombrotrophic–minerotrophic gradient in this region. Thethe field, ≈3-g dry mass resin was extracted twice in 1 Mbog sites (n 5 5) had a mean soil pH of 3.8 and were vegetatedKCl and passed through a Whatman #1 filter (Clifton, NJ).with black spruce [Picea mariana (P. Mill.) B.S.P.], SphagnumNitrogen in the extracts was determined on a Lachat autoana-L., and stunted ericaceous shrubs. They were located at Pinelyzer, while P was determined either on the Lachat autoana-Island, Red Lake, Toivola, Arlberg, and Ash River near Voya-lyzer or manually with the absorbic acid method (Olsen andgeurs National Park. Fen sites were dominated by sedgesSommers, 1982), depending on concentration.(Carex L) and were located at Red Lake, McGregor, Alborn,
and Marcel. The fens were separated into acidic fens (5 poorfens, n 5 2) with a mean soil pH of 4.1, and intermediate Plant Nutrient Concentrationsfens with a mean soil pH of 5.2 (n 5 2). Plant community
Vegetation samples were taken to determine total N andcomposition supported this distinction, with cover of Sphag-P concentrations from five 10- by 10-cm quadrats in eachnum and ericaceous shrubs in the acidic fens more similar towetland in October 1993, immediately adjacent to the resinbog sites then to intermediate fen sites. Forested swamp siteslocations. Since there were no species common to all wetlands,included cedar swamps (Thuja occidentalis L.) near Mead-we took all graminoids and mosses from each quadrant andowlands, Isabella and Ash River (n 5 3), and tamarack swampsmixed them to give an average ground layer nutrient content[Larix laricina (Du Roi) K. Koch] near Meadowlands andfor each site. Total P concentrations were determined in driedAsh River (n 5 2). They had mean soil pHs of 5.5 and 5.8,(708C) subsamples with a H2SO4–H2O2 digestion (Lowther,respectively. We also sampled two beaver meadows in Voya-1980). Total N concentrations were determined on dried sub-geurs National Park. They had a mean soil pH of 6.0 and weresamples by combustion on a CHN analyzer (Leco Corp., St.dominated by Canada blue joint [Calamagrostis canadensisJoseph, MI).(Michx.) Beauv.], wool grass [Scirpus cyperinus (L.) Kunth],
and sedges (Erickson, 1994).These sites are described in greater detail in Bridgham et Statistics
al. (1998), including a site map and an extensive table withData for all variables were log transformed to fit normaltheir physical and chemical soil characteristics. The bogs are
distributions. Wetland sites were considered the replicate unitsSphagnic Cryofibrists, the acidic fens are Typic Cryofibrists,(n 5 2–5). Differences among community types were deter-the intermediate fens are Typic Cryohemists or Typic Cryo-mined with one-way ANOVAs with the five subreplicates persaprists, and the tamarack and cedar swamps are Typic Cry-wetland nested to account for intrasite variation. Pairwiseohemists (Soil Survey Staff, 1998). The soils in the beavermeans comparisons were done with Tukey’s test using themeadows had an O horizon of 8- to 21-cm depth over theANOVA model mean square error term. Spearman rank-mineral substratum and are Typic Argiaquolls or Typic Epia-order correlation coefficients were performed on all variablesqualfs (Johnston et al., 1995; C. Johnston, personal communi-using the means for each site. Systat 7.0 was used for allcation, 1999). Soil bulk density varied dramatically amonganalyses (SPSS Inc., Chicago, IL).sites, varying from 0.045 g cm23 in the bogs to 0.224 g cm23
in the beaver meadows (all 0- to 25-cm depth, except O horizonin beaver meadows, Bridgham et al., 1998). RESULTS AND DISCUSSION
The Ombrotrophic–MinerotrophicResins Gradient: Nitrogen
We put in five H–OH or HCO23 charged exchange resins Nitrogen recovered from in situ resins was greatest
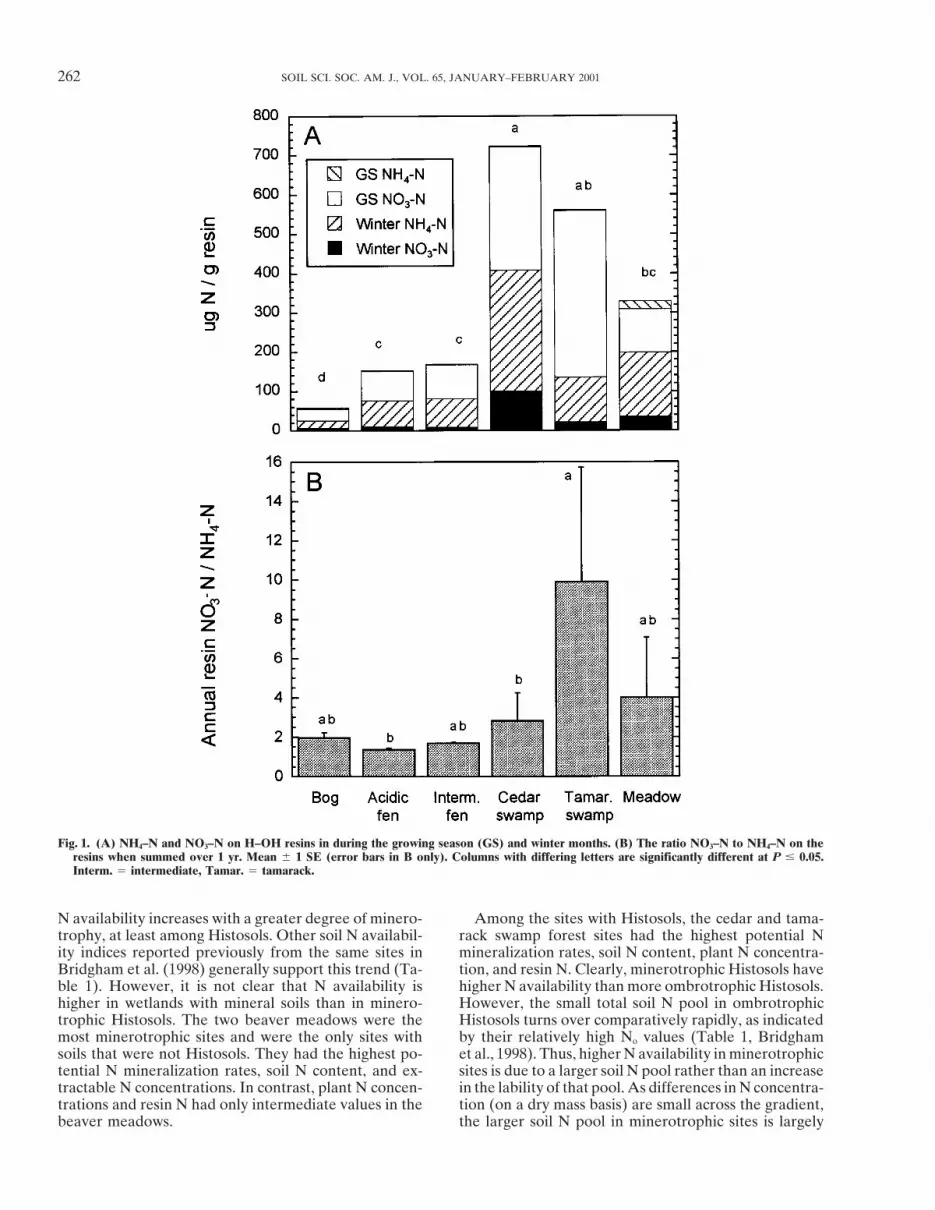
at 10-cm depth in approximately the same locations in the annually in the minerotrophic cedar and tamarack16 wetlands as the cores were taken for the mineralization swamp forests, was intermediate in the beaver meadowsexperiment reported in Bridgham et al. (1998). Resins were
and fens, and was lowest in the bog sites (Fig. 1A, P ,placed in hollows when significant microtopography was pres-0.001 for community effect). However, there were largeent. Resins were placed in the field in mid-May 1993 andseasonal differences in the accumulation of NO3–N andremoved in the beginning of October, replaced with a freshNH4–N on the resins. During the growing season,set of resins, which were then removed in mid-May 1994. TheNO3–N dominated resin N, but during the winter NH4–NMay 1993 through October 1993 period represents growing
season nutrient availability, while the October 1993 through dominated resin N (Fig. 1A). Cumulative over the entireMay 1994 period represents winter nutrient availability. Only year, about twice as much NO3–N as NH4–N was cap-a small percentage of the exchange capacity of the resins (3.2 tured on the resins in most sites, with the exception thatmeq/g dry resin for HCO2
3 , 3.87 meq/g dry resin for H–OH) NO3–N was 4- and 10-fold higher than NH4–N in thewas used over these periods. beaver meadows and tamarack swamps, respectively
Bicarbonate-charged resins were used to assess P availabil- (Fig. 1B).ity, and H–OH mixed-charge resins were used to assess both Nitrogen concentration in vegetation was highest inN and P availability. Approximately 10-g wet mass of each
the herbaceous vegetation of the cedar and tamarackresin type was placed separately in nylon bags. For HCO23
swamp forests and similar in the rest of the wetlandresins, the 20-50 mesh AG 1-X8 anion-exchange resin (Bio-communities (Fig. 2, P , 0.001 for community effect).Rad Laboratories, Hercules, CA) was originally in the Cl2
The greater resin N and plant N concentration in theform. It was acid-rinsed in 0.5 M HCl, rinsed with deionizedwater, and charged with HCO2
3 by several successive soakings minerotrophic swamp forests suggests that in situ soil
262 SOIL SCI. SOC. AM. J., VOL. 65, JANUARY–FEBRUARY 2001
Fig. 1. (A) NH4–N and NO3–N on H–OH resins in during the growing season (GS) and winter months. (B) The ratio NO3–N to NH4–N on theresins when summed over 1 yr. Mean 6 1 SE (error bars in B only). Columns with differing letters are significantly different at P # 0.05.Interm. 5 intermediate, Tamar. 5 tamarack.
N availability increases with a greater degree of minero- Among the sites with Histosols, the cedar and tama-rack swamp forest sites had the highest potential Ntrophy, at least among Histosols. Other soil N availabil-
ity indices reported previously from the same sites in mineralization rates, soil N content, plant N concentra-tion, and resin N. Clearly, minerotrophic Histosols haveBridgham et al. (1998) generally support this trend (Ta-
ble 1). However, it is not clear that N availability is higher N availability than more ombrotrophic Histosols.However, the small total soil N pool in ombrotrophichigher in wetlands with mineral soils than in minero-
trophic Histosols. The two beaver meadows were the Histosols turns over comparatively rapidly, as indicatedby their relatively high No values (Table 1, Bridghammost minerotrophic sites and were the only sites with
soils that were not Histosols. They had the highest po- et al., 1998). Thus, higher N availability in minerotrophicsites is due to a larger soil N pool rather than an increasetential N mineralization rates, soil N content, and ex-
tractable N concentrations. In contrast, plant N concen- in the lability of that pool. As differences in N concentra-tion (on a dry mass basis) are small across the gradient,trations and resin N had only intermediate values in the
beaver meadows. the larger soil N pool in minerotrophic sites is largely

BRIDGHAM ET AL: NUTRIENT INDICES IN PEATLANDS 263
Fig. 2. Plant N concentration along an ombrotrophic–minerotrophic gradient in Minnesota wetlands. Mean 6 1 SE. Columns with differingletters are significantly different at P # 0.05. Interm. 5 intermediate, Tamar. 5 tamarack.
mobility of NO3–N as compared to NH4–N (Binkley,due to the 12-fold increase in soil bulk density (Bridg-1984).ham et al. 1998).
The Ombrotrophic—MinerotrophicNitrateGradient: Soil Phosphorus
The high percentage of NO3–N on the H–OH resinsAlthough both HCO2
3 and H–OH resin P differedin the growing season in the low pH, more ombrotrophicamong communities in both the growing and wintersoils was surprising as others have found that NO3–Nseasons (Fig. 3, P , 0.001 for community effect), theylevels are near detection limits in porewater (Hemond,gave quite different relative responses across the gradi-1983; Gorham et al., 1985; Vitt and Chee, 1990) andent. HCO2
3 resin P increased along the ombrotrophic–soil from Histosols (Waughman, 1980; Bridgham andminerotrophic gradient, with highest availability in ce-Richardson, 1993). Nitrification rates in low pH organicdar swamps and the beaver meadows and lowestsoils have been found to be very low (Martin and Hold-availability in fens and bogs. In contrast, there was noing, 1978; Rosswall and Granhall, 1980; Rangeley andclear trend in H–OH resin P along the community gradi-Knowles, 1988; Regina et al., 1996).ent, with highest availability in acidic fens and beaverWe can compare the recovery of NO3–N on resinsmeadows and lowest availability in the intermediatewith extractable NO3–N concentrations and potential
nitrification rates from these same sites (Table 1, Bridg- fens. Moreover, there was more than an order of magni-tude difference among community types in the ratio ofham et al., 1998). The potential N mineralization and
extractable N data support the generalization that nitri- HCO23 resin P/H–OH resin P (Fig. 3C). Much more P
was sorbed on the HCO23 resins than on the H–OHfication is severely inhibited in low pH, ombrotrophic
soils. Only the beaver meadows had substantial extract- resins in more minerotrophic, higher pH wetlands, sug-gesting a direct pH or cation affect on their activities.able NO3–N, and the percentage conversion of mineral-
ized N to NO3–N increased along the ombrotrophic– Plant P concentrations showed a more complex re-sponse (Fig. 4, P , 0.001 for community effect). Theminerotrophic gradient and was positively correlated
with soil pH (r 2 5 0.90). Resin data gave a more compli- herbaceous layer in the minerotrophic swamp forestshad the highest concentrations, the beaver meadow,cated result, with a switch from dominance of NO3–N
in the growing season to dominance by NH4–N in the bog, and acidic fen sites had intermediate concentra-tions, and the intermediate fens had the lowest concen-winter, suggesting a strong temperature dependence of
nitrifying bacteria. Also, NO3–N was a much larger per- trations.We can compare these results with other indices ofcentage of resin N annually in the tamarack swamps,
which are among the most minerotrophic Histosol sites. P availability previously published by Bridgham et al.(1998, Table 2). Different methods of determining soilThe high NO3–N loading on the resins in the growing
season in the low pH soils may also reflect the greater P availability gave disparate results across the ombro-

264 SOIL SCI. SOC. AM. J., VOL. 65, JANUARY–FEBRUARY 2001
Fig. 3. Phosphorus retained on (A) HCO23 and (B) H–OH charged resins during the growing season and winter. (C) Ratio of HCO2
3 resin Pto H–OH resin P when summed over 1 yr. Mean 6 1 SE. Columns with differing letters are significantly different at P 6 0.05. Interm. 5intermediate, Tamar. 5 tamarack.

BRIDGHAM ET AL: NUTRIENT INDICES IN PEATLANDS 265
Fig. 4. Plant P concentration along an ombrotrophic–minerotrophic gradient in Minnesota wetlands. Mean 6 1 SE. Columns with differingletters are significantly different at P # 0.05. Interm. 5 intermediate, Tamar. 5 tamarack.
trophic–minerotrophic gradient, although all methods soils, the results are probably translatable to mineralsoils. Many studies have used the same or similar meth-showed large differences among communities. As with
total soil N content, total soil P content increased in a ods to compare nutrient availability among diverse natu-ral ecosystems with widely varying soil characteristicsconsistent manner across the gradient, but the small
total soil P pool in more ombrotrophic sites was rela- (Pastor et al., 1984; Hart and Firestone, 1989; Zak etal., 1989; Giblin et al., 1991; Walbridge, 1991; Bridghamtively labile and turned over quickly. Higher total soil
P content in more minerotrophic sites were offset by and Richardson, 1993). Spearman rank-order correla-tions among the N–availability indices measured in thislower concentrations of labile P (Po), so there was no
clear trend in potential P mineralization rates across the study are presented in Table 3. any indices are highlypositively correlated, suggesting that most N–avail-gradient. Net P mineralization also includes geochemical
sorption of biologically mineralized P, and this appears ability indices do indeed effectively measure compo-nents of a common available pool.to have been much greater in more minerotrophic sites.
The two soil extractants (Table 2) and the two resin There were several exceptions to this generalization.NH4–N on the H–OH resins during the growing seasontypes (Fig. 3) also gave contradictory results. The acid-
fluoride extract and the HCO23 resins suggested that was not highly correlated with any other N index, but
this probably simply reflects the predominance ofmore minerotrophic sites have greater P availability,but the CaCl2 extracts and the H–OH resins did not NO3–N on the resins during the growing season (Fig.
1). The aerobic 2-wk potential mineralization resultsshow a consistent change across the gradient, althoughthere were large differences among communities. Over- were poorly correlated with other N indices, as opposed
to the 59-wk aerobic potential mineralization results,all, the majority of the methods (i.e., HCO23 resins, total
soil P content, acid-fluoride P, plant P) suggest that P suggesting that a 2-wk incubation time is insufficient todetermine potential N availability. However, anaerobicavailability is higher in minerotrophic swamp forests or
beaver meadows, but P availability appears to be low 2-wk, anaerobic 59-wk, and aerobic 59-wk potentialmineralization results generally gave similar correla-in bogs and fens.tions to the other N indices, with anaerobic 59-wk miner-alization giving the highest correlation in almost allA Comparison of Methodscases. Aerobic No was negatively correlated with mostSoils other N indices. Differences in N content among soils
This study provides a useful opportunity to compare overwhelmed trends in No across the ombrotrophic–the relative results of a large number of commonly used minerotrophic gradient, yielding an opposite trend toindices of soil nutrient availability in a diverse group of No in other availability indices. Anaerobic No was poorlyorganic soils. Despite the fact that each method mea- correlated with almost all other N indices.sures a somewhat different soil nutrient pool (Binkley In contrast to the N results, the different methods ofand Hart, 1989), it is reasonable to assume that they determining soil P availability were generally poorlyshould provide similar predictive trends in widely dif- correlated (Table 4). In particular, there were no consis-
tent relationships between resin P or extractable P andfering soils. Although we have focused here on organic

266 SOIL SCI. SOC. AM. J., VOL. 65, JANUARY–FEBRUARY 2001
Table 3. Spearman correlations (r $ 0.50) for N related variables measured in sites across an ombrotrophic-minerotrophic gradient.
GS GS GS W W Yr Yr Yr Total Aer An Aer AnNH4–N NO3–N total NH4–N NO3–N W total NH4–N NO3–N total CaCl2– Plant soil N 59-wk 59-wk 2-wk 2-wk Aerresin† resin resin N resin resin resin N resin resin resin N N N cm23 Min Min Min Min N0
GS NO3–N resinGS total resin N 0.99W NH4–N resin 0.89 0.92W NO3–N resinW total resin N 0.73 0.80 0.89 0.61Yr NH4–N resin 0.89 0.92 1.00 0.89Yr NO3–N resin 0.84 0.89 0.84 0.60 0.93 0.84Yr total resin N 0.86 0.91 0.89 0.58 0.95 0.89 0.99CaCl3–N 0.64 0.72 0.69 0.76 0.81 0.69 0.83 0.83Plant NTotal soil N cm23 0.67 0.62 0.67 0.63 0.76Aer 59-wk Min 0.55 0.60 0.54 0.54 0.61 0.54 0.66 0.67 0.82 0.88An 59-wk Min 0.62 0.66 0.62 0.68 0.68 0.62 0.72 0.73 0.87 0.95 0.93Aer 2-wk Min 0.56An 2-wk Min 0.52 0.54 0.50 0.59 0.54 0.59 0.61 0.68 0.84 0.89 0.89 0.63 20.52Aer No 20.73 20.69 20.59 20.60 20.59 20.59 20.69 20.65 20.72 20.62 20.65 20.67An No
† GS 5 growing season; W 5 winter; Yr 5 annual; CaCl2–N 5 0.01 M CaCl2–extractable N; Aer 5 aerobic; An 5 anaerobic; Min 5 laboratorymineralization potentials.
mineralized P. Acid-fluoride P was positively correlated ins may also cause acidity changes in their immediatesurroundings when deployed in the field, which maywith resin P and total soil P. Additionally, total soil P
was correlated with HCO23 resin P. explain the changes seen in the ratio of HCO2
3 resin P/H–OH resin P across sites (Fig. 3C). However, H–OHIt is particularly problematic that closely related
methods were often poorly correlated. For example, the resins have long been successfully used to measure Navailability, were relatively successful in this regard incorrelations between H–OH and HCO2
3 resin P in thetwo seasons was ,0.46. The results from the HCO2
3 this study, and have the advantage of allowing for simul-taneous measurement of NH4–N, NO3–N, and PO4–Presins suggested higher available P in the minerotrophic
sites, but the H–OH resins gave relatively high available availability.Acid-fluoride extractable P and CaCl2-extractable PP in the acidic fens (Fig. 3). Additionally, the ratio of
HCO23 resin P to H–OH resin P increased dramatically were also not particularly well correlated (r 5 0.51).
The acid-fluoride extract removes easily acid-soluble Pacross the ombrotrophic–minerotrophic gradient (Fig.3C). Thus, these two resins seem to be measuring differ- forms, largely Ca–phosphates and a portion of the Al–
and Fe–phosphates (Stevenson, 1986). The weak saltent P pools, with much greater P sorption on theHCO2
3 resins in soils with higher pH and cation content. solution of CaCl2 would measure porewater P and onlythe most weakly bound soil P pools. The two extractantsSen Tran et al. (1992) examined correlations in P avail-
ability among resins charged with HCO23 , F2, Cl2, and gave similar pool sizes in all but the minerotrophic tama-
rack swamps and beaver meadows, where the acid-fluo-H–OH in mineral soils that varied greatly in acidity andfound Pearson r $ 0.68 among the different resins. The ride extract suggested much greater available P. This
probably reflects more Ca-, Fe-, and Al-bound P incorrelation between HCO23 and H–OH charged resins
was even higher r 5 0.82). These authors cautioned these higher pH, less organic soils.Overall, these contradictory results suggest that ei-against using H–OH resins for P because of pH changes
in the soil–solution matrix, but they used small volume ther, (i) the various methods of determining P availabil-ity are characterizing different soil pools that do notcontainers in the laboratory. Potentially, the H–OH res-
Table 4. Spearman correlations (r $ 0.50) for P related variables measured in sites across an ombrotrophic-minerotrophic gradient.
GS GS W W Yr Yr Total Aer An Aer AnHCO2
3 H–OH HCO23 H–OH HCO2
3 H–OH Plant soil P 59-wk 59-wk 2-wk 2-wk Aerresin† resin resin resin resin resin AF–P CaCl2–P P cm23 Min Min Min Min P0
GS H–OH resinW HCO2
3 resin 0.75W H–OH resinYr HCO2
3 resin 0.85 0.96Yr H–OH resin 0.92 0.66AF–P 0.75 0.54 0.64 0.65 0.63CaCl2–P 0.54 0.57 0.51Plant P 0.75 0.62 0.74 0.61Total soil P cm23 0.72 0.53 0.61 0.77 0.58Aer 59-wk MinAn 59-wk Min 0.54 0.63 0.50 0.54Aer 2-wk Min 0.67 0.66 0.76 0.77An 2-wk Min 0.72 0.76Aer Po 20.59 0.73An Po 20.64 0.78 0.63 0.78
† Variables as in Table 3, except AF–P 5 acid-fluoride extractable P and CaCl2–P 5 0.01 M CaCl2-extractable P.

BRIDGHAM ET AL: NUTRIENT INDICES IN PEATLANDS 267
HCO23 resin P, acid-fluoride extractable P, total soil Pchange in a concerted manner across the ombrotrophic–
content, and anaerobic 59-wk mineralization potentialsminerotrophic gradient, or (ii) the large number of stan-(Table 4). These results suggest that either, (i) soil Ndard methodologies that we used are inadequate to de-availability indices do not adequately reflect plant Ntermine differences in P availability in a wide range ofavailability, (ii) N does not limit plant growth, or (iii) ourorganic soils. Although we did not determine differentsampling scheme for plants was inadequate to capturesoil P pools, it is reasonable to assume that they wouldchanges in nutrient availability across the ombro-change in the variety of soils used in this study. Thus,trophic–minerotrophic gradient. Concerning the firstthe differences among P–availability methods could bepossibility, numerous studies have examined the rela-real and biologically meaningful. Other studies havetionship between plant–nutrient uptake in nutrient-lim-found better correlations among P–availability indicesited vegetation and many of the soil nutrient availabilityin mineral soils (Sharpley et al., 1984; Schoenau andindices, and they have generally shown a good correla-Huang, 1991; Sen Tran et al., 1992), which would sup-tion among them (Binkley and Hart, 1989). Addition-port the first possibility.ally, the soil N availability indices tended to give consis-These common methods all have limitations for thetent relative results across the gradient, in contrast tomeasurement of P availability. In particular, geochemicalthe soil P availability indices. Thus, we conclude that itsorption of P places severe methodological limitationsis unlikely that the low correlation between plant Non common measurements of biologically availableconcentration and the soil N indices is because theseP. Isotopic techniques such as isotopically exchangeablesoil indices are inherently poor at predicting plant nutri-P (White, 1976) may give more meaningful results, al-ent availability.though they do not inherently separate out biological
One way to examine the second possibility (i.e., Nmineralization, geochemical sorption, and resultant bio-does not limit plant growth) is to consider the stoichiom-logical availability. Isotopic gross P mineralization tech-etry of nutrient concentrations in leaf tissue. Koersel-niques hold promise (Walbridge and Vitousek, 1987;man and Meuleman (1996) suggested that N/P ratiosFrossard et al., 1996; Lopez-Hernandez et al., 1998), but.16 indicate P limitation, ratios ,14 indicate N limita-they are less developed than gross N mineralizationtion, and intermediate ratios indicate colimitation by Ntechniques, are quite time consuming, and have beenand P. In our study, the highest N/P ratios in plant tissueproblematic to interpret in some instances. Character-occurred in intermediate fens (x 5 30.4, SE 5 0.5), theization of P pools in soils is common as an index oflowest ratios occurred in cedar swamps (x 5 12.0, SE 5availability (Stevenson, 1986), but the results reflect static0.7) and beaver meadows (x 5 12.3, SE 5 0.9), andpools unless placed within an experimental context.intermediate ratios occurred in tamarack swamps (x 514.5, SE 5 3.5), bogs (x 5 16.6, SE 5 0.7), and acidicPlant N and P Concentrations fens (x 5 17.5, SE 5 2.8) (Fig. 5, P , 0.001 for commu-nity effect on N/P ratio). Nutrient stoichiometry suggestsPlant N concentrations were not well correlated with
any soil N availability index (Table 3). In contrast, plant N limitation of minerotrophic cedar swamps and beavermeadows, P limitation of intermediate fens, and colimi-P concentrations were positively correlated with
Fig. 5. Nitrogen concentration relative to P concentration in plant tissue across an ombrotrophic–minerotrophic gradient in Minnesota wetlands.According to Koerselman and Meuleman (1996), a N/P ratio ,14 indicates N limitation, whereas a N/P ratio .16 indicates P limitation. B 5bog, AF 5 acidic fen, IF 5 intermediate fen, CS 5 cedar swamp, TS 5 tamarack swamp, M 5 beaver meadow.

268 SOIL SCI. SOC. AM. J., VOL. 65, JANUARY–FEBRUARY 2001
tation by N and P in tamarack swamps, bogs, and Concerning the third possibility (i.e., our samplingscheme for plants was inadequate to capture changesacidic fens.
Fertilization experiments are a more direct test of in nutrient availability), we picked two plant life forms,graminoids and bryophytes, to examine tissue N concen-plant nutrient limitation. A review of nutrient fertiliza-
tion studies in peatlands showed that N, P, or K were trations, but species within these life forms variedgreatly among sites. Individual species within these lifelimiting plant growth, or there was no nutrient limita-
tion, depending on the particular study (Bridgham et forms may respond very differently to nutrient limita-tion (Chapin and Shaver, 1985; Chapin, 1998). Addition-al., 1996). Additionally, we and our colleagues have
carried out fertilization studies with N and P in one of ally, we sampled the vegetation in October when nutri-ent concentrations were probably at a seasonal low. Itthe bog and intermediate fen sites and both of the beaver
meadows included in this study. Overall net primary is quite possible that individual species were nutrientlimited, but our sampling scheme and the lack of com-production (NPP) in the bog showed N toxicity with an
addition of only 6 g N m22 yr21 and no effect of P mon species across the gradient limited our ability todetect these limitations.fertilization, whereas P fertilization increased NPP in
the fen (Chapin, 1998). Nitrogen and P were colimiting In conclusion, most soil N availability indices in-creased along the ombrotrophic–minerotrophic gradi-in one of the beaver meadows, but the other meadow
showed no significant response to fertilization (Erick- ent. Additionally, there was a high degree of correspon-dence among soil N availability indices along thisson, 1994). In both of these studies, nutrient additions
tended to cause higher nutrient concentrations in above gradient, indicating that they may be used somewhatinterchangeably despite measuring different pools andground vegetation, even when there was no increase in
NPP, demonstrating luxury nutrient uptake. However, fluxes. In contrast, P availability indices were poorlycorrelated and gave contrasting results across the om-in the bog and fen examined by Chapin (1998), the
effect of fertilization on tissue nutrient concentrations brotrophic–minerotrophic gradient. However, therewas an overall suggestion that soil P availability wasvaried among species, and there was no increase in N
concentration in the overall fen community. Thus, ex- greatest in minerotrophic swamp forests and/or beavermeadows and low in bogs and fens. We suggest thatperimental data show that nutrient effects on NPP and
tissue nutrient concentrations in wetlands depend on current P–availability methods may give highly contra-dictory results and more research is necessary in devel-plant community composition and do not necessarily
change in a concerted manner across the ombrotrophic– oping techniques that give straightforward biologicalinterpretation. Plant nutrient concentrations did notminerotrophic gradient, suggesting that this is a reason-
able explanation for the lack of correlation of plant N show clear relationships with soil nutrient indices, par-ticularly for N, which probably reflects the complicatedconcentration with the soil N availability indices. Others
have suggested that nutrient supply rate (as measured relationship between soil nutrient availability and plantresponse in natural wetlands.by soil nutrient availability indices) and plant nutrient
limitation may be decoupled in natural communitiesgrowing in low nutrient environments (Chapin et al., ACKNOWLEDGMENTS1986; Binkley and Vitousek, 1989).
We wish to thank Carol Johnston for information on soilTwo recent reviews examined changes in nutrient taxonomy of the beaver meadow soils and Edward Murrayconcentrations in plant tissue across the ombrotrophic– and Mark Schmisek for technical assistance. This research wasminerotrophic gradient, with each using a somewhat funded by the National Science Foundation (DEB 99496305,different group of published and unpublished studies. DEB9629415, DEB9707426) and a Department of EnergyUsing only North American data, N and P concentra- Distinguished Global Change Postdoctoral Fellowship to S.
Bridgham.tions in plants increased along the ombrotrophic–minerotrophic gradient (Bedford et al., 1999). Basedupon N/P ratios of plants and soils, they suggested that REFERENCESNorth American wetland vegetation was limited by P Aerts, R., and F.S. Chapin III. 2000. The mineral nutrition of wildor showed colimitation by N and P, with the exception plants revisited: A re-evaluation of processes and patterns. Adv.
Ecol. Res. 30:1–67.that marsh vegetation (qualitatively similar to our bea-Aerts, R., V.T.A. Verhoeven, and D.F. Whigham. 1999. Plant-medi-ver meadow vegetation) showed N limitation. In con-
ated controls on nutrient cycling in temperate fens and bogs. Ecol-trast, Aerts et al. (1999) used a global data set and foundogy 80:2170–2181.
no difference in the N concentration of plants in bogs Bedford, B.L., M.R. Walbridge, and A. Aldous. 1999. Patterns inand fens, but fen species had a higher P concentration nutrient availability and plant diversity of temperate North Ameri-
can wetlands. Ecol. Applic. 80:2151–2169.than bog species. In the present study, we found thatBinkley, D. 1984. Ion exchange resin bags: Factors affecting estimatesplant N concentrations were highest in minerotrophic
of nitrogen availability. Soil Sci. Soc. Am. J. 48:1181–1184.swamp forests and lowest in fens and beaver meadows Binkley, D., and S.C. Hart. 1989. The components of nitrogen avail-(Fig. 2), and that plant P concentrations were highest ability in forest soils. Advances Soil Sci. 10:57–112.
Binkley, D., and P. Vitousek. 1989. Soil nutrient availability. p. 75–96.in the swamp forests and lowest in the intermediateIn R.W. Pearcy et al. (ed.) Plant physiology ecology. Chapman &fens (Fig. 4). Thus, our data and other studies presentHall, London, UK.somewhat conflicting findings on whether nutrient con- Bridgham, S.D., J. Pastor, J. Janssens, C. Chapin, and T. Malterer.
centrations increase in plant tissue across the ombro- 1996. Multiple limiting gradients in peatlands: A call for a newparadigm. Wetlands 16:45–65.trophic–minerotrophic gradient.

BRIDGHAM ET AL: NUTRIENT INDICES IN PEATLANDS 269
Bridgham, S.D., C.-L. Ping, J.L. Richardson, and K. Updegraff. 2000. Martin, N.J., and A.J. Holding. 1978. Nutrient availability and otherSoils of northern peatlands: Histosols and Gelisols. p. 343–370. In factors limiting microbial activity in blanket peat. p. 113–135. InJ.L. Richardson and M.J. Vepraskas (ed.) Wetland soils: Genesis, O.W. Heal and D.F. Perkins (ed.) Production ecology of Britishhydrology, landscapes, and classification. CRC Press, Boca Ra- moors and montane grasslands. Springer-Verlag, Berlin.ton, FL. Olsen, S.R., and L.E. Sommers. 1982. Phosphorus. p. 403–430. In A.L.
Bridgham, S.D., and C.J. Richardson. 1993. Hydrology and nutrient Page et al. (ed.) Methods of soil analysis. Part 2. Chemical andgradients in North Carolina peatlands. Wetlands 13:207–218. microbiological properties. Am. Soc. Agron., Madison, WI.
Bridgham, S.D., K. Updegraff, and J. Pastor. 1998. Carbon, nitrogen, Pastor, J., J.D. Aber, and C.A. McClaugherty. 1984. Abovegroundand phosphorus mineralization in northern wetlands. Ecology production and N and P cycling along a nitrogen mineralization79:1545–1561. gradient on Blackhawk Island, Wisconsin. Ecology 65:256–268.
Chapin, C.T. 1998. Plant community response and nutrient dynamics Pastor, J., and S.D. Bridgham. 1999. Nutrient efficiency along nutrientas a result of manipulations of pH and nutrients in a bog and fen availability gradients. Oecologia (Berlin) 118:50–58.in northeastern Minnesota. Ph.D. diss. Univ. of Notre Dame, Notre Rangeley, A., and R. Knowles. 1988. Nitrogen transformations in aDame, IN. Scottish peat soil under laboratory conditions. Soil Biol. Bio-
Chapin III, F.S., and G.R. Shaver. 1985. Individualistic growth re- chem. 20:385–391.sponse of tundra plant species to environmental manipulations in Regina, K., H. Nyknen, J. Silvola, and P.J. Martikainen. 1996. Fluxesthe field. Ecology 66:564–576. of nitrous oxide from boreal peatlands as affected by peatland
Chapin III, F.S., P.M. Vitousek, and K. Van Cleve. 1986. The nature type, water table level and nitrification capacity. Biogeochemis-of nutrient limitation in plant communities. Am. Nat. 127:48–58. try 35:401–418.
Erickson, H.E. 1994. Nitrogen and phosphorus availability, ecosystem Rosswall, T., and U. Granhall. 1980. Nitrogen cycling in a subarcticprocesses and plant community dynamics in boreal wetland mead- ombrotrophic mire. Ecol. Bull. 30:209–234.ows. Ph.D. diss. Univ. of Washington, Seattle, WA. Schoenau, J.J., and W.J. Huang. 1991. Anion-exchange membrane,
Frossard, E., D. Lopez-Hernandez, and M. Brossard. 1996. Can isoto- water, and sodium bicarbonate extractions as soil tests for phospho-pic exchange kinetics give valuable information on the rate of rus. Commun. Soil Sci. Plant Anal. 22:465–492.mineralization of organic phosphorus in soils? Soil Biol. Biochem.Sen Tran, T., R.R. Simard, and J.C. Fardeau. 1992. A comparison of28:857–864.
four resin extractions and 32P isotopic exchange for the assessmentGiblin, A.E., K.J. Nadelhoffer, G.R. Shaver, and J.A. Laundre. 1991.of plant-available P. Can. J. Soil Sci. 72:281–294.Biogeochemical diversity along a riverside toposequence in arctic
Sharpley, A.N., C.A. Jones, C. Gray, and C.V. Cole. 1984. A simplifiedAlaska. Ecol. Monogr. 61:415–435.soil and plant phosphorus model: II. Prediction of labile, organic,Glaser, P.H. 1987. The ecology of patterned boreal peatlands of north-and sorbed phosphorus. Soil Sci. Soc. Am. J. 48:805–809.ern Minnesota: A community profile. Rep. 85(7.14). USFWS, U.S.
Soil Survey Staff. 1998. Keys to Soil Taxonomy. Eighth edition. Nat.Gov. Print. Office, Washington, DC.Resour. Conserv. Serv., USDA, Washington, DC.Gorham, E., S.J. Eisenreich, J. Ford, and M.V. Santelman. 1985. The
Stevenson, F.J. 1986. Cycles of soil: Carbon, nitrogen, phosphorus,chemistry of bog waters. p. 339–363. In W. Stumm (ed.) Chemicalsulfur, micronutrients. Wiley, New York.processes in lakes. Wiley, New York.
Verhoeven, J.T.A., E. Maltby, and M.B. Schmitz. 1990. Nitrogen andGorham, E., and J.A. Janssens. 1992. Concepts of fen and bog re-phosphorus mineralization in fens and bogs. J. Ecol. 78:713–726.examined in relation to bryophyte cover and the acidity of surface
Vitt, D.H., and W.-L. Chee. 1990. The relationships of vegetation towaters. Acta Soc. Bot. Pol. 61:7–20.surface water chemistry and peat chemistry in fens of Alberta,Hart, S.C., and M.K. Firestone. 1989. Evaluation of three in situ soilCanada. Vegetatio 89:87–106.nitrogen availability assays. Can. J. For. Res. 19:185–191.
Walbridge, M.R. 1991. Phosphorus availability in acid organic soilsHemond, H.F. 1983. The nitrogen budget of Thoreaus Bog. Ecol-of the Lower North Carolina Coastal Plain. Ecology 72:2083–2109.ogy 64:99–109.
Walbridge, M.R., and P.M. Vitousek. 1987. Phosphorus mineralizationJohnston, C.A., G. Pinay, C. Arens, and R.J. Naiman. 1995. Influencepotentials in acid organic soils: Processes affecting 32PO32
4 isotopeof soil properties on the biogeochemistry of a beaver meadowdilution measurements. Soil Biol. Biochem. 19:709–717.hydrosequence. Soil Sci. Soc. Am. J. 59:1789–1799.
Waughman, G.J. 1980. Chemical aspects of the ecology of some southKoerselman, W., and A.F.M. Meuleman. 1996. The vegetation N:Pratio, a new tool to detect the nature of nutrient limitation. J. Appl. German peatlands. J. Ecol. 68:1025–1046.Ecol. 33:1441–1450. White, R.E. 1976. Concepts and methods in the measurement of
Lopez-Hernandez, D., M. Brossard, and E. Frossard. 1998. P-isotopic isotopically exchangeable phosphate in soil. Phosphorus Agric.exchange values in relation mineralization in soils with very low 67:9–16.P-sorbing capacities. Soil Biol. Biochem. 30:1663–1670. Zak, D.R., G.E. Host, and K.S. Pregitzer. 1989. Regional variability
Lowther, J.R. 1980. Use of a single sulfuric acid and hydrogen peroxide in nitrogen mineralization, nitrification, and overstory biomass indigest for the analysis of Pinus radiata needles. Commun. Soil Sci. northern Michigan. Can. J. For. Res. 19:1521–1526.Plant Anal. 11:175–188.