a comparison between aqueous and organic electrolytes for
TRANSCRIPT
IN DEGREE PROJECT CHEMICAL SCIENCE AND ENGINEERING,SECOND CYCLE, 30 CREDITS
, STOCKHOLM SWEDEN 2021
A comparison between aqueous and organic electrolytes for lithium-ion batteries
GABRIEL QUINTANS DE SOUZA
KTH ROYAL INSTITUTE OF TECHNOLOGYSCHOOL OF ENGINEERING SCIENCES IN CHEMISTRY, BIOTECHNOLOGY AND HEALTH

A comparison between aqueous and organicelectrolytes for lithium-ion batteries
Gabriel Quintans∗
Sammanfattning
Många batteriers användningsområden kräver att batterierna har hög upp- och urladdningshastighet samt låg kostnad.För dessa användningsområden är vattenbaserade laddningsbara batterier (ARB) ett möjligt alternativ i och med att deär svårantändliga, har god jonledningsförmåga, lägre inre resistans, billigare elektrolytlösning och tillverkning och harpotentiellt högre upp- och urladdningshastigheter. Genom att utgå från en cell med LiMn2O4 och V2O5 som katodrespektive anod, utvecklades en cell med en spänning på 1 V och prestanda för 2 mol/L LiTSFI i organisk respektivevattenlöslig lösning jämfördes i ett SEI-fritt system. Prestandan kvantifierades med avseende på urladdningskapacitetenvid olika urladdningshastigheter samt fördelningen av de interna överpotentialerna. Vid C/4 behöll den organiskaelektrolyten 88.3% av den initiala kapaciteten efter 10 cykler medan den vattenlösliga behöll 98.8%. En gräns på20 C påvisades för den organiska elektrolyten och vid försök att gå över denna hastighet svällde pouch cellen upp.Den vattenlösliga elektrolyten, å andra sidan, bevarade 37 mAh/g vid 50 C. Skillnaden i potentialfördelning i de tvåsystemen analyserades även genom att använda tunnare elektroder. Den organiska elektrolyten visade då en förbättringav prestandan vid höga hastigheter, med en urladdningskapacitet på 8.8 mAh/g vid 50 C, jämfört med 30 mAh/gför den vattenlösliga elektrolyten. IR-fallet var 7 gånger högre för den organiska elektrolyten. Eventuell skillnad iladdningsöverföring och por-resistans kunde inte analyseras då flera processer ägde rum på samma gång i systemen,vilket gav ett impedansspektrum med en komplex associerad ekvivalent krets.
1
A comparison between aqueous and organic electrolytes for lithium-ion batteries 2
Abstract
For several battery applications, high dis-/charge rate and low cost are imperatives. It is for these applications thataqueous rechargeable batteries (ARB) rise as potential candidates given the non-flammability, potentially higher ionicconductivity and dis-/charge rates, lower internal resistances and lower price of the electrolyte solvents and manufacture.By benchmarking a cell with LiMn2O4 and V2O5 as cathode and anode, respectively, a cell with a operating voltagewindow of 1 V was developed and the performance of 2 mol/L LiTFSI in organic and aqueous solvent compared in aSEI-free system. This performance was quantified in terms of discharge capacity at different rates of discharge and thedistribution of internal overpotentials. At C/4, the organic electrolyte held 88.3% of the initial capacity after 10 cycleswhile the aqueous, 98.8%. A limit of 20 C for the organic electrolyte was seen, and at the attempt of cycling abovethis rate, swelling of the pouch cell took place. The aqueous electrolyte, on the other hand, conserved 37 mAh/g at 50C. The difference of overpotentials distribution in both systems was also assessed by employing thinner electrodes.The organic electrolyte showed then an improvement on high-rate performance, reaching 50 C, but with a dischargecapacity of 8.8 mAh/g, against 30 mAh/g for the aqueous electrolyte. The IR-drop was 7 times higher for the organicelectrolyte. The differentiation between charge-transfer and pore resistance, however, was not possible, because of thepresence of several processes taking place at similar time-scales in both systems, yielding a impedance spectra with acomplex associated equivalent circuit.
Contents1 Introduction 2
1.1 The lithium-ion cell . . . . . . . . . . . . . . . . . . 31.2 Cell voltage and capacity . . . . . . . . . . . . . . . 31.3 Cell under operation . . . . . . . . . . . . . . . . . . 51.4 Power and energy . . . . . . . . . . . . . . . . . . . 5
2 Cell components 62.1 Electrodes . . . . . . . . . . . . . . . . . . . . . . . 62.2 Separators . . . . . . . . . . . . . . . . . . . . . . . 72.3 Current collectors . . . . . . . . . . . . . . . . . . . 72.4 Electrolyte . . . . . . . . . . . . . . . . . . . . . . . 7
2.4.1 Ionic conductivity and charge transport . . . . 72.4.2 Electrochemical stability window of the elec-
trolyte . . . . . . . . . . . . . . . . . . . . . 82.4.3 Organic electrolytes . . . . . . . . . . . . . . 92.4.4 Aqueous electrolytes . . . . . . . . . . . . . 10
3 Bulk and interface processes 113.1 Insertion electrodes in organic electrolytes . . . . . . 123.2 Insertion electrodes in aqueous electrolytes . . . . . . 12
4 Techniques 12
5 Scope of the thesis 15
6 Materials and Methods 15
7 Results and discussion 17
8 Conclusion and outlook 26
∗Applied Electrochemistry, KTH Royal Institute of Technol-ogy, Stockholm, SE-100 44, Sweden. Email: [email protected]. Su-pervisor: Dr. Erik Berg, Department of Chemistry – ÅngströmLaboratory, Uppsala University, 751 21 Uppsala, Sweden. Email:[email protected]
1 Introduction
Motivation
The hereby presented degree project investigates the per-formance of electrolytes in lithium-ion batteries (LIB).The hypothesis is that a LIB based on an aqueous elec-trolyte (ALIB) will provide a higher power density (whilestill maintaining high specific energy) when compared toan otherwise similar cell based on an organic electrolyte.Because water has a smaller thermodynamic stability win-dow (1.23 V (1) against 4 V (2) of organic electrolytes), thecondition that both cells are operated within electrochem-ical stability window (ESW) of water is necessary. Morespecifically, the cells developed will have a limited volt-age of 1 V. The reason for turning to a limited voltagewindow is that, although ways of extending the stabilityof the aqueous electrolyte have been presented in litera-ture, these solutions still come with important demerits.One example is the use of highly concentrated aqueouselectrolytes (also referred to as Water-In-Salt electrolytes,or WISE), which employ electrolyte with concentrationsfrom 3 to 21 M (3,4), but these systems still present draw-backs such as high viscosity, associated material costs (3)
and self-discharge (5). The challenges of WISE, therefore,leave room for the development of new ways of extend-ing aqueous ESW, that can be developed by the study ofaqueous electrolytes in their original ESW and the com-parison of their properties with organic electrolytes. Infact, highly concentrated electrolytes were first introducedin combination with organic solvents (6), which points to
A comparison between aqueous and organic electrolytes for lithium-ion batteries 3
fruitful developments by drawing lines between organicand aqueous systems. This thesis aims to serve as a steptowards the development of more electrochemically sta-ble aqueous electrolytes by characterizing these systemselectrochemically in a operating lithium-ion (Li-ion) cell.In order to achieve this characterization: (1) a benchmarkcell will be developed, (2) both electrolyte systems willbe electrochemically compared, (3) the specific reasonswhy aqueous electrolytes can enable higher power batter-ies will be identified, (4) the relationship between the fun-damental properties of the electrolytes and their electro-chemical performance will be assessed.
Outline
In Section 1 to 2.3, a brief introduction to battery fun-damentals is given and then, under Section 2.4, the roleof parallel organic and aqueous electrolyte developmentis discussed. In Section 3 the physicochemical processesin a typical Li-ion cell are elucidated and how cell devel-opment is influenced by them. Under Section 4, a criticaldiscussion of literature will then be conducted and howthis thesis can contribute to the knowledge in the field. OnSections 5 and 6, the methods and techniques of choicewill be briefly introduced and then, on Section 7, the ex-perimental results will be shown, discussed and reflectedagainst the initial hypothesis. The intended reader aretechnical professionals with the possession of a master’sdegree, regardless of their familiarity with Li-ion batter-ies research, hence the fundamental approach in the firstsections. However, if the reader is familiar with the field,starting from Section 2.4 would be adequate.
1.1 The lithium-ion cell
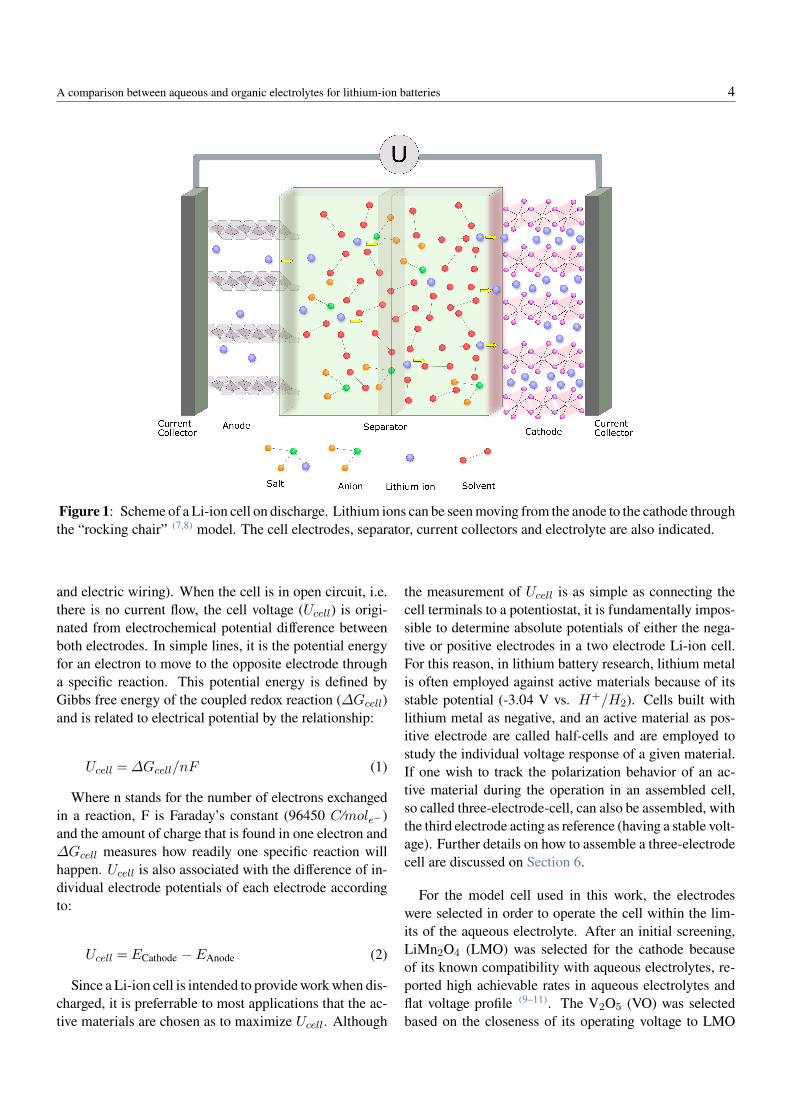
A lithium battery is a device capable of convertingchemical energy into electrical energy by electrochemicalreactions, it consists of two or more lithium-ion cells elec-trically connected with cables, terminals, controls fusesand other auxiliary devices in a way that can deliver volt-age and current to a specific system. The most fundamen-tal part of a lithium battery system is the lithium-ion cell.The performance of this cell will be dictated by the chem-istry of its components, from their individual properties totheir mutual interactions. In order to understand the finalperformance parameters of a Li-ion battery (e.g. operat-ing voltage, overpotentials, energy and power, etc.), it isimperative to first understand the basic processes withinan individual Li-ion cell. The most basic design of thesekind of cells consists of two electrodes separated by an
electrolyte and a separator, while being connected by anexternal wiring as seen in Figure 1. Upon charge, elec-trons flow through the external wiring from the positive tothe negative electrode and, to balance the charge, cationsmove through the electrolyte in the same direction. Ondischarge, the same process happens, but in the positiveelectrode direction.
The electrodes are the components of the Li-ion cellcapable of storing and releasing ions by undergoing elec-trochemical reactions (active materials), more specifically,they undergo electrochemical oxidation and reduction re-actions (redox). As Figure 1 shows1, these two reactionsare interdependent and will happen simultaneously dur-ing charge/discharge of a battery, in the positive (cathode)and negative (anode) electrodes. The negative electrode isdefined as the one that is oxidized on discharge (donateselectrons) and the positive electrode as the one which is re-duced on discharge (receives electrons) 2. During charge,the same process happens in opposite direction. The elec-trolyte is defined as a solution of one or more dissolvedsalts in one or more solvents capable of maintaining ions,its function is to transport ions and to act as an isolation forelectrons conduction. When electrical current is imposedbetween the Li-ion cell electrodes, the electrical energyis converted into chemical energy. Because electrical cur-rent is charge delivered per time unit, the applied current acell can withstand for a given amount of time is known ascharge capacity (analogously, the current a cell can deliverin a given time is known as discharge capacity) and it isusually assigned to the weight of the active material, persay, specific capacity (mAh/g). One consecutive chargeand discharge of a Li-ion cell is normally referred to as“one cycle”.
1.2 Cell voltage and capacity
As aforementioned, the term redox stands for a pairof oxidation and reduction reactions occurring simultane-ously. These reactions are interdependent, that is, an elec-tron will necessarily leave from one species to the other.Inside the electrochemical cell, the reaction will happenbetween the active materials (the electrodes) just as anyother redox reaction, the difference being that the electronpathway will be longer (throughout the current collectors
1The shown “rocking chair” model refers to the way lithium-ionsare shuttled between electrodes within the electrolyte, following theelectrons direction in a back and forward motion, which resembles arocking-chair movement
2Species which strongly tend to reduce and oxidize are also re-ferred to as oxidizing and reducing agents, respectively.
A comparison between aqueous and organic electrolytes for lithium-ion batteries 4
Figure 1: Scheme of a Li-ion cell on discharge. Lithium ions can be seen moving from the anode to the cathode throughthe “rocking chair” (7,8) model. The cell electrodes, separator, current collectors and electrolyte are also indicated.
and electric wiring). When the cell is in open circuit, i.e.there is no current flow, the cell voltage (Ucell) is origi-nated from electrochemical potential difference betweenboth electrodes. In simple lines, it is the potential energyfor an electron to move to the opposite electrode througha specific reaction. This potential energy is defined byGibbs free energy of the coupled redox reaction (∆Gcell)and is related to electrical potential by the relationship:
Ucell =∆Gcell/nF (1)
Where n stands for the number of electrons exchangedin a reaction, F is Faraday’s constant (96450 C ⁄mole−)and the amount of charge that is found in one electron and∆Gcell measures how readily one specific reaction willhappen. Ucell is also associated with the difference of in-dividual electrode potentials of each electrode accordingto:
Ucell = ECathode − EAnode (2)
Since a Li-ion cell is intended to provide work when dis-charged, it is preferrable to most applications that the ac-tive materials are chosen as to maximize Ucell. Although
the measurement of Ucell is as simple as connecting thecell terminals to a potentiostat, it is fundamentally impos-sible to determine absolute potentials of either the nega-tive or positive electrodes in a two electrode Li-ion cell.For this reason, in lithium battery research, lithium metalis often employed against active materials because of itsstable potential (-3.04 V vs. H+/H2). Cells built withlithium metal as negative, and an active material as pos-itive electrode are called half-cells and are employed tostudy the individual voltage response of a given material.If one wish to track the polarization behavior of an ac-tive material during the operation in an assembled cell,so called three-electrode-cell, can also be assembled, withthe third electrode acting as reference (having a stable volt-age). Further details on how to assemble a three-electrodecell are discussed on Section 6.
For the model cell used in this work, the electrodeswere selected in order to operate the cell within the lim-its of the aqueous electrolyte. After an initial screening,LiMn2O4 (LMO) was selected for the cathode becauseof its known compatibility with aqueous electrolytes, re-ported high achievable rates in aqueous electrolytes andflat voltage profile (9–11). The V2O5 (VO) was selectedbased on the closeness of its operating voltage to LMO
A comparison between aqueous and organic electrolytes for lithium-ion batteries 5
and also the reported stability of vanadium oxides in aque-ous electrolytes (12). The half reactions on the positive andnegative electrode as well as the global cell reaction are:3
Volt. vs Li (V)LiMn2O4 −−−− xe− + xLi+ + Li1−xMn2O4 4.1V2O5 + e− + Li+ −−−− LiV2O5 3.1
LiMn2O4 + V2O5 −−−− LiV2O5 + Mn2O4 1.0
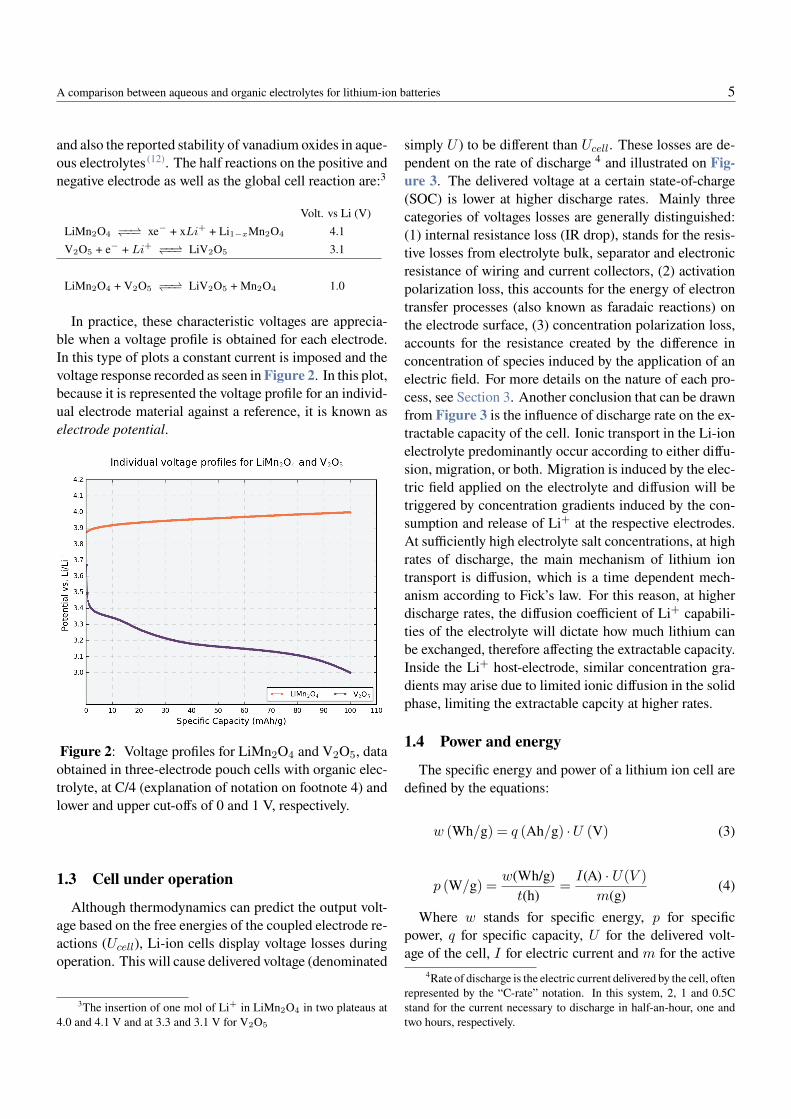
In practice, these characteristic voltages are apprecia-ble when a voltage profile is obtained for each electrode.In this type of plots a constant current is imposed and thevoltage response recorded as seen in Figure 2. In this plot,because it is represented the voltage profile for an individ-ual electrode material against a reference, it is known aselectrode potential.
Figure 2: Voltage profiles for LiMn2O4 and V2O5, dataobtained in three-electrode pouch cells with organic elec-trolyte, at C/4 (explanation of notation on footnote 4) andlower and upper cut-offs of 0 and 1 V, respectively.
1.3 Cell under operation
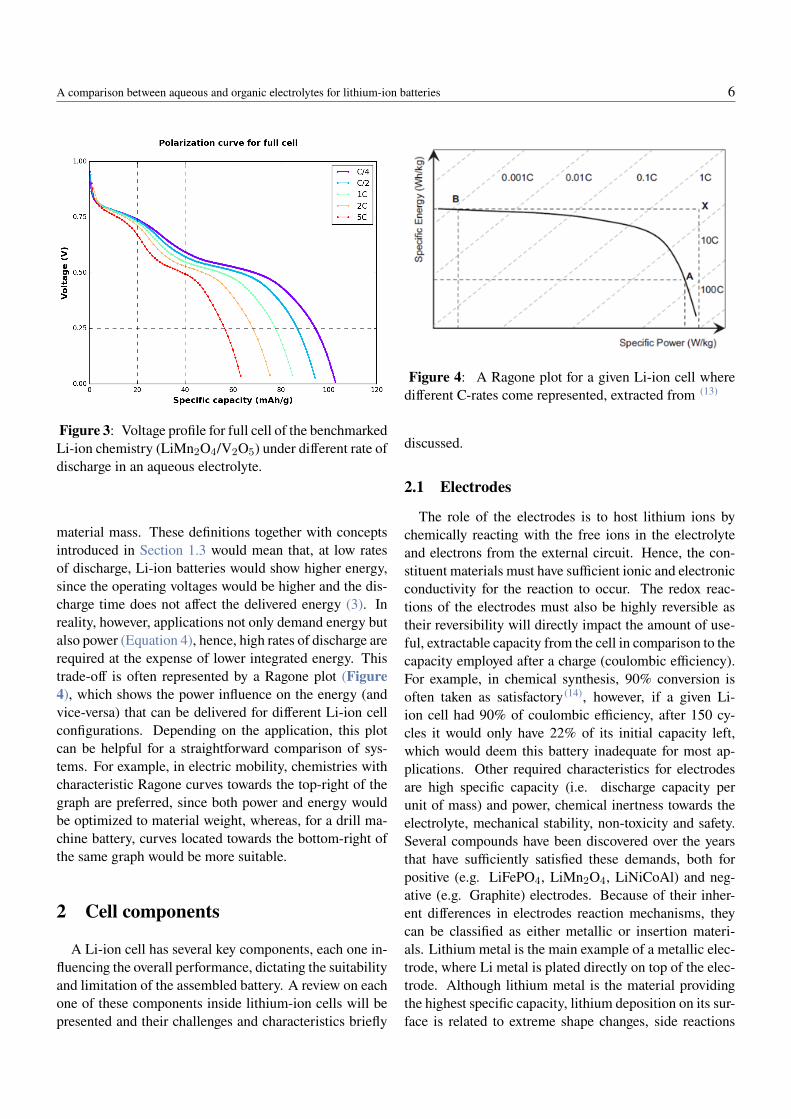
Although thermodynamics can predict the output volt-age based on the free energies of the coupled electrode re-actions (Ucell), Li-ion cells display voltage losses duringoperation. This will cause delivered voltage (denominated
3The insertion of one mol of Li+ in LiMn2O4 in two plateaus at4.0 and 4.1 V and at 3.3 and 3.1 V for V2O5
simply U ) to be different than Ucell. These losses are de-pendent on the rate of discharge 4 and illustrated on Fig-ure 3. The delivered voltage at a certain state-of-charge(SOC) is lower at higher discharge rates. Mainly threecategories of voltages losses are generally distinguished:(1) internal resistance loss (IR drop), stands for the resis-tive losses from electrolyte bulk, separator and electronicresistance of wiring and current collectors, (2) activationpolarization loss, this accounts for the energy of electrontransfer processes (also known as faradaic reactions) onthe electrode surface, (3) concentration polarization loss,accounts for the resistance created by the difference inconcentration of species induced by the application of anelectric field. For more details on the nature of each pro-cess, see Section 3. Another conclusion that can be drawnfrom Figure 3 is the influence of discharge rate on the ex-tractable capacity of the cell. Ionic transport in the Li-ionelectrolyte predominantly occur according to either diffu-sion, migration, or both. Migration is induced by the elec-tric field applied on the electrolyte and diffusion will betriggered by concentration gradients induced by the con-sumption and release of Li+ at the respective electrodes.At sufficiently high electrolyte salt concentrations, at highrates of discharge, the main mechanism of lithium iontransport is diffusion, which is a time dependent mech-anism according to Fick’s law. For this reason, at higherdischarge rates, the diffusion coefficient of Li+ capabili-ties of the electrolyte will dictate how much lithium canbe exchanged, therefore affecting the extractable capacity.Inside the Li+ host-electrode, similar concentration gra-dients may arise due to limited ionic diffusion in the solidphase, limiting the extractable capcity at higher rates.
1.4 Power and energy
The specific energy and power of a lithium ion cell aredefined by the equations:
w (Wh/g) = q (Ah/g) ·U (V) (3)
p (W/g) =w(Wh/g)
t(h)=
I(A) · U(V )
m(g)(4)
Where w stands for specific energy, p for specificpower, q for specific capacity, U for the delivered volt-age of the cell, I for electric current and m for the active
4Rate of discharge is the electric current delivered by the cell, oftenrepresented by the “C-rate” notation. In this system, 2, 1 and 0.5Cstand for the current necessary to discharge in half-an-hour, one andtwo hours, respectively.
A comparison between aqueous and organic electrolytes for lithium-ion batteries 6
Figure 3: Voltage profile for full cell of the benchmarkedLi-ion chemistry (LiMn2O4/V2O5) under different rate ofdischarge in an aqueous electrolyte.
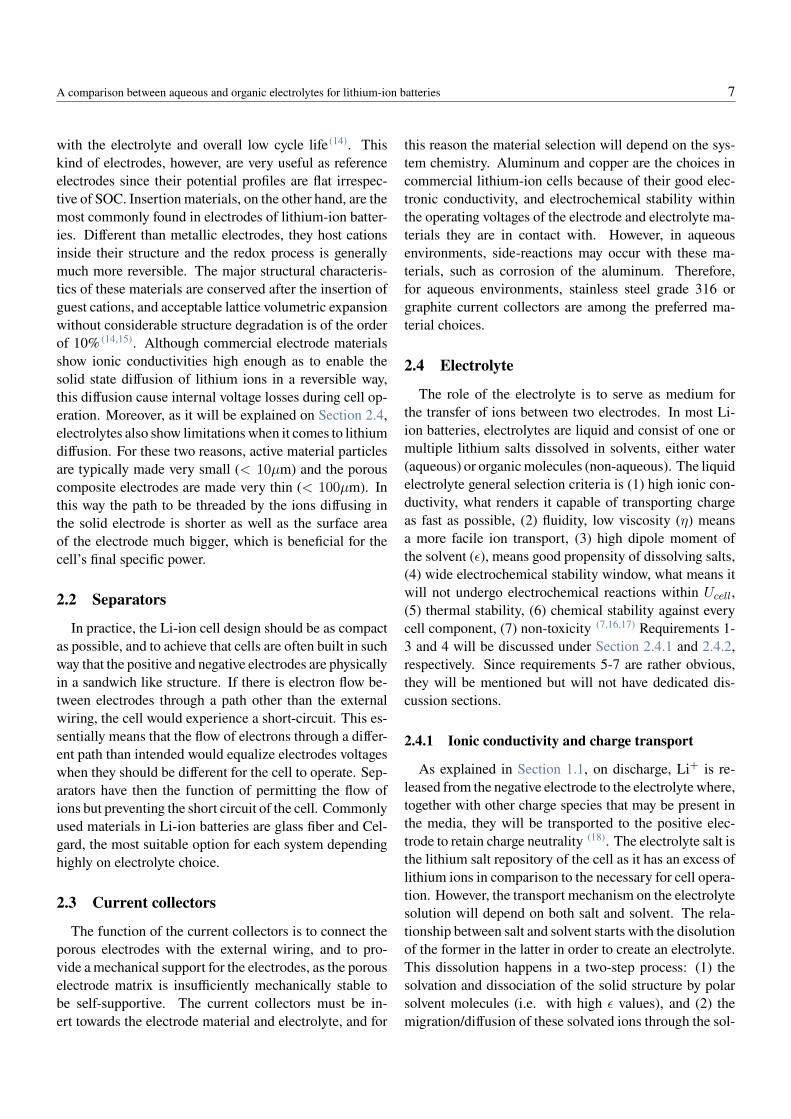
material mass. These definitions together with conceptsintroduced in Section 1.3 would mean that, at low ratesof discharge, Li-ion batteries would show higher energy,since the operating voltages would be higher and the dis-charge time does not affect the delivered energy (3). Inreality, however, applications not only demand energy butalso power (Equation 4), hence, high rates of discharge arerequired at the expense of lower integrated energy. Thistrade-off is often represented by a Ragone plot (Figure4), which shows the power influence on the energy (andvice-versa) that can be delivered for different Li-ion cellconfigurations. Depending on the application, this plotcan be helpful for a straightforward comparison of sys-tems. For example, in electric mobility, chemistries withcharacteristic Ragone curves towards the top-right of thegraph are preferred, since both power and energy wouldbe optimized to material weight, whereas, for a drill ma-chine battery, curves located towards the bottom-right ofthe same graph would be more suitable.
2 Cell components
A Li-ion cell has several key components, each one in-fluencing the overall performance, dictating the suitabilityand limitation of the assembled battery. A review on eachone of these components inside lithium-ion cells will bepresented and their challenges and characteristics briefly
Figure 4: A Ragone plot for a given Li-ion cell wheredifferent C-rates come represented, extracted from (13)
discussed.
2.1 Electrodes
The role of the electrodes is to host lithium ions bychemically reacting with the free ions in the electrolyteand electrons from the external circuit. Hence, the con-stituent materials must have sufficient ionic and electronicconductivity for the reaction to occur. The redox reac-tions of the electrodes must also be highly reversible astheir reversibility will directly impact the amount of use-ful, extractable capacity from the cell in comparison to thecapacity employed after a charge (coulombic efficiency).For example, in chemical synthesis, 90% conversion isoften taken as satisfactory (14), however, if a given Li-ion cell had 90% of coulombic efficiency, after 150 cy-cles it would only have 22% of its initial capacity left,which would deem this battery inadequate for most ap-plications. Other required characteristics for electrodesare high specific capacity (i.e. discharge capacity perunit of mass) and power, chemical inertness towards theelectrolyte, mechanical stability, non-toxicity and safety.Several compounds have been discovered over the yearsthat have sufficiently satisfied these demands, both forpositive (e.g. LiFePO4, LiMn2O4, LiNiCoAl) and neg-ative (e.g. Graphite) electrodes. Because of their inher-ent differences in electrodes reaction mechanisms, theycan be classified as either metallic or insertion materi-als. Lithium metal is the main example of a metallic elec-trode, where Li metal is plated directly on top of the elec-trode. Although lithium metal is the material providingthe highest specific capacity, lithium deposition on its sur-face is related to extreme shape changes, side reactions
A comparison between aqueous and organic electrolytes for lithium-ion batteries 7
with the electrolyte and overall low cycle life (14). Thiskind of electrodes, however, are very useful as referenceelectrodes since their potential profiles are flat irrespec-tive of SOC. Insertion materials, on the other hand, are themost commonly found in electrodes of lithium-ion batter-ies. Different than metallic electrodes, they host cationsinside their structure and the redox process is generallymuch more reversible. The major structural characteris-tics of these materials are conserved after the insertion ofguest cations, and acceptable lattice volumetric expansionwithout considerable structure degradation is of the orderof 10% (14,15). Although commercial electrode materialsshow ionic conductivities high enough as to enable thesolid state diffusion of lithium ions in a reversible way,this diffusion cause internal voltage losses during cell op-eration. Moreover, as it will be explained on Section 2.4,electrolytes also show limitations when it comes to lithiumdiffusion. For these two reasons, active material particlesare typically made very small (< 10µm) and the porouscomposite electrodes are made very thin (< 100µm). Inthis way the path to be threaded by the ions diffusing inthe solid electrode is shorter as well as the surface areaof the electrode much bigger, which is beneficial for thecell’s final specific power.
2.2 Separators
In practice, the Li-ion cell design should be as compactas possible, and to achieve that cells are often built in suchway that the positive and negative electrodes are physicallyin a sandwich like structure. If there is electron flow be-tween electrodes through a path other than the externalwiring, the cell would experience a short-circuit. This es-sentially means that the flow of electrons through a differ-ent path than intended would equalize electrodes voltageswhen they should be different for the cell to operate. Sep-arators have then the function of permitting the flow ofions but preventing the short circuit of the cell. Commonlyused materials in Li-ion batteries are glass fiber and Cel-gard, the most suitable option for each system dependinghighly on electrolyte choice.
2.3 Current collectors
The function of the current collectors is to connect theporous electrodes with the external wiring, and to pro-vide a mechanical support for the electrodes, as the porouselectrode matrix is insufficiently mechanically stable tobe self-supportive. The current collectors must be in-ert towards the electrode material and electrolyte, and for
this reason the material selection will depend on the sys-tem chemistry. Aluminum and copper are the choices incommercial lithium-ion cells because of their good elec-tronic conductivity, and electrochemical stability withinthe operating voltages of the electrode and electrolyte ma-terials they are in contact with. However, in aqueousenvironments, side-reactions may occur with these ma-terials, such as corrosion of the aluminum. Therefore,for aqueous environments, stainless steel grade 316 orgraphite current collectors are among the preferred ma-terial choices.
2.4 Electrolyte
The role of the electrolyte is to serve as medium forthe transfer of ions between two electrodes. In most Li-ion batteries, electrolytes are liquid and consist of one ormultiple lithium salts dissolved in solvents, either water(aqueous) or organic molecules (non-aqueous). The liquidelectrolyte general selection criteria is (1) high ionic con-ductivity, what renders it capable of transporting chargeas fast as possible, (2) fluidity, low viscosity (η) meansa more facile ion transport, (3) high dipole moment ofthe solvent (ε), means good propensity of dissolving salts,(4) wide electrochemical stability window, what means itwill not undergo electrochemical reactions within Ucell,(5) thermal stability, (6) chemical stability against everycell component, (7) non-toxicity (7,16,17) Requirements 1-3 and 4 will be discussed under Section 2.4.1 and 2.4.2,respectively. Since requirements 5-7 are rather obvious,they will be mentioned but will not have dedicated dis-cussion sections.
2.4.1 Ionic conductivity and charge transport
As explained in Section 1.1, on discharge, Li+ is re-leased from the negative electrode to the electrolyte where,together with other charge species that may be present inthe media, they will be transported to the positive elec-trode to retain charge neutrality (18). The electrolyte salt isthe lithium salt repository of the cell as it has an excess oflithium ions in comparison to the necessary for cell opera-tion. However, the transport mechanism on the electrolytesolution will depend on both salt and solvent. The rela-tionship between salt and solvent starts with the disolutionof the former in the latter in order to create an electrolyte.This dissolution happens in a two-step process: (1) thesolvation and dissociation of the solid structure by polarsolvent molecules (i.e. with high ε values), and (2) themigration/diffusion of these solvated ions through the sol-
A comparison between aqueous and organic electrolytes for lithium-ion batteries 8
vent media. During step (1), the driving force for solvationis the energetic stabilization of the salt crystal lattice by acoordination of solvent dipoles around naked ions (espe-cially cations); therefore, in a solvent, lithium ions alwaysmigrate with a “solvation sheath” around them, whichconsists of a certain number of oriented solvent moleculesas seen in Figure 1. Therefore, it is beneficial to use sol-vents with high ε to guarantee most of the salt will be dis-solved. During step (2), these formed ion/solvent com-plexes of both charges will be responsible by the ionic con-duction of a liquid electrolyte. How facile the movementof the formed ion/solvent complexes will be can be quan-tified by the ion’s mobility µ, which is mainly determinedby the ionic radius (ri) of the ion and the viscosity (ηi) ofthe electrolyte as descripted by Stokes-Einstein relation:
µi−−1
6πηiri(5)
It is important to note, however, that both cation and an-ion will be coordinated by solvents. Ionic conductivity (σ)will hence consist of the oriented movement of ion/solventcomplexes of both charges5 and can be quantified by theequation:
σ−−∑i
niµiZie (6)
Where Zi stands for the valence order of ionic speciesi, e is the unit charge of electrons, ni the free ion numberand µi the ion’s ionic mobility. These two equations actu-ally show the advantages of lithium ions for rechargeablebatteries because of its small ionic radius and higher µi
and σ.Since ionic conductivity measures the mobility of all
charged species in the electrolyte, and we are interestedonly in the Li+ transport characteristics, a quantificationof the contribution of Li+ to the overall ionic current isnecessary. This quantification can be done by the lithium-ion transference number (tLi), that is defined as:
tLi−−µi∑i µi
(7)
Where the numerator is the lithium ion mobility andthe denominator the sum of all charged species i in the
5Although there is overwhelming evidence that cation-solventcomplexes far outweigh the number of anion-solvent complexes (19,20)
electrolyte. The transfer number for lithium ions is impor-tant for electrolyte optimization, since it is the true deter-mining factor for battery’s maximum charge and dischargerates.
2.4.2 Electrochemical stability window of the elec-trolyte
The only active materials of a Li-ion cell are containedin the electrodes, which means that, besides them, no othercell component should chemically interact with the elec-trons being exchanged between cell terminals. This re-quirement naturally applies to the electrolyte, and sinceit surrounds both active materials, its electrochemical sta-bility is of particular interest for a correct functioning ofthe cell. Apart from the Li+ ions, the electrolyte in the Li-ion cell should not display any redox reactivity towards theelectrodes. The electrochemical stability window (ESW)can be analyzed by a study of the energy separation be-tween the LUMO (lowest unoccupied molecular orbital)and HOMO (highest occupied molecular orbital) levelsof the electrolyte. Figure 5 shows the ESW of an elec-trolyte wider than Ucell, seen in the diagram as the gap be-tween the fermi levels of the negative (EF,neg) and positive(EF,pos) electrodes. The rationale behind this is that if theLUMO level of a given electrolyte is lower than EF,red theelectrolyte will be reduced; analogously, a HOMO with ahigher energy level than EF,pos will cause electrolyte oxi-dation (13,16,18)
Figure 5: Electrochemical stability window schematic,with the HOMO and LUMO levels visible and the require-ment of a smaller Ucell than the electrolyte’s ESW illus-trated.
However, these are thermodynamic considerations andboth the electrode and electrolyte could rather be kinet-ically stabilized versus side-reactions. If a passivation
A comparison between aqueous and organic electrolytes for lithium-ion batteries 9
layer is present on the electrode, the ESW of the elec-trolyte would be less of importance. Such passivation lay-ers are commonly found in modern Li-ion batteries, ofwhich the solid electrolyte interphase (SEI) is the mostprominent example. The SEI is formed on the nega-tive electrode surface and prevents long-term capacityloss related to side reactions between electrolyte and elec-trodes (16–19). The SEI is normally formed by reduction ofelectrolyte species upon the cell’s first charging cycle, andits key ability is to be ionic conductive while electroni-cally insulating (21). Because of the possibility of form-ing an SEI, electrolytes may have an ESW slightly smallerthan Ucell, and after the first cycle (and formation of SEI)the electrode may be operated within a voltage windowbroader than ESW. The discovery of the SEI in organicelectrolytes was a landmark for Li-ion cells development.The electrolyte’s ability to be reduced by design as to formthis passivation layer was converted in a selection criterionfor lithium salts and solvents used in commercial elec-trolytes today (22).
2.4.3 Organic electrolytes
State-of-the-artCommercial Li-ion cells employ lithium salts dissolved
in organic solvent blends of at least two carbonates, singlesolvent formulas being very rare (2,16). One of the mostused combination of salt-solvent is 1M LiPF6 in a 1:1(by weight or volume) EC:DMC solvent mixture, whichshows an ionic conductivity of ∼ 7x10⁻³ S/cm at 20 Cand a moderate lithium-ion transfer number (∼0.35) (2).The choice of LiPF6 is motivated by its balanced proper-ties when it comes to lithium electrolyte salt requirements.These requirements are (1) high solubility, (2) high ionicconductivity, (3) thermal stability, (4) non-reactivity withall cell components and (5) cost (16). The preference forLiPF6 instead of simpler, more abundant salts (e.g. LiCl,LiF and Li2O) is because of lithium small ionic radius,which leads to a very low solubility of these salts in or-ganic solvents, that normally have lower dielectric con-stant (ε) than aqueous solvents.Previous screening stud-ies of lithium salts concluded that the salt formula LiABn
(where A = Cl, P, As, B or Sb, B = F or O, n = 4 or6) can show high solubility and stability in organic sol-vents (16). Other compounds of the LiABn family, how-ever, show significant drawbacks like instability at hightemperature and high current density (e.g. LiClO4) (16,23)
and toxicity of reaction products formed during cell oper-ation (LiAsF6) (16,24). For LiPF6, two drawbacks are the
tendency to react with any residual moisture to form hy-drofluoric acid (HF) and to thermal decomposition, whichcan be addressed by handling the salt in inert atmospheresand the development of advanced battery managementsystems in final applications, respectively (25–27). LiPF6
choice is hence motivated by its balanced properties com-bined with the manageableness of its drawbacks.
For the solvent criterias, the key requirements is to com-bine high ε (determines ni in Equation 6) with minimum η(determines µi in Equation 5). As these are often contra-dictory characteristics for electrolyte solvent candidates,blends are preferred. These blends are typically com-binations of cyclic (e.g. EC or PC) and linear carbon-ates (e.g. DEC, EMC and DMC) in fractions of 1:1 asto maximize ionic conductivity (13,16). The possibility tocombine these carbonates characteristics in a blend is at-tributed to the additive influence of linear carbonates per-centage on lowering viscosity while still maintaining therelatively high dielectric constant of the cyclic carbon-ate. The influece of a high dielectric constant can be ob-served, for example, on the strong preference for EC overDMC or EMC in Li+ coordination. Assisted by quan-tum mechanics modeling studies (28), electrospray ioniza-tion (EIS) mass spectroscopy (29), nuclear magnetic reso-nance (NMR) (30,31) and molecular dynamics studies (32),authors have proposed a synergetic action of the two vari-ables (ε and η) through a mechanism that involves a prefer-able population of the cation’s solvation sheath by EC inmoderate salt concentrations (under 3 M). This results inthe consequent conjunct transport with the lithium ions tothe electrode interface, which would put these moleculesin a more likely position to be involved in oxidative orreductive processes (SEI forming) than non-coordinating,low ε molecules, linear carbonates.
In fact, the success of current state-of-the-art, non-aqueous electrolyte is due to EC’s ability of forming astable SEI on the negative electrode surface. The pres-ence of the SEI, for example, is the responsible of widen-ing the ESW of ∼1.0 – 4.2 vs Li/Li+ for the mentioned1.0 M LiPF6 in 1:1 EC/DMC electrolyte which enablesits coupling with graphitic negative electrodes (0.4 V vsLi/Li+). The presence of the SEI prevents continuouselectrolyte reduction, ensures high coulombic and volt-age efficiency (33), cycle life (33,34) and safety (35) over thecourse of the battery lifetime. When this SEI is notpresent, rapid cell failure is expected to happen because ofparasitic reactions on the negative electrode surface (36,37).
The main drawbacks of the state-of-the-art non-aqueous electrolyte blend is its limited thermal stability
A comparison between aqueous and organic electrolytes for lithium-ion batteries 10
and cost. The former is mostly related to the fact that theorganic components are flammable, while the latter is re-lated to the air sensitivity of the electrolyte components,which requires rigorous manufacturing conditions. More-over, a limited number of salts can be dissolved in organicmedia, which hinders the use of cheaper, more abudantlithium salts, like LiSO4 or LiNO3.
2.4.4 Aqueous electrolytes
Water as a charge carrier
From a physicochemical point of view, water is the idealsolvent for liquid electrolytes, which is due to its very suit-able balance of properties. A compilation of them at 25 Cis: (1) a dielectric constant value of 78.3 (38), (2) a viscos-ity value of 0.88 cP (39), and (3) an ionic conductivity of 41mS/cm (in a 2M LiTFSI salt solution, against 8 mS/cm ina solution with EC/DMC as solvent) (1). These propertiesof water (and aqueous electrolyte in the ionic conductiv-ity case) are more suitable for lithium ion electrolytes thanorganic solvent blends. Moreover, water is a readily acces-sible resource and has an innate non-flammability. Whena lithium salt is dissolved in an aqueous media, however,some changes are observed. The 1.23 V ESW of wateris normally extended to a value that will depend on thecharacteristics of the salt’s anion. In the case of LiTFSI,a high stability against hydrolysis causes the electrolyte tohave the extended ESW of 2.15 V at pH = 7 and 2.7 and4.85 V vs. Li/Li+ as cathodic and anodic limits (1). Thischaracteristic together with the high solubility of this saltin water has motivated its extended use in highly concen-trated aqueous electrolytes WISE systems, which, despitesome of its demerits, have enabled aqueous Li-ion cellswith operating voltages higher than 3 V (3,4).
State-of-the-art
Back in the 90’s and early 2000’s, pioneered byDahn et al and followed by different groups, aqueouselectrolytes were showcased primarily with Li2SO4 andLiNO3
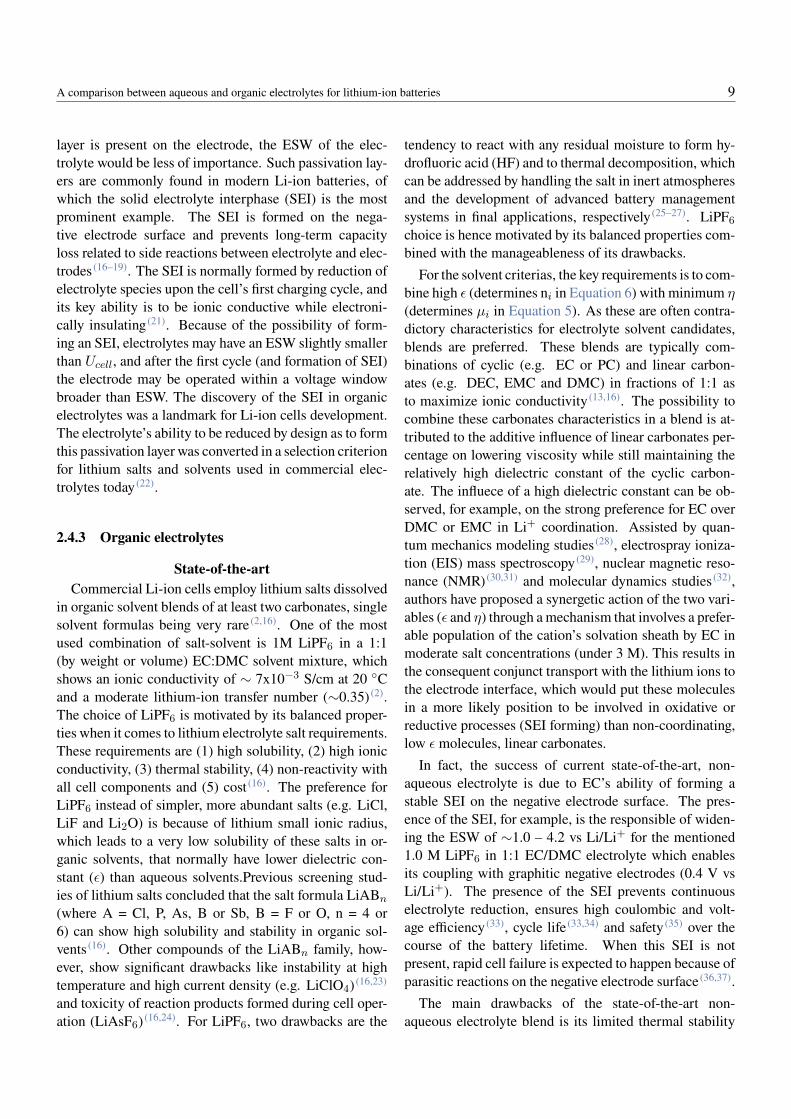
(11,12,40) as salts. These studies were quickly setaside due to the development of higher voltage electrodematerials that were not compatible with the narrow ESWof water (∼1.23 V (1)) and apparent inability of water toform an SEI on the negative electrode surface (i.e. wa-ter reduction forms OH−, H2 or O2). In Figure 6, severalelectrode materials are shown against the stability windowof pure water, and it becomes evident that a decent volt-age Li-ion cell (Ucell > 3 V) would not be possible toassemble within aqueous electrolyte’s ESW.
Figure 6: Typical Li-ion electrode materials, their oper-ating voltage window and the ESW of pure water, WISEand organic carbonates, extracted from (41).
For a long time, this limitation was accepted, and re-search efforts focused on combinations of cyclic and lin-ear carbonates electrolyte chemistries. This tendencychanged in 2015, when L. Suo et al showcased a highlyconcentrated aqueous electrolyte with LiTFSI as a saltwith a reported ESW of 3 V (Figure 6) which enabledthe cycling of a LiMn2O4/Mo6S8 Li-ion cell with highcoulombic efficiency over 1000 cycles (4). This widerESW was enabled by a so-called “artificial SEI” thatwas achieved by the manipulation of solvation sheath ofcations (42). Suo et al pioneering work opened a newbranch of highly concentrated aqueous electrolyte re-search, WISE, under which several different groups pub-lished subsequent studies employing different electrodechemistries, cell materials and operating conditions (43–45).This kind of highly concentrated electrolytes (concentra-tions higher than 3-5 M, depending on the salt-solvent sys-tem (3)) do not come without demerits though, since theirextremely high viscosity and high amounts of electrolytesalt lower the power density of the cell, increases materialcosts besides still suffering from self-discharge (3,5). As anexample, while commercial, organic electrolytes have vis-cosities of the order of 3 cP (which needs around 24h fora proper wetting), the typical viscosity values of WISEelectrolytes are of the order of 240 cP (3). Although thefurther commercialization of WISE is still in question,the concept proves that, by manipulation of electrolyte de-composition during initial charging processes, an aqueoussystem can form dense, solid state passivation layers (arti-ficial SEI) on a negative electrode surface. In fact, by theemployment of organic co-solvents, the formation of an
A comparison between aqueous and organic electrolytes for lithium-ion batteries 11
artificial SEI in aqueous electrolytes was shown possiblenot only in lithium (46) but also in sodium based aqueousbatteries. By employing an aqueous electrolyte with anorganic co-solvent, Huaisheng et al showcased an aque-ous, sodium ion cell that achieved 80% capacity retentionafter 2000 cycles at 2C (47). This was enabled by the cre-ation of an artificial SEI that was mainly composed by re-duction products from organic co-solvents that preferablypopulated the cation solvation sheath. This finding sug-gests that the preference of high ε molecules to coordinatelithium cations can also be seen in aqueous systems andshow a way of designing artificial SEIs in aqueous elec-trolytes that follows the same rationale as in organic or-ganic systems as mentioned in Section 2.4.3.
3 Bulk and interface processes
In this section, the possible charge transfer/-transportprocesses (in a SEI-free) Li-ion cell will be discussed.During charge, lithium ions travel from the positive to thenegative electrode active material particles. This path en-compasses several processes that happen in series and inparallel with each other. If one start from the microfiberseparator to the negative electrode lattice, the essentialprocesses taking place are: (1) ion transport through theseparator, (2) ion transport in the bulk liquid electrolyte,(3) ion transport in the electrolyte-filled electrode pores,(4) absorption of lithium ions on the active material sur-face, (5) chemical reaction (charge transfer) on the sur-face, (6) ion transport inside the active material. In Figure7, these processes are depicted as well as the desorption ofreduced species and subsequent distancing from the neg-ative electrode surface.
Figure 7: possible processes in the electrode/electrolytebulk and interphase, extracted from (48).
The factors these processes will mostly depend on are:for step (1), the wettability of the separator material withthe electrolyte as well as the diffusion coefficient of thelithium ions through it; for step (2), the ions mobility, di-electric constant of the solvent, concentration polarizationof the electrolyte and diffusion of lithium ions through it,as it has been explained in Section 2.4.1; for step (3), elec-trolyte viscosity, electrode porosity and pore structure (16);for step (4), solvation sheath of lithium ion in the elec-trolyte, since a de-solvation step is necessary before ad-sorption (although different mechanisms may exist (16);for step (5), the kinetics of the reaction of the specific elec-trode with lithium and electrode’s surface area (49) and, forstep (6), material´s particle size, grain boundaries, solidstate ionic conductivity and the presence of conductivityenhancers.
Parallel to the transport of lithium ions, the electronsconducted from the electrode material to the current col-lectors and then to the external circuit will also go throughvarious processes until it meets the ion on the oppositeelectrode’s surface Figure 1. These processes are: (I)electronic conduction on the electrode particles, (II) elec-tronic conduction through the current collectors and (III)electronic conduction through the external wiring. Elec-tronic processes are, however, considered much faster thanionic conduction (49). Although the electrode often re-quires electric conductivity-enhancing additives (e.g. car-bon) when intrinsic electronic conductivity of materials istoo low, what is the case for LiFePO4, for instance (50). Insummary, Li-ion cells rate capability is more often limitedby ionic than electronic transport. (51)
Under dis-/charge cycling, the electrons in a Li-ion cellgo through the outer circuit and the lithium ions throughthe ”inside” of the cell, where the processes elucidatedin this section take place. The electrons flowing throughthe outer circuit will suffer resistance from the materialsthey are transported through, which are pure ohmic re-sistances to the electrons flow and usually very low. Theions flowing through the inside of the cell, however, willface significant resistances that will cause the deliveredenergy to be used in other processes (e.g. internal heat-ing, de-solvation, absorption, pure ohmic resistance to ionflow), lowering the amount of energy available to insertlithium cells in the active material (useful capacity). Al-though several processes happen inside a cell, it is usuallya challenge to assess the contribution of every single oneof them to the overall resistances. Therefore, the resis-tance to the lithium ion movements can be clustered inthree main groups: (1) ohmic resistances (ionic conduc-
A comparison between aqueous and organic electrolytes for lithium-ion batteries 12
tivity of the electrolyte, resistance of the separator), (2)charge transfer (de-solvation of lithium ions, pore conduc-tion, absorption and reaction at the surface) and (3) con-centration polarization resistances (diffusion resistances).
While a redox reaction will happen at certain elec-trode potentials independently of the applied current, re-sistances associated to the aforementioned processes willlead to cell voltage losses (in simple words, dissipate volt-age) proportionally to the applied current, as discussed onSection 1.3. It is then logical to conclude that for each sys-tem, there is a certain sufficiently high current that yieldsoverpotentials so high that, instead of cycling the cell, thevoltages are virtually displaced immediately to the lowerand upper cut-off voltages, reducing the useful capacityof this cell to zero. The distribution of resistances in a Li-ion cell during dis-/charge cycling will depend on their ar-chitecture and materials choice. For aqueous and organicelectrolytes, this resistances will be distributed differently,as it will be discussed in the subsections below.
3.1 Insertion electrodes in organic electrolytes
A key parameter for the commercialization of any elec-trode material is the assessment of the sources of resis-tances to lithium conduction in its core as well as on its in-terfaces. These resistances will condition the architectureof the final cells and their performance limitations. In thecase of the widely commercialized LiCoO2/Graphite elec-trode pair, high charge transfer resistance due to the de-solvation step on the electrolyte/electrode interface (49),resistances to the solid-state diffusion in electrode mate-rial as well as in the liquid electrolyte have motivated themanufacturing of high surface area and thin electrodes (51).These adaptations to Li-ion cells structure, however, comewith the demerits of less absolute capacity of the elec-trodes (Ah) which causes lower specific capacity on thepack level, since it will require more current collectors.Another issue is the need for ”inert” (e.g. additives andbinders) materials, which add more complexity and vul-nerabilities to the system, as they are not as chemicallynor electrochemically inert as their definition might sug-gest (51).
3.2 Insertion electrodes in aqueous electrolytes
In comparison with organic electrolytes, aqueous elec-trolytes have received less attention regarding the study ofits rate limiting steps when coupled with insertion elec-trodes. The available literature often focuses on the chargetransfer resistances of these systems. On the LiFePO4
case, impedance spectroscopy pointed to values of chargetransfer resistance two orders of magnitude lower (4.7 Ωin 0.5 M of Li2SO4) than the same electrode in an or-ganic electrolytes (148.3 Ω in LiPF6 propylene carbonate(PC)-based electrolyte). These values together with thelower apparent diffusion coefficient for the organic systempointed to the charge transfer being the reason for higherrates enabled by the aqueous electrolyte (52). The useof PC as solvent for representing the organic electrolyteand assess charge transfer, however, is of dubious moti-vation, since it is known to cause solvent co-intercalationin, for example, graphite and have been widely substitutedfor ethylene carbonate (EC) as the cyclic carbonate sol-vent (51). In fact, the comparison of charge transfer re-sistances of another electrode material (LiMn2O4) withthe same salt (LiTFSI) in a 1:1v% EC:DEC and in waterhave shown the co-existence of different phenomena onthe electrode/electrolyte interface. This high number ofprocesses happening at similar time renders the discrimi-nation between charge transfer resistances from other onesa rather challenging task to be done with certainty (53).
4 Techniques
There are a large number of electrochemical technqi-ues to characterize Li-ion batteries, of which galvanostaticcycling, potentiostatic electrochemical impedance spec-troscopy, intermittent current interruption are utilized inthis work.
Galvanostatic cycling (GC)
GC the most commonly applied electrochemical charac-terization technique for Li-ion batteries and used to com-pare different electrode/electrolyte systems. Essentially, aconstant current is applied, and the cell is charged untilan upper cutoff voltage, then discharged at a constant cur-rent to a lower cutoff voltage. The capacity (Ah) is auto-matically recorded by the testing equipment as the productof current (Amps) and time (hours). Rate is designed inthe C-rate notation as previously explained in Section 1.2.When applying GC (an also electrochemical techniques ingeneral), a common nomenclature is to refer to the elec-trode being studied as the working electrode (WE) and theother one as counter electrode (CE). In order to study onespecific electrode, what is commonly done is to oversizethe other, this way the limitations of the cell will be mostlydue to the WE characteristics.
A comparison between aqueous and organic electrolytes for lithium-ion batteries 13
Potentiostatic Electrochemical ImpedanceSpectroscopy (PEIS)
PEIS is capable of measuring the resistance to an elec-tric current flow inside the Li-ion cell and separating pro-cesses occurring at different time scales. More specifi-cally, a sinusoidal voltage is applied, which induce a si-nusoidal current as response by the cell. Because in anPEIS measurement the voltage wave is of the amplitudeof the order of 10 mV, the current response can be as-sumed to be lineraly proportional to the applied voltage,even though electrochemical processes show an exponen-tial relationship between potential and current accordingto Butler-Volmer equation. A linear current response of asinusoidal wave is a wave of the same frequency but witha difference in phase and amplitude (48)
Examples of processes that will introduce resistancesinside a Li-ion cell are the migration of ions in the liquidelectrolyte and their solid-state diffusion in the electrodeparticles. The former can be categorized as a fast processwhile the latter, a slow one. In other words, they presentdifferent characteristic times (τ ). A PEIS uses the differ-ent τ of processes to separate their contributions to theoverall resistance. Since a sweeping of frequency values(ω) is done under an alternate current (AC), the probingtime at each frequency is controlled, selecting this wayonly processes that happen within a given time-frame. Be-sides characteristic time constants, resistance processesinside a Li-ion cell also show different interactions withthe electric current which can be categorized in capacitive(Q), inductive (I) and pure resistive (R) behaviors. A focushere will be made on resistive and capacitive processes.
Resistance to ionic movements in the liquid electrolyte,electronic resistances of the electrode material and con-tact resistances between the current collectors and elec-trode materials are examples of pure resistive processes.These processes will show a ohmic response, hence, in-dependent of the frequency of the AC applied. Examplesof capacitive-like behaviors are the double-layer charg-ing and the diffusion and build up of concentration gra-dients in liquid and solid media. These processes are typ-ically represented in electrochemical circuits as a constantphase element (CPE) and a Warburg element, respectively.These elements are treated as non-ideal capacitors, and in-stead of the ideal C(jω)−1 impendace of capacitors, theirimpedance response is described by C(jω)−α, where α isdimensionless value between 0 and 1 for the CPE and hasa fixed value of 0.5 for the Warburg element. The constantC stands for Q−1 (s/Ω or F) for CPE and W (Ω.s−2) forthe Warburg element.
Based on these grounds, the impedance (Z) can be cal-culated from voltage (Ucell) and current (I) with the equa-tion: (2)
Z(ωt) =U(ωt)
I(ωt)=
|U |sin(ωt)|I|sin(ωt− φ)
(8)
where ω is the frequency and φ is the phase differencebetween the applied sinusoidal potential and measured si-nusoidal current. Another way of expressing impedanceis with complex numbers: (2,48,54)
Z(ω t) = |Z|ejφ = Zreal + jZimaginary (9)
The plotting of the impedance as Zreal vs. Zimaginary iscalled Nyquist plot and it is the most common way of ana-lyzing and showing PEIS data. In this kind of representa-tion, Zreal (often as Re(Z)) is represented in the x-axis and-Zimaginary (often as -Im(Z)) in the y-axis.
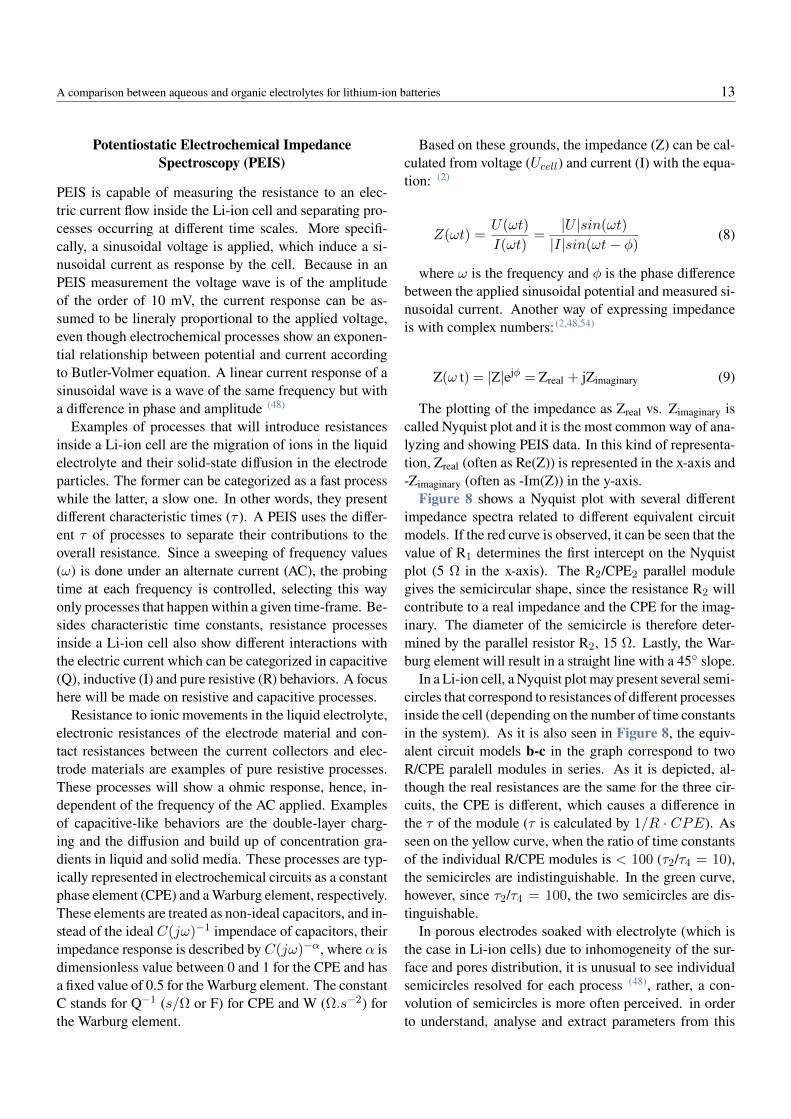
Figure 8 shows a Nyquist plot with several differentimpedance spectra related to different equivalent circuitmodels. If the red curve is observed, it can be seen that thevalue of R1 determines the first intercept on the Nyquistplot (5 Ω in the x-axis). The R2/CPE2 parallel modulegives the semicircular shape, since the resistance R2 willcontribute to a real impedance and the CPE for the imag-inary. The diameter of the semicircle is therefore deter-mined by the parallel resistor R2, 15 Ω. Lastly, the War-burg element will result in a straight line with a 45 slope.
In a Li-ion cell, a Nyquist plot may present several semi-circles that correspond to resistances of different processesinside the cell (depending on the number of time constantsin the system). As it is also seen in Figure 8, the equiv-alent circuit models b-c in the graph correspond to twoR/CPE paralell modules in series. As it is depicted, al-though the real resistances are the same for the three cir-cuits, the CPE is different, which causes a difference inthe τ of the module (τ is calculated by 1/R · CPE). Asseen on the yellow curve, when the ratio of time constantsof the individual R/CPE modules is < 100 (τ2/τ4 = 10),the semicircles are indistinguishable. In the green curve,however, since τ2/τ4 = 100, the two semicircles are dis-tinguishable.
In porous electrodes soaked with electrolyte (which isthe case in Li-ion cells) due to inhomogeneity of the sur-face and pores distribution, it is unusual to see individualsemicircles resolved for each process (48), rather, a con-volution of semicircles is more often perceived. in orderto understand, analyse and extract parameters from this
A comparison between aqueous and organic electrolytes for lithium-ion batteries 14
Figure 8: Nyquist plot for different equivalent circuitmodel, where the influence of parameters in the shape ofthe semi-circles come depicted.
Table I: Parameters used in equivalent circuit modeldepicted in Figure 8.
Parameter Value UnitR1 5 Ω
R2 = R3 = R4 15 ΩCPE2 2 · 10−5 s/Ω or FCPE3 2 · 10−3 s/Ω or FCPE4 2 · 10−4 s/Ω or F
α2 = α3 = α4 0.9 -W 1 Ω · s−2
τ2 3333 sτ3 33 sτ4 333 s
kind of curves, the fitting of the data with an equivalentcircuit is normally done. For Li-ion cells, several mod-els have been proposed in literature (e.g. tranmission-line,RC modules in series, nested circuits, Voigt equivalent cir-cuits, Maxwell equivalent circuits, etc.) (54). The correctapplication of a equivalent circuit model will depend onthe physicochemical configuration of the system and con-ditions in which the PEIS data was obtained.
Although the more time constants a system have,the more convoluted the semi-circles might appear ina Nyquist plot, two very distinct characteristics remaindistinguishable in most Li-ion impedance plots: (1) the
ohmic resistance due to electronic and ionic resistances(of the electrode materials and bulk electrolyte, respec-tively) as the first x-axis value and (2) a ”tail” related todiffusion processes taking place at lower frequencies (ei-ther solid-state diffusion or in the liquid electrolyte).
Intermittent Current Interruption (ICI)
In this method, GC is applied, but the current is inter-rupted in intervals (every 5 minutes, for example) and in-terrupted for short periods of time (10 seconds). When atrest, the system returns to OCV and the evolution of cellvoltage is recorded by the testing equipment. The voltageresponse of the system during the rest at OCV will evolvedepending on the cell resistances and their time scales.The change in voltage is divided by the applied currentto calculate resistances due to different processes withinthe cell. For commercial cells, the observable trends involtage responses can be asigned to: (1) milliseconds af-ter the interruption, the voltage response is dictated by re-sistances related to ionic conductivity of the electrolyte,electronic resistance of the electrodes and current collec-tors, (2) around 1 second after the interruption, the volt-age response will be dictated by charge transfer resistancesand (3) from 1 second and beyond, the voltage will evolvelinearly with the square root of time reflecting the resis-tances due to ionic diffusion in the cell, either in the solidor in the liquid (55,56). Reality in research, however, is thatcell set-up and limitations of the testing equipment oftenrender processes (1) and (2) impossible to be resolved dur-ing the ICI rest step, because of their small characteristictimes.
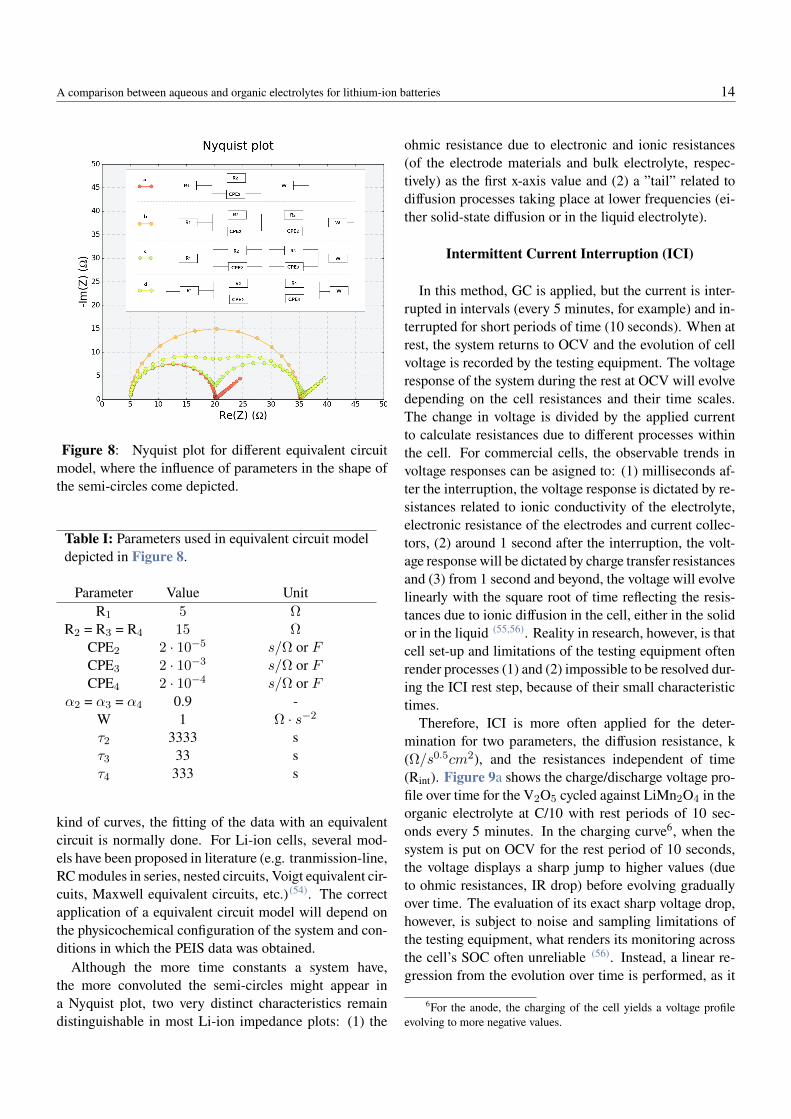
Therefore, ICI is more often applied for the deter-mination for two parameters, the diffusion resistance, k(Ω/s0.5cm2), and the resistances independent of time(Rint). Figure 9a shows the charge/discharge voltage pro-file over time for the V2O5 cycled against LiMn2O4 in theorganic electrolyte at C/10 with rest periods of 10 sec-onds every 5 minutes. In the charging curve6, when thesystem is put on OCV for the rest period of 10 seconds,the voltage displays a sharp jump to higher values (dueto ohmic resistances, IR drop) before evolving graduallyover time. The evaluation of its exact sharp voltage drop,however, is subject to noise and sampling limitations ofthe testing equipment, what renders its monitoring acrossthe cell’s SOC often unreliable (56). Instead, a linear re-gression from the evolution over time is performed, as it
6For the anode, the charging of the cell yields a voltage profileevolving to more negative values.
A comparison between aqueous and organic electrolytes for lithium-ion batteries 15
(a)
(b)
Figure 9: (a) Zoom on ICI step for the charging of the V2O5
anode at C/10 around the 20% SOC mark of the 4th cycle, wherethe rest step can be seen in detail, (b) an example of the linearregression of the part where voltage evolves linearly with thesquare root of time is depicted and the intercept with the y-axishighlighted, where Rint is evaluated.
can be seen on Figure 9b, where the same potential evo-lution come represented over the square root of time forthe duration of the rest period.
A clear linear trend is observed, which is adjusted to theequation of a line ax+b and the intercept with the y-axisis calculated. The intercept value is key to a more reliablemonitoring of IR drop related resistance Rint, which is thencalculated according to:
Rint−−−(V0−Vreg)
I(10)
Where U0 is the last voltage recorded when current isapplied, before the rest period, and Ureg is the voltage cal-
culated from the linear regression at t = 0. The diffusionresistance k is calculated with the slope of the part of thecurve that evolves linearly with the square root of time ac-cording to:
k−−−1
I
dU
dt1/2(11)
5 Scope of the thesis
Several approaches to enlarge the ESW of aqueous elec-trolytes have been explored in recent years. These solutionwere developed by engineering cation solvation sheaths(e.g. by reducing the number of water molecules in itor employment of co-solvents). These modifications evenenabled the formation of an artificial SEI in anode inter-faces with aqueous electrolyte, which was deemeed im-possible until less than a decade ago. The current solu-tion to water’s electrochemical instability, however, comewith inherent challenges regarding electrolyte viscosityand projected material costs of assembled batteries. Onthe other side, the state-of-the art organic electrolytes wereenabled by the architecture and material adaptations thataided rate limitations steps both on intercalation materi-als as in the electrolyte. These adaptations, however, stillshow important demerits, such as limited power and en-ergy density for some applications and the abuse of inertmaterials (conductivity enhancers, additives and interfaceformation precursors). These added materials add higherdegrees of complexity to the already prone to unexpectedelectrochemical phenomena system that is a Li-ion cell.The aim of this work is to elucidate the differences be-tween both electrolytes and how their characteristics affectcell operation. This aim will be reached by maintainingthe same salt in both solvents as well as same lithium con-centration. The cells performances will then be assessedspecially regarding their performance at higher rates ofdis-/charge. The different overpotentials attributed to pro-cesses within the electrolyte will be measured with differ-ent techniques and their origins discussed. Different elec-trode thicknesses will also be probed to confirm the pa-rameter’s role on improving transport in the organic elec-trolyte.
6 Materials and Methods
Electrode preparation – Cathodes were prepared fromLiMn2O4 powder (LMO, Sedema), polyvinylene difluo-ride (PVdF HSV 900, KYNAR), and carbon black (Su-
A comparison between aqueous and organic electrolytes for lithium-ion batteries 16
per C65, C-NERGY). The powders were mixed in amass ratio of 85:5:10 (LMO:PVdF:carbon black) and dis-solved in NMP (N-methyl pyrrolidone, anhydrous, Sigma-Aldrich) followed by one mixing step with a planetarymixer (Retsch MM 400) for 1 hour. The final ink hada solid content of 30% and was coated on a graphitesheet (SIGRAFLEX, ∼152 µm) on a wet film thicknessof ∼200 µm with a doctor blade coating device (ZUA2000.80, ZEHNTNER). The resulting loading of the elec-trodes was ∼3.85 mgLMO/cm2
Electrode, corresponding to∼0.57 mAh/cm2
Electrode based on a theoretical capacity of140 mAh/gLMO. The cathodes had a 42 µm dry thickness.Thinner electrodes were coated with the same procedure,but with an adjusted wet thickness of 80 µm, which re-sulted in 18 µm dry coatings. The higher thickness cath-odes will be regarded in Section 7 as ‘thick’ electrodesand the lower thickness ones as ‘thin’. The cathodes ofboth thicknesses were punched out with a diameter of 15mm and had a porosity of ∼75%. Anodes were preparedfrom V2O5 powder (VO, Strem Chemicals), PVdF andcarbon black with a mass ratio of 85:8:7 (VO:PVdF:car-bon black), dissolved in NMP and mixed in an identicalway as the cathodes. The ink had a solid content of 30%and was coated on a graphite sheet on a wet film thicknessof ∼150 µm with a doctor blade. The electrodes werepunched out with a diameter of 12 mm and had a poros-ity of ∼75%. The final loading of the anodes was ∼2.44mgVO/cm2
Electrode corresponding to ∼0.37 mAh/cm2Electrode
based on a theoretical capacity of 150 mAh/gVO (for anoperating potential between 3.9-2.8 V vs. Li+/Li). Theanodes had a 35 μm dry thickness. Thinner electrodeswere coated with the same procedure, but with an adjustedthickness of 80 µm, which resulted in 28 µm dry coatings.The higher thickness anodes will be regarded in the resultssection as ‘thick’ electrodes and the lower thickness onesas ‘thin’. The anodes of both thicknesses were punchedout with a diameter of 12 mm and had a porosity of∼75%.
Anode and cathode coatings were dried at room tem-perature overnight in a fume-hood. Electrodes based onLiFePO4 (producer) and TiS2 (producer) were preparedin the same way as for LMO and VO electrodes, respec-tively. For electrodes cycled in the organic electrolyte, anadditional vacuum drying step at 120 C for 12 hours wasperformed in a vacuum oven (Büchi, Switzerland) insidean argon filled glove box. The levels of O2 and H2O in theglove box were both < 1 ppm. For the electrodes employedin aqueous electrolyte cells, no drying step was performed.
Li1.5Mn2O4 was identified as a reference electrode ma-terial (57), and was synthesized according to the following
reaction:
4 LiMn2O4 + 2 LiI −−−− 4 Li1.5Mn2O4 + I2 (12)
Which was conducted by mixing 3.0 g of LMO with1.11 g of LiI in the vacuum oven at 120 C for 17 hours.The resulting product was washed with 200 mL of ace-tonitrile (Sigma Aldrich) in order to remove any remain-ing LiI. The powder was recuperated and dried in a vac-uum oven for 1 hour at 40 C. The Li1.5Mn2O4 (Li1.5MO)powder was then mixed with PVdF and carbon black witha mass ratio of 85:5:10 (Li1.5MO:PVdF:carbon black),dissolved in NMP and mixed in the planetary mixer for1 hour. The final ink had a solid content of ∼20% and2.5 cm wide stripes of graphite sheet were dip-coated inthe solution and dried in a fume-hood overnight. Thesestripes were cut in thinner rectangular electrodes in orderto be placed in the assembled three-electrode pouch cell(Figure 13).
Electrolyte preparation – The aqueous electrolyte wasprepared from commercial LiTFSI salt (lithium-bis(triflu-oromethanesulfonyl)imide 99%, Solvonic) kept in argonthat was previously dried in a Büchi oven at 120 C for12 hours. The appropriate amount of the salt of dried saltwas dissolved in ASTM type I water (18 MΩ, SPEX Cr-tiPrep) to obtain a 2 mol/L solution. Although the saltwas stored in an argon filled glovebox, it was weighted andtaken out thereof, and all subsequent procedures were per-formed in atmospheric conditions. The organic electrolytewas prepared from commercial LiTFSI salt in a solution ofethyl carbonate (EC, Sigma Aldrich) and diethyl carbon-ate (DEC, Sigma Aldrich). The solvents were previouslymixed in a mass ratio of 1:1 (EC:DEC) and then the ap-propriate amount of LiTFSI salt was dissolved to obtain a2 mol/L solution .All procedures of the organic electrolytesynthesis were done in an argon-filled glovebox.
Cell assembly – Pouch cells, three-electrode cells wereassembled with 20 x 15 cm dimensions (Skultuna Flex-ible) at the lab bench for the aqueous electrolyte and inan argon filled glove-box for the organic electrolyte. Anamount of 200 µL of electrolyte was employed by wet-ting two glass fiber separators (Whatman) of 18 mm ofdiameter with 100 µL of solution on each. The layout of athree-electrode pouch cell can be seen on Figure 13. Thehalf-cell measurements were performed in a designed cellacquired from Paul Scherrer Institute, (PSI cell) that is de-picted in the appendix (A1).
Galvanostatic cycling - The full cells were cycled be-tween 0 and 1 V cell voltage. In the following plots, when
A comparison between aqueous and organic electrolytes for lithium-ion batteries 17
the heading refers to Li-metal, the cell voltages are ex-tracted as is and referred to Li/Li+; when the headingsrefer to full cells but show y-axis in potentials vs Li/Li+,a conversion of potentials was done from the employedreference (Li1.5MO, 2.96 and ∼3.36 V vs Li/Li+ in or-ganic and aqueous, respectively). The graphs where they-axis refers to voltage, cell-voltages are depicted. For thefull cells, the current densities were calculated based onthe mass of the anode active material, 1C was defined as239 mAh/g for Ti2S according to its theoretical specificcapacity and of 145 mAh/g for V2O5 for the 2.8 - 3.9 Vvs. Li/Li+ potential window. For the half-cells employedto validate the cathode materials, 1C was defined at 145mAh/g for LFP and of 145 for LiMn2O4. All galvanostaticcycling measurements were performed at room tempera-ture, with pouch and PSI cells on an Astrol potentiostat(BatSmall, Astrol Electronic AG).
Pre-lithiation of the reference electrode – after thecells were assembled, a pre lithiation step was done on thereference electrode. This was done in the already assem-bled cell before their electrochemical tests with a currentof 15.9 µA for 5 minutes.
Impedance spectroscopy measurements – theimpedance data were obtained on a three-electrode pouchcell. The measurement was done after one full cycle andon the 50% depth-of-discharge of the second discharge.The cells were cycled on the equipment used for galvano-static cycling and then the impedance measurement wasdone on a VMP3 potentiostat (Bio-logic). The impedancemeasurements were recorded from 200 kHz until 2 mHz,with an amplitude of 15 mV and in a clean room set at22.5 C. The resistance values were normalized by eachelectrode geometrical area (πr2).
Intermittent current interruption measurements – Acurrent of C/10 calculated based on the active mass of theanode, as in the galvanostatic cycling, was applied for thedis-/charge of the cells. Intervals of 10 s every 5 minuteswere applied. The measurements were done at room tem-perature in a MPG-2 potentiostat (Bio-logic). The linearregression was calculated for the time resolution range of0.1 to 1 second and the values were normalized by eachelectrode geometrical area (πr2).
Rate tests – The rate tests were conducted by and As-trol potentiostat at room temperature. The cells were sub-sequently cycled at C/4, C/2, C, 2C, 5C, 10C, 20C and50C each for 3 cycles. The power and energy were calcu-lated with Equations 3 and 4 with nominal voltage of 1 Vand mass of the anode active material of the V2O5 anode.For the Ragone plot, the discharge capacity of the second
cycle at each C-rate was taken.Viscosity, ionic conductivity and density measure-
ments – the viscosity of each electrolyte was measuredby a viscosimeter (DMA 4100 M, Anton Paar). The ionicconductivity measurement was measured by a cond meter(Mettler Toledo, Switzerland). The density was estimatedby weighing a known volume of electrolyte measured bya micro-pipette.
7 Results and discussion
Electrolytes properties
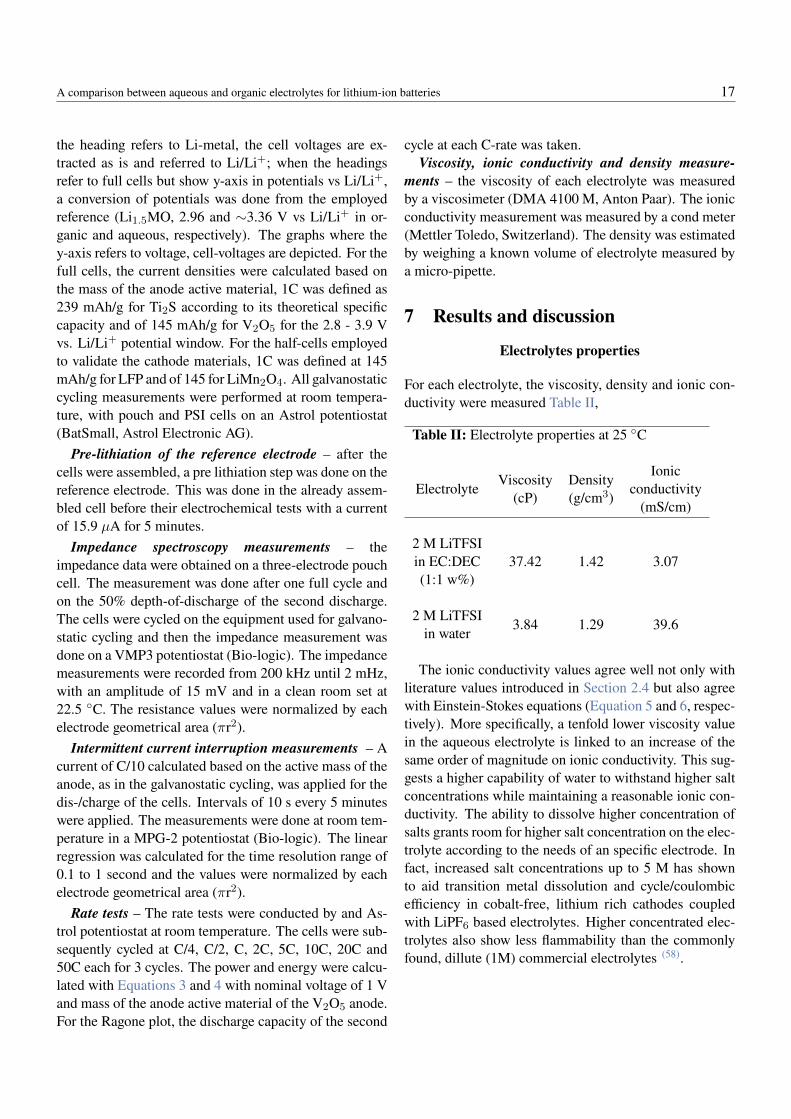
For each electrolyte, the viscosity, density and ionic con-ductivity were measured Table II,
Table II: Electrolyte properties at 25 C
Electrolyte Viscosity(cP)
Density(g/cm3)
Ionicconductivity
(mS/cm)
2 M LiTFSIin EC:DEC(1:1 w%)
37.42 1.42 3.07
2 M LiTFSIin water 3.84 1.29 39.6
The ionic conductivity values agree well not only withliterature values introduced in Section 2.4 but also agreewith Einstein-Stokes equations (Equation 5 and 6, respec-tively). More specifically, a tenfold lower viscosity valuein the aqueous electrolyte is linked to an increase of thesame order of magnitude on ionic conductivity. This sug-gests a higher capability of water to withstand higher saltconcentrations while maintaining a reasonable ionic con-ductivity. The ability to dissolve higher concentration ofsalts grants room for higher salt concentration on the elec-trolyte according to the needs of an specific electrode. Infact, increased salt concentrations up to 5 M has shownto aid transition metal dissolution and cycle/coulombicefficiency in cobalt-free, lithium rich cathodes coupledwith LiPF6 based electrolytes. Higher concentrated elec-trolytes also show less flammability than the commonlyfound, dillute (1M) commercial electrolytes (58).
A comparison between aqueous and organic electrolytes for lithium-ion batteries 18
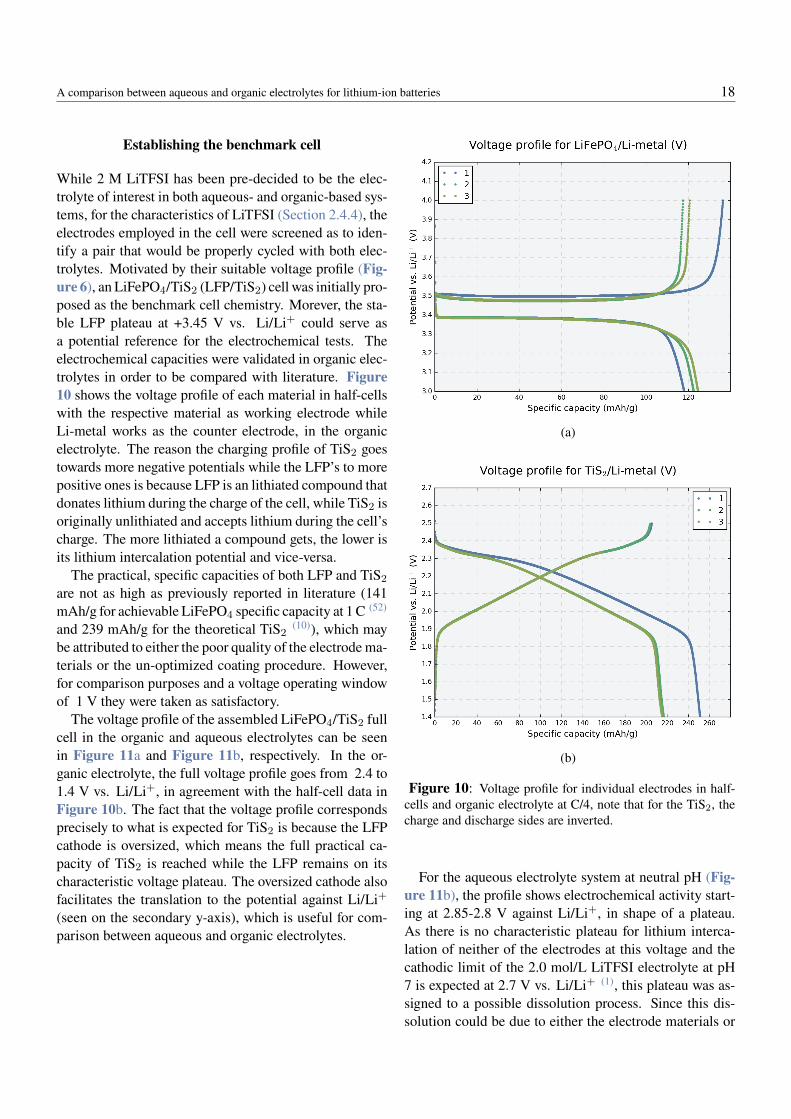
Establishing the benchmark cell
While 2 M LiTFSI has been pre-decided to be the elec-trolyte of interest in both aqueous- and organic-based sys-tems, for the characteristics of LiTFSI (Section 2.4.4), theelectrodes employed in the cell were screened as to iden-tify a pair that would be properly cycled with both elec-trolytes. Motivated by their suitable voltage profile (Fig-ure 6), an LiFePO4/TiS2 (LFP/TiS2) cell was initially pro-posed as the benchmark cell chemistry. Morever, the sta-ble LFP plateau at +3.45 V vs. Li/Li+ could serve asa potential reference for the electrochemical tests. Theelectrochemical capacities were validated in organic elec-trolytes in order to be compared with literature. Figure10 shows the voltage profile of each material in half-cellswith the respective material as working electrode whileLi-metal works as the counter electrode, in the organicelectrolyte. The reason the charging profile of TiS2 goestowards more negative potentials while the LFP’s to morepositive ones is because LFP is an lithiated compound thatdonates lithium during the charge of the cell, while TiS2 isoriginally unlithiated and accepts lithium during the cell’scharge. The more lithiated a compound gets, the lower isits lithium intercalation potential and vice-versa.
The practical, specific capacities of both LFP and TiS2
are not as high as previously reported in literature (141mAh/g for achievable LiFePO4 specific capacity at 1 C (52)
and 239 mAh/g for the theoretical TiS2(10)), which may
be attributed to either the poor quality of the electrode ma-terials or the un-optimized coating procedure. However,for comparison purposes and a voltage operating windowof 1 V they were taken as satisfactory.
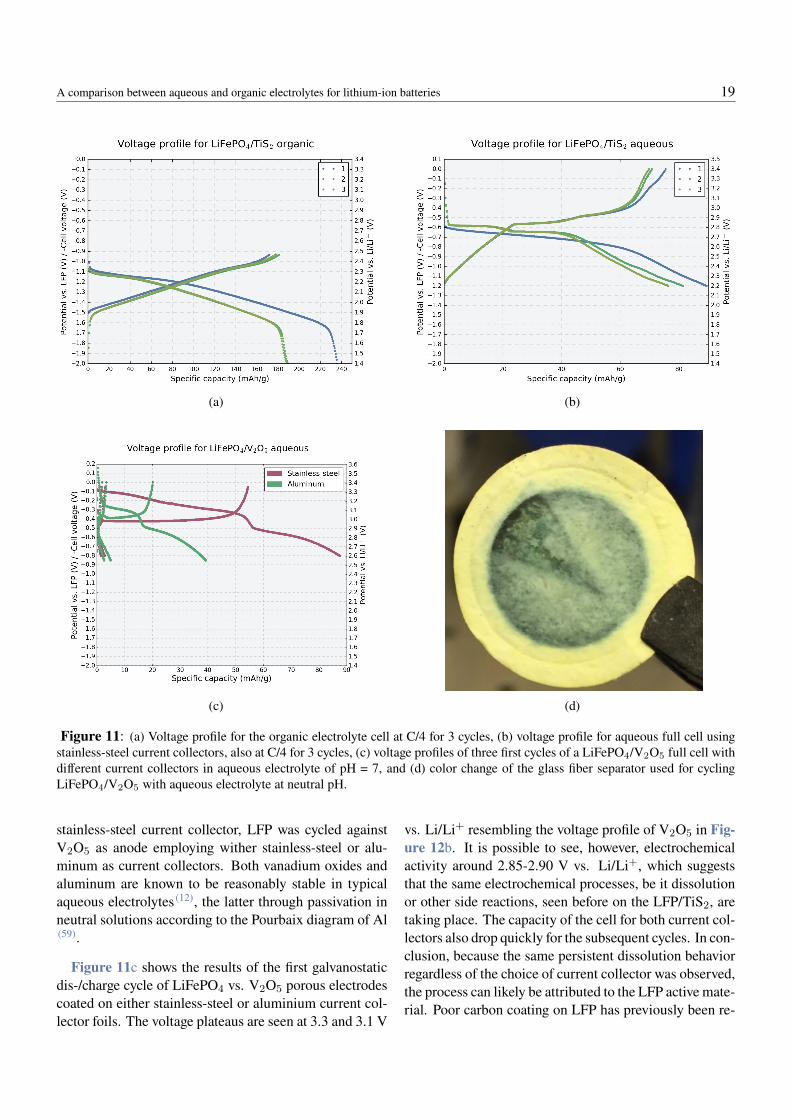
The voltage profile of the assembled LiFePO4/TiS2 fullcell in the organic and aqueous electrolytes can be seenin Figure 11a and Figure 11b, respectively. In the or-ganic electrolyte, the full voltage profile goes from 2.4 to1.4 V vs. Li/Li+, in agreement with the half-cell data inFigure 10b. The fact that the voltage profile correspondsprecisely to what is expected for TiS2 is because the LFPcathode is oversized, which means the full practical ca-pacity of TiS2 is reached while the LFP remains on itscharacteristic voltage plateau. The oversized cathode alsofacilitates the translation to the potential against Li/Li+(seen on the secondary y-axis), which is useful for com-parison between aqueous and organic electrolytes.
(a)
(b)
Figure 10: Voltage profile for individual electrodes in half-cells and organic electrolyte at C/4, note that for the TiS2, thecharge and discharge sides are inverted.
For the aqueous electrolyte system at neutral pH (Fig-ure 11b), the profile shows electrochemical activity start-ing at 2.85-2.8 V against Li/Li+, in shape of a plateau.As there is no characteristic plateau for lithium interca-lation of neither of the electrodes at this voltage and thecathodic limit of the 2.0 mol/L LiTFSI electrolyte at pH7 is expected at 2.7 V vs. Li/Li+ (1), this plateau was as-signed to a possible dissolution process. Since this dis-solution could be due to either the electrode materials or
A comparison between aqueous and organic electrolytes for lithium-ion batteries 19
(a) (b)
(c) (d)
Figure 11: (a) Voltage profile for the organic electrolyte cell at C/4 for 3 cycles, (b) voltage profile for aqueous full cell usingstainless-steel current collectors, also at C/4 for 3 cycles, (c) voltage profiles of three first cycles of a LiFePO4/V2O5 full cell withdifferent current collectors in aqueous electrolyte of pH = 7, and (d) color change of the glass fiber separator used for cyclingLiFePO4/V2O5 with aqueous electrolyte at neutral pH.
stainless-steel current collector, LFP was cycled againstV2O5 as anode employing wither stainless-steel or alu-minum as current collectors. Both vanadium oxides andaluminum are known to be reasonably stable in typicalaqueous electrolytes (12), the latter through passivation inneutral solutions according to the Pourbaix diagram of Al(59).
Figure 11c shows the results of the first galvanostaticdis-/charge cycle of LiFePO4 vs. V2O5 porous electrodescoated on either stainless-steel or aluminium current col-lector foils. The voltage plateaus are seen at 3.3 and 3.1 V
vs. Li/Li+ resembling the voltage profile of V2O5 in Fig-ure 12b. It is possible to see, however, electrochemicalactivity around 2.85-2.90 V vs. Li/Li+, which suggeststhat the same electrochemical processes, be it dissolutionor other side reactions, seen before on the LFP/TiS2, aretaking place. The capacity of the cell for both current col-lectors also drop quickly for the subsequent cycles. In con-clusion, because the same persistent dissolution behaviorregardless of the choice of current collector was observed,the process can likely be attributed to the LFP active mate-rial. Poor carbon coating on LFP has previously been re-
A comparison between aqueous and organic electrolytes for lithium-ion batteries 20
(a) (b)
(c) (d)
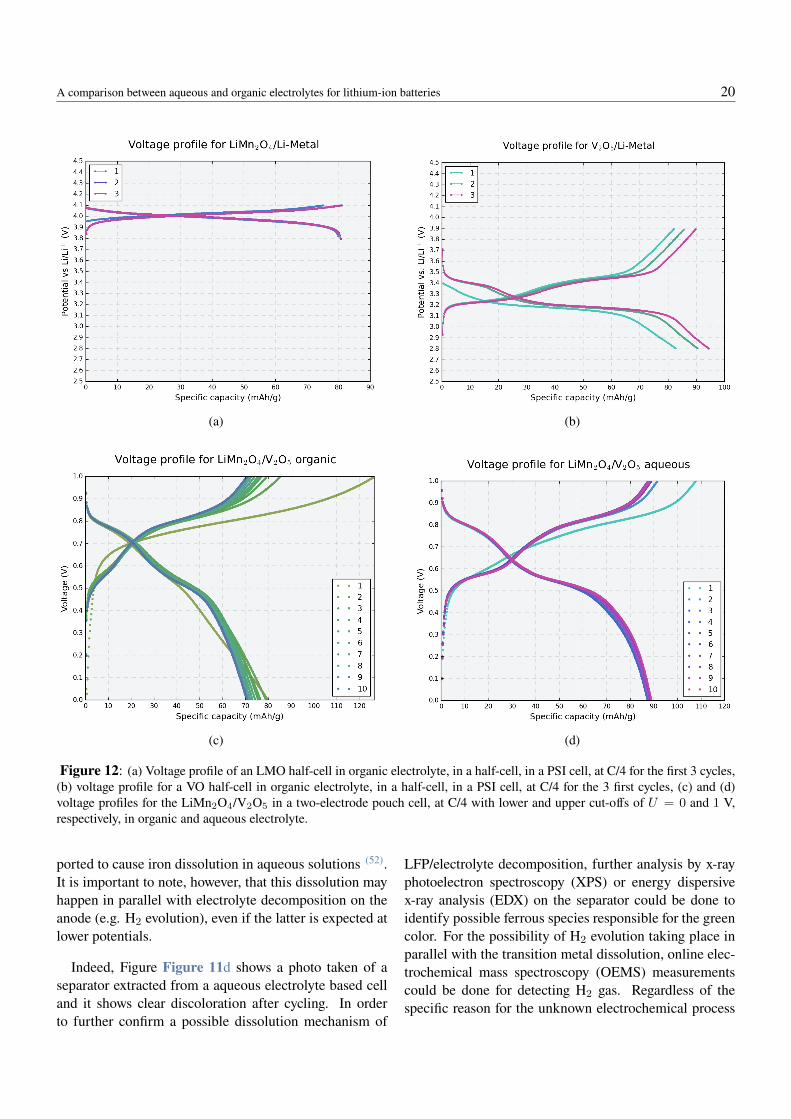
Figure 12: (a) Voltage profile of an LMO half-cell in organic electrolyte, in a half-cell, in a PSI cell, at C/4 for the first 3 cycles,(b) voltage profile for a VO half-cell in organic electrolyte, in a half-cell, in a PSI cell, at C/4 for the 3 first cycles, (c) and (d)voltage profiles for the LiMn2O4/V2O5 in a two-electrode pouch cell, at C/4 with lower and upper cut-offs of U = 0 and 1 V,respectively, in organic and aqueous electrolyte.
ported to cause iron dissolution in aqueous solutions (52).It is important to note, however, that this dissolution mayhappen in parallel with electrolyte decomposition on theanode (e.g. H2 evolution), even if the latter is expected atlower potentials.
Indeed, Figure Figure 11d shows a photo taken of aseparator extracted from a aqueous electrolyte based celland it shows clear discoloration after cycling. In orderto further confirm a possible dissolution mechanism of
LFP/electrolyte decomposition, further analysis by x-rayphotoelectron spectroscopy (XPS) or energy dispersivex-ray analysis (EDX) on the separator could be done toidentify possible ferrous species responsible for the greencolor. For the possibility of H2 evolution taking place inparallel with the transition metal dissolution, online elec-trochemical mass spectroscopy (OEMS) measurementscould be done for detecting H2 gas. Regardless of thespecific reason for the unknown electrochemical process
A comparison between aqueous and organic electrolytes for lithium-ion batteries 21
happening with the LiFePO4/TiS2 and LiFePO4/V2O5
full cells, the voltage profile of the assembled cells weredeemed unsuitable for the cycling of a 1 V aqueous elec-trolyte cell, as it shows dominance of side reactions andirreversibility.
By looking at the operating potentials of common elec-trodes against the ESW of pure water at neutral pH (Fig-ure 6), the LiMn2O4/V2O5 (LMO/VO) cell chemistrywas then proposed. Both electrodes were, in this case,coated on graphitic current collectors which were em-ployed because of their resistivity against corrosion. Li-ion cells were assembled and first cycled in the organicelectrolyte for validation with literature (Figure 12a andFigure 12b). In these two figures, the voltage profilesof the first three cycles for both materials were depictedfrom a half-cell obtained with a C-rate of C/4. The practi-cal specific capacity of LMO is lower than expected fromprevious reports (110 mAh/g at 4.5 C according to (60))mainly because only its first plateau (at 4.0 V vs Li/Li+)is assessed, while the second plateau (at 4.1 V vs Li/Li+(57)) is not utilized. For the VO, within the voltage win-dow used in the test, about 145 mAh/g has previouslybeen reported in literature (61), which means the coatedelectrodes achieved about ∼70% of the expected practicalspecific capacity, likely because of the un-optimized elec-trode preparation process employed in this thesis work, orthe poor quality of the raw active material.
The voltage profile of the VO agrees well with previousobservations, the plateaus being located around 3.4 and3.2 V vs. Li/Li+. Figure 12c and Figure 12d show theresults of the first ten galvanostatic dis-/charge cycles ofLiMn2O4 vs. V2O5 porous electrodes coated on graphitefoils, for a C-rate of C/4. Although the voltage profiles fororganic and aqueous electrolytes are essentially similar,clear dissimilarities are observed: (1) the plateau around0.5 V is shorter in the organic cell, what also causes alower specific capacity, and (2) there is a faster capacityfade in the organic electrolyte.
The shorter plateaus points to higher over-potentials,which limits the achievable capacity. The capacity fadeleaves the cell at the 10th cycle with 88.3% of its first-cycle discharge capacity while the aqueous system stillholds 98.8% of its first-cycle discharge capacity. In or-der to better assess the origin of the observed differences,a three-electrode-cell incorporating a Li1.5Mn2O4 refer-ence electrode was developed. This material selected be-cause of its characteristic plateau at 2.96 V vs. Li/Li+(57) that can serve as a reference for assessing the polar-ization behavior of each electrode during operation. Fig-
ure 13 shows various takes of the three-electrode-cell de-velopment, from the coating of the reference electrode tocell assembly as well as a schematic of how the elementswere placed in the cell. For validation of the synthesizedreference Li1.5Mn2O4 material, a half-cell was assembledagainst lithium metal. The potential of the synthesizedLi1.5Mn2O4 was of 3.04 V vs Li/Li+. Since this mate-rial’s voltage should be at 2.96 V vs. Li/Li+, the lithiationwas further completed electrochemically and the final po-tential of 2.96 V vs. Li/Li+ obtained. Figure 14 showsthe voltage profile for the first 8 cycles of the individualelectrodes in the aqueous and organic electrolyte cells, atC/4 facilitated by the three-electrode set-up, with lowerand upper cut-offs at U = 0 and 1 V, respectively.
In the organic electrolyte, the voltages of the electrodesare similar to the data obtained in half-cells for each elec-trode, despite an added overpotential that result in theslight shift of LMO plateau towards 3.9 V and VO plateausto just under 3.4 and 3.2 V. This added overpotential couldbe due to a shift in the referece electrode potential, that de-pends on the lithium activity in the electrolyte accordingto Nernst equation. The overall shape of the curve as wellas the achievable capacities are comparable to the half-cell data (Figure 12), therefore the reference electrode wasdeemed as suitable for the organic system since the LMOand VO potential profiles appear as expected. In the aque-ous electrolyte case, the reference electrode showed a be-havior less than ideal: (1) the potential profiles of the in-dividual electrodes are shifted to lower values and (2) theLMO voltage profile has a wider voltage range. The poten-tial shift of ∼0.4 V cannot be attributed to the positive ornegative electrodes, since LMO and vanadium oxides havesimilarly reported electrochemical potentials in water as inorganic electrolytes (12,62). Besides, the same shift occursfor both electrodes equally, as the full cell data is nearlyidentical for both systems. It is then concluded that the ref-erence electrode exhibits a drift in the aqueous electrolyteof ∼+0.4 V, the exact value varying ±50 mV on differentassembled cells. This shift can be attributed to a possi-ble redox pair of electrode active materials with the OH−
and H+ present in the aqueous environment and their af-fect on Li+ activity. These would change the potentialof the electrodes according to Nernst equation. A similarphenomenon has been reported in literature for aqueousLiTFSI electrolytes with different concentrations, wherea potential drift was observed according to Li+ activity(53).
A comparison between aqueous and organic electrolytes for lithium-ion batteries 22
(a) (b)
(c) (d)
Figure 13: (a) Pouch cell with graphite current collectors and reference electrode, (b) 2.5 cm wide graphite sheet strip dip coatedin reference slurry, (c) schematics of the final cell design, cathode (φ = 15 mm), separators (φ = 18 mm) and anode (φ = 12 mm),(d) The same cell with the first separator placed between the LMO cathode and the reference.
Electrochemical characterization
Based on the poorer cyclability of the Li-ion cells withthe organic electrolyte (lower capacity and higher capacityfade) and the discussed physicochemical differences ob-served between organic and aqueous electrolyte systems(Section 2.4), it was then hypothesized that the origin ofthe organic system limitations is partly due to its slug-gish ionic transport. If this hypothesis holds, the possi-ble manufacturing of thinner electrodes could potentiallybring the specific energy and specific power of the organicsystem closer to that of the aqueous, the rationale beingthat Li+ transport will be less hindered by a thinner elec-trode. The hypothesis was tested by establishing a Ragoneplot to compare electrodes of different thicknesses in bothelectrolytes (Figure 15).
A clear difference in the evolution of power at the detri-ment of energy can be seen by comparing the performanceof thick electrodes in aqueous and organic systems. Forthe organic, the cells could not be cycled much over the
1500 W/Kg mark (3.2 in the y(log)-axis), and showedswelling of the pouch cell and short-circuiting at powersequivalent to C-rates over 10 C. For the aqueous system,the thick electrode showed much smaller loss of energywhen more power was extracted from the cell, reachingC-rates of 50 C. For the thin electrodes, the behaviors ofthe two systems are much more similar between each otherthan in the comparison for thick electrodes. The organicelectrolyte, when employed in thinner electrodes, reach50C (over 7000 W/Kg, 3.8 in the y(log)-axis), which sug-gest that it has benefited from thinner electrodes. Also, thespecific energy in the lower power zone for the thin elec-trode with organic electrolyte have increased to the levelof the aqueous (thin and thick), pointing to lower inter-nal resistances. This improvement of performance in thinelectrodes points to two reasons for the inferior cyclabilityof the thick electrode organic system: (1) mass transportof the electrolyte, and (2) the build-up of inhomogeneouselectrode reactions. Regarding the aqueous electrolyte, a
A comparison between aqueous and organic electrolytes for lithium-ion batteries 23
(a) (b)
Figure 14: (a) Individual voltage profiles for the positive and negative electrodes in an organic three-electrodes-cell withLi1.5Mn2O4 pre-lithiated as reference (2.96 V vs. Li+/Li), and (b) the voltage profiles for each electrode in the same cell de-sign but with the aqueous electrolyte; the transparent curves are the voltage profiles when the drift is not considered (reference at2.96 V vs. Li/Li+), the solid lines were obtained with a reference at 3.38 V vs. Li/Li+, corresponding to a + 0.42 V drift from thevalue in organic electrolyte.
Figure 15: Ragone plots for organic and aqueous sys-tems of different electrode thicknesses. Each point of thecurve of each system corresponds to the C-rates: C/4, C/2,1C, 2C, 5C, 10C, 20C, 50C. Note that the thin aqueous ismissing the C/4 point for a data acquisition problem.
nearly identical behavior is seen for both the thin and thickelectrodes, the difference being attributed to the differencein batches of coated electrodes.
To better understand the origin of the overpotentialsthat results in inferior performance of the thick electrodein organic system, as compared to that in the aqueous sys-tem, hysteresis curves were examined. In Figure 16 andFigure 17 the hysteresis curves facilitate the evaluationof overpotentials in certain SOC. The overpotentials arevisibly higher in the organic electrolyte cell, especially athigher C-rates (Figure 17). The nature of the overpoten-tials can be attributed partially to a higher IR drop, whichcan be seen as higher in the organic system by comparingthe voltage at 100% SOC during charge and discharge Fig-ure 16a. This larger IR overpotential can be assigned to alower conductivity of the electrolyte. The IR drop, how-ever, does not account for all the overpotential, since thedifference in voltages in charge and discharge for 100%SOC is not as big as the overpotentials at, for instance,25% SOC in Figure 16a. In fact, the higher overpotentialvalues in the zones of voltage profile with intense chargetransfer reactions such as the 0.5 V plateau points to possi-bly higher charge transfer/diffusion resistance overpoten-tials in the organic system.
An interesting characteristic of the hysteresis curve inorganic (Figure 17a) is the gradual increase on overpo-tentials with higher C-rates preferably on discharge, whilethe charge curve stays reasonably similar. Another featureis that the organic system shows a much more linear vari-
A comparison between aqueous and organic electrolytes for lithium-ion batteries 24
(a)
(b)
Figure 16: Hysteresis curves for organic and aqueous elec-trolyte cells, at C/4, overpotentials referred to 10th cycle, The100% state-of-charge is referred to the discharge capacity ofeach cycle
ation of voltage at the 0-20% SOC. On the aqueous elec-trolyte case, the interval starts with a nicely curved voltageresponse but evolves to an also linear one. The evolutionof the aqueous response in this interval to a linear behav-ior suggests that it grows higher according to concentra-tion polarization resistances induced by higher rates. Onthe organic case, hence, the concentration polarization re-sistances would already be high to cause a linear voltageresponse.
(a)
(b)
Figure 17: Hysteresis curves for organic and aqueous elec-trolyte cells, at different rates of discharge, normalized for thestate of charge, the 100% state-of-charge is referred to the dis-charge capacity of each C-rate.
In order to monitor the evolution of resistances over thewhole dis-/charging curve of the cells, as well as to com-pare diffusion resistances (k), ICI test was performed forboth systems. Because the LMO cathode is oversized, itis considered as the counter electrode (CE), hence the ICItest is only depicted for the VO (WE), following the ratio-nale explained under Section 5. The results come depictedin Figure 18, where both the electrode internal resistanceRint and the diffusion parameter k are represented. Thenegative extremes of the Rint data shall be disregarded, as
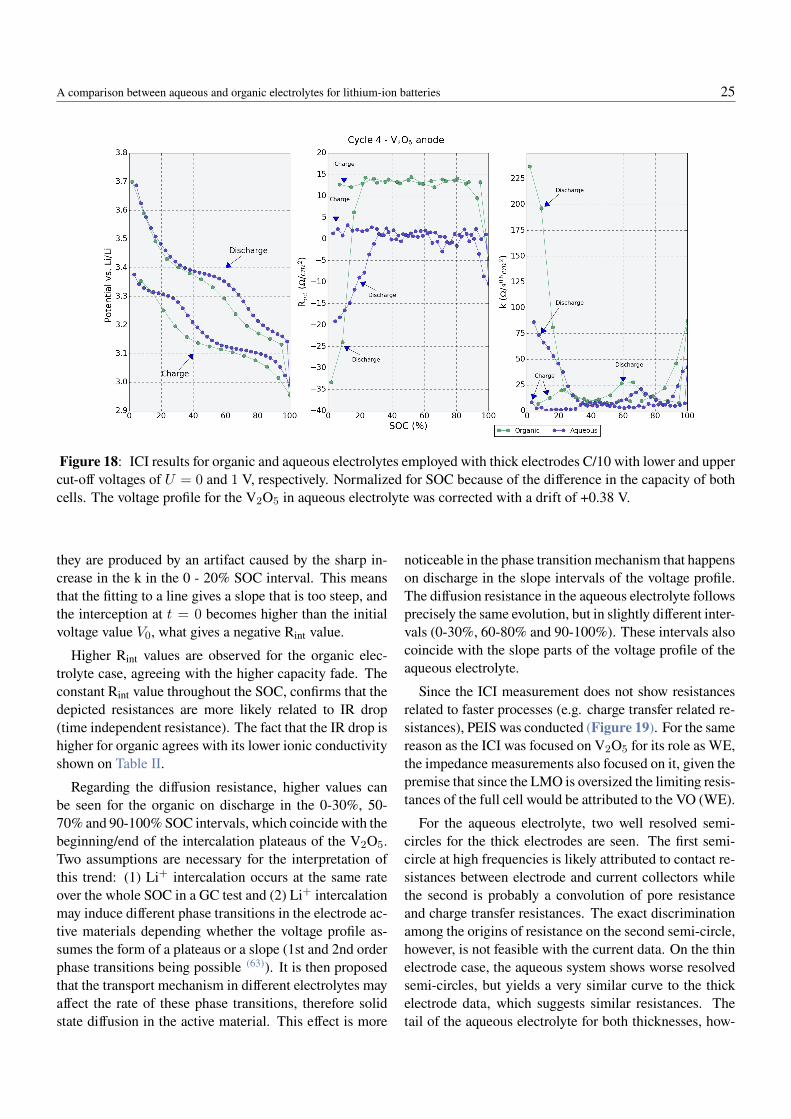
A comparison between aqueous and organic electrolytes for lithium-ion batteries 25
Figure 18: ICI results for organic and aqueous electrolytes employed with thick electrodes C/10 with lower and uppercut-off voltages of U = 0 and 1 V, respectively. Normalized for SOC because of the difference in the capacity of bothcells. The voltage profile for the V2O5 in aqueous electrolyte was corrected with a drift of +0.38 V.
they are produced by an artifact caused by the sharp in-crease in the k in the 0 - 20% SOC interval. This meansthat the fitting to a line gives a slope that is too steep, andthe interception at t = 0 becomes higher than the initialvoltage value V0, what gives a negative Rint value.
Higher Rint values are observed for the organic elec-trolyte case, agreeing with the higher capacity fade. Theconstant Rint value throughout the SOC, confirms that thedepicted resistances are more likely related to IR drop(time independent resistance). The fact that the IR drop ishigher for organic agrees with its lower ionic conductivityshown on Table II.
Regarding the diffusion resistance, higher values canbe seen for the organic on discharge in the 0-30%, 50-70% and 90-100% SOC intervals, which coincide with thebeginning/end of the intercalation plateaus of the V2O5.Two assumptions are necessary for the interpretation ofthis trend: (1) Li+ intercalation occurs at the same rateover the whole SOC in a GC test and (2) Li+ intercalationmay induce different phase transitions in the electrode ac-tive materials depending whether the voltage profile as-sumes the form of a plateaus or a slope (1st and 2nd orderphase transitions being possible (63)). It is then proposedthat the transport mechanism in different electrolytes mayaffect the rate of these phase transitions, therefore solidstate diffusion in the active material. This effect is more
noticeable in the phase transition mechanism that happenson discharge in the slope intervals of the voltage profile.The diffusion resistance in the aqueous electrolyte followsprecisely the same evolution, but in slightly different inter-vals (0-30%, 60-80% and 90-100%). These intervals alsocoincide with the slope parts of the voltage profile of theaqueous electrolyte.
Since the ICI measurement does not show resistancesrelated to faster processes (e.g. charge transfer related re-sistances), PEIS was conducted (Figure 19). For the samereason as the ICI was focused on V2O5 for its role as WE,the impedance measurements also focused on it, given thepremise that since the LMO is oversized the limiting resis-tances of the full cell would be attributed to the VO (WE).
For the aqueous electrolyte, two well resolved semi-circles for the thick electrodes are seen. The first semi-circle at high frequencies is likely attributed to contact re-sistances between electrode and current collectors whilethe second is probably a convolution of pore resistanceand charge transfer resistances. The exact discriminationamong the origins of resistance on the second semi-circle,however, is not feasible with the current data. On the thinelectrode case, the aqueous system shows worse resolvedsemi-circles, but yields a very similar curve to the thickelectrode data, which suggests similar resistances. Thetail of the aqueous electrolyte for both thicknesses, how-
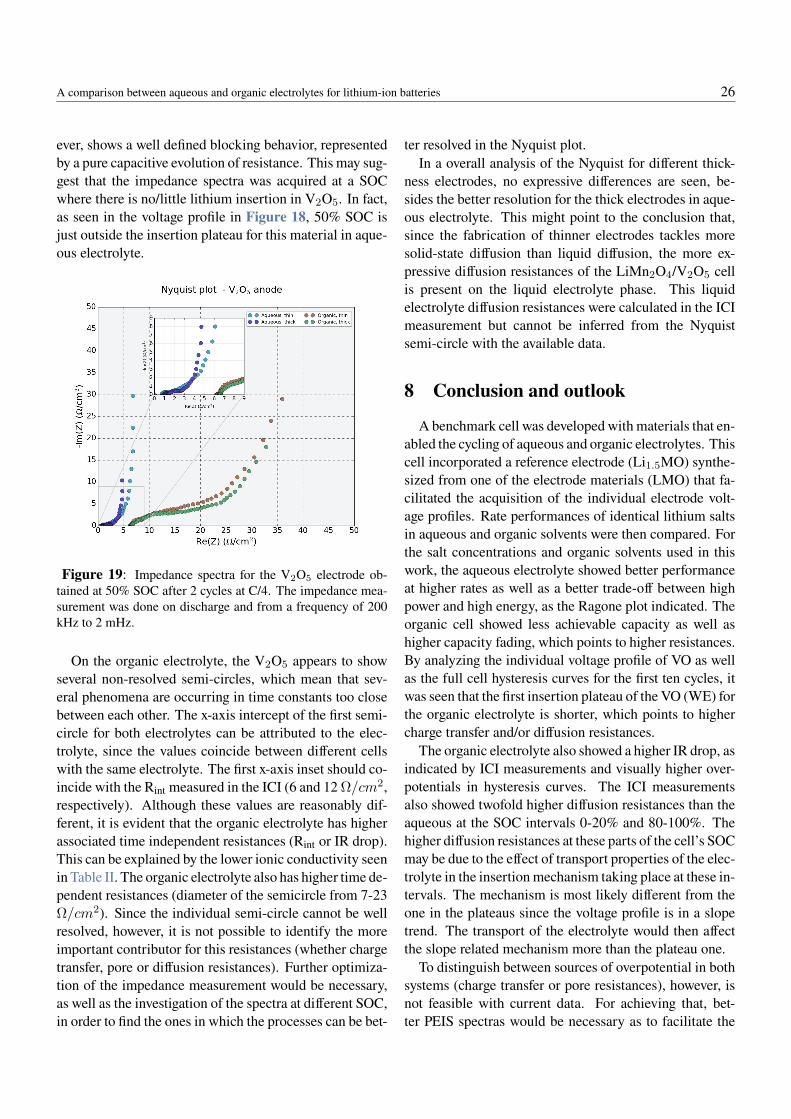
A comparison between aqueous and organic electrolytes for lithium-ion batteries 26
ever, shows a well defined blocking behavior, representedby a pure capacitive evolution of resistance. This may sug-gest that the impedance spectra was acquired at a SOCwhere there is no/little lithium insertion in V2O5. In fact,as seen in the voltage profile in Figure 18, 50% SOC isjust outside the insertion plateau for this material in aque-ous electrolyte.
Figure 19: Impedance spectra for the V2O5 electrode ob-tained at 50% SOC after 2 cycles at C/4. The impedance mea-surement was done on discharge and from a frequency of 200kHz to 2 mHz.
On the organic electrolyte, the V2O5 appears to showseveral non-resolved semi-circles, which mean that sev-eral phenomena are occurring in time constants too closebetween each other. The x-axis intercept of the first semi-circle for both electrolytes can be attributed to the elec-trolyte, since the values coincide between different cellswith the same electrolyte. The first x-axis inset should co-incide with the Rint measured in the ICI (6 and 12 Ω/cm2,respectively). Although these values are reasonably dif-ferent, it is evident that the organic electrolyte has higherassociated time independent resistances (Rint or IR drop).This can be explained by the lower ionic conductivity seenin Table II. The organic electrolyte also has higher time de-pendent resistances (diameter of the semicircle from 7-23Ω/cm2). Since the individual semi-circle cannot be wellresolved, however, it is not possible to identify the moreimportant contributor for this resistances (whether chargetransfer, pore or diffusion resistances). Further optimiza-tion of the impedance measurement would be necessary,as well as the investigation of the spectra at different SOC,in order to find the ones in which the processes can be bet-
ter resolved in the Nyquist plot.In a overall analysis of the Nyquist for different thick-
ness electrodes, no expressive differences are seen, be-sides the better resolution for the thick electrodes in aque-ous electrolyte. This might point to the conclusion that,since the fabrication of thinner electrodes tackles moresolid-state diffusion than liquid diffusion, the more ex-pressive diffusion resistances of the LiMn2O4/V2O5 cellis present on the liquid electrolyte phase. This liquidelectrolyte diffusion resistances were calculated in the ICImeasurement but cannot be inferred from the Nyquistsemi-circle with the available data.
8 Conclusion and outlook
A benchmark cell was developed with materials that en-abled the cycling of aqueous and organic electrolytes. Thiscell incorporated a reference electrode (Li1.5MO) synthe-sized from one of the electrode materials (LMO) that fa-cilitated the acquisition of the individual electrode volt-age profiles. Rate performances of identical lithium saltsin aqueous and organic solvents were then compared. Forthe salt concentrations and organic solvents used in thiswork, the aqueous electrolyte showed better performanceat higher rates as well as a better trade-off between highpower and high energy, as the Ragone plot indicated. Theorganic cell showed less achievable capacity as well ashigher capacity fading, which points to higher resistances.By analyzing the individual voltage profile of VO as wellas the full cell hysteresis curves for the first ten cycles, itwas seen that the first insertion plateau of the VO (WE) forthe organic electrolyte is shorter, which points to highercharge transfer and/or diffusion resistances.
The organic electrolyte also showed a higher IR drop, asindicated by ICI measurements and visually higher over-potentials in hysteresis curves. The ICI measurementsalso showed twofold higher diffusion resistances than theaqueous at the SOC intervals 0-20% and 80-100%. Thehigher diffusion resistances at these parts of the cell’s SOCmay be due to the effect of transport properties of the elec-trolyte in the insertion mechanism taking place at these in-tervals. The mechanism is most likely different from theone in the plateaus since the voltage profile is in a slopetrend. The transport of the electrolyte would then affectthe slope related mechanism more than the plateau one.
To distinguish between sources of overpotential in bothsystems (charge transfer or pore resistances), however, isnot feasible with current data. For achieving that, bet-ter PEIS spectras would be necessary as to facilitate the
A comparison between aqueous and organic electrolytes for lithium-ion batteries 27
adjusting to a realistic electrochemical equivalent circuitmodel. For solving the closeness of time scales of pro-cesses, PEIS could be done at different SOC, since it ispossible that a certain SOC would yield better resolvedsemi-circles. PEIS experiments could also be done at dif-ferent temperature/electrolyte concentrations as to single-out specific processes.
For assessing of the diffusion resistances by PEIS (forconfirming ICI results), a fitting of the Nyquist semi-circletail could be conducted. This calculation can be done aslong as the tail show a 45 slope, which is characteris-tic of a diffusion process. This diffusion would than bea result of solid and liquid diffusion combined. For thetail does not show such a slope, its calculation is impossi-ble with available data. For assessing charge transfer re-sistances, PEIS data could acquired for low temperatures(where charge transfer processes are usually rate limiting),an Arrhenius plot could be obtained as to evaluate its valueat room temperature.
For a correct determination of an upper cut-off limit be-yond U = 1 V, cyclic voltammetry could be used to definea safe, higher value that could enable higher specific ener-gies in the aqueous cell within the ESW of the electrolyte.This would substitute the arbitrary 1 V limit and anotherplateau of the V2O5 could be used. Another techniquethat could be used is OEMS, that would help to determinewhere the cathodic and anodic limits of the aqueous elec-trolytes are by identifying where gas evolution starts ocur-ring.
List of abbreviations and symbols
LIB Lithium-ion batteriesLi-ion Lithium-ionARB Aqueous rechargeable batteriesESW Electrochemical stability windowIR drop Internal resistances dropWISE Water in salt electrolyteSOC State-of-chargeLFP LiFePO4
VO V2O5
LMO LiMn2O4
Li1.5MO Li1.5Mn2O4
PEIS Potentiostatic electrochemical impedancespectroscopy
ICI Intermittent current interruption
OCV Open circuit voltageSEI Solid electrolyte interfaceEC Ethylene carbonateEPositive Electrochemical potential of the
positive electrodeENegative Electrochemical potential of the
negative electrodePC Propylene carbonateDEC Diethyl carbonateOEMS On-line electrochemical mass spectroscopyLiTFSI Lithium-bis(trifluoromethanesulfonyl)imideNMP N-methyl pyrrolidoneAC Alternating currentDC Direct currentNMR Nuclear magnetic resonanceLUMO Lowest unoccupied molecular orbitalHOMO Highest occupied molecular orbitalCPE Constant phase elementRint Resistance independent of time [Ω]I Electric current [A]m Active material mass [g]Ucell Thermodynamically calculated
cell voltage [V ]t Time [s or h]U Delivered cell voltage [V ]U0 Delivered cell voltage before ICI step [V ]Ureg Delivered cell voltage at t=0
obtained by linear regression [V ]w Specific energy [Wh/g]p Specific power [W/g]q Specific capacity [mAh/g = Ah/Kg]k Diffusion resistance [m2/s]ω Frequency [Hz]η, ηi Viscosity [cP ]µ, µi Ionic mobility [m2s−1V −1]τ Characteristic time
of electrochemical process [s]ε Dielectric constantri Ionic radius [m]tLi Lithium ion transference numberσ Ionic conductivity [mS/cm]
Acknowledgements
First, I would like to thank Dr. Erik Berg for your trustand guidance, as your supervision has been one of the bestI have ever received in a research project. Then, a hugethank you addressed to the other master thesis students inthe Ångström lab, specially Pontus, Mattias and Tamara,
A comparison between aqueous and organic electrolytes for lithium-ion batteries 28
since your insights, conversations and support have madea big difference on my mindset during this project. Thanksto Dr. Leiting, for without your valuable comments, anal-ysis and ideas, my thesis would not have achieved the levelit did. Finally, thank you to the Applied Electrochemistrydepartment in KTH, specially Prof. Ann Cornell, for con-stant guidance, not only in this project, but in others in thepast.
References
[1] Lux, S. et al. Litfsi stability in water and its possi-ble use in aqueous lithium-ion batteries: ph depen-dency, electrochemical window and temperature sta-bility. Journal of The Electrochemical Society 160,A1694 (2013).
[2] Reddy, T. B. Linden’s handbook of batteries(McGraw-Hill Education, 2011).
[3] Yamada, Y., Wang, J., Ko, S., Watanabe, E. & Ya-mada, A. Advances and issues in developing salt-concentrated battery electrolytes. Nature Energy 4,269–280 (2019).
[4] Suo, L. et al. “water-in-salt” electrolyte enableshigh-voltage aqueous lithium-ion chemistries. Sci-ence 350, 938–943 (2015).
[5] Droguet, L., Grimaud, A., Fontaine, O. & Tarascon,J.-m. Water-in-salt electrolyte (wise) for aqueousbatteries: A long way to practicality. Advanced En-ergy Materials 10, 2002440 (2020).
[6] Wang, J. et al. Superconcentrated electrolytes for ahigh-voltage lithium-ion battery. Nature communi-cations 7, 1–9 (2016).
[7] Armand, M. Intercalation electrodes. In Materialsfor advanced batteries, 145–161 (Springer, 1980).
[8] Besenhard, J. O. & Winter, M. Insertion reactions inadvanced electrochemical energy storage. Pure andApplied Chemistry 70, 603–608 (1998).
[9] Wang, Y.-g. & Xia, Y.-y. Hybrid aqueous energystorage cells using activated carbon and lithium-intercalated compounds: I. the system. Journal ofThe Electrochemical Society 153, A450 (2006).
[10] Sun, W. et al. “water-in-salt” electrolyte enabledlimn2o4/tis2 lithium-ion batteries. ElectrochemistryCommunications 82, 71–74 (2017).
[11] Li, W., McKinnon, W. R. & Dahn, J. R. Lithiumintercalation from aqueous solutions. Journal of theElectrochemical Society 141, 2310 (1994).
[12] Li, W. & Dahn, J. R. Lithium-ion cells with aqueouselectrolytes. Journal of the Electrochemical Society142, 1742 (1995).
[13] Berg, H. Batteries for electric vehicles: materialsand electrochemistry (Cambridge university press,2015).
[14] Winter, M., Besenhard, J. O., Spahr, M. E. & No-vak, P. Insertion electrode materials for rechargeablelithium batteries. Advanced materials 10, 725–763(1998).
[15] Whittingham, M. S. Chemistry of intercalationcompounds: Metal guests in chalcogenide hosts.Progress in Solid State Chemistry 12, 41–99 (1978).
[16] Xu, K. Nonaqueous liquid electrolytes for lithium-based rechargeable batteries. Chemical reviews 104,4303–4418 (2004).
[17] Aurbach, D. et al. Design of electrolyte solutions forli and li-ion batteries: a review. Electrochimica Acta50, 247–254 (2004).
[18] Goodenough, J. B. & Kim, Y. Challenges forrechargeable li batteries. Chemistry of materials 22,587–603 (2010).
[19] Xu, K. Electrolytes and interphases in li-ionbatteries and beyond. Chemical reviews 114,11503–11618 (2014).
[20] Bockris, J. O., Reddy, A. K. & Gamboa-Aldeco, M.Electrodics. Modern Electrochemistry 2A: Funda-mentals of Electrodics 1035–1400 (2000).
[21] Peled, E. The electrochemical behavior of alkaliand alkaline earth metals in nonaqueous batterysystems—the solid electrolyte interphase model.Journal of The Electrochemical Society 126, 2047(1979).
[22] Ding, M., Xu, K. & Jow, T. Phase diagram of ec–dmc binary system and enthalpic determination ofits eutectic composition. Journal of thermal analysisand calorimetry 62, 177–186 (2000).

A comparison between aqueous and organic electrolytes for lithium-ion batteries 29
[23] Besenhard, J. & Eichinger, G. High energy densitylithium cells: Part i. electrolytes and anodes. Jour-nal of Electroanalytical Chemistry and InterfacialElectrochemistry 68, 1–18 (1976).
[24] Younesi, R., Veith, G. M., Johansson, P., Edström,K. & Vegge, T. Lithium salts for advanced lithiumbatteries: Li–metal, li–o 2, and li–s. Energy & En-vironmental Science 8, 1905–1922 (2015).
[25] Campion, C. L., Li, W. & Lucht, B. L. Thermal de-composition of lipf6-based electrolytes for lithium-ion batteries. Journal of The Electrochemical Soci-ety 152, A2327 (2005).
[26] Sloop, S. E., Pugh, J. K., Wang, S., Kerr, J. &Kinoshita, K. Chemical reactivity of pf 5 andlipf6 in ethylene carbonate/dimethyl carbonate so-lutions. Electrochemical and Solid State Letters 4,A42 (2001).
[27] Stich, M., Gottlinger, M., Kurniawan, M., Schmidt,U. & Bund, A. Hydrolysis of lipf6 in carbonate-based electrolytes for lithium-ion batteries and inaqueous media. The Journal of Physical ChemistryC 122, 8836–8842 (2018).
[28] Blint, R. J. Competitive coordination of lithiumion. Journal of the Electrochemical Society 144, 787(1997).
[29] Matsuda, Y., Fukushima, T., Hashimoto, H. &Arakawa, R. Solvation of lithium ions in mixed or-ganic electrolyte solutions by electrospray ionizationmass spectroscopy. Journal of The ElectrochemicalSociety 149, A1045 (2002).
[30] Yang, L., Xiao, A. & Lucht, B. L. Investigation ofsolvation in lithium ion battery electrolytes by nmrspectroscopy. Journal of Molecular Liquids 154,131–133 (2010).
[31] Bogle, X., Vazquez, R., Greenbaum, S., Cresce, A.v. W. & Xu, K. Understanding li+–solvent interac-tion in nonaqueous carbonate electrolytes with 17onmr. The Journal of Physical Chemistry Letters 4,1664–1668 (2013).
[32] Borodin, O. et al. Competitive lithium solvation oflinear and cyclic carbonates from quantum chem-istry. Physical Chemistry Chemical Physics 18,164–175 (2016).
[33] Smith, A., Burns, J., Trussler, S. & Dahn, J. Pre-cision measurements of the coulombic efficiency oflithium-ion batteries and of electrode materials forlithium-ion batteries. Journal of The Electrochemi-cal Society 157, A196 (2009).
[34] Shim, J., Kostecki, R., Richardson, T., Song, X. &Striebel, K. A. Electrochemical analysis for cycleperformance and capacity fading of a lithium-ionbattery cycled at elevated temperature. Journal ofpower sources 112, 222–230 (2002).
[35] Menkin, S., Golodnitsky, D. & Peled, E. Artifi-cial solid-electrolyte interphase (sei) for improvedcycleability and safety of lithium–ion cells for evapplications. Electrochemistry Communications 11,1789–1791 (2009).
[36] Gauthier, M. et al. Electrode–electrolyte interfacein li-ion batteries: current understanding and newinsights. The journal of physical chemistry letters 6,4653–4672 (2015).
[37] Manthiram, A. Materials challenges and opportuni-ties of lithium ion batteries. The Journal of PhysicalChemistry Letters 2, 176–184 (2011).
[38] Malmberg, C. & Maryott, A. Dielectric constant ofwater from 00 to 1000 c. Journal of research of theNational Bureau of Standards 56, 1 (1956).
[39] Swindells, J., Coe Jr, J. & Godfrey, T. Absolute vis-cosity of water at 20 c. Journal of Research of theNational Bureau of Standard 48 (1952).
[40] Wang, H., Zeng, Y., Huang, K., Liu, S. & Chen,L. Improvement of cycle performance of lithiumion cell limn2o4/lixv2o5 with aqueous solution elec-trolyte by polypyrrole coating on anode. Elec-trochimica acta 52, 5102–5107 (2007).
[41] Smith, L. & Dunn, B. Opening the window for aque-ous electrolytes. Science 350, 918–918 (2015).
[42] Suo, L. et al. How solid-electrolyte interphase formsin aqueous electrolytes. Journal of the AmericanChemical Society 139, 18670–18680 (2017).
[43] Becker, M., Kühnel, R.-S. & Battaglia, C. Water-in-salt electrolytes for aqueous lithium-ion batterieswith liquidus temperatures below- 10° c. ChemicalCommunications 55, 12032–12035 (2019).
A comparison between aqueous and organic electrolytes for lithium-ion batteries 30
[44] Wang, F. et al. Stabilizing high voltage licoo2 cathode in aqueous electrolyte with interphase-forming additive. Energy & Environmental Science9, 3666–3673 (2016).
[45] Yang, C. et al. 4.0 v aqueous li-ion batteries. Joule1, 122–132 (2017).
[46] Hou, Z. et al. Formation of solid–electrolyte in-terfaces in aqueous electrolytes by altering cation-solvation shell structure. Advanced Energy Materi-als 10, 1903665 (2020).
[47] Ao, H. et al. Electrolyte solvation structure ma-nipulation enables safe and stable aqueous sodiumion batteries. Journal of Materials Chemistry A 8,14190–14197 (2020).
[48] Qu, D. et al. Electrochemical impedance and its ap-plications in energy-storage systems. Small Methods2, 1700342 (2018).
[49] Abe, T., Fukuda, H., Iriyama, Y. & Ogumi, Z. Sol-vated li-ion transfer at interface between graphiteand electrolyte. Journal of the Electrochemical So-ciety 151, A1120 (2004).
[50] Zhou, F., Kang, K., Maxisch, T., Ceder, G. & Mor-gan, D. The electronic structure and band gap oflifepo4 and limnpo4. Solid State Communications132, 181–186 (2004).
[51] Winter, M., Barnett, B. & Xu, K. Before li ion bat-teries. Chemical reviews 118, 11433–11456 (2018).
[52] He, P., Zhang, X., Wang, Y.-G., Cheng, L. & Xia,Y.-Y. Lithium-ion intercalation behavior of lifepo4in aqueous and nonaqueous electrolyte solutions.Journal of the Electrochemical Society 155, A144(2007).
[53] Nikitina, V. A. et al. Lithium ion coupled electron-transfer rates in superconcentrated electrolytes: ex-ploring the bottlenecks for fast charge-transfer rateswith limn2o4 cathode materials. Langmuir 33,9378–9389 (2017).
[54] Lasia, A. Electrochemical impedance spectroscopyand its applications. In Modern aspects of electro-chemistry, 143–248 (Springer, 2002).
[55] Geng, Z., Thiringer, T. & Lacey, M. J. Intermittentcurrent interruption method for commercial lithium
ion batteries aging characterization. arXiv preprintarXiv:2104.09260 (2021).
[56] Lacey, M. J., Edström, K. & Brandell, D. Visualis-ing the problems with balancing lithium–sulfur bat-teries by “mapping” internal resistance. ChemicalCommunications 51, 16502–16505 (2015).
[57] Tarascon, J. & Guyomard, D. Li metal-free recharge-able batteries based on li1+ x mn2 o 4 cathodes (0≤x≤ 1) and carbon anodes. Journal of The Electro-chemical Society 138, 2864 (1991).
[58] Liu, W. et al. Inhibition of transition metals dis-solution in cobalt-free cathode with ultrathin robustinterphase in concentrated electrolyte. Nature com-munications 11, 1–11 (2020).
[59] Deltombe, E., de Zoubov, N. & Pourbaix, M. Vana-dium. Atlas of Electrochemical Equilibria in Aque-ous Solutions, Pergamon Press, Oxford-London234–245 (1966).
[60] Tang, W. et al. Limn2o4 nanorods as a super-fastcathode material for aqueous rechargeable lithiumbatteries. Electrochemistry Communications 13,1159–1162 (2011).
[61] Wang, S. et al. Porous monodisperse v 2 o 5 micro-spheres as cathode materials for lithium-ion batter-ies. Journal of Materials Chemistry 21, 6365–6369(2011).
[62] Li, N., Patrissi, C. J., Che, G. & Martin, C. R. Ratecapabilities of nanostructured limn2 o 4 electrodes inaqueous electrolyte. Journal of the electrochemicalSociety 147, 2044 (2000).
[63] Hou, P., Chu, G., Gao, J., Zhang, Y. & Zhang, L. Li-ion batteries: Phase transition. Chinese Physics B25, 016104 (2015).

Appendix 31
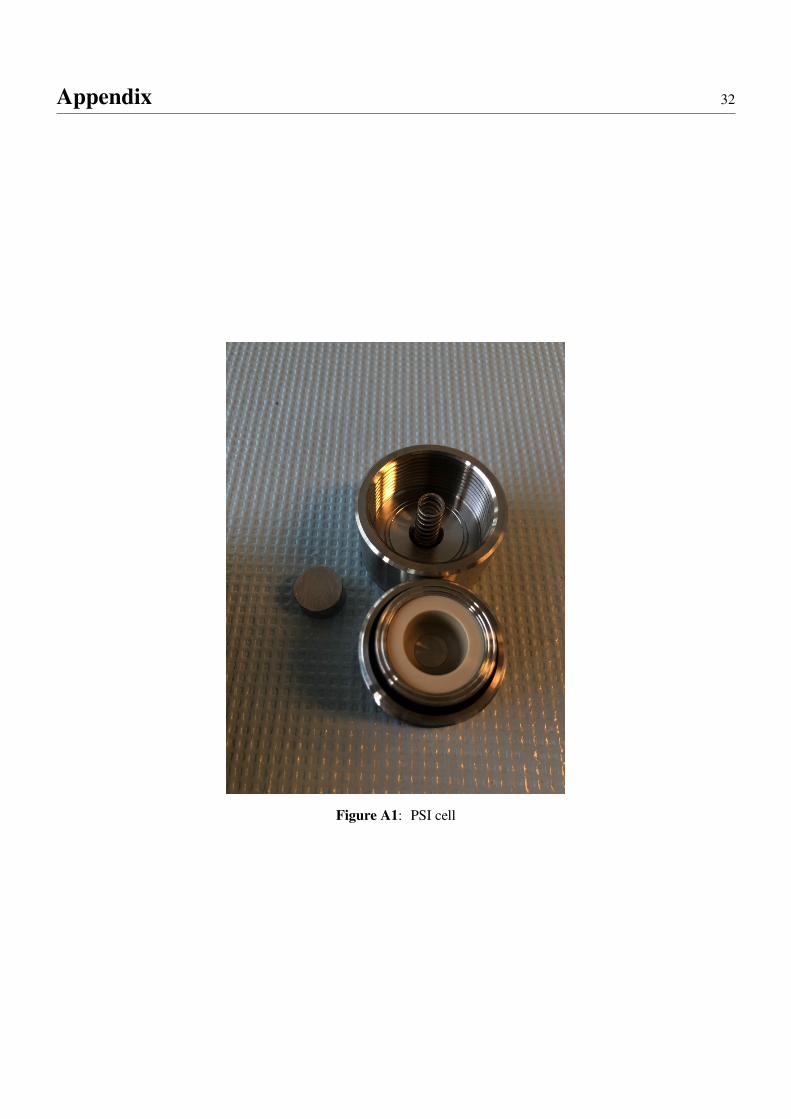
Appendix 32
Figure A1: PSI cell

TRITA TRITA-XXXX
www.kth.se