implications of partial tryptic digestion in organic–aqueous solvent systems for bottom-up...
TRANSCRIPT
Ib
MD
a
ARRAA
KSTAREBS
1
aappaacliAs
i(bpatps
0d
Analytica Chimica Acta 703 (2011) 194– 203
Contents lists available at ScienceDirect
Analytica Chimica Acta
jou rn al hom epa ge: www.elsev ier .com/ locate /aca
mplications of partial tryptic digestion in organic–aqueous solvent systems forottom-up proteome analysis
ark J. Wall, Andrew M.J. Crowell, Gordon A. Simms, Fang Liu, Alan A. Doucette ∗
epartment of Chemistry, Dalhousie University, 6274 Coburg Road, Halifax, NS, Canada B3H 4J3
r t i c l e i n f o
rticle history:eceived 14 January 2011eceived in revised form 8 July 2011ccepted 10 July 2011vailable online 5 August 2011
eywords:
a b s t r a c t
For bottom-up MS, the digestion step is critical and is typically performed with trypsin. Solvent-assisteddigestion in 80% acetonitrile has previously been shown to improve protein sequence coverage at shorterdigestion times. This has been attributed to enhanced enzyme digestion efficiency in this solvent. How-ever, our results demonstrate that tryptic digestion in 80% acetonitrile is less efficient than that ofconventional (aqueous) digestion. This is a consequence of decreased enzyme activity beyond ∼40%acetonitrile, increased enzyme autolysis and lower protein solubility in 80% acetonitrile. We observemultiple missed cleavages and reduced concentration of fully cleaved digestion products. Nonetheless
olvent-assisted digestionrypsincetonitrileapid digestionnzyme activity
we confirm, through room temperature solvent-assisted digestion, a consistent improvement in pro-tein sequence coverage when analyzed by mass spectrometry. These results are explained through theincreased number of unique digestion products available for detection. Thus, while solvent-assisted diges-tion has clear merits for proteome analysis, one should be aware of the inefficiency of protein digestion
ticula
ottom-up mass spectrometryhotgun proteomicsthough this protocol, par
. Introduction
While eliminating the need for all sample processing stepshead of MS would be ideal, multi-step platforms remain a criticalspect of proteome analysis. Gaining traction to profile complexroteome mixtures, top-down MS provides a direct approach torotein characterization [1]. Nonetheless, bottom-up MS, whichdds the necessary step of proteome digestion, is the most widelydopted strategy for proteome analysis. Notwithstanding otherritical sample manipulations (fractionation, purification, isotopeabelled, etc.), proper proteome digestion can have substantialnfluence on qualitative as well as quantitative proteome profiling.s a consequence, improvements in the digestion step have been aubject of continued research.
As the most widely used protease for bottom-up MS, trypsins well characterized to cleave after lysine and arginine residuesexceptions noted) [2]. Tryptic peptides are ideal for bottom-up MS,eing of suitable size and charge for tandem MS. The conventionalrotocol for tryptic digestion requires a minimal number of steps;n aqueous protein solution is buffered, disulfides are reduced, andhe sample is incubated at 37 ◦C, typically overnight, with an appro-
riate ratio of protein to trypsin (10:1 to 100:1 by mass). Whileimple, this protocol has considerable room for improvement.∗ Corresponding author. Tel.: +1 902 494 3714; fax: +1 902 494 1319.E-mail address: [email protected] (A.A. Doucette).
003-2670/$ – see front matter © 2011 Elsevier B.V. All rights reserved.oi:10.1016/j.aca.2011.07.025
rly with absolute protein quantitation experiments.© 2011 Elsevier B.V. All rights reserved.
With a continued push towards higher throughput, researchershave explored methods to maximize the efficiency of tryptic diges-tion. Summarizing some of the more common approaches, theseinclude gel-assisted digestion [3], immobilized enzymes or sub-strates [4,5], microwave radiation [6], detergents [7], ultrasound[8], elevated pressure [9], non-aqueous solvent systems [10], andcombinations thereof [11]. Encompassing the main objectives ofthese approaches, a loose definition for ‘improved’ digestion isto afford shorter digestion times, to facilitate automation, or togenerate a greater number of peptides suitable for MS. Also con-sidering absolute protein quantitation [12], the completeness ofdigestion is another important aspect. Missed cleavages, thoughpotentially desirable for improved protein sequence coverage [13],will potentially skew results for absolute quantitation, if the degreeof digestion is either irreproducible or is unknown [14].
Among the systems to enhance tryptic digestion, solvent-assisted digestion is particularly well studied. First applied tobottom-up MS by Russell et al. in 2001 [10], the strategy bor-rows from a practice in industrial enzymatic processing [15,16].Here, organic solvents have been shown to enhance or alterthe selectivity and/or stability of various enzymes. Extended toproteomics, a motivation to solvent-assisted digestion is the poten-tial for enhanced tryptic activity, or more favourable conditionsto digest ‘difficult’ proteins. Through solvent-assisted digestion,
numerous studies have demonstrated improved sequence cover-age [17], more rapid digestion (typically <1 h) [10,18] or morecomplete digestion [18]. Given the mounting evidence, solvent-assisted digestion has clear merit in the field of proteomics.
himica
dfesdwrtliaws
oatarcsta
2
2
upCa(emBws1S
2
aw1toilttrtt
st(ta
M.J. Wall et al. / Analytica C
While favourable results are evident for solvent-assistedigestion, an important question remains: What is the causeor improvements in digestions? It has been speculated thatnhanced enzyme activity [19] and/or more favourable sub-trate digestion conditions [10,19] (i.e. improved solubility,enatured protein) are obtained in mixed solvents. However,hen placed in a high percent of acetonitrile (≥50%), it was
eported that tryptic activity is significantly reduced relativeo pure water [20,21]. Moreover, organic solvents, in particu-ar 80% acetonitrile, will precipitate many proteins [22]. Themproved outcomes (faster digestion, higher sequence cover-ge, etc.) of solvent-assisted digestion are therefore inconsistentith the expected behaviour of trypsin in a non-aqueous solvent
ystem.Presented in this work is an examination of the utility
f solvent-assisted trypsin digestion for proteome analysis. Ancetonitrile/water solvent system was investigated, supportinghe merits of this strategy for high protein sequence cover-ge when analyzed by bottom-up MS. However, our results alsoeveal a clear deficiency of tryptic digestion in a high per-entage of acetonitrile. An alternative explanation for improvedequence coverage is provided, along with a discussion ofhe implications of this approach on quantitative proteomenalysis.
. Materials and methods
.1. Reagents and protein standards
Two types of TPCK-treated trypsin were used, includingnmodified bovine trypsin (catalogue T8802) and dimethylatedorcine trypsin (catalogue T6567), each from Sigma (Oakville,anada). All standard proteins were from Sigma, along with formiccid, trifluoroacetic acid (TFA), triethylammonium bicarbonateTEAB), trisodium phosphate, and N�-benzoyl-l-arginine ethylster (BAEE). Tris, iodoacetamide, dithiothreitol (DTT), along withaterials for casting and running SDS-PAGE were purchased from
io-Rad (Hercules, CA). D2-formaldehyde, originally from Sigma,as a gift from Ken Chisholm at the Institute for Marine Bio-
ciences in Halifax, Canada. Milli-Q grade water was purified to8.2 M� cm−1. Solvents were of HPLC grade and were from Fishercientific (Ottawa, Canada).
.2. Yeast extraction and preparation
S. cerevisiae was grown in YEPD media at 25 ◦C and harvested atn OD of 0.5 by centrifugation at 3500 × g for 5 min. The pellet wasashed in PBS buffer and collected by centrifugation at 3200 g for
5 min at 4 ◦C, and a portion was stored at −20 ◦C before use. Forhe protein solubility study, the frozen (and thawed) yeast pelletbtained from ∼200 mL growth media was transferred dropwisento liquid nitrogen. The cells were then ground for 10 min underiquid nitrogen using a mortar and pestle. Proteins were extractedhrough addition of 3 mL of 50 mM Tris (pH 8) plus inhibitor cock-ail (Sigma catalogue # P2714), with gentle shaking for 20 min atoom temperature, followed by a 5 min centrifugation at 13000 × go clarify the extract. The final protein concentration, determinedhrough a Pierce BCA assay (Rockford, IL) was 3.9 g L−1.
For LC/MS, the freshly cultured yeast pellet was immediatelyuspended in 2% SDS and HEPES buffer (pH 7.6), along with pro-
ease inhibitors, and extracted using three passes in a French Press20,000 psi). Following a BCA assay to determine protein content,he extract was divided into 1 mg aliquots and precipitated withddition of 4 volumes cold acetone [23].Acta 703 (2011) 194– 203 195
2.3. Tryptic digestion
For LC/MS analysis, proteins were first reduced and alkylatedin aqueous solvent. For this, protein standards were prepared in0.25 M Tris–HCl (pH 8). DTT was added to a final concentrationof 5 mM, with incubation at 55 ◦C for 20 min. Then iodoacetamidewas added to a final concentration of 12.5 mM, with incubationat room temperature in the dark for a further 20 min. The 1 mgyeast pellet was resuspended in 200 �L of 0.5 M Tris–HCl (pH 8)with 2 mM DTT then incubated at 55 ◦C (20 min), followed by 5 �Lof 200 mM iodoacetamide with incubation at room temperature(dark) for 20 min.
To 100 �L of the reduced protein stocks (final protein concen-tration 0.5 g L−1 per protein, yeast ∼5 g L−1) 440 �L of 37 ◦C water,or room temperature (i.e. 22–24 ◦C, specified in the results sec-tion) acetonitrile was added. Digestion was immediately initiatedthrough addition of 10 �L of 0.1 g L−1 trypsin (for standard pro-tein digests) or 0.5 g L−1 trypsin in 1 mM HCl (for yeast digest).This resulted in a 50:1 ratio of protein:trypsin for standard proteindigests, or a 100:1 ratio for the yeast digest. Final solutions con-sisted of 0.1 g L−1 per standard protein or ∼1 g L−1 for yeast proteins,digested in a purely aqueous or 80% acetonitrile solvent system.A trypsin autolysis experiment involved incubating the enzyme(0.1 g L−1) in a solvent system consisting of 80% acetonitrile, 50 mMTris, pH 8 (based on pH of stock Tris solution). Digests were ter-minated by addition of 50 �L 10% TFA, following a 5 min, 1 h, orovernight (16 h) digestion at room temperature or 37 ◦C. Sampleswere then dried in a SpeedVac and suspended in 105 �L of 0.1% TFAin water prior to cleanup by RP-HPLC. For visualization using SDSPAGE (Section 2.6), the dried samples were directly resuspended ingel loading buffer.
2.4. Protein solubility in aqueous/organic solvents
For the solubility study, the BSA protein and aqueous yeastextract were diluted to 0.1 and 0.5 g L−1 respectively, in the appro-priate solvent (water or 80% acetonitrile), and digested withomission of the reduction/alkylation step. Trypsin was added at a20:1 ratio for BSA, or a 100:1 ratio for yeast, with incubation at 37 ◦Cfor 16 h. Trypsin solubility was obtained following 1 h incubationin the appropriate solvent, buffered with Tris (from 1 M stock at pH8), to a final concentration of 50 mM Tris. Following centrifugationin a bench top centrifuge (10 min, 13,000 rpm), the top and bottomlayers were quantified by BCA.
2.5. Isotopic labelling
Relative quantitation was performed using differential iso-topic labelling of lysine and N-terminal groups of peptideswith formaldehyde (deuterated/non-deuterated) as described [24].Briefly, the cleaned and dried peptide samples were resuspendedin a 100 �L solution of 100 mM TEAB (pH 8.5), to which 14.3 �L of a20% solution of formaldehyde (H2 or D2) was added per 200 �gof peptide. The sample was incubated at room temperature for5 min, which was followed by addition of 16.7 �L of a 6 M sodiumcyanoborohydride solution per 200 �g of peptides, with incubationat room temperature for 2 h. Isotopically labelled peptides werecleaned of residual reagents through reversed phase chromatog-raphy, dried using a SpeedVac to remove solvent, and then frozenuntil analyzed by LC–MS/MS.
2.6. BAEE enzyme activity assay
Trypsin activity was determined using a standard protocol[25]. In brief, BAEE (0.086 g L−1) was prepared in 100 mM Tris/HCl(diluted from 1 M Tris at pH 8.0), containing the organic solvent
1 himica Acta 703 (2011) 194– 203
samtwi8
a(iwiBtaeses
2
PdwtBn
2
aai(1wo6iwp
a(sa1Btib−S
2
wnPr0
Table 1Protein sequence coverage following tryptic digestion under various conditions.
Protein 1 h Overnight
Aqueous 80% ACN Aqueous 80% ACN
37 ◦C 24 ◦C 37 ◦C 24 ◦C 37 ◦C 24 ◦C 37 ◦C 24 ◦C
BSA 22.7 36.8 13.3 53.5 33.8 48.4 33.7 55.4Myoglobin 7.8 10.5 9.8 34.6 0 22.9 9.8 45.1
96 M.J. Wall et al. / Analytica C
ystem (acetonitrile/water) at a specified composition. The temper-ture of the BAEE solution was adjusted before adding trypsin, andaintained over the course of the assay. To 1 mL of the BAEE solu-
ion, 66.7 �L of trypsin (0.012 g L−1) prepared in 1 mM aqueous HClas added directly before measurement. Sample absorbance read-
ngs (253 nm) were taken at times 0 and 5 min using an Agilent353 spectrophotometer (Palo Alto, CA), in a 1 cm quartz cuvette.
The residual activity of trypsin following pre-incubation waslso assessed through a BAEE assay. For this, a stock trypsin solutionunmodified) in either 1 mM HCl or 100 mM Tris/HCl, contain-ng the appropriate concentration of acetonitrile (0%, 20%, 70%)
as incubated at 37 ◦C for a specified amount of time. Follow-ng this incubation period, 66.7 �L of trypsin was added to 1.0 mLAEE solution (0.086 g L−1, 100 mM Tris, with 0, 20 or 70% acetoni-rile) and the enzyme activity was determined as the change inbsorbance (253 nM) from times 15 to 75 s following addition ofnzyme to the BAEE. The concentration of enzyme was adjusteduch that the initial activity of trypsin (i.e. time zero) would bequal at all level of acetonitrile tested (described further in resultsection).
.7. Gel electrophoresis
Tryptic BSA digests were subjected to one dimensional SDS-AGE. A 15%T resolving gel with a 4%T stacking gel in aiscontinuous buffer system was used [26]. Before loading, samplesere heated at 95◦ for 5 min in a reducing sample buffer [26], and
he loading was 50 �g per lane. Gels were stained using Coomassielue (Bio-Rad) and visualized with a conventional document scan-er.
.8. Liquid chromatography
Offline reversed phase sample cleanups were conducted onn Agilent 1200 HPLC system (Palo Alto, CA) with autosamplernd diode array detector operating at 214 nm. Samples suspendedn 0.1% TFA/water were injected onto a self-packed C18 column5 �m beads, 300 A pore size, 100 × 1 mm i.d.) at a flow rate of00 �L min−1. Gradient elution between solvent A (0.1% TFA inater, v/v) and solvent B (0.1% TFA in acetonitrile, v/v) consisted
f a 5 min hold at 100% A followed by a linear gradient from 0% to0% B over 5 min then ramping to 80% B in another 5 min. The elut-
ng peptides were collected using a fraction collector; the solventas completely removed via SpeedVac, and frozen until furtherrocessing.
Cation exchange of the digested yeast sample was performed on home packed polysulfyl strong cation exchanger (SCX) column5 �m beads, 300 A pore size, 100 mm × 1 mm). Separation con-isted of a linear gradient between solvent A (0.1% TFA in water)nd solvent B (0.1% TFA in water with 500 mM NaCl), starting at00% A and ramping to 40% B over 40 min, then ramping to 60%
over 10 min. A total of 9 × 5-min fractions were collected acrosshe separation gradient. Fractions were dried, brought up to 105 �Ln water with 0.1% TFA and subjected to reversed phase cleanupefore LC–MS/MS. As required, processed samples were stored at20 ◦C following removal of residual solvent, as recommended byhevchenko and Mann [27].
.9. LC–MS/MS
A ThermoFisher LTQ linear ion trap mass spectrometer equippedith a nanospray ionization source coupled to an Agilent 1200
anoflow HPLC system was used to analyze the protein digests.eptide separation was performed on a home packed C18eversed phase column (30 cm × 75 �m i.d., 3 �m beads) flowing at.25 �L min−1. Chromatographic separation was performed usingCytchrome c 34.6 26.9 26.9 31.7 23.1 16.3 34.6 51.0�-Lactalbumin 8.6 17.3 8.6 30.2 6.2 28.4 28.4 34.6Lysozyme 18.6 23.3 11.6 60.5 24.8 27.1 20.2 41.9
a linear gradient between 5% ACN and 30% ACN over 100 min fol-lowed by a ramp to 80% ACN to regenerate the column. For BSA,500 fmol per labelled sample was injected and for yeast, 1 �g fromeach SCX fraction (determined from UV signals during samplecleanup) was injected for analysis. The NSI voltage was set to 2.5 kVand transfer capillary temperature was set to 225 ◦C. The MS scanrange was set to 400–1700 m/z for all experiments. Max fill time forthe ion trap was set to 100 ms, and automatic gain control was setto allow up to 1E5 ions to enter the trap for MS and 1E4 for MS/MS.Data dependant acquisition was set to collect 1 MS scan followedby MS/MS of the top 3 ions. Dynamic exclusion duration was setto 2 min. Duplicate runs were performed for each yeast fraction,while multiple replicates for the labelled BSA were conducted, asdescribed in the results.
2.10. Data processing
Peptide identifications were performed using the Sequest algo-rithm within the Thermo Xcalibur Bioworks (version 3.3) softwarepackage. Peptide filters were set to provide a false discovery rateof 1% or less when searched against a decoy reversed database. ForBSA searches, Xcorr versus charge state was set to 1.5 (+1), 2.0 (+2)and 3.25 (+3), respectively. Peptide probability was set to 1E−2 withdelta CN ≥ 0.1 and RSp ≤ 4. For yeast searches, Xcorr versus chargestate was set to 1.9 (+1), 2.5 (+1), and 3.75 (+3). Peptide probabilitywas set to 5E−3 with a delta CN and Rsp filters the same as that forBSA searches.
Peptide quantitation was performed using the PepQuan func-tion within the Bioworks software. Peak area was obtained with aminimum intensity values set to 100, a peptide tolerance of 1.0 amuand 3 smoothing points. All peak areas were manually inspected toensure consistent selection of the peaks. A filtering step was incor-porated wherein only those peptides which were identified across≥75% of all LC–MS/MS runs from a given digestion condition werekept.
3. Results and discussion
3.1. Optimization of solvent-assisted digestion
Solvent-assisted tryptic digestion has been shown to enhanceprotein sequence coverage when subject to bottom-up LC–MS/MSanalysis [10,19,28]. We sought to confirm this result through diges-tion of a simple (5 protein) standard mixture. Unmodified trypsinwas used for this study. Realizing that tryptic digestion respondsto several additional variables, our own results may conflict withthose previously reported. Thus, in addition to solvent effects(water vs. 80% acetonitrile), the digestion time (overnight vs. 1 h)and reaction temperature (24 ◦C vs. 37 ◦C) were also investigated,with results summarized in Table 1.
A multiple regression model was applied to the results of Table 1using SAS v9.2 (Cary, North Carolina), with between subject factorsof temperature (37 ◦C vs. 24 ◦C), solvent (80% acetonitrile vs. water),time (overnight vs. 1 h), as well as protein (5 different types) and an
M.J. Wall et al. / Analytica Chimica Acta 703 (2011) 194– 203 197
Table 2Analysis of variance identifies the conditions with greatest contribution to protein sequence coverage, as shown in Table 1.
Comparison Parameter estimate (�%sequence coverage)
Standard error (95%confidence)
P-value
37 ◦C vs. 24 ◦C (in 80% ACN) −24.6 3.6 <0.000180% ACN vs. water (at 24 ◦C) 18.5 3.6 <0.000137 ◦C vs. 24 ◦C −16.2 2.6 <0.000180% ACN vs. water 10.1 2.6 0.0005
◦ ◦
opkrcaasiitcdowimftcwseccsb
3
acy(wtsdc
tcdtstiHtwiF1
main bottleneck of a proteomics workflow, a proposed strategy toimprove proteome coverage following multiple MS injections is tosubject the sample to multiple digestion protocols. The differencesobserved here between aqueous and organic digestion point to a
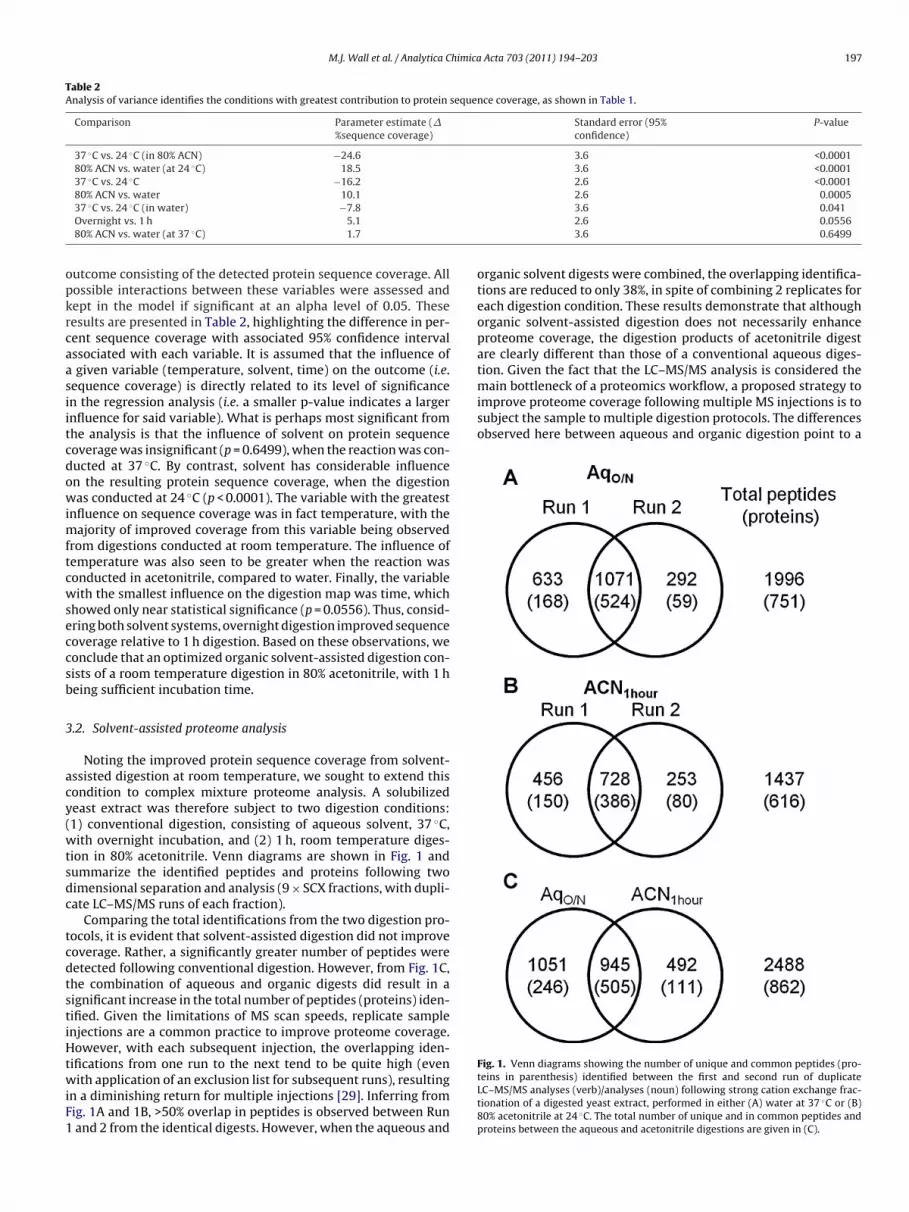
Fig. 1. Venn diagrams showing the number of unique and common peptides (pro-
37 C vs. 24 C (in water) −7.8
Overnight vs. 1 h 5.1
80% ACN vs. water (at 37 ◦C) 1.7
utcome consisting of the detected protein sequence coverage. Allossible interactions between these variables were assessed andept in the model if significant at an alpha level of 0.05. Theseesults are presented in Table 2, highlighting the difference in per-ent sequence coverage with associated 95% confidence intervalssociated with each variable. It is assumed that the influence of
given variable (temperature, solvent, time) on the outcome (i.e.equence coverage) is directly related to its level of significancen the regression analysis (i.e. a smaller p-value indicates a largernfluence for said variable). What is perhaps most significant fromhe analysis is that the influence of solvent on protein sequenceoverage was insignificant (p = 0.6499), when the reaction was con-ucted at 37 ◦C. By contrast, solvent has considerable influencen the resulting protein sequence coverage, when the digestionas conducted at 24 ◦C (p < 0.0001). The variable with the greatest
nfluence on sequence coverage was in fact temperature, with theajority of improved coverage from this variable being observed
rom digestions conducted at room temperature. The influence ofemperature was also seen to be greater when the reaction wasonducted in acetonitrile, compared to water. Finally, the variableith the smallest influence on the digestion map was time, which
howed only near statistical significance (p = 0.0556). Thus, consid-ring both solvent systems, overnight digestion improved sequenceoverage relative to 1 h digestion. Based on these observations, weonclude that an optimized organic solvent-assisted digestion con-ists of a room temperature digestion in 80% acetonitrile, with 1 heing sufficient incubation time.
.2. Solvent-assisted proteome analysis
Noting the improved protein sequence coverage from solvent-ssisted digestion at room temperature, we sought to extend thisondition to complex mixture proteome analysis. A solubilizedeast extract was therefore subject to two digestion conditions:1) conventional digestion, consisting of aqueous solvent, 37 ◦C,ith overnight incubation, and (2) 1 h, room temperature diges-
ion in 80% acetonitrile. Venn diagrams are shown in Fig. 1 andummarize the identified peptides and proteins following twoimensional separation and analysis (9 × SCX fractions, with dupli-ate LC–MS/MS runs of each fraction).
Comparing the total identifications from the two digestion pro-ocols, it is evident that solvent-assisted digestion did not improveoverage. Rather, a significantly greater number of peptides wereetected following conventional digestion. However, from Fig. 1C,he combination of aqueous and organic digests did result in aignificant increase in the total number of peptides (proteins) iden-ified. Given the limitations of MS scan speeds, replicate samplenjections are a common practice to improve proteome coverage.owever, with each subsequent injection, the overlapping iden-
ifications from one run to the next tend to be quite high (even
ith application of an exclusion list for subsequent runs), resultingn a diminishing return for multiple injections [29]. Inferring fromig. 1A and 1B, >50% overlap in peptides is observed between Run
and 2 from the identical digests. However, when the aqueous and
3.6 0.0412.6 0.05563.6 0.6499
organic solvent digests were combined, the overlapping identifica-tions are reduced to only 38%, in spite of combining 2 replicates foreach digestion condition. These results demonstrate that althoughorganic solvent-assisted digestion does not necessarily enhanceproteome coverage, the digestion products of acetonitrile digestare clearly different than those of a conventional aqueous diges-tion. Given the fact that the LC–MS/MS analysis is considered the
teins in parenthesis) identified between the first and second run of duplicateLC–MS/MS analyses (verb)/analyses (noun) following strong cation exchange frac-tionation of a digested yeast extract, performed in either (A) water at 37 ◦C or (B)80% acetonitrile at 24 ◦C. The total number of unique and in common peptides andproteins between the aqueous and acetonitrile digestions are given in (C).
198 M.J. Wall et al. / Analytica Chimica
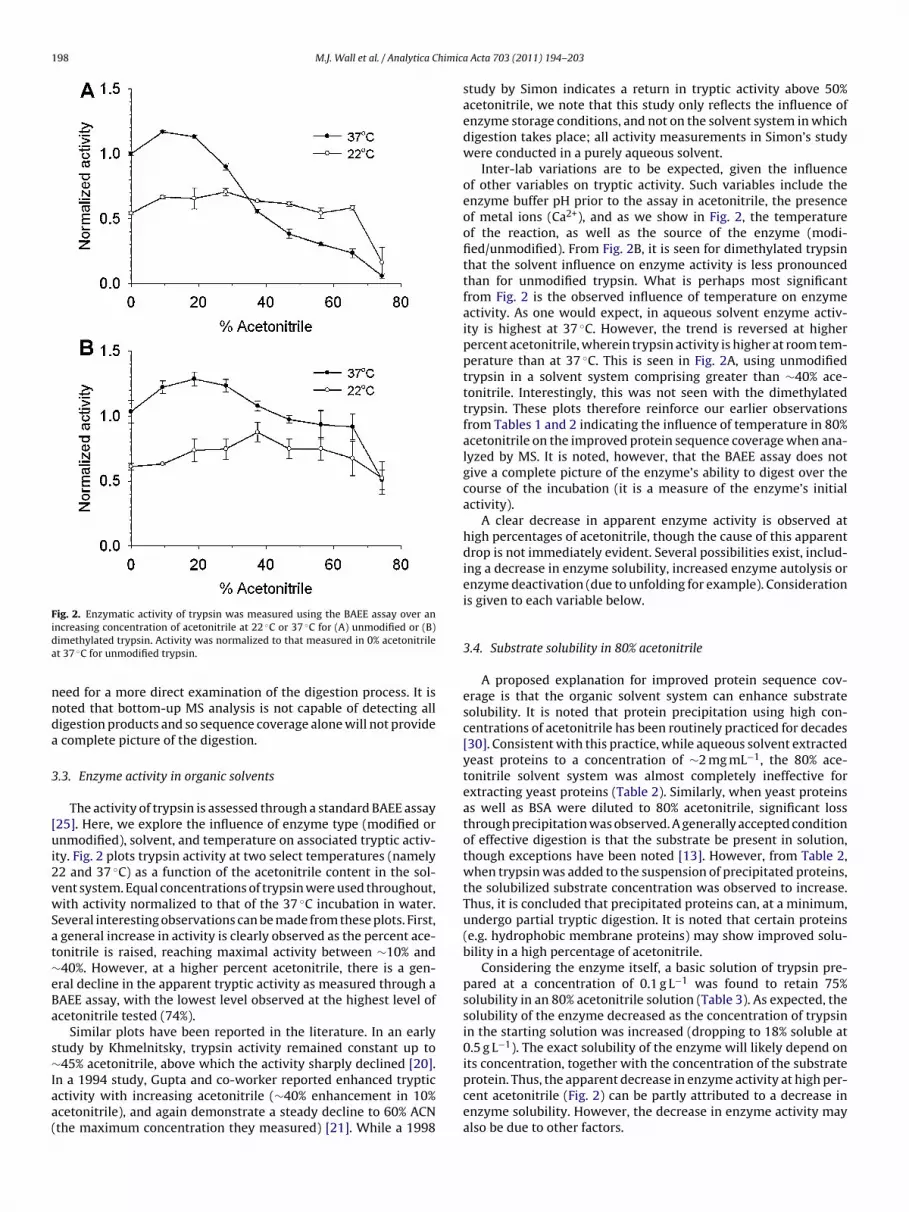
Fig. 2. Enzymatic activity of trypsin was measured using the BAEE assay over ani ◦ ◦
da
nnda
3
[ui2vwSat∼eBa
s∼Iaa(
ncreasing concentration of acetonitrile at 22 C or 37 C for (A) unmodified or (B)imethylated trypsin. Activity was normalized to that measured in 0% acetonitrilet 37 ◦C for unmodified trypsin.
eed for a more direct examination of the digestion process. It isoted that bottom-up MS analysis is not capable of detecting alligestion products and so sequence coverage alone will not provide
complete picture of the digestion.
.3. Enzyme activity in organic solvents
The activity of trypsin is assessed through a standard BAEE assay25]. Here, we explore the influence of enzyme type (modified ornmodified), solvent, and temperature on associated tryptic activ-
ty. Fig. 2 plots trypsin activity at two select temperatures (namely2 and 37 ◦C) as a function of the acetonitrile content in the sol-ent system. Equal concentrations of trypsin were used throughout,ith activity normalized to that of the 37 ◦C incubation in water.
everal interesting observations can be made from these plots. First, general increase in activity is clearly observed as the percent ace-onitrile is raised, reaching maximal activity between ∼10% and40%. However, at a higher percent acetonitrile, there is a gen-ral decline in the apparent tryptic activity as measured through aAEE assay, with the lowest level observed at the highest level ofcetonitrile tested (74%).
Similar plots have been reported in the literature. In an earlytudy by Khmelnitsky, trypsin activity remained constant up to45% acetonitrile, above which the activity sharply declined [20].
n a 1994 study, Gupta and co-worker reported enhanced trypticctivity with increasing acetonitrile (∼40% enhancement in 10%cetonitrile), and again demonstrate a steady decline to 60% ACNthe maximum concentration they measured) [21]. While a 1998
Acta 703 (2011) 194– 203
study by Simon indicates a return in tryptic activity above 50%acetonitrile, we note that this study only reflects the influence ofenzyme storage conditions, and not on the solvent system in whichdigestion takes place; all activity measurements in Simon’s studywere conducted in a purely aqueous solvent.
Inter-lab variations are to be expected, given the influenceof other variables on tryptic activity. Such variables include theenzyme buffer pH prior to the assay in acetonitrile, the presenceof metal ions (Ca2+), and as we show in Fig. 2, the temperatureof the reaction, as well as the source of the enzyme (modi-fied/unmodified). From Fig. 2B, it is seen for dimethylated trypsinthat the solvent influence on enzyme activity is less pronouncedthan for unmodified trypsin. What is perhaps most significantfrom Fig. 2 is the observed influence of temperature on enzymeactivity. As one would expect, in aqueous solvent enzyme activ-ity is highest at 37 ◦C. However, the trend is reversed at higherpercent acetonitrile, wherein trypsin activity is higher at room tem-perature than at 37 ◦C. This is seen in Fig. 2A, using unmodifiedtrypsin in a solvent system comprising greater than ∼40% ace-tonitrile. Interestingly, this was not seen with the dimethylatedtrypsin. These plots therefore reinforce our earlier observationsfrom Tables 1 and 2 indicating the influence of temperature in 80%acetonitrile on the improved protein sequence coverage when ana-lyzed by MS. It is noted, however, that the BAEE assay does notgive a complete picture of the enzyme’s ability to digest over thecourse of the incubation (it is a measure of the enzyme’s initialactivity).
A clear decrease in apparent enzyme activity is observed athigh percentages of acetonitrile, though the cause of this apparentdrop is not immediately evident. Several possibilities exist, includ-ing a decrease in enzyme solubility, increased enzyme autolysis orenzyme deactivation (due to unfolding for example). Considerationis given to each variable below.
3.4. Substrate solubility in 80% acetonitrile
A proposed explanation for improved protein sequence cov-erage is that the organic solvent system can enhance substratesolubility. It is noted that protein precipitation using high con-centrations of acetonitrile has been routinely practiced for decades[30]. Consistent with this practice, while aqueous solvent extractedyeast proteins to a concentration of ∼2 mg mL−1, the 80% ace-tonitrile solvent system was almost completely ineffective forextracting yeast proteins (Table 2). Similarly, when yeast proteinsas well as BSA were diluted to 80% acetonitrile, significant lossthrough precipitation was observed. A generally accepted conditionof effective digestion is that the substrate be present in solution,though exceptions have been noted [13]. However, from Table 2,when trypsin was added to the suspension of precipitated proteins,the solubilized substrate concentration was observed to increase.Thus, it is concluded that precipitated proteins can, at a minimum,undergo partial tryptic digestion. It is noted that certain proteins(e.g. hydrophobic membrane proteins) may show improved solu-bility in a high percentage of acetonitrile.
Considering the enzyme itself, a basic solution of trypsin pre-pared at a concentration of 0.1 g L−1 was found to retain 75%solubility in an 80% acetonitrile solution (Table 3). As expected, thesolubility of the enzyme decreased as the concentration of trypsinin the starting solution was increased (dropping to 18% soluble at0.5 g L−1). The exact solubility of the enzyme will likely depend onits concentration, together with the concentration of the substrate
protein. Thus, the apparent decrease in enzyme activity at high per-cent acetonitrile (Fig. 2) can be partly attributed to a decrease inenzyme solubility. However, the decrease in enzyme activity mayalso be due to other factors.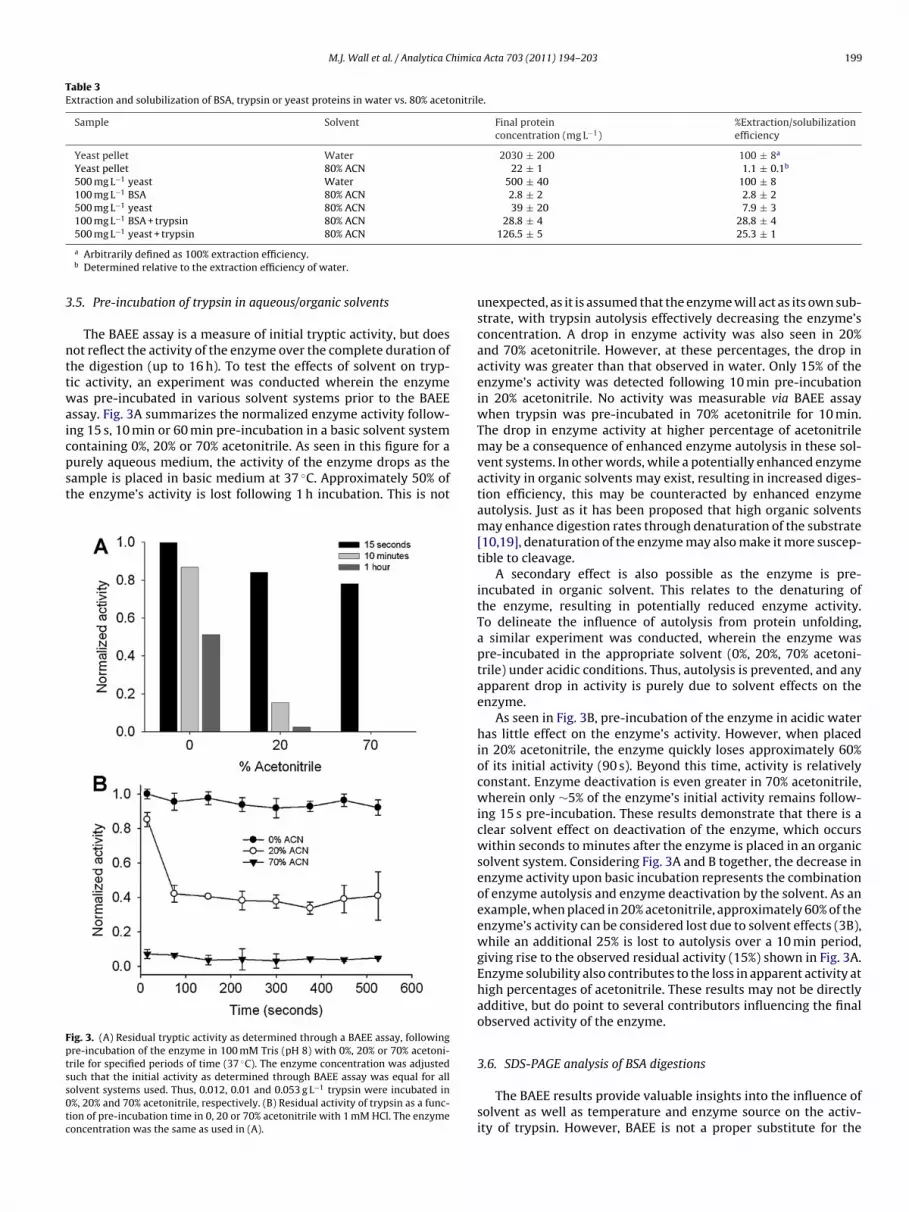
M.J. Wall et al. / Analytica Chimica Acta 703 (2011) 194– 203 199
Table 3Extraction and solubilization of BSA, trypsin or yeast proteins in water vs. 80% acetonitrile.
Sample Solvent Final proteinconcentration (mg L−1)
%Extraction/solubilizationefficiency
Yeast pellet Water 2030 ± 200 100 ± 8a
Yeast pellet 80% ACN 22 ± 1 1.1 ± 0.1b
500 mg L−1 yeast Water 500 ± 40 100 ± 8100 mg L−1 BSA 80% ACN 2.8 ± 2 2.8 ± 2500 mg L−1 yeast 80% ACN 39 ± 20 7.9 ± 3100 mg L−1 BSA + trypsin 80% ACN 28.8 ± 4 28.8 ± 4500 mg L−1 yeast + trypsin 80% ACN 126.5 ± 5 25.3 ± 1
3
nttwaicpst
Fptss0tc
a Arbitrarily defined as 100% extraction efficiency.b Determined relative to the extraction efficiency of water.
.5. Pre-incubation of trypsin in aqueous/organic solvents
The BAEE assay is a measure of initial tryptic activity, but doesot reflect the activity of the enzyme over the complete duration ofhe digestion (up to 16 h). To test the effects of solvent on tryp-ic activity, an experiment was conducted wherein the enzymeas pre-incubated in various solvent systems prior to the BAEE
ssay. Fig. 3A summarizes the normalized enzyme activity follow-ng 15 s, 10 min or 60 min pre-incubation in a basic solvent systemontaining 0%, 20% or 70% acetonitrile. As seen in this figure for a
urely aqueous medium, the activity of the enzyme drops as theample is placed in basic medium at 37 ◦C. Approximately 50% ofhe enzyme’s activity is lost following 1 h incubation. This is notig. 3. (A) Residual tryptic activity as determined through a BAEE assay, followingre-incubation of the enzyme in 100 mM Tris (pH 8) with 0%, 20% or 70% acetoni-rile for specified periods of time (37 ◦C). The enzyme concentration was adjusteduch that the initial activity as determined through BAEE assay was equal for allolvent systems used. Thus, 0.012, 0.01 and 0.053 g L−1 trypsin were incubated in%, 20% and 70% acetonitrile, respectively. (B) Residual activity of trypsin as a func-ion of pre-incubation time in 0, 20 or 70% acetonitrile with 1 mM HCl. The enzymeoncentration was the same as used in (A).
unexpected, as it is assumed that the enzyme will act as its own sub-strate, with trypsin autolysis effectively decreasing the enzyme’sconcentration. A drop in enzyme activity was also seen in 20%and 70% acetonitrile. However, at these percentages, the drop inactivity was greater than that observed in water. Only 15% of theenzyme’s activity was detected following 10 min pre-incubationin 20% acetonitrile. No activity was measurable via BAEE assaywhen trypsin was pre-incubated in 70% acetonitrile for 10 min.The drop in enzyme activity at higher percentage of acetonitrilemay be a consequence of enhanced enzyme autolysis in these sol-vent systems. In other words, while a potentially enhanced enzymeactivity in organic solvents may exist, resulting in increased diges-tion efficiency, this may be counteracted by enhanced enzymeautolysis. Just as it has been proposed that high organic solventsmay enhance digestion rates through denaturation of the substrate[10,19], denaturation of the enzyme may also make it more suscep-tible to cleavage.
A secondary effect is also possible as the enzyme is pre-incubated in organic solvent. This relates to the denaturing ofthe enzyme, resulting in potentially reduced enzyme activity.To delineate the influence of autolysis from protein unfolding,a similar experiment was conducted, wherein the enzyme waspre-incubated in the appropriate solvent (0%, 20%, 70% acetoni-trile) under acidic conditions. Thus, autolysis is prevented, and anyapparent drop in activity is purely due to solvent effects on theenzyme.
As seen in Fig. 3B, pre-incubation of the enzyme in acidic waterhas little effect on the enzyme’s activity. However, when placedin 20% acetonitrile, the enzyme quickly loses approximately 60%of its initial activity (90 s). Beyond this time, activity is relativelyconstant. Enzyme deactivation is even greater in 70% acetonitrile,wherein only ∼5% of the enzyme’s initial activity remains follow-ing 15 s pre-incubation. These results demonstrate that there is aclear solvent effect on deactivation of the enzyme, which occurswithin seconds to minutes after the enzyme is placed in an organicsolvent system. Considering Fig. 3A and B together, the decrease inenzyme activity upon basic incubation represents the combinationof enzyme autolysis and enzyme deactivation by the solvent. As anexample, when placed in 20% acetonitrile, approximately 60% of theenzyme’s activity can be considered lost due to solvent effects (3B),while an additional 25% is lost to autolysis over a 10 min period,giving rise to the observed residual activity (15%) shown in Fig. 3A.Enzyme solubility also contributes to the loss in apparent activity athigh percentages of acetonitrile. These results may not be directlyadditive, but do point to several contributors influencing the finalobserved activity of the enzyme.
3.6. SDS-PAGE analysis of BSA digestions
The BAEE results provide valuable insights into the influence ofsolvent as well as temperature and enzyme source on the activ-ity of trypsin. However, BAEE is not a proper substitute for the
200 M.J. Wall et al. / Analytica Chimica Acta 703 (2011) 194– 203
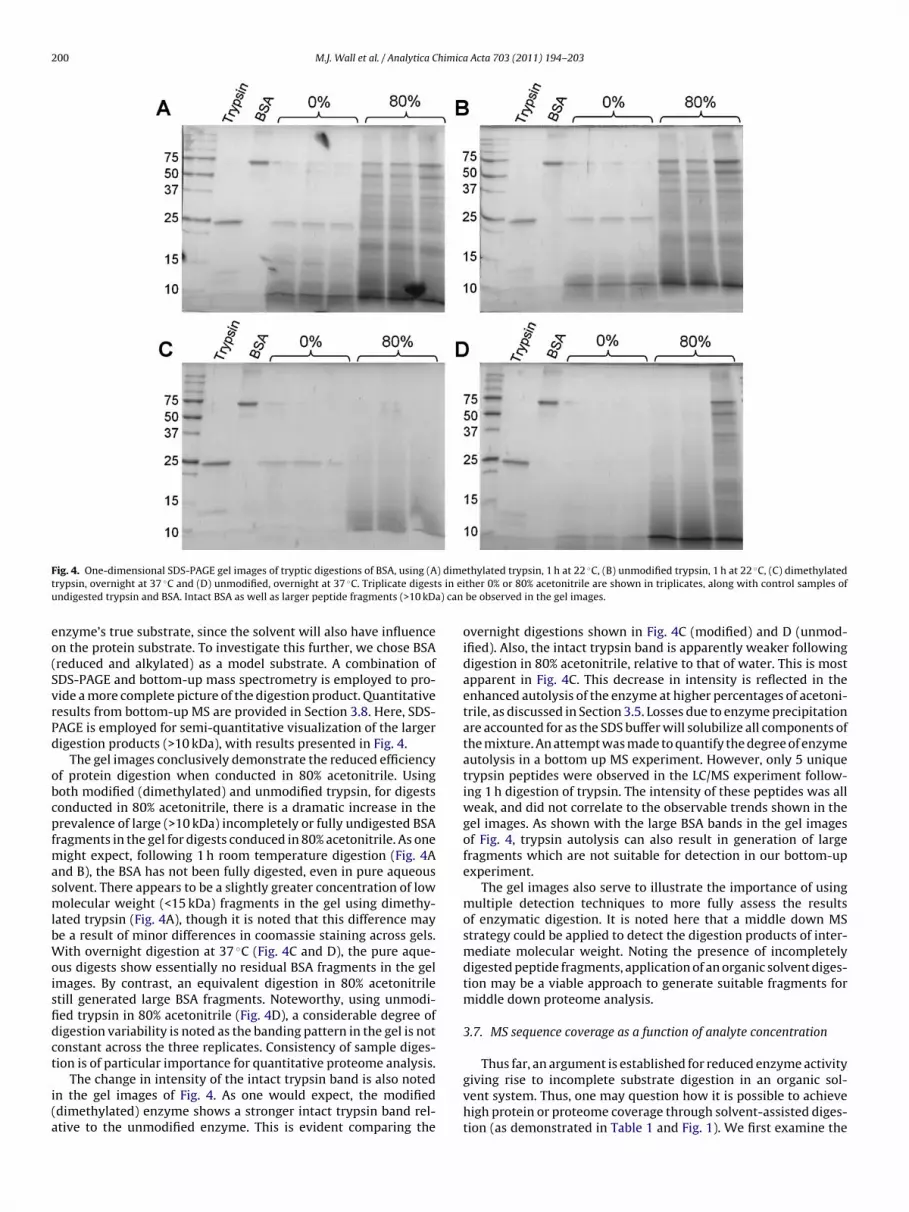
F ) dimet s in eiu ) can
eo(SvrPd
obcpfmasmlbWoisfidct
i(a
ig. 4. One-dimensional SDS-PAGE gel images of tryptic digestions of BSA, using (Arypsin, overnight at 37 ◦C and (D) unmodified, overnight at 37 ◦C. Triplicate digestndigested trypsin and BSA. Intact BSA as well as larger peptide fragments (>10 kDa
nzyme’s true substrate, since the solvent will also have influencen the protein substrate. To investigate this further, we chose BSAreduced and alkylated) as a model substrate. A combination ofDS-PAGE and bottom-up mass spectrometry is employed to pro-ide a more complete picture of the digestion product. Quantitativeesults from bottom-up MS are provided in Section 3.8. Here, SDS-AGE is employed for semi-quantitative visualization of the largerigestion products (>10 kDa), with results presented in Fig. 4.
The gel images conclusively demonstrate the reduced efficiencyf protein digestion when conducted in 80% acetonitrile. Usingoth modified (dimethylated) and unmodified trypsin, for digestsonducted in 80% acetonitrile, there is a dramatic increase in therevalence of large (>10 kDa) incompletely or fully undigested BSAragments in the gel for digests conduced in 80% acetonitrile. As one
ight expect, following 1 h room temperature digestion (Fig. 4And B), the BSA has not been fully digested, even in pure aqueousolvent. There appears to be a slightly greater concentration of lowolecular weight (<15 kDa) fragments in the gel using dimethy-
ated trypsin (Fig. 4A), though it is noted that this difference maye a result of minor differences in coomassie staining across gels.ith overnight digestion at 37 ◦C (Fig. 4C and D), the pure aque-
us digests show essentially no residual BSA fragments in the gelmages. By contrast, an equivalent digestion in 80% acetonitriletill generated large BSA fragments. Noteworthy, using unmodi-ed trypsin in 80% acetonitrile (Fig. 4D), a considerable degree ofigestion variability is noted as the banding pattern in the gel is notonstant across the three replicates. Consistency of sample diges-ion is of particular importance for quantitative proteome analysis.
The change in intensity of the intact trypsin band is also notedn the gel images of Fig. 4. As one would expect, the modifieddimethylated) enzyme shows a stronger intact trypsin band rel-tive to the unmodified enzyme. This is evident comparing the
thylated trypsin, 1 h at 22 ◦C, (B) unmodified trypsin, 1 h at 22 ◦C, (C) dimethylatedther 0% or 80% acetonitrile are shown in triplicates, along with control samples of
be observed in the gel images.
overnight digestions shown in Fig. 4C (modified) and D (unmod-ified). Also, the intact trypsin band is apparently weaker followingdigestion in 80% acetonitrile, relative to that of water. This is mostapparent in Fig. 4C. This decrease in intensity is reflected in theenhanced autolysis of the enzyme at higher percentages of acetoni-trile, as discussed in Section 3.5. Losses due to enzyme precipitationare accounted for as the SDS buffer will solubilize all components ofthe mixture. An attempt was made to quantify the degree of enzymeautolysis in a bottom up MS experiment. However, only 5 uniquetrypsin peptides were observed in the LC/MS experiment follow-ing 1 h digestion of trypsin. The intensity of these peptides was allweak, and did not correlate to the observable trends shown in thegel images. As shown with the large BSA bands in the gel imagesof Fig. 4, trypsin autolysis can also result in generation of largefragments which are not suitable for detection in our bottom-upexperiment.
The gel images also serve to illustrate the importance of usingmultiple detection techniques to more fully assess the resultsof enzymatic digestion. It is noted here that a middle down MSstrategy could be applied to detect the digestion products of inter-mediate molecular weight. Noting the presence of incompletelydigested peptide fragments, application of an organic solvent diges-tion may be a viable approach to generate suitable fragments formiddle down proteome analysis.
3.7. MS sequence coverage as a function of analyte concentration
Thus far, an argument is established for reduced enzyme activity
giving rise to incomplete substrate digestion in an organic sol-vent system. Thus, one may question how it is possible to achievehigh protein or proteome coverage through solvent-assisted diges-tion (as demonstrated in Table 1 and Fig. 1). We first examine the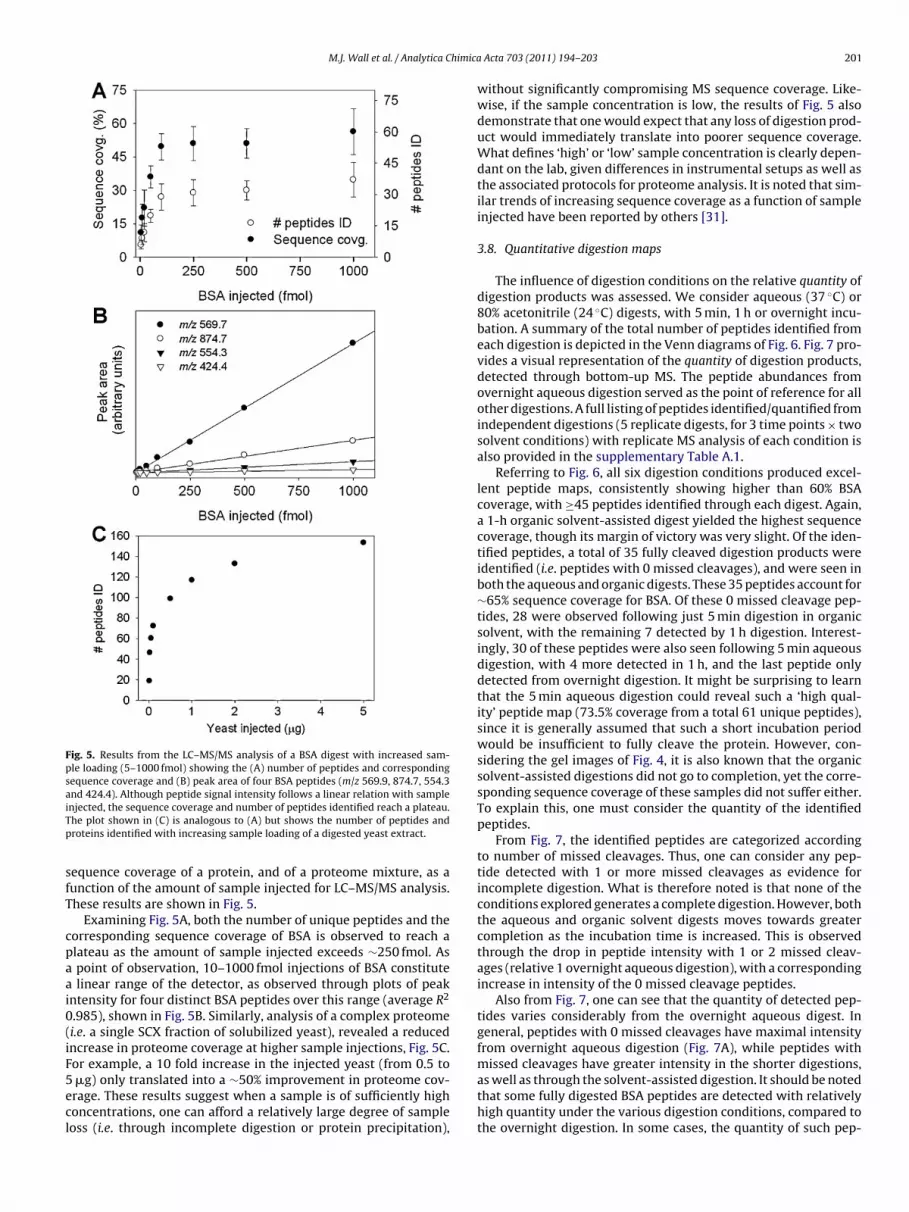
M.J. Wall et al. / Analytica Chimica
Fig. 5. Results from the LC–MS/MS analysis of a BSA digest with increased sam-ple loading (5–1000 fmol) showing the (A) number of peptides and correspondingsequence coverage and (B) peak area of four BSA peptides (m/z 569.9, 874.7, 554.3and 424.4). Although peptide signal intensity follows a linear relation with sampleiTp
sfT
cpaai0(iF5ecl
njected, the sequence coverage and number of peptides identified reach a plateau.he plot shown in (C) is analogous to (A) but shows the number of peptides androteins identified with increasing sample loading of a digested yeast extract.
equence coverage of a protein, and of a proteome mixture, as aunction of the amount of sample injected for LC–MS/MS analysis.hese results are shown in Fig. 5.
Examining Fig. 5A, both the number of unique peptides and theorresponding sequence coverage of BSA is observed to reach alateau as the amount of sample injected exceeds ∼250 fmol. As
point of observation, 10–1000 fmol injections of BSA constitute linear range of the detector, as observed through plots of peakntensity for four distinct BSA peptides over this range (average R2
.985), shown in Fig. 5B. Similarly, analysis of a complex proteomei.e. a single SCX fraction of solubilized yeast), revealed a reducedncrease in proteome coverage at higher sample injections, Fig. 5C.or example, a 10 fold increase in the injected yeast (from 0.5 to
�g) only translated into a ∼50% improvement in proteome cov-rage. These results suggest when a sample is of sufficiently highoncentrations, one can afford a relatively large degree of sampleoss (i.e. through incomplete digestion or protein precipitation),
Acta 703 (2011) 194– 203 201
without significantly compromising MS sequence coverage. Like-wise, if the sample concentration is low, the results of Fig. 5 alsodemonstrate that one would expect that any loss of digestion prod-uct would immediately translate into poorer sequence coverage.What defines ‘high’ or ‘low’ sample concentration is clearly depen-dant on the lab, given differences in instrumental setups as well asthe associated protocols for proteome analysis. It is noted that sim-ilar trends of increasing sequence coverage as a function of sampleinjected have been reported by others [31].
3.8. Quantitative digestion maps
The influence of digestion conditions on the relative quantity ofdigestion products was assessed. We consider aqueous (37 ◦C) or80% acetonitrile (24 ◦C) digests, with 5 min, 1 h or overnight incu-bation. A summary of the total number of peptides identified fromeach digestion is depicted in the Venn diagrams of Fig. 6. Fig. 7 pro-vides a visual representation of the quantity of digestion products,detected through bottom-up MS. The peptide abundances fromovernight aqueous digestion served as the point of reference for allother digestions. A full listing of peptides identified/quantified fromindependent digestions (5 replicate digests, for 3 time points × twosolvent conditions) with replicate MS analysis of each condition isalso provided in the supplementary Table A.1.
Referring to Fig. 6, all six digestion conditions produced excel-lent peptide maps, consistently showing higher than 60% BSAcoverage, with ≥45 peptides identified through each digest. Again,a 1-h organic solvent-assisted digest yielded the highest sequencecoverage, though its margin of victory was very slight. Of the iden-tified peptides, a total of 35 fully cleaved digestion products wereidentified (i.e. peptides with 0 missed cleavages), and were seen inboth the aqueous and organic digests. These 35 peptides account for∼65% sequence coverage for BSA. Of these 0 missed cleavage pep-tides, 28 were observed following just 5 min digestion in organicsolvent, with the remaining 7 detected by 1 h digestion. Interest-ingly, 30 of these peptides were also seen following 5 min aqueousdigestion, with 4 more detected in 1 h, and the last peptide onlydetected from overnight digestion. It might be surprising to learnthat the 5 min aqueous digestion could reveal such a ‘high qual-ity’ peptide map (73.5% coverage from a total 61 unique peptides),since it is generally assumed that such a short incubation periodwould be insufficient to fully cleave the protein. However, con-sidering the gel images of Fig. 4, it is also known that the organicsolvent-assisted digestions did not go to completion, yet the corre-sponding sequence coverage of these samples did not suffer either.To explain this, one must consider the quantity of the identifiedpeptides.
From Fig. 7, the identified peptides are categorized accordingto number of missed cleavages. Thus, one can consider any pep-tide detected with 1 or more missed cleavages as evidence forincomplete digestion. What is therefore noted is that none of theconditions explored generates a complete digestion. However, boththe aqueous and organic solvent digests moves towards greatercompletion as the incubation time is increased. This is observedthrough the drop in peptide intensity with 1 or 2 missed cleav-ages (relative 1 overnight aqueous digestion), with a correspondingincrease in intensity of the 0 missed cleavage peptides.
Also from Fig. 7, one can see that the quantity of detected pep-tides varies considerably from the overnight aqueous digest. Ingeneral, peptides with 0 missed cleavages have maximal intensityfrom overnight aqueous digestion (Fig. 7A), while peptides withmissed cleavages have greater intensity in the shorter digestions,
as well as through the solvent-assisted digestion. It should be notedthat some fully digested BSA peptides are detected with relativelyhigh quantity under the various digestion conditions, compared tothe overnight digestion. In some cases, the quantity of such pep-
202 M.J. Wall et al. / Analytica Chimica Acta 703 (2011) 194– 203
F percend imes
teottter
ptdtscreg
Fiqad
ig. 6. Venn diagrams show the comparison of the peptides identified, as well as
igestions in (A) aqueous 37 ◦C and (B) 80% acetonitrile 24 ◦C using the incubation t
ides is actually higher from shorter digestion times, which can bexplained through possible side reactions (chymotrypsin, peptidexidation, etc.), which would shift the mass of these peptides andhus lower the observed intensity. One can therefore infer that cer-ain portions of the BSA protein are digested by trypsin more rapidlyhan others. However, considering the protein as a whole, it is stillvident that a longer digestion time increases the quantity of theesulting digestion products.
Taking both Figs. 6 and 7 into consideration, while high qualityeptide maps are possible through rapid, solvent-assisted diges-ions, this in itself cannot be taken as evidence for improvedigestion efficiency. Our results clearly indicate a difference inhe quantity of the resulting digestion products, wherein organicolvent-assisted digestion generally produces a significantly loweroncentration of peptides. However, the variety of peptides
emains, albeit at reduced sample quantity. In fact, given the pres-nce of peptides with multiple missed cleavage sites, an evenreater variety of peptides is present from solvent-assisted diges-ig. 7. Quantitative maps show the relative concentration of peptides detected in a (A) 5 mn 80% acetonitrile (ACN5min), (D) 1 h digestion in 80% acetonitrile (ACN1h) and (E) overuantified in an aqueous overnight digestion (AqO/N). Each bar in the plots represents a sirranged in order according to observed ratio vs. conventional digestion. Bars which exteetected in only one of the test or the aqueous overnight digestion. A full listing of the pe
t sequence coverage and total peptides observed from LC–MS/MS analysis of theof 5 min, 1 h and overnight (16 h).
tion, which in itself can explain the improved sequence coverageobserved through such a digestion protocol. As discussed fromFig. 5, the inefficient digests observed for both solvent-assisteddigestion, as well as rapid (5 min) aqueous digestion do not trans-late into notable drops in the number of peptides identified. In thiscase, the concentration of protein being analyzed was sufficientlyhigh that even the small quantity of digestion products produced(see peptide quantity ratios of Fig. 7) could be detected and identi-fied. Thus, if high protein sequence coverage is the only goal of theexperiment, either a rapid aqueous digestion, or a solvent-assisteddigestion can achieve this result, so long as sufficient protein isavailable.
Considering other aspects of proteome analysis, the incorpora-tion of a ‘complete’ (or near complete) digestion into the workflowis favoured when sample is limited, as well as for absolute quanti-
tation. For accurate quantitation, one makes an assumption that agiven number of moles of protein will generate the same numberof moles of peptide. If the digestion is only 10% efficient, then thein aqueous digestion (Aq5min), (B) 1 h aqueous digestion (Aq1h), (C) 5 min digestionnight digestion in 80% acetonitrile (ACNO/N), versus those peptides detected andngle peptide, sorted first according to number of missed cleavages (0, 1 or 2), thennd to the edges of the graph (ratio >100 or <0.01) represent peptides which were
ptides used to generate these plots can be found in Appendix A.
himica
pt(tott(tcoqaod
4
‘rthlfudtcstt5tsrwrqgat
A
tc
[[
[
[[
[[[[
[
[
[[
[
[[[[
M.J. Wall et al. / Analytica C
rotein quantity will be underestimated by a factor of 10. Whilehe conventional (aqueous overnight) digestion is still not idealsome missed cleavage products observed), it does present the bet-er option relative to rapid, solvent-assisted digestions. Certainly,ne might explore other digestion conditions, such as the addi-ion of a second aliquot of trypsin to the sample to help furtherhe reaction. The incorporation of lower percentages of acetonitrile10–20%) would also appear a reasonable strategy. Finally, we notehat our results were generated under a defined set of digestiononditions, and (primarily) for a given protein substrate. Clearly,ther variables are at play which will influence the variety anduantity of the resulting digestion products. Nonetheless, solvent-ssisted digestion can be described as yielding a partial cleavagef the sample with reduced quantity of desirable (fully cleaved)igestion products
. Concluding remarks
The assumption that improved protein sequence coverage fromimproved’ organic solvent digestions is flawed. Partial digestionesults when trypsin is placed in a high concentration of ace-onitrile. Nonetheless, high sequence coverage is possible despiteaving minimal quantity of digestion products. The presence of
arger peptides with multiple missed cleavages can be favouredor generation of high-coverage protein maps, and may also havese for other applications such as middle-down proteomics. Similarigestion maps are obtained from a rapid (5 min) aqueous diges-ion, though again it is known that the digestion has not gone toompletion. Given the importance of high peptide variety for highequence coverage, we suggest a proteomics experiment whereinhe sample is split in two, subject to varying digestion conditions,hen recombined for LC/MS analysis (e.g. partial digest through
min reaction in aqueous solvent, as well as more complete diges-ion through overnight aqueous incubation). In general, organicolvent-assisted digestion is prone to other variables, such aseaction temperature and enzyme source (modified/unmodified),hich brings a concern for inter-lab variability, and generally
esults in incomplete digestion which negates its use for proteinuantitation. Consistency in the digestion should be viewed withreater importance over digestion rate, and thus a conventionalqueous digestion is still viewed as the favoured approach for pro-eome analysis.
cknowledgments
The authors thank Mr. Steve Doucette, senior biostatistician athe Capital District Health Authority, Halifax, Nova Scotia, whoonducted the statistical analysis of variance presented in this
[[[[
Acta 703 (2011) 194– 203 203
work. The authors also acknowledge the Natural Sciences and Engi-neering Research Council of Canada, the Canada Foundation forInnovation and the Nova Scotia Research and Innovation Trust forproviding funding to support this work.
Appendix A. Supplementary data
Supplementary data associated with this article can be found, inthe online version, at doi:10.1016/j.aca.2011.07.025.
References
[1] K.R. Durbin, J.C. Tran, L. Zamdborg, S.M.M. Sweet, A.D. Catherman, J.E. Lee, M.Li, J.F. Kellie, N.L. Kelleher, Proteomics 10 (2010) 3589–3597.
[2] J. Rodriguez, N. Gupta, R.D. Smith, P.A. Pevzner, J. Proteome Res. 7 (2008)300–305.
[3] B. Granvogl, P. Gruber, L.A. Eichacker, Proteomics 7 (2007) 642–654.[4] X.Q. Xu, C.H. Deng, P.Y. Yang, X.M. Zhang, J. Proteome Res. 6 (2007) 3849–3855.[5] A. Doucette, D. Craft, L. Li, J. Am. Soc. Mass Spectrom. 14 (2003) 203–214.[6] S.S. Lin, C.H. Wu, M.C. Sun, C.M. Sun, Y.P. Ho, J. Am. Soc. Mass Spectrom. 16
(2005) 581–588.[7] N. Zhang, R. Chen, N. Young, D. Wishart, P. Winter, J.H. Weiner, L. Li, Proteomics
7 (2007) 484–493.[8] R. Rial-Otero, R.J. Carreira, F.M. Cordeiro, A.J. Moro, H.M. Santos, G. Vale, I.
Moura, J.L. Capelo, J. Chromatogr. A 1166 (2007) 101–107.[9] D. Lopez-Ferrer, K. Petritis, N.M. Lourette, B. Clowers, K.K. Hixson, T. Heibeck,
D.C. Prior, L. Pasa-Tolic, D.G. Camp, M.E. Belov II., R.D. Smith, Anal. Chem. 80(2008) 8930–8936.
10] W.K. Russell, Z.Y. Park, D.H. Russell, Anal. Chem. 73 (2001) 2682–2685.11] G.W. Slysz, D.C. Schriemer, Rapid Commun. Mass Spectrom. 17 (2003)
1044–1050.12] M.A. Kuzyk, D. Smith, J. Yang, T.J. Cross, A.M. Jackson, D.B. Hardie, N.L. Anderson,
C.H. Borchers, Mol. Cell. Proteomics 8 (2009) 1860–1877.13] A. Doucette, D. Craft, L. Li, Anal. Chem. 72 (2000) 3355–3362.14] J.L. Proc, M.A. Kuzyk, D.B. Hardie, J. Yang, D.S. Smith, A.M. Jackson, C.E. Parker,
C.H. Borchers, J. Proteome Res. 9 (2010) 5422–5437.15] A.M. Klibanov, Nature 409 (2001) 241–246.16] M.N. Gupta, I. Roy, Eur. J. Biochem. 271 (2004) 2575–2583.17] W.J. Hervey IV, M.B. Strader, G.B. Hurst, J. Proteome Res. 6 (2007) 3054–3061.18] C.G. Arsene, R. Ohlendorf, W. Burkitt, C. Pritchard, A. Henrion, G. O’Connor, D.M.
Bunk, B. Guettler, Anal. Chem. 80 (2008) 4154–4160.19] M.B. Strader, D.L. Tabb, W.J. Hervey, C.L. Pan, G.B. Hurst, Anal. Chem. 78 (2006)
125–134.20] Y.L. Khmelnitsky, V.V. Mozhaev, A.B. Belova, M.V. Sergeeva, K. Martinek, Eur. J.
Biochem. 198 (1991) 31–41.21] R. Batra, M.N. Gupta, Biotechnol. Lett. 16 (1994) 1059–1064.22] C. Polson, P. Sarkar, B. Incledon, V. Raguvaran, R. Grant, J. Chromatogr. B 785
(2003) 263–275.23] D. Botelho, M.J. Wall, D.B. Vieira, S. Fitzsimmons, F. Liu, A. Doucette, J. Proteome
Res. 9 (2010) 2863–2870.24] J.E. Melanson, S.L. Avery, D.M. Pinto, Proteomics 6 (2006) 4466–4474.25] G.W. Schwert, Y. Takenaka, Biochim. Biophys. Acta 16 (1955) 570–575.26] U.K. Laemmli, Nature 227 (1970) 680–685.27] A. Shevchenko, H. Tomas, J. Havlis, J.V. Olsen, M. Mann, Nat. Protocols 1 (2006)
2856–2860.28] W.J. Hervey, M.B. Strader, G.B. Hurst, J. Proteome Res. 6 (2007) 3054–3061.29] N. Wang, L. Li, Anal. Chem. 80 (2008) 4696–4710.30] J.C. Mathies, M.A. Austin, Clin. Chem. 26 (1980) 1760.31] N. Wang, C. Xie, J.B. Young, L. Li, Anal. Chem. 81 (2009) 1049–1060.