a classical brown adipose tissue mrna signature partly overlaps with brite in the supraclavicular...
TRANSCRIPT

Cell Metabolism
Short Article
A Classical Brown Adipose TissuemRNA Signature Partly Overlaps with Britein the Supraclavicular Region of Adult HumansNaja Zenius Jespersen,1,7 Therese Juhlin Larsen,1,7 Lone Peijs,1 Søren Daugaard,2 Preben Homøe,3 Annika Loft,4
Jasper de Jong,5 Neha Mathur,1 Barbara Cannon,5 Jan Nedergaard,5 Bente Klarlund Pedersen,1 Kirsten Møller,1,6
and Camilla Scheele1,*1Centre of Inflammation and Metabolism, Department of Infectious Diseases2Department of Pathology3Department of Oto-Rhino-Laryngology, Head and Neck Surgery and Audiology4Department of Clinical Physiology, Nuclear Medicine and PET
Rigshospitalet, DK-2100 Copenhagen, Denmark5Department of Molecular Biosciences, The Wenner-Gren Institute, Stockholm University, SE-106 91 Stockholm, Sweden6Neurointensive Care Unit, Department of Neuroanaesthesia, Rigshospitalet, DK-2100 Copenhagen, Denmark7These authors contributed equally to this work
*Correspondence: [email protected]://dx.doi.org/10.1016/j.cmet.2013.04.011
SUMMARY
Human brown adipose tissue (BAT) has beendetected in adults but was recently suggested tobe of brite/beige origin. We collected BAT fromthe supraclavicular region in 21 patients undergoingsurgery for suspected cancer in the neck area andassessed the gene expression of established mu-rine markers for brown, brite/beige, and whiteadipocytes. We demonstrate that a classical brownexpression signature, including upregulation ofmiR-206, miR-133b, LHX8, and ZIC1 and downre-gulation of HOXC8 and HOXC9, coexists with anupregulation of two newly established brite/beigemarkers, TBX1 and TMEM26. A similar mRNAexpression profile was observed when comparingisolated human adipocytes from BAT and whiteadipose tissue (WAT) depots, differentiatedin vitro. In conclusion, our data suggest that humanBAT might consist of both classical brown andrecruitable brite adipocytes, an observation impor-tant for future considerations on how to induce hu-man BAT.
INTRODUCTION
Metabolically active brown adipose tissue (BAT) depots
have been detected in adult humans by positron emission to-
mography/computed tomography with the glucose analog
F18-fluorodeoxyglucose (FDG-PET/CT). Human BAT is located
mainly to the cervical, supraclavicular, and paravertebral areas
and can be activated by cold (Nedergaard et al., 2007; van
Marken Lichtenbelt et al., 2009; Cypess et al., 2009; Virtanen
et al., 2009; Zingaretti et al., 2009; Saito et al., 2009). BAT
provides nonshivering thermogenesis through the action of un-
798 Cell Metabolism 17, 798–805, May 7, 2013 ª2013 Elsevier Inc.
coupling protein 1 (UCP1) (Matthias et al., 2000), and human
BAT activity correlates negatively with body mass index (BMI)
(Cypess et al., 2009; Saito et al., 2009). In mice, BAT is an
important regulator of whole-body metabolism (Cannon and
Nedergaard, 2004). Whether BAT has a similar role in humans
is not yet known, and further characterization is therefore
warranted.
Classical brown fat and skeletal muscle progenitors share a
common progenitor (Atit et al., 2006; Timmons et al., 2007; Seale
et al., 2008; Kajimura et al., 2009), whereas precursors within
both white fat depots and skeletal muscle can be recruited to ex-
press some brown fat properties (Petrovic et al., 2010; Seale
et al., 2011; Schulz et al., 2011). These adipocytes are called
‘‘brite,’’ ‘‘beige,’’ or ‘‘recruitable brown’’ adipocytes (from now
on annotated as ‘‘brite’’ in the current manuscript). Murine white
adipose tissues can be divided into brite and white based on
UCP1 induction during cold acclimation. It has been found that
the subcutaneous depot, inguinal white adipose tissue (WAT),
represents a brite phenotype (Walden et al., 2012; Seale et al.,
2011).
It was recently proposed that supraclavicular fat of adult hu-
mans consists of brite rather than classical brown fat (Wu
et al., 2012; Sharp et al., 2012). However, in order to exclude
the possibility of the presence of classical brown fat in adult hu-
mans, the newly established markers must be compared with
well-established markers in a larger sample set. This is impor-
tant, as it is possible that the regulation and function of brown
and brite adipose tissue differ, and the mode of recruiting the tis-
sue for counteracting the development of obesity might depend
on the nature of the tissue.
Therefore, the aim of this study was to further assess the na-
ture of human BAT from the supraclavicular regions, in compar-
ison to WAT from subcutaneous abdominal biopsies, by
measuring a range of well-established as well as newly identified
markers for brown and brite fat. A further aim was to examine
whether preadipocytes could be differentiated from the above-
mentioned depots and to assess whether the marker expression
signature was conserved.

Table 1. Subject Characteristics and Sample Description
Subject Diagnosisa Age Gender BMI
Reported Change
in Weight within
6 Months
FDG-PET/
CT Scan
Biopsy
LevelcUCP1 IHC
Staining
UCP1 mRNA/
18S Relative
to WAT
UCP1
Western
Blot
Duplicate
Samples
1 Thyroid cancer 49 M 26 – n/a IV – 0.5 33.1
21 Thyroid cancer 63 F 28 – n/a IV n/a 1.6 109.9
7 Thyroid cancer 54 M 28 – n/a n/a + 2.3 2.9
2 Thyroid cancer 84 M 27 – – IV – 5.0 101.9
17 Tonsillar
carcinoma
69 M 22 – – IV – 8.9 122.1
13 Thyroid cancer 26 F 28 – – IV + 11.1 85.8
18 Benign thyroid
adenoma
51 F 23 – – IV – 17.3 n/a
16 Tonsillar
carcinoma
54 F 21 – – VI + 17.7 n/a 16a
3 Oral squamous
cell carcinoma
57 M 18 Minus 12.5 kg – IV – 22.8 85.6
12a Thyroid cancer 22 M 20 – + VI + 152.1 86.6
16b Tonsillar
carcinoma
54 F 21 – – VI n/a 161.6 175.6 16b
20a Benign thyroid
adenoma
32 F 21 – n/a IV + 276.9 n/a 20a
4a Thyroid cancer 34 F 22 – n/a VB + 439.6 n/a
9a Thyroid cancer 28 M 22 – – IV + 521.5 n/a 9a
20b Benign thyroid
adenoma
32 F 21 – n/a VI n/a 1,601.9 222.6 20b
15 Thyroid cancer 47 M 28 – – VI – 2,737.3 161.3
9b Thyroid cancer 28 M 22 – – IV n/a 9,565.0 n/a 9b
19 Thyroid cancer 23 M 24 – n/a VI + 10,054.5 n/a
8a Thyroid cancer 43 F 26 – n/a IV + 12,594.9 141.0
6 Thyroid cancer 38 F 26 Minus 2 kg n/a IV + 13,677.8 62.9
5 Thyroid cancer 57 F 31 – – IV + 20,717.3 93.5
10 Thyroid cancer 60 F 22 – – n/a – 42,777.1 n/a
11a Thyroid cancer 30 M 23 – n/a IV + 43,449.5 191.3
14 Oral squamous
cell carcinoma
56 F 22 – – VI + 82,125.9 159.9
aSamples from which cell cultures were included in the current study.bDuplicate samples.cBiopsy levels are visually described in Figure 1A.
Cell Metabolism
Human BAT—Brown and Brite?
RESULTS
Subject CharacterizationTwenty-one patients were involved in the study (Table 1). In 16 of
the 17 patients in whom thyroid disease was suspected, thyroid-
stimulating hormone (TSH) was measured within 1 week prior to
operation. None of the patients were diagnosed with hyperthy-
roidism. Two of the included patients had previously been diag-
nosed with hypothyroidism, whereas two others had elevated
TSH levels in accordance with such a diagnosis. Subject 12,
who was the only patient with a BAT-positive FDG-PET/CT
scan, was diagnosed with a mutation in the RET-proto-onco-
gene which is associated with various human cancers including
thyroid cancer and pheochromocytoma. He did, however, have
normal plasma-metanephrine (an epinephrine metabolite used
to diagnose pheochromocytoma) and normal urine cathechol-
C
amine levels, and had thus no adrenal gland involvement. Sub-
ject 3 displayed signs of cancer-induced cachexia with a re-
ported weight loss of 12.5 kg within 6 months prior to
operation, equivalent to 19% of his total body weight.
Indications for Brown Fat Activity in Adult HumansPatients were kept normothermic during both FDG-PET/CT scan
and during the surgery when supraclavicular biopsies were
collected (Figure 1A). In accordance, only 1 of the 12 FDG-
PET/CT scanned subjects had PET-detectable brown fat activity
(Table 1). Nevertheless, all subjects assessed had detectable
UCP1 mRNA in the biopsies (Table 1). In 3 of the 21 patients
enrolled in the study, biopsies from two separated areas were
obtained. As the UCP1 expression varied between samples ob-
tained from the same subject (Table 1), all biopsies were
included as individual samples. Thus, in total we assessed
ell Metabolism 17, 798–805, May 7, 2013 ª2013 Elsevier Inc. 799
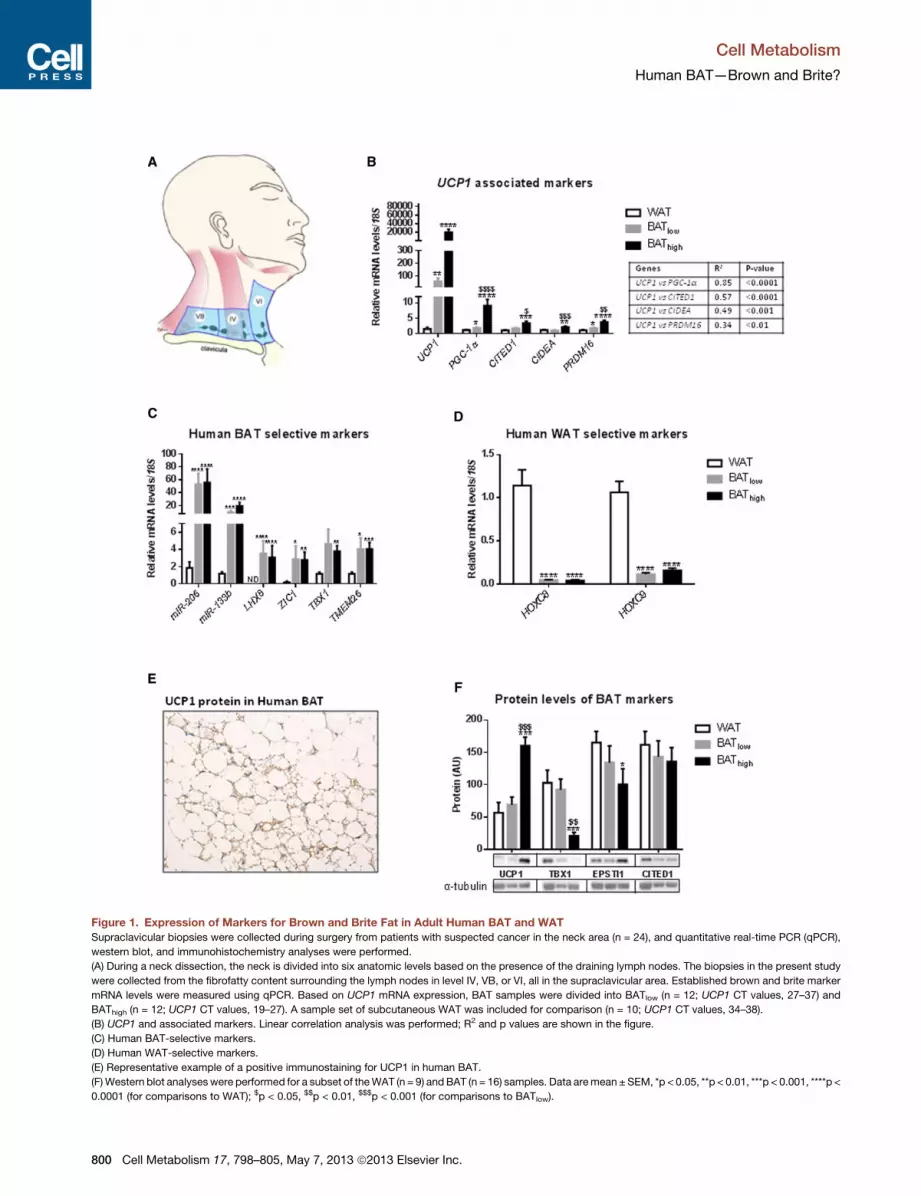
Figure 1. Expression of Markers for Brown and Brite Fat in Adult Human BAT and WAT
Supraclavicular biopsies were collected during surgery from patients with suspected cancer in the neck area (n = 24), and quantitative real-time PCR (qPCR),
western blot, and immunohistochemistry analyses were performed.
(A) During a neck dissection, the neck is divided into six anatomic levels based on the presence of the draining lymph nodes. The biopsies in the present study
were collected from the fibrofatty content surrounding the lymph nodes in level IV, VB, or VI, all in the supraclavicular area. Established brown and brite marker
mRNA levels were measured using qPCR. Based on UCP1 mRNA expression, BAT samples were divided into BATlow (n = 12; UCP1 CT values, 27–37) and
BAThigh (n = 12; UCP1 CT values, 19–27). A sample set of subcutaneous WAT was included for comparison (n = 10; UCP1 CT values, 34–38).
(B) UCP1 and associated markers. Linear correlation analysis was performed; R2 and p values are shown in the figure.
(C) Human BAT-selective markers.
(D) Human WAT-selective markers.
(E) Representative example of a positive immunostaining for UCP1 in human BAT.
(F)Western blot analyseswere performed for a subset of theWAT (n = 9) andBAT (n = 16) samples. Data aremean ± SEM, *p < 0.05, **p < 0.01, ***p < 0.001, ****p <
0.0001 (for comparisons to WAT); $p < 0.05, $$p < 0.01, $$$p < 0.001 (for comparisons to BATlow).
Cell Metabolism
Human BAT—Brown and Brite?
800 Cell Metabolism 17, 798–805, May 7, 2013 ª2013 Elsevier Inc.

Cell Metabolism
Human BAT—Brown and Brite?
mRNA levels in 24 samples. No correlations between UCP1 and
gender, age, or BMI were observed (data not shown).
Based on the large variation inUCP1mRNA levels, we divided
our BAT data set into BATlow (n = 12) and BAThigh (n = 12) groups
and assessed established markers for BAT, WAT, and brite fat.
For comparison, we included a WAT sample set (n = 10), ob-
tained from other patients, consisting of abdominal subcutane-
ous fat biopsies collected during gallstone surgery (see Table
S1 online). Although there was an overlap between some sam-
ples in BATlow with some samples in WAT, as a group BATlowhad a higher UCP1 expression compared to WAT (Figure 1B).
UCP1mRNA levels correlated with several other factors previ-
ously associated with the presence of active BAT or brite recruit-
ment in mice, including PGC-1a, CITED1, CIDEA, and PRDM16
(Figure 1B) (Puigserver et al., 1998; Sharp et al., 2012; Bostrom
et al., 2012; Seale et al., 2008, 2011; Kajimura et al., 2009).
This indicates a distinct degree of brown fat activity, in particular
in the BAThigh samples.
Overlap between Markers for Classical Brown and BriteAdipocytesTo further characterize humanBAT, wemeasured a range of pre-
viously identified markers and grouped them based on their
expression in our data set. BAT-selective markers included the
myomiRsmiR-206 andmiR-133b, shown to be present or upre-
gulated inmurine classical BAT (miR-206) (Walden et al., 2012) or
downregulated during browning of WAT (miR-133) and thereby
allowing for Prdm16 to be upregulated (Trajkovski et al., 2012;
Yin et al., 2013). ZIC1 and LHX8, two brown-versus-white
markers (Timmons et al., 2007; Seale et al., 2007), also clustered
with the BAT-selective group. Importantly, neither of these
markers was induced during browning (Petrovic et al., 2010;
Walden et al., 2012) (Figure 1C). Intriguingly, TBX1 and
TMEM26, two markers recently defined as brite in a screening
of immortalized brite and brown cell lines (Wu et al., 2012),
also ended up in the BAT-selective group.
Hoxc8 and Hoxc9 are more highly expressed in WAT and brite
adipocytes compared to BAT (Timmons et al., 2007; Walden
et al., 2012). Here, we observed a lower expression of HOXC8
and HOXC9 in both BAT groups compared to WAT (Figure 1D).
Although Hoxc8 has been shown to be downregulated during
browning of WAT (Mori et al., 2012; Walden et al., 2012),
Hoxc9was induced during browning of white adipocyte cultures
(Petrovic et al., 2010). Thus, our marker expression profiling
strongly suggests the presence of classical BAT in adult humans,
while the upregulation of clonal brite markers allows for the pos-
sibility that both types of adipocytes coexist within human BAT.
Additional markers were measured but either were not selec-
tive for either BAT or WAT or were not detectable (Figure S1).
UCP1 Is Upregulated at Protein Level in Human BATBy using immunohistochemistry analysis, we found that biopsies
from 65% of 20 analyzed patients stained positive for UCP1 pro-
tein (Figure 1E, Table 1). We then measured the UCP1 protein
levels by western blot and, similarly to the mRNA analysis, de-
tected a range of UCP1 expression (Figure 1F). Again, we divided
the data set in a BATlow (n = 8) and a BAThigh (n = 8) group, this
time based on protein expression. The division between BATlowand BAThigh in the protein analysis did not completely match the
C
one for mRNA, probably reflecting the fact that different parts
of the biopsy, with different levels of BAT recruitment, were
used for the two analyses (Table 1). UCP1 was upregulated by
2.8-fold in the BAThigh group compared to the WAT group (n =
9). In contrast to mRNA measurements showing a high expres-
sion of TBX1 in the BAThigh group, protein levels were downregu-
lated in this group compared to BATlow and WAT groups. Thus,
TBX1 seems BAT selective at the mRNA but not the protein level
in humans. EPSTI1 was modestly downregulated in BAThigh,
while protein levels of CITED1 did not differ between groups
(Figure 1F).
Preadipocytes Derived from Human BAT or WATDifferentiated EquallyWe isolated preadipocytes from a subset of the supraclavicular
biopsies (Table 1, subjects from which cell cultures were
analyzed are labeled with an asterisk) and from subcutaneous
abdominal biopsies of age-, BMI- and gender-matched donors
(Table S2). The cells were cultured and differentiated into mature
fat droplet-containing adipocytes (Figure 2A). We included adi-
pocytes derived from three of the samples in the BATlow group
and three of the samples in the BAThigh group. There was no cor-
relation between the UCP1 mRNA levels in the tissue samples
versus the cell samples (data not shown). There was no differ-
ence in oil red O staining or FABP4 mRNA levels between the
two groups, suggesting equal differentiation (Figure 2B).
The Marker Expression Profile in Human BAT IsGenerally Conserved in Isolated AdipocytesDifferentiated adipocytes derived from the supraclavicular re-
gion (BAT-adipocytes) demonstrated a marker expression pro-
file generally in accordance with the tissue BAThigh group. This
included an upregulated UCP1, LHX8, TBX1, PRDM16, and
PGC-1a expression (Figure 2C). Although previously annotated
as murine brown adipocytes markers, EBF3 and FBXO31 were
not annotated as BAT selective in tissue (Wu et al., 2012, and
the current study). In the BAT adipocytes, however, these
markers displayed a modest upregulation (Figure 2C).
Consistent with our findings in BAT tissue,HOXC8 andHOXC9
were expressed much less in BAT compared toWAT adipocytes
(Figure 2D). Thus, the mRNA expression profile observed in tis-
sue seemed to a large extent to be conserved in isolated adipo-
cytes. Additional markers were measured but were not selective
for either BAT or WAT or were not detectable (Figure S2).
Human BAT Adipocytes Respond to NorepinephrineTo further test whether human BAT adipocytes, in relation to
WAT adipocytes, possess BAT-specific properties, we stimu-
lated the differentiated adipocytes with norepinephrine for 4 hr
and subsequently assessed mRNA expression of UCP1 and
UCP1-associated genes from Figure 1B. We observed a sub-
stantial upregulation of PGC-1a and a more modest induction
of UCP1 in BAT compared to WAT adipocytes, while the
tendency for upregulation of additional UCP1-associated genes
did not reach significance (Figure 2E). At the protein level, norepi-
nephrine induced a modest upregulation of UCP1 in BAT adipo-
cytes compared to WAT adipocytes, while CITED1 remained
unchanged (Figure 2F).
ell Metabolism 17, 798–805, May 7, 2013 ª2013 Elsevier Inc. 801

Figure 2. Characterization of Cultured Hu-
man BAT and WAT Adipocytes
Preadipocytes from the subcutaneous abdominal
(WAT) (n = 6) and supraclavicular (BAT) (n = 6) fat
regions differentiated into mature adipocytes
in vitro at passage 4–7.
(A) Differentiation status of WAT and BAT adipo-
cytes. Representative phase contrast pictures
of unstained (103 magnification) and oil red
O-stained (43 magnification) adipocytes.
(B) FABP4 mRNA levels were measured using
qPCR. Oil red O staining was quantified (n = 6 in
each group). Established brown and brite marker
mRNA levels were measured using qPCR.
(C) Human BAT adipocyte-selective markers.
(D) Human WAT-selective markers.
(E) WAT and BAT adipocytes were stimulated with
10 mM norepinephrine (NE) for 4 hr, and qPCR
analysis of UCP1 and associated markers were
performed. For each gene, the level in un-
stimulated WAT (white bars) or BAT (black bars)
adipocytes was set to 1 (stippled line), and the
effect of norepinephrine between BAT and WAT
adipocytes was compared.
(F) Western blot analysis of NE-stimulated adipo-
cytes described in (E). Fold change between NE-
stimulated and unstimulated adipocytes is shown.
Data are mean ± SEM, *p < 0.05, **p < 0.01, ***p <
0.001.
Cell Metabolism
Human BAT—Brown and Brite?
DISCUSSION
We asked whether classical brown fat was present in human
BAT derived from the supraclavicular regions of adults or
whether this depot, as recently implied (Wu et al., 2012; Sharp
et al., 2012), resembles the brite fat type observed within sub-
cutaneous fat and skeletal muscle. We characterized adipose
tissue in the supraclavicular regions of adult humans by
measuring established and novel markers for BAT, WAT, and
brite adipocytes in a cohort of human BAT and WAT tissue and
isolated preadipocytes differentiated in vitro. We demonstrate
a typical classical BAT expression signature in humanBAT tissue
and cells. We were also able to reproduce some of the findings
by Wu et al., as two of the brite markers clustered with the clas-
sical brown markers in the BAT-selective group, suggesting the
possibility of brown and brite adipcytes coexisting in human
BAT. In contrast to WAT adipocytes, BAT adipocytes responded
to norepinephrine treatment by upregulating PGC-1a andUCP1.
A third brite marker defined by Wu et al. (2012), CD137, was
only upregulated in a few of our human BAT samples. Some dif-
ferences between the data sets might explain the discrepancy,
including that the biopsies in the study by Wu et al. were ob-
tained during cold exposure and from healthy subjects, with
BAT and WAT samples collected from the same individual. The
802 Cell Metabolism 17, 798–805, May 7, 2013 ª2013 Elsevier Inc.
majority of our BAT donors had thyroid
cancer, while WAT samples were
obtained from subjects that underwent
gallstone surgery. The possibility of a dis-
ease-induced BAT activity should there-
fore be discussed. We investigated
known relationships between BAT activity
and thyroid cancer including hyperthyroidism (Lopez et al., 2010;
Lee et al., 2012), pheochromocytoma (Hadi et al., 2007; Lean
et al., 1986; Frontini et al., 2013), and cachexia (Frontini et al.,
2013). Of these conditions we only observed one possible
case of cachexia in our cohort. We cannot exclude a potential ef-
fect of disease on BAT activity in our samples but find it unlikely.
We used markers established in murine tissue and cells for
characterization of human BAT. Therefore, we divided the
markers into groups based on their regulation between our hu-
man BAT and WAT samples, regardless of their previous anno-
tation in mice. The UCP1-associated group included markers
that were previously linked to BAT activity as well as browning
(CIDEA, PGC-1a, PRDM16) (Seale et al., 2007, 2011; Petrovic
et al., 2010). Hence, these markers cannot be used to discrimi-
nate between classical brown and brite adipose tissue. CITED1
is a newly defined marker for rosiglitazone-induced browning of
murine subcutaneous adipocytes (Sharp et al., 2012). Consistent
with our findings, Sharp et al. demonstrated a correlation be-
tween CITED1 and PRDM16 mRNA levels as well as costaining
with UCP1 in human supraclavicular BAT. CITED1 was anno-
tated as a brite marker by Sharp et al. However, differences in
CITED1 expression in this original screening may also represent
a rosiglitazone-dependent difference in BAT recruitment,
possibly also inducible in classical BAT, rather than a bona fide

Cell Metabolism
Human BAT—Brown and Brite?
difference between brite and classical brown adipocytes. The
UCP1-coordinated upregulation of these markers strongly sug-
gested brown fat activity in our BAT samples and was in accor-
dance with previous reports on gene expression of PGC-1a and
PRDM16 in human BAT (Virtanen et al., 2009).
BothUCP1mRNA and protein analysis indicated a wide range
of brown fat differentiation across biopsies. We therefore divided
our sample set into two subgroups based on UCP1 expression:
BATlow and BAThigh. We defined the human BAT-selective
markers as being upregulated in both the BATlow and BAThighgroups, and thus expressed independently ofUCP1. We demon-
strate a human classical brown signature with upregulation of
well-established markers for classical BAT including miR-206
and miR-133b, LHX8 and ZIC1, and a downregulation of the
white/brite markers HOXC8 and HOXC9, suggesting that human
BAT originates from a classical brown developmental pathway.
However, consistent with the findings of Wu et al. (2012), TBX1
and TMEM26, annotated as brite markers, were also among
the human BAT-selective genes, potentially suggesting a pres-
ence of both classical brown and brite cell lineages coexisting
within human BAT. Notably, our finding that TBX1 is downregu-
lated at protein levels in the BAThigh group (similarly to the protein
regulation observed between murine BAT and inguinal WAT by
Wu et al.) calls for caution when using this marker for classifica-
tion of human tissue.
There is a current lack of in vitro models for studying hu-
man brown fat function. We demonstrate that preadipocytes
derived from human BAT can be differentiated into mature adi-
pocytes with fat droplets and express established markers for
brown fat. Despite equal rosiglitazone levels in the differentiation
media (which was necessary in order to obtain fat droplets both
in BAT and WAT adipocytes, data not shown), BAT adipocytes
were responsive to thermogenic gene expression induction by
norepinephrine, while WAT adipocytes was not. The thermo-
genic capacity of human BAT adipocytes will be important to
further address in future studies by applying assays for oxygen
consumption and lipid oxidation. Previous models for human
brown adipocytes have been presented (Lee et al., 2011; Nishio
et al., 2012). However, brown versus brite marker expression
profiles have not previously been investigated, which we here
contribute.
In conclusion, we provide data arguing for the presence of
classical BAT in the supraclavicular region of adult humans,
and we demonstrate that preadipocytes can be isolated from
these regions and could be utilized for future studies to further
understand the function of BAT in adult humans. Our data further
indicate that a coexistence of classical brown and brite adipo-
cytes in human BAT should be considered.
EXPERIMENTAL PROCEDURES
Subjects
Twenty-one subjects—10 male and 11 female, aged 22–84 years, under sus-
picion of cancer in the neck and head area—were included in the study (Table
1). Control samples were obtained from the subcutaneous abdominal area of
ten subjects undergoing gallbladder surgery (Table S1). All subjects provided
written informed consent. The Scientific-Ethics Committees of the Capital Re-
gion and of Copenhagen and Frederiksberg Municipalities Denmark approved
the study protocols, journal numbers H-A-2009-020, H-A-2008-081, and (KF)
01-141/04, respectively, and the studies were performed in accordance with
C
the Helsinki declaration. For details, please refer to the Supplemental
Information.
Biopsies
Adipose tissue biopsies were collected during surgery. Experienced surgeons
performed the surgery according to standard procedure with the patient in
general anesthesia. Biopsies from the supraclavicular area were collected as
described in Figure 1A and Table 1. No additional surgery was necessary to
obtain the biopsies. Subcutaneous adipose tissue biopsies from the abdom-
inal area were obtained during gallbladder surgery. Immediately after removal,
tissue samples for RNA and protein analysis were immediately flash frozen in
liquid nitrogen.
Human Primary Adipocyte Cultures
Preadipocytes were isolated from supraclavicular (n = 6) and abdominal sub-
cutaneous (n = 6) adipose tissue biopsies (Table S2). Following 12 days of dif-
ferentiation, cells were harvested for RNA, protein, or oil red O analysis. When
stated in the figure legend, cells were stimulated with 10 mM norepinephrine
(Sigma-Aldrich) for 4 hr before RNA and protein were isolated. Two hours prior
to the norepinephrine stimulation, old medium was replaced by DMEM/F12
containing 1% penicillin-streptomycin. Experiments were performed on cells
at passage 4–7. A detailed isolation and differentiation protocol can be found
in the Supplemental Information.
Oil Red O Staining
The cultured adipocytes were fixed in 10%ShandonGlyo-Fixx (Thermo Scien-
tific), washed twice with distilled water and once with 60% isopropanol, and
then stained with 0.21% oil red O in 100% isopropanol (Sigma-Aldrich) for
30 min. The dye was eluted by adding 100% isopropanol for 8 min, and the
OD was measured at 492 nm in a microplate reader (FLUOstar Optima BMG
Labtech).
RNA Isolation and Quantitative Real-Time PCR
Total RNA from adipose tissue biopsies and human adipocytes was isolated
with TRIzol reagent (Invitrogen), according to the manufacturer’s recommen-
dations. Protocol specifications and primer sequences can be found in the
Supplemental Information. Target mRNA was normalized to 18S ribosomal
RNA and calculated with the deltadelta-Ct method. For the genes expressed
in all samples, relative expression was calculated by relating dCT values for
each sample to the average of dCT values for the WAT samples. For LHX8
and ZIC1, relative expression was calculated by relating dCT values for each
sample to the average of dCT values for the BAT samples.
Protein Analysis
Immunohistochemical analysis was performed at the Department of Pathol-
ogy, Rigshospitalet; UCP1 was detected using rabbit polyclonal anti-UCP1
(ab10983, Abcam), dilution 1:500, protease pretreatment (8 min). Further de-
tails can be found in the Supplemental Information.
Western blot analysis was performed using antibodies against UCP1, TBX1,
and CITED1 from Abcam and a-tubulin from Cell Signaling Technology.
Appropriate secondary HRP-conjugated IgG (Dako) was used for detection
and visualized using Supersignal on a Biorad Chemidoc XRS imager. Image-
Lab (Bio-Rad) were used for quantification of the bands. Further details on
the protein analyses can be found in the Supplemental Information.
Statistical Analysis
Statistical analysis for assessing differences in mRNA levels was performed
using GraphPad Prism software. Data are presented as mean, and error
bars represent SEM. Nonparametric Mann-Whitney tests were used for com-
parisons between WAT and the two BAT groups for each gene. Linear corre-
lation analyses were performed on relative expression levels of UCP1 versus
relative expression values of the other genes. Sample size and significance
level for each analysis are stated in figure legends. A p value of 0.05 was
considered significant.
ell Metabolism 17, 798–805, May 7, 2013 ª2013 Elsevier Inc. 803
Cell Metabolism
Human BAT—Brown and Brite?
SUPPLEMENTAL INFORMATION
Supplemental Information includes two figures, two tables, and Supplemental
Experimental Procedures and can be found with this article online at http://dx.
doi.org/10.1016/j.cmet.2013.04.011.
ACKNOWLEDGMENTS
The Centre of Inflammation andMetabolism (CIM) is supported by a grant from
the Danish National Research Foundation (#02-512-55). This study was further
supported by the Danish Council for Independent Research–Medical Sci-
ences, The Danish Medical Society of Copenhagen, the Beckett Foundation,
and the Augustinus Foundation. CIM is part of the UNIK Project: Food,
Fitness & Pharma for Health and Disease, supported by the Danish Ministry
of Science, Technology and Innovation. CIM is a member of DD2 - the Danish
Center for Strategic Research in Type 2 Diabetes (the Danish Council for Stra-
tegic Research, grant no. 09-067009 and 09-075724). J.N. is on the Scientific
Advisory Board of Ember Therapeutics and is also a shareholder. B.C. is on the
Scientific and Medical Advisory Board of Metabolic Solutions Development
Corporation.
Received: January 29, 2013
Revised: April 7, 2013
Accepted: April 18, 2013
Published: May 7, 2013
REFERENCES
Atit, R., Sgaier, S.K., Mohamed, O.A., Taketo, M.M., Dufort, D., Joyner, A.L.,
Niswander, L., and Conlon, R.A. (2006). Beta-catenin activation is necessary
and sufficient to specify the dorsal dermal fate in the mouse. Dev. Biol. 296,
164–176.
Bostrom, P., Wu, J., Jedrychowski, M.P., Korde, A., Ye, L., Lo, J.C., Rasbach,
K.A., Bostrom, E.A., Choi, J.H., Long, J.Z., et al. (2012). A PGC1-a-dependent
myokine that drives brown-fat-like development of white fat and thermogene-
sis. Nature 481, 463–468.
Cannon, B., and Nedergaard, J. (2004). Brown adipose tissue: function and
physiological significance. Physiol. Rev. 84, 277–359.
Cypess, A.M., Lehman, S., Williams, G., Tal, I., Rodman, D., Goldfine, A.B.,
Kuo, F.C., Palmer, E.L., Tseng, Y.H., Doria, A., et al. (2009). Identification
and importance of brown adipose tissue in adult humans. N. Engl. J. Med.
360, 1509–1517.
Frontini, A., Vitali, A., Perugini, J., Murano, I., Romiti, C., Ricquier, D., Guerrieri,
M., and Cinti, S. (2013). White-to-brown transdifferentiation of omental adipo-
cytes in patients affected by pheochromocytoma. Biochim. Biophys. Acta
1831, 950–959.
Hadi, M., Chen, C.C., Whatley, M., Pacak, K., and Carrasquillo, J.A. (2007).
Brown fat imaging with (18)F-6-fluorodopamine PET/CT, (18)F-FDG PET/CT,
and (123)I-MIBG SPECT: a study of patients being evaluated for pheochromo-
cytoma. J. Nucl. Med. 48, 1077–1083.
Kajimura, S., Seale, P., Kubota, K., Lunsford, E., Frangioni, J.V., Gygi, S.P.,
and Spiegelman, B.M. (2009). Initiation of myoblast to brown fat switch by a
PRDM16-C/EBP-beta transcriptional complex. Nature 460, 1154–1158.
Lean, M.E., James, W.P., Jennings, G., and Trayhurn, P. (1986). Brown adi-
pose tissue in patients with phaeochromocytoma. Int. J. Obes. 10, 219–227.
Lee, P., Swarbrick, M.M., Zhao, J.T., and Ho, K.K. (2011). Inducible brown adi-
pogenesis of supraclavicular fat in adult humans. Endocrinology 152, 3597–
3602.
Lee, J.Y., Takahashi, N., Yasubuchi, M., Kim, Y.I., Hashizaki, H., Kim, M.J.,
Sakamoto, T., Goto, T., and Kawada, T. (2012). Triiodothyronine induces
UCP-1 expression and mitochondrial biogenesis in human adipocytes. Am.
J. Physiol. Cell Physiol. 302, C463–C472.
Lopez, M., Varela, L., Vazquez, M.J., Rodrıguez-Cuenca, S., Gonzalez, C.R.,
Velagapudi, V.R., Morgan, D.A., Schoenmakers, E., Agassandian, K., Lage,
R., et al. (2010). Hypothalamic AMPK and fatty acid metabolism mediate thy-
roid regulation of energy balance. Nat. Med. 16, 1001–1008.
804 Cell Metabolism 17, 798–805, May 7, 2013 ª2013 Elsevier Inc.
Matthias, A., Ohlson, K.B., Fredriksson, J.M., Jacobsson, A., Nedergaard, J.,
and Cannon, B. (2000). Thermogenic responses in brown fat cells are fully
UCP1-dependent. UCP2 or UCP3 do not substitute for UCP1 in adrenergically
or fatty scid-induced thermogenesis. J. Biol. Chem. 275, 25073–25081.
Mori, M., Nakagami, H., Rodriguez-Araujo, G., Nimura, K., and Kaneda, Y.
(2012). Essential role for miR-196a in brown adipogenesis of white fat progen-
itor cells. PLoS Biol. 10, e1001314. http://dx.doi.org/10.1371/journal.pbio.
1001314.
Nedergaard, J., Bengtsson, T., and Cannon, B. (2007). Unexpected evidence
for active brown adipose tissue in adult humans. Am. J. Physiol. Endocrinol.
Metab. 293, E444–E452.
Nishio, M., Yoneshiro, T., Nakahara, M., Suzuki, S., Saeki, K., Hasegawa, M.,
Kawai, Y., Akutsu, H., Umezawa, A., Yasuda, K., et al. (2012). Production of
functional classical brown adipocytes from human pluripotent stem cells using
specific hemopoietin cocktail without gene transfer. Cell Metab. 16, 394–406.
Petrovic, N., Walden, T.B., Shabalina, I.G., Timmons, J.A., Cannon, B., and
Nedergaard, J. (2010). Chronic peroxisome proliferator-activated receptor
gamma (PPARgamma) activation of epididymally derived white adipocyte cul-
tures reveals a population of thermogenically competent, UCP1-containing
adipocytes molecularly distinct from classic brown adipocytes. J. Biol.
Chem. 285, 7153–7164.
Puigserver, P., Wu, Z., Park, C.W., Graves, R., Wright, M., and Spiegelman,
B.M. (1998). A cold-inducible coactivator of nuclear receptors linked to adap-
tive thermogenesis. Cell 92, 829–839.
Saito, M., Okamatsu-Ogura, Y., Matsushita, M., Watanabe, K., Yoneshiro, T.,
Nio-Kobayashi, J., Iwanaga, T., Miyagawa, M., Kameya, T., Nakada, K., et al.
(2009). High incidence of metabolically active brown adipose tissue in healthy
adult humans: effects of cold exposure and adiposity. Diabetes 58, 1526–
1531.
Schulz, T.J., Huang, T.L., Tran, T.T., Zhang, H., Townsend, K.L., Shadrach,
J.L., Cerletti, M., McDougall, L.E., Giorgadze, N., Tchkonia, T., et al. (2011).
Identification of inducible brown adipocyte progenitors residing in skeletal
muscle and white fat. Proc. Natl. Acad. Sci. USA 108, 143–148.
Seale, P., Kajimura, S., Yang, W., Chin, S., Rohas, L.M., Uldry, M., Tavernier,
G., Langin, D., and Spiegelman, B.M. (2007). Transcriptional control of brown
fat determination by PRDM16. Cell Metab. 6, 38–54.
Seale, P., Bjork, B., Yang, W., Kajimura, S., Chin, S., Kuang, S., Scime, A.,
Devarakonda, S., Conroe, H.M., Erdjument-Bromage, H., et al. (2008).
PRDM16 controls a brown fat/skeletal muscle switch. Nature 454, 961–967.
Seale, P., Conroe, H.M., Estall, J., Kajimura, S., Frontini, A., Ishibashi, J.,
Cohen, P., Cinti, S., and Spiegelman, B.M. (2011). Prdm16 determines the
thermogenic program of subcutaneous white adipose tissue in mice. J. Clin.
Invest. 121, 96–105.
Sharp, L.Z., Shinoda, K., Ohno, H., Scheel, D.W., Tomoda, E., Ruiz, L., Hu, H.,
Wang, L., Pavlova, Z., Gilsanz, V., and Kajimura, S. (2012). Human BAT pos-
sesses molecular signatures that resemble beige/brite cells. PLoS ONE 7,
e49452. http://dx.doi.org/10.1371/journal.pone.0049452.
Timmons, J.A., Wennmalm, K., Larsson, O., Walden, T.B., Lassmann, T.,
Petrovic, N., Hamilton, D.L., Gimeno, R.E., Wahlestedt, C., Baar, K., et al.
(2007). Myogenic gene expression signature establishes that brown and white
adipocytes originate from distinct cell lineages. Proc. Natl. Acad. Sci. USA
104, 4401–4406.
Trajkovski, M., Ahmed, K., Esau, C.C., and Stoffel, M. (2012). MyomiR-133
regulates brown fat differentiation through Prdm16. Nat. Cell Biol. 14, 1330–
1335.
van Marken Lichtenbelt, W.D., Vanhommerig, J.W., Smulders, N.M.,
Drossaerts, J.M., Kemerink, G.J., Bouvy, N.D., Schrauwen, P., and Teule,
G.J. (2009). Cold-activated brown adipose tissue in healthy men. N. Engl. J.
Med. 360, 1500–1508.
Virtanen, K.A., Lidell, M.E., Orava, J., Heglind, M., Westergren, R., Niemi, T.,
Taittonen, M., Laine, J., Savisto, N.J., Enerback, S., and Nuutila, P. (2009).
Functional brown adipose tissue in healthy adults. N. Engl. J. Med. 360,
1518–1525.

Cell Metabolism
Human BAT—Brown and Brite?
Walden, T.B., Hansen, I.R., Timmons, J.A., Cannon, B., and Nedergaard, J.
(2012). Recruited vs. nonrecruited molecular signatures of brown, ‘‘brite,’’
and white adipose tissues. Am. J. Physiol. Endocrinol. Metab. 302, E19–E31.
Wu, J., Bostrom, P., Sparks, L.M., Ye, L., Choi, J.H., Giang, A.H., Khandekar,
M., Virtanen, K.A., Nuutila, P., Schaart, G., et al. (2012). Beige adipocytes
are a distinct type of thermogenic fat cell in mouse and human. Cell 150,
366–376.
C
Yin, H., Pasut, A., Soleimani, V.D., Bentzinger, C.F., Antoun, G., Thorn, S.,
Seale, P., Fernando, P., van Ijcken, W., Grosveld, F., et al. (2013).
MicroRNA-133 controls brown adipose determination in skeletal muscle
satellite cells by targeting Prdm16. Cell Metab. 17, 210–224.
Zingaretti, M.C., Crosta, F., Vitali, A., Guerrieri, M., Frontini, A., Cannon, B.,
Nedergaard, J., and Cinti, S. (2009). The presence of UCP1 demonstrates
that metabolically active adipose tissue in the neck of adult humans truly rep-
resents brown adipose tissue. FASEB J. 23, 3113–3120.
ell Metabolism 17, 798–805, May 7, 2013 ª2013 Elsevier Inc. 805