a century of purchasing power parity confirmed: the role of nonlinearity
TRANSCRIPT
A Century of Purchasing Power Parity Confirmed:
The Role of Nonlinearity
Hyeongwoo Kim∗ and Young-Kyu Moh†
Auburn University and Texas Tech University
January 2009
Abstract
Taylor (2002) claims that Purchasing Power Parity (PPP) has held over the 20th century
based on strong evidence of stationarity for century-long real exchange rates for 20 countries.
Lopez et al. (2005), however, found much weaker evidence of PPP with alternative lag selection
methods. We reevaluate Taylor’s claim by implementing a recently developed nonlinear unit
root test by Park and Shintani (2005). We find strong evidence of nonlinear mean-reversion
in real exchange rates that confirms Taylor’s claim. We also find a possible misspecification
problem in using the ESTAR model that may not be detected with Taylor-approximation based
tests.
Keywords: Purchasing Power Parity, Transition Autoregressive Process, inf-t Unit Root Test
JEL Classification: C22, F31
∗Corresponding Author: Hyeongwoo Kim, Department of Economics, College of Business, Auburn University, 415W. Magnolia Ave., Auburn, AL 36849. Tel: 334-844-2928. Fax: 334-844-4615. Email: [email protected]
†Department of Economics, Texas Tech University, Lubbock, TX 79409. Tel: 806-742-2466. Fax: 806-742-1137.Email: [email protected]
1
1 Introduction
Purchasing power parity (PPP) is a simple theory of real exchange rate determination that continues
to serve as a key building block for many open economy macro models. Despite its popularity
and extensive studies, however, empirical evidence on PPP still remains elusive. Taylor (2002)
constructed over a century-long real exchange rates for 20 countries, and implemented an array of
unit root tests. Finding very strong evidence for PPP, he concluded that PPP has held over the
20th century. His claim, however, was upset by Lopez et al. (2005) who pointed out that his results
were sensitive to the choice of lag selection methods. They reported much weaker evidence of PPP
from implementing the same unit root tests for his data with alternative lag selection methods.
This paper takes a different road and reevaluates Taylor’s claim by implementing a new nonlinear
unit root test proposed by Park and Shintani (2005). Recent theoretical and empirical studies on
real exchange rates have shown the importance of nonlinear adjustment of the real exchange rate
toward long-run equilibrium value. Dumas (1992) and Sercu et al. (1995) show how transaction
costs in international arbitrage can induce nonlinear adjustment of the real exchange rates toward
PPP. Michael et al. (1997) and Obstfeld and Taylor (1997) study nonlinear adjustment process
motivated by transaction costs that define a neutral band with profitable commodity arbitrage
opportunities at the boundary. It should be noted that a failure to account for such nonlinearity
may underlie the difficulties in better understanding real exchange rates dynamics (see, among
others, Taylor, 2001).
We also note the low power problem of the conventional linear unit-root tests when the true
data generating process is nonlinear mean-reverting process. Pippenger and Goering (1993) find
that conventional linear tests perform poorly when the true data generating process is the threshold
autoregressive (TAR) model, and are sensitive to the speed of adjustment as well as location of the
threshold parameter. Taylor et al. (2001) show with Monte Carlo simulations that the Dicky-Fuller
test has low power against exponential smooth transition autoregressive (ESTAR) process. This
body of work suggests that nonlinear models can provide an explanation for the poor performance
of conventional linear unit-root tests on PPP deviations and why the deviations from the PPP
appear to be nonstationary or extremely slowly mean-reverting (see, among others, Crucini and
2
Shintani, 2007).
In this light, we reinvestigate Taylor’s (2002) claim by testing the null of unit root for his
century long real exchange rate data against nonlinear alternatives. We consider three types of
transition autoregressive process: exponential smooth transition autoregression (ESTAR), band
logistic smooth transition autoregression (BLSTAR), and band threshold autoregression (BTAR).
For this purpose, we implement the inf-t test by Park and Shintani (2005) for Taylor’s data extended
through 2004. Their test is superior than many previously proposed nonlinear unit root tests in
various aspects. The inf-t test does not require stationary threshold variables, while other tests
such as the one by Caner and Hansen (2001) does. Unlike the test by Kapetanios et al. (2003),
the inf-t test does not need any Taylor approximation to deal with the so-called “Davies problem.”
Their test requires much less stringent assumptions on the parameter space compared with more
recently proposed tests that include Kapetanios and Shin (2003), Seo (2006), and Bec et al. (2004).
By testing the null of unit root against three types of transition AR models for Taylor’s (2002)
data, we obtain very strong evidence of PPP. The inf-t test rejects a maximum of 14 out of 16 de-
veloped countries with standard lag selection procedures. Our results, thus, confirm Taylor’s claim.
We also report some evidence against the use of ESTAR models due to a potential misspecification
problem that may not be detected when one uses Taylor approximation based tests such as the test
by Kapetanios et al. (2003).
The remainder of the paper is organized as follows. Section 2 briefly describes Park and Shin-
tani’s (2005) inf-t test. In Section 3, we describe the three transition functions we employ in this
paper. In Section 4, we provide a brief data description and report some pre-test results. Then, we
report our main empirical results. Section 5 concludes.
2 The inf-t Test
Park and Shintani (2005) consider the transition between the following two regimes: the unit root
regime,
∆qt = ut (1)
3

and the stationary regime,
∆qt = λqt−1 + ut, (2)
where λ < 0 and ut is the zero mean sequence of possibly serially correlated errors. The transition
function π(qt−d|θ) is defined as a weight on the stationary regime. Then, the stochastic process of
qt can be jointly represented by
∆qt = λqt−1π(qt−d|θ) + ut, (3)
where qt−d is the potentially nonstationary transition variable with delay lag d ≥ 1.1 θ is an m-
dimensional vector of parameters that can be identified only in the stationary regime and π(·)
denotes a real-valued transition function on (m+1)-dimensional real space. Serial correlation in ut
can be accommodated as usual by adding lagged dependent variables in the right hand side of (3),
∆qt = λqt−1π(qt−d|θ) +kX
j=1
βj∆qt−j + εt, (4)
where εt is a martingale difference sequence that generates ut.2
With a broad choice of the transition function π(·), the model (4) can represent a wide array of
nonlinear partial adjustment AR models. Note that if λ = 0, the stochastic process of qt is governed
solely by the unit root regime. Therefore, one may test the null of the unit root hypothesis,
H0 : λ = 0
against the alternative hypothesis
H1 : λ < 0,
which would imply that qt obeys a nonlinear mean-reverting process.
The test can be implemented as follows. Let Θn denote a random sequence of parameter spaces
given for each n as functions of the sample (q1, ..., qn). For each θ ∈ Θn, one obtains the t-statistic
1This is one of the very attractive properties of the inf-t test. Caner and Hansen’s (2001) test, for example,requires stationary transition variables, which can be a quite stringent requirement in practice.
2For detailed explanations about εt, see Park and Shintani (2005).
4

for λ in (4),
Tn(θ) =λ̂n(θ)
s(λ̂n(θ)), (5)
where λ̂n(θ) is the least squares estimate and s(λ̂n(θ)) is the corresponding standard error. The
inf-t test is then defined as
Tn = infθ∈Θn
Tn(θ), (6)
which is the infimum of t-ratios in (5) taken over all possible values of θ ∈ Θn. The limit distribution
of inf-t statistic is free from any nuisance parameters and depends only on the transition function
and the limit parameter space.
3 The Nonlinear Models of the Real Exchange Rate
Let pt be the log domestic price level, p∗t be the log foreign price level, and et be the log nominal
exchange rate as the unit price of the foreign currency in terms of the home currency. The real
exchange rate qt is defined as p∗t+et−pt. We consider three nonlinear stationary alternatives for the
natural logarithm of the real exchange rate (qt): ESTAR, BLSTAR, and BTAR models described
in (7) — (9), respectively.
∆qt = λ(qt−1 − μ)h1− exp
n−κ2 (qt−1 − μ)2
oi+
kXi=1
βi∆qt−i + εt (7)
∆qt = λ
∙qt−1 − τ1
1 + exp {κ (qt−1 − τ1)}+
qt−1 − τ21 + exp {−κ (qt−1 − τ2)}
¸+
kXi=1
βi∆qt−i + εt (8)
∆qt = λ [(qt−1 − τ1)I {qt−1 ≤ τ1}+ (qt−1 − τ2)I {qt−1 ≥ τ2}] +kXi=1
βi∆qt−i + εt, (9)
where μ, τ1, and τ2 are either the location or threshold parameters and κ is the scale parameter.
All regression equations include an intercept.
These functional forms are considered to properly model the commodity arbitrage view of
PPP with fixed transaction cost. When there is a relatively small real exchange rate deviation in
either directions, commodity arbitrages may not occur due to prohibitively high transaction costs.
5
Putting it differently, a real exchange rate may follow a unit root process locally around the long-
run equilibrium PPP. Such a property may be well captured by ESTAR models. The BLSTAR
and BTAR models can further allow an “inaction" band ([τ1, τ2]) where real exchange rates follow
unit root process inside the band. Note also that for a very high value for κ, the smooth transition
function collapses to a discrete transition function. For instance, the BLSTAR model becomes the
BTAR model in such a case.
For the scale parameter κ, we implement grid search for (6) over the parameter space given
[10−1Pn, 103Pn], (10)
where Pn =¡Pn
t=1 q2t /n
¢−1/2 as recommended by van Dijk et al. (2002). For the location parameterμ, we choose the interval
[Ψn,15,Ψn,85], (11)
where Ψn,p denotes the pth percentile of (q1, q2, · · · , qn) as suggested by Caner and Hansen (2001).
For the BLSTAR model, we grid search over the 2-dimensional parameter space of (κ, μ) spanned
by (10) and (11).
4 Empirical Results
We consider Taylor’s (2002) over a hundred-year long annual real exchange rate data relative to
the US dollar. We extend the data through 1998 for Eurozone countries and through 2004 for
non-Eurozone countries using the IFS CD-ROM. We focus on 16 developed countries by dropping
Argentina, Brazil, and Mexico from the original data set.3 We select the number of lags (k) by
the General-to-Specific (GTS) rule for the linear model as recommended by Ng and Perron (2001).
For nonlinear models (7) through (9), we employ the Partial Autocorrelation rule (PAR) following
Granger and Teräsvirta’s (1993) suggestion for the state-dependent autoregressive models. We
choose a conventional value for the delay parameter, d = 1.
As a pre-test, we implement the conventional linear augmented Dickey-Fuller (ADF) test for
3All real exchange rates are CPI-based with the exception of Portugal, which is the deflator-based rate.
6
the real exchange rates. Results are reported in Table 1. The test rejects the null of unit root for
only 9 out of 16 developed countries vis-à-vis the US at the 5% significance level, roughly consistent
with the results of Lopez et al. (2005).4
Table 1
As another pre-test, we implement the ESTAR unit root test by Kapetanios et al. (2003), one
of the most widely used nonlinear unit root tests. We consider two specifications for the test, one
with no serial correlation (k = 0) and one that accounts for serial correlation (k = 1).5 Results
are reported in Table 2. The test rejects the null of a unit root for 13 and 8 out of 16 countries
at the 5% significance level with and without serial correlation, respectively.6 However, it should
be noted that their test requires the Taylor-approximation to avoid “Davies problem.” Since the
test computes the test statistics without directly estimating the key parameter, error-correction
coefficient, it is very difficult to identify potentially serious misspecification problems. In Section
5, we show that there is a misspecification problem by using the ESTAR model for Taylor’s data.
Table 2
We conduct the inf-t test for the three nonlinear AR models (7) — (9) and results are presented
in Tables 3-5. As mentioned before, one clear advantage of using Park and Shintani’s (2005) inf-t
test over the Taylor-approximation based test is that it directly estimates all parameters in the
model, thus can provide useful information on misspecification problems. Our test results with the
ESTAR model clearly demonstrate that this is not a negligible matter. The inf-t test rejects the
unit root null for 11 countries at the 5% significance level, roughly consistent with the results in
Table 2. For instance, the test rejects the unit root null for Portugal at the 1% significance level.
4Lopez et al. (2005) reported 8 rejections out of 16 countries at the 5% significance level from the same specification.However, with our extended data through 2004, we were able to reject the unit-root null for one additional country,Australia.
5k is set at 1 by the Bayesian Information Criteria (BIC).6As an anonymous referee suggested, we implemented Monte Carlo simulations to obtain critical values for the
sample sizes used in the paper. We obtained quantitatively very similar critical values as asymptotic ones so thatour statistic inferences are unchanged.
7

It should be noted, however, that the λ estimate is by far less than -2. Since k = 0 for the country,
this implies that the real exchange rate is cyclically explosive, inconsistent with stationarity. One
can see similar problems for Belgium, Denmark, France, Germany, Italy, Japan, Spain, Sweden,
and Switzerland.7,8 This implies that ESTAR may not be an appropriate model for the data.
Table 3
Next, we implement the inf-t test with the BLSTAR specification and results are reported in
Table 4. The test rejects the null of unit root for 14 out of 16 countries favoring the nonlinear
stationarity alternative. One interesting finding is that the estimate for κ was often very big, which
implies that the data can be successfully approximated by the BTAR model for those countries.
Our test with the BTAR specification (Table 5) reveals that this is indeed the case. For example,
we find quite similar values for λ and τs as well as the inf-t statistics for Finland using the BTAR
and BLSTAR specifications. We find similar observations for many other countries.9 This is not
surprising, because the BLSTAR collapses to the BTAR process as κ increases to infinity. This
finding implies that a very simple nonlinear model such as BTAR is good enough to approximate
century-long real exchange rate dynamics.10
Table 4
Table 5
7As an anonymous referee suggested, we implemented some robustness analyses. First, we ran estimations as-suming not only λ but also βis are state-dependent. We obtained quantitatively similar results. Second, we alsoimplemented estimations with demeaned series, again yielding similar results. All results are available from theauthors upon request.
8When k > 0, this may not be a problem, since the sum of autoregressive coefficients can be still less than one inabsolute value. This was not the case.
9As an anonymous referee suggested, we conducted Monte Carlo simulations to examine precision of λ estimates.Our simulations were carried out with a sample size of 120 and with 5,000 replications for each real exchange rate. Foreach replication, 620 pseudo observations were generated then the first 500 observations were discarded to minimizethe influence of initial values. For most of the cases, we obtained compact 95 confidence bands for λ and the medianvalues were close to the reported point estimates. The simulation results are available from the authors upon request.10We also implemented the inf-t test with the General-to-Specific (Hall 1994) criteria and obtained similar results.
The test fails to reject the null of unit root for Canada, Denmark, Japan, and Switzerland at the 5% significancelevel. At the 10% level, the test rejects the null for one additional country, Switzerland, totalling 13 rejections out of16 countries.
8
5 Concluding Remarks
With over hundred-year long real exchange rate data for 20 countries, Taylor report very strong
evidence of PPP from an array of linear unit root tests leading him to conclude that PPP has
held over the 20th century. Lopez et al. (2005), however, question the validity of this conclusion.
Implementing the same linear unit root tests with alternative lag selection procedures, they reported
much weaker evidence of PPP.
We take a different avenue by investigating nonlinear mean-reversion properties for Taylor’s
long-horizon data that may be consistent with the commodity arbitrage view of PPP with fixed
transaction costs. We test the null of a unit root against three types of stationary transition
AR processes with the inf-t test by Park and Shintani (2005), which does not require the Taylor-
approximation to avoid the “Davies problem.” The test is general enough to include virtually any
class of nonlinear AR models.
We apply the inf-t test to Taylor’s (2002) data extended through 2004 for non-Eurozone countries
and 1998 for Eurozone countries. Our main finding is twofold. First, we obtain very strong evidence
of nonlinear mean-reversion as the test rejects the null of a unit root for 14 out of 16 developed
countries at the 5% significance level. Our finding seems enough to confirm Taylor’s claim that
PPP has held over the 20th century.
Second, we find some empirical evidence against the ESTAR specification with unreasonable
estimates for the error-correction coefficient (λ) for many countries even when the test statistic lies
in the rejection region. It should be noted that the Taylor-approximation based tests such as the
one by Kapetanios et al. (2003) are not able to detect such a misspecification problem.
Acknowledgement: We thank Mototsugu Shintani, Masao Ogaki, Nelson Mark, Henry Thomp-
son, and an anonymous referee for helpful comments and suggestions and Brad Higginbotham for
excellent research assistance.
9

References
Bec, Frederic, Melika Ben Salem, and Marine Carrasco, 2004, Test for unit-root asymmetric thresh-
old specification with an application to the purchasing power parity relationship, Journal of
Business and Economic Statistics 22, 382—395.
Caner, Mehmet, and Bruce E. Hansen, 2001, Threshold autoregression with a unit root, Econo-
metrica 69, 1555—1596.
Crucini, Mario J., , and Mototsugu Shintani, 2007, Persistence in law-of-one-price deviations:
Evidence from micro-data, Journal of Monetary Economics.
Dumas, Bernard, 1992, Dynamic equilibrium and the real exchange rate in a spatially separated
world, Review of Financial Studies 5, 153—180.
Granger, Clive W.J., and Timo Teräsvirta, 1993, Modelling Nonlinear Economic Relationships
(Oxford University Press: Oxford).
Hall, Alastair, 1994, Testing for a unit root in time series with pretest data-based model selection,
Journal of Business and Economic Statistics 12, 461—470.
Hansen, Bruce E., 1999, The grid bootstrap and the autoregressive model, Review of Economics
and Statistics 81, 594—607.
Harris, Richard Ian, 1992, Testing for unit roots using the augmented dickey-fuller test: Some issues
relating to the size, power and the lag structure of the test, Economics Letters 38, 381—386.
Kapetanios, George, Yongcheol Shin, and Andy Snell, 2003, Testing for a unit root in the nonlinear
star framework, Journal of Econometrics 112, 359—379.
Kapetaniosa, George, and Yongcheol Shin, 2003, Unit root tests in three-regime setar models,
Manuscript, University of Edinburgh.
Lopez, Claude, Christian Murray, and David H. Papell, 2005, State of the art unit root tests and
purchasing power parity, Journal of Money, Credit, and Banking 37, 361—369.
10
Michael, Panos, A. Robert Nobay, and David A. Peel, 1997, Transaction costs and nonlinear ad-
justment in real exchange rates: An empirical investigation, Journal of Political Economy 105,
862—879.
Ng, Serena, and Pierre Perron, 2001, Lag length selection and the construction of unit root tests
with good size and power, Econometrica 69, 1519—1554.
Obstfeld, Maurice, and Alan M. Taylor, 1997, Nonlinear aspects of goods-market arbitrage and
adjustment: Heckscher’s commodity points revisited, Journal of the Japanese and International
Economics 11, 441—479.
Park, Joon Y., and Mototsugu Shintani, 2005, Testing for a unit root against transitional autore-
gressive models, Working Paper No. 05-W10, Vanderbilt University.
Pippenger, Michael K., and Gregory E. Goering, 1993, A note on the empirical power of unit root
tests under threshold processes, Oxford Bulletin of Economics and Statistics 55, 473—481.
Seo, Myung Hwan, 2006, Unit root test in a threshold autoregression: Asymptotic theory and
residual-based block bootstrap, Econometric Theory, forthcoming.
Sercu, Piet, Raman Uppal, and Cynthia Van Hulle, 1995, The exchange rate in the presence of
transactions costs: Implications for tests of purchasing power parity, Journal of Finance 50,
1309—1319.
Taylor, Alan M., 2001, Potential pitfalls for the purchasing-power-parity puzzle? sampling and
specification biases in mean-reversion tests of the law of one price, Econometrica 69, 473—498.
, 2002, A century of purchasing power parity, Review of Economics and Statistics 84, 139—
150.
Taylor, Mark P., David A. Peel, and Lucio Sarno, 2001, Nonlinear mean-reversion in real exchange
rates: Toward a solution to the purchasing power parity puzzles, International Economic Review
42, 1015—1042.
van Dijk, Dick, Timo Teräsvirta, and Philip Hans Franses, 2002, Smooth transition autoregressive
models: A survey of recent developments, Econometric Reviews 21, 1—47.
11
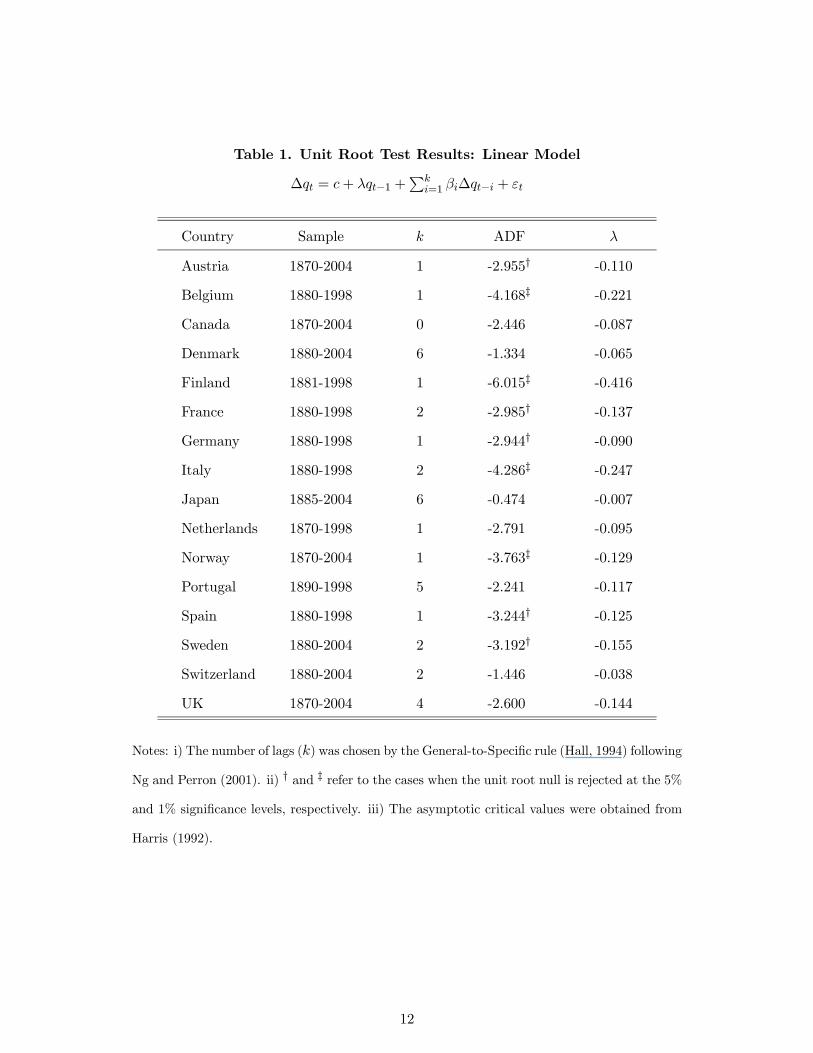
Table 1. Unit Root Test Results: Linear Model
∆qt = c+ λqt−1 +Pk
i=1 βi∆qt−i + εt
Country Sample k ADF λ
Austria 1870-2004 1 -2.955† -0.110
Belgium 1880-1998 1 -4.168‡ -0.221
Canada 1870-2004 0 -2.446 -0.087
Denmark 1880-2004 6 -1.334 -0.065
Finland 1881-1998 1 -6.015‡ -0.416
France 1880-1998 2 -2.985† -0.137
Germany 1880-1998 1 -2.944† -0.090
Italy 1880-1998 2 -4.286‡ -0.247
Japan 1885-2004 6 -0.474 -0.007
Netherlands 1870-1998 1 -2.791 -0.095
Norway 1870-2004 1 -3.763‡ -0.129
Portugal 1890-1998 5 -2.241 -0.117
Spain 1880-1998 1 -3.244† -0.125
Sweden 1880-2004 2 -3.192† -0.155
Switzerland 1880-2004 2 -1.446 -0.038
UK 1870-2004 4 -2.600 -0.144
Notes: i) The number of lags (k) was chosen by the General-to-Specific rule (Hall, 1994) following
Ng and Perron (2001). ii) † and ‡ refer to the cases when the unit root null is rejected at the 5%
and 1% significance levels, respectively. iii) The asymptotic critical values were obtained from
Harris (1992).
12

Table 2. Unit Root Test Results: Taylor-Approximation Based Exponential
Smooth Transition Autoregressive Model by Kapetanios et al. (2003)
∆qt = δq3t−1 +Pk
i=1 βi∆qt−i + εt
Country NLADFk=0 NLADFk=1
Australia -2.801 -3.542‡
Belgium -7.904‡ -10.08‡
Canada -1.925 -2.019
Denmark -2.435 -3.121†
Finland -5.115‡ -8.113‡
France -3.544‡ -4.567‡
Germany -2.378 -3.874‡
Italy -3.962‡ -4.884‡
Japan -1.143 -1.972
Netherlands -2.246 -3.129†
Norway -2.902 -4.688‡
Portugal -4.500‡ -6.553‡
Spain -3.083† -4.366‡
Sweden -3.728‡ -5.125‡
Switzerland -1.654 -2.745
UK -3.733‡ -4.641‡
Notes: i) NLADF denotes the t-statistic for δ as described in Kapetanios et al. (2003). ii) The
regression was implemented with the demeaned data. iii) † and ‡ refer to the cases when the
unit root null is rejected at the 5% and 1% significance levels, respectively. iv) The asymptotic
critical values were obtained from Kapetanios et al. (2003). Simulated critical values with actual
sample sizes yielded same conclusions.
13

Table 3. Unit Root Test Results: Exponential Smooth Transition Autore-
gressive Model
∆qt = λ(qt−1 − μ)h1− exp
n−κ2 (qt−1 − μ)2
oi+Pk
i=1 βi∆qt−i + εt
Country k inf-t λ κ μ
Australia 1 -3.648† -0.317 2.074 -0.190
Belgium 1 -10.01‡ -548.2 0.026 -3.760
Canada 0 -2.500 -0.090 17.82 -0.140
Denmark 0 -3.041 -388.9 0.045 -2.130
Finland 1 -8.157‡ -1.076 1.008 -1.500
France 1 -4.479‡ -683.3 0.058 -1.740
Germany 1 -3.820† -49.66 0.128 -0.740
Italy 1 -4.950‡ -2470 0.013 -7.380
Japan 1 -2.437 -145.5 0.017 -5.600
Netherlands 1 -3.214 -1.723 0.655 -0.880
Norway 1 -5.517‡ -0.340 1.995 -2.140
Portugal 0 -4.683‡ -28.07 0.169 -5.380
Spain 1 -4.253‡ -1503 0.020 -5.100
Sweden 1 -5.435‡ -1094 0.046 -2.100
Switzerland 1 -2.934 -29.82 0.105 -0.820
UK 0 -3.857‡ -0.392 3.075 0.380
Notes: i) The number of lags (k) was chosen by the Partial Autocorrelation rule following
Granger and Teräsvirta (1993). ii) exp{·} is an exponential function. iii) † and ‡ refer to the
cases when the unit root null is rejected at the 5% and 1% significance levels, respectively. iv)
The asymptotic critical values were obtained from Park and Shintani (2005).
14
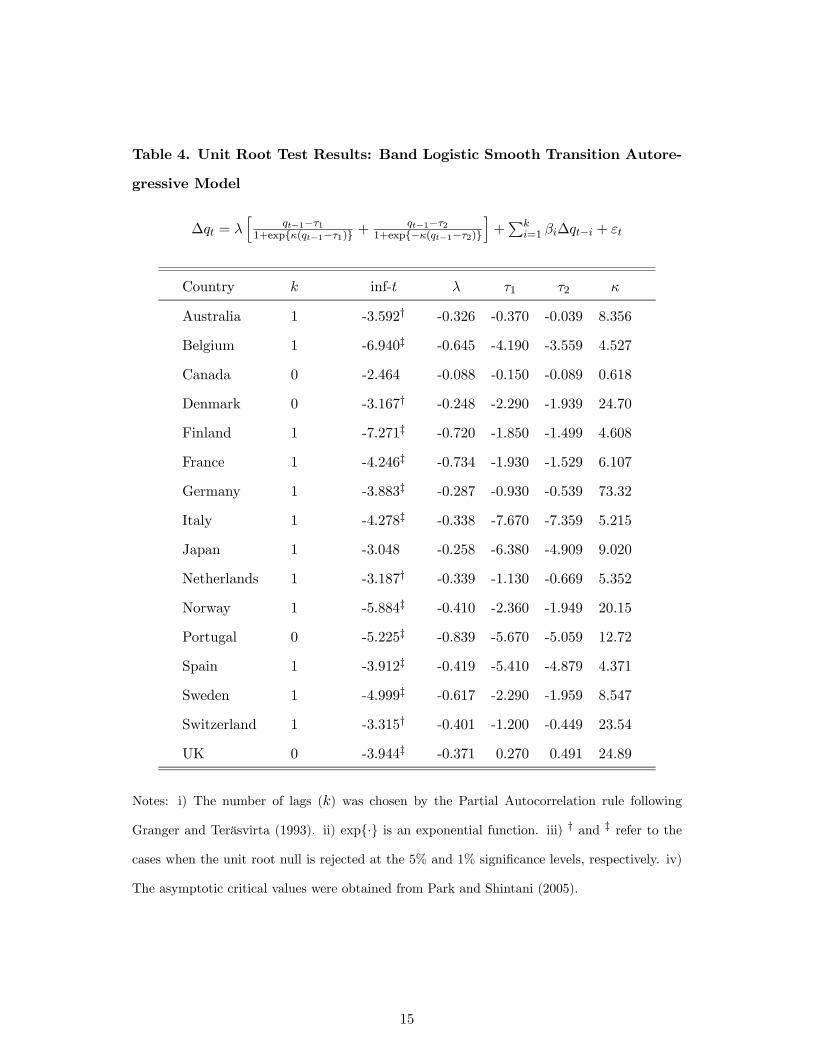
Table 4. Unit Root Test Results: Band Logistic Smooth Transition Autore-
gressive Model
∆qt = λh
qt−1−τ11+exp{κ(qt−1−τ1)} +
qt−1−τ21+exp{−κ(qt−1−τ2)}
i+Pk
i=1 βi∆qt−i + εt
Country k inf-t λ τ1 τ2 κ
Australia 1 -3.592† -0.326 -0.370 -0.039 8.356
Belgium 1 -6.940‡ -0.645 -4.190 -3.559 4.527
Canada 0 -2.464 -0.088 -0.150 -0.089 0.618
Denmark 0 -3.167† -0.248 -2.290 -1.939 24.70
Finland 1 -7.271‡ -0.720 -1.850 -1.499 4.608
France 1 -4.246‡ -0.734 -1.930 -1.529 6.107
Germany 1 -3.883‡ -0.287 -0.930 -0.539 73.32
Italy 1 -4.278‡ -0.338 -7.670 -7.359 5.215
Japan 1 -3.048 -0.258 -6.380 -4.909 9.020
Netherlands 1 -3.187† -0.339 -1.130 -0.669 5.352
Norway 1 -5.884‡ -0.410 -2.360 -1.949 20.15
Portugal 0 -5.225‡ -0.839 -5.670 -5.059 12.72
Spain 1 -3.912‡ -0.419 -5.410 -4.879 4.371
Sweden 1 -4.999‡ -0.617 -2.290 -1.959 8.547
Switzerland 1 -3.315† -0.401 -1.200 -0.449 23.54
UK 0 -3.944‡ -0.371 0.270 0.491 24.89
Notes: i) The number of lags (k) was chosen by the Partial Autocorrelation rule following
Granger and Teräsvirta (1993). ii) exp{·} is an exponential function. iii) † and ‡ refer to the
cases when the unit root null is rejected at the 5% and 1% significance levels, respectively. iv)
The asymptotic critical values were obtained from Park and Shintani (2005).
15

Table 5. Unit Root Test Results: Band Threshold Autoregressive Model
∆qt = λ [(qt−1 − τ1)I {qt−1 ≤ τ1}+ (qt−1 − τ2)I {qt−1 ≥ τ2}] +Pk
i=1 βi∆qt−i + εt
Country k inf-t λ τ1 τ2
Australia 1 -3.486† -0.301 -0.380 -0.039
Belgium 1 -6.674‡ -0.600 -4.190 -3.559
Canada 0 -2.352 -0.120 -0.190 -0.089
Denmark 0 -3.134† -0.250 -2.300 -1.939
Finland 1 -7.093‡ -0.694 -1.810 -1.499
France 1 -3.849‡ -0.657 -1.930 -1.529
Germany 1 -3.874‡ -0.276 -0.930 -0.549
Italy 1 -4.165‡ -0.316 -7.650 -7.359
Japan 1 -3.007 -0.233 -6.380 -4.909
Netherlands 1 -3.089† -0.138 -0.980 -0.829
Norway 1 -5.834‡ -0.407 -2.370 -1.949
Portugal 0 -4.955‡ -0.816 -5.680 -5.039
Spain 1 -3.679‡ -0.361 -5.390 -4.879
Sweden 1 -4.905‡ -0.568 -2.310 -1.959
Switzerland 1 -3.268† -0.386 -1.200 -0.449
UK 0 -3.910‡ -0.343 0.270 0.481
Notes: i) The number of lags (k) was chosen by the Partial Autocorrelation rule following
Granger and Teräsvirta (1993). ii) I{·} is an indicator function. iii) † and ‡ refer to the cases
when the unit root null is rejected at the 5% and 1% significance levels, respectively. iv) The
asymptotic critical values were obtained from Park and Shintani (2005).
16