a catalyst for the connected society - enea
TRANSCRIPT
ANNUAL REPORT 2014
A CATALYST FOR THE CONNECTED SOCIETY

You have probably already used Enea’s technology today without
even realising it. Every day, millions of people use Enea’s software for
their mobile calls and data communication. Enea’s operating systems
are embedded in most 3G/4G infrastructures around the world.
World-leading telecoms come to Enea when building their wireless communica-tion infrastructure. Enea’s solutions work in a raft of different types of communicating system, so in our customer base includes companies active in sectors like medical devices, as well as the aerospace and automotive industries.
Building tomorrow’s wireless infrastruc-ture is a complex task that requires expert knowledge. Enea is an expert in this field with extensive experience of managing large-scale global projects, building future-proof solutions in partnership with the customer.
Enea is one of the few companies in the world that can offer a combination of real-time operating systems (RTOS) and Linux. Enea has extensive experience in the RTOS market, and launched a Linux solution in 2012. The combination of RTOS and Linux is creating new opportunities for Enea on the global market.
RTOS +Linux
The telecom leaders choose Enea
The future systems is built by Enea
Enea in five minutes
A word from the CEO 2–3Strategy and business model 4–6Market 7–9 Products and geographical progress 10–11Employees, values and sustainability 12–13 The share and shareholders 14–15
Directors’ Report 16–19Risks and risk management 18–19
Corporate Governance Report 20–24Board of Directors 22Executive Management Team 23
Financial information 25–53Consolidated Income Statement 25Consolidated Balance Sheet 26Consolidated Statement of Changes in Equity 27Consolidated Cash Flow Statement 28Parent Company Income Statement 29Parent Company Balance Sheet 30Parent Company Statement of Changes in Equity 31Parent Company Cash Flow Statement 32Notes 33 Accounting principles 33
Audit Report 55Five-year summary 56Financial definitions 56Information to shareholders 57Notice of Annual General Meeting 2014 57Financial calendar 57
Contents

ANNUAL REPORT 2014 ENEA 1
Products and services for companies that develop communication-intensive products
REVENUE
0
100
200
300
400
500
2012 2013 2014
SEK million
REVENUE BY REGION, %
REVENUE BY SEGMENT, %REVENUE BY PRODUCT GROUP, %
EMPLOYEES BY COUNTRY, %OPERATING PROFIT AND
OPERATING MARGIN
0
20
40
60
80
100
2012 2013 2014
SEK milion
0
6
12
18
24
30
■ OPERATING PROFIT ■ OPERATING MARGIN
%
0
20
40
60
80
100
0
6
12
18
24
30
Enea delivers products and services for companies that develop communication-intensive products. Our operating systems are the core of product portfolios, and are sold embedded in customer- specific solutions. There is a need for differ-ent types of operating system depending on where in the system it should be placed, what other systems it must interact with, and the features required.
Real-time operating systems are used when the priority is very high performance and predictability.
Apart from operating systems, Enea offers development tools, databases, middleware,
communication protocols and communica-tion software. Enea’s products are modified in large-scale customer engagements, where our services portfolio and expertise are at least as important as our products.
REAL-TIME OPERATING SYSTEMSEnea OSE and Enea OSEck are Enea’s market-leading real-time operating systems.
LINUXEnea Linux was launched in 2012 and is designed for embedded systems and ad-dress the needs of the telecom market.
■ EUROPE, 68%■ AMERICAS, 27%■ ASIA, 5%
■ TELECOM INFRASTRUCTURE, 62%■ MOBILE DEVICES, 7%■ MEDICAL, 4%■ AERO/DEFENSE, 12%■ OTHER, 15%
■ OPERATING SYSTEMS INCLUDING TOOLS, 59%■ MIDDLEWARE, 8%■ SERVICES, 31%■ OTHER, 2%
■ ROMANIA, 59%■ SWEDEN, 22%■ USA, 15%■ OTHER, 4%
MIDDLEWAREEnea Element, Enea Polyhedra and Enea Netbricks are examples of Enea’s middle-ware offering. Middleware is software that interconnects operating systems with applications.
SERVICESEnea’s Bridged Services concepts delivers broad-based competence across a raft of segments, such as telecom and medical devices, as well as developing and modify-ing products according to customer needs. By combining competence, high quality and innovation, Enea services delivers highly developed applications for global players.
Key data 2014 2013 2012
Net sales, SEK million 429.3 408.5 467.8
Revenue growth, % 5 –13 5
Revenue growth, currency adjusted, % 3 –11 4
Operating profit, SEK million 93.8 82.1 72.5
Operating margin, % 21.9 20.1 15.5
Net profit before tax, SEK million 95.3 83.8 76.7
Net profit after tax, SEK million 74.5 63.2 53.6
Earnings per share, SEK 4.58 3.83 3.18
Cash flow (operating activities), SEK million 116.2 76.6 80.1
Cash, cash equivalents, and financial investments, SEK million 215.3 163.6 146.7

2 ENEA ANNUAL REPORT 2014
In the fourth quarter, we achieved the best operating profit and highest operating mar-gin in the company’s history, while revenue grew by over 10 percent. For the second consecutive quarter, we beat our profitability target of a 20 percent operating margin. Overall, the combination of financial results and a number of new business account wins is confirmation that the strategy we launched ahead of 2012 is paying off, and that its execu-tion is delivering the desired results.
The new business account share of total revenues increased in 2014, which is a strategically significant in a long-term perspective. Less dependency on a small number of key accounts gives us a healthier and more balanced customer portfolio. As an example, revenues in China increased by 50 percent in the year, while we also secured four new customers. The combination of our Linux offering and real-time operating system (OSE) offering, as well as products in our middleware portfolio like Enea Element and Enea Polyhedra, are key components of these deals. For Bridged Services, we opened up a new market when we executed our first deal of this type in Germany in the year. This has opened a new, major market for this type of business, which eventually, will help bring yet more balance to our customer portfolio. Continuing to invest in product development the future is critical to a company like Enea. That is why we reinvest over 20 percent of our revenues in R&D—where more than 30 percent of our people work. In the year, we continued to
invest in embedded Linux-based solutions, and during the summer, launched a new, powerful version of Enea Linux, which had a positive market reception. The deals we also secured that combine Linux with real-time operating systems, and our LINX communi-cation solution, are especially promising. In combination, this creates a unique offering on the highly attractive market for system-on-chip (SoC) solutions.
The open source trend is here to stay, and our commitment to the open source world is continuing to grow. This is not only important as a component of our own Linux offering, but is also the driver of services and training associated with open source. Our partnership with the Linux Foundation on Linux training is continuing to progress positively, and we are noting growing interest in our portfolio of training courses on Linux-based embedded systems. We also decided to enter another partnership driven by the Linux Foundation in the year, when we became a Silver Member of the OPNFV (Open Platform for NFV) project. This is a natural step for us, as NFV (Network Functions Virtualization) is a central concept of many discussions on the architecture of future network nodes and functionality. Progress
towards more software-defined networks (SDN) and NFV is clear. This is fundamentally positive progress, with the focus shifting still more towards software, and the competence that Enea delivers. But simultaneously, this places big demands on our capacity to adapt and regenerate in terms of competence, our offerings and business model. Our market positioning evolved well over the past year, and now, we are more stable than ever. Competition between the two dominant hardware architectures and ecosystems is continuing to intensify. Being an independ-ent software vendor in a world where our competitors are becoming more vertically integrated and closely associated with specific hardware, means we get great scope and freedom for our customers. We often take on the role of platform vendor, where our customers purchase several different products from us, bundled with services.
A global, well functioning sales and marketing organisation is critical for Enea. Our customers are global, as is our market. Just as in product development, we reinvest around 20 percent of our revenues in sales and marketing. Obviously, our main focus is on the sale of products and services, but this is also where we have responsibility
I had like to start by thanking our shareholders, customers and employees for the
confidence they showed us last year—2014 was a really good year for Enea. For the
full year 2014, our operating margin, operating profit and cash flow from operating
activities were the highest ever, while our sales also increased.
Record profits and a lot of new business customers
A WORD FROM THE CEO
“ We will continue our efforts to achieve improved growth, high profitability and create unique value for our shareholders, customers and employees all over the world.”
A WORD FROM THE CEO
ANNUAL REPORT 2014 ENEA 3
for our partners, and for our key accounts. Continuously maintaining a close dialogue with the market leaders, through channels including shared marketing and product development projects, ensures that what we do is consistent with how the market is evolving. We regularly implement chang-es and improvements to our sales and marketing organisation to increase efficiency and upgrade competence. In 2014, we saw a good pay-off from these actions, and we will continue to build on this in 2015. With a stronger market position, we take a confident view of the challenges we face in 2015. Our objectives are to achieve revenue growth, and we think sales will improve compared with 2014. We will continue our efforts to achieve improved growth, high profitability and create unique value for our
shareholders, customers and employees all over the world. We are standing by our long-term ambition from 2012, to create a global software company with significantly higher sales, high profitability, strong cash flows and a high share of repeat revenues. The past year, 2014, saw us take another step on this journey.
Once again, thank you for the confidence you showed us.
March 2015
Anders LidbeckPresident and CEO
4 ENEA ANNUAL REPORT 2014
Business conceptEnea delivers the software platforms and expert services necessary in network solutions for the connected society of today and tomorrow.
VisionOur software and our expertise help you develop amazing functions in the connected society.
StrategyTechnology and productsEnea has always worked on software and services focusing on embedded applications in general, and network applications in particular. Enea has been a leading vendor of real-time operating systems for three decades, and has accumulated world-lead-ing competence in the real-time segment. Within mobile infrastructure, where most of Enea’s customer base is active, real-time features are often critical. Performance and predictability are often key factors that con-fer real-time operating systems with strong status in embedded and hardware-related solutions. Continuously enhancing these fea-tures is vital for maintaining competitiveness in this portion of Enea’s product offering. Going forward, the company’s primary focus on real-time operating systems is to further improve performance.
Over time, Linux has become a progressively more central component of many solutions. The first version of the development platform that integrates Enea’s proprietary Linux offering (Enea Linux) with our carrier-grade middleware solution (Enea Element), with one of our real-time operating systems (OSEck) was launched in the fourth quarter of 2014. This version specifically targets HP’s new Moonshot servers. We also delivered Enea Linux bundled with our OSE or OSEck real-time operating systems in a variety of configurations last year. By enhancing the as-pects of Linux that are demanded for commu-nication solutions, such as real-time features, virtualisation support and IP performance, Enea’s objective is to further consolidate its offering for this customer segment.
Today, Linux is often used side by side with real-time operating systems, and Enea’s strategy is to deliver a broad-based product portfolio that include a wide range of operating system solutions for embedded systems. This is a positive trend for existing and new customers, who increasingly, are combining several products. This is enabling us to deliver more content and value for our users.
Expertise and servicesGiven the complex challenges facing Enea’s customers, just selling a combination of complete products and solutions from our existing portfolio is often not enough. We of-ten need to adapt them to each customer’s unique circumstances. Enea’s offering is not confined to its proprietary product portfolio, but is backed by an equally strong services offering. Enea’s experience as a leading ven-dor of software for communication solutions means we can move into other adjacent sectors like medical technology, the automo-tive, aero and defense industries, where we already manage a number of services-only projects for leading players.
Most of our service revenues is sourced from large-scale global projects. Having the right expertise to undertake this type of project effectively is critical. To deliver optimal quality at a competitive price, we staff projects with consultants from different countries, usually putting key team members close to the customer.
Customers and marketEnea currently has strong status with a number of key customers. One prerequisite for success on these projects is that we know the customer well, and participate in forward-looking discussions at an early stage. This type of project requires customer-spe-cific solutions, and an organisation that can manage customer-specific product develop-ment, and the related support, effectively.
Enea works to deepen and expand its collaborations with all key customers. We also continuously strive to create new customer relations. We initiate new customer dialogues from many of market activities we execute worldwide, from partnerships or through references from existing customers. Usually, new customers start as users of our service portfolio, or use our products in an early phase of their development cycle, long before they know whether the end-product they are developing will be successful.
Most of Enea’s key customers are active in the telecom segment, while many of its smaller customers operate in other sectors. We are noting how communica-tion-intensive solutions and embedded systems are spreading into a raft of new products and solutions. Enea’s strength is
STRATEGY AND BUSINESS MODEL
Strategy to achieve our vision

ANNUAL REPORT 2014 ENEA 5
communication-intensive solutions, which are now used far beyond the telecom segment. With most customers, hardware and software go hand in hand, and often, modifications of operating systems and other software are necessary to fully exploit the underlying hardware. Accordingly, Enea will continue to develop and deepen its relationships with hardware vendors so it can offer well-integrated products and solutions.
EmployeesEnea works continuously to enhance its status as an attractive employer and create a stimulating and rewarding workplace. Innovative and knowledgeable employees are the drivers behind the company and its solutions. We aim to continue to attract and stimulate individuals with an exceptional attitude and expertise.
Financial targets Performance in 2014In the year, Enea communicated targets of working towards its long-term profitability target of 20 percent. For the full year 2014, our assessment was that earning per share would improve.
During 2014, we achieved our long-term target of a 20 percent operating margin, not just in individual quarters, but also for the full year. Year over year, this was an improvement from a 20.1 percent operating margin for 2013, to 21.9 percent for 2014. Earnings per share improved from SEK 3.83 in 2013 to SEK 4.58 in 2014. Accordingly, Enea thus met its targets for 2014.
Outlook for 2015The objective for 2015 is to achieve revenue growth, and our assessments are that earnings per share will improve compared with 2014.
Long-term ambition The ambition over a period of five years, commencing in 2012, is to create a global software company with considerably higher net sales, high profitability, good cash flows, and a large proportion of recurring revenue.
The company will be focusing on organic growth, but both strategic and complementary acquisitions will be eval-uated regularly. Growth will vary over the years and between the quarters, depending on how individual deals take place and the development of royalty flows, which depend on customers’ sales volumes. The operating margin will vary in line with growth over the various quarters of the period. Enea’s objective over this period is to achieve an operating margin of 20 percent.
STRATEGY AND BUSINESS MODEL
6 ENEA ANNUAL REPORT 2014
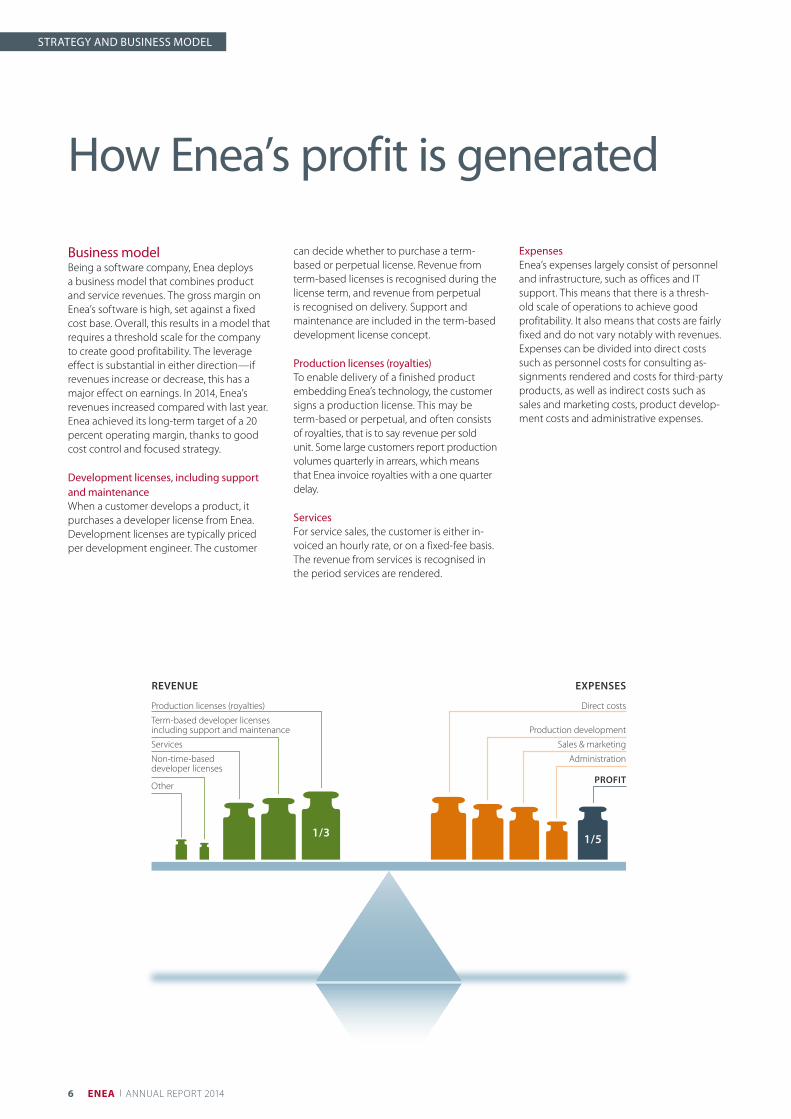
Business modelBeing a software company, Enea deploys a business model that combines product and service revenues. The gross margin on Enea’s software is high, set against a fixed cost base. Overall, this results in a model that requires a threshold scale for the company to create good profitability. The leverage effect is substantial in either direction—if revenues increase or decrease, this has a major effect on earnings. In 2014, Enea’s revenues increased compared with last year. Enea achieved its long-term target of a 20 percent operating margin, thanks to good cost control and focused strategy.
Development licenses, including support and maintenanceWhen a customer develops a product, it purchases a developer license from Enea. Development licenses are typically priced per development engineer. The customer
can decide whether to purchase a term-based or perpetual license. Revenue from term-based licenses is recognised during the license term, and revenue from perpetual is recognised on delivery. Support and maintenance are included in the term-based development license concept.
Production licenses (royalties)To enable delivery of a finished product embedding Enea’s technology, the customer signs a production license. This may be term-based or perpetual, and often consists of royalties, that is to say revenue per sold unit. Some large customers report production volumes quarterly in arrears, which means that Enea invoice royalties with a one quarter delay.
ServicesFor service sales, the customer is either in-voiced an hourly rate, or on a fixed-fee basis. The revenue from services is recognised in the period services are rendered.
ExpensesEnea’s expenses largely consist of personnel and infrastructure, such as offices and IT support. This means that there is a thresh-old scale of operations to achieve good profitability. It also means that costs are fairly fixed and do not vary notably with revenues. Expenses can be divided into direct costs such as personnel costs for consulting as-signments rendered and costs for third-party products, as well as indirect costs such as sales and marketing costs, product develop-ment costs and administrative expenses.
STRATEGY AND BUSINESS MODEL
How Enea’s profit is generated
Direct costs
Production development
Sales & marketing
Administration
REVENUE EXPENSES
PROFIT
Production licenses (royalties)
Term-based developer licensesincluding support and maintenance
Services
Non-time-based developer licenses
Other
1/51/3

ANNUAL REPORT 2014 ENEA 7
In recent years, Enea has pursued a clear strategy that focuses on communication-in-tensive applications. Its target market is defined by the keywords of communication, which is now a constant presence in home electronics, medical devices, the automotive industry, and the telecom sector.
The majority of revenues are sourced from operating system solutions for telecom-munication, but also from various types of service. While Enea’s operating system business is based on licensing, royalties and product-related services, its services business is based on an expanding portfolio of servic-es across all segments affecting the product or system development of software. Enea’s successful reference cases are now in many sectors, and are based on a delivery model of projects and programme management located close to the customer physically, combined with a highly competent delivery organisation in Bucharest, Romania.
In 2014, new business sales as a share of total increased, which is a strategically posi-tive change to Enea’s customer portfolio. The traditional dependency on a cluster of key customers is reducing in favour of a healthier and more balanced portfolio composition.
Communication solutions in general, and telecom networks in particular, remain Enea’s natural territory. Similarly, operating systems remain a core competence, and this service offering is a central component of operations.
While these are still mainstays, recent years have seen new trends for Enea and its market generally.
Open source partnerships have become central in all segments, and technology trends such as virtualisation, i.e. the separation of software and hardware, are exerting an impact in a growing number of segments..
Open source Open source is a software development model that is gaining increasing ground. The open source concept is closely associated with the Linux operating system, but Linux is only one in an array of projects based on this development model. Linux and other open source software are now an important component of Enea’s product portfolio.
Enea was founded nearly 50 years ago. The first product developed and sold successfully
was an operating system for the Swedish Armed Forces. This marked the start of a wide
range of operating system created by Enea. Now, Enea’s solutions are the mainstay of
many communicating systems and mobile networks.
Enea has a strong product portfolio and world-leading competence in operating
system technology for advanced network solutions. Throughout its history, Enea has
maintained its course and been true to its origins. The operating system and network
solution concepts have always been, and remain, central to its business. Currently, half of
the world’s radio base stations run on Enea software, while three billion people rely on
Enea software to make calls or connect to the Internet from their phones every day.
Software and services for the connected society
MARKET
8 ENEA ANNUAL REPORT 2014
MARKET
Enea has been offering a proprietary Linux distribution, Enea Linux, for the past three years, which focuses on embedded systems and solutions. Enea Linux is based on a project focused on embedded solutions that is managed by the Linux Foundation, called Yocto. Enea is a member of the Linux Foundation and the Yocto project, and is an active contributor to Yocto’s continued development.
Enea was one of five companies in the world certified as an Authorised Training Partner for the Linux Foundation in 2014. Enea already offered courses and specialist training in software for embedded appli-cations, and can now also offer a compre-hensive portfolio of tailored Linux training packages for global and local customers.
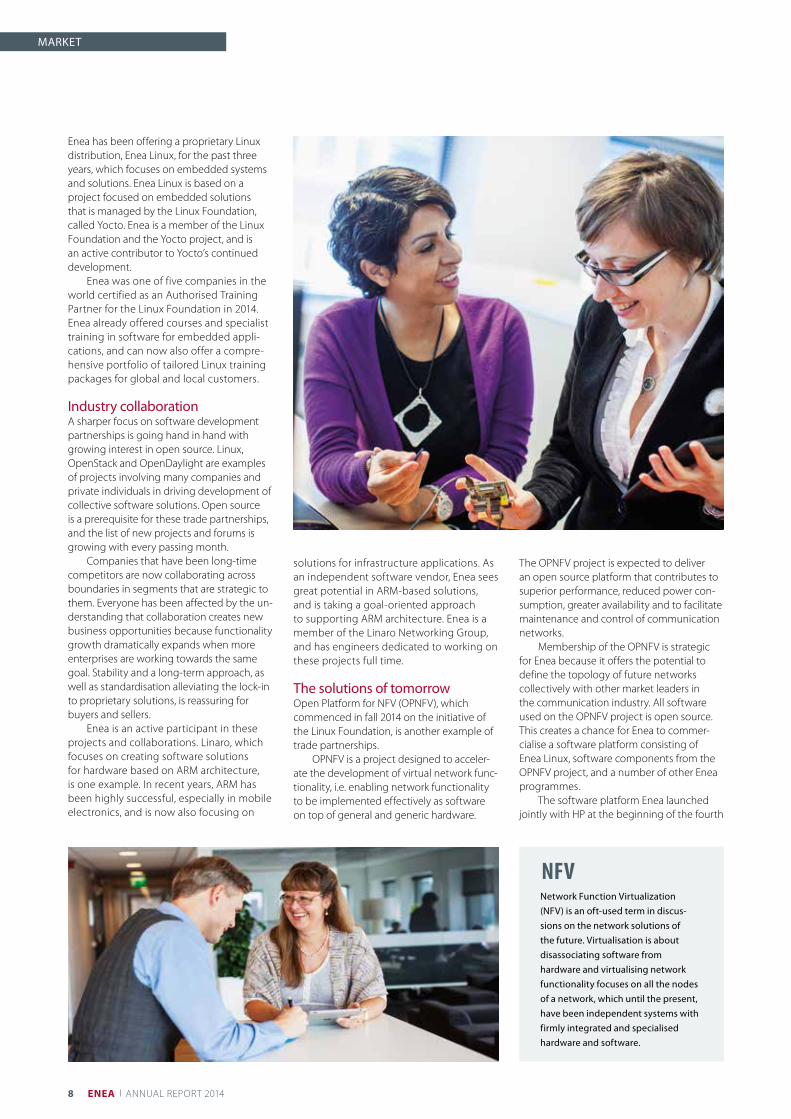
Industry collaborationA sharper focus on software development partnerships is going hand in hand with growing interest in open source. Linux, OpenStack and OpenDaylight are examples of projects involving many companies and private individuals in driving development of collective software solutions. Open source is a prerequisite for these trade partnerships, and the list of new projects and forums is growing with every passing month.
Companies that have been long-time competitors are now collaborating across boundaries in segments that are strategic to them. Everyone has been affected by the un-derstanding that collaboration creates new business opportunities because functionality growth dramatically expands when more enterprises are working towards the same goal. Stability and a long-term approach, as well as standardisation alleviating the lock-in to proprietary solutions, is reassuring for buyers and sellers.
Enea is an active participant in these projects and collaborations. Linaro, which focuses on creating software solutions for hardware based on ARM architecture, is one example. In recent years, ARM has been highly successful, especially in mobile electronics, and is now also focusing on
solutions for infrastructure applications. As an independent software vendor, Enea sees great potential in ARM-based solutions, and is taking a goal-oriented approach to supporting ARM architecture. Enea is a member of the Linaro Networking Group, and has engineers dedicated to working on these projects full time.
The solutions of tomorrowOpen Platform for NFV (OPNFV), which commenced in fall 2014 on the initiative of the Linux Foundation, is another example of trade partnerships.
OPNFV is a project designed to acceler-ate the development of virtual network func-tionality, i.e. enabling network functionality to be implemented effectively as software on top of general and generic hardware.
The OPNFV project is expected to deliver an open source platform that contributes to superior performance, reduced power con-sumption, greater availability and to facilitate maintenance and control of communication networks.
Membership of the OPNFV is strategic for Enea because it offers the potential to define the topology of future networks collectively with other market leaders in the communication industry. All software used on the OPNFV project is open source. This creates a chance for Enea to commer-cialise a software platform consisting of Enea Linux, software components from the OPNFV project, and a number of other Enea programmes.
The software platform Enea launched jointly with HP at the beginning of the fourth
NFVNetwork Function Virtualization
(NFV) is an oft-used term in discus-
sions on the network solutions of
the future. Virtualisation is about
disassociating software from
hardware and virtualising network
functionality focuses on all the nodes
of a network, which until the present,
have been independent systems with
firmly integrated and specialised
hardware and software.
ANNUAL REPORT 2014 ENEA 9
quarter 2014, the Enea Telco Development Platform, is another step in this direction. This platform facilitates rapid development, low operating expenses, high availability and the optimal performance of network applications. It is platform independent and confers the user with excellent flexibility and porting potential between different hardware architectures.
Network operating systemsThe OPNFV project and Enea Telco Development Platform are designed to produce software platforms for the next generation of communication solutions, consisting of network functionality on top of generic hardware. Linux plays a key role as a mainstay of these systems, but is also only one of several components of the overall solution. Depending on usage, Linux sometimes needs the addition of a real-time operating system (RTOS), and on top of this, a fast-growing stack of application software and middleware, which adds functionality at the system level between the operating system and application itself.
In simple terms, the overall solution can be considered an operating system for the network functionality of tomorrow in the broad sense—a network operating system. Such a platform, an operating system for the networks of the future, will be a necessary component for any party building communi-cation systems.
This creates business opportunities for enterprises that can package, maintain and provide support for such software solutions. Enea, with its expertise in software for the communication industry, is well positioned to become an important player in this context.
MARKET
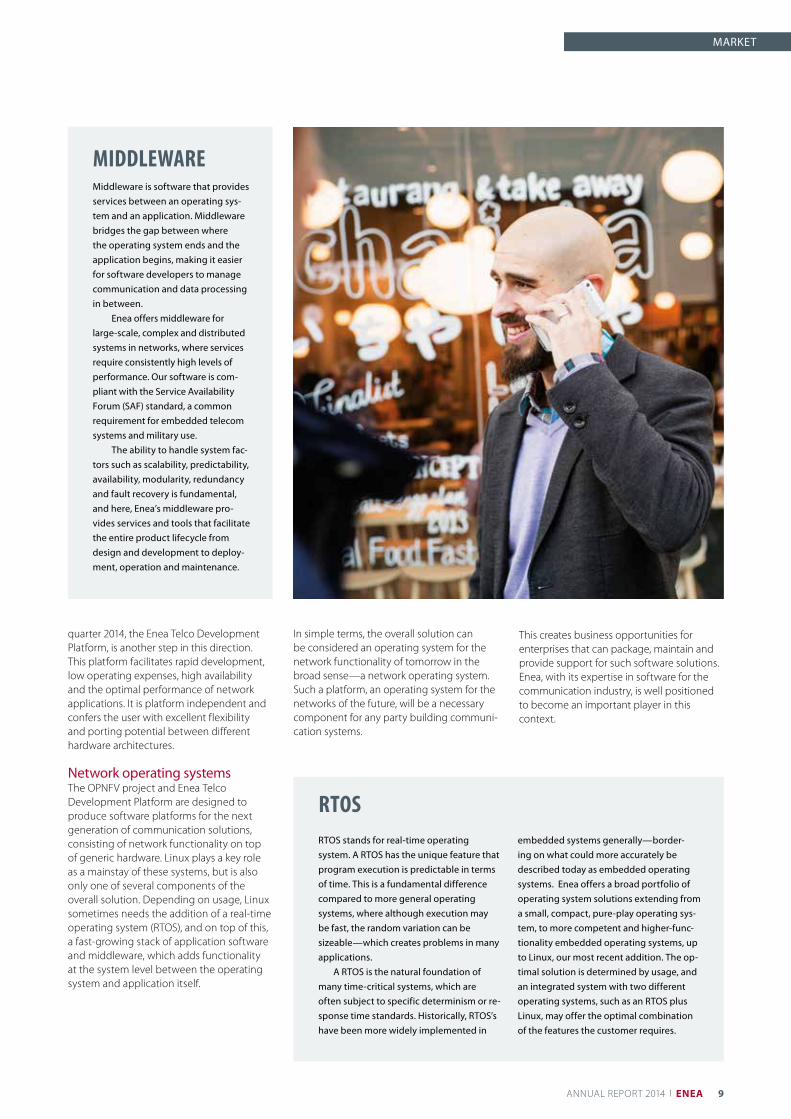
MIDDLEWAREMiddleware is software that provides
services between an operating sys-
tem and an application. Middleware
bridges the gap between where
the operating system ends and the
application begins, making it easier
for software developers to manage
communication and data processing
in between.
Enea offers middleware for
large-scale, complex and distributed
systems in networks, where services
require consistently high levels of
performance. Our software is com-
pliant with the Service Availability
Forum (SAF) standard, a common
requirement for embedded telecom
systems and military use.
The ability to handle system fac-
tors such as scalability, predictability,
availability, modularity, redundancy
and fault recovery is fundamental,
and here, Enea’s middleware pro-
vides services and tools that facilitate
the entire product lifecycle from
design and development to deploy-
ment, operation and maintenance.
RTOSRTOS stands for real-time operating
system. A RTOS has the unique feature that
program execution is predictable in terms
of time. This is a fundamental difference
compared to more general operating
systems, where although execution may
be fast, the random variation can be
sizeable—which creates problems in many
applications.
A RTOS is the natural foundation of
many time-critical systems, which are
often subject to specific determinism or re-
sponse time standards. Historically, RTOS’s
have been more widely implemented in
embedded systems generally—border-
ing on what could more accurately be
described today as embedded operating
systems. Enea offers a broad portfolio of
operating system solutions extending from
a small, compact, pure-play operating sys-
tem, to more competent and higher-func-
tionality embedded operating systems, up
to Linux, our most recent addition. The op-
timal solution is determined by usage, and
an integrated system with two different
operating systems, such as an RTOS plus
Linux, may offer the optimal combination
of the features the customer requires.
10 ENEA ANNUAL REPORT 2014
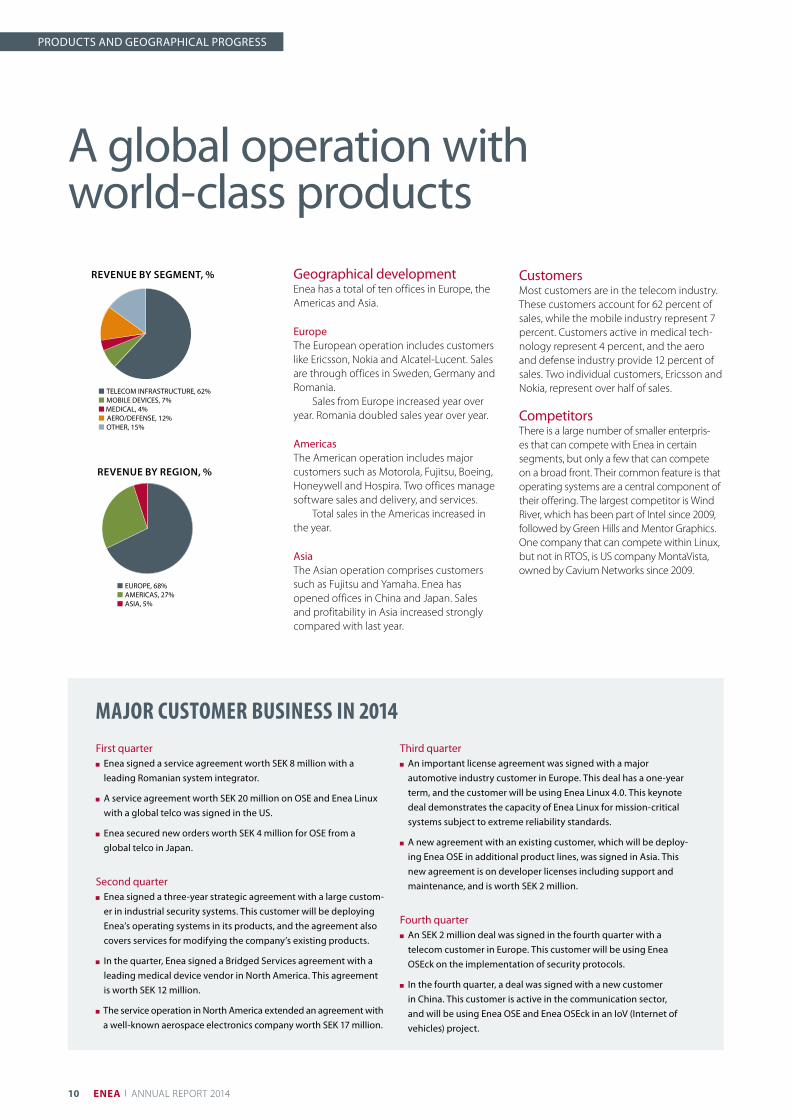
Geographical developmentEnea has a total of ten offices in Europe, the Americas and Asia.
EuropeThe European operation includes customers like Ericsson, Nokia and Alcatel-Lucent. Sales are through offices in Sweden, Germany and Romania.
Sales from Europe increased year over year. Romania doubled sales year over year.
AmericasThe American operation includes major customers such as Motorola, Fujitsu, Boeing, Honeywell and Hospira. Two offices manage software sales and delivery, and services.
Total sales in the Americas increased in the year.
AsiaThe Asian operation comprises customers such as Fujitsu and Yamaha. Enea has opened offices in China and Japan. Sales and profitability in Asia increased strongly compared with last year.
CustomersMost customers are in the telecom industry. These customers account for 62 percent of sales, while the mobile industry represent 7 percent. Customers active in medical tech-nology represent 4 percent, and the aero and defense industry provide 12 percent of sales. Two individual customers, Ericsson and Nokia, represent over half of sales.
CompetitorsThere is a large number of smaller enterpris-es that can compete with Enea in certain segments, but only a few that can compete on a broad front. Their common feature is that operating systems are a central component of their offering. The largest competitor is Wind River, which has been part of Intel since 2009, followed by Green Hills and Mentor Graphics. One company that can compete within Linux, but not in RTOS, is US company MontaVista, owned by Cavium Networks since 2009.
A global operation with world-class products
PRODUCTS AND GEOGRAPHICAL PROGRESS
MAJOR CUSTOMER BUSINESS IN 2014First quarter Enea signed a service agreement worth SEK 8 million with a
leading Romanian system integrator.
A service agreement worth SEK 20 million on OSE and Enea Linux
with a global telco was signed in the US.
Enea secured new orders worth SEK 4 million for OSE from a
global telco in Japan.
Second quarter Enea signed a three-year strategic agreement with a large custom-
er in industrial security systems. This customer will be deploying
Enea’s operating systems in its products, and the agreement also
covers services for modifying the company’s existing products.
In the quarter, Enea signed a Bridged Services agreement with a
leading medical device vendor in North America. This agreement
is worth SEK 12 million.
The service operation in North America extended an agreement with
a well-known aerospace electronics company worth SEK 17 million.
Third quarter An important license agreement was signed with a major
automotive industry customer in Europe. This deal has a one-year
term, and the customer will be using Enea Linux 4.0. This keynote
deal demonstrates the capacity of Enea Linux for mission-critical
systems subject to extreme reliability standards.
A new agreement with an existing customer, which will be deploy-
ing Enea OSE in additional product lines, was signed in Asia. This
new agreement is on developer licenses including support and
maintenance, and is worth SEK 2 million.
Fourth quarter An SEK 2 million deal was signed in the fourth quarter with a
telecom customer in Europe. This customer will be using Enea
OSEck on the implementation of security protocols.
In the fourth quarter, a deal was signed with a new customer
in China. This customer is active in the communication sector,
and will be using Enea OSE and Enea OSEck in an IoV (Internet of
vehicles) project.
■ TELECOM INFRASTRUCTURE, 62%■ MOBILE DEVICES, 7%■ MEDICAL, 4%■ AERO/DEFENSE, 12%■ OTHER, 15%
REVENUE BY SEGMENT, %
REVENUE BY REGION, %
■ EUROPE, 68%■ AMERICAS, 27%■ ASIA, 5%

ANNUAL REPORT 2014 ENEA 11
PRODUCTS AND GEOGRAPHICAL PROGRESS
PRODUCT AND SERVICE OFFERINGOSE and Linux operating systems are the core of Enea’s product
offering. Enea also provides a range of complementary products
that are usually combined into a custom solution and backed by
consulting services.
Enea OSE—a real-time operating system for embedded systems.
The operating system is the software that is closest to the hard-
ware and is the link between hardware and software.
Enea OSEck—a real-time operating system optimised specifically
for digital signal processors, the hardware component that deal
with communication.
Enea Linux—an open-source operating system. Enea Linux is a
distribution designed specifically for telecom purposes, based on
Yocto packages. Enea offers expertise and technology that is spe-
cifically focused on next-generation communications solutions.
Enea Netbricks—a communications protocol for telecom.
Enea Hypervisor—software that enables several operating
systems to be run in parallel, such as OSE and Linux.
Enea Optima—a development environment for developing
software that runs on Enea’s operating systems.
Enea Polyhedra—a database developed specifically for embed-
ded systems.
Enea Element—middleware, meaning software that intercon-
nects operating systems with applications. Middleware runs in
background, and has functions including ensuring that a system is
reliable, predictable and scalable.
Enea LINX—software to handle the communication between
various kernels on the hardware chip. These kernels can also run
different operating systems.
Services—Enea has capacity for complex projects of various size
and geographical distribution, including design and develop-
ment, project management, training and quality assurance.
PRODUCT REVENUES IN 2014Operating systems including tools make up a product group with
the largest share of Enea’s sales: 59 percent of revenue. Sales in the
year increased somewhat year over year. Middleware represented
8 percent of Enea’s total sales, up somewhat year over year. Total
service sales increased in the year, making up 31 percent of sales.
Other sales represented 2 percent.
SEK million
0
15
30
45
60
75
90
Q1 Q2 Q3 Q4 Q1 Q2 Q3 Q42012 2013 2014
■ OPERATING SYSTEMS INCLUDING TOOLS ■ MIDDLEWARE■ SERVICES
Q1 Q2 Q3 Q4
SALES BY PRODUCT GROUP

12 ENEA ANNUAL REPORT 2014
DiversityWe encourage progress towards greater di-versity. Employees that dare to think in new and different ways have made the company what it is today. Differing backgrounds and experience are something positive that we wish to promote. Enea’s equal opportunities policy prohibits discrimination against employees in terms of employment or duties based on sex, religion, age, disability, sexual orientation, nationality, political opinion, or social and ethnic origin.
ParticipationEach unit of Enea is responsible for con-tinuously communicating information to employees about its activities as well as other activities within the group. Global information meetings are held via web-conferencing, and local meetings are held at each office. Enea’s management holds monthly informative meetings, where one of the most important items on the agenda is questions and feedback to management. Enea’s intranet is a well-developed tool that most employees use daily. In addition
to information and news, the intranet contains interviews and articles that aim to raise awareness and promote an inclusive workplace culture.
Ethics and responsibilityEnea’s Code of Conduct summarises the group’s ethical guidelines. The Code of Conduct includes guidelines for compliance with laws and ordinances, rights of the individual and rules for anti-corruption and ethical business practice. The aim of the Code of Conduct is to emphasise the fundamental principles by which Enea operates and manages relationships with its employees, business partners and other stakeholders. Enea supports the UN Global Compact. Corporate social responsibilityEnea contributes directly and indirectly to the communities where it operates. Millions of people use Enea’s products in communi-cation. Increased communication alleviates the need for unnecessary travel, and provides greater security. Enea also seeks
to improve conditions by contributing to various community projects, particularly in Romania, where the company has its largest office.
Enea’s responsibility to stakeholders is to generate profitable growth. The long-term objective is to increase the value of the company and thus ensure sustainable devel-opment and long-term returns for share-holders. Enea contributes to socioeconomic development through product usage and by creating employment opportunities. Enea’s responsibility to employees is based on the company’s core values the corporate culture is built on. Every employee should feel valued and part of the company’s success. Enea respects individual dignity and human rights, develops the skills of individuals, pays a fair salary, provides opportunities for advancement, promotes open and honest communication and provides a safe and healthy working environment.
EnvironmentOur business concept is about delivering the software platforms and expert services that are necessary in various network solutions. Many of Enea’s customers develop products that alleviate environmental impact. Many telecom solutions improve communication and mitigate the need for physical meetings. Enea also helps customers build products that consume less energy and use resources more efficiently. Creating innovative solutions that promote sustainable development is a key component of Enea’s future product plans.
Although Enea does not conduct activities that are subject to permit or notification requirements under the Swedish Environmental Code, environmental practice is an integral part of our daily business.
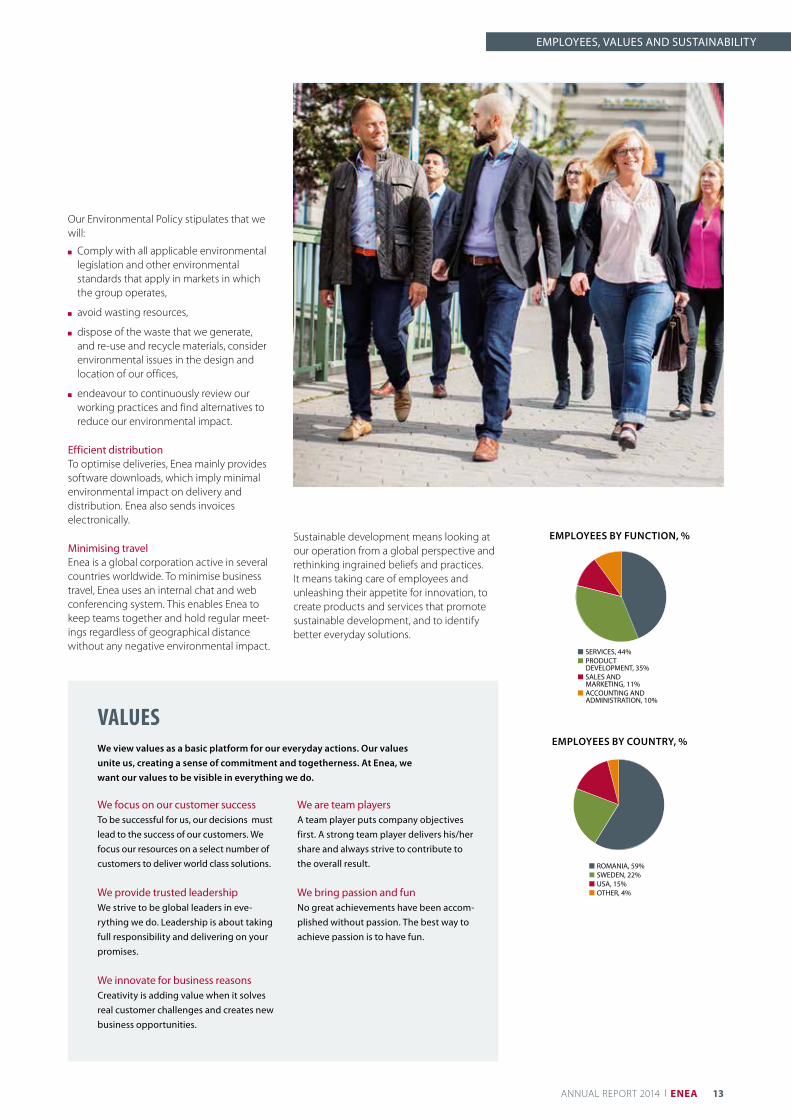
Enea has some 400 employees based in eight countries. Just over half of group staff are
stationed in Romania. In order of headcount, this is followed by Sweden and the US. Enea’s
smallest offices are in China, Japan, France, Germany and the UK. The absolute majority of
employees are graduates, most of them engineers. 23 percent of group staff are women.
400 employees in eight countries
EMPLOYEES, VALUES AND SUSTAINABILITY
ORGANISATION 2014
President & CEOAnders Lidbeck
R&DSenior Vice President
Karl Mörner
Software Sales Key Accounts Europe & Asia
Senior Vice PresidentAdrian Leufvén
Global ServicesSenior Vice President
Bogdan Putinica
Software Sales & Strategic
Alliances AmericasSenior Vice President
Kirk Fuller
Product ManagementSenior Vice President
Daniel Forsgren
FinanceCFO
Håkan Rippe
ANNUAL REPORT 2014 ENEA 13
Our Environmental Policy stipulates that we will:
Comply with all applicable environmental legislation and other environmental standards that apply in markets in which the group operates,
avoid wasting resources,
dispose of the waste that we generate, and re-use and recycle materials, consider environmental issues in the design and location of our offices,
endeavour to continuously review our working practices and find alternatives to reduce our environmental impact.
Efficient distribution To optimise deliveries, Enea mainly provides software downloads, which imply minimal environmental impact on delivery and distribution. Enea also sends invoices electronically.
Minimising travel Enea is a global corporation active in several countries worldwide. To minimise business travel, Enea uses an internal chat and web conferencing system. This enables Enea to keep teams together and hold regular meet-ings regardless of geographical distance without any negative environmental impact.
Sustainable development means looking at our operation from a global perspective and rethinking ingrained beliefs and practices. It means taking care of employees and unleashing their appetite for innovation, to create products and services that promote sustainable development, and to identify better everyday solutions.
EMPLOYEES, VALUES AND SUSTAINABILITY
VALUES We view values as a basic platform for our everyday actions. Our values
unite us, creating a sense of commitment and togetherness. At Enea, we
want our values to be visible in everything we do.
We focus on our customer successTo be successful for us, our decisions must
lead to the success of our customers. We
focus our resources on a select number of
customers to deliver world class solutions.
We provide trusted leadershipWe strive to be global leaders in eve-
rything we do. Leadership is about taking
full responsibility and delivering on your
promises.
We innovate for business reasonsCreativity is adding value when it solves
real customer challenges and creates new
business opportunities.
We are team playersA team player puts company objectives
first. A strong team player delivers his/her
share and always strive to contribute to
the overall result.
We bring passion and funNo great achievements have been accom-
plished without passion. The best way to
achieve passion is to have fun.
EMPLOYEES BY COUNTRY, %
■ ROMANIA, 59%■ SWEDEN, 22%■ USA, 15%■ OTHER, 4%
EMPLOYEES BY FUNCTION, %
■ SERVICES, 44%■ PRODUCT DEVELOPMENT, 35%■ SALES AND MARKETING, 11%■ ACCOUNTING AND ADMINISTRATION, 10%
14 ENEA ANNUAL REPORT 2014
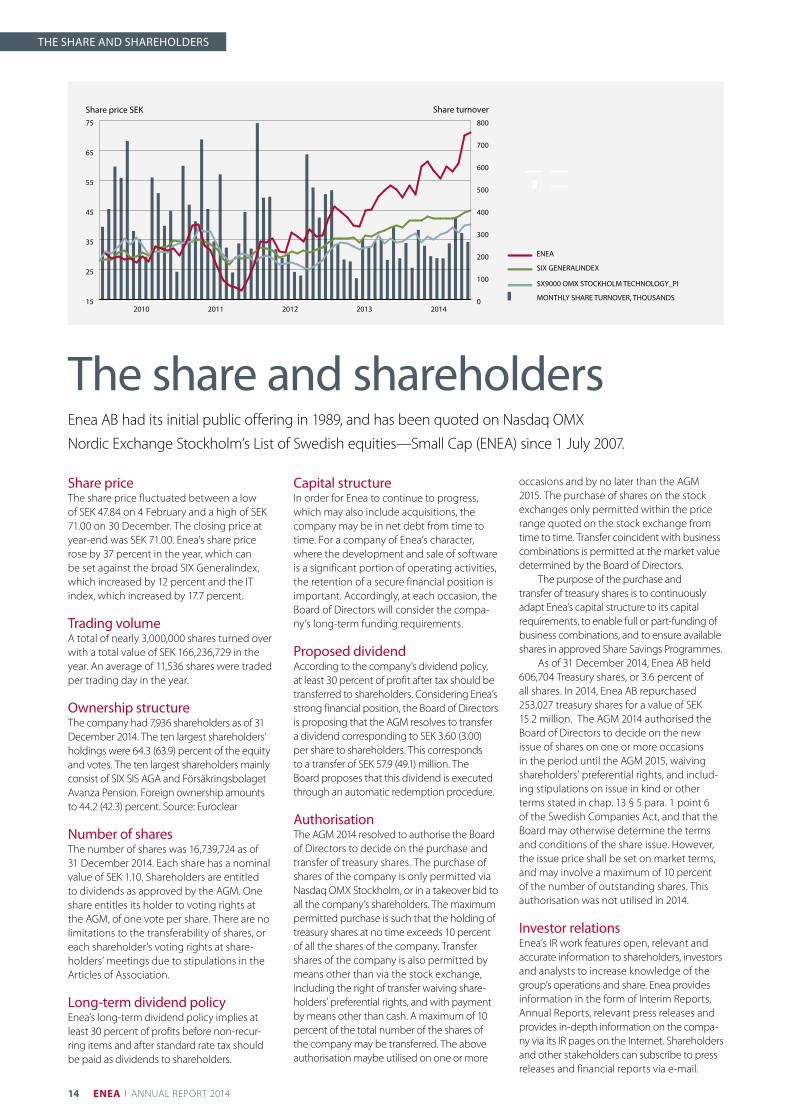
Share priceThe share price fluctuated between a low of SEK 47.84 on 4 February and a high of SEK 71.00 on 30 December. The closing price at year-end was SEK 71.00. Enea’s share price rose by 37 percent in the year, which can be set against the broad SIX Generalindex, which increased by 12 percent and the IT index, which increased by 17.7 percent.
Trading volumeA total of nearly 3,000,000 shares turned over with a total value of SEK 166,236,729 in the year. An average of 11,536 shares were traded per trading day in the year.
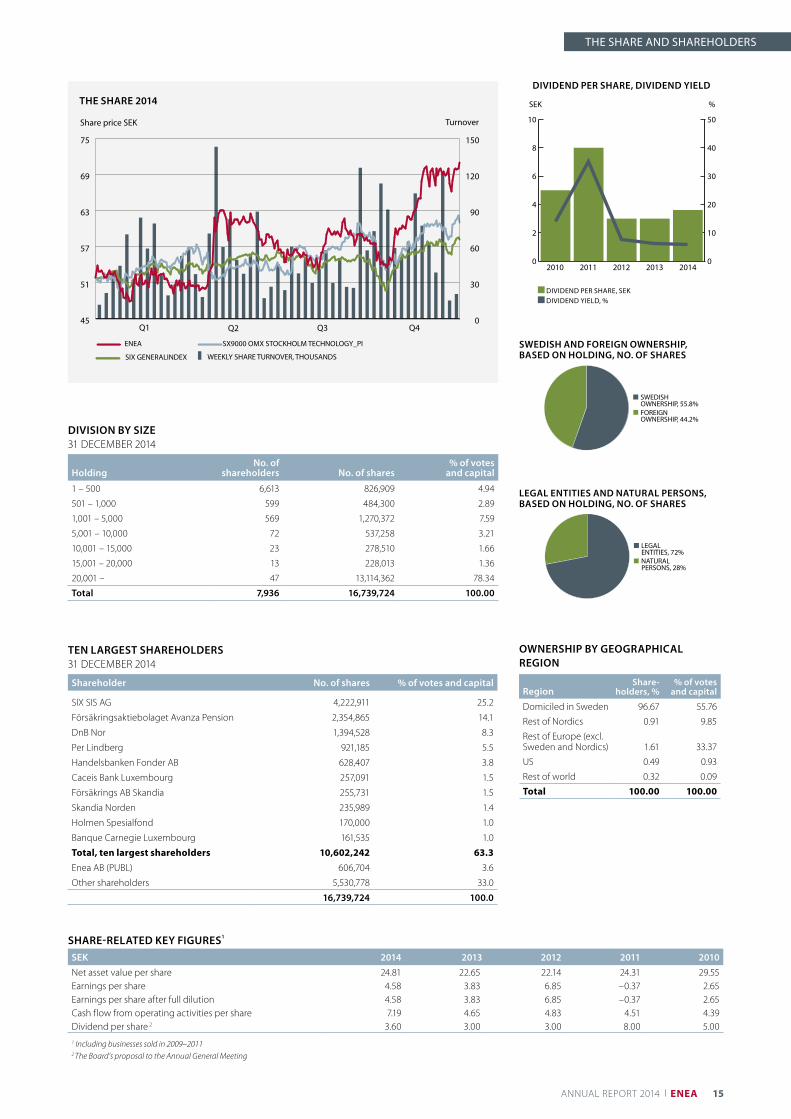
Ownership structureThe company had 7,936 shareholders as of 31 December 2014. The ten largest shareholders’ holdings were 64.3 (63.9) percent of the equity and votes. The ten largest shareholders mainly consist of SIX SIS AGA and Försäkringsbolaget Avanza Pension. Foreign ownership amounts to 44.2 (42.3) percent. Source: Euroclear
Number of sharesThe number of shares was 16,739,724 as of 31 December 2014. Each share has a nominal value of SEK 1.10. Shareholders are entitled to dividends as approved by the AGM. One share entitles its holder to voting rights at the AGM, of one vote per share. There are no limitations to the transferability of shares, or each shareholder’s voting rights at share-holders’ meetings due to stipulations in the Articles of Association.
Long-term dividend policyEnea’s long-term dividend policy implies at least 30 percent of profits before non-recur-ring items and after standard rate tax should be paid as dividends to shareholders.
Capital structureIn order for Enea to continue to progress, which may also include acquisitions, the company may be in net debt from time to time. For a company of Enea’s character, where the development and sale of software is a significant portion of operating activities, the retention of a secure financial position is important. Accordingly, at each occasion, the Board of Directors will consider the compa-ny’s long-term funding requirements.
Proposed dividendAccording to the company’s dividend policy, at least 30 percent of profit after tax should be transferred to shareholders. Considering Enea’s strong financial position, the Board of Directors is proposing that the AGM resolves to transfer a dividend corresponding to SEK 3.60 (3.00) per share to shareholders. This corresponds to a transfer of SEK 57.9 (49.1) million. The Board proposes that this dividend is executed through an automatic redemption procedure.
AuthorisationThe AGM 2014 resolved to authorise the Board of Directors to decide on the purchase and transfer of treasury shares. The purchase of shares of the company is only permitted via Nasdaq OMX Stockholm, or in a takeover bid to all the company’s shareholders. The maximum permitted purchase is such that the holding of treasury shares at no time exceeds 10 percent of all the shares of the company. Transfer shares of the company is also permitted by means other than via the stock exchange, including the right of transfer waiving share-holders’ preferential rights, and with payment by means other than cash. A maximum of 10 percent of the total number of the shares of the company may be transferred. The above authorisation maybe utilised on one or more
occasions and by no later than the AGM 2015. The purchase of shares on the stock exchanges only permitted within the price range quoted on the stock exchange from time to time. Transfer coincident with business combinations is permitted at the market value determined by the Board of Directors.
The purpose of the purchase and transfer of treasury shares is to continuously adapt Enea’s capital structure to its capital requirements, to enable full or part-funding of business combinations, and to ensure available shares in approved Share Savings Programmes.
As of 31 December 2014, Enea AB held 606,704 Treasury shares, or 3.6 percent of all shares. In 2014, Enea AB repurchased 253,027 treasury shares for a value of SEK 15.2 million. The AGM 2014 authorised the Board of Directors to decide on the new issue of shares on one or more occasions in the period until the AGM 2015, waiving shareholders’ preferential rights, and includ-ing stipulations on issue in kind or other terms stated in chap. 13 § 5 para. 1 point 6 of the Swedish Companies Act, and that the Board may otherwise determine the terms and conditions of the share issue. However, the issue price shall be set on market terms, and may involve a maximum of 10 percent of the number of outstanding shares. This authorisation was not utilised in 2014.
Investor relations Enea’s IR work features open, relevant and accurate information to shareholders, investors and analysts to increase knowledge of the group’s operations and share. Enea provides information in the form of Interim Reports, Annual Reports, relevant press releases and provides in-depth information on the compa-ny via its IR pages on the Internet. Shareholders and other stakeholders can subscribe to press releases and financial reports via e-mail.
Enea AB had its initial public offering in 1989, and has been quoted on Nasdaq OMX
Nordic Exchange Stockholm’s List of Swedish equities—Small Cap (ENEA) since 1 July 2007.
The share and shareholders
0
100
200
300
400
500
600
700
800
2014201320122011201015
25
35
45
55
65
75
Share turnover
MONTHLY SHARE TURNOVER, THOUSANDS
Share price SEK
THE SHARE AND SHAREHOLDERS
ANNUAL REPORT 2014 ENEA 15
OWNERSHIP BY GEOGRAPHICAL REGION
RegionShare-
holders, %% of votes
and capital
Domiciled in Sweden 96.67 55.76
Rest of Nordics 0.91 9.85
Rest of Europe (excl. Sweden and Nordics) 1.61 33.37
US 0.49 0.93
Rest of world 0.32 0.09
Total 100.00 100.00
■ SWEDISH OWNERSHIP, 55.8%■ FOREIGN OWNERSHIP, 44.2%
SWEDISH AND FOREIGN OWNERSHIP, BASED ON HOLDING, NO. OF SHARES
HoldingNo. of
shareholders No. of shares% of votes
and capital
1 – 500 6,613 826,909 4.94
501 – 1,000 599 484,300 2.89
1,001 – 5,000 569 1,270,372 7.59
5,001 – 10,000 72 537,258 3.21
10,001 – 15,000 23 278,510 1.66
15,001 – 20,000 13 228,013 1.36
20,001 – 47 13,114,362 78.34
Total 7,936 16,739,724 100.00
DIVISION BY SIZE31 DECEMBER 2014
■ LEGAL ENTITIES, 72%■ NATURAL PERSONS, 28%
LEGAL ENTITIES AND NATURAL PERSONS, BASED ON HOLDING, NO. OF SHARES
DIVIDEND PER SHARE, SEK DIVIDEND YIELD, %
0
2
4
6
8
10
2010 2011 2012 2013 2014
SEK
0
10
20
30
40
50
%
DIVIDEND PER SHARE, DIVIDEND YIELD
Shareholder No. of shares % of votes and capital
SIX SIS AG 4,222,911 25.2
Försäkringsaktiebolaget Avanza Pension 2,354,865 14.1
DnB Nor 1,394,528 8.3
Per Lindberg 921,185 5.5
Handelsbanken Fonder AB 628,407 3.8
Caceis Bank Luxembourg 257,091 1.5
Försäkrings AB Skandia 255,731 1.5
Skandia Norden 235,989 1.4
Holmen Spesialfond 170,000 1.0
Banque Carnegie Luxembourg 161,535 1.0
Total, ten largest shareholders 10,602,242 63.3
Enea AB (PUBL) 606,704 3.6
Other shareholders 5,530,778 33.0
16,739,724 100.0
TEN LARGEST SHAREHOLDERS31 DECEMBER 2014
SHARE-RELATED KEY FIGURES1
SEK 2014 2013 2012 2011 2010
Net asset value per share 24.81 22.65 22.14 24.31 29.55Earnings per share 4.58 3.83 6.85 –0.37 2.65Earnings per share after full dilution 4.58 3.83 6.85 –0.37 2.65Cash flow from operating activities per share 7.19 4.65 4.83 4.51 4.39Dividend per share 2 3.60 3.00 3.00 8.00 5.00
1 Including businesses sold in 2009–20112 The Board’s proposal to the Annual General Meeting
THE SHARE 2014
0
30
60
90
120
150
45
51
57
63
69
75
Share price SEK Turnover
WEEKLY SHARE TURNOVER, THOUSANDS
Q4Q3Q2Q1
THE SHARE AND SHAREHOLDERS
16 ENEA ANNUAL REPORT 2014
Enea is a global vendor of software solutions that include Linux and real-time operating systems, middleware, tools and protocols, as well as consulting services. Enea is a world leader in producing software platforms for communication-driven products subject to extreme availability and performance stand-ards. Enea’s expertise in operating systems and middleware helps companies shorten development lifecycles and reduce expenses, simultaneous with increasing reliability.
SalesIn 2014, Enea’s sales increased by 5 (13) percent to SEK 429.3 (408.5) million. Currency-adjusted, sales increased by 3 percent for the full year. Sales of term-based development licenses including support and maintenance increased somewhat compared with last year, while revenues from perpetual licenses reduced. Production licenses, which are largely dependent on customer sales volumes, increased somewhat year over year. Non-recurring revenues from production li-censes decreased, while revenues from repeat production licenses increased. Effective the Fourth-quarter Interim Report 2013, support
and maintenance are included in the term-based development licenses. Service sales produced the greatest sales increase in 2014.
Profit/lossEnea’s operating profit was SEK 93.8 (82.1) million, corresponding to an operating margin of 21.9 (20.1) percent. The currency effects on the Group’s profit is marginal.
Gross margin for the full year was 71.8 (72.7) percent.
Financial net for the full year was SEK 1.5 (1.7) million. Profit after tax was SEK 74.5 (63.2) million for the full year. Earnings per share increased to SEK 4.58 (3.83) for the full year. Without adjusting for holdings of treasury shares, earnings per share were SEK 4.45 for the full year.
Cash flow and financial positionCash flow from operating activities was SEK 116.2 (76.6) million for the full year. Total cash flow was SEK 13.1 (17.3) million. Shares worth SEK 15.2 million were repurchased in the year. On 30 May 2014, SEK 3.00 (3.00) was disbursed through an automatic redemption program
corresponding to a transfer amounting to SEK 49.1 (49.4) million to shareholders.
Cash and cash equivalents and short-term investments were SEK 215.3 (163.6) million at year-end. Additionally, the Group has an unutilised credit of SEK 15 million. Enea still has a strong financial position, with an equity ratio of 79.4 (84.5) percent.
Investments, depreciation and amortisationThe Group’s investments for the full year were SEK 15.0 (14.3) million. The depreciation of investments was SEK 18.6 (18.2) million. SEK 12.3 (12.6) million of product develop-ment expenses were capitalised in the year. The amortisation of capitalised product development expenses was SEK 14.5 (12.6) million in the year.
Parent companyThe parent company’s operating activities are primarily focused on group-wide admin-istration of management, accounting and finance, administration and IT.
The Board of Directors and Chief Executive Officer of Enea AB (publ) Corp. ID no. 5562097146
with registered office in Kista, Stockholm, Sweden, hereby present the annual report for the
financial year 1 January–31 December 2014, for the Parent Company and the Group.
Focused strategy resulted in increased profitability
DIRECTORS’ REPORT
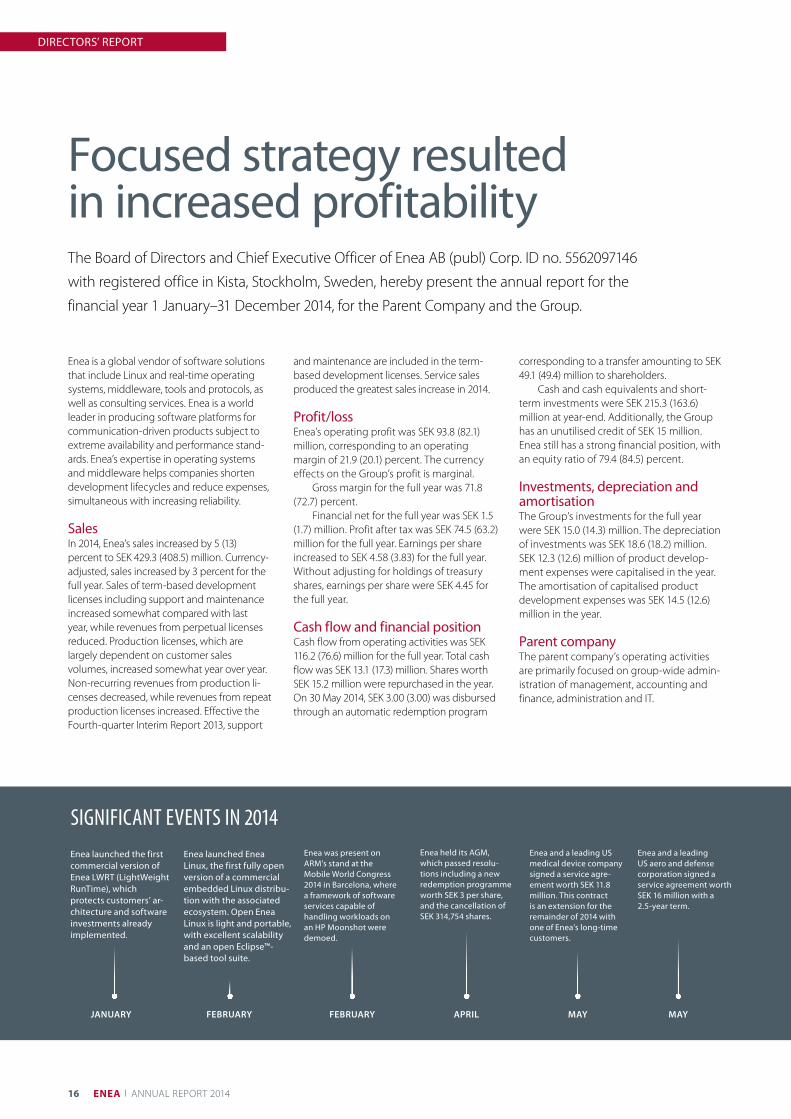
SIGNIFICANT EVENTS IN 2014Enea launched the first commercial version of Enea LWRT (LightWeight RunTime), which protects customers’ ar-chitecture and software investments already implemented.
Enea launched Enea Linux, the first fully open version of a commercial embedded Linux distribu-tion with the associated ecosystem. Open Enea Linux is light and portable, with excellent scalability and an open Eclipse™-based tool suite.
Enea was present on ARM’s stand at the Mobile World Congress 2014 in Barcelona, where a framework of software services capable of handling workloads on an HP Moonshot were demoed.
Enea held its AGM, which passed resolu-tions including a new redemption programme worth SEK 3 per share, and the cancellation of SEK 314,754 shares.
Enea and a leading US medical device company signed a service agre-ement worth SEK 11.8 million. This contract is an extension for the remainder of 2014 with one of Enea’s long-time customers.
Enea and a leading US aero and defense corporation signed a service agreement worth SEK 16 million with a 2.5-year term.
JANUARY FEBRUARY FEBRUARY APRIL MAY MAY

ANNUAL REPORT 2014 ENEA 17
Parent company net sales in the year were SEK 51.6 (48.8) million, and profit before ap-propriations and tax was SEK 2.2 (2.8) million. The financial net of the parent company was SEK 2.2 (2.7) million, and cash and cash equivalents and financial investments were SEK 184.1 (131.4) million at year-end. Parent company investments were SEK 1.4 (0.8) million. There were 13 (13) employees of the parent company at year-end. The parent company does not conduct any operations, and primarily, its risks relate to the operations of subsidiaries.
Transfer to shareholdersThe Board of Directors is proposing a transfer to shareholders in the form of an automatic redemption program combined with a 2:1 share split to the Annual General Meeting. This program involves each share being divided into one ordinary share and one redemption share. There will be no transfer of shares the company has re-purchased. The proposal is for redemption of the redemption shares for SEK 3.60 per share, corresponding to a maximum transfer of SEK 60,263,006 (57,912,955 excluding treasury shares as of 9 March 2015) to the company’s shareholders. After implementation of the proposed appropriation of profits and redemption programme, non-restricted and total equity of parent company Enea AB will be SEK 143,776,000 and SEK 162,132,000 respectively.
Board of Directors’ statement regarding the proposed redemption programme, pursuant to chap. 18 § 4 of the Swedish Companies Act. The proposed dividend to shareholders reduces the parent compa-ny’s equity ratio from 58.0 percent to 50.4 percent, and the group’s equity ratio from 79.4 percent to 76.8 percent. Against the background of the company’s and the group’s operating activities continuing to be
DIRECTORS’ REPORT
conducted profitably, the equity ratio and liquidity are satisfactory.
The Board of Directors’ opinion is that the proposed value transfer does not prevent the company, or other member companies of the group, from fulfilling their obligations in the short and long term, nor from completing the necessary investments. Accordingly, the proposed value transfer can be considered justifiable in terms of what is stated in chap. 17 § 3, para. 2-3 of the Swedish Companies Act. The Board of Directors proposes that the Annual General Meeting authorises the Board to set a record date for the share split and redemption procedure, and the period for trading in redemption shares.
Regarding the company’s results of operation and financial position otherwise,
the reader is referred to the following Income Statements and Balance Sheets, as well as Cash Flow Statements and associated Notes. These financial statements were approved for issue by the parent company’s Board of Directors on 26 March 2015.
Proposed appropriation of profitsThe following funds are at the disposal of the parent company, SEK: 2014Share premium reserve 3,050,047Retained earnings 197,387,646Profit (loss) for the year 1,251,202Total 201,688,895
The Board of Directors proposes that these funds are appropriated so that SEK 201,688,895 is carried forward.
Enea and a leading US aero and defense corporation signed a new service agreement worth SEK 9.2 million over a five-month period.
Enea launched version 3.4.0 of its middleware of-fering Enea Element. Enea is one of few independent players with the capacity to deliver applications management and system support of embedded and cloud-based software for customers.
Release of version 4.0 Enea Linux, which includes technology that promotes system performance and en-ables virtualisation of network functionality.
Enea presented the Enea Telco Development Platform, a software platform produced exclusively in collaboration with HP for its ProLiant m800 server cartridge in its Moonshot server system.
Enea signed a three-year contract worth SEK 6 million with a major telco. Enea will be providing this customer with Enea Element middleware for its new Ethernet switches.
Enea announced a training partnership with the Linux Foundation on the resale of its full selection of courses in embedded Linux programming and related subjects.
Enea became a silver member of the OPNFV (Open Network Functions Virtualization) project.
JUNE JUNE SEPTEMBER SEPTEMBER OCTOBER OCTOBER DECEMBER
18 ENEA ANNUAL REPORT 2014
RISKS AND RISK MANAGEMENT
Operational risk Comments Exposure
Customer structureEnea is dependent on a few major customers such as Ericsson and Nokia, all of which are significant suppliers of telecom equipment.
Enea is dependent on its major customers’ long-term plans for investment and product develop-ment, since the development of new generations of products can involve major decisions that affect how products and services are used.
Total revenue from Ericsson and Nokia constitutes more than half of the company’s sales.
The risk of rapid negative fluctuations is limited due to long-term agreements and difficulties for customers to change the degree to which they use Enea’s products and services at short notice.
Contract structureA high proportion of software revenue is repeat revenue and derived from long-term royalty and maintenance agreements. Revenue from consultan-cy services is not normally repeatable.
Enea cannot influence the progress of its future royalty streams. Enea’s royalty streams are largely dependent on customer production volumes. However, expenses related to simultaneous revenue streams are limited.
Repeat revenue streams represent the majority of annual software revenue.
Competence supply Enea’s success is very closely linked to the compa-ny’s ability to employ, stimulate, motivate and retain highly-qualified personnel.
Competition for highly-qualified personnel in the IT industry is intense. However, Enea’s combination of products and services represents a competitive ad-vantage, as the company is able to offer more career opportunities. The launch of Enea’s Linux product also increases the company’s technical range, a factor that could be significant for recruiting and retaining engineers.
Enea’s staff turnover is considered comparable to the industry average.
Product liability, intellectual property rights and legal disputesEnea’s products are critical components of its customers’ products, and faulty products could compromise customer relationships and generate claims for damages. Enea’s intellectual property is at risk of infringements. There is also a risk that Enea’s products infringe on external parties’ intellectual property.
Enea is insured against product liability and judges that the company’s insurance cover adequately limits its direct risk exposure.
Enea is also covered by insurance in the event that its products infringe on external parties’ pa-tents or copyright. Enea continuously obtains legal advice in order to protect its intellectual property rights and reduce the risk of infringement of its intellectual property.
Neither Enea AB nor its subsidiaries are currently involved in any litigation, court proceedings or arbitration, with the exception of some minor disputes that are not expected to have any material adverse effect on the company’s financial position. Enea continuously reviews the application of its contract terms with its customers and suppliers. Disagreements relating to how contracts are to be interpreted could lead to disputes.
Market-related risks Comments Exposure
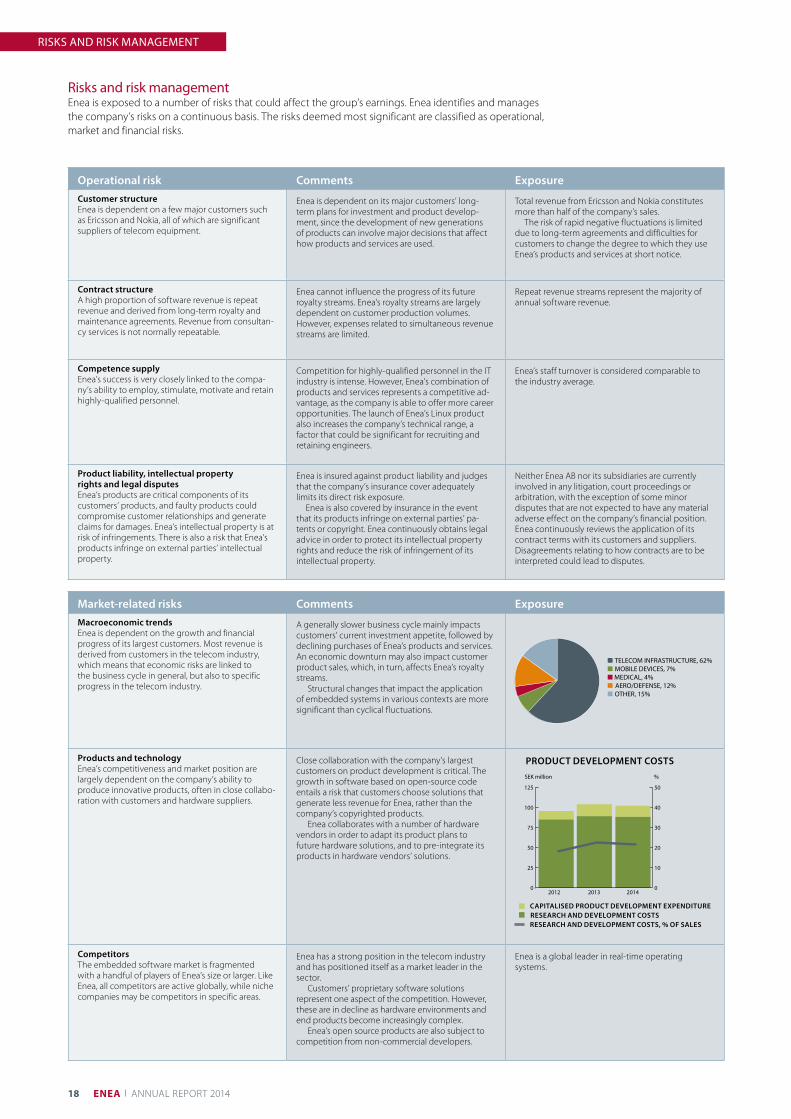
Macroeconomic trendsEnea is dependent on the growth and financial progress of its largest customers. Most revenue is derived from customers in the telecom industry, which means that economic risks are linked to the business cycle in general, but also to specific progress in the telecom industry.
A generally slower business cycle mainly impacts customers’ current investment appetite, followed by declining purchases of Enea’s products and services. An economic downturn may also impact customer product sales, which, in turn, affects Enea’s royalty streams.
Structural changes that impact the application of embedded systems in various contexts are more significant than cyclical fluctuations.
Products and technologyEnea’s competitiveness and market position are largely dependent on the company’s ability to produce innovative products, often in close collabo-ration with customers and hardware suppliers.
Close collaboration with the company’s largest customers on product development is critical. The growth in software based on open-source code entails a risk that customers choose solutions that generate less revenue for Enea, rather than the company’s copyrighted products.
Enea collaborates with a number of hardware vendors in order to adapt its product plans to future hardware solutions, and to pre-integrate its products in hardware vendors’ solutions.
CompetitorsThe embedded software market is fragmented with a handful of players of Enea’s size or larger. Like Enea, all competitors are active globally, while niche companies may be competitors in specific areas.
Enea has a strong position in the telecom industry and has positioned itself as a market leader in the sector.
Customers’ proprietary software solutions represent one aspect of the competition. However, these are in decline as hardware environments and end products become increasingly complex.
Enea’s open source products are also subject to competition from non-commercial developers.
Enea is a global leader in real-time operating systems.
Risks and risk managementEnea is exposed to a number of risks that could affect the group’s earnings. Enea identifies and manages the company’s risks on a continuous basis. The risks deemed most significant are classified as operational, market and financial risks.
PRODUCT DEVELOPMENT COSTS
■ TELECOM INFRASTRUCTURE, 62%■ MOBILE DEVICES, 7%■ MEDICAL, 4%■ AERO/DEFENSE, 12%■ OTHER, 15%
CAPITALISED PRODUCT DEVELOPMENT EXPENDITURE RESEARCH AND DEVELOPMENT COSTS RESEARCH AND DEVELOPMENT COSTS, % OF SALES
0
25
50
75
100
125
2012 2013 2014
SEK million %
0
10
20
30
40
50

ANNUAL REPORT 2014 ENEA 19
RISKS AND RISK MANAGEMENT
Financial risks Comments Exposure
Currency riskCurrency risk means the risk that the value of a financial instrument fluctuates due to changes in exchange rates.
Enea operates in an international environment and conducts most of its sales in SEK, EUR and USD. Currency exposure is largely minimised by conducting business activities in subsidiaries with revenue and expenses de-nominated in local currency. A group account structure that uses multiple currencies minimises exchange rate fluctuations and increases flexibility regarding the timing of foreign exchange transaction. Major expected foreign currency deposits and payments are hedged through currency forwards, in line with Enea’s financial policy.
Foreign subsidiaries are translated into SEK using the current rate method, which means that the Statement of Comprehensive Income is translated at the average exchange rate for the period, while the Balance Sheet is translated at the closing-day rate. Translation exposure is not hedged.
In 2014, a total of EUR 8 (7) million was hedged. At the end of 2014, the value of two derivatives outstanding totalled EUR 3 million, at rates of 8.85 and 8.87 respecti-vely at year-end 2014.
Average appreciation/depreciation of 5 percent against the EUR would have implied a decrease/increa-se of SEK 5 million in revenue in 2014, all things being equal. The corresponding effect on revenue against the USD would total SEK 7 million.
Liquidity riskLiquidity risk is the risk that Enea is unable to obtain financing, or only access finan-cing at a significantly increased cost.
Enea’s cash pool, with cash and cash equivalents mainly in its Swedish companies and financial investments, is managed by the parent company. The group’s liquidity is reported and monitored weekly on an ongoing basis. Surplus liquidity is invested in interest-bearing assets with a term of less than one year, and a specified pro-portion for a period up to a maximum of two years with reputable financial institutions. It is possible to terminate investments during the term. The risk associated with the investments is limited in accordance with the group’s Finance Policy which has been authorised by Enea’s Board of Directors.
Enea’s liquidity risk is limited. Cash and cash equivalents and financial investments totalled SEK 215.3 (163.6) million as of 31 December. The group has no interest-be-aring liabilities.
Capital riskThe objective of the group’s capital structure is to ensure a stable financial position that secures the group’s ability to continue operating and generate returns for its shareholders, benefit other stakeholders and inspire confidence in the company’s frequently close and long-term customer relationships.
To maintain or adjust its capital structure, the group may pay dividends, or repay capital to shareholders, or issue new shares, or sell assets to reduce liabilities.
At the end of the year, the group had no external financing..
Interest rate riskInterest rate risk means the risk that the value of a financial instrument will fluctua-te due to changes in market interest rates.
The group has credit facilities totalling SEK 15 million, of which SEK 15 million was unutilised as of 31 December 2014.
Interest rate risk in the group’s cash and cash equiva-lents is primarily due to progress on the Swedish bond market.
Since the group has no interest-bearing liabilities, Enea’s interest rate risk is low.
An increase/decrease of 1 percent in interest rates on cash and cash equivalents and invested surplus liquidity would generate an increase/decrease of some SEK 2 million in the financial net.
Credit riskCredit risk refers to the risk that the counterparty in a transaction involving a financial instrument is unable to meet its obligations. The primary credit risk is that Enea fails to receive payment for its accounts receivable.
The group’s customers are predominantly large, well-established companies with high solvency ratios, spread across several geographical markets. To limit risks, the company’s credit policy contains guidelines and regulations for assessing the credit risk of new customers, payment terms and procedures and processes for handling outstanding claims.
Provisions of SEK 4.5 (0) million were made for doubtful debt in 2014.
CASH AND CASH EQUIVALENTS AND FINANCIAL INVESTMENTS
2012 2013 2014
SEK million
0
50
100
150
200
250

20 ENEA ANNUAL REPORT 2014
Swedish Code of Corporate GovernanceThe following description of the Corporate Governance Report has been prepared in ac-cordance with the Swedish Code of Corporate Governance. During the financial year, Enea complied with the Code without exception.
ShareholdersEnea’s ordinary shares are listed on NASDAQ OMX Stockholm’s Small Cap list. According to the share register maintained by Euroclear Sweden, Enea had 16,739,724 shares as of 31 December 2014. On the same date, Enea AB’s share capital amounted to SEK 18,355,714, divided between 16,739,724 ordinary shares, each carrying the same voting rights and participation in the company’s earnings and capital. Enea owns 606,704 treasury shares, corresponding to 3.6 percent of total shares. On 31 December 2014, the largest sharehold-ers were SIX SIS AG, with 25.2 percent and Försäkringsbolaget Avanza Pension, with 14.1 percent of the shares.
Annual General MeetingThe Annual General Meeting, or where ap-plicable, an Extraordinary General Meeting, is Enea’s highest decision-making body. All shareholders are entitled to participate in the Annual General Meeting, either in person or through a representative given Power of Attorney. All shareholders are entitled to request that a matter be addressed by the Meeting.
Enea AB’s Annual General Meeting was held on 24 April 2014 in Kista, Sweden. The Annual General Meeting’s responsibilities include adopting the Articles of Association, appointing the Board of Directors and Chairman, appointing the Auditors, adopting the Income Statement and Balance Sheet, adopting a resolution on the appropria-tion of earnings, discharging the Board
of Directors and the CEO from liability, resolutions on the Nomination Committee, deciding the remuneration principles for the CEO and other senior executives, etc. A two-thirds majority is required to amend the Articles of Association.
The Annual General Meeting 2014 adopted the following resolutions adopting the company’s and the group’s
Income Statement and Balance Sheet,
discharging the Board of Directors and the CEO from liability,
remuneration to the Board of Directors and the Auditors,
guidelines for remuneration to senior executives,
introducing an automatic redemption programme involving a share split, the re-demption of shares and a bonus issue. The redemption programme involved a trans-fer of SEK 3.00 per share to shareholders,
a reduction in share capital and a bonus issue,
a reduction of the statutory reserve,
Board authorisation to pass resolutions on acquisitions and transfers of treasury shares corresponding to a maximum of 10 percent of the company’s shares,
Board authorisation to reach resolutions on new share issues relating to share or business acquisitions corresponding to a maximum increase of 10 percent of share capital,
election of Board members, Åsa Landén Ericsson, Mats Lindoff, Anders Skarin, and Kjell Duveblad, Torbjörn Nilsson and Robert Andersson were re-elected as Board members. Anders Skarin was elected Chairman of the Board.
The complete minutes from the Annual General Meeting, together with the Meeting’s supporting decision-making data, can be found on the company’s website (www.enea.se), under Investor Relations.
Nomination CommitteeThe Annual General Meeting appoints Nomination Committee members or states how they are to be appointed. Enea’s Nomination Committee for the Annual General Meeting 2015 will be appointed from a minimum of two and a maximum of four of the largest shareholders in descending order from the share register as of 31 August 2014. If more than two of the four largest shareholders in terms of votes declines to appoint a representative of the Nomination Committee, the next sharehold-er in order of size shall be given the opportu-nity to appoint a representative. The names of the Nomination Committee’s represent-atives shall be published in the company’s Third-quarter Interim Report. The mandate period for the Nomination Committee runs until a new Nomination Committee has become effective. A shareholder represent-ative should be appointed Chairman of the Nomination Committee.
In accordance with the above, the Chairman of the Board contacted the four largest shareholders, in terms of votes, at the end of August 2014 to request that they ap-point one member each to the Nomination Committee. Two of these appointed a representative, and two declined. If any sig-nificant changes take place to the ownership structure following the appointment of the Nomination Committee, the composition of the Nomination Committee will be amended in accordance with the above principles.
Enea AB is a Swedish public limited company listed on the NASDAQ OMX Nordic Exchange in Stockholm,
Sweden. The Enea group’s corporate governance is based on Swedish legislation and the rules and
recommendations issued by relevant organisations, including the Swedish Corporate Governance Board,
NASDAQ OMX, the Swedish Securities Council and others. Enea’s governance, management and control
are divided between the shareholders at the Annual General Meeting, the Board of Directors and the
CEO in compliance with the Swedish Companies Act and the Board of Directors’ Rules of Procedure.
Corporate Governance Report 2014
CORPORATE GOVERNANCE REPORT

ANNUAL REPORT 2014 ENEA 21
The Nomination Committee will prepare and submit proposals to the Annual General Meeting for: the Chairman of the forthcoming Annual
General Meeting,
the election of the Chairman and other Board members,
Board remuneration divided between the Chairman and other Board members, as well as guidelines for potential remunera-tion for committee work,
the election and fees for Auditors and Deputy Auditors (where applicable),
resolution on guidelines for the composi-tion of the Nomination Committee.
Prior to the 2015 Annual General Meeting, the Nomination Committee consists of Per Lindberg, Sverre Bergland (DnB Nor) as well as Anders Skarin (Chairman of the Board of Enea AB). The Nomination Committee appointed Per Lindberg as its Chairman.
The work of the Board of DirectorsThe Board manages the company’s affairs in the interests of the company and all share-holders. The Board’s tasks include adopting business objectives and strategy, appointing, evaluating and, where necessary, dismissing the CEO, ensuring that effective systems are in place for monitoring and reviewing the company’s operations, ensuring that there is satisfactory control of the company’s compli-ance with laws and other regulations appli-cable to the company’s operations, ensuring that the requisite ethical guidelines are adopted regarding the company’s conduct and ensuring that the company’s corporate communication features transparency and that it is accurate, relevant and reliable.
The CEO participates at every Board meeting and reports on the company’s business situation, future prospects, financial position and events of material significance, as well as the management’s budget propos-als and action plan for the coming financial year. Other company executives also participate in Board meetings and present
CORPORATE GOVERNANCE REPORT
reports when necessary. The CEO does not participate in the parts of Board meetings that deal with the relationship between the CEO and the company, and the work of the CEO and other senior executives is evaluated at least yearly.
The Board members’ shareholdings are provided in the presentation of the Board of Directors, see page 22.
Every year, the company’s Auditor pre-sents a report to the Board of Directors based on observations made during the review and assessment of the company’s internal control. The guidelines for the Board of Directors’ work are based on the Rules of Procedure that reg-ulate the division of responsibilities between the Board of Directors, the Chairman and the CEO, and the matters that are to be discussed at ordinary Board meetings. The Board of Directors’ Rules of Procedure are adopted annually at the statutory Board meeting following the Annual General Meeting and adjusted as required.
Apart from the above duties, the Rules of Procedure include approval of the Board of Directors’ agenda, instructions for the CEO, decision-making procedures within the com-pany, the appropriate division of responsibili-ties as well as information flows between the company and the Board of Directors.
In 2014, the Board of Directors addressed the Enea group’s strategy and business op-erations, remuneration of senior executives, continuously monitored operations and forecasts, interim reports, budgets and the business plan for 2015, as well as a repur-chase of treasury shares. The work of the Board of Directors was appraised at year-end. In 2014, the Board of Directors held eight meetings, as well as one meeting following election. In addition to regular Board work, some Board members are also members of the company’s Audit Committee and Remuneration Committee. Attendance sta-tistics for Board meetings in 2014 are shown in the following table.
The Board received remuneration of SEK 1,600,000, to be divided as follows: SEK 420,000 to the Chairman of the Board and
SEK 200,000 each to other Board members appointed by the Annual General Meeting, as well as SEK 180,000 to be divided among Board members according to their efforts and participation in committee work. Details of Board members’ remuneration are stated in Note 4.
Board of Directors independenceAll Board members were judged to be independent in respect of the company and group management and in respect of major shareholders. For information on Board members and the CEO, see pages 22–23.
Audit CommitteeThe Audit Committee consisted of Åsa Landén Ericsson (Chairman), Torbjörn Nilsson and Robert Andersson. Enea’s CFO and the company’s Auditor are co-opted to the meetings, which are normally held once quarterly. Minutes are kept at Audit Committee meetings and presented to the Board of Directors.
The Audit Committee is responsible for the preparation of the Board of Directors’ quality assurance of the company’s financial reporting, keeping informed of the focus and scope of the audit, discussing coordinating between external Auditors and the compa-ny’s internal control functions, evaluating the company’s risk exposure, adopting guide-lines for services other than those provided by the company Auditor, evaluating the au-dit and informing the company’s Nomination Committee of the evaluation, as well as assisting the Nomination Committee with its proposals for Auditors and remuneration.
In 2014, the Audit Committee held four meetings, all in connection with the quarterly financial statements. Board mem-bers’ attendance statistics at Remuneration Committee meetings in 2014 are indicated below. The main topics addressed included presentations of the company’s Interim Reports, product profitability, goodwill and other intangible assets, accounts receivable, risk management, finance-related issues and internal reviews.
Board member 1 2 3 41 5 6 7 8 9
Anders Skarin (Chairman) X X X X X X X X X
Robert Andersson X X X X X X X X X
Kjell Duveblad X X X X X X X X X
Åsa Landén Ericsson X – X X X X X X X
Mats Lindoff X X X X X X X X X
Torbjörn Nilsson X X X X X X X X X
Eva Swedberg X – X X X X X X X
1 Meeting no. 4 was statutory
ATTENDANCE AT BOARD MEETINGS
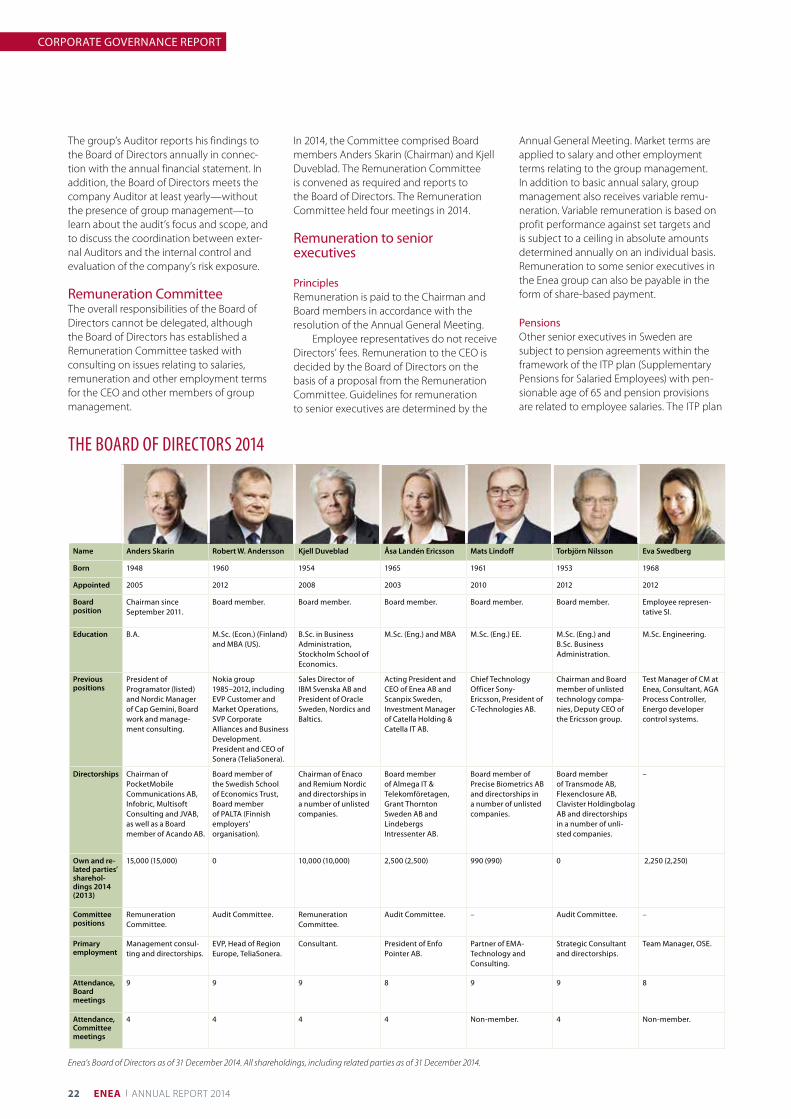
22 ENEA ANNUAL REPORT 2014
The group’s Auditor reports his findings to the Board of Directors annually in connec-tion with the annual financial statement. In addition, the Board of Directors meets the company Auditor at least yearly—without the presence of group management—to learn about the audit’s focus and scope, and to discuss the coordination between exter-nal Auditors and the internal control and evaluation of the company’s risk exposure.
Remuneration CommitteeThe overall responsibilities of the Board of Directors cannot be delegated, although the Board of Directors has established a Remuneration Committee tasked with consulting on issues relating to salaries, remuneration and other employment terms for the CEO and other members of group management.
In 2014, the Committee comprised Board members Anders Skarin (Chairman) and Kjell Duveblad. The Remuneration Committee is convened as required and reports to the Board of Directors. The Remuneration Committee held four meetings in 2014.
Remuneration to senior executives
PrinciplesRemuneration is paid to the Chairman and Board members in accordance with the resolution of the Annual General Meeting.
Employee representatives do not receive Directors’ fees. Remuneration to the CEO is decided by the Board of Directors on the basis of a proposal from the Remuneration Committee. Guidelines for remuneration to senior executives are determined by the
Annual General Meeting. Market terms are applied to salary and other employment terms relating to the group management. In addition to basic annual salary, group management also receives variable remu-neration. Variable remuneration is based on profit performance against set targets and is subject to a ceiling in absolute amounts determined annually on an individual basis. Remuneration to some senior executives in the Enea group can also be payable in the form of share-based payment.
PensionsOther senior executives in Sweden are subject to pension agreements within the framework of the ITP plan (Supplementary Pensions for Salaried Employees) with pen-sionable age of 65 and pension provisions are related to employee salaries. The ITP plan
CORPORATE GOVERNANCE REPORT
THE BOARD OF DIRECTORS 2014
Enea’s Board of Directors as of 31 December 2014. All shareholdings, including related parties as of 31 December 2014.
Name Anders Skarin Robert W. Andersson Kjell Duveblad Åsa Landén Ericsson Mats Lindoff Torbjörn Nilsson Eva Swedberg
Born 1948 1960 1954 1965 1961 1953 1968
Appointed 2005 2012 2008 2003 2010 2012 2012
Board position
Chairman since September 2011.
Board member. Board member. Board member. Board member. Board member. Employee represen-tative SI.
Education B.A. M.Sc. (Econ.) (Finland) and MBA (US).
B.Sc. in Business Administration, Stockholm School of Economics.
M.Sc. (Eng.) and MBA M.Sc. (Eng.) EE. M.Sc. (Eng.) and B.Sc. Business Administration.
M.Sc. Engineering.
Previous positions
President of Programator (listed) and Nordic Manager of Cap Gemini, Board work and manage-ment consulting.
Nokia group 1985–2012, including EVP Customer and Market Operations, SVP Corporate Alliances and Business Development. President and CEO of Sonera (TeliaSonera).
Sales Director of IBM Svenska AB and President of Oracle Sweden, Nordics and Baltics.
Acting President and CEO of Enea AB and Scanpix Sweden, Investment Manager of Catella Holding & Catella IT AB.
Chief Technology Officer Sony-Ericsson, President of C-Technologies AB.
Chairman and Board member of unlisted technology compa-nies, Deputy CEO of the Ericsson group.
Test Manager of CM at Enea, Consultant, AGA Process Controller, Energo developer control systems.
Directorships Chairman of PocketMobile Communications AB, Infobric, Multisoft Consulting and JVAB, as well as a Board member of Acando AB.
Board member of the Swedish School of Economics Trust, Board member of PALTA (Finnish employers’ organisation).
Chairman of Enaco and Remium Nordic and directorships in a number of unlisted companies.
Board member of Almega IT & Telekomföretagen, Grant Thornton Sweden AB and Lindebergs Intressenter AB.
Board member of Precise Biometrics AB and directorships in a number of unlisted companies.
Board member of Transmode AB, Flexenclosure AB, Clavister Holdingbolag AB and directorships in a number of unli-sted companies.
–
Own and re-lated parties’ sharehol-dings 2014 (2013)
15,000 (15,000) 0 10,000 (10,000) 2,500 (2,500) 990 (990) 0 2,250 (2,250)
Committee positions
Remuneration Committee.
Audit Committee. Remuneration Committee.
Audit Committee. – Audit Committee. –
Primary employment
Management consul-ting and directorships.
EVP, Head of Region Europe, TeliaSonera.
Consultant. President of Enfo Pointer AB.
Partner of EMA-Technology and Consulting.
Strategic Consultant and directorships.
Team Manager, OSE.
Attendance, Board meetings
9 9 9 8 9 9 8
Attendance, Committee meetings
4 4 4 4 Non-member. 4 Non-member.

ANNUAL REPORT 2014 ENEA 23
is largely defined-benefit. The ITP plan is cov-ered by insurance through Alecta. Pension premiums are paid continuously.
Severance payA six-month notice period applies in the event of termination of employment of the CEO initiated by either the company or the CEO. In addition, severance pay correspond-ing to six months’ basic salary is payable should employment be terminated by the company. Should the ownership structure change so that a new majority shareholder emerges, the CEO is entitled to severance pay of six months’ salary. All dismissal and severance pay are deducted from any other income. For other senior executives, a notice period of three to twelve months applies.
The Board of Directors reserves the right to depart from the proposed guidelines in individual cases where special conditions apply.
CORPORATE GOVERNANCE REPORT
CEOAnders Lidbeck has been Enea’s CEO since 2011. The CEO’s other significant assignments and previous experience are detailed in the presentation of senior executives on page 23. Anders Lidbeck has no significant shareholdings in companies that Enea has a business relationship with.
Internal control and risk manage-ment of financial reportingThe Board is responsible for internal control in accordance with the Swedish Companies Act, the Swedish Annual Accounts Act and the Swedish Code of Corporate Governance. The following description is limited to inter-nal controls over financial reporting.
Control environmentEnea’s objective is to fulfil the requirements for ongoing work pertaining to risk and inter-nal control as part of Enea’s compliance with
the Swedish Code of Corporate Governance. At Enea, internal control over financial report-ing is an integral part of corporate govern-ance. It includes procedures and methods to secure the group’s assets and the accuracy of financial reporting, and this aims to protect shareholders’ investments in the company.
The Board monitors the quality of the financial reporting in a number of ways. The Board approves the rules of procedure each year, which include regulating the duties of the Chairman and CEO. According to these instructions, the CEO is responsible for re-viewing and ensuring the quality of financial reporting, and for ensuring that the Board of Directors receives the reports required in or-der to evaluate the group’s financial position on a continuous basis. The instructions to the CEO include matters on which the CEO is authorised to represent the company, but only after receiving authorisation or approval from the Board.
MANAGEMENT 2014
Oskar Swirtun was part of Enea’s management team as Interim SVP Marketing in the financial year 2014.
Name Anders Lidbeck Håkan Rippe Karl Mörner Adrian Leufvén Bogdan Putinica Daniel Forsgren Kirk Fuller
Born 1962 1968 1975 1972 1977 1973 1958
Employed since
2011 2009 1998 1998 2007 2006 2014
Member of manage-ment since
2011 2009 2011 2008 2011 2014 2014
Position President and Chief Executive Officer.
CFO. Senior Vice President R&D.
Senior Vice President Software Sales Key Accounts Europe & Asia.
Senior Vice President Global Services.
Senior Vice President Product Management.
Senior Vice President, Sales and Strategic Alliances.
Education M.Sc. in Business Administration and Economics, University of Lund.
M.Sc. in Industrial Engineering and Management, Chalmers University of Technology, Gothenburg.
Software Engineering, University of Skövde.
M.Sc. Mechatronics, Royal Institute of Technology, Stockholm
International Finance and Banking, Academy of Economic Studies, Bucharest, Romania.
Industrial Engineering and Management, M.Sc. in Applied Physics and Electrical Engineering, Linköping Institute of Technology.
M.Sc. in Computer Science, Central Michigan University, B.Sc. in Business Administration, Aquinas.
Previous positions
President and CEO of Telelogic, sales and marketing positions at Nokia, ICL and Telia Megacom, including as President of ICL Direct in Benelux and Vice President of Sales and Marketing for ICL Industry systems Europe.
Head of Business Development at Enea, Senior Vice President Nordic Consulting at Enea, Business Development Executive at IBM Rational Software and Executive Vice President CorporateDevelopment at Telelogic.
Director of Product Management at Enea, Director of System Management at Enea, System Architect at Enea and Team Leader at Enea.
Development Manager at Enea, VP Strategic Outsourcing at Enea, VP Support at Enea, VP Marketing at Enea, Director Asian Sales at Enea.
CEO of Enea Romania, Global Sales Director Product Services at Enea Romania and President of IP Devel.
Principle Engineer at Enea’s CTO office, System Architect, System Manager, Software Engineer at Enea. Software Engineer at Virtutech.
VP, Worldwide Field Operations and Sales—Simics, Wind River Systems (an Intel Subsidiary); SVP,WW Field Operations, Virtutech, Inc.
Own and re-lated parties’ sharehol-dings 2014 (2013)
50,000 (through en-dowment insurance)(50,000).
45,000 (of which 35,000 through en-dowment insurance).
500 (500) 17,000 (29,500) 3,500 (3,500) 11,000 (0) 0 (0)
24 ENEA ANNUAL REPORT 2014
At the statutory Board meeting following the Annual General Meeting, Enea’s Board of Directors adopts the Rules of Procedure for the Board of Directors, the Audit Committee and the Remuneration Committee.
In addition, the instruction to the CEO, approvals list and instruction for trading in the company’s shares are approved.
Enea’s CEO and group management bear operational responsibility for internal control. Based on the Board of Directors’ guide-lines alongside legislation and regulations governing financial reporting, management has established the division of roles and responsibilities for staff working on financial reporting in the group. The Group is divided into units, with each unit manager responsible for meeting objectives and budgets, as well as compliance with governance issues relating to the unit. Enea’s organisational structure is presented on the Group’s intranet so that roles and responsibilities are made clear to everyone working on financial information.
Enea has issued instructions to subsidi-ary managers based on the framework and guidelines that apply to Enea AB’s CEO. Enea also presents a number of policies on the in-tranet, which govern work at Enea and create a basis for good internal control, including a Finance Policy, Approvals Policy, IT Policy,
Environmental Policy, Insider Trading Policy and Communications Policy. The Group also has an accounting and reporting manual with instructions on the group’s accounting policies, reporting instructions and a sched-ule that ensure that consistent and accurate accounting information is provided in a time-ly manner. These guidelines are followed up and updated regularly and presented to all employees who work directly or indirectly on financial reporting.
Risk assessmentThe objective of Enea’s risk assessment is to secure the group’s earnings progress and fi-nancial position. Enea AB’s Board of Directors approves Enea’s risk management policies and guidelines, and the CEO and group management have operational responsi-bility. Regular risk assessments are carried out within the scope of Enea’s monthly financial follow-ups by unit managers, the Management group and the controller, and measures are implemented as required.
Control activitiesEnea’s business areas are followed up month-ly by the relevant manager and controller. Results are compared to previous figures and budgets for all units. Enea’s group
CORPORATE GOVERNANCE REPORT
management held scheduled bi-monthly meetings in 2014 to monitor operations and business progress, the financial outcome against budget and preceding periods, to establish forward-looking sales and earnings forecasts, as well as determining necessary measures for ensuring good internal control. The CEO presents an aggregated monthly report to the Board of Directors. When nec-essary, more detailed follow-ups are carried out, for example, in the form of reviews of subsidiaries by controllers.
In 2014, Enea’s Auditors conducted a summary review of quarter three Interim Report and submitted a review in the Interim Report for 1 January–30 September 2014, and a review of the annual financial state-ment when presenting their Audit Report in the company’s Annual Report 2014.
Given the scope and limited complex-ity of operations, combined with existing reporting to the Board of Directors and Audit Committee, the Board does not consider the establishment of a specific internal audit function to be financially justifiable. The internal control described above is deemed sufficient to assure the quality of financial reporting.

ANNUAL REPORT 2014 ENEA 25
INCOME STATEMENT
consolidated
CONSOLIDATED STATEMENT OF COMPREHENSIVE INCOME
SEK 000 (1 January–31 December) Note 2014 2013
Net sales 429,298 408,518
Operating expenses
Cost of sold products and services –120,850 –111,576
Gross profit 308,448 296,942
Sales and marketing expenses –80,338 –76,052
Product development expenses –87,895 –90,362
Administrative expenses –46,400 –48,412
Operating profit 3,4,5,6,7,10,11,22 93,815 82,116
Financial income 5,540 7,041
Financial expenses –4,065 –5,351
Financial net 8 1,475 1,690
Profit before tax 95,290 83,806
Tax 9 –20,784 –20,631
Net profit 74,506 63,175
Other comprehensive income
Exchange rate difference 14,341 1,012
Cash flow hedges, profit/loss before tax –1,144 –743
Cash flow hedges, tax effect 252 163
Total comprehensive income for the year, net after tax 87,955 63,607
Profit for the period attributable to parent company shareholders 74,506 63,175
Comprehensive income for the period attributable to parent company shareholders 87,955 63,607
Earnings per share, SEK 17 4.58 3.83
The company has no outstanding instruments that may entail a dilution effect.
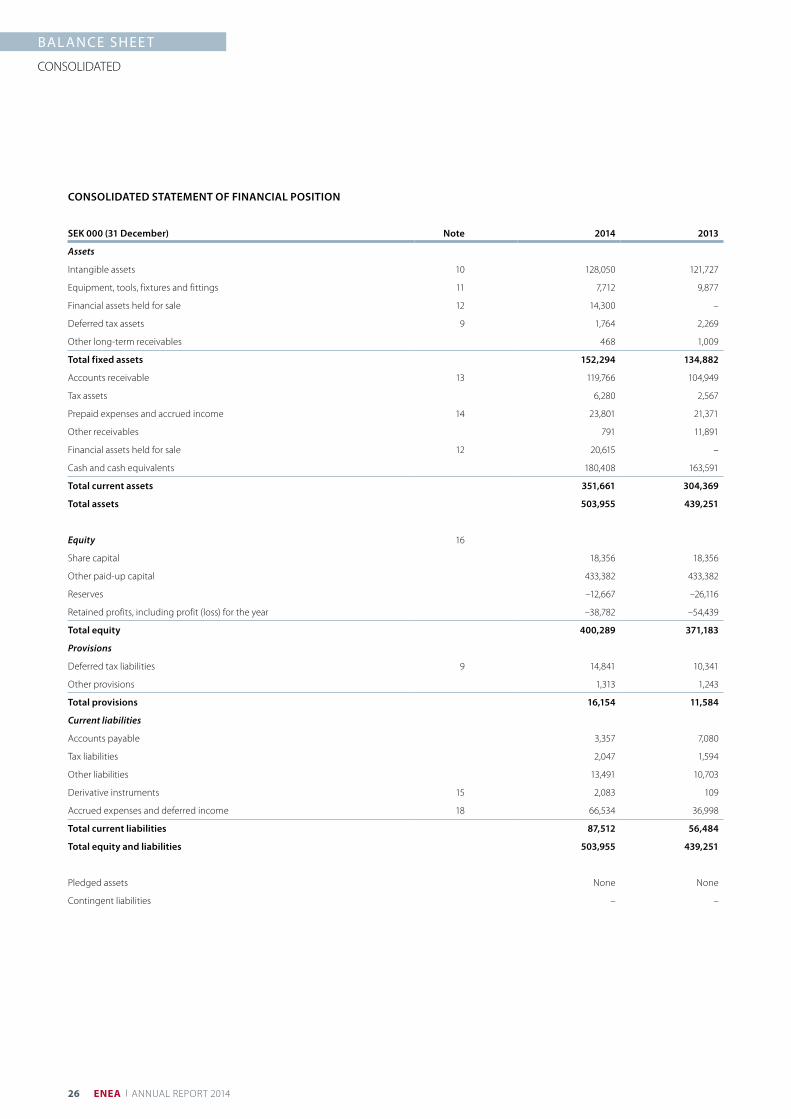
26 ENEA ANNUAL REPORT 2014
CONSOLIDATED STATEMENT OF FINANCIAL POSITION
SEK 000 (31 December) Note 2014 2013
Assets
Intangible assets 10 128,050 121,727
Equipment, tools, fixtures and fittings 11 7,712 9,877
Financial assets held for sale 12 14,300 –
Deferred tax assets 9 1,764 2,269
Other long-term receivables 468 1,009
Total fixed assets 152,294 134,882
Accounts receivable 13 119,766 104,949
Tax assets 6,280 2,567
Prepaid expenses and accrued income 14 23,801 21,371
Other receivables 791 11,891
Financial assets held for sale 12 20,615 –
Cash and cash equivalents 180,408 163,591
Total current assets 351,661 304,369
Total assets 503,955 439,251
Equity 16
Share capital 18,356 18,356
Other paid-up capital 433,382 433,382
Reserves –12,667 –26,116
Retained profits, including profit (loss) for the year –38,782 –54,439
Total equity 400,289 371,183
Provisions
Deferred tax liabilities 9 14,841 10,341
Other provisions 1,313 1,243
Total provisions 16,154 11,584
Current liabilities
Accounts payable 3,357 7,080
Tax liabilities 2,047 1,594
Other liabilities 13,491 10,703
Derivative instruments 15 2,083 109
Accrued expenses and deferred income 18 66,534 36,998
Total current liabilities 87,512 56,484
Total equity and liabilities 503,955 439,251
Pledged assets None None
Contingent liabilities – –
BAL ANCE SHEE T
consolidated

ANNUAL REPORT 2014 ENEA 27
CONSOLIDATED STATEMENT OF CHANGE IN EQUITY
Reserves
SEK 000 (1 January–31 December)Share
capital
Other paid-up
capitalCash flow
hedgesTranslation
reserve
Retained profits including profit
(loss) for the yearTotal
equity
Opening equity, 1 Jan. 2013 18,356 713,992 580 –27,128 –338,586 367,214
Comprehensive income
Profit for the year 63,175 63,175
Other comprehensive income
Cash flow hedges, profit/loss before tax –743 –743
Cash flow hedges, tax effect 163 163
Translation difference 1,012 1,012
Total other comprehensive income –580 1,012 432
Total comprehensive income –580 1,012 63,175 63,607
Transactions with shareholders
Dividend –9,177 –40,304 –49,481
Reduction of share capital –629 629 –
Bonus issue 9,806 –280,610 270,804 –
Share savings plan 3,432 3,432
Repurchase of treasury shares –13,589 –13,589
Total transactions with shareholders – –280,610 220,972 –59,638
Closing equity, 31 Dec. 2013 18,356 433,382 – –26,116 –54,439 371,183
Opening equity, 1 Jan. 2014 18,356 433,382 – –26,116 –54,439 371,183
Comprehensive income
Profit for the year 74,506 74,506
Other comprehensive income
Cash flow hedges, profit/loss before tax –1,144 –1,144
Cash flow hedges, tax effect 252 252
Translation difference 14,341 14,341
Total other comprehensive income –892 14,341 13,449
Total comprehensive income –892 14,341 74,506 87,955
Transactions with shareholders
Dividend –9,178 –40,143 –49,321
Reduction of share capital –339 339 –
Bonus issue 9,517 –9,517 –
Share savings plan 5,706 5,706
Repurchase of treasury shares –15,234 –15,234
Total transactions with shareholders – – –58,849 –58,849
Closing equity, 31 Dec. 2014 18,356 433,382 –892 –11,775 –38,782 400,289
STATEMENT OF CHANGE IN EQUITY
consolidated
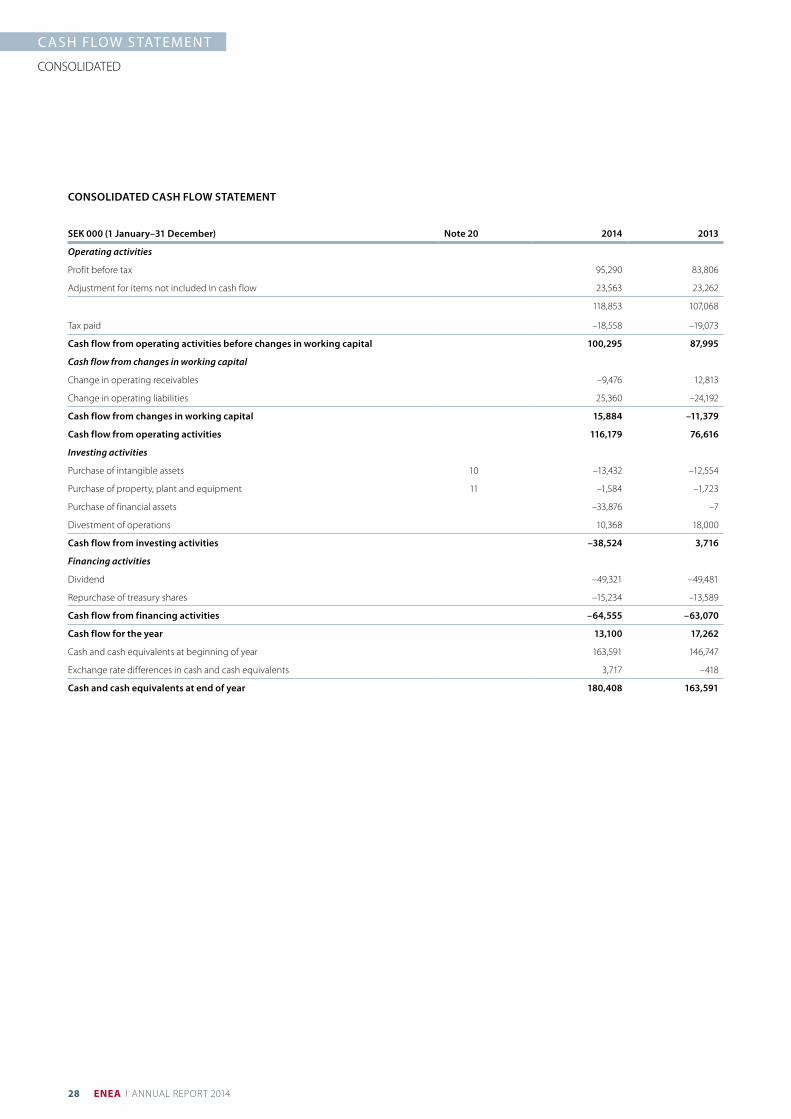
28 ENEA ANNUAL REPORT 2014
CONSOLIDATED CASH FLOW STATEMENT
SEK 000 (1 January–31 December) Note 20 2014 2013
Operating activities
Profit before tax 95,290 83,806
Adjustment for items not included in cash flow 23,563 23,262
118,853 107,068
Tax paid –18,558 –19,073
Cash flow from operating activities before changes in working capital 100,295 87,995
Cash flow from changes in working capital
Change in operating receivables –9,476 12,813
Change in operating liabilities 25,360 –24,192
Cash flow from changes in working capital 15,884 –11,379
Cash flow from operating activities 116,179 76,616
Investing activities
Purchase of intangible assets 10 –13,432 –12,554
Purchase of property, plant and equipment 11 –1,584 –1,723
Purchase of financial assets –33,876 –7
Divestment of operations 10,368 18,000
Cash flow from investing activities –38,524 3,716
Financing activities
Dividend –49,321 –49,481
Repurchase of treasury shares –15,234 –13,589
Cash flow from financing activities –64,555 –63,070
Cash flow for the year 13,100 17,262
Cash and cash equivalents at beginning of year 163,591 146,747
Exchange rate differences in cash and cash equivalents 3,717 –418
Cash and cash equivalents at end of year 180,408 163,591
C ASH FLOW STATEMENT
consolidated
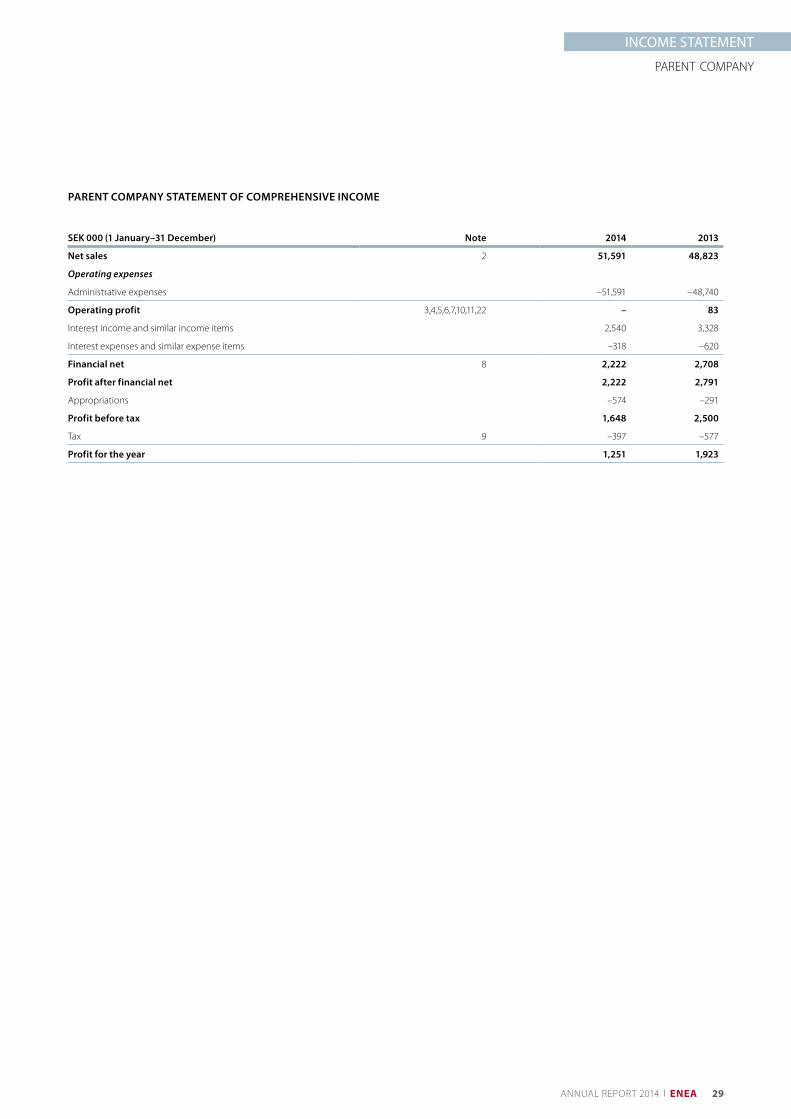
ANNUAL REPORT 2014 ENEA 29
PARENT COMPANY STATEMENT OF COMPREHENSIVE INCOME
SEK 000 (1 January–31 December) Note 2014 2013
Net sales 2 51,591 48,823
Operating expenses
Administrative expenses –51,591 –48,740
Operating profit 3,4,5,6,7,10,11,22 – 83
Interest income and similar income items 2,540 3,328
Interest expenses and similar expense items –318 –620
Financial net 8 2,222 2,708
Profit after financial net 2,222 2,791
Appropriations –574 –291
Profit before tax 1,648 2,500
Tax 9 –397 –577
Profit for the year 1,251 1,923
INCOME STATEMENT
parent company

30 ENEA ANNUAL REPORT 2014
PARENT COMPANY BALANCE SHEET
SEK 000 (31 December) Note 2014 2013
Assets
Intangible assets 10 1,035 52
Equipment, tools, fixtures and fittings 11 2,656 3,924
Participations in group companies 19 172,034 172,034
Financial assets held for sale 12 14,300 –
Total fixed assets 190,025 176,010
Receivables from group companies 21 11,850 2,781
Tax assets 2,721 1,582
Prepaid expenses and accrued income 14 4,898 4,931
Other receivables – 10,370
Financial assets held for sale 12 20,615 –
Cash and bank balances 149,184 131,419
Total current assets 189,268 151,083
Total assets 379,293 327,093
Equity 16
Restricted equity
Share capital 18,356 18,356
Non-restricted equity
Share premium reserve 3,050 2,711
Retained profits 197,388 254,653
Profit for the year 1,251 1,923
Total equity 220,045 277,643
Provisions
Untaxed reserves 6,626 6,053
Total provisions 6,626 6,053
Liabilities
Accounts payable 656 1,020
Liabilities to group companies 21 136,207 32,306
Other liabilities 1,958 1,031
Accrued expenses and deferred income 18 13,801 9,040
Total current liabilities 152,622 43,397
Total equity and liabilities 379,293 327,093
Pledged assets None None
Contingent liabilities – –
BAL ANCE SHEE T
parent company
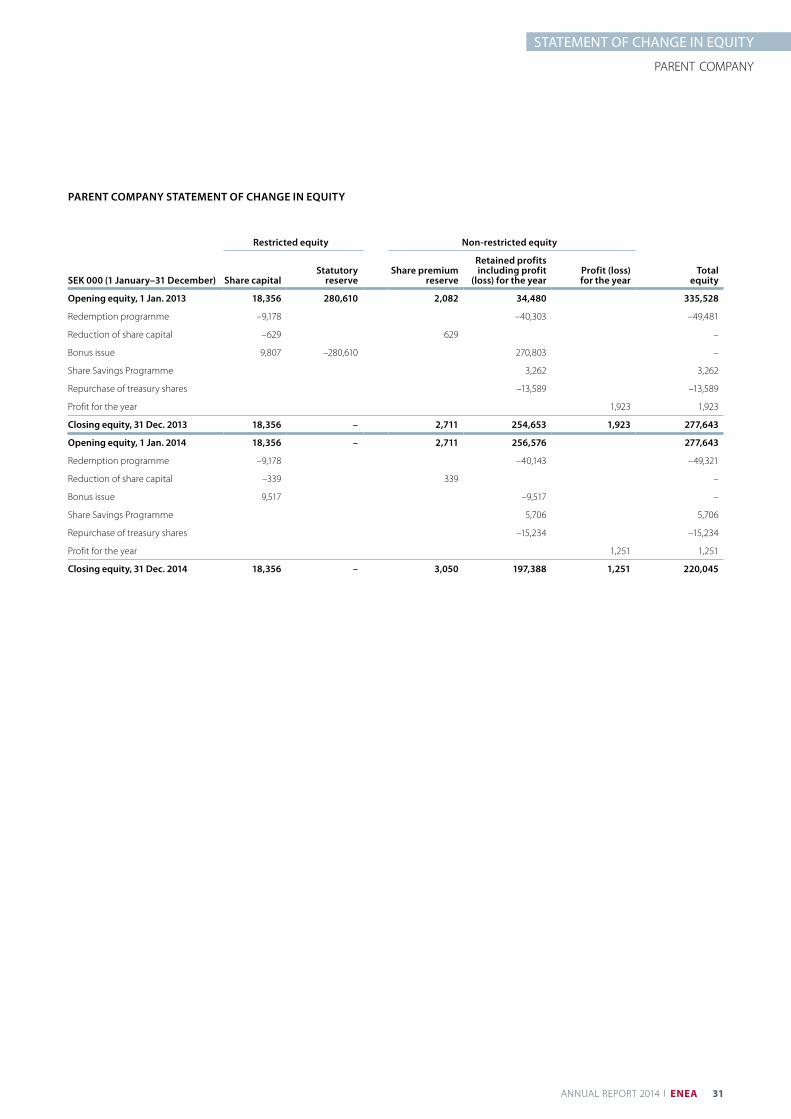
ANNUAL REPORT 2014 ENEA 31
PARENT COMPANY STATEMENT OF CHANGE IN EQUITY
Restricted equity Non-restricted equity
SEK 000 (1 January–31 December) Share capitalStatutory
reserveShare premium
reserve
Retained profits including profit
(loss) for the yearProfit (loss) for the year
Total equity
Opening equity, 1 Jan. 2013 18,356 280,610 2,082 34,480 335,528
Redemption programme –9,178 –40,303 –49,481
Reduction of share capital –629 629 –
Bonus issue 9,807 –280,610 270,803 –
Share Savings Programme 3,262 3,262
Repurchase of treasury shares –13,589 –13,589
Profit for the year 1,923 1,923
Closing equity, 31 Dec. 2013 18,356 – 2,711 254,653 1,923 277,643
Opening equity, 1 Jan. 2014 18,356 – 2,711 256,576 277,643
Redemption programme –9,178 –40,143 –49,321
Reduction of share capital –339 339 –
Bonus issue 9,517 –9,517 –
Share Savings Programme 5,706 5,706
Repurchase of treasury shares –15,234 –15,234
Profit for the year 1,251 1,251
Closing equity, 31 Dec. 2014 18,356 – 3,050 197,388 1,251 220,045
STATEMENT OF CHANGE IN EQUITY
parent company
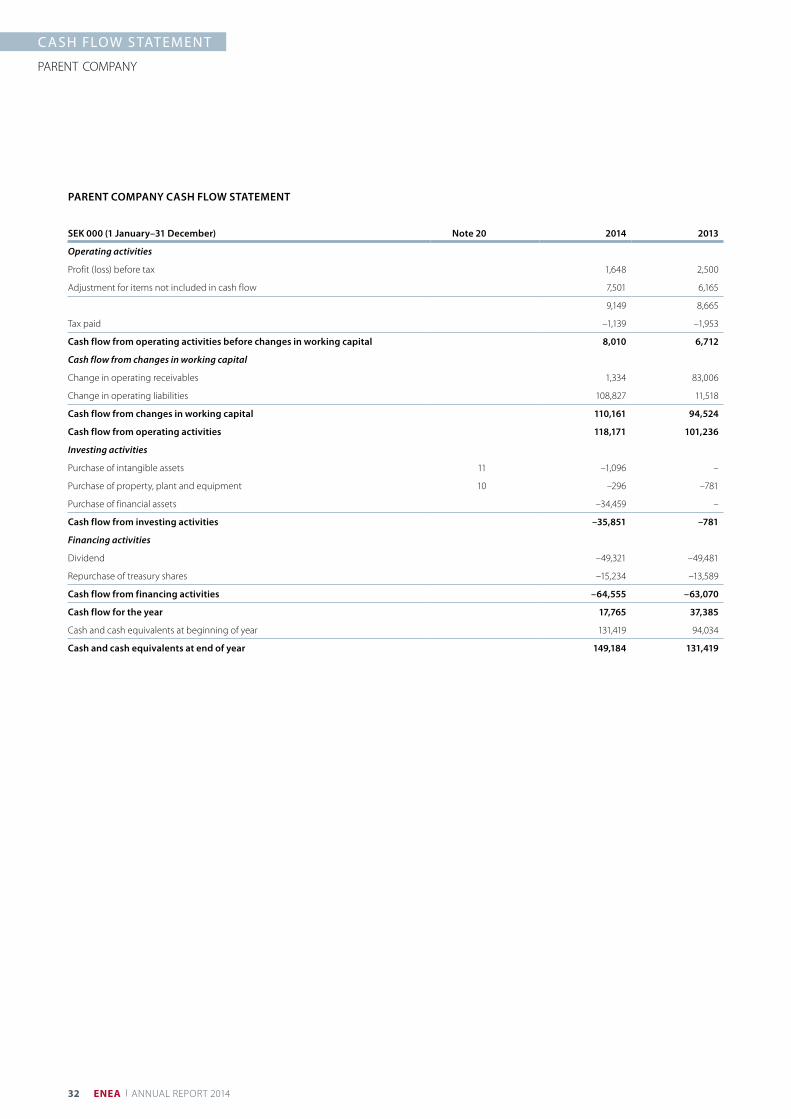
32 ENEA ANNUAL REPORT 2014
PARENT COMPANY CASH FLOW STATEMENT
SEK 000 (1 January–31 December) Note 20 2014 2013
Operating activities
Profit (loss) before tax 1,648 2,500
Adjustment for items not included in cash flow 7,501 6,165
9,149 8,665
Tax paid –1,139 –1,953
Cash flow from operating activities before changes in working capital 8,010 6,712
Cash flow from changes in working capital
Change in operating receivables 1,334 83,006
Change in operating liabilities 108,827 11,518
Cash flow from changes in working capital 110,161 94,524
Cash flow from operating activities 118,171 101,236
Investing activities
Purchase of intangible assets 11 –1,096 –
Purchase of property, plant and equipment 10 –296 –781
Purchase of financial assets –34,459 –
Cash flow from investing activities –35,851 –781
Financing activities
Dividend –49,321 –49,481
Repurchase of treasury shares –15,234 –13,589
Cash flow from financing activities –64,555 –63,070
Cash flow for the year 17,765 37,385
Cash and cash equivalents at beginning of year 131,419 94,034
Cash and cash equivalents at end of year 149,184 131,419
C ASH FLOW STATEMENT
parent company

ANNUAL REPORT 2014 ENEA 33
NOTE 1 – Accounting principles
Amounts in SEK 000 unless otherwise stated.
Compliance with standards and legislationThe consolidated accounts have been prepared in accordance with the Swedish Annual Accounts Act, International Financial Reporting Standards (IFRS) published by the International Accounting Standards Board (IASB), and interpretation pronouncements from the International Financial Reporting Interpretations Committee (IFRIC) as endorsed by the EU. The Swedish Financial Reporting Board’s recommendation RFR 1 Supplementary accounting rules for groups has also been applied.
The parent company applies the same accounting policies as the group except in the cases stated below in the section on “parent company account-ing policies”. The inconsistencies between the parent company’s and the group’s policies stem from the limited potential for applying IFRS to the parent company as a consequence of the Swedish Annual Accounts Act, and in some instances, for tax reasons.
Conditions applying to preparation of parent company financial statements and consolidated financial statements The parent company’s functional currency is Swedish kronor (SEK) which also constitutes the presentation currency for the parent company and the group. This means that the financial statements are presented in SEK. Assets and liabilities are recognised at historical cost, except certain financial assets and liabilities, which are measured at fair value.
In order to prepare financial statements in accordance with IFRS, man-agement is required to make accounting judgements and estimates as well as assumptions that affect the application of the accounting policies and the carrying amounts of assets, liabilities, income and costs. The estimates and assumptions are based on historical experience and a number of other factors that are deemed reasonable under prevailing circumstances. The result of these estimates and assumptions are then used to assess the carrying amounts of assets and liabilities that are not otherwise clear from other sources. Actual outcomes may differ from these estimates and judgements.
The estimates and assumptions are reviewed regularly. Changes to esti-mates are recognised in the period in which the change is made if the change has only affected that period, or in the period in which the change is made and future periods if the change affects both the current period and future periods.
When applying IFRS, assessments made by executive management that have a significant impact on the financial statements and the estimates and which could result in substantial adjustments to the financial statements of subsequent years are described in greater detail in Note 24.
The accounting policies stated below for the group have been applied consistently to all periods presented in the consolidated accounts unless other-wise stated. The group’s accounting policies have been applied consistently to the recognition and consolidation of subsidiaries.
Changes in accounting policies and disclosuresNew and revised standards and interpretations of existing standards applied by the group IFRS 10, “Consolidated Financial Statements”The standard is based on existing policies since it identifies control as the decisive factor in determining whether a company needs to be included in the consolidated financial statements and also provides further guidance for how to determine whether there are grounds for control in cases where this may be difficult to determine. The standard also denotes how the consolidated financial statements should be presented. The standard came into effect on 1 January 2014. The standard does not have any material impact on the consolidated financial statements.
IFRS 12 “Disclosures of Interests in Other Entities” StThe standard covers disclosure requirements for all forms of holdings in other companies, such as subsidiaries, joint arrangements, associated companies and consolidated structured entities. The standard applies from 1 January 2014 and does not have any material impact on the consolidated financial statements.
Other standards, amendments and interpretation statements that apply to the financial year beginning on 1 January 2014 have not had any significant impact on the consolidated financial statements.
New standards, amendments and interpretation statements regarding existing standards that have not been applied prospectively by the groupA number of new standards and amendments to existing standards and interpretations come into effect for financial years beginning after 1 January 2014 and have not been applied prospectively by the group. The following is a description of new and amended standards that are regarded as relevant to and that could impact future consolidated financial statements.
IFRS 9 “Financial Instruments”The standard deals with the presentation, measurement and recognition of financial liabilities and assets. The complete version of IFRS 9 was issued in July 2014 and replaces those parts of IAS 39 relating to the presentation and measurement of financial instruments. IFRS 9 retains a mixed-measurement model, although it has been simplified in some respects. There are three measurement categories for financial assets, amortised cost, fair value recog-nised in other comprehensive income and fair value recognised in the Income Statement. The presentation of an instrument depends on the company’s business model and the characteristics of the instrument. Investments in equity instruments are recognised at fair value in the Income Statement but there is also an option to recognise the instrument at fair value in other comprehensive income on first-time recognition. In such cases, no reclassifi-cation to the Income Statement will occur when the instrument is sold. IFRS 9 also introduces a new model for computing credit loss provisions arising from doubtful debt. For financial liabilities, there is no change in presentation and measurement except in cases where a liability is reported at fair value in the Income Statement based on the fair value option. Changes in value attributa-ble to changes in own credit risk are then recognised in other comprehensive income. IFRS 9 reduces the requirements for hedge accounting as the 80-125 criterion is replaced by a requirement for a economic relationship between the hedging instrument and the hedged item where the hedging ratio must correspond to that used in risk management. There are also only limited changes to the hedging documentation compared to those produced under IAS 39. The standard will apply from the financial year starting 1 January 2018. Prospective adoption is permitted. The group has not yet evaluated the effects of introducing the standard.
IFRS 15 “Revenue from Contracts with Customers” IFRS 15 “Revenue from Contracts with Customers” regulates revenue recogni-tion. The principles IFRS 15 is based on are intended to give users of financial reports more useful information about the company’s revenue. The expanded disclosure requirements mean that information relating to revenue class, date of settlement, uncertainty associated with revenue recognition and cash flow attributable to the company’s customer contracts must be presented. According to IFRS 15, income is recognised when the customer obtains control over the good or service sold and is able to utilise and obtain benefit from the good or service.
IFRS 15 replaces IAS 18 “Revenue” and IAS 11 “Construction Contracts” and associated SIC and IFRIC. IFRS 15 becomes effective on 1 January 2017. Prospective adoption is permitted. The group has not yet evaluated the implications of introducing the standard.
Segment reportingThe operating segments are reported in a manner that complies with the internal reporting provided to the chief operating decision-maker. The chief operating decision-maker is the function responsible for allocating resources and assessing the performance of segments. For the group, this function has been identified as the CEO. The group has applied IFRS 8 Operating segments effective 1 January 2009.
Classification, etcFixed assets and long-term liabilities in the parent company and group essen-tially consist only of amounts expected to be recovered or paid after more than 12 months of the reporting date. Current assets and current liabilities in the parent company and group essentially consist only of amounts expected to be recovered or paid within 12 months of the reporting date.
ACCOUNTING PRINCIPLES
34 ENEA ANNUAL REPORT 2014
Consolidation policiesSubsidiariesSubsidiaries are companies over which Enea AB exercises a controlling influence. Controlling influence entails a direct or indirect right to determine a company’s financial and operational strategies with the purpose of generating financial benefits. When assessing whether controlling influence exists, shares providing potential entitlement to votes that can be utilised or converted without delay are taken into account. The financial statements of subsidiaries are included in the consolidated financial statements as of the date on which the controlling influence is transferred to the group until the time that the controlling influence ceases.
The purchase method is used to recognise the group’s business combina-tions. The purchase consideration for the acquisition of a subsidiary comprises the fair value of transferred assets, liabilities and the shares issued by the group. The consideration also includes the fair value of all assets or liabilities resulting from an agreement concerning a contingent consideration. Acquisition-related costs are expensed as they arise. Identifiable acquired assets and assumed liabilities in a business acquisition are initially measured at fair value on the date of acquisition. For each acquisition, the group determines whether all non-controlling interests in the acquired company
are recognised at fair value or at the proportionate share of net assets of the acquired company.
The amount by which the transferred consideration, any non-controlling interests and the fair value of previous shareholdings on the date of transfer exceeds the fair value of the group’s share of identifiable acquired net assets is recognised as goodwill. When the difference is negative, it is recognised directly in profit or loss.
Intra-group receivables, liabilities, income or expenses and unrealised gains or losses attributable to intra-group transactions are eliminated when the consolidated financial statements are prepared.
Unrealised losses are eliminated in the same manner as unrealised gains.
Foreign currencyTransactions in foreign currencyTransactions in foreign currencies are translated into the functional currency at the rate of exchange ruling on the transaction date. Monetary assets and liabil-ities in foreign currencies are translated into the functional currency at the rate of exchange ruling on the reporting date. Exchange rate differences arising in conjunction with such translation are recognised in profit or loss. Exchange rate differences on non-monetary assets and liabilities are recognised in oper-ating profit, while exchange rate differences on monetary assets and liabilities are recognised in financial net. Non-monetary assets and liabilities that are recognised at historical cost are translated at the rate of exchange ruling on the transaction date. Non-monetary assets and liabilities recognised at fair value are translated into the functional currency at the rate of exchange ruling on the date of fair value measurement. The exchange rate change is then recognised in the same way as the other value changes in respect of the asset or liability.
Functional currency is the currency in the primary economic environments where the companies included in the group run their business. The companies included in the group are the parent company and subsidiaries. The parent company’s functional currency and reporting currency is Swedish kronor (SEK). The group’s reporting currency is SEK.
Financial statements of foreign operationsAssets and liabilities in foreign operations, including goodwill and other consolidated surplus and deficit value, are translated to SEK at the closing day date. Income and expenses in foreign operations are translated to SEK using an average exchange rate that represents an approximation of the exchange rates for each particular transaction date. Translation differences that arise from currency translation of foreign operations are recognised in other comprehensive income. On the sale of a foreign operation, the accumulated translation differences attributable to the operation are realised. Accumulated translation differences are presented as a separate category under “Reserves” and include translation differences accumulated from 1 January 2004 onwards. Accumulated translation differences before 1 January 2004 are allocated to other equity categories and are not recognised separately.
RevenueThe group generates revenue from sales of software and services.
The following are the criteria for recognising the revenue from licenses and, wherever appropriate, the revenue from services: A written contract signed by both parties, Delivery has occurred, The license fee must be a fixed amount or calculated using a reliable
method, and no withdrawal options are available, or the credit period is less than 12 months,
It is probable that payment will be received.
Software salesSales of software generate revenue in the form of license fees, buyouts (the customer purchases the product for an unlimited time), royalties and mainte-nance contracts.
Developer licenses and buyoutsFor both developer licenses and buyouts, income is recognised when delivery of the software has been completed. Income from time-based license fees is accrued over the contract period in accordance with the economic substance of the contract, while income from non-time-based license fees and buyouts is recognised at delivery when no material obligations remain.
Support and maintenance are sold in part separately and in part together with the licenses. Separate maintenance contracts normally have a term of 12 months and the income is allocated on a straight-line basis over the contract term.
In connection with sales of time-based developer licenses, support and maintenance is included in the license fee, as is entitlement to upgrades. In respect of such multi-component contracts, revenue from license sales is recognised in the amount representing the fair value of the license in relation to the fair value of the sales contract as a whole. Revenue from the service component, which corresponds to the fair value of the service component in relation to the fair value of the sales contract, is allocated over the service period. The fair value of the various components is measured on the basis of current market prices of these components when they are sold separately.
Product licenses (royalties)Royalty revenue is allocated in accordance with the economic substance of the relevant agreement, went full delivery has been completed.
ServicesThe revenue from service assignments rendered on open account is recog-nised as the work is completed. The revenue from services that are based on a functional undertaking are recognised on a straight-line basis over the contract term during which the services are rendered. A functional undertaking involves a service function with an indefinite number of services that are to be maintained over a specific period. Revenue from projects that are executed on a fixed-fee basis is recognised by degree of completion, which is determined on the basis of contract costs incurred in relation to estimated contract costs for the whole contract in accordance with the percentage of completion method. If a loss risk is deemed to exist, individual provisions are posted continuously.
Operating expenses and financial income and expensesCost of operating leases The cost of operating lease arrangements is recognised on a straight-line basis in profit or loss over the lease term. Benefits accrued on signing an agreement are recognised as a part of the total lease expense in profit or loss.
Financial income and expenses Financial income and expenses may consist of interest income from bank balances and receivables and fixed-income securities, interest on loans, dividend income, exchange rate differences and unrealised and realised gains on financial investments, as well as derivative instruments used in financing activities.
Interest income on receivables and interest expenses on liabilities are measured using the effective interest rate method. The effective interest rate is the interest rate that makes the current value of all future deposits and disbursements during the fixed interest term the same as the carrying amount of the receivable or liability. Interest income includes accrued amounts of
ACCOUNTING PRINCIPLES

ANNUAL REPORT 2014 ENEA 35
transaction expenses and any discounts, premiums and other differences between the original value of the receivable and the amount received upon maturity. The group does not capitalise interest on the cost of assets, since its development projects do not extend over a period exceeding one year.
Financial instrumentsFinancial instruments recognised in the Balance Sheet include, on the assets side, financial assets held for sale, cash and cash equivalents and accounts receivable, and, on the liabilities and equity side, accounts payable and other current and non-current liabilities. A financial asset or financial liability is recognised in the Balance Sheet when the company becomes a party to the contractual terms of the instrument. Accounts receivable are recognised in the Balance Sheet when the invoice has been sent.
Accounts payable are recognised in the Balance Sheet when the invoice has been received. A financial asset is derecognised from the Balance Sheet when the contractual rights have been realised, expire or the company loses control over them. Spot purchases and sales of financial assets are recognised on the transaction date, which is the date on which the company commits to acquire or sell the asset. A financial liability is derecognised from the Balance Sheet when the contractual obligation has been fulfilled or is in some other way extinguished.
The fair value of quoted financial assets corresponds to the highest price paid quoted for the asset on the reporting date. Should no such price be available, valuation takes place through generally acceptable methods, such as discounting of future cash flows to the market interest rate for the particular maturity.
For short-term loans and investments, the fair value is assumed to corre-spond to book value since a change in market interest rates would not have a material effect on market value.
Financial assets and liabilities are offset and recognised in a net amount in the Balance Sheet only when a legal right exists to offset the items and there is an intention to settle the amount net, or to simultaneously realise the asset and settle the liability. Financial assets and liabilities are divided into the following categories according to IAS 39.
Loans and accounts receivable This category includes financial assets that are not derivative instruments, with fixed or determinable payments, and that are not listed on an active market. These receivables arise when money, goods or services are provided directly to another party without an intention to trade in the receivables. The assets in this category are measured at amortised cost, less any provision for value depletion. The category includes accounts receivable and cash and cash equivalents.
Accounts receivableWhen the estimated maturity of accounts receivable is short, recognition occurs in the amount expected to flow in based on an individual assessment of doubtful receivables and without discounting, according to the method for recognising accrued cost. Any impairment losses on accounts receivable are recognised in operating profit.
Cash and cash equivalentsCash and cash equivalents consist of cash at financial institutions and short- term investments with an original maturity of less than three months. Cash and cash equivalents are recognised at nominal amount.
Financial assets held for saleFinancial assets held for sale are assets that are not derivatives and where the assets have been identified as being held for sale or have not been classified in any other category. The assets form part of non-current assets unless management intends to divest the asset within 12 months of the end of the reporting period.
Financial assets at fair value through profit or loss This category includes assets intended to be sold in the short term. Derivatives with a positive market value are included in this category if they are not subject to hedge accounting. The assets in this category are measured continuously at fair value and the changes in value are recognised in profit or loss. During the year, no financial derivatives were classified in this category.
Financial liabilities measured at fair value through profit or loss This category includes derivative instruments with a negative market value if they are not subject to hedge accounting. Similarly, it includes financial liabili-ties held for sale. The liabilities in this category are measured continuously at fair value and the changes in value are recognised in profit or loss. During the year, no financial derivatives were classified in this category.
Recognition of derivatives used in hedge accounting All derivatives are measured initially and then continuously at fair value in the Balance Sheet. Gains (loss)es arising from the re-measurement of derivatives are used for hedging purposes as follows. Changes in value pertaining to cash flow hedges are recognised in other comprehensive income and entered in profit or loss at the pace at which the hedged cash flow impacts profit or loss. Any ineffective component is recognised directly in profit or loss. Gains (loss)es arising from the re-measurement of derivatives intended as fair value hedges are recognised in profit or loss together with changes in the fair value of the receivable or liability that is exposed to the hedged risk. To qualify for hedge accounting, certain documentation is required concerning the hedging instrument and its relationship to the hedged item. The group also documents objectives and strategies for risk management and hedging measures together with an assessment of how effective the hedging relationship is in terms of evening out changes in fair value or cash flow for hedged items, both when the hedge is initiated and in continuous recognition.
Financial liabilities measured at amortised costThis category includes financial liabilities that are not held for trading, such as accounts payable and loan liabilities. These are initially recognised at fair value, net, after transaction costs and subsequently at amortised cost, applying the effective-interest rate method.
Accounts payableThe measurement policy used for accounts payable is accrued cost. Since the expected maturity of accounts payable is short, such liabilities are recognised at a nominal amount without discounting.
ACCOUNTING PRINCIPLES
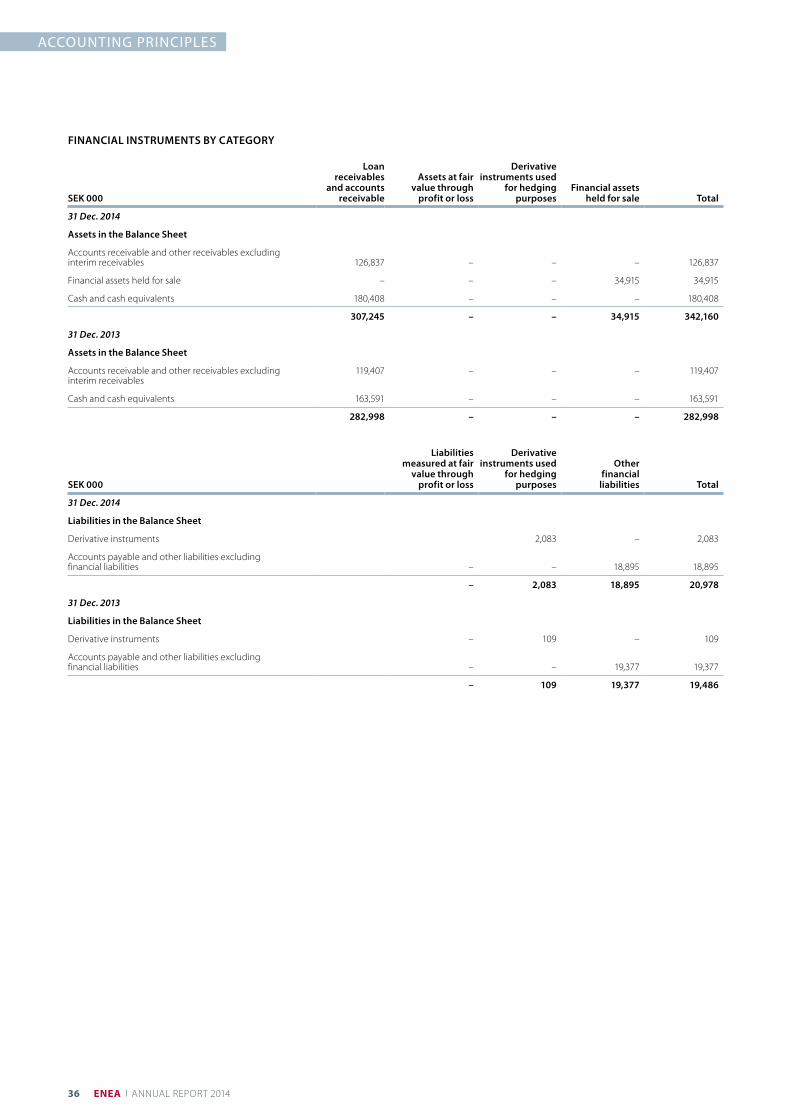
36 ENEA ANNUAL REPORT 2014
ACCOUNTING PRINCIPLES
FINANCIAL INSTRUMENTS BY CATEGORY
SEK 000
Loan receivables
and accounts receivable
Assets at fair value through
profit or loss
Derivative instruments used
for hedging purposes
Financial assets held for sale Total
31 Dec. 2014
Assets in the Balance Sheet
Accounts receivable and other receivables excluding interim receivables 126,837 – – – 126,837
Financial assets held for sale – – – 34,915 34,915
Cash and cash equivalents 180,408 – – – 180,408
307,245 – – 34,915 342,160
31 Dec. 2013
Assets in the Balance Sheet
Accounts receivable and other receivables excluding interim receivables
119,407 – – – 119,407
Cash and cash equivalents 163,591 – – – 163,591
282,998 – – – 282,998
SEK 000
Liabilities measured at fair
value through profit or loss
Derivative instruments used
for hedging purposes
Other financial
liabilities Total
31 Dec. 2014
Liabilities in the Balance Sheet
Derivative instruments 2,083 – 2,083
Accounts payable and other liabilities excluding financial liabilities – – 18,895 18,895
– 2,083 18,895 20,978
31 Dec. 2013
Liabilities in the Balance Sheet
Derivative instruments – 109 – 109
Accounts payable and other liabilities excluding financial liabilities – – 19,377 19,377
– 109 19,377 19,486

ANNUAL REPORT 2014 ENEA 37
Intangible assetsGoodwillGoodwill represents the difference between the cost of an acquired business operation and the fair value of the acquired assets, assumed liabilities and contingent liabilities. Goodwill is measured at cost less any accumulated impairment. Goodwill is divided between cash-generating units and is impair-ment tested at least annually.
Research and development Research expenses aimed at obtaining new scientific or technical knowledge are recognised as an expense when they arise.
Development expenditure, where the research results are aimed at achieving new or improved products or processes, is recognised as an asset in the Balance Sheet when the following criteria have been fulfilled: it is technically feasible to complete the asset, the company intends to complete the asset and use or sell it, the company has sufficient resources to complete development , the asset is expected to generate future financial benefits, it is possible to measure the expenditure required to complete the asset reliably.
The carrying amount includes expenditure for materials, direct expenditure for salaries and indirect expenditure attributable to the asset in a reasonable and consistent manner. Other development costs are recognised as expenses in profit or loss when they arise. The development expenditure recognised in the Balance Sheet is booked at cost, less accumulated amortisation and impairment losses.
Other intangible assets These consist mainly of trademarks and brands, licenses and contractual customer relations arising through business combinations. The assets are recognised at fair value on the acquisition date less accumulated amortisation.
Amortisation policiesAmortisation is recognised on a straight-line basis in profit or loss over the estimated useful life of the intangible assets, assuming that useful life is not indeterminable. Goodwill is impairment tested on a quarterly basis or as soon as there are indications that the asset in question has declined in value. Amortisable intangible assets are amortised as of the date on which they become available for use. The estimated useful life of capitalised development expenditure is between three and five years. Acquired trademarks and licenses are amortised over five years, while acquired contractual customer relations are amortised over three years.
Property, plant and equipmentOwned assets Property, plant and equipment are recognised as assets in the Balance Sheet when it is probable that the future economic benefits associated with the holding will accrue to the company and that the cost of the asset can be measured reliably. Property, plant and equipment are recognised at cost inthe group less accumulated depreciation and any impairment losses. Cost includes the purchase price and expenses directly attributable to bringing the asset to the site and condition required for it to be used in accordance with the aim of the purchase. Examples of directly attributable expenses included in cost are expenses for delivery and handling, installation, consultancy services and legal services.
Leased assetsIAS 17 is applied in respect of leased assets. In the consolidated accounts, leases are classified either as finance or operating leases. With no significant exceptions, all leases are operating and relate mainly to cars and rent for premises. For operating leases, the lease fee is expensed over the duration of the lease based on useful life, which can differ from the actual payment made to cover the leasing fee during the year. The cost of leasing is recognised on a straight-line basis over the useful life.
Depreciation policies Depreciation is conducted on a straight-line basis over the asset’s estimated useful life. The estimated useful life for property, plant and equipment such as equipment, tools and installations is five years. The useful life and residual value of assets are tested annually.
ImpairmentThe carrying amounts of the group’s assets, with the exception of deferred tax assets and financial assets, are impairment tested at each reporting date. If there is any indication of impairment, the recoverable amount of the asset is calculat-ed. For the exempted assets as stated above, the carrying amounts are tested in accordance with the relevant standard. For goodwill and intangible assets, which are not yet ready for use, the recoverable amount is estimated annually.
If it is not possible to determine essentially independent cash flows for an individual asset, the assets are to be grouped at the lowest level at which it is possible to identify essentially independent cash flows (known as a cash-gen-erating unit). An impairment loss is recognised when the carrying amount of an asset or cash-generating unit exceeds the recoverable amount. Impairment is recognised as an expense in profit or loss.
Impairment of assets identified for a cash-generating unit (group of units) is allocated initially to goodwill. Subsequently, proportional impairment of other assets included in the unit (group of units) is conducted.
Measurement of recoverable amounts The recoverable amount is the highest of the fair value less selling expenses and value in use. When calculating the value in use, future cash flow is discounted using a discount rate that takes into account risk-free interest and the risk associated with the specific asset. For an asset that does not generate cash flows that are significantly independent of other assets, the recoverable amount is calculated for the cash-generating unit to which the asset belongs.
Reversal of impairment losses Goodwill impairments are not reversed. Impairment losses on other assets are reversed if a change occurs in the assumptions that formed the basis for the measurement of the recoverable amount. A reversal is only conducted to the extent that the asset’s carrying amount after reversal does not exceed the carrying amount that would have been recognised, less the depreciation that would then have been applied, if no impairment loss had been recognised.
Employee benefitsPensionsObligations regarding fees for defined-contribution plans are recognised as expenses in profit or loss when they arise. All pension solutions in foreign subsidiaries are classified and recognised as defined-contribution plans, which means that the group’s profit (loss) is charged with pension expenses in pace with the vesting of benefits.
Salaried employees in Sweden are covered by the ITP plan, which is recognised as a defined-contribution pension plan. Commitments for retirement pensions and survivors’ pensions for salaried employees in Sweden are assured through an insurance policy with Alecta. According to a statement from the Swedish Financial Reporting Board, UFR 10, this is a multi-employer defined-benefit plan. Alecta is unable to provide Enea or other Swedish com-panies with sufficient information to determine an individual company’s share of the total commitment and its plan assets. Accordingly, ITP pension plans covered by insurance with Alecta are recognised as defined-contribution. This plan is being financed on an ongoing basis through pension insurance policies. Alecta’s surplus can be distributed to the policyholders and/or the insured. The collective consolidation ratio consists of the market value of Alecta’s assets as a percentage of its insurance obligations, calculated in accordance with Alecta’s actuarial accounting assumptions, which do not comply with IAS 19.
Severance pay In conjunction with notice of employment termination, a provision is posted only if the company is contractually obligated to terminate an employment position before the normal time, or when payments are made as an offering to encourage voluntary termination. For cases in which the company imple-ments personnel cutbacks, a detailed plan is prepared that covers at least the workplace concerned, positions, and the approximate number of affected employees and disbursements for every personnel category or position, as well as a time schedule for the plan’s implementation.
ACCOUNTING PRINCIPLES
38 ENEA ANNUAL REPORT 2014
Remuneration of senior executivesThe guidelines for remuneration of senior executives are adopted by the Annual General Meeting. For group management, salaries and other employment conditions are applied based on market conditions. In addition to basic annual salaries, members of the group’s Executive Management Team receive variable remuneration based on earnings performance in relation to predetermined targets. Remuneration of certain senior executives within the Enea group can also be paid in the form of share-based payment.
Share-based payment The group has two outstanding Share Savings Programmes from which payments are made in the form of shares, with the company receiving services from employees as payment for the group’s equity instruments (shares). The fair value of the service that provides the employees with entitlement to an allotment of equity instruments is expensed over the vesting period. The Share Savings Programme is measured using conventional models. For more information about the Share Savings Programme, also refer to Note 22.
ProvisionsA provision is recognised in the Balance Sheet when the group has an existing legal or informal commitment resulting from an event that has occurred, and it is probable that an outflow of resources will be required to settle the com-mitment and the amount concerned can be reliably estimated. If the effect of when payment is made is significant, the provision is measured by means of discounting of the anticipated future cash flow at a pre-tax interest rate that reflects current market assessments of the time value of money and, where applicable, the risks associated with the liability.
RestructuringA provision for restructuring is recognised when the group has established a detailed and formal restructuring plan, and restructuring has either been com-menced or announced publicly. No provisions are made for future operating expenses.
Onerous contractsA provision for onerous contracts is recognised when the expected benefits that the group is expecting to obtain from a contract are lower than the unavoidable costs for fulfilling the terms of the contract.
TaxesIncome taxes comprise current tax and deferred tax. Income tax is recognised in profit or loss, except when the underlying transaction is recognised directly against equity, in which case the related tax effect is recognised in equity. Current tax is tax to be paid or recovered for the current year using the tax rates already enacted or substantively enacted at the reporting date, including adjustments of current tax attributable to earlier periods.
Deferred tax is calculated in accordance with the balance sheet method, based on temporary differences between carrying amounts and tax bases of assets and liabilities. The following temporary differences are not taken into account: temporary differences arising upon initial recognition of goodwill; in-itial recognition of assets and liabilities that are not business combinations and which at the time of the transaction did not affect either recognised or taxable gains. Temporary differences attributable to participations in subsidiaries that are not expected to be reversed in the foreseeable future are not taken into account. Measurement of deferred tax is based on how the carrying amount of underlying assets or liabilities is expected to be recovered or settled. Deferred tax is measured using the tax rates and regulations enacted or substantively enacted at the reporting date.
Deferred tax assets pertaining to deductible temporary differences and tax loss carry-forwards are only recognised insofar as they are likely to be utilised in the future. The value of deferred tax assets is reduced when it is no longer proba-ble that the assets can be utilised. Any additional income tax relating to dividends is recognised at the same date as the dividend is recognised as a liability.
Financial risksThe greatest financial risk is currency risk. Enea has a financial policy estab-lished by the Board, which forms a framework of guidelines for managing financial risks. A detailed description of the financial risks is presented in the Directors’ Report.
Earnings per shareThe measurement of earnings per share is based on consolidated profit for the year attributable to the parent company’s shareholders and on the weighted average number of shares outstanding during the year. When measuring earnings per share after dilution, earnings and the average number of shares is restated to take into account the diluting effects of potential common shares, which arise during reported periods from convertible debentures and warrants issued to employees. Dilution occurs only when the share price is lower than the market price. The share price is adjusted by means of a supplement for the value of future services linked to an equity-settled stock option programme recognised as share-based payments in accordance with IFRS 2.
Contingent liabilitiesA contingent liability is recognised when there is a possible commitment deriv-ing from events that have occurred whose existence can only be confirmed if one or more uncertain future events occur or when there is a commitment that has not been recognised as a liability or entered as a provision because it is not certain that an outflow of resources will be required.
Parent company’s accounting policiesThe parent company has prepared its annual accounts in accordance with the Swedish Annual Accounts Act (1995:1554) and the Swedish Financial Accounting Standards Council’s recommendation RFR 2 Accounting for Legal Entities. According to RFR 2, the parent company, as the legal entity, must apply all of the EU-approved IFRS and statements insofar as this is possible within the framework of the Swedish Annual Accounts Act and taking into account the relationship between accounting and taxation. The recommendation indicates the exceptions and supplements that are to be made compared with IFRS. The differences between the group’s and parent company’s accounting policies are described below.
Differences between the group’s and parent company’s accounting policies The differences between the group’s and parent company’s accounting poli-cies are described below. The accounting policies stated below for the parent company were applied consistently in all periods presented in the parent company’s financial statements.
SubsidiariesParticipations in subsidiaries are recognised in the parent company in accord-ance with the cost method. Dividends received are only recognised as revenue if they are derived from profits earned after acquisition. Dividends in excess of such earnings are regarded as repayment of the investment and reduce the carrying amount of the participating interest.
DividendsDividends to the parent company’s shareholders are recognised as liabilities in the consolidated financial statements for the period in which the dividend is approved by the parent company’s shareholders. Anticipated dividends from subsidiaries are recognised if the parent company has sole entitlement to decide on the size of the dividend and the parent company has made a decision on the size of the dividend before the parent company has published its financial statements.
TaxesThe parent company recognises untaxed reserves including deferred tax liabilities. In the consolidated financial statements, however, untaxed reserves are divided into deferred tax liabilities and equity.
Group and shareholder contributions for legal entitiesShareholder contributions are entered directly in the equity of the recipient and are capitalised in shares and participations by the donor, to the extent that impair-ment is not required. Due to the correlation between recognition and taxation, group contributions paid by the parent company to subsidiaries are recognised as a financial cost in profit or loss. Group contributions received are recognised as appropriations. The tax effect is recognised in accordance with IAS 12.
ACCOUNTING PRINCIPLES

ANNUAL REPORT 2014 ENEA 39
NOTE 2 – Nature of income and operating segment reporting
Operating segments are recognised in accordance with how financial information is presented internally to the chief operating decision-maker. The chief operating decision-maker is the function responsible for allocating resources and evaluating the performance of segments.
In the group, this function has been identified as the CEO and Enea reports the whole operation as a single segment.
Sales by type of income 2014 2013
Time-based developer licenses including support and maintenance 136,354 139,329
Non-time-based developer licenses 5,395 7,700
Production licenses (Royalties) 145,348 141,005
Services 133,098 111,283
Other 9,103 9,201
429,298 408,518
Sales by product group 2014 2013
RTOS including tools 252,663 252,436
Middleware 33,584 29,960
Services 133,411 111,283
Other 9,640 14,839
429,298 408,518
Sales by geography 2014 2013
Sweden 184,955 192,460
Americas 113,097 112,392
Rest of Europe and Asia 131,246 103,666
429,298 408,518
Fixed assets by geography 2014 2013
Sweden 70,321 73,731
Americas 33,700 28,038
Rest of Europe and Asia 31,741 29,835
135,762 131,604
Enea has a few major customers that account for a large portion of the company’s sales. Two of the company’s customers each account for 10 percent or more of the company’s sales, with a share of 40 (43) percent and 14 (15) percent respectively of the company’s sales.
NOTE 3 – Exchange rate gains and losses 2014 2013
GROUP
Exchange rate gains on operating receivables/liabilities 1,847 2,617
Exchange rate losses on operating receivables/liabilities –1,448 –2,871
2014 2013
PARENT COMPANY
Exchange rate gains on operating receivables/liabilities 1 –
Exchange rate losses on operating receivables/liabilities –1 –1
NOTES

40 ENEA ANNUAL REPORT 2014
NOTE 4 – Employees and other senior executives
2014 2013
Average number of employees Total Of which men, % Total Of which men, %
Parent company 13 52 13 59
Subsidiaries 379 77 371 79
Group total 392 77 384 78
Of which:
Sweden 88 78 97 79
US 56 82 52 77
Romania 228 74 209 77
China 4 75 9 71
Japan 4 100 4 100
France 3 100 5 83
Germany 4 75 4 75
United Kingdom 5 100 5 100
Group total 392 77 384 78
Division between sexes, group management
Board of Directors 6 83 6 83
Other senior executives 8 100 7 86
Salary, other benefits and social security expenses 2014 2013
GROUP
Salary and benefits* 170,284 174,580
Share-based payment* 5,706 3,262
* of which to the Board, CEO and other senior executives 1 25,229 23,389
Pension expenses 2 14,809 14,490
of which defined-benefit pension plans – –
of which defined-contribution pension plans 14,809 14,490
Other social security expenses 40,879 41,670
Total 225,972 230,740
Salary, other benefits and social security expenses 2014 2013
PARENT COMPANY
Salary and benefits* 14,300 15,658
Share-based payment* 2,037 1,702
* of which to the Board, CEO and other senior executives 3 10,094 11,313
Pension expenses 4 3,612 2,952
of which defined-benefit pension plans – –
of which defined-contribution pension plans 3,612 2,952
Other social security expenses 4,950 5,358
Total 22,862 23,968
1 Of the group’s salary and benefits, SEK 1,779,000 (2,359,000) pertains to variable remuneration to the group comprising the Board of Directors and the CEO (including Presidents and Boards of subsidiaries).2 Of the group’s pension expenses, SEK 2,144,000 (1,470,000) pertains to the group comprising the Board and CEO.3 Of the parent company’s salary and benefits, SEK 771,000 (433,000) pertains to variable remuneration for the group comprising the Board and CEO.4 Of the parent company’s pension expenses, SEK 1,902,000 (1,042,000) pertains to the group comprising the Board and CEO.
NOTES
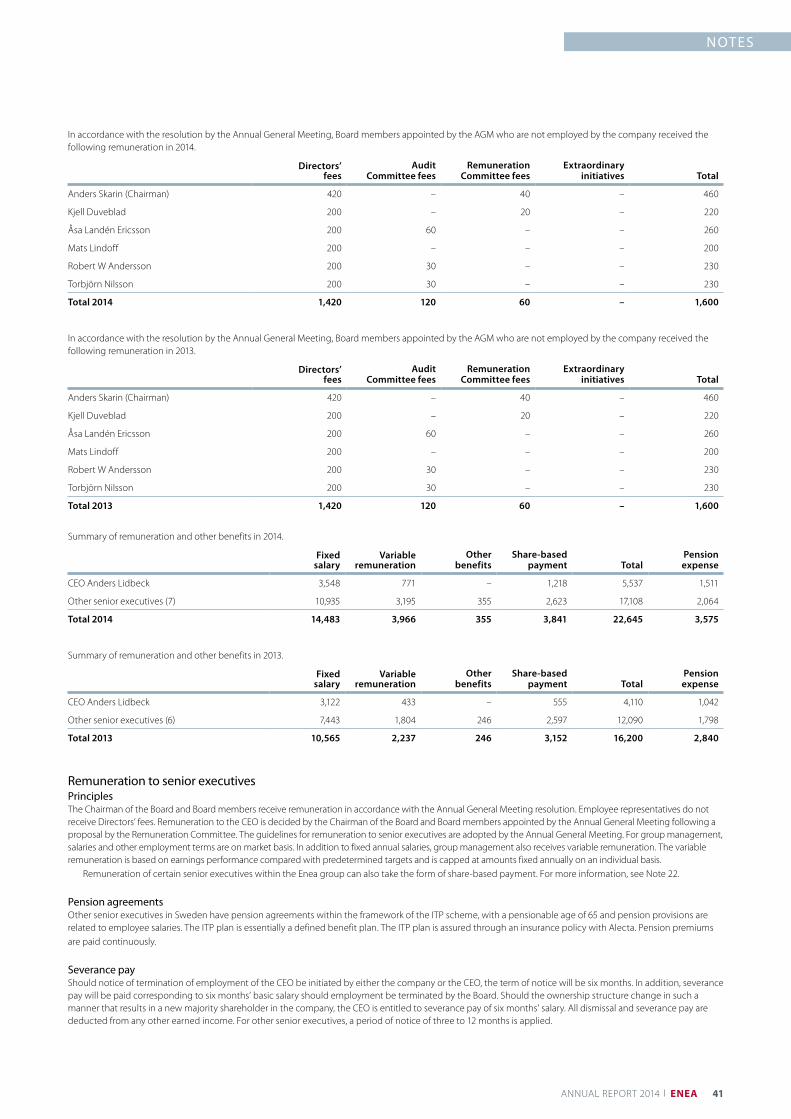
ANNUAL REPORT 2014 ENEA 41
In accordance with the resolution by the Annual General Meeting, Board members appointed by the AGM who are not employed by the company received the following remuneration in 2014.
Directors’ fees
Audit Committee fees
Remuneration Committee fees
Extraordinary initiatives Total
Anders Skarin (Chairman) 420 – 40 – 460
Kjell Duveblad 200 – 20 – 220
Åsa Landén Ericsson 200 60 – – 260
Mats Lindoff 200 – – – 200
Robert W Andersson 200 30 – – 230
Torbjörn Nilsson 200 30 – – 230
Total 2014 1,420 120 60 – 1,600
In accordance with the resolution by the Annual General Meeting, Board members appointed by the AGM who are not employed by the company received the following remuneration in 2013.
Directors’ fees
Audit Committee fees
Remuneration Committee fees
Extraordinary initiatives Total
Anders Skarin (Chairman) 420 – 40 – 460
Kjell Duveblad 200 – 20 – 220
Åsa Landén Ericsson 200 60 – – 260
Mats Lindoff 200 – – – 200
Robert W Andersson 200 30 – – 230
Torbjörn Nilsson 200 30 – – 230
Total 2013 1,420 120 60 – 1,600
Summary of remuneration and other benefits in 2014.
Fixed salary
Variable remuneration
Other benefits
Share-based payment Total
Pension expense
CEO Anders Lidbeck 3,548 771 – 1,218 5,537 1,511
Other senior executives (7) 10,935 3,195 355 2,623 17,108 2,064
Total 2014 14,483 3,966 355 3,841 22,645 3,575
Summary of remuneration and other benefits in 2013.
Fixed salary
Variable remuneration
Other benefits
Share-based payment Total
Pension expense
CEO Anders Lidbeck 3,122 433 – 555 4,110 1,042
Other senior executives (6) 7,443 1,804 246 2,597 12,090 1,798
Total 2013 10,565 2,237 246 3,152 16,200 2,840
Remuneration to senior executives PrinciplesThe Chairman of the Board and Board members receive remuneration in accordance with the Annual General Meeting resolution. Employee representatives do not receive Directors’ fees. Remuneration to the CEO is decided by the Chairman of the Board and Board members appointed by the Annual General Meeting following a proposal by the Remuneration Committee. The guidelines for remuneration to senior executives are adopted by the Annual General Meeting. For group management, salaries and other employment terms are on market basis. In addition to fixed annual salaries, group management also receives variable remuneration. The variable remuneration is based on earnings performance compared with predetermined targets and is capped at amounts fixed annually on an individual basis.
Remuneration of certain senior executives within the Enea group can also take the form of share-based payment. For more information, see Note 22.
Pension agreementsOther senior executives in Sweden have pension agreements within the framework of the ITP scheme, with a pensionable age of 65 and pension provisions are related to employee salaries. The ITP plan is essentially a defined benefit plan. The ITP plan is assured through an insurance policy with Alecta. Pension premiums are paid continuously.
Severance payShould notice of termination of employment of the CEO be initiated by either the company or the CEO, the term of notice will be six months. In addition, severance pay will be paid corresponding to six months’ basic salary should employment be terminated by the Board. Should the ownership structure change in such a manner that results in a new majority shareholder in the company, the CEO is entitled to severance pay of six months’ salary. All dismissal and severance pay are deducted from any other earned income. For other senior executives, a period of notice of three to 12 months is applied.
NOTES

42 ENEA ANNUAL REPORT 2014
NOTE 5 – Fees and reimbursement to Auditors
Auditing assignments are defined as examinations of the Annual Report and financial statements, as well as of the administration of the Board of Directors and CEO, other duties that the company’s Auditors are obliged to conduct and advice or other assistance required due to observations made during such reviews or during the performance of such other duties. All other work is defined as other assignments.
2014 2013
GROUP
Öhrlings PricewaterhouseCoopers
Auditing 650 853
Audit in addition to the audit assignment 40 74
Tax consultancy – –
Other assignments 68 207
Other Auditors
Auditing – 189
Tax consultancy – 150
Other assignments – 340
758 1,813
2014 2013
PARENT COMPANY
Öhrlings PricewaterhouseCoopers
Auditing assignments 490 575
Audit in addition to the audit assignment 40 74
Tax consultancy – –
Other assignments 68 207
598 856
NOTE 6 – Operating costs divided by type
2014 2013
Consumables and subcontracting consultants 8,509 14,457
Other external costs 46,402 51,582
Personnel costs 261,979 242,166
Depreciation/amortisation and impairment losses 18,593 18,197
335,483 326,402
Depreciation/amortisation and impairment losses for the year are allocated between cost of sold products and services totalling SEK 15.7 (13.6) million, sales and marketing expenses totalling SEK 0.1 (0.2) million, product development costs totalling SEK 1.1 (1.3) million and administrative costs totalling SEK 1.7 (3.1) million.
NOTES
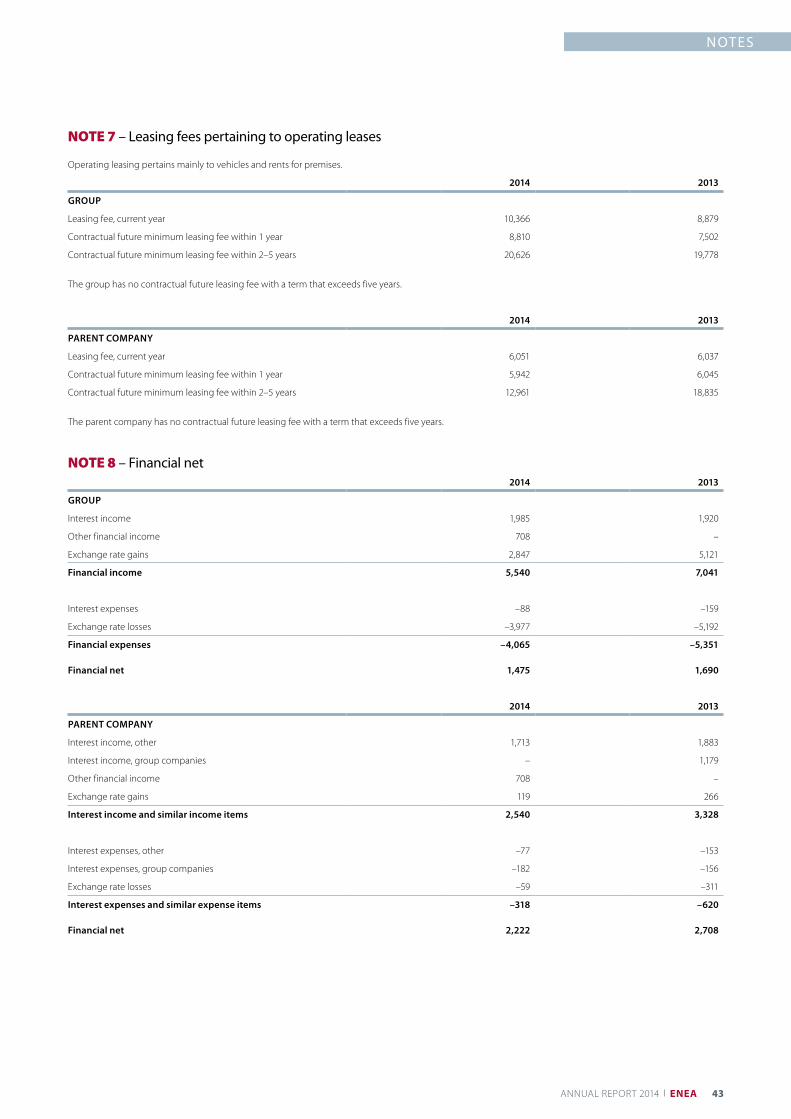
ANNUAL REPORT 2014 ENEA 43
NOTE 7 – Leasing fees pertaining to operating leases
Operating leasing pertains mainly to vehicles and rents for premises.
2014 2013
GROUP
Leasing fee, current year 10,366 8,879
Contractual future minimum leasing fee within 1 year 8,810 7,502
Contractual future minimum leasing fee within 2–5 years 20,626 19,778
The group has no contractual future leasing fee with a term that exceeds five years.
2014 2013
PARENT COMPANY
Leasing fee, current year 6,051 6,037
Contractual future minimum leasing fee within 1 year 5,942 6,045
Contractual future minimum leasing fee within 2–5 years 12,961 18,835
The parent company has no contractual future leasing fee with a term that exceeds five years.
NOTE 8 – Financial net2014 2013
GROUP
Interest income 1,985 1,920
Other financial income 708 –
Exchange rate gains 2,847 5,121
Financial income 5,540 7,041
Interest expenses –88 –159
Exchange rate losses –3,977 –5,192
Financial expenses –4,065 –5,351
Financial net 1,475 1,690
2014 2013
PARENT COMPANY
Interest income, other 1,713 1,883
Interest income, group companies – 1,179
Other financial income 708 –
Exchange rate gains 119 266
Interest income and similar income items 2,540 3,328
Interest expenses, other –77 –153
Interest expenses, group companies –182 –156
Exchange rate losses –59 –311
Interest expenses and similar expense items –318 –620
Financial net 2,222 2,708
NOTES
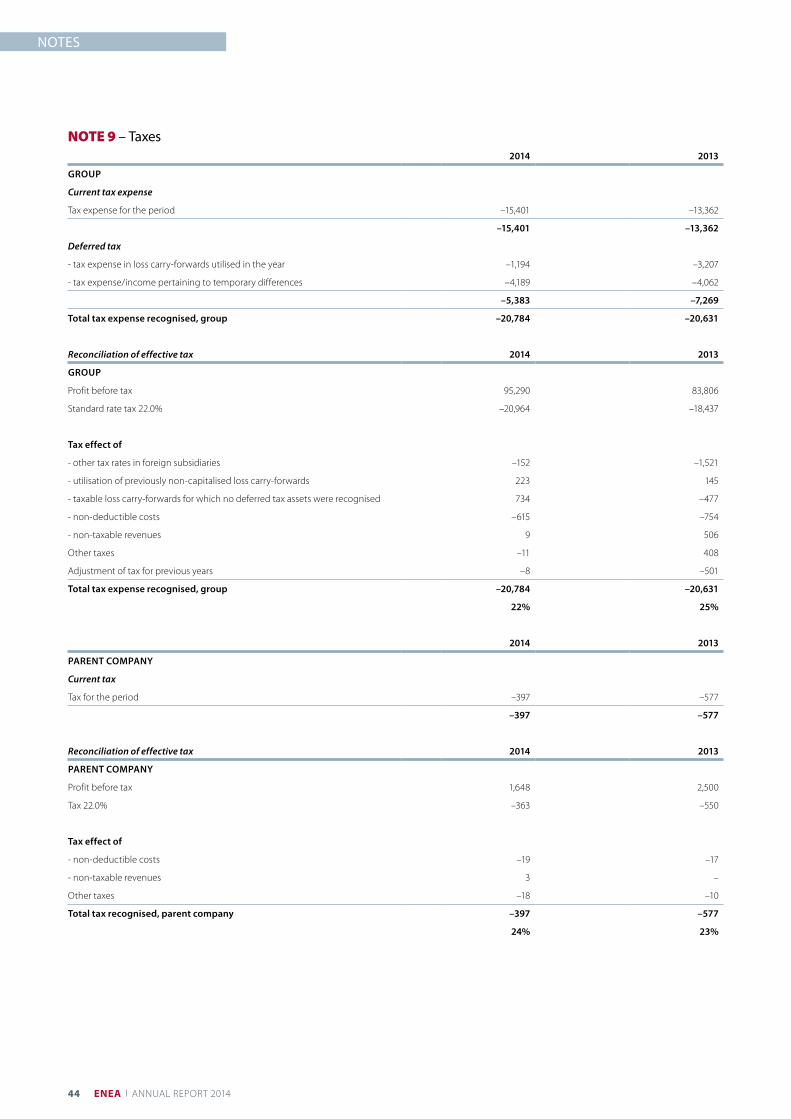
44 ENEA ANNUAL REPORT 2014
NOTE 9 – Taxes2014 2013
GROUP
Current tax expense
Tax expense for the period –15,401 –13,362
–15,401 –13,362
Deferred tax
- tax expense in loss carry-forwards utilised in the year –1,194 –3,207
- tax expense/income pertaining to temporary differences –4,189 –4,062
–5,383 –7,269
Total tax expense recognised, group –20,784 –20,631
Reconciliation of effective tax 2014 2013
GROUP
Profit before tax 95,290 83,806
Standard rate tax 22.0% –20,964 –18,437
Tax effect of
- other tax rates in foreign subsidiaries –152 –1,521
- utilisation of previously non-capitalised loss carry-forwards 223 145
- taxable loss carry-forwards for which no deferred tax assets were recognised 734 –477
- non-deductible costs –615 –754
- non-taxable revenues 9 506
Other taxes –11 408
Adjustment of tax for previous years –8 –501
Total tax expense recognised, group –20,784 –20,631
22% 25%
2014 2013
PARENT COMPANY
Current tax
Tax for the period –397 –577
–397 –577
Reconciliation of effective tax 2014 2013
PARENT COMPANY
Profit before tax 1,648 2,500
Tax 22.0% –363 –550
Tax effect of
- non-deductible costs –19 –17
- non-taxable revenues 3 –
Other taxes –18 –10
Total tax recognised, parent company –397 –577
24% 23%
NOTES
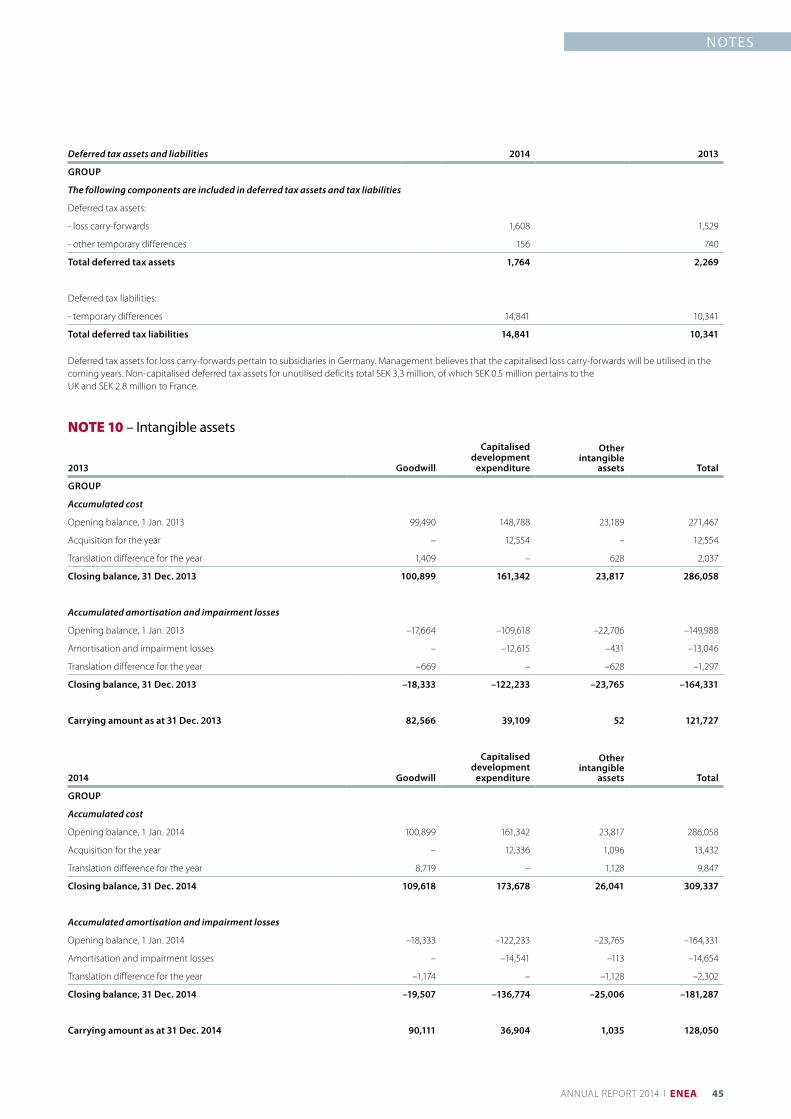
ANNUAL REPORT 2014 ENEA 45
Deferred tax assets and liabilities 2014 2013
GROUP
The following components are included in deferred tax assets and tax liabilities
Deferred tax assets:
- loss carry-forwards 1,608 1,529
- other temporary differences 156 740
Total deferred tax assets 1,764 2,269
Deferred tax liabilities:
- temporary differences 14,841 10,341
Total deferred tax liabilities 14,841 10,341
Deferred tax assets for loss carry-forwards pertain to subsidiaries in Germany. Management believes that the capitalised loss carry-forwards will be utilised in the coming years. Non-capitalised deferred tax assets for unutilised deficits total SEK 3.3 million, of which SEK 0.5 million pertains to theUK and SEK 2.8 million to France.
NOTE 10 – Intangible assets
2013 Goodwill
Capitalised development
expenditure
Other intangible
assets Total
GROUP
Accumulated cost
Opening balance, 1 Jan. 2013 99,490 148,788 23,189 271,467
Acquisition for the year – 12,554 – 12,554
Translation difference for the year 1,409 – 628 2,037
Closing balance, 31 Dec. 2013 100,899 161,342 23,817 286,058
Accumulated amortisation and impairment losses
Opening balance, 1 Jan. 2013 –17,664 –109,618 –22,706 –149,988
Amortisation and impairment losses – –12,615 –431 –13,046
Translation difference for the year –669 – –628 –1,297
Closing balance, 31 Dec. 2013 –18,333 –122,233 –23,765 –164,331
Carrying amount as at 31 Dec. 2013 82,566 39,109 52 121,727
2014 Goodwill
Capitalised development
expenditure
Other intangible
assets Total
GROUP
Accumulated cost
Opening balance, 1 Jan. 2014 100,899 161,342 23,817 286,058
Acquisition for the year – 12,336 1,096 13,432
Translation difference for the year 8,719 – 1,128 9,847
Closing balance, 31 Dec. 2014 109,618 173,678 26,041 309,337
Accumulated amortisation and impairment losses
Opening balance, 1 Jan. 2014 –18,333 –122,233 –23,765 –164,331
Amortisation and impairment losses – –14,541 –113 –14,654
Translation difference for the year –1,174 – –1,128 –2,302
Closing balance, 31 Dec. 2014 –19,507 –136,774 –25,006 –181,287
Carrying amount as at 31 Dec. 2014 90,111 36,904 1,035 128,050
NOTES
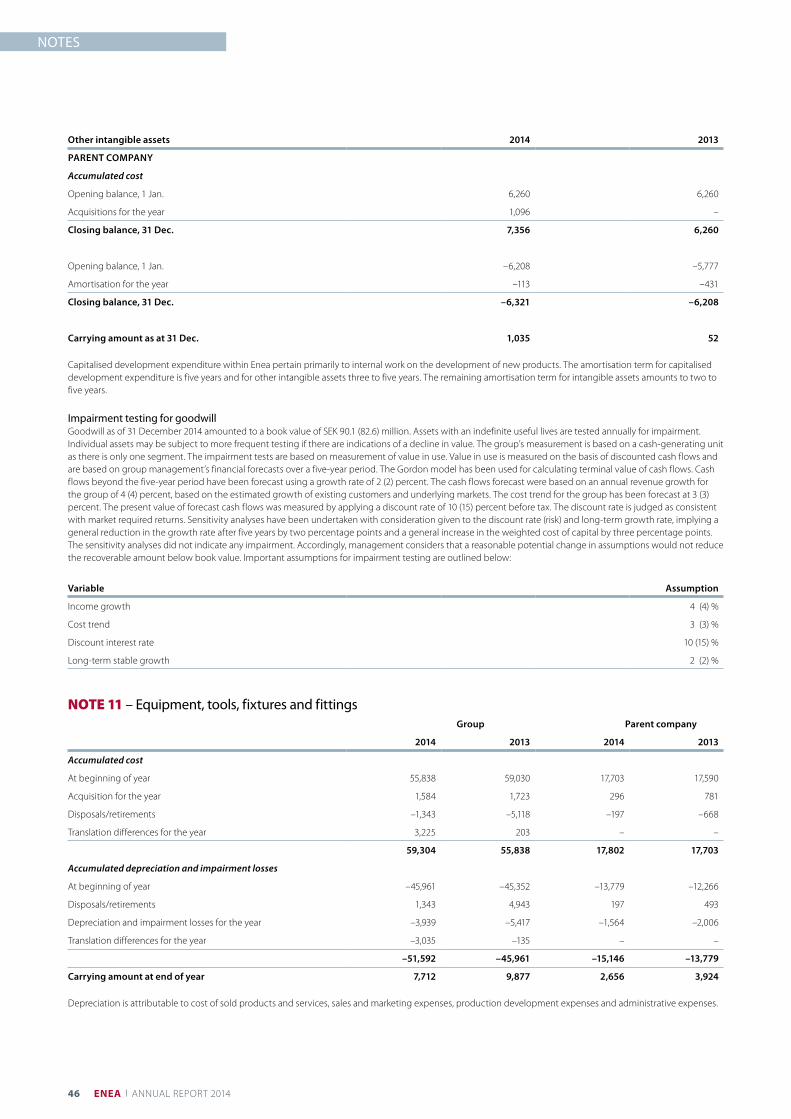
46 ENEA ANNUAL REPORT 2014
Other intangible assets 2014 2013
PARENT COMPANY
Accumulated cost
Opening balance, 1 Jan. 6,260 6,260
Acquisitions for the year 1,096 –
Closing balance, 31 Dec. 7,356 6,260
Opening balance, 1 Jan. –6,208 –5,777
Amortisation for the year –113 –431
Closing balance, 31 Dec. –6,321 –6,208
Carrying amount as at 31 Dec. 1,035 52
Capitalised development expenditure within Enea pertain primarily to internal work on the development of new products. The amortisation term for capitalised development expenditure is five years and for other intangible assets three to five years. The remaining amortisation term for intangible assets amounts to two to five years.
Impairment testing for goodwillGoodwill as of 31 December 2014 amounted to a book value of SEK 90.1 (82.6) million. Assets with an indefinite useful lives are tested annually for impairment. Individual assets may be subject to more frequent testing if there are indications of a decline in value. The group’s measurement is based on a cash-generating unit as there is only one segment. The impairment tests are based on measurement of value in use. Value in use is measured on the basis of discounted cash flows and are based on group management’s financial forecasts over a five-year period. The Gordon model has been used for calculating terminal value of cash flows. Cash flows beyond the five-year period have been forecast using a growth rate of 2 (2) percent. The cash flows forecast were based on an annual revenue growth for the group of 4 (4) percent, based on the estimated growth of existing customers and underlying markets. The cost trend for the group has been forecast at 3 (3) percent. The present value of forecast cash flows was measured by applying a discount rate of 10 (15) percent before tax. The discount rate is judged as consistent with market required returns. Sensitivity analyses have been undertaken with consideration given to the discount rate (risk) and long-term growth rate, implying a general reduction in the growth rate after five years by two percentage points and a general increase in the weighted cost of capital by three percentage points. The sensitivity analyses did not indicate any impairment. Accordingly, management considers that a reasonable potential change in assumptions would not reduce the recoverable amount below book value. Important assumptions for impairment testing are outlined below:
Variable Assumption
Income growth 4 (4) %
Cost trend 3 (3) %
Discount interest rate 10 (15) %
Long-term stable growth 2 (2) %
NOTE 11 – Equipment, tools, fixtures and fittings Group Parent company
2014 2013 2014 2013
Accumulated cost
At beginning of year 55,838 59,030 17,703 17,590
Acquisition for the year 1,584 1,723 296 781
Disposals/retirements –1,343 –5,118 –197 –668
Translation differences for the year 3,225 203 – –
59,304 55,838 17,802 17,703
Accumulated depreciation and impairment losses
At beginning of year –45,961 –45,352 –13,779 –12,266
Disposals/retirements 1,343 4,943 197 493
Depreciation and impairment losses for the year –3,939 –5,417 –1,564 –2,006
Translation differences for the year –3,035 –135 – –
–51,592 –45,961 –15,146 –13,779
Carrying amount at end of year 7,712 9,877 2,656 3,924
Depreciation is attributable to cost of sold products and services, sales and marketing expenses, production development expenses and administrative expenses.
NOTES

ANNUAL REPORT 2014 ENEA 47
NOTE 12 – Financial assets held for sale
Financial assets held for sale 2014 2013
GROUP
Corporate bonds 14,300 –
Corporate bond fund 20,615 –
Total 34,915 –
Financial assets held for sale 2014 2013
PARENT COMPANY
Corporate bonds 14,300 –
Corporate bond fund 20,615 –
Total 34,915 –
All financial assets held for sale are in SEK. None of these financial assets are due for payment or subject to impairment.
NOTE 13 – Accounts receivable
Non-overdue accounts receivable pertain to customers with good solvency and payment history. Accounts receivable with an existing impairment requirement correspond to the provision made for doubtful debt. Provisions for doubtful debt amounted to SEK 4.5 (0) million. The fair value of accounts receivable corresponds to carrying amount. Accounts receivable are predominantly denominated in SEK, EUR and USD. The age analysis of accounts receivable follows:
Age analysis of accounts receivable 2014 2013
GROUP
Not due 106,084 74,675
Due 1–60 days 12,605 29,056
Due 61–90 days 460 936
Due 90 days 617 282
Total 119,766 104,949
NOTE 14 – Prepaid expenses and accrued income2014 2013
GROUP
Prepaid insurance 236 223
Prepaid rents 2,093 2,068
Accrued income 15,781 13,468
Other prepaid expenses 5,691 5,612
23,801 21,371
2014 2013
PARENT COMPANY
Prepaid insurance 4 160
Prepaid rents 1,491 1,491
Accrued income 307 148
Other prepaid expenses 3,096 3,132
4,898 4,931
NOTES
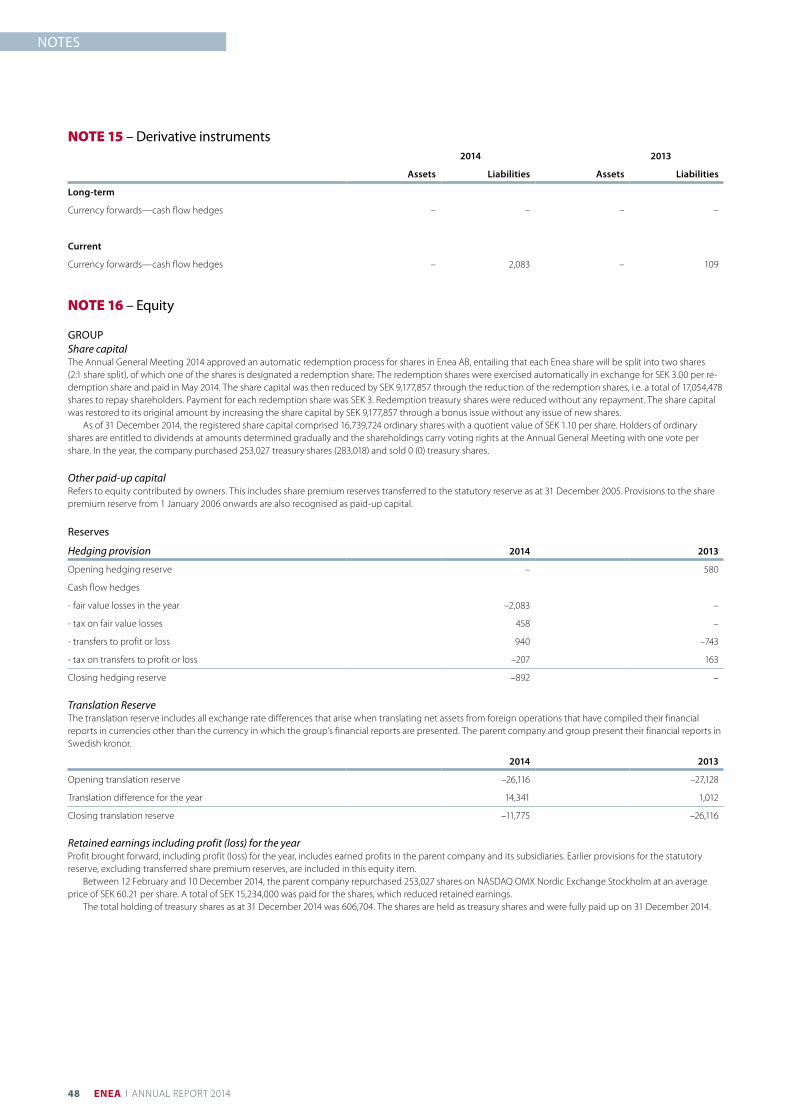
48 ENEA ANNUAL REPORT 2014
NOTE 15 – Derivative instruments2014 2013
Assets Liabilities Assets Liabilities
Long-term
Currency forwards—cash flow hedges – – – –
Current
Currency forwards—cash flow hedges – 2,083 – 109
NOTE 16 – Equity
GROUPShare capitalThe Annual General Meeting 2014 approved an automatic redemption process for shares in Enea AB, entailing that each Enea share will be split into two shares (2:1 share split), of which one of the shares is designated a redemption share. The redemption shares were exercised automatically in exchange for SEK 3.00 per re-demption share and paid in May 2014. The share capital was then reduced by SEK 9,177,857 through the reduction of the redemption shares, i.e. a total of 17,054,478 shares to repay shareholders. Payment for each redemption share was SEK 3. Redemption treasury shares were reduced without any repayment. The share capital was restored to its original amount by increasing the share capital by SEK 9,177,857 through a bonus issue without any issue of new shares.
As of 31 December 2014, the registered share capital comprised 16,739,724 ordinary shares with a quotient value of SEK 1.10 per share. Holders of ordinary shares are entitled to dividends at amounts determined gradually and the shareholdings carry voting rights at the Annual General Meeting with one vote per share. In the year, the company purchased 253,027 treasury shares (283,018) and sold 0 (0) treasury shares.
Other paidup capitalRefers to equity contributed by owners. This includes share premium reserves transferred to the statutory reserve as at 31 December 2005. Provisions to the share premium reserve from 1 January 2006 onwards are also recognised as paid-up capital.
Reserves
Hedging provision 2014 2013
Opening hedging reserve – 580
Cash flow hedges
- fair value losses in the year –2,083 –
- tax on fair value losses 458 –
- transfers to profit or loss 940 –743
- tax on transfers to profit or loss –207 163
Closing hedging reserve –892 –
Translation ReserveThe translation reserve includes all exchange rate differences that arise when translating net assets from foreign operations that have compiled their financial reports in currencies other than the currency in which the group’s financial reports are presented. The parent company and group present their financial reports in Swedish kronor.
2014 2013
Opening translation reserve –26,116 –27,128
Translation difference for the year 14,341 1,012
Closing translation reserve –11,775 –26,116
Retained earnings including profit (loss) for the yearProfit brought forward, including profit (loss) for the year, includes earned profits in the parent company and its subsidiaries. Earlier provisions for the statutory reserve, excluding transferred share premium reserves, are included in this equity item.
Between 12 February and 10 December 2014, the parent company repurchased 253,027 shares on NASDAQ OMX Nordic Exchange Stockholm at an average price of SEK 60.21 per share. A total of SEK 15,234,000 was paid for the shares, which reduced retained earnings.
The total holding of treasury shares as at 31 December 2014 was 606,704. The shares are held as treasury shares and were fully paid up on 31 December 2014.
NOTES

ANNUAL REPORT 2014 ENEA 49
NON-RESTRICTED EQUITYShare premium reserveWhen shares are issued at a premium, meaning that a higher amount is to be paid for the shares than their quotient value, an amount corresponding to the amount received in addition to the quotient value of the share is transferred to the share premium reserve.
Retained earningsThis consists of the preceding year’s non-restricted equity following any statutory reserve provisions and dividends. Together with the profit (loss) for the year, this constitutes total non-restricted equity, i.e. the amount available as dividends to shareholders.
See also the Consolidated Statement of Change in Equity and Parent Company Statement of Change in Equity.
NOTE 17 – Earnings per share2014 2013
Earnings per share before dilution
Profit for the year after tax 74,506 63,175
Average number of shares, thousands 16,271 16,477
Earnings per share before dilution, SEK 4,58 3,83
Earnings per share after dilution
Profit for the year after tax 74,506 63,175
Average number of shares, thousands 16,271 16,477
Earnings per share after dilution, SEK 4.58 3.83
Earnings per share is measured by dividing earnings for the period attributable to the parent company’s shareholders by the average number of shares.
NOTE 18 – Accrued expenses and deferred income 2014 2013
GROUP
Support income 23,687 8,694
Accrued personnel expenses 29,009 18,999
Other 13,838 9,305
66,534 36,998
2014 2013
PARENT COMPANY
Accrued personnel expenses 11,822 6,615
Other 1,979 2,425
13,801 9,040
NOTES

50 ENEA ANNUAL REPORT 2014
NOTE 19 – Parent company holdings in group companies
Country Participating interest, %
Enea Software AB Sweden 100
Enea Zealcore AB Sweden 100
Enea Software & Services, Inc US 100
Enea Netbricks SAS France 100
Enea GmbH Germany 100
Enea Software (Beijing) Co. , Ltd. China 100
Enea KK Japan 100
Enea Polyhedra Ltd UK 100
Enea Romania SRL Romania 100
2014 2013
Accumulated cost
At beginning of year 330,630 330,630
Closing balance, 31 December 330,630 330,630
Accumulated impairment losses
At beginning of year –158,596 –158,596
Closing balance, 31 December –158,596 –158,596
Carrying amount at end of year 172,034 172,034
Carrying amount
Specification of the parent company’s holdings in subsidiaries No. of participations Holding, % 2014 2013
Subsidiary/Corp. ID. no./Reg. office
Enea Software AB, 556183-3012, Kista 5,900 100 172,034 172,034
172,034 172,034
NOTE 20 – Cash Flow Statement
Cash and cash equivalents The subcomponents included in cash and cash equivalents are cash, bank and special deposits or commercial paper with an insignificant risk of fluctuations in value and can easily be converted into cash and cash equivalents, and which have a maturity of no more than three months from the time of acquisition.
Group Parent company
Information on interest 2014 2013 2014 2013
Interest received in the period amounted to 1,975 1,919 1,713 3,062
Interest paid in the period amounted to –78 –159 –259 –309
Group Parent company
Adjustment for items not included in cash flow 2014 2013 2014 2013
Depreciation/amortisation and impairment losses 18,593 18,463 1,677 2,437
Gains (loss)es on retirement of fixed assets – 175 – 175
Share Savings Programme 5,706 3,418 5,706 3,262
Appropriations – – 574 291
Provisions –9 1,071 – –
Value change, financial assets –456 – –456 –
Exchange rate differences, net –271 135 – –
Total 23,563 23,262 7,501 6,165
NOTES
ANNUAL REPORT 2014 ENEA 51
NOTE 21 – Related parties
Summary of transactions with related parties
GROUPThere were no transactions with related parties
PARENT COMPANY Related party Year
Sales of goods and services to related parties
Purchase of goods and services from
related parties
Supplementary purchase consideration for
acquisition of subsidiaries from related parties
Liabilities to related
parties on 31 December
Receivables from related parties on 31
December
Subsidiaries 2014 48,023 136,207 11,850
Subsidiaries 2013 48,399 1,210 – 32,306 2,781
Transactions with related parties are on and arm’s length basis.For information on remuneration of key personnel in executive positions, see Note 4, Employees and personnel expenses, and Note 22, Pensions, share-based
payment, benefits to senior executives.
The parent company has a close relationship with its subsidiaries (see Note 19).
NOTE 22 – Pensions and share-based payment
Defined-contribution plansThe methods for calculating pension expenses and pension liabilities differ from country to country. Companies report according to local regulations and the re-ported figures are consolidated in the consolidated financial statements. All pension solutions in foreign subsidiaries are defined-contribution plans, which means that the group’s profit (loss) is charged with pension expenses in pace with the vesting of benefits. Salaried employees in Sweden are assured by the ITP plan, which is reported as a defined-contribution pension plan. Obligations for retirement pension and survivors’ pension for salaried employees in Sweden are secured through an insurance policy with Alecta. According to a statement from the Swedish Financial Reporting Board, UFR 10, this is a multi-employer defined-benefit plan. Alecta, which is a mutual insurance company that also administers benefits under the pension plan, is unable to provide Enea or other Swedish companies with sufficient information to determine an individual company’s share of the total commitment and its assets. Accordingly, ITP pension plans that are assured through an insurance policy with Alecta are reported as defined-contribution. The cost for 2014 amounts to SEK 5,018,000 (4,361,000). The cost for 2015 is estimated to amount to an equivalent figure. Alecta’s surplus can be distributed to policyholders and/or the insured.
At the end of 2014, Alecta’s surplus in the form of its collective consolidation ratio amounted to 143 (148) percent. The collective consolidation ratio consists of the market value of Alecta’s assets as a percentage of its insurance obligations, calculated in accordance with Alecta’s actuarial accounting assumptions, which do not comply with IAS 19.
Group Parent company
2014 2013 2014 2013
Cost of defined-contribution plans 14,809 14,490 3,612 2,952
Share-based payment Share Savings Programme 2014In April 2014, the Annual General Meeting resolved to offer key employees the opportunity to participate in a Share Savings Programme. The principal objective of the Programme is to enhance the company’s ability to retain and recruit key employees and, by means of a personal long-term ownership commitment of the participants, to stimulate greater commitment to operations and results, to increase motivation, as well as to enhance the sense of togetherness with the company.
The Programme involves 24 senior executives, key individuals and certain other employees.By 10 June 2014, employees had invested in 71,800 Enea shares (“Savings Shares”). If the employee retains the shares for three years and remains employed by
the Enea group, an equivalent number of shares (“Matching Shares”) will be granted.On condition that special performance requirements are met, participants are also entitled to receive, free of charge, additional Enea shares (Performance
Shares) for each saving share. The allocation of Performance Shares is conditional on special performance requirements linked to the fulfilment of Enea’s accu-mulated earnings per share in the years 2014-2016. The threshold value for earnings per share is SEK 4.21 (2014), SEK 4.63 (2015), SEK 5.10 (2016) and/or SEK 13.95 (2014–2016 accumulated).
The fair value of services rendered is based on the share price of the Matching Shares expected to be granted. The share price is determined at the time of the participants’ investment, adjusted for the dividends that do not accrue to the employee during the vesting period.
The Share Savings Programme entails a financial exposure for the company as a result of changes in Enea’s share price and the anticipated allocation of match-ing and Performance Shares. To secure the Programme, a decision was made to transfer acquired treasury shares under the Programme. Not more than 500,000 shares may be transferred to participants in the Programme, free of charge, in the form of Matching Shares and Performance Shares, including dividend remunera-tion. The sale of 114,000 shares is permitted on the stock market or to a third party to cover costs for social security expenses and the like.
Share Savings Programme 2012In April 2012, the Annual General Meeting resolved to offer key employees the opportunity to participate in a Share Savings Programme. The principal objective of the Programme is to enhance the company’s ability to retain and recruit key employees and, by means of a personal long-term ownership commitment of the participants, to stimulate greater commitment to operations and results, to increase motivation, as well as to enhance the sense of togetherness with the company.
The Programme involves 33 senior executives, key individuals and certain other employees.By 8 June 2012, employees had invested in 65,335 Enea shares (“Savings Shares”). If the employee retains the shares for three years and remains employed by
the Enea group, an equivalent number of shares (“Matching Shares”) will be granted.On condition that special performance requirements are met, participants are also entitled to receive, free of charge, additional Enea shares (Performance Shares)
for each saving share. The allocation of Performance Shares is conditional on special performance requirements linked to the fulfilment of Enea’s accumulated EBIT in the years 2012-2014. The performance requirement for the performance shares is linked to accumulated EBIT in the interval of SEK 180–220 million.
NOTES

52 ENEA ANNUAL REPORT 2014
The fair value of services rendered is based on the share price of the Matching Shares expected to be granted. The share price is determined at the time of the participants’ investment, adjusted for the dividends that do not accrue to the employee during the vesting period.
The Share Savings Programme entails a financial exposure for the company as a result of changes in Enea’s share price and the anticipated allocation of match-ing and Performance Shares. To secure the Programme, a decision was made to transfer acquired treasury shares under the Programme. Not more than 541,500 shares may be transferred to participants in the Programme, free of charge, in the form of Matching Shares and Performance Shares, including dividend remunera-tion. The sale of 126,000 shares is permitted on the stock market or to a third party to cover costs for social security expenses and the like.
The fair value of services rendered is based on the share price of the Matching Shares expected to be granted. The share price is determined at the time of the participants’ investment, adjusted for the dividends that do not accrue to the employee during the vesting period.
The Share Savings Programme entails a financial exposure for the company as a result of changes in Enea’s share price and the anticipated allocation of Matching and Performance shares. To secure the Programme, a decision was made to transfer acquired treasury shares under the Programme. Not more than 541,500 shares may be transferred to participants in the Programme, free of charge, in the form of Matching Shares and Performance Shares, including dividend remuneration. The sale of 126,000 shares is permitted on the stock market or to a third party to cover costs for social security expenses and the like.
Share Savings Programme 2014 2014 2013
Number of matching shares at beginning of period – –
Granted in the period 71,800 –
Forfeited in the period – –
Outstanding at end of period 71,800 –
Number of participants as at 31 December 24 –
Share Savings Programme 2012 2014 2013
Number of matching shares at beginning of period 57,285 62,835
Granted in the period – –
Forfeited in the period –10,030 –5,550
Due in the period – –
Outstanding at end of period 47,255 57,285
Number of participants as at 31 December 26 30
Personnel expenses for share-based payment Group 2014 2013
Share Savings Programmes 9,309 5,415
NOTES

ANNUAL REPORT 2014 ENEA 53
NOTE 23 – Translation exposure
Enea’s foreign subsidiaries are translated into Swedish kronor in accordance with the current method. This means that the Balance Sheet is translated at the closing day rate and the Income Statement at average rates of exchange for the period.
The rates used for the group’s significant currencies are stated in the table below.
Closing day rate Average rate
Currency 2014 2013 2014 2013
EUR 9.5155 8.9430 9.0968 8.6494
USD 7.8117 6.5084 6.8577 6.5140
GBP 12.1388 10.7329 11.2917 10.1863
JPY 0.0654 0.0618 0.0649 0.0669
RON 2.1298 1.9955 2.0450 1.9554
CNY 1.2595 1.0732 1.1135 1.0596
ILS 1.9958 1.8573 1.9150 1.8024
When translating foreign subsidiaries’ balance sheets to Swedish kronor, the group is exposed to exchange rate fluctuations. The effect on equity in 2014 for the translation of foreign subsidiaries’ accounts to Swedish kronor was a positive SEK 14,341,000 (1,012,000). The group’s exposure in equity for exchange rate fluctua-tions on the reporting date was as follows:
2014 2013
Currency AmountTranslated into SEK
at closing day rate AmountTranslated into SEK
at closing day rate
EUR 81 771 13 116
USD 3.418 26.700 3.475 22.617
GBP 314 3.812 285 3.059
JPY 43.146 2.820 42.775 2.643
RON 13.443 28.631 8.422 16.806
CNY 2.262 2.849 2.255 2.420
ILS 0 0 69 128
NOTE 24 – Significant estimates and judgements
Estimates and judgements, which are reviewed continuously, are based on historical experience and other factors, including expectations of future events that are considered reasonable under the prevailing conditions..
Significant judgements regarding the application of the group’s accounting policies Company management has discussed with the Audit Committee the progress, choice and disclosures regarding the group’s most important accounting policies and estimates, and the application of these policies and estimates. These estimates and judgements mainly include revenue recognition, the valuation of deferred tax assets on loss carry-forwards and any impairment. Some important accounting estimates made on application of the group’s accounting policies are described below.
Important sources of uncertainty in estimates Impairment testing of goodwillWhen measuring the recoverable amount of cash-generating units for judging goodwill impairment, a number of assumptions have been made regarding future conditions and estimates of parameters. Enea has conducted a sensitivity analysis of key assumptions in which management found that no reasonable changes to these assumptions would result in any impairment as at 31 December 2014. They are reviewed in Note 10.
Impairment testing of capitalised development expenditure When measuring the recoverable amount of cash-generating units for judging impairment of capitalised development expenditure, a number of assumptions have been made regarding future conditions and estimates of parameters. Enea has conducted a sensitivity analysis of key assumptions in which management found that no reasonable changes to these assumptions would result in any impairment as at 31 December 2014. They are reviewed in Note 10.
NOTES

54 ENEA ANNUAL REPORT 2014
DECL AR ATION
The Board and CEO declare that the consolidated accounts have been prepared in accordance with the International Financial Reporting Standards, IFRS, as endorsed by the EU, and the Swedish Annual Accounts Act, and give a true and fair view of the group’s results of operations
and Financial position. The Directors’ Report for the group and parent company give a true and fair view of the progress of the group and parent company’s operating activities, financial position and results of operations, and covers significant risks and safety factors affecting the parent
company and companies within the group.
As stated above, the annual accounts and consolidated accounts were approved for issue by the Board of Directors on 26 March 2015. The Consolidated Income Statement and Consolidated Balance Sheet, and the Parent Company Income Statement and Parent Company Balance
Sheet will be subject to adoption by the Annual General Meeting on 7 May 2015.
Stockholm, Sweden, 26 March 2015Enea AB (556209-7146)
Anders SkarinChairman
Robert AnderssonBoard member
Kjell DuvebladBoard member
Åsa Landén EricssonBoard member
Mats LindoffBoard member
Torbjörn NilssonBoard member
Eva SwedbergEmployee representative
Anders LidbeckPresident and CEO
Our Audit Report was presented on 27 March 2015Öhrlings PricewaterhouseCoopers AB
Niklas RenströmAuthorized Public Accountant

ANNUAL REPORT 2014 ENEA 55
AUDIT REPOR T
To the Annual General Meeting of Enea AB (publ.), Corp. Reg. No 556209-7146
Report on the annual accounts and consolidated accountsWe have audited the annual accounts and consolidated accounts of Enea AB (publ) for the year 2014, except for the corporate governance state-ment on pages 20– 24. The annual accounts and consolidated accounts of the company are included in the printed version of this document on pages 16–54.
Responsibilities of the Board of Directors and the Managing Director for the annual accounts and consolidated accountsThe Board of Directors and the Managing Director are responsible for the preparation and fair presentation of these annual accounts in accord-ance with the Annual Accounts Act and of the consolidated accounts in accordance with International Financial Reporting Standards, as adopted by the EU, and the Annual Accounts Act, and for such internal control as the Board of Directors and the Managing Director determine is necessary to enable the preparation of annual accounts and consolidated accounts that are free from material misstatement, whether due to fraud or error.
Auditor’s responsibilityOur responsibility is to express an opinion on these annual accounts and consolidated accounts based on our audit. We conducted our audit in ac-cordance with International Standards on Auditing and generally accepted auditing standards in Sweden. Those standards require that we comply with ethical requirements and plan and perform the audit to obtain reasonable assurance about whether the annual accounts and consolidated accounts are free from material misstatement.
An audit involves performing procedures to obtain audit evidence about the amounts and disclosures in the annual accounts and con-solidated accounts. The procedures selected depend on the auditor’s judgment, including the assessment of the risks of material misstatement of the annual accounts and consolidated accounts, whether due to fraud or error. In making those risk assessments, the auditor considers internal control relevant to the company’s preparation and fair presentation of the annual accounts and consolidated accounts in order to design audit procedures that are appropriate in the circumstances, but not for the purpose of expressing an opinion on the effectiveness of the company’s internal control. An audit also includes evaluating the appropriateness of accounting policies used and the reasonableness of accounting estimates made by the Board of Directors and the Managing Director, as well as evaluating the overall presentation of the annual accounts and consolidat-ed accounts.
We believe that the audit evidence we have obtained is sufficient and appropriate to provide a basis for our audit opinions.
OpinionsIn our opinion, the annual accounts have been prepared in accordance with the Annual Accounts Act and present fairly, in all material respects, the financial position of the parent company as of 31 December 2014 and of its financial performance and its cash flows for the year then ended in accord-ance with the Annual Accounts Act. The consolidated accounts have been prepared in accordance with the Annual Accounts Act and present fairly, in all material respects, the financial position of the group as of 31 December 2014 and of their financial performance and cash flows for the year then ended in accordance with International Financial Reporting Standards, as adopted by the EU, and the Annual Accounts Act. Our opinions do not cover the corporate governance statement on pages 20–24. The statutory administration report is consistent with the other parts of the annual accounts and consolidated accounts.
We therefore recommend that the annual meeting of shareholders adopt the income statement and balance sheet for the parent company and the group.
Report on other legal and regulatory requirementsIn addition to our audit of the annual accounts and consolidated accounts, we have also audited the proposed appropriations of the company’s profit or loss and the administration of the Board of Directors and the Managing Director of Enea AB (publ) for the year 2014. We have also conducted a statutory examination of the corporate governance statement.
Responsibilities of the Board of Directors and the Managing DirectorThe Board of Directors is responsible for the proposal for appropriations of the company’s profit or loss, and the Board of Directors and the Managing Director are responsible for administration under the Companies Act, and that the corporate governance statement on pages 20–24 has been prepared in accordance with the Annual Accounts Act.
Auditor’s responsibilityOur responsibility is to express an opinion with reasonable assurance on the proposed appropriations of the company’s profit or loss and on the administration based on our audit. We conducted the audit in accordance with generally accepted auditing standards in Sweden.
As basis for our opinion on the Board of Directors’ proposed appropriations of the company’s profit or loss, we examined the Board of Directors’ reasoned statement and a selection of supporting evidence in order to be able to assess whether the proposal is in accordance with the Companies Act.
As basis for our opinion concerning discharge from liability, in addition to our audit of the annual accounts and consolidated accounts, we exam-ined significant decisions, actions taken and circumstances of the company in order to determine whether any member of the Board of Directors or the Managing Director is liable to the company. We also examined whether any member of the Board of Directors or the Managing Director has, in any oth-er way, acted in contravention of the Companies Act, the Annual Accounts Act or the Articles of Association.
We believe that the audit evidence we have obtained as above is suf-ficient and appropriate to provide a basis for our opinions. Furthermore, we have read the corporate governance statement and based on that reading and our knowledge of the company and the group we believe that we have sufficient basis for our opinions. This means that our statutory examination of the corporate governance statement is different and substantially less in scope than an audit conducted in accordance with International Standards on Auditing and generally accepted audit standards in Sweden.
OpinionsWe recommend to the annual meeting of shareholders that the profit be appropriated in accordance with the proposal in the statutory adminis-tration report and that the members of the Board of Directors and the Managing Director be discharged from liability for the financial year.
A corporate governance statement has been prepared, and its statutory content is consistent with the other parts of the annual accounts and consolidated accounts.
Stockholm, Sweden, 27 March 2015 Öhrlings PricewaterhouseCoopers AB
Niklas RenströmAuktoriserad revisor
Audit Report
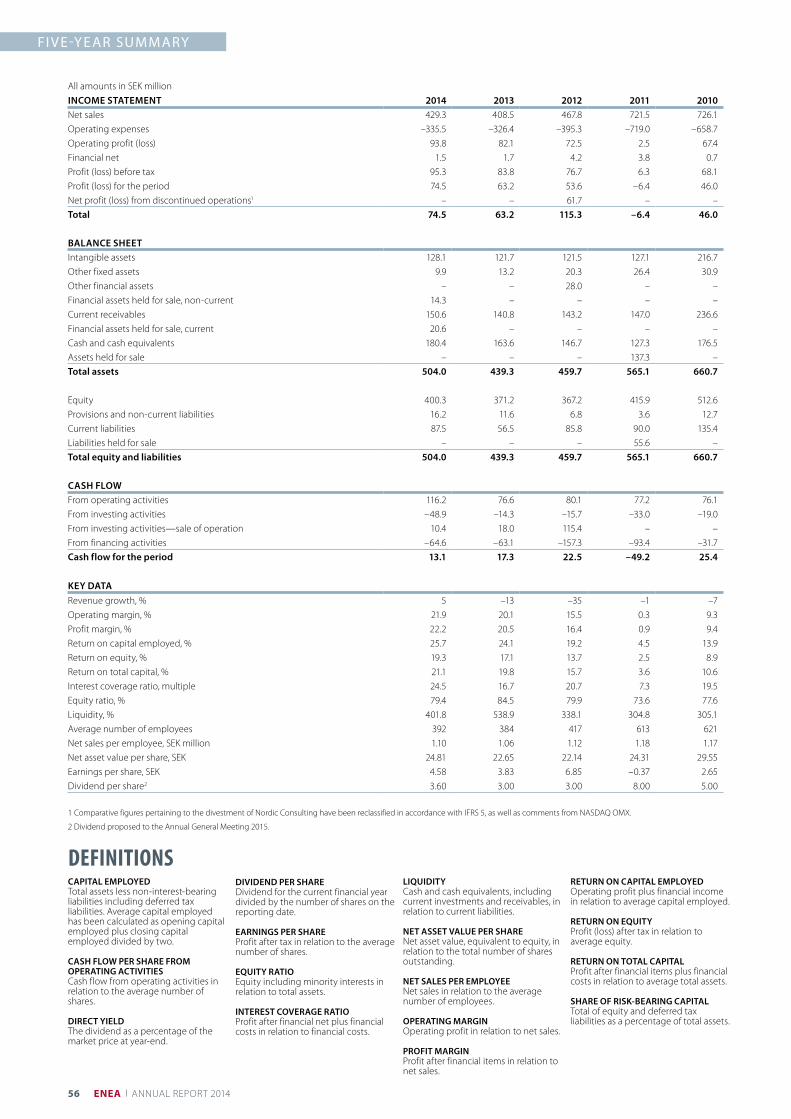
56 ENEA ANNUAL REPORT 2014
FIVE-YE AR SUMMARY
All amounts in SEK million
INCOME STATEMENT 2014 2013 2012 2011 2010
Net sales 429.3 408.5 467.8 721.5 726.1
Operating expenses –335.5 –326.4 –395.3 –719.0 –658.7
Operating profit (loss) 93.8 82.1 72.5 2.5 67.4
Financial net 1.5 1.7 4.2 3.8 0.7
Profit (loss) before tax 95.3 83.8 76.7 6.3 68.1
Profit (loss) for the period 74.5 63.2 53.6 –6.4 46.0
Net profit (loss) from discontinued operations1 – – 61.7 – –
Total 74.5 63.2 115.3 –6.4 46.0
BALANCE SHEET
Intangible assets 128.1 121.7 121.5 127.1 216.7
Other fixed assets 9.9 13.2 20.3 26.4 30.9
Other financial assets – – 28.0 – –
Financial assets held for sale, non-current 14.3 – – – –
Current receivables 150.6 140.8 143.2 147.0 236.6
Financial assets held for sale, current 20.6 – – – –
Cash and cash equivalents 180.4 163.6 146.7 127.3 176.5
Assets held for sale – – – 137.3 –
Total assets 504.0 439.3 459.7 565.1 660.7
Equity 400.3 371.2 367.2 415.9 512.6
Provisions and non-current liabilities 16.2 11.6 6.8 3.6 12.7
Current liabilities 87.5 56.5 85.8 90.0 135.4
Liabilities held for sale – – – 55.6 –
Total equity and liabilities 504.0 439.3 459.7 565.1 660.7
CASH FLOW
From operating activities 116.2 76.6 80.1 77.2 76.1
From investing activities –48.9 –14.3 –15.7 –33.0 –19.0
From investing activities—sale of operation 10.4 18.0 115.4 – –
From financing activities –64.6 –63.1 –157.3 –93.4 –31.7
Cash flow for the period 13.1 17.3 22.5 –49.2 25.4
KEY DATA
Revenue growth, % 5 –13 –35 –1 –7
Operating margin, % 21.9 20.1 15.5 0.3 9.3
Profit margin, % 22.2 20.5 16.4 0.9 9.4
Return on capital employed, % 25.7 24.1 19.2 4.5 13.9
Return on equity, % 19.3 17.1 13.7 2.5 8.9
Return on total capital, % 21.1 19.8 15.7 3.6 10.6
Interest coverage ratio, multiple 24.5 16.7 20.7 7.3 19.5
Equity ratio, % 79.4 84.5 79.9 73.6 77.6
Liquidity, % 401.8 538.9 338.1 304.8 305.1
Average number of employees 392 384 417 613 621
Net sales per employee, SEK million 1.10 1.06 1.12 1.18 1.17
Net asset value per share, SEK 24.81 22.65 22.14 24.31 29.55
Earnings per share, SEK 4.58 3.83 6.85 –0.37 2.65
Dividend per share2 3.60 3.00 3.00 8.00 5.00
1 Comparative figures pertaining to the divestment of Nordic Consulting have been reclassified in accordance with IFRS 5, as well as comments from NASDAQ OMX.
2 Dividend proposed to the Annual General Meeting 2015.
CAPITAL EMPLOYEDTotal assets less non-interest-bearing liabilities including deferred tax liabilities. Average capital employed has been calculated as opening capital employed plus closing capital employed divided by two.
CASH FLOW PER SHARE FROM OPERATING ACTIVITIESCash flow from operating activities in relation to the average number of shares.
DIRECT YIELDThe dividend as a percentage of the market price at year-end.
DIVIDEND PER SHAREDividend for the current financial year divided by the number of shares on the reporting date.
EARNINGS PER SHAREProfit after tax in relation to the average number of shares.
EQUITY RATIOEquity including minority interests in relation to total assets.
INTEREST COVERAGE RATIOProfit after financial net plus financial costs in relation to financial costs.
LIQUIDITYCash and cash equivalents, including current investments and receivables, in relation to current liabilities.
NET ASSET VALUE PER SHARENet asset value, equivalent to equity, in relation to the total number of shares outstanding.
NET SALES PER EMPLOYEENet sales in relation to the average number of employees.
OPERATING MARGINOperating profit in relation to net sales.
PROFIT MARGINProfit after financial items in relation to net sales.
RETURN ON CAPITAL EMPLOYED Operating profit plus financial income in relation to average capital employed.
RETURN ON EQUITYProfit (loss) after tax in relation to average equity.
RETURN ON TOTAL CAPITALProfit after financial items plus financial costs in relation to average total assets.
SHARE OF RISK-BEARING CAPITALTotal of equity and deferred tax liabilities as a percentage of total assets.
DEFINITIONS
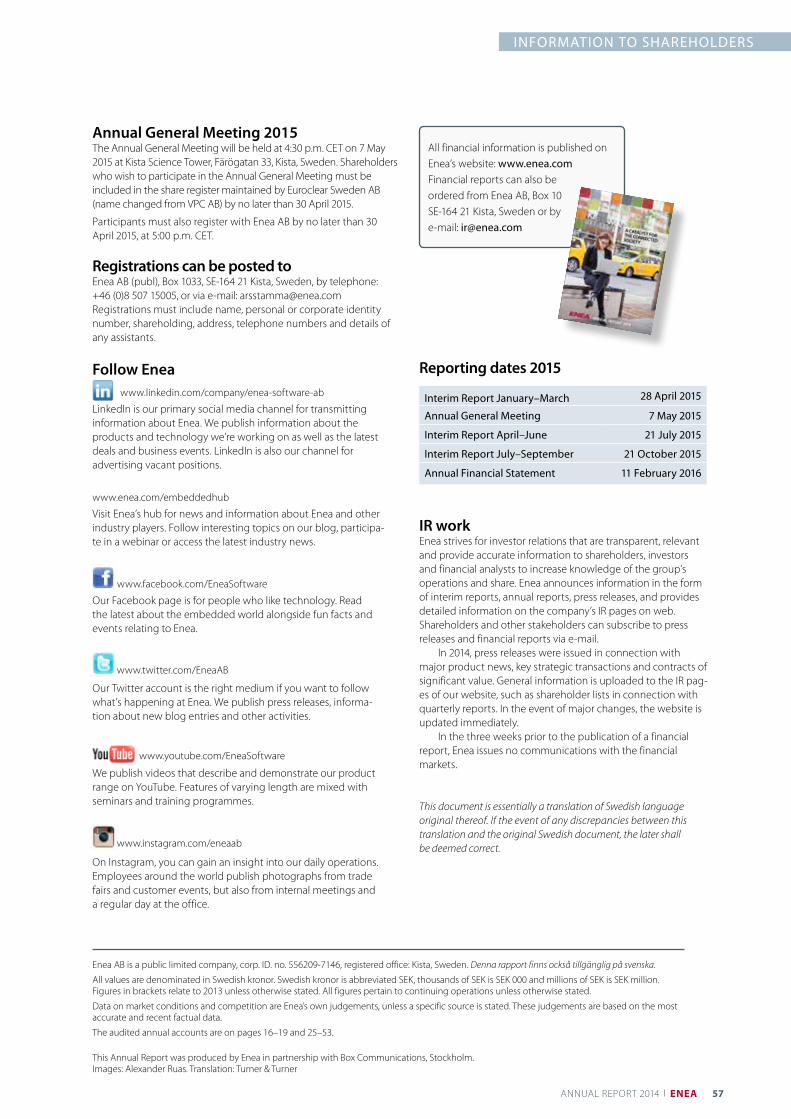
ANNUAL REPORT 2014 ENEA 57
INFORMATION TO SHAREHOLDERS
This Annual Report was produced by Enea in partnership with Box Communications, Stockholm.Images: Alexander Ruas. Translation: Turner & Turner
Enea AB is a public limited company, corp. ID. no. 556209-7146, registered office: Kista, Sweden. Denna rapport finns också tillgänglig på svenska.
All values are denominated in Swedish kronor. Swedish kronor is abbreviated SEK, thousands of SEK is SEK 000 and millions of SEK is SEK million. Figures in brackets relate to 2013 unless otherwise stated. All figures pertain to continuing operations unless otherwise stated.
Data on market conditions and competition are Enea’s own judgements, unless a specific source is stated. These judgements are based on the most accurate and recent factual data.
The audited annual accounts are on pages 16–19 and 25–53.
Annual General Meeting 2015The Annual General Meeting will be held at 4:30 p.m. CET on 7 May 2015 at Kista Science Tower, Färögatan 33, Kista, Sweden. Shareholders who wish to participate in the Annual General Meeting must be included in the share register maintained by Euroclear Sweden AB (name changed from VPC AB) by no later than 30 April 2015.
Participants must also register with Enea AB by no later than 30 April 2015, at 5:00 p.m. CET.
Registrations can be posted toEnea AB (publ), Box 1033, SE-164 21 Kista, Sweden, by telephone:+46 (0)8 507 15005, or via e-mail: [email protected] must include name, personal or corporate identity number, shareholding, address, telephone numbers and details of any assistants.
All financial information is published on Enea’s website: www.enea.com Financial reports can also be ordered from Enea AB, Box 10 SE-164 21 Kista, Sweden or by e-mail: [email protected]
Follow Enea
www.facebook.com/EneaSoftware
www.twitter.com/EneaAB
www.youtube.com/EneaSoftware
www.instagram.com/eneaab
IR workEnea strives for investor relations that are transparent, relevant and provide accurate information to shareholders, investors and financial analysts to increase knowledge of the group’s operations and share. Enea announces information in the form of interim reports, annual reports, press releases, and provides detailed information on the company’s IR pages on web. Shareholders and other stakeholders can subscribe to press releases and financial reports via e-mail. In 2014, press releases were issued in connection with major product news, key strategic transactions and contracts of significant value. General information is uploaded to the IR pag-es of our website, such as shareholder lists in connection with quarterly reports. In the event of major changes, the website is updated immediately. In the three weeks prior to the publication of a financial report, Enea issues no communications with the financial markets.
This document is essentially a translation of Swedish language original thereof. If the event of any discrepancies between this translation and the original Swedish document, the later shall be deemed correct.
Reporting dates 2015
Our Facebook page is for people who like technology. Read the latest about the embedded world alongside fun facts and events relating to Enea.
Our Twitter account is the right medium if you want to follow what’s happening at Enea. We publish press releases, informa-tion about new blog entries and other activities.
We publish videos that describe and demonstrate our product range on YouTube. Features of varying length are mixed with seminars and training programmes.
On Instagram, you can gain an insight into our daily operations. Employees around the world publish photographs from trade fairs and customer events, but also from internal meetings and a regular day at the office.
www.enea.com/embeddedhub
Visit Enea’s hub for news and information about Enea and other industry players. Follow interesting topics on our blog, participa-te in a webinar or access the latest industry news.
www.linkedin.com/company/enea-software-ab
LinkedIn is our primary social media channel for transmitting information about Enea. We publish information about the products and technology we’re working on as well as the latest deals and business events. LinkedIn is also our channel for advertising vacant positions.
Interim Report January–March 28 April 2015
Annual General Meeting 7 May 2015
Interim Report April–June 21 July 2015
Interim Report July–September 21 October 2015
Annual Financial Statement 11 February 2016
www.enea.com
Enea delivers products and services to companies that develop
communication-intensive products. Enea’s operating systems are
the backbone of the company’s product portfolio and are sold as
part of custom solutions for major global telecom companies.
Enea®, Enea OSE®, Netbricks®, Polyhedra® and Zealcore® are registered trademarks of Enea AB and its subsidiaries. Enea OSE®ck, Enea OSE® Epsilon, Enea®
Element, Enea® Optima, Enea® Optima Log Analyzer, Enea® Black Box Recorder, Enea® LINX, Enea® Accelerator, Polyhedra® Lite, Enea® dSPEED Platform,
Enea® System Manager, Accelerating Network Convergence (TM), Device Software Optimized (TM) and Embedded for Leaders (TM) are unregistered
trademarks of Enea AB. All rights reserved. © 2014 Enea AB.
SWEDENHead office STOCKHOLMP.O. Box 1033Jan Stenbecks Torg 17SE-164 26 Kista, Sweden Tel: +46 8 507 140 00 ROMANIABUCHAREST319 Splaiul IndependenteiOB403A District 6Bucharest 060044, RomaniaTel: +40 21 311 43 00
GERMANYMUNICHSchlosserstrasse 480336 München, GermanyTel: +49 89 544 6760
FRANCEAIX EN PROVENCEEnea Netbricks SASAix Arche Centre d’Affaires5 rue des Allumettes13090 Aix en Provence, FranceTel: +33 (0)4 42 16 08 85
DOURDANEnea Netbricks SAS1 rue de la Belette - Le Castillan91410 Dourdan, FranceTel: +33 (0)1 64 95 96 14
UKSHEPTON MALLETCharlton Barn Lower Charlton Trading EstateShapton Mallet BA4 5QE, EnglandTel: +44 1749 346784
JAPANTOKYOFu-undo annex 4F1-4-2 Kanda Ogawa-machiChiyoda-kuTokyo 101-0052, JapanTel: +81 3 5207 6167
CHINASHANGHAIRoom 1203, Silver TowerNo.218 South XiZang RoadShanghai 200021, ChinaTel: +86 21 6334 3406
USABOSTON402 Amherst StreetSuite 300Nashua, NH 03063, USATel: +1 480 753 9200
PHOENIX2575 East Camelback RoadSuite 400Phoenix, AZ 85016, USATel: +1 480 753 9200