a 3d geographic information system for 'mapping the via appia
TRANSCRIPT
Faculty of Economics and Business Administration
A 3D Geographic Information System for
‘Mapping the Via Appia’
Research Memorandum 2015-1
Maurice de Kleijn
Rens de Hond
Oscar Martinez-Rubi
Pjotr Svetachov
1
A 3D Geographic Information System for
‘Mapping the Via Appia’1
Maurice de Kleijn, MA, Rens de Hond, MA, Oscar Martinez-Rubi, MSc, and Pjotr Svetachov, MSc
Introduction
The accurate registration of observations in the field is
an important activity during archaeological fieldwork.
In many archaeological projects, two-dimensional
geographic information systems (GIS) and relational
databases are being employed to store these data.2 In
many cases, this method of documentation is sufficient.
However, when complex monumental sites are con-
cerned, of which large portions are still standing, a two-
dimensional approach is not adequate. It requires much
imaginative power of the researcher to analyse the
relations between objects and structures of a three-
dimensional nature in a two-dimensional system. A 3D
GIS could offer a solution for this problem. Although
the use of 3D technologies in archaeology has greatly
increased over the past decennia, only a few archaeolog-
ical projects are known to have been working towards a
3D GIS.3
This article presents the steps that have been
taken to develop a 3D GIS for ‘Mapping the Via Ap-
pia‘.4 This project investigates the area around the fifth
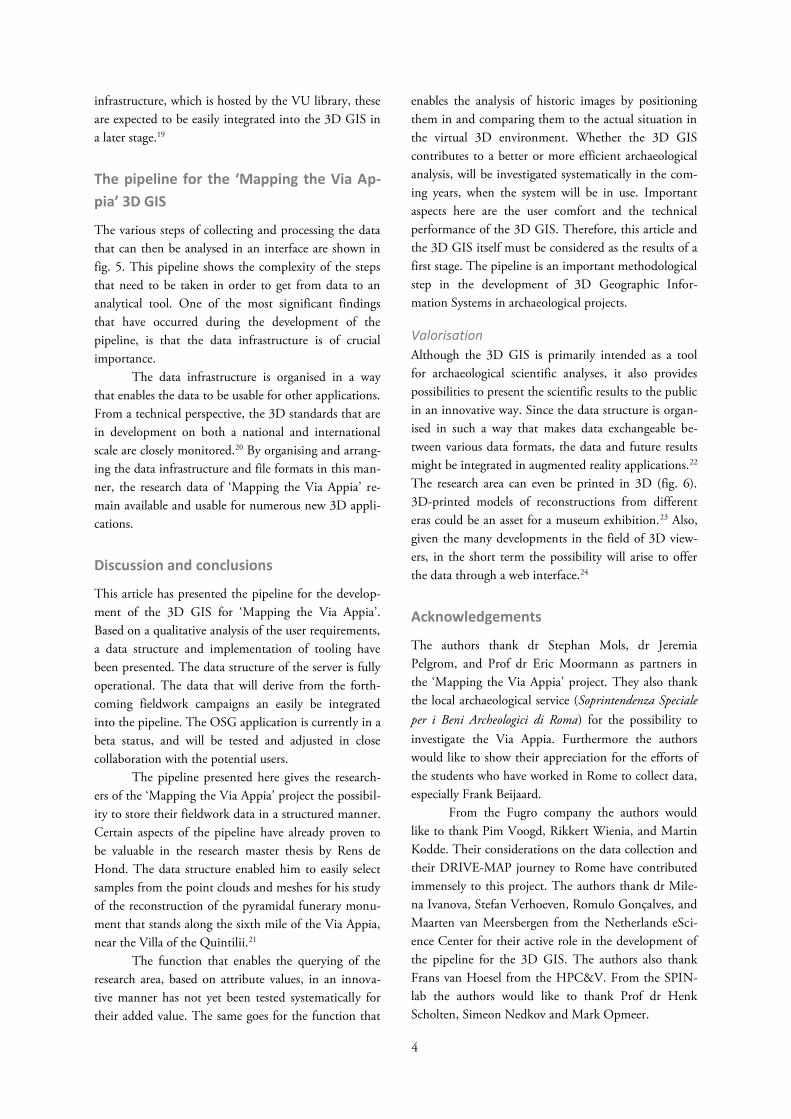
and sixth miles of the Via Appia Antica (fig. 1). In
antiquity, the Via Appia ranked as the most significant
route from Rome to southern Italy. The road was con-
structed from 312 BC onwards, and has seen many
changes since.5 In antiquity, the Via Appia was an area
flourishing with various cultural, economic, and reli-
gious activities, of which physical traces remain nowa-
days in the form of funerary monuments, villas, sanctu-
aries and farmsteads. In medieval times, the areas
around Rome fell into decay. The ancient remains were
reused or fell victim to treasure hunters. Round 1800 it
was decided to protect the landscape of the Via Appia,
and to organise it as an archaeological area. Landscape
architects and artists were commissioned to rearrange
the area, resulting in new landscapes and reconstruc-
tions of sometimes dubious quality.
‘Mapping the Via Appia’ aims to gain an insight into
the Roman interventions in this suburban landscape.
Applying multiple archaeological methods (excavations,
archive studies, field surveys, remote sensing techniques
and geophysical prospection), it makes a thorough
inventory of the archaeological remains from all eras.
This inventory serves as a basis not only for scientific
analyses of the use of the road and its surrounding areas
in ancient times, but also for present-day heritage man-
agement and the planning of future interventions.
Concerning the size, complexity, and nature of the
research area, a 3D GIS could play a significant part in
the analysis and preservation of the data.
This article presents the pipeline that has been
developed for the 3D GIS of the ‘Mapping the Via
Appia’ project. In order to identify the needs that the
system will have to cover, it starts with an analysis of
the user requirements, which will then be converted
into the technical implementation. A distinction has
been drawn between data collection, data processing,
and the development of analytical tooling. The article
provides insight into the complex technical steps that
have to be taken in order to create a 3D GIS that can
be used for analyses. Besides, it describes applications
that can be developed in the future if an open and
standards-based data infrastructure is being used.
User requirements
In the initial stages of the 3D GIS development, poten-
tial users of the system were interviewed.6 Based on
these conversations, a set of user requirements has been
defined.
- The measurements need to be accurate. The
analysis of the various archaeological objects
requires precise measurements and compari-
sons. A margin of 5 cm at most has been de-
termined.
2
- The 3D GIS must enable researchers to query
the set of objects according to features such as
date, material, decoration, and size. The selec-
tion and filtering of objects based on attribut-
ed data can provide insight into spatial distri-
bution, which contributes to the interpreta-
tion and reconstruction of the archaeological
structures.
- The 3D GIS must contain the possibility to
position historic images within the virtual 3D
environment. Through the ages, the Via Ap-
pia has been the subject of numerous paint-
ings, drawings and photographs, which has re-
sulted in more than three centuries worth of
visual material. By positioning these pictures
within the virtual 3D environment, the rela-
tively recent changes within the landscape and
its archaeological objects can be determined.
- Since the project’s team consists of members
from different universities and institutes, it is
crucial that the system can be used from mul-
tiple locations at the same time.
- The 3D GIS should have the possibility to in-
tegrate 2D GIS data. The various activities
within the ‘Mapping the Via Appia’ project
generate two-dimensional GIS data like
georeferenced historic maps and aerial photo-
graphs, excavation drawings, remote sensing
data, and geophysics data. The spatial combi-
nation of these data with the 3D data con-
tributes to the archaeological analysis.
- The 3D data of the 3D GIS serve as the basis
of archaeological 3D reconstructions of the
objects surrounding the Via Appia. Therefore,
it should be possible to export these data to
existing 3D modelling software.7 In order to
enrich the 3D GIS with archaeological 3D re-
constructions of monuments and architecture,
it should also be possible to import 3D mod-
els.
- Ultimately, the system must be organised in
such a way that the data will be available and
usable in the long run, and that they can be
integrated with other infrastructures for herit-
age management and valorisation purposes.
In order to transform these requirements into technical
implementations, a distinction has been made between
the data collection, the data structure and the analytical
tooling. Table 1 provides an overview of the user re-
quirements and indicates focal points in the develop-
ment of the 3D GIS. The collection of the data, the
data structure, and the tooling are components of the
pipeline for creating the 3D GIS.
Data collection and processing
Data collection
Various techniques are applied in order to measure and
capture the monumental sites in the area directly along-
side the Via Appia. First of all, a 2D footprint of each
site is measured with a differential GPS.8 These foot-
prints are stored as polygons, to which identification
numbers (IDs) are attributed. This ID enables relation
to other data sets.
During fieldwork, the archaeological sites are
studied closely. Features such as material, construction
technique, decoration, and date are documented in a
structured manner and stored in a relational database.9
A distinction is being made between ‘sites’ and ‘ob-
jects’; a site consists of one or multiple objects. In order
to enable easy sharing of this relational database and
integration with the 3D GIS at a later stage, conversion
of this database to PostgreSQL is part of the pipeline.10
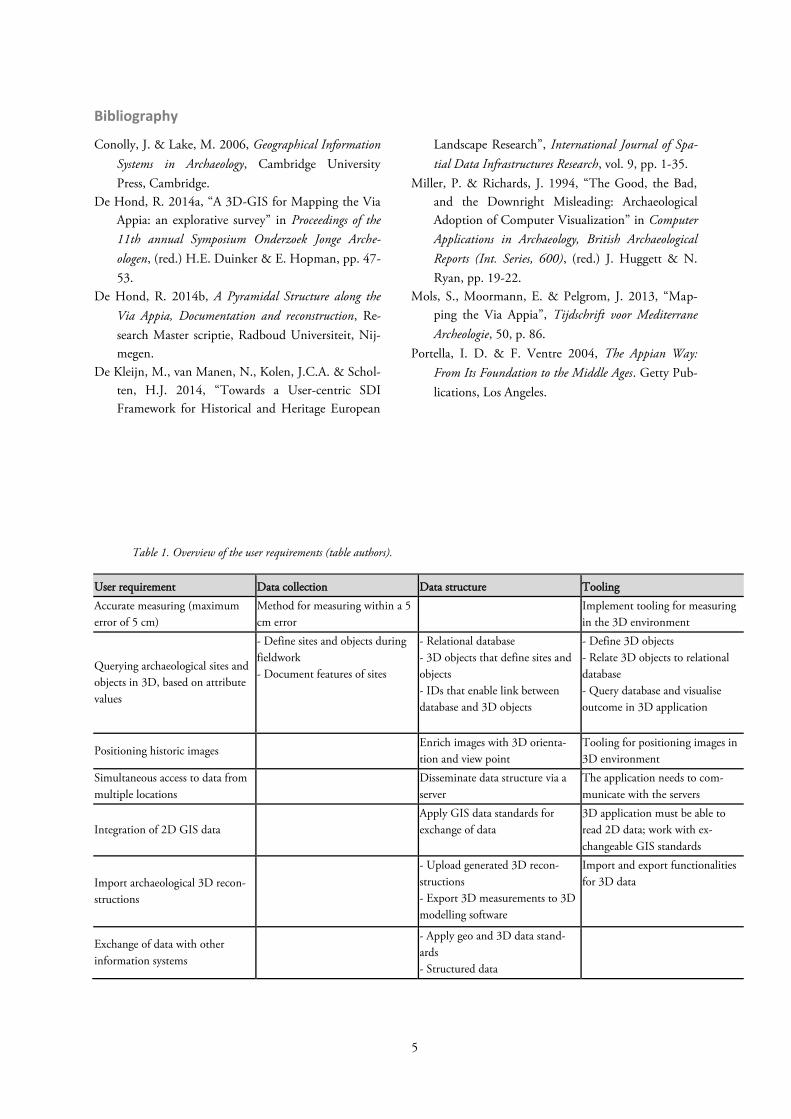
In order to generate an accurate 3D data set, a
combination of range-based modelling (laser scanning)
and image-based modelling (structure from motion) is
being used. As for the former, the size of the research
area led to the use of Fugro’s DRIVE-MAP applica-
tion. DRIVE-MAP is a dynamic laser scanning applica-
tion that consists of a 360° laser scanner, a panorama
camera, a metric camera, a GPS, and accelerometers, all
mounted on a car.11 This scan results in a scaled and
coloured 3D point cloud with xyz measurements that
are related to the earth’s surface (fig. 2). The point
cloud has a relative accuracy of ca 1 cm. This means
that the measured points have a maximum error of 1
cm in relation to each other. As for the exact location,
the DGPS has an error of ca 10 cm. This accuracy is
well within the limits that are set for ‘Mapping the Via
Appia’s’ goals.
Since DRIVE-MAP can only obtain data from
its position on the road, the rear sides of the monu-
ments are not present in the point cloud. In order to
create a complete model, a separate point cloud is pro-
duced of each object using Autodesk 123D Catch.12
123D Catch is based on structure from motion tech-
nology. The software applies photogrammetric algo-
rithms to a series of stereo photos, thus computing a
point cloud. Simultaneously, 123D Catch provides
3
textured meshes.13 To put it simply, the creation of a
mesh is like draping a blanket over the point cloud.
Surfaces are computed between the points, based on
various interpolation methods. To enhance the realism,
the original photographs are projected onto the surface
as a texture.
Processing the data (post processing)
To scale and align the 123D Catch models to the
DRIVE-MAP point cloud, the open source software
CloudCompare is used.14 This software has functionali-
ty to semi automatically align point clouds. After the
user has roughly scaled and positioned the 123D Catch
point cloud, CloudCompare can automatically align it
to the DRIVE-MAP point cloud. The software identi-
fies common shapes in the point clouds, and merges
them. CloudCompare can only process a limited
amount of points, and is therefore unable to visualise
the entire DRIVE-MAP point cloud at once.
Because of this problem, a script has been de-
veloped that saves a selection of the DRIVE-MAP
point cloud in a separate file, which can be imported in
CloudCompare.
This selection is based on the 2D footprints of
the archaeological sites. The footprints, together with
the DRIVE-MAP point cloud, have been imported in a
PostgreSQL database with PostGIS extension.15 The
database provides tooling that enable scripts and soft-
ware to manage various analytical functions. The script
combines the footprint polygons and the DRIVE-MAP
data set, and thus generates a sample from the DRIVE-
MAP point cloud.
In order to be able query the sites and objects
that have been identified in the field, the relational
database needs to be linked to the objects that are de-
fined in the virtual 3D model. However, the combined
DRIVE-MAP and 123D Catch point cloud does not
yet contain archaeologically defined 3D objects; it
consists purely of xyz points and meshes.
To define the archaeological objects in the 3D
model, a visualisation system developed by the Centre
for High Performance Computing and Visualisation
(HPC&V) of the Rijksuniversiteit Groningen is used.
This system is based in the open source toolkit
OpenSceneGraph (OSG).16 This OSG application
contains tooling to define 3D objects by means of
bounding boxes. This creates a new data set of the
defined 3D areas.
Implementation of analytical functionality
in the 3D GIS
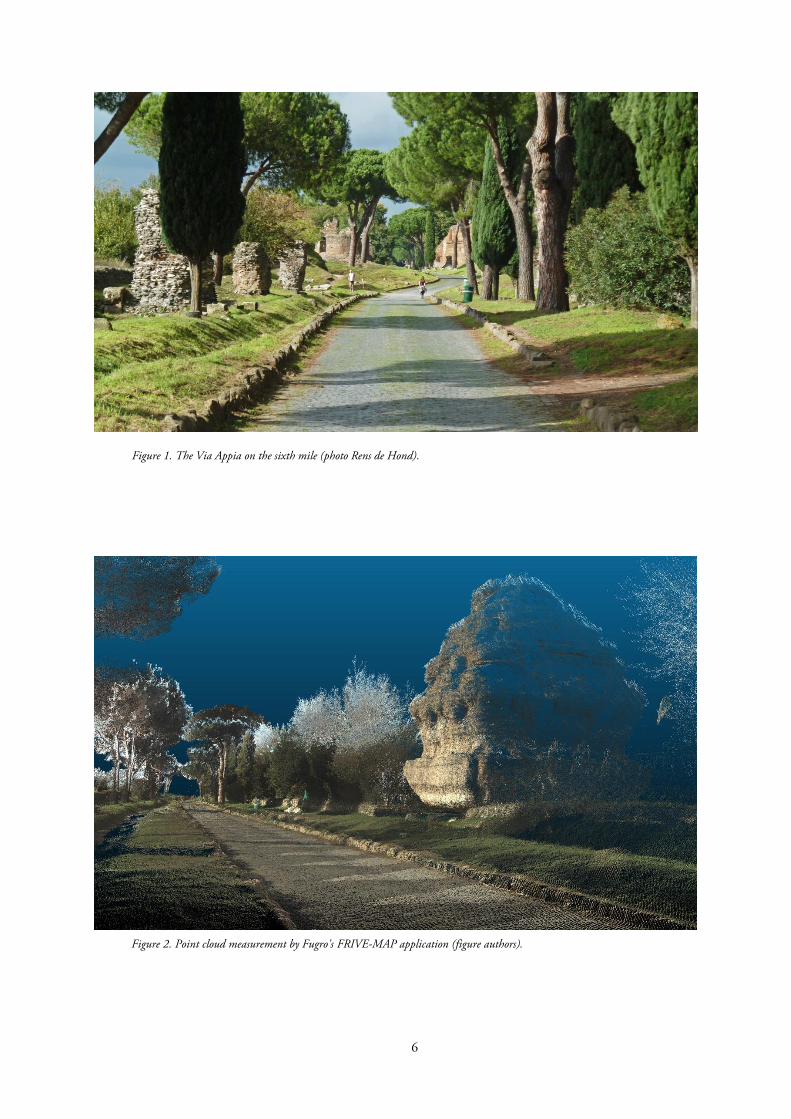
In order to be able to analyse the data in 3D, a visuali-
sation and analysis interface has been developed based
on the OSG application by HPC&V. The original
application already contains some functionalities that
are on the list of user requirements for the ‘Mapping
the Via Appia’ 3D GIS, such as measuring in 3D space
(fig. 3), import and positioning of common 3D model
file formats, defining 3D objects, and the positioning
of images in the 3D space. For this project, specific
additional functionalities have been developed, such as
the simultaneous use of the system from different loca-
tions and the possibility to query the 3D data based on
the fields in the relational database.
A synchronisation approach has been applied in
order to enable researchers to use the system from
multiple locations at the same time. The application is
installed on each individual computer and receives the
data from a dedicated server. Because of the size of the
dataset, estimated to be ca 40 GB, communication
with the server is synchronisation-based instead of
streaming-based. At the start of each first session on
each computer, all data is downloaded from the server.
Before each following session, only the changes will be
synchronised.17
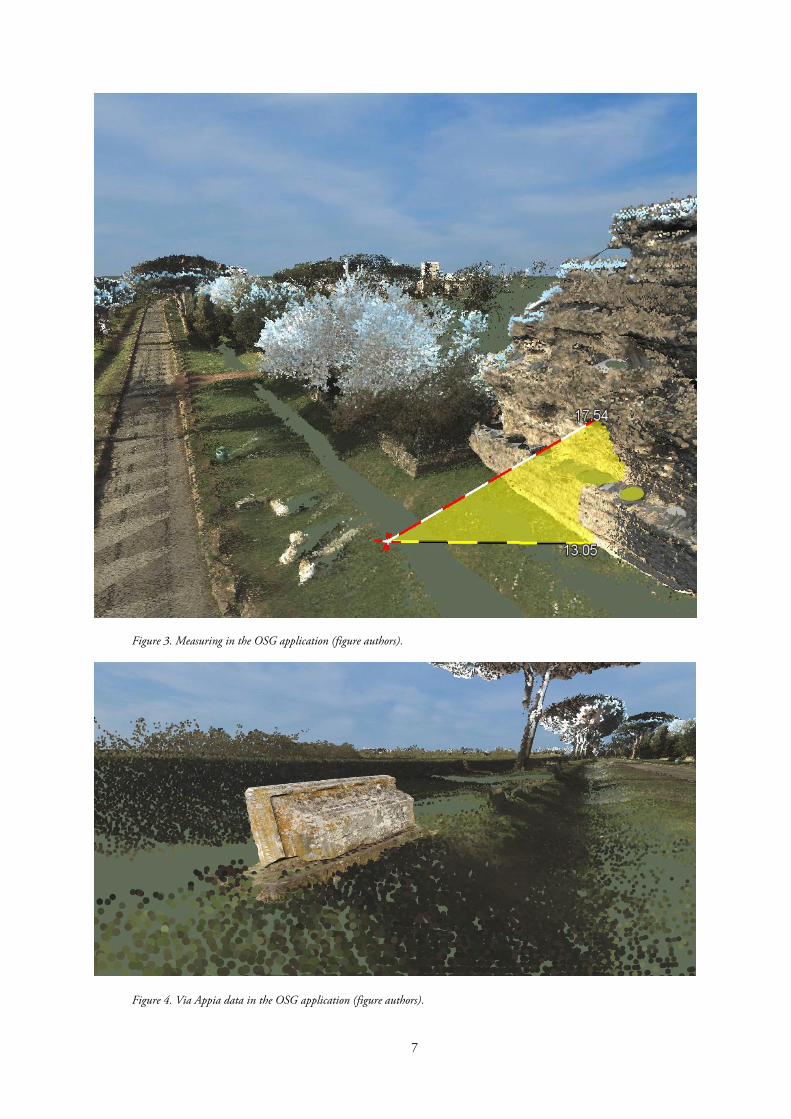
The functionality of querying the sites and ob-
jects is based on a link between the relational database
and the 3D bounding boxes. In case one wants to know
which objects are defined as travertine from the second
century AD, this question is delivered as a statement to
the relational PostgreSQL database. The outcome is a
series of site IDs and accompanying object IDs, which
are related to the corresponding bounding boxes. The
3D bounding boxes in question are illuminated in the
OSG application. The point cloud and meshes only
have a visual function (fig. 4).
A functionality in the list of user requirements
that has not yet been implemented in the application,
is the possibility to add 2D GIS data from the various
research components of the ‘Mapping the Via Appia’
project. Given the development of osgEarth, this might
well be easily realisable in the near future. OsgEarth is a
development within the OSG community that focusses
on the integration of OSG and geographical data. The
integration of standardised GIS services for instance is
one of the goals.18 Since the 2D research data of ‘Map-
ping the Via Appia’ have already been stored according
to such standards in a protected section of the Geoplaza
4
infrastructure, which is hosted by the VU library, these
are expected to be easily integrated into the 3D GIS in
a later stage.19
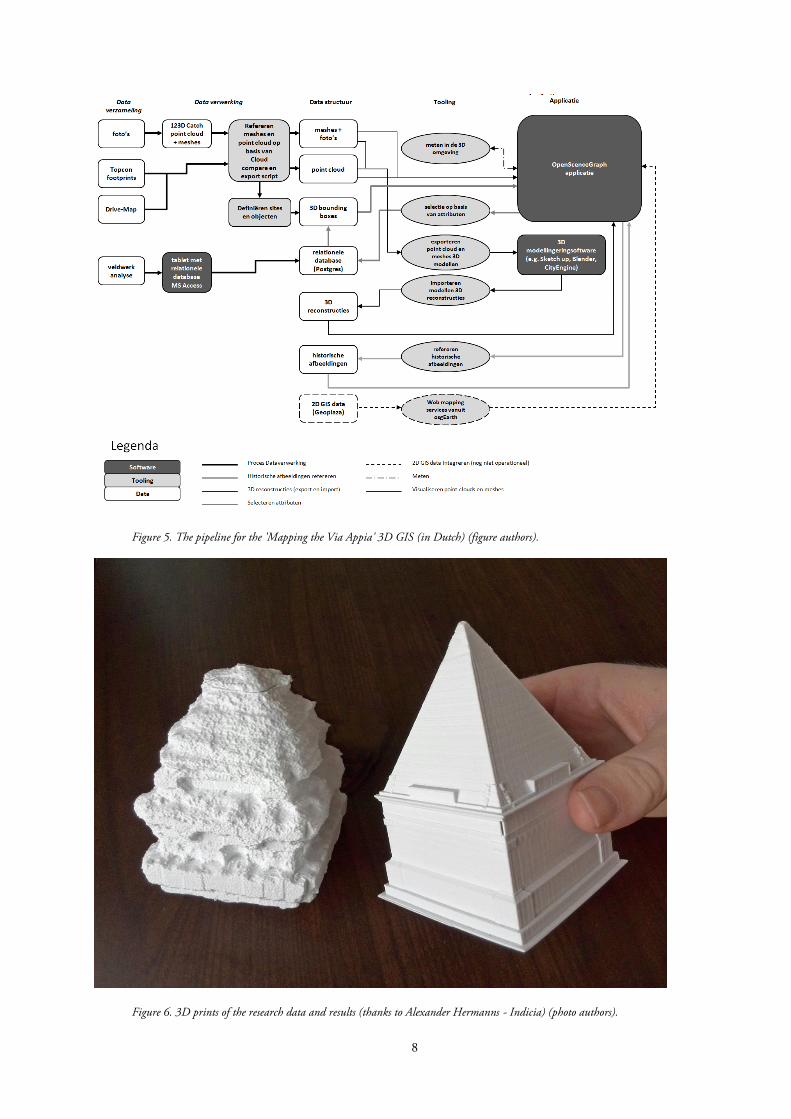
The pipeline for the ‘Mapping the Via Ap-
pia’ 3D GIS
The various steps of collecting and processing the data
that can then be analysed in an interface are shown in
fig. 5. This pipeline shows the complexity of the steps
that need to be taken in order to get from data to an
analytical tool. One of the most significant findings
that have occurred during the development of the
pipeline, is that the data infrastructure is of crucial
importance.
The data infrastructure is organised in a way
that enables the data to be usable for other applications.
From a technical perspective, the 3D standards that are
in development on both a national and international
scale are closely monitored.20 By organising and arrang-
ing the data infrastructure and file formats in this man-
ner, the research data of ‘Mapping the Via Appia’ re-
main available and usable for numerous new 3D appli-
cations.
Discussion and conclusions
This article has presented the pipeline for the develop-
ment of the 3D GIS for ‘Mapping the Via Appia’.
Based on a qualitative analysis of the user requirements,
a data structure and implementation of tooling have
been presented. The data structure of the server is fully
operational. The data that will derive from the forth-
coming fieldwork campaigns an easily be integrated
into the pipeline. The OSG application is currently in a
beta status, and will be tested and adjusted in close
collaboration with the potential users.
The pipeline presented here gives the research-
ers of the ‘Mapping the Via Appia’ project the possibil-
ity to store their fieldwork data in a structured manner.
Certain aspects of the pipeline have already proven to
be valuable in the research master thesis by Rens de
Hond. The data structure enabled him to easily select
samples from the point clouds and meshes for his study
of the reconstruction of the pyramidal funerary monu-
ment that stands along the sixth mile of the Via Appia,
near the Villa of the Quintilii.21
The function that enables the querying of the
research area, based on attribute values, in an innova-
tive manner has not yet been tested systematically for
their added value. The same goes for the function that
enables the analysis of historic images by positioning
them in and comparing them to the actual situation in
the virtual 3D environment. Whether the 3D GIS
contributes to a better or more efficient archaeological
analysis, will be investigated systematically in the com-
ing years, when the system will be in use. Important
aspects here are the user comfort and the technical
performance of the 3D GIS. Therefore, this article and
the 3D GIS itself must be considered as the results of a
first stage. The pipeline is an important methodological
step in the development of 3D Geographic Infor-
mation Systems in archaeological projects.
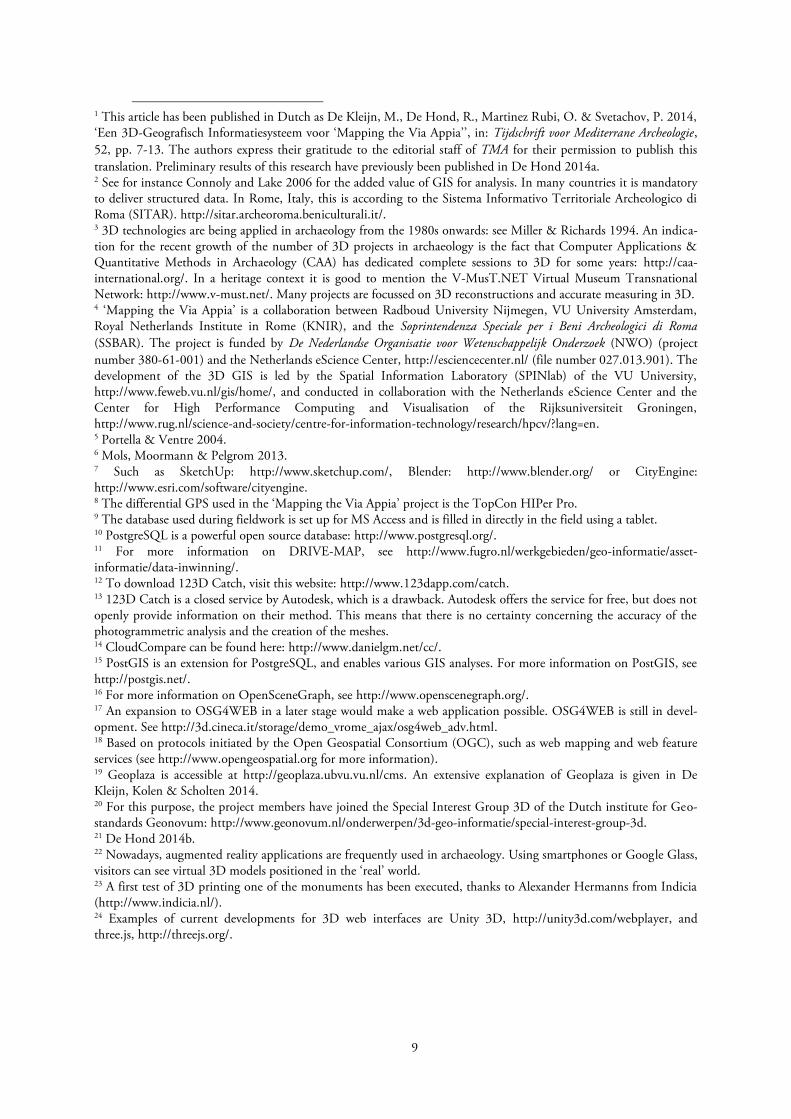
Valorisation
Although the 3D GIS is primarily intended as a tool
for archaeological scientific analyses, it also provides
possibilities to present the scientific results to the public
in an innovative way. Since the data structure is organ-
ised in such a way that makes data exchangeable be-
tween various data formats, the data and future results
might be integrated in augmented reality applications.22
The research area can even be printed in 3D (fig. 6).
3D-printed models of reconstructions from different
eras could be an asset for a museum exhibition.23 Also,
given the many developments in the field of 3D view-
ers, in the short term the possibility will arise to offer
the data through a web interface.24
Acknowledgements
The authors thank dr Stephan Mols, dr Jeremia
Pelgrom, and Prof dr Eric Moormann as partners in
the ‘Mapping the Via Appia’ project. They also thank
the local archaeological service (Soprintendenza Speciale
per i Beni Archeologici di Roma) for the possibility to
investigate the Via Appia. Furthermore the authors
would like to show their appreciation for the efforts of
the students who have worked in Rome to collect data,
especially Frank Beijaard.
From the Fugro company the authors would
like to thank Pim Voogd, Rikkert Wienia, and Martin
Kodde. Their considerations on the data collection and
their DRIVE-MAP journey to Rome have contributed
immensely to this project. The authors thank dr Mile-
na Ivanova, Stefan Verhoeven, Romulo Gonçalves, and
Maarten van Meersbergen from the Netherlands eSci-
ence Center for their active role in the development of
the pipeline for the 3D GIS. The authors also thank
Frans van Hoesel from the HPC&V. From the SPIN-
lab the authors would like to thank Prof dr Henk
Scholten, Simeon Nedkov and Mark Opmeer.
5
Bibliography
Conolly, J. & Lake, M. 2006, Geographical Information
Systems in Archaeology, Cambridge University
Press, Cambridge.
De Hond, R. 2014a, “A 3D-GIS for Mapping the Via
Appia: an explorative survey” in Proceedings of the
11th annual Symposium Onderzoek Jonge Arche-
ologen, (red.) H.E. Duinker & E. Hopman, pp. 47-
53.
De Hond, R. 2014b, A Pyramidal Structure along the
Via Appia, Documentation and reconstruction, Re-
search Master scriptie, Radboud Universiteit, Nij-
megen.
De Kleijn, M., van Manen, N., Kolen, J.C.A. & Schol-
ten, H.J. 2014, “Towards a User-centric SDI
Framework for Historical and Heritage European
Landscape Research”, International Journal of Spa-
tial Data Infrastructures Research, vol. 9, pp. 1-35.
Miller, P. & Richards, J. 1994, “The Good, the Bad,
and the Downright Misleading: Archaeological
Adoption of Computer Visualization” in Computer
Applications in Archaeology, British Archaeological
Reports (Int. Series, 600), (red.) J. Huggett & N.
Ryan, pp. 19-22.
Mols, S., Moormann, E. & Pelgrom, J. 2013, “Map-
ping the Via Appia”, Tijdschrift voor Mediterrane
Archeologie, 50, p. 86.
Portella, I. D. & F. Ventre 2004, The Appian Way:
From Its Foundation to the Middle Ages. Getty Pub-
lications, Los Angeles.
Table 1. Overview of the user requirements (table authors).
User requirement Data collection Data structure Tooling
Accurate measuring (maximum
error of 5 cm)
Method for measuring within a 5
cm error
Implement tooling for measuring
in the 3D environment
Querying archaeological sites and
objects in 3D, based on attribute
values
- Define sites and objects during
fieldwork
- Document features of sites
- Relational database
- 3D objects that define sites and
objects
- IDs that enable link between
database and 3D objects
- Define 3D objects
- Relate 3D objects to relational
database
- Query database and visualise
outcome in 3D application
Positioning historic images Enrich images with 3D orienta-
tion and view point
Tooling for positioning images in
3D environment
Simultaneous access to data from
multiple locations
Disseminate data structure via a
server
The application needs to com-
municate with the servers
Integration of 2D GIS data
Apply GIS data standards for
exchange of data
3D application must be able to
read 2D data; work with ex-
changeable GIS standards
Import archaeological 3D recon-
structions
- Upload generated 3D recon-
structions
- Export 3D measurements to 3D
modelling software
Import and export functionalities
for 3D data
Exchange of data with other
information systems
- Apply geo and 3D data stand-
ards
- Structured data
6
Figure 1. The Via Appia on the sixth mile (photo Rens de Hond).
Figure 2. Point cloud measurement by Fugro's FRIVE-MAP application (figure authors).
7
Figure 3. Measuring in the OSG application (figure authors).
Figure 4. Via Appia data in the OSG application (figure authors).
8
Figure 5. The pipeline for the 'Mapping the Via Appia' 3D GIS (in Dutch) (figure authors).
Figure 6. 3D prints of the research data and results (thanks to Alexander Hermanns - Indicia) (photo authors).
9
1 This article has been published in Dutch as De Kleijn, M., De Hond, R., Martinez Rubi, O. & Svetachov, P. 2014, ‘Een 3D-Geografisch Informatiesysteem voor ‘Mapping the Via Appia’’, in: Tijdschrift voor Mediterrane Archeologie,
52, pp. 7-13. The authors express their gratitude to the editorial staff of TMA for their permission to publish this
translation. Preliminary results of this research have previously been published in De Hond 2014a. 2 See for instance Connoly and Lake 2006 for the added value of GIS for analysis. In many countries it is mandatory to deliver structured data. In Rome, Italy, this is according to the Sistema Informativo Territoriale Archeologico di Roma (SITAR). http://sitar.archeoroma.beniculturali.it/. 3 3D technologies are being applied in archaeology from the 1980s onwards: see Miller & Richards 1994. An indica-tion for the recent growth of the number of 3D projects in archaeology is the fact that Computer Applications & Quantitative Methods in Archaeology (CAA) has dedicated complete sessions to 3D for some years: http://caa-international.org/. In a heritage context it is good to mention the V-MusT.NET Virtual Museum Transnational Network: http://www.v-must.net/. Many projects are focussed on 3D reconstructions and accurate measuring in 3D. 4 ‘Mapping the Via Appia’ is a collaboration between Radboud University Nijmegen, VU University Amsterdam, Royal Netherlands Institute in Rome (KNIR), and the Soprintendenza Speciale per i Beni Archeologici di Roma
(SSBAR). The project is funded by De Nederlandse Organisatie voor Wetenschappelijk Onderzoek (NWO) (project
number 380-61-001) and the Netherlands eScience Center, http://esciencecenter.nl/ (file number 027.013.901). The development of the 3D GIS is led by the Spatial Information Laboratory (SPINlab) of the VU University, http://www.feweb.vu.nl/gis/home/, and conducted in collaboration with the Netherlands eScience Center and the Center for High Performance Computing and Visualisation of the Rijksuniversiteit Groningen, http://www.rug.nl/science-and-society/centre-for-information-technology/research/hpcv/?lang=en. 5 Portella & Ventre 2004. 6 Mols, Moormann & Pelgrom 2013. 7 Such as SketchUp: http://www.sketchup.com/, Blender: http://www.blender.org/ or CityEngine: http://www.esri.com/software/cityengine. 8 The differential GPS used in the ‘Mapping the Via Appia’ project is the TopCon HIPer Pro. 9 The database used during fieldwork is set up for MS Access and is filled in directly in the field using a tablet. 10 PostgreSQL is a powerful open source database: http://www.postgresql.org/. 11 For more information on DRIVE-MAP, see http://www.fugro.nl/werkgebieden/geo-informatie/asset-informatie/data-inwinning/. 12 To download 123D Catch, visit this website: http://www.123dapp.com/catch. 13 123D Catch is a closed service by Autodesk, which is a drawback. Autodesk offers the service for free, but does not openly provide information on their method. This means that there is no certainty concerning the accuracy of the photogrammetric analysis and the creation of the meshes. 14 CloudCompare can be found here: http://www.danielgm.net/cc/. 15 PostGIS is an extension for PostgreSQL, and enables various GIS analyses. For more information on PostGIS, see http://postgis.net/. 16 For more information on OpenSceneGraph, see http://www.openscenegraph.org/. 17 An expansion to OSG4WEB in a later stage would make a web application possible. OSG4WEB is still in devel-opment. See http://3d.cineca.it/storage/demo_vrome_ajax/osg4web_adv.html. 18 Based on protocols initiated by the Open Geospatial Consortium (OGC), such as web mapping and web feature services (see http://www.opengeospatial.org for more information). 19 Geoplaza is accessible at http://geoplaza.ubvu.vu.nl/cms. An extensive explanation of Geoplaza is given in De Kleijn, Kolen & Scholten 2014. 20 For this purpose, the project members have joined the Special Interest Group 3D of the Dutch institute for Geo-standards Geonovum: http://www.geonovum.nl/onderwerpen/3d-geo-informatie/special-interest-group-3d. 21 De Hond 2014b. 22 Nowadays, augmented reality applications are frequently used in archaeology. Using smartphones or Google Glass, visitors can see virtual 3D models positioned in the ‘real’ world. 23 A first test of 3D printing one of the monuments has been executed, thanks to Alexander Hermanns from Indicia (http://www.indicia.nl/). 24 Examples of current developments for 3D web interfaces are Unity 3D, http://unity3d.com/webplayer, and three.js, http://threejs.org/.