30773217-mit.pdf - dspace@mit
TRANSCRIPT
THE ROLE OF THE CYTOSKELETON IN THE MORPHOGENESISOF THE AVIAN ERYTHROCYTE
byBettina Winckler
B.A., Swarthmore College1986
Submitted to the Department of Biology in partial fulfillment of therequirements for the degree of
Doctor of Philosophyin Biology
at theMassachusetts Institute of Technology
February 1994
© Massachusetts Institute of Technology, 1994All rights reserved
Signature of AuthorDepartment of Biology
,-2/7 _ December 10, 1993
Certified by -- --Professor Frank Solomon
.. ,, / Thesis Advisor
Accepted by -. .Professor Frank Solomon
Chairman of the Graduate Committee
A~ASS;~f;CH'I'~'EtT2 !NST1,UI E
JlA,', 8 l. Y994
' j. ~': ,"it'' 2 LS a-iF;s ,,g, 943.1-;~~~~~~~~~~~~~~~41
The Role of the Cytoskeleton in the Morphogenesis of the AvianErythrocyte
by
Bettina Winckler
Submitted to the Department of Biology on December 10, 1993 in partialfulfillment of the requirements for the Degree of
Doctor of Philosophy in Biology
Abstract
The chicken red blood cell serves as a good model system for studying therole of the cytoskeleton in the determination of cell shape because of itssimplicity. Its shape is that of a flattened ellipsoid. A bundle ofmicrotubules, the marginal band, encircles the cell at the equator. Thismicrotubule organelle is rigorously specified, qualitatively andquantitatively. The precursors to this cell can be obtained in synchronouspopulations from the circulation of embryos. They develop in suspensionwithout cell-cell or cell-substrate contacts. This dissertation analyzes thecytoskeleton of developing red cells and its role in morphogenesis.Disruption of the F-actin in embryonic cells in a narrow developmentalwindow leads to microtubule-dependent shape changes giving rise tohighly asymmetric cells. We propose that the establishment of aflattenend cell shape and of the marginal band occurs by a microtubule-autonomous mechanism. We establish that two proteins of the ERMprotein family (ezrin-radixin-moesin) are components of the marginalband. Radixin is the major ERM protein associated with the cytoskeleton.The expression pattern and localization of the ERM proteins in chickenerythrocytes limit previous models for ERM function and raisepossibilities for their role in erythrocyte morphogenesis. We propose thatthe ERM proteins play functionally conserved roles in quite diverseorganelles.
Thesis Advisor: Dr. Frank SolomonTitle: Professor of Biology
2
Acknowledgments
I have been in graduate school for over six years and have notregretted it (yet). Most of the good times I have had are connected to thepeople I have met. Frank's lab was a great place for me, and I willcertainly miss it. It is intellectually stimulating and challenging (lots ofgreat people with whom to have good scientific conversations). It providesa very friendly and supportive atmosphere. Everybody is multi-dimensional, with lots of different interests, not only restricted to science.Besides scientific conversations, the lab has always been a great place todiscuss politics, movies, and life in general, as well as for exchanging theworst puns. And last not least, everybody is addicted to chocolate (and/orcaf6 latte)-- and if you are not when you start, Frank will make sure youare by the time you leave.
Turning me into a chocolaholic is not the only thing, though, Frankdid for me during my time in the lab. (If he should claim that it was mewho turned him into a chocolate addict who will stop short of nothing, justsay one word: "Napoleon", and he will hold his peace forever.) He taughtme not only how to find the focal plane in the microscope, but how todevise controls, how to think about my experiments quantitatively as wellas qualitatively, how to play devil's advocate with every experimentaloutcome and every interpretation, how to do a good experiment. Now andin the future, I always think: what would Frank think of this experiment,this line of experimentation, this model? He has been supportive of me inso many ways, but always challenging, always pushing me just a littlefarther, as long ago as the walk from Toscaninni's and as recently as hiscomments on the introduction for this dissertation. There are not enoughtorronis in the world to pay back the energy that Frank has spent onmaking me a Ph.D. For his mentorship, his enthusiasm, hisencouragement and understanding, his guidance, and his M&M habit, Iwill be grateful for all times.
I also want to thank the other members of the lab-- past andpresent-- for making life so enjoyable. Margaret Magendantz deserveshighest praise not only for teaching me how to do most experiments, butalso for her encouraging words, her cheerfulness and friendliness, and hergood advice on so many issues. Furthermore, she saved me many hoursand days by starting egg incubations on the weekends, changing dialysisbuffers or turning my 2D gels up early in the morning, and generallykeeping an eye on my experiments while I was not there. Without her,the lab would not be the friendly place it is. Of the past members, I wantto thank Wilma Wasco and Laurie Connell for teaching me (among otherthings) which steps are unnecessary in experimental procedures, JonDinsmore for many pieces of good advice and Brant Weinstein for asking:"Was ist los?" so many times, leading to good debates about my project.
3
Of the current members, I want to thank my baymate Vida Praitis,who was usually the first to hear about experimental results and ideas,frustrations and triumphs, for her friendship. I want to thank SuzanneGu6nette, Charo Gonzalez Agosti, Vida Praitis and Jill Hahn for enduringendless conversations about 13H9 and 904 and about less confused, morefun topics. I want to thank Suzanne Guenette, Charo Gonzalez Agosti,and Julie Archer for putting me up for many nights when I came up fromNew York. I also want to thank Lisa Urry for her advice andencouragement during my first two years, Megan Grether for endlessdiscussions about science and life before and after exercise classes, myclassmates Rachel Meyer, Martha Marvin, Mary Herndon, DawnFaruggio, Megan Grether, Bronwen Brown, and Jan Carminati for manydinners and a great support network, and Julie Archer, Michael Henry,Letty Vega, Adam Grancell, and David Kirkpatrick for many fruitfulconversations.
For five years, I lived with several roommates who made it greatfun to come home at night and I want to thank Martha Marvin, MarthaLees, Laura Stewart, and Sue Oleski Farrell for their friendship andmany pints of Ben&Jerry's. I want to thank my friends Chhaya Rao,Bianca Falbo, Martha Marvin, Charo Gonzalez Agosti and SuzanneGu6nette for standing by me when I was not a lot of fun, cranky andstressed-out. I hope I will be able to do the same for them some time.
I would also like to acknowledge gratefully the time and energyspent by my thesis committee members, Arthur Lander, Paul Matsudaira,and Richard Hynes, and the fruitful discussions we had in our meetings.They have contributed in many ways to making this dissertation and thisscientist.
Nicht zuletzt m6chte ich meinen Eltern, Susanne Winckler-Kaliesund Heino Winckler, danken fiur alles, was sie fuir mich getan haben. Siehaben mich immer umgeben mit Liebe und Beistand. Ohne ihr Vertrauenin meine Fahigkeiten und ihre Unterstiitzung-- emotional, finanziell undin jeder anderen Hinsicht-- ware ich heute nicht an dieser Stelle.
I dedicate this dissertation to Jeff Olick for everything he has beenand done for me, most of which cannot be put into words.
4
TABLE OF CONTENTS
Title page 1Abstract 2Acknowledgment 3Table of contents 6List of figures and tables 8
CHAPTER ONE: The Role of the Cytoskeleton in theestablishment and maintenance of cell shape 10
Introduction 11The major cytoskeletal elements 14Interactions among different cytoskeletal elements 20Determinants of cytoskeletal diversity 23The chicken erythrocyte as a model system 34The ERM-proteins: ezrin, radixin, and moesin 45
CHAPTER TWO: Cytochalasin D induces asymmetry inembryonic chicken erythroblasts: Microtubules as a drivingforce for morphological change 52
Introduction 53Materials and Methods 55Results 58Discussion 88
CHAPTER THREE: The 13H9 Antigen in ChickenErythrocytes: Death of the Subset Hypothesis 93
Introduction 94Materials and Methods 98Results 103Discussion 139
CHAPTER FOUR: Expression and Localization ofERM-Proteins in a Simple Cell, the Chicken Erythrocyte 143
Introduction 144Materials and Methods 148Results 154Discussion 182
5
CHAPTER FIVE: The Morphogenesis of the ChickenErythrocyte 188
APPENDICES 198
Appendix one: Association of Ezrin Isoforms With theNeuronal Cytoskeleton 198
Introduction 199Materials and Methods 200Results 201Discussion 207
Appendix two: Testing the Subset HypothesisIntroduction 209Materials and Methods 211Results 219Discussion 231
Appendix three: Nocodazole-sensitivity of the13H9-Antigen in HeLa Cells
Introduction 232Materials and Methods 234Results 235Discussion 246
Appendix four: Identifying Near Neighbors of the904-Antigen in the Marginal Band by Crosslinking
Introduction 248Materials and Methods 250Results 252Discussion 258
BIBLIOGRAPHY 259
6
LIST OF FIGURES AND TABLES
1-1: Domain comparison of members of the band 4.1 superfamily 482-1: Microtubule intermediates during chicken primitive series
erythropoiesis 602-2: Induction of asymmetric morphologies in red blood cells
from day 2 embryos 632-3: Shape change as a function of development 662-4: Morphologies of embryonic red blood cells isolated and
incubated in the absence of cytochalasin D 692-5: Time-lapse photography of cytochalasin D-induced shape
changes 722-6: Double immunofluorescence of tubulin and F-actin in a gallery
of control day 2 red blood cells 742-7: Double immunofluorescence localization of tubulin and F-actin
in a gallery of cytochalasin D-treated day 2 red blood cells 762-8: Microtubules in cytochalasin D-treated red blood cells 79Table 2-1: Inhibition of cytochalasin D-induced shape change by
nocodazole and taxol 812-9: Effect of nocodazole and taxol on anti-tubulin
immunofluorescence 832-10: Levels of microtubule assembly in day 3 red blood cells
after drug treatment 85Table 2-2: Reversal of cytochalasin D-induced shape changes by
nocodazole 873-1: Comparison of the staining patterns of 904 and 13H9 on two-
dimensional gels 1053-2: Comparison of the staining patterns of 904 and 13H9 by
immunofluorescence 1093-3: Fractionation of 904 and 13H9 antigens in chicken red
blood cells 1133-4: Staining patterns of 904 and 13H9 during development of
the red blood cell 1173-5: Efficiency of ERM purification steps 1203-6: Comparison of the isoform prevalence before and after the
purification 1233-7: Purification of ERM-proteins from chicken erythrocyte
cytoskeletons 1253-8: Comparison of mouse ERM-proteins with peptide sequences
obtained from the 80 kd band purified on the hydroxyapatitecolumn 129
3-9: Anti-radixin antibody 457 recognizes the upper band in both
7
two-dimensional separations of chicken erythrocyte cytoskeletonsand eluates from the hydroxyapatite column 132
3-10: None of the ERM antibodies recognizes the lower band in redblood cell cytoskeletal fractions 134
3-11: None of the ERM antibodies recognizes the lower band ineluate fractions 136
3-12: The lower band in eluates is immunologically relatedto ezrin 138
4-1: Mapping of the 13H9 epitope 1564-2: Consensus sequence of mouse ERM proteins 1594-3: Comparison of the sequences from the PCR-products using
conserved ERM-primers with the mouse ERM-sequences 1614-4: Western blots on 3T3-cells using specific ERM
anti-peptide antibodies 1644-5: Western blots on cytoskeletal fractions from chicken red
blood cells using specific ERM anti-peptide antibodies 1674-6: Localization of radixin and ezrin in adult chicken
erythrocytes 1694-7: Localization of radixin in developing chicken
red blood cells 172Table 4-1: Subcellular fractionation of radixin in embryonic
chicken red blood cells 1744-8: Comparison of the localization of radixin with the
localization of F-actin and microtubules in day 3embryonic red blood cells 176
4-9: Radixin persists in the position of the marginal band whenmicrotubules are depolymerized 178
4-10: Radixin staining is not disrupted by cytochalasin D 181Al-i: Immunoblot of EC cell extracts probed with anti-ezrin
serum 904 202A1-2: Immunofluorescence of EC cells with 13H9 and 904 204A1-3: Double immunofluorescence of a DRG growth cone
stained with 13H9 and phalloidin 205A1-4: Immunofluorescence staining of cryostat sections of E 15
rat spinal cord 206A1-5: Comparison of 13H9 and anti-tubulin staining on ventral
root nerve 207A2-1: Simplified restriction map of human ezrin 218A2-2: Treatment of ezrin with prostate acid phosphatase does
not change the 13H9 signal 221A2-3: Treatment with tyrosine phosphatase IB does not change
the 13H9 signal 223A2-4: Phosphorylation of the epitope fusion protein with v-src
does not change the 13H9 signal 226A2-5: RNAse protection assay of HeLa RNA using an ezrin
8
riboprobe 229A3- 1: Fractionation of 904 antigen in HeLa cells 237A3-2: Fractionation of 13H9 antigen in HeLa cells 240A3-3: 13H9 immunofluorescence of HeLa cells 242A3-4: Nocodazole sensitivity of some 13H9 structures 245A4-1: Crosslinking of chicken red blood cell cytoskeletons 254A4-2: Comparison of actin- and tubulin-containing complexes
to the 904-antigen complexes 257
9
Chapter 1
The Role of the Cytoskeleton in the Establishment andMaintenance of Cell Shape
10
Introduction
Differentiated cells display a variety of distinct shapes, including
highly asymmetric ones. The asymmetric shape of a particular cell type is
often intimately linked to its function. Nerve cells, for instance, are
highly asymmetric, extending long processes that serve to propagate
electric signals over long distances to particular target cells. Similarly,
the polarized morphology of the epithelial cells of the intestinal brush
border is critical to their absorptive function. In order to understand a
cell's function, we must understand what determines its particular
asymmetric shape as well as what constitutes its physiological properties.
In many cell types, a structural matrix which retains the shape of
the intact cell remains after detergent extraction. This so-called
cytoskeleton is composed of filamentous elements. (Detergent-extracted
cytoskeletons include the filamentous elements of the cytoskeleton, but
also proteins from other structure, i.e. the nucleus.) On the basis of
electron microscopic observations, the cytoskeletal filaments have been
grouped into three major classes according to their diameters:
microfilaments are 7 nm in diameter, microtubules are cylinders of 25 nm,
and intermediate filaments are of intermediate diameter (10 nm). The
placement of these filaments inside cells suggested early on that they
might be involved in cell shape determination. Byers and Porter (1964),
for instance, described the appearance of oriented microtubules in
elongating cells of the developing lens rudiment during placode formation,
and postulated that microtubules are instrumental in affecting the
cellular elongation. The discovery of treatments that disrupted
microfilaments (the cytochalasins) or microtubules (cold, colchicine,
11
vinblastine) soon led to descriptions of many morphogenetic processes
that require intact microtubules or microfilaments. Neuronal cells in
culture, for example, extend neurites that retract after disruption of
microtubules (Seeds, 1970). Microtubules and microfilaments are also
necessary in multicellular morphogenetic events in which extracellular
factors (cell-cell contacts, cell-extracellular matrix interactions) are likely
to play a role as well. Isolated salivary glands from mouse embryos in
organ culture, for instance, lose their clefts in cytochalasin B, but regain
them after removal of the drug (Spooner and Wessels, 1972). During
neurulation in amphibian embryos, microtubules are necessary for cell
elongation, while microfilaments are needed for apical constriction of the
cells (Burnside, 1973).
It is well established that the cytoskeleton is involved in the
maintenance and establishment of cell shape generally. An important
question now under investigation is how a particular cell shape is
specified. In several systems, the ability of extracellular factors to
influence cell shape has been demonstrated (Weiss, 1958; Lander, 1989).
When a grid of laminin is laid down on a coverslip, neuronal growth cones
follow the predetermined pattern of laminin. But it is also clear that
some of the information specifying cell shape must come from intrinsic
determinants. Albrecht-Buehler (1977) showed that mitotic sisters of 3T3
cells re-establish a similar polarity and choose related migratory paths in
culture. The intrinsic information specifying neurite morphology of
neuroblastoma cells in culture persists through mitosis and microtubule
depolymerization (Solomon 1979, 1980), since mitotic sisters extend
neurites in related patterns and cells re-capitulate their neurite
morphology after nocodazole depolymerization of microtubules.
12
Deforming the cell membrane to change shape requires force. The
shape that a cell displays is ultimately the integration of all forces-- intra-
and extracellular-- which act on it. From in vitro experiments, we know
that polymerization of both tubulin and actin can result in enough force to
distort lipid vesicles (Cortese et al., 1989; Hotani et al., 1992).
Understanding cell shape, therefore, requires a detailed understanding of
the generation and maintenance of cytoskeletal order. As a first step, we
need a detailed description of the proteins present in the cytoskeleton and
their positioning.
13
The major cytoskeletal elements
There are three major cytoskeletal filaments commonly found in
eukaryotic cells: microtubules, microfilaments, and intermediate
filaments. Each filament system is a polymer composed of a different
subunit. In microtubules, the subunit is a dimer of a- and -tubulin.
Microfilaments are made up of actin molecules. Intermediate filaments
are polymers of cell-type specific proteins, such as the keratins, vimentin,
desmin, glial fibrillary acidic protein, neurofilaments etc. The following
section gives a brief description of each filament system.
Microfilaments
Since their first description in muscle, microfilaments have been
found in virtually all eukaryotic cells. Microfilaments are double-helical
polymers of the globular protein actin (G-actin). This filamentous form of
actin is also called F-actin. Actin filaments are involved in many dynamic
cellular processes such as cell motility, cytokinesis, cytoplasmic
streaming, and muscle contraction. Consequently, they have been
identified as components of leading edges, ruffling membranes, growth
cones, filopodia, cleavage furrows, etc. But they are also found in places
that suggest a more structural role, as in stress fibers and cell-substrate
contacts, in brush border microvilli, or in the cortical membrane skeleton
in erythrocytes. Actin filaments are dynamic and their polymerization
and depolymerization in the cell are tightly controlled both spatially and
temporally. The assembly reaction of actin has been studied extensively
in vitro (Pollard and Cooper, 1986). Actin filaments have polarity and
their ends differ in their kinetic parameters (Wegner, 1976). One can
14
distinguish the two ends from each other ultrastructurally because the S 1
fragment of myosin binds with a defined orientation to actin filaments
which gives rise to arrowhead images in electron micrographs. The faster
growing end is called the barbed end, while the slower growing end is
called pointed. Actin filaments in cells are often oriented with uniform
polarity. Frequently, the barbed end is found at the membrane, as in
microvilli or focal contacts.
Microtubules
Microtubules were first identified in cilia and flagella where they
are arranged in a strict 9 + 2 arrangement of microtubule pairs. After
glutaraldehyde came into use as a fixative, cylindrical profiles
reminiscent of flagellar microtubules were found in electron micrographs
of animal cells as well (Porter, 1966). The cylindrical wall of microtubules
is usually made up of 13 protofilaments of tubulin dimers arranged with a
slight helical pitch of 8-10 degrees. Microtubules are found, for example,
in mitotic spindles, marginal bands of disk-shaped blood cells, neurites of
neuronal cells, and are, therefore, implicated in chromosome segregation,
maintenance of cell shape, and organelle transport among others.
As is the case for microfilaments, microtubules are dynamic and
their assembly is regulated. Microtubule assembly in vitro is well
studied: GTP-bound tubulin dimers assemble into polymer. After
assembly, GTP is hydrolyzed. The hydrolysis of GTP is not needed for
assembly since microtubules form even when non-hydrolyzable analogs
are substituted for GTP (Arai and Kaziro, 1976; Hyman et al., 1992).
Since GTP hydrolysis is coupled to assembly, microtubules are not true
equilibrium polymers. The coupling of assembly to GTP hydrolysis has
15
several important consequences which are crucial for understanding
microtubule functioning. For microtubules, the association reaction is not
the reverse of the dissociation reaction. For completely reversible
association reactions, the dissociation constant (Kd) must be identical on
both ends of the polymer (Wegner, 1976). This is not true for
microtubules. The Kd for the plus end (the fast growing end) differs from
that for the minus end (the slow growing end). The difference in Kd for
the two ends leads to the possibility that a polymer grows from one end
and shrinks from the other in vitro, leading to "treadmilling". Since
microtubules in cells are usually capped at one end (the minus end),
treadmilling is unlikely to be an important feature of microtubules in
vivo.
The two ends can be distinguished ultrastructurally by the so-
called hook assay (Heidemann and McIntosh, 1981). Under certain
conditions, tubulin polymerizes into non-cylindrical polymers shaped like
sheets which appear S-shaped or as hooks in cross-section. When
permeabilized cells are incubated with tubulin under those conditions,
protofilament hooks polymerize onto the sides of pre-existing
microtubules with a defined polarity. Electron micrographs of cross-
sections of decorated microtubules show either clockwise or
counterclockwise hooks attached to the microtubule wall. The direction of
the hook is dependent on the polarity of the microtubule.
When fluorescently labeled microtubules are nucleated of
centrosomes in vitro, some microtubules grow while others shrink in the
same population, with rather infrequent transitions between them. This
phenomenon was named "dynamic instability" (Mitchison and Kirschner,
1984). Microtubule behavior consistent with dynamic instability is also
16
found in cultured cells (Schulze and Kirschner, 1986; Sammack et al.,
1987). Injection of biotinylated tubulin into cells results initially in
labeling of the distal ends of microtubules (near the cell periphery), but
not of their middle or of their proximal ends (at the centrosome). After
longer times, unlabeled microtubules disappear completely. Thus, there
is a continuous cycle of microtubule polymerization at the plus ends,
followed by depolymerization (Schulze and Kirschner, 1986).
Photobleaching of continuously labeled fluorescent microtubules shows
that microtubules recover fluorescence independently of their neighbors
(Sammack et al., 1987). Although the resolution of these experiments is
insufficient to follow individual microtubules inside cells, these results
are consistent with dynamic instability.
It is unclear right now how a growing end of a microtubule differs
from a shrinking end on the molecular level. The best model currently
available is the postulated existence of a GTP cap at the polymerizing
end. Since GTP hydrolysis occurs with a delay after polymerization, a cap
of tubulin subunits carrying GTP can form if polymerization is sufficiently
fast. Since the dissociation of GTP-tubulin is slower than that of GDP-
tubulin, microtubules capped by GTP-tubulin depolymerize more slowly
than microtubules capped by GDP-tubulin. This might lead to
catastrophic disassembly once the GTP cap is converted to GDP
(Kirschner and Mitchison, 1986). The observation that the slowly
hydrolyzed GTP analog GMPCPP stabilizes microtubules in vitro is
consistent with the existence of a GTP cap (Hyman et al., 1992).
In cultured cell, microtubules are usually found to be associated
with a single microtubule-organizing center (MTOC) which is active in
nucleation and sequesters the minus end of microtubules. Many MTOCs
17
have ultrastructural correlates, such as centrosomes, basal bodies and
spindle pole bodies. Since microtubules frequently convert from growing
to shrinking (dynamic instability) and since at steady state the tubulin
concentration is below the critical concentration for the minus end, only
microtubules whose minus ends are sequestered by a MTOC can survive,
and microtubules forming independently of the MTOC rapidly
disassemble. This leads to polar arrays of microtubules radiating from
the MTOC. Dynamic instability and sequestration of minus ends can,
therefore, explain some of the important aspects of microtubule
organization in cultured cells. As discussed later, the microtubule array
of terminally differentiated cells which have exited the cell cycle might be
quite different, and different mechanisms might be in effect to establish
their microtubule organization.
Intermediate filaments
Intermediate filaments are polymers assembled from cell-type
specific subunits that have been grouped into several classes by sequence
homology. The subunits are extended rather than globular molecules that
form coiled-coil associations with one another, more similar to collagen
assemblies than to either microtubules or microfilaments. In contrast to
tubulin and actin, there is usually no soluble pool of intermediate
filament subunits in cells (Hynes and Destree, 1978). Nevertheless, some
subunit exchange does occur, as judged by the incorporation of biotin-
labeled vimentin and FRAP studies (Stewart, 1993). The assembly
reaction into intermediate filaments is not nearly as well understood as
that for either microtubules or microfilaments. Up to now, no condition
has been found that reversibly disassembles intermediate filaments in
18
vivo. This complicates experiments addressing their function. In
addition, in vitro assembly can only be performed by dialysis of subunits
from urea. In cultured cells, intermediate filaments course in wavy
arrays through the cytoplasm. In epithelial cells, intermediate filaments
insert into specialized membrane structures called desmosomes that
maintain cell-cell contact.
Microinjection of antibodies against intermediate filament subunits
has no effect on cell shape, motility or viability of cultured cells (Gawlitta
et al., 1981; Lin and Feramisco, 1981). These results suggested that
intermediate filaments play mostly structural roles and might not be
needed for cells grown in culture. More recently, advances in transgenic
mouse technology have made it possible to disrupt genes in mammals and
study the phenotype. Transgenic mice carrying dominant negative
mutations in intermediate filament proteins (keratin 14 or 10) show
epidermal blistering (Vassar et al., 1991; Fuchs et al., 1992). The keratin
14 mutant mice showed the phenotype only after mechanical stress to the
tissue. These results argue that intermediate filaments play an
important structural role in maintaining tissue integrity.
19
Interactions among different cytoskeletal elements
In order to achieve a concerted shape change, the different
cytoskeletal elements of a cell need to communicate with one another.
Evidence for interaction among different filament systems has emerged
from a variety of observations. In several cells, close apposition of
different filament system can be detected by electron microscopy
(Ellisman and Porter, 1980; Schliwa and van Blerkom, 1981; Hirokawa,
1982; Bowser et al., 1988). The structural interdependence of diverse
filament systems was confirmed by observing the effect that the
disruption of one filament system has on the integrity of another. For
example, intermediate filament networks frequently collapse around the
nucleus when microtubules are disassembled with drugs (Starger et al.,
1978). This intermediate filament collapse appears to be actin-dependent
since it can be prevented by cytochalasin (Hollenbeck et al., 1989). This
argues for extensive structural interdependence of these cytoskeletal
networks.
Disruption of microtubules or microfilaments does not usually
affect the integrity of the other polymer, but more subtle interactions are
evident. These interactions may have a strong impact on the function of
the cytoskeleton, specifically on the regulation of cell shape. The
retraction of neurites induced by microtubule disassembly, for instance, is
inhibited by incubation with cytochalasin D (Solomon and Magendantz,
1981). Cytochalasin does not act by inhibiting the action of nocodazole,
i.e. microtubule disassembly. This result argues that loss of microtubules
is not sufficient to cause the loss of asymmetry, but that microfilaments
are probably actively involved in the retraction process as well.
20
In several cases, the actin- and tubulin-systems modulate each
others activity. Cytochalasin treatment of Aplysia bag cell neurons in
culture, for example, leads to extension of microtubules into the distal
regions of the growth cone (Forscher and Smith, 1988), which does not
usually contain large numbers of microtubules. Fibroblasts grown on a
silicone rubber substratum deform it and cause wrinkles. In the presence
of nocodazole, the contractile strength of fibroblasts is increased
(Danowski, 1989). Observations like these have given rise to the idea
that animal cells share properties with tensegrity structures (Ingber and
Folkman, 1989; Ingber and Jamieson, 1985; Buxbaum and Heidemann,
1988). According to this model, microtubules play the role of compressive
struts while microfilaments are the contractile elements connecting them.
This results in mutual interdependence of these two systems.
Microtubules and microfilaments probably interact in other ways as
well. Rinnerthaler et al. (1988) analyzed contact formation in locomoting
fibroblasts by live-cell video microscopy with phase and interference
reflection optics and subsequent fixation and immunostaining. They
found a correlation between membrane ruffles and subsequent contact
formation. These initial contacts were either transient or persistent. The
persistent contacts were frequently associated with microtubules. It is
clear that microtubules are not necessary for fibroblast locomotion per se
(Lloyd et al., 1977), but locomotion is frequently not persistent in one
direction in the absence of microtubules. Rinnerthaler et al. (1988)
suggested that microtubules might influence contact development and
thereby affect directionality of migration and cell shape. This result also
highlights the importance of attachment to a substratum in its interplay
with the cytoskeleton to produce cell shape.
21
What are the molecular correlates of interacting cytoskeletal
networks? There are numerous reports of proteins which interact with
more than one polymer type in vitro. Itano and Hatano (1991), for
example, purified a protein activity from Physarum polycephalum which
forms co-bundles of F-actin and microtubules. Microtubule associated
proteins were found to interact with intermediate filaments (Bloom and
Vallee, 1983) or actin filaments in vitro (Sattilaro et al., 1981; Griffith and
Pollard, 1982; Selden and Pollard, 1983). Although these in vitro
interactions are intriguing, their in vivo relevance remains to be
demonstrated.
22
Determinants of cytoskeletal diversity
Microtubules and microfilaments are found in a great variety of
different cells and in a great variety of different arrangements. For
instance, microtubules can be organized in stable bundled arrays as in
marginal bands or in axons, in dynamic diffuse arrays as in interphase
cells in culture, as a stable membrane skeleton as in the subpellicular
microtubule array of trypanosomes, in the dynamic organization found in
the mitotic spindle, in highly structured stable organizations of cilia and
flagella, among others. In each of these arrangements, microtubules are
virtually identical on the ultrastructural level. Since microtubules can
influence cell shape, part of the question of how cell shape is determined
can be rephrased as: How are the diverse arrays of microtubules
specified? The two most promising candidates to account for the diversity
of microtubule organization -- singly or in combination-- are multiple gene
products for tubulins (isotypes) and microtubule-associated proteins. The
same arguments can be made for actin organization.
Isotypes
Most animal genomes encode multiple isotypes of both actin and
the tubulins. In all cases, there is extensive regulation of the expression
of individual isotypes, both during development and with respect to cell
type. For instance, there are muscle-specific isotypes of actin which are
different from the isotypes expressed in nonmuscle cells. Among -
tubulin isotypes, there is an erythrocyte-specific isotype in chicken, a
testis-specific isotype in Drosophila, etc. From the sequence data from
many tubulins from several species, one could identify conserved and
23
divergent regions among isotypes. In the predicted sequences from -
tubulins, the C-terminal -15 residues were identified as a characteristic
variable region which showed conservation across species and allowed the
classification of sequences into isotype classes (Cleveland, 1986). The
existence of diverse actin and tubulin isotypes and their complex spatial
and temporal expression patterns suggested that the different isotypes
might be necessary-- maybe even sufficient-- to specify a particular
microtubule organization. In this scenario, the divergent regions
determine specific interactions with other tubulin subunits or non-tubulin
proteins, thereby influencing the organization of microtubules. Evidence
has been presented that some microtubule-associated proteins might
interact with the C-terminus of tubulin (Littauer et al., 1986; Maccioni et
al., 1988). In addition, different isotypes differ in their assembly
properties in vitro (Murphy and Wallis, 1983, 1985; Trinczek et al., 1993).
It is, therefore, possible that the particular tubulin isotype present
determines some of the dynamic properties of the polymer as well as
aspects of its interaction with other tubulin subunits and associated
proteins. An alternative explanation of the existence of divergent regions
is that their exact sequence is not crucial to the proper folding and
functioning of the protein and, therefore, that there is little evolutionary
pressure to conserve those residues exactly (Katz and Solomon, 1989).
What is the evidence for and against functional differences among
isotypes? Up to now, not much evidence supporting functional differences
among isotypes has accumulated. Generally, when a cell expresses more
than one isotype, each isotype participates quantitatively in all
microtubule structures in the cell and is not segregated to a subset of the
microtubule structures (Kemphues et al., 1982; Murphy et al., 1986).
24
These results argue that different isotypes are compatible to co-assemble
into a common polymer. [For actin, there are reports providing evidence
that some cells might position different isotypes into different functional
domains within a cell (Hoock et al., 1991).] Heterologous expression of
tubulin genes --from a different organism or a different cell type-- in
cultured animal cells usually results in incorporation of the heterologous
tubulin into all cellular microtubules (Bond et al., 1986; Joshi et al., 1987;
Lewis et al., 1987). This argues that, in general, a particular isotype is
not sufficient to specify a particular microtubule organization, and that
tubulins from evolutionary distant sources can co-assemble.
In organisms where gene replacements are easily achieved, the
necessity for particular tubulins can be tested directly by gene disruption
or replacement. Both Schizosaccharomyces pombe and Saccharonyces
cerevisiae contain two a-tubulin genes. Disruption of one of the a-tubulin
genes results in lethality, while the disruption of the other does not.
When the nonessential a-tubulin is overexpressed in a strain which
carries a conditional mutation of the essential a-tubulin gene, viability is
restored (Adachi et al., 1986; Schatz et al., 1986). This argues that at
sufficient protein levels either a-tubulin is competent for all essential
microtubule functions in these organisms. In Aspergillus, mutants which
do not produce the 3-tubulin that is normally only produced during
conidiation (sporulation) have no sporulation defect (May, 1989). This is
the best example to date where a tubulin with a restricted expression
pattern is not necessary for any stage in the life cycle of the organism.
In animal cells where the variety of isotypes is much greater,
testing the necessity of particular tubulin isotypes is harder because it
requires gene replacement at comparable expression levels. Replacement
25
of the testis-specific -tubulin (2) in Drosophila melanogaster with a
developmentally-regulated isotype (3) which is not expressed in the male
germ line offers a promising system for studying the possible functional
differences among 1-tubulin isotypes. Raff and co-workers have tackled
this problem, but a conclusive answer is not available yet. The main
problem lies in achieving high enough expression levels of the
heterologous 3 gene. 2 mutant strains are transformed with a 3
containing P element in which the transcription of the 3 gene is under
control of the 2 promoter. These strains produce sterile males (Hoyle
and Raff, 1990). Some of the cytoplasmic microtubules form normally
(mitochondrial derivative associated microtubules), but the axoneme is
not assembled. Unfortunately, the highest expression levels obtained for
the heterologous 3 were only 15% of wild type 32 levels.
In related experiments, the heterologous 3 was expressed
simultaneously with the endogenous P2. In these experiments, the
phenotype depended upon the ratio of 13 to total 1-tubulin. In strains
where the heterologous 3 comprised less than 20% of the total 1-tubulin
levels, males were fertile. 3 was incorporated into all microtubule
structures at comparable levels, even into axonemes. In strains where the
heterologous 3 comprised more than 20% of the total P-tubulin levels,
males were sterile. The axonemes in these animals were abnormal: the
doublet tubules looked more like the singlet pair. Therefore, 3 in excess
of 20% poisons axoneme assembly.
One interpretation of these results is that the divergent 3 cannot
assemble into axonemal structures, but only into cytoplasmic
microtubules. This possibility is easy to envision since the doublet
microtubules of the axoneme might require different packing properties
26
than singlet microtubules. Alternatively, 3 might poison the polymer at
higher stoichiometry because it does not co-assemble efficiently with J32
into axonemal structures. Whether or not 3 at sufficiently high levels of
expression could form axonemal microtubules by itself awaits further
experiments. The experimental evidence obtained so far leans towards
the conclusion that tubulin isotypes are neither sufficient nor necessary to
specify a particular microtubule array. Nevertheless, we cannot rule out
the possibility that particular tubulin isotypes contribute to some extent
to the specific properties of the microtubule structures of which they are a
part.
Microtubule-associated proteins
Since Weisenberg (1972) successfully polymerized microtubules
from brain extracts in vitro, numerous proteins have been identified as
microtubule-associated proteins (MAPs) based on their ability to cycle to
constant specific activity with microtubules through repeated cycles of
temperature-dependent polymerization/depolymerization. The best
studied MAPs are those from brain where high concentrations of
microtubule protein facilitates in vitro assembly reactions. The most
prominent MAPs from brain identified in this fashion are the high
molecular weight (HMW) MAPs (several species of MAP1 and MAP2)
(Sloboda et al., 1975,1976) and the tau proteins (MW 55-62 kd)
(Weingarten et al., 1975; Cleveland et al., 1977).
Many of the proteins which bind microtubules in vitro interact
because of non-specific electrostatic interactions rather than because they
interact with microtubules in vivo. In addition, in vitro microtubule
assembly is driven by MAPs. Since MAPs often compete for binding, this
27
procedure selects for high affinity MAPs while lower affinity MAPs are
lost (Wiche, 1989). This shortcoming was circumvented by the discovery
of the plant alkaloid taxol which stimulates microtubule assembly and
stabilizes microtubules in vitro and in vivo. In the presence of taxol,
microtubules could be assembled without MAPs from sources with low
microtubule protein concentration. This led to the identification of
numerous putative MAPs from non-neuronal sources (Wiche, 1989).
Solomon et al. (1979) developed a procedure which was based on
interaction with microtubules inside cells. Experimental cell populations
are extracted with non-ionic detergents under microtubule stabilizing
conditions to get rid of soluble proteins. Microtubules and their
associated proteins are left in the pellet. Subsequent addition of calcium
results in disassembly of microtubules: tubulin and MAPs are solubilized.
A control cell population is treated with nocodazole prior to detergent
extraction which leads to solubilization of tubulin and MAPs in the initial
detergent step. The addition of calcium to those pellets releases other
calcium-sensitive proteins. These proteins are found as background
polypeptides in the calcium release fraction of the experimental
population. Proteins unique to the experimental calcium release fraction
are putative MAPs. Using this procedure, the chartins were identified as
MAPs (Duerr et al., 1981). MAP2 also behaves as a MAP in this
procedure (Dinsmore and Solomon, 1991). Since this procedure relies on
the solubilization of MAPs when microtubules are disassembled, MAPs
that interact additionally with stable non-tubulin components will not be
recovered (Swan, 1985).
What is known about the in vitro and in vivo activities of MAPs
and how might these activities specify microtubule organization? Several
28
MAPs show nucleotide-sensitive microtubule binding and translocate
microtubules in vitro (motor MAPs). Recently, a MAP with microtubule
severing activity (katanin) has been identified from Xenopus oocytes
(Vale, 1991; McNally and Vale, 1993). In the following section, I will not
discuss motor MAPs which are for the most part better understood than
their non-motor counterparts. Rather, I will discuss studies of the two
best understood non-motor MAPs, MAP2 and tau.
Both MAP2 and tau are found at high levels in neuronal cells,
although proteins which share epitopes with MAP2 or tau are present in
non-neuronal cells as well (Wiche, 1989). Immunofluorescence on
neuronal cells showed that MAP2 is expressed mainly in dendrites
(Bernhardt and Matus, 1984) while tau is found in the axon (Binder et al.,
1985). In cultured neuronal cells, the distinction between dendrites and
axons can usually not be made and MAP2 and tau are found in all
processes (called neurites).
Microtubules in neuronal cells are organized differently in different
domains of the cell: in the cell body, microtubules are found in
centrosomal radial arrays, while in the neurites microtubules are found in
parallel bundles. In the growth cone, microtubule bundles splay out and
individual microtubules sometimes extend into the lamellipodial regions
of the growth cone. In axons, microtubules have a uniform polarity with
their plus ends towards the growth cone, while dendritic microtubules
have mixed polarity.
The microtubules in neuronal processes differ significantly from
microtubule arrays of cultured cells in that they are not attached to the
MTOC. In addition, they are not continuous along the whole length of the
process. Neuronal microtubules, therefore, have properties (stability
29
independent of a MTOC, defined orientation, stiffness) that might be
accounted for by neuronal MAPs. The in vitro activities of MAP2 and tau
are consistent with the suggestion that they determine to some extent the
special properties of neuronal microtubules. They promote microtubule
assembly and stabilize microtubules in vitro.
Ectopic expression of MAP2 and tau in cultured cells was used to
study possible effects on microtubule organization and cell shape.
Transfection of cultured cells with MAP2 cDNA results in formation of
stable bundles of microtubules (Lewis et al., 1989; Weisshaar et al., 1992).
These stable bundles are not associated with a MTOC and often form
rings near the membrane. Microinjection of tau into fibroblasts (Drubin
and Kirschner, 1986) leads to an increase in stable microtubules, but no
change in either microtubule organization or cell shape. Transfection of
fibroblasts with tau cDNA leads to the formation of microtubule bundles
(Kanai et al., 1989). These results showed that tau and MAP2 can in fact
stabilize microtubules. Whether or not they also bundle microtubules in
vivo is the matter of some contention. Chapin et al. (1991) argued that
the brain MAPs cause stabilization of microtubules which are then
bundled by other cellular components. This argument rests on the
observation that microtubules stabilized by taxol also form bundles
connected by fine filaments in vivo. Chen et al. (1992) obtained results
which strongly suggest that MAP2 and tau can play a role in bundling of
microtubules (see below).
Expression of tau in a different cultured cell, Sf9, leads to changes
in microtubule organization, but also to a change in shape (Knops et al.,
1991). These cells produce long cellular processes up to 300 gm in length
and of variable diameter. This argues that in some cell backgrounds,
30
expression of tau is sufficient to induce a change in microtubule
organization and a concomitant change in cell shape. Baas et al. (1991)
showed that the overwhelming majority of microtubules in the processes
of the tau transfectants (90%) were of uniform polarity with their plus
ends distal. This is the same orientation that microtubules display in
axons. This result raises the possibility that tau is capable-- in the
appropriate cellular context-- of promoting microtubule
stabilization/bundling, and process formation. Whether or not tau also
determines the polarity of microtubules in processes is unclear since the
uniform polarity might simply be a result of the coordinated release from
the MTOC (Yu et al., 1993). Sf9 cells transfected with MAP2 also extend
processes containing bundles of microtubules with overwhelmingly
uniform polarity (Chen et al., 1992). Therefore, the uniform polarity of
axonal microtubules is probably not due to the interaction with tau. Chen
et al. (1992) found also that the spacing of microtubules in the processes
differed between MAP2 and tau transfectants: in cells expressing MAP2,
the spacing is similar to that in dendrites (60 nm) while in cells
expressing tau, the spacing is similar to that in axons (20 nm). These
results argue that MAPs determine the spacing between microtubules.
The evidence over all supports the hypothesis that MAPs are potent
organizers of microtubules and as a consequence might play an important
role in cell shape determination.
Since few non-motor MAPs have been cloned in genetically
accessible organisms, little is known about whether or not these proteins
are essential for cell function. In one of the few genetic approaches to
MAP function to date, Pereira et al. (1992) reported that Drosophila
strains homozygous for a deficiency covering the 200 kd MAP are viable
31
and show no phenotype. The notion that the cytoskeleton harbors
considerable functional redundancy is also supported by studies on actin-
binding proteins, discussed below.
Actin-binding proteins
Many accessory proteins with actin-binding activity in vitro have
been identified from various cell types. Their in vitro activities include
many more than currently known for MAPs: capping of the barbed end
(e.g. cap42), nucleation of assembly (e.g. ponticulin, fragmin), severing of
filaments (e.g. villin, gelsolin, severin), crosslinking or bundling of
filaments (e.g. villin, a-actinin, filamin), mechanical force production
(myosins), and monomer sequestration (e.g. profilin, thymosin 34). Often
the same protein displays more than one of these activities and is subject
to regulation by other molecules, as for instance calcium/calmodulin, or
polyphosphoinositides.
More recently, efforts have concentrated on elucidating the in vivo
function of these various actin-binding proteins. Disruption of genes
encoding various actin binding proteins in Saccharomyces cerevisiae and
Dictyostelium discoideum have shown that some actin binding proteins
are essential for viability (i.e. cofilin in yeast; Moon et al., 1993) while
others are not and their disruption results in no phenotype (i.e. a-actinin,
gelation factor in D. discoideum; Witke et al., 1992). The lack of a
disruption phenotype raises the possibility that more than one protein can
perform the same function in the cell and that they can substitute for
each other.
An alternative to gene disruption for assessing function is
overexpression or ectopic expression of the protein of interest. In animal
32
cells (CV1 cells), overexpression of gelsolin leads to disappearance of
stress fibers. Expressing only the N-terminal half of gelsolin (which is
involved in calcium regulation of activity) is lethal (Finidori et al., 1992).
Ectopic expression of villin in fibroblasts leads to the formation of
microvilli on the cell surface (Friederich et al, 1989; Franck et al., 1990).
These results suggest that the in vitro activities of gelsolin and villin are
relevant to their in vivo function and that these proteins can modulate the
actin network in cells. These proteins are, therefore, potential regulators
of cell shape.
Many models for actin-based cell motility have been proposed. The
force for cell advancement could be derived from any combination of actin-
based motors, polymerization of actin filaments, and gel-sol transitions
which give rise to gel osmotic pressure, among others (Oster, 1989).
Actin-binding proteins could play a crucial role in the generation of
several of these forces. For instance, actin solutions in vitro change their
visco-elastic properties (Janmey, 1991) from a gel to a sol (liquid). Similar
gel-sol transitions of cortical actin filaments have been proposed to
account for a variety of observations in vivo (Bray and White, 1988). The
visco-elastic properties of actin are determined in large part by the length
of the filament and the extent of cross-linking among filaments (Janmey,
1991). Both of these properties (filament length and cross-linking) are
most likely controlled by actin binding proteins. The regulation of their
activity can, therefore, change the properties of the network and lead to
shape change.
33
The chicken erythrocyte as a model system
Meves (1904, 1911; ref. in Behnke, 1970) described a structure in
amphibian erythrocytes which he called "Randreifen" or marginal band.
From stained specimens, Meves described the marginal band as being
composed of fibrillar elements encircling the erythrocyte at its periphery.
He observed that the shape of the cell was distorted in response to a
variety of stresses but returned to the original flattened elliptical shape
when the stress was discontinued. Meves ascribed these observations to
the elasticity of the marginal band and concluded that the marginal band
determined the shape of the cell: "Es ist erhebt fiber jeden Zweifel, daB
wir in dem Randreifen ein festes und elastisches Gebilde vor uns haben,
und daB der Randreifen es ist, welcher die Form der roten Blutkrperchen
bedingt" [It is beyond any doubt that we have in front of us in the
marginal band a firm and elastic structure, and that it is the marginal
band which causes the shape of the red blood cells (Meves, 1911 in
Behnke, 1970).] Since then, much work has aimed at elucidating the
structure and function of marginal bands.
Chicken erythrocytes are nucleated disk-shaped cells which contain
a ring of microtubules, called the marginal band, at the equator. The
microtubules of the marginal band are stable to nocodazole treatment and
are not associated with a MTOC. In these respects, they are similar to the
microtubules of neuronal cells. In fact, microtubules in many postmitotic,
terminally differentiated cells might differ in their properties from those
of cultured cells which need to re-organize their microtubule network
drastically during the cell cycle from interphase arrays to mitotic spindles
and back to interphase arrays. Studying the cytoskeleton of the chicken
34
erythrocyte, therefore, could prove relevant to understanding the
cytoskeletons of terminally differentiated cells in general (Solomon, 1988).
The simplicity of the chicken erythrocyte makes this cell a good
model system. Compared to neurons, the asymmetry of chicken
erythrocytes is extremely simple: cross-sections parallel and
perpendicular to the marginal band are elliptical. They display the
overall shape of a disk-shaped ellipsoid. One can obtain large numbers of
identical cells from chicken blood. The microtubule organization is also
simple by comparison. All microtubules are contained in the marginal
band and there are no heterogeneous regions in the cell that differ in
microtubule organization. This microtubule structure is, therefore, under
tight spatial control. It is also under tight quantitative control: there is
always close to the same number of microtubule profiles in chicken
marginal bands (10-14) (Miller and Solomon, 1984). We are interested in
understanding this differentiated cytoskeleton in detail, in particular the
molecular basis for the quantitative and qualitative control of its
microtubule organelle. In addition, erythropoietic precursors are easily
available from the circulation of chicken embryos and allow us to study
not only the maintenance, but also the establishment of the differentiated
cytoskeleton of this cell.
The non-tubulin cytoskeleton of the mature chicken erythrocyte
How is the cytoskeleton of the avian erythrocyte put together?
Avian erythrocytes contain all three cytoskeletal networks (microtubules,
microfilaments, and intermediate filaments), in contrast to mammalian
erythrocytes which lack microtubules and intermediate filaments at their
mature stages. The actin organization is similar to that described in
35
detail for the membrane skeleton of mammalian erythrocytes (Branton et
al., 1981; Bennett, 1982) which consists of an extensive spectrin-actin
network underlying the membrane.
Briefly, the membrane skeleton of human erythrocytes consists of
10-20 polypeptides, the bulk of which (-75%) is contributed by spectrins.
The spectrins are long molecules which form dimers. In the cell, spectrin
dimers most likely associate into tetramers by head-to-head association.
From in vitro studies with purified components as well as inside-out
vesicles, the following picture of the organization of the membrane
skeleton has emerged: Spectrin dimers bind to oligomers of actin, an
interaction which is enhanced by protein 4.1. There are at least two ways
that the spectrin-actin network is linked to plasma membrane proteins.
The first is through the spectrin binding protein ankyrin which also binds
the anion exchange protein band 3. The second is through the binding of
band 4.1 to the transmembrane protein glycophorin. The exact
interactions of other membrane cytoskeleton components is less well
understood.
The membrane skeleton of mammalian erythrocytes plays an
important structural role because mutations in the constituent proteins
cause disease: for instance, three different mutations giving rise to
hemolytic anemias in the mouse have been found to be deficient in a-
spectrin, -spectrin, and ankyrin, respectively (Bodine et al., 1984). The
organization of the membrane skeleton in chicken erythrocytes has been
studied much less extensively, but appears essentially identical to that of
mammalian erythrocytes (Lazarides, 1987). In chicken erythrocytes, F-
actin is found in the membrane skeleton and, additionally, concentrated
in the position of the marginal band (Kim et al., 1987). It is unknown
36
exactly how the F-actin in the position of the marginal band is organized
or whether or not it interacts with microtubules, since it cannot be easily
visualized in electron micrographs.
Avian erythrocytes also contain an intermediate filament network
which is composed of vimentin with associated synemin (Granger et al.,
1982; Granger and Lazarides, 1982). When erythrocytes on coverslips are
lysed hypotonically and then disrupted by sonication, the nucleus and
much of the cytoplasm is removed. Some of the intermediate filaments,
though, are left behind. Platinum replicas of these sonicated
cytoskeletons show that intermediate filaments are found in an elliptical
patch between nucleus and plasma membrane (Granger et al., 1982;
Granger and Lazarides, 1982). Georgatos and Blobel (1987) provided
evidence by in vitro binding studies of isolated bovine lens vimentin to
avian erythrocyte membranes that both the nucleus and the plasma
membrane contain vimentin binding sites and that vimentin binds to
these two sites with different domains.
In platinum replicas, the distribution of vimentin filaments and
microtubules appeared complementary (Granger and Lazarides, 1982).
Since these preparations were significantly disrupted and did not contain
the full complement of intermediate filaments, it is not possible to
conclude firmly that intermediate filaments and microtubules occupy
complementary domains in the intact cell.
The marginal band of disc-shaped blood cells
Disc-shaped blood cells, including non-mammalian nucleated
erythrocytes and mammalian and non-mammalian platelets, contain
marginal bands at their equator (Fawcett and Witebsky, 1964; Behnke,
37
1970a). The number of microtubule profiles found in cross-sections of
marginal bands from erythrocytes of several species is highly conserved
within each species, but different among different species (Goniakowska-
Witalinska and Witalinski, 1976). The number of microtubules per band
correlates positively with the size of the cell.
Starting with the first descriptions of marginal bands in disc-
shaped blood cells, workers speculated how the disc-shape is maintained
and what role the marginal band plays in the maintenance of this shape.
This question can be addressed by observing the shape of blood cells
whose marginal bands are depolymerized by cold treatment (Behnke,
1970b). The results differ among different blood cells. Cold treatment for
one hour leads to disassembly of microtubules in platelets and
concomitant loss of disc-shape. The cells become spherical. Upon
rewarming, microtubules repolymerize. Many cells assume a lentiform
shape again, and in these cells microtubules reform a marginal band.
Some platelets, though, become spindle-shaped. In these cells,
microtubules are organized in arrays parallel to the long axis of the cell
rather than in a marginal band (Behnke, 1970b). The organization of
microtubules, therefore, correlates with the final shape of the cell.
The microtubules of frog erythrocytes are resistant to cold
depolymerization and the shape of the cell does not change. Chicken
erythrocytes lose their microtubules in the cold, but remain disc-shaped.
In mature chicken erythrocytes, therefore, microtubules are not
responsible for maintaining the lentiform shape of the cell. The
erythrocytes from dogfish behave identically to those of chicken, i.e. the
flattened elliptical shape is maintained in the absence of microtubules
(Cohen et al., 1982). Joseph-Silverstein and Cohen (1984) demonstrated
38
that the marginal band still fulfills a role in mature dogfish erythrocytes
since cells containing microtubules are better able to withstand
deformation caused by fluxing through a capillary tube than cells without
microtubules.
MAPs in marginal bands
In electron micrographs of marginal bands of some species (duck,
horse shoe crab, newt, dog fish, blood clams, toad) crossbridges which
seem to connect adjacent microtubules to each other can be seen (Behnke,
1970a; Nemhauser et al., 1980, 1983; Monaco et al., 1982; Cohen et al,
1982; Centonze and Sloboda, 1986). This suggests that at least in some
marginal bands there exist MAPs which mediate microtubule-microtubule
interactions. Three major approaches-- alone and in combination-- have
been used in attempts to identify MAPs in the marginal bands of various
cells. Several groups have used antibodies to the known neuronal MAPs
(MAP2 and tau) in order to identify crossreacting proteins (Sloboda and
Dickersin, 1980; Murphy and Wallis, 1983). Others have isolated
marginal bands and started an analysis of the polypeptides found in the
preparations (Cohen et al, 1982; Monaco et al., 1982; Sanchez et al.,
1990). A third approach is to look for proteins in nucleated erythrocytes
which bind to tubulin or microtubules (Centonze and Sloboda, 1986;
Stetzkowski-Marden et al., 1991; Feick et al., 1991).
In chicken erythrocytes, a 280 kd protein which shares an epitope
with MAP2 was identified and named syncolin (Feick et al., 1991).
Antibodies elicited to this protein do not recognize brain MAP2. These
antibodies stain the position of the marginal band. Purified syncolin co-
sediments with microtubules in vitro and induces their bundling, but does
39
not promote polymerization of microtubules. Syncolin might, therefore,
provide microtubule-microtubule links in the marginal band. This issue
needs to be studied more extensively since microtubule crosslinkers were
not observed in chicken erythrocyte marginal bands nor are they required
for marginal band reformation (Swan and Solomon, 1984; Swan, 1985; see
below). Proteins sharing epitopes with tau have also been identified in
chicken marginal bands (Murphy and Wallis, 1985; Sanchez et al., 1991).
Further experiments are needed to establish how closely these proteins
resemble brain tau proteins and what their function in the marginal band
is.
Stetzkowski-Marden et al. (1991) report that two proteins of
molecular weight 78 kd and 48 kd that are components of chicken
erythrocyte plasma membrane preparations bind tubulin in gel overlay
assays. Antibodies to both of these proteins bind the marginal band. In
addition, the staining of the marginal band with the anti-78kd antiserum
remains after cold depolymerization of microtubules. This result is
reminiscent of results obtained for the antigen identified by Birgbauer
and Solomon (1989; see below). It is clear that chicken erythrocytes
contain multiple proteins that interact with microtubules in vitro and
which might function to organize the marginal band.
Determinants of the chicken erythrocyte marginal band
As described above, about 10-14 microtubules are found in a tight
bundle encircling the cell's periphery at the equator. In order to
understand the organization of the marginal band microtubules, Miller
and Solomon (1984) analyzed the kinetics and intermediates of marginal
band re-formation after cold depolymerization of microtubules. They
40
found that microtubules repolymerized in a peripheral position and a
complete marginal band consisting of about 10 microtubule profiles
reformed. At early time points after rewarming, incomplete marginal
bands could be observed, consisting of one or two microtubules encircling
only a fraction of the perimeter. No multiple short microtubules were
observed. Rather a single microtubule completed the full perimeter before
multiple profiles could be observed. Microtubule assembly, therefore,
appears to initiate at a single site at the periphery and growth appears to
occur from one or two growing ends only. A specific structure associated
with the single initiating site could not be identified ultrastructurally. It
thus appears that assembly is controlled and guided by dispersed
elements localized at the periphery of the cell. Marginal band
microtubules of other species, on the other hand, can be nucleated from a
centrosome which also directs their regrowth after cold depolymerization
(Nemhauser et al., 1983).
Swan and Solomon (1984) found that detergent-extracted chicken
erythrocyte cytoskeletons devoid of microtubules still support faithful
regrowth of marginal band microtubules from exogenously added calf
brain tubulin. The information specifying where to assemble how many
microtubules is still present after detergent extraction and
depolymerization of microtubules. In addition, the erythrocyte specific 3-
tubulin is not necessary for the reformation of the marginal band. Swan
and Solomon concluded that there exist proteins that interact with
microtubules, but which are not solubilized when microtubules
disassemble. Furthermore, no MAPs which could provide microtubule-
microtubule linkages are detectable in the added brain tubulin. Thus,
microtubules can reform a marginal band solely by interactions with
41
insoluble components. These "insoluble" MAPs serve as determinants of
the marginal band microtubules. The direct identification of these
proteins, though, has proven difficult (Swan, 1985).
In an attempt to identify "insoluble MAPs" like the one predicted
from Swan and Solomon (1984), Eric Birgbauer carried out a monoclonal
antibody screen for marginal band components. As an antigen, he used
MAPs isolated from chicken brain. He identified one monoclonal
antibody, called 13H9, which stained the position of the marginal band
(Birgbauer and Solomon, 1989). This antigen was also present in the
position of the marginal band after cold depolymerization of microtubules.
It thus has some of the properties expected for the determinant of the
marginal band. A substantial part of this dissertation is concerned with
the characterization and identification of the 13H9 antigen in chicken
erythrocytes (Chapters 3 and 4).
Formation of the marginal band during development and
establishment of the flattened elliptical cell shape
Mature erythrocytes develop from erythropoietic precursors which
are mitotic and spherical. Flattening to a disk-shaped occurs after the
final mitosis. In vertebrates, there are two series of erythropoiesis. The
primitive series constitutes the first transient population of erythropoietic
cells of the developing embryo. These cells are formed in the blood islands
of early embryos, released into the circulation between day one and two of
development, and develop synchronously in suspension (Small and
Davies, 1972). Fairly synchronous populations of erythropoietic
precursors can, therefore, be isolated from the circulation of early chicken
embryos. The second, definitive series of erythropoietic cells constitutes
42
the permanent erythroid population and persists into adulthood. In
chicken, the first definitive cells start to appear in the circulation around
day 5 of development. The definitive series maintains a stem cell
population which resides initially in the fetal liver and later in the bone
marrow. As a consequence, only mature erythrocytes are in circulation at
later stages of development and in adults. Cells obtained from the bone
marrow are always mixed populations at various stages of erythropoietic
maturation.
Barrett and Dawson (1974) provided one of the first reports about
microtubule organization and shape of immature erythropoietic cells of
the chick. They found that bone marrow cells from chicks consist of a
mixture of spherical, flat, and flat elliptical cells. The flat cells become
spherical in the cold. Upon rewarming, they resume a disk-shape.
Microtubules, therefore, seem to be responsible for establishing and
maintaining the disk-shape of immature cells. In flat elliptical cells in
adults and chicks, on the other hand, other components of the
cytoskeleton appear sufficient for maintaining the shape in the absence of
microtubules. Barrett and Dawson (1974) also reported that immature
cells contain more microtubule profiles per marginal band than mature
cells. In addition, microtubules in immature cells depolymerize faster in
the cold than do microtubules of mature cells. This indicates that the
microtubules of immature and mature cells might differ in some of their
properties.
Kim et al. (1987) analyzed the marginal band of primitive chicken
red blood cells obtained from the circulation of embryos between day 2
and day 5 of development. Microtubules in the earliest cells are found in
diffuse cytoplasmic arrays. Occasionally, centrioles can be detected in
43
these early cells. Later, several bundles of microtubules are found near
the plasma membrane. By day 4 of development, almost all microtubules
are found in a single peripheral bundle. The occurrence of this single
bundle of microtubules coincides with the flattening of the cell to a disk-
shape. A similar sequence of events was described for immature
definitive cells obtained from bone marrow (Murphy et al., 1986).
According to Kim et al. (1987), the properties of microtubules change
during the development of the red blood cell: microtubules of immature
cells share many properties with microtubules of cultured cells, while
microtubules of mature cells have different properties. For instance,
microtubules of immature cells are susceptible to nocodazole-induced
depolymerization while microtubules of mature cells are not; regrowth of
marginal bands after microtubule depolymerization is faithful in adult
cells (see Miller and Solomon, 1984) while in immature cells it is not.
These results suggested that lateral interactions become increasingly
important during the maturation of the marginal band. The question of
how the position of the marginal band becomes specified during
development is the subject of Chapter 2 of this dissertation.
44
The ERM-proteins: ezrin, radixin, and moesin
As mentioned briefly above, Birgbauer and Solomon (1989)
identified a monoclonal antibody, 13H9, which binds to the position of the
marginal band even in the absence of microtubules. They reported that
13H9 bound to a protein called ezrin which had been previously identified
by Bretscher (1983). This section summarizes some of what is known
about ezrin and about two highly related proteins, radixin and moesin.
Ezrin was purified from intestinal brush border microvilli and
represented a minor stoichiometric component (Bretscher, 1983). Ezrin is
detected in other cell types besides intestinal brush border using
antibodies raised to purified chicken intestinal ezrin, where it is
concentrated in particular in actin-rich surface structures. Gould et al.
(1989) and Turunen et al. (1989) cloned ezrin from human cells. The
predicted molecular weight of ezrin is only 69 kd, even though ezrin
shows migration around 80 kd on SDS-PAGE. This anomalous migration
is unlikely to be due to posttranslational modifications, since in vitro
translated ezrin using the ezrin clone migrates at 80 kd as well (Gould et
al., 1989). Sequence analysis shows that ezrin is very hydrophilic (38.5%
charged amino acids; pI 6.15) and predicts that the carboxy terminal
region, amino acids 300-366, forms an alpha helix.
The sequence of ezrin contains a region of homology with band 4.1:
there is a 34% amino acid identity between the amino terminal 260 amino
acids of ezrin with the amino terminal 240 amino acids of band 4.1. In
addition, this region of ezrin shows 23% amino acid identity to the amino
terminal domain of talin (Rees et al., 1990). The region of band 4.1 which
shows homology to ezrin and talin has been implicated in the
45
polyphosphoinositide sensitive binding of band 4.1 to glycophorin in vitro
(Leto et al., 1986, although the actual data are not presented; Anderson
and Marchesi, 1985).
Two cDNAs highly related to ezrin were identified at the end of
1991 (Lankes and Furthmayr, 1991; Funayama et al., 1991). Both moesin
(Lankes and Furthmayr, 1991) and radixin (Funayama et al., 1991) are
about 72% identical on the amino acid level to ezrin over their entire
lengths (see Figure 1-1). The amino terminal halves show more than 80%
identity. Figure 1-1, in addition, shows the domain structure of several
other proteins which share homology with the membrane-binding domain
of band 4.1. Based on this sequence homology and immunolocalization
studies, members of this family are thought to play a role as membrane-
cytoskeleton linkers.
The moesin cDNA (Lankes and Furthmayr, 1991) was obtained
from an expression library using a monoclonal antibody which had been
raised against a putative heparin receptor from endothelial cells (Lankes
et al., 1988). Since the amino acid composition of the isolated heparin-
binding protein does not match the predicted amino acid sequence of the
moesin clone, moesin and the heparin-binding protein most likely share
only the epitope of the antibody used for the library screening.
Radixin was isolated as a component of liver adherens junctions
(Tsukita et al., 1989) and antibodies raised to the purified protein stain
adherens junctions in frozen sections from a variety of tissues. These
same antibodies also decorate the cleavage furrows of cultured cells (Sato
et al., 1991). Tsukita et al. (1989) isolated liver adherens junctions and
prepared low salt extracts from them. These low salt extracts contained
10 polypeptides, among them known adherens junction proteins such as
46
Figure 1-1. Domain comparison of members of the band 4.1 superfamily.
Domains of homology are separated into boxes. The numbers refer to the
amino acid residue of the predicted protein sequence. Percentages
indicate extent of identity between dashed lines.
47
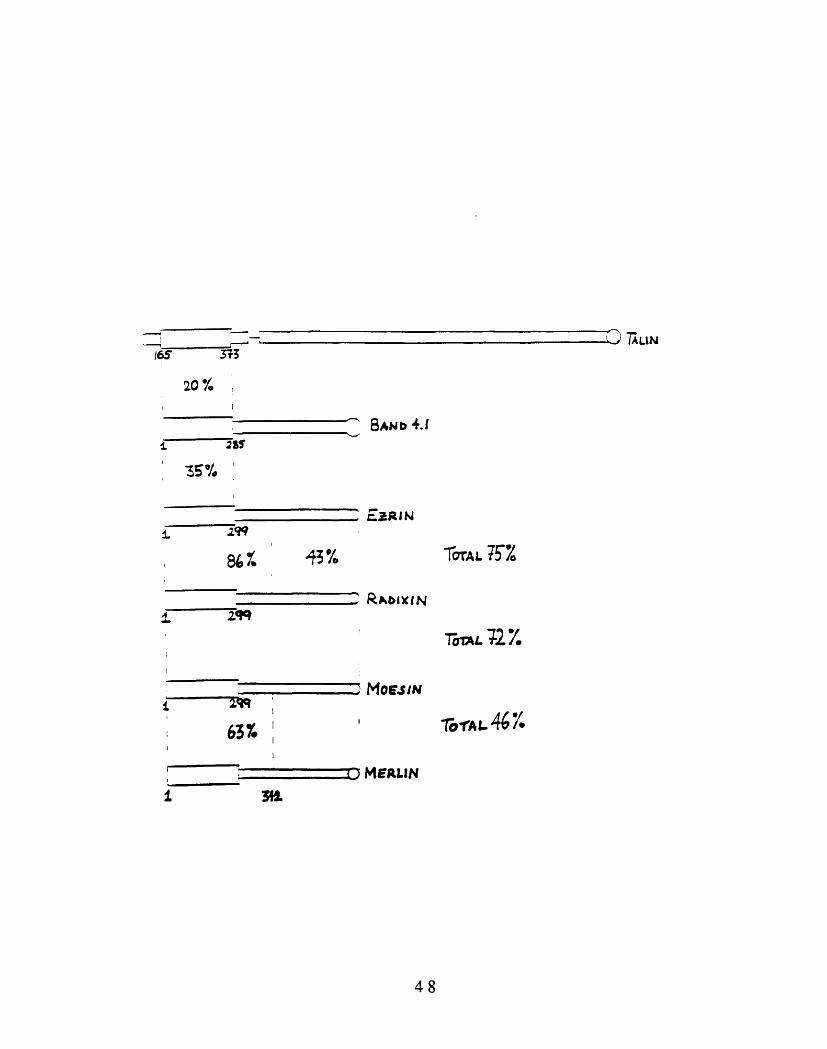
) TALIN_-
165 3f3
20 o
BAND 4.1
°s/o
L 2Sq
43%. TOTAL 75%
Z iLbfIXII
± 2qq
ouL 2%.
n, MO$EIN
63.! 63
( J MERLIN1 31L
48
_ _
- >
.
i
__, 5
I
v , . _- **
-rep-AL 46 y
s -W ....v _
actin, vinculin, and a-actinin. When these extracts were further
fractionated over DNAseI-actin columns, a protein of 82 kd bound and
could be eluted with high KC1 buffers. This protein, named radixin,
showed barbed end capping activity in vitro. As far as I can conclude
from the somewhat vague Materials and Methods sections of these papers,
the antibody (with the above described staining patterns) was raised to
the 82 kd band cut from gels after running the low salt extract on SDS-
PAGE rather than from radixin further fractionated on DNAse-actin
columns. It is, therefore, possible that radixin does not have the barbed
end capping activity ascribed to it, but rather it is due to a co-migrating
protein.
As can be expected from the high degree of sequence conservation
among the ERM-proteins (ezrin, radixin, moesin), most antibodies raised
to individual proteins cross-react extensively (Bretscher, 1989; Lankes
and Furthmayr, 1991; Sato et al., 1992). The identity of numerous
proteins which were identified as ezrin-related based on antibody
reactivity needs to be established (Birgbauer and Solomon, 1989; Goslin
et al., 1989; Everett and Nichol, 1990; Hanzel et al., 1991). Bretscher and
co-workers obtained antibodies specific to either moesin or ezrin by cross-
absorption. Immunostaining using these reagents shows that ezrin and
moesin co-localize to a considerable extent in certain cultured cells, for
instance in the microvilli of A431 cells (Franck et al., 1993), while in
tissue sections, moesin and ezrin show little overlap (Berryman et al.,
1993). Rather, as a first approximation ezrin is found highly expressed in
epithelial cells while moesin shows high expression in endothelial cells.
Staining with specific anti-radixin antibodies has not been published.
49
Chapters 3 and 4 of this dissertation characterize the ERM-proteins in the
chicken erythrocyte.
Many of the ERM proteins are phosphoproteins. Hunter and co-
workers identified a tyrosine kinase substrate (p81) by analyzing proteins
which become tyrosine phosphorylated upon EGF stimulation of A431
cells (Hunter and Cooper, 1981). This p81 phosphoprotein shows
crossreactivity with Bretscher's anti-ezrin antibodies (Gould et al., 1986).
EGF-stimulated A431 cells start to develop microvilli in 30 seconds and
vigorous membrane ruffles in 2-5 min of EGF application and eventually
round up for cell division. Ezrin is redistributed to microvilli and
membrane ruffles after EGF stimulation with a similar time course to
that of phosphate incorporation (Bretscher, 1989). The phosphorylated
ezrin ( 10% of total ezrin) does not show differences in cytoskeletal
association by fractionation from unphosphorylated ezrin (50% is
cytoskeleton associated). The functional importance of this
phosphorylation event, therefore, remains unknown. Using specific cross-
absorbed antibody reagents, Franck et al. (1993) showed that it is in fact
ezrin which becomes phosphorylated in A431 cells, while moesin does not
incorporate phosphate label. Krieg and Hunter (1992) mapped the
tyrosine phosphorylation sites on ezrin in A431 cells to tyr145 and tyr353.
Tyr 145 is conserved in moesin and radixin as well.
Other examples in which ezrin-like proteins are phosphorylated
include the 80K phosphoprotein of cAMP-stimulated parietal cells
(Hanzel et al., 1989), an 80 kd protein in RSV-transformed cells (Linder
and Burr, 1988), and an 81 kd phosphoprotein in T cells (Egerton et al.,
1992). Fazioli et al. (1993) identified ERM proteins as phosphoproteins by
screening an expression library with polyclonal antibodies which were
50
raised to NIH3T3-proteins bound to an anti-phosphotyrosine affinity
column. Ezrin was phosphorylated in 3T3 cells by EGF and PDGF
stimulation, while radixin was only phosphorylated by PDGF stimulation
and moesin by neither. In addition, they found that ezrin is expressed at
very high levels and extracellularly in a chemically induced mouse
sarcoma. These findings raise the possibility that the activity of the ERM
proteins are regulated by phosphorylation.
Two groups have identified a candidate tumor suppressor gene for
neurofibromatosis 2 which is related (45% identity) to the ERM-proteins
(Trofatter et al., 1993; Rouleau et al., 1993), called merlin/schwannomin.
Neurofibromatosis 2 patients suffer from multiple nervous system tumors,
such as schwannomas and meningiomas. Since tumor cells frequently
show abnormal cytoskeletal arrangements and proteins such as talin and
vinculin have been implicated in some cancer phenotypes (Pasquale et al.,
1986; Schaller et al., 1992; Rodriguez Fernmndez et al., 1993), it is
intriguing to consider the mechanisms which might link a cytoskeletal
protein to cancer.
51
Chapter 2
Cytochalasin D Induces Asymmetry in EmbryonicChicken Erythroblasts: Microtubules as a Driving Force
for Morphological Change
52
Introduction
The expression of a characteristic asymmetric morphology is one of
the hallmarks of a differentiated cell. An issue of fundamental
importance is understanding how these detailed asymmetries of
differentiated cells are arrived at during development. The mechanics of
morphological differentiation clearly depend upon the cytoskeleton.
Morphological correlations and drug interference experiments strongly
implicate a role for both microtubules and microfilaments (Porter, 1966;
Goldman and Knipe, 1973).
More problematic is identifying the information which specifies a
particular cell shape. In several systems, the ability of specific
extracellular factors - either diffusible or substrate-attached - to influence
cell shape has been rigorously demonstrated (Weiss, 1958; Lander 1989).
But it is also clear that some of the information specifying cell shape must
come from within the cell: to distinguish the generic morphologies of one
cell type from another, and to specify some of the unique properties of
individual cells (Ramon y Cajal, in Jacobson, 1978; Albrecht-Buehler,
1977; Solomon, 1979,1981). In every case, there must exist cellular
mechanisms for transducing information - intracellular or extracellular -
into cytoskeletal function.
We are studying the origins of cellular asymmetry in the chicken
red blood cell. The asymmetry displayed by these cells is subtle
compared, for example, to that expressed by neurons extending processes:
during differentiation, the spherical precursor becomes a lentiform cell
organized relative to the marginal band, a bundle of microtubules circling
the cell's periphery in one plane. Nevertheless, this unambiguous
53
morphological differentiation provides many properties of a good model
system. The developing cells are available in large and roughly
synchronous populations. At maturity, all cells display the same
morphology in striking detail. Most importantly, though, this
differentiation occurs largely in suspension, in unattached cells which are
free to tumble (Small and Davies, 1972) and so are isolated from
gradients or extracellular contacts.
The properties of this system allow one to ask which intracellular
elements specify the position of the marginal band, and so contribute to
the morphogenesis of the red blood cell. Here we show that cytochalasin
D induces developing red blood cells to express highly asymmetric
morphologies, including elongated cell bodies and long processes. The
results suggest that the driving force for these shape changes comes from
microtubules and is normally counteracted by F-actin structures in the
cell. The capacity to change shape is lost as the cells mature. These
results support and extend models for marginal band formation and
morphological differentiation of red blood cells that depend upon the
properties of microtubules (Birgbauer and Solomon, 1989) and may apply
to other situations where cells or parts of cells change shape by extension
rather than by contraction.
54
Materials and Methods
Materials
Fertilized eggs were purchased from SPAFAS (Norwich, CT) and
incubated from 2 to 7 days in an Humidaire egg incubator (model 80; The
Humidaire Incubator Co., New Madison, OH). Cytochalasin D (CCD),
nocodazole and taxol were kept frozen is stock solutions in DMSO. They
were added to cells as 1000-fold dilutions of these stocks. This
concentration of DMSO was routinely included in the control preparations
and had no effect on cell morphology. Cytochalasin D and nocodazole
were purchased from Aldrich Chemical Co., Inc. (Milwaukee, WI). Taxol
was kindly provided by Dr. M. Suffness, Bethesda, MD.
Preparation of cells
The preparation of embryonic red blood cells was as described
earlier (Kim et al., 1987). After the isolation, cells were washed twice in
PBS (171 mM NaCl, 3.35 mM KC1, 10.1 mM Na2 HP0 4, 1.84 mM
KH2PO4, pH 7.2) plus 0.025 M glucose (PBS/glucose) at 380C, by
centrifugations of 4 minutes at 500 rpm in an IEC model HN-S centrifuge.
Dissected cells were sometimes fixed before the centrifugations (referred
to as "freshly dissected" in the Results) or right after the second
centrifugation. Cells were then incubated at 380C for 30 to 60 minutes in
PBS/glucose with either a) 0.1% DMSO for control cells, b) 0.1 ,ug/ml CCD,
c) 1 ug/ml nocodazole, or d) 5 ,ug/ml taxol. Cells were then plated on glass
coverslips for 5 minutes and subsequently fixed for 30 minutes in 3.7%
formaldehyde/PBS. Coverslips were mounted in 90% glycerol/PBS and
viewed in a Zeiss Universal microscope under phase optics. When cells
55
were fixed in suspension instead, formaldehyde was added from a 37%
stock to give a final concentration of 3.7%. These cells were mounted in
cell chambers (Solomon, 1980) for viewing.
Inhibition and reversal experiments
For the inhibition experiments, cells were prepared as described
above and incubated for 30 minutes in either 1 gg/ml nocodazole or 5
plg/ml taxol; subsequently CCD was added to a final concentration of 0.1
pg/ml for another 30 minutes, and the cells processed further. For the
reversal experiments, cells were incubated for 30 minutes in 0.1 pg/ml
CCD, pelleted at 500 rpm for four minutes in an IEC model HN-S
centrifuge and resuspended in medium containing either 0.1% DMSO or 1
pg/ml nocodazole for 30 minutes.
Time course studies
Cells which had been washed twice were mounted in live-cell
chambers in PBS/glucose medium for photography and videotaping. The
medium was then exchanged with PBS/glucose containing 0.1 pg/ml CCD.
The field was either filmed for 60 minutes or photographed at intervals.
During the entire course of the experiment, the microscope stage was kept
at 380C using an air curtain incubator (Sage Instruments, Model 279).
Preparation of cells for immunofluorescence
Cells were plated on coverslips for five minutes, extracted for ten
seconds in 0.01% NP-40 in 0.1 M Pipes, 2 mM EGTA, 1 mM magnesium
sulfate, 2 M glycerol, pH 6.9 (PM2G) and 5 pg/ml taxol, fixed for 30
minutes in 3.7% formaldehyde/PM2G and permeabilized for 15 minutes in
56
0.1% NP-40/PBS. Immunofluorescence staining of coverslips was as
previously described (Kim et al., 1987). FITC-conjugated goat anti-rabbit
Ig was obtained from Organon Teknika-Cappel (Malvern, PA).
Rhodamine-labeled phalloidin was obtained from Molecular Probes Inc.
(Junction City, OR). Coverslips were mounted in gelvatol mounting
medium containing 15 mg/ml 1,4-diazobicyclo[2.2.2]octane (Johnson et al.,
1982), obtained from Aldrich Chemical Co. (Milwaukee, WI).
Photography was performed on a Zeiss Axioplan microscope using a 100x
lens (1.3 NA) with Kodak Tri-X film.
Preparation of cells for electron microscopy
For electron microscopy, cells were washed twice as described
above, incubated in medium containing 0.1 gg/ml CCD for 60 minutes and
allowed to attach to tissue culture dishes for ten minutes. They were
fixed in 2% glutaraldehyde and 0.2% tannic acid for 45 minutes, and then
postfixed in 1% OSO4. After washing and dehydration, the cells were
imbedded in Epon. Thin sections (700 A) were viewed on a Philips 201
electron microscope. The electron microscopy was done in collaboration
with P. Riley (M.I.T.).
Detergent-extraction for Western blots
To quantify assembled and unassembled tubulin pools, cells were
extracted in NP-40 under microtubule-stabilizing conditions as previously
described (Solomon, 1979; Swan and Solomon, 1984) and the remaining
pellet dissolved in 8M urea. Aliquots representing equivalent proportions
of the two fractions were separated on 7.5% SDS-PAGE gels, blotted onto
57
nitrocellulose paper and probed with anti-tubulin antiserum 429 and 125I-
protein A.
Results
Morphological differentiation of chicken erythroblasts and
formation of the marginal band
The experiments presented in this chapter address mechanisms for
the morphological differentiation of chicken red blood cells. The events
along this morphogenetic pathway in embryonic cells have been
characterized in considerable detail (Small, 1969; Small and Davies, 1972;
Bruns and Ingram, 1973; Kim et al., 1987). To summarize, the first
hemopoietic cells of the chick embryo, the primitive series, develop in the
yolk sac as aggregates of cells attached to the vessel walls (called blood
islands). During the second day of development, they are released into
the circulation as free cells. These cells develop roughly synchronously
and can be obtained as fairly homogeneous populations between days two
and six of development. The earliest embryonic red blood cells obtainable,
from day 2 embryos, are essentially spherical, typical for cells in
suspension. In some cells among these earliest populations individual
microtubules appear to radiate from a microtubule organizing center
throughout the cell. However, beginning already on day 2 of
development, bundles of microtubules appear in the cytoplasm. These
bundles contain between two and twenty microtubules and traverse the
cytoplasm in several planes. By day 4 of development, the microtubules
in most of the red blood cells are confined to one circumferential and
58
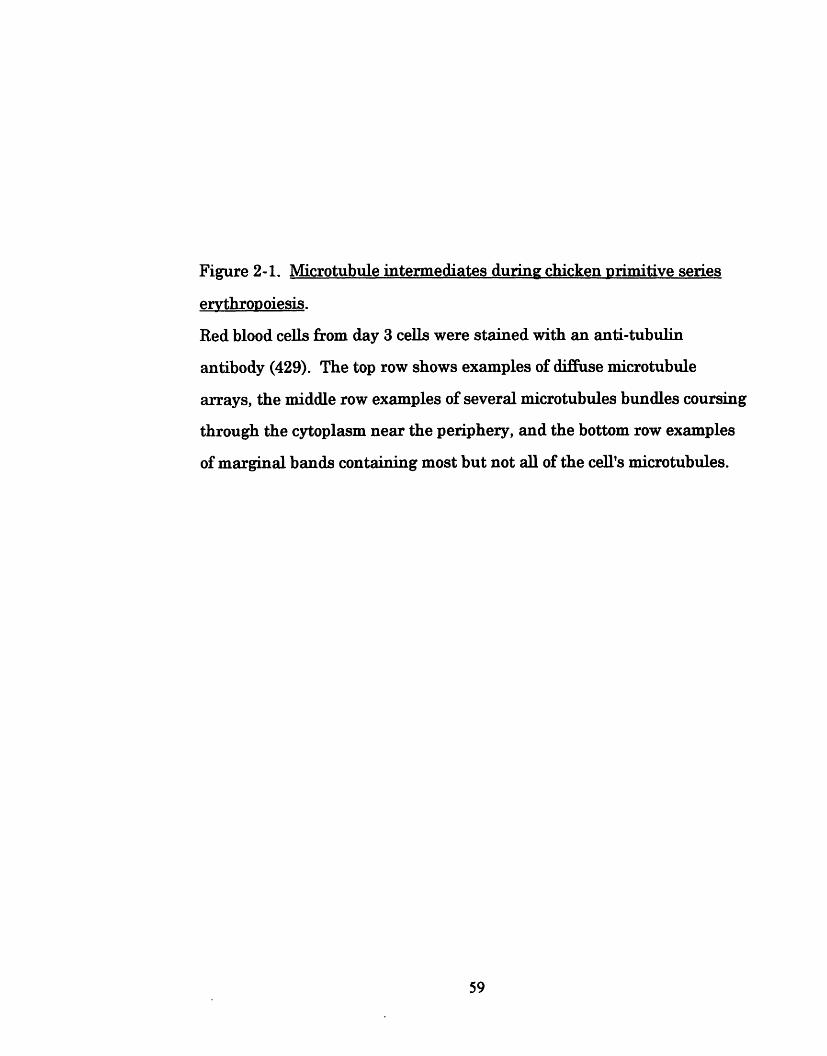
Figure 2-1. Microtubule intermediates during chicken primitive series
erythropoiesis.
Red blood cells from day 3 cells were stained with an anti-tubulin
antibody (429). The top row shows examples of diffuse microtubule
arrays, the middle row examples of several microtubules bundles coursing
through the cytoplasm near the periphery, and the bottom row examples
of marginal bands containing most but not all of the cell's microtubules.
59
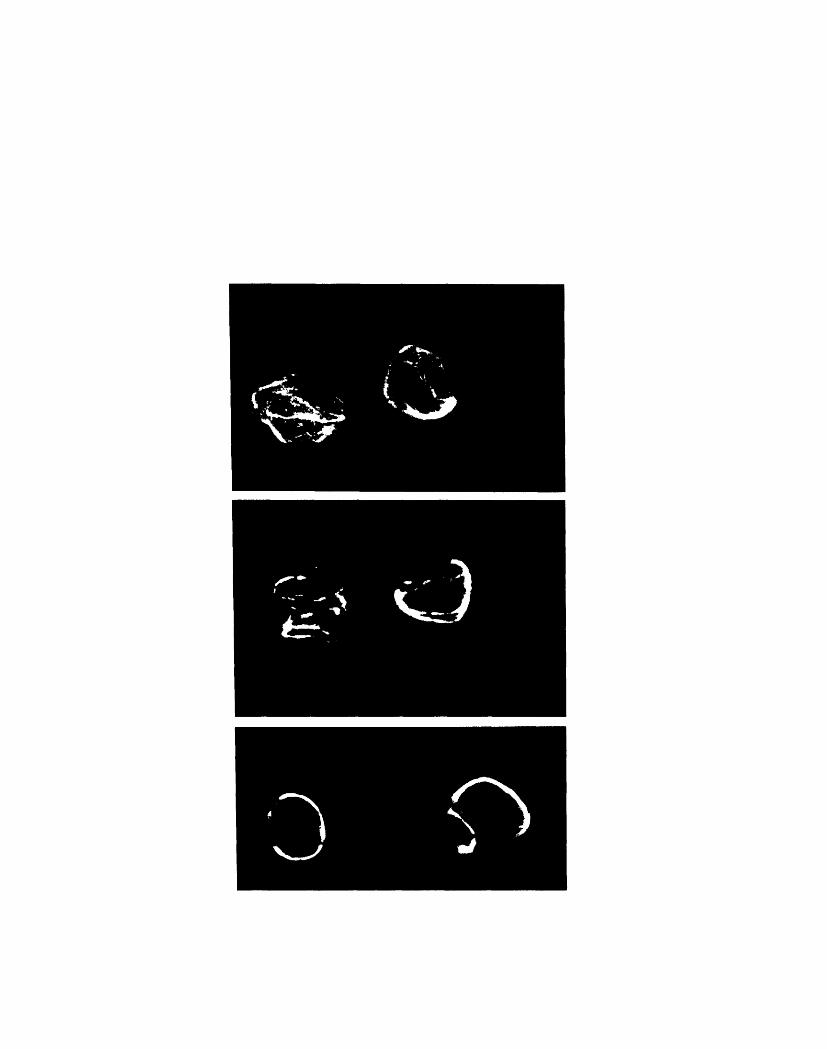
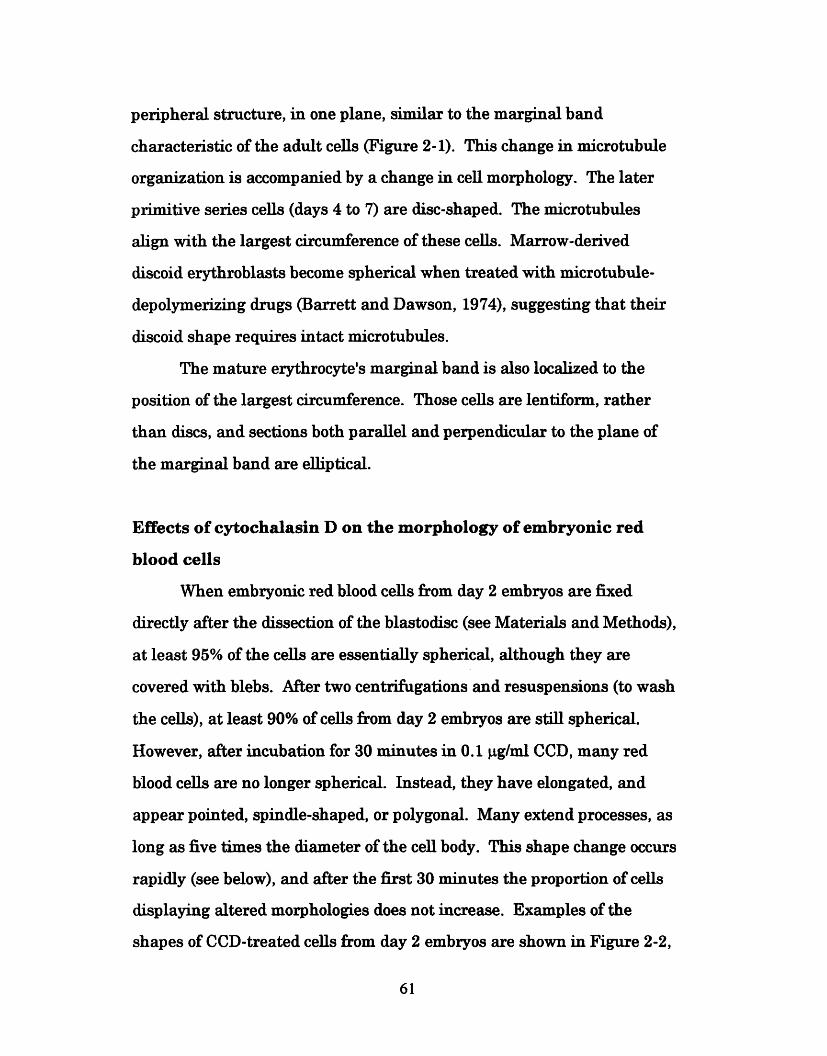
peripheral structure, in one plane, similar to the marginal band
characteristic of the adult cells (Figure 2-1). This change in microtubule
organization is accompanied by a change in cell morphology. The later
primitive series cells (days 4 to 7) are disc-shaped. The microtubules
align with the largest circumference of these cells. Marrow-derived
discoid erythroblasts become spherical when treated with microtubule-
depolymerizing drugs (Barrett and Dawson, 1974), suggesting that their
discoid shape requires intact microtubules.
The mature erythrocyte's marginal band is also localized to the
position of the largest circumference. Those cells are lentiform, rather
than discs, and sections both parallel and perpendicular to the plane of
the marginal band are elliptical.
Effects of cytochalasin D on the morphology of embryonic red
blood cells
When embryonic red blood cells from day 2 embryos are fixed
directly after the dissection of the blastodisc (see Materials and Methods),
at least 95% of the cells are essentially spherical, although they are
covered with blebs. After two centrifugations and resuspensions (to wash
the cells), at least 90% of cells from day 2 embryos are still spherical.
However, after incubation for 30 minutes in 0.1 ,ug/ml CCD, many red
blood cells are no longer spherical. Instead, they have elongated, and
appear pointed, spindle-shaped, or polygonal. Many extend processes, as
long as five times the diameter of the cell body. This shape change occurs
rapidly (see below), and after the first 30 minutes the proportion of cells
displaying altered morphologies does not increase. Examples of the
shapes of CCD-treated cells from day 2 embryos are shown in Figure 2-2,
61
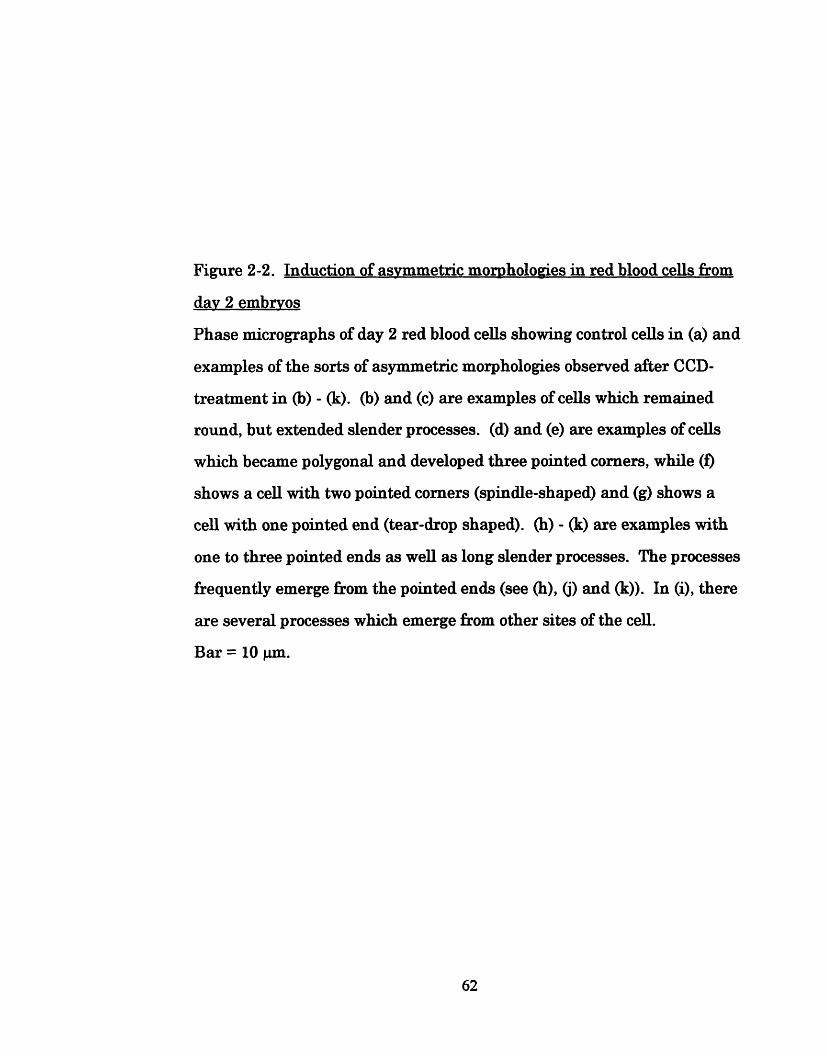
Figure 2-2. Induction of asymmetric morphologies in red blood cells from
day 2 embryos
Phase micrographs of day 2 red blood cells showing control cells in (a) and
examples of the sorts of asymmetric morphologies observed after CCD-
treatment in (b) - (k). (b) and (c) are examples of cells which remained
round, but extended slender processes. (d) and (e) are examples of cells
which became polygonal and developed three pointed corners, while (f)
shows a cell with two pointed corners (spindle-shaped) and (g) shows a
cell with one pointed end (tear-drop shaped). (h) - (k) are examples with
one to three pointed ends as well as long slender processes. The processes
frequently emerge from the pointed ends (see (h), (j) and (k)). In (i), there
are several processes which emerge from other sites of the cell.
Bar = 10 m.
62
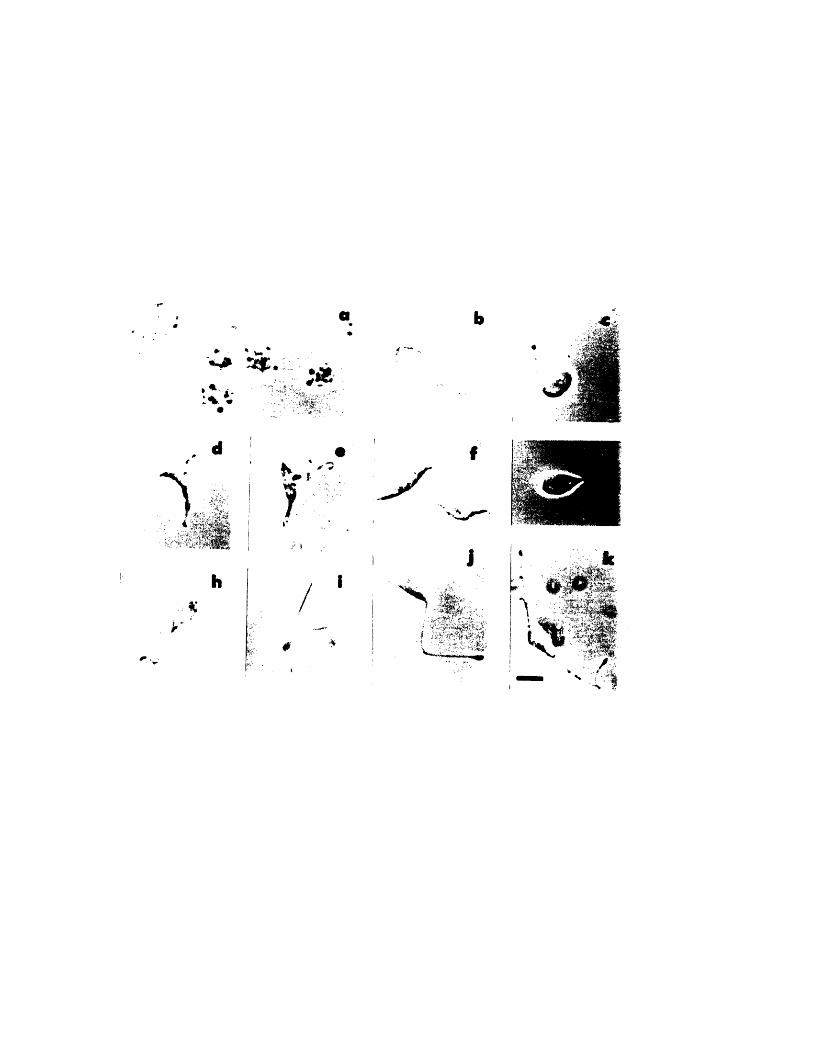
ae
:4 S * 1 *0 t;
.4.. ...~
, d
An
fIZ . .
. ,-W ..
/
I
Ak
b-.- 4
h
..
I
i,. 4
'i.,:-.
f , ~ :ll~
14i
I.
b-k. We identify a wide variety of morphologies in these cells which can
be grouped into three classes: 1. Cells remain round, but develop long
processes (Figure 2-2 b,c). 2. Cells elongate and develop one or more
pointed ends (Figure 2-2 d-g). 3. Cells elongate and develop pointed ends
as well as processes (Figure 2-2 h-k). In some experiments, as many as
80% of the cells change shape as a response to CCD. In contrast, parallel
incubations in the same buffer have no effect on the shapes of washed day
2 red blood cells, either in the presence or absence of DMSO, the solvent
for CCD (Figure 2-2a and Figure 2-3 "mech").
It seems likely that all of the classes of morphological changes are
the consequences of the same mechanism, since they behave alike in a
variety of circumstances (see below). Therefore, to quantify shape change
among embryonic red blood cells, we counted all of the altered
morphologies as equivalent. Average values from multiple experiments
are presented in Figure 2-3.
The ability of red blood cells to change shape depends upon their
developmental stage
The proportion of cells changing shape in response to CCD declines
after day 3, from about 50% of the cells to about 15% on day 6 and less
than .5% on day 7 (Figure 2-3). The response to the washing procedure
also varies with time. The frequency of cells that change shape in these
"control" populations increases from about 5% on day 2 to about 20% on
day 5; freshly dissected cells from each stage, fixed immediately, do not
show shape changes. At subsequent stages, both control and CCD-
induced values decline, and become essentially zero at day 7 (Figure 2-3).
Micrographs of washed cells, from day 3 through day 6 embryos, are
64
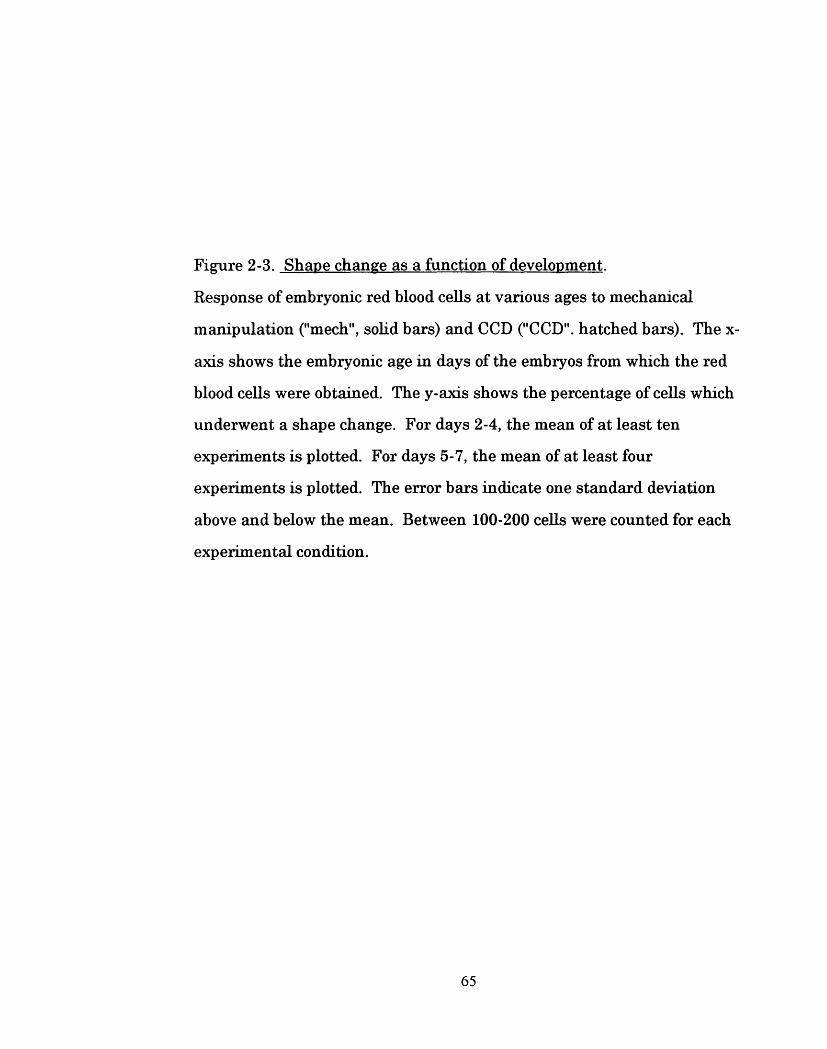
Figure 2-3. Shape change as a function of development.
Response of embryonic red blood cells at various ages to mechanical
manipulation ("mech", solid bars) and CCD ("CCD". hatched bars). The x-
axis shows the embryonic age in days of the embryos from which the red
blood cells were obtained. The y-axis shows the percentage of cells which
underwent a shape change. For days 2-4, the mean of at least ten
experiments is plotted. For days 5-7, the mean of at least four
experiments is plotted. The error bars indicate one standard deviation
above and below the mean. Between 100-200 cells were counted for each
experimental condition.
65
T T
* mechE CCD
T
T T
TT
2 3 4 5 6 7
day of development
66
70-
60
50-
40-
30-
20-
o
Cn
U
. _
cE
u,
10-
I
shown in Figure 2-4. Each of the three classes of shape change observed
in CCD-treated cells are found in these preparations.
The expression of asymmetric morphology is not anchorage
dependent
Many morphological changes require that cells interact with solid
substrata. That is not the case, however, for the morphological changes
displayed by embryonic red blood cells, either during the isolation
procedure or in response to CCD. For example, when cells are incubated
in CCD in suspension for 30 minutes and then fixed without being
allowed to attach to solid substrata, the percentage of cells undergoing all
types of shape changes is the same as that obtained with cells from the
same suspensions but which were plated before fixation.
The time course of CCD-induced shape changes
To study the time course of the CCD-induced shape changes, we
mounted freshly-dissected day 2 red blood cells in live-cell chambers.
After identifying and recording cells in their initial state, medium
containing CCD was perfused into the chambers and the shapes of
individual cells recorded by photography or video. The response to CCD is
rapid: the first cells start to change shape less than two minutes after
exposure to CCD. They also rapidly lose the blebs from their surface.
When cells both elongate their cell bodies and extend processes, the
elongation precedes the formation of the process.
The rate of process growth can be as fast as 10 Pum/min, as assessed
from continuous video tape records. As a comparison, the rate of neurite
extension varies between 0.07 to 0.4 gum/min (Sargent, 1989). The
67
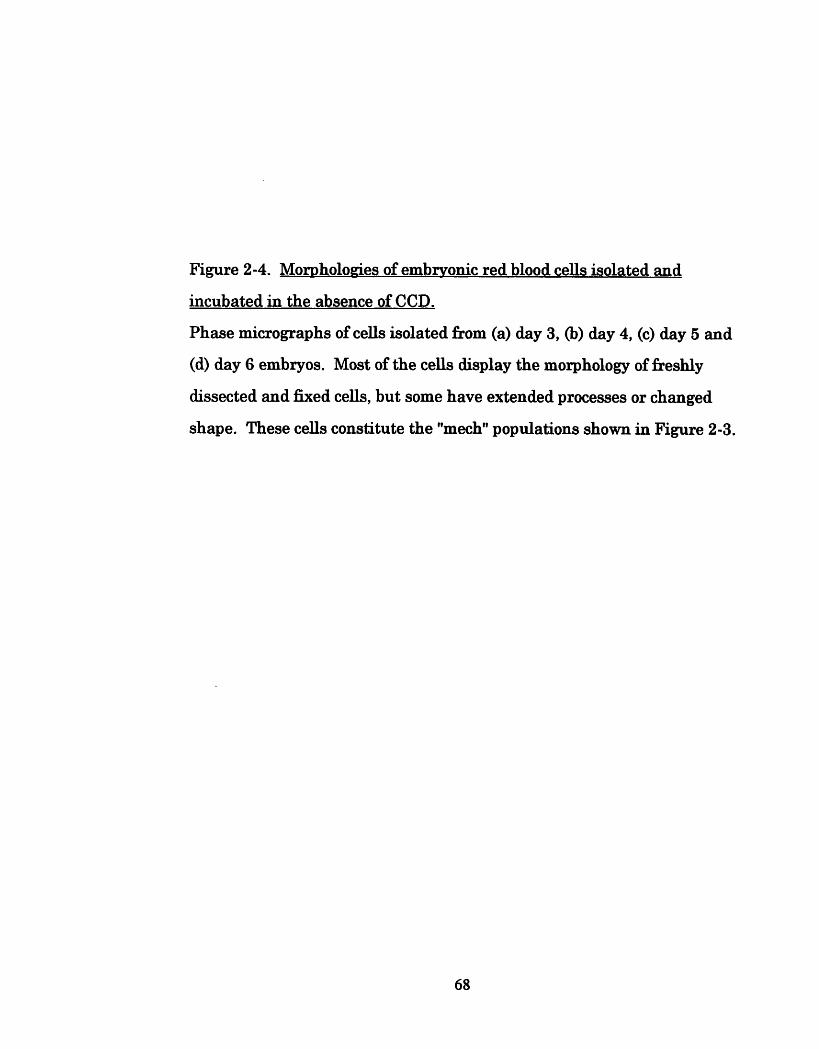
Figure 2-4. Morphologies of embryonic red blood cells isolated and
incubated in the absence of CCD.
Phase micrographs of cells isolated from (a) day 3, (b) day 4, (c) day 5 and
(d) day 6 embryos. Most of the cells display the morphology of freshly
dissected and fixed cells, but some have extended processes or changed
shape. These cells constitute the "mech" populations shown in Figure 2-3.
68
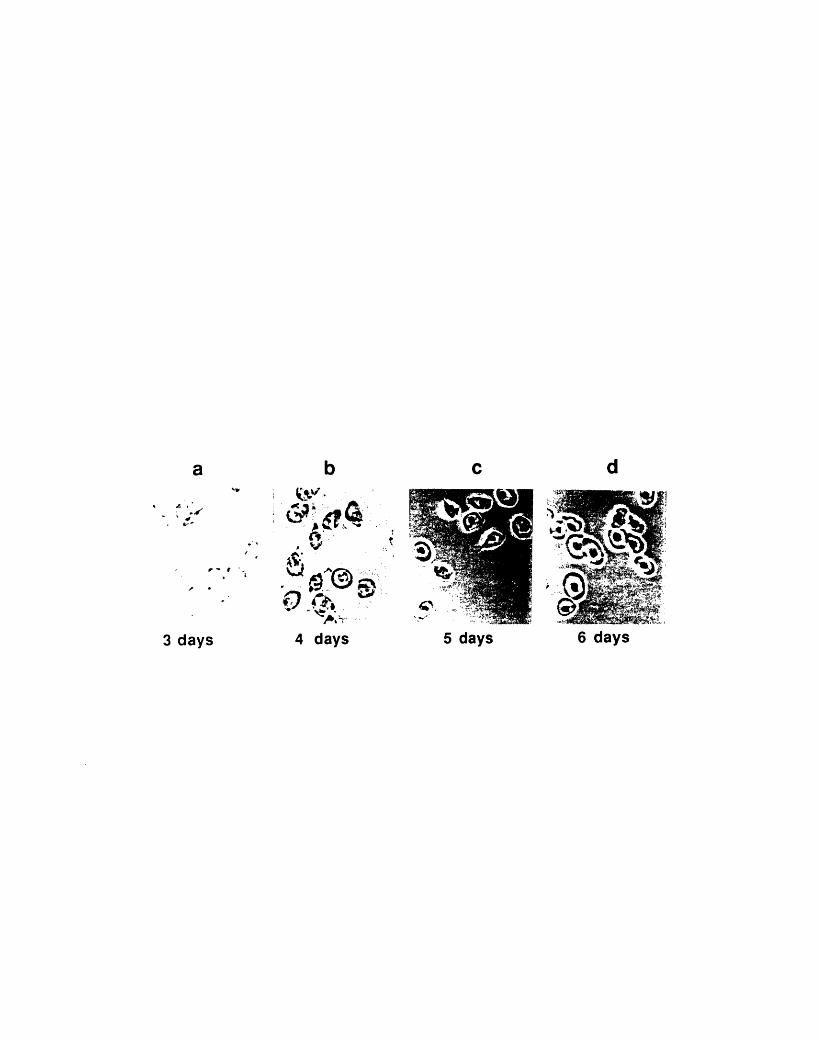
C d
5 days 6 days
a b
t
v i .. .
I It
d~~~~~~~~~i.
3 days
Awu ^ F":I
, 9;,- 0- .4 r . ...4 days
,,:
processes themselves are dynamic, and can switch between growing and
shrinking. These changes in length are not the result of processes leaving
and re-entering the focal plane, which would have been detected by
continuous refocusing during the observations. One or more processes
can retract at the same time other processes appear at other sites on the
cell. Figure 2-5 shows phase micrographs of cells which display examples
of this dynamic behavior. The growing and shrinking processes indicated
by the arrows are described in detail in the legend. In contrast, we do not
observe continual variation in the shapes of the cell bodies once they
elongate.
Red blood cell processes contain microtubules but probably do
not contain F-actin
Figures 2-6 and 2-7 show micrographs of untreated and CCD-
treated day 2 red blood cells, respectively. The same cells are visualized
by phase microscopy (Figures 2-6a, 2-7a), fluorescence using rhodamine-
coupled phalloidin (Figure 2-6b, 2-7b), and anti-tubulin antibody followed
by FITC-labeled second antibody (Figures 2-6c, 2-7c,d). Representative
individual cells are shown, since the platings are too sparse to obtain
representative images in a single microscope field. The cells were chosen
to represent the classes of shape changes described above.
As reported previously (Kim et al., 1987), F-actin as visualized by
phalloidin in day 2 cells shows primarily uniform and diffuse staining,
largely at the cortex (Figure 2-6b). In CCD-treated cells, the pattern of F-
actin staining is markedly changed. It occurs in very bright patches
throughout the cell body, with apparently reduced cortical staining
(Figure 2-7b). Only rare processes stain with phalloidin, and those
70
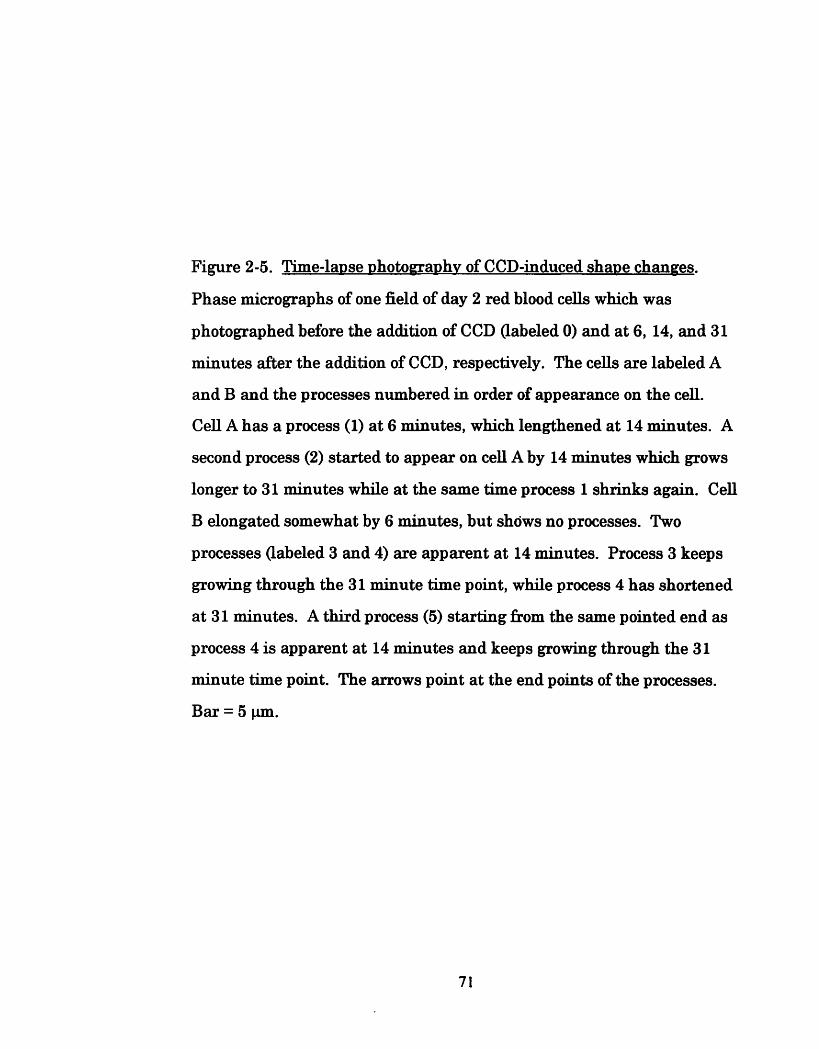
Figure 2-5. Time-lapse photography of CCD-induced shape changes.
Phase micrographs of one field of day 2 red blood cells which was
photographed before the addition of CCD (labeled 0) and at 6, 14, and 31
minutes after the addition of CCD, respectively. The cells are labeled A
and B and the processes numbered in order of appearance on the cell.
Cell A has a process (1) at 6 minutes, which lengthened at 14 minutes. A
second process (2) started to appear on cell A by 14 minutes which grows
longer to 31 minutes while at the same time process 1 shrinks again. Cell
B elongated somewhat by 6 minutes, but shows no processes. Two
processes (labeled 3 and 4) are apparent at 14 minutes. Process 3 keeps
growing through the 31 minute time point, while process 4 has shortened
at 31 minutes. A third process (5) starting from the same pointed end as
process 4 is apparent at 14 minutes and keeps growing through the 31
minute time point. The arrows point at the end points of the processes.
Bar = 5 m.
71
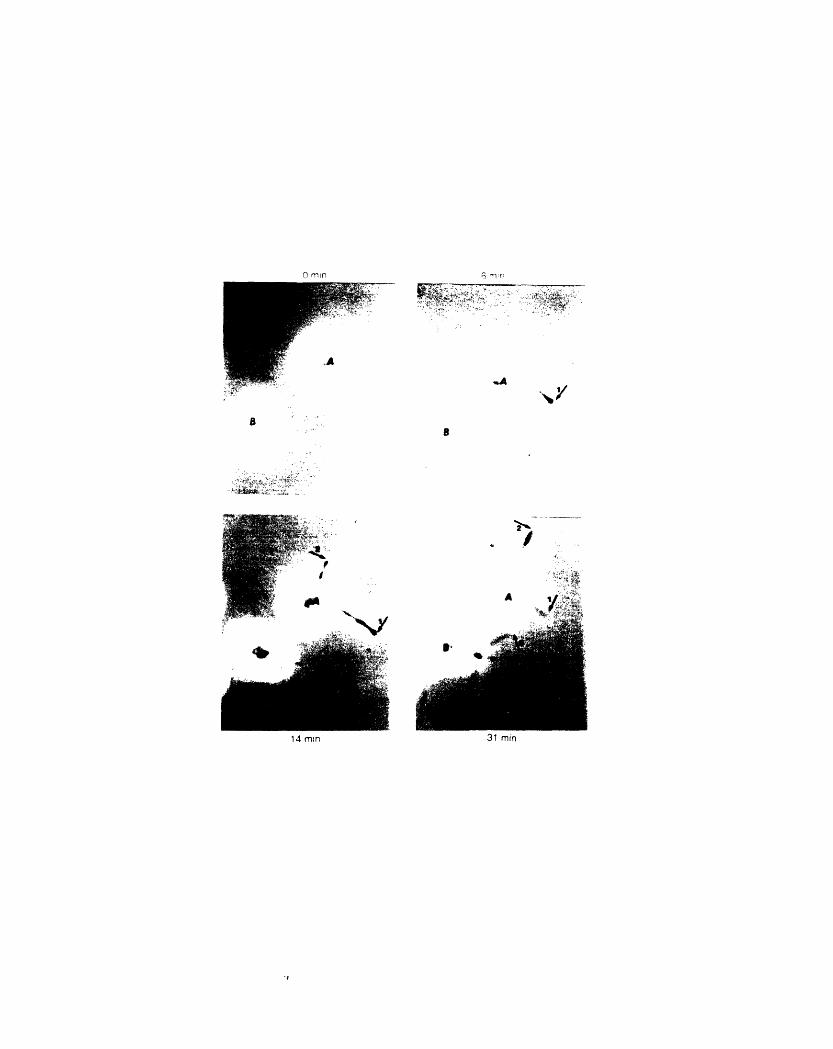
6 nr,
MA
a~~~a
e;,
ff
14 min
0 min
B .
·--o ' '.- i- $~ii;~:- ~ *&~
2-/ ,"I , -:·5A
- v
31 min
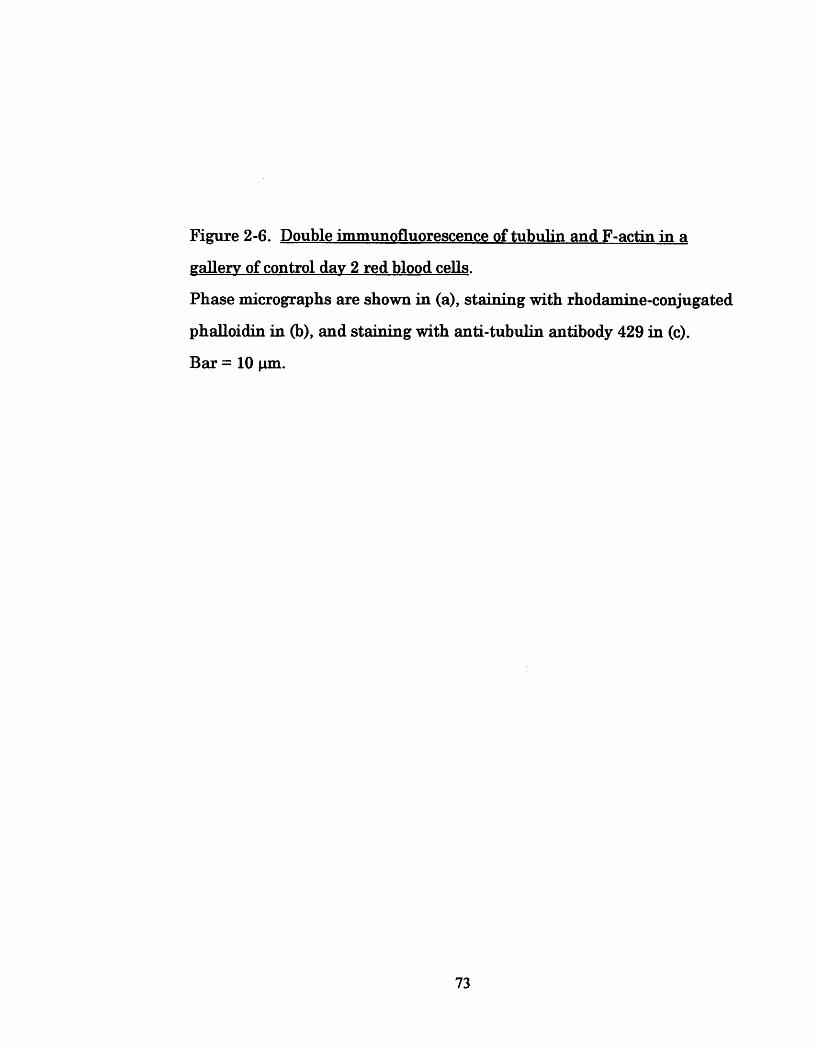
Figure 2-6. Double immunofluorescence of tubulin and F-actin in a
gallery of control day 2 red blood cells.
Phase micrographs are shown in (a), staining with rhodamine-conjugated
phalloidin in (b), and staining with anti-tubulin antibody 429 in (c).
Bar = 10 m.
73
bphalloidin
C
anti-tubulina
phase
-
-I..
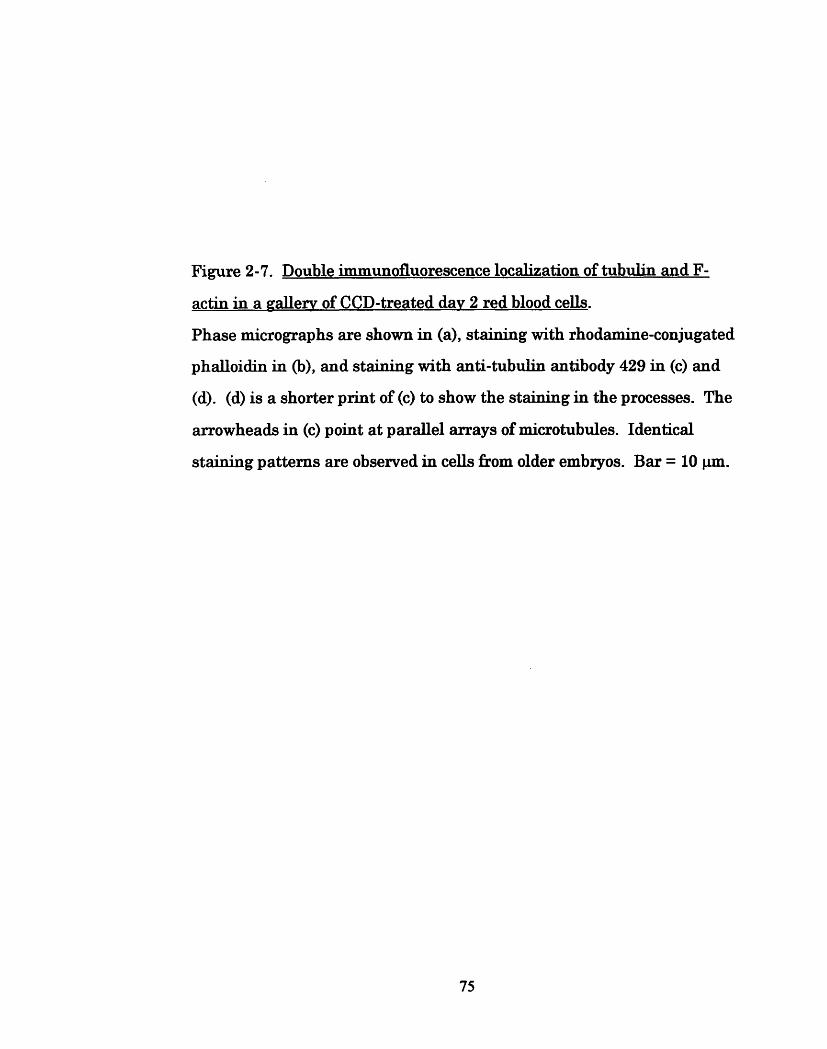
Figure 2-7. Double immunofluorescence localization of tubulin and F-
actin in a gallery of CCD-treated day 2 red blood cells.
Phase micrographs are shown in (a), staining with rhodamine-conjugated
phalloidin in (b), and staining with anti-tubulin antibody 429 in (c) and
(d). (d) is a shorter print of (c) to show the staining in the processes. The
arrowheads in (c) point at parallel arrays of microtubules. Identical
staining patterns are observed in cells from older embryos. Bar = 10 rnm.
75
Canti-tubulin
danti-tubulin
aphasc
bphalloidin
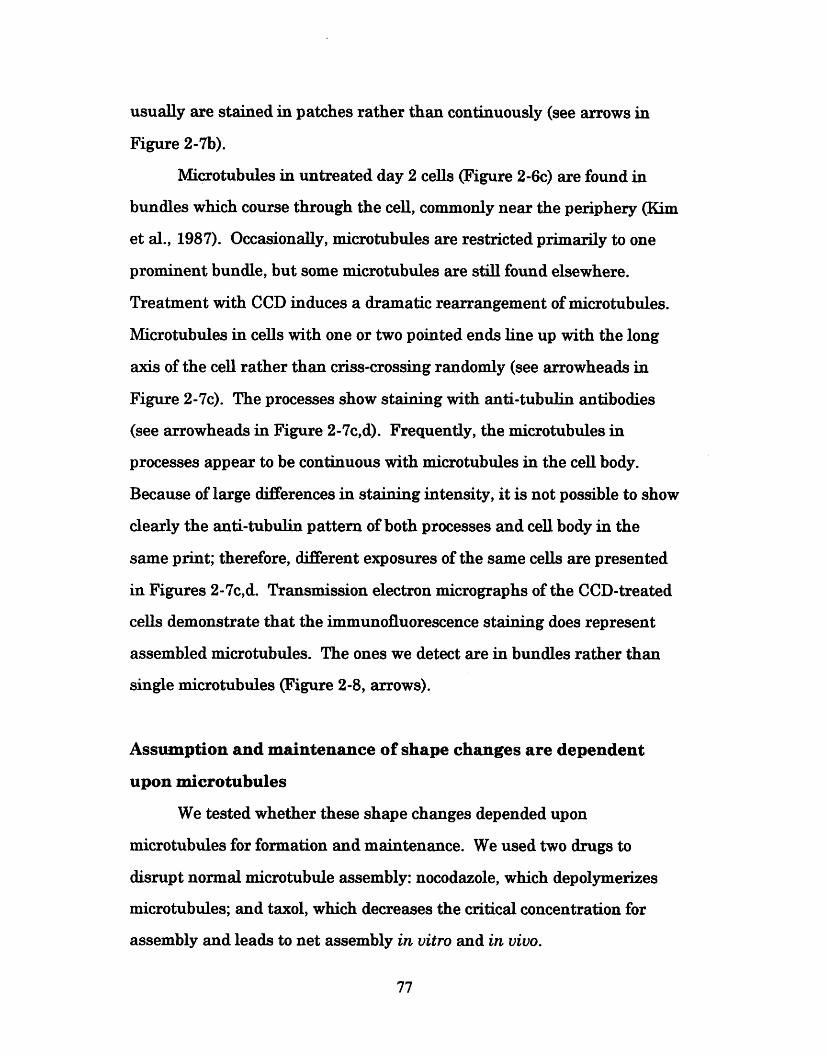
usually are stained in patches rather than continuously (see arrows in
Figure 2-7b).
Microtubules in untreated day 2 cells (Figure 2-6c) are found in
bundles which course through the cell, commonly near the periphery (Kim
et al., 1987). Occasionally, microtubules are restricted primarily to one
prominent bundle, but some microtubules are still found elsewhere.
Treatment with CCD induces a dramatic rearrangement of microtubules.
Microtubules in cells with one or two pointed ends line up with the long
axis of the cell rather than criss-crossing randomly (see arrowheads in
Figure 2-7c). The processes show staining with anti-tubulin antibodies
(see arrowheads in Figure 2-7c,d). Frequently, the microtubules in
processes appear to be continuous with microtubules in the cell body.
Because of large differences in staining intensity, it is not possible to show
clearly the anti-tubulin pattern of both processes and cell body in the
same print; therefore, different exposures of the same cells are presented
in Figures 2-7c,d. Transmission electron micrographs of the CCD-treated
cells demonstrate that the immunofluorescence staining does represent
assembled microtubules. The ones we detect are in bundles rather than
single microtubules (Figure 2-8, arrows).
Assumption and maintenance of shape changes are dependent
upon microtubules
We tested whether these shape changes depended upon
microtubules for formation and maintenance. We used two drugs to
disrupt normal microtubule assembly: nocodazole, which depolymerizes
microtubules; and taxol, which decreases the critical concentration for
assembly and leads to net assembly in vitro and in vivo.
77
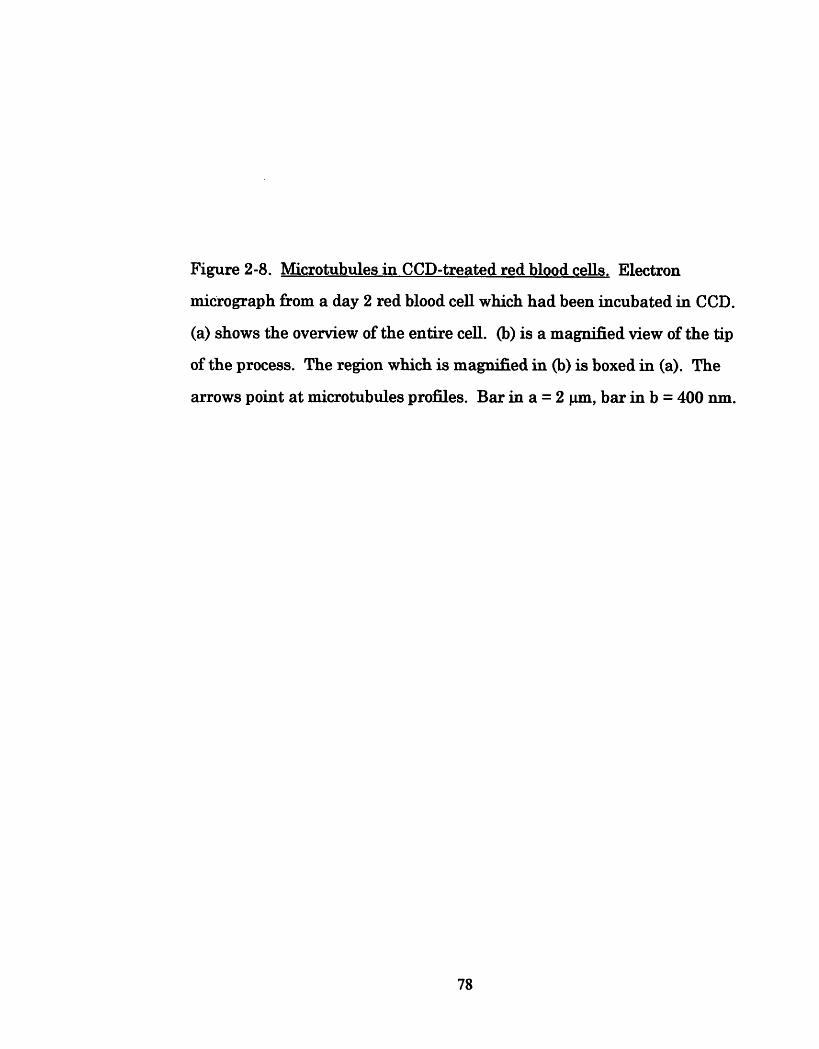
Figure 2-8. Microtubules in CCD-treated red blood cells. Electron
micrograph from a day 2 red blood cell which had been incubated in CCD.
(a) shows the overview of the entire cell. (b) is a magnified view of the tip
of the process. The region which is magnified in (b) is boxed in (a). The
arrows point at microtubules profiles. Bar in a = 2 gm, bar in b = 400 nm.
78
b
i r,- ,-.I-,
:-% Ao -e.-k A ,'get'
-a;;~"'~
kP 4tP
a
.
-Nocodazole inhibits CCD-induced shape changes. Day 2 red
blood cells were pre-incubated with 1 ig/ml nocodazole for 30 minutes,
then CCD was added to a final concentration of 0.1 gg/ml. Under these
conditions, nocodazole completely inhibits CCD-induced shape changes
(Table 2-1). This inhibition occurs even though, by two criteria, the
incubation with nocodazole was not sufficient to disassemble completely
the microtubules in these cells. By immunofluorescence staining with
anti-tubulin antibodies, about 50% of the cells show little or no staining,
but the rest still contain tubulin staining similar to that of control cells
(compare Figure 2-9a,b). This result is supported by analysis of
detergent-extracted cells to quantitate assembled and unassembled
tubulin. Incubation with nocodazole decreases the pool of assembled
tubulin by only a factor of two -- in these preparations, from about 65%
assembled to 33% assembled (Figure 2-10, "CNTRL" and "NOCOD").
-Taxol inhibits CCD-induced shape changes. Preincubation of
red blood cells with 5 jig/ml taxol before adding CCD to the suspension
also completely inhibits CCD-induced shape changes (Table 2-1). These
cells show extremely bright staining with anti-tubulin antibodies (see
Figure 2-9c). Analysis of tubulin pools in the taxol-treated cells
demonstrates that the proportion of assembled tubulin increases to about
90% (Figure 2-10, "TAXOL").
-CCD has no detectable quantitative effect on microtubule
assembly. Under conditions where CCD induces significant microtubule-
dependent shape changes in a population of day 2 cells, we detect no
significant change in the levels of assembled tubulin compared to those
from untreated cells (Figure 2-10, "CNTRL" and "CCD").
80
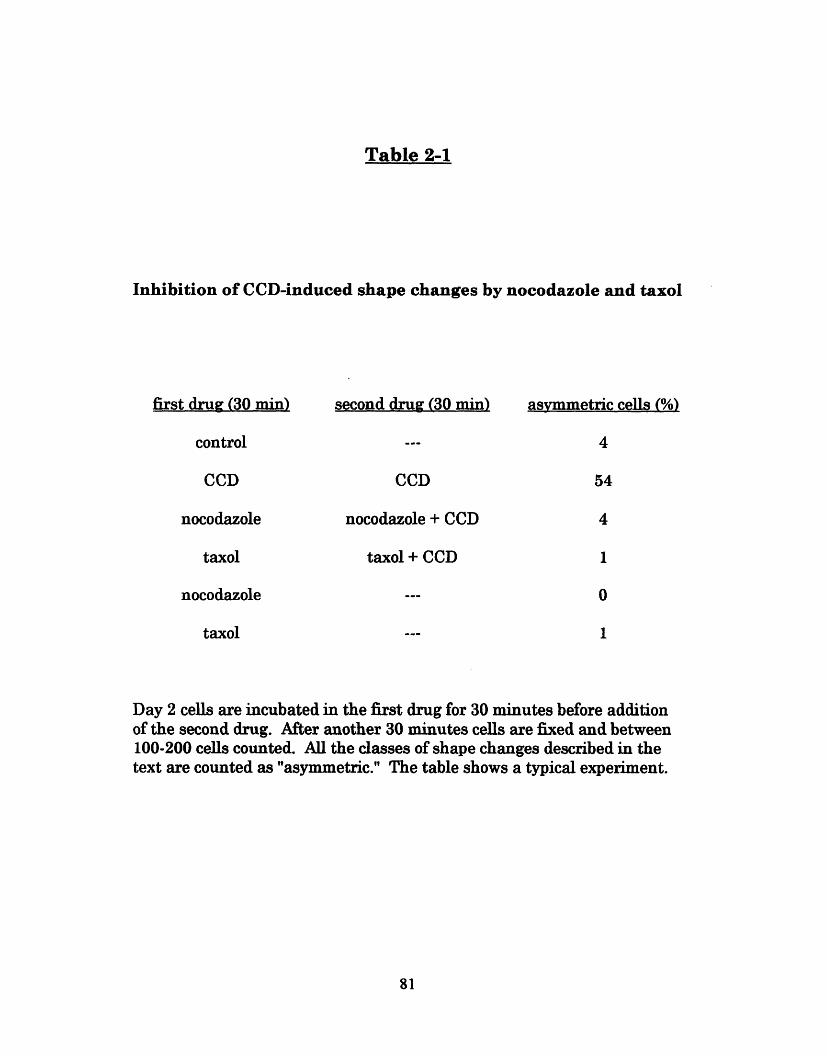
Table 2-1
Inhibition of CCD-induced shape changes by nocodazole and taxol
first drug (30 min) second drug (30 min) asymmetric cells (%)
control 4
CCD CCD 54
nocodazole
taxol
nocodazole + CCD
taxol + CCD
4
1
nocodazole
taxol
0
1
Day 2 cells are incubated in the first drug for 30 minutes before additionof the second drug. After another 30 minutes cells are fixed and between100-200 cells counted. All the classes of shape changes described in thetext are counted as "asymmetric." The table shows a typical experiment.
81
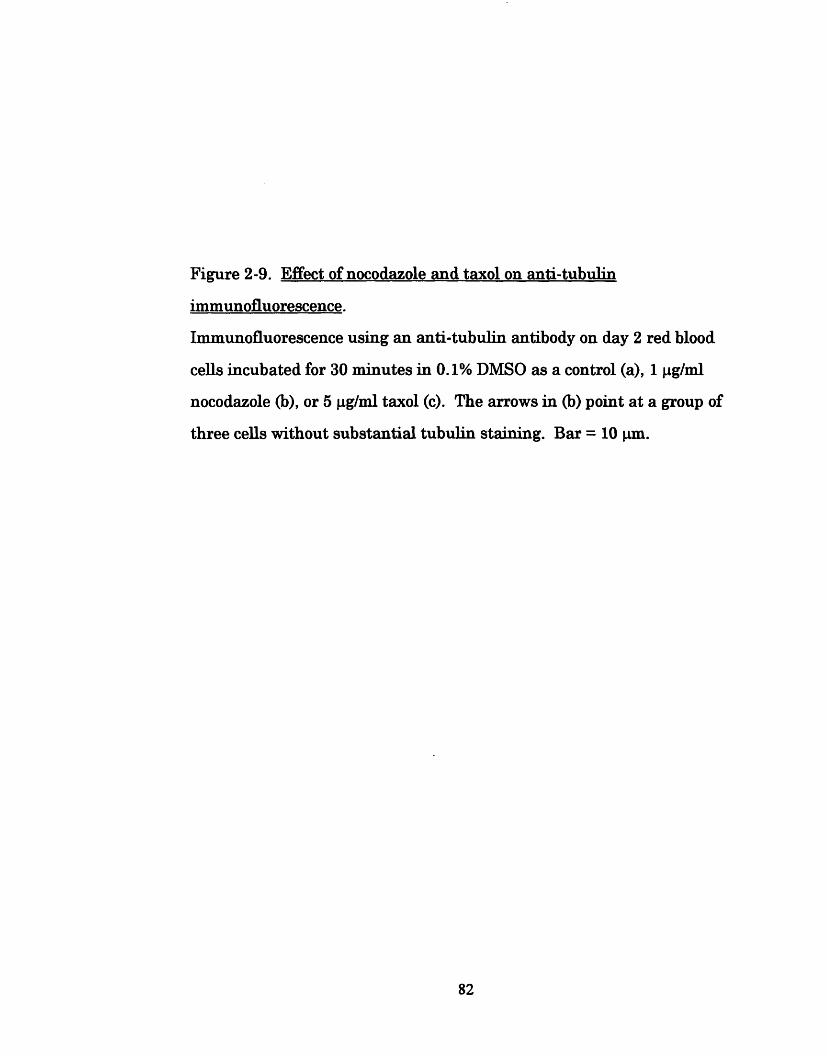
Figure 2-9. Effect of nocodazole and taxol on anti-tubulin
immunofluorescence.
Immunofluorescence using an anti-tubulin antibody on day 2 red blood
cells incubated for 30 minutes in 0.1% DMSO as a control (a), 1 ,g/ml
nocodazole (b), or 5 ptg/ml taxol (c). The arrows in (b) point at a group of
three cells without substantial tubulin staining. Bar = 10 gm.
82
a b C
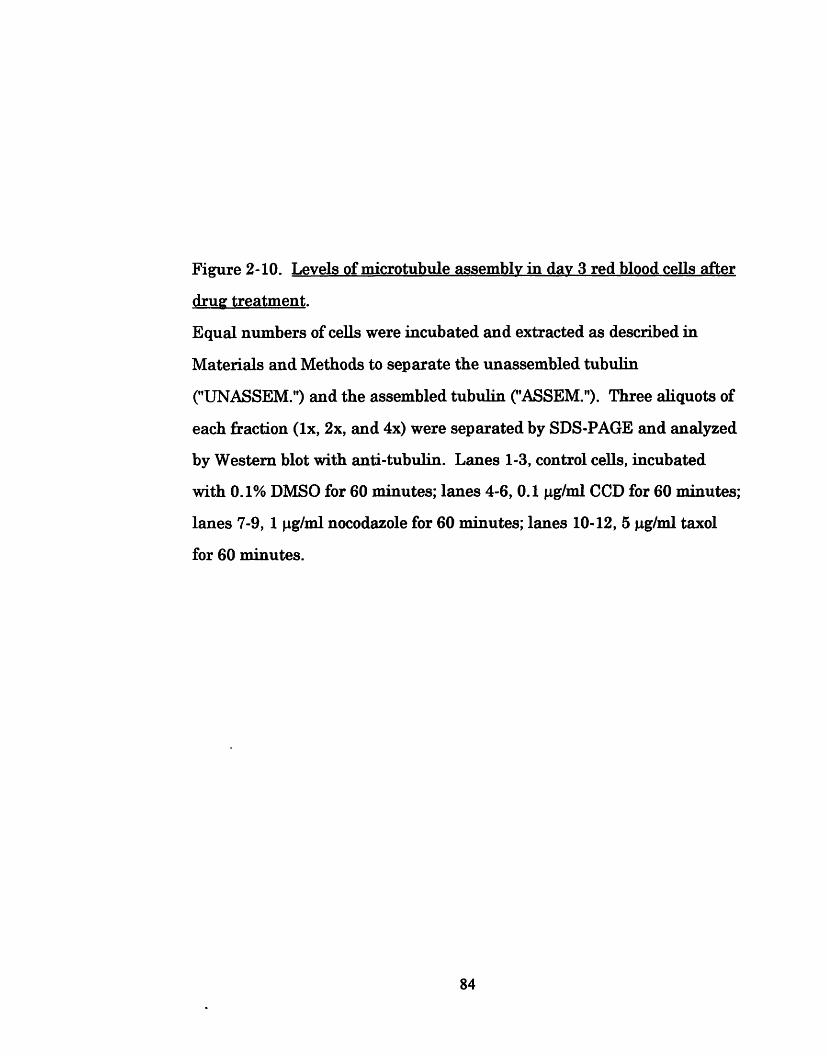
Figure 2-10. Levels of microtubule assembly in day 3 red blood cells after
drug treatment.
Equal numbers of cells were incubated and extracted as described in
Materials and Methods to separate the unassembled tubulin
("UNASSEM.") and the assembled tubulin C("ASSEM."). Three aliquots of
each fraction (lx, 2x, and 4x) were separated by SDS-PAGE and analyzed
by Western blot with anti-tubulin. Lanes 1-3, control cells, incubated
with 0.1% DMSO for 60 minutes; lanes 4-6, 0.1 ,ug/ml CCD for 60 minutes;
lanes 7-9, 1 gg/ml nocodazole for 60 minutes; lanes 10-12, 5 pg/ml taxol
for 60 minutes.
84
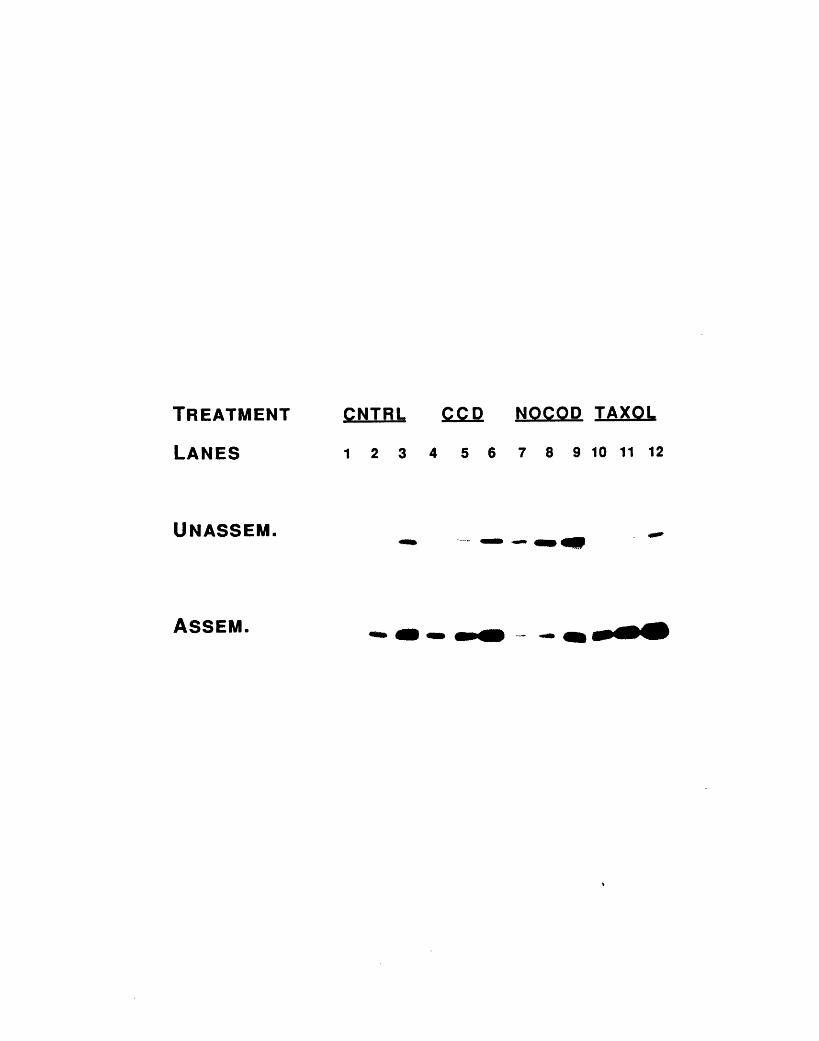
TREATMENT
LANES
UNASSEM.
ASSEM.
CNTRL
1 2 3
CCD
4 5 6
NOCOD TAXOL
7 8 9 10 11 12
_m -. -m i
-Disruption of microtubules leads to loss of CCD-induced
asymmetry. The shape changes induced by CCD do not require the
continuous presence of drug. Cells exposed to CCD for 30 minutes, and
then changed to medium without drug, do not revert to their original
shape, even after two hours. In contrast, when the CCD-containing
medium is replaced with medium containing nocodazole, the shape
change completely reverses and cells round up (see Table 2-2). In
addition, the cells which become asymmetric as a consequence of the
washing procedure (Figure 2-4) also round up when exposed to nocodazole
(data not shown). Therefore, the maintenance of asymmetry (both
mechanically- and CCD-induced) is dependent upon intact microtubules.
86
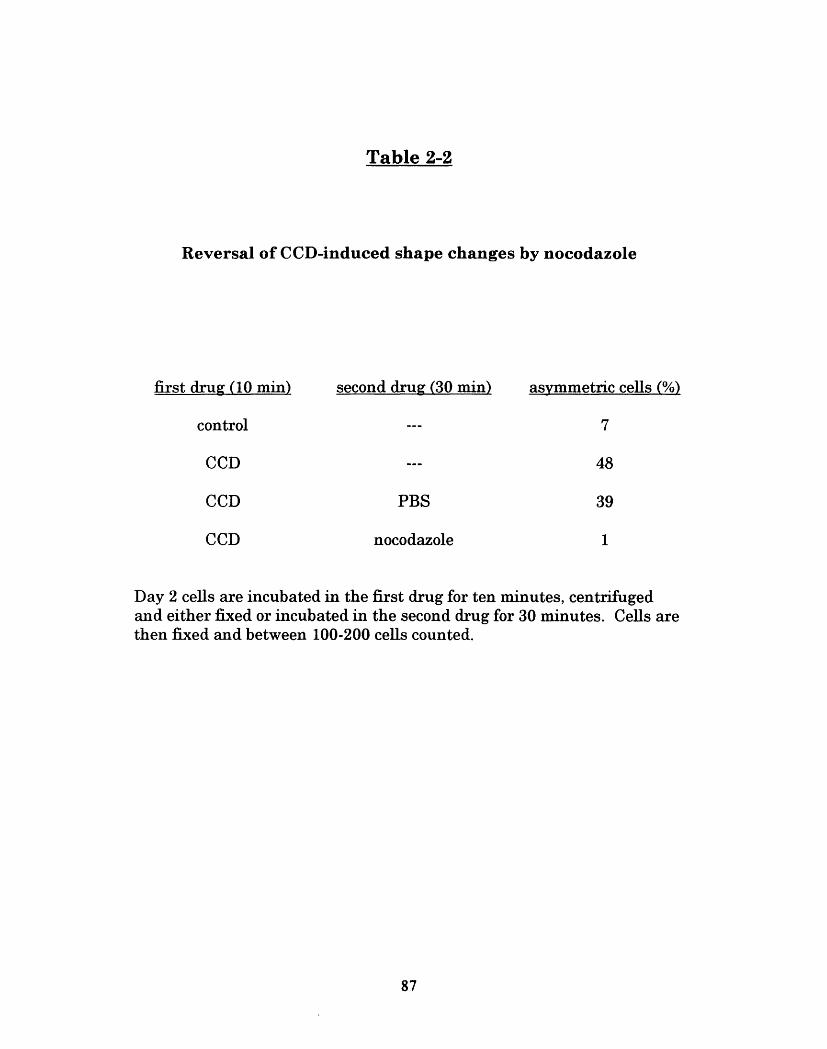
Table 2-2
Reversal of CCD-induced shape changes by nocodazole
first drug (10 min) second drug (30 min) asymmetric cells (%)
control
CCD
7
48
CCD PBS 39
CCD nocodazole 1
Day 2 cells are incubated in the first drug for ten minutes, centrifugedand either fixed or incubated in the second drug for 30 minutes. Cells arethen fixed and between 100-200 cells counted.
87
Discussion
The experiments presented above show that chicken red blood cells
of the primitive series have the capacity to assume highly asymmetric
morphologies, with elongated cell bodies and long processes. The
properties of the shape changes documented here -- they are stimulated
by cytochalasin; independent of attachment to substratum; and dependent
on the state of the microtubules and on the age of the cells -- suggest
mechanisms for how they might occur. They also suggest how the same
mechanisms might participate in the normal development of red blood cell
morphology and the formation of the marginal band.
Mechanisms of CCD-induction of asymmetry in erythroblasts
When isolated from the blastodisc, early embryonic red blood cells
are spherical, the lowest energy state for cells in suspension. Deviation
from that shape, to produce pointed ends or long processes, requires force.
The results suggest that that force is generated by microtubules, possibly
by either of two sorts of mechanism: straightening of pre-existing
microtubules, or formation of longer microtubules.
In the first model, we suggest that in the spherical cell,
microtubules are bent or distorted, a state that depends upon intact F-
actin. If the F-actin is disrupted by CCD (Cooper, 1987), and the
microtubules are no longer constrained, they can straighten and thereby
change the shape of the cell. In early embryonic red blood cells, long
microtubule bundles traverse the cytoplasm in several planes (Kim et al.,
1987). Bundles of microtubules might be more resistant to bending than
are individual microtubules. Curvilinear individual microtubules are
88
common to fibroblastic cells, but typically when microtubules are bundled
they tend to be straight (e.g. axonal microtubules). By this model,
nocodazole and taxol might inhibit elongation of the cells by shortening
the existing microtubules -- nocodazole, by depolymerizing them; taxol, by
producing more, but shorter microtubules as it does in other cell types
(DeBrabander, 1981).
By the second model, addition of more tubulin onto the ends of
existing microtubules is inhibited by the physical constraints imposed by
F-actin. Once those constraints are released, microtubules can grow
longer and change the shape of the cell. In fact, the observed rate of
process extension (up to 10 !pm/min) lies in the same range as rates of in
vivo microtubule assembly reported in the literature: 15 !Am/min for the
regrowth of marginal band microtubules in adult red blood cells (Miller
and Solomon, 1984), 4 Im/min in cultured cells (Schulze and Kirschner,
1988). Lengthening of microtubules could be the result of net
polymerization or of a re-distribution of assembled tubulin from shorter to
longer microtubules, as occurs in vitro under steady-state conditions
(Mitchison and Kirschner, 1984); drugs affecting microtubule assembly
could interfere with either process. There are other examples of cells
undergoing dramatic changes in shape driven by a polymerization. In
sickle cell anemia, the mutant hemoglobin S can polymerize so that the
red blood cells take on a sickle shape (Finch et al., 1973) which is
strikingly similar to erythroblasts incubated with CCD. Another example
is extension of the acrosomal process by thyone sperm driven by actin
polymerization (Tilney et al., 1973). However, we do not detect an
increase in net microtubule assembly after CCD-induced shape change.
89
Of course, other mechanisms for providing force may participate.
For example, lengthening of bundles could be achieved by sliding of
microtubules with respect to one another, possibly by a microtubule motor
(Shpetner and Vallee, 1989).
The potential for changing shape is restricted in developmental
time
The proportion of cells which are capable of undergoing shape
change decreases over the course of development and disappears virtually
completely by day 7. The most striking response is restricted to red blood
cells from day 2 and day 3 embryos. The capacity to change shape could
depend upon the relative strength of the driving force -- the microtubules
-- and the cellular elements which normally constrain them. Microtubules
become refractory to depolymerizing drugs during the course of
development (Kim et al., 1987), perhaps because of lateral interactions
with other elements of the cytoskeleton or cell cortex. Such stabilizing
interactions might be expected to act against the tendency of microtubules
to straighten (first model above), and so prevent shape change.
Alternatively, the microtubules could be stabilized by capping, which
could then interfere not only with depolymerization but with
polymerization as well, thus altering the ability of the microtubules to
drive elongation by the second model.
Elements of the cell which might constrain microtubules also
change during development. One is the maturing membrane skeleton,
associated with F-actin (Lazarides, 1987). Another is the appearance of
intermediate filament proteins; messenger RNA for vimentin starts to
appear at day 4 (Granger, 1982; Capetanaki, 1983). Either of these
90
changes in the red blood cell cytoskeleton could increase the resistance to
elongation, past the ability of CCD to disrupt that resistance.
A model for the morphogenesis of the erythrocyte and the
marginal band
Generation of force by microtubule straightening fits a model for
morphogenesis both of the marginal band and of the mature erythrocyte
based on properties of the microtubules themselves. That model suggests
that the formation of microtubule bundles might be a crucial step in the
formation of the band. If those bundles grew long enough, and thick
enough, their tendency to grow straight could dictate that they follow the
longest possible path in the cell. In a spherical cell, the longest path is a
circumference. One circumference could be expanded as a consequence of
the same tendency to grow straight, and so distort the cell to the shape of
a disc. If one circumferential path expands, all other circumferences
become shorter, driving all the bundles into the longest one. In this way,
the properties of microtubule bundles alone could specify the localization
of all the microtubules to one equatorial structure and lead to the normal
flattening of these cells. The observations described here are consistent
with this model. The ability of the earliest cells to elongate may be a
manifestation of the same forces for straightening of microtubules that,
normally, produce the marginal band. These considerations do not
explain, though, why the cell becomes elliptical in the plane of the
microtubule equator.
A prediction of part of this model is borne out by the recent
demonstration that ectopic expression of MAP2 which induces bundling of
microtubules produces circumferential loops of microtubules in
91
fibroblastic cells (Lewis et al., 1989; Weisshaar et al., 1992).
Furthermore, when the MAP2 transfectants are treated with cytochalasin
D, they form processes in a fashion reminiscent of the ones described here
(Edson et al., 1993).
Microtubule-driven shape changes
Other cell types undergo microtubule-dependent shape change in
response to CCD -- for example, lymphoblasts (Bornens et al., 1989) and
photoreceptor cells (Madreperla and Adler, 1989). Those systems differ
fundamentally from the one described here. Most importantly, those cells
normally display microfilament-dependent motility -- the lymphoblasts
oscillate and the photoreceptor cells extend neurites -- and the effect of
CCD is to alter the pattern of that motility. In contrast, the red blood
cells show no microfilament-dependent motility, and exhibit the CCD
response only in a narrow developmental stage. The two systems lead to
different conclusions: in lymphoblasts the microtubules appear to regulate
normal microfilament function and organization (Bornens et al., 1989); in
red blood cells, it is the F-actin which constrains microtubules. The CCD-
induced processes in red blood cells resemble the processes extended by
neural cells. Models for neurite extension have been proposed by several
groups which are based on integrating cytoskeletal forces for contraction
and tension (Joshi et al., 1985; Letourneau et al., 1987; Buxbaum and
Heidemann, 1988), possibly involving localized weakening of the actin
network with concomitant extension of microtubules (Goldberg and
Burmeister, 1989).
92
Chapter 3
The 13H9 Antigen in Chicken Erythrocytes: Death of theSubset Hypothesis
93
Introduction
The in vitro reconstitution experiment by Swan and Solomon
(Swan and Solomon, 1984) described in Chapter 1 demonstrated that
insoluble microtubule-binding proteins are localized at the position of the
marginal band which can redirect the formation of the marginal band
from bovine brain tubulin after cold depolymerization of microtubules and
detergent-extraction. Birgbauer and Solomon (1989) tried to identify this
"insoluble MAP" by raising monoclonal antibodies to chick brain MAPs
and screening for antibodies that stained the marginal band, but were not
tubulin or actin-- known components of the marginal band. They
identified one such antibody, called 13H9, which stained the marginal
band irrespective of the presence of microtubules and which recognized a
band of ~80kd on Western blots of chicken red blood cell cytoskeletons
and chick brain. The 13H9 antigen was present in embryonic red blood
cells, but did not co-localize to the position of the marginal band until
after microtubules already arrived there. Rather, in early embryonic cells
the 13H9-staining more closely resembled the distribution of F-actin.
This suggested that the 13H9-antigen is not involved in the formation of
the marginal band, but maybe rather in its stabilization at later stages
(Birgbauer and Solomon, 1989). The experiments presented in Chapter 2
suggest that the formation of the marginal band during development
might be microtubule-autonomous, independent of associated proteins.
The 13H9 antigen is not specific to erythrocytes, but found in a
wide variety of cells in culture. In neurons and fibroblasts, it shows a
very striking localization: it stains growth cones of hippocampal neurons
and of P19 retinoic acid-induced neuronal cells (Birgbauer et al., 1991;
94
Goslin et al., 1989) and leading edges of fibroblasts (Birgbauer, Ph.D.
Thesis). Its localization in these cells more closely resembles the
distribution of F-actin rather than that of microtubules. To investigate
the possible interaction of the 13H9 antigen with microtubules, Eric
Birgbauer in collaboration with Kimberly Goslin and Gary Banker
followed the 13H9 antigen after nocodazole treatment in hippocampal
neurons (Goslin et al., 1989): Treatment with nocodazole leads to
progressive depolymerization of microtubules from the distal tip down the
shaft of the neurite. The 13H9 antigen delocalizes from the growth cone
and is found in progressively more proximal portions of the neurite, at all
times staying distal to the end of the depolymerizing microtubules. After
removal of the drug, the 13H9 antigen reappears in growth cones, but not
until microtubules have repolymerized to that position. These
experiments showed that the localization of the 13H9 antigen to growth
cones is dependent on intact microtubules and suggested that there was
at least an indirect interaction of the 13H9 antigen with microtubules.
The 13H9-antigen, therefore, has properties of both microtubule- and
microfilament-association. Since then, no clear picture of the possible
interaction of the 13H9 antigen with microtubules has emerged (see also
Appendix 3).
Eric Birgbauer (Birgbauer and Solomon, 1989) showed that the
13H9 antigen is related to ezrin: 13H9 recognizes purified chick intestinal
ezrin, and anti-ezrin antibodies (from A. Bretscher) recognize a band of
similar mobility on chicken red blood cell cytoskeletons as does 13H9.
Ezrin was initially identified as a minor component of intestinal brush
border microvilli and shown to be present in surface protrusions of chick
embryo fibroblasts (Bretscher, 1983). Margaret Magendantz mapped the
95
epitope of 13H9 to a 13 aa region of human ezrin using TrpE fusion
proteins (see Chapter 4 and Birgbauer Ph.D. Thesis) of human ezrin
cDNA (kindly provided by T. Hunter).
In late 1991, two proteins, moesin and radixin, closely-related to
ezrin (>75% amino acid identity) were cloned (Funayama et al., 1991;
Lankes and Furthmayr, 1991). Radixin was purified from liver adherens
junctions and shown to cap the barbed end of F-actin (Tsukita et al.,
1989). Antibodies raised against purified radixin stained adherens
junctions in several tissues and also stained cleavage furrows in cultured
cells (Sato et al., 1991). These antibodies were later shown to react with
ezrin, radixin and moesin (Sato et al., 1992). Moesin was cloned from a
human cell line, HL60, (Lankes and Furthmayr, 1991) and shows a
similar immunofluorescence distribution to that described for ezrin
(Franck et al., 1993). The 13 aa 13H9 epitope was almost perfectly
conserved in all three proteins. (Isoleucine in ezrin is replaced with
valine in radixin and moesin.) We think that 13H9 recognizes all three
proteins because fusion proteins containing only six ezrin residues
(QDLEMY) are still recognized by 13H9 (Margaret Magendantz,
unpublished observation). These six residues are completely conserved in
all of the ERM-members. They are also present in the recently cloned
neurofibromatosis 2 gene product, merlin/schwannomin (Rouleau et al.,
1993; Trofatter et al., 1993).
The 13H9 antibody is an IgM and gives poor Western signals on
most material. For this reason, Eric Birgbauer raised a polyclonal
antiserum against purified chicken intestinal ezrin (Ph.D. Thesis). This
antiserum, called 904, recognizes ezrin on blots, but differs in several
respects from 13H9: 1) it recognizes additional spots on two-dimensional
96
separations of chicken red blood cell cytoskeletons, and 2) it gives
different immunofluorescence staining. These results raised the
possibility that 13H9 recognizes only a subset of ezrin isoforms and that
these 13H9-positive isoforms localize to specialized regions and are
involved in different interactions with the cytoskeleton than the bulk of
ezrin. This chapter discusses the evidence in favor of the subset
hypothesis (obtained by Eric Birgbauer and myself) and the experiments
leading to the refutation of that idea.
97
Materials and Methods
Preparation of cells for immunofluorescence
Embryonic red blood cells were drained from the circulation of
dissected blastodiscs of appropriately aged embryos (days 5,7, 9, 14). The
cells were washed twice in PBS/glucose (PBS containing 0.025 M glucose)
and resuspended in the same buffer. For immunofluorescence, a dilute
cell suspension was pipetted onto flamed glass coverslips and cells were
allowed to settle for five minutes. Each coverslip was picked up
individually with forceps and drained on a paper towel. It was then
placed in 0.1% NP-40/PM2G for five minutes, drained and placed into
0.25% glutaraldehyde/PM2G for one minute, drained and placed into 4%
paraformaldehyde/PM2G for 30 minutes. After several rinses in PBS, the
glutaraldehyde was quenched by addition of 5 mg/ml sodium
borohydride/PBS for five minutes three times. The coverslips were then
washed repeatedly in PBS and stored at 40C until use. The coverslips
could be used for several weeks.
HeLa cells were grown in 5% horse serum/MEM- and passaged by
regular trypsinization. For immunofluorescence, cell suspensions were
plated sterilely onto flamed glass coverslips and allowed to grow for 24
hours. They were then fixed for 30 minutes in 4% paraformaldehyde/PBS
and subsequently permeabilized in 0.1% NP-40/PBS for 15 minutes.
Retinoic acid-induced P19 embryonal carcinoma cells growing on
coverslips were provided by Jon Dinsmore. They were fixed identically to
HeLa cells.
For antibody staining, coverslips were blocked for 15 minutes in
10% normal goat serum/1% BSA/PBS. Antibodies were diluted in 1%
98
BSA/PBS and spun in a microfuge. 13H9 tissue culture supernatants
were used as 1:10 (adult red blood cells), 1:30 (HeLa cells) or 1:100
dilutions (embryonic red blood cells, P19 cells). 904 was used at 1:10 or
1:100 dilutions. Texas red coupled goat anti rabbit and fluorescein
coupled goat anti mouse antibodies were used as secondary antibodies at
1:1000 dilutions. Antibody incubations were done in a tissue culture
incubator for 30 minutes. In between incubations, coverslips were
washed by dipping repeatedly into three beakers of PBS. Before
mounting in gelvatol with 15 mg/ml 1,4-diazobicyclo[2.2.2]octane
(Johnson et al., 1982), obtained from Aldrich Chemical Co. (Milwaukee,
WI), coverslips were dipped in water and drained.
Preparation of fusion proteins
To prepare fusion proteins, E. coli strains carrying the 5' or 3' SacI-
SacI fragments on a pATH 11 vector (strains were constructed by
Margaret Magendantz) were inoculated in an overnight culture in M9
medium (42 mM Na 2HP0 4, 22 mM KH2PO4, 0.5 g/l NaCl, 1 g/l NH4Cl, 5
g/l casamino acids, 1 mM MgSO4, 0.1 mM CaC12, 0.2% glucose pH 7.1)
containing 0.02 mg/ml tryptophan and 0.1 mg/ml ampicillin at 370C. For
induction of the fusion protein, the cultures were transferred to M9
medium without tryptophan for 90 minutes and then 20 mg/ml
indoleacrylic acid was added for four hours at 370C. To test for successful
induction, 1 ml of cell suspension was taken out after three hours,
centrifuged one minute in a microfuge and the pellet dissolved in 3x
sample buffer (GSD). The extract was separated on a 7.5% minigel and
stained with Coomassie Brilliant Blue. After one more hour, strains that
99
had induced fusion protein production were centrifuged and pellets
dissolved in GSD and frozen.
Preparation of affinity-eluted antibodies
The fusion proteins preparations from which antibodies were to be
eluted were separated on 7.5% SDS-PAGE, transferred to nitrocellulose
and stained with Ponceau S. The position of the fusion protein (which
corresponded to the most abundant protein band by Ponceau S staining)
was marked with a pencil. One narrow strip was cut from the
nitrocellulose to test the affinity-eluted serum later. The nitrocellulose
blot was incubated in 2% hemoglobin/PBS or 3% BSA/PBS for three to
four hours. The blot was incubated with antibody 904 at a 1:100 dilution
in 2% hemoglobin/PBS or 3% BSA/PBS overnight. The blot was then
washed three times in hemoglobin or BSA/PBS containing 0.1% NP-40
and 0.05% SDS and three times in PBS. The marked area (corresponding
to the fusion protein) was excised and cut into 1 mm2 pieces. The pieces
were transferred to a 3ml-syringe containing PBS. The nitrocellulose
pieces were washed twice in 3 ml water in the syringe and then 0.5 ml ice-
cold 0.2 M glycine pH 2.7 was taken up into the syringe. The
nitrocellulose pieces were agitated in the syringe for three minutes and
then the eluate extruded into a tube containing 100 . 1 M Tris-HC1 pH
8.1 to neutralize the pH. BSA and sodium azide were added to final
concentrations of 0.1% and 0.05%, respectively.
Two-dimensional gel electrophoresis
Two-dimensional isoelectric focusing (IEF) SDS-PAGE was
performed according to the method of O'Farrell (1975) as modified by
100
Pallas and Solomon (1982). Briefly, the urea-acrylamide gels contained a
mixture of 0.4% pH 3.5-10 and 0.15% pH 6.0-8.0 ampholines. Samples
were reduced in 0-mercaptoethanol in the presence of saturating amounts
of urea. Electrophoresis in the first dimension was performed for 14-17
kilovolt-hours in a Hoeffer Electrophoresis Unit with the buffer chambers
containing 20 mM NaOH or 10 mM phosphoric acid. The tube gels were
removed and equilibrated for 30 minutes in equilibration buffer (10%
glycerol, 5% -mercaptoethanol, 62.5 mM Tris-HC1 pH 6.9, 2.5% SDS).
They were then placed across 7.5% SDS-PAGE gels, sealed with agar
containing bromphenol blue, electrophoresed and transferred to
nitrocellulose.
Purification of ERM-members from adult chicken erythrocytes
A cytoskeletal fraction was prepared from the blood from 4 - 12
chickens as described in Chapter 2 except that 4 washes were performed
before solubilization in 8 M urea. The urea extract was dialyzed against
PBS + 1 mM DTT overnight at 40C with 3 changes of buffer. After
addition of protease inhibitors the dialysate was centrifuged for 10
minutes at 27,000 g at 40C. Further steps followed the published protocol
for the purification of ezrin from chicken intestine (Bretscher, 1983;
Bretscher, 1986). The supernatant was adjusted to 40% ammonium
sulfate and stirred for 30 minutes at 40C. After centrifugation the
supernatant was adjusted to 65% ammonium sulfate and stirred for 30
minutes. The pellet was recovered and dissolved in a minimal volume of
20 mM NaCl, 1 mM DTT and 10 mM imidazole-HCl pH 6.7 and dialyzed
against this buffer overnight. After centrifugation the supernatant was
made 0.1 M in KH2PO4/K2HPO 4 pH 7.0 by addition of a 0.8 M stock. It
101
was then loaded onto a 12ml hydroxyapatite column pre-equilibrated with
0.1 M KH2PO4/K2HPO4 + 1 mM DTT pH 7.0. The column was developed
with a 40 ml linear gradient of 0.1 - 0.8 M KH2PO4/K2HPO 4 + 1 mM DTT.
The elution was monitored by O.D. 280 nm and all protein fractions were
dialyzed against PBS + 1 mM DTT.
Silver staining of protein gels
Silver staining was performed according to the procedure modified
by Morissey (1981). Briefly, gels were fixed overnight in 50% methanol
with 0.04% formaldehyde. The gel was then soaked in 5 mg/ml
dithiothreitol for 30 minutes, and then in 0.1% silver nitrate for 30
minutes over a light box. The gel was then rinsed in water and twice in
developer (50 p1 of 37% formaldehyde in 100 ml 3% sodium carbonate).
The gel was then placed in developer until the desired level of staining is
attained. The reaction was stopped by addition of 5 ml 2.3 M citric acid.
102
Results
13H9 binds to a subset of the 904-positive spots on two-
dimensional separations of chicken erythrocyte cytoskeletons
13H9 recognizes a single row of multiple spots in the cytoskeletons
of chicken erythrocytes (Birgbauer and Solomon, 1989). 904, raised
against purified intestinal ezrin, on the other hand, recognizes two rows
of spots (Figure 3-1A, B; Birgbauer Ph.D. Thesis). The intensity of the
upper band with 904 is somewhat variable and can sometimes be almost
undetectable. The upper of the two rows corresponds to the 13H9-positive
spots. To test that the lower row of spots shared epitopes with ezrin and
was not due to spurious reactivity in the antiserum, Birgbauer affinity-
eluted 904 antibodies off TrpE fusion proteins encompassing most of the
coding region of human ezrin (5' + 3' SacI-SacI fragments). The affinity-
eluted antibodies bound to the lower band (Birgbauer, Ph.D. Thesis).
Therefore, the lower band proteins are immunologically related to ezrin.
Since 13H9 is a monoclonal antibody recognizing a single epitope of
human ezrin, the extent of immunological relatedness of upper and lower
row proteins might be restricted to the single 13H9-epitope. I, therefore,
affinity-eluted 904 off the 3' SacI-SacI fragment of human ezrin which
does not contain the 13H9-epitope and probed two-dimensional
separations of chicken erythrocyte cytoskeletons (Figure 3-1C). The
affinity-eluted 904 antibodies recognize both rows, with reactivities
virtually indistinguishable from the whole 904 serum.
103
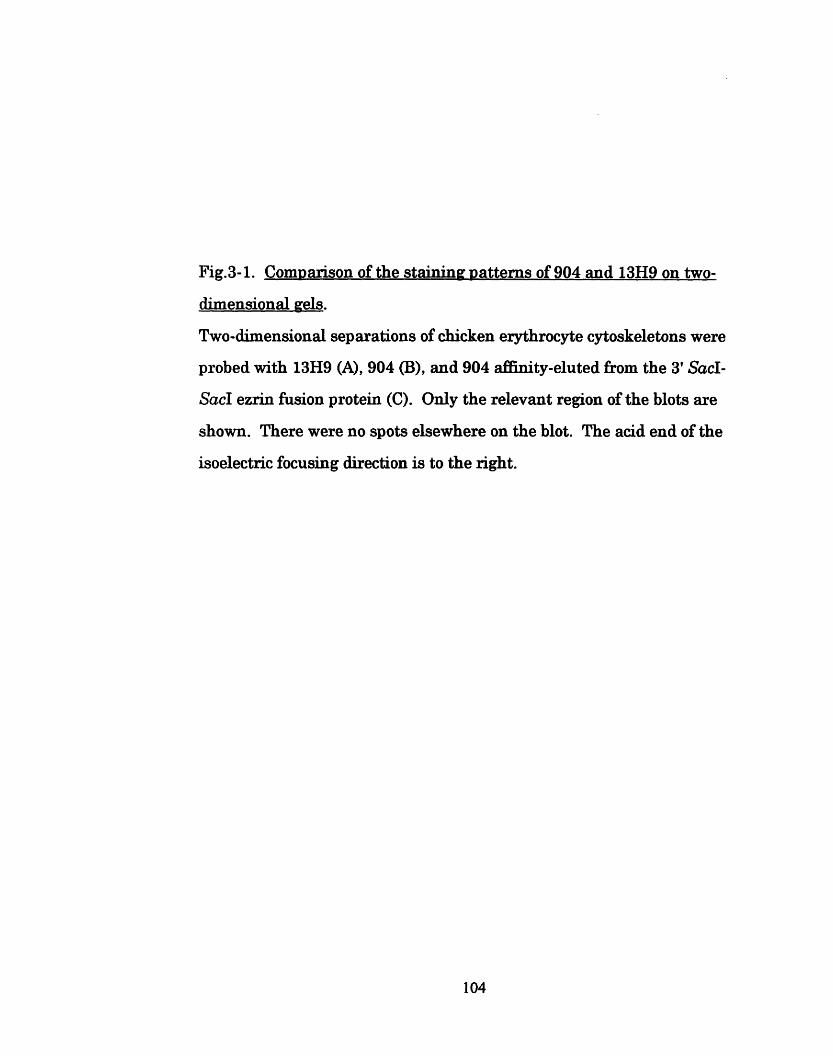
Fig.3-1. Comparison of the staining patterns of 904 and 13H9 on two-
dimensional gels.
Two-dimensional separations of chicken erythrocyte cytoskeletons were
probed with 13H9 (A), 904 (B), and 904 affinity-eluted from the 3' SacI-
SacI ezrin fusion protein (C). Only the relevant region of the blots are
shown. There were no spots elsewhere on the blot. The acid end of the
isoelectric focusing direction is to the right.
104
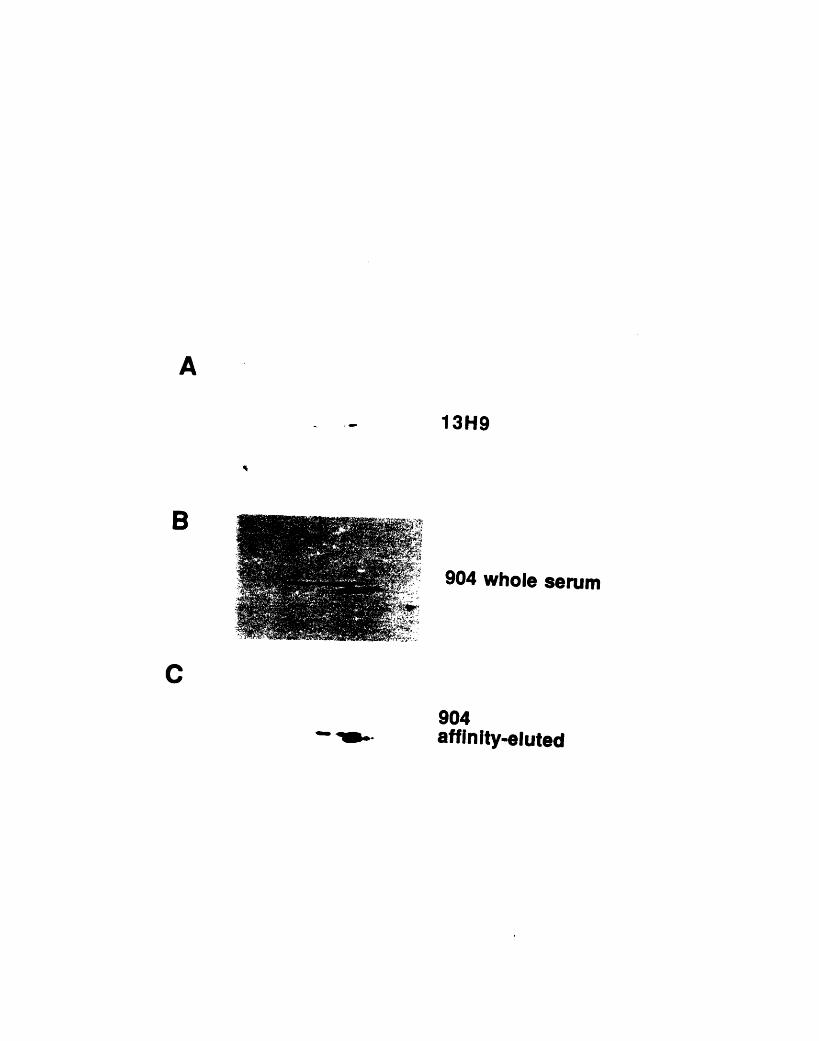
13H9
904 whole serum
C
904afflnity-eluted
A
B
The subset hypothesis
Based on these data, we propose the following hypothesis: 904
binds to multiple protein spots (ezrin isoforms) of erythrocyte
cytoskeletons which fall on two rows of electrophoretic mobility. The
lower row is recognized more strongly due to either higher abundance of
those proteins or higher affinity or titer of the antibodies recognizing
those proteins. Given that all spots in both rows are immunologically
related to ezrin and that 904 is a polyclonal antibody which recognizes
multiple epitopes on ezrin (Birgbauer Ph.D. Thesis), we favored the
interpretation that the lower row spots are more abundant than the upper
row spots. 13H9 recognizes only a subset of these spots, the upper row,
which gives a weaker 904 signal. Two possible explanations for the
restricted reactivity of 13H9 are: there exists a posttranslational
modification of the 13H9 epitope which changes 13H9 reactivity, or there
exist alternatively spliced ezrin isoforms which do not contain the 13H9
epitope. Appendix 2 describes results obtained testing these two
possibilities. Due to the poor blotting results obtained with 13H9 on most
materials, we could not confirm the restricted reactivity of 13H9 with a
subset of 904-positive isoforms on other cellular material besides chicken
erythrocytes.
13H9 binds to a subset of 904-positive structures by
immunofluorescence
13H9 stains a subset of F-actin containing structures by
immunofluorescence in a variety of cell types (Birgbauer Ph.D. Thesis;
Appendix 1, 3). 904, on the other hand, gives generally a much more
106
diffuse staining pattern. This is true both for the whole 904 serum and
for antibodies affinity-eluted from ezrin fusion proteins. Figure 3-2 shows
double-immunofluorescence with 904 and 13H9 on three different cell
types, chicken red blood cells (Figure 3-2A), fibroblastic flat cells in
retinoic acid-induced populations of P19 cells (Figure 3-2B), and neuronal
cell in retinoic acid-induced populations of P19 cells (Figure 3-2C). In
each case, 904 gives more diffuse general cytoplasmic staining in addition
to staining the 13H9-positive structures (see also Appendix 1). These
observations are consistent with the notion that 13H9 recognizes only a
subset of 904-isoforms. Furthermore, it suggests that these 13H9-positive
isoforms localize differently than the bulk of ezrin.
The 13H9-positive isoforms fractionate differently than the bulk
of ezrin
Figure 3-3 shows two-dimensional separations of chicken
erythrocyte soluble and insoluble fractions which were obtained either
from day 5 embryonic cells ("IMMATURE") or from adult cells ("ADULT")
probed with 904 (Figure 3-3A) or 13H9 (Figure 3-3B). 904 recognizes
several spots in both soluble and insoluble fractions of both immature and
adult cells (Figure 3-3A). In the cytoskeletal fraction of adult cells, 904
recognizes two rows of different electrophoretic mobility as described
above, while in the soluble fraction we detect only a single row. In the
cytoskeletal fraction of immature cells, only a single row of spots is
visible. For 13H9, on the other hand, no signal is detectable in the soluble
fraction of either immature or adult cells (Figure 3-3B). 13H9 recognizes a
single row of spots in the cytoskeletons of adult erythrocytes, but
recognizes spots in two rows in immature cytoskeletons. These data
107
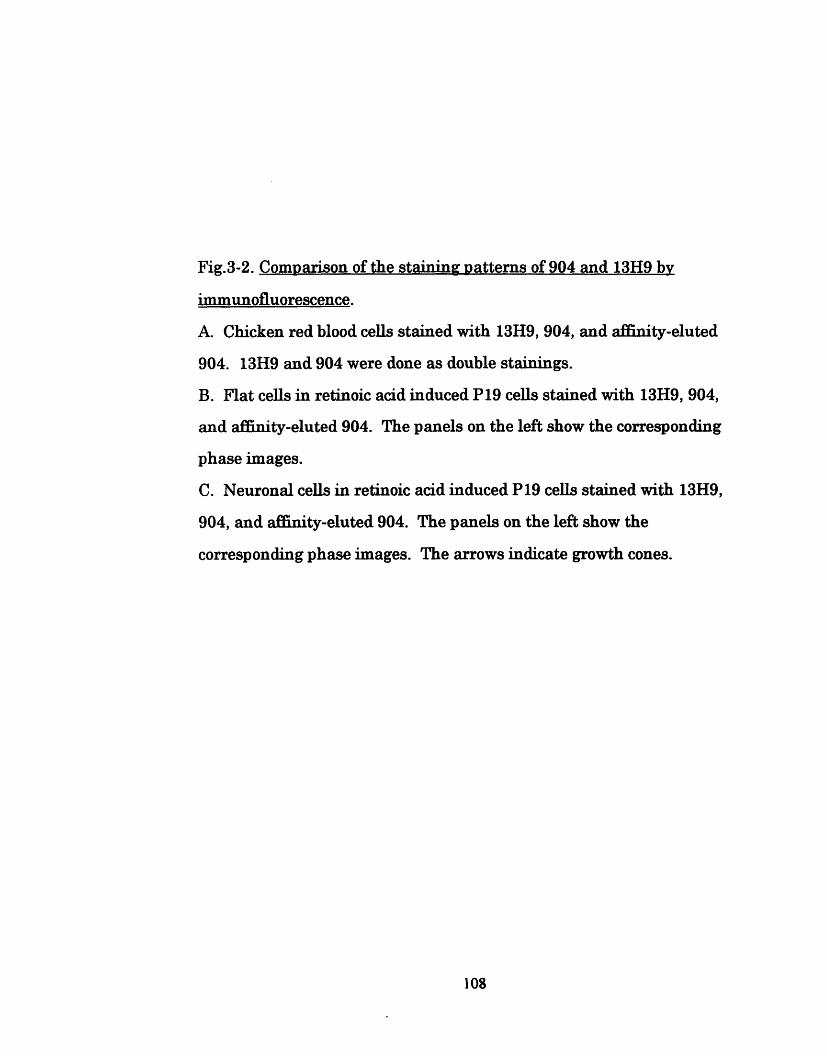
Fig.3-2. Comparison of the staining patterns of 904 and 13H9 by
immunofluorescence.
A. Chicken red blood cells stained with 13H9, 904, and affinity-eluted
904. 13H9 and 904 were done as double stainings.
B. Flat cells in retinoic acid induced P19 cells stained with 13H9, 904,
and affinity-eluted 904. The panels on the left show the corresponding
phase images.
C. Neuronal cells in retinoic acid induced P19 cells stained with 13H9,
904, and affinity-eluted 904. The panels on the left show the
corresponding phase images. The arrows indicate growth cones.
108
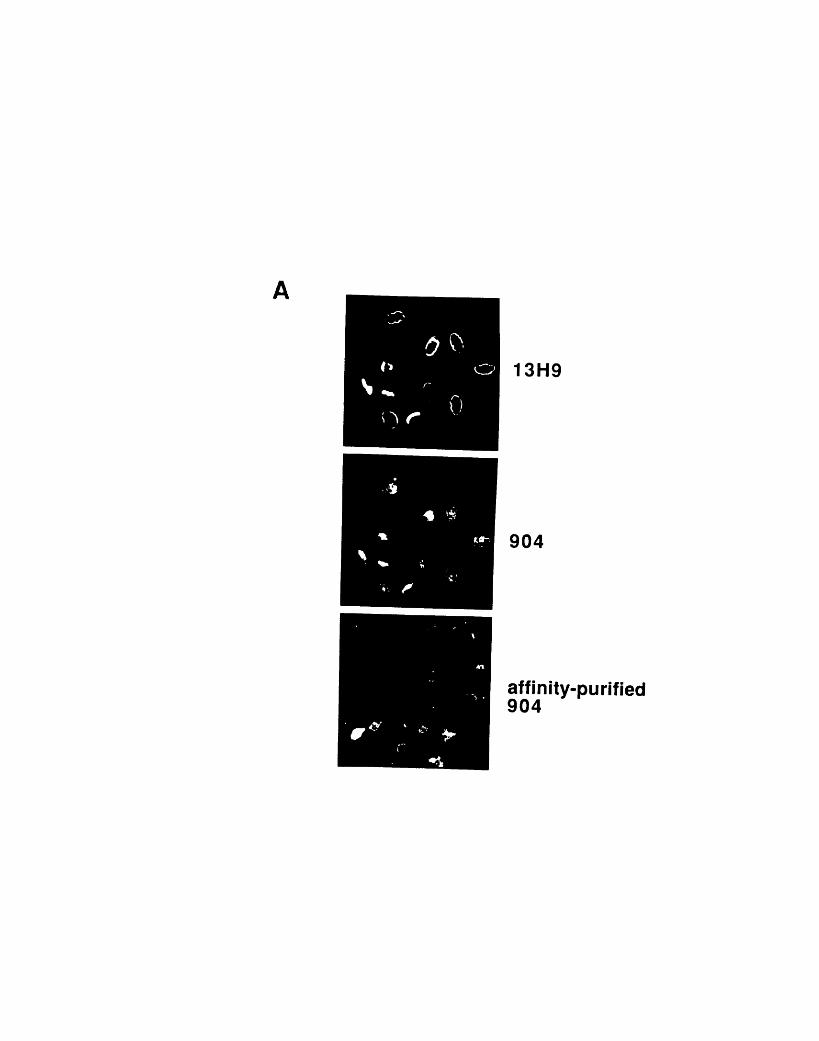
A
13H9
904
affinity-purified904
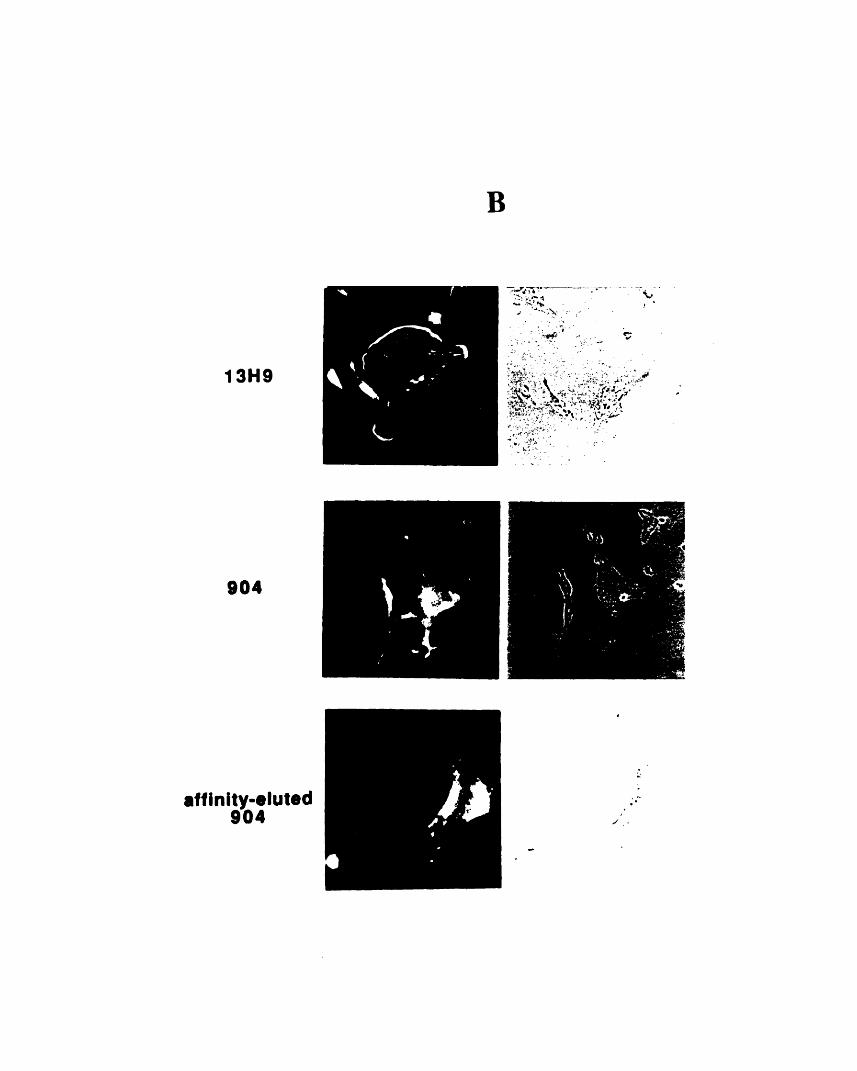
B
'r~~~~~~~~~~~~4~
13H9
904
affinity-oluted904
, . .
, ,. l:~... -. I."K*.
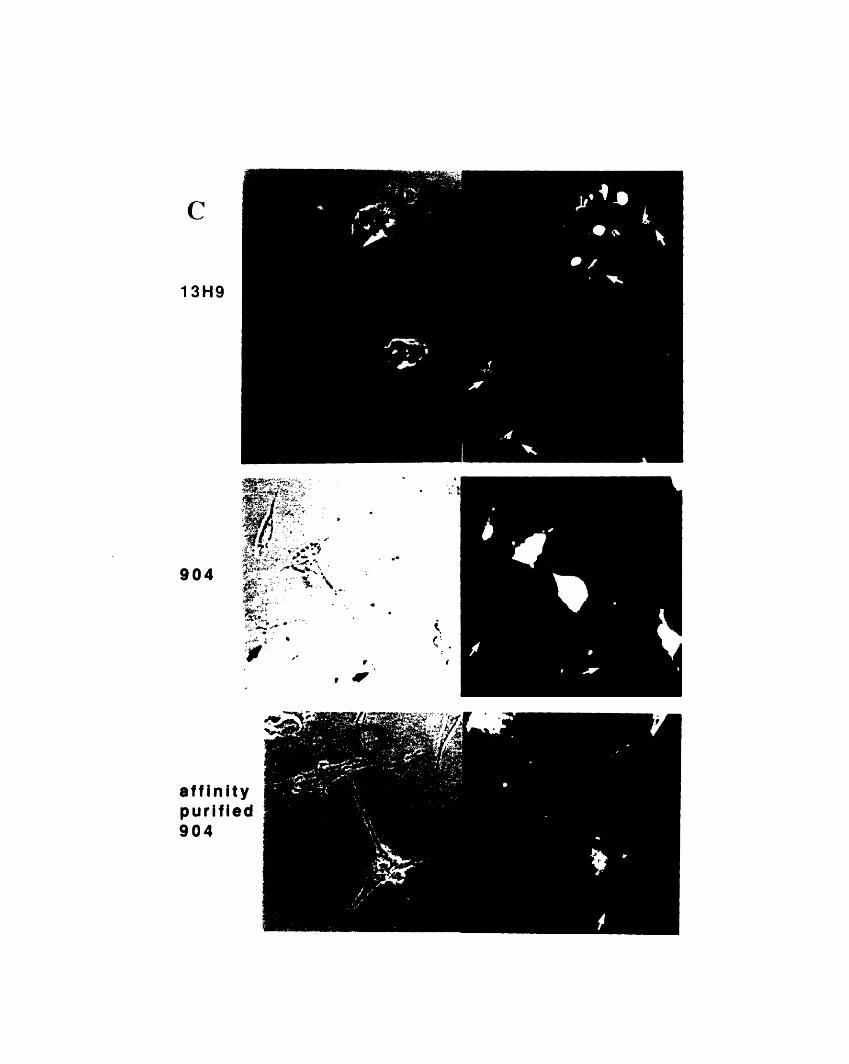
C
13H9
904
-4 4 - % -V
~f I- r .44
affinitypurified904
i
Fig.3-3. Fractionation of 904 and 13H9 antigens in chicken red blood
cells.
A. Two-dimensional separations of soluble ("SOLUBLE") or cytoskeletal
("CYOSKEL.") fractions of red blood cells obtained from day 5 embryos
("IMMATURE") or adult chickens ("MATURE") probed with 904. The
arrow points at the upper row which is positive by 13H9.
B. Two-dimensional separations of soluble ("SOLUBLE") or cytoskeletal
("CYOSKELETAL") fractions of red blood cells obtained from day 5
embryos ("IMMATURE") or adult chickens ("MATURE") probed with
13H9.
112
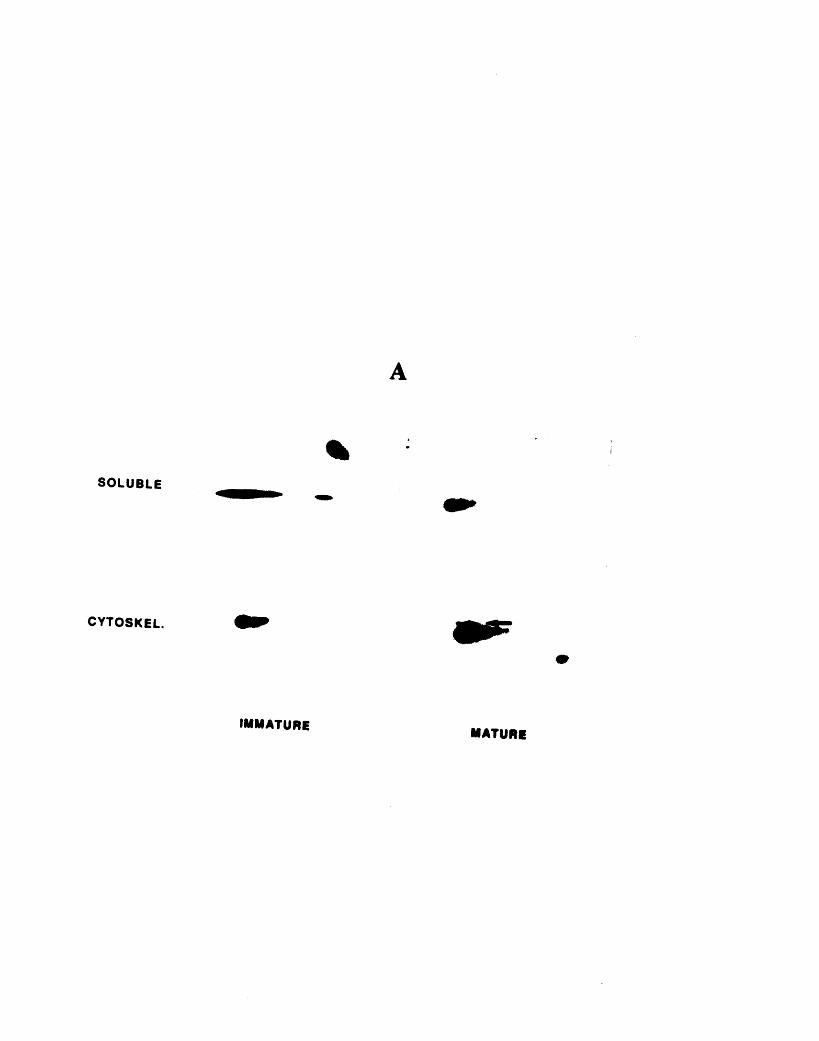
A
SOLUBLE
CYTOSKEL.
IMMATUREMATURE
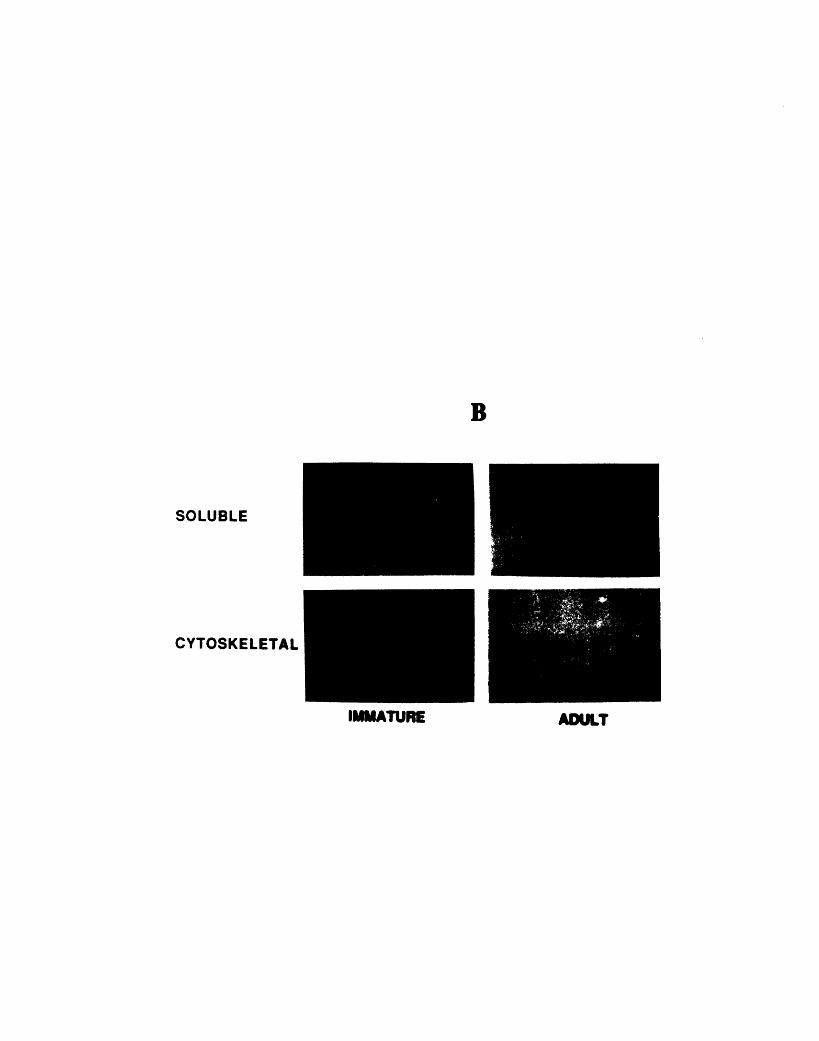
B
SOLUBLE
CYTOSKELETAL
ADULTIMMATURE
argue that the 13H9-positive isoforms fractionate in the cytoskeleton
while the 904-positive isoforms are soluble as well as cytoskeleton-
associated. The 13H9-positive isoforms might, therefore, participate in
different interactions with the cytoskeleton than the bulk of ezrin.
From these data, we also find that a protein can be 13H9-positive
and still migrate in the lower row on SDS-PAGE (see immature
cytoskeletal fractions probed with 13H9, Figure 3-3B). Therefore, any
simple model suggesting that 13H9-positive isoforms acquire slower
electrophoretic mobility is ruled out. There is no correlation between
electrophoretic mobility and 13H9 reactivity.
In embryonic red blood cells, 904 stains the marginal band more
crisply than 13H9: trouble for the subset hypothesis?
Figure 3-4 shows double immunofluorescence using 904 and 13H9
on embryonic red blood cells obtained from embryos aged 5, 7, 9, and 14
days. In day 5 cells, 904 shows punctate staining in the marginal band
with an occasional dot in the cytoplasm. 13H9, on the other hand, shows
considerable off-band staining over the nucleus and in the cytoplasm.
From this staining, one would be more likely to conclude that 904
recognized a subset of 13H9 rather than the other way around. In day 7
and 9 cells, the stainings of 904 and 13H9 are quite similar with respect
to the extent of off-band staining. By day 14, 904 shows considerable off-
band staining. In adult cells (Figure 3-2A), as discussed above, 13H9
staining is restricted to the position of the marginal band with only an
occasional cytoplasmic dot. 904, on the other hand, gives weak staining of
the marginal band with considerable nuclear and cytoplasmic staining.
115
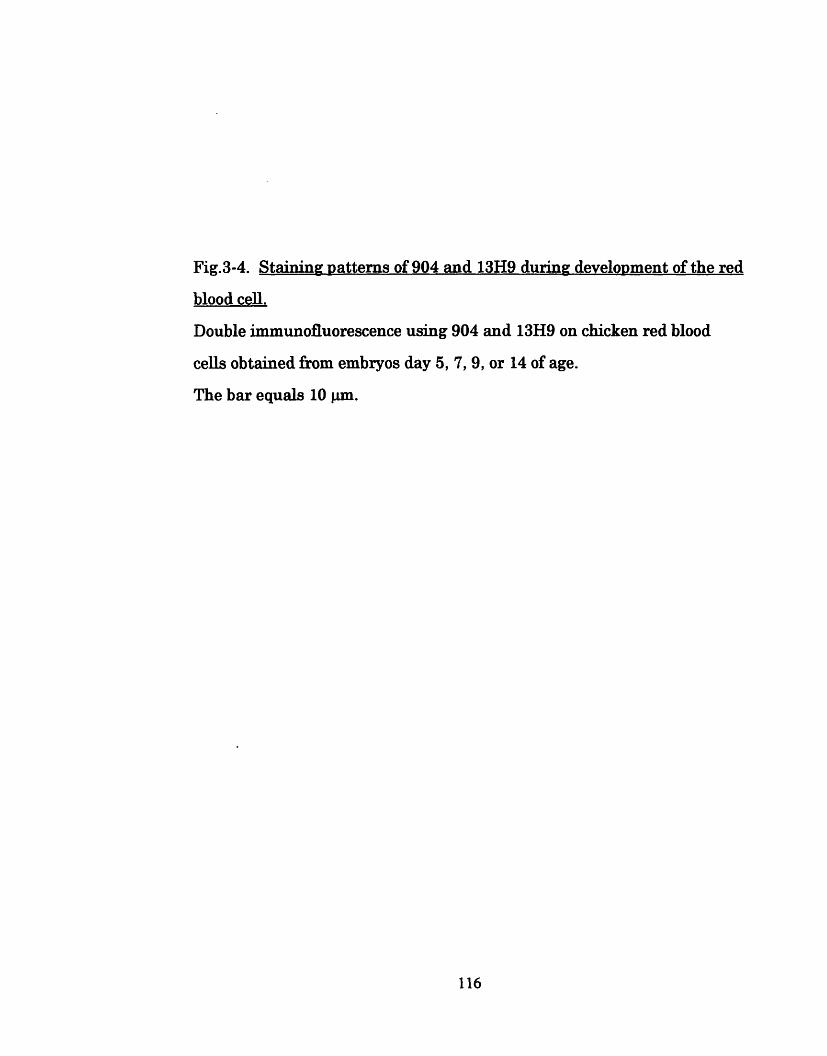
Fig.3-4. Staining patterns of 904 and 13H9 during development of the red
blood cell.
Double immunofluorescence using 904 and 13H9 on chicken red blood
cells obtained from embryos day 5, 7, 9, or 14 of age.
The bar equals 10 gm.
116
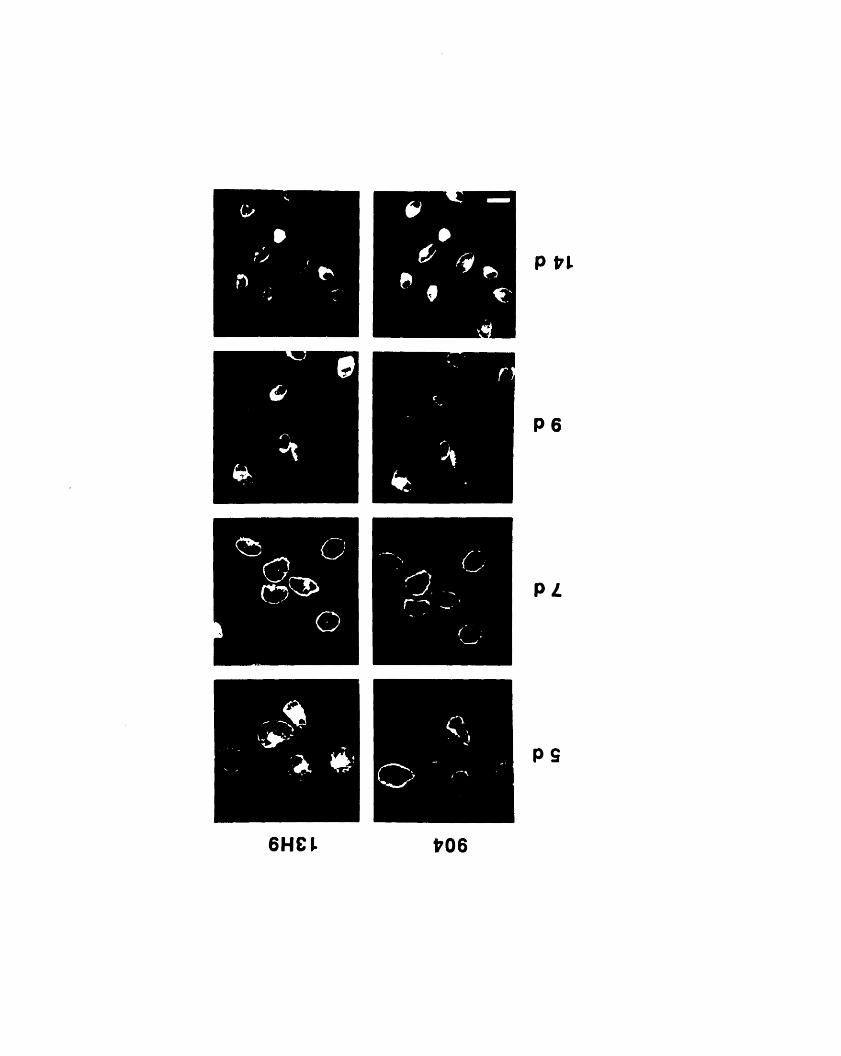
p .
P6
P L
PS
6HE l I06
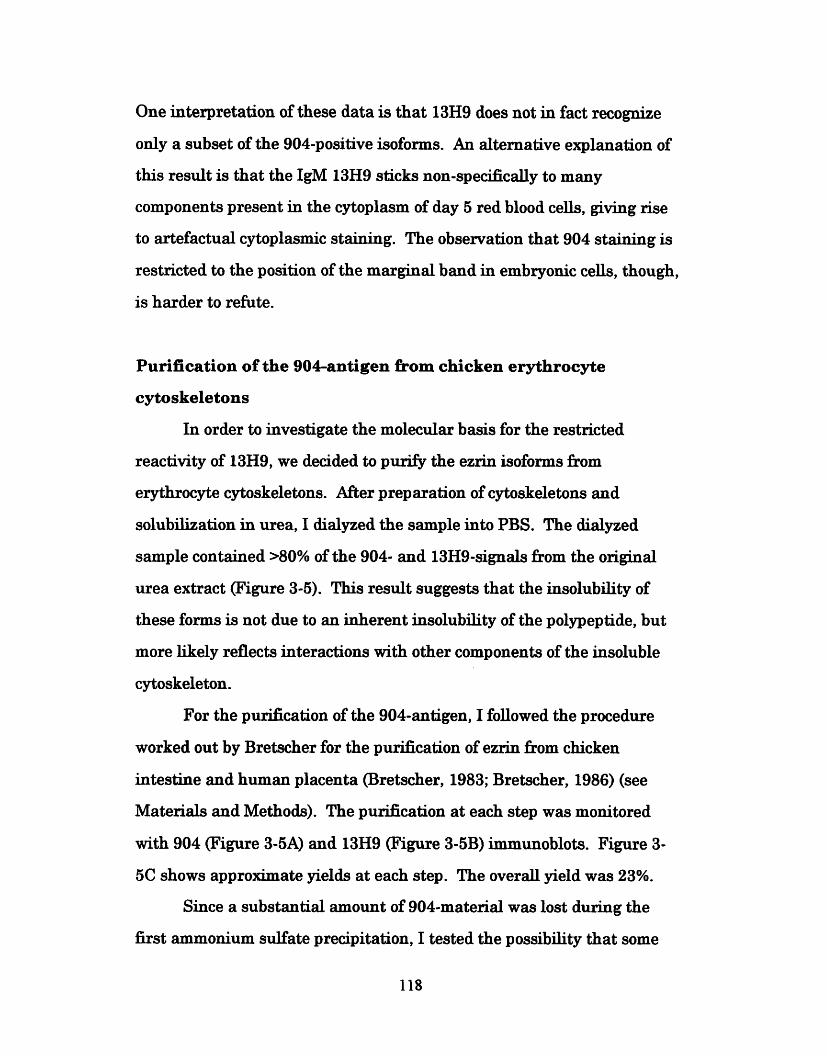
One interpretation of these data is that 13H9 does not in fact recognize
only a subset of the 904-positive isoforms. An alternative explanation of
this result is that the IgM 13H9 sticks non-specifically to many
components present in the cytoplasm of day 5 red blood cells, giving rise
to artefactual cytoplasmic staining. The observation that 904 staining is
restricted to the position of the marginal band in embryonic cells, though,
is harder to refute.
Purification of the 904-antigen from chicken erythrocyte
cytoskeletons
In order to investigate the molecular basis for the restricted
reactivity of 13H9, we decided to purify the ezrin isoforms from
erythrocyte cytoskeletons. After preparation of cytoskeletons and
solubilization in urea, I dialyzed the sample into PBS. The dialyzed
sample contained >80% of the 904- and 13H9-signals from the original
urea extract (Figure 3-5). This result suggests that the insolubility of
these forms is not due to an inherent insolubility of the polypeptide, but
more likely reflects interactions with other components of the insoluble
cytoskeleton.
For the purification of the 904-antigen, I followed the procedure
worked out by Bretscher for the purification of ezrin from chicken
intestine and human placenta (Bretscher, 1983; Bretscher, 1986) (see
Materials and Methods). The purification at each step was monitored
with 904 (Figure 3-5A) and 13H9 (Figure 3-5B) immunoblots. Figure 3-
5C shows approximate yields at each step. The overall yield was 23%.
Since a substantial amount of 904-material was lost during the
first ammonium sulfate precipitation, I tested the possibility that some
118
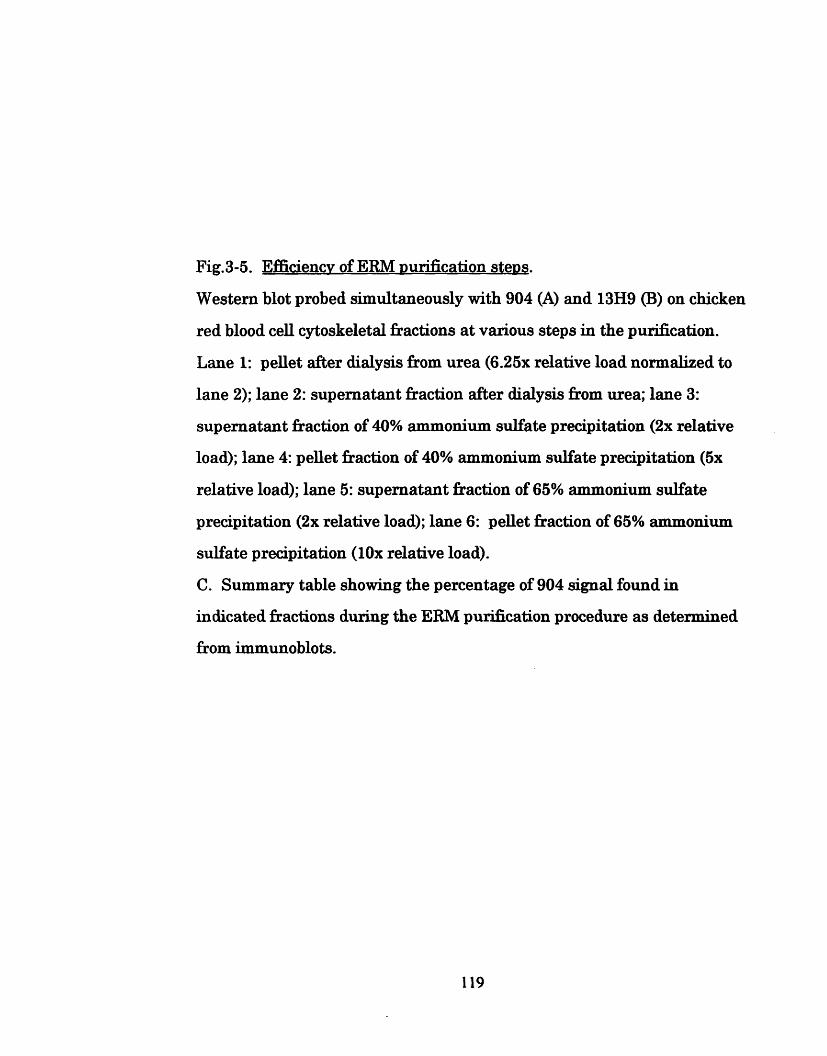
Fig.3-5. Efficiency of ERM purification steps.
Western blot probed simultaneously with 904 (A) and 13H9 (B) on chicken
red blood cell cytoskeletal fractions at various steps in the purification.
Lane 1: pellet after dialysis from urea (6.25x relative load normalized to
lane 2); lane 2: supernatant fraction after dialysis from urea; lane 3:
supernatant fraction of 40% ammonium sulfate precipitation (2x relative
load); lane 4: pellet fraction of 40% ammonium sulfate precipitation (5x
relative load); lane 5: supernatant fraction of 65% ammonium sulfate
precipitation (2x relative load); lane 6: pellet fraction of 65% ammonium
sulfate precipitation (10x relative load).
C. Summary table showing the percentage of 904 signal found in
indicated fractions during the ERM purification procedure as determined
from immunoblots.
119
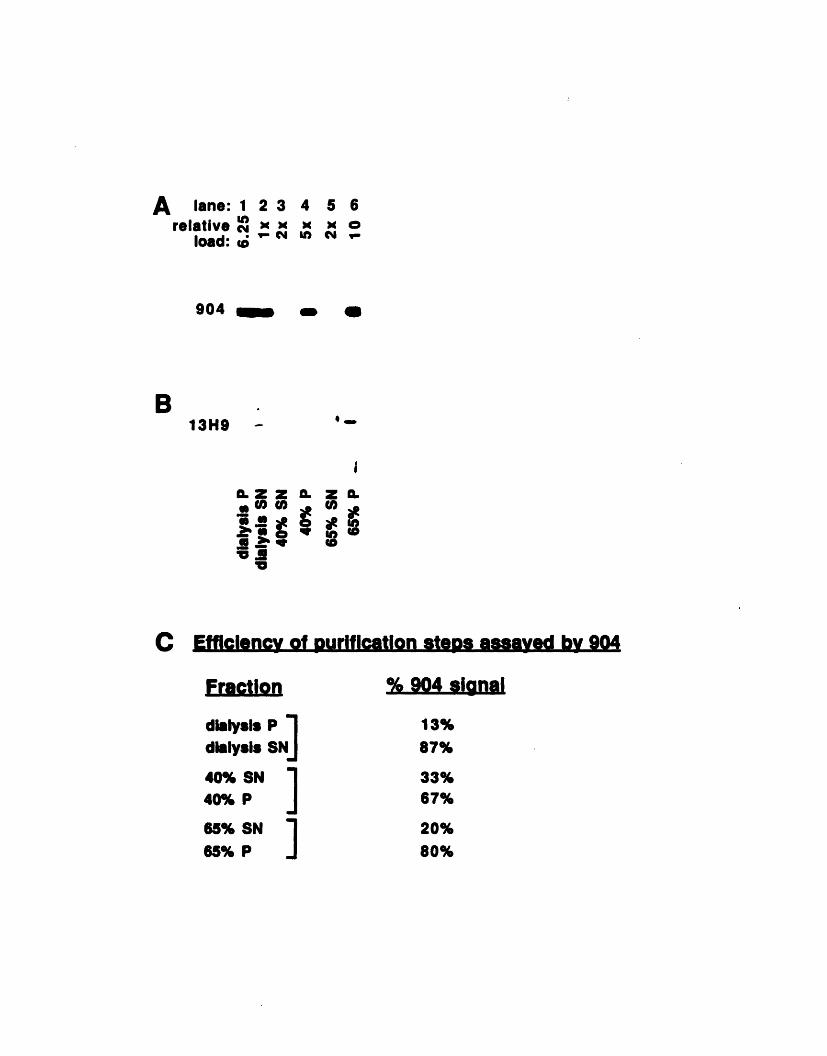
A lane: 1 2 3 4 5 6relative x x 0 °
load: e "N
904 m
B13H9 -
L Z L Z
o w
C Efficiency of urification steops assayed by 904
Fraction % 904 signal
dialysis P 13%dialysis SN 87%
40% SN 33%
40% P 67%
65% SN 1 20%
65% 80%
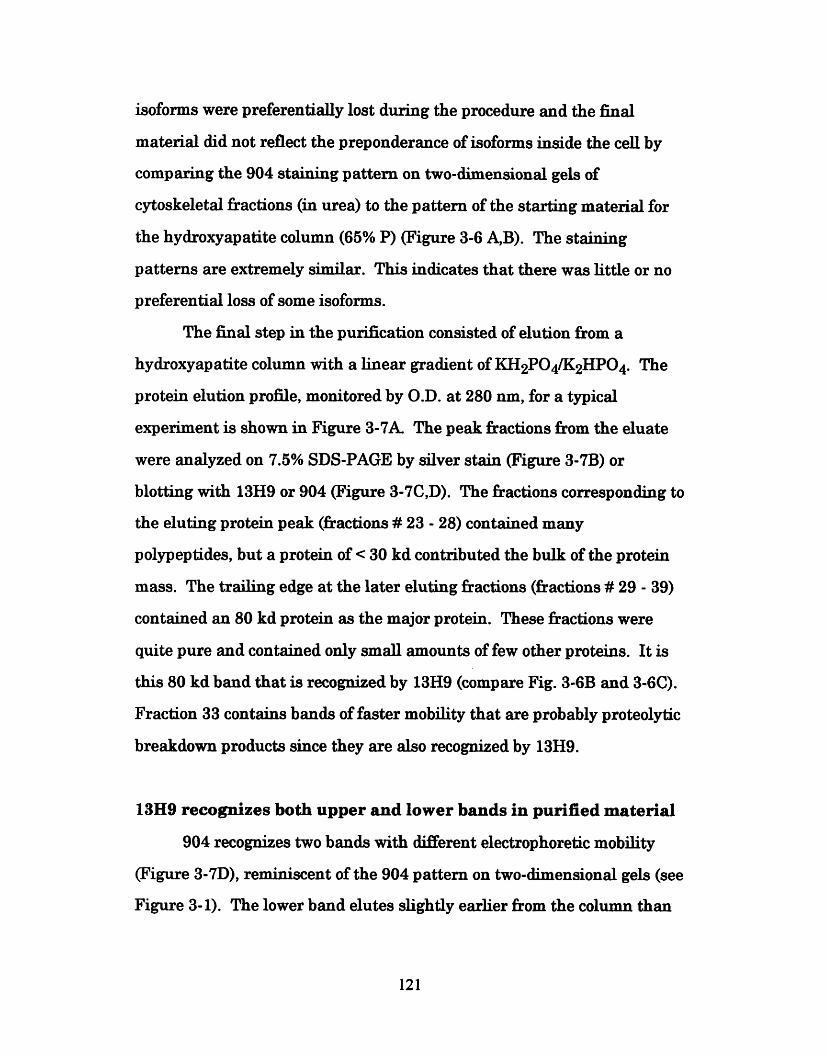
isoforms were preferentially lost during the procedure and the final
material did not reflect the preponderance of isoforms inside the cell by
comparing the 904 staining pattern on two-dimensional gels of
cytoskeletal fractions (in urea) to the pattern of the starting material for
the hydroxyapatite column (65% P) (Figure 3-6 A,B). The staining
patterns are extremely similar. This indicates that there was little or no
preferential loss of some isoforms.
The final step in the purification consisted of elution from a
hydroxyapatite column with a linear gradient of KH2PO4/K2HP0 4. The
protein elution profile, monitored by O.D. at 280 nm, for a typical
experiment is shown in Figure 3-7A. The peak fractions from the eluate
were analyzed on 7.5% SDS-PAGE by silver stain (Figure 3-7B) or
blotting with 13H9 or 904 (Figure 3-7C,D). The fractions corresponding to
the eluting protein peak (fractions # 23 - 28) contained many
polypeptides, but a protein of < 30 kd contributed the bulk of the protein
mass. The trailing edge at the later eluting fractions (fractions # 29 - 39)
contained an 80 kd protein as the major protein. These fractions were
quite pure and contained only small amounts of few other proteins. It is
this 80 kd band that is recognized by 13H9 (compare Fig. 3-6B and 3-6C).
Fraction 33 contains bands of faster mobility that are probably proteolytic
breakdown products since they are also recognized by 13H9.
13H9 recognizes both upper and lower bands in purified material
904 recognizes two bands with different electrophoretic mobility
(Figure 3-7D), reminiscent of the 904 pattern on two-dimensional gels (see
Figure 3-1). The lower band elutes slightly earlier from the column than
121
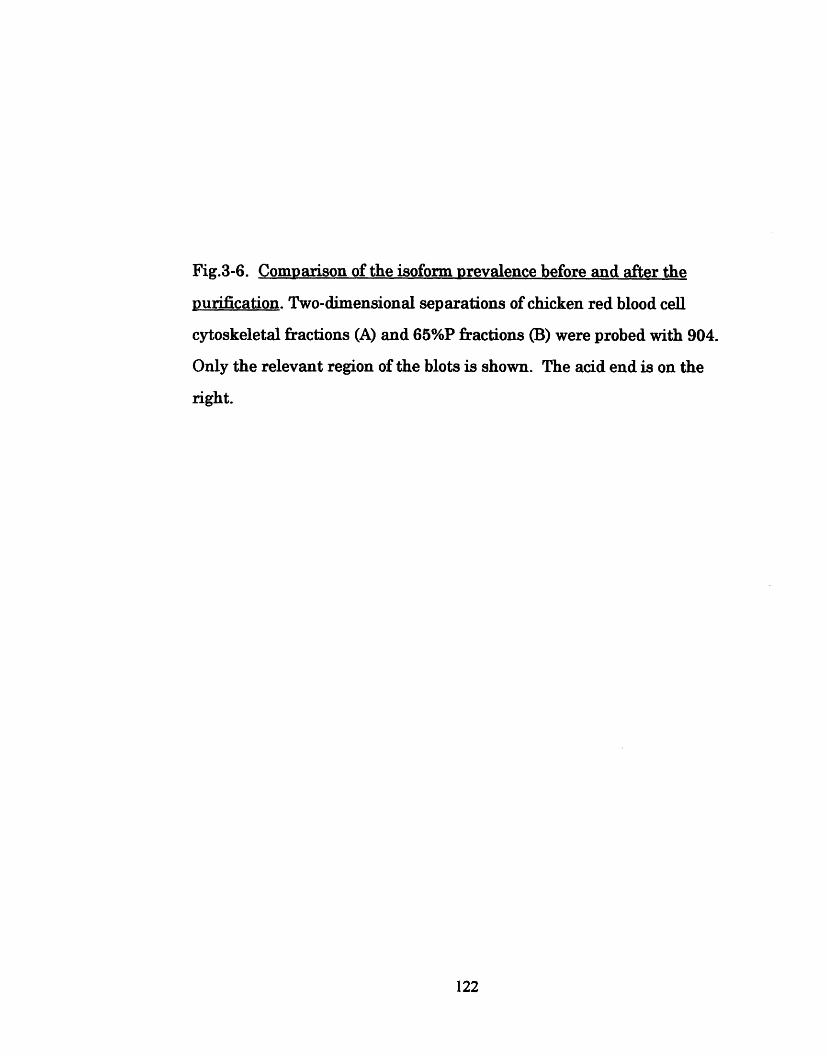
Fig.3-6. Comparison of the isoform prevalence before and after the
purification. Two-dimensional separations of chicken red blood cell
cytoskeletal fractions (A) and 65%P fractions (B) were probed with 904.
Only the relevant region of the blots is shown. The acid end is on the
right.
122
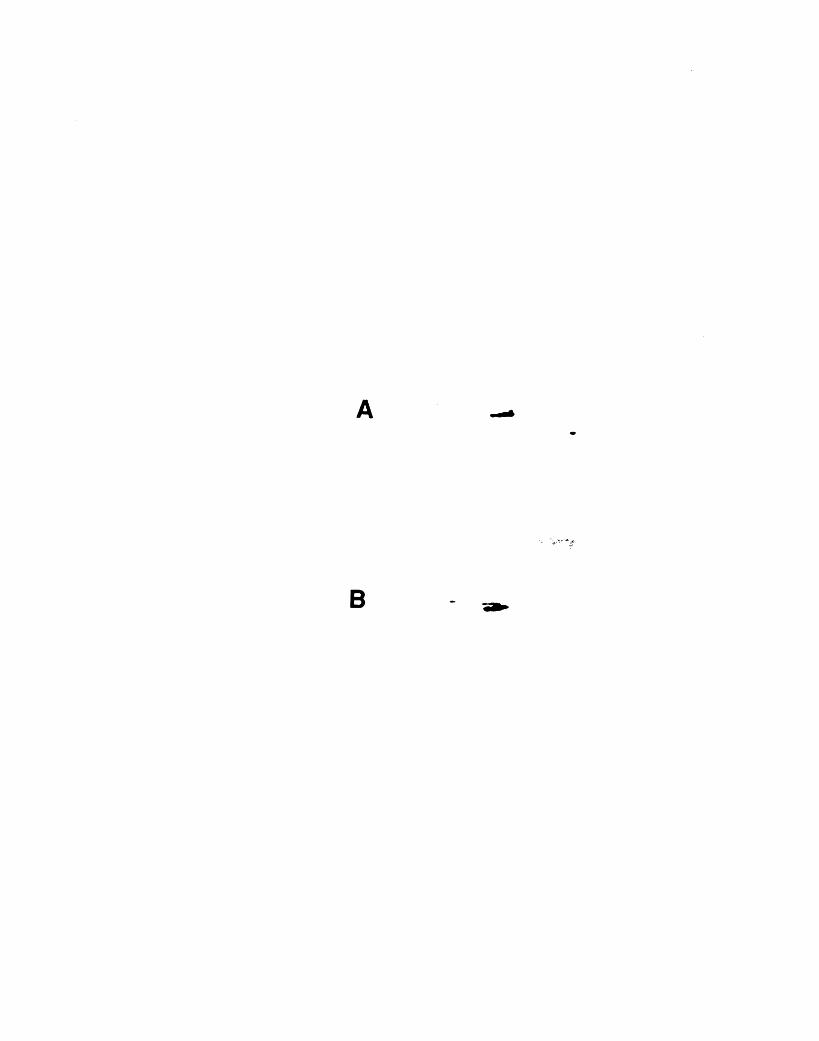
A
B
Fig.3-7. Purification of ERM-proteins from chicken erythrocyte
cytoskeletons.
A. Elution profile from the hydroxyapatite column monitored by O.D. at
280 nm. A single protein peak elutes in a linear gradient of
KH2PO4/K2HPO4. Eluate fractions 24 through 39 were used for the
analysis shown in B, C and D.
B. Silver stained gel of the hydroxyapatite column fractions. The
flowthrough fraction 4 and eluate fractions 24 through 39 were separated
on a 7.5% SDS-PAGE and silver-stained. The trailing edge of the protein
peak (fractions 29 - 39) contains an 80 kd band as the major species.
Fraction 33 suffered some proteolysis (lower bands).
C, D. Double Western blots using 13H9 (C) and 904 (D) on the
hydroxyapatite column fractions, visualized with 12 5I-protein A or an
alkaline phosphatase catalyzed Color reaction. On a blot containing the
same fractions as in B, 13H9 recognizes the 80 kd band in the trailing
edge fractions and a minor species of faster mobility in fractions 25
through 30. The arrows point at the position of the doublet recognized by
13H9. 904 recognizes the faster mobility species with similar intensity as
the 80 kd band.
124
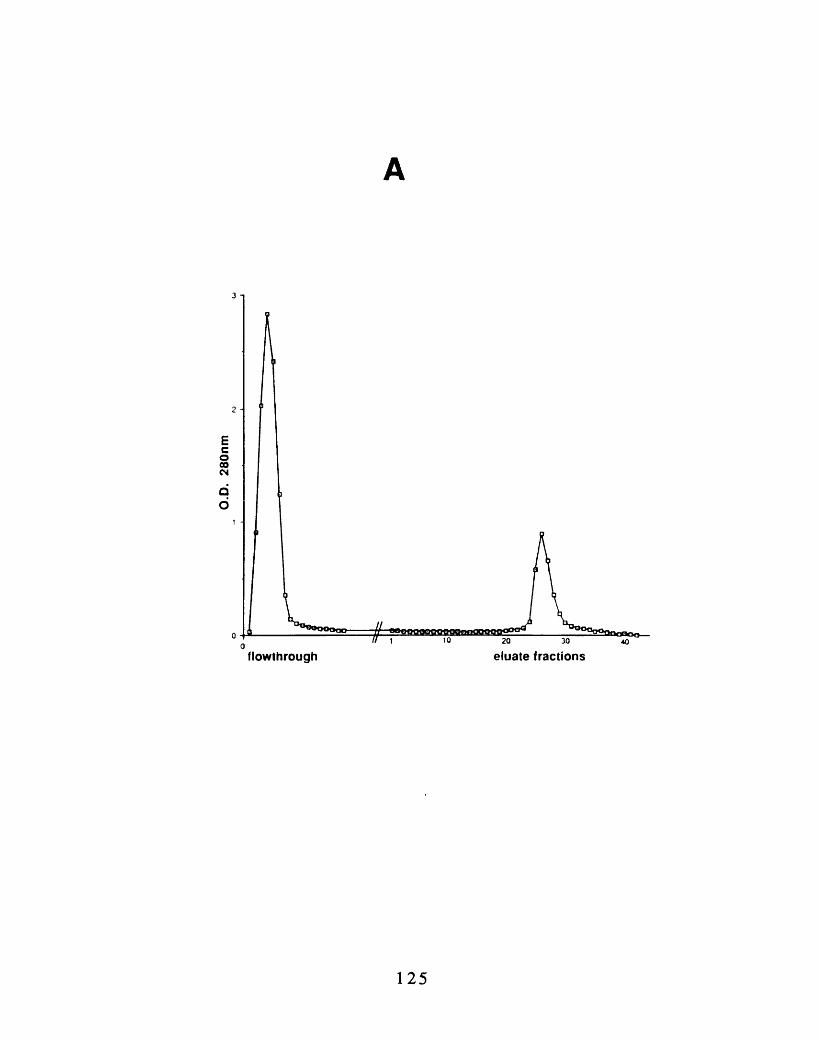
A
40
flowthrough eluate fractions
125
EC0co
d6
u
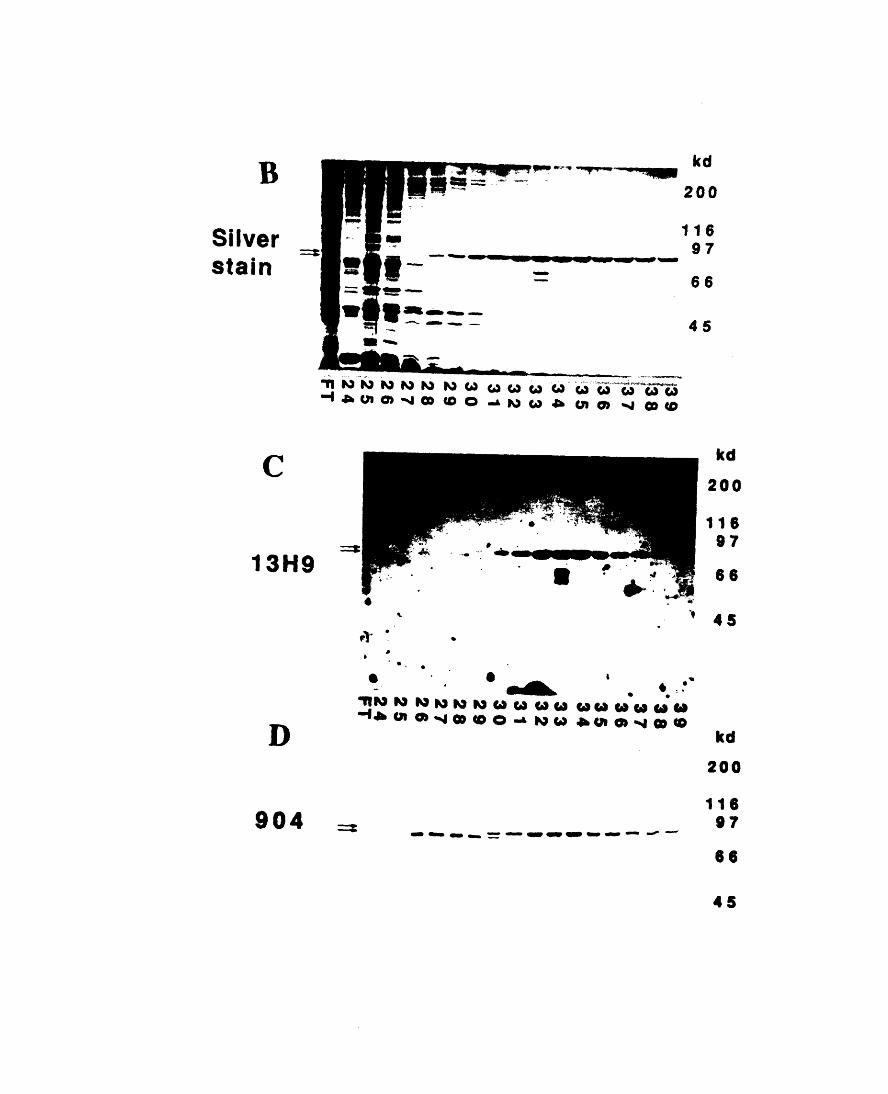
B
Silverstain
C
13H9
In .M " l 1f n b c" - C (DOco to 0 UIO .. D
b
UcaJ 0
0
=r mmI, m,,'Z1 -·· -· ~ ~, L I-
kd
200
11697
66
45
kd
200
11697
66
45
D
!.
o oWW (
904
kd
200
11697
66
45
r mmwmm - " '-' '
_
- - fw C w -A " w :b
-mm _
_so
a
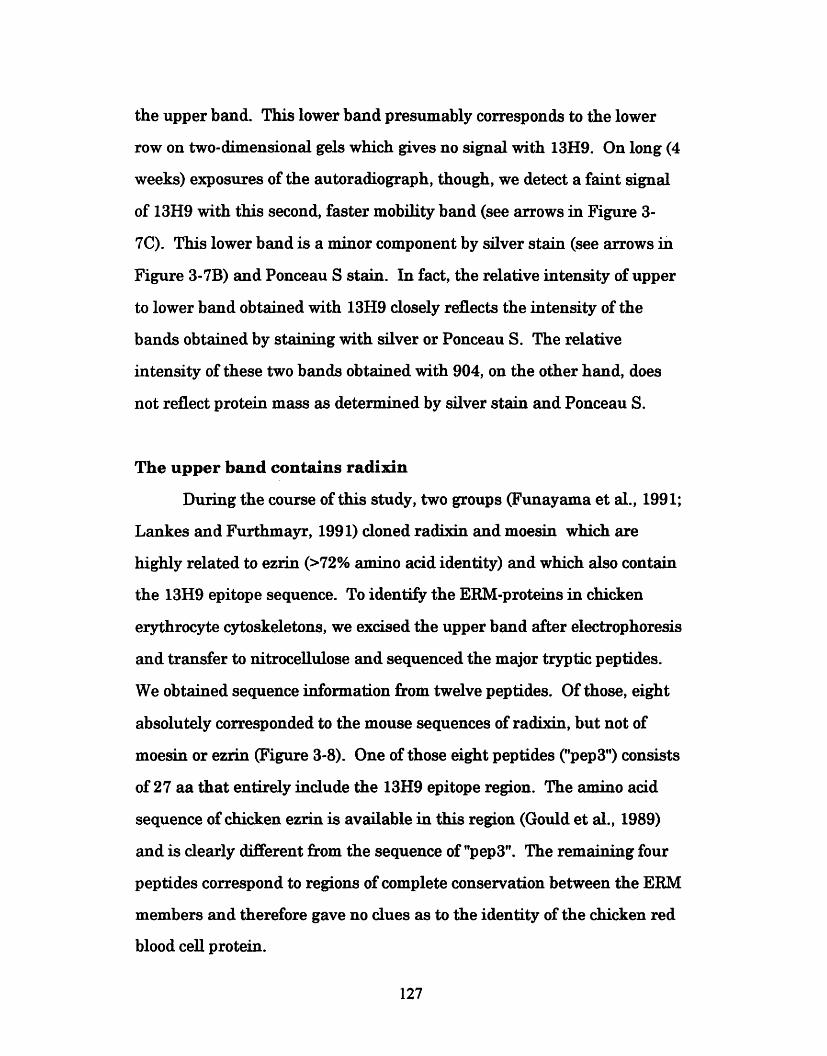
the upper band. This lower band presumably corresponds to the lower
row on two-dimensional gels which gives no signal with 13H9. On long (4
weeks) exposures of the autoradiograph, though, we detect a faint signal
of 13H9 with this second, faster mobility band (see arrows in Figure 3-
7C). This lower band is a minor component by silver stain (see arrows in
Figure 3-7B) and Ponceau S stain. In fact, the relative intensity of upper
to lower band obtained with 13H9 closely reflects the intensity of the
bands obtained by staining with silver or Ponceau S. The relative
intensity of these two bands obtained with 904, on the other hand, does
not reflect protein mass as determined by silver stain and Ponceau S.
The upper band contains radixin
During the course of this study, two groups (Funayama et al., 1991;
Lankes and Furthmayr, 1991) cloned radixin and moesin which are
highly related to ezrin (>72% amino acid identity) and which also contain
the 13H9 epitope sequence. To identify the ERM-proteins in chicken
erythrocyte cytoskeletons, we excised the upper band after electrophoresis
and transfer to nitrocellulose and sequenced the major tryptic peptides.
We obtained sequence information from twelve peptides. Of those, eight
absolutely corresponded to the mouse sequences of radixin, but not of
moesin or ezrin (Figure 3-8). One of those eight peptides C'pep3") consists
of 27 aa that entirely include the 13H9 epitope region. The amino acid
sequence of chicken ezrin is available in this region (Gould et al., 1989)
and is clearly different from the sequence of "pep3". The remaining four
peptides correspond to regions of complete conservation between the ERM
members and therefore gave no clues as to the identity of the chicken red
blood cell protein.
127
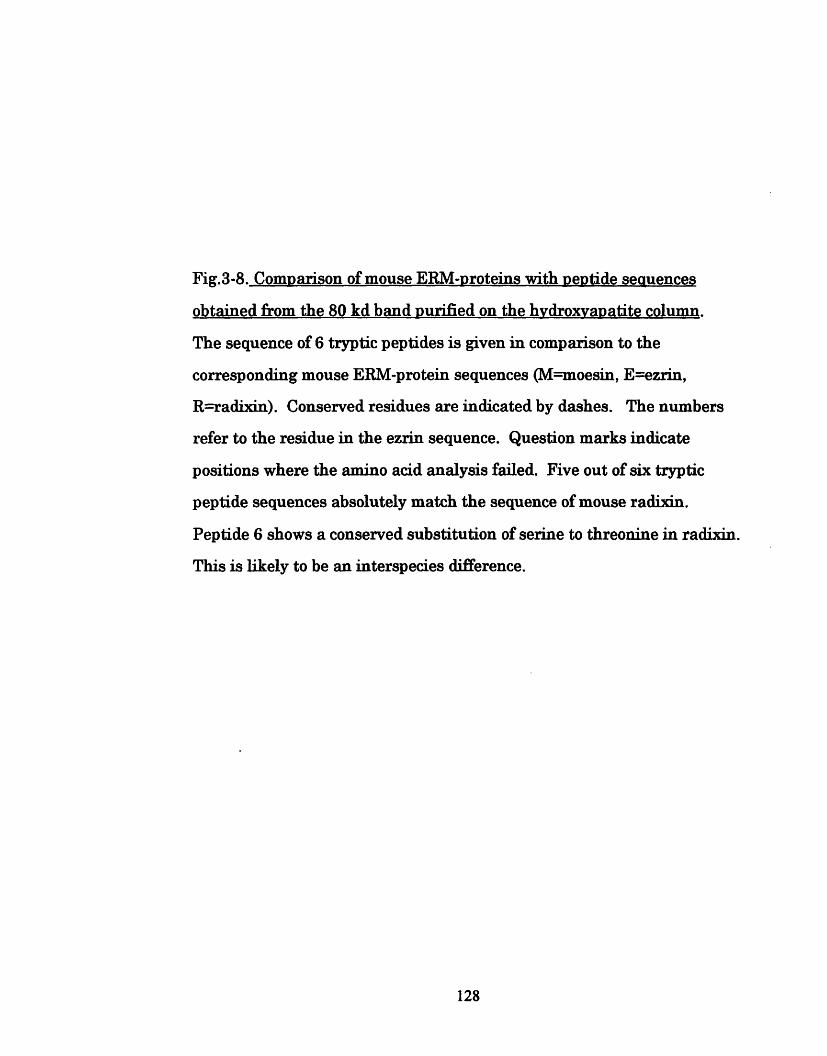
Fig.3-8. Comparison of mouse ERM-proteins with peptide sequences
obtained from the 80 kd band purified on the hydroxyapatite column.
The sequence of 6 tryptic peptides is given in comparison to the
corresponding mouse ERM-protein sequences (M=moesin, E=ezrin,
R=radixin). Conserved residues are indicated by dashes. The numbers
refer to the residue in the ezrin sequence. Question marks indicate
positions where the amino acid analysis failed. Five out of six tryptic
peptide sequences absolutely match the sequence of mouse radixin.
Peptide 6 shows a conserved substitution of serine to threonine in radixin.
This is likely to be an interspecies difference.
128
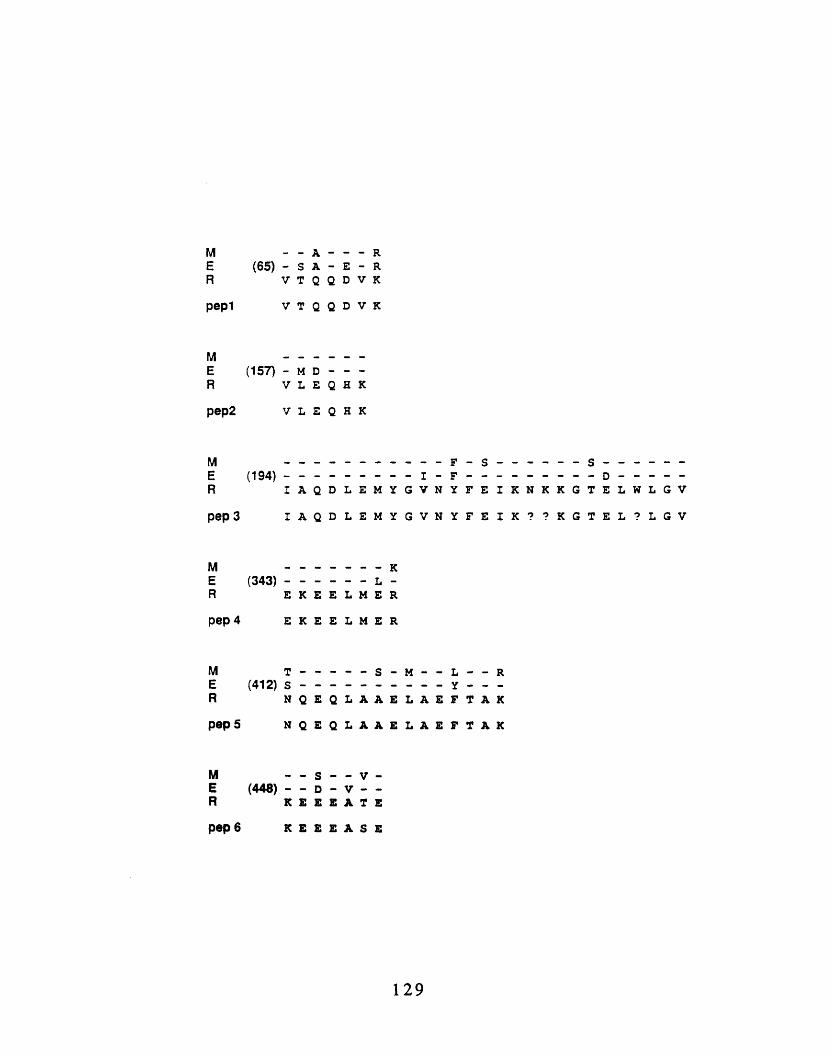
- - A - - - R(65) - S A - E - R
VT Q Q D VK
VTQQDVK
(157) - M D- - -VL EQ H K
VLEQHK
(194)IAQDLEMI A Q D L E M
- - - - F - S - - - - - - S- - I - F - - - - - - - - - D - - - - -YGVNYFE I KNKKGTELWLG V
IAQDLEMYGVNYFE IK? ?KGTEL ? L G GVV
(343) - - - - - -L -EK X E ELMEREKEELMER
T(412) S
N
- - - - -S - M- - L- - R
QEQLAAELAE F T AK
NQEQLAAELAAE EF TA
(448) - - D - v- -KEEEATEKE E EAS E
129
MER
pep1
MER
pep2
MER
pep 3
MER
pep 4
MER
pep 5
MER
pep 6
The conclusion that the upper band contained radixin is supported
by the fact that an anti-peptide anti-radixin antibody (antiserum 457, see
Chapter 4 for details on the antibody) recognized the upper band on both
two-dimensional separations of chicken erythrocyte cytoskeletons and on
one-dimensional separations of eluates from the hydroxyapatite column
(Figure 3-9A,B)
Identity of the lower band
Due to its low abundance, we were unable to obtain peptide
sequence from the lower band. Since 904 was raised against purified
intestinal ezrin, it was possible that the lower band corresponded to ezrin.
We tested the possibility that the lower band corresponded to either ezrin
or moesin by using immunoblots with anti-peptide antibodies specific to
only one ERM-protein (see Chapter 4 for details on the antibodies).
Figure 3-10 shows adjacent strips with erythrocyte cytoskeletons probed
with 904, anti-ezrin (464), and anti-moesin (458) antibodies. All three
anti-peptide antibodies recognize a band of slower mobility and not the
lower band preferentially recognized by 904. The same is true when
eluates from the hydroxyapatite fraction were probed (Figure 3-11). To
test whether the lower band from eluates, in fact, was immunologically
related to ezrin, I probed the eluates with 904, affinity-eluted from the 3'
SacI-SacI ezrin fusion protein (Figure 3-12). The affinity-eluted
antibodies still recognized both rows in eluate fractions, consistent with
our finding on whole cytoskeletons (Figure 3-1C).
130
Fig.3-9. Anti-radixin antibody 457 recognizes the upper band in both two-
dimensional separations of chicken erythrocyte cytoskeletons and eluates
from the hydroxyapatite column.
A. Immunoblot of two-dimensional separations of chicken erythrocyte
cytoskeletons probed with anti-radixin antibody 457. The acid end is on
the right.
B. One-dimensional immunoblot of eluates from the hydroxyapatite
column probed with anti-radixin antibody 457.
131
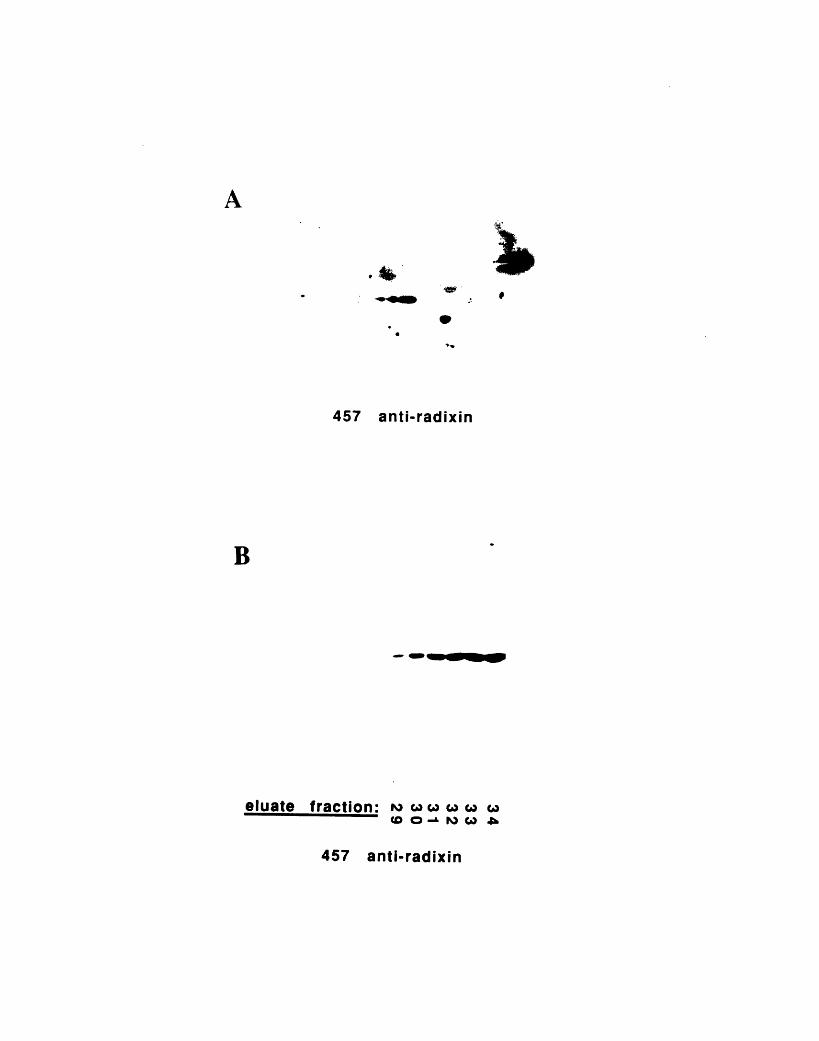
A
457 anti-radixin
457 anti-radixin
B
eluate fraction: "(a co c~ w ww 0 A co-sED O- M) X
457 anti-radixin

Fig.3-10. None of the ERM antibodies recognizes the lower band in red
blood cell cytoskeletal fractions.
Adjacent strips of chicken erythrocyte cytoskeletons were probed with
904, or specific anti-peptide antibodies to ezrin (464), radixin (457), and
moesin (458).
133
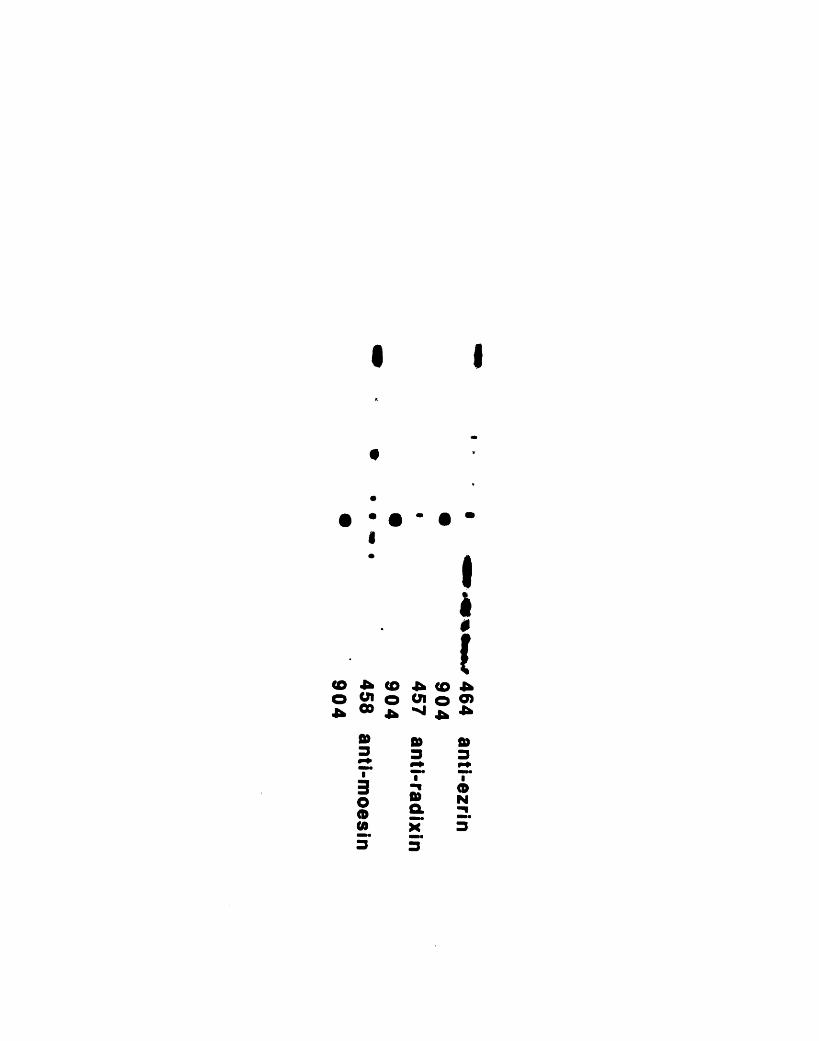
I
0.
O .bo h 0co
P
0-
300mO
10oO
SE
%,.
I
iI~
0)
Bi,
NSE'
Fig.3-11. None of the ERM antibodies recognizes the lower band in eluate
fractions.
Three eluate fractions from the hydroxyapatite column separated on 5%
SDS-PAGE were probed with the anti-peptide antibodies 454 (anti-
moesin) (A; lane 1), and 464 (anti-ezrin) (B; lane 1) and visualized with
125I-protein A. Subsequently, the same blots were probed with 904 (lane
2 in A and B) and developed with an alkaline phosphatase catalyzed Color
reaction. No bands were bound by the 464 preimmune serum (C). Only
the lower half of the blots is shown.
135
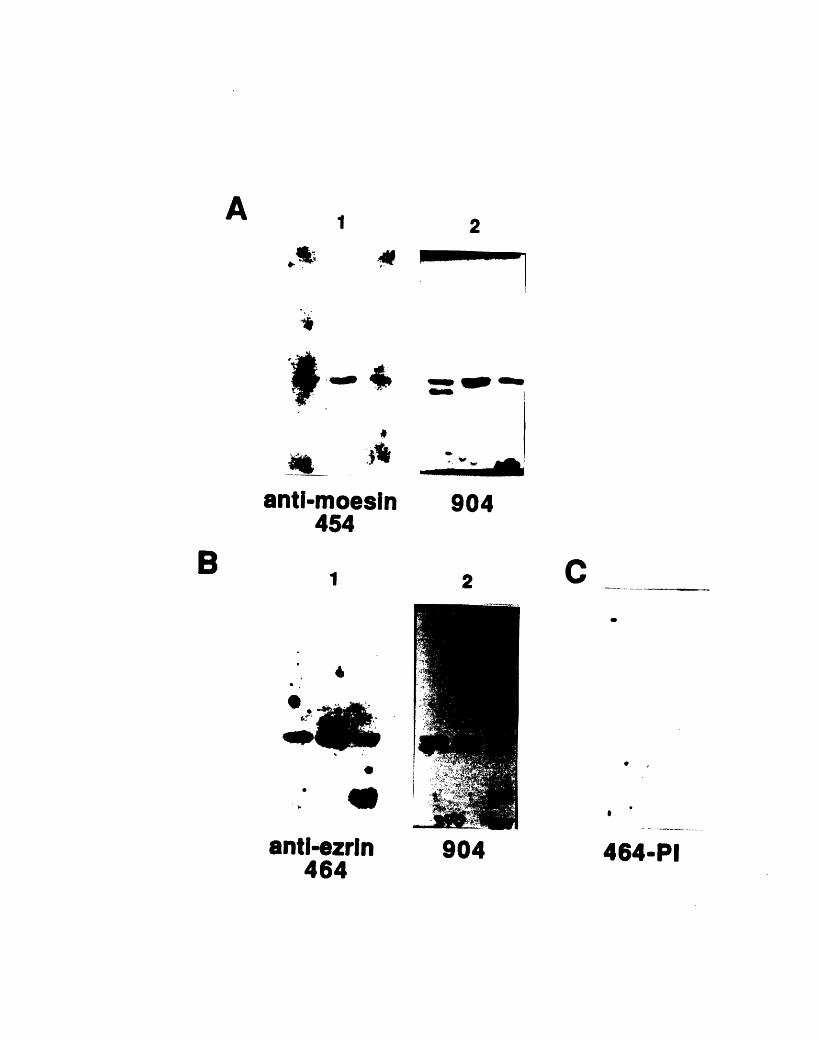
1
V
anti-moesin454
1
46
antl-ezrin464
I
464-PI904
A2
B
904
2 C
BBIommwm
"No 4,
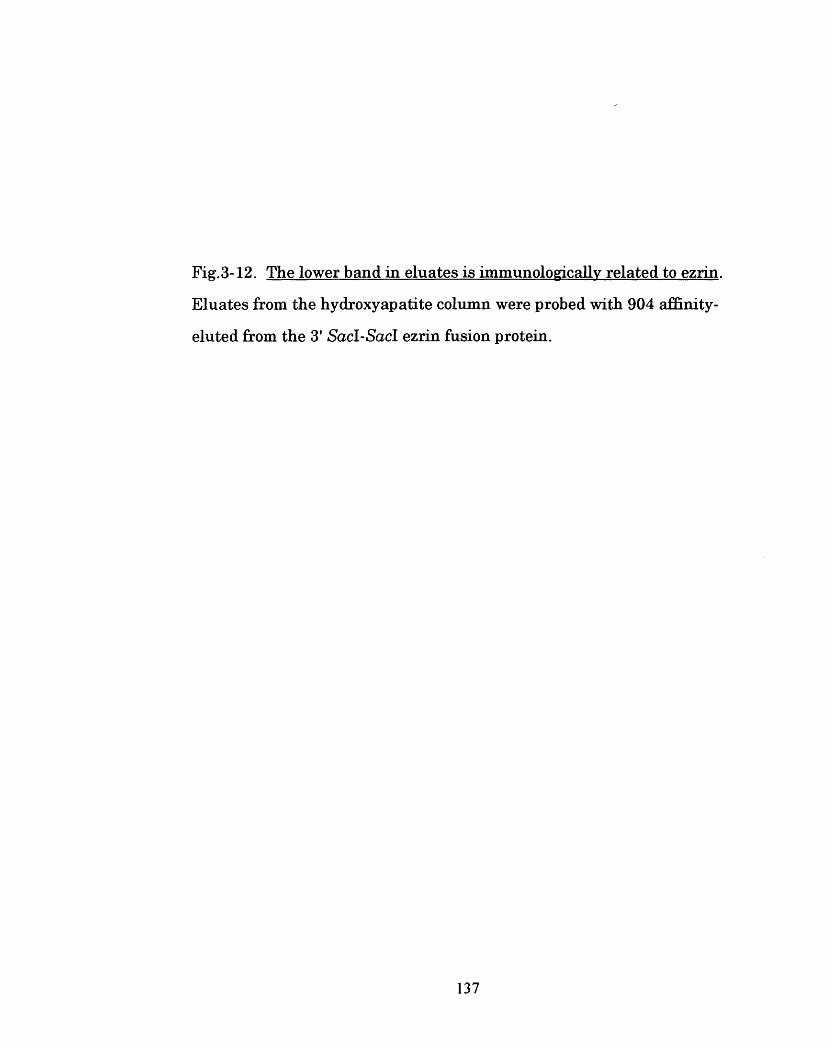
Fig.3-12. The lower band in eluates is immunologically related to ezrin.
Eluates from the hydroxyapatite column were probed with 904 affinity-
eluted from the 3' SacI-SacI ezrin fusion protein.
137
Affinity-eluted904 on eluates
__m
Discussion
The data described here provide evidence that -- counter to our
hypothesis-- 13H9 recognizes both the upper and the lower band and its
reactivity is not restricted to a subset of isoforms. 904, on the other hand,
shows biased reactivity with the lower row, and its staining intensities do
not reflect protein amounts. It appears that 13H9 is a low affinity
reagent (as is common for IgM molecules) and gives no signal for the low
amount of lower band protein present in cytoskeletal fractions. Upon
enrichment of the lower band by purification, 13H9 does react with this
lower band as well as with the prominent upper band. This raises the
strong possibility that 13H9 in fact recognizes all proteins carrying the
epitope sequence (ezrin, moesin, radixin, and merlin/schwannomin).
We have identified radixin as the major cytoskeletal ERM-protein
in adult chicken erythrocytes by purifying and obtaining peptide sequence
from the major protein. The peptide sequences obtained were all identical
or highly related to the sequence of mouse radixin. ("Pep6" shows a
conserved substitution of serine to threonine for radixin. This is likely to
be an interspecies difference.) No peptides contained sequences of other
ERM-proteins. Therefore, radixin must make up the majority of the
upper band. Of course, some contamination (up to 20%; Richard Cook
(M.I.T. Biopolymers Facility), personal communication) by other ERM-
proteins would not be picked up during the sequencing. We believe that
the upper band probably does contain moesin and ezrin as well, because
specific anti-peptide antibodies bind to it.
The identity of the lower band is unknown as of now. We know
that it fractionates differently on hydroxyapatite columns from the upper
139
band, and that it is recognized preferentially by antiserum 904. It is
recognized by 13H9 --albeit weakly-- and must, therefore, contain the
13H9 epitope region. It is also recognized by 904 affinity-eluted off the 3'
SacI-SacI TrpE-human ezrin fusion proteins and, therefore, shares other
epitopes besides the 13H9-epitope with ezrin. It appears that the lower
band is immunologically related to the ERM proteins, even though it is
recognized by neither anti-radixin, anti-moesin nor anti-ezrin sera. 904
was raised against ezrin purified from chicken intestinal brush border.
The purified protein contained ezrin by peptide sequence, but might have
contained other minor related contaminants. In this context, it is
interesting to note that another antibody raised against purified chicken
intestinal ezrin by Bretscher (serum 507) also recognizes the lower row of
spots on two-dimensional separations of chicken erythrocyte cytoskeletons
(Eric Birgbauer, unpublished observations).
There are two possible explanations for this set of results. First,
the lower band could be a fourth member (unknown or possibly merlin) of
the ERM-family that shares regions of homology with ezrin, but does not
contain the region spanning the peptide used for raising the anti-ezrin
serum. A major reactivity of the 904 antiserum, in this case, would be
directed to an epitope present in this fourth member, but not in ezrin or
any other ERM protein. This putative fourth member would be present in
both chicken erythrocytes and intestinal brush border.
Secondly, the lower band could be a breakdown product of a known
ERM protein contained in the upper row. If it were a breakdown product
of radixin, a major reactivity of the 904 antiserum must be directed to an
epitope arising after proteolysis to account for the preferential recognition
of the lower band by 904. Additionally, 904 would not recognize this
140
"proteolysis-specific" epitope in the full length protein. The proteolyzed
lower band would lack the C-terminal -100 amino acid because it retains
no reactivity with the anti-peptide antibody 457. Since the lower band is
only about 2-3 kD (rather than 10 kD) smaller than the upper band by
its mobility on SDS-PAGE, one also needs to invoke abnormal mobility of
the proteolyzed protein. The proteolysis event creating the major 904
epitope is very specific because the proteolysis products in fraction 33 are
not reactive with 904 at all. This scenario might be less likely than the
scenario of a fourth protein. But there is, in fact, precedent for an
antibody recognizing only the shorter, but not the full length protein: in
Saccharomyces cerevisiae, Wendy Katz created a 1-tubulin gene missing
the last 12 amino acids. This "tailless" 3-tubulin is recognized by an
antibody against its C-terminus. Even though this C-terminal peptide is
present in wild type full length -tubulin, this antibody does not bind to it
either on immunoblots or by immunofluorescence (Katz and Solomon,
1988).
If the lower band were a breakdown product of either moesin or
ezrin, it again would have to lack the C-terminal 100 amino acids and
migrate abnormally for its molecular size. Since we do not know the
abundance of ezrin or moesin in the upper band, we cannot address
whether there is preferential recognition of the lower band. Therefore, we
cannot at this point rule out the possibility that the lower band is a
breakdown product of the upper band.
The data described in this chapter clarify the reactivities of both
13H9 and 904. 13H9 recognizes an epitope common to at least four
proteins and is likely to be a universal ERM-reagent. 904, on the other
hand, is not a universal ERM-reagent, but shows preferred binding to the
141
lower row protein. Because of its unknown reactivities, 904 is a reagent
of limited use. These new data predict that at least one of the four
proteins sharing the 13H9 epitope is present in each of the 13H9-positive
structures, thereby significantly simplifying the first question at hand:
which protein gives rise to the 13H9 staining of the marginal band, of
leading edges, of growth cones etc.? In the next chapter, we report on
anti-peptide antibodies specific to individual ERM-proteins which enable
us to answer that question. We now have results that show staining of
growth cones from embryonic chick sympathetic neurons with affinity-
purified anti-radixin antibody as well as with affinity-purified 904 (Charo
Gonzalez Agosti, unpublished observations). In Chapter 4, we
characterize the ERM-proteins in one of the structures mentioned above,
the marginal band.
142
Chapter 4
Expression and Localization of ERM-Proteins in aSimple Cell, the Chicken Erythrocyte
143
Introduction
Differentiated cells express a wide variety of asymmetric
morphologies that are often intimately linked to the cells' functioning in
the body. Drug interference experiments and morphological correlations
indicate that the cytoskeleton is involved in establishing and maintaining
these asymmetric cell shapes. The cytoskeletons in these various cell
types are composed of essentially the same major building blocks (tubulin,
actin and intermediate filament subunits). We are interested in the
question of how a particular cell shape is specified. The existence of
minor cytoskeletal components might account for the establishment of
different shapes by differentially regulating the form and function of the
major cytoskeletal elements. Proteins that interact with microtubules
(Matus, 1988; Tucker, 1990; Wiche, 1989; Wiche et al., 1991) or
microfilaments (Pollard and Cooper, 1986; Matsudaira, 1991; Stossel,
1993; Luna, 1991) in vitro have been described in many systems.
As a model system for studying how the cytoskeleton specifies
asymmetric cell shape, we have tried to understand a relatively simple
asymmetric cell shape, that of the chicken erythrocyte, and its relatively
simple cytoskeletal structure, the marginal band. The chicken
erythrocyte is shaped like a flattened ellipsoid. At the equator of this
ellipsoid lies a bundle of microtubules, the marginal band. The marginal
band is thought to play a role in establishing the asymmetric shape of the
mature cell (Behnke, 1970a). The marginal band is the only microtubule-
containing element of the chicken red blood cell, and it is precisely
conserved qualitatively and quantitatively in each cell: the position of the
marginal band in the cell and the number of microtubule profiles in each
144
marginal band are highly conserved in each individual cell. Some other
proteins beside tubulin have also been found in the position of the
marginal band: a significant fraction of the cell's F-actin (Kim et al., 1987)
and at least two proteins that interact with microtubules in vitro, tau
(Murphy and Wallis, 1985), and syncolin (Feick et al., 1991).
Functional interactions between the cell membrane and the
cytoskeleton are required for many cellular events, including the
establishment of cell shape. The marginal band may serve as a valuable
model system for identifying proteins that modulate interactions between
cytoskeletal elements and the cell membrane for several reasons:
Microtubules, F-actin and a domain of the plasma membrane are in close
apposition to one another. There is little apparent heterogeneity of
microtubule and microfilament organization in the cell. One can obtain
large quantities of adult cells. One can obtain fairly homogeneous
populations of developmental precursor cells from the circulation of young
embryos. In order to understand the marginal band on a molecular level,
we conducted a monoclonal antibody search and identified a monoclonal
antibody, 13H9, that decorates the position of the marginal band and
binds to an 80kd protein (Birgbauer and Solomon, 1989). The 13H9
antigen behaves as if it were a stable component of the marginal band. It
is not restricted to chicken erythrocytes. Rather, it is present in actin-rich
structures such as growth cones of neurons in culture (Goslin et al., 1989;
Birgbauer et al., 1991) and leading edges of fibroblasts (E. Birgbauer,
Ph.D. Thesis M.I.T.). In neurons, it has properties indicating a possible
association with both microtubules and microfilaments (Birgbauer and
Solomon, 1989; Goslin et al., 1989). Because of its interesting properties
and distribution, we have studied the 13H9 antigen further.
145
We showed previously that 13H9 binds to purified intestinal ezrin
(Birgbauer and Solomon, 1989). Two more recently identified proteins,
moesin and radixin, are highly related to ezrin (75% amino acid identity)
(Funayama et al., 1991; Lankes and Furthmayr, 1991). Ezrin was
initially identified as a minor component of brush border microvilli and is
found in actin-rich surface structures of many cell types (Bretscher, 1989;
Franck et al., 1993; Turunen et al., 1989). Moesin (Lankes and
Furthmayr, 1991) was cloned from the human cell line HL60 and shows a
distribution by immunofluorescence similar to that of ezrin (Franck et al.,
1993). Radixin was identified as a component of liver cell-cell adherens
junctions and may bind to F-actin in vitro (Funayama et al., 1991; Sato et
al., 1992). Antibodies that bind to radixin stain both adherens junctions
and cleavage furrows (Sato et al., 1991), but these antibodies also
recognized ezrin and moesin (Sato et al., 1992).
Ezrin, radixin and moesin (ERM) show about 30% sequence
similarity in the amino terminal 260 amino acids with the amino terminal
domain of band 4.1 (Gould et al., 1989) and talin (Rees et al., 1990). This
region of band 4.1 has been implicated in poly-phosphoinositide-sensitive
binding to glycophorin (Anderson and Marchesi, 1985). In addition, the
predicted protein product of the neurofibromatosis 2 gene, called merlin or
schwannomin (Rouleau et al., 1993; Trofatter et al., 1993), displays 45%
homology with the ERM proteins. Based mostly on the homology to the
membrane-binding region of band 4.1 and the immunolocalization,
several groups have suggested that the ERM-proteins might serve as
linkers between the membrane and the cytoskeleton (Gould et al., 1989;
Rees et al., 1990; Algrain et al., 1993; Franck et al., 1993; Sato et al.,
1992).
146
One important question is why there are three highly related
proteins (ezrin, radixin and moesin). Berryman et al. (1993) showed that
ezrin and moesin are expressed in different cell types in tissues. An
attractive hypothesis is that each member of the ERM-family is found in
different subcellular structures and interacts with different membrane
and cytoskeletal proteins. The ERM proteins might then perform
different functions in different structures in the cell.
In this chapter, we identify the precise amino acid sequence
recognized by 13H9 and show that its epitope is present in all members of
the ERM-family. We provide evidence that all members of this family are
expressed in a simple cell type, the chicken red blood cell which is
postmitotic (no cleavage furrow), non-motile (no leading edges) and exists
in suspension (no adhesion contacts). Radixin is the major ERM-
component in the cytoskeleton. Using antipeptide antibodies that
discriminate between the three proteins, we show that both radixin and
ezrin are found in the same subcellular structure, the marginal band. We
follow the behavior of radixin during erythropoietic development and
show that radixin co-localizes with F-actin throughout development. In
addition, radixin becomes increasingly associated with the cytoskeleton
over the course of development. This time course of increasing
cytoskeletal association of radixin parallels that of increasing stability of
the cells to the microfilament-disrupting drug cytochalasin D (Chapter 2;
Winckler and Solomon, 1991). This raises the possibility that radixin
plays a role in stabilizing the shape of the mature erythrocyte.
147
Materials and Methods
Antibodies
Monoclonal antibodies 13H9 and 6-1D, both of the IgM class, have
been previously described (Birgbauer et al., 1991; Birgbauer and Solomon,
1989; Goslin et al., 1989; Bond et al., 1986). To raise antisera specific to
moesin, ezrin and radixin, the following acetylated peptides
corresponding to mouse sequences were synthesized onto a lysine core
(Tam, 1988) by Research Genetics, Huntsville, Alabama:
Moesin 466-477 AMSTPHVAEPA
Radixin 400-409 KSAIAKQAAD
Ezrin 480-489 PVNYHVQEGL
Rabbits were injected subcutaneously with 500 - 750 jig of peptide
in Freund's complete adjuvant, followed by three boosts, at two week
intervals, with 500-750 rg of peptide in Freund's incomplete adjuvant.
Mapping the 13H9 ezrin epitope
TrpE fusion proteins were produced using the pATH 11 vector
(Koerner et al., 1991) in E. coli HB101 by induction with 20 mg/ml
indoleacrylic acid in the absence of tryptophan. Bacterial extracts were
prepared for SDS-PAGE by lysing cells in gel loading buffer.
The 13H9 epitope was mapped using a 815 bp SacI-SacI fragment
and a 1053 bp SacI-SacI fragment from the human ezrin pGEM-4Z/p81
plasmid (kindly provided by T. Hunter, Salk Institute, San Diego, CA;
(Gould et al., 1989) in pATHll (shown in Figure 4-1A). Restriction sites
within the ezrin Sad-SacI 815bp/pATH11l plasmid were used to map the
13H9 epitope to a region containing the ezrin amino acids 170 to 281. The
148
epitope mapping procedures of Mehra et al. (1986) and Kosik et al.(1988a,
b) using DNAse were used to construct Xgtl 1 libraries containing
fragments of the 324 bp BamH 1-BamH 1 ezrin pATH 11 plasmid.
Unamplified Xgtl 1 libraries were screened following the methods of
Young and Davis (1985), using 13H9 as the primary antibody and
biotinylated goat anti-mouse Ig (Vector Labs) as secondary antibody
followed by the Vectastain Avidin-Biotin horseradish peroxidase complex
reagent (Vector Labs). The 13H9 positive plaques were amplified by PCR
(Perkin Elmer Gene AMP PCR DNA Kit) and subcloned into M13mp 18
phage for sequencing with Sequenase (United States Biochemical Co.)
using the dideoxy chain termination method of Sanger and the M13/pUC
sequencing primer (-20) (New England Biolabs). The shortest DNA
sequence common to the 26 sequenced clones defined a 13H9 epitope
comprising the 15 ezrin amino acids 191-205. The 13H9 epitope was
further delimited to the 13 amino acids 193-205 by cloning a PCR product
coding for the 13 amino acids and with 5' and 3' EcoR1 sites into pATH11.
The correct clone was confirmed by sequencing.
Polymerase chain reaction
PolyA+ RNA was prepared from 9 day embryonic chicken
erythrocytes (see "Cell isolation and immunofluorescence" below) by lysis
of 109 cells in 0.2 M NaCl, 0.2 M Tris pH 7.5, 1.5 mM MgC12, 2% SDS and
200 pig/ml proteinase K at 450C and elution from oligo dT-cellulose. To
obtain cDNA, we used the First-Strand cDNA Synthesis Kit (Pharmacia).
This cDNA prepared from 5 ,ug polyA+ RNA was used as a template for
PCR experiments. Two sets of degenerate primers were chosen from
conserved regions in all ERM proteins (Funayama et al., 1991; Gould et
149
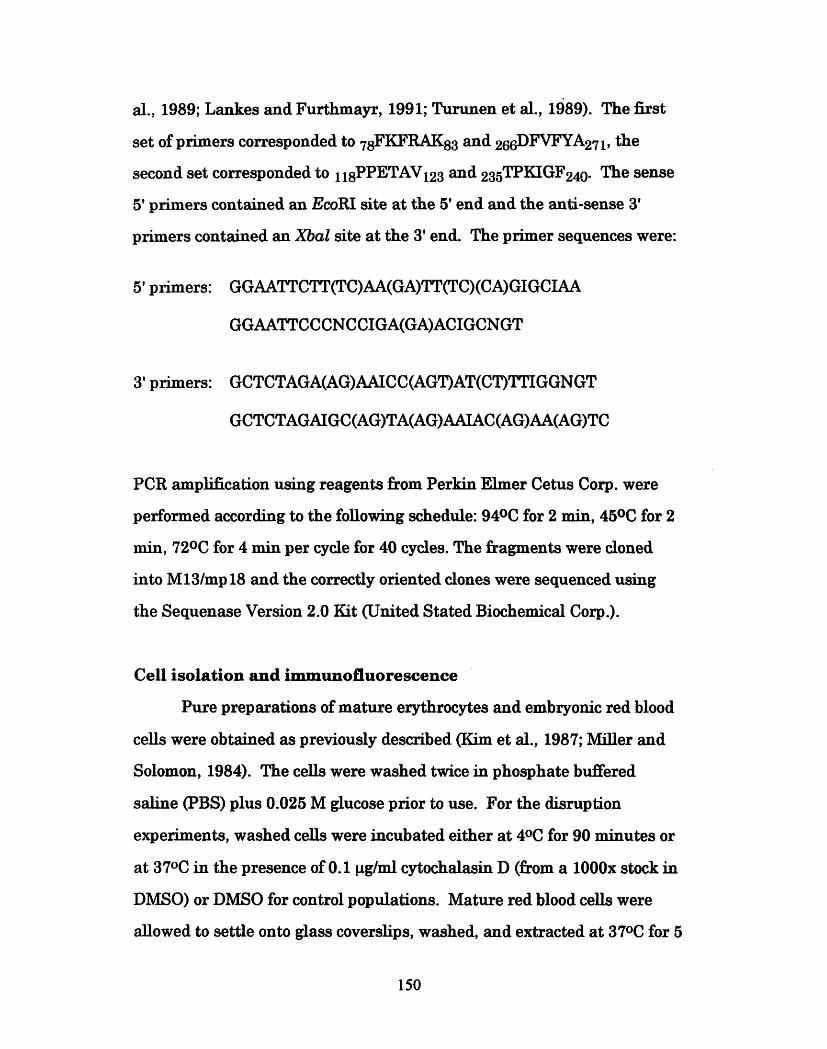
al., 1989; Lankes and Furthmayr, 1991; Turunen et al., 1989). The first
set of primers corresponded to 78FKFRAK83 and 266DFVFYA2 7 1, the
second set corresponded to 118PPETAV 12 3 and 235TPKIGF240. The sense
5' primers contained an EcoRI site at the 5' end and the anti-sense 3'
primers contained an Xbal site at the 3' end. The primer sequences were:
5' primers: GGAATTCTT(TC)AA(GA)TT(TC)(CA)GIGCIAA
GGAATTCCCNCCIGA(GA)ACIGCNGT
3' primers: GCTCTAGA(AG)AAICC(AGT)AT(CT)TTIGGNGT
GCTCTAGAIGC(AG)TA(AG)AAIAC(AG)AA(AG)TC
PCR amplification using reagents from Perkin Elmer Cetus Corp. were
performed according to the following schedule: 940C for 2 min, 450C for 2
min, 720C for 4 min per cycle for 40 cycles. The fragments were cloned
into M13/mp 18 and the correctly oriented clones were sequenced using
the Sequenase Version 2.0 Kit (United Stated Biochemical Corp.).
Cell isolation and immunofluorescence
Pure preparations of mature erythrocytes and embryonic red blood
cells were obtained as previously described (Kim et al., 1987; Miller and
Solomon, 1984). The cells were washed twice in phosphate buffered
saline (PBS) plus 0.025 M glucose prior to use. For the disruption
experiments, washed cells were incubated either at 4oC for 90 minutes or
at 370C in the presence of 0.1 gg/ml cytochalasin D (from a 1000x stock in
DMSO) or DMSO for control populations. Mature red blood cells were
allowed to settle onto glass coverslips, washed, and extracted at 370C for 5
150
minutes with 0.1% NP-40 in PM2G (Solomon et al., 1979) (0.1 M Pipes, 2
mM EGTA, 1 mM magnesium sulfate, 2 M glycerol, pH 6.9). They were
then fixed for 1 minute with 0.25 % glutaraldehyde in PM2G, followed by
30 minutes with 4% paraformaldehyde in PM2G. Immature red blood
cells were extracted for 10 seconds in 0.5 % NP-40 in PM2G, then fixed in
0.25 % glutaraldehyde/PM2G for one minute followed by 4 %
paraformaldehyde/PM2G for 30 minutes. After several washes in PBS,
coverslips were quenched in 5 mg/ml sodium borohydride in PBS three
times for 5 minutes each time.
Affinity purified antibodies were prepared by slight modifications
of established procedures (Olmsted, 1981) from proteins transferred onto
nitrocellulose. Anti-radixin 457 was ffinity-eluted from hydroxyapatite-
purified radixin or from the radixin-immunoreactive band of NIH-3T3
cells; anti-moesin 454 was affinity-eluted from the moesin-
immunoreactive band of NIH-3T3 or of P19 mouse teratocarcinoma cells;
and anti-ezrin 464 was affinity-eluted from the ezrin-immunoreactive
band of P19 mouse teratocarcinoma cells.
Immunofluorescence was performed with anti-tubulin mAb 6-1D
(Bond et al., 1986), anti-ezrin pAb 464, anti-moesin pAb 454 and anti-
radixin pAb 457, and FITC-conjugated goat anti-mouse and FITC- or
Texas Red-conjugated goat anti-rabbit secondary antibodies (Organon
Teknika-Cappel Malvern, PA). To visualize F-actin, we used rhodamine-
coupled phalloidin (Molecular Probes, Eugene OR) simultaneously with
the FITC-conjugated goat anti-rabbit secondary antibodies. Prior to the
primary antibody incubations, coverslips were blocked for 20 minutes at
370C with 10% normal goat serum and 1% bovine serum albumin (BSA)
in PBS. The antibody incubations were carried out for 30 minutes each
151
time at 370C in a moist chamber in the presence of 1% BSA (Sigma
Chemical Co., St. Louis, MO) in PBS. Coverslips were mounted onto
slides using gelvatol mounting medium containing 15 mg/ml 1,4-
diazabicyclo[2.2.2]octane, an anti-fade agent obtained from Aldrich
Chemical Co., Milwaukee, WI. They were examined on an Axioplan
microscope (Carl Zeiss, Inc., Thornwood, NY) using a 100x, 1.4 NA,
objective.
Protein extracts and protein blotting
Red blood cell extractions were performed similarly to those
previously described (Birgbauer and Solomon, 1989). Briefly, red blood
cells were extracted for 5 minutes with 0.1% NP-40 in PM2G in the
presence of protease inhibitors (aprotinin, leupeptin, PMSF or Pefabloc
(Boehringer Mannheim)) to obtain the "soluble" fraction. After one wash
with the extraction buffer, the pellet was further extracted with 8 M urea
in phosphate-buffered saline (PBS) with protease inhibitors to obtain the
"cytoskeletal" fraction. Unless otherwise noted, the cytoskeletal fraction
was dialyzed into PBS + 1 mM dithiothreitol prior to SDS-PAGE.
For total cell extracts from 3T3 cells, 9 confluent 100mm tissue
culture dishes, grown in DME with 10% bovine calf serum, were washed
once in PBS, cells were scraped into PBS and spun down at 1000 rpm in
an IEC model HN-S centrifuge. The cell pellet was resuspended in 400 1l
PBS with protease inhibitors, then 3x sample buffer was added to a final
concentration of lx. The extract was passed repeatedly through a 26 G
needle to shear the DNA.
For immunoblotting, samples separated on a 7.5% polyacrylamide
gel with a 3% polyacrylamide stacker, according to the method of Laemmli
152
(Laemmli, 1970), were transferred to nitrocellulose electrophoretically
and probed by slight modifications of standard procedures (Tobin et al.,
1979). The nitrocellulose filters were stained for total protein with 0.2%
Ponceau S (Sigma Chemical Co., St. Louis, MO) in 3% trichloroacetic acid,
photographed, and then the Ponceau S was washed away. The
nitrocellulose filters were blocked with 3% BSA in PBS with 0.05%
sodium azide for several hours. Antibody incubations (overnight for first
antibody, one hour for second antibody) were done in the same buffer.
Following the primary and secondary antibody incubations, blots were
washed in blocking buffer which contained 0.1% SDS and 0.05% NP-40.
125I-labeled goat anti-mouse Ig and Protein A were obtained from Dupont
New England Nuclear, Boston, MA.
Binding of 13H9 to synthetic peptides
The peptide IAQDLEMYGINYF was synthesized by the M.I.T.
Biopolymers Facility with an unblocked amino-terminus. This peptide
was completely insoluble in aqueous solutions over a range of pHs and
was dissolved in DMSO. Two unrelated peptides were used as controls:
CQQLRELQRH and CADSYAEEEE. The control peptides dissolved in
water. A 1 mg/ml solution of the peptides was prepared and 1, 2, 4 and
7.5 pl were applied onto PVDF membrane using a BioRad slot blot
apparatus. One row of slots was filled with DMSO alone. The membrane
was processed as described above for Western blots except that TNT (25
mM Tris, 170 mM NaC1, 0.05% Tween-20 pH 7.5) was used instead of 3%
BSA/PBS.
153
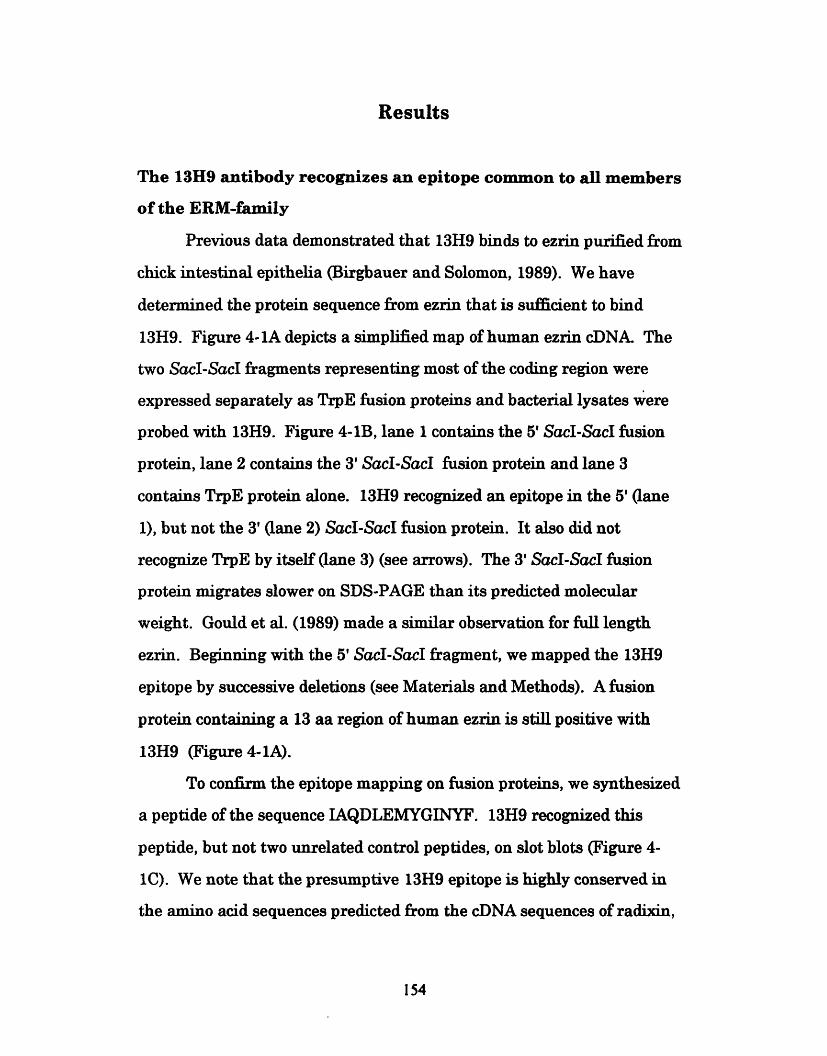
Results
The 13H9 antibody recognizes an epitope common to all members
of the ERM-family
Previous data demonstrated that 13H9 binds to ezrin purified from
chick intestinal epithelia (Birgbauer and Solomon, 1989). We have
determined the protein sequence from ezrin that is sufficient to bind
13H9. Figure 4-1A depicts a simplified map of human ezrin cDNA. The
two SacI-SacI fragments representing most of the coding region were
expressed separately as TrpE fusion proteins and bacterial lysates were
probed with 13H9. Figure 4-1B, lane 1 contains the 5' SacI-SacI fusion
protein, lane 2 contains the 3' SacI-SacI fusion protein and lane 3
contains TrpE protein alone. 13H9 recognized an epitope in the 5' (lane
1), but not the 3' (lane 2) SacI-SacI fusion protein. It also did not
recognize TrpE by itself (lane 3) (see arrows). The 3' SacI-SacI fusion
protein migrates slower on SDS-PAGE than its predicted molecular
weight. Gould et al. (1989) made a similar observation for full length
ezrin. Beginning with the 5' SacI-SacI fragment, we mapped the 13H9
epitope by successive deletions (see Materials and Methods). A fusion
protein containing a 13 aa region of human ezrin is still positive with
13H9 (Figure 4-1A).
To confirm the epitope mapping on fusion proteins, we synthesized
a peptide of the sequence IAQDLEMYGINYF. 13H9 recognized this
peptide, but not two unrelated control peptides, on slot blots (Figure 4-
1C). We note that the presumptive 13H9 epitope is highly conserved in
the amino acid sequences predicted from the cDNA sequences of radixin,
154
Fig.4-1 Mapping of the 13H9 epitope.
A. Simplified restriction map of human ezrin showing the position of the
SacI restriction sites used for making the TrpE fusion proteins shown in
part B. The position and sequence of the 13 aa 13H9 epitope are
indicated.
B. Western blot using 13H9 on human ezrin TrpE fusion proteins. Lane 1
contains the 5' SacI-SacI fusion protein, lane 2 the 3' SacI-SacI fusion
protein, and lane 3 the TrpE protein without insert. The black arrowhead
indicates the position of the 5' SacI-SacI fusion protein which is
recognized by 13H9. The white arrowhead points at the position of the 3'
SacI-SacI fusion protein which is not recognized by 13H9. The black
arrow indicates the position of TrpE alone.
C. Peptide slot blot using 13H9. 13H9 binds to the epitope peptide
(IAQDLEMYGINYF) but not to two control peptide 1 (CQQLRELQRH) or
control peptide 2 (CADSYAEEEE) or DMSO. The amount of peptide
spotted is indicated across the top.
155
A
ATG Sac Sac 1 TAA SaC 1
1 276 o 21092 1845 2155bp
577bp - 615bpATT GCT CAG GAC CTG GAA ATG TAT GCA ATC ATAC TAT TTC
Ilr Ala Gln Asp Lou Glu t Tyr Gly XIe An Tyr Phb
B C13H9 ua Bde:
13H9 epitope peptidocontrol peptide 1control peptide 2
DMSO
1 2 3
moesin and merlin/schwannomin. There is a single amino acid
substitution from isoleucine in ezrin to valine in moesin, radixin and
merlin/schwannomin. The sequence QDLEMY, completely conserved in
all of these proteins, is sufficient for binding of 13H9 (data not shown).
Therefore, this reagent can not distinguish among these four proteins.
Expression of ERM-family members in chicken red blood cells
To determine which members of the ERM-family are expressed in
chicken red blood cells, we performed PCR using primers from regions
conserved among the three proteins (see Materials and Methods; Figure 4-
2). Since erythrocytes are not transcriptionally active after they mature,
we used mRNA from embryonic chicken red blood cells. We obtained 14
independent sequences from the resulting products. Figure 4-3 shows the
comparison of the amino acid sequences predicted from the PCR products
and the published mouse cDNA sequences. The predicted amino acid
sequence of twelve of the clones corresponded precisely to the mouse
radixin sequence (sequence A in Figure 4-3). The amino acid sequence of
the two other clones was 96% identical to mouse moesin and 84% identical
to mouse ezrin and radian (sequence B in Figure 4-3). This result
demonstrates that more than one ERM-member (radixin and presumably
moesin) is expressed in 9 day chicken red blood cells. The failure to detect
a third sequence (presumably ezrin) by PCR might arise because of its low
abundance or because of differences between the chosen primers and the
unknown chicken sequence. We demonstrate below, by immunological
techniques, that ezrin is expressed in these cells as well.
157
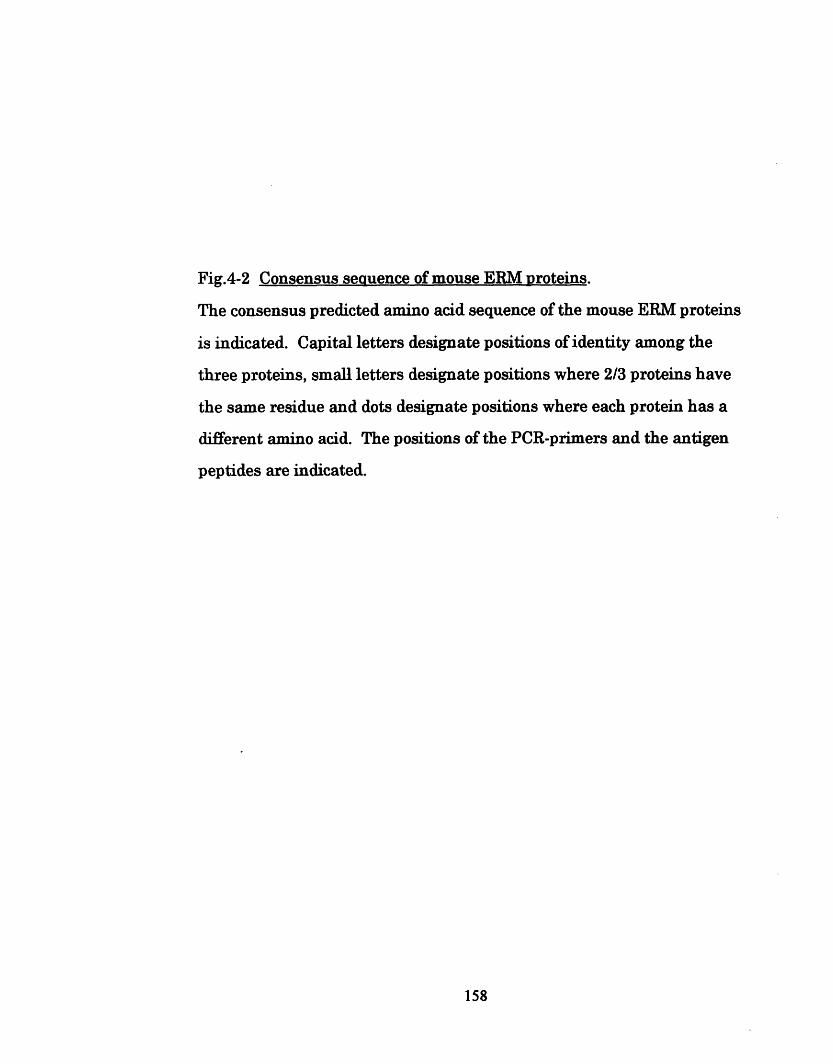
Fig.4-2 Consensus sequence of mouse ERM proteins.
The consensus predicted amino acid sequence of the mouse ERM proteins
is indicated. Capital letters designate positions of identity among the
three proteins, small letters designate positions where 2/3 proteins have
the same residue and dots designate positions where each protein has a
different amino acid. The positions of the PCR-primers and the antigen
peptides are indicated.
158
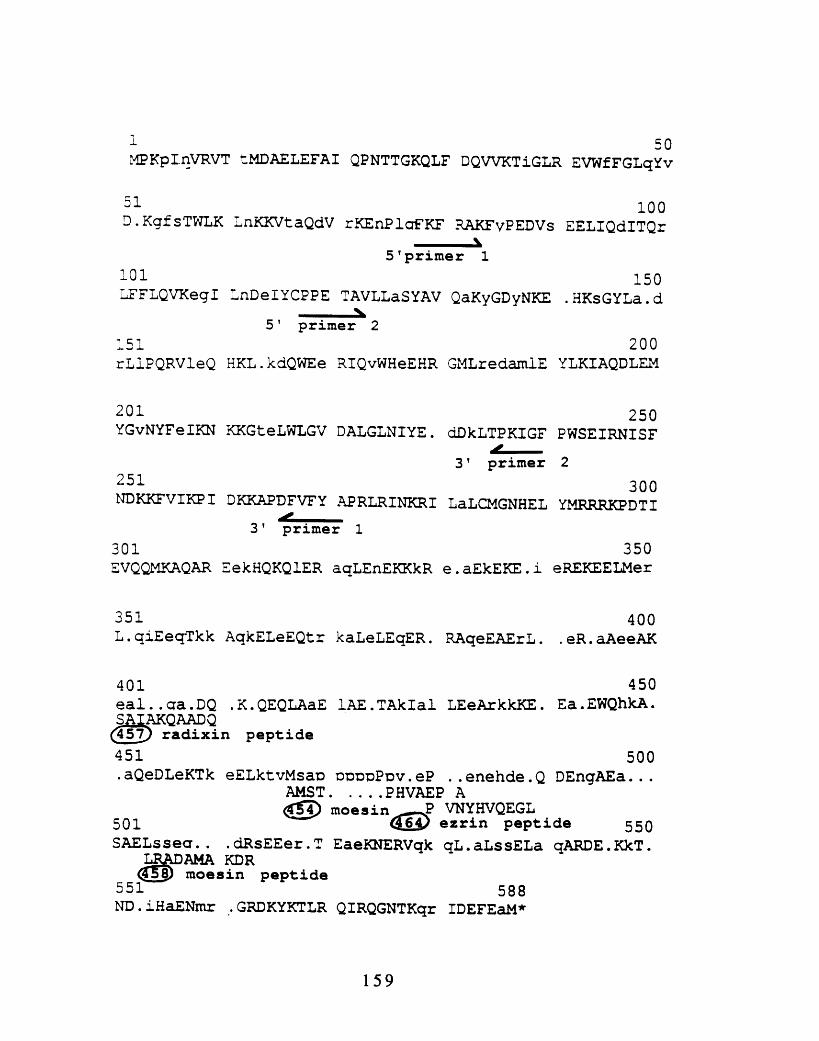
i 50
LMPKpInVRVT tMDAELEFAI QPNTTGKQLF DQVVKTiGLR EVWfFGLqYv
:.12 100D.KgfsTWLK LnKKVtaQdV rKEnPlaFKF RAKFvPEDVs EELIQdITQr
5' primer 1101LFFLQVKegI LnDeIYCPPE TAVLLaSYAV
5' primer 2151rLPQRVleQ HKL.kdQWEe RIQvWHeEHR
150QaKyGDyNKE .HKsGYLa.d
200GMLredamlE YLKIAQDLEM
201YGvNYFeIKN KKGteLWLGV DALGLNIYE.
251NDKKFVIKPI DKKAPDFVFY APRLRINKRI
3' primer 1
301
dDkLTPKIGF
3' primer
250PWSEIRNISF
2
300LaLCMGNHEL YMRRRKPDTI
350EVQQMKAQAR EekHQKQlER aqLEnEKKkR e.aEkEKE.i eREKEELMer
351L.qiEeqTkk AqkELeEQtr kaLeLEaER. RAqeEAErL.
401eal..qa.DQ .K.QEQLAaE AE.TAkIal LEeArkkKE. EZ
ILAKQAADQ~(41 radixin peptide451.aQeDLeKTk eELktvMsaD DDvPPDv.eP ..enehde.Q DE
AMST. ....PHVAEP A6) moesin P VNYHVQEGL
501 ) ezrin peptide
400.eR. aAeeAK
450a.EWQhkA.
500:ngAEa...
SAELssea.. . dRsEEer. T EaeKNERVqk qL.aLssELa qARDE.KkT._DAMA KDR
551 moesin peptide551 588ND. iHaENmr . GRDKYKTLR QIRQGNTKqr IDEFEaM*
159
550
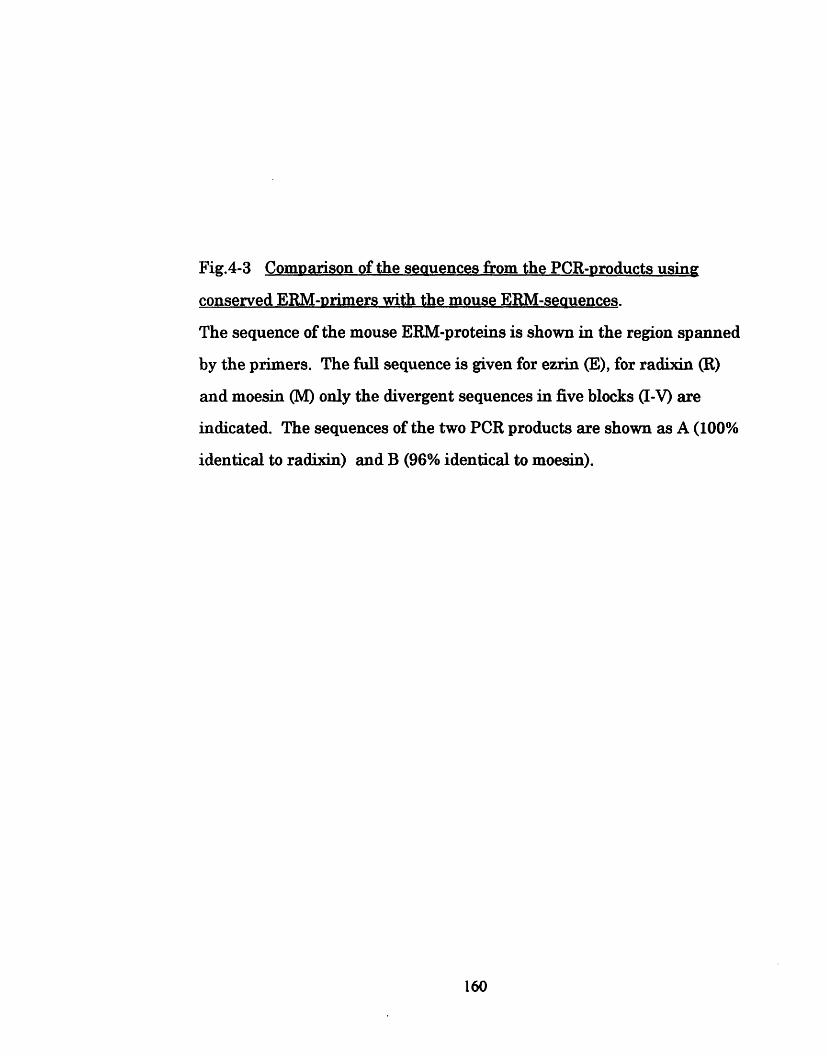
Fig.4-3 Comparison of the sequences from the PCR-products using
conserved ERM-primers with the mouse ERM-sequences.
The sequence of the mouse ERM-proteins is shown in the region spanned
by the primers. The full sequence is given for ezrin (E), for radixin (R)
and moesin (M) only the divergent sequences in five blocks (I-V) are
indicated. The sequences of the two PCR products are shown as A (100%
identical to radixin) and B (96% identical to moesin).
160
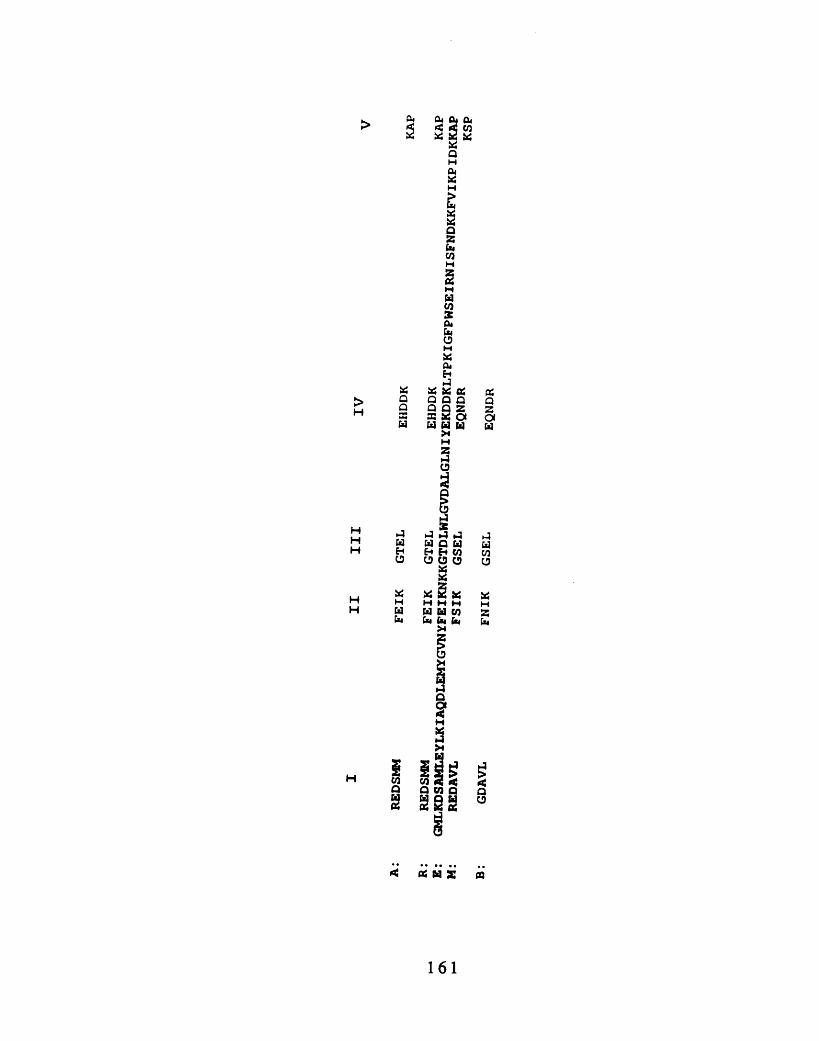
:3
a
zn
=Z
a
E C
X W
Z
S a w Co
161
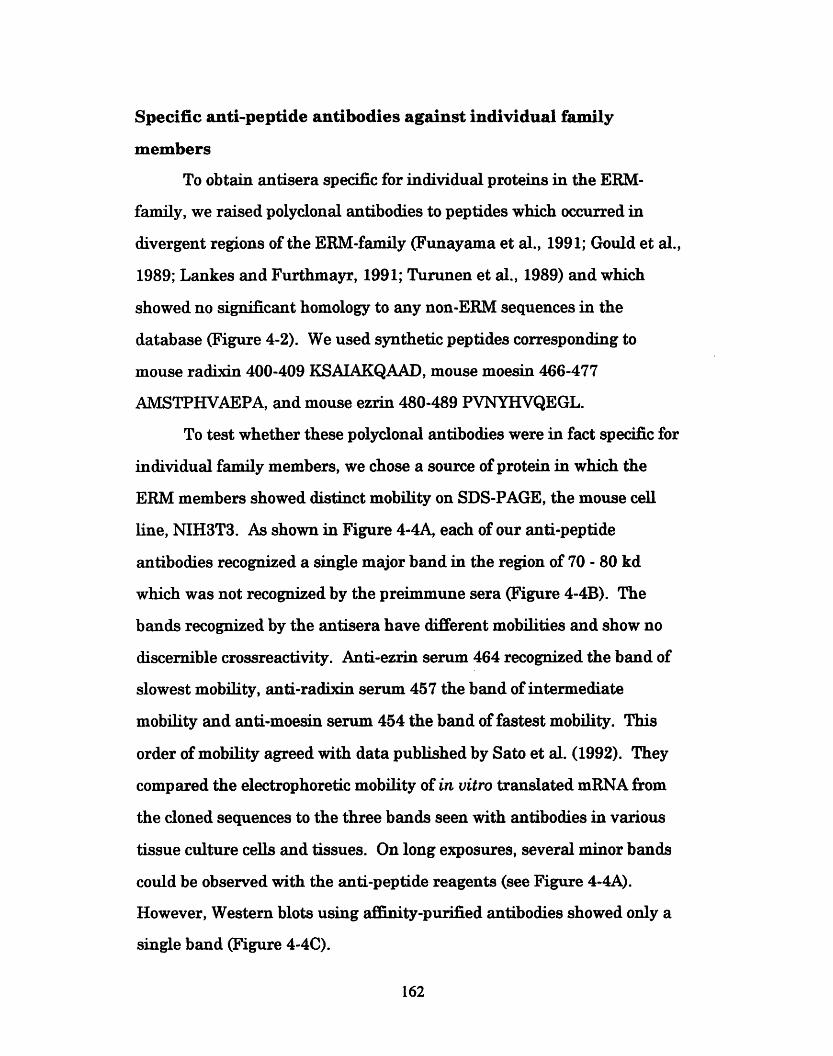
Specific anti-peptide antibodies against individual family
members
To obtain antisera specific for individual proteins in the ERM-
family, we raised polyclonal antibodies to peptides which occurred in
divergent regions of the ERM-family (Funayama et al., 1991; Gould et al.,
1989; Lankes and Furthmayr, 1991; Turunen et al., 1989) and which
showed no significant homology to any non-ERM sequences in the
database (Figure 4-2). We used synthetic peptides corresponding to
mouse radixin 400-409 KSAIAKQAAD, mouse moesin 466-477
AMSTPHVAEPA, and mouse ezrin 480-489 PVNYHVQEGL.
To test whether these polyclonal antibodies were in fact specific for
individual family members, we chose a source of protein in which the
ERM members showed distinct mobility on SDS-PAGE, the mouse cell
line, NIH3T3. As shown in Figure 4-4A, each of our anti-peptide
antibodies recognized a single major band in the region of 70 - 80 kd
which was not recognized by the preimmune sera (Figure 4-4B). The
bands recognized by the antisera have different mobilities and show no
discernible crossreactivity. Anti-ezrin serum 464 recognized the band of
slowest mobility, anti-radixin serum 457 the band of intermediate
mobility and anti-moesin serum 454 the band of fastest mobility. This
order of mobility agreed with data published by Sato et al. (1992). They
compared the electrophoretic mobility of in vitro translated mRNA from
the cloned sequences to the three bands seen with antibodies in various
tissue culture cells and tissues. On long exposures, several minor bands
could be observed with the anti-peptide reagents (see Figure 4-4A).
However, Western blots using affinity-purified antibodies showed only a
single band (Figure 4-4C).
162
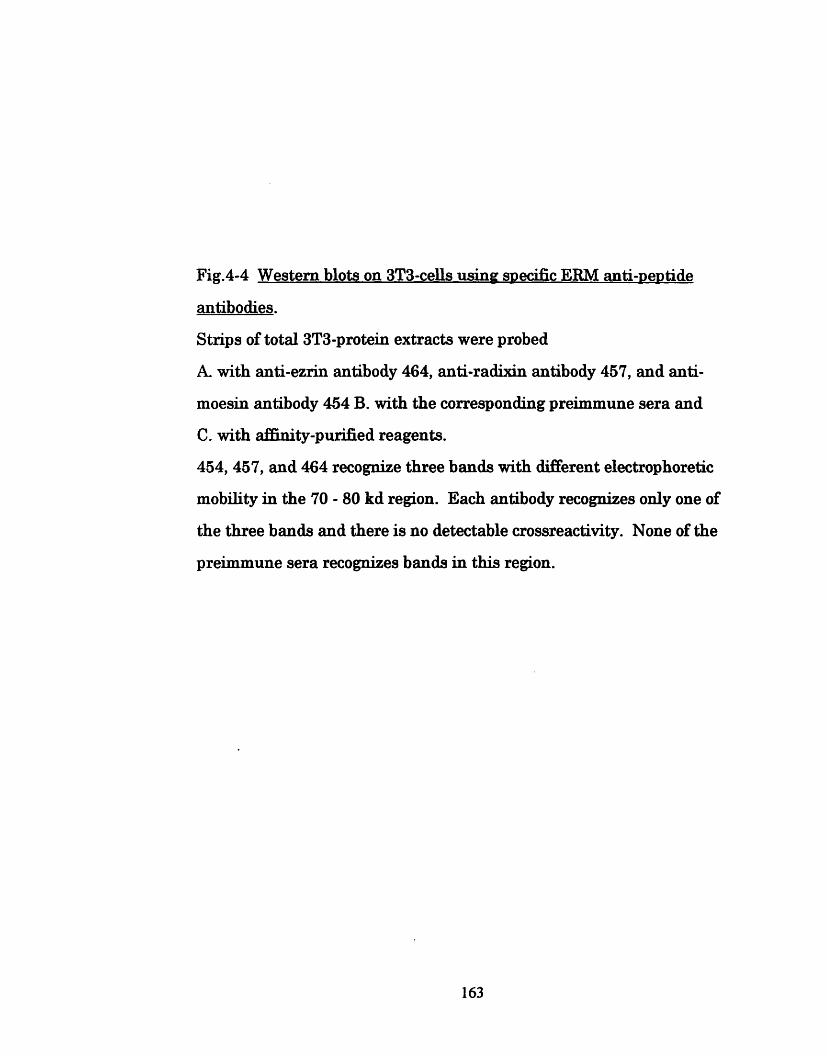
Fig.4-4 Western blots on 3T3-cells using specific ERM anti-peptide
antibodies.
Strips of total 3T3-protein extracts were probed
A. with anti-ezrin antibody 464, anti-radixin antibody 457, and anti-
moesin antibody 454 B. with the corresponding preimmune sera and
C. with affinity-purified reagents.
454, 457, and 464 recognize three bands with different electrophoretic
mobility in the 70 - 80 kd region. Each antibody recognizes only one of
the three bands and there is no detectable crossreactivity. None of the
preimmune sera recognizes bands in this region.
163
c cNa00 a E
cI U I
o w rIV V I
0a
q
I-
q . q-
r IC c
d1 1' qr
C ~Cc ccE EEEEE0 nO
IV r q*E U to
0.
D
Using the antipeptide polyclonal antibodies on chicken red blood
cell cytoskeletal fractions, we saw reactivity with bands of 80 kd which
were not present in the preimmune sera (see Figure 4-5). On 7.5% SDS-
PAGE, the three sera gave bands of identical mobility on chicken red
blood cell material which could not be separated from one another. We
cannot completely rule out the possibility that the avian ERM-sequences
are sufficiently different from the mouse sequences that the anti-peptide
antibodies crossreact on chicken protein. We consider this possibility
remote since a sequence which was chosen especially because it was
characteristic and unique for a particular ERM protein from the
published sequences of several species would have to be present in more
than one ERM protein in chicken. The absolute test of this possibility,
though, awaits the cloning of the chicken sequences.
Radixin and ezrin are components of the marginal band
To localize radixin in chicken erythrocyte cytoskeletons, we
performed immunofluorescence using anti-radixin antibody 457 on NP40-
extracted cytoskeletons. Figure 4-6A shows staining with the whole anti-
radixin 457 serum, Figure 4-6B staining with 457 preimmune serum and
Figure 4-6C staining with affinity-eluted 457. Affinity-purified anti-
radixin 457 crisply stains the marginal band with little staining
elsewhere in the cell. Affinity-eluted anti-ezrin antiserum 464 also stains
the marginal band of adult erythrocytes (Figure 4-6D) - albeit with
substantially lower intensity than the anti-radixin antiserum. A control
staining without first antibody, but only FITC-goat anti-rabbit is shown
in Figure 4-6E. Affinity-eluted anti-moesin antibody 454 gives no
staining over background (data not shown).
165
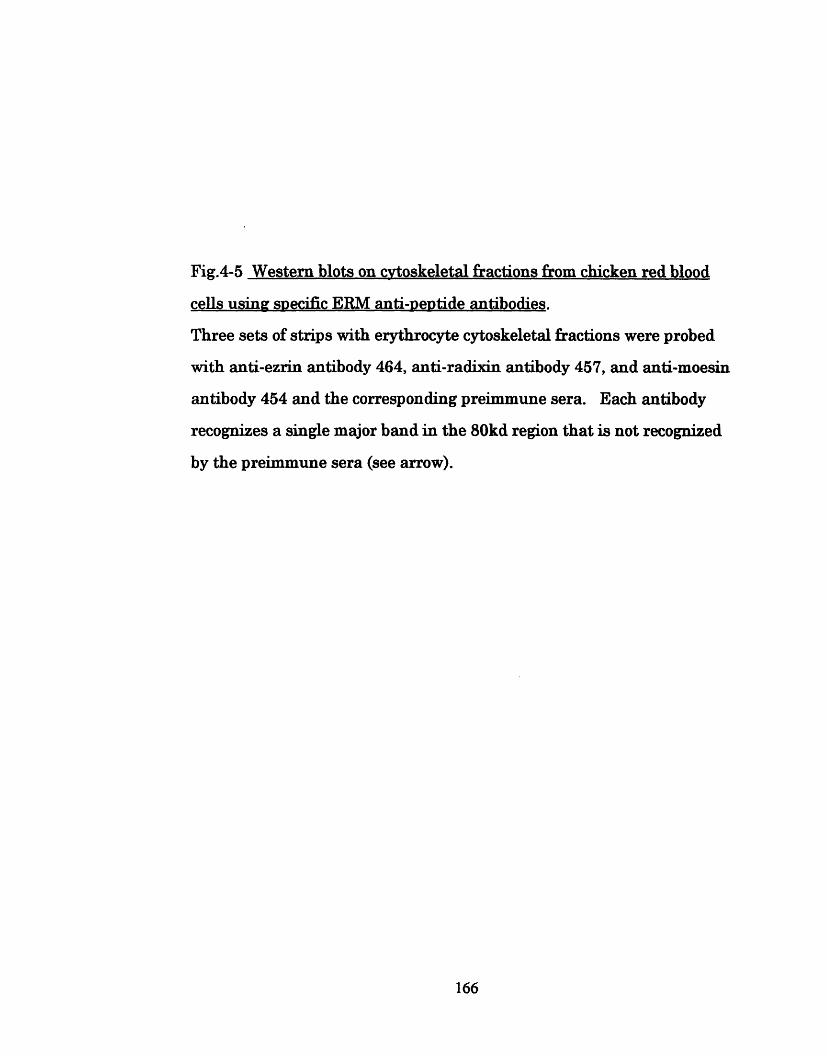
Fig.4-5 Western blots on cvtoskeletal fractions from chicken red blood
cells using specific ERM anti-peptide antibodies.
Three sets of strips with erythrocyte cytoskeletal fractions were probed
with anti-ezrin antibody 464, anti-radixin antibody 457, and anti-moesin
antibody 454 and the corresponding preimmune sera. Each antibody
recognizes a single major band in the 80kd region that is not recognized
by the preimmune sera (see arrow).
166
?
a
I
3 3
0
moesin
0
C0 ezrin
ezrin
0
UI JI
3go3 ·_
3
0
radixin
Fig.4-6 Localization of radixin and ezrin in adult chicken erythrocytes.
Adult chicken erythrocytes were stained with
A. anti-radixin 457 whole serum,
B. 457 preimmune serum,
C. 457 affinity-purified antibody,
D. anti-ezrin 464 affinity-purified antibody, and
E. FITC-goat anti rabbit secondary antibody alone.
Radixin and ezrin localize to the marginal band. Bar = 10 pm.
168
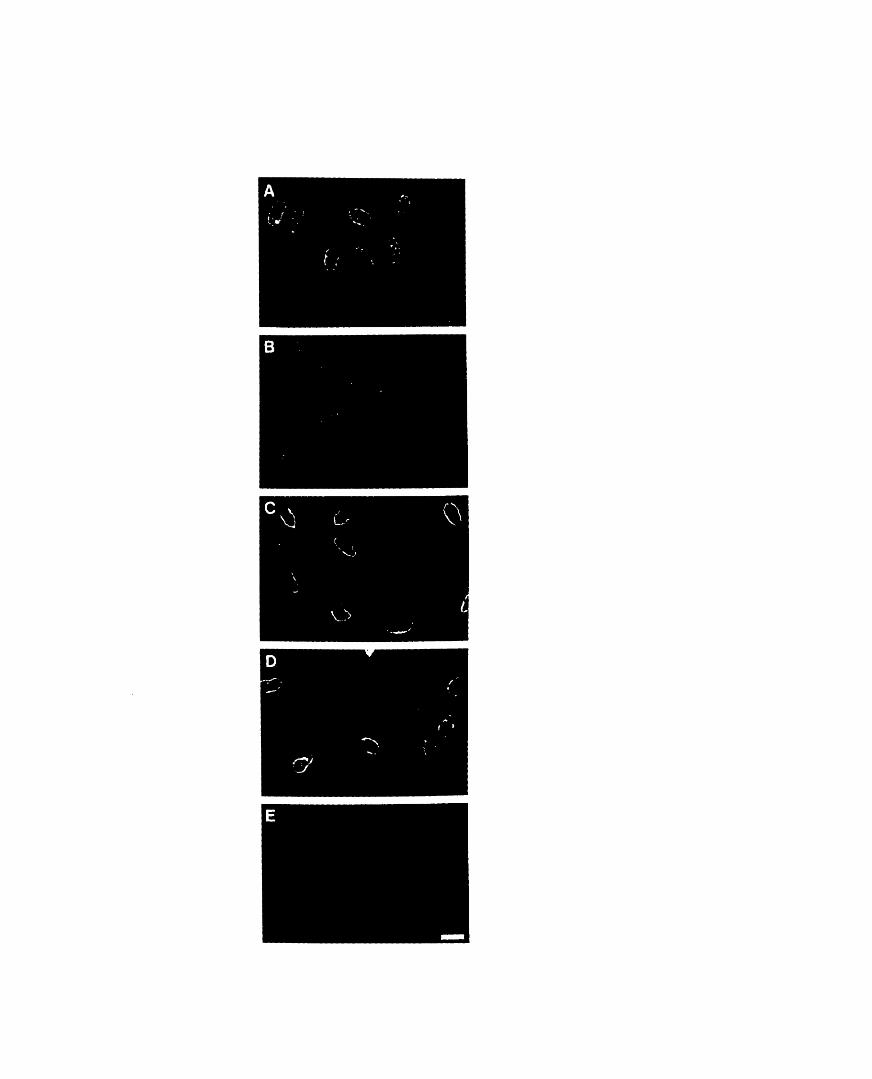
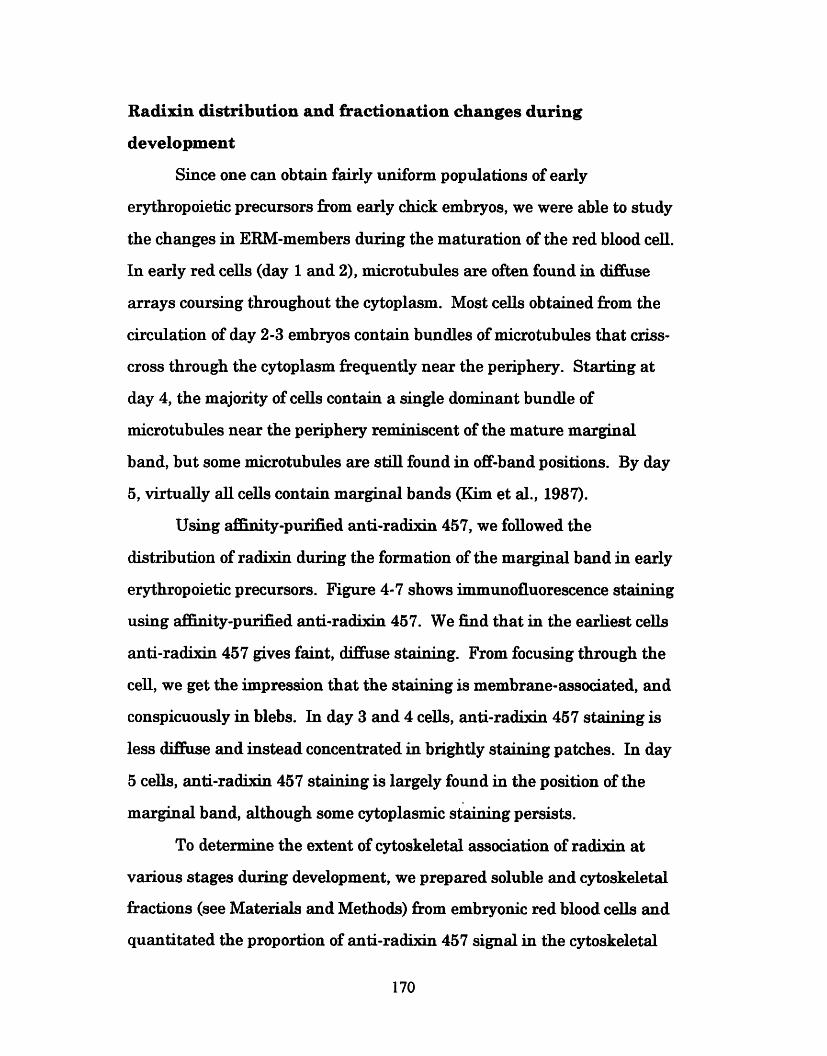
Radixin distribution and fractionation changes during
development
Since one can obtain fairly uniform populations of early
erythropoietic precursors from early chick embryos, we were able to study
the changes in ERM-members during the maturation of the red blood cell.
In early red cells (day 1 and 2), microtubules are often found in diffuse
arrays coursing throughout the cytoplasm. Most cells obtained from the
circulation of day 2-3 embryos contain bundles of microtubules that criss-
cross through the cytoplasm frequently near the periphery. Starting at
day 4, the majority of cells contain a single dominant bundle of
microtubules near the periphery reminiscent of the mature marginal
band, but some microtubules are still found in off-band positions. By day
5, virtually all cells contain marginal bands (Kim et al., 1987).
Using affinity-purified anti-radixin 457, we followed the
distribution of radixin during the formation of the marginal band in early
erythropoietic precursors. Figure 4-7 shows immunofluorescence staining
using affinity-purified anti-radixin 457. We find that in the earliest cells
anti-radixin 457 gives faint, diffuse staining. From focusing through the
cell, we get the impression that the staining is membrane-associated, and
conspicuously in blebs. In day 3 and 4 cells, anti-radixin 457 staining is
less diffuse and instead concentrated in brightly staining patches. In day
5 cells, anti-radixin 457 staining is largely found in the position of the
marginal band, although some cytoplasmic staining persists.
To determine the extent of cytoskeletal association of radixin at
various stages during development, we prepared soluble and cytoskeletal
fractions (see Materials and Methods) from embryonic red blood cells and
quantitated the proportion of anti-radixin 457 signal in the cytoskeletal
170
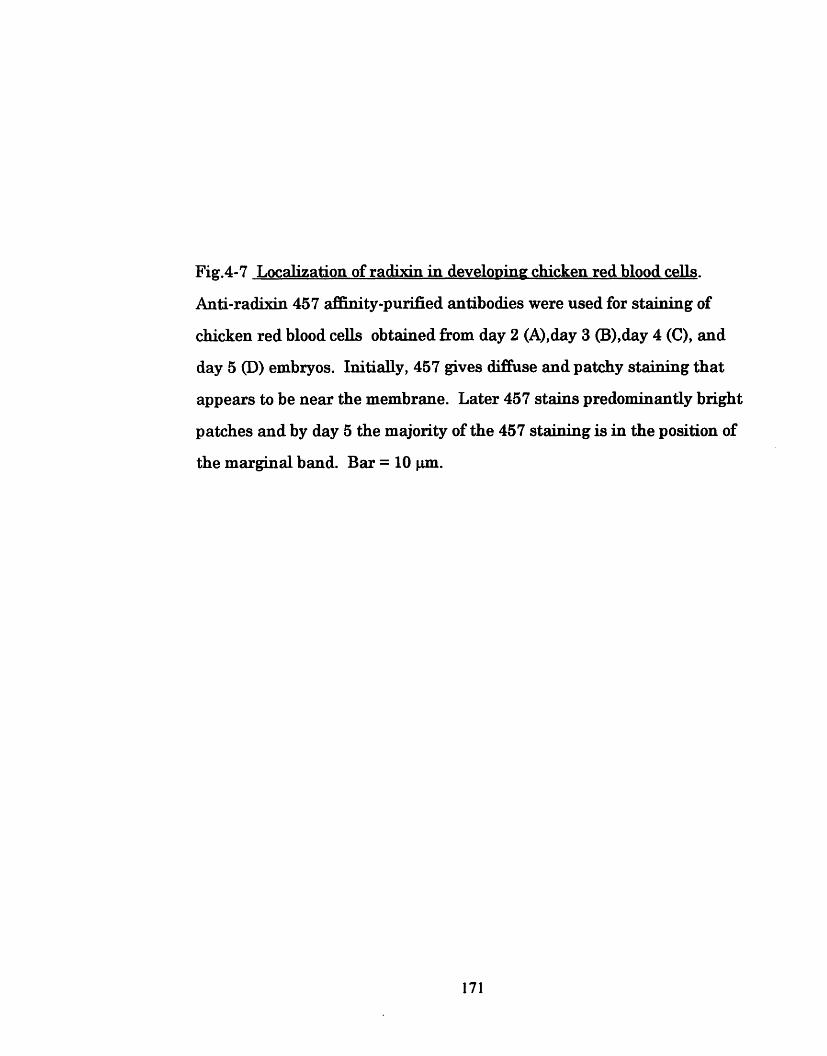
Fig.4-7 Localization of radixin in developing chicken red blood cells.
Anti-radixin 457 affinity-purified antibodies were used for staining of
chicken red blood cells obtained from day 2 (A),day 3 (B),day 4 (C), and
day 5 (D) embryos. Initially, 457 gives diffuse and patchy staining that
appears to be near the membrane. Later 457 stains predominantly bright
patches and by day 5 the majority of the 457 staining is in the position of
the marginal band. Bar = 10 tm.
171
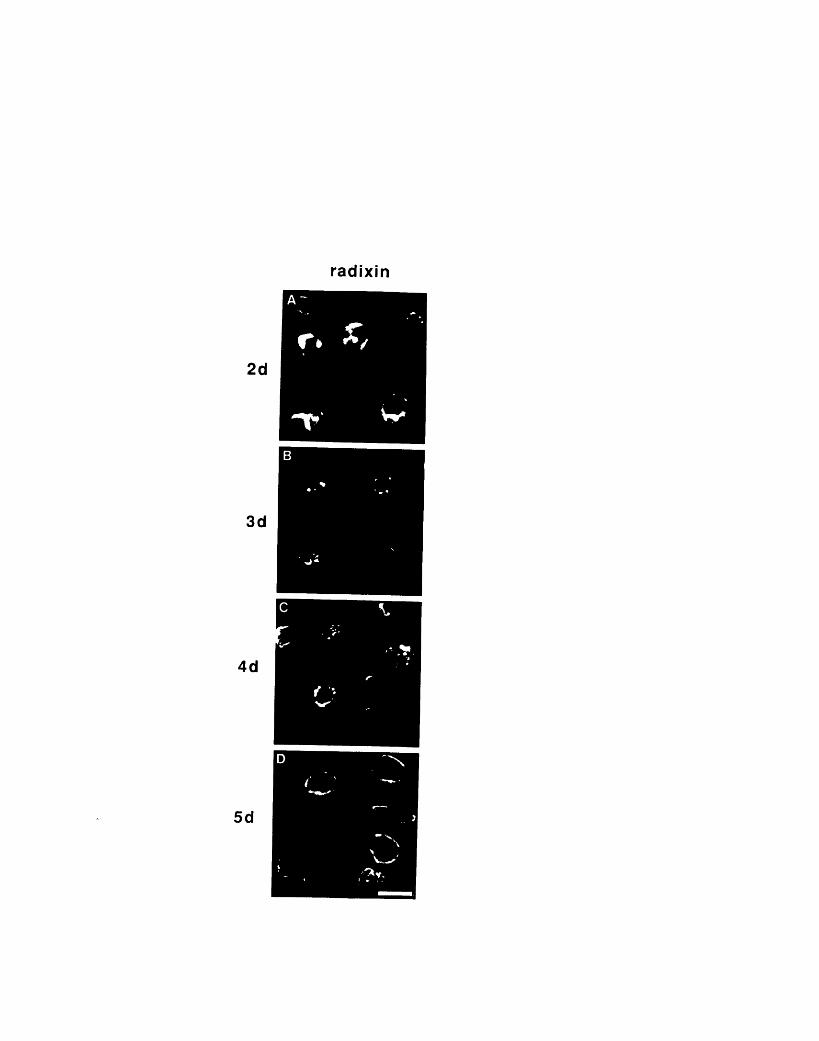
radixin
2d
3d
4d
5d
fraction. As shown in Table 4-1, the proportion of radixin in the
cytoskeleton increases over the course of development from 5% to 40% in
adult cells.
Radixin co-localizes with F-actin during development of the red
blood cell, but not with microtubules
Since radixin colocalizes with both microtubules and F-actin in the
adult red blood cell, the cytoskeletal association of radixin could be
mediated by the interaction with microtubules or F-actin. To address this
possibility, we simultaneously visualized radixin and F-actin or radixin
and tubulin. Figure 4-8A,B shows double staining of day 3 cells with
anti-radixin 457 (A) and rhodamine-phalloidin (B). Figure 4-8C,D shows
double staining with anti-radixin 457 (C) and the monoclonal anti-tubulin
antibody 6-1D (D). Radixin distribution largely overlaps that of F-actin,
while the overlap with microtubules is not striking until later in
development. At no developmental stage do we detect radixin at the
equator before microtubules. These results show that radixin follows
microtubules to the position of the marginal band, but arrives there
concurrently with F-actin.
Since radixin is found in the position of the marginal band, it might
interact with microtubules. To test whether radixin localization to the
position of the marginal band was dependent on intact microtubules, we
disrupted microtubules in day 5 cells. Cold treatment leads to virtually
complete disappearance of the tubulin staining. The anti-radixin 457
staining on the other hand is entirely unchanged and still found in the
position of the marginal band (Figure 4-9). The same result had been
obtained with 13H9 (Birgbauer and Solomon, 1989). We conclude that
173
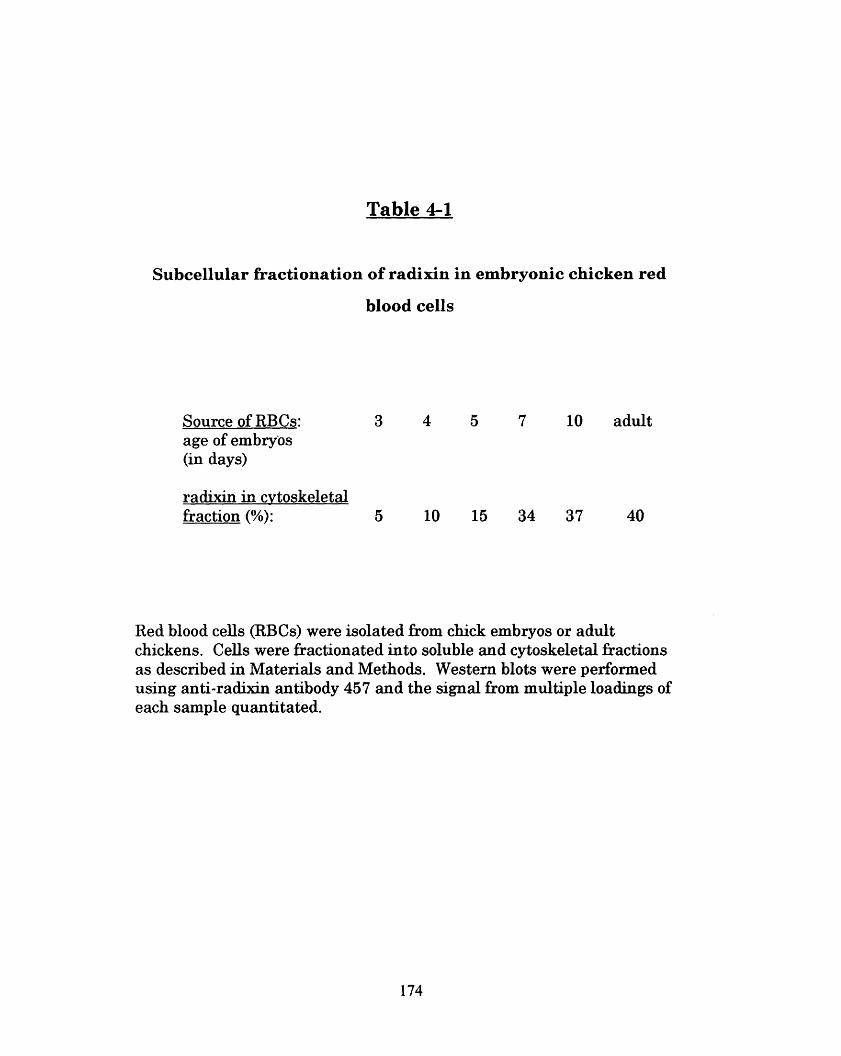
Table 4-1
Subcellular fractionation of radixin in embryonic chicken red
blood cells
Source of RBCs:age of embryos(in days)
radixin in cvtoskeletalfraction (%):
3 4 5 7 10 adult
5 10 15 34 37 40
Red blood cells (RBCs) were isolated from chick embryos or adultchickens. Cells were fractionated into soluble and cytoskeletal fractionsas described in Materials and Methods. Western blots were performedusing anti-radixin antibody 457 and the signal from multiple loadings ofeach sample quantitated.
174
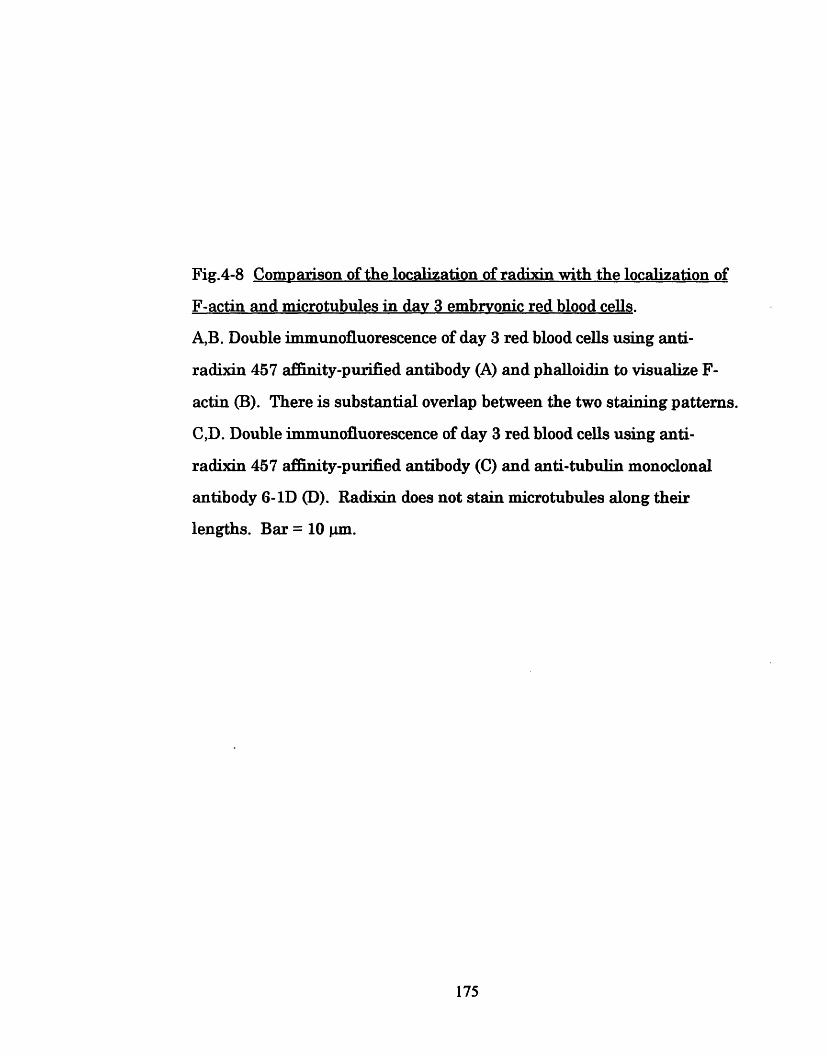
Fig.4-8 Comparison of the localization of radixin with the localization of
F-actin and microtubules in day 3 embryonic red blood cells.
A,B. Double immunofluorescence of day 3 red blood cells using anti-
radixin 457 affinity-purified antibody (A) and phalloidin to visualize F-
actin (B). There is substantial overlap between the two staining patterns.
C,D. Double immunofluorescence of day 3 red blood cells using anti-
radixin 457 affinity-purified antibody (C) and anti-tubulin monoclonal
antibody 6-1D (D). Radixin does not stain microtubules along their
lengths. Bar = 10 m.
175
radixin
radixin
F-actin
tubulin
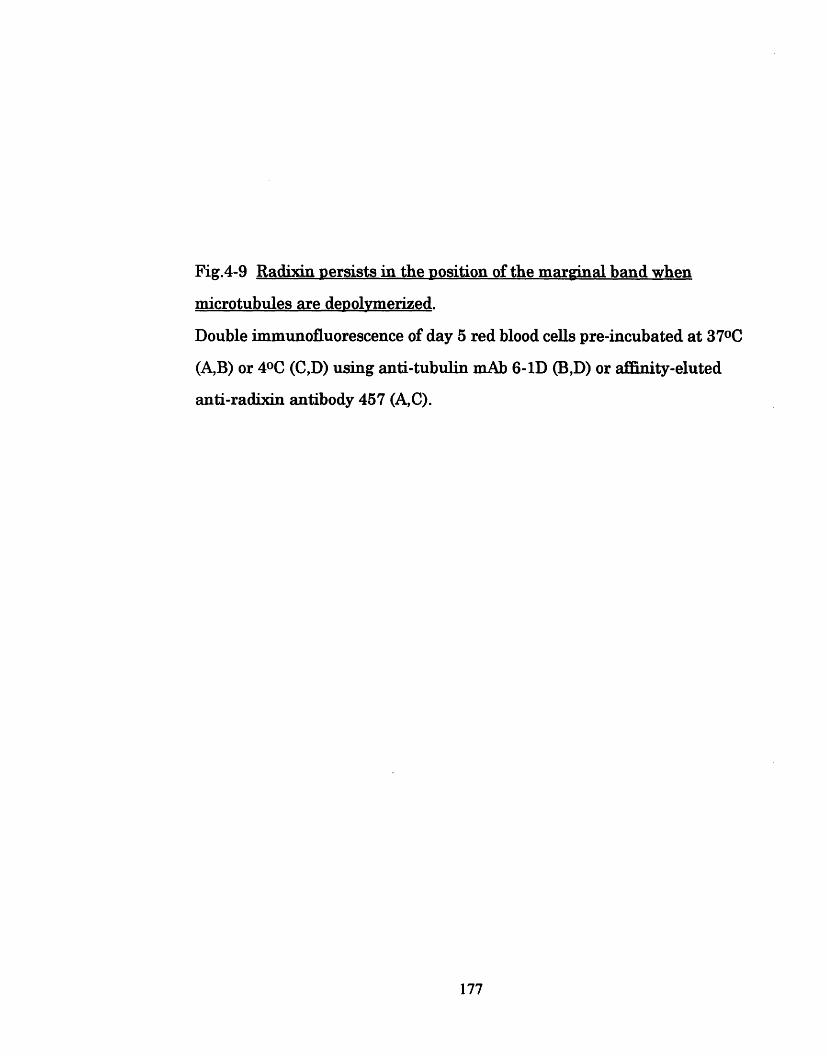
Fig.4-9 Radixin persists in the position of the marginal band when
microtubules are depolvmerized.
Double immunofluorescence of day 5 red blood cells pre-incubated at 370C
(A,B) or 40C (C,D) using anti-tubulin mAb 6-1D (B,D) or affinity-eluted
anti-radixin antibody 457 (A,C).
177
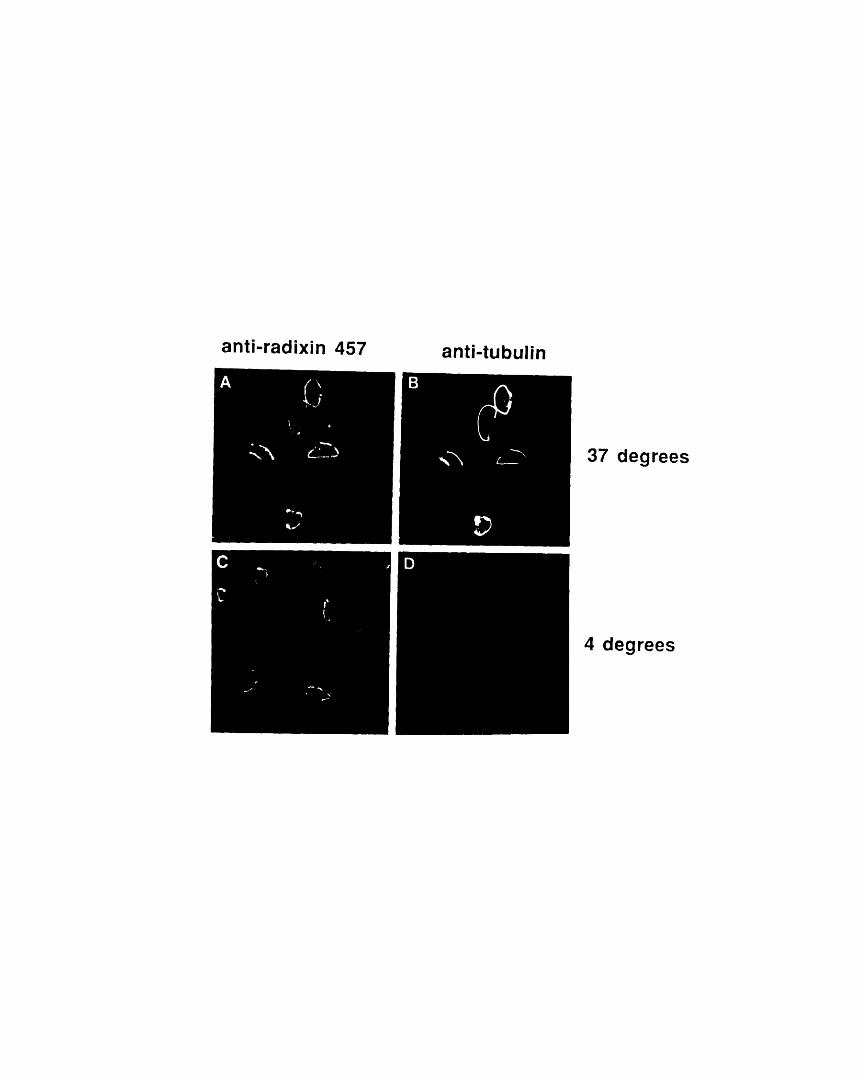
anti-radixin 457 anti-tubulin
37 degrees
4 degrees
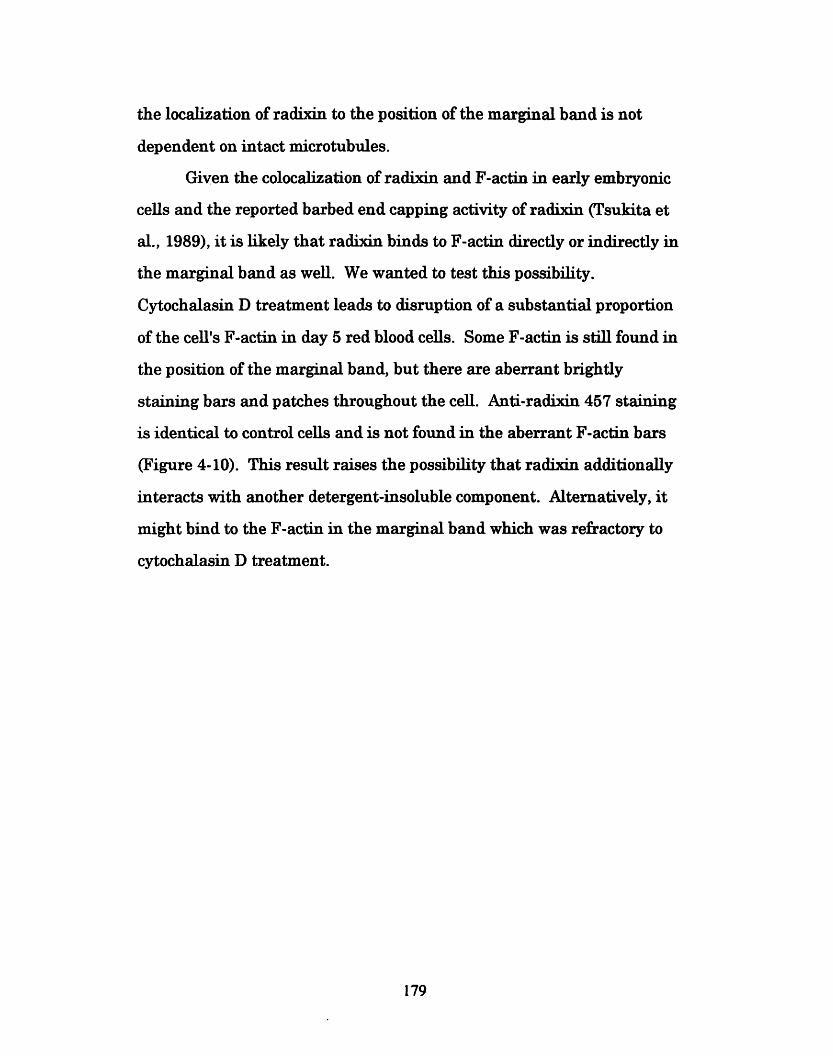
the localization of radixin to the position of the marginal band is not
dependent on intact microtubules.
Given the colocalization of radixin and F-actin in early embryonic
cells and the reported barbed end capping activity of radixin (Tsukita et
al., 1989), it is likely that radixin binds to F-actin directly or indirectly in
the marginal band as well. We wanted to test this possibility.
Cytochalasin D treatment leads to disruption of a substantial proportion
of the cell's F-actin in day 5 red blood cells. Some F-actin is still found in
the position of the marginal band, but there are aberrant brightly
staining bars and patches throughout the cell. Anti-radixin 457 staining
is identical to control cells and is not found in the aberrant F-actin bars
(Figure 4-10). This result raises the possibility that radixin additionally
interacts with another detergent-insoluble component. Alternatively, it
might bind to the F-actin in the marginal band which was refractory to
cytochalasin D treatment.
179
Fig.4-10 Radixin staining is not disrupted by cytochalasin D.
Double immunofluorescence of day 5 red blood cells pre-incubated in
DMSO as a control (A,B) or O.1 g/ml cytochalasin D (C,D) using
rhodamine-coupled phalloidin to visualize F-actin (B,D) or affinity-eluted
anti-radixin antibody 457 (A,C).
180
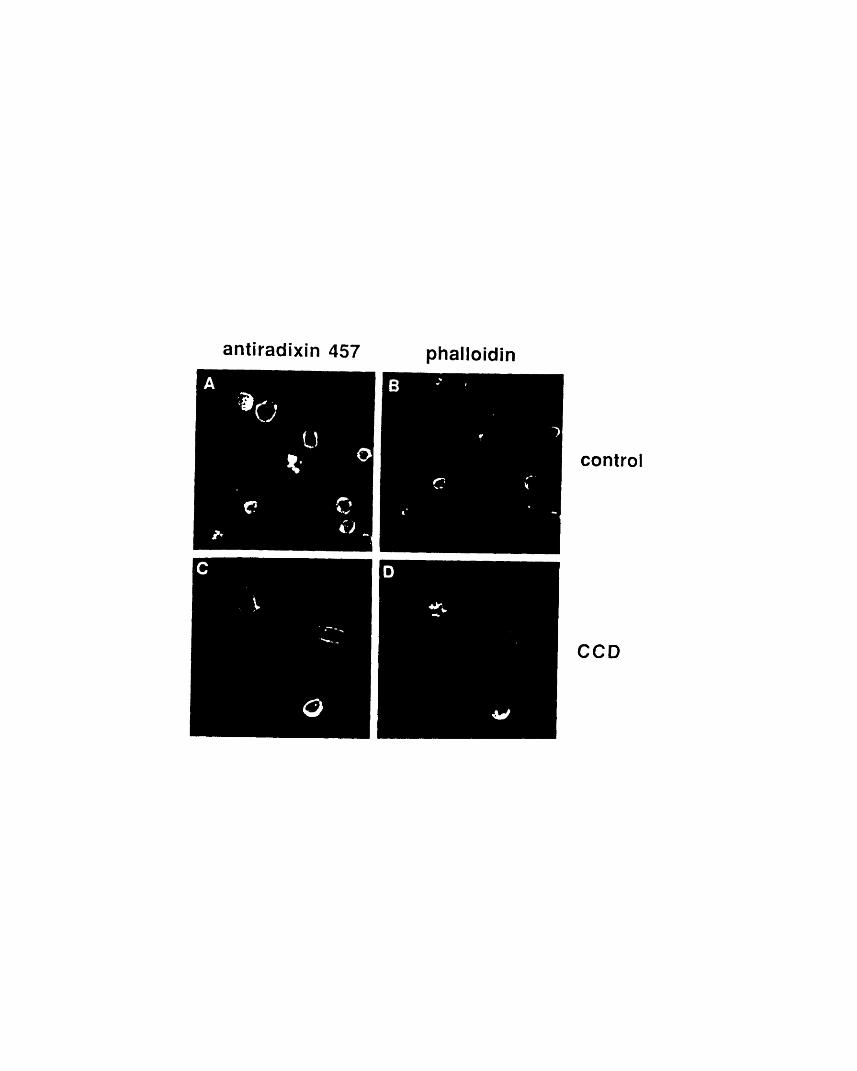
antiradixin 457
control
CCD
phalloidin
Discussion
We are interested in studying the molecular structure of
membrane-cytoskeleton interactions in a simple model system, the
marginal band of chicken erythrocytes, in order to elucidate how the
cytoskeleton is put together to support a particular cell shape. We have
previously shown that one antibody, 13H9, binds to ezrin, and binds to a
protein that co-assembles with tubulin (Birgbauer and Solomon, 1989;
Goslin et al., 1989; Birgbauer et al., 1991). 13H9 intensely stains both the
non-motile marginal band in chicken erythrocytes and the motile domains
of fibroblasts and neurons. We show here that the epitope of 13H9 is
present in at least four related proteins (ezrin, radixin, moesin and
merlin/schwannomin). The expression pattern and localization of the
ERM-family in chicken erythrocytes limits previous models for ERM-
function and raises possibilities for their role in erythrocyte
morphogenesis.
A postmitotic non-motile cell in suspension, the chicken
erythrocyte, expresses all three ERM-proteins
We present evidence that all three ERM proteins are expressed in a
single cell type, the chicken erythrocyte, from three distinct lines of
experimentation: 1. using PCR to look at expressed transcripts, we were
able to detect the expression of both radixin and moesin in day 9
embryonic red blood cells; 2. purification of the cytoskeletal ERM proteins
from mature erythrocytes and microsequencing of the major protein
confirmed the PCR result that radixin is the major ERM protein, in
particular in the cytoskeletal fraction of this cell (see Chapter 3); 3. we
182
raised anti-peptide antibodies to divergent regions of the ERM family in
order to distinguish the ERM proteins from each other. The availability
of these specific reagents overcomes a major problem arising in many
previous studies of the ERM proteins using cross-reacting reagents, and
allows us to track all three proteins individually in the same cell type.
The ERM proteins have been previously localized to cell-cell and cell-
substrate adhesion points, cleavage furrows, microvilli, and leading edges
(Bretscher, 1983; Tsukita et al., 1989; Sato et al. 1991,1992). Chicken
erythrocytes are post-mitotic (no cleavage furrow), are non-motile (no
leading edges) and develop and function in suspension (no adhesion
contacts), but apparently express all three ERM proteins.
Radixin and ezrin localize to the same subcellular structure, the
marginal band
Using the specific antibody reagents, we were able to show that at
least two of these proteins (radixin and ezrin) co-localize to the same
subcellular structure, the marginal band. All of the cell's microtubules
and the majority of the cell's F-actin are found in this position. Therefore,
in the avian erythrocyte, there are not many functionally and structurally
distinct populations of F-actin (i.e. adherens junctions vs. microvilli vs.
focal contacts etc.) that might require different members of the ERM-
family as Sato et al. (1992) suggested. Radixin has so far been identified
as a component of two structures: cell-cell adherens junctions and
cleavage furrows (Sato et al., 1991; Tsukita et al., 1989), although the
antibodies used for the localizations showed crossreactivity with ezrin and
moesin (Sato et al., 1992). We show here with specific antibodies that
radixin is found in a third structure, the marginal band. These structures
183
perform quite distinct functions in cells, but share structural features,
namely a close apposition of F-actin and the cell membrane. Radixin's
role could, therefore, be one of a universal cytoskeleton-membrane linker
whose activity is regulated by associated proteins that are specific to a
given structure and confer functional specificity.
Binding partners of radixin and ezrin in the marginal band
We show here that the fractionation of radixin changes over the
course of development: it is increasingly associated with the cytoskeleton
as assayed by insolubility in nonionic detergents. We are interested in
determining the molecular basis for this association and for the change in
association in development. We demonstrate here that the cytoskeletal
fractionation of radixin is not due to inherent insolubility of the
polypeptide, but likely reflects the association with other cytoskeletal or
membrane components. Both radixin and ezrin can be phosphorylated
(Bretscher, 1989; Fazioli et al., 1993). It is possible that the presence of a
post-translational modification determines the association of radixin with
the cytoskeleton. This possibility needs to be addressed directly. In A431
cells, no correlation exists between the phosphorylation state of ezrin and
its fractionation properties (Bretscher, 1989).
It remains to be determined whether ezrin and radixin have
identical binding partners in the marginal band or might bind a common
membrane protein through the highly conserved amino terminus (>80%
identity), but different cytoskeletal elements through the divergent
carboxy termini. Members of this family might also form dimers with one
another as has been suggested in preliminary reports (Andreoli et al.,
1992; Gary et al., 1992).
184
A role for radixin in the formation of the marginal band
During the development of the chicken red blood cell, the
postmitotic spherical precursor cell undergoes a series of morphological
changes that are accompanied or even driven by cytoskeletal
rearrangements (Kim et al., 1987; Winckler and Solomon, 1991; Chapter
2). In the spherical cell microtubules are in diffuse arrays. Later they
form several bundles near the periphery. By day 4-5 a single microtubule
bundle encircling the cell's periphery is found. At this stage, the cell is
disc-shaped, and the microtubule bundle is at the equator.
Here, we show that radixin co-localizes with F-actin in brightly
stained patches in early erythropoietic cells and does not localize to the
cell's equator until microtubules have already arrived in this position. We
have argued previously that the structural properties of microtubule
bundles alone could be responsible for driving all microtubules into a
single bundle and flattening the cell to a disc-shape (Birgbauer and
Solomon, 1989; Winckler and Solomon, 1991; Chapter 2). This
microtubule-autonomous model of erythrocyte morphogenesis was based
on the observation that experimental manipulations, especially disrupting
the F-actin network with cytochalasin D, lead to dramatic microtubule-
dependent shape changes in embryonic chicken red blood cells. The
susceptibility to undergo cytochalasin D-induced shape changes was
restricted to a narrow early window in development (day 2-3), and
disappeared with increasing developmental age (Winckler and Solomon,
1991; Chapter 2). The radixin localization studies presented here are in
agreement with a microtubule-autonomous model of marginal band
185
formation and suggest that radixin is not involved in directing the
formation of the marginal band.
The flattened shape of the mature erythrocyte is not dependent on
intact microtubules while that of the immature red blood cell is (Behnke,
1970a). That suggests that components of the non-tubulin cytoskeleton
which assemble over the course of development are sufficient to maintain
the flattened cell shape. Therefore, radixin might play a role in
stabilizing the cytoskeleton at later developmental stages by providing
membrane-cytoskeletal linkages. This suggestion is supported by the
observation that the time course of the association of radixin with the
cytoskeleton and the time course of the cell's loss of cytochalasin D
susceptibility are co-incident (Winckler and Solomon, 1991; Chapter 2).
186
Acknowledgment of collaborators
The work presented in this chapter was the result of a collaboration
with Charo Gonzalez Agosti and Margaret Magendantz. Margaret
Magendantz performed the mapping of the 13H9 epitope; Charo Gonzilez
Agosti and Margaret Magendantz performed the PCR experiments; and
Charo Gonzalez Agosti and myself raised the anti-peptide antibodies and
performed the characterizations. I would like to thank them for this
productive and enjoyable collaboration.
187
Chapter 5The Morphogenesis of the Chicken Erythrocyte
188
The primitive erythropoietic cell of the chick embryo develops from
a mitotic spherical precursor to a flattened ellipsoid. Concomitant with
this cell flattening, microtubules rearrange from several bundles in many
planes to a single bundle at the equator of the ellipse (Kim et al., 1987).
This series of morphogenetic events occurs in suspension without cell-cell
or cell-substrate contacts and is, therefore, intrinsic to the cell, driven by
the cytoskeleton. How does the cytoskeleton effect these changes?
Microtubules and erythrocyte morphogenesisOn a molecular level, we envision the following series of events
taking place: After the final mitosis, the properties of microtubules
change in a manner that suggests increasing lateral interactions (Kim et
al., 1987). These interactions might be facilitated by the onset of the
expression of a microtubule associated protein that mediates microtubule-
microtubule interactions resulting in the formation of microtubule
bundles. Since there are no data concerning the expression of the
putative erythrocyte bundling protein syncolin (Feick et al., 1991), we do
not know whether or not syncolin might fulfill this function. The
requirement for this putative bundling protein might be restricted to a
discrete developmental stage, since no proteins other than tubulin are
necessary for in vitro regrowth of the marginal band (Swan and Solomon,
1984).
The results described in Chapter 2 suggest that developing
erythrocytes pass through a developmental stage during which
microtubules are competent to exert elongating forces on the cell. The
properties of this phenomenon are consistent with a role for microtubules
189
in specifying the characteristic morphology of these cells. The initial
flattening of the cell might, therefore, be due to the pushing forces of
microtubule bundles which also lead to the formation of a single
peripheral bundle of microtubules. With further development, the
properties of microtubules change further. The loss of nocodazole
sensitivity (Kim et al., 1987) might reflect stabilization of microtubules by
lateral interactions or a capping protein.
Other cytoskeletal elements and erythrocytemorphogenesis
Not only microtubules, but also other cytoskeletal elements mature
during development. This is most noticeable by the fact that more mature
erythrocytes do not lose their flattened shape when microtubules are
depolymerized while immature cells do. Therefore, at some point in
development cytoskeletal elements other than microtubules become
sufficient for maintaining the flattened shape. The spectrin-actin
network assembles (Lazarides, 1987). Vimentin expression is detected
from day 4 on. Vimentin filaments are found connecting the nucleus to
the membrane skeleton and could conceivably play a crucial role in
stabilizing the flattened elliptical shape of more mature erythrocytes.
Changes in these two other cytoskeletal elements might also lead to the
observed loss of cytochalasin D susceptibility in development (Chapter 2).
A role for radixin in erythrocyte morphogenesisRadixin becomes increasingly associated with the cytoskeleton, as
shown in Chapter 4. We do not know at this point, what is the molecular
basis for this increasing association with the cytoskeleton. It is possible
190
that the radixin binding sites are limiting for cytoskeleton association, so
that most of the radixin is soluble in early red cells. As the cell matures,
it might express higher levels of radixin binding proteins which recruit
radixin into the cytoskeleton. Alternatively, the soluble and cytoskeletal
forms of radixin might differ from each other on the molecular level. For
instance, it is possible that a posttranslational modification determines
the cytoskeletal association of radixin. In this case, the activity of the
modifying enzyme might be developmentally regulated.
All available evidence suggests that radixin interacts with F-actin.
Consistent with this notion is our observation that in primitive
erythrocytes radixin is associated with F-actin patches at stages before
marginal band formation is complete. Eventually, it is found exclusively
in the position of the marginal band. One important question is why
radixin localizes to only a subset of F-actin, that in the position of the
marginal band but not that in the cortex. This question is directly related
to the question of the function of radixin as well. It is possible that the
radixin binding protein is itself restricted to the position of the marginal
band. In terms of the development of the restricted distribution, this
potential answer just shifts the question from why radixin is restricted to
the marginal band to why the radixin binding protein is restricted to the
marginal band. It is, therefore, tempting to speculate that radixin in
some fashion interacts with microtubules since we have evidence for a
mechanism in which microtubules can place themselves into an
equatorial, peripheral position. Microtubules could then serve as a kind
of assembly matrix for other proteins (for instance radixin) in this
position. In this model, radixin binds to F-actin only near microtubules
and therefore, accumulates in the position of the marginal band. It might
191
serve a role in stabilizing the marginal band by being part of a link
between actin, microtubules and the membrane.
What is the evidence favoring the interaction of radixin with
microtubules? We know that the localization of radixin to the position of
the marginal band is not dependent on intact microtubules (Birgbauer
and Solomon, 1989; Chapter 4). This does not disprove the idea, though,
that radixin might bind microtubules since detergent-insoluble proteins
could additionally bind to microtubules (Swan and Solomon, 1984). It
merely argues that radixin binds more than one cytoskeletal component.
Birgbauer and Solomon (1989) already argued that the 13H9 antigen has
properties of both microtubule- and microfilament-association. The
argument for microfilament association was based on the fact that 13H9
stains a subset of F-actin containing structures in many cell types.
Arguments for microtubule association came from two observations: 1. the
source of the 13H9 antigen (chick brain MAPs) which demonstrated at
least an in vitro association with microtubules and 2. the microtubule-
dependence of the growth cone association of the 13H9 antigen (Goslin et
al., 1989).
The question of the possible association of the 13H9 antigen with
microtubules has been redirected due to the fact that the 13H9 antigen is
not a single polypeptide. We now want to know which ERM protein
interacts with microtubules. For instance, it would be important to know
which of the 13H9 epitope containing proteins constitutes the
microtubule-sensitive growth cone component. Experiments by Charo
Gonzalez Agosti demonstrate that radixin is found in growth cones of
chick sympathetic neurons. Whether or not radixin localization is
microtubule-sensitive has not been determined. We also do not know
192
which of the ERM proteins cycle with microtubules in vitro. Since cDNAs
exist for all three ERM proteins, these experiments could now be
performed using fusion proteins.
In chicken erythrocytes, the possibility of microtubule binding of
radixin could be addressed in several ways. Stetzkowski-Marden et al.,
1991) identified a 78kd marginal band component by in vitro tubulin
overlay assays. One could establish whether this protein is an ERM
protein. Crosslinking experiments as those described in Appendix 4 could
test the possibility that radixin is a near neighbor of tubulin in the
marginal band. In addition, immunoelectron microscopy of sectioned
erythrocytes using the anti-radixin antibody could shed light on the
proximity of radixin to microtubules and the membrane.
A role for microtubule-cortex linkages in erythrocytemorphogenesis
It is likely that microtubules start interacting increasingly with the
cortex over the course of development. Swan and Solomon (1984)
obtained evidence for the existence of a microtubule associated protein
present in the position of the marginal band even in the absence of
microtubules which can direct microtubule reassembly (i.e. a marginal
band determinant). This determinant might also be involved in
organizing microtubules during development. Kim et al. (1987) showed
that the regrowth of the microtubule marginal band in vivo occurs in
primitive red cells as well, but in contrast to the regrowth in adult cells
(Miller and Solomon, 1984), not all microtubules are confined to the
marginal band. The results in Chapter 2 suggest that microtubule
bundles alone can lead to a marginal band without the presence of a
193
determinant during development or during in vivo regrowth. The in vivo
regrowth experiment on embryonic red cells, therefore, does not address
whether the regrowth is microtubule-driven or determinant-specified.
This point would be better addressed by in vitro regrowth experiments as
those performed by Swan and Solomon (1984) on adult cells using
embryonic red cells instead. Since the in vitro regrowth is performed on
detergent-extracted cytoskeletons in the absence of the plasma
membrane, a microtubule-driven regrowth mechanism would not be
expected to result in a marginal band in the absence of the plasma
membrane. On the other hand, if the determinant was already in place in
embryonic red cells, the in vitro regrowth should result in at least some
curved microtubules in the position of the marginal band. This
experiment has not been done.
A related question is whether radixin could be the marginal band
determinant in adult cells identified by Swan and Solomon (1984). 13H9
was identified in a search for this component (Birgbauer and Solomon,
1989). Some of the properties of radixin are consistent with the
determinant role: It is present in the marginal band and its localization
is independent of intact microtubules. Since there are no data addressing
its association with microtubules in erythrocytes, it is presently unclear
whether or not radixin could serve to direct the in vitro regrowth of
marginal band microtubules. One possibility is to perform the regrowth
experiment in the presence or absence of anti-radixin antibodies to see if
they would block regrowth. This experiment was much talked about but
never done with 13H9 because a positive result could not be interpreted
due to the possibility that steric hindrance by the IgM could alone inhibit
regrowth. A necessary control would be an antibody to another marginal
194
band component which does not block regrowth. We now have IgG
antibodies specific to radixin, which could also be used as Fab fragments.
In addition, we identified a second marginal band component, ezrin. Fab
fragments of the anti-ezrin antibody potentially could serve as a negative
control. It would be interesting if one but not the other of the antibodies
inhibited regrowth.
A general role for radixin
In the marginal band, radixin is placed ideally for mediating
microtubule-microfilament interactions. Radixin is probably also found in
adherens junctions, and cleavage furrows (Sato et al., 1992), and in
growth cones. Is the localization of radixin in these structures consistent
with a role in microtubule-microfilament interactions? There is no
documented interaction between microtubules and microfilaments in
adherens junctions, but for both growth cones and cleavage furrows there
is. It has been known for decades that the position of the cleavage furrow
in developing eggs is determined by the position of the spindle asters
(reviewed in Strome, 1993). In turning growth cones, microtubules are
often found in the direction of the future turn (Sabry et al., 1990; Tanaka
and Kirschner, 1990) in close association with the actin network. This is
consistent with the intriguing possibility that radixin is in the right place
to mediate interactions between microtubules and microfilaments.
Clearly, the test of this possibility needs further experimentation.
We have identified both radixin and ezrin as components of the
marginal band (Chapter 4). More than one ERM protein is also found in
microvilli of A431 cells (Franck et al., 1993). The co-localization can be
interpreted in several ways. It is possible that the ERM proteins perform
195
essentially the same function and, therefore, do not segregate to different
cellular structures. Given the degree of functional redundancy among
actin binding proteins with much less sequence homology than the ERM
proteins, this is not unlikely. Alternatively, they might function as
complexes in the same structure. For instance, one can envision a
situation in the marginal band in which radixin-- let's say-- binds
microtubules and dimerizes with ezrin, while ezrin is bound to radixin but
also to F-actin, thereby, establishing a crossbridge between microtubules
and microfilaments via a radixin-ezrin dimer. Given the difference in
stoichiometry of ezrin and radixin in the erythrocyte cytoskeleton, this
would clearly not be the case for every radixin molecule.
Unresolved questions in erythrocyte morphogenesisThere are two aspects of erythrocyte morphogenesis which
we have not been able to address at all. One is the shape change from a
flattened disk to a flattened ellipse, the other one is the molecular basis
for the tight quantitative control of marginal band microtubules. What
controls the levels of polymerized tubulin in these cells is largely
unknown. Embryonic red cells contain many more microtubule profiles
than mature cells. This might be due-- at least in part-- to the fact that
they also contain higher levels of assembly promoting activity than adult
cells (Ranerjee et al., 1979). It is unknown how the levels of tubulin
expression, the presence of MAPs and turnover of microtubules are
regulated to achieve precisely the correct number of microtubules in the
cell.
Early embryonic red cells can be isolated and survive in culture for
several days (Barrett and Scheinberg, 1972; Hagopian et al., 1972). The
196
aim of these older studies was primarily to analyze the mitotic potential
and the pattern of hemoglobin synthesis in these cells, rather than cell
shape. From the few published pictures, it is possible that cultured red
cells undergo the transition from spherical to flattened, and from
flattened to flattened ellipsoid in culture. A careful quantitative analysis
would be needed before we can conclude that the information for
elongation to an ellipse might also be intrinsic to the cell rather than, for
instance, caused by squeezing through capillaries.
Conclusion
Our current model for the role of the cytoskeleton in chicken
erythrocyte morphogenesis is that microtubules-- bundled by MAPs--
drive the change from a spherical to a flattened cell and are, therefore,
instrumental in the initial establishment of the asymmetric morphology of
embryonic red cells. The integrity of F-actin is also crucial for these early
steps in the morphogenesis by restricting microtubules to a circular
conformation. Microtubules are not, however, involved in the
maintenance of the flattened shape. Both the spectrin-actin network
(including ERM proteins) and the vimentin filaments-- alone or in
combination-- are likely to be involved in the maintenance of the flattened
shape, once it is established.
197
Appendix 1: Association of Ezrin Isoforms With theNeuronal Cytoskeleton
198
Journal of Neuroscience Research 30:232-241 (1991)
Association of Ezrin Isoforms With theNeuronal CytoskeletonE. Birgbauer, J.H. Dinsmore, B. Winckler, A.D. Lander, and F. SolomonDepartment of Biology (E.B.. J.H.D.. B.W.. A.D.L.. F.S.), Center for Cancer Research(E.B.. J.H.D., B.W.. F.S.). and Department of Brain and Cognitive Sciences (A.D.L.),Massachusetts Institute of Technology, Cambridge, Massachusetts
We are studying the changes in the organization ofthe cytoskeleton which accompany expression of dif-ferentiated neuronal morphology. Of particular in-terest is the elaboration of growth cones, the motiledomains of the neuronal plasma membrane, and thecytoskeletal structures that underlie them. A candi-date for a component of the growth cone cytoskeletonof cultured hippocampal neurons is the antigen rec-ognized by the monoclonal antibody, 13H9 (Birg-bauer and Solomon, J Cell Biol 109:1609-1620, 1989;Goslin et al., J Cell Biol 109:1621-1631, 1989). Thatantibody binds strongly to growth cones, but barelystains neurites. The characterization of the antigen,both biochemical and microscopic, suggests that itmay interact with microfilaments and microtubules.We have established that 13119 recognizes a subset ofthe isoforms of ezrin (unpublished results). Here, wedescribe the properties and localization of ezrin iso-forms in differentiating neuronal cells, using two invitro systems and developing spinal cord. In embry-onal carcinoma cells, both the abundance of ezrin andthe proportion of ezrin associated with the cytoskel-etal fraction increase upon induction of neuronal dif-ferentiation with retinoic acid. In the neuronal cellswithin such cultures, the 13H9-positive forms of ezrinare enriched in the growth cone, while the bulk ofezrin identified by a polyclonal antibody shows nospecific localization. In mouse DRG neurons, 13H9staining is asymmetrically distributed along the edgesof the complex growth cones of these cells. Staining ofdeveloping spinal cord in rat embryos also demon-strates that the 13H9-positive forms of ezrin do notcolocalize with the majority of ezrin. These resultssupport the conclusion that ezrin is a component ofthe neuronal cytoskeleton, and that the localization ofcovalently distinct isoforms of the protein may be sig-nificant for growth cone function.
Key words: growth cone, actin-associated protein,microtubule-associated protein, neuronal differentia-tion
INTRODUCTION
Cell motility, to produce new cell shapes or tomove the cell across a substratum, is ultimately a func-tion of the leading edge of the cell. Membrane special-izations such as lamellipodia and filopodia, and mem-brane domains such as ruffling edges or growth cones,are the sites at which cells undergo the deformations thatare fundamental to movement. The expression and func-tion of these edges clearly depend upon appropriate or-ganization of the cytoskeleton; that fact is established bya long list of drug interference experiments and morpho-logical correlations. Among the issues that remain to beresolved is how cytoskeletal elements interact with oneanother and with other cellular structures to produce theorganizations required for cell motility. These interactingproteins need not be distributed uniformly along thelength of cytoskeletal fibers, but instead may be re-stricted to domains of cells where crucial events in mo-tility occur.
One possible candidate for such a protein was iden-tified by analyses of the marginal band of avian erythro-cytes. Although the marginal band probably is not in-volved in typical motility, it does represent a domainwhere microtubules, microfilaments, and the cell surfaceare in close proximity. A monoclonal antibody, called13H9, binds to the position of the marginal band even inthe absence of assembled microtubules, as assayed byimmunofluorescence (Birgbauer and Solomon, 1989).That same antibody applied to hippocampal neurons inculture recognizes an epitope in growth cones but isbarely detectable in the shafts of neurites. The stainingpattern of 13H9 on growth cones is similar to that ofphalloidin; however, unlike F-actin, the 13H9 localiza-
Received March 15, 1991; revised April 28. 1991; accepted April 30.1991.
Address reprint requests to Frank Solomon, Building El7, Room 220,M.I.T.. Cambridge, MA 02139.
Eric Brigbauer's present address is Department of Physiology andBiophysics. University of California. Irvine. CA.
,) 1991 Wilev-Liss, Inc.
II
tion is dependent upon the maintenance of intact, assem-bled microtubules (Goslin et al., 1989). The antigen isalso greatly enriched in ruffling edges of migrating fi-broblastic cells (Birgbauer, 1991). These results, andother experiments, suggest that the 13H9 antigen mayinteract with both microtubules and microfilaments (Birg-bauer and Solomon, 1989). We now know that 13H9antigen recognizes a subset of the isoforms of the proteinezrin (Bretscher, 1983). The epitope is specified by lessthan 13 amino acids of the ezrin sequence, and the iso-forms are generated by either covalent modifications oralternative splicing (unpublished results). Here, we haveused 13H9 and another antibody, 904, which recognizesmost if not all isoforms of ezrin to characterize the be-havior of this protein in neurons, both in vivo and invitro. The results show that the 13H9-positive isoformsof ezrin are localized differently than is the majority ofcellular ezrin, supporting the conclusion that these formsof ezrin are a component of the neuronal cytoskeleton indomains specialized for motility.
MATERIALS AND METHODSCulture of Embryonal Carcinoma Cells
The embryonal carcinoma (EC) cell line P19 wasobtained from M. McBurney, University of Ottawa.Cells were cultured as previously described (Rudnickiand McBurney, 1987), except that 0.5 p.M retinoic acid(RA) was used to induce neuronal cells (Dinsmore andSolomon, 1991). Uninduced EC cells were plated ontocoverslips coated with 0.1% gelatin (Sigma ChemicalCo., St. Louis, MO), allowed to grow for I day, andthen fixed with 4% paraformaldehyde in PBS. RA-in-duced cells were trypsinized from dishes, dispersed bypipetting, and plated onto coverslips coated either with50 pug/ml laminin (GIBCO Laboratories, Grand Island,NY) or with 0.1 mg/ml polylysine and then 20 jLg/mllaminin.
Antibodies
Anti-ezrin serum 904 is a rabbit polyclonal serumraised against ezrin purified from intestinal epithelia.kindly provided by P. Matsudaira (Whitehead Instituteand M.I.T., Cambridge, MA). Rabbits were injectedsubcutaneously with 50 ig of ezrin in Freund's completeadjuvant, followed by two boosts, at 3-week intervals,with 50 ,ug of ezrin in Freund's incomplete adjuvant.The specificity of 904 for ezrin is based on several cri-teria. Briefly, 904 binds to several spots of about 80 kdresolved by two-dimensional gel electrophoresis of ma-terial from chicken erythrocytes; it binds to bacteriallyexpressed ezrin fusion proteins specified by at least twodistinct domains of the human ezrin cDNA; and antibod-ies affinity purified from those fusion proteins give blot-
Ezrin in Neuronal Cytoskeleton 233
ting patterns of animal cell ezrin identical to that ob-tained with the whole serum.
Monoclonal antibody 13H9, of the IgM class, hasbeen previously described (Birgbauer and Solomon.1989); its characterization has been extended. Briefly, a13 amino acid domain of the ezrin sequence is both nec-essary and sufficient for 13H9 binding. In two-dimen-sional separations (iso-electric focusing followed bySDS-PAGE) of chicken erythrocyte ezrin, only a minorsubset of 904-positive spots is stained by 13H9.
A control monoclonal IgM, AD4, which was madeagainst mouse CD8 antigen, was kindly provided by D.Raulet (Berkeley). Culture supernatants of AD4 wereused at the same concentration as 13H9. The anti-tubulinantibody (6-1D) is a mouse monoclonal IgM describedpreviously (Magendantz and Solomon, 1985). The anti-neurofilament antibody, RT97, is a mouse monoclonalantibody previously described (Wood and Anderton,1981). Rhodamine-, Texas Red-, and FITC-conjugatedsecond antibodies were obtained from Organon Teknika-Cappel, Malvern, PA.
Immunofluorescence of EmbryonalCarcinoma Cells
Cells were fixed by underlaying the medium with4% paraformaldehyde in PBS with 10% sucrose, thenpermeabilizing with 0.5% Triton X-100 in PBS for 5min. Cells were stained with 13H9 or 904, followed byFITC-conjugated goat anti-mouse Ig and Texas Red-con-jugated goat anti-rabbit IgG secondary antibodies. Priorto the primary antibody incubations, coverslips wereblocked for 20 min at 37°C with 10% normal goat serumand 1% BSA in PBS. The antibody incubations werecarried out in the presence of 1% BSA (Sigma ChemicalCo., St. Louis, MO) in PBS. Coverslips were mountedonto slides using gelvatol mounting media containing 15mg/ml 1,4-diazabicyclo-[2.2.2]-octane, an anti-fadeagent (Aldrich Chemical Co., Milwaukee, WI). Theywere examined on an Axioplan microscope (Carl Zeiss,Inc., Thornwood, NY) using a 100 x, 1.3 NA, objec-tive. Photography was done using Kodak Tri-X 400 film.
Fractionation and Protein Analysis of EC Cells
To prepare lysates, EC cells were resuspended inPBS with protease inhibitors (leupeptin, pepstatin,PMSF, TAME, soybean trypsin inhibitor, and aproti-nin), then diluted into gel-loading buffer to a final con-centration of 2% SDS and 5% -mercaptoethanol andboiled for 2 min. Subcellular fractionation of EC cellswas performed as follows (with the above protease in-hibitors present in all buffers): Cells on tissue culturedishes were washed with PBS, then washed with PM2G10.05M PIPES, 2 M glycerol, 5 x 10- 3 M EGTA, 10
- 3
M MgSO 4, pH 6.9), and then extracted for 10 min at
200
234 Birgbauer et al.
37°C with 0.1% NP-40 in PM2G. The dishes werescraped and the suspension pelleted; supernatants weresaved as the "NP-40 SOLUBLE" fraction. The pelletwas washed once with PM2G, and then extracted for 20min on ice with 5 mM CaC12 in 0.05 M Pipes pH 6.9 and5 mM MgSO 4 . After pelleting again at 15,000g for 10min, the supernatant was saved as the "CALCIUM EX-TRACTABLE" fraction. The SDS RESIDUE" frac-tion was then obtained by dissolving the pellet in gelloading buffer (containing 2% SDS and 5% P3-mercap-toethanol).
For immunoblotting, samples separated on a 7.5%polyacrylamide gel with a 5% polyacrylamide stacker,according to the method of Laemmli (1970), were trans-ferred to nitrocellulose electrophoretically and probed byslight modifications of standard procedures (Tobin et al.,1979). The nitrocellulose filters were stained for totalprotein with 0.2% Ponceau S (Sigma Chemical Co., St.Louis MO) in 3% trichloroacetic acid, photographed,and then the Ponceau S was washed away. The nitrocel-lulose filters were blocked with 2% hemoglobin in PBSwith 0.05% sodium azide. Antibody incubations weredone in the same buffer. Following the primary and sec-ondary antibody incubations, blots were washed inblocking buffer that contained 0.1% SDS and 0.05%NP-40. ' 25 I-labeled goat anti-mouse Ig and protein Awere obtained from New England Nuclear (Boston,MA).
Culture and Staining of DRG NeuronsSpinal ganglia were dissected from adult female
CD-1 mice. Dorsal root ganglion neurons were isolatedas described by Lindsay (1988). The culture medium was45% Hams F12, 45% Dulbecco's modified Eagle's me-dium. and 10% heat-inactivated horse serum, plus pen-icillin (25 IU/ml), streptomycin (25 pLg/ml), glutamine (ImM) and 2.5 S nerve growth factor (I ng/ml). Cells werecultured on glass coverslips pretreated with laminin (20ig/ml). After about 6 hr in culture, cells were fixed in10% formalin and 5% sucrose in PBS, and permeabilizedwith 1% Triton X-100. Cells were stained with either13H9 or with phalloidin coupled to rhodamine (Molec-ular Probes, Inc., Junction City, OR) as describedabove.
Immunostaining of Rat Embryo SectionsRat embryos (Sprague-Dawley) were staged by
embryonic day, with date of sperm positivity defined asEO. Embryos were dissected from pregnant rats (TaconicFarms) and fixed overnight by immersion in ice cold 4%paraformaldehyde in 0.1 M sodium phosphate, pH 7.4.The fixed embryos were washed thoroughly with PBS,then washed with 5% sucrose in PBS, and then equili-brated with 15% sucrose in PBS. The embryos were
embedded in 7.5% gelatin in PBS plus 15% sucrose.Prior to sectioning, the embryos were embedded in OCTcompound and frozen on dry ice. 14-r.m cryostat sec-tions were mounted onto subbed microscope slides andstored frozen until stained. Subbing of slides wasachieved by treating Premium microscope slides (Fisher)with 0.25% gelatin plus 0.25 mg/ml Chrom-Alum. Sec-tions were blocked for 1-3 hr at room temperature with10% goat serum plus 1% BSA in PBS prior to antibodyincubations. The primary antibodies were diluted in theabove buffer and incubated on the sections overnight at4°C. The sections were washed four times, and thenincubated at room temperature for 1-5 hr with rho-damine- or Texas Red-labelled secondary antibodies inthe above buffer. After washing four times, the sectionswere dehydrated by washing sequentially in 70% etha-nol, twice in 100% ethanol, and twice in xylene. Cov-erslips were then mounted with Pro-Texx, and the slidesexamined on a Zeiss Axiophot microscope with a 10 x,0.30 NA lens or a 25 x, 0.80 NA lens.
RESULTSAn Embryonal Carcinoma Model System to StudyEzrin During Neuronal Differentiation
To study expression and localization of ezrin dur-ing neuronal differentiation, we have taken advantage ofan embryonal carcinoma cell line, P19, characterized byMcBurney and colleagues (McBurney et al., 1982). Innormal culture medium, these cells grow and divide asundifferentiated cells. They can be induced to differen-tiate into either neuronal cells or muscle cells by expos-ing aggregates in suspension to either retinoic acid (RA)or dimethyl sulfoxide (DMSO), respectively. In eachcase, the assays for differentiation are expression ofcharacteristic morphologies and molecular markers(Jones-Villeneuve et al., 1982; Sharma and Notter,1988). In particular, 50 to 70% of the RA-induced cellsdisplay neuronal morphology: they develop well-definedgrowth cones and send out long thin processes that fre-quently branch. The rest of the cells in the culture arelarge and flattened, but do not extend processes and donot express neuronal markers (Dinsmore and Solomon,1991).
Quantitative and Qualitative Changes in Ezrin as aResult of P19 Cell Differentiation
We analyzed the levels of ezrin during EC celldifferentiation on immunoblots with the polyclonal anti-ezrin serum 904 (see Materials and Methods). The levelof ezrin in RA-induced EC cells was compared to thatpresent in uninduced and DMSO-induced EC cells.Equal amounts of protein from whole cell lysates wereloaded onto a gel, and immunoblots were probed with
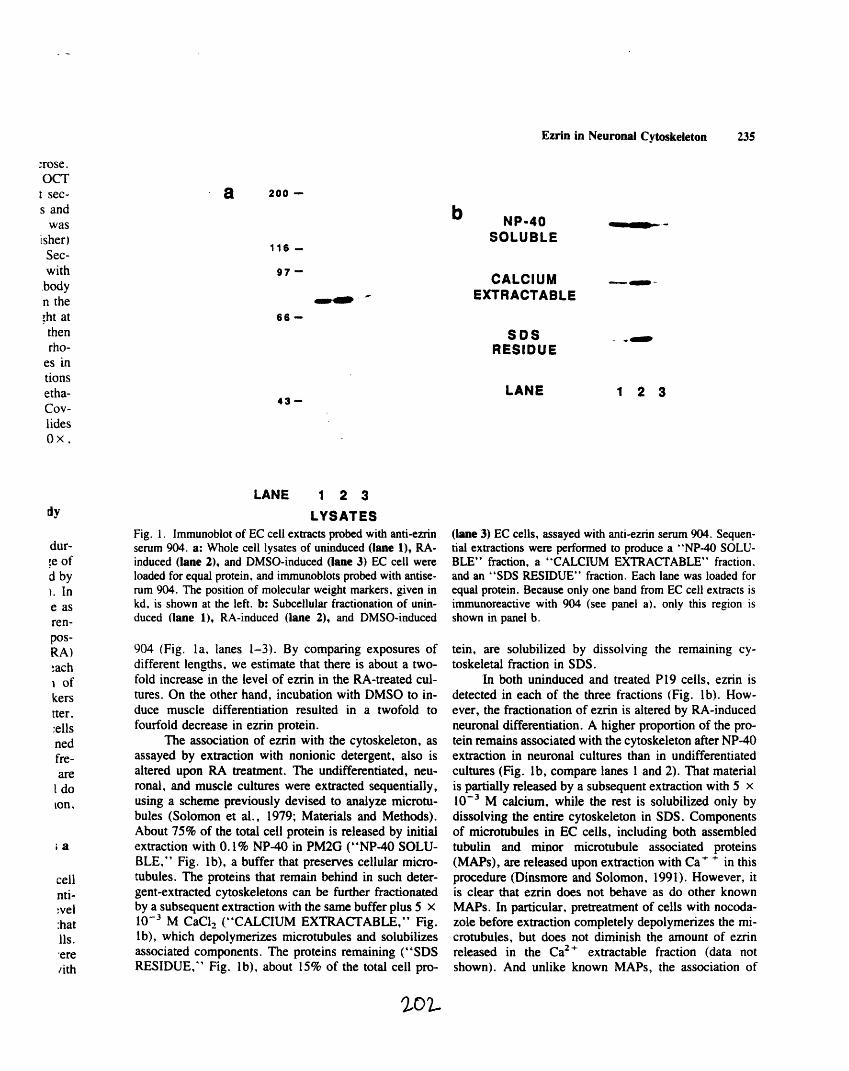
Ezrin in Neuronal Cytoskeleton 235
b
116 -
97 -
NP-40SOLUBLE
CALCIUMEXTRACTABLE
66 -
SDSRESIDUE
LANE 1 2 3
LANE 1 2 3
LYSATESFig. 1. Immunoblot of EC cell extracts probed with anti-ezrinserum 904. a: Whole cell lysates of uninduced (lane 1), RA-induced (lane 2), and DMSO-induced (lane 3) EC cell wereloaded for equal protein, and immunoblots probed with antise-rum 904. The position of molecular weight markers, given inkd, is shown at the left. b: Subcellular fractionation of unin-duced (lane 1), RA-induced (lane 2), and DMSO-induced
904 (Fig. la, lanes 1-3). By comparing exposures ofdifferent lengths, we estimate that there is about a two-fold increase in the level of ezrin in the RA-treated cul-tures. On the other hand, incubation with DMSO to in-duce muscle differentiation resulted in a twofold tofourfold decrease in ezrin protein.
The association of ezrin with the cytoskeleton, asassayed by extraction with nonionic detergent, also isaltered upon RA treatment. The undifferentiated, neu-ronal, and muscle cultures were extracted sequentially,using a scheme previously devised to analyze microtu-bules (Solomon et al., 1979; Materials and Methods).About 75% of the total cell protein is released by initialextraction with 0. 1% NP-40 in PM2G ("NP-40 SOLU-BLE," Fig. lb), a buffer that preserves cellular micro-tubules. The proteins that remain behind in such deter-gent-extracted cytoskeletons can be further fractionatedby a subsequent extraction with the same buffer plus 5 x10⁻³ M CaC12 ("CALCIUM EXTRACTABLE," Fig.lb), which depolymerizes microtubules and solubilizesassociated components. The proteins remaining ("SDSRESIDUE," Fig. lb), about 15% of the total cell pro-
(lane 3) EC cells, assayed with anti-ezrin serum 904. Sequen-tial extractions were performed to produce a "NP-40 SOLU-BLE" fraction, a "CALCIUM EXTRACTABLE" fraction,and an "SDS RESIDUE" fraction. Each lane was loaded forequal protein. Because only one band from EC cell extracts isimmunoreactive with 904 (see panel a). only this region isshown in panel b.
tein, are solubilized by dissolving the remaining cy-toskeletal fraction in SDS.
In both uninduced and treated P19 cells, ezrin isdetected in each of the three fractions (Fig. lb). How-ever, the fractionation of ezrin is altered by RA-inducedneuronal differentiation. A higher proportion of the pro-tein remains associated with the cytoskeleton after NP-40extraction in neuronal cultures than in undifferentiatedcultures (Fig. lb, compare lanes 1 and 2). That materialis partially released by a subsequent extraction with 5 x10- 3 M calcium, while the rest is solubilized only bydissolving the entire cytoskeleton in SDS. Componentsof microtubules in EC cells, including both assembledtubulin and minor microtubule associated proteins(MAPs), are released upon extraction with Ca' + in thisprocedure (Dinsmore and Solomon, 1991). However, itis clear that ezrin does not behave as do other knownMAPs. In particular, pretreatment of cells with nocoda-zole before extraction completely depolymerizes the mi-crotubules, but does not diminish the amount of ezrinreleased in the Ca2 + extractable fraction (data notshown). And unlike known MAPs, the association of
a 200 -
:rose.OCTt sec-s and
wasisher)
Sec-withbodyn the.ht atthenrho-
es intionsetha-Cov-lidesOx.
43-
dy
dur-,e ofd by). Ine asren-pos-RA)iach
ofkerstter.:ellsnedfre-are
I do
ion,
;a
cellnti-:vel
:hatIls.,ere/ith
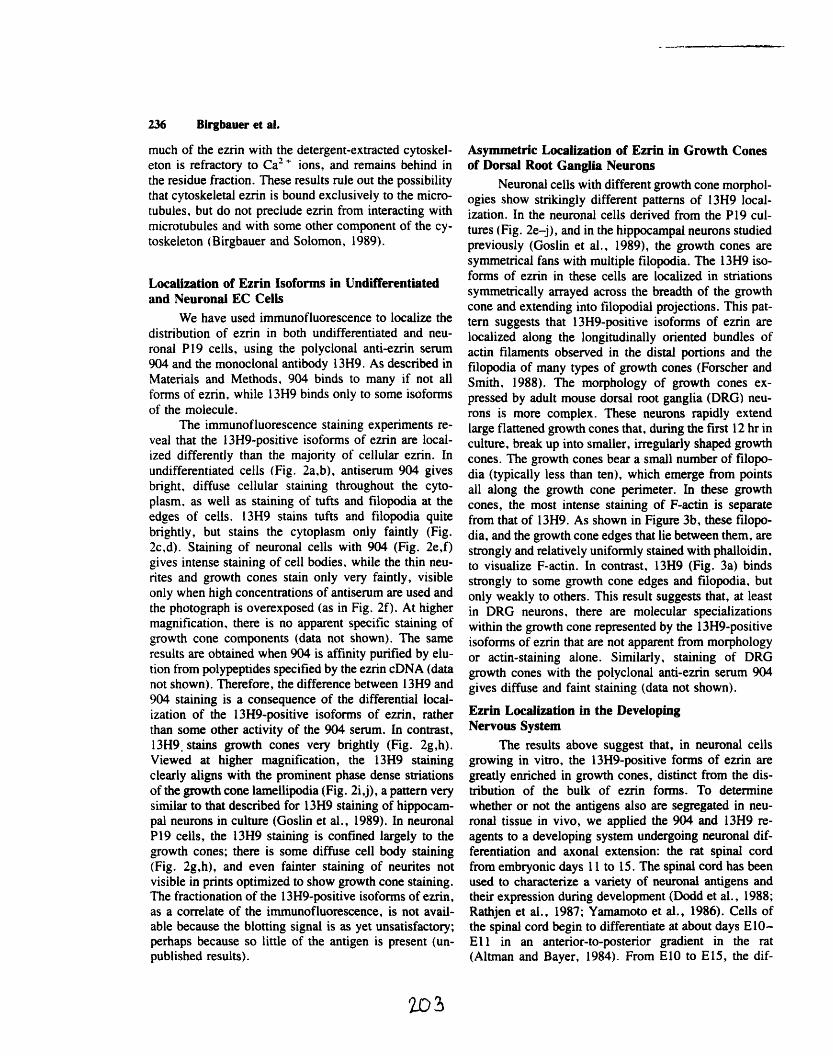
236 Birgbauer et al.
much of the ezrin with the detergent-extracted cytoskel-eton is refractory to Ca 2 + ions, and remains behind inthe residue fraction. These results rule out the possibilitythat cytoskeletal ezrin is bound exclusively to the micro-tubules, but do not preclude ezrin from interacting withmicrotubules and with some other component of the cy-toskeleton (Birgbauer and Solomon, 1989).
Localization of Ezrin Isoforms in Undifferentiatedand Neuronal EC Cells
We have used immunofluorescence to localize thedistribution of ezrin in both undifferentiated and neu-ronal P19 cells, using the polyclonal anti-ezrin serum904 and the monoclonal antibody 13H9. As described inMaterials and Methods. 904 binds to many if not allforms of ezrin, while 13H9 binds only to some isoformsof the molecule.
The immunofluorescence staining experiments re-veal that the 13H9-positive isoforms of ezrin are local-ized differently than the majority of cellular ezrin. Inundifferentiated cells (Fig. 2a,b), antiserum 904 givesbright, diffuse cellular staining throughout the cyto-plasm, as well as staining of tufts and filopodia at theedges of cells. 13H9 stains tufts and filopodia quitebrightly, but stains the cytoplasm only faintly (Fig.2c,d). Staining of neuronal cells with 904 (Fig. 2e,f)gives intense staining of cell bodies, while the thin neu-rites and growth cones stain only very faintly, visibleonly when high concentrations of antiserum are used andthe photograph is overexposed (as in Fig. 2f). At highermagnification, there is no apparent specific staining ofgrowth cone components (data not shown). The sameresults are obtained when 904 is affinity purified by elu-tion from polypeptides specified by the ezrin cDNA (datanot shown). Therefore, the difference between 13H9 and904 staining is a consequence of the differential local-ization of the 13H9-positive isoforms of ezrin, ratherthan some other activity of the 904 serum. In contrast,13H9. stains growth cones very brightly (Fig. 2g,h).Viewed at higher magnification, the 13H9 stainingclearly aligns with the prominent phase dense striationsof the growth cone lamellipodia (Fig. 2i,j), a pattern verysimilar to that described for 13H9 staining of hippocam-pal neurons in culture (Goslin et al., 1989). In neuronalP19 cells, the 13H9 staining is confined largely to thegrowth cones; there is some diffuse cell body staining(Fig. 2g,h), and even fainter staining of neurites notvisible in prints optimized to show growth cone staining.The fractionation of the 13H9-positive isoforms of ezrin,as a correlate of the immunofluorescence, is not avail-able because the blotting signal is as yet unsatisfactory;perhaps because so little of the antigen is present (un-published results).
Asymmetric Localization of Ezrin in Growth Conesof Dorsal Root Ganglia Neurons
Neuronal cells with different growth cone morphol-ogies show strikingly different patterns of 13H9 local-ization. In the neuronal cells derived from the P19 cul-tures (Fig. 2e-j), and in the hippocampal neurons studiedpreviously (Goslin et al., 1989), the growth cones aresymmetrical fans with multiple filopodia. The 13H9 iso-forms of ezrin in these cells are localized in striationssymmetrically arrayed across the breadth of the growthcone and extending into filopodial projections. This pat-tern suggests that 13H9-positive isoforms of ezrin arelocalized along the longitudinally oriented bundles ofactin filaments observed in the distal portions and thefilopodia of many types of growth cones (Forscher andSmith, 1988). The morphology of growth cones ex-pressed by adult mouse dorsal root ganglia (DRG) neu-rons is more complex. These neurons rapidly extendlarge flattened growth cones that, during the first 12 hr inculture, break up into smaller, irregularly shaped growthcones. The growth cones bear a small number of filopo-dia (typically less than ten), which emerge from pointsall along the growth cone perimeter. In these growthcones, the most intense staining of F-actin is separatefrom that of 13H9. As shown in Figure 3b, these filopo-dia, and the growth cone edges that lie between them, arestrongly and relatively uniformly stained with phalloidin,to visualize F-actin. In contrast, 13H9 (Fig. 3a) bindsstrongly to some growth cone edges and filopodia, butonly weakly to others. This result suggests that, at leastin DRG neurons, there are molecular specializationswithin the growth cone represented by the 13H9-positiveisoforms of ezrin that are not apparent from morphologyor actin-staining alone. Similarly, staining of DRGgrowth cones with the polyclonal anti-ezrin serum 904gives diffuse and faint staining (data not shown).
Ezrin Localization in the DevelopingNervous System
The results above suggest that, in neuronal cellsgrowing in vitro, the 13H9-positive forms of ezrin aregreatly enriched in growth cones, distinct from the dis-tribution of the bulk of ezrin forms. To determinewhether or not the antigens also are segregated in neu-ronal tissue in vivo, we applied the 904 and 13H9 re-agents to a developing system undergoing neuronal dif-ferentiation and axonal extension: the rat spinal cordfrom embryonic days I I to 15. The spinal cord has beenused to characterize a variety of neuronal antigens andtheir expression during development (Dodd et al., 1988;Rathjen et al., 1987; Yamamoto et al., 1986). Cells ofthe spinal cord begin to differentiate at about days E10-Ell in an anterior-to-posterior gradient in the rat(Altman and Bayer, 1984). From ElO to E15, the dif-
2 3
__ _ _- .
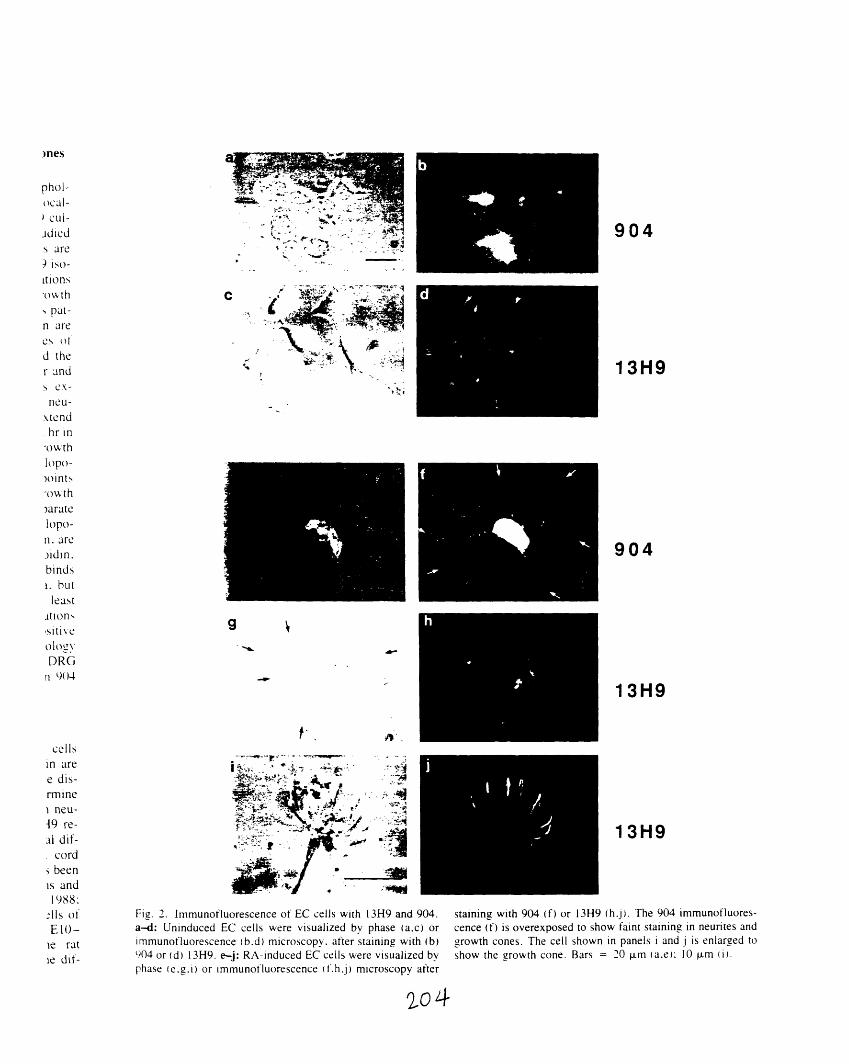
904
13H9
904
9
13H9
t .-
. .- IeL CI~r.J* j * p 1 1 I
Fig. 2. Immunofluorescence of EC cells with 13H9 and 904.a-d: Uninduced EC cells were visualized by phase (a,c) orimmunofluorescence (b.d) microscopy, after staining with (b)904 or (d) 13H9. e-j: RA-induced EC cells were visualized byphase (e.g.i) or immunofluorescence (f.h.j) microscopy after
13H9
staining with 904 (f) or 13H9 (h.j). The 904 immunofluores-cence (f) is overexposed to show faint staining in neurites andgrowth cones. The cell shown in panels i and j is enlarged toshow the growth cone. Bars = 20 tm a.e): 10 Cpm i).
9to4
)nes
phol-ocal-)cul-idleds are
) iso-itions-ow th
· pat-
n arecs otd the
r andS Cx-
neu-xtendhr in
-owthlopo-)oints-owth)aratelopo-n. are)idin.bindsi. but
leastitlons,siti veoloCX
DRGn 9()4
cellsin are
e dis-rmineI neu-
19 re-
l dif-cordbeen
is and1988:lIls of
ElO-le ratle dif-
- 1, -, A-~I -C, I
I , h,
�-T -'lql(�CT gc �·i-·
:.h·
',ff
. I
., ·
...:4
;·. .,q'? . Z3- V
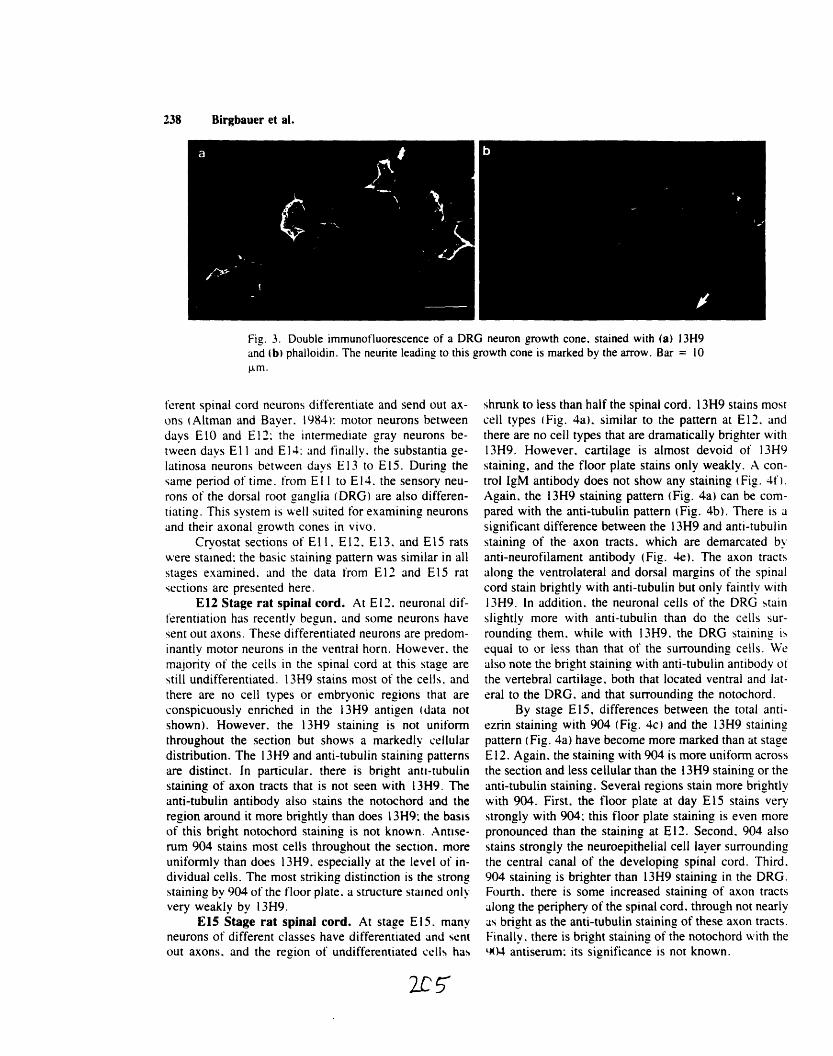
238 Birgbauer et al.
Fig. 3. Double immunofluorescence of a DRG neuron growth cone. stained with (a) 13H9and (b) phalloidin. The neurite leading to this growth cone is marked by the arrow. Bar = 10Lpm.
ferent spinal cord neurons differentiate and send out ax-ons Altman and Baver. 1984): motor neurons betweendays EIO and E12: the intermediate gray neurons be-tween days El I and El4: and finally. the substantia ge-latinosa neurons between days E13 to E15. During thesame period of time. from El I to E14. the sensory neu-rons of the dorsal root ganglia (DRG) are also differen-tiating. This system is well suited for examining neuronsand their axonal growth cones in vivo.
Crvostat sections of El I. E 12. E 13. and E15 ratswere stained: the basic staining pattern was similar in allstages examined. and the data from E12 and E15 ratsections are presented here.
E12 Stage rat spinal cord. At E12. neuronal dif-tferentiation has recently begun. and some neurons havesent out axons. These differentiated neurons are predom-inantly motor neurons in the ventral horn. However. themajority of the cells in the spinal cord at this stage arestill undifferentiated. 13H9 stains most of the cells. andthere are no cell types or embryonic regions that areconspicuously enriched in the 13H9 antigen data notshown). However. the 13H9 staining is not uniformthroughout the section but shows a markedly cellulardistribution. The 13H9 and anti-tubulin staining patternsare distinct. In particular. there is bright anti-tubulinstaining of axon tracts that is not seen with 13H9. Theanti-tubulin antibody also stains the notochord and theregion around it more brightly than does 13H9: the basisof this bright notochord staining is not known. Antlse-rum 904 stains most cells throughout the section. moreuniformly than does 13H9. especially at the level of in-dividual cells. The most striking distinction is the strongstaining by 904 of the floor plate. a structure stained onlyvery weakly by 13H9.
E15 Stage rat spinal cord. At stage E15. manyneurons of different classes have differentiated and sentout axons. and the region of undifferentiated cells has
shrunk to less than half the spinal cord. 1 3H9 stains mostcell types Fig. 4a),. similar to the pattern at E12. andthere are no cell types that are dramatically brighter with13H9. However. cartilage is almost devoid of 13H9staining, and the floor plate stains only weakly. A con-trol IgM antibody does not show any staining (Fig. 4tf).Again, the 13H9 staining pattern (Fig. 4a) can be com-pared with the anti-tubulin pattern (Fig. 4b). There is asignificant difference between the 13H9 and anti-tubulinstaining of the axon tracts. which are demarcated byanti-neurofilament antibody (Fig. 4e). The axon tractsalong the ventrolateral and dorsal margins of the spinalcord stain brightly with anti-tubulin but only faintly with13H9. In addition. the neuronal cells of the DRG stainslightly more with anti-tubulin than do the cells sur-rounding them, while with 13H9. the DRG staining isequal to or less than that of the surrounding cells. Wealso note the bright staining with anti-tubulin antibody otthe vertebral cartilage. both that located ventral and lat-eral to the DRG. and that surrounding the notochord.
By stage E15. differences between the total anti-ezrin staining with 904 (Fig. 4c) and the 13H9 stainingpattern (Fig. 4a) have become more marked than at stageE12. Again. the staining with 904 is more uniform acrossthe section and less cellular than the 13H9 staining or theanti-tubulin staining. Several regions stain more brightlywith 904. First, the floor plate at day E15 stains verystrongly with 904; this floor plate staining is even morepronounced than the staining at E12. Second. 904 alsostains strongly the neuroepithelial cell layer surroundingthe central canal of the developing spinal cord. Third.904 staining is brighter than 13H9 staining in the DRG.Fourth. there is some increased staining of axon tractsalong the periphery of the spinal cord. through not nearlyas bright as the anti-tubulin staining of these axon tracts.Finally. there is bright staining of the notochord with the'404 antiserum; its significance is not known.
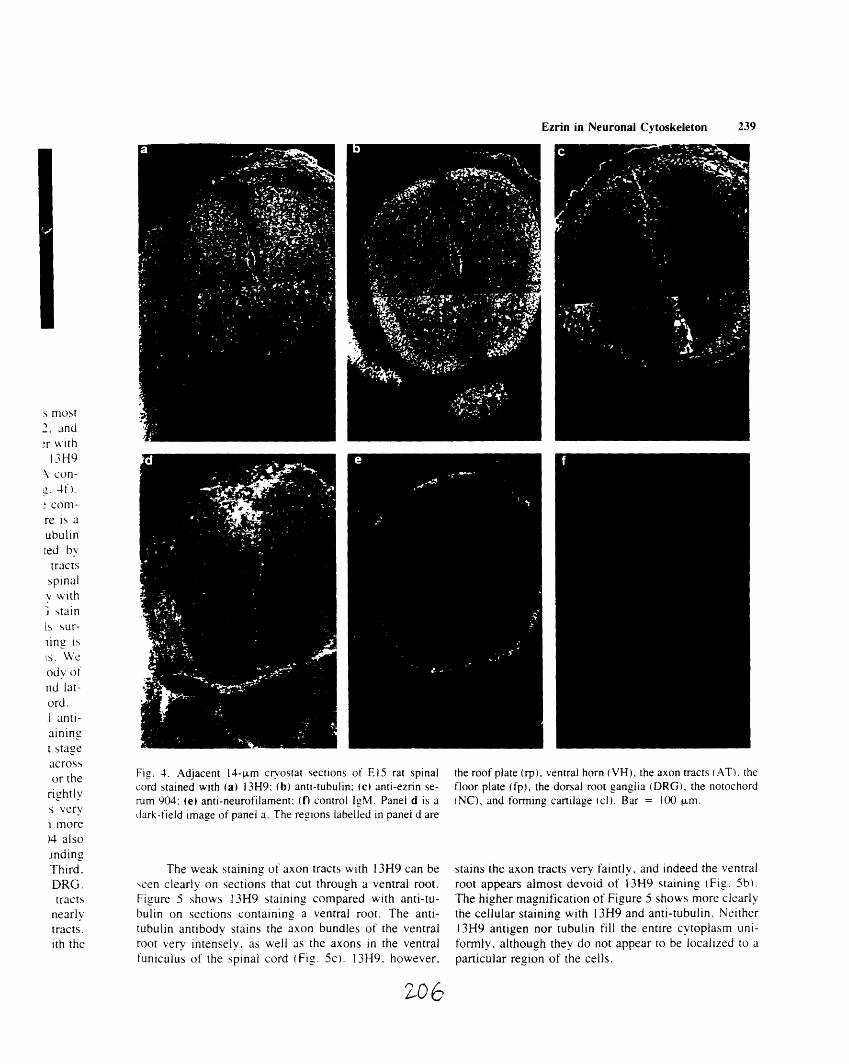
Ezrin in Neuronal Cytoskeleton 239
Fig. 4. Adjacent 14-pLm crvostat sections of E15 rat spinalcord stained with (a) 13H9: (b) anti-tubulin: (c} anti-eznn se-rum 904: (e) anti-neurofilament: (f) control IgM. Panel d is alark-field image of panel a. The regions labelled in panel d are
The weak staining of axon tracts with 13H9 can be,een clearly on sections that cut through a ventral root.Figure 5 shows 13H9 staining compared with anti-tu-bulin on sections containing a ventral root. The anti-tubulin antibody stains the axon bundles of the ventralroot very intensely, as well as the axons in the ventralfuniculus of the spinal cord (Fig. 5c). 13H9. however.
the roof plate (rp), ventral horn (VH), the axon tracts (AT). thefloor plate (fp), the dorsal root ganglia (DRG), the notochord(NC), and forming cartilage (cl). Bar = 100 pLm.
stains the axon tracts very faintly, and indeed the ventralroot appears almost devoid of 13H9 staining (Fig. 5b).The higher magnification of Figure 5 shows more clearlythe cellular staining with 13H9 and anti-tubulin. Neither13H9 antigen nor tubulin fill the entire cytoplasm uni-formly, although they do not appear to be localized to aparticular region of the cells.
-06
s most2. and-r with
13H9X con-!. 4f).
com-re is a
ubulinted by
tractsspinalv with
, tainis sur-lin isis. We
odv otnd lat-
ord..1 anti-
ainingt stageacrossor the
rightlvs very
1 more
(4 alsoindingThird.DRG.tracts
nearlytracts.'ith the
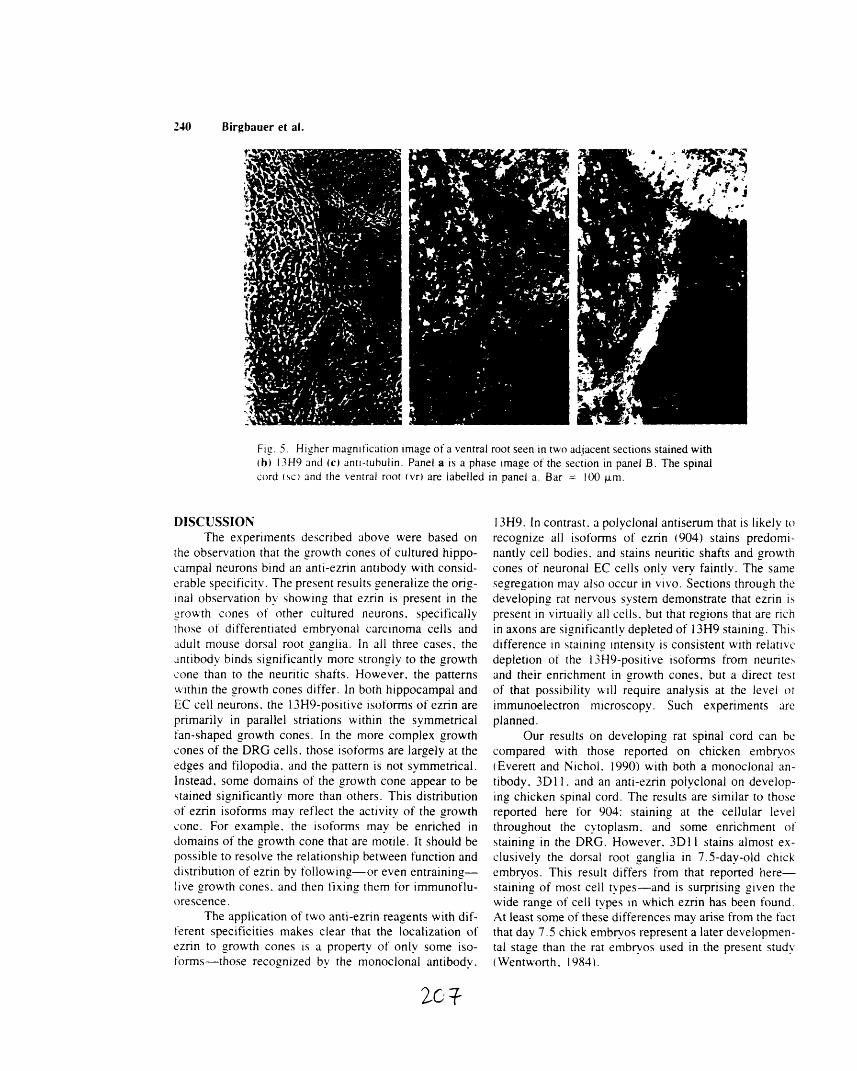
240 Birgbauer et al.
Fi. 5. Higher magnification image of a ventral root seen in two adjacent sections stained with(b) 13H9 and (c) anti-tubulin. Panel a is a phase image of the section in panel B. The spinalcord (sc) and the ventral root vr) are labelled in panel a. Bar = 100 ~Lm.
DISCUSSIONThe experiments described above were based on
the observation that the growth cones of cultured hippo-campal neurons bind an anti-eznn antibody with consid-erable specificity. The present results generalize the orig-inal observation bv showing that ezrin is present in thegrowth cones of other cultured neurons. specificallythose of differentiated embrvonal carcinoma cells andadult mouse dorsal root ganglia. In all three cases, theantibody binds significantly more strongly to the growthcone than to the neuritic shafts. However. the patternswithin the growth cones differ. In both hippocampal andEC cell neurons, the 13H9-positive isoforms of ezrin areprimarily in parallel striations within the symmetricalfan-shaped growth cones. In the more complex growthcones of the DRG cells. those isoforms are largely at theedges and filopodia. and the pattern is not symmetrical.Instead, some domains of the growth cone appear to bestained significantly more than others. This distributionof ezrin isoforms may reflect the activity of the growthcone. For example. the isoforms may be enriched indomains of the growth cone that are motile. It should bepossible to resolve the relationship between function anddistribution of ezrin bv following-or even entraining-live growth cones, and then fixing them for immunoflu-orescence.
The application of two anti-ezrin reagents with dif-ferent specificities makes clear that the localization ofeznn to growth cones is a property of only some iso-forms-those recognized bv the monoclonal antibody,
13H9. In contrast. a polyclonal antiserum that is likely torecognize all isoforms of ezrin (904) stains predomi-nantly cell bodies. and stains neuritic shafts and growthcones of neuronal EC cells only very faintly. The samesegregation may also occur in vivo. Sections through thedeveloping rat nervous system demonstrate that ezrin ispresent in virtually all cells. but that regions that are richin axons are significantly depleted of 13H9 staining. Thisdifference in stainin intensity is consistent with relativedepletion of the 13H9-positive isoforms from neunritesand their enrichment in growth cones, but a direct testof that possibility will require analysis at the level otimmunoelectron microscopy. Such experiments areplanned.
Our results on developing rat spinal cord can becompared with those reported on chicken embryos(Everett and Nichol. 1990) with both a monoclonal an-tibody. 3D1 I. and an anti-ezrin polyclonal on develop-ing chicken spinal cord. The results are similar to thosereported here for 904: staining at the cellular levelthroughout the cytoplasm and some enrichment otstaining in the DRG. However. 3D1 1 stains almost ex-clusively the dorsal root ganglia in 7.5-day-old chickembryos. This result differs from that reported here-staining of most cell types-and is surprising given thewide range of cell types in which ezrin has been found.At least some of these differences may arise from the factthat day 7.5 chick embryos represent a later developmen-tal stage than the rat embryos used in the present study,(Wentworth. 1984).
Zc+
Ezrin in Neuronal Cytoskeleton 241
Finally, these experiments reveal two characteris-tics of the association of ezrin with the cytoskeleton.First. upon induction of neuronal differentiation in ECcells, the level of ezrin increases and, more important.the proportion of ezrin apparently associated with thecytoskeleton also increases markedly. Second. the asso-ciation with growth cones is particularly striking for asubset of the ezrin isoforms-those that are 13H9-posi-tive. As the molecular basis for 13H9 binding is eluci-dated. it should be possible to determine if it is directlyrelated to the interaction with other structures of thegrowth cone, such as the F-actin filaments.
The role of ezrin in organizing the cytoskeleton isunlikely to be restricted to neuronal cells. The proteinitself is apparently ubiquitous. More to the point, theisoforms that align with F-actin in the growth cone-theisoforms that bind 13H9-are present in specialized do-mains of other cells as well: the ruffling edge of fibro-blasts and the marginal band of nucleated erythrocytes(Birgbauer and Solomon. 1989: Birgbauer. 1991). Theselocalizations and other results suggest that ezrin may becapable of multiple associations with the cytoskeletonand perhaps with the plasma membrane as well. In ad-dition, the homology between ezrin and band 4.1 in aregion of the latter suspected to mediate binding to gly-cophorin (Gould et al.. 1989: Rees et al.. 1990) suggeststhat this protein may also interact with integral mem-brane proteins. These lines of evidence suggest that iso-forms of ezrin may mediate functional connections be-tween the cytoskeleton and the cell cortex at sites wheremotility events occur.
sCKNOWLEDGMENTS
We thank M. Magendantz for valuable contribu-tions. This work was supported by grants from theN.I.H. (F.S.) and the David and Lucile Packard Fellow-ship in Science and Engineering (A.D.L.); postdoctoralfellowship PF-3255 from the American Cancer Society(J.H.D.); a predoctoral fellowship from the N.S.F. and atraining grant from the N.I.H. to the Department of Bi-ology, M.I.T. (E.B.); and a fellowship from the WilliamKeck Foundation (B.W.).
REFERENCES
Altman J. Bayer SA (1984): "The Development of the Rat SpinalCord.-' Berlin: Springer-Verlag. pp 1-166.
Birgbauer E. Solomon F (1989): A marginal band-associated proteinhas properties of both microtubule- and microfilament-associ-ated proteins. J Cell Biol 109:1609-1620.
Birgbauer E. (1991) "Cytoskeletal Interactions of Ezrin in Differen-tiated cells." Cambridge: MIT Press.
Bretscher A (1983): Purification of an 80,000-dalton protein that is acomponent of the isolated microvillus cytoskeleton. and itslocalization in nonmuscle cells. J Cell Biol 97:425-432.
Dinsmore JH. Solomon F (1991): Inhibition of MAP2 expression af-fects both morphological and cell division phenotypes of neu-ronal differentiation. Cell 64:817-826.
Dodd J. Morton SB. Karagogeos D. Yamamoto M. Jessell TM (1988):Spatial regulation of axonal glycoprotein expression on subsetsof embryonic spinal neurons. Neuron 1: 105-116.
Everett AW. Nichol KA (1990): Ezrin immunoreactivity in neuronsubpopulations: Cellular distribution in relation to cytoskeletalproteins in sensory neurons. J Histochem Cytochem 38: 1137-1144.
Forscher P. Smith SJ (1988): Actions of cytochalasins on the organi-zation of actin filaments and microtubules in a neuronal growthcone. I Cell Biol 107:1505-1516.
Goslin K. Birgbauer E. Banker G. Solomon F (1989): The role ofcyvtoskeleton in organizing growth cones: A microfilament-as-sociated growth cone component depends upon microtubulesfor its localization. J Cell Biol 109:1621-1631.
Gould KL. Bretscher A. Esch FS. Hunter T (1989): cDNA cloningand sequencing of the protein-tyrosine kinase substrate. ezrin.reveals homology to band 4.1. EMBO J 8:4133-4142.
Jones-Villeneuve EMV. McBurney MW. Rogers KA. Kalnins VI(1982): Retinoic acid induces embryonal carcinoma cells todifferentiate into neurons and glial cells. J Cell Biol 94:253-262.
Laemmli UK (1970): Cleavage of structural proteins during the as-sembly of the head of bacteriophage T4. Nature 227:680-685.
Lindsay RM (1988): Nerve growth factors (NGF. BDNF) enhanceaxonal regeneration but are not required for survival of adultsensory neurons. J Neurosci 8:2394-2405.
Magendantz M. Solomon F (1985): Analyzing the components ofmicrotubules: Antibodies against chartins. associated proteinsfrom cultured cells. Proc Natl Acad Sci USA 82:6581-6585.
McBurney MW. Jones-Villeneuve EMV. Edwards MKS. AndersonPJ (1982): Control of muscle and neuronal differentiation in acultured embryonal carcinoma cell line. Nature 299:165-167.
Rathjen FG. Wolff JM. Chang S. Bonhoeffer F. Raper JA (1987):neurofascin: A novel chick cell-surface glycoprotein involvedin neurite-neurite interactions. Cell 51:841-849.
Rees DJG. Ades SE. Singer SJ. Hynes RO (1990): Sequence anddomain structure of talin. Nature 347:685-689.
Rudnicki MA. McBurney MW (1987) Cell culture methods and in-duction of differentiation of embryonal carcinoma cell lines. InRobertson EJ (ed): "Teratocarcinomas and Embryonic StemCells: A Practical Approach." Oxford: IRL Press Limited. pp19-49.
Sharma S. Notter MFD (1988): Characterization of neurotransmitterphenotype during neuronal differentiation of embryonal carci-noma cells. Dev Biol 125:246-254.
Solomon F. Magendantz M. Salzman A (1979): Identification withcellular microtubules of one of the co-assembling microtubule-associated proteins. Cell 18:431-438.
Tobin H. Staehelin T. Gordon J (1979): Electrophoretic transfer ofproteins from polyacrylamide gels to nitrocellulose sheets: Pro-cedure and some applications. Proc Natl Acad Sci USA 76:4350-4354.
Wentworth LE (1984): The development of cervical spinal cord of themouse embryo. II. A golgi analysis of sensory, commissural.and association cell differentiation. J Comp Neurol 222:96-115.
Wood JN. Anderton BH (198 1): Monoclonal antibodies to mammalianneurofilaments. Biosci Rep 1:263-268.
Yamamoto M. Boyer AM, Crandall JE. Edwards M. Tanaka H(1986): Distribution of stage-specific neurite-associated pro-teins in the developing murine nervous system recognized by amonoclonal antibody. J Neurosci 6:3576-3594.
CG 8
likely toredomi-growth
ae same)ugh theezrin isare richng. Thisrelativeneuritesrect testlevel of.nts are
I can beembryosonal an-develop-to those.ar levelment ofmost ex-Id chickI here-iven then found.i the fact:lopmen-nt study
Appendix 2: Testing the Subset Hypothesis
Introduction
Eric Birgbauer showed in his dissertation that 13H9 appeared to
recognize only a subset of the ezrin isoforms recognized by 904 (see also
Chapter 3). In chicken red blood cells, 904 binds to two rows of isoforms
on two-dimensional gels, while 13H9 staining is only detected in the
upper row. We also showed that 13H9 stains only a subset of the 904-
positive regions in several cell types by immunofluorescence (Birgbauer,
Ph.D Thesis, Appendix 1, and Chapter 3). We made numerous attempts
to identify the molecular basis for the seeming restricted reactivity of
13H9. The two most likely and most easily testable hypotheses were:
1. Post-translational modification of the epitope sequence modifies the
binding affinity of 13H9. Since the epitope region contained two tyrosines
and ezrin was known to be phosphorylated on tyrosine in A431-cells upon
EGF-stimulation (Bretscher, 1989), phosphorylation was a good candidate
for providing the crucial modification.
2. Alternative splicing of mRNA leads to two different polypeptides, one
containing the epitope sequence giving rise to the slower mobility, 13H9-
positive species on gels, and one missing the epitope sequence giving rise
to the faster mobility, 13H9-negative species.
Eric Birgbauer reported in his dissertation that treatment of
nitrocellulose strips carrying one of three substrates (chicken red blood
cell cytoskeletons, purified intestinal ezrin, and the 13 aa epitope fusion
protein) with wheat germ acid phosphatase or prostate acid phosphatase
209
reduced the 13H9 signal significantly. Inclusion of phosphatase
inhibitors in the incubation prevented the loss of signal. This result
raised the possibility that 13H9 recognized the phosphorylated version of
the 13 aa epitope only, but not the unphosphorylated version. We first
tested the hypothesis that phosphorylation of one or both of the tyrosine
residues present in the 13 amino acid 13H9 epitope determines 13H9
reactivity.
To address the second hypothesis, alternative splicing, I performed
several RNAse-protection experiments using a fragment of the human
ezrin cDNA with mRNA from HeLa cells.
210
Materials and Methods
Materials
HeLa cells were a kind gift from Phillip Sharp (M.I.T.). The cells
had been grown continuously in roller bottles in 5% horse serum/MEM-.
Placental phophotyrosine phosphatase IB was kindly provided as a
glutathione-S-transferase fusion protein by Ray Erickson (Harvard). Cell
pellets of Sf9 cells overexpressing either avian pp60v-src or src 295 (a
kinase dead mutant) from a baculovirus and antibody EC10 against
avian pp60src were kindly provided by Helen Piwnica-Worms (Tufts
Medical School). Prostate acid phosphatase was purchased from Sigma
(P-3627, 10 U = 15.6 mg). Purified intestinal ezrin was kindly provided
by Paul Matsudaira (M.I.T.). The pGEM7 vector containing the SacI-
SacI fragment of human ezrin was constructed by Jon Dinsmore (Figure
A2-1B).
Treatment with phosphatase
10 ul purified intestinal ezrin (0.1 mg/ml) was mixed with 40 1
acid phosphatase reaction buffer (40 mM Pipes pH 6.0, 1 mM DTT)
containing 0.1% bovine serum albumin (BSA) and a cocktail of protease
inhibitors (0.2 mM PMSF, 5 gg/ml SBTI (soybean trypsin inhibitor), 10
gg/ml TAME, 1 pg/ml pepstatin, 1 g/ml leupeptin, 0.03 TIU/ml
aprotinin). Then 0.25 units of wheat germ acid phosphatase or 2 units of
prostate acid phosphatase were added. The reaction was stopped after 30,
60, or 120 minutes at room temperature by the addition of boiling 3x
sample buffer. As controls, one reaction was stopped at 0 time, one
reaction contained no phosphatase, and one reaction was incubated for
211
120 minutes in the presence of phosphatase and phosphatase inhibitors (1
mM sodium vanadate, 50 mM sodium fluoride, 13.4 mg/ml sodium
pyrophoshate, 10 mM o-phosphotyrosine). Phosphatase was added after
addition of sample buffer to the reaction containing no phosphatase to
insure even running of lanes. Samples were separated by SDS-PAGE
(7.5%) and transferred to nitrocellulose for Western blots using 13H9.
For the tyrosine phosphatase experiments, the reaction was as
described above, except that the phosphatase reaction buffer contained 50
mM Tris-HC1 pH 7.5, 5 mM EDTA, 1 mM DTT and only 1 mM sodium
vanadate was used as phosphatase inhibitor, following a protocol provided
by R. Erickson. In addition to purified intestinal ezrin, two human ezrin
fusion proteins were used as substrates: the Bam-Bam fragment (Figure
A2-1A) and the 13 aa epitope fragment, both as TrpE fusion proteins.
Treatment with src-kinase
I followed the protocol provided by H. Piwnica-Worms for the in
vitro kinase reaction with v-src immunoprecipitated from frozen cell
pellets. Frozen cell pellets of Sf9 cells which had been infected with
baculovirus encoding either avian pp60v-src or mutant v-src (295) (which
has no kinase activity due to a mutation in the ATP binding site) were
resuspended in 400 01 of buffer A (10 mM sodium phosphate pH 7.2, 150
mM NaCl, 1% NP-40, 0.1% deoxycholate, 0.1% SDS, 2 mM EDTA
supplemented with 2 mM PMSF, 0.15 U/ml Aprotinin (Sigma), 20 mM
leupeptin and 1 mM orthovanadate) and rocked at 40C for 15 minutes.
After a 15 minute spin in the microfuge, the supernatant was transferred
to a fresh tube and 10 p1 of monoclonal antibody EC10 against chicken src
added. The mixture was incubated for two hours at 40C with gentle
212
rocking. In the meantime, 0.15 g protein A-sepharose beads Cl-4B
(Sigma) were hydrated in one milliliter water and then incubated for one
hour at 40C in coating buffer (50 mM Tris pH 8.0, 10% BSA, 0.02%
sodium azide). The beads were then washed three times in water and
resuspended in an equal volume of water. 40 p1 of the bead slurry was
added to the antibody mixture and incubated for one hour at 4oC with
rocking. The beads were washed twice in Buffer B (0.5 M lithium
chloride, 20 mM Tris pH 8.0) and once in kinase buffer (50 mM Tris-HC1
pH 7.4, 10 mM MnC12 ) by spinning them a few seconds on setting 3 of the
microfuge each time. For the kinase reaction, the beads were incubated
for 20 minutes at 300C with 10 jL of purified intestinal ezrin, 13 aa
epitope fusion protein or TrpE alone, 40 p1 1.25x kinase buffer with
protease inhibitors and 2 1 32 P-yATP (New England Nuclear NEG 002A).
The reaction was stopped by addition of 15 p1 5x sample buffer. The
samples were separated on 7.5% SDS-PAGE, transferred to nitrocellulose
and probed with 13H9 and alkaline phosphatase-coupled goat-anti-mouse
second antibody. The incorporation of 32p was visualized by
autoradiography.
Preparation of RNA from HeLa cells
7.5x10⁷ HeLa cells grown in suspension were washed twice in PBS
and then resuspended in 5 ml lysis buffer (10% SDS in ACE-buffer (10
mM sodium acetate pH 5.1, 50 mM NaCl, 3 mM disodium EDTA) with
200 mM VRC (vanadyl ribonucleoside complexes; an RNAse inhibitor)). 5
ml ACE saturated phenol was added and incubated at 550C with vigorous
shaking. After centrifugation at 3000 rpm at 4oC for ten minutes, the
upper phase was transferred to a clean tube. After addition of 5 ml
213
chloroform: isoamylalcohol (96:4 v/v), the mixture was shaken vigorously
for two minutes and centrifuged at 3000 rpm at 40C for two minutes. The
upper aqueous phase was transferred to a clean tube and extracted
repeatedly in phenol/chloroform until no protein interface was visible
(four times). The final aqueous phase was adjusted with 1/10 volume
sodium acetate pH 6.0 and 3 volumes ethanol at -20oC in an autoclaved
Corex tube. RNA was precipitated overnight at -20oC. After
centrifugation at 10,000 rpm at 40C for five minutes, the pellet was
washed once in 70% ethanol and airdried. The RNA was resuspended in
sterile water and stored frozen at -70oC.
32 P-UTP riboprobe synthesis
The template for the synthesis was a pGEM7-plasmid carrying the
5' SacI-SacI fragment of human ezrin between a T7 (for sense
transcription) and SP6 (for antisense transcription) promoter (Figure A2-
1B). The plasmid had been linearized at the 5' end by cutting with
HindIII in the polylinker (the cut plasmid was made available by Jon
Dinsmore). The transcription reaction was assembled from a Promega kit
according to the instructions of the manufacturer using SP6 polymerase.
1 01 of linearized plasmid, 2 p1 of 100 mM DTT, 1 p1 of each ATP, CTP,
and GTP (10 mM), 1 p1 water, 4 p1 5x transcription buffer, 0.8 p1 RNAsin
(25 units/l), 8 p1 32p UTP (400 Ci/mM), and 0.5 p1 SP6 polymerase (10
units) were mixed and incubated for 1 hour at room temperature. Then
the template was digested for 15 minutes with RQ1-DNAse at 370C. After
addition of water, the reaction was extracted in phenol/chloroform and
precipitated in ammonium acetate and ethanol at -20oC overnight.
214
Gel-purification of the riboprobe
After one wash in 70% ethanol, the probe was resuspended in 50 p1
formamide loading buffer and run on a 5% acrylamide/7 M urea gel in
TBE buffer. The gel was covered with Saran wrap and exposed for one
minute to autoradiography film. After development of the film, the gel
piece that corresponded to the band on the film was cut out and the probe
eluted from the gel for 3 hours at 370C in 0.3 M sodium acetate, 2 mM
EDTA, 10 pg/ml tRNA and 0.5% SDS. After a short spin, the supernatant
was precipitated in -20oC ethanol for one hour, washed in 70% ethanol
and resuspended in 25 ml water.
RNAse protection experiment
30 or 10 pg of total HeLa RNA, 10 pg of total yeast RNA (kindly
provided by Brant Weinstein) or 0.1 pg of linearized ezrin template
plasmid were incubated with 1 1 gel-purified riboprobe and precipitated
in sodium acetate and ethanol at -200C for one hour. After one wash in
70% ethanol, the pellet was resuspended in 24 p1 formamide, 3 p1 water
and 3 p1 10x hybridization buffer (4 M NaCl, 400 mM Pipes pH 6.9, 10
mM EDTA), heated to 850C for five minutes and incubated overnight at
450C. 450 p0 RNAse digestion buffer (300 mM NaCl, 10 mM Tris-HC1 pH
7.5, 5 mM EDTA, 10 pg/ml DNAse-free RNAse A, 1000 U RNAse T1) was
added for 30 minutes at 370°C. After addition of 12.5 p1 20% SDS and 2.5
pL 25 mg/ml proteinase K for 15 minutes at 370C, the mixture was
extracted once in phenol/chloroform and the aqueous phase precipitated
in -200C ethanol after addition of 12 pg tRNA. After one wash in 70%
ethanol, the pellet was resuspended in formamide loading buffer and run
on a 5% acrylamide/7 M urea gel next to size markers and the probe
215

alone. The gel was wetted with 7% acetic acid and dried for
autoradiography.
216
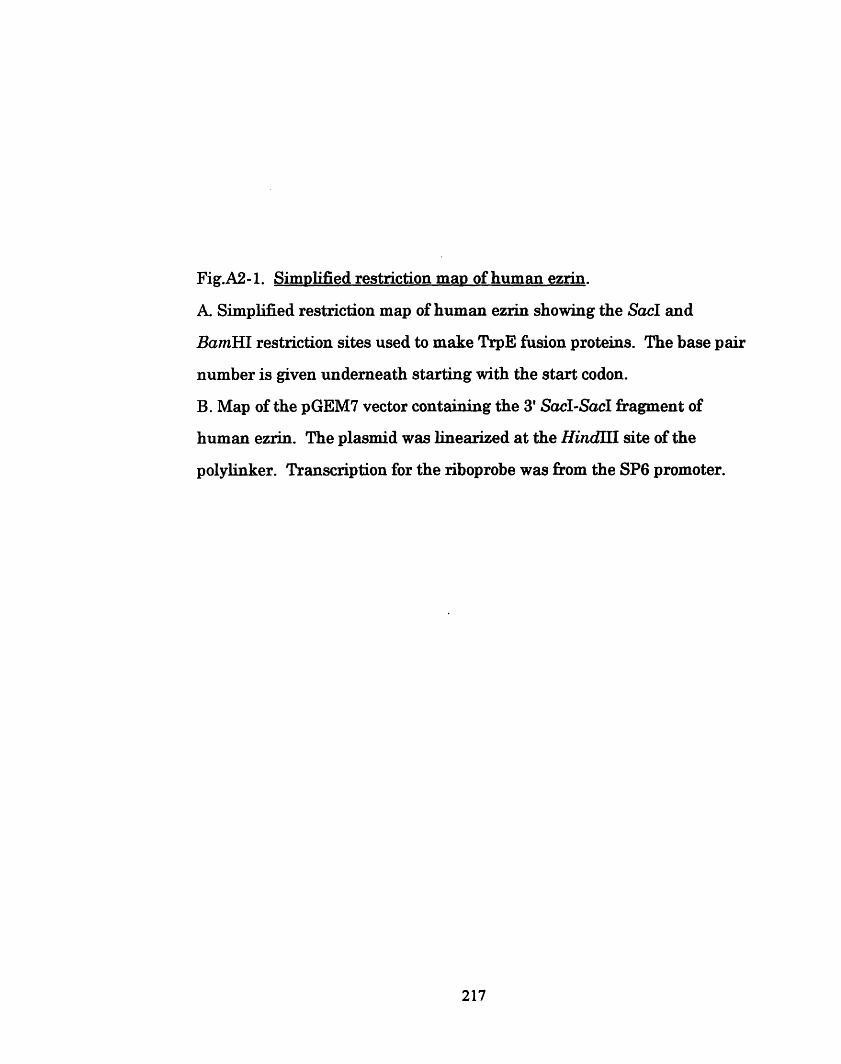
Fig.A2-1. Simplified restriction map of human ezrin.
A. Simplified restriction map of human ezrin showing the SacI and
BamHI restriction sites used to make TrpE fusion proteins. The base pair
number is given underneath starting with the start codon.
B. Map of the pGEM7 vector containing the 3' SacI-SacI fragment of
human ezrin. The plasmid was linearized at the HindIII site of the
polylinker. Transcription for the riboprobe was from the SP6 promoter.
217
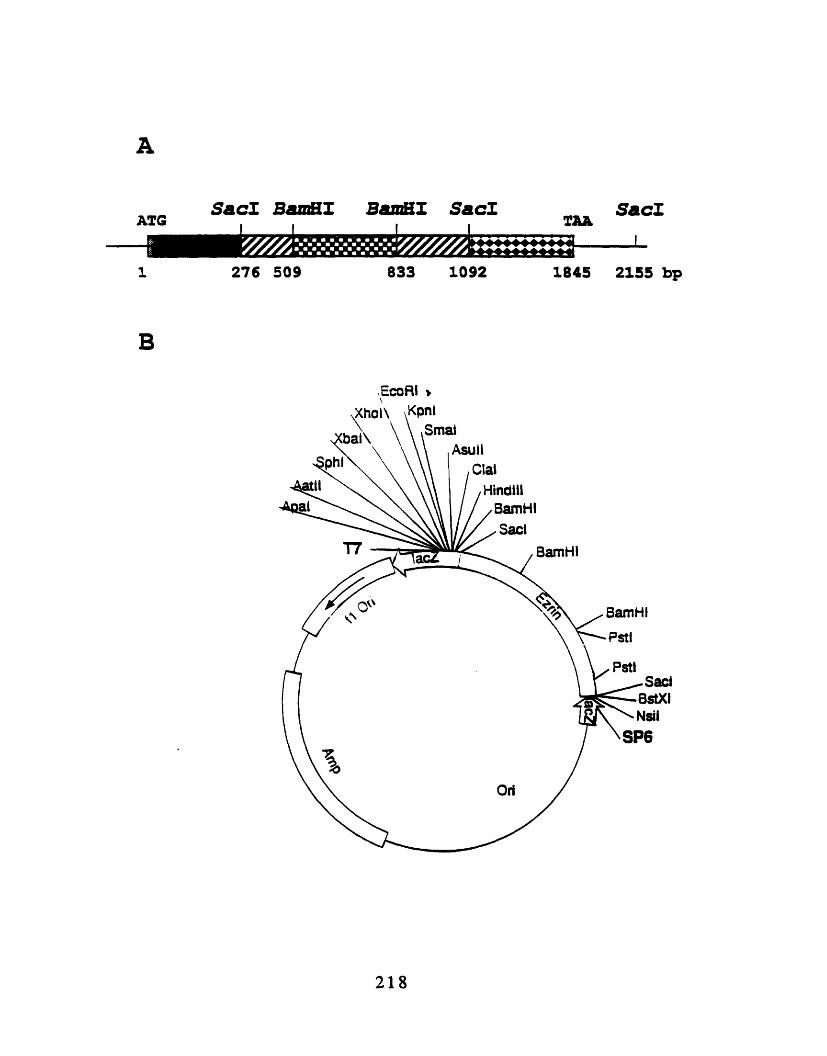
SacI BamHI BamH I SacII I I I -
y//~~.~mmm""""'^.·~~------ i833 1092 1845 2155 bp
B
,EcoRI ,
218
A
1 276 509
SacIATGr,,
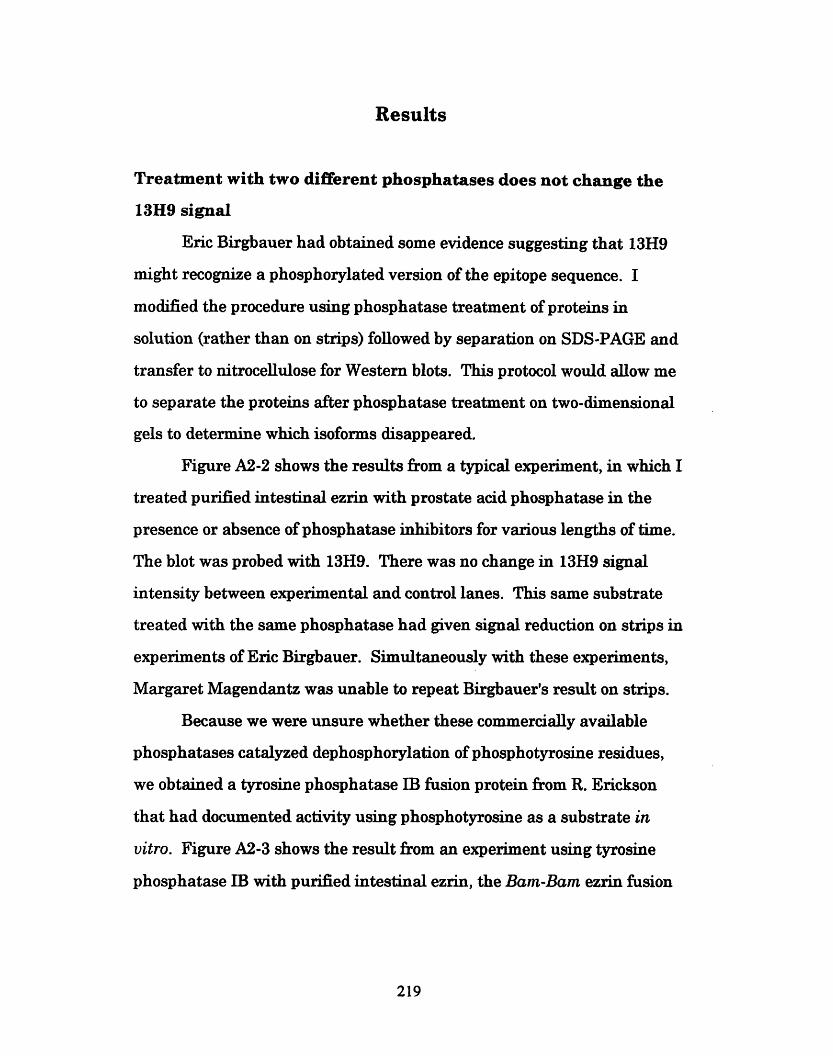
Results
Treatment with two different phosphatases does not change the
13H9 signal
Eric Birgbauer had obtained some evidence suggesting that 13H9
might recognize a phosphorylated version of the epitope sequence. I
modified the procedure using phosphatase treatment of proteins in
solution (rather than on strips) followed by separation on SDS-PAGE and
transfer to nitrocellulose for Western blots. This protocol would allow me
to separate the proteins after phosphatase treatment on two-dimensional
gels to determine which isoforms disappeared.
Figure A2-2 shows the results from a typical experiment, in which I
treated purified intestinal ezrin with prostate acid phosphatase in the
presence or absence of phosphatase inhibitors for various lengths of time.
The blot was probed with 13H9. There was no change in 13H9 signal
intensity between experimental and control lanes. This same substrate
treated with the same phosphatase had given signal reduction on strips in
experiments of Eric Birgbauer. Simultaneously with these experiments,
Margaret Magendantz was unable to repeat Birgbauer's result on strips.
Because we were unsure whether these commercially available
phosphatases catalyzed dephosphorylation of phosphotyrosine residues,
we obtained a tyrosine phosphatase IB fusion protein from R. Erickson
that had documented activity using phosphotyrosine as a substrate in
vitro. Figure A2-3 shows the result from an experiment using tyrosine
phosphatase IB with purified intestinal ezrin, the Bam-Bam ezrin fusion
219
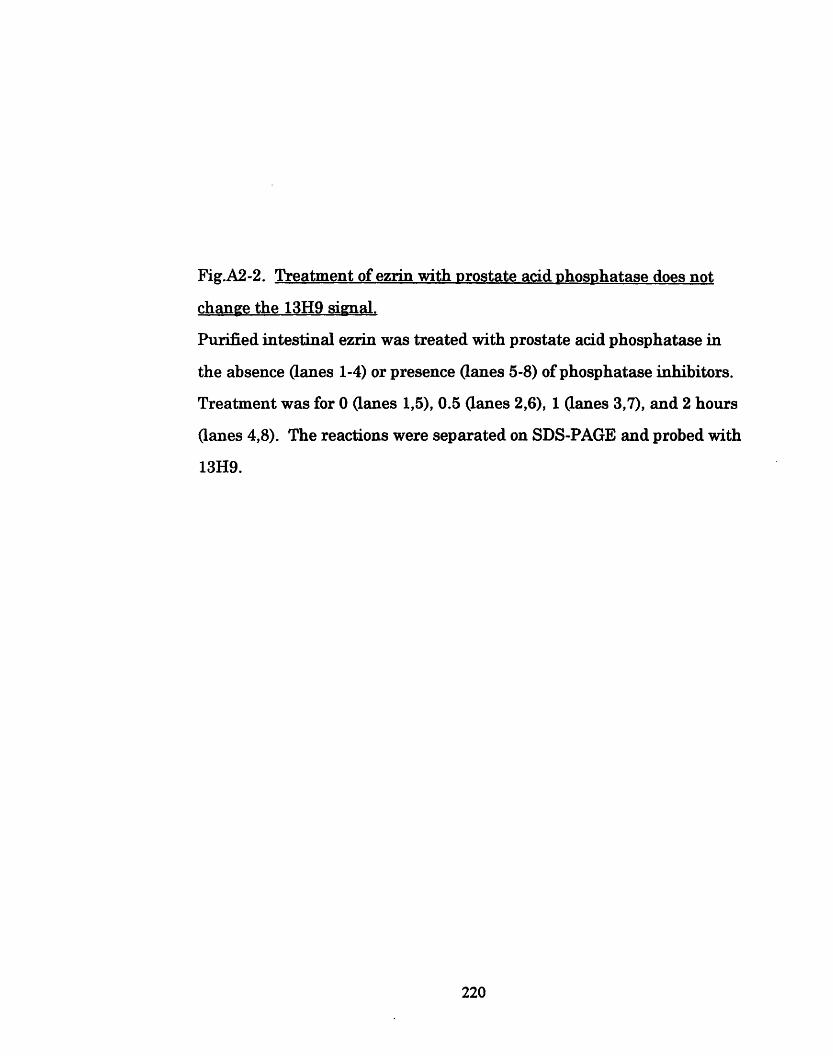
Fig.A2-2. Treatment of ezrin with prostate acid phosphatase does not
change the 13H9 signal.
Purified intestinal ezrin was treated with prostate acid phosphatase in
the absence (lanes 1-4) or presence (lanes 5-8) of phosphatase inhibitors.
Treatment was for 0 (lanes 1,5), 0.5 (lanes 2,6), 1 (lanes 3,7), and 2 hours
(lanes 4,8). The reactions were separated on SDS-PAGE and probed with
13H9.
220
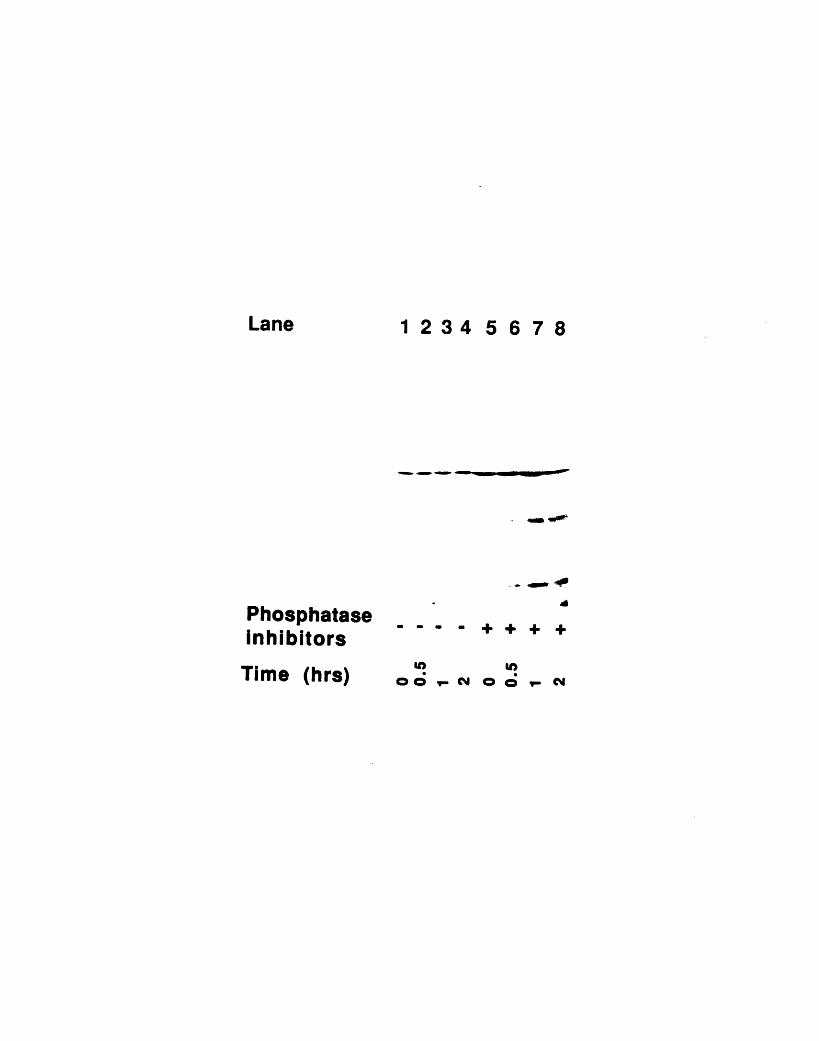
1234 5678
PhosphataseInhibitors .... + + + +
u0 en00 _) o O O _
Lane
__ ii Jll l -
_ _W
Time Mhrs)
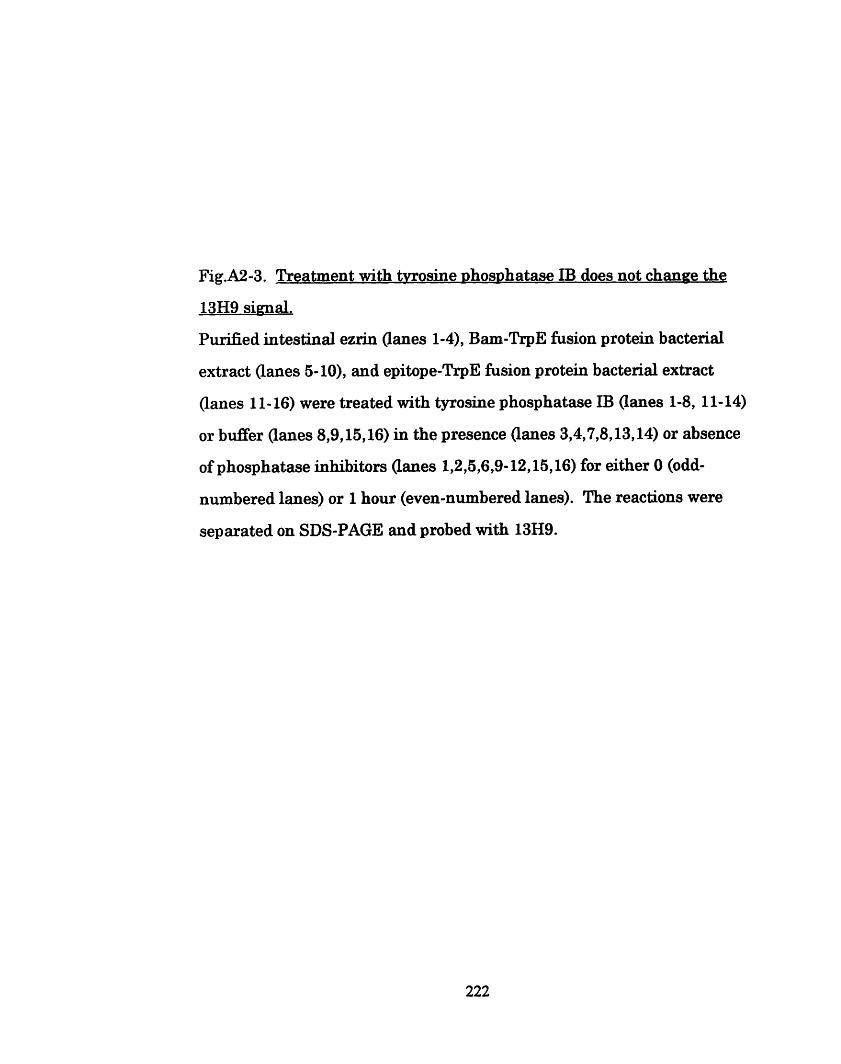
Fig.A2-3. Treatment with tyrosine phosphatase IB does not change the
13H9 signal.
Purified intestinal ezrin (lanes 1-4), Bam-TrpE fusion protein bacterial
extract (lanes 5-10), and epitope-TrpE fusion protein bacterial extract
(lanes 11-16) were treated with tyrosine phosphatase IB (lanes 1-8, 11-14)
or buffer (lanes 8,9,15,16) in the presence (lanes 3,4,7,8,13,14) or absence
of phosphatase inhibitors (lanes 1,2,5,6,9-12,15,16) for either 0 (odd-
numbered lanes) or 1 hour (even-numbered lanes). The reactions were
separated on SDS-PAGE and probed with 13H9.
222
Lane
Substrate1 2 3 4 5 6 7 8 910 11 12 13 14 15 16
Ezrin Bam-TrpE Epitope-TrpE
Phosphatase + + + + + + + . + + + -
Phosphataseinhibitor - - + + - + + . . + + - -
Time (hrs) 0 1 o 1 1 1 1 1 o 1 o
__~
protein and the epitope ezrin fusion protein with or without phosphatase
inhibitors after 0 or 60 minutes of incubation. No change in 13H9
reactivity could be found. These negative results might arise from several
factors. Most importantly, we are unable to demonstrate that the
phosphatases used removed a phosphate group at the crucial site.
Src-kinase phosphorylates ezrin and the epitope fusion protein
without leading to a change in 13H9 reactivity.
We decided to modify the phosphorylation status of the epitope in
the opposite direction (phosphorylating rather than dephosphorylating)
by using v-src kinase which phosphorylates fairly indiscriminately in
vitro. If 13H9 binds with high affinity only to the phosphorylated epitope
sequence, we expect to see an increase in 13H9 signal after kinase
treatment. Figure A2-4 shows the autoradiograph of the 32 P-signal (A)
and the corresponding Color Western with 13H9 (B). The three
substrates used were purified intestinal ezrin (lanes 1-3), 13 aa epitope
fusion protein (lanes 4-6) and TrpE alone (lanes 7-9). The substrates
were treated with either v-src (lanes 1,3,6), the kinase dead mutant 295
(lanes 2,5,7) or no beads (lanes 3,6,9). The autoradiograph shows that v-
src phosphorylates itself (arrow) as well as purified ezrin (ane 1) and the
epitope fusion protein (lane 4), but TrpE only very weakly (lane 7). The
src-autophosphorylation is much stronger in lane 1, while roughly
comparable in lanes 4 and 7. This is probably due to the fact that the
fusion proteins were used as whole bacterial extracts that contained large
amounts of bacterial proteins. The Western blot (B) shows that there is
no difference in 13H9 reactivity between active and non-active kinase.
This result carries some weight because the phosphorylation of the
224
Fig.A2-4. Phosphorylation of the epitope fusion protein with v-src does
not change the 13H9 signal.
Purified intestinal ezrin (lanes 1-3), epitope-TrpE fusion protein bacterial
extract (lanes 4-6), and TrpE bacterial extracts (lanes 7-9) were incubated
with immunoprecipitated v-src anes 1,4,7), kinase mutant 295 (lanes
2,5,8) or buffer (lanes 3,6,9) in the presence of 32p-yATP. The reactions
were separated on SDS-PAGE. The 32p-yATP signal was visualized by
autoradiography (A). The arrow indicates the position of
autophosphorylated v-src. The blot was probed with 13H9 (B) and
developed with an alkaline-phosphatase based color reaction.
225
A
U
a9
LaneSubstrate
Kinase
123Ezrin
a U .
CIICO
456Epitope
U aJ .
a-
789TrpE alone
0 -* I
0)aCDcmu'
B
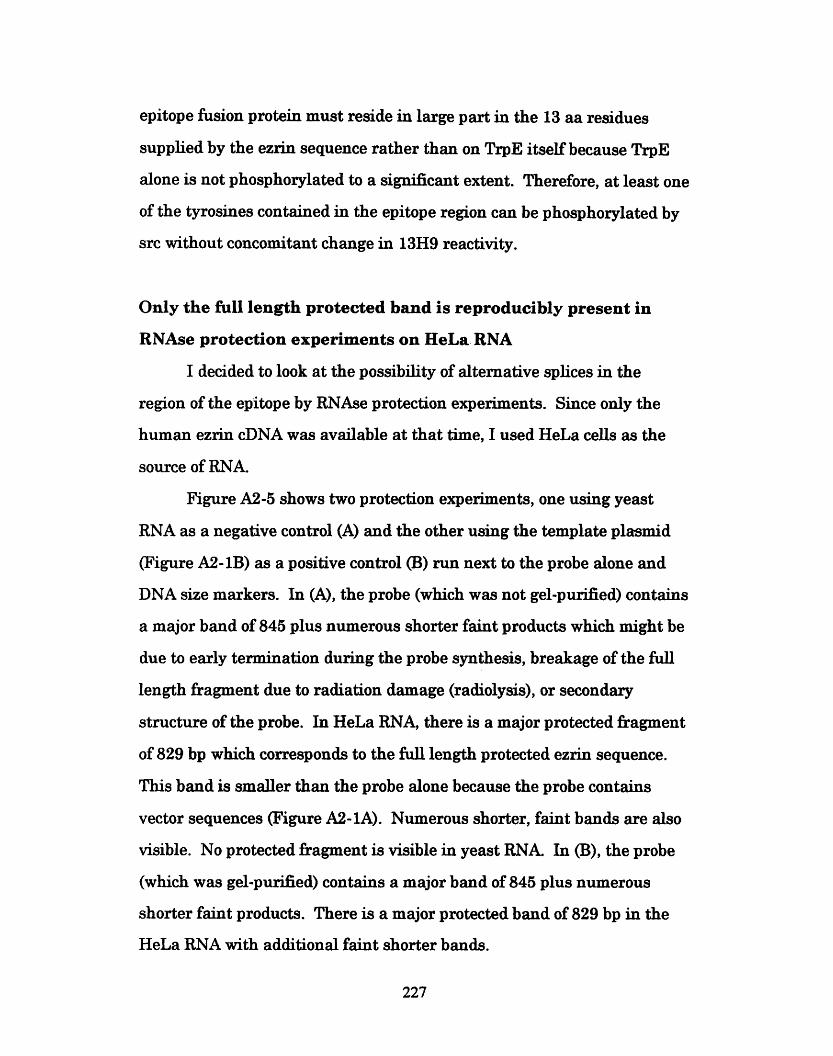
epitope fusion protein must reside in large part in the 13 aa residues
supplied by the ezrin sequence rather than on TrpE itself because TrpE
alone is not phosphorylated to a significant extent. Therefore, at least one
of the tyrosines contained in the epitope region can be phosphorylated by
src without concomitant change in 13H9 reactivity.
Only the full length protected band is reproducibly present in
RNAse protection experiments on HeLa RNA
I decided to look at the possibility of alternative splices in the
region of the epitope by RNAse protection experiments. Since only the
human ezrin cDNA was available at that time, I used HeLa cells as the
source of RNA.
Figure A2-5 shows two protection experiments, one using yeast
RNA as a negative control (A) and the other using the template plasmid
(Figure A2-1B) as a positive control (B) run next to the probe alone and
DNA size markers. In (A), the probe (which was not gel-purified) contains
a major band of 845 plus numerous shorter faint products which might be
due to early termination during the probe synthesis, breakage of the full
length fragment due to radiation damage (radiolysis), or secondary
structure of the probe. In HeLa RNA, there is a major protected fragment
of 829 bp which corresponds to the full length protected ezrin sequence.
This band is smaller than the probe alone because the probe contains
vector sequences (Figure A2-1A). Numerous shorter, faint bands are also
visible. No protected fragment is visible in yeast RNA. In (B), the probe
(which was gel-purified) contains a major band of 845 plus numerous
shorter faint products. There is a major protected band of 829 bp in the
HeLa RNA with additional faint shorter bands.
227
Fig.A2-5 RNAse protection assay of HeLa RNA using an ezrin riboprobe.
A. A riboprobe containing 829 bp of antisense ezrin sequence of the 3'
SacI-SacI fragment plus 16 bp of vector sequence (lane "Probe") was used
to protect total HeLa RNA (lane "HeLa RNA") or total yeast RNA (lane
"yeast RNA").
B. A riboprobe containing 829 bp of antisense ezrin sequence of the 3'
SacI-SacI fragment plus 16 bp of vector sequence after gel purification
(lane "Probe") was used to protect total HeLa RNA C("HeLa RNA") or the
pGEM7 plasmid containing the 3' SacI-SacI fragment of human ezrin
("Ezrin Plasmid").
228
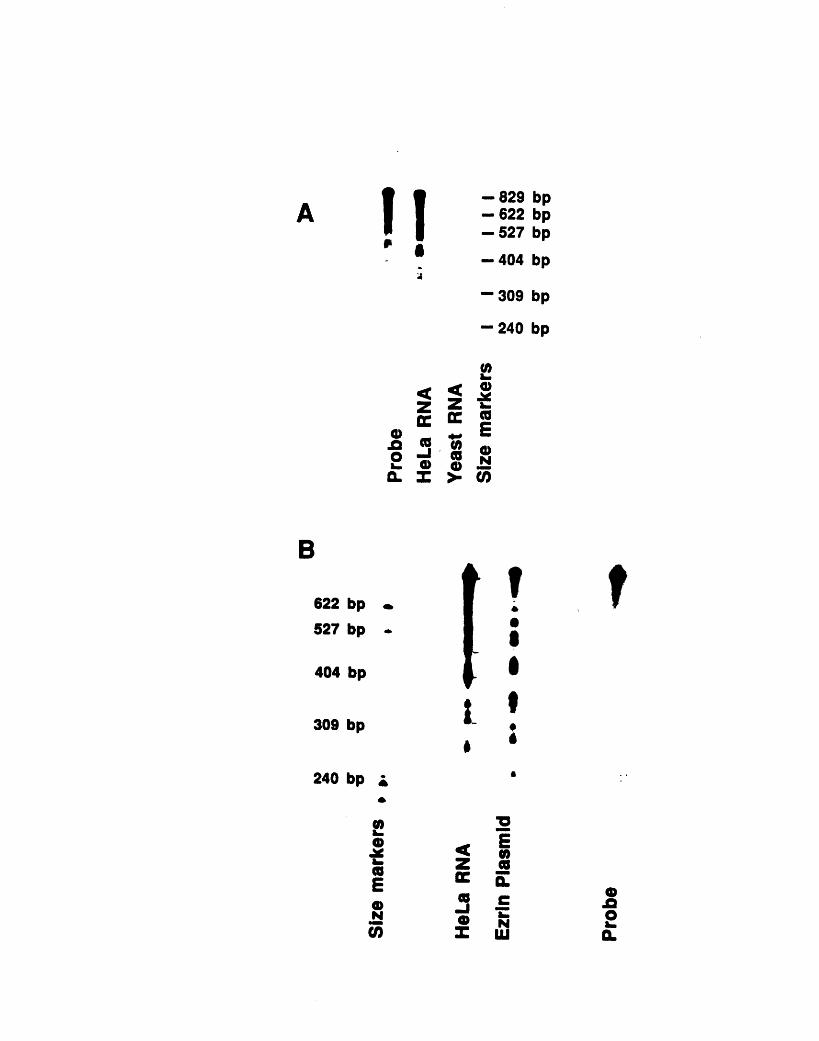
II - 829 bpA - 622 bp!s - 527 bp- 404 bp
- 309 bp
- 240 bp
C. _ *>Eo ' cnX n0 J Dur
B
622 bp
527 bp -
404 bp
309 bp
240 bp &
0_)
Cm
E4)N
/'
L !aA 6
a
'OE
Z XI0.c E
.j C) N
: iw
V
.0o0
Protection of the template DNA should give rise to only a single band of
845 bp. Many smaller bands, though, are detected. Comparison of the
minor bands arising from protection of HeLa RNA and template DNA
shows that they are found in a very similar pattern, offset in size by the
size of the vector sequences which are contained in protected fragments
from template DNA, but not in protected fragments from HeLa RNA.
This result strongly suggests that none of the minor bands in HeLa
RNA arose from the protection of alternatively spliced transcripts. We
cannot exclude the possibility, though, that there exists a
stoichiometrically very minor alternatively spliced transcript in the
protected region. Even if that would be the case, we would still need to
ascertain that the splice affected the region of the epitope.
230
Discussion
We have accumulated a large body of negative evidence that
phosphorylation of the 13H9 epitope does not affect binding of the
antibody:
1. Phosphatase treatment of material on strips leaves the 13H9 signal
unchanged (Margaret Magendantz, unpublished observation).
2. Phosphatase treatment of material in solution leaves the 13H9 signal
unchanged.
3. The epitope fusion protein (but not TrpE alone) can be tyrosine
phosphorylated by pp60V' src without affecting 13H9 reactivity.
4. In vivo labeling of CRBCs with 32p shows no incorporation into the
ezrin family spots on two-dimensional gels (Eric Birgbauer, unpublished
observations).
5. In vivo labeling of E. coli encoding 13H9-positive fusion protein with
32p shows no incorporation into the fusion proteins (Margaret
Magendantz, unpublished observation).
We conclude that there is no evidence at this point in support of the
hypothesis that phosphorylation of the 13H9 epitope determines 13H9
reactivity. Also, there is no evidence that there exist alternatively spliced
forms of ezrin in HeLa cells.
231
Appendix 3: Nocodazole-Sensitivity of the 13H9-Antigen in HeLa Cells
Introduction
13H9 was raised against a protein fraction from chick brain that
cycled with microtubules in vitro. Inside cells, the 13H9
immunofluorescence staining more closely resembles the distribution of F-
actin rather than that of microtubules (Goslin et al., 1989; Birgbauer,
Ph.D. Thesis). Our lab has investigated the possible interactions of the
13H9 antigen with microtubules extensively. 13H9 stains growth cones of
hippocampal neurons brightly. This staining is disrupted by treatment
with nocodazole which leads to microtubule depolymerization (Goslin et
al., 1989). In nocodazole, the 13H9 staining is found progressively in
more proximal regions of the neurite rather than at the neurite tip and
eventually is found in the cell body. This apparent delocalization of the
13H9 antigen from the growth cone follows the depolymerizing
microtubule ends, but always stays distal to them. Upon removal of
nocodazole, 13H9 staining reappears in growth cones, but never until
after microtubules have repolymerized to that position. These
experiments suggested that the localization of 13H9 to the growth cones of
hippocampal neurons is dependent on intact microtubules.
In other cell types, 13H9 localization is not dependent on intact
microtubules. In CRBCs, 13H9 stains the position of the marginal band
even after microtubules are depolymerized by cold treatment (Birgbauer
and Solomon, 1989). In chicken embryo fibroblasts, 13H9 stains leading
232
edges (Birgbauer, Ph.D. Thesis). This staining also is not disrupted by
nocodazole (Margaret Magendantz, unpublished observation).
We now know that the 13H9 epitope is present in at least four
different proteins (ezrin, radixin, moesin, merlin/schwannomin). The
growth cone component might, therefore, be a different protein than the
marginal band component. (In Chapter 4, we showed that the marginal
band contains both radixin and ezrin.) Additionally, the same protein
might be found in different interactions in different cell types and have,
therefore, different solubility characteristics. In vitro, ezrin fusion
proteins pellet with taxol-stabilized microtubules (Marcia Falconer,
unpublished observations). This interaction can be competed away with
purified intestinal ezrin. We do not know whether fusion proteins of
moesin or radixin can also bind microtubules in vitro.
To test whether there was a second example in which the 13H9
antigen was nocodazole-sensitive, I performed several experiments in
HeLa cells.
233
Materials and Methods
Cells
HeLa cells were a kind gift from Phillip Sharp. The cells had been
grown continuously in roller bottles in 5% horse serum/MEM-. To grow
HeLa cells attached, the cells were plated in the same medium on tissue
culture plastic and split regularly by trypsinization. HeLa cells are
epithelial in origin and do not migrate. Rather they grow in clusters.
Drug treatment and immunofluorescence
For immunofluorescence experiments, cells after trypsinization
were plated on sterile glass coverslips and grown overnight. They were
then treated with either 10 gg/ml nocodazole or DMSO for 15 minutes at
370C. For recovery from nocodazole, the drug-containing medium was
exchanged with normal medium after one rinse and cells left to recover for
one hour before fixation. Cells were fixed for 30 minutes in 4%
paraformaldehyde/ PBS, rinsed in PBS and then permeabilized in 0.1%
NP-40/PBS for 15 minutes. Staining was performed as described in
previous chapters.
Fractionated cell extracts for Western blots
For cell fractionation into soluble and insoluble pools, cells were
extracted by the same method as applied to chicken red blood cells (see
Chapters 2 to 4). Cells in suspension were pelleted and extracted twice in
0.1% NP-40/PM2G with a cocktail of protease inhibitors for 5 minutes
each time. The final pellet was dissolved in 8 M urea with protease
inhibitors. Attached cells were extracted on the tissue culture dishes
234
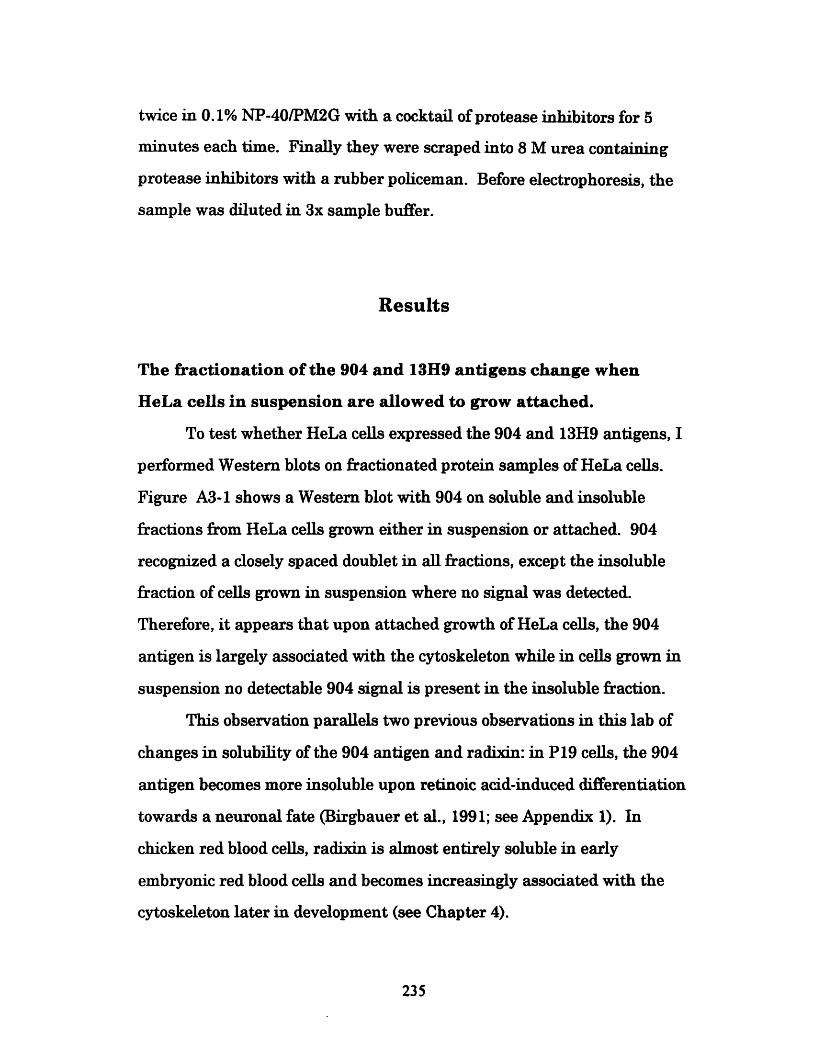
twice in 0.1% NP-40/PM2G with a cocktail of protease inhibitors for 5
minutes each time. Finally they were scraped into 8 M urea containing
protease inhibitors with a rubber policeman. Before electrophoresis, the
sample was diluted in 3x sample buffer.
Results
The fractionation of the 904 and 13H9 antigens change when
HeLa cells in suspension are allowed to grow attached.
To test whether HeLa cells expressed the 904 and 13H9 antigens, I
performed Western blots on fractionated protein samples of HeLa cells.
Figure A3-1 shows a Western blot with 904 on soluble and insoluble
fractions from HeLa cells grown either in suspension or attached. 904
recognized a closely spaced doublet in all fractions, except the insoluble
fraction of cells grown in suspension where no signal was detected.
Therefore, it appears that upon attached growth of HeLa cells, the 904
antigen is largely associated with the cytoskeleton while in cells grown in
suspension no detectable 904 signal is present in the insoluble fraction.
This observation parallels two previous observations in this lab of
changes in solubility of the 904 antigen and radixin: in P19 cells, the 904
antigen becomes more insoluble upon retinoic acid-induced differentiation
towards a neuronal fate (Birgbauer et al., 1991; see Appendix 1). In
chicken red blood cells, radian is almost entirely soluble in early
embryonic red blood cells and becomes increasingly associated with the
cytoskeleton later in development (see Chapter 4).
235
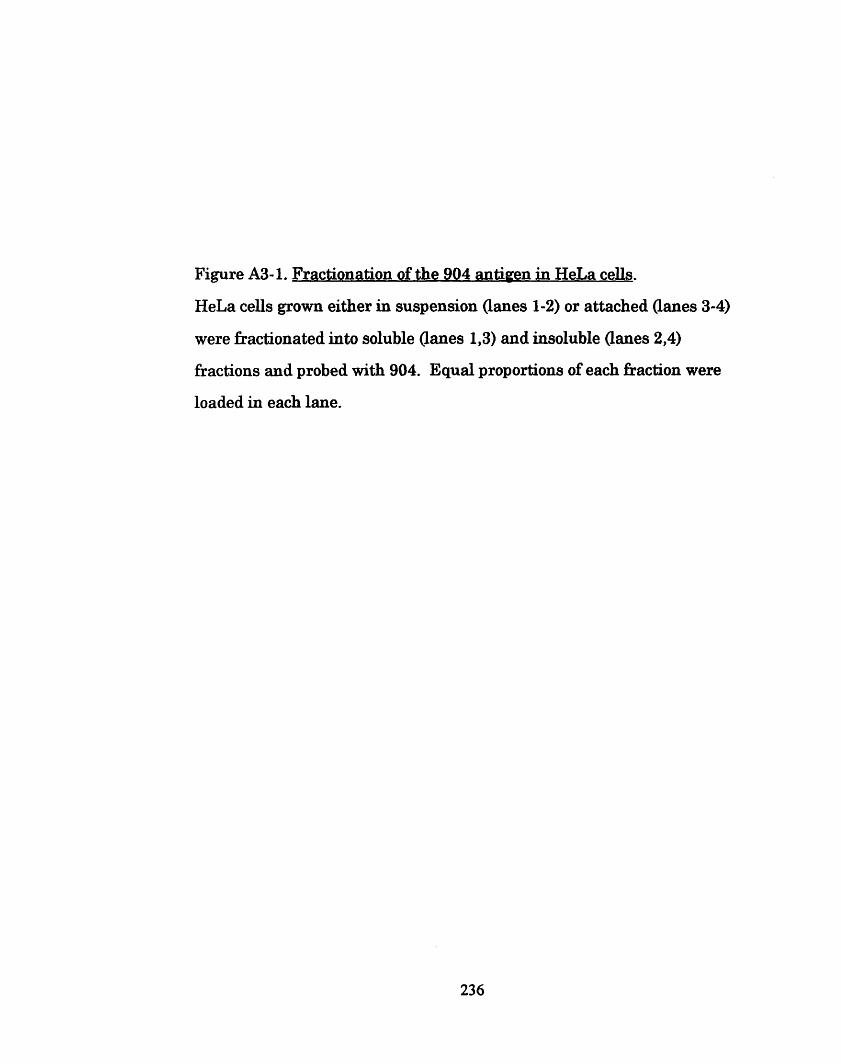
Figure A3-1. Fractionation of the 904 antigen in HeLa cells.
HeLa cells grown either in suspension (lanes 1-2) or attached (lanes 3-4)
were fractionated into soluble (lanes 1,3) and insoluble (lanes 2,4)
fractions and probed with 904. Equal proportions of each fraction were
loaded in each lane.
236
1 2
FractionGrowth
sol insolIn suspension
sol Insolattached
Lane 3 4
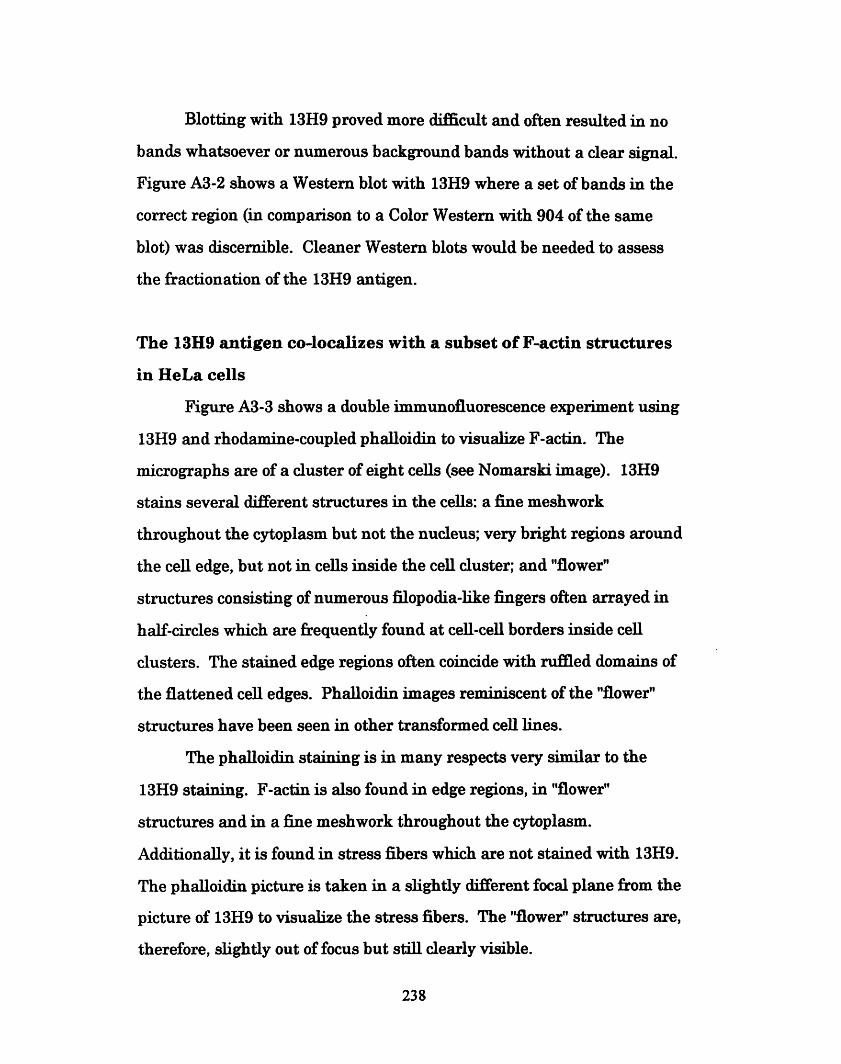
Blotting with 13H9 proved more difficult and often resulted in no
bands whatsoever or numerous background bands without a clear signal.
Figure A3-2 shows a Western blot with 13H9 where a set of bands in the
correct region (in comparison to a Color Western with 904 of the same
blot) was discernible. Cleaner Western blots would be needed to assess
the fractionation of the 13H9 antigen.
The 13H9 antigen co-localizes with a subset of F-actin structures
in HeLa cells
Figure A3-3 shows a double immunofluorescence experiment using
13H9 and rhodamine-coupled phalloidin to visualize F-actin. The
micrographs are of a cluster of eight cells (see Nomarski image). 13H9
stains several different structures in the cells: a fine meshwork
throughout the cytoplasm but not the nucleus; very bright regions around
the cell edge, but not in cells inside the cell cluster; and "flower"
structures consisting of numerous filopodia-like fingers often arrayed in
half-circles which are frequently found at cell-cell borders inside cell
clusters. The stained edge regions often coincide with ruffled domains of
the flattened cell edges. Phalloidin images reminiscent of the "flower"
structures have been seen in other transformed cell lines.
The phalloidin staining is in many respects very similar to the
13H9 staining. F-actin is also found in edge regions, in "flower"
structures and in a fine meshwork throughout the cytoplasm.
Additionally, it is found in stress fibers which are not stained with 13H9.
The phalloidin picture is taken in a slightly different focal plane from the
picture of 13H9 to visualize the stress fibers. The "flower" structures are,
therefore, slightly out of focus but still clearly visible.
238

Figure A3-2. Fractionation of the 13H9 antigen in HeLa cells.
HeLa cells grown either in suspension (lanes 1-2) or attached (lanes 3-4)
were fractionated into soluble (lanes 1,3) and insoluble (lanes 2,4)
fractions and probed with 13H9. Equal proportions of each fraction were
loaded in each lane.
239
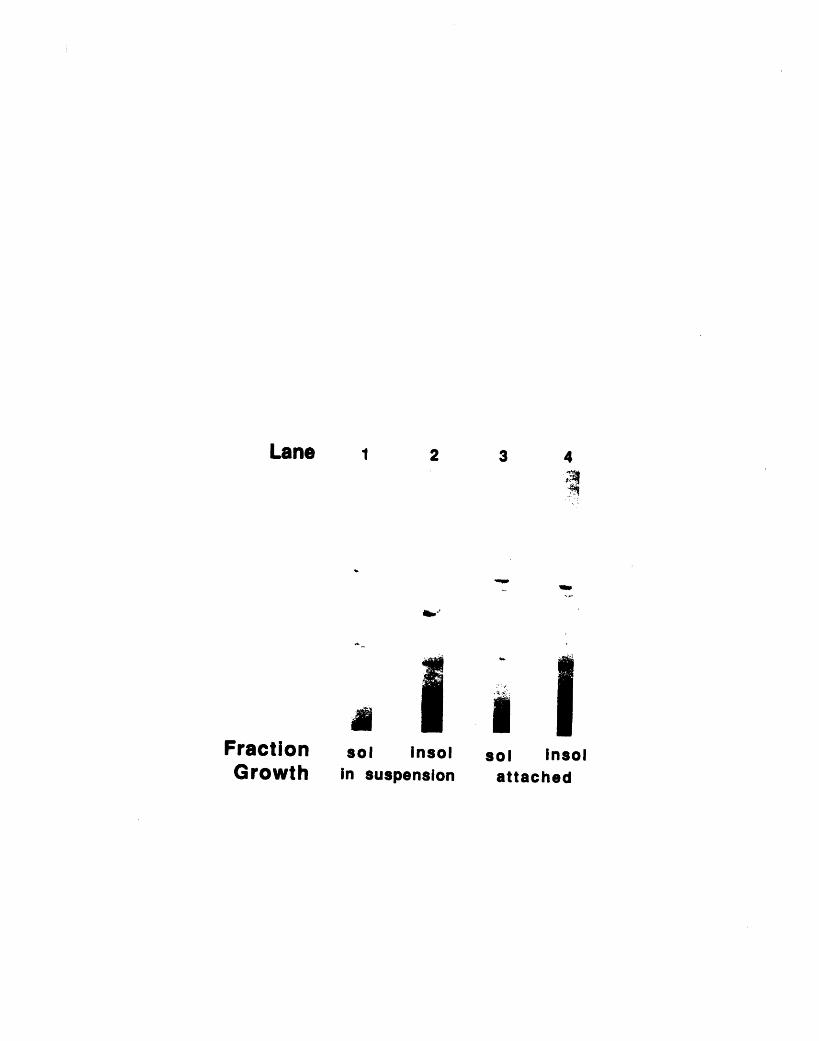
1 2
FractionGrowth
aisol insol sol insol
in suspension attached
3 4Lane
Figure A3-3. 13H9 immunofluorescence of HeLa cells.
HeLa cells grown for 24 hours on coverslips were fixed and double stained
with 13H9 (A) and phalloidin (B). The Nomarski image is shown in (C).
241
13H9
phalloidin
Nomarski
· · ::~-~·"; -ij.
r} ·
, -
?I·L' ·I. · ~~~~~~~~~~~~~~~~~~~t -,-~ . .:
In agreement with numerous other observations from this lab, I find that
the 13H9 antigen is found in a subset of F-actin structures in HeLa cells.
Nocodazole treatment disrupts the edge region staining of 13H9,
but not the "flower" structure staining.
In two experiments, I treated the cells with nocodazole for five to 20
minutes before fixation. Figure A3-4 shows staining with 13H9 of HeLa
cells treated with DMSO as a control (A), with nocodazole for 15 minutes
(B), or with nocodazole for 15 minutes and then recovered without
nocodazole for one hour (C). Nocodazole treatment leads to diminution of
the edge region staining while leaving the "flower" staining unchanged.
After removal of nocodazole, the regions around the edge are prominently
stained again. This result raises the possibility that some 13H9-
containing structures are microtubule-dependent. I also stained the cells
with anti-tubulin antibodies to assess the extent of microtubule
depolymerization or repolymerization. Because of the roundness of the
cells, I was unable to obtain satisfactory microtubule images.
243
Figure A3-4. Nocodazole sensitivity of some 13H9 structures.
HeLa cells were treated with either DMSO (A), 10 pg/ml nocodazole (B),
or 10 ig/ml nocodazole and then medium without nocodazole (C). The
cells were stained with 13H9.
244
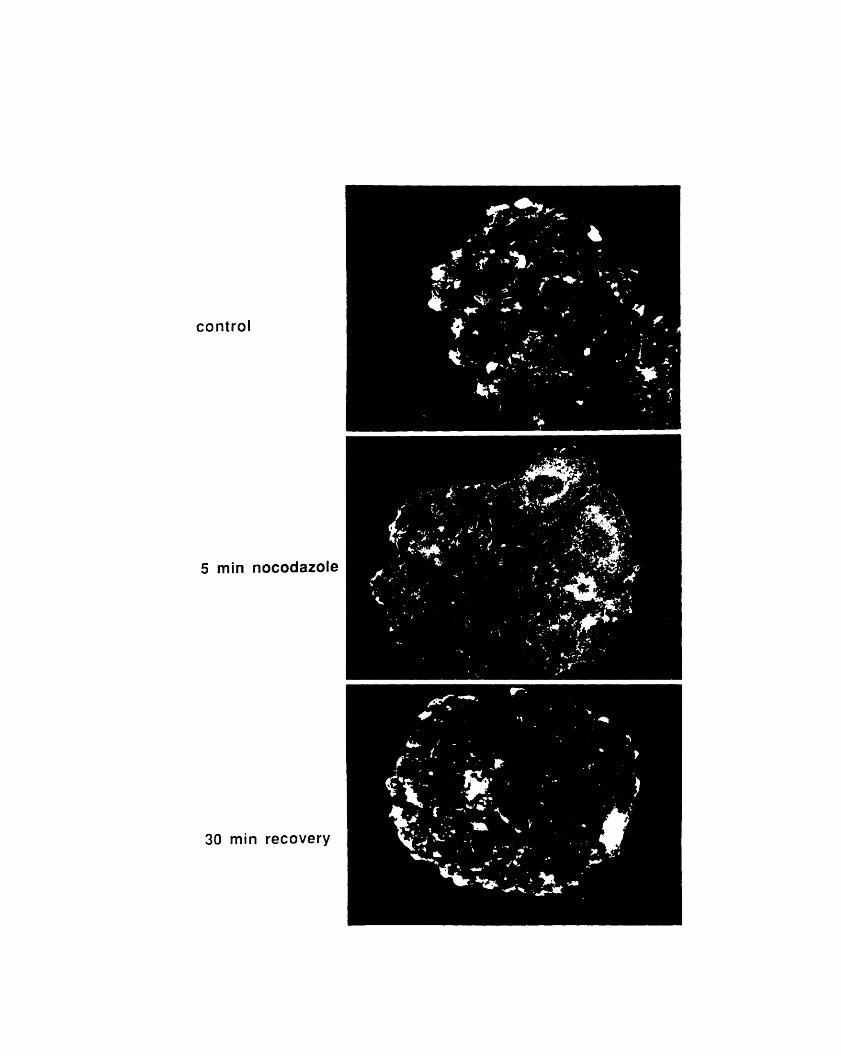
control
5 min nocodazole
30 min recovery
Discussion
We are interested in determining the protein(s) or circumstances
under which the 13H9 antigen might interact with microtubules. We
have four pieces of evidence that there might be some interaction with
microtubules:
1. The 13H9 antigen from brain cycles with microtubules through two
cycles of temperature-dependent polymerization-depolymerization. It
does not, however, cycle to constant specific activity (Margaret
Magendantz, unpublished observation).
2. Bacterial TrpE-ezrin fusion proteins bind taxol-stabilized microtubules
in a competable fashion (Marcia Falconer, unpublished observations).
3. The localization of the 13H9-antigen to growth cones is dependent on
intact microtubules (Goslin et al., 1989).
4. The localization of 13H9 to edge regions in HeLa cells is disrupted by
nocodazole.
Since 13H9 recognizes at least four related proteins (ezrin, radixin,
moesin, and merlin/schwannomin), it is possible that HeLa cells express
several of these proteins and that a different protein is found in "flowers"
vs. edge regions etc. This raises the possibility that only one of the ERM-
proteins or merlin shows some interaction with microtubules in cells,
while others do not. These other proteins might be insensitive to
disruption by nocodazole (for instance in marginal bands and leading
edges). In two cell types, more than one of the ERM proteins is found in
the same subcellular structure: In chicken red blood cells (Chapter 4),
radixin and ezrin localize to the marginal band. In A431 cells, both
moesin and ezrin localize to microvilli (Franck et al., 1993). Alternatively,
246
as pointed out above, the same protein might be found in different multi-
protein complexes in different cell types. I also want to point out that
there could exist proteins that interact with microtubules but are not
solubilized when microtubules are depolymerized (Swan and Solomon,
1984).
The ERM-proteins do not fit the standard definition of a
microtubule-associated protein, nor do they fit the standard definition of
an actin-binding protein. They might be involved in multiple low-affinity
interactions with additional regulation by posttranslational modification.
With our new anti-peptide antibodies which are specific for ezrin, radixin,
or moesin, it could be fruitful to attempt again to dissect the ERM-
proteins in HeLa cells.
247
Appendix 4: Identifying Near Neighbors of the 904-Antigen in the Marginal Band by Crosslinking
Introduction
Judy Swan was able to show that extracted red blood cell
cytoskeletons after cold depolymerization of microtubules supported the
faithful regrowth of marginal bands from exogenously added calf brain
tubulin (Swan and Solomon, 1984). Her experiments suggested that there
exists an insoluble cytoskeletal component that interacts with
microtubules. In an attempt to identify candidate proteins, Eric
Birgbauer raised monoclonal antibodies to chick brain MAPs and
identified one, 13H9, whose antigen is a component of the marginal band.
By fractionation, the 13H9 antigen is in the insoluble residue of chicken
red blood cells (Birgbauer and Solomon, 1989). It was of great interest to
identify the binding partners of the 13H9 antigen in the chicken red blood
cell and other cell types. This also addresses the question of whether the
13H9 antigen might interact with microtubules directly. Another good
candidate for binding to the 13H9 antigen is F-actin because of its
localization to the marginal band and the suspected actin-association of
the ERM proteins.
I attempted to identify nearest neighbors of the 13H9 antigen by
using bifunctional chemical crosslinkers. Crosslinking reagents have
been used successfully in several other systems to identify binding
partners (Peters and Richards, 1977; Ji, 1979; Gaffney, 1985). There are
several major caveats to using crosslinkers, and the in vivo relevance of
248
identified candidates needs to be tested by independent means. The
caveats include crosslinking after random collisions, danger of postlysis
artefacts due to nonspecific adsorption during the experiment, or disulfide
exchange. Additionally, successful crosslinking depends on the right
arrangement of interactive groups in the interacting complex. For this
reason, many different kinds of chemical crosslinkers are commercially
available, which differ by functional group, hydrophobicity, linker lengths
etc.
The chicken red blood cell is a good candidate system for
attempting to identify neighbors by crosslinking because 1. the cell is very
simple and contains the marginal band as the only microtubule and the
major F-actin containing structure; 2. the crosslinking can be performed
after detergent extraction so that the vast majority of the cell's soluble
components are washed away. Both of these factors should greatly
simplify and enrich for the relevant complexes.
249
Materials and Methods
Chemical crosslinkers
I used two homobifunctional crosslinkers which can be cleaved by
reduction of disulfide bonds. The reactive groups are n-
hydroxysuccinimide esters which react with free amino groups. The
linker is 12 A in length. Dithiobis(succinimidylpropionate) (DSP) is
hydrophobic, while 3,3'-dithiobis(sulfosuccinimidylpropionate) (DTSSP) is
a hydrophilic homolog of DSP. The crosslinkers were purchased from
Pierce Chemical Co.
Preparation of cytoskeletons and crosslinking
The blood from one adult chicken was washed twice in 0.025 M
glucose in PBS. The final cell pellet was extracted twice in 0.1% NP-
40/PM2G containing 5 tg/ml taxol and a cocktail of protease inhibitors for
five minutes at 370C. After centrifugation, the pellet was resuspended in
PM2G pH 7.8 and various concentrations of crosslinker were added for 10
to 20 minutes. The reaction was stopped by the addition of lysine to
quench unreacted reactive groups. Subsequently, the sample was
adjusted to 10 mM MgCl2 and DNAseI was added to digest chromatin for
30 minutes at 370C. The cytoskeletons were pelleted and resuspended in
PM2G containing 1 mM Ellman's reagent (5',5'-dithiobis(2-benzoic acid))
to quench free sulffiydryl groups. The sample was then solubilized in 2%
SDS, spun in a microfuge and the supernatant frozen until analysis by
SDS-PAGE. In controls, only the solvent for the crosslinker (DMSO for
DSP or water for DTSSP) was added to the reaction.
250
Analysis of crosslinked products
The crosslinked products were dissolved in sample buffer with or
without reducing agent. In the presence of reducing agent, the disulfide
bond of the crosslinker is broken and crosslinked proteins separate from
one another. The samples were separated on 7.5% SDS-PAGE and either
stained with Coomassie Brilliant Blue, silver stain, or transferred to
nitrocellulose for Western blotting. Antibody 904 was used for most
experiments because the background using 13H9 is too high to detect
possible minor crosslinked products. In one experiment, antibodies to
tubulin and actin were used to assess whether complexes of similar
electrophoretic mobility to those obtained with 904 were present.
251
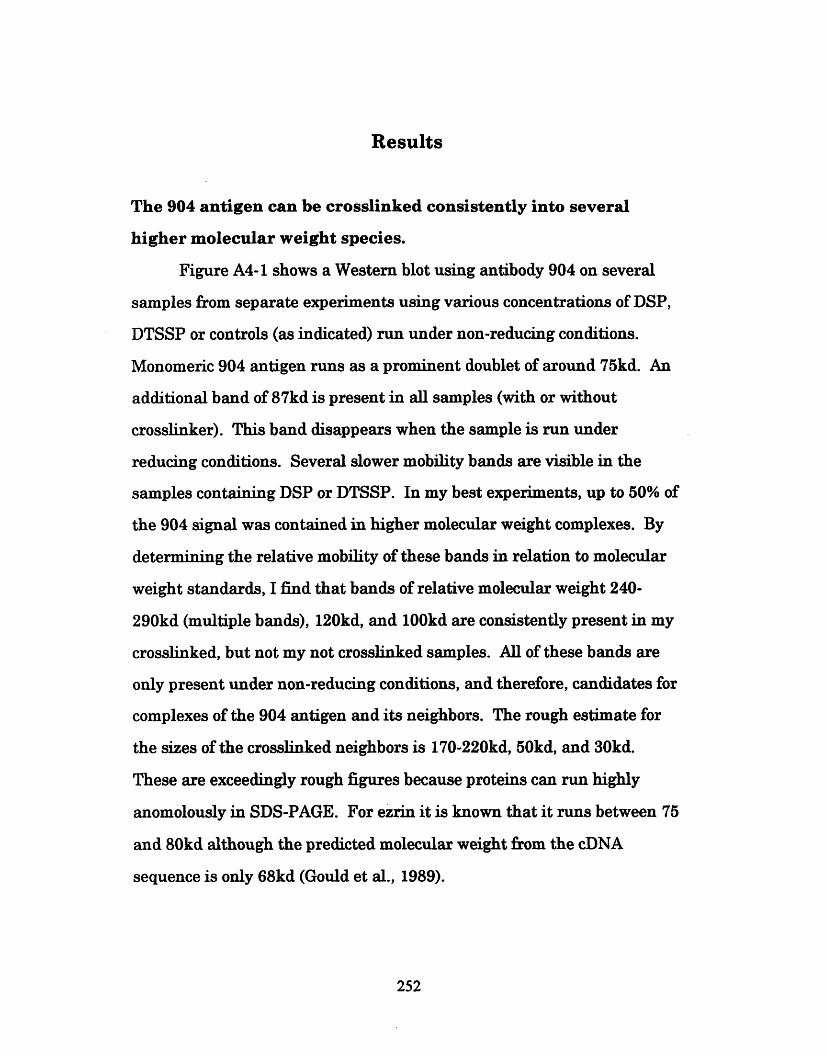
Results
The 904 antigen can be crosslinked consistently into several
higher molecular weight species.
Figure A4-1 shows a Western blot using antibody 904 on several
samples from separate experiments using various concentrations of DSP,
DTSSP or controls (as indicated) run under non-reducing conditions.
Monomeric 904 antigen runs as a prominent doublet of around 75kd. An
additional band of 87kd is present in all samples (with or without
crosslinker). This band disappears when the sample is run under
reducing conditions. Several slower mobility bands are visible in the
samples containing DSP or DTSSP. In my best experiments, up to 50% of
the 904 signal was contained in higher molecular weight complexes. By
determining the relative mobility of these bands in relation to molecular
weight standards, I find that bands of relative molecular weight 240-
290kd (multiple bands), 120kd, and 100kd are consistently present in my
crosslinked, but not my not crosslinked samples. All of these bands are
only present under non-reducing conditions, and therefore, candidates for
complexes of the 904 antigen and its neighbors. The rough estimate for
the sizes of the crosslinked neighbors is 170-220kd, 50kd, and 30kd.
These are exceedingly rough figures because proteins can run highly
anomolously in SDS-PAGE. For ezrin it is known that it runs between 75
and 80kd although the predicted molecular weight from the cDNA
sequence is only 68kd (Gould et al., 1989).
252
Fig.A4-1. Crosslinking of chicken red blood cell cytoskeletons.
904 immunoblot on chicken red blood cell cytoskeletons treated with
either buffer (lanes 1,6,8), the crosslinker DTSSP (lanes 2-3,5,7) or the
crosslinker DSP (lane 4). The gel was run under non-reducing conditions.
253
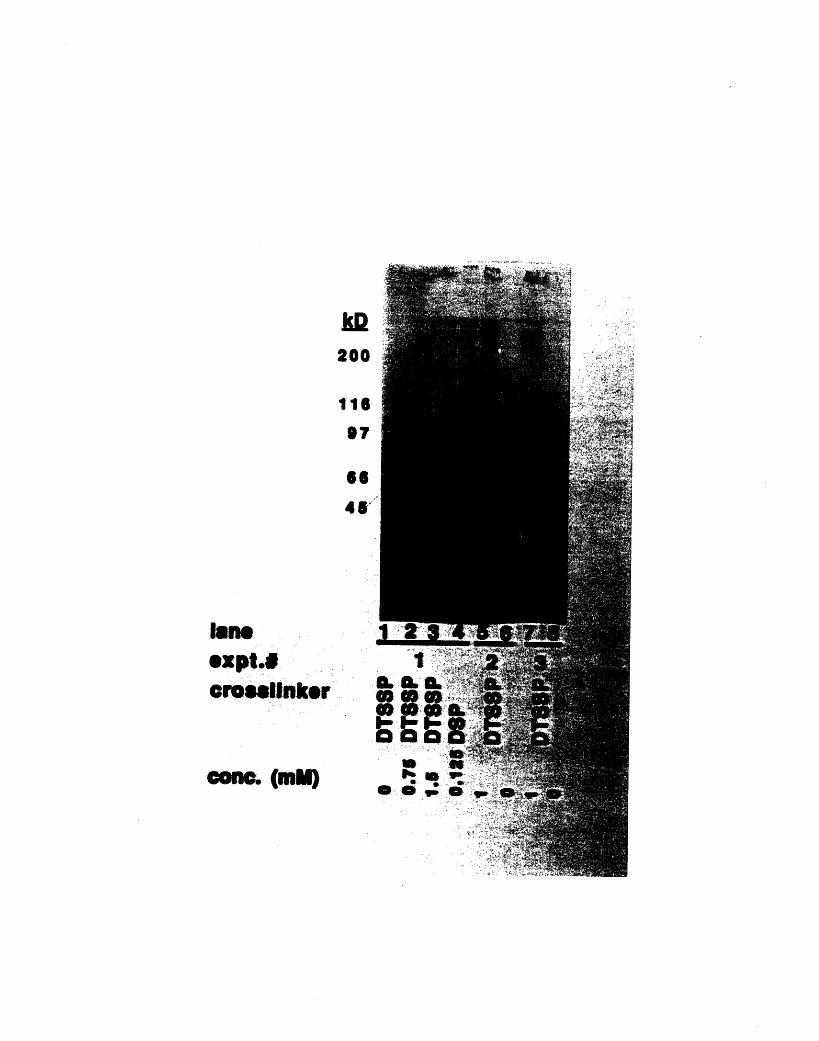
kO
200
11697
t6
or'ollnkeor
cons (mM)
II··~
m.Ai~Iom
EUra~~~
S-1FrlC:
Are actin or tubulin contained in the 904-positive crosslinked
complexes?
To address whether actin or tubulin are contained in a crosslinked
complex with the 904 antigen, I performed Western blots using anti-
tubulin antibody 429 or anti-actin antibody 751 (generously provided by
P. Matsudaira) on adjacent strips of crosslinked or control samples.
Figure A4-2 shows strips run non-reduced probed with 429, 751 or 904.
904 recognizes several high molecular weight bands which are not present
in the controls. 751 also detects several slower mobility bands, but none
comigrate with 904-positive crosslinked products. These might represent
oligomers of actin. 429 recognizes many higher molecular weight
complexes. This is not surprising since microtubules are tubulin polymers
and the crosslinking of tubulin multimers of various lengths is expected.
There is a smear of crosslinked tubulin in the vicinity of crosslinked 904-
antigen, which makes it at least possible that tubulin and the 904-antigen
are contained in the same complex.
To test this possibility more directly, I attempted several immuno-
precipitations using antibody 904 or anti-tubulin antibody 429 on
crosslinked material. I analyzed the precipitates by either silver staining
or autoradiography after iodination of my samples. I was never able to
precipitate more than 50% of the 904-positive material. In no case did I
detect additional co-precipitating proteins in the crosslinked samples that
were not present in the control samples.
255
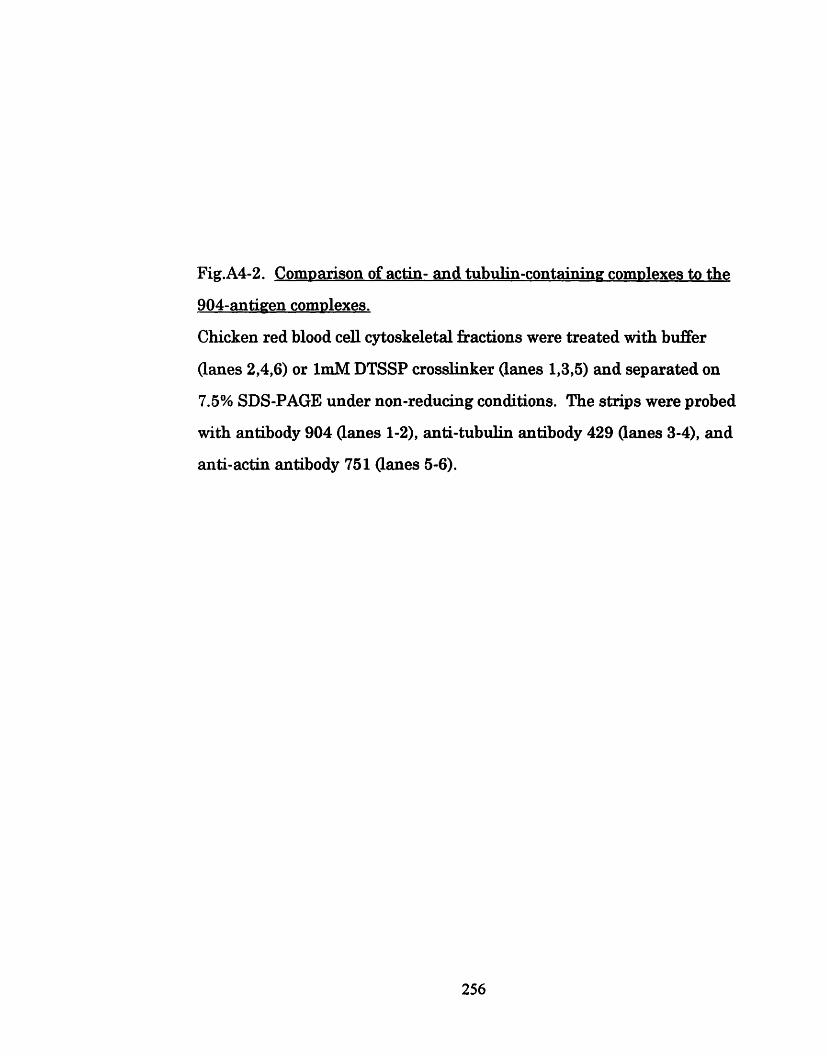
Fig.A4-2. Comparison of actin- and tubulin-containing complexes to the
904-antigen complexes.
Chicken red blood cell cytoskeletal fractions were treated with buffer
(lanes 2,4,6) or mM DTSSP crosslinker (lanes 1,3,5) and separated on
7.5% SDS-PAGE under non-reducing conditions. The strips were probed
with antibody 904 (lanes 1-2), anti-tubulin antibody 429 (lanes 3-4), and
anti-actin antibody 751 (lanes 5-6).
256
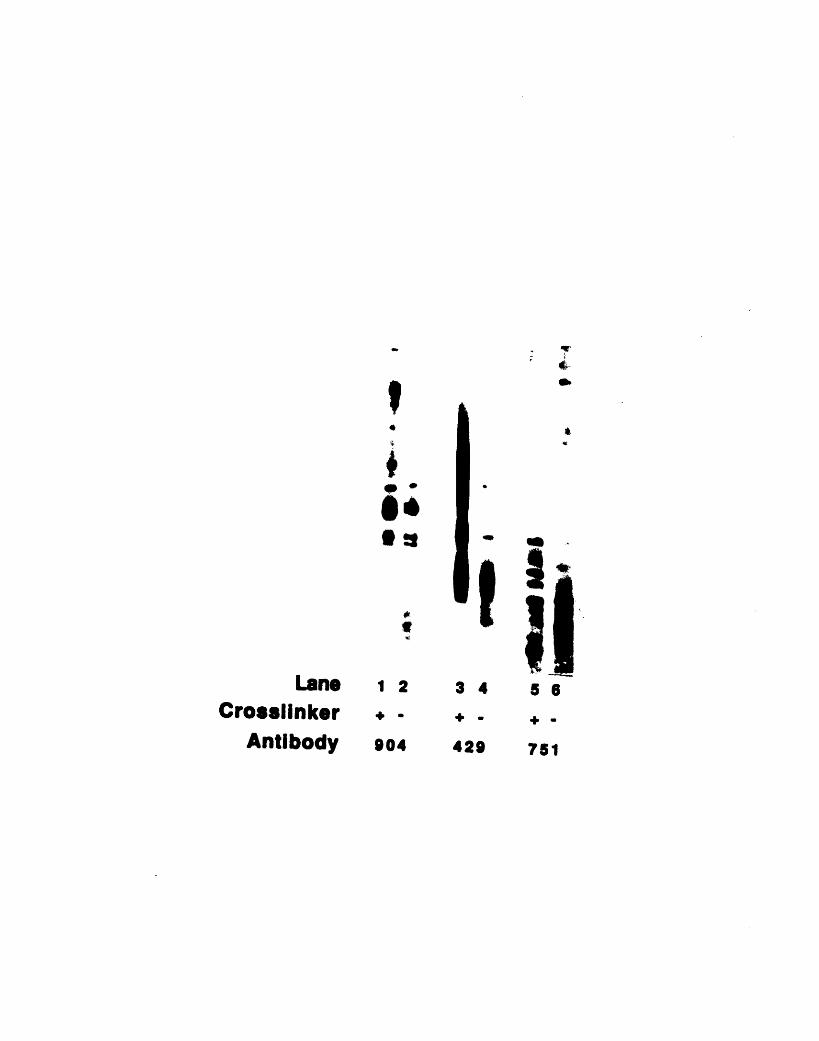
0
46160 3
*vc
Lane
CrosslinkerAntibody
1 2
, -
904 429
' i
4 5 6
751
Ilw
3
Discussion
In an attempt to identify binding partners of the 904 antigen, I
reacted chicken red blood cell cytoskeletons with chemical bifunctional
crosslinkers. Several high molecular weight complexes containing the 904
antigen were consistently detected in these experiments. It was not
possible, though, to analyze the complexes further since none of the
complexes could be immunoprecipitated with an antibody against tubulin
or antibody 904. We now also know that the major 904 reactive band in
chicken red blood cell cytoskeletons is probably not ezrin, radixin or
moesin (see Chapter 3), but an unknown protein which nonetheless
carries the 13H9 epitope. Given that we now have a better understanding
of the prevalence of ERM-proteins in the marginal band (i.e. radixin is the
major one) and given that we now have specific reagents, it might be
worthwhile to repeat these preliminary results with better reagents.
258
Bibliography
Adachi, Y., T. Toda, O. Niwa, and M. Yanagida. 1986. Differentialexpressions of essential and non-essential a-tubulin genes inSchizosaccharomyces pombe. Mol. Cell. Biol. 6:2168.
Albrecht-Buehler, G. 1977. Daugther 3T3 cells. Are they mirror images ofeach other? J. Cell Biol. 75:595
Algrain, M., O. Turunen, A. Vaheri, D. Louvard, and M. Arpin. 1993.Ezrin contains cytoskeleton and membrane binding domainsaccounting for its proposed role as a membrane-cytoskeletal linker.J. Cell Biol. 120: 129-139.
Anderson, R.A., and V.T. Marchesi. 1985. Regulation of the association ofmembrane skeletal protein 4.1 with glycophorin by apolyphosphoinositide. Nature 318:295.
Andreoli, C., R. Le Borgne, M. Martin, and P. Mangeat. 1992. Ezrin-binding proteins from gastric tissue. Molecular Biology of the Cell3:364a.
Arai, T., and Y. Kaziro. 1976. Effect of guanine nucleotides on theassembly of brain microtubules: ability of 5'-guanlylimidophosphate to replace GTP in promoting the polymerization ofmicrotubules in vitro. Biochem. Biophys. Res. Commun. 69:369.
Baas, P.W., T.P. Pienkowski, and K.S. Kosik. 1991. Processes induced bytau expression in Sf9 cells have an axon-like microtubuleorganization. J. Cell Biol. 115:1333.
Barrett, L.A., and S.L. Scheinberg. 1972. The development of avian redcell shape. J. Exp. Zool. 182:1.
Barrett, L., and R. Dawson. 1974. Avian erythrocyte development:microtubules and the formation of the disc shape. Dev. Biol. 36:72.
Behnke, O. 1970a. Microtubules in disc-shaped blood cells. Int. Rev. Exp.Pathol. 9:1.
Behnke, O. 1970b. A comparative study of microtubules of disk-shapedblood cells. J. Ultrastruc. Res. 31:61.
259
Bennett, V. 1982. The molecular basis for membrane-cytoskeletonassociation in human erythrocytes. J. Cell. Biochem. 18:49.
Bernhardt, R., and A. Matus. 1984. Light and electron microscopicstudies of the distribution of microtubule-associated protein 2 in ratbrain: a difference between dendritic and axonal cytoskeletons. J.comp. Neurol. 226:203.
Binder, L.I., A. Frankfurter, and L.I. Rebhun. 1985. The distribution oftau in the mammalian central nervous system. J. Cell Biol.101:1371.
Birgbauer, E., and F. Solomon. 1989. A marginal band-associatedprotein has properties of both microtubule- and microfilament-associated proteins. J. Cell Biol. 109: 1609-1620.
Birgbauer, E., J. H. Dinsmore, B. Winckler, A. D. Lander, and F. Solomon.1991. Association of Ezrin Isoforms With the NeuronalCytoskeleton. J. Neurosci. Res. 30: 232-241.
Birgbauer, E. 1991. Cytoskeletal interactions of ezrin in differentiatedcells. Ph.D. Thesis, M.I.T.
Bloom, G.S., and R.B. Vallee. 1983. Association of microtubule-associatedprotein 2 (MAP2) with microtubules and intermediate filaments incultured brain cells. J. Cell Biol. 96:1523.
Bodine, D.M., C.S. Birkenmeier, and J.E. Barker. 1984. Spectrin deficientinherited hemolytic anemias in the mouse: characterization byspectrin synthesis and mRNA activity in reticulocytes. Cell 37:721.
Bond, J.F., J.L. Fridovich-Keil, L. Pillus, R.C. Mulligan, and F. Solomon.1986. A chicken-yeast chimeric b-tubulin protein is incorporatedinto mouse microtubules in vivo. Cell 44:461.
Bornens, M., M. Paintrand, and C. Celati. 1989. The corticalmicrofilament system of lymphoblasts displays a periodicoscillatory activity in the absence of microtubules: implications forcell polarity. J. Cell Biol. 109:1071.
Bowser, S.S., J.L. Travis, and C.L. Rieder. 1988. Microtubules associatewith actin-containing filaments at discrete sites along the ventralsurface of Allogromia reticulopods. J. Cell Sci. 89:297.
260
Branton, D., C.M. Cohen, and J. Tyler. 1981. Interaction of cytoskeletalproteins on the human erythrocyte membrane. Cell 24:24.
Bray, D., and J.G. White. 1988. Cortical flow in animal cells. Science239:883.
Bretscher, A. 1983. Purification of an 80,000-dalton protein that is acomponent of the isolated microvillus cytoskeleton, and itslocalization in nonmuscle cells. J. Cell Biol. 97: 425-532.
Bretscher, A. 1986. Purification of the intestinal microvillus cytoskeletalproteins villin, fimbrin, and ezrin. Meth. Enzymology 134: 24-37.
Bretscher, A. 1989. Rapid Phosphorylation and Reorganization of Ezrinand Spectrin Accompany Morphological Changes Induced in A-431Cells by Epidermal Growth Factor. J. Cell Biol. 108: 921-930.
Bruns, G.A., and V.M. Ingram. 1973. The erythroid cells and hemoglobinof the chick embryo. Philos. Trans. R. Soc. Lond. B Biol. Sci.266:225.
Burnside, B. 1973. Microtubules and microfilaments in amphibianneurulation. Amer. Zool. 13:989.
Burridge, K., K. Fath, G. Nuckolls, and C. Turner. 1988. Focaladhesions: transmembrane junctions between the extracellularmatrix and the cytoskeleton. Ann. Rev. Cell Biol. 4: 487-525.
Buxbaum, R.E., and S.R. Heidemann. 1988. A thermodynamic model forforce integration and microtubule assembly during axonalelongation. J. theor. Biol. 134:379.
Byers, B. and K.R. Porter. 1964. Oriented microtubules in elongatingcells of the developing lens rudiment after induction. PNAS52:1091.
Capetanaki, Y.G., J. Ngai, C.N. Flytzanis, and E. Lazarides. 1983.Tissue-specific expression of two mRNA species transcribed from asingle vimentin gene. Cell 35:411.
Centonze, V.E., and R.D. Sloboda. 1986. A protein factor from Bufomarinus erythrocytes cross-bridges microtubules in vitro. Exp. CellRes. 167:471.
261
Chapin, S.J., J.C. Bulinski, and G.G. Gundersen. 1991. Microtubulebundling in cells. Nature 349:24.
Chen,J., Y. Kanai, N.J. Cowan, and N. Hirokawa. 1992. Projectiondomains of MAP2 and tau determine spacings betweenmicrotubules in dendrites and axons. Nature 360:674.
Cleveland, D.W. 1986. The multi-tubulin hypothesis revisited: what havewe learned? J. Cell Biol. 104:381.
Cohen, W.D., D. Bartelt, R. Jaeger, G. Langford, and I. Nemhauser. 1982.The cytoskeletal system of nucleated erythrocytes. I. Compositionand function of major elements. J. Cell Biol. 93:828.
Cooper, J.A. 1987. Effects of cytochalasin and phalloidin on actin. J. CellBiol. 105:1473.
Cortese, J.D., B. Schwab, C. Frieden, and E.L. Elson. 1989. Actinpolymerization induces a shape change in actin-containing vesicles.PNAS 86:5773.
Danowski, B.A. 1989. Fibroblast contractility and actin organization arestimulated by microtubule inhibitors. J. Cell Sci. 93:255.
DeBrabander, M., G. Geuens, R. Nuydens, R. Willebrords, and J. DeMey.1981. Microtubule stability and assembly in living cells: theinfluence of metabolic inhibitors, taxol, and pH. Cold SpringHarbor Symp. Quant. Biol. Vol. XLVI. pp.227-240.
Dinsmore, J.D., and F. Solomon. 1991. Inhibition of MAP2 expressionaffects both morphological and cell division phenotypes of neuronaldifferentiation. Cell 64:817.
Drubin, D.G., and M.W. Kirschner. 1986. Tau protein function in livingcells. J. Cell Biol. 103:2739.
Duerr, A., D. Pallas, and F. Solomon. 1981. Molecular analysis ofcytoplasmic microtubules in situ: identification of both widespreadand specific proteins. Cell 24:203.
Edson, K., B. Weisshaar, and A. Matus. 1993. Actin depolymerizationinduces process formation on MAP2-transfected non-neuronal cells.Dev. 117:689.
262
Egerton, M., W.H. Burgess, D. Chen, B.J. Druker, A. Bretscher, and L.E.Samelson. 1992. Identification of ezrin as an 81-kDa tyrosine-phosphorylated protein in T cells. J. Immunol. 149:1847.
Ellisman, M.H., and K.R. Porter. 1980. Microtrabecular-structure of theaxoplasmic matrix: visualization of cross-linking structures andtheir distribution. J. Cell Biol. 87:464.
Everett, A.W., and K.A. Nichol. 1990. Ezrin immunoreactivity in neuronsubpopulations: cellular distribution in relation to cytoskeletalproteins in sensory neurons. J. Histochem. Cytochem. 38:1137.
Fawcett D.W., and F. Witebsky. 1964. Observations on the ultrastructureof nucleated erythrocytes and thrombocytes, with particularreference to the structural basis of their discoid shape. Zeitschr. f.Zellforsch. 62:785.
Fazioli, F., W. T. Wong, S. J. Ullrich, K. Sakaguchi, E. Appella, and P. P.Di Fiore. 1993. The ezrin-like family of tyrosine kinase substrates:receptor-specific pattern of tyrosine phosphorylation andrelationship to malignant transformation. Oncogene 8: 1335-1345.
Feick, P., R. Foisner, and G. Wiche. 1991. Immunolocalization andmolecular properties of a high molecular weight microtubule-bundling protein (syncolin) from chicken erythrocytes. J. Cell Biol.112:689.
Finch, J.T., M.F. Perutz, J.F. Bertles, and J. Dobler. 1973. Structure ofsickled erythrocytes and of sickle-cell hemoglobin fibers. PNAS70:719.
Finidori, J., E. Friederich, D.J. Kwiatkowski and D. Louvard. 1992. Invivo analysis of functional domains from villin and gelsolin. J.Cell Biol. 116:1145.
Forscher P., and S.J. Smith. 1988. Action of cytochalasins on theorganization of actin filaments and microtubules in a neuronalgrowth cone. J. Cell Biol. 107:1505.
Franck, Z., M. Footer, and A. Bretscher. 1990. Microinjection of villininto cultured cells induces rapid and long-lasting changes in cellmorphology but does not inhibit cytokinesis, cell motility, ormembrane ruffling. J. Cell Biol. 111:2475.
263
Franck, Z., R. Gary, and A. Bretscher. 1993. Moesin, like ezrin,colocalizes with actin in the cortical cytoskeleton in cultured cells,but its expression is more variable. J.C. Sci. 105: 219-231.
Friederich, E., C. Huet, M. Arpin, and D. Louvard. 1989. Villin inducesmicrovilli growth and actin redistribution in transfected fibroblasts.Cell 59:461.
Fuchs, E., R.A. Esteves, P.A. Coulombe. 1992. Transgenic miceexpressing a mutant keratin 10 gene reveal the likely genetic basisfor epidermolytic hyperkeratosis. PNAS 89:6096.
Funayama, A., A. Nagafuchi, N. Sato, S. Tsukita, and S. Tsukita. 1991.Radixin is a novel member of the band 4.1 family. J.Cell Biol.115: 1039-1048.
Gaffney, B.J. 1985. Chemical and biochemical crosslinking of membranecomponents. Biochim. Biophys. Acta 822:289.
Gary, R., Z. Franck, and A. Bretscher. 1992. Ezrin binds moesin in vivoand in vitro. Molecular Biology of the Cell 3: 364a.
Gawlitta, W., M. Osborn, and K. Weber. 1981. Coiling of intermediatefilaments induced by microinjection of a vimentin-specific antibodydoes not interfere with locomotion and mitosis. Eur. J. Cell Biol.26:83.
Georgatos, S.D., and G. Blobel. 1987. Two distinct attachment sites forvimentin along the plasma membrane and the nuclear envelope inavian erythrocytes: A basis for a vectorial assembly of intermediatefilaments. J. Cell Biol. 105:105.
Goldberg, D.J., and D.W. Burmeister. 1988. Looking into growth cones.Trends in Neuroscience 12:503.
Goldman, R.D., and D.M. Knipe. 1973. Functions of cytoplasmic fibers innon-muscle cell motility. Cold Spring Harbor Symp. Quant. Biol.37:523.
Goniakowska-Witalinska, L, and W. Witalinski. 1976. Evidence for acorrelation between the number of marginal band microtubules andthe size of vertebrate erythrocytes. J. Cell Sci. 22:397.
264
Goslin, K., E. Birgbauer, G. Banker, and F. Solomon. 1989. The role ofcytoskeleton in organizing growth cones: a microfilament-associated growth cone component depends upon microtubules forits localization. J. Cell Biol. 109: 1621-1631.
Gould, K.L., J.A. Cooper, A. Bretscher, and T. Hunter. 1896. The proteintyrosine kinase substrate, p81, is homologous to a chickenmicrovillar core protein. J. Cell Biol. 102:660.
Gould, K. L., A. Bretscher, F. S. Esch, and T. Hunter. 1989. cDNAcloning and sequencing of the protein-tyrosine kinase substrate,ezrin, reveals homology to band 4.1. EMBO J. 8: 4133-4142.
Granger, B.L., E.A. Repasky, and E. Lazarides. 1982. Synemin andvimentin are components of intermediate filaments in avianerythrocytes. J. Cell Biol. 92:299.
Granger, B.L., and E. Lazarides. 1982. Structural associations of syneminand vimentin filaments in avian erythrocytes revealed byimmunoelectron microscopy. Cell 30:263.
Griffith, L.M., and T.D. Pollard. 1982. The interaction of actin filamentswith microtubules and microtubule-associated proteins. J. Biol.Chem. 257:9143.
Hagopian, H.K., J.A. Lippke, and V.M. Ingram. 1972. Erythropoietic cellculture from chick embryos. J. Cell Biol. 54:98.
Hanzel, D.K., T. Urushidani, W.R. Usinger, A. Smolka, and J.G. Forte.1989. Immunological localization of an 80-kDa phosphoprotein tothe apical membrane of gastric parietal cells. Am. J. Physiol.256:G1082.
Hanzel, D., H. Reggio, A. Bretscher, J.G. Forte, and P. Mangeat. 1991.The secretion-stimulated 80K phosphoprotein of parietal cells isezrin, and has properties of a membrane cytoskeletal linker in theinduced apical microvilli. EMBO J. 10:2363.
Heidemann, S.R., and J.R. McIntosh. 1981. Visualization of thestructural polarity of microtubules. Nature 286:517.
Hirokawa, N. 1982. Cross-linker system between neurofilaments,microtubules, and membranous organelles in frog axons revealedby the quick-freeze, deep-etching method. J. Cell Biol. 94:129.
265
Hollenbeck, P.J., A.D. Bershadsky, O.Y. Pletjushkina, I.S. Tint, and J.M.Vasiliev. 1989. Intermediate filament collapse is an ATP-dependent and actin-dependent process. J. Cell Sci. 92:621.
Hoock T.C., P.M. Newcomb, and Ira M. Herman. 1991. [3 actin and itsmRNA are localized to the plasma membrane and the regions ofmoving cytoplasm during the cellular response to injury. J. CellBiol. 112:653.
Hotani, H., R. Lahoz-Beltra, B. Combs, S. Hameroff, and S. Rasmussen.1992. Microtubule dynamics, liposomes and artificial cells: In vitroobservation and cellular automata simulation of microtubuleassembly/disassembly and membrane morphogenesis. Nanobiol.1:61.
Hoyle, H.D., and E.C. Raff. 1990. Two Drosophila beta tubulin isoformsare not functionally equivalent. J. Cell Biol. 111:1009.
Hunter, T. and J.A. Cooper. 1981. Epidermal growth factor induces rapidtyrosine phosphorylation of proteins in A431 human tumor cells.Cell 24:741.
Hyman, A. A., and T. J. Mitchison. 1990. Modulation of microtubulestability by kinetochores. J. Cell. Biol. 110: 1607-1616.
Hyman, A.A., S. Salser, D. Drechsel, N. Unwin, and T.J. Mitchison. 1992.The role of GTP hydrolysis in microtubule dynamics: Informationfrom a slowly hydrolyzable analog, GMPCPP. Mol. Biol. Cell3:1155.
Hynes, R.O., and A.T. Destree. 1978. 10-nm filaments in normal andtransformed cells. Cell 13:151.
Ingber, D.E., and J.D. Jamieson. 1985. Cells as tensegrity structures:architectural regulation of histodifferentiation by physical forcestransduced over basement membranes. In Gene Expression DuringNormal and Malignant Differentiation, pp. 13-32. Anderson, L.C.,C.G. Gahnberg, and P. Ekblom, eds. Academic Press, New York.
Ingber D.E., and J. Folkman. 1989. Tension and compression as basicdeterminants of cell form and function: utilization of a cellulartensegrity mechanism. In: Cell Shape, Determinants, Regulation,
266
and Regulatory Role, pp.1-25. Stein, W.D., and F. Bronner, eds.Academic Press, New York.
Itano, N., and S. Hatano. 1991. F-actin bundling protein from Physarumpolycephalum: purification and its capacity for co-bundling of actinfilaments and microtubules. Cell Motil. Cytoskel. 19:244.
Jacobson, M. 1978. Developmental Neurobiology. Plenum Press, Inc.,New York.
Janmey, P.A. 1991. Mechanical properties of cytoskeletal polymers.Curr. Opin. Cell Biol. 2:4.
Ji, T.H. 1979. The application of chemical crosslinking for studies on cellmembranes and the identification of surface receptors. Biochim.Biophys. Acta 559:39.
Johnson, G.D., R.S. Davidson, K.C. McNamee, G. Russell, D. Goodwin,and E.J. Holborow. 1982. Fading of immunofluorescence duringmicroscopy: a study of the phenomenon and its remedy. J. Immun.Methods 55:231.
Joseph-Silverstein J., and W.D. Cohen. 1984. The cytoskeletal system ofnucleated erythrocytes. III. Marginal band function in mature cells.J. Cell Biol. 98:2118.
Joshi, H.C., D. Chu, R.E. Buxbaum, and S.R. Heidemann. 1985. Tensionand compression in the cytoskeleton of PC 12 neurites. J. Cell Biol.101:697.
Joshi, H.C., T.J. Yen, and D.W. Cleveland. 1987. In vivo coassembly of adivergent b-tubulin subunit (c036) into microtubules of differentfunction. J. Cell Biol. 105:2179.
Kanai, Y., R. Takemura, T. Oshima, H. Mori, Y. Ihara, M. Yanagisawa, T.Masaki, and N. Hirokawa. 1989. Expression of multiple tauisoforms and microtubule bundle formation in fibroblaststransfected with a single tau cDNA. J. Cell Biol. 109:1173.
Katz, W.S., and F. Solomon. 1989. Organizing microtubules in thecytoplasm: Genetic approaches in yeast and animal cells. CellMotil. Cytoskel. 14:50.
267
Kemphues, K.J., T.C. Kaufman, R.A. Raff, and E.C. Raff. 1982. Thetestis-specific 1-tubulin subunit in Drosophila melanogaster hasmultiple functions in spermatogenesis. Cell 31:655.
Kim, S., M. Magendantz, W. Katz, and F. Solomon. 1987. Developmentof a differentiated microtubule structure: formation of the chickenerythrocyte marginal band in vivo. J. Cell Biol. 104: 51-59.
Kirschner, M. and T. Mitchison. 1986. Beyond self-assembly: Frommicrotubules to morphogenesis. Cell 45:329.
Knops, J., K.S. Kosik, G. Lee, J.D. Pardee, L. Cohen-Gould, and L.McConlogue. 1991. Overexpression of tau in non-neuronal cellsinduces expression of long cellular processes. J. Cell Biol. 114:725.
Koerner,T.J., J.E.Hill, A.M.Myers, and A.Tzagoloff. 1991. Methods inEnzymology 194: 477 - 490.
Kosik, K. S., L. D. Orecchio, S. Bakalis, L. Duffy, and R. L. Neve. 1988a.Partial sequence of MAP2 in the region of a shared epitope withAlzheimer neurofibrillary tangles. J. Neurochem. 51: 587-598.
Kosik, K. S., L. D. Orecchio, L. Binder, J. Q. Trojanowski, V. M.-Y. Lee,and G. Lee. 1988b. Epitopes that span the tau molecule are sharedwith paired helical filaments. Neuron 1:817-825.
Krieg, J., and T. Hunter. 1992. Identification of the two major epidermalgrowth factor-induced tyrosine phosphorylation sites in themicrovillar core protein ezrin. J. Biol. Chem. 267:19258.
Lander, A. 1989. Understanding the molecules of neural cell contacts:emerging patterns of structure and function. Trends inNeuroscience 12:189.
Laemmli, U. K. 1970. Cleavage of structural proteins during theassembly of the head of bacteriophage T4. Nature 227: 680-685.
Lankes, W. T., and H. Furthmayr. 1991. Moesin: A member of theprotein 4. 1-talin-ezrin family of proteins. Proc. Natl. Acad. Sci.USA 88: 8297-8301.
Lankes, W., A. Griesmacher, J. Griinwald, R Schwartz-Albiez, and R.Keller. 1988. A heparin-binding protein involved in inhibition ofsmooth-muscle cell proliferation. Biochem. J. 251:831.
268
Lazarides, E. 1987. From genes to structural morphogenesis: the genesisand epigenesis of a red blood cell. Cell 51:345.
Leto, T.L., I. Correas, T. Tobe, R.A. Anderson, and W.C. Horne. 1986.Structure and function of human erythrocyte cytoskeletal protein4.1. In: Membrane Skeletons and Cytoskeletal-MembraneAssociations, pp.201-209. Bennett, V., C.M. Cohen, S.E. Lux, andJ. Palek, eds. Alan R. Liss, Inc. New York.
Letourneau, P.C., T.A. Shattuck, and A.H. Ressler. 1987. "Pull" and"push" in neurite elongation: observations on the effects ofdifferent concentrations of cytochalasin B and taxol. Cell Motil.Cytoskel. 8:193.
Lewis, S.A., W. Gu, and N.J. Cowan. 1987. Free intermingling ofmammalian -tubulin isotypes among functionally distinctmicrotubules. Cell 49:539.
Lewis, S.A., I. Ivanov, G.-H. Leed, and N. Cowan. 1989. Organization ofmicrotubules in dendrites and axons is determined by a shorthydrophobic zipper in microtubule-associated proteins MAP2 andtau. Nature 342:498.
Lin, J.J.-C., and J.R. Feramisco. 1981. Disruption of the in vivodistribution of the intermediate filaments in fibroblasts through themicroinjection of a specific monoclonal antibody. Cell 24:185.
Linder, M.E., and J.G. Burr. 1988. Immunological characterization ofproteins detected by phosphotyrosine antibodies in cellstransformed by Rous sarcoma virus. J. Virol. 62:2665.
Littauer, U.Z., D. Giveo, M. Thierauf, I. Ginzburg, and H. Ponstingl. 1986.Common and distinct tubulin binding sites for microtubule-associated proteins. PNAS 83:7162.
Lloyd, C.W., C.G. Smith, A. Woods, and D.A. Rees. 1977. Mechanisms ofcellular adhesion II. The interplay between adhesion, thecytoskeleton and morphology in substrate-attached cells. Exp. CellRes. 110:427.
Luna, E. J. 1991. Molecular links between the cytoskeleton andmembranes. Curr. Opin. Cell Biol. 3: 120-126.
269
Maccioni, R.B., C.I. Rivas, and J.C. Vera. 1988. Differential interaction ofsynthetic peptides from the carboxyl-terminal regulatory domain oftubulin with microtubule-associated proteins. EMBO J. 7:1957.
Madreperla, S.A., and R. Adler. 1989. Opposing microtubule- and actin-dependent forces in the development and maintenance of structuralpolarity in retinal photoreceptors. Dev. Biol. 131:149.
Matsudaira, P. 1991. Modular organization of actin crosslinkingproteins. TIBS 16: 87-90.
Matus, A. 1988. Microtubule-associated proteins: their role indetermining neuronal morphology. Ann. Rev. Neurosci. 11: 29-44.
May G.S. 1989. The highly divergent -tubulins of Aspergillus arefunctionally interchangeable. J. Cell Biol. 109:2267.
McNally, F.J., and R.D. Vale. 1993. Identification of katanin, an ATPasethat severs and disassembles stable microtubules. Cell 75:419.
Mehra, V. D., D. Sweetser, and R. A. Young. 1986. Efficient mapping ofprotein antigenic determinants. Proc. Natl. Acad. Sci. USA 83:7013-7017.
Miller, M., and F. Solomon. 1984. Kinetics and intermediates of marginalband reformation : evidence for peripheral determinants ofmarginal band organization. J. Cell Biol. 99:2108.
Mitchison, T. and M. Kirschner. 1984. Dynamic instability of microtubulegrowth. Nature 312:237.
Monaco G., A. Salestrini, and B. Bertolini. 1982. Observations on themolecular components stabilizing the microtubular system of themarginal band in the newt erythrocyte. J. Cell Sci. 58:149.
Moon, A.L., P.A. Janmey, K.A. Louie, D.G. Drubin. 1993. Cofilin is anessential component of the yeast cortical cytoskeleton. J. Cell Biol.120:421.
Murphy, D.B., and K.T. Wallis. 1983. Isolation of microtubule proteinfrom chicken erythrocytes and determination of the criticalconcentration for tubulin polymerization in vitro and in vivo. J.Biol. Chem. 258:8357.
270
Murphy, D.B., and K.T. Wallis. 1985. Erythrocyte microtubule assemblyin vitro. J. Biol. Chem. 260:12293.
Murphy, D.B., W.A. Grasser, and K.T. Wallis. 1986. Immunofluorescenceexamination of -tubulin expression and marginal band formationin developing chicken erythroblasts. J. Cell Biol. 102:628.
Nemhauser, I., R. Omberg, and W.D. Cohen. 1980. Marginal bands inblood cells of invertebrates. J. Ultrastruc. Res. 70:308.
Nemhauser, I., J. Joseph-Silverstein, and W.D. Cohen. 1983. Centriolesas microtubule organizing centers for marginal bands of molluscanerythrocytes. J. Cell Biol. 96:979.
O'Farrell, P.H. 1975. High resolution two-dimensional electrophoresis ofproteins. J. Biol. Chem. 250: 587-590.
Olmsted, J. B. 1981. Affinity purification of antibodies from diazotizedpaper blots of heterogeneous protein samples. J. Biol. Chem. 256:11955-11957.
Oster, G. 1989. Cell motility and tissue morphogenesis. In: Cell Shape.Determinants, Regulation, and Regulatory Role, pp.33-61. Stein,W.D., and F. Bronner, eds. Academic Press, New York.
Pallas, D., and F. Solomon. 1982. Cytoplasmic microtubule-associatedproteins: phosphorylation at novel sites is correlated with theirincorporation into assembled microtubules. Cell 30: 407-414.
Pasquale, E.B., P.A. Maher, and S.J. Singer. 1986. Talin isphosphorylated on tyrosine in chicken embryo fibroblaststransformed by Rous sarcoma virus. PNAS 83:5507.
Pereira, A., J. Doshen, E. Tanaka, and L.S.B. Goldstein. 1992. Geneticanalysis of a Drosophila MAP. J. Cell Biol. 116:377.
Peters, K., and F.M. Richards. 1977. Chemical cross-linking reagents andproblems in studies of membrane structure. Ann. Rev. Biochem.46:523.
Pollard, T.D., and J.A. Cooper. 1986. Actin and actin-binding proteins. Acritical evaluation of mechanisms and functions. Ann. Rev.Biochem. 55:987.
271
Porter, K. 1966. Cytoplasmic microtubules and their function. In:Principles of Biomolecular Structure, Ciba Foundation Symposium.G.E. Wolstenholme and M. O'Connor, (eds.). Boston: Little, Brownand Co. pp. 308:356.
Ranerjee, A.C., A. Banerjee, B. Bhattacharyya, and B.B. Biswas. 1978.Tubulin and its assembly promoting factor(s) during maturation ofavian erythrocytes. FEBS letters 107:383.
Rees, D. J. G., S. A. Ades, S. J. Singer, and R. O. Hynes. 1990. Sequenceand domain structure of talin. Nature 347: 685-689.
Rinnerthaler, G., B. Geiger, and J.V. Small. 1988. Contact formationduring fibroblast locomotion: involvement of membrane rufflesand microtubules. J. Cell Biol. 106:747.
Rodriguez Fernandez, J.L., B. Geiger, D. Salomon, and A. Ben-Ze'ev.1993. Suppression of vinculin expression by antisense transfectionconfers changes in cell morphology, cell motility, and anchorage-dependent growth of 3T3 cells. J. Cell Biol. 122:1285.
Rouleau, G. A., P. Merel, M. Lutchman, M. Sanson, J. Zucman, C.Marineau, K. Hoang-Xuan, S. Demczuk, C. Desmaze, and B.Plougastel and others. 1993. Alteration in a new gene encoding aputative membrane-organizing protein causes neurofibromatosistype 2. Nature 363: 515-521.
Sabry, J., T. O'Connor, D. Bentley, and M. Kirschner. 1991. Microtubulebehavior during guidance of pioneer neuron growth cones in situ.J. Cell Biol. 115:381.
Sammack, P.J., G.J. Gorbsky, and G.G. Borisy. 1987. Microtubuledynamics in vivo: a test of mechanisms of turnover. J. Cell Biol.104: 395.
Sanchez, I., L.H. Twersky, and W.D. Cohen. 1990. Detergent-basedisolation of marginal bands from nucleated erythrocytes. Eur. J.Cell Biol. 52:349.
Sargent, P.B. 1989. What distinguishes axons from dendrites? Neuronsknow more than we do. Trends in Neuroscience 12:203.
Sato, N., S. Yonemura, T. Obinata, S. Tsukita, and S. Tsukita. 1991.Radixin, a barbed end-capping actin-modulating protein, is
272
concentrated at the cleavage furrow during cytokinesis. J. CellBiol. 113: 321-330.
Sato, N., N. Funayama, A. Nagafuchi, S. Yonemura, S. Tsukita, and S.Tsukita. 1992. A gene family consisting of ezrin, radixin andmoesin. Its specific localization at actin filament/plasmamembrane association sites. J. Cell Sci. 103: 131-143.
Sattilaro, R.F., W.L. Dentler, and E.L. LeCluyse. 1981. Microtubule-associated proteins (MAPs) and the organization of actin filamentsin vitro. J. Cell Biol. 90:467.
Schaller, M.D., C.A. Borgman, B.S. Cobb, R.R. Vines, A.B. Reynolds, andJ.T. Parsons. 1992. pp 125FAK, a structurally distinctive protein-tyrosine kinase associated with focal adhesions. PNAS 89:5192.
Schatz, P.J., F. Solomon, and D. Botstein. 1986. Genetically essential andnon-essential a-tubulin genes specify functionally interchangeableproteins. Mol. Cell. Biol. 6:3722.
Schliwa, M., and J. van Blerkom. 1981. Structural interactions ofcytoskeletal components. J. Cell Biol. 90:222.
Schulze, E., and M. Kirschner. 1986. Microtubule dynamics in interphasecells. J. Cell Biol. 102:1020.
Seeds, N.W., A.G. Gilman, T. Amano, and M.W. Nirenberg. 1970.Regulation of axon formation by clonal lines of a neural tumor.PNAS 66:160.
Selden S.C., and T.D. Pollard. 1983. Phosphorylation of microtubule-associated proteins regulates their interaction with actin filaments.J. Biol. Chem. 258:7064.
Shpetner, H.S., and R.B. Vallee. 1989. Identification of dynamin, a novelmechanochemical enzyme that mediates interactions betweenmicrotubules. Cell 59:421.
Sloboda, R.D., S.A. Rudolph, J.L. Rosenbaum, and P. Greengard. 1975.Cyclic AMP-dependent endogenous phosphorylation of amicrotubule-associated protein. PNAS 72:171.
273
Sloboda, R.D., W.L. Dentler, and J.L. Rosenbaum. 1976. Microtubule-associated proteins and the stimulation of tubulin assembly invitro. Biochemistry 15:4497.
Sloboda, R.D., and K. Dickersin. 1980. Structure and composition of thecytoskeleton of nucleated erythrocytes I. The presence of MAP2 inthe marginal band. J. Cell Biol. 87:170.
Small, J.V. 1969. Studies on erythropoietic cells in the chick embryo.Ph.D. Thesis. University of London.
Small, J.V., and H.G. Davies. 1972. Erythropoiesis in the yolk sac of theearly chick embryo: an electron microscope andmicrospectrophotometric study. Tissue and Cell 4:341.
Solomon, F., M. Magendantz, and A. Salzman. 1979. Identification withcellular microtubules of one of the co-assembling microtubule-associated proteins. Cell 18:431.
Solomon, F. 1979. Detailed neurite morphologies of sister neuroblastomacells are related. Cell 16:165.
Solomon, F. 1980. Neuroblastoma cells recapitulate their detailed neuritemorphologies after reversible microtubule disassembly. Cell21:333.
Solomon, F. 1981. Specification of cell morphology by endogenousdeterminants. J. Cell Biol. 90:547.
Solomon, F., and M. Magendantz. 1981. Cytochalasin separatesmicrotubule disassembly from loss of asymmetric morphology. J.Cell Biol. 89:157.
Solomon, F. 1988. Determinants of microtubule organization indifferentiated cells: the axon and the marginal band. In: IntrinsicDeterminants of Neuronal Form and Function, pp.361-370. M.M.Black, eds. Alan R. Liss, Inc., New York.
Spooner, B.S. and N.K. Wessels. 1972. An analysis of salivary glandmorphogenesis: Role of cytoplasmic microfilaments andmicrotubules. Dev. Biol. 27:38.
Starger, J.M., W.E. Brown, A.E. Goldman, and R.D. Goldman. 1978.Biochemical and immunological analysis of rapidly purified 10-nm
274
filaments from baby hamster kidney (BHK-2 1) cells. J. Cell Biol.78:93.
Stetzkowski-Marden, F., C. Deprette, and R. Cassoly. 1991. Identificationof tubulin-binding proteins of the chicken erythrocyte plasmamembrane skeleton which co-localize with the microtubularmarginal band. Eur. J. Cell Biol. 54:102.
Stewart, M. 1993. Intermediate filament structure and assembly. Curr.Opin. Cell Biol. 5:3.
Stone, K. L., J. I. Elliott, G. Peterson, W. McMurray, and K. R. Williams.1990. Reversed-phase high-performance liquid chromatography forfractionation of enzymatic digests and chemical cleavage productsof proteins. Methods in Enzymology 193: 389-412.
Stossel, Thomas P. 1993. On the crawling of animal cells. Science 260:1086-1094.
Strome, S. 1993. Determination of cleavage planes. Cell 72:3.
Swan, J. A., and F. Solomon. 1984. Reformation of the marginal band ofavian erythrocytes in vitro using calf-brain tubulin: peripheraldeterminants of microtubule form. J. Cell Biol. 99: 2108-2113.
Swan, J.A. 1985. Organization of the marginal band of avianerythrocytes. Ph.D. Thesis, M.I.T.
Tam, J. P. 1988. Synthetic peptide vaccine design: Synthesis andproperties of a high-density multiple antigenic peptide system.Proc. Natl. Acad. Sci. USA 85: 5409-5413.
Tanaka, E.M., and M.W. Kirschner. 1991. Microtubule behavior in thegrowth cones of living neurons during axon elongation. J. CellBiol. 115:345.
Tilney, L.G., S. Hatano, H. Ishikawa, and M.S. Mooseker. 1973. Thepolymerization of actin: its role in the generation of the acrosomalprocess of certain echinoderm sperm. J. Cell Biol. 59:109.
Trinczek, B., A. Marx, E.-M. Mandelkow, D.B. Murphy, and E.Mandelkow. 1993. Dynamics of microtubules from erythrocytemarginal bands. Mol. Biol. Cell 4:323.
275
Trofatter, J. A., M. M. MacCollin, J. L. Rutter, J. R. Murrell, M. P. Duyao,D. M. Parry, R. Eldridge, N. Kley, A. G. Menon, K. Pulaski, V. H.Haase, C. M. Ambrose, D. Munroe, C. Bove, J. L. Haines, R. L.Martuza, M. E. MacDonald, B. R. Seizinger, M. P. Short, A. J.Buckler, and J. F. Gusella. 1993. A novel moesin-, ezrin-, radixin-like gene is a candidate for the neurofibromatosis 2 tumorsuppressor. Cell 72: 791-800.
Tsukita, S., Y. Hieda, and S. Tsukita. 1989. A new 82-kD barbed end-capping protein (radixin) localized in the cell-to-cell adherensjunction: Purification and characterization. J. Cell Biol. 108: 2369-2382.
Tucker, R. P. 1990. The roles of microtubule-associated proteins in brainmorphogenesis: a review. Brain Res Brain Res Rev 15: 101-20.
Turunen, O., R. Winqvist, R. Pakkanen, K.-H. Grzeschik, T. Wahlstrom,and A. Vaheri. 1989. Cytovillin, a microvillar Mr 75,000 protein:cDNA sequence, prokaryotic expression, and chromosomallocalization. J. Biol. Chem. 264: 16727-16732.
Vale, R.D. 1991. Severing of stable microtubules by a mitoticallyactivated protein in Xenopus egg extracts. Cell 64:827.
Vassar, R., P.A. Coulombe, L. Degenstein, K. Albers, and E. Fuchs. 1991.Mutant keratin expression in transgenic mice causes markedabnormalities resembling a human genetic skin disease. Cell64:365.
Wegner, A. 1976. Head to tail polymerization of actin. Mol Biol. 108:139.
Weingarten, M.D., A.H. Lockwood, S.Y. Hwo, and M.W. Kirschner. 1975.A protein factor essential for microtubule assembly. PNAS72:1858.
Weisenberg, R. 1972. Microtubule formation in vitro in solutionscontaining low calcium concentration. Science 177:1104.
Weiss, P. 1958. Cell contact. Int. Rev. Cytol. 7:391.
Weisshaar, B., T. Doll, and A. Matus. 1992. Reorganization of themicrotubule cytoskeleton by embryonic MAP2 (MAP2C). Dev.116:1151.
276
Wiche, G. 1989. High-Mr microtubule associated proteins: properties andfunctions. Biochem. J. 259:1.
Wiche, G., C. Oberkanins, and A. Himmler. 1991. Molecular structureand function of microtubule-associated proteins. Int. Rev. Cytol.124: 217-273.
Winckler, B., and F. Solomon. 1991. A role for microtubule bundles inthe morphogenesis of chicken erythrocytes. Proc. Natl. Acad. Sci.USA 88: 6033-6037
Witke, W., M. Schleicher, and A.A. Noegel. 1992. Redundancy in themicrofilament system: abnormal development of Dictyosteliumcells lacking two F-actin crosslinking proteins. Cell 68:53.
Young, R. A., and R. W. Davis. 1985. Immunoscreening .gtllrecombinant DNA expression libraries. In Genetic Engineering:Principles and Methods. Edited by J. K. Setlow and A. Hollaender.pp. 29-41. Plenum.
Yu, W., V. E. Centonze, F.J. Ahmad, and P.W. Baas. 1993. Microtubulenucleation and release from the neuronal centrosome. J. Cell Biol.122:349.
277