2nd progress report - climate technology centre & network
TRANSCRIPT
1 How Supply chain works and at what points the greatest amounts of wood waste is generated.
www.eclimateadvisory.com
2nd Progress Report
Presented to: CTCN
Author: Climate and Energy (C&E) Advisory Ltd & S2 Services
Date: 28/08/2020
Version: Output D2.1: A report with the collected information that
explains how supply chains work and at what points the greatest amount of
wood waste is generated (ENG).
Technical Assistance for a Study on Forest Biomass Energy Conversion
Second Progress Delivery Report Output D 2.1
A report with the collected information that explains how supply chains work and at what points the greatest
amount of wood waste is generated
www.eclimateadvisory.com Citadel of Resilience and Sustainability
2 How Supply chain works and at what points the greatest amounts of wood waste is generated.
Table of Contents
1.0 INTRODUCTION ................................................................................................................................. 14
1.1 OBJECTIVES AND SCOPE OF THE STUDY ..................................................................................................... 14 1.2 TECHNICAL APPROACH AND METHODOLOGY .............................................................................................. 16
2.0 OVERVIEW OF THE FOREST AND ENERGY SECTOR IN AFRICA ............................................................. 18
2.1 AN OVERVIEW OF THE FOREST SECTOR IN AFRICA ......................................................................................... 18 2.1.1 Economic importance of Africa’s forest and role in climate change mitigation .......................... 18 2.1.2 Deforestation and forest degradation in Africa ......................................................................... 19 2.1.3 Rate of Plantation Establishment in Africa ................................................................................ 21
2.2 AN OVERVIEW OF THE ENERGY SECTOR IN AFRICA ........................................................................................ 22 2.2.1 Forests – Energy – Climate Nexus ............................................................................................. 27 2.2.2 Importance of the Bio-energy Sub Sector in Africa .................................................................... 30 2.2.3 Bio-energy needs and potential ................................................................................................ 31 2.2.4 Bio- energy development: drivers and barriers.......................................................................... 32 2.2.5 Gender dynamics in the bioenergy sub sector ........................................................................... 34 2.2.6 Bioenergy and sustainable development goals ......................................................................... 36
3.0 OVERVIEW OF TARGETED REGIONS AND COUNTRIES ........................................................................ 37
3.1 STATUS OF BIOENERGY AND REGIONAL PERSPECTIVE ..................................................................................... 38 3.1.1 Central Africa........................................................................................................................... 38 3.1.2 West Africa .............................................................................................................................. 45
3.1.2.1 General ..............................................................................................................................................45 3.1.3 Eastern Africa - Burundi and Djibouti........................................................................................ 53
4.0 FOREST BIOMASS RESIDUES: KEY PLAYERS AND SOURCES OF RESIDUES ............................................ 57
4.1 CENTRAL AFRICA ................................................................................................................................. 57 4.1.1 Forest value chain in Central Africa .......................................................................................... 57
4.1.1.1 Key players involved in forest biomass management ...........................................................................58 4.1.1.2 Forest biomass harvesters...................................................................................................................59 4.1.1.3 Large forest owners/producers ...........................................................................................................59 4.1.1.4 Transporters or logistical operators .....................................................................................................60 4.1.1.5 Merchants ..........................................................................................................................................60
4.1.2 Mapping of forest value chains in Central Africa target countries ............................................. 61 4.1.2.1. Case of the Democratic Republic of Congo (DRC) .................................................................. 62
4.1.2.1.1 Forest resources in DRC .................................................................................................................62 4.1.2.1.2 Forest value chain in DRC...............................................................................................................63 4.1.2.1.3 Players involved in the forest value chain in the DRC ......................................................................64
4.1.2.2. Case of Cameroon ................................................................................................................ 68 4.1.2.2.1 Forest resources in Cameroon .......................................................................................................68 4.1.2.2.2 Sources and types of forest biomass residue in Cameroon ..............................................................78 4.1.2.2.3 Availability of forest biomass residue and conclusion .....................................................................79
4.1.2.3. Case of Congo ...................................................................................................................... 79 4.1.2.3.1 Forest resources in Congo..............................................................................................................79 4.1.2.3.2 Forest value chain in Congo ...........................................................................................................80 4.1.2.3.3 The players involved in the forestry chain of the Republic of Congo ................................................81
4.1.2.4. Case of Gabon...................................................................................................................... 89 4.1.2.4.1 Forest resources in Gabon .............................................................................................................89 4.1.2.4.2 Forest value chain in Gabon ...........................................................................................................90 4.1.2.4.3 The players involved in Gabon's forestry chain ...............................................................................92
4.1.2.5. Case of Equatorial Guinea .................................................................................................... 99 4.1.2.5.1 Forest resources in Equatorial Guinea ............................................................................................99
3 How Supply chain works and at what points the greatest amounts of wood waste is generated.
4.1.2.5.2 Players involved in the forestry chain in Equatorial Guinea ........................................................... 100 4.1.2.5.3 Actors involved in the extraction of forest resources .................................................................... 101 4.1.2.5.4 Actors in primary and secondary transformations of forest resources ........................................... 102 4.1.2.5.5 Transporters / logistic operators .................................................................................................. 102
4.1.2.6. Case of the Central African Republic (CAR) .......................................................................... 104 4.1.2.6.1 Forest resources in Central African Republic................................................................................. 104 4.1.2.6.2 Forest value chain in Central African Republic .............................................................................. 105 4.1.2.6.3 The players involved in the CAR forestry chain ............................................................................. 105 4.1.2.6.4 Transporters / logistic operators .................................................................................................. 109 4.1.2.6.5 Merchant and consumers ............................................................................................................ 110 4.1.2.6.6 Sources and types of forest biomass residue in Central Africa Republic ......................................... 110
4.1.2.7. Case of the Republic of Chad .............................................................................................. 111 4.1.2.7.1 Forest resources in Chad.............................................................................................................. 111 4.1.2.7.2 Forest value chain in Chad ........................................................................................................... 113 4.1.2.7.3 The players involved in Chad's forest value chain ......................................................................... 113
4.2 WEST AFRICA REGION ......................................................................................................................... 116 4.2.1 Forest value chain in West Africa ........................................................................................... 116 4.2.2 Key players involved in forest biomass management .............................................................. 117 4.2.3 Mapping of forest value chains in West Africa target countries .............................................. 119 4.2.3.1. Case of Benin ..................................................................................................................... 120
4.2.3.1.1 Forest resources in Benin............................................................................................................. 120 4.2.3.1.2 Players involved in Benin forest value chain ................................................................................. 127 4.2.3.1.3 Actors involved in exploitation and harvesting ............................................................................. 128 4.2.3.1.4 Actors in wood energy harvesting and processing ........................................................................ 130 4.2.3.1.5 Actors involved in timber harvesting and processing .................................................................... 131 4.2.3.1.6 Actors involved in transport of wood energy and timber .............................................................. 131 4.2.3.1.7 Actors involved in marketing of wood products ............................................................................ 131 4.2.3.1.8 Actors involved in wood consumption.......................................................................................... 134 4.2.3.1.9 Summary of key actors ................................................................................................................ 134 4.2.3.1.10 Sources and types of forest biomass residue in Benin ................................................................. 135 4.2.3.1.11 Estimated amount of cashew waste available in Benin ............................................................... 139 4.2.3.1.12 Shea butter chain ...................................................................................................................... 140 4.2.3.1.13 General Conclusion .................................................................................................................... 141
4.2.3.2. Case of Burkina Faso .......................................................................................................... 142 4.2.3.2.1 Forest resources in Burkina Faso .................................................................................................. 142 4.2.3.2.2 Wood energy supply/demand ...................................................................................................... 143 4.2.3.2.3 Forest value chain in Burkina Faso ............................................................................................... 144
4.2.3.3. Case of Côte d'Ivoire........................................................................................................... 156 4.2.3.3.1 Forest resources in Cote d’vore.................................................................................................... 156 4.2.3.3.2 Forest value chain in Cote d’vore ................................................................................................. 161 4.2.3.3.3 Players involved in Cote d’vore forest value chain ........................................................................ 164 4.2.3.3.4 Sources and types of forest biomass residues in Cote d’vore ........................................................ 169 4.2.3.3.5 Conclusion on the availability of forest biomass residues .............................................................. 172
4.2.3.4. Case of Mali ....................................................................................................................... 173 4.2.3.4.1 Forest resources in Mali............................................................................................................... 173 4.2.3.4.2 Actors in primary and secondary transformation .......................................................................... 180 4.2.3.4.3 Sources and types of forest biomass in Mali ................................................................................. 183 4.2.3.4.4 Sources and types of forest biomass residue in Mali ..................................................................... 185
4.2.3.5. Case of Senegal .................................................................................................................. 188 4.2.3.5.1 Forest resources in Senegal ......................................................................................................... 188 4.2.3.5.2 Analysis of wood energy supply and demand ............................................................................... 188 4.2.3.5.3 Forest Value chain in Senegal....................................................................................................... 190 4.2.3.5.4 Players involved in Senegal forest value chain .............................................................................. 191 4.2.3.5.5 Sources and types of forest biomass in Senegal ............................................................................ 193
4.2.3.6. Case of Togo ...................................................................................................................... 194 4.2.3.6.1 Forest resources in Republic of Togo ............................................................................................ 194
4 How Supply chain works and at what points the greatest amounts of wood waste is generated.
4.2.3.6.2 Wood energy supply and demand ................................................................................................ 195 4.2.3.6.3 Wood energy supply basins ......................................................................................................... 197 4.2.3.6.4 Forest species exploited for wood energy .................................................................................... 200 4.2.3.6.5 Players involved in Togo forest value chain .................................................................................. 201 4.2.3.6.6 Main sources and types of forest biomass residues in Togo .......................................................... 205
4.3 EASTERN AFRICA ............................................................................................................................... 211 4.3.1 Forest value chain in Eastern Africa countries ......................................................................... 211 4.3.2 Key players involved in forest biomass management .............................................................. 212 4.3.3 Mapping of forest value chains in Eastern Africa target countries ........................................... 212 4.3.3.1. The case of the Republic of Burundi .................................................................................... 212
4.3.3.1.1 Forest resources in Burundi ......................................................................................................... 212 4.3.3.1.2 Forest value chain in Burundi ....................................................................................................... 215
4.3.3.2 The players involved in Burundi's forest value chain .......................................................................... 216 4.3.3.2.1 Forest management and conservation actors ............................................................................... 216 4.3.3.2.2 Transporters and logistics players ................................................................................................ 216 4.3.3.2.3 Actors in primary and secondary transformation .......................................................................... 217 4.3.3.2.4 Consumers .................................................................................................................................. 217 4.3.3.2.5 Sources and types of forest biomass resides in Burundi ................................................................ 217 4.3.3.2.6 Conclusion .................................................................................................................................. 224
4.3.3.2. The case of Djibouti............................................................................................................ 224 4.3.3.2.1. Forest resources in Djibouti ................................................................................................ 224 4.3.3.2.2. Forest value chain in Djibouti ............................................................................................. 227
4.3.3.3 The players involved in Djibouti's forest value chain .......................................................................... 227 4.3.3.3.1 Forest management actors .......................................................................................................... 227 4.3.3.3.2 Other actors ................................................................................................................................ 227 4.3.3.3.3 Sources and types of forest biomass in Djibouti ............................................................................ 228 4.3.3.3.4 Conclusion .................................................................................................................................. 229
REFERENCES ................................................................................................................................................. 229
4.3.4 Annexes ................................................................................................................................. 239
5 How Supply chain works and at what points the greatest amounts of wood waste is generated.
List of Figures
Figure 1: Annual forest area net change, by decade and region, 1990-2020 Source: FAO, 2020 ...................... 20
Figure 2: Total primary energy demand for energy sources in Africa Source: (IEA, 2010) ................................ 23
Figure 3: Proportion of roundwood used as fuel in different regions and across countries ............................... 24
Figure 4: Annual incremental increases in electrification and population, 2016-2018, by region ...................... 25
Figure 5: Regional populations, by rate of access to clean cooking fuels and technologies, 2018...................... 26
Figure 6: Top 20 access deficit countries, 2014-2018 ....................................................................................... 26
Figure 7: Change in forest biomass carbon stock, by region and sub-region, 1990-2020 Source: FAO, 2020 .... 29
Figure 8: Percentage of households that rely on woodfuel for cooking globally ............................................... 31
Figure 9: The charts show the shares of bioenergy in the TPES * ..................................................................... 32
Figure 10: Central Africa Map ......................................................................................................................... 38
Figure 11: Final energy consumption in 2017 in the six West African Countries of the study ............................ 47
Figure 12: Proportion of traditional biomass in total final energy consumption in 2010 in ECOWAS countries . 47
Figure 13: Installed capacity of grid-connected renewables in West Africa ...................................................... 53
Figure 14:Map of Eastern Africa countries ...................................................................................................... 53
Figure 15: Forest value chain in Central Africa Source: (Bakouma, 2017) ....................................................... 58
Figure 16: Main products from the mining industry in the Congo basin ........................................................... 61
Figure 17: Forest value chain in DRC ............................................................................................................... 64
Figure 18: Forestry value chain in Cameroon Source: (Bakouma, 2017) ........................................................... 70
Figure 19: A logging chain in Cameroon Source: (MINFOF, 2012)..................................................................... 73
Figure 20: Production chain of artisanal lumber Source: (HiolHiol, 2019) ....................................................... 74
Figure 21: Value chain of forest of the Congo Republic Source: (Bakouma, 2017) ........................................... 81
Figure 22: Logging chain of the Republic of Congo Source: (Am, 2019) ......................................................... 87
Figure 23: Gabon's forest value chain ............................................................................................................. 91
Figure 24: Gabon's fuelwood value chain ........................................................................................................ 91
Figure 25: Loggin in Gabon ............................................................................................................................. 94
Figure 26: Activities and products of the processing industries Source: (Madingou, Mabiala, & Nziengui, 2019)
...................................................................................................................................................................... 98
Figure 27: Typical forest and wood products further processing value and supply chain ................................ 116
Figure 28: Land use map of Benin, years 1975 and 2000 ............................................................................... 121
Figure 29: Land use map of Benin from 1995-2006 ....................................................................................... 122
Figure 30: Flow of wood fuel to urban centres of Benin ................................................................................ 124
Figure 31: Abomey-Bohicon supply basin ...................................................................................................... 124
Figure 32: Malanville supply basin ................................................................................................................ 125
6 How Supply chain works and at what points the greatest amounts of wood waste is generated.
Figure 33: Djogou supply basin ..................................................................................................................... 125
Figure 34: Parakou supply basin .................................................................................................................... 125
Figure 35: Lokossa supply basin .................................................................................................................... 126
Figure 36: Natitingou supply basin ................................................................................................................ 126
Figure 37: Cotonou-Porto-Novo supply basin ................................................................................................ 127
Figure 38: Cotonou supply basins ................................................................................................................. 127
Figure 39: Diagram of stakeholders in the wood energy sector...................................................................... 132
Figure 40: Sale of tam-tams in Bohicon (Benin) ............................................................................................ 134
Figure 41: Woodcarved armchairs by DanielliaOliveri in the Commune of Zagnando in Central Benin ............ 134
Figure 42: Mortar and pestle seller in Benin .................................................................................................. 134
Figure 43: Cashew nut production areas in Benin .......................................................................................... 139
Figure 44: Land use in 2000 .......................................................................................................................... 143
Figure 45: Location of carbonization sites ..................................................................................................... 145
Figure 46: Different service woods in a construction site in Bobo-Dioulasso .................................................. 146
Figure 47: Loading a truck with firewood at the village of Nimnilaye, in the Silly-Pouni-Zawara logging site ... 147
Figure 48: A truck loaded with 30 steres of wood in the Silly-Pouni-Zawara logging yared in Nimnilaye ......... 147
Figure 49: A tricycle carrying wood towards Bobo ......................................................................................... 147
Figure 50: A wholesale carrier from the Silly-Pouni-Zawara yard ................................................................... 147
Figure 51: Cashew Production regions .......................................................................................................... 152
Figure 52: Annual cashew production (in tonnes) between 2012 and 2020 ................................................... 152
Figure 53: Regional map of almond production in 2012................................................................................. 154
Figure 54: Location of parks and reserves (left) and classified forests (right) in Côte d'Ivoire ......................... 157
Figure 55: Exploited species .......................................................................................................................... 158
Figure 56: Location of PIF zones .................................................................................................................... 159
Figure 57: Issues related to wood energy ...................................................................................................... 160
Figure 58: Main sectors of plantation timber and the place of tropical timber operators ............................... 161
Figure 59: Overall value chain for timber and service operations ................................................................... 162
Figure 60: Charcoal value chain .................................................................................................................... 163
Figure 61: Firewood value chain ................................................................................................................... 163
Figure 62: Agroecological zones in Côte d'Ivoire ((Country Pasture/drilling Resource Profiles-Cote d'Ivoire) .. 171
Figure 63: Summary of the potential annual amount of wood residues available for bioenergy purposes in Côte
d'Ivoire ......................................................................................................................................................... 173
Figure 64: Evolution of the wood energy production/sampling balance in the supply basin of Sègou City ...... 175
Figure 65: Projected demand for wood energy in Bamako City supply basin 1998-2025(in tons/year)............ 176
Figure 66: Timber value chain in Mali............................................................................................................ 177
Figure 67: Charcoal value chain .................................................................................................................... 178
7 How Supply chain works and at what points the greatest amounts of wood waste is generated.
Figure 68: Firewood value chain ................................................................................................................... 179
Figure 69: Evolution of the harvested area and production of shea nuts in Mali from 2010 to 2017 ............... 186
Figure 70: Sources of wood energy production ............................................................................................. 190
Figure 71: Organization of the charcoal industry ........................................................................................... 191
Figure 72: Land use map of Togo in 2017 ...................................................................................................... 195
Figure 73: Location of the main exploitation basins. Savannah region ........................................................... 198
Figure 74: Location of the main exploitation basins, Kara region ................................................................... 198
Figure 75: Location of the main operating basins, Central region................................................................... 199
Figure 76: Location of the main operating basins, Plateau region .................................................................. 199
Figure 77: Location of the main operating basins, Maritime region ............................................................... 200
Figure 78: Location map of the main wood energy flows, 2017 ..................................................................... 200
Figure 79: Landscape of wood energy stakeholders inTogo ........................................................................... 201
Figure 80: Overview of agro-ecological zones for cashew nut cultivation in Togo........................................... 208
Figure 81: Number of cashew producers and production volume 2013/2014 ................................................ 208
Figure 82: Production flow in the forest value chain ...................................................................................... 212
Figure 83: Landcover in Burundi ................................................................................................................... 213
Figure 84: Landcover map of Djibouti ........................................................................................................... 226
List of Tables
Table 1: Project impacts, co-benefits, and contribution to INDCs and SDGs ..................................................... 15
Table 2: Forest area, by region and sub-region, 1990-2020 ............................................................................. 18
Table 3: Deforestation rate, by region and subregion, for four periods spanning 1990-2020 ............................ 20
Table 4: Area of planted forest, by region and subregion, 1990-2020 .............................................................. 21
Table 5: Annual change in the area of planted forest, by region and sub-region, 1990-2020 ............................ 22
Table 6: Forest carbon stock in carbon pools, by region and sub-region, 2020 ................................................. 28
Table 7: Statistical Factsheet for Africa, 2020 .................................................................................................. 30
Table 8: Forest cover extent of target countries: 1990-2020............................................................................ 37
Table 9: Baseline data for the wood energy sector in Central Africa ................................................................ 38
Table 10: Energy resources mix potential in Central African Countries............................................................. 41
Table 11: General data for target countries in Central Africa ........................................................................... 43
Table 12: Energy indicators 2018 .................................................................................................................... 49
Table 13: Percentage of rrenewables in total final energy consumption (2010) .............................................. 51
Table 14: Installed renewable energy capacity (grid-connected) of ECOWAS Member States in 2014 .............. 52
Table 15: General data for Burundi and Djibouti ............................................................................................. 55
8 How Supply chain works and at what points the greatest amounts of wood waste is generated.
Table 16: Sources of forest biomass in DR Congo ............................................................................................ 67
Table 17: Forest operators and administrative location ................................................................................... 75
Table 18: Geographical distribution of UTB ..................................................................................................... 77
Table 19: Sources of forest biomass in Cameroon ........................................................................................... 78
Table 20: Forest concession holders ............................................................................................................... 83
Table 21: Primary and secondary transformation industries ............................................................................ 84
Table 22: List of selected craftsmen ................................................................................................................ 85
Table 23: Selected transporters ...................................................................................................................... 86
Table 24 : Sources of forest biomass in Congo................................................................................................. 88
Table 25: Gabon's forest resource management actors ................................................................................... 92
Table 26: Gabon's logging industry ................................................................................................................. 95
Table 27: Key actors at provinces .................................................................................................................... 97
Table 28: Sources of forest biomass in Gabon ................................................................................................. 99
Table 29: List of forest companies ................................................................................................................. 102
Table 30: Wood processing companies in Equatorial Guinea ......................................................................... 102
Table 31: Timber transport companies in Equatorial Guinea ......................................................................... 102
Table 32: Sources of forest biomass in Equatorial Guinea .............................................................................. 103
Table 33: Breakdown of the various operating titles for the year 2018 .......................................................... 108
Table 34: Wood processing industries in Central African Republic ................................................................. 109
Table 35: Sources of forest biomass in Central Africa Republic ...................................................................... 111
Table 36: Sources of forest biomass in Republic of Chad ............................................................................... 115
Table 37: Forest cover in Benin ..................................................................................................................... 121
Table 38: Wood energy supply in Benin ........................................................................................................ 122
Table 39: Forest productivity assumptions for Benin .................................................................................... 123
Table 40: Statistics on the issuance of licences in 2014, 2015 and 2017 ......................................................... 129
Table 41: Main actors in the forest residue value chain ................................................................................. 134
Table 42: Sources of forest biomass residues related to the charcoal sector .................................................. 136
Table 43: Sources of forest biomass residues related to the fuelwood sector ................................................ 136
Table 44: Sources of forest biomass residues relative to the timber sector .................................................... 137
Table 45: Timber exports to Benin (in tonnes) ............................................................................................... 138
Table 46: Evolution of forest area from 1992 to 2020 in Burkina Faso ........................................................... 142
Table 47: Evolution of natural and planted forests in Burkina Faso ................................................................ 143
Table 48: Main actors in the forest residue value chain ................................................................................. 148
Table 49: Sources of forest biomass residues related to the "Charcoal" sector .............................................. 149
Table 50: Source of forest biomass residues related to the "fuelwood" sector ............................................... 149
Table 51: Sources of forest biomass residues related to the "Timber and service" sector............................... 150
9 How Supply chain works and at what points the greatest amounts of wood waste is generated.
Table 52: Population and potential of Vitellaria paradoxa ............................................................................. 154
Table 53: Industrial units processing shea almonds into shea butter in Burkina Faso (2014 capacity estimate)
.................................................................................................................................................................... 155
Table 54: The main species planted by SODEFOR (SODEFOR) ........................................................................ 157
Table 55: Area of compensation plantation between 1996 and 2014 (DCDF) ................................................. 157
Table 56: Wood supply projections (kilotonnes) ........................................................................................... 159
Table 57: Key actors in the wood sector in general ........................................................................................ 164
Table 58: List of approved wood processing units ......................................................................................... 166
Table 59: Sources of forest biomass residues related to the "charcoal" sector ............................................... 169
Table 60:Sources of forest biomass residues related to the "fuelwood" sector .............................................. 169
Table 61: Sources of forest biomass residues related to the "timber and service" sector ............................... 170
Table 62: Availability of logging residues for bioenergy purposes in Côte d'Ivoire (BEFSRA analysis - woodfuel
use) .............................................................................................................................................................. 171
Table 63: Availability of wood processing residues for bioenergy purposes in Côte d'Ivoire ........................... 172
Table 64: Evaluation in the availability of wood processing residues for bioenergy purposes in the Côte d'Ivoire
from 2004 to 2010........................................................................................................................................ 172
Table 65: Administrative categories of forests............................................................................................... 174
Table 66: Summary of the main forest actors in Mali .................................................................................... 181
Table 67: Sources of forest biomass residues related to the charcoal sector .................................................. 183
Table 68: Sources of forest biomass residues related to the "fuelwood" sector ............................................. 183
Table 69: Sources of forest biomass residues related to the "NTFP/Shea butter" sector ................................ 184
Table 70: Evaluation of residues from shea almond processing in Mali .......................................................... 187
Table 71: Breakdown of consumption of different fuels in Senegal's main cities [tonnes] .............................. 189
Table 72: Quantities of timber harvested by number of feet ......................................................................... 192
Table 73: Changes in the quantities of timber allocated and harvested in number of feet ............................. 192
Table 74: Allocated and operated volumes of bamboo stems and crinting boards ......................................... 193
Table 75: Sources of forest biomass residues related to the charcoal sector .................................................. 193
Table 76: Sources of forest biomass residues related to the "fuelwood" sector ............................................. 193
Table 77: Breakdown of area by category and region, 2016 .......................................................................... 194
Table 78: Total wood energy supply in Togo, 2016 ........................................................................................ 196
Table 79: Annual consumption of wood energy by socio-professional categories in Togo, 2017 ..................... 196
Table 80: Region/Prefecture and concern areas ............................................................................................ 199
Table 81: Region/Prefecture and concern areas ............................................................................................ 199
Table 82: Region/Prefecture and concern areas ............................................................................................ 200
Table 83: Sources of forest biomass residues related to the charcoal sector .................................................. 205
Table 84: Sources of forest biomass residues related to the fuelwood sector ................................................ 205
Table 85: Souces of forest biomass residues relative to the timber and service sector ................................... 206
10 How Supply chain works and at what points the greatest amounts of wood waste is generated.
Table 86: Timber exports to Togo (in tonnes) ................................................................................................ 207
Table 87: Landcover in Burundi by aTable 88: Forest biomass sources and generators in State Forest of Gakara-
Gahunirea and percentage ........................................................................................................................... 213
Table 89: Forest biomass sources and generators in State Forest of Gakara-Gahuni ...................................... 218
Table 90: Forest biomass souces from the co-managed afforestation from Magara to Ngozi ......................... 219
Table 91: Forest biomass sources from the co-managed afforestation from Ntaba to Muyinga ..................... 220
Table 92: Forest biomass sources and generators in State Forest of Vyanda-Bururi ....................................... 220
Table 93: Forest biomass sources and generators in State forest of Rugazi .................................................... 222
Table 94: Forest biomass souces and generators from woodlots belonging to institutional organizations and
religious denominations ............................................................................................................................... 223
Table 95: Forest biomass sources and generators from Natural forests ......................................................... 223
Table 96: Size of Djibouti's forests ................................................................................................................ 227
Table 97: The main Prosopis vegetated areas by areal coverage and percentage ........................................... 228
Table 98: Potential yield of Prosopis as Biomass and Harvested Wood fuel ................................................... 228
Table 99: Potential supply of Prosopis by site ................................................................................................ 229
11 How Supply chain works and at what points the greatest amounts of wood waste is generated.
List of Abbreviations
ABO Association Burundaise pour la Protection des Oiseaux
ACVE Action Ceinture Verte pour l’Environnement
ADICN Association pour le Développement Intégré et la Conservation de la Nature
AFD African Development Bank
AFEB Association of Women for the Environment in Burundi
ANCPA National Association of Cashew Producers and Cooperatives
APEX Promotion Agency of Exports of Burkina Faso
APFG Association for the Promotion of Women of Gaoua
APFG Association for the Promotion of Women of Gaoua
APFNL Agency for the Promotion of Non-Timber Forest Products
CARITAS Centre de Médecine Traditionnelle de Buta
CARPE Central African Regional Programme for the Environment
CARPE Central African Regional Programme for the Environment
CBO Community Based Organisations
CERD Centre d'Etude et de Recherche de Djibouti
CFA Compagnie Forestière des Abeilles
CFA Centre de Formation Artisanal
CFA Centre de Formation Artisanal
CIFAT Interprofessional Council of the Cashew Industry of Togo
CNT Cashew Nut Tax
COMIFAC African Forest Commission or Commission des Forêtsd'Afrique Centrale
CSO Civil Society Organizations
CTCN Climate Centre for Technology and Network
ECREEE Center for Renewable Energy and Energy Efficiency
EDD Électricité de Djibouti
FAO Food and Agriculture Organization
FAO Food and Agriculture Organization
12 How Supply chain works and at what points the greatest amounts of wood waste is generated.
FRA Forest Resources Assessment
GDP Gross Development Product
GDP Gross Domestic Product
GIZ German Technical Cooperation
INDC Intended Nationally Determined Contributions
INECN Institut National de l’Environnementet de la Conservation de la Nature
IUCN International Union for Conservation of Nature
IUCN International Union for Conservation of Nature
MEDD Ministry of Environment and Sustainable Development
NGO Non-Governmental Organisation
NIOTO New Oilseed Industries of Togo
OBPE Office Burundais pour la Protection de l’Environnemen
ODEB Organisation de défense de l'environnement au Burundi
ODEF Office for the Development and Exploitation of Timber
PMG Participatory Management Group
ProDRA Program for Rural Development and Agriculture
REDD+ Reducing emissions from deforestation and forest degradation
SDG Sustainable Development GoalsG
SODEFOR Forest Development Corporation
SORAD Regional planning and development corporations
SPGS Sawlog Production Grant Scheme
UGPPK Union of Groups of Producers of Shea Products of Koundougou
UNAPROKA National Union of Shea Producers
UNDP United Nations Development Program
UNEC United Nations Economic Commission
USAID United States Agency for International Development
13 How Supply chain works and at what points the greatest amounts of wood waste is generated.
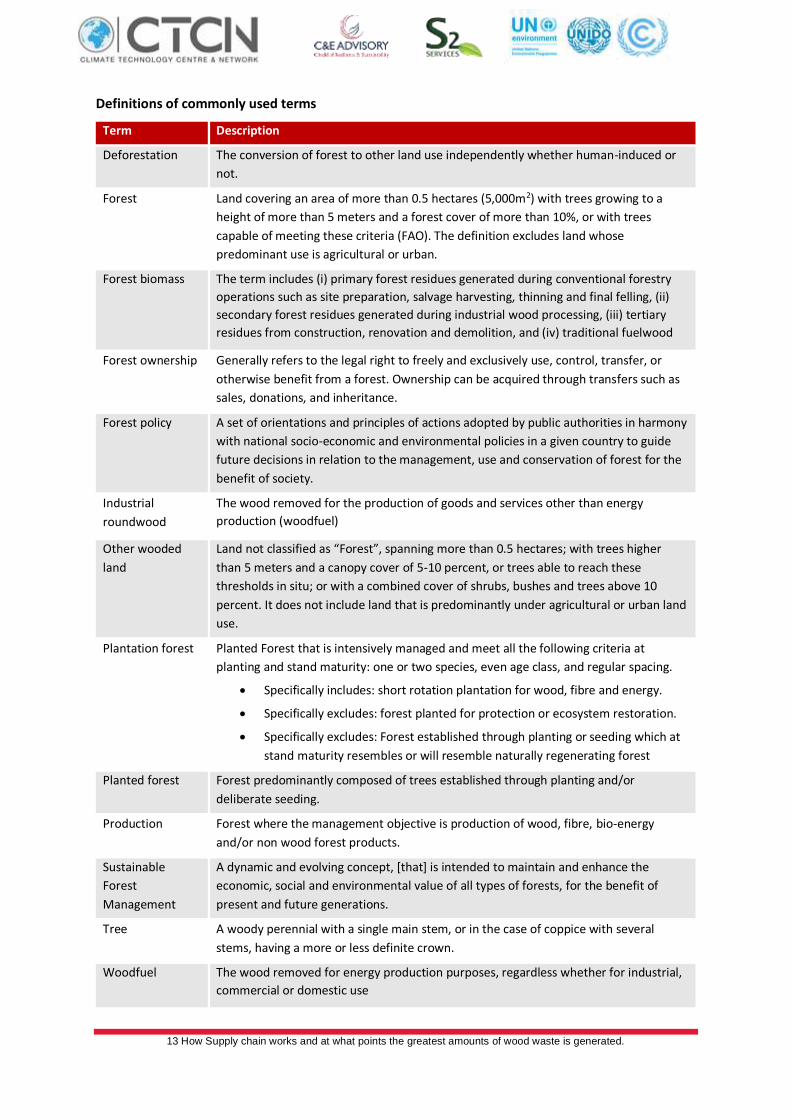
Definitions of commonly used terms
Term Description
Deforestation The conversion of forest to other land use independently whether human-induced or
not.
Forest Land covering an area of more than 0.5 hectares (5,000m2) with trees growing to a
height of more than 5 meters and a forest cover of more than 10%, or with trees
capable of meeting these criteria (FAO). The definition excludes land whose
predominant use is agricultural or urban.
Forest biomass The term includes (i) primary forest residues generated during conventional forestry
operations such as site preparation, salvage harvesting, thinning and final felling, (ii)
secondary forest residues generated during industrial wood processing, (iii) tertiary
residues from construction, renovation and demolition, and (iv) traditional fuelwood
Forest ownership Generally refers to the legal right to freely and exclusively use, control, transfer, or
otherwise benefit from a forest. Ownership can be acquired through transfers such as
sales, donations, and inheritance.
Forest policy A set of orientations and principles of actions adopted by public authorities in harmony
with national socio-economic and environmental policies in a given country to guide
future decisions in relation to the management, use and conservation of forest for the
benefit of society.
Industrial
roundwood
The wood removed for the production of goods and services other than energy
production (woodfuel)
Other wooded
land
Land not classified as “Forest”, spanning more than 0.5 hectares; with trees higher
than 5 meters and a canopy cover of 5-10 percent, or trees able to reach these
thresholds in situ; or with a combined cover of shrubs, bushes and trees above 10
percent. It does not include land that is predominantly under agricultural or urban land
use.
Plantation forest Planted Forest that is intensively managed and meet all the following criteria at
planting and stand maturity: one or two species, even age class, and regular spacing.
• Specifically includes: short rotation plantation for wood, fibre and energy.
• Specifically excludes: forest planted for protection or ecosystem restoration.
• Specifically excludes: Forest established through planting or seeding which at
stand maturity resembles or will resemble naturally regenerating forest
Planted forest Forest predominantly composed of trees established through planting and/or
deliberate seeding.
Production Forest where the management objective is production of wood, fibre, bio-energy
and/or non wood forest products.
Sustainable
Forest
Management
A dynamic and evolving concept, [that] is intended to maintain and enhance the
economic, social and environmental value of all types of forests, for the benefit of
present and future generations.
Tree A woody perennial with a single main stem, or in the case of coppice with several
stems, having a more or less definite crown.
Woodfuel The wood removed for energy production purposes, regardless whether for industrial,
commercial or domestic use
14 How Supply chain works and at what points the greatest amounts of wood waste is generated.
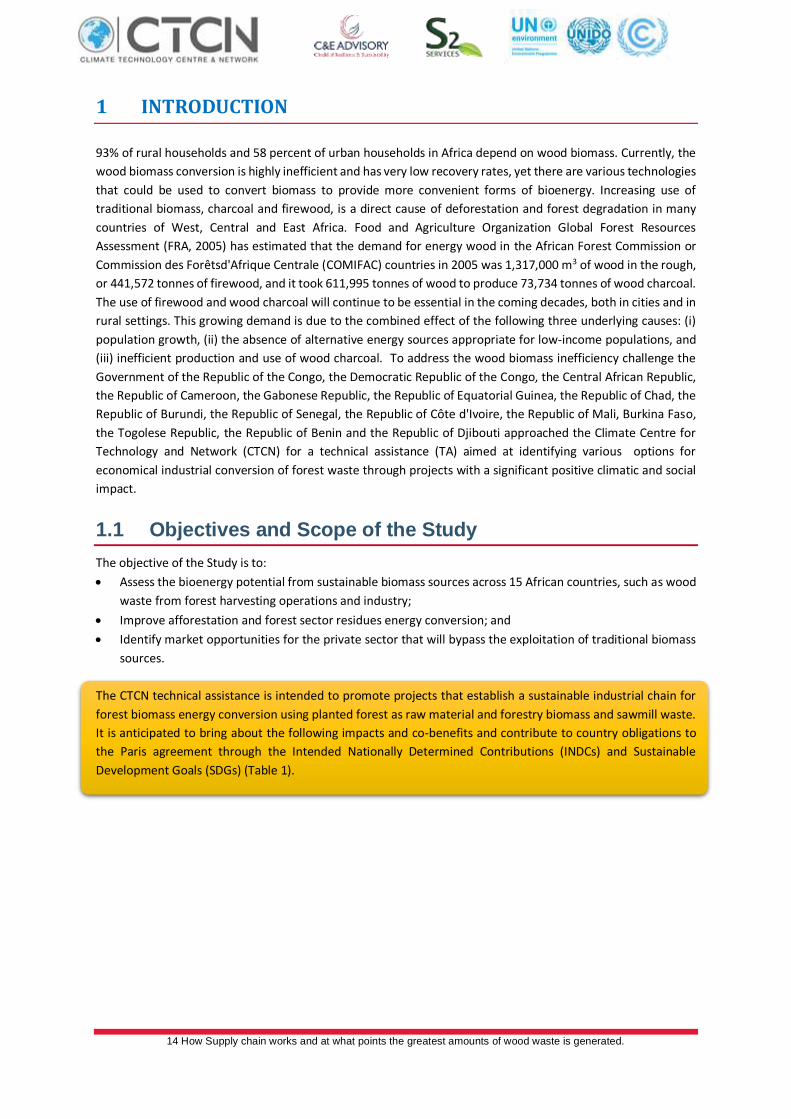
1 INTRODUCTION
93% of rural households and 58 percent of urban households in Africa depend on wood biomass. Currently, the
wood biomass conversion is highly inefficient and has very low recovery rates, yet there are various technologies
that could be used to convert biomass to provide more convenient forms of bioenergy. Increasing use of
traditional biomass, charcoal and firewood, is a direct cause of deforestation and forest degradation in many
countries of West, Central and East Africa. Food and Agriculture Organization Global Forest Resources
Assessment (FRA, 2005) has estimated that the demand for energy wood in the African Forest Commission or
Commission des Forêtsd'Afrique Centrale (COMIFAC) countries in 2005 was 1,317,000 m3 of wood in the rough,
or 441,572 tonnes of firewood, and it took 611,995 tonnes of wood to produce 73,734 tonnes of wood charcoal.
The use of firewood and wood charcoal will continue to be essential in the coming decades, both in cities and in
rural settings. This growing demand is due to the combined effect of the following three underlying causes: (i)
population growth, (ii) the absence of alternative energy sources appropriate for low-income populations, and
(iii) inefficient production and use of wood charcoal. To address the wood biomass inefficiency challenge the
Government of the Republic of the Congo, the Democratic Republic of the Congo, the Central African Republic,
the Republic of Cameroon, the Gabonese Republic, the Republic of Equatorial Guinea, the Republic of Chad, the
Republic of Burundi, the Republic of Senegal, the Republic of Côte d'Ivoire, the Republic of Mali, Burkina Faso,
the Togolese Republic, the Republic of Benin and the Republic of Djibouti approached the Climate Centre for
Technology and Network (CTCN) for a technical assistance (TA) aimed at identifying various options for
economical industrial conversion of forest waste through projects with a significant positive climatic and social
impact.
1.1 Objectives and Scope of the Study
The objective of the Study is to:
• Assess the bioenergy potential from sustainable biomass sources across 15 African countries, such as wood
waste from forest harvesting operations and industry;
• Improve afforestation and forest sector residues energy conversion; and
• Identify market opportunities for the private sector that will bypass the exploitation of traditional biomass
sources.
The CTCN technical assistance is intended to promote projects that establish a sustainable industrial chain for
forest biomass energy conversion using planted forest as raw material and forestry biomass and sawmill waste.
It is anticipated to bring about the following impacts and co-benefits and contribute to country obligations to
the Paris agreement through the Intended Nationally Determined Contributions (INDCs) and Sustainable
Development Goals (SDGs) (Table 1).
15 How Supply chain works and at what points the greatest amounts of wood waste is generated.
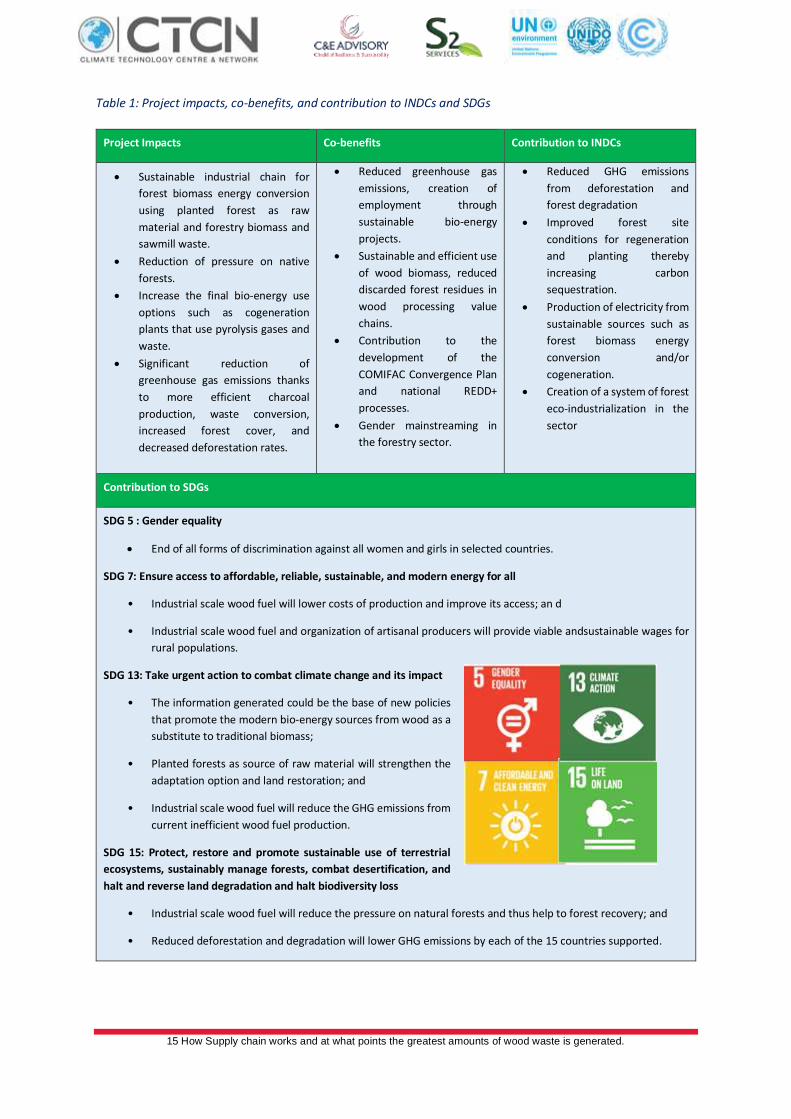
Table 1: Project impacts, co-benefits, and contribution to INDCs and SDGs
Project Impacts Co-benefits Contribution to INDCs
• Sustainable industrial chain for
forest biomass energy conversion
using planted forest as raw
material and forestry biomass and
sawmill waste.
• Reduction of pressure on native
forests.
• Increase the final bio-energy use
options such as cogeneration
plants that use pyrolysis gases and
waste.
• Significant reduction of
greenhouse gas emissions thanks
to more efficient charcoal
production, waste conversion,
increased forest cover, and
decreased deforestation rates.
• Reduced greenhouse gas
emissions, creation of
employment through
sustainable bio-energy
projects.
• Sustainable and efficient use
of wood biomass, reduced
discarded forest residues in
wood processing value
chains.
• Contribution to the
development of the
COMIFAC Convergence Plan
and national REDD+
processes.
• Gender mainstreaming in
the forestry sector.
• Reduced GHG emissions
from deforestation and
forest degradation
• Improved forest site
conditions for regeneration
and planting thereby
increasing carbon
sequestration.
• Production of electricity from
sustainable sources such as
forest biomass energy
conversion and/or
cogeneration.
• Creation of a system of forest
eco-industrialization in the
sector
Contribution to SDGs
SDG 5 : Gender equality
• End of all forms of discrimination against all women and girls in selected countries.
SDG 7: Ensure access to affordable, reliable, sustainable, and modern energy for all
• Industrial scale wood fuel will lower costs of production and improve its access; an d
• Industrial scale wood fuel and organization of artisanal producers will provide viable andsustainable wages for
rural populations.
SDG 13: Take urgent action to combat climate change and its impact
• The information generated could be the base of new policies
that promote the modern bio-energy sources from wood as a
substitute to traditional biomass;
• Planted forests as source of raw material will strengthen the
adaptation option and land restoration; and
• Industrial scale wood fuel will reduce the GHG emissions from
current inefficient wood fuel production.
SDG 15: Protect, restore and promote sustainable use of terrestrial
ecosystems, sustainably manage forests, combat desertification, and
halt and reverse land degradation and halt biodiversity loss
• Industrial scale wood fuel will reduce the pressure on natural forests and thus help to forest recovery; and
• Reduced deforestation and degradation will lower GHG emissions by each of the 15 countries supported.
16 How Supply chain works and at what points the greatest amounts of wood waste is generated.
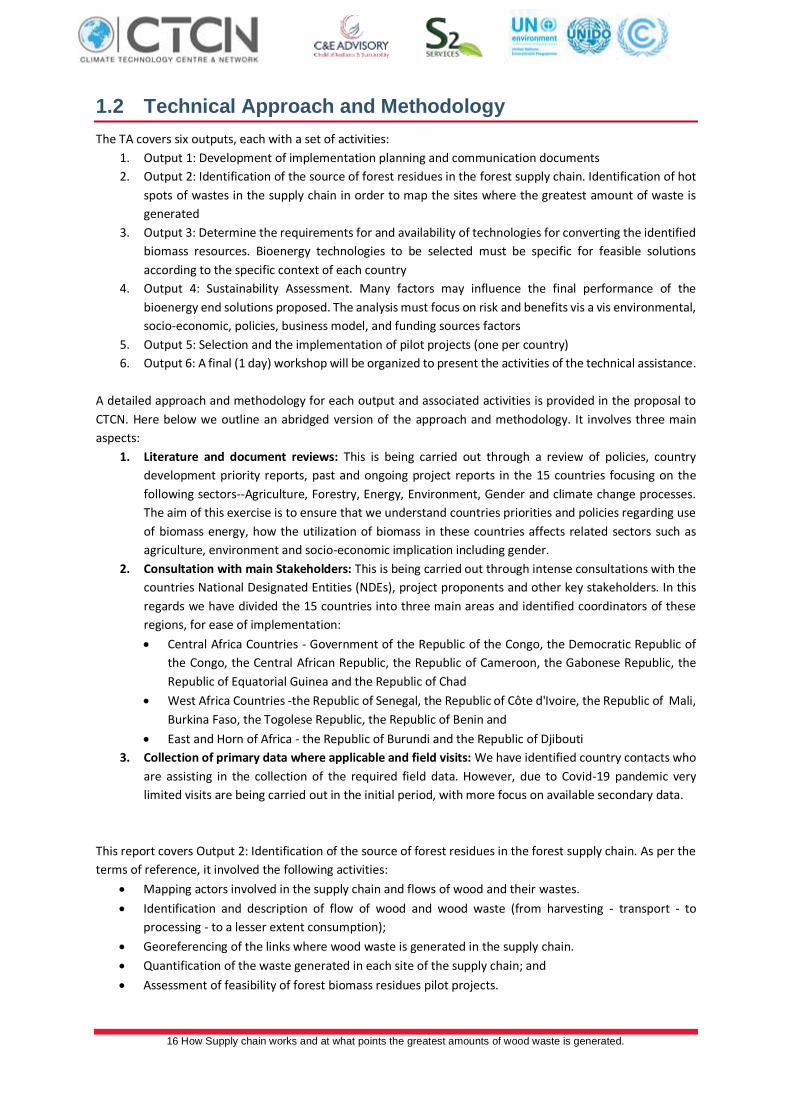
1.2 Technical Approach and Methodology
The TA covers six outputs, each with a set of activities:
1. Output 1: Development of implementation planning and communication documents
2. Output 2: Identification of the source of forest residues in the forest supply chain. Identification of hot
spots of wastes in the supply chain in order to map the sites where the greatest amount of waste is
generated
3. Output 3: Determine the requirements for and availability of technologies for converting the identified
biomass resources. Bioenergy technologies to be selected must be specific for feasible solutions
according to the specific context of each country
4. Output 4: Sustainability Assessment. Many factors may influence the final performance of the
bioenergy end solutions proposed. The analysis must focus on risk and benefits vis a vis environmental,
socio-economic, policies, business model, and funding sources factors
5. Output 5: Selection and the implementation of pilot projects (one per country)
6. Output 6: A final (1 day) workshop will be organized to present the activities of the technical assistance.
A detailed approach and methodology for each output and associated activities is provided in the proposal to
CTCN. Here below we outline an abridged version of the approach and methodology. It involves three main
aspects:
1. Literature and document reviews: This is being carried out through a review of policies, country
development priority reports, past and ongoing project reports in the 15 countries focusing on the
following sectors--Agriculture, Forestry, Energy, Environment, Gender and climate change processes.
The aim of this exercise is to ensure that we understand countries priorities and policies regarding use
of biomass energy, how the utilization of biomass in these countries affects related sectors such as
agriculture, environment and socio-economic implication including gender.
2. Consultation with main Stakeholders: This is being carried out through intense consultations with the
countries National Designated Entities (NDEs), project proponents and other key stakeholders. In this
regards we have divided the 15 countries into three main areas and identified coordinators of these
regions, for ease of implementation:
• Central Africa Countries - Government of the Republic of the Congo, the Democratic Republic of
the Congo, the Central African Republic, the Republic of Cameroon, the Gabonese Republic, the
Republic of Equatorial Guinea and the Republic of Chad
• West Africa Countries -the Republic of Senegal, the Republic of Côte d'Ivoire, the Republic of Mali,
Burkina Faso, the Togolese Republic, the Republic of Benin and
• East and Horn of Africa - the Republic of Burundi and the Republic of Djibouti
3. Collection of primary data where applicable and field visits: We have identified country contacts who
are assisting in the collection of the required field data. However, due to Covid-19 pandemic very
limited visits are being carried out in the initial period, with more focus on available secondary data.
This report covers Output 2: Identification of the source of forest residues in the forest supply chain. As per the
terms of reference, it involved the following activities:
• Mapping actors involved in the supply chain and flows of wood and their wastes.
• Identification and description of flow of wood and wood waste (from harvesting - transport - to
processing - to a lesser extent consumption);
• Georeferencing of the links where wood waste is generated in the supply chain.
• Quantification of the waste generated in each site of the supply chain; and
• Assessment of feasibility of forest biomass residues pilot projects.
17 How Supply chain works and at what points the greatest amounts of wood waste is generated.
In order to map out forest biomass residue sources and users and to quantify forest biomass residues in different
forest areas in each of the 15 countries, three types of forms (presented in Annex 1a, 1b and 1c) were used to
collect information. Using these forms, the following information was collected and analysed: sources and
generators of forest residue biomass, forest biomass residue availability and quantities in target countries and
estimated costs of generating different bioenergy products and biproducts.
18 How Supply chain works and at what points the greatest amounts of wood waste is generated.
2 OVERVIEW OF THE FOREST AND ENERGY SECTOR IN AFRICA
2.1 An overview of the Forest Sector in Africa
2.1.1 Economic importance of Africa’s forest and role in climate change mitigation
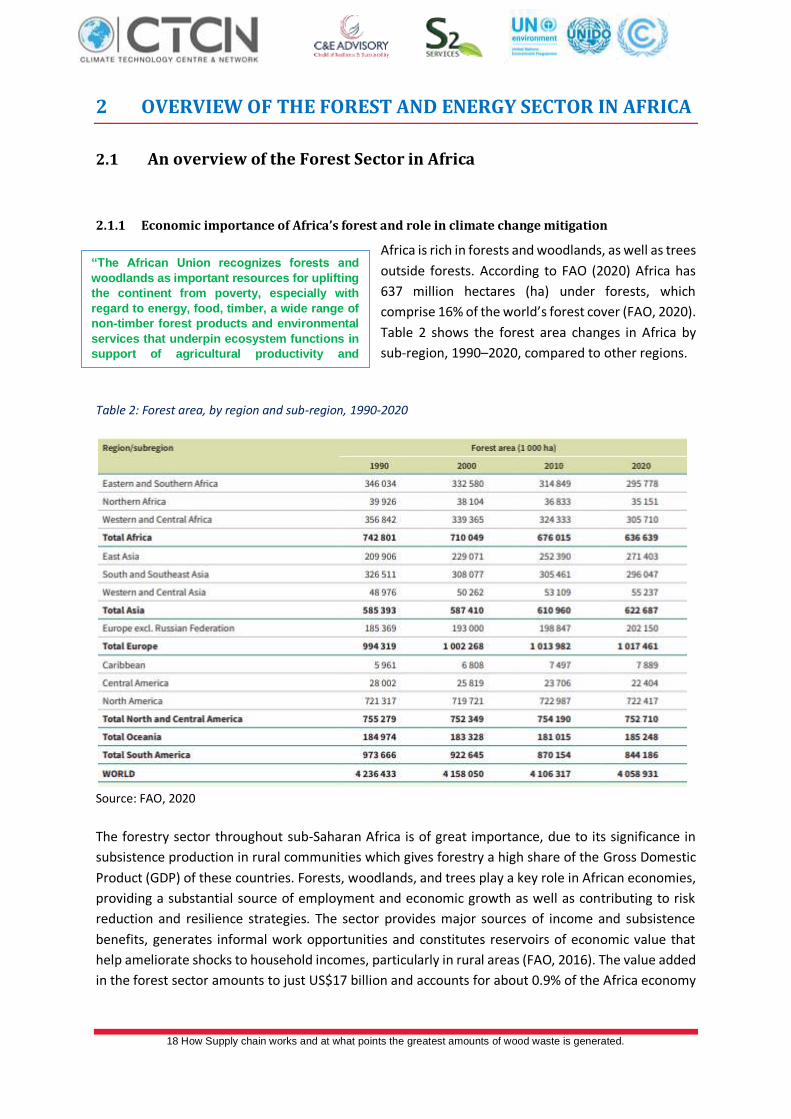
Africa is rich in forests and woodlands, as well as trees
outside forests. According to FAO (2020) Africa has
637 million hectares (ha) under forests, which
comprise 16% of the world’s forest cover (FAO, 2020).
Table 2 shows the forest area changes in Africa by
sub-region, 1990–2020, compared to other regions.
Table 2: Forest area, by region and sub-region, 1990-2020
Source: FAO, 2020
The forestry sector throughout sub-Saharan Africa is of great importance, due to its significance in
subsistence production in rural communities which gives forestry a high share of the Gross Domestic
Product (GDP) of these countries. Forests, woodlands, and trees play a key role in African economies,
providing a substantial source of employment and economic growth as well as contributing to risk
reduction and resilience strategies. The sector provides major sources of income and subsistence
benefits, generates informal work opportunities and constitutes reservoirs of economic value that
help ameliorate shocks to household incomes, particularly in rural areas (FAO, 2016). The value added
in the forest sector amounts to just US$17 billion and accounts for about 0.9% of the Africa economy
“The African Union recognizes forests and
woodlands as important resources for uplifting
the continent from poverty, especially with
regard to energy, food, timber, a wide range of
non-timber forest products and environmental
services that underpin ecosystem functions in
support of agricultural productivity and
sustainability”
19 How Supply chain works and at what points the greatest amounts of wood waste is generated.
(FAO, 2014). Enterprises producing solid wood products are the largest employers at the global level
and in all regions except Africa, with total employment at about 5.4 million people (FAO, 2014).
Forests are important sources of energy for many countries. They generate considerable biomass that
supports an overwhelming majority of Africans with their energy needs, mostly as wood-fuel. Forests
and woodlands are the main source of household energy in Africa, with 82% of households relying on
fuel-wood and charcoal for cooking and heating. Demand is expected to increase by 20% over the
2010–2030 period (Bromhead, 2012). Forests are also good sanctuaries for wildlife, offer
opportunities for beekeeping, support many important ecosystem services and goods, and are home
to many genetic resources. They are catchments to many rivers that are essential to the economic
development of the continent.
Forests and trees in Africa account for 23% of global carbon stored in forests, and deforestation and
forest degradation account for 30% of Africa’s Greenhouse Gas (GHG) emissions. Forests and trees
have the potential to become a significant carbon sink and contribute to climate regulation. Between
1990 and 2010, Africa contributed 21% of the global total of carbon in forest biomass, with Central
Africa containing the largest amount of carbon in forest biomass. Côte d’Ivoire reported the highest
level of carbon stock per hectare in the region (177 tonnes per hectare) followed by the Republic of
the Congo.
2.1.2 Deforestation and forest degradation in Africa
Despite their importance, Africa continues to lose its forest cover. The global forest area declined by
about 178 million ha (an area approximately the size of Libya) in the 30 years from 1990 to 2020
according to the FAO 2020 Global Forests Resource Assessment (FAO, 2020). The rate of net forest
loss decreased substantially over the period 1990–2020 due to a reduction in deforestation in some
countries, plus increases in forest area in others through afforestation and the natural expansion of
forests.
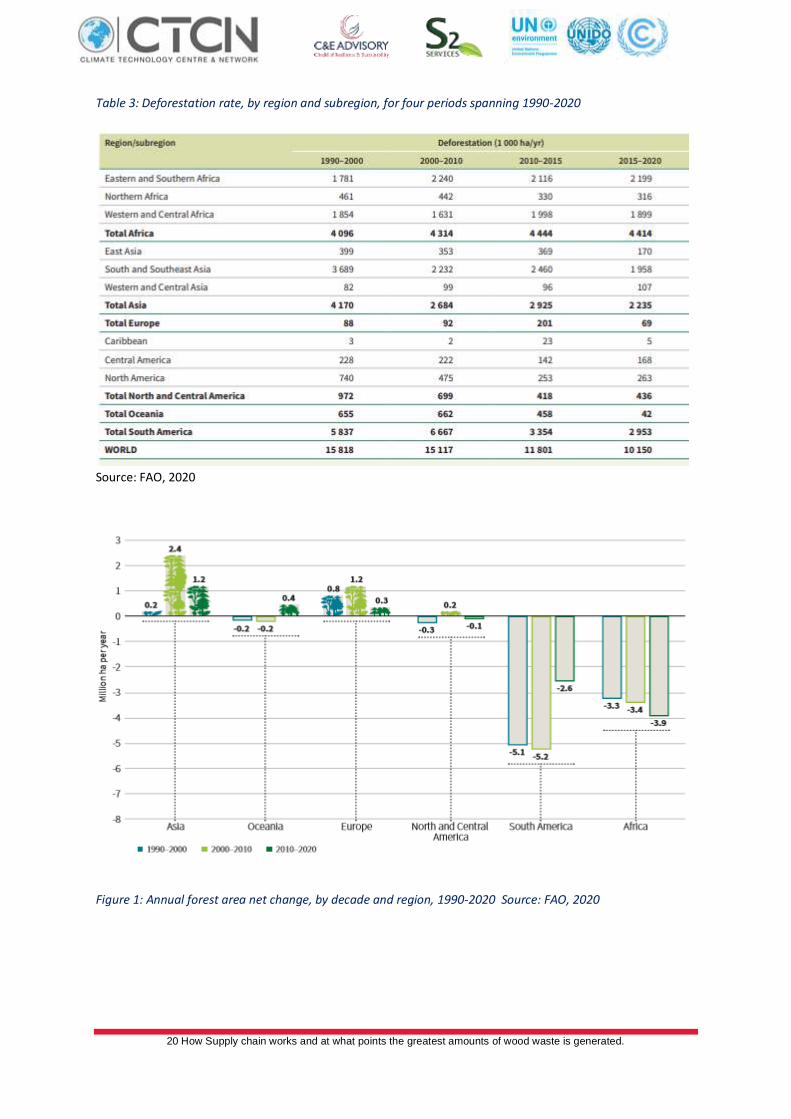
Africa had the highest net loss of forest area in the decade to 2020, with Eastern and Southern Africa
and Western and Central Africa accounting for most of the losses (Table 3). There has been an increase
in the average annual rate of net forest loss in Africa since 1990, from 3.28 million ha in 1990–2000,
to 3.40 million ha in 2000–2010, to 3.94 million ha in the most recent decade (Figure 1). The main
causes of deforestation are increases in the area planted for subsistence agriculture to meet food
security needs and increasing demands for wood energy.
20 How Supply chain works and at what points the greatest amounts of wood waste is generated.
Table 3: Deforestation rate, by region and subregion, for four periods spanning 1990-2020
Source: FAO, 2020
Figure 1: Annual forest area net change, by decade and region, 1990-2020 Source: FAO, 2020
21 How Supply chain works and at what points the greatest amounts of wood waste is generated.
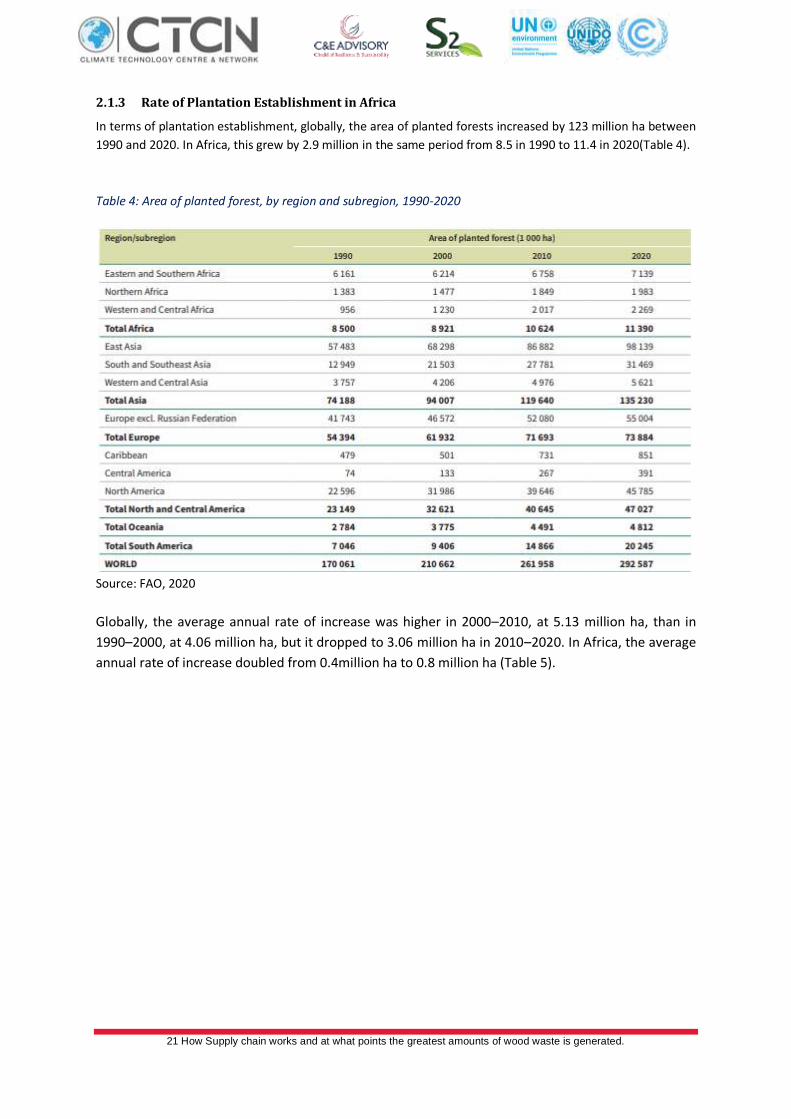
2.1.3 Rate of Plantation Establishment in Africa
In terms of plantation establishment, globally, the area of planted forests increased by 123 million ha between
1990 and 2020. In Africa, this grew by 2.9 million in the same period from 8.5 in 1990 to 11.4 in 2020(Table 4).
Table 4: Area of planted forest, by region and subregion, 1990-2020
Source: FAO, 2020
Globally, the average annual rate of increase was higher in 2000–2010, at 5.13 million ha, than in
1990–2000, at 4.06 million ha, but it dropped to 3.06 million ha in 2010–2020. In Africa, the average
annual rate of increase doubled from 0.4million ha to 0.8 million ha (Table 5).
22 How Supply chain works and at what points the greatest amounts of wood waste is generated.
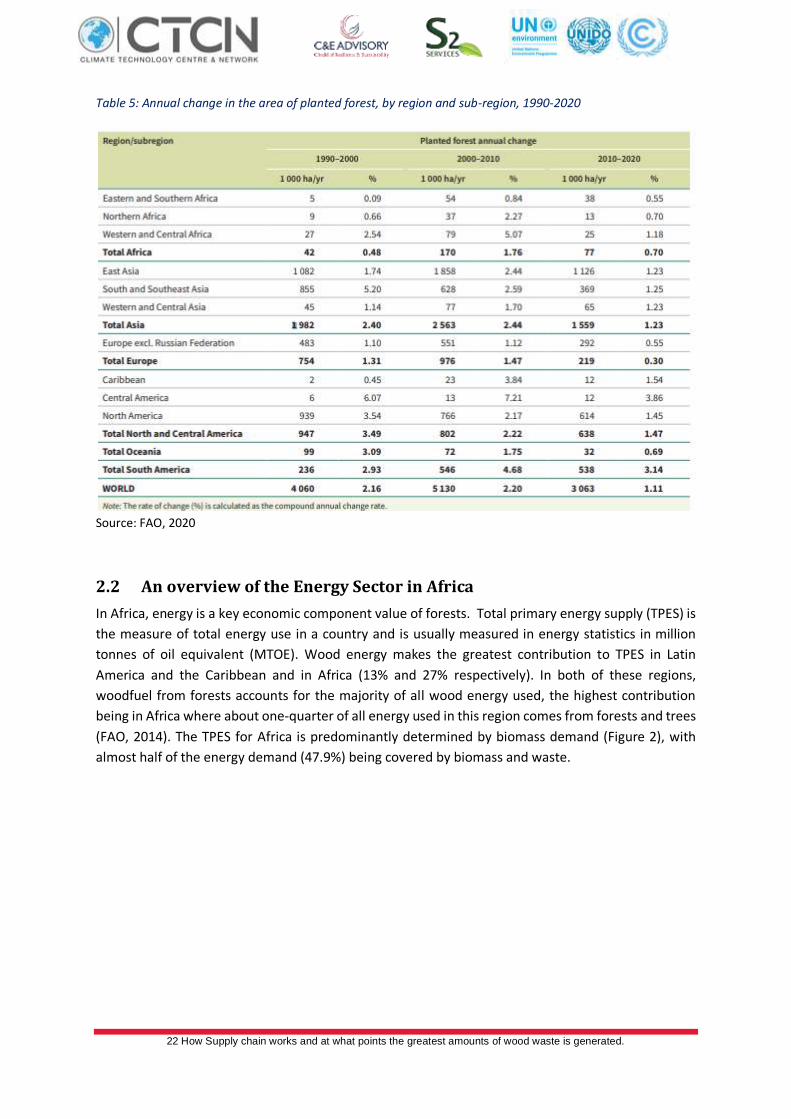
Table 5: Annual change in the area of planted forest, by region and sub-region, 1990-2020
Source: FAO, 2020
2.2 An overview of the Energy Sector in Africa
In Africa, energy is a key economic component value of forests. Total primary energy supply (TPES) is
the measure of total energy use in a country and is usually measured in energy statistics in million
tonnes of oil equivalent (MTOE). Wood energy makes the greatest contribution to TPES in Latin
America and the Caribbean and in Africa (13% and 27% respectively). In both of these regions,
woodfuel from forests accounts for the majority of all wood energy used, the highest contribution
being in Africa where about one-quarter of all energy used in this region comes from forests and trees
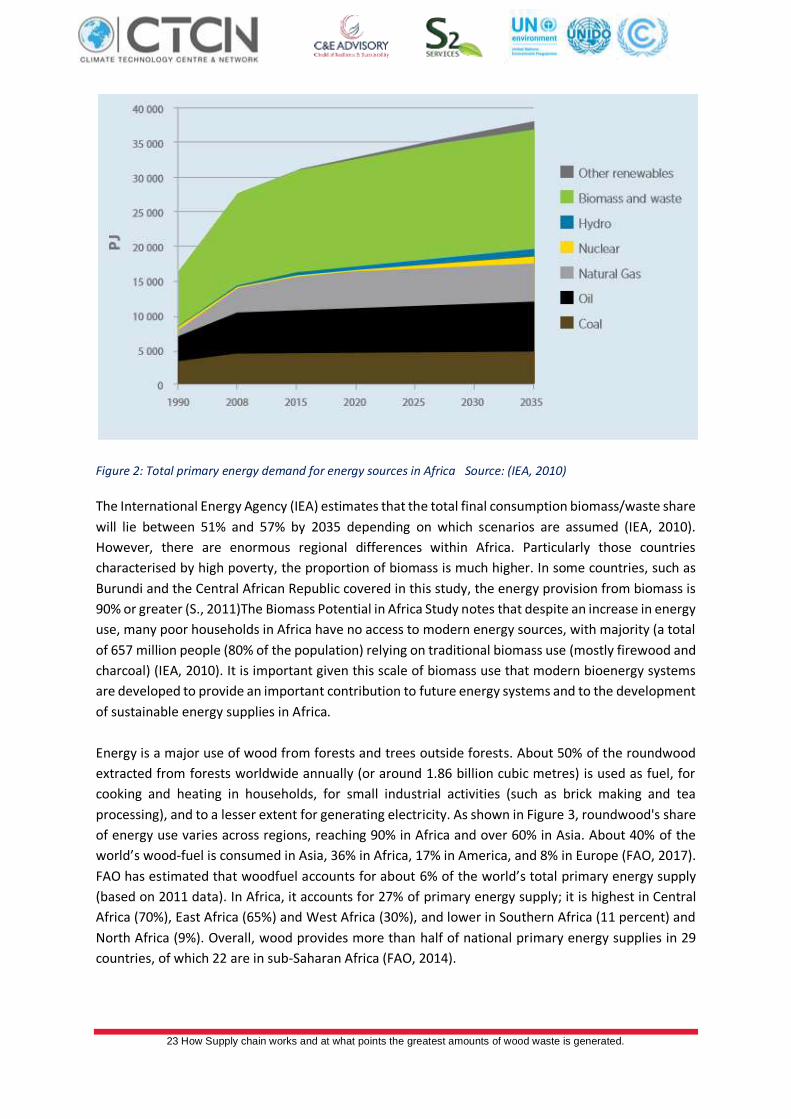
(FAO, 2014). The TPES for Africa is predominantly determined by biomass demand (Figure 2), with
almost half of the energy demand (47.9%) being covered by biomass and waste.
23 How Supply chain works and at what points the greatest amounts of wood waste is generated.
Figure 2: Total primary energy demand for energy sources in Africa Source: (IEA, 2010)
The International Energy Agency (IEA) estimates that the total final consumption biomass/waste share
will lie between 51% and 57% by 2035 depending on which scenarios are assumed (IEA, 2010).
However, there are enormous regional differences within Africa. Particularly those countries
characterised by high poverty, the proportion of biomass is much higher. In some countries, such as
Burundi and the Central African Republic covered in this study, the energy provision from biomass is
90% or greater (S., 2011)The Biomass Potential in Africa Study notes that despite an increase in energy
use, many poor households in Africa have no access to modern energy sources, with majority (a total
of 657 million people (80% of the population) relying on traditional biomass use (mostly firewood and
charcoal) (IEA, 2010). It is important given this scale of biomass use that modern bioenergy systems
are developed to provide an important contribution to future energy systems and to the development
of sustainable energy supplies in Africa.
Energy is a major use of wood from forests and trees outside forests. About 50% of the roundwood
extracted from forests worldwide annually (or around 1.86 billion cubic metres) is used as fuel, for
cooking and heating in households, for small industrial activities (such as brick making and tea
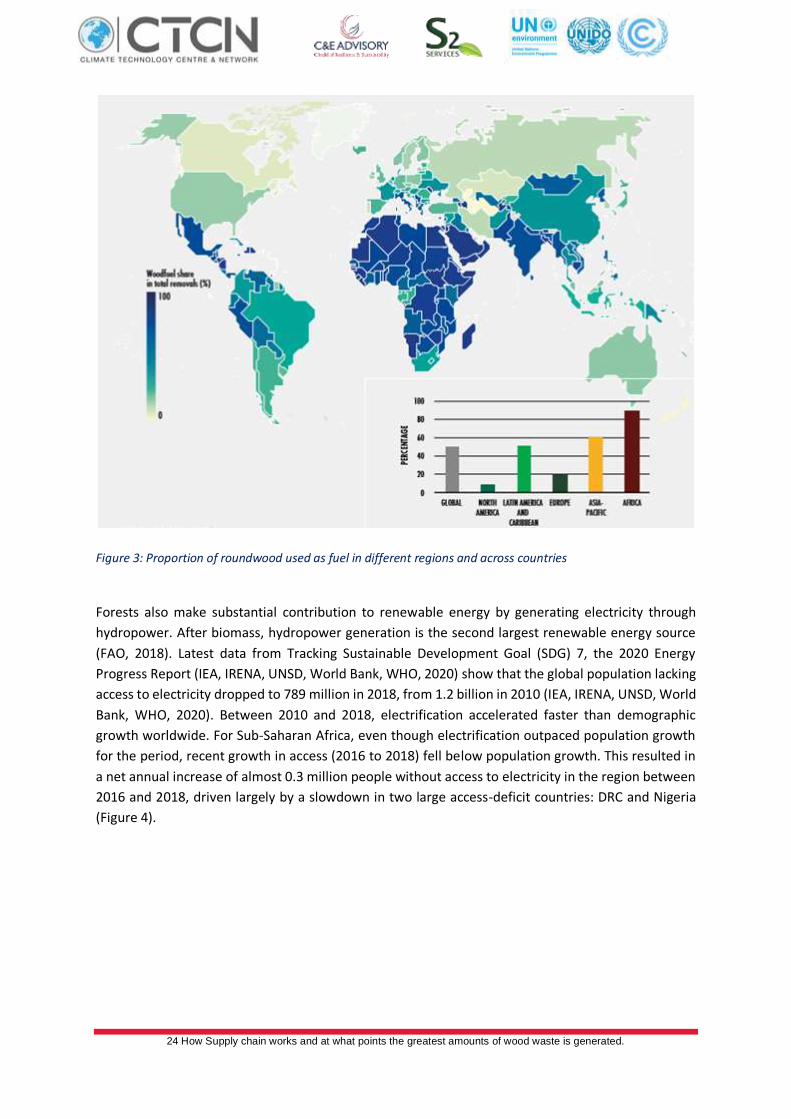
processing), and to a lesser extent for generating electricity. As shown in Figure 3, roundwood's share
of energy use varies across regions, reaching 90% in Africa and over 60% in Asia. About 40% of the
world’s wood-fuel is consumed in Asia, 36% in Africa, 17% in America, and 8% in Europe (FAO, 2017).
FAO has estimated that woodfuel accounts for about 6% of the world’s total primary energy supply
(based on 2011 data). In Africa, it accounts for 27% of primary energy supply; it is highest in Central
Africa (70%), East Africa (65%) and West Africa (30%), and lower in Southern Africa (11 percent) and
North Africa (9%). Overall, wood provides more than half of national primary energy supplies in 29
countries, of which 22 are in sub-Saharan Africa (FAO, 2014).
24 How Supply chain works and at what points the greatest amounts of wood waste is generated.
Figure 3: Proportion of roundwood used as fuel in different regions and across countries
Forests also make substantial contribution to renewable energy by generating electricity through
hydropower. After biomass, hydropower generation is the second largest renewable energy source
(FAO, 2018). Latest data from Tracking Sustainable Development Goal (SDG) 7, the 2020 Energy
Progress Report (IEA, IRENA, UNSD, World Bank, WHO, 2020) show that the global population lacking
access to electricity dropped to 789 million in 2018, from 1.2 billion in 2010 (IEA, IRENA, UNSD, World
Bank, WHO, 2020). Between 2010 and 2018, electrification accelerated faster than demographic
growth worldwide. For Sub-Saharan Africa, even though electrification outpaced population growth
for the period, recent growth in access (2016 to 2018) fell below population growth. This resulted in
a net annual increase of almost 0.3 million people without access to electricity in the region between
2016 and 2018, driven largely by a slowdown in two large access-deficit countries: DRC and Nigeria
(Figure 4).
25 How Supply chain works and at what points the greatest amounts of wood waste is generated.
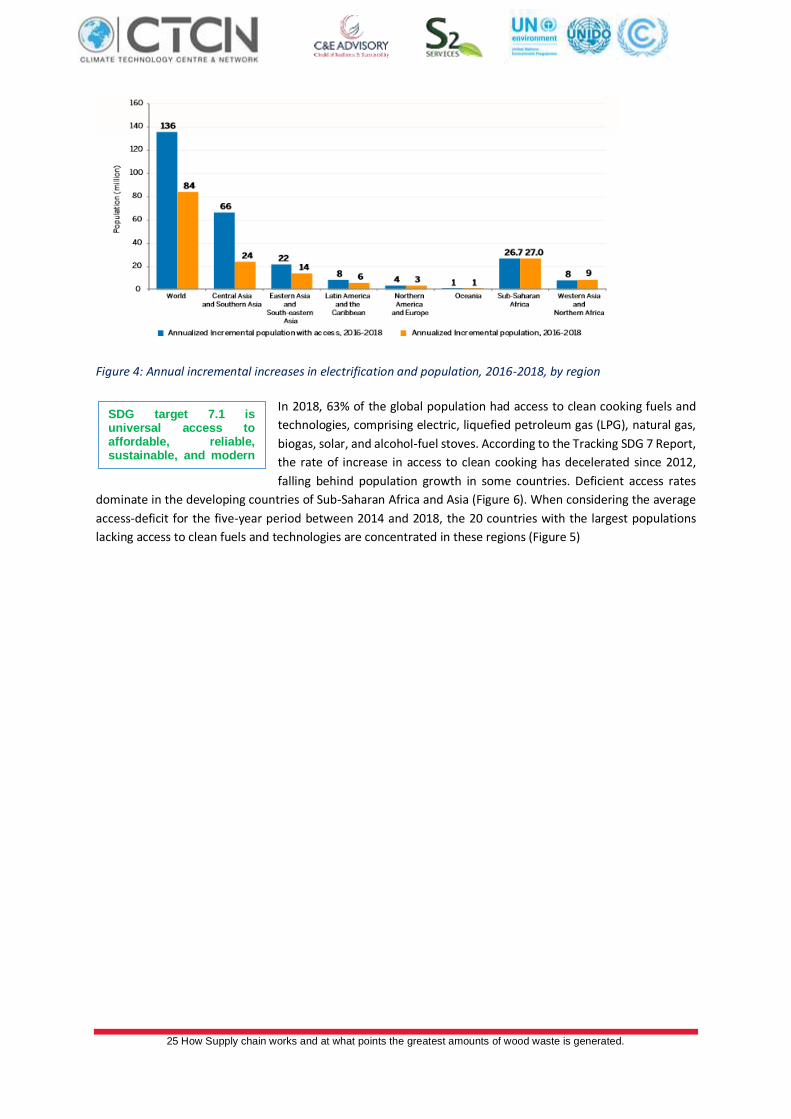
Figure 4: Annual incremental increases in electrification and population, 2016-2018, by region
In 2018, 63% of the global population had access to clean cooking fuels and
technologies, comprising electric, liquefied petroleum gas (LPG), natural gas,
biogas, solar, and alcohol-fuel stoves. According to the Tracking SDG 7 Report,
the rate of increase in access to clean cooking has decelerated since 2012,
falling behind population growth in some countries. Deficient access rates
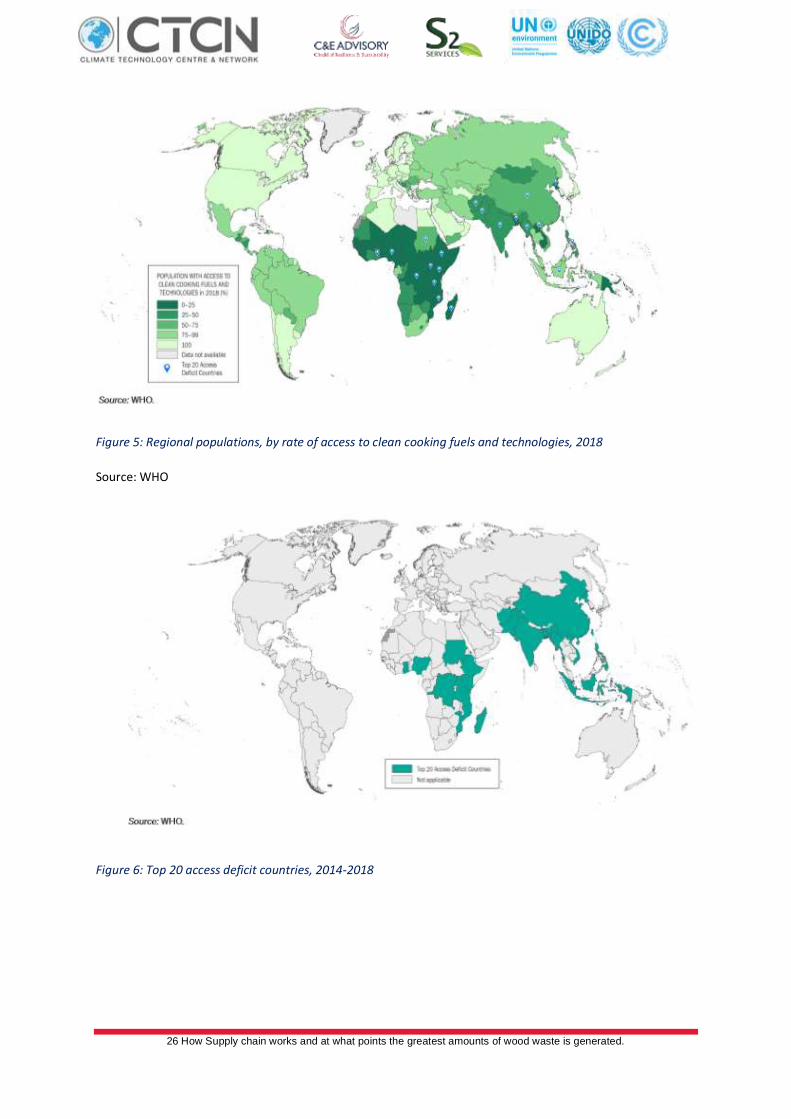
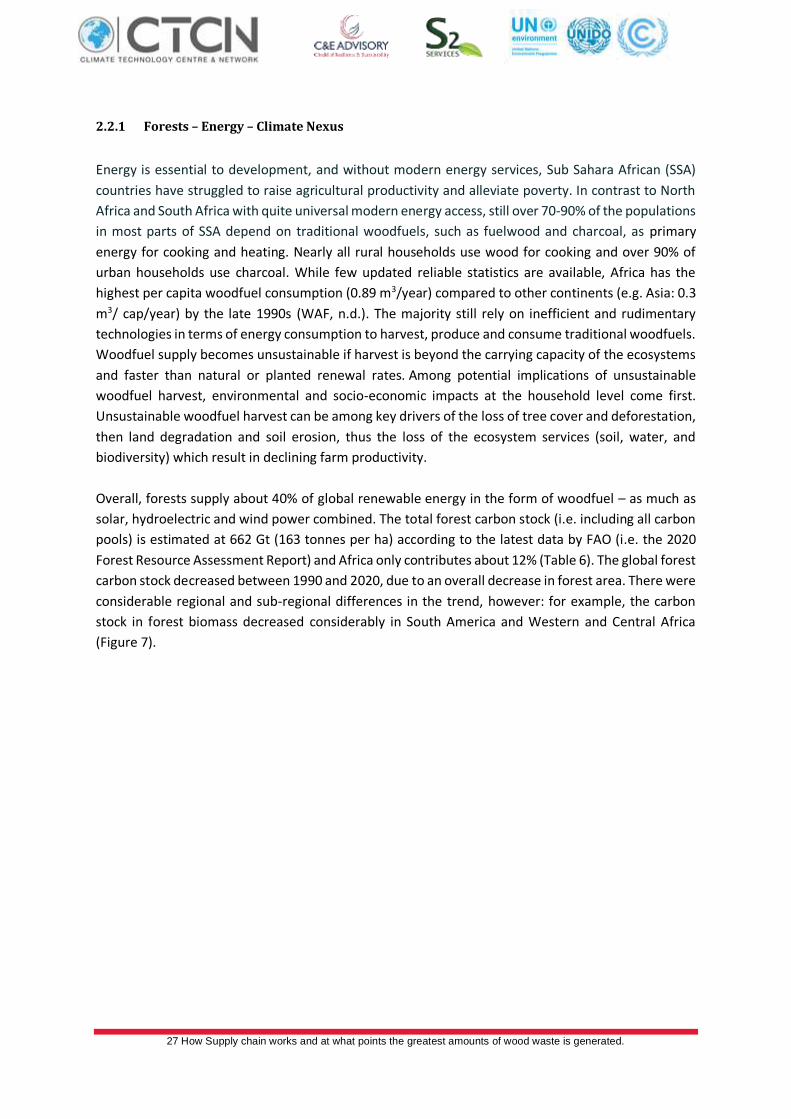
dominate in the developing countries of Sub-Saharan Africa and Asia (Figure 6). When considering the average
access-deficit for the five-year period between 2014 and 2018, the 20 countries with the largest populations
lacking access to clean fuels and technologies are concentrated in these regions (Figure 5)
SDG target 7.1 is universal access to affordable, reliable, sustainable, and modern energy services
26 How Supply chain works and at what points the greatest amounts of wood waste is generated.
Figure 5: Regional populations, by rate of access to clean cooking fuels and technologies, 2018
Source: WHO
Figure 6: Top 20 access deficit countries, 2014-2018
27 How Supply chain works and at what points the greatest amounts of wood waste is generated.
2.2.1 Forests – Energy – Climate Nexus
Energy is essential to development, and without modern energy services, Sub Sahara African (SSA)
countries have struggled to raise agricultural productivity and alleviate poverty. In contrast to North
Africa and South Africa with quite universal modern energy access, still over 70-90% of the populations
in most parts of SSA depend on traditional woodfuels, such as fuelwood and charcoal, as primary
energy for cooking and heating. Nearly all rural households use wood for cooking and over 90% of
urban households use charcoal. While few updated reliable statistics are available, Africa has the
highest per capita woodfuel consumption (0.89 m3/year) compared to other continents (e.g. Asia: 0.3
m3/ cap/year) by the late 1990s (WAF, n.d.). The majority still rely on inefficient and rudimentary
technologies in terms of energy consumption to harvest, produce and consume traditional woodfuels.
Woodfuel supply becomes unsustainable if harvest is beyond the carrying capacity of the ecosystems
and faster than natural or planted renewal rates. Among potential implications of unsustainable
woodfuel harvest, environmental and socio-economic impacts at the household level come first.
Unsustainable woodfuel harvest can be among key drivers of the loss of tree cover and deforestation,
then land degradation and soil erosion, thus the loss of the ecosystem services (soil, water, and
biodiversity) which result in declining farm productivity.
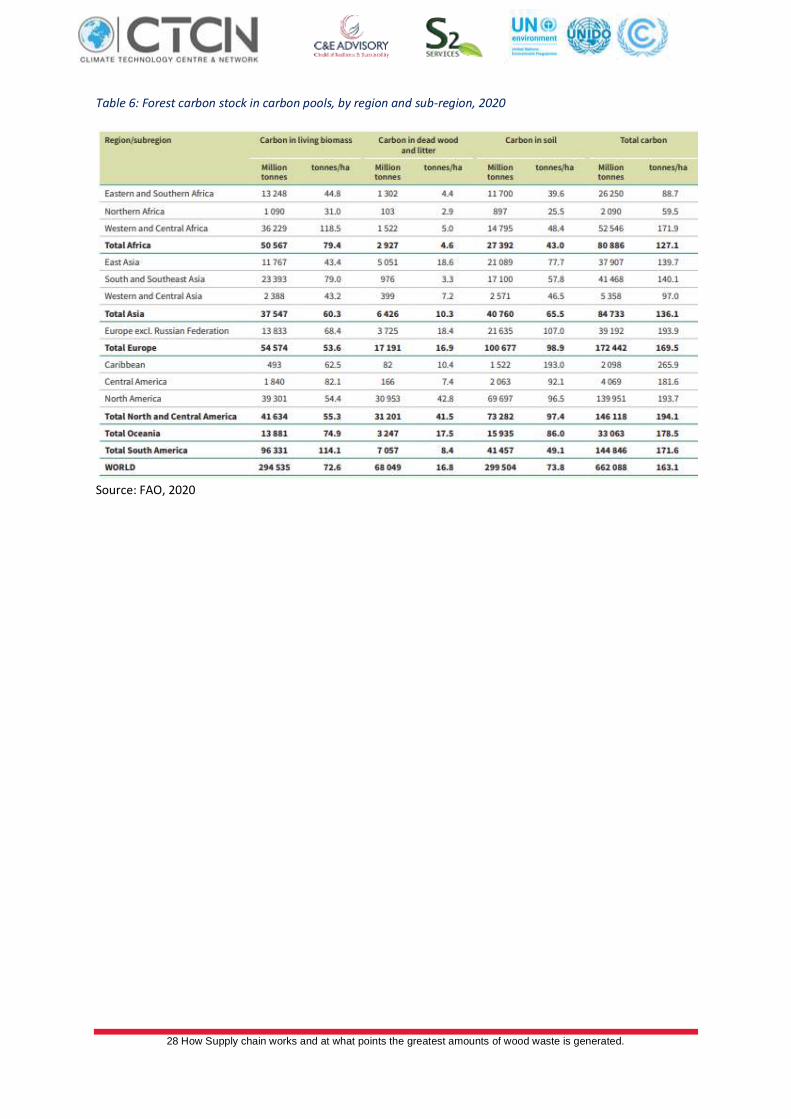
Overall, forests supply about 40% of global renewable energy in the form of woodfuel – as much as
solar, hydroelectric and wind power combined. The total forest carbon stock (i.e. including all carbon
pools) is estimated at 662 Gt (163 tonnes per ha) according to the latest data by FAO (i.e. the 2020
Forest Resource Assessment Report) and Africa only contributes about 12% (Table 6). The global forest
carbon stock decreased between 1990 and 2020, due to an overall decrease in forest area. There were
considerable regional and sub-regional differences in the trend, however: for example, the carbon
stock in forest biomass decreased considerably in South America and Western and Central Africa
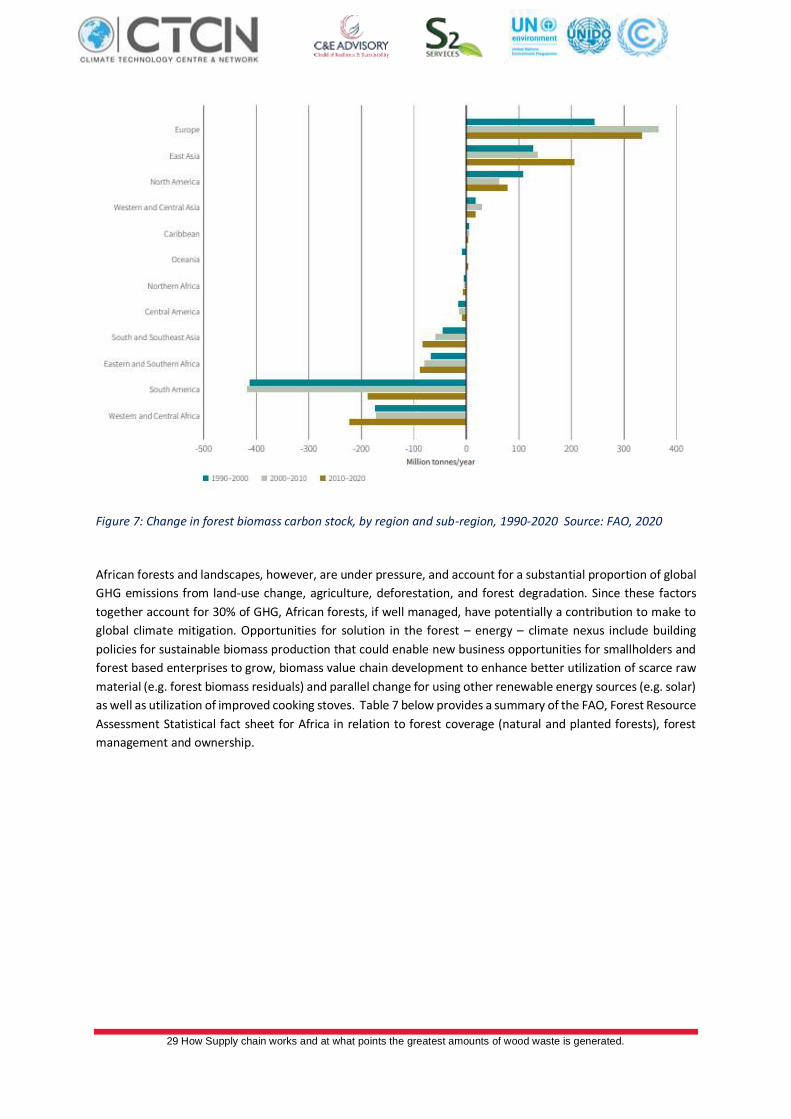
(Figure 7).
28 How Supply chain works and at what points the greatest amounts of wood waste is generated.
Table 6: Forest carbon stock in carbon pools, by region and sub-region, 2020
Source: FAO, 2020
29 How Supply chain works and at what points the greatest amounts of wood waste is generated.
Figure 7: Change in forest biomass carbon stock, by region and sub-region, 1990-2020 Source: FAO, 2020
African forests and landscapes, however, are under pressure, and account for a substantial proportion of global
GHG emissions from land-use change, agriculture, deforestation, and forest degradation. Since these factors
together account for 30% of GHG, African forests, if well managed, have potentially a contribution to make to
global climate mitigation. Opportunities for solution in the forest – energy – climate nexus include building
policies for sustainable biomass production that could enable new business opportunities for smallholders and
forest based enterprises to grow, biomass value chain development to enhance better utilization of scarce raw
material (e.g. forest biomass residuals) and parallel change for using other renewable energy sources (e.g. solar)
as well as utilization of improved cooking stoves. Table 7 below provides a summary of the FAO, Forest Resource
Assessment Statistical fact sheet for Africa in relation to forest coverage (natural and planted forests), forest
management and ownership.
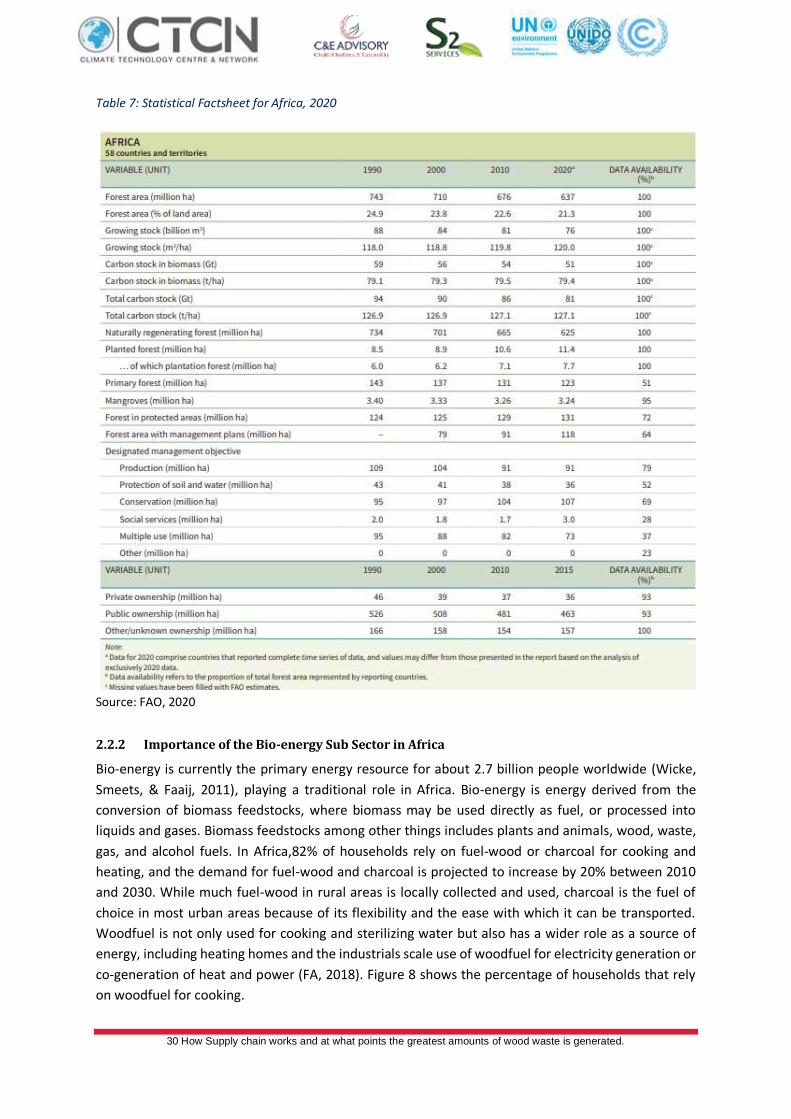
30 How Supply chain works and at what points the greatest amounts of wood waste is generated.
Table 7: Statistical Factsheet for Africa, 2020
Source: FAO, 2020
2.2.2 Importance of the Bio-energy Sub Sector in Africa
Bio-energy is currently the primary energy resource for about 2.7 billion people worldwide (Wicke,
Smeets, & Faaij, 2011), playing a traditional role in Africa. Bio-energy is energy derived from the
conversion of biomass feedstocks, where biomass may be used directly as fuel, or processed into
liquids and gases. Biomass feedstocks among other things includes plants and animals, wood, waste,
gas, and alcohol fuels. In Africa,82% of households rely on fuel-wood or charcoal for cooking and
heating, and the demand for fuel-wood and charcoal is projected to increase by 20% between 2010
and 2030. While much fuel-wood in rural areas is locally collected and used, charcoal is the fuel of
choice in most urban areas because of its flexibility and the ease with which it can be transported.
Woodfuel is not only used for cooking and sterilizing water but also has a wider role as a source of
energy, including heating homes and the industrials scale use of woodfuel for electricity generation or
co-generation of heat and power (FA, 2018). Figure 8 shows the percentage of households that rely
on woodfuel for cooking.
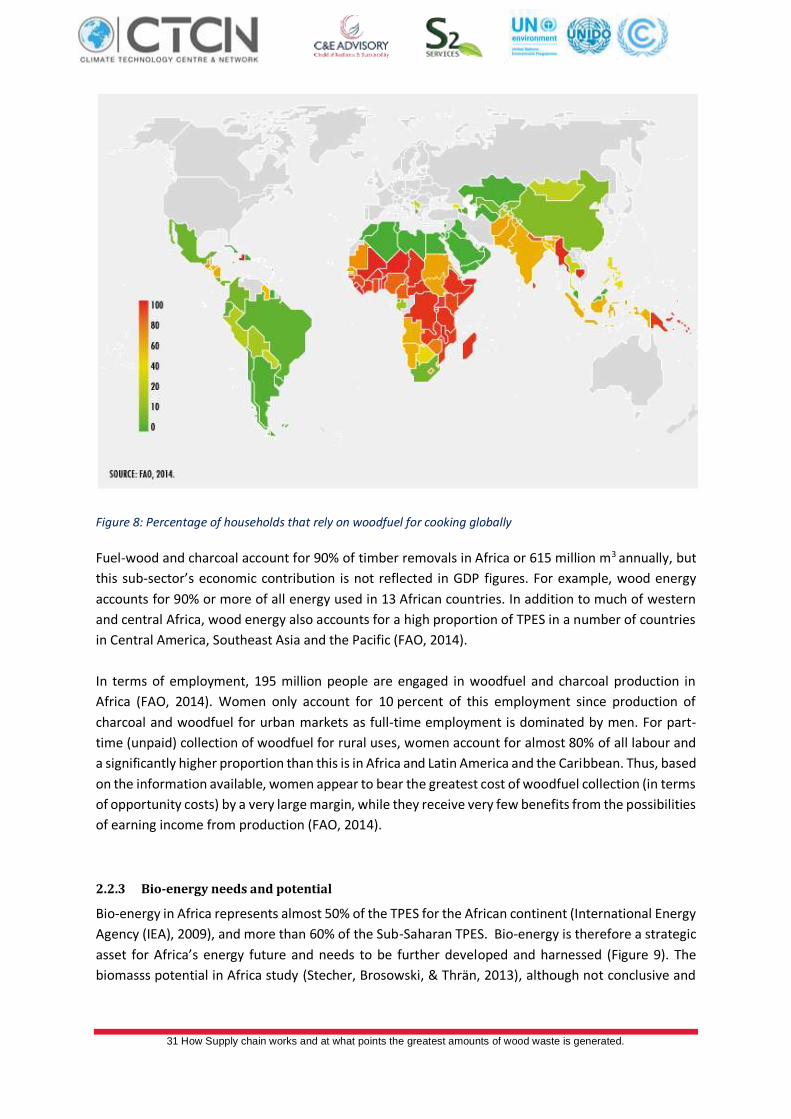
31 How Supply chain works and at what points the greatest amounts of wood waste is generated.
Figure 8: Percentage of households that rely on woodfuel for cooking globally
Fuel-wood and charcoal account for 90% of timber removals in Africa or 615 million m3 annually, but
this sub-sector’s economic contribution is not reflected in GDP figures. For example, wood energy
accounts for 90% or more of all energy used in 13 African countries. In addition to much of western
and central Africa, wood energy also accounts for a high proportion of TPES in a number of countries
in Central America, Southeast Asia and the Pacific (FAO, 2014).
In terms of employment, 195 million people are engaged in woodfuel and charcoal production in
Africa (FAO, 2014). Women only account for 10 percent of this employment since production of
charcoal and woodfuel for urban markets as full-time employment is dominated by men. For part-
time (unpaid) collection of woodfuel for rural uses, women account for almost 80% of all labour and
a significantly higher proportion than this is in Africa and Latin America and the Caribbean. Thus, based
on the information available, women appear to bear the greatest cost of woodfuel collection (in terms
of opportunity costs) by a very large margin, while they receive very few benefits from the possibilities
of earning income from production (FAO, 2014).
2.2.3 Bio-energy needs and potential
Bio-energy in Africa represents almost 50% of the TPES for the African continent (International Energy
Agency (IEA), 2009), and more than 60% of the Sub-Saharan TPES. Bio-energy is therefore a strategic
asset for Africa’s energy future and needs to be further developed and harnessed (Figure 9). The
biomasss potential in Africa study (Stecher, Brosowski, & Thrän, 2013), although not conclusive and
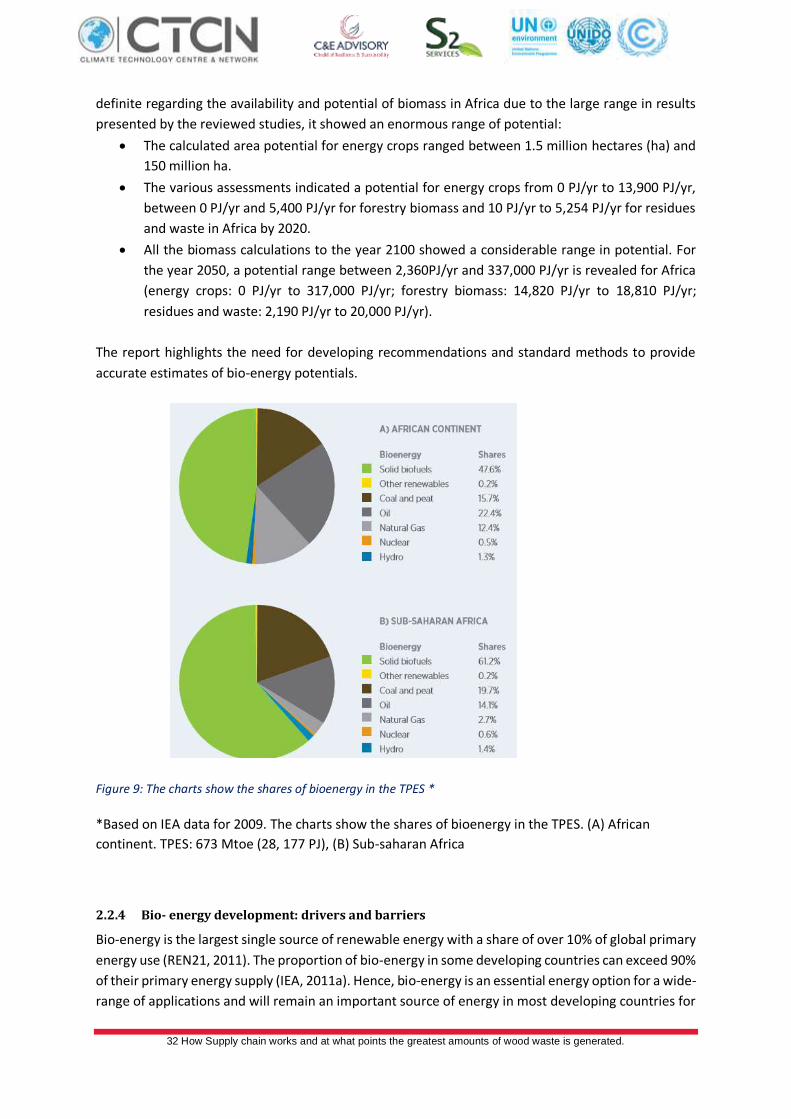
32 How Supply chain works and at what points the greatest amounts of wood waste is generated.
definite regarding the availability and potential of biomass in Africa due to the large range in results
presented by the reviewed studies, it showed an enormous range of potential:
• The calculated area potential for energy crops ranged between 1.5 million hectares (ha) and
150 million ha.
• The various assessments indicated a potential for energy crops from 0 PJ/yr to 13,900 PJ/yr,
between 0 PJ/yr and 5,400 PJ/yr for forestry biomass and 10 PJ/yr to 5,254 PJ/yr for residues
and waste in Africa by 2020.
• All the biomass calculations to the year 2100 showed a considerable range in potential. For
the year 2050, a potential range between 2,360PJ/yr and 337,000 PJ/yr is revealed for Africa
(energy crops: 0 PJ/yr to 317,000 PJ/yr; forestry biomass: 14,820 PJ/yr to 18,810 PJ/yr;
residues and waste: 2,190 PJ/yr to 20,000 PJ/yr).
The report highlights the need for developing recommendations and standard methods to provide
accurate estimates of bio-energy potentials.
Figure 9: The charts show the shares of bioenergy in the TPES *
*Based on IEA data for 2009. The charts show the shares of bioenergy in the TPES. (A) African
continent. TPES: 673 Mtoe (28, 177 PJ), (B) Sub-saharan Africa
2.2.4 Bio- energy development: drivers and barriers
Bio-energy is the largest single source of renewable energy with a share of over 10% of global primary
energy use (REN21, 2011). The proportion of bio-energy in some developing countries can exceed 90%
of their primary energy supply (IEA, 2011a). Hence, bio-energy is an essential energy option for a wide-
range of applications and will remain an important source of energy in most developing countries for
33 How Supply chain works and at what points the greatest amounts of wood waste is generated.
the foreseeable future. However, the current utilisation of bio-energy in the continent is unsustainable
and inefficient. Although there are huge prospects in deploying modern and more efficient biomass
fuels in the continent, there is a lack of information and limited knowledge on the achievements made
in harnessing bio-energy in Africa, the constraints and opportunities as well as future prospects for its
development in Africa. There are many other barriers against successful and widespread exploitation
of bio-energy on the continent, including ineffective supporting policy (and associated regulations and
legislations) and lack of financial support. Bio-energy exploitation in Africa has therefore largely
remained focused on unsustainable systems with negative impacts on livelihoods in the areas of
health, environment and social impacts, including gender.
Bio-energy technologies such as power from small-scale gasification fuelled by agricultural residues or
wood from sustainable sources exhibit promising potential for expansion. While small scale
photovoltaic systems to provide household lighting and electricity for charging cell phones or a radio
at an affordable price, gasifier systems produce electricity at scales starting around 10 kw, a scale
where photovoltaic systems become costly compared to other alternatives such as diesel-fuelled
generators. While a 10 kW could provide electricity to around 10 households in the US only, in rural
Africa this scale is able to power water pumps, grain mills, mini-grids at trading centres, or medium-
sized commercial loads powering for instance a telecommunication tower, thereby increasing the
standard of living significantly in a whole community and region that previously had no access to
electricity.
A widespread application of these bio-energy systems is however hampered by several factors
including a lack of business models to run the units and the absence of frameworks to measure the
potential ecological risks of putting an additional biomass-consuming system into place in an already
constraint ecosystem. Implementing a biomass based electricity system can further contribute to
these problems if the biomass fuel supply is not sustainably managed. While per capita wood
consumption in sub-Saharan Africa is between 500 to 1,000 kg of dry wood per year, gathered mainly
for cooking, a 10 kW gasifier placed in a community and providing basic electricity services would
require an equivalent of another 7 kg of dry wood per capita and year. Therefore, for these systems
to become truly sustainable, their design needs to consider ecological and social factors on the ground
as well as fulfil larger policy goals within a regional context. Although many gasifiers that utilise
agricultural residues exists, use of forest biomass residue is another alternative, but this has so far not
been well developed in Africa. In order to be viable, a good understanding the forest biomass supply
chain and identifying sustainable sources of biomass residues within the supply chain is needed.
34 How Supply chain works and at what points the greatest amounts of wood waste is generated.
2.2.5 Gender dynamics in the bioenergy sub sector
Affordable, clean, sustainable, reliable modern energy
services, as well as gender equality are critical development-
enabler for Africa by creating solutions to climate crisis and
are essential for ensuring the global SDG 2030, in general and
“the AU Agenda 2063 –The Africa We Want” in particular.
However, lack of access to energy sources for lighting, heating, cooking, agriculture and other
productive activities inhibits the productivity of men and women and society at large. Furthermore,
the lack of access to modern energy also affects at local and national level, children education, access
to clean water, health and well-being. This is the reason why gender is important in the energy sector.
The gendered division of labour creates different energy needs, as do different perceptions of the
benefits depending on one’s gender. This makes the access, use, and impact of energy services differ
for women and men.
Improved access to energy can improve the quality of women’s and men’s lives, especially the poor
women and girls in many ways, including time savings due to electrification, lighting for reading and
access to entertainment via radio and television; and access to new jobs and improved livelihoods
through energy sources, infrastructure and technology. Narrowing gender disparities is critical to
reducing and boosting shared prosperity and growth.
Energy access and energy poverty have been defined and measured in various ways.According to the
World Bank (IEA), in 2018 about 573 million people in Africa did not have access to electricity (World
Bank, 2018).
Gender matters in the energy sector because energy affects women and men differently, as men and
women have different roles and responsibilities in households, markets and their communities.This
leads to differences in their access and use of energy, and the impact of energy services on their
lives.Issues arise from women’s primary role in cooking, fuel collecting, and their greater exposure to
indoor air pollution associated with cooking. Other issues include women’s lack of decision-making
power and access to finance for improved cooking technologies.
It has been established that there is a clear linkage between energy and gender. We cannot reduce
poverty and achieve growth and prosperity without universal access to reliable modern
energy.Ensuring that both men and women are included in consultations on interventions in the
energy sector is essential.
The main form of energy used in African continent is bioenergy, mostly due to its low cost and
relatively easy and availability.In Africa, firewood and charcoal are the two main forms of biomass
used for energy sources (UNEP, 2019). Wood-fuel is widely used in Africa, 850 million people rely on
traditional, polluting cooking solutions in 2014 (World Bank, 2017). Traditional biomass is the energy
source for the poor since it is generally freely available.
“Energy decides our lives…If women
are going to make decisions about
their lives, they have to be able to
make decisions about energy”
ChitaroopaPalit, Narmada
BachaoAndalan social movement
35 How Supply chain works and at what points the greatest amounts of wood waste is generated.
Energy poverty on the continent is gendered. Women and men have different energy needs linked to
their gender roles. Rural women and girls are especially affected as the majority of energy is derived
from traditional biomass fuel such as wood, charcoal and agricultural waste.According to IEA
approximatively 730 million people in Africa rely on traditional uses of biomass.In many parts of Sub-
Saharan Africa, more than 90 % of the population relies on biomass (Prebble & Rojus, 2018). Countries
like Burundi and Chad have the highest percentage in traditional use and are largely dependent on
biomass based energy sources.
In many agrarian settings, women and girls have the primary responsibilities for collecting household
fuelwood and many have to walk for several hours, frequently under insecure conditions to do so.The
more time spent collecting fuelwood (and water), the less time women have available for other
activities including education, community participation, income-earning activities and leisure. In
average, a woman spends 1,9 in Burkina Faso, 2,7 in Benin, 3,1 in Senegal and 3,1 hours in Cameroon
collecting fuelwood for cooking, heating and lighting. (UNEP, 2017a).Women generally play a big role
in collecting traditional fuels, although men and children are sometimes involved as well (e.g.
Benin).Rural women and girls are especially affected as the majority of energy is derived from
traditional biomass fuel such as wood, charcoal and agricultural waste.In refugee and conflict
situations (Burkina Faso, CAR, RDC, Chad, Cameroon, Mali) women are particularly vulnerable to
gender-based violence while collecting fuelwood.
Women are the main consumers of wood-fuels and are negatively impacted from the impacts of
cooking. Energy combustion is mostly inefficient and toxic. With regards to the cooking environment,
the combustion of biomass (including fuelwood) releases significant quantities of pollutants that
damage the health of those who do the cooking, the vast majority of whom are women. Poor
ventilation in kitchens is common in many parts of the world and increases the health risks associated
with cooking. Exposure to indoor smoke has been found to be responsible for 39% of deaths due to
chronic pulmonary disease in women, compared with 12% in men. About 600,000 people die each
year as a result of household air pollution and approximatively 60% of these victims are women (WHO,
2012). These deaths which are due to lung disease, acute respiratory infections, lung cancer, and
pneumonia, affect mostly women and young children who spend the most time near the domestic
hearth. UN Women notes that illness indoor pollution result in more deaths of women and children
annually then HIV/AIDS, malaria, tuberculosis, and malnutrition combined. Other health hazards from
cooking with solid fuels in poorly ventilated stoves and kitchen include asthma, burns from cooking
with open fires, and cataracts, which are the leading cause of blindness in developing countries. Annex
2 provide a detailed assessment of gender issues in Africa and the study target countries.
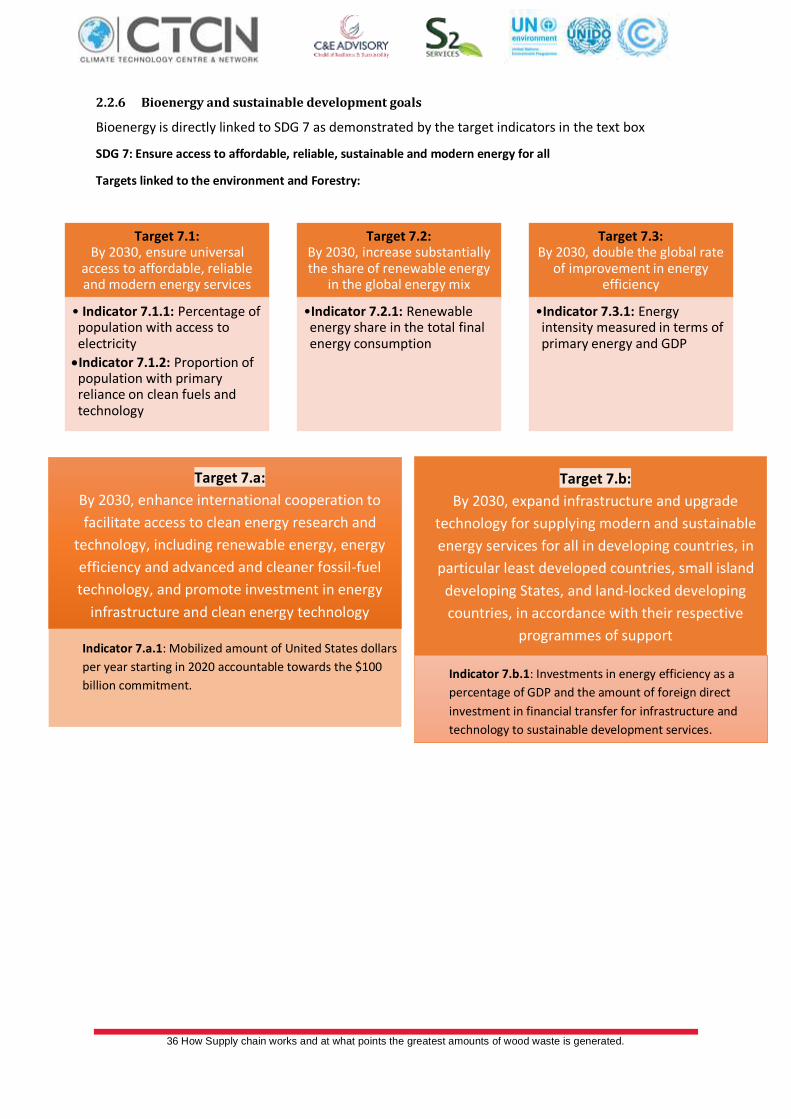
36 How Supply chain works and at what points the greatest amounts of wood waste is generated.
2.2.6 Bioenergy and sustainable development goals
Bioenergy is directly linked to SDG 7 as demonstrated by the target indicators in the text box
SDG 7: Ensure access to affordable, reliable, sustainable and modern energy for all
Targets linked to the environment and Forestry:
Target 7.1: By 2030, ensure universal
access to affordable, reliable and modern energy services
• Indicator 7.1.1: Percentage of population with access to electricity
•Indicator 7.1.2: Proportion of population with primary reliance on clean fuels and technology
Target 7.2: By 2030, increase substantially the share of renewable energy
in the global energy mix
•Indicator 7.2.1: Renewable energy share in the total final energy consumption
Target 7.3: By 2030, double the global rate
of improvement in energy efficiency
•Indicator 7.3.1: Energy intensity measured in terms of primary energy and GDP
Target 7.a:
By 2030, enhance international cooperation to
facilitate access to clean energy research and
technology, including renewable energy, energy
efficiency and advanced and cleaner fossil-fuel
technology, and promote investment in energy
infrastructure and clean energy technology
Indicator 7.a.1: Mobilized amount of United States dollars
per year starting in 2020 accountable towards the $100
billion commitment.
Target 7.b:
By 2030, expand infrastructure and upgrade
technology for supplying modern and sustainable
energy services for all in developing countries, in
particular least developed countries, small island
developing States, and land-locked developing
countries, in accordance with their respective
programmes of support
Indicator 7.b.1: Investments in energy efficiency as a
percentage of GDP and the amount of foreign direct
investment in financial transfer for infrastructure and
technology to sustainable development services.
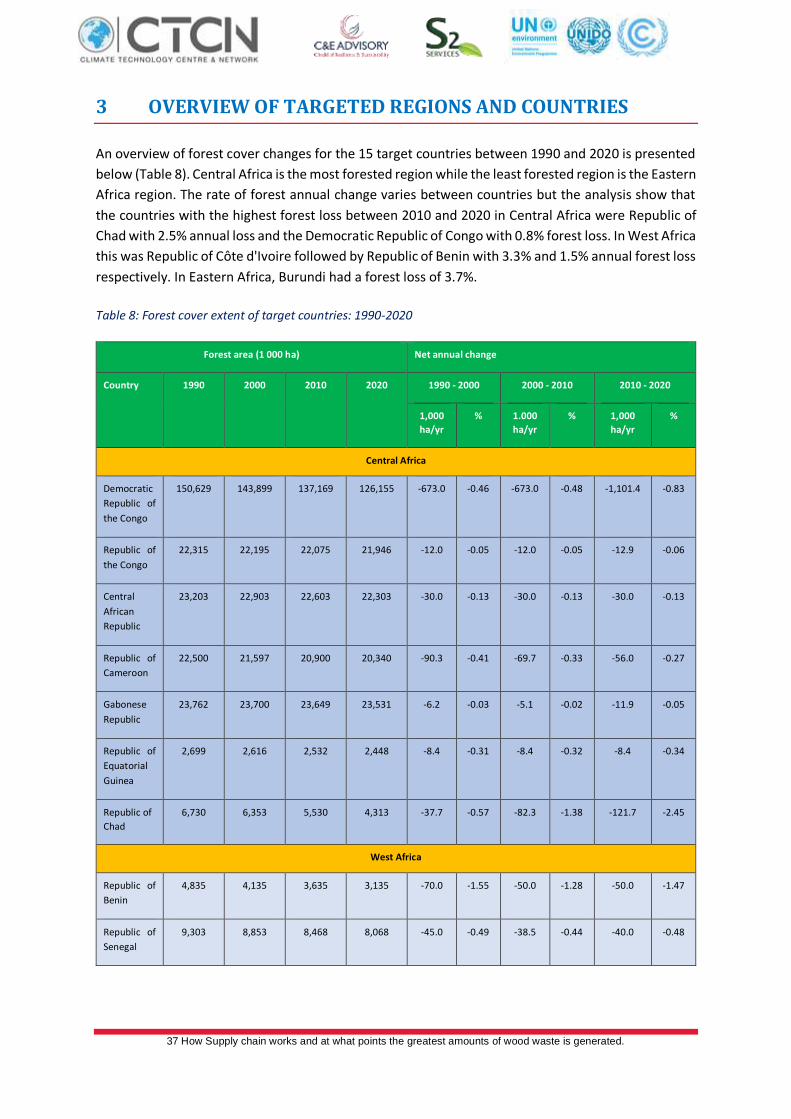
37 How Supply chain works and at what points the greatest amounts of wood waste is generated.
3 OVERVIEW OF TARGETED REGIONS AND COUNTRIES
An overview of forest cover changes for the 15 target countries between 1990 and 2020 is presented
below (Table 8). Central Africa is the most forested region while the least forested region is the Eastern
Africa region. The rate of forest annual change varies between countries but the analysis show that
the countries with the highest forest loss between 2010 and 2020 in Central Africa were Republic of
Chad with 2.5% annual loss and the Democratic Republic of Congo with 0.8% forest loss. In West Africa
this was Republic of Côte d'Ivoire followed by Republic of Benin with 3.3% and 1.5% annual forest loss
respectively. In Eastern Africa, Burundi had a forest loss of 3.7%.
Table 8: Forest cover extent of target countries: 1990-2020
Forest area (1 000 ha) Net annual change
Country 1990 2000 2010 2020 1990 - 2000 2000 - 2010 2010 - 2020
1,000
ha/yr
% 1.000
ha/yr
% 1,000
ha/yr
%
Central Africa
Democratic
Republic of
the Congo
150,629 143,899 137,169 126,155 -673.0 -0.46 -673.0 -0.48 -1,101.4 -0.83
Republic of
the Congo
22,315 22,195 22,075 21,946 -12.0 -0.05 -12.0 -0.05 -12.9 -0.06
Central
African
Republic
23,203 22,903 22,603 22,303 -30.0 -0.13 -30.0 -0.13 -30.0 -0.13
Republic of
Cameroon
22,500 21,597 20,900 20,340 -90.3 -0.41 -69.7 -0.33 -56.0 -0.27
Gabonese
Republic
23,762 23,700 23,649 23,531 -6.2 -0.03 -5.1 -0.02 -11.9 -0.05
Republic of
Equatorial
Guinea
2,699 2,616 2,532 2,448 -8.4 -0.31 -8.4 -0.32 -8.4 -0.34
Republic of
Chad
6,730 6,353 5,530 4,313 -37.7 -0.57 -82.3 -1.38 -121.7 -2.45
West Africa
Republic of
Benin
4,835 4,135 3,635 3,135 -70.0 -1.55 -50.0 -1.28 -50.0 -1.47
Republic of
Senegal
9,303 8,853 8,468 8,068 -45.0 -0.49 -38.5 -0.44 -40.0 -0.48
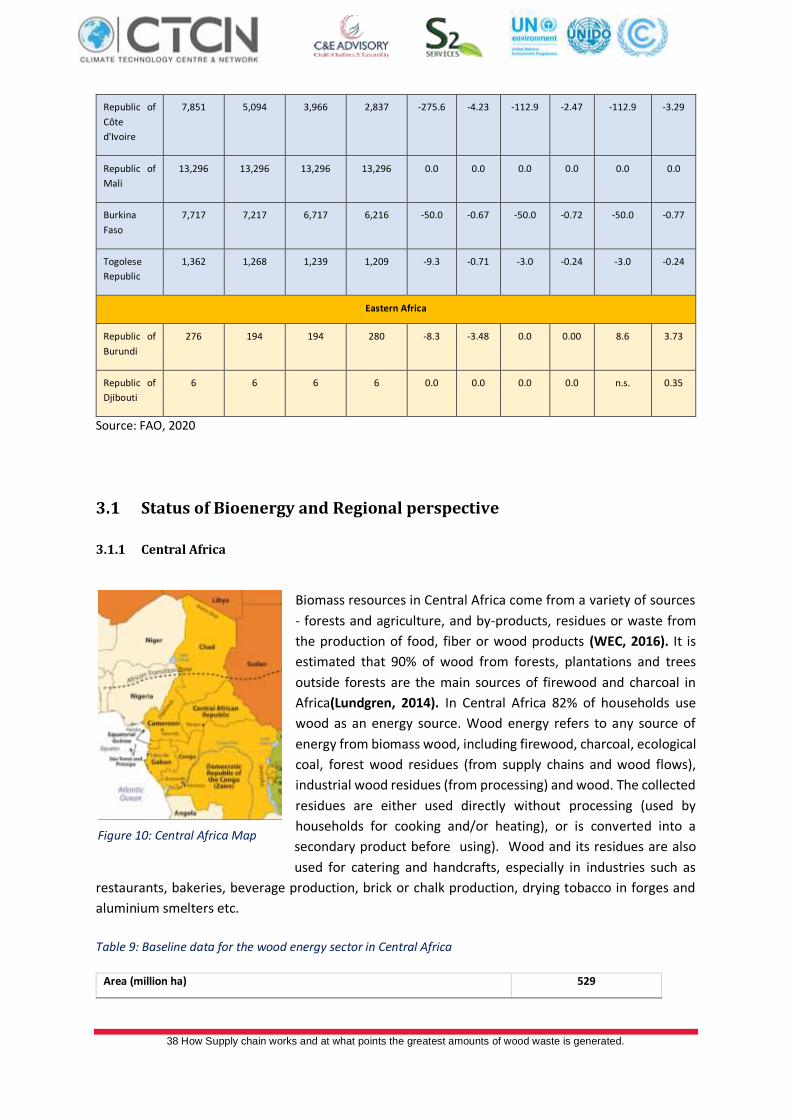
38 How Supply chain works and at what points the greatest amounts of wood waste is generated.
Republic of
Côte
d'Ivoire
7,851 5,094 3,966 2,837 -275.6 -4.23 -112.9 -2.47 -112.9 -3.29
Republic of
Mali
13,296 13,296 13,296 13,296 0.0 0.0 0.0 0.0 0.0 0.0
Burkina
Faso
7,717 7,217 6,717 6,216 -50.0 -0.67 -50.0 -0.72 -50.0 -0.77
Togolese
Republic
1,362 1,268 1,239 1,209 -9.3 -0.71 -3.0 -0.24 -3.0 -0.24
Eastern Africa
Republic of
Burundi
276 194 194 280 -8.3 -3.48 0.0 0.00 8.6 3.73
Republic of
Djibouti
6 6 6 6 0.0 0.0 0.0 0.0 n.s. 0.35
Source: FAO, 2020
3.1 Status of Bioenergy and Regional perspective
3.1.1 Central Africa
Biomass resources in Central Africa come from a variety of sources
- forests and agriculture, and by-products, residues or waste from
the production of food, fiber or wood products (WEC, 2016). It is
estimated that 90% of wood from forests, plantations and trees
outside forests are the main sources of firewood and charcoal in
Africa(Lundgren, 2014). In Central Africa 82% of households use
wood as an energy source. Wood energy refers to any source of
energy from biomass wood, including firewood, charcoal, ecological
coal, forest wood residues (from supply chains and wood flows),
industrial wood residues (from processing) and wood. The collected
residues are either used directly without processing (used by
households for cooking and/or heating), or is converted into a
secondary product before using). Wood and its residues are also
used for catering and handcrafts, especially in industries such as
restaurants, bakeries, beverage production, brick or chalk production, drying tobacco in forges and
aluminium smelters etc.
Table 9: Baseline data for the wood energy sector in Central Africa
Area (million ha) 529
Figure 10: Central Africa Map
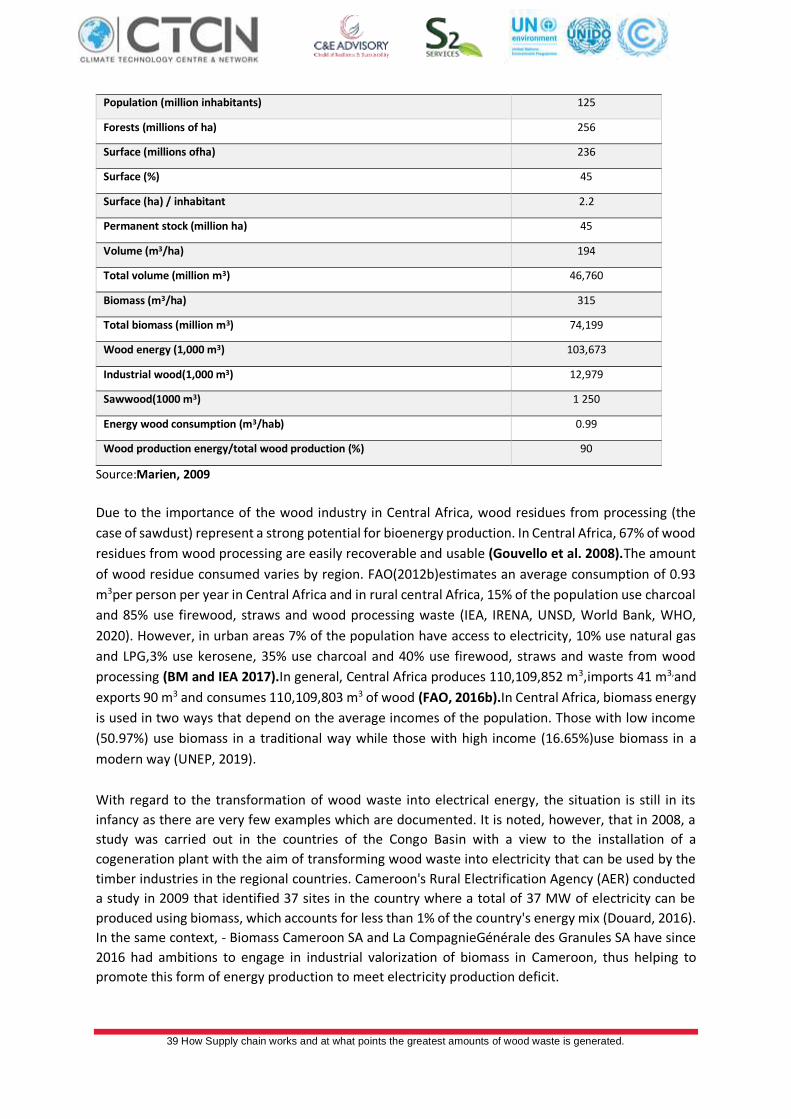
39 How Supply chain works and at what points the greatest amounts of wood waste is generated.
Population (million inhabitants) 125
Forests (millions of ha) 256
Surface (millions ofha) 236
Surface (%) 45
Surface (ha) / inhabitant 2.2
Permanent stock (million ha) 45
Volume (m3/ha) 194
Total volume (million m3) 46,760
Biomass (m3/ha) 315
Total biomass (million m3) 74,199
Wood energy (1,000 m3) 103,673
Industrial wood(1,000 m3) 12,979
Sawwood(1000 m3) 1 250
Energy wood consumption (m3/hab) 0.99
Wood production energy/total wood production (%) 90
Source:Marien, 2009
Due to the importance of the wood industry in Central Africa, wood residues from processing (the
case of sawdust) represent a strong potential for bioenergy production. In Central Africa, 67% of wood
residues from wood processing are easily recoverable and usable (Gouvello et al. 2008).The amount
of wood residue consumed varies by region. FAO(2012b)estimates an average consumption of 0.93
m3per person per year in Central Africa and in rural central Africa, 15% of the population use charcoal
and 85% use firewood, straws and wood processing waste (IEA, IRENA, UNSD, World Bank, WHO,
2020). However, in urban areas 7% of the population have access to electricity, 10% use natural gas
and LPG,3% use kerosene, 35% use charcoal and 40% use firewood, straws and waste from wood
processing (BM and IEA 2017).In general, Central Africa produces 110,109,852 m3,imports 41 m3,and
exports 90 m3 and consumes 110,109,803 m3 of wood (FAO, 2016b).In Central Africa, biomass energy
is used in two ways that depend on the average incomes of the population. Those with low income
(50.97%) use biomass in a traditional way while those with high income (16.65%)use biomass in a
modern way (UNEP, 2019).
With regard to the transformation of wood waste into electrical energy, the situation is still in its
infancy as there are very few examples which are documented. It is noted, however, that in 2008, a
study was carried out in the countries of the Congo Basin with a view to the installation of a
cogeneration plant with the aim of transforming wood waste into electricity that can be used by the
timber industries in the regional countries. Cameroon's Rural Electrification Agency (AER) conducted
a study in 2009 that identified 37 sites in the country where a total of 37 MW of electricity can be
produced using biomass, which accounts for less than 1% of the country's energy mix (Douard, 2016).
In the same context, - Biomass Cameroon SA and La CompagnieGénérale des Granules SA have since
2016 had ambitions to engage in industrial valorization of biomass in Cameroon, thus helping to
promote this form of energy production to meet electricity production deficit.
40 How Supply chain works and at what points the greatest amounts of wood waste is generated.
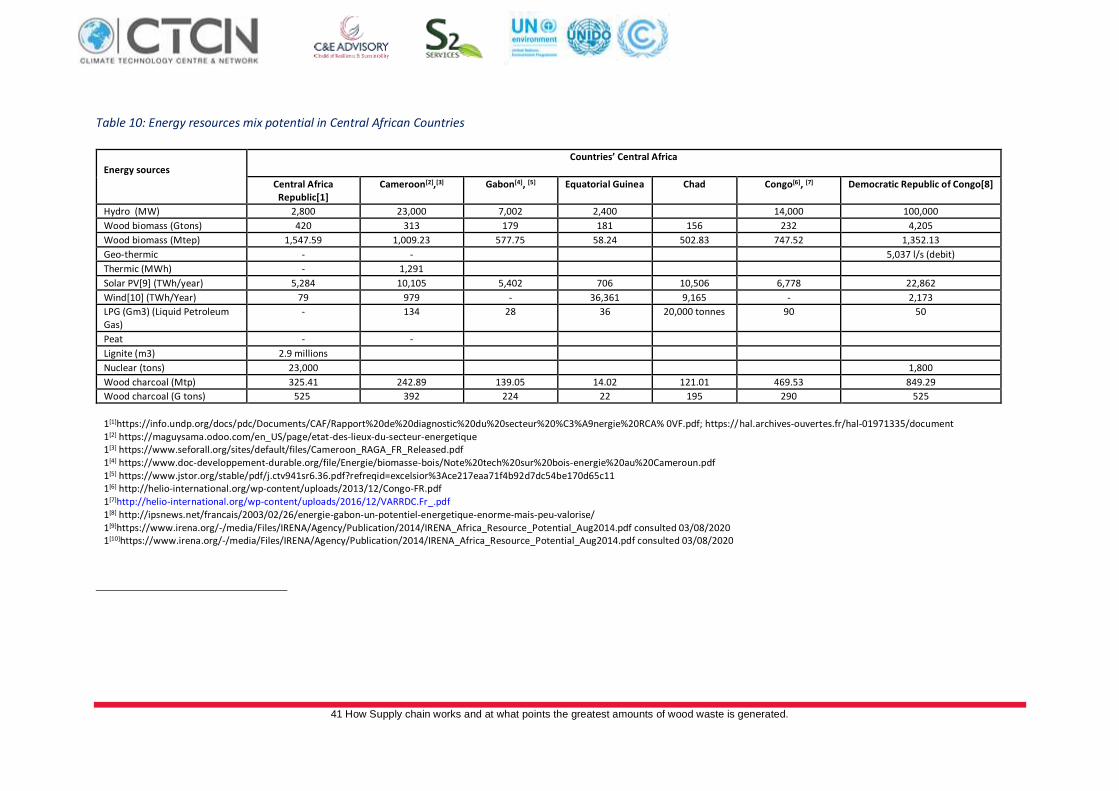
41 How Supply chain works and at what points the greatest amounts of wood waste is generated.
Table 10: Energy resources mix potential in Central African Countries
Energy sources
Countries’ Central Africa
Central Africa Republic[1]
Cameroon[2],[3] Gabon[4], [5] Equatorial Guinea Chad Congo[6], [7] Democratic Republic of Congo[8]
Hydro (MW) 2,800 23,000 7,002 2,400 14,000 100,000
Wood biomass (Gtons) 420 313 179 181 156 232 4,205
Wood biomass (Mtep) 1,547.59 1,009.23 577.75 58.24 502.83 747.52 1,352.13
Geo-thermic - - 5,037 l/s (debit)
Thermic (MWh) - 1,291
Solar PV[9] (TWh/year) 5,284 10,105 5,402 706 10,506 6,778 22,862
Wind[10] (TWh/Year) 79 979 - 36,361 9,165 - 2,173
LPG (Gm3) (Liquid Petroleum Gas)
- 134 28 36 20,000 tonnes 90 50
Peat - -
Lignite (m3) 2.9 millions
Nuclear (tons) 23,000 1,800
Wood charcoal (Mtp) 325.41 242.89 139.05 14.02 121.01 469.53 849.29
Wood charcoal (G tons) 525 392 224 22 195 290 525
1[1]https://info.undp.org/docs/pdc/Documents/CAF/Rapport%20de%20diagnostic%20du%20secteur%20%C3%A9nergie%20RCA% 0VF.pdf; https://hal.archives-ouvertes.fr/hal-01971335/document 1[2] https://maguysama.odoo.com/en_US/page/etat-des-lieux-du-secteur-energetique 1[3] https://www.seforall.org/sites/default/files/Cameroon_RAGA_FR_Released.pdf 1[4] https://www.doc-developpement-durable.org/file/Energie/biomasse-bois/Note%20tech%20sur%20bois-energie%20au%20Cameroun.pdf 1[5] https://www.jstor.org/stable/pdf/j.ctv941sr6.36.pdf?refreqid=excelsior%3Ace217eaa71f4b92d7dc54be170d65c11 1[6] http://helio-international.org/wp-content/uploads/2013/12/Congo-FR.pdf 1[7]http://helio-international.org/wp-content/uploads/2016/12/VARRDC.Fr_.pdf 1[8] http://ipsnews.net/francais/2003/02/26/energie-gabon-un-potentiel-energetique-enorme-mais-peu-valorise/ 1[9]https://www.irena.org/-/media/Files/IRENA/Agency/Publication/2014/IRENA_Africa_Resource_Potential_Aug2014.pdf consulted 03/08/2020 1[10]https://www.irena.org/-/media/Files/IRENA/Agency/Publication/2014/IRENA_Africa_Resource_Potential_Aug2014.pdf consulted 03/08/2020
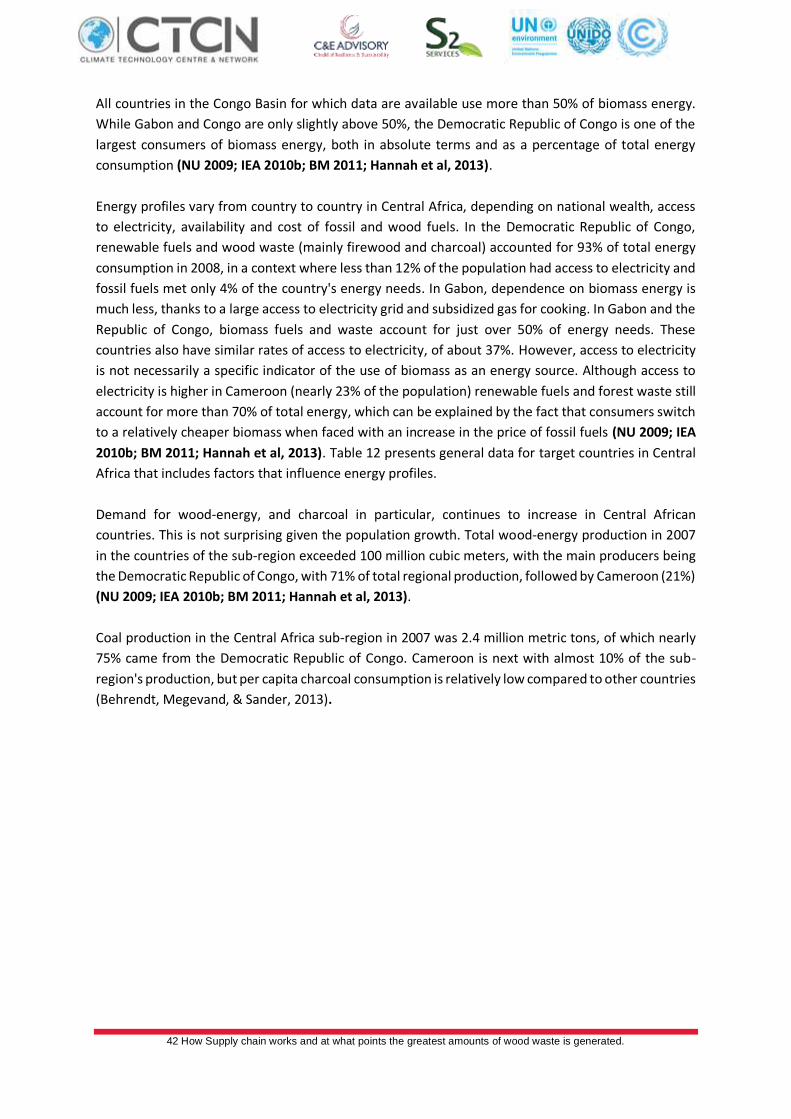
42 How Supply chain works and at what points the greatest amounts of wood waste is generated.
All countries in the Congo Basin for which data are available use more than 50% of biomass energy.
While Gabon and Congo are only slightly above 50%, the Democratic Republic of Congo is one of the
largest consumers of biomass energy, both in absolute terms and as a percentage of total energy
consumption (NU 2009; IEA 2010b; BM 2011; Hannah et al, 2013).
Energy profiles vary from country to country in Central Africa, depending on national wealth, access
to electricity, availability and cost of fossil and wood fuels. In the Democratic Republic of Congo,
renewable fuels and wood waste (mainly firewood and charcoal) accounted for 93% of total energy
consumption in 2008, in a context where less than 12% of the population had access to electricity and
fossil fuels met only 4% of the country's energy needs. In Gabon, dependence on biomass energy is
much less, thanks to a large access to electricity grid and subsidized gas for cooking. In Gabon and the
Republic of Congo, biomass fuels and waste account for just over 50% of energy needs. These
countries also have similar rates of access to electricity, of about 37%. However, access to electricity
is not necessarily a specific indicator of the use of biomass as an energy source. Although access to
electricity is higher in Cameroon (nearly 23% of the population) renewable fuels and forest waste still
account for more than 70% of total energy, which can be explained by the fact that consumers switch
to a relatively cheaper biomass when faced with an increase in the price of fossil fuels (NU 2009; IEA
2010b; BM 2011; Hannah et al, 2013). Table 12 presents general data for target countries in Central
Africa that includes factors that influence energy profiles.
Demand for wood-energy, and charcoal in particular, continues to increase in Central African
countries. This is not surprising given the population growth. Total wood-energy production in 2007
in the countries of the sub-region exceeded 100 million cubic meters, with the main producers being
the Democratic Republic of Congo, with 71% of total regional production, followed by Cameroon (21%)
(NU 2009; IEA 2010b; BM 2011; Hannah et al, 2013).
Coal production in the Central Africa sub-region in 2007 was 2.4 million metric tons, of which nearly
75% came from the Democratic Republic of Congo. Cameroon is next with almost 10% of the sub-
region's production, but per capita charcoal consumption is relatively low compared to other countries
(Behrendt, Megevand, & Sander, 2013).
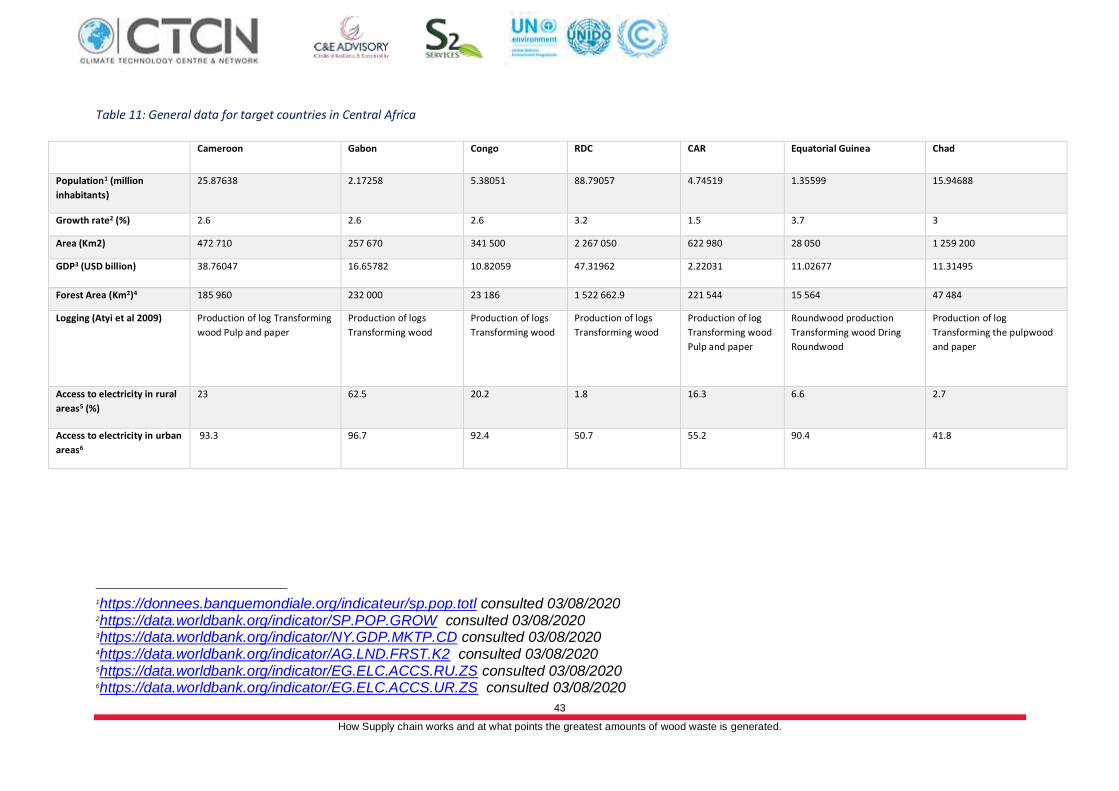
43
How Supply chain works and at what points the greatest amounts of wood waste is generated.
Table 11: General data for target countries in Central Africa
Cameroon Gabon Congo RDC CAR Equatorial Guinea Chad
Population1 (million
inhabitants)
25.87638 2.17258 5.38051 88.79057 4.74519 1.35599 15.94688
Growth rate2 (%) 2.6 2.6 2.6 3.2 1.5 3.7 3
Area (Km2) 472 710 257 670 341 500 2 267 050 622 980 28 050 1 259 200
GDP3 (USD billion) 38.76047 16.65782 10.82059 47.31962 2.22031 11.02677 11.31495
Forest Area (Km2)4 185 960 232 000 23 186 1 522 662.9 221 544 15 564 47 484
Logging (Atyi et al 2009) Production of log Transforming
wood Pulp and paper
Production of logs
Transforming wood
Production of logs
Transforming wood
Production of logs
Transforming wood
Production of log
Transforming wood
Pulp and paper
Roundwood production
Transforming wood Dring
Roundwood
Production of log
Transforming the pulpwood
and paper
Access to electricity in rural
areas5 (%)
23 62.5 20.2 1.8 16.3 6.6 2.7
Access to electricity in urban
areas6
93.3 96.7 92.4 50.7 55.2 90.4 41.8
1https://donnees.banquemondiale.org/indicateur/sp.pop.totl consulted 03/08/2020
2https://data.worldbank.org/indicator/SP.POP.GROW consulted 03/08/2020
3https://data.worldbank.org/indicator/NY.GDP.MKTP.CD consulted 03/08/2020
4https://data.worldbank.org/indicator/AG.LND.FRST.K2 consulted 03/08/2020
5https://data.worldbank.org/indicator/EG.ELC.ACCS.RU.ZS consulted 03/08/2020
6https://data.worldbank.org/indicator/EG.ELC.ACCS.UR.ZS consulted 03/08/2020
44
How Supply chain works and at what points the greatest amounts of wood waste is generated.
Renewable Energy Sources
(WhitePaper)
Biomass
Solar
Wind
Hydro
Biomass
Solar
Wind
Hydro
Biomass
Solar
Wind
Hydro
Biomass
Solar
Wind
Hydro
Biomass
Solar
Wind
Hydro
Biomass
Solar
Wind
Hydro
Biomass
Solar
Wind
Hydro
45
How Supply chain works and at what points the greatest amounts of wood waste is generated.
3.1.2 West Africa
3.1.2.1 General
In the ECOWAS (Economic Community of West African States) area, the extent of forest resources is
estimated at 66.85 million ha, i.e. about 14% of the total area of the 15 ECOWAS States (FAO 2015).
These forest resources undoubtedly constitute the main source of supply of fuelwood, service wood,
timber and roundwood for export for a population estimated at almost 356 million inhabitants
(ECOWAS 2016). They also provide these populations with various Non-Timber Forest Products
(NTFPs) that contribute to the improvement of food security, health, and household incomes.
With regard to the state of bioenergy, on the specific level of cooking energy, the Center for
Renewable Energy and Energy Efficiency (ECREEE) of ECOWAS estimates that 80% to 95% of the
population in this area still use traditional biomass for cooking (ECREEE 2015), often unsustainably
with inefficient stoves. As a result, the cost of cooking fuels continues to rise and the unsustainable
supply chains for firewood lead to environmental degradation and deforestation, especially in areas
close to urban centres. The alarming degradation of forests and their resources makes this energy
dependence precarious and poses a threat to the entire sub-region if no action is taken to reverse the
trend.
In a highly degraded state due to several natural and anthropogenic factors, forests in the ECOWAS
space experienced an annual deforestation level of about 652,000 ha during the 2010-2015 period,
i.e. a 1.08% forest loss (FAO 2015). In terms of forest exploitation, in almost all the countries in the
region there is a lack of organisation of the different production chains (timber, fuelwood, NTFPs, etc.)
which results in the non-professionalization of the actors (except for timber). However, in recent years
and following a gradual awareness among States, significant efforts have been made to increasingly
ensure sustainable management of forests in the sub-region by improving forest exploitation,
improving knowledge of potential, making better use of geomatics for forest management, drawing
up forest development and management plans and defining exploitation standards, improving
monitoring of the implementation of management plans, improving the participation of the
populations, etc.
The total production of wood energy is experiencing a progressive upward trend in all ECOWAS
countries. The largest producers of wood energy remain, in order, Nigeria (almost 70,500,000 m3 in
2005), Ghana, Guinea, Côte d'Ivoire, Burkina Faso, Sierra Leone and Senegal. Guinea Bissau, Gambia
and Cape Verde have the lowest production. The production of woodfuel remains strongly correlated
with its consumption of woodfuel and therefore with the demographic weight of the countries. Wood
energy is also an export product, notably charcoal. Charcoal is indeed the third largest export product
for countries in the sub-region, not counting unrecorded cross-border trade. While industrial wood is
mainly shipped to Europe and Asia, most of the cross-border movement of wood energy takes place
within the countries in the region.
The analysis of wood energy supply/demand shows that the supply of wood energy to the countries
in this area is not sustainable because there is a progressive degradation of the resource. The demand
46
How Supply chain works and at what points the greatest amounts of wood waste is generated.
for wood energy is growing and is maintained by: (i) population growth, (ii) the rate of urbanization,
(iii) cooking practices based on wood energy, and (iv); and the accessibility of wood energy
(availability, price, etc.).
Aware of the unsustainable supply of wood energy due to unsustainable harvesting, countries have
developed projects and programmes to disseminate improved stoves to increase energy efficiency in
the sector. The outputs are often mixed at the country level, especially in the introduction of more
efficient charcoal grinders. At the same time, alternative energy sources have been promoted in the
region, such as butane gas, kerosene, bio-coal, etc., without much success. These experiences have
been limited due to various constraints among which we can note (i) the relativity of the efficiency of
equipment (still depending on the level of training of the actors), (ii) the absence or inadequacy of
consensual standards, (iii) the still high prices of equipment and alternative energy sources and (iv);
the irregularity of supply.
Regionally, all ECOWAS countries have a strategy oriented towards the decentralisation of forest
resource management. In the arrangements put in place for decentralised forest management, the
States, decentralised territorial collectivises and grassroots communities, the private sector (forest
operators), civil society and NGOs each play key roles and responsibilities.
Total energy consumption
According to AFREC's7 Energy Information System (EIS), TPEC in the six West African countries in the
study is about 24.6 Mtoe per year (AFREC 2020). Wood and charcoal, used for domestic and
commercial cooking, are the main energy sources and account for 61% of primary energy consumption
(2017 data). Note, however, that biomass consumption in Senegal appears to be underestimated in
these analyses. Modern commercial energy consumption consists of 8 Mtoe of petroleum products
and 1.6 Mtoe of electricity (see Figure 11 below).
7African Energy Commission
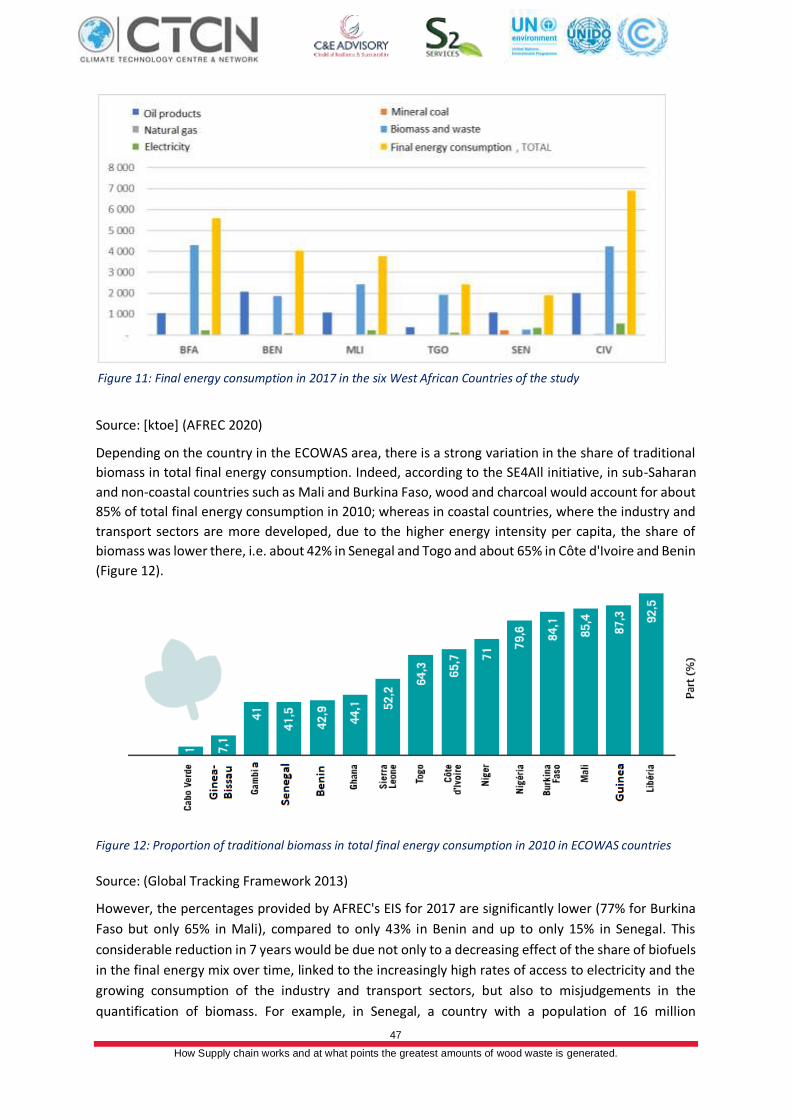
47
How Supply chain works and at what points the greatest amounts of wood waste is generated.
Source: [ktoe] (AFREC 2020)
Depending on the country in the ECOWAS area, there is a strong variation in the share of traditional
biomass in total final energy consumption. Indeed, according to the SE4All initiative, in sub-Saharan
and non-coastal countries such as Mali and Burkina Faso, wood and charcoal would account for about
85% of total final energy consumption in 2010; whereas in coastal countries, where the industry and
transport sectors are more developed, due to the higher energy intensity per capita, the share of
biomass was lower there, i.e. about 42% in Senegal and Togo and about 65% in Côte d'Ivoire and Benin
(Figure 12).
Figure 12: Proportion of traditional biomass in total final energy consumption in 2010 in ECOWAS countries
Source: (Global Tracking Framework 2013)
However, the percentages provided by AFREC's EIS for 2017 are significantly lower (77% for Burkina
Faso but only 65% in Mali), compared to only 43% in Benin and up to only 15% in Senegal. This
considerable reduction in 7 years would be due not only to a decreasing effect of the share of biofuels
in the final energy mix over time, linked to the increasingly high rates of access to electricity and the
growing consumption of the industry and transport sectors, but also to misjudgements in the
quantification of biomass. For example, in Senegal, a country with a population of 16 million
Figure 11: Final energy consumption in 2017 in the six West African Countries of the study
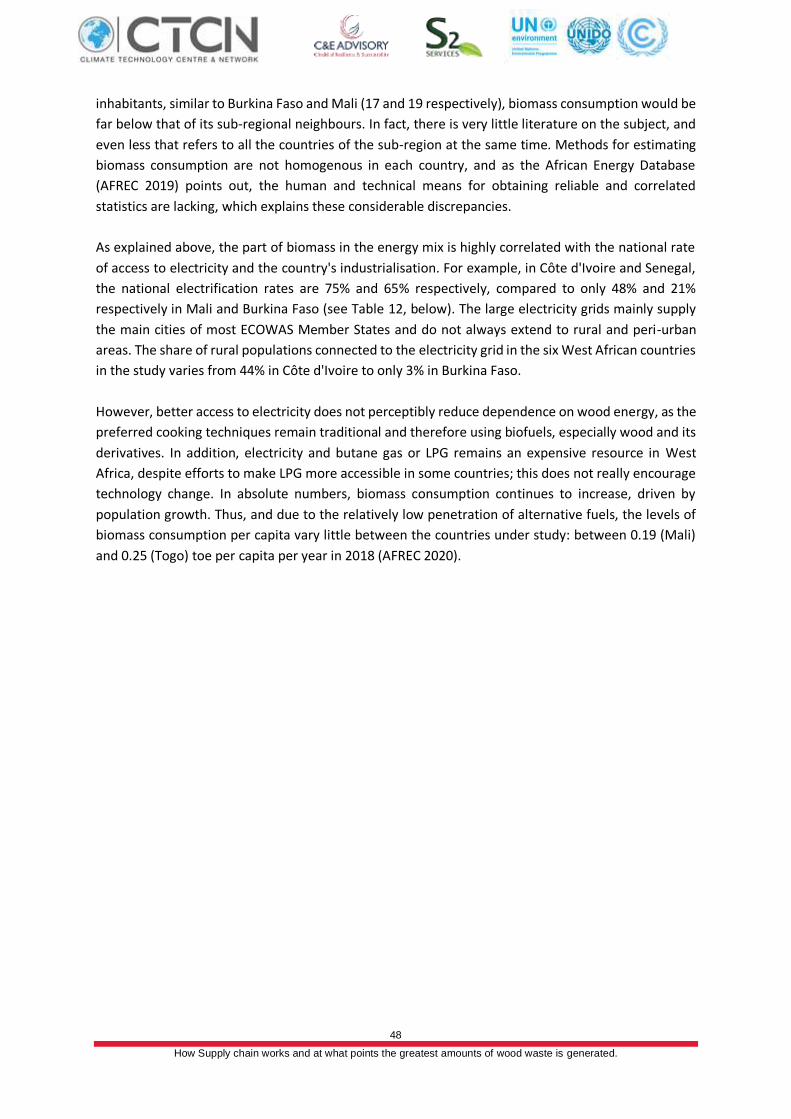
48
How Supply chain works and at what points the greatest amounts of wood waste is generated.
inhabitants, similar to Burkina Faso and Mali (17 and 19 respectively), biomass consumption would be
far below that of its sub-regional neighbours. In fact, there is very little literature on the subject, and
even less that refers to all the countries of the sub-region at the same time. Methods for estimating
biomass consumption are not homogenous in each country, and as the African Energy Database
(AFREC 2019) points out, the human and technical means for obtaining reliable and correlated
statistics are lacking, which explains these considerable discrepancies.
As explained above, the part of biomass in the energy mix is highly correlated with the national rate
of access to electricity and the country's industrialisation. For example, in Côte d'Ivoire and Senegal,
the national electrification rates are 75% and 65% respectively, compared to only 48% and 21%
respectively in Mali and Burkina Faso (see Table 12, below). The large electricity grids mainly supply
the main cities of most ECOWAS Member States and do not always extend to rural and peri-urban
areas. The share of rural populations connected to the electricity grid in the six West African countries
in the study varies from 44% in Côte d'Ivoire to only 3% in Burkina Faso.
However, better access to electricity does not perceptibly reduce dependence on wood energy, as the
preferred cooking techniques remain traditional and therefore using biofuels, especially wood and its
derivatives. In addition, electricity and butane gas or LPG remains an expensive resource in West
Africa, despite efforts to make LPG more accessible in some countries; this does not really encourage
technology change. In absolute numbers, biomass consumption continues to increase, driven by
population growth. Thus, and due to the relatively low penetration of alternative fuels, the levels of
biomass consumption per capita vary little between the countries under study: between 0.19 (Mali)
and 0.25 (Togo) toe per capita per year in 2018 (AFREC 2020).
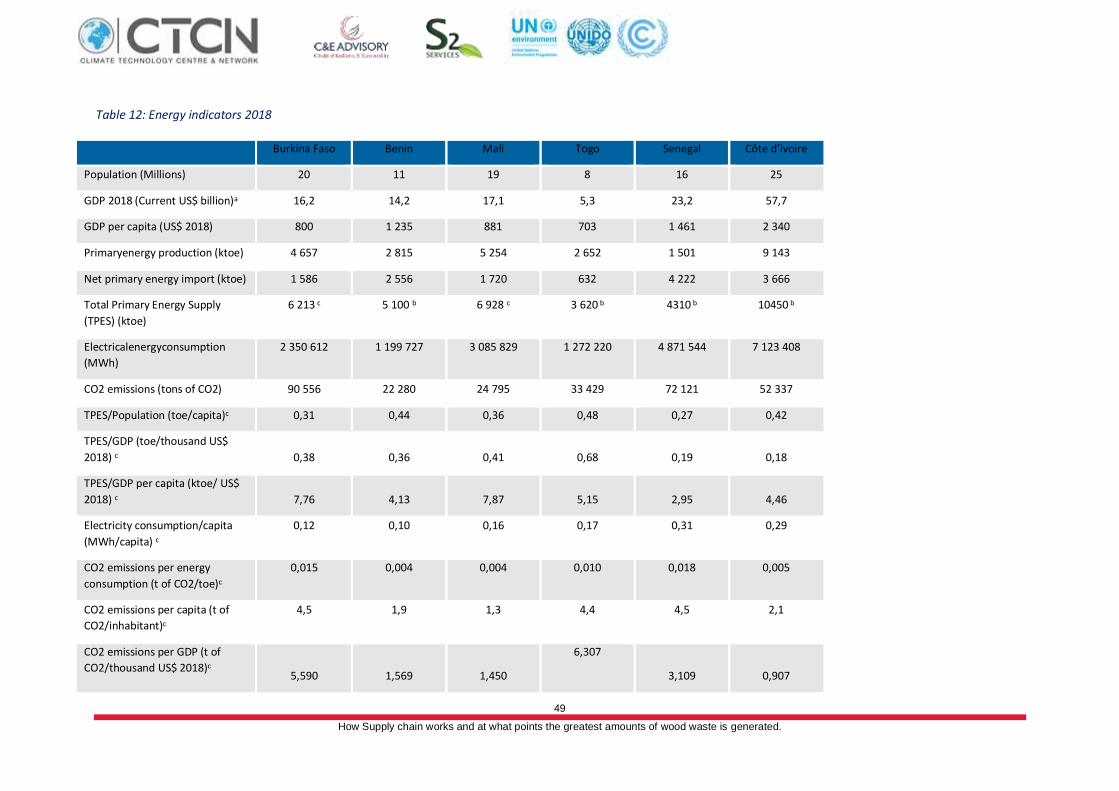
49
How Supply chain works and at what points the greatest amounts of wood waste is generated.
Table 12: Energy indicators 2018
Burkina Faso Benin Mali Togo Senegal Côte d’ivoire
Population (Millions) 20 11 19 8 16 25
GDP 2018 (Current US$ billion)a 16,2 14,2 17,1 5,3 23,2 57,7
GDP per capita (US$ 2018) 800 1 235 881 703 1 461 2 340
Primaryenergy production (ktoe) 4 657 2 815 5 254 2 652 1 501 9 143
Net primary energy import (ktoe) 1 586 2 556 1 720 632 4 222 3 666
Total Primary Energy Supply
(TPES) (ktoe)
6 213 c 5 100 b 6 928 c 3 620 b 4310 b 10450 b
Electricalenergyconsumption
(MWh)
2 350 612 1 199 727 3 085 829 1 272 220 4 871 544 7 123 408
CO2 emissions (tons of CO2) 90 556 22 280 24 795 33 429 72 121 52 337
TPES/Population (toe/capita)c 0,31 0,44 0,36 0,48 0,27 0,42
TPES/GDP (toe/thousand US$
2018) c 0,38 0,36 0,41 0,68 0,19 0,18
TPES/GDP per capita (ktoe/ US$
2018) c 7,76 4,13 7,87 5,15 2,95 4,46
Electricity consumption/capita
(MWh/capita) c
0,12 0,10 0,16 0,17 0,31 0,29
CO2 emissions per energy
consumption (t of CO2/toe)c
0,015 0,004 0,004 0,010 0,018 0,005
CO2 emissions per capita (t of
CO2/inhabitant)c
4,5 1,9 1,3 4,4 4,5 2,1
CO2 emissions per GDP (t of
CO2/thousand US$ 2018)c 5,590 1,569 1,450
6,307
3,109 0,907
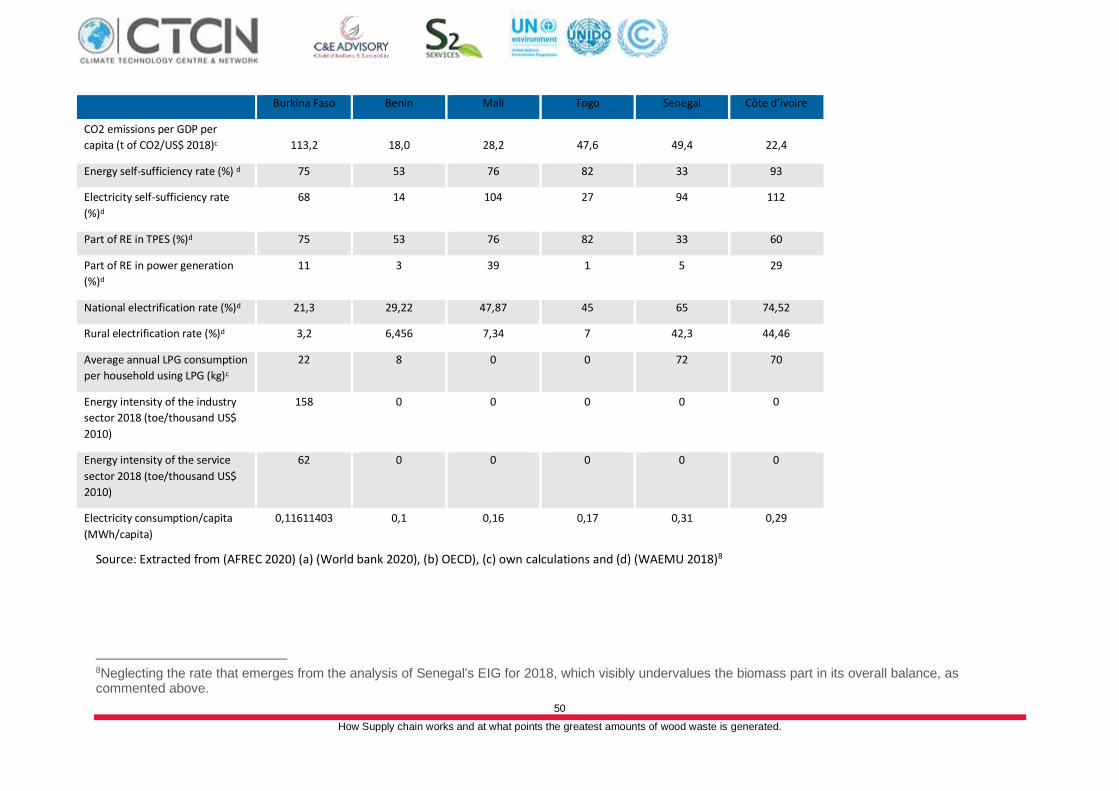
50
How Supply chain works and at what points the greatest amounts of wood waste is generated.
Burkina Faso Benin Mali Togo Senegal Côte d’ivoire
CO2 emissions per GDP per
capita (t of CO2/US$ 2018)c 113,2 18,0 28,2 47,6 49,4 22,4
Energy self-sufficiency rate (%) d 75 53 76 82 33 93
Electricity self-sufficiency rate
(%)d
68 14 104 27 94 112
Part of RE in TPES (%)d 75 53 76 82 33 60
Part of RE in power generation
(%)d
11 3 39 1 5 29
National electrification rate (%)d 21,3 29,22 47,87 45 65 74,52
Rural electrification rate (%)d 3,2 6,456 7,34 7 42,3 44,46
Average annual LPG consumption
per household using LPG (kg)c
22 8 0 0 72 70
Energy intensity of the industry
sector 2018 (toe/thousand US$
2010)
158 0 0 0 0 0
Energy intensity of the service
sector 2018 (toe/thousand US$
2010)
62 0 0 0 0 0
Electricity consumption/capita
(MWh/capita)
0,11611403 0,1 0,16 0,17 0,31 0,29
Source: Extracted from (AFREC 2020) (a) (World bank 2020), (b) OECD), (c) own calculations and (d) (WAEMU 2018)8
8Neglecting the rate that emerges from the analysis of Senegal's EIG for 2018, which visibly undervalues the biomass part in its overall balance, as commented above.
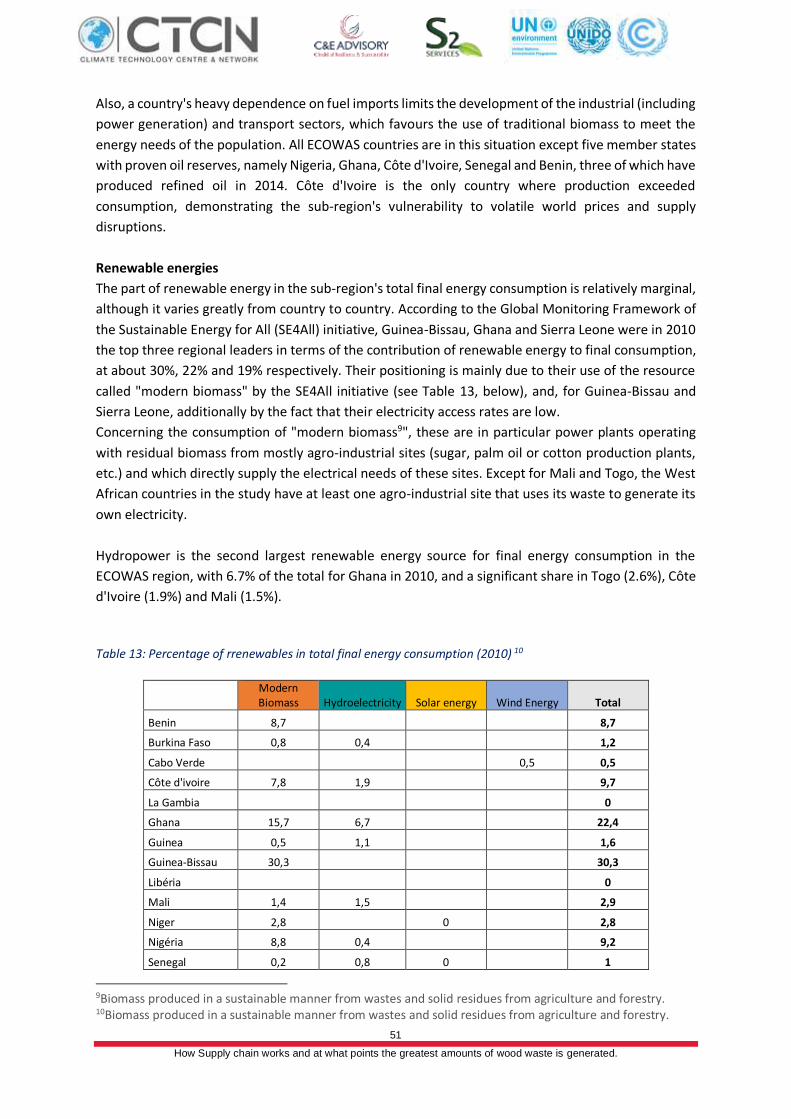
51
How Supply chain works and at what points the greatest amounts of wood waste is generated.
Also, a country's heavy dependence on fuel imports limits the development of the industrial (including
power generation) and transport sectors, which favours the use of traditional biomass to meet the
energy needs of the population. All ECOWAS countries are in this situation except five member states
with proven oil reserves, namely Nigeria, Ghana, Côte d'Ivoire, Senegal and Benin, three of which have
produced refined oil in 2014. Côte d'Ivoire is the only country where production exceeded
consumption, demonstrating the sub-region's vulnerability to volatile world prices and supply
disruptions.
Renewable energies
The part of renewable energy in the sub-region's total final energy consumption is relatively marginal,
although it varies greatly from country to country. According to the Global Monitoring Framework of
the Sustainable Energy for All (SE4All) initiative, Guinea-Bissau, Ghana and Sierra Leone were in 2010
the top three regional leaders in terms of the contribution of renewable energy to final consumption,
at about 30%, 22% and 19% respectively. Their positioning is mainly due to their use of the resource
called "modern biomass" by the SE4All initiative (see Table 13, below), and, for Guinea-Bissau and
Sierra Leone, additionally by the fact that their electricity access rates are low.
Concerning the consumption of "modern biomass9", these are in particular power plants operating
with residual biomass from mostly agro-industrial sites (sugar, palm oil or cotton production plants,
etc.) and which directly supply the electrical needs of these sites. Except for Mali and Togo, the West
African countries in the study have at least one agro-industrial site that uses its waste to generate its
own electricity.
Hydropower is the second largest renewable energy source for final energy consumption in the
ECOWAS region, with 6.7% of the total for Ghana in 2010, and a significant share in Togo (2.6%), Côte
d'Ivoire (1.9%) and Mali (1.5%).
Table 13: Percentage of rrenewables in total final energy consumption (2010) 10
Modern Biomass Hydroelectricity Solar energy Wind Energy Total
Benin 8,7 8,7
Burkina Faso 0,8 0,4 1,2
Cabo Verde 0,5 0,5
Côte d'ivoire 7,8 1,9 9,7
La Gambia 0
Ghana 15,7 6,7 22,4
Guinea 0,5 1,1 1,6
Guinea-Bissau 30,3 30,3
Libéria 0
Mali 1,4 1,5 2,9
Niger 2,8 0 2,8
Nigéria 8,8 0,4 9,2
Senegal 0,2 0,8 0 1
9Biomass produced in a sustainable manner from wastes and solid residues from agriculture and forestry. 10Biomass produced in a sustainable manner from wastes and solid residues from agriculture and forestry.
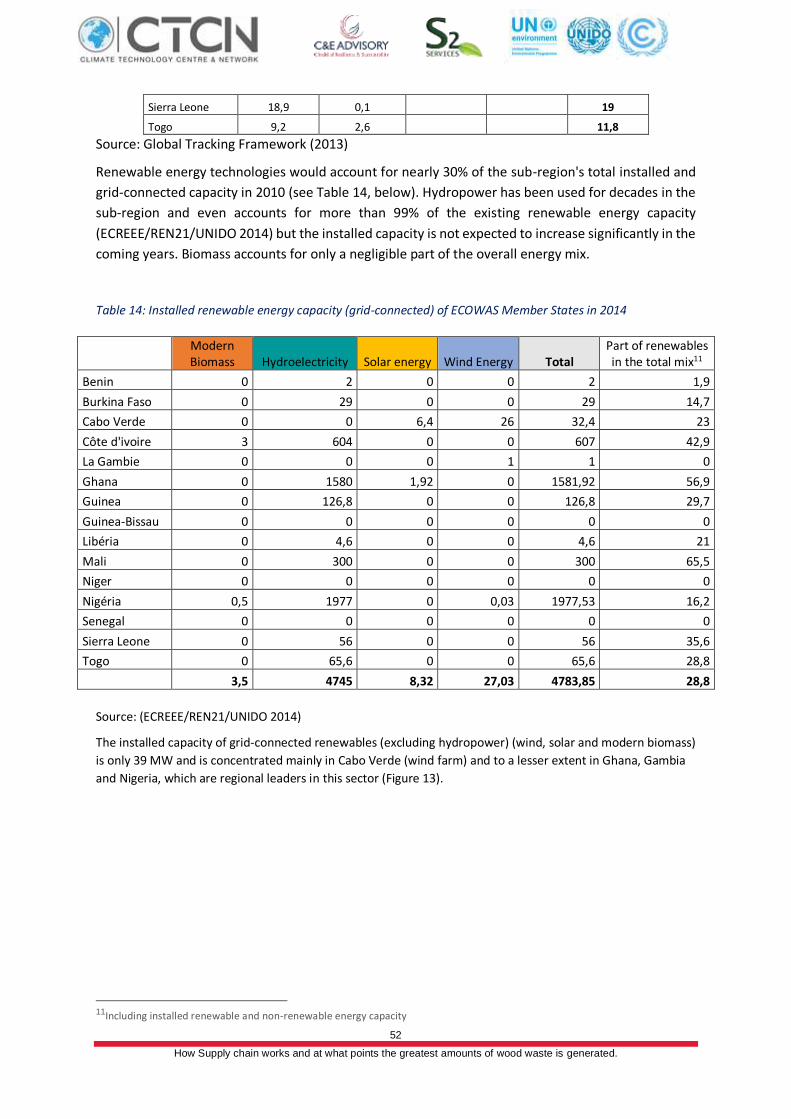
52
How Supply chain works and at what points the greatest amounts of wood waste is generated.
Sierra Leone 18,9 0,1 19
Togo 9,2 2,6 11,8
Source: Global Tracking Framework (2013)
Renewable energy technologies would account for nearly 30% of the sub-region's total installed and
grid-connected capacity in 2010 (see Table 14, below). Hydropower has been used for decades in the
sub-region and even accounts for more than 99% of the existing renewable energy capacity
(ECREEE/REN21/UNIDO 2014) but the installed capacity is not expected to increase significantly in the
coming years. Biomass accounts for only a negligible part of the overall energy mix.
Table 14: Installed renewable energy capacity (grid-connected) of ECOWAS Member States in 2014
Modern Biomass Hydroelectricity Solar energy Wind Energy Total
Part of renewables in the total mix11
Benin 0 2 0 0 2 1,9
Burkina Faso 0 29 0 0 29 14,7
Cabo Verde 0 0 6,4 26 32,4 23
Côte d'ivoire 3 604 0 0 607 42,9
La Gambie 0 0 0 1 1 0
Ghana 0 1580 1,92 0 1581,92 56,9
Guinea 0 126,8 0 0 126,8 29,7
Guinea-Bissau 0 0 0 0 0 0
Libéria 0 4,6 0 0 4,6 21
Mali 0 300 0 0 300 65,5
Niger 0 0 0 0 0 0
Nigéria 0,5 1977 0 0,03 1977,53 16,2
Senegal 0 0 0 0 0 0
Sierra Leone 0 56 0 0 56 35,6
Togo 0 65,6 0 0 65,6 28,8
3,5 4745 8,32 27,03 4783,85 28,8
Source: (ECREEE/REN21/UNIDO 2014)
The installed capacity of grid-connected renewables (excluding hydropower) (wind, solar and modern biomass)
is only 39 MW and is concentrated mainly in Cabo Verde (wind farm) and to a lesser extent in Ghana, Gambia
and Nigeria, which are regional leaders in this sector (Figure 13).
11Including installed renewable and non-renewable energy capacity
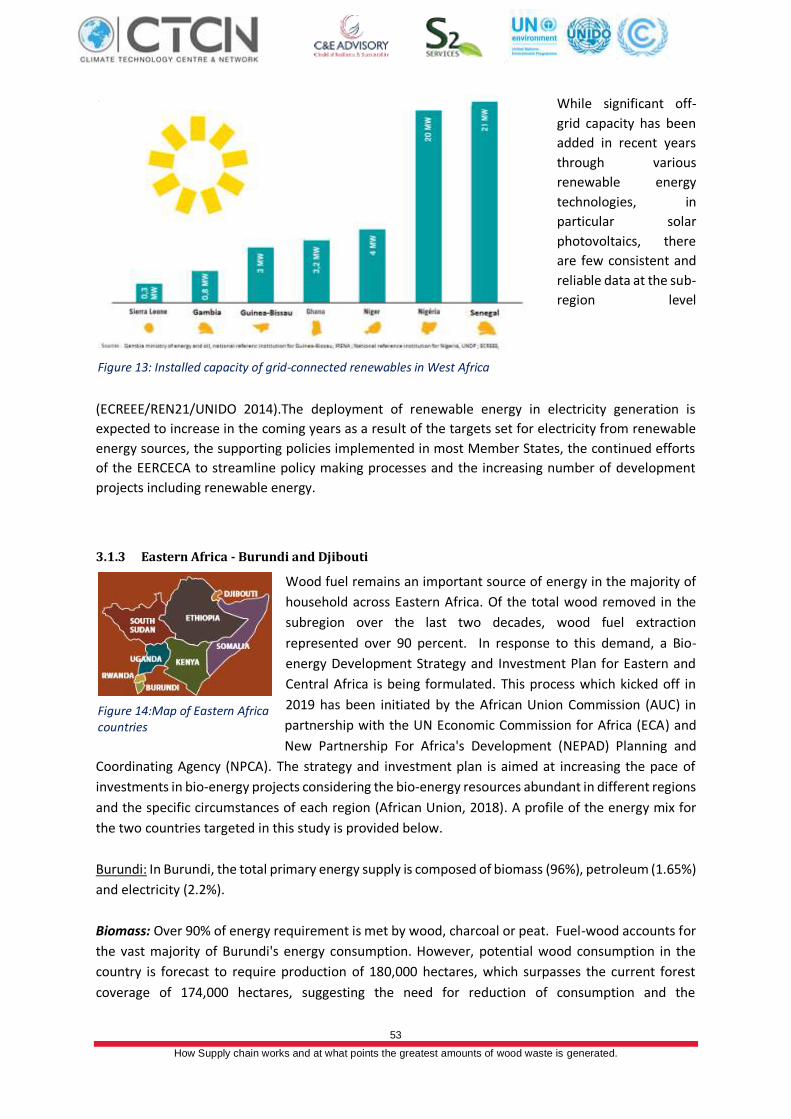
53
How Supply chain works and at what points the greatest amounts of wood waste is generated.
While significant off-
grid capacity has been
added in recent years
through various
renewable energy
technologies, in
particular solar
photovoltaics, there
are few consistent and
reliable data at the sub-
region level
(ECREEE/REN21/UNIDO 2014).The deployment of renewable energy in electricity generation is
expected to increase in the coming years as a result of the targets set for electricity from renewable
energy sources, the supporting policies implemented in most Member States, the continued efforts
of the EERCECA to streamline policy making processes and the increasing number of development
projects including renewable energy.
3.1.3 Eastern Africa - Burundi and Djibouti
Wood fuel remains an important source of energy in the majority of
household across Eastern Africa. Of the total wood removed in the
subregion over the last two decades, wood fuel extraction
represented over 90 percent. In response to this demand, a Bio-
energy Development Strategy and Investment Plan for Eastern and
Central Africa is being formulated. This process which kicked off in
2019 has been initiated by the African Union Commission (AUC) in
partnership with the UN Economic Commission for Africa (ECA) and
New Partnership For Africa's Development (NEPAD) Planning and
Coordinating Agency (NPCA). The strategy and investment plan is aimed at increasing the pace of
investments in bio-energy projects considering the bio-energy resources abundant in different regions
and the specific circumstances of each region (African Union, 2018). A profile of the energy mix for
the two countries targeted in this study is provided below.
Burundi: In Burundi, the total primary energy supply is composed of biomass (96%), petroleum (1.65%)
and electricity (2.2%).
Biomass: Over 90% of energy requirement is met by wood, charcoal or peat. Fuel-wood accounts for
the vast majority of Burundi's energy consumption. However, potential wood consumption in the
country is forecast to require production of 180,000 hectares, which surpasses the current forest
coverage of 174,000 hectares, suggesting the need for reduction of consumption and the
Figure 13: Installed capacity of grid-connected renewables in West Africa
Figure 14:Map of Eastern Africa countries
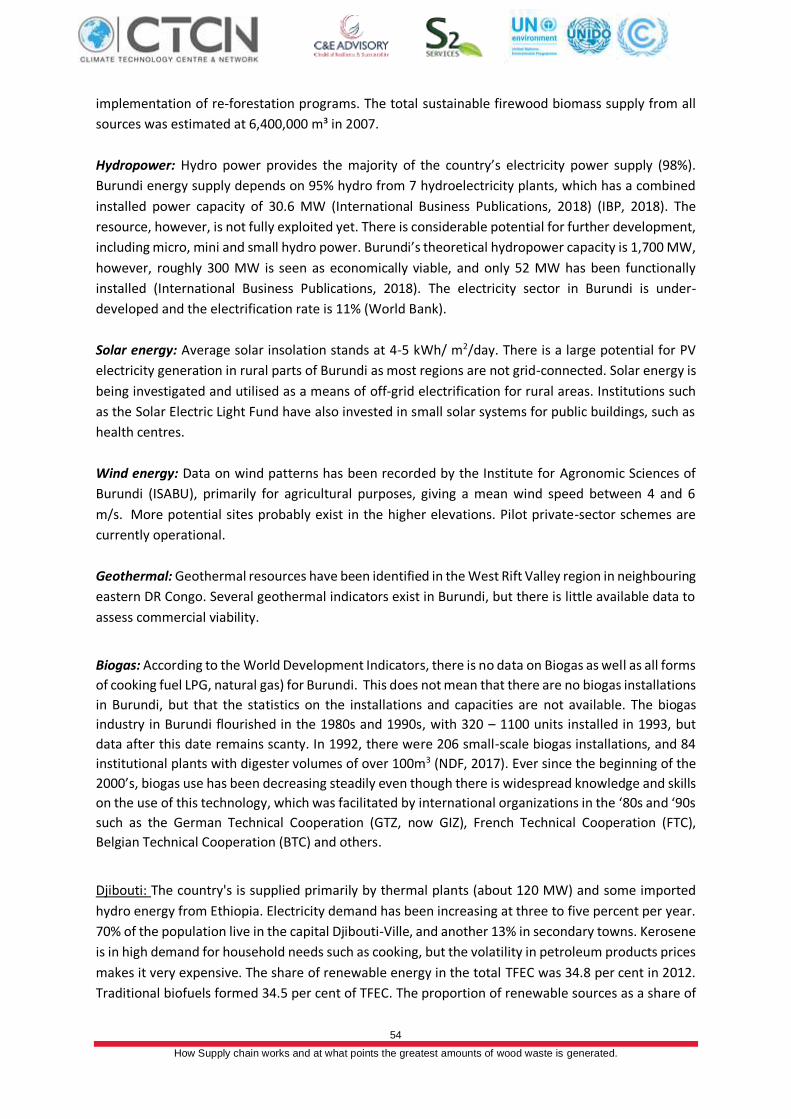
54
How Supply chain works and at what points the greatest amounts of wood waste is generated.
implementation of re-forestation programs. The total sustainable firewood biomass supply from all
sources was estimated at 6,400,000 m³ in 2007.
Hydropower: Hydro power provides the majority of the country’s electricity power supply (98%).
Burundi energy supply depends on 95% hydro from 7 hydroelectricity plants, which has a combined
installed power capacity of 30.6 MW (International Business Publications, 2018) (IBP, 2018). The
resource, however, is not fully exploited yet. There is considerable potential for further development,
including micro, mini and small hydro power. Burundi’s theoretical hydropower capacity is 1,700 MW,
however, roughly 300 MW is seen as economically viable, and only 52 MW has been functionally
installed (International Business Publications, 2018). The electricity sector in Burundi is under-
developed and the electrification rate is 11% (World Bank).
Solar energy: Average solar insolation stands at 4-5 kWh/ m2/day. There is a large potential for PV
electricity generation in rural parts of Burundi as most regions are not grid-connected. Solar energy is
being investigated and utilised as a means of off-grid electrification for rural areas. Institutions such
as the Solar Electric Light Fund have also invested in small solar systems for public buildings, such as
health centres.
Wind energy: Data on wind patterns has been recorded by the Institute for Agronomic Sciences of
Burundi (ISABU), primarily for agricultural purposes, giving a mean wind speed between 4 and 6
m/s. More potential sites probably exist in the higher elevations. Pilot private-sector schemes are
currently operational.
Geothermal: Geothermal resources have been identified in the West Rift Valley region in neighbouring
eastern DR Congo. Several geothermal indicators exist in Burundi, but there is little available data to
assess commercial viability.
Biogas: According to the World Development Indicators, there is no data on Biogas as well as all forms
of cooking fuel LPG, natural gas) for Burundi. This does not mean that there are no biogas installations
in Burundi, but that the statistics on the installations and capacities are not available. The biogas
industry in Burundi flourished in the 1980s and 1990s, with 320 – 1100 units installed in 1993, but
data after this date remains scanty. In 1992, there were 206 small-scale biogas installations, and 84
institutional plants with digester volumes of over 100m3 (NDF, 2017). Ever since the beginning of the
2000’s, biogas use has been decreasing steadily even though there is widespread knowledge and skills
on the use of this technology, which was facilitated by international organizations in the ‘80s and ‘90s
such as the German Technical Cooperation (GTZ, now GIZ), French Technical Cooperation (FTC),
Belgian Technical Cooperation (BTC) and others.
Djibouti: The country's is supplied primarily by thermal plants (about 120 MW) and some imported
hydro energy from Ethiopia. Electricity demand has been increasing at three to five percent per year.
70% of the population live in the capital Djibouti-Ville, and another 13% in secondary towns. Kerosene
is in high demand for household needs such as cooking, but the volatility in petroleum products prices
makes it very expensive. The share of renewable energy in the total TFEC was 34.8 per cent in 2012.
Traditional biofuels formed 34.5 per cent of TFEC. The proportion of renewable sources as a share of
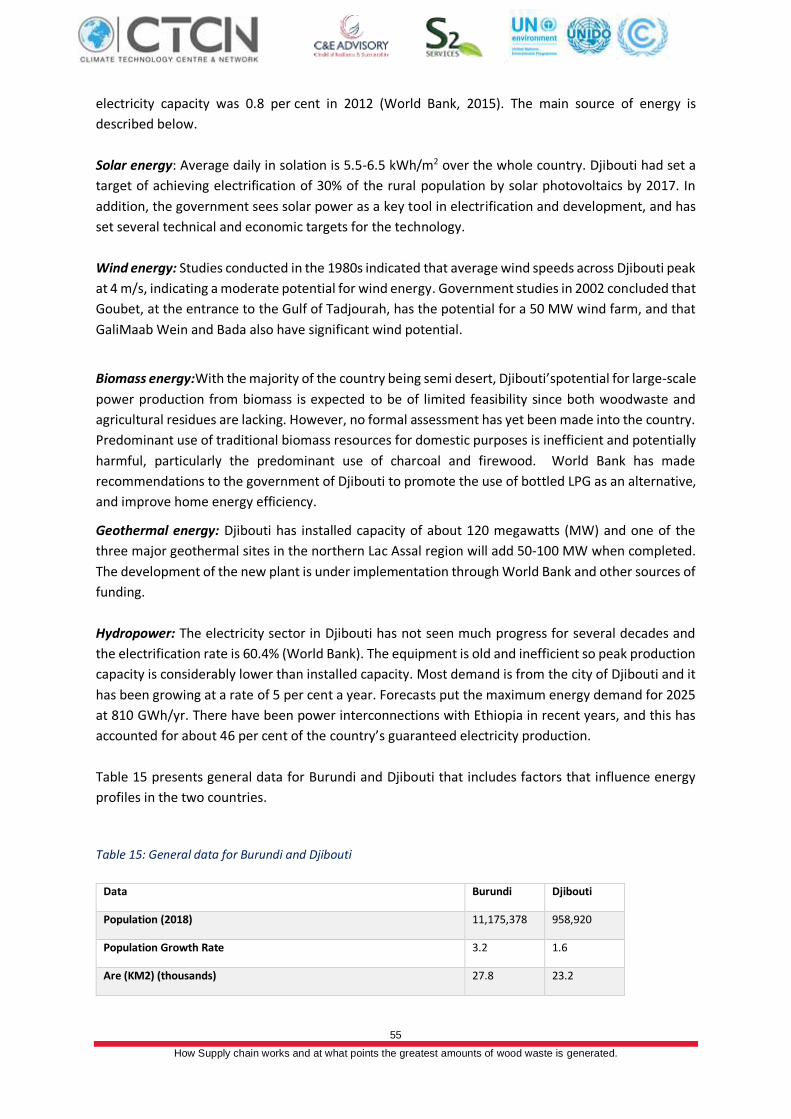
55
How Supply chain works and at what points the greatest amounts of wood waste is generated.
electricity capacity was 0.8 per cent in 2012 (World Bank, 2015). The main source of energy is
described below.
Solar energy: Average daily in solation is 5.5-6.5 kWh/m2 over the whole country. Djibouti had set a
target of achieving electrification of 30% of the rural population by solar photovoltaics by 2017. In
addition, the government sees solar power as a key tool in electrification and development, and has
set several technical and economic targets for the technology.
Wind energy: Studies conducted in the 1980s indicated that average wind speeds across Djibouti peak
at 4 m/s, indicating a moderate potential for wind energy. Government studies in 2002 concluded that
Goubet, at the entrance to the Gulf of Tadjourah, has the potential for a 50 MW wind farm, and that
GaliMaab Wein and Bada also have significant wind potential.
Biomass energy:With the majority of the country being semi desert, Djibouti’spotential for large-scale
power production from biomass is expected to be of limited feasibility since both woodwaste and
agricultural residues are lacking. However, no formal assessment has yet been made into the country.
Predominant use of traditional biomass resources for domestic purposes is inefficient and potentially
harmful, particularly the predominant use of charcoal and firewood. World Bank has made
recommendations to the government of Djibouti to promote the use of bottled LPG as an alternative,
and improve home energy efficiency.
Geothermal energy: Djibouti has installed capacity of about 120 megawatts (MW) and one of the
three major geothermal sites in the northern Lac Assal region will add 50-100 MW when completed.
The development of the new plant is under implementation through World Bank and other sources of
funding.
Hydropower: The electricity sector in Djibouti has not seen much progress for several decades and
the electrification rate is 60.4% (World Bank). The equipment is old and inefficient so peak production
capacity is considerably lower than installed capacity. Most demand is from the city of Djibouti and it
has been growing at a rate of 5 per cent a year. Forecasts put the maximum energy demand for 2025
at 810 GWh/yr. There have been power interconnections with Ethiopia in recent years, and this has
accounted for about 46 per cent of the country’s guaranteed electricity production.
Table 15 presents general data for Burundi and Djibouti that includes factors that influence energy
profiles in the two countries.
Table 15: General data for Burundi and Djibouti
Data Burundi Djibouti
Population (2018) 11,175,378 958,920
Population Growth Rate 3.2 1.6
Are (KM2) (thousands) 27.8 23.2
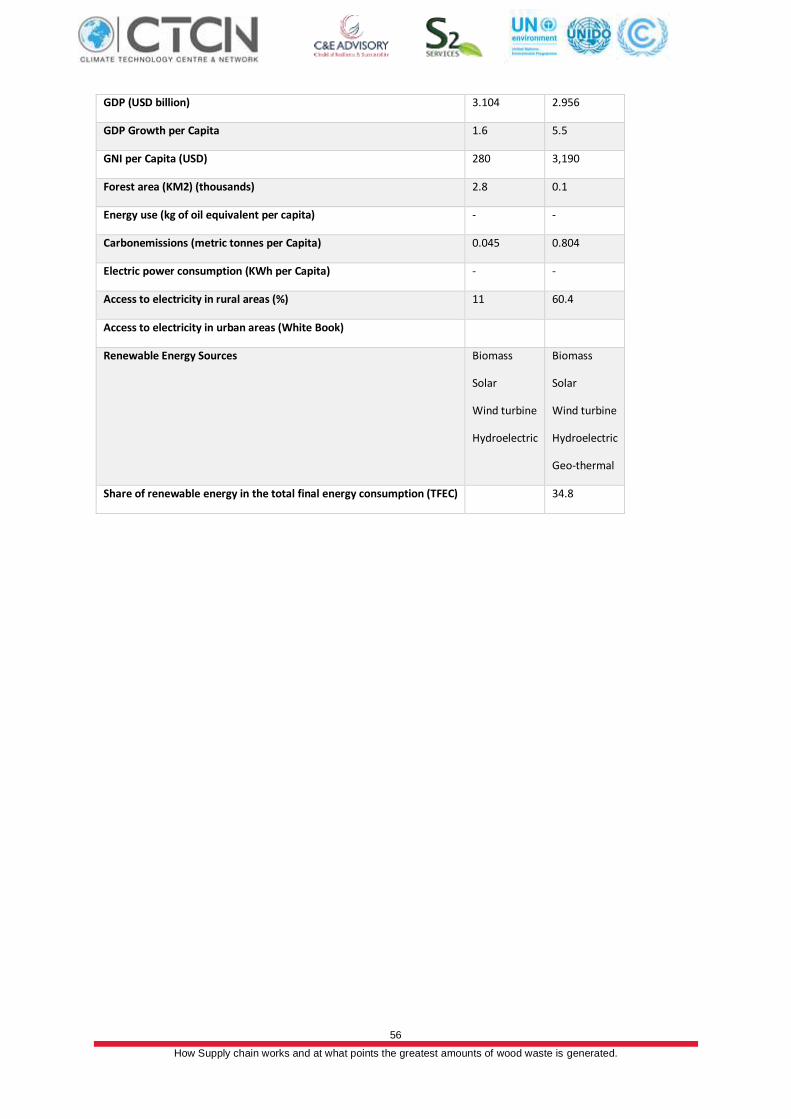
56
How Supply chain works and at what points the greatest amounts of wood waste is generated.
GDP (USD billion) 3.104 2.956
GDP Growth per Capita 1.6 5.5
GNI per Capita (USD) 280 3,190
Forest area (KM2) (thousands) 2.8 0.1
Energy use (kg of oil equivalent per capita) - -
Carbonemissions (metric tonnes per Capita) 0.045 0.804
Electric power consumption (KWh per Capita) - -
Access to electricity in rural areas (%) 11 60.4
Access to electricity in urban areas (White Book)
Renewable Energy Sources Biomass
Solar
Wind turbine
Hydroelectric
Biomass
Solar
Wind turbine
Hydroelectric
Geo-thermal
Share of renewable energy in the total final energy consumption (TFEC)
34.8
57
How Supply chain works and at what points the greatest amounts of wood waste is generated.
4 FOREST BIOMASS RESIDUES: KEY PLAYERS AND SOURCES OF RESIDUES
Because of its diverse resources, the forest value chains involve multiple actors, at varying levels and
with interests more often divergent than converging. The identification of actors is necessary for the
development of any sustainable management approach to the forests. These actors are involved in
the entire forest resource management process from decision-making to implementation and
evaluation and monitoring. A good understanding of the interactions between the different actors and
their implications in forest resource management require an analysis of the forest value chain in the
formal and informal sectors.
4.1 Central Africa
4.1.1 Forest value chain in Central Africa
The forests of the Congo Basin are increasingly integrated into global value chains, which in addition
promote sustainable forestry management, providing opportunities to integrate into the global
economy. Overall, forest management actors were categorized into several categories under the
FORAFRI (Programme de capitalisation et transfert des résultats des recherches menées dans les
forêts denses humides d’Afrique) project between 1996-2002. These potential players are either
directly or indirectly involved in the forest biomass of Central Africa:
- Management actors: Water and forest administration and environment, public or para public
Organization, private industrial organization, private artisanal organization, NGOs, people,
natural resource management communities.
- Training: Universities, forestry and environmental colleges and schools.
- Financing actors: multilateral donors, bilateral and national donors.
- Research actors: institutes, forestry schools, universities, researchcentres, etc.
- Advisory support players: private companies and design offices, international organizations
and NGOs Networks, etc.
- Political actors.
- Exploitation actors: These are actors who are directly involved in the management of forest
biomass sources, biomass harvesting, primary processing, and secondary processing and are
present in consumption sites.
The value chain of all Central African countries have common forest products. The three key markets
are the Asian, European and African markets. This value chain represents all stakeholders (actors)
involved in the forestry sector. It includes players ranging from production to consumption of forest
products through, operators, processors, transporters and merchants. Figure 15 summarizes all the
players and their activities and the resulting products.
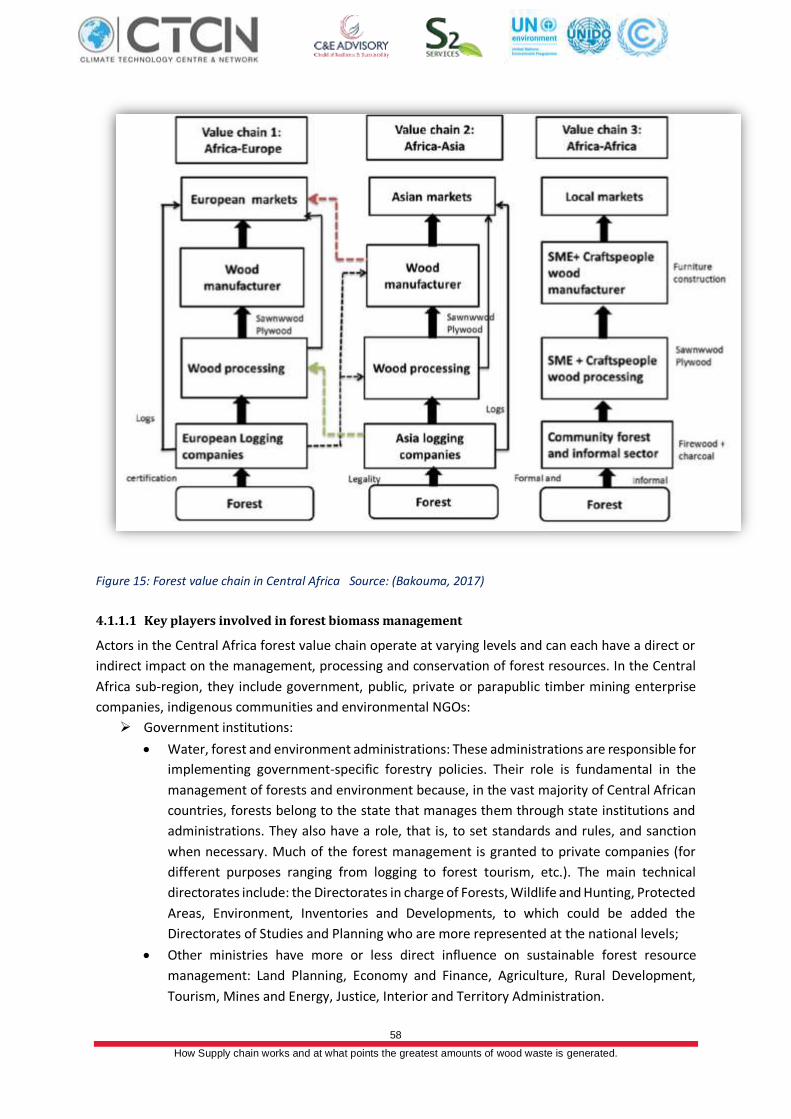
58
How Supply chain works and at what points the greatest amounts of wood waste is generated.
Figure 15: Forest value chain in Central Africa Source: (Bakouma, 2017)
4.1.1.1 Key players involved in forest biomass management
Actors in the Central Africa forest value chain operate at varying levels and can each have a direct or
indirect impact on the management, processing and conservation of forest resources. In the Central
Africa sub-region, they include government, public, private or parapublic timber mining enterprise
companies, indigenous communities and environmental NGOs:
➢ Government institutions:
• Water, forest and environment administrations: These administrations are responsible for
implementing government-specific forestry policies. Their role is fundamental in the
management of forests and environment because, in the vast majority of Central African
countries, forests belong to the state that manages them through state institutions and
administrations. They also have a role, that is, to set standards and rules, and sanction
when necessary. Much of the forest management is granted to private companies (for
different purposes ranging from logging to forest tourism, etc.). The main technical
directorates include: the Directorates in charge of Forests, Wildlife and Hunting, Protected
Areas, Environment, Inventories and Developments, to which could be added the
Directorates of Studies and Planning who are more represented at the national levels;
• Other ministries have more or less direct influence on sustainable forest resource
management: Land Planning, Economy and Finance, Agriculture, Rural Development,
Tourism, Mines and Energy, Justice, Interior and Territory Administration.
59
How Supply chain works and at what points the greatest amounts of wood waste is generated.
➢ Public and parapublic bodies: The management of protected areas is most often entrusted to
public or parapublic bodies that have management independence. They are involved not only
in the management of protected areas but also in the management of the activities of the
wood subsidiary as well as public works. The agencies provide the public service (management
of national parks, public works, scholarships and internships, activities of the wood sector...).
➢ Private mining companies: The logging sector is one of the engines of the national economies
of Central African countries. Most forest concessions and permits are operated by large
groups of European and Asian origin. The large group includes operators: Danzer, Feldmeyer,
Man Fai Tai, RimbunanHijau, Rougier, Sonae, Thanry and Wijma. Most of them are present in
several countries in the sub-region and operate at the local level. In theory, the role of the
forestry industry is to supply wood. These companies are also committed to the
implementation of a development plan and sustainable operation. This is the case, for
example, of the CEB (Compagnie Equatoriale des Bois), Leroy-Gabon or Rougier based in
Gabon.
➢ Aboriginal communities: The involvement of people in the management of forest resources
can be according to their own initiatives or based on local water and forest management
institutions. These populations are structured in organized groups that are officially in charge
of forest resource management. These groups contribute to the regulation of the use of land
for subsistence and commercial exploitation, as well as in the control of the exogenous
populations involved in the exploitation of cash crops and products (hunting, gathering,
agriculture).
➢ Environmental NGOs: Are directly involved in forest resource management actions. They have
a relay of state action and help fill some gaps (Goyet, 2001). For example, World Wildlife Fund
(WWF) and Wildlife Conservation Society (WCS) are involved in conservation, forest
management and the development of ecotourism. Some national NGOs are involved in the
local and sustainable conservation and development of forests and are organized in a
network, as is the case of the African Forest Action Network (RAAF) which operates beyond
the Congo Basin (CEFDHAC, 2006) (Bakouma, 2017; Moulongui, 2014).
In the Central Africa sub-region as well as in other sub-regions, access or exploitation of forest
resources is based on standards and regulations dictated by forest resource management actors.
4.1.1.2 Forest biomass harvesters
The right to exploit forest resources is generally assigned to harvesters or mining actors. These
categories of forest biomass players get their income directly from forest resources. At the same time,
access to these resources is done in several ways:
4.1.1.3 Large forest owners/producers
As mentioned above, in Central Africa, the state is the main owner of all national forest areas.
According to FRA, 2015, two categories of homeowners are defined: public owners and private
owners.
➢ Public properties (the state): A forest owner who licenses the management while regulating
and controlling the wood sector up to the end customers or borders (export), but also as an
60
How Supply chain works and at what points the greatest amounts of wood waste is generated.
investor in the logging areas. There are also state-owned public services at the national and
sub-national government level.
➢ Private properties (non-Natives): Forests owned by oil producers: they are forests allocated
to individuals or families who can exploit or delegate production on the basis of agreement
with producers against a remuneration or share of the production. There are also forests
belonging to private entities or institutions (non-natives). These are forests that are owned by
companies, cooperatives, companies and other commercial entities and private organizations
such as NGOs, associations for the conservation of nature, religious institutions, educational
institutions, etc.
➢ Forests belonging to local communities and indigenous/tribal (indigenous) communities:
Forest belonging to a group of people from the same community living within or near a forest
or forest area belonging to communities of indigenous or tribal populations. Community
members are co-owners who share exclusive rights and duties and the benefits contribute to
community development.
4.1.1.4 Transporters or logistical operators
Procurement, production, distribution, sales, recycling and valorisation processes involve material
flows. The transporters or logistics operators in Central Africa use four modes of transport (road, rail,
river and sea) as well as logistic nodes (river and seaports, railway stations). Depending on the type of
forest resources, carriers can be distinguished from wood forest products (logs, charcoal, sawmill
residues) and non-wood forest products (farming products).
4.1.1.5 Merchants
Actors in primary and secondary transformations
Wood processing capacity in Central Africa is limited to primary processing. Primary transformations
are limited to sawing, unwinding, cutting, plywood manufacturing, veneer and charcoal. However,
secondary transformations generate moldings, plating dry and contoured wood. Furniture production
is still in its infancy. These industrial wood processors operate in the private sector and are for the
most part owners of concessions. In the processing sector, several players can be identified: national
or international industries, craftsmen, carpenters, etc.
One of the major players here is the French company Rougier, which is the most exploitative forest
resource in Central Africa and present in the entire value chain (exploitation, processing, distribution
and marketing). Other industries like CIFO, Alam, SOMNAB are also present. Figure 16 below shows
the wood product processing value chain from harvesting to secondary processing.
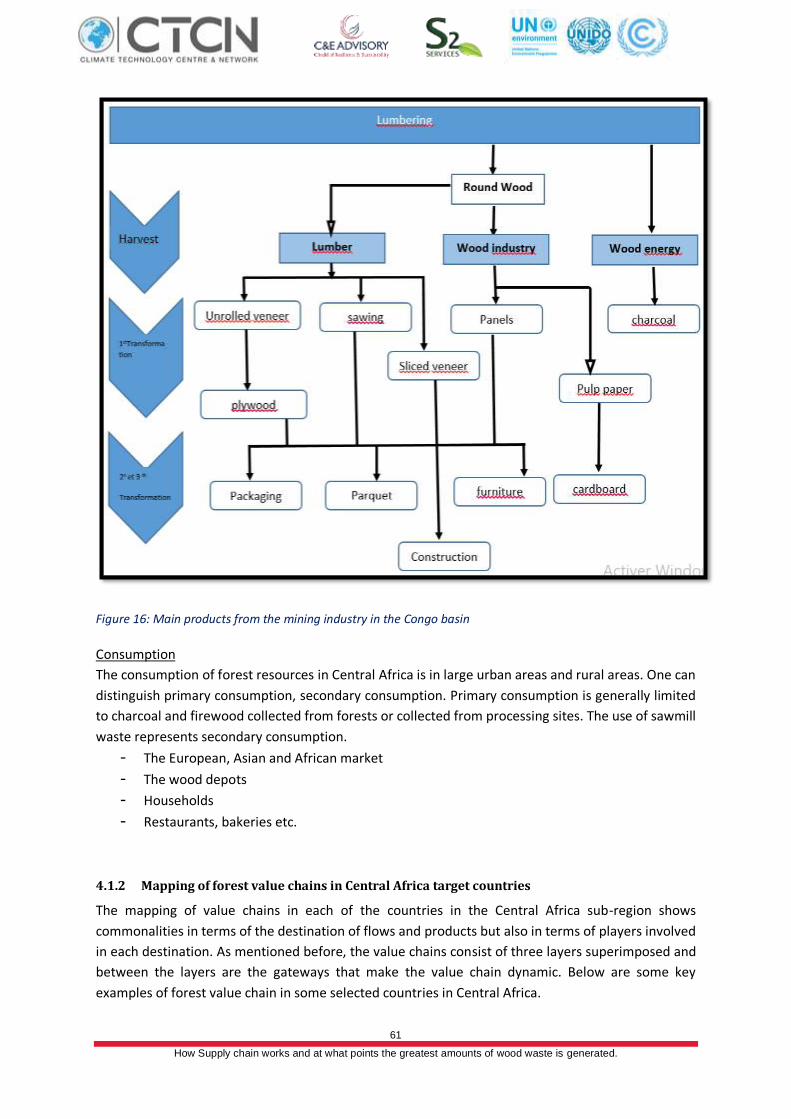
61
How Supply chain works and at what points the greatest amounts of wood waste is generated.
Figure 16: Main products from the mining industry in the Congo basin
Consumption
The consumption of forest resources in Central Africa is in large urban areas and rural areas. One can
distinguish primary consumption, secondary consumption. Primary consumption is generally limited
to charcoal and firewood collected from forests or collected from processing sites. The use of sawmill
waste represents secondary consumption.
- The European, Asian and African market
- The wood depots
- Households
- Restaurants, bakeries etc.
4.1.2 Mapping of forest value chains in Central Africa target countries
The mapping of value chains in each of the countries in the Central Africa sub-region shows
commonalities in terms of the destination of flows and products but also in terms of players involved
in each destination. As mentioned before, the value chains consist of three layers superimposed and
between the layers are the gateways that make the value chain dynamic. Below are some key
examples of forest value chain in some selected countries in Central Africa.
62
How Supply chain works and at what points the greatest amounts of wood waste is generated.
4.1.2.1. Case of the Democratic Republic of Congo (DRC)
4.1.2.1.1 Forest resources in DRC
The DRC has enormous forestry potential over an area estimated over 145 million hectares, which
represent 54% of the national extent. It is considered as one of the most important African countries
because of its extraordinary specific genetic richness. It is indeed home to a wide range of biomes,
ecosystems and habitats which give it the first place among African countries in terms of species
diversity for several taxonomic groups with more than 11,000 species of angiosperms including 3,200
endemic. From these forests, we distinguish forests on hydromorphic soil, Primary forest, Secondary
forest, Plantation, Regeneration and agriculture and Savannah. Eight physiognomic types of
vegetation are found in the Democratic Republic of the Congo, namely: dense humid evergreen
forests, dense humid semi-deciduous forests, mountain forests, edaphic forest formations, dense dry
forests, open forests, mangroves and savannas (wooded and grassy) (Kamungandu, 2009).
Protected areas consist of 10 national parks, totalling over 10 million ha in area (including 9.3 million
ha of forest), four of which are listed as UNESCO World Heritage Sites. The DRC also has three
biosphere reserves totalling nearly 300 000 ha in size, managed under the supervision of the National
MAB (Man and the Biosphere) Committee, five botanical gardens covering 100 000 ha and 57 hunting
reserves of around 10 000 000 ha, of which only 21 have been maintained in recent years by the
Congolese Institute for Nature Conservation39.
Various natural regeneration studies have led to certain conclusions about operations to promote
seed-trees, such as vine removal, clearing and so forth, which can multiply seeding by an average 100
to 400 percent. The cover afforded by shelter wood also favors natural regeneration. A number of
planting techniques have also been tested, such as standardization from the ground up, strip methods,
row-planting, the plot method, planting in full sunlight etc. Terminalia spp. are among the main timber
species planted for industrial purposes. Eucalyptus spp., Acacia spp., Pinus spp. and Gmelinaarborea
tend to be used for fuelwood, as well as for soil protection (Amsallem, 2002).
The volume of wood produced in 2010 was estimated at 1,314,281 m3 and 1,405,421 m3 in 2012. Of
these volumes of wood produced, 589,833 m3 were processed in 2010 and 595,981 m3 in 2012. Over
one million of wood products were exported each year between 2010 and 2012, which allowed a
contribution of 8.8% in 2010 and 3% in 2012 on the country's GDP and 0.22% on tax revenues. The
forestry sector every year between 2010 and 2012 generated more than 7,000 direct jobs and more
than 5,000 indirect jobs (Wasseige, Flynn, Louppe, Hiol, & Mayaux, 2014).While these immense
resources constitute a major asset for the sustainable development of the country, it is no less true
that they pose many problems of conservation, management, sustainable use and development.
These problems are political, legislative, scientific, material, financial, social, economic and cultural.
63
How Supply chain works and at what points the greatest amounts of wood waste is generated.
4.1.2.1.2 Forest value chain in DRC
DRC’s forest value chain has three destination points for products and involves various types of
players. This chain is composed of the Europe, Asia and Africa chain. Figure 17 below represents DRC's
forest value chain.
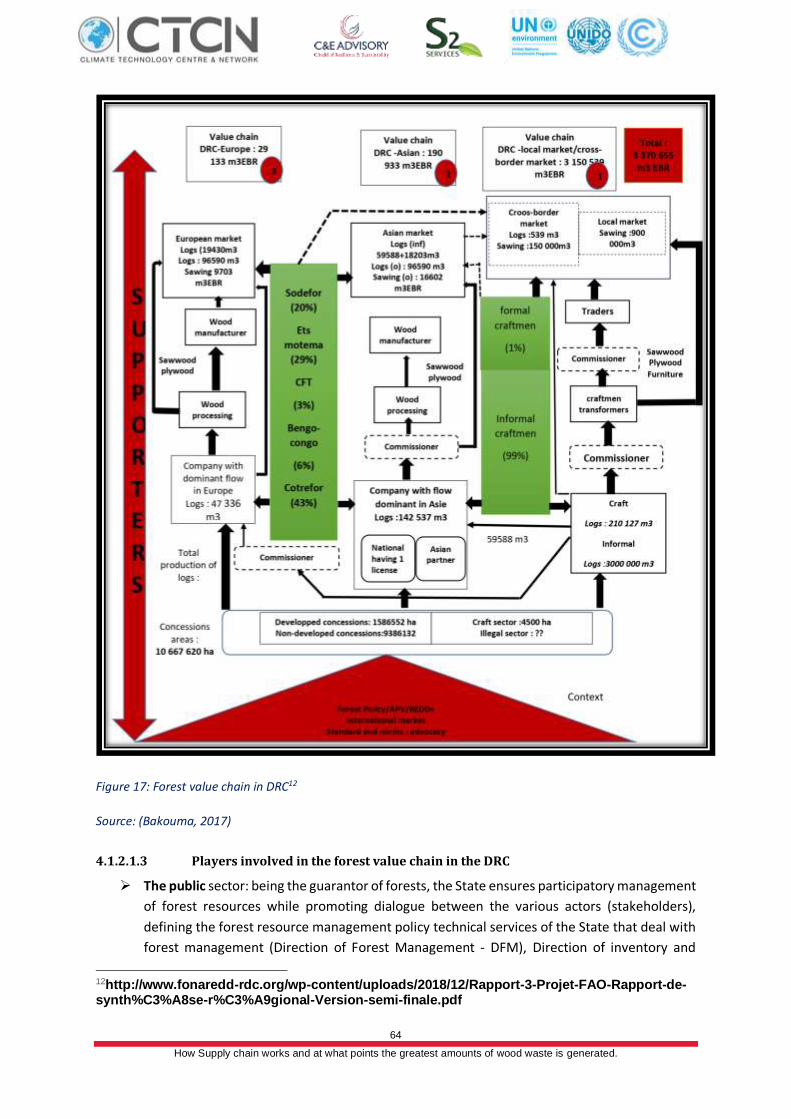
64
How Supply chain works and at what points the greatest amounts of wood waste is generated.
Figure 17: Forest value chain in DRC12
Source: (Bakouma, 2017)
4.1.2.1.3 Players involved in the forest value chain in the DRC
➢ The public sector: being the guarantor of forests, the State ensures participatory management
of forest resources while promoting dialogue between the various actors (stakeholders),
defining the forest resource management policy technical services of the State that deal with
forest management (Direction of Forest Management - DFM), Direction of inventory and
12http://www.fonaredd-rdc.org/wp-content/uploads/2018/12/Rapport-3-Projet-FAO-Rapport-de-synth%C3%A8se-r%C3%A9gional-Version-semi-finale.pdf
65
How Supply chain works and at what points the greatest amounts of wood waste is generated.
forest development (DIAF) and Green spaces advisory committee (GSAC). Other public sector
actors are:
• The Congolese Institute for Conservation of Nature (ICCN) which is responsible for the
management of national parks, wildlife reserves and hunting grounds. More specifically,
it implements forest guarding and anti-poaching systems, conducts monitoring, different
studies, surveillance and service tracks, the installation of hospitality facilities (hotel
facilities, camps, supply system bridges, etc.) and communication.
• The Institute of Zoological and Botanical Gardens of Congo (IJZBC) manages the
conservation of woody and non-woody resources outside their natural environment. Its
activities are the acquisition of new species, the provision of veterinary services for
animals in captivity, scientific research (experimentation, taxonomy, ecology, ethology,
agronomy, forestry, horticulture, etc.), herbaria management and land management.
➢ The Administration is composed of two distinct levels: centralized administration working
directly with the Government and decentralized administration (Provincial Government
/Territory/Sector, Chiefdom, Cities or Municipalities / Groups / Villages).
➢ The private (industrial) sector: this sector operates in concessions granted by the public
sector and operates it according to the development plan approved by the administration. In
addition to logging, this sector maintains relationships with governments, stakeholders and
participates in negotiations and decisions for sustainable forest resource management. The
artisanal sector, on the other hand, operates informally and is not well structured to
participate in the management of forest resources.
➢ The NGOs: local (or civil society representatives) are numerous and are interested in various
fields. These NGOs quickly collect field information and serve as whistle-blowers to
international NGOs (Greenpeace, WWF, Friends of the Earth, Global Witness, Rainforest UK
and Rainforest Norway, etc.) that relay and strengthen the means of investigation and
communication. In addition, NGOs are recognized stakeholders in pre-certification
consultation processes (such as FSC).
4.1.2.1.3.1 Actors in the extraction (harvest) of forest resources
Forest harvesters derive their income directly from forest resources. The harvests are done according
to the regulations defined by actors in charge of forestry management. This category includes forest
owners, industrial mining companies, artisanal operators, extractors, transporters and merchants.
➢ The owners of the concessions: the State being the owner of the forest areas grants forest
concessions to public, parapublic and/or private enterprises via its administrations and
ministries for the exploitation of forest resources according to the regulations in place.
➢ Industrial wood companies Contractors: These include Forester, SAFBOIS, TRANS-M,
FORABOLA, SIFORCO, ITB, SODEFOR, FORABOLA, SODEFOR, COTREFOR, SOFORMA, ITB,
SEDAF / SIFORCO and SAFO.
➢ Artisanal operators: they are national entrepreneurs from the Democratic Republic of Congo.
➢ Local authorities: are the local customary authorities. Under local custom and practice, they
impose new conditions of access to the resource beyond those legally recognized.
➢ Local communities: they are the local populations (including traditional authorities), with
rights over customary areas where exploitation takes place.
66
How Supply chain works and at what points the greatest amounts of wood waste is generated.
➢ The machinists and its helpers are natural persons who carry out the logging, cutting and
sawing of timber.
➢ Owners of large trucks who transport wood from the loading site to point of sales.
➢ Handlers: this is the labour recruited locally by artisanal operators for the evacuation of wood
from the cutting site at the place of loading. It brings together members of local communities
and indigenous people.
➢ State and parastatal services: are the services committed to collecting various taxes and
royalties FFN (National Fund Forestry), Environment, OCC and DGDA (General Directorate of
Customs and Access)).
➢ Wood traders: are intermediaries that facilitate the exchange between operators and
exporters.
➢ Wood exporters: feeds the state pockets by exporting and selling Congolese timber abroad.
4.1.2.1.3.2 Actors in primary and secondary transformations
Industrial sector
The Congolese industry consists of two sub-sectors:
➢ The primary subsector: the first transformations.
➢ The secondary subsector: including all manufacturing industries.
The primary subsector is for the external market while the secondary subsector is for the domestic
market. DRC has a strong potential for the development of its industrial sector due to an abundance
of natural resources, a permanent workforce and a high energy potential) (FAO, n.d.). Wood
processing includes several operations that contribute to the manufacturing of products such as
sawing products, panels, plywood, furniture, packaging, paper, etc. These operations involve:
➢ Workers' groups such as: log park agents, operators, electro-mechanics, sharpeners and
drivers.
➢ Maintenance officers: forest machinery mechanics, truck mechanics, light vehicle mechanics
and mechanics-planters (turners, millers, planers, grinders, etc.)
The main players in the transformation of woody resources in the DRC are private sector companies.
These are subdivided into large enterprises, medium-sized enterprises and small businesses. The
wood sector in the DRC is very dynamic. The DRC in 2019 had a total of 29 wood processing companies
and 15 in operations.
➢ Major public sector industries: SODEFOR which is based in Kinshasa and Nioki. it exports
unprocessed wood. It has a sawmill and plywood manufacturing plant. The supply of timber
from the forest concessions and the supply of the internal market are via the river.
➢ Private sector industries operate in both the primary and secondary subsectors. Unprocessed
wood is exported to neighbouring countries and Asian and European markets. The secondary
subsector consist of slicing, plating and drying; Wood panel factories and wood-impregnating
factory; Building carpentry, cabinet makers, parquet factories; Packaging industries; Cork
products, mats and brushes; Furniture manufacturing; Making pulp, paper and cardboard. The
main wood processing companies in operation include: MANIEMA UNION, FORABOLA and
BOOMING GREEN, CFT, IFCO, SOMIFOR and KITENGELOLA. These companies have moved to
eight provinces that are qualified as forest provinces: ITURI, KASA, EQUATEUR, MA-NDOMBE,
MONGALA, TSHUAPA, TSHOPO and SUD-UBANGI (ATBIT, 2019).
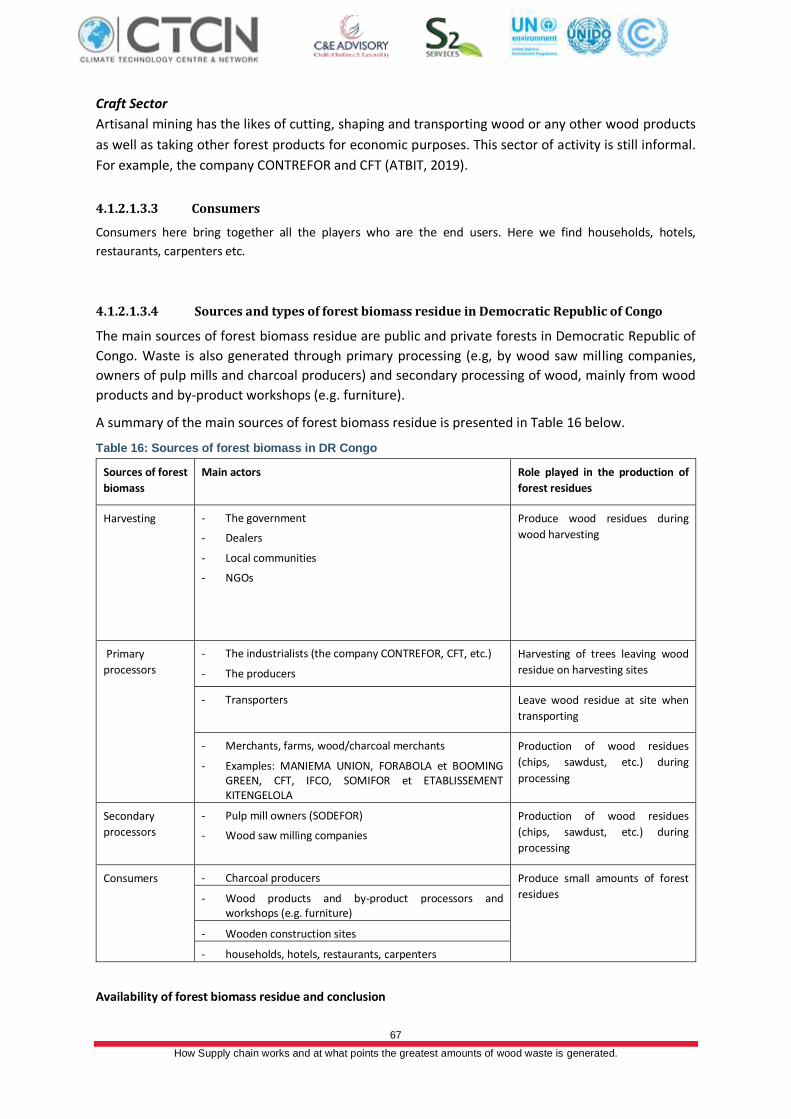
67
How Supply chain works and at what points the greatest amounts of wood waste is generated.
Craft Sector
Artisanal mining has the likes of cutting, shaping and transporting wood or any other wood products
as well as taking other forest products for economic purposes. This sector of activity is still informal.
For example, the company CONTREFOR and CFT (ATBIT, 2019).
4.1.2.1.3.3 Consumers
Consumers here bring together all the players who are the end users. Here we find households, hotels,
restaurants, carpenters etc.
4.1.2.1.3.4 Sources and types of forest biomass residue in Democratic Republic of Congo
The main sources of forest biomass residue are public and private forests in Democratic Republic of
Congo. Waste is also generated through primary processing (e.g, by wood saw milling companies,
owners of pulp mills and charcoal producers) and secondary processing of wood, mainly from wood
products and by-product workshops (e.g. furniture).
A summary of the main sources of forest biomass residue is presented in Table 16 below.
Table 16: Sources of forest biomass in DR Congo
Sources of forest
biomass
Main actors Role played in the production of
forest residues
Harvesting
- The government
- Dealers
- Local communities
- NGOs
Produce wood residues during
wood harvesting
Primary
processors
- The industrialists (the company CONTREFOR, CFT, etc.)
- The producers
Harvesting of trees leaving wood
residue on harvesting sites
- Transporters Leave wood residue at site when
transporting
- Merchants, farms, wood/charcoal merchants
- Examples: MANIEMA UNION, FORABOLA et BOOMING GREEN, CFT, IFCO, SOMIFOR et ETABLISSEMENT KITENGELOLA
Production of wood residues
(chips, sawdust, etc.) during
processing
Secondary
processors
- Pulp mill owners (SODEFOR)
- Wood saw milling companies
Production of wood residues
(chips, sawdust, etc.) during
processing
Consumers
- Charcoal producers Produce small amounts of forest
residues - Wood products and by-product processors and workshops (e.g. furniture)
- Wooden construction sites
- households, hotels, restaurants, carpenters
Availability of forest biomass residue and conclusion
68
How Supply chain works and at what points the greatest amounts of wood waste is generated.
There are large amount of quantities of wood that is produced in the Democratic Republic of Congo.
These generates a lot of logging residues at the harvesting sites. 283,397M3 of wood is transformed
in Congolese companies, and it is estimated that about 60% of wood for processing are residues, i.e
about 170,038.20 M3. However, this varies from year to year and as mentioned elsewhere in this
report, 589,833 m3 were processed in 2010 and 595,981 m3 in 2012. The forest value chain in the
Democratic Republic of Congo therefore has huge potential in generating forest biomass residues for
bioenergy, especially at the wood harvesting and primary processing stages.
4.1.2.2. Case of Cameroon
4.1.2.2.1 Forest resources in Cameroon
Several types of forests exists in Cameroon namely: Dense humid evergreen forest, Dense humid semi
deciduous forest, Deciduous forest Gallery forest, Swamp forest, Other natural forests, Plantations,
Shrub formations, Fallow land, Tree savannah Bare soil. These forests according to the FAO inventories
between 2003 and 2004 covered 21,236,475 ha of the national territory and the wooded lands cover
an area of 12,714,956 ha. These values differ slightly from those obtained by FRA 2005 where they
estimated at 21,245,000 ha of forest and 14,758,259 ha of woodland (FAO, 2014). Rainforests cover
over 40 percent of the area of Cameroon and constitute a significant part of the Congo Basin forest
ecosystem (FAO, 2020).In terms of biodiversity, Cameroon is one of the most diverse countries in
Africa from an ecological point of view. The main reason for the high biodiversity of these forests is
that they constitute an old and very stable system, in particular the forests of the littoral plain. It is
estimated that 9,000 plant species are found in Cameroon: at least 156 are endemic, including 45 on
Mount Cameroon alone. A study identified more than 200 species of woody plants on a site of 0.1 ha
of coastal forest, one of the highest levels of diversity observed in the world. More than 1,000 species
of butterflies have been recorded in the forests of the Gulf of Guinea (Mbous, 2002).
Forest resources encompass a multitude of riches in Cameroon and forests are important in terms of
extent, potential and biodiversity. In terms of extent, Cameroon is ranked 2nd in Africa: around 20
million hectares. In terms of potential, the Cameroonian forests contain 300 marketable species, of
which only sixty are subject to regular exploitation. The exploitable potential of forest products
(Medicinal plants, nutrients, service plants, etc.) on the basis of timber market conditions amounts to
around 750 million m3.
Forest harvesting in Cameroon began around the end of the nineteenth century, and it is likely that
the first silvicultural trials also date from that time. It had been decided from the outset that loggers
should plant from three to ten seedlings of the same species for each tree logged. In 1947, after World
War Two, natural regeneration was promoted in Cameroon in the forest areas of some regions, only
to be replaced in the early 1960s by plantations, the results from natural regeneration having proved
unimpressive. The natural regeneration technique in use at that time was confined to simple
operations of vine clearing, devitalization, and release clearing around regenerated trees. These
practices had virtually disappeared by 1960-1980. Savannah plantation programmes for fuelwood and
service wood production and windbreaks for soil conservation and crop protection were successfully
implemented after World War Two. From 1946-1957, tree-planting schemes for soil rehabilitation
were also introduced in the Mokolo and Yagoua regions.
69
How Supply chain works and at what points the greatest amounts of wood waste is generated.
Production forests under Forest Management Units (FMUs) in 2001 covered an area of over 3.8 million
hectares, only 200,000 hectares of which comprised pilot projects submitted at the same time as the
management plans approved by the forest service (i.e. 11 management plans for 11 FMUs). Others
are in the planning or final stages.
Two procedures for enriching natural forests through tree-planting have been used in Cameroon, the
strip method and parcels:
• The strip technique was introduced in Mbalmayo over 60 years ago.
The main species were ayous (Triplochitonscleroxylon), mahogany (Khayaivorensis), sapelli
(Entandrophragmacylindricum) and bibolo (Lovoatrichiloides).
• The parcel procedure was based on the conventional notion of “support points”, averagesized
plots of 10 m x 20 m distributed in accordance with a square mesh of roughly 100 meters.
After harvesting, the plots are planted with commercial species (Amsallem, 2002).
With a GDP per capita of US $ 2,000 and a forest cover of “20,009,000 hectares (tropical forests), the
forests of Cameroon represent one of the main sources of tropical timber in the world with 2,437,300
logs produced among which 1,070,900 are processed into various products and 1,414,468 m3 are
exported to the international market. As a result, timber exports in Cameroon will constitute a very
important part of foreign exchange earnings, given the decline in oil deposits and the fall in the prices
of industrial crops such as coffee and cocoa. The forestry sector since 2006 employs more than 13,000
people each year with 150,000 indirect jobs (Amsallem, 2002; Mbous, 2002).
Forest value chain in Cameroon
Like the DRC, Cameroon's forestry value chain has three destination points for products and involves
various types of players. This chain is composed of the Europe, Asia and Africa chain. Figure 18 below
represents Cameroon's forest value chain.
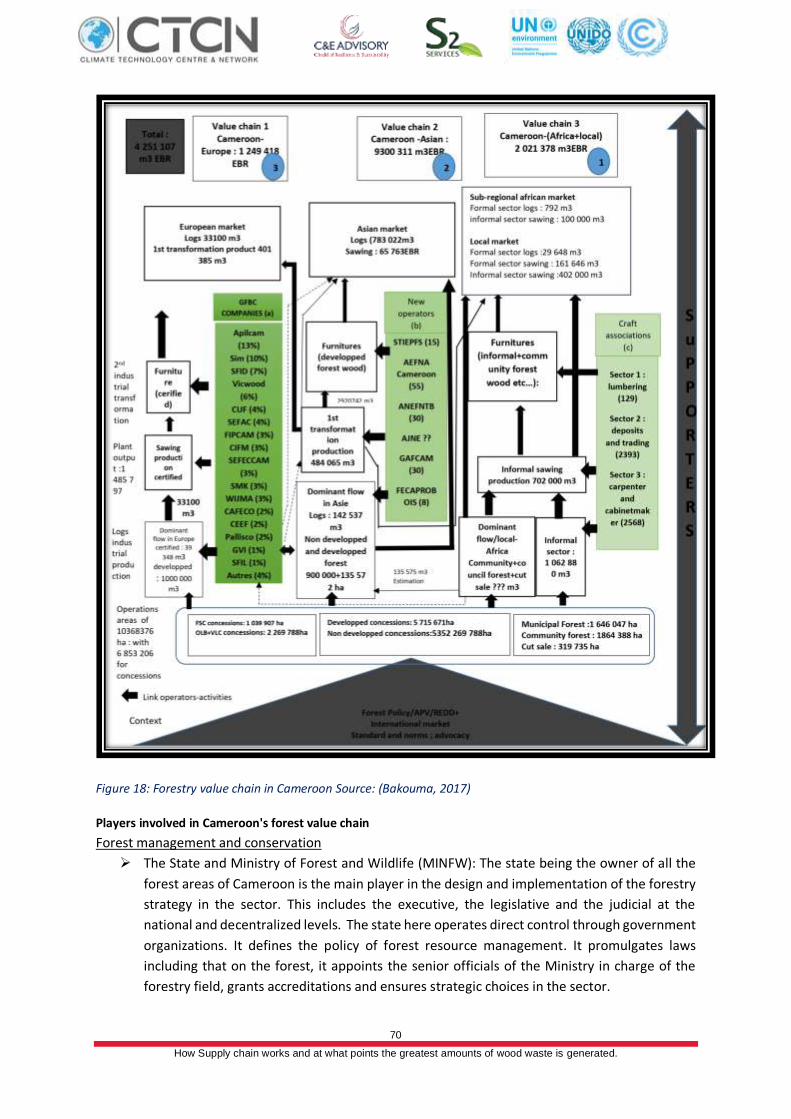
70
How Supply chain works and at what points the greatest amounts of wood waste is generated.
Figure 18: Forestry value chain in Cameroon Source: (Bakouma, 2017)
Players involved in Cameroon's forest value chain
Forest management and conservation
➢ The State and Ministry of Forest and Wildlife (MINFW): The state being the owner of all the
forest areas of Cameroon is the main player in the design and implementation of the forestry
strategy in the sector. This includes the executive, the legislative and the judicial at the
national and decentralized levels. The state here operates direct control through government
organizations. It defines the policy of forest resource management. It promulgates laws
including that on the forest, it appoints the senior officials of the Ministry in charge of the
forestry field, grants accreditations and ensures strategic choices in the sector.
71
How Supply chain works and at what points the greatest amounts of wood waste is generated.
The Prime Minister as the head of government is in charge of the implementation of policies:
exercises regulatory power, enacts forest classification texts of the Permanent Forest Estate,
grants various logging titles, and appoints some senior officials of MINFW (Ministry of Forest
and Wildlife) MINFW is the main player in the forestry sector. It manages the sector in
particular through the implementation of forest policy in collaboration with other state actors.
Other relevant government ministries involved in the forestry sector include: Ministry of
Agriculture and Rural Development (MINADER), Ministry of Livestock, Fishing and Animal
Industries (MINEPIA), and Ministry of Environment, Nature Protection and Sustainable
Development (MINEPDED) are constantly interacting with MINFOF because they operate in
same territories and with the same farmers, herders, lumberjacks, coal miners, hunters,
gatherers. These ministries are also guarantor of the conservation of natural heritage and
sustainable management of the land.
➢ The private sector is the major player in all the production and development of forest
resources. Businesses are the main component of economic growth in four levels: investment,
value added, wealth and employment. The private sector contributes to forest resource
management activities at all levels: studies, forest management activities, exploitation of
forest and wildlife resources, development and processing of wood and non-wood forest
products, and other forest and wildlife services in production and conservation areas.
➢ Civil society includes non-governmental organizations, associations and other forms of groups
of common interest, trade unions, forums, etc. that intervene directly on the ground or at the
national level. Civil society is multifaceted and multicultural. Civil society in the forest and
wildlife sector is extremely active, participating in all major reflections on sustainable resource
management and at all levels of society. Civil society put in evidence overall concerns on the
management of forests, protected areas, national heritage, governance of financial resources,
consideration of local communities along the river, etc.
➢ Neighboring communities are divided between those who get their living from forest
resources and those who live in the forest, the most vulnerable populations.
➢ International agencies and organisations: They assist the government in the development and
implementation of the- forest sector policy through the coordination of programs, but also on
the ground in support of institutions and organizations. All of these organizations are
members of the PFBC (Partnership for the Forests of the Congo Basin),a Type II organization
that brings together all the major players in forest management in Central Africa, and use the
Convergence Plan as a reference for planning their activities in COMIFAC (Central Africa Forest
commission) member countries. These include:
o Sub-regional cooperation within COMIFAC, the CEEAC's specially regulated forestry
body, bringing together the 10 Central African states using the Convergence Plan as a
common tool for coordinating forest actions, and whose headquarters and executive
secretariat are in Yaoundé;
o Bilateral cooperation (France, Netherlands, UK, Norway, Canada, Germany, EU, Japan,
USA, etc.)
o Multilateral cooperation: United Nation Agencies (UNDP, FAO, UNEP);
o Financing institutions, World Bank, AfDB, FFBC, IFAD, IDB, etc.;
o Specialized forest and conservation research organizations and institutions (IUCN,
CIFOR, WWF, OIBT, ICRAF, WCS, FTNS, IRAD, CIRAD, etc.) (MINFOF, 2012).
72
How Supply chain works and at what points the greatest amounts of wood waste is generated.
Exploitation / harvesting actors
The pattern of the forest exploitation chain (e.g. wood) can be segmented into four distinct levels:
upstream, downstream, meso and transversal. Different categories of actors are in each level
➢ Upstream of the production of wood forest products (wood harvesting) are the economic
operators holding licenses of access to the forest resource. With this in mind, Cameroon's
logging legislation provides, among other things, for exploitation titles giving access to wood
and/or non-wood forest resources: forest concession, communal forest, logging sale,
community forest, timber license and personal logging permits, as well as hunting permits. In
2019, MINFOF declared 93 forest concessions, 38 communal forests, 142 logging sales and
some 50 community forests valid in the first quarter of the year. These forest titles are
managed by 59 large international or national companies, 46 medium-sized enterprises and
38 rural municipalities owners of communal forests.
➢ At the meso level of the logging chain, we mainly meet the economic companies/operators of
the wood processing niche. They process wood into various products (including cut, veneers,
plywood, furniture, etc.). In this sense, the forestry administration maintains an updated list
of companies/operators authorized to act as wood processor (UTB).
➢ At transversal level, a category of private actors operates cross-cuttingly along the wood
production chain in Cameroon. These are the carriers of woody products, either in the form
of logs or in the form of processed products. However, this category of economic operators
(transporters), although influential in the activities of logging, do not fall under the technical
tutelage of MINFOF. Because of the nature of their activities (road transport, railway and
maritime transport), it escapes directly from the grip of the forestry administration.
➢ The downstream production of wood is structured around economic operators who operate
either as exporters of raw and processed wood products (logs, cut, veneers, plywood and
other finished or semi-finished products), or as traders or commodity brokers.
Figure 19 represents the logging chain in Cameroon.
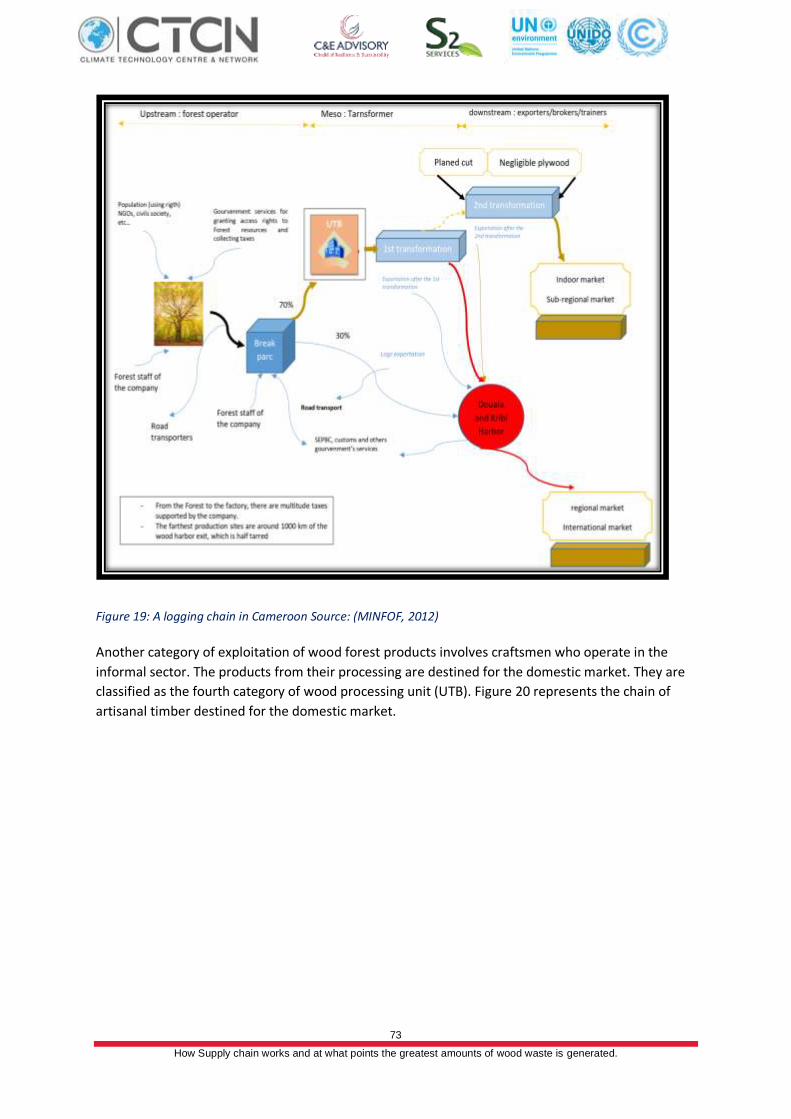
73
How Supply chain works and at what points the greatest amounts of wood waste is generated.
Figure 19: A logging chain in Cameroon Source: (MINFOF, 2012)
Another category of exploitation of wood forest products involves craftsmen who operate in the
informal sector. The products from their processing are destined for the domestic market. They are
classified as the fourth category of wood processing unit (UTB). Figure 20 represents the chain of
artisanal timber destined for the domestic market.
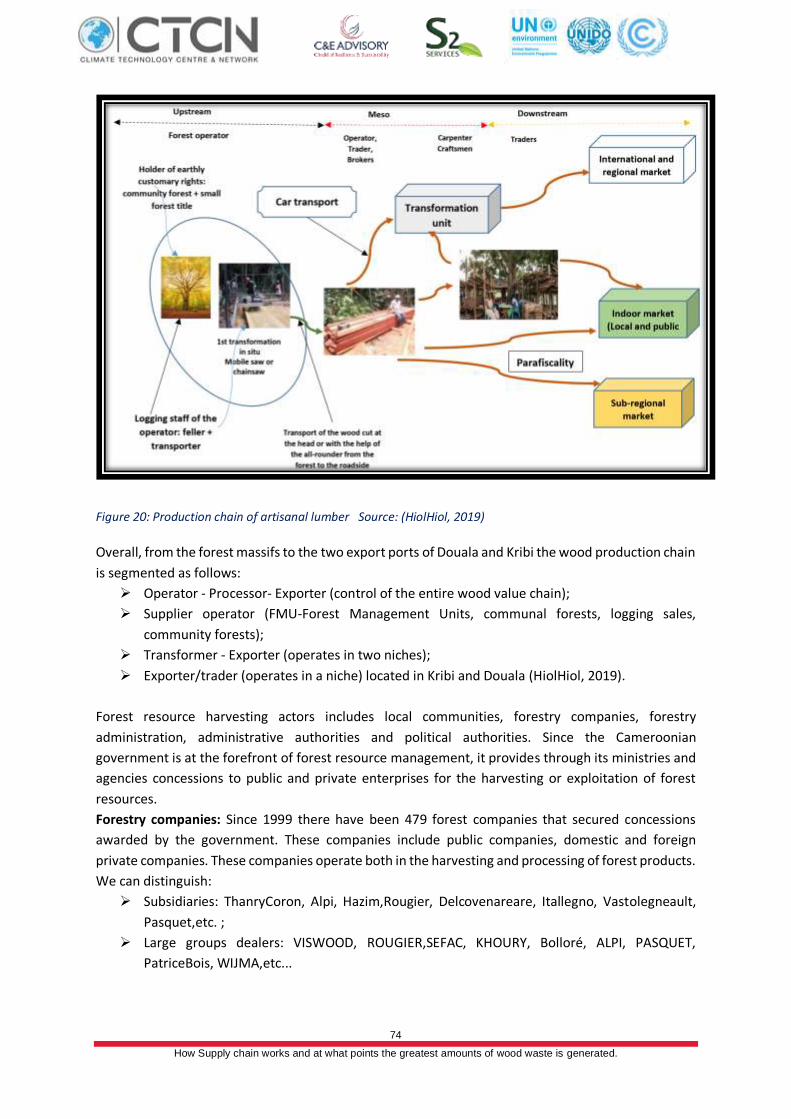
74
How Supply chain works and at what points the greatest amounts of wood waste is generated.
Figure 20: Production chain of artisanal lumber Source: (HiolHiol, 2019)
Overall, from the forest massifs to the two export ports of Douala and Kribi the wood production chain
is segmented as follows:
➢ Operator - Processor- Exporter (control of the entire wood value chain);
➢ Supplier operator (FMU-Forest Management Units, communal forests, logging sales,
community forests);
➢ Transformer - Exporter (operates in two niches);
➢ Exporter/trader (operates in a niche) located in Kribi and Douala (HiolHiol, 2019).
Forest resource harvesting actors includes local communities, forestry companies, forestry
administration, administrative authorities and political authorities. Since the Cameroonian
government is at the forefront of forest resource management, it provides through its ministries and
agencies concessions to public and private enterprises for the harvesting or exploitation of forest
resources.
Forestry companies: Since 1999 there have been 479 forest companies that secured concessions
awarded by the government. These companies include public companies, domestic and foreign
private companies. These companies operate both in the harvesting and processing of forest products.
We can distinguish:
➢ Subsidiaries: ThanryCoron, Alpi, Hazim,Rougier, Delcovenareare, Itallegno, Vastolegneault,
Pasquet,etc. ;
➢ Large groups dealers: VISWOOD, ROUGIER,SEFAC, KHOURY, Bolloré, ALPI, PASQUET,
PatriceBois, WIJMA,etc...
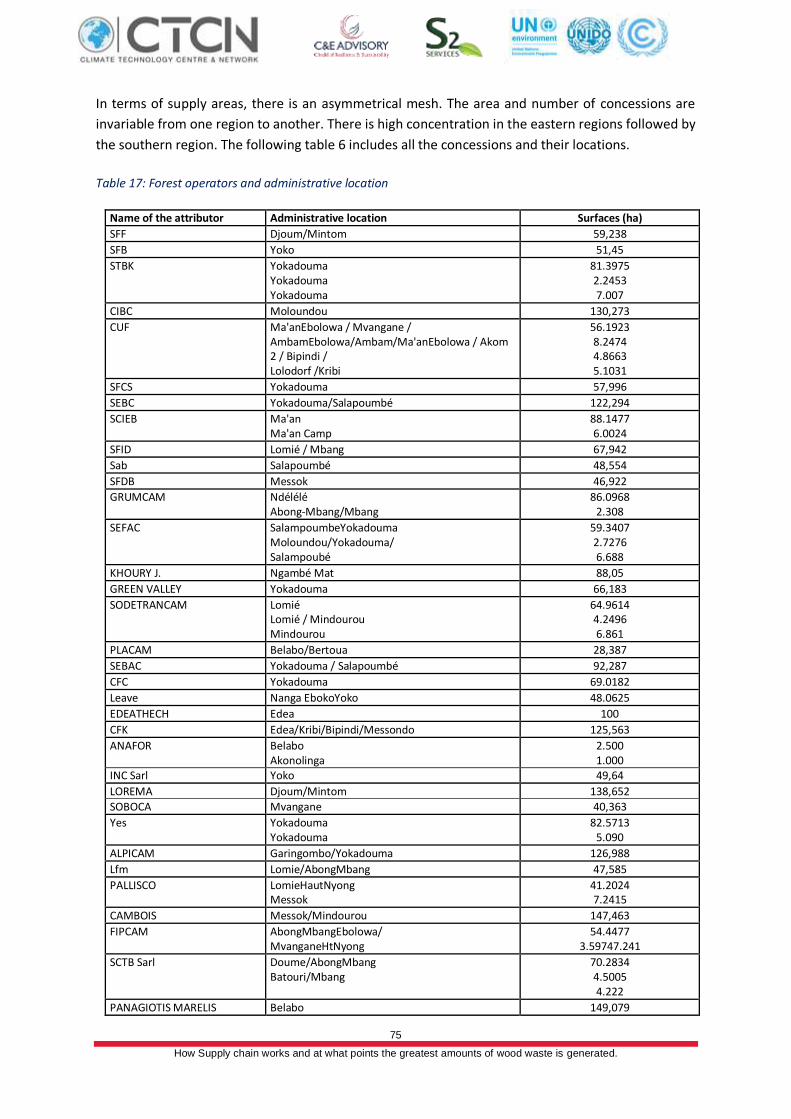
75
How Supply chain works and at what points the greatest amounts of wood waste is generated.
In terms of supply areas, there is an asymmetrical mesh. The area and number of concessions are
invariable from one region to another. There is high concentration in the eastern regions followed by
the southern region. The following table 6 includes all the concessions and their locations.
Table 17: Forest operators and administrative location
Name of the attributor Administrative location Surfaces (ha)
SFF Djoum/Mintom 59,238
SFB Yoko 51,45
STBK Yokadouma Yokadouma Yokadouma
81.3975 2.2453 7.007
CIBC Moloundou 130,273
CUF Ma'anEbolowa / Mvangane / AmbamEbolowa/Ambam/Ma'anEbolowa / Akom 2 / Bipindi / Lolodorf /Kribi
56.1923 8.2474 4.8663 5.1031
SFCS Yokadouma 57,996
SEBC Yokadouma/Salapoumbé 122,294
SCIEB Ma'an Ma'an Camp
88.1477 6.0024
SFID Lomié / Mbang 67,942
Sab Salapoumbé 48,554
SFDB Messok 46,922
GRUMCAM Ndélélé Abong-Mbang/Mbang
86.0968 2.308
SEFAC SalampoumbeYokadouma Moloundou/Yokadouma/ Salampoubé
59.3407 2.7276 6.688
KHOURY J. Ngambé Mat 88,05
GREEN VALLEY Yokadouma 66,183
SODETRANCAM Lomié Lomié / Mindourou Mindourou
64.9614 4.2496 6.861
PLACAM Belabo/Bertoua 28,387
SEBAC Yokadouma / Salapoumbé 92,287
CFC Yokadouma 69.0182
Leave Nanga EbokoYoko 48.0625
EDEATHECH Edea 100
CFK Edea/Kribi/Bipindi/Messondo 125,563
ANAFOR Belabo Akonolinga
2.500 1.000
INC Sarl Yoko 49,64
LOREMA Djoum/Mintom 138,652
SOBOCA Mvangane 40,363
Yes Yokadouma Yokadouma
82.5713 5.090
ALPICAM Garingombo/Yokadouma 126,988
Lfm Lomie/AbongMbang 47,585
PALLISCO LomieHautNyong Messok
41.2024 7.2415
CAMBOIS Messok/Mindourou 147,463
FIPCAM AbongMbangEbolowa/ MvanganeHtNyong
54.4477 3.59747.241
SCTB Sarl Doume/AbongMbang Batouri/Mbang
70.2834 4.5005 4.222
PANAGIOTIS MARELIS Belabo 149,079
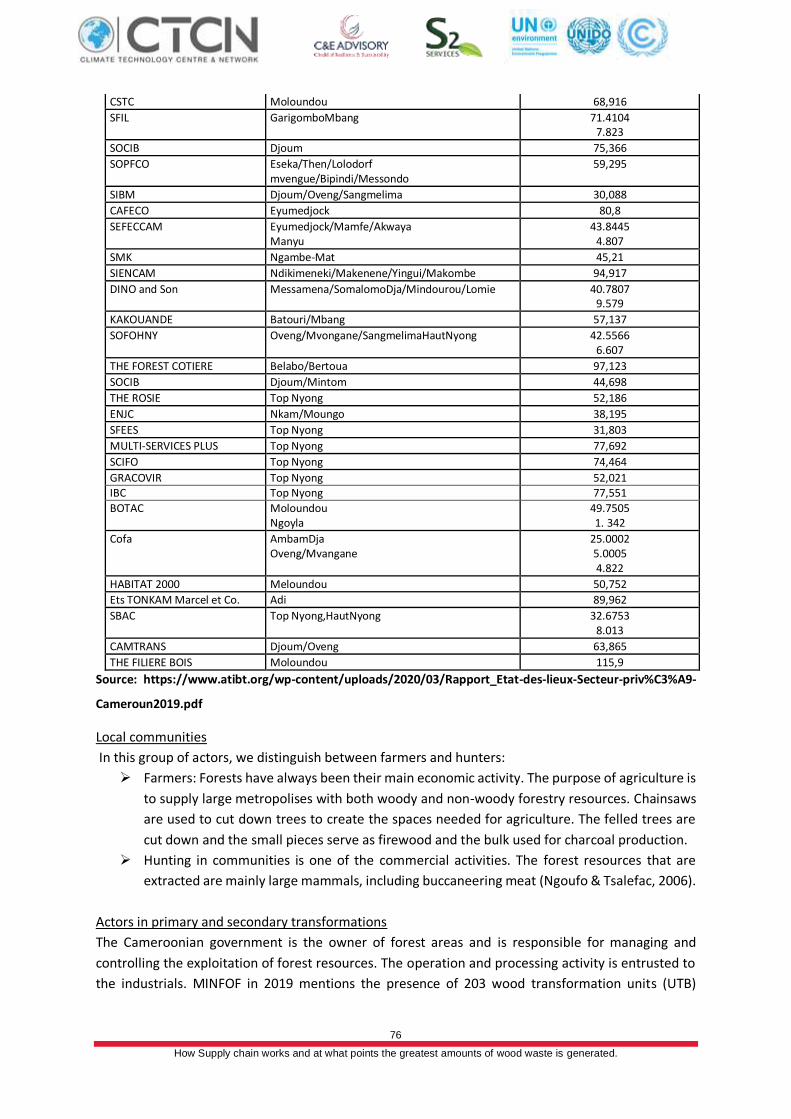
76
How Supply chain works and at what points the greatest amounts of wood waste is generated.
CSTC Moloundou 68,916
SFIL GarigomboMbang 71.4104 7.823
SOCIB Djoum 75,366
SOPFCO Eseka/Then/Lolodorf mvengue/Bipindi/Messondo
59,295
SIBM Djoum/Oveng/Sangmelima 30,088
CAFECO Eyumedjock 80,8
SEFECCAM Eyumedjock/Mamfe/Akwaya Manyu
43.8445 4.807
SMK Ngambe-Mat 45,21
SIENCAM Ndikimeneki/Makenene/Yingui/Makombe 94,917
DINO and Son Messamena/SomalomoDja/Mindourou/Lomie 40.7807 9.579
KAKOUANDE Batouri/Mbang 57,137
SOFOHNY Oveng/Mvongane/SangmelimaHautNyong 42.5566 6.607
THE FOREST COTIERE Belabo/Bertoua 97,123
SOCIB Djoum/Mintom 44,698
THE ROSIE Top Nyong 52,186
ENJC Nkam/Moungo 38,195
SFEES Top Nyong 31,803
MULTI-SERVICES PLUS Top Nyong 77,692
SCIFO Top Nyong 74,464
GRACOVIR Top Nyong 52,021 IBC Top Nyong 77,551
BOTAC Moloundou Ngoyla
49.7505 1. 342
Cofa AmbamDja Oveng/Mvangane
25.0002 5.0005 4.822
HABITAT 2000 Meloundou 50,752
Ets TONKAM Marcel et Co. Adi 89,962
SBAC Top Nyong,HautNyong 32.6753 8.013
CAMTRANS Djoum/Oveng 63,865
THE FILIERE BOIS Moloundou 115,9
Source: https://www.atibt.org/wp-content/uploads/2020/03/Rapport_Etat-des-lieux-Secteur-priv%C3%A9-
Cameroun2019.pdf
Local communities
In this group of actors, we distinguish between farmers and hunters:
➢ Farmers: Forests have always been their main economic activity. The purpose of agriculture is
to supply large metropolises with both woody and non-woody forestry resources. Chainsaws
are used to cut down trees to create the spaces needed for agriculture. The felled trees are
cut down and the small pieces serve as firewood and the bulk used for charcoal production.
➢ Hunting in communities is one of the commercial activities. The forest resources that are
extracted are mainly large mammals, including buccaneering meat (Ngoufo & Tsalefac, 2006).
Actors in primary and secondary transformations
The Cameroonian government is the owner of forest areas and is responsible for managing and
controlling the exploitation of forest resources. The operation and processing activity is entrusted to
the industrials. MINFOF in 2019 mentions the presence of 203 wood transformation units (UTB)
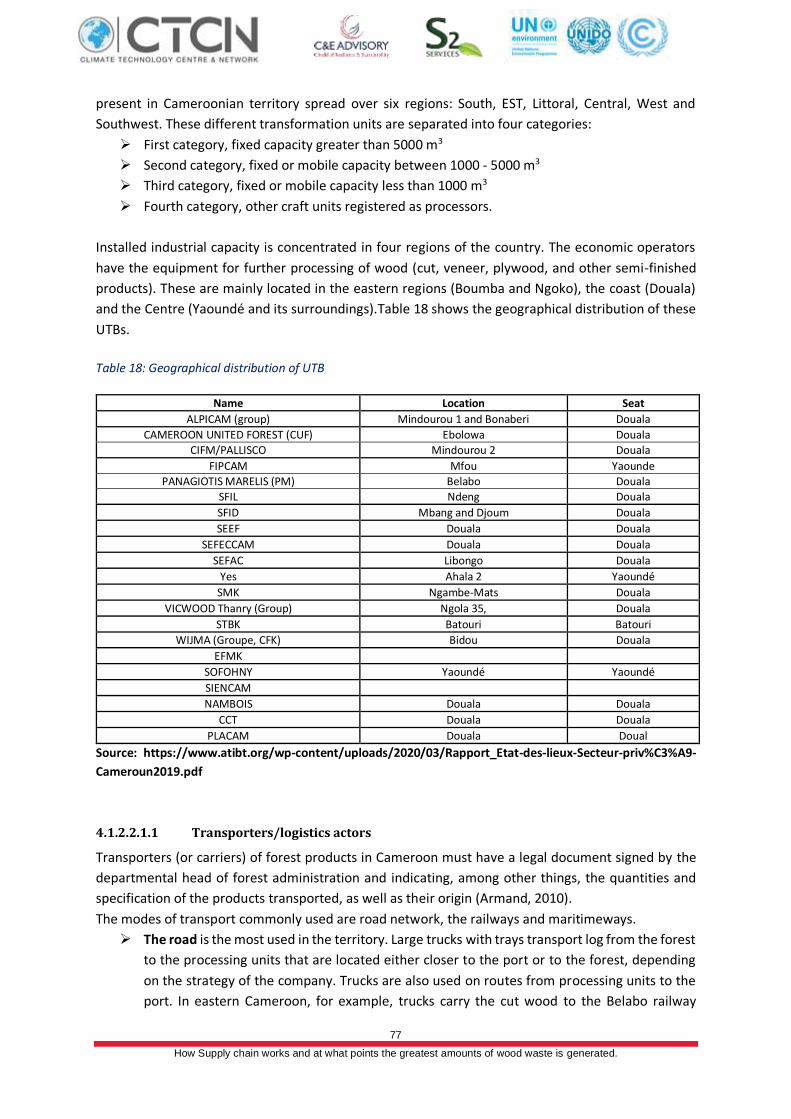
77
How Supply chain works and at what points the greatest amounts of wood waste is generated.
present in Cameroonian territory spread over six regions: South, EST, Littoral, Central, West and
Southwest. These different transformation units are separated into four categories:
➢ First category, fixed capacity greater than 5000 m3
➢ Second category, fixed or mobile capacity between 1000 - 5000 m3
➢ Third category, fixed or mobile capacity less than 1000 m3
➢ Fourth category, other craft units registered as processors.
Installed industrial capacity is concentrated in four regions of the country. The economic operators
have the equipment for further processing of wood (cut, veneer, plywood, and other semi-finished
products). These are mainly located in the eastern regions (Boumba and Ngoko), the coast (Douala)
and the Centre (Yaoundé and its surroundings).Table 18 shows the geographical distribution of these
UTBs.
Table 18: Geographical distribution of UTB
Name Location Seat
ALPICAM (group) Mindourou 1 and Bonaberi Douala
CAMEROON UNITED FOREST (CUF) Ebolowa Douala
CIFM/PALLISCO Mindourou 2 Douala
FIPCAM Mfou Yaounde
PANAGIOTIS MARELIS (PM) Belabo Douala
SFIL Ndeng Douala
SFID Mbang and Djoum Douala
SEEF Douala Douala
SEFECCAM Douala Douala
SEFAC Libongo Douala
Yes Ahala 2 Yaoundé
SMK Ngambe-Mats Douala
VICWOOD Thanry (Group) Ngola 35, Douala
STBK Batouri Batouri
WIJMA (Groupe, CFK) Bidou Douala
EFMK
SOFOHNY Yaoundé Yaoundé
SIENCAM
NAMBOIS Douala Douala
CCT Douala Douala
PLACAM Douala Doual
Source: https://www.atibt.org/wp-content/uploads/2020/03/Rapport_Etat-des-lieux-Secteur-priv%C3%A9-
Cameroun2019.pdf
4.1.2.2.1.1 Transporters/logistics actors
Transporters (or carriers) of forest products in Cameroon must have a legal document signed by the
departmental head of forest administration and indicating, among other things, the quantities and
specification of the products transported, as well as their origin (Armand, 2010).
The modes of transport commonly used are road network, the railways and maritimeways.
➢ The road is the most used in the territory. Large trucks with trays transport log from the forest
to the processing units that are located either closer to the port or to the forest, depending
on the strategy of the company. Trucks are also used on routes from processing units to the
port. In eastern Cameroon, for example, trucks carry the cut wood to the Belabo railway
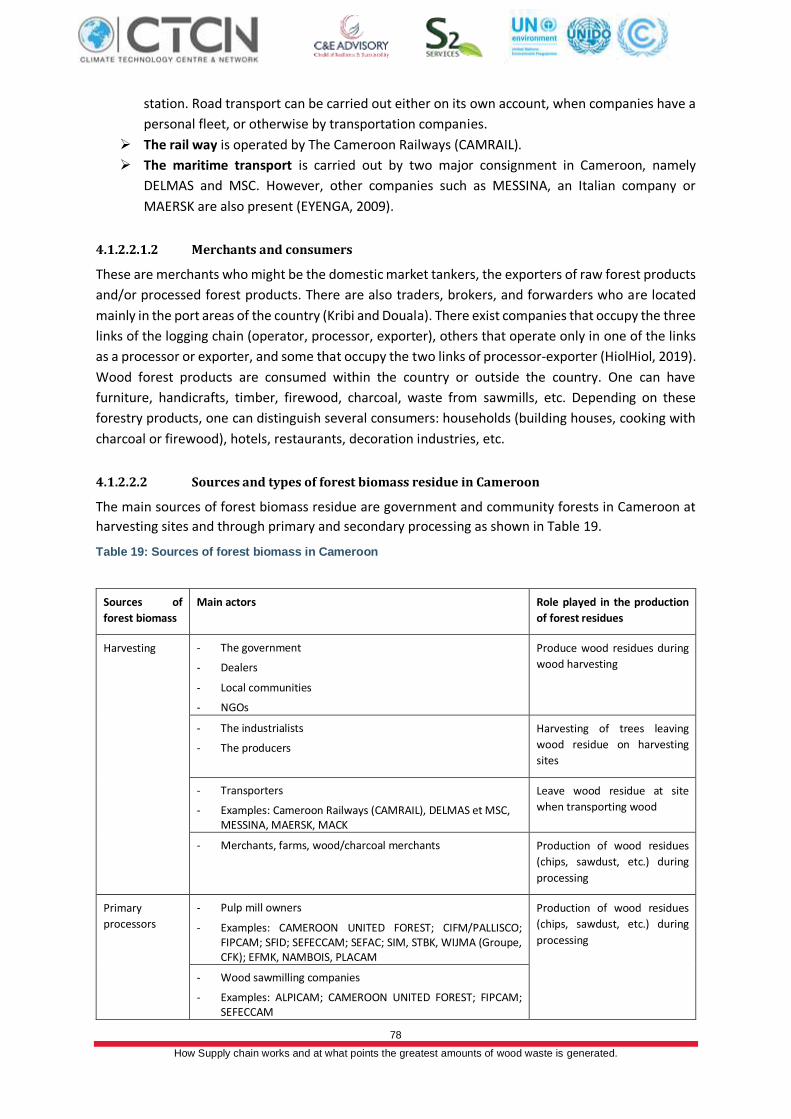
78
How Supply chain works and at what points the greatest amounts of wood waste is generated.
station. Road transport can be carried out either on its own account, when companies have a
personal fleet, or otherwise by transportation companies.
➢ The rail way is operated by The Cameroon Railways (CAMRAIL).
➢ The maritime transport is carried out by two major consignment in Cameroon, namely
DELMAS and MSC. However, other companies such as MESSINA, an Italian company or
MAERSK are also present (EYENGA, 2009).
4.1.2.2.1.2 Merchants and consumers
These are merchants who might be the domestic market tankers, the exporters of raw forest products
and/or processed forest products. There are also traders, brokers, and forwarders who are located
mainly in the port areas of the country (Kribi and Douala). There exist companies that occupy the three
links of the logging chain (operator, processor, exporter), others that operate only in one of the links
as a processor or exporter, and some that occupy the two links of processor-exporter (HiolHiol, 2019).
Wood forest products are consumed within the country or outside the country. One can have
furniture, handicrafts, timber, firewood, charcoal, waste from sawmills, etc. Depending on these
forestry products, one can distinguish several consumers: households (building houses, cooking with
charcoal or firewood), hotels, restaurants, decoration industries, etc.
4.1.2.2.2 Sources and types of forest biomass residue in Cameroon
The main sources of forest biomass residue are government and community forests in Cameroon at
harvesting sites and through primary and secondary processing as shown in Table 19.
Table 19: Sources of forest biomass in Cameroon
Sources of
forest biomass
Main actors Role played in the production
of forest residues
Harvesting
- The government
- Dealers
- Local communities
- NGOs
Produce wood residues during
wood harvesting
- The industrialists
- The producers
Harvesting of trees leaving
wood residue on harvesting
sites
- Transporters
- Examples: Cameroon Railways (CAMRAIL), DELMAS et MSC, MESSINA, MAERSK, MACK
Leave wood residue at site
when transporting wood
- Merchants, farms, wood/charcoal merchants Production of wood residues
(chips, sawdust, etc.) during
processing
Primary
processors
- Pulp mill owners
- Examples: CAMEROON UNITED FOREST; CIFM/PALLISCO; FIPCAM; SFID; SEFECCAM; SEFAC; SIM, STBK, WIJMA (Groupe, CFK); EFMK, NAMBOIS, PLACAM
Production of wood residues
(chips, sawdust, etc.) during
processing
- Wood sawmilling companies
- Examples: ALPICAM; CAMEROON UNITED FOREST; FIPCAM; SEFECCAM
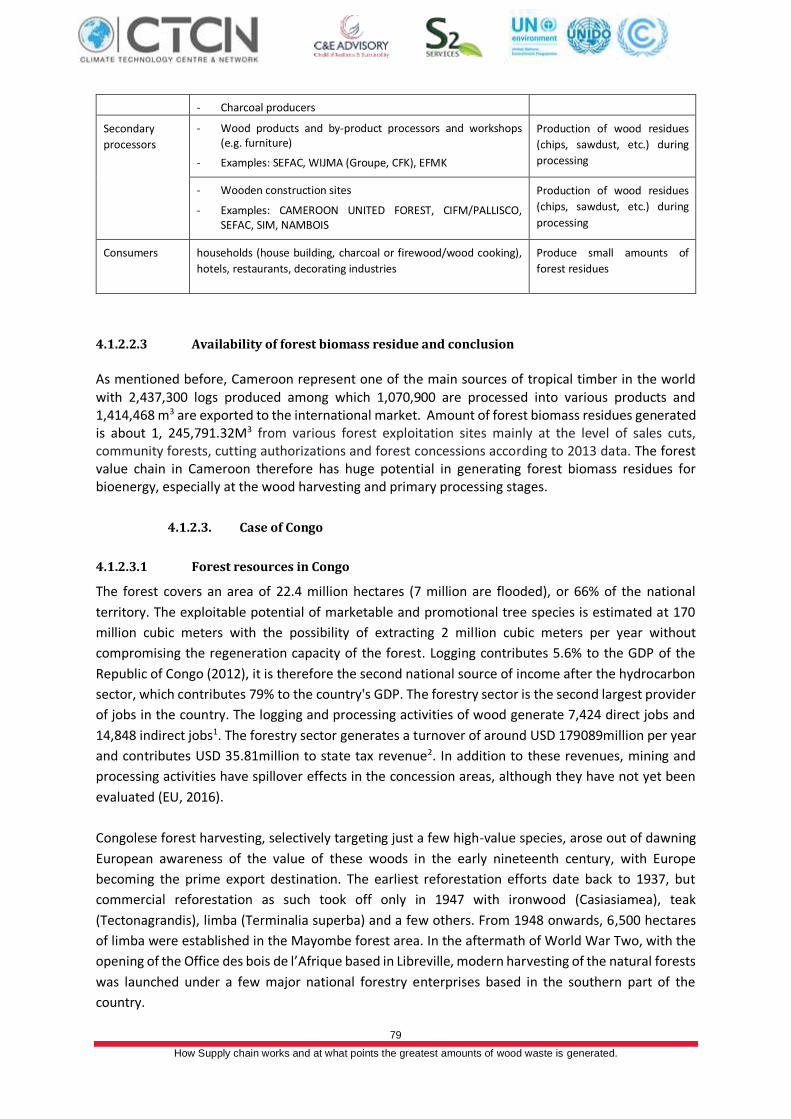
79
How Supply chain works and at what points the greatest amounts of wood waste is generated.
- Charcoal producers
Secondary
processors
- Wood products and by-product processors and workshops (e.g. furniture)
- Examples: SEFAC, WIJMA (Groupe, CFK), EFMK
Production of wood residues
(chips, sawdust, etc.) during
processing
- Wooden construction sites
- Examples: CAMEROON UNITED FOREST, CIFM/PALLISCO, SEFAC, SIM, NAMBOIS
Production of wood residues
(chips, sawdust, etc.) during
processing
Consumers
households (house building, charcoal or firewood/wood cooking),
hotels, restaurants, decorating industries
Produce small amounts of
forest residues
4.1.2.2.3 Availability of forest biomass residue and conclusion
As mentioned before, Cameroon represent one of the main sources of tropical timber in the world with 2,437,300 logs produced among which 1,070,900 are processed into various products and 1,414,468 m3 are exported to the international market. Amount of forest biomass residues generated is about 1, 245,791.32M3 from various forest exploitation sites mainly at the level of sales cuts, community forests, cutting authorizations and forest concessions according to 2013 data. The forest value chain in Cameroon therefore has huge potential in generating forest biomass residues for bioenergy, especially at the wood harvesting and primary processing stages.
4.1.2.3. Case of Congo
4.1.2.3.1 Forest resources in Congo
The forest covers an area of 22.4 million hectares (7 million are flooded), or 66% of the national
territory. The exploitable potential of marketable and promotional tree species is estimated at 170
million cubic meters with the possibility of extracting 2 million cubic meters per year without
compromising the regeneration capacity of the forest. Logging contributes 5.6% to the GDP of the
Republic of Congo (2012), it is therefore the second national source of income after the hydrocarbon
sector, which contributes 79% to the country's GDP. The forestry sector is the second largest provider
of jobs in the country. The logging and processing activities of wood generate 7,424 direct jobs and
14,848 indirect jobs1. The forestry sector generates a turnover of around USD 179089million per year
and contributes USD 35.81million to state tax revenue2. In addition to these revenues, mining and
processing activities have spillover effects in the concession areas, although they have not yet been
evaluated (EU, 2016).
Congolese forest harvesting, selectively targeting just a few high-value species, arose out of dawning
European awareness of the value of these woods in the early nineteenth century, with Europe
becoming the prime export destination. The earliest reforestation efforts date back to 1937, but
commercial reforestation as such took off only in 1947 with ironwood (Casiasiamea), teak
(Tectonagrandis), limba (Terminalia superba) and a few others. From 1948 onwards, 6,500 hectares
of limba were established in the Mayombe forest area. In the aftermath of World War Two, with the
opening of the Office des bois de l’Afrique based in Libreville, modern harvesting of the natural forests
was launched under a few major national forestry enterprises based in the southern part of the
country.
80
How Supply chain works and at what points the greatest amounts of wood waste is generated.
The main species planted in rainforest areas are okoumé (Aucomeaklaineana), limba, bilinga
(Naucleadiderrichii), moabi (Baillonellataxisperma), pao-rose, (Swartiafistuloïdes) and tiama
(Entandrophragmaangolense). Species planted in savanna areas are pines (P. caribaea, P. oocarpa),
Eucalyptus spp., Araucacia spp. and Acacia spp. Congolese forestry silvicultural research has obtained
some impressive results with selected local species, especially limba; with fast-growing exotics, mainly
eucalyptus and pines; and with industrial plantations of these species. Eucalyptus cloning techniques
with fast-growing Eucalyptus spp had already been developed by 1976, and were later extended on
an industrial scale. Limba, a sun-loving species, has been used since 1949 following the partial or total
destruction of forests by manual or mechanized methods. Plantation spacing can be as wide as 12 m
x 12 m. Natural forest improvement is also practiced in Congo. The forest cover is opened for the first
time by commercial harvesting. Complementary selective thinning of the dominant secondary species
follows immediately to favor the growth of the dominant commercial species. This mixed
regeneration/shelter cut is also intended to stimulate the long-term regeneration of commercial
species.
In the matter of protection and follow-up of the state-owned forest, the administration of water and
forests are responsible, according to the management plan at national, regional and local levels that
the authorized activities in this area don’t lead to forests destruction, but assure their sustainability,
their extension and harvesting in rational conditions. These activities must be carried out in the
framework of rational management of forest resources, on the basis of sustainable management of
forest ecosystems, assuring a sustainable forest yield and environment conservation, notably in
regards to biological diversity (Amsallem, 2002)
4.1.2.3.2 Forest value chain in Congo
In Congo-Brazzaville, the economic performance of the forestry value chain is linked to trade with
Asia, notably China and the Middle East, Europe and Africa, and the dynamism of the informal sector.
The players involved in Congolese forestry are represented in Figure 21.
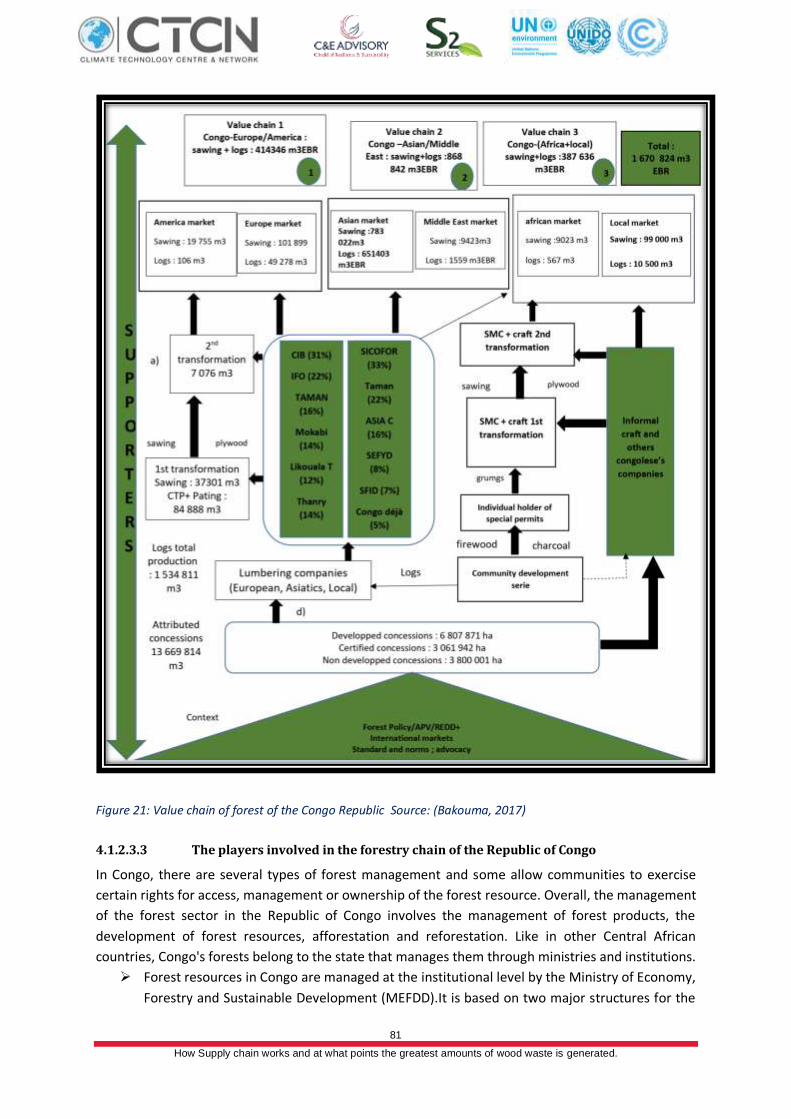
81
How Supply chain works and at what points the greatest amounts of wood waste is generated.
Figure 21: Value chain of forest of the Congo Republic Source: (Bakouma, 2017)
4.1.2.3.3 The players involved in the forestry chain of the Republic of Congo
In Congo, there are several types of forest management and some allow communities to exercise
certain rights for access, management or ownership of the forest resource. Overall, the management
of the forest sector in the Republic of Congo involves the management of forest products, the
development of forest resources, afforestation and reforestation. Like in other Central African
countries, Congo's forests belong to the state that manages them through ministries and institutions.
➢ Forest resources in Congo are managed at the institutional level by the Ministry of Economy,
Forestry and Sustainable Development (MEFDD).It is based on two major structures for the
82
How Supply chain works and at what points the greatest amounts of wood waste is generated.
management of forest activities throughout the country. These two major structures are
under the control of the General Inspectorate of Forest Economics and Sustainable
Development (ISGSEFDD):
- The Directorate General of Forestry Economics (DGEF), which has five (5) central and
twelve (12) departmental branches;
- The Directorate General for Sustainable Development (DGDD), which has four central
branches.
To ensure the rational management of renewable resources, Congolese forest authorities have put in
place a policy of sustainable exploitation of forest ecosystems and advocate for sustainable protection
of the environment. In this regard, strategic planning exercises such as the National Forest Action Plan
(NFPP), the National Strategy and the Biological Diversity Action Plan (SNPADB) and the Interim
Poverty Reduction Strategy Document (IPSD) have been developed.
The Forest Code challenges neither the roles and responsibilities of the various stakeholders, leading
to institutional reform and leading to the creation of the MEF (Ministry of Forestry economic) but also
the General Inspectorate of Forest Economics (IGEF), the Forest Products Control Service for Export
(SCPFE), the General Monitoring Society (SGS), the Forest Fund (FF) and the National Centre for Forest
And Wildlife Inventory and Management (CNI). The projects Congo Sustainable Forest Management
Support (PAGEF), the National Forest Inventory (IFN), the Congo Basin Ecosystem Conservation
Support, and the sustainable management of Pericopciselata/Afrormosia in the Congo Basin are
hosted by the CNIAF (Centre National d’Inventaire et Aménagement forestier). Its attributions are:
➢ Implement national forest and wildlife inventory programs;
➢ Process, conserve and update inventory data on forest, wildlife and protected areas;
➢ Develop and update national mapping;
➢ Develop national forest management plans;
➢ Propose and follow the possible revision of forest and protected areasmanagement plans ;
➢ Assist and monitor regional water and forest services, public bodies and private companies in
the forestry and wildlife sectors in conducting and monitoring of inventory and management
of forests and protected areas (MEF, 2017).
Apart from the state that manages through its institutions, the private sector plays a significant role
in the management of forest resources. This is to ensure the sustainable use of these resources. This
private sector consists of domestic and foreign companies that are public, parastatal or private. They
have limited shares in concessions granted by the government.
Indigenous peoples have a collective and individual right to property, possession, access, and the use
of the land and natural resources they traditionally occupy or use for subsistence, pharmacopoeia,
and work. People consider certain forests to be sacred forests and management is to protect these
forests and their resources for traditional purposes (Faure, 2013).
The role of NGOs in forest management lies mainly in the level of support of the council. Similarly, the
State entrusts the management and conservation of wildlife to these NGOs (Wildlife Conservation
Society - WCS, World Wildlife Fund –WWF. Some of their activities include:
➢ Full protection of certain animals and their habitat;
➢ Development of all wildlife through the creation and management of parks and protected
areas;
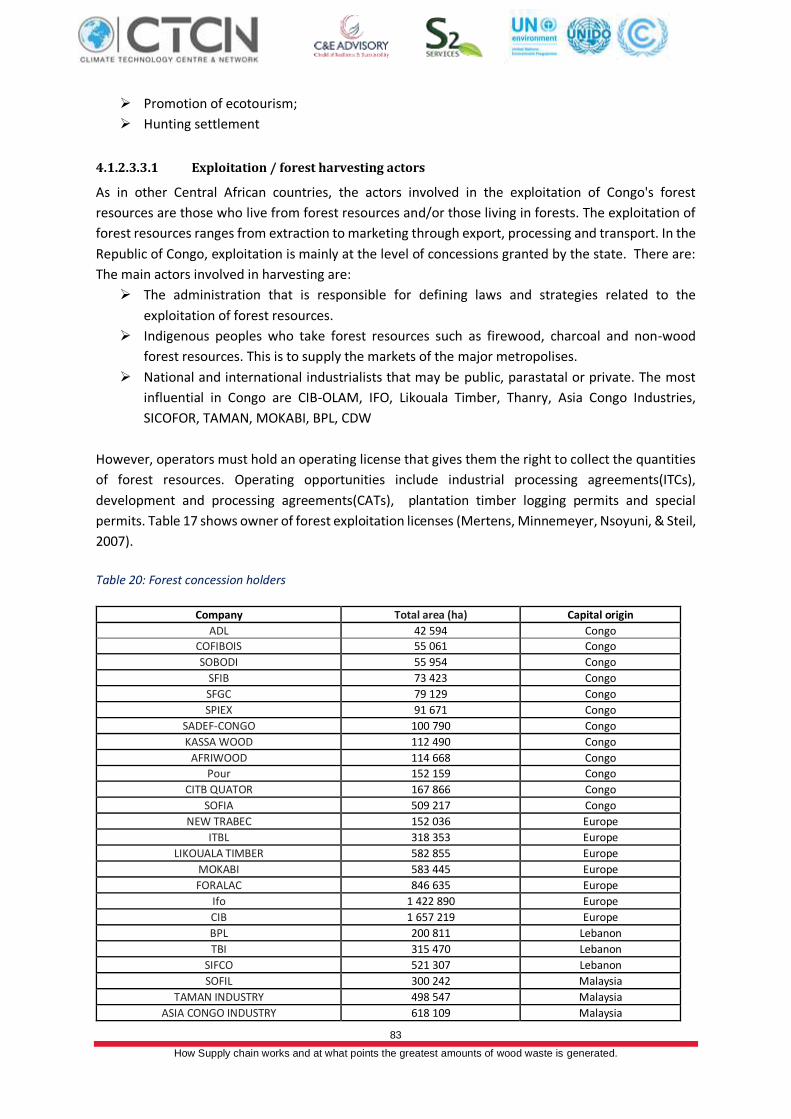
83
How Supply chain works and at what points the greatest amounts of wood waste is generated.
➢ Promotion of ecotourism;
➢ Hunting settlement
4.1.2.3.3.1 Exploitation / forest harvesting actors
As in other Central African countries, the actors involved in the exploitation of Congo's forest
resources are those who live from forest resources and/or those living in forests. The exploitation of
forest resources ranges from extraction to marketing through export, processing and transport. In the
Republic of Congo, exploitation is mainly at the level of concessions granted by the state. There are:
The main actors involved in harvesting are:
➢ The administration that is responsible for defining laws and strategies related to the
exploitation of forest resources.
➢ Indigenous peoples who take forest resources such as firewood, charcoal and non-wood
forest resources. This is to supply the markets of the major metropolises.
➢ National and international industrialists that may be public, parastatal or private. The most
influential in Congo are CIB-OLAM, IFO, Likouala Timber, Thanry, Asia Congo Industries,
SICOFOR, TAMAN, MOKABI, BPL, CDW
However, operators must hold an operating license that gives them the right to collect the quantities
of forest resources. Operating opportunities include industrial processing agreements(ITCs),
development and processing agreements(CATs), plantation timber logging permits and special
permits. Table 17 shows owner of forest exploitation licenses (Mertens, Minnemeyer, Nsoyuni, & Steil,
2007).
Table 20: Forest concession holders
Company Total area (ha) Capital origin
ADL 42 594 Congo
COFIBOIS 55 061 Congo
SOBODI 55 954 Congo
SFIB 73 423 Congo
SFGC 79 129 Congo
SPIEX 91 671 Congo
SADEF-CONGO 100 790 Congo
KASSA WOOD 112 490 Congo
AFRIWOOD 114 668 Congo
Pour 152 159 Congo
CITB QUATOR 167 866 Congo
SOFIA 509 217 Congo
NEW TRABEC 152 036 Europe
ITBL 318 353 Europe
LIKOUALA TIMBER 582 855 Europe
MOKABI 583 445 Europe
FORALAC 846 635 Europe
Ifo 1 422 890 Europe
CIB 1 657 219 Europe
BPL 200 811 Lebanon
TBI 315 470 Lebanon
SIFCO 521 307 Lebanon
SOFIL 300 242 Malaysia
TAMAN INDUSTRY 498 547 Malaysia
ASIA CONGO INDUSTRY 618 109 Malaysia
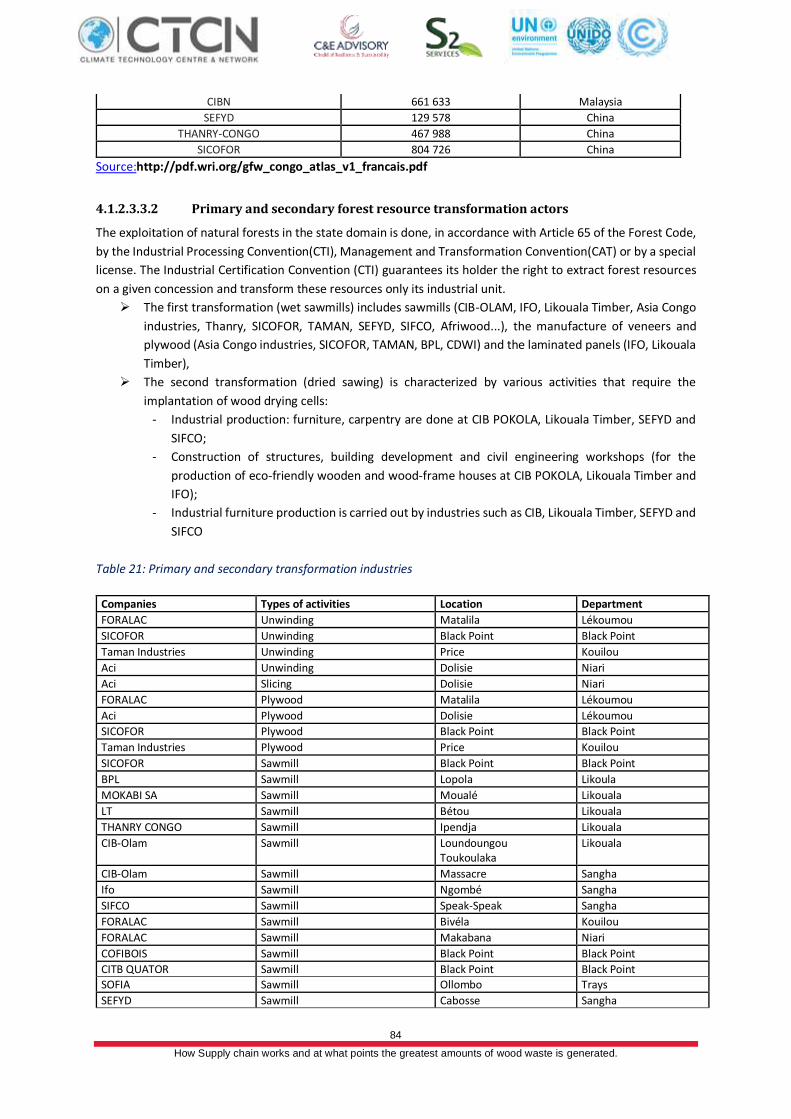
84
How Supply chain works and at what points the greatest amounts of wood waste is generated.
CIBN 661 633 Malaysia
SEFYD 129 578 China
THANRY-CONGO 467 988 China
SICOFOR 804 726 China
Source:http://pdf.wri.org/gfw_congo_atlas_v1_francais.pdf
4.1.2.3.3.2 Primary and secondary forest resource transformation actors
The exploitation of natural forests in the state domain is done, in accordance with Article 65 of the Forest Code,
by the Industrial Processing Convention(CTI), Management and Transformation Convention(CAT) or by a special
license. The Industrial Certification Convention (CTI) guarantees its holder the right to extract forest resources
on a given concession and transform these resources only its industrial unit.
➢ The first transformation (wet sawmills) includes sawmills (CIB-OLAM, IFO, Likouala Timber, Asia Congo
industries, Thanry, SICOFOR, TAMAN, SEFYD, SIFCO, Afriwood...), the manufacture of veneers and
plywood (Asia Congo industries, SICOFOR, TAMAN, BPL, CDWI) and the laminated panels (IFO, Likouala
Timber),
➢ The second transformation (dried sawing) is characterized by various activities that require the
implantation of wood drying cells:
- Industrial production: furniture, carpentry are done at CIB POKOLA, Likouala Timber, SEFYD and
SIFCO;
- Construction of structures, building development and civil engineering workshops (for the
production of eco-friendly wooden and wood-frame houses at CIB POKOLA, Likouala Timber and
IFO);
- Industrial furniture production is carried out by industries such as CIB, Likouala Timber, SEFYD and
SIFCO
Table 21: Primary and secondary transformation industries
Companies Types of activities Location Department
FORALAC Unwinding Matalila Lékoumou
SICOFOR Unwinding Black Point Black Point
Taman Industries Unwinding Price Kouilou
Aci Unwinding Dolisie Niari
Aci Slicing Dolisie Niari
FORALAC Plywood Matalila Lékoumou
Aci Plywood Dolisie Lékoumou
SICOFOR Plywood Black Point Black Point
Taman Industries Plywood Price Kouilou
SICOFOR Sawmill Black Point Black Point
BPL Sawmill Lopola Likoula
MOKABI SA Sawmill Moualé Likouala
LT Sawmill Bétou Likouala
THANRY CONGO Sawmill Ipendja Likouala
CIB-Olam Sawmill Loundoungou Toukoulaka
Likouala
CIB-Olam Sawmill Massacre Sangha
Ifo Sawmill Ngombé Sangha
SIFCO Sawmill Speak-Speak Sangha
FORALAC Sawmill Bivéla Kouilou
FORALAC Sawmill Makabana Niari
COFIBOIS Sawmill Black Point Black Point
CITB QUATOR Sawmill Black Point Black Point
SOFIA Sawmill Ollombo Trays
SEFYD Sawmill Cabosse Sangha
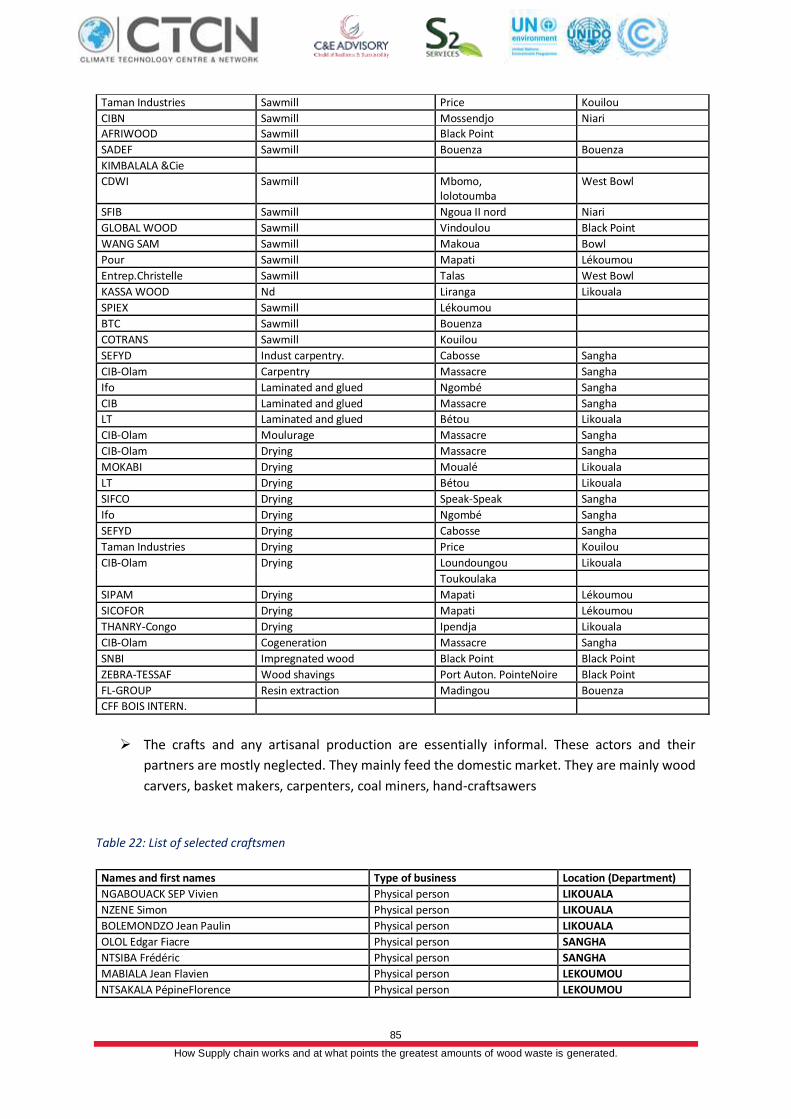
85
How Supply chain works and at what points the greatest amounts of wood waste is generated.
Taman Industries Sawmill Price Kouilou
CIBN Sawmill Mossendjo Niari
AFRIWOOD Sawmill Black Point
SADEF Sawmill Bouenza Bouenza
KIMBALALA &Cie
CDWI Sawmill Mbomo, lolotoumba
West Bowl
SFIB Sawmill Ngoua II nord Niari
GLOBAL WOOD Sawmill Vindoulou Black Point
WANG SAM Sawmill Makoua Bowl
Pour Sawmill Mapati Lékoumou
Entrep.Christelle Sawmill Talas West Bowl
KASSA WOOD Nd Liranga Likouala
SPIEX Sawmill Lékoumou
BTC Sawmill Bouenza
COTRANS Sawmill Kouilou
SEFYD Indust carpentry. Cabosse Sangha
CIB-Olam Carpentry Massacre Sangha
Ifo Laminated and glued Ngombé Sangha
CIB Laminated and glued Massacre Sangha
LT Laminated and glued Bétou Likouala
CIB-Olam Moulurage Massacre Sangha
CIB-Olam Drying Massacre Sangha
MOKABI Drying Moualé Likouala
LT Drying Bétou Likouala
SIFCO Drying Speak-Speak Sangha
Ifo Drying Ngombé Sangha
SEFYD Drying Cabosse Sangha
Taman Industries Drying Price Kouilou
CIB-Olam Drying Loundoungou Likouala
Toukoulaka
SIPAM Drying Mapati Lékoumou
SICOFOR Drying Mapati Lékoumou
THANRY-Congo Drying Ipendja Likouala
CIB-Olam Cogeneration Massacre Sangha
SNBI Impregnated wood Black Point Black Point
ZEBRA-TESSAF Wood shavings Port Auton. PointeNoire Black Point
FL-GROUP Resin extraction Madingou Bouenza
CFF BOIS INTERN.
➢ The crafts and any artisanal production are essentially informal. These actors and their
partners are mostly neglected. They mainly feed the domestic market. They are mainly wood
carvers, basket makers, carpenters, coal miners, hand-craftsawers
Table 22: List of selected craftsmen
Names and first names Type of business Location (Department)
NGABOUACK SEP Vivien Physical person LIKOUALA
NZENE Simon Physical person LIKOUALA
BOLEMONDZO Jean Paulin Physical person LIKOUALA
OLOL Edgar Fiacre Physical person SANGHA
NTSIBA Frédéric Physical person SANGHA
MABIALA Jean Flavien Physical person LEKOUMOU
NTSAKALA PépineFlorence Physical person LEKOUMOU
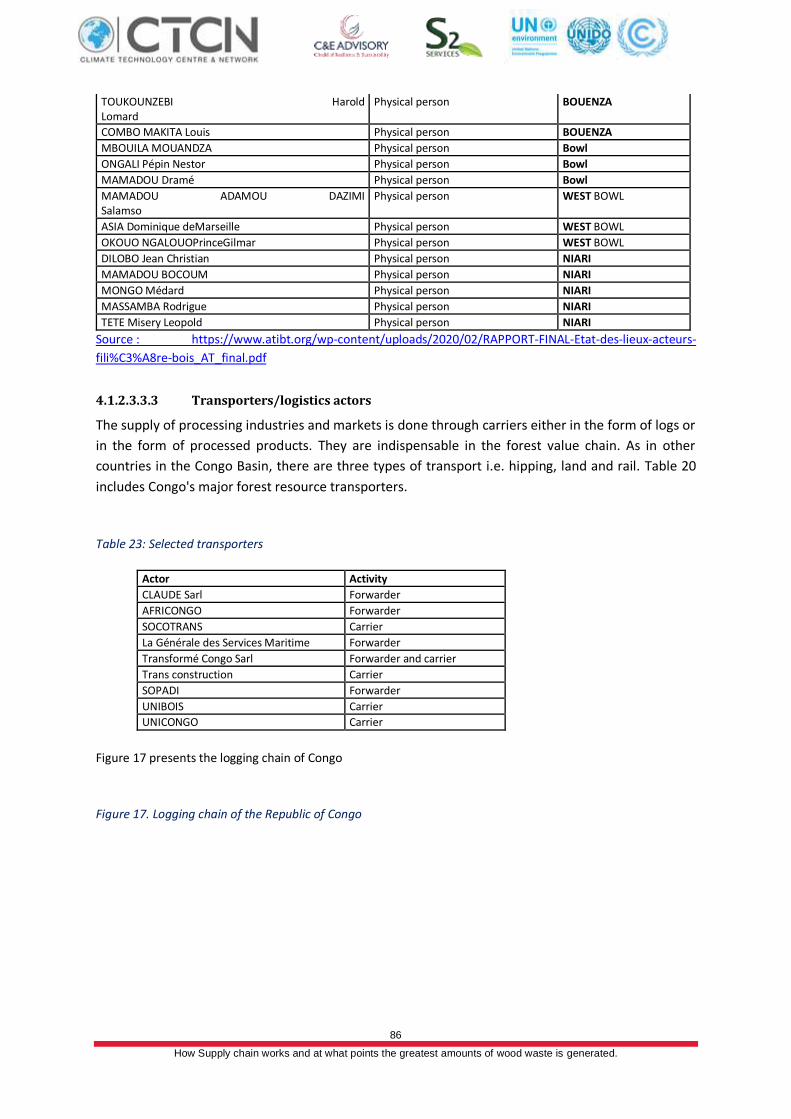
86
How Supply chain works and at what points the greatest amounts of wood waste is generated.
TOUKOUNZEBI Harold Lomard
Physical person BOUENZA
COMBO MAKITA Louis Physical person BOUENZA
MBOUILA MOUANDZA Physical person Bowl
ONGALI Pépin Nestor Physical person Bowl
MAMADOU Dramé Physical person Bowl
MAMADOU ADAMOU DAZIMI Salamso
Physical person WEST BOWL
ASIA Dominique deMarseille Physical person WEST BOWL
OKOUO NGALOUOPrinceGilmar Physical person WEST BOWL
DILOBO Jean Christian Physical person NIARI
MAMADOU BOCOUM Physical person NIARI
MONGO Médard Physical person NIARI
MASSAMBA Rodrigue Physical person NIARI
TETE Misery Leopold Physical person NIARI
Source : https://www.atibt.org/wp-content/uploads/2020/02/RAPPORT-FINAL-Etat-des-lieux-acteurs-
fili%C3%A8re-bois_AT_final.pdf
4.1.2.3.3.3 Transporters/logistics actors
The supply of processing industries and markets is done through carriers either in the form of logs or
in the form of processed products. They are indispensable in the forest value chain. As in other
countries in the Congo Basin, there are three types of transport i.e. hipping, land and rail. Table 20
includes Congo's major forest resource transporters.
Table 23: Selected transporters
Actor Activity
CLAUDE Sarl Forwarder
AFRICONGO Forwarder
SOCOTRANS Carrier
La Générale des Services Maritime Forwarder
Transformé Congo Sarl Forwarder and carrier
Trans construction Carrier
SOPADI Forwarder
UNIBOIS Carrier
UNICONGO Carrier
Figure 17 presents the logging chain of Congo
Figure 17. Logging chain of the Republic of Congo
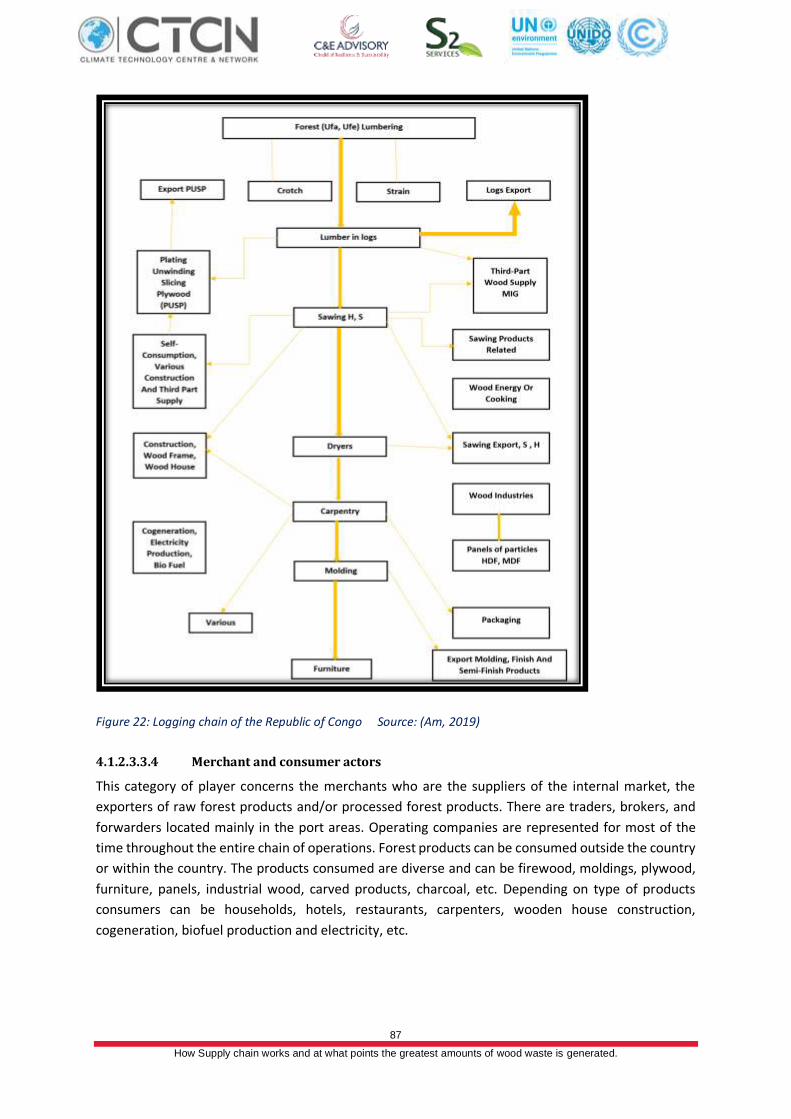
87
How Supply chain works and at what points the greatest amounts of wood waste is generated.
Figure 22: Logging chain of the Republic of Congo Source: (Am, 2019)
4.1.2.3.3.4 Merchant and consumer actors
This category of player concerns the merchants who are the suppliers of the internal market, the
exporters of raw forest products and/or processed forest products. There are traders, brokers, and
forwarders located mainly in the port areas. Operating companies are represented for most of the
time throughout the entire chain of operations. Forest products can be consumed outside the country
or within the country. The products consumed are diverse and can be firewood, moldings, plywood,
furniture, panels, industrial wood, carved products, charcoal, etc. Depending on type of products
consumers can be households, hotels, restaurants, carpenters, wooden house construction,
cogeneration, biofuel production and electricity, etc.
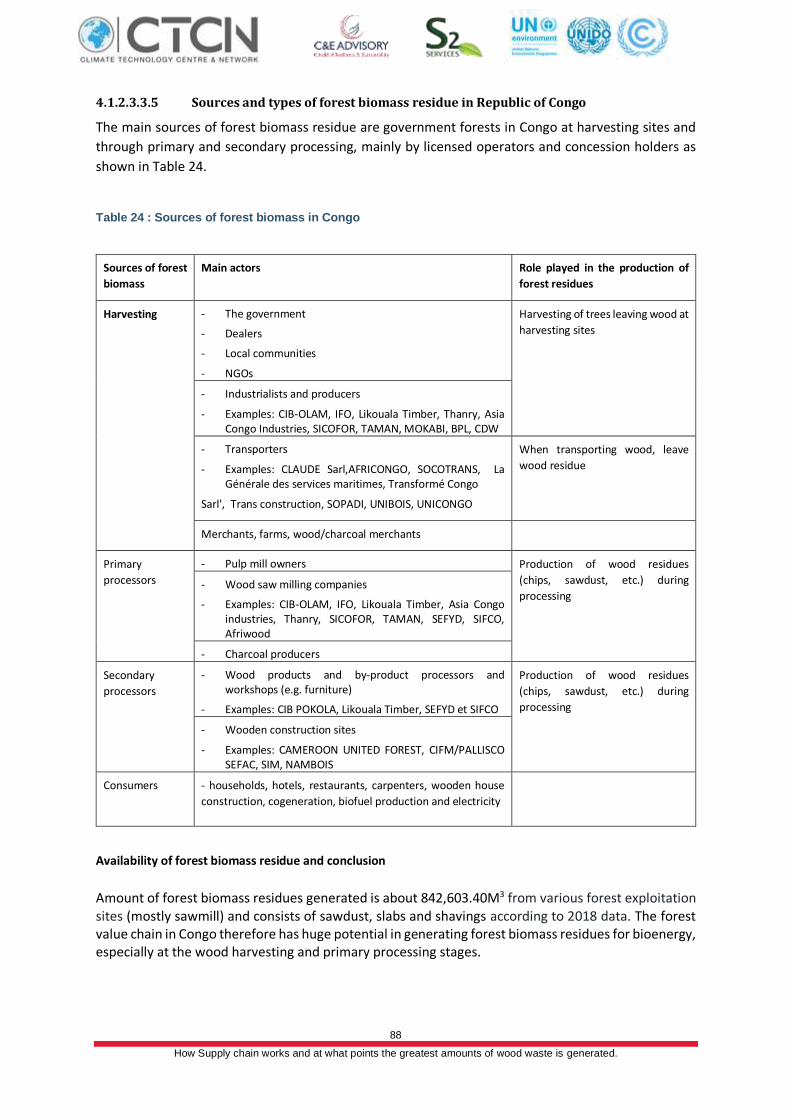
88
How Supply chain works and at what points the greatest amounts of wood waste is generated.
4.1.2.3.3.5 Sources and types of forest biomass residue in Republic of Congo
The main sources of forest biomass residue are government forests in Congo at harvesting sites and
through primary and secondary processing, mainly by licensed operators and concession holders as
shown in Table 24.
Table 24 : Sources of forest biomass in Congo
Sources of forest
biomass
Main actors Role played in the production of
forest residues
Harvesting - The government
- Dealers
- Local communities
- NGOs
Harvesting of trees leaving wood at
harvesting sites
- Industrialists and producers
- Examples: CIB-OLAM, IFO, Likouala Timber, Thanry, Asia Congo Industries, SICOFOR, TAMAN, MOKABI, BPL, CDW
- Transporters
- Examples: CLAUDE Sarl,AFRICONGO, SOCOTRANS, La Générale des services maritimes, Transformé Congo
Sarl', Trans construction, SOPADI, UNIBOIS, UNICONGO
When transporting wood, leave
wood residue
Merchants, farms, wood/charcoal merchants
Primary
processors
- Pulp mill owners Production of wood residues
(chips, sawdust, etc.) during
processing - Wood saw milling companies
- Examples: CIB-OLAM, IFO, Likouala Timber, Asia Congo industries, Thanry, SICOFOR, TAMAN, SEFYD, SIFCO, Afriwood
- Charcoal producers
Secondary
processors
- Wood products and by-product processors and workshops (e.g. furniture)
- Examples: CIB POKOLA, Likouala Timber, SEFYD et SIFCO
Production of wood residues
(chips, sawdust, etc.) during
processing
- Wooden construction sites
- Examples: CAMEROON UNITED FOREST, CIFM/PALLISCO SEFAC, SIM, NAMBOIS
Consumers
- households, hotels, restaurants, carpenters, wooden house
construction, cogeneration, biofuel production and electricity
Availability of forest biomass residue and conclusion
Amount of forest biomass residues generated is about 842,603.40M3 from various forest exploitation sites (mostly sawmill) and consists of sawdust, slabs and shavings according to 2018 data. The forest value chain in Congo therefore has huge potential in generating forest biomass residues for bioenergy, especially at the wood harvesting and primary processing stages.
89
How Supply chain works and at what points the greatest amounts of wood waste is generated.
4.1.2.4. Case of Gabon
4.1.2.4.1 Forest resources in Gabon
With an area of 267,677 km2, Gabon is a rich forest country. About 85% of the country's land area is
forested, or nearly 22 million hectares. Gabon ranks first among African forest producers with its ratio
of forest area per capita (22 ha per capital), one of the highest in Africa. The Gabonese vegetation
belongs to the Guinean-Congolese rainforest. It stretches across the country and is divided into two
large groups; dense humid forest and savannah which respectively cover 85% and 15% of the land
area. This vegetation is rich and varied. It includes 6 large forest formations which contain many woody
species whose economic exploitation is interesting, and which are:
• Forest of the coastal basin (Forests in Okoumé, Ozouga, anonaceae, Irvingiaceae,
Myristicaceae and various legumes);
• Central forest (Okoumé, ozigoSorro and Legumes with inclusion of Terminalia Superba
(Limba));
• Northern Forest (semi-deciduous) (Gradual disappearance of Okoumé and Sorro, appearance
of Terminalia and TriplochitonScleroxylon (Ayous));
• Mangroves, forest galleries (On the seafront, in Estuaries, deltas, near lagoons along rivers
and streams); Bushy, wooded grassy savannahs (In the drier parts of the country).
Forests have always played an important role in the way of life of the populations and in the economic
activity of the country. Indeed, were the main wealth of the country before being overtaken by oil in
the early 1970s. Currently, the forest sector ranks second in the revenues that the State derives from
the exploitation of its resources. Natural resources remains the second largest employer after the
State with more than 20,000 direct jobs and 5,000 indirect jobs (FAO, n.d; Wasseige, Flynn, Louppe,
Hiol, & Mayaux, 2014).
The volume of wood produced in 2010 was estimated at 1,861,116 m3 and 1,709,413 m3 in 2011. Of
these volumes of wood produced, 827,637 m3 were processed in 2011. Over 700,000 of wood
products were exported each year between 2011, which allowed a contribution of 1.7% in 2010 and
1.8% in 2011 on the country's GDP and 0.22% on tax revenues. The forestry sector every year between
2010 and 2012 generated more than 7,000 direct jobs and more than 5,000 indirect jobs72.
Timber harvesting in Gabon began at the close of the nineteenth century and continued virtually
unregulated up to the year 1913. The resumption of logging at a much faster pace following World
War One made regulation of the sector imperative. In September 1924, a law was passed defining the
various types of logging permits. This was paralleled by research and planting trials in 1928 on okoumé
(Aucoumeaklaineana), the major forest species harvested in Gabon. Some 30,000 ha of okoumé were
established, particularly in the early 1950s in the Mondah, N’koulounga, Bokoué, Mvoum, Haut Como
and Mbiné forests. Forest tree improvement work was also done on these stands from 1950 to 1957.
The main actor at that time was the STFO (Société technique de la forêtd’Okoumé), now replaced by
the DGEF (Drection générale des Eaux et forêts). Other fast-growing species were also introduced
(Pinus spp., Eucalyptus spp.) for plantations and for research. Various timber species were planted
from 1985 to 1993, especially in the Bokoué stands, for clear felling. These included framiré
(Terminalia ivorensis), limba (Terminalia superba) and bilinga (Naucleatrillesii).
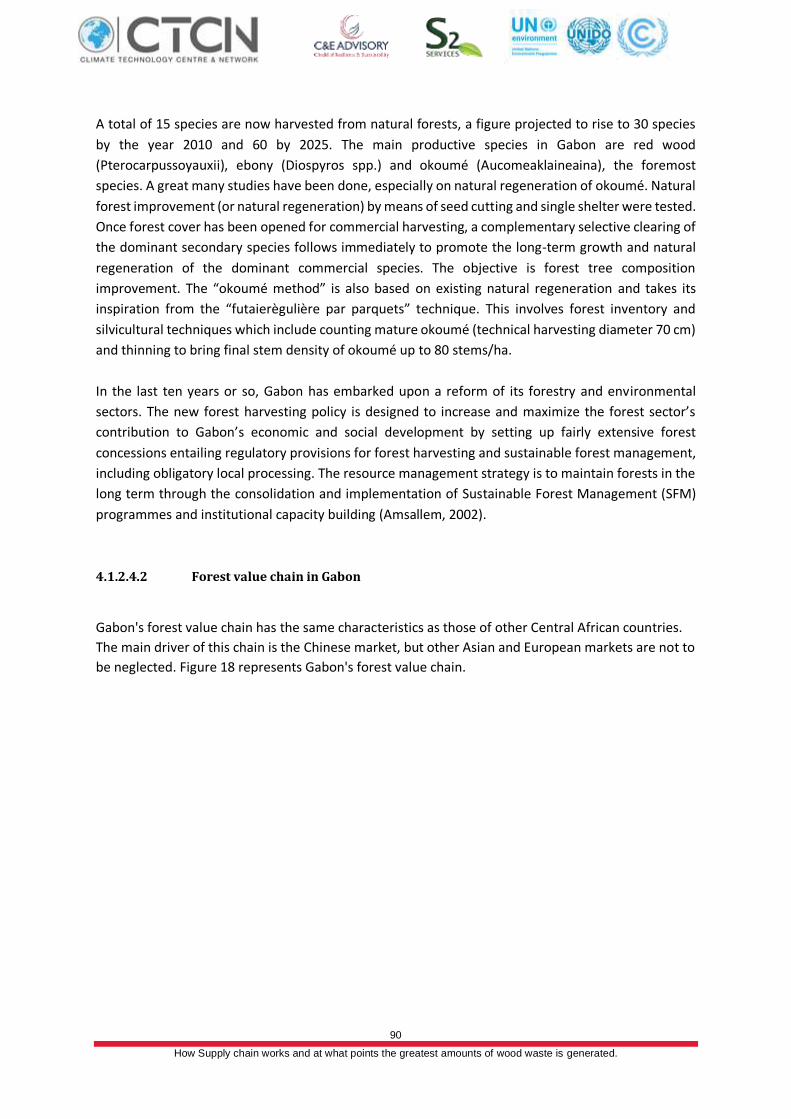
90
How Supply chain works and at what points the greatest amounts of wood waste is generated.
A total of 15 species are now harvested from natural forests, a figure projected to rise to 30 species
by the year 2010 and 60 by 2025. The main productive species in Gabon are red wood
(Pterocarpussoyauxii), ebony (Diospyros spp.) and okoumé (Aucomeaklaineaina), the foremost
species. A great many studies have been done, especially on natural regeneration of okoumé. Natural
forest improvement (or natural regeneration) by means of seed cutting and single shelter were tested.
Once forest cover has been opened for commercial harvesting, a complementary selective clearing of
the dominant secondary species follows immediately to promote the long-term growth and natural
regeneration of the dominant commercial species. The objective is forest tree composition
improvement. The “okoumé method” is also based on existing natural regeneration and takes its
inspiration from the “futaierègulière par parquets” technique. This involves forest inventory and
silvicultural techniques which include counting mature okoumé (technical harvesting diameter 70 cm)
and thinning to bring final stem density of okoumé up to 80 stems/ha.
In the last ten years or so, Gabon has embarked upon a reform of its forestry and environmental
sectors. The new forest harvesting policy is designed to increase and maximize the forest sector’s
contribution to Gabon’s economic and social development by setting up fairly extensive forest
concessions entailing regulatory provisions for forest harvesting and sustainable forest management,
including obligatory local processing. The resource management strategy is to maintain forests in the
long term through the consolidation and implementation of Sustainable Forest Management (SFM)
programmes and institutional capacity building (Amsallem, 2002).
4.1.2.4.2 Forest value chain in Gabon
Gabon's forest value chain has the same characteristics as those of other Central African countries.
The main driver of this chain is the Chinese market, but other Asian and European markets are not to
be neglected. Figure 18 represents Gabon's forest value chain.
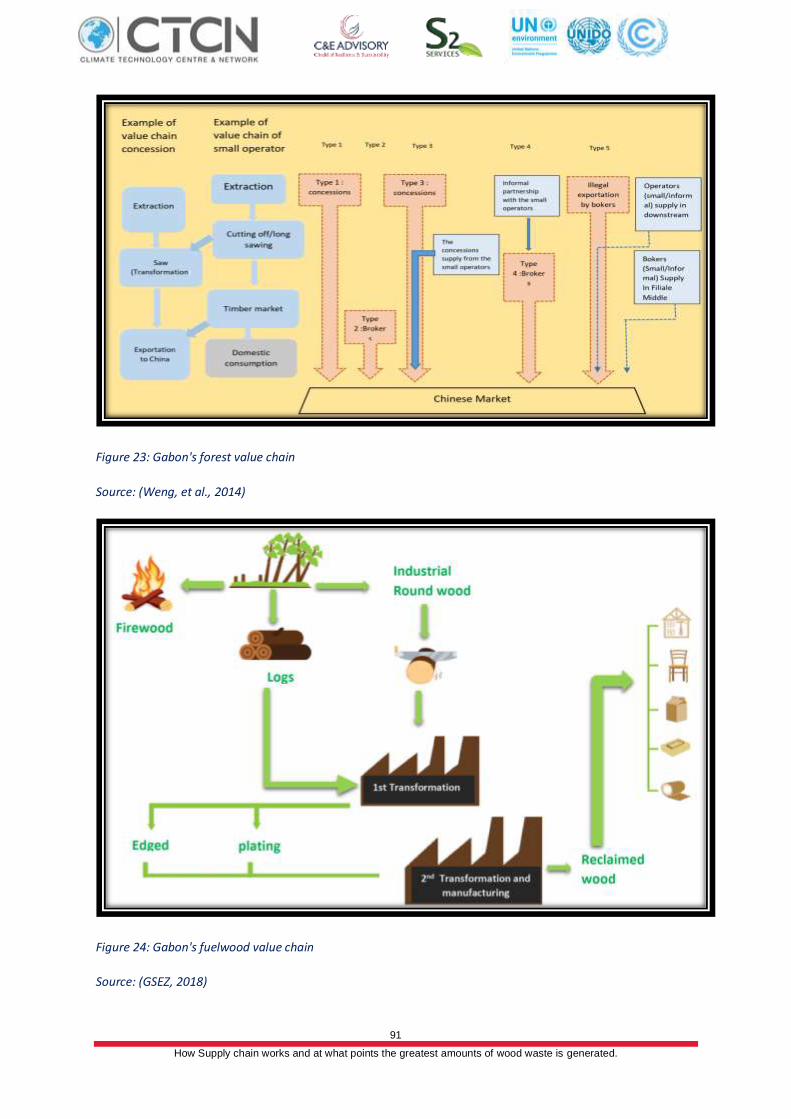
91
How Supply chain works and at what points the greatest amounts of wood waste is generated.
Figure 23: Gabon's forest value chain
Source: (Weng, et al., 2014)
Figure 24: Gabon's fuelwood value chain
Source: (GSEZ, 2018)
92
How Supply chain works and at what points the greatest amounts of wood waste is generated.
4.1.2.4.3 The players involved in Gabon's forestry chain
The forest in Gabon has several categories of management actors: government, intergovernmental
and administrative institutions (political actors), private operators, and NGOs (civil society), etc.
➢ Government, intergovernmental and administrative institutions
These actors play key roles in the development and implementation of forest policies at the
international, regional, national, provincial or local levels. They conceive and define the policy
framework:
- The Ministry in charge of Waters and Forests is the main actor at the top of the pyramid. It is the
first administration created to manage natural resources in the fields of fauna, flora and aquatic
environments. Through the General Directorate of Waters and Forestry (DGEF), it is in charge of
the management of the forest domain, wildlife, general control and enforcement of forest
regulations in state owned forests.
- The legislative bodies are made up of the Senate and the national assembly. Those of the technical
commissions in charge of the forestry issue are involved in the construction and validation of
forest laws.
- Organizations such as FAO, UNEP, UNDP, and ITTO are involved in the management of forest
resources in Gabon by influencing policy design.
- Other political actors include governors, prefects, sub-prefects, representatives of the state or
institutions.
➢ The NGOsare the are involved in the development, conservation of forest concessions and the
development of ecotourism. They are also involved in the local and sustainable conservation
and development of forests.
➢ Private operators: all stakeholders have in common the participation in the management of
forest resources. Private players are concession companies exploiting forest resources. As
stipulated in the Gabonese forest code, the management of certain territories is entrusted to
private operators but remains conditioned by the application of state directives. There are
companies like CEB, Rougier, etc. NGOs are committed to the implementation of a
development plan and sustainable operations. One can find NGOs such as WWF, WCS, Friends
of pangolin, the Action Centerfor Sustainable Development and the Environment, World
Promus, Adventures Without Borders, Brainforest, Carpe, etc.
➢ Local people also have a big role in forest resource management. Their actions are limited to
the level of the community forests that they protect (Moulongui, 2014).
Table 25: Gabon's forest resource management actors
Management players Characteristics How to participate
Economic operators (sub-sector industry and timber trade)
Private companies. Interested or involved in forest management and certification. Varied levels in wood processing
Collaborate and comply with legal requirements including compliance with operating rules, national forest management standards and traceability of processed products
Specialized suppliers in exploitation, forest management and wood processing
Consulting firms or individual consultants Perform the activities of their expertise in accordance with the rules and principles of certification of the GDF and the quality of the products
93
How Supply chain works and at what points the greatest amounts of wood waste is generated.
Village association for participatory and community management of the forest
Poorly organized village structures to participate in sustainable management without financial autonomy
Strengthen the awarenessof populations on reforestation and wood processing operations
The Professional Associations of the forest sector
Grouping of forest and/or industrial processing industries
Internal organization and the development of an inter-union platform
Ministry of Forestry and Environment in charge of Climate Plan development
The development of public policies on the management of natural resources and the development of the timber industry Responsible for monitoring the implementation of management tools Ensure the legality forest exploiters and wood industries developers
Creating the conditions for successful processes (sustainable management, development, certification, APV FLEGT) Strengthen monitoring and evaluation activities
Decentralized administration (councils, association of neighbouring councils)
Territorial collectivity with legal status and financial autonomy.
Maintaining a peaceful environmental
Civil society (NGOs, Association of neighbouring villages)
Organizations of society attentive to the socio-economic conditions of populations
Technical support for NGOs and maintaining peaceful environmental for development associations
Other Ministries (in charge of trade and industry, labour, justice, transport, economy, research, etc.)
Intervene in the fields of trade and the wood industry, guide the development and tax conditions, research on silviculture
Working together to strengthen synergy between institutions Create a partnership with national agencies and improve management methods and techniques
4.1.2.4.3.1 Exploitation of forest resources in Gabon
Logging includes all harvesting activities that comply with regulations, from site planning to storage.
In Gabon, as in other countries in the Congo Basin, timber extraction is mostly done for commercial
purposes. Private concessionaire companies practice the extraction of forest resources. Forestry
activities include the exploitation of forest products and non-lumber products, the wood processing
industry, the marketing of products on the local and international markets. The various policies,
strategies, programs, action plans and projects are implemented for the benefit of all stakeholders in
the public sector, the private sector, local authorities, professional associations, and the population.
➢ Extracting forests resources: it is both technical and commercial activity. Resources are shaped,
dotted and classified for export, domestic or international market or made available to
processors.
➢ Industrial transformation: the first and second industrial transformation. The nature of the
products resulting from this transformation depends on the technology used to develop the
wood material.
✓ For the first transformation: sawmill, ties; unrolling of unrolled veneers and plywood; panels,
particle or fibre panels, slicing of sliced veneers; making pulp and cardboard.
✓ For the second processing: using products from the first processing to obtain finished or semi-
finished products.
➢ Commercial distribution: bring together products from previous transformations and offer them to
different consumers.
These actors are available in eight regions of Gabon: Estuary, HautOgooue, Middle Ogooue, Ngounie,
Nyanga, OgooueIvindo, Ogooue Lolo, Ogooue Maritime, WoleuNtem (ITTO, 2006).
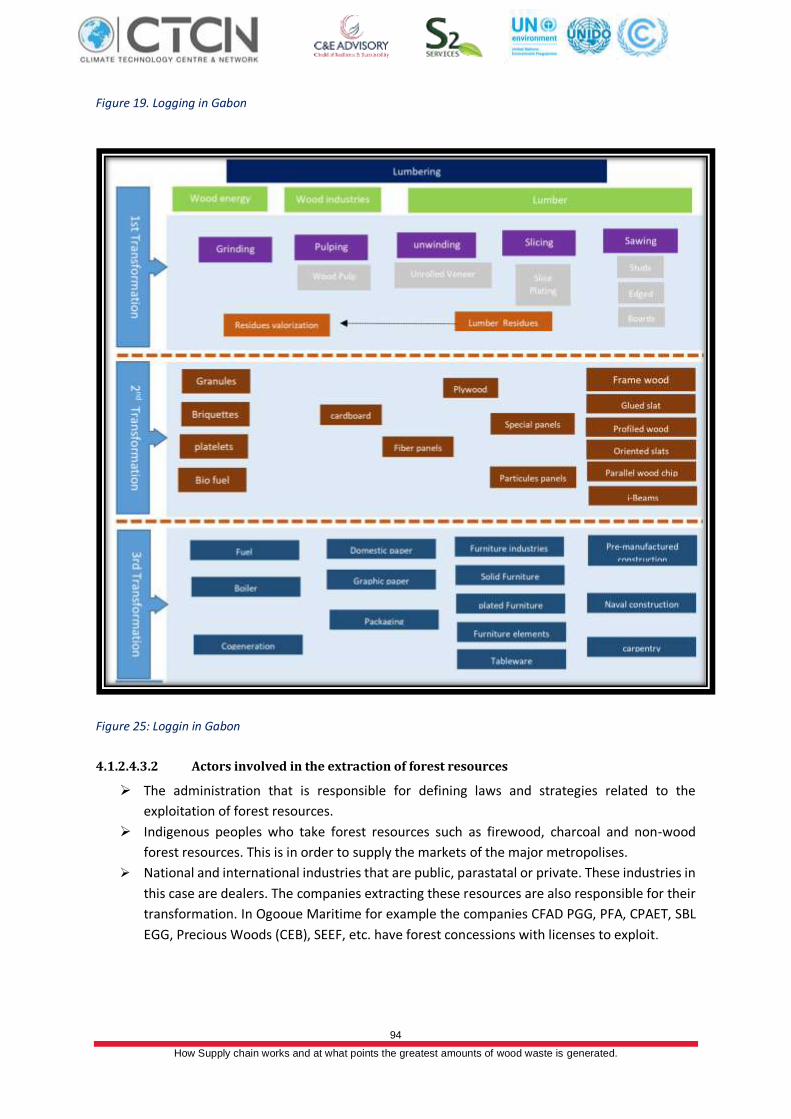
94
How Supply chain works and at what points the greatest amounts of wood waste is generated.
Figure 19. Logging in Gabon
Figure 25: Loggin in Gabon
4.1.2.4.3.2 Actors involved in the extraction of forest resources
➢ The administration that is responsible for defining laws and strategies related to the
exploitation of forest resources.
➢ Indigenous peoples who take forest resources such as firewood, charcoal and non-wood
forest resources. This is in order to supply the markets of the major metropolises.
➢ National and international industries that are public, parastatal or private. These industries in
this case are dealers. The companies extracting these resources are also responsible for their
transformation. In Ogooue Maritime for example the companies CFAD PGG, PFA, CPAET, SBL
EGG, Precious Woods (CEB), SEEF, etc. have forest concessions with licenses to exploit.
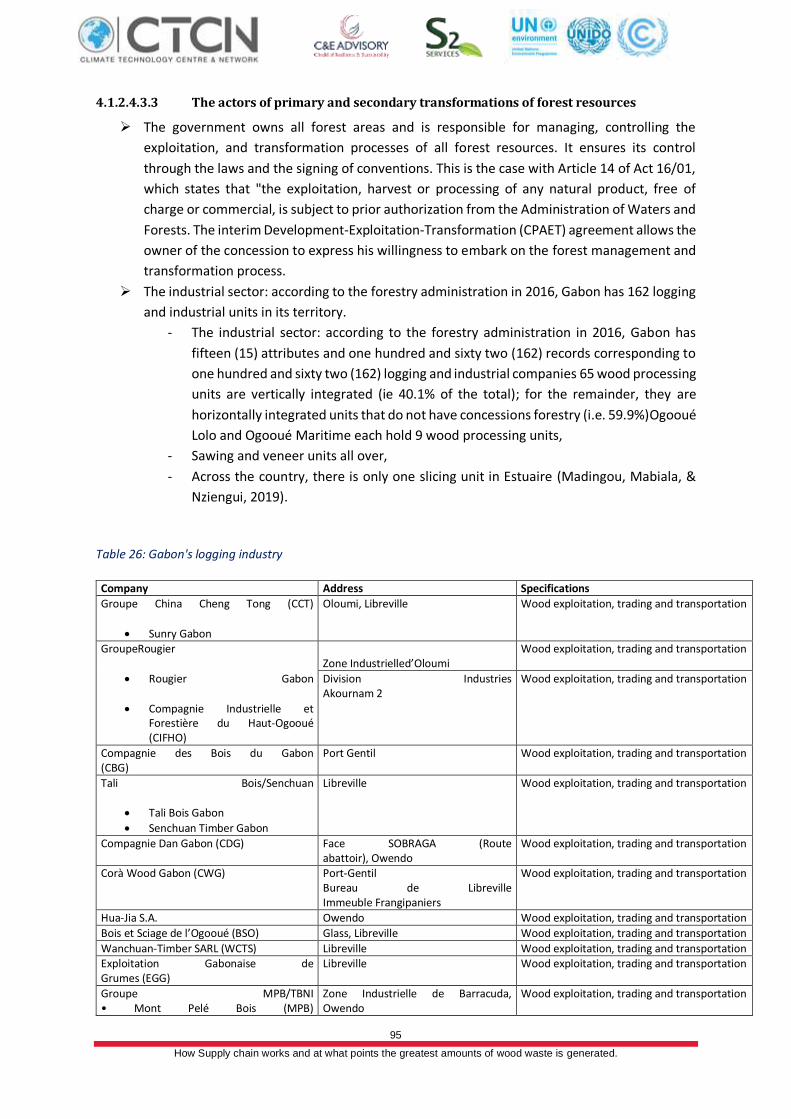
95
How Supply chain works and at what points the greatest amounts of wood waste is generated.
4.1.2.4.3.3 The actors of primary and secondary transformations of forest resources
➢ The government owns all forest areas and is responsible for managing, controlling the
exploitation, and transformation processes of all forest resources. It ensures its control
through the laws and the signing of conventions. This is the case with Article 14 of Act 16/01,
which states that "the exploitation, harvest or processing of any natural product, free of
charge or commercial, is subject to prior authorization from the Administration of Waters and
Forests. The interim Development-Exploitation-Transformation (CPAET) agreement allows the
owner of the concession to express his willingness to embark on the forest management and
transformation process.
➢ The industrial sector: according to the forestry administration in 2016, Gabon has 162 logging
and industrial units in its territory.
- The industrial sector: according to the forestry administration in 2016, Gabon has
fifteen (15) attributes and one hundred and sixty two (162) records corresponding to
one hundred and sixty two (162) logging and industrial companies 65 wood processing
units are vertically integrated (ie 40.1% of the total); for the remainder, they are
horizontally integrated units that do not have concessions forestry (i.e. 59.9%)Ogooué
Lolo and Ogooué Maritime each hold 9 wood processing units,
- Sawing and veneer units all over,
- Across the country, there is only one slicing unit in Estuaire (Madingou, Mabiala, &
Nziengui, 2019).
Table 26: Gabon's logging industry
Company Address Specifications
Groupe China Cheng Tong (CCT)
• Sunry Gabon
Oloumi, Libreville Wood exploitation, trading and transportation
GroupeRougier
• Rougier Gabon
• Compagnie Industrielle et Forestière du Haut-Ogooué (CIFHO)
Zone Industrielled’Oloumi
Wood exploitation, trading and transportation
Division Industries Akournam 2
Wood exploitation, trading and transportation
Compagnie des Bois du Gabon (CBG)
Port Gentil Wood exploitation, trading and transportation
Tali Bois/Senchuan
• Tali Bois Gabon
• Senchuan Timber Gabon
Libreville Wood exploitation, trading and transportation
Compagnie Dan Gabon (CDG) Face SOBRAGA (Route abattoir), Owendo
Wood exploitation, trading and transportation
Corà Wood Gabon (CWG) Port-Gentil Bureau de Libreville Immeuble Frangipaniers
Wood exploitation, trading and transportation
Hua-Jia S.A. Owendo Wood exploitation, trading and transportation
Bois et Sciage de l’Ogooué (BSO) Glass, Libreville Wood exploitation, trading and transportation
Wanchuan-Timber SARL (WCTS) Libreville Wood exploitation, trading and transportation Exploitation Gabonaise de Grumes (EGG)
Libreville Wood exploitation, trading and transportation
Groupe MPB/TBNI • Mont Pelé Bois (MPB)
Zone Industrielle de Barracuda, Owendo
Wood exploitation, trading and transportation
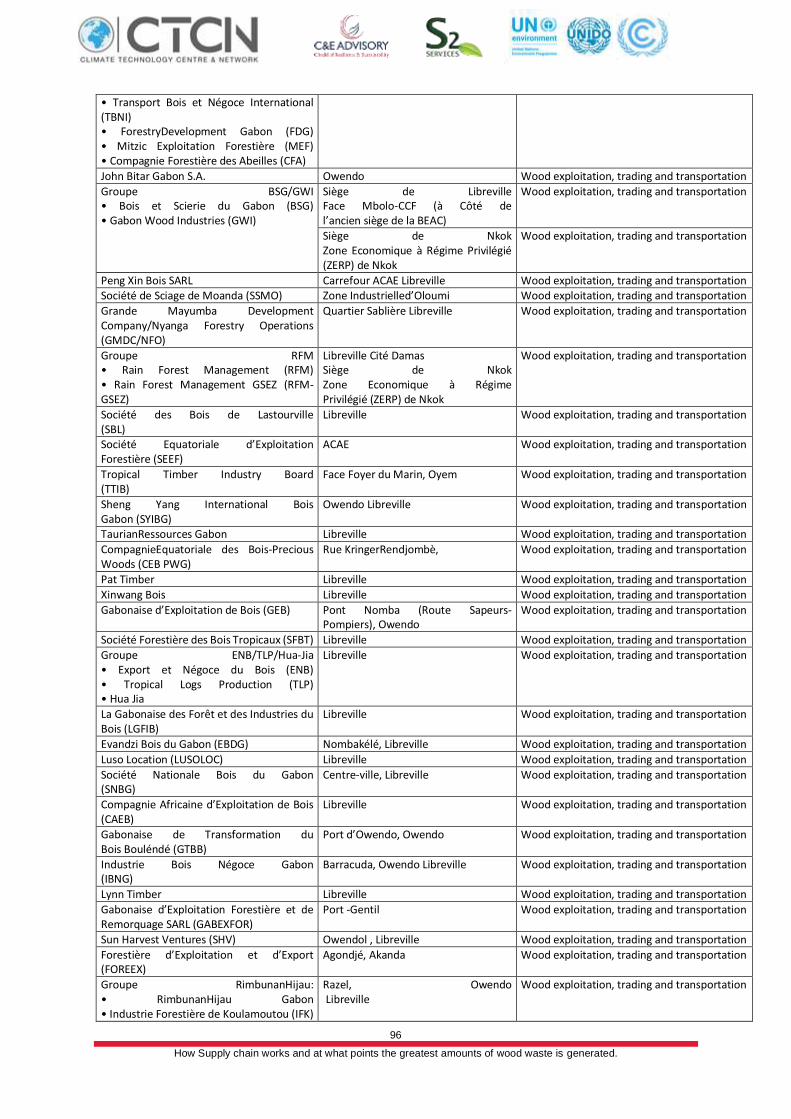
96
How Supply chain works and at what points the greatest amounts of wood waste is generated.
• Transport Bois et Négoce International (TBNI) • ForestryDevelopment Gabon (FDG) • Mitzic Exploitation Forestière (MEF) • Compagnie Forestière des Abeilles (CFA)
John Bitar Gabon S.A. Owendo Wood exploitation, trading and transportation
Groupe BSG/GWI • Bois et Scierie du Gabon (BSG) • Gabon Wood Industries (GWI)
Siège de Libreville Face Mbolo-CCF (à Côté de l’ancien siège de la BEAC)
Wood exploitation, trading and transportation
Siège de Nkok Zone Economique à Régime Privilégié (ZERP) de Nkok
Wood exploitation, trading and transportation
Peng Xin Bois SARL Carrefour ACAE Libreville Wood exploitation, trading and transportation Société de Sciage de Moanda (SSMO) Zone Industrielled’Oloumi Wood exploitation, trading and transportation
Grande Mayumba Development Company/Nyanga Forestry Operations (GMDC/NFO)
Quartier Sablière Libreville Wood exploitation, trading and transportation
Groupe RFM • Rain Forest Management (RFM) • Rain Forest Management GSEZ (RFM-GSEZ)
Libreville Cité Damas Siège de Nkok Zone Economique à Régime Privilégié (ZERP) de Nkok
Wood exploitation, trading and transportation
Société des Bois de Lastourville (SBL)
Libreville Wood exploitation, trading and transportation
Société Equatoriale d’Exploitation Forestière (SEEF)
ACAE Wood exploitation, trading and transportation
Tropical Timber Industry Board (TTIB)
Face Foyer du Marin, Oyem Wood exploitation, trading and transportation
Sheng Yang International Bois Gabon (SYIBG)
Owendo Libreville Wood exploitation, trading and transportation
TaurianRessources Gabon Libreville Wood exploitation, trading and transportation
CompagnieEquatoriale des Bois-Precious Woods (CEB PWG)
Rue KringerRendjombè, Wood exploitation, trading and transportation
Pat Timber Libreville Wood exploitation, trading and transportation
Xinwang Bois Libreville Wood exploitation, trading and transportation
Gabonaise d’Exploitation de Bois (GEB) Pont Nomba (Route Sapeurs-Pompiers), Owendo
Wood exploitation, trading and transportation
Société Forestière des Bois Tropicaux (SFBT) Libreville Wood exploitation, trading and transportation
Groupe ENB/TLP/Hua-Jia • Export et Négoce du Bois (ENB) • Tropical Logs Production (TLP) • Hua Jia
Libreville Wood exploitation, trading and transportation
La Gabonaise des Forêt et des Industries du Bois (LGFIB)
Libreville Wood exploitation, trading and transportation
Evandzi Bois du Gabon (EBDG) Nombakélé, Libreville Wood exploitation, trading and transportation
Luso Location (LUSOLOC) Libreville Wood exploitation, trading and transportation
Société Nationale Bois du Gabon (SNBG)
Centre-ville, Libreville Wood exploitation, trading and transportation
Compagnie Africaine d’Exploitation de Bois (CAEB)
Libreville Wood exploitation, trading and transportation
Gabonaise de Transformation du Bois Bouléndé (GTBB)
Port d’Owendo, Owendo Wood exploitation, trading and transportation
Industrie Bois Négoce Gabon (IBNG)
Barracuda, Owendo Libreville Wood exploitation, trading and transportation
Lynn Timber Libreville Wood exploitation, trading and transportation
Gabonaise d’Exploitation Forestière et de Remorquage SARL (GABEXFOR)
Port -Gentil Wood exploitation, trading and transportation
Sun Harvest Ventures (SHV) Owendol , Libreville Wood exploitation, trading and transportation
Forestière d’Exploitation et d’Export (FOREEX)
Agondjé, Akanda Wood exploitation, trading and transportation
Groupe RimbunanHijau: • RimbunanHijau Gabon • Industrie Forestière de Koulamoutou (IFK)
Razel, Owendo Libreville
Wood exploitation, trading and transportation
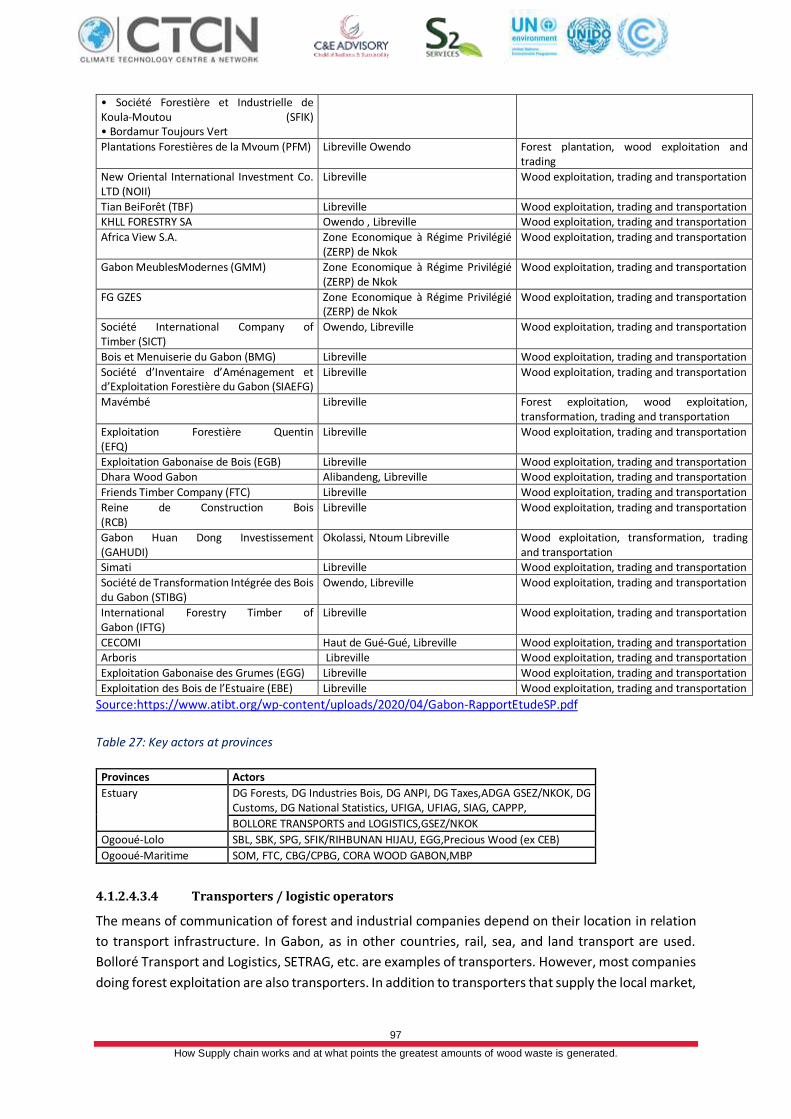
97
How Supply chain works and at what points the greatest amounts of wood waste is generated.
• Société Forestière et Industrielle de Koula-Moutou (SFIK) • Bordamur Toujours Vert
Plantations Forestières de la Mvoum (PFM) Libreville Owendo Forest plantation, wood exploitation and trading
New Oriental International Investment Co. LTD (NOII)
Libreville Wood exploitation, trading and transportation
Tian BeiForêt (TBF) Libreville Wood exploitation, trading and transportation KHLL FORESTRY SA Owendo , Libreville Wood exploitation, trading and transportation
Africa View S.A. Zone Economique à Régime Privilégié (ZERP) de Nkok
Wood exploitation, trading and transportation
Gabon MeublesModernes (GMM) Zone Economique à Régime Privilégié (ZERP) de Nkok
Wood exploitation, trading and transportation
FG GZES Zone Economique à Régime Privilégié (ZERP) de Nkok
Wood exploitation, trading and transportation
Société International Company of Timber (SICT)
Owendo, Libreville Wood exploitation, trading and transportation
Bois et Menuiserie du Gabon (BMG) Libreville Wood exploitation, trading and transportation
Société d’Inventaire d’Aménagement et d’Exploitation Forestière du Gabon (SIAEFG)
Libreville Wood exploitation, trading and transportation
Mavémbé Libreville Forest exploitation, wood exploitation, transformation, trading and transportation
Exploitation Forestière Quentin (EFQ)
Libreville Wood exploitation, trading and transportation
Exploitation Gabonaise de Bois (EGB) Libreville Wood exploitation, trading and transportation Dhara Wood Gabon Alibandeng, Libreville Wood exploitation, trading and transportation
Friends Timber Company (FTC) Libreville Wood exploitation, trading and transportation
Reine de Construction Bois (RCB)
Libreville Wood exploitation, trading and transportation
Gabon Huan Dong Investissement (GAHUDI)
Okolassi, Ntoum Libreville Wood exploitation, transformation, trading and transportation
Simati Libreville Wood exploitation, trading and transportation
Société de Transformation Intégrée des Bois du Gabon (STIBG)
Owendo, Libreville Wood exploitation, trading and transportation
International Forestry Timber of Gabon (IFTG)
Libreville Wood exploitation, trading and transportation
CECOMI Haut de Gué-Gué, Libreville Wood exploitation, trading and transportation Arboris Libreville Wood exploitation, trading and transportation
Exploitation Gabonaise des Grumes (EGG) Libreville Wood exploitation, trading and transportation
Exploitation des Bois de l’Estuaire (EBE) Libreville Wood exploitation, trading and transportation
Source:https://www.atibt.org/wp-content/uploads/2020/04/Gabon-RapportEtudeSP.pdf
Table 27: Key actors at provinces
Provinces Actors
Estuary DG Forests, DG Industries Bois, DG ANPI, DG Taxes,ADGA GSEZ/NKOK, DG Customs, DG National Statistics, UFIGA, UFIAG, SIAG, CAPPP,
BOLLORE TRANSPORTS and LOGISTICS,GSEZ/NKOK
Ogooué-Lolo SBL, SBK, SPG, SFIK/RIHBUNAN HIJAU, EGG,Precious Wood (ex CEB)
Ogooué-Maritime SOM, FTC, CBG/CPBG, CORA WOOD GABON,MBP
4.1.2.4.3.4 Transporters / logistic operators
The means of communication of forest and industrial companies depend on their location in relation
to transport infrastructure. In Gabon, as in other countries, rail, sea, and land transport are used.
Bolloré Transport and Logistics, SETRAG, etc. are examples of transporters. However, most companies
doing forest exploitation are also transporters. In addition to transporters that supply the local market,
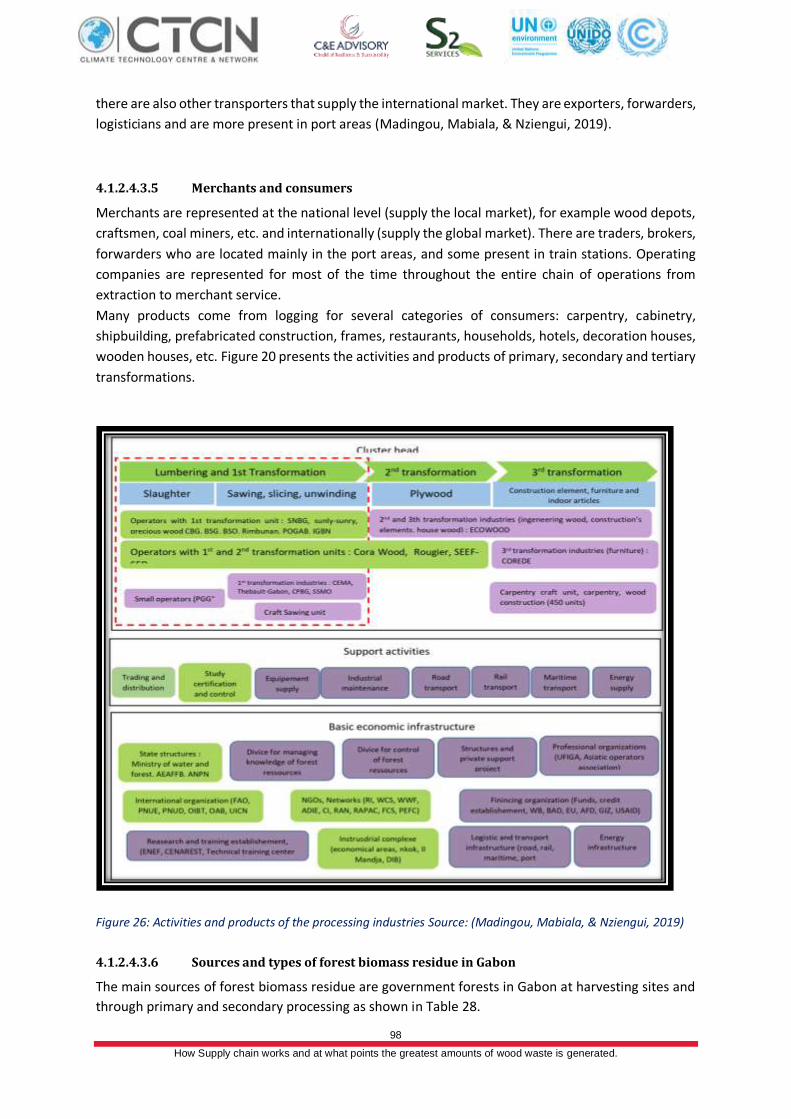
98
How Supply chain works and at what points the greatest amounts of wood waste is generated.
there are also other transporters that supply the international market. They are exporters, forwarders,
logisticians and are more present in port areas (Madingou, Mabiala, & Nziengui, 2019).
4.1.2.4.3.5 Merchants and consumers
Merchants are represented at the national level (supply the local market), for example wood depots,
craftsmen, coal miners, etc. and internationally (supply the global market). There are traders, brokers,
forwarders who are located mainly in the port areas, and some present in train stations. Operating
companies are represented for most of the time throughout the entire chain of operations from
extraction to merchant service.
Many products come from logging for several categories of consumers: carpentry, cabinetry,
shipbuilding, prefabricated construction, frames, restaurants, households, hotels, decoration houses,
wooden houses, etc. Figure 20 presents the activities and products of primary, secondary and tertiary
transformations.
Figure 26: Activities and products of the processing industries Source: (Madingou, Mabiala, & Nziengui, 2019)
4.1.2.4.3.6 Sources and types of forest biomass residue in Gabon
The main sources of forest biomass residue are government forests in Gabon at harvesting sites and
through primary and secondary processing as shown in Table 28.
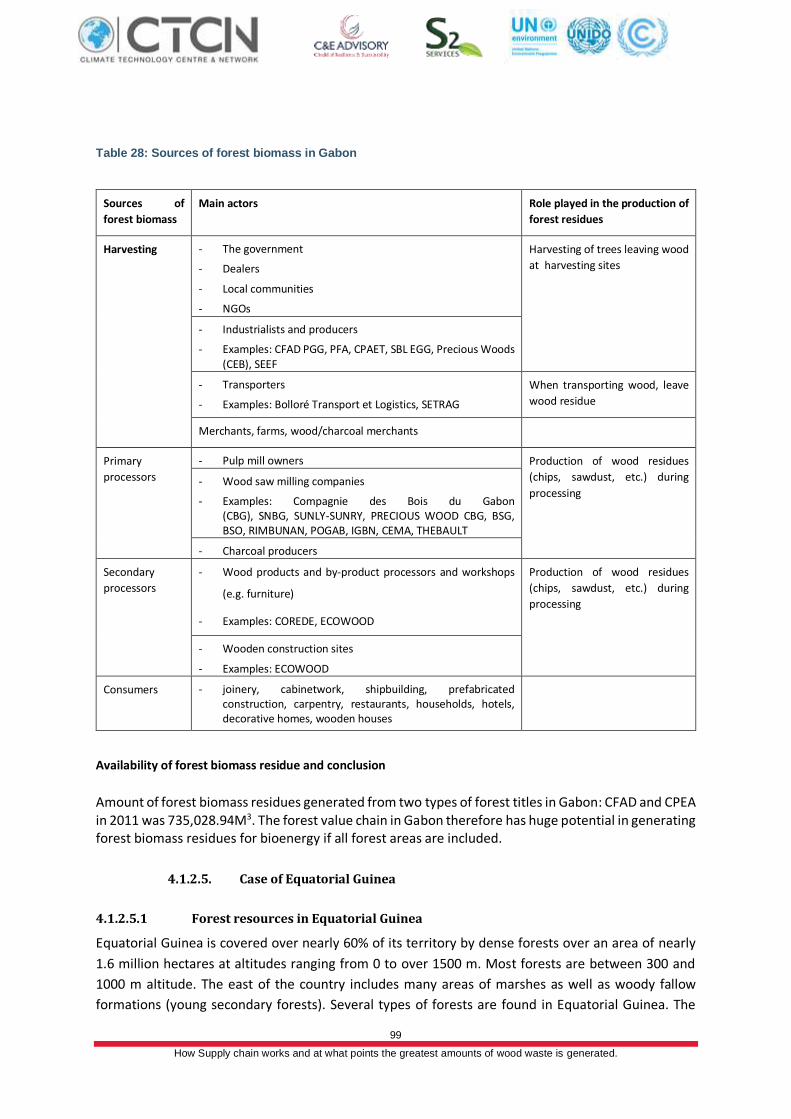
99
How Supply chain works and at what points the greatest amounts of wood waste is generated.
Table 28: Sources of forest biomass in Gabon
Sources of
forest biomass
Main actors Role played in the production of
forest residues
Harvesting - The government
- Dealers
- Local communities
- NGOs
Harvesting of trees leaving wood
at harvesting sites
- Industrialists and producers
- Examples: CFAD PGG, PFA, CPAET, SBL EGG, Precious Woods (CEB), SEEF
- Transporters
- Examples: Bolloré Transport et Logistics, SETRAG
When transporting wood, leave
wood residue
Merchants, farms, wood/charcoal merchants
Primary
processors
- Pulp mill owners Production of wood residues
(chips, sawdust, etc.) during
processing - Wood saw milling companies
- Examples: Compagnie des Bois du Gabon (CBG), SNBG, SUNLY-SUNRY, PRECIOUS WOOD CBG, BSG, BSO, RIMBUNAN, POGAB, IGBN, CEMA, THEBAULT
- Charcoal producers
Secondary
processors
- Wood products and by-product processors and workshops
(e.g. furniture)
- Examples: COREDE, ECOWOOD
Production of wood residues
(chips, sawdust, etc.) during
processing
- Wooden construction sites
- Examples: ECOWOOD
Consumers
- joinery, cabinetwork, shipbuilding, prefabricated construction, carpentry, restaurants, households, hotels, decorative homes, wooden houses
Availability of forest biomass residue and conclusion
Amount of forest biomass residues generated from two types of forest titles in Gabon: CFAD and CPEA in 2011 was 735,028.94M3. The forest value chain in Gabon therefore has huge potential in generating forest biomass residues for bioenergy if all forest areas are included.
4.1.2.5. Case of Equatorial Guinea
4.1.2.5.1 Forest resources in Equatorial Guinea
Equatorial Guinea is covered over nearly 60% of its territory by dense forests over an area of nearly
1.6 million hectares at altitudes ranging from 0 to over 1500 m. Most forests are between 300 and
1000 m altitude. The east of the country includes many areas of marshes as well as woody fallow
formations (young secondary forests). Several types of forests are found in Equatorial Guinea. The
100
How Supply chain works and at what points the greatest amounts of wood waste is generated.
forest type most represented is the humid dense forest of low and medium altitude. This type of forest
suffers a lot from heavy logging. There are still primary forests in the country which may soon
disappear if commercial exploitation continues at the same rate. The young forest of low and medium
altitude is also very represented and dominated by Okoume.
A significant part of the continental zone supports permanent or temporary marshy formations. Dense
sub-montane forests are found in the highest regions of the country on Bioko Island. However, this
type of forest represents only a small part of the national forest cover (Mugnier & Santiago, 2009).
Lowland rainforest was replaced by cocoa and coffee plantations in the late 17th century. Over 90,000
ha had been converted to cocoa plantations by the end of the 19th century. Trees have been logged
since the 1920s, mainly in the coastal part of the country, with operations continuing up to the close
of the colonial era in 1968. During the 1960s, plantation trials with Aucoumeaklaineana were
introduced, but the results were not promising. Due to the great expense involved, no industrial forest
plantations were established. Forest projects prior to independence mainly dealt with the need to
inventory resources. Major logging activities in the 1960s came to a virtual standstill with the
departure of the Spanish business sector, only to be re-launched in the mid-1970s, and then further
expanded in the early 1980s with the arrival of new logging companies (though never matching the
pace of the early 1960s). Forest production has doubled since 1993-1994.
In the light of the country’s high rate of forest cover and successful natural regeneration, there has
been no forest planting (Amsallem, 2002). The volume of wood produced in 2010 was estimated at
more than 300 thousand m3. Of these volumes of wood produced, 16,790 m3 were processed. Over
35,000 m3 miles of wood product were exported in 2010, which allowed a contribution of 0.01% on
the country's GDP. The forestry sector since 2007 has generated more than 2000 direct jobs
(Wasseige, Flynn, Louppe, Hiol, & Mayaux, 2014).
The forest sector’s management and conservation strategy is written into Equatorial Guinea’s Tropical
Forests Action Plan (TFAP) approved in 1990. The objectives of Equatorial Guinea’s new forest
development policy are to upgrade the forestry administration, work for rational, sustainable and
diversified use of forest resources, including their protection, observe the principle of multiple use
while maintaining ecological equilibrium, and aim at sustainable management of protected areas and
wildlife. The trend in the forest sector is also to enhance the efficiency of forest product harvesting
and marketing systems. Public participation in natural resource management is also on the upswing
(Amsallem, 2002).
Forest value chain in Equatorial Guinea
The value chain of all Central African countries including Equatorial Guinea have common forest
products. The three key markets are the Asian, European and African markets. This value chain
represents all stakeholders (actors) involved in the forestry sector. It includes players ranging from
production to consumption of forest products through, operators, processors, transporters and
merchants
4.1.2.5.2 Players involved in the forestry chain in Equatorial Guinea
The government is at the top of the country's forest resource management and manages forest
resources through its ministries and departments. Law 1/1997 recognizes two types of forests, a
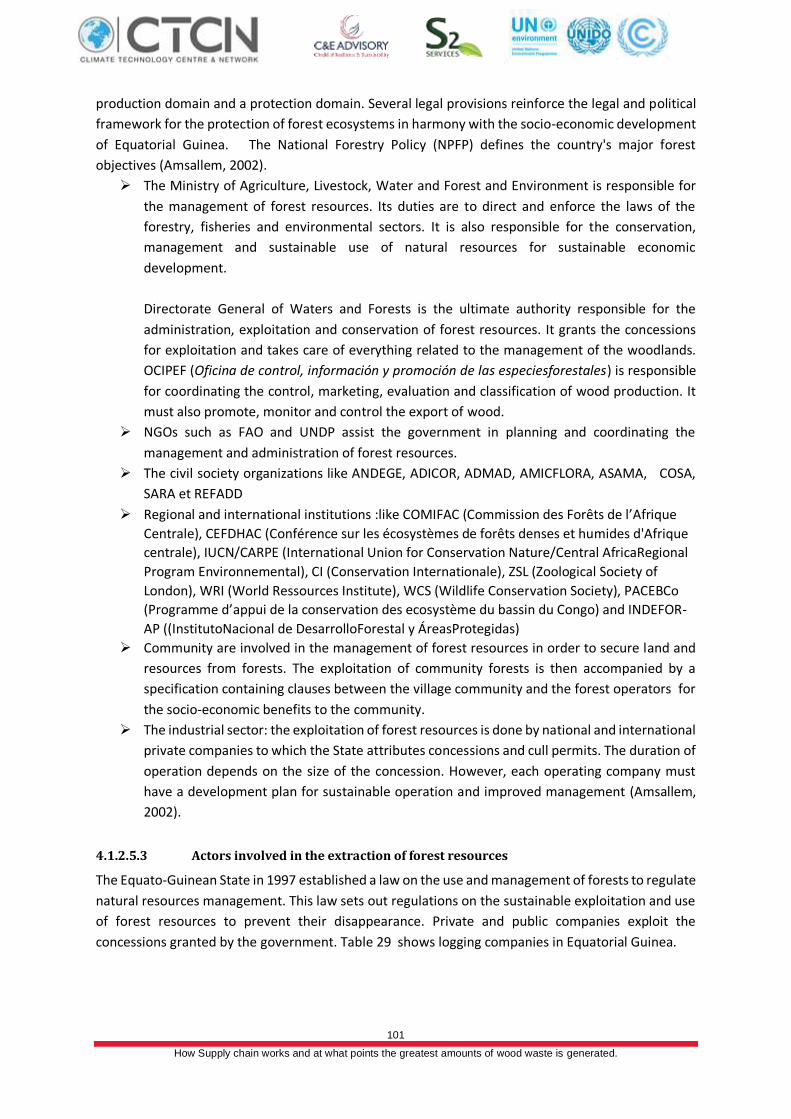
101
How Supply chain works and at what points the greatest amounts of wood waste is generated.
production domain and a protection domain. Several legal provisions reinforce the legal and political
framework for the protection of forest ecosystems in harmony with the socio-economic development
of Equatorial Guinea. The National Forestry Policy (NPFP) defines the country's major forest
objectives (Amsallem, 2002).
➢ The Ministry of Agriculture, Livestock, Water and Forest and Environment is responsible for
the management of forest resources. Its duties are to direct and enforce the laws of the
forestry, fisheries and environmental sectors. It is also responsible for the conservation,
management and sustainable use of natural resources for sustainable economic
development.
Directorate General of Waters and Forests is the ultimate authority responsible for the
administration, exploitation and conservation of forest resources. It grants the concessions
for exploitation and takes care of everything related to the management of the woodlands.
OCIPEF (Oficina de control, información y promoción de las especiesforestales) is responsible
for coordinating the control, marketing, evaluation and classification of wood production. It
must also promote, monitor and control the export of wood.
➢ NGOs such as FAO and UNDP assist the government in planning and coordinating the
management and administration of forest resources.
➢ The civil society organizations like ANDEGE, ADICOR, ADMAD, AMICFLORA, ASAMA, COSA,
SARA et REFADD
➢ Regional and international institutions :like COMIFAC (Commission des Forêts de l’Afrique
Centrale), CEFDHAC (Conférence sur les écosystèmes de forêts denses et humides d'Afrique
centrale), IUCN/CARPE (International Union for Conservation Nature/Central AfricaRegional
Program Environnemental), CI (Conservation Internationale), ZSL (Zoological Society of
London), WRI (World Ressources Institute), WCS (Wildlife Conservation Society), PACEBCo
(Programme d’appui de la conservation des ecosystème du bassin du Congo) and INDEFOR-
AP ((InstitutoNacional de DesarrolloForestal y ÁreasProtegidas)
➢ Community are involved in the management of forest resources in order to secure land and
resources from forests. The exploitation of community forests is then accompanied by a
specification containing clauses between the village community and the forest operators for
the socio-economic benefits to the community.
➢ The industrial sector: the exploitation of forest resources is done by national and international
private companies to which the State attributes concessions and cull permits. The duration of
operation depends on the size of the concession. However, each operating company must
have a development plan for sustainable operation and improved management (Amsallem,
2002).
4.1.2.5.3 Actors involved in the extraction of forest resources
The Equato-Guinean State in 1997 established a law on the use and management of forests to regulate
natural resources management. This law sets out regulations on the sustainable exploitation and use
of forest resources to prevent their disappearance. Private and public companies exploit the
concessions granted by the government. Table 29 shows logging companies in Equatorial Guinea.
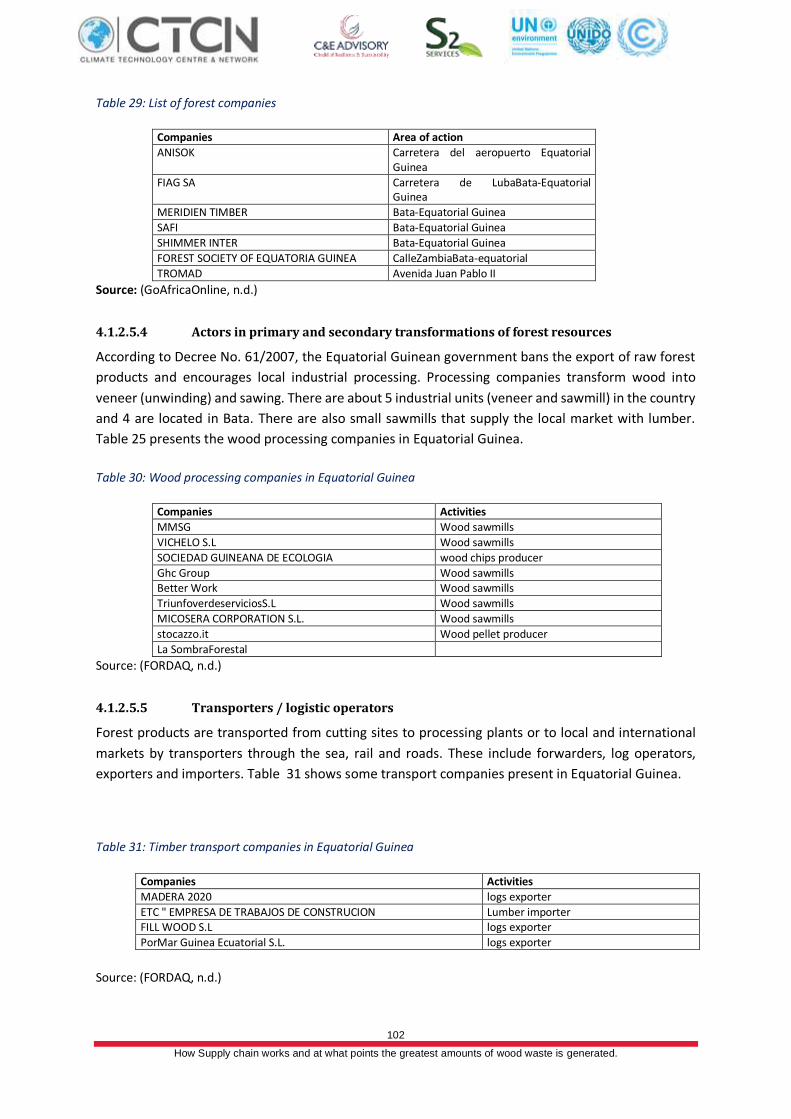
102
How Supply chain works and at what points the greatest amounts of wood waste is generated.
Table 29: List of forest companies
Companies Area of action
ANISOK Carretera del aeropuerto Equatorial Guinea
FIAG SA Carretera de LubaBata-Equatorial Guinea
MERIDIEN TIMBER Bata-Equatorial Guinea
SAFI Bata-Equatorial Guinea
SHIMMER INTER Bata-Equatorial Guinea
FOREST SOCIETY OF EQUATORIA GUINEA CalleZambiaBata-equatorial
TROMAD Avenida Juan Pablo II
Source: (GoAfricaOnline, n.d.)
4.1.2.5.4 Actors in primary and secondary transformations of forest resources
According to Decree No. 61/2007, the Equatorial Guinean government bans the export of raw forest
products and encourages local industrial processing. Processing companies transform wood into
veneer (unwinding) and sawing. There are about 5 industrial units (veneer and sawmill) in the country
and 4 are located in Bata. There are also small sawmills that supply the local market with lumber.
Table 25 presents the wood processing companies in Equatorial Guinea.
Table 30: Wood processing companies in Equatorial Guinea
Companies Activities
MMSG Wood sawmills
VICHELO S.L Wood sawmills
SOCIEDAD GUINEANA DE ECOLOGIA wood chips producer
Ghc Group Wood sawmills Better Work Wood sawmills
TriunfoverdeserviciosS.L Wood sawmills
MICOSERA CORPORATION S.L. Wood sawmills
stocazzo.it Wood pellet producer
La SombraForestal Source: (FORDAQ, n.d.)
4.1.2.5.5 Transporters / logistic operators
Forest products are transported from cutting sites to processing plants or to local and international
markets by transporters through the sea, rail and roads. These include forwarders, log operators,
exporters and importers. Table 31 shows some transport companies present in Equatorial Guinea.
Table 31: Timber transport companies in Equatorial Guinea
Companies Activities
MADERA 2020 logs exporter
ETC " EMPRESA DE TRABAJOS DE CONSTRUCION Lumber importer FILL WOOD S.L logs exporter
PorMar Guinea Ecuatorial S.L. logs exporter
Source: (FORDAQ, n.d.)
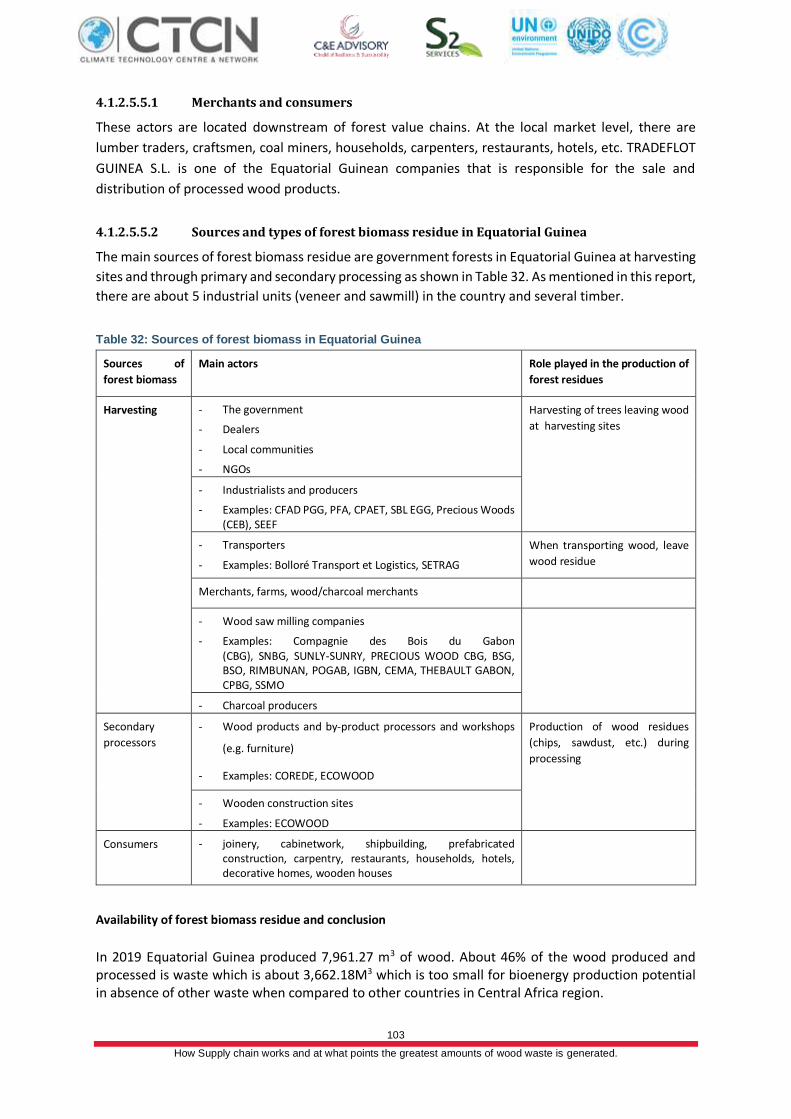
103
How Supply chain works and at what points the greatest amounts of wood waste is generated.
4.1.2.5.5.1 Merchants and consumers
These actors are located downstream of forest value chains. At the local market level, there are
lumber traders, craftsmen, coal miners, households, carpenters, restaurants, hotels, etc. TRADEFLOT
GUINEA S.L. is one of the Equatorial Guinean companies that is responsible for the sale and
distribution of processed wood products.
4.1.2.5.5.2 Sources and types of forest biomass residue in Equatorial Guinea
The main sources of forest biomass residue are government forests in Equatorial Guinea at harvesting
sites and through primary and secondary processing as shown in Table 32. As mentioned in this report,
there are about 5 industrial units (veneer and sawmill) in the country and several timber.
Table 32: Sources of forest biomass in Equatorial Guinea
Sources of
forest biomass
Main actors Role played in the production of
forest residues
Harvesting - The government
- Dealers
- Local communities
- NGOs
Harvesting of trees leaving wood
at harvesting sites
- Industrialists and producers
- Examples: CFAD PGG, PFA, CPAET, SBL EGG, Precious Woods (CEB), SEEF
- Transporters
- Examples: Bolloré Transport et Logistics, SETRAG
When transporting wood, leave
wood residue
Merchants, farms, wood/charcoal merchants
- Wood saw milling companies
- Examples: Compagnie des Bois du Gabon (CBG), SNBG, SUNLY-SUNRY, PRECIOUS WOOD CBG, BSG, BSO, RIMBUNAN, POGAB, IGBN, CEMA, THEBAULT GABON, CPBG, SSMO
- Charcoal producers
Secondary
processors
- Wood products and by-product processors and workshops
(e.g. furniture)
- Examples: COREDE, ECOWOOD
Production of wood residues
(chips, sawdust, etc.) during
processing
- Wooden construction sites
- Examples: ECOWOOD
Consumers
- joinery, cabinetwork, shipbuilding, prefabricated construction, carpentry, restaurants, households, hotels, decorative homes, wooden houses
Availability of forest biomass residue and conclusion
In 2019 Equatorial Guinea produced 7,961.27 m3 of wood. About 46% of the wood produced and processed is waste which is about 3,662.18M3 which is too small for bioenergy production potential in absence of other waste when compared to other countries in Central Africa region.
104
How Supply chain works and at what points the greatest amounts of wood waste is generated.
4.1.2.6. Case of the Central African Republic (CAR)
4.1.2.6.1 Forest resources in Central African Republic
The Central African Republic (CAR) covers an area of 623,000 km2 and has about 23 million hectares
of forests, or about 37% of its total area. The forest-timber sector operates from the southwestern
forest massif where only industrial logging is carried out. Currently, eleven (11) forestry companies
are operating, with an average annual production of approximately 400,000 m3. Exports of logs and
sawnwood are approximately 160,000 m3 and 40,000 m3 respectively. The forest-timber sector
contributes 11% of the GDP and 13% of the country's export earnings. The main destinations for
Central African timber are Europe (47%) and Asia (49%).
Annual production rose from around 670,000 m3 at the turn of the century to around 420,000 m3 in
2016. It hit an all-time low in 2014, at around 235,000 m3, but has been increasing since then. As in
the other Congo Basin countries, a reduced number of species represents between 70% and 80% of
total production. During the past six years, there has been a decrease in the production of ayous
(Triplochytonscleroxylon) and an increase in the production of mukulungu (Autranellacongolensis), tali
(Erythropleumivorense) and iroko (Miliciaexcelsa) (Cerutti, Mbangolo, Nakoe, Vandenhaute, & Hubert,
2018).
Forest conservation efforts have their origin in colonial laws passed in 1916 concerning the
establishment of national parks and reserves. The first national park was established in 1933, and the
first game reserves also date from the 1930s. Because CAR is a landlocked country far from
international markets, the southwestern forests were not opened to commercial logging until 1945,
and even then on a fairly small-scale basis, with a few logging companies working in Lobaye to produce
sawn wood for the local market. In the early 1950s, an inventory programme was designed and
implemented by the national forest service, and later by the Tropical Forest Technical Centre (CTFT).
The objective was a detailed review of the state and size of exploitable rainforest and the potential
value of the standing crop of high-value forest species. CAR was one of the first African countries to
undertake forest inventories and to call for detailed regulations and management plans as a
prerequisite to harvesting permits. In 1967, the first forest harvesting permits (temporary harvesting
permitswere issued in the prefectures of what are now Haute Sangha and Mambéré-Kadei. At that
time, a logging company could only move in after a convention had been signed between the company
and the Ministry of Forestry (Amsallem, 2002).
Unallocated public domain forest covers some 1.3 million hectares. This includes 0.3 million hectares
of forest reserves, comprising 250,000 hectares of reserves and parks and 50,000 hectares of classified
forests in the southwestern zone. Unallocated area thus totals about one million hectares, but much
of this is made up of secondary forest92.The area currently under forest plantations is estimated at
3,000 hectares. Plantation programmes established by the Ministry in charge of forests are still in the
experimental stages, and planted areas are quite small for lack of an effective reforestation policy92.
CAR’s greatest timber assets feature a small number of commercially valuable species. The main forest
species logged are ayous (Triplochitonscleroxylon) and limba (Terminalia superba) for plywood, sipo
(Entandrophragma utile), sapelli(E. cylindricum), tiama (E. angolense) and dibetou (Lovoatrichiloides).
Experimental designs have been in place in the Mbaiki region since the 1980s to study the dynamics
105
How Supply chain works and at what points the greatest amounts of wood waste is generated.
of natural forest under various silvicultural treatments so as to devise silvicultural practices that
successfully reconcile conservation with sustainable forest production. The dimensions studied were:
the dynamics of untouched natural stands, tree growth in a natural stand following harvesting with or
without thinning, general stand behavior, etc. The silvicultural rules laid down by the forest code
concern reduced impact logging to enable natural regeneration and avoid high-grading (skimming off
the cream of the forest crop), stipulating minimum harvest diameters, and the protection of young
trees during the extraction process. Forest plantations are only in the very earliest stages in CAR.
Leaving out the teak (Tectonagrandis) plantations established by FAO in the Bimbo forests in the
1960s, tree-planting efforts only truly took off in 1972. The plantations generally included fast-growing
species with an estimated felling cycle of 40 years, including Eucalyptus, Cedrella, Cordia and all red
wood species processed or used for veneering. Gmelinaarborea, Terminalia ivorensis and Pinus spp.
were also planted. In the Mbaiki plantations, timber production is the only objective, and so the
species planted include sapelli (Entandrophragmacylindricum), sipo (Entandrophragma utile) and
tiama (Entandrophragmaangolense). These plantations were not successful, however, for lack of
maintenance and monitoring, and at present the reforested area amounts to just a little over 3,000
hectares, mostly full plantations, and about 80 hectares of in-forest strip plantations.
There has been a substantial shift from centralized forest management focussed on timber production
to multi-use management enlisting, to a growing extent, the participation of local people. There is a
clear trend towards greater consideration of the needs of local people, and the integration of the
logging sector into the local economy, as the base of the new sustainable forest management
approach. The new guidelines of forest ecosystem management now concern four sectors: planning
processes, protected area management, the establishment of “community” or “village” forests, and,
lastly, forest management for timber production. A further and striking event of the last decade
concerns the introduction of institutional reforms and new forest legislation based on a new
determination to decentralize forest management92.
4.1.2.6.2 Forest value chain in Central African Republic
The CAR's forest value chain involves different categories of actors ranging from management actors,
consumers, producers, to actors in the transformation as well as transporters and merchants.
4.1.2.6.3 The players involved in the CAR forestry chain
4.1.2.6.3.1 Forest resource management and conservation actors in CAR
In the Central African Republic, forest resource management places emphasis on combating land and
forest degradation. There are several actors operating at different levels: public administration,
research institutions, the private sector, NGOs, sub-regional organizations, international organizations
and individuals (Global Mechanism, 2018).
➢ The public administration acts through its ministries: they maintain management rights and
responsibilities within the limits specified by law. The Departments responsible for the
management of forest ecosystems are the Ministry of Water, Forests, Hunting and Fishing and
the Minister of Environment and Sustainable Development.
106
How Supply chain works and at what points the greatest amounts of wood waste is generated.
The Department in charge of Forests has for main missions the development and implementation
of government policy in the areas of water, forests, hunting and fishing. One of its responsibilities
is to promote the conservation and sustainable management of natural resources by developing
and popularizing national development techniques. It is made up of the following structures:
- The General Directorate of Forests, Hunting and Fishing (DGEFCP) is responsible for
designing and implementing sectoral policies in the areas of water, forests, hunting
and fishing. One of its responsibilities is to ensure the rational exploitation of forest,
wildlife and fish resources;
- The General Directorate of Studies, Planning, Legal Support and Regional Services
(DGEPAJSR) is responsible for planning research work in the areas of competence of
the ministry, centralizing and disseminating the results of research work in matters of
water, forests, hunting and fishing;
- The Forestry Data Center is responsible for the monthly and annual production of the
data necessary for the Forestry Administration and all other users for efficient
decision-making within the framework of rational management of natural resources
and also for updating. sub-regional databases for the harmonization of forest
management in the Congo Basin;
- The Economic Observatory of the Wood Sector has the mission, among other things,
to provide the State, forestry companies, civil society and development partners with
the information necessary for monitoring activities concerning the profitability of the
wood sector in order to '' optimize its operation;
- The Unit responsible for the implementation and verification of FLEGT license
documents. Its mission is to implement and monitor the application of forest
regulations, governance and trade;
- The APV / FLEGT Permanent Technical Secretariat is responsible for monitoring the
implementation of the Voluntary Partnership Agreement between the Central African
Republic and the European Union within the framework of the FLEGT process;
- The Forest Development Fund's mission is to finance development programs (forest
management, reforestation, forest regeneration, soil restoration, agroforestry and
the fight against soil degradation), research in the fields of forestry, hunting, fishing
and the counterparts of the Programs / Projects and the commitments made with
sub-regional and international organizations in terms of national contributions in
favor of the forestry sector;
- The AGDRF (Sustainable Forest Resources Management Agency), formerly the
PARPAF Project, supervises and supports forest operators in carrying out
development plans. But this Agency was restricted to a simple Coordination (at the
level of a general directorate) following a government decision reducing the number
of Agencies in the country ;
- The Mobile Control Brigade: In addition to the sovereign activities of the Mobile
Control Brigade (BMC) relating to the fight against artisanal and illegal logging, the
Mixed Mobile Brigade for Intervention and Verification (BMIV ) of the FLEGT Unit are
presented as a tool for verifying, strengthening and improving governance and
sustainable management of forest resources.
➢ The private sector intervenes in the management of forest resources through a forest
management plan. In CAR, it is the State which is involved in the drafting of the development
107
How Supply chain works and at what points the greatest amounts of wood waste is generated.
plan as the contracting authority through the PARPAF project in the years 2000 to 2011 and
in recent years with the AGDRF. The private sector is involved in the decision-making process
for the drafting of the development plan and is responsible for the technical, financial and
inventory implementation of the development. The formal forestry sector is largely
dominated by forest companies with foreign capital. To date, the country has 11 logging
companies (and 14 Exploitation and Development Permits) with varying levels of activity. They
are: SCAD, SEFCA, VICA, Thanry, IFB, SOFOKAD, SINFOCAM, STBCA, ROUGIER SANGHA
MBAERE, CENTRABOIS (Boisrobert & Bégoto, 2010).
➢ NGOs: in the countries of Central Africa as well as the CAR, NGOs play a relay role for the State
in the management of forest resources. They are particularly involved in the maintenance,
advice and protection of forest resources. There are NGOs such as WWF, WCS, CIEDD, I3D,
Maison de l'Enfant et de la Femme Pygmée, Femme BATA GBAKO. NGOs and Associations
working in the field of environment and forests are grouped together in a Platform called
"Sustainable Management of Natural Resources and the Environment"
➢ Sub-regional and international organizations like the Central African Forests Commission
(COMIFAC), the Central African Forests Observatory (OFAC), CIFOR, WCS, European Union,
AFD, the World Bank, the FAO are present in CAR (N'Gasse, 2002).
➢ The populations: in CAR, the so-called unmanaged forests belong to the indigenous
community.
4.1.2.6.3.2 Actors involved in the exploitation of forest resources in CAR
In CAR, logging is located in the forest massif in the south-west of the country. The logging scheme
presents upstream resource extraction and downstream consumption. Thus, there are several players:
extraction actors, transformation actors, transporters, merchants.
The State is the main actor in the management of forest resources and grants the exploitation permit
through the Department in charge of Forests. The only formal logging title in the CAR is the
Exploitation and Development Permit (PEA). This permit grants the right to industrial exploitation,
according to the national standards in force supplemented by the specific clauses of a development
agreement which is equivalent to specifications. In return, the manufacturer pays rent per area and a
tax linked to the volumes produced and exported. The concessionaires pay the reforestation tax
(based on exported logs) because, after logging, the Ministry of Water, Forests, Hunting and Fishing
(MEFCP) must take care of the reforestation of deforested areas in order to protect the forest.
Industrial operators: This category of actor concerns the owners of forest areas. There are dealers and
individuals. It should be noted here that the concessionaires have operating permits accompanied by
a management plan. This is the case, for example, for companies such as Thanry Centrafrique, IFB,
SCAD, SEFCA, SOFOCAD, VICA, Timberland Industrie SA, STBCA, SINFOCAM, RSM, CENTRABOIS
(Cerutti, Mbangolo, Nakoe, Vandenhaute, & Hubert, 2018).
Communities: People who use chainsaws for felling trees, farmers and hunters are most often found.
The extraction of woody or non-woody resources is for commercial purposes. Coal miners are
included in this category, they either exploit whole trees or the residues from woodcuts to make
charcoal or use as firewood.
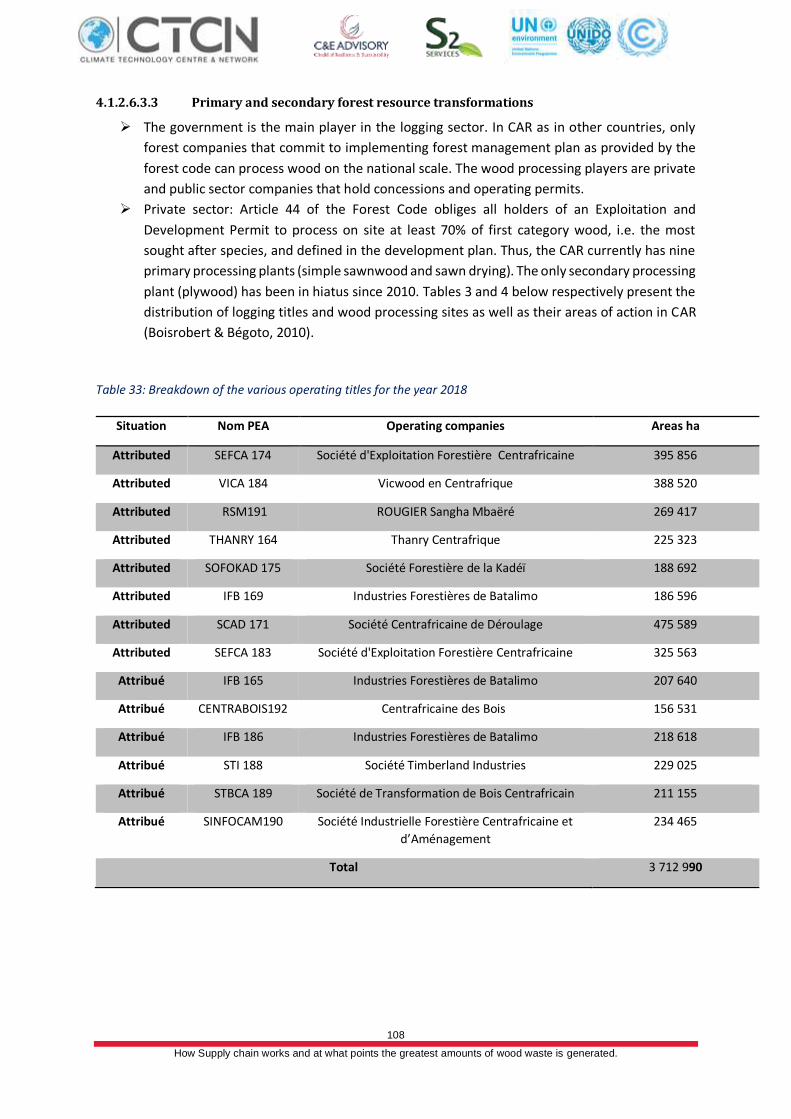
108
How Supply chain works and at what points the greatest amounts of wood waste is generated.
4.1.2.6.3.3 Primary and secondary forest resource transformations
➢ The government is the main player in the logging sector. In CAR as in other countries, only
forest companies that commit to implementing forest management plan as provided by the
forest code can process wood on the national scale. The wood processing players are private
and public sector companies that hold concessions and operating permits.
➢ Private sector: Article 44 of the Forest Code obliges all holders of an Exploitation and
Development Permit to process on site at least 70% of first category wood, i.e. the most
sought after species, and defined in the development plan. Thus, the CAR currently has nine
primary processing plants (simple sawnwood and sawn drying). The only secondary processing
plant (plywood) has been in hiatus since 2010. Tables 3 and 4 below respectively present the
distribution of logging titles and wood processing sites as well as their areas of action in CAR
(Boisrobert & Bégoto, 2010).
Table 33: Breakdown of the various operating titles for the year 2018
Situation Nom PEA Operating companies Areas ha
Attributed SEFCA 174 Société d'Exploitation Forestière Centrafricaine 395 856
Attributed VICA 184 Vicwood en Centrafrique 388 520
Attributed RSM191 ROUGIER Sangha Mbaëré 269 417
Attributed THANRY 164 Thanry Centrafrique 225 323
Attributed SOFOKAD 175 Société Forestière de la Kadéï 188 692
Attributed IFB 169 Industries Forestières de Batalimo 186 596
Attributed SCAD 171 Société Centrafricaine de Déroulage 475 589
Attributed SEFCA 183 Société d'Exploitation Forestière Centrafricaine 325 563
Attribué IFB 165 Industries Forestières de Batalimo 207 640
Attribué CENTRABOIS192 Centrafricaine des Bois 156 531
Attribué IFB 186 Industries Forestières de Batalimo 218 618
Attribué STI 188 Société Timberland Industries 229 025
Attribué STBCA 189 Société de Transformation de Bois Centrafricain 211 155
Attribué SINFOCAM190 Société Industrielle Forestière Centrafricaine et
d’Aménagement
234 465
Total 3 712 990
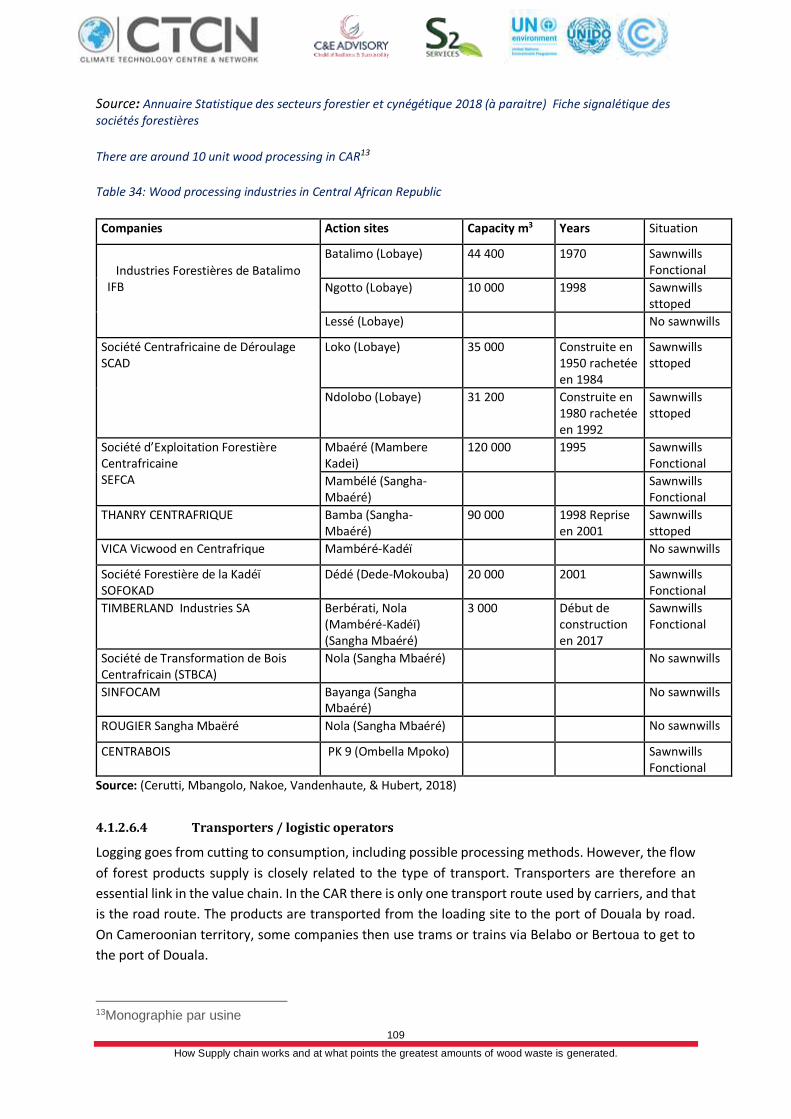
109
How Supply chain works and at what points the greatest amounts of wood waste is generated.
Source: Annuaire Statistique des secteurs forestier et cynégétique 2018 (à paraitre) Fiche signalétique des sociétés forestières
There are around 10 unit wood processing in CAR13
Table 34: Wood processing industries in Central African Republic
Companies Action sites Capacity m3 Years Situation
Industries Forestières de Batalimo IFB
Batalimo (Lobaye) 44 400 1970 Sawnwills Fonctional
Ngotto (Lobaye) 10 000 1998 Sawnwills sttoped
Lessé (Lobaye) No sawnwills
Société Centrafricaine de Déroulage SCAD
Loko (Lobaye) 35 000 Construite en 1950 rachetée en 1984
Sawnwills sttoped
Ndolobo (Lobaye) 31 200 Construite en 1980 rachetée en 1992
Sawnwills sttoped
Société d’Exploitation Forestière Centrafricaine SEFCA
Mbaéré (Mambere Kadei)
120 000 1995 Sawnwills Fonctional
Mambélé (Sangha-Mbaéré)
Sawnwills Fonctional
THANRY CENTRAFRIQUE Bamba (Sangha-Mbaéré)
90 000 1998 Reprise en 2001
Sawnwills sttoped
VICA Vicwood en Centrafrique Mambéré-Kadéï No sawnwills
Société Forestière de la Kadéï SOFOKAD
Dédé (Dede-Mokouba) 20 000 2001 Sawnwills Fonctional
TIMBERLAND Industries SA Berbérati, Nola (Mambéré-Kadéï) (Sangha Mbaéré)
3 000 Début de construction en 2017
Sawnwills Fonctional
Société de Transformation de Bois Centrafricain (STBCA)
Nola (Sangha Mbaéré) No sawnwills
SINFOCAM Bayanga (Sangha Mbaéré)
No sawnwills
ROUGIER Sangha Mbaëré Nola (Sangha Mbaéré) No sawnwills
CENTRABOIS PK 9 (Ombella Mpoko) Sawnwills Fonctional
Source: (Cerutti, Mbangolo, Nakoe, Vandenhaute, & Hubert, 2018)
4.1.2.6.4 Transporters / logistic operators
Logging goes from cutting to consumption, including possible processing methods. However, the flow
of forest products supply is closely related to the type of transport. Transporters are therefore an
essential link in the value chain. In the CAR there is only one transport route used by carriers, and that
is the road route. The products are transported from the loading site to the port of Douala by road.
On Cameroonian territory, some companies then use trams or trains via Belabo or Bertoua to get to
the port of Douala.
13Monographie par usine
110
How Supply chain works and at what points the greatest amounts of wood waste is generated.
4.1.2.6.5 Merchant and consumers
Markets for the CAR forest products are Asian, European and African. The market and consumer
players encountered in CAR are diverse and depend on the types of forest products encountered on
the market or in processing sites. The wood industry, for example, is still precarious. Existing product
are from sawing, unwinding, slicing, debit drying and plywood. The main merchants and consumers
are:
➢ Timber Depot Managers: There is currently no industrial sawn timber depot in the country, as
some companies have stopped making sawnwood for local sales. CENTRA-BOIS is trying to
supply the city of Bangui with industrial sawnwood but orders are limited. A few wholesalers
buy various packages of sawnwood from the companies IFB Batalimo and SEFCA 174 in
Mambélé. They complement the other deposits of illicit artisanal sawnwood, which are in the
majority;
➢ Joinery: the furniture is made with different products from industrial sawnwood or illegal
artisanal sawnwood. But there is a serious problem of hardness, quality (furniture made from
illegal artisanal sawnwood) and high cost (furniture made from industrial sawnwood);
➢ The Charbonniers: The populations are grouped together on the site of forest residues of
certain companies to recover the crowns and certain sawn timber to make charcoal. These
coals are then resold in the localities or in Bangui;
➢ Households: Households benefit from the charcoal made by the charcoal burners and the
furniture made by the carpenters;
Craftsmen: They use certain species that have fallen during slaughtering and also species
such as Difou, Mahogany, Padouk, Gmelina, Ebony, etc. to turn them into works of art.
4.1.2.6.6 Sources and types of forest biomass residue in Central Africa Republic
The main sources of forest biomass residue are government forests in CAR since the government is
the main player. Biomass residue is generated at harvesting sites and through primary and secondary
processing as shown in Table 35.
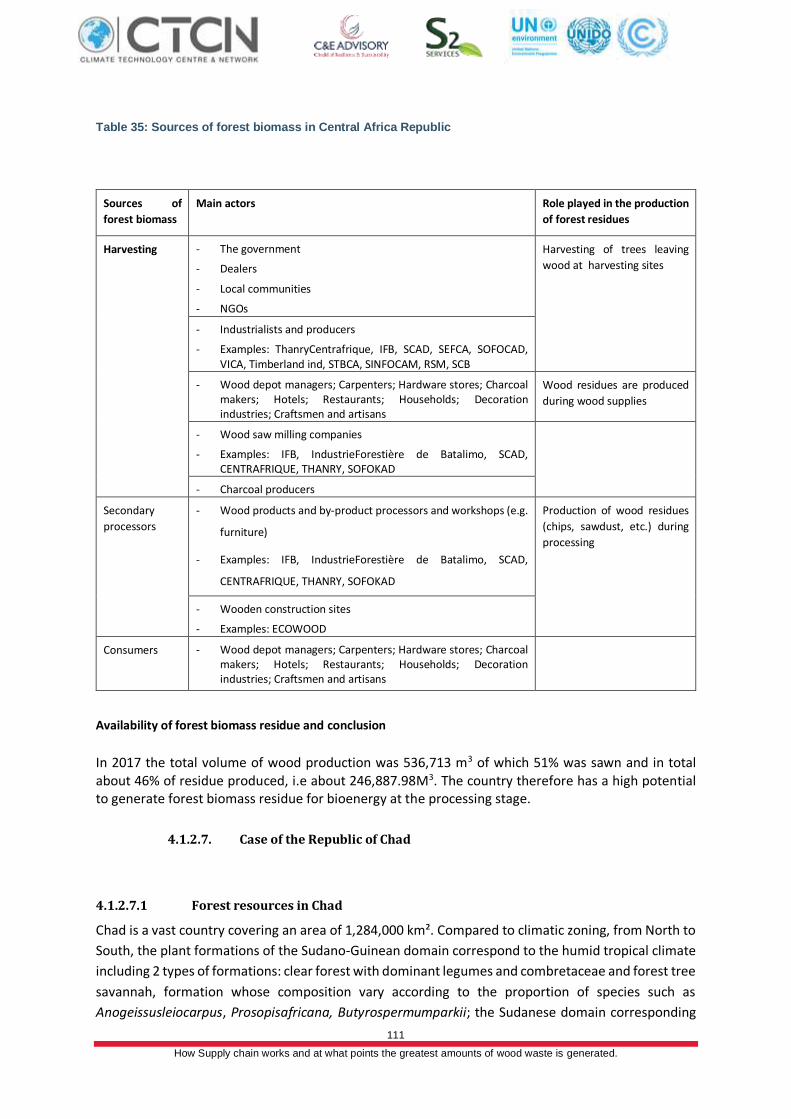
111
How Supply chain works and at what points the greatest amounts of wood waste is generated.
Table 35: Sources of forest biomass in Central Africa Republic
Sources of
forest biomass
Main actors Role played in the production
of forest residues
Harvesting - The government
- Dealers
- Local communities
- NGOs
Harvesting of trees leaving
wood at harvesting sites
- Industrialists and producers
- Examples: ThanryCentrafrique, IFB, SCAD, SEFCA, SOFOCAD, VICA, Timberland ind, STBCA, SINFOCAM, RSM, SCB
- Wood depot managers; Carpenters; Hardware stores; Charcoal makers; Hotels; Restaurants; Households; Decoration industries; Craftsmen and artisans
Wood residues are produced
during wood supplies
- Wood saw milling companies
- Examples: IFB, IndustrieForestière de Batalimo, SCAD, CENTRAFRIQUE, THANRY, SOFOKAD
- Charcoal producers
Secondary
processors
- Wood products and by-product processors and workshops (e.g.
furniture)
- Examples: IFB, IndustrieForestière de Batalimo, SCAD,
CENTRAFRIQUE, THANRY, SOFOKAD
Production of wood residues
(chips, sawdust, etc.) during
processing
- Wooden construction sites
- Examples: ECOWOOD
Consumers
- Wood depot managers; Carpenters; Hardware stores; Charcoal makers; Hotels; Restaurants; Households; Decoration industries; Craftsmen and artisans
Availability of forest biomass residue and conclusion
In 2017 the total volume of wood production was 536,713 m3 of which 51% was sawn and in total about 46% of residue produced, i.e about 246,887.98M3. The country therefore has a high potential to generate forest biomass residue for bioenergy at the processing stage.
4.1.2.7. Case of the Republic of Chad
4.1.2.7.1 Forest resources in Chad
Chad is a vast country covering an area of 1,284,000 km². Compared to climatic zoning, from North to
South, the plant formations of the Sudano-Guinean domain correspond to the humid tropical climate
including 2 types of formations: clear forest with dominant legumes and combretaceae and forest tree
savannah, formation whose composition vary according to the proportion of species such as
Anogeissusleiocarpus, Prosopisafricana, Butyrospermumparkii; the Sudanese domain corresponding
112
How Supply chain works and at what points the greatest amounts of wood waste is generated.
to formations of the Sudanese savannah type more or less wooded with combretaceae; the Sahel-
Sudanese area corresponding to the southern margin of the Sahelian climate characteristic of shrub
savannas where Acacias dominate, the Sahelian area corresponding to the northern margin of the
Sahelian climate and the desert climate and has for characteristic low, open or pseudo-steppe
formations.
In Chad, the forest domain brings together the massifs under the jurisdiction of the forest regimes:
classified forests, protected and defended forests, national parks, wildlife reserves, game reserves.
Added to this, are reforestation areas. Several estimates have been made on the area of forests in
Chad. The areas of classified forests (593,000 ha), national parks (414,000 ha) and wildlife reserves
(11,080,000 ha) constitute approximately 12,087,000 hectares. The natural plant formations
according to the Tropical Forest Technical Center (1989) would be around 23,000,000 hectares. Using
the degradation rate estimated by FAO in 1995, which is 0.6% / year, it is estimated at about
21,000,000 ha (Haggar, 2001).
Reforestation operations in Chad were launched in 1950 with the establishment of the forest service
in 1949. Early on, plantations were established as a soil protection measure. During colonial times and
up to independence in 1960, plantations and plantation management were the responsibility of the
forest service. Tree-planting by communities and private citizens began to be encouraged in 1961.
Successive droughts have raged over most of Chad since the 1970s. The Government has been trying
ever since to combat desertification by installing forest plantations and by soil conservation and
rehabilitation efforts.
The main species planted are neem (Azadarichtaindica) and Khayasenegalensis, as shadetrees and for
row-plantings, Eucalyptus spp. and Parkinsoniaaculeata for hedgerows and windbreaks, Acacia
nilotica, Prosopisjuliflora and Acacia senegal. Forest nurseries, managed by the forest service usually
with the active participation of village communities, are common. State-owned plantations are
increasingly giving way to village plantations. Planting density in arid zones is about 1,100
seedlings/ha. Felling cycles for fuelwood production can be 4 to 5 years, with Eucalyptus spp. in the
sudano-sahelian zone. For the production of poles, a longer cycle is required, about 6 to 7 years, at
spacing of 4 x 4 m, for full planting.
Chad’s forest resource conservation policy orientation excluded public participation. In earlier times,
forest management was based on strict repression, and the results were mixed if not mediocre.
Mounting awareness of the issues involved led to a number of government initiatives such as the
formulation and adoption of a 1989 national plan to combat desertification, a global framework for
the use and management of natural resources, and the preparation of a new forest code calling for
the transfer of responsibility for natural resources to local people and private citizens and a
reorientation of the role of the state. The country also intends to reinforce the current arrangements
for resource protection, expand its protected areas, and introduce watershed management. All these
operations plan to enlist the participation of local people in line with the trend towards
decentralization.
113
How Supply chain works and at what points the greatest amounts of wood waste is generated.
4.1.2.7.2 Forest value chain in Chad
Like all other Central African countries, Chad's forest value chain is dominated by Asian, European and
African markets. This value chain goes from production to processing and sale of forest products. At
each level of the link in the chain is an actor or a group of actors. They interact for the purpose of
sustainable exploitation of forest resources. There are several actors such as management actors,
extraction actors, processors, transporters, merchants, consumers. It should be noted that the
management actors intervene at all level of the chain to ensure compliance with established forest
rules and codes.
4.1.2.7.3 The players involved in Chad's forest value chain
4.1.2.7.3.1 Forest resource management and conservation actors in Chad
➢ The Government: The Chadian government role is to establish a comprehensive mechanism
governing the status, development, exploitation and protection of its various resources
through a new code (Law 36 / PR / 94 on the organization of the marketing and transport of
fuelwood in large agglomerations and the taxation applicable to them and the Decree No. 107
/ MTE / 97 implementing this law).. This code defines the principle of sustainability that
requires rational, fair and balanced management of resources. The Chadian government
manages its forest sources through its ministries and administrations (Haggar, 2001).
- The Ministry of Environment and Water through its main branches is responsible for
safeguarding the environment, combating desertification through environmental
protection and the development of any action aimed at generating renewable
natural resources; coordinating activities to combat desertification, initiation,
coordination, regulation and monitoring of actions related to environmental clean-
up and improving the living species in both rural and urban areas. It is responsible
for monitoring forest and wildlife policy through the constitution, classification,
conservation, management plan and management of the national forest heritage.
- The forestry administration is represented by the Directorate of Forests and
Environmental Protection (DFPE), and is responsible for the implementation and
monitoring of national environmental and forest policy, enforcing national
regulations of regional and international environmental, prevention and
environmental conventions, designing and developing strategies to combat
desertification and coordinating related programs.
- The forest inspections at the departmental level assist the DFPE in the performance
of its duties.
➢ The private sector is involved in forest management defined by the Plan for Fighting
Desertification. The private sector is comprised of industrials who own concessions and
operating permits. Forest resources are managed through an operating and management
plan. These industrials are the main actors in the extraction and processing of forest resources
(Haggar, 2001).
➢ The international and sub-regional organizations: they support the State and intervene in the
development of strategies to combat desertification aimed at finding a socio-economic
114
How Supply chain works and at what points the greatest amounts of wood waste is generated.
balance between meeting the basic needs of the population and preserving the environment.
They include:
o la Commission du Bassin du Lac Tchad (CBLT) ;
o l'Autorité du Bassin du Niger (ABN);
o The Economic Community of Livestock, Meat and Fish (CEBEVIRHA);
o The National Committee of the CILSS (CONACILSS);
o Central African Forestry Commission (COMIFAC);
o RAPAC (the Central A Protected Areas Network);
o The Central African Forest Observatory (OFAC) (GEF, n.d).
➢ Communities: The new forest texts define the legal and institutional framework for the
participation of communities in the management of forest resources. They are involved in
crop development, soil protection, streamlining of tree felling activities, etc. These
communities most often act under the support of:
o NGOs
o Community environmental actions such as Green Village, ILOT, CVS, etc. (GEF, n.d)
4.1.2.7.3.2 Actors involved in the exploitation of forest resources
The state being the owner of all forest areas intervenes at all levels of the forest value chain. At this
level:
➢ The state through its ministries, departments and branches establishes laws, regulations and
a tax system to ensure the exploitation of sustainable forest resources. It also allocates
concessions and operating permits to private and public sector companies.
➢ Operating companies: these are domestic and foreign. They are responsible for harvesting the
various forest products for commercial purposes. These products are then transported either
to processing sites or exported. Companies such as Rougier, Thanry are present in Chad.
➢ Communities: these actors harvest forest products mainly for commercial purposes. They
supply the local market with forest products. They include coal miners, craftsmen and farmers.
➢ NGOs
Transporters and logistic operators
Transporters are usually self-employed and do not belong to any company. Wood transporters from
Chad mainly use the roadway:
o the road from Kousseri (Cameroon) to N'Djamena (Chad);
o the road out of N'Djamena for Abéché;
o the road to Moundou (Chad) from the south;
o Moundou exit routes to towns in the southern area of Chad, where human density is high.
Merchants and consumers
Traders, craftsmen, households, carpentry, restaurants are the main marketers and consumers of
sawdust imported from Cameroon and CAR (Lescuye & Tal, 2016).
In conclusion, there are several forestry activities in the different countries of Central Africa. These
activities range from logging to sale, including possible transformations. Similarly, these activities vary
from one country to another depending on the economic situation, access to energy, laws and
regulations, etc.... As a result, there are also different types of waste produced as a function of the
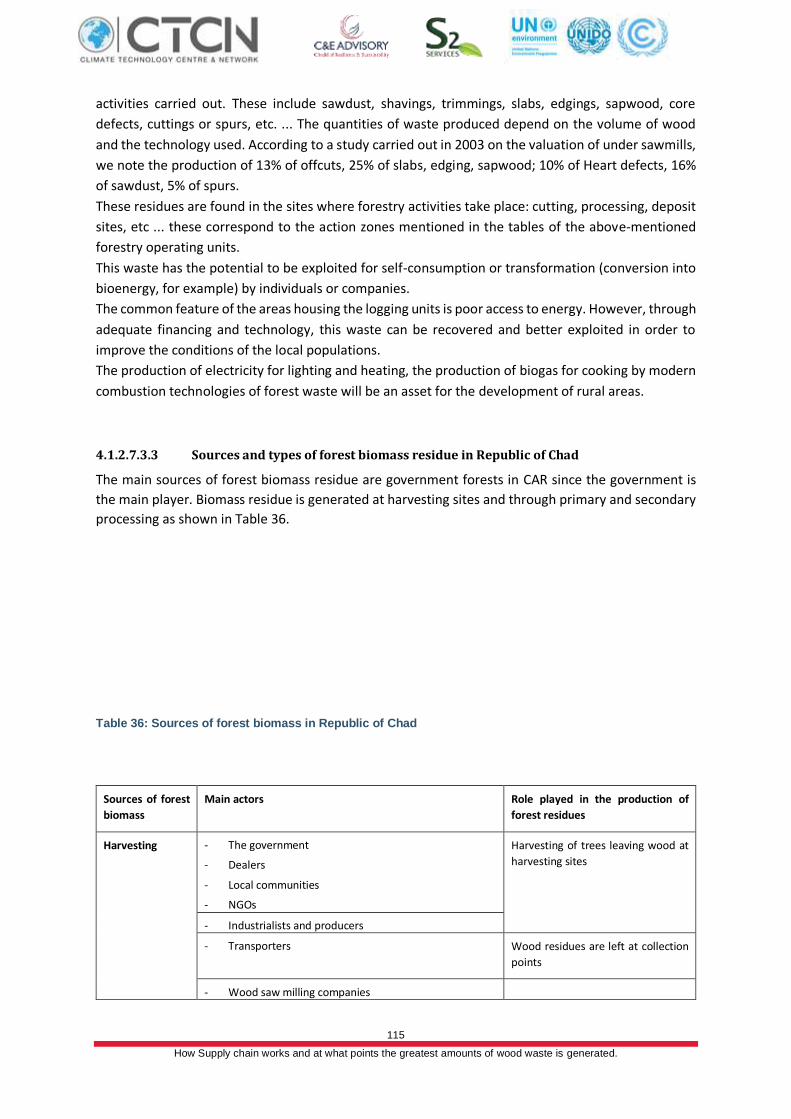
115
How Supply chain works and at what points the greatest amounts of wood waste is generated.
activities carried out. These include sawdust, shavings, trimmings, slabs, edgings, sapwood, core
defects, cuttings or spurs, etc. ... The quantities of waste produced depend on the volume of wood
and the technology used. According to a study carried out in 2003 on the valuation of under sawmills,
we note the production of 13% of offcuts, 25% of slabs, edging, sapwood; 10% of Heart defects, 16%
of sawdust, 5% of spurs.
These residues are found in the sites where forestry activities take place: cutting, processing, deposit
sites, etc ... these correspond to the action zones mentioned in the tables of the above-mentioned
forestry operating units.
This waste has the potential to be exploited for self-consumption or transformation (conversion into
bioenergy, for example) by individuals or companies.
The common feature of the areas housing the logging units is poor access to energy. However, through
adequate financing and technology, this waste can be recovered and better exploited in order to
improve the conditions of the local populations.
The production of electricity for lighting and heating, the production of biogas for cooking by modern
combustion technologies of forest waste will be an asset for the development of rural areas.
4.1.2.7.3.3 Sources and types of forest biomass residue in Republic of Chad
The main sources of forest biomass residue are government forests in CAR since the government is
the main player. Biomass residue is generated at harvesting sites and through primary and secondary
processing as shown in Table 36.
Table 36: Sources of forest biomass in Republic of Chad
Sources of forest
biomass
Main actors Role played in the production of
forest residues
Harvesting - The government
- Dealers
- Local communities
- NGOs
Harvesting of trees leaving wood at
harvesting sites
- Industrialists and producers
- Transporters Wood residues are left at collection
points
- Wood saw milling companies
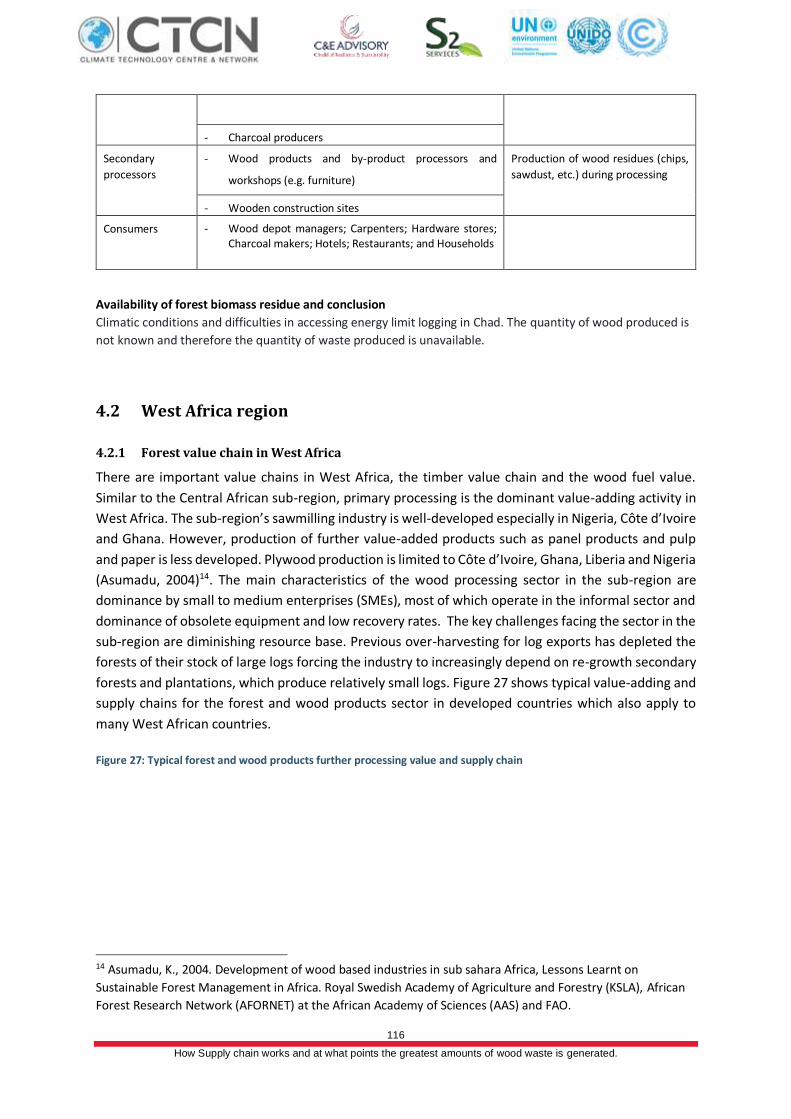
116
How Supply chain works and at what points the greatest amounts of wood waste is generated.
- Charcoal producers
Secondary
processors
- Wood products and by-product processors and
workshops (e.g. furniture)
Production of wood residues (chips,
sawdust, etc.) during processing
- Wooden construction sites
Consumers
- Wood depot managers; Carpenters; Hardware stores; Charcoal makers; Hotels; Restaurants; and Households
Availability of forest biomass residue and conclusion
Climatic conditions and difficulties in accessing energy limit logging in Chad. The quantity of wood produced is
not known and therefore the quantity of waste produced is unavailable.
4.2 West Africa region
4.2.1 Forest value chain in West Africa
There are important value chains in West Africa, the timber value chain and the wood fuel value.
Similar to the Central African sub-region, primary processing is the dominant value-adding activity in
West Africa. The sub-region’s sawmilling industry is well-developed especially in Nigeria, Côte d’Ivoire
and Ghana. However, production of further value-added products such as panel products and pulp
and paper is less developed. Plywood production is limited to Côte d’Ivoire, Ghana, Liberia and Nigeria
(Asumadu, 2004)14. The main characteristics of the wood processing sector in the sub-region are
dominance by small to medium enterprises (SMEs), most of which operate in the informal sector and
dominance of obsolete equipment and low recovery rates. The key challenges facing the sector in the
sub-region are diminishing resource base. Previous over-harvesting for log exports has depleted the
forests of their stock of large logs forcing the industry to increasingly depend on re-growth secondary
forests and plantations, which produce relatively small logs. Figure 27 shows typical value-adding and
supply chains for the forest and wood products sector in developed countries which also apply to
many West African countries.
Figure 27: Typical forest and wood products further processing value and supply chain
14 Asumadu, K., 2004. Development of wood based industries in sub sahara Africa, Lessons Learnt on
Sustainable Forest Management in Africa. Royal Swedish Academy of Agriculture and Forestry (KSLA), African
Forest Research Network (AFORNET) at the African Academy of Sciences (AAS) and FAO.
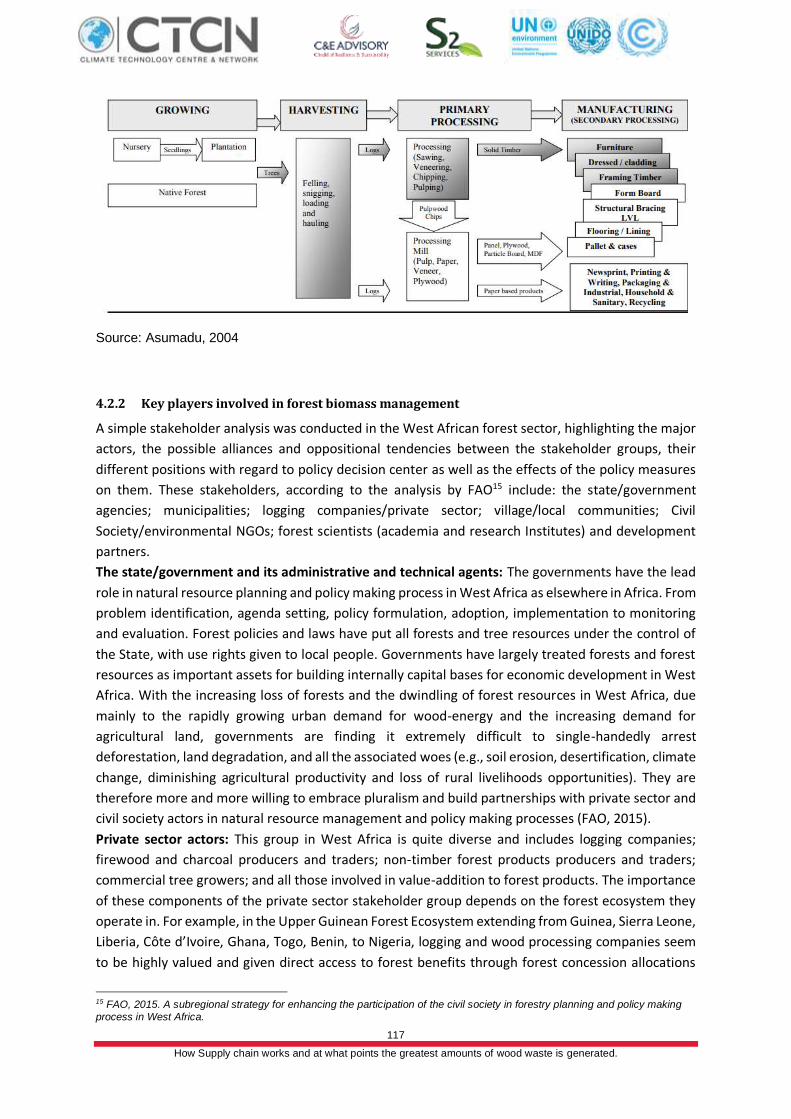
117
How Supply chain works and at what points the greatest amounts of wood waste is generated.
Source: Asumadu, 2004
4.2.2 Key players involved in forest biomass management
A simple stakeholder analysis was conducted in the West African forest sector, highlighting the major
actors, the possible alliances and oppositional tendencies between the stakeholder groups, their
different positions with regard to policy decision center as well as the effects of the policy measures
on them. These stakeholders, according to the analysis by FAO15 include: the state/government
agencies; municipalities; logging companies/private sector; village/local communities; Civil
Society/environmental NGOs; forest scientists (academia and research Institutes) and development
partners.
The state/government and its administrative and technical agents: The governments have the lead
role in natural resource planning and policy making process in West Africa as elsewhere in Africa. From
problem identification, agenda setting, policy formulation, adoption, implementation to monitoring
and evaluation. Forest policies and laws have put all forests and tree resources under the control of
the State, with use rights given to local people. Governments have largely treated forests and forest
resources as important assets for building internally capital bases for economic development in West
Africa. With the increasing loss of forests and the dwindling of forest resources in West Africa, due
mainly to the rapidly growing urban demand for wood-energy and the increasing demand for
agricultural land, governments are finding it extremely difficult to single-handedly arrest
deforestation, land degradation, and all the associated woes (e.g., soil erosion, desertification, climate
change, diminishing agricultural productivity and loss of rural livelihoods opportunities). They are
therefore more and more willing to embrace pluralism and build partnerships with private sector and
civil society actors in natural resource management and policy making processes (FAO, 2015).
Private sector actors: This group in West Africa is quite diverse and includes logging companies;
firewood and charcoal producers and traders; non-timber forest products producers and traders;
commercial tree growers; and all those involved in value-addition to forest products. The importance
of these components of the private sector stakeholder group depends on the forest ecosystem they
operate in. For example, in the Upper Guinean Forest Ecosystem extending from Guinea, Sierra Leone,
Liberia, Côte d’Ivoire, Ghana, Togo, Benin, to Nigeria, logging and wood processing companies seem
to be highly valued and given direct access to forest benefits through forest concession allocations
15 FAO, 2015. A subregional strategy for enhancing the participation of the civil society in forestry planning and policy making
process in West Africa.
118
How Supply chain works and at what points the greatest amounts of wood waste is generated.
than the other private sector stakeholders. This is because of their capacity to finance forest
exploitation and pay taxes and fees to the State. They are therefore natural associates to the
government.
Forest Scientists (Academia and Research Institutes): Forest scientists have developed a science of
forest exploitation and conservation; and have provided a stream of forestry professionals to both
government and forest industry. Applying these forestry and wood processing technologies, forest
industries generate jobs, capital and products which are highly valued in government development
agenda. Therefore, a high degree of association exists between government, industry and forest
scientists.
Municipalities: Municipalities, as decentralized government extension entities, are least affected by
forest policy decisions but influential in making forest decisions and laws. They are also high on the
list of those stakeholder groups benefiting from forest resources exploitation. They play the dual role
of serving as a vector for disseminating public policy decisions and legislative measures; and also as a
defender of the interests of local people and their communities.
Village/local communities: The “Village/local communities” is the stakeholder group most affected
by forest policy decisions but least influential in the policy making process. The degree of association
of the “Village/local communities” is naturally high with Civil Society Organizations/non-governmental
organizations (NGOs) which they tend to look at as partner and trusted allied given the NGOs’
reputation as non-profit organizations working for the promotion of the livelihoods of the poor rural
people and communities.
Development partners: Development partners , including international aid agencies and multilateral
banks, are external key actors which have important direct and indirect impacts and interests in the
forestry sector. Their interests in the forestry sector could be best looked at as that of the international
community, interested in (i) the improvement of the livelihoods of the poor and marginalized people
or communities in rural areas, most affected by forest planning and policy decisions and the depletion
of forest resources; and (ii) the value of the forests as crucial sink for carbon sequestration for climate
change regulation for the benefit of planet earth as a whole.
Civil Society Organizations (CSOs): This group of stakeholders is the most heterogeneous group in the
forest sector; and their diversity makes the analysis of their relationships with other stakeholder
groups complex. Nevertheless, CSOs can roughly be grouped into two categories: Community-Based
Organizations (CBOs) on one hand and Non-Governmental Organizations (NGOs) on the other.
Generally NGOs are the most formally organized form of CSO and are non-profit and voluntary in
nature. They also generally share a common zeal for addressing developmental issues —touching the
livelihoods of the poor and marginalized in rural areas— that have not been adequately addressed by
other societal institutions. For their potentially important roles, CSOs in West Africa tend to have a
higher degree of association with development Partners, because of their effectiveness on the ground
where the actions that make a difference in the lives of local people take place.
Wood industry players: West Africa has a well-developed sawmilling industry, largely based in Nigeria,
Côte d'Ivoire and Ghana, which together accounted for about 93 percent of sawnwood production in
2000.
Consumers: In the West Africa forest value chain, consumers also stand out as key players.
Undoubtedly the most important product derived from forests and woodland is woodfuel, which
accounts for over 85 percent of the total energy consumption of West African countries and provides
most household energy needs.
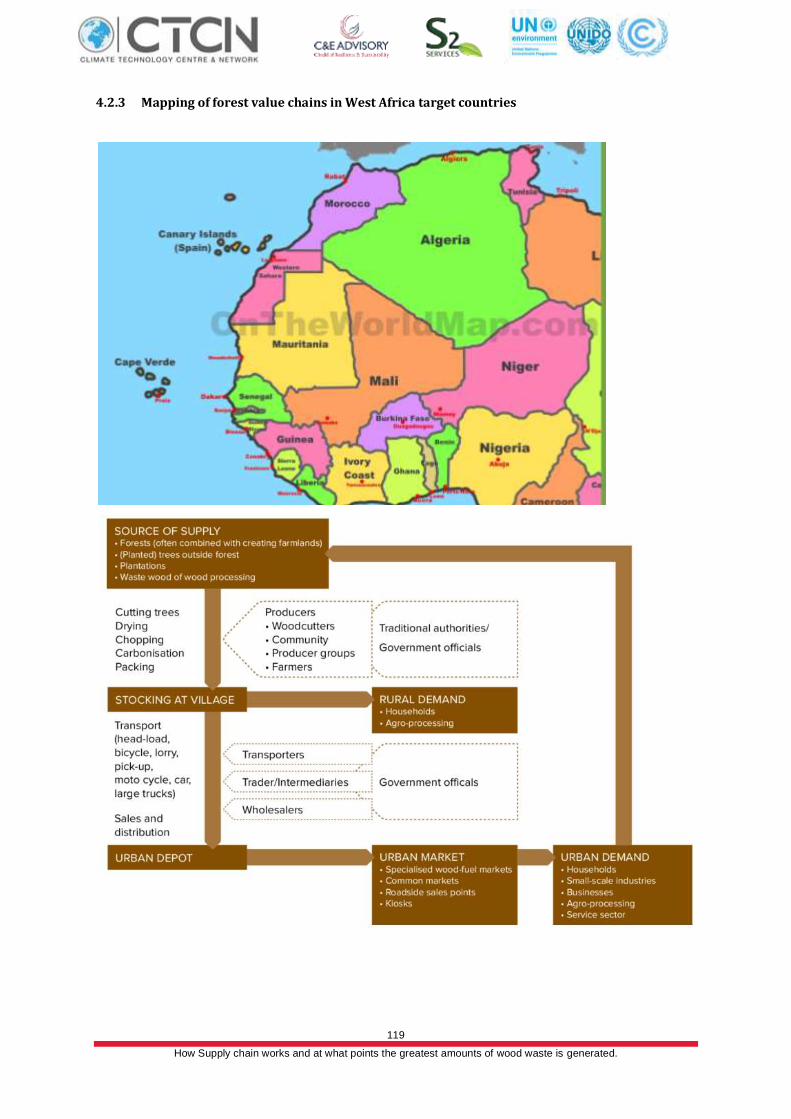
119
How Supply chain works and at what points the greatest amounts of wood waste is generated.
4.2.3 Mapping of forest value chains in West Africa target countries
120
How Supply chain works and at what points the greatest amounts of wood waste is generated.
4.2.3.1. Case of Benin
4.2.3.1.1 Forest resources in Benin
In terms of vegetation, despite its apparently favourable position, Benin is not a forest country. Law
93-0009 on the forest regime distinguishes 3 categories of forests: natural forests (those in which
there is no sylvicultural development action), semi-natural forests (developed natural forests) and
artificial forests (land planted by hand. According to article 10 of the Law, forests are classified as
follows:
• classified area : includes classified forests, reforestation areas, national parks, hunting
areas;
• Protected area: the protected forests made up of the rest of forests in the State domain
that have not been classified.
In general, the vegetation cover of Benin is represented by a few relics of dense semi-deciduous
forests, dense dry forests and gallery forests, the whole dominated by vast expanses of savannas
ranging from the Sahelian to Guinean type. The few islands of dense natural forests often constitute
sacred places (sacred forests). The vegetation cover of Benin is experiencing a worrying rate of
degradation due to the combined actions of the farming system (slash-and-burn agriculture) and
anthropogenic actions (uncontrolled cutting). Thus, the national forest cover evaluated in 1957
at 2,700,000 hectares decreased to 1,500,000 hectares in 1980. According to a study by the FAO in
1975, and the Directorate of Energy on energy strategy in Benin in 1995, losses in plant cover reached
3781 km2 in 20 years, or about 190 km2 per year16. Sources agree that natural resources steadily
declined during this period. Thus, the National Center for Remote Sensing (CENATEL) also reports that
from 1978 to 1998, the main courses fell by 3 million hectares, or 1 60 000 ha per year17.
16 (CIMA International / DIRECTORATE OF FORESTS AND NATURAL RESOURCES, November 2005) 17 (General Directorate of Forests and Natural Resources / National Program for Sustainable Management of Natural Resources,
November 2008)
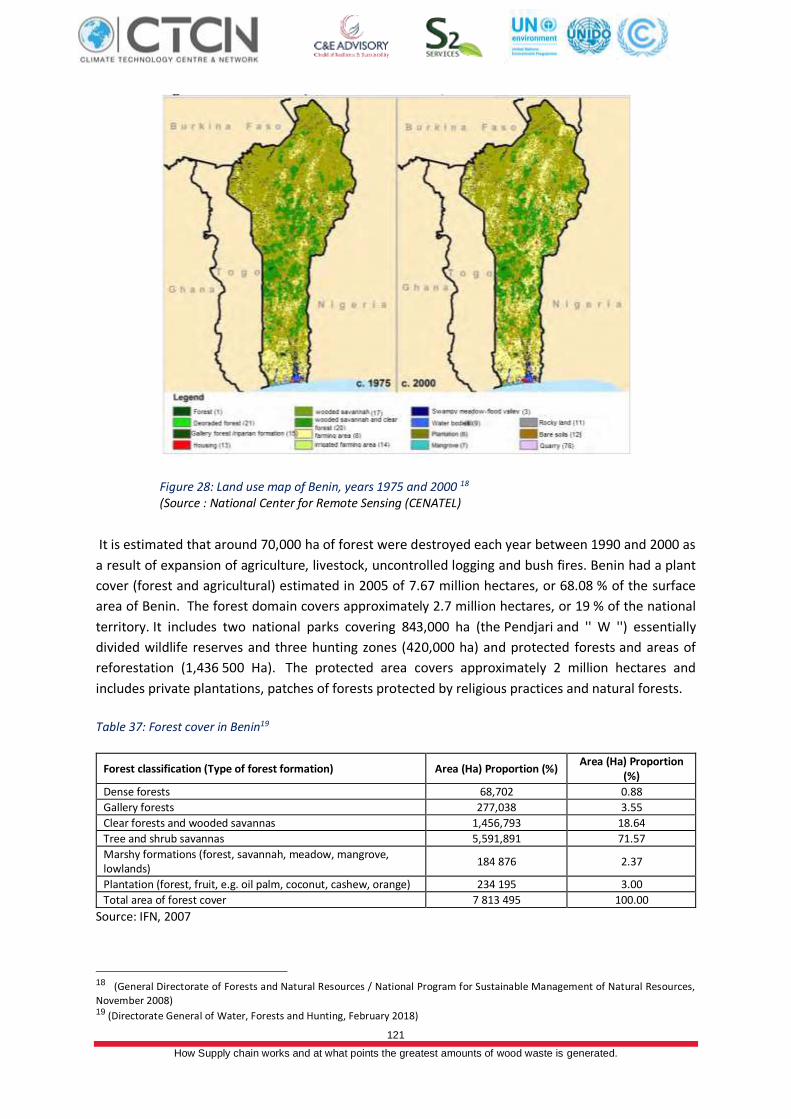
121
How Supply chain works and at what points the greatest amounts of wood waste is generated.
Figure 28: Land use map of Benin, years 1975 and 2000 18 (Source : National Center for Remote Sensing (CENATEL)
It is estimated that around 70,000 ha of forest were destroyed each year between 1990 and 2000 as
a result of expansion of agriculture, livestock, uncontrolled logging and bush fires. Benin had a plant
cover (forest and agricultural) estimated in 2005 of 7.67 million hectares, or 68.08 % of the surface
area of Benin. The forest domain covers approximately 2.7 million hectares, or 19 % of the national
territory. It includes two national parks covering 843,000 ha (the Pendjari and '' W '') essentially
divided wildlife reserves and three hunting zones (420,000 ha) and protected forests and areas of
reforestation (1,436 500 Ha). The protected area covers approximately 2 million hectares and
includes private plantations, patches of forests protected by religious practices and natural forests.
Table 37: Forest cover in Benin19
Forest classification (Type of forest formation) Area (Ha) Proportion (%) Area (Ha) Proportion
(%)
Dense forests 68,702 0.88
Gallery forests 277,038 3.55
Clear forests and wooded savannas 1,456,793 18.64
Tree and shrub savannas 5,591,891 71.57
Marshy formations (forest, savannah, meadow, mangrove, lowlands)
184 876 2.37
Plantation (forest, fruit, e.g. oil palm, coconut, cashew, orange) 234 195 3.00
Total area of forest cover 7 813 495 100.00
Source: IFN, 2007
18 (General Directorate of Forests and Natural Resources / National Program for Sustainable Management of Natural Resources,
November 2008) 19 (Directorate General of Water, Forests and Hunting, February 2018)
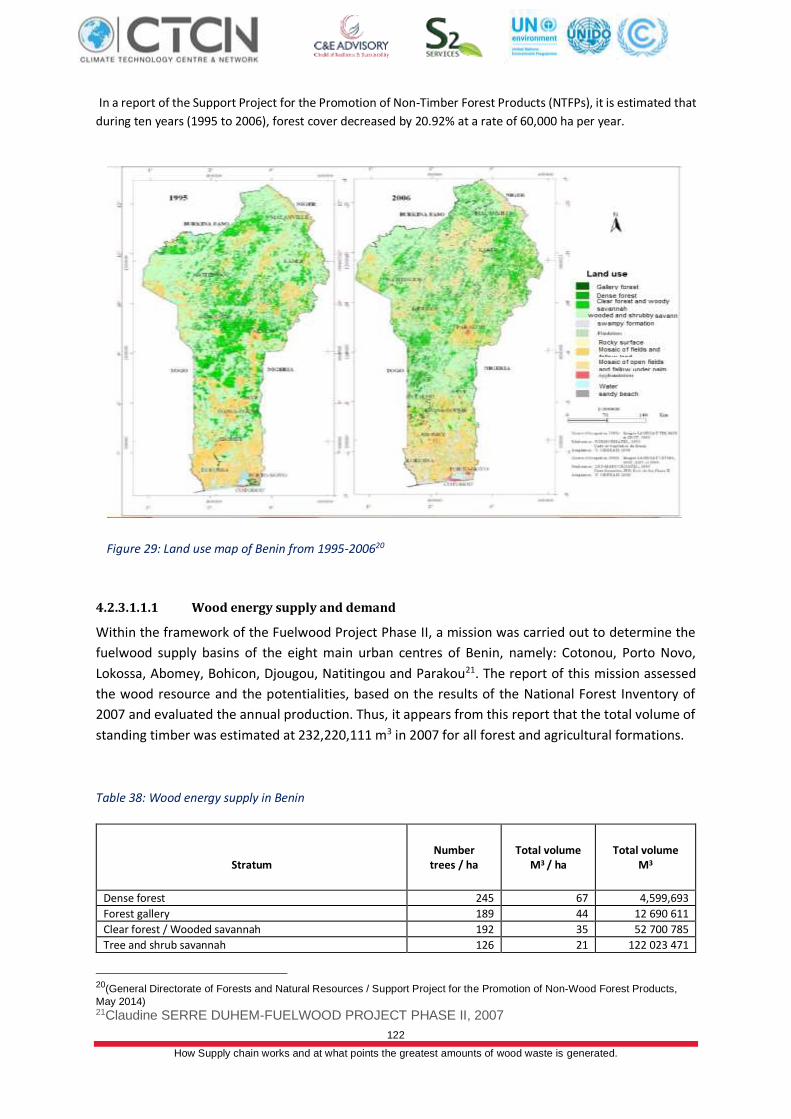
122
How Supply chain works and at what points the greatest amounts of wood waste is generated.
In a report of the Support Project for the Promotion of Non-Timber Forest Products (NTFPs), it is estimated that
during ten years (1995 to 2006), forest cover decreased by 20.92% at a rate of 60,000 ha per year.
Figure 29: Land use map of Benin from 1995-200620
4.2.3.1.1.1 Wood energy supply and demand
Within the framework of the Fuelwood Project Phase II, a mission was carried out to determine the
fuelwood supply basins of the eight main urban centres of Benin, namely: Cotonou, Porto Novo,
Lokossa, Abomey, Bohicon, Djougou, Natitingou and Parakou21. The report of this mission assessed
the wood resource and the potentialities, based on the results of the National Forest Inventory of
2007 and evaluated the annual production. Thus, it appears from this report that the total volume of
standing timber was estimated at 232,220,111 m3 in 2007 for all forest and agricultural formations.
Table 38: Wood energy supply in Benin
Stratum
Number trees / ha
Total volume M3 / ha
Total volume M3
Dense forest 245 67 4,599,693
Forest gallery 189 44 12 690 611
Clear forest / Wooded savannah 192 35 52 700 785
Tree and shrub savannah 126 21 122 023 471
20(General Directorate of Forests and Natural Resources / Support Project for the Promotion of Non-Wood Forest Products,
May 2014) 21Claudine SERRE DUHEM-FUELWOOD PROJECT PHASE II, 2007
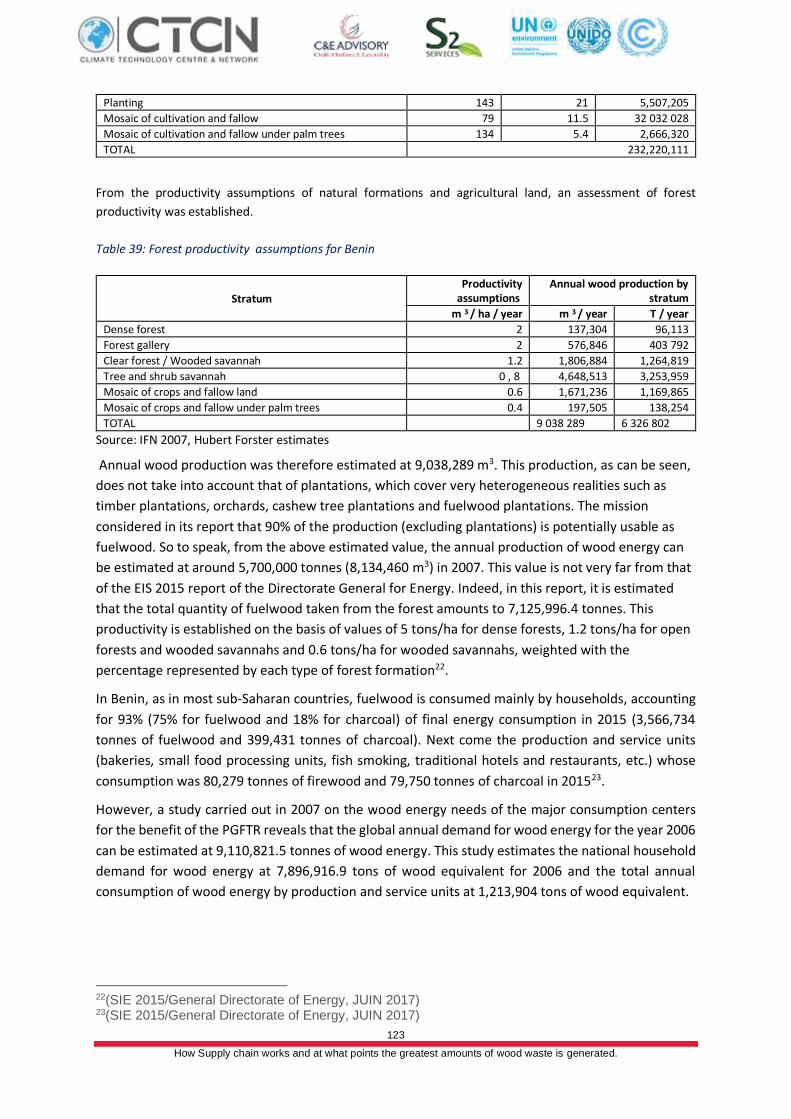
123
How Supply chain works and at what points the greatest amounts of wood waste is generated.
Planting 143 21 5,507,205
Mosaic of cultivation and fallow 79 11.5 32 032 028
Mosaic of cultivation and fallow under palm trees 134 5.4 2,666,320
TOTAL 232,220,111
From the productivity assumptions of natural formations and agricultural land, an assessment of forest
productivity was established.
Table 39: Forest productivity assumptions for Benin
Stratum Productivity
assumptions Annual wood production by
stratum
m 3 / ha / year m 3 / year T / year
Dense forest 2 137,304 96,113
Forest gallery 2 576,846 403 792
Clear forest / Wooded savannah 1.2 1,806,884 1,264,819
Tree and shrub savannah 0 , 8 4,648,513 3,253,959
Mosaic of crops and fallow land 0.6 1,671,236 1,169,865
Mosaic of crops and fallow under palm trees 0.4 197,505 138,254
TOTAL 9 038 289 6 326 802
Source: IFN 2007, Hubert Forster estimates
Annual wood production was therefore estimated at 9,038,289 m3. This production, as can be seen,
does not take into account that of plantations, which cover very heterogeneous realities such as
timber plantations, orchards, cashew tree plantations and fuelwood plantations. The mission
considered in its report that 90% of the production (excluding plantations) is potentially usable as
fuelwood. So to speak, from the above estimated value, the annual production of wood energy can
be estimated at around 5,700,000 tonnes (8,134,460 m3) in 2007. This value is not very far from that
of the EIS 2015 report of the Directorate General for Energy. Indeed, in this report, it is estimated
that the total quantity of fuelwood taken from the forest amounts to 7,125,996.4 tonnes. This
productivity is established on the basis of values of 5 tons/ha for dense forests, 1.2 tons/ha for open
forests and wooded savannahs and 0.6 tons/ha for wooded savannahs, weighted with the
percentage represented by each type of forest formation22.
In Benin, as in most sub-Saharan countries, fuelwood is consumed mainly by households, accounting
for 93% (75% for fuelwood and 18% for charcoal) of final energy consumption in 2015 (3,566,734
tonnes of fuelwood and 399,431 tonnes of charcoal). Next come the production and service units
(bakeries, small food processing units, fish smoking, traditional hotels and restaurants, etc.) whose
consumption was 80,279 tonnes of firewood and 79,750 tonnes of charcoal in 201523.
However, a study carried out in 2007 on the wood energy needs of the major consumption centers
for the benefit of the PGFTR reveals that the global annual demand for wood energy for the year 2006
can be estimated at 9,110,821.5 tonnes of wood energy. This study estimates the national household
demand for wood energy at 7,896,916.9 tons of wood equivalent for 2006 and the total annual
consumption of wood energy by production and service units at 1,213,904 tons of wood equivalent.
22(SIE 2015/General Directorate of Energy, JUIN 2017) 23(SIE 2015/General Directorate of Energy, JUIN 2017)
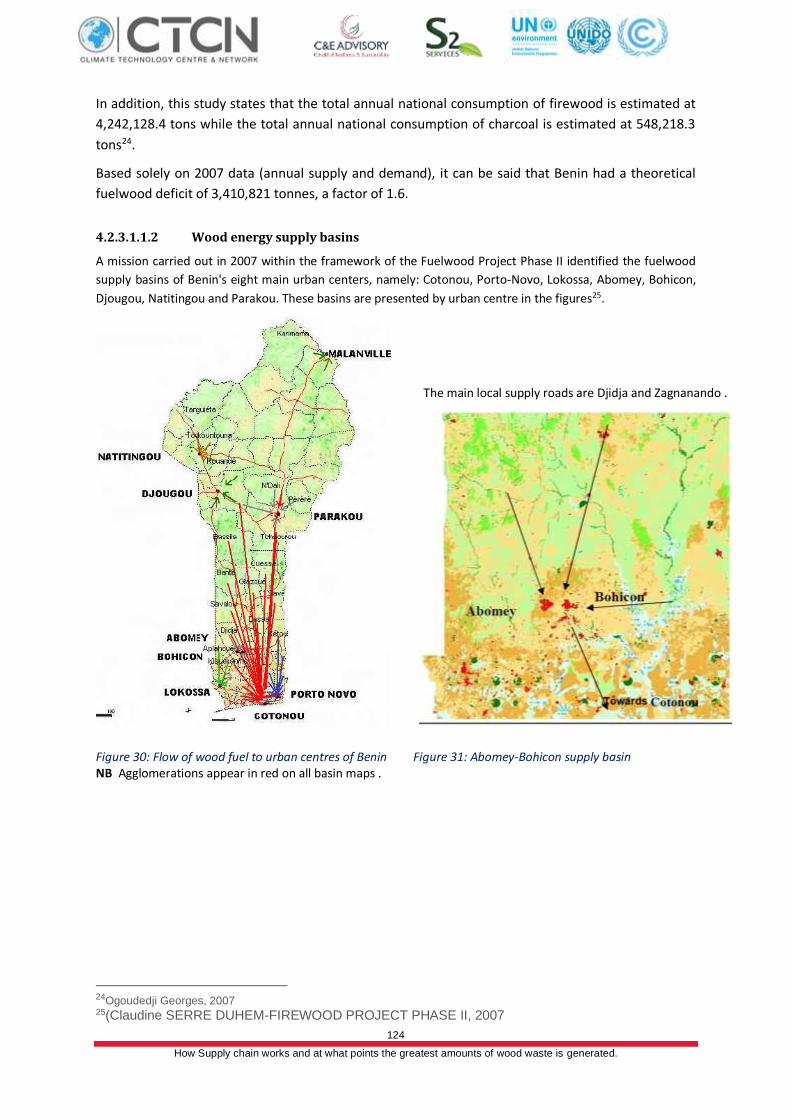
124
How Supply chain works and at what points the greatest amounts of wood waste is generated.
In addition, this study states that the total annual national consumption of firewood is estimated at
4,242,128.4 tons while the total annual national consumption of charcoal is estimated at 548,218.3
tons24.
Based solely on 2007 data (annual supply and demand), it can be said that Benin had a theoretical
fuelwood deficit of 3,410,821 tonnes, a factor of 1.6.
4.2.3.1.1.2 Wood energy supply basins
A mission carried out in 2007 within the framework of the Fuelwood Project Phase II identified the fuelwood
supply basins of Benin's eight main urban centers, namely: Cotonou, Porto-Novo, Lokossa, Abomey, Bohicon,
Djougou, Natitingou and Parakou. These basins are presented by urban centre in the figures25.
Figure 30: Flow of wood fuel to urban centres of Benin
The main local supply roads are Djidja and Zagnanando .
Figure 31: Abomey-Bohicon supply basin NB Agglomerations appear in red on all basin maps .
24Ogoudedji Georges, 2007 25(Claudine SERRE DUHEM-FIREWOOD PROJECT PHASE II, 2007
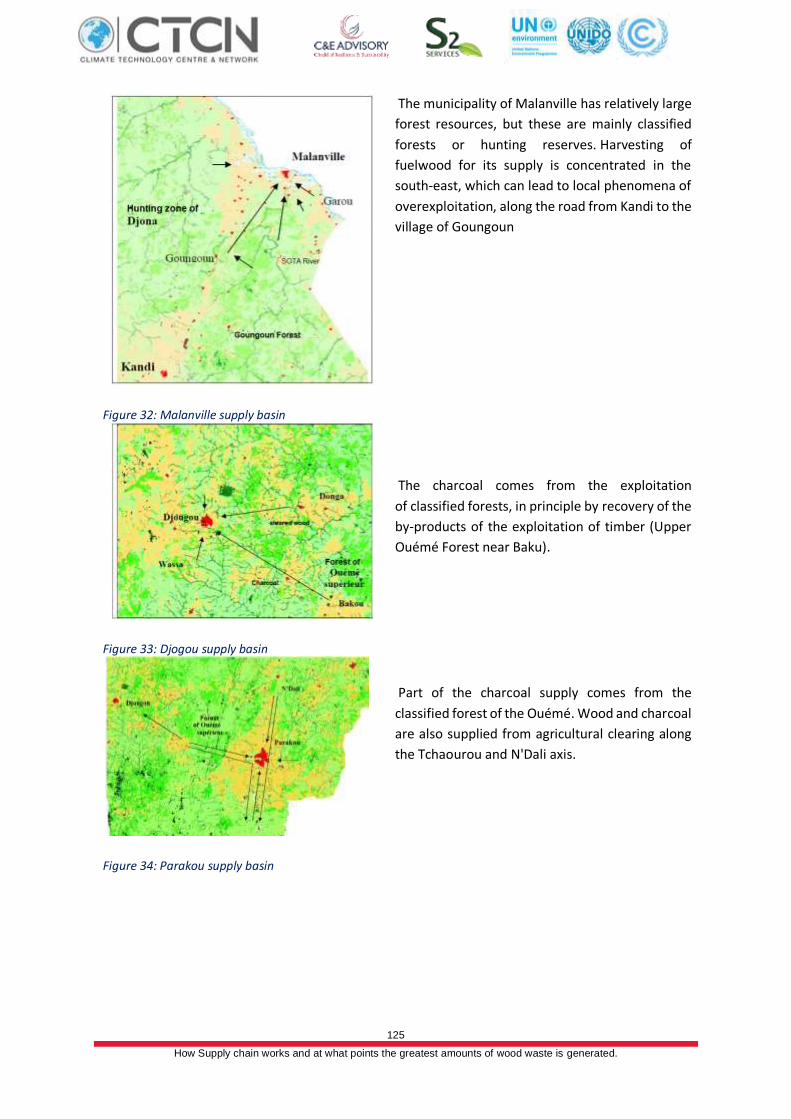
125
How Supply chain works and at what points the greatest amounts of wood waste is generated.
Figure 32: Malanville supply basin
The municipality of Malanville has relatively large
forest resources, but these are mainly classified
forests or hunting reserves. Harvesting of
fuelwood for its supply is concentrated in the
south-east, which can lead to local phenomena of
overexploitation, along the road from Kandi to the
village of Goungoun
Figure 33: Djogou supply basin
The charcoal comes from the exploitation
of classified forests, in principle by recovery of the
by-products of the exploitation of timber (Upper
Ouémé Forest near Baku).
Figure 34: Parakou supply basin
Part of the charcoal supply comes from the
classified forest of the Ouémé. Wood and charcoal
are also supplied from agricultural clearing along
the Tchaourou and N'Dali axis.
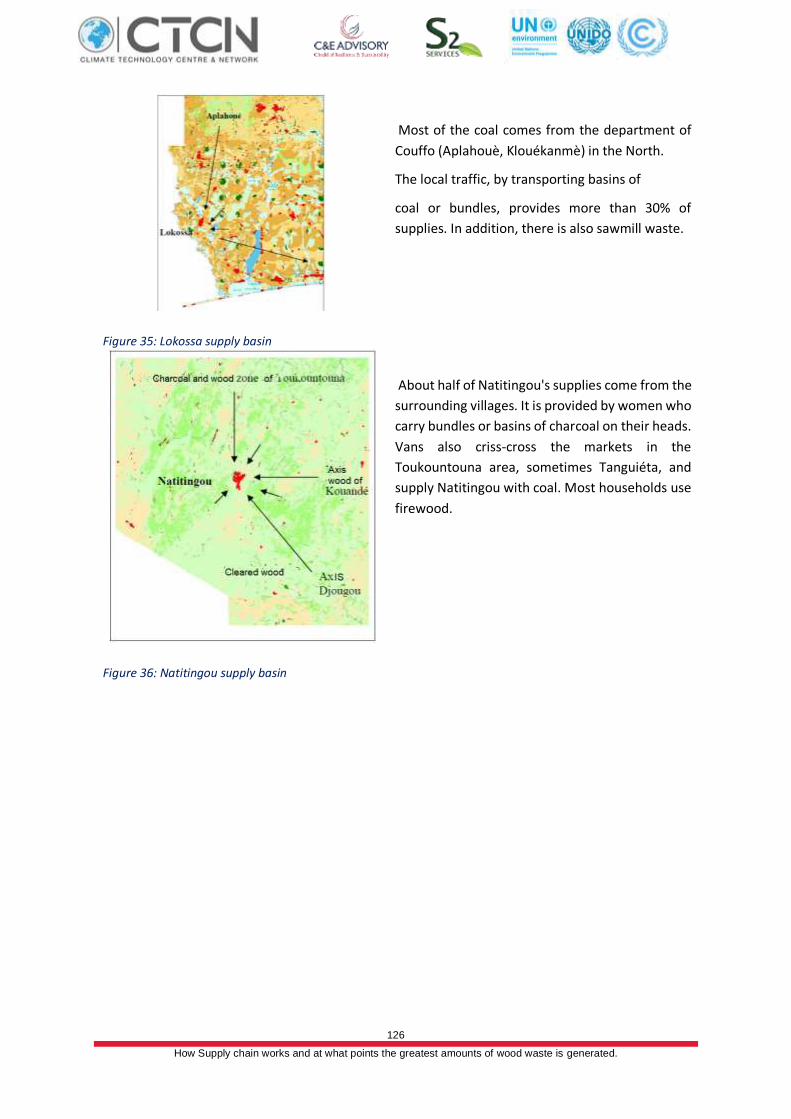
126
How Supply chain works and at what points the greatest amounts of wood waste is generated.
Figure 35: Lokossa supply basin
Most of the coal comes from the department of
Couffo (Aplahouè, Klouékanmè) in the North.
The local traffic, by transporting basins of
coal or bundles, provides more than 30% of
supplies. In addition, there is also sawmill waste.
Figure 36: Natitingou supply basin
About half of Natitingou's supplies come from the
surrounding villages. It is provided by women who
carry bundles or basins of charcoal on their heads.
Vans also criss-cross the markets in the
Toukountouna area, sometimes Tanguiéta, and
supply Natitingou with coal. Most households use
firewood.
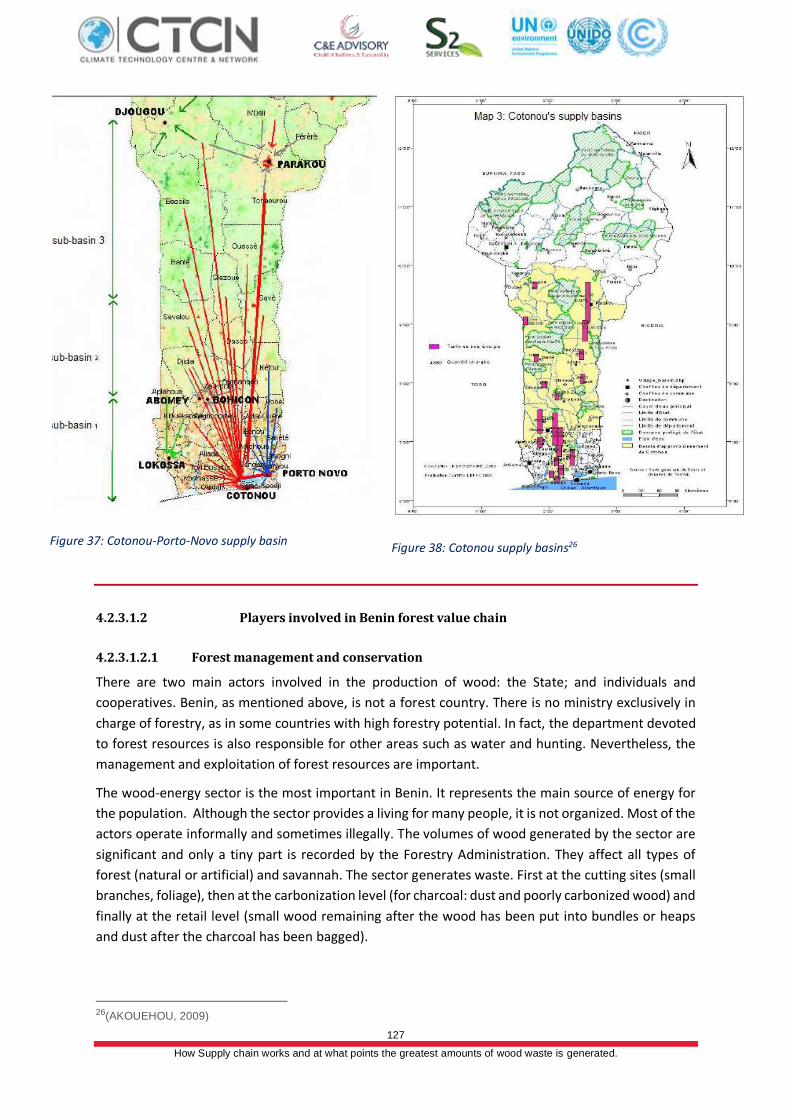
127
How Supply chain works and at what points the greatest amounts of wood waste is generated.
Figure 37: Cotonou-Porto-Novo supply basin
Figure 38: Cotonou supply basins26
4.2.3.1.2 Players involved in Benin forest value chain
4.2.3.1.2.1 Forest management and conservation
There are two main actors involved in the production of wood: the State; and individuals and
cooperatives. Benin, as mentioned above, is not a forest country. There is no ministry exclusively in
charge of forestry, as in some countries with high forestry potential. In fact, the department devoted
to forest resources is also responsible for other areas such as water and hunting. Nevertheless, the
management and exploitation of forest resources are important.
The wood-energy sector is the most important in Benin. It represents the main source of energy for
the population. Although the sector provides a living for many people, it is not organized. Most of the
actors operate informally and sometimes illegally. The volumes of wood generated by the sector are
significant and only a tiny part is recorded by the Forestry Administration. They affect all types of
forest (natural or artificial) and savannah. The sector generates waste. First at the cutting sites (small
branches, foliage), then at the carbonization level (for charcoal: dust and poorly carbonized wood) and
finally at the retail level (small wood remaining after the wood has been put into bundles or heaps
and dust after the charcoal has been bagged).
26(AKOUEHOU, 2009)
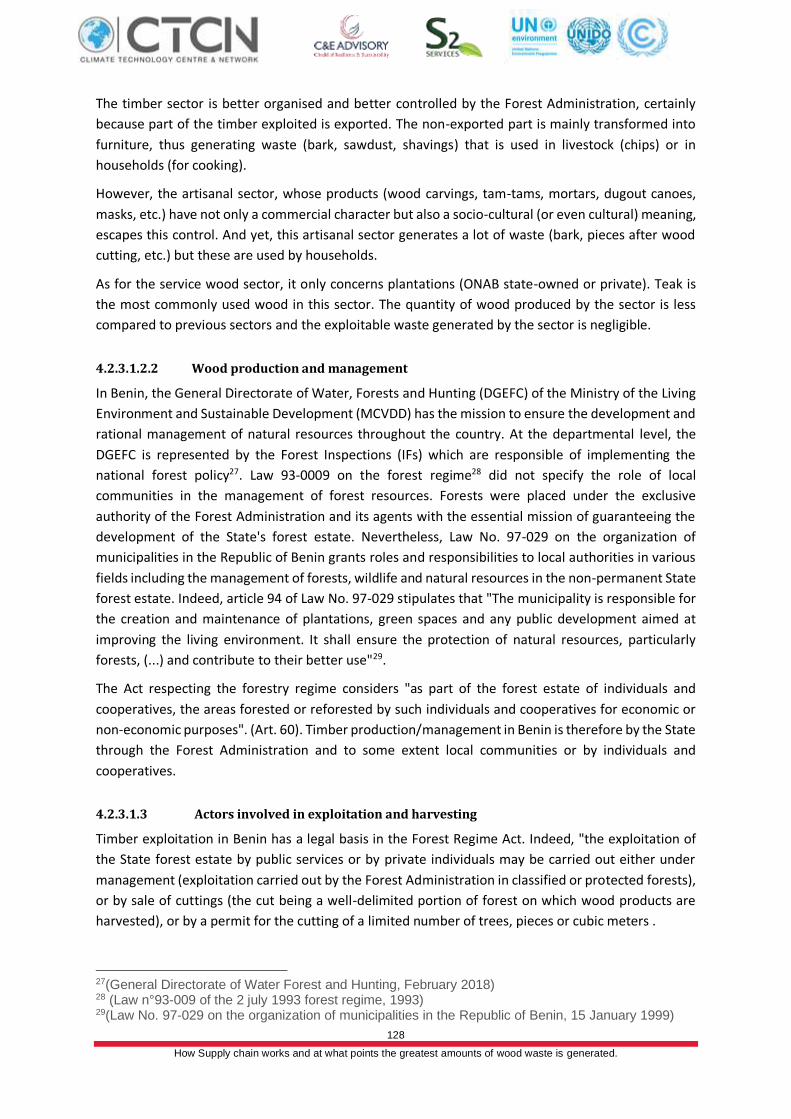
128
How Supply chain works and at what points the greatest amounts of wood waste is generated.
The timber sector is better organised and better controlled by the Forest Administration, certainly
because part of the timber exploited is exported. The non-exported part is mainly transformed into
furniture, thus generating waste (bark, sawdust, shavings) that is used in livestock (chips) or in
households (for cooking).
However, the artisanal sector, whose products (wood carvings, tam-tams, mortars, dugout canoes,
masks, etc.) have not only a commercial character but also a socio-cultural (or even cultural) meaning,
escapes this control. And yet, this artisanal sector generates a lot of waste (bark, pieces after wood
cutting, etc.) but these are used by households.
As for the service wood sector, it only concerns plantations (ONAB state-owned or private). Teak is
the most commonly used wood in this sector. The quantity of wood produced by the sector is less
compared to previous sectors and the exploitable waste generated by the sector is negligible.
4.2.3.1.2.2 Wood production and management
In Benin, the General Directorate of Water, Forests and Hunting (DGEFC) of the Ministry of the Living
Environment and Sustainable Development (MCVDD) has the mission to ensure the development and
rational management of natural resources throughout the country. At the departmental level, the
DGEFC is represented by the Forest Inspections (IFs) which are responsible of implementing the
national forest policy27. Law 93-0009 on the forest regime28 did not specify the role of local
communities in the management of forest resources. Forests were placed under the exclusive
authority of the Forest Administration and its agents with the essential mission of guaranteeing the
development of the State's forest estate. Nevertheless, Law No. 97-029 on the organization of
municipalities in the Republic of Benin grants roles and responsibilities to local authorities in various
fields including the management of forests, wildlife and natural resources in the non-permanent State
forest estate. Indeed, article 94 of Law No. 97-029 stipulates that "The municipality is responsible for
the creation and maintenance of plantations, green spaces and any public development aimed at
improving the living environment. It shall ensure the protection of natural resources, particularly
forests, (...) and contribute to their better use"29.
The Act respecting the forestry regime considers "as part of the forest estate of individuals and
cooperatives, the areas forested or reforested by such individuals and cooperatives for economic or
non-economic purposes". (Art. 60). Timber production/management in Benin is therefore by the State
through the Forest Administration and to some extent local communities or by individuals and
cooperatives.
4.2.3.1.3 Actors involved in exploitation and harvesting
Timber exploitation in Benin has a legal basis in the Forest Regime Act. Indeed, "the exploitation of
the State forest estate by public services or by private individuals may be carried out either under
management (exploitation carried out by the Forest Administration in classified or protected forests),
or by sale of cuttings (the cut being a well-delimited portion of forest on which wood products are
harvested), or by a permit for the cutting of a limited number of trees, pieces or cubic meters .
27(General Directorate of Water Forest and Hunting, February 2018) 28 (Law n°93-009 of the 2 july 1993 forest regime, 1993) 29(Law No. 97-029 on the organization of municipalities in the Republic of Benin, 15 January 1999)
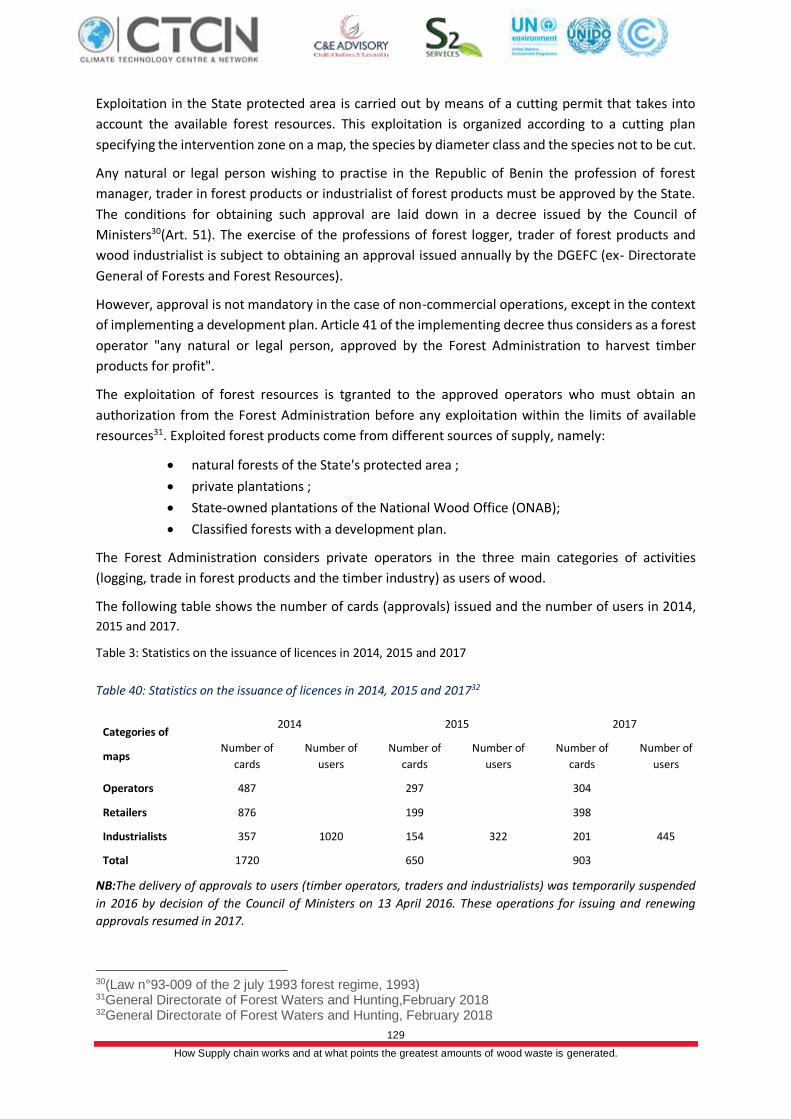
129
How Supply chain works and at what points the greatest amounts of wood waste is generated.
Exploitation in the State protected area is carried out by means of a cutting permit that takes into
account the available forest resources. This exploitation is organized according to a cutting plan
specifying the intervention zone on a map, the species by diameter class and the species not to be cut.
Any natural or legal person wishing to practise in the Republic of Benin the profession of forest
manager, trader in forest products or industrialist of forest products must be approved by the State.
The conditions for obtaining such approval are laid down in a decree issued by the Council of
Ministers30(Art. 51). The exercise of the professions of forest logger, trader of forest products and
wood industrialist is subject to obtaining an approval issued annually by the DGEFC (ex- Directorate
General of Forests and Forest Resources).
However, approval is not mandatory in the case of non-commercial operations, except in the context
of implementing a development plan. Article 41 of the implementing decree thus considers as a forest
operator "any natural or legal person, approved by the Forest Administration to harvest timber
products for profit".
The exploitation of forest resources is tgranted to the approved operators who must obtain an
authorization from the Forest Administration before any exploitation within the limits of available
resources31. Exploited forest products come from different sources of supply, namely:
• natural forests of the State's protected area ;
• private plantations ;
• State-owned plantations of the National Wood Office (ONAB);
• Classified forests with a development plan.
The Forest Administration considers private operators in the three main categories of activities
(logging, trade in forest products and the timber industry) as users of wood.
The following table shows the number of cards (approvals) issued and the number of users in 2014,
2015 and 2017.
Table 3: Statistics on the issuance of licences in 2014, 2015 and 2017
Table 40: Statistics on the issuance of licences in 2014, 2015 and 201732
Categories of
maps
2014 2015 2017
Number of
cards
Number of
users
Number of
cards
Number of
users
Number of
cards
Number of
users
Operators 487
1020
297
322
304
445
Retailers 876 199 398
Industrialists 357 154 201
Total 1720 650 903
NB:The delivery of approvals to users (timber operators, traders and industrialists) was temporarily suspended
in 2016 by decision of the Council of Ministers on 13 April 2016. These operations for issuing and renewing
approvals resumed in 2017.
30(Law n°93-009 of the 2 july 1993 forest regime, 1993) 31General Directorate of Forest Waters and Hunting,February 2018 32General Directorate of Forest Waters and Hunting, February 2018
130
How Supply chain works and at what points the greatest amounts of wood waste is generated.
In 2012, the associations of wood operators wished to create a Union bringing together their various
associations. This union, called the National Federation of Associations of Timber Professionals and
Users (FENAPUB-Benin), was supposed to bring together associations such as Anub (National
Association of Timber Users), Upb-Benin (Union of Timber Professionals of Benin), Acoprof, Adcppf,
Udaebo and Anebr-Pr33
4.2.3.1.4 Actors in wood energy harvesting and processing
The General Directorate of Forestry and Natural Resources (DGFRN) estimated in its report of activities
in 2015, the volume of operations of timber to 72,982 m3 from the North essentially
( Atakora / Dong has , 28514 m3 and Borgou / Alibori, 26,266 m3 ). In 2017, in its activity report, the
Directorate General of Water, Forests and Hunting (formerly DGFRN) estimated the volume of timber
harvested at 122,073 m3 without specifying the origins by department. However, the two activity
reports indicate that the most exploited species is Tectona grandis (called Teck) both in
terms of number of plants and volume.
Regarding timber processing, very little is mentioned in the documentation. However, the 2015 and
2017 activity reports mentioned above reveal that 357 cards in 2014, 154 cards in 2015 and 201 cards
in 2017 (i.e. 712 cards) were issued to wood industry (wood machining).
The implementing decree considers "as a forest industry, the transformation of all forest products
into semi-finished or finished products"34. The industries covered by this decree are: fixed or semi-
mobile sawmills, industrial charcoal factories, match factories, plywood, panel, fibre, particle and post,
glulam industries , wood pulp and paper pulp industries, joinery and cabinet work. (Art.56.
implementing decree). There are very few large wood processing units in Benin as cited in Article 56.
In the early 2000s, a study of the timber sector in Benin revealed that 11 sawmills would be officially
approved and registered with the Directorate of Forests and Natural Resources35. However, this study
specified that there would be at most five so-called modern sawmills whose characteristic is the
processing of teak wood, which they export exclusively. These mills are: the Beninese Wood Industry
(IBB) (Industry Branch of ONAB), the Compagnie du Golfe, Bentect S.A., SOPACOB and the Justin
Company. The products manufactured by these factories are sawing, squared timber, parquet,
parquet frieze, pallets, furniture. The ONAB sawmill had, according to this study, the largest
production capacity and by far the most sophisticated. Another processing unit called ATC-Industrie
de bois (ATC-IB) located in Sékou (commune of Allada) stands out nevertheless. Erected on an area of
eight hectares, ATC-IB is dedicated to the transformation of wood and the manufacture of furniture
of all ranges. It includes various sections including the sawmill, machining, assembly, sharpening,
parquet flooring, paint finishing, and upholstery.36
On the other hand, there is a multitude of wood processing stores (joinery or cabinet making) using
only rudimentary tools such as saws, planes, chisels, bits, etc. These stores are exempted from
approval according to article 57 of the implementing decree. Moreover, in Benin, as in some sub-
Saharan countries, there are "manual" wood processing industries. The products of these processes
include mortars, tam-tams, sculptures and canoes.
33Jean-Claude D. DOSSA/specificevent log, 2012 34(Benin/Forestry Regime Application Decree, 1996) 35(TCHIWANOU, OctobER 2000) 36Maryse ASSOGBADJO, 2015
131
How Supply chain works and at what points the greatest amounts of wood waste is generated.
4.2.3.1.5 Actors involved in timber harvesting and processing
Service wood in Benin is essentially made up of poles and posts of small diameters (6 to 20 cm in
diameter) for 5 to 12 m in length all species combined37. These are generally plantation woods. In this
sector, the operators are mainly individuals who have an approval (for ONAB state plantations) or an
authorization from the owner (for private plantations). According to the General Directorate of Forests
and Natural Resources (DGFRN), a total of 101 permits have been granted for the exploitation of
approximately 159,157 feet (essentially in the departments of Mono/Couffo, 77,464 feet and Ouemé-
Plateau, 63,901 feet), the majority of which is teak. In its 2017 activity report, the Directorate General
of Waters, Forestry and Hunting formerly the Directorate General of Waters, Forestry and Hunting
(DGFRN)) indicates that 224 cutting permits were issued for the exploitation of 857,139 feet in both
ONAB's state-owned and private plantations. The departments of the Atlantic and Coastal regions lead
the way in the exploitation of service timber (471,886 feet granted). A priori, there are no processing
units for service wood in Benin.
4.2.3.1.6 Actors involved in transport of wood energy and timber
The main means of transport for wood energy are38:
- Non-motorized short: mainly small towns involving pedestrians (mostly women) carrying
bundles (of wood) or basins (of coal) on their heads or two-wheelers or carts ;
- Medium "vans or tarpaulin-covered": circuits that are often "informal", little controlled by the
forest services, active within a radius of less than 100 km, particularly when the supply of
wood energy is scattered;
- Medium "trucks": characteristic of a rather important demand for wood and an
impoverishment of the soils closest to the city;
- Medium "Titan trucks": more formal, involving approved operators, mainly supplies Cotonou
and over long distances (more than 200 km).
This sector is regulated by article 84 of the implementing decree39. Indeed, "Any person transporting
wood, charcoal for commercial purposes by pirogue, boat, cart, car, truck, wagon, bicycle, animals or
any other means is required to submit to controls of his load by Forest Administration agents.
The transportation of timber is mainly done with trailers or semi-trailers from logging sources. The
same is true for service timber when the distance is long.
4.2.3.1.7 Actors involved in marketing of wood products
The decree implementing the forestry regime defines as trade in forest products any activity carried
out for profit and relating to the purchase, sale, import and export of forest products (art. 13). Forest
products are essentially defined as :
• wood for heating, charcoal and sawing ;
37TCHIWANOU, October 2000) 38Claudine SERRE DUHEM-FIREWOOD PROJECT PHASE II, 2007 39(Benin/Forestry Regime Implementation Decree, 1996)
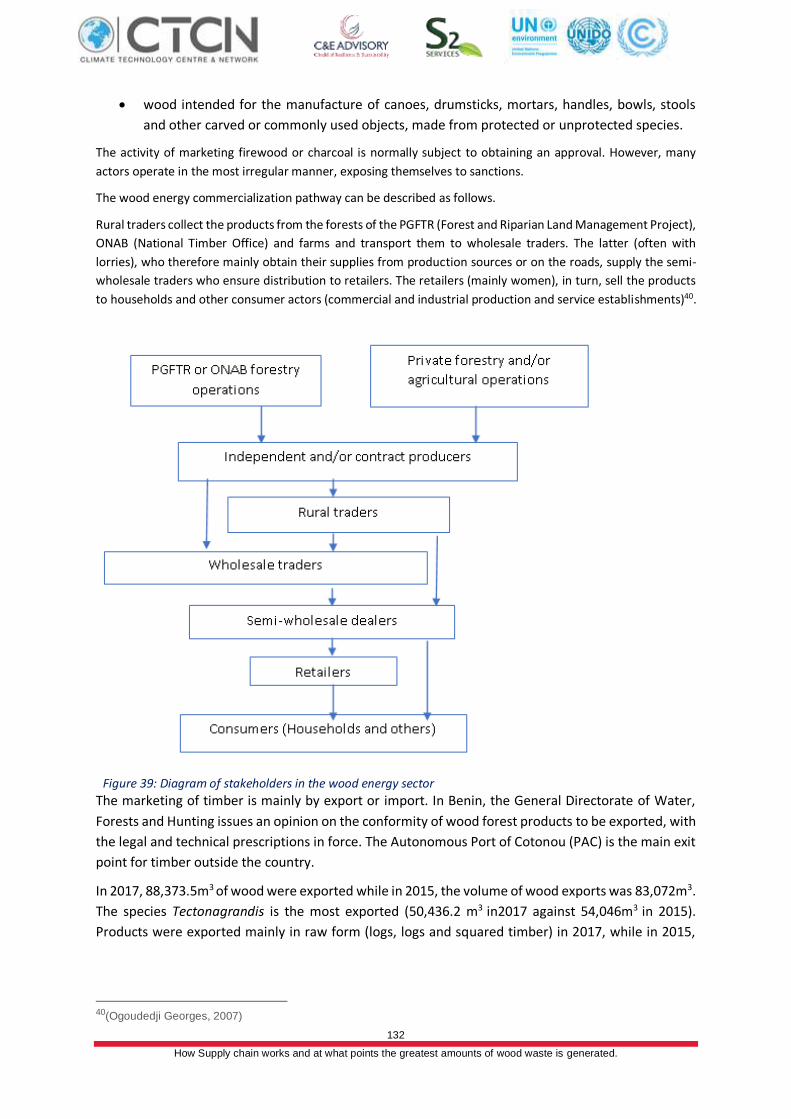
132
How Supply chain works and at what points the greatest amounts of wood waste is generated.
• wood intended for the manufacture of canoes, drumsticks, mortars, handles, bowls, stools
and other carved or commonly used objects, made from protected or unprotected species.
The activity of marketing firewood or charcoal is normally subject to obtaining an approval. However, many
actors operate in the most irregular manner, exposing themselves to sanctions.
The wood energy commercialization pathway can be described as follows.
Rural traders collect the products from the forests of the PGFTR (Forest and Riparian Land Management Project),
ONAB (National Timber Office) and farms and transport them to wholesale traders. The latter (often with
lorries), who therefore mainly obtain their supplies from production sources or on the roads, supply the semi-
wholesale traders who ensure distribution to retailers. The retailers (mainly women), in turn, sell the products
to households and other consumer actors (commercial and industrial production and service establishments)40.
Figure 39: Diagram of stakeholders in the wood energy sector
The marketing of timber is mainly by export or import. In Benin, the General Directorate of Water,
Forests and Hunting issues an opinion on the conformity of wood forest products to be exported, with
the legal and technical prescriptions in force. The Autonomous Port of Cotonou (PAC) is the main exit
point for timber outside the country.
In 2017, 88,373.5m3 of wood were exported while in 2015, the volume of wood exports was 83,072m3.
The species Tectonagrandis is the most exported (50,436.2 m3 in2017 against 54,046m3 in 2015).
Products were exported mainly in raw form (logs, logs and squared timber) in 2017, while in 2015,
40(Ogoudedji Georges, 2007)
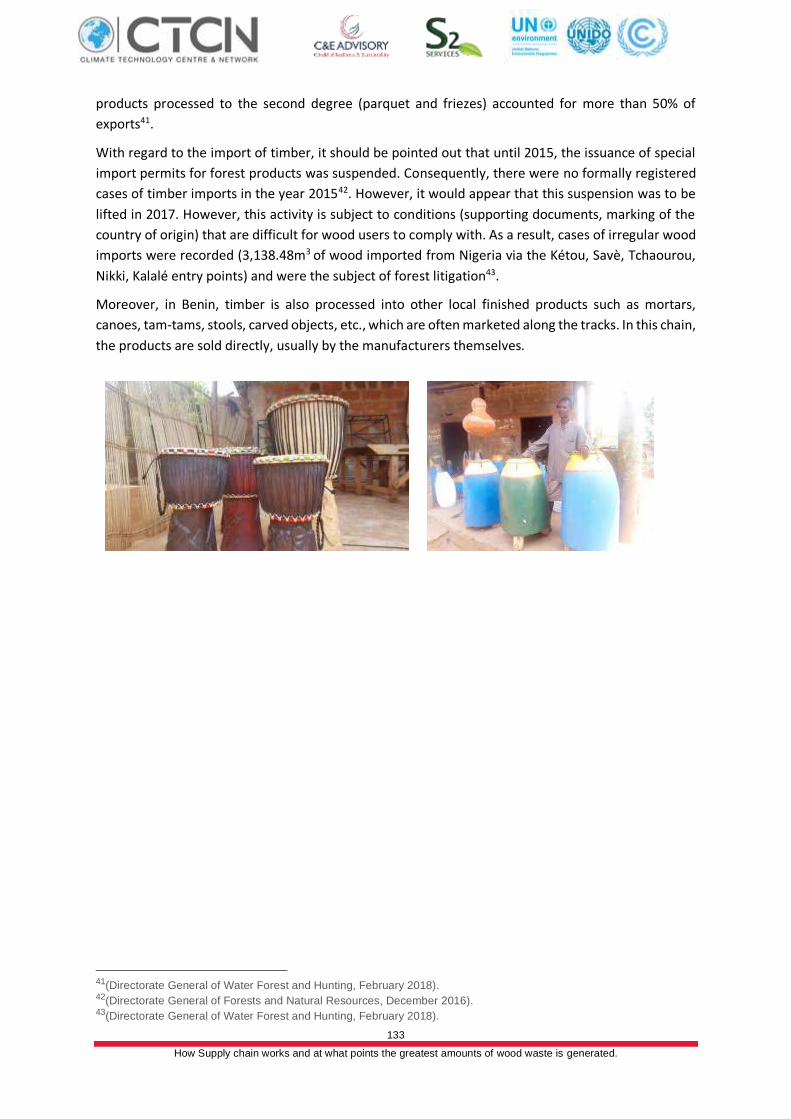
133
How Supply chain works and at what points the greatest amounts of wood waste is generated.
products processed to the second degree (parquet and friezes) accounted for more than 50% of
exports41.
With regard to the import of timber, it should be pointed out that until 2015, the issuance of special
import permits for forest products was suspended. Consequently, there were no formally registered
cases of timber imports in the year 201542. However, it would appear that this suspension was to be
lifted in 2017. However, this activity is subject to conditions (supporting documents, marking of the
country of origin) that are difficult for wood users to comply with. As a result, cases of irregular wood
imports were recorded (3,138.48m3 of wood imported from Nigeria via the Kétou, Savè, Tchaourou,
Nikki, Kalalé entry points) and were the subject of forest litigation43.
Moreover, in Benin, timber is also processed into other local finished products such as mortars,
canoes, tam-tams, stools, carved objects, etc., which are often marketed along the tracks. In this chain,
the products are sold directly, usually by the manufacturers themselves.
41(Directorate General of Water Forest and Hunting, February 2018). 42(Directorate General of Forests and Natural Resources, December 2016). 43(Directorate General of Water Forest and Hunting, February 2018).
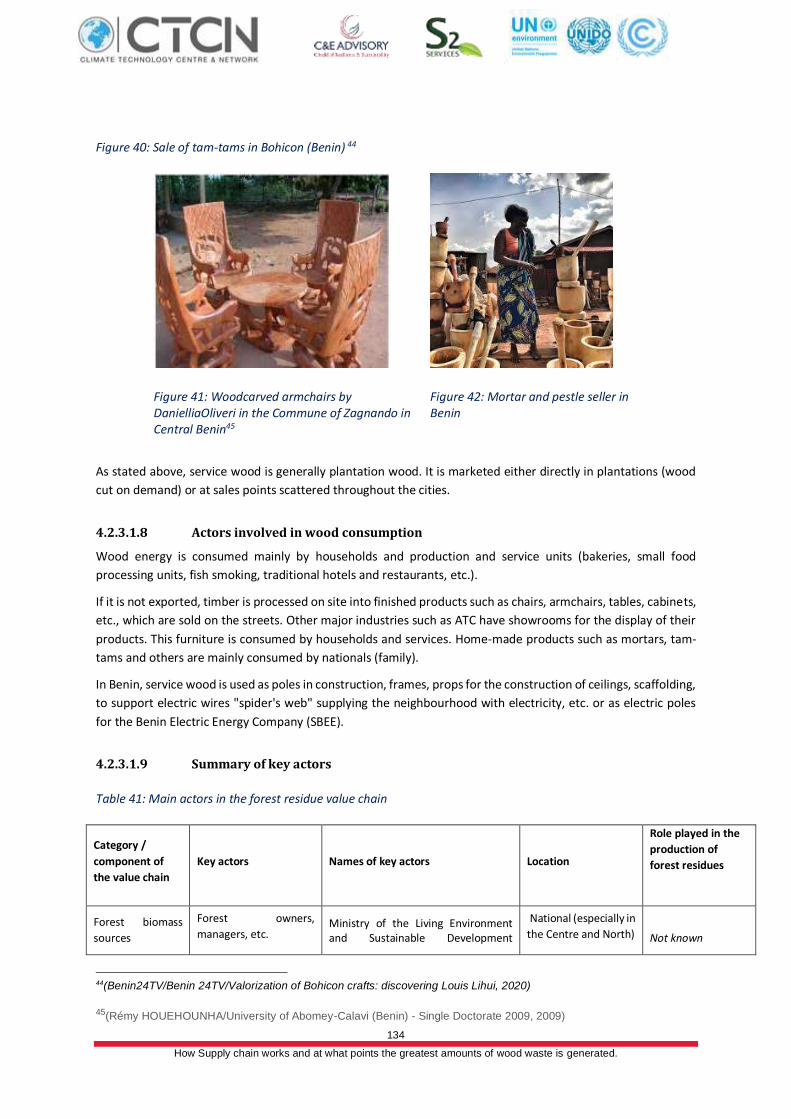
134
How Supply chain works and at what points the greatest amounts of wood waste is generated.
Figure 40: Sale of tam-tams in Bohicon (Benin) 44
Figure 41: Woodcarved armchairs by DanielliaOliveri in the Commune of Zagnando in Central Benin45
Figure 42: Mortar and pestle seller in Benin
As stated above, service wood is generally plantation wood. It is marketed either directly in plantations (wood
cut on demand) or at sales points scattered throughout the cities.
4.2.3.1.8 Actors involved in wood consumption
Wood energy is consumed mainly by households and production and service units (bakeries, small food
processing units, fish smoking, traditional hotels and restaurants, etc.).
If it is not exported, timber is processed on site into finished products such as chairs, armchairs, tables, cabinets,
etc., which are sold on the streets. Other major industries such as ATC have showrooms for the display of their
products. This furniture is consumed by households and services. Home-made products such as mortars, tam-
tams and others are mainly consumed by nationals (family).
In Benin, service wood is used as poles in construction, frames, props for the construction of ceilings, scaffolding,
to support electric wires "spider's web" supplying the neighbourhood with electricity, etc. or as electric poles
for the Benin Electric Energy Company (SBEE).
4.2.3.1.9 Summary of key actors
Table 41: Main actors in the forest residue value chain
Category /
component of
the value chain
Key actors Names of key actors Location
Role played in the
production of
forest residues
Forest biomass
sources
Forest owners,
managers, etc. Ministry of the Living Environment and Sustainable Development
National (especially in
the Centre and North)
Not known
44(Benin24TV/Benin 24TV/Valorization of Bohicon crafts: discovering Louis Lihui, 2020)
45(Rémy HOUEHOUNHA/University of Abomey-Calavi (Benin) - Single Doctorate 2009, 2009)
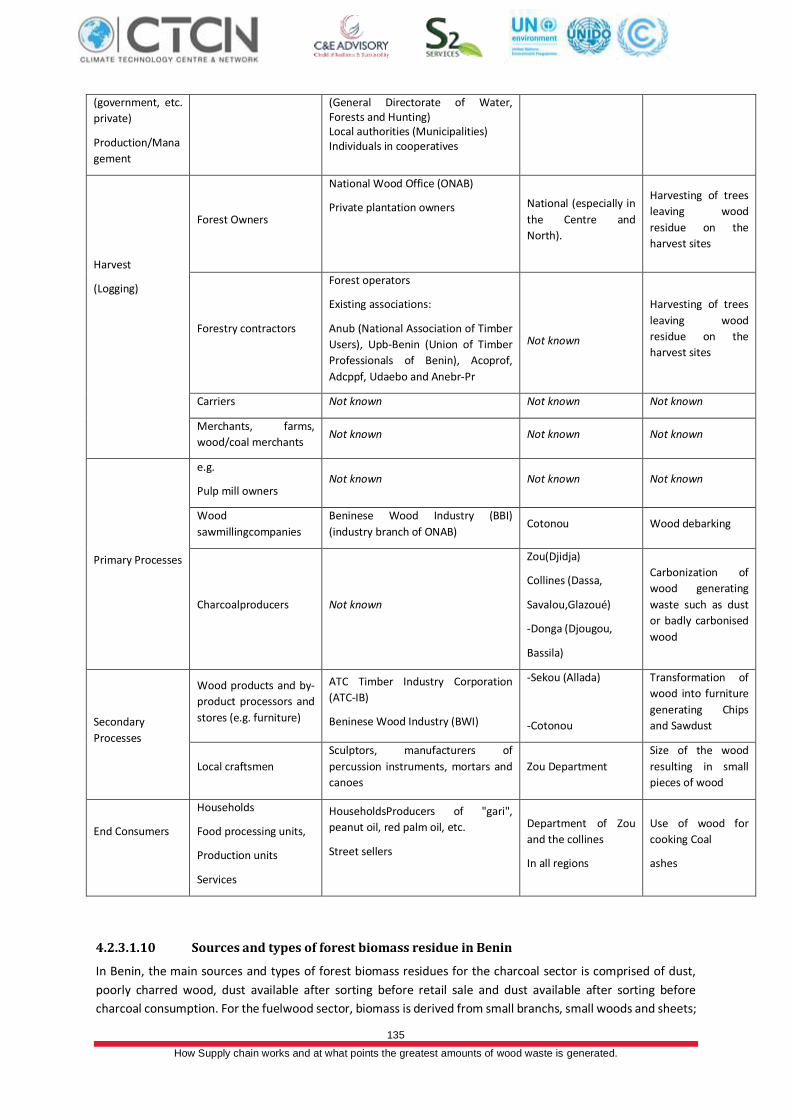
135
How Supply chain works and at what points the greatest amounts of wood waste is generated.
(government, etc.
private)
Production/Mana
gement
(General Directorate of Water, Forests and Hunting) Local authorities (Municipalities) Individuals in cooperatives
Harvest
(Logging)
Forest Owners
National Wood Office (ONAB)
Private plantation owners
National (especially in
the Centre and
North).
Harvesting of trees
leaving wood
residue on the
harvest sites
Forestry contractors
Forest operators
Existing associations:
Anub (National Association of Timber
Users), Upb-Benin (Union of Timber
Professionals of Benin), Acoprof,
Adcppf, Udaebo and Anebr-Pr
Not known
Harvesting of trees
leaving wood
residue on the
harvest sites
Carriers Not known Not known Not known
Merchants, farms,
wood/coal merchants Not known Not known Not known
Primary Processes
e.g.
Pulp mill owners Not known Not known Not known
Wood
sawmillingcompanies
Beninese Wood Industry (BBI)
(industry branch of ONAB) Cotonou Wood debarking
Charcoalproducers Not known
Zou(Djidja)
Collines (Dassa,
Savalou,Glazoué)
-Donga (Djougou,
Bassila)
Carbonization of
wood generating
waste such as dust
or badly carbonised
wood
Secondary
Processes
Wood products and by-
product processors and
stores (e.g. furniture)
ATC Timber Industry Corporation
(ATC-IB)
Beninese Wood Industry (BWI)
-Sekou (Allada)
-Cotonou
Transformation of
wood into furniture
generating Chips
and Sawdust
Local craftsmen
Sculptors, manufacturers of
percussion instruments, mortars and
canoes
Zou Department
Size of the wood
resulting in small
pieces of wood
End Consumers
Households
Food processing units,
Production units
Services
HouseholdsProducers of "gari",
peanut oil, red palm oil, etc.
Street sellers
Department of Zou
and the collines
In all regions
Use of wood for
cooking Coal
ashes
4.2.3.1.10 Sources and types of forest biomass residue in Benin
In Benin, the main sources and types of forest biomass residues for the charcoal sector is comprised of dust,
poorly charred wood, dust available after sorting before retail sale and dust available after sorting before
charcoal consumption. For the fuelwood sector, biomass is derived from small branchs, small woods and sheets;
136
How Supply chain works and at what points the greatest amounts of wood waste is generated.
while for timber it comes from branches, twigs, bark, sheets, sawdust, shavings, bark, chips, used pallets and
furniture bi-products at the end of the cycle. These main sources, where they are generated from and current
use are presented in Tables 42,43 and 44 below
Table 42: Sources of forest biomass residues related to the charcoal sector
Categories in the
value chain Type of residues Location Actors Current use
Primary
exploitation
(charcoal
production)
Charcoal residue (dust)
Poorly charred wood
Charcoal production
sites
Self-employed or
contract coal miners Not known
Distribution Dust available after sorting
before retail sale Retailoutlets Retailers
Sales to forges and
vulcanizers ("gluers")
Filling of holes to prevent
water stagnation
Rejection
Consumption Dust available after sorting
before coal consumption
Private homes
Restaurants
Seller on the street
Households and
professional users
such as restaurants
Disposal in the garbage
Filling of holes to prevent
water stagnation
Table 43: Sources of forest biomass residues related to the fuelwood sector
Categories in the
value chain Type of residues Location Actors Current use
Primary
exploitation
(felling and
logging)
Small branchs
Sheets Cutting sites Lumberjacks Not known
Distribution Small woods Retailoutlets Retailers Rejection
Consumption Charcoal
Private homes
School Restaurants and Canteens
Artisanal bakeries
Smoking of poisons
Local breweries (''tchoucoutou'')
Gari producers in the Zou, the Couffo,
Collines
Red palm oil or peanut oil producers
Households, food
production and
processing units
Reuse of coal
produced
Discharge of ashes
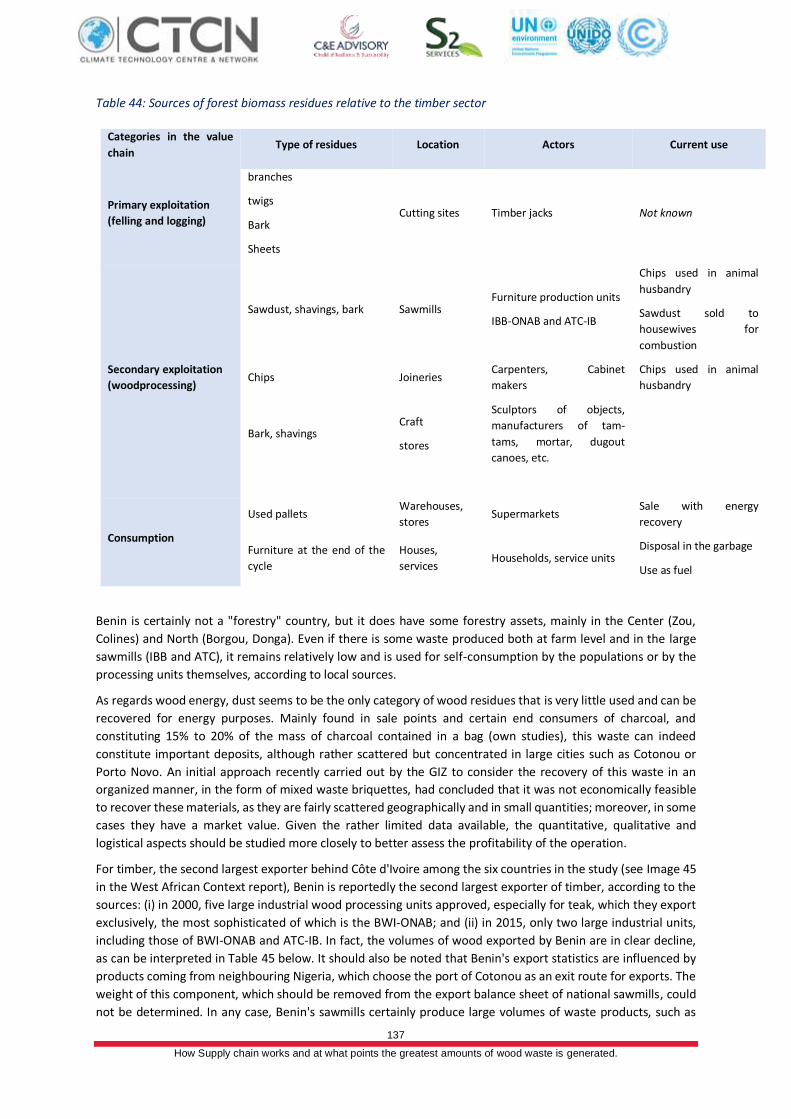
137
How Supply chain works and at what points the greatest amounts of wood waste is generated.
Table 44: Sources of forest biomass residues relative to the timber sector
Categories in the value
chain Type of residues Location Actors Current use
Primary exploitation
(felling and logging)
branches
twigs
Bark
Sheets
Cutting sites Timber jacks Not known
Secondary exploitation
(woodprocessing)
Sawdust, shavings, bark Sawmills Furniture production units
IBB-ONAB and ATC-IB
Chips used in animal
husbandry
Sawdust sold to
housewives for
combustion
Chips Joineries Carpenters, Cabinet
makers
Chips used in animal
husbandry
Bark, shavings Craft
stores
Sculptors of objects,
manufacturers of tam-
tams, mortar, dugout
canoes, etc.
Consumption
Used pallets Warehouses,
stores Supermarkets
Sale with energy
recovery
Furniture at the end of the
cycle
Houses,
services Households, service units
Disposal in the garbage
Use as fuel
Benin is certainly not a "forestry" country, but it does have some forestry assets, mainly in the Center (Zou,
Colines) and North (Borgou, Donga). Even if there is some waste produced both at farm level and in the large
sawmills (IBB and ATC), it remains relatively low and is used for self-consumption by the populations or by the
processing units themselves, according to local sources.
As regards wood energy, dust seems to be the only category of wood residues that is very little used and can be
recovered for energy purposes. Mainly found in sale points and certain end consumers of charcoal, and
constituting 15% to 20% of the mass of charcoal contained in a bag (own studies), this waste can indeed
constitute important deposits, although rather scattered but concentrated in large cities such as Cotonou or
Porto Novo. An initial approach recently carried out by the GIZ to consider the recovery of this waste in an
organized manner, in the form of mixed waste briquettes, had concluded that it was not economically feasible
to recover these materials, as they are fairly scattered geographically and in small quantities; moreover, in some
cases they have a market value. Given the rather limited data available, the quantitative, qualitative and
logistical aspects should be studied more closely to better assess the profitability of the operation.
For timber, the second largest exporter behind Côte d'Ivoire among the six countries in the study (see Image 45
in the West African Context report), Benin is reportedly the second largest exporter of timber, according to the
sources: (i) in 2000, five large industrial wood processing units approved, especially for teak, which they export
exclusively, the most sophisticated of which is the BWI-ONAB; and (ii) in 2015, only two large industrial units,
including those of BWI-ONAB and ATC-IB. In fact, the volumes of wood exported by Benin are in clear decline,
as can be interpreted in Table 45 below. It should also be noted that Benin's export statistics are influenced by
products coming from neighbouring Nigeria, which choose the port of Cotonou as an exit route for exports. The
weight of this component, which should be removed from the export balance sheet of national sawmills, could
not be determined. In any case, Benin's sawmills certainly produce large volumes of waste products, such as
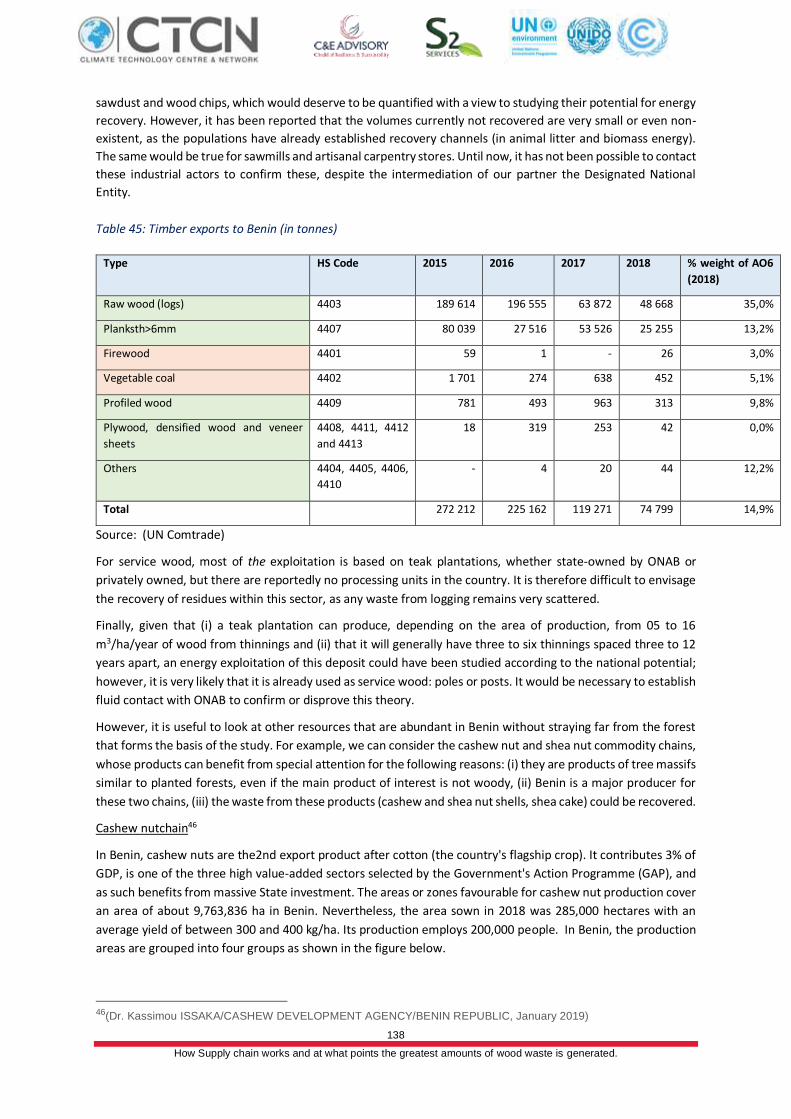
138
How Supply chain works and at what points the greatest amounts of wood waste is generated.
sawdust and wood chips, which would deserve to be quantified with a view to studying their potential for energy
recovery. However, it has been reported that the volumes currently not recovered are very small or even non-
existent, as the populations have already established recovery channels (in animal litter and biomass energy).
The same would be true for sawmills and artisanal carpentry stores. Until now, it has not been possible to contact
these industrial actors to confirm these, despite the intermediation of our partner the Designated National
Entity.
Table 45: Timber exports to Benin (in tonnes)
Type HS Code 2015 2016 2017 2018 % weight of AO6
(2018)
Raw wood (logs) 4403 189 614 196 555 63 872 48 668 35,0%
Planksth>6mm 4407 80 039 27 516 53 526 25 255 13,2%
Firewood 4401 59 1 - 26 3,0%
Vegetable coal 4402 1 701 274 638 452 5,1%
Profiled wood 4409 781 493 963 313 9,8%
Plywood, densified wood and veneer
sheets
4408, 4411, 4412
and 4413
18 319 253 42 0,0%
Others 4404, 4405, 4406,
4410
- 4 20 44 12,2%
Total
272 212 225 162 119 271 74 799 14,9%
Source: (UN Comtrade)
For service wood, most of the exploitation is based on teak plantations, whether state-owned by ONAB or
privately owned, but there are reportedly no processing units in the country. It is therefore difficult to envisage
the recovery of residues within this sector, as any waste from logging remains very scattered.
Finally, given that (i) a teak plantation can produce, depending on the area of production, from 05 to 16
m3/ha/year of wood from thinnings and (ii) that it will generally have three to six thinnings spaced three to 12
years apart, an energy exploitation of this deposit could have been studied according to the national potential;
however, it is very likely that it is already used as service wood: poles or posts. It would be necessary to establish
fluid contact with ONAB to confirm or disprove this theory.
However, it is useful to look at other resources that are abundant in Benin without straying far from the forest
that forms the basis of the study. For example, we can consider the cashew nut and shea nut commodity chains,
whose products can benefit from special attention for the following reasons: (i) they are products of tree massifs
similar to planted forests, even if the main product of interest is not woody, (ii) Benin is a major producer for
these two chains, (iii) the waste from these products (cashew and shea nut shells, shea cake) could be recovered.
Cashew nutchain46
In Benin, cashew nuts are the2nd export product after cotton (the country's flagship crop). It contributes 3% of
GDP, is one of the three high value-added sectors selected by the Government's Action Programme (GAP), and
as such benefits from massive State investment. The areas or zones favourable for cashew nut production cover
an area of about 9,763,836 ha in Benin. Nevertheless, the area sown in 2018 was 285,000 hectares with an
average yield of between 300 and 400 kg/ha. Its production employs 200,000 people. In Benin, the production
areas are grouped into four groups as shown in the figure below.
46(Dr. Kassimou ISSAKA/CASHEW DEVELOPMENT AGENCY/BENIN REPUBLIC, January 2019)
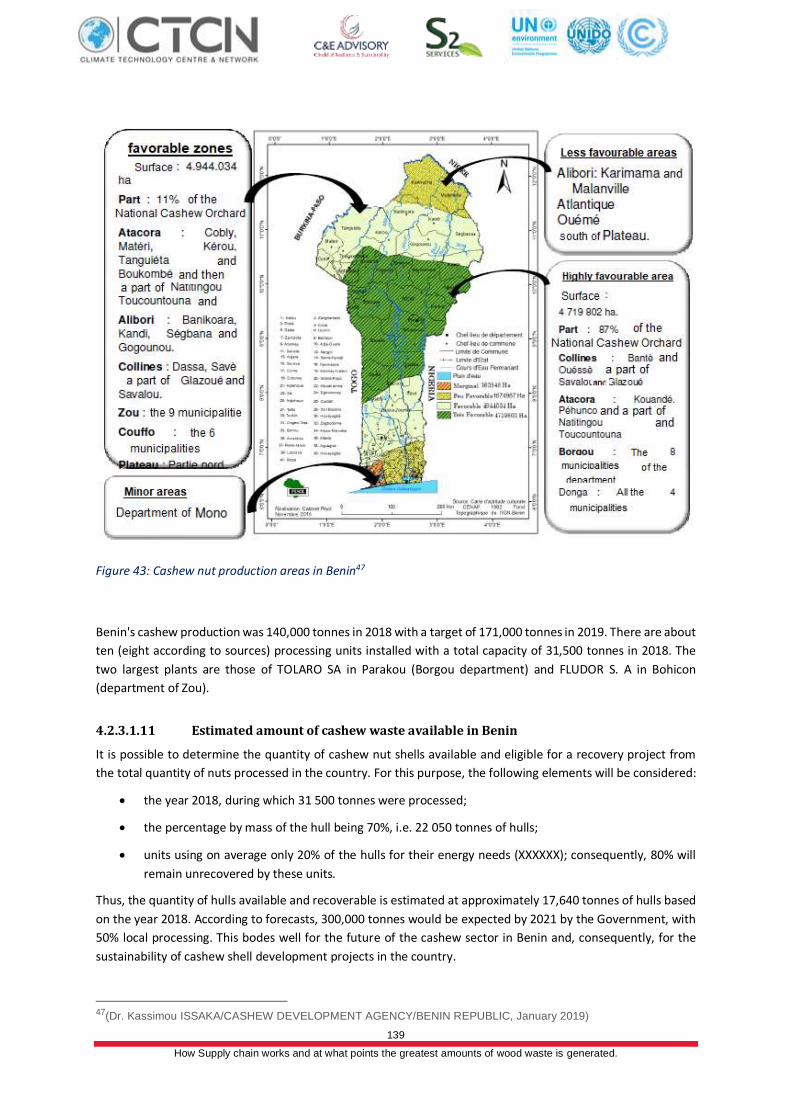
139
How Supply chain works and at what points the greatest amounts of wood waste is generated.
Figure 43: Cashew nut production areas in Benin47
Benin's cashew production was 140,000 tonnes in 2018 with a target of 171,000 tonnes in 2019. There are about
ten (eight according to sources) processing units installed with a total capacity of 31,500 tonnes in 2018. The
two largest plants are those of TOLARO SA in Parakou (Borgou department) and FLUDOR S. A in Bohicon
(department of Zou).
4.2.3.1.11 Estimated amount of cashew waste available in Benin
It is possible to determine the quantity of cashew nut shells available and eligible for a recovery project from
the total quantity of nuts processed in the country. For this purpose, the following elements will be considered:
• the year 2018, during which 31 500 tonnes were processed;
• the percentage by mass of the hull being 70%, i.e. 22 050 tonnes of hulls;
• units using on average only 20% of the hulls for their energy needs (XXXXXX); consequently, 80% will
remain unrecovered by these units.
Thus, the quantity of hulls available and recoverable is estimated at approximately 17,640 tonnes of hulls based
on the year 2018. According to forecasts, 300,000 tonnes would be expected by 2021 by the Government, with
50% local processing. This bodes well for the future of the cashew sector in Benin and, consequently, for the
sustainability of cashew shell development projects in the country.
47(Dr. Kassimou ISSAKA/CASHEW DEVELOPMENT AGENCY/BENIN REPUBLIC, January 2019)
140
How Supply chain works and at what points the greatest amounts of wood waste is generated.
4.2.3.1.12 Shea butter chain
It is very difficult to find documentation on the shea industry in Benin, even though the country is a major
producer. This could be explained by the non-organization of the sector and its quasi-informal nature. There
would be small processing units but no mention of large processing industries. There is, however, a recently
created umbrella organization, AKBEN (Association karitéBénin).
The shea tree (vitellaria paradoxa) grows wild in the dry forests and fallow lands of the northern half of the
country, stopping approximately at Parakou. It is not cultivated but is a species preserved by the populations
because of the interest of the products it provides, in particular nuts containing a fatty substance, which can be
used in food and cosmetics, called shea butter.
The following information has been taken from the sites of public bodies, but it is to be taken with caution.
Unlike cashew nuts or even pineapple, shea is not included among the priority sectors of the Government's
Action Programme. But it remains an important agricultural product, given the number of people it employs and
its increasingly important share in Benin's trade balance (Presidency of the Republic of Benin, 2013). Shea is the
country's third largest export product after cotton and cashew nuts. It grows in three large basins, one in the
centre of the country and two in the northern part of the country (the area with the highest shea potential is
the Alibori). Its contribution to the GDP is 1.23%.
It is estimated that more than 500,000 rural women live directly off the shea tree. The production of shea
encompasses more than 20 municipalities whose populations are involved in the marketing of shea kernels and
the processing of the kernels into butter. Benin is currently the third largest producer of shea kernels in West
Africa after Mali, Burkina Faso and Nigeria, with average annual export volumes of about 30,000 tonnes of dry
almonds. As for what remains to be processed in the country, around 13,108 tonnes of shea kernels are
marketed locally and generate a total added value of about 3.4 billion CFA (Prudencio, 2018) francs in the
Beninese economy.
According to the N'Kalô service in Nitidæ, between 2014 and 2019, approximately 110,435 tonnes of shea
kernels, processed or not, were exported from Benin (of which 101 558 tonnes were exported as whole kernels
and 8,877 tonnes were processed into butter representing 3,551 tonnes of butter).
Knowing that a given quantity of almonds processed into butter produces up to 50% cake, it can be estimated
that over this period the production of butter for export generated a theoretical cumulative total of
approximately 4,450 tonnes of cake. Assuming that the processing units use up to 30% of this cake (1,330
tonnes), we can estimate that 3,100 tonnes of cake waste can be potentially recovered over the five-year period
from 2015 to 2019. However, a major difficulty in envisaging the recovery of these residues is their real
accessibility because the processing centers remain very artisanal and therefore scattered in addition to the
poorly counted. In this context, all these estimates remain speculation and therefore need to be confirmed.
To sum up, Benin is a country, which by its geographical position should be a wood-producing country. This is
not the case. It is true that there are some exploited forest resources, but this is still much lower than in Central
African countries. However, the exploitation of these forest resources (production, processing & marketing)
generates residues but these are already valued either by the processing units themselves (ATC and IBB) or by
the populations for their own consumption. As a result, the potentially valuable forest residues remain very
small or even insignificant. That said, by looking at other forest-related pathways, it is possible to find
recoverable residues.
Thus, the cashew and shea butter sectors have attracted our attention in Benin. Even though these two chains
represent important export products in the country, the first seems to be better organized, especially since it
benefits from state investment. Analyses have shown that the sector generates a significant amount of
recoverable waste, particularly cashew nut shells, estimated at more than 17,000 tonnes in 2018. It is therefore
possible to envisage the feasibility of recovering energy from these shells at the present time. However, it should
141
How Supply chain works and at what points the greatest amounts of wood waste is generated.
be pointed out that this waste is currently the subject of attention and, consequently, it is not impossible that
there will be projects for its recovery in the coming years. One example is the project that Fludor Benin is
announcing for the recovery of its cashew hull meal (Prudencio, 2018), or the project for the energy recovery of
the hull for the benefit of Tolaro (Kerekou, 2020). Concerning the shea industry, information is difficult to find
and remains very speculative. It would therefore be complicated to guarantee the reliability of this data. In
addition, the majority of processing units are artisanal. Due to the low availability of accurate data, it is difficult
to recommend the feasibility of recovering waste (cake) from shea processing units in Benin.
4.2.3.1.13 General Conclusion
Benin is characterized by a climate of the Sudano-Guinean type that is contrasted from north to south and is
oriented towards the Atlantic Ocean in the south. It includes modified natural or semi-natural forests as well as
forest plantations according to FAO definitions. Representing a total area of about 7.8 million hectares in 2007,
i.e. 68% of the national territory, Benin's forest cover is mainly composed of wooded savannah with shrubs, less
open forests and wooded savannah and, to a lesser extent, gallery or dense forests and plantations for forestry
or agriculture.
Very heavily used by the Beninese population, wood energy accounted for 93% of final household energy
consumption in 2015. The country would theoretically have a deficit in wood energy, i.e. 3.4 million tonnes of
wood equivalent in 2007, taking into account (i) the forest productivity of all forest areas, excluding plantations,
but including fallow land and (ii) the national demand for firewood and charcoal for domestic and professional
use.
With a view to increasing the country's energy supply, one of the most appropriate solutions could be the use
of forest biomass residues generated by the wood energy, timber/service wood and non-timber forest products
sectors.
As regards the wood energy value chain, a valorisation of charcoal dust could possibly be envisaged. However,
availability has been limited and at present further studies are needed to assess the resource in a comprehensive
way.
Although Benin ranks second among the six West African countries under study in terms of volume of timber
exported, its size relative to Côte d'Ivoire remains very modest (about one-fifth of timber exports relative to
Côte d'Ivoire in 2018). Roundwood and service wood sector actors have seen their numbers and volumes of
wood exported gradually decrease; it will therefore be crucial to obtain more first-hand data from existing
industrial actors (IBB-ONAB and ATC-IB), which has not been possible for the moment. Teak wood from
plantation thinnings would also be an interesting source, but no information could be extracted at this level; and
it would not be uncommon to find that these trunks are already being used for service wood.
As far as NTFPs are concerned, the cashew nut sector, the country's second most promising export product after
cotton, seems to be the most promising with a relatively developed industrialization with a dozen cashew nut
processing units for a total capacity of 31,500 tons in 2018. The total potential of recoverable waste in these
plants can indeed be estimated at more than 17,500 tonnes for this year.
Despite shea is Benin's third largest export product, this sector is not very recommendable in terms of waste
recovery. Indeed, the processing of almonds into shea butter would only take place in small, mostly informal
artisanal units, whose cakes would be difficult to collect because of the wide geographical dispersion of these
units, not to mention the fact that local use as fuel cannot be ruled out. Also, although the quantity of shea nut
shells generated should be much greater than that of the cake, the context for collecting these residues seems
even more unfavourable, since the nut producers operating the shelling process are even more scattered than
the processors.
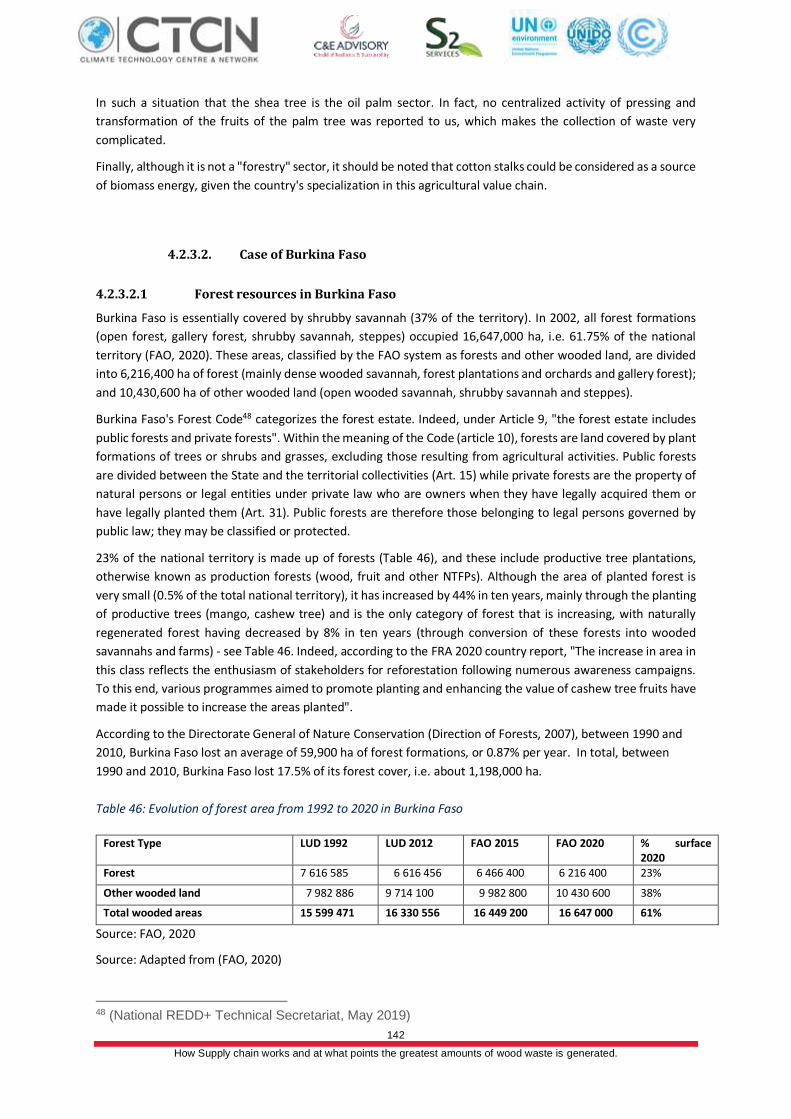
142
How Supply chain works and at what points the greatest amounts of wood waste is generated.
In such a situation that the shea tree is the oil palm sector. In fact, no centralized activity of pressing and
transformation of the fruits of the palm tree was reported to us, which makes the collection of waste very
complicated.
Finally, although it is not a "forestry" sector, it should be noted that cotton stalks could be considered as a source
of biomass energy, given the country's specialization in this agricultural value chain.
4.2.3.2. Case of Burkina Faso
4.2.3.2.1 Forest resources in Burkina Faso
Burkina Faso is essentially covered by shrubby savannah (37% of the territory). In 2002, all forest formations
(open forest, gallery forest, shrubby savannah, steppes) occupied 16,647,000 ha, i.e. 61.75% of the national
territory (FAO, 2020). These areas, classified by the FAO system as forests and other wooded land, are divided
into 6,216,400 ha of forest (mainly dense wooded savannah, forest plantations and orchards and gallery forest);
and 10,430,600 ha of other wooded land (open wooded savannah, shrubby savannah and steppes).
Burkina Faso's Forest Code48 categorizes the forest estate. Indeed, under Article 9, "the forest estate includes
public forests and private forests". Within the meaning of the Code (article 10), forests are land covered by plant
formations of trees or shrubs and grasses, excluding those resulting from agricultural activities. Public forests
are divided between the State and the territorial collectivities (Art. 15) while private forests are the property of
natural persons or legal entities under private law who are owners when they have legally acquired them or
have legally planted them (Art. 31). Public forests are therefore those belonging to legal persons governed by
public law; they may be classified or protected.
23% of the national territory is made up of forests (Table 46), and these include productive tree plantations,
otherwise known as production forests (wood, fruit and other NTFPs). Although the area of planted forest is
very small (0.5% of the total national territory), it has increased by 44% in ten years, mainly through the planting
of productive trees (mango, cashew tree) and is the only category of forest that is increasing, with naturally
regenerated forest having decreased by 8% in ten years (through conversion of these forests into wooded
savannahs and farms) - see Table 46. Indeed, according to the FRA 2020 country report, "The increase in area in
this class reflects the enthusiasm of stakeholders for reforestation following numerous awareness campaigns.
To this end, various programmes aimed to promote planting and enhancing the value of cashew tree fruits have
made it possible to increase the areas planted".
According to the Directorate General of Nature Conservation (Direction of Forests, 2007), between 1990 and
2010, Burkina Faso lost an average of 59,900 ha of forest formations, or 0.87% per year. In total, between
1990 and 2010, Burkina Faso lost 17.5% of its forest cover, i.e. about 1,198,000 ha.
Table 46: Evolution of forest area from 1992 to 2020 in Burkina Faso
Forest Type LUD 1992 LUD 2012 FAO 2015 FAO 2020 % surface 2020
Forest 7 616 585 6 616 456 6 466 400 6 216 400 23%
Other wooded land 7 982 886 9 714 100 9 982 800 10 430 600 38%
Total wooded areas 15 599 471 16 330 556 16 449 200 16 647 000 61%
Source: FAO, 2020
Source: Adapted from (FAO, 2020)
48 (National REDD+ Technical Secretariat, May 2019)
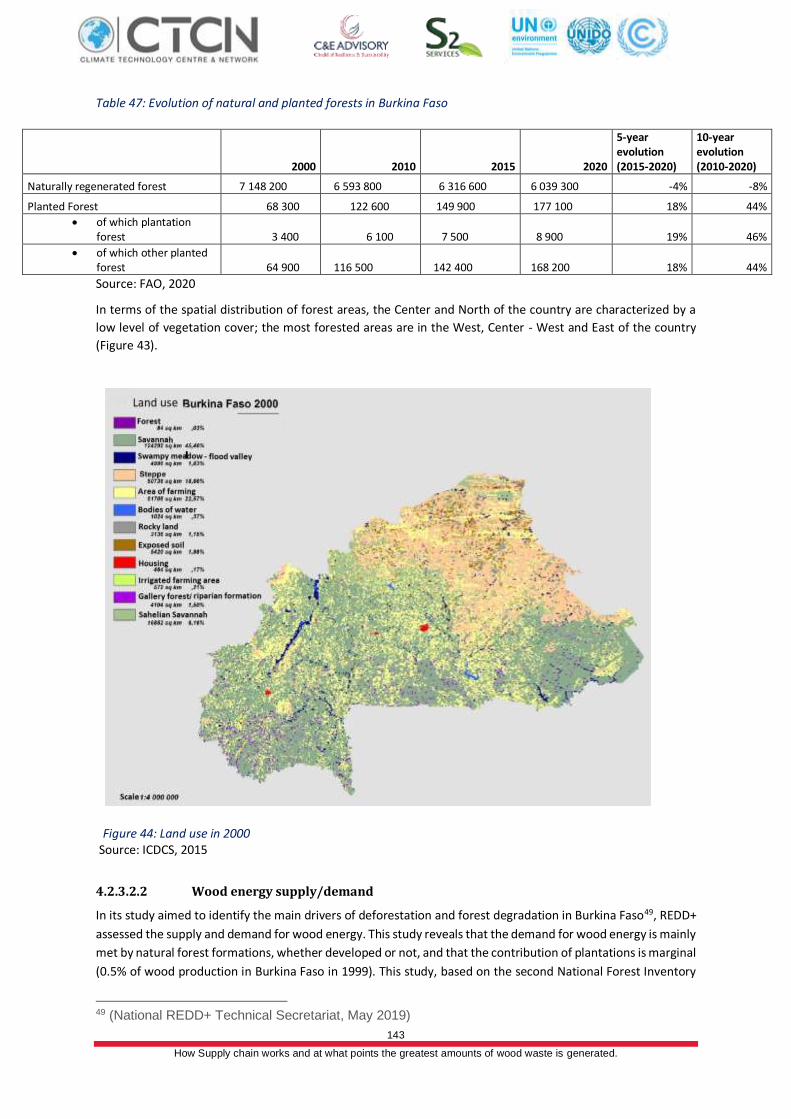
143
How Supply chain works and at what points the greatest amounts of wood waste is generated.
Table 47: Evolution of natural and planted forests in Burkina Faso
2000 2010 2015 2020
5-year evolution (2015-2020)
10-year evolution (2010-2020)
Naturally regenerated forest 7 148 200 6 593 800 6 316 600 6 039 300 -4% -8%
Planted Forest 68 300 122 600 149 900 177 100 18% 44%
• of which plantation forest 3 400 6 100 7 500 8 900 19% 46%
• of which other planted forest 64 900 116 500 142 400 168 200 18% 44%
Source: FAO, 2020
In terms of the spatial distribution of forest areas, the Center and North of the country are characterized by a
low level of vegetation cover; the most forested areas are in the West, Center - West and East of the country
(Figure 43).
Figure 44: Land use in 2000 Source: ICDCS, 2015
4.2.3.2.2 Wood energy supply/demand
In its study aimed to identify the main drivers of deforestation and forest degradation in Burkina Faso49, REDD+
assessed the supply and demand for wood energy. This study reveals that the demand for wood energy is mainly
met by natural forest formations, whether developed or not, and that the contribution of plantations is marginal
(0.5% of wood production in Burkina Faso in 1999). This study, based on the second National Forest Inventory
49 (National REDD+ Technical Secretariat, May 2019)
144
How Supply chain works and at what points the greatest amounts of wood waste is generated.
(NFI 2 - 2017), indicates that the total volume of live trees with a diameter greater than or equal to 5 cm (D1, 30
m ≥ 5 cm), is estimated at a national level at 467.9 million m3 , or 374.32 million tons. The volume of potentially
exploitable firewood is estimated at 207 million m or 165.6 million tons.
The demand for wood energy is estimated at 8.3 million tonnes in 2018, equivalent to 10.375 million m3. It is
broken down as follows: 3.4 million tonnes (4.25 million m3) for urban areas and 4.9 million tonnes (6.125 million
m3) for rural areas. The report points out that in 2012, Burkina Faso's demand for wood energy was estimated
at 6.880 million tonnes of wood (FAO, 2012).
In 2018, the balance between supply (165.6 million tonnes) and demand (8.3 million tonnes) for wood energy
was therefore largely positive, with standing dead wood alone covering about 88% of wood energy needs. In
fact, the total volume of dead wood at the national level was estimated at 9.1 million m3, i.e. about 7.28 million
tonnes, mainly located in the following regions: East, Boucle du Mouhoun, Hauts-Bassins, Cascades and South-
West.
However, the study points out that in reality, the supply-demand balance for wood energy indicated above is
very mixed, as corrective factors, including accessibility, local use and the size of the wood, can considerably
reduce the quantities available. So the actual availability or possible drawdown can tip the balance in the other
direction.
4.2.3.2.3 Forest value chain in Burkina Faso
4.2.3.2.3.1 Forest management and conservation value chain
The State forest estate is managed by the State forest services. The State's forest services are thus the guarantors
of the preservation of forest resources considered to be part of the national heritage. One of these services is
the General Directorate of Water and Forestry of the Ministry of the Environment, Green Economy and Climate
Change. This directorate is in charge, among other things, of the protection of forest resources, the organization
and control of exploitation and the marketing of forest products of plant origin. As for the management of local
government forests, it is carried out by the latter through management structures based on partnership (Art.38).
Lastly, private forests are managed freely by their owners, subject to declarations of exploitation and any
restrictions imposed for the preservation of the natural environment (Art. 32).
4.2.3.2.3.2 Forest exploitation /harvesting actors
Article 52 of the Code states that logging may be carried out for domestic, commercial, industrial, scientific,
educational and cultural purposes. With regard to domestic logging, the Code specifies that it is carried out in
the form of traditional use rights to gather (ripe fruit), collect (dead wood lying on the ground), take or extract
(Art. 53). This right is recognized in classified and protected forests to the riparian populations. It is therefore a
question here of self-consumption limited to the satisfaction of the personal, individual or family needs of the
users. This right is granted free of charge and without permit.
4.2.3.2.3.3 Exploitation and processing of wood energy
Exploitation of wood energy
The main product exploited in classified developed forests is fuelwood. The wood energy sector employs
hundreds of thousands of private actors in the following links: debtors/producers, wholesalers/transporters and
retail traders. There were 1,117 fuelwood wholesaler-transporters and 2,210 fuelwood retailers in 201150.
50 (Forest Investment Program) (PIF)/Ministry of the Environment and Sustainable Development, 15 May 2011)
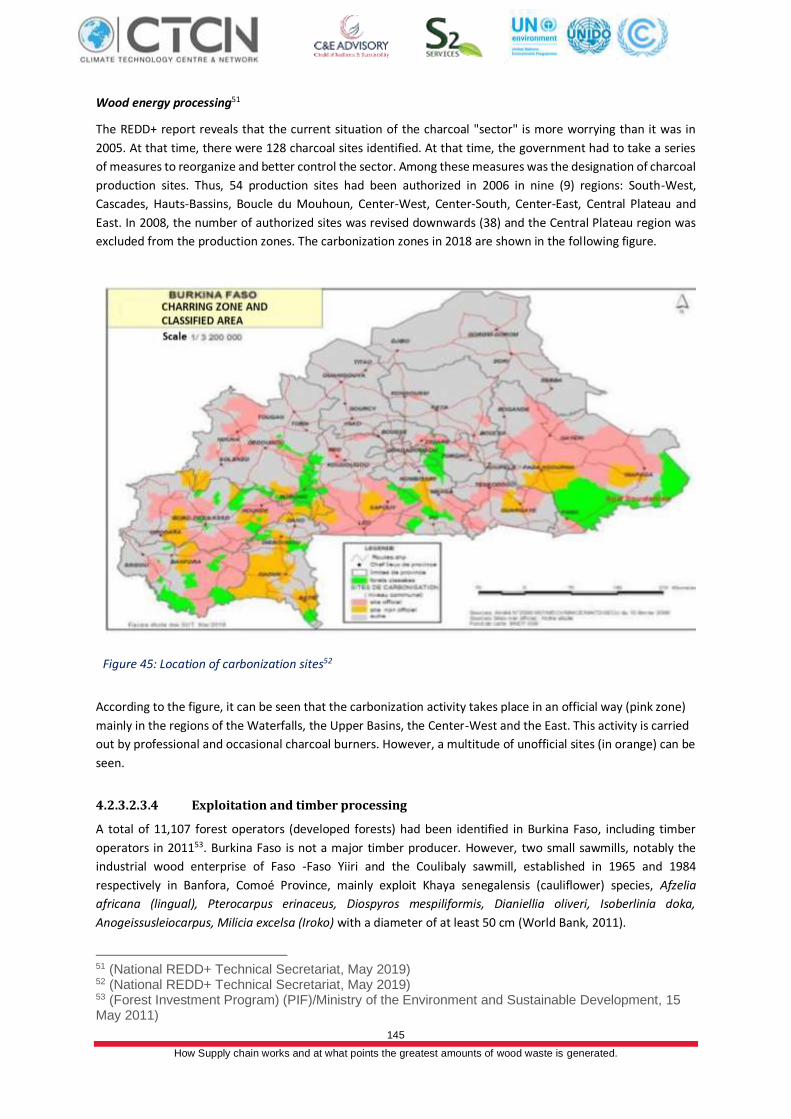
145
How Supply chain works and at what points the greatest amounts of wood waste is generated.
Wood energy processing51
The REDD+ report reveals that the current situation of the charcoal "sector" is more worrying than it was in
2005. At that time, there were 128 charcoal sites identified. At that time, the government had to take a series
of measures to reorganize and better control the sector. Among these measures was the designation of charcoal
production sites. Thus, 54 production sites had been authorized in 2006 in nine (9) regions: South-West,
Cascades, Hauts-Bassins, Boucle du Mouhoun, Center-West, Center-South, Center-East, Central Plateau and
East. In 2008, the number of authorized sites was revised downwards (38) and the Central Plateau region was
excluded from the production zones. The carbonization zones in 2018 are shown in the following figure.
Figure 45: Location of carbonization sites52
According to the figure, it can be seen that the carbonization activity takes place in an official way (pink zone)
mainly in the regions of the Waterfalls, the Upper Basins, the Center-West and the East. This activity is carried
out by professional and occasional charcoal burners. However, a multitude of unofficial sites (in orange) can be
seen.
4.2.3.2.3.4 Exploitation and timber processing
A total of 11,107 forest operators (developed forests) had been identified in Burkina Faso, including timber
operators in 201153. Burkina Faso is not a major timber producer. However, two small sawmills, notably the
industrial wood enterprise of Faso -Faso Yiiri and the Coulibaly sawmill, established in 1965 and 1984
respectively in Banfora, Comoé Province, mainly exploit Khaya senegalensis (cauliflower) species, Afzelia
africana (lingual), Pterocarpus erinaceus, Diospyros mespiliformis, Dianiellia oliveri, Isoberlinia doka,
Anogeissusleiocarpus, Milicia excelsa (Iroko) with a diameter of at least 50 cm (World Bank, 2011).
51 (National REDD+ Technical Secretariat, May 2019) 52 (National REDD+ Technical Secretariat, May 2019) 53 (Forest Investment Program) (PIF)/Ministry of the Environment and Sustainable Development, 15 May 2011)
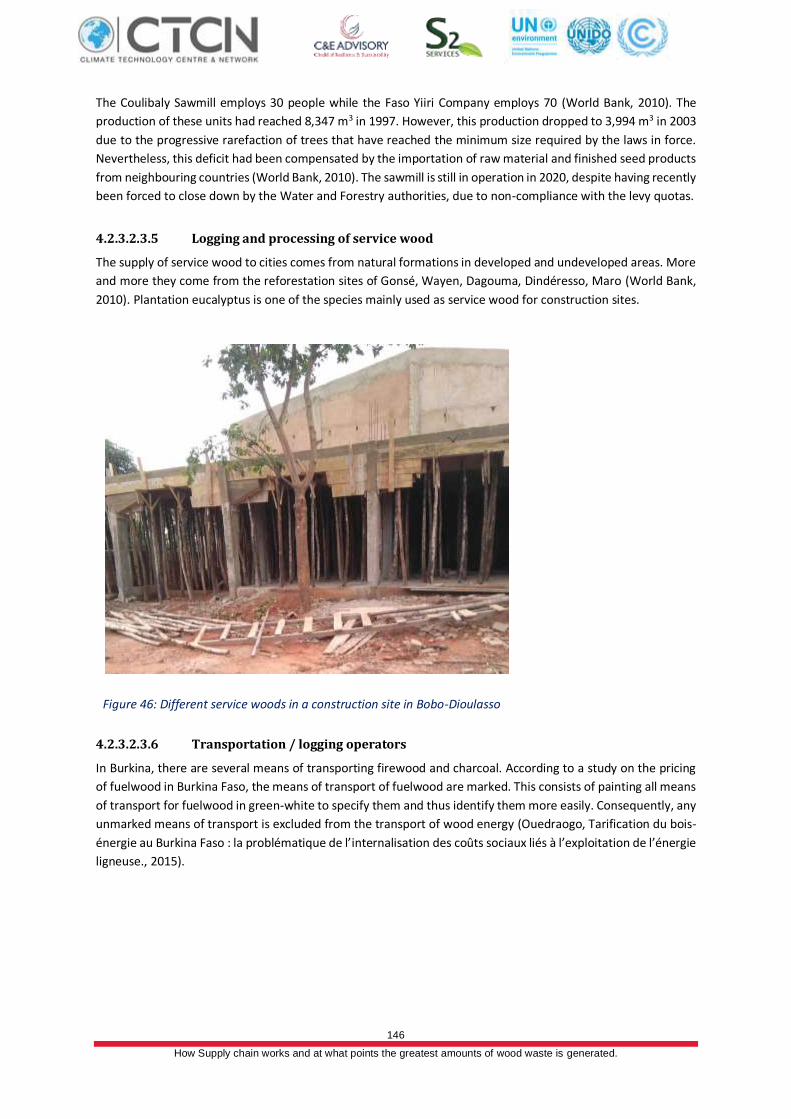
146
How Supply chain works and at what points the greatest amounts of wood waste is generated.
The Coulibaly Sawmill employs 30 people while the Faso Yiiri Company employs 70 (World Bank, 2010). The
production of these units had reached 8,347 m3 in 1997. However, this production dropped to 3,994 m3 in 2003
due to the progressive rarefaction of trees that have reached the minimum size required by the laws in force.
Nevertheless, this deficit had been compensated by the importation of raw material and finished seed products
from neighbouring countries (World Bank, 2010). The sawmill is still in operation in 2020, despite having recently
been forced to close down by the Water and Forestry authorities, due to non-compliance with the levy quotas.
4.2.3.2.3.5 Logging and processing of service wood
The supply of service wood to cities comes from natural formations in developed and undeveloped areas. More
and more they come from the reforestation sites of Gonsé, Wayen, Dagouma, Dindéresso, Maro (World Bank,
2010). Plantation eucalyptus is one of the species mainly used as service wood for construction sites.
Figure 46: Different service woods in a construction site in Bobo-Dioulasso
4.2.3.2.3.6 Transportation / logging operators
In Burkina, there are several means of transporting firewood and charcoal. According to a study on the pricing
of fuelwood in Burkina Faso, the means of transport of fuelwood are marked. This consists of painting all means
of transport for fuelwood in green-white to specify them and thus identify them more easily. Consequently, any
unmarked means of transport is excluded from the transport of wood energy (Ouedraogo, Tarification du bois-
énergie au Burkina Faso : la problématique de l’internalisation des coûts sociaux liés à l’exploitation de l’énergie
ligneuse., 2015).
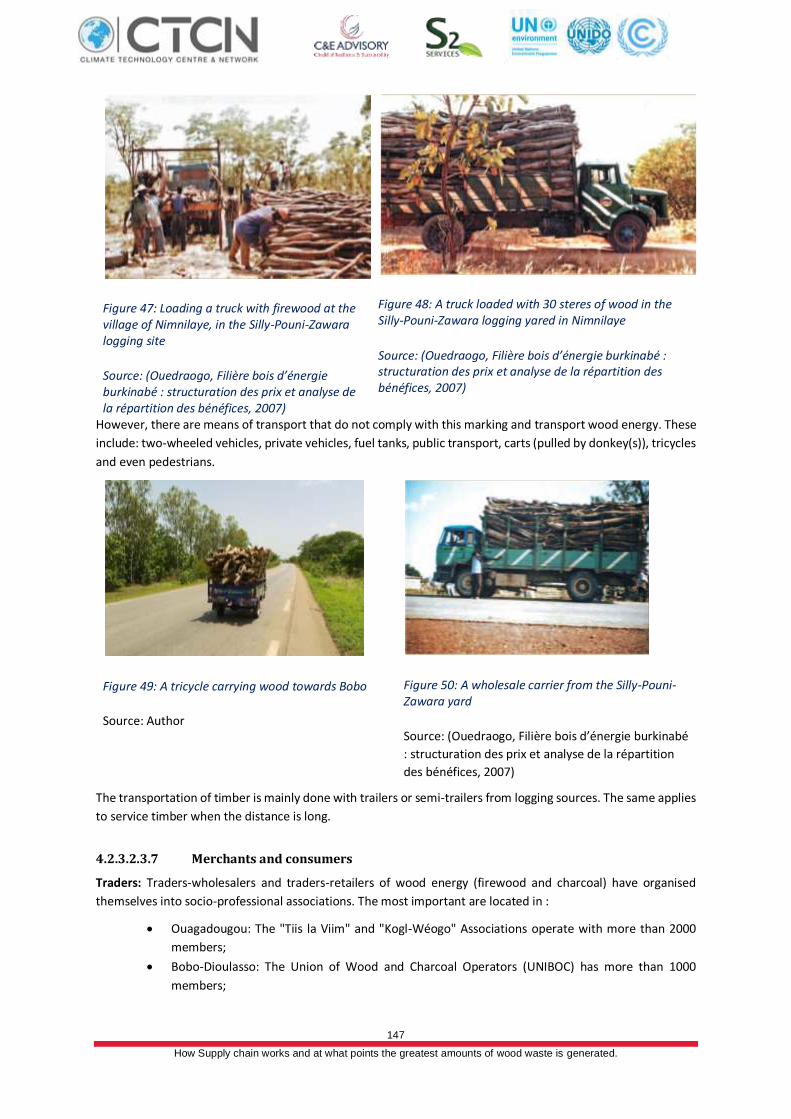
147
How Supply chain works and at what points the greatest amounts of wood waste is generated.
Figure 47: Loading a truck with firewood at the village of Nimnilaye, in the Silly-Pouni-Zawara logging site
Source: (Ouedraogo, Filière bois d’énergie burkinabé : structuration des prix et analyse de la répartition des bénéfices, 2007)
Figure 48: A truck loaded with 30 steres of wood in the Silly-Pouni-Zawara logging yared in Nimnilaye
Source: (Ouedraogo, Filière bois d’énergie burkinabé : structuration des prix et analyse de la répartition des bénéfices, 2007)
However, there are means of transport that do not comply with this marking and transport wood energy. These
include: two-wheeled vehicles, private vehicles, fuel tanks, public transport, carts (pulled by donkey(s)), tricycles
and even pedestrians.
Figure 49: A tricycle carrying wood towards Bobo
Source: Author
Figure 50: A wholesale carrier from the Silly-Pouni-Zawara yard
Source: (Ouedraogo, Filière bois d’énergie burkinabé
: structuration des prix et analyse de la répartition
des bénéfices, 2007)
The transportation of timber is mainly done with trailers or semi-trailers from logging sources. The same applies
to service timber when the distance is long.
4.2.3.2.3.7 Merchants and consumers
Traders: Traders-wholesalers and traders-retailers of wood energy (firewood and charcoal) have organised
themselves into socio-professional associations. The most important are located in :
• Ouagadougou: The "Tiis la Viim" and "Kogl-Wéogo" Associations operate with more than 2000
members;
• Bobo-Dioulasso: The Union of Wood and Charcoal Operators (UNIBOC) has more than 1000
members;
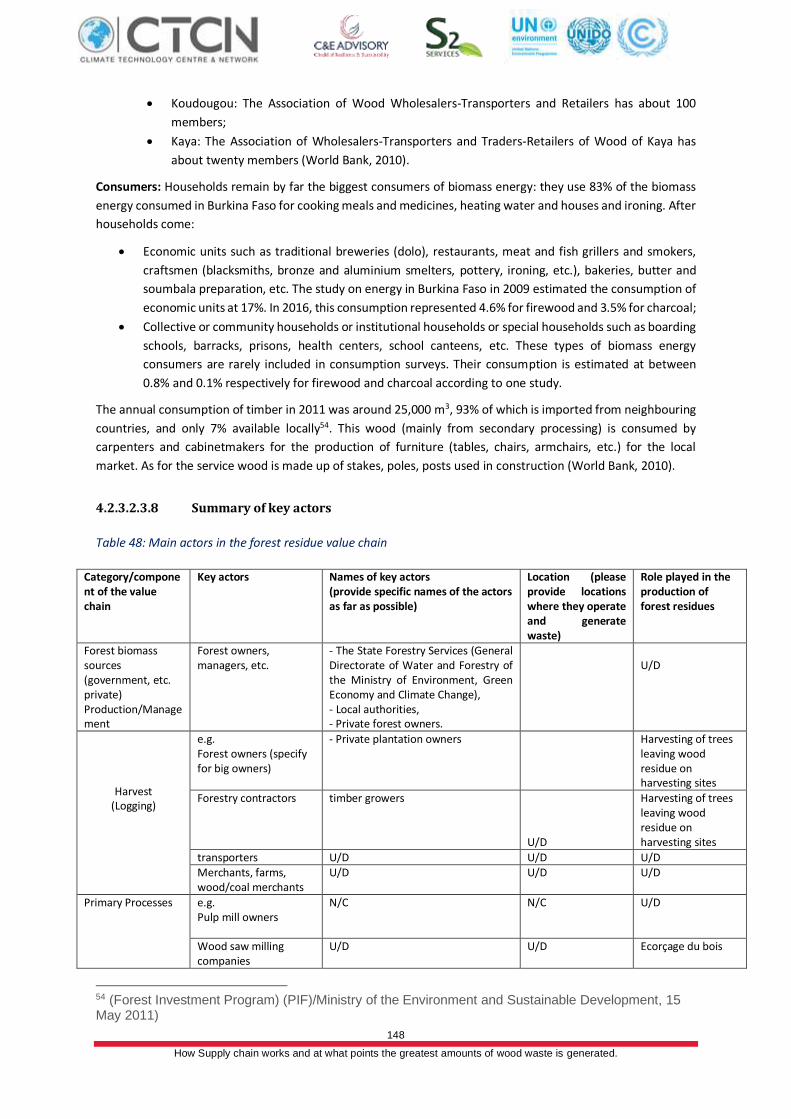
148
How Supply chain works and at what points the greatest amounts of wood waste is generated.
• Koudougou: The Association of Wood Wholesalers-Transporters and Retailers has about 100
members;
• Kaya: The Association of Wholesalers-Transporters and Traders-Retailers of Wood of Kaya has
about twenty members (World Bank, 2010).
Consumers: Households remain by far the biggest consumers of biomass energy: they use 83% of the biomass
energy consumed in Burkina Faso for cooking meals and medicines, heating water and houses and ironing. After
households come:
• Economic units such as traditional breweries (dolo), restaurants, meat and fish grillers and smokers,
craftsmen (blacksmiths, bronze and aluminium smelters, pottery, ironing, etc.), bakeries, butter and
soumbala preparation, etc. The study on energy in Burkina Faso in 2009 estimated the consumption of
economic units at 17%. In 2016, this consumption represented 4.6% for firewood and 3.5% for charcoal;
• Collective or community households or institutional households or special households such as boarding
schools, barracks, prisons, health centers, school canteens, etc. These types of biomass energy
consumers are rarely included in consumption surveys. Their consumption is estimated at between
0.8% and 0.1% respectively for firewood and charcoal according to one study.
The annual consumption of timber in 2011 was around 25,000 m3, 93% of which is imported from neighbouring
countries, and only 7% available locally54. This wood (mainly from secondary processing) is consumed by
carpenters and cabinetmakers for the production of furniture (tables, chairs, armchairs, etc.) for the local
market. As for the service wood is made up of stakes, poles, posts used in construction (World Bank, 2010).
4.2.3.2.3.8 Summary of key actors
Table 48: Main actors in the forest residue value chain
Category/component of the value chain
Key actors Names of key actors (provide specific names of the actors as far as possible)
Location (please provide locations where they operate and generate waste)
Role played in the production of forest residues
Forest biomass sources (government, etc. private) Production/Management
Forest owners, managers, etc.
- The State Forestry Services (General Directorate of Water and Forestry of the Ministry of Environment, Green Economy and Climate Change), - Local authorities, - Private forest owners.
U/D
Harvest
(Logging)
e.g. Forest owners (specify for big owners)
- Private plantation owners
Harvesting of trees leaving wood residue on harvesting sites
Forestry contractors timber growers U/D
Harvesting of trees leaving wood residue on harvesting sites
transporters U/D U/D U/D Merchants, farms, wood/coal merchants
U/D U/D U/D
Primary Processes e.g. Pulp mill owners
N/C N/C U/D
Wood saw milling companies
U/D U/D Ecorçage du bois
54 (Forest Investment Program) (PIF)/Ministry of the Environment and Sustainable Development, 15 May 2011)
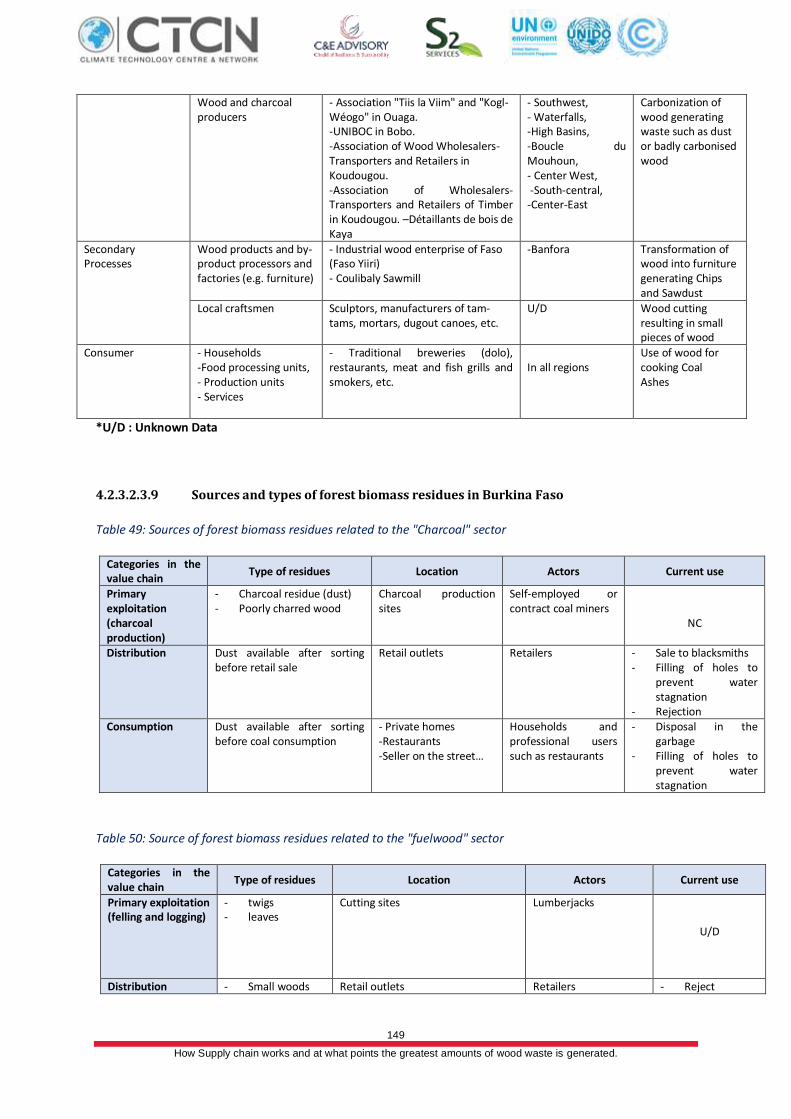
149
How Supply chain works and at what points the greatest amounts of wood waste is generated.
Wood and charcoal producers
- Association "Tiis la Viim" and "Kogl-Wéogo" in Ouaga. -UNIBOC in Bobo. -Association of Wood Wholesalers-Transporters and Retailers in Koudougou. -Association of Wholesalers-Transporters and Retailers of Timber in Koudougou. –Détaillants de bois de Kaya
- Southwest, - Waterfalls, -High Basins, -Boucle du Mouhoun, - Center West, -South-central, -Center-East
Carbonization of wood generating waste such as dust or badly carbonised wood
Secondary Processes
Wood products and by-product processors and factories (e.g. furniture)
- Industrial wood enterprise of Faso (Faso Yiiri) - Coulibaly Sawmill
-Banfora Transformation of wood into furniture generating Chips and Sawdust
Local craftsmen Sculptors, manufacturers of tam-tams, mortars, dugout canoes, etc.
U/D Wood cutting resulting in small pieces of wood
Consumer - Households -Food processing units, - Production units - Services
- Traditional breweries (dolo), restaurants, meat and fish grills and smokers, etc.
In all regions
Use of wood for cooking Coal Ashes
*U/D : Unknown Data
4.2.3.2.3.9 Sources and types of forest biomass residues in Burkina Faso
Table 49: Sources of forest biomass residues related to the "Charcoal" sector
Categories in the value chain
Type of residues Location Actors Current use
Primary exploitation (charcoal production)
- Charcoal residue (dust) - Poorly charred wood
Charcoal production sites
Self-employed or contract coal miners
NC
Distribution Dust available after sorting before retail sale
Retail outlets Retailers - Sale to blacksmiths - Filling of holes to
prevent water stagnation
- Rejection Consumption Dust available after sorting
before coal consumption - Private homes -Restaurants -Seller on the street…
Households and professional users such as restaurants
- Disposal in the garbage
- Filling of holes to prevent water stagnation
Table 50: Source of forest biomass residues related to the "fuelwood" sector
Categories in the value chain
Type of residues Location Actors Current use
Primary exploitation (felling and logging)
- twigs - leaves
Cutting sites Lumberjacks
U/D
Distribution - Small woods Retail outlets Retailers - Reject
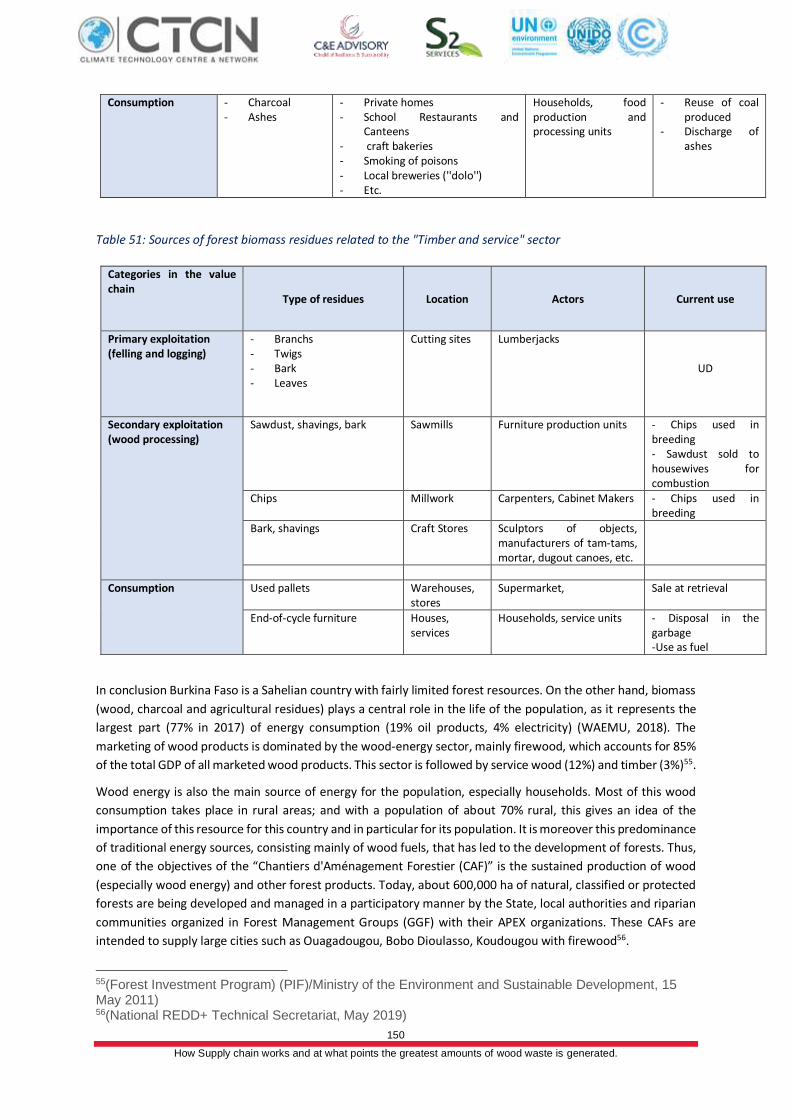
150
How Supply chain works and at what points the greatest amounts of wood waste is generated.
Consumption - Charcoal - Ashes
- Private homes - School Restaurants and
Canteens - craft bakeries - Smoking of poisons - Local breweries (''dolo'') - Etc.
Households, food production and processing units
- Reuse of coal produced
- Discharge of ashes
Table 51: Sources of forest biomass residues related to the "Timber and service" sector
Categories in the value chain
Type of residues Location Actors Current use
Primary exploitation (felling and logging)
- Branchs - Twigs - Bark - Leaves
Cutting sites Lumberjacks
UD
Secondary exploitation (wood processing)
Sawdust, shavings, bark Sawmills Furniture production units - Chips used in breeding - Sawdust sold to housewives for combustion
Chips Millwork Carpenters, Cabinet Makers - Chips used in breeding
Bark, shavings Craft Stores Sculptors of objects, manufacturers of tam-tams, mortar, dugout canoes, etc.
Consumption Used pallets Warehouses, stores
Supermarket, Sale at retrieval
End-of-cycle furniture Houses, services
Households, service units - Disposal in the garbage -Use as fuel
In conclusion Burkina Faso is a Sahelian country with fairly limited forest resources. On the other hand, biomass
(wood, charcoal and agricultural residues) plays a central role in the life of the population, as it represents the
largest part (77% in 2017) of energy consumption (19% oil products, 4% electricity) (WAEMU, 2018). The
marketing of wood products is dominated by the wood-energy sector, mainly firewood, which accounts for 85%
of the total GDP of all marketed wood products. This sector is followed by service wood (12%) and timber (3%)55.
Wood energy is also the main source of energy for the population, especially households. Most of this wood
consumption takes place in rural areas; and with a population of about 70% rural, this gives an idea of the
importance of this resource for this country and in particular for its population. It is moreover this predominance
of traditional energy sources, consisting mainly of wood fuels, that has led to the development of forests. Thus,
one of the objectives of the “Chantiers d'Aménagement Forestier (CAF)” is the sustained production of wood
(especially wood energy) and other forest products. Today, about 600,000 ha of natural, classified or protected
forests are being developed and managed in a participatory manner by the State, local authorities and riparian
communities organized in Forest Management Groups (GGF) with their APEX organizations. These CAFs are
intended to supply large cities such as Ouagadougou, Bobo Dioulasso, Koudougou with firewood56.
55(Forest Investment Program) (PIF)/Ministry of the Environment and Sustainable Development, 15 May 2011) 56(National REDD+ Technical Secretariat, May 2019)
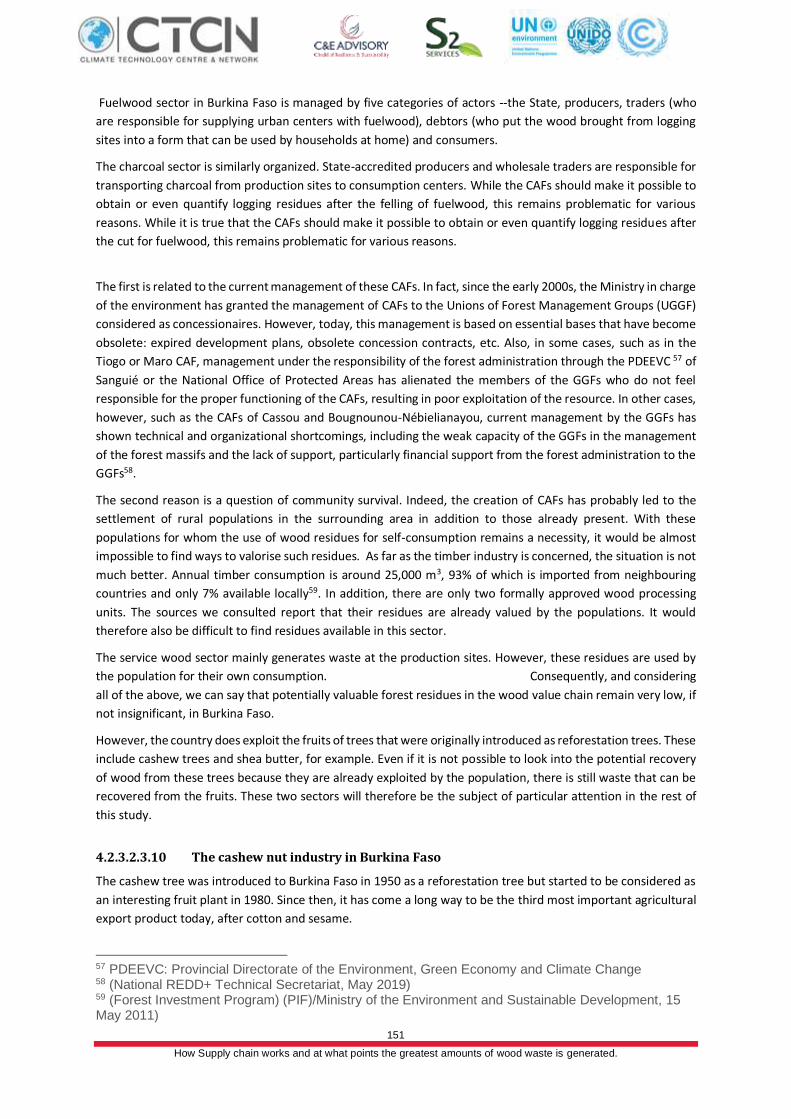
151
How Supply chain works and at what points the greatest amounts of wood waste is generated.
Fuelwood sector in Burkina Faso is managed by five categories of actors --the State, producers, traders (who
are responsible for supplying urban centers with fuelwood), debtors (who put the wood brought from logging
sites into a form that can be used by households at home) and consumers.
The charcoal sector is similarly organized. State-accredited producers and wholesale traders are responsible for
transporting charcoal from production sites to consumption centers. While the CAFs should make it possible to
obtain or even quantify logging residues after the felling of fuelwood, this remains problematic for various
reasons. While it is true that the CAFs should make it possible to obtain or even quantify logging residues after
the cut for fuelwood, this remains problematic for various reasons.
The first is related to the current management of these CAFs. In fact, since the early 2000s, the Ministry in charge
of the environment has granted the management of CAFs to the Unions of Forest Management Groups (UGGF)
considered as concessionaires. However, today, this management is based on essential bases that have become
obsolete: expired development plans, obsolete concession contracts, etc. Also, in some cases, such as in the
Tiogo or Maro CAF, management under the responsibility of the forest administration through the PDEEVC 57 of
Sanguié or the National Office of Protected Areas has alienated the members of the GGFs who do not feel
responsible for the proper functioning of the CAFs, resulting in poor exploitation of the resource. In other cases,
however, such as the CAFs of Cassou and Bougnounou-Nébielianayou, current management by the GGFs has
shown technical and organizational shortcomings, including the weak capacity of the GGFs in the management
of the forest massifs and the lack of support, particularly financial support from the forest administration to the
GGFs58.
The second reason is a question of community survival. Indeed, the creation of CAFs has probably led to the
settlement of rural populations in the surrounding area in addition to those already present. With these
populations for whom the use of wood residues for self-consumption remains a necessity, it would be almost
impossible to find ways to valorise such residues. As far as the timber industry is concerned, the situation is not
much better. Annual timber consumption is around 25,000 m3, 93% of which is imported from neighbouring
countries and only 7% available locally59. In addition, there are only two formally approved wood processing
units. The sources we consulted report that their residues are already valued by the populations. It would
therefore also be difficult to find residues available in this sector.
The service wood sector mainly generates waste at the production sites. However, these residues are used by
the population for their own consumption. Consequently, and considering
all of the above, we can say that potentially valuable forest residues in the wood value chain remain very low, if
not insignificant, in Burkina Faso.
However, the country does exploit the fruits of trees that were originally introduced as reforestation trees. These
include cashew trees and shea butter, for example. Even if it is not possible to look into the potential recovery
of wood from these trees because they are already exploited by the population, there is still waste that can be
recovered from the fruits. These two sectors will therefore be the subject of particular attention in the rest of
this study.
4.2.3.2.3.10 The cashew nut industry in Burkina Faso
The cashew tree was introduced to Burkina Faso in 1950 as a reforestation tree but started to be considered as
an interesting fruit plant in 1980. Since then, it has come a long way to be the third most important agricultural
export product today, after cotton and sesame.
57 PDEEVC: Provincial Directorate of the Environment, Green Economy and Climate Change 58 (National REDD+ Technical Secretariat, May 2019) 59 (Forest Investment Program) (PIF)/Ministry of the Environment and Sustainable Development, 15 May 2011)
152
How Supply chain works and at what points the greatest amounts of wood waste is generated.
The sector is organized around three actors: the National Union of Cashew Producers of Burkina Faso (UNPA-
BF) created in 2013, the National Association of Cashew Processors of Burkina Faso (ANTA-BF) created in 2012,
the National Union of Cashew Traders and Exporters of Burkina Faso (UNCEA-BF) created in 2016 and an inter-
professional body (the Inter-professional Committee of Cashew in Burkina (CIA-B) created in 2015).
The area sown in (2015) was 255,000 hectares with an average yield of between 400 and 500 kg/ha60. The
average size of orchards remains modest, with most producers being smallholders, although a part is organized
in cooperatives. The production areas are: the Cascades (40%), the South-West (30%), the hauts- Basins (20%),
the Center-West (10%) (Sanfo, 2020). Production is undergoing a significant evolution thanks to the involvement
of all stakeholders. Thus, from 55,000 t in 2012, it will reach 120,000 t in 2020, i.e. an increase of 117% in less
than a decade. The objective is to reach 200,000 t by 2030.
Figure 51: Cashew Production regions
Figure 52: Annual cashew production (in tonnes) between 2012 and 2020
Source: (Sanfo, 2020)
The cashew processing link in Burkina Faso also seems to be doing well. The majority of processors are members
of the National Cashew Processors Association of Burkina Faso (ANTA-BF). The number of units in 2019 was 16
and 05 new units are expected in 2020. There are also craft groups processors.
In 2018, according to ANTA-BF, there were: 03 semi-industrial units (automatic grading and shelling of nuts), 09
semi-craft units and 15 craft groups processors61. The units are distributed in the production areas. Thus, among
the units currently in activity62 are the following:
- In the High Basins: ANATRANS (created in 2009), GEBANA (created in 2011) and UNION YANTA (created
in 2006) in Bobo-Dioulasso; UTAK (created in 2010) and COOPAKE in Orodara; ECLA in Toussiana.
- In the Cascades: SOTRIA/B (created in 2003) in Banfora; UTAB (created in 2001) in Bérégadougou.
- In the South - West: UTASO in Kampti.
In 2019, at the beginning of the campaign, the expressed needs of ANTA member units were 20,400 t. But the
quantity processed locally in 2019 was 17 200 t (until October 2019). It is also
reported that the processing capacity in 2018 was 20,000 t/year, i.e. 26.6% of national production. The
perspective for 2030 being a production of 200 000 t, the objective is to reach a processing of 50% of the national
production, i.e. 100 000 tonnes63.
From the point of view of waste generation in the value chain, there are two main types of waste: the false fruit
or cashew apple, which grows next to the nut and is in most cases abandoned in orchards; and the shell after
shelling the nut in processing units. While the apple has an interesting potential for energy recovery, the
60 Interprofessional Committee of Burkina Faso cashew nut, 2018 61 (cashew Interprofessional Committee of Burkina Faso, 2018 ) 62 (KABORE, november, 2015) 63 (cashew Interprofessional Committee of Burkina Faso, 2018 )
153
How Supply chain works and at what points the greatest amounts of wood waste is generated.
significant quantities of cashew nut shells, which are highly energetic, accumulated in the few processing centers
and which are not fully recovered at present, make us prefer to analyze their energy potential.
4.2.3.2.3.11 Estimated amount of cashew waste available in Burkina Faso
It is possible to determine the quantity of cashew nut shells available and eligible for a recovery project from
the total quantity of nuts processed in the country.
Considering the needs expressed in 2019:
- i.e. approximately 20,000 tones? to be processed,
- the percentage by mass of the hull being 70 %, i.e. 14 000 t of hulls
- units using on average only 20% of the hulls for their needs; consequently, 80% will remain unvalued
by these units.
Thus, the quantity of available and recoverable hulls is estimated in 2019 to be around 11,200 tones of hulls.
Assuming a production of 200,000 t and a processing of 50% of the national production, 56,000 t of hulls could
be available for valorisation.
4.2.3.2.3.12 The shea industry in Burkina Faso
Burkina Faso is one of Africa's largest shea producers. The country is even the 1st exporter if we consider the
volumes of almonds. The sector ranks 7th in exports after gold, cotton, sesame, cashew nuts, zinc and the
livestock/meat sector and contributes 0.6% of GDP. However, in the 1960s, shea was the leading export product
with a contribution of up to 33% of GDP64.
According to a study on the socio-economic aspects of the priority non-timber forest product commodity chains
and reported in a monograph on the shea commodity chain written by APEX, the shea tree stand has increased
from 190 million trees to 280,802,860 trees. It is stated that the production potential of shea almonds has
increased from 850,000 tons of almonds per year to 1,247,295 tons per year. Unfortunately, however, only 32
per cent of the current potential of 404,412 tonnes is being exploited. So about 68% of this current potential, or
842,883 tonnes, remains unexploited.
The production areas in 2013 are shown on the map in the figure below
64 Promotion Agency of Exports of Burkina Faso (APEX), 2019
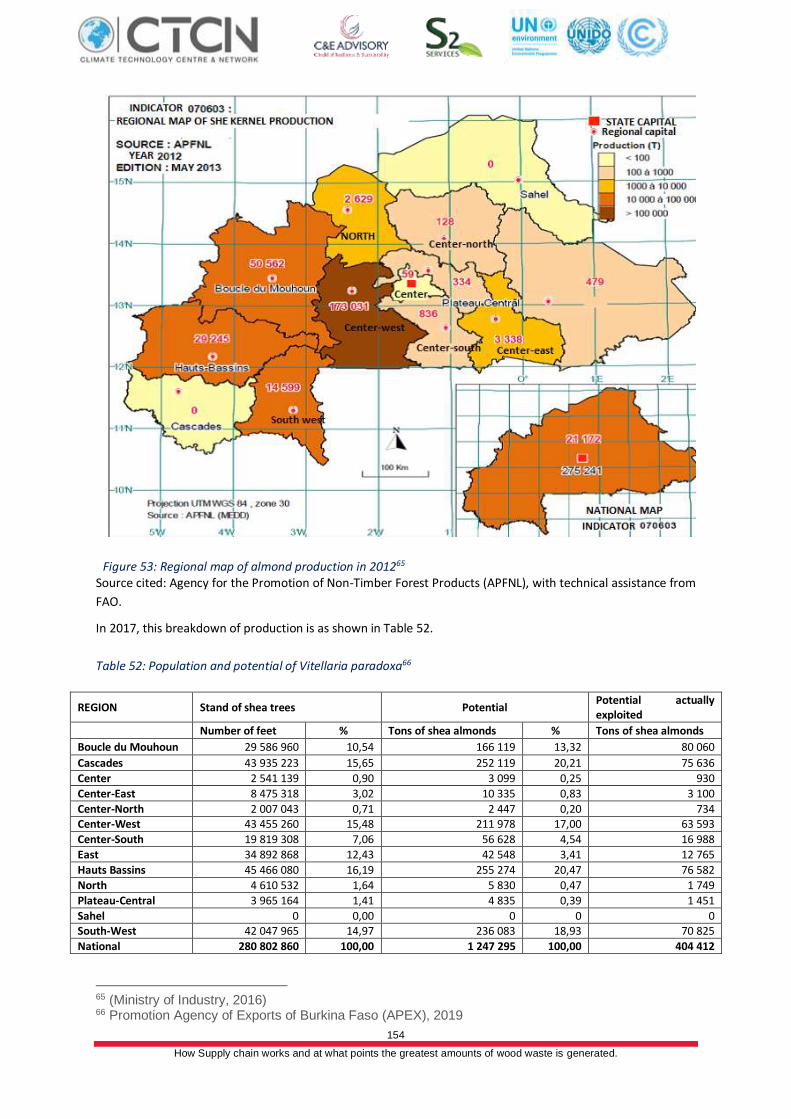
154
How Supply chain works and at what points the greatest amounts of wood waste is generated.
Figure 53: Regional map of almond production in 201265 Source cited: Agency for the Promotion of Non-Timber Forest Products (APFNL), with technical assistance from
FAO.
In 2017, this breakdown of production is as shown in Table 52.
Table 52: Population and potential of Vitellaria paradoxa66
REGION Stand of shea trees Potential Potential actually exploited
Number of feet % Tons of shea almonds % Tons of shea almonds
Boucle du Mouhoun 29 586 960 10,54 166 119 13,32 80 060
Cascades 43 935 223 15,65 252 119 20,21 75 636
Center 2 541 139 0,90 3 099 0,25 930
Center-East 8 475 318 3,02 10 335 0,83 3 100
Center-North 2 007 043 0,71 2 447 0,20 734 Center-West 43 455 260 15,48 211 978 17,00 63 593
Center-South 19 819 308 7,06 56 628 4,54 16 988
East 34 892 868 12,43 42 548 3,41 12 765
Hauts Bassins 45 466 080 16,19 255 274 20,47 76 582
North 4 610 532 1,64 5 830 0,47 1 749
Plateau-Central 3 965 164 1,41 4 835 0,39 1 451
Sahel 0 0,00 0 0 0 South-West 42 047 965 14,97 236 083 18,93 70 825
National 280 802 860 100,00 1 247 295 100,00 404 412
65 (Ministry of Industry, 2016) 66 Promotion Agency of Exports of Burkina Faso (APEX), 2019
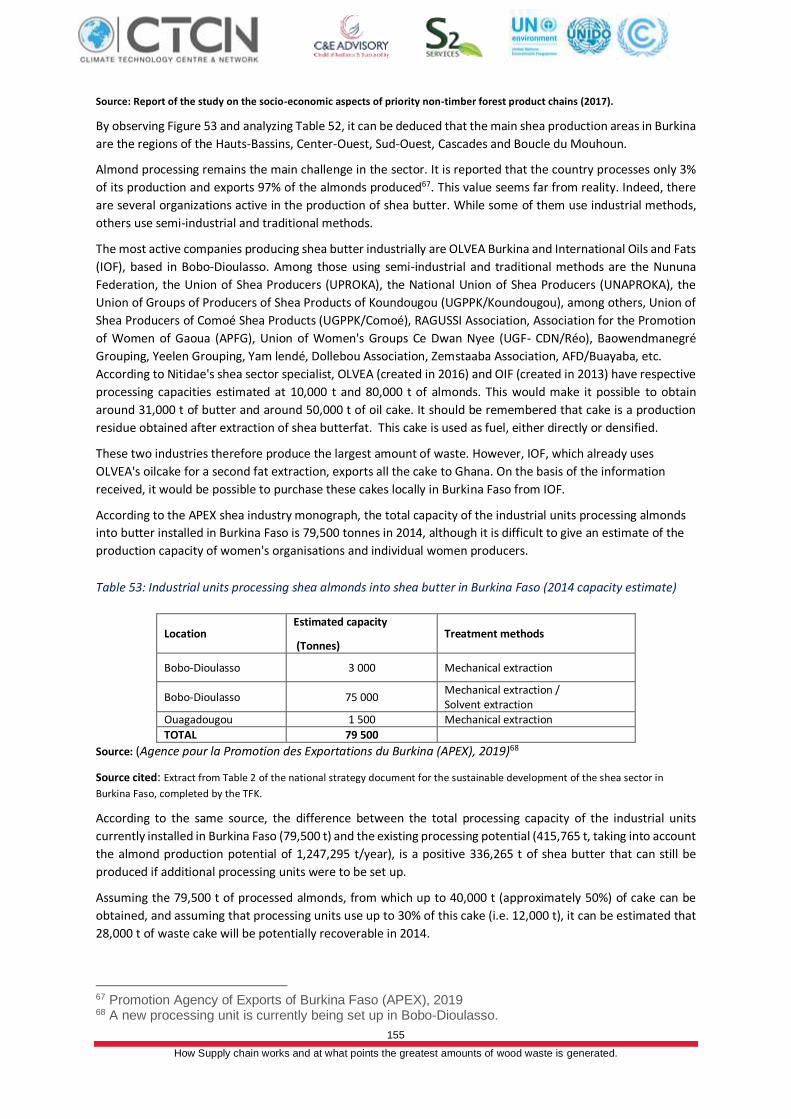
155
How Supply chain works and at what points the greatest amounts of wood waste is generated.
Source: Report of the study on the socio-economic aspects of priority non-timber forest product chains (2017).
By observing Figure 53 and analyzing Table 52, it can be deduced that the main shea production areas in Burkina
are the regions of the Hauts-Bassins, Center-Ouest, Sud-Ouest, Cascades and Boucle du Mouhoun.
Almond processing remains the main challenge in the sector. It is reported that the country processes only 3%
of its production and exports 97% of the almonds produced67. This value seems far from reality. Indeed, there
are several organizations active in the production of shea butter. While some of them use industrial methods,
others use semi-industrial and traditional methods.
The most active companies producing shea butter industrially are OLVEA Burkina and International Oils and Fats
(IOF), based in Bobo-Dioulasso. Among those using semi-industrial and traditional methods are the Nununa
Federation, the Union of Shea Producers (UPROKA), the National Union of Shea Producers (UNAPROKA), the
Union of Groups of Producers of Shea Products of Koundougou (UGPPK/Koundougou), among others, Union of
Shea Producers of Comoé Shea Products (UGPPK/Comoé), RAGUSSI Association, Association for the Promotion
of Women of Gaoua (APFG), Union of Women's Groups Ce Dwan Nyee (UGF- CDN/Réo), Baowendmanegré
Grouping, Yeelen Grouping, Yam lendé, Dollebou Association, Zemstaaba Association, AFD/Buayaba, etc.
According to Nitidae's shea sector specialist, OLVEA (created in 2016) and OIF (created in 2013) have respective
processing capacities estimated at 10,000 t and 80,000 t of almonds. This would make it possible to obtain
around 31,000 t of butter and around 50,000 t of oil cake. It should be remembered that cake is a production
residue obtained after extraction of shea butterfat. This cake is used as fuel, either directly or densified.
These two industries therefore produce the largest amount of waste. However, IOF, which already uses
OLVEA's oilcake for a second fat extraction, exports all the cake to Ghana. On the basis of the information
received, it would be possible to purchase these cakes locally in Burkina Faso from IOF.
According to the APEX shea industry monograph, the total capacity of the industrial units processing almonds
into butter installed in Burkina Faso is 79,500 tonnes in 2014, although it is difficult to give an estimate of the
production capacity of women's organisations and individual women producers.
Table 53: Industrial units processing shea almonds into shea butter in Burkina Faso (2014 capacity estimate)
Location Estimated capacity
(Tonnes) Treatment methods
Bobo-Dioulasso 3 000 Mechanical extraction
Bobo-Dioulasso 75 000 Mechanical extraction / Solvent extraction
Ouagadougou 1 500 Mechanical extraction
TOTAL 79 500
Source: (Agence pour la Promotion des Exportations du Burkina (APEX), 2019)68
Source cited: Extract from Table 2 of the national strategy document for the sustainable development of the shea sector in
Burkina Faso, completed by the TFK.
According to the same source, the difference between the total processing capacity of the industrial units
currently installed in Burkina Faso (79,500 t) and the existing processing potential (415,765 t, taking into account
the almond production potential of 1,247,295 t/year), is a positive 336,265 t of shea butter that can still be
produced if additional processing units were to be set up.
Assuming the 79,500 t of processed almonds, from which up to 40,000 t (approximately 50%) of cake can be
obtained, and assuming that processing units use up to 30% of this cake (i.e. 12,000 t), it can be estimated that
28,000 t of waste cake will be potentially recoverable in 2014.
67 Promotion Agency of Exports of Burkina Faso (APEX), 2019 68 A new processing unit is currently being set up in Bobo-Dioulasso.
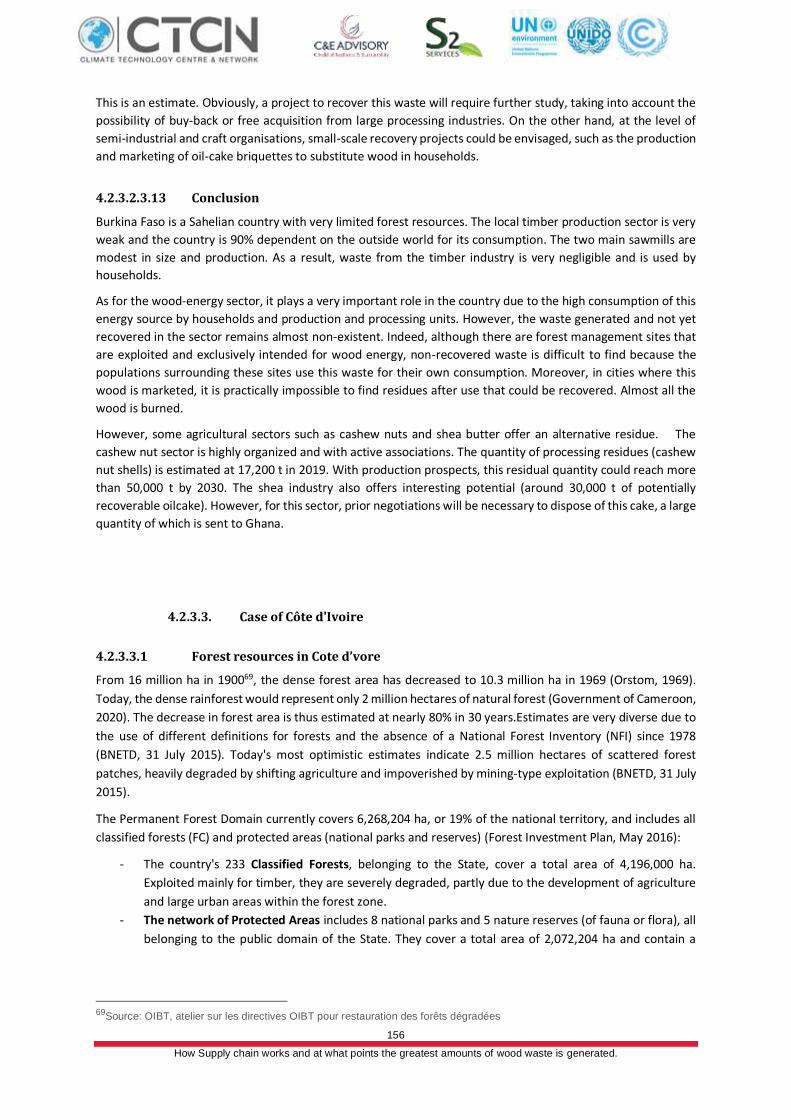
156
How Supply chain works and at what points the greatest amounts of wood waste is generated.
This is an estimate. Obviously, a project to recover this waste will require further study, taking into account the
possibility of buy-back or free acquisition from large processing industries. On the other hand, at the level of
semi-industrial and craft organisations, small-scale recovery projects could be envisaged, such as the production
and marketing of oil-cake briquettes to substitute wood in households.
4.2.3.2.3.13 Conclusion
Burkina Faso is a Sahelian country with very limited forest resources. The local timber production sector is very
weak and the country is 90% dependent on the outside world for its consumption. The two main sawmills are
modest in size and production. As a result, waste from the timber industry is very negligible and is used by
households.
As for the wood-energy sector, it plays a very important role in the country due to the high consumption of this
energy source by households and production and processing units. However, the waste generated and not yet
recovered in the sector remains almost non-existent. Indeed, although there are forest management sites that
are exploited and exclusively intended for wood energy, non-recovered waste is difficult to find because the
populations surrounding these sites use this waste for their own consumption. Moreover, in cities where this
wood is marketed, it is practically impossible to find residues after use that could be recovered. Almost all the
wood is burned.
However, some agricultural sectors such as cashew nuts and shea butter offer an alternative residue. The
cashew nut sector is highly organized and with active associations. The quantity of processing residues (cashew
nut shells) is estimated at 17,200 t in 2019. With production prospects, this residual quantity could reach more
than 50,000 t by 2030. The shea industry also offers interesting potential (around 30,000 t of potentially
recoverable oilcake). However, for this sector, prior negotiations will be necessary to dispose of this cake, a large
quantity of which is sent to Ghana.
4.2.3.3. Case of Côte d'Ivoire
4.2.3.3.1 Forest resources in Cote d’vore
From 16 million ha in 190069, the dense forest area has decreased to 10.3 million ha in 1969 (Orstom, 1969).
Today, the dense rainforest would represent only 2 million hectares of natural forest (Government of Cameroon,
2020). The decrease in forest area is thus estimated at nearly 80% in 30 years.Estimates are very diverse due to
the use of different definitions for forests and the absence of a National Forest Inventory (NFI) since 1978
(BNETD, 31 July 2015). Today's most optimistic estimates indicate 2.5 million hectares of scattered forest
patches, heavily degraded by shifting agriculture and impoverished by mining-type exploitation (BNETD, 31 July
2015).
The Permanent Forest Domain currently covers 6,268,204 ha, or 19% of the national territory, and includes all
classified forests (FC) and protected areas (national parks and reserves) (Forest Investment Plan, May 2016):
- The country's 233 Classified Forests, belonging to the State, cover a total area of 4,196,000 ha.
Exploited mainly for timber, they are severely degraded, partly due to the development of agriculture
and large urban areas within the forest zone.
- The network of Protected Areas includes 8 national parks and 5 nature reserves (of fauna or flora), all
belonging to the public domain of the State. They cover a total area of 2,072,204 ha and contain a
69Source: OIBT, atelier sur les directives OIBT pour restauration des forêts dégradées
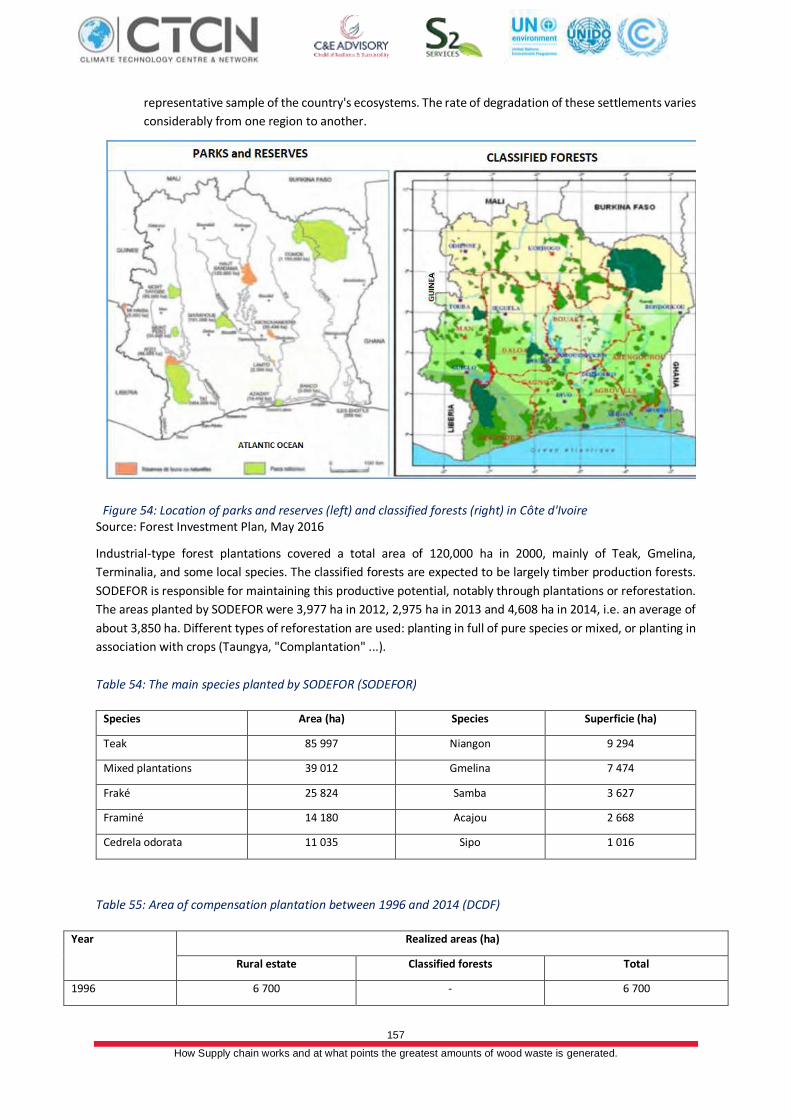
157
How Supply chain works and at what points the greatest amounts of wood waste is generated.
representative sample of the country's ecosystems. The rate of degradation of these settlements varies
considerably from one region to another.
Figure 54: Location of parks and reserves (left) and classified forests (right) in Côte d'Ivoire Source: Forest Investment Plan, May 2016
Industrial-type forest plantations covered a total area of 120,000 ha in 2000, mainly of Teak, Gmelina,
Terminalia, and some local species. The classified forests are expected to be largely timber production forests.
SODEFOR is responsible for maintaining this productive potential, notably through plantations or reforestation.
The areas planted by SODEFOR were 3,977 ha in 2012, 2,975 ha in 2013 and 4,608 ha in 2014, i.e. an average of
about 3,850 ha. Different types of reforestation are used: planting in full of pure species or mixed, or planting in
association with crops (Taungya, "Complantation" ...).
Table 54: The main species planted by SODEFOR (SODEFOR)
Species Area (ha) Species Superficie (ha)
Teak 85 997 Niangon 9 294
Mixed plantations 39 012 Gmelina 7 474
Fraké 25 824 Samba 3 627
Framiné 14 180 Acajou 2 668
Cedrela odorata 11 035 Sipo 1 016
Table 55: Area of compensation plantation between 1996 and 2014 (DCDF)
Year Realized areas (ha)
Rural estate Classified forests Total
1996 6 700 - 6 700
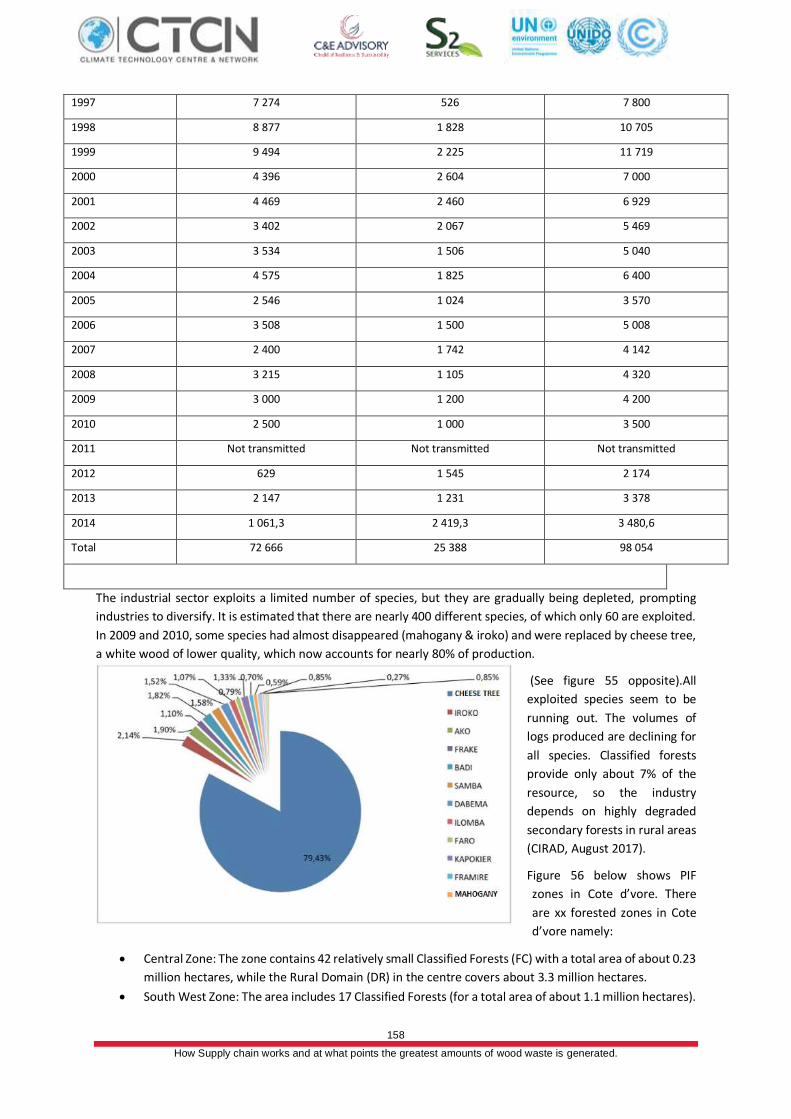
158
How Supply chain works and at what points the greatest amounts of wood waste is generated.
1997 7 274 526 7 800
1998 8 877 1 828 10 705
1999 9 494 2 225 11 719
2000 4 396 2 604 7 000
2001 4 469 2 460 6 929
2002 3 402 2 067 5 469
2003 3 534 1 506 5 040
2004 4 575 1 825 6 400
2005 2 546 1 024 3 570
2006 3 508 1 500 5 008
2007 2 400 1 742 4 142
2008 3 215 1 105 4 320
2009 3 000 1 200 4 200
2010 2 500 1 000 3 500
2011 Not transmitted Not transmitted Not transmitted
2012 629 1 545 2 174
2013 2 147 1 231 3 378
2014 1 061,3 2 419,3 3 480,6
Total 72 666 25 388 98 054
The industrial sector exploits a limited number of species, but they are gradually being depleted, prompting
industries to diversify. It is estimated that there are nearly 400 different species, of which only 60 are exploited.
In 2009 and 2010, some species had almost disappeared (mahogany & iroko) and were replaced by cheese tree,
a white wood of lower quality, which now accounts for nearly 80% of production.
(See figure 55 opposite).All
exploited species seem to be
running out. The volumes of
logs produced are declining for
all species. Classified forests
provide only about 7% of the
resource, so the industry
depends on highly degraded
secondary forests in rural areas
(CIRAD, August 2017).
Figure 56 below shows PIF
zones in Cote d’vore. There
are xx forested zones in Cote
d’vore namely:
• Central Zone: The zone contains 42 relatively small Classified Forests (FC) with a total area of about 0.23
million hectares, while the Rural Domain (DR) in the centre covers about 3.3 million hectares.
• South West Zone: The area includes 17 Classified Forests (for a total area of about 1.1 million hectares).
Figure 55: Exploited species
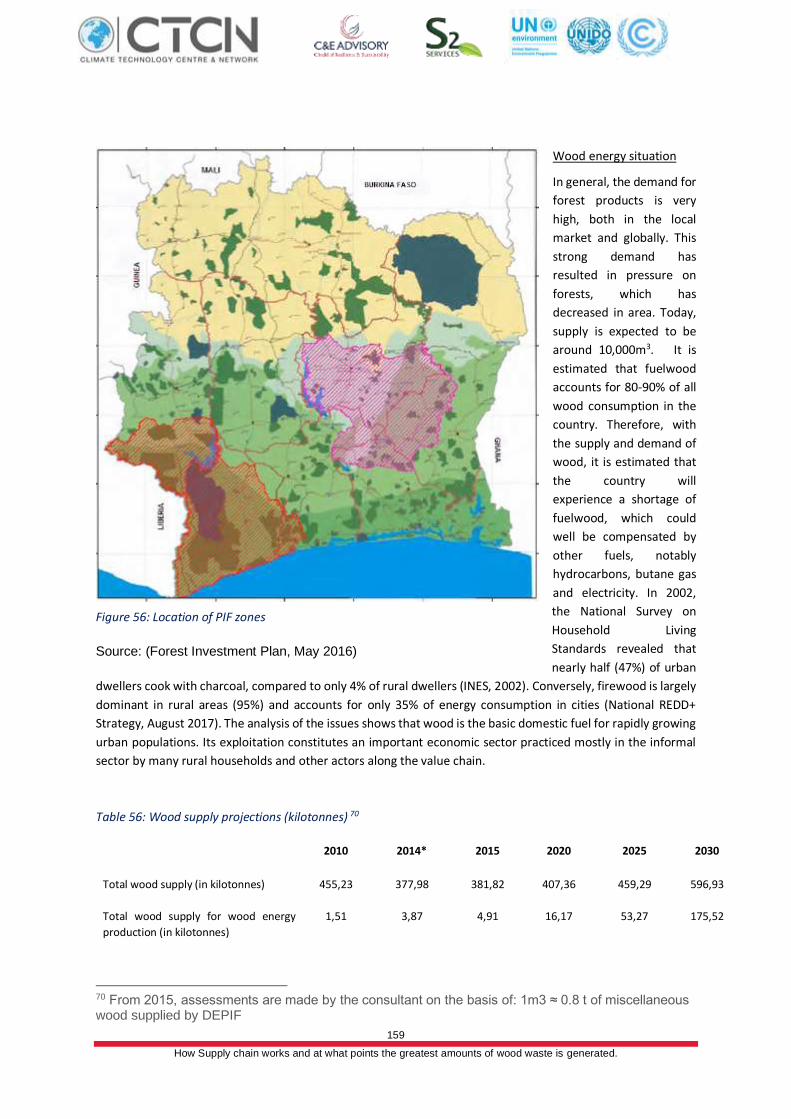
159
How Supply chain works and at what points the greatest amounts of wood waste is generated.
Wood energy situation
In general, the demand for
forest products is very
high, both in the local
market and globally. This
strong demand has
resulted in pressure on
forests, which has
decreased in area. Today,
supply is expected to be
around 10,000m3. It is
estimated that fuelwood
accounts for 80-90% of all
wood consumption in the
country. Therefore, with
the supply and demand of
wood, it is estimated that
the country will
experience a shortage of
fuelwood, which could
well be compensated by
other fuels, notably
hydrocarbons, butane gas
and electricity. In 2002,
the National Survey on
Household Living
Standards revealed that
nearly half (47%) of urban
dwellers cook with charcoal, compared to only 4% of rural dwellers (INES, 2002). Conversely, firewood is largely
dominant in rural areas (95%) and accounts for only 35% of energy consumption in cities (National REDD+
Strategy, August 2017). The analysis of the issues shows that wood is the basic domestic fuel for rapidly growing
urban populations. Its exploitation constitutes an important economic sector practiced mostly in the informal
sector by many rural households and other actors along the value chain.
Table 56: Wood supply projections (kilotonnes) 70
2010 2014* 2015 2020 2025 2030
Total wood supply (in kilotonnes) 455,23 377,98 381,82 407,36 459,29 596,93
Total wood supply for wood energy
production (in kilotonnes)
1,51 3,87 4,91 16,17 53,27 175,52
70 From 2015, assessments are made by the consultant on the basis of: 1m3 ≈ 0.8 t of miscellaneous wood supplied by DEPIF
Figure 56: Location of PIF zones
Source: (Forest Investment Plan, May 2016)
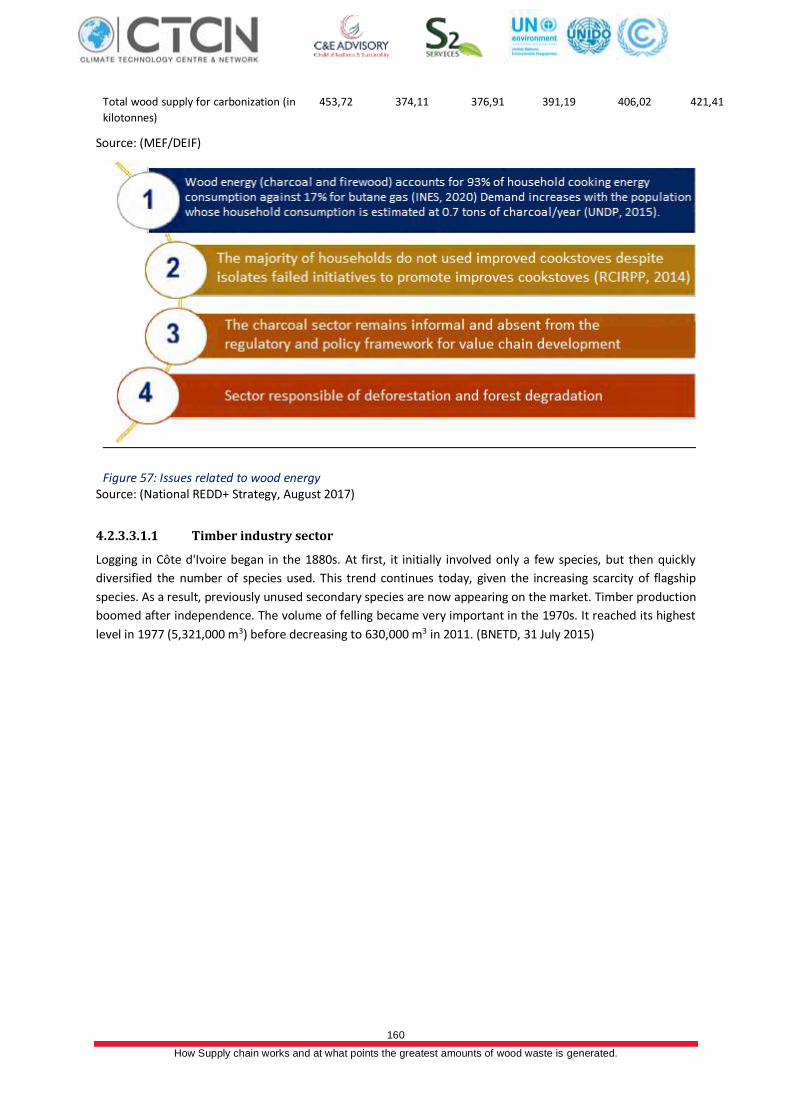
160
How Supply chain works and at what points the greatest amounts of wood waste is generated.
Total wood supply for carbonization (in
kilotonnes)
453,72 374,11 376,91 391,19 406,02 421,41
Source: (MEF/DEIF)
Figure 57: Issues related to wood energy Source: (National REDD+ Strategy, August 2017)
4.2.3.3.1.1 Timber industry sector
Logging in Côte d'Ivoire began in the 1880s. At first, it initially involved only a few species, but then quickly
diversified the number of species used. This trend continues today, given the increasing scarcity of flagship
species. As a result, previously unused secondary species are now appearing on the market. Timber production
boomed after independence. The volume of felling became very important in the 1970s. It reached its highest
level in 1977 (5,321,000 m3) before decreasing to 630,000 m3 in 2011. (BNETD, 31 July 2015)
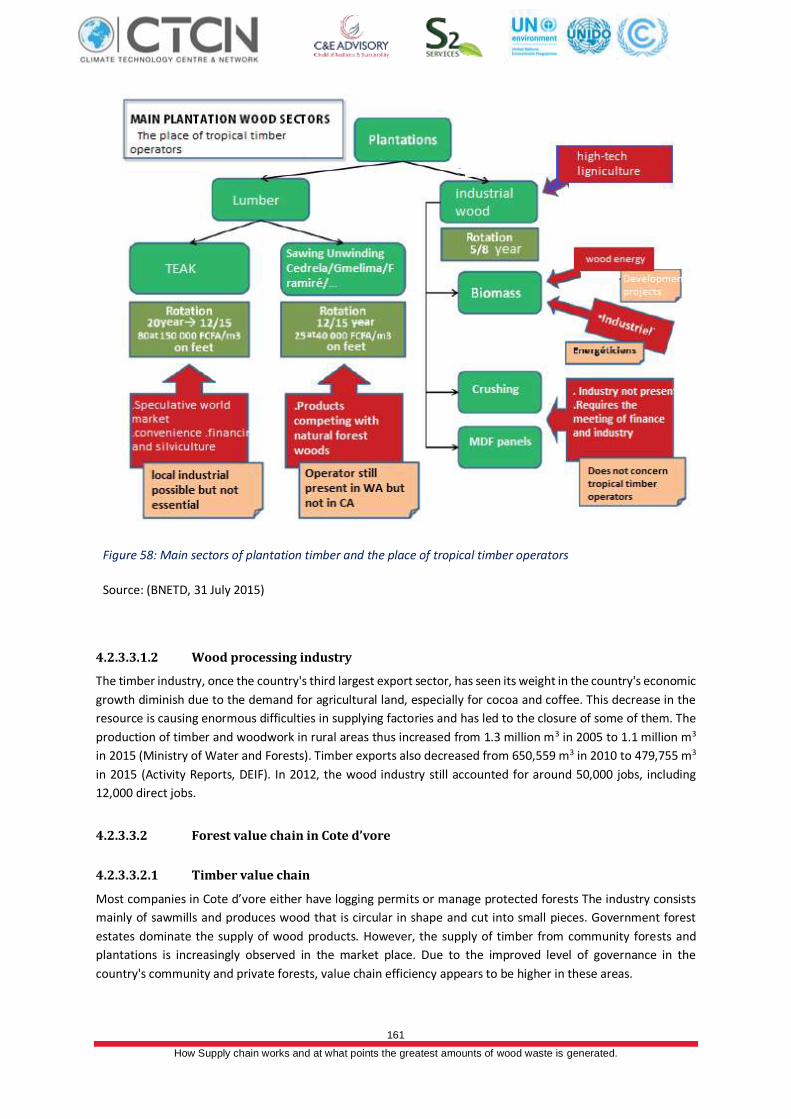
161
How Supply chain works and at what points the greatest amounts of wood waste is generated.
Figure 58: Main sectors of plantation timber and the place of tropical timber operators
Source: (BNETD, 31 July 2015)
4.2.3.3.1.2 Wood processing industry
The timber industry, once the country's third largest export sector, has seen its weight in the country's economic
growth diminish due to the demand for agricultural land, especially for cocoa and coffee. This decrease in the
resource is causing enormous difficulties in supplying factories and has led to the closure of some of them. The
production of timber and woodwork in rural areas thus increased from 1.3 million m3 in 2005 to 1.1 million m3
in 2015 (Ministry of Water and Forests). Timber exports also decreased from 650,559 m3 in 2010 to 479,755 m3
in 2015 (Activity Reports, DEIF). In 2012, the wood industry still accounted for around 50,000 jobs, including
12,000 direct jobs.
4.2.3.3.2 Forest value chain in Cote d’vore
4.2.3.3.2.1 Timber value chain
Most companies in Cote d’vore either have logging permits or manage protected forests The industry consists
mainly of sawmills and produces wood that is circular in shape and cut into small pieces. Government forest
estates dominate the supply of wood products. However, the supply of timber from community forests and
plantations is increasingly observed in the market place. Due to the improved level of governance in the
country's community and private forests, value chain efficiency appears to be higher in these areas.
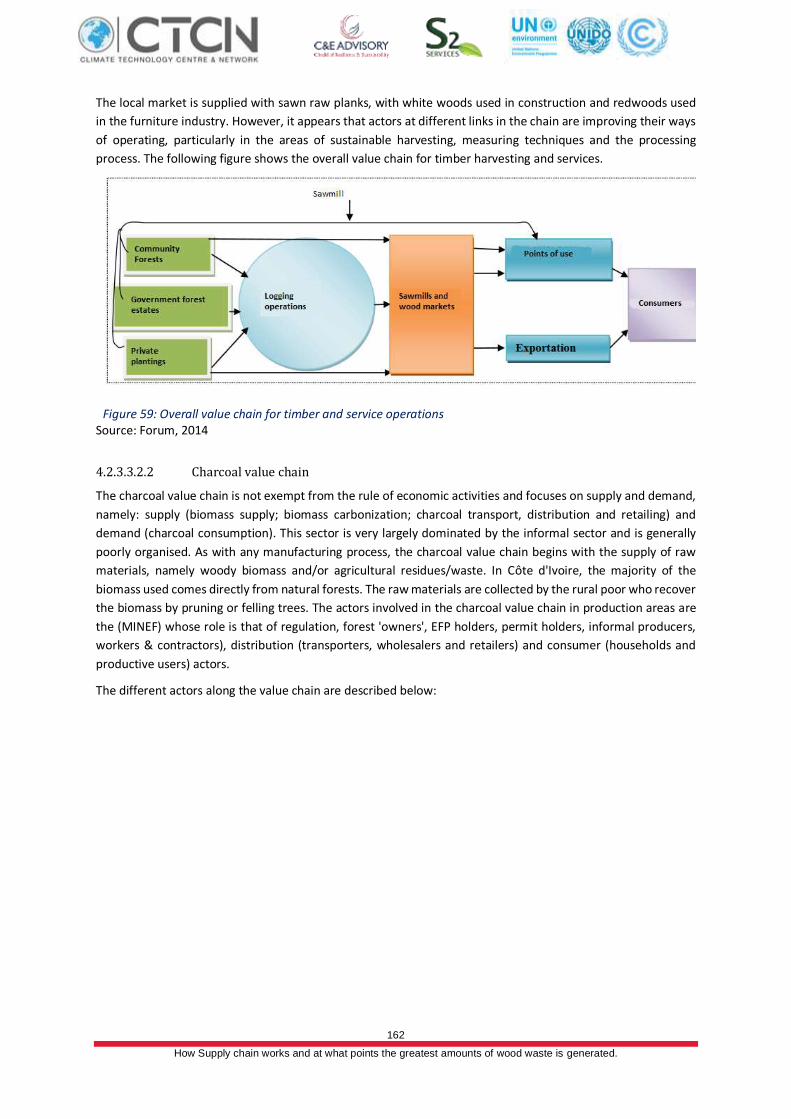
162
How Supply chain works and at what points the greatest amounts of wood waste is generated.
The local market is supplied with sawn raw planks, with white woods used in construction and redwoods used
in the furniture industry. However, it appears that actors at different links in the chain are improving their ways
of operating, particularly in the areas of sustainable harvesting, measuring techniques and the processing
process. The following figure shows the overall value chain for timber harvesting and services.
Figure 59: Overall value chain for timber and service operations Source: Forum, 2014
4.2.3.3.2.2 Charcoal value chain
The charcoal value chain is not exempt from the rule of economic activities and focuses on supply and demand,
namely: supply (biomass supply; biomass carbonization; charcoal transport, distribution and retailing) and
demand (charcoal consumption). This sector is very largely dominated by the informal sector and is generally
poorly organised. As with any manufacturing process, the charcoal value chain begins with the supply of raw
materials, namely woody biomass and/or agricultural residues/waste. In Côte d'Ivoire, the majority of the
biomass used comes directly from natural forests. The raw materials are collected by the rural poor who recover
the biomass by pruning or felling trees. The actors involved in the charcoal value chain in production areas are
the (MINEF) whose role is that of regulation, forest 'owners', EFP holders, permit holders, informal producers,
workers & contractors), distribution (transporters, wholesalers and retailers) and consumer (households and
productive users) actors.
The different actors along the value chain are described below:
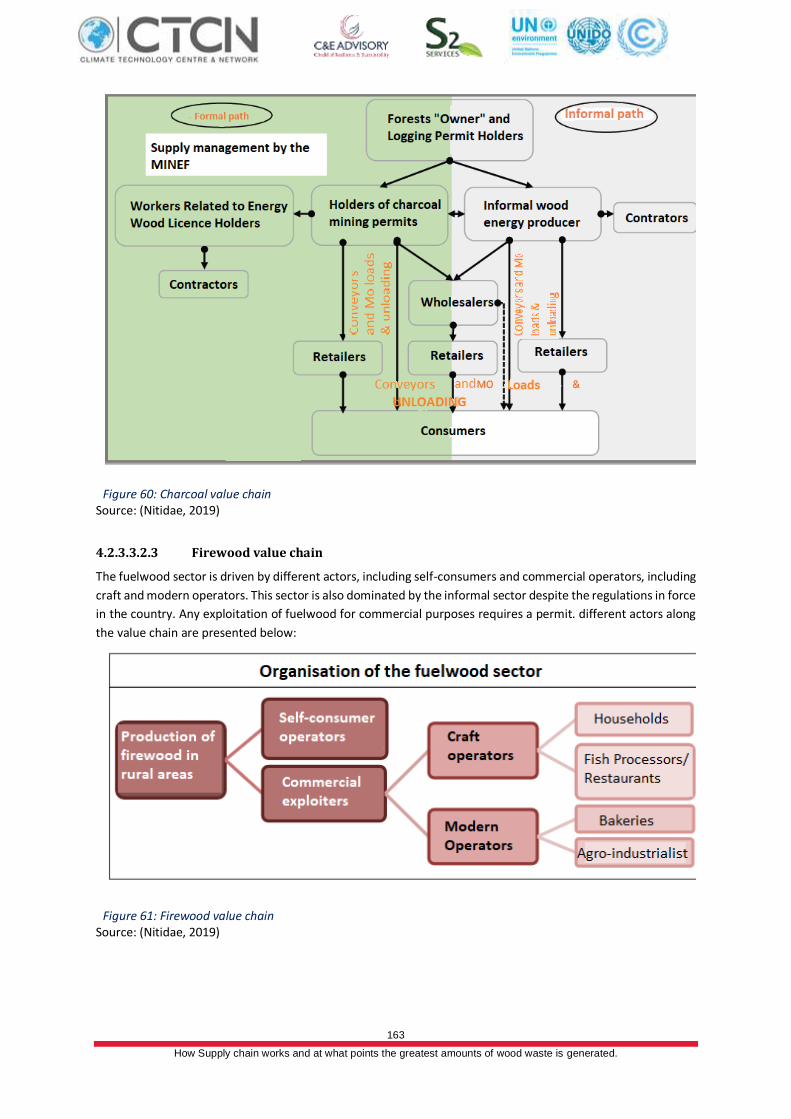
163
How Supply chain works and at what points the greatest amounts of wood waste is generated.
Figure 60: Charcoal value chain Source: (Nitidae, 2019)
4.2.3.3.2.3 Firewood value chain
The fuelwood sector is driven by different actors, including self-consumers and commercial operators, including
craft and modern operators. This sector is also dominated by the informal sector despite the regulations in force
in the country. Any exploitation of fuelwood for commercial purposes requires a permit. different actors along
the value chain are presented below:
Figure 61: Firewood value chain Source: (Nitidae, 2019)
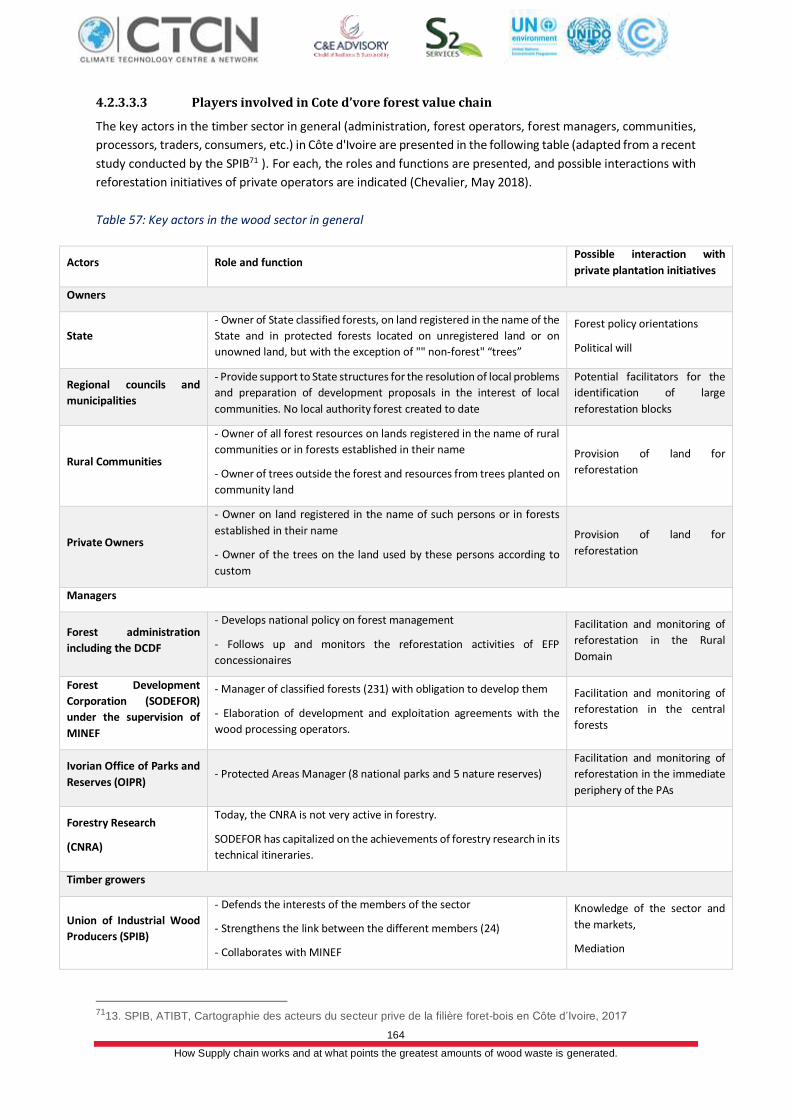
164
How Supply chain works and at what points the greatest amounts of wood waste is generated.
4.2.3.3.3 Players involved in Cote d’vore forest value chain
The key actors in the timber sector in general (administration, forest operators, forest managers, communities,
processors, traders, consumers, etc.) in Côte d'Ivoire are presented in the following table (adapted from a recent
study conducted by the SPIB71 ). For each, the roles and functions are presented, and possible interactions with
reforestation initiatives of private operators are indicated (Chevalier, May 2018).
Table 57: Key actors in the wood sector in general
Actors Role and function Possible interaction with
private plantation initiatives
Owners
State
- Owner of State classified forests, on land registered in the name of the
State and in protected forests located on unregistered land or on
unowned land, but with the exception of "" non-forest" “trees”
Forest policy orientations
Political will
Regional councils and
municipalities
- Provide support to State structures for the resolution of local problems
and preparation of development proposals in the interest of local
communities. No local authority forest created to date
Potential facilitators for the
identification of large
reforestation blocks
Rural Communities
- Owner of all forest resources on lands registered in the name of rural
communities or in forests established in their name
- Owner of trees outside the forest and resources from trees planted on
community land
Provision of land for
reforestation
Private Owners
- Owner on land registered in the name of such persons or in forests
established in their name
- Owner of the trees on the land used by these persons according to
custom
Provision of land for
reforestation
Managers
Forest administration
including the DCDF
- Develops national policy on forest management
- Follows up and monitors the reforestation activities of EFP
concessionaires
Facilitation and monitoring of
reforestation in the Rural
Domain
Forest Development
Corporation (SODEFOR)
under the supervision of
MINEF
- Manager of classified forests (231) with obligation to develop them
- Elaboration of development and exploitation agreements with the
wood processing operators.
Facilitation and monitoring of
reforestation in the central
forests
Ivorian Office of Parks and
Reserves (OIPR) - Protected Areas Manager (8 national parks and 5 nature reserves)
Facilitation and monitoring of
reforestation in the immediate
periphery of the PAs
Forestry Research
(CNRA)
Today, the CNRA is not very active in forestry.
SODEFOR has capitalized on the achievements of forestry research in its
technical itineraries.
Timber growers
Union of Industrial Wood
Producers (SPIB)
- Defends the interests of the members of the sector
- Strengthens the link between the different members (24)
- Collaborates with MINEF
Knowledge of the sector and
the markets,
Mediation
7113. SPIB, ATIBT, Cartographie des acteurs du secteur prive de la filière foret-bois en Côte d’Ivoire, 2017
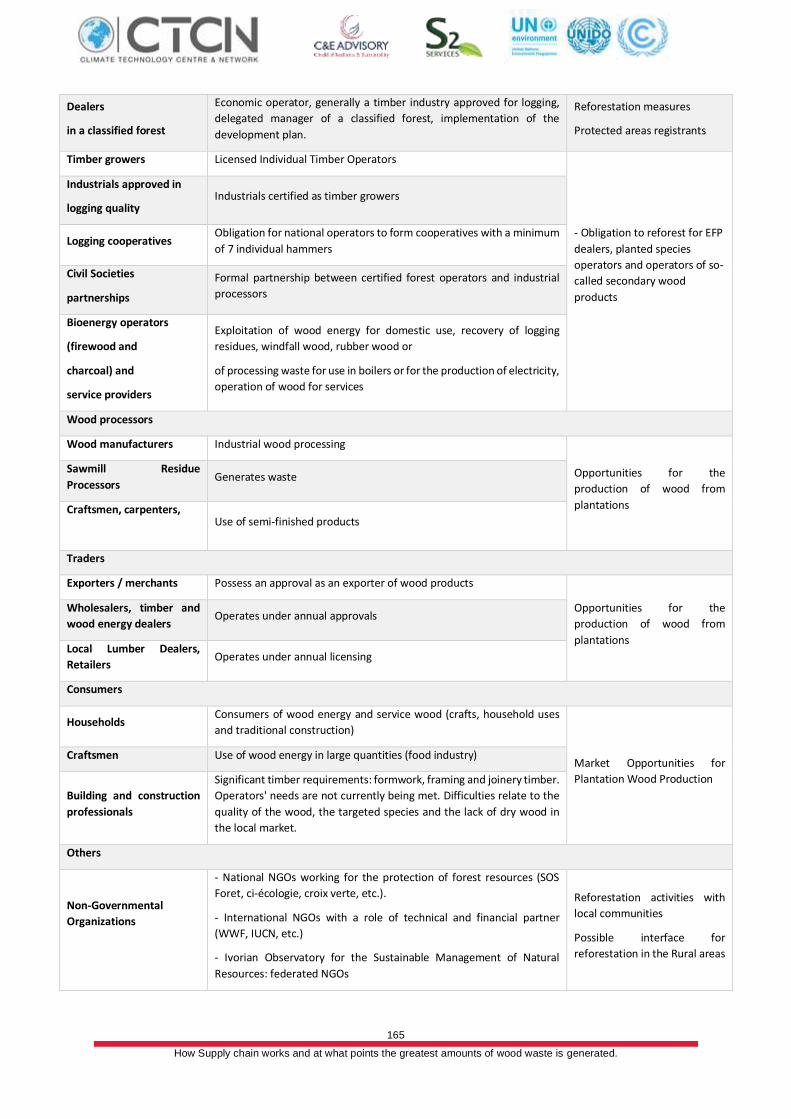
165
How Supply chain works and at what points the greatest amounts of wood waste is generated.
Dealers
in a classified forest
Economic operator, generally a timber industry approved for logging,
delegated manager of a classified forest, implementation of the
development plan.
Reforestation measures
Protected areas registrants
Timber growers Licensed Individual Timber Operators
- Obligation to reforest for EFP
dealers, planted species
operators and operators of so-
called secondary wood
products
Industrials approved in
logging quality Industrials certified as timber growers
Logging cooperatives Obligation for national operators to form cooperatives with a minimum
of 7 individual hammers
Civil Societies
partnerships
Formal partnership between certified forest operators and industrial
processors
Bioenergy operators
(firewood and
charcoal) and
service providers
Exploitation of wood energy for domestic use, recovery of logging
residues, windfall wood, rubber wood or
of processing waste for use in boilers or for the production of electricity,
operation of wood for services
Wood processors
Wood manufacturers Industrial wood processing
Opportunities for the
production of wood from
plantations
Sawmill Residue
Processors Generates waste
Craftsmen, carpenters,
Use of semi-finished products
Traders
Exporters / merchants Possess an approval as an exporter of wood products
Opportunities for the
production of wood from
plantations
Wholesalers, timber and
wood energy dealers Operates under annual approvals
Local Lumber Dealers,
Retailers Operates under annual licensing
Consumers
Households Consumers of wood energy and service wood (crafts, household uses
and traditional construction)
Market Opportunities for
Plantation Wood Production
Craftsmen Use of wood energy in large quantities (food industry)
Building and construction
professionals
Significant timber requirements: formwork, framing and joinery timber.
Operators' needs are not currently being met. Difficulties relate to the
quality of the wood, the targeted species and the lack of dry wood in
the local market.
Others
Non-Governmental
Organizations
- National NGOs working for the protection of forest resources (SOS
Foret, ci-écologie, croix verte, etc.).
- International NGOs with a role of technical and financial partner
(WWF, IUCN, etc.)
- Ivorian Observatory for the Sustainable Management of Natural
Resources: federated NGOs
Reforestation activities with
local communities
Possible interface for
reforestation in the Rural areas
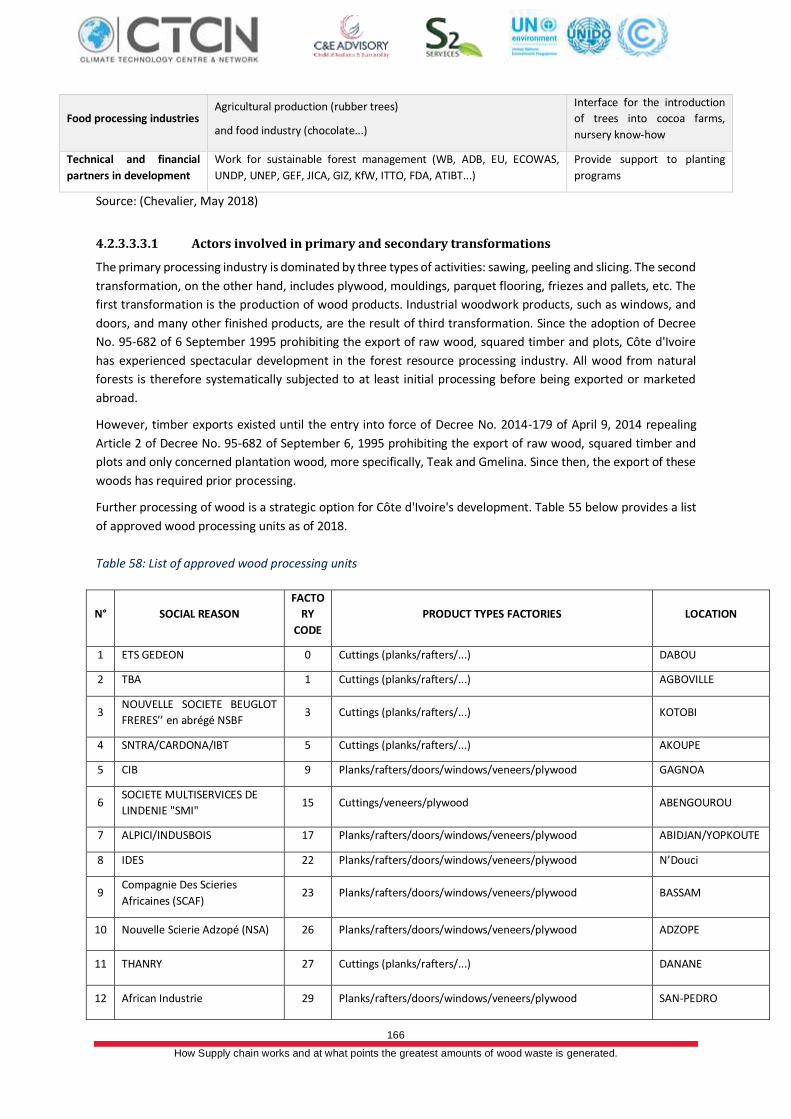
166
How Supply chain works and at what points the greatest amounts of wood waste is generated.
Food processing industries Agricultural production (rubber trees)
and food industry (chocolate...)
Interface for the introduction
of trees into cocoa farms,
nursery know-how
Technical and financial
partners in development
Work for sustainable forest management (WB, ADB, EU, ECOWAS,
UNDP, UNEP, GEF, JICA, GIZ, KfW, ITTO, FDA, ATIBT...)
Provide support to planting
programs
Source: (Chevalier, May 2018)
4.2.3.3.3.1 Actors involved in primary and secondary transformations
The primary processing industry is dominated by three types of activities: sawing, peeling and slicing. The second
transformation, on the other hand, includes plywood, mouldings, parquet flooring, friezes and pallets, etc. The
first transformation is the production of wood products. Industrial woodwork products, such as windows, and
doors, and many other finished products, are the result of third transformation. Since the adoption of Decree
No. 95-682 of 6 September 1995 prohibiting the export of raw wood, squared timber and plots, Côte d'Ivoire
has experienced spectacular development in the forest resource processing industry. All wood from natural
forests is therefore systematically subjected to at least initial processing before being exported or marketed
abroad.
However, timber exports existed until the entry into force of Decree No. 2014-179 of April 9, 2014 repealing
Article 2 of Decree No. 95-682 of September 6, 1995 prohibiting the export of raw wood, squared timber and
plots and only concerned plantation wood, more specifically, Teak and Gmelina. Since then, the export of these
woods has required prior processing.
Further processing of wood is a strategic option for Côte d'Ivoire's development. Table 55 below provides a list
of approved wood processing units as of 2018.
Table 58: List of approved wood processing units
N° SOCIAL REASON
FACTO
RY
CODE
PRODUCT TYPES FACTORIES LOCATION
1 ETS GEDEON 0 Cuttings (planks/rafters/...) DABOU
2 TBA 1 Cuttings (planks/rafters/...) AGBOVILLE
3 NOUVELLE SOCIETE BEUGLOT
FRERES’’ en abrégé NSBF 3 Cuttings (planks/rafters/...) KOTOBI
4 SNTRA/CARDONA/IBT 5 Cuttings (planks/rafters/...) AKOUPE
5 CIB 9 Planks/rafters/doors/windows/veneers/plywood GAGNOA
6 SOCIETE MULTISERVICES DE
LINDENIE "SMI" 15 Cuttings/veneers/plywood ABENGOUROU
7 ALPICI/INDUSBOIS 17 Planks/rafters/doors/windows/veneers/plywood ABIDJAN/YOPKOUTE
8 IDES 22 Planks/rafters/doors/windows/veneers/plywood N’Douci
9 Compagnie Des Scieries
Africaines (SCAF) 23 Planks/rafters/doors/windows/veneers/plywood BASSAM
10 Nouvelle Scierie Adzopé (NSA) 26 Planks/rafters/doors/windows/veneers/plywood ADZOPE
11 THANRY 27 Cuttings (planks/rafters/...) DANANE
12 African Industrie 29 Planks/rafters/doors/windows/veneers/plywood SAN-PEDRO
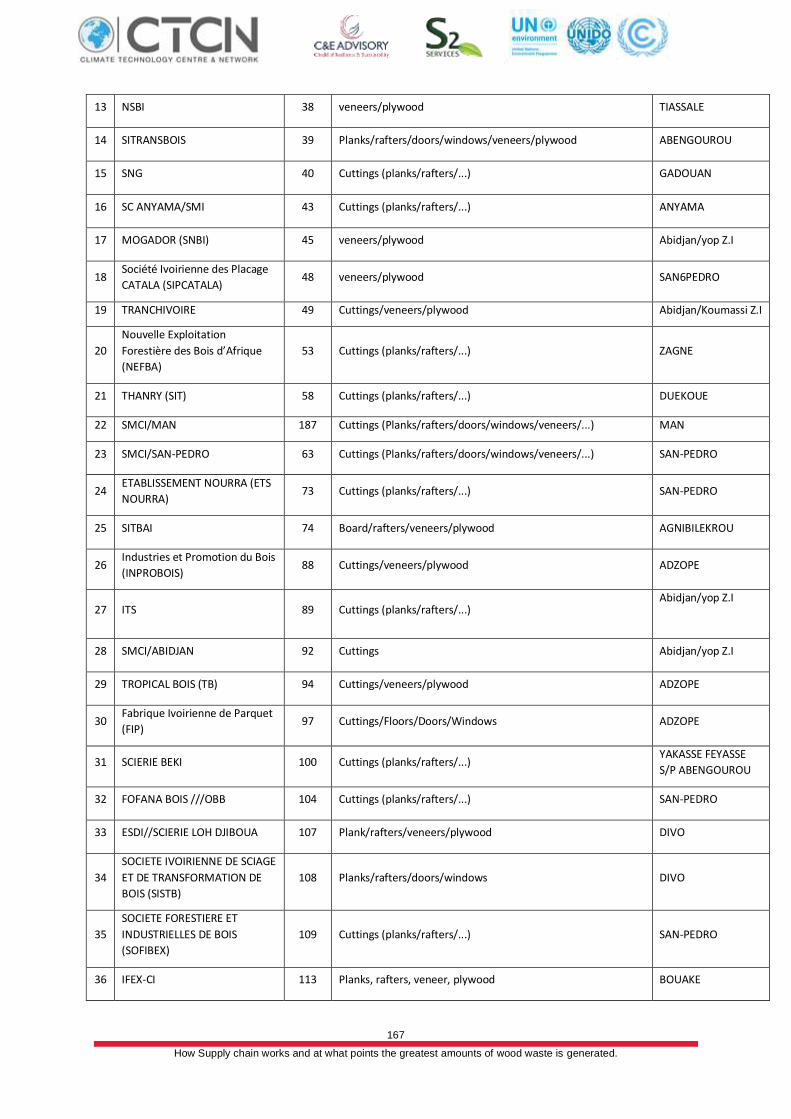
167
How Supply chain works and at what points the greatest amounts of wood waste is generated.
13 NSBI 38 veneers/plywood TIASSALE
14 SITRANSBOIS 39 Planks/rafters/doors/windows/veneers/plywood ABENGOUROU
15 SNG 40 Cuttings (planks/rafters/...) GADOUAN
16 SC ANYAMA/SMI 43 Cuttings (planks/rafters/...) ANYAMA
17 MOGADOR (SNBI) 45 veneers/plywood Abidjan/yop Z.I
18 Société Ivoirienne des Placage
CATALA (SIPCATALA) 48 veneers/plywood SAN6PEDRO
19 TRANCHIVOIRE 49 Cuttings/veneers/plywood Abidjan/Koumassi Z.I
20
Nouvelle Exploitation
Forestière des Bois d’Afrique
(NEFBA)
53 Cuttings (planks/rafters/...) ZAGNE
21 THANRY (SIT) 58 Cuttings (planks/rafters/...) DUEKOUE
22 SMCI/MAN 187 Cuttings (Planks/rafters/doors/windows/veneers/...) MAN
23 SMCI/SAN-PEDRO 63 Cuttings (Planks/rafters/doors/windows/veneers/...) SAN-PEDRO
24 ETABLISSEMENT NOURRA (ETS
NOURRA) 73 Cuttings (planks/rafters/...) SAN-PEDRO
25 SITBAI 74 Board/rafters/veneers/plywood AGNIBILEKROU
26 Industries et Promotion du Bois
(INPROBOIS) 88 Cuttings/veneers/plywood ADZOPE
27 ITS 89 Cuttings (planks/rafters/...) Abidjan/yop Z.I
28 SMCI/ABIDJAN 92 Cuttings Abidjan/yop Z.I
29 TROPICAL BOIS (TB) 94 Cuttings/veneers/plywood ADZOPE
30 Fabrique Ivoirienne de Parquet
(FIP) 97 Cuttings/Floors/Doors/Windows ADZOPE
31 SCIERIE BEKI 100 Cuttings (planks/rafters/...) YAKASSE FEYASSE
S/P ABENGOUROU
32 FOFANA BOIS ///OBB 104 Cuttings (planks/rafters/...) SAN-PEDRO
33 ESDI//SCIERIE LOH DJIBOUA 107 Plank/rafters/veneers/plywood DIVO
34
SOCIETE IVOIRIENNE DE SCIAGE
ET DE TRANSFORMATION DE
BOIS (SISTB)
108 Planks/rafters/doors/windows DIVO
35
SOCIETE FORESTIERE ET
INDUSTRIELLES DE BOIS
(SOFIBEX)
109 Cuttings (planks/rafters/...) SAN-PEDRO
36 IFEX-CI 113 Planks, rafters, veneer, plywood BOUAKE
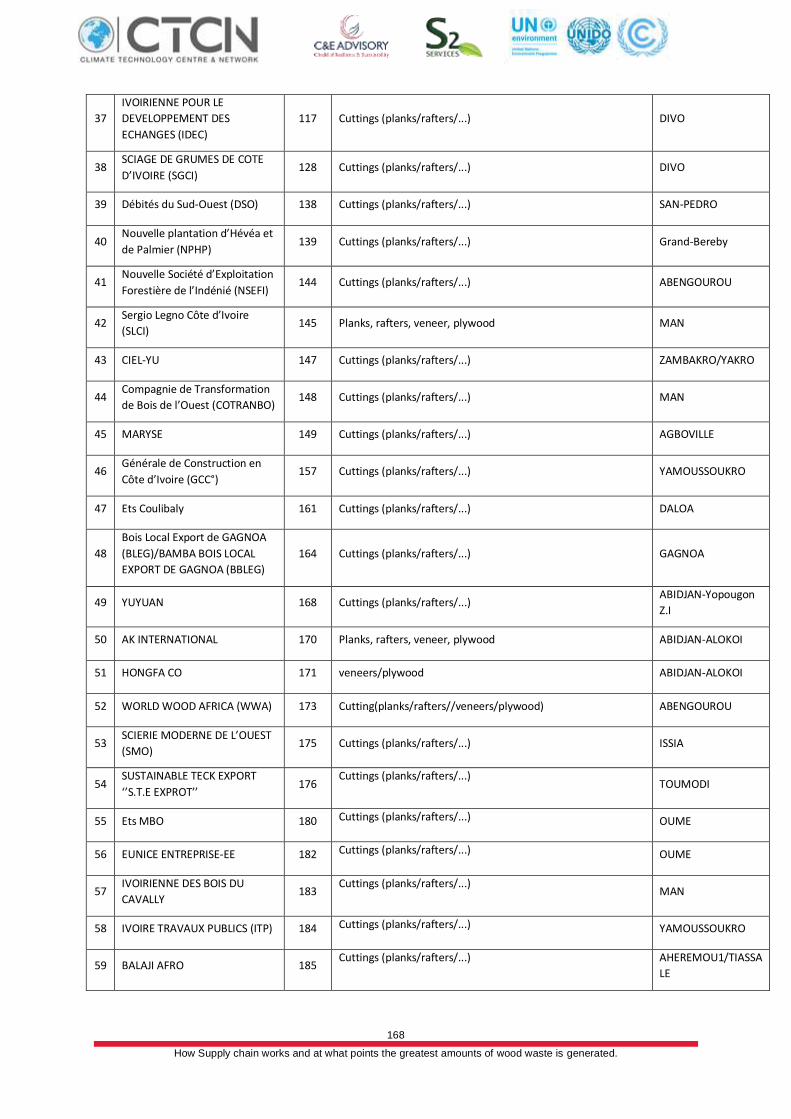
168
How Supply chain works and at what points the greatest amounts of wood waste is generated.
37
IVOIRIENNE POUR LE
DEVELOPPEMENT DES
ECHANGES (IDEC)
117 Cuttings (planks/rafters/...) DIVO
38 SCIAGE DE GRUMES DE COTE
D’IVOIRE (SGCI) 128 Cuttings (planks/rafters/...) DIVO
39 Débités du Sud-Ouest (DSO) 138 Cuttings (planks/rafters/...) SAN-PEDRO
40 Nouvelle plantation d’Hévéa et
de Palmier (NPHP) 139 Cuttings (planks/rafters/...) Grand-Bereby
41 Nouvelle Société d’Exploitation
Forestière de l’Indénié (NSEFI) 144 Cuttings (planks/rafters/...) ABENGOUROU
42 Sergio Legno Côte d’Ivoire
(SLCI) 145 Planks, rafters, veneer, plywood MAN
43 CIEL-YU 147 Cuttings (planks/rafters/...) ZAMBAKRO/YAKRO
44 Compagnie de Transformation
de Bois de l’Ouest (COTRANBO) 148 Cuttings (planks/rafters/...) MAN
45 MARYSE 149 Cuttings (planks/rafters/...) AGBOVILLE
46 Générale de Construction en
Côte d’Ivoire (GCC°) 157 Cuttings (planks/rafters/...) YAMOUSSOUKRO
47 Ets Coulibaly 161 Cuttings (planks/rafters/...) DALOA
48
Bois Local Export de GAGNOA
(BLEG)/BAMBA BOIS LOCAL
EXPORT DE GAGNOA (BBLEG)
164 Cuttings (planks/rafters/...) GAGNOA
49 YUYUAN 168 Cuttings (planks/rafters/...) ABIDJAN-Yopougon
Z.I
50 AK INTERNATIONAL 170 Planks, rafters, veneer, plywood ABIDJAN-ALOKOI
51 HONGFA CO 171 veneers/plywood ABIDJAN-ALOKOI
52 WORLD WOOD AFRICA (WWA) 173 Cutting(planks/rafters//veneers/plywood) ABENGOUROU
53 SCIERIE MODERNE DE L’OUEST
(SMO) 175 Cuttings (planks/rafters/...) ISSIA
54 SUSTAINABLE TECK EXPORT
‘’S.T.E EXPROT’’ 176
Cuttings (planks/rafters/...) TOUMODI
55 Ets MBO 180 Cuttings (planks/rafters/...) OUME
56 EUNICE ENTREPRISE-EE 182 Cuttings (planks/rafters/...) OUME
57 IVOIRIENNE DES BOIS DU
CAVALLY 183
Cuttings (planks/rafters/...) MAN
58 IVOIRE TRAVAUX PUBLICS (ITP) 184 Cuttings (planks/rafters/...) YAMOUSSOUKRO
59 BALAJI AFRO 185 Cuttings (planks/rafters/...) AHEREMOU1/TIASSA
LE
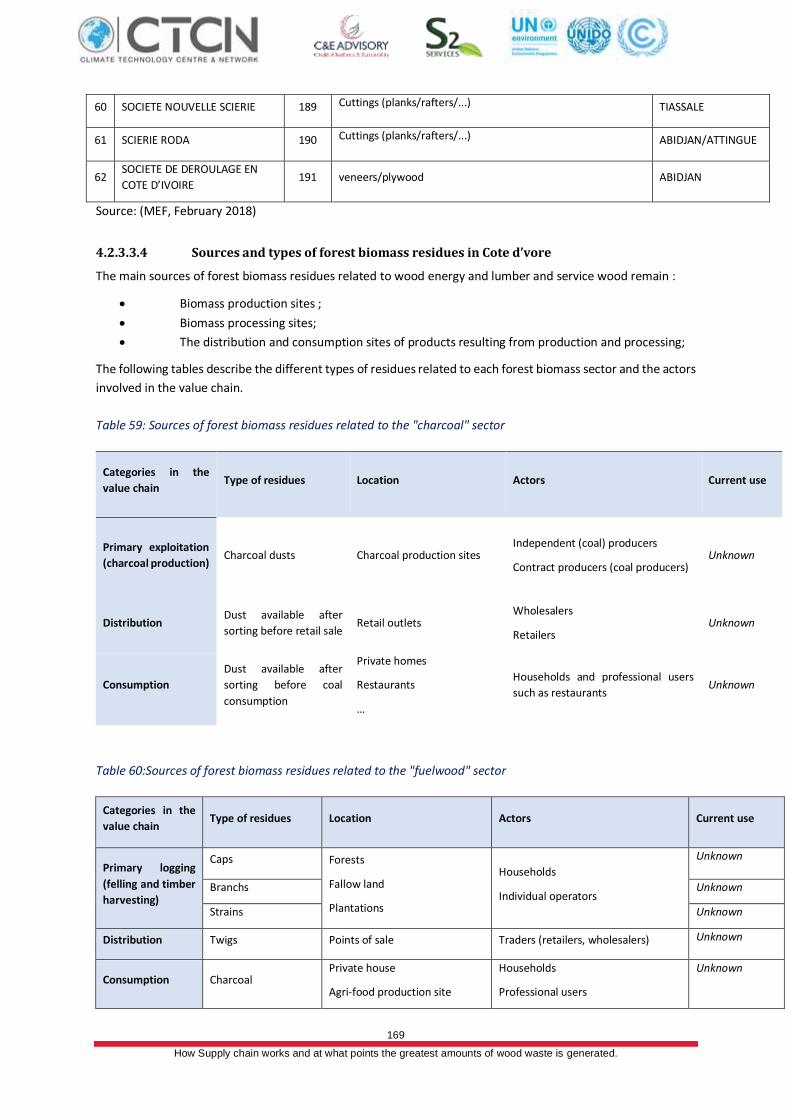
169
How Supply chain works and at what points the greatest amounts of wood waste is generated.
60 SOCIETE NOUVELLE SCIERIE 189 Cuttings (planks/rafters/...) TIASSALE
61 SCIERIE RODA 190 Cuttings (planks/rafters/...) ABIDJAN/ATTINGUE
62 SOCIETE DE DEROULAGE EN
COTE D’IVOIRE 191 veneers/plywood ABIDJAN
Source: (MEF, February 2018)
4.2.3.3.4 Sources and types of forest biomass residues in Cote d’vore
The main sources of forest biomass residues related to wood energy and lumber and service wood remain :
• Biomass production sites ;
• Biomass processing sites;
• The distribution and consumption sites of products resulting from production and processing;
The following tables describe the different types of residues related to each forest biomass sector and the actors
involved in the value chain.
Table 59: Sources of forest biomass residues related to the "charcoal" sector
Categories in the
value chain Type of residues Location Actors Current use
Primary exploitation
(charcoal production) Charcoal dusts Charcoal production sites
Independent (coal) producers
Contract producers (coal producers) Unknown
Distribution Dust available after
sorting before retail sale Retail outlets
Wholesalers
Retailers Unknown
Consumption
Dust available after
sorting before coal
consumption
Private homes
Restaurants
…
Households and professional users
such as restaurants Unknown
Table 60:Sources of forest biomass residues related to the "fuelwood" sector
Categories in the
value chain Type of residues Location Actors Current use
Primary logging
(felling and timber
harvesting)
Caps Forests
Fallow land
Plantations
Households
Individual operators
Unknown
Branchs Unknown
Strains Unknown
Distribution Twigs Points of sale Traders (retailers, wholesalers) Unknown
Consumption Charcoal Private house
Agri-food production site
Households
Professional users
Unknown
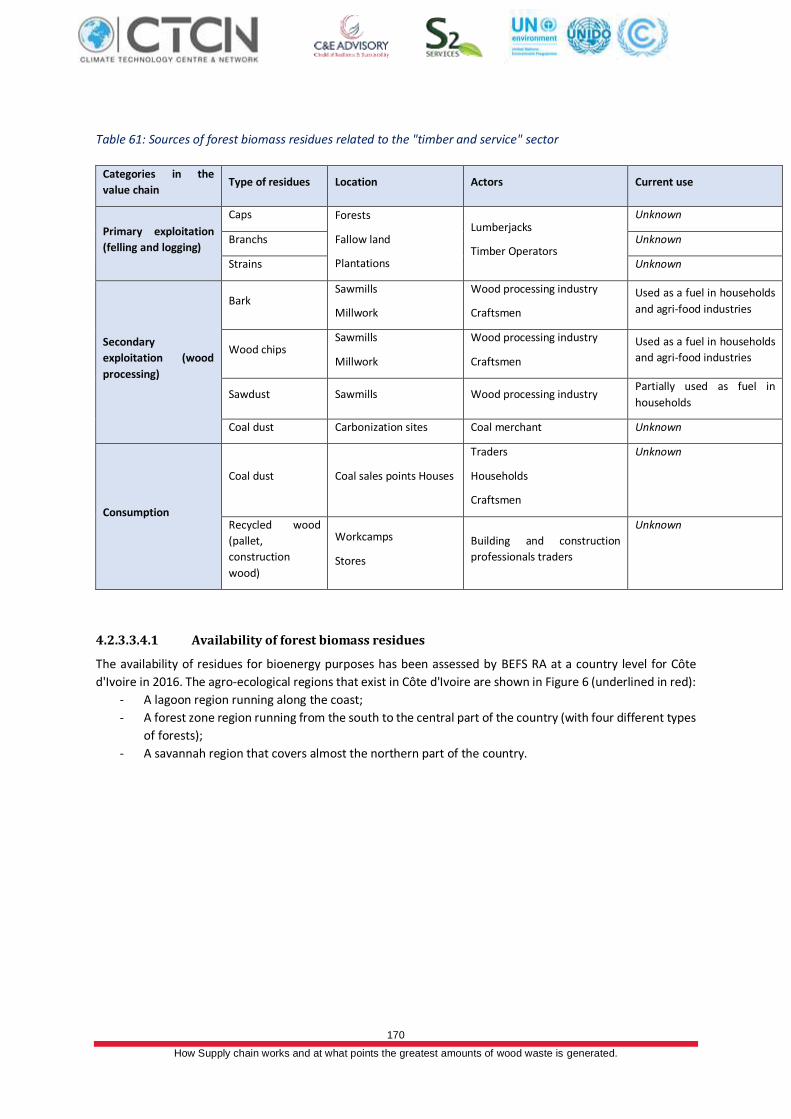
170
How Supply chain works and at what points the greatest amounts of wood waste is generated.
Table 61: Sources of forest biomass residues related to the "timber and service" sector
Categories in the
value chain Type of residues Location Actors Current use
Primary exploitation
(felling and logging)
Caps Forests
Fallow land
Plantations
Lumberjacks
Timber Operators
Unknown
Branchs Unknown
Strains Unknown
Secondary
exploitation (wood
processing)
Bark Sawmills
Millwork
Wood processing industry
Craftsmen
Used as a fuel in households
and agri-food industries
Wood chips Sawmills
Millwork
Wood processing industry
Craftsmen
Used as a fuel in households
and agri-food industries
Sawdust Sawmills Wood processing industry Partially used as fuel in
households
Coal dust Carbonization sites Coal merchant Unknown
Consumption
Coal dust Coal sales points Houses
Traders
Households
Craftsmen
Unknown
Recycled wood
(pallet,
construction
wood)
Workcamps
Stores
Building and construction
professionals traders
Unknown
4.2.3.3.4.1 Availability of forest biomass residues
The availability of residues for bioenergy purposes has been assessed by BEFS RA at a country level for Côte
d'Ivoire in 2016. The agro-ecological regions that exist in Côte d'Ivoire are shown in Figure 6 (underlined in red):
- A lagoon region running along the coast;
- A forest zone region running from the south to the central part of the country (with four different types
of forests);
- A savannah region that covers almost the northern part of the country.
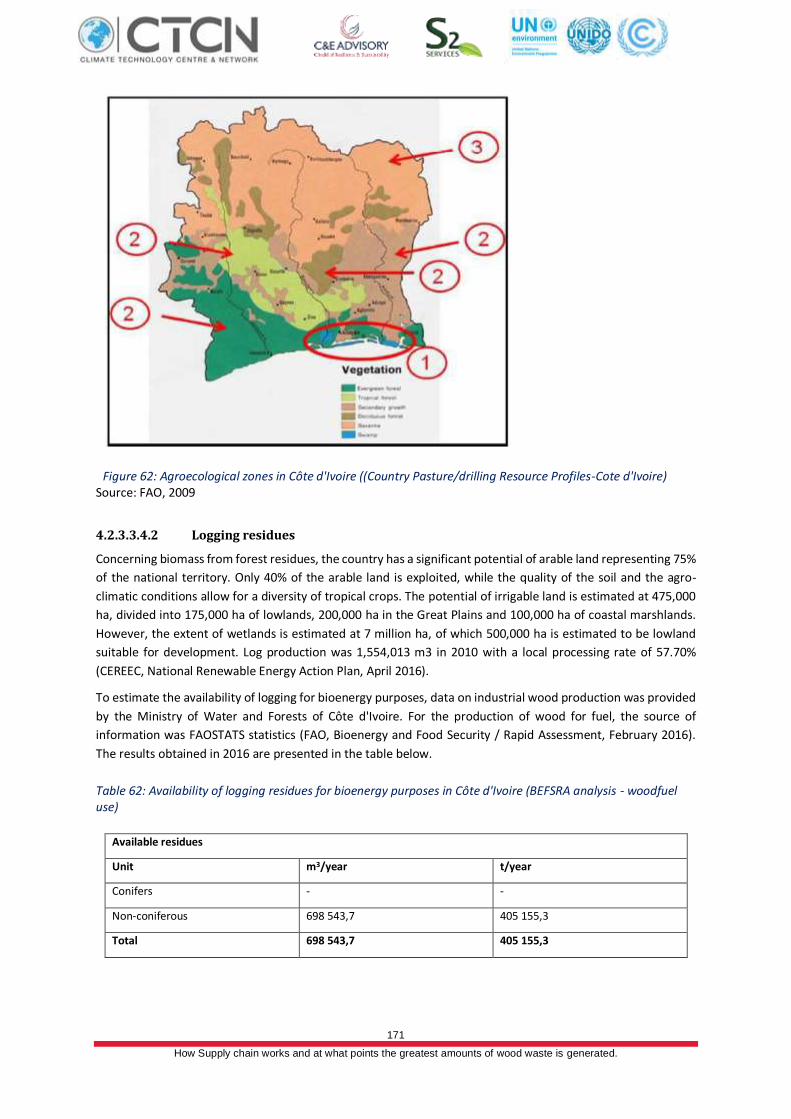
171
How Supply chain works and at what points the greatest amounts of wood waste is generated.
Figure 62: Agroecological zones in Côte d'Ivoire ((Country Pasture/drilling Resource Profiles-Cote d'Ivoire) Source: FAO, 2009
4.2.3.3.4.2 Logging residues
Concerning biomass from forest residues, the country has a significant potential of arable land representing 75%
of the national territory. Only 40% of the arable land is exploited, while the quality of the soil and the agro-
climatic conditions allow for a diversity of tropical crops. The potential of irrigable land is estimated at 475,000
ha, divided into 175,000 ha of lowlands, 200,000 ha in the Great Plains and 100,000 ha of coastal marshlands.
However, the extent of wetlands is estimated at 7 million ha, of which 500,000 ha is estimated to be lowland
suitable for development. Log production was 1,554,013 m3 in 2010 with a local processing rate of 57.70%
(CEREEC, National Renewable Energy Action Plan, April 2016).
To estimate the availability of logging for bioenergy purposes, data on industrial wood production was provided
by the Ministry of Water and Forests of Côte d'Ivoire. For the production of wood for fuel, the source of
information was FAOSTATS statistics (FAO, Bioenergy and Food Security / Rapid Assessment, February 2016).
The results obtained in 2016 are presented in the table below.
Table 62: Availability of logging residues for bioenergy purposes in Côte d'Ivoire (BEFSRA analysis - woodfuel use)
Available residues
Unit m3/year t/year
Conifers - -
Non-coniferous 698 543,7 405 155,3
Total 698 543,7 405 155,3
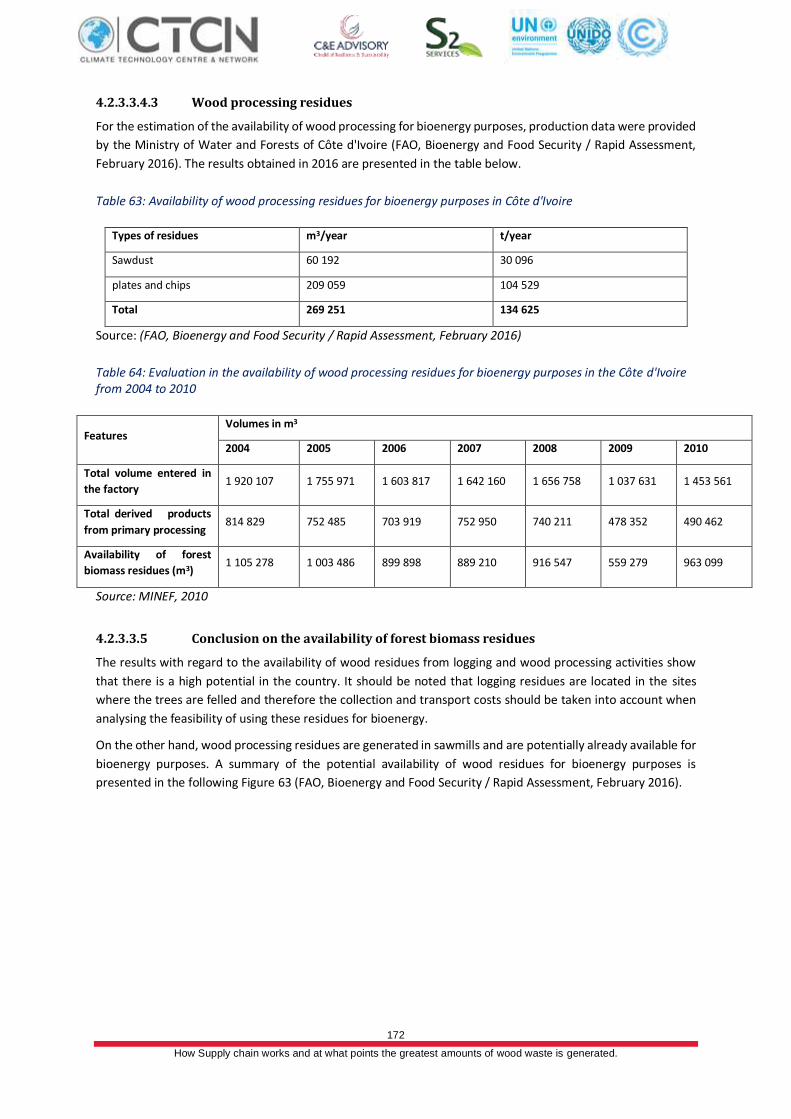
172
How Supply chain works and at what points the greatest amounts of wood waste is generated.
4.2.3.3.4.3 Wood processing residues
For the estimation of the availability of wood processing for bioenergy purposes, production data were provided
by the Ministry of Water and Forests of Côte d'Ivoire (FAO, Bioenergy and Food Security / Rapid Assessment,
February 2016). The results obtained in 2016 are presented in the table below.
Table 63: Availability of wood processing residues for bioenergy purposes in Côte d'Ivoire
Types of residues m3/year t/year
Sawdust 60 192 30 096
plates and chips 209 059 104 529
Total 269 251 134 625
Source: (FAO, Bioenergy and Food Security / Rapid Assessment, February 2016)
Table 64: Evaluation in the availability of wood processing residues for bioenergy purposes in the Côte d'Ivoire from 2004 to 2010
Features Volumes in m3
2004 2005 2006 2007 2008 2009 2010
Total volume entered in
the factory 1 920 107 1 755 971 1 603 817 1 642 160 1 656 758 1 037 631 1 453 561
Total derived products
from primary processing 814 829 752 485 703 919 752 950 740 211 478 352 490 462
Availability of forest
biomass residues (m3) 1 105 278 1 003 486 899 898 889 210 916 547 559 279 963 099
Source: MINEF, 2010
4.2.3.3.5 Conclusion on the availability of forest biomass residues
The results with regard to the availability of wood residues from logging and wood processing activities show
that there is a high potential in the country. It should be noted that logging residues are located in the sites
where the trees are felled and therefore the collection and transport costs should be taken into account when
analysing the feasibility of using these residues for bioenergy.
On the other hand, wood processing residues are generated in sawmills and are potentially already available for
bioenergy purposes. A summary of the potential availability of wood residues for bioenergy purposes is
presented in the following Figure 63 (FAO, Bioenergy and Food Security / Rapid Assessment, February 2016).
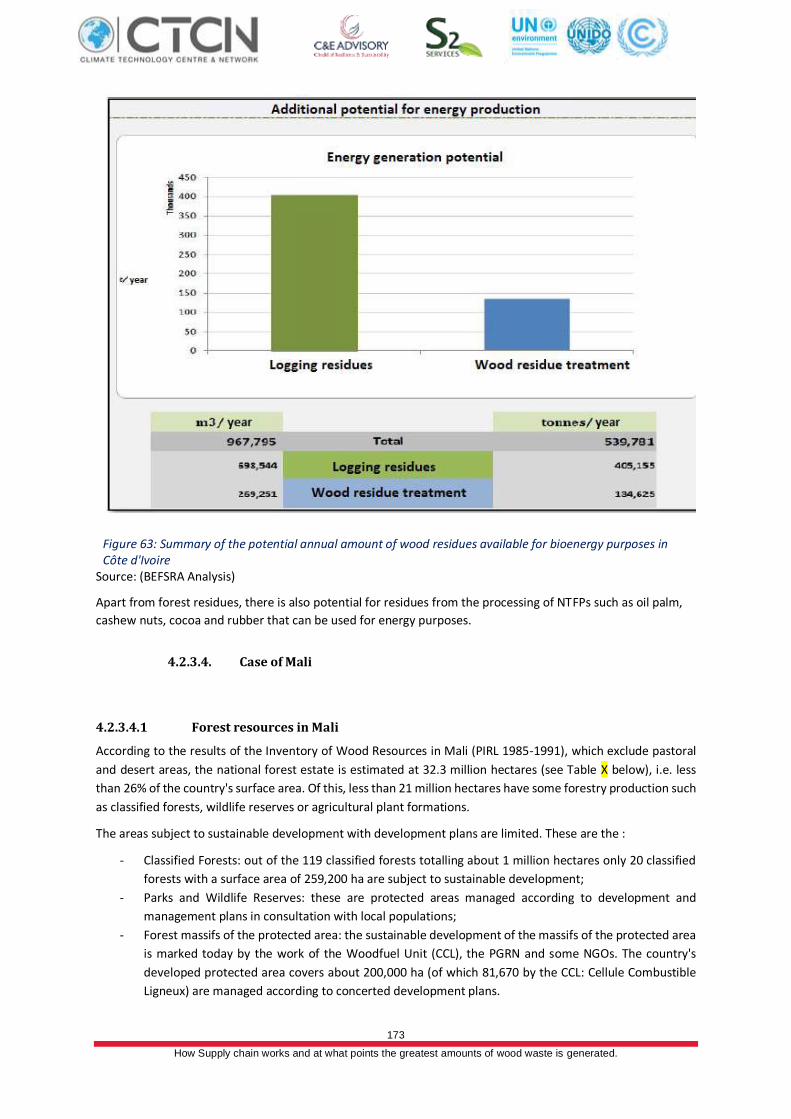
173
How Supply chain works and at what points the greatest amounts of wood waste is generated.
Figure 63: Summary of the potential annual amount of wood residues available for bioenergy purposes in Côte d'Ivoire
Source: (BEFSRA Analysis)
Apart from forest residues, there is also potential for residues from the processing of NTFPs such as oil palm,
cashew nuts, cocoa and rubber that can be used for energy purposes.
4.2.3.4. Case of Mali
4.2.3.4.1 Forest resources in Mali
According to the results of the Inventory of Wood Resources in Mali (PIRL 1985-1991), which exclude pastoral
and desert areas, the national forest estate is estimated at 32.3 million hectares (see Table X below), i.e. less
than 26% of the country's surface area. Of this, less than 21 million hectares have some forestry production such
as classified forests, wildlife reserves or agricultural plant formations.
The areas subject to sustainable development with development plans are limited. These are the :
- Classified Forests: out of the 119 classified forests totalling about 1 million hectares only 20 classified
forests with a surface area of 259,200 ha are subject to sustainable development;
- Parks and Wildlife Reserves: these are protected areas managed according to development and
management plans in consultation with local populations;
- Forest massifs of the protected area: the sustainable development of the massifs of the protected area
is marked today by the work of the Woodfuel Unit (CCL), the PGRN and some NGOs. The country's
developed protected area covers about 200,000 ha (of which 81,670 by the CCL: Cellule Combustible
Ligneux) are managed according to concerted development plans.
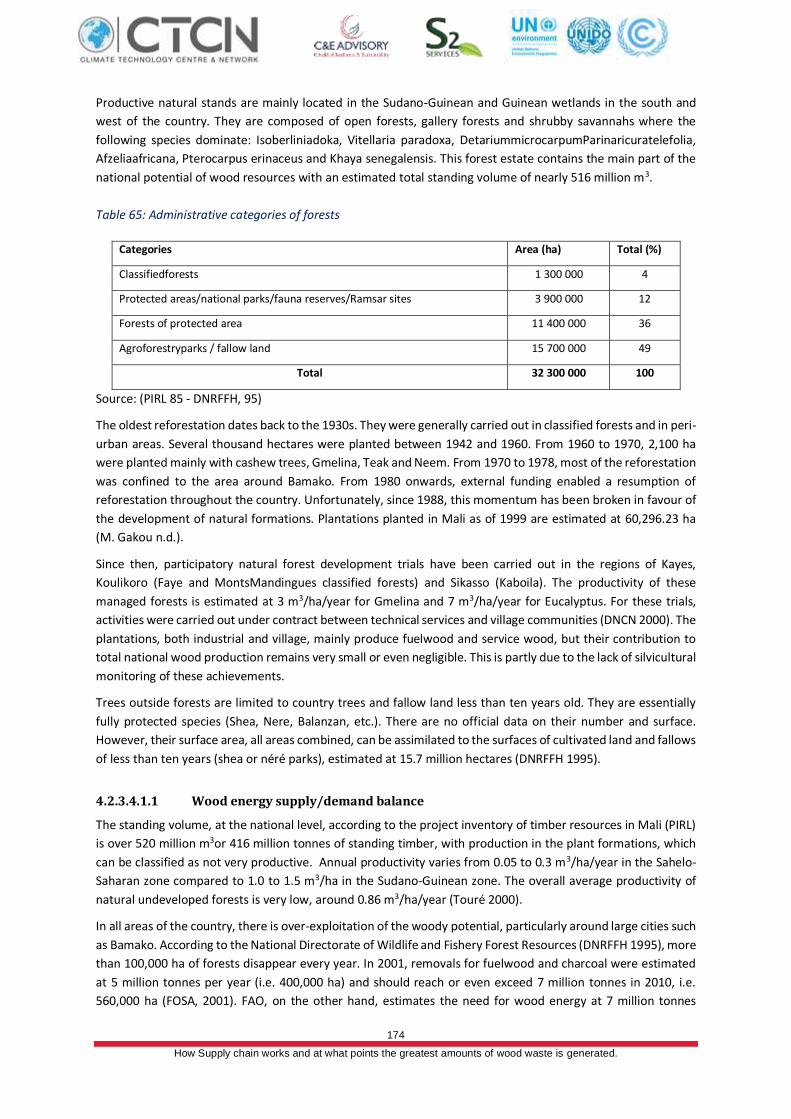
174
How Supply chain works and at what points the greatest amounts of wood waste is generated.
Productive natural stands are mainly located in the Sudano-Guinean and Guinean wetlands in the south and
west of the country. They are composed of open forests, gallery forests and shrubby savannahs where the
following species dominate: Isoberliniadoka, Vitellaria paradoxa, DetariummicrocarpumParinaricuratelefolia,
Afzeliaafricana, Pterocarpus erinaceus and Khaya senegalensis. This forest estate contains the main part of the
national potential of wood resources with an estimated total standing volume of nearly 516 million m3.
Table 65: Administrative categories of forests
Categories Area (ha) Total (%)
Classifiedforests 1 300 000 4
Protected areas/national parks/fauna reserves/Ramsar sites 3 900 000 12
Forests of protected area 11 400 000 36
Agroforestryparks / fallow land 15 700 000 49
Total 32 300 000 100
Source: (PIRL 85 - DNRFFH, 95)
The oldest reforestation dates back to the 1930s. They were generally carried out in classified forests and in peri-
urban areas. Several thousand hectares were planted between 1942 and 1960. From 1960 to 1970, 2,100 ha
were planted mainly with cashew trees, Gmelina, Teak and Neem. From 1970 to 1978, most of the reforestation
was confined to the area around Bamako. From 1980 onwards, external funding enabled a resumption of
reforestation throughout the country. Unfortunately, since 1988, this momentum has been broken in favour of
the development of natural formations. Plantations planted in Mali as of 1999 are estimated at 60,296.23 ha
(M. Gakou n.d.).
Since then, participatory natural forest development trials have been carried out in the regions of Kayes,
Koulikoro (Faye and MontsMandingues classified forests) and Sikasso (Kaboila). The productivity of these
managed forests is estimated at 3 m3/ha/year for Gmelina and 7 m3/ha/year for Eucalyptus. For these trials,
activities were carried out under contract between technical services and village communities (DNCN 2000). The
plantations, both industrial and village, mainly produce fuelwood and service wood, but their contribution to
total national wood production remains very small or even negligible. This is partly due to the lack of silvicultural
monitoring of these achievements.
Trees outside forests are limited to country trees and fallow land less than ten years old. They are essentially
fully protected species (Shea, Nere, Balanzan, etc.). There are no official data on their number and surface.
However, their surface area, all areas combined, can be assimilated to the surfaces of cultivated land and fallows
of less than ten years (shea or néré parks), estimated at 15.7 million hectares (DNRFFH 1995).
4.2.3.4.1.1 Wood energy supply/demand balance
The standing volume, at the national level, according to the project inventory of timber resources in Mali (PIRL)
is over 520 million m3or 416 million tonnes of standing timber, with production in the plant formations, which
can be classified as not very productive. Annual productivity varies from 0.05 to 0.3 m3/ha/year in the Sahelo-
Saharan zone compared to 1.0 to 1.5 m3/ha in the Sudano-Guinean zone. The overall average productivity of
natural undeveloped forests is very low, around 0.86 m3/ha/year (Touré 2000).
In all areas of the country, there is over-exploitation of the woody potential, particularly around large cities such
as Bamako. According to the National Directorate of Wildlife and Fishery Forest Resources (DNRFFH 1995), more
than 100,000 ha of forests disappear every year. In 2001, removals for fuelwood and charcoal were estimated
at 5 million tonnes per year (i.e. 400,000 ha) and should reach or even exceed 7 million tonnes in 2010, i.e.
560,000 ha (FOSA, 2001). FAO, on the other hand, estimates the need for wood energy at 7 million tonnes
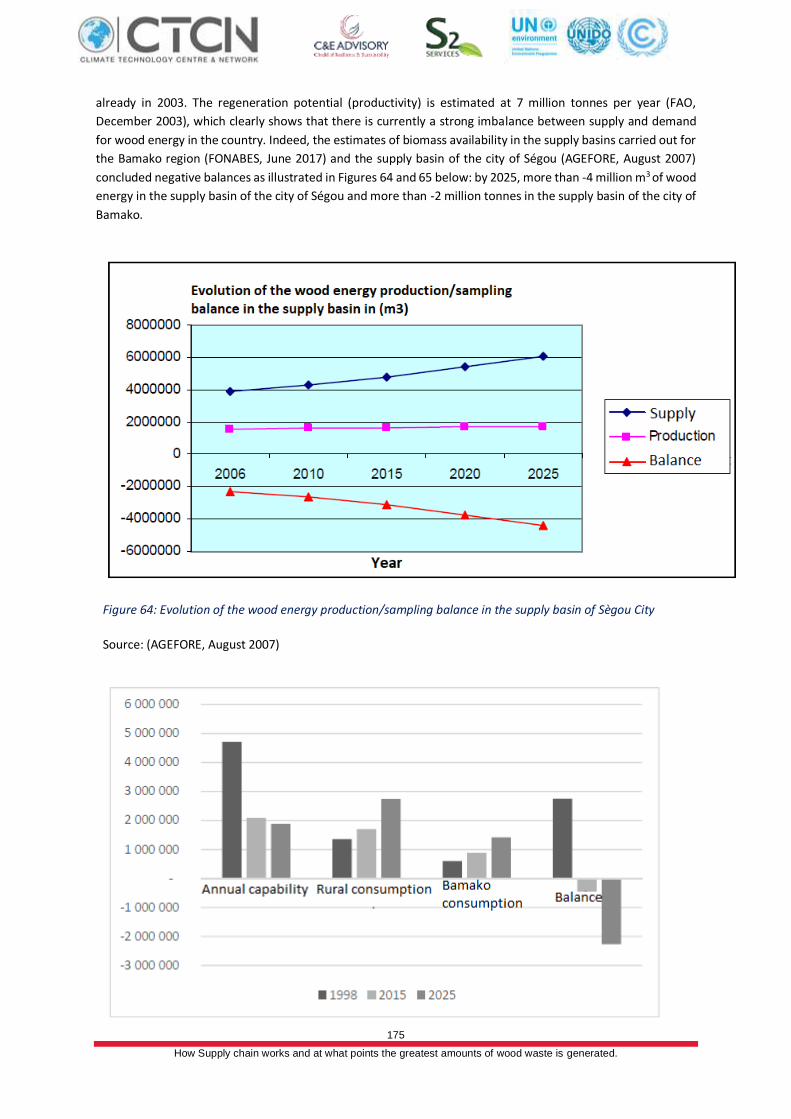
175
How Supply chain works and at what points the greatest amounts of wood waste is generated.
already in 2003. The regeneration potential (productivity) is estimated at 7 million tonnes per year (FAO,
December 2003), which clearly shows that there is currently a strong imbalance between supply and demand
for wood energy in the country. Indeed, the estimates of biomass availability in the supply basins carried out for
the Bamako region (FONABES, June 2017) and the supply basin of the city of Ségou (AGEFORE, August 2007)
concluded negative balances as illustrated in Figures 64 and 65 below: by 2025, more than -4 million m3 of wood
energy in the supply basin of the city of Ségou and more than -2 million tonnes in the supply basin of the city of
Bamako.
Figure 64: Evolution of the wood energy production/sampling balance in the supply basin of Sègou City
Source: (AGEFORE, August 2007)
176
How Supply chain works and at what points the greatest amounts of wood waste is generated.
Source: (FONABES, June 2017)
The legislative and regulatory framework for forest resource management in Mali has undergone many changes
since 1960. The first texts were essentially based on the protection of resources and were of a prohibitory and
repressive nature. The management of forest resources was governed by the 1968 Code (Law No. 68-8/AN-RM
of 17 February 1968). However new laws have been adopted since 1995.
4.2.3.4.1.2 Forest value chain in Mali
The exploitation of timber is often carried out by forestry companies (sawmills, peeling units, etc.) which pay
forest royalties and taxes to the State to exploit the forests. Exploitation is carried out by more or less informal
companies, which are sawmills, to which the State annually gives exploitation permits or concessions depending
on the region. At the production level, the main actor is the State, which holds the rights of access to the
resource. The other key actors are local communities, landowners and forest operators as shown in the following
value chain.The following figure represents the different levels of transaction involved in the timber supply value
chain.
Figure 65: Projected demand for wood energy in Bamako City supply basin 1998-2025(in tons/year)
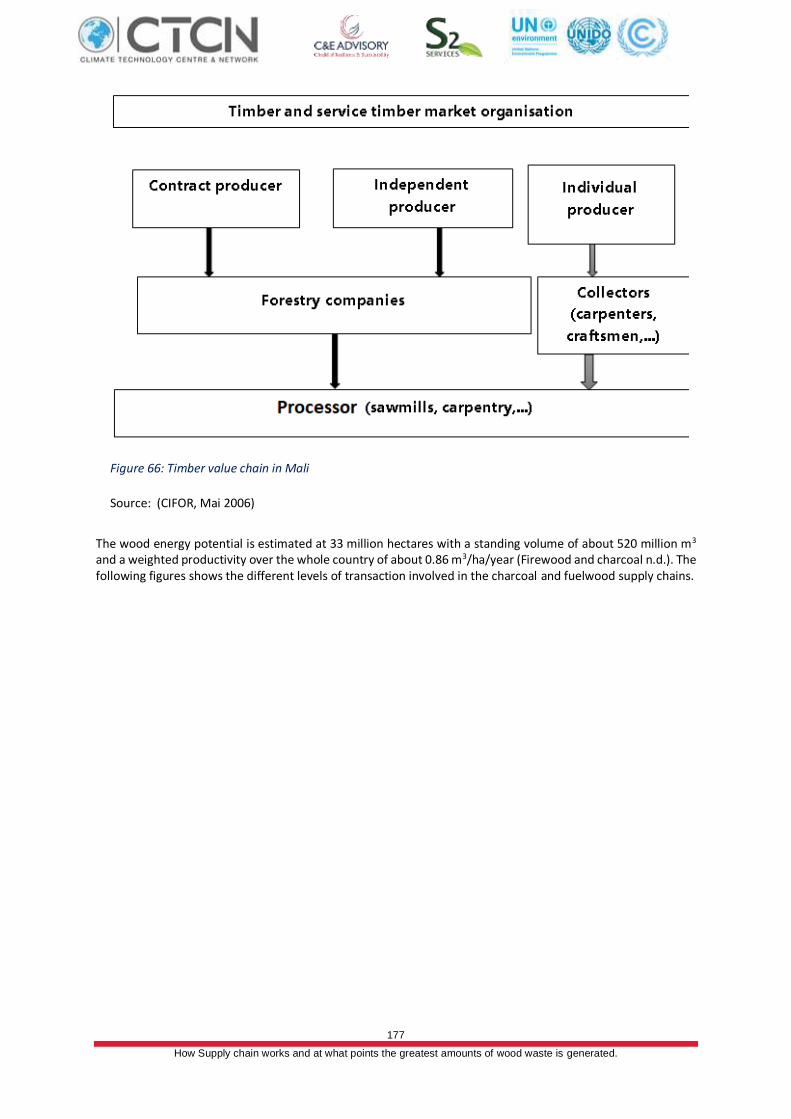
177
How Supply chain works and at what points the greatest amounts of wood waste is generated.
Figure 66: Timber value chain in Mali
Source: (CIFOR, Mai 2006)
The wood energy potential is estimated at 33 million hectares with a standing volume of about 520 million m3 and a weighted productivity over the whole country of about 0.86 m3/ha/year (Firewood and charcoal n.d.). The following figures shows the different levels of transaction involved in the charcoal and fuelwood supply chains.
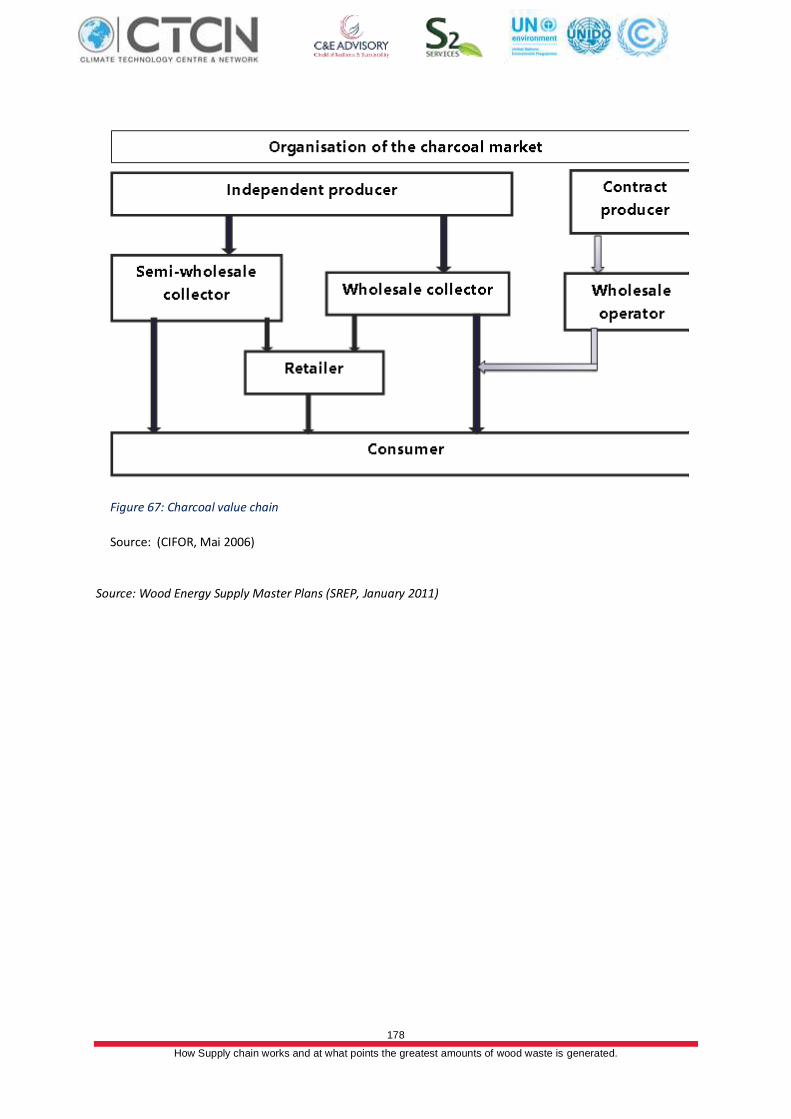
178
How Supply chain works and at what points the greatest amounts of wood waste is generated.
Figure 67: Charcoal value chain
Source: (CIFOR, Mai 2006)
Source: Wood Energy Supply Master Plans (SREP, January 2011)
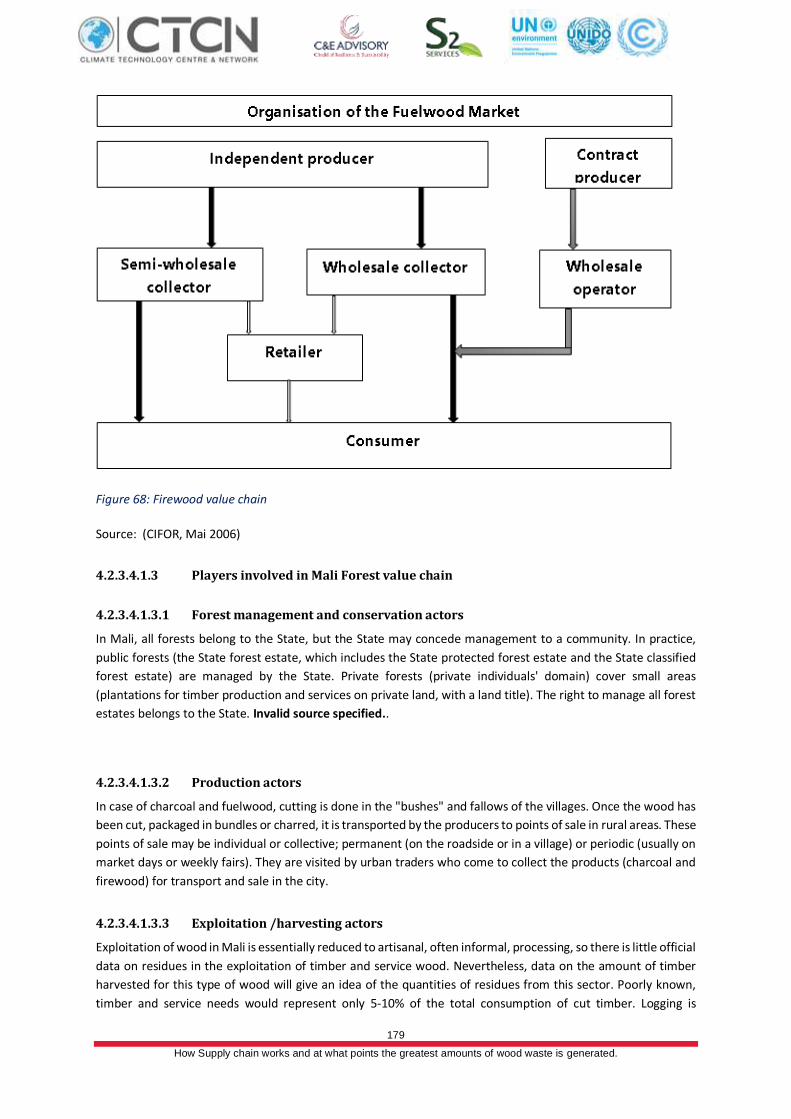
179
How Supply chain works and at what points the greatest amounts of wood waste is generated.
Figure 68: Firewood value chain
Source: (CIFOR, Mai 2006)
4.2.3.4.1.3 Players involved in Mali Forest value chain
4.2.3.4.1.3.1 Forest management and conservation actors
In Mali, all forests belong to the State, but the State may concede management to a community. In practice,
public forests (the State forest estate, which includes the State protected forest estate and the State classified
forest estate) are managed by the State. Private forests (private individuals' domain) cover small areas
(plantations for timber production and services on private land, with a land title). The right to manage all forest
estates belongs to the State. Invalid source specified..
4.2.3.4.1.3.2 Production actors
In case of charcoal and fuelwood, cutting is done in the "bushes" and fallows of the villages. Once the wood has
been cut, packaged in bundles or charred, it is transported by the producers to points of sale in rural areas. These
points of sale may be individual or collective; permanent (on the roadside or in a village) or periodic (usually on
market days or weekly fairs). They are visited by urban traders who come to collect the products (charcoal and
firewood) for transport and sale in the city.
4.2.3.4.1.3.3 Exploitation /harvesting actors
Exploitation of wood in Mali is essentially reduced to artisanal, often informal, processing, so there is little official
data on residues in the exploitation of timber and service wood. Nevertheless, data on the amount of timber
harvested for this type of wood will give an idea of the quantities of residues from this sector. Poorly known,
timber and service needs would represent only 5-10% of the total consumption of cut timber. Logging is
180
How Supply chain works and at what points the greatest amounts of wood waste is generated.
currently based on the needs of small sawmills and merchants with mechanized logging equipment and is most
often carried out on the fringes of new sustainable management rules.
4.2.3.4.2 Actors in primary and secondary transformation
The country produces almost no timber that can be processed industrially. The reduction of the wood stock,
following deforestation and forest degradation, limits the development of the forest industry. The supply of
wood for carpentry is marginal. Most of the timber used is imported from Côte d'Ivoire and Ghana (85%) (Konaté
2001).Thus, only primary processing takes place in small sawmills. This transformation is carried out by sawmills
supplying planks for making canoes as well as planks, rafters and battens for joinery. The need for lumber for
the manufacture of dugout canoes is estimated at 2,500 tonnes/year in 2003. Apart from this type of
manufacture made from local species, other products are not very competitive compared to imported products.
Malian sawmills are characterised by obsolete equipment, semi-mechanisation (except for a match factory) and
their energy dependence on the Société Energie du Mali. They suffer from poor management due to inadequate
training of contractors and workers, outdated equipment and poor organisation of the timber sector. As a result,
operators in the sector are considering investing in a modern sawmill to improve and expand the range of
products (Konaté 2000).
4.2.3.4.2.1 Transporters / logistic operators
The transport of wood energy by private individuals is authorized and limited to quantities for self-consumption
and must be justified by a transport ticket called Coupon issued by the Forest Administration, certifying the
origin of the product. These quantities will be determined by order of the Minister in charge of Forests. In the
case of fuelwood exploited in a plantation or in a private forest, the coupon is issued by the forest owner.
For timber, logs are most often transported directly from the logging sites to the sawmills where they are
processed. Given the low level of equipment in these sawmills, processing is often primary and not very
diversified (planks, trays, etc.) and the level of yield is rather low. Charcoal and fuelwood are transported to
cities by hired vehicles by wood merchants. Once in the city, wood fuel is either sold directly to consumers by
the collecting dealer or resold to retailers in urban markets or at the street/roadside.Retailers like for charcoal
obtain their supplies in town from wholesalers in the markets or sometimes from lorry drivers (especially tanker
drivers) who conveniently bring in charcoal in addition to their official load.
4.2.3.4.2.2 Consumption
The final consumer of forest products does not play a decisive role in the structuring of supply circuits. Suppliers
collect products in rural areas, and dominate the main types of supply circuits. In terms of energy consumption,
more than 90% of the energy consumed in Mali comes from wood products whose annual needs are estimated
at 0.9 m3 /inhabitant (FAO, December 2003). This high consumption of ligneous fuel would correspond to an
annual deforestation of nearly 600,000 hectares 20 years ago (Touré, 2000) and is very likely much higher today.
The main actors involved in the wood energy and timber industries are summarised in the following table.
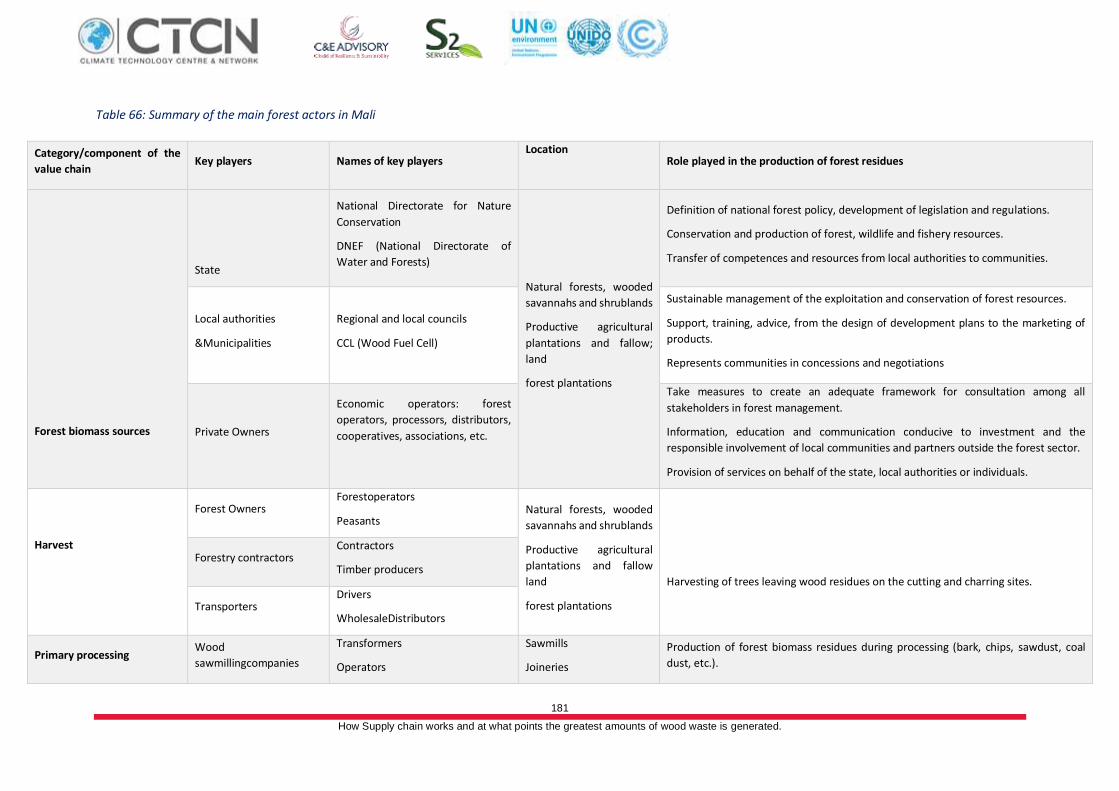
181
How Supply chain works and at what points the greatest amounts of wood waste is generated.
Table 66: Summary of the main forest actors in Mali
Category/component of the
value chain Key players Names of key players
Location
Role played in the production of forest residues
Forest biomass sources
State
National Directorate for Nature
Conservation
DNEF (National Directorate of
Water and Forests)
Natural forests, wooded
savannahs and shrublands
Productive agricultural
plantations and fallow;
land
forest plantations
Definition of national forest policy, development of legislation and regulations.
Conservation and production of forest, wildlife and fishery resources.
Transfer of competences and resources from local authorities to communities.
Local authorities
&Municipalities
Regional and local councils
CCL (Wood Fuel Cell)
Sustainable management of the exploitation and conservation of forest resources.
Support, training, advice, from the design of development plans to the marketing of
products.
Represents communities in concessions and negotiations
Private Owners
Economic operators: forest
operators, processors, distributors,
cooperatives, associations, etc.
Take measures to create an adequate framework for consultation among all
stakeholders in forest management.
Information, education and communication conducive to investment and the
responsible involvement of local communities and partners outside the forest sector.
Provision of services on behalf of the state, local authorities or individuals.
Harvest
Forest Owners Forestoperators
Peasants Natural forests, wooded
savannahs and shrublands
Productive agricultural
plantations and fallow
land
forest plantations
Harvesting of trees leaving wood residues on the cutting and charring sites.
Forestry contractors Contractors
Timber producers
Transporters Drivers
WholesaleDistributors
Primary processing Wood
sawmillingcompanies
Transformers
Operators
Sawmills
Joineries
Production of forest biomass residues during processing (bark, chips, sawdust, coal
dust, etc.).
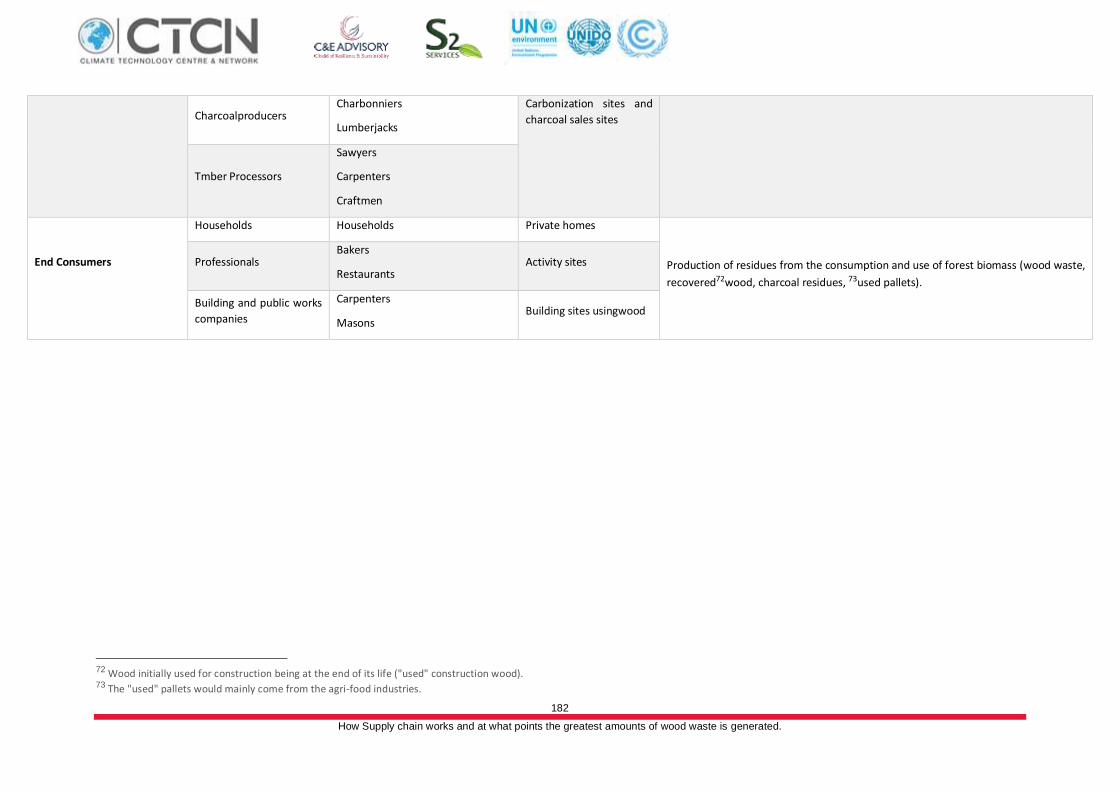
182
How Supply chain works and at what points the greatest amounts of wood waste is generated.
Charcoalproducers Charbonniers
Lumberjacks
Carbonization sites and
charcoal sales sites
Tmber Processors
Sawyers
Carpenters
Craftmen
End Consumers
Households Households Private homes
Production of residues from the consumption and use of forest biomass (wood waste,
recovered72wood, charcoal residues, 73used pallets).
Professionals Bakers
Restaurants Activity sites
Building and public works
companies
Carpenters
Masons Building sites usingwood
72 Wood initially used for construction being at the end of its life ("used" construction wood). 73 The "used" pallets would mainly come from the agri-food industries.
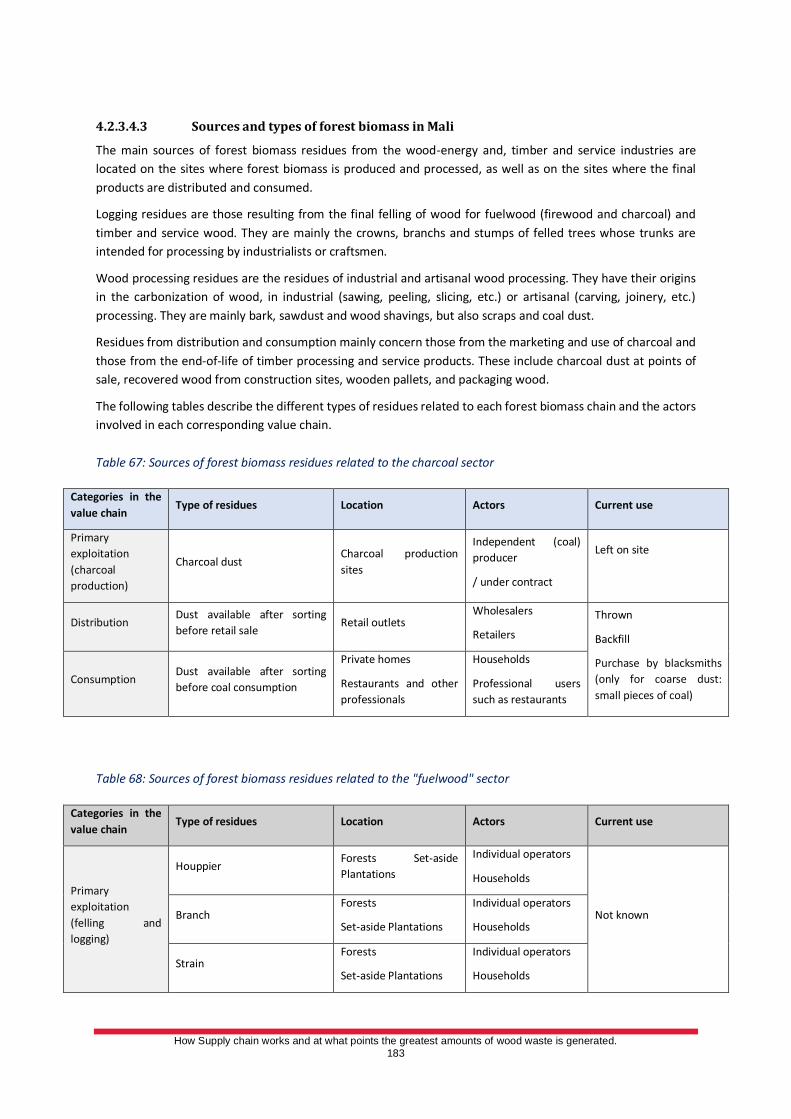
How Supply chain works and at what points the greatest amounts of wood waste is generated.
183
4.2.3.4.3 Sources and types of forest biomass in Mali
The main sources of forest biomass residues from the wood-energy and, timber and service industries are
located on the sites where forest biomass is produced and processed, as well as on the sites where the final
products are distributed and consumed.
Logging residues are those resulting from the final felling of wood for fuelwood (firewood and charcoal) and
timber and service wood. They are mainly the crowns, branchs and stumps of felled trees whose trunks are
intended for processing by industrialists or craftsmen.
Wood processing residues are the residues of industrial and artisanal wood processing. They have their origins
in the carbonization of wood, in industrial (sawing, peeling, slicing, etc.) or artisanal (carving, joinery, etc.)
processing. They are mainly bark, sawdust and wood shavings, but also scraps and coal dust.
Residues from distribution and consumption mainly concern those from the marketing and use of charcoal and
those from the end-of-life of timber processing and service products. These include charcoal dust at points of
sale, recovered wood from construction sites, wooden pallets, and packaging wood.
The following tables describe the different types of residues related to each forest biomass chain and the actors
involved in each corresponding value chain.
Table 67: Sources of forest biomass residues related to the charcoal sector
Categories in the
value chain Type of residues Location Actors Current use
Primary
exploitation
(charcoal
production)
Charcoal dust Charcoal production
sites
Independent (coal)
producer
/ under contract
Left on site
Distribution Dust available after sorting
before retail sale Retail outlets
Wholesalers
Retailers
Thrown
Backfill
Purchase by blacksmiths
(only for coarse dust:
small pieces of coal)
Consumption Dust available after sorting
before coal consumption
Private homes
Restaurants and other
professionals
Households
Professional users
such as restaurants
Table 68: Sources of forest biomass residues related to the "fuelwood" sector
Categories in the
value chain Type of residues Location Actors Current use
Primary
exploitation
(felling and
logging)
Houppier Forests Set-aside
Plantations
Individual operators
Households
Not known Branch Forests
Set-aside Plantations
Individual operators
Households
Strain Forests
Set-aside Plantations
Individual operators
Households
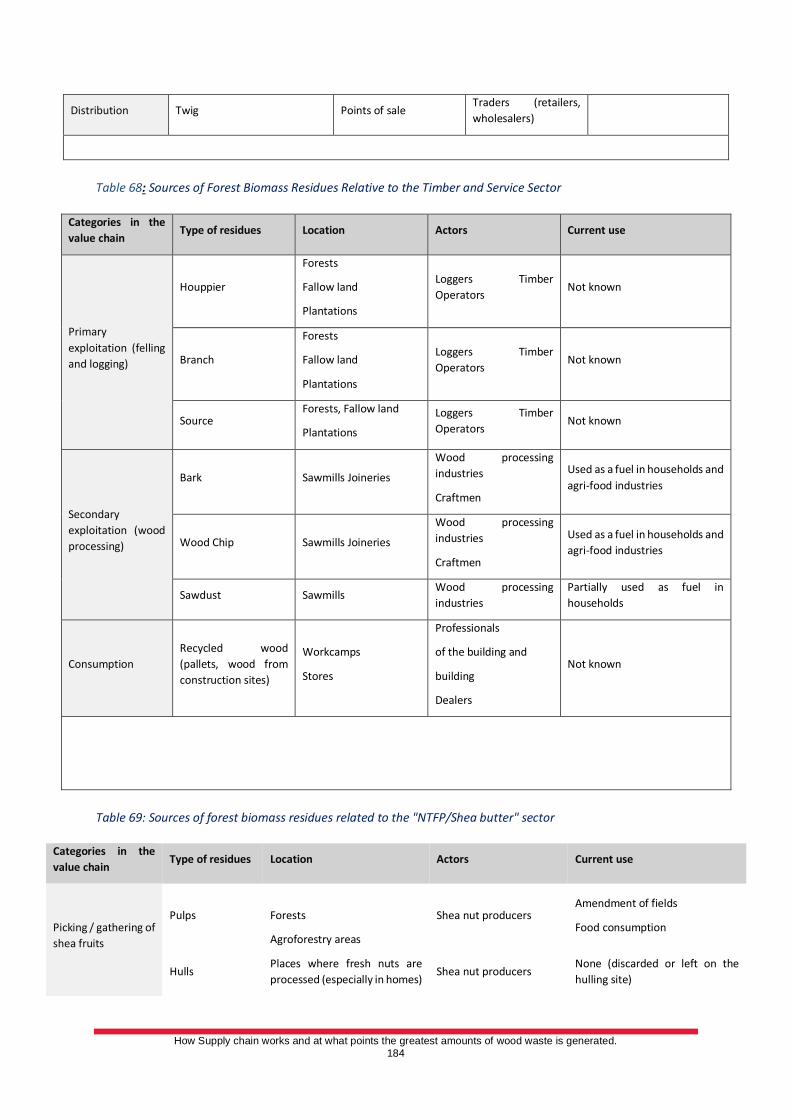
How Supply chain works and at what points the greatest amounts of wood waste is generated.
184
Distribution Twig Points of sale Traders (retailers,
wholesalers)
Table 68: Sources of Forest Biomass Residues Relative to the Timber and Service Sector
Categories in the
value chain Type of residues Location Actors Current use
Primary
exploitation (felling
and logging)
Houppier
Forests
Fallow land
Plantations
Loggers Timber
Operators Not known
Branch
Forests
Fallow land
Plantations
Loggers Timber
Operators Not known
Source Forests, Fallow land
Plantations
Loggers Timber
Operators Not known
Secondary
exploitation (wood
processing)
Bark Sawmills Joineries
Wood processing
industries
Craftmen
Used as a fuel in households and
agri-food industries
Wood Chip Sawmills Joineries
Wood processing
industries
Craftmen
Used as a fuel in households and
agri-food industries
Sawdust Sawmills Wood processing
industries
Partially used as fuel in
households
Consumption
Recycled wood
(pallets, wood from
construction sites)
Workcamps
Stores
Professionals
of the building and
building
Dealers
Not known
Table 69: Sources of forest biomass residues related to the "NTFP/Shea butter" sector
Categories in the
value chain Type of residues Location Actors Current use
Picking / gathering of
shea fruits
Pulps
Forests
Agroforestry areas
Shea nut producers Amendment of fields
Food consumption
Hulls Places where fresh nuts are
processed (especially in homes) Shea nut producers
None (discarded or left on the
hulling site)
How Supply chain works and at what points the greatest amounts of wood waste is generated.
185
Transformation of
almonds into butter
Tourteaux
Places of artisanal production
of shea butter (houses of
individual or collective
processors)
Butter production plant
Butter production groups
/ cooperatives
Individual transformers
Shea processing
industries
Use as fuel (bakeries...)
Compost production
Sewage water74
Places of artisanal production
of shea butter (houses of
individual or collective
processors)
Butter production groups
/ cooperatives
Individual transformers
None (discarded)
Black residue75
Places of artisanal production
of shea butter (houses of
individual or collective
processors)
Butter production groups
/ cooperatives
Individual transformers
Use as fuel
4.2.3.4.4 Sources and types of forest biomass residue in Mali
Landlocked and characterized by a Saharan climate in the north, a Sahelo-Sudanian climate in the centre and a
Sudano-Guinean climate in the south, Mali is made up of forests of modified natural and semi-natural types as
well as forest plantations and other wooded or tree-covered land, according to the classification defined by the
FAO. With an estimated standing volume of nearly 520 million m3, its national forest estate is spread over nearly
32 million ha, representing about 25% of the territory, and comprises mainly shrubby to tree-covered savannah
and open or gallery forests, half of which are agroforestry parks or fallow land.
Traditional biomass, particularly firewood and charcoal, is largely the main fuel used by the population to meet
its energy needs, accounting for nearly 90% of the total. Due to population growth and low forest productivity,
there is a strong imbalance between supply and demand for wood energy, especially in the supply basins of
large cities, such as Bamako, where the projection for 2025 shows an annual negative balance of more than
2,000,000 tonnes of wood energy.
In view of the current context linked to the degradation of forest resources, the use of forest biomass residues
for the production of thermal energy or even electrification would be necessary in order to increase the country's
energy supply. In the wood energy sector, the most promising residues in terms of energy recovery seem to be
coal dust. Indeed, which can represent up to 20% of the total weight of a sack of charcoal, fairly large deposits
of fine and coarse dust could be collected in large cities, especially from charcoal distributors, particularly
retailers sorting before sale and, to a lesser extent, from end consumers buying by the sack, particularly relatively
well-off households or professionals such as restaurant owners. Once mixed with a binder and then compacted
using a press, this raw material would be used to produce biochar as an alternative fuel to charcoal.
As for the timber and service sector, residues generated in sawmills, such as sawdust or wood chips, seem to
have little potential for valorization in the country. With a low production of wood specifically dedicated to this
sector and a low level of industrialisation for processing, the deposits of these biomasses are indeed not very
concentrated and scattered in the various small artisanal sawmills. Moreover, according to local sources, poultry
farmers are already using these biomasses as litter in poultry houses.
74 Liquid residue after decanting of the liquid cake obtained after churning of the crushed amalgamates 75 Residue obtained after settling of the oil (liquid butter)
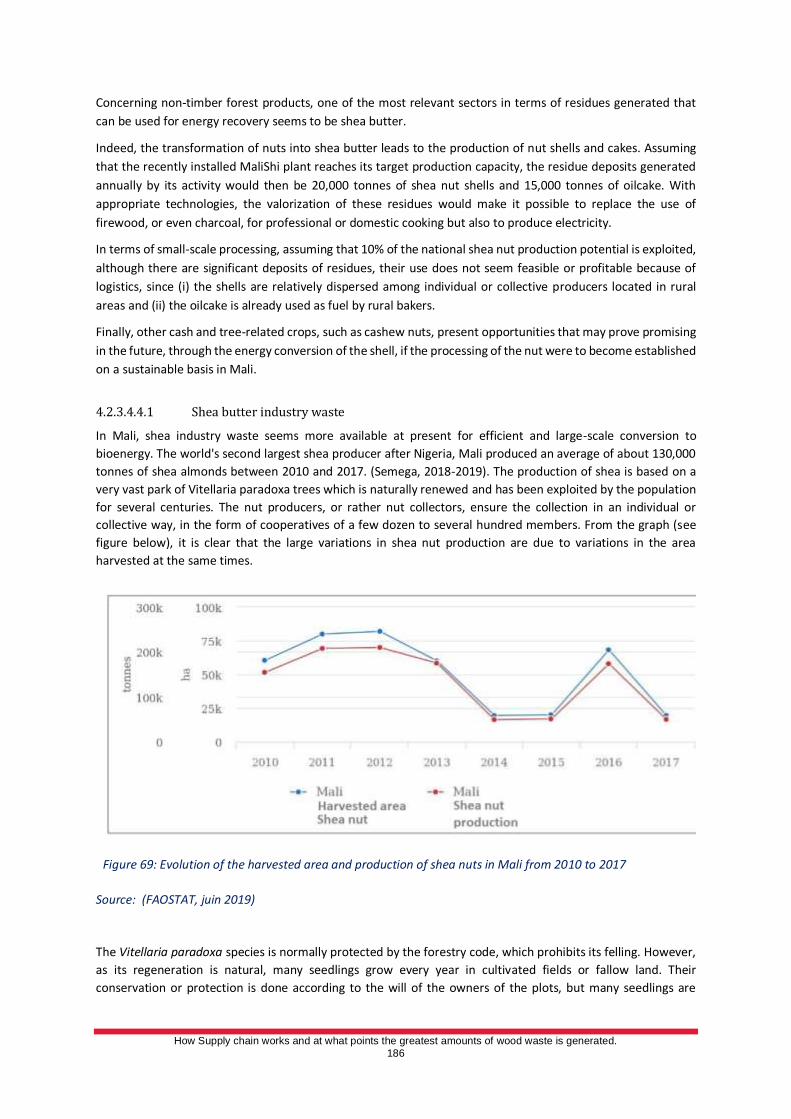
How Supply chain works and at what points the greatest amounts of wood waste is generated.
186
Concerning non-timber forest products, one of the most relevant sectors in terms of residues generated that
can be used for energy recovery seems to be shea butter.
Indeed, the transformation of nuts into shea butter leads to the production of nut shells and cakes. Assuming
that the recently installed MaliShi plant reaches its target production capacity, the residue deposits generated
annually by its activity would then be 20,000 tonnes of shea nut shells and 15,000 tonnes of oilcake. With
appropriate technologies, the valorization of these residues would make it possible to replace the use of
firewood, or even charcoal, for professional or domestic cooking but also to produce electricity.
In terms of small-scale processing, assuming that 10% of the national shea nut production potential is exploited,
although there are significant deposits of residues, their use does not seem feasible or profitable because of
logistics, since (i) the shells are relatively dispersed among individual or collective producers located in rural
areas and (ii) the oilcake is already used as fuel by rural bakers.
Finally, other cash and tree-related crops, such as cashew nuts, present opportunities that may prove promising
in the future, through the energy conversion of the shell, if the processing of the nut were to become established
on a sustainable basis in Mali.
4.2.3.4.4.1 Shea butter industry waste
In Mali, shea industry waste seems more available at present for efficient and large-scale conversion to
bioenergy. The world's second largest shea producer after Nigeria, Mali produced an average of about 130,000
tonnes of shea almonds between 2010 and 2017. (Semega, 2018-2019). The production of shea is based on a
very vast park of Vitellaria paradoxa trees which is naturally renewed and has been exploited by the population
for several centuries. The nut producers, or rather nut collectors, ensure the collection in an individual or
collective way, in the form of cooperatives of a few dozen to several hundred members. From the graph (see
figure below), it is clear that the large variations in shea nut production are due to variations in the area
harvested at the same times.
Figure 69: Evolution of the harvested area and production of shea nuts in Mali from 2010 to 2017
Source: (FAOSTAT, juin 2019)
The Vitellaria paradoxa species is normally protected by the forestry code, which prohibits its felling. However,
as its regeneration is natural, many seedlings grow every year in cultivated fields or fallow land. Their
conservation or protection is done according to the will of the owners of the plots, but many seedlings are
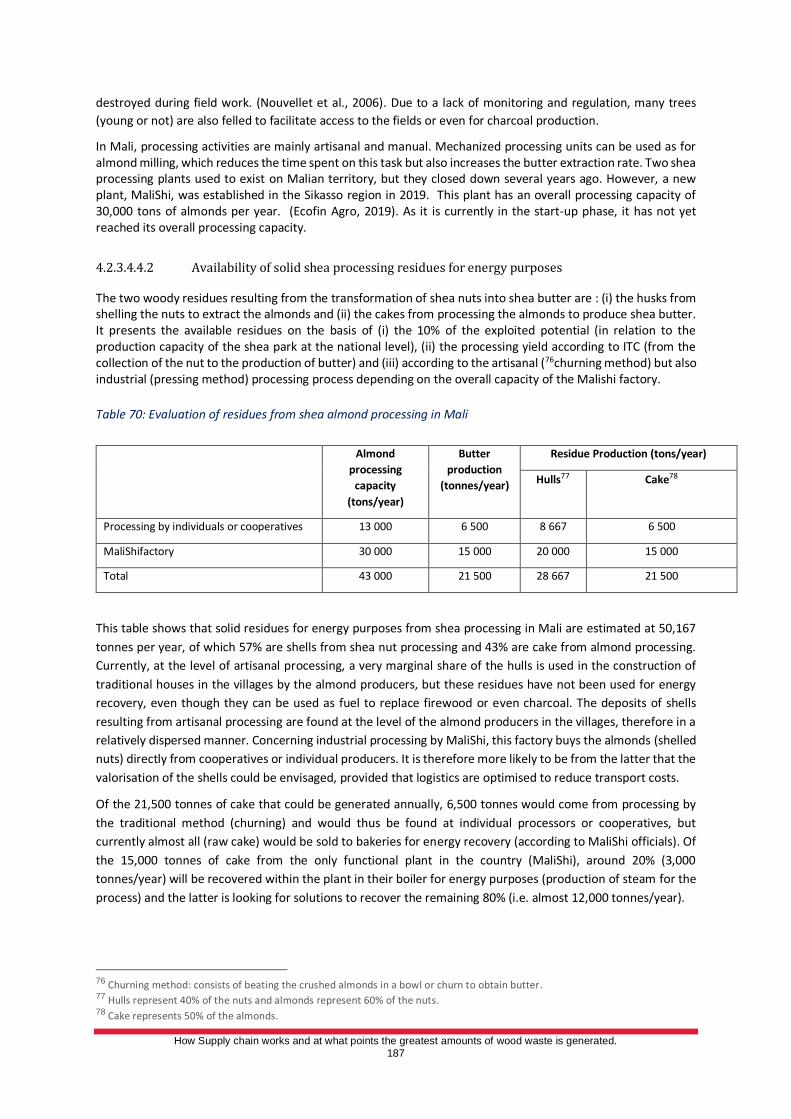
How Supply chain works and at what points the greatest amounts of wood waste is generated.
187
destroyed during field work. (Nouvellet et al., 2006). Due to a lack of monitoring and regulation, many trees
(young or not) are also felled to facilitate access to the fields or even for charcoal production.
In Mali, processing activities are mainly artisanal and manual. Mechanized processing units can be used as for almond milling, which reduces the time spent on this task but also increases the butter extraction rate. Two shea processing plants used to exist on Malian territory, but they closed down several years ago. However, a new plant, MaliShi, was established in the Sikasso region in 2019. This plant has an overall processing capacity of 30,000 tons of almonds per year. (Ecofin Agro, 2019). As it is currently in the start-up phase, it has not yet reached its overall processing capacity.
4.2.3.4.4.2 Availability of solid shea processing residues for energy purposes
The two woody residues resulting from the transformation of shea nuts into shea butter are : (i) the husks from shelling the nuts to extract the almonds and (ii) the cakes from processing the almonds to produce shea butter. It presents the available residues on the basis of (i) the 10% of the exploited potential (in relation to the production capacity of the shea park at the national level), (ii) the processing yield according to ITC (from the collection of the nut to the production of butter) and (iii) according to the artisanal (76churning method) but also industrial (pressing method) processing process depending on the overall capacity of the Malishi factory.
Table 70: Evaluation of residues from shea almond processing in Mali
This table shows that solid residues for energy purposes from shea processing in Mali are estimated at 50,167
tonnes per year, of which 57% are shells from shea nut processing and 43% are cake from almond processing.
Currently, at the level of artisanal processing, a very marginal share of the hulls is used in the construction of
traditional houses in the villages by the almond producers, but these residues have not been used for energy
recovery, even though they can be used as fuel to replace firewood or even charcoal. The deposits of shells
resulting from artisanal processing are found at the level of the almond producers in the villages, therefore in a
relatively dispersed manner. Concerning industrial processing by MaliShi, this factory buys the almonds (shelled
nuts) directly from cooperatives or individual producers. It is therefore more likely to be from the latter that the
valorisation of the shells could be envisaged, provided that logistics are optimised to reduce transport costs.
Of the 21,500 tonnes of cake that could be generated annually, 6,500 tonnes would come from processing by
the traditional method (churning) and would thus be found at individual processors or cooperatives, but
currently almost all (raw cake) would be sold to bakeries for energy recovery (according to MaliShi officials). Of
the 15,000 tonnes of cake from the only functional plant in the country (MaliShi), around 20% (3,000
tonnes/year) will be recovered within the plant in their boiler for energy purposes (production of steam for the
process) and the latter is looking for solutions to recover the remaining 80% (i.e. almost 12,000 tonnes/year).
76 Churning method: consists of beating the crushed almonds in a bowl or churn to obtain butter. 77 Hulls represent 40% of the nuts and almonds represent 60% of the nuts. 78 Cake represents 50% of the almonds.
Almond
processing
capacity
(tons/year)
Butter
production
(tonnes/year)
Residue Production (tons/year)
Hulls77 Cake78
Processing by individuals or cooperatives 13 000 6 500 8 667 6 500
MaliShifactory 30 000 15 000 20 000 15 000
Total 43 000 21 500 28 667 21 500
How Supply chain works and at what points the greatest amounts of wood waste is generated.
188
4.2.3.5. Case of Senegal
4.2.3.5.1 Forest resources in Senegal
Senegal has been subdivided into six relatively homogeneous eco-geographical zones (ZEG) from the point of
view of the potentialities and constraints related to forestry and rural development with various types of
vegetation (steppes, savannahs and forests) in relation to the climatic gradient and topography.
• Shrubby and tree-covered regions covering 3,244,448 ha (PFS, 2014) in the Sahelian domain. They are
characterized by a very open woody stratum dominated by thorny trees (Acacia senegal, Balanites
aegyptiaca, Boscia senegalensis ...) and accompanied by a discontinuous herbaceous carpet dominated
by annual grasses;
• Shrubby and wooded savannahs, with 8,120,513 ha (PFS, 2014), located in the south of the Sahelian
domain and in the Sudanian domain;
• The clear forests, with 1,785,457 ha (PFS, 2014), correspond to the southern part of the Sudanese
domain, with a woody stratum whose cover is higher than 50%;
• Gallery forests, representing 725,177 ha (PFS, 2014), corresponding to the Sub-guinean domain
(extreme south-west of the country) ;
The global diagnosis of the forest sub-sector, carried out within the framework of the elaboration of the forest
policy document 2005 - 2025 carried out in 2006 and its revision in 2014, confirmed a trend of degradation and
regression of forest resources under the effect of recurrent drought combined with harmful anthropogenic
actions such as: abusive cutting, recurrent bush fires, overgrazing and agricultural clearing.
In addition to these large plant formations of the different climatic regions, there are different types of
vegetation linked to particular topographic conditions, these are the:
• Gallery forests bordering watercourses and located in the Sudanian and Sub-guinean domains;
• Fluviolacustrine vegetation with hydrophytes such as Pistia stratiotes, Typha australis, Nymphea lotus...
(invasive species);
• Mangroves with Avicennia africana and Rhizophora racemosain estuaries;
• Niayes, a coastal wetland in the middle of the Sahel with a zonal vegetation with Sudano-Guinean
species;
• Specific plant formations due to the dominance of a single species (oil palm grove,rôneraie, bamboo
grove or gonakeraie).
4.2.3.5.2 Analysis of wood energy supply and demand
In Senegal, as in other Sahelian countries, traditional fuels (firewood and charcoal) are the main sources of
household energy. Indeed, Senegal depends on more than 70% of forest resources to meet its cooking energy
needs (Frank Richter, Marion and Abdoul A SOW, August 2014). This is one of the causes of the degradation of
forest resources, especially when combined with agricultural clearing and bush fires.
In 2013, with the support of PROGEDE 2, a national survey was conducted on domestic fuel consumption and
household practices. They reveal that the quantities of cooking fuels used in Senegal are :
• 1,735,219 tonnes for firewood;
• 482,248 tonnes for charcoal;
• 108,001 tonnes for butane gas.
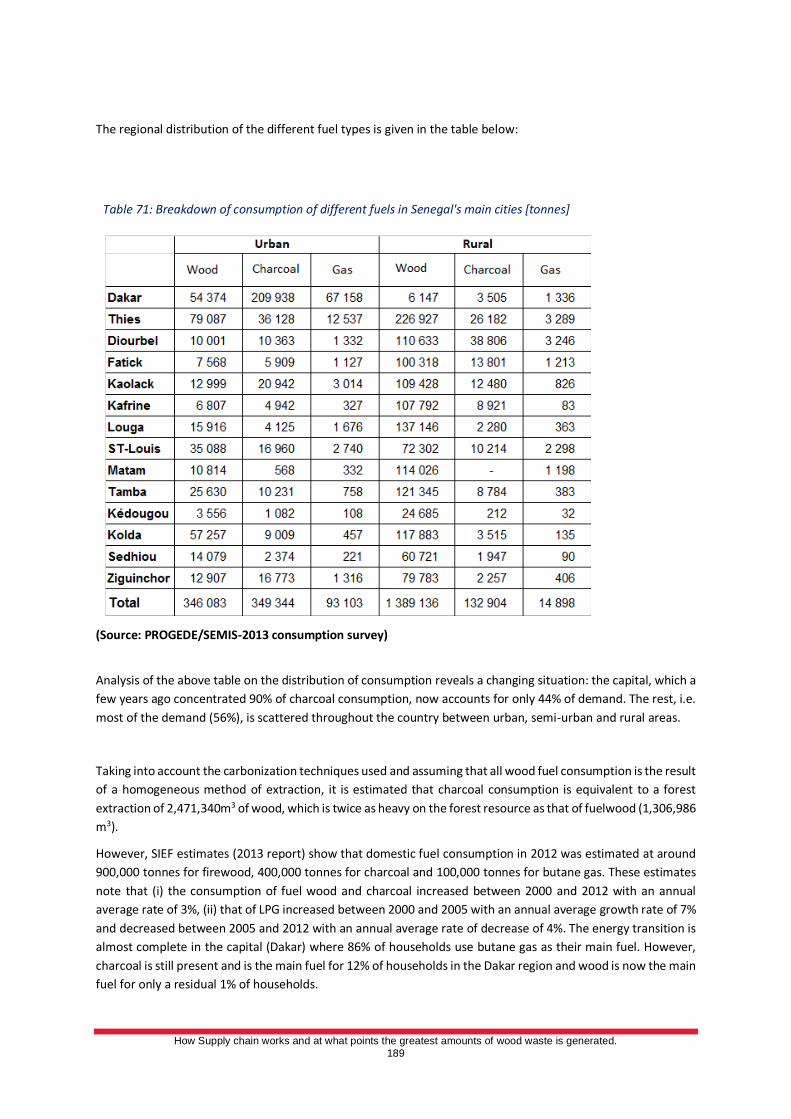
How Supply chain works and at what points the greatest amounts of wood waste is generated.
189
The regional distribution of the different fuel types is given in the table below:
Table 71: Breakdown of consumption of different fuels in Senegal's main cities [tonnes]
(Source: PROGEDE/SEMIS-2013 consumption survey)
Analysis of the above table on the distribution of consumption reveals a changing situation: the capital, which a
few years ago concentrated 90% of charcoal consumption, now accounts for only 44% of demand. The rest, i.e.
most of the demand (56%), is scattered throughout the country between urban, semi-urban and rural areas.
Taking into account the carbonization techniques used and assuming that all wood fuel consumption is the result
of a homogeneous method of extraction, it is estimated that charcoal consumption is equivalent to a forest
extraction of 2,471,340m3 of wood, which is twice as heavy on the forest resource as that of fuelwood (1,306,986
m3).
However, SIEF estimates (2013 report) show that domestic fuel consumption in 2012 was estimated at around
900,000 tonnes for firewood, 400,000 tonnes for charcoal and 100,000 tonnes for butane gas. These estimates
note that (i) the consumption of fuel wood and charcoal increased between 2000 and 2012 with an annual
average rate of 3%, (ii) that of LPG increased between 2000 and 2005 with an annual average growth rate of 7%
and decreased between 2005 and 2012 with an annual average rate of decrease of 4%. The energy transition is
almost complete in the capital (Dakar) where 86% of households use butane gas as their main fuel. However,
charcoal is still present and is the main fuel for 12% of households in the Dakar region and wood is now the main
fuel for only a residual 1% of households.
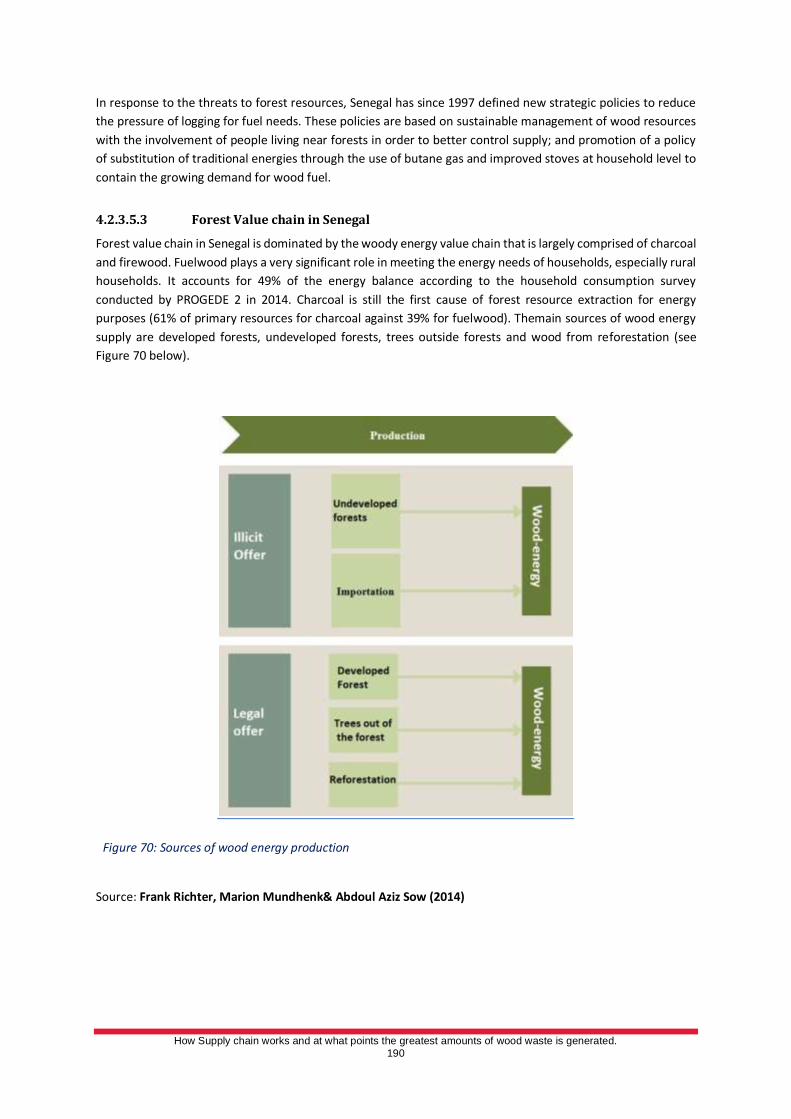
How Supply chain works and at what points the greatest amounts of wood waste is generated.
190
In response to the threats to forest resources, Senegal has since 1997 defined new strategic policies to reduce
the pressure of logging for fuel needs. These policies are based on sustainable management of wood resources
with the involvement of people living near forests in order to better control supply; and promotion of a policy
of substitution of traditional energies through the use of butane gas and improved stoves at household level to
contain the growing demand for wood fuel.
4.2.3.5.3 Forest Value chain in Senegal
Forest value chain in Senegal is dominated by the woody energy value chain that is largely comprised of charcoal
and firewood. Fuelwood plays a very significant role in meeting the energy needs of households, especially rural
households. It accounts for 49% of the energy balance according to the household consumption survey
conducted by PROGEDE 2 in 2014. Charcoal is still the first cause of forest resource extraction for energy
purposes (61% of primary resources for charcoal against 39% for fuelwood). Themain sources of wood energy
supply are developed forests, undeveloped forests, trees outside forests and wood from reforestation (see
Figure 70 below).
Figure 70: Sources of wood energy production
Source: Frank Richter, Marion Mundhenk& Abdoul Aziz Sow (2014)
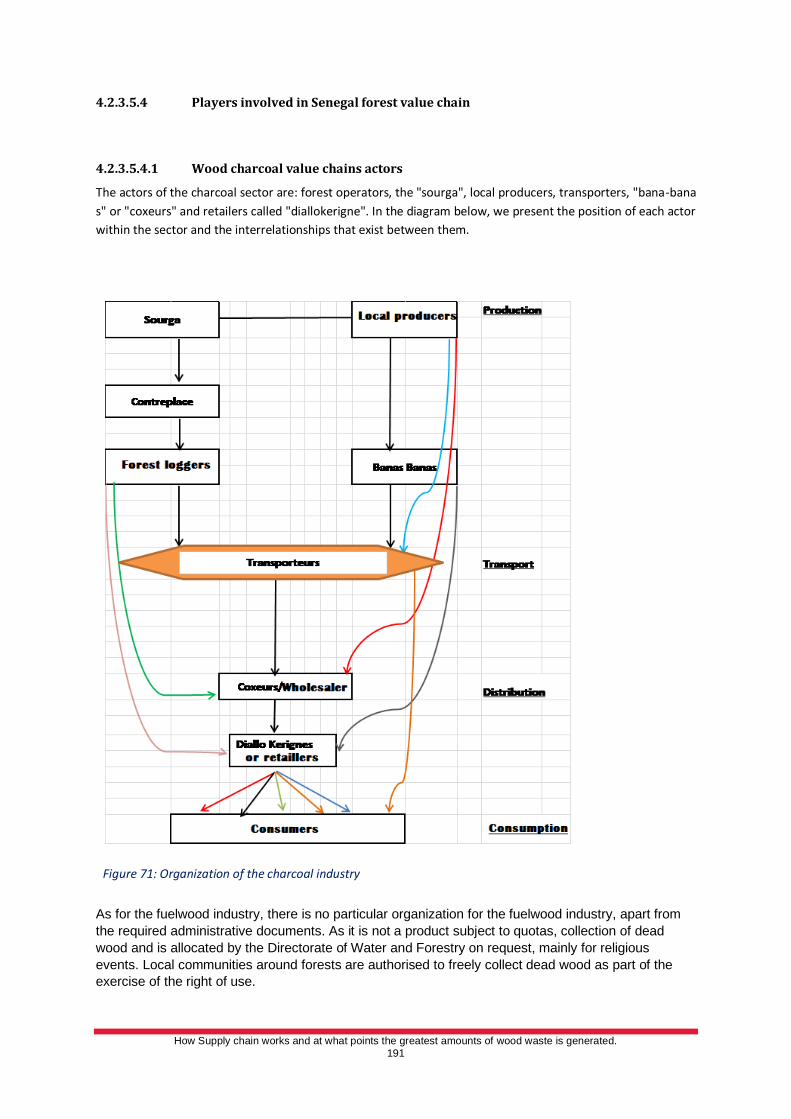
How Supply chain works and at what points the greatest amounts of wood waste is generated.
191
4.2.3.5.4 Players involved in Senegal forest value chain
4.2.3.5.4.1 Wood charcoal value chains actors
The actors of the charcoal sector are: forest operators, the "sourga", local producers, transporters, "bana-bana
s" or "coxeurs" and retailers called "diallokerigne". In the diagram below, we present the position of each actor
within the sector and the interrelationships that exist between them.
Figure 71: Organization of the charcoal industry
As for the fuelwood industry, there is no particular organization for the fuelwood industry, apart from
the required administrative documents. As it is not a product subject to quotas, collection of dead
wood and is allocated by the Directorate of Water and Forestry on request, mainly for religious
events. Local communities around forests are authorised to freely collect dead wood as part of the
exercise of the right of use.
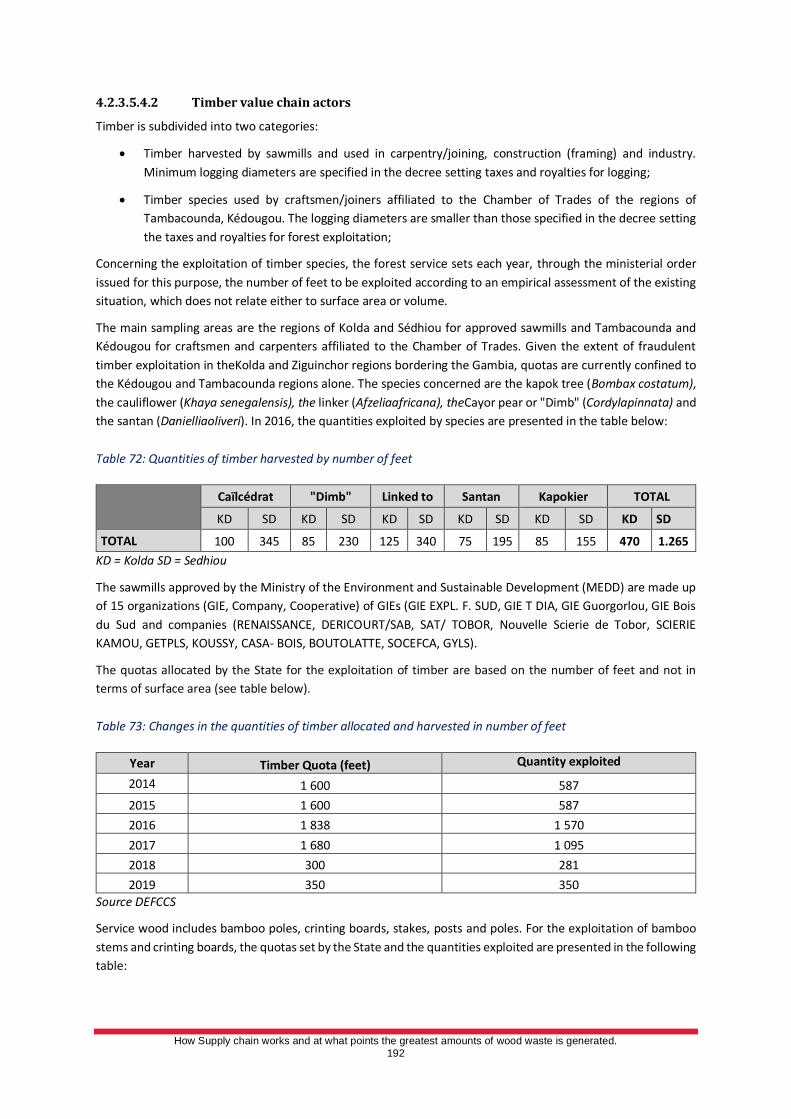
How Supply chain works and at what points the greatest amounts of wood waste is generated.
192
4.2.3.5.4.2 Timber value chain actors
Timber is subdivided into two categories:
• Timber harvested by sawmills and used in carpentry/joining, construction (framing) and industry.
Minimum logging diameters are specified in the decree setting taxes and royalties for logging;
• Timber species used by craftsmen/joiners affiliated to the Chamber of Trades of the regions of
Tambacounda, Kédougou. The logging diameters are smaller than those specified in the decree setting
the taxes and royalties for forest exploitation;
Concerning the exploitation of timber species, the forest service sets each year, through the ministerial order
issued for this purpose, the number of feet to be exploited according to an empirical assessment of the existing
situation, which does not relate either to surface area or volume.
The main sampling areas are the regions of Kolda and Sédhiou for approved sawmills and Tambacounda and
Kédougou for craftsmen and carpenters affiliated to the Chamber of Trades. Given the extent of fraudulent
timber exploitation in theKolda and Ziguinchor regions bordering the Gambia, quotas are currently confined to
the Kédougou and Tambacounda regions alone. The species concerned are the kapok tree (Bombax costatum),
the cauliflower (Khaya senegalensis), the linker (Afzeliaafricana), theCayor pear or "Dimb" (Cordylapinnata) and
the santan (Danielliaoliveri). In 2016, the quantities exploited by species are presented in the table below:
Table 72: Quantities of timber harvested by number of feet
Caïlcédrat "Dimb" Linked to Santan Kapokier TOTAL
KD SD KD SD KD SD KD SD KD SD KD SD
TOTAL 100 345 85 230 125 340 75 195 85 155 470 1.265
KD = Kolda SD = Sedhiou
The sawmills approved by the Ministry of the Environment and Sustainable Development (MEDD) are made up
of 15 organizations (GIE, Company, Cooperative) of GIEs (GIE EXPL. F. SUD, GIE T DIA, GIE Guorgorlou, GIE Bois
du Sud and companies (RENAISSANCE, DERICOURT/SAB, SAT/ TOBOR, Nouvelle Scierie de Tobor, SCIERIE
KAMOU, GETPLS, KOUSSY, CASA- BOIS, BOUTOLATTE, SOCEFCA, GYLS).
The quotas allocated by the State for the exploitation of timber are based on the number of feet and not in
terms of surface area (see table below).
Table 73: Changes in the quantities of timber allocated and harvested in number of feet
Year Timber Quota (feet) Quantity exploited
2014 1 600 587
2015 1 600 587
2016 1 838 1 570
2017 1 680 1 095
2018 300 281
2019 350 350
Source DEFCCS
Service wood includes bamboo poles, crinting boards, stakes, posts and poles. For the exploitation of bamboo
stems and crinting boards, the quotas set by the State and the quantities exploited are presented in the following
table:
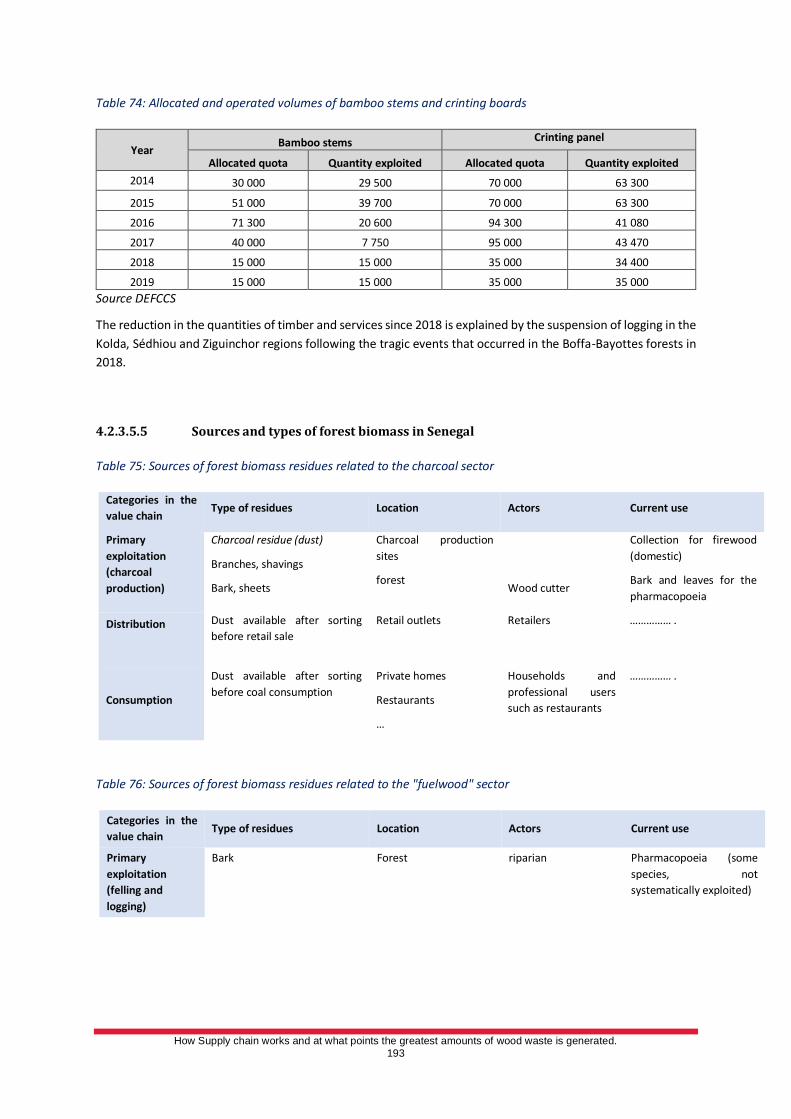
How Supply chain works and at what points the greatest amounts of wood waste is generated.
193
Table 74: Allocated and operated volumes of bamboo stems and crinting boards
Year Bamboo stems Crinting panel
Allocated quota Quantity exploited Allocated quota Quantity exploited
2014 30 000 29 500 70 000 63 300
2015 51 000 39 700 70 000 63 300
2016 71 300 20 600 94 300 41 080
2017 40 000 7 750 95 000 43 470
2018 15 000 15 000 35 000 34 400
2019 15 000 15 000 35 000 35 000
Source DEFCCS
The reduction in the quantities of timber and services since 2018 is explained by the suspension of logging in the
Kolda, Sédhiou and Ziguinchor regions following the tragic events that occurred in the Boffa-Bayottes forests in
2018.
4.2.3.5.5 Sources and types of forest biomass in Senegal
Table 75: Sources of forest biomass residues related to the charcoal sector
Categories in the
value chain Type of residues Location Actors Current use
Primary
exploitation
(charcoal
production)
Charcoal residue (dust)
Branches, shavings
Bark, sheets
Charcoal production
sites
forest
Wood cutter
Collection for firewood
(domestic)
Bark and leaves for the
pharmacopoeia
Distribution
Dust available after sorting
before retail sale
Retail outlets Retailers …………… .
Consumption
Dust available after sorting
before coal consumption
Private homes
Restaurants
…
Households and
professional users
such as restaurants
…………… .
Table 76: Sources of forest biomass residues related to the "fuelwood" sector
Categories in the
value chain Type of residues Location Actors Current use
Primary
exploitation
(felling and
logging)
Bark Forest riparian Pharmacopoeia (some
species, not
systematically exploited)
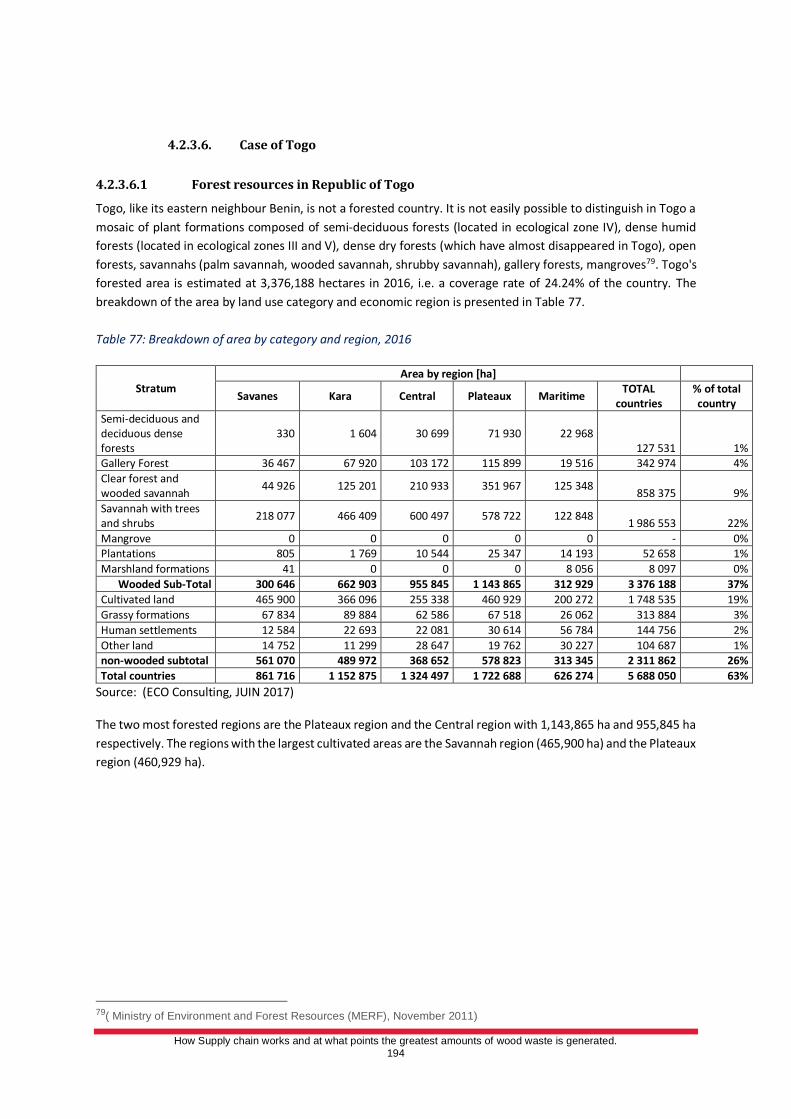
How Supply chain works and at what points the greatest amounts of wood waste is generated.
194
4.2.3.6. Case of Togo
4.2.3.6.1 Forest resources in Republic of Togo
Togo, like its eastern neighbour Benin, is not a forested country. It is not easily possible to distinguish in Togo a
mosaic of plant formations composed of semi-deciduous forests (located in ecological zone IV), dense humid
forests (located in ecological zones III and V), dense dry forests (which have almost disappeared in Togo), open
forests, savannahs (palm savannah, wooded savannah, shrubby savannah), gallery forests, mangroves79. Togo's
forested area is estimated at 3,376,188 hectares in 2016, i.e. a coverage rate of 24.24% of the country. The
breakdown of the area by land use category and economic region is presented in Table 77.
Table 77: Breakdown of area by category and region, 2016
Stratum Area by region [ha]
Savanes Kara Central Plateaux Maritime TOTAL
countries % of total country
Semi-deciduous and deciduous dense forests
330 1 604 30 699 71 930 22 968 127 531 1%
Gallery Forest 36 467 67 920 103 172 115 899 19 516 342 974 4%
Clear forest and wooded savannah
44 926 125 201 210 933 351 967 125 348 858 375 9%
Savannah with trees and shrubs
218 077 466 409 600 497 578 722 122 848 1 986 553 22%
Mangrove 0 0 0 0 0 - 0% Plantations 805 1 769 10 544 25 347 14 193 52 658 1%
Marshland formations 41 0 0 0 8 056 8 097 0%
Wooded Sub-Total 300 646 662 903 955 845 1 143 865 312 929 3 376 188 37%
Cultivated land 465 900 366 096 255 338 460 929 200 272 1 748 535 19%
Grassy formations 67 834 89 884 62 586 67 518 26 062 313 884 3%
Human settlements 12 584 22 693 22 081 30 614 56 784 144 756 2%
Other land 14 752 11 299 28 647 19 762 30 227 104 687 1% non-wooded subtotal 561 070 489 972 368 652 578 823 313 345 2 311 862 26%
Total countries 861 716 1 152 875 1 324 497 1 722 688 626 274 5 688 050 63%
Source: (ECO Consulting, JUIN 2017) The two most forested regions are the Plateaux region and the Central region with 1,143,865 ha and 955,845 ha
respectively. The regions with the largest cultivated areas are the Savannah region (465,900 ha) and the Plateaux
region (460,929 ha).
79( Ministry of Environment and Forest Resources (MERF), November 2011)
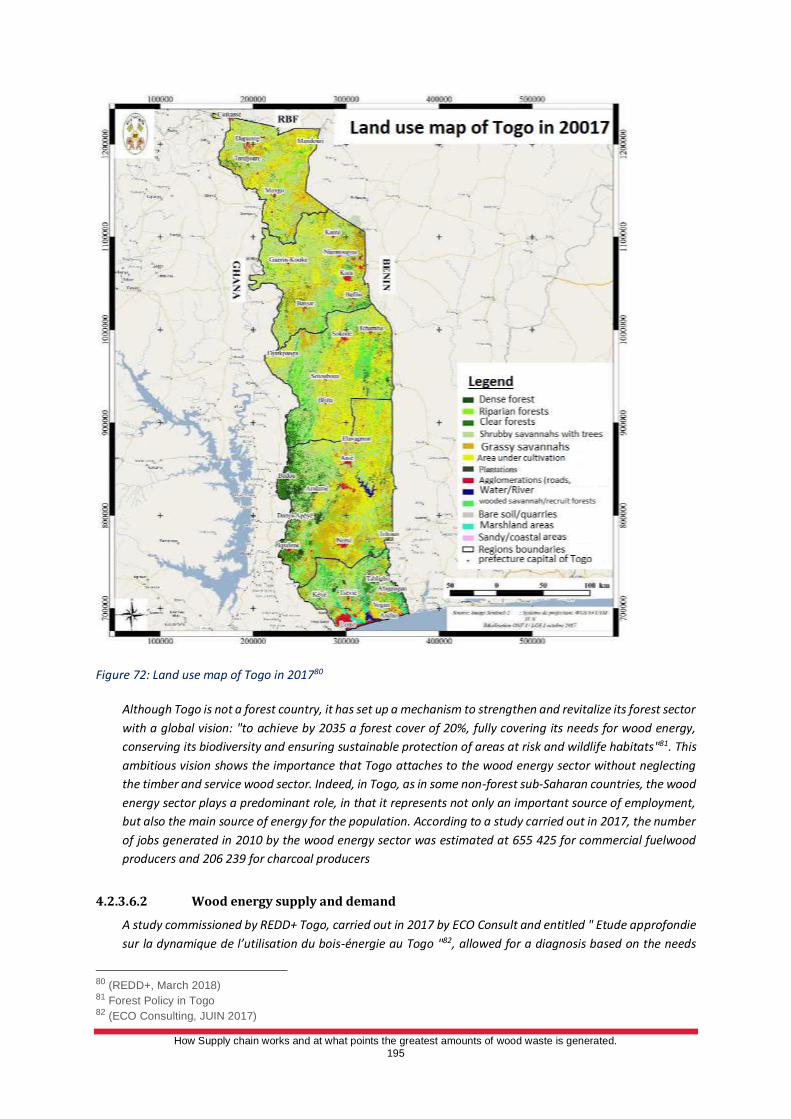
How Supply chain works and at what points the greatest amounts of wood waste is generated.
195
Figure 72: Land use map of Togo in 201780
Although Togo is not a forest country, it has set up a mechanism to strengthen and revitalize its forest sector
with a global vision: "to achieve by 2035 a forest cover of 20%, fully covering its needs for wood energy,
conserving its biodiversity and ensuring sustainable protection of areas at risk and wildlife habitats"81. This
ambitious vision shows the importance that Togo attaches to the wood energy sector without neglecting
the timber and service wood sector. Indeed, in Togo, as in some non-forest sub-Saharan countries, the wood
energy sector plays a predominant role, in that it represents not only an important source of employment,
but also the main source of energy for the population. According to a study carried out in 2017, the number
of jobs generated in 2010 by the wood energy sector was estimated at 655 425 for commercial fuelwood
producers and 206 239 for charcoal producers
4.2.3.6.2 Wood energy supply and demand
A study commissioned by REDD+ Togo, carried out in 2017 by ECO Consult and entitled " Etude approfondie
sur la dynamique de l’utilisation du bois-énergie au Togo "82, allowed for a diagnosis based on the needs
80 (REDD+, March 2018) 81 Forest Policy in Togo 82 (ECO Consulting, JUIN 2017)
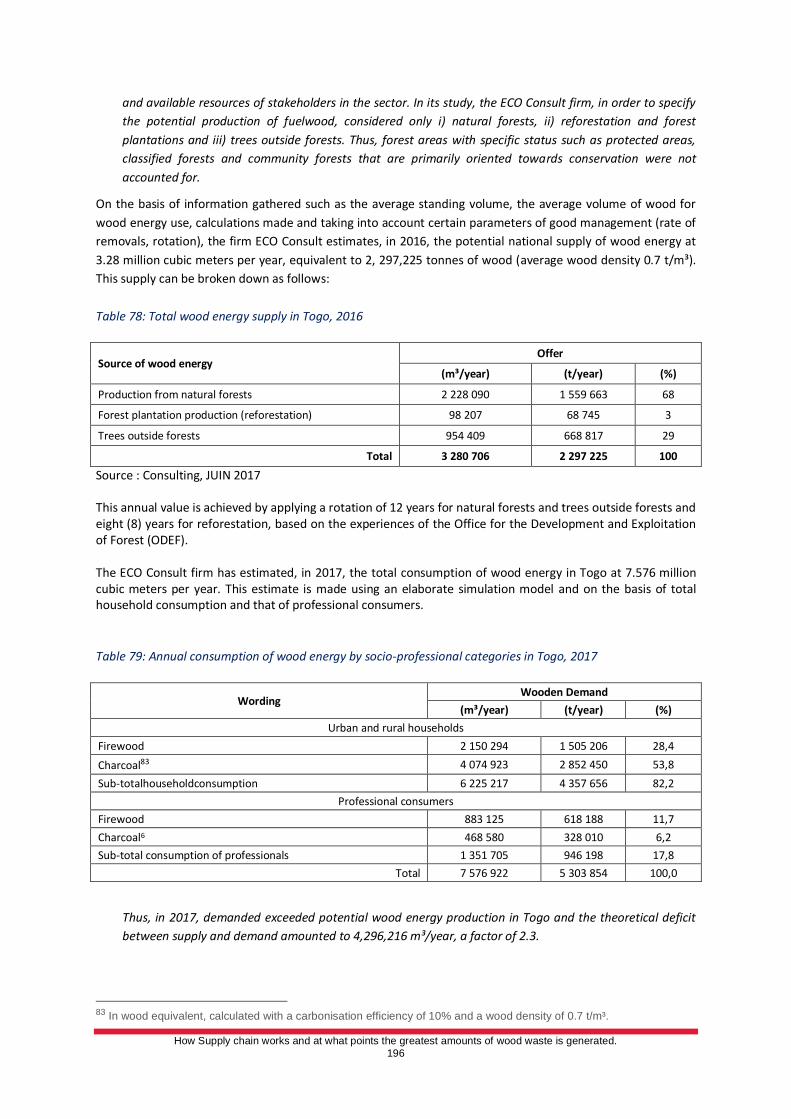
How Supply chain works and at what points the greatest amounts of wood waste is generated.
196
and available resources of stakeholders in the sector. In its study, the ECO Consult firm, in order to specify
the potential production of fuelwood, considered only i) natural forests, ii) reforestation and forest
plantations and iii) trees outside forests. Thus, forest areas with specific status such as protected areas,
classified forests and community forests that are primarily oriented towards conservation were not
accounted for.
On the basis of information gathered such as the average standing volume, the average volume of wood for
wood energy use, calculations made and taking into account certain parameters of good management (rate of
removals, rotation), the firm ECO Consult estimates, in 2016, the potential national supply of wood energy at
3.28 million cubic meters per year, equivalent to 2, 297,225 tonnes of wood (average wood density 0.7 t/m³).
This supply can be broken down as follows:
Table 78: Total wood energy supply in Togo, 2016
Source of wood energy Offer
(m³/year) (t/year) (%)
Production from natural forests 2 228 090 1 559 663 68
Forest plantation production (reforestation) 98 207 68 745 3
Trees outside forests 954 409 668 817 29
Total 3 280 706 2 297 225 100
Source : Consulting, JUIN 2017 This annual value is achieved by applying a rotation of 12 years for natural forests and trees outside forests and eight (8) years for reforestation, based on the experiences of the Office for the Development and Exploitation of Forest (ODEF). The ECO Consult firm has estimated, in 2017, the total consumption of wood energy in Togo at 7.576 million cubic meters per year. This estimate is made using an elaborate simulation model and on the basis of total household consumption and that of professional consumers.
Table 79: Annual consumption of wood energy by socio-professional categories in Togo, 2017
Wording Wooden Demand
(m³/year) (t/year) (%)
Urban and rural households
Firewood 2 150 294 1 505 206 28,4
Charcoal83 4 074 923 2 852 450 53,8
Sub-totalhouseholdconsumption 6 225 217 4 357 656 82,2
Professional consumers
Firewood 883 125 618 188 11,7
Charcoal6 468 580 328 010 6,2
Sub-total consumption of professionals 1 351 705 946 198 17,8
Total 7 576 922 5 303 854 100,0
Thus, in 2017, demanded exceeded potential wood energy production in Togo and the theoretical deficit
between supply and demand amounted to 4,296,216 m³/year, a factor of 2.3.
83 In wood equivalent, calculated with a carbonisation efficiency of 10% and a wood density of 0.7 t/m³.
How Supply chain works and at what points the greatest amounts of wood waste is generated.
197
4.2.3.6.3 Wood energy supply basins
The location of the main logging basins in each of the country's economic regions is illustrated in the following
figures84:
84(ECO Consulting, JUIN 2017)
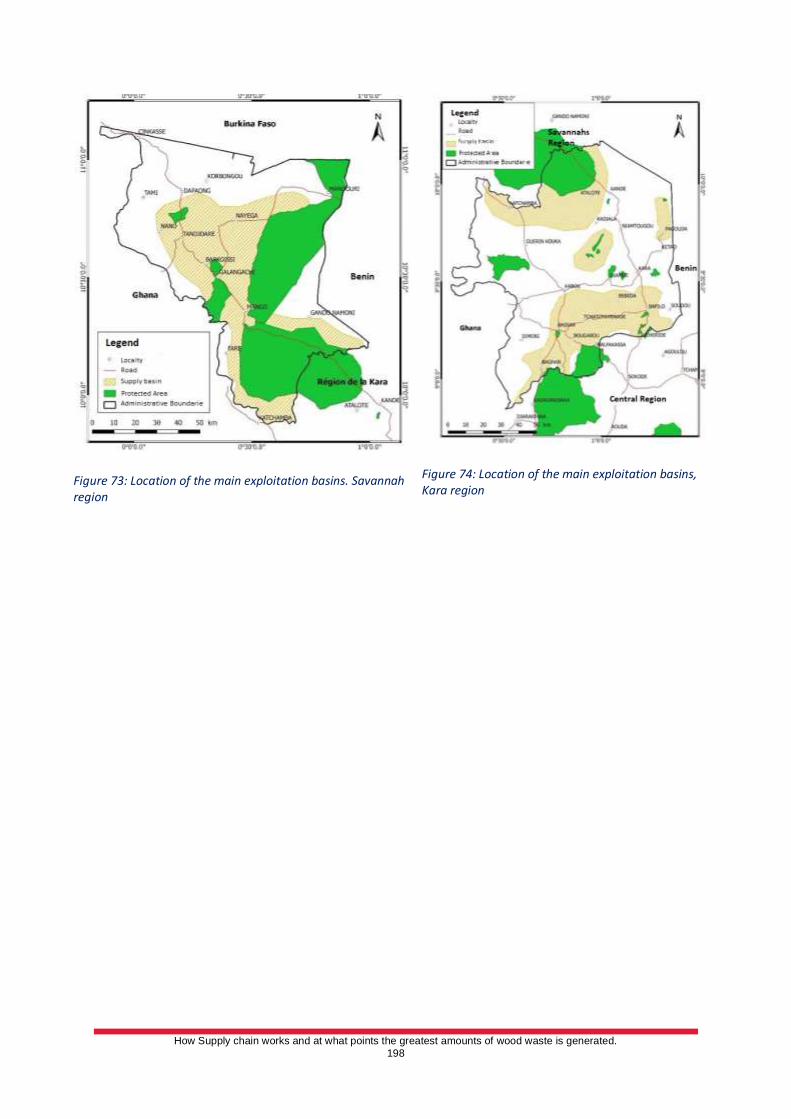
How Supply chain works and at what points the greatest amounts of wood waste is generated.
198
Figure 73: Location of the main exploitation basins. Savannah region
Figure 74: Location of the main exploitation basins, Kara region
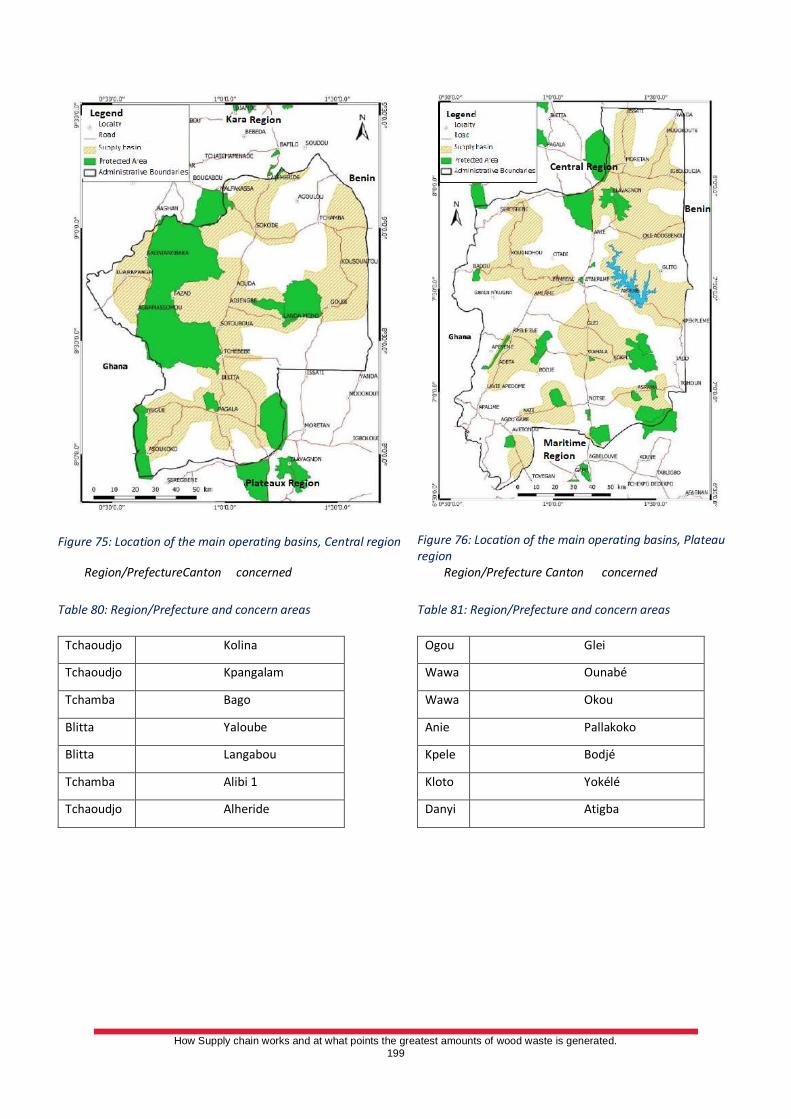
How Supply chain works and at what points the greatest amounts of wood waste is generated.
199
Figure 75: Location of the main operating basins, Central region
Figure 76: Location of the main operating basins, Plateau region
Region/PrefectureCanton concerned
Table 80: Region/Prefecture and concern areas
Tchaoudjo Kolina
Tchaoudjo Kpangalam
Tchamba Bago
Blitta Yaloube
Blitta Langabou
Tchamba Alibi 1
Tchaoudjo Alheride
Region/Prefecture Canton concerned
Table 81: Region/Prefecture and concern areas
Ogou Glei
Wawa Ounabé
Wawa Okou
Anie Pallakoko
Kpele Bodjé
Kloto Yokélé
Danyi Atigba
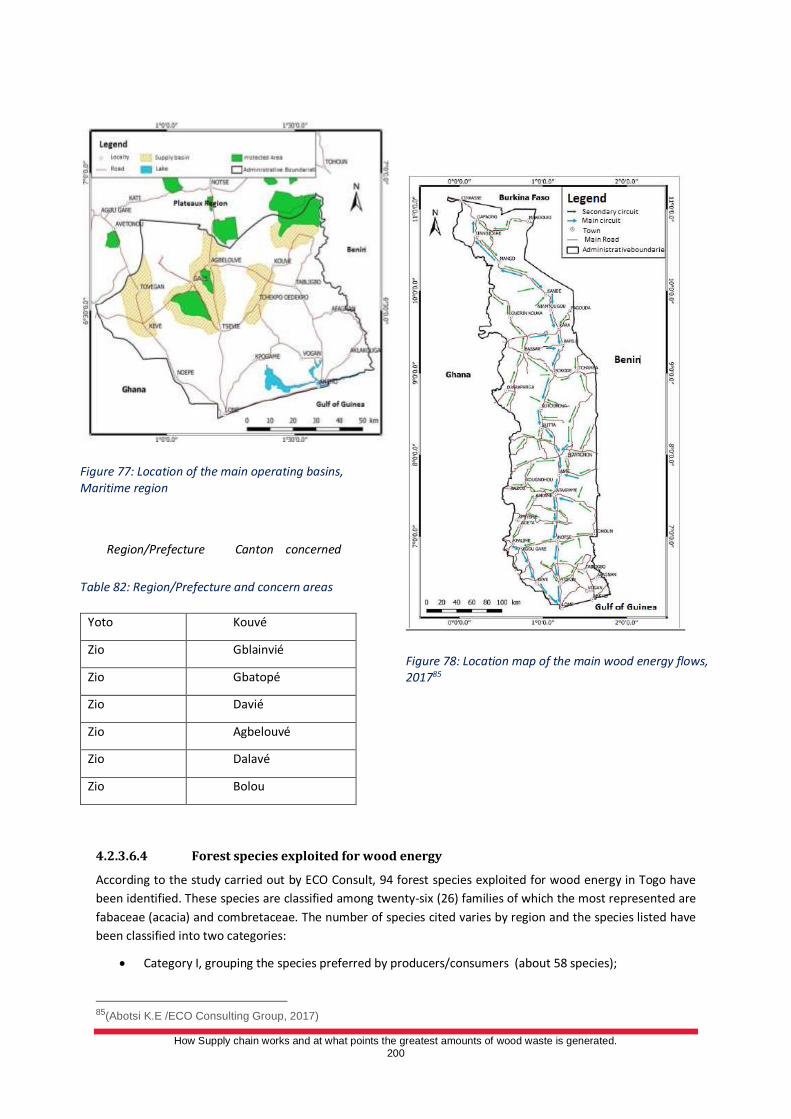
How Supply chain works and at what points the greatest amounts of wood waste is generated.
200
Figure 77: Location of the main operating basins, Maritime region
Region/Prefecture Canton concerned
Table 82: Region/Prefecture and concern areas
Yoto Kouvé
Zio Gblainvié
Zio Gbatopé
Zio Davié
Zio Agbelouvé
Zio Dalavé
Zio Bolou
Figure 78: Location map of the main wood energy flows, 201785
4.2.3.6.4 Forest species exploited for wood energy
According to the study carried out by ECO Consult, 94 forest species exploited for wood energy in Togo have
been identified. These species are classified among twenty-six (26) families of which the most represented are
fabaceae (acacia) and combretaceae. The number of species cited varies by region and the species listed have
been classified into two categories:
• Category I, grouping the species preferred by producers/consumers (about 58 species);
85(Abotsi K.E /ECO Consulting Group, 2017)
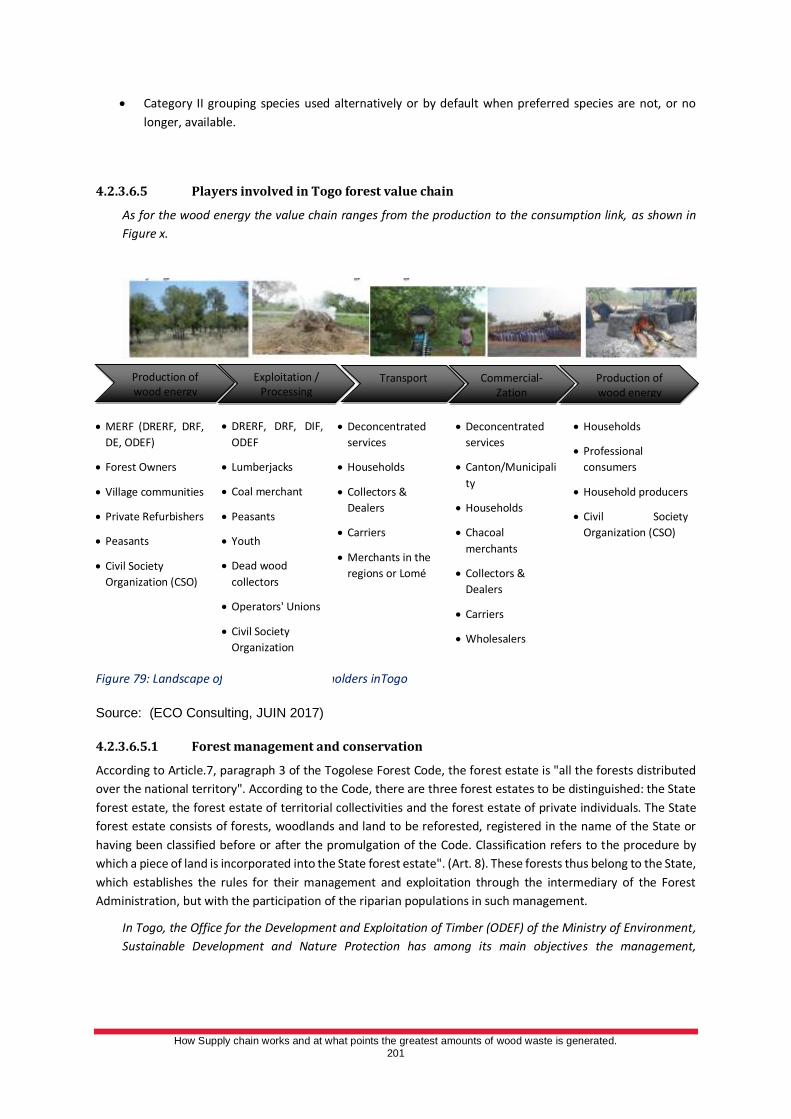
How Supply chain works and at what points the greatest amounts of wood waste is generated.
201
• Category II grouping species used alternatively or by default when preferred species are not, or no
longer, available.
4.2.3.6.5 Players involved in Togo forest value chain
As for the wood energy the value chain ranges from the production to the consumption link, as shown in
Figure x.
4.2.3.6.5.1 Forest management and conservation
According to Article.7, paragraph 3 of the Togolese Forest Code, the forest estate is "all the forests distributed
over the national territory". According to the Code, there are three forest estates to be distinguished: the State
forest estate, the forest estate of territorial collectivities and the forest estate of private individuals. The State
forest estate consists of forests, woodlands and land to be reforested, registered in the name of the State or
having been classified before or after the promulgation of the Code. Classification refers to the procedure by
which a piece of land is incorporated into the State forest estate". (Art. 8). These forests thus belong to the State,
which establishes the rules for their management and exploitation through the intermediary of the Forest
Administration, but with the participation of the riparian populations in such management.
In Togo, the Office for the Development and Exploitation of Timber (ODEF) of the Ministry of Environment,
Sustainable Development and Nature Protection has among its main objectives the management,
Figure 79: Landscape of wood energy stakeholders inTogo
Source: (ECO Consulting, JUIN 2017)
Production of wood energy
Exploitation / Processing
Transport
Commercial-
Zation
Production of wood energy
• MERF (DRERF, DRF,
DE, ODEF)
• Forest Owners
• Village communities
• Private Refurbishers
• Peasants
• Civil Society
Organization (CSO)
• DRERF, DRF, DIF,
ODEF
• Lumberjacks
• Coal merchant
• Peasants
• Youth
• Dead wood
collectors
• Operators' Unions
• Civil Society
Organization
• Deconcentrated
services
• Households
• Collectors &
Dealers
• Carriers
• Merchants in the
regions or Lomé
• Deconcentrated
services
• Canton/Municipali
ty
• Households
• Chacoal
merchants
• Collectors &
Dealers
• Carriers
• Wholesalers
• Retailers
• Households
• Professional
consumers
• Household producers
• Civil Society
Organization (CSO)
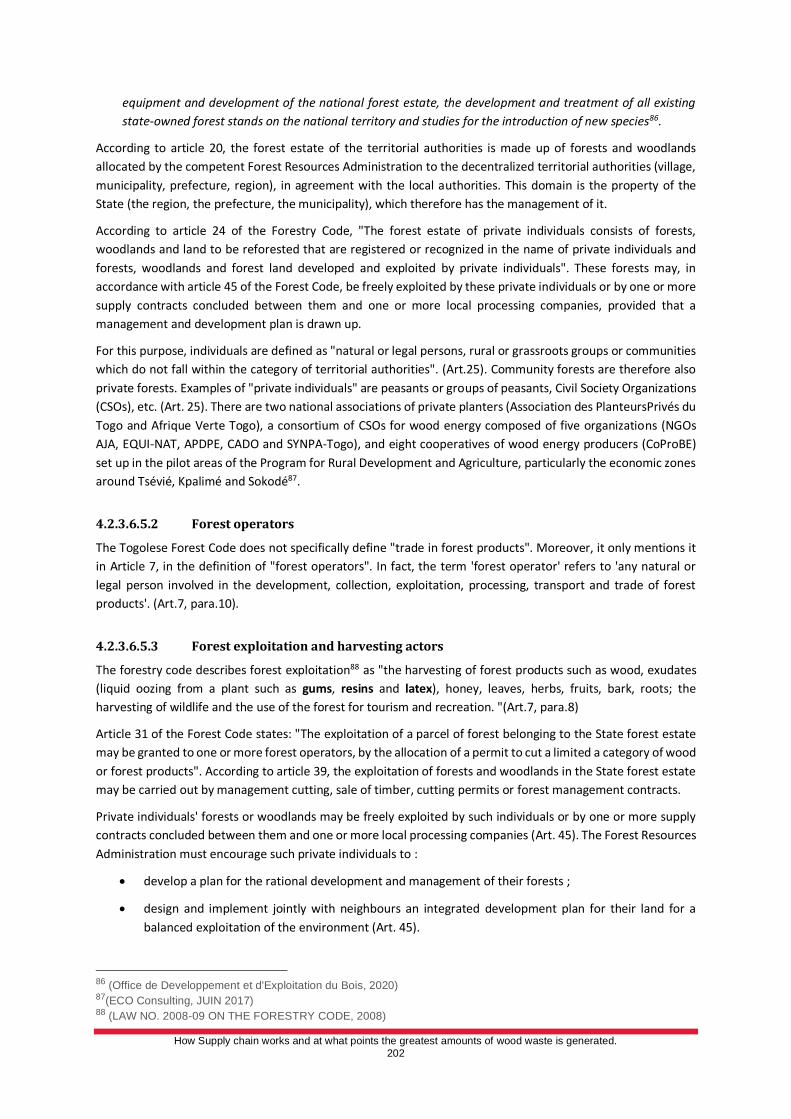
How Supply chain works and at what points the greatest amounts of wood waste is generated.
202
equipment and development of the national forest estate, the development and treatment of all existing
state-owned forest stands on the national territory and studies for the introduction of new species86.
According to article 20, the forest estate of the territorial authorities is made up of forests and woodlands
allocated by the competent Forest Resources Administration to the decentralized territorial authorities (village,
municipality, prefecture, region), in agreement with the local authorities. This domain is the property of the
State (the region, the prefecture, the municipality), which therefore has the management of it.
According to article 24 of the Forestry Code, "The forest estate of private individuals consists of forests,
woodlands and land to be reforested that are registered or recognized in the name of private individuals and
forests, woodlands and forest land developed and exploited by private individuals". These forests may, in
accordance with article 45 of the Forest Code, be freely exploited by these private individuals or by one or more
supply contracts concluded between them and one or more local processing companies, provided that a
management and development plan is drawn up.
For this purpose, individuals are defined as "natural or legal persons, rural or grassroots groups or communities
which do not fall within the category of territorial authorities". (Art.25). Community forests are therefore also
private forests. Examples of "private individuals" are peasants or groups of peasants, Civil Society Organizations
(CSOs), etc. (Art. 25). There are two national associations of private planters (Association des PlanteursPrivés du
Togo and Afrique Verte Togo), a consortium of CSOs for wood energy composed of five organizations (NGOs
AJA, EQUI-NAT, APDPE, CADO and SYNPA-Togo), and eight cooperatives of wood energy producers (CoProBE)
set up in the pilot areas of the Program for Rural Development and Agriculture, particularly the economic zones
around Tsévié, Kpalimé and Sokodé87.
4.2.3.6.5.2 Forest operators
The Togolese Forest Code does not specifically define "trade in forest products". Moreover, it only mentions it
in Article 7, in the definition of "forest operators". In fact, the term 'forest operator' refers to 'any natural or
legal person involved in the development, collection, exploitation, processing, transport and trade of forest
products'. (Art.7, para.10).
4.2.3.6.5.3 Forest exploitation and harvesting actors
The forestry code describes forest exploitation88 as "the harvesting of forest products such as wood, exudates
(liquid oozing from a plant such as gums, resins and latex), honey, leaves, herbs, fruits, bark, roots; the
harvesting of wildlife and the use of the forest for tourism and recreation. "(Art.7, para.8)
Article 31 of the Forest Code states: "The exploitation of a parcel of forest belonging to the State forest estate
may be granted to one or more forest operators, by the allocation of a permit to cut a limited a category of wood
or forest products". According to article 39, the exploitation of forests and woodlands in the State forest estate
may be carried out by management cutting, sale of timber, cutting permits or forest management contracts.
Private individuals' forests or woodlands may be freely exploited by such individuals or by one or more supply
contracts concluded between them and one or more local processing companies (Art. 45). The Forest Resources
Administration must encourage such private individuals to :
• develop a plan for the rational development and management of their forests ;
• design and implement jointly with neighbours an integrated development plan for their land for a
balanced exploitation of the environment (Art. 45).
86 (Office de Developpement et d'Exploitation du Bois, 2020) 87(ECO Consulting, JUIN 2017) 88 (LAW NO. 2008-09 ON THE FORESTRY CODE, 2008)
How Supply chain works and at what points the greatest amounts of wood waste is generated.
203
The exploitation of private individuals' forests is therefore subject to a management and development plan
drawn up by them.
Several private actors are involved in the forest sector in Togo, including timber exploitation companies, wood
processing industries and units, etc. However, the sector remains dominated by the informal sector. Thus, a total
of 570 individuals (mainly peasants or rural dwellers), often referred to as farmers and working in the informal
sector, are involved in chainsaw sawing of forest species from natural forests in general and rarely in private
teak plantations89.
As for the wood processing sector, it is very poorly developed. Indeed, there are no real wood processing units
in the country. Togo has no large sawmills or peeling or slicing units. Sawing of wood is generally done in an
artisanal way using chainsaws.
4.2.3.6.5.4 Actors involved in exploitation of wood energy
There are three categories of wood collectors/operators90:
• Rural (more than 80%) and urban/peri-urban (46%) populations collecting for self-consumption: in rural
areas, especially women and children collect dead wood or cut small wood. No statistics are available
as no prior application or administrative document is required.
• Occasional (91%) or regular (professional loggers (9%) foresters, living in the locality, who collect or cut
trees for marketing: mostly men, 74% of the farmers are loggers woodcutters engaged in felling and
cutting trees.
• The ODEF (Office for the Development and Exploitation of Forests) which produces and markets a
certain amount of firewood. The wood, of modest quantity, put on the market by ODEF comes from the
valorization of by-products resulting from the works of preparation of the grounds during the actions
of reforestation, from the products resulting from thinning and from the waste of sawing of teak.
4.2.3.6.5.5 Transporters / logistic actors
The transport of wood energy differs according to whether it is used for self-consumption or commercial
purposes. For household self-consumption, the transport of woodfuel is mainly done by head carrying (mostly
by women and children) and sometimes by bicycle or motorcycle by men.
For the transport of wood energy (firewood and charcoal) used for commercial purposes, there is a short supply
circuit to secondary towns and a long circuit to the main towns (regional capitals) and the Grand-Lomé. Different
transporters provide the link between the production areas and the main centers of consumption.
• Wholesale transporters: they mainly supply the Greater Lomé region on journeys from north to south
using semi-trailers or Titans (35 tonnes) for the transport of goods destined for the interior of the
country or the hinterland.
• Semi-wholesale transporters: they use six (06) wheel trucks (between 10 and 35 tons) to supply the main
urban centers (regional or prefecture capitals); their main customers are bakeries, soap factories, and
agricultural product processing units.
• Collector-Retailer Conveyors : They collect wood or coal from rural areas within a radius of about 30
kilometers and transport it to urban centers to sell it directly to customers using motorized logistics
means such as tarpaulins, minibuses, etc.
89 (Ministry of Environment and Forest Resources (MERF), November 2011) 90 (Rural Development Program including Agri-culture (ProDRA) Component III, 2014)
How Supply chain works and at what points the greatest amounts of wood waste is generated.
204
• Private transporters: these are private individuals who occasionally transport small quantities of wood
(less than 500kg) or charcoal (3 bags maximum) purchased on the road for domestic needs.
Theygenerally use pick-up trucks or privatevehicles.
• Retail transporters: They transport wood in small quantities (one bag of charcoal or less than 100 kg of
wood) in urban centers, particularly by bicycle or on their heads (walking transport).
In terms of stakeholder organization, there are woodfuel shippers' associations in most regions but none at the
national level.
The transportation of timber is mainly done with trailers or semi-trailers from logging sources. The same applies
to service timber when the distance is long.
4.2.3.6.5.6 Wood fuel traders and consumption actors
In Togo, the use of forest biomass (firewood and charcoal) for domestic energy needs plays an important role.
Self-consumption of firewood and charcoal represents 76% and 14.5% of national production respectively. While
the marketing of fuelwood represents 24% and charcoal 85.5% of national production. Only 30% of the volume
of fuelwood and 65% of the volume of charcoal traded is controlled by the forest services.91Fuelwood is mainly
marketed by heap (63.3%), by bundle (30.3%) and by cart (4.6%).
Firewood is used in a high proportion by rural households while charcoal is used in large part by urban
households. The choice of fuel use (firewood or charcoal) depends on several factors such as availability,
convenience of use (smoke, soiling, etc.), cost, storage, etc. The choice of fuel (firewood or charcoal) depends
on several factors such as availability, convenience of use (smoke, soiling, etc.), cost, storage, etc. The choice of
fuel (firewood or charcoal) depends on several factors such as availability, convenience of use (smoke, soiling,
etc.), cost, storage, etc.
The reference units for charcoal marketing are variable throughout the chain. Upstream, between producers
and traders, marketing is mainly done by bag. Downstream of the sector, at the level of wholesale and retail
traders, the reference units are: the bag (34.51%), the basin (31.86%), the pot (7.96%) and the plastic bag
(25.66%). In the vast majority of cases, the marketing activity (wholesale and retail sales) is carried out by
women including through cooperatives.
In its study, ECO Consult considered two major actors in the consumption of wood energy. These are the
households and socio-professional categories (CSP) among which we can cite artisanal bakeries, school
canteens, local breweries, fish smoking, Gargotes / Maquis, traditional soap factories, pottery / ceramics
cooking, the Forge, units processing agricultural products, the preparation of gari and the preparation of oil
(peanut oil, palm oil).
4.2.3.6.5.7 Timber traders and consumption actors
There are several private actors involved in the forest products trade in Togo, including timber import and export
companies. Timber import companies maintain a marketing circuit for logs or sawn timber products between
Togo and neighbouring countries. They also import furniture or peeling products for national consumption. Togo
is largely dependent on the outside (mainly Ghana) for sawn timber, which provides about 62% of consumption.
The main companies involved in timber exports to Togo are : SODETRANS, TOGO-BOIS, SUPER AVENIR, GLOBAL
SUCCES, GAT, TRASDETO, JUMEAUTRANS, DOUKKEHTRANS, TRANSACOM, SECATRANS, CDA, SOKEY, ETS SHAKTI
91(Ministry of Environment and Forest Resources (MERF), November 2011)
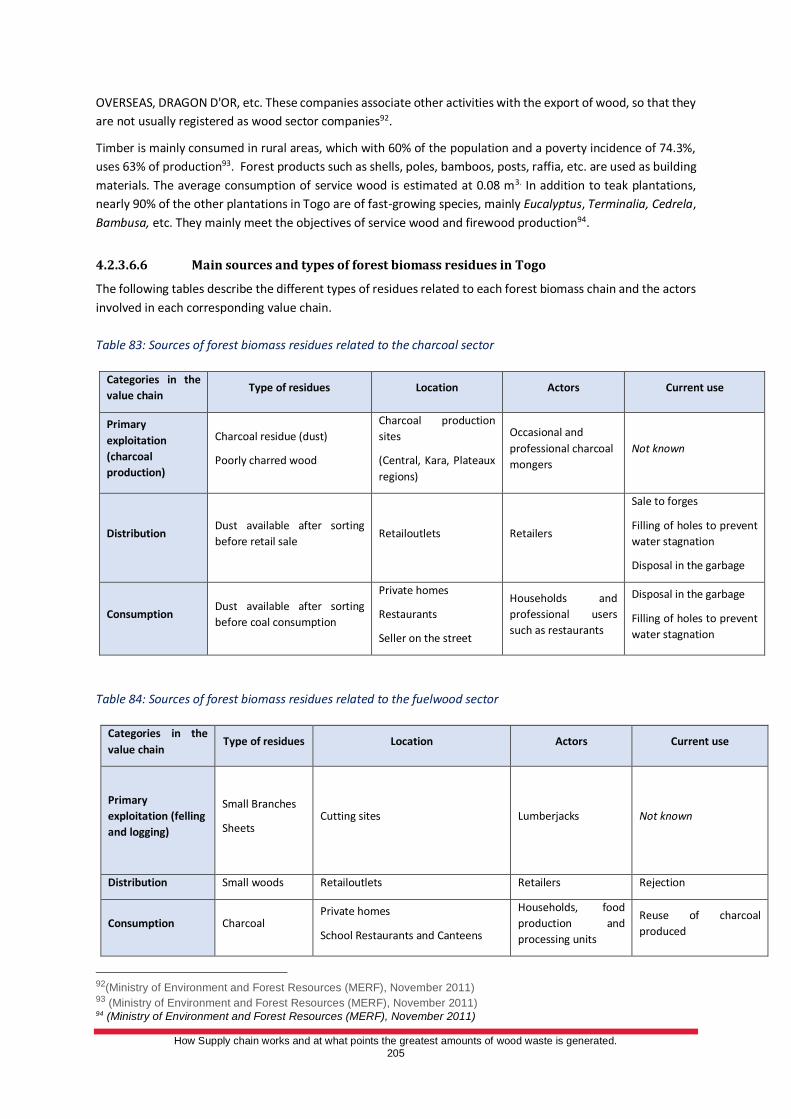
How Supply chain works and at what points the greatest amounts of wood waste is generated.
205
OVERSEAS, DRAGON D'OR, etc. These companies associate other activities with the export of wood, so that they
are not usually registered as wood sector companies92.
Timber is mainly consumed in rural areas, which with 60% of the population and a poverty incidence of 74.3%,
uses 63% of production93. Forest products such as shells, poles, bamboos, posts, raffia, etc. are used as building
materials. The average consumption of service wood is estimated at 0.08 m3. In addition to teak plantations,
nearly 90% of the other plantations in Togo are of fast-growing species, mainly Eucalyptus, Terminalia, Cedrela,
Bambusa, etc. They mainly meet the objectives of service wood and firewood production94.
4.2.3.6.6 Main sources and types of forest biomass residues in Togo
The following tables describe the different types of residues related to each forest biomass chain and the actors
involved in each corresponding value chain.
Table 83: Sources of forest biomass residues related to the charcoal sector
Categories in the
value chain Type of residues Location Actors Current use
Primary
exploitation
(charcoal
production)
Charcoal residue (dust)
Poorly charred wood
Charcoal production
sites
(Central, Kara, Plateaux
regions)
Occasional and
professional charcoal
mongers
Not known
Distribution Dust available after sorting
before retail sale Retailoutlets Retailers
Sale to forges
Filling of holes to prevent
water stagnation
Disposal in the garbage
Consumption Dust available after sorting
before coal consumption
Private homes
Restaurants
Seller on the street
Households and
professional users
such as restaurants
Disposal in the garbage
Filling of holes to prevent
water stagnation
Table 84: Sources of forest biomass residues related to the fuelwood sector
Categories in the
value chain Type of residues Location Actors Current use
Primary
exploitation (felling
and logging)
Small Branches
Sheets Cutting sites Lumberjacks Not known
Distribution Small woods Retailoutlets Retailers Rejection
Consumption Charcoal Private homes
School Restaurants and Canteens
Households, food
production and
processing units
Reuse of charcoal
produced
92(Ministry of Environment and Forest Resources (MERF), November 2011) 93 (Ministry of Environment and Forest Resources (MERF), November 2011) 94 (Ministry of Environment and Forest Resources (MERF), November 2011)
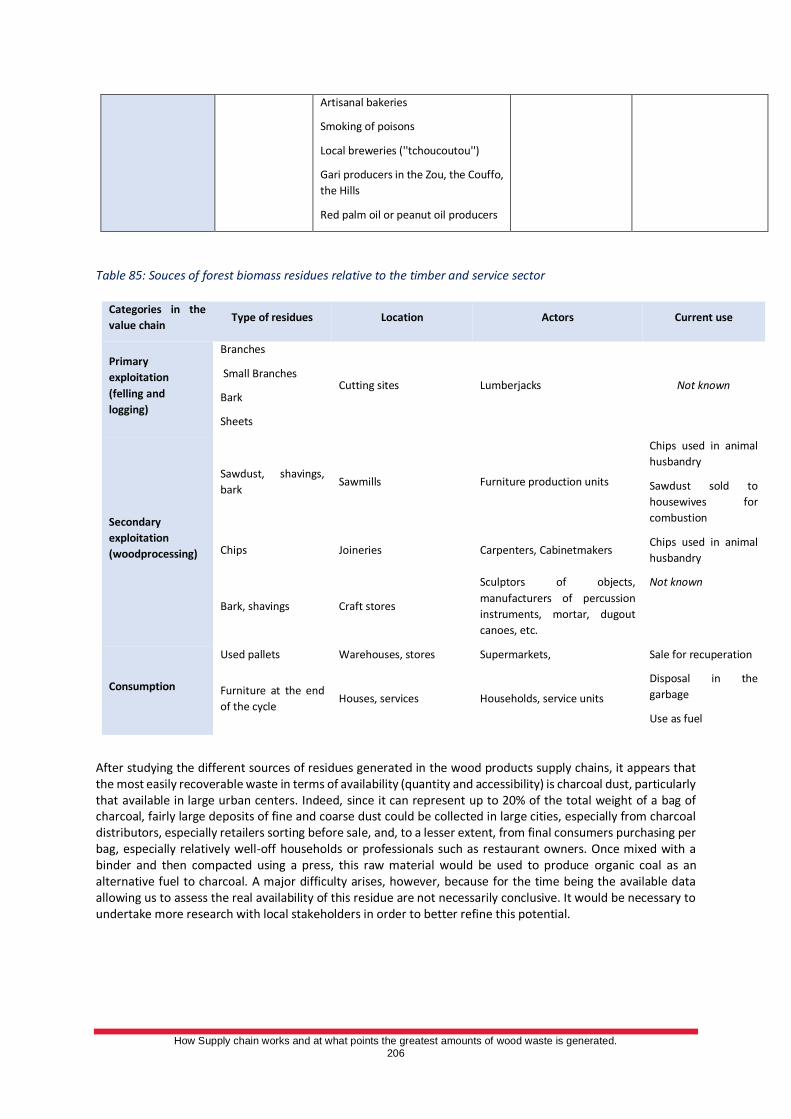
How Supply chain works and at what points the greatest amounts of wood waste is generated.
206
Artisanal bakeries
Smoking of poisons
Local breweries (''tchoucoutou'')
Gari producers in the Zou, the Couffo,
the Hills
Red palm oil or peanut oil producers
Table 85: Souces of forest biomass residues relative to the timber and service sector
Categories in the
value chain Type of residues Location Actors Current use
Primary
exploitation
(felling and
logging)
Branches
Small Branches
Bark
Sheets
Cutting sites Lumberjacks Not known
Secondary
exploitation
(woodprocessing)
Sawdust, shavings,
bark Sawmills Furniture production units
Chips used in animal
husbandry
Sawdust sold to
housewives for
combustion
Chips Joineries Carpenters, Cabinetmakers Chips used in animal
husbandry
Bark, shavings Craft stores
Sculptors of objects,
manufacturers of percussion
instruments, mortar, dugout
canoes, etc.
Not known
Consumption
Used pallets Warehouses, stores Supermarkets, Sale for recuperation
Furniture at the end
of the cycle Houses, services Households, service units
Disposal in the
garbage
Use as fuel
After studying the different sources of residues generated in the wood products supply chains, it appears that the most easily recoverable waste in terms of availability (quantity and accessibility) is charcoal dust, particularly that available in large urban centers. Indeed, since it can represent up to 20% of the total weight of a bag of charcoal, fairly large deposits of fine and coarse dust could be collected in large cities, especially from charcoal distributors, especially retailers sorting before sale, and, to a lesser extent, from final consumers purchasing per bag, especially relatively well-off households or professionals such as restaurant owners. Once mixed with a binder and then compacted using a press, this raw material would be used to produce organic coal as an alternative fuel to charcoal. A major difficulty arises, however, because for the time being the available data allowing us to assess the real availability of this residue are not necessarily conclusive. It would be necessary to undertake more research with local stakeholders in order to better refine this potential.
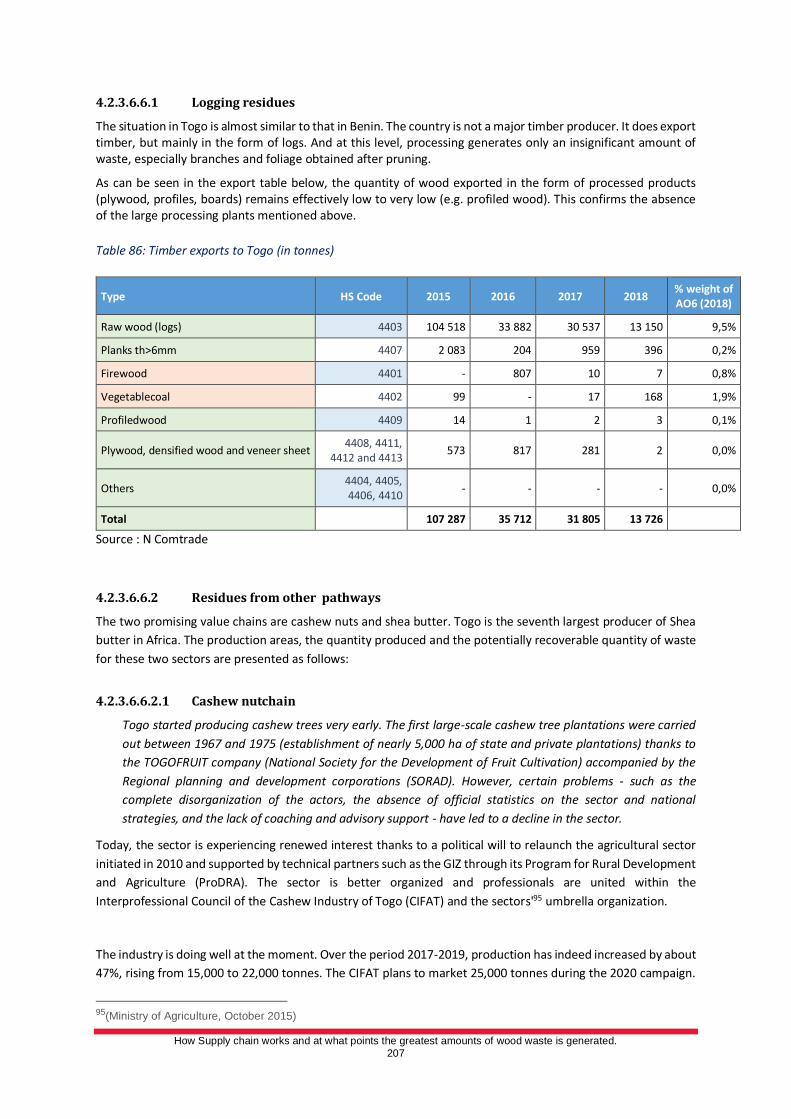
How Supply chain works and at what points the greatest amounts of wood waste is generated.
207
4.2.3.6.6.1 Logging residues
The situation in Togo is almost similar to that in Benin. The country is not a major timber producer. It does export timber, but mainly in the form of logs. And at this level, processing generates only an insignificant amount of waste, especially branches and foliage obtained after pruning.
As can be seen in the export table below, the quantity of wood exported in the form of processed products (plywood, profiles, boards) remains effectively low to very low (e.g. profiled wood). This confirms the absence of the large processing plants mentioned above.
Table 86: Timber exports to Togo (in tonnes)
Type HS Code 2015 2016 2017 2018 % weight of AO6 (2018)
Raw wood (logs) 4403 104 518 33 882 30 537 13 150 9,5%
Planks th>6mm 4407 2 083 204 959 396 0,2%
Firewood 4401 - 807 10 7 0,8%
Vegetablecoal 4402 99 - 17 168 1,9%
Profiledwood 4409 14 1 2 3 0,1%
Plywood, densified wood and veneer sheet 4408, 4411,
4412 and 4413 573 817 281 2 0,0%
Others 4404, 4405, 4406, 4410
- - - - 0,0%
Total 107 287 35 712 31 805 13 726
Source : N Comtrade
4.2.3.6.6.2 Residues from other pathways
The two promising value chains are cashew nuts and shea butter. Togo is the seventh largest producer of Shea
butter in Africa. The production areas, the quantity produced and the potentially recoverable quantity of waste
for these two sectors are presented as follows:
4.2.3.6.6.2.1 Cashew nutchain
Togo started producing cashew trees very early. The first large-scale cashew tree plantations were carried
out between 1967 and 1975 (establishment of nearly 5,000 ha of state and private plantations) thanks to
the TOGOFRUIT company (National Society for the Development of Fruit Cultivation) accompanied by the
Regional planning and development corporations (SORAD). However, certain problems - such as the
complete disorganization of the actors, the absence of official statistics on the sector and national
strategies, and the lack of coaching and advisory support - have led to a decline in the sector.
Today, the sector is experiencing renewed interest thanks to a political will to relaunch the agricultural sector
initiated in 2010 and supported by technical partners such as the GIZ through its Program for Rural Development
and Agriculture (ProDRA). The sector is better organized and professionals are united within the
Interprofessional Council of the Cashew Industry of Togo (CIFAT) and the sectors'95 umbrella organization.
The industry is doing well at the moment. Over the period 2017-2019, production has indeed increased by about
47%, rising from 15,000 to 22,000 tonnes. The CIFAT plans to market 25,000 tonnes during the 2020 campaign.
95(Ministry of Agriculture, October 2015)
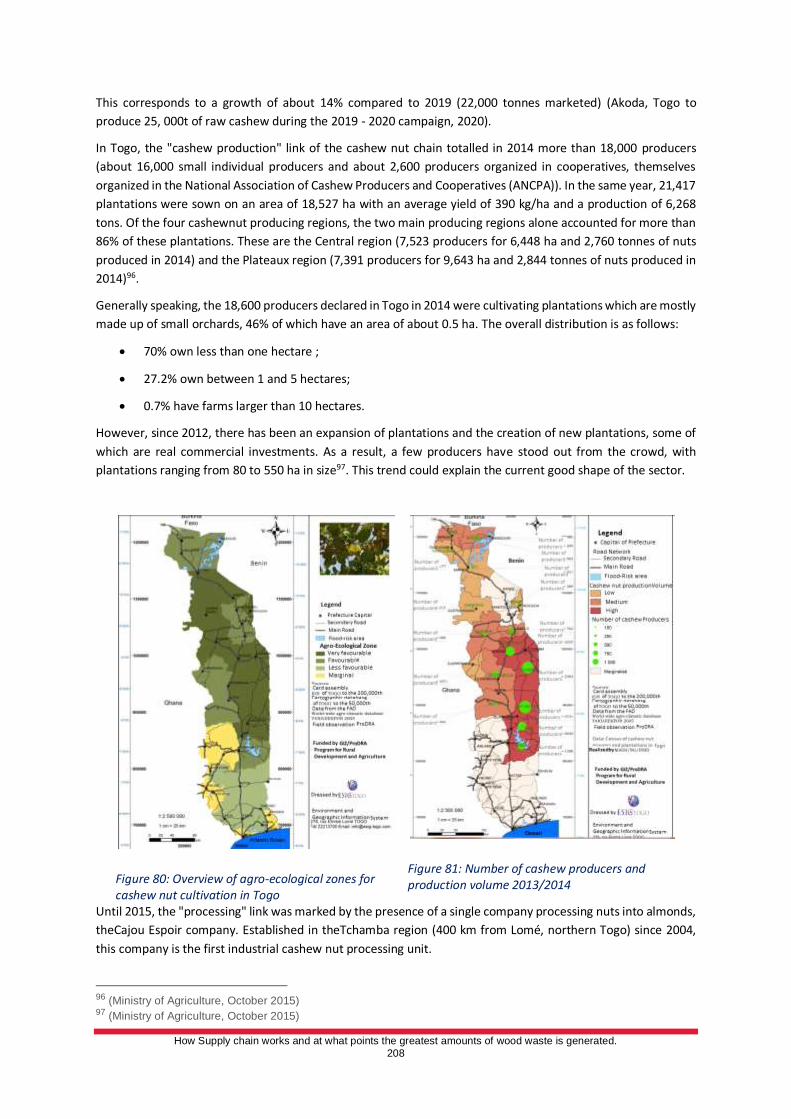
How Supply chain works and at what points the greatest amounts of wood waste is generated.
208
This corresponds to a growth of about 14% compared to 2019 (22,000 tonnes marketed) (Akoda, Togo to
produce 25, 000t of raw cashew during the 2019 - 2020 campaign, 2020).
In Togo, the "cashew production" link of the cashew nut chain totalled in 2014 more than 18,000 producers
(about 16,000 small individual producers and about 2,600 producers organized in cooperatives, themselves
organized in the National Association of Cashew Producers and Cooperatives (ANCPA)). In the same year, 21,417
plantations were sown on an area of 18,527 ha with an average yield of 390 kg/ha and a production of 6,268
tons. Of the four cashewnut producing regions, the two main producing regions alone accounted for more than
86% of these plantations. These are the Central region (7,523 producers for 6,448 ha and 2,760 tonnes of nuts
produced in 2014) and the Plateaux region (7,391 producers for 9,643 ha and 2,844 tonnes of nuts produced in
2014)96.
Generally speaking, the 18,600 producers declared in Togo in 2014 were cultivating plantations which are mostly
made up of small orchards, 46% of which have an area of about 0.5 ha. The overall distribution is as follows:
• 70% own less than one hectare ;
• 27.2% own between 1 and 5 hectares;
• 0.7% have farms larger than 10 hectares.
However, since 2012, there has been an expansion of plantations and the creation of new plantations, some of
which are real commercial investments. As a result, a few producers have stood out from the crowd, with
plantations ranging from 80 to 550 ha in size97. This trend could explain the current good shape of the sector.
Figure 80: Overview of agro-ecological zones for cashew nut cultivation in Togo
Figure 81: Number of cashew producers and production volume 2013/2014
Until 2015, the "processing" link was marked by the presence of a single company processing nuts into almonds,
theCajou Espoir company. Established in theTchamba region (400 km from Lomé, northern Togo) since 2004,
this company is the first industrial cashew nut processing unit.
96 (Ministry of Agriculture, October 2015) 97 (Ministry of Agriculture, October 2015)
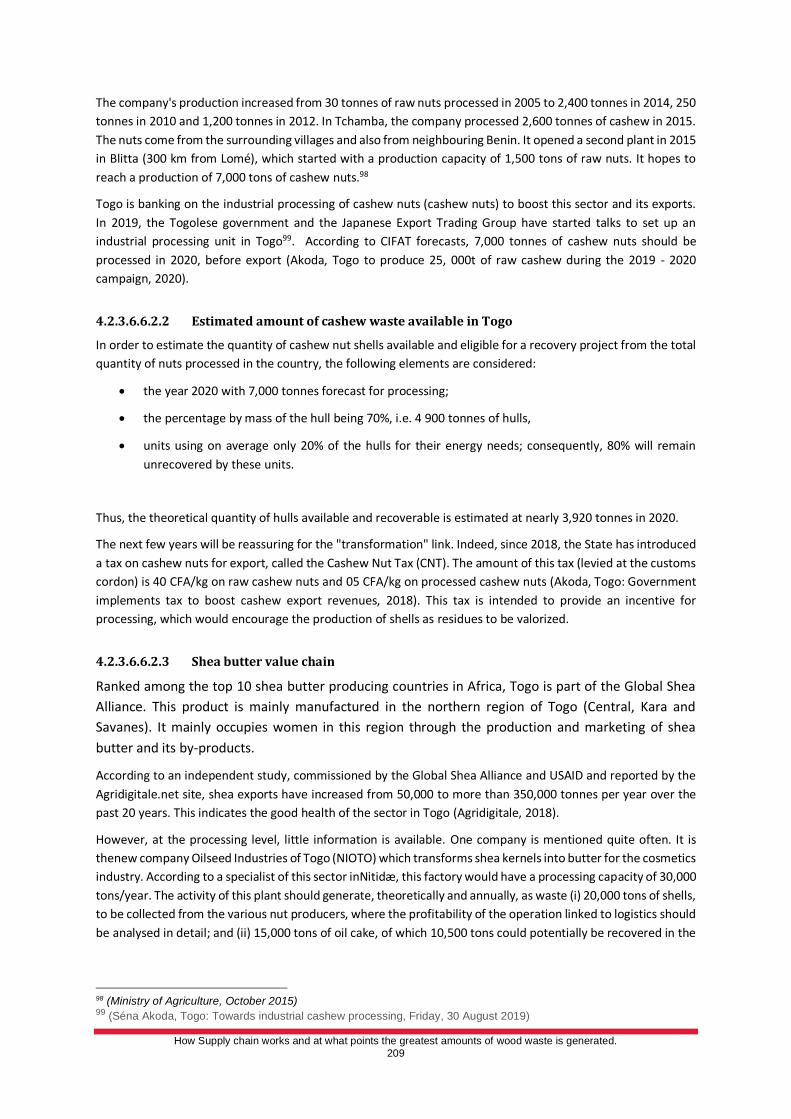
How Supply chain works and at what points the greatest amounts of wood waste is generated.
209
The company's production increased from 30 tonnes of raw nuts processed in 2005 to 2,400 tonnes in 2014, 250
tonnes in 2010 and 1,200 tonnes in 2012. In Tchamba, the company processed 2,600 tonnes of cashew in 2015.
The nuts come from the surrounding villages and also from neighbouring Benin. It opened a second plant in 2015
in Blitta (300 km from Lomé), which started with a production capacity of 1,500 tons of raw nuts. It hopes to
reach a production of 7,000 tons of cashew nuts.98
Togo is banking on the industrial processing of cashew nuts (cashew nuts) to boost this sector and its exports.
In 2019, the Togolese government and the Japanese Export Trading Group have started talks to set up an
industrial processing unit in Togo99. According to CIFAT forecasts, 7,000 tonnes of cashew nuts should be
processed in 2020, before export (Akoda, Togo to produce 25, 000t of raw cashew during the 2019 - 2020
campaign, 2020).
4.2.3.6.6.2.2 Estimated amount of cashew waste available in Togo
In order to estimate the quantity of cashew nut shells available and eligible for a recovery project from the total
quantity of nuts processed in the country, the following elements are considered:
• the year 2020 with 7,000 tonnes forecast for processing;
• the percentage by mass of the hull being 70%, i.e. 4 900 tonnes of hulls,
• units using on average only 20% of the hulls for their energy needs; consequently, 80% will remain
unrecovered by these units.
Thus, the theoretical quantity of hulls available and recoverable is estimated at nearly 3,920 tonnes in 2020.
The next few years will be reassuring for the "transformation" link. Indeed, since 2018, the State has introduced
a tax on cashew nuts for export, called the Cashew Nut Tax (CNT). The amount of this tax (levied at the customs
cordon) is 40 CFA/kg on raw cashew nuts and 05 CFA/kg on processed cashew nuts (Akoda, Togo: Government
implements tax to boost cashew export revenues, 2018). This tax is intended to provide an incentive for
processing, which would encourage the production of shells as residues to be valorized.
4.2.3.6.6.2.3 Shea butter value chain
Ranked among the top 10 shea butter producing countries in Africa, Togo is part of the Global Shea
Alliance. This product is mainly manufactured in the northern region of Togo (Central, Kara and
Savanes). It mainly occupies women in this region through the production and marketing of shea
butter and its by-products.
According to an independent study, commissioned by the Global Shea Alliance and USAID and reported by the
Agridigitale.net site, shea exports have increased from 50,000 to more than 350,000 tonnes per year over the
past 20 years. This indicates the good health of the sector in Togo (Agridigitale, 2018).
However, at the processing level, little information is available. One company is mentioned quite often. It is
thenew company Oilseed Industries of Togo (NIOTO) which transforms shea kernels into butter for the cosmetics
industry. According to a specialist of this sector inNitidæ, this factory would have a processing capacity of 30,000
tons/year. The activity of this plant should generate, theoretically and annually, as waste (i) 20,000 tons of shells,
to be collected from the various nut producers, where the profitability of the operation linked to logistics should
be analysed in detail; and (ii) 15,000 tons of oil cake, of which 10,500 tons could potentially be recovered in the
98 (Ministry of Agriculture, October 2015) 99 (Séna Akoda, Togo: Towards industrial cashew processing, Friday, 30 August 2019)
How Supply chain works and at what points the greatest amounts of wood waste is generated.
210
plant, considering a self-consumption of 30%. These hypotheses could not be confirmed as it has not been
possible until now to obtain any feedback from the company on this point.
The N'Kalô service in Nitidæ reports that between 2015 and 2019, 55,128 tonnes of shea butter were exported
from Togo, corresponding to 137,820 tonnes of processed almonds.
Knowing that a quantity of almonds produces up to 50% of oilcake, it can be estimated that over this period, the
production of butter for export generated approximately 68 900 tonnes of oilcake. Assuming that processing
units use up to 30% of this cake (i.e. 20,673 tonnes), we can then estimate 48,237 tonnes of cake as potentially
recoverable waste between 2015 and 2019.
We can therefore say that there is a significant amount of shea waste in Togo. On the other hand, are these
potentially recoverable waste cakes currently available? Or, are they marketed, recovered through projects,
used for other purposes? These questions will have to be answered during a feasibility study on shea cake
recovery.
4.2.3.6.6.3 Conclusion on the availability of forest biomass residues
Bordering the Atlantic Ocean to the south, Togo has a tropical climate of the Sudanian type on the northern half
and Guinean on the southern half. Its national forest estate is made up mainly of shrubby or wooded savannahs
and clear, gallery or dense dry/humid forests, not forgetting the various plantations. From the point of view of
the FAO classification, these are modified natural or semi-natural forests and forest plantations. Covering almost
a quarter of the country, its total forest area is almost 3.38 million hectares in 2016.
Accounting for 76% of the country's final energy consumption, firewood and charcoal are widely used to meet
the energy needs of the population, particularly for domestic and professional cooking. Without considering
conservation forest areas, the country would present a theoretical negative deficit between supply and demand
for wood energy of about 4.3 million m3 in 2017, due to the insufficiency of potential wood energy production
compared to its ever-increasing demand.
In view of this observation, it is becoming necessary to study the potential for energy recovery from residues
from the various forest biomass sectors.
In the wood energy sector, the most promising residues in terms of energy recovery seem to be coal dust.
However, the data allowing a realistic estimate of the deposit is very limited.
As regards the timber and service sector, the sector is dominated by the informal sector and wood processing is
poorly developed because it is carried out by hand in small stores, with the exception of ODEF, which is the
largest wood processing unit in the country. Togo would not be self-sufficient in timber since it would import a
significant quantity to meet its national consumption, about 29,104m3 in 2010. Thus, the country mainly exports
logs and, more rarely, planks, while the volumes of processed products are minute. In Togolese sawmills, as in
neighbouring countries, the residues produced, such as sawdust and wood chips, are already used locally,
especially by poultry farmers. Consequently, the potential should be studied at the ODEF stores level, or even in
the small private sawmills that have been booming in the big cities since 2017, whose waste generated could
not be characterized or quantified and whose recovery rate has not been verified.
As regards forest plantations for agricultural use, the use of residues from the cashew nut chain can be of major
interest. Indeed, the country (i) has two industrial cashew nut processing units, not to mention the project
underway between the state and a Japanese company to set up a new large factory there; and (ii) should reach
this year, according to CIFAT, the 7,000 tons of nuts processed industrially before export. On this basis, the
potential for recoverable hulls for energy purposes would then be estimated theoretically at almost 4,000 tonnes
in 2020.
How Supply chain works and at what points the greatest amounts of wood waste is generated.
211
In addition, another relevant avenue seems to be the "shea" sector. Togo is indeed ranked seventh in Africa in
terms of shea butter production, and industrial processing is said to be dominated by the NIOTO company, which
has a capacity of 30,000 tons of almonds per year. Recoverable waste would theoretically be available on a single
site and at volumes of around 10,000 tonnes per year - but this availability remains, once again, a hypothesis to
be confirmed.
4.3 Eastern Africa
4.3.1 Forest value chain in Eastern Africa countries
The forestry value chain in East Africa covers:
- Input suppliers (Planting material): Nurseries (government and private) and local unknown sources;
- Production (establishment): Government and private supported and community plantations;
- Harvesting: large companies, pitsaws, chainsaws and portable sawmills:
- Timber traders: Many small urban associations and traders, large, medium and size companies;
- Primary processing: SMEs, large companies, individuals and communities;
- Secondary processing: Informal sector, SMEs and companies;
- Consumption: Construction companies, hardware stores, other large consumers such as electricity
power generating companies, corporate companies, individual buyers and exports.
The figure below shows an overview of steps in product value addition from forest resource to end-market as
well as actors involved.
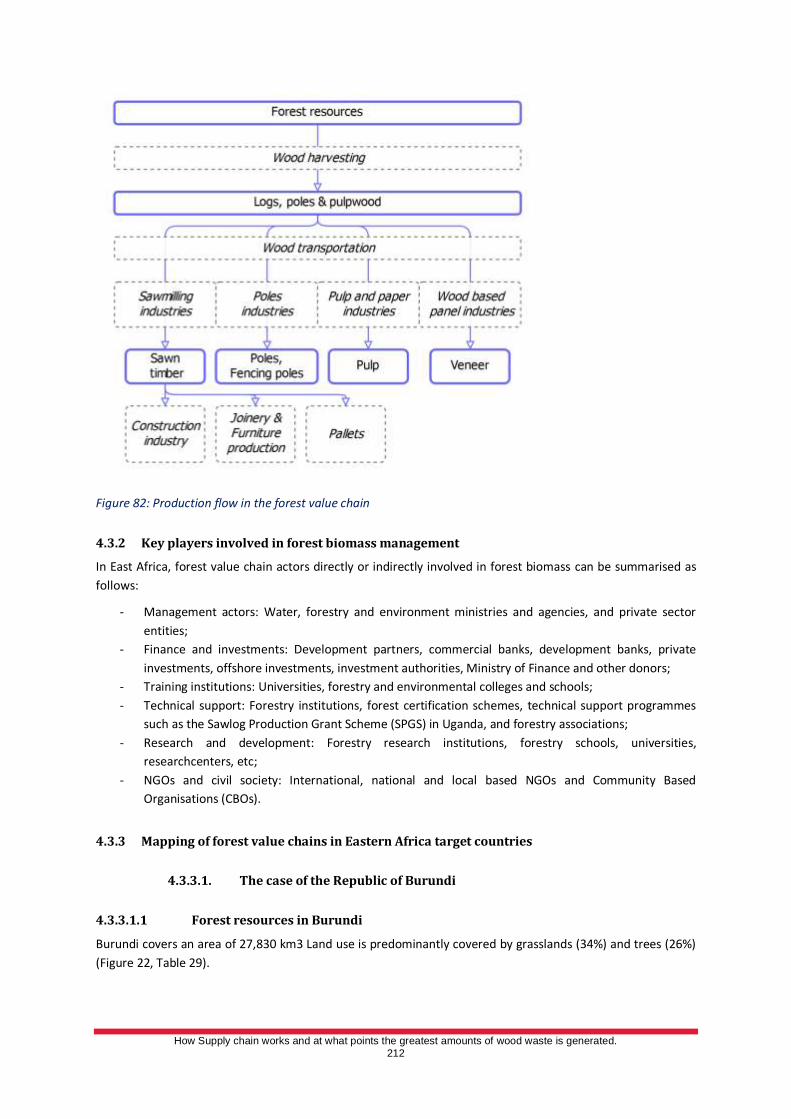
How Supply chain works and at what points the greatest amounts of wood waste is generated.
212
Figure 82: Production flow in the forest value chain
4.3.2 Key players involved in forest biomass management
In East Africa, forest value chain actors directly or indirectly involved in forest biomass can be summarised as
follows:
- Management actors: Water, forestry and environment ministries and agencies, and private sector
entities;
- Finance and investments: Development partners, commercial banks, development banks, private
investments, offshore investments, investment authorities, Ministry of Finance and other donors;
- Training institutions: Universities, forestry and environmental colleges and schools;
- Technical support: Forestry institutions, forest certification schemes, technical support programmes
such as the Sawlog Production Grant Scheme (SPGS) in Uganda, and forestry associations;
- Research and development: Forestry research institutions, forestry schools, universities,
researchcenters, etc;
- NGOs and civil society: International, national and local based NGOs and Community Based
Organisations (CBOs).
4.3.3 Mapping of forest value chains in Eastern Africa target countries
4.3.3.1. The case of the Republic of Burundi
4.3.3.1.1 Forest resources in Burundi
Burundi covers an area of 27,830 km3 Land use is predominantly covered by grasslands (34%) and trees (26%)
(Figure 22, Table 29).
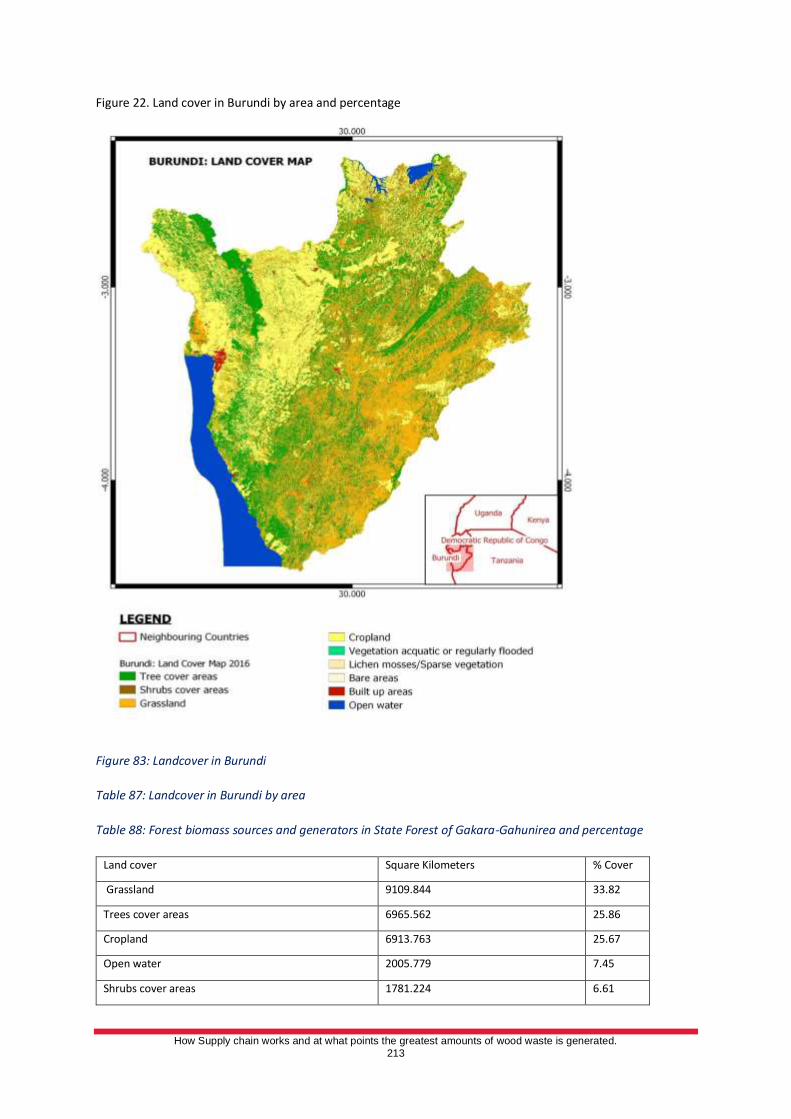
How Supply chain works and at what points the greatest amounts of wood waste is generated.
213
Figure 22. Land cover in Burundi by area and percentage
Figure 83: Landcover in Burundi
Table 87: Landcover in Burundi by area
Table 88: Forest biomass sources and generators in State Forest of Gakara-Gahunirea and percentage
Land cover Square Kilometers % Cover
Grassland 9109.844 33.82
Trees cover areas 6965.562 25.86
Cropland 6913.763 25.67
Open water 2005.779 7.45
Shrubs cover areas 1781.224 6.61
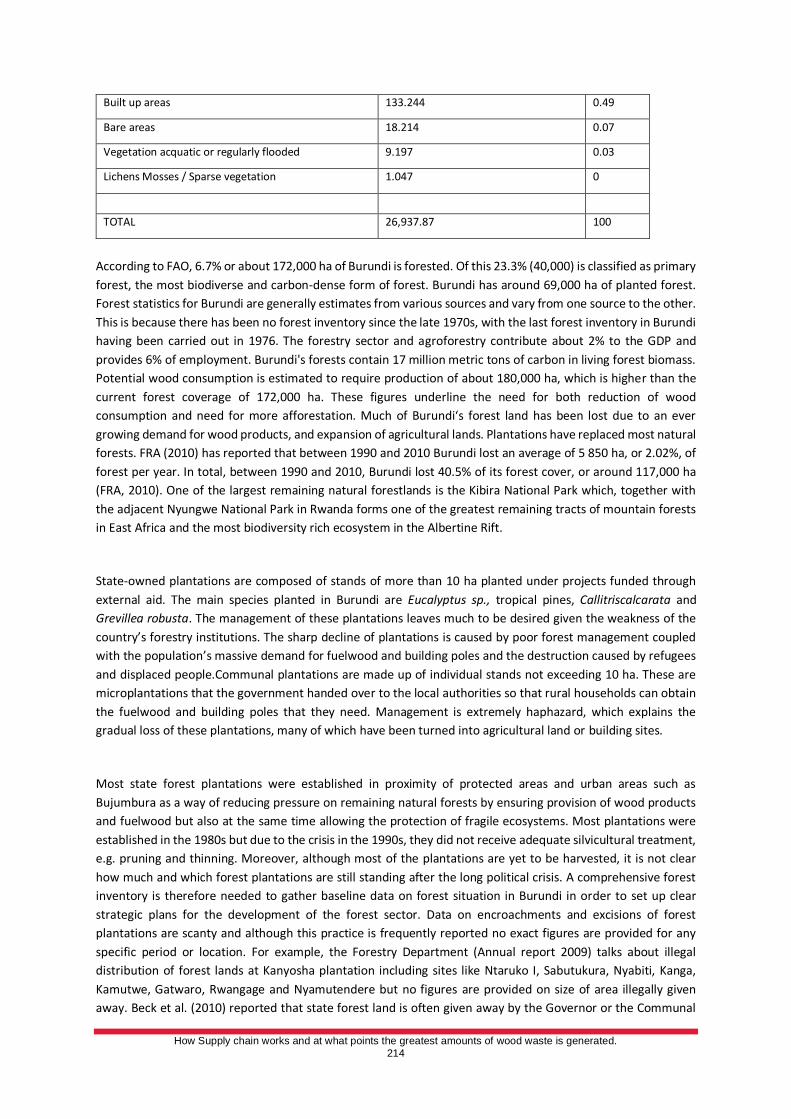
How Supply chain works and at what points the greatest amounts of wood waste is generated.
214
Built up areas 133.244 0.49
Bare areas 18.214 0.07
Vegetation acquatic or regularly flooded 9.197 0.03
Lichens Mosses / Sparse vegetation 1.047 0
TOTAL 26,937.87 100
According to FAO, 6.7% or about 172,000 ha of Burundi is forested. Of this 23.3% (40,000) is classified as primary
forest, the most biodiverse and carbon-dense form of forest. Burundi has around 69,000 ha of planted forest.
Forest statistics for Burundi are generally estimates from various sources and vary from one source to the other.
This is because there has been no forest inventory since the late 1970s, with the last forest inventory in Burundi
having been carried out in 1976. The forestry sector and agroforestry contribute about 2% to the GDP and
provides 6% of employment. Burundi's forests contain 17 million metric tons of carbon in living forest biomass.
Potential wood consumption is estimated to require production of about 180,000 ha, which is higher than the
current forest coverage of 172,000 ha. These figures underline the need for both reduction of wood
consumption and need for more afforestation. Much of Burundi‘s forest land has been lost due to an ever
growing demand for wood products, and expansion of agricultural lands. Plantations have replaced most natural
forests. FRA (2010) has reported that between 1990 and 2010 Burundi lost an average of 5 850 ha, or 2.02%, of
forest per year. In total, between 1990 and 2010, Burundi lost 40.5% of its forest cover, or around 117,000 ha
(FRA, 2010). One of the largest remaining natural forestlands is the Kibira National Park which, together with
the adjacent Nyungwe National Park in Rwanda forms one of the greatest remaining tracts of mountain forests
in East Africa and the most biodiversity rich ecosystem in the Albertine Rift.
State-owned plantations are composed of stands of more than 10 ha planted under projects funded through
external aid. The main species planted in Burundi are Eucalyptus sp., tropical pines, Callitriscalcarata and
Grevillea robusta. The management of these plantations leaves much to be desired given the weakness of the
country’s forestry institutions. The sharp decline of plantations is caused by poor forest management coupled
with the population’s massive demand for fuelwood and building poles and the destruction caused by refugees
and displaced people.Communal plantations are made up of individual stands not exceeding 10 ha. These are
microplantations that the government handed over to the local authorities so that rural households can obtain
the fuelwood and building poles that they need. Management is extremely haphazard, which explains the
gradual loss of these plantations, many of which have been turned into agricultural land or building sites.
Most state forest plantations were established in proximity of protected areas and urban areas such as
Bujumbura as a way of reducing pressure on remaining natural forests by ensuring provision of wood products
and fuelwood but also at the same time allowing the protection of fragile ecosystems. Most plantations were
established in the 1980s but due to the crisis in the 1990s, they did not receive adequate silvicultural treatment,
e.g. pruning and thinning. Moreover, although most of the plantations are yet to be harvested, it is not clear
how much and which forest plantations are still standing after the long political crisis. A comprehensive forest
inventory is therefore needed to gather baseline data on forest situation in Burundi in order to set up clear
strategic plans for the development of the forest sector. Data on encroachments and excisions of forest
plantations are scanty and although this practice is frequently reported no exact figures are provided for any
specific period or location. For example, the Forestry Department (Annual report 2009) talks about illegal
distribution of forest lands at Kanyosha plantation including sites like Ntaruko I, Sabutukura, Nyabiti, Kanga,
Kamutwe, Gatwaro, Rwangage and Nyamutendere but no figures are provided on size of area illegally given
away. Beck et al. (2010) reported that state forest land is often given away by the Governor or the Communal
How Supply chain works and at what points the greatest amounts of wood waste is generated.
215
administration and harvested or simply converted into other land uses such as pastures or settlements.
Moreover, the war situation and the resulting lawlessness led to the loss of forest plantations through arson
fires, annexation or illegal clear felling. In fact, during the 1990s, Burundi experienced the highest deforestation
rate in the world at about 9% (Athman et al., 2006). Estimates of forests destroyed during the civil war vary from
8,000 to 32,000 ha (Banderembako, 2006).
The practice of forestry in Burundi is constrained by land scarcity in general and severe poverty of the people
coupled with political instability. The other problems include lack of accurate forest statistics, insufficient
financial and technical capacity of the government (human and financial resources), land conflicts and political
ambitions, population pressure, lack of forest management plans, disorganisation in the wood industry and lack
of supporting research to help adapt forest production to needs and provide guidance to proper forest
management (FAO, 2002; Banderambako, 2006). Burundi has limited government capacity to manage its forests
or undertake forest-related programmes. In many communes, national forests are subject to unrestricted illegal
harvesting, clearing for agriculture, and collection of fuelwood. In efforts to reduce unsustainable activities, the
government has engaged local communities in plantation projects, but results have been mixed, with economic
pressures on the population often overwhelming the government‘s capacity to manage sustainable use
programmes (Banderembako, 2006).
There are very high risks associated with forest investments because of the political instability in the country
and the lack of financial incentives that could attract large investment in forestry ventures. The lack of
sufficiently large block of forest land also makes it impossible for big investment in forestry business in Burundi.
For example, some of the Pinus plantations established in the 1980s were intended for a pulp and paper plant
but this objective was finally abandoned largely due to lack of reasonable amount of raw material that would
warrant investment in such an expensive plant (Beck et al., 2010). Governance issues and fiscal policy also
impose high risk to forest investment because of corruption at the level of local authorities and police.
Nevertheless, there are opportunities that could enhance forestry business in the country. Such opportunities
include the mobilisation of the Burundian people and the international community for the promotion of
sustainable environmental management; the existence of skilled human resources with varying levels of
expertise since the establishment of the Higher Institute of Agriculture (ISA); a pattern of rainfall (nine months
of rain a year in many regions of the country) conducive to the rapid growth of many forest species; a growing
awareness on the part of the government of the importance of forestry, guaranteeing action, funding, and
training for intensifying reforestation and rural forestry programmes; versatility of Burundian peasant farmers,
enabling them to engage in crop farming, stock-raising, and forestry activities simultaneously (Banderembako,
2006).
4.3.3.1.2 Forest value chain in Burundi
The forest value chain in Burundi is similar to that of the Eastern African countries presented earlier in this
chapter.
How Supply chain works and at what points the greatest amounts of wood waste is generated.
216
4.3.3.2 The players involved in Burundi's forest value chain
4.3.3.2.1 Forest management and conservation actors
4.3.3.2.1.1 Public actors
Forests in Burundi are managed by the Directorate of Forests under the Office Burundais pour la Protection de
l’Environnemen (OBPE), the office in charge of environment in the Ministry of Water, Environment, Land
Management and Urban Planning. There are three main types of forest ownerships in Burundi; State forests,
Communes forests (Local governments) and forests belonging to private individuals. There is no reliable data on
extent of forest plantations owned by these different entities since no recent inventory has been conducted.
State forests include natural forests, which are inalienable and within either national parks or protected forest
reserves. State plantations are usually 10 or more hectares.
The Forestry Department is the key institution responsible for management of state forests while forest
communes are management by local governments. All smaller state plantations (below 10 ha) have been
allocated for management to Communes. Most tree seeds used in public and forest project nurseries are
supplied by the Tree Seed Centre (Centrale de GrainesForestièresetAgroforestières) which is managed by the
Forestry Department.
INECN (Institut National de l’Environnementet de la Conservation de la Nature) also has forestry responsibilities
and has been engaging local communities in forest management programmes in some parts of the country such
as in Kibira National Park since the 1970s. Burundi is a partner country within USAID‘s Central African Regional
Programme for the Environment (CARPE) initiative aimed at promoting sustainable natural resource
management in the Congo Basin. CARPE programmes help governments implement sustainable forest and
biodiversity management practices, strengthen environmental governance, and work to monitor forests and
other natural resources throughout the region (AFF, 2011) (Nduwamungu, 2011).
4.3.3.2.1.2 Private actors
Private forests including forest plantations owned by organisations such as religious groups (churches, religious
congregations), schools, cooperatives and tea plantation companies are managed by respective private entities.
4.3.3.2.1.3 NGOs and Civil Society Organisations (CSOs)
The International Union for Conservation of Nature (IUCN) has in the recent past been involved in forest
conservation programmes in Burundi. A number of local NGOs are alsoinvolved in treeplanting and forest
conservation in Burundi, including: Association of Women for the Environment in Burundi (AFEB); ACVE (Action
Ceinture Verte pour l’Environnement); ENVIRO PROTEC, Association Burundaise pour la Protection des Oiseaux
(ABO), Organisation de défense de l'environnement au Burundi (ODEB), Association des Femmes pour
l’Environnement au Burundi, Association pour le Développement Intégré et la Conservation de la Nature
(ADICN), and Centre de Médecine Traditionnelle de Buta; CARITAS Belgium and Reseau Burundi 2000.
4.3.3.2.1.4 Donors
Major funders that have helped in afforestation projects from 1976 onwards include Belgium, Saudi Arabia,
France, the European Union, IDA, ILO, World Bank, UNDP and others. However, due to the war situation that
prevailed between 1993 and 2005, many donors have not been very active in Burundi.
4.3.3.2.2 Transporters and logistics players
Transportation of forest products, whether from private, communal or state forests require a transport permit
and a copy of a valid harvesting permit or proof of forest ownership for private forest owners. There are several
How Supply chain works and at what points the greatest amounts of wood waste is generated.
217
road blocks for controlling transport of forest products throughout the country and particularly on major
entrances to Bujumbura and other important towns in the country. Most of the forest products is transported
by roads.
4.3.3.2.3 Actors in primary and secondary transformation
The wood processing business sector in Burundi is generally characterised by individual businessmen and
informal groups, there is limited industrial scale processing. Pit sawyers, secondary processors and charcoal
makers are informally organised in cooperatives and self-formed associations. The main commercialised forest
products are firewood, charcoal, construction wood (poles, posts and lumber) and sawn wood for furniture.
With the exception of major towns like Bujumbura where there are few wood working machines, wood
processing is carried out mainly with hand tools. Most of the wood finished with hand tools haverelatively low
quality since the handling and conversion process is inefficient with considerable degradation. The lack of well-
trained skilled artisans in the timber processing industry is also a factor for poor quality of products and a lot of
wood waste during processing (AFF, 2011).
Some of the large companies and sawmillers involved in primary and secondary processing in some of the big
forest plantation estates in Burundi include Woodperfect, Participatory Management Group (PMG), Coopérative
INEZA des menuisiers du Marché de Mutanga Nord (INEZA), Cooperative of carpenters - Mutanga North
Market and different carpenters associations working at the artisanal training center of Jabe ( Centre de
Formation Artisanal (CFA).
4.3.3.2.4 Consumers
There are no wood processing industries in Burundi with the exception of sawn wood (for furniture and other
uses) and construction wood (such as building timber, poles and posts). The greatest proportion of saw-logs in
Burundi is mainly processed by hand using the pit sawing technique. The forest trade flow in Burundi is a mix of
direct consumption, barter and sales. The prices of forest products vary from one place to another (generally
being higher in major towns and the city of Bujumbura) and from one species to another. As for the exports, the
industrial roundwood is the major wood product exported (AFF, 2011).
4.3.3.2.5 Sources and types of forest biomass resides in Burundi
The main sources of forest biomass production are:
1. State forest of Gakara-Gahuni;
2. The co-managed afforestation from Magara to Ngozi;
3. The co-managed afforestation from Ntamba to Muyinga;
4. State forest of VYANDA-BURURI;
5. State forest of Rugazi; and
6. Private afforestation.
The tree species planted, area covered and volume of timber produced varies between forests, and hence
forest biomass residues:
1. State forest of Gakara-Gahuni: The main tree species is Eucalyptus. The total forest (Gakara-Gahuni)
extends over more or less 2,000 hectares, of which nearly 1150 (Rufuguta, 2010) are jointly managed.
Usable volume of timber on the co-managed area is estimated on average at 670,197 m3. In terms of
management, the Gakara-Gahuni block is co-managed between the State represented by the Forestry
Department and groups of people called participatory Management Group (PMG) namely:
a. Mashambaramba
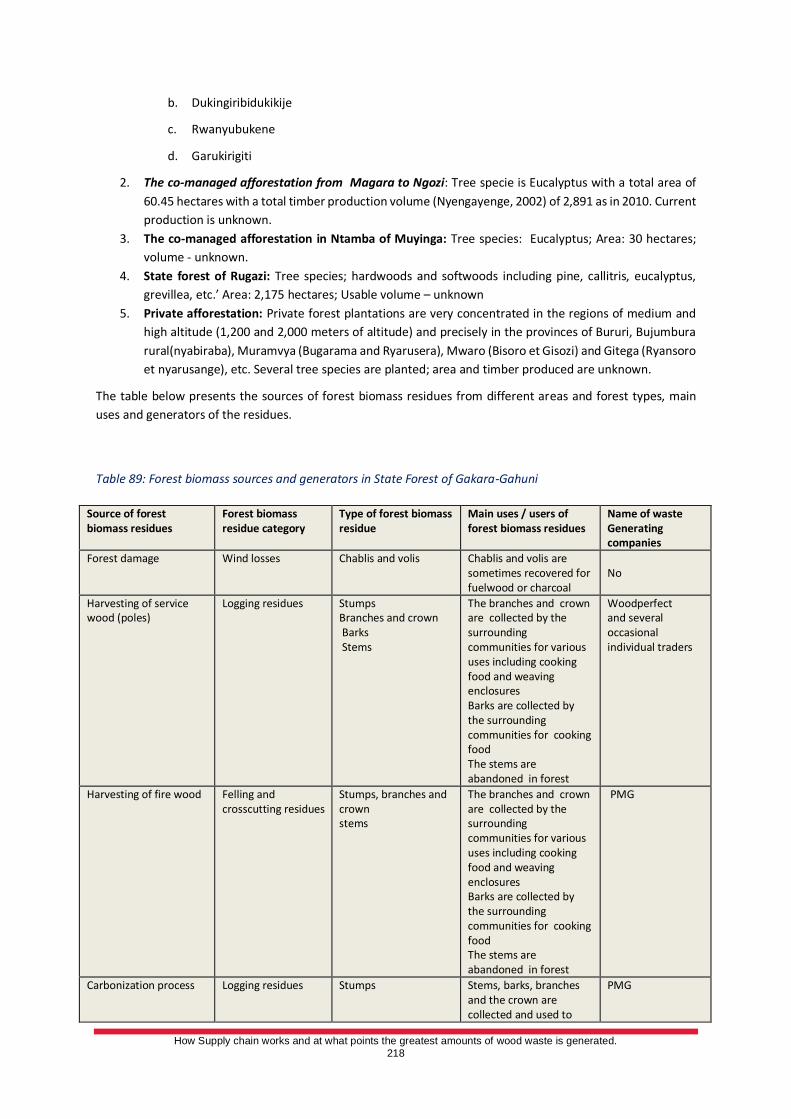
How Supply chain works and at what points the greatest amounts of wood waste is generated.
218
b. Dukingiribidukikije
c. Rwanyubukene
d. Garukirigiti
2. The co-managed afforestation from Magara to Ngozi: Tree specie is Eucalyptus with a total area of
60.45 hectares with a total timber production volume (Nyengayenge, 2002) of 2,891 as in 2010. Current
production is unknown.
3. The co-managed afforestation in Ntamba of Muyinga: Tree species: Eucalyptus; Area: 30 hectares;
volume - unknown.
4. State forest of Rugazi: Tree species; hardwoods and softwoods including pine, callitris, eucalyptus,
grevillea, etc.’ Area: 2,175 hectares; Usable volume – unknown
5. Private afforestation: Private forest plantations are very concentrated in the regions of medium and
high altitude (1,200 and 2,000 meters of altitude) and precisely in the provinces of Bururi, Bujumbura
rural(nyabiraba), Muramvya (Bugarama and Ryarusera), Mwaro (Bisoro et Gisozi) and Gitega (Ryansoro
et nyarusange), etc. Several tree species are planted; area and timber produced are unknown.
The table below presents the sources of forest biomass residues from different areas and forest types, main
uses and generators of the residues.
Table 89: Forest biomass sources and generators in State Forest of Gakara-Gahuni
Source of forest biomass residues
Forest biomass residue category
Type of forest biomass residue
Main uses / users of forest biomass residues
Name of waste Generating companies
Forest damage Wind losses Chablis and volis Chablis and volis are sometimes recovered for fuelwood or charcoal
No
Harvesting of service wood (poles)
Logging residues Stumps Branches and crown Barks Stems
The branches and crown are collected by the surrounding communities for various uses including cooking food and weaving enclosures Barks are collected by the surrounding communities for cooking food The stems are abandoned in forest
Woodperfect and several occasional individual traders
Harvesting of fire wood Felling and crosscutting residues
Stumps, branches and crown stems
The branches and crown are collected by the surrounding communities for various uses including cooking food and weaving enclosures Barks are collected by the surrounding communities for cooking food The stems are abandoned in forest
PMG
Carbonization process Logging residues Stumps
Stems, barks, branches and the crown are collected and used to
PMG
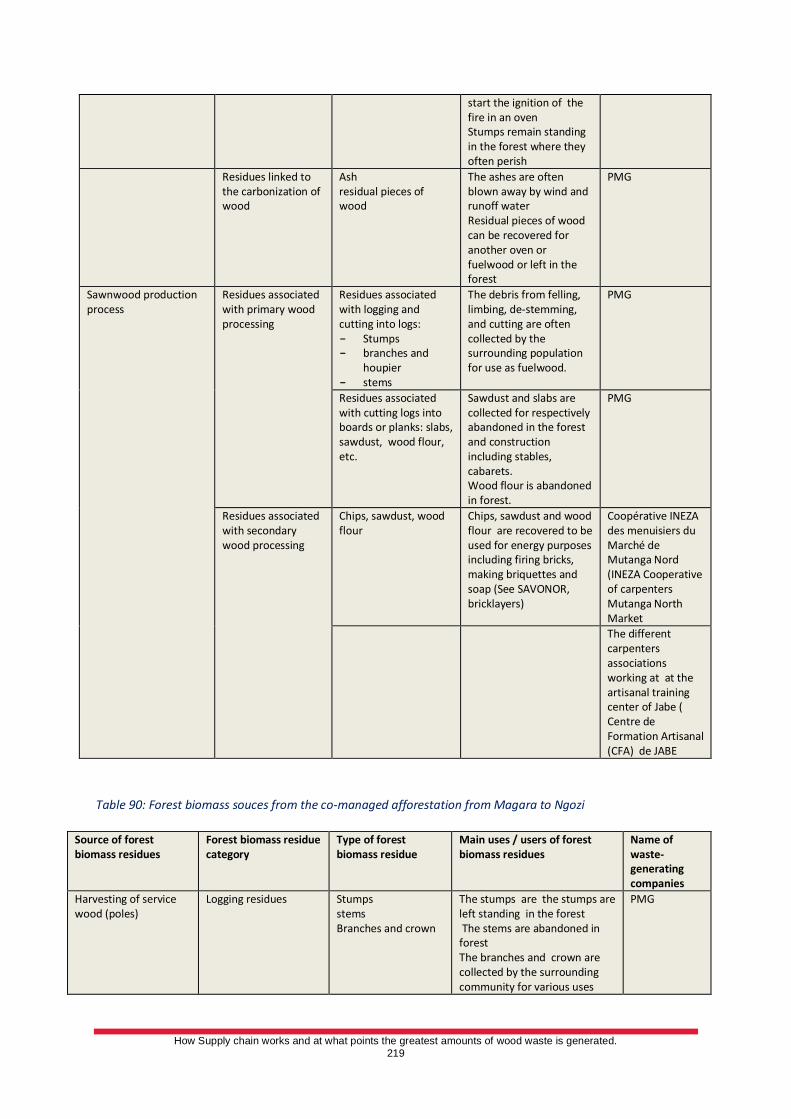
How Supply chain works and at what points the greatest amounts of wood waste is generated.
219
start the ignition of the fire in an oven Stumps remain standing in the forest where they often perish
Residues linked to the carbonization of wood
Ash residual pieces of wood
The ashes are often blown away by wind and runoff water Residual pieces of wood can be recovered for another oven or fuelwood or left in the forest
PMG
Sawnwood production process
Residues associated with primary wood processing
Residues associated with logging and cutting into logs: - Stumps - branches and
houpier - stems
The debris from felling, limbing, de-stemming, and cutting are often collected by the surrounding population for use as fuelwood.
PMG
Residues associated with cutting logs into boards or planks: slabs, sawdust, wood flour, etc.
Sawdust and slabs are collected for respectively abandoned in the forest and construction including stables, cabarets. Wood flour is abandoned in forest.
PMG
Residues associated with secondary wood processing
Chips, sawdust, wood flour
Chips, sawdust and wood flour are recovered to be used for energy purposes including firing bricks, making briquettes and soap (See SAVONOR, bricklayers)
Coopérative INEZA des menuisiers du Marché de Mutanga Nord (INEZA Cooperative of carpenters Mutanga North Market
The different carpenters associations working at at the artisanal training center of Jabe ( Centre de Formation Artisanal (CFA) de JABE
Table 90: Forest biomass souces from the co-managed afforestation from Magara to Ngozi
Source of forest biomass residues
Forest biomass residue category
Type of forest biomass residue
Main uses / users of forest biomass residues
Name of waste-generating companies
Harvesting of service wood (poles)
Logging residues Stumps stems Branches and crown
The stumps are the stumps are left standing in the forest The stems are abandoned in forest The branches and crown are collected by the surrounding community for various uses
PMG
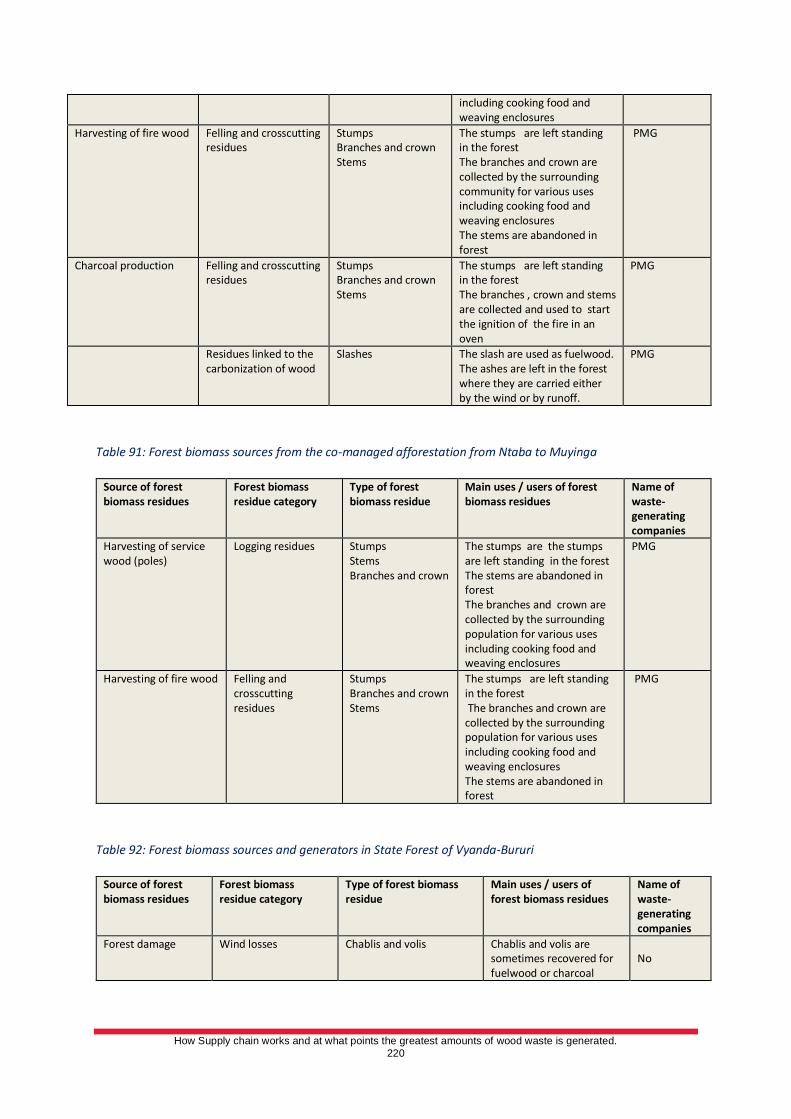
How Supply chain works and at what points the greatest amounts of wood waste is generated.
220
including cooking food and weaving enclosures
Harvesting of fire wood Felling and crosscutting residues
Stumps Branches and crown Stems
The stumps are left standing in the forest The branches and crown are collected by the surrounding community for various uses including cooking food and weaving enclosures The stems are abandoned in forest
PMG
Charcoal production Felling and crosscutting residues
Stumps Branches and crown Stems
The stumps are left standing in the forest The branches , crown and stems are collected and used to start the ignition of the fire in an oven
PMG
Residues linked to the carbonization of wood
Slashes The slash are used as fuelwood. The ashes are left in the forest where they are carried either by the wind or by runoff.
PMG
Table 91: Forest biomass sources from the co-managed afforestation from Ntaba to Muyinga
Source of forest biomass residues
Forest biomass residue category
Type of forest biomass residue
Main uses / users of forest biomass residues
Name of waste-generating companies
Harvesting of service wood (poles)
Logging residues Stumps Stems Branches and crown
The stumps are the stumps are left standing in the forest The stems are abandoned in forest The branches and crown are collected by the surrounding population for various uses including cooking food and weaving enclosures
PMG
Harvesting of fire wood Felling and crosscutting residues
Stumps Branches and crown Stems
The stumps are left standing in the forest The branches and crown are collected by the surrounding population for various uses including cooking food and weaving enclosures The stems are abandoned in forest
PMG
Table 92: Forest biomass sources and generators in State Forest of Vyanda-Bururi
Source of forest biomass residues
Forest biomass residue category
Type of forest biomass residue
Main uses / users of forest biomass residues
Name of waste-generating companies
Forest damage Wind losses Chablis and volis Chablis and volis are sometimes recovered for fuelwood or charcoal
No
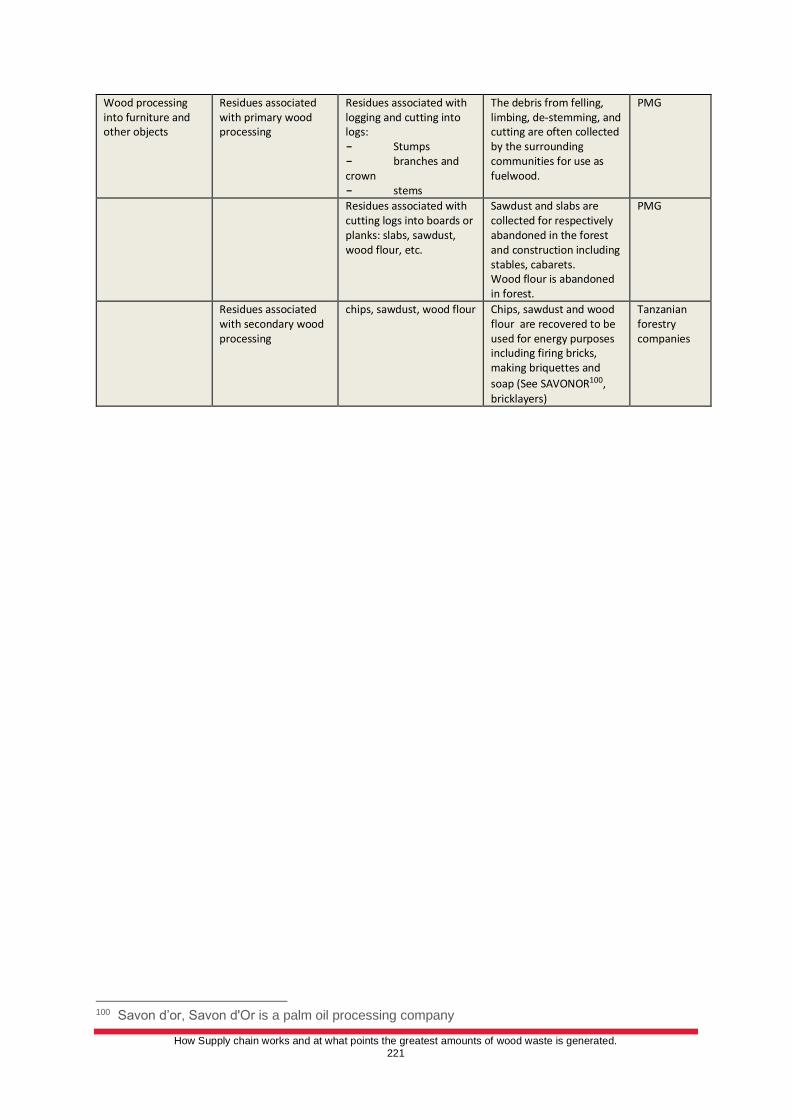
How Supply chain works and at what points the greatest amounts of wood waste is generated.
221
Wood processing into furniture and other objects
Residues associated with primary wood processing
Residues associated with logging and cutting into logs: - Stumps - branches and crown - stems
The debris from felling, limbing, de-stemming, and cutting are often collected by the surrounding communities for use as fuelwood.
PMG
Residues associated with cutting logs into boards or planks: slabs, sawdust, wood flour, etc.
Sawdust and slabs are collected for respectively abandoned in the forest and construction including stables, cabarets. Wood flour is abandoned in forest.
PMG
Residues associated with secondary wood processing
chips, sawdust, wood flour Chips, sawdust and wood flour are recovered to be used for energy purposes including firing bricks, making briquettes and
soap (See SAVONOR100, bricklayers)
Tanzanian forestry companies
100 Savon d’or, Savon d'Or is a palm oil processing company
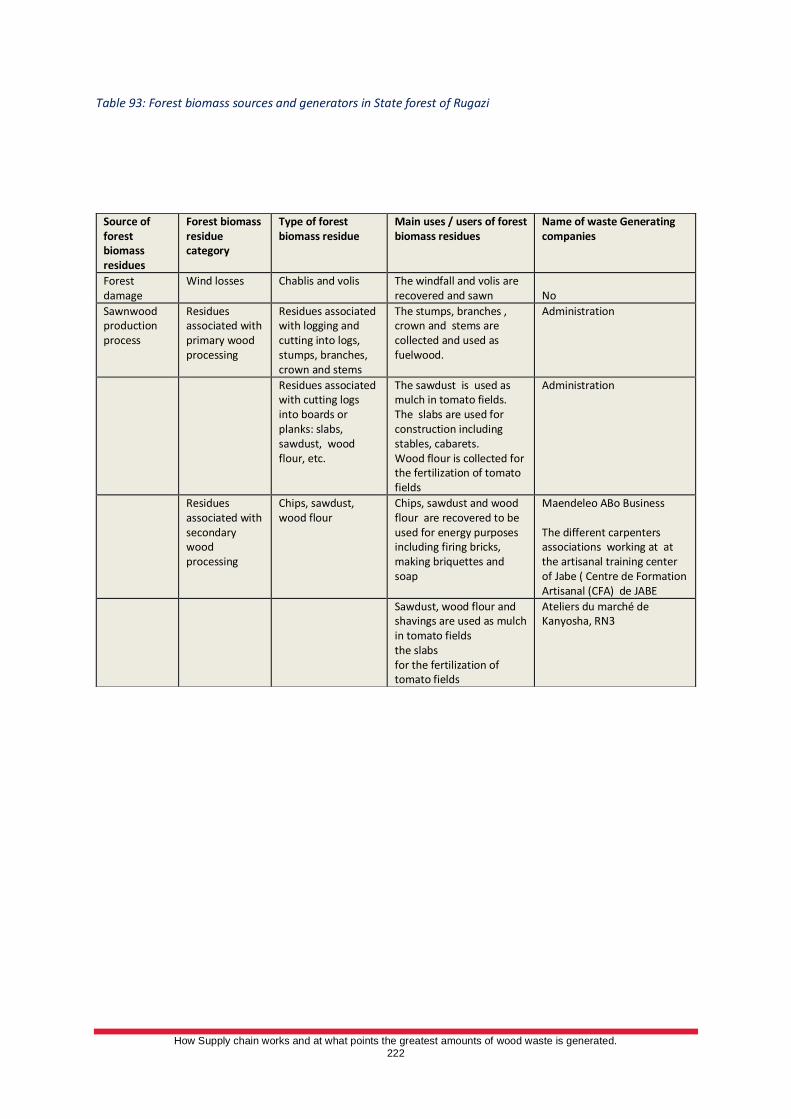
How Supply chain works and at what points the greatest amounts of wood waste is generated.
222
Table 93: Forest biomass sources and generators in State forest of Rugazi
Source of forest biomass residues
Forest biomass residue category
Type of forest biomass residue
Main uses / users of forest biomass residues
Name of waste Generating companies
Forest damage
Wind losses Chablis and volis The windfall and volis are recovered and sawn
No
Sawnwood production process
Residues associated with primary wood processing
Residues associated with logging and cutting into logs, stumps, branches, crown and stems
The stumps, branches , crown and stems are collected and used as fuelwood.
Administration
Residues associated with cutting logs into boards or planks: slabs, sawdust, wood flour, etc.
The sawdust is used as mulch in tomato fields. The slabs are used for construction including stables, cabarets. Wood flour is collected for the fertilization of tomato fields
Administration
Residues associated with secondary wood processing
Chips, sawdust, wood flour
Chips, sawdust and wood flour are recovered to be used for energy purposes including firing bricks, making briquettes and soap
Maendeleo ABo Business The different carpenters associations working at at the artisanal training center of Jabe ( Centre de Formation Artisanal (CFA) de JABE
Sawdust, wood flour and shavings are used as mulch in tomato fields the slabs for the fertilization of tomato fields
Ateliers du marché de Kanyosha, RN3
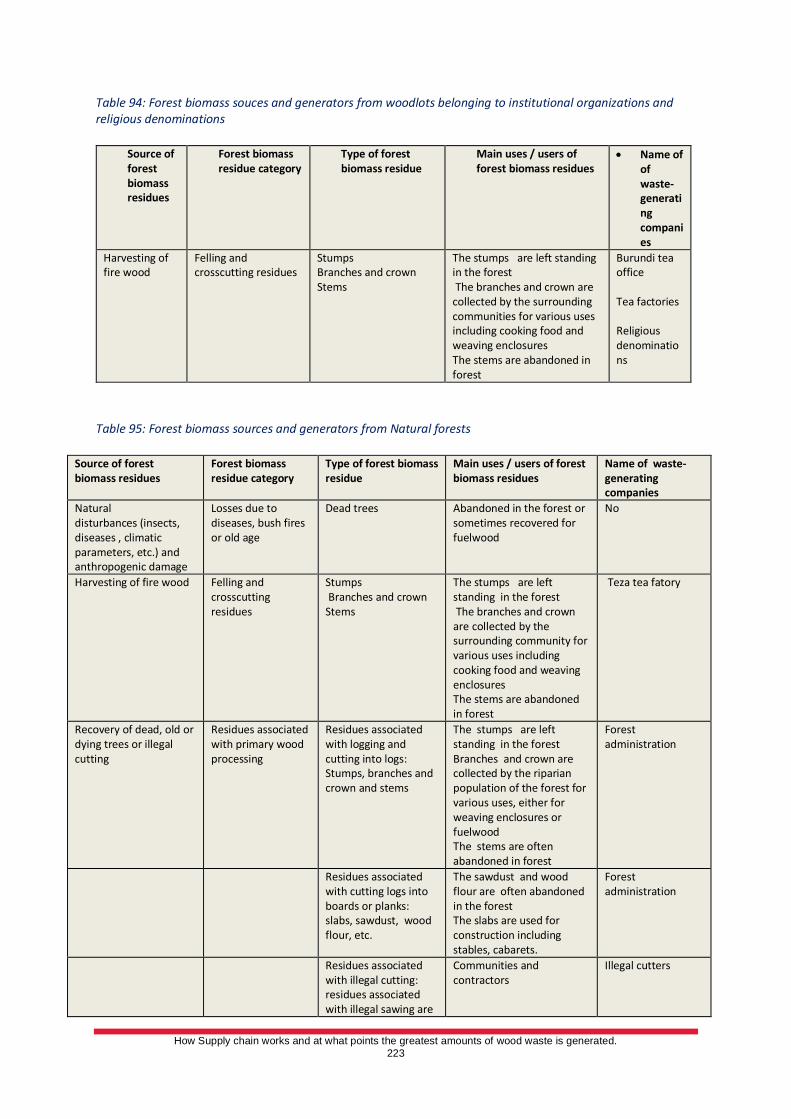
How Supply chain works and at what points the greatest amounts of wood waste is generated.
223
Table 94: Forest biomass souces and generators from woodlots belonging to institutional organizations and religious denominations
Source of forest biomass residues
Forest biomass residue category
Type of forest biomass residue
Main uses / users of forest biomass residues
• Name of of waste-generating companies
Harvesting of fire wood
Felling and crosscutting residues
Stumps Branches and crown Stems
The stumps are left standing in the forest The branches and crown are collected by the surrounding communities for various uses including cooking food and weaving enclosures The stems are abandoned in forest
Burundi tea office Tea factories Religious denominations
Table 95: Forest biomass sources and generators from Natural forests
Source of forest biomass residues
Forest biomass residue category
Type of forest biomass residue
Main uses / users of forest biomass residues
Name of waste-generating companies
Natural disturbances (insects, diseases , climatic parameters, etc.) and anthropogenic damage
Losses due to diseases, bush fires or old age
Dead trees Abandoned in the forest or sometimes recovered for fuelwood
No
Harvesting of fire wood Felling and crosscutting residues
Stumps Branches and crown Stems
The stumps are left standing in the forest The branches and crown are collected by the surrounding community for various uses including cooking food and weaving enclosures The stems are abandoned in forest
Teza tea fatory
Recovery of dead, old or dying trees or illegal cutting
Residues associated with primary wood processing
Residues associated with logging and cutting into logs: Stumps, branches and crown and stems
The stumps are left standing in the forest Branches and crown are collected by the riparian population of the forest for various uses, either for weaving enclosures or fuelwood The stems are often abandoned in forest
Forest administration
Residues associated with cutting logs into boards or planks: slabs, sawdust, wood flour, etc.
The sawdust and wood flour are often abandoned in the forest The slabs are used for construction including stables, cabarets.
Forest administration
Residues associated with illegal cutting: residues associated with illegal sawing are
Communities and contractors
Illegal cutters
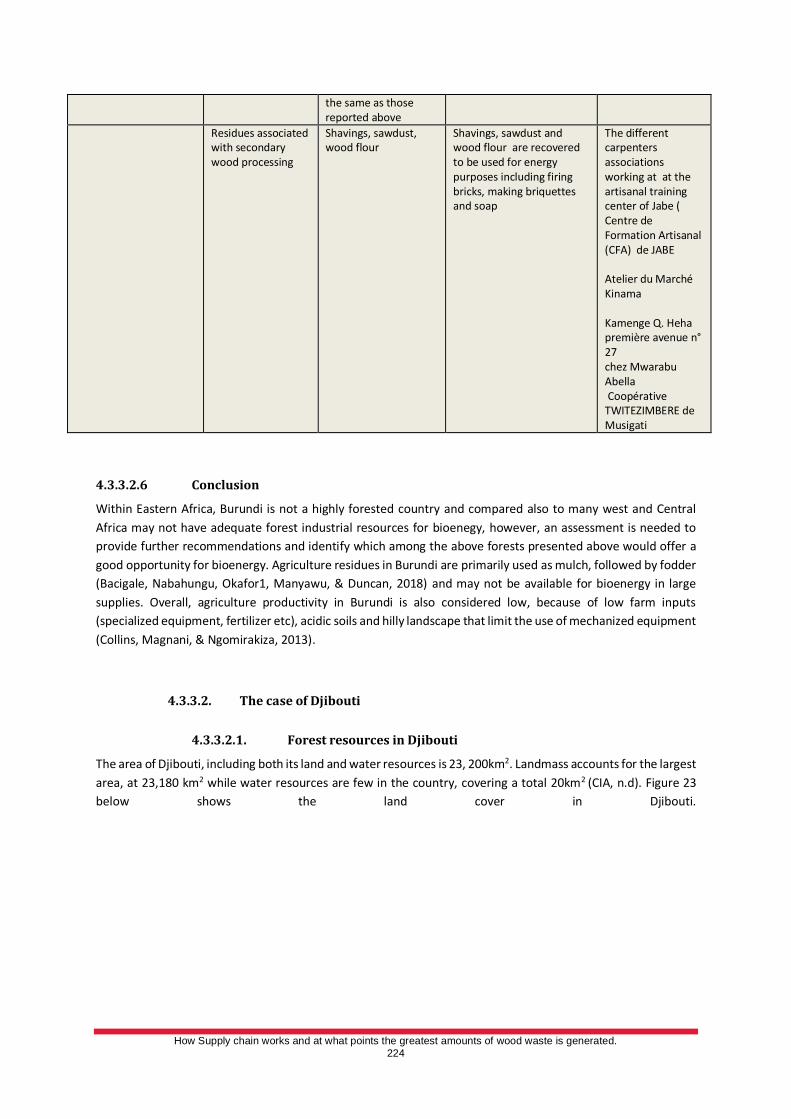
How Supply chain works and at what points the greatest amounts of wood waste is generated.
224
the same as those reported above
Residues associated with secondary wood processing
Shavings, sawdust, wood flour
Shavings, sawdust and wood flour are recovered to be used for energy purposes including firing bricks, making briquettes and soap
The different carpenters associations working at at the artisanal training center of Jabe ( Centre de Formation Artisanal (CFA) de JABE Atelier du Marché Kinama Kamenge Q. Heha première avenue n° 27 chez Mwarabu Abella Coopérative TWITEZIMBERE de Musigati
4.3.3.2.6 Conclusion
Within Eastern Africa, Burundi is not a highly forested country and compared also to many west and Central
Africa may not have adequate forest industrial resources for bioenegy, however, an assessment is needed to
provide further recommendations and identify which among the above forests presented above would offer a
good opportunity for bioenergy. Agriculture residues in Burundi are primarily used as mulch, followed by fodder
(Bacigale, Nabahungu, Okafor1, Manyawu, & Duncan, 2018) and may not be available for bioenergy in large
supplies. Overall, agriculture productivity in Burundi is also considered low, because of low farm inputs
(specialized equipment, fertilizer etc), acidic soils and hilly landscape that limit the use of mechanized equipment
(Collins, Magnani, & Ngomirakiza, 2013).
4.3.3.2. The case of Djibouti
4.3.3.2.1. Forest resources in Djibouti
The area of Djibouti, including both its land and water resources is 23, 200km2. Landmass accounts for the largest
area, at 23,180 km2 while water resources are few in the country, covering a total 20km2 (CIA, n.d). Figure 23
below shows the land cover in Djibouti.
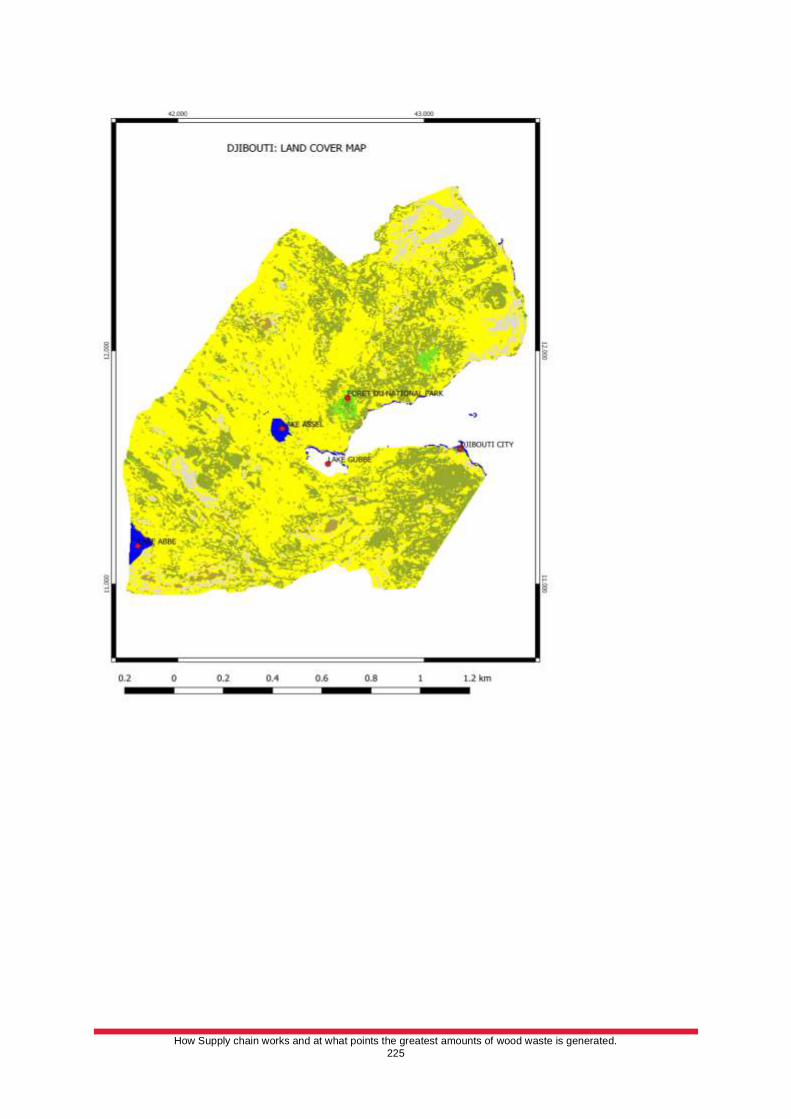
How Supply chain works and at what points the greatest amounts of wood waste is generated.
225
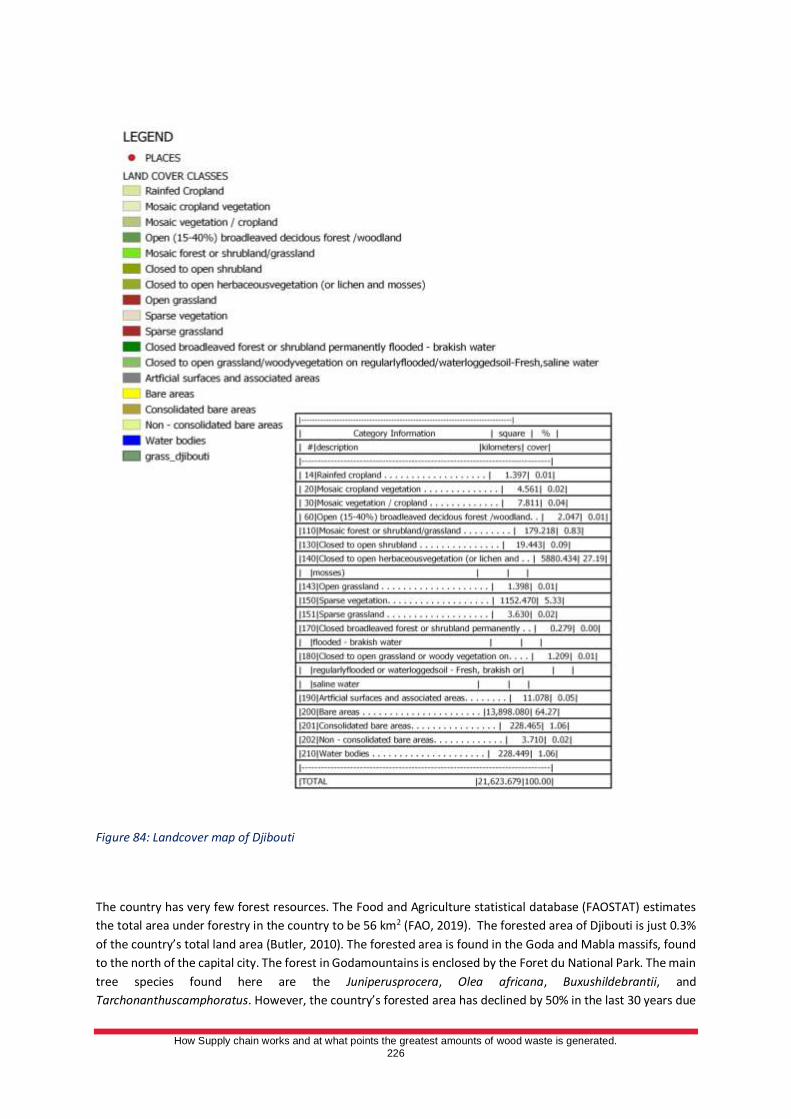
How Supply chain works and at what points the greatest amounts of wood waste is generated.
226
Figure 84: Landcover map of Djibouti
The country has very few forest resources. The Food and Agriculture statistical database (FAOSTAT) estimates
the total area under forestry in the country to be 56 km2 (FAO, 2019). The forested area of Djibouti is just 0.3%
of the country’s total land area (Butler, 2010). The forested area is found in the Goda and Mabla massifs, found
to the north of the capital city. The forest in Godamountains is enclosed by the Foret du National Park. The main
tree species found here are the Juniperusprocera, Olea africana, Buxushildebrantii, and
Tarchonanthuscamphoratus. However, the country’s forested area has declined by 50% in the last 30 years due
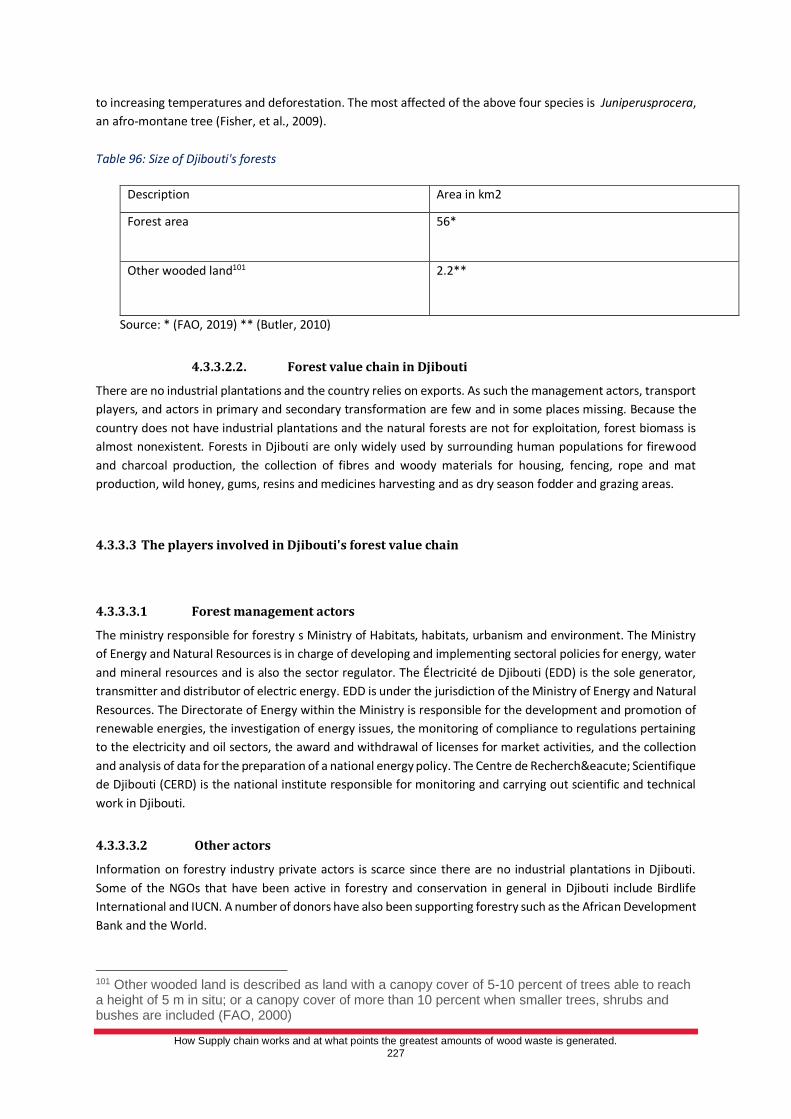
How Supply chain works and at what points the greatest amounts of wood waste is generated.
227
to increasing temperatures and deforestation. The most affected of the above four species is Juniperusprocera,
an afro-montane tree (Fisher, et al., 2009).
Table 96: Size of Djibouti's forests
Description Area in km2
Forest area 56*
Other wooded land101 2.2**
Source: * (FAO, 2019) ** (Butler, 2010)
4.3.3.2.2. Forest value chain in Djibouti
There are no industrial plantations and the country relies on exports. As such the management actors, transport
players, and actors in primary and secondary transformation are few and in some places missing. Because the
country does not have industrial plantations and the natural forests are not for exploitation, forest biomass is
almost nonexistent. Forests in Djibouti are only widely used by surrounding human populations for firewood
and charcoal production, the collection of fibres and woody materials for housing, fencing, rope and mat
production, wild honey, gums, resins and medicines harvesting and as dry season fodder and grazing areas.
4.3.3.3 The players involved in Djibouti's forest value chain
4.3.3.3.1 Forest management actors
The ministry responsible for forestry s Ministry of Habitats, habitats, urbanism and environment. The Ministry
of Energy and Natural Resources is in charge of developing and implementing sectoral policies for energy, water
and mineral resources and is also the sector regulator. The Électricité de Djibouti (EDD) is the sole generator,
transmitter and distributor of electric energy. EDD is under the jurisdiction of the Ministry of Energy and Natural
Resources. The Directorate of Energy within the Ministry is responsible for the development and promotion of
renewable energies, the investigation of energy issues, the monitoring of compliance to regulations pertaining
to the electricity and oil sectors, the award and withdrawal of licenses for market activities, and the collection
and analysis of data for the preparation of a national energy policy. The Centre de Recherché Scientifique
de Djibouti (CERD) is the national institute responsible for monitoring and carrying out scientific and technical
work in Djibouti.
4.3.3.3.2 Other actors
Information on forestry industry private actors is scarce since there are no industrial plantations in Djibouti.
Some of the NGOs that have been active in forestry and conservation in general in Djibouti include Birdlife
International and IUCN. A number of donors have also been supporting forestry such as the African Development
Bank and the World.
101 Other wooded land is described as land with a canopy cover of 5-10 percent of trees able to reach a height of 5 m in situ; or a canopy cover of more than 10 percent when smaller trees, shrubs and bushes are included (FAO, 2000)
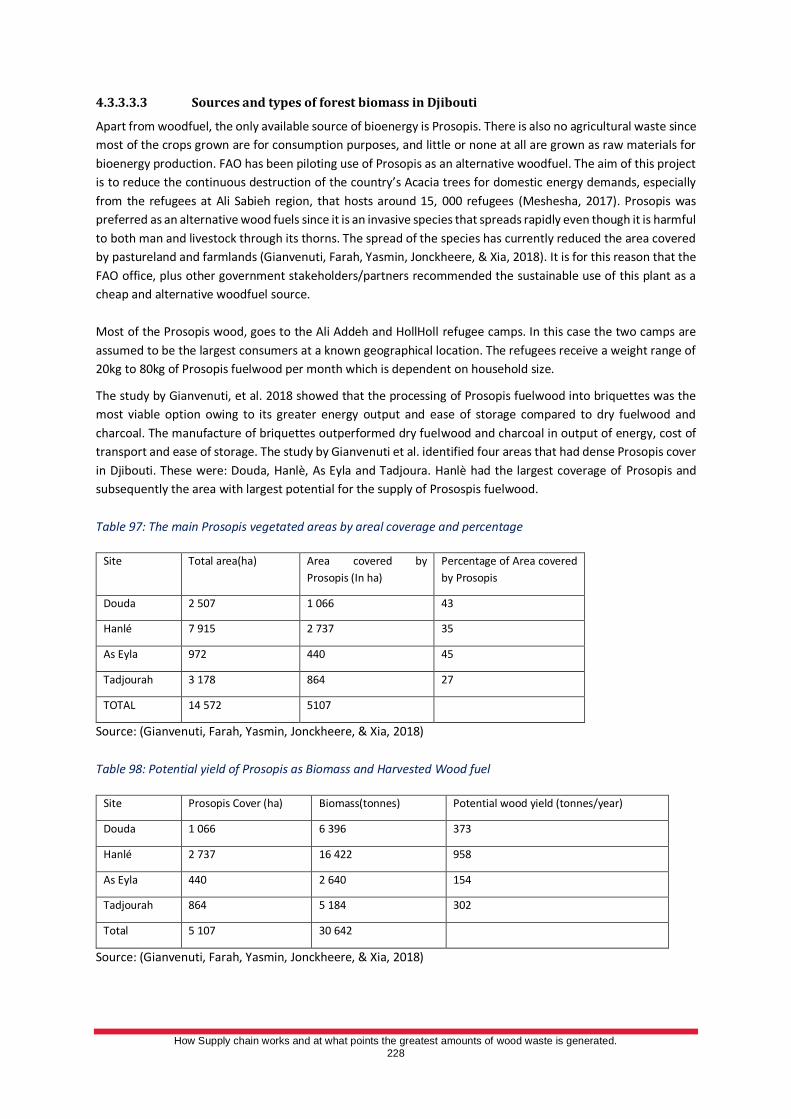
How Supply chain works and at what points the greatest amounts of wood waste is generated.
228
4.3.3.3.3 Sources and types of forest biomass in Djibouti
Apart from woodfuel, the only available source of bioenergy is Prosopis. There is also no agricultural waste since
most of the crops grown are for consumption purposes, and little or none at all are grown as raw materials for
bioenergy production. FAO has been piloting use of Prosopis as an alternative woodfuel. The aim of this project
is to reduce the continuous destruction of the country’s Acacia trees for domestic energy demands, especially
from the refugees at Ali Sabieh region, that hosts around 15, 000 refugees (Meshesha, 2017). Prosopis was
preferred as an alternative wood fuels since it is an invasive species that spreads rapidly even though it is harmful
to both man and livestock through its thorns. The spread of the species has currently reduced the area covered
by pastureland and farmlands (Gianvenuti, Farah, Yasmin, Jonckheere, & Xia, 2018). It is for this reason that the
FAO office, plus other government stakeholders/partners recommended the sustainable use of this plant as a
cheap and alternative woodfuel source.
Most of the Prosopis wood, goes to the Ali Addeh and HollHoll refugee camps. In this case the two camps are
assumed to be the largest consumers at a known geographical location. The refugees receive a weight range of
20kg to 80kg of Prosopis fuelwood per month which is dependent on household size.
The study by Gianvenuti, et al. 2018 showed that the processing of Prosopis fuelwood into briquettes was the
most viable option owing to its greater energy output and ease of storage compared to dry fuelwood and
charcoal. The manufacture of briquettes outperformed dry fuelwood and charcoal in output of energy, cost of
transport and ease of storage. The study by Gianvenuti et al. identified four areas that had dense Prosopis cover
in Djibouti. These were: Douda, Hanlè, As Eyla and Tadjoura. Hanlè had the largest coverage of Prosopis and
subsequently the area with largest potential for the supply of Prosospis fuelwood.
Table 97: The main Prosopis vegetated areas by areal coverage and percentage
Site Total area(ha) Area covered by
Prosopis (In ha)
Percentage of Area covered
by Prosopis
Douda 2 507 1 066 43
Hanlé 7 915 2 737 35
As Eyla 972 440 45
Tadjourah 3 178 864 27
TOTAL 14 572 5107
Source: (Gianvenuti, Farah, Yasmin, Jonckheere, & Xia, 2018)
Table 98: Potential yield of Prosopis as Biomass and Harvested Wood fuel
Site Prosopis Cover (ha) Biomass(tonnes) Potential wood yield (tonnes/year)
Douda 1 066 6 396 373
Hanlé 2 737 16 422 958
As Eyla 440 2 640 154
Tadjourah 864 5 184 302
Total 5 107 30 642
Source: (Gianvenuti, Farah, Yasmin, Jonckheere, & Xia, 2018)
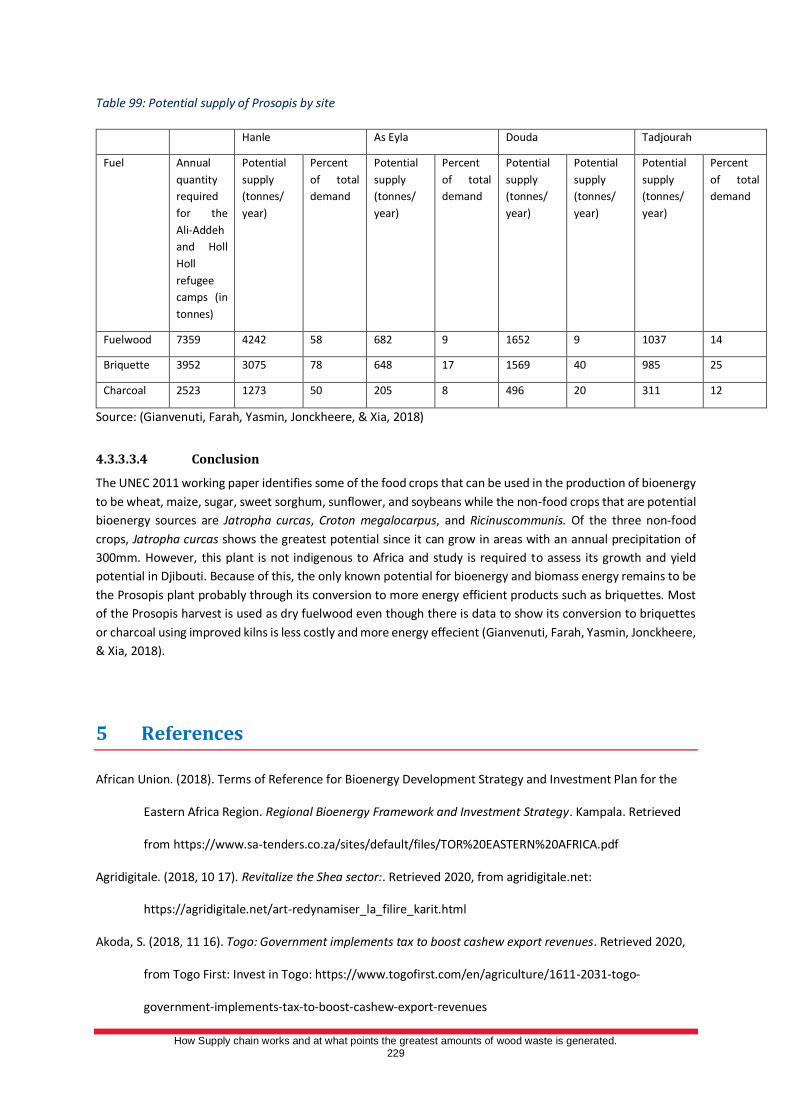
How Supply chain works and at what points the greatest amounts of wood waste is generated.
229
Table 99: Potential supply of Prosopis by site
Hanle As Eyla Douda Tadjourah
Fuel Annual
quantity
required
for the
Ali-Addeh
and Holl
Holl
refugee
camps (in
tonnes)
Potential
supply
(tonnes/
year)
Percent
of total
demand
Potential
supply
(tonnes/
year)
Percent
of total
demand
Potential
supply
(tonnes/
year)
Potential
supply
(tonnes/
year)
Potential
supply
(tonnes/
year)
Percent
of total
demand
Fuelwood 7359 4242 58 682 9 1652 9 1037 14
Briquette 3952 3075 78 648 17 1569 40 985 25
Charcoal 2523 1273 50 205 8 496 20 311 12
Source: (Gianvenuti, Farah, Yasmin, Jonckheere, & Xia, 2018)
4.3.3.3.4 Conclusion
The UNEC 2011 working paper identifies some of the food crops that can be used in the production of bioenergy
to be wheat, maize, sugar, sweet sorghum, sunflower, and soybeans while the non-food crops that are potential
bioenergy sources are Jatropha curcas, Croton megalocarpus, and Ricinuscommunis. Of the three non-food
crops, Jatropha curcas shows the greatest potential since it can grow in areas with an annual precipitation of
300mm. However, this plant is not indigenous to Africa and study is required to assess its growth and yield
potential in Djibouti. Because of this, the only known potential for bioenergy and biomass energy remains to be
the Prosopis plant probably through its conversion to more energy efficient products such as briquettes. Most
of the Prosopis harvest is used as dry fuelwood even though there is data to show its conversion to briquettes
or charcoal using improved kilns is less costly and more energy effecient (Gianvenuti, Farah, Yasmin, Jonckheere,
& Xia, 2018).
5 References
African Union. (2018). Terms of Reference for Bioenergy Development Strategy and Investment Plan for the
Eastern Africa Region. Regional Bioenergy Framework and Investment Strategy. Kampala. Retrieved
from https://www.sa-tenders.co.za/sites/default/files/TOR%20EASTERN%20AFRICA.pdf
Agridigitale. (2018, 10 17). Revitalize the Shea sector:. Retrieved 2020, from agridigitale.net:
https://agridigitale.net/art-redynamiser_la_filire_karit.html
Akoda, S. (2018, 11 16). Togo: Government implements tax to boost cashew export revenues. Retrieved 2020,
from Togo First: Invest in Togo: https://www.togofirst.com/en/agriculture/1611-2031-togo-
government-implements-tax-to-boost-cashew-export-revenues
How Supply chain works and at what points the greatest amounts of wood waste is generated.
230
Akoda, S. (2020, 3 9). Togo to produce 25, 000t of raw cashew during the 2019 - 2020 campaign. Retrieved
2020, from Togo First: Invest in Togo: https://www.togofirst.com/en/agriculture/0903-5093-togo-to-
produce-25-000t-of-raw-cashew-during-the-2019-2020-campaign
Am, N.-K. (2019). Statement of Private Sector Actors in the Forest-wood Industry in Congo. Association
Technique Internationale des Bois Tropicaux(ATIBT). Retrieved from https://www.atibt.org/wp-
content/uploads/2020/02/RAPPORT-FINAL-Etat-des-lieux-acteurs-fili%C3%A8re-bois_AT_final.pdf
Amsallem, I. (2002). Status and Trends in Forest Management in Central Africa. Rome: Forest Resources
Development Service,FAO. Retrieved from
http://www.fao.org/tempref/docrep/fao/008/y8127e/y8127e.pdf
Armand, H. J. (2010). Collection and Analysis of Statistical Data on Products made of Pericopsis elata Harms /
Assamela (Fabaceae) in view of a Sustainable Management in Cameroon. University of Dschang,
Forestry Department. Retrieved from
https://www.itto.int/files/user/cites/cameroon/Memoire_Collecte des données
statistiques_assamela_Hagbe.pdf
ATBIT. (2019). State of play of actors in the forest-wood sector in the Democratic Republic of Congo. Ecole
Régionale Post-University of Planning and ManagementIntegrated Tropical Forests and
Territories(ERAIFT). Retrieved from https://www.atibt.org/wp-content/uploads/2020/03/Rapport-
final_Etude-sur-létat-de-lieu-du-secteur-forestier-1.pdf
Bacigale, S. B., Nabahungu, L. N., Okafor1, C., Manyawu, G. J., & Duncan, A. (2018). Assessment of Livestock
Feed Resources and Potential Feed Options in the farming systems of Eastern DR Congo and Burundi.
International Livestock Research Institute (ILRI).
Bakouma, J. (2017). Sustainable forestry value chain assessment in REDD+ countries of the Congo Basin.
FAO/WWF. Retrieved from http://www.fonaredd-rdc.org/wp-content/uploads/2018/12/Rapport-3-
Projet-FAO-Rapport-de-synth%C3%A8se-r%C3%A9gional-Version-semi-finale.pdf
Behrendt, H., Megevand, C., & Sander, K. (2013). Deforestation dynamics in the Congo basin: Reconcile
economic growth and forest protection. Working Paper No. 5 . Retrieved from
http://documents1.worldbank.org/curated/en/286441468193753313/pdf/779400NWP0Fren0t0FREN
CH0FINAL0may13.pdf
How Supply chain works and at what points the greatest amounts of wood waste is generated.
231
Boisrobert, L., & Bégoto, G. (2010). Interactive forest atlas of the Central African Republic (Version 1.0).
Washington DC., USA: World Resources Institute. Retrieved from https://files.wri.org/s3fs-
public/pdf/interactive_forest_atlas_car_fr.pdf
Bromhead, M.-A. (2012). Forests, Trees and Woodlands in Africa: An action plan for World Bank engagement.
Washington, D.C: The World Bank. Retrieved from
http://documents1.worldbank.org/curated/en/616631468004826427/pdf/730260REPLACEM0tion0Pl
an06014012web.pdf
Butler, R. (2010). Djibouti Forest Information and Data. Retrieved 2020, from Mongabay.com:
https://rainforests.mongabay.com/deforestation/2000/Djibouti.htm
Cerutti, P. O., Mbangolo, J. D., Nakoe, G. P., Vandenhaute, M., & Hubert, D. (2018). State of the Timber Sector
in Central African Republic (2016). Bogor: United Nations Food and Agriculture Organization and
Centre for International Forestry Research (FAO/CIFOR). Retrieved from
http://www.fao.org/3/i8596en/I8596EN.pdf
CIA. (n.d). The World Factbook. Retrieved 2020, from Central Intelligence Agency:
https://www.cia.gov/library/publications/the-world-factbook/geos/dj.html
CIFOR. (Mai 2006). Analyse de l'évolution des filières d'approvisionnement en bois-énergie de la ville de
Bamako. Mali.
Collins, C., Magnani, R., & Ngomirakiza, E. (2013). USAID Office of Food for Peace for Food Security Country
Framework for Burundi (FY 2014–FY 2019). Washington DC.: USAID.
Douard, F. (2016, 4 18). Two industrial projects for the production of wood energy in Cameroon. Retrieved from
The bioenergy portal: https://www.bioenergie-promotion.fr/45677/deux-projets-industriels-de-
production-de-bois-energie-au-cameroun/
ECO Consulting, R. T. (JUIN 2017). Etude approfondie sur la dynamique de l’utilisation du bois-énergie au Togo.
République du Togo,Lomé.
Ecofin Agro, 2019. (n.d.).
EU. (2016). Joint annual report 2016 on the implementation of the FLEGT VPA. Retrieved from
http://www.apvflegtcongo.com/images/pdf/rapport_conjoint_apvflegt_2016.pdf
How Supply chain works and at what points the greatest amounts of wood waste is generated.
232
EYENGA, D. P.-H. (2009). The Supply Chain Management: A level for integration of global value chains. The case
of Cameroon. Thesis for Doctor in Management Sciences, University of Mediteranne (AIX-MARSEILLE
II), Faculty of Economics and Management. Retrieved from http://livre.fun/LIVREF/F28/F028063.pdf
FAO. (2000). FRA 2000 on Definitions of Forest and Forest Change. Rome: Food and Agriculture Organization of
the United Nations. Retrieved from http://www.fao.org/3/ad665e/ad665e00.htm#TopOfPage
FAO. (2014). Forest Resource Assessment World 2015: Cameroon national report. Rome: Food and Agriculture
Organization of the United Nations. Retrieved from
https://www.onlinedoctranslator.com/gettranslateddocument/a-az180f.fr.en.pdf
FAO. (2017). FAOSTAT. Retrieved 2020, from Food and Agriculture Organization of the United Nations:
Statistics division: http://www.fao.org/faostat/en/#home
FAO. (2019). FAOSTAT. Retrieved 2020, from http://www.fao.org/faostat/en/#data/GF
FAO. (2020). Global Forest resource assessment 2020. Rome: Food and Agriculture Organization of the United
Nations. doi:doi.org/10.4060/ca8753en
FAO. (n.d). View of the National Forest Program Process in Gabon. Retrieved from
http://www.fao.org/3/AC916F/AC916F02.htm
FAO. (n.d.). The forestry sector prospective study in Africa: Democratic Republic of Congo. Food and Agriculture
Organization of the United Nations. Retrieved from
https://www.onlinedoctranslator.com/gettranslateddocument/a-x6779f.fr.en.pdf
FAOSTAT. (juin 2019).
Faure, N. (2013). Management of Community Forests: State of play in the Republic of Congo and other models.
London: Client Earth. Retrieved from http://www.archive.clientearth.org/ressources-
externes/congo/gestion-communautaire-des-forets-etat-des-lieux-et-modeles-clientearth-juillet-
2013.pdf
Fisher, Z. S., Cartwright, S., Bealey, C., Rayaleh, H. A., McGowan, P., & Gulland, E. M. (2009, October). The
Djibouti francolin and juniper forest in Djibouti: The need for both ecosystem and species-specific
conservation. Oryx, 43(4), 542-551. Retrieved from
https://www.cambridge.org/core/journals/oryx/article/djibouti-francolin-and-juniper-forest-in-
djibouti-the-need-for-both-ecosystem-and-speciesspecific-
conservation/EFCBF16F8ED134FBA4F7BA99167FF097/core-reader
How Supply chain works and at what points the greatest amounts of wood waste is generated.
233
FORDAQ. (n.d.). Companies in the Timber Industry in Equatorial Guinea. Retrieved 2020, from FORDAQ SA, The
Timber Network: https://bois.fordaq.com/dir/entreprises-de-guin%C3%A9e-equatoriale?cs=79
GEF. (n.d). Chad GEF Microfinancing Program Strategy for the Fifth Operational Phase (January 2011 -
December 2014). Fund Microfinancing Program for the Global Environment. Chad: Global
Environmental Fund. Retrieved from https://sgp.undp.org/all-documents/country-documents/341-
sgp-country-programme-strategy-80/file
Gianvenuti, A., Farah, I., Yasmin, N., Jonckheere, I., & Xia, Z. (2018). Using Prosopis as an energy source for
refugees and host communities in Djibouti, and controlling its rapid spread. Rome: Food and
Agriculture Organization of the United Nations. Retrieved from
http://www.fao.org/3/CA0163EN/ca0163en.pdf
Global Mechanism. (2018). Central African Republic National Land Degradation Neutrality Target Definitions
Program (PDC/NDT). NDT-RCA Process Report. Retrieved from
https://knowledge.unccd.int/sites/default/files/ldn_targets/Central African Republic LDN TSP Country
Report.pdf
GoAfricaOnline. (n.d.). GoAfricaOnline: Lumbering. Retrieved 2020, from GoAfricaOnline:
https://www.goafricaonline.com/gq/annuaire/exploitation-forestiere%20
Government of Cameroon. (2020). Introductory statements by the Minister of Water and Forests. Government
of Cameroon Press Release. (Google Translate, Trans.) Cameroon. Retrieved from
http://www.gouv.ci/_discours-detail.php?recordID=304
GSEZ. (2018). Main innovation platform for transformation of the wood industry and the development of
regional timber market and wood products. International Timber Fair of Central and West Africa.
Libreville, Gabon: Gabon Special Economic Zone (GSEZ). Retrieved from
https://www.woodshowglobal.com/gabon/en-US/PDF-s/Gabon-WoodShow_Brochure_2018_Fr
Haggar, M. A. (2001). The Forestry Sector Prospective Study in Africa (FOSA): Chad. Rome: Food and Agriculture
Organization of the United Nations. Retrieved from http://www.fao.org/3/a-ab579f.pdf
HiolHiol, F. (2019). State of Play for Industry Players from the Forest-wood filiere in Cameroon. ATIBT. Retrieved
from https://www.atibt.org/wp-content/uploads/2020/03/Rapport_Etat-des-lieux-Secteur-privé-
Cameroun2019.pdf
How Supply chain works and at what points the greatest amounts of wood waste is generated.
234
IBP. (2018). Burundi Energy Policy, Laws and Regulations Handbook: Strategic Information and Regulations.
Washington DC., USA: International Business Publications. Retrieved from
https://books.google.co.ke/books?id=LvX_BgAAQBAJ&lpg=PA2&ots=79-
SfbMill&dq=International%20Business%20Publications%2C%202018.%20Updated%20Reprint.%20Bur
undi%20Energy%20Policy%2C%20Laws%2C%20Regulations%20Handbook.%20Volume%201%20Strat
egic%20Information%20
IEA. (2010). World Energy Outlook 2010. (R. Priddle, Ed.) Paris, France: International Energy Agency (IEA).
Retrieved from https://webstore.iea.org/download/direct/717?fileName=weo2010.pdf
IEA, IRENA, UNSD, World Bank, WHO. (2020). Tracking SDG 7: The Energy Progress Report 2020. Washington
DC: International Bank for Reconstruction and Development/The World Bank. Retrieved from
https://openknowledge.worldbank.org/handle/10986/33822
ITTO. (2006). Promotion of Gabonese nationals to the Grace Forest Profession to the Development of the Forest
SME Partnership. International Tropical Timber Organization (ITTO). Retrieved from
https://www.itto.int/files/itto_project_db_input/2572/Technical/PD347-05_PRODUIT_1.pdf
Kamungandu, C. M. (2009). Forest degradation in the Republic of Congo. Rome: Food and Agriculture
Organization of the United Nations. Retrieved from http://www.fao.org/3/k8270f/k8270f00.pdf
Kerekou, K. G. (2020, 6 10). Press Release : Final results of the OCEF Second Call for Proposals. Cotonou, Benin.
Retrieved 2020, from https://ocef.bj/en/pages/media?article=r%C3%A9sultats-d%C3%A9finitifs-du-
deuxi%C3%A8me-appel-%C3%A0-propositions-de-projets-de-locef
Lescuye, G., & Tal, M. (2016). Timber Exports from Cameroon to Chad: Commercial success but a failing
legality. Bois et forêts des tropiques(329). Retrieved from https://ur-forets-
societes.cirad.fr/content/download/4617/36996/version/1/file/Lescuyer329.pdf
Madingou, A. J., Mabiala, N., & Nziengui, M. (2019). Study of the State of Play of Actors in the Sector in the
Private Forest-Wood Industry Sector in Gabon. Final Report, Libreville. Retrieved from
https://www.atibt.org/wp-content/uploads/2020/04/Gabon-RapportEtudeSP.pdf
Mbous, P. T. (2002). Logging and community forest development in Cameroon. collective action for the
protection of biodiversity. Retrieved 2020, from Memoire Online:
https://www.memoireonline.com/05/08/1105/m_exploitation-forestiere-et-developpement-forets-
communautaires-cameroun-biodiversite1.html
How Supply chain works and at what points the greatest amounts of wood waste is generated.
235
MEF. (2017). National Centre for Inventory and Development of Forest and Wildlife Resources (CNIAF).
Retrieved from Republic of Congo: Ministry of Forest Economy: http://www.mefdd.cg/le-
ministere/organismes-sous-tutelle/cniaf/
Mertens, B., Minnemeyer, S., Nsoyuni, L. A., & Steil, M. (2007). Interactive forest atlas of the Congo (Vol. 1).
Washington DC., USA: Global Forest Watch. Retrieved from
https://www.onlinedoctranslator.com/gettranslateddocument/gfw-congo-pt1.fr.en.pdf
Meshesha, T. (2017, 7 3). FAO, partners explore Prosopis biomass as energy source in Djibouti. (Food and
Agriculture Organization of the United Nations) Retrieved 2020, from FAO Regional Office for Africa:
http://www.fao.org/africa/news/detail-news/en/c/903653/
MINFOF. (2012). Republic of Cameroon; Strategy 2020 of the Forests and Wildlife Sub-Sector. Ministry of
Forests and Wildlife. Retrieved from
http://www.minfof.cm/documentation/Strategie_MINFOF_Version_du_26_novembre_2012_v18H.p
df
Moulongui, A. G. (2014). Governance of forest resources, Gabon: Actors and Challenges. Doctoral Thesis,
Université d’Orléans. Retrieved from https://tel.archives-ouvertes.fr/tel-01004403/document
Mugnier, A., & Santiago, M.-P. (2009). Chapter 4: The forests of Equatorial Guinea in 2008. In d. W. C., D. D., d.
M. P., E. A. R., N. R., & M. Ph. (Eds.), The Forests of the Congo Basin - state of the forests 2008.
Luxembourg: Publications Office of the European Union. Retrieved 2020, from
https://www.observatoire-comifac.net/docs/edf2008/FR/Etat-des-forets_2008-04.pdf
NDF. (2017). Renewable Energy Market Landscape Study covering 15 countries in Southern and Eastern Africa.
Danish Energy Management & Esbensen.
Nduwamungu, J. (2011). Forest Plantations and Woodlots in Burundi (Vol. 1). African Forest Forum (AFF).
Retrieved from https://www.sifi.se/wp-content/uploads/2012/02/Forest-plantations-and-woodlots-
in-Burundi.pdf
N'Gasse, G. (2002). Case study of exemplary forest management in Central Africa: The exploitation and
management permit no. 169 of the forest of Ngotto, Central African Republic. Forest Resource
Development Service, Forest Resources Division. Rome: FAO. Retrieved from
http://www.fao.org/tempref/docrep/fao/008/y9380f/y9380f.pdf
How Supply chain works and at what points the greatest amounts of wood waste is generated.
236
Ngoufo, R., & Tsalefac, M. (2006). Actors' logic and risk scales in forestry in Cameroon. Les Cahiers d'Outre-
Mer, 115-132. doi:doi.org/10.4000/com.206
Nouvellet et al., 2006. (n.d.).
Nyengayenge, D. (2002). Exemplary forest management case study in Central Africa: Participatory
management of plantations, Magara Forest, Burundi. Forestry Department. Rome: Food and
Agriculture Organization of the United Nations. Retrieved from
http://www.fao.org/3/Y9383f/Y9383f.pdf
Ouedraogo, B. (2007, 01 01). Filière bois d’énergie burkinabé : structuration des prix et analyse de la
répartition des bénéfices. Bois et Forets des Tropiques, 61. Retrieved from
https://www.researchgate.net/publication/272479737_Filiere_bois_d'energie_burkinabe_structurati
on_des_prix_et_analyse_de_la_repartition_des_benefices
Ouedraogo, B. (2015). Tarification du bois-énergie au Burkina Faso : la problématique de l’internalisation des
coûts sociaux liés à l’exploitation de l’énergie ligneuse. doi:10.13140/RG.2.1.1793.1600
Prebble, M., & Rojus, A. (2018). Energizing Equality: Sub-Saharan Africa’s integration of gender equality
principles in national energy policies and frameworks. Washington, DC: International Union for
Conservation of Nature (IUCN). Retrieved from
https://portals.iucn.org/union/sites/union/files/doc/iucn-egi-ssa-web-final.pdf
Presidency of the Republic of Benin. (2013). Agricultural development: The challenges of the Shea sector.
Retrieved 2020, from Investment and Export Promotion Agency, Republic of Benin:
http://www.gufebenin.org/index.php/actualites/157-developpement-agricole-les-defis-de-la-filiere-
karite
Prudencio, R. (2018, 12 12). The cashew nut shell soon to be used as a source of energy in Benin. Retrieved
2020, from Technoserve Benin: https://www.tnsbenin.org/blog/la-coque-de-la-noix-de-cajou-bientot-
valorisee-comme-source-denergie
Rufuguta, E. (2010). Demonstrative development plan of Gakara Forest stands 2010: Support project for the
sustainable management of eucalyptus and pinus populations and sharing equitable profits.
Bujumbura. Retrieved from http://bi.chm-cbd.net/implementation/programmes-
thematiques/biodiversite-forestiere/pa_gakara.2010.11.pdf/download/en/1/pa_gakara.2010.11.pdf
How Supply chain works and at what points the greatest amounts of wood waste is generated.
237
S., D. (2011). Potential of biomass energy for electricity generation in sub-Saharan Africa. Energy for
sustainable development. doi:10.1016/j.esd.2011.07.006
Sanfo, I. (2020). Cashew sector in Burkina Faso. Retrieved from
http://www.cashewconvention.com/presentation/english/Ibrahim-Sanfo.pdf
Stecher, K., Brosowski, A., & Thrän, D. (2013). Biomass Potential in Africa. Abu Dhabi: International Renewable
Energy Agency (IRENA). Retrieved from https://www.irena.org/-
/media/Files/IRENA/Agency/Publication/2013/IRENA-DBFZ_Biomass-Potential-in-Africa.pdf
UN Comtrade. (n.d.). Trade statistics. Retrieved 07 2020, from https://comtrade.un.org/data/
UNEP. (2019). Review of Woodfuel Biomass Production and Utilization in Africa: A Desk Study. Nairobi: United
Nations Environmental Programme (UNEP). Retrieved from
https://wedocs.unep.org/bitstream/handle/20.500.11822/28515/WoodfuelRpt.pdf?sequence=1&isAl
lowed=y
UNIDO. (n.d.). Baseline Report of Clean Cooking fuels in the East African Community (EAC) Region. United
Nations Development Organization (UNIDO). Retrieved from
https://cdn2.b2match.io/event/2901/assets/8478585412-9cc8c37a39.pdf
WAF. (n.d.). Bioenergy Provision within Agroforestry systems in East Africa. (World Agroforestry) Retrieved
2020, from worldagroforestry.org: http://www.worldagroforestry.org/project/bioenergy-provision-
within-agroforestry-systems-east-africa
Wasseige, C. d., Flynn, J., Louppe, D., Hiol, H., & Mayaux, P. (2014). The Forests of the Congo Basin - State of
the forests 2013. Neufchâteau: WEYRICH ÉDITION. Retrieved from https://www.observatoire-
comifac.net/docs/edf2013/FR/EDF2013_FR.pdf
Weng, X., Putzel, L., Kandulu, M. M., Ekman, S.-M. S., Zafinikamia, M.-L. B., Assembe-Mvondo, S., . . . Lescuyer,
G. (2014). The Timber Trade between China and Africa: Diversity of economic models and the need to
imagine specific responses for public action. Bogor: Centre for International Forestry Research
(CIFOR). Retrieved from
https://pdfs.semanticscholar.org/c60d/055c1ab42db1d5b6607d3ff36c51a32a2fd9.pdf
Wicke, B., Smeets, E., & Faaij, A. (2011). The current bioenergy production potential of semi-arid and arid
regions in sub-Saharan Africa. Biomass & Bioenergy - BIOMASS BIOENERG, 35, 2773-2786.
doi:10.1016/j.biombioe.2011.03.010
How Supply chain works and at what points the greatest amounts of wood waste is generated.
238
World Bank. (2010, 10 11-13). Aide Mémoire Mission Preparation of the Burkina Faso PIF. Forest Investment
Program (PIF) - Burkina Faso. Ougadougou, Burkina Faso: World Bank. Retrieved from
https://www.climateinvestmentfunds.org/sites/cif_enc/files/PIF.BURKINA.AIDEMEMOIRE%20-
%20EN%20-%208%20mars.pdf
World Bank. (2011). Forest Investment Program (FIP): Burkina Faso. Retrieved from
https://www.climateinvestmentfunds.org/sites/cif_enc/files/PIF.BURKINA.AIDEMEMOIRE%20-
%20EN%20-%208%20mars.pdf
World Bank. (2018). Tracking SDG 7: The Energy Progress Report 2018. Washington D.C.: International Bank for
Reconstruction and Development/ The World Bank. Retrieved from https://www.irena.org/-
/media/Files/IRENA/Agency/Publication/2018/May/SDG7_Tracking_report_executive_summary_201
8.pdf
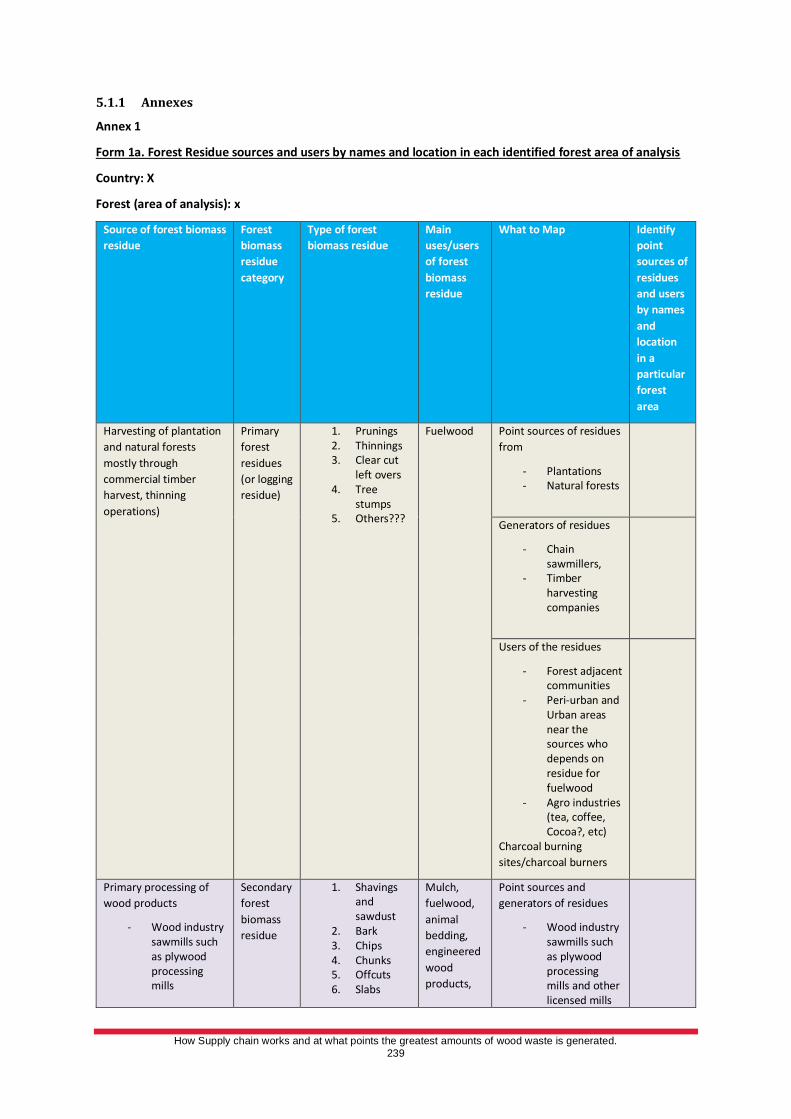
How Supply chain works and at what points the greatest amounts of wood waste is generated.
239
5.1.1 Annexes
Annex 1
Form 1a. Forest Residue sources and users by names and location in each identified forest area of analysis
Country: X
Forest (area of analysis): x
Source of forest biomass
residue
Forest
biomass
residue
category
Type of forest
biomass residue
Main
uses/users
of forest
biomass
residue
What to Map Identify
point
sources of
residues
and users
by names
and
location
in a
particular
forest
area
Harvesting of plantation
and natural forests
mostly through
commercial timber
harvest, thinning
operations)
Primary
forest
residues
(or logging
residue)
1. Prunings 2. Thinnings 3. Clear cut
left overs 4. Tree
stumps 5. Others???
Fuelwood Point sources of residues
from
- Plantations - Natural forests
Generators of residues
- Chain sawmillers,
- Timber harvesting companies
Users of the residues
- Forest adjacent communities
- Peri-urban and Urban areas near the sources who depends on residue for fuelwood
- Agro industries (tea, coffee, Cocoa?, etc)
Charcoal burning
sites/charcoal burners
Primary processing of
wood products
- Wood industry sawmills such as plywood processing mills
Secondary
forest
biomass
residue
1. Shavings and sawdust
2. Bark 3. Chips 4. Chunks 5. Offcuts 6. Slabs
Mulch,
fuelwood,
animal
bedding,
engineered
wood
products,
Point sources and
generators of residues
- Wood industry sawmills such as plywood processing mills and other licensed mills
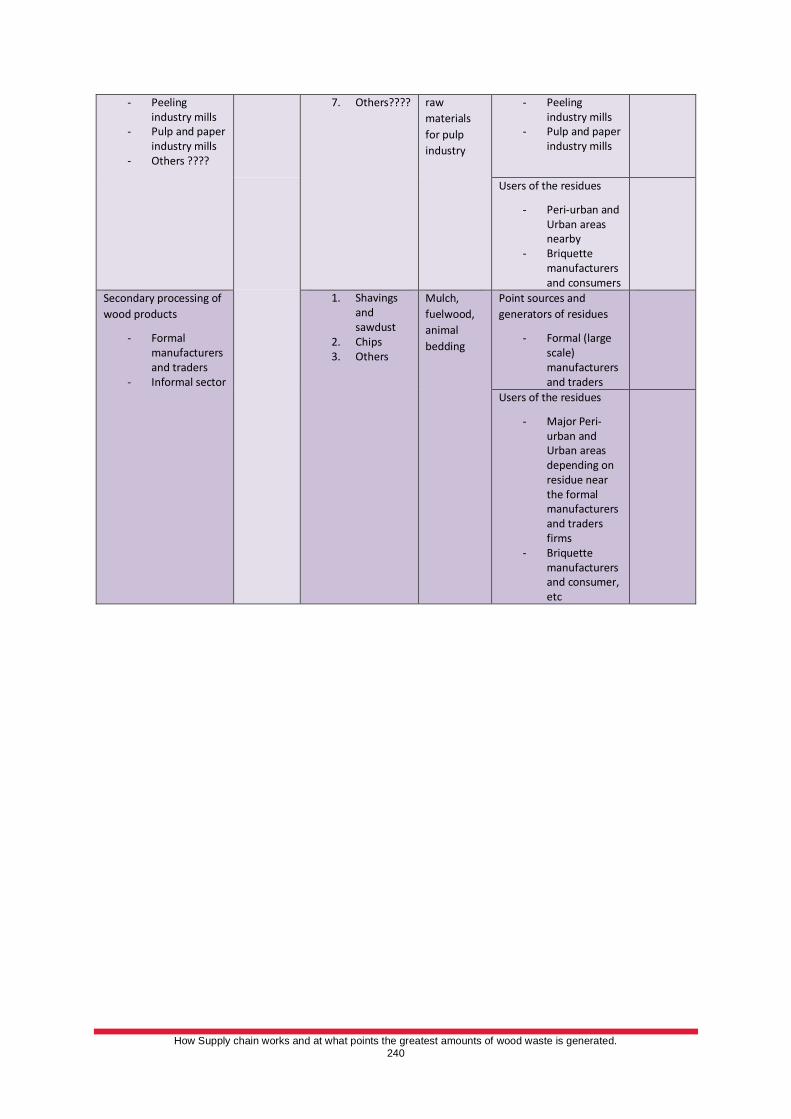
How Supply chain works and at what points the greatest amounts of wood waste is generated.
240
- Peeling industry mills
- Pulp and paper industry mills
- Others ????
7. Others???? raw
materials
for pulp
industry
- Peeling industry mills
- Pulp and paper industry mills
Users of the residues
- Peri-urban and Urban areas nearby
- Briquette manufacturers and consumers
Secondary processing of
wood products
- Formal manufacturers and traders
- Informal sector
1. Shavings and sawdust
2. Chips 3. Others
Mulch,
fuelwood,
animal
bedding
Point sources and
generators of residues
- Formal (large scale) manufacturers and traders
Users of the residues
- Major Peri-urban and Urban areas depending on residue near the formal manufacturers and traders firms
- Briquette manufacturers and consumer, etc
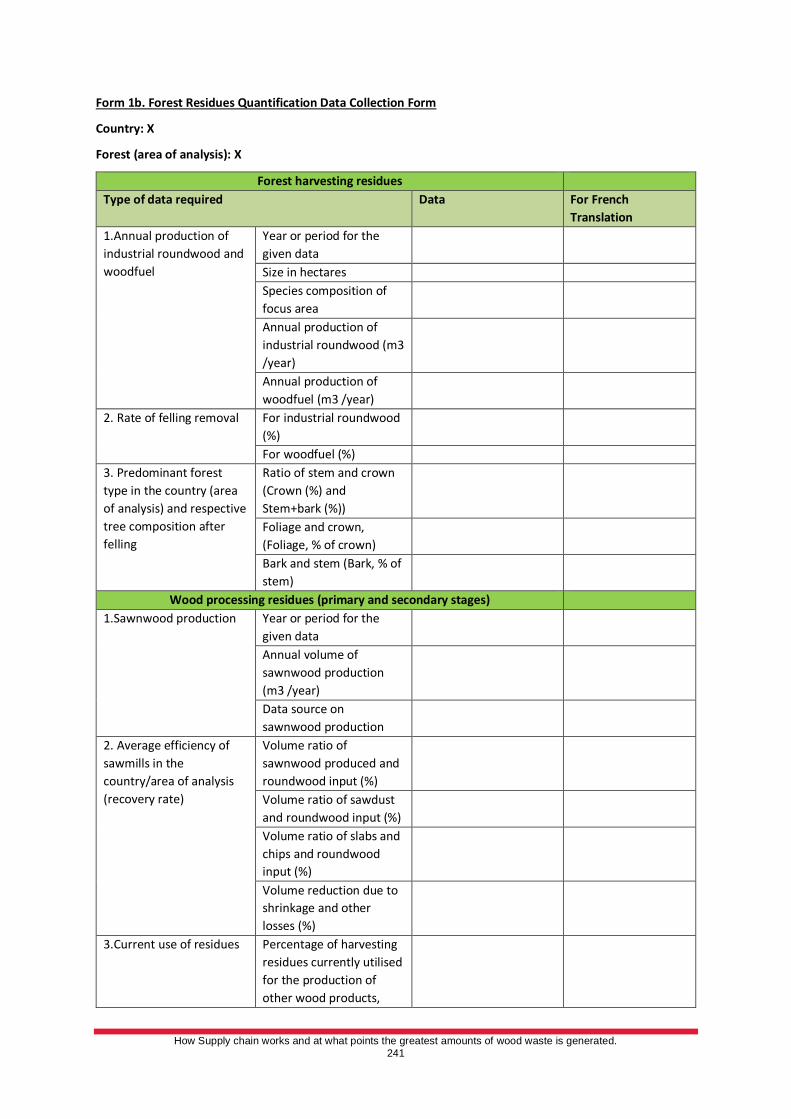
How Supply chain works and at what points the greatest amounts of wood waste is generated.
241
Form 1b. Forest Residues Quantification Data Collection Form
Country: X
Forest (area of analysis): X
Forest harvesting residues
Type of data required Data For French
Translation
1.Annual production of
industrial roundwood and
woodfuel
Year or period for the
given data
Size in hectares
Species composition of
focus area
Annual production of
industrial roundwood (m3
/year)
Annual production of
woodfuel (m3 /year)
2. Rate of felling removal For industrial roundwood
(%)
For woodfuel (%)
3. Predominant forest
type in the country (area
of analysis) and respective
tree composition after
felling
Ratio of stem and crown
(Crown (%) and
Stem+bark (%))
Foliage and crown,
(Foliage, % of crown)
Bark and stem (Bark, % of
stem)
Wood processing residues (primary and secondary stages)
1.Sawnwood production Year or period for the
given data
Annual volume of
sawnwood production
(m3 /year)
Data source on
sawnwood production
2. Average efficiency of
sawmills in the
country/area of analysis
(recovery rate)
Volume ratio of
sawnwood produced and
roundwood input (%)
Volume ratio of sawdust
and roundwood input (%)
Volume ratio of slabs and
chips and roundwood
input (%)
Volume reduction due to
shrinkage and other
losses (%)
3.Current use of residues Percentage of harvesting
residues currently utilised
for the production of
other wood products,
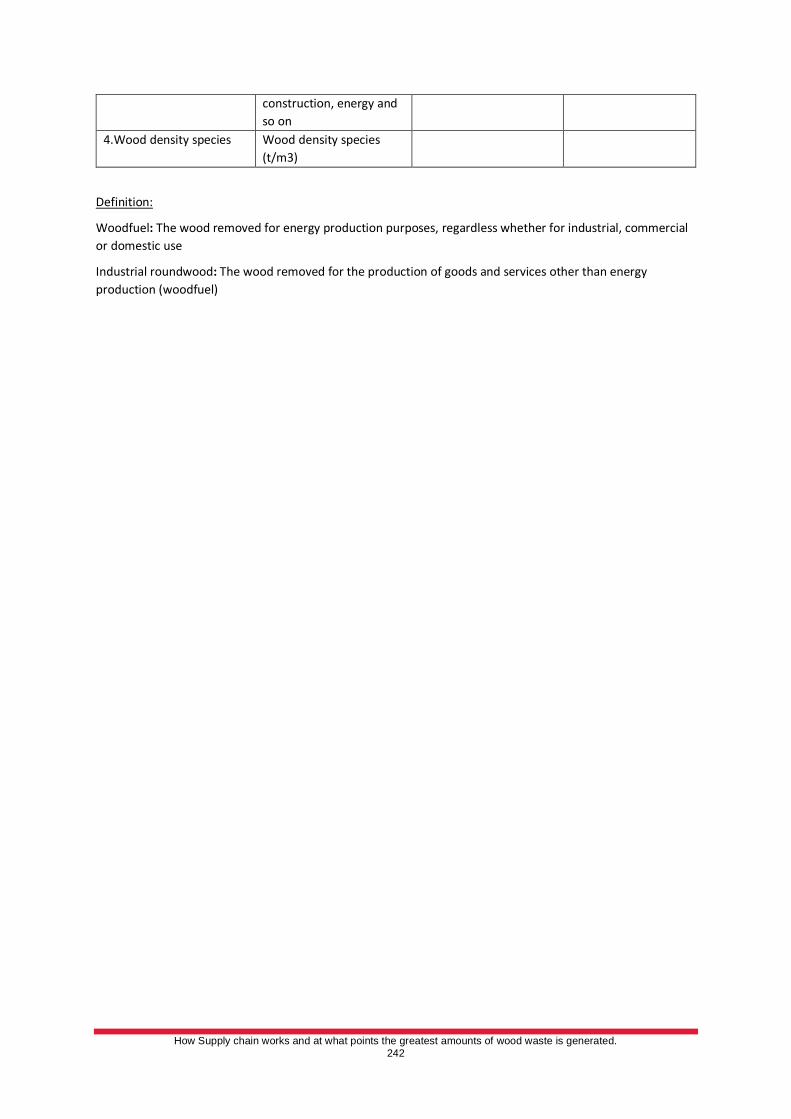
How Supply chain works and at what points the greatest amounts of wood waste is generated.
242
construction, energy and
so on
4.Wood density species Wood density species
(t/m3)
Definition:
Woodfuel: The wood removed for energy production purposes, regardless whether for industrial, commercial
or domestic use
Industrial roundwood: The wood removed for the production of goods and services other than energy
production (woodfuel)
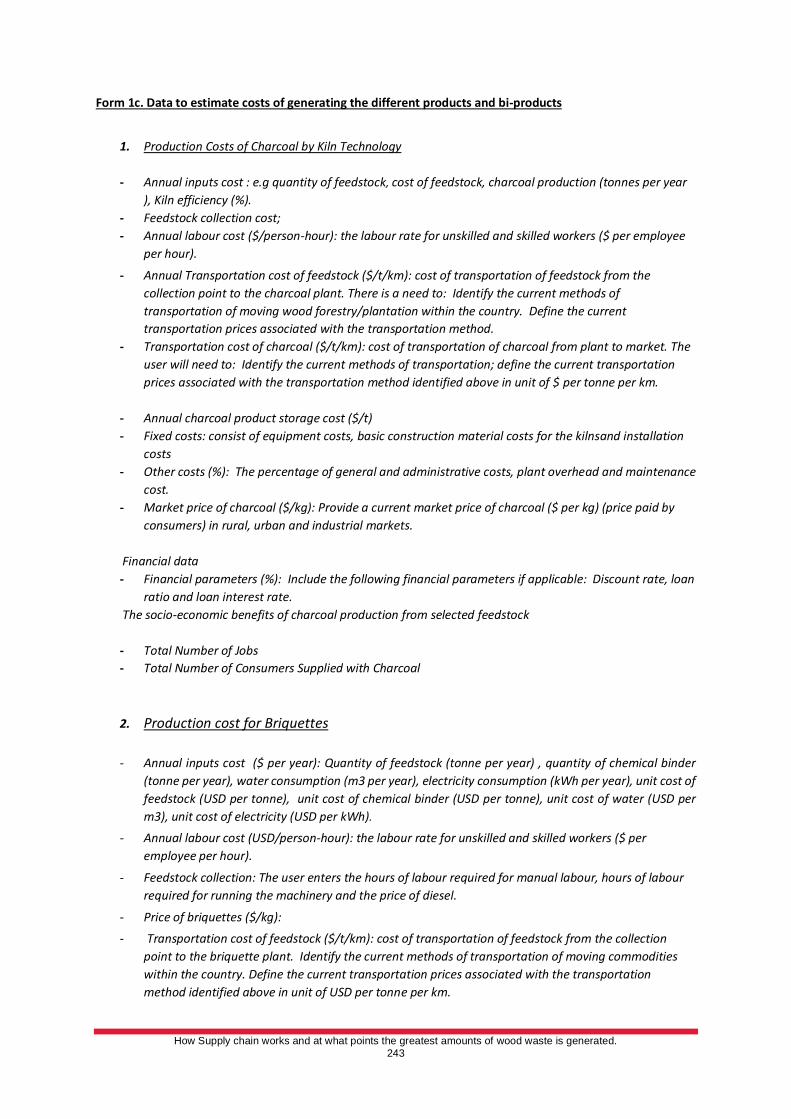
How Supply chain works and at what points the greatest amounts of wood waste is generated.
243
Form 1c. Data to estimate costs of generating the different products and bi-products
1. Production Costs of Charcoal by Kiln Technology
- Annual inputs cost : e.g quantity of feedstock, cost of feedstock, charcoal production (tonnes per year
), Kiln efficiency (%).
- Feedstock collection cost;
- Annual labour cost ($/person-hour): the labour rate for unskilled and skilled workers ($ per employee
per hour).
- Annual Transportation cost of feedstock ($/t/km): cost of transportation of feedstock from the
collection point to the charcoal plant. There is a need to: Identify the current methods of
transportation of moving wood forestry/plantation within the country. Define the current
transportation prices associated with the transportation method.
- Transportation cost of charcoal ($/t/km): cost of transportation of charcoal from plant to market. The
user will need to: Identify the current methods of transportation; define the current transportation
prices associated with the transportation method identified above in unit of $ per tonne per km.
- Annual charcoal product storage cost ($/t)
- Fixed costs: consist of equipment costs, basic construction material costs for the kilnsand installation
costs
- Other costs (%): The percentage of general and administrative costs, plant overhead and maintenance
cost.
- Market price of charcoal ($/kg): Provide a current market price of charcoal ($ per kg) (price paid by
consumers) in rural, urban and industrial markets.
Financial data
- Financial parameters (%): Include the following financial parameters if applicable: Discount rate, loan
ratio and loan interest rate.
The socio-economic benefits of charcoal production from selected feedstock
- Total Number of Jobs
- Total Number of Consumers Supplied with Charcoal
2. Production cost for Briquettes
- Annual inputs cost ($ per year): Quantity of feedstock (tonne per year) , quantity of chemical binder
(tonne per year), water consumption (m3 per year), electricity consumption (kWh per year), unit cost of
feedstock (USD per tonne), unit cost of chemical binder (USD per tonne), unit cost of water (USD per
m3), unit cost of electricity (USD per kWh).
- Annual labour cost (USD/person-hour): the labour rate for unskilled and skilled workers ($ per
employee per hour).
- Feedstock collection: The user enters the hours of labour required for manual labour, hours of labour
required for running the machinery and the price of diesel.
- Price of briquettes ($/kg):
- Transportation cost of feedstock ($/t/km): cost of transportation of feedstock from the collection
point to the briquette plant. Identify the current methods of transportation of moving commodities
within the country. Define the current transportation prices associated with the transportation
method identified above in unit of USD per tonne per km.
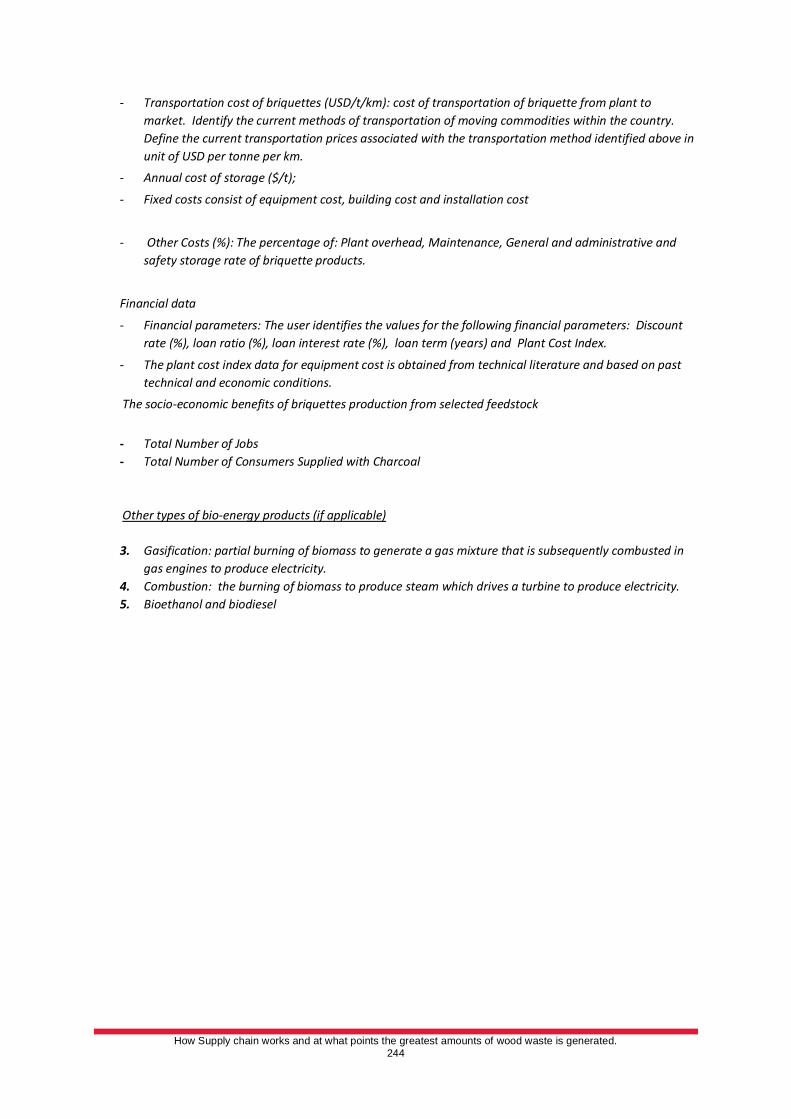
How Supply chain works and at what points the greatest amounts of wood waste is generated.
244
- Transportation cost of briquettes (USD/t/km): cost of transportation of briquette from plant to
market. Identify the current methods of transportation of moving commodities within the country.
Define the current transportation prices associated with the transportation method identified above in
unit of USD per tonne per km.
- Annual cost of storage ($/t);
- Fixed costs consist of equipment cost, building cost and installation cost
- Other Costs (%): The percentage of: Plant overhead, Maintenance, General and administrative and
safety storage rate of briquette products.
Financial data
- Financial parameters: The user identifies the values for the following financial parameters: Discount
rate (%), loan ratio (%), loan interest rate (%), loan term (years) and Plant Cost Index.
- The plant cost index data for equipment cost is obtained from technical literature and based on past
technical and economic conditions.
The socio-economic benefits of briquettes production from selected feedstock
- Total Number of Jobs
- Total Number of Consumers Supplied with Charcoal
Other types of bio-energy products (if applicable)
3. Gasification: partial burning of biomass to generate a gas mixture that is subsequently combusted in
gas engines to produce electricity.
4. Combustion: the burning of biomass to produce steam which drives a turbine to produce electricity.
5. Bioethanol and biodiesel