2040 long range transportation plan
TRANSCRIPT
2040 Long Range Transportation Plan
October 2017
This document has been prepared by the Rockingham Planning Commission in cooperation with the U.S. Department of Transportation - Federal Highway Administration; the New Hampshire Department of Transportation; and the Federal
Transit Administration. The contents of the report reflect the views of the authors who are responsible for the facts and accuracy of the data presented herein. The contents do not necessarily reflect the official views or policies of the
Federal Highway Administration, the New Hampshire Department of Transportation, or the Federal Transit Administration. This report does not constitute a standard, specification, or regulation.

Long Range Transportation Plan Table of Contents
i
Table of Contents ______________________________________________________________________________________________________________________
1. Introduction
Purpose and Scope ...................................................................... 1-1
The Planning Process .................................................................. 1-2
Plan Structure & Contents .......................................................... 1-4
2. Planning Framework
New Hampshire Livability Principles ........................................... 2-1
Vision for 2040 ............................................................................ 2-2
Regional Goal .............................................................................. 2-3
Federal Planning Factors ............................................................. 2-3
Performance Based Approach .................................................... 2-3
National Performance Goals ....................................................... 2-4
National Performance Measures ................................................ 2-4
MPO Transportation Goals and Performance Measures ............ 2-5
Performance Measures and Targets………………………………...........2.6
Project Selection Criteria and Process ........................................ 2-8
3. Existing Conditions
Population & Growth .................................................................. 3-1
Land Use ...................................................................................... 3-4
Climate Change ........................................................................... 3-6
Housing ....................................................................................... 3-8
Transportation ............................................................................ 3-9
State and Local Roadway Network .................................... 3-9
Vehicle Miles of Travel and Congestion ........................... 3-15
Commuter Flows .............................................................. 3-19
Traffic Safety .................................................................... 3-21
Pavement Conditions ....................................................... 3-28
Bridge Conditions ............................................................. 3-28
Freight Transportation ..................................................... 3-31
Public Transportation ....................................................... 3-34
Transportation Demand Management ............................ 3-37
Bicycle Facilities and Programs ........................................ 3-39
Pedestrian Facilities and Programs .................................. 3-42
4. Current Trends and Future Conditions
Vision and Objective ................................................................... 4-1
Basis in Projections...................................................................... 4-1
Population Projections ....................................................... 4-1
Employment Projections .................................................... 4-4
Scenario Planning ............................................................... 4-4
Long Range Transportation Plan Table of Contents
2
Needs Assessment ...................................................................... 4-8
Mobility Needs ................................................................... 4-8
Accessibility & Transportation Choice Needs .................. 4-13
System Preservation & Modernization ............................ 4-19
Safety and Security Needs ............................................... 4-20
Land Use Integration Needs ............................................. 4-23
Resource Protection Needs ............................................. 4-24
Economic Vitality Needs .................................................. 4-28
Resiliency Needs .............................................................. 4-30
Public Health Needs ......................................................... 4-35
Planning Process Needs ................................................... 4-35
Resource Needs ............................................................... 4-37
5. The Constrained Transportation Plan
Projects and Financing ................................................................ 5-1
Anticipated Revenues ................................................................. 5-2
Anticipated Costs ........................................................................ 5-8
Fiscally Constrained Projects List .............................................. 5-10
Transportation Improvement Program ........................... 5-10
Transportation Plan Projects ........................................... 5-10
Unfunded Projects .................................................................... 5-10
6. Implementation Strategies
Mobility ....................................................................................... 6-1
Accessibility & Transportation Choice ........................................ 6-2
System Preservation & Modernization ....................................... 6-3
Safety and Security ..................................................................... 6-4
Land Use Integration ................................................................... 6-5
Resource Protection .................................................................... 6-7
Resiliency..................................................................................... 6-8
Economic Vitality....................................................................... 6-10
Public Health ............................................................................. 6-11
Planning Process ....................................................................... 6-12
Funding Availability ................................................................... 6-13
Plan Impacts and Mitigation ..................................................... 6-13
Appropriate Types of Mitigation ...................................... 6-14
Identifying Opportunities for Mitigation ......................... 6-16
Environmental Justice ...................................................... 6-17
Long Range Transportation Plan Introduction
1-1
1. Introduction
The Rockingham Planning Commission region’s vitality and the
quality of life for its residents depend greatly on the mobility of
people and goods, the accessibility of destinations by multiple
modes of travel, and the safe accommodation of all users of the
transportation system. The region enjoys a strong interregional
backbone transportation system, with an excellent highway
network, airport, deep water port and intercity bus and rail
access. Public transit and human service transportation are more
readily accessible in the region than in many parts of the state,
between the COAST and CART public transit systems and non-
profit providers. The region has seen improvement in travel
options in the past decade, with the expansion of transit services
and greater attention to bicycle and pedestrian accommodation.
At the same time the region, and the state as a whole, face
significant challenges in maintaining, modernizing and improving
the safety of our transportation system. Among these are
changing travel demand patterns associated with economic
change and demographic shifts; and perennial funding
constraints. New Hampshire suffers from a lack of funding for the
transportation system in general, including system maintenance
and operation, and there is a particular lack of funding for modes
other than highways. Public transportation availability varies
significantly across the region by community, with major gaps in
access in the middle of Rockingham County. Total traffic volume,
which had leveled off and in fact declined during the economic
downturn, has again begun to climb with potential implications
for congestion and capacity. Observed and projected patterns of
more severe coastal flooding related to storm
events and sea level rise will increasingly
impact transportation infrastructure along
the coastline. Lastly, the aging of the Baby
Boom generation will result in a near
doubling of the senior population in the
coming 25 years, creating demands for new
transit options and other changes to the build
environment to support aging in place. These
existing conditions, system needs and
challenges are set out in greater detail in the
following pages, together with regional goals
and strategies to improve mobility,
accessibility, and safety; and otherwise
maintain and enhance the region’s economic
vitality and quality of life.
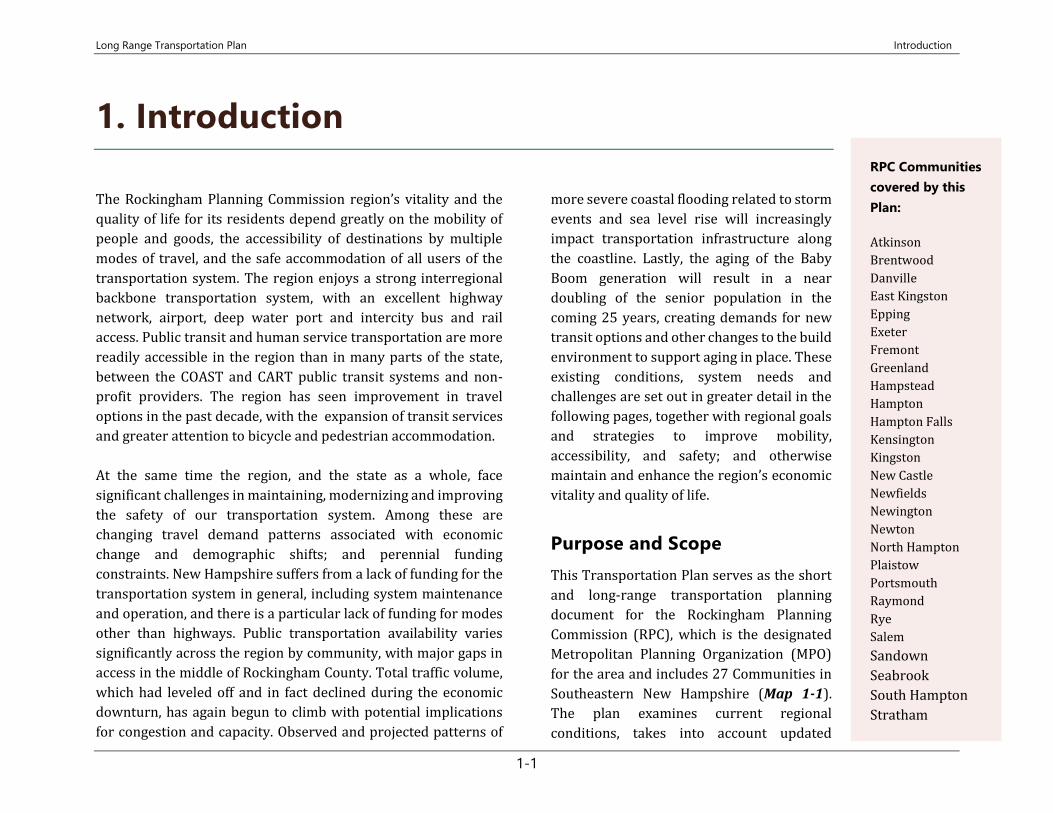
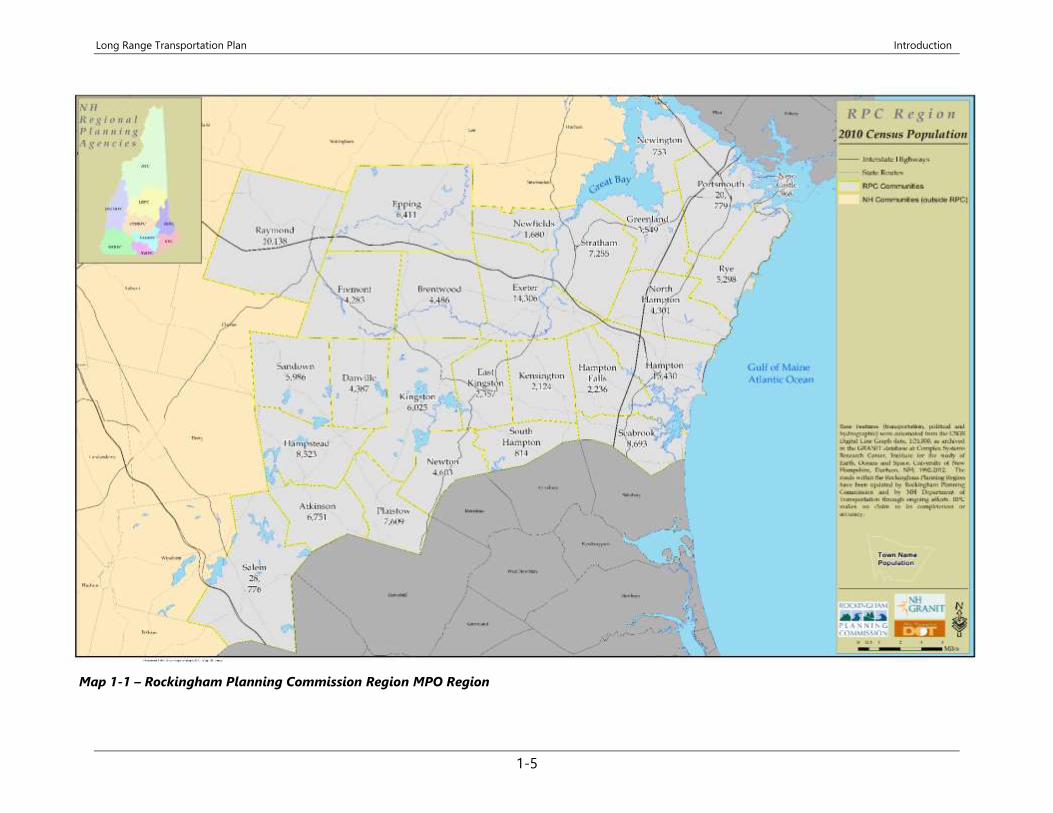
Purpose and Scope
This Transportation Plan serves as the short
and long-range transportation planning
document for the Rockingham Planning
Commission (RPC), which is the designated
Metropolitan Planning Organization (MPO)
for the area and includes 27 Communities in
Southeastern New Hampshire (Map 1-1).
The plan examines current regional
conditions, takes into account updated
RPC Communities
covered by this
Plan:
Atkinson
Brentwood
Danville
East Kingston
Epping
Exeter
Fremont
Greenland
Hampstead
Hampton
Hampton Falls
Kensington
Kingston
New Castle
Newfields
Newington
Newton
North Hampton
Plaistow
Portsmouth
Raymond
Rye
Salem
Sandown
Seabrook
South Hampton
Stratham
Long Range Transportation Plan Introduction
1-2
socioeconomic projections and changing growth patterns, and
describes the financial resources available through current law
and policy and how well those meet the identified transportation
needs for the region.
Shaped by these factors, the plan sets out the region’s adopted
goals, strategies for achieving those goals, performance metrics
for measuring progress in implementation, and specific project
proposals to improve the transportation system through the year
2040.
It is in compliance with the Fixing America’s Surface
Transportation Act (FAST Act), and addresses a minimum
twenty-year planning horizon (22 years at adoption) as directed
by the FAST Act’s planning standards.
The plan has been developed as part of the region’s continuing,
cooperative, and comprehensive planning process, which
considers all transportation modes and supports metropolitan
community development. It reflects the goals and objectives of
member communities in their own master plans and policies, of
the NH Department of Transportation in its Long Range
Transportation Plan, as well as those established by the
Rockingham Planning Commission via the Regional Master Plan
and the MPO process.
The responsibilities for carrying out transportation planning are
specified in a Memorandum of Understanding between the New
Hampshire Department of Transportation (NHDOT), Rockingham
Planning Commission and the three transit agencies serving the
region: the Cooperative Alliance for Seacoast Transportation
(COAST), the Greater Derry-Salem Cooperative Alliance for
Regional Transportation (CART), and the University of New
Hampshire Wildcat Transit system.
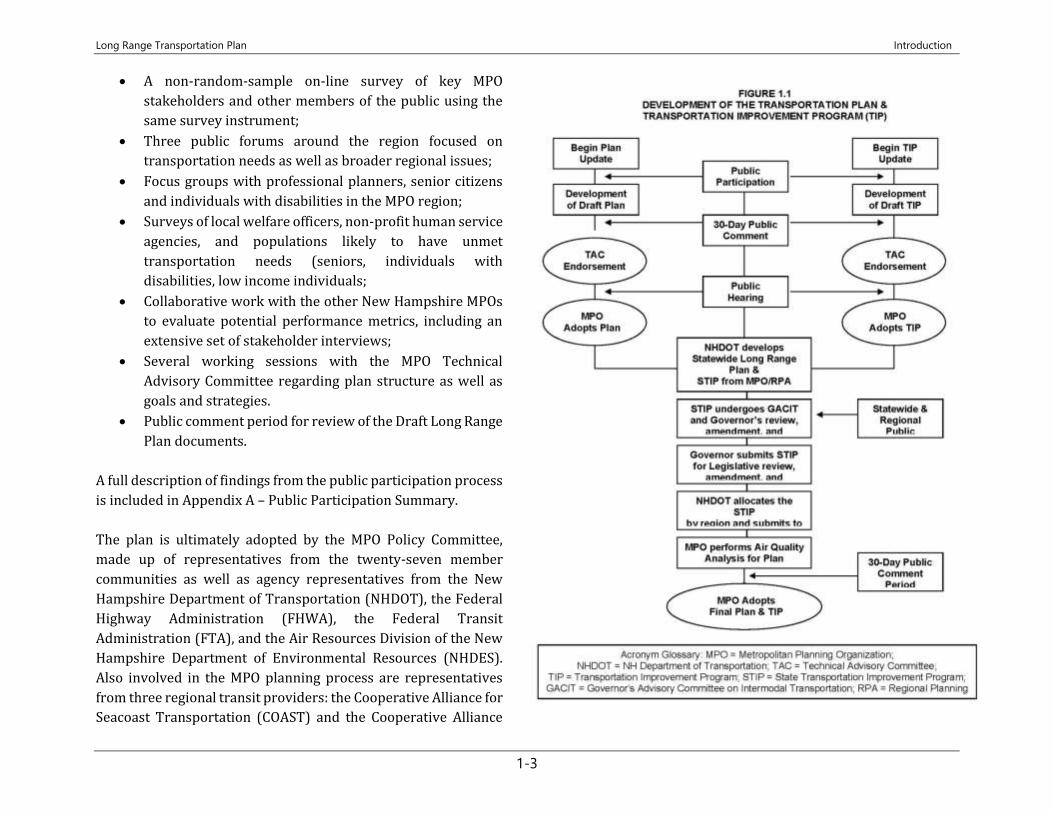
The Planning Process
The Long Range Plan is generally developed by the RPC as
illustrated in Figure 1.1. In accordance with FAST Act, the MPO
must review and update the transportation plan at least every five
(5) years in air quality attainment areas. Updates must, at a
minimum confirm the validity and consistency of the Plan’s major
assumptions regarding forecasted land use and transportation
assumptions for the region. To maintain consistency with the
State’s two-year update cycle of the New Hampshire Ten Year
Transportation Plan, the MPO will update the project-specific
aspects of the Plan every two years as needed. Such shorter term
updates will be timed so as to occur concurrently with the biennial
TIP development process.
The goals, needs and strategies identified in this Plan have been
developed based on extensive public input gathered as part of the
most recent update to the RPC’s Regional Master Plan and other
public engagement efforts over the past three years. These efforts
have included outreach to stakeholders already active in the
transportation planning process, but also input from the
community at large that may not otherwise attend a
transportation planning forum. As part of the MPO’s
Environmental Justice and transit coordination work, there has
also been targeted outreach to groups particularly likely to have
unmet transportation needs, and from specific sectors such as
senior citizens and individuals with disabilities and low income
populations. These outreach efforts have included:
• A telephone survey of 2,935 randomly-selected
households across New Hampshire, including 400 in the
MPO region, conducted by the UNH Survey Center;
Long Range Transportation Plan Introduction
1-3
• A non-random-sample on-line survey of key MPO
stakeholders and other members of the public using the
same survey instrument;
• Three public forums around the region focused on
transportation needs as well as broader regional issues;
• Focus groups with professional planners, senior citizens
and individuals with disabilities in the MPO region;
• Surveys of local welfare officers, non-profit human service
agencies, and populations likely to have unmet
transportation needs (seniors, individuals with
disabilities, low income individuals;
• Collaborative work with the other New Hampshire MPOs
to evaluate potential performance metrics, including an
extensive set of stakeholder interviews;
• Several working sessions with the MPO Technical
Advisory Committee regarding plan structure as well as
goals and strategies.
• Public comment period for review of the Draft Long Range
Plan documents.
A full description of findings from the public participation process
is included in Appendix A – Public Participation Summary.
The plan is ultimately adopted by the MPO Policy Committee,
made up of representatives from the twenty-seven member
communities as well as agency representatives from the New
Hampshire Department of Transportation (NHDOT), the Federal
Highway Administration (FHWA), the Federal Transit
Administration (FTA), and the Air Resources Division of the New
Hampshire Department of Environmental Resources (NHDES).
Also involved in the MPO planning process are representatives
from three regional transit providers: the Cooperative Alliance for
Seacoast Transportation (COAST) and the Cooperative Alliance
Long Range Transportation Plan Introduction
1-4
for Regional Transportation (CART), University of New
Hampshire Wildcat Transit; and the Pease Development
Authority (PDA). A full list of the current Commissioners is
included in the MPO Prospectus which is available at the RPC
website (http://www.rpc-nh.org/docs.htm).
Plan Structure & Contents
The Long Range Plan is composed of both FAST Act required
elements as well as other components that, while not required,
help provide a more complete picture of the transportation
system and future needs. The plan is organized into seven
chapters. The intent is that the structure enables readers to more
quickly find the information that they are seeking by simplifying
the organization and developing chapters that can each be
considered a standalone document, or all taken together. The
seven chapters are:
Chapter 1: Introduction. This chapter summarizes the MPO’s
responsibilities under the Federal transportation planning
process, the scope and structure of the plan, and the extensive
public input process that has shaped the plan.
Chapter 2: Planning Framework. This chapter sets out the MPO’s
Goals for the regional transportation system and the
transportation planning process, and describes the broader
planning context in which the MPO works, including Federal
requirements, the New Hampshire Livability Principles, and the
Regional Vision for the RPC region as defined in the Regional
Master Plan.
Chapter 3: Existing Conditions. This chapter provides the
background information on the region. This includes a description
of land use patterns, demographic data and commuting travel
patterns, as well as overviews of the modal components of the
transportation system, including Highways, Bicycle and
Pedestrian Facilities, Public Transportation, Transportation
Demand Management, and Freight Transportation facilities and
programs.
Chapter 4: Trends & Anticipated Future Conditions. This
chapter provides a context for future transportation system needs
based on regional growth and forecasting. A needs assessment is
structured around the Plan’s nine goal areas. Scenarios for
various growth patterns demonstrate alternative plans for future
development. The region’s needs are projected based on these
scenarios.
Chapter 5: The Constrained Transportation Plan. This chapter
lists those projects that are feasible given existing and expected
financial resources as well as other limitations as required by the
FAST Act. The project listing is organized into the Transportation
Improvement Program (TIP) which lists the first four years of
projects (2018-2021) and the Plan projects which are the
remaining years of 2022 to 2040.
Chapter 6: Implementation Strategies. This chapter sets out a
range of actions for the MPO, member municipalities and other
stakeholders to move the region toward attaining the Plan’s
stated goals. Implementation strategies are organized by goal
area, including Mobility, Transportation Choices, Integrated
Planning for Transportation & Land Use, System Preservation &
Modernization, Energy & Environment, Safety, Economic Vitality,
Resiliency, Public Health, Efficient Planning Process, and Resource
Availability. Certain strategies are cross cutting and will help in
attaining multiple goals, and these are identified accordingly.
Long Range Transportation Plan Introduction
1-5
Map 1-1 – Rockingham Planning Commission Region MPO Region
Long Range Transportation Plan Introduction
1-6
Long Range Transportation Plan Planning Framework
2-1
2. Planning Framework
The planning framework establishes the foundation of the
planning process in the Regional Master Plan for the Rockingham
Planning Commission region and guides the development of the
Long Range Transportation Plan around the principles, vision,
goals and recommendations of that document. In addition, the
planning framework incorporates the federal planning factors
and performance based (3Cs) transportation planning process
and the project selection criteria that are utilized to prioritize
projects for funding.
New Hampshire Livability Principles
Working with the other New Hampshire Planning Commissions as
part of a Sustainable Communities Initiative grant from the US
Department of Housing and Urban Development, the RPC
developed a Regional Master Plan constructed around a common
set of livability principles. These values are grounded in the New
Hampshire Smart Growth Principles found in NH RSA 9-A, the
Federal Partnership Livability Principles that guide the HUD-EPA-
DOT Sustainable Communities Program, as well as the visions,
goals, and objectives in local master plans and other documents
concerned with the future. While only one of these principles
directly addresses transportation issues, all impact, or are related
to, the transportation system in some manner.
1. Traditional Settlement Patterns & Development Design
Keep the traditional New Hampshire landscape intact by focusing
development in town centers and village areas, while leaving open
and rural areas for agriculture, recreation, and other suitable uses.
2. Housing Choices
Ensure that everyone, regardless of income level, has convenient
and affordable choices in where they live. This includes a variety
of housing options and ownership types that appeal to people at
any stage of life and is convenient to where they work, shop, and
play.
3. Transportation Choices
Provide a number of options that help people safely and efficiently
get where they need to go, whether it is by walking, driving,
biking, public transportation, carpooling, or taking a train or
plane. Transportation networks should make it easy to get from
one place to another, and should also allow the efficient
movement of goods to support the economy (commercial freight,
rail, and air transport).
4. Natural Resource Functions and Quality
Make sure that we protect New Hampshire’s beautiful natural
landscape, which is home to all of us as well as a wide range of
wildlife species. This includes protecting and improving the water
we drink, the air we breathe, the forests we love, and the farmland
that sustains us.
5. Community and Economic Vitality
Continue to make New Hampshire a great place in which to do
business, raise a family, recreate, visit, and retire. Our
neighborhoods and communities offer opportunities for an
excellent education, good health, cultural happenings, and social
connections.
Long Range Transportation Plan Planning Framework
2-2
6. Climate Change and Energy Efficiency
Identify opportunities to save energy and costs and reduce risks
to our communities, businesses and citizens. In recent decades,
New Hampshire has seen an increase in extreme storms
and flooding coupled with steadily rising fuel and energy prices.
How can we reduce dependence on outside sources of energy,
construct homes and buildings that are more efficient, and reduce
impacts to our communities and infrastructure from extreme
storms and flooding?
Vision for 2040
The 2040 Regional Master Plan for the Rockingham Planning
Commission includes the formation of a shared vision for the
future region. This Vision is crafted around ideals espoused in
local master plans, past regional master plans, and through input
from RPC Commissioners and the general public during the plan
development process and represents a compelling picture of the
RPC region of the future that balances local and regional needs:
The southeastern New Hampshire region enjoys a high
quality of life represented by a strong regional economy,
distinct community character, and outstanding natural
and recreational resources. This has been achieved
through careful planning, wise stewardship of natural
resources, infrastructure investment, and increasing
regional cooperation on shared issues. This vision is
supported when:
• Communities are working together to ensure that long-
term economic, social and environmental factors are
balanced in the planning and decision-making process.
• Development and redevelopment are enhancing and
strengthening community centers, preserving rural
character, and maintaining traditional landscapes. This
provides open space for agriculture, recreation and
wildlife areas, and protection of natural resources, while
providing residents with a variety of choices for places to
live, work, and play.
• Communities are allowing a variety of housing choices for
residents of all income levels to strengthen our
communities and economic vitality.
• We are investing in the infrastructure systems that
support our communities and businesses.
• The region is promoting economic opportunities that
result in more high quality jobs, stable property tax rates,
enhanced educational opportunities, and improved
services for residents and businesses.
• We are striving to protect our natural environment so
residents can benefit from its resources without
diminishing its quality for other living creatures and
future generations.
• Our sense of community is being preserved by protecting
and actively using the region’s historical resources and
cultural heritage.
• Communities are acknowledging and planning for the
effects of a changing climate. Anticipated changes include
sea-level rise, increasing flood events, more erosion,
periods of drought and other natural hazards.
• Residents, businesses, and communities are adapting to
the high cost of energy by implementing efficiency
measures for building, increasing public transit options,
and developing local renewable energy resources.
Long Range Transportation Plan Planning Framework
2-3
• Communities are respectful of property rights in their
efforts to manage growth and development.
Regional Goal
To support the Regional Vision and the New Hampshire Livability
Principles, a regional goal was developed to better describe the
desired end state:
Promote efficient use of land, resources and infrastructure
in southeastern New Hampshire that:
• Creates a high quality built environment while protecting
important natural and cultural resources.
• Promotes positive effects of development and minimizes
adverse impacts.
• Promotes economic opportunities and community vitality.
• Enhances the coordination of planning between land use,
transportation, housing and natural resources.
• Considers and incorporates climate change into local and
regional planning efforts.
Federal Planning Factors
When developing the Long Range Transportation Plan and other
transportation planning documents, the ten planning factors
identified in 23 U.S. Code § 134 (23 C.F.R. Part 450.306 of the
Planning Regulations) must be considered. Like the New
Hampshire Livability Principles these provide broad-based
guidance and apply to multiple aspects of the planning process:
1. Support the economic viability of the metropolitan area, especially by enabling global competitiveness, productivity and efficiency;
2. Increase the safety of the transportation system for motorized and non-motorized users;
3. Increase the security of the transportation system for motorized and non-motorized users;
4. Increase accessibility and mobility of people and freight;
5. Protect and enhance the environment, promote energy conservation, improve the quality of life, and promote consistency between transportation improvements and State and local planned growth and economic development patterns;
6. Enhance the integration and connectivity of the transportation system, across and between modes, for people and freight;
7. Promote efficient system management and operation;
8. Emphasize preservation of the existing transportation system;
9. Improve the resiliency and reliability of the transportation system and reduce or mitigate stormwater impacts of surface transportation; and
10. Enhance travel and tourism.
Performance-Based Approach
Performance-based planning methods help transform long-term,
broad visions of the future into measurable goals and objectives,
which can be used to guide decisions and measure success. There
are a number of benefits to this approach:
• Improved decision-making regarding infrastructure
investments
• Improved return on investments and resource allocation
• Improved system performance
• Increased accountability and transparency
• Demonstrates link between funding and system
performance
Long Range Transportation Plan Planning Framework
2-4
This update to the Long Range Transportation Plan is the first
attempt by the MPO to implement performance-based planning as
required by FAST. This work is being completed in conjunction
with a cooperative effort of the four New Hampshire MPOs to
implement the 21 currently known and required federal
performance measures, and to develop a common set of vetted
supplemental performance measures, that can be utilized by
MPOs as needed. Several of the FHWA performance measures are
not required to be fully integrated into the MPO LRTP and TIP
until after May, 2018 and there are still FTA Safety measures that
have not been released. For that reason, this update to the LRTP
will represent a partial implementation of the performance-based
planning requirement that will be updated as the remaining
measures are integrated.
National Performance Goals
The Moving Ahead for Progress in the 21st Century Act (MAP-21)
and the subsequent Fixing America’s Surface Transportation
(FAST) Act, extended these planning factors by establishing seven
National Goals for the Federal Aid Highway System. These
national goals constitute a set of broad, over-arching
requirements that must be incorporated into planning documents
and processes as a basis from which progress can be measured on
solving the problems of the current transportation system.
1. Safety – To achieve a significant reduction in traffic
fatalities and serious injuries on all public roads.
2. Infrastructure Condition – To maintain the highway
infrastructure asset system in a state of good repair.
3. Congestion Reduction – To achieve a significant
reduction in congestion on the National Highway System.
4. System Reliability – To improve the efficiency of the
surface transportation system.
5. Freight Movement and Economic Vitality – To improve
the national freight network, strengthen the ability of
rural communities to access national and international
trade markets, and support regional economic
development.
6. Environmental Sustainability – To enhance the
performance of the transportation system while
protecting and enhancing the natural environment.
7. Reduced Project Delivery Delays – To reduce project
costs, promote jobs and the economy, and expedite the
movement of people and goods by accelerating project
completion through eliminating delays in the project
development and delivery process, including reducing
regulatory burdens and improving agencies’ work
practices.
National Performance Measures
Performance measures are utilized to assess progress towards meeting broad goals and objectives and define precisely how that progress will be measured. Within a performance based planning process, performance measures serve to clarify the definition of goals, monitor performance over time, are used as a reference point for target setting, form the basis of policy and investment decisions, and allow planners and the public to assess the effectiveness of projects and strategies in achieving goals and objectives. The Federal Highway administration (17) and Federal Transit Administration (4) have established 21 required metrics (so far) that each MPO must utilize as part of the transportation planning process. These metrics are focused on addressing aspects of the National Performance Goals and covering the following areas:
Long Range Transportation Plan Planning Framework
2-5
• Pavement condition on the Interstate System and on
remainder of the National Highway System (NHS)
• Performance of the Interstate System and the remainder
of the NHS
• Bridge condition on the NHS
• Fatalities and serious injuries—both number and rate per
vehicle mile traveled--on all public roads
• Traffic congestion
• On-road mobile source emissions
• Freight movement on the Interstate System
• Transit Asset Management
• Transit Safety
Within one year of the release of final rules on each of these
performance areas, State DOTs must establish performance
targets for urbanized and rural areas in coordination with MPOs
and public transportation providers. Further, the MPOs
themselves set targets within 180 days of the State, again in
coordination with the State and public transportation providers.
Targets are in place for the State and transit operators relating to
Transit Asset Management and must be in place for MPOs by June
30, 2017. Safety related targets are currently being developed at
the State level for an August, 2017 deadline and will be followed
by MPO targets in February, 2018.
MPO Goals & Performance Measures
The MPO has developed a set of goals based on the New
Hampshire Livability Principles, the Regional Master Plan Vision
and Goal, and the Federal Planning Factors and the National Goals
for the Federal Aid Highway System as well as past iterations of
the Long Range Transportation Plan. These goals are intended to
aid in directing transportation funding and prioritizing regional
transportation projects and for that reason have been coordinated
with a set of performance measures for the transportation system.
Table 2-1 provides the connection between the 11 regional
transportation goals and the Federal Planning Factors, National
Performance Goals, Known Federal Performance Metrics, New
Hampshire Sustainability Principles, and the Regional Vision and
Goals as expressed in the RPC Regional Master Plan.
Goal 1 - Mobility
The region’s transportation system offers safe, secure, efficient,
and reliable access to employment, housing, commerce, services,
entertainment, and recreation.
Goal 2 – Transportation Choices
The region’s transportation system offers equitable and reliable
multi-modal transportation choices to better connect people to
jobs and services.
Goal 3 – System Preservation & Modernization
The region’s transportation system is maintained in good
condition and the preservation and modernization needs of
existing components are prioritized ahead of adding new highway
capacity.
Goal 4 - Safety & Security
The region’s transportation system is safe and secure for all users.
Long Range Transportation Plan Planning Framework
2-6
Goal 5 – Land Use Integration
New commercial and residential development supports multiple
modes of transportation and minimizes the need for expanding
capacity of adjacent roads
Goal 6 – Energy & Environment
The region’s transportation system is proactive in protecting
natural and historic resources; and is forward looking regarding
energy use, energy efficiency and conversion to renewable energy
sources.
Goal 7 – Resiliency
The region’s transportation system is adaptive and resilient to
climate change and natural and other hazards.
Goal 8 - Economic Vitality
Through strategic investment, the region’s transportation system
supports an innovative and competitive 21st century economy
that connects people, goods, and communities to desired activity
and economic centers.
Goal 9 - Public Health
The region’s transportation system is designed and built to
support safe and healthy communities, facilitate active living
opportunities, and aging in place.
Goal 10 - Efficient and Effective Planning Process
The MPO provides an efficient and effective implementation of the cooperative, coordinated, and continuous (3C) federal transportation planning process that aids in the efficient and effective implementation of projects.
Goal 11 – Funding Availability
Adequate and predictable funding is available to meet current and
future needs for transportation system maintenance, operation
and modernization across all modes.
Performance Measures and Targets
Performance measures and targets provide a direct and
measurable connection between the regional goals as established
in the Long Range Transportation Plan and specific desired
outcomes. Federal regulations require that the MPO set targets in
relation to the national performance measures described earlier
in this chapter, and that those targets be included in any MPO
Long Range Transportation Plan updates after May 1, 2018. US
DOT also encourages the inclusion of other metrics that reflect
regional goals and priorities not covered under the national
performance goals.
Long Range Transportation Plan Planning Framework
2-7
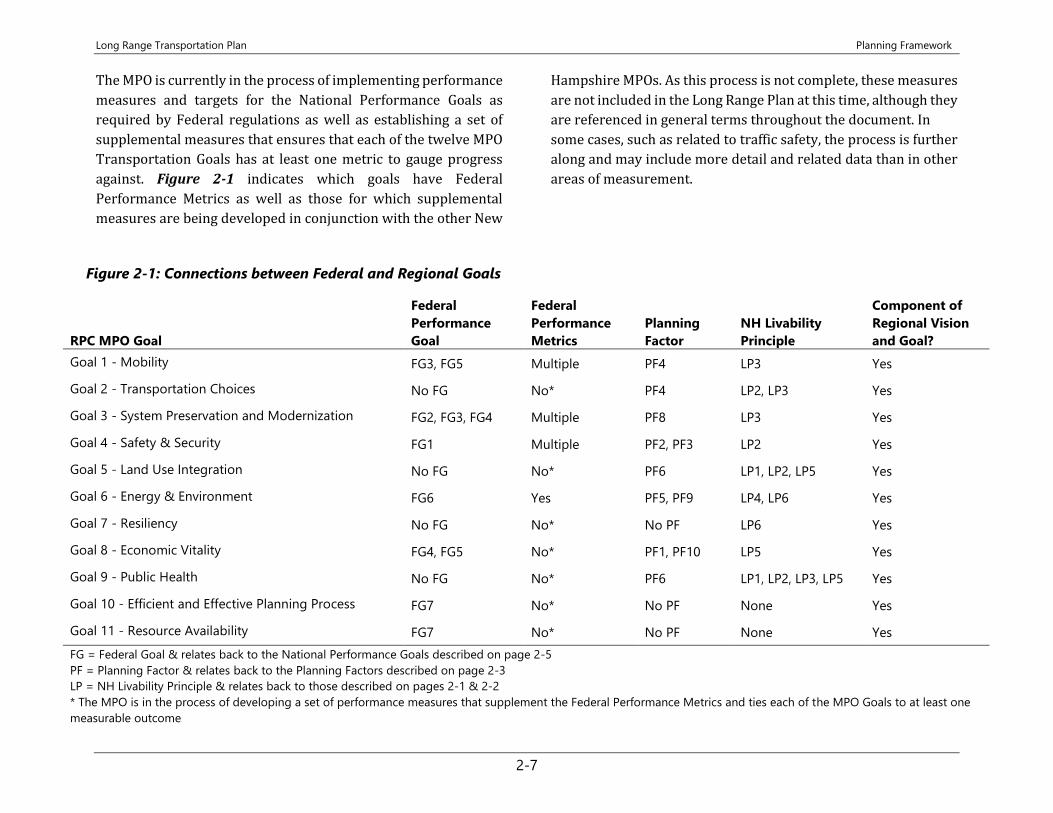
The MPO is currently in the process of implementing performance
measures and targets for the National Performance Goals as
required by Federal regulations as well as establishing a set of
supplemental measures that ensures that each of the twelve MPO
Transportation Goals has at least one metric to gauge progress
against. Figure 2-1 indicates which goals have Federal
Performance Metrics as well as those for which supplemental
measures are being developed in conjunction with the other New
Hampshire MPOs. As this process is not complete, these measures
are not included in the Long Range Plan at this time, although they
are referenced in general terms throughout the document. In
some cases, such as related to traffic safety, the process is further
along and may include more detail and related data than in other
areas of measurement.
Figure 2-1: Connections between Federal and Regional Goals
RPC MPO Goal
Federal
Performance
Goal
Federal
Performance
Metrics
Planning
Factor
NH Livability
Principle
Component of
Regional Vision
and Goal?
Goal 1 - Mobility FG3, FG5 Multiple PF4 LP3 Yes
Goal 2 - Transportation Choices No FG No* PF4 LP2, LP3 Yes
Goal 3 - System Preservation and Modernization FG2, FG3, FG4 Multiple PF8 LP3 Yes
Goal 4 - Safety & Security FG1 Multiple PF2, PF3 LP2 Yes
Goal 5 - Land Use Integration No FG No* PF6 LP1, LP2, LP5 Yes
Goal 6 - Energy & Environment FG6 Yes PF5, PF9 LP4, LP6 Yes
Goal 7 - Resiliency No FG No* No PF LP6 Yes
Goal 8 - Economic Vitality FG4, FG5 No* PF1, PF10 LP5 Yes
Goal 9 - Public Health No FG No* PF6 LP1, LP2, LP3, LP5 Yes
Goal 10 - Efficient and Effective Planning Process FG7 No* No PF None Yes
Goal 11 - Resource Availability FG7 No* No PF None Yes
FG = Federal Goal & relates back to the National Performance Goals described on page 2-5
PF = Planning Factor & relates back to the Planning Factors described on page 2-3
LP = NH Livability Principle & relates back to those described on pages 2-1 & 2-2
* The MPO is in the process of developing a set of performance measures that supplement the Federal Performance Metrics and ties each of the MPO Goals to at least one
measurable outcome
Long Range Transportation Plan Planning Framework
2-8
Project Selection Criteria and Process
In a 2012 statewide effort involving all nine planning commissions, NHDOT, and FHWA, it was determined that the best approach to prioritizing projects was to first examine projects for eligibility and feasibility, and follow that by scoring those eligible and feasible projects against a common set of selection criteria. Once that had been determined, it was left to the individual agencies to establishing the relative weights of each of the selection criteria to establish priorities within their regions. The most recent iteration of this biennial process was completed by the MPO Transportation Advisory Committee at the February 23rd, 2017 meeting and that established the relative weights as shown below. The project selection criteria were defined and applied as follows:
• Congestion (10.36%): The extent to which the project is intended to reduce traveler delay. Estimated based on scope of project, location, and current levels of congestion.
• Freight Mobility (5.16%): The degree to which the project impacts the movement of goods. Estimated based on perceived utility as a freight corridor.
• Alternative Modes (13.87%): The extent to which the project impacts accommodations for alternative modes of travel. Does the project improve access to goods and services for people without a car.
• Traffic Volume (8.47%): The highest volume project location receive the highest score and the lowest volume project location receives the lowest score.
• Facility Importance (6.9%): Based on Functional classification. Higher classes of roadways receive higher scores. This reflects NHDOT’s “Tiered” approach.
• Safety measures (16.96%): To what degree is the project oriented towards making the roadways safer. Is the project purpose primarily safety or is it something else.
• Safety Performance (6.06%): Relative crash frequency at the location based on the last 5 years of data (2009-2013). Crash severity is also considered.
• Service Life Remaining (3.79%): The physical condition of the road and remaining useful life of the pavement. Roadways in better condition will score higher. Currently this is based on the same information from 2013 and 2014, but will be updated when the new data is received from NHDOT.
• Current Bridge Condition (9.67%): The physical condition of the bridge and those in the worst condition (Red List) will score higher. Currently this is based on the same information from 2013 and 2014 but will be updated when the new data is received from NHDOT.
• Support (18.8%): The regional priority of the project. This includes consideration of the local priority, potential economic impacts, the degree to which the project supports the vision, goals, and objectives of the region, as well as whether the project is listed in local or regional planning documents.
In December 2016, the MPO solicited projects from the
communities in the region to be considered for inclusion in the
MPO Long Range Transportation Plan as well as to be prioritized
for potential inclusion in the State Ten Year Transportation Plan.
Long Range Transportation Plan Existing Conditions
3-1
3. Existing Conditions
The following pages offer an overview of land use patterns,
demographic and socioeconomic makeup and commuting travel
patterns in the MPO region, as well snapshots of the modal
components of the transportation system, including highways,
bicycle and pedestrian facilities, public transportation,
transportation demand management, and freight transportation
facilities and programs.
P O P U L A T I O N & G R O W T H
Demographic conditions and trends significantly influence the
trajectory of the region’s future development, land use, housing,
and infrastructure needs; along with virtually all other aspects of
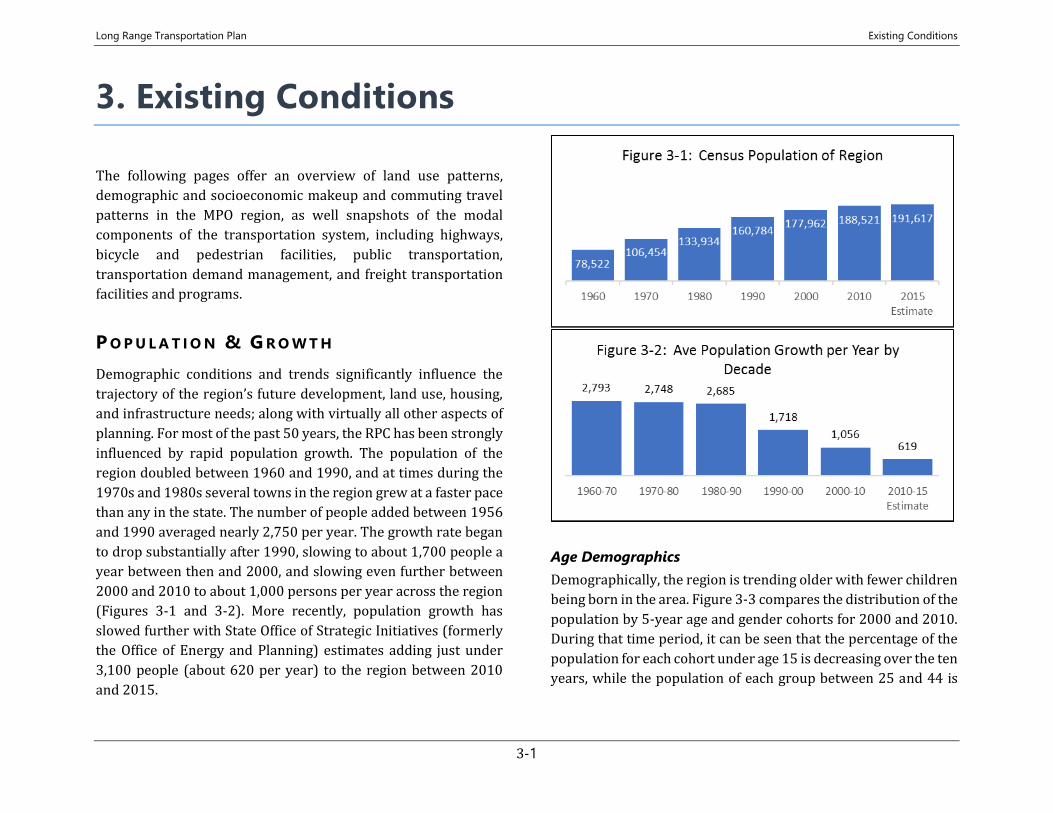
planning. For most of the past 50 years, the RPC has been strongly
influenced by rapid population growth. The population of the
region doubled between 1960 and 1990, and at times during the
1970s and 1980s several towns in the region grew at a faster pace
than any in the state. The number of people added between 1956
and 1990 averaged nearly 2,750 per year. The growth rate began
to drop substantially after 1990, slowing to about 1,700 people a
year between then and 2000, and slowing even further between
2000 and 2010 to about 1,000 persons per year across the region
(Figures 3-1 and 3-2). More recently, population growth has
slowed further with State Office of Strategic Initiatives (formerly
the Office of Energy and Planning) estimates adding just under
3,100 people (about 620 per year) to the region between 2010
and 2015.
Age Demographics
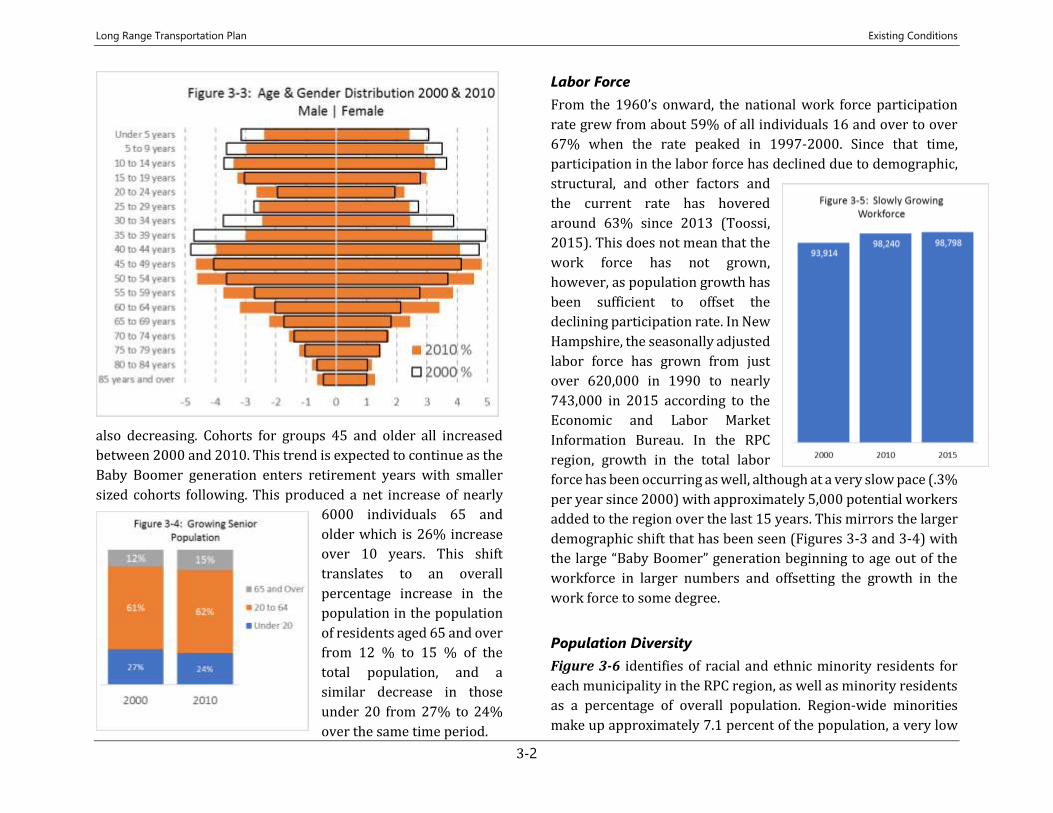
Demographically, the region is trending older with fewer children
being born in the area. Figure 3-3 compares the distribution of the
population by 5-year age and gender cohorts for 2000 and 2010.
During that time period, it can be seen that the percentage of the
population for each cohort under age 15 is decreasing over the ten
years, while the population of each group between 25 and 44 is
Long Range Transportation Plan Existing Conditions
3-2
also decreasing. Cohorts for groups 45 and older all increased
between 2000 and 2010. This trend is expected to continue as the
Baby Boomer generation enters retirement years with smaller
sized cohorts following. This produced a net increase of nearly
6000 individuals 65 and
older which is 26% increase
over 10 years. This shift
translates to an overall
percentage increase in the
population in the population
of residents aged 65 and over
from 12 % to 15 % of the
total population, and a
similar decrease in those
under 20 from 27% to 24%
over the same time period.
Labor Force
From the 1960’s onward, the national work force participation
rate grew from about 59% of all individuals 16 and over to over
67% when the rate peaked in 1997-2000. Since that time,
participation in the labor force has declined due to demographic,
structural, and other factors and
the current rate has hovered
around 63% since 2013 (Toossi,
2015). This does not mean that the
work force has not grown,
however, as population growth has
been sufficient to offset the
declining participation rate. In New
Hampshire, the seasonally adjusted
labor force has grown from just
over 620,000 in 1990 to nearly
743,000 in 2015 according to the
Economic and Labor Market
Information Bureau. In the RPC
region, growth in the total labor
force has been occurring as well, although at a very slow pace (.3%
per year since 2000) with approximately 5,000 potential workers
added to the region over the last 15 years. This mirrors the larger
demographic shift that has been seen (Figures 3-3 and 3-4) with
the large “Baby Boomer” generation beginning to age out of the
workforce in larger numbers and offsetting the growth in the
work force to some degree.
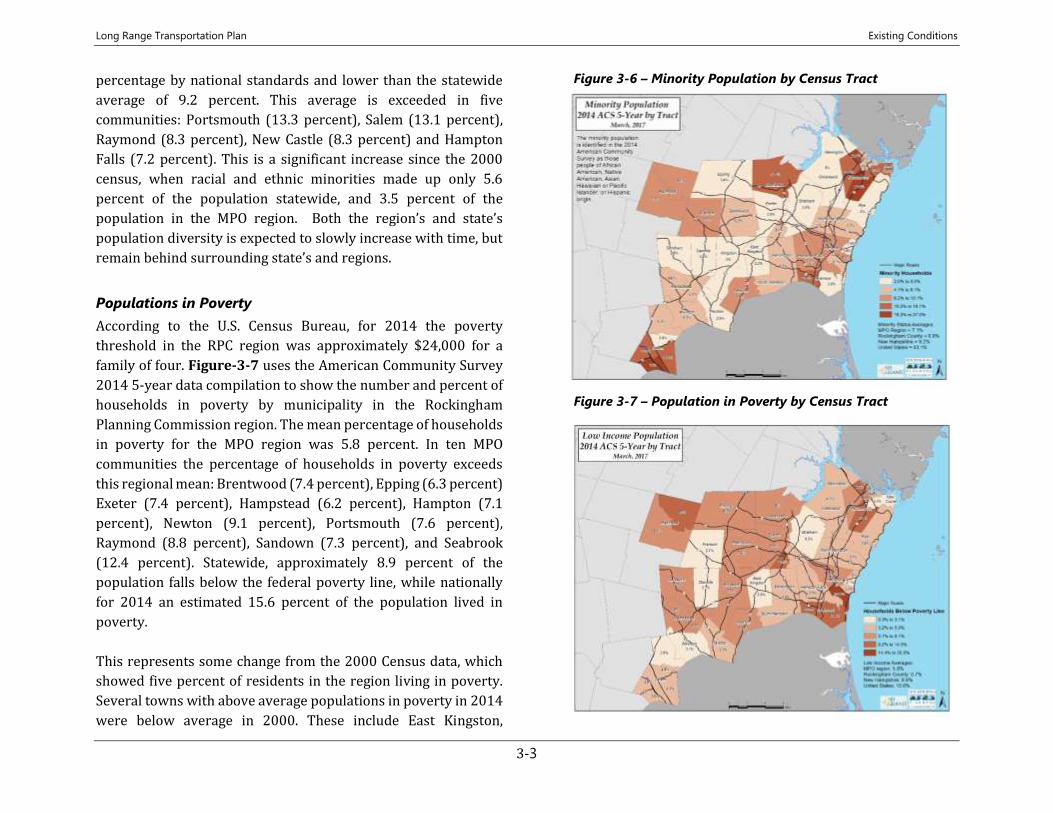
Population Diversity
Figure 3-6 identifies of racial and ethnic minority residents for
each municipality in the RPC region, as well as minority residents
as a percentage of overall population. Region-wide minorities
make up approximately 7.1 percent of the population, a very low
Long Range Transportation Plan Existing Conditions
3-3
percentage by national standards and lower than the statewide
average of 9.2 percent. This average is exceeded in five
communities: Portsmouth (13.3 percent), Salem (13.1 percent),
Raymond (8.3 percent), New Castle (8.3 percent) and Hampton
Falls (7.2 percent). This is a significant increase since the 2000
census, when racial and ethnic minorities made up only 5.6
percent of the population statewide, and 3.5 percent of the
population in the MPO region. Both the region’s and state’s
population diversity is expected to slowly increase with time, but
remain behind surrounding state’s and regions.
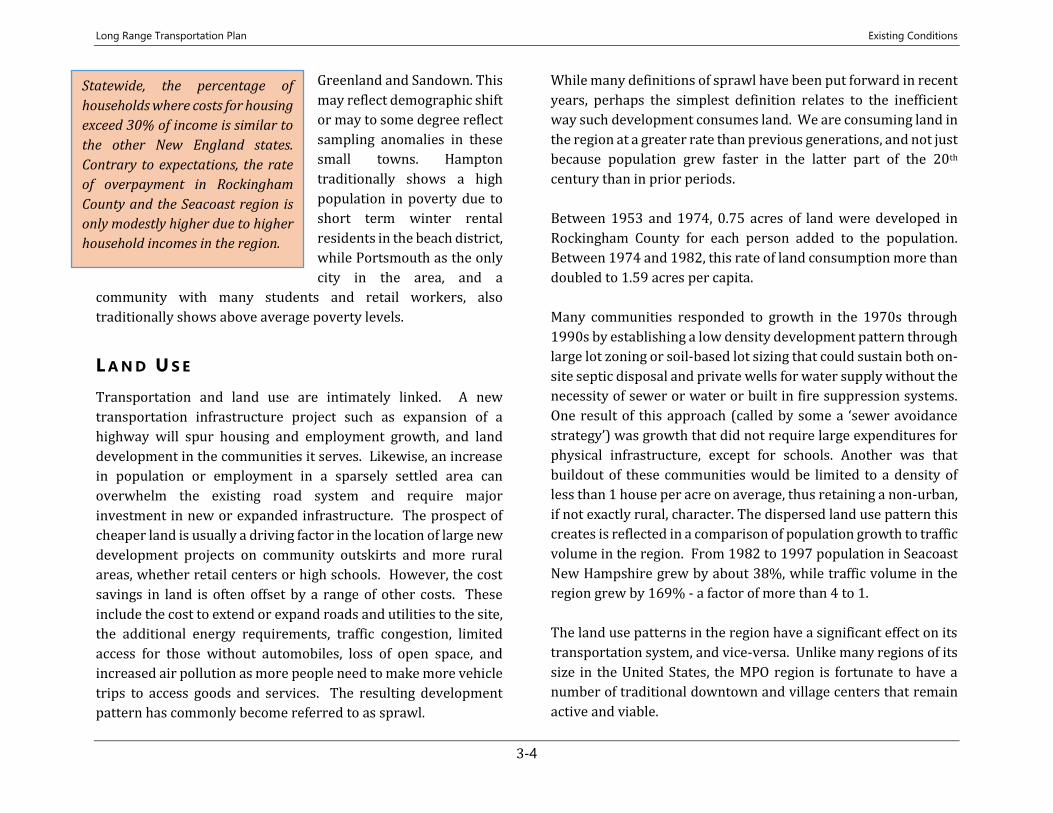
Populations in Poverty
According to the U.S. Census Bureau, for 2014 the poverty
threshold in the RPC region was approximately $24,000 for a
family of four. Figure-3-7 uses the American Community Survey
2014 5-year data compilation to show the number and percent of
households in poverty by municipality in the Rockingham
Planning Commission region. The mean percentage of households
in poverty for the MPO region was 5.8 percent. In ten MPO
communities the percentage of households in poverty exceeds
this regional mean: Brentwood (7.4 percent), Epping (6.3 percent)
Exeter (7.4 percent), Hampstead (6.2 percent), Hampton (7.1
percent), Newton (9.1 percent), Portsmouth (7.6 percent),
Raymond (8.8 percent), Sandown (7.3 percent), and Seabrook
(12.4 percent). Statewide, approximately 8.9 percent of the
population falls below the federal poverty line, while nationally
for 2014 an estimated 15.6 percent of the population lived in
poverty.
This represents some change from the 2000 Census data, which
showed five percent of residents in the region living in poverty.
Several towns with above average populations in poverty in 2014
were below average in 2000. These include East Kingston,
Figure 3-6 – Minority Population by Census Tract
Figure 3-7 – Population in Poverty by Census Tract
Long Range Transportation Plan Existing Conditions
3-4
Greenland and Sandown. This
may reflect demographic shift
or may to some degree reflect
sampling anomalies in these
small towns. Hampton
traditionally shows a high
population in poverty due to
short term winter rental
residents in the beach district,
while Portsmouth as the only
city in the area, and a
community with many students and retail workers, also
traditionally shows above average poverty levels.
L A N D U S E
Transportation and land use are intimately linked. A new
transportation infrastructure project such as expansion of a
highway will spur housing and employment growth, and land
development in the communities it serves. Likewise, an increase
in population or employment in a sparsely settled area can
overwhelm the existing road system and require major
investment in new or expanded infrastructure. The prospect of
cheaper land is usually a driving factor in the location of large new
development projects on community outskirts and more rural
areas, whether retail centers or high schools. However, the cost
savings in land is often offset by a range of other costs. These
include the cost to extend or expand roads and utilities to the site,
the additional energy requirements, traffic congestion, limited
access for those without automobiles, loss of open space, and
increased air pollution as more people need to make more vehicle
trips to access goods and services. The resulting development
pattern has commonly become referred to as sprawl.
While many definitions of sprawl have been put forward in recent
years, perhaps the simplest definition relates to the inefficient
way such development consumes land. We are consuming land in
the region at a greater rate than previous generations, and not just
because population grew faster in the latter part of the 20th
century than in prior periods.
Between 1953 and 1974, 0.75 acres of land were developed in
Rockingham County for each person added to the population.
Between 1974 and 1982, this rate of land consumption more than
doubled to 1.59 acres per capita.
Many communities responded to growth in the 1970s through
1990s by establishing a low density development pattern through
large lot zoning or soil-based lot sizing that could sustain both on-
site septic disposal and private wells for water supply without the
necessity of sewer or water or built in fire suppression systems.
One result of this approach (called by some a ‘sewer avoidance
strategy’) was growth that did not require large expenditures for
physical infrastructure, except for schools. Another was that
buildout of these communities would be limited to a density of
less than 1 house per acre on average, thus retaining a non-urban,
if not exactly rural, character. The dispersed land use pattern this
creates is reflected in a comparison of population growth to traffic
volume in the region. From 1982 to 1997 population in Seacoast
New Hampshire grew by about 38%, while traffic volume in the
region grew by 169% - a factor of more than 4 to 1.
The land use patterns in the region have a significant effect on its
transportation system, and vice-versa. Unlike many regions of its
size in the United States, the MPO region is fortunate to have a
number of traditional downtown and village centers that remain
active and viable.
Statewide, the percentage of
households where costs for housing
exceed 30% of income is similar to
the other New England states.
Contrary to expectations, the rate
of overpayment in Rockingham
County and the Seacoast region is
only modestly higher due to higher
household incomes in the region.
Long Range Transportation Plan Existing Conditions
3-5
Nonetheless, much of the residential, commercial, and industrial
development is dispersed, encouraging and sometimes
necessitating a large amount of travel for individuals to work,
shop, and fulfill their other daily needs. This sprawling
development pattern makes it difficult for any mode other than
the automobile to meet these needs.
The result is a high level of vehicle miles traveled (VMT) per capita
and inefficient (if not infeasible) public transportation services.
Not surprisingly, a large majority of the population uses private
automobiles exclusively to meet their transportation needs. This
increases traffic volumes, and places a greater demand on road
infrastructure as the population grows. This pattern has also
meant that individuals without access to an automobile encounter
serious mobility problems. In turn, new road infrastructure
needed to accommodate growth in traffic, encourages
development and a continuation of dispersed land use patterns.
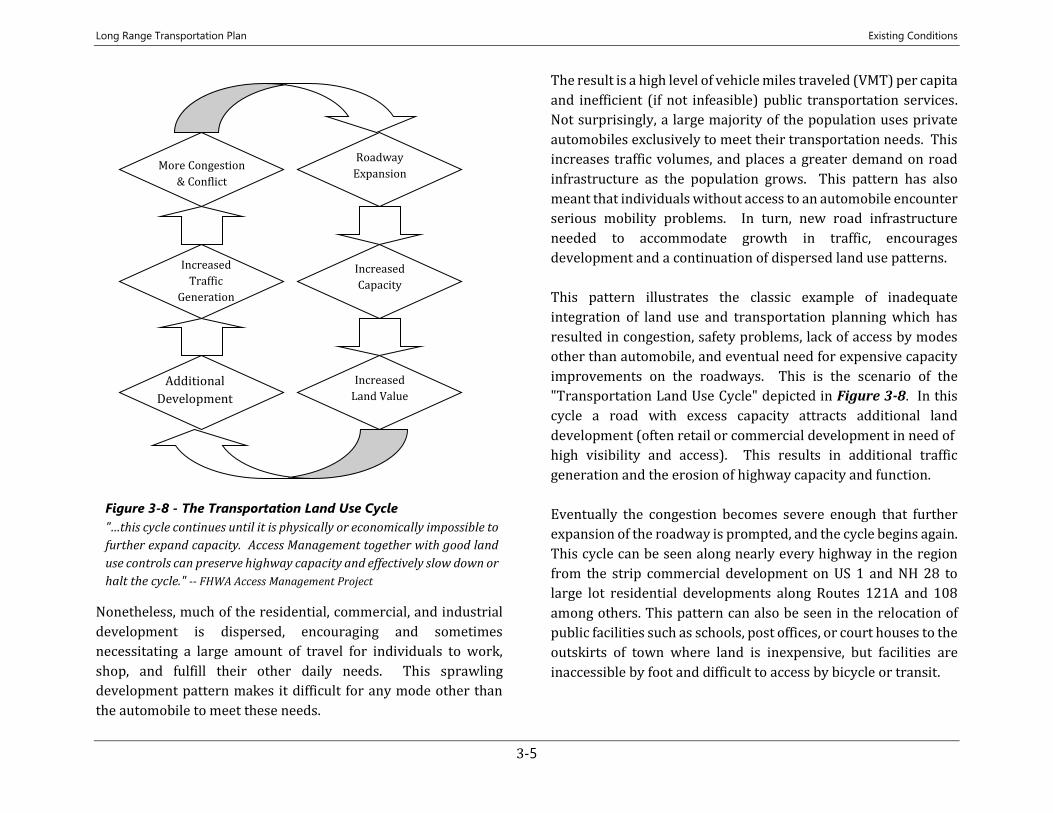
This pattern illustrates the classic example of inadequate
integration of land use and transportation planning which has
resulted in congestion, safety problems, lack of access by modes
other than automobile, and eventual need for expensive capacity
improvements on the roadways. This is the scenario of the
"Transportation Land Use Cycle" depicted in Figure 3-8. In this
cycle a road with excess capacity attracts additional land
development (often retail or commercial development in need of
high visibility and access). This results in additional traffic
generation and the erosion of highway capacity and function.
Eventually the congestion becomes severe enough that further
expansion of the roadway is prompted, and the cycle begins again.
This cycle can be seen along nearly every highway in the region
from the strip commercial development on US 1 and NH 28 to
large lot residential developments along Routes 121A and 108
among others. This pattern can also be seen in the relocation of
public facilities such as schools, post offices, or court houses to the
outskirts of town where land is inexpensive, but facilities are
inaccessible by foot and difficult to access by bicycle or transit.
Roadway
Expansion
Increased
Capacity
Increased
Land Value
More Congestion
& Conflict
Increased
Traffic
Generation
Additional
Development
Figure 3-8 - The Transportation Land Use Cycle
"…this cycle continues until it is physically or economically impossible to
further expand capacity. Access Management together with good land
use controls can preserve highway capacity and effectively slow down or
halt the cycle." -- FHWA Access Management Project
Long Range Transportation Plan Existing Conditions
3-6
In the past decade there has been increased interest in multiple
communities in the MPO region in shifting these patterns.
Approaches have included updating zoning regulations,
encouraging more compact mixed-use development in their town
centers, while leaving open and rural areas for agriculture,
recreation and other suitable uses. More residential development
in close proximity to town centers and schools increases
accessibility by walking, bicycling or transit. It also boosts the
vitality of downtowns as easier access supports increased
patronage of downtown businesses. Stratham, Seabrook,
Hampton Falls and Portsmouth have adopted form-based type
zoning to achieve this result. Additional towns such as Newington
have focused on access management to limit curb cuts from new
development on state highways, and thus manage the impact of
new development on road capacity and congestion.
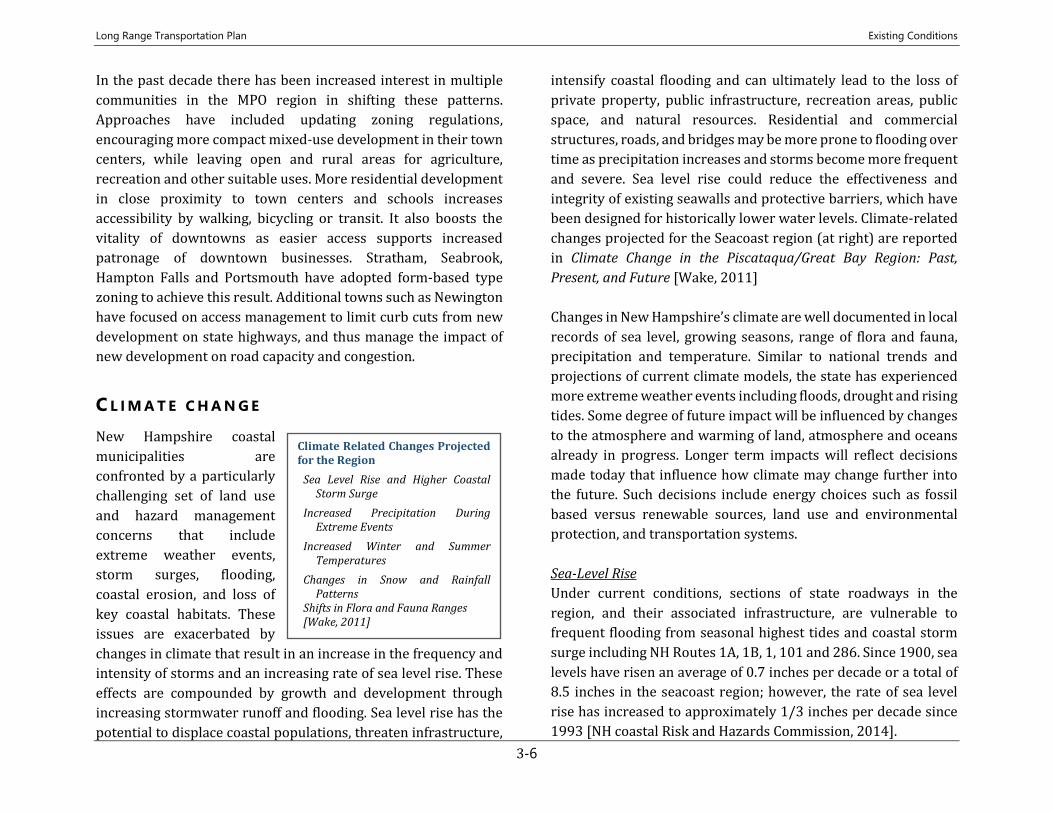
C L I M A T E C H A N G E
New Hampshire coastal
municipalities are
confronted by a particularly
challenging set of land use
and hazard management
concerns that include
extreme weather events,
storm surges, flooding,
coastal erosion, and loss of
key coastal habitats. These
issues are exacerbated by
changes in climate that result in an increase in the frequency and
intensity of storms and an increasing rate of sea level rise. These
effects are compounded by growth and development through
increasing stormwater runoff and flooding. Sea level rise has the
potential to displace coastal populations, threaten infrastructure,
intensify coastal flooding and can ultimately lead to the loss of
private property, public infrastructure, recreation areas, public
space, and natural resources. Residential and commercial
structures, roads, and bridges may be more prone to flooding over
time as precipitation increases and storms become more frequent
and severe. Sea level rise could reduce the effectiveness and
integrity of existing seawalls and protective barriers, which have
been designed for historically lower water levels. Climate-related
changes projected for the Seacoast region (at right) are reported
in Climate Change in the Piscataqua/Great Bay Region: Past,
Present, and Future [Wake, 2011]
Changes in New Hampshire’s climate are well documented in local
records of sea level, growing seasons, range of flora and fauna,
precipitation and temperature. Similar to national trends and
projections of current climate models, the state has experienced
more extreme weather events including floods, drought and rising
tides. Some degree of future impact will be influenced by changes
to the atmosphere and warming of land, atmosphere and oceans
already in progress. Longer term impacts will reflect decisions
made today that influence how climate may change further into
the future. Such decisions include energy choices such as fossil
based versus renewable sources, land use and environmental
protection, and transportation systems.
Sea-Level Rise
Under current conditions, sections of state roadways in the
region, and their associated infrastructure, are vulnerable to
frequent flooding from seasonal highest tides and coastal storm
surge including NH Routes 1A, 1B, 1, 101 and 286. Since 1900, sea
levels have risen an average of 0.7 inches per decade or a total of
8.5 inches in the seacoast region; however, the rate of sea level
rise has increased to approximately 1/3 inches per decade since
1993 [NH coastal Risk and Hazards Commission, 2014].
Climate Related Changes Projected for the Region
Sea Level Rise and Higher Coastal Storm Surge
Increased Precipitation During Extreme Events
Increased Winter and Summer Temperatures
Changes in Snow and Rainfall Patterns
Shifts in Flora and Fauna Ranges [Wake, 2011]
Long Range Transportation Plan Existing Conditions
3-7
Extreme Precipitation and Flooding
Under current conditions, sections of state roadways in the
region, and their associated infrastructure, are vulnerable to
frequent flooding from seasonal highest tides and coastal storm
surge including NH Routes 1A, 1B, 1, 101 and 286. In recent
years, coastal roadway flooding across NH’s seacoast has been
widely documented as part of annual “King Tide Photo Contest”
sponsored by the NH Costal Adaptation Workgroup and the
Piscataqua Region Estuaries Partnership:
http://www.nhcaw.org/what/king-tide-contests/.
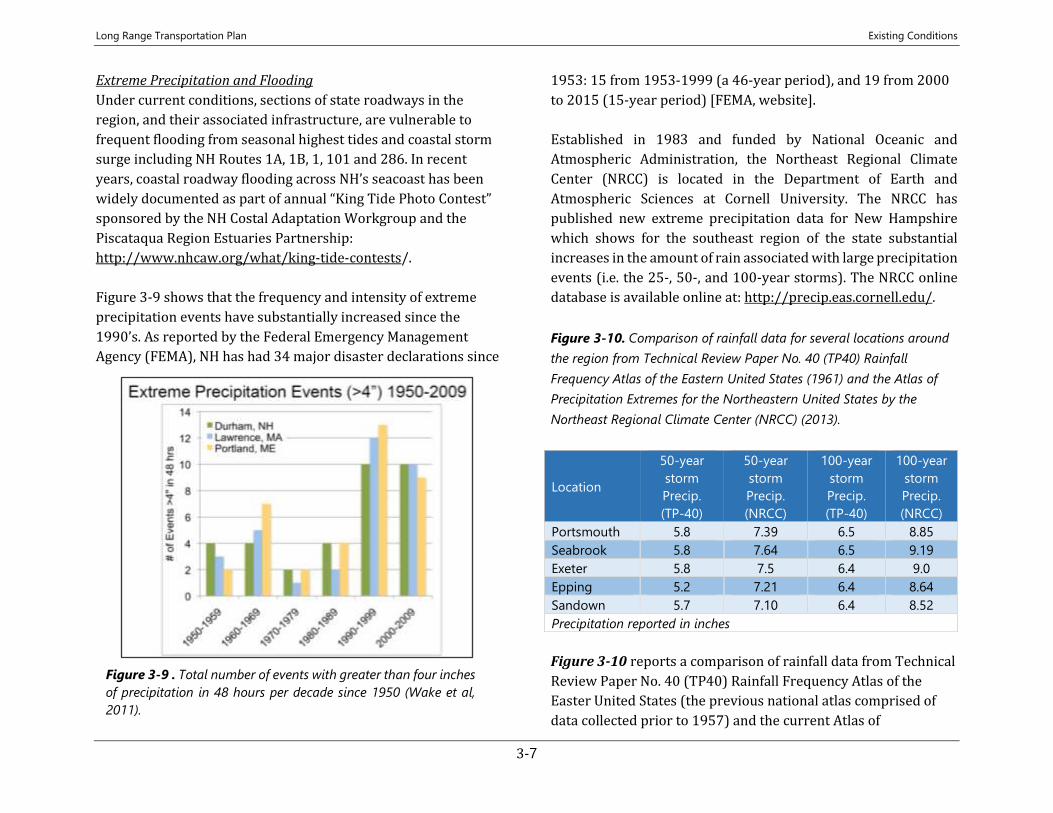
Figure 3-9 shows that the frequency and intensity of extreme
precipitation events have substantially increased since the
1990’s. As reported by the Federal Emergency Management
Agency (FEMA), NH has had 34 major disaster declarations since
1953: 15 from 1953-1999 (a 46-year period), and 19 from 2000
to 2015 (15-year period) [FEMA, website].
Established in 1983 and funded by National Oceanic and
Atmospheric Administration, the Northeast Regional Climate
Center (NRCC) is located in the Department of Earth and
Atmospheric Sciences at Cornell University. The NRCC has
published new extreme precipitation data for New Hampshire
which shows for the southeast region of the state substantial
increases in the amount of rain associated with large precipitation
events (i.e. the 25-, 50-, and 100-year storms). The NRCC online
database is available online at: http://precip.eas.cornell.edu/.
Figure 3-10. Comparison of rainfall data for several locations around
the region from Technical Review Paper No. 40 (TP40) Rainfall
Frequency Atlas of the Eastern United States (1961) and the Atlas of
Precipitation Extremes for the Northeastern United States by the
Northeast Regional Climate Center (NRCC) (2013).
Figure 3-10 reports a comparison of rainfall data from Technical
Review Paper No. 40 (TP40) Rainfall Frequency Atlas of the
Easter United States (the previous national atlas comprised of
data collected prior to 1957) and the current Atlas of
Location
50-year
storm
Precip.
(TP-40)
50-year
storm
Precip.
(NRCC)
100-year
storm
Precip.
(TP-40)
100-year
storm
Precip.
(NRCC)
Portsmouth 5.8 7.39 6.5 8.85
Seabrook 5.8 7.64 6.5 9.19
Exeter 5.8 7.5 6.4 9.0
Epping 5.2 7.21 6.4 8.64
Sandown 5.7 7.10 6.4 8.52
Precipitation reported in inches
Figure 3-9 . Total number of events with greater than four inches
of precipitation in 48 hours per decade since 1950 (Wake et al,
2011).
Long Range Transportation Plan Existing Conditions
3-8
Precipitation Extremes for the Northeastern United States
published by the Northeast Regional Climate Center (2013).
The data sample from across the RPC region in Figure 3-10
shows an increase in rainfall amounts of 25-39 percent for the
50-year storm event and 35-49 percent for the 100-year storm
event. Since the early 200’s, freshwater flooding from extreme
precipitation events have frequently impacted state roadways in
the region including Routes 150, 108, 111, 111A, 88 and 27 as
well as numerous local roadways, bridges, and culverts. This
flooding is not unexpected given that these roads and supporting
infrastructure were designed based on the TP-40 precipitation
data making stormwater conveyance systems undersized for
today’s conditions.
In response to the publication of new precipitation data, the
Department of Environmental Services incorporated NRCC’s new
precipitation atlas as part of its Alteration of Terrain permit
program in 2014, requiring site development and stormwater
management plans to design infrastructure to account for
increased rainfall and runoff. Some municipalities in the region
are using the NRCC data in the design and planning of road and
stormwater infrastructure improvement projects.
Integration of Environment and Land Use
New Hampshire has good information from which to plan for
climate change impacts but more research and analysis is needed
to develop site and asset specific actions to build resilience into
natural and man-made systems. Certainly, common sense
practices such as incorporating new precipitation data and
current sea-level rise projections into project planning and design
are prudent short terms action. We know that stormwater runoff,
the evolution of floodplains and changing shorelines can have
negative impacts on transportation infrastructure and the
environment. Investigating these interactions is a necessary step
in understanding how these systems can be managed to sustain
them into the future.
H O U S I N G
Cost of Ownership
Housing availability, diversity and affordability are important
factors in creating and maintaining a favorable environment for
creative, diverse, vibrant communities and healthy economic
development. The quality of the housing stock in the region, as
measured by common census statistics like age of units, number
of bedrooms, utility status, etc., is generally good. Another positive
metric for the state and region is the high homeownership rate,
which correlates with overall prosperity. New Hampshire ranked
second nationwide in homeownership with 71 percent of
occupied housing units being owned versus rented (ACS 2012, 3
Year Data). In Rockingham County, 77 percent are owned, the
highest of all areas in the state except Carroll County. On the other
hand, the RPC region has comparatively high housing costs which
can translate into higher living costs for the region’s workforce,
and in turn, high labor costs for the region’s employers if higher
wages are needed to attract the workforce their businesses.
Supply of Workforce Housing
Beginning in the 1970s and continuing to today, the region has
had a relatively constrained supply of workforce-affordable
housing, both owned and rental. At least two factors have and
continue to contribute to this. First, the proximity to the Boston
housing market and high housing costs in neighboring
communities in Massachusetts tend to inflate the cost of housing
here, whereas wages are not as strongly affected. Second, there is
Long Range Transportation Plan Existing Conditions
3-9
an undersupply in multifamily housing - an important source of
both rental and other affordable housing units in the region. Two
additional factors contribute to this lack of multifamily housing:
lack of municipal sewer and water services which permit
development density conducive to multifamily development; and
zoning provisions that discourage or make it infeasible. The
Workforce Housing statute (RSA 674:58-674:61) requires
municipalities to provide reasonable and realistic opportunities
for the development of workforce housing by removing
unnecessary barriers in zoning and land use regulations.
Nevertheless legacy zoning provisions, combined with density
limitations from lack of sewer, make such housing economically
unattractive to developers in many parts of the region.
Lack of Affordable and Multi-Family Units
As of the 2010 Census, about two-thirds of the housing units in the
region were single-family units, but for many small communities
that number is over 80 percent. Zoning restrictions in many
communities make it more difficult to construct affordable multi-
family housing, but these restrictions are often in place because of
the lack of municipal sewer and water infrastructure in the
majority of the towns in the region. Only ten of the 26 RPC
communities have municipal sewer systems, and in most of those,
the sewer district covers only a small portion of the town. Even
where allowed by zoning, that lack of infrastructure increases the
relative cost of multifamily construction in rural areas and
becomes less attractive to builders. Another factor in the
comparatively small supply of multifamily housing presently
available in the region is the relative weakness in the housing
construction sector which began with the recession in the early to
mid-1990s which affected the multi-family sector more than the
single family sector.
T R A N S P O R T A T I O N
The region is served by a well-developed roadway network, a
small and geographically limited public transportation system,
and a large variety of domestic and international freight
transportation carriers. All modes of transport and goods
movement are available within or near to the region including the
Port of New Hampshire, Pan Am Railways main line (the former
Eastern Line of the Boston and Maine Railroad) and the Pease and
Manchester airports. Rail freight access has significantly declined
over the past 50 year, while motor carrier freight access has
dramatically increased.
S T A T E A N D L O C A L R O A D W A Y N E T W O R K
In post-World War II New Hampshire the pattern of development
has been defined almost solely by the extent of the roadway
network. Since that time, emphasis has been placed on expansion
of the capacity of the highway system, and this is reflected in the
more than 1,800 miles of well-developed state, local, and private
roads in the region. These roadways are organized in different
classification schemes depending upon their urban or rural
location, their role in providing mobility or access to property, and
the volume and type of traffic that they are intended to serve, who
they are maintained and owned by, or other attributes. Several of
these classification schemes are used in New Hampshire.
Long Range Transportation Plan Existing Conditions
3-10
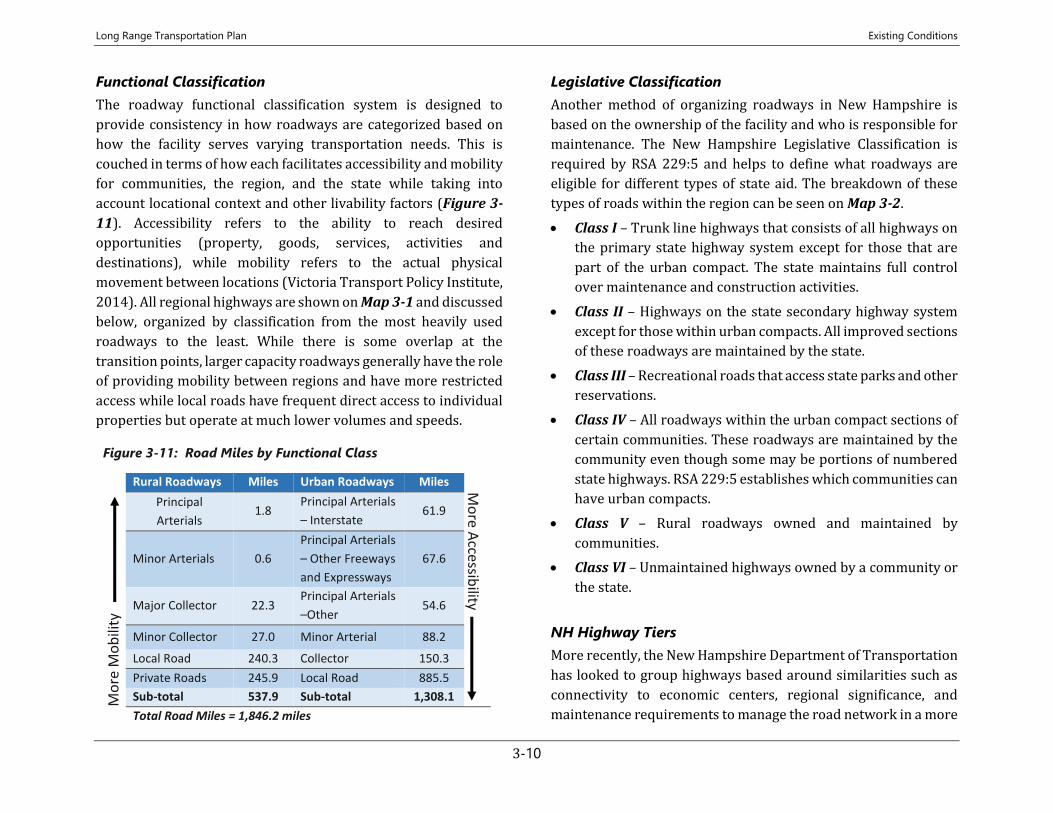
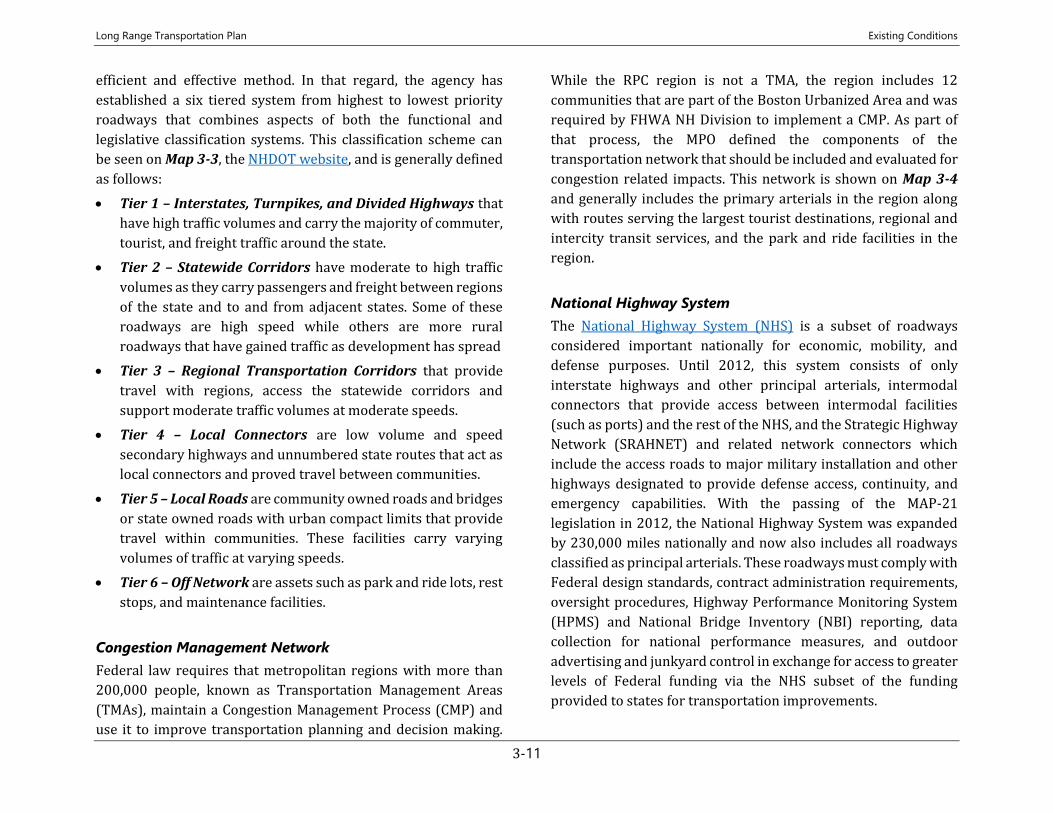
Functional Classification
The roadway functional classification system is designed to
provide consistency in how roadways are categorized based on
how the facility serves varying transportation needs. This is
couched in terms of how each facilitates accessibility and mobility
for communities, the region, and the state while taking into
account locational context and other livability factors (Figure 3-
11). Accessibility refers to the ability to reach desired
opportunities (property, goods, services, activities and
destinations), while mobility refers to the actual physical
movement between locations (Victoria Transport Policy Institute,
2014). All regional highways are shown on Map 3-1 and discussed
below, organized by classification from the most heavily used
roadways to the least. While there is some overlap at the
transition points, larger capacity roadways generally have the role
of providing mobility between regions and have more restricted
access while local roads have frequent direct access to individual
properties but operate at much lower volumes and speeds.
Legislative Classification
Another method of organizing roadways in New Hampshire is
based on the ownership of the facility and who is responsible for
maintenance. The New Hampshire Legislative Classification is
required by RSA 229:5 and helps to define what roadways are
eligible for different types of state aid. The breakdown of these
types of roads within the region can be seen on Map 3-2.
• Class I – Trunk line highways that consists of all highways on
the primary state highway system except for those that are
part of the urban compact. The state maintains full control
over maintenance and construction activities.
• Class II – Highways on the state secondary highway system
except for those within urban compacts. All improved sections
of these roadways are maintained by the state.
• Class III – Recreational roads that access state parks and other
reservations.
• Class IV – All roadways within the urban compact sections of
certain communities. These roadways are maintained by the
community even though some may be portions of numbered
state highways. RSA 229:5 establishes which communities can
have urban compacts.
• Class V – Rural roadways owned and maintained by
communities.
• Class VI – Unmaintained highways owned by a community or
the state.
NH Highway Tiers
More recently, the New Hampshire Department of Transportation
has looked to group highways based around similarities such as
connectivity to economic centers, regional significance, and
maintenance requirements to manage the road network in a more
Figure 3-11: Road Miles by Functional Class
Rural Roadways Miles Urban Roadways Miles
Mo
re M
ob
ility
Principal
Arterials 1.8
Principal Arterials
– Interstate 61.9
Mo
re Accessib
ility
Minor Arterials 0.6
Principal Arterials
– Other Freeways
and Expressways
67.6
Major Collector 22.3 Principal Arterials
–Other 54.6
Minor Collector 27.0 Minor Arterial 88.2
Local Road 240.3 Collector 150.3
Private Roads 245.9 Local Road 885.5
Sub-total 537.9 Sub-total 1,308.1
Total Road Miles = 1,846.2 miles
Long Range Transportation Plan Existing Conditions
3-11
efficient and effective method. In that regard, the agency has
established a six tiered system from highest to lowest priority
roadways that combines aspects of both the functional and
legislative classification systems. This classification scheme can
be seen on Map 3-3, the NHDOT website, and is generally defined
as follows:
• Tier 1 – Interstates, Turnpikes, and Divided Highways that
have high traffic volumes and carry the majority of commuter,
tourist, and freight traffic around the state.
• Tier 2 – Statewide Corridors have moderate to high traffic
volumes as they carry passengers and freight between regions
of the state and to and from adjacent states. Some of these
roadways are high speed while others are more rural
roadways that have gained traffic as development has spread
• Tier 3 – Regional Transportation Corridors that provide
travel with regions, access the statewide corridors and
support moderate traffic volumes at moderate speeds.
• Tier 4 – Local Connectors are low volume and speed
secondary highways and unnumbered state routes that act as
local connectors and proved travel between communities.
• Tier 5 – Local Roads are community owned roads and bridges
or state owned roads with urban compact limits that provide
travel within communities. These facilities carry varying
volumes of traffic at varying speeds.
• Tier 6 – Off Network are assets such as park and ride lots, rest
stops, and maintenance facilities.
Congestion Management Network
Federal law requires that metropolitan regions with more than
200,000 people, known as Transportation Management Areas
(TMAs), maintain a Congestion Management Process (CMP) and
use it to improve transportation planning and decision making.
While the RPC region is not a TMA, the region includes 12
communities that are part of the Boston Urbanized Area and was
required by FHWA NH Division to implement a CMP. As part of
that process, the MPO defined the components of the
transportation network that should be included and evaluated for
congestion related impacts. This network is shown on Map 3-4
and generally includes the primary arterials in the region along
with routes serving the largest tourist destinations, regional and
intercity transit services, and the park and ride facilities in the
region.
National Highway System
The National Highway System (NHS) is a subset of roadways
considered important nationally for economic, mobility, and
defense purposes. Until 2012, this system consists of only
interstate highways and other principal arterials, intermodal
connectors that provide access between intermodal facilities
(such as ports) and the rest of the NHS, and the Strategic Highway
Network (SRAHNET) and related network connectors which
include the access roads to major military installation and other
highways designated to provide defense access, continuity, and
emergency capabilities. With the passing of the MAP-21
legislation in 2012, the National Highway System was expanded
by 230,000 miles nationally and now also includes all roadways
classified as principal arterials. These roadways must comply with
Federal design standards, contract administration requirements,
oversight procedures, Highway Performance Monitoring System
(HPMS) and National Bridge Inventory (NBI) reporting, data
collection for national performance measures, and outdoor
advertising and junkyard control in exchange for access to greater
levels of Federal funding via the NHS subset of the funding
provided to states for transportation improvements.
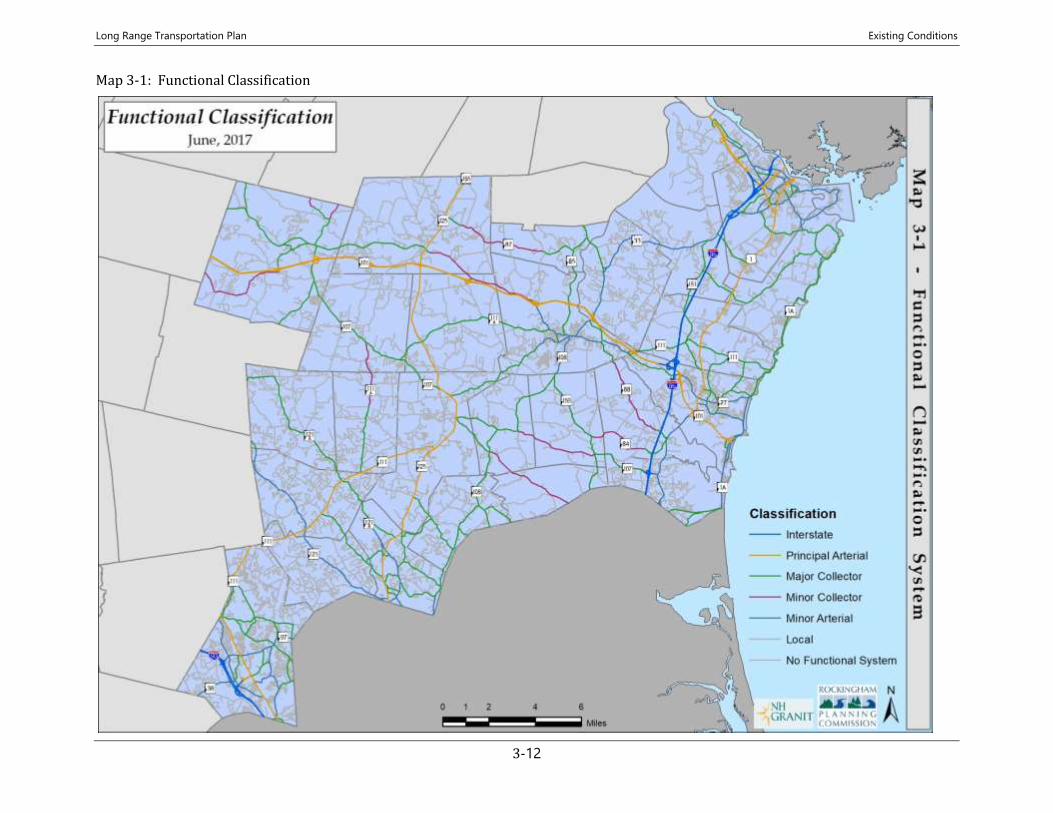
Long Range Transportation Plan Existing Conditions
3-12
Map 3-1: Functional Classification
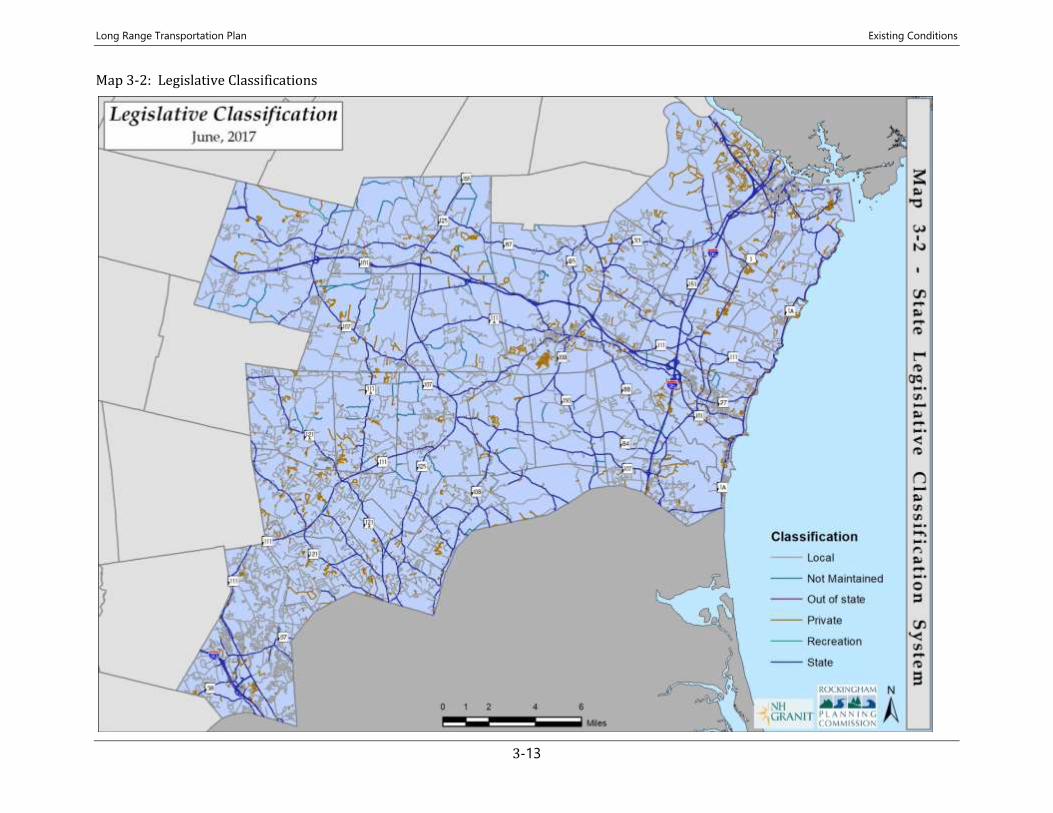
Long Range Transportation Plan Existing Conditions
3-13
Map 3-2: Legislative Classifications
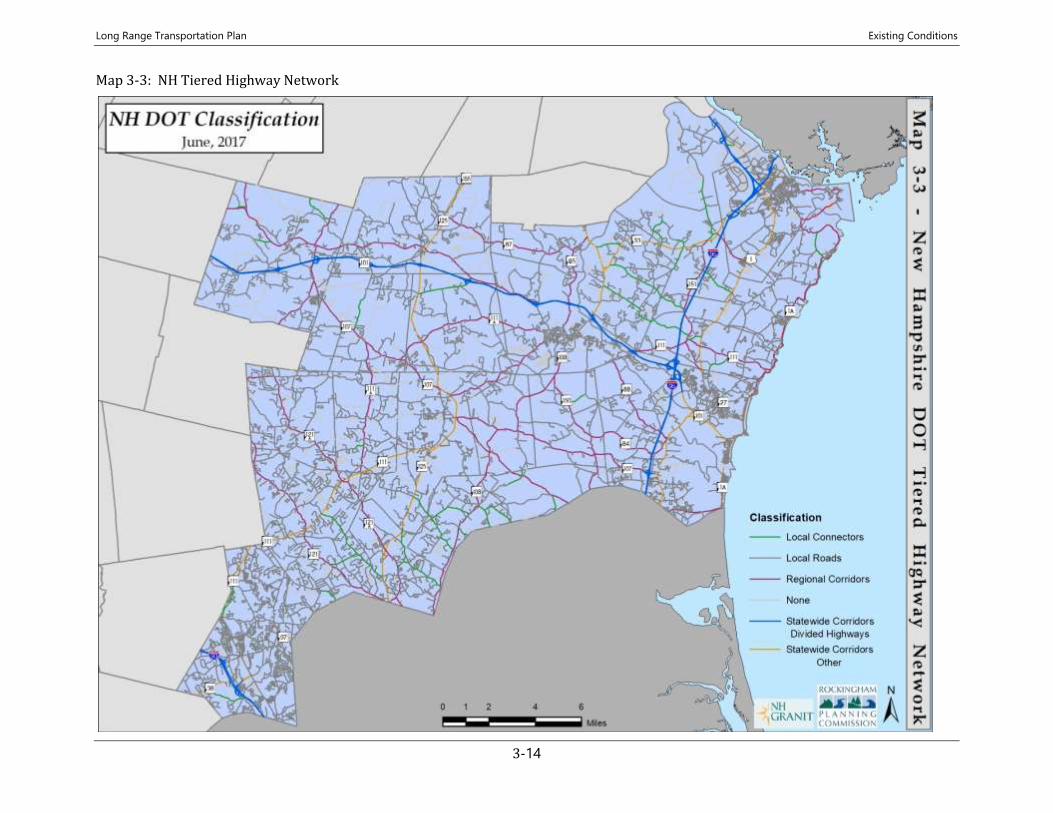
Long Range Transportation Plan Existing Conditions
3-14
Map 3-3: NH Tiered Highway Network
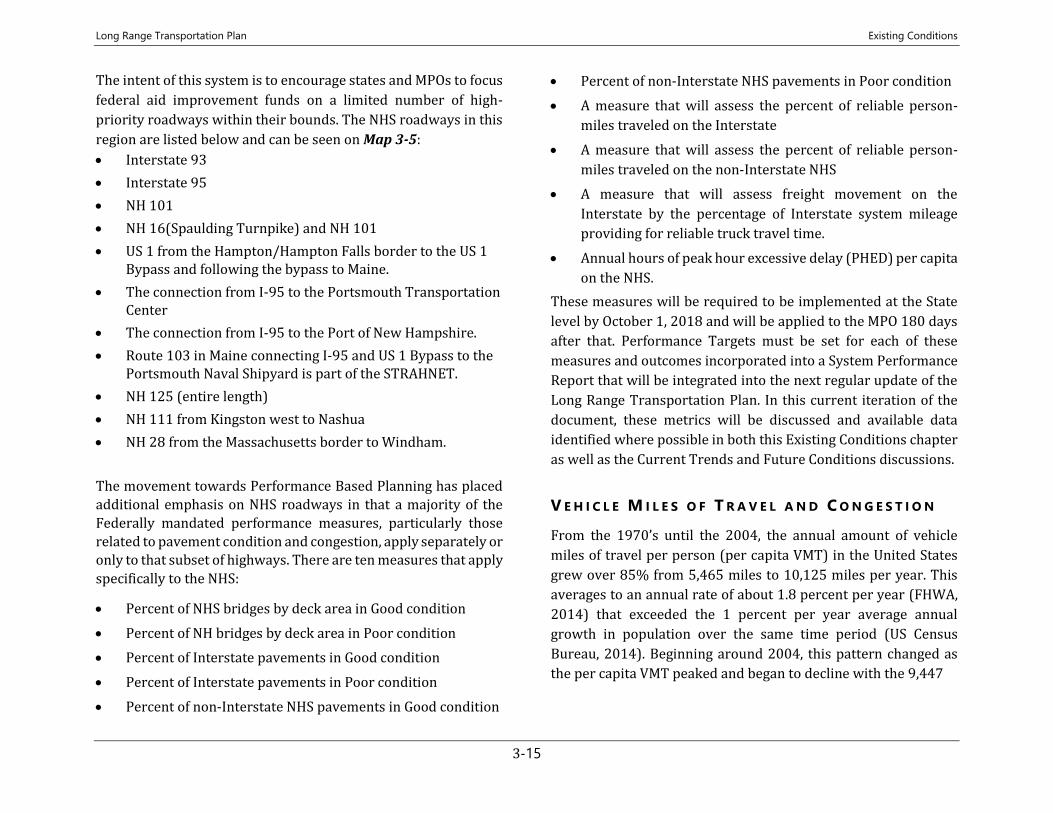
Long Range Transportation Plan Existing Conditions
3-15
The intent of this system is to encourage states and MPOs to focus
federal aid improvement funds on a limited number of high-
priority roadways within their bounds. The NHS roadways in this
region are listed below and can be seen on Map 3-5:
• Interstate 93
• Interstate 95
• NH 101
• NH 16(Spaulding Turnpike) and NH 101
• US 1 from the Hampton/Hampton Falls border to the US 1 Bypass and following the bypass to Maine.
• The connection from I-95 to the Portsmouth Transportation Center
• The connection from I-95 to the Port of New Hampshire.
• Route 103 in Maine connecting I-95 and US 1 Bypass to the Portsmouth Naval Shipyard is part of the STRAHNET.
• NH 125 (entire length)
• NH 111 from Kingston west to Nashua
• NH 28 from the Massachusetts border to Windham.
The movement towards Performance Based Planning has placed
additional emphasis on NHS roadways in that a majority of the
Federally mandated performance measures, particularly those
related to pavement condition and congestion, apply separately or only to that subset of highways. There are ten measures that apply
specifically to the NHS:
• Percent of NHS bridges by deck area in Good condition
• Percent of NH bridges by deck area in Poor condition
• Percent of Interstate pavements in Good condition
• Percent of Interstate pavements in Poor condition
• Percent of non-Interstate NHS pavements in Good condition
• Percent of non-Interstate NHS pavements in Poor condition
• A measure that will assess the percent of reliable person-
miles traveled on the Interstate
• A measure that will assess the percent of reliable person-
miles traveled on the non-Interstate NHS
• A measure that will assess freight movement on the
Interstate by the percentage of Interstate system mileage
providing for reliable truck travel time.
• Annual hours of peak hour excessive delay (PHED) per capita
on the NHS.
These measures will be required to be implemented at the State
level by October 1, 2018 and will be applied to the MPO 180 days
after that. Performance Targets must be set for each of these
measures and outcomes incorporated into a System Performance
Report that will be integrated into the next regular update of the
Long Range Transportation Plan. In this current iteration of the
document, these metrics will be discussed and available data
identified where possible in both this Existing Conditions chapter
as well as the Current Trends and Future Conditions discussions.
V E H I C L E M I L E S O F T R A V E L A N D C O N G E S T I O N
From the 1970’s until the 2004, the annual amount of vehicle
miles of travel per person (per capita VMT) in the United States
grew over 85% from 5,465 miles to 10,125 miles per year. This
averages to an annual rate of about 1.8 percent per year (FHWA,
2014) that exceeded the 1 percent per year average annual
growth in population over the same time period (US Census
Bureau, 2014). Beginning around 2004, this pattern changed as
the per capita VMT peaked and began to decline with the 9,447
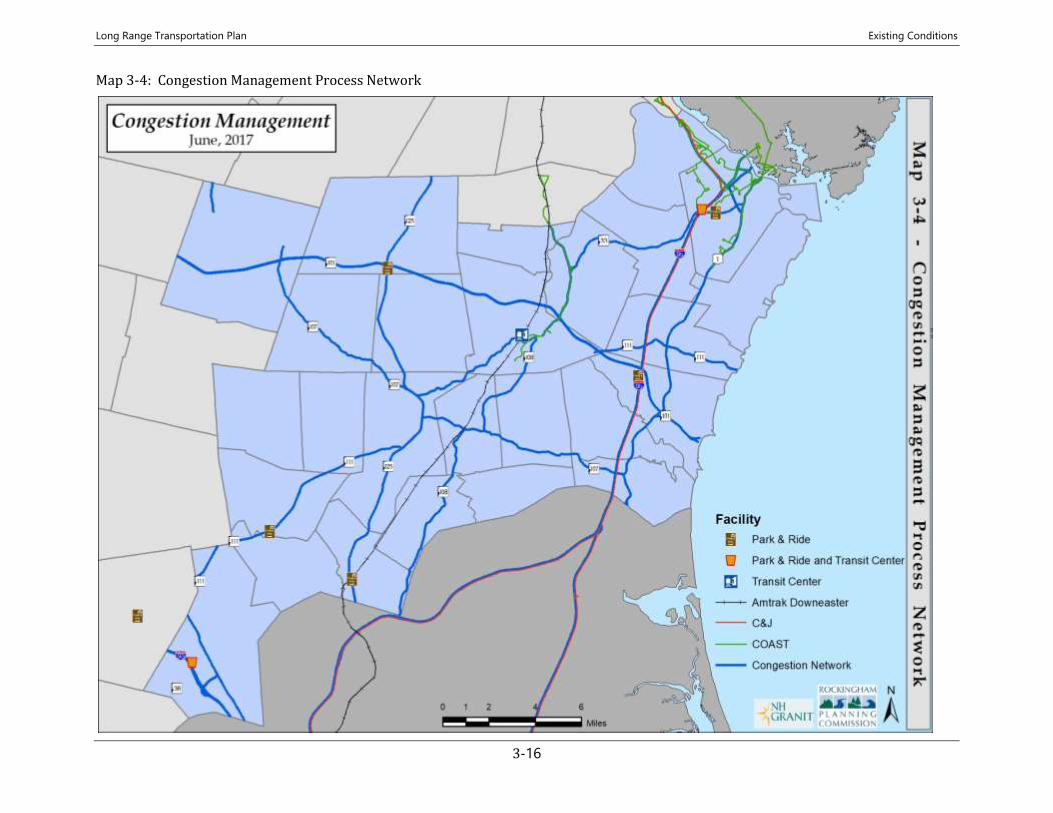
Long Range Transportation Plan Existing Conditions
3-16
Map 3-4: Congestion Management Process Network
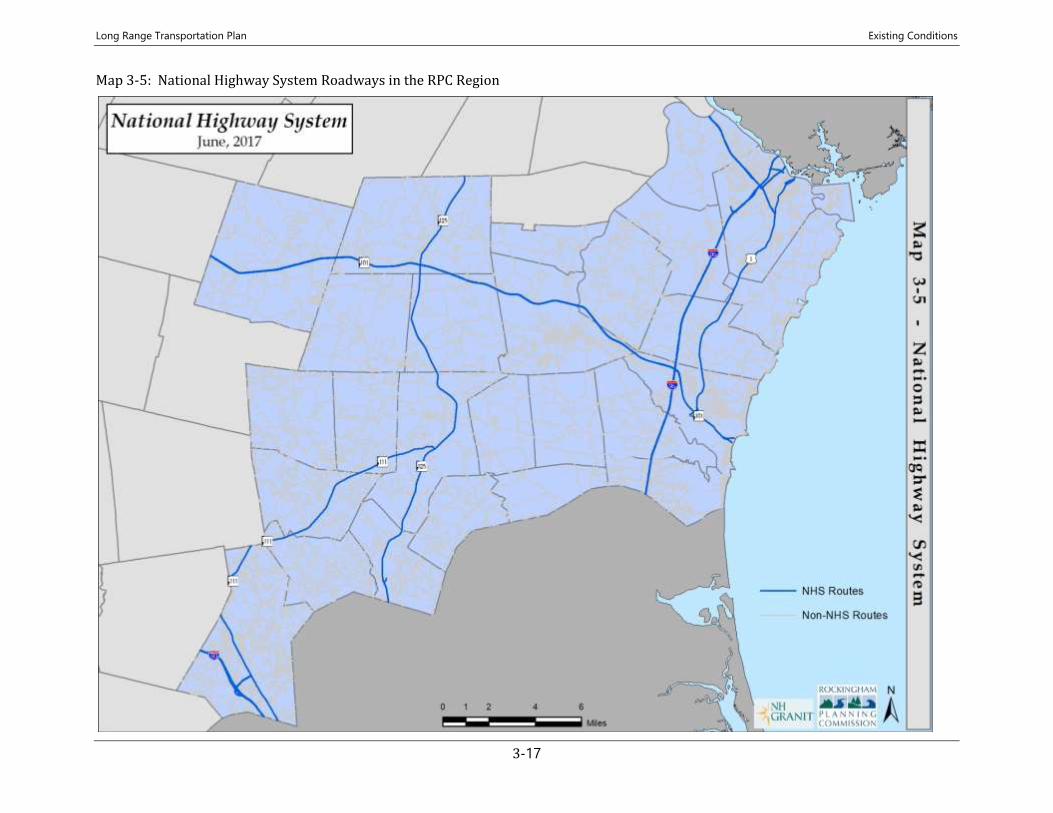
Long Range Transportation Plan Existing Conditions
3-17
Map 3-5: National Highway System Roadways in the RPC Region
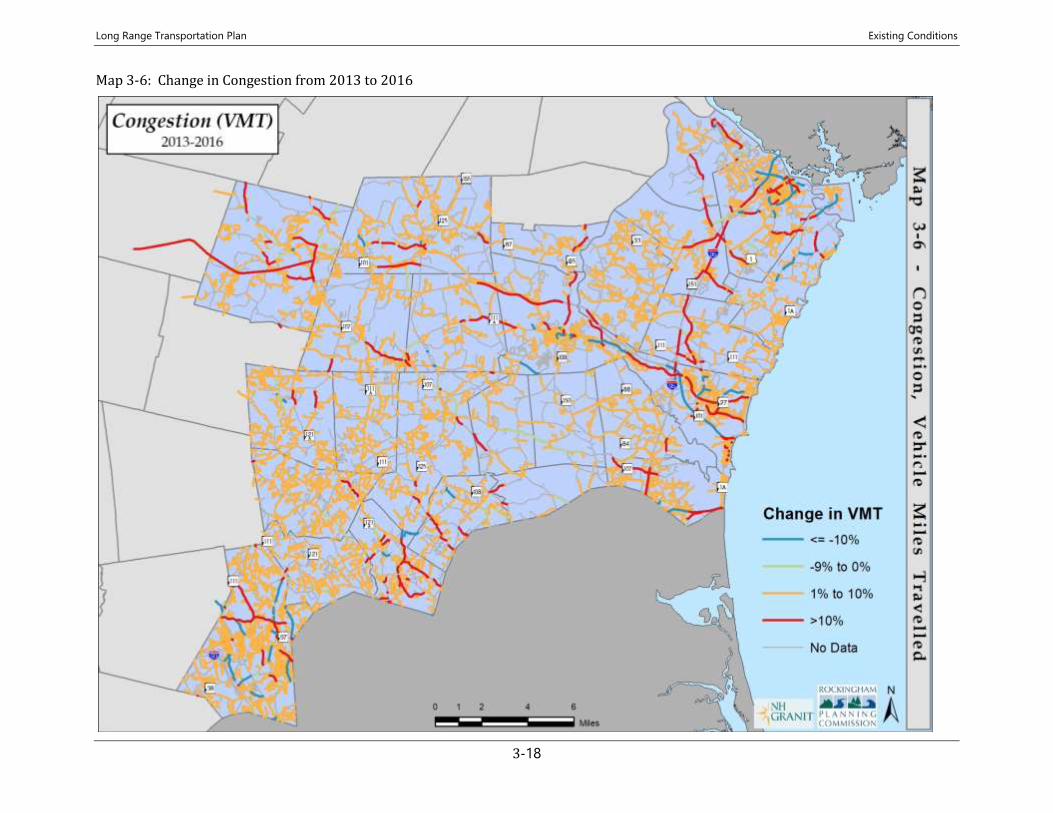
Long Range Transportation Plan Existing Conditions
3-18
Map 3-6: Change in Congestion from 2013 to 2016
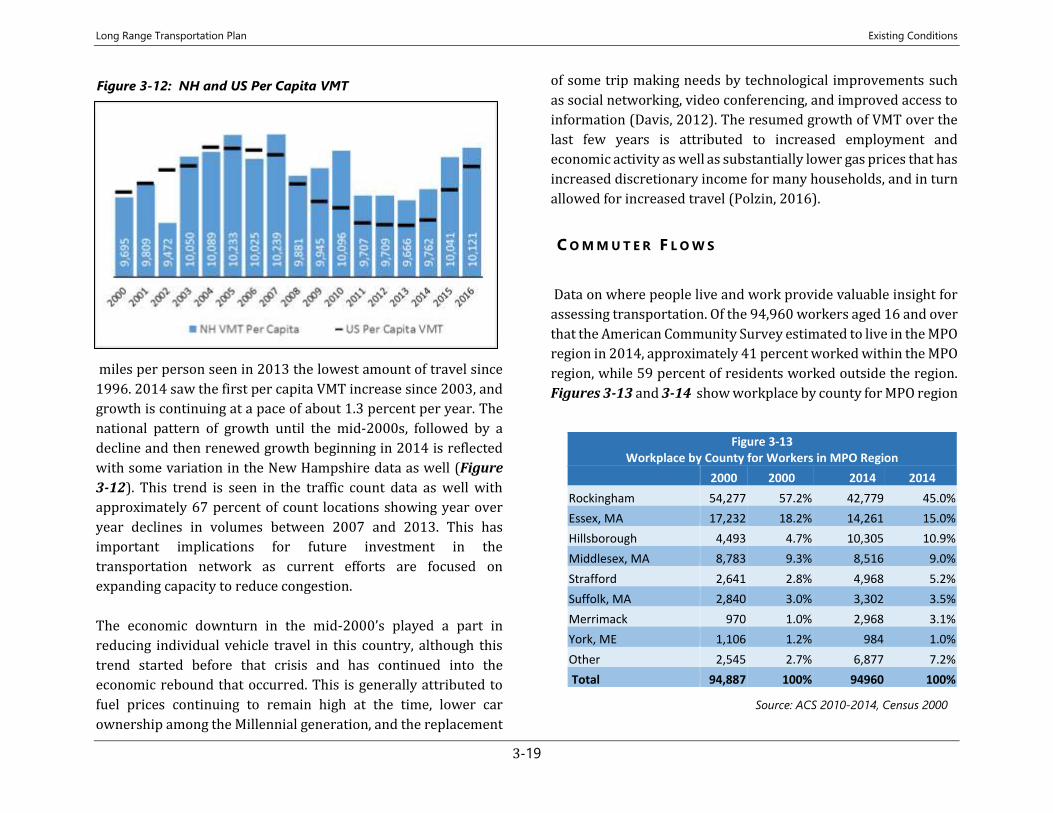
Long Range Transportation Plan Existing Conditions
3-19
miles per person seen in 2013 the lowest amount of travel since
1996. 2014 saw the first per capita VMT increase since 2003, and
growth is continuing at a pace of about 1.3 percent per year. The
national pattern of growth until the mid-2000s, followed by a
decline and then renewed growth beginning in 2014 is reflected
with some variation in the New Hampshire data as well (Figure
3-12). This trend is seen in the traffic count data as well with
approximately 67 percent of count locations showing year over
year declines in volumes between 2007 and 2013. This has
important implications for future investment in the
transportation network as current efforts are focused on
expanding capacity to reduce congestion.
The economic downturn in the mid-2000’s played a part in
reducing individual vehicle travel in this country, although this
trend started before that crisis and has continued into the
economic rebound that occurred. This is generally attributed to
fuel prices continuing to remain high at the time, lower car
ownership among the Millennial generation, and the replacement
of some trip making needs by technological improvements such
as social networking, video conferencing, and improved access to
information (Davis, 2012). The resumed growth of VMT over the
last few years is attributed to increased employment and
economic activity as well as substantially lower gas prices that has
increased discretionary income for many households, and in turn
allowed for increased travel (Polzin, 2016).
C O M M U T E R F L O W S
Data on where people live and work provide valuable insight for
assessing transportation. Of the 94,960 workers aged 16 and over
that the American Community Survey estimated to live in the MPO
region in 2014, approximately 41 percent worked within the MPO
region, while 59 percent of residents worked outside the region.
Figures 3-13 and 3-14 show workplace by county for MPO region
Figure 3-13 Workplace by County for Workers in MPO Region
2000 2000 2014 2014
Rockingham 54,277 57.2% 42,779 45.0%
Essex, MA 17,232 18.2% 14,261 15.0%
Hillsborough 4,493 4.7% 10,305 10.9%
Middlesex, MA 8,783 9.3% 8,516 9.0%
Strafford 2,641 2.8% 4,968 5.2%
Suffolk, MA 2,840 3.0% 3,302 3.5%
Merrimack 970 1.0% 2,968 3.1%
York, ME 1,106 1.2% 984 1.0%
Other 2,545 2.7% 6,877 7.2%
Total 94,887 100% 94960 100%
Figure 3-12: NH and US Per Capita VMT
Source: ACS 2010-2014, Census 2000
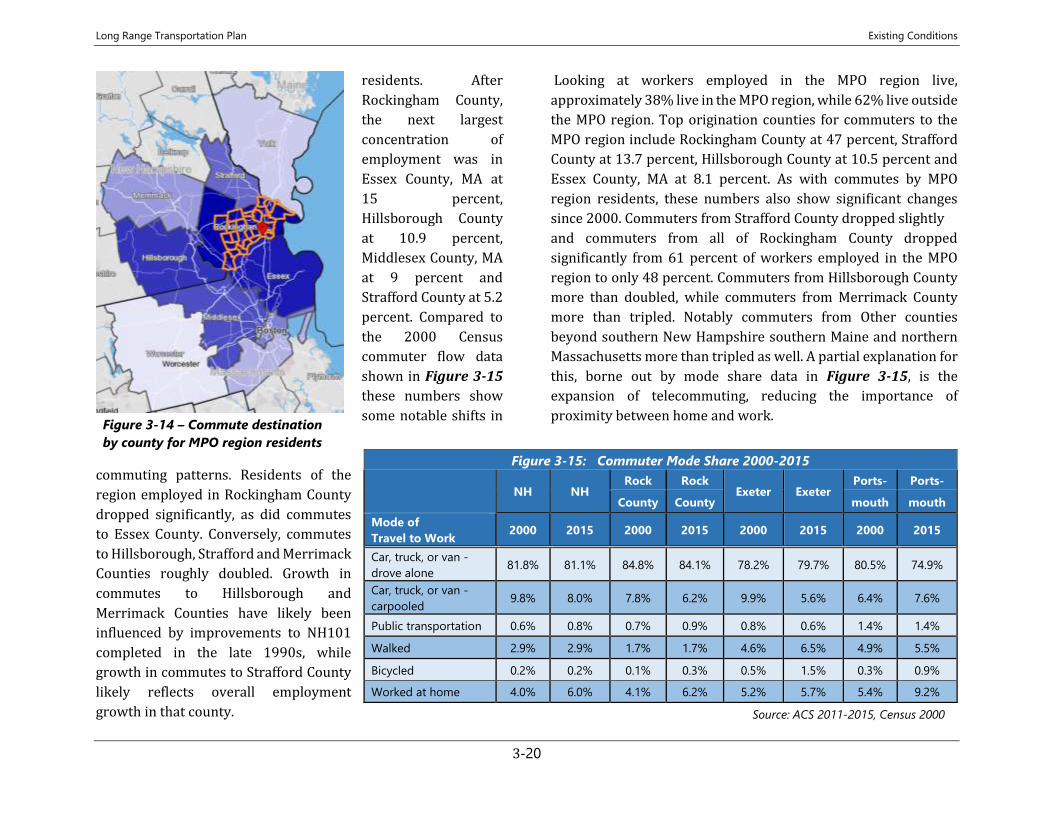
Long Range Transportation Plan Existing Conditions
3-20
residents. After
Rockingham County,
the next largest
concentration of
employment was in
Essex County, MA at
15 percent,
Hillsborough County
at 10.9 percent,
Middlesex County, MA
at 9 percent and
Strafford County at 5.2
percent. Compared to
the 2000 Census
commuter flow data
shown in Figure 3-15
these numbers show
some notable shifts in
commuting patterns. Residents of the
region employed in Rockingham County
dropped significantly, as did commutes
to Essex County. Conversely, commutes
to Hillsborough, Strafford and Merrimack
Counties roughly doubled. Growth in
commutes to Hillsborough and
Merrimack Counties have likely been
influenced by improvements to NH101
completed in the late 1990s, while
growth in commutes to Strafford County
likely reflects overall employment
growth in that county.
Looking at workers employed in the MPO region live,
approximately 38% live in the MPO region, while 62% live outside
the MPO region. Top origination counties for commuters to the
MPO region include Rockingham County at 47 percent, Strafford
County at 13.7 percent, Hillsborough County at 10.5 percent and
Essex County, MA at 8.1 percent. As with commutes by MPO
region residents, these numbers also show significant changes
since 2000. Commuters from Strafford County dropped slightly
and commuters from all of Rockingham County dropped
significantly from 61 percent of workers employed in the MPO
region to only 48 percent. Commuters from Hillsborough County
more than doubled, while commuters from Merrimack County
more than tripled. Notably commuters from Other counties
beyond southern New Hampshire southern Maine and northern
Massachusetts more than tripled as well. A partial explanation for
this, borne out by mode share data in Figure 3-15, is the
expansion of telecommuting, reducing the importance of
proximity between home and work.
Figure 3-15: Commuter Mode Share 2000-2015
NH NH
Rock Rock Exeter Exeter
Ports- Ports-
County County mouth mouth
Mode of
Travel to Work 2000 2015 2000 2015 2000 2015 2000 2015
Car, truck, or van -
drove alone 81.8% 81.1% 84.8% 84.1% 78.2% 79.7% 80.5% 74.9%
Car, truck, or van -
carpooled 9.8% 8.0% 7.8% 6.2% 9.9% 5.6% 6.4% 7.6%
Public transportation 0.6% 0.8% 0.7% 0.9% 0.8% 0.6% 1.4% 1.4%
Walked 2.9% 2.9% 1.7% 1.7% 4.6% 6.5% 4.9% 5.5%
Bicycled 0.2% 0.2% 0.1% 0.3% 0.5% 1.5% 0.3% 0.9%
Worked at home 4.0% 6.0% 4.1% 6.2% 5.2% 5.7% 5.4% 9.2%
Figure 3-14 – Commute destination
by county for MPO region residents
Source: ACS 2011-2015, Census 2000
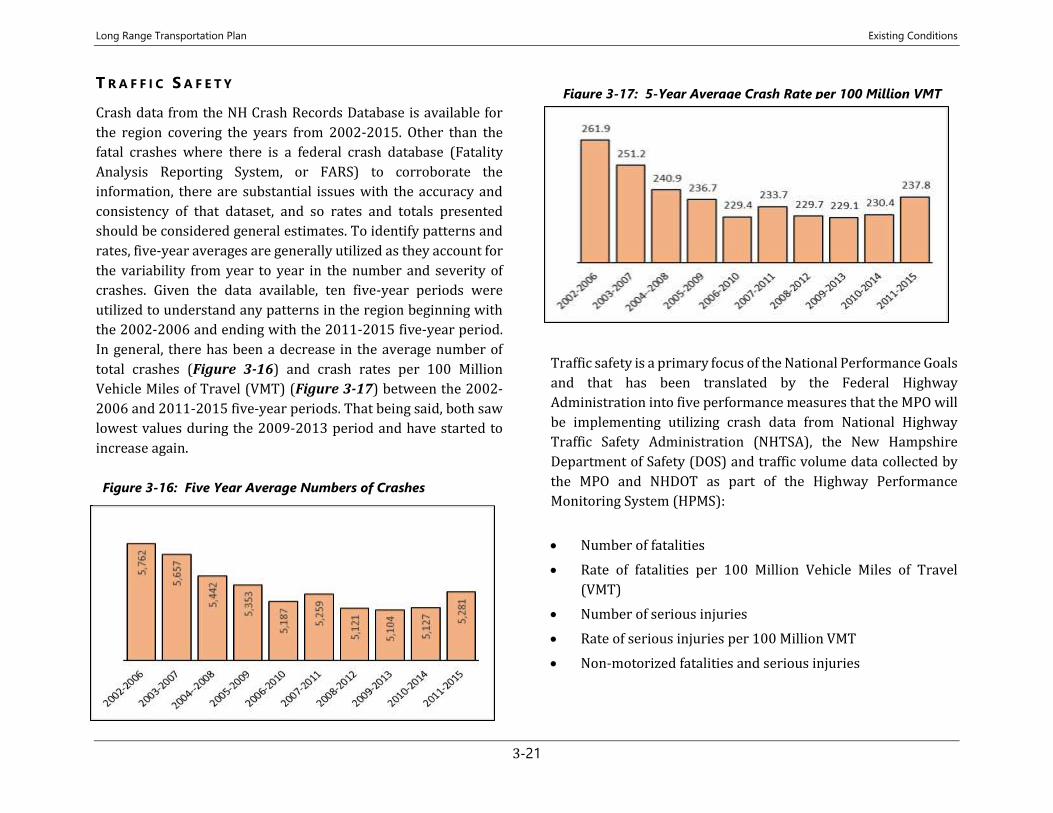
Long Range Transportation Plan Existing Conditions
3-21
T R A F F I C S A F E T Y
Crash data from the NH Crash Records Database is available for
the region covering the years from 2002-2015. Other than the
fatal crashes where there is a federal crash database (Fatality
Analysis Reporting System, or FARS) to corroborate the
information, there are substantial issues with the accuracy and
consistency of that dataset, and so rates and totals presented
should be considered general estimates. To identify patterns and
rates, five-year averages are generally utilized as they account for
the variability from year to year in the number and severity of
crashes. Given the data available, ten five-year periods were
utilized to understand any patterns in the region beginning with
the 2002-2006 and ending with the 2011-2015 five-year period.
In general, there has been a decrease in the average number of
total crashes (Figure 3-16) and crash rates per 100 Million
Vehicle Miles of Travel (VMT) (Figure 3-17) between the 2002-
2006 and 2011-2015 five-year periods. That being said, both saw
lowest values during the 2009-2013 period and have started to
increase again.
Traffic safety is a primary focus of the National Performance Goals
and that has been translated by the Federal Highway
Administration into five performance measures that the MPO will
be implementing utilizing crash data from National Highway
Traffic Safety Administration (NHTSA), the New Hampshire
Department of Safety (DOS) and traffic volume data collected by
the MPO and NHDOT as part of the Highway Performance
Monitoring System (HPMS):
• Number of fatalities
• Rate of fatalities per 100 Million Vehicle Miles of Travel
(VMT)
• Number of serious injuries
• Rate of serious injuries per 100 Million VMT
• Non-motorized fatalities and serious injuries
Figure 3-17: 5-Year Average Crash Rate per 100 Million VMT
Figure 3-16: Five Year Average Numbers of Crashes
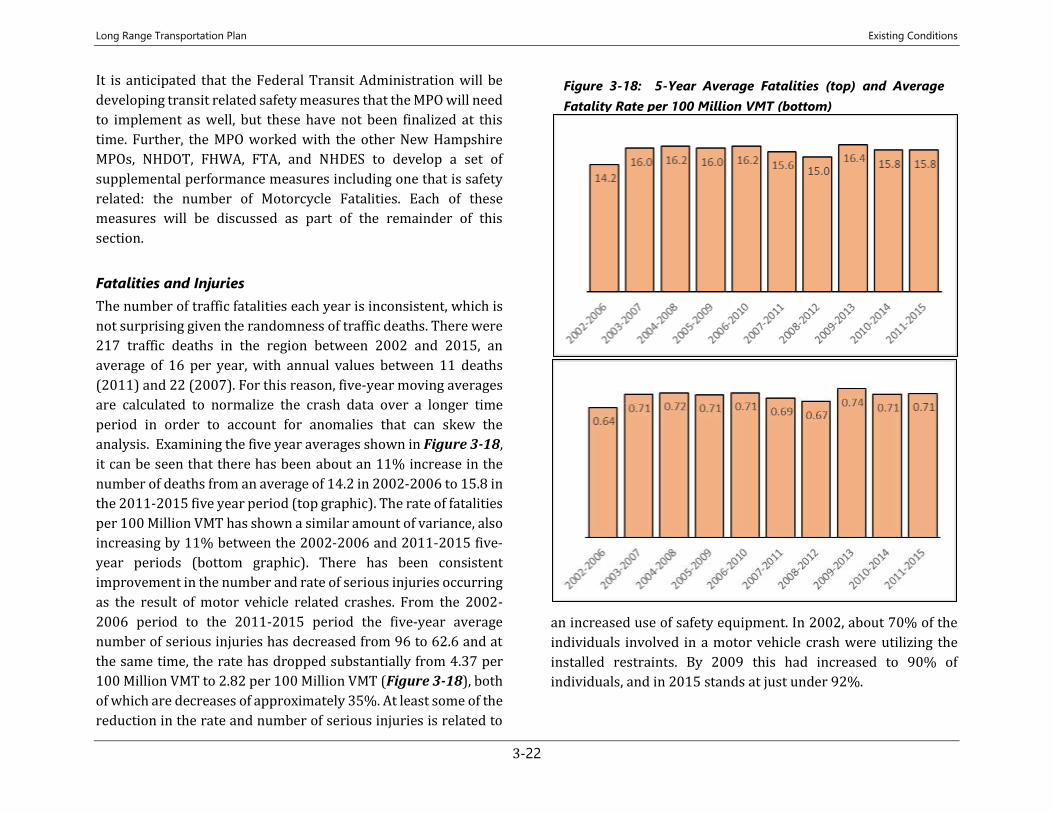
Long Range Transportation Plan Existing Conditions
3-22
It is anticipated that the Federal Transit Administration will be
developing transit related safety measures that the MPO will need
to implement as well, but these have not been finalized at this
time. Further, the MPO worked with the other New Hampshire
MPOs, NHDOT, FHWA, FTA, and NHDES to develop a set of
supplemental performance measures including one that is safety
related: the number of Motorcycle Fatalities. Each of these
measures will be discussed as part of the remainder of this
section.
Fatalities and Injuries
The number of traffic fatalities each year is inconsistent, which is
not surprising given the randomness of traffic deaths. There were
217 traffic deaths in the region between 2002 and 2015, an
average of 16 per year, with annual values between 11 deaths
(2011) and 22 (2007). For this reason, five-year moving averages
are calculated to normalize the crash data over a longer time
period in order to account for anomalies that can skew the
analysis. Examining the five year averages shown in Figure 3-18,
it can be seen that there has been about an 11% increase in the
number of deaths from an average of 14.2 in 2002-2006 to 15.8 in
the 2011-2015 five year period (top graphic). The rate of fatalities
per 100 Million VMT has shown a similar amount of variance, also
increasing by 11% between the 2002-2006 and 2011-2015 five-
year periods (bottom graphic). There has been consistent
improvement in the number and rate of serious injuries occurring
as the result of motor vehicle related crashes. From the 2002-
2006 period to the 2011-2015 period the five-year average
number of serious injuries has decreased from 96 to 62.6 and at
the same time, the rate has dropped substantially from 4.37 per
100 Million VMT to 2.82 per 100 Million VMT (Figure 3-18), both
of which are decreases of approximately 35%. At least some of the
reduction in the rate and number of serious injuries is related to
an increased use of safety equipment. In 2002, about 70% of the
individuals involved in a motor vehicle crash were utilizing the
installed restraints. By 2009 this had increased to 90% of
individuals, and in 2015 stands at just under 92%.
Figure 3-18: 5-Year Average Fatalities (top) and Average
Fatality Rate per 100 Million VMT (bottom)
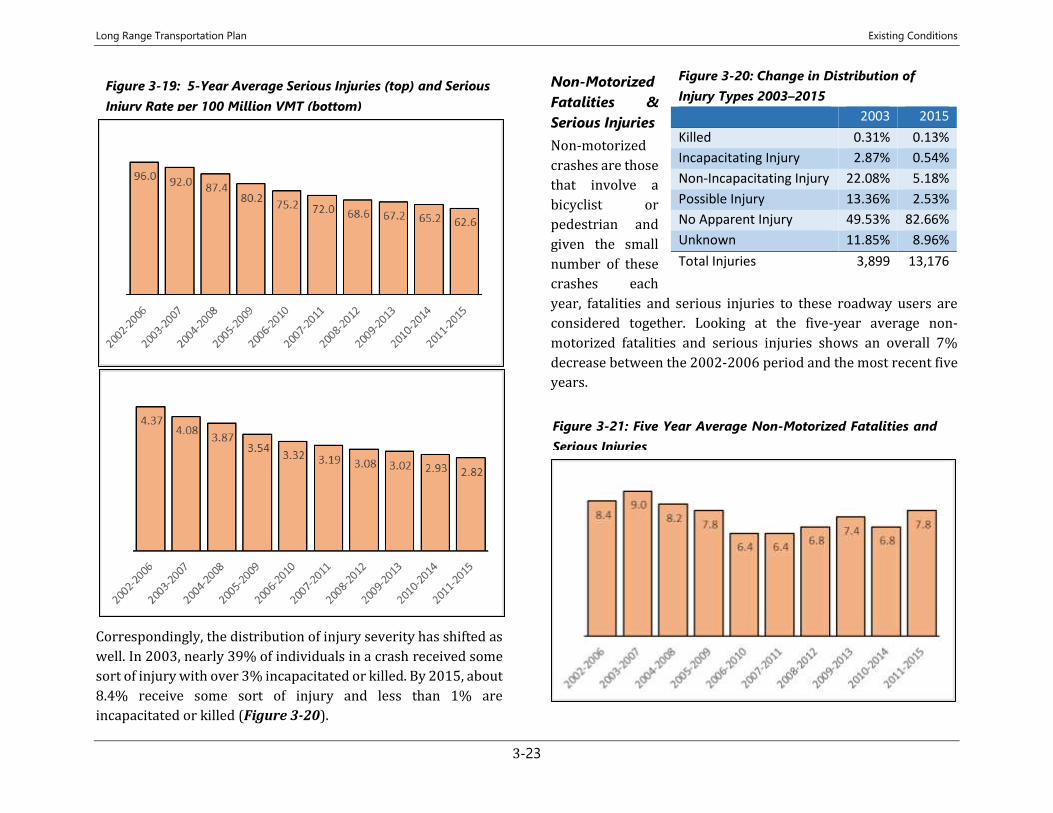
Long Range Transportation Plan Existing Conditions
3-23
Correspondingly, the distribution of injury severity has shifted as
well. In 2003, nearly 39% of individuals in a crash received some
sort of injury with over 3% incapacitated or killed. By 2015, about
8.4% receive some sort of injury and less than 1% are
incapacitated or killed (Figure 3-20).
Non-Motorized
Fatalities &
Serious Injuries
Non-motorized
crashes are those
that involve a
bicyclist or
pedestrian and
given the small
number of these
crashes each
year, fatalities and serious injuries to these roadway users are
considered together. Looking at the five-year average non-
motorized fatalities and serious injuries shows an overall 7%
decrease between the 2002-2006 period and the most recent five
years.
Figure 3-20: Change in Distribution of
Injury Types 2003–2015
2003 2015
Killed 0.31% 0.13%
Incapacitating Injury 2.87% 0.54%
Non-Incapacitating Injury 22.08% 5.18%
Possible Injury 13.36% 2.53%
No Apparent Injury 49.53% 82.66%
Unknown 11.85% 8.96%
Total Injuries 3,899 13,176
Figure 3-19: 5-Year Average Serious Injuries (top) and Serious
Injury Rate per 100 Million VMT (bottom)
Figure 3-21: Five Year Average Non-Motorized Fatalities and
Serious Injuries
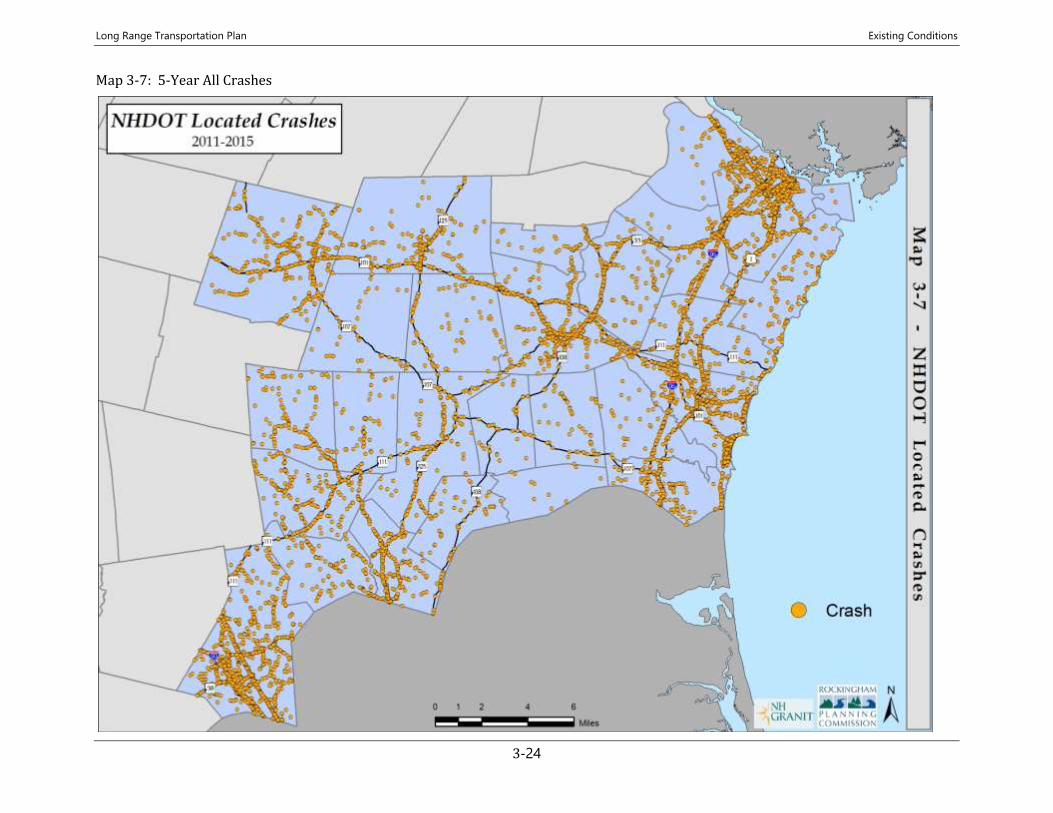
Long Range Transportation Plan Existing Conditions
3-24
Map 3-7: 5-Year All Crashes
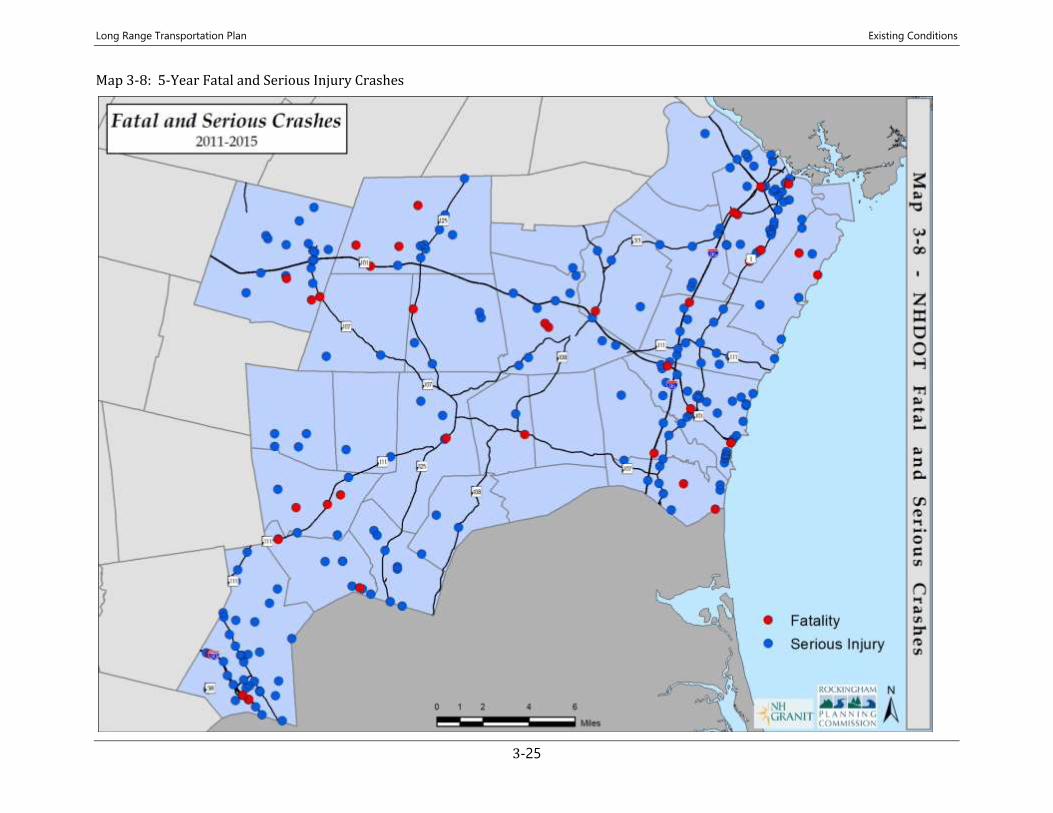
Long Range Transportation Plan Existing Conditions
3-25
Map 3-8: 5-Year Fatal and Serious Injury Crashes
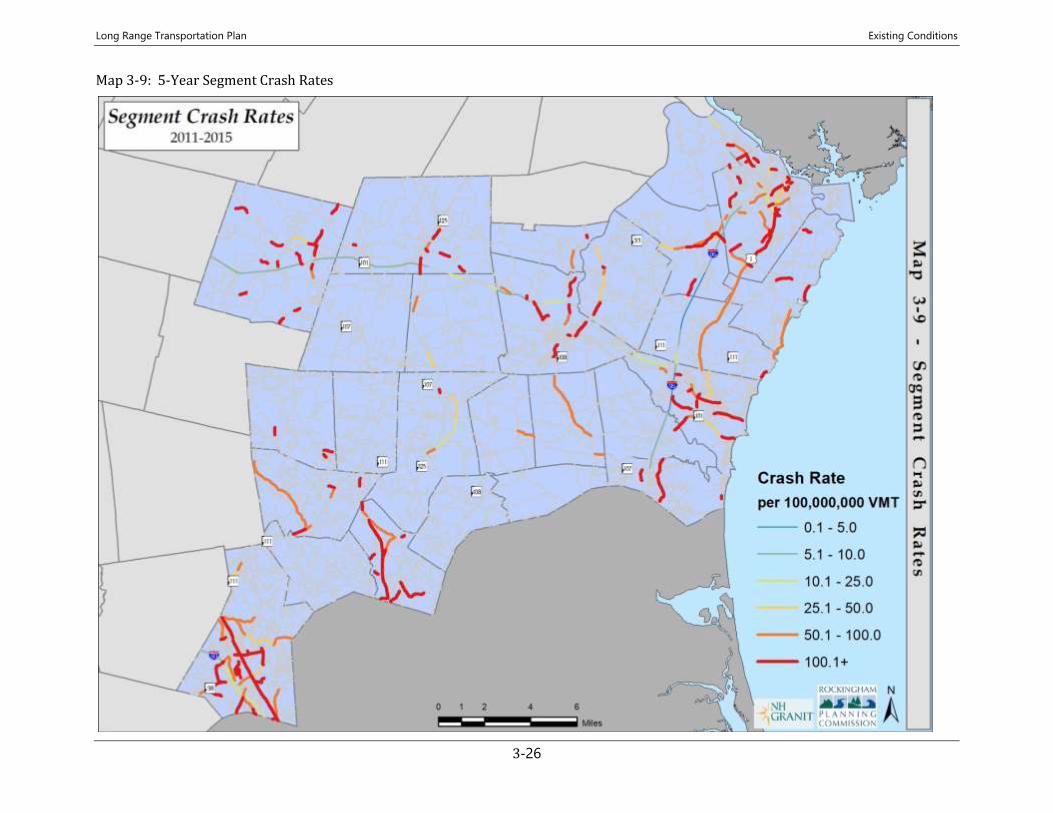
Long Range Transportation Plan Existing Conditions
3-26
Map 3-9: 5-Year Segment Crash Rates
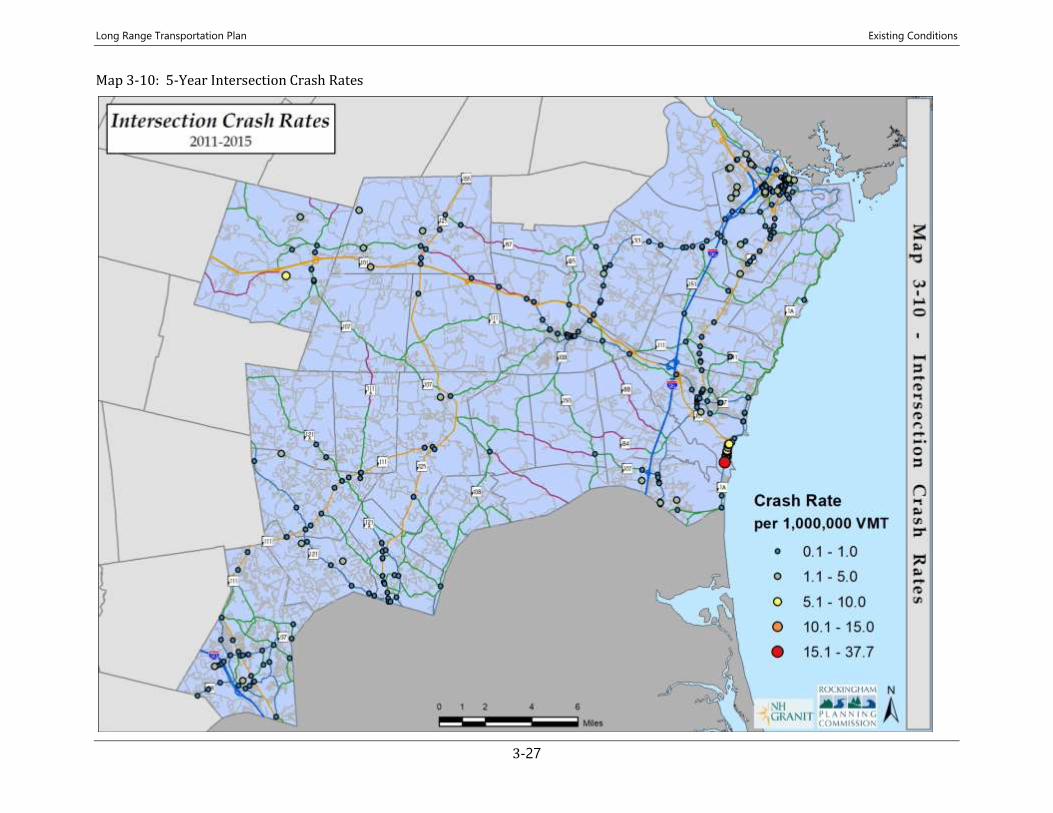
Long Range Transportation Plan Existing Conditions
3-27
Map 3-10: 5-Year Intersection Crash Rates
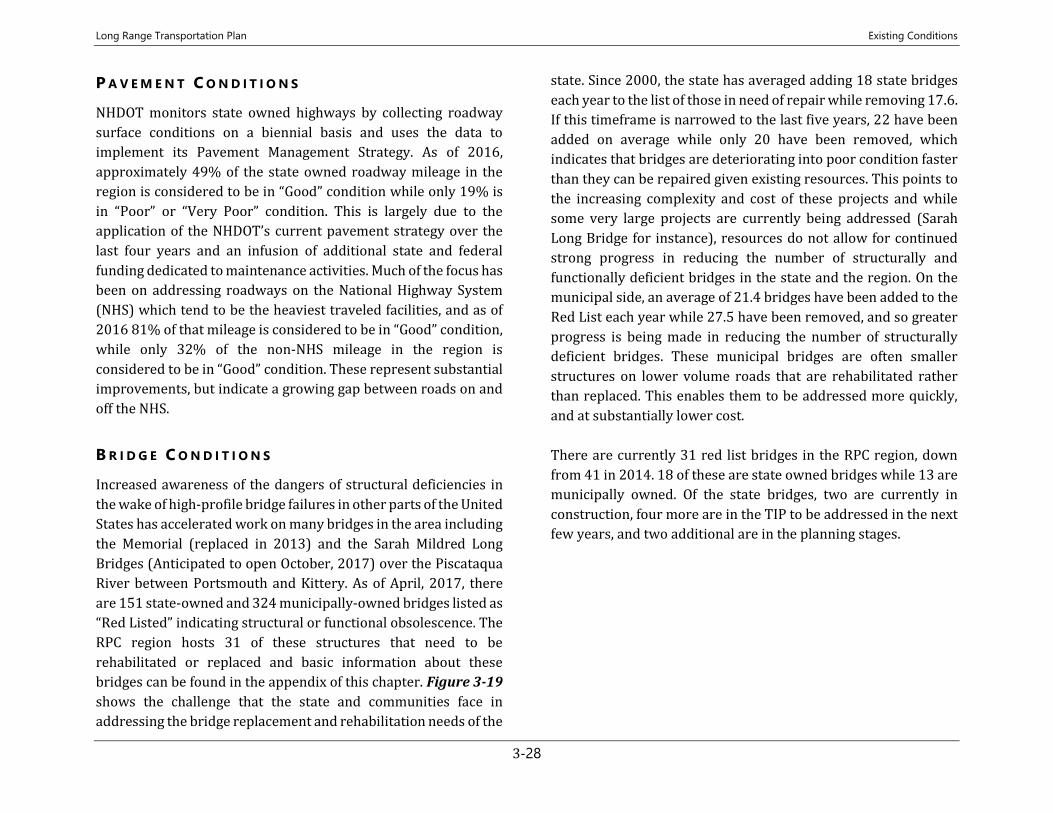
Long Range Transportation Plan Existing Conditions
3-28
P A V E M E N T C O N D I T I O N S
NHDOT monitors state owned highways by collecting roadway
surface conditions on a biennial basis and uses the data to
implement its Pavement Management Strategy. As of 2016,
approximately 49% of the state owned roadway mileage in the
region is considered to be in “Good” condition while only 19% is
in “Poor” or “Very Poor” condition. This is largely due to the
application of the NHDOT’s current pavement strategy over the
last four years and an infusion of additional state and federal
funding dedicated to maintenance activities. Much of the focus has
been on addressing roadways on the National Highway System
(NHS) which tend to be the heaviest traveled facilities, and as of
2016 81% of that mileage is considered to be in “Good” condition,
while only 32% of the non-NHS mileage in the region is
considered to be in “Good” condition. These represent substantial
improvements, but indicate a growing gap between roads on and
off the NHS.
B R I D G E C O N D I T I O N S
Increased awareness of the dangers of structural deficiencies in
the wake of high-profile bridge failures in other parts of the United
States has accelerated work on many bridges in the area including
the Memorial (replaced in 2013) and the Sarah Mildred Long
Bridges (Anticipated to open October, 2017) over the Piscataqua
River between Portsmouth and Kittery. As of April, 2017, there
are 151 state-owned and 324 municipally-owned bridges listed as
“Red Listed” indicating structural or functional obsolescence. The
RPC region hosts 31 of these structures that need to be
rehabilitated or replaced and basic information about these
bridges can be found in the appendix of this chapter. Figure 3-19
shows the challenge that the state and communities face in
addressing the bridge replacement and rehabilitation needs of the
state. Since 2000, the state has averaged adding 18 state bridges
each year to the list of those in need of repair while removing 17.6.
If this timeframe is narrowed to the last five years, 22 have been
added on average while only 20 have been removed, which
indicates that bridges are deteriorating into poor condition faster
than they can be repaired given existing resources. This points to
the increasing complexity and cost of these projects and while
some very large projects are currently being addressed (Sarah
Long Bridge for instance), resources do not allow for continued
strong progress in reducing the number of structurally and
functionally deficient bridges in the state and the region. On the
municipal side, an average of 21.4 bridges have been added to the
Red List each year while 27.5 have been removed, and so greater
progress is being made in reducing the number of structurally
deficient bridges. These municipal bridges are often smaller
structures on lower volume roads that are rehabilitated rather
than replaced. This enables them to be addressed more quickly,
and at substantially lower cost.
There are currently 31 red list bridges in the RPC region, down
from 41 in 2014. 18 of these are state owned bridges while 13 are
municipally owned. Of the state bridges, two are currently in
construction, four more are in the TIP to be addressed in the next
few years, and two additional are in the planning stages.
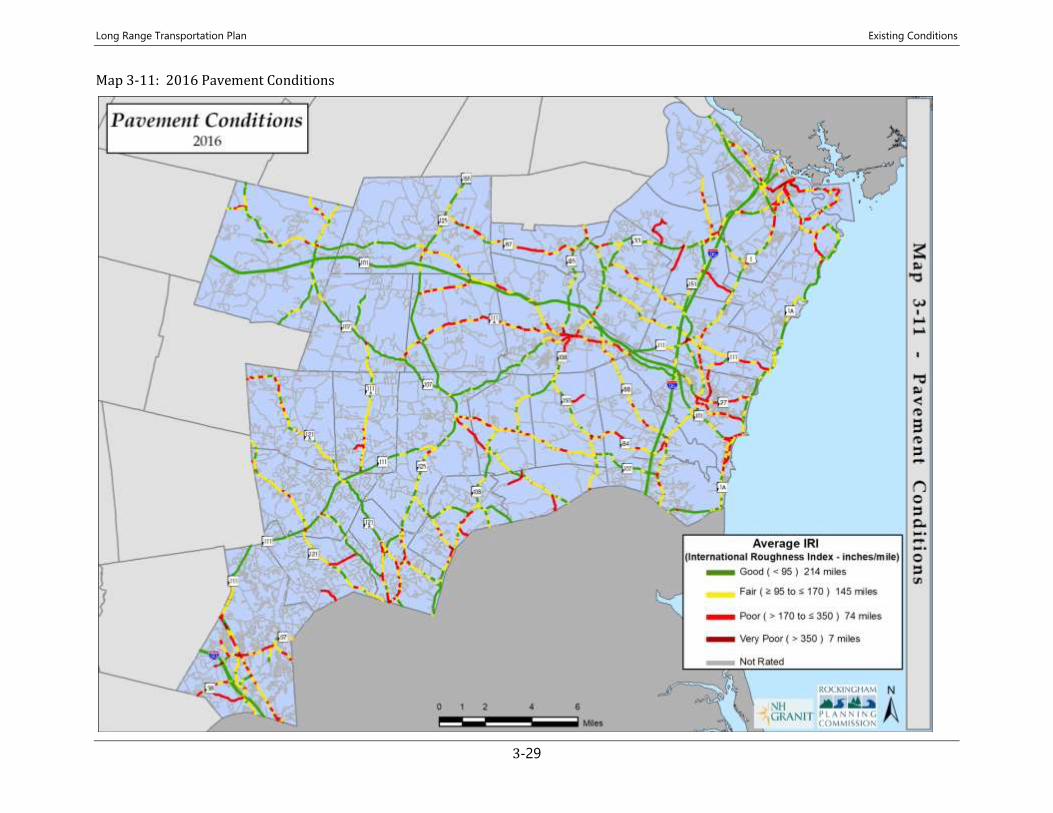
Long Range Transportation Plan Existing Conditions
3-29
Map 3-11: 2016 Pavement Conditions
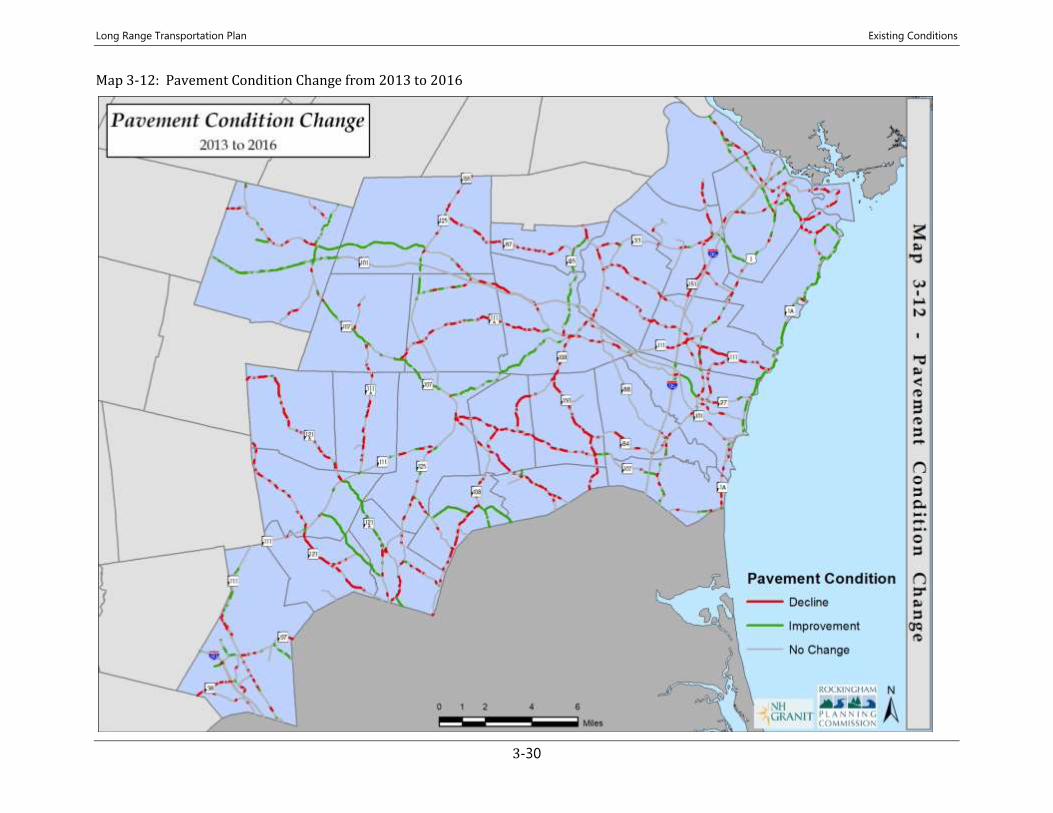
Long Range Transportation Plan Existing Conditions
3-30
Map 3-12: Pavement Condition Change from 2013 to 2016
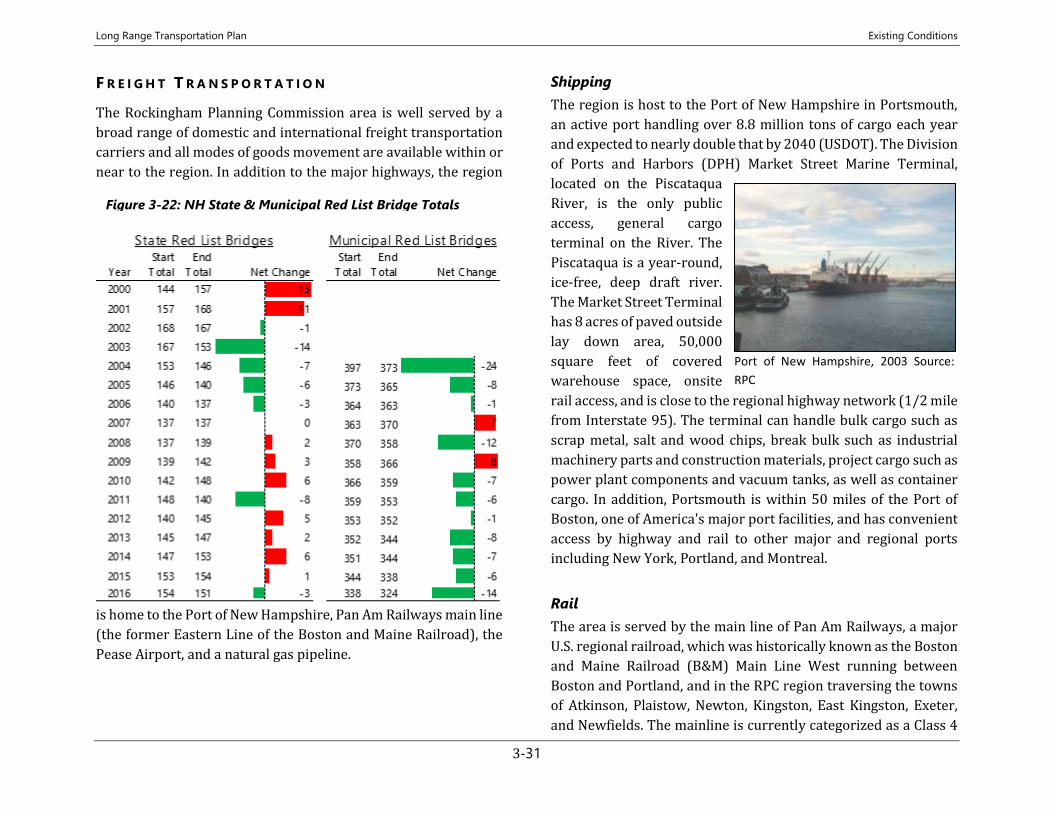
Long Range Transportation Plan Existing Conditions
3-31
F R E I G H T T R A N S P O R T A T I O N
The Rockingham Planning Commission area is well served by a
broad range of domestic and international freight transportation
carriers and all modes of goods movement are available within or
near to the region. In addition to the major highways, the region
is home to the Port of New Hampshire, Pan Am Railways main line
(the former Eastern Line of the Boston and Maine Railroad), the
Pease Airport, and a natural gas pipeline.
Shipping
The region is host to the Port of New Hampshire in Portsmouth,
an active port handling over 8.8 million tons of cargo each year
and expected to nearly double that by 2040 (USDOT). The Division
of Ports and Harbors (DPH) Market Street Marine Terminal,
located on the Piscataqua
River, is the only public
access, general cargo
terminal on the River. The
Piscataqua is a year-round,
ice-free, deep draft river.
The Market Street Terminal
has 8 acres of paved outside
lay down area, 50,000
square feet of covered
warehouse space, onsite
rail access, and is close to the regional highway network (1/2 mile
from Interstate 95). The terminal can handle bulk cargo such as
scrap metal, salt and wood chips, break bulk such as industrial
machinery parts and construction materials, project cargo such as
power plant components and vacuum tanks, as well as container
cargo. In addition, Portsmouth is within 50 miles of the Port of
Boston, one of America's major port facilities, and has convenient
access by highway and rail to other major and regional ports
including New York, Portland, and Montreal.
Rail
The area is served by the main line of Pan Am Railways, a major
U.S. regional railroad, which was historically known as the Boston
and Maine Railroad (B&M) Main Line West running between
Boston and Portland, and in the RPC region traversing the towns
of Atkinson, Plaistow, Newton, Kingston, East Kingston, Exeter,
and Newfields. The mainline is currently categorized as a Class 4
Port of New Hampshire, 2003 Source:
RPC
Figure 3-22: NH State & Municipal Red List Bridge Totals
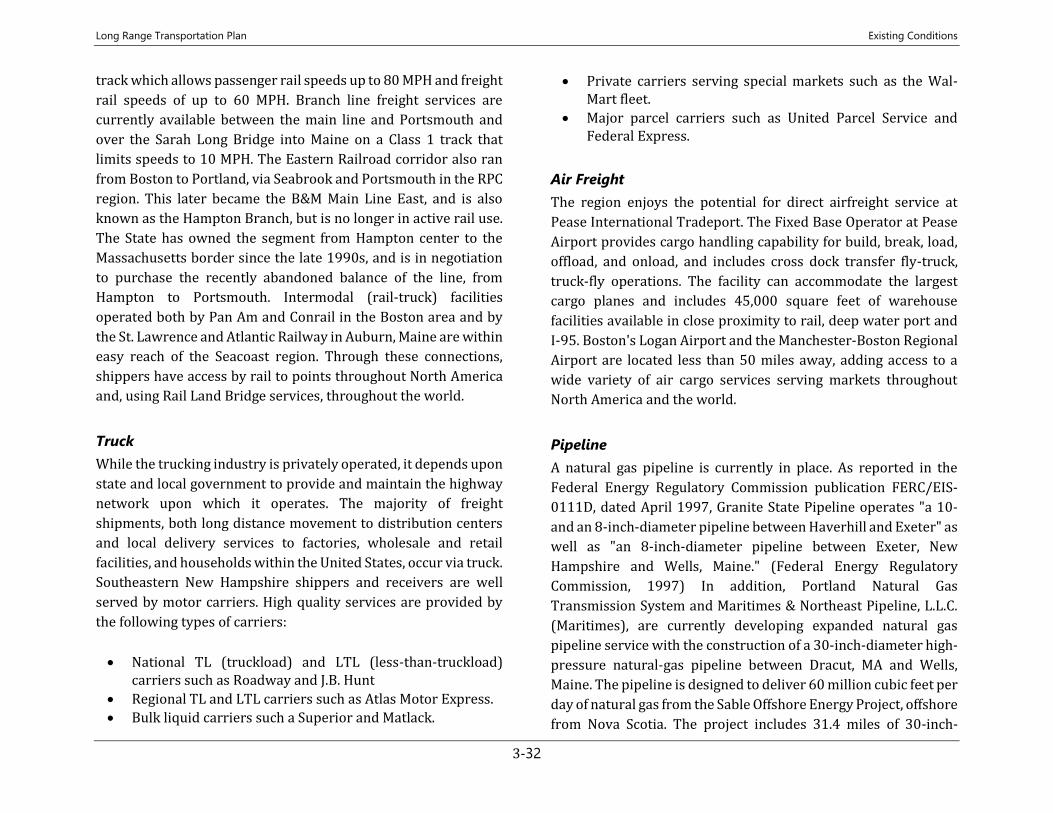
Long Range Transportation Plan Existing Conditions
3-32
track which allows passenger rail speeds up to 80 MPH and freight
rail speeds of up to 60 MPH. Branch line freight services are
currently available between the main line and Portsmouth and
over the Sarah Long Bridge into Maine on a Class 1 track that
limits speeds to 10 MPH. The Eastern Railroad corridor also ran
from Boston to Portland, via Seabrook and Portsmouth in the RPC
region. This later became the B&M Main Line East, and is also
known as the Hampton Branch, but is no longer in active rail use.
The State has owned the segment from Hampton center to the
Massachusetts border since the late 1990s, and is in negotiation
to purchase the recently abandoned balance of the line, from
Hampton to Portsmouth. Intermodal (rail-truck) facilities
operated both by Pan Am and Conrail in the Boston area and by
the St. Lawrence and Atlantic Railway in Auburn, Maine are within
easy reach of the Seacoast region. Through these connections,
shippers have access by rail to points throughout North America
and, using Rail Land Bridge services, throughout the world.
Truck
While the trucking industry is privately operated, it depends upon
state and local government to provide and maintain the highway
network upon which it operates. The majority of freight
shipments, both long distance movement to distribution centers
and local delivery services to factories, wholesale and retail
facilities, and households within the United States, occur via truck.
Southeastern New Hampshire shippers and receivers are well
served by motor carriers. High quality services are provided by
the following types of carriers:
• National TL (truckload) and LTL (less-than-truckload) carriers such as Roadway and J.B. Hunt
• Regional TL and LTL carriers such as Atlas Motor Express.
• Bulk liquid carriers such a Superior and Matlack.
• Private carriers serving special markets such as the Wal-Mart fleet.
• Major parcel carriers such as United Parcel Service and Federal Express.
Air Freight
The region enjoys the potential for direct airfreight service at
Pease International Tradeport. The Fixed Base Operator at Pease
Airport provides cargo handling capability for build, break, load,
offload, and onload, and includes cross dock transfer fly-truck,
truck-fly operations. The facility can accommodate the largest
cargo planes and includes 45,000 square feet of warehouse
facilities available in close proximity to rail, deep water port and
I-95. Boston's Logan Airport and the Manchester-Boston Regional
Airport are located less than 50 miles away, adding access to a
wide variety of air cargo services serving markets throughout
North America and the world.
Pipeline
A natural gas pipeline is currently in place. As reported in the
Federal Energy Regulatory Commission publication FERC/EIS-
0111D, dated April 1997, Granite State Pipeline operates "a 10-
and an 8-inch-diameter pipeline between Haverhill and Exeter" as
well as "an 8-inch-diameter pipeline between Exeter, New
Hampshire and Wells, Maine." (Federal Energy Regulatory
Commission, 1997) In addition, Portland Natural Gas
Transmission System and Maritimes & Northeast Pipeline, L.L.C.
(Maritimes), are currently developing expanded natural gas
pipeline service with the construction of a 30-inch-diameter high-
pressure natural-gas pipeline between Dracut, MA and Wells,
Maine. The pipeline is designed to deliver 60 million cubic feet per
day of natural gas from the Sable Offshore Energy Project, offshore
from Nova Scotia. The project includes 31.4 miles of 30-inch-
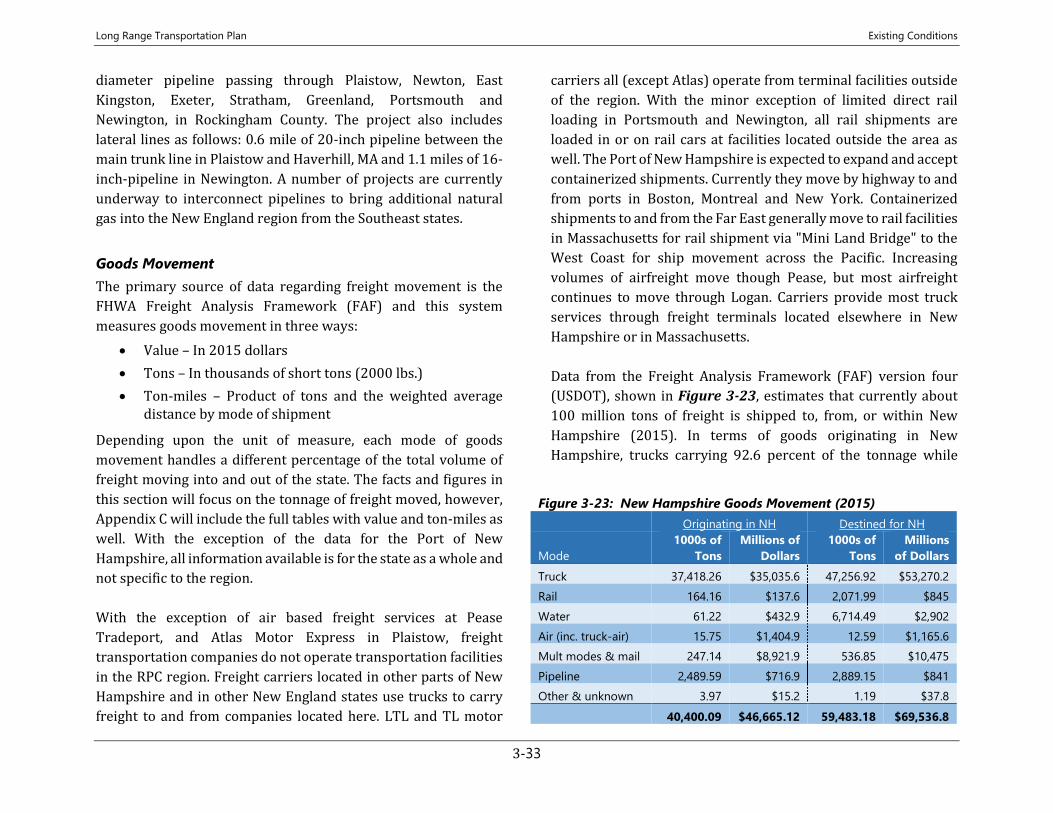
Long Range Transportation Plan Existing Conditions
3-33
diameter pipeline passing through Plaistow, Newton, East
Kingston, Exeter, Stratham, Greenland, Portsmouth and
Newington, in Rockingham County. The project also includes
lateral lines as follows: 0.6 mile of 20-inch pipeline between the
main trunk line in Plaistow and Haverhill, MA and 1.1 miles of 16-
inch-pipeline in Newington. A number of projects are currently
underway to interconnect pipelines to bring additional natural
gas into the New England region from the Southeast states.
Goods Movement
The primary source of data regarding freight movement is the
FHWA Freight Analysis Framework (FAF) and this system
measures goods movement in three ways:
• Value – In 2015 dollars
• Tons – In thousands of short tons (2000 lbs.)
• Ton-miles – Product of tons and the weighted average distance by mode of shipment
Depending upon the unit of measure, each mode of goods
movement handles a different percentage of the total volume of
freight moving into and out of the state. The facts and figures in
this section will focus on the tonnage of freight moved, however,
Appendix C will include the full tables with value and ton-miles as
well. With the exception of the data for the Port of New
Hampshire, all information available is for the state as a whole and
not specific to the region.
With the exception of air based freight services at Pease
Tradeport, and Atlas Motor Express in Plaistow, freight
transportation companies do not operate transportation facilities
in the RPC region. Freight carriers located in other parts of New
Hampshire and in other New England states use trucks to carry
freight to and from companies located here. LTL and TL motor
carriers all (except Atlas) operate from terminal facilities outside
of the region. With the minor exception of limited direct rail
loading in Portsmouth and Newington, all rail shipments are
loaded in or on rail cars at facilities located outside the area as
well. The Port of New Hampshire is expected to expand and accept
containerized shipments. Currently they move by highway to and
from ports in Boston, Montreal and New York. Containerized
shipments to and from the Far East generally move to rail facilities
in Massachusetts for rail shipment via "Mini Land Bridge" to the
West Coast for ship movement across the Pacific. Increasing
volumes of airfreight move though Pease, but most airfreight
continues to move through Logan. Carriers provide most truck
services through freight terminals located elsewhere in New
Hampshire or in Massachusetts.
Data from the Freight Analysis Framework (FAF) version four
(USDOT), shown in Figure 3-23, estimates that currently about
100 million tons of freight is shipped to, from, or within New
Hampshire (2015). In terms of goods originating in New
Hampshire, trucks carrying 92.6 percent of the tonnage while
Figure 3-23: New Hampshire Goods Movement (2015)
Originating in NH Destined for NH
Mode
1000s of
Tons
Millions of
Dollars
1000s of
Tons
Millions
of Dollars
Truck 37,418.26 $35,035.6 47,256.92 $53,270.2
Rail 164.16 $137.6 2,071.99 $845
Water 61.22 $432.9 6,714.49 $2,902
Air (inc. truck-air) 15.75 $1,404.9 12.59 $1,165.6
Mult modes & mail 247.14 $8,921.9 536.85 $10,475
Pipeline 2,489.59 $716.9 2,889.15 $841
Other & unknown 3.97 $15.2 1.19 $37.8
40,400.09 $46,665.12 59,483.18 $69,536.8
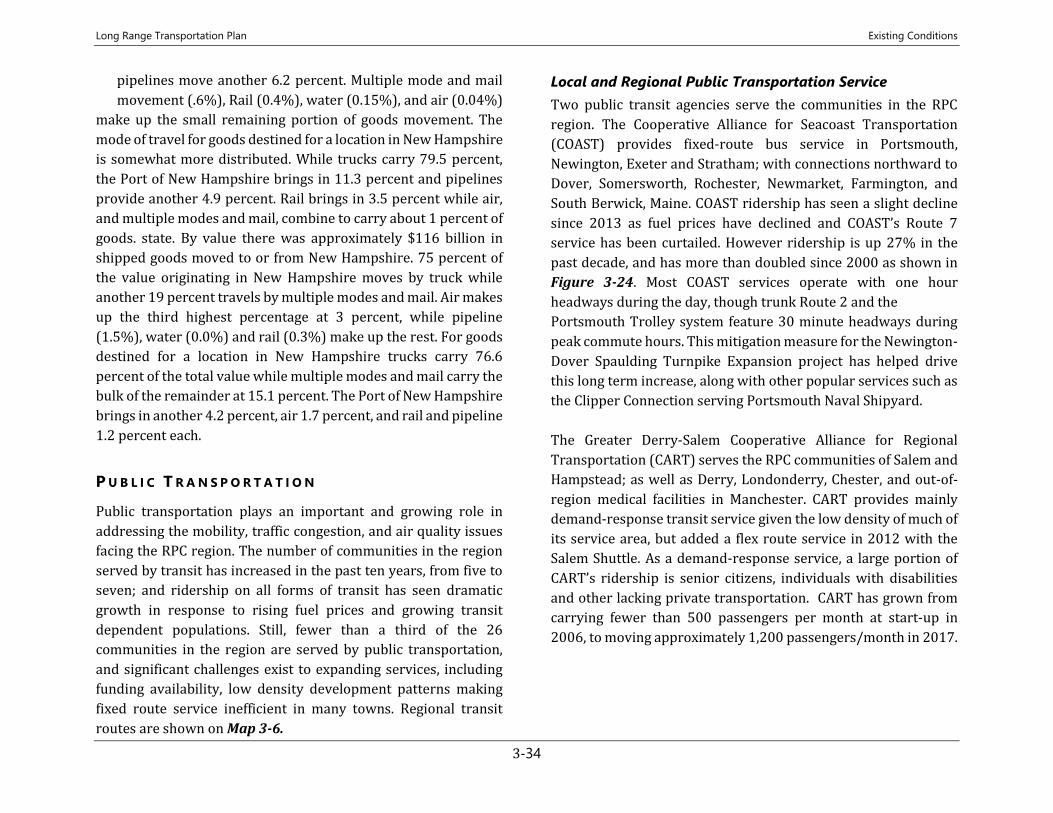
Long Range Transportation Plan Existing Conditions
3-34
pipelines move another 6.2 percent. Multiple mode and mail
movement (.6%), Rail (0.4%), water (0.15%), and air (0.04%)
make up the small remaining portion of goods movement. The
mode of travel for goods destined for a location in New Hampshire
is somewhat more distributed. While trucks carry 79.5 percent,
the Port of New Hampshire brings in 11.3 percent and pipelines
provide another 4.9 percent. Rail brings in 3.5 percent while air,
and multiple modes and mail, combine to carry about 1 percent of
goods. state. By value there was approximately $116 billion in
shipped goods moved to or from New Hampshire. 75 percent of
the value originating in New Hampshire moves by truck while
another 19 percent travels by multiple modes and mail. Air makes
up the third highest percentage at 3 percent, while pipeline
(1.5%), water (0.0%) and rail (0.3%) make up the rest. For goods
destined for a location in New Hampshire trucks carry 76.6
percent of the total value while multiple modes and mail carry the
bulk of the remainder at 15.1 percent. The Port of New Hampshire
brings in another 4.2 percent, air 1.7 percent, and rail and pipeline
1.2 percent each.
P U B L I C T R A N S P O R T A T I O N
Public transportation plays an important and growing role in
addressing the mobility, traffic congestion, and air quality issues
facing the RPC region. The number of communities in the region
served by transit has increased in the past ten years, from five to
seven; and ridership on all forms of transit has seen dramatic
growth in response to rising fuel prices and growing transit
dependent populations. Still, fewer than a third of the 26
communities in the region are served by public transportation,
and significant challenges exist to expanding services, including
funding availability, low density development patterns making
fixed route service inefficient in many towns. Regional transit
routes are shown on Map 3-6.
Local and Regional Public Transportation Service
Two public transit agencies serve the communities in the RPC
region. The Cooperative Alliance for Seacoast Transportation
(COAST) provides fixed-route bus service in Portsmouth,
Newington, Exeter and Stratham; with connections northward to
Dover, Somersworth, Rochester, Newmarket, Farmington, and
South Berwick, Maine. COAST ridership has seen a slight decline
since 2013 as fuel prices have declined and COAST’s Route 7
service has been curtailed. However ridership is up 27% in the
past decade, and has more than doubled since 2000 as shown in
Figure 3-24. Most COAST services operate with one hour
headways during the day, though trunk Route 2 and the
Portsmouth Trolley system feature 30 minute headways during
peak commute hours. This mitigation measure for the Newington-
Dover Spaulding Turnpike Expansion project has helped drive
this long term increase, along with other popular services such as
the Clipper Connection serving Portsmouth Naval Shipyard.
The Greater Derry-Salem Cooperative Alliance for Regional
Transportation (CART) serves the RPC communities of Salem and
Hampstead; as well as Derry, Londonderry, Chester, and out-of-
region medical facilities in Manchester. CART provides mainly
demand-response transit service given the low density of much of
its service area, but added a flex route service in 2012 with the
Salem Shuttle. As a demand-response service, a large portion of
CART’s ridership is senior citizens, individuals with disabilities
and other lacking private transportation. CART has grown from
carrying fewer than 500 passengers per month at start-up in
2006, to moving approximately 1,200 passengers/month in 2017.
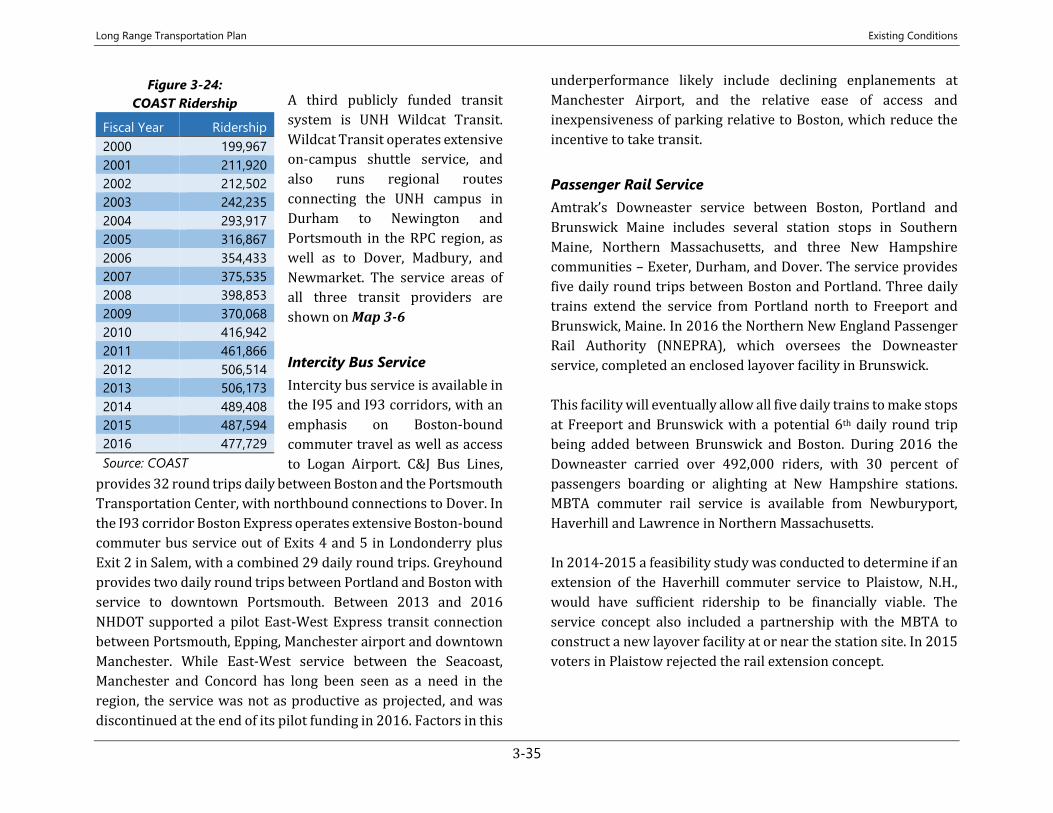
Long Range Transportation Plan Existing Conditions
3-35
A third publicly funded transit
system is UNH Wildcat Transit.
Wildcat Transit operates extensive
on-campus shuttle service, and
also runs regional routes
connecting the UNH campus in
Durham to Newington and
Portsmouth in the RPC region, as
well as to Dover, Madbury, and
Newmarket. The service areas of
all three transit providers are
shown on Map 3-6
Intercity Bus Service
Intercity bus service is available in
the I95 and I93 corridors, with an
emphasis on Boston-bound
commuter travel as well as access
to Logan Airport. C&J Bus Lines,
provides 32 round trips daily between Boston and the Portsmouth
Transportation Center, with northbound connections to Dover. In
the I93 corridor Boston Express operates extensive Boston-bound
commuter bus service out of Exits 4 and 5 in Londonderry plus
Exit 2 in Salem, with a combined 29 daily round trips. Greyhound
provides two daily round trips between Portland and Boston with
service to downtown Portsmouth. Between 2013 and 2016
NHDOT supported a pilot East-West Express transit connection
between Portsmouth, Epping, Manchester airport and downtown
Manchester. While East-West service between the Seacoast,
Manchester and Concord has long been seen as a need in the
region, the service was not as productive as projected, and was
discontinued at the end of its pilot funding in 2016. Factors in this
underperformance likely include declining enplanements at
Manchester Airport, and the relative ease of access and
inexpensiveness of parking relative to Boston, which reduce the
incentive to take transit.
Passenger Rail Service
Amtrak’s Downeaster service between Boston, Portland and
Brunswick Maine includes several station stops in Southern
Maine, Northern Massachusetts, and three New Hampshire
communities – Exeter, Durham, and Dover. The service provides
five daily round trips between Boston and Portland. Three daily
trains extend the service from Portland north to Freeport and
Brunswick, Maine. In 2016 the Northern New England Passenger
Rail Authority (NNEPRA), which oversees the Downeaster
service, completed an enclosed layover facility in Brunswick.
This facility will eventually allow all five daily trains to make stops
at Freeport and Brunswick with a potential 6th daily round trip
being added between Brunswick and Boston. During 2016 the
Downeaster carried over 492,000 riders, with 30 percent of
passengers boarding or alighting at New Hampshire stations.
MBTA commuter rail service is available from Newburyport,
Haverhill and Lawrence in Northern Massachusetts.
In 2014-2015 a feasibility study was conducted to determine if an
extension of the Haverhill commuter service to Plaistow, N.H.,
would have sufficient ridership to be financially viable. The
service concept also included a partnership with the MBTA to
construct a new layover facility at or near the station site. In 2015
voters in Plaistow rejected the rail extension concept.
Figure 3-24:
COAST Ridership
Fiscal Year Ridership
2000 199,967
2001 211,920
2002 212,502
2003 242,235
2004 293,917
2005 316,867
2006 354,433
2007 375,535
2008 398,853
2009 370,068
2010 416,942
2011 461,866
2012 506,514
2013 506,173
2014 489,408
2015 487,594
2016 477,729
Source: COAST
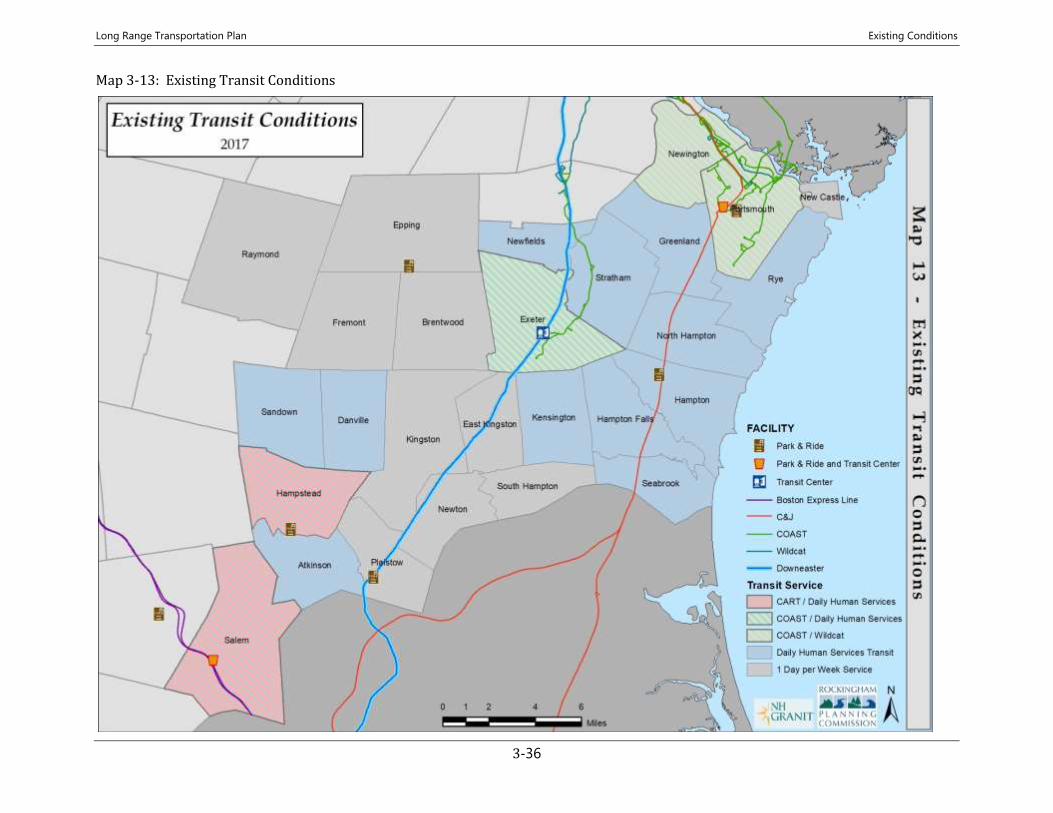
Long Range Transportation Plan Existing Conditions
3-36
Map 3-13: Existing Transit Conditions
Long Range Transportation Plan Existing Conditions
3-37
Park and Ride Facilities
There are currently seven Park & Ride facilities in the region
operated by the N.H. Department of Transportation (NHDOT).
These include lots in Epping at the intersection of Routes 101 and
125; in Hampstead at the intersection of Route 111 and 121; in
Hampton at the intersection of Route 101 and 27; in Plaistow on
Westville Road just east of Route 125; in Salem at Exit 2 on I93
and in Portsmouth at Exit 3A on I95, and on Route 33 just east of
I95. The Exeter rail station, operated by the Town of Exeter, also
functions as a Park & Ride facility. Of these, three feature Boston-
bound intercity transit service (Portsmouth, Salem and Exeter).
Those park and ride facilities without transit service see lower
usage. Park & Ride locations are noted on Map 3-13.
Other Community Transportation Services
In addition to the transportation providers listed above, there are
a number of other transportation services available to
communities in the RPC region. These can most easily be
differentiated by type of service provided.
Shuttle and Taxi Services
Numerous companies offer private market-rate shuttle services
between the RPC region, Logan Airport and Manchester-Boston
Regional Airport. Both door-to-door service and scheduled
pickups at central locations are available. Over twenty companies
also offer local and regional taxi service.
Special Population Services
There are more than two dozen health and human service
agencies and volunteer driver organizations in Rockingham
County providing demand response transportation for agency
clients or specific eligible populations such as senior citizens or
individuals with disabilities. Towns shown in red or blue on Map
3-13 benefit from demand-response transit service for seniors
and individuals with disabilities that operate at least five days per
week. A gap in service is readily identifiable in the center of
Rockingham County, shaded gray, roughly following NH125. This
area is west of the TASC volunteer driver program service area,
and east of the region covered by Greater Salem Caregivers and
Community Caregivers of Greater Derry.
Many of these agencies have been involved with regional planning
initiatives in the Derry-Salem area or Seacoast area focused on
coordinating and consolidating functions such as trip scheduling
and dispatching, and expanding access in communities with
limited service. These collaborative efforts are formalized
through the Southeast New Hampshire Regional Coordination
Council (RCC) for Community Transportation (RCC), and the
companion Greater Derry-Salem RCC in western Rockingham
County.
T R A N S P O R T A T I O N D E M A N D M A N A G E M E N T
Transportation Demand Management (TDM) is an approach to
improving the efficiency of the transportation system through
encouraging alternatives to driving alone – particularly for
commute trips. Three TDM initiatives serve the RPC region,
including statewide programs for New Hampshire and
Massachusetts, as well as commuteSMARTSeacoast, the regional
Transportation Management Association (TMA) working with
Seacoast employers to encourage alternatives to driving alone on
daily commutes. Efforts targeting Boston area commuters have a
successful history, given high levels of congestion, high parking
costs, a long commute distance, and a Massachusetts state law
requiring large employers to invest in commute trip reduction
programs. Initiatives in New Hampshire have had a more difficult
Long Range Transportation Plan Existing Conditions
3-38
time convincing employees to shift modes, given relatively limited
traffic congestion, relatively abundant free parking, less frequent
transit services, and lack of a state mandate for employers.
However, over the past ten years these efforts have gained
traction. Multiple years of increasing gas prices were one driver of
this, but even with relatively low gas prices in 2015-2017, interest
and participation in ridesharing has continued to increase.
Existing TDM programs serving the region are described below.
Rideshare Programs Managed by NHDOT and MassDOT
MassRides, funded by the State of Massachusetts, operates a
relatively successful ride matching and vanpool program for
Boston commuters. Daily vanpools to Boston and suburban
employment centers depart from Hampton (2), Portsmouth (4),
Salem (1), and other New Hampshire communities outside the
RPC region. Between 1996-2011 the NHDOT ran a statewide
Rideshare program designed to match individuals interested in
carpooling or vanpooling using an on-line ride matching service.
This program was eliminated by the legislature in 2011 as part of
cuts to the NHDOT budget, though a statewide ride matching
database continues to exist, with software purchased by NHDOT
for use by regional ridesharing initiatives.
Transportation Management Associations (TMAs)
In 2013 COAST launched commuteSMARTseacoast – a TMA
focused on employees at Pease Tradeport and other major
employers in the Greater Portsmouth-Dover Area. TMAs work
with employers to promote alternative commute options to
employees and establish incentives such as discounted transit
passes, online ride matching programs, commuter challenges and
prize drawings, emergency rides home to provide flexibility for
transit users, and programs allowing use of pre-tax dollars for
transit or vanpool expenses. Funding for commuteSMART-
seacoast is part of the Newington-Dover Little Bay Bridges
highway widening project. As of 2017 commuteSMARTseacoast
has signed up 49 member companies representing 11,599
employees, established over 243 carpools, and won national
awards for successful commuter challenge events encouraging
commuters who previously drove alone to try alternate commute
options. As part of commuteSMART’s month-long 2017 Business
to Business (B2B) commuter challenge, 820 participants logged
7,291 commute trips via carpool, transit, walking, bicycling or
telecommuting. These avoided 212,438 automobile miles, saving
$121,318 in normal auto commute costs. Funding has also been
programmed as part of the I93 widening project for TDM activities
in the I93 corridor. Planning for these activities is currently
underway by NHDOT.
Telecommuting Infrastructure
The number of people working from home and telecommuting in
the United States has grown significantly since 2000. Between
2000 and 2015, those working from home nationally grew from
an estimated 3.3 percent to 4.4 percent of the workforce.
Telecommuters make up a larger share of the workforce in
Rockingham County, where telecommuting grew from an
estimated 4.1 percent to 6.2 percent of the workforce between
2000 and 2015. For Portsmouth this share is still larger, and grew
from 5.4 percent to 9.2 percent between 2000 and 2015.
This relatively high instance of telecommuting in the region is
consistent with the relatively high education levels and
employment mix in the region. The increase since 2000 is also
consistent with improvements in access to broadband
telecommunications infrastructure, but there are still gaps within
the region.
Long Range Transportation Plan Existing Conditions
3-39
B I C Y C L E F A C I L I T I E S A N D P R O G R A M S
While the private automobile is the dominant mode of
transportation in the RPC region, and will continue to be for the
foreseeable future, improving the safety and convenience of non-
motorized transportation is a key policy of the MPO. According to
the most recent National Household Travel Survey (2009), more
than 60 percent of all trips are fewer than five miles in length, and
more than 22 percent are shorter than one mile – distances easily
traveled by bicycle or on foot. However, more than 80 percent of
these trips are taken with an automobile. Converting some of
these short trips to bicycling and walking has the potential to
reduce vehicle miles traveled, and consequently
congestion, air quality impacts, and parking demand in
downtowns. Investments in bicycle and pedestrian
facilities also support public health and safety; and
even economic development in the form of bicycle
tourism. Achieving this increase in non-motorized
transportation, though, will require investments in a
combination of facility improvements and programs to
encourage bicycling, teach safe bicycle operation to
children and adults, and ensure enforcement of laws
related to bicycle operation and safety.
Bicycle Transportation Facilities
For the purposes of this chapter, bicycle transportation facilities
consist of shoulders with a width of four feet or greater on the
region’s roads (the minimum width for a shoulder bicycle route
recommended by AASHTO, except next to curb or guardrail where
minimum width increases to five feet) and paved off-road multi-
use paths. This said, roads without such provisions are still legally
and appropriately used by bicyclists. In addition, the State Bureau
of Trails maintains numerous trails in the State and region that are
unpaved or feature a stonedust surface, such as the Rockingham
Recreation Trail connecting Newfields-Manchester, and Fremont-
Windham .
Paved off-road paths in the region are uncommon, but include the
Southern New Hampshire Rail Trail being developed between
Salem and Concord, the recently completed Pease Multi-Use Path
at the south entrance to the Pease TradePort, a path connecting
Fox Point Road in Newington to the Tradeport, and a side-path in
Odiorne State Park in Rye. Planning is also underway for the New
Hampshire segment of the East Coast Greenway, stretching from
Florida to Maine. The State of New Hampshire is
currently negotiation with Pan Am Railways to
purchase a 9.7-mile segment of the Hampton Branch
rail corridor between Hampton and Portsmouth for
use as a rail trail. The State already owns the southern
4.5 miles of the corridor between Hampton and the
Massachusetts border, on which the Town of
Seabrook is actively pursuing rail trail development.
The remainder of what may be termed bicycle
facilities in the region consists of paved shoulders on
roads. Shoulders on many state roads in the region are narrower
than four feet. Map 3-14 shows the State Bicycle Route Network
in the MPO region. These routes were designated through a
process that gathered public input on commonly traveled routes,
then assessed these routes for safety and filled in connections
between towns based on a combination of shoulder width and
traffic volume.
The “Five E”s of
bicycle/pedestrian
accommodation:
• Engineering
• Education
• Encouragement
• Enforcement
• Evaluation
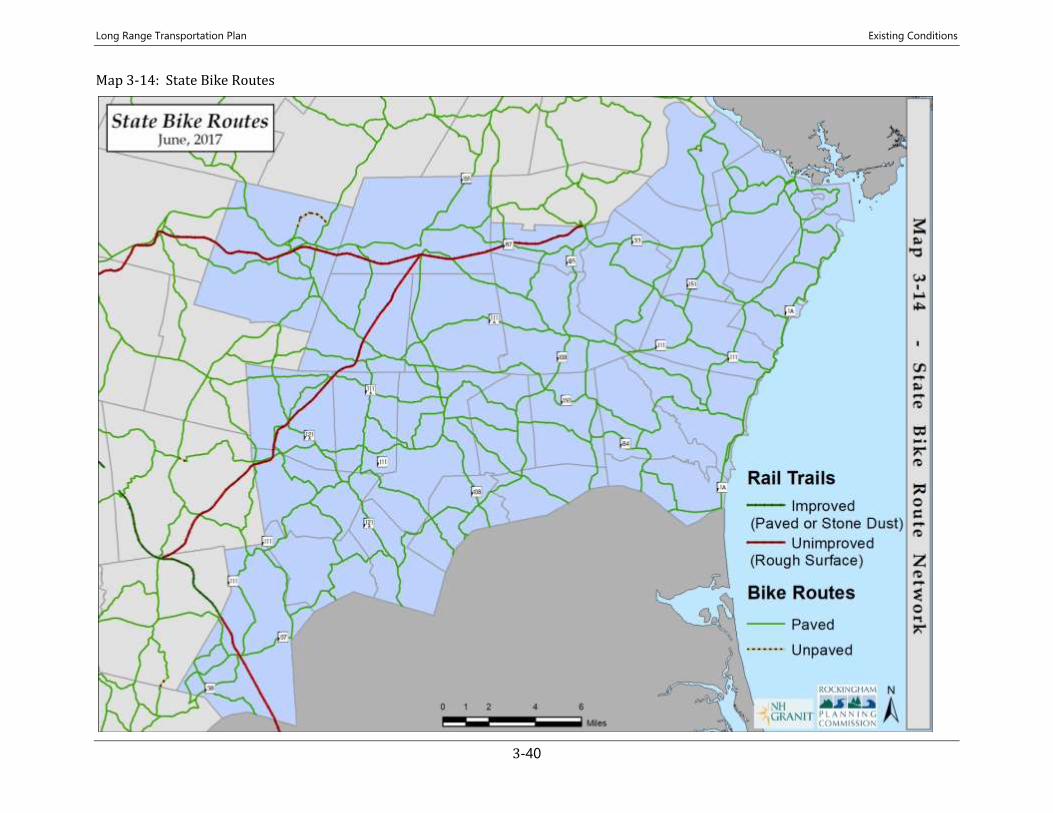
Long Range Transportation Plan Existing Conditions
3-40
Map 3-14: State Bike Routes
Long Range Transportation Plan Existing Conditions
3-41
The RPC has worked with Seacoast Area Bicycle Riders (SABR)
and member communities to secure funding to extend shoulders
and complete regional routes including the Great Bay Bicycle
Loop, the Exeter-Hampton-North Hampton Bicycle Loop and the
NH Coastal Byway. The success of these efforts has varied by
municipality, depending on the interest of Towns to appropriate
matching funding needed to access federal funding under the
Transportation Alternatives (TAP), or Congestion Mitigation/Air
Quality (CMAQ) programs. NHDOT has adopted a policy to add
width for shoulder bicycle routes when state highways are
reconstructed, which happens on a 20-30 year cycle. NHDOT
Maintenance District 6 has also created extra shoulder width in
some cases as part of routine resurfacing by narrowing travel
lanes to 11 feet or even 10 feet from a traditional 12 feet or
more. In some cases opportunities remain to allocate more width
to shoulders on low-speed roads where 10 foot lanes would be
adequate (Institute for Transportation Engineers).
After “maintenance of roads and bridges”, respondents to the UNH
Regional Needs Survey identified “availability of bike paths” as the
next highest priority for increased transportation system
investment in the region. Community meeting and other public
input underscored this, identifying a particular need for improved
bicycle and pedestrian facilities within communities that connect
residential areas to services and schools and provide safe passage
for students or adults on foot or bicycle. Reflecting this, six
communities in the RPC region have initiated Safe Routes to
School (SRTS) initiatives, including Hampton, Newfields, Plaistow,
Portsmouth, Rye, and Seabrook. While federal Safe Routes to
School funds have now been rolled into the new Transportation
Alternatives program under MAP-21 and the FAST Act, the SRTS
model remains an excellent one for municipalities and school
districts.
Supporting Facilities for Bicycles
A safe place to park your bike can be a major factor for commuters
deciding whether to drive or bicycle to school, work or
recreational areas. Some larger businesses in the area do provide
amenities for bicycle commuters such as allowing them to store
their bicycles indoors and providing shower facilities.
Another important step is to support better connections between
bicycles and other modes of transportation. This includes secure
parking at bus stops and train stations as well as accommodations
for carrying bicycles such as racks on the front of buses. COAST
has installed bike racks on the front of all their buses, as has
Wildcat Transit. The NHDOT has installed bicycle lockers or racks
at most Park & Ride locations as well as the Exeter rail station.
With assistance of FTA Transit Enhancements funding from
COAST, the City of Portsmouth has made extensive improvements
to bicycle parking at downtown transit stops and other locations
the past four years.
In 2017 Portsmouth launched a city-wide bike-share program in
collaboration with the firm Zagster. Bike stations are located in
five pilot sites around the city, and for a nominal membership fee
users can check out a bicycle free for up to two hours, with
incremental cost for longer trips.
Education, Encouragement, and Enforcement
Providing new facilities is only part of the solution to encouraging
non-motorized alternatives to driving. The other part of the
equation involves changing behavior – of both potential cyclists as
well as drivers. This integrated approach is often referred to as
the “Five Es” – Engineering (bicycle infrastructure) must be
accompanied by efforts at Education (regarding cyclists rights and
responsibilities), Encouragement (to try a new way to travel),
Long Range Transportation Plan Existing Conditions
3-42
Enforcement (of traffic rules for both drivers and cyclists), and
Evaluation to ensure data-driven decision making.
At present, educational efforts in the region and much of the state
are limited to outreach to young children first learning to ride a
bicycle. The Bike/Walk Alliance of New Hampshire (BWANH)
provides classroom instruction in bike safety to 4th and 5th grade
classes with funding through the Safe Routes to School program.
Efforts targeting older children, as well as adult cyclists and
drivers are more limited. RSA 265:143a, passed in 2010, clarified
many state traffic laws around bicycling, and included an
innovative provision known as the Three Foot Law – that
automobiles must allow at least 3 feet of buffer when passing a
bicycle at 30 mph, and an additional foot for each 10 mph above
that. BWANH has worked to get information on bike-related
traffic law into the state driver education curriculum, as well as
into police officer training.
Initiatives to encourage more people to ride bicycle and ensure
they can do so safely include the RPC’s work with
commuteSMARTseacoast to promote annual events for national
Bike Month and Seacoast Bike/Walk to Work Day, and assistance
to communities in implementing Safe Routes to School programs.
A challenge in evaluating the success of facility improvements or
education and encouragement efforts is the lack of data on
bicycling and walking relative to automobile traffic. Improving
data on bicycle and pedestrian travel volume is a key need
identified through the work of the BPTAC, the Regional Master
Plan process, and efforts to date to define performance metrics for
the MPO. While extensive data are available on automobile traffic
volumes, data on bicycle and pedestrian travel has to-date been
collected only as part of specific planning studies such as the
Corridor Management Plan for the NH Coastal Byway, the NH-ME
Connections Study, or the Portsmouth Bicycle/Pedestrian Master
Plan. In 2015 RPC purchased automated bicycle and pedestrian
counting equipment as part of a statewide project initiated
through the BPTAC. RPC is also analyzing three years of data from
the smartphone app Strava, purchased by NHDOT. The Strava app
is used by many recreational walkers and bicycle riders for
tracking riding and walking trips, and allows a statewide picture
of major walking and riding routes.
Map 3-15 shows Strava trip volume from 2016, highlighting the
relatively heavy usage of NH1A and NH1B – both State bicycle
routes, part of U.S. Bike Route 1, the NH Coastal Byway. Work is
underway to identify the extent to which Strava volume data
correlates with overall bike/ped usage. Combined with an
expanded program of manual bicycle and pedestrian counts, the
Strava data and automated counting equipment will expand the
MPO’s data on bicycle and pedestrian travel patterns to support
planning and project evaluation.
P E D E S T R I A N F A C I L I T I E S A N D P R O G R A M S
In the RPC region, pedestrian facilities vary considerably from
community to community. Portsmouth, Exeter and Hampton
feature substantial downtowns, as well as centrally located
elementary schools, which encourage people to walk. Many of the
more rural communities in the region have few if any sidewalks.
Beyond sheer size, the presence or absence of sidewalks relates in
large part to when and how a community has grown. Salem
provides a case in point. While the largest municipality in the
region, Salem has experienced much of its development in the last
40 years when accommodating the automobile has been the focus
of most transportation planning. As such, the town has a less
comprehensive sidewalk network than smaller communities that
developed earlier, such as Portsmouth and Exeter.
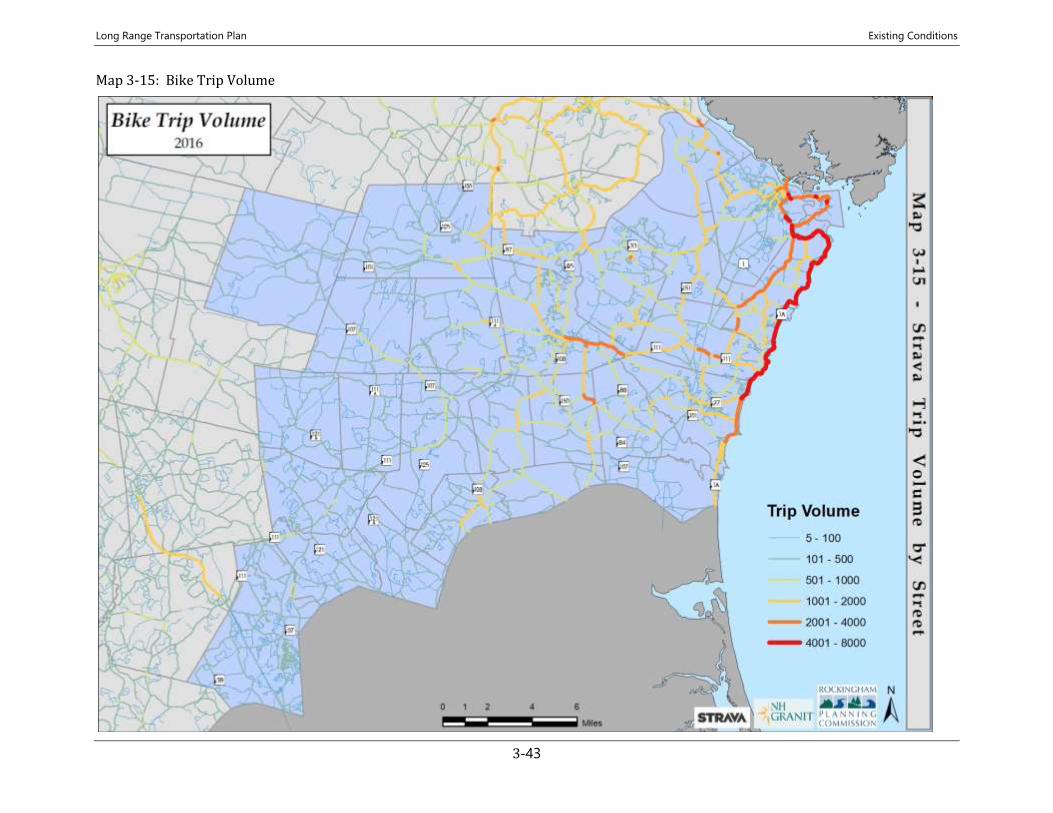
Long Range Transportation Plan Existing Conditions
3-43
Map 3-15: Bike Trip Volume
Long Range Transportation Plan Existing Conditions
3-44
In more rural communities residents walk on shoulder or in the
automobile travel lane. While people have done this for
generations, increasing traffic volumes and speeds, and drivers
increasingly distracted by cell phones and other devices, have
reduced safety for all users of the road, whether on foot, on bicycle
or in an automobile. This can be made somewhat safer when
shoulder lanes are available for use.
In general sidewalks and other pedestrian accommodations are
limited in the more rural communities in the region, with an
exception for recreational trails in some communities. Much of
this has to do with density, and the relatively long distances
between schools or other town facilities and the nearest
residential neighborhoods which would discourage walking even
if sidewalks existed. Communities with concentrations of
residential development or other trip produces in their town
center, though, are recognizing that pedestrian facilities will play
an important role in future development. For example, in Plaistow
sidewalks are already in place in parts of Town and the Town has
developed a three-phase plan for developing sidewalks linking all
the major facilities in the community that generate substantial
pedestrian traffic. The Town has implemented the plan
incrementally using Transportation Enhancement (TE) funds. The
Town of Salem also has sidewalks in place in some areas, but they
do not form a cohesive network.
Construction of sidewalks can be expensive, and many
communities are unable to identify local funds to fully support
construction of facilities for pedestrians. The Transportation
Alternatives Program (TAP) and its predecessor the TE program,
have been is the primary sources of federal funding assistance for
sidewalk construction used in New Hampshire. These funds have
always been limited and highly competitive, and will be still more
competitive in the future as TAP program is funded at a level
about 30% lower than the combination of the four programs it
replaced.
Another barrier to sidewalk construction is the cost of long term
maintenance, including winter snow clearing; and the question of
who assumes this responsibility. Current NHDOT policy is to build
sidewalks as part of highway reconstruction projects, but only if
municipalities request the sidewalks and will assume
maintenance responsibility. In some cases municipalities have
been unwilling to take on this maintenance responsibility out of
cost concerns, and the result has been a lost opportunity to
improve pedestrian safety along state highways.
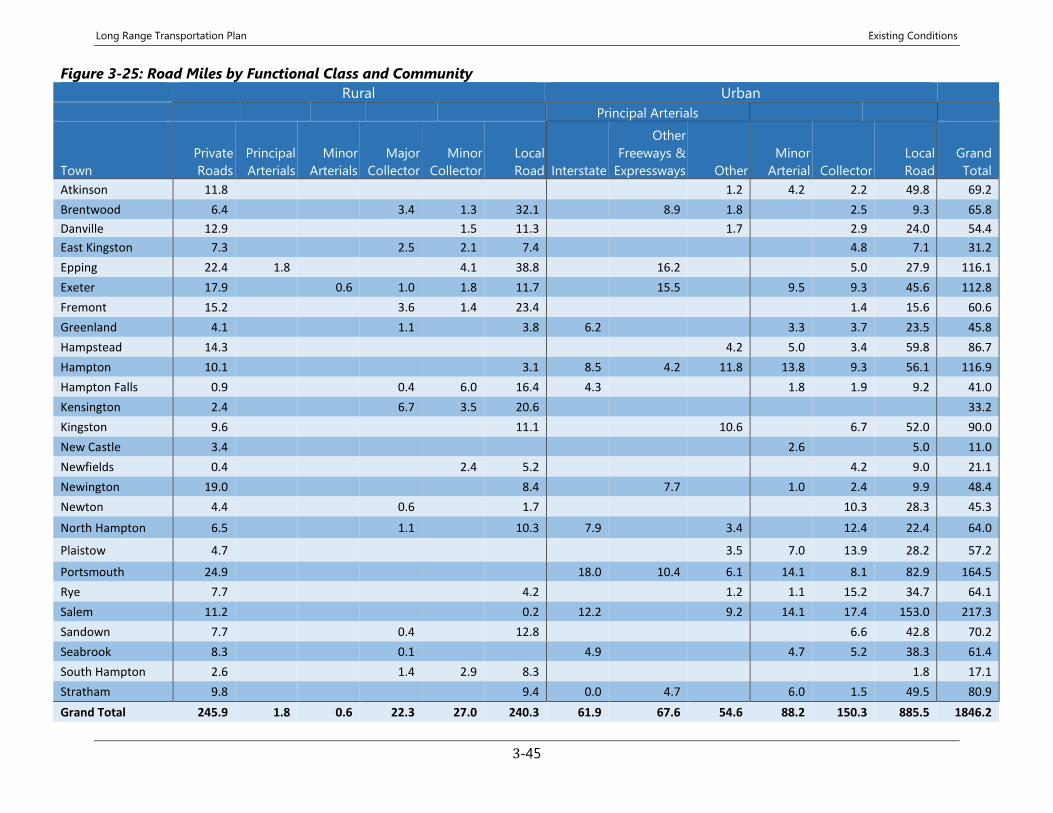
Long Range Transportation Plan Existing Conditions
3-45
Figure 3-25: Road Miles by Functional Class and Community Rural Urban
Principal Arterials
Town
Private
Roads
Principal
Arterials
Minor
Arterials
Major
Collector
Minor
Collector
Local
Road Interstate
Other
Freeways &
Expressways Other
Minor
Arterial Collector
Local
Road
Grand
Total
Atkinson 11.8 1.2 4.2 2.2 49.8 69.2
Brentwood 6.4 3.4 1.3 32.1 8.9 1.8 2.5 9.3 65.8
Danville 12.9 1.5 11.3 1.7 2.9 24.0 54.4
East Kingston 7.3 2.5 2.1 7.4 4.8 7.1 31.2
Epping 22.4 1.8 4.1 38.8 16.2 5.0 27.9 116.1
Exeter 17.9 0.6 1.0 1.8 11.7 15.5 9.5 9.3 45.6 112.8
Fremont 15.2 3.6 1.4 23.4 1.4 15.6 60.6
Greenland 4.1 1.1 3.8 6.2 3.3 3.7 23.5 45.8
Hampstead 14.3 4.2 5.0 3.4 59.8 86.7
Hampton 10.1 3.1 8.5 4.2 11.8 13.8 9.3 56.1 116.9
Hampton Falls 0.9 0.4 6.0 16.4 4.3 1.8 1.9 9.2 41.0
Kensington 2.4 6.7 3.5 20.6 33.2
Kingston 9.6 11.1 10.6 6.7 52.0 90.0
New Castle 3.4 2.6 5.0 11.0
Newfields 0.4 2.4 5.2 4.2 9.0 21.1
Newington 19.0 8.4 7.7 1.0 2.4 9.9 48.4
Newton 4.4 0.6 1.7 10.3 28.3 45.3
North Hampton 6.5 1.1 10.3 7.9 3.4 12.4 22.4 64.0
Plaistow 4.7 3.5 7.0 13.9 28.2 57.2
Portsmouth 24.9 18.0 10.4 6.1 14.1 8.1 82.9 164.5
Rye 7.7 4.2 1.2 1.1 15.2 34.7 64.1
Salem 11.2 0.2 12.2 9.2 14.1 17.4 153.0 217.3
Sandown 7.7 0.4 12.8 6.6 42.8 70.2
Seabrook 8.3 0.1 4.9 4.7 5.2 38.3 61.4
South Hampton 2.6 1.4 2.9 8.3 1.8 17.1
Stratham 9.8 9.4 0.0 4.7 6.0 1.5 49.5 80.9
Grand Total 245.9 1.8 0.6 22.3 27.0 240.3 61.9 67.6 54.6 88.2 150.3 885.5 1846.2

Long Range Transportation Plan Existing Conditions
3-46
Long Range Transportation Plan Current Trends & Future Conditions
4-1
4. Current Trends and Future Conditions
V I S I O N A N D O B J E C T I V E
The regional vision for the future, as established in the Regional
Master Plan, indicates a desire for a strong regional economy,
preservation of community character, and maintenance of the
region’s natural and recreational resources. Further, the regional
vision states a desire to strengthen community centers and
maintain traditional landscapes, provide a variety of housing
choices, invest in supportive infrastructure, and provide
improved services for residents and businesses. Projection and
estimates of future conditions supports the regional vision by
identifying and comparing the benefits and impacts of anticipated
outcome, or outcomes. It also can help decision-makers
understand how policy and project choices may impact achieving
a desired future condition. In this case, the RPC is utilizing
planning and forecasting tools to gauge two prospective
alternatives for the magnitude of growth in the region (slow or
strong growth), and two alternatives for the pattern of that change
on the landscape (dispersed or concentrated growth).
B A S I S I N P R O J E C T I O N S
Independently developed population and employment
projections, shown in Figure 4-1, offer different visions of change
in the region between now and 2040. The population is expected
to remain relatively flat with a growth rate of about 0.31 percent
per year. However, employment has a different trajectory,
growing at slightly over 1 percent per year. Examining these
different expectations of growth, as well as where people live and
work around the region, can help decision makers understand
what it means for each of those projections to be an accurate
prediction of the future. From that understanding,
recommendations can be developed that point the communities
and region towards achieving the desired outcomes, or in some
cases, away from undesired outcomes.
P O P U L A T I O N P R O J E C T I O N S
The New Hampshire Office of Strategic Initiatives (OSI), formerly
the Office of Energy and Planning (OEP), is responsible for
producing population projections at the state, county, regional
planning commissions, and community levels every five years.
The most recent set of projections was completed in 2013 utilizing
2010 census data as the basis. OEP worked directly with the
regional planning commissions to derive planning commission
and community level projections from estimates completed at the
county and state level. These projections show a very low growth
rate (0.27 percent per year) with the region increasing from
178,000 to 193,000 residents. This is primarily due to slowing
natural population growth (slightly more births than deaths) and
continued small positive migration into the region. Figure 4-2
shows how the distribution of the population by age and gender
is expected to change between 2010 and 2040. It is expected that
the population aged 65 and over will more than double while
decreases are expected in most other younger age groups over
that period. This has implications for the labor force because,
despite a growing population, most of this increase is in a portion
of the population that does not participate in the labor force.
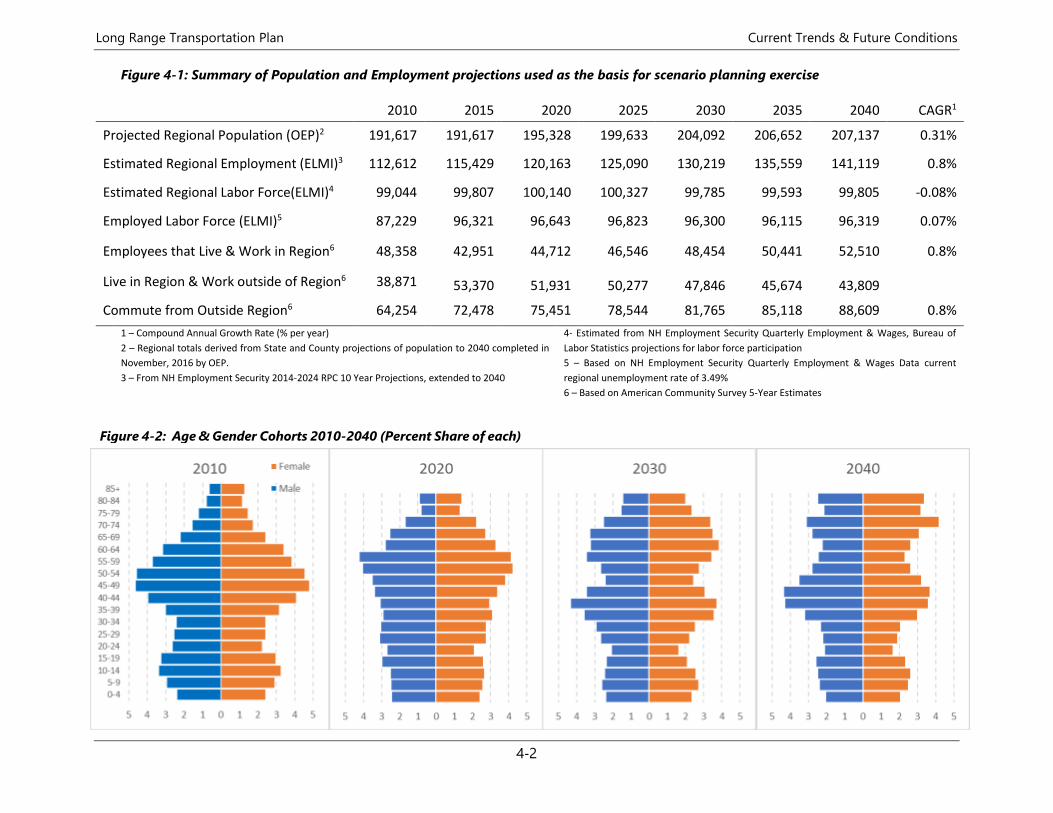
Long Range Transportation Plan Current Trends & Future Conditions
4-2
Figure 4-1: Summary of Population and Employment projections used as the basis for scenario planning exercise
2010 2015 2020 2025 2030 2035 2040 CAGR1
Projected Regional Population (OEP)2 191,617 191,617 195,328 199,633 204,092 206,652 207,137 0.31%
Estimated Regional Employment (ELMI)3 112,612 115,429 120,163 125,090 130,219 135,559 141,119 0.8%
Estimated Regional Labor Force(ELMI)4 99,044 99,807 100,140 100,327 99,785 99,593 99,805 -0.08%
Employed Labor Force (ELMI)5 87,229 96,321 96,643 96,823 96,300 96,115 96,319 0.07%
Employees that Live & Work in Region6 48,358 42,951 44,712 46,546 48,454 50,441 52,510 0.8%
Live in Region & Work outside of Region6 38,871 53,370 51,931 50,277 47,846 45,674 43,809
Commute from Outside Region6 64,254 72,478 75,451 78,544 81,765 85,118 88,609 0.8%
1 – Compound Annual Growth Rate (% per year)
2 – Regional totals derived from State and County projections of population to 2040 completed in
November, 2016 by OEP.
3 – From NH Employment Security 2014-2024 RPC 10 Year Projections, extended to 2040
4- Estimated from NH Employment Security Quarterly Employment & Wages, Bureau of
Labor Statistics projections for labor force participation
5 – Based on NH Employment Security Quarterly Employment & Wages Data current
regional unemployment rate of 3.49%
6 – Based on American Community Survey 5-Year Estimates
Figure 4-2: Age & Gender Cohorts 2010-2040 (Percent Share of each)
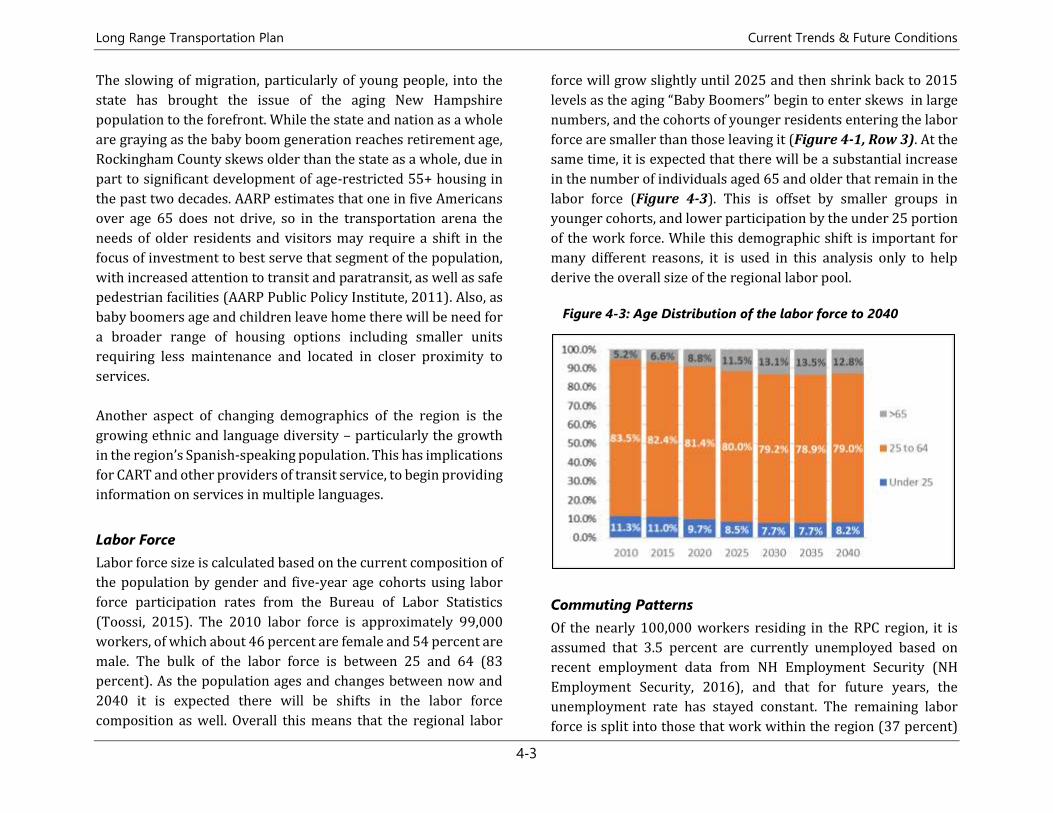
Long Range Transportation Plan Current Trends & Future Conditions
4-3
The slowing of migration, particularly of young people, into the
state has brought the issue of the aging New Hampshire
population to the forefront. While the state and nation as a whole
are graying as the baby boom generation reaches retirement age,
Rockingham County skews older than the state as a whole, due in
part to significant development of age-restricted 55+ housing in
the past two decades. AARP estimates that one in five Americans
over age 65 does not drive, so in the transportation arena the
needs of older residents and visitors may require a shift in the
focus of investment to best serve that segment of the population,
with increased attention to transit and paratransit, as well as safe
pedestrian facilities (AARP Public Policy Institute, 2011). Also, as
baby boomers age and children leave home there will be need for
a broader range of housing options including smaller units
requiring less maintenance and located in closer proximity to
services.
Another aspect of changing demographics of the region is the
growing ethnic and language diversity – particularly the growth
in the region’s Spanish-speaking population. This has implications
for CART and other providers of transit service, to begin providing
information on services in multiple languages.
Labor Force
Labor force size is calculated based on the current composition of
the population by gender and five-year age cohorts using labor
force participation rates from the Bureau of Labor Statistics
(Toossi, 2015). The 2010 labor force is approximately 99,000
workers, of which about 46 percent are female and 54 percent are
male. The bulk of the labor force is between 25 and 64 (83
percent). As the population ages and changes between now and
2040 it is expected there will be shifts in the labor force
composition as well. Overall this means that the regional labor
force will grow slightly until 2025 and then shrink back to 2015
levels as the aging “Baby Boomers” begin to enter skews in large
numbers, and the cohorts of younger residents entering the labor
force are smaller than those leaving it (Figure 4-1, Row 3). At the
same time, it is expected that there will be a substantial increase
in the number of individuals aged 65 and older that remain in the
labor force (Figure 4-3). This is offset by smaller groups in
younger cohorts, and lower participation by the under 25 portion
of the work force. While this demographic shift is important for
many different reasons, it is used in this analysis only to help
derive the overall size of the regional labor pool.
Commuting Patterns
Of the nearly 100,000 workers residing in the RPC region, it is
assumed that 3.5 percent are currently unemployed based on
recent employment data from NH Employment Security (NH
Employment Security, 2016), and that for future years, the
unemployment rate has stayed constant. The remaining labor
force is split into those that work within the region (37 percent)
Figure 4-3: Age Distribution of the labor force to 2040
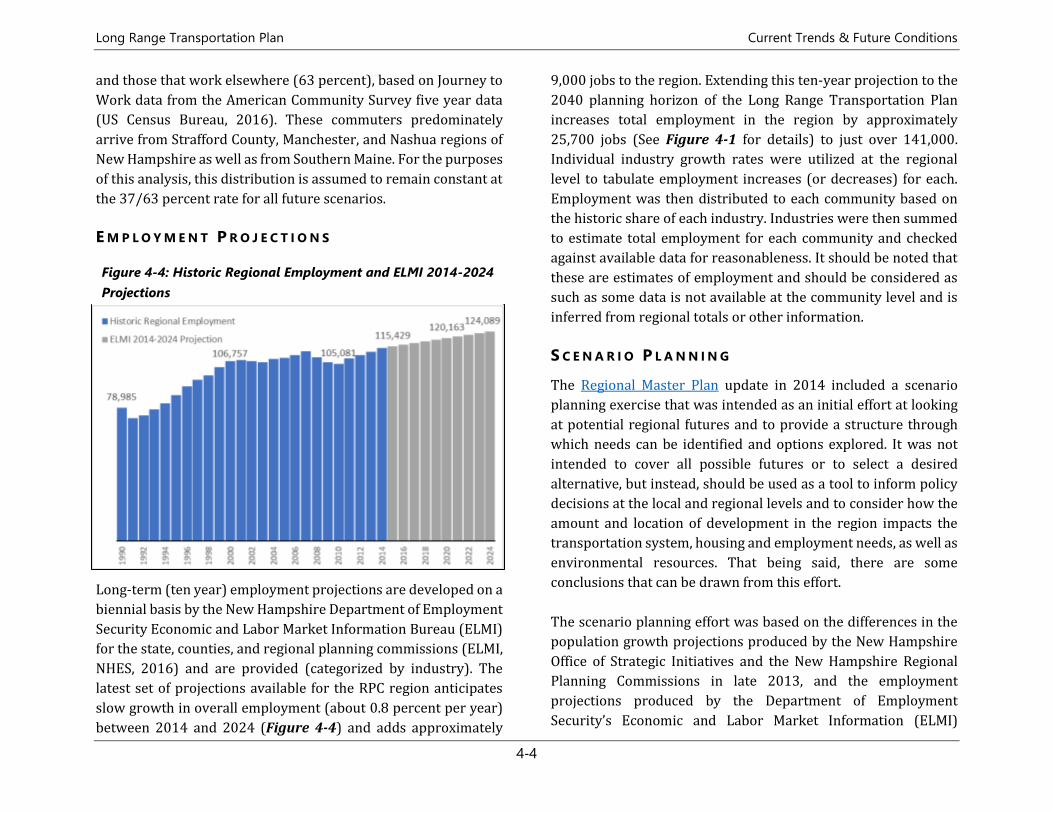
Long Range Transportation Plan Current Trends & Future Conditions
4-4
and those that work elsewhere (63 percent), based on Journey to
Work data from the American Community Survey five year data
(US Census Bureau, 2016). These commuters predominately
arrive from Strafford County, Manchester, and Nashua regions of
New Hampshire as well as from Southern Maine. For the purposes
of this analysis, this distribution is assumed to remain constant at
the 37/63 percent rate for all future scenarios.
E M P L O Y M E N T P R O J E C T I O N S
Long-term (ten year) employment projections are developed on a
biennial basis by the New Hampshire Department of Employment
Security Economic and Labor Market Information Bureau (ELMI)
for the state, counties, and regional planning commissions (ELMI,
NHES, 2016) and are provided (categorized by industry). The
latest set of projections available for the RPC region anticipates
slow growth in overall employment (about 0.8 percent per year)
between 2014 and 2024 (Figure 4-4) and adds approximately
9,000 jobs to the region. Extending this ten-year projection to the
2040 planning horizon of the Long Range Transportation Plan
increases total employment in the region by approximately
25,700 jobs (See Figure 4-1 for details) to just over 141,000.
Individual industry growth rates were utilized at the regional
level to tabulate employment increases (or decreases) for each.
Employment was then distributed to each community based on
the historic share of each industry. Industries were then summed
to estimate total employment for each community and checked
against available data for reasonableness. It should be noted that
these are estimates of employment and should be considered as
such as some data is not available at the community level and is
inferred from regional totals or other information.
S C E N A R I O P L A N N I N G
The Regional Master Plan update in 2014 included a scenario
planning exercise that was intended as an initial effort at looking
at potential regional futures and to provide a structure through
which needs can be identified and options explored. It was not
intended to cover all possible futures or to select a desired
alternative, but instead, should be used as a tool to inform policy
decisions at the local and regional levels and to consider how the
amount and location of development in the region impacts the
transportation system, housing and employment needs, as well as
environmental resources. That being said, there are some
conclusions that can be drawn from this effort.
The scenario planning effort was based on the differences in the
population growth projections produced by the New Hampshire
Office of Strategic Initiatives and the New Hampshire Regional
Planning Commissions in late 2013, and the employment
projections produced by the Department of Employment
Security’s Economic and Labor Market Information (ELMI)
Figure 4-4: Historic Regional Employment and ELMI 2014-2024
Projections
Long Range Transportation Plan Current Trends & Future Conditions
4-5
Bureau. The population projections were predicting extremely
low levels of growth in the region due to slowing migration into
the region and demographic shifts such as the movement of the
“Baby Boomer” generation into retirement and higher mortality
cohorts. The ELMI employment projections, on the other hand,
predicted a steady 1 percent growth per year in employment in
the region, which, when extended out to 2040, added almost
40,000 jobs to the region. This created a theoretical disparity
between the expected low population growth in the region and
the labor force needed to fill the many jobs being vacated by
retiring “Baby Boomers” as well as the predicted increase in
employment. When combined with two potential land use
distribution alternatives, the difference produced three scenarios
that were compared to the baseline condition to gauge the
impacts on the regional transportation system:
Slow Growth Scenario: A future of slow population growth is
anticipated by the population projections and the work force and
employment are sized to fit that slow change. Under this scenario,
the population projections from OEP and the RPCs are utilized and
employment growth is reduced to levels supported by the
expected available labor force. In this scenario, there is little land
use growth and so the distribution and amount stay generally the
same as exists in the 2010 baseline.
Strong, Dispersed Growth Scenario: This concept moves
towards the Regional Vision with strong population and economic
growth. For this alternative NH Employment Security projections
provide the employment growth rate and the population is
increased to the point where the labor force is large enough to
support the larger number of jobs. This scenario continues the
current dispersed residential growth pattern with more rural
communities growing faster than more urbanized ones.
Employment is slowly diffused in some industry categories such
as retail following current trends.
Strong, Concentrated Growth Scenario: The final alternative
has similar population and employment as the dispersed growth
scenario. It differs in that it concentrates residential growth into
the largest employment centers in the region and further focuses
employment growth in those same areas. These areas currently
host just under 50 percent of the population in the region and 74
percent of the employment. To facilitate a change in distribution,
80 percent of the new population and 90 percent of new jobs are
concentrated into the regional employment centers of Exeter,
Hampton, Portsmouth/Newington, Salem, and Seabrook.
Scenario Planning Results
The Planning Commission utilized three different tools to examine
the future scenarios. A regional buildout analysis examined
changes from a land use perspective, the New Hampshire
Econometric Model estimated economic impacts, and the MPO
Regional Travel Demand Model calculated travel and
transportation changes (Shown in Figure 4-5). Each of these
analyses was conducted independently but in a coordinated
manner that allowed each to inform the others (Note: Raymond
was not part of the RPC region at the time of this analysis and is
not included in the results). The full analysis included in the
Regional Master Plan is available on the RPC website. In most
measures, the “low growth” scenario produces the smallest
impacts on the transportation system with the lowest amount of
delay and congestion. However, the economic implications of that
scenario also indicate that it is not a desired future for the region.
Some of those impacts by 2040 are:
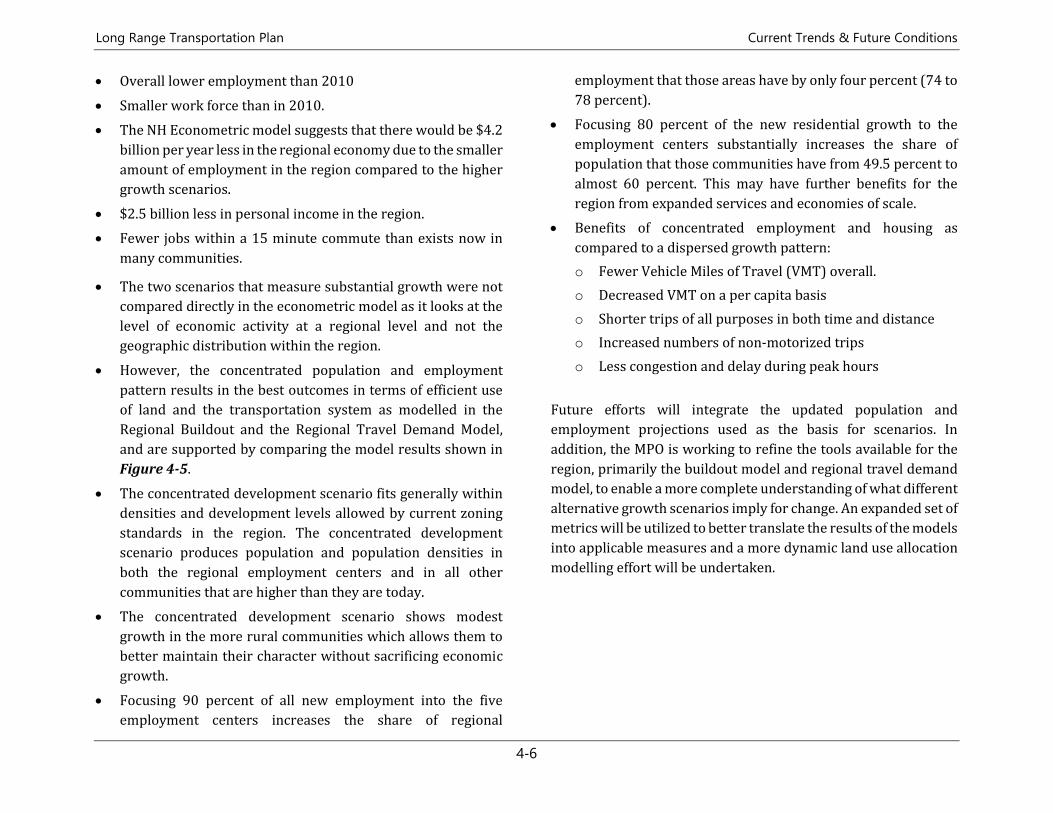
Long Range Transportation Plan Current Trends & Future Conditions
4-6
• Overall lower employment than 2010
• Smaller work force than in 2010.
• The NH Econometric model suggests that there would be $4.2
billion per year less in the regional economy due to the smaller
amount of employment in the region compared to the higher
growth scenarios.
• $2.5 billion less in personal income in the region.
• Fewer jobs within a 15 minute commute than exists now in
many communities.
• The two scenarios that measure substantial growth were not
compared directly in the econometric model as it looks at the
level of economic activity at a regional level and not the
geographic distribution within the region.
• However, the concentrated population and employment
pattern results in the best outcomes in terms of efficient use
of land and the transportation system as modelled in the
Regional Buildout and the Regional Travel Demand Model,
and are supported by comparing the model results shown in
Figure 4-5.
• The concentrated development scenario fits generally within
densities and development levels allowed by current zoning
standards in the region. The concentrated development
scenario produces population and population densities in
both the regional employment centers and in all other
communities that are higher than they are today.
• The concentrated development scenario shows modest
growth in the more rural communities which allows them to
better maintain their character without sacrificing economic
growth.
• Focusing 90 percent of all new employment into the five
employment centers increases the share of regional
employment that those areas have by only four percent (74 to
78 percent).
• Focusing 80 percent of the new residential growth to the
employment centers substantially increases the share of
population that those communities have from 49.5 percent to
almost 60 percent. This may have further benefits for the
region from expanded services and economies of scale.
• Benefits of concentrated employment and housing as
compared to a dispersed growth pattern:
o Fewer Vehicle Miles of Travel (VMT) overall.
o Decreased VMT on a per capita basis
o Shorter trips of all purposes in both time and distance
o Increased numbers of non-motorized trips
o Less congestion and delay during peak hours
Future efforts will integrate the updated population and
employment projections used as the basis for scenarios. In
addition, the MPO is working to refine the tools available for the
region, primarily the buildout model and regional travel demand
model, to enable a more complete understanding of what different
alternative growth scenarios imply for change. An expanded set of
metrics will be utilized to better translate the results of the models
into applicable measures and a more dynamic land use allocation
modelling effort will be undertaken.
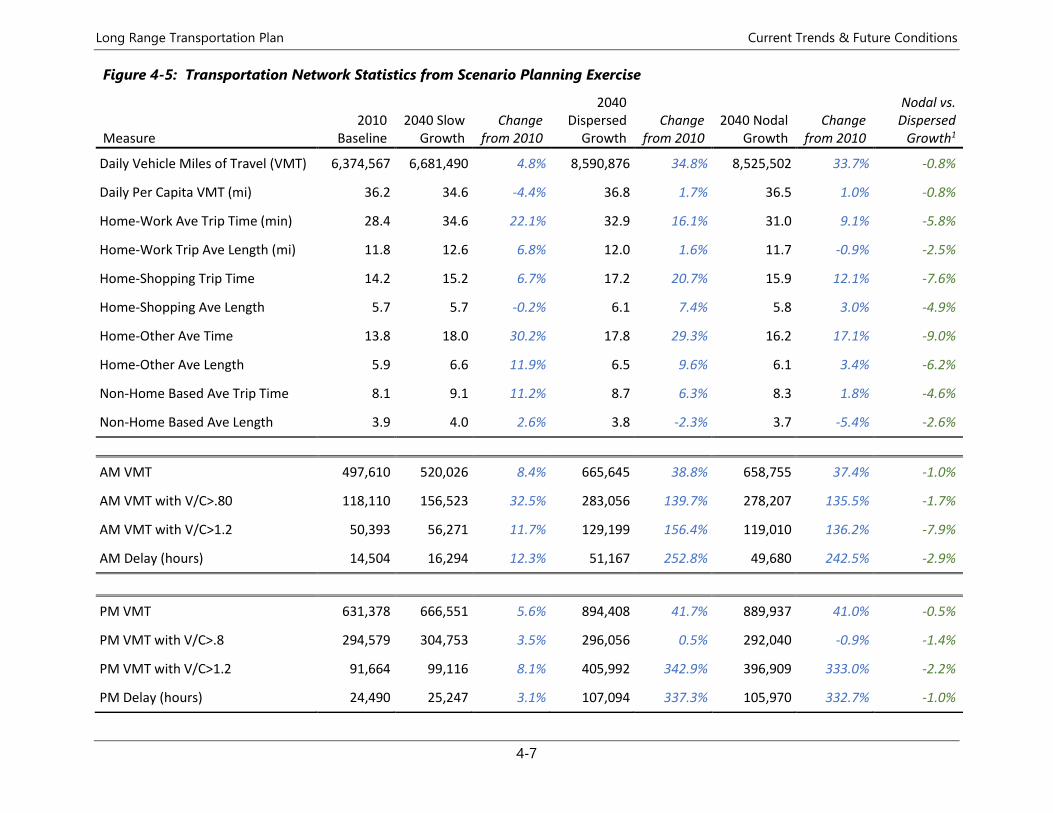
Long Range Transportation Plan Current Trends & Future Conditions
4-7
Figure 4-5: Transportation Network Statistics from Scenario Planning Exercise
Measure 2010
Baseline 2040 Slow
Growth Change
from 2010
2040 Dispersed
Growth Change
from 2010 2040 Nodal
Growth Change
from 2010
Nodal vs. Dispersed
Growth1
Daily Vehicle Miles of Travel (VMT) 6,374,567 6,681,490 4.8% 8,590,876 34.8% 8,525,502 33.7% -0.8%
Daily Per Capita VMT (mi) 36.2 34.6 -4.4% 36.8 1.7% 36.5 1.0% -0.8%
Home-Work Ave Trip Time (min) 28.4 34.6 22.1% 32.9 16.1% 31.0 9.1% -5.8%
Home-Work Trip Ave Length (mi) 11.8 12.6 6.8% 12.0 1.6% 11.7 -0.9% -2.5%
Home-Shopping Trip Time 14.2 15.2 6.7% 17.2 20.7% 15.9 12.1% -7.6%
Home-Shopping Ave Length 5.7 5.7 -0.2% 6.1 7.4% 5.8 3.0% -4.9%
Home-Other Ave Time 13.8 18.0 30.2% 17.8 29.3% 16.2 17.1% -9.0%
Home-Other Ave Length 5.9 6.6 11.9% 6.5 9.6% 6.1 3.4% -6.2%
Non-Home Based Ave Trip Time 8.1 9.1 11.2% 8.7 6.3% 8.3 1.8% -4.6%
Non-Home Based Ave Length 3.9 4.0 2.6% 3.8 -2.3% 3.7 -5.4% -2.6%
AM VMT 497,610 520,026 8.4% 665,645 38.8% 658,755 37.4% -1.0%
AM VMT with V/C>.80 118,110 156,523 32.5% 283,056 139.7% 278,207 135.5% -1.7%
AM VMT with V/C>1.2 50,393 56,271 11.7% 129,199 156.4% 119,010 136.2% -7.9%
AM Delay (hours) 14,504 16,294 12.3% 51,167 252.8% 49,680 242.5% -2.9%
PM VMT 631,378 666,551 5.6% 894,408 41.7% 889,937 41.0% -0.5%
PM VMT with V/C>.8 294,579 304,753 3.5% 296,056 0.5% 292,040 -0.9% -1.4%
PM VMT with V/C>1.2 91,664 99,116 8.1% 405,992 342.9% 396,909 333.0% -2.2%
PM Delay (hours) 24,490 25,247 3.1% 107,094 337.3% 105,970 332.7% -1.0%
Long Range Transportation Plan Current Trends & Future Conditions
4-8
N E E D S A S S E S S M E N T
The needs assessment for the Long Range Transportation Plan
examines the existing conditions of the region described in
Chapter 3, as well as the current trends and expected future
conditions described earlier in this chapter and identifies areas
where transportation solutions are needed. These solutions can
be in the form of specific projects or broader policy statements.
The needs assessment is organized around the regional goals
detailed in Chapter 2.
M O B I L I T Y N E E D S
Mobility generally refers to the ability and ease with which
individuals and goods can move from place to place. This is most
often measured at the regional scale in Vehicle Miles of Travel
(VMT) for automobile traffic, passenger miles of travel for transit,
or in ton-miles for freight and needs are most often identified by
examining areas of congestion where traffic and travel are greater
than the capacity to support that level of activity.
Congestion
The primary tools utilized to identify areas of expected future
highway congestion in the region are the Regional Travel Demand
Model and travel time date from the National Performance
Management Research Data Set (NPMRDS). The model utilizes
expected population and employment growth and distribution to
estimate traffic volume and distribution of traffic moving through
the region. This provides the capacity to identify the roadways
that are approaching capacity during peak hour travel periods,
and, if provided with different population values and
distributions, estimate the impacts of differing land use scenarios
on travel in the region. As part of the scenario planning exercise
related to the development of the LRTP, the model was provided
with three different distributions of population and employment
utilizing the base year (2010) transportation network to estimate
future capacity needs in the region.
The model outputs indicate that there is substantial overlap
between scenarios in terms of “congested” segments of roadway.
For the most part, the roadways that are congested under one
scenario are congested under all with some variance in the
amount of congestion. Figure 4-5 shows the transportation
network statistics from the 2010 baseline and all three future
development scenarios. Overall, results indicate that the
concentrated development pattern provides significant efficiency
gains compared to the dispersed pattern. Shorter automobile trip
lengths and times are seen for all trip purposes when compared
to the dispersed development scenario indicating that more
desired destinations are closer to where people live when land
use is more concentrated into urban centers. Vehicle Miles of
Travel statistics help to support that notion, as travel under
congested conditions is decreased both in volume and in hours of
delay during both the morning and evening peak periods when
comparing the concentrated pattern to the dispersed pattern.
Maps showing congestion on the regional roadways indicate that
despite efficiency gains, the concentrated growth pattern does not
substantially change the location or magnitude of congestion
compared to the dispersed development pattern.
Goal 1 - Mobility
The region’s transportation system offers safe, secure, efficient, and
reliable access to employment, housing, commerce, services,
entertainment, and recreation
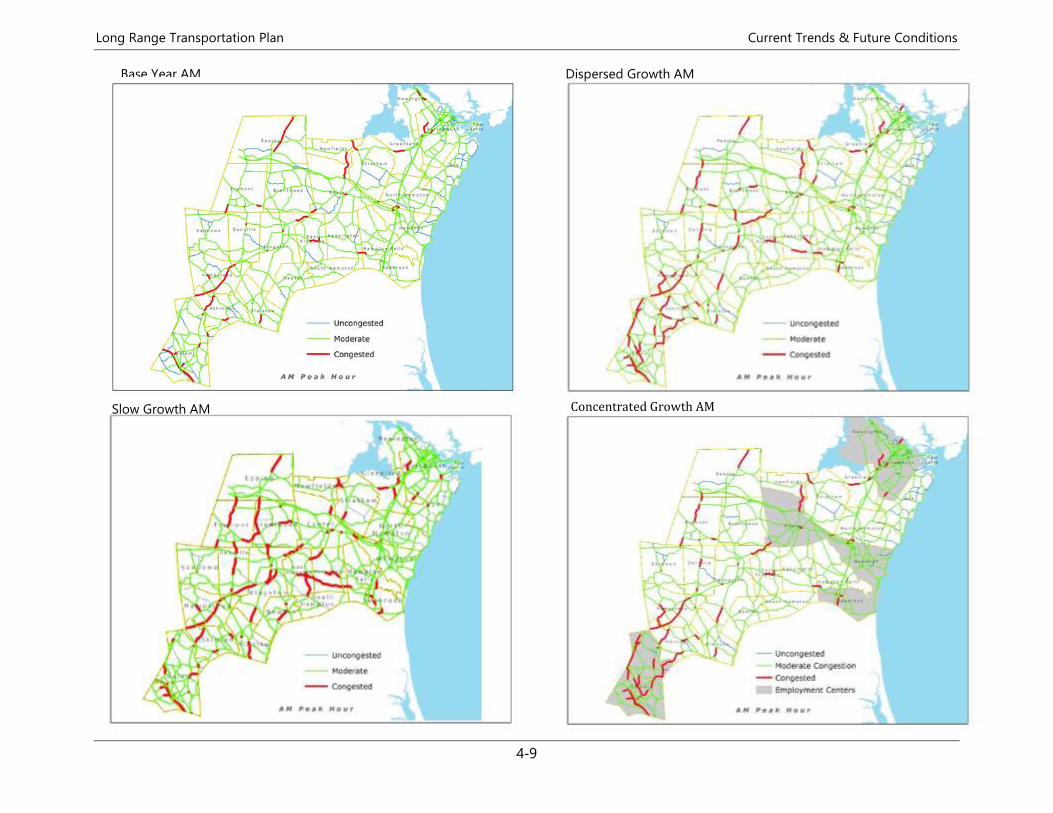
Long Range Transportation Plan Current Trends & Future Conditions
4-9
Base Year AM Dispersed Growth AM
Concentrated Growth AM Slow Growth AM
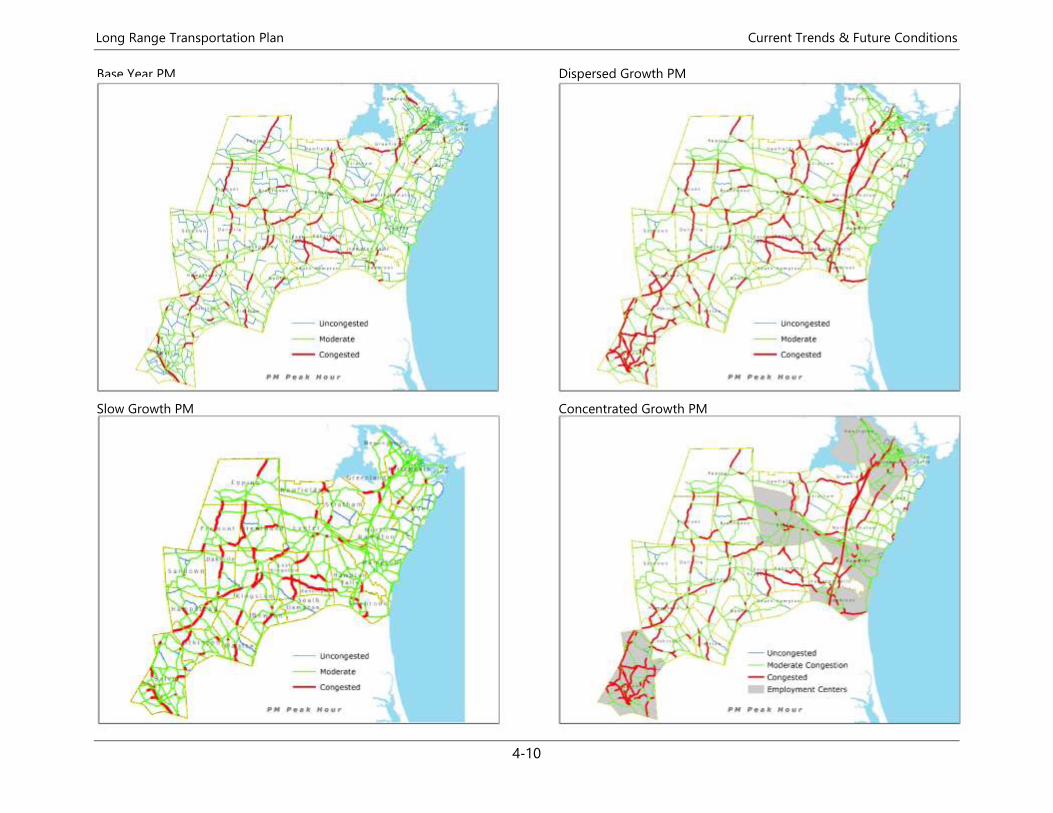
Long Range Transportation Plan Current Trends & Future Conditions
4-10
Base Year PM
Concentrated Growth PM
Dispersed Growth PM
Slow Growth PM
Long Range Transportation Plan Current Trends & Future Conditions
4-11
Figure 4-6 shows the baseline conditions of congestion during the
AM and compares them to the 2040 condition under each of the
scenarios classifying roads as “Uncongested”, “Moderately
Congested”, or “Congested” based on the volume to capacity ratio
as modeled. Figure 4-7 shows the same information for the PM
peak period. Each of the future year scenarios shows an increase
in congested driving over the base year of the analysis. During the
AM peak period, the slow growth scenario shows a greater
number of congested roadways in the center and western portion
of the region, specifically on NH 107, NH 111, and NH 125. The
Concentrated Growth scenario shows the least number of
congested roadways while the Dispersed Growth pattern is
somewhere in between. In the PM peak period congestion is more
widespread in the baseline condition and each of the future year
scenarios adds to that, especially in the number of “moderately
congested” roadways. Both of the stronger growth scenarios show
substantially more PM peak period congestion than the slow
growth model however they differ somewhat in the distribution
of that congestion.
The Dispersed land use pattern scenario indicates congestion
spread along the length of most major highways in the region
while the Concentrated development pattern indicates slightly
less widespread traffic disruption. In both stronger growth
patterns congestion is prevalent during the PM peak period on I-
95, US 1, NH 28, NH 33, NH 107, NH 108, NH 111, NH 125, and
several other routes.
The differences between the growth scenarios in terms of impacts
on congestion may be understated as the model currently relies
on static transit routes and proportions of non-motorized trips.
This does not allow the model to adapt to stronger demand for
transit by adding new routes without them being coded into the
system, nor does it adapt to more concentrated development by
increasing the percentage of non-motorized trips. Future efforts
in scenario planning will investigate the impacts of additional
transit routes and increased non-motorized trip percentages for
more densely settled areas.
A number of roadways were identified as “congested” from the
results of the travel demand model and many of these results are
supported by current experience traveling these highways during
peak hours. Congested routes in the 2040 Network (from the
travel demand model):
• NH 111 in Hampstead, Atkinson, and Salem
• NH 125 in Plaistow, Kingston, and Epping
• NH 28 North of Main Street in Salem
• US 1 in Seabrook, Hampton Falls, Hampton, North Hampton,
Rye, and Portsmouth (Ten Year Plan projects in Seabrook,
Hampton Falls, and Portsmouth are not accounted for and
may address some of this)
• NH 33 in Greenland and Stratham
• Pease Tradeport Access Roads
• NH 107 From Seabrook to Kingston
• I-95 (entire length)
• I-93 (Entire length)
• NH 108 in Stratham and Newfields
• NH 1A in Portsmouth and Rye
• NH 101 Interchanges and adjacent roadway connections
There are multiple capacity improvement projects that are
currently underway, are in design, or are in the State Ten Year
Plan that will address the congestion seen at some of these
locations:
Long Range Transportation Plan Current Trends & Future Conditions
4-12
• NH 125 Plaistow-Kingston: Construction is wrapping up on
the expansion of the roadway to 5-lanes between East Road
and Old County Road in Plaistow. Additional work is
scheduled in the State Ten Year Plan for between Old County
Road and Hunt Road/Newton Junction Road in Kingston.
• NH 125 in Plaistow: A signal coordination/improved signal
control project is in the State Ten Year Plan.
• NH125 in Epping: A signal coordination/improved signal
control project is in the State Ten Year Plan as well as a
project to implement capacity improvements between NH 27
and NH 87.
• Salem to Manchester I-93 Widening: The model accounts for
only three lanes in each direction and does not include
NHDOT’s announced plans to pave four lanes in each
direction.
• Newington-Dover Spaulding Turnpike Expansion: Expanded
capacity between Exits 2 and 6, and new interchanges will
ease congestion on that route.
• US Route 1 Seabrook: Construction is nearly complete on a
project that will create a consistent 5-lane cross-section
between NH 107 and Lake Shore Drive.
• US Route 1 Hampton Falls: A planning study begins in 2018
to begin to address the capacity constraints on US 1 through
town.
• US Route 1 Portsmouth: State Ten Year Plan includes a
project to create a consistent 5-lane cross-section between
Ocean Road and Peverly Hill Road.
• NH 28 in Salem: Project is scheduled at the intersection of
NH 28 and NH 97 (Salem Depot) to expand the capacity and
reduce congestion.
While these projects will address some of the congestion issues
seen in the model results, there are still some significant areas that
require attention. Some of these locations (US 1, Much of NH 125)
have benefited from corridor studies and other plans that have
defined the projects necessary to meet the capacity and other
needs along the corridor (See Chapter 5 for the full project
listing), while others are still awaiting a comprehensive look at the
transportation improvement needs. The MPO has identified
several areas that are in need of corridor studies to systematically
address congestion, safety, and other transportation needs:
• NH 108/33 corridor between Portsmouth and Exeter: Growing
Populations in the towns along this corridor as well as the
growing popularity of the route as an alternative to get to
employment at the Pease Tradeport and Portsmouth have
increased traffic volumes and safety concerns.
• NH 111 between Kingston and Salem: This corridor has
experienced significant land use growth that has increased
traffic volumes, generated safety concerns and requests for
intersection signals along the corridor.
• NH 101 Interchanges between Raymond and Hampton: Traffic
volumes have doubled on this route since the expansion of the
roadway to a two-lane grade separated facility was completed
in 2001. Many of the interchanges, specifically those without
traffic signal control are experiencing substantial peak-hour
congestion for some movements.
• NH 125: Corridor studies have been completed from Plaistow
to Rochester however there was a gap between the northern NH 111 intersection in Kingston through Brentwood, and to
NH 101 in Epping. This area was slated for a corridor study in
the late 2000s however funding was unavailable and so no
comprehensive look at that part of the roadway has occurred.
Long Range Transportation Plan Current Trends & Future Conditions
4-13
A C C E S S I B I L I T Y & T R A N S P O R T A T I O N C H O I C E
N E E D S
Accessibility refers to a traveler’s ability to reach desired goods,
services, activities and destinations. Accessibility in the MPO
region is excellent for individuals with a motor vehicle. In contrast
accessibility is very limited in much of the region for senior
citizens, individuals with disabilities or other residents who lack
a private motor vehicle or who are otherwise unable to drive to
get to work, perform errands, or travel for other reasons.
For the region’s growing senior population, access to
transportation for medical care, grocery shopping or other basic
life needs can make the difference between being able to live
independently or enter long term care. On the other end of the age
spectrum, national data show the Millennial generation
gravitating to communities where access to work, services and
entertainment isn’t wholly dependent on auto ownership.
Improving accessibility in the region will become increasingly
important over the period covered by this plan given this
changing makeup of the region’s population.
This problem is less acute in communities served by public transit,
or communities like Exeter or Portsmouth where residential
neighborhoods are situated close to employment centers and
services and walking or bicycling is a viable choice for many trips.
Needs in the region associated with transit access and bicycle and
pedestrian access are described below.
Transit
The development of the CART system in the Salem-Derry area, the
expansion of volunteer driver programs like TASC and Ready
Rides in the Seacoast and the expansion of transit along the
Spaulding Turnpike and I-93 corridors have done much to
improve accessibility in the region in the past decade. Still there
is only limited transit access to major employment centers such as
Exeter and Salem, and none to Plaistow and Hampton. The region
benefits from inter-city commuter bus service on I-95 and I-93,
though these are focused on Boston commutes and don’t serve
employment centers in northern Massachusetts or typical
employment schedules in New Hampshire. A third of the region
lacks even basic transit or volunteer driver program access for
seniors and individuals with disabilities. Key transit accessibility
improvements needed in the region include:
• Access in underserved communities - Basic daily community
transportation access for seniors and individuals with
disabilities is absent in the communities including Fremont,
Brentwood, Epping, Kingston, East Kingston, Plaistow and
Raymond. These communities currently receive one day per
week service through Lamprey Healthcare, but are not
covered by any regional volunteer driver program such as
TASC, Salem Caregivers, Derry Caregivers, or Ready Rides.
• Continuing I-93 & Spaulding Turnpike Commuter Services -
Boston Express commuter bus service on I-93 and COAST and
UNH Wildcat Transit service on the Spaulding Turnpike have
been supported by mitigation funding for those two major
Goal 2 – Transportation Choices
The region’s transportation system offers equitable and reliable
multi-modal transportation choices to better connect people to jobs
and services.
Long Range Transportation Plan Current Trends & Future Conditions
4-14
highway projects. As those projects conclude new sources of
funding will be needed to support the services. FTA funding
through the Boston Urbanized Area (UZA) is available to
support the I-93 services on an ongoing basis. There is not
currently adequate FTA funding through the Portsmouth and
Dover-Rochester UZAs to support expanded commute hour
service on the Spaulding Turnpike on an ongoing basis.
Flexing Surface Transportation Block Grant Program may be
an option for ongoing support after 2020.
• Capacity at Park & Ride facilities on I-95 corridor - The
Portsmouth Transportation Center (PTC) is at or above
capacity even with recent incremental expansions. An
intermodal center at the interchange of US1 and NH101 in
Hampton was found to not be acceptable to the community.
Siting for such a facility closer to Exit 2 may not be feasible.
Proposed expansion at Exit 57 in Newburyport will help with
demand from southern Seacoast communities, but less so the
Greater Portsmouth area. Demand management through
pricing parking at the PTC can also partially address this need,
while generating revenue for facility maintenance and actual
transit service.
• Employment transportation options – While fixed route
service is difficult to sustain in low-population density areas
of the RPC region, there appears to be potential for expanded
commuter transit serving certain concentrations of
employment such as Pease Tradeport and areas of Salem.
Partnerships would likely be needed with specific employers
to make service viable, similar to COAST’s Clipper Connection
service. An expansion of the COAST Clipper Connection
commuter service to points south and west of Portsmouth
Naval Shipyard and Pease Tradeport would an example of this
(Epping, Exeter, Hampton).
• Inter-regional connections – The failure of the pilot East-West
Express transit service has for the time being eliminated calls
for a transit connection between the Seacoast and the I-93
corridor. For the CART service area there is strong interest in
creating regular transit connections between the Greater
Derry-Salem area, Manchester, Nashua and northern
Massachusetts.
• Downeaster Improvements – Inadequate parking capacity at
the Exeter train station continues to be a limiting factor for
train access. Addressing this is a need not just for host
community Exeter, but the broader catchment area towns
from which riders are drawn. and support NNEPRA work to
increase service frequency to 6-7 daily round trips between
Portland and Boston from the current five daily round trips.
• Transit funding (non-Federal) – Funding for regional transit
service is a perennial challenge in New Hampshire. This is
especially the case for non-federal funding required to access
FTA dollars. Addressing most of the needs described above
will require development of new sources of non-federal
revenue at the state level, whether from the General Fund,
parking revenues at state-owned park and ride facilities, or
other sources.
• Expand transit funding (Federal) – Public transit agencies in
New Hampshire are also increasingly fully programmed with
their FTA formula dollars. This applies to COAST as well as
Nashua Transit System, and soon CART. This highlights the
importance of access to Congestion Mitigation/Air Quality
Long Range Transportation Plan Current Trends & Future Conditions
4-15
(CMAQ) or flexed funds from other FHWA programs for
vehicle replacement.
Bicycle & Pedestrian Facilities & Program Needs
• Complete Streets Policy Development - The concept of
Complete Streets, fundamentally, is that streets and roads are
transportation facilities that need to be designed to safely
accommodate all travelers – whether driving a motor vehicle,
walking, waiting for a bus or riding a bicycle. Nationally 28
states have adopted Complete Streets policies, including all
five of the other New England states. More than 700 county
and municipal governments nationally have adopted such
policies, including Portsmouth, Concord, Keene and Dover in
New Hampshire. A Complete Streets policy is not a one size
fits all mandate. It is more of a process than a prescription,
ensuring that safety needs of all potential users are
considered from the beginning of the design process. Needs
will vary greatly between urban and rural communities. The
Regional Master Plan calls for development of regional
complete streets policies at the state, regional and local levels.
A complete streets study committee established by the state
Legislature in 2016 stopped short of calling for a statewide
complete streets policy, but did direct NHDOT to revisit
existing policies related to street design and establish an
internal advisory committee.
• Data collection on bicycle and pedestrian traffic volumes – The
lack of data on bicycle and pedestrian traffic volumes is a
significant problem in building the case for facility
investments, particularly as the project selection process
shifts toward a greater emphasis on performance targets. In
the past three years staff have increased collection of
bike/ped traffic volume data, though mainly in association
with specific projects (NH Coastal Byway, NH Seacoast
Greenway, Portsmouth bike/ped monitoring program).
Availability of Strava data presents the opportunity to track
change over time on road segments where facility
improvements are made, and also to prioritize projects likely
to have the greatest impact on bike/ped safety.
• Improvements on identified regional bicycle and pedestrian
routes – Long-standing regional priorities for improving
specific on-road bicycle and pedestrian routes include:
o U.S. Bike Route 1/NH Coastal Byway (NH1A & NH1B)
o Great Bay Bicycle Loop (US4/NH108/ NH33/Pease
TradePort)
o Exeter-Hampton-North Hampton Loop
(NH111/NH1A/NH27)
Priority off-road routes include
o NH Seacoast Greenway following the abandoned
Hampton Branch rail line
o Salem-Concord Bikeway following the abandoned
Manchester-Lawrence rail line.
• Facilitate local Safe Routes to School initiatives – The Safe
Routes to School program no longer has a dedicated pool of
funding for infrastructure investments. However, funding
remains available to communities for planning and other non-
infrastructure work, and the 5Es structure of the program
(Education, Encouragement, Engineering, Enforcement,
Evaluation) remains an effective model for engaging parents,
schools, police departments, public works departments and
other community members. Bicycle and pedestrian facilities
in school zones should continue to be a funding priority, and
Long Range Transportation Plan Current Trends & Future Conditions
4-16
funds pursued for SRTS planning and program start-ups in
new communities.
• Signage and lane marking – Improving use of safety signage
and lane markings can be a cost-effective approach to
improving bicycle and pedestrian safety given limited
resources for constructing new facilities. The NHDOT
Bike/Ped Advisory Committee in 2016 completed a set of
recommendations to the department related to lane striping
and signage, including identifying opportunities for
narrowing travel lanes to gain shoulder width and calm traffic,
modifying striping tapers at intersections, use of shared lane
markings (sharrows), and increased use of warning signage at
crosswalks and hazard areas. Also, there is a potential role for
the MPO in working with communities and NHDOT on
scheduled highway resurfacing, and the opportunity that can
present for adjusting striping to calm traffic and provide
additional shoulder width.
• Maintenance of bicycle and pedestrian facilities –
Unwillingness to accept maintenance responsibility for
sidewalks or bicycle traffic markings on state highways
contributes to bike/ped safety improvements not being made
as part of highway improvement projects. NHDOT will
generally offer to construct sidewalks as part of highway
improvement projects, but state policy is to not maintain
bicycle and pedestrian facilities on state highways, on the
basis that these are mainly for local rather than regional use.
NHDOT’s policy not to handle winter maintenance on
sidewalks is understandable, given the impracticality of
transporting a sidewalk plow to clear short segments of
sidewalk. However, general maintenance of sidewalks,
pedestrian crossing signals, and pavement markings that are
integral to state highways should be handled by the same
entity that covers of the highway itself – whether NHDOT or
an urban compact community.
Transportation Demand Management
• Continue commuteSMARTSeacoast TMA following end of
Newington-Dover project subsidy – The commuteSMART-
Seacoast program has exceeded projections with its success in
facilitating ridematching and promoting transit, bicycling and
walking as commuting options for employees at Pease, PNSY
and elsewhere in the Seacoast. In so doing it has reduced
single occupant vehicle trips on the Spaulding Turnpike. The
TMA has also served as an effective marketing arm for COAST.
Current funding runs out in 2019 following completion of the
Little Bay Bridges project.
• Evaluate TMA potential along southern I93 Corridor – The
Town of Salem previously attempted to establish a
transportation management association (TMA) among major
employers in Salem as part of their Salem Employment Trip
Reduction Integration Program (SE-TRIP) CMAQ project.
While the original outreach for this effort did not turn up
significant employer interest, the tightened labor market and
challenges in hiring may make timing good for a second
attempt at this work.
S h a r e d M o b i l i t y S e r v i c e s
The growth of shared mobility services such as ZipCar, Uber and
Lyft has significantly changed travel demand in many cities
nationally. Such services fill an important gap in mobility options
in urban areas where short trip distances and robust transit,
Long Range Transportation Plan Current Trends & Future Conditions
4-17
bicycle and pedestrian networks allow most trips to be taken by
these modes. Together with these other travel options, on-
demand access to a carshare vehicle for weekend trips or hauling
groceries can allow many urban households to avoid the
considerable expense of owning, driving and parking a private
automobile.
All three companies have a presence in southern New Hampshire,
though are not yet major factors in the transportation system.
ZipCar has several cars on the University of New Hampshire
campus in Durham as well as at Dartmouth College in Hanover.
Uber entered the New Hampshire market in 2015 and publicizes
that it has over 500 drivers and 40,000 members statewide. Their
advertised primary service area extends from Concord to Nashua
and eastward to Durham and Portsmouth, along with the Upper
Valley communities of Hanover and Lebanon. The company claims
an average ride arrival time of 5-7 minutes, with business
concentrated on weekends. Lyft entered the New Hampshire
market in 2017 and doesn’t publish the size of its driver pool or
rider membership. (MUL 4/4/17)
Uber’s entry in the New Hampshire market has not been without
controversy. Portsmouth and Manchester have both passed
ordinances requiring stricter background checks, commercial
insurance coverage and local registration for drivers. However
these ordinances were preempted by a new state law in 2016
(RSA 376-A) requiring simplified driver background checks.
While the state law is viewed as unfair by livery companies that
face stricter regulation, it clears the way for expansion of Uber and
Lyft service in the region and elsewhere in New Hampshire.
Service is likely to be concentrated in urban areas and college
communities; but also potentially tourism areas attracting out of
state visitors including areas of the Seacoast beyond Portsmouth,
the lakes region and ski resorts.
These services are typically used mostly used by younger, tech-
savvy travelers, but also have potential to broaden transportation
options for seniors and individuals with disabilities. The services’
current model of scheduling via smartphone is a barrier for many
seniors, though not all. Moreover, Uber is reportedly
experimenting with a call center in some markets to assist non-
tech-savvy seniors with scheduling a ride. Regarding access for
individuals with disabilities, these services are already well suited
to ambulatory travelers with vision impairments. In larger cities
Uber and Lyft are working to add wheelchair accessible vehicles
to their fleet, and over time this will likely spread to smaller
markets such as Portsmouth and elsewhere in the MPO region.
Eventual integration of commercial shared mobility services into
regional transit coordination efforts could expand capacity and
possibly present cost savings. If regulatory issues can be worked
out such coordination could also benefit public transit providers
in implementing ADA paratransit service.
A u t o n o m o u s V e h i c l e s
Fully autonomous vehicles are already in field test operation in
urban environments, and several companies have announced that
they will begin selling fully automated vehicles to consumers in
the next few years. Potential advantages are myriad and include
improved safety with the removal of human error; reduced traffic
congestion as automated vehicles are able to communicate with
one another and move more efficiently on highways; improved
mobility for individuals with disabilities or the elderly who cannot
drive themselves; reduced city center parking need as
autonomous vehicles could drop off passengers downtown then
park themselves at satellite lots; and more productive use of
commuting time as drivers become passengers free to read, catch
Long Range Transportation Plan Current Trends & Future Conditions
4-18
up on email or even sleep as their vehicles drive them to work.
Some writers have even suggested autonomous vehicles will
eventually eliminate the need for public transit (Keen, 2013).
The National Highway Traffic Safety Administration (NHTSA) has
defined five levels of vehicle automation, ranging from Function-
Specific Automation (Level 1) to Full Self Driving Automation
(Level 5). Level 1 features such as cruise control have been
available for years. Level 2 features such as adaptive cruise
control with lane centering are available on higher-end cars
currently. NHTSA’s Level 3 covers features that would allow
drivers to have hands off the wheel and foot off the accelerator
much of the time, but still be available to resume control
immediately. Level 4 vehicles can perform all driving functions
under certain conditions, such as on limited access highways, but
need driver control in other settings. Level 5 vehicles are fully
autonomous on all road times and in all environmental conditions
(NHTSA, 2013).
While fully autonomous vehicles will likely be available at the high
end of the market in the next 2-3 years, realizing many of the
benefits described above will be a slow process in suburban and
rural areas that make up much of the MPO region. Many may not
be seen until the out-years of this plan or even beyond its horizon
year of 2040.
The central challenges to realizing the benefits described above
are achieving affordability and then ubiquity. Affluent non-drivers
will likely be able to benefit from fully autonomous vehicles by
2020 or soon after, but those benefits won’t be realized by lower
income groups (which make up most of the non-driving
population) until autonomous vehicles become affordable and
readily available on the pre-owned market.
Analyzing integration timelines for other such technological
advances, the Victoria Transportation Policy Institute has
projected that level of ubiquity likely in the 2040s or 2050s (VTPI,
2017). Having most if not all vehicles on the road be autonomous
is also key to realizing some of the best safety and congestion
mitigation benefits of automated vehicles, which assume all
vehicles are able to communicate with one another to achieve
optimal follow distances and driving speeds.
Development and deployment of autonomous vehicles are being
driven by the private sector. Preparing the transportation
network and local land use regulations for that deployment will
be a public endeavor that will require careful planning and
investment in the next two decades. One land-use benefit of an
all-autonomous vehicle fleet include reduced need for downtown
parking, and consequent availability for redevelopment of space
currently devoted to parking. A potential challenge will be that if
self-driving cars reduce the perceived time and cost of travel, the
distances people are willing to commute to work will increase and
encourage further sprawl development.
Identified Needs in Shared Mobility
• Pursue integration commercial shared mobility services such as Uber and Lyft with regional transit coordination efforts.
• A comprehensive assessment of planning issues related to autonomous vehicle implementation, including but not limited to changes to travel demand modeling and traffic impact analyses to account for autonomous vehicles; new infrastructure and road markings needed to support autonomous vehicles; new measures to discourage induced sprawl; and changes in parking provision.
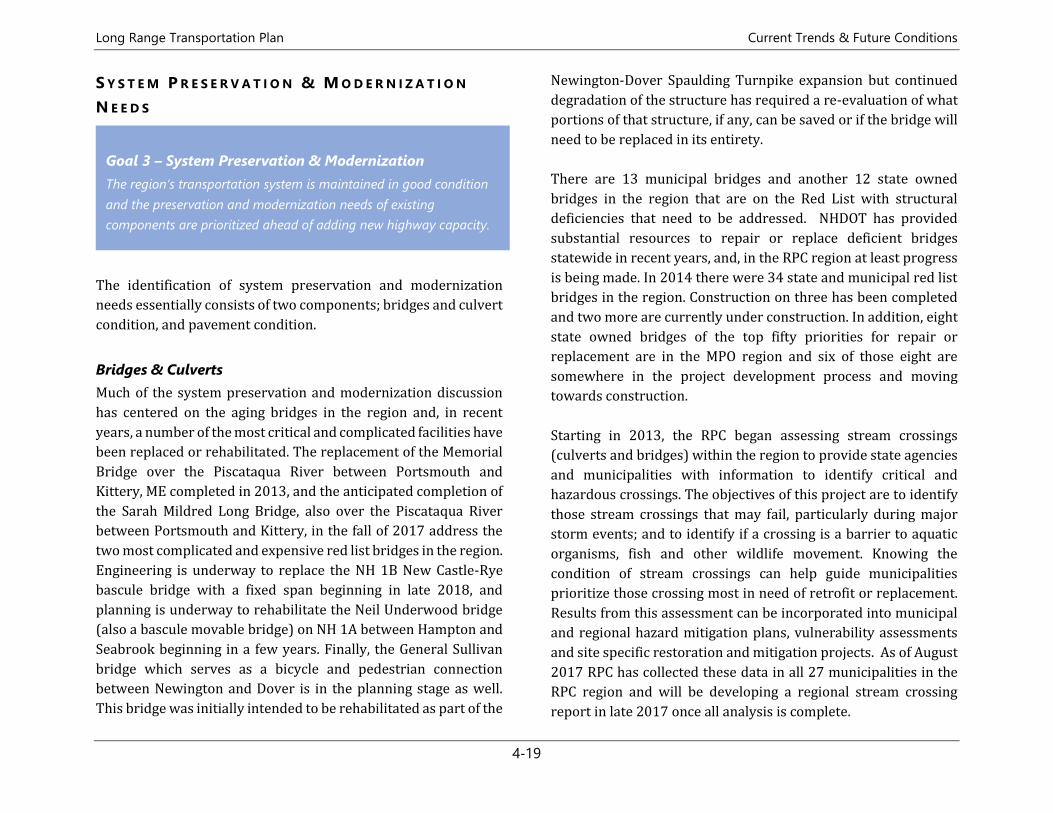
Long Range Transportation Plan Current Trends & Future Conditions
4-19
S Y S T E M P R E S E R V A T I O N & M O D E R N I Z A T I O N
N E E D S
The identification of system preservation and modernization
needs essentially consists of two components; bridges and culvert
condition, and pavement condition.
Bridges & Culverts
Much of the system preservation and modernization discussion
has centered on the aging bridges in the region and, in recent
years, a number of the most critical and complicated facilities have
been replaced or rehabilitated. The replacement of the Memorial
Bridge over the Piscataqua River between Portsmouth and
Kittery, ME completed in 2013, and the anticipated completion of
the Sarah Mildred Long Bridge, also over the Piscataqua River
between Portsmouth and Kittery, in the fall of 2017 address the
two most complicated and expensive red list bridges in the region.
Engineering is underway to replace the NH 1B New Castle-Rye
bascule bridge with a fixed span beginning in late 2018, and
planning is underway to rehabilitate the Neil Underwood bridge
(also a bascule movable bridge) on NH 1A between Hampton and
Seabrook beginning in a few years. Finally, the General Sullivan
bridge which serves as a bicycle and pedestrian connection
between Newington and Dover is in the planning stage as well.
This bridge was initially intended to be rehabilitated as part of the
Newington-Dover Spaulding Turnpike expansion but continued
degradation of the structure has required a re-evaluation of what
portions of that structure, if any, can be saved or if the bridge will
need to be replaced in its entirety.
There are 13 municipal bridges and another 12 state owned
bridges in the region that are on the Red List with structural
deficiencies that need to be addressed. NHDOT has provided
substantial resources to repair or replace deficient bridges
statewide in recent years, and, in the RPC region at least progress
is being made. In 2014 there were 34 state and municipal red list
bridges in the region. Construction on three has been completed
and two more are currently under construction. In addition, eight
state owned bridges of the top fifty priorities for repair or
replacement are in the MPO region and six of those eight are
somewhere in the project development process and moving
towards construction.
Starting in 2013, the RPC began assessing stream crossings
(culverts and bridges) within the region to provide state agencies
and municipalities with information to identify critical and
hazardous crossings. The objectives of this project are to identify
those stream crossings that may fail, particularly during major
storm events; and to identify if a crossing is a barrier to aquatic
organisms, fish and other wildlife movement. Knowing the
condition of stream crossings can help guide municipalities
prioritize those crossing most in need of retrofit or replacement.
Results from this assessment can be incorporated into municipal
and regional hazard mitigation plans, vulnerability assessments
and site specific restoration and mitigation projects. As of August
2017 RPC has collected these data in all 27 municipalities in the
RPC region and will be developing a regional stream crossing
report in late 2017 once all analysis is complete.
Goal 3 – System Preservation & Modernization
The region’s transportation system is maintained in good condition
and the preservation and modernization needs of existing
components are prioritized ahead of adding new highway capacity.
Long Range Transportation Plan Current Trends & Future Conditions
4-20
Pavement Condition
NHDOT monitors state owned highways by collecting roadway
surface conditions on a biennial basis and uses the data to
implement its Pavement Management Strategy. The Pavement
Management Strategy is based around the delineation of a tiered
roadway network, making sustainable investments, and
establishing funding priorities. In this strategy pavement
preservation actions have the highest priority on all roadways as
this is the most cost-effective method to address wear and tear.
More intensive (and expensive) actions such as rehabilitations
and reconstructions are implemented only on a case-by-case
basis, and roadways in poor condition are instead addressed
through more frequent application of paving to restore the facility
to a minimum acceptable standard.
In terms of overall condition, approximately 49% of the state
owned roadway mileage in the region is considered to be in
“Good” condition as of 2016, up from 28% in 2014. On the
opposite end of the scale, 19% of roadway mileage is in “Poor” or
“Very Poor” condition which is down from 23% in 2014. This is
largely due to the application of the current pavement strategy
over the last four years and an infusion of additional state and
federal funding dedicated to maintenance activities. Based on
NHDOT’s pavement strategy, much of the focus has been on
addressing roadways on the National Highway System (NHS)
which tend to be the heaviest traveled facilities, and as of 2016
81% of that mileage is considered to be in “Good” condition, while
only 32% of the non-NHS mileage in the region is considered to be
in “Good” condition. These represent substantial improvements
from 59% and 11% in 2014 respectively, but indicate a growing
gap between roads on and off the NHS.
Identified Needs in System Preservation and Modernization
• Continue to dedicate resources to reduce the number of Red List bridges in the region.
• Continue to work with NHDOT to ensure that bridge designs use materials promoting long lifespans and incorporate consideration for bicycle and pedestrian needs as well as the potential impacts of climate change.
• Continue to encourage the state and communities to provide adequate resources for bridge and culvert maintenance and retrofitting.
• Continue to maintain (at a minimum) the resources being dedicated to pavement preservation and reducing the miles of roadway in poor condition.
• Direct additional resources towards pavement maintenance activities on non-NHS roadways.
• Assess the functional classification and National Highway System status of roadways in the region to ensure that each is receiving the level of focus appropriate for the facilities function within the transportation system.
S A F E T Y A N D S E C U R I T Y N E E D S
Two Sources of data provide input for safety related needs in the
region; the “5 Percent Report” which lists the locations in the state
with the highest number of crashes, and the State Crash Records
Database which provides relatively detailed information
regarding the types of crashes that are occurring, who tends to be
Goal 4 – Safety & Security
The region’s transportation system is safe and secure for all users.
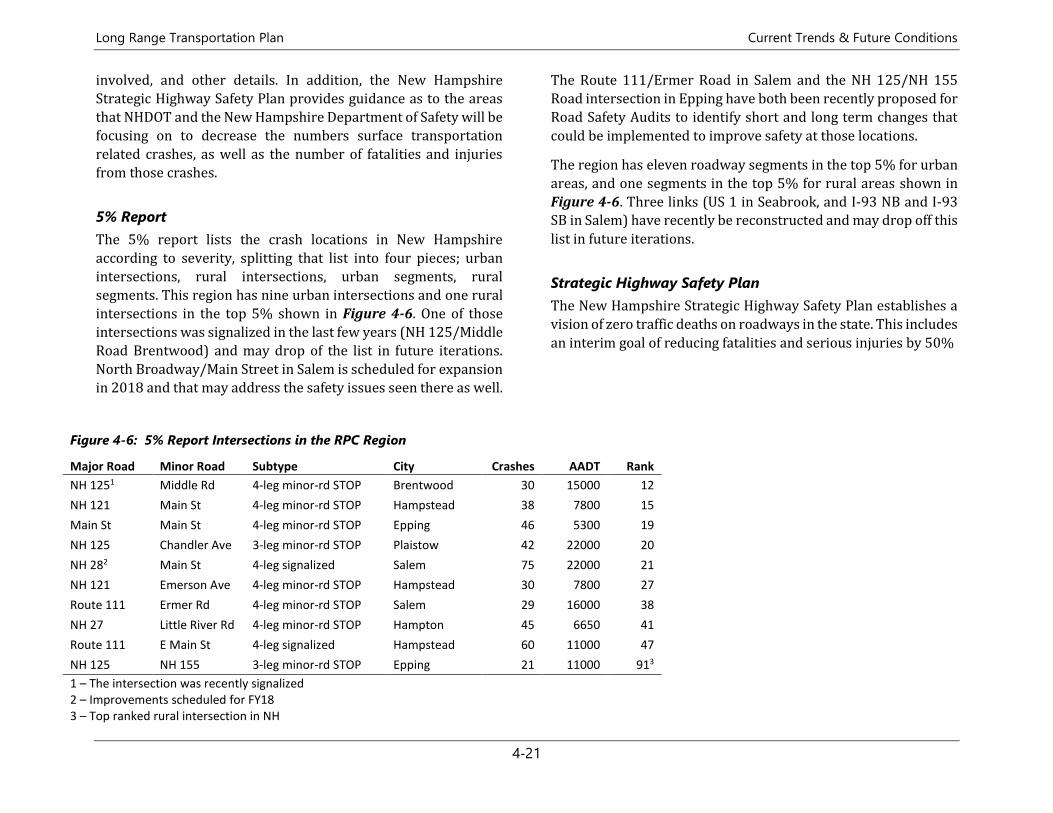
Long Range Transportation Plan Current Trends & Future Conditions
4-21
involved, and other details. In addition, the New Hampshire
Strategic Highway Safety Plan provides guidance as to the areas
that NHDOT and the New Hampshire Department of Safety will be
focusing on to decrease the numbers surface transportation
related crashes, as well as the number of fatalities and injuries
from those crashes.
5% Report
The 5% report lists the crash locations in New Hampshire
according to severity, splitting that list into four pieces; urban
intersections, rural intersections, urban segments, rural
segments. This region has nine urban intersections and one rural
intersections in the top 5% shown in Figure 4-6. One of those
intersections was signalized in the last few years (NH 125/Middle
Road Brentwood) and may drop of the list in future iterations.
North Broadway/Main Street in Salem is scheduled for expansion
in 2018 and that may address the safety issues seen there as well.
The Route 111/Ermer Road in Salem and the NH 125/NH 155
Road intersection in Epping have both been recently proposed for
Road Safety Audits to identify short and long term changes that
could be implemented to improve safety at those locations.
The region has eleven roadway segments in the top 5% for urban
areas, and one segments in the top 5% for rural areas shown in
Figure 4-6. Three links (US 1 in Seabrook, and I-93 NB and I-93
SB in Salem) have recently be reconstructed and may drop off this
list in future iterations.
Strategic Highway Safety Plan
The New Hampshire Strategic Highway Safety Plan establishes a
vision of zero traffic deaths on roadways in the state. This includes
an interim goal of reducing fatalities and serious injuries by 50%
Figure 4-6: 5% Report Intersections in the RPC Region
Major Road Minor Road Subtype City Crashes AADT Rank
NH 1251 Middle Rd 4-leg minor-rd STOP Brentwood 30 15000 12
NH 121 Main St 4-leg minor-rd STOP Hampstead 38 7800 15
Main St Main St 4-leg minor-rd STOP Epping 46 5300 19
NH 125 Chandler Ave 3-leg minor-rd STOP Plaistow 42 22000 20
NH 282 Main St 4-leg signalized Salem 75 22000 21
NH 121 Emerson Ave 4-leg minor-rd STOP Hampstead 30 7800 27
Route 111 Ermer Rd 4-leg minor-rd STOP Salem 29 16000 38
NH 27 Little River Rd 4-leg minor-rd STOP Hampton 45 6650 41
Route 111 E Main St 4-leg signalized Hampstead 60 11000 47
NH 125 NH 155 3-leg minor-rd STOP Epping 21 11000 913
1 – The intersection was recently signalized 2 – Improvements scheduled for FY18 3 – Top ranked rural intersection in NH
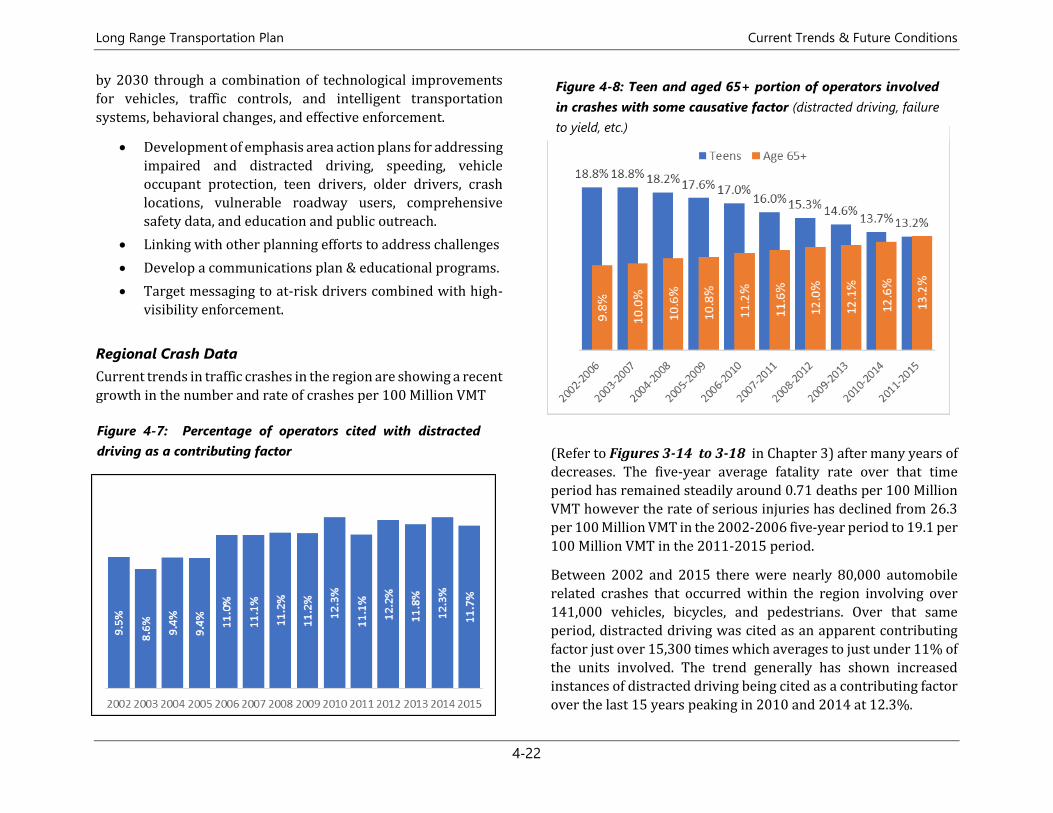
Long Range Transportation Plan Current Trends & Future Conditions
4-22
by 2030 through a combination of technological improvements
for vehicles, traffic controls, and intelligent transportation
systems, behavioral changes, and effective enforcement.
• Development of emphasis area action plans for addressing
impaired and distracted driving, speeding, vehicle
occupant protection, teen drivers, older drivers, crash
locations, vulnerable roadway users, comprehensive
safety data, and education and public outreach.
• Linking with other planning efforts to address challenges
• Develop a communications plan & educational programs.
• Target messaging to at-risk drivers combined with high-
visibility enforcement.
Regional Crash Data
Current trends in traffic crashes in the region are showing a recent
growth in the number and rate of crashes per 100 Million VMT
(Refer to Figures 3-14 to 3-18 in Chapter 3) after many years of
decreases. The five-year average fatality rate over that time
period has remained steadily around 0.71 deaths per 100 Million
VMT however the rate of serious injuries has declined from 26.3
per 100 Million VMT in the 2002-2006 five-year period to 19.1 per
100 Million VMT in the 2011-2015 period.
Between 2002 and 2015 there were nearly 80,000 automobile
related crashes that occurred within the region involving over
141,000 vehicles, bicycles, and pedestrians. Over that same
period, distracted driving was cited as an apparent contributing
factor just over 15,300 times which averages to just under 11% of
the units involved. The trend generally has shown increased
instances of distracted driving being cited as a contributing factor
over the last 15 years peaking in 2010 and 2014 at 12.3%.
Figure 4-8: Teen and aged 65+ portion of operators involved
in crashes with some causative factor (distracted driving, failure
to yield, etc.)
Figure 4-7: Percentage of operators cited with distracted
driving as a contributing factor
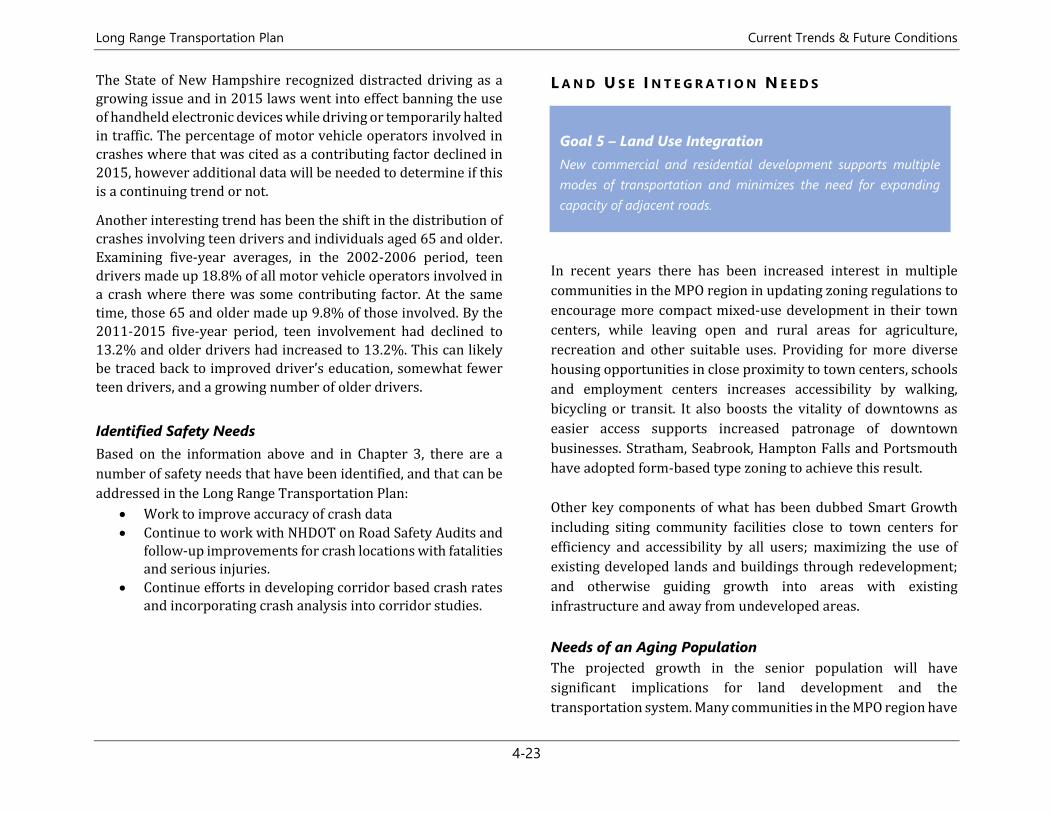
Long Range Transportation Plan Current Trends & Future Conditions
4-23
The State of New Hampshire recognized distracted driving as a
growing issue and in 2015 laws went into effect banning the use
of handheld electronic devices while driving or temporarily halted
in traffic. The percentage of motor vehicle operators involved in
crashes where that was cited as a contributing factor declined in
2015, however additional data will be needed to determine if this
is a continuing trend or not.
Another interesting trend has been the shift in the distribution of
crashes involving teen drivers and individuals aged 65 and older.
Examining five-year averages, in the 2002-2006 period, teen
drivers made up 18.8% of all motor vehicle operators involved in
a crash where there was some contributing factor. At the same
time, those 65 and older made up 9.8% of those involved. By the
2011-2015 five-year period, teen involvement had declined to
13.2% and older drivers had increased to 13.2%. This can likely
be traced back to improved driver’s education, somewhat fewer
teen drivers, and a growing number of older drivers.
Identified Safety Needs
Based on the information above and in Chapter 3, there are a
number of safety needs that have been identified, and that can be
addressed in the Long Range Transportation Plan:
• Work to improve accuracy of crash data
• Continue to work with NHDOT on Road Safety Audits and follow-up improvements for crash locations with fatalities and serious injuries.
• Continue efforts in developing corridor based crash rates and incorporating crash analysis into corridor studies.
L A N D U S E I N T E G R A T I O N N E E D S
In recent years there has been increased interest in multiple
communities in the MPO region in updating zoning regulations to
encourage more compact mixed-use development in their town
centers, while leaving open and rural areas for agriculture,
recreation and other suitable uses. Providing for more diverse
housing opportunities in close proximity to town centers, schools
and employment centers increases accessibility by walking,
bicycling or transit. It also boosts the vitality of downtowns as
easier access supports increased patronage of downtown
businesses. Stratham, Seabrook, Hampton Falls and Portsmouth
have adopted form-based type zoning to achieve this result.
Other key components of what has been dubbed Smart Growth
including siting community facilities close to town centers for
efficiency and accessibility by all users; maximizing the use of
existing developed lands and buildings through redevelopment;
and otherwise guiding growth into areas with existing
infrastructure and away from undeveloped areas.
Needs of an Aging Population
The projected growth in the senior population will have
significant implications for land development and the
transportation system. Many communities in the MPO region have
Goal 5 – Land Use Integration
New commercial and residential development supports multiple
modes of transportation and minimizes the need for expanding
capacity of adjacent roads.
Long Range Transportation Plan Current Trends & Future Conditions
4-24
permitted elderly housing and 55+ housing in the past two
decades, but typically those developments have been sited distant
from grocery stores, medical facilities, public libraries other
services. As many residents of these communities eventually age
out of driving, this siting will become a problem as residents are
not able to walk to needed destinations, and low density areas
cannot be effectively served by regular public transit. Aside from
age restricted developments, national data show retirees looking
to downsize from the 3 and 4 bedroom homes in which they raised
families to smaller more easily maintained 1-2 bedroom units
with proximity to downtowns in which they can age in place
independently. There is currently limited supply of this sort of
smaller unit. It will be important in the coming years for
communities to assess how they will need to develop in the next
10-15 years to become more Age Friendly; including housing mix
and supply, walkability of downtowns, transit access, and
community services. The AARP has developed national guidance
for such community assessments, and the Southern NH Planning
Commission is already piloting this work. A similar initiative is
needed in the near future for the RPC MPO region.
Autonomous Vehicles & Land Use
Eventual integration of fully autonomous vehicles is likely to have
significant land use implications. Key among these land allocation
for parking. Self-driving vehicles are likely to reduce the need for
downtown parking, as travelers can be dropped off and vehicles
programmed to park at a remote location until needed. This could
eventually free up land in downtowns for redevelopment, and
create new demand for satellite parking facilities. Another
potential implication is longer commute trips and sprawl, if
autonomous vehicles reduce the perceived time and convenience
cost of longer commutes.
E N E R G Y & E N V I R O N M E N T N E E D S
Stormwater Runoff, Impervious Surfaces and Water Quality:
Increasing rates of land use change in the region have had a direct
impact on declining surface water quality. According to the New
Hampshire Department of Environmental Services (NHDES), over
90 percent of water pollution in the region is caused or
attributable to stormwater runoff. The main source of this runoff
originates from impervious surfaces (e.g. parking lots, roads and
rooftops) which have nearly doubled in the last twenty years. The
best practices to preventing stormwater pollution are to minimize
stormwater runoff and to protect areas adjacent to water ways
with buffer areas.
The infrastructure that helps to move stormwater off roads,
buildings and parking lots has traditionally been constructed to
move water from these locations as quickly as possible and to
direct it into waterways. This allows for little if any removal of
pollutants or chance for water infiltration into the ground, and can
increase the potential for erosion and flooding issues. Stormwater
infrastructure is often considered forgotten infrastructure, as the
cost to construct or maintain it is often incorporated into the
construction and maintenance of roadways and parking lots.
Maintaining and retrofitting stormwater infrastructure is critical
in combating water pollution. This work will likely be expensive:
Goal 6 – Energy & Environment
The region’s transportation system is proactive in protecting
natural and historic resources; and is forward looking regarding
energy use, energy efficiency and conversion to renewable energy
sources
Long Range Transportation Plan Current Trends & Future Conditions
4-25
NHDES has estimated the RPC region’s total stormwater
infrastructure costs to be almost $37 million dollars. The cost of
protecting water quality through maintaining stormwater
infrastructure is directly tied to the Federal MS4 Stormwater
Permit for municipalities. The MS4 Permit is intended to address
and reduce stormwater pollution originating from municipally-
owned facilities and land, including local roads. The NHDOT is
require to address stormwater pollution via a similar permit.
With many roadways, both local and state, and parking lots being
located near water the maintenancnce and treatment of these
areas also has a direct impact on water quality and stormwater
runoff. The sanding and salting of paved areas during winter
month is directly attributable to the chloride and total suspended
solids (TSS) levels in waterways, leading pollutants for both
aquatic organisms and impacting drinking water sources.
Currently, New Hampshire law incentivizes private property
owners to reduce their salt use on parking lots by reducing
liability through the Green Snow Pro program. NHDOT and
municipalities have been working to reduce salt usage,
particularly near water supplies, but are often expected to provide
perfectly cleared pavement.
Groundwater is particularly impacted by increases in land use
change and imperious surfaces specifically due to the change in
recharge areas for precipitation to infiltrate into the ground.
Increases in development, wider. In 2008, U.S. Geological Survey
(USGS) released the Seacoast New Hampshire Groundwater
Availability Study, an assessment to determine the long-term
availability of groundwater in a region where groundwater is the
primary source of drinking water. The overall finding, is that there
are sufficient groundwater supplies to meet this growing demand
in the RPC region. However, the land use and other policy
decisions made at the state and municipal level could alter this
scenario. Simply put, the more impervious surfaces allowed the
greater the potential impact to water quality.
Wildlife, Habitat, and Open Space
In the RPC region there is a tremendous variety of wildlife and
habitat types due to its unique position along the coast and the
various types of wetlands, forests, grasslands and freshwater
resources found within the region’s boarders. Preserving large
areas of forests and open space are critical for sustaining wildlife.
Development of the natural landscape results in the loss of habitat
and habitat fragmentation. Fragmentation reduces the quality of
habitat by altering its size, shape and distribution, creating more
“edge” and less “interior”. The construction of new roads
increases this fragmentation unless efforts are made to connect
existing open spaces to protect critical lands.
As growth continues in the region, development is working its
way into difficult areas, those with marginal soils, adjacent to
wetlands and aquifers, and with other environmental constraints.
It was often believed that these lands would remain open space
because of the expense and difficulty to develop them. However,
these marginal lands are now being developed, particularly in
areas where water and services have been extended. For example,
when roads cross streams and rivers the structures that allow the
water pass under the road can often cause problems by changing
the shape and structure of the stream, degrading aquatic habitat,
disrupting water flows, and by restricting the movement of fish
and other wildlife (NHDES, 2008).
Amongst RPC comminutes, several of the highest priorities
identified in local master plans include protecting natural
resources for water quality protection, recreation, open space,
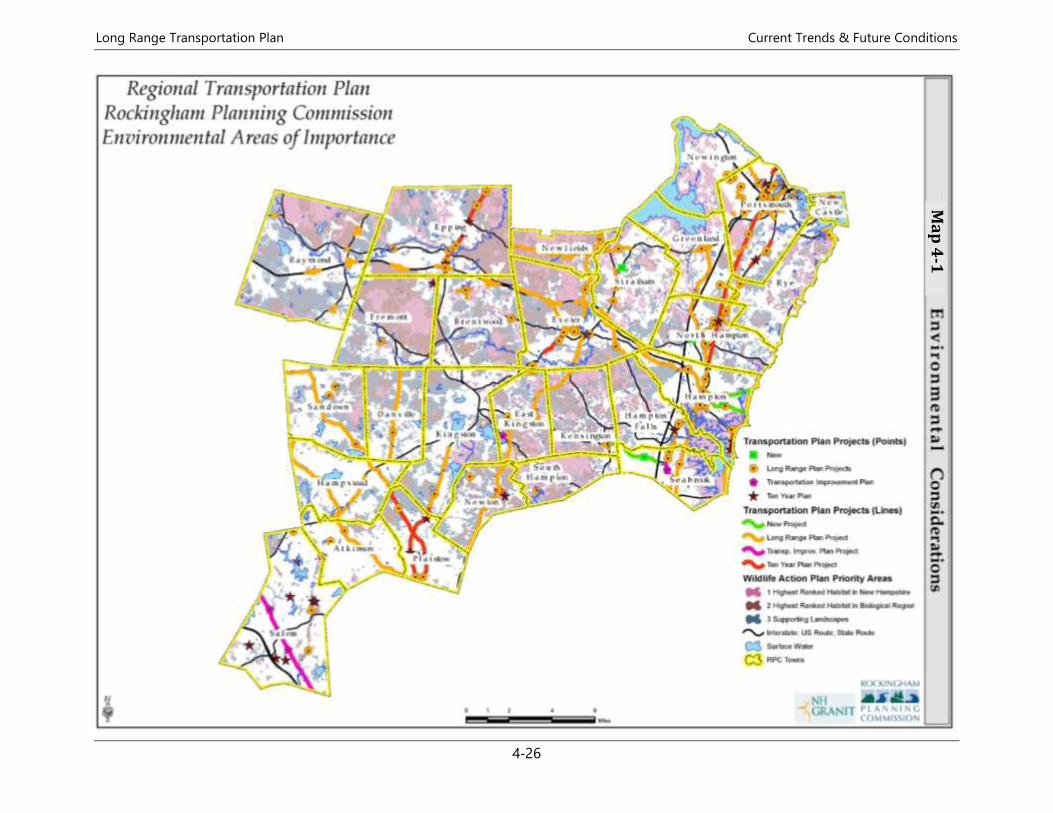
Long Range Transportation Plan Current Trends & Future Conditions
4-26
Ma
p 4
-1
Long Range Transportation Plan Current Trends & Future Conditions
4-27
and wildlife. Currently, only 14.8 percent of land in the RPC region
is permanently protected and ranges greatly by community.
A number of planning efforts have occurred in the region and the
state in recent years that can inform the transportation planning
process and aid in understanding the impacts of projects on the
natural environment. Several data sources for natural resources
exist which can provide detailed information on the location,
quality, and extent of discreet natural resource types as map
“layers”, such as wetlands, aquifers, forest areas by type, and soils.
However, there are fewer sources which look at these resource
layers in combination and assess the value of different
geographical areas based on the presence, quality, and interaction
of two or more of these resource layers based on their value as a
functioning ecosystem.
Air Quality
After nearly 20 years as part of a Non-Attainment Area for the
NAAQS, New Hampshire was designated as being in Attainment
for NOx and VOCs in July, 2015. During that time as a Non-
Attainment Area, many efforts were focused on reducing the
impacts of the transportation system on air quality through
projects and policies that reduce Vehicle Miles of Travel and
promote less polluting modes of travel. While the region no longer
needs to conduct Transportation Conformity and emissions
analysis to demonstrate that the projects being constructed and
implemented do not have a detrimental impact on air quality, air
pollutants and greenhouse gas emissions remain a concern and a
component of the over-arching RPC strategy for continuing to
maintain and improve the air quality of the region.
Energy
Transportation is the highest energy use sector in New
Hampshire, accounting for over 35 percent of total energy
consumption in the state versus approximately 28 percent
nationwide. The transportation sector also features heavy use of
fossil fuels across all modes, accounting for about 70 percent of
total U.S. oil consumption. While federal CAFÉ standards and
technological advances have significantly improved average fuel
economy over the past 40 years, low fuel prices have increased
demand for trucks and sport utility vehicles and decreased
demand for hybrid vehicles in recent years. Nationally hybrid
vehicle sales peaked in 2013 at 3.2 percent market share, falling
to 2.0 percent of new car sales by 2016. (PIRA Energy Group).
These factors, along with the resumption of annual increases in
total Vehicle Miles Traveled (VMT), raise concerns for air quality
as well as efforts to reduce regional greenhouse gas emissions.
Statewide planning efforts in climate change and energy serve as
guides for all regions of the state to work toward a more resilient
and secure energy future. The New Hampshire Climate Action
Plan (2009) and State Energy Strategy (2014) contain
recommendations to guide collaborative efforts across multiple
sectors, including transportation, towards common goals of
energy efficiency. Specifically, the New Hampshire State Energy
Strategy (2014) calls out the following needs for reducing energy
consumption related to transportation:
• Promoting better fuel economy.
• Increasing use of electric and natural gas vehicles,
including building out infrastructure to support these
technologies for consumers and fleets.
Long Range Transportation Plan Current Trends & Future Conditions
4-28
• Increasing use of transportation options beyond the single
occupant vehicle, including transit, ridesharing and active
transportation.
• Implementing smart growth strategies to reduce VMT and
efficiency.
• Exploring pricing programs to reduce VMT
Historic Resources
The MPO region is rich in American history, dating to its original
European settlement in 1623; but also extending into pre-history
with the earliest Native American sites dating back 9,000 years.
Among these resources are buildings and sites that trace the
history of not just individual towns or cities, but the State of New
Hampshire and the nation as a whole. These resources help to
define the character of our communities, and contribute to the
region’s quality of life and economic vitality.
The rapid growth and land development of the 1970s-1990s has
changed somewhat in the past decade with demographic shifts
and extensive planning and land conservation efforts; and the
economic downturn of the late 2000s temporarily reduced or
removed development pressure in many communities. While the
region as a whole is not likely to see growth on the order of the
1980s again, development pressure has returned as the economy
has rebounded from the Great Recession, and indeed it never
really slowed in communities such as Portsmouth and Seabrook.
As the supply of open land diminishes, there is also increasing
emphasis on redevelopment in some communities, with
implications for existing lower density historic development.
More communities are facing up to the dilemma: how to allow for
necessary growth while preserving traditional community
character.
In the past twenty years municipalities in the Rockingham
Planning Commission region have made strides in recognizing the
value of their historical resources – buildings, structures,
neighborhoods, and landscapes – and the role they play in
economic development and a community’s sense of itself.
Seventeen of the twenty-six communities in the RPC region
currently have Historic Resources chapters in their local master
plans. An increasing number of communities have established
Heritage Commissions to raise local awareness of the value of
Historical resources and protect those resources. Local, regional
and statewide initiatives in land conservation over the past
decade have protected thousands of acres of environmentally and
culturally valuable lands, and supported a resurgence of small
scale farming as part of a nationwide local agriculture movement.
Heritage tourism is an increasingly important component of the
regional visitor industry, not just in communities with
concentrations of high style buildings like Portsmouth and Exeter
but in other communities that have banded together to designate
Scenic Byways including the American Independence Byway, the
NH Coastal Byway and the Robert Frost/Old Stage Coach Scenic
Byway. Lastly, as communities have looked to manage sprawl
there has been increasing recognition that contemporary models
of compact, mixed use development draw largely on traditional
New England village development patterns.
Data on historic resources tend to be less complete, as few
municipalities have comprehensive and up to date historical and
cultural resource inventories. Much of the cultural resource
inventory data from the past 20 years has been compiled for
limited geographic areas as part of regulatory requirements for
permitting public infrastructure projects such as highways or
utility lines. These data are compiled at the NH Division of Historic
Resources, but most are not readily available to municipalities as
they have never been digitized and made available through
Long Range Transportation Plan Current Trends & Future Conditions
4-29
GRANIT. RPC has digitized locations of all resources listed on the
the State and National Registers of Historic Places, but this doesn’t
include resources identified through NEPA inventories as eligible
for the Register but not listed. Making these data more readily
available to municipalities and the MPO is a significant need, as is
updating municipal resource inventories to capture resources
that have become eligible for the National Register since many
inventories were last updated in the 1980s.
R E S I L I E N C Y N E E D S
New Hampshire’s roadways and transportation infrastructure are
highly susceptible to climate change impacts including increased
precipitation, rising temperatures and rising seas. These changes
in environmental conditions result in inland freshwater flooding,
flooding from daily tides, pollution entering waterways and
wetlands from increased stormwater runoff from roads and
parking lots, impacts to pavement surfaces from extreme summer
temperatures, and impacts to roadway subbases and pavement
surfaces from rising groundwater levels.
New Hampshire and its municipalities have ample opportunities
and time to prepare and adapt to a changing climate. This effort
will require understanding of recent climate projections and
assessments, applying technology and data to solve problems, and
learning from other states and communities that have successfully
implemented effective strategies and solutions.
With respect to climate change, mitigation is the reduction of
greenhouse gas (GHG) emissions achieved through energy
efficiency and conservation, use of renewable and alternative
energy sources, and CO2 storage in forests and biomass.
Incorporating the latest future projections of sea-level rise and
storm flooding into municipal planning and projects will minimize
vulnerability and prove beneficial even if future hazards turn out
to be less extreme than anticipated. Adaptation to changing
conditions means designing buildings and facilities that account
for flooding or modifying uses of land that are compatible under a
wide range of conditions. The process of adapting creates
buildings and systems that are more resilient and better able to
perform with fewer impacts.
C l i m a t e C h a n g e
Carbon dioxide (CO2), a primary contributor to the problem of
global climate change, is emitted through the combustion of fossil
fuels and the concentration of this compound has increased
substantially since the industrial revolution and continues to do
so today (EPA, 2014). The transportation sector contributes
roughly 28 percent of the total US greenhouse gas emissions each
year and is an area where we can continue to make changes to
reduce the impacts. Increased frequency and severity of storm
events over the past decade, and anticipated continuation of this
trend in the coming decades related to climate change, has
significant implications for transportation system operations,
maintenance and future investment planning. It is the
responsibility of the MPO to identify the measures that are
necessary to plan for a transportation system that is resistant to
damage from extreme weather and more resilient when weather-
Goal 7 – Resiliency
The region’s transportation system is adaptive and
resilient to climate change and natural and other hazards.
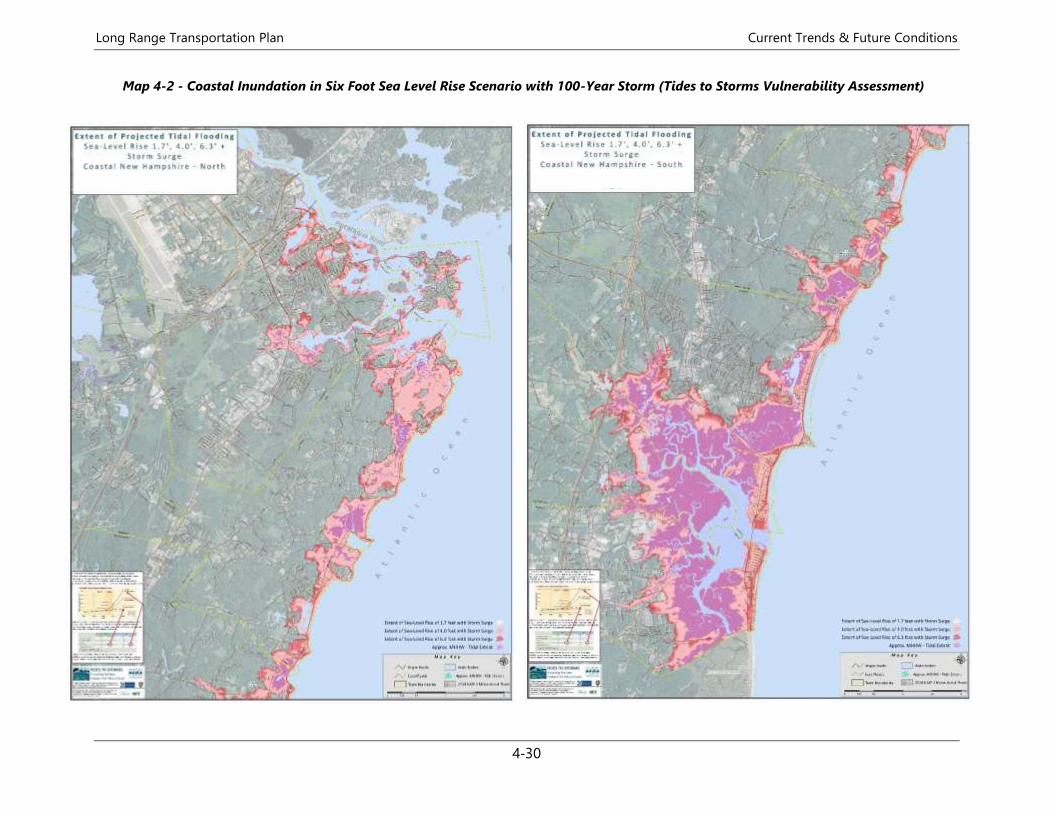
Long Range Transportation Plan Current Trends & Future Conditions
4-30
Map 4-2 - Coastal Inundation in Six Foot Sea Level Rise Scenario with 100-Year Storm (Tides to Storms Vulnerability Assessment)
Long Range Transportation Plan Current Trends & Future Conditions
4-31
related impacts do occur. The challenges that the MPO faces from
this include:
• Development of the data necessary to estimate the
vulnerability of the transportation system to increased
storm activity and sea level rise.
• Finding the funding to address specific facilities that are
vulnerable to sea level rise and increased storm activity.
Climate change can have a variety of impacts on the
transportation system of the region and coastal areas are
particularly vulnerable to those impacts. Higher temperatures can
cause problems with softening pavement and expanding bridge
joints creating stresses on the affected facilities. More intense
storm activity results in more frequent flooding causing traffic
problems as well as damage to roadways, culverts, railroads, and
bridges. Coastal inundation from storm events brings the addition
of damage from wave action and salt water.
RPC’s Tides to Storms Vulnerability Assessment (2015) examines
the impacts of flooding due to sea level rise and inundation from
storm surge. This analysis found that under the highest expected
sea level rise scenario, 100-year storm events (1 percent
probability per year) will impact over 80 miles of roadway and
bridges in the Seacoast. Map 4-2 shows the extent of these
impacts under that scenario. The impacts from this flooding are in
many of the regionally significant economic centers along the
coast and could have substantial negative effects on tourism and
the economy of the region and work needs to continue to mitigate
these issues before the problems occur.
Accommodating Future Conditions
Sea-Level Rise: Coastal Vulnerability Assessments
The Tides to Storms (RPC, 2015) and Climate Risk in the Seacoast
(RPC and SRPC, 2017) Vulnerability Assessments evaluated
impacts to the 17 coastal NH municipalities from sea-level rise of
1.4 feet, 4.0 feet and 6.3 feet, as well as these three scenarios plus
storm surge. Affected critical facilities and infrastructure,
transportation infrastructure, and natural resources were
inventoried and mapped. Reports and maps are available on the
RPC website at: http://www.rpc-nh.org/regional-community-
planning/climate-change/resources.
These assessments document sections of state roadways, and
their associated infrastructure, that are vulnerable to flooding
from sea-level rise and storm surge at the year 2100. Roadways
affected include Routes NH1A, NH1B, NH101, NH286, NH108,
and NH16; US1 and US4; and I-95.
Rising Groundwater
Researchers at the University of New Hampshire have modeled
the effects of rising groundwater and rising temperature on
pavement condition and performance [Knott, 2017]. The Knott et
al study (2017) evaluated several functional classifications of
roadway to determine the magnitude of fatigue and rutting life
reduction expected from four scenarios of sea level rise. All sites
evaluated experienced service life reduction, the magnitude and
timing of which depended on the current depth to groundwater,
the pavement structure, and the subgrade. The report suggests
the use of this assessment methodology will enable pavement
engineers to target coastal road adaptation projects effectively.
Long Range Transportation Plan Current Trends & Future Conditions
4-32
Rising groundwater levels may also result in increases in
freshwater wetlands throughout the Seacoast region which might
influence the scale and complexity of permitting requirements for
freshwater wetland, saltmarsh and riverine impacts
related to expansion and modification of existing
roadways and transportation infrastructure.
Rising Temperature
Researchers at the University of New Hampshire have
modeled the effects of rising temperature on
pavement condition and performance [Rajib, 2016].
The model results found a significant increase in
deterioration of roads resulting from projected
climate change-related temperature parameters
compared to a ‘no climate change’ scenario. The model
can be used to estimate the risk of negative impact of
such change on pavement lifecycle and performance,
and evaluate the effectiveness of various adaptation
approaches.
Spatial Variability
Analysis of climate change impacts from sea-level rise
must factor in the variability of water surface
elevations and hydraulic dynamics resulting from rising sea levels
along the Atlantic coast, tidal riverine systems and the Great Bay.
The presence of saltmarsh and freshwater wetlands in tidally
influenced areas may also effect the spatial extent of sea-level rise
as these systems act as buffers that can store large amounts of
water.
With respect to bridges, under certain scenarios bridge structures
themselves may be situated above the projected elevation of
rising sea levels but the lower lying approaches are inundated and
highly susceptible to flooding even under the lowest sea-level rise
scenarios.
With respect to culverts, coastal vulnerability
assessments report that a number of existing
freshwater culverts could be inundated by rising sea
levels. These freshwater structures were designed for
unidirectional flow, not to withstand bidirectional
tidal flow
and currents. In many instances the road surface
elevation at these culvert locations is also susceptible
to inundation. These culverts and road segments
should be considered highly vulnerable infrastructure
and prioritized for analysis and modifications.
Coastal vulnerability assessments recognize that
modifications to state roadways to adapt them to sea-
level rise impacts would also affect all connecting local
roadways, driveways and other access points. Changes
to surface elevation, orientation and location would
need to factor in all of these other connection points.
Close coordination with municipalities and affected
property owners in high risk flood areas is necessary
to plan transportation system modifications in the short-term and
long-term to respond to changing conditions as sea levels rise.
Additional Considerations and Resources
Site Specific Analyses
Site specific analyses and modeling are necessary to quantify
these various climate change impacts. For example, modeling
groundwater rise can project future hydrologic conditions but
those conditions will impact transportation assets and resources
Adaptation – adjustments in ecological, social, or economic systems in response to actual or expected climatic change and their effects or impacts. It refers to changes in processes, practices, and structures to moderate potential damages or to benefit from opportunities associated with climate change. [http://unfccc.int/focus/adaptation/items/6999.php] Resilience - a capability to anticipate, prepare for, respond to, and recover from significant multi-hazard threats with minimum damage to social well-being, the economy, and the environment. [EPA http://epa.gov/climatechange/glossary.html]
Long Range Transportation Plan Current Trends & Future Conditions
4-33
in different ways and different degrees of severity based on
factors such as: roadway and infrastructure location; roadway
and infrastructure construction and design specifications; age of a
roadway, culvert or bridge; and current condition and intensity of
use of a roadway or infrastructure.
Planning and Environmental Linkages
With respect to Planning and Environmental linkages, future
growth will further distribute roads and parking areas that serve
development across the landscape, intensifying their secondary
impacts such as increased impervious surfaces, increased
stormwater runoff and nonpoint source pollution, water quality
impairments, and habitat fragmentation. These growth-related
impacts may be magnified particularly in rural areas of the region
where thousands of acres of land have development potential and
land use and environmental regulation are implemented
primarily by local land use boards one municipality at a time.
Careful consideration of cumulative impacts especially at the
watershed scale are necessary to ensure future growth and
development maintains high water quality, protects sensitive
natural resources and habitats, and protects resources for public
health and safety such as drinking water sources.
Technical Resources
The New Hampshire Coastal Adaptation Workgroup (NH CAW) is
a collaboration of 24 organizations (state, regional, municipal,
non-profit, academia, private sector) working to ensure coastal
watershed communities are resourceful, ready and resilient to the
impacts of extreme weather and long term climate change. The
mission of the NH CAW is to assist communities in NH’s coastal
watershed to prepare for the impacts of extreme weather and long
term climate change by providing resources, facilitation, and
guidance that enhance readiness and resilience. NH CAW has
successfully secured federal funds to support research, analysis,
planning and outreach throughout the coastal watershed. Refer to
the NH CAW website for more information at
http://www.nhcaw.org/.
E C O N O M I C V I T A L I T Y N E E D S
Continued economic success in the region will rely significantly on
the quality of our infrastructure, including and especially our
transportation network. Deferred investment in transportation
infrastructure is shifting capital costs to the future and adding a
cost burden on the economy going forward – either through loss
of services from failed infrastructure or from higher fees and taxes
required to restore it.
The Regional Economic Development Center for Southern New
Hampshire (REDC) annually updates the Comprehensive
Economic Development Strategy (CEDS) for a region that includes
the 27 communities in the MPO region, the remaining ten towns
in Rockingham County plus five communities in the Greater
Nashua area. The CEDS essentially serves as the economic
development master plan for the region. The 2017 CEDS
emphasizes infrastructure investment, as well as regional
cooperation, workforce attraction and retention, affordable
housing and sustainable living (REDC, 2017)
Goal 8 – Economic Vitality
Through strategic investment, the region’s transportation system
supports an innovative and competitive 21st century economy
that connects people, goods, and communities to desired activity
and economic centers.
Long Range Transportation Plan Current Trends & Future Conditions
4-34
The goals, implementation strategies and projects included here
are largely consistent with the goals and objectives of the CEDS.
The proposals in this plan will benefit the region’s economy by
providing improved mobility through currently congested areas
of the region, improving access to employment through transit
development, improving freight flows, encouraging compact
mixed-use development and pedestrian friendly downtowns,
developing a regional trails system for residents and visitors alike,
and improving safety for tourists and other travelers on key
roadways in coastal tourism areas. Discussion and
recommendations related to transit, compact mixed-use
development and walkable communities are covered under Goals
2 & 3. Key aspects of the transportation system related to
economic development, including the freight system and
investments to support travel and tourism, are discussed below:
Freight
Goods movement continues to be a growing sector of travel in the
region as well as an important aspect of the regional and national
economy. The Freight Analysis Framework is predicting that
overall freight movement will increase by 48 percent between
2011 and 2040. Overall the share of freight carried by truck has
peaked and more goods will be shipped by all other modes. Truck
freight currently carries about 82.5 percent of all goods by weight
(KTons) but this is expected to decrease to 80.2 percent by 2040
with all other land based modes showing increased utilization.
Between 2011 and 2040 the volume of Air freight is expected to
increase by 195 percent, rail freight by 107 percent, and
multimodal freight by 109 percent. The increased volume of
freight being moved in the region brings with it a number of
issues, concerns and needs.
• Intermodal freight infrastructure - The investment in rail,
port, and connecting transportation infrastructure has been
lower than may be needed to adequately manage the expected
freight volumes. The replacement of the Sarah Mildred Long
Bridge represents one major investment in the region’s freight
system as it improves shipping access at the Port of New
Hampshire and addresses other operational needs at the Port.
Double tracking the B&M main line through New Hampshire
is another frequently cited need that would expand freight
and passenger rail capacity. A less capital intensive but still
important need is improving truck rest area facilities. The new
NHDOT State Freight Plan will identify other strategic
investments to improve the region’s freight infrastructure.
Completion of the Freight Plan is also key to maintaining
access to FHWA funding specific to freight projects.
• Heavy truck damage to roadways - Longer, heavier trucks are
damaging roadways that were not designed to manage
current allowable weights and infrastructure not designed for
the turning radii necessary for the longest trucks. New pricing
strategies are needed to ensure trucks are contributing to the
Highway Fund commensurate with their impact on the
region’s and state’s roads and bridges.
• Hauling hazardous materials - Public concern has increased
regarding the safety of moving hazardous materials through
communities on rail and roadway. This underscores the
important of public engagement in system planning and
project programming.
Long Range Transportation Plan Current Trends & Future Conditions
4-35
Travel & Tourism
The FAST Act gives new attention to the role of the transportation
system in supporting travel and tourism by adding a new national
Planning Factor focused on this area. This is particularly
appropriate for the MPO region, as coastal tourism is a major
driver of our economy. In State fiscal year 2014 over 36.6 million
visitors came to New Hampshire and directly spent approximately
$4.95 billion dollars. With secondary impacts in supply industries
and travel industry worker spending the Institute for New
Hampshire Studies at Plymouth State University estimates total
contribution of tourism to the state’s economy at $15.2 billion.
The Seacoast region generates the largest share of this revenue
among the State’s seven tourism regions, accounting for 15.4% of
direct traveler spending or $1.064 billion dollars. (PSU/NHDTTD)
In 2014 & 2015 RPC commissioned the UNH Department of
Natural Resources to conduct a visitor survey and tourism needs
assessment as part of the update to the NH Coastal Byway
Corridor Management Plan. Over 3,000 interviews were
conducted. Among the top priorities related to the transportation
system included improved information on parking availability
(69%), improving shoulders on Route 1A and Route 1B to
accommodate sharing of the road by people driving, bicycling and
walking (60%), and improved signage to recreation and historic
attractions (52%).
Given the importance of coastal tourism to the region’s economy,
it will also be critical to begin implementation of
recommendations from the 2016 Coastal Risks and Hazards
Commission report to incrementally improve the resiliency of
NH1A and NH1B and other coastal infrastructure to increasing
severe storm activity and best available projections for future sea
level rise.
P U B L I C H E A L T H N E E D S
The transportation system has implications for public health in
multiple ways. These include general transportation safety,
impacts of vehicle emissions on air quality, and the extent to
which people can access transportation to medical care. Multiple
agencies have found lack of transportation to be a significant
barrier to accessing routine health care for seniors and others in
New Hampshire unable to drive themselves. These factors have
all been discussed in the previous pages. A fourth facet of public
health impacted by the transportation system is physical activity,
and the extent to which our communities are built to support
active transportation – i.e. walking or bicycling for short trips.
An often-cited statistic is that in 1969 48 percent of school age
children typically walked or bicycled to school. In 2011 only 13
percent of that same age group walked or bicycled to school.
(National Center for Safe Routes to School). Factors in this change
include longer travel distances as communities become more
spread out, parent concern about traffic danger as traffic has
grown heavier, faster and more distracted; parent concern about
crime, and more hectic family schedules.
A public health implication of more kids being driven rather than
walking or bicycle is a decline in physical activity, which has in
turn contributes to significant increases in childhood obesity seen
Goal 9 – Public Health
The region’s transportation system is designed and built to support
safe and healthy communities, facilitate active living opportunities,
and aging in place.
Long Range Transportation Plan Current Trends & Future Conditions
4-36
over the past three decades. According to the Center for Disease
Control, in 2009 35.7% of New Hampshire adults were obese,
compared to fewer than 14% in 1960. In 2009 33% of New
Hampshire third graders were above a healthy weight, with 21%
of boys and 15% of girls obese. The National Institute of Health
has estimated the impact of weight related diseases at $147 billion
annually on the U.S. healthcare system – or about 10% of all
medical spending. Lost productivity for employers was estimated
at an additional $3.4-$6.4 billion annually.
Needs to address the MPOs Public Health goal overlap largely with
needs identified for other goals, including adoption of complete
streets policies, development of local Safe Routes to School
initiatives even in the absence of a state or federal commitment to
funding these, and expanded community transportation to ensure
access to medical are for vulnerable populations.
P L A N N I N G P R O C E S S N E E D S
As the designated MPO for its 27-community region, RPC is
responsible for carrying out the federal 3Cs metropolitan
transportation planning process. The planning process involves a
coordinated, cooperative and comprehensive effort among local,
regional, state, and federal agencies.
The MPO process consists of a number of interrelated elements
and actions centered on the development and update of the Long
Range Transportation Plan (LRTP) and the short range
Transportation Improvement Program (TIP) for the region in a
performance based planning framework. Integral to the
development of the TIP and Plan is effective public involvement
process. Addressing the anticipated needs to maintain an effective
and efficient process means both continuing to refine current
efforts as well as undertake new approaches and methods.
Work in recent years has focused on applying consistent
methodologies and coordinated efforts with neighboring New
Hampshire MPOs and NHDOT to produce consistent results. In
that regard, the MPO has worked with those regional, state, and
federal partners to develop project selection criteria and
methodologies that are consistent statewide, coordinated data
collection efforts and methods, and worked to understand the
requirements for full implementation of the performance based
planning process required by MAP-21 and the FAST Act.
A critical role of the MPO is to establish project priorities for
implementation given limited funding for investment in the
maintenance, preservation, modernization, and improvement of
transportation infrastructure. Project selection criteria and
processes have been used by the MPO for many years to quantify
and justify priorities but until recent iterations, criteria were not
consistently applied at the state level. For the 2013-2024 Ten Year
Plan development cycle, a comprehensive process and a common
set of selection criteria were created based around project
benefits and impacts as well as project readiness and support.
Variations on these criteria have been used as part of the process
ever since.
Goal 10 – Efficient & Effective Planning Process
The MPO provides an efficient and effective implementation of the
cooperative, coordinated, and continuous (3C) federal
transportation planning process that aids in the efficient and
effective implementation of projects.
Long Range Transportation Plan Current Trends & Future Conditions
4-37
There is a strong interest in extending this project prioritization
process to many types of projects at the regional and state level
across all modes of travel. To facilitate that, this process and the
selection criteria need to be further defined and refined to better
reflect the need for a strong transportation system across all
modes and scales, and that reflects local, regional, and state
priorities in the implementation of projects.
The involvement of the communities of the region is a critical
component to the success of the MPO in putting forward the
project priorities of the region. Participation in the
Transportation Advisory Committee and the MPO Policy
Committee remain at less than 100% and further efforts will be
needed to engage those that do not participate in the regional
process. There is also a need to expand the public involvement
process to include educating community leadership and
legislators about the MPO planning process and the role that the
MPO and communities play in understanding and prioritizing the
transportation needs that are addressed in the region. Work in
that regard will provide benefits in terms of greater participation
in the process as well.
With the assistance of a grant from the second Strategic Highway
Research Program (SHRP2), the implementation of performance
based planning as required under MAP-21 and the FAST Act is
currently underway in partnership with the other NH MPOs,
NHDOT, FHWA, FTA, and NHDES. The effort has produced data
and methodologies for the required performance measures as
well as a set of supplemental measures that are important to the
regions. Just as importantly, it has established a partnership
between the agencies that can be applied to addressing almost any
mutual issue.
While the process will require ongoing coordination of efforts,
there will be benefits for the content of the Plan and TIP, as well
as supporting efforts.
R E S O U R C E N E E D S
The physical state of transportation infrastructure in the region
has been a significant issue for many years and maintaining the
system in the current era of inadequate funding remains a
challenge.
Bridges are added to the NHDOT’s Red List at a faster rate than
repairs can be made to remove others from the list, as described
in the previous chapter. While NHDOT has traditionally targeted
paving/rehabilitation of 500 miles of roadway on an annual basis,
in recent years fiscal constraint has allowed less than 300 miles to
be completed per year. The gas tax and other methods of funding
the transportation system have remained static since the early
1990s and when combined with fuel efficiency gains, have not
kept pace with inflationary pressures that have raised
construction and materials costs significantly over the same
timeframe. This has resulted in significant underfunding of
investment in the transportation infrastructure.
Goal 11 – Resource Availability
Adequate and predictable funding is available to meet current and
future needs for transportation system maintenance, operation
and modernization across all modes
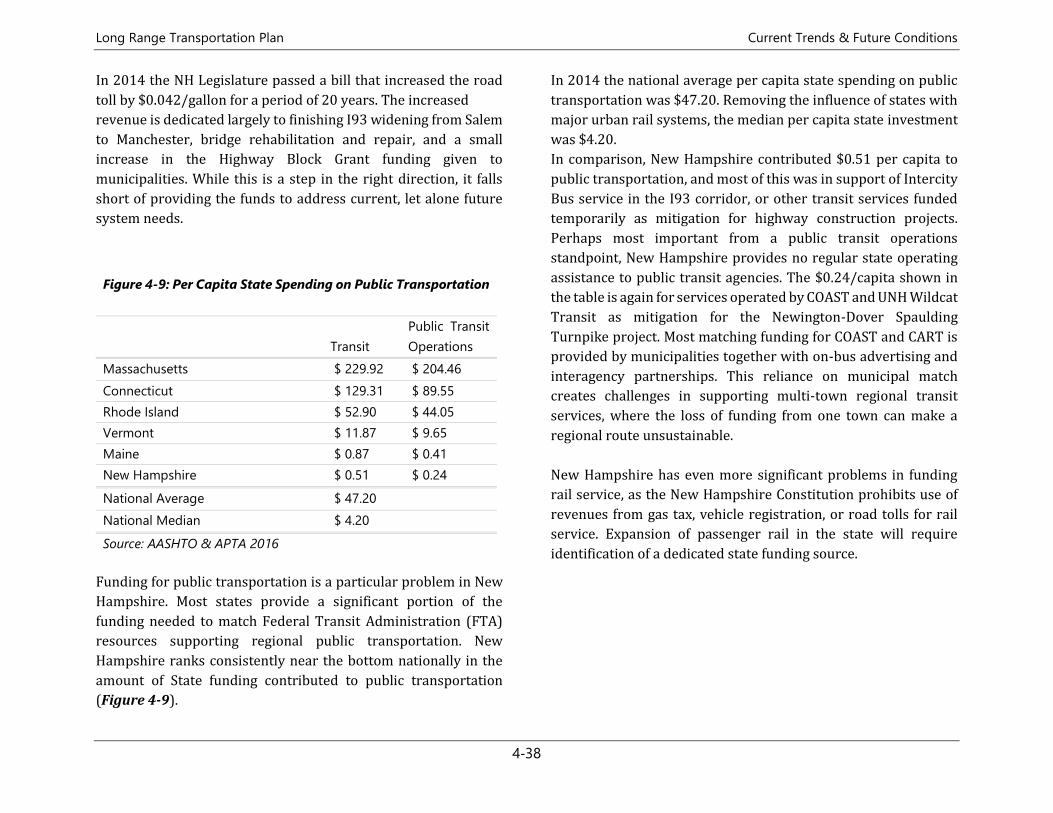
Long Range Transportation Plan Current Trends & Future Conditions
4-38
In 2014 the NH Legislature passed a bill that increased the road
toll by $0.042/gallon for a period of 20 years. The increased
revenue is dedicated largely to finishing I93 widening from Salem
to Manchester, bridge rehabilitation and repair, and a small
increase in the Highway Block Grant funding given to
municipalities. While this is a step in the right direction, it falls
short of providing the funds to address current, let alone future
system needs.
Funding for public transportation is a particular problem in New
Hampshire. Most states provide a significant portion of the
funding needed to match Federal Transit Administration (FTA)
resources supporting regional public transportation. New
Hampshire ranks consistently near the bottom nationally in the
amount of State funding contributed to public transportation
(Figure 4-9).
In 2014 the national average per capita state spending on public
transportation was $47.20. Removing the influence of states with
major urban rail systems, the median per capita state investment
was $4.20.
In comparison, New Hampshire contributed $0.51 per capita to
public transportation, and most of this was in support of Intercity
Bus service in the I93 corridor, or other transit services funded
temporarily as mitigation for highway construction projects.
Perhaps most important from a public transit operations
standpoint, New Hampshire provides no regular state operating
assistance to public transit agencies. The $0.24/capita shown in
the table is again for services operated by COAST and UNH Wildcat
Transit as mitigation for the Newington-Dover Spaulding
Turnpike project. Most matching funding for COAST and CART is
provided by municipalities together with on-bus advertising and
interagency partnerships. This reliance on municipal match
creates challenges in supporting multi-town regional transit
services, where the loss of funding from one town can make a
regional route unsustainable.
New Hampshire has even more significant problems in funding
rail service, as the New Hampshire Constitution prohibits use of
revenues from gas tax, vehicle registration, or road tolls for rail
service. Expansion of passenger rail in the state will require
identification of a dedicated state funding source.
Figure 4-9: Per Capita State Spending on Public Transportation
Transit
Public Transit
Operations
Massachusetts $ 229.92 $ 204.46
Connecticut $ 129.31 $ 89.55
Rhode Island $ 52.90 $ 44.05
Vermont $ 11.87 $ 9.65
Maine $ 0.87 $ 0.41
New Hampshire $ 0.51 $ 0.24
National Average $ 47.20
National Median $ 4.20
Source: AASHTO & APTA 2016
Long Range Transportation Plan Constrained Plan
5-1
5. The Constrained Transportation Plan
This chapter contains the fiscally constrained project list for the Long Range Transportation Plan.
P R O J E C T S A N D F I N A N C E S
For purposes of implementing the provisions of the Moving Ahead
for Progress in the 21st Century Act (MAP-21), and its successor,
Fixing America’s Surface Transportation (FAST) Act, the Federal
Highway Administration (FHWA), and the Federal Transit
Administration (FTA) jointly issued revised planning regulations
governing the development of the Long Range Transportation
Plans (the Plan) and Transportation Improvement Programs for
urbanized areas. These regulations are designed to ensure that
metropolitan transportation planning and programming are
adequate and that the areas are eligible for Federal highway and
transit funds. One part of the planning regulations requires that
the Plan include a financial plan “that demonstrates how the
adopted transportation plan can be implemented” and provides
supporting regulations in 23 CFR Part 450.324(g)(11):
(i) For purposes of transportation system operations and
maintenance, the financial plan shall contain system-level
estimates of costs and revenue sources that are reasonably
expected to be available to adequately operate and maintain
Federal-aid highways (as defined by 23 U.S.C. 101(a)(5))
and public transportation (as defined by title 49 U.S.C.
Chapter 53).
(ii) For the purpose of developing the metropolitan
transportation plan, the MPO, public transportation
operator(s), and State shall cooperatively develop estimates
of funds that will be available to support metropolitan
transportation plan implementation, as required under
§450.314(a). All necessary financial resources from public
and private sources that are reasonably expected to be
made available to carry out the transportation plan shall be
identified.
(iii) The financial plan shall include recommendations on any
additional financing strategies to fund projects and
programs included in the metropolitan transportation plan.
In the case of new funding sources, strategies for ensuring
their availability shall be identified.
(iv) In developing the financial plan, the MPO shall take into
account all projects and strategies proposed for funding
under title 23 U.S.C., title 49 U.S.C. Chapter 53 or with other
Federal funds; State assistance; local sources; and private
participation. Revenue and cost estimates that support the
metropolitan transportation plan must use an inflation
rate(s) to reflect “year of expenditure dollars,” based on
reasonable financial principles and information, developed
cooperatively by the MPO, State(s), and public
transportation operator(s).
(v) For the outer years of the metropolitan transportation plan
(i.e., beyond the first 10 years), the financial plan may reflect
aggregate cost ranges/cost bands, as long as the future
funding source(s) is reasonably expected to be available to
support the projected cost ranges/cost bands.
(vi) For nonattainment and maintenance areas, the financial
plan shall address the specific financial strategies required
Long Range Transportation Plan Constrained Plan
5-2
to ensure the implementation of TCMs (Transportation
Control Measures) in the applicable SIP.
(vii) For illustrative purposes, the financial plan may include
additional projects that would be included in the adopted
transportation plan if additional resources beyond those
identified in the financial plan were to become available.
(viii) In cases that the FHWA and the FTA find a metropolitan
transportation plan to be fiscally constrained and a revenue
source is subsequently removed or substantially reduced
(i.e., by legislative or administrative actions), the FHWA and
the FTA will not withdraw the original determination of
fiscal constraint; however, in such cases, the FHWA and the
FTA will not act on an updated or amended metropolitan
transportation plan that does not reflect the changed
revenue situation.
A N T I C I P A T E D R E V E N U E S
Revenues expected to be available for transportation
improvement projects were estimated utilizing data from the
2017-2020 Transportation Improvement Program (TIP) and
State Transportation Improvement Program (STIP), adopted in
December 2016, as well as the financial plan from the 2017-2026
State Ten Year Plan approved by the Legislature and signed by the
Governor in the summer of 2016. Those documents provided the
total funding estimates for FHWA and FTA apportioned funds,
State funding sources, and Local (and other) resources for
projects in the region. Also included are Toll Credits being utilized
on transportation projects, GARVEE bonds and TIFIA funds for I-
93 and the major infrastructure projects, Turnpike funds, as well
as revenues from the recent four cent increase in the state road
toll. Beyond 2026, revenues are projected based on the expected
trend in Federal (small annual increase) and State (flat future
year) revenues. This fiscal constraint documentation details the
Federal, State, and Local/other resources expected to be available
for the duration of the Plan and is included in this document as
Figure 5-1.
Figure 5.2 shows projections of Federal Transit Administration
Section 5307 Urban Formula funding anticipated to be available
to COAST and CART, the two public transit agencies in the region.
Allowable uses for Section 5307 differ based on the size of the
Census-defined Urbanized Area (UZA) in which a transit system
operates. In Urbanized Areas with population between 50,000
and 200,000 (Small UZAs), Section 5307 funding may be used for
operating expense (at a 50% federal/50% non-federal match
split) as well as capital expenses (at an 80% federal/20% non-
federal match split). In Urbanized Areas over 200,000 in
population (Large UZAs), Section 5307 funding may only be used
for capital expenses (at an 80% federal/20% non-federal match
split). Non-federal funding is typically drawn from municipalities
in New Hampshire, but may also include state, private sector, and
other sources. Both systems receive funds based on the New
Hampshire portion of the Boston Urbanized Area, which may be
used only for capital expenses. COAST also receives funding based
on apportionments to the Dover-Rochester and Portsmouth
Urbanized Areas, which may be used for either capital or
operating expenses. CART also receives Section 5307 funding
based on the apportionment to the Derry-Londonderry-Windham
segment of the Nashua Urbanized Area, which may be used for
either capital or operating expenses. Beyond apportionments for
FY2017-FY2020 identified in the FAST Act, future allocations are
forecast to increase 1.5% annually. The Plan anticipates that the
two transit systems will provide service levels that can be
supported by this level of funding, including continuation of
existing service and proposed service expansions. Although the
plan is constrained on an annual basis by available federal
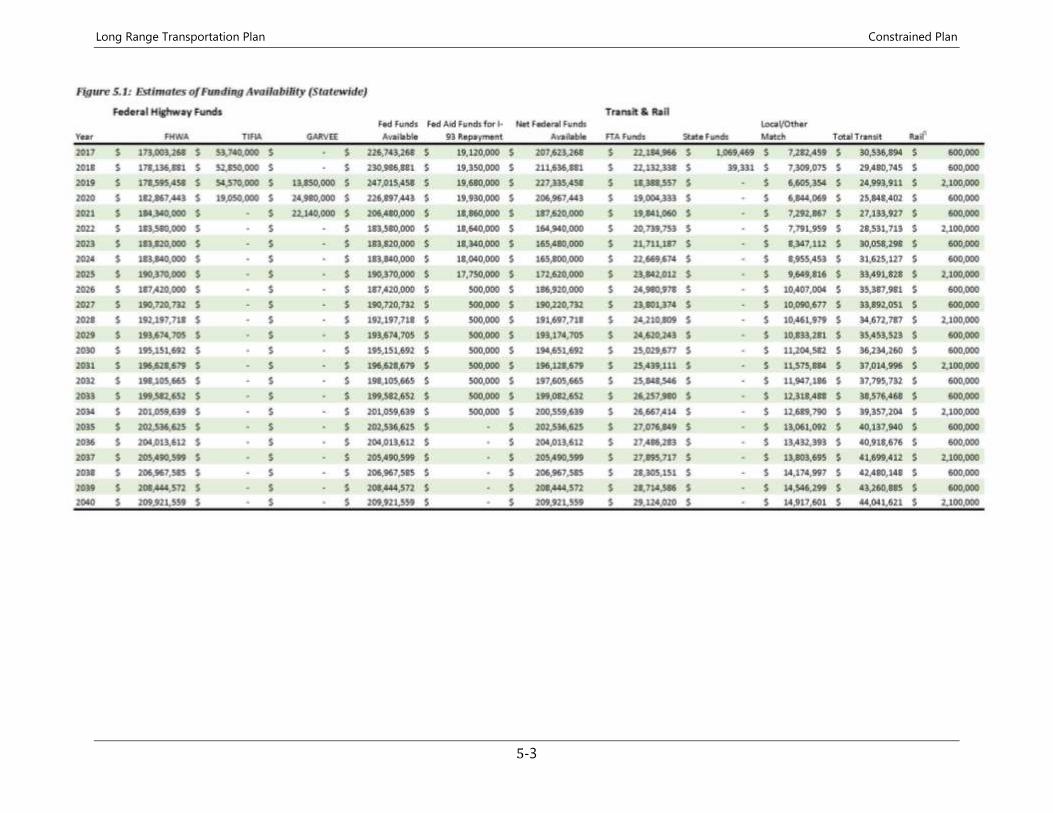
Long Range Transportation Plan Constrained Plan
5-3
Figure 5.1
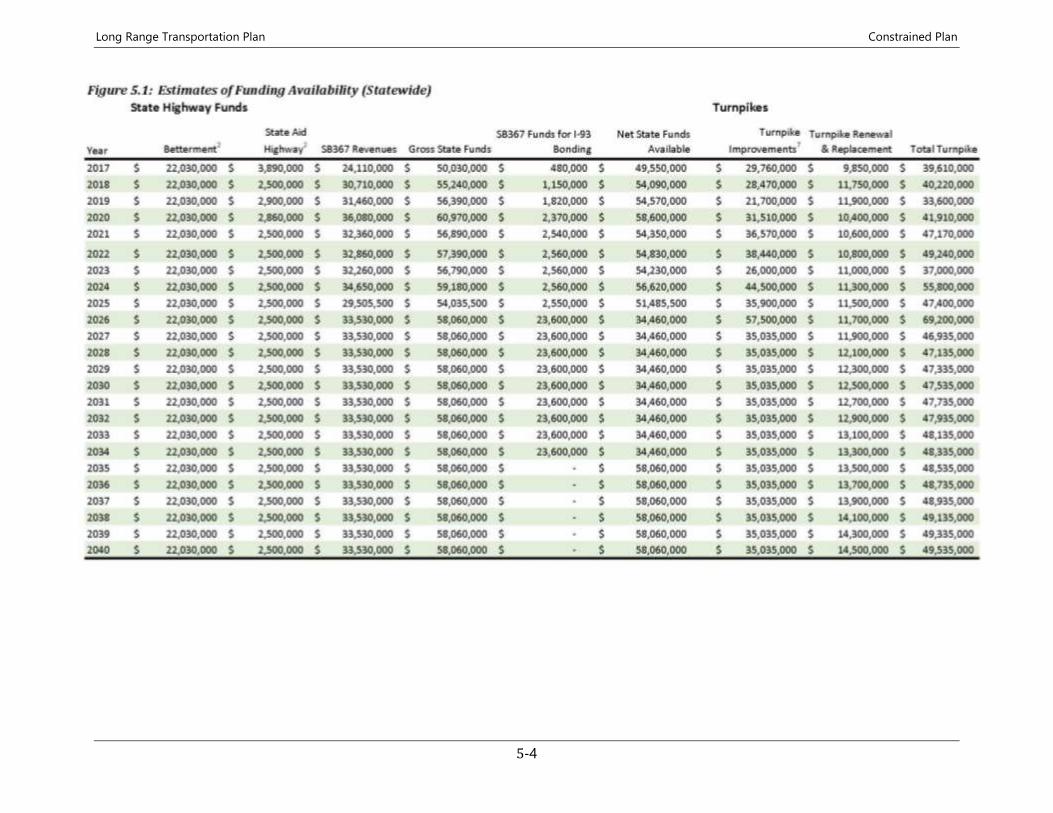
Long Range Transportation Plan Constrained Plan
5-4
Figure 5.1 Continued
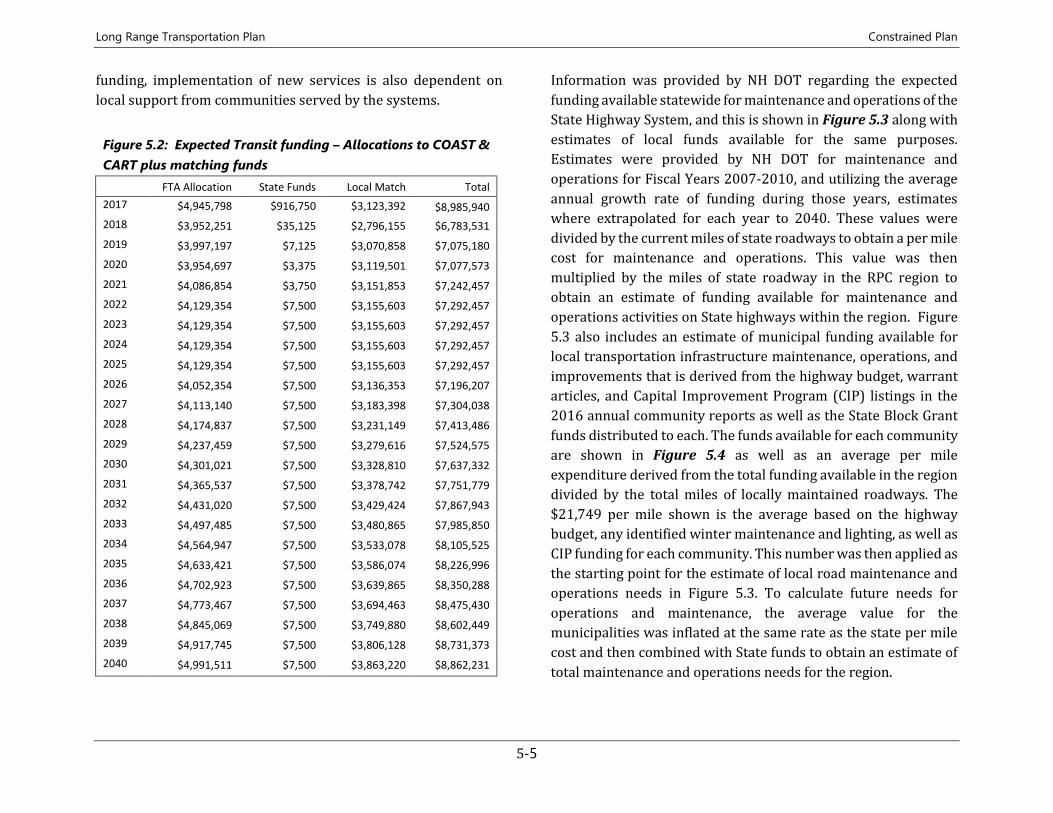
Long Range Transportation Plan Constrained Plan
5-5
funding, implementation of new services is also dependent on
local support from communities served by the systems.
Information was provided by NH DOT regarding the expected
funding available statewide for maintenance and operations of the
State Highway System, and this is shown in Figure 5.3 along with
estimates of local funds available for the same purposes.
Estimates were provided by NH DOT for maintenance and
operations for Fiscal Years 2007-2010, and utilizing the average
annual growth rate of funding during those years, estimates
where extrapolated for each year to 2040. These values were
divided by the current miles of state roadways to obtain a per mile
cost for maintenance and operations. This value was then
multiplied by the miles of state roadway in the RPC region to
obtain an estimate of funding available for maintenance and
operations activities on State highways within the region. Figure
5.3 also includes an estimate of municipal funding available for
local transportation infrastructure maintenance, operations, and
improvements that is derived from the highway budget, warrant
articles, and Capital Improvement Program (CIP) listings in the
2016 annual community reports as well as the State Block Grant
funds distributed to each. The funds available for each community
are shown in Figure 5.4 as well as an average per mile
expenditure derived from the total funding available in the region
divided by the total miles of locally maintained roadways. The
$21,749 per mile shown is the average based on the highway
budget, any identified winter maintenance and lighting, as well as
CIP funding for each community. This number was then applied as
the starting point for the estimate of local road maintenance and
operations needs in Figure 5.3. To calculate future needs for
operations and maintenance, the average value for the
municipalities was inflated at the same rate as the state per mile
cost and then combined with State funds to obtain an estimate of
total maintenance and operations needs for the region.
Figure 5.2: Expected Transit funding – Allocations to COAST &
CART plus matching funds
FTA Allocation State Funds Local Match Total
2017 $4,945,798 $916,750 $3,123,392 $8,985,940
2018 $3,952,251 $35,125 $2,796,155 $6,783,531
2019 $3,997,197 $7,125 $3,070,858 $7,075,180
2020 $3,954,697 $3,375 $3,119,501 $7,077,573
2021 $4,086,854 $3,750 $3,151,853 $7,242,457
2022 $4,129,354 $7,500 $3,155,603 $7,292,457
2023 $4,129,354 $7,500 $3,155,603 $7,292,457
2024 $4,129,354 $7,500 $3,155,603 $7,292,457
2025 $4,129,354 $7,500 $3,155,603 $7,292,457
2026 $4,052,354 $7,500 $3,136,353 $7,196,207
2027 $4,113,140 $7,500 $3,183,398 $7,304,038
2028 $4,174,837 $7,500 $3,231,149 $7,413,486
2029 $4,237,459 $7,500 $3,279,616 $7,524,575
2030 $4,301,021 $7,500 $3,328,810 $7,637,332
2031 $4,365,537 $7,500 $3,378,742 $7,751,779
2032 $4,431,020 $7,500 $3,429,424 $7,867,943
2033 $4,497,485 $7,500 $3,480,865 $7,985,850
2034 $4,564,947 $7,500 $3,533,078 $8,105,525
2035 $4,633,421 $7,500 $3,586,074 $8,226,996
2036 $4,702,923 $7,500 $3,639,865 $8,350,288
2037 $4,773,467 $7,500 $3,694,463 $8,475,430
2038 $4,845,069 $7,500 $3,749,880 $8,602,449
2039 $4,917,745 $7,500 $3,806,128 $8,731,373
2040 $4,991,511 $7,500 $3,863,220 $8,862,231
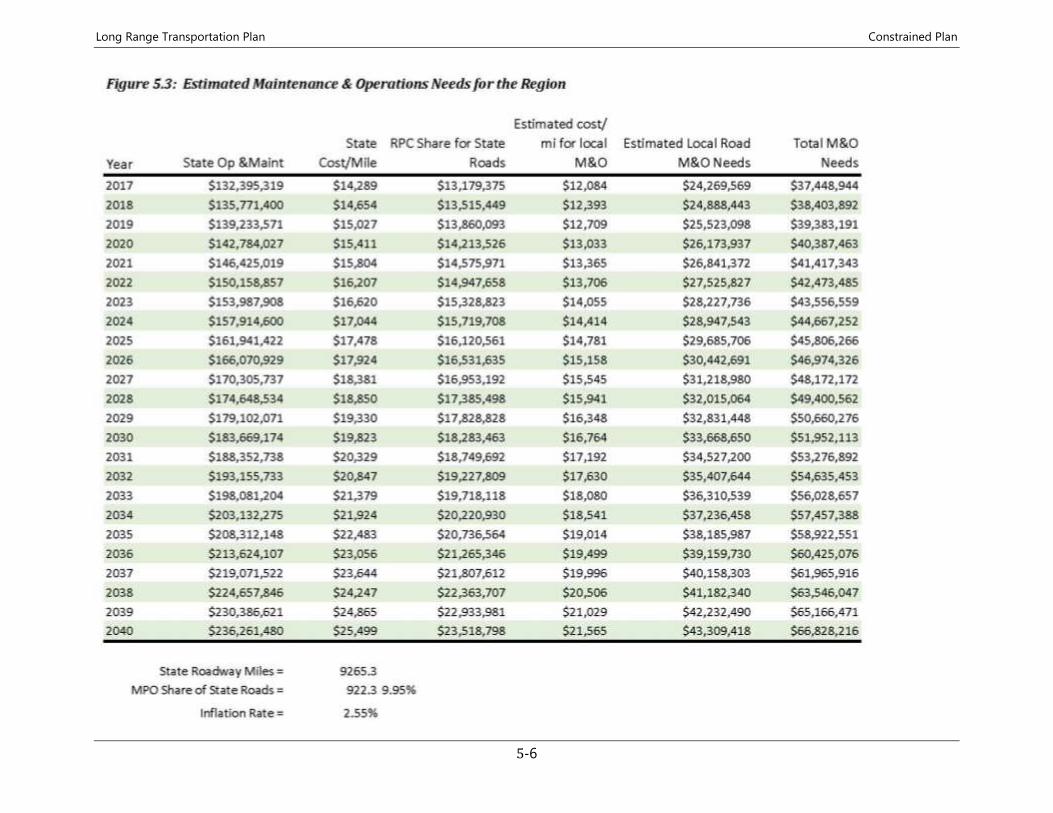
Long Range Transportation Plan Constrained Plan
5-6
Figure 5.3
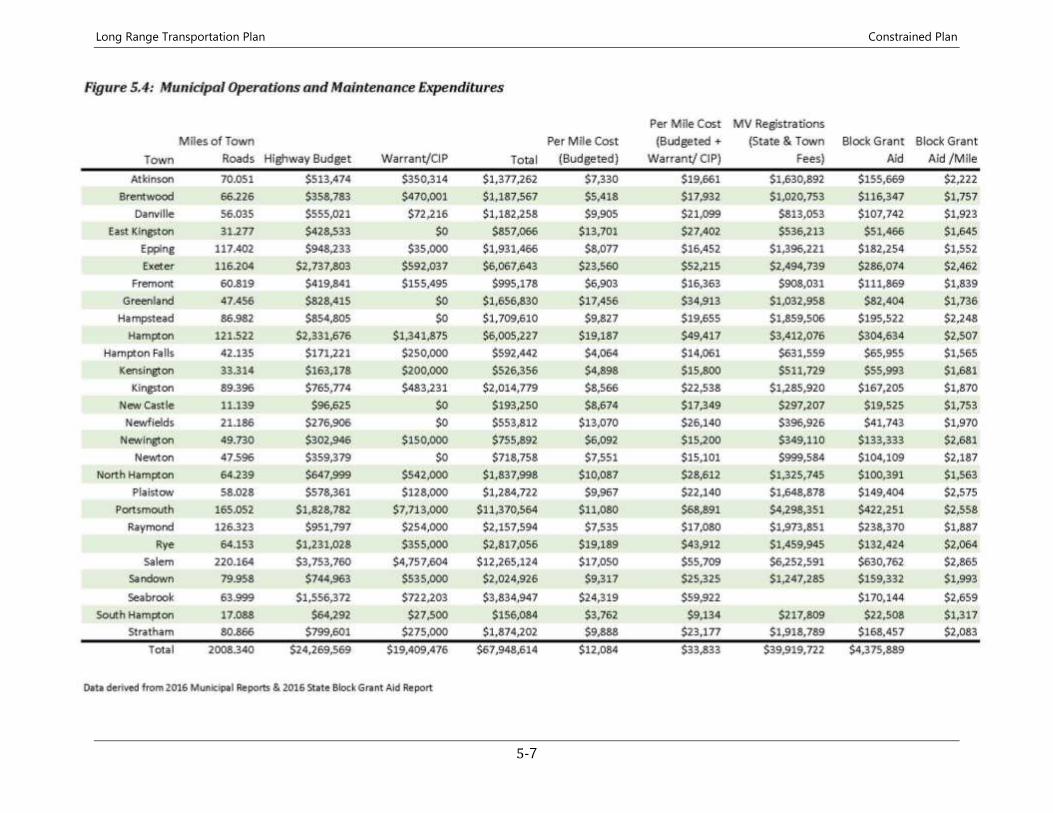
Long Range Transportation Plan Constrained Plan
5-7
Figure 5.4
Long Range Transportation Plan Constrained Plan
5-8
A N T I C I P A T E D C O S T S
The transportation projects included in the Long Range Plan
encompass all of those in the 2017-2020 Transportation
Improvement Program (TIP), The 2017-2026 State Ten Year Plan,
and other project needs identified by communities, transit
agencies, as well as the RPC. These projects are divided into two
groups for inclusion in the LRTP to separate those in the TIP from
the other proposals.
Project costs for the Transportation Improvement Program are
taken directly from the year of expenditure inflated values
included in the 2017-2020 Transportation Improvement Program
(TIP) as of Amendment #2. As the State of New Hampshire does
not sub-allocate funds to the MPOs for programming the TIPs, the
assumption is that since the State Transportation Improvement
Program (STIP) is fiscally constrained, and the MPO TIP is directly
derived from that document, it must therefore be fiscally
constrained as well. A similar method is used to determine
anticipated regional revenues and costs for the remainder of the
State Ten Year Plan period (2021-2026) and the project costs
included, are taken directly from that document and are inflated
to year of construction dollars.
While the financial picture for the remainder of the Plan is less
clear than that of the TIP and the Ten Year Plan portion, the costs
associated with the listed projects are within the estimates of
funding available to the region based on the methodology
described, and based on the assumption that the State Ten Year
Plan is fiscally constrained and that all the projects listed for the
MPO region will be constructed within that timeframe. Given the
information available from NH DOT regarding the funds available
within the Ten Year Plan, and estimates of funding available in the
later years of the plan, it is expected that the current list of
projects is financially constrained assuming that there is some
growth in revenues during the period of the Long Range Plan.
Figure 5.5 integrates the information included in Figure 5.1
through 5.4 into a summary of projected total funding available
each year for the region, as well as anticipated expenditures based
on current project programming. Figure 5.5 develops an RPC
share of funding based on an average of the region’s percentage of
New Hampshire’s population (14.45%) and lane miles of roadway
(12.4%) for an average value of 13.3%. Turnpike funding is
calculated somewhat differently as the RPC region has a greater
share of Turnpike lane miles (28.6%) and that share is used from
2027-2040. Additionally, it is assumed that the amount of funding
available to the RPC is equal to the amount programmed in the TIP
for the RPC region for years 2017-2020, and in the Ten Year Plan
for years 2021-2026. This means that the percentage of funding
allocated to the region will vary more through that time period.
After 2026, the RPC share is constrained to the calculated 13.3%
rate and 28.6% of turnpike funds. Once expenses are removed, the
revenues must balance annually with costs so that the region is
not spending more funding than is anticipated to be available in a
given year.
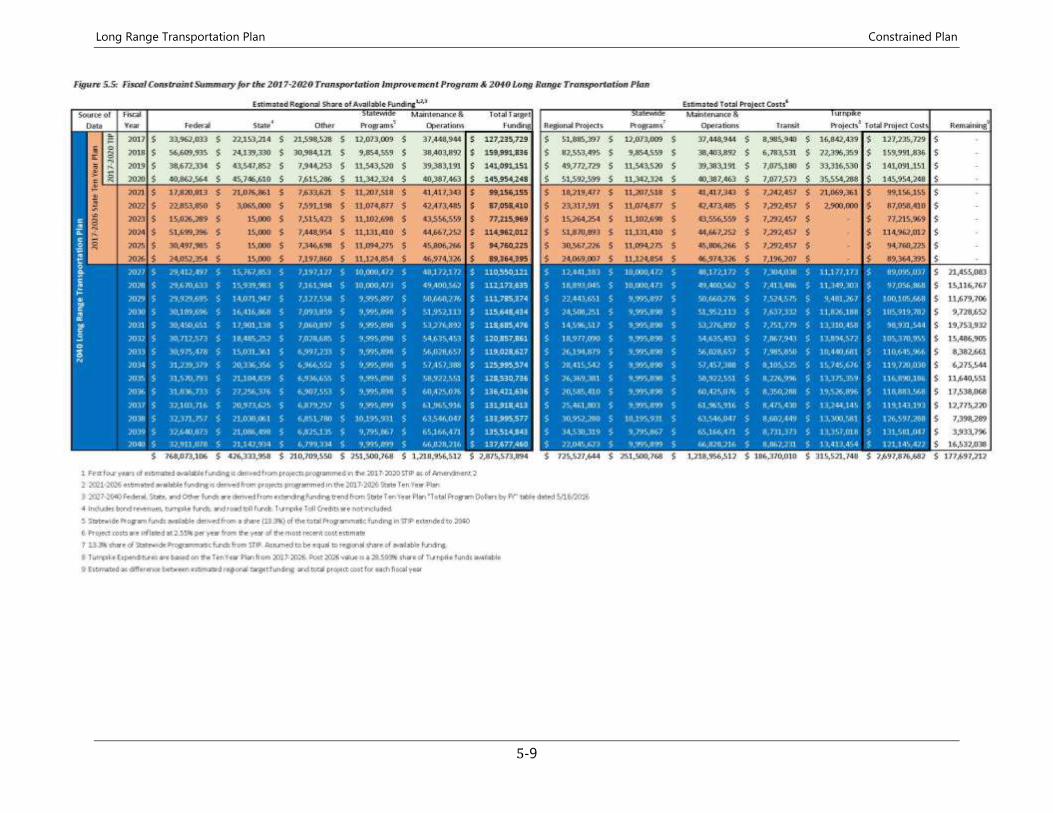
Long Range Transportation Plan Constrained Plan
5-9
Figure 5.5
Long Range Transportation Plan Constrained Plan
5-10
F I S C A L L Y C O N S T R A I N E D P R O J E C T S L I S T S
The projects for the 2040 Long Range Plan are divided into two
tables. The first is the 2017-2020 Transportation Improvement
Program (TIP), while the second contains all of the projects in
the years after the TIP (2021-2040). Each of these tables is
described in more detail below.
T R A N S P O R T A T I O N I M P R O V E M E N T P R O G R A M
( T I P )
The Transportation Improvement Program (TIP) encompasses
the first four years of the Plan (2017-2020) and only those
projects that are committed to be implemented can be listed. For
that reason, the scope of the project is generally well defined, and
include cost estimates are more detailed and accurate for the
work that is anticipated. TIP projects are shown in detail in Figure
5.6 and Map 5.1. The TIP is organized alphabetically by project
name, and the listing for each includes the location, scope of work,
Clean Air Act (CAA) code, funding category, phases included, and
funding listed by fiscal year and by source. The costs of the
projects are year-of-expenditure estimates taken directly from
the NH DOT database for the 2017-2020 STIP and the RPC 2017-
2020 TIP. Project costs for years 2017 and 2018 are uninflated,
while those for 2019 and 2020 are inflated at 2.55% per year
T R A N S P O R T A T I O N P L A N P R O J E C T S
Those projects not in the 2017-2020 TIP are listed in the
Transportation Plan project listing which covers the years from
2021 to 2040. As these projects are less well developed than
those projects in the TIP, the information available regarding the
scope and cost is less definite. The project list as detailed in Figure
5.7, includes the RPC assigned project number, the community
that the project is occurring in, project rank, years for which funds
are programmed, and cost by project phase. In addition, the first
year of construction is listed to indicate when the project is
estimated to begin that phase of work. These projects are shown
on Map 5.2. While some costs have a basis in a corridor study or
other engineers estimates, most are simply order of magnitude
estimates of the construction (CON) costs of each project as well
as considerations for preliminary engineering (PE), right-of-way
(ROW), and Other costs.
U N F U N D E D P R O J E C T S
There are a number of projects in the Plan project listing that
have no cost estimates associated with them. These are projects
for which no cost estimate is available, the scope is not
determined, or the need for the project is unclear. These projects
are included for Illustrative purposes only. In the case of the
bridge projects, no estimate has been produced either by the
community or the NH DOT Bridge Section. The remaining
projects have either no estimate available or questions regarding
their scope, purpose, or ultimate need. The projects are:
• 6153006 – Exeter: Pedestrian improvements linking Amtrak
station and downtown.
• 6153007 – Exeter: Washington St Traffic Calming
• 6001003 – Exeter to Newton: NH 108 Shoulder widening
• 6167002 – Fremont: Scribner Rd Bridge
Rehab/Replacement
• 6187001 – Greenland: Truck Stop Electrification
• 6187002 – Greenland: Capacity Improvements NH 33
• 6001004 – Hampstead to Plaistow: NH 121A Shoulder
widening
• 6001005 – Hampstead to Sandown: NH 121A Shoulder
widening
• 6197003 – Seabrook-Hampton: Replace NH 1A Bridge
• 6197007 – Hampton: Service Road parallel to US 1
Long Range Transportation Plan Constrained Plan
5-11
• 6327001 – Newfields: New Road Bridge Replace/
Rehabilitation
• 6341003 – Newton: NH 108 Shoulders
• 6375002 – Plaistow: MBTA Extension
• 6001009 – Atkinson to Plaistow: NH 121 Safety
Improvements
• 6379009 – Portsmouth: New travel corridor paralleling
Islington Street
• 6399002 – Salem: Emerson Way Bridge Replacement
• 6399003 – Salem: Haverhill Road Bridge Replacement
• 6399005 – Salem: Lawrence Road bridge rehabilitation
• 6409020 – Seabrook: NH 107 Capacity Expansion
MPO Staff will continue to work with the DOT and communities
to generate estimates for them as well as determine their scope
and need.
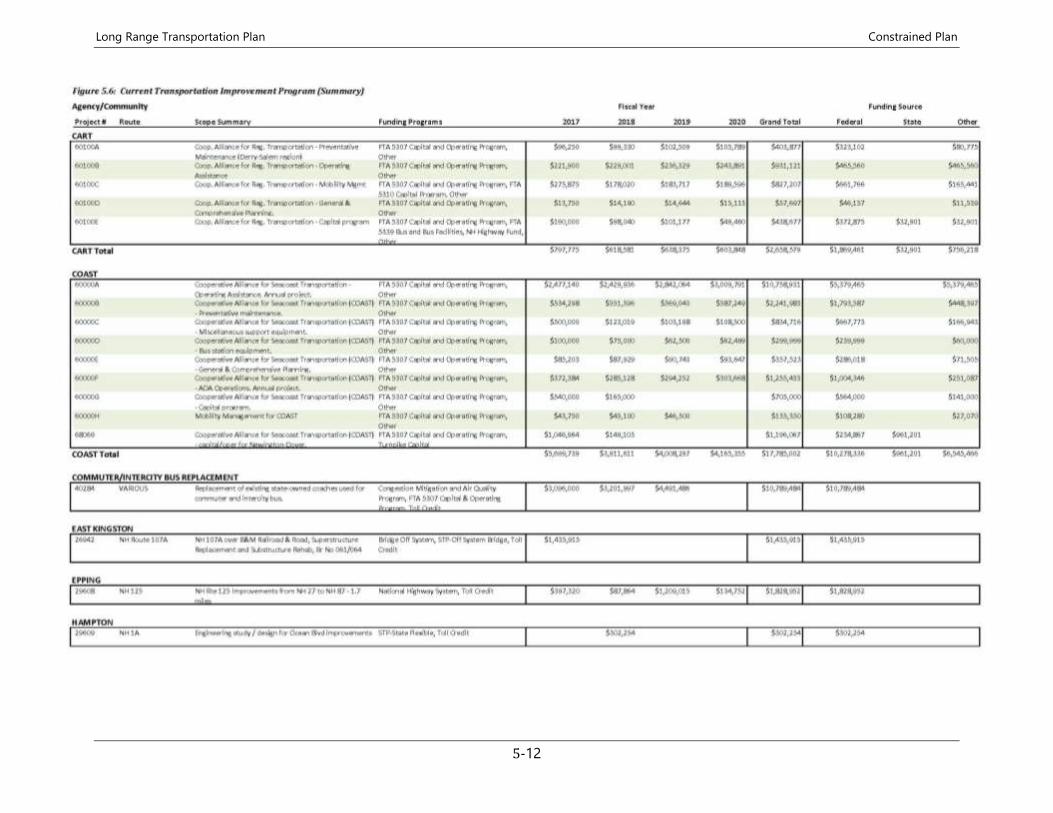
Long Range Transportation Plan Constrained Plan
5-12
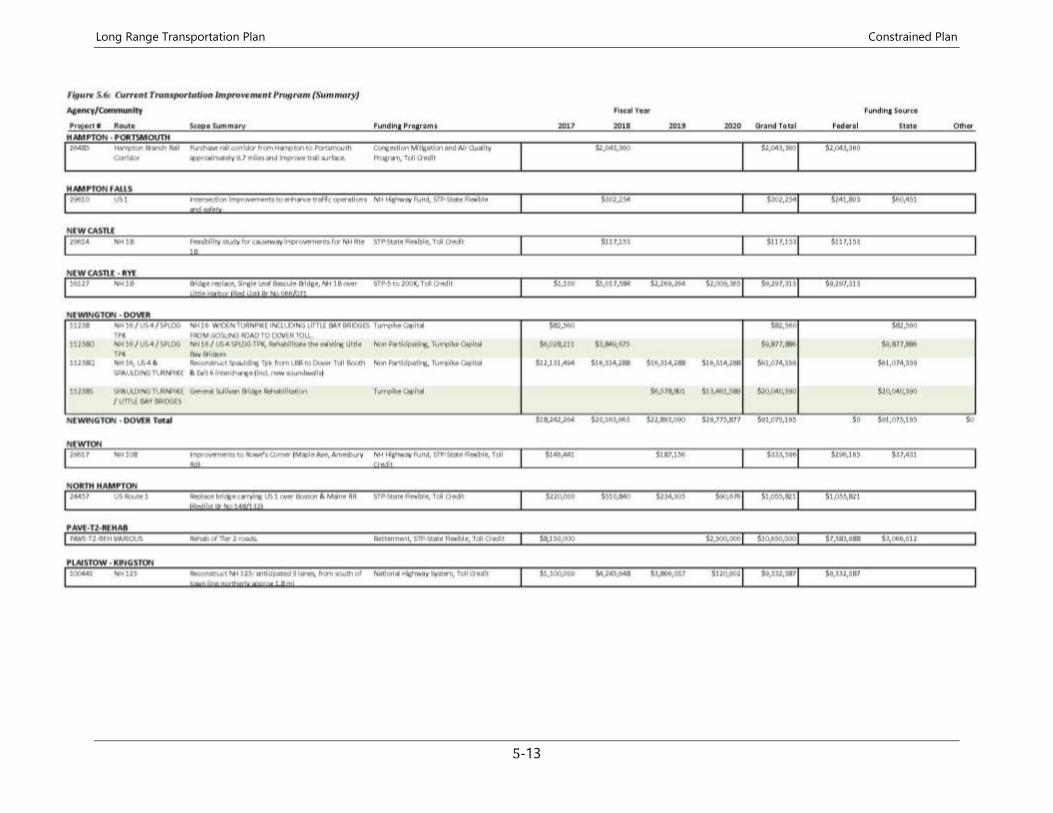
Long Range Transportation Plan Constrained Plan
5-13
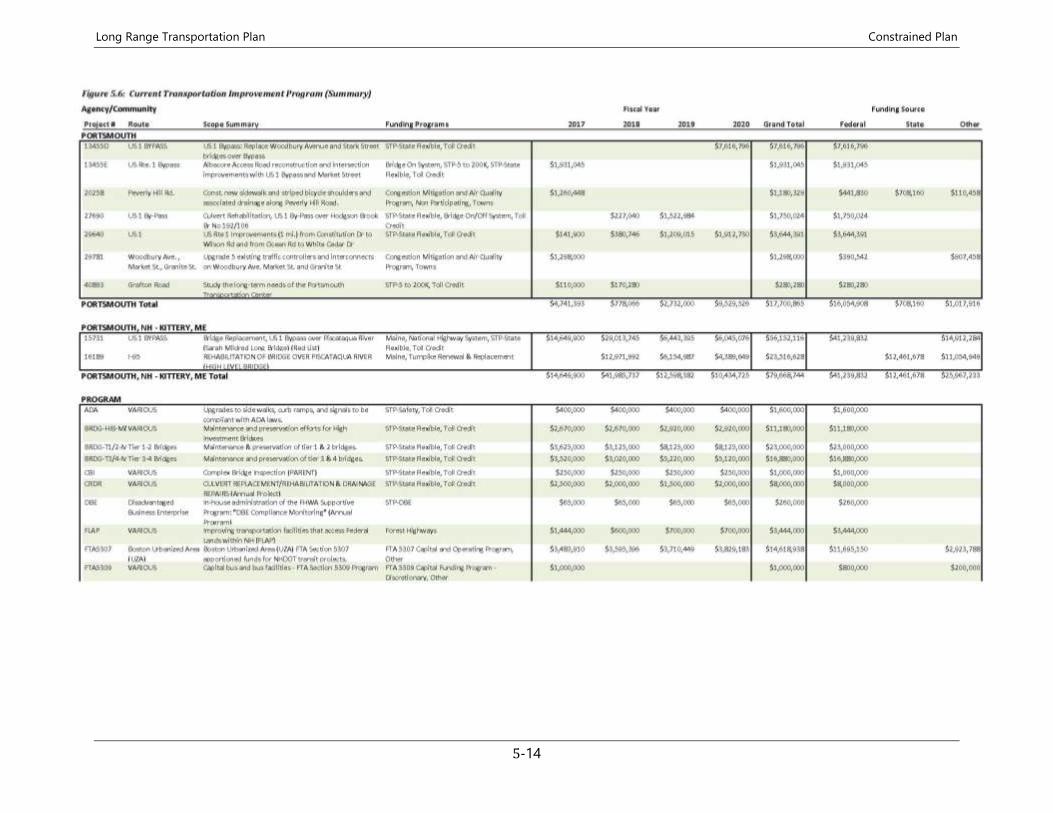
Long Range Transportation Plan Constrained Plan
5-14
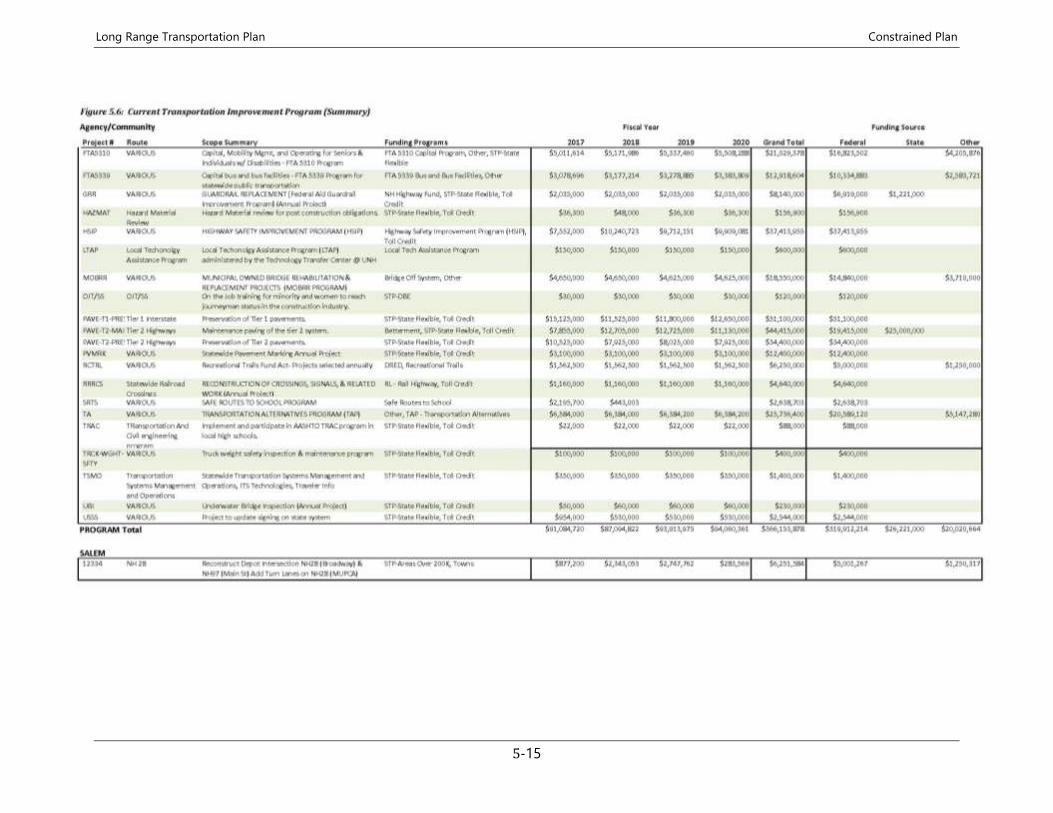
Long Range Transportation Plan Constrained Plan
5-15
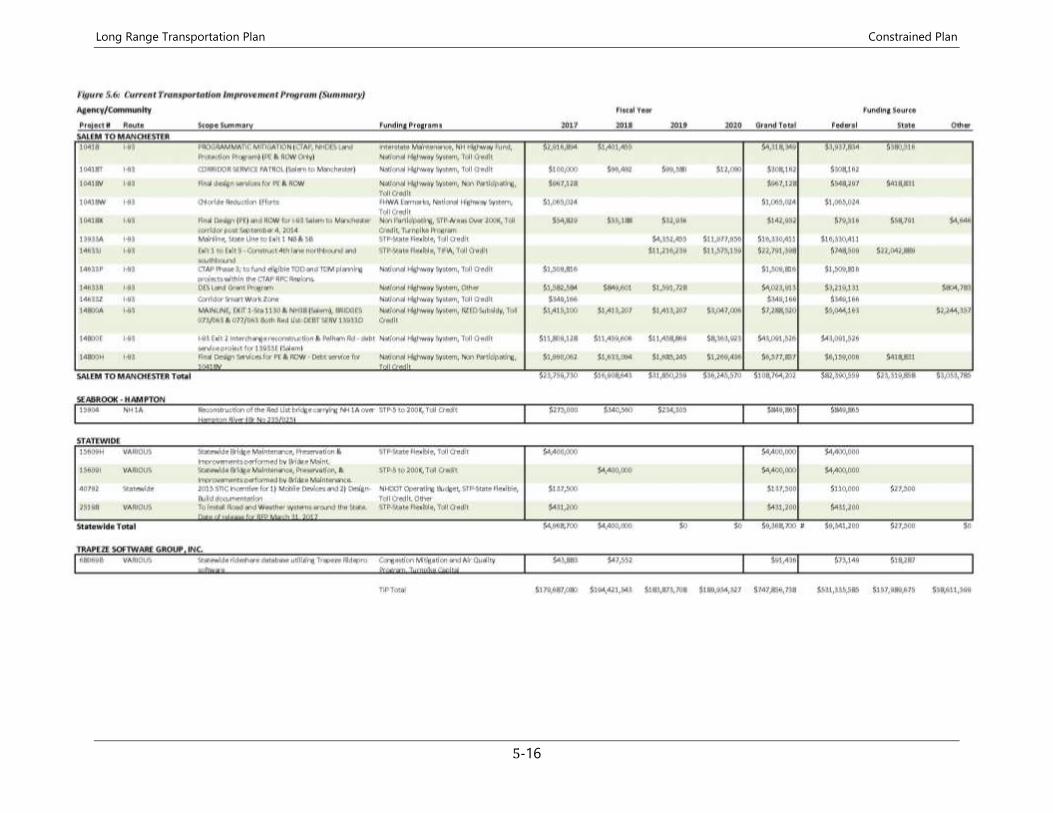
Long Range Transportation Plan Constrained Plan
5-16
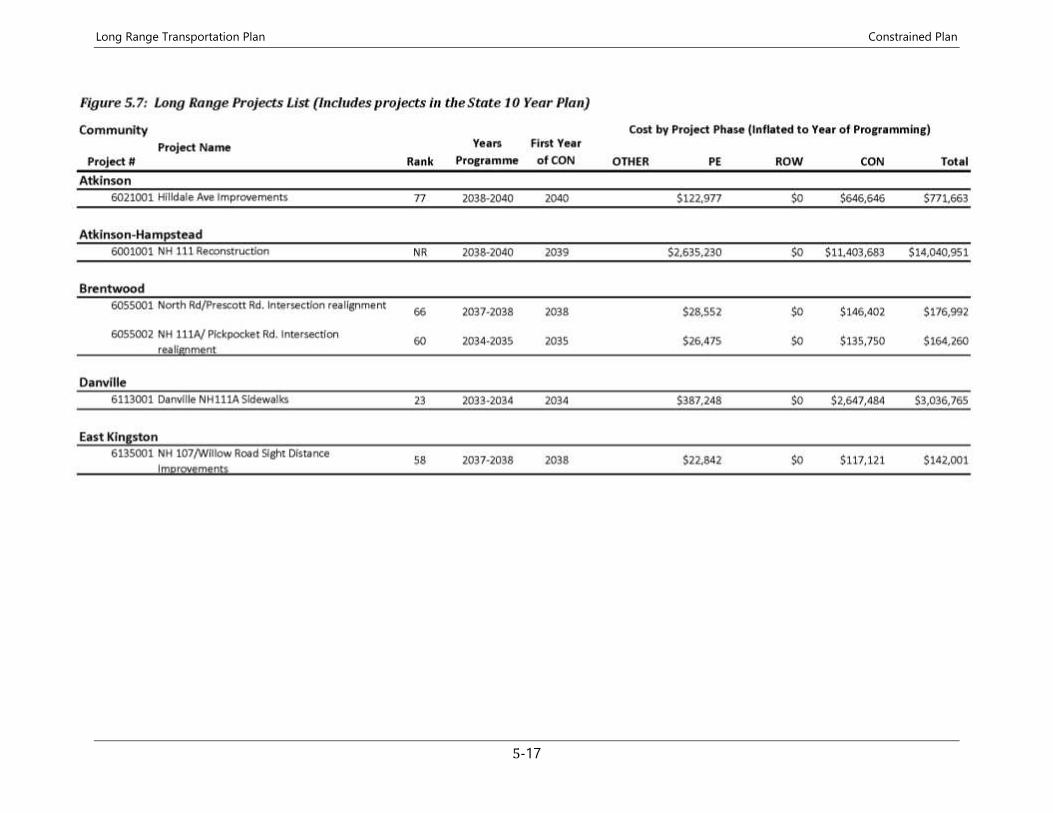
Long Range Transportation Plan Constrained Plan
5-17
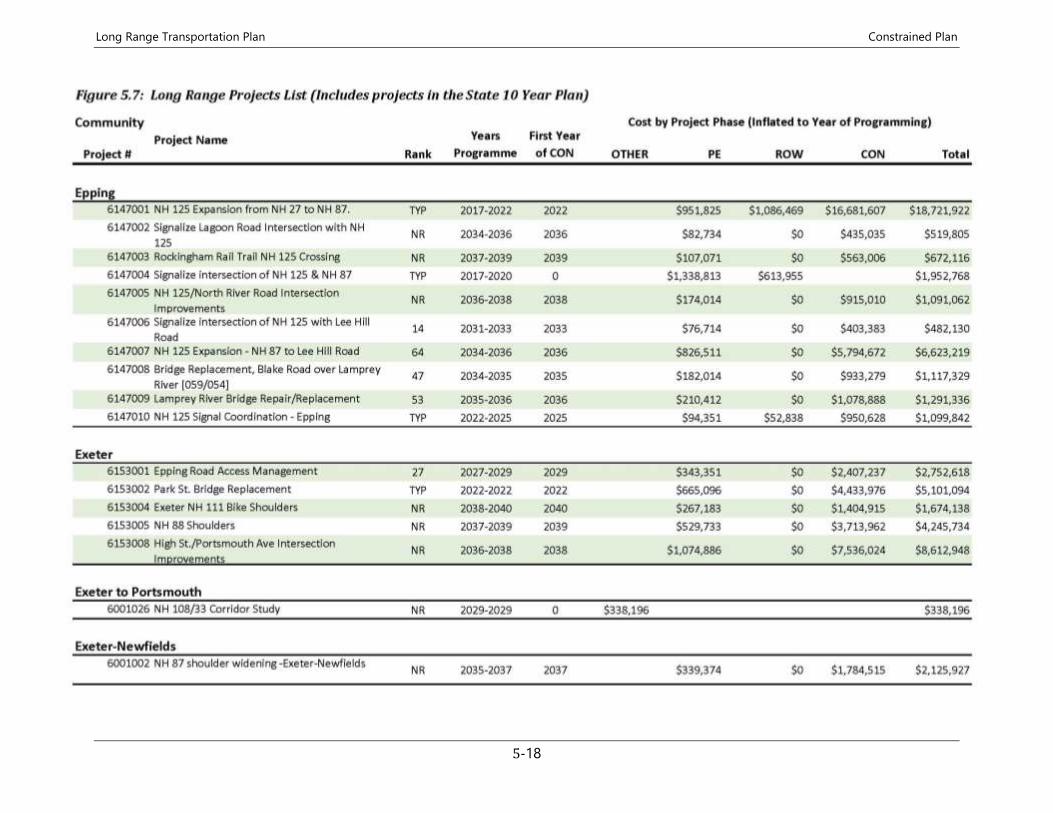
Long Range Transportation Plan Constrained Plan
5-18
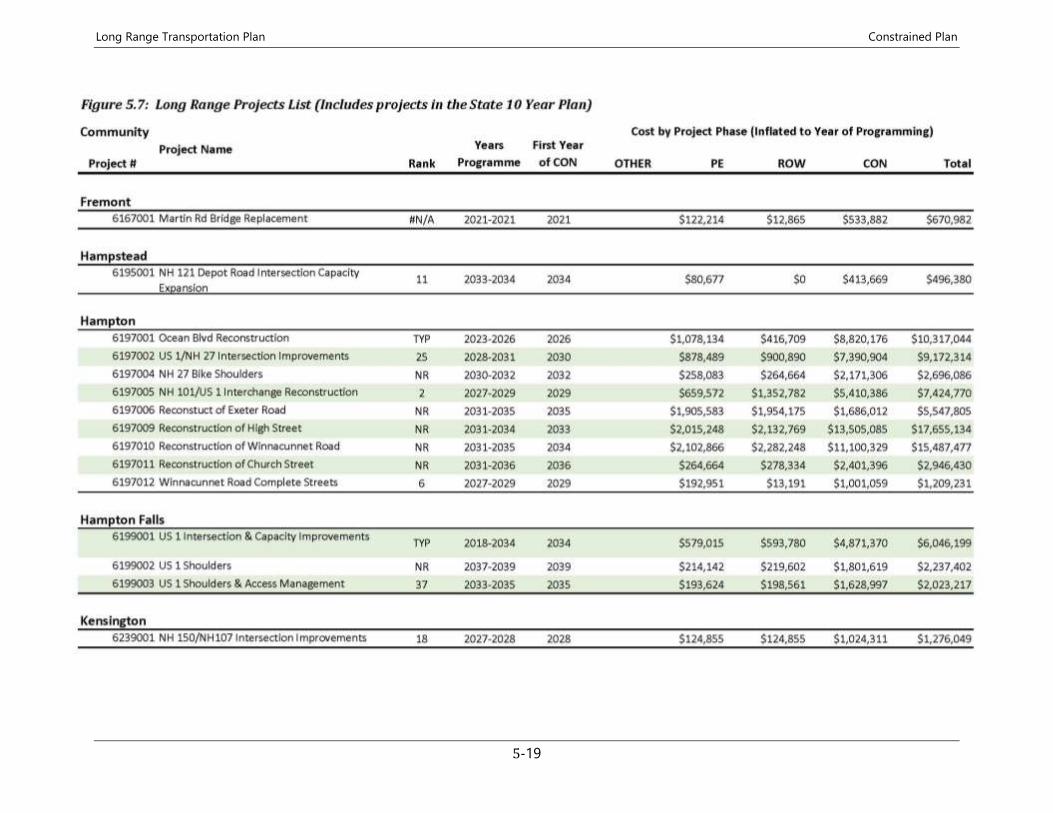
Long Range Transportation Plan Constrained Plan
5-19
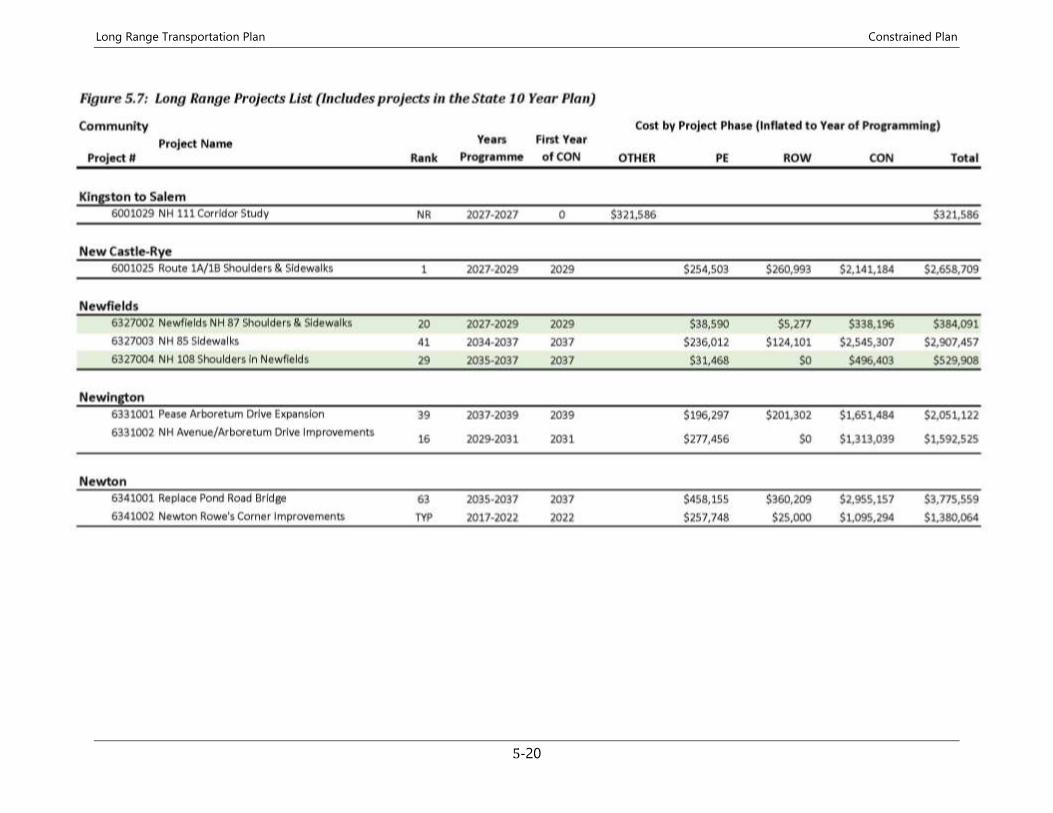
Long Range Transportation Plan Constrained Plan
5-20
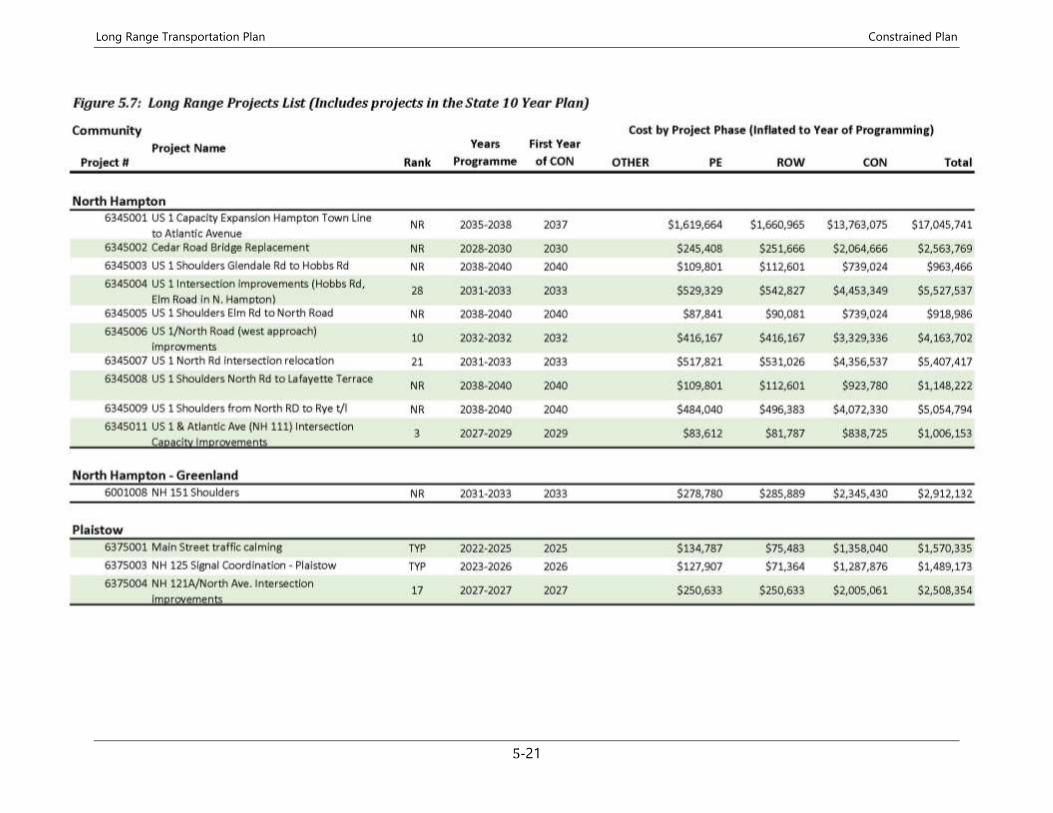
Long Range Transportation Plan Constrained Plan
5-21
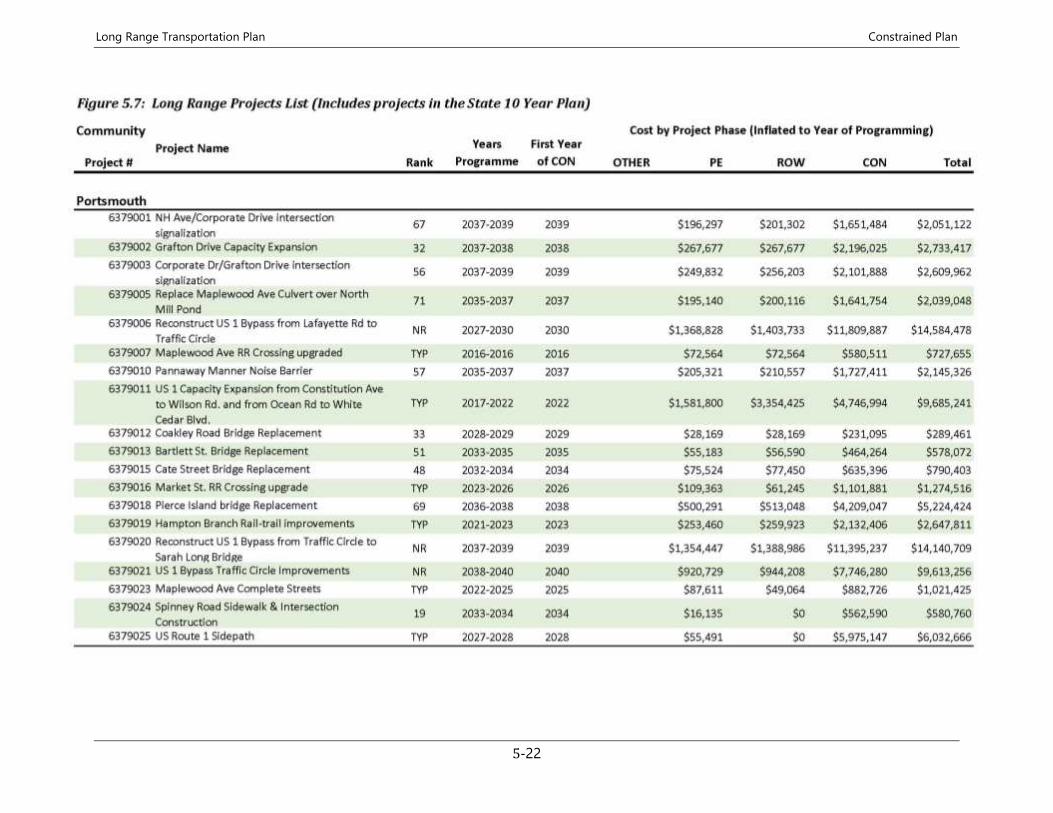
Long Range Transportation Plan Constrained Plan
5-22
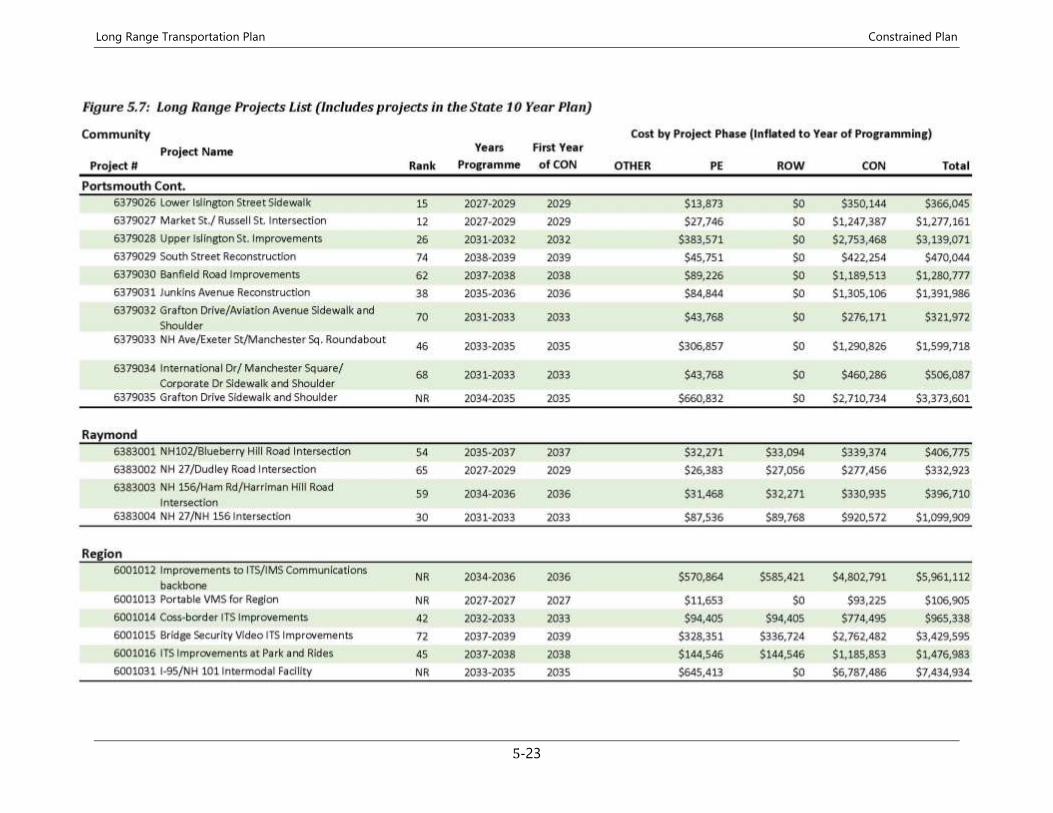
Long Range Transportation Plan Constrained Plan
5-23
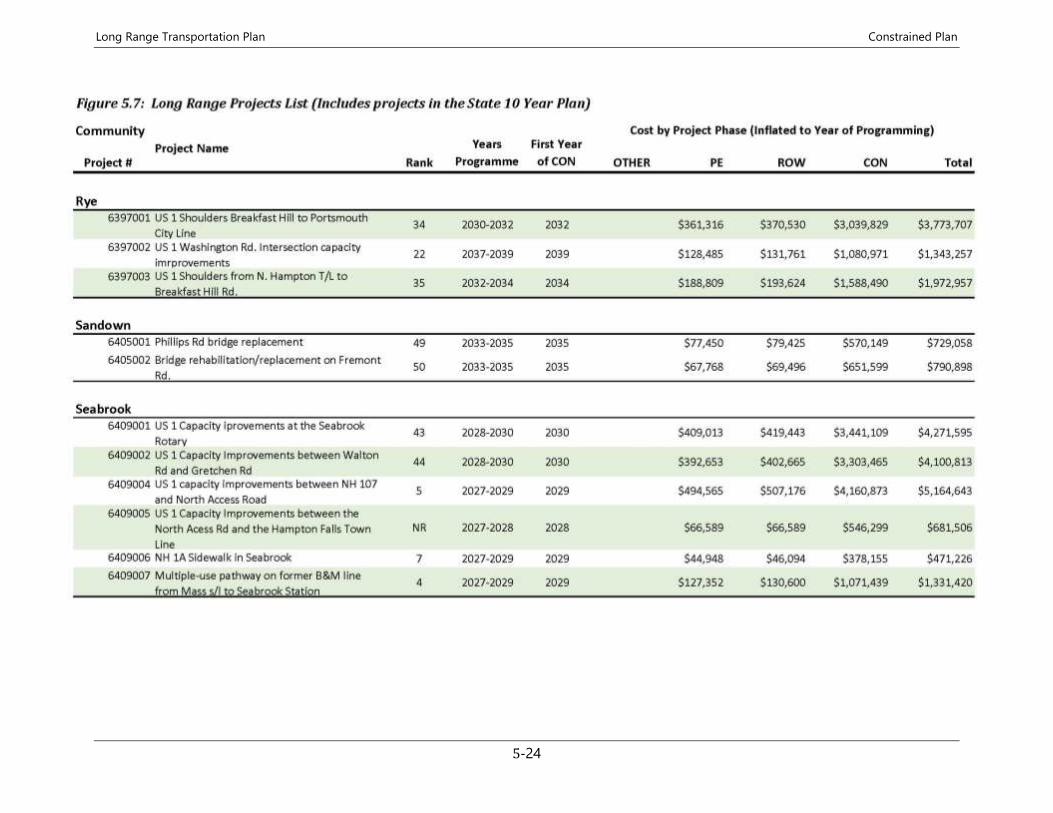
Long Range Transportation Plan Constrained Plan
5-24
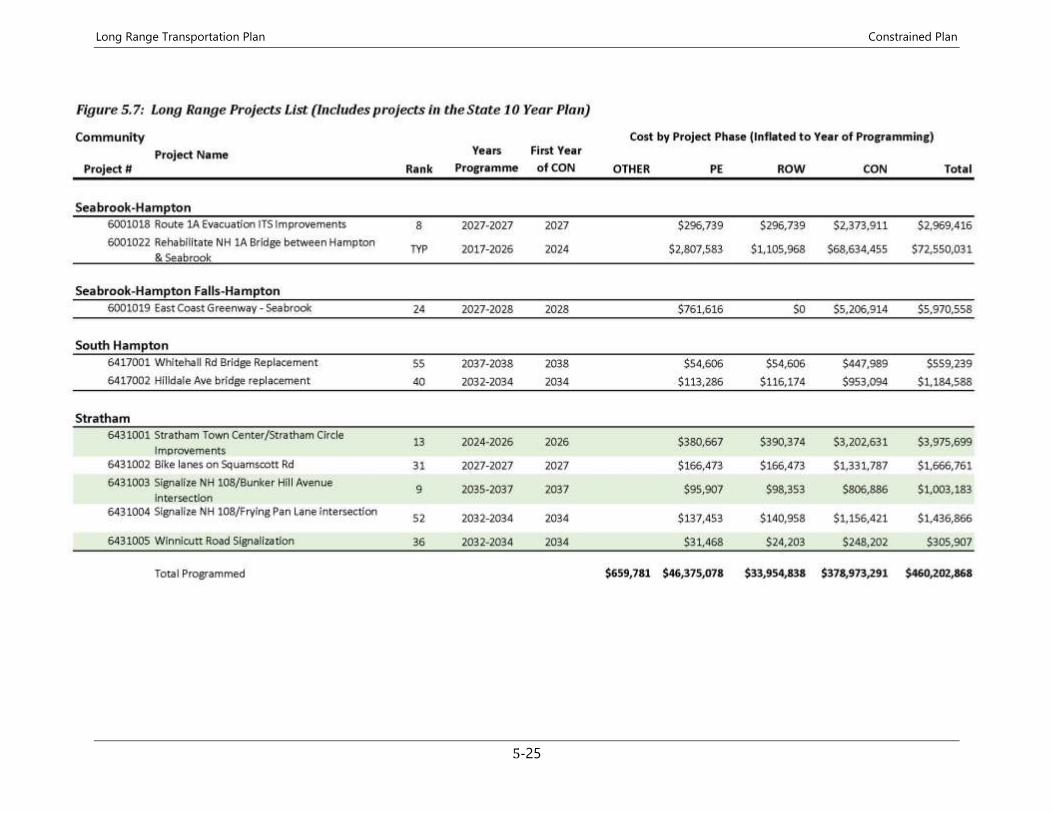
Long Range Transportation Plan Constrained Plan
5-25
Long Range Transportation Plan Constrained Plan
5-26
Long Range Transportation Plan Implementation Strategies
6-1
6. Implementation Strategies
I N T R O D U C T I O N
The implementation of the Long Range Transportation Plan is
more than simply the construction of the projects contained
within it. Many of the goals identified in Chapter 2 are necessary
additions to the local and regional planning process to ensure that
all aspects of the transportation system are developed and
maintained. Implementation strategies and recommendations are
set out on the following pages organized by the eleven Long Range
Plan Goals. These include a mix of actions that the MPO, member
municipalities and other partners can take to help the region
move toward attaining its goals.
M O B I L I T Y
Addressing the ability and ease with which individuals and goods
can move from place to place has long been a centerpiece of
making improvements to the transportation system. The
widespread economic expansion after World War II in the United
States was facilitated by the addition of interstate highways and
the overall increase in the capacity of our roadways to move
vehicles. Over the last twenty years, the high economic and social
cost of further expansion has necessitated the use of a wider range
of strategies to ensure that existing capacity is utilized as
effectively and efficiently as possible. There are a variety of ways
in which this can be implemented, notably through access
management strategies and Intelligent Transportation Systems
(ITS) improvements. Access management typically involves small
scale policy, regulation, and design changes that minimize traffic
conflicts and maximize traffic flow on existing facilities. Strong
Access Management standards are recommended for
communities to implement on state highways and other
important roadways within their jurisdiction. This should be
supplemented with an Access Management Memorandum of
Understanding (MOU) between the New Hampshire Department
of Transportation and the community to ensure that each entity
understands the access control desired on a particular state
highway.
ITS uses technological advances to improve traffic flow and safety
and reduce congestion through strategies like traffic signal
synchronization, electronic tolling, and traveler information
services. The region has an approved and up-to-date ITS
Architecture in place that guides investment strategies through
agreed on policies and technology standards.
A C T I O N S
• Continue scheduled updates to Regional ITS Architecture
and Strategy Plan and participate in updates to Statewide
ITS Architecture. (Timeframe: 1-5 years)
Goal 1 - Mobility
The region’s transportation system offers safe, secure, efficient, and
reliable access to employment, housing, commerce, services,
entertainment, and recreation
Long Range Transportation Plan Implementation Strategies
6-2
• Promote integration of ITS and other efficiency strategies
into the design of transportation projects as appropriate.
(Timeframe: Ongoing)
• Continue implementation of improvements from corridor
studies to address congestion on US 1 and NH 125
(Timeframe: Ongoing)
• Conduct corridor studies of other key congested highways
(Timeframe: 1-10 Years):
o NH 108/33 between Exeter and Portsmouth
o NH 111 between Kingston & Salem
o NH 101 Interchanges between Raymond & Hampton
o NH 125 from NH 111 in Kingston to NH 101 in Epping
• Revisit Congestion Management Process (CMP) as a tool
for identifying and tracking congested locations in the
region. (Timeframe: 1-5 Years)
• Implement improvement to the Regional Travel Demand
Model. (Timeframe: 1-5 Years)
A C C E S S I B I L I T Y & T R A N S P O R T A T I O N C H O I C E
Ensuring that all travelers have options beyond the single
occupant vehicle is key to meeting the accessibility goals of the
region. Beyond simply planning for and providing bicycle and
pedestrian facilities and transit services, though, there is a role for
the MPO in actively encouraging use of these options. The New
Hampshire Climate Action Plan identified the transportation
sector as the source of 33 percent of greenhouse gas emissions in
New Hampshire, and identified actions for reducing those
emissions including promoting alternatives to driving alone.
Experience nationally in promoting safe walking and bicycling to
school has shown that building new sidewalks or bikeways alone
is often not enough to induce more kids walk or bicycle. There is
a need for the other four elements of the 5Es model (Education,
Encouragement, Enforcement and Evaluation) to build
awareness, incentive behavior change and ensure safety.
A C T I O N S
• Work to expand transit access in key underserved
communities lacking basic Monday-Friday demand
response or volunteer driver transportation services.
(Timeframe: 1-5 Years)
• Provide technical assistance to COAST, CART and TASC in
developing regional community transportation options.
(Timeframe: Ongoing)
• Facilitate regional efforts to coordinate public transit and
human service transportation as a key strategy to expand
access to community transportation. (Timeframe: Ongoing)
• Work with State and regional partners to sustain and
expand inter-city rail and bus transportation options.
(Timeframe: Ongoing)
• Ensure adequate capacity at Park and Ride facilities in the
region (Timeframe: Ongoing)
• Support continued funding for the commuteSMARTseacoast
TMA following completion of Spaulding Turnpike widening
• Work with transit agencies, TMAs, and others to expand
employment transportation options in the region.
(Timeframe: 1-5 Years)
Goal 2 – Transportation Choices
The region’s transportation system offers equitable and reliable
multi-modal transportation choices to better connect people to jobs
and services.
Long Range Transportation Plan Implementation Strategies
6-3
• Evaluate potential for TMA along southern I-93 corridor.
(Timeframe: 1-10 Years)
• Work to expand Federal and State funding available for
transit services. (Timeframe: Ongoing)
• Collaborate with TMAs and other regional and statewide
partners on initiatives to encourage alternative commutes
such as Seacoast Bike/Walk to Work Day and Commute
Green New Hampshire (Timeframe: Ongoing)
• Develop a stand-alone bicycle and pedestrian plan for the
RPC region. (Timeframe: 1-5 years)
• Implement a complete streets policy for the region and
corresponding approach for all federally funded
transportation projects. (Timeframe: 1-5 Years)
• Expand data collection on bicycle and pedestrian volumes
and routes. to provide a better basis for evaluating bicycle
and pedestrian project needs. (Timeframe: 1-5 Years)
• Assist communities in implementing bicycle improvements
on key regional bicycle and pedestrian routes. (Timeframe:
Ongoing)
• Collaborate with regional and statewide partners on public
education and enforcement initiatives to promote safe
travel on the region’s transportation system for all users.
(Timeframe: 1-3 years and ongoing)
• Facilitate local Safe Routes to School programs and safety
improvements connecting neighborhoods to schools.
(Timeframe: 1-10 Years)
• Implement signage and lane marking improvements and
standards that aid in wayfinding and improve safety for
travelers. (Timeframe: 1-10 Years)
• Develop an assessment of likely implications of autonomous
vehicle integration for the region, and local and regional
actions needed to prepare for this. (Timeframe: 1-5 Years)
SYSTEM PRESERVATION & MODERNIZATION
As the condition of roadways and bridge structures declines, the
cost of repair rises substantially in both time and funds required.
At appropriate funding levels, these structures are addressed
prior to declining to the point where extensive and expensive fixes
are needed to bring the facility back to good condition. NHDOT has
undertaken a two-prong approach to addressing system
preservation and modernization needs that differentiates
between how roads and bridges are treated.
Bridges & Culverts
As discussed in the existing conditions chapter, NHDOT’s Bridge
Strategy consists of three components; establishing bridge
priorities, making sustainable investments, and assessing the
utility of redundant bridges, and this methodology sets the order
in which deficient bridges in the region are addressed. In the RPC
region, much of the system preservation and modernization
discussion has centered around the aging bridges in the region
and, in recent years, a number of the most critical and complicated
facilities have been replaced or rehabilitated. This has resulted in
substantial progress in repairing or replacing the state owned
Goal 3 – System Preservation & Modernization
The region’s transportation system is maintained in good condition
and the preservation and modernization needs of existing
components are prioritized ahead of adding new highway capacity.
Long Range Transportation Plan Implementation Strategies
6-4
“Red List” bridges in the region, and some progress reducing the
number of municipal bridges that are in poor condition as well.
The RPC has also been assessing stream crossings (culverts and
bridges) within the region to provide state agencies and
municipalities with information to identify critical and hazardous
crossings. While not fully completed, the objective is to identify
those stream crossings that may fail, particularly during major
storm events and to identify if a crossing is a barrier to aquatic
organisms, fish and other wildlife movement. Knowing the
condition of stream crossings can help guide municipalities
prioritize those crossing most in need of retrofit or replacement.
Results from this assessment can be incorporated into municipal
and regional hazard mitigation plans, vulnerability assessments
and site specific restoration and mitigation projects.
Pavement Condition
Similar to the NHDOT Bridge Strategy, the NHDOT Pavement
Strategy is based on three concepts: establishing tiers, focuses on
sustainable investments, and keeping roads in working order. The
pavement strategy differs in that the facilities in the worst
condition will be maintained as best as possible, while those in
good to fair condition will be maintained in that condition. This is
based around the tier system which prioritizes preservation and
rehabilitation work on the Interstate Highways, Turnpikes, and
major roadway corridors, while the lower tiered state roadways
are kept in good working order through maintenance paving. Map
3-3 (Existing Conditions Chapter) shows how the tiered system is
applied in the RPC region. NHDOT’s short-term paving plan
covering calendar years 2017-2019 establishes the initial strategy
A C T I O N S
• Complete regional stream crossing condition analysis and provide information to communities and state agencies (Timeframe: 1-5 Years)
• Continue to dedicate resources to reduce the number of Red List bridges in the region. (Timeframe: Ongoing)
• Continue to work with NHDOT to ensure that bridge designs use materials promoting long lifespans and incorporate consideration for bicycle and pedestrian needs, minimize the impacts of natural hazards on the structures, as well as the potential impacts of climate change. (Timeframe: Ongoing)
• Continue to encourage the state and communities to provide adequate resources for bridge and culvert maintenance. (Timeframe: Ongoing)
• Encourage communities to adopt and maintain pavement management systems to track roadway conditions and plan for future maintenance and preservation needs. (Timeframe: Ongoing)
• Continue to encourage the expansion of resources available to maintain all modal elements of the transportation system to keep up with identified needs. (Timeframe: Ongoing)
S A F E T Y A N D S E C U R I T Y
A primary focus of roadway improvements in the region is
improving safety for all users. Based on the information in
Existing Conditions (Chapter 3) and the Needs Assessment
Goal 4 – Safety & Security
The region’s transportation system is safe and secure for all users.
Long Range Transportation Plan Implementation Strategies
6-5
(Chapter 4), a number of project specific actions have been
identified to address safety and security concerns in the region. In
addition, the New Hampshire Strategic Highway Safety Plan and
the State Five Percent Report detailing high crash frequency
intersections and segments in the region provide areas of focus
for crash reduction efforts. While the region is seeing recent
growth in the number and rate of crashes per 100 Million VMT, it
is unclear if this is a long-term pattern. In either case, a broad
focus on transportation safety will begin to address the problem.
There are currently few projects in the region that are designed
specifically to address transportation system security concerns.
However, ensuring that the network is resilient and adaptive to
the impacts of natural and man-made hazards and climate change
is a critical aspect of planning for the future of the region.
Translating findings from recent vulnerability analyses into
specific resiliency projects will be an emphasis for the MPO in the
upcoming decade.
A C T I O N S
• Work to improve accuracy of crash data. (Timeframe: Ongoing)
• Continue to work with NHDOT on Road Safety Audits and follow-up improvements for crash locations with fatalities and serious injuries. (Timeframe: Ongoing)
• Support the implementation by NHDOT and NHDOS of strategies identified in the Strategic Highway Safety Plan. (Timeframe: 1-5 Years)
• Ensure that safety for all users is included in the design of transportation improvement projects. (Timeframe: Ongoing)
• Ensure that transit stop locations have adequate and safe pedestrian access to adjacent land uses. (Timeframe: Ongoing)
• Work with state and regional partners to reduce distracted driving through a combination of education and enforcement. (Timeframe: 1-5 Years)
• Incorporate mandated Federal Performance Targets and metrics into the MPO Long Range Transportation Plan (Timeframe: 1-5 Years)
• Better define the role of safety in the Ten Year Plan project selection process (Timeframe: 1-5 Years)
• Incorporate more substantive safety analysis, including corridor-based crash rates, into any corridor studies conducted in the region to better identify deficiencies and address concerns. (Timeframe: ongoing)
• Work to ensure that the movement of hazardous materials through communities on rail and roadway is conducted in as safe a manner as possible. (Timeframe: Ongoing)
• Undertake a coastal evacuation route capacity and safety analysis. (Timeframe: 1-5 Years)
• Incorporate outcomes of the Regional Stream Crossing Assessment into the MPO Long Range Transportation Plan (Timeframe: 1-5 Years).
• Fully integrate analysis of regional vulnerability to sea level rise and storm surge into the Long Range Plan and project selection process for the region. (Timeframe: 1-5 Years)
• Work with state and regional partners to define the MPO role in security planning for the transportation system. This role should provide tangible benefits without adding a level of bureaucracy to the security planning process. (Timeframe: 1-5 Years)
Long Range Transportation Plan Implementation Strategies
6-6
• Incorporate transportation network planning into the current work with FEMA and local communities to develop hazard mitigation plans. (Timeframe: Ongoing)
• Analyze the transportation system for capacity and safety deficiencies that impact security and disaster planning concerns, and incorporate security and disaster planning into the project design and prioritization process. (Timeframe: 1-5 Years, Ongoing)
• Implement the recommendations from the 2016 Coastal Risks and Hazards Commission report for incrementally improving coastal infrastructure to increasingly severe storm activity and best available projections for future sea level rise. (Timeframe: 1-10 Years)
L A N D U S E I N T E G R A T I O N
The pattern of land use and the needs of the transportation system
are closely linked, and changes to each can have a significant effect
on the other. Over time it has become clear that development
patterns can strongly influence the growth in travel demand in a
region. Regions with compact city centers that have a mix of uses
and serve as employment hubs can generate 20-30 percent less
automobile travel per capita than regions that are highly sprawled
in their pattern. While the RPC region historically was compact in
its settlement pattern, with many traditional downtown and
village centers that remain active and viable, most of the
development that has occurred over the past four decades has
been far more dispersed and sprawling in character. This led to
growth in the number of vehicle miles travelled at a rate two to
three times that of the population growth and was unsustainable
in the long term. There was a brief decline in VMT that
accompanied the high energy costs and unemployment of the
economic downturn. However, starting in 2008, as gas costs have
declined and the economy has returned to full employment, VMT
is on the rise again at a rate that is much higher than the growth
in population.
Despite these rising numbers, market demand for housing in
mixed-use downtown areas, together with extensive public input
data, point to growing interest in “walkable” communities. As a
transportation planning policy this Plan advocates efficient land
use strategies which, among other benefits, continue to lower
demand for automobile travel and reduce congestion. These
strategies are critical mechanisms to maintain healthy air quality,
as well preserve and maintain other natural resources, mitigate
natural hazards and adapt to a changing climate, as well as
minimize land consumption.
A C T I O N S
• Promote compact, mixed use development, including
Transit Oriented Design (TOD) where appropriate.
(Timeframe: Ongoing)
• Prioritize transportation investment in the region’s already
developed areas through weighting of project selection
criteria. (Timeframe: Ongoing)
• Promote development of Access Management standards for
state highways in communities, and assist communities and
NHDOT with the development of Access Management
Goal 5 – Land Use Integration
New commercial and residential development supports multiple
modes of transportation and minimizes the need for expanding
capacity of adjacent roads.
Long Range Transportation Plan Implementation Strategies
6-7
agreements to guide project permitting. (Timeframe: 1-10
Years)
• Promote strong Access Management in designs for
improvements (publicly and privately financed) along state
highways and other corridors. (Timeframe: Immediate and
ongoing)
• Encourage communities to conduct rigorous traffic impact
analysis as part of development site review. (Timeframe: 1-
5 Years, Ongoing)
• Encourage expanded use of the Developments of Regional
Impact process to address concerns regarding the impacts
of development beyond community boundaries.
(Timeframe: 1-5 Years, Ongoing)
• Require the consideration of hazard mitigation and climate
adaptation needs in the development of transportation
projects. (Timeframe: 1-5 Years, Ongoing)
E N E R G Y & E N V I R O N M E N T
The interaction of the transportation system with natural and
cultural resources and energy use covers a multitude of topic
areas and issues of concern to the region. Prominent among these
for the MPO for many years has been reducing the impacts of the
transportation system on air quality through projects and policies
that reduce Vehicle Miles of Travel and promote less polluting
modes of travel. While the MPO region is no longer in Non-
Attainment for the National Ambient Air Quality Standards,
strategies to reduce emissions of air pollutants and greenhouse
gases remain a priority. Other work of the MPO under this goal
includes improving resource inventories to better understand
natural and cultural resources in the region and minimize impacts
from new transportation; and conveying that information to
project designers and the public to shape project development.
A C T I O N S
• Expand natural and cultural resource inventory data to guide project planning and mitigation efforts. (Timeframe: Ongoing)
• Participate in project development to provide information to minimize resource impacts as well as shape mitigation efforts. (Timeframe: Ongoing)
• Continue to track NAAQS criteria pollutant levels in the region and prioritize projects that improve air quality. (Timeframe: Ongoing)
• Complete the stream crossing inventory on the state highway system to identify adverse ecological impacts from undersized culverts. (Timeframe: 1-5 Years)
• Incorporate greenhouse gas emissions into regional performance based planning efforts. (Timeframe: 1-5 Years)
• Promote transportation projects in the region that reduce total Vehicle Miles Traveled. (Timeframe: Ongoing)
Goal 6 – Energy & Environment
The region’s transportation system is proactive in protecting natural
and historic resources; and is forward looking regarding energy use,
energy efficiency and conversion to renewable energy sources.
Long Range Transportation Plan Implementation Strategies
6-8
R E S I L I E N C Y
Goal 7 – Resiliency
The region’s transportation system is adaptive and resilient to
climate change and natural and other hazards.
Changing weather patterns and the prevalence of extreme storm
events in the northeast over the last ten years have focused
attention on the vulnerability of the transportation network.
Although many local and regional studies have confirmed that our
climate may change more rapidly in the future, there is still
uncertainty about when and how much it will occur. Tackling the
impacts and in some instances positive opportunities that long
term climate change pose requires integrating environmental and
land use considerations with transportation planning. In order to
accomplish this, integration must be a primary driver in the
decision-making process supported by translation of sound
science, research and analyses into policy and practice. The goal
of resilience is to make decisions that ensure systems can respond
with less impact and recover from extreme events faster.
The MPO can play a role in conducting the analysis necessary to
understand where impacts from natural or other hazards may
occur; and working to mitigate that potential where possible. Map
4-2 indicates that over 80 miles of roadways in the seacoast could
be impacted by sea level rise and coastal inundation from storms
and the region needs to begin addressing and mitigating that risk.
NH Climate Action Plan The NH Climate Action Plan (2009) recommends statewide
actions to address existing and future challenges relating to
economics, human health, natural systems, and infrastructure.
The report offers guidance that “The state will need to plan for
these impacts with the best understanding of the resources that
are available to address the issue at the state, regional and
national level. This would require more comprehensive and
integrated planning with a variety of stakeholders and should
begin immediately and continue into the future.” Mitigation
and adaptation are two of the primary strategies recommended
to slow the rate of environmental change and reduce the
potentially harmful effects of climate change.
The NH Climate Action Plan is available at
https://www.des.nh.gov/organization/divisions/air/tsb/tps/clima
te/action_plan/nh_climate_action_plan.htm.
NH Coastal Risks and Hazards Commission
The NH Coastal Risks and Hazards Commission (CRHC) was
charged with investigating future impacts of climate change and
coastal hazards including flooding from increased precipitation,
coastal storms and sea-level rise. Completing its work in
December 2016, the CRHC issued a final report which is available
at http://www.nhcrhc.org/. With respect to state and municipal
planning, infrastructure management, land use and development,
and environmental protection, the Commission’s report offers 35
recommendations relating to the built landscape, natural
resources, heritage and economy, and recommends the following
general guidelines and principals to guide informed decisions
today and in the future.
Long Range Transportation Plan Implementation Strategies
6-9
▪ Act Early. Responding now to the future threat of coastal
flooding will maximize long-term cost savings that result from
building a more resilient community.
▪ Respond Incrementally. Incremental and iterative approaches
allow the community to refine and correction actions as
information becomes available and conditions change.
▪ Revisit and Revise. As climate science is refined, periodically
revisit climate change projections and assumptions, and
adjust actions accordingly.
▪ Collaborate and Coordinate. To decrease costs and increase
effectiveness of planning and preparation, state and local
governments need to align policies, plans and responses about
future coastal hazards to the greatest extent possible.
▪ Incorporate Risk Tolerance in Design. Buildings and facilities
that are critical to public functions or safety, that are intended
to last a very long time or that are expensive to replace, should
be considered to have low risk tolerance and should consider
future flood and coastal hazard in their design.
▪ Make No Regrets Decisions. A no regrets policy or approach
refers to actions that yield multiples benefits even under the
lowest flood or coastal hazard scenario, and should incur low
costs or save money over the medium to long term.
The CRHC guidelines could serve as a standard framework for
transportation related activities such as long range planning and
decision making, maintenance of existing assets and resources,
infrastructure siting and design, and investment in existing and
future transportation assets and resources to ensure
implementation of beneficial climate adaptation and resilience
actions.
A C T I O N S
• Incorporate impacts from sea-level rise and coastal storm
surge flooding identified in the Tides to Storms Vulnerability
Assessment (2015, RPC) and Climate Risk in the Seacoast
Vulnerability Assessment (2016, RPC, SRPC, NH Coastal
Program) into infrastructure management and improvement
plans and other local and state policies and regulations.
(Timeframe: 1-5 Years)
• Plan for necessary improvements to roadways and their
supporting infrastructure to manage additional stormwater
runoff from more frequent and extreme storm events, and
adapt to long term sea-level rise. (Timeframe: 1-5 Years)
• Assess the impact of freshwater and tidal crossings on
adjacent tidal wetlands, aquatic organism passage, and public
safety under existing and future climate conditions.
(Timeframe: 1-5 Years)
• Implement regulatory standards and/or enact enabling
legislation to ensure that the best available climate science
and flood risk information are used for the siting and design
of new, reconstructed, and rehabilitated state-funded
structures and facilities. (Timeframe: 1-5 Years)
• Develop natural resource restoration plans/strategies that
explicitly consider future coastal risk and hazards, and the
ecological services that they impact. (Timeframe: 1-10 Years)
• Work with state and regional partners to define the MPO role
in security planning for the transportation system. This role
should provide tangible benefits without adding a level of
bureaucracy to the security planning process. (Timeframe:
Ongoing)
• Incorporate transportation network planning into the current
work with FEMA and local communities to develop hazard
mitigation plans. (Timeframe: 5-10 Years)
Long Range Transportation Plan Implementation Strategies
6-10
• Analyze the transportation system for capacity and safety
deficiencies that impact security and disaster planning
concerns. (Timeframe: 5-10 Years)
• Incorporate security and disaster planning aspects into the
project design and prioritization process. (Timeframe: 1-5
Years)
• Prioritize projects designed to increase the resiliency of the
transportation system to anticipated impacts of climate
change. (Timeframe: Ongoing)
• Coordinate with coastal municipalities on timely
implementation of recommendations identified in municipal
Natural Hazards Mitigation Plans, and consider impacts
identified in the Tides to Storms Vulnerability Assessment and
Climate Risk in the Seacoast Vulnerability Assessment.
(Timeframe: Immediate and Ongoing)
E C O N O M I C V I T A L I T Y
Continued economic success in the region will rely upon the
efficiency, effectiveness, safety and appeal of the transportation
network that connects people and goods for commerce and
recreation. Many of the projects included in the Long Range Plan
support economic vitality locally or regionally through improved
personal or freight mobility; access to employment and basic life
needs; enhancing the safety and attractiveness of downtowns, and
improvements on key tourism routes.
A C T I O N S
• Prioritize projects for funding that are identified as regional infrastructure priorities in the Comprehensive Economic Development Strategy (CEDS). (Timeframe: Ongoing)
• Participate in the development of the New Hampshire State Freight Plan and integrate its recommendations into the Long Range Transportation Plan (Timeframe: 1-5 Years)
• Prioritize investment in rail, the Port of New Hampshire, and connecting transportation infrastructure. (Timeframe: 1-5 Years, Ongoing)
• Increase the capacity for both freight and inter-city passenger travel by constructing double-track on the B&M railway through entire region. (Timeframe: 10-20 Years)
• Implement recommendations from recently completed Scenic Byway Corridor Management Plans to improve wayfinding and visitor information. (Timeframe: 1-10 Years)
• Implement safety improvements along the NH Coastal Byway to accommodate sharing of the road by people driving, bicycling, and walking. (Timeframe: 1-10 Years)
• Undertake a study of tourism-based travel in the region and the transportation improvements necessary to maintain this economic base of the region. (Timeframe: 1-10 Years)
• Implement the recommendations from the 2016 Coastal Risks and Hazards Commission report to incrementally improve the resiliency of NH1A, NH1B and other coastal infrastructure to increasingly severe storm activity and best available projections for future sea level rise. (Timeframe: 1-10 Years)
Goal 8 – Economic Vitality
Through strategic investment, the region’s transportation system
supports an innovative and competitive 21st century economy that
connects people, goods, and communities to desired activity and
economic centers.
Long Range Transportation Plan Implementation Strategies
6-11
P U B L I C H E A L T H
Goal 9 – Public Health
The region’s transportation system is designed and built to support
safe and healthy communities, facilitate active living opportunities,
and aging in place.
Public health is influenced by the transportation system in
multiple ways. Examples include something as simple as people’s
ability to travel to medical appointments, the impacts of vehicle
emissions on air quality which affects heart and lung function, and
the safety of the transportation system for people traveling by all
modes – whether driving, walking, bicycling or riding transit.
A fourth facet of public health impacted by the transportation
system is physical activity, and the extent to which our
transportation system and communities are built to support
active transportation – i.e. walking or bicycling for short trips.
Each of these aspects, and the strategies below, are addressed
under other plan goals. However public health is pulled out
explicitly as a goal, and the following strategies aggregated here,
to underscore the impact transportation investments have on
public health and healthcare. While often excluded from measures
of economic vitality, these sectors account for over 17% of our
economy, and are central to any measure of quality of life.
A C T I O N S
• Facilitate development of volunteer driver program
capacity or other transit service to provide access to medical
care and other basic life needs in underserved communities.
(Timeframe: 1-5 Years)
• Facilitate development of local Safe Routes to School
programs to enable children to walk/bike to school safely
and encourage active transportation. (Timeframe: 1-10
Years, ongoing)
• Support safe accommodation of all travelers in roadway
design through an MPO Complete Streets Policy, and assist
municipalities in development of local policies. (Timeframe:
1-5 years)
• Encourage communities to implement compact, mixed-use
development patterns that facilitate active transportation.
(Timeframe: 1-10 Years, Ongoing)
• Assist in planning and implementation of a regional network
of multi-use trails as traffic-separated transportation and
recreation facilities supporting physical activity.
(Timeframe: 1-5 Years, Ongoing)
• Continue to prioritize projects that improve air quality.
(Timeframe: Ongoing)
P L A N N I N G P R O C E S S
A critical role of the MPO is to establish project priorities for
implementation given limited funding for investment in the
Goal 10 – Efficient & Effective Planning Process
The MPO provides an efficient and effective implementation of the
cooperative, coordinated, and continuous (3C) federal
transportation planning process that aids in the efficient and
effective implementation of projects.
Long Range Transportation Plan Implementation Strategies
6-12
maintenance, preservation, modernization, and improvement of
transportation infrastructure. Project selection criteria and
processes have been used by the MPO for many years to quantify
and justify priorities but until recent years criteria were not
consistently applied at the state level. In 2012-2013 NHDOT and
the MPO developed and utilized a comprehensive process and a
common set of criteria based around project benefits and impacts
as well as project readiness and support concerns. These criteria
were used in the development of the 2017-2026 Ten Year Plan
and resulted in five of the region’s top ten project priorities being
programmed in the statewide Plan.
There is a strong interest in applying this process to project
prioritization at the regional and state level for many types of
projects across all modes of travel. To facilitate that, this process
and the selection criteria need to be further defined and refined to
better reflect the need for a strong transportation system across
all modes and that reflects local, regional, and state priorities in
the implementation of projects in the Ten Year Plan and the
Transportation Improvement Program (TIP). Chapter 5 lists the
current prioritized list of transportation projects for the region.
A C T I O N S
• Work with NHDOT to ensure that project selection criteria are
regularly updated to reflect evolving local and regional
priorities. (Timeframe: 1-2 Years)
• Refine the project development process through early data
collection and scoping to better enable the project selection
process with more complete information regarding project
proposals. (Timeframe: 1-2 Years)
• Update the list of prioritized projects in the Long Range
Transportation Plan to reflect the latest planning
assumptions. (Timeframe: 1-2 Years - cyclical)
• Solicit communities, transit providers, and NHDOT for
transportation needs over the short and long-term within the
region. (Timeframe: 1-2 Years - cyclical)
• Assist communities in developing projects to be constructed
through the biennial State Ten Year Plan process. (Timeframe:
1-2 Years - cyclical)
• Assist communities in developing projects to be constructed
as part of the Transportation Alternatives and Congestion
Mitigation and Air Quality Programs. (Timeframe: 1-2 Years -
cyclical)
• Expand the MPO’s initial list of federally mandated and SHRP2
performance measures to address regional needs and ensure
measures addressing each MPO Goal (Timeframe: 1-5 Years)
• Maintain and expand participation by communities,
particularly those lacking planning staff, and other
stakeholders in MPO process (Timeframe: Ongoing)
F U N D I N G A V A I L A B I L I T Y
One of the biggest challenges facing the state, the region, and
communities is maintaining, operating and updating the
transportation system in an era of reduced resources and weak
political will to invest in infrastructure. Traditionally projects
have been advanced to the State Ten Year Plan to be queued for
eventual construction. However, given the current financial
limitations with respect to state and federal funding, waiting for
Goal 11 – Funding Availability
Adequate and predictable funding is available to meet current and
future needs for transportation system maintenance, operation
and modernization across all modes
Long Range Transportation Plan Implementation Strategies
6-13
any individual project to be constructed via that route is likely to
take a minimum of 10 to 15 years, and might be a viable option
only for large, long range projects. Even then, funding for
maintaining the transportation system has not kept up with the
repair and replacement needs of the infrastructure. The municipal
and business sectors have a shared interest in working to restore
state and federal investment in transportation infrastructure. In
addition, communities will benefit from finding alternate means
of financing many improvements. This will mean working with
citizens, other communities, NH DOT, and private interests to find
appropriate mechanisms. In addition, many communities have
had success in recent years leveraging private development
interests to achieve public transportation improvement goals
through the use of development exactions and public/private
partnerships.
A C T I O N S
• Work with federal, state and regional partners to increase the amount of Federal and State funding available in the region to address project needs. In particular, work to establish a dedicated state funding stream for public transportation. (Timeframe: Immediate and ongoing)
• Work directly with communities to expand the options available for local financing of transportation system maintenance, preservation, and improvement. (Timeframe: Immediate and ongoing)
• Promote the use of public/private partnerships to spur investment in the transportation system where private development goals facilitate achievement of public priorities. (Timeframe: Immediate and Ongoing)
• Assist communities with the development of policies and regulations that aid in securing private development funding appropriate to the level of impact expected on adjacent transportation facilities. (Timeframe: 1-10 Years)
• Work with NH DOT to identify projects that may benefit from non-traditional contracting mechanisms such as design-build to expedite implementation. (Timeframe: 1-5 Years, Ongoing)
P L A N I M P A C T S & M I T I G A T I O N
Beginning with the enactment of SAFETEA-LU and continuing
with the FAST Act, MPO Long Range Transportation Plans are
required to address the issue of environmental mitigation with
the objective of introducing some forethought into how
environmental impacts from major transportation projects in the
region will be mitigated. While not intended to identify project
specific mitigation requirements or opportunities, the plan must
include a generalized discussion of potential mitigation activities
and compare transportation plans with available State
conservation plans, maps, and inventories. As we interpret it, the
objective is to identify both the types of mitigation that are
appropriate to the region and the potential opportunities for
mitigation that are present in the region.
A P P R O P R I A T E T Y P E S O F M I T I G A T I O N
Environmental impacts associated with transportation projects include both direct and indirect impacts. Mitigation activities considered will differ depending upon the type of impact, the specific resource affected, as well as the severity and duration of the impact. The following sequential mitigation strategy applies generally to all resources:
1. Avoidance – Alter the project so an impact does not occur
2. Minimization – Modify the project to reduce the severity of
the impact
3. Mitigation – Undertake an action to alleviate or offset an
impact, or to replace an appropriated resource.
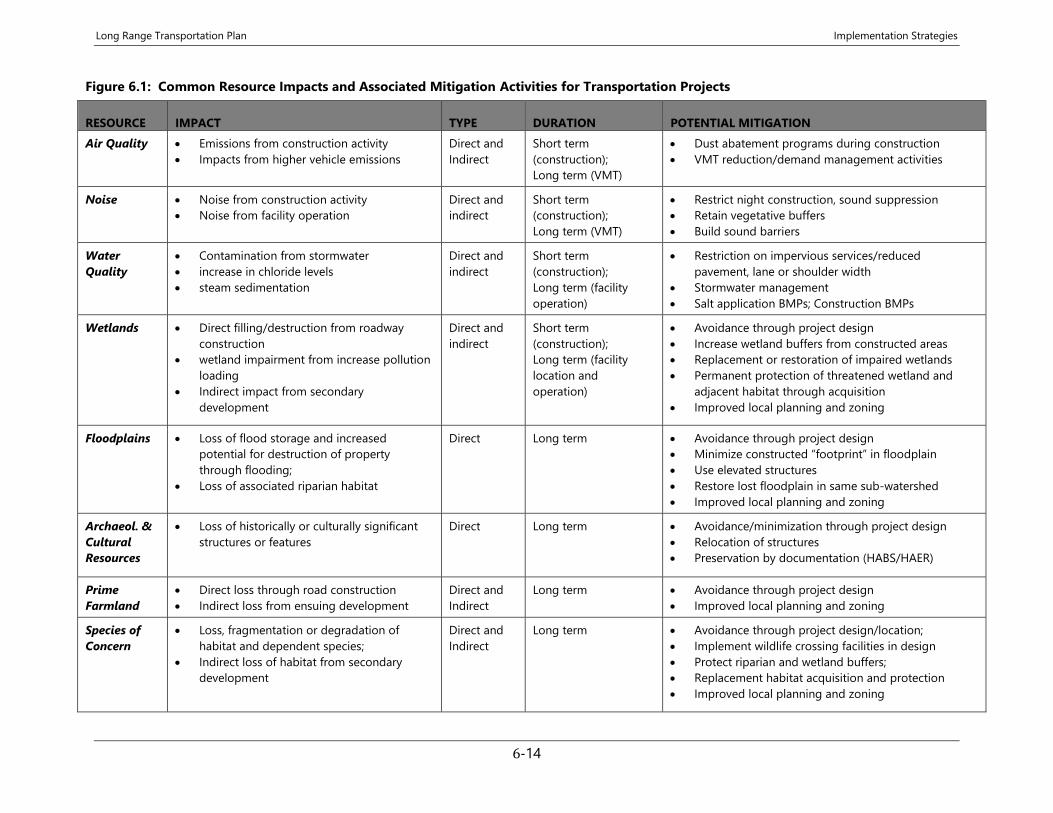
Long Range Transportation Plan Implementation Strategies
6-14
Figure 6.1: Common Resource Impacts and Associated Mitigation Activities for Transportation Projects
RESOURCE IMPACT TYPE DURATION POTENTIAL MITIGATION
Air Quality
• Emissions from construction activity
• Impacts from higher vehicle emissions
Direct and
Indirect
Short term
(construction);
Long term (VMT)
• Dust abatement programs during construction
• VMT reduction/demand management activities
Noise
• Noise from construction activity
• Noise from facility operation
Direct and
indirect
Short term
(construction);
Long term (VMT)
• Restrict night construction, sound suppression
• Retain vegetative buffers
• Build sound barriers
Water
Quality
• Contamination from stormwater
• increase in chloride levels
• steam sedimentation
Direct and
indirect
Short term
(construction);
Long term (facility
operation)
• Restriction on impervious services/reduced
pavement, lane or shoulder width
• Stormwater management
• Salt application BMPs; Construction BMPs
Wetlands
• Direct filling/destruction from roadway
construction
• wetland impairment from increase pollution
loading
• Indirect impact from secondary
development
Direct and
indirect
Short term
(construction);
Long term (facility
location and
operation)
• Avoidance through project design
• Increase wetland buffers from constructed areas
• Replacement or restoration of impaired wetlands
• Permanent protection of threatened wetland and
adjacent habitat through acquisition
• Improved local planning and zoning
Floodplains
• Loss of flood storage and increased
potential for destruction of property
through flooding;
• Loss of associated riparian habitat
Direct Long term • Avoidance through project design
• Minimize constructed “footprint” in floodplain
• Use elevated structures
• Restore lost floodplain in same sub-watershed
• Improved local planning and zoning
Archaeol. &
Cultural
Resources
• Loss of historically or culturally significant
structures or features
Direct Long term • Avoidance/minimization through project design
• Relocation of structures
• Preservation by documentation (HABS/HAER)
Prime
Farmland
• Direct loss through road construction
• Indirect loss from ensuing development
Direct and
Indirect
Long term • Avoidance through project design
• Improved local planning and zoning
Species of
Concern
• Loss, fragmentation or degradation of
habitat and dependent species;
• Indirect loss of habitat from secondary
development
Direct and
Indirect
Long term • Avoidance through project design/location;
• Implement wildlife crossing facilities in design
• Protect riparian and wetland buffers;
• Replacement habitat acquisition and protection
• Improved local planning and zoning
Long Range Transportation Plan Implementation Strategies
6-15
Figure 6.1 shows the most common types of impacts associated
with constructed transportation projects in the RPC region in the
past, as well as potential actions that have been or could be used
to mitigate the impacts.
I D E N T I F Y I N G O P P O R T U N I T I E S F O R M I T I G A T I O N
Mitigation strategies for most environmental impacts begin with
an assessment of existing natural and cultural resources. Several
data sources for natural resources exist which can provide
detailed information on the location, quality, and extent of
discreet natural resource types as map “layers”, such as wetlands,
aquifers, forest areas by type, and soils. However, there are fewer
sources which look at these resource layers in combination and
assess the value of different geographical areas based on the
presence, quality, and interaction of two or more of these resource
layers based on their value as a functioning ecosystem. Data on
cultural resources tend to be less comprehensive, as few
municipalities have comprehensive historical and cultural
resource inventories. Much of the cultural resource inventory
data from the past 20 years has been compiled for limited
geographic areas as part of regulatory requirements for
permitting public infrastructure projects such as highways or
utility lines.
The Rockingham Planning Commission has been involved with
the development of two sources of natural resource data for the
region that provide resource information within a framework of
analysis of the co-occurrence of two or more resource layers: the
New Hampshire Natural Services Network, and the Land
Conservation Plan for New Hampshire’s Coastal Watersheds.
The New Hampshire Wildlife Action Plan provides another
important data set useful in identifying high-value resource areas,
and was used in part in the Coastal Land Conservation Plan’s co-
occurrence data. Both the Wildlife Action Plan and the Natural
Services Network contain data at state, regional, and municipal
scales and are therefore available for the entire RPC/MPO area.
The Land Conservation Plan contains data for the coastal
watershed region of New Hampshire, which includes about three-
fifths of the land area of the RPC/MPO.
The two coastal vulnerability assessments completed in the past
three years (Tides to Storms, 2015 and Climate Risk in the
Seacoast, 2017) identified natural resource impacts from
projected sea level rise and storm surge in addition to
infrastructure impacts.
We have utilized all of these data sources here to identify
opportunities for mitigation projects that involve habitat
protection and resource conservation as prescribed in Figure 6.1
for transportation projects that impact water quality, wetlands,
floodplains, farmland soils or critical habitat.
Transportation project planners should consult these resources in
developing mitigation recommendations for transportation
projects in the RPC/MPO area:
• The Natural Services Network includes the following
information: Water supply, flood storage, economically
important soils, significant wildlife habitat, NH Wildlife
Action Plan supporting landscapes, local natural resource
inventory data, local land protection priorities, land trust
protection priorities, class VI roads, recreation trails, active
farms, and tree farms.
Long Range Transportation Plan Implementation Strategies
6-16
• The Land Conservation Plan for Coastal Watersheds contains
information on the following resources and systems: forest
ecosystems, freshwater ecosystems, irreplaceable coastal and
estuarine resources, critical plant and wildlife habitat, and
conservation focus areas.
• The NH Wildlife Action Plan: includes the following resource
information: NH Wildlife habitat land cover, highest-ranking
wildlife habitat by ecological condition, conservation focus
areas, and species distribution.
• Cultural and Historic Resource Inventories on file with the NH
Division of Historic Resources (NHDHR). Given the
requirements of the National Historic Preservation Act of
1966, inventories have been prepared as part of Section 106
reviews for any federally funded or permitted public
infrastructure project in the past 30 years. Some
municipalities have also taken on comprehensive cultural
resource inventories, known in NH as Town Wide Area Forms.
• Coastal Vulnerability Assessments including Tides to Storms
(2015) focused on the seven Atlantic coast communities, and
Climate Risk in the Seacoasts (C-RiSe, 2017) focused on ten
additional communities with frontage on Great Bay or tidal
rivers.
In addition to the conventional mitigation strategies identified in
Figure 6.1, land use strategies have become increasingly
important to mitigate the environmental impacts of
transportation projects – especially impact related to induced and
secondary growth. These include but are not limited to tools such
as districts or ordinances based on identified natural resources
areas. Examples include the Conservation Overlay District model
ordinance found in the Land Conservation Plan, as well as
ordinances as found in Innovative Land Use Controls: A Handbook,
prepared jointly by the NH Office of Energy and Planning (now the
Office of Strategic Initiatives), the NH Department of
Environmental Services, and the nine regional planning
commissions. Tools in the Handbook include model ordinances
on Transfer of Density Rights, The Village Plan Alternative
Subdivision, Conservation Subdivisions, Erosion and Sediment
Control, and Protection of Wildlife Habitat, among others.
Other mitigation strategies include land-trading programs in
which impacts to natural resource areas may be mitigated by the
purchase or protection of other high value natural resources areas
within a defined geographical region.
Examples of such programs include wetland trading programs,
transfer of density credit programs, and trading programs for high
value, contiguous habitat areas that connects to existing protected
areas. It is important to stress that any mitigation activities may
involve not only the development community and planning
professionals, but also must involve natural resource consultants
and local and regional conservation organizations who can assist
in the process of formulating successful mitigation strategies.
E N V I R O N M E N T A L J U S T I C E
An important consideration for the 2040 Long Range
Transportation Plan is the impact of its elements on minority and
low-income populations in the MPO region. Title VI of the 1964
Civil Rights Act prohibits discrimination on the basis of race, color,
or ethnic origin in the provision of transportation benefits and in
the imposition of adverse impacts.
Long Range Transportation Plan Implementation Strategies
6-17
Building on Title VI, Executive Order 12898 (1994) , requires each
federal agency to achieve environmental justice by identifying and
addressing any disproportionately high and adverse human
health or environmental effects, including interrelated social and
economic effects, of its programs, policies, and activities on
minority or low income population. Executive Order 12898
defines “minority” as a person who is African American, Hispanic,
Asian American, American Indian, or an Alaskan Native. A low-
income person means a person whose household income is at or
below the federal poverty level. For 2017 the poverty threshold
was $24,600 for a family of four.
The USDOT’s Final Order to Address Environmental Justice in
Minority Populations and Low Income Populations requires
transportation programming and planning activities to:
▪ Include explicit consideration of the effects of
transportation decisions on minority and low-income
populations.
▪ Provide meaningful opportunities for public involvement
by members of minority and low-income populations.
▪ Gather, where relevant, appropriate and practical,
demographic information (race, color, national origin, and
income level) on populations served or affected by
transportation decisions.
▪ Minimize or mitigate any adverse impact on minority or
low-income populations.
The Executive Order and Civil Rights Act require this Long Range
Transportation Plan to address the needs and concerns of
protected communities, both in terms of benefits received and
impacts imposed. Procedurally, the MPO is working to address
these needs through expanding its public outreach efforts.
Substantively, the MPO is working to expand access to
transportation for low-income and minority populations.