2030 ggra plan - maryland department of the environment
TRANSCRIPT
The Greenhouse Gas Emissions Reduction Act
2030 GGRA Plan
Prepared for:
Governor Larry J. Hogan State of Maryland
and the Maryland General Assembly
February 19, 2021
Maryland Department of the Environment 2030 Greenhouse Gas Emissions Reduction Act Plan
This page left intentionally blank.
Maryland Department of the Environment 2030 Greenhouse Gas Emissions Reduction Act Plan
Table of Contents
SECRETARY OF THE ENVIRONMENT BEN GRUMBLES’ MESSAGE
EXECUTIVE SUMMARY ............................................................................................................................. I ES.1 The Greenhouse Gas Emissions Reduction Act – Reauthorization of 2016 and Maryland Climate Goals ........ I ES.2 Climate Change and the Cost of Inaction in Maryland ................................................................................. III ES.3 Environmental and Climate Justice ............................................................................................................. III ES.4 Emissions Reductions and Modeling ............................................................................................................ V ES.5 Economic Benefits ...................................................................................................................................... IX ES.6 Federal Action and Inaction ........................................................................................................................ XI ES.7 Adaptation and Resiliency ......................................................................................................................... XII ES.8 Getting to Net Zero .................................................................................................................................. XIII ES.9 Sectors and Programs ............................................................................................................................... XIV
Electricity Generation ................................................................................................................................................ XV Transportation ......................................................................................................................................................... XVII Residential and Commercial Buildings ...................................................................................................................... XIX Carbon Sequestration on Natural and Working Lands ............................................................................................... XX Short-Lived and Super-Pollutant Greenhouse Gases ................................................................................................ XXI
ES.10 Conclusions ............................................................................................................................................. XXII
CHAPTER 1: CLIMATE CHANGE, THE COST OF INACTION, AND GGRA BACKGROUND ........ 1 1.1 The Science of Climate Change .................................................................................................................... 1
1.1.1 Greenhouse Gas Emissions ............................................................................................................................ 2 1.1.2 Temperature .................................................................................................................................................. 3 1.1.3 Ocean ............................................................................................................................................................ 3 1.1.4 Cryosphere .................................................................................................................................................... 3 1.1.5 Extreme Events .............................................................................................................................................. 4 1.1.6 Human Health................................................................................................................................................ 5 1.1.7 Wildfire .......................................................................................................................................................... 6
1.2 Climate Change and the Cost of Inaction in Maryland .................................................................................. 7 1.2.1 Maryland’s Environment ............................................................................................................................... 8 1.2.2 Jobs and the Economy ..................................................................................................................................13 1.2.3 Public Health.................................................................................................................................................16
1.3 The 2030 GGRA Plan .................................................................................................................................. 20 1.4 The Greenhouse Gas Emissions Reduction Act – Reauthorization of 2016 .................................................. 20 1.5 The 2030 GGRA Plan Requirements ........................................................................................................... 21 1.6 Climate Change-Related Legislation (2015 – 2019) ..................................................................................... 22
CHAPTER 2: CLIMATE JUSTICE AND EQUITY IN THE 2030 GGRA PLAN ................................ 25 2.1 Overview .................................................................................................................................................. 25 2.2 Climate Justice .......................................................................................................................................... 26 2.3 Climate Equity ........................................................................................................................................... 28 2.4 Equitable Economics ................................................................................................................................. 29
2.4.1 The Energy Burden .......................................................................................................................................29 2.4.2 Jobs ...............................................................................................................................................................30 2.4.3 Just Transition...............................................................................................................................................32 2.4.4 Just Transition Programs ..............................................................................................................................34
2.5 Commissions ............................................................................................................................................. 35 2.5.1 The Commission on Environmental Justice and Sustainable Communities (CEJSC) ......................................35 2.5.2 Maryland Commission on Climate Change Environmental Justice Approach ...............................................36
2.6 Public Health Considerations for all Marylanders ...................................................................................... 38
Maryland Department of the Environment 2030 Greenhouse Gas Emissions Reduction Act Plan
2.7 Vulnerability and Risk ............................................................................................................................... 40
CHAPTER 3: THE 2030 GGRA PLAN .................................................................................................. 42 3.1 Sectors and Programs ................................................................................................................................ 42
3.1.1 Electricity Generation ...................................................................................................................................42 3.1.2 Transportation ..............................................................................................................................................45 3.1.3 Residential and Commercial Buildings ..........................................................................................................47 3.1.4 Carbon Sequestration on Natural and Working Lands ..................................................................................48 3.1.5 Short-Lived and Super-Pollutant Greenhouse Gases ....................................................................................49 3.1.6 Waste Management .....................................................................................................................................49 3.1.7 Manufacturing ..............................................................................................................................................50 3.1.8 Program Summary ........................................................................................................................................50
3.2 Core Programs .......................................................................................................................................... 51 3.2.1 EmPOWER Maryland ....................................................................................................................................51 3.2.2 Programs to Support Energy Efficiency and Clean Energy via the Strategic Energy Investment Fund (SEIF) 54 3.2.3 The Maryland Renewable Energy Portfolio Standard (RPS) ..........................................................................56 3.2.4 The Clean and Renewable Energy Standard (CARES) ....................................................................................59 3.2.5 The Regional Greenhouse Gas Initiative (RGGI) ............................................................................................60 3.2.6 Housing and Building Energy Programs ........................................................................................................69 3.2.7 Other Energy Programs ................................................................................................................................76 3.2.8 Building and Trade Codes in Maryland .........................................................................................................79 3.2.9 Transportation Technologies ........................................................................................................................82 3.2.10 Multimodal Freight ......................................................................................................................................92 3.2.11 Public Transportation ...................................................................................................................................94 3.2.12 Pricing Initiatives ........................................................................................................................................100 3.2.13 Bicycle and Pedestrian Initiatives ...............................................................................................................103 3.2.14 Forestry and Sequestration ........................................................................................................................107 3.2.15 Ecosystems Markets ...................................................................................................................................143 3.2.16 Sustainable Materials Management ..........................................................................................................145 3.2.17 Innovative Voluntary Initiatives .................................................................................................................155 3.2.18 Land Use Programs ....................................................................................................................................157 3.2.19 Outreach Efforts.........................................................................................................................................161 3.2.20 Federal Measures ......................................................................................................................................162
3.3 Short-Lived Climate Pollutants (SLCPs) .................................................................................................... 164 3.3.1 Why Are SLCPs Important? .........................................................................................................................166 3.3.2 Uncertainty from Federal Regulations on SLCPs .........................................................................................167 3.3.3 SLCP Emissions in Maryland........................................................................................................................167 3.3.4 What is Maryland Doing to Reduce SLCP Emissions?..................................................................................168 3.3.5 In-State Methane Minimization ..................................................................................................................170 3.3.6 Hydrofluorocarbons (HFCs) ........................................................................................................................172
3.4 Voluntary and Non-Traditional Programs ................................................................................................ 173 3.4.1 The United States Climate Alliance .............................................................................................................173 3.4.2 Zero Emission Vehicle (ZEV) MOU Partnership ...........................................................................................174 3.4.3 The Maryland Green Registry .....................................................................................................................178 3.4.4 Idle Free Maryland......................................................................................................................................179 3.4.5 The Port Partnership ...................................................................................................................................180 3.4.6 The Volkswagen Mitigation Fund ...............................................................................................................184 3.4.7 The Metropolitan Washington Council of Governments’ (MWCOG) Climate Energy and Environmental Policy Committee (CEEPC) ........................................................................................................................................186 3.4.8 Medium- and Heavy-Duty Zero Emission Vehicle (ZEV) Memorandum of Understanding (MOU)..............189 3.4.9 Transportation and Climate Initiative (TCI) .................................................................................................190 3.4.10 Leadership-By-Example – State of Maryland Initiatives .............................................................................190
3.5 Emerging Technologies ............................................................................................................................ 199 3.5.1 Energy Storage............................................................................................................................................199 3.5.2 Carbon Capture Utilization and Sequestration (Power and Industrial) .......................................................200 3.5.3 Small Modular Reactors (SMRs)..................................................................................................................200 3.5.4 Smart Grid Technology ...............................................................................................................................200
Maryland Department of the Environment 2030 Greenhouse Gas Emissions Reduction Act Plan
3.5.5 The Water-Energy Nexus ............................................................................................................................201 3.5.6 CO2 Reduction Technology .........................................................................................................................201 3.5.7 Bioenergy with Carbon Capture and Storage (BECCS) ................................................................................201 3.5.8 Direct Air Capture (DAC) .............................................................................................................................201 3.5.9 Biochar .......................................................................................................................................................202 3.5.10 Green Cement .............................................................................................................................................202 3.5.11 Algae Systems .............................................................................................................................................202 3.5.12 Fuel Cell Vehicles ........................................................................................................................................202 3.5.13 Mass Timber ................................................................................................................................................203
CHAPTER 4: MEETING LONGER-TERM GOALS ............................................................................ 204 4.1 Overview ................................................................................................................................................ 204 4.2 An Increased Sense of Urgency ................................................................................................................ 205 4.3 Key Programs that Will Achieve Deeper Reductions in the 2040 to 2050 Time Frame .............................. 206
4.3.1 Key Programs That Generate Deeper GHG Reductions After 2030 .............................................................206 4.4 Challenging the Federal Government Over Weakening Key Programs that are Critical to Meeting Maryland’s Long-Term Climate Change Goals ....................................................................................................... 211
4.4.1 Critical Actions ............................................................................................................................................212
CHAPTER 5: EMISSIONS MODELING AND ECONOMIC IMPACTS............................................ 215 5.1 Emissions and Economic Impact Analysis ................................................................................................. 215 5.2 Emissions Modeling ................................................................................................................................ 215
5.2.1 Background .................................................................................................................................................215 5.2.2 Reference Case Results ...............................................................................................................................216 5.2.3 Policy Scenarios ..........................................................................................................................................218
5.3 Economic Impacts ................................................................................................................................... 219 5.3.1 Background .................................................................................................................................................219 5.3.2 Criteria for Evaluating the Economic Impact of Policy Scenarios ................................................................219 5.3.3 Policy Scenarios ..........................................................................................................................................220
5.4 Scenario Assumptions ............................................................................................................................. 225 5.4.1 Overview of Modeling Scenarios ................................................................................................................225 5.4.2 The Reference Scenario ..............................................................................................................................225 5.4.3. Policy Scenarios ..........................................................................................................................................226
CHAPTER 6: GREENHOUSE GAS EMISSIONS THROUGH 2020 ................................................ 229 6.1 Overview ................................................................................................................................................ 229
6.1.1 Introduction ................................................................................................................................................229 6.1.2 The Goal .....................................................................................................................................................229
6.2 Basic Assumptions................................................................................................................................... 230 6.2.1 Greenhouse Gas Pollutant GWP .................................................................................................................230 6.2.2. Data Sources ...............................................................................................................................................231 6.2.3 Changes in Numbers ...................................................................................................................................232
6.3 Source Categories ................................................................................................................................... 233 6.3.1 Electricity Supply ........................................................................................................................................233 6.3.2 RCI Fuel Combustion...................................................................................................................................233 6.3.3 Transportation ............................................................................................................................................233 6.3.4 Fossil Fuel Industry .....................................................................................................................................233 6.3.5 Industrial Processes ....................................................................................................................................233 6.3.6 Agriculture ..................................................................................................................................................234 6.3.7 Waste Management ...................................................................................................................................234 6.3.8 Forestry and Land Use ................................................................................................................................234
6.4 Out of State Methane Inventory .............................................................................................................. 234
Maryland Department of the Environment 2030 Greenhouse Gas Emissions Reduction Act Plan
CHAPTER 7: ADAPTATION AND RESILIENCY .............................................................................. 236 7.1 Background ............................................................................................................................................. 236 7.2 Adaptation Introduction.......................................................................................................................... 237 7.3 Adaptation in Maryland .......................................................................................................................... 237
7.3.1 Phase III Watershed Implementation Plan (WIP) ........................................................................................237 7.3.2 Adaptation Framework ...............................................................................................................................237 7.3.3 Adaptation Indicators .................................................................................................................................238
7.4 Adaptation Implementation Updates (2015-2020) ................................................................................... 238 7.4.1 Practice and Place .......................................................................................................................................238 7.4.2 Community Engagement and Communication ...........................................................................................242 7.4.3 Advancing the Science ................................................................................................................................244
7.5 Short- and Long-Term Initiatives to Better Address Climate Change ........................................................ 246 7.5.1 Environmental Justice Addressing Disproportionate Impacts of Climate Change .......................................246 7.5.2 Building Financial Resilience .......................................................................................................................247
7.6 State Enhancement Actions ..................................................................................................................... 247 7.6.1 Local Governments – Resilience Authorities – Authorization .....................................................................247 7.6.2 Coast Smart Construction Program ............................................................................................................247 7.6.3 Nuisance Flood Plan Guidance....................................................................................................................248 7.6.4 Saltwater Intrusion Plan .............................................................................................................................248
7.7 Conclusions ............................................................................................................................................. 248
Maryland Department of the Environment 2030 Greenhouse Gas Emissions Reduction Act Plan
The following appendices have been added to supplement the chapters of this plan:
Appendix A: The Greenhouse Gas Emissions Reduction Act of 2009
Appendix B: The Greenhouse Gas Emissions Reduction Act – Reauthorization of 2016
Appendix C: GGRA Projections Documentation
Appendix D: 2017 Greenhouse Gas Emissions Inventory Documentation
Appendix E: Natural Gas Life-Cycle Emissions Inventory Attributable to Fracked Gas in 2017
Appendix F: Documentation of Maryland PATHWAYS Scenario Modeling
Appendix G: Economic Impacts
Appendix H: Impact Analysis of the GGRA of 2009 on Manufacturing Industry in Maryland
Appendix I: Just Transition
Appendix J: MDOT GGRA Draft Plan
Appendix K: MDA Recommended Practices
Appendix L: Public Comments on the 2019 GGRA Draft Plan
Maryland Department of the Environment 2030 Greenhouse Gas Emissions Reduction Act Plan
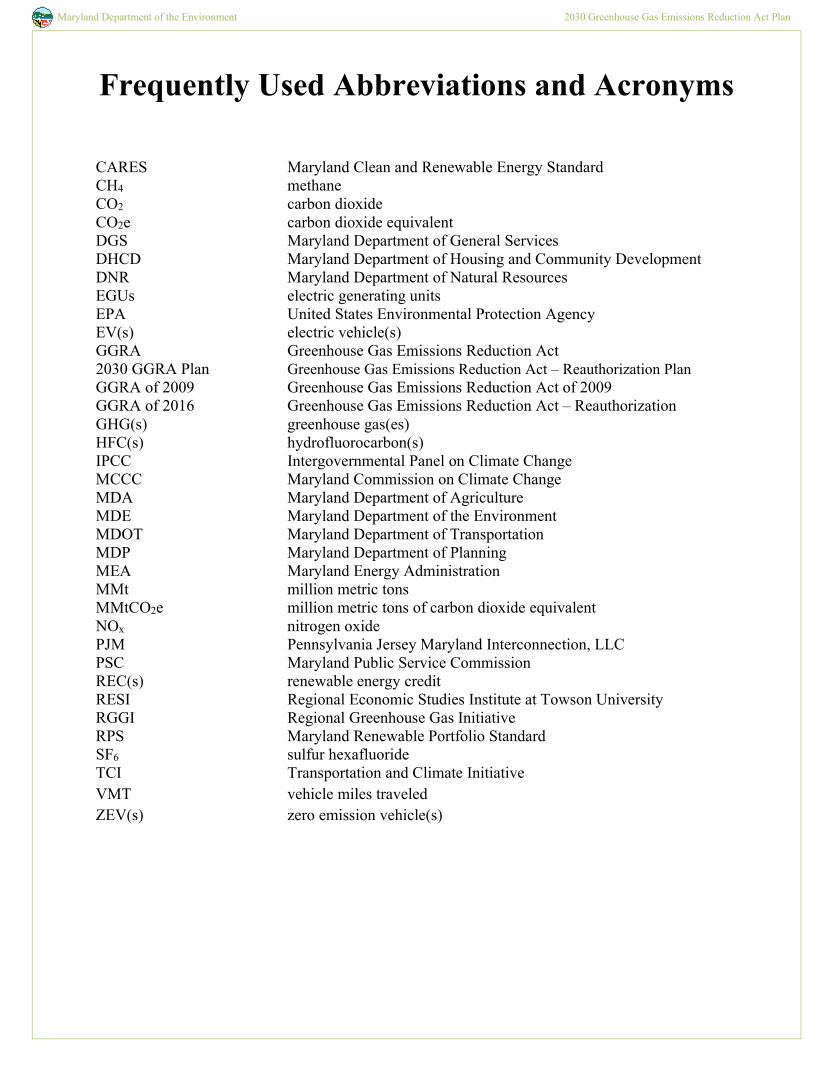
Frequently Used Abbreviations and Acronyms CARES Maryland Clean and Renewable Energy Standard CH4 methane CO2 carbon dioxide CO2e carbon dioxide equivalent DGS Maryland Department of General Services DHCD Maryland Department of Housing and Community Development DNR Maryland Department of Natural Resources EGUs electric generating units EPA United States Environmental Protection Agency EV(s) electric vehicle(s) GGRA Greenhouse Gas Emissions Reduction Act 2030 GGRA Plan Greenhouse Gas Emissions Reduction Act – Reauthorization Plan GGRA of 2009 Greenhouse Gas Emissions Reduction Act of 2009 GGRA of 2016 Greenhouse Gas Emissions Reduction Act – Reauthorization GHG(s) greenhouse gas(es) HFC(s) hydrofluorocarbon(s) IPCC Intergovernmental Panel on Climate Change MCCC Maryland Commission on Climate Change MDA Maryland Department of Agriculture MDE Maryland Department of the Environment MDOT Maryland Department of Transportation MDP Maryland Department of Planning MEA Maryland Energy Administration MMt million metric tons MMtCO2e million metric tons of carbon dioxide equivalent NOx nitrogen oxide PJM Pennsylvania Jersey Maryland Interconnection, LLC PSC Maryland Public Service Commission REC(s) renewable energy credit RESI Regional Economic Studies Institute at Towson University RGGI Regional Greenhouse Gas Initiative RPS Maryland Renewable Portfolio Standard SF6 sulfur hexafluoride TCI Transportation and Climate Initiative VMT vehicle miles traveled ZEV(s) zero emission vehicle(s)
Maryland Department of the Environment 2030 Greenhouse Gas Emissions Reduction Act Plan
Secretary of the
Environment Ben Grumbles’ Message
The need to act swiftly and decisively to combat climate change grows more urgent every year. Maryland is one of the most vulnerable states to the effects of climate change, with thousands of miles of shoreline, large areas of low-lying land, and populations throughout the state threatened by more intense rainfall, heatwaves, and other impacts. Maryland has long been a leader in the fight against climate change, with our first comprehensive Climate Action Plan published in 2008, followed shortly by the first Greenhouse Gas Emissions Reduction Act becoming law in 2009 along with our participation in the groundbreaking Regional Greenhouse Gas Initiative. Our early and sustained effort in this area was recently recognized by the World Resources Institute when they found that Maryland was first among all 50 states at reducing our greenhouse gas emissions while growing our economy.1 The 2030 GGRA Plan sets forth a comprehensive set of measures to reduce and sequester GHGs, including investments in energy efficiency and clean and renewable energy solutions, clean transportation projects and widespread adoption of electric vehicles, and improved management of forests and farms to sequester more carbon in trees and soils. In addition to reducing GHG emissions, these measures will make our economy stronger, create thousands of Maryland jobs, and improve the health of communities throughout the state. The plan advances each of these measures with an eye toward how they can best benefit overburdened and underserved communities and address long-standing environmental and racial injustices. The 2030 GGRA Plan benefited immeasurably from the input of the Maryland Commission on Climate Change and from members of the public who participated in the outreach and comment process for the 2019 GGRA Draft Plan. That partnership will continue as we build upon this plan and accelerate our progress in the future. Maryland’s ambitious and inclusive approach to climate action and justice has grown more effective over time, with updates to our GGRA Plan in 2013, 2015, and 2019. This 2030 GGRA Plan continues that progress, putting us on a track to achieve deep GHG reductions of nearly 50% by 2030, and calling for net-zero economywide GHG emissions by 2045. We have much more work to do to achieve that bold goal, but with determined focus by all parts of state government, leaders and experts on the Commission, and Marylanders in all parts of our state, we can meet this challenge and secure a prosperous and healthy Maryland and Chesapeake Bay.
1 https://www.wri.org/blog/2020/07/decoupling-emissions-gdp-us
Maryland Department of the Environment 2030 Greenhouse Gas Emissions Reduction Act Plan
I
Executive Summary
ES.1 The Greenhouse Gas Emissions Reduction Act – Reauthorization of 2016 and Maryland Climate Goals
On April 4, 2016, the Greenhouse Gas Emissions Reduction Act – Reauthorization (GGRA of 2016) was signed into law by Maryland Governor Larry Hogan. Expanding on the requirements of the original GGRA law (GGRA of 2009), the GGRA of 2016 requires the state to achieve a minimum of a 40% reduction in statewide greenhouse gas (GHG) emissions from 2006 levels by 2030, which is substantially more ambitious than the United States’ international commitment under the Paris accord to reduce emissions by 26-28% by 2025. To achieve this goal, the GGRA of 2016 requires the Maryland Department of the Environment (MDE) to develop a statewide GHG reduction plan (2030 GGRA Plan). The GGRA also requires MDE to solicit public comment on the proposed draft plan from interested stakeholders and the public, and to adopt a final plan by Dec. 31, 2019. The state is also required to demonstrate that the new reduction goal can be achieved in a way that has a net positive impact on Maryland’s economy, protects existing manufacturing jobs and creates significant new “green” jobs in Maryland. In its 2020 Annual Report,1 the Maryland Commission on Climate Change (MCCC)2 recommended that Maryland update the GGRA of 2016 and adopt a more ambitious reduction goal of 50% reduction from 2006 levels by 2030 and recognize the finding by the Intergovernmental Panel on Climate Change (IPCC) that developed nations will need to reduce emissions to net zero as early as 2045. The 2030 GGRA Plan treats the more ambitious 2030 recommendation as a stretch goal and includes a series of measures that will reduce emissions more than required by the goal in current law. MDE’s emissions analysis shows that the 2030 GGRA Plan will come very close to achieving a 50% reduction by 2030 without accounting for some anticipated new federal government policies to reduce emissions. If the incoming federal administration takes action to improve vehicle efficiency, reduce the cost of electric vehicles (EVs), deploy more clean and renewable electricity, and invest in energy efficiency and electrification, Maryland will be able to achieve a 50% reduction in GHG emissions by 2030. Future iterations of the GGRA Plan will continue to identify additional measures to reduce GHG emissions as new technologies become available. The requirements and content of the GGRA of 2016 are summarized below:
1 https://mde.maryland.gov/programs/Air/ClimateChange/MCCC/Documents/MCCCAnnualReport2020.pdf 2 https://mde.maryland.gov/programs/Air/ClimateChange/MCCC/Pages/index.aspx
Maryland Department of the Environment 2030 Greenhouse Gas Emissions Reduction Act Plan
II
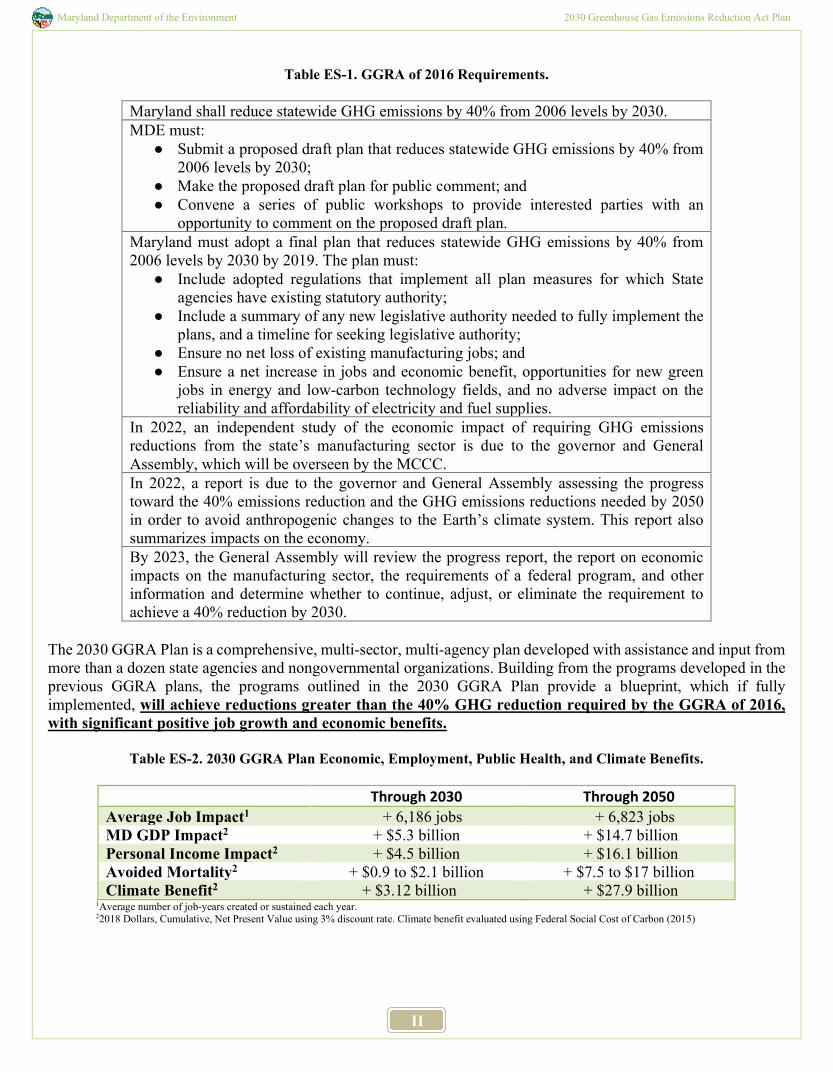
Table ES-1. GGRA of 2016 Requirements.
Maryland shall reduce statewide GHG emissions by 40% from 2006 levels by 2030. MDE must:
● Submit a proposed draft plan that reduces statewide GHG emissions by 40% from 2006 levels by 2030;
● Make the proposed draft plan for public comment; and ● Convene a series of public workshops to provide interested parties with an
opportunity to comment on the proposed draft plan. Maryland must adopt a final plan that reduces statewide GHG emissions by 40% from 2006 levels by 2030 by 2019. The plan must:
● Include adopted regulations that implement all plan measures for which State agencies have existing statutory authority;
● Include a summary of any new legislative authority needed to fully implement the plans, and a timeline for seeking legislative authority;
● Ensure no net loss of existing manufacturing jobs; and ● Ensure a net increase in jobs and economic benefit, opportunities for new green
jobs in energy and low-carbon technology fields, and no adverse impact on the reliability and affordability of electricity and fuel supplies.
In 2022, an independent study of the economic impact of requiring GHG emissions reductions from the state’s manufacturing sector is due to the governor and General Assembly, which will be overseen by the MCCC. In 2022, a report is due to the governor and General Assembly assessing the progress toward the 40% emissions reduction and the GHG emissions reductions needed by 2050 in order to avoid anthropogenic changes to the Earth’s climate system. This report also summarizes impacts on the economy. By 2023, the General Assembly will review the progress report, the report on economic impacts on the manufacturing sector, the requirements of a federal program, and other information and determine whether to continue, adjust, or eliminate the requirement to achieve a 40% reduction by 2030.
The 2030 GGRA Plan is a comprehensive, multi-sector, multi-agency plan developed with assistance and input from more than a dozen state agencies and nongovernmental organizations. Building from the programs developed in the previous GGRA plans, the programs outlined in the 2030 GGRA Plan provide a blueprint, which if fully implemented, will achieve reductions greater than the 40% GHG reduction required by the GGRA of 2016, with significant positive job growth and economic benefits.
Table ES-2. 2030 GGRA Plan Economic, Employment, Public Health, and Climate Benefits.
Through 2030 Through 2050 Average Job Impact1 + 6,186 jobs + 6,823 jobs MD GDP Impact2 + $5.3 billion + $14.7 billion Personal Income Impact2 + $4.5 billion + $16.1 billion Avoided Mortality2 + $0.9 to $2.1 billion + $7.5 to $17 billion Climate Benefit2 + $3.12 billion + $27.9 billion
1Average number of job-years created or sustained each year. 22018 Dollars, Cumulative, Net Present Value using 3% discount rate. Climate benefit evaluated using Federal Social Cost of Carbon (2015)
Maryland Department of the Environment 2030 Greenhouse Gas Emissions Reduction Act Plan
III
ES.2 Climate Change and the Cost of Inaction in Maryland
With 3,100 miles of shoreline, Maryland is one of the most vulnerable parts of the U.S. to the effects of sea level rise associated with climate change. Rising sea levels and increased storm intensity could have devastating and far-reaching impacts on the Atlantic coast and the Chesapeake Bay ecosystem that affect the environmental, recreational and economic benefits enjoyed by Maryland and its visitors. Although Maryland's coastal areas may be considered particularly vulnerable, all areas of the state are at risk. In general, climate change alters the severity, frequency or distribution of existing issues that are impacted either directly or indirectly by temperature and precipitation. This includes, but is not limited to:
• Impacts on coastal, bay, and inland water quality parameters that may change the viable uses of surface water, such as for irrigation, recreation, or human consumption;
• More frequent disruptions to urban and coastal infrastructure in Maryland caused by extreme weather events and sea level rise that may indirectly impact the economy of the region by restricting the flow of goods and affecting days worked;
• Common stressors experienced among ecosystems, agriculture, fisheries, and forestry such as those caused by general changes in temperature and precipitation regimes; increased extreme weather events; and increased pressures from weeds, diseases, and pests;
• Human health issues, including those affected by impacts on food and water supply, air quality and extreme weather events; and
• A higher probability of negative outcomes for disadvantaged communities and individuals inherently more sensitive or with a reduced adaptive capacity for responding to the impacts of climate change.
Detailed discussion of the latest scientific findings on the impacts of climate change is included in Chapter 1.
ES.3 Environmental and Climate Justice
Environmental justice (EJ) is an ethical mandate that seeks equal protection from environmental and public health hazards for all people regardless of race, income, culture and social class. Additionally, EJ means that no group of people, including racial, ethnic and socioeconomic groups, should bear a disproportionate share of the negative environmental consequences resulting from industrial, land-use planning and zoning, municipal, and commercial operations, or the execution of federal, state, local, and municipal programs and policies. EJ requires the development, implementation, and enforcement of environmental laws, regulations, and policies that ensure that no single community will bear a disproportionate share of the negative environmental conditions or pollution. This may include industrial operations, land-use planning and zoning, or municipal and commercial operations, such as through Title V permits issued by environmental regulatory agencies. Climate change poses a significant threat to vulnerable communities with little adaptive capacity. Furthermore, disadvantaged communities are disproportionately impacted by pollution, often stemming from previous policy and planning decisions. The state must ensure that equity and EJ are key principles of climate policies moving into 2021. Maryland must also ensure that residents and businesses across all communities have ample opportunity to shape and comment on climate policy, direct resources from climate programs like the Regional Greenhouse Gas Initiative (RGGI) to help disadvantaged communities address climate change and benefit from the transition to clean energy, and to repair damage to communities from previous policies. “Climate justice” is a term that acknowledges climate change can have differing social, economic, public health, and other adverse impacts on disadvantaged populations. Climate justice begins with recognizing that key groups bear disproportionate climate change impacts. Climate impacts can exacerbate inequitable social conditions.
Maryland Department of the Environment 2030 Greenhouse Gas Emissions Reduction Act Plan
IV
Achieving environmental and climate justice will require multidisciplinary collaboration among various stakeholders, including communities, businesses, public health and education experts, air quality scientists, meteorologists, engineers and community planners, and federal, state, and local regulatory agencies. Climate justice principles may include:
• Supporting the right to economic development and employment opportunities; • Sharing benefits and burdens equitably; • Ensuring decisions are participatory, transparent, and accountable; • Supporting education for climate stewardship; and • Using effective partnerships.
Necessary steps and opportunities to achieve environmental and climate justice are included throughout the 2030 GGRA Plan, and considerations of how each measure can advance those objectives is considered in the program-by-program discussions in Chapter 3. Some ways in which programs in the 2030 GGRA Plan address environmental and climate justice include:
• Community solar expands the benefits of access to renewable energy to individuals who do not own land or rooftop space, allowing them to enjoy the benefits of solar power generation, while the Community Solar Low to Moderate Income (LMI) Power Purchase Agreement (PPA) grant provides funding to offer community solar subscriptions with deep discounts below the utility’s standard offer service rates for LMI households.
• The Maryland Department of Housing and Community Development (DHCD) provides financing from the EmPOWER Maryland Program for projects that reduce energy costs and address critical health and safety issues for residents and limited income families.
• Under RGGI, more than half of all funds collected by Maryland are invested in energy assistance for low-income households, and energy efficiency in LMI homes and communities.
• The Maryland Department of Natural Resources (DNR) has helped to fund tree planting in urban areas, which has been shown to remove air pollutants, reduce the risk of certain health problems, keep urban areas cooler, as well as sequestering carbon dioxide (CO2) from the atmosphere.
• The Maryland Department of Planning (MDP) is taking measures to mitigate the impact of saltwater intrusion on agricultural communities on the Eastern Shore, and DNR's Park Equity Tool identifies underserved communities that may benefit from preservation of open space, shoreline enhancement, and other nature-based approaches to risk reduction.
• Transportation technologies play a critical role in reducing emissions from the transportation sector which disproportionately impact low-income communities and communities of color. The state has several programs that deploy electric buses and trucks, reducing pollutants that can contribute to health problems in communities while also reducing CO2 emissions.
The 2030 GGRA Plan aims to achieve Maryland’s GHG reduction goals in a way that benefits Maryland’s economy and creates jobs, and that shares those benefits broadly. Economic impact analysis by Towson University estimates that the 2030 GGRA Plan will primarily create middle-class jobs.
Maryland Department of the Environment 2030 Greenhouse Gas Emissions Reduction Act Plan
V
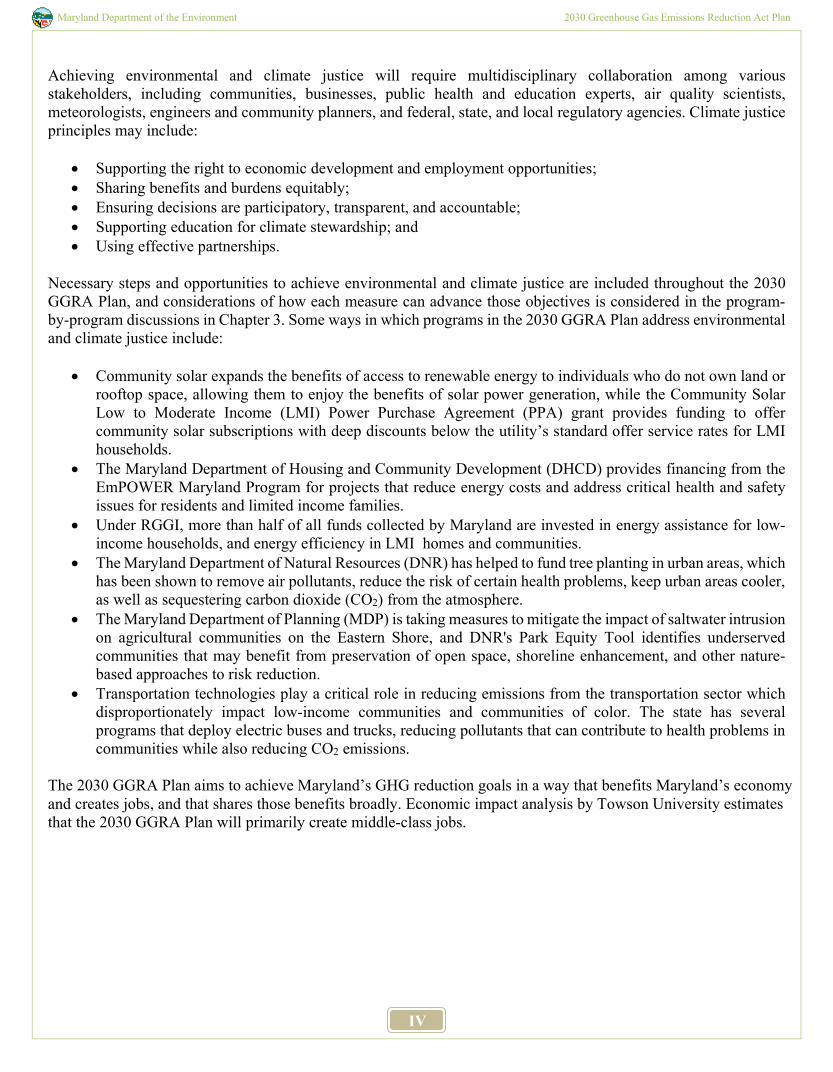
Figure ES-1. Employment impacts from the 2030 GGRA Plan through 2030 in the lower, middle, and upper thirds of the income distribution.
The economic impact analysis also finds that the jobs created by the 2030 GGRA Plan are expected to be broadly spread across Maryland’s geography, and across racial and ethnic groups. Detailed discussion of environmental and climate justice is included in Chapter 2.
ES.4 Emissions Reductions and Modeling
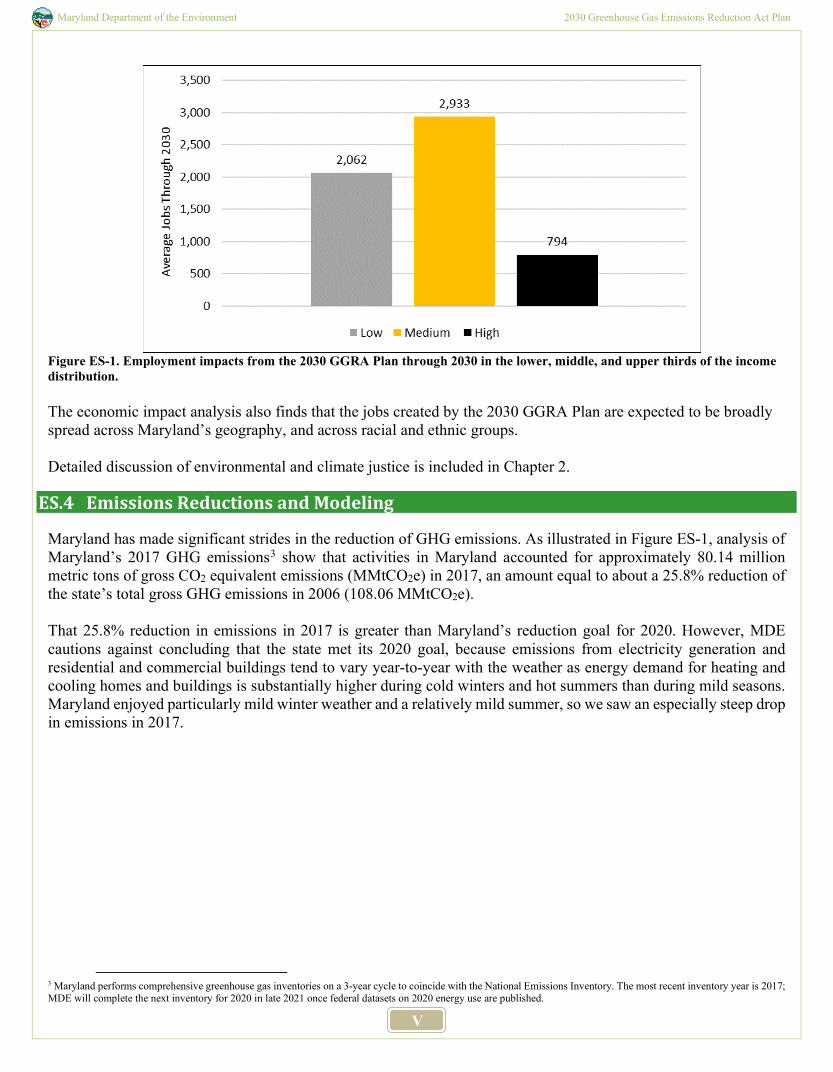
Maryland has made significant strides in the reduction of GHG emissions. As illustrated in Figure ES-1, analysis of Maryland’s 2017 GHG emissions3 show that activities in Maryland accounted for approximately 80.14 million metric tons of gross CO2 equivalent emissions (MMtCO2e) in 2017, an amount equal to about a 25.8% reduction of the state’s total gross GHG emissions in 2006 (108.06 MMtCO2e). That 25.8% reduction in emissions in 2017 is greater than Maryland’s reduction goal for 2020. However, MDE cautions against concluding that the state met its 2020 goal, because emissions from electricity generation and residential and commercial buildings tend to vary year-to-year with the weather as energy demand for heating and cooling homes and buildings is substantially higher during cold winters and hot summers than during mild seasons. Maryland enjoyed particularly mild winter weather and a relatively mild summer, so we saw an especially steep drop in emissions in 2017.
3 Maryland performs comprehensive greenhouse gas inventories on a 3-year cycle to coincide with the National Emissions Inventory. The most recent inventory year is 2017; MDE will complete the next inventory for 2020 in late 2021 once federal datasets on 2020 energy use are published.
Maryland Department of the Environment 2030 Greenhouse Gas Emissions Reduction Act Plan
VI
Figure ES-2. Historic decrease in Maryland’s GHG emissions compared to GGRA goals.
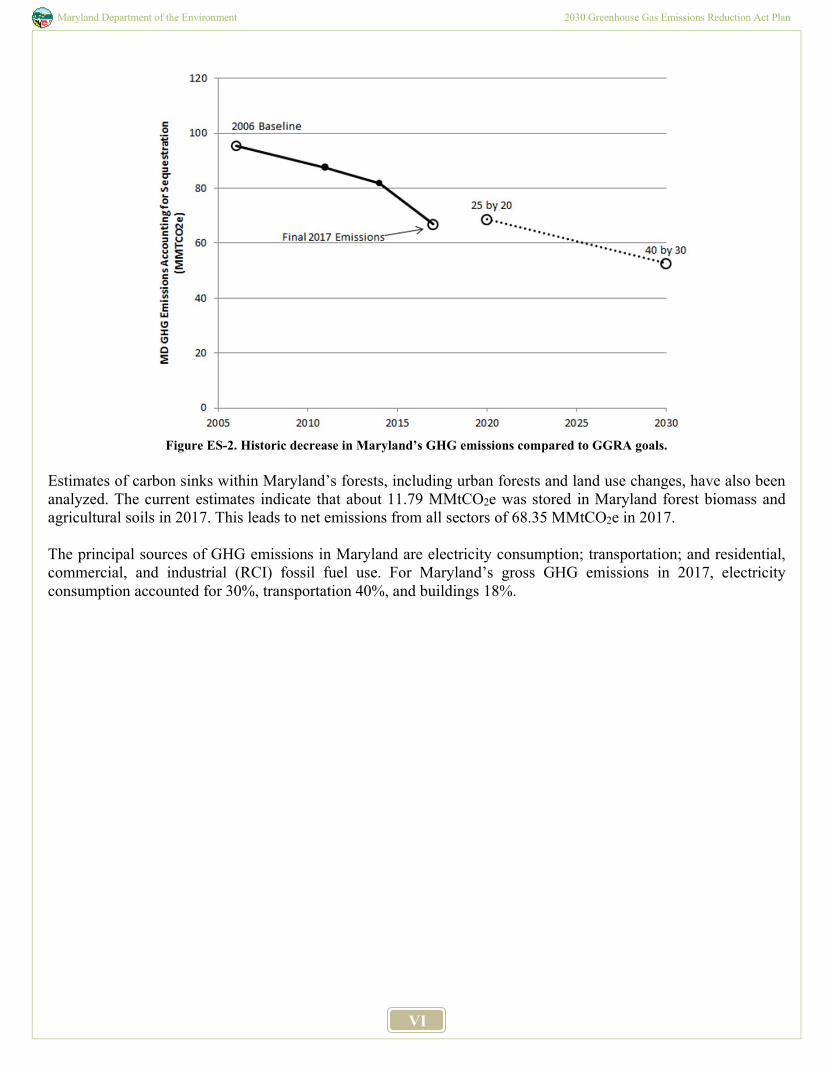
Estimates of carbon sinks within Maryland’s forests, including urban forests and land use changes, have also been analyzed. The current estimates indicate that about 11.79 MMtCO2e was stored in Maryland forest biomass and agricultural soils in 2017. This leads to net emissions from all sectors of 68.35 MMtCO2e in 2017. The principal sources of GHG emissions in Maryland are electricity consumption; transportation; and residential, commercial, and industrial (RCI) fossil fuel use. For Maryland’s gross GHG emissions in 2017, electricity consumption accounted for 30%, transportation 40%, and buildings 18%.
Maryland Department of the Environment 2030 Greenhouse Gas Emissions Reduction Act Plan
VII
Figure ES-3. Maryland’s 2017 Gross GHG Emissions by Sector.
The GGRA of 2016 requires that the state must reduce emissions by 43.22 MMtCO2e (40% of the state’s total gross GHG emissions in 2006) to achieve the 2030 goal. To account for both reductions in emissions and improvements in sequestration from forests and agricultural soils, Maryland’s net GHG emissions must be reduced to 53 MMtCO2e (43.22 MMtCO2e below the state’s net GHG emissions in 2006).4 The combined emissions reductions of all programs in the 2030 GGRA Plan will yield a total of 52.7 MMtCO2e in emissions reductions in 2030, compared to 2006. This will result in a total reduction of 48.7%, achieving 9.45 MMtCO2e of emission reductions more than the 2030 GGRA goal. The 2030 GGRA Plan yields greater emissions reductions than the 2019 GGRA Draft Plan that MDE published in October 2019, thanks to additional reductions in electricity generation, RCI fuel use, transportation, and methane (CH4) leakage from the natural gas supply chain.
4 MDE has updated the Global Warming Potential (GWP) factors used to evaluate the impact of greenhouse gases other than carbon dioxide to reflect the latest available from the Intergovernmental Panel on Climate Change (IPCC) Fifth Assessment Report. Prior iterations of GGRA plans, including the 2019 GGRA Draft Plan, used GWP values from the Second Assessment Report.
Maryland Department of the Environment 2030 Greenhouse Gas Emissions Reduction Act Plan
VIII
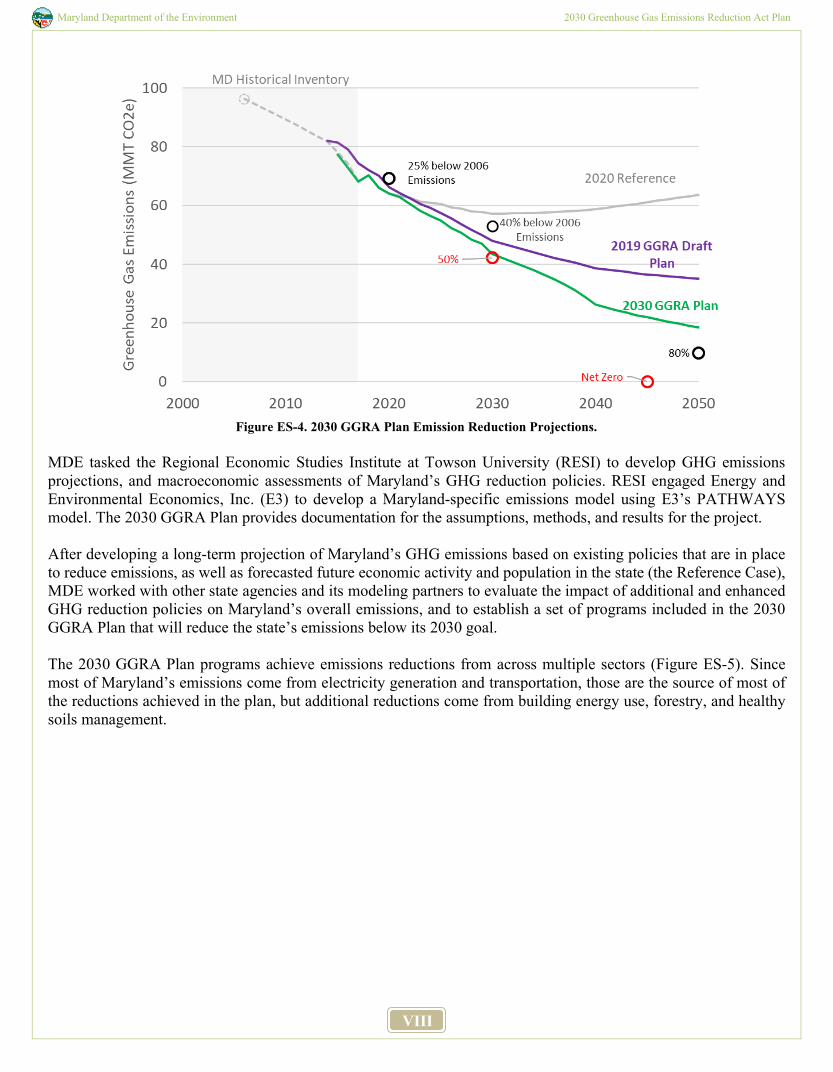
Figure ES-4. 2030 GGRA Plan Emission Reduction Projections.
MDE tasked the Regional Economic Studies Institute at Towson University (RESI) to develop GHG emissions projections, and macroeconomic assessments of Maryland’s GHG reduction policies. RESI engaged Energy and Environmental Economics, Inc. (E3) to develop a Maryland-specific emissions model using E3’s PATHWAYS model. The 2030 GGRA Plan provides documentation for the assumptions, methods, and results for the project. After developing a long-term projection of Maryland’s GHG emissions based on existing policies that are in place to reduce emissions, as well as forecasted future economic activity and population in the state (the Reference Case), MDE worked with other state agencies and its modeling partners to evaluate the impact of additional and enhanced GHG reduction policies on Maryland’s overall emissions, and to establish a set of programs included in the 2030 GGRA Plan that will reduce the state’s emissions below its 2030 goal. The 2030 GGRA Plan programs achieve emissions reductions from across multiple sectors (Figure ES-5). Since most of Maryland’s emissions come from electricity generation and transportation, those are the source of most of the reductions achieved in the plan, but additional reductions come from building energy use, forestry, and healthy soils management.
Maryland Department of the Environment 2030 Greenhouse Gas Emissions Reduction Act Plan
IX
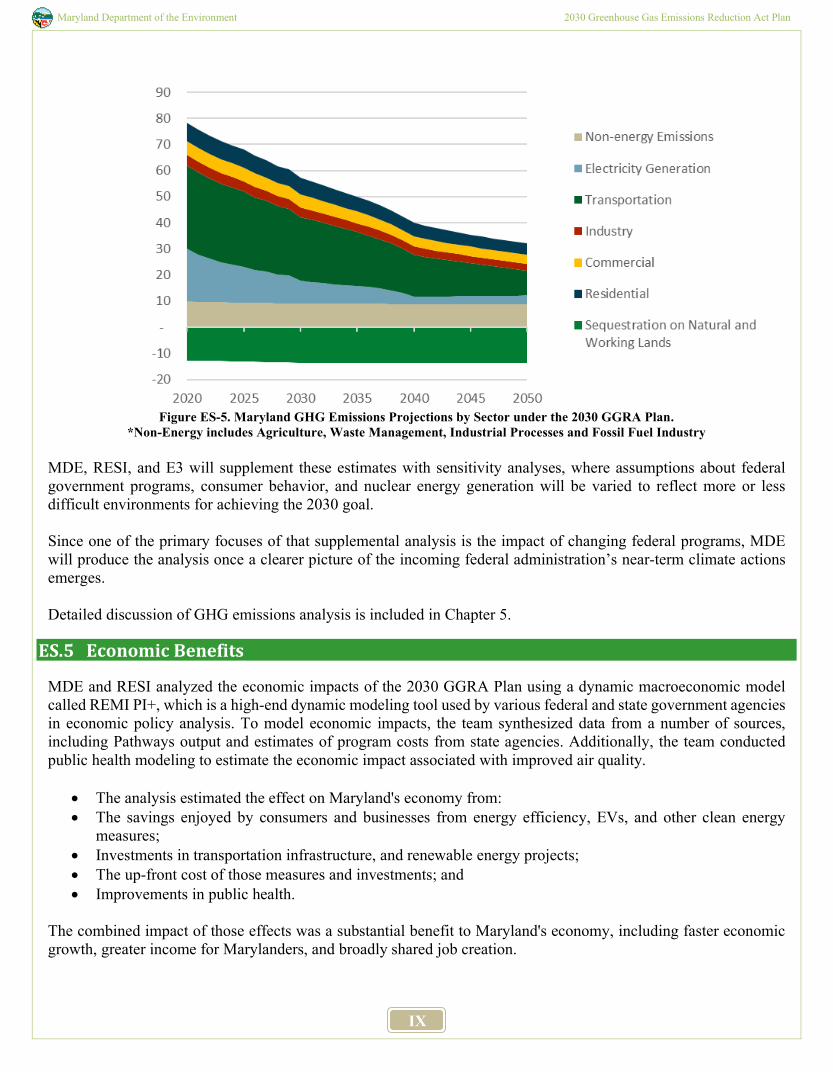
Figure ES-5. Maryland GHG Emissions Projections by Sector under the 2030 GGRA Plan.
*Non-Energy includes Agriculture, Waste Management, Industrial Processes and Fossil Fuel Industry MDE, RESI, and E3 will supplement these estimates with sensitivity analyses, where assumptions about federal government programs, consumer behavior, and nuclear energy generation will be varied to reflect more or less difficult environments for achieving the 2030 goal. Since one of the primary focuses of that supplemental analysis is the impact of changing federal programs, MDE will produce the analysis once a clearer picture of the incoming federal administration’s near-term climate actions emerges. Detailed discussion of GHG emissions analysis is included in Chapter 5.
ES.5 Economic Benefits
MDE and RESI analyzed the economic impacts of the 2030 GGRA Plan using a dynamic macroeconomic model called REMI PI+, which is a high-end dynamic modeling tool used by various federal and state government agencies in economic policy analysis. To model economic impacts, the team synthesized data from a number of sources, including Pathways output and estimates of program costs from state agencies. Additionally, the team conducted public health modeling to estimate the economic impact associated with improved air quality.
• The analysis estimated the effect on Maryland's economy from: • The savings enjoyed by consumers and businesses from energy efficiency, EVs, and other clean energy
measures; • Investments in transportation infrastructure, and renewable energy projects; • The up-front cost of those measures and investments; and • Improvements in public health.
The combined impact of those effects was a substantial benefit to Maryland's economy, including faster economic growth, greater income for Marylanders, and broadly shared job creation.
Maryland Department of the Environment 2030 Greenhouse Gas Emissions Reduction Act Plan
X
Sources: E3, MDE, RESI
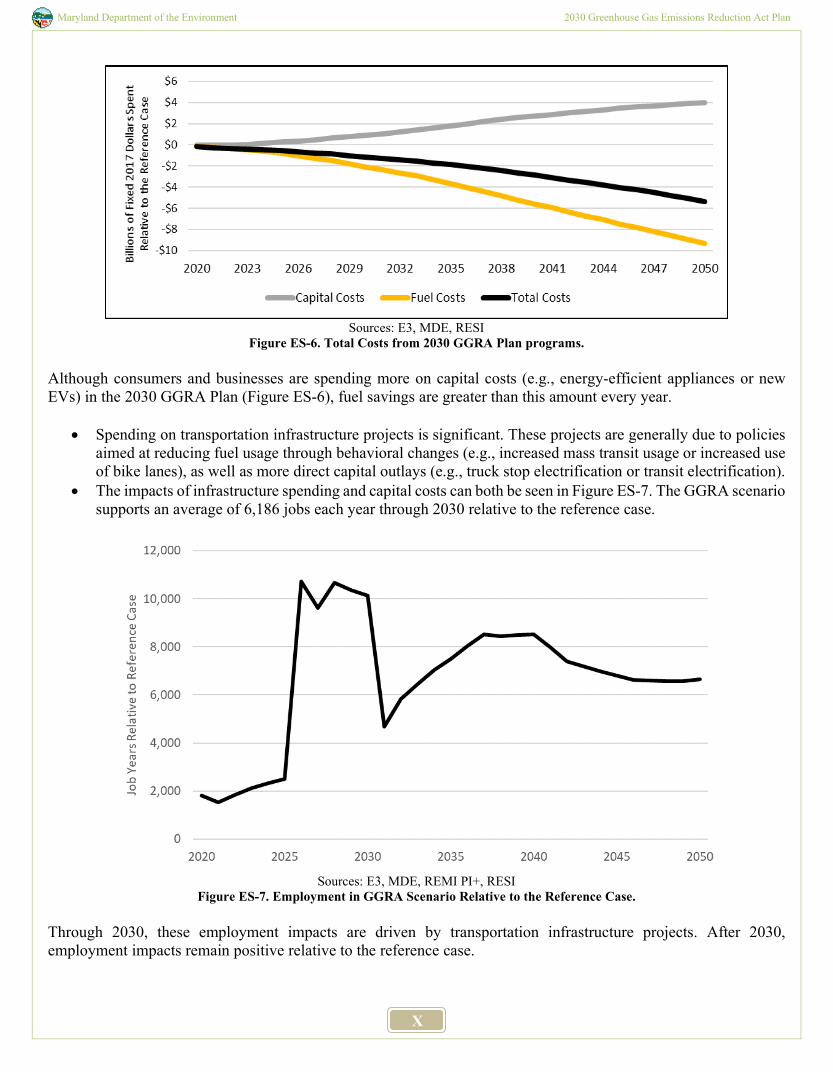
Figure ES-6. Total Costs from 2030 GGRA Plan programs. Although consumers and businesses are spending more on capital costs (e.g., energy-efficient appliances or new EVs) in the 2030 GGRA Plan (Figure ES-6), fuel savings are greater than this amount every year.
• Spending on transportation infrastructure projects is significant. These projects are generally due to policies aimed at reducing fuel usage through behavioral changes (e.g., increased mass transit usage or increased use of bike lanes), as well as more direct capital outlays (e.g., truck stop electrification or transit electrification).
• The impacts of infrastructure spending and capital costs can both be seen in Figure ES-7. The GGRA scenario supports an average of 6,186 jobs each year through 2030 relative to the reference case.
Sources: E3, MDE, REMI PI+, RESI
Figure ES-7. Employment in GGRA Scenario Relative to the Reference Case. Through 2030, these employment impacts are driven by transportation infrastructure projects. After 2030, employment impacts remain positive relative to the reference case.
Maryland Department of the Environment 2030 Greenhouse Gas Emissions Reduction Act Plan
XI
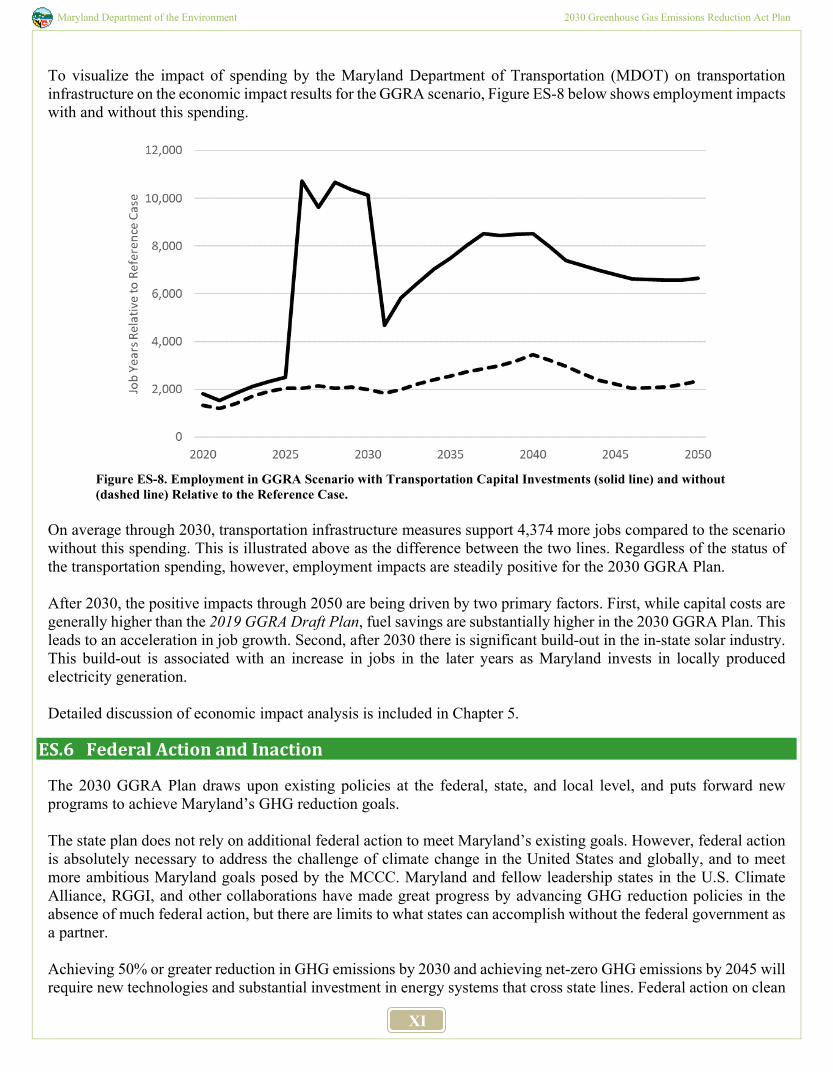
To visualize the impact of spending by the Maryland Department of Transportation (MDOT) on transportation infrastructure on the economic impact results for the GGRA scenario, Figure ES-8 below shows employment impacts with and without this spending.
Figure ES-8. Employment in GGRA Scenario with Transportation Capital Investments (solid line) and without (dashed line) Relative to the Reference Case.
On average through 2030, transportation infrastructure measures support 4,374 more jobs compared to the scenario without this spending. This is illustrated above as the difference between the two lines. Regardless of the status of the transportation spending, however, employment impacts are steadily positive for the 2030 GGRA Plan. After 2030, the positive impacts through 2050 are being driven by two primary factors. First, while capital costs are generally higher than the 2019 GGRA Draft Plan, fuel savings are substantially higher in the 2030 GGRA Plan. This leads to an acceleration in job growth. Second, after 2030 there is significant build-out in the in-state solar industry. This build-out is associated with an increase in jobs in the later years as Maryland invests in locally produced electricity generation. Detailed discussion of economic impact analysis is included in Chapter 5.
ES.6 Federal Action and Inaction
The 2030 GGRA Plan draws upon existing policies at the federal, state, and local level, and puts forward new programs to achieve Maryland’s GHG reduction goals. The state plan does not rely on additional federal action to meet Maryland’s existing goals. However, federal action is absolutely necessary to address the challenge of climate change in the United States and globally, and to meet more ambitious Maryland goals posed by the MCCC. Maryland and fellow leadership states in the U.S. Climate Alliance, RGGI, and other collaborations have made great progress by advancing GHG reduction policies in the absence of much federal action, but there are limits to what states can accomplish without the federal government as a partner. Achieving 50% or greater reduction in GHG emissions by 2030 and achieving net-zero GHG emissions by 2045 will require new technologies and substantial investment in energy systems that cross state lines. Federal action on clean
Maryland Department of the Environment 2030 Greenhouse Gas Emissions Reduction Act Plan
XII
electricity can reduce emissions from power plants outside of Maryland that supply electricity into Maryland. Federal action on vehicle efficiency and EV incentives can reduce emissions from Maryland vehicles and from vehicles passing through Maryland. Federal action on building efficiency can deploy new technologies. New technologies to capture and store carbon, and to produce and use green hydrogen and other clean and renewable fuels will require investments in technology development and new interstate infrastructure systems. Maryland will continue its nation-leading work5 to reduce GHG emissions and grow its economy, and to work with other states to deploy solutions at greater scale. Maryland looks forward to partnering with the new federal administration as it renews the federal government’s commitment to reducing GHGs and addressing climate change and environmental injustice.
ES.7 Adaptation and Resiliency
The Chesapeake Bay region’s geography and geology make the state one of the three most vulnerable areas of the country to changes resulting from sea level rise – only Louisiana and southern Florida are more susceptible. Historic tide records show sea level has increased approximately one foot in the Chesapeake Bay over the last 100 years.6 Over the past 10 years (2010-2020), Maryland has experienced 10 weather-related events warranting Presidential Disaster declarations, including five coastal flood events.7 In Maryland, climate change risks include increased frequency, duration and intensity of events such as drought, storms, flooding, and forest fires; more heat-related stress; the spread of existing or new vector-borne diseases; changes to public health challenges as a result of climate-driven stressors, and increased erosion and inundation of low-lying areas along the state’s shoreline and coast. These impacts will influence the interactions and management of our resources now and into the future. Maryland has been implementing climate adaptation efforts for more than a decade. In 2008, the Adaptation and Resiliency Working Group (ARWG), a working group of the MCCC, published Phase I: Comprehensive Strategy to Reduce Maryland’s Vulnerability to Climate Change,8 which focused on sea level rise and coastal storms. In 2011 the second phase strategy was published, focused on societal, economic and ecological resilience.9 These strategies together laid out recommendations on adaptation efforts that address changes in precipitation patterns and increased temperature as well as the likely impacts to human health, agriculture, forest and terrestrial ecosystems, bay and aquatic environments, water resources, and population growth and infrastructure. Climate adaptation is also a key component of Maryland’s Chesapeake Bay restoration efforts. Maryland has participated in the Chesapeake Bay Agreement since its inception in 1983, and has remained an engaged leader and member, working together with neighboring states to address all issues impacting the Bay. Maryland has signed and agreed to all subsequent goals and agreements since the initial program in 1983, including the 2014 Chesapeake Bay Watershed Agreement,10 which included climate resilience as one of its main goals. Adaptation refers to action to prepare for and adjust to new conditions, thereby reducing harm or taking advantage of new opportunities.11 Climate change adaptation is an extremely complex process with no single means of response. As stressed in a recent report by the National Academies,12 climate change adaptation must be a highly integrated process that occurs on a continuum, across all levels of government, involving many internal and external
5 https://www.wri.org/blog/2020/07/decoupling-emissions-gdp-us 6 Chesapeake Bay Foundation. What is Climate Change? (2020) https://www.cbf.org/issues/climate-change/ 7 FEMA All Disasters Database. (2020) https://www.fema.gov/disasters/disaster-declarations 8 Comprehensive Strategy for Reducing Maryland’s Vulnerability to Climate Change Phase I: Sea-level rise and coastal storms (2008) https://dnr.maryland.gov/ccs/Publication/Comprehensive_Strategy.pdf 9 Comprehensive Strategy for Reducing Maryland’s Vulnerability to Climate Change Phase II: Building societal, economic and ecological resilience (2011) https://climatechange.maryland.gov/wp-content/uploads/sites/16/2014/12/ian_report_2991.pdf 10 Chesapeake Bay Watershed Agreement (2020) chesapeakebay.net/documents/FINAL_Ches_Bay_Watershed_Agreement.withsignatures-HIres.pdf 11 Bierbaum, R., A. Lee, J. Smith, M. Blair, L. M. Carter, F. S. Chapin, III, P. Fleming, S. Ruffo, S. McNeeley, M. Stults, L. Verduzco, and E. Seyller, 2014: Ch. 28: Adaptation. Climate Change Impacts in the United States: The Third National Climate Assessment, J. M. Melillo, Terese (T.C.) Richmond, and G. W. Yohe, Eds., U.S. Global Change Research Program, 670-706. doi:10.7930/J07H1GGT. 12 National Research Council. 2010. Adapting to the Impacts of Climate Change. National Academies Press, Washington, DC
Maryland Department of the Environment 2030 Greenhouse Gas Emissions Reduction Act Plan
XIII
partners and individual actions, and often evolves at different spatial and temporal scales. Maryland recognizes the need to include robust adaptation and resiliency efforts alongside the aggressive GHG mitigation measures put in place to effectively address and protect the state from climate change impacts. These actions are increasingly dependent on one another, and any program or policy to mitigate the effects of climate change will complement steps to reduce the state’s risk to those impacts. Mitigation without adaptation, or vice versa, could render Maryland, its people, and resources vulnerable to harm from impacts of climate change. Adaptation aims to enhance the resilience of natural and human-based systems across multiple sectors, including bay and aquatic environments, agriculture, human health, water resources, population growth and infrastructure, forest and terrestrial ecosystems and our coastal zone. Maryland does not work in isolation on these efforts and relies on diverse partnerships at the local, state, and federal levels. Since the MCCC’s inception, the ARWG has served as the state’s leader on adaptation and resiliency. The ARWG develops comprehensive strategies to reduce Maryland’s climate change vulnerability, serves as a resource to state and local governments for tools and planning resources and provides a platform for collaboration. In addition to the ARWG, Maryland’s participation in multi-jurisdictional compacts such as the Chesapeake Bay Program (CBP) is essential to the state’s success in the adaptation arena. The CBP’s Climate Resiliency Work Group (CRWG) leads and monitors work being done in accordance with the climate resilience goal of the 2014 Chesapeake Bay Watershed Agreement. The ARWG, CBP, and CRWG memberships include representatives across state government agencies, institutes of higher education, and non-governmental organizations. Working across and between compacts like the CRWG and the ARWG ensures Maryland relies upon a large, diverse, and committed group of organizations and individuals implementing climate adaptation efforts across the state, protecting Maryland’s societal, economic, and ecological resources for years to come. Detailed discussion of adaptation and resiliency is included in Chapter 7.
ES.8 Getting to Net Zero
The GGRA of 2016 requires that the 2030 GGRA Plan be developed in recognition of the need for developed nations to reduce GHG emissions between 80% and 95% from 1990 levels by 2050. In its 2020 Annual Report, the MCCC recommended that Maryland adopt a more ambitious long-term goal of achieving net zero GHG emissions as early as 2045. The 2030 GGRA Plan acts as an important step toward achieving this ambitious goal and provides a strong foundation on which to continue the effort to reduce GHG emissions within Maryland far into the future. The analysis in the 2030 GGRA Plan includes several additional “what if” scenarios to estimate the future impact of various climate policies that extend beyond the 2030 goal of the GGRA of 2016, including a scenario that achieves an 80% reduction in GHG emissions by 2050. That analysis identified several potential measures and technologies that the state could deploy after 2030 to achieve deeper reductions by 2045 and 2050.
Maryland Department of the Environment 2030 Greenhouse Gas Emissions Reduction Act Plan
XIV
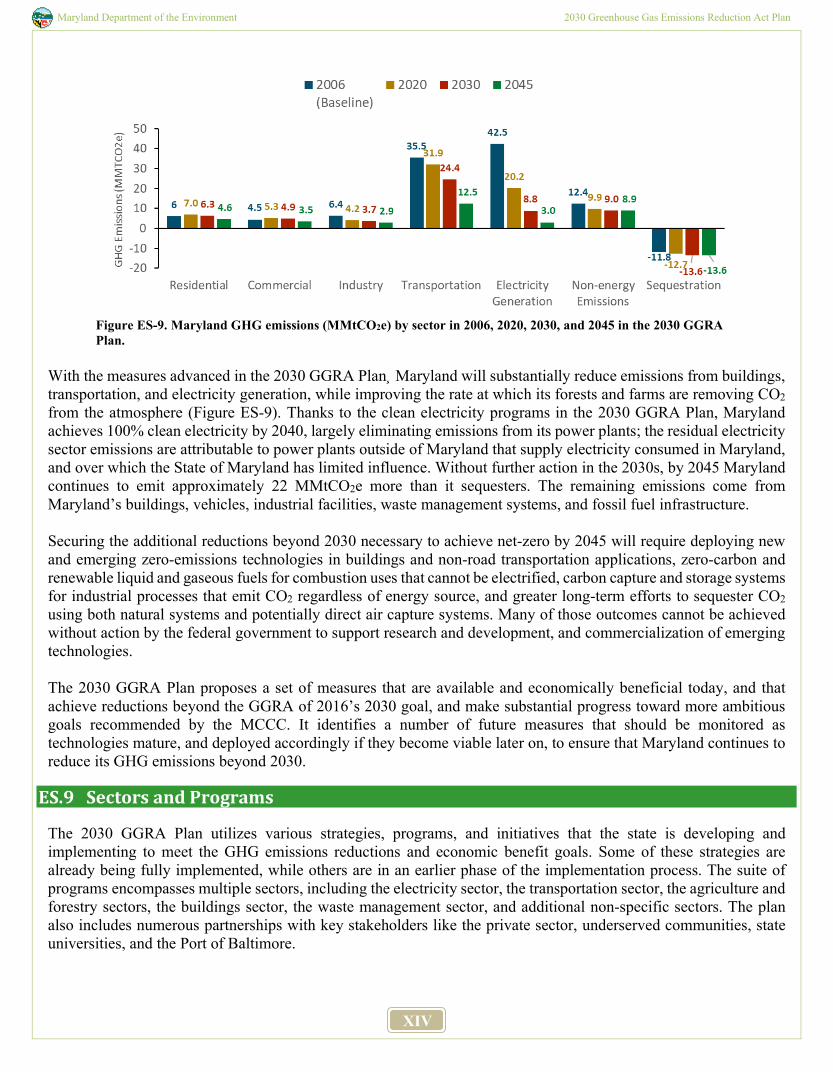
Figure ES-9. Maryland GHG emissions (MMtCO2e) by sector in 2006, 2020, 2030, and 2045 in the 2030 GGRA Plan.
With the measures advanced in the 2030 GGRA Plan¸ Maryland will substantially reduce emissions from buildings, transportation, and electricity generation, while improving the rate at which its forests and farms are removing CO2 from the atmosphere (Figure ES-9). Thanks to the clean electricity programs in the 2030 GGRA Plan, Maryland achieves 100% clean electricity by 2040, largely eliminating emissions from its power plants; the residual electricity sector emissions are attributable to power plants outside of Maryland that supply electricity consumed in Maryland, and over which the State of Maryland has limited influence. Without further action in the 2030s, by 2045 Maryland continues to emit approximately 22 MMtCO2e more than it sequesters. The remaining emissions come from Maryland’s buildings, vehicles, industrial facilities, waste management systems, and fossil fuel infrastructure. Securing the additional reductions beyond 2030 necessary to achieve net-zero by 2045 will require deploying new and emerging zero-emissions technologies in buildings and non-road transportation applications, zero-carbon and renewable liquid and gaseous fuels for combustion uses that cannot be electrified, carbon capture and storage systems for industrial processes that emit CO2 regardless of energy source, and greater long-term efforts to sequester CO2 using both natural systems and potentially direct air capture systems. Many of those outcomes cannot be achieved without action by the federal government to support research and development, and commercialization of emerging technologies. The 2030 GGRA Plan proposes a set of measures that are available and economically beneficial today, and that achieve reductions beyond the GGRA of 2016’s 2030 goal, and make substantial progress toward more ambitious goals recommended by the MCCC. It identifies a number of future measures that should be monitored as technologies mature, and deployed accordingly if they become viable later on, to ensure that Maryland continues to reduce its GHG emissions beyond 2030.
ES.9 Sectors and Programs
The 2030 GGRA Plan utilizes various strategies, programs, and initiatives that the state is developing and implementing to meet the GHG emissions reductions and economic benefit goals. Some of these strategies are already being fully implemented, while others are in an earlier phase of the implementation process. The suite of programs encompasses multiple sectors, including the electricity sector, the transportation sector, the agriculture and forestry sectors, the buildings sector, the waste management sector, and additional non-specific sectors. The plan also includes numerous partnerships with key stakeholders like the private sector, underserved communities, state universities, and the Port of Baltimore.
Maryland Department of the Environment 2030 Greenhouse Gas Emissions Reduction Act Plan
XV
The core programs of the 2030 GGRA Plan extend from the suite of programs developed for previous GGRA plans, specifically the state’s 25% by 2020 Plan and the 2019 GGRA Draft Plan. Based on the recently completed 2017 inventory, the state’s GHG emissions are already below the 2020 Plan goal. These results are encouraging; however, they are at least partly due to mild weather in 2017, so continued progress is necessary to ensure we maintain and sustain reductions beyond 2020. The core programs included in the 25% by 2020, along with recommended new programs, voluntary and non-traditional programs, outreach efforts to build public awareness and promote voluntary action, additional programs being analyzed, and emerging technologies, will all contribute to the state’s goal of reducing GHG emissions by 40% by 2030. Electricity Generation Now Maryland’s second-largest source of GHG emissions, the electricity generation sector includes emissions from Maryland’s fossil fuel-burning power plants, as well as estimates of the emissions associated with electricity generated outside of Maryland, but used in the state (Imported Power). The electricity generation strategy in the 2030 GGRA Plan is designed to achieve 100% Clean and Renewable Electricity by 2040 by both deploying energy through the existing Renewable Portfolio Standard (RPS) and the proposed Clean and Renewable Energy Standard (CARES), and by capping and reducing emissions through RGGI. Achieving 100% clean electricity is an essential part of the economy-wide decarbonization and electrification strategy, as it will not only reduce emissions from Maryland power plants, but also provide carbon-free energy to decarbonize the buildings and transportation sectors by replacing fossil-powered systems with electric systems that run on increasingly clean and renewable electricity.
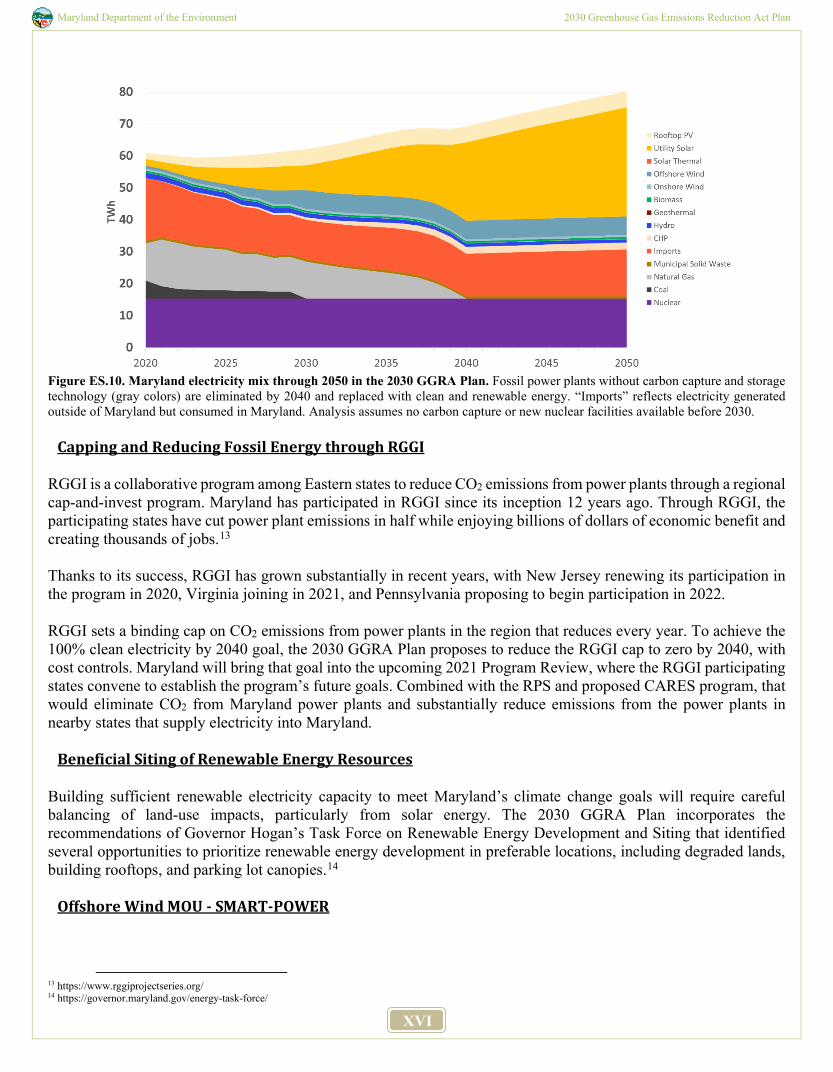
Deploying Clean and Renewable Energy through the RPS and CARES Maryland’s RPS requires Maryland electric utilities to purchase increasingly large proportions of Maryland’s electricity from renewable energy sources like solar, wind, hydropower, and qualifying biomass. The current RPS goal is for 50% of Maryland’s electricity to come from renewable sources by 2030 through substantial increases in solar power and deployment of new offshore wind energy off the Atlantic coast. The proposed CARES would build upon the existing RPS to achieve 100% clean electricity by 2040. It would rely on both renewable energy and additional zero- and low-carbon electricity sources to meet that goal where most cost-effective, including:
• Additional Maryland solar power beyond the current RPS requirements; • New efficient Combined Heat and Power (CHP) systems in Maryland buildings; • New nuclear power; and • Natural gas or qualifying biomass power plants with carbon capture and storage (CCS).
Analyses by MDE and Resources for the Future (RFF) estimate that the CARES program would result in substantial increases in Maryland solar power and efficient CHP systems under current projections of resource costs. Should other eligible clean energy sources become less expensive, the CARES program would deploy the most cost-effective mix of resources to meet the 100% clean electricity goal.
Maryland Department of the Environment 2030 Greenhouse Gas Emissions Reduction Act Plan
XVI
Figure ES.10. Maryland electricity mix through 2050 in the 2030 GGRA Plan. Fossil power plants without carbon capture and storage technology (gray colors) are eliminated by 2040 and replaced with clean and renewable energy. “Imports” reflects electricity generated outside of Maryland but consumed in Maryland. Analysis assumes no carbon capture or new nuclear facilities available before 2030.
Capping and Reducing Fossil Energy through RGGI RGGI is a collaborative program among Eastern states to reduce CO2 emissions from power plants through a regional cap-and-invest program. Maryland has participated in RGGI since its inception 12 years ago. Through RGGI, the participating states have cut power plant emissions in half while enjoying billions of dollars of economic benefit and creating thousands of jobs.13 Thanks to its success, RGGI has grown substantially in recent years, with New Jersey renewing its participation in the program in 2020, Virginia joining in 2021, and Pennsylvania proposing to begin participation in 2022. RGGI sets a binding cap on CO2 emissions from power plants in the region that reduces every year. To achieve the 100% clean electricity by 2040 goal, the 2030 GGRA Plan proposes to reduce the RGGI cap to zero by 2040, with cost controls. Maryland will bring that goal into the upcoming 2021 Program Review, where the RGGI participating states convene to establish the program’s future goals. Combined with the RPS and proposed CARES program, that would eliminate CO2 from Maryland power plants and substantially reduce emissions from the power plants in nearby states that supply electricity into Maryland.
Beneficial Siting of Renewable Energy Resources Building sufficient renewable electricity capacity to meet Maryland’s climate change goals will require careful balancing of land-use impacts, particularly from solar energy. The 2030 GGRA Plan incorporates the recommendations of Governor Hogan’s Task Force on Renewable Energy Development and Siting that identified several opportunities to prioritize renewable energy development in preferable locations, including degraded lands, building rooftops, and parking lot canopies.14
Offshore Wind MOU - SMART-POWER
13 https://www.rggiprojectseries.org/ 14 https://governor.maryland.gov/energy-task-force/
Maryland Department of the Environment 2030 Greenhouse Gas Emissions Reduction Act Plan
XVII
Maryland also continues to work with its regional partners, and most recently Maryland joined North Carolina and Virginia in launching the Southeast and Mid-Atlantic Regional Transformative Partnership for Offshore Wind Energy Resources (SMART-POWER). This tri-state collaborative effort to promote the Southeast and mid-Atlantic United States as a hub for offshore wind and industry. Under this initiative the three states agree to cooperatively promote, develop and expand the offshore wind industries, estimated to support up to 86,000 jobs and $57 billion in investment by 2030.
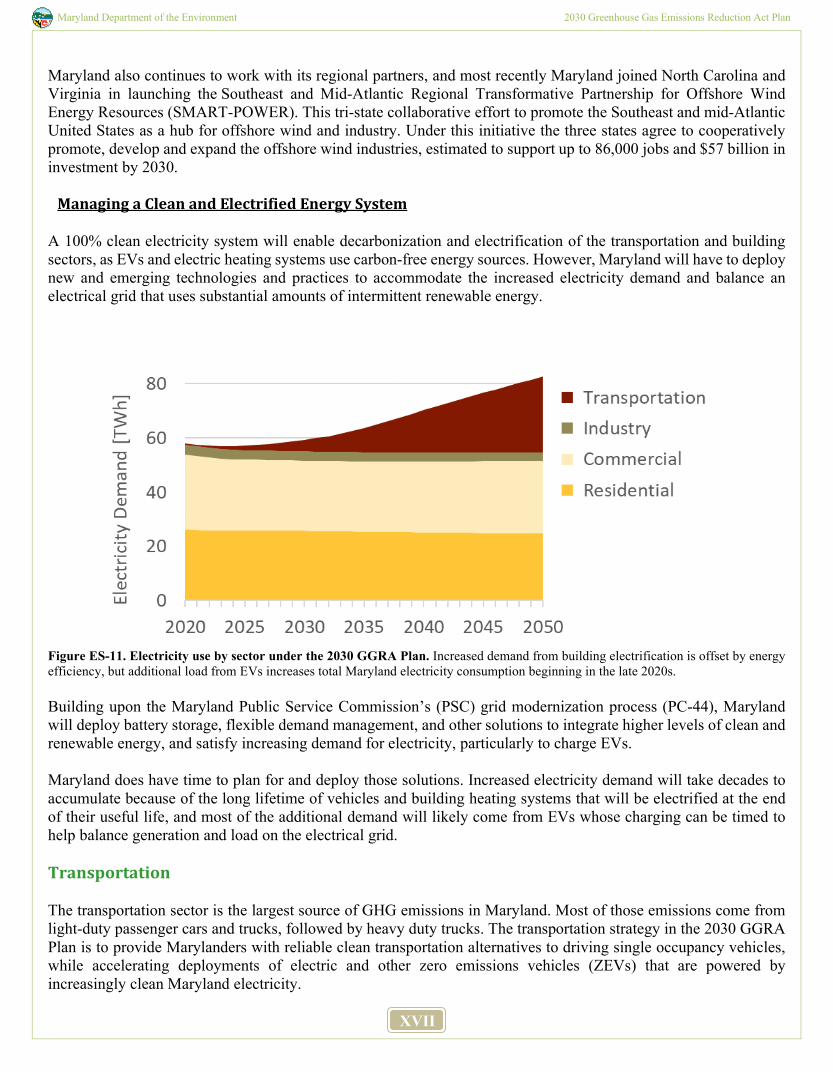
Managing a Clean and Electrified Energy System A 100% clean electricity system will enable decarbonization and electrification of the transportation and building sectors, as EVs and electric heating systems use carbon-free energy sources. However, Maryland will have to deploy new and emerging technologies and practices to accommodate the increased electricity demand and balance an electrical grid that uses substantial amounts of intermittent renewable energy.
Figure ES-11. Electricity use by sector under the 2030 GGRA Plan. Increased demand from building electrification is offset by energy efficiency, but additional load from EVs increases total Maryland electricity consumption beginning in the late 2020s. Building upon the Maryland Public Service Commission’s (PSC) grid modernization process (PC-44), Maryland will deploy battery storage, flexible demand management, and other solutions to integrate higher levels of clean and renewable energy, and satisfy increasing demand for electricity, particularly to charge EVs. Maryland does have time to plan for and deploy those solutions. Increased electricity demand will take decades to accumulate because of the long lifetime of vehicles and building heating systems that will be electrified at the end of their useful life, and most of the additional demand will likely come from EVs whose charging can be timed to help balance generation and load on the electrical grid.
Transportation The transportation sector is the largest source of GHG emissions in Maryland. Most of those emissions come from light-duty passenger cars and trucks, followed by heavy duty trucks. The transportation strategy in the 2030 GGRA Plan is to provide Marylanders with reliable clean transportation alternatives to driving single occupancy vehicles, while accelerating deployments of electric and other zero emissions vehicles (ZEVs) that are powered by increasingly clean Maryland electricity.
Maryland Department of the Environment 2030 Greenhouse Gas Emissions Reduction Act Plan
XVIII
Promoting Reliable Clean Transportation Options
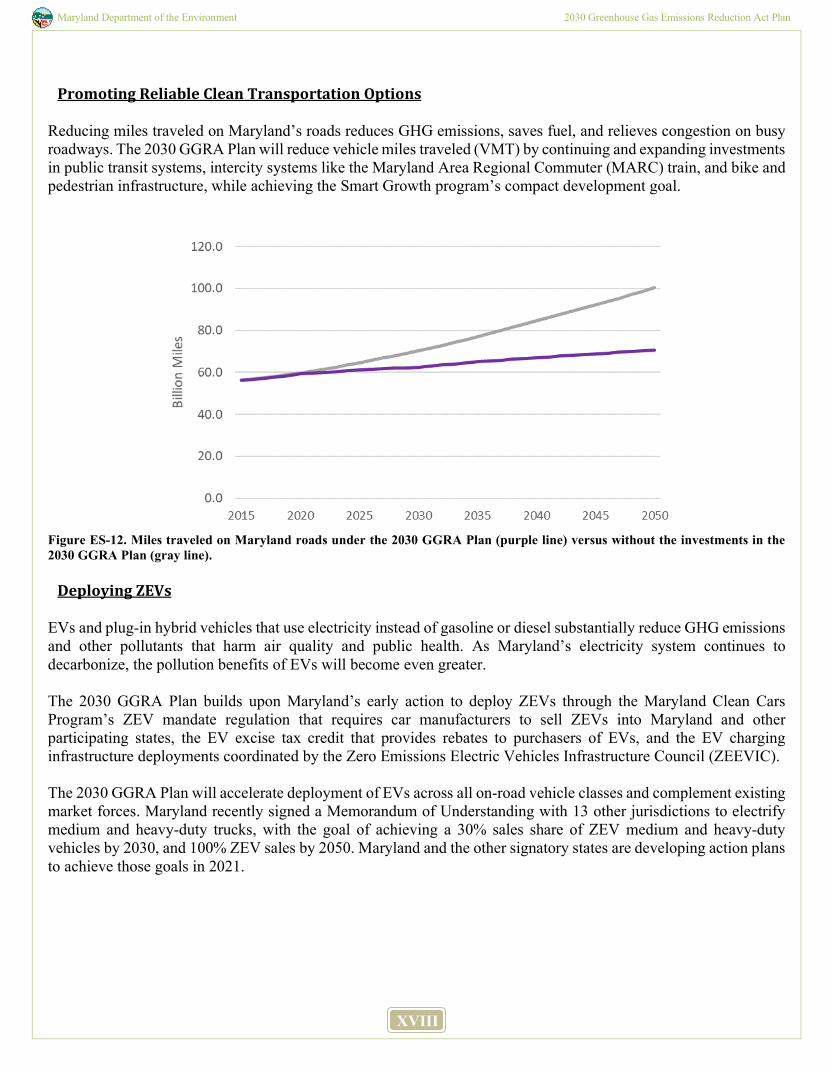
Reducing miles traveled on Maryland’s roads reduces GHG emissions, saves fuel, and relieves congestion on busy roadways. The 2030 GGRA Plan will reduce vehicle miles traveled (VMT) by continuing and expanding investments in public transit systems, intercity systems like the Maryland Area Regional Commuter (MARC) train, and bike and pedestrian infrastructure, while achieving the Smart Growth program’s compact development goal.
Figure ES-12. Miles traveled on Maryland roads under the 2030 GGRA Plan (purple line) versus without the investments in the 2030 GGRA Plan (gray line).
Deploying ZEVs EVs and plug-in hybrid vehicles that use electricity instead of gasoline or diesel substantially reduce GHG emissions and other pollutants that harm air quality and public health. As Maryland’s electricity system continues to decarbonize, the pollution benefits of EVs will become even greater. The 2030 GGRA Plan builds upon Maryland’s early action to deploy ZEVs through the Maryland Clean Cars Program’s ZEV mandate regulation that requires car manufacturers to sell ZEVs into Maryland and other participating states, the EV excise tax credit that provides rebates to purchasers of EVs, and the EV charging infrastructure deployments coordinated by the Zero Emissions Electric Vehicles Infrastructure Council (ZEEVIC). The 2030 GGRA Plan will accelerate deployment of EVs across all on-road vehicle classes and complement existing market forces. Maryland recently signed a Memorandum of Understanding with 13 other jurisdictions to electrify medium and heavy-duty trucks, with the goal of achieving a 30% sales share of ZEV medium and heavy-duty vehicles by 2030, and 100% ZEV sales by 2050. Maryland and the other signatory states are developing action plans to achieve those goals in 2021.
Maryland Department of the Environment 2030 Greenhouse Gas Emissions Reduction Act Plan
XIX
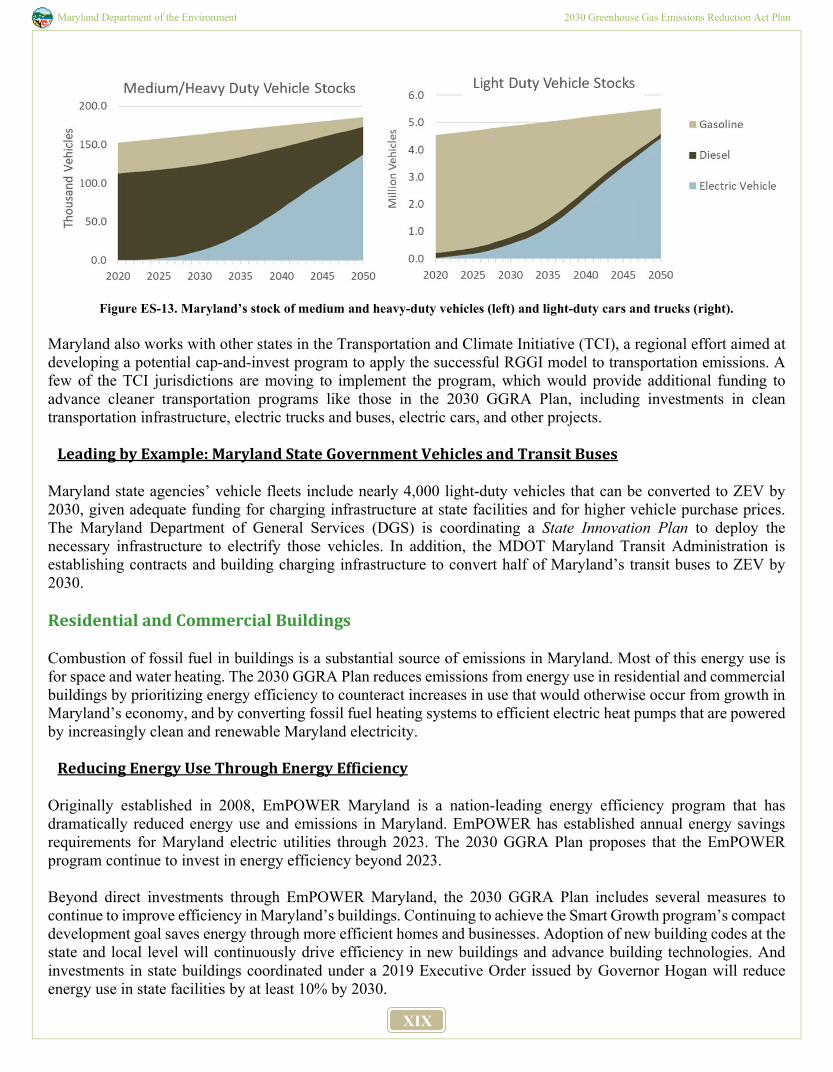
Figure ES-13. Maryland’s stock of medium and heavy-duty vehicles (left) and light-duty cars and trucks (right). Maryland also works with other states in the Transportation and Climate Initiative (TCI), a regional effort aimed at developing a potential cap-and-invest program to apply the successful RGGI model to transportation emissions. A few of the TCI jurisdictions are moving to implement the program, which would provide additional funding to advance cleaner transportation programs like those in the 2030 GGRA Plan, including investments in clean transportation infrastructure, electric trucks and buses, electric cars, and other projects.
Leading by Example: Maryland State Government Vehicles and Transit Buses Maryland state agencies’ vehicle fleets include nearly 4,000 light-duty vehicles that can be converted to ZEV by 2030, given adequate funding for charging infrastructure at state facilities and for higher vehicle purchase prices. The Maryland Department of General Services (DGS) is coordinating a State Innovation Plan to deploy the necessary infrastructure to electrify those vehicles. In addition, the MDOT Maryland Transit Administration is establishing contracts and building charging infrastructure to convert half of Maryland’s transit buses to ZEV by 2030. Residential and Commercial Buildings Combustion of fossil fuel in buildings is a substantial source of emissions in Maryland. Most of this energy use is for space and water heating. The 2030 GGRA Plan reduces emissions from energy use in residential and commercial buildings by prioritizing energy efficiency to counteract increases in use that would otherwise occur from growth in Maryland’s economy, and by converting fossil fuel heating systems to efficient electric heat pumps that are powered by increasingly clean and renewable Maryland electricity.
Reducing Energy Use Through Energy Efficiency Originally established in 2008, EmPOWER Maryland is a nation-leading energy efficiency program that has dramatically reduced energy use and emissions in Maryland. EmPOWER has established annual energy savings requirements for Maryland electric utilities through 2023. The 2030 GGRA Plan proposes that the EmPOWER program continue to invest in energy efficiency beyond 2023. Beyond direct investments through EmPOWER Maryland, the 2030 GGRA Plan includes several measures to continue to improve efficiency in Maryland’s buildings. Continuing to achieve the Smart Growth program’s compact development goal saves energy through more efficient homes and businesses. Adoption of new building codes at the state and local level will continuously drive efficiency in new buildings and advance building technologies. And investments in state buildings coordinated under a 2019 Executive Order issued by Governor Hogan will reduce energy use in state facilities by at least 10% by 2030.
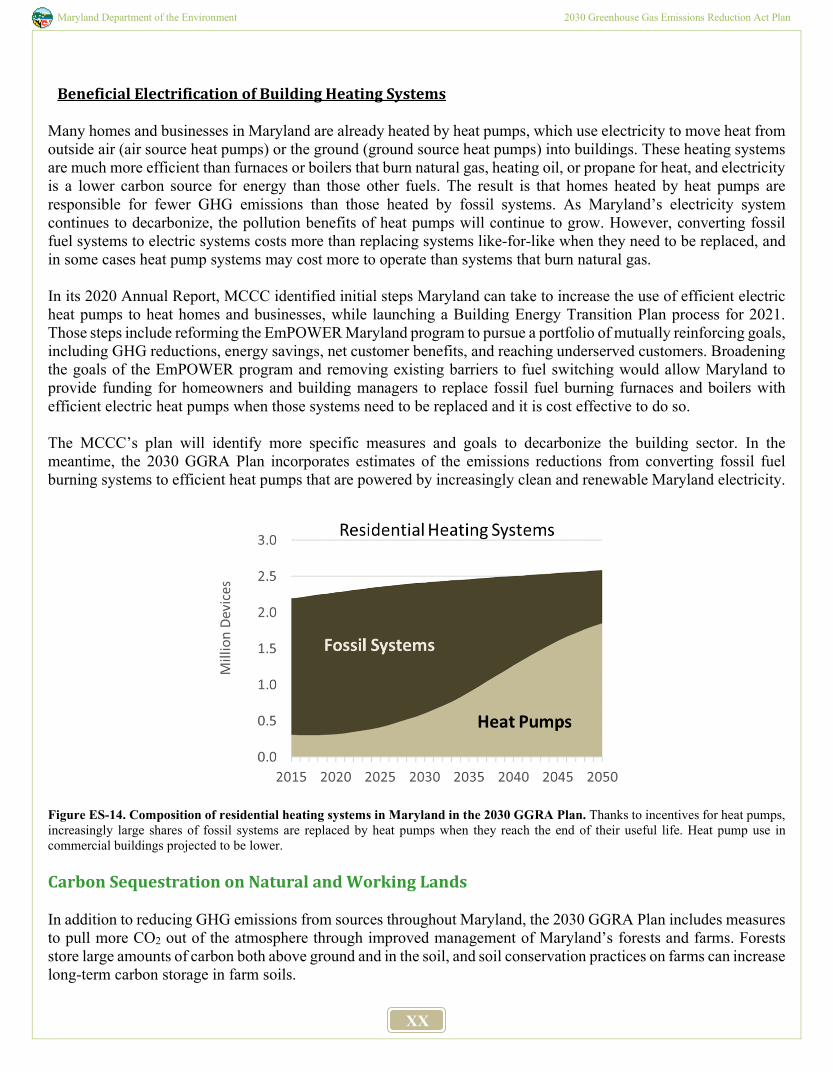
Maryland Department of the Environment 2030 Greenhouse Gas Emissions Reduction Act Plan
XX
Beneficial Electrification of Building Heating Systems
Many homes and businesses in Maryland are already heated by heat pumps, which use electricity to move heat from outside air (air source heat pumps) or the ground (ground source heat pumps) into buildings. These heating systems are much more efficient than furnaces or boilers that burn natural gas, heating oil, or propane for heat, and electricity is a lower carbon source for energy than those other fuels. The result is that homes heated by heat pumps are responsible for fewer GHG emissions than those heated by fossil systems. As Maryland’s electricity system continues to decarbonize, the pollution benefits of heat pumps will continue to grow. However, converting fossil fuel systems to electric systems costs more than replacing systems like-for-like when they need to be replaced, and in some cases heat pump systems may cost more to operate than systems that burn natural gas. In its 2020 Annual Report, MCCC identified initial steps Maryland can take to increase the use of efficient electric heat pumps to heat homes and businesses, while launching a Building Energy Transition Plan process for 2021. Those steps include reforming the EmPOWER Maryland program to pursue a portfolio of mutually reinforcing goals, including GHG reductions, energy savings, net customer benefits, and reaching underserved customers. Broadening the goals of the EmPOWER program and removing existing barriers to fuel switching would allow Maryland to provide funding for homeowners and building managers to replace fossil fuel burning furnaces and boilers with efficient electric heat pumps when those systems need to be replaced and it is cost effective to do so. The MCCC’s plan will identify more specific measures and goals to decarbonize the building sector. In the meantime, the 2030 GGRA Plan incorporates estimates of the emissions reductions from converting fossil fuel burning systems to efficient heat pumps that are powered by increasingly clean and renewable Maryland electricity.
Figure ES-14. Composition of residential heating systems in Maryland in the 2030 GGRA Plan. Thanks to incentives for heat pumps, increasingly large shares of fossil systems are replaced by heat pumps when they reach the end of their useful life. Heat pump use in commercial buildings projected to be lower. Carbon Sequestration on Natural and Working Lands In addition to reducing GHG emissions from sources throughout Maryland, the 2030 GGRA Plan includes measures to pull more CO2 out of the atmosphere through improved management of Maryland’s forests and farms. Forests store large amounts of carbon both above ground and in the soil, and soil conservation practices on farms can increase long-term carbon storage in farm soils.
Maryland Department of the Environment 2030 Greenhouse Gas Emissions Reduction Act Plan
XXI
Improved Forest Management and Tree Planting Maryland’s forests play an important role in mitigating GHG emissions and actions are being taken by the state to enhance this conservation practice. Enrolling previously unmanaged forests into sustainable management regimes enhances forest productivity, which increases rates of carbon sequestration in forest biomass and the amount of carbon stored in harvested durable wood products. Increasing forest management has economic benefits and results in additional availability of renewable biomass for energy production. The 2030 goals for managing Maryland forests are to provide sustainable forest management on 38,000 acres of private land annually, ensure greater than 50% of state-owned forest lands will continue to be third-party certified as sustainably managed, support forest markets that keep land in forest use, and provide sustainable management for multiple benefits on other state lands where possible. In addition to managing existing forests, many new trees are planted in the state every single year. These plantings expand the state’s forest cover and stores of carbon by regenerating or establishing healthy, functional canopies and forests utilizing practices such as soil preparation, erosion control and supplemental planting. By 2030, the goal is to achieve the afforestation or reforestation of 68,530 acres in Maryland, including planting 4.6 million trees. The 2030 GGRA Plan also includes planting 2.65 million urban trees, for a total of 7.25 million trees planted by 2030.
Maryland Healthy Soils Initiative In addition to reducing nutrient and sediment flows into the Chesapeake Bay and its tributaries, many of the agronomic and conservation practices already used by Maryland’s farmers have the potential to make a significant contribution to the state’s climate change goals by sequestering carbon and other GHGs. The 2017 Healthy Soils Act charged the Maryland Department of Agriculture (MDA) with the development of a healthy soils program to improve the health, yield, and profitability of Maryland’s soils and promote the further adoption of conservation practices that foster soil health while increasing sequestration capacity. In support of this initiative, MDA has collaborated with stakeholders from the Healthy Soils Consortium to complete a comprehensive scientific literature review to identify those practices that are most effective in improving soil health and building soil carbon stocks and create a menu of Maryland-specific practices. MDA also intends to use this information to explore the options for the metrics and tools that will be used to quantify soil carbon as well as provide incentives to encourage the widespread implementation of climate-friendly soil practices. Existing programs, too, are being examined and expanded to find ways to capitalize on co-benefits for both air and water quality, and carbon sequestration that build upon Maryland’s nationally-recognized progressive farming practices and programs. Short-Lived and Super-Pollutant Greenhouse Gases While the bulk of Maryland GHG emissions are CO2 from combusting fossil fuels, substantial amounts of climate-warming pollution comes from emissions of methane from the natural gas system, agriculture and waste management, and from other pollutants like hydrofluorocarbons (HFCs). The 2030 GGRA Plan includes targeted measures and regulations to identify and mitigate those emissions sources.
Eliminating Super-Polluting HFCs HFCs are chemicals used as propellants and refrigerants in a variety of products, air conditioning and refrigeration systems that are extremely potent GHGs when released into the atmosphere. After efforts to limit fugitive emissions of HFCs stalled at the federal level, several states began their own initiatives to phase out certain highly potent HFCs - some with the climate forcing effect of approximately 1,400 pounds of CO2. MDE finalized regulations in 2020 that will phase out the use of certain HFCs in multiple end-uses, such as foam products and certain refrigeration equipment in retail establishments such as supermarkets. The phase out of HFCs will require the use of alternatives with much lower GHG emissions.
Maryland Department of the Environment 2030 Greenhouse Gas Emissions Reduction Act Plan
XXII
Catching and Eliminating Methane Leaks
Methane, the primary constituent of natural gas, is a short-lived but potent GHG that leaks from the natural gas delivery system. The 2030 GGRA Plan includes measures to catch and eliminate those leaks, including regulations MDE finalized in 2020 that require leak detection and repair measures in the transmission system, and replacement of old and leaky pipes throughout the utility distribution systems. Detailed discussion of each of the dozens of GHG reduction measures in the 2030 GGRA Plan is included in Chapter 3.
ES.10 Conclusions
The 2030 GGRA Plan is both ambitious and achievable and includes dozens of important large and small initiatives to reduce GHG emissions in Maryland. When fully implemented, the 2030 GGRA Plan will achieve more than the 40% by 2030 emissions reduction required by the GGRA of 2016 law, have a positive impact on Maryland’s economy, create and maintain new jobs, and also help Maryland protect public health and meet Chesapeake Bay and air quality goals. Additionally, the progress made through implementation of the 2030 GGRA Plan will position the state to achieve more ambitious goals recommended by the MCCC, including a 50% reduction in GHG emissions by 2030, and net zero emissions by 2045. While the economic and environmental effects of the COVID-19 pandemic are still uncertain, the state’s focus on combating climate change and reducing GHG remains on track.
Maryland Department of the Environment 2030 Greenhouse Gas Emissions Reduction Act Plan
1
Chapter 1 Climate Change, the Cost of
Inaction, and GGRA Background
1.1 The Science of Climate Change
Maryland continues to rely on scientific evidence to guide its evaluations and recommendations in response to global climate change. The trends in the emission of heat trapping GHGs into the atmosphere and the projected rise in global temperatures closely follow the scientific predictions providing confidence in the predictive capacity of the models employed over the past five decades.1 The body of scientific evidence for global climate change is both clear and growing and has demonstrated with a very high degree of certainty that the dominant cause is human activity.2,3 The IPCC, an intergovernmental body of the United Nations dedicated to providing the world with an objective, scientific view of climate change and its natural, political, and economic impacts, risks, and possible responses, has concluded that human drivers, including GHG emissions, are “extremely likely to have been the dominant cause of the observed warming since the mid-20th century,” recently estimating that human activities have contributed to approximately 1°C (1.8oF) of global warming above pre-industrial levels, particularly the emission of heat-trapping GHGs into the atmosphere. The findings of the IPCC that concluded anthropogenic activity is the primary factor in the current global warming is further confirmed by detailed analyses of the past 2,000 years, which showed there was no similar time where the Earth had heated or cooled over the entire globe simultaneously and at such a high rate.4 The IPCC in 2018 reiterated the importance of keeping global warming below 1.5oC (2.7oF) and this has been reinforced by multiple scientific assessments.5,6,7,8 More recent analyses have evaluated progress toward GHG
1 Hausfather et al., 2019. Even 50-year-old climate models correctly predicted global warming. Science Dec. 4. https://www.sciencemag.org/news/2019/12/even-50-year-old-climate-models-correctly-predicted-global-warming 2 Maryland Commission on Climate Change Scientific and Technical Working Group, "Appendix 1 of 2015 Maryland Commission on Climate Change Report: Reducing Emissions of Greenhouse Gases Beyond 2020," in 2015 Maryland Commission on Climate Change Annual Report, 2015. 3 U.S. Global Change Research Program, Climate Science Special Report: Fourth National Climate Assessment, Volume I, D. Wuebbles, D. Fahey, K. Hibbard, D. Dokken, B. Steward and T. Maycock, Eds., Washington, DC, 2017, p. 470. 4 Neukom, R., N. Steiger, J. José Gómez-Navarro, J. Wang & J. P. Werner. No evidence for globally coherent warm and cold periods over the preindustrial Common Era. Nature. Vol 571. 25 July 2019. p552 5 Ripple, W.J, C. Wolf, T.M Newsome, P. Barnard, W.R. Moomaw and 11,258 Scientist signatories from 153 Countries 2019. World Scientists' Warning of a Climate Emergency. Bioscience. November 5, 2019. 6 IPCC, 2018: Global Warming of 1.5°C. An IPCC Special Report on the impacts of global warming of 1.5°C above pre-industrial levels and related global greenhouse gas emission pathways, in the context of strengthening the global response to the threat of climate change, sustainable development, and efforts to eradicate poverty [Masson-Delmotte, V., P. Zhai, H.-O. P.rtner, D. Roberts, J. Skea, P.R. Shukla, A. Pirani, W. Moufouma-Okia, C. P.an, R. Pidcock, S. Connors, J.B.R. Matthews, Y. Chen, X. Zhou, M.I. Gomis, E. Lonnoy, T. Maycock, M. Tignor, and T. Waterfield (eds.)]. 7 World Meteorological Organization, 2019. WMO Statement on the State of Global Climate in 2018. WMO No 1233. 44pp 8 World Meteorological Organization, 2019. The Global Climate in 2015-19. 24pp.
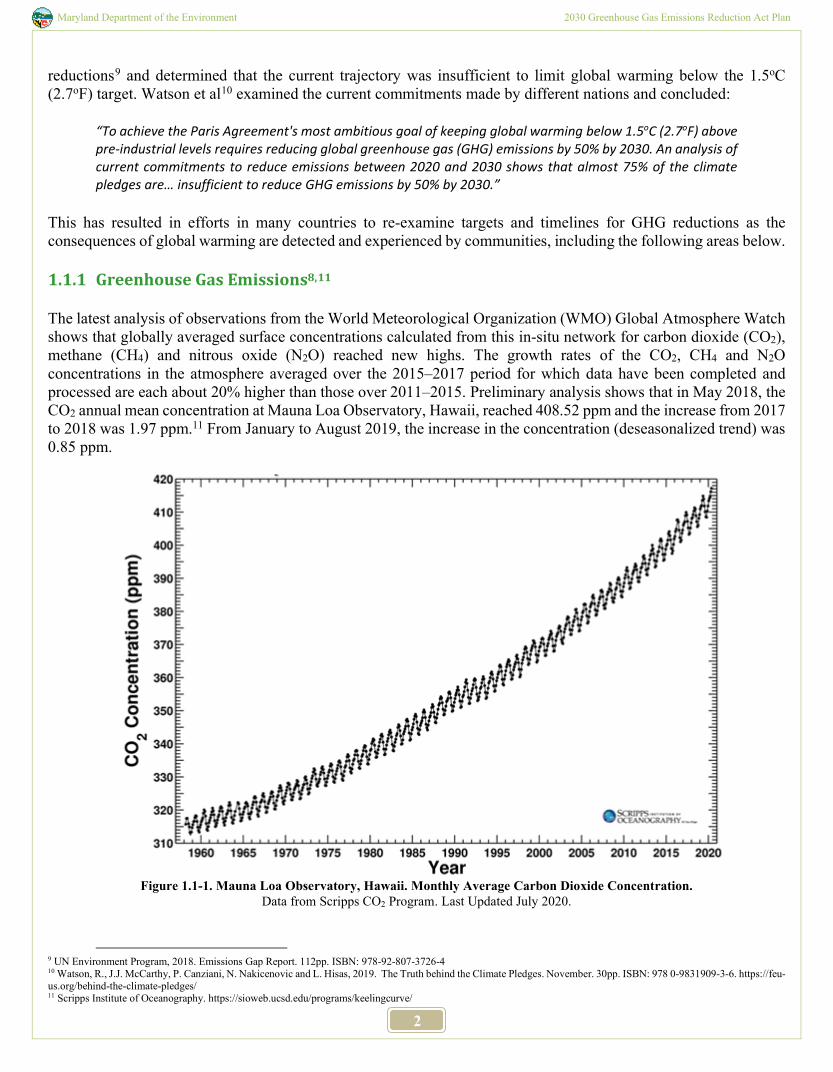
Maryland Department of the Environment 2030 Greenhouse Gas Emissions Reduction Act Plan
2
reductions9 and determined that the current trajectory was insufficient to limit global warming below the 1.5oC (2.7oF) target. Watson et al10 examined the current commitments made by different nations and concluded:
“To achieve the Paris Agreement's most ambitious goal of keeping global warming below 1.5oC (2.7oF) above pre-industrial levels requires reducing global greenhouse gas (GHG) emissions by 50% by 2030. An analysis of current commitments to reduce emissions between 2020 and 2030 shows that almost 75% of the climate pledges are… insufficient to reduce GHG emissions by 50% by 2030.”
This has resulted in efforts in many countries to re-examine targets and timelines for GHG reductions as the consequences of global warming are detected and experienced by communities, including the following areas below. 1.1.1 Greenhouse Gas Emissions8,11 The latest analysis of observations from the World Meteorological Organization (WMO) Global Atmosphere Watch shows that globally averaged surface concentrations calculated from this in-situ network for carbon dioxide (CO2), methane (CH4) and nitrous oxide (N2O) reached new highs. The growth rates of the CO2, CH4 and N2O concentrations in the atmosphere averaged over the 2015–2017 period for which data have been completed and processed are each about 20% higher than those over 2011–2015. Preliminary analysis shows that in May 2018, the CO2 annual mean concentration at Mauna Loa Observatory, Hawaii, reached 408.52 ppm and the increase from 2017 to 2018 was 1.97 ppm.11 From January to August 2019, the increase in the concentration (deseasonalized trend) was 0.85 ppm.
Figure 1.1-1. Mauna Loa Observatory, Hawaii. Monthly Average Carbon Dioxide Concentration.
Data from Scripps CO2 Program. Last Updated July 2020.
9 UN Environment Program, 2018. Emissions Gap Report. 112pp. ISBN: 978-92-807-3726-4 10 Watson, R., J.J. McCarthy, P. Canziani, N. Nakicenovic and L. Hisas, 2019. The Truth behind the Climate Pledges. November. 30pp. ISBN: 978 0-9831909-3-6. https://feu-us.org/behind-the-climate-pledges/ 11 Scripps Institute of Oceanography. https://sioweb.ucsd.edu/programs/keelingcurve/
Maryland Department of the Environment 2030 Greenhouse Gas Emissions Reduction Act Plan
3
The urgent need to increase Nationally Determined Contributions (NDC) to reduce GHG emissions has been highlighted in numerous recent scientific analyses.9,10 The United Nations Environment Program concluded in 2018:
“Current commitments expressed in the NDCs are inadequate to bridge the emissions gap in 2030. Technically, it is still possible to bridge the gap to ensure global warming stays well below 2oC and 1.5oC, but if NDC ambitions are not increased before 2030, exceeding the 1.5oC goal can no longer be avoided. Now more than ever, unprecedented and urgent action is required by all nations. The assessment of actions by the G20 countries indicates that this is yet to happen; in fact, global CO2 emissions increased in 2017 after three years of stagnation.”9
Preliminary analyses12 conducted in 2020 have suggested that the goals of the United Nations Paris Climate Agreement are ‘getting within reach’ if the new national climate promises (e.g, China) and the Carbon Plan of the incoming United States administration are implemented but the outcome is highly dependent on the effectiveness of short-term plans. The effects of these additional measures will receive more detailed scrutiny in the coming months together with ongoing assessments of emerging technologies that show promise of being scaled up to significantly reduce emissions or facilitate direct capture.13 1.1.2 Temperature7,8 Despite developing La Niña conditions, provisional results by the WMO indicate 2020 is likely to be tied for the warmest year on record. The past six years, including 2020, are likely to be the six warmest years on record. The average global temperatures for the five-year period 2015‒2019 were the highest on record, with 2019 being the second warmest. The average global temperature for 2015–2019 was 1.1oC (1.98oF) above pre-industrial (1850–1900) level and is the warmest of any equivalent period on record. The average temperature is 0.20oC (0.36oF) warmer than the average for 2011–2015. 1.1.3 Ocean Scientific evidence is mounting of the significant changes occurring in the oceans. This is captured in the recent IPCC report:14
“It is virtually certain that the global ocean has warmed unabated since 1970 and has taken up more than 90% of the excess heat in the climate system (high confidence). Since 1993, the rate of ocean warming has more than doubled (likely). Marine heatwaves have very likely doubled in frequency since 1982 and are increasing in intensity (very high confidence). By absorbing more CO2, the ocean has undergone increasing surface acidification (virtually certain). A loss of oxygen has occurred from the surface to 1000 m (medium confidence).”
In response to this global consequence of climate change, Maryland has prepared the first Maryland Ocean Acidification Action Plan in 2020 in collaboration with the International Alliance to Combat Ocean Acidification.15 1.1.4 Cryosphere
12 https://climateactiontracker.org 13 Hepburn, C. et al., 2019. The technological and economic prospects for CO2 utilizations and removal. Nature, Vol 575, 7 November 2019. 87-97. 14 IPCC, 2019: IPCC Special Report on the Ocean and Cryosphere in a Changing Climate [H.O. Pörtner, D.C. Roberts, V. Masson-Delmotte, P. Zhai, M. Tignor, E. Poloczanska, K. Mintenbeck, M. Nicolai, A. Okem, J. Petzold, B. Rama, N. Weyer (eds.)]. 15 Maryland Department of the Environment and Maryland Department of Natural Resources, 2020. Maryland Ocean Acidification Action Plan. 17p.
Maryland Department of the Environment 2030 Greenhouse Gas Emissions Reduction Act Plan
4
During 2019 and 2020 there continued to be an alarming reduction in the amount of ice on Earth’s surface, the so-called cryosphere. Around the world, mountain glaciers are continuing to retreat. Arctic surface air temperatures have increased more than twice as fast as the global mean since the mid-1980s.16 This is linked to the continued decline in the extent and thickness of ice cover in the Arctic Ocean, which by mid-October 2020 was the least ever recorded at that time of the year. The decline in ice cover is allowing the sea surface to warm, which has far-reaching consequences for weather. As a result of the warming of both the air and surrounding seas, the Greenland ice sheet has been losing mass at an unprecedented rate since the 1990s, twice as fast in 2019 than the average over 2003‒2016. Some scientists have suggested that Greenland has reached the point of no return such that, even if global warming were to stop today, the ice sheet would continue to shrink.17 Although air temperatures over Antarctica are not warming as rapidly as in the Arctic, the surrounding seas are warming. This is destabilizing the ice shelves where massive glaciers meet the ocean,18 which alone could cause several meters of sea-level rise over the next century or two. The IPCC Special Report11 reviewed the observed physical changes in the cryosphere and projected future changes and their implications for sea-level rise under different pathways of global GHG emissions. Sea-level rise in the future will largely be determined by the rate of melting of polar ice sheets, which will be determined by the warming of the atmosphere and surface ocean waters. For the unabated warming path we have been on, the IPCC’s median estimate was 71 cm (2.3 feet) of sea-level rise by 2100; however, if GHG emissions were reduced quickly enough to limit the increase of global mean temperature to less than 2°C (3.6oF), as per the Paris Agreement, the median estimate was 39 cm (1.3 feet). That does not tell the full story, as the IPCC estimated that it is possible that sea-level could rise more than 1 m this century and as much as 5 m by 2300 if global emissions continue to grow over the next 60 years. On the other hand, it is unlikely to exceed 1 meter even through the next century if emissions can be brought to net zero by or shortly after 2050. A more recent expert estimate generally agrees with the IPCC but also suggests that sea-level rise could be even higher under an unabated warming path.19 To put it quite simply, the future of Maryland’s low-lying coastal areas essentially depends on the amount of ice lost from Antarctic and Greenland ice sheets. 1.1.5 Extreme Events7,8 Many of the extreme events associated with climate change, such as hurricanes, floods or droughts, can bring substantial loss of life or population displacement and inflict major economic impacts.
16 Blunden, J., and D.S. Arndt. 2020. State of the Climate in 2019. Bulletin of the American Meteorological Society 101(8): Si–S429. 17 King, M.D., I.M. Howat, S.G. Candela, M.J. Noh, S. Jeong, B.P.Y. Noel, M.R. van den Broeke, B. Wouters, and A. Negrete. Dynamic ice loss from the Greenland Ice Sheet driven by sustained glacier retreat. Communications Earth & Environment 1 (1) doi: 10.1038/s43247-020-0001-2 18 Lhermitte, S., S. Sun, C. Shuman, B. Wouters, F. Pattyn, J. Wuite, E. Berthier and T. Nagler. 2020. Damage accelerates ice shelf instability and mass loss in Amundsen Sea Embayment. Proceedings of the National Academy of Sciences. 19 Horton, B.P., N.S. Khan, N. Cahill, J.S.H. Lee, T.A. Shaw, A.J. Garner, A.C. Kemp, S.E. Engelhart, and S. Rahmstorf. 2020. Estimating global mean sea-level rise and its uncertainties by 2100 and 2300 from an expert survey. npj Climate and Atmospheric Science 3, 18. doi: 10.1038/s41612-020-0121-5
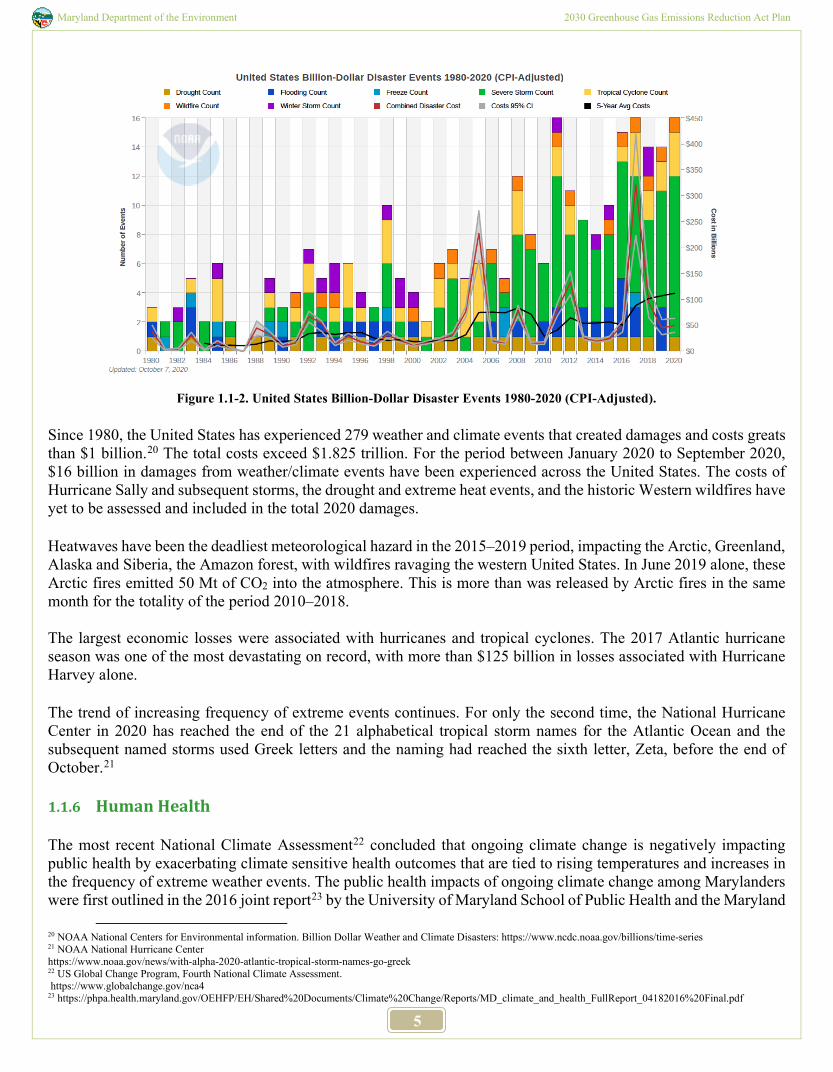
Maryland Department of the Environment 2030 Greenhouse Gas Emissions Reduction Act Plan
5
Figure 1.1-2. United States Billion-Dollar Disaster Events 1980-2020 (CPI-Adjusted).
Since 1980, the United States has experienced 279 weather and climate events that created damages and costs greats than $1 billion.20 The total costs exceed $1.825 trillion. For the period between January 2020 to September 2020, $16 billion in damages from weather/climate events have been experienced across the United States. The costs of Hurricane Sally and subsequent storms, the drought and extreme heat events, and the historic Western wildfires have yet to be assessed and included in the total 2020 damages. Heatwaves have been the deadliest meteorological hazard in the 2015–2019 period, impacting the Arctic, Greenland, Alaska and Siberia, the Amazon forest, with wildfires ravaging the western United States. In June 2019 alone, these Arctic fires emitted 50 Mt of CO2 into the atmosphere. This is more than was released by Arctic fires in the same month for the totality of the period 2010–2018. The largest economic losses were associated with hurricanes and tropical cyclones. The 2017 Atlantic hurricane season was one of the most devastating on record, with more than $125 billion in losses associated with Hurricane Harvey alone. The trend of increasing frequency of extreme events continues. For only the second time, the National Hurricane Center in 2020 has reached the end of the 21 alphabetical tropical storm names for the Atlantic Ocean and the subsequent named storms used Greek letters and the naming had reached the sixth letter, Zeta, before the end of October.21 1.1.6 Human Health The most recent National Climate Assessment22 concluded that ongoing climate change is negatively impacting public health by exacerbating climate sensitive health outcomes that are tied to rising temperatures and increases in the frequency of extreme weather events. The public health impacts of ongoing climate change among Marylanders were first outlined in the 2016 joint report23 by the University of Maryland School of Public Health and the Maryland
20 NOAA National Centers for Environmental information. Billion Dollar Weather and Climate Disasters: https://www.ncdc.noaa.gov/billions/time-series 21 NOAA National Hurricane Center https://www.noaa.gov/news/with-alpha-2020-atlantic-tropical-storm-names-go-greek 22 US Global Change Program, Fourth National Climate Assessment. https://www.globalchange.gov/nca4 23 https://phpa.health.maryland.gov/OEHFP/EH/Shared%20Documents/Climate%20Change/Reports/MD_climate_and_health_FullReport_04182016%20Final.pdf
Maryland Department of the Environment 2030 Greenhouse Gas Emissions Reduction Act Plan
6
Department of Health.24 Direct threats of increasing extreme events in Maryland are best exemplified by the experience of communities in Ellicott City, who have had to deal with three “once in a thousand-year rainfall events” over the last decade alone. Studies have shown that rising frequencies of extreme heat and precipitation events are increasing risk of asthma hospitalizations, myocardial infarctions, and motor vehicle accidents, as well as food and waterborne illness in Maryland.25,26,27,28,29 More recent work has demonstrated how climate change can simultaneously impact ecosystem health and human health. For example, wintertime temperature anomalies are changing the timing of spring onset, which is closely linked with the tree pollen season, and thus, increasing the risk of asthma hospitalization in Maryland.30,31,32 Since the ongoing trends in increasing frequency of extreme events are projected to continue in the foreseeable future, protecting public health will require the capacity to anticipate and adapt to these new threats. This should be supported by a clear understanding of underlying community vulnerabilities. For instance, a community may be more vulnerable because they are disproportionately exposed to the new threats, such as inner-city residents with higher prevalence of poverty and air pollution exposure are excessively exposed to heat because of the urban heat island effect, or coastal residents who are increasingly exposed to allergenic mold because of frequent flooding. Likewise, communities may be more vulnerable because they lack the capacity to adapt to the new threats. For example, poor communities are more vulnerable to heat exposure because they do not have access to air conditioning, and individuals undergoing dialysis cannot cope with the heat by drinking more water because of medical restrictions to their liquid intake. Moreover, certain subgroups may be more vulnerable to the new threats because of their underlying conditions, such as certain minority groups, linguistically isolated communities, those suffering from mental health issues, or individuals living with preexisting conditions. The most recent IPCC report highlighted that keeping the ongoing warming to 1.5oC (2.7oF) above the preindustrial average as opposed to 2oC (3.6oF) will reduce frequent exposure to extreme heat waves among 420 million people. Similarly, in Korea it is estimated such benefits will translate into 12% reduction in heat wave related mortality.33 Moving forward, public health early warning systems with seasonal to sub-seasonal lead times incorporating such community specific vulnerabilities may help communities to better prepare against the threats of climate change. 1.1.7 Wildfire The year 2020 is one of the worst United States wildfire seasons with several western states experiencing record areas burned and smoke plumes visible in Maryland. Changing precipitation patterns, rising temperatures and inadequate forestry management combine to exacerbate the intensity and duration of dry periods, yielding more intense wildfires that are frequently beyond our ability to control. The western United States provides examples of this year after year; however, in 2016, the Great Smoky Mountain wildfires burned into Gatlinburg Tennessee, destroying thousands of homes and structures, causing over $1 billion in damages, and costing 14 lives, indicating that the eastern United States is vulnerable, too. Future climate projections for the region anticipate increases in the frequency of both high and low precipitation events with an overall trend of drying soils.18 In the United States (1992‒2015), approximately 44% of wildfires were ignited by lightning, but they accounted for more than 70% of
24 Maryland Department of Health and Mental Hygiene and UM School of Public Health, 2016. Maryland Climate and Health Profile Report. 67p. 25 Soneja S, Jiang C, Fisher J, Upperman CR, Mitchell C, Sapkota A. Exposure to extreme heat and precipitation events associated with increased risk of hospitalization for asthma in Maryland, U.S.A. Environ Health. 2016;15:57. 26 Fisher JA, Jiang C, Soneja SI, Mitchell C, Puett RC, Sapkota A. Summertime extreme heat events and increased risk of acute myocardial infarction hospitalizations. J Expo Sci Environ Epidemiol. 2017;27(3):276-280. 27 Liu A, Soneja SI, Jiang C, et al. Frequency of extreme weather events and increased risk of motor vehicle collision in Maryland. Sci Total Environ. 2017;580:550-555. 28 Soneja S, Jiang C, Romeo Upperman C, et al. Extreme precipitation events and increased risk of campylobacteriosis in Maryland, U.S.A. Environ Res. 2016;149:216-221. 29 Jiang C, Shaw KS, Upperman CR, et al. Climate change, extreme events and increased risk of salmonellosis in Maryland, USA: Evidence for coastal vulnerability. Environ Int. 2015;83:58-62. 30 Sapkota A, Dong Y, Li L, et al. Association Between Changes in Timing of Spring Onset and Asthma Hospitalization in Maryland. JAMA Netw Open. 2020;3(7):e207551. 31 Li X, Zhou Y, Meng L, Asrar G, Sapkota A, Coates F. Characterizing the relationship between satellite phenology and pollen season: A case study of birch. Remote Sensing of Environment. 2019;222:267-274. 32 Li X, Zhou Y, Asrar GR, Mao J, Li X, Li W. Response of vegetation phenology to urbanization in the conterminous United States. Glob Chang Biol. 2017;23(7):2818-2830 33 Lee et al, 2018. Projection of Future Mortality Due to Temperature and Population Changes under Representative Concentration Pathways and Shared Socioeconomic Pathways. Int J Environ Res Public Health 2018 Apr 21;15(4):822. doi: 10.3390/ijerph15040822.
Maryland Department of the Environment 2030 Greenhouse Gas Emissions Reduction Act Plan
7
land burned.34 Lightning strikes are likely to increase with climate change but to an uncertain degree in the United States, with projected increases ranging from slight35 to as much as 50%.36 The potential for increasing wildfire in Maryland and implications for carbon emissions and sequestration are uncertain, although Maryland scientists at the Maryland Department of Natural Resources (DNR) and academy continue to monitor and research the changing landscape characteristics of Maryland. These changes to the physical systems reverberate through biological and human systems, which have co-evolved to exist under current conditions. A thorough understanding of the ramifications that accompany unmitigated climate change, as well as the complexity of costs and benefits (economic, environmental and human) associated with climate action, is essential to the core function of the Climate Change Commission. The scientific community is constantly improving and refining the models and projections for various emission reduction scenarios, providing policy makers with increasingly detailed information on which to base its decisions and recommendations.
1.2 Climate Change and the Cost of Inaction in Maryland
In order to limit the temperature increase to the established 1.5oC (2.7oF) threshold goal, the IPCC calculated that global GHG emissions must be reduced by 40% to 70% from 2010 levels by 2050, and further to near or below zero in 2100.37 It is with this goal in mind that Maryland adopted both the Greenhouse Gas Emissions Reduction Act (GGRA) of 2009 to reduce emissions 25% from 2006 levels by 2020, as well as the updated and enhanced Greenhouse Gas Emissions Reduction Act – Reauthorization (GGRA of 2016) to reduce emissions 40% from 2006 levels by 2030. Documented changes are already occurring, and the response of the environment to the current levels of anthropogenic GHG emissions is still being realized.38,39,40,41 However, actions taken at this time are still capable of mitigating the damage of future impacts, and delayed action or inaction may lead to a more severe outcome.38,39 An urgent response is critical to minimizing both costs and risks, while increasing the likelihood to survive and thrive in a changing world.42,43 As with any major adjustments, delaying action is likely to necessitate changes that are more dramatic and economically disruptive. In the Northeastern U.S., the rate of sea level rise already observed is greater than the global average, having increased about one foot since 1990 (average is 8 inches),44 likely due to both increased Greenland ice loss as well as changes in regional currents and land subsidence.45,46,47 Maryland has experienced an increase in annual average
34 Short, K.C., 2017. Spatial Wildfire occurrence data for the United States, 1992-2015, 4th Edition. https://doi.org/10.2737/RDS-2013-0009.4 35 Finney, D.L., et al., 2018. A Projected decrease in lightening under climate change. Nature Climate Change. Vol 8, 210-213 36 Romos, D.C, et al., 2014. Projected increase in lightning strikes in the United States due to global warming. Science Vol. 346, Issue 6211, 14 Nov. pp 851-854. 37 Intergovernmental Panel on Climate Change, Climate Change 2014: Synthesis Report. Contribution of Working Groups I, II, and III to the Fifth Assessment Report of the Intergovernmental Panel on Climate Change, R. Pachauri and L. Meyer, Eds., Geneva, 2014. 38 American Meteorological Society, "Climate Change: An Information Statement of the American Meteorological Society," 2012. [Online]. Available: https://www.ametsoc.org/ams/index.cfm/about-ams/ams-statements/statements-of-the-ams-in-force/climate-change/. [Accessed 9 August 2017]. 39 National Oceanic and Atmospheric Administration, "What is the difference between weather and climate?," 2014. [Online]. Available: http://oceanservice.noaa.gov/facts/weather_climate.html. [Accessed 17 April 2017]. 40 J. Hansen, L. Nazarenko, R. Ruedy, M. Sato, J. Willis, A. Del Genio, D. Koch, A. Lacis, K. Lo, S. Menon, T. Novakov, J. Perlwitz, G. Russell, G. A. Schmidt and N. Tausnev, "Earth's Energy Imbalance: Confirmation and Implications," Science, vol. 308, pp. 1431-1435, 2005. 41 D. J. Wuebbles, D. W. Fahey, K. A. Hibbard, B. DeAngelo, S. Doherty, K. Hayhoe, R. Horton, J. P. Kossin, P. C. Taylor, A. M. Waple and C. P. Weaver, "Executive Summary," in Climate Science Special Report: Fourth National Climate Assessment, Volume I, D. Wuebbles, D. Fahey, K. Hibbard, D. Dokken, B. Stewart and T. Maycock, Eds., Washington, DC, U.S. Global Change Research Program, 2017, pp. 12-34. 42 American Geophysical Union, "Human-Induced Climate Change Requires Urgent Action," 2014. [Online]. Available: http://sciencepolicy.agu.org/files/2013/07/AGU-Climate-Change-Position-Statement_August-2013.pdf. [Accessed 9 August 2017]. 43 American Association for the Advancement of Science, "What We Know: The reality, risks, and response to climate change," 2014. [Online]. Available: http://whatweknow.aaas.org/get-the-facts/. [Accessed 8 August 2017]. 44 R. Horton, G. Yohe, W. Easterling, R. Kates, M. Ruth, E. Sussman, A. Whelchel, D. Wolfe and a. F. Lipschultz, "Chapter 16: Northeast," in Climate Change Impacts in the United States, 2014, pp. 371-395. 45 J. L. Davis and N. T. Vinogradova, "Causes of accelerating sea level on the East Coast of North America," Geophysical Research Letters, vol. 44, no. 10, pp. 5133-5141, 2017. 46 U.S. Environmental Protection Agency, "Climate Change Indicators in the United States," Washington DC, 2016. 47 U.S. Environmental Protection Agency, "Climate Change in the United States: Benefits of Global Action," United States Environmental Protection Agency, Office of Atmospheric Programs, 2015.
Maryland Department of the Environment 2030 Greenhouse Gas Emissions Reduction Act Plan
8
temperature of 1.5°F (0.83oC) since the beginning of the 20th century, and a winter warming trend reflected in the average of less than one day per year of nights below 0°F (-17.78oC) since the mid 1990’s, as compared to an average of two nights per year between 1950 and 1994.48 Annual precipitation, though more variable, increased by approximately 0.39 inches per decade in the Northeast during this same time,49 with Maryland’s annual mean precipitation having been above average for the past two decades. The climate in this region is generally expected to continue trending warmer and wetter over the next century, accompanied by an increase in extreme heat waves and precipitation events.47,48 These consequences to the physical systems will reverberate through biological and human systems, the three of which have co-evolved to exist under current conditions. The global climate system is complex, and a large number of variables interact to determine the eventual impact of expected changes to various segments of the natural and built environment. While not every individual change is necessarily harmful, the negative consequences of unmitigated climate change will far outweigh those select benefits.46 This section contains just a brief overview of those that are most high-profile, and generally well-accepted by the scientific community. A more detailed examination of these and other projected impacts can also be found in the Maryland Commission on Climate Change’s (MCCC) annual reports. 1.2.1 Maryland’s Environment Ecosystems consist of networks of interactions among the biosphere, atmosphere and geosphere (living and nonliving components, including chemical, biological and physical interactions). Human systems, or the “built environment,” can be considered a more recently evolved component, which is equally intertwined with and dependent upon these same resources. As noted earlier, the climate in Maryland and the rest of the northeastern U.S. is currently trending warmer and wetter, a trajectory that is expected to continue. Heat waves are likely to increase in frequency, intensity and duration corresponding directly to increases in emissions; and Maryland is expected to have a notable increase in days with extreme heat (over 90oF or 32.2oC) by 2050, as compared to the late 1900’s44. The trend in average precipitation is expected to remain seasonal, increasing in the winter and spring, with less change expected in the fall and summer49. Combined with the higher summer temperatures, greater evaporation and earlier snowmelt will create a risk of drought during the growing season (significant for both ecosystems and human systems). Additional impacts in Maryland could include increased frequency and severity of other existing problems such as storms, flooding, and forest fires, as well as erosion, saltwater intrusion and inundation of low-lying areas along the State’s shoreline and coast.50 In general, “climate change increases the risk, frequency, and intensity of certain extreme events like intense heat waves, heavy downpours, flooding from intense precipitation and coastal storm surges, and disease incidence related to temperature and precipitation changes”.51 The direct impacts to Maryland’s ecosystems and built environment are assessed in the following sub-section.
Maryland Ecosystems When attempting to either qualify or quantify the value of ecosystems, a term commonly used is “ecosystem services.” These refer to the benefits and resources afforded to people by the normal and healthy functioning of the
48 J. Runkel, K. Kunkel, D. Easterling, B. Stewart, S. Champion, R. Frankson and W. Sweet, "Maryland State Summary," National Oceanic and Atmospheric Administration, 2017. 49 K. E. Kunkel, L. E. Stevens, L. Sun, E. Janssen, D. Wuebbles, J. Rennells, A. DeGaetano and J. G. Dobson, "Regional Climate Trends and Scenarios for the U.S. National Climate Assessment: Part 1. Climate of the Northeast U.S.," National Oceanic and Atmospheric Administration, 2013. 50 Maryland Commission on Climate Change Adaptation and Response Working Group, " Adaptation and Response Working Group Annual Report," in Appendix E of 2016 Maryland Commission on Climate Change Annual Report, 2016. 51 U.S. Global Change Research Program, Climate Change Impacts in the United States: The Third National Climate Assessment, J. Melillo, T. Richmond and G. Yohe, Eds., 2014.
Maryland Department of the Environment 2030 Greenhouse Gas Emissions Reduction Act Plan
9
ecosystem, such as robust fisheries, cleaner air and drinking water, and recreational opportunities.52,53 As the introduction highlighted, the success of the ecosystem is intimately connected to the success of the human system. People depend on these ecosystem services, and loss or degradation of the ecosystem will have a negative impact on both the quality of life and the economy in Maryland53, including:
• Maryland’s Atlantic coast provides ecosystem services such as fisheries, recreational opportunities, and storm-surge protection.
• The Chesapeake Bay ecosystem is the largest estuary in the United States and an invaluable and iconic part of Maryland, providing a broad range of environmental, recreational, and economic services.
• Maryland’s forest ecosystem provides a large number of benefits, which include stormwater management, acting as a sink for atmospheric carbon, and providing essential habitat for wildlife and commercial and recreational opportunities for people.
Maryland’s ecosystems are threatened in various ways by the changing climate. Depending on the specific traits of a given population of organisms, and the pressures they are exposed to in a changing environment, the population may experience adaptation (e.g., natural selection or behavioral changes), migration to maintain residence in suitable habitat (e.g., expanding or contracting, strict directional movement), phenological shifts (i.e., changes in the timing of seasonal life-cycle events), or even local extinction when other mechanisms are not successful.52,54,55 In general, rising temperatures are expected to change species distribution by latitude and elevation, a trend that has already been documented in the scientific literature, particularly for temperate locations;56,57,58 however additional factors such as changes in precipitation regimes may also play a role in the directional nature of these shifts.58,59 This would not mean that all species in Maryland migrate out of the State; species for which Maryland is in the middle of their range or that are better able to adapt may persist in the area, while the overall composition of the communities they are a part of may change as others migrate or become locally extinct. Furthermore, variable adaptation within an ecosystem or community via habitat shifting or changes in phenology (such as when flowers bloom or animals become active in spring) will result in changes to community interactions. This could lead to novel interactions between species that were not previously associated, or asynchronies in the life cycles and distribution of some species that have key interactions, like plant/pollinator and predator/prey.44,52 While individual populations may experience many different impacts, positive or negative from the population’s perspective, the overall stability and persistence of the community (i.e., resilience to these changes and ability to adapt its complex network of interactions to maintain its productivity and fundamental identity) is far more significant from a broader perspective;60,61 and from the perspective of maintaining ecosystem services. The following are several highlights of ecosystem-specific changes that are already occurring or are predicted for Maryland, but by no means the only potential impact.
52 P. M. Groffman, P. Kareiva, S. Carter, N. B. Grimm, J. Lawler, M. Mack, V. Matzek and H. Tallis, "Chapter 8: Ecosystems, Biodiversity, and Ecosystem Services," in Climate Change Impacts in the United States: The Third National Climate Assessment, J. Melilo, T. Richmond and G. Yohe, Eds., U.S. Global Change Research Program, 2014, pp. 195-219. 53 Maryland Department of Natural Resources, "Accounting for Maryland's Ecosystem Services: Integrating the Value of Nature into Decision Making," 2018. 54 M. Staudinger, N. Grimm, A. Staudt, S. Carter, F. Chapin, P. Kareiva, M. Ruckelshaus and B. Stein, "Impacts of Climate Change on Biodiversity, Ecosystems, and Ecosystem Services: Technical Input to the 2013 National Climate Assessment," 2013. 55 J. L. a. J.-C. Svennig, "Climate-related range shifts: A global multidimensional synthesis and new research directions," Ecography, pp. 001-014, 2014. 56 I.-C. Chen, J. K. Hill, R. Ohlemuller, D. B. Roy and C. D. Thomas, "Rapid Range Shifts of Species Associated with High Levels of Climate Warming," Science, vol. 333, no. 6045, pp. 1024-1026, 2011. 57 J. Lenoir, J. C. Gegout, P. A. Marquet, P. de Ruffray and H. Brisse, "A significant upward shift in plant species optimum elevation during the 20th century," Science, 2008. 58 J. VanDerWal, H. T. Murphy, A. S. Kutt, G. C. Perkins, B. L. Bateman, J. J. Perry and A. E. Reside, "Focus on poleward shifts in species' distribution underestimates the fingerprint of climate change," Nature Climate Change, vol. 3, 2012. 59 S. M. Crimmins, S. Z. Dobrowski, J. A. Greenberg, J. T. Abatzoglou and A. R. Mynsberge, "Changes in climatic water balance drive downhill shifts in plant species' optimum elevations," Science, vol. 331, 2011. 60 S. Gilman, M. Urban, J. Tweksbury, G. Gilchrist and R. Holt, "A framework for community interactions under climate change," Trends in Ecological Evolution, vol. 25, pp. 325-331, 2010. 61 L. Brandt, H. He, L. Iverson, F. Thompson III, P. Butler, S. Handler, M. Janowiak, P. Shannon, C. Swanston, M. Albrecht, R. Blume-Weaver, P. Deizman, J. DePuy, W. Dijak, G. Dinkel, S. Fei, D. Jones-Farrand, M. Leahy, S. Matthews, P. Nelson, B. Oberle, J. Perez, M. Peters, A. Prasad, J. Schneiderman, J. Shuey, A. Smith, C. Studyvin, J. Tirpak, J. Walk, W. Wang, L. Watts, D. Weigel and S. Westin, "Central Hardwoods Ecosystem Vulnerability Assessment and Synthesis: A Report from the Central Hardwoods Climate Change Response Framework Project," 2014.
Maryland Department of the Environment 2030 Greenhouse Gas Emissions Reduction Act Plan
10
Coastal and Ocean Ecosystems Coastal and ocean ecosystems are particularly vulnerable to physical and chemical changes brought about by rising ocean temperatures, sea level rise, ocean acidification, and increased precipitation and freshwater inputs from rivers. Sea-surface temperature in the mid-Atlantic has demonstrated a long-term warming trend since the late 1800’s, with a steady increase since the mid-1960’s.62,63 Higher ocean surface temperatures are directly impacting the species distribution of marine fish and invertebrates. One study of U.S. coasts found that for over 100 species sampled, the average center of biomass shifted north by approximately 10 miles and deeper by an average of 20 feet since the 1980’s.46 Another study found that bottom-dwelling mid-Atlantic marine species specifically show a northeastern shift, noting that the ocean-floor depth in this region is relatively uniform and shallow.64 Rising global temperatures also impact dissolved oxygen concentrations in water by decreasing oxygen solubility and increasing respiration rates (and oxygen consumption); exacerbated by changing ocean circulation and, in coastal areas, increased nutrient loading from changes in precipitation.38,65 Reduced oxygen ultimately impacts productivity and biodiversity through influence over many biological and nutrient-cycling processes.65,66 Sea level rise threatens the coastline and other marginal habitats, such as marshes and tidal wetlands through inundation and exacerbation of erosion, the latter having a particular impact on the sandy coastline of the mid-Atlantic.67 In fact, saltwater intrusion/inundation has been identified as the primary cause of wetland losses in the mid-Atlantic region in recent decades.68 While sea level has changed in the past and coastal environments have adjusted by shifting location, the speed at which the change is occurring and the prevalence of human development will continue contributing to the likelihood of successful habitat migration and the associated impacts.67 Where tidal marshes become submerged or are eroded, impacts would likely be seen in the populations of birds, fish and shellfish that utilize tidal marsh habitat for spawning, nursery and shelter areas.69
The Chesapeake Bay Region Many of the coastal, wetland and marsh impacts discussed for the coast are also applicable to the Bay, but due to its significance, the Chesapeake Bay has drawn the attention of researchers. Estuarine systems are expected to experience some unique impacts due to climate change, and scientists have already identified clear climatic trends for the Bay region, which are influencing its habitats and the species that reside there.70 Distinctive climatic changes noted over this period include a growing season, which is expanding at an even greater rate than that of the East coast overall. This has been observed as an issue for some migratory species, which reside in the Bay during the spring and summer months, but farther south during the winter. Warmer fall weather has meant that these species are not beginning their migration early enough, lacking the usual indicator of oncoming cold. Then, when the temperature drops suddenly, these species may suffer from cold-shock, resulting in incidents such as the cold-snap-associated death of thousands of Speckled Trout in February 2014, or 2 million juvenile Spot in 2011.70
62 R. K. Shearman and S. J. Lentz, "Long-Term Sea Surface Temperature Variability along the U.S. East Coast," Journal of Physical Oceanography, vol. 40, pp. 1004-1017, 2010. 63 Ecosystem Assessment Program, "Ecosystem Assessment Report for the Northeast U.S. Continental Shelf Large Marine Ecosystem," National Oceanic and Atmospheric Administration, 2009. 64 K.M. Kleisner, M.J. Fogarty, S. McGee, A. Barnett, P. Fratantoni, J. Greene, J.A. Hare, S.M. Lucey, C. McGuire, J. Odell, V.S. Saba, L. Smith, K.J. Weaver, and M.L. Pinsky, "The effects of sub-regional climate velocity on the distribution and spatial extent of marine species assemblages," PLoS ONE, vol. 11, no. 2, p. e0149220, 2016. 65 D. Breitburg, L. Levin, A. Oschlies, M. Grégoire, F. Chavez, D. Conley, V. Garcon, D. Gilbert, D. Gutiérrez, K. Isensee, G. Jacinto, K. Limberg, I. Montes, S. Naqvi, G. Pitcher, N. Rabalais, M. Roman, K. Rose, B. Seibel, M. Telszewski, M. Yasuhara and J. Zhang, "Declining oxygen in the global ocean and coastal waters," Science, vol. 359, no. 6371, p. eaam7240, 2018. 66 U.S. Global Change Research Program, Climate Science Special Report: Fourth National Climate Assessment, Volume I, D.J. Wuebbles, D.W. Fahey, K.A. Hibbard, D.J. Dokken, B.C. Stewart, T.K. Maycock, Eds., Washington, DC, 2017, p. 470. 67 K.E. Anderson, D.R. Cahoon, S.K. Gill, B.T. Gutierrez, E.R. Thieler, J.G. Titus, and S.J. Williams, "Coastal Sensitivity to Sea level Rise: A Focus on the Mid-Atlantic Region," The U.S. Climate Change Science Program and the Subcommittee on Global Change Research, U.S. Environmental Protection Agency, Washington DC, 2009. 68 T.E. Dahl and S.M. Stedman, "Status and trends of wetlands in the coastal watersheds of the Conterminous United States 2004 to 2009," U.S. Department of the Interior, Fish and Wildlife Service and National Oceanic and Atmospheric Administration, National Marine Fisheries Service, 2013. 69 K. Anderson, D. Cahoon, S. Gill, B. Gutierrez, E. Thieler, J. Titus and S. Williams, "Coastal Sensitivity to Sea level Rise: A Focus on the Mid-Atlantic Region," The U.S. Climate Change Science Program and the Subcommittee on Global Change Research, U.S. Environmental Protection Agency, Washington DC, 2009. 70 Chesapeake Environmental Communications, "The Changing Chesapeake," 2017. [Online]. Available: http://www.chesapeakedata.com/changingchesapeake/. [Accessed 21 August 2017].
Maryland Department of the Environment 2030 Greenhouse Gas Emissions Reduction Act Plan
11
In addition to temperature changes, an increase in total annual precipitation by approximately 12% holds particular significance in the Bay region, due to the correlation between precipitation and nitrogen/sediment pollution brought into the Bay with runoff, mentioned earlier.52,70 Wetlands in the area actually provide ecosystem services that help to mitigate some of the nutrient loads, but excess nutrients that reach the Bay can still cause algal blooms. The blooms, while active, reduce light penetration to the bottom of the bay, and sediment pollution further reduces clarity. Then, as they die off, their decomposition reduces oxygen levels at the bottom of the Bay, compounding the impact of warmer summer temperatures to exacerbate low-oxygen “dead-zones”.71 Aquatic vegetation, which provides food and habitat for fish, crabs, and waterfowl, tends to be stressed by any combination of these factors (increased temperatures, decreased oxygen, nutrient pollution, and reduced clarity).70
Forest Ecosystems In 2015, it was estimated that about 2.5 million acres of Maryland was covered by forest.72 Quantified, the value of forests in reducing air pollution alone is $140 million/year for the state; and wetlands and forests together provide value for flood prevention and stormwater mitigation at $3.1 billion/year, and surface water protection at $246 million/year.53 Climate change may have direct impacts on the distribution of tree species in our forests, or indirect effects through previously discussed changes to other populations within the ecosystem such as pests and pathogens, with the most significant changes expected to appear in the long-term.73,74 Whether population can shift successfully depends on the interplay of abiotic, biotic, and ecological variables;75 and for tree species this may include dispersal capacity and generation time, as well as environmental heterogeneity and succession processes.74,76 Maryland’s three different forest “ecological provinces” in the western, central, and coastal regions of the state77 are each expected to be most impacted by slightly different factors. Freshwater stream habitat in western Maryland is also at risk from rising temperatures. From 1960 through 2014, the water temperature increased at 79% of all stream sites measured in the Chesapeake Bay region, and several stream gauges in Maryland demonstrated a statistically significant increase in temperature of 2 to 4 degrees Fahrenheit (1.1 to 2.2oC) during this time.46 According to the EPA, under a business-as-usual emissions scenario, those sites, which are currently cold water fisheries are projected to become unsuitable for this use by 2100, as is true for most of Appalachia; however, under a 2 degrees Celsius (3.6oF) mitigation scenario, this use may be maintained.47
The Built Environment Projections from the Third National Climate Assessment of the U.S. Global Change Research Program (USGRP) indicate that infrastructure (e.g., roads, bridges, and buildings) in the northeastern U.S. is expected to be at particularly high risk from the impacts of sea level rise, coastal flooding, and more intense precipitation events brought by climate change.44 The East Coast infrastructure represents some of the oldest in the U.S., and was designed to a certain standard based on the elements and stressors, which it was expected to withstand. Climate
71 National Oceanic and Atmospheric Administration, "Climate Change and the Chesapeake Bay," 2011. 72 T. Lister and R. Widmann, "Forests of Maryland, 2015," U.S. Department of Agriculture, Forest Service, Northern Research Station, Newtown Square, PA, 2016. 73 P. Butler, L. Iverson, F. Thompson III, L. Brandt, S. Handler, M. Janowiak, P. Shannon, C. Swanston, K. Karriker, J. Bartig, S. Connolly, W. Dijak, S. Bearer, S. Blatt, A. Brandon, E. Byers, C. Coon, T. Culbreth, J. Daly, W. Dorsey, D. Ede, C. Euler, N. Gillies, D. Hix, C. Johnson, L. Lyte, S. Matthews, D. McCarthy, D. Minney, D. Murphy, C. O'Dea, R. Orwan, M. Peters, A. Prasad, C. Randall, J. Reed, C. Sandeno, T. Schuler, L. Sneddon, B. Stanley, A. Steele, S. Stout, R. Swaty, J. Teets, T. Tomon, J. Venderhorst, J. Whatley and N. Zegre, "Central Appalachians Forest Ecosystem Vulnerability Assessment and Synthesis: A Report from the Central Appalachians Climate Change Response Framework Project," USDA Forest Service, 2015. 74 W. Wang, H. He, F. Thompson III, J. Fraser and W. Dijak, "Changes in forest biomass and tree species distribution under climate change in the northeastern United States," Landscape Ecology, 2016. 75 S. Normand, N. Zimmermann, F. Schurr and H. Lischke, "Demography as the basis for understanding and predicting range dynamics," Ecography, vol. 37, pp. 1149-1154, 2014. 76 W. Wang, H. He, F. Thompson III, M. Spetich and J. Fraser, "Effects of species biological traits and environmental heterogeneity on simulated tree species distribution shifts under climate change," Science of the Total Environment, vol. 634, pp. 1214-1221, 2018. 77 D. Cleland, J. Freeouf, J. Keys, G. Nowacki, C. Carpenter and W. McNab, Ecological Subregions: Sections and Subsections of the Conterminous United States, USDA Forest Service, 2007.
Maryland Department of the Environment 2030 Greenhouse Gas Emissions Reduction Act Plan
12
change exposes these already aging structures to increased stress such as extreme temperatures and weather events, which can shorten their useful lifetime, increase maintenance costs, or even render them unusable.51,78,79
Coastal Hazards As previously noted, the northeastern U.S. is actually experiencing a rate of sea level rise greater than the global or national average, and the mid-Atlantic has experienced a disproportionately large increase in the frequency of flooding since the 1950’s.46 In the 2018 Annual Report from the MCCC, the Scientific and Technical Working Group provided preliminary updated projections on sea level rise impacts in Maryland. They stated that “Maryland should plan for a relative sea level rise of between 0.8-1.6 ft by 2050 and 1.6-3.4 ft by 2100 - considerably more if GHG emissions are not stabilized.”80 Sea level rise puts the people and infrastructure of Maryland’s extensive coastline at increased risk of damage from hazards such as flooding, saltwater intrusion, subsidence, storm surge, and erosion.46 In addition, higher temperatures and greater air moisture are expected to contribute to Atlantic hurricanes with greater precipitation rates, and more frequent occurrences of the most intense storms. The impacts of storm surge on transportation infrastructure can compound the loss of human life during storm events if major evacuation routes become impassable. It may lengthen the process of community recovery after events, due to a decreased ability to access work or school, or to receive much-needed supplies. These same impacts may directly affect the economic viability of main harbors, airports, and supply chains in coastal areas; and indirectly those locations that rely upon their goods and services.78,81 In 2017, the Port of Baltimore handled 38.4 million tons of international cargo (worth $53.9 billion), ranking it 9th in all U.S. ports by dollar value; and the Port generates $310 million in taxes, nearly $3 billion in annual wages and salaries, and supports 13,650 direct jobs.82 Imported and exported product is heavily reliant on not only port infrastructure, but the major highways and railways out of Baltimore City: Domino Sugar alone is estimated to generate 33,000 truck trips and more than 1,100 rail cars per year.83
Inland Flooding While Maryland's coastal areas may be considered particularly vulnerable, many areas of the state have infrastructure susceptible to impacts from climate change. Non-coastal (riverine and urban) flooding is a result of multiple factors, including those related to the design of the built environment (e.g., river modifications, drainage, and land use) and climate factors such as precipitation.84 This type of urban flooding can be caused by high-intensity, heavy rainfall events, which have increased in frequency in the Northeast (71% from 1958 to 2012) and are expected to continue to increase with unmitigated climate change. According to the 2017 USGRP Climate Science Special Report, the increased atmospheric water vapor associated with global warming means that when rainfall occurs, the amount of rain falling in a given event tends to be greater than it would have been under previous conditions. When combined with the low permeability of the majority of urban surfaces, large quantities of runoff may quickly overwhelm the capacity of stormwater drainage systems,47,84 affecting homes, businesses, roads, bridges, public railways, and other infrastructure. Inland bridges are particularly vulnerable to increased riverine storm flow and flooding, and the U.S. Geological Survey hydrologic region, which includes most of Maryland (Hydrologic Unit Code 02, or HUC02) is expected to experience some of the greatest impacts, with 76% (more than 20,000) of inland bridges projected as
78 S. C. Moser, M. A. Davidson, P. Kirshen, P. Mulvaney, J. F. Murley, J. E. Neumann, L. Petes and D. Reed, "Chapter 25: Coastal Zone Development and Ecosystems," in Climate Change Impacts in the United States: The Third National Climate Assessment, J. Melillo, T. Richmond and G. Yohe, Eds., U.S. Global Change Research Program, 2014, pp. 579-618. 79 S. L. Cutter, W. Solecki, N. Bragado, J. Carmin, M. Fragkias, M. Ruth and T. J. Wilbanks, "Chapter 11: Urban Systems, Infrastructure, and Vulnerability," in Climate Change Impacts in the United States: The Third National Climate Assessment, J. Melillo, T. Richmond and G. Yohe, Eds., U.S. Global Change Research Program, 2014, pp. 282-296. 80 Maryland Commission on Climate Change, "2018 Annual Report," Baltimore, Maryland, USA, 2018. 81 H. G. Schwartz, M. Meyer, C. J. Burbank, M. Kuby, C. Oster, J. Posey, E. J. Russo and A. Rypinski, "Chapter 5: Transportation," in Climate Change Impacts in the United States: The Third National Climate Assessment, J. Melillo, T. Richmond and G. Yohe, Eds., U.S. Global Change Research Program, 2014, pp. 130-149. 82 Maryland State Archives, "Maryland at a Glance: Waterways: Port of Baltimore," 2018. [Online]. Available: http://msa.maryland.gov/msa/mdmanual/01glance/html/port.html. [Accessed 25 September 2018]. 83 T. Karpovich, "Domino Sugar in Locust Point Receives Its Largest Shipment of Raw Sugar: Cargo Arrives from Malawi, Mozambique, Swaziland and Zimbabwe," The Port of Baltimore, pp. 22-23, November/December 2017. 84 A. Georgakakos, P. Flemming, M. Dettinger, C. Peters-Lidard, T. Richmond, K. Reckhow, K. White and D. Yates, "Chapter 3: Water Resources," in Climate Change Impacts in the United States: The Third National Climate Assessment, M. Melillo, T. Richmond and G. Yohe, Eds., U.S. Global Change Research Program, 2014, pp. 69-112.
Maryland Department of the Environment 2030 Greenhouse Gas Emissions Reduction Act Plan
13
vulnerable by 2100 without mitigation; while a successful 2 degrees Celsius (3.6oF) scenario reduces this number to 35%.47 Across HUC02, the cost of damages from inland flooding under a business-as-usual scenario is projected to be between $1 and $2 billion (in 2014 $) in 2100, significantly different from historic numbers.47 1.2.2 Jobs and the Economy Damages to natural or built systems may necessitate diversion of public funds for the replacement of ecosystem services or infrastructure repairs. Climate impacts can alter the natural resource productivity or availability in a region, and therefore the viability of the various economic sectors that depended on them. More frequent disruptions to urban and coastal infrastructure caused by extreme weather events may indirectly impact the economy of the region by restricting the flow of goods and impacting days worked. Decisions surrounding the adaptive management of various sectors are critical to the eventual outcome, but complicated by mitigation goals, socioeconomic factors, and concerns regarding uncertainty. This section provides an overview of some of the major economic sectors in Maryland, and the anticipated climate impacts.
Agriculture, Fisheries, and Forestry Agriculture and forestry are cultivated under human control, yet directly and clearly linked to the impacts of climate change on ecosystems. Common stressors will be experienced among ecosystems, agriculture, fisheries and forestry, such as those caused by general changes in temperature and precipitation regimes; increased extreme weather events; and increased pressures from weeds, diseases and pests. Maryland’s Eastern Shore farmers will be at particular risk from additional issues such as sea level rise, coastal storms, and saltwater intrusion. While not all individual impacts are necessarily negative (e.g., the growing season is expected to lengthen in Maryland, which may initially benefit some crops), issues such as increased temperature extremes and pest activity may negate these benefits;85 and beyond 2050, impacts are expected to be increasingly unfavorable in most situations.86 The overall impact, however, will depend in part on the level of adaptation that is achieved at the production level, as well as the response of the global market to these shifts.86 Although total farm acreage has been decreasing from historic levels,87 agriculture remained the largest single land use (almost one third of the total land area) and the largest commercial industry in the State, employing approximately 350,000 Marylanders.88 According to the U.S. Department of Agriculture (USDA) survey data, Maryland’s total production in 2017 included over $1 billion in broiler chickens, $699 million in field crops, and $169 million in milk.89 In 2016, the market value of all agricultural products was over $2.3 billion; which, after production costs, translated to a net farm income of about $370 million ($42,091 per farm on average) in that year.88 Poultry farms, the highest grossing agricultural industry in the state, are expected to see increased summer cooling costs, decreased growth rates, increased mortality and increased risk of Salmonella with increasing temperatures;85 challenging slim margins. Increased frequency of summer heat stress has the potential to negatively affect both field crops and milk production yields,86 and may amplify water demand, increasing the risk of over pumping groundwater for irrigation. This latter tendency, combined with sea level rise, places unconfined aquifers exposed to the freshwater-saltwater interface on the Eastern Shore at risk from saltwater intrusion. Saline water may also flood fields during storm events, leaving salt behind after evaporation, which can disrupt the soil structure and leach vital trace minerals, and release legacy soil phosphorus.
85 University of Maryland Center for Environmental Science, "Land Management: Farming in a Changing Climate," 2014. [Online]. Available: https://climatechange.maryland.gov/wp-content/uploads/sites/16/2014/12/ian_newsletter_4061.pdf. [Accessed 11 September 2017]. 86 J. Hatfield, G. Takle, R. Grotjahn, P. Holden, R. C. Izaurralde, T. Mader, E. Marshall and E. Liverman, "Chapter 6: Agriculture," in Climate Change Impacts in the United States: The Third National Climate Assessment, J. Melillo, T. Richmond and G. Yohe, Eds., U.S. Global Change Research Program, 2014, pp. 150-174. 87 Maryland Department of Planning, "2012 Census of Agriculture For Maryland and its Jurisdictions," U.S. Department of Agriculture, National Agricultural Statistics Service, 2012. [Online]. Available: http://planning.maryland.gov/msdc/S6_Econ_Agri_Census.shtml. [Accessed 12 September 2017]. 88 Maryland State Archives, "Maryland at a Glance: Agriculture," [Online]. Available: http://msa.maryland.gov/msa/mdmanual/01glance/html/agri.html. [Accessed 28 September 2018]. 89 USDA National Agricultural Statistics Service, "Quick Stats," 2017. [Online]. Available: https://quickstats.nass.usda.gov/. [Accessed 28 September 2018].
Maryland Department of the Environment 2030 Greenhouse Gas Emissions Reduction Act Plan
14
Changes in temperature and precipitation are likely to alter the types of crops that can be grown in a given region, similar to the effects on natural plant populations. Where field crops are grown is generally determined by USDA hardiness zones, and while most of Maryland is currently in zone 7, the USDA predicts that much or part of Maryland may be in zone 8 under various future scenarios, both mid- and late-century.90 The seasonality of trends in temperature and precipitation is also particularly relevant to the agricultural sector. As noted earlier in this chapter, average precipitation is expected to continue increasing in the winter and spring, with less change expected in the fall and summer.49 Combined with the higher summer temperatures, this will likely increase the intensity of any droughts during the growing season.48 Perennial crops such as fruit trees and vines are also at risk, since their life cycles rely on particular seasonal cues. These crops may also become more sensitive to hard freezes, as unusually warm winters can de-harden vines, or cause spring growth to begin prematurely only to be later destroyed by a hard freeze.86 In 2017, Maryland’s apple and peach orchards produced over $11.5 million utilized for fresh eating and in processing87. Additionally, the State has 858 acres of vineyards, 70% of which are owned by wineries that sold $47 million worth of product in 2015.88 While the effect on forestry is not predicted to be as substantial as that on agriculture, and increased incidence of wildfires is not expected to be as significant a concern in Maryland as in other regions of the U.S.,44,47 there are still potential threats and changes to the industry that merit attention. An analysis published in 2018 by the BEACON institute of Salisbury University entitled The Impact of Resource Based Industries on the Maryland Economy demonstrates that in 2015 the forest industry contributed $3.5 billion annually to Maryland’s economy, and $133 million in state and local tax revenue, making it one of the largest contributors. This analysis also found that the forestry industry supports over 15,000 jobs. As noted in the ecosystem section, changes in average temperature and precipitation have the potential to shift, shrink, or expand the ranges for various species, including trees such as the loblolly pine, oak, and hickory, which are most prevalent in Maryland.91 On the Eastern Shore, where forestry is the second largest employer,92 sea level rise, storm surge, and salt-water intrusion were discussed as local concerns. The positive contribution to global forestry production from lengthened growing seasons and increased CO2 concentrations is unclear; though similar to agriculture, it is expected that negative climate impacts such as wildfires, insects and pathogens, heat and water stress, and extreme weather events may eclipse these benefits.91,92 In Maryland, DNR has already noted that pests such as the gypsy moth, Southern pine bark beetle, loblolly pine sawfly, spotted lanternfly, and fall cankerworm have begun to threaten forests in recent decades.93 Not only may a changing climate impact the prevalence of these pests, but it may also stress trees or otherwise affect defense mechanisms, making them more susceptible to damage.92 In addition, forest management will be an important component of mitigation, since forests play a major role as carbon sinks, already having absorbed about 17% of anthropogenic CO2 emissions the past several decades.93 Depending on the chosen strategies, we may either expand or reduce this capacity. The Chesapeake Bay fisheries are expected to be impacted by a combination of environmental stressors, including those previously discussed for Bay and coastal ecosystems such as basic water quality issues (e.g., changes in temperature, salinity, and dissolved oxygen), as well as habitat loss due to sea level rise and projected impacts on submerged grasses. Many commercially important fisheries species are projected to move northward as waters warm and suitable habitats shift; and as previously noted, this shift could also bring new pests or increase the damages done by diseases such as bacteria that thrive in warmer waters.94 According to the Maryland Department of
90 S. Matthews, L. Iverson, M. Peters and A. Prasad, "Assessing Potential Climate Change Pressures across the Conterminous United States: Mapping Plant Hardiness Zones, Heat Zones, Growing Degree Days, and Cumulative Drought Severity throughout this Century," USDA Forest Service, 2018. 91 W. H. McNab, M. A. Spetich, R. W. Perry, J. D. Haywood, S. G. Laird, S. L. Clark, J. L. Hart, S. J. Torreano and M. L. Buchanan, "Climate-Induced Migration of Native Tree Populations and Consequences for Forest Composition," in Climate change adaptation and mitigation management options: A guide for natural resource managers in southern forest ecosystems, 2014, pp. 307-378. 92 A. P. Kirilenko and R. A. Sedjo, "Climate change impacts on forestry," Proceedings of the National Academy of Sciences of the United States of America, vol. 104, no. 50, pp. 19697-19702, 2007. 93 H. D. Jacoby, A. C. Janetos, R. Birdsey, J. Buizer, K. Calvin, F. de la Chesnaye, D. Schimel, I. Sue Wing, R. Detchon, J. Edmonds, L. Russell and J. West, "Chapter 27: Mitigation," in Climate Change Impacts in the United States: The Third National Climate Assessment, J. Melillo, T. Richmond and G. Yohe, Eds., U.S. Global Change Research Program, 2014, pp. 648-669. 94 Maryland State Archives, "Maryland at a Glance: Economy," [Online]. Available: http://msa.maryland.gov/msa/mdmanual/01glance/economy/html/economy.html.
Maryland Department of the Environment 2030 Greenhouse Gas Emissions Reduction Act Plan
15
Agriculture (MDA), Maryland’s seafood industry contributes nearly $600 million to the state economy each year. In 2016, the commercial landings value of Maryland’s seafood industry was $90,361,277. Within the state, the blue crab remained the most lucrative species by far, accounting for over $54 million in revenue in 2015, with the oyster coming in second at $15 million.93 In addition to concerns regarding ocean acidification, oysters may be at an increased risk of suffocation by sediment loads, exposure to low-oxygen dead zones, and damages from the diseases such as Dermo and MSX; all of which have contributed to the decline of the oyster population95 and may be exacerbated directly or indirectly by the changing climate as previously discussed. For blue crabs, a study of current life cycle variations across their native range (Maryland/Virginia, North Carolina, and Florida) concluded that since the Chesapeake Bay is towards the northern edge, increased temperatures taken independently may provide certain benefits currently experienced by their more southern populations such as a longer reproductive season with additional broods, increased growth rate and maturation, and decreased deaths over winter.96 However, the peak summer water temperatures of the three regions studied were very similar, despite the marked differences in temperature the remainder of the seasons, and so the current climates of the southern sites cannot necessarily be considered an accurate representation of those temperature differences expected in the Chesapeake as a result of climate change. Furthermore, many other potential impacts are projected to affect blue crabs negatively, including loss of submerged grass habitat and expanded dead zones.96
Tourism Businesses involved in the State’s tourism sector are also likely to feel the impact of climate change. In 2016, Maryland visitors spent $17.3 billion, more than 60% of which was in the industries of transportation, food and beverage, and lodging.97 Tourism in the State supported 146,012 direct full-time equivalent jobs in that year, bringing in wages of approximately $6 billion; while visitor spending generated over $2.3 billion in state and local taxes.97,98 The Maryland Office of Tourism Development often touts Maryland as “America in miniature,” with the wide array of regional activities.99 The natural beauty of the State could suffer the effects of climate change, depriving Maryland residents and visitors of a wealth of experiences, including:.
• Snow sports such as skiing are at obvious risk from rising temperatures and longer growing seasons, especially for lower-elevation resorts such as those in Maryland.100 Wisp Mountain Park has a winter employment of 600, ranking it among the top employers in Garrett County.101
• Maryland’s sizable sport fishing industry has an estimated economic impact of nearly 7,000 jobs and $300 million in income across the State; with 352,000 anglers (nearly half of the total) coming from out-of-state in 2015.100 Similarly to commercial fisheries, key species will face increasing risks brought by higher temperature surface water, changes in precipitation, and other indirect effects.
• Maryland’s beaches will be susceptible to more extreme weather events as well as sea level rise and are difficult to protect from storms and erosion without negatively impacting their aesthetics.100 Ocean City generated around $60 million in tourism-related taxes each year from 2014-2017 (60% during the months of June, July, and August).102
• Tourism in cities and urban centers is also expected to be impacted by climate change, experiencing the effects of extreme heat and precipitation events as discussed surrounding the built environment.
95 Chesapeake Bay Program, "Oysters," [Online]. Available: http://www.chesapeakebay.net/issues/oysters. [Accessed 21 September 2017]. 96 A. H. Hines, E. G. Johnson, M. Z. Darnell, D. Rittschof, T. J. Miller, L. J. Bauer and P. Rodgers, "Predicting Effects of Climate Change on Blue Crabs in the Chesapeake Bay," in Biology and Management of Exploited Crab Populations under Climate Change, G. Kruse, G. Eckert, R. Foy, R. Lipcius, B. Sainte-Marie, D. Stram and D. Woodby, Eds., Alaska Sea Grant, University of Alaska Fairbanks, 2010. 97 Maryland Office of Tourism, FY17 Tourism Development Board Annual Report, Maryland Tourism Development Board and Maryland Department of Commerce, 2018. 98 Maryland Office of Tourism, Tourism Works for Maryland, 2018. 99 Maryland Office of Tourism Development, "Visit Maryland," 2017. [Online]. Available: http://www.visitmaryland.org/. [Accessed 28 September 2018]. 100 M. Nicholls, "Climate Change: Implications for Tourism," University of Cambridge, 2014. 101 Maryland Department of Commerce, "Brief Economic Facts: Garrett County, Maryland," 2018. 102 Maryland Department of Tourism, "Ocean City Maryland Tourism Metrics Report," [Online]. Available: http://ococean.com/media/metrics-reports. [Accessed 28 September 2018].
Maryland Department of the Environment 2030 Greenhouse Gas Emissions Reduction Act Plan
16
Energy The energy sector tends to be thought of in terms of its potential impact on emissions; however, it is also at risk from negative impacts due to the increasing temperatures, decreasing water availability, and increasing storms, flooding, and sea level rise associated with climate change.103 Particularly in the Northeast, hotter summer temperatures are expected to increase peak electricity demand in this season due to increased use of air conditioning units; with overall increased demand outweighing the decreased need for heating in winter.47 This makes it more difficult and potentially more expensive for utilities to meet the immediate peak demand, and also increases the risk of system failure precisely when it is most needed.44 In a scenario where global average temperature increases by 3.5 to 5 degrees Celsius (6.3 to 9oF) , it is estimated that a 10% to 20% increase in total U.S. electric generating capacity will be required by 2050.104 Beyond mitigation, programs for adaptation such as enhanced urban tree canopies can help increase resiliency by providing shade relief to buildings during the summer, which helps alleviate the demand for electric cooling. Additionally, extreme weather events that threaten coastal and urban infrastructure include direct threats to electricity infrastructure (e.g. transmission lines) throughout the state; as well as indirect impacts already mentioned, such as issues with fuel extraction, processing, and delivery.103,105 The majority of thermoelectric power plants (e.g. nuclear, coal, oil, and natural gas) are specifically located near bodies of water (since they require constant cooling), which are expected to become more susceptible to flooding. Furthermore, as atmospheric temperatures increase, the temperature of surface water also increases and the water being used for this purpose becomes a less effective coolant, reducing the efficiency of thermoelectric generation.103 Warmer water would also be discharged back into the Bay, with potentially negative impacts on the ecosystem. 1.2.3 Public Health In 2009, under section 202(a) of the Clean Air Act, the EPA Administrator issued an endangerment finding that stated that “based on careful consideration of the full weight of scientific evidence and a thorough review of numerous public comments” the cumulative impacts of GHGs endanger the public’s health and welfare.106 Climate change is expected to alter the severity, frequency, and distribution of health problems, which are affected either directly or indirectly by temperature and precipitation.47,107 Impacts may be related to changes in the natural or built environment, including effects on our food and water supply, air quality, and extreme weather events;47 and several examples of expected consequences will be discussed in the following section.
Extreme Heat and Air Quality Extreme heat events have been increasing in frequency over the past several decades at the national level,46 and between 2050 and 2100 the incidence is expected to more than triple under a business-as-usual scenario.47 These events are directly associated with a greater risk of illness or death due to conditions such as heat stroke, cardiovascular disease, and respiratory disease,46,47 even if only small differences in average seasonal temperature occur. The Maryland Climate and Health Report released in 2016 found that, between 2000 and 2012, extreme summer heat events (95th percentile for the baseline day) increased the risk of hospitalization for heart attack by 11% statewide and by up to 43% in some areas; and increased the risk of hospitalization due to asthma by 22%.108
103 C. Zamunda, B. Mignone, D. Bilello, K. Hallett, C. Lee, J. Macknick, R. Newmark and D. Steinberg, "U.S. Energy Sector Vulnerabilities to Climate Change and Extreme Weather," U.S. Department of Energy, 2013. 104 U.S. Environmental Protection Agency, "Climate Impacts on Energy," [Online]. Available: https://www.epa.gov/climate-impacts/climate-impacts-energy. [Accessed 20 October 2016]. 105 J. Dell, S. Tierney, G. Franco, R. G. Newell, R. Richels, J. Weyant and T. J. Wilbanks, "Chapter 4: Energy Supply and Use," in Climate Change Impacts in the United States: The Third National Climate Assessment, J. Melillo, T. Richmond and G. Yohe, Eds., U.S. Global Change Research Program, 2014, pp. 113-129. 106 U.S. Environmental Protection Agency, "Endangerment and Cause or Contribute Findings for Greenhouse Gases Under Section 202(a) of the Clean Air Act," Federal Register, vol. 74, no. 239, 2009. 107 U.S. Global Change Research Program, The Impacts of Climate Change on Human Health in the United States: A Scientific Assessment, A. Crimmins, J. Balbus, J. Gamble, C. Beard, J. Bell, D. Dodgen, R. Eisen, N. Fann, M. Hawkins, S. Herring, L. Jantarasami, D. Mills, S. Saha, M. Sarofim, J. Trtanj and L. Ziska, Eds., 2016. 108 Maryland Institute for Applied Environmental Health and University of Maryland School for Public Health College Park, "Maryland Climate and Health Profile Report," 2016.
Maryland Department of the Environment 2030 Greenhouse Gas Emissions Reduction Act Plan
17
Air quality is also projected to decline under a business-as- usual scenario, especially in the eastern U.S.,47 which increases the risk of cardiovascular and respiratory issues. Higher atmospheric temperatures increase the rate of chemical reactions, such as the formation of ground-level ozone, when the pollutants that participate in these reactions (nitrogen oxide and volatile organic compounds) are present in sufficient quantities. All else equal, increased temperatures will make it more difficult for cities in particular to achieve or maintain compliance with ozone standards, and the risk of health impacts associated with non-attainment, including reduced lung function, asthma attacks, and premature death, will increase.47 Mitigation (2oC or 3.6oF scenario) is projected to avoid 13,000 premature deaths in 2050 and 57,000 in 2100 nationwide due to impacts from ozone and particulates, with an estimated economic benefit of $160 billion and $930 billion respectively.47 Additionally, climate change and even increased CO2 concentrations alone may impact seasonal plant-based allergies through several pathways: altering the distribution of plants, lengthening the growing season, and altering the dispersion or allergenicity of the pollen.109,110 The season for ragweed pollen, for example, has already begun to lengthen in a large percentage of locations where the trend has been studied, and is expected to continue exhibiting higher pollen counts due to earlier springs, increasing temperatures, later fall frosts, and increased CO2 concentrations.46 Another recent study predicted increased emergency room visits in the Northeast due to allergic asthma caused by oak pollen under several future climate scenarios that worsened with the severity of change.110 Increased pollen exposure in general is expected to increased incidence of asthma in sensitive groups, especially when compounded by other air-quality issues.40
Water Quality, Extreme Precipitation, and Infectious Disease As previously stated, changes to precipitation in the Chesapeake Bay region are expected to increase the pollutant load to the Bay, a trend that is generally true for other water bodies in the State as well. Combined with increasing atmospheric temperatures, these changes are expected to negatively impact water quality parameters and potentially change the viable uses of surface water, such as recreation or human consumption.47 Warmer winters and springs are associated with increased occurrence of Vibrio bacteria, including V. cholerae, which causes cholera, and V. vulnificus, which can cause similar symptoms or infect open wounds. Over the past century, the likelihood of encountering these bacteria in the Bay has already increased as conditions become more favorable to them.70 Overall, increased temperatures and nutrient loads are expected to expand suitable habitats for toxic freshwater and marine algae, to which people may be exposed through consuming contaminated seafood or drinking water, or via direct contact in recreational waters.107 Another potential concern from seafood is accumulated heavy metals, especially methylmercury, which is taken up at greater rates in warmer waters.107 Extreme precipitation poses a threat to drinking water supplies and may be one of the largest climate threats to water quality, having preceded 68% of waterborne disease outbreaks between 1948 and 1994.107 Such events may overburden stormwater and drainage systems, which can cause discharge of untreated sewage into waterways, exposing individuals to human pathogens. Private wells can also be contaminated by extreme precipitation events. In other cases, flooding events may cause direct injury to those caught in its path, or damage to infrastructure, which leads to increased growth of mold or bacteria that can aggravate allergies and asthma.46 Adaptation or upgrades to stormwater management systems to accommodate for increased peak flow and nutrient removal, or otherwise decrease direct human contributions (such as impervious land-cover), may help alleviate some of these impacts. As with other plants and animals, climate influences the habitat, population, and active season of ticks, which spread Lyme disease and mosquitoes that spread West Nile virus and other pathogens.107 According to one recent review, the Gulf Coast Tick, which had a historic range suitable to its name, has expanded its geographic distribution northwards, including into the piedmont and coastal areas of Maryland.111 The specific influence of climate change on disease incidence is, however, difficult to predict owing to the large number of other factors, which also influence
109 U.S. Environmental Protection Agency, EPA's Endangerment Finding: Health Effects, 2017. 110 S. Anenberg, K. Weinberger, H. Roman, J. Neumann, A. Crimmins, N. Fann, J. Martinich and P. Kinney, "Impacts of oak pollen on allergic asthma in the United States and potential influence of future climate change," GeoHealth, vol. 1, pp. 80-92, 2017. 111 D. Sonenshine, "Range expansion of tick disease vectors in North America: Implications for spread of tick-borne disease.," International Journal of Environmental Research and Public Health, vol. 15, no. 478, 2018.
Maryland Department of the Environment 2030 Greenhouse Gas Emissions Reduction Act Plan
18
the spread of these diseases.107 For example, it has been determined that the recent increase in Lyme disease cases in the Northeast is driven by multiple factors,46 though geographic location and seasonal climate variability are very likely to be significant factors in determining when and where exposure is most likely.107 Adaptation of the human population to this increased risk is again likely to have a strong influence on the eventual outcome of infection rates,107 including factors such as access to air conditioning or vector control measures such as spraying.
Food Security Climate change is expected to increase the exposure of food and consumers to pathogens, toxins, and chemical contaminants, and to increase the risk of disruptions to distribution systems107 (Figure 1.2-1). Changes to precipitation patterns in the mid-Atlantic region are likely to increase overland flow and therefore the chemicals and other contaminants discharged into bodies of water, including sources used for irrigation or fisheries.107 Flooding caused by extreme precipitation further increases the likelihood that fields or fisheries are contaminated by pathogens, such as those released by overwhelmed sewer systems or carried from livestock manure. Climate change may alter the range of bacterial and fungal pathogens, which normally affect crops, and higher temperatures may improve growing conditions, increasing their concentrations where they exist during various stages of food production and storage.107
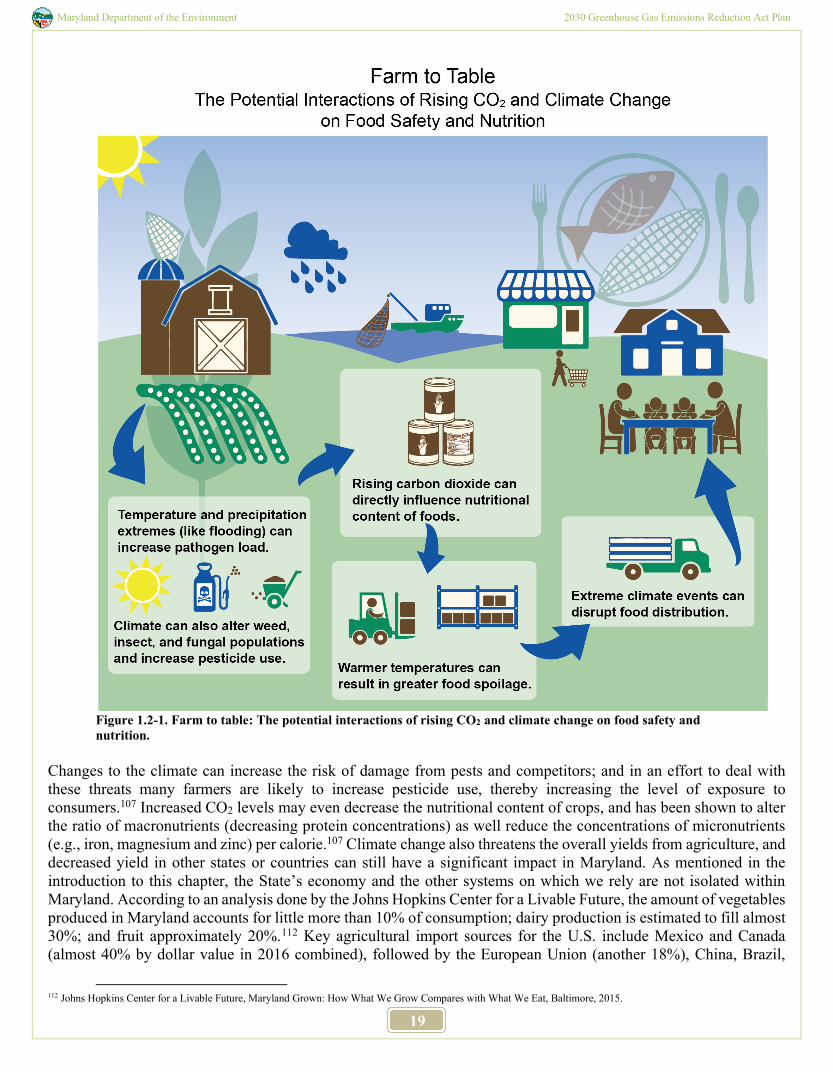
Maryland Department of the Environment 2030 Greenhouse Gas Emissions Reduction Act Plan
19
Figure 1.2-1. Farm to table: The potential interactions of rising CO2 and climate change on food safety and nutrition.
Changes to the climate can increase the risk of damage from pests and competitors; and in an effort to deal with these threats many farmers are likely to increase pesticide use, thereby increasing the level of exposure to consumers.107 Increased CO2 levels may even decrease the nutritional content of crops, and has been shown to alter the ratio of macronutrients (decreasing protein concentrations) as well reduce the concentrations of micronutrients (e.g., iron, magnesium and zinc) per calorie.107 Climate change also threatens the overall yields from agriculture, and decreased yield in other states or countries can still have a significant impact in Maryland. As mentioned in the introduction to this chapter, the State’s economy and the other systems on which we rely are not isolated within Maryland. According to an analysis done by the Johns Hopkins Center for a Livable Future, the amount of vegetables produced in Maryland accounts for little more than 10% of consumption; dairy production is estimated to fill almost 30%; and fruit approximately 20%.112 Key agricultural import sources for the U.S. include Mexico and Canada (almost 40% by dollar value in 2016 combined), followed by the European Union (another 18%), China, Brazil,
112 Johns Hopkins Center for a Livable Future, Maryland Grown: How What We Grow Compares with What We Eat, Baltimore, 2015.
Maryland Department of the Environment 2030 Greenhouse Gas Emissions Reduction Act Plan
20
Australia, Chile and Indonesia, among others.113 These imports are, for the most part, processed goods such as coffee, wine, and cocoa (the top three by dollar value in 2016), however staples such as beef, grains, fruits, vegetables, and dairy products also make the top 25.
1.3 The 2030 GGRA Plan
The Maryland Department of the Environment (MDE), in coordination with other agencies and stakeholders, has proposed a draft GGRA plan to achieve Maryland’s goal of reducing GHG emissions by 40% by 2030 while benefiting the State’s economy and creating jobs, entitled the 2030 GGRA Plan. The 2030 GGRA Plan sets forth a comprehensive set of measures to reduce and sequester GHGs, including investments in energy efficiency and clean and renewable energy solutions, widespread adoption of electric vehicles (EVs), and improved management of forests and farms to sequester more carbon in trees and soils. The 2030 GGRA Plan sets Maryland on a path to achieve an ambitious goal and set an example for how the nation can respond to the threat of climate change while growing the economy and creating jobs. Before finalizing the GGRA Plan, Maryland undertook a significant stakeholder process to ensure that opportunities existed to publicly comment on the 2019 GGRA Draft Plan, which can be read in Appendix L. The release of the 2030 GGRA Plan is the culmination of this process.
1.4 The Greenhouse Gas Emissions Reduction Act – Reauthorization of 2016
On April 4, 2016 the GGRA of 2016 was signed into law by Maryland Governor Larry Hogan. Expanding on the requirements of the original law, the GGRA of 2016 requires the State to achieve a minimum of a 40% reduction in statewide GHG emissions from 2006 levels by 2030. To achieve this goal, the GGRA of 2016 requires MDE to develop a proposed statewide GHG reduction plan, entitled the 2030 GGRA Plan. The GGRA of 2016 also requires MDE to solicit public comment on the proposed draft plan from interested stakeholders and the public, and to adopt a final plan by Dec. 31, 2019. The State is also required to demonstrate that the new reduction goal can be achieved in a way that has a net positive impact on Maryland’s economy, protects existing manufacturing jobs and creates significant new “green” jobs in Maryland. The requirements and content of the GGRA of 2016 are summarized below:
Table 1.4-1. GGRA of 2016 Requirements.
Maryland shall reduce statewide GHG emissions by 40% from 2006 levels by 2030. MDE must:
● Submit a proposed draft plan that reduces statewide GHG emissions by 40% from 2006 levels by 2030;
● Make the proposed draft plan for public comment; and ● Convene a series of public workshops to provide interested parties with an
opportunity to comment on the proposed draft plan. By 2019, Maryland must adopt a final plan that reduces statewide GHG emissions by 40% from 2006 levels by 2030. The plan must:
● Include adopted regulations that implement all plan measures for which State agencies have existing statutory authority;
● Include a summary of any new legislative authority needed to fully implement the plans, and a timeline for seeking legislative authority;
● Ensure no net loss of existing manufacturing jobs; and
113 U.S. Department of Agriculture, "USDA Economic Research Service: Data Products," [Online]. Available: https://www.ers.usda.gov/data-products/. [Accessed 14 September 2017].
Maryland Department of the Environment 2030 Greenhouse Gas Emissions Reduction Act Plan
21
● Ensure a net increase in jobs and economic benefit, opportunities for new green jobs in energy and low-carbon technology fields, and no adverse impact on the reliability and affordability of electricity and fuel supplies.
In 2022, an independent study of the economic impact of requiring GHG emissions reductions from the State’s manufacturing sector is due to the Governor and General Assembly, which will be overseen by the MCCC. In 2022, a report is due to the Governor and General Assembly assessing the progress toward the 40% emissions reduction and the GHG emissions reductions needed by 2050 in order to avoid anthropogenic changes to the Earth’s climate system. This report also summarizes impacts on the economy. By 2023, the General Assembly will review the progress report, the report on economic impacts on the manufacturing sector, the requirements of a federal program, and other information and determine whether to continue, adjust, or eliminate the requirement to achieve a 40% reduction by 2030.
MDE was previously required by the GGRA of 2009 to submit an updated report, the 2015 GGRA Plan Update, to the Governor and General Assembly by October 1, 2015. The 2015 GGRA Plan Update provided updated information contained within the 2012 GGRA Plan, summarized the State’s progress toward achieving the 2020 emissions reduction goal, and satisfied the remaining requirements of the GGRA of 2009.
1.5 The 2030 GGRA Plan Requirements
In developing and implementing the 2030 GGRA Plan MDE must:
• Develop the plans in recognition of the finding by the IPCC that developed countries will need to reduce GHG emissions by between 80% and 95% from 1990 levels by 2050;
• Analyze the feasibility of measures to comply with the GHG reductions required by the GGRA of 2016; • Consider the impact on rural communities of any transportation-related measures proposed in the plans; • Provide that a GHG emissions source that voluntarily reduces its GHG emissions before the implementation
of the GGRA of 2016 shall receive appropriate credit for its early voluntary actions; • Provide for the use of offset credits generated by alternative compliance mechanisms executed within the
State, including carbon sequestration projects, to achieve compliance with GHG emissions reduction required by the GGRA of 2016;
• Ensure that the plans do not decrease the likelihood of reliable and affordable electrical service and statewide fuel supplies;
• Consider whether the measures would result in an increase in electricity costs to consumers in the State; • Consider the impact of the plans on the ability of the State to attract, expand, and retain commercial aviation
services and conserve, protect, and retain agriculture; and • Ensure that the GHG emissions reduction measures implemented in accordance with the plans:
o Are implemented in an efficient and cost-effective manner; o Do not disproportionately impact rural and low-income, low-to-moderate-income, or minority
communities or any other particular class of electricity ratepayers; o Minimize leakage; o Are quantifiable, verifiable, and enforceable; o Directly cause no loss of existing jobs in the manufacturing sector; o Produce a net economic benefit to the State’s economy and a net increase in jobs in the State; and o Encourage new employment opportunities in the State related to energy conservation, alternative
energy supply, and GHG reduction technologies.
Maryland Department of the Environment 2030 Greenhouse Gas Emissions Reduction Act Plan
22
The 2030 GGRA Plan is a comprehensive, multi-sector, multi-agency plan developed with assistance and input from more than a dozen state agencies and nongovernmental organizations. Building from the programs developed in the previous GGRA plans, the programs outlined in the 2030 GGRA Plan provide a blueprint, which if fully implemented, will achieve reductions greater than the 40% GHG reduction required by the GGRA of 2016, with significant positive job growth and economic benefit. As this is an iterative planning process, in considering the impacts of climate change and Maryland’s response, there is still much work that needs to be done in upcoming updates to the plan. The programs outlined in the 2030 GGRA Plan can still be modified and improved as new opportunities arise to achieve greater GHG reductions while benefiting Maryland’s economy.
1.6 Climate Change-Related Legislation (2015 – 2019)
Maryland has historically been at the forefront of states taking action to address both the drivers and consequences of climate change. Beginning with the development of A Sea Level Rise Response Strategy for Maryland in 2000; the passage of the Healthy Air and Clean Cars Acts of 2006 and 2007 respectively; participation in the Regional Greenhouse Gas Initiative (RGGI) (2007-present); creation of the Coast Smart Council in 2014; and reauthorization of the GGRA in 2016; Maryland has consistently advanced efforts to combat climate change. Following the 2015 legislative session, Governor Larry Hogan signed the MCCC Act of 2015 to codify the commission into law. The tasks and responsibilities assigned to the MCCC under the act are generally similar to those under the 2014 Executive Order, including the requirement to report to the Governor and General Assembly each year on the status of the state’s efforts to “mitigate the causes, prepare for and adapt to the consequences of climate change, including future plans and recommendations, if any, to be considered by the General Assembly.” The MCCC now has representatives from the administration, the legislature, business, nonprofit organizations, academia, and local governments. On April 4, 2016, Governor Hogan signed the GGRA of 2016 into law, which requires Maryland to reduce statewide GHG emissions by 40% from 2006 levels by 2030. The GGRA of 2009 was created based on the recommendations of the MCCC’s 2008 Climate Action Plan. The original law required Maryland to achieve a 25% reduction in statewide GHG emissions from 2006 levels by 2020. MDE’s 2015 GGRA Plan Update, showed that Maryland was on target to not only meet but exceed the emission reduction goal; and that this was being accomplished with an estimated economic benefit between $2.5 and $3.5 billion in increased economic output by 2020 as well as creation and maintenance of between 26,000 and 33,000 new jobs. Governor Hogan signed legislation in 2017 establishing the Maryland Healthy Soils Program and making Maryland among the first to pass such a state-sponsored initiative in the nation. House Bill 1063, directs MDA to provide farmers with the research, education, and assistance necessary to improve the health, yield, and profitability of Maryland’s soils and increase soil carbon storage capacity on Maryland farms. The Governor announced Maryland’s intention to join the U.S. Climate Alliance following the United States withdrawing from the 2015 Paris Agreement (2018). Subsequently, he signed HB3: Environment - U.S. Climate Alliance – Membership, which codified the decision, requiring the Governor join the Alliance and to report to certain committees of the General Assembly on any collaborations among Alliance members and any policies or programs that the Alliance has endorsed or undertaken. A number of bills about EVS were passed recent years. In 2020 the membership of ZEEVIC was expanded further and the council’s termination date was extended to 2026. The use of specified high occupancy vehicle (HOV) lanes regardless of the number of passengers was extended to EVs in 2016. The Clean Car Act (2017) extended the Electric Vehicle Recharging Equipment Rebate Program and created tax credits for specified qualified plug-in electric drive vehicles.
Maryland Department of the Environment 2030 Greenhouse Gas Emissions Reduction Act Plan
23
Recognizing the economic, environmental, fuel diversity, and security benefits of renewable energy resources, Maryland became one of the first states to adopt a RPS in 2004. The legislature intended the RPS law to establish support for the development of renewable electricity generation within Maryland and the PJM Interconnection region that includes Maryland, by requiring that power providers procure renewable energy credits (RECs) from renewable sources. The Maryland legislature updated the original legislation in 2017, to increase the goal to 25% of retail electricity sales by 2020, replacing the 20% by 2022 target. This includes a 2.5% carve-out specifically for solar energy. The RPS legislation has a clear and direct impact on GHG emissions from the electricity sector, by increasing the percentage of electricity that comes from zero emission generation sources. Other energy bills have been supported in Annapolis as well. The State signed into law the Maryland Offshore Wind Energy Act of 2013. This initiative amended the RPS to include offshore wind projects located between 10 and 30 miles off of Maryland’s coast and to provide financial support for projects in the form of offshore wind renewable energy credits (ORECs). The law also created an application and review process for offshore wind developers to propose OREC projects tailored for Maryland. The OREC process is coordinated by the Maryland Public Service Commission (PSC). In 2015, SB 398: Electricity - Community Solar Energy Generating System Program established a pilot program on community solar energy generating systems under the authority of the PSC. Several bills passed in 2016 including HB 1106 Clean Energy Jobs - Renewable Energy Portfolio Standard Revisions, which altered the renewable energy portfolio standard percentage derived from solar energy for specified years and required the Department of Labor, Licensing, and Regulation to study the workforce development training needs for the clean energy industry in the State. The same year, SB 936: Maryland Clean Energy Incentive Act of 2016 extended a specified credit against the State income tax for electricity-producing facilities using specified qualified energy resources and established the Maryland Clean Energy Incentive Tax Credit Reserve Fund. In 2017, Governor Hogan announced support of a hydraulic fracturing prohibition, which was affirmed by the General Assembly in HB1325 – Oil and Natural Gas - Hydraulic Fracturing - Prohibition. Additionally, that year, HB 1414: Renewable Energy Portfolio Standard required the Power Plant Research Program to conduct a study on the renewable energy portfolio standard and related matters. During the 2018 legislative session, HB1456 – Offshore Drilling Liability Act, established “offshore drilling activity” as an ultrahazardous and abnormally dangerous activity and that a person that causes a spill of “oil” or “gas” while engaged in an offshore drilling activity is strictly liable for damages for any injury, death, or loss to person or property that is caused by the spill. The Sea Level Rise Inundation and Coastal Flooding - Construction, Adaptation, and Mitigation Act (House Bill 1350 / Senate Bill 1006) also passed in 2018. In addition to making changes to the Maryland Coast Smart Council, over the next two years work will move ahead through State agencies, local jurisdictions and other partners to establish plans to adapt to saltwater intrusion and nuisance flooding; and, with the Board of Public Works and in conjunction with DNR, MDE, and the Maryland Emergency Management Agency, partners will establish criteria to evaluate whether state funds may be used to mitigate hazards associated with sea level rise inundation and coastal flooding. Maryland passed the Clean Energy Jobs Act (CEJA) in May 2019, which sets an RPS goal of 50% by 2030. CEJA allocates 14.5% of this target for mandated solar development and 1.2 GW of offshore wind solicitations. In 2020, Governor Hogan proposed legislation to put Maryland on a path of 100% clean electricity by 2040 through the Clean and Renewable Energy Standard (CARES). The legislation did not pass (in a truncated general assembly session), but a revised CARES bill that would require that an increasingly large share of Maryland’s electricity be generated by zero- and low-carbon resources is currently being drafted for proposal during the 2021 legislative session. Maryland is also a member of RGGI, where auction proceeds fund various state and local programs through the
Maryland Department of the Environment 2030 Greenhouse Gas Emissions Reduction Act Plan
24
Strategic Energy Investment Fund (SEIF) which promote energy efficiency, renewable energy, bill assistance, and other consumer benefits.
Maryland Department of the Environment 2030 Greenhouse Gas Emissions Reduction Act Plan
25
Chapter 2 Climate Justice and Equity
in the 2030 GGRA Plan
2.1 Overview
Climate and Environmental Justice (EJ) is an ethical mandate that seeks equal protection from climate, environmental, and public health hazards for all people regardless of race, income, culture and social class. The state must ensure that equity, climate and environmental justice are key principles of climate policies. Maryland state government fully considers climate change impacts as they relate to community concerns and engages with others on this issue through multiple avenues, including the GGRA, the Commission on Environmental Justice and Sustainable Communities (CEJSC), and the MCCC. There are numerous safeguards in the Code of Maryland Regulations (COMAR) related to the GGRA of 2016, which specifically address considerations for a variety of vulnerable populations and historically disadvantaged communities. These include the implemented GGRA plan’s possible impacts on electricity costs; the availability of reliable and affordable electrical service and fuel supplies; the State’s agricultural and manufacturing sectors; and rural or low-income, low to moderate-income, or minority communities. Specific protections related to public health, jobs, and the economy are discussed in this chapter. Some state agencies are required by statute to be mindful of EJ issues with regard to their work; but many, if not all, are at least implicitly tied to EJ. Any State agency that receives federal assistance is required to be in compliance with Title VI of the Civil Rights Act of 1964. Title VI prohibits discrimination on the basis of race, color, or national origin, in programs or activities receiving federal financial assistance. Collectively, Maryland State agencies influence a significant portion of people’s lives. For instance, what permits are issued and what modes of transportation are available are at least partially determined by state agencies. These choices ultimately impact certain communities more so than others. It is state government’s responsibility to ensure that the burden associated with choices like the ones listed above are evenly and fairly distributed, rather than becoming the burden of a small group of communities or a sole group of people. Significant overlap exists between “populations of concern” and historically disadvantaged communities, which may be defined by race, color, national origin, or income. Some of the problems these groups face include proximity to polluting facilities, barriers to participating in decision-making processes, disproportionate levels of chronic disease, neighborhood disinvestment, and poor or no access to jobs and services. In the context of pollutants and other environmental concerns, these communities are often discussed in terms of EJ.
Maryland Department of the Environment 2030 Greenhouse Gas Emissions Reduction Act Plan
26
2.2 Climate Justice
Climate change poses a significant threat to vulnerable communities with little adaptive capacity. “Climate justice” is a term that acknowledges climate change can have differing social, economic, public health, and other adverse impacts on disadvantaged populations. Climate justice begins with recognizing that key groups, often historically marginalized or underserved communities, bear disproportionate impacts. Climate impacts can exacerbate inequitable social conditions. The concept behind the term EJ is that all people – regardless of their race, color, national origin or income – are able to enjoy equally high levels of environmental protection. Some of the challenges that disadvantaged populations face include proximity to polluting facilities, barriers to participating in decision-making processes, disproportionate levels of chronic disease, neighborhood disinvestment, and poor or no access to jobs and services. Low-income communities, people of color, indigenous people, people with disabilities, older or very young people, women – all can be more susceptible to risks posed by climate impacts like extreme storms and floods, wildfire, severe heat, poor air quality, access to food and water, and disappearing shorelines. Here are a few examples of how some communities may be more affected by these impacts than others – and may have fewer resources to adapt to those impacts, too:
• Communities of color are often more at risk from air pollution, according to both the NAACP, the American Lung Association, and countless research papers.
• Seniors, people with disabilities, and people with chronic illnesses may have a harder time living through periods of severe heat or being able to quickly and safely evacuate from major storms or fire.
• People with limited income have limited housing options. The indoor environment of their homes may also have inadequate insulation, mold problems, or air conditioning to effectively combat severe heat or cope with strong storms.
• Economically challenged people may not have resources for flood or fire insurance, repairs for damaged homes, or pay for medical bills after catastrophe strikes.
• Language barriers can make it difficult for immigrant communities to get learn about early information about incoming storms or weather disasters or wildfires, or to communicate effectively with first responders in the midst of an evacuation order.
• Today’s youth and future generations will experience more profound impacts of climate change as it worsens over time, from direct adverse health impacts to the financial implications of needing to shore-up infrastructure and other adaptation and mitigation needs.
It is important that communities affected by climate justice become aware of the environmental issues in their area, participate in the policy-making process and utilize resources available from government and private entities in order to ensure safe, healthy and sustainable communities for all. Achieving environmental and climate justice will require multidisciplinary collaboration among various stakeholders, including communities, businesses, public health and education experts, scientists, engineers, community planners, and federal, state and local regulatory agencies. Climate justice principles may include:
• Supporting the right to economic development and employment opportunities; • Sharing benefits and burdens equitably; • Ensuring decisions are participatory, transparent, and accountable;
Maryland Department of the Environment 2030 Greenhouse Gas Emissions Reduction Act Plan
27
• Supporting education for climate stewardship; and • Using effective partnerships to secure climate justice.
Supporting the right to economic development and employment opportunities114
Climate change highlights our true interdependence and must lead to a new and respectful paradigm of sustainable development, based on the urgent need to scale up and transfer green technologies and to support low carbon climate resilient strategies for mitigation and adaptation while creating new green jobs.
Share Benefits and Burdens Equitably The benefits and burdens associated with climate change and its resolution must be fairly allocated. People in low-income communities must have access to opportunities to adapt to the impacts of climate change.
Ensure that Decisions on Climate Change are Participatory, Transparent and Accountable The opportunity to participate in decision-making processes which are fair, accountable, and open is essential to the growth of a culture of climate justice. The voices of the most vulnerable to climate change must be heard and acted upon. A basic of good international practice is the requirement for transparency in decision-making, and accountability for decisions that are made. It must be possible to ensure that policy developments and policy implementation in this field are seen to be informed by an understanding of the needs of low-income communities in relation to climate justice, and that these needs are adequately understood and addressed.
Supporting education for climate stewardship The transformative power of education under-pins other principles, making their successful adoption more likely. Delivered in an effective school, college or university environmental education can increase consciousness of climate change, producing new insights not only at the scientific but also at the sociological and political level. Education also is achievable outside the formal system, through public and, increasingly, virtual (i.e., web-based) activity. The learning required to see climate change in justice terms cannot be done at the schools and university alone; it is a life-long responsibility and therefore a commitment.
Using effective partnerships to secure climate justice The principle of partnership points in the direction of solutions to climate change that are integrated both within states and across state boundaries. Climate justice requires effective action. Openness to partnership is a vital aspect of any coherent approach to climate change, and in the name of climate justice, this must also involve partnership with those most affected by climate change and least able adequately to deal with it – the poor and under-resourced. Implementation of Climate Justice is to emphasize improvements in quality of life, economic development, and environmental protection for all communities.115 Implementation efforts of Climate Justice can include: Proactive Engagement:
• Integrate and incorporate EJ ideals into state environmental policy in order to protect all communities.
114 https://www.mrfcj.org/principles-of-climate-justice/ 115 https://mde.maryland.gov/programs/Crossmedia/EnvironmentalJustice/Pages/resources.aspx
Maryland Department of the Environment 2030 Greenhouse Gas Emissions Reduction Act Plan
28
• Continue education of state regulators on environmental justice and sustainable communities, with specialized focus given to disenfranchised communities.
• Strengthen government infrastructure at local levels to support marginalized communities. Recognize EJ concerns with collaborative approaches:
• Build a network of people who are knowledgeable about EJ that can share expertise. This includes reaching out to local businesses, legislators, planning and community organizations, and the academic community.
• Use this network when working to find mutually beneficial solutions for communities and regulated facilities.
• Work with the CEJSC and the MCCC who have EJ experts as members, particularly the EJ co-chair.
Offer Solutions:
• Optimize state resources. Solutions could appear in the form of increased public participation and education, public-private partnerships, innovative outreach advertising (social media, newspapers, press releases, outdoor signs), and strategic enforcement.
In the end, there is no single way to define, let alone champion, climate justice. But in combination with other current social justice movements many experts see climate justice becoming an increasingly significant component of overall concerns raised by climate change.
2.3 Climate Equity
The 2030 GGRA Plan defines equity in terms of EJ and, more specifically, climate justice. How equitable actions are determined, balanced with other important factors, and executed through policy is complex but critical for holistic and sustainable climate action in Maryland. It is related not to equal but to fair distribution of both the costs and the benefits of an environmental action or inaction. The EPA encourages its staff to evaluate the distribution of not only risk and burdens, but also positive environmental and health outcomes related to actions. There are numerous safeguards in the Code of Maryland Regulations related to the GGRA of 2016, which specifically address considerations for a variety of vulnerable populations and historically disadvantaged communities that have been evaluated. These include consideration of the impacts of implementation of the 40% by 2030 plan may have on: electricity costs; the availability of reliable and affordable electrical service and fuel supplies; the state’s agricultural and manufacturing sectors; and rural or low-income, low- to moderate-income, or minority communities. Specific protections related to public health, jobs, and the economy are discussed below. The state must ensure that equity as well as climate and environmental justice are key principles of climate policies moving forward. Maryland must also ensure that residents and businesses across all communities have ample opportunity to shape and comment on climate policy, direct resources from climate programs like RGGI to help disadvantaged communities address climate change and benefit from the transition to cleaner energy. While equity cannot be completely captured using quantitative modeling, and modeling is unavoidably limited by monetary and financial restraints, the Maryland Department of the Environment (MDE) did include specific parameters and analyses for the purpose of evaluating the distribution of potential health and economic impacts. Some of the economic parameters evaluated in the modeling included average job growth, cumulative personal income growth, and cumulative gross state product. MDE modeled how job losses or gains would be distributed among various jobs based on type (construction; sales; transportation; management, business and financial; and maintenance and repair), wages (low wage, medium wage, and high wage jobs), required education /training (a range from low to high, labeled zones 1-5), and distribution across racial and ethnic groups (white non-Hispanic, Black or
Maryland Department of the Environment 2030 Greenhouse Gas Emissions Reduction Act Plan
29
African American, Asian, Hispanic, Indigenous and other). This was done for each of the policy scenarios modeled and allowed for comparison of the scenario outcomes through an equity lens. Much of Maryland’s initial progress in adaptation had been focused on the coastal regions of the state, as these communities are apparently and directly vulnerable to changes in sea level rise and storm surge. There are several new and ongoing programs to address adaptation. Some overarching equity components of adaptation include ensuring economic diversification and access to jobs in areas where single sectors dominate and are expected to be negatively impacted, and/or adapting this sector to increase its resilience; ensuring access to healthcare to address the amplified or changing health impacts associated with climate change; ensuring relocation or other structural changes are economically feasible where necessary for coastal or riverine residential and commercial buildings; ensuring transportation and its infrastructure are able to effectively maintain their necessary functions in all communities, especially those in rural locations where there may only be one major route; and ensuring basic access to potable water, electricity, and other essential resources that may be threatened by climate change.
2.4 Equitable Economics
The GGRA of 2016 includes numerous safeguards to protect Maryland jobs and economic prosperity at the State level, as well as some considerations for specific groups, listed below. Additional considerations have been made by MDE to examine the equity of the plan's economic impacts, such as analyzing the geographic distribution of changes, and any disproportionate impacts to vulnerable populations or historically disadvantaged communities. In general, COMAR, Environment Article §2-1206 (8) requires that the GGRA plan produce a net economic benefit to the State’s economy, and a net increase in jobs in the State. §2-1205 (f)(1) prohibits the GGRA plan from requiring greenhouse gas (GHG) emission reductions from the State’s manufacturing sector, or otherwise causing significant cost increases in this sector, unless an existing law already requires such regulation. This is based on the finding in §2-1201 (10) and (11) that GHG emissions from the manufacturing and commercial services sectors are most effectively regulated on a national level, in order to maintain competitiveness with other states or countries and to preserve existing jobs in the State. Further, §2-1206 (8) requires that the plans ensure measures do not directly cause job loss in the manufacturing sector. These regulations help protect workers. §2-1206 (5) and (6) require MDE to ensure that the plan doesn’t threaten the reliability and affordability of electrical service and statewide fuel supplies, and to consider whether it will increase electricity costs to consumers. The household energy burden is a significant issue for low- and moderate-income Marylanders.
§2-1206 (8) requires MDE to ensure that the plan does not disproportionately impact rural or low-income, low to moderate-income, or minority communities, or any other particular class of electricity ratepayer. This same section also requires the plan to encourage new employment opportunities in the State related to energy conservation, alternative energy supply, and GHG emissions reduction technologies. Equity considerations for job creation and economic development are related to the impacts of both climate change and climate change mitigation on communities who depend on specific sectors that are being impacted. The main mitigation-based example is ensuring a ‘just transition’ for workers and communities dependent on the fossil fuel industry. Though some jobs will be created in the green energy fields, these are not inherently of the same quality, in the same location, or otherwise accessible to the displaced workers. Therefore, a just transition will require workforce development and job training programs in alternative in-demand fields that are or will be made accessible to affected communities. 2.4.1 The Energy Burden
Maryland Department of the Environment 2030 Greenhouse Gas Emissions Reduction Act Plan
30
According to a 2020 report (by Fisher, Sheehan and Colton) the most recent five-year American Community Survey, nearly 102,000 Maryland households live with income at or below 50% of the federal Poverty Level and face a home energy burden of 35%. And nearly 109,000 additional Maryland households live with incomes between 50% and 100% of the federal Poverty Level and face a home energy burden of 19%. In 2019 the total number of Maryland households below 200% of the federal Poverty Level stayed relatively constant from the prior year.116 As hotter summer temperatures increase peak cooling demand, an increased energy burden may lead low-income households to either reduce usage of air conditioning or to increasingly pull funds from other goods and services. Decreasing A/C usage during heat waves increases exposure to extreme heat, which, as previously discussed, increases the risk of cardiovascular impacts, especially for the very young or elderly populations. Increasing A/C usage to maintain a healthy indoor temperature during heat waves will inevitably increase the energy burden of that individual or family and may mean they have less money to spend on healthy food, for example. Several energy programs in Maryland assist low-income households, both with direct bill payments and long-term solutions. Necessary steps and opportunities to achieve environmental and climate justice are included throughout the 2030 GGRA Plan, and considerations of how each measure can advance those objectives is considered in the program-by-program discussions in Chapter 3. Some ways in which programs in the 2030 GGRA Plan address environmental and climate justice include:
• Community solar expands the benefits of access to renewable energy to individuals who do not own land or rooftop space, allowing them to enjoy the benefits of solar power generation, while the Community Solar Low to Moderate Income (LMI)-Power Purchase Agreement (PPA) grant provides funding to offer community solar subscriptions with deep discounts below the utility’s standard offer service rates for LMI households.
• The Maryland Department of Housing and Community Development (DHCD) provides financing from the EmPOWER Maryland program for projects that reduce energy costs and address critical health and safety issues for residents and limited income families.
• Under RGGI, more than half of all funds collected by Maryland are invested in energy assistance for low-income households, and grants for energy efficiency in low- and moderate-income homes and communities provided by MEA. The Maryland Department of Natural Resources (DNR) has helped to fund tree planting in urban areas, which has been shown to remove air pollutants, reduce the risk of certain health problems, keep urban areas cooler, as well as sequestering carbon dioxide (CO2) from the atmosphere.
• The Maryland Department of Planning is taking measures to mitigate the impact of saltwater intrusion on agricultural communities on the Eastern Shore, and DNR's Park Equity Tool identifies underserved communities that may benefit from preservation of open space, shoreline enhancement, and other nature-based approaches to risk reduction.
• Transportation technologies play a critical role in reducing emissions from the transportation sector, which disproportionately impact low-income communities and communities of color. The state has several programs that deploy electric buses and trucks, reducing pollutants that can contribute to health problems in communities while also reducing CO2 emissions.
2.4.2 Jobs The 2030 GGRA Plan aims to achieve Maryland’s GHG reduction goals in a way that benefits Maryland’s economy and creates jobs, and that shares those benefits broadly. Economic impact analysis by Towson University estimates that the 2030 GGRA Plan will primarily create middle-class jobs.
116 http://www.homeenergyaffordabilitygap.com/03a_affordabilityData.html
Maryland Department of the Environment 2030 Greenhouse Gas Emissions Reduction Act Plan
31
Impacts on sectors such as agriculture, fisheries and tourism discussed in terms of jobs and the economy, must not overlook that negative impacts to these industries have a very real and direct impact to individuals and families whose livelihoods depend on their yearly success. If regions or communities become unfavorable for an activity or industry that was historically a large part of their economy, they may need to shift or diversify quickly to avoid substantial economic impact. In general, this is likely to be a disproportionate burden on rural communities, which tend to have less diverse economic portfolios.117 This section provides a few examples of equity concerns in sectors for which general impacts were discussed in more detail previously. Agriculture is a significant commercial industry in Maryland, employing some 350,000 people, including nearly 6,000 full-time farmers, and contributing some $8.25 billion annually to the economy. In 2019, some 12,400 Maryland farms averaged 161 acres each. According to the 2017 Census, 96% farms are family owned. In 2019, the average net income was $64,257 per farm,118 meaning that impacts to productivity and yield will challenge already slim margins for farmers. Potential agricultural impacts due to climate change are broad and varied. They are caused by increased summer temperatures (affecting cooling costs, crop yield, animal mortality and milk production), and changes in the growing season and precipitation patterns (affecting what crops can be grown). Farmers on the Eastern Shore are additionally at risk from saltwater intrusion due to sea level rise and over-pumping of groundwater and flooding during storm events. Farmers may be able to adapt in part to the impacts of climate change by exploring new crop options or adjusting management practices, however, these adaptations are not cost- or risk-free, and may be especially challenging for those who maintain orchards and vineyards, as these perennial crops represent a significant long-term investment. Though introducing varieties from other areas could be an effective form of adaptation, existing orchards and vineyards represent a significant investment, and replacing them with an entirely new stock may not be financially feasible. Another significant industry in the State, forestry has a value of about $4 billion. In western Maryland, the industry is the largest employer in Allegany and Garrett counties and on the Eastern Shore, it is the second largest. In 2019, the industry generated 5,150 forestry-related jobs, with a payroll of $292 million. This means that any changes in the productivity of the forestry industry are likely to have a disproportionate impact on communities and individuals in these areas. For example, forestry on the Eastern Shore is likely to be impacted similarly to agriculture, with sea level rise and saltwater intrusion impinging upon suitable habitat. Many tourist attractions in Maryland are regional activities: skiing, boating, and mountain scenery in the west; national sports, restaurants, and shopping in the cities; winery tours, fishing, and historic and natural history in the central and southern regions; and seafood, beaches, and marshlands on the Eastern Shore. Maryland’s lower-elevation ski resorts such as Wisp Mountain Park, ranking among the top employers in Garrett County, is just one example of a local tourism economy. The inability to keep snow on the ground during unseasonably warm weather does demonstrate how important dependable cold weather is to the resort’s seasonal functionality, which increasing global temperatures could debilitate. The resort is also a good example of how diversification may become significant, like increasing attractions in the other three seasons to make up for lost revenue in winter. Certainly, new opportunities can arise due to climate change; however, as with many of the anticipated changes, the speed that they are occurring is the key factor. Adaptation at a matching pace could be challenging and not always entirely feasible, especially when considering the time and money invested, such as in equipment or training for a particular vocation. Efforts in mitigation are therefore required in addition to plans for adjusting to these changes, to reduce the extent and pace of adaptation that is needed and make it more manageable. The 2030 GGRA Plan has included objectives beyond reducing GHG emissions, intended to balance costs and complement benefits to produce net positive results for Maryland overall. The way in which equitable actions are
117 D. Hales, W. Hohenstein, M. D. Bidwell, C. Landry, D. McGranahan, J. Molnar, L. W. Morton and M. Vasquez, "Chapter 14: Rural Communities," in Climate Change Impacts in the United States: The Third National Climate Assessment, J. Melillo, T. Richmond and G. Yohe, Eds., U.S. Global Change Research Program, 2014, pp. 333-349. 118 Maryland State Archives, "Maryland at a Glance: Agriculture," [Online]. Available: http://msa.maryland.gov/msa/mdmanual/01glance/html/agri.html. [Accessed 28 September 2018].
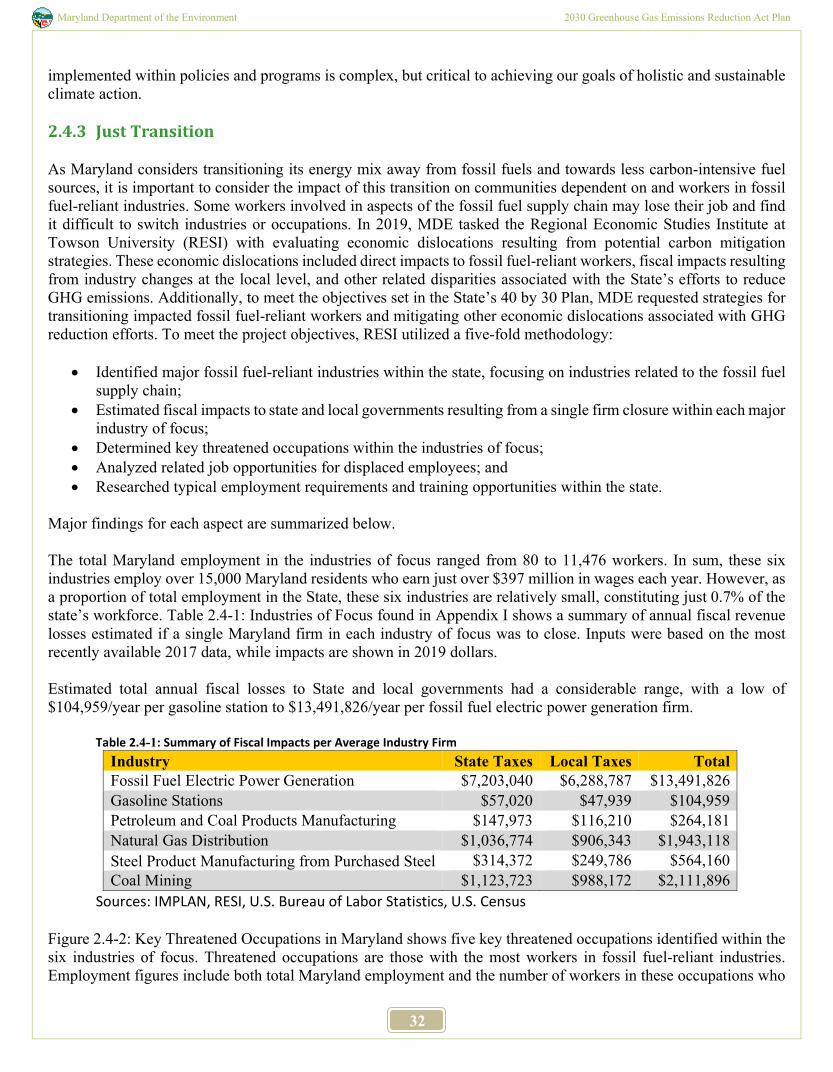
Maryland Department of the Environment 2030 Greenhouse Gas Emissions Reduction Act Plan
32
implemented within policies and programs is complex, but critical to achieving our goals of holistic and sustainable climate action. 2.4.3 Just Transition As Maryland considers transitioning its energy mix away from fossil fuels and towards less carbon-intensive fuel sources, it is important to consider the impact of this transition on communities dependent on and workers in fossil fuel-reliant industries. Some workers involved in aspects of the fossil fuel supply chain may lose their job and find it difficult to switch industries or occupations. In 2019, MDE tasked the Regional Economic Studies Institute at Towson University (RESI) with evaluating economic dislocations resulting from potential carbon mitigation strategies. These economic dislocations included direct impacts to fossil fuel-reliant workers, fiscal impacts resulting from industry changes at the local level, and other related disparities associated with the State’s efforts to reduce GHG emissions. Additionally, to meet the objectives set in the State’s 40 by 30 Plan, MDE requested strategies for transitioning impacted fossil fuel-reliant workers and mitigating other economic dislocations associated with GHG reduction efforts. To meet the project objectives, RESI utilized a five-fold methodology:
• Identified major fossil fuel-reliant industries within the state, focusing on industries related to the fossil fuel supply chain;
• Estimated fiscal impacts to state and local governments resulting from a single firm closure within each major industry of focus;
• Determined key threatened occupations within the industries of focus; • Analyzed related job opportunities for displaced employees; and • Researched typical employment requirements and training opportunities within the state.
Major findings for each aspect are summarized below. The total Maryland employment in the industries of focus ranged from 80 to 11,476 workers. In sum, these six industries employ over 15,000 Maryland residents who earn just over $397 million in wages each year. However, as a proportion of total employment in the State, these six industries are relatively small, constituting just 0.7% of the state’s workforce. Table 2.4-1: Industries of Focus found in Appendix I shows a summary of annual fiscal revenue losses estimated if a single Maryland firm in each industry of focus was to close. Inputs were based on the most recently available 2017 data, while impacts are shown in 2019 dollars. Estimated total annual fiscal losses to State and local governments had a considerable range, with a low of $104,959/year per gasoline station to $13,491,826/year per fossil fuel electric power generation firm.
Table 2.4-1: Summary of Fiscal Impacts per Average Industry Firm Industry State Taxes Local Taxes Total Fossil Fuel Electric Power Generation $7,203,040 $6,288,787 $13,491,826 Gasoline Stations $57,020 $47,939 $104,959 Petroleum and Coal Products Manufacturing $147,973 $116,210 $264,181 Natural Gas Distribution $1,036,774 $906,343 $1,943,118 Steel Product Manufacturing from Purchased Steel $314,372 $249,786 $564,160 Coal Mining $1,123,723 $988,172 $2,111,896
Sources: IMPLAN, RESI, U.S. Bureau of Labor Statistics, U.S. Census
Figure 2.4-2: Key Threatened Occupations in Maryland shows five key threatened occupations identified within the six industries of focus. Threatened occupations are those with the most workers in fossil fuel-reliant industries. Employment figures include both total Maryland employment and the number of workers in these occupations who
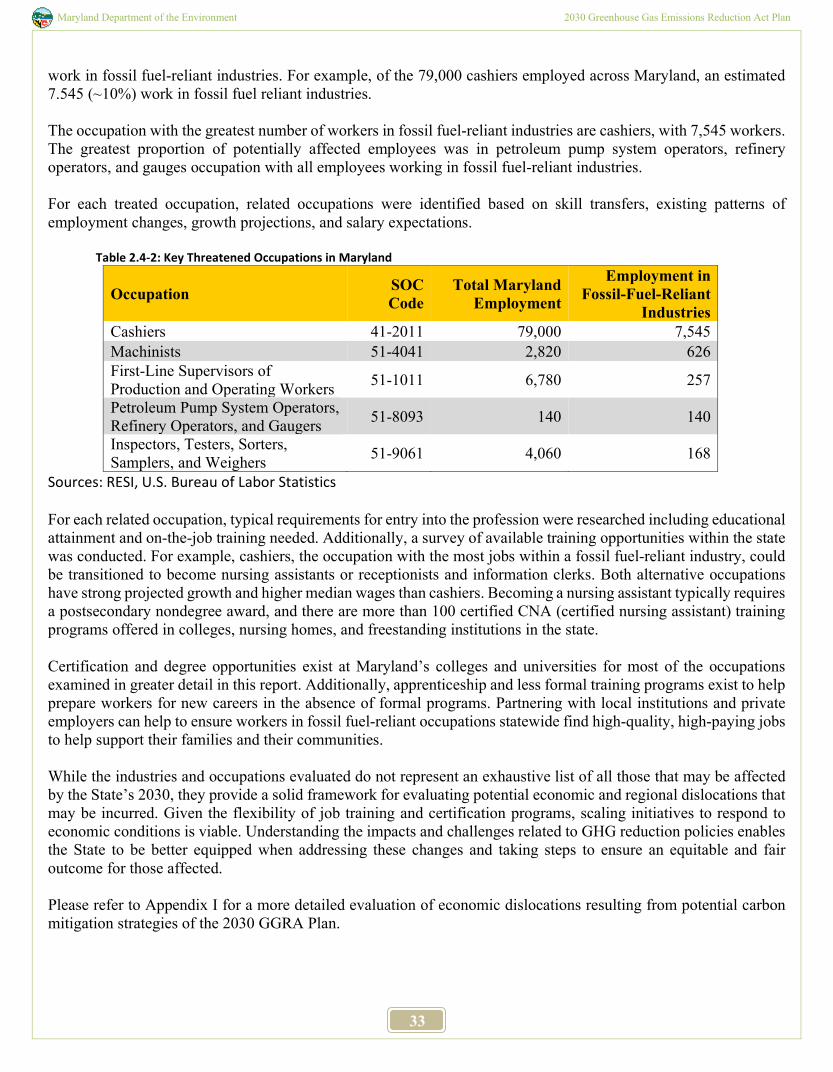
Maryland Department of the Environment 2030 Greenhouse Gas Emissions Reduction Act Plan
33
work in fossil fuel-reliant industries. For example, of the 79,000 cashiers employed across Maryland, an estimated 7.545 (~10%) work in fossil fuel reliant industries. The occupation with the greatest number of workers in fossil fuel-reliant industries are cashiers, with 7,545 workers. The greatest proportion of potentially affected employees was in petroleum pump system operators, refinery operators, and gauges occupation with all employees working in fossil fuel-reliant industries. For each treated occupation, related occupations were identified based on skill transfers, existing patterns of employment changes, growth projections, and salary expectations.
Table 2.4-2: Key Threatened Occupations in Maryland
Occupation SOC Code
Total Maryland Employment
Employment in Fossil-Fuel-Reliant
Industries Cashiers 41-2011 79,000 7,545 Machinists 51-4041 2,820 626 First-Line Supervisors of Production and Operating Workers 51-1011 6,780 257
Petroleum Pump System Operators, Refinery Operators, and Gaugers 51-8093 140 140
Inspectors, Testers, Sorters, Samplers, and Weighers 51-9061 4,060 168
Sources: RESI, U.S. Bureau of Labor Statistics For each related occupation, typical requirements for entry into the profession were researched including educational attainment and on-the-job training needed. Additionally, a survey of available training opportunities within the state was conducted. For example, cashiers, the occupation with the most jobs within a fossil fuel-reliant industry, could be transitioned to become nursing assistants or receptionists and information clerks. Both alternative occupations have strong projected growth and higher median wages than cashiers. Becoming a nursing assistant typically requires a postsecondary nondegree award, and there are more than 100 certified CNA (certified nursing assistant) training programs offered in colleges, nursing homes, and freestanding institutions in the state. Certification and degree opportunities exist at Maryland’s colleges and universities for most of the occupations examined in greater detail in this report. Additionally, apprenticeship and less formal training programs exist to help prepare workers for new careers in the absence of formal programs. Partnering with local institutions and private employers can help to ensure workers in fossil fuel-reliant occupations statewide find high-quality, high-paying jobs to help support their families and their communities. While the industries and occupations evaluated do not represent an exhaustive list of all those that may be affected by the State’s 2030, they provide a solid framework for evaluating potential economic and regional dislocations that may be incurred. Given the flexibility of job training and certification programs, scaling initiatives to respond to economic conditions is viable. Understanding the impacts and challenges related to GHG reduction policies enables the State to be better equipped when addressing these changes and taking steps to ensure an equitable and fair outcome for those affected. Please refer to Appendix I for a more detailed evaluation of economic dislocations resulting from potential carbon mitigation strategies of the 2030 GGRA Plan.
Maryland Department of the Environment 2030 Greenhouse Gas Emissions Reduction Act Plan
34
2.4.4 Just Transition Programs
2.4.4.1 Employment Advancement Right Now (EARN)
Lead Agency: Department of Labor Maryland is the State’s nationally recognized workforce solution. EARN Maryland is an industry-led initiative meant to ensure that employers have the talent they need to compete and grow, while preparing Marylanders for meaningful careers. The program encourages collaboration, funding Strategic Industry Partnerships comprising employers, non-profits, higher education, local workforce investment boards, Registered Apprenticeship Sponsors, and local governments. Partnerships provide in-demand, relevant training to Maryland’s workforce based upon industry identified needs. In 2019, the Maryland General Assembly passed the Clean Energy Jobs Act, which in part, establishes the Clean Energy Workforce Account in the EARN Maryland program. Beginning in FY21, this account will provide up to $8 million, which must be used to fund Registered Apprenticeship, Pre-Apprenticeship, and Youth Apprenticeship programs that prepare Marylanders for careers in clean industry jobs. This solicitation reflects the requirements of the enabling legislation. Generally, EARN Maryland is designed to:
• Address business workforce needs by focusing on industry sector strategies that seek long-term solutions to sustained skills gaps and personnel shortages;
• Address the needs of workers by creating formal career paths to good jobs, and sustaining or growing middle class jobs;
• Encourage mobility for Maryland’s most hard-to-serve jobseekers through targeted job readiness training; and
• Foster better coordination between the public, private, and nonprofit sectors and the workforce, economic development, and education partners around the State.
2.4.4.2 Maryland Apprenticeship and Training Program (MATP) – Division of Workforce Development and Adult Learning
Lead Agency: Department of Labor Registered Apprenticeships combine supervised, structured, on-the-job learning, and related technical instruction to teach apprentices the skills necessary to succeed in a specific occupation. The apprentice works full-time and receives training from the sponsoring organization. Typically, apprentices are hired at a percentage of a journeyperson’s salary. As the apprentice completes training and demonstrates skills mastery, the percentage of a journeyperson’s wage received increases until the apprentice makes journeyperson’s wages upon completing the program. Registered Apprenticeship programs in the skilled trades, such as electrical, plumbing and other construction trades, can play a key role in building a sustainable pipeline of available workers for green jobs. Currently there are no "standalone" apprenticeship programs for occupations in the green energy industry. For example, there are no apprenticeships for "Solar Installer" or "Solar Technician". These skills are often included within apprenticeship programs for other occupations. Read about some examples in Chapter 3.
2.4.4.3 Job Creation and Economic Development Initiatives Related to Climate Change Lead Agency: Department of Commerce
Maryland Department of the Environment 2030 Greenhouse Gas Emissions Reduction Act Plan
35
This program promotes economic development opportunities associated with reducing GHG emissions in Maryland. There are six areas of focus:
• Strengthen coordination and communication across State agencies, partners and stakeholders to provide strategic vision for advancing a green economy.
• Promote energy and resource efficiency efforts. • Develop and foster clean, local energy production and industrial capacity. • Capitalize upon economic opportunities to restore and protect Maryland’s natural resources. • Promote sustainable development practices that create jobs, generate prosperity and make Maryland more
self-reliant. • Increase access to capital for green businesses and projects.
This is a voluntary initiative.
2.5 Commissions
2.5.1 The Commission on Environmental Justice and Sustainable Communities (CEJSC) The CEJSC was established by Executive Order in January 2001 and as of 2003 is statutorily codified under Maryland Environment § 1-701. The Commission examines EJ and sustainable community issues that may be associated with creating healthy, safe, economically vibrant, environmentally sound communities for all Marylanders. The CEJSC uses the definition of EJ from the Maryland Environment Article §1–701d. Environmental justice is defined as the “equal protection from environmental and public health hazards for all people regardless of race, income, culture, and social status”. Maryland’s definition of EJ is consistent with the approach advocated by the EPA. The EPA’s Office of Environmental Justice also prioritizes the fair treatment and meaningful involvement of all people regardless of race, color, national origin, or income with respect to the development, implementation and enforcement of environmental laws, regulations and policies.119 The CEJSC shall:
1. Advise State government agencies on environmental justice and related community issues; 2. Review and analyze the impact of current State laws and policies on the issue of environmental justice and
sustainable communities; 3. Assess the adequacy of State and local government laws to address the issue of environmental justice and
sustainable communities; 4. Coordinate with the Children’s Environmental Health and Protection Advisory Council on recommendations
related to environmental justice and sustainable communities; 5. Develop criteria to assess whether communities in the State may be experiencing environmental justice
issues; and 6. Recommend options to the Governor for addressing issues, concerns, or problems related to environmental
justice that surface after reviewing State laws and policies, including prioritizing areas of the State that need immediate attention.
a. On or before October 1 of each year, the Commission shall report its findings and recommendations to the Governor and, subject to §2–1257 of the State Government Article, the General Assembly.
119 https://www.epa.gov/environmentaljustice
Maryland Department of the Environment 2030 Greenhouse Gas Emissions Reduction Act Plan
36
By early 2021, the CEJSC will make recommendations to submit not only to the Governor and General Assembly, but also to itself, in order to accelerate EJ change in Maryland. The CEJSC, tasked with working with Children’s Environmental Health and Protection Advisory Council (CEHPAC) created a Health in All Policies (HiAP) workgroup. CEHPAC was established in 2000 with the purpose to identify environmental hazards that may affect children's health and recommend solutions to those hazards. CEHPAC reviews existing and proposed regulations and serves as a source of information and education for the public, professionals, State agencies, the General Assembly and the Governor regarding environmental hazards. The HiAP work group considered state legislation regarding environmental hazards such as Per-and Polyfluoroalkyl Substances (PFAS). They worked with the National Association of Clean Water Agencies (NACWA) on national trends that could affect the environment locally. The group also supported state legislation which would require jurisdictions to lower the blood lead level that triggers lead risk reduction requirements when testing children for lead poisoning from 10 ppm to 5 ppm. The HiAP work group believes that CEHPAC and CEJSC have a responsibility to respond to these types of bills. 2.5.2 Maryland Commission on Climate Change Environmental Justice Approach The MCCC offers a series of recommendations to the Governor and General Assembly to enhance the state’s efforts in climate change mitigation, adaptation, and resilience, to better incorporate environmental and climate justice into the state’s climate approach, and to more meaningfully engage with disadvantaged and overburdened communities.
A More Equitable and Inclusive Climate Strategy The state must ensure that equity and EJ are key principles of climate policies. Maryland must also ensure that residents and businesses across all communities have ample opportunity to shape and comment on climate policy, direct resources from climate programs like RGGI to help disadvantaged communities address climate change and benefit from the transition to clean energy, and to repair damage to communities from previous policies. EJ requires the development, implementation, and enforcement of environmental laws, regulations, and policies that ensure that no single community will bear a disproportionate share of the negative environmental conditions or pollution. This may include industrial operations, land-use planning and zoning, or municipal and commercial operations, such as through Title V permits issued by environmental regulatory agencies. Achieving environmental and climate justice will require multidisciplinary collaboration among various stakeholders, including communities, businesses, public health and education experts, scientists, engineers and community planners, and federal, state and, local regulatory agencies. Climate justice principles may include:
• Supporting the right to economic development and employment opportunities; • Sharing benefits and burdens equitably; • Ensuring decisions are participatory, transparent, and accountable; • Supporting education for climate stewardship; and • Using effective partnerships.
The MCCC and its working groups actively pursue more diverse membership and will provide recommendations for individuals and organizations to the MCCC’s appointing authorities to support this change. The chair appointed a third co-chair in 2020 who is specifically empowered to ensure that climate justice is considered and included in all MCCC and working group deliberations and products. The co-chair leads a team of Steering Committee members consisting of one or two Steering Committee appointees with EJ knowledge and one
Maryland Department of the Environment 2030 Greenhouse Gas Emissions Reduction Act Plan
37
liaison from each of the MCCC’s working groups. The Co-chair and Steering Committee EJ team will provide a progress report in the MCCC’s 2021 annual report. Environmental and climate justice considerations will be reflected in recommendations that the MCCC provides to the state and will identify opportunities to better incorporate those considerations into state programs.
Environmental and Climate Justice and Just Transition MDE should work with the public, other agencies, the General Assembly, and the CEJSC to identify environmental and climate justice communities and the threats and effects those individual communities are facing. To supplement that practice, MDE could complete a thorough community environmental equity analysis regarding the impact of its suite of climate action policies, programs and proposals on communities of color, low-income communities, communities historically overburdened by pollution, and communities underserved by our historic energy and transportation systems. Community representatives should be included in the design of the study. The plan could be designed to identify specific goals and objectives (and evaluation/reporting thereof) to ensure equitable distribution of economic benefits produced by climate action strategies, policies and programs. MDE should commit to prioritizing benefits to communities who have been disproportionately burdened by GHG emissions and other pollutants and are underserved or under-resourced. As part of the manufacturing study required by the GGRA of 2016 in 2022, MCCC, working with other state agencies should analyze (1) how to promote manufacturing in-state in a way that creates sustainable, high-quality jobs related to renewable energy (including transportation, buildings etc.), and (2) benefits of including provisions in procurement and other policies like prevailing wages, project labor agreements, labor harmony agreements, and buy Maryland/buy USA/hire Maryland policies. The MWG should study and report on long-term job impacts on industries and communities as energy transition policies are implemented. This includes both job loss and job creation opportunities. The goal is to ensure the generation of sustainable economic benefits from climate action strategies, policies, and programs and address economic dislocations. Design efforts to ensure a just transition for workers and communities. Transition policies may address wage replacement, guarantees of health care and retirement security, job training and job placement. Efforts for communities must address loss of tax base and strains on community programs. The study should also include programs to minimize negative impacts, including creating jobs in remediation and clean up.
MCCC Working groups: The MCCC is committed to incorporating environmental and climate justice considerations into all of the recommendations it makes to the state. Some examples of recommendations and actions in its 2020 annual report that address environmental and climate justice include:
• Adaptation and Resiliency Working Group (ARWG): Environmental and Climate Justice: ARWG will work alongside other working groups and the MCCC to thoroughly and meaningfully integrate EJ considerations and action steps into all programming and initiatives. ARWG will look to provide expertise and partner with the CEJSC to advise and ensure vulnerable, underserved, and under-resourced communities are given the assistance needed to prepare for and adapt to the impacts of climate change.
• Mitigation Working Group (MWG): MDE should complete a thorough community environmental equity
analysis regarding the impact of its suite of climate action policies, programs and proposals on communities of color, low-income communities, communities historically overburdened by pollution, and communities underserved by our energy and transportation systems. Community representatives should be included in the design of the study. The plan should be designed to identify specific goals and objectives (and
Maryland Department of the Environment 2030 Greenhouse Gas Emissions Reduction Act Plan
38
evaluation/reporting thereof) to ensure equitable distribution of economic benefits produced by climate action strategies, policies, and programs. MDE should commit to prioritizing benefits to communities who have been disproportionately burdened by GHG emissions and other pollutants and are underserved or under-resourced.
• Education, Communication, and Outreach Working Group (ECO): The working group will provide support
to the MCCC, its working groups, and will collaborate with the CEJSC where possible. ECO recommends that the MCCC improve EJ outcomes by working with the CEJSC to use their tools to support the actions incorporated into all MCCC work products (recommendations, work plans, meetings/discussions, membership/participation). ECO will host five public listening sessions in 2021 and then report to the MCCC, about the concerns and guidance from vulnerable and underrepresented communities. Working with the MCCC co-chair, ECO is compiling its own list of contacts with whom to work on identifying opportunities to set up listening sessions and more.
• Science and Technical Working Group (STWG): The working group will identify experts from within the
academic community that can be a resource to its working group or others. As the various strategies addressing structural racism related to climate evolve within Maryland, STWG will ensure this critical factor is included wherever needed.
2.6 Public Health Considerations for all Marylanders
Maryland and the United States confronted unprecedented challenges in 2020. As the climate crisis continues to grow, the COVID-19 pandemic precipitated public health and economic emergencies and exacerbated inequities that have plagued communities for decades. The 2030 GGRA Plan includes a suite of programs that will enhance the state’s efforts in climate change mitigation, adaptation, and resilience, to better incorporate environmental and climate justice into the state’s climate approach, and to more meaningfully engage with disadvantaged and overburdened communities. The fourth and most recent National Climate Assessment for the United States concluded that ongoing climate change is negatively impacting public health by exacerbating climate sensitive health outcomes that are tied to rising temperatures and increases in the frequency of extreme weather events. The public health impacts of ongoing climate change among Marylanders were first outlined in the 2016 joint report by the University of Maryland School of Public Health and the Maryland Department of Health. Direct threats of increasing extreme events in Maryland are best exemplified by the experience of communities in Ellicott City, which have had to deal with two “once in a thousand-year rainfall events” over the last decade alone. Studies have shown that rising frequencies of extreme heat and precipitation events are increasing risk of asthma hospitalizations, myocardial infarctions, and motor vehicle accidents, as well as food and waterborne illness in Maryland. More recent work has demonstrated how climate change can simultaneously impact ecosystem health and human health. For example, wintertime temperature anomalies are changing the timing of spring onset, which is closely linked with the tree pollen season, and thus, increasing the risk of asthma hospitalization in Maryland. Since the ongoing trends in increasing frequency of extreme events are projected to continue in the foreseeable future, protecting public health will require the capacity to anticipate and adapt to these new threats. This should be supported by a clear understanding of underlying community vulnerabilities. For instance, a community may be more vulnerable because it is disproportionately exposed to the new threats, such as inner-city areas with higher prevalence of poverty and air pollution exposure are excessively exposed to heat because of the urban heat island effect, or coastal areas, which are increasingly exposed to allergenic mold because of constant flooding. Likewise, communities may be more vulnerable because they lack the capacity to adapt to the new threats. For example, low-income communities are more vulnerable to heat exposure because they do not have access to air conditioning, and individuals undergoing dialysis cannot cope with the heat by drinking more water because of medical restrictions to their liquid intake. Moreover, certain subgroups may be more vulnerable to the new threats because of their
Maryland Department of the Environment 2030 Greenhouse Gas Emissions Reduction Act Plan
39
underlying conditions, such as certain minority groups, linguistically isolated communities, those suffering from mental health issues, or individuals living with preexisting conditions. The most recent IPCC report highlighted that keeping the ongoing warming to 1.5C (2.7F) above the preindustrial average as opposed to 2C (3.6F) will reduce frequent exposure to extreme heat waves among 420 million people. Moving forward, public health early warning systems with seasonal to sub-seasonal lead times incorporating such community specific vulnerabilities may help communities to better prepare against the threats of climate change. Maryland is making progress on an ongoing effort to integrate health adaptation into the state’s 2030 GGRA Plan. The Maryland Department of Health leads the public health response efforts across the state, through technical assistance, development of epidemiologic tools and data products, and education and outreach. The Agency primarily addresses extreme heat, air quality and respiratory illness, water-borne diseases, and extreme weather events, such as hurricanes and tornadoes. In their 2020 Annual Report, the independent MCCC recommended additional outreach and education to disproportionately impacted communities including school age youth (K-12), minority groups, community health workers, and informal healthcare networks. Among the products of the program is a climate change training curriculum for community health workers and extension workers. The training increases competency among informal healthcare networks in order to advise patients and community members on how to understand climate impact on themselves and their health. Maryland’s students require tools and information to educate and empower themselves and their communities to respond to the impacts of a changing climate. Achieving environmental and climate justice will require multidisciplinary collaboration among various stakeholders, including communities, businesses, public health and education experts, scientists, engineers and community planners, and federal, state and, local regulatory agencies. Maryland recognizes that an inequitable and non-inclusive climate strategy poses a significant threat to vulnerable communities with little adaptive capacity. Disadvantaged communities are disproportionately impacted by pollution, often stemming from previous policy and planning decisions. A reduction in GHGs corresponds with increased air quality, leading to a number of health benefits for Maryland residents. These include reduced hospital visits, fewer days missed of work, improved quality of life, and decreased mortality. Maryland has identified EJ as an ethical mandate and seeks equal protection from environmental and public health hazards for all residents regardless of race, income, culture and social class. A key piece of the 2030 GGRA Plan is Maryland’s commitment to ensure that equity and environmental justice are key principles of all climate policies moving into 2021. Maryland must also ensure that residents and businesses across all communities have ample opportunity to shape and comment on climate policy, direct resources from climate programs like RGGI to help disadvantaged communities address climate change and benefit from the transition to clean energy, and to repair damage to communities from previous policies. EJ requires the development, implementation, and enforcement of environmental laws, regulations, and policies that ensure that no single community will bear a disproportionate share of the negative environmental conditions or pollution. This may include industrial operations, land-use planning and zoning, or municipal and commercial operations, such as through Title V permits issued by environmental regulatory agencies. Environmental and climate justice considerations have been included in a number of the programs in the 2030 GGRA Plan. However, there is additional opportunity to weave climate justice more thoroughly into many of the policies. The State will utilize the CEJSC to identify additional opportunities to better incorporate those considerations into all state programs in this and future climate Plans.
Maryland Department of the Environment 2030 Greenhouse Gas Emissions Reduction Act Plan
40
There is recognition that climate change plays a significant role in public health. Maryland has already made significant progress to develop tools and resources for local communities in a variety of ways. While there are challenges such as capacity constraints and the diverse array of stakeholders, the strength and success of the programs comes from the continued engagement of partners such as individual community members, school leadership and state agency and MCCC and CEJSC leadership to address these difficulties as they arise. Maryland can rely on the MCCC and the CEJSC for development and implementation of programs and initiatives to continue the successes of climate change mitigation and adaptation with a focus on health and justice for all Marylanders. It is this collaborative approach that allows climate and health work in Maryland to succeed and continues to increase community resilience to climate change.
2.7 Vulnerability and Risk
Risk is a term used frequently in discussing both present and future scenarios related to climate change impacts. It can be defined as the relationship between the likelihood of exposure to a given hazard, and the damage expected if exposure occurs. A basic qualitative risk assessment can be visualized across a matrix, such as the one in Figure 2.7-1. Considering the relative risk posed by potential future impacts, under a variety of scenarios, is an important component of informed decision-making. Risks associated with the impacts of climate change, however, are not the same for all Marylanders. Nor are the risks or costs associated with certain mitigation or adaptation actions. Qualities of an individual or community such as geographical location, pre-existing health conditions, or socioeconomic status will influence the factors that go into determining both the likelihood of exposure and the damage expected if exposure occurs, ultimately impacting the associated risk for these groups. Individuals or groups may therefore be considered more vulnerable to climate impacts compared to the general population if they have a higher likelihood of exposure to climate impacts or are expected to suffer greater damage than the average person if exposed. Expected damage may be affected either by a sensitivity to the particular impact, or by the capacity to adapt or react to the impact. Communities that live along the coast, for example, are clearly more likely to be exposed to impacts caused by sea level rise than those who live in Garrett County. Among this coastal group, some individuals may not have access to the financial resources to rebuild or relocate if flooding or storm damage does occur. This group has a reduced adaptive capacity, or a decreased ability to respond to the consequences, increasing the damage they experience if flooding does occur. A third important factor, also related to damage caused by exposure, is sensitivity. This is most often thought of in relation to health impacts, for example the elderly and children are considered more sensitive to extreme heat (for a variety of specific reasons) and are therefore more likely to experience a negative impact due to extreme heat exposure.
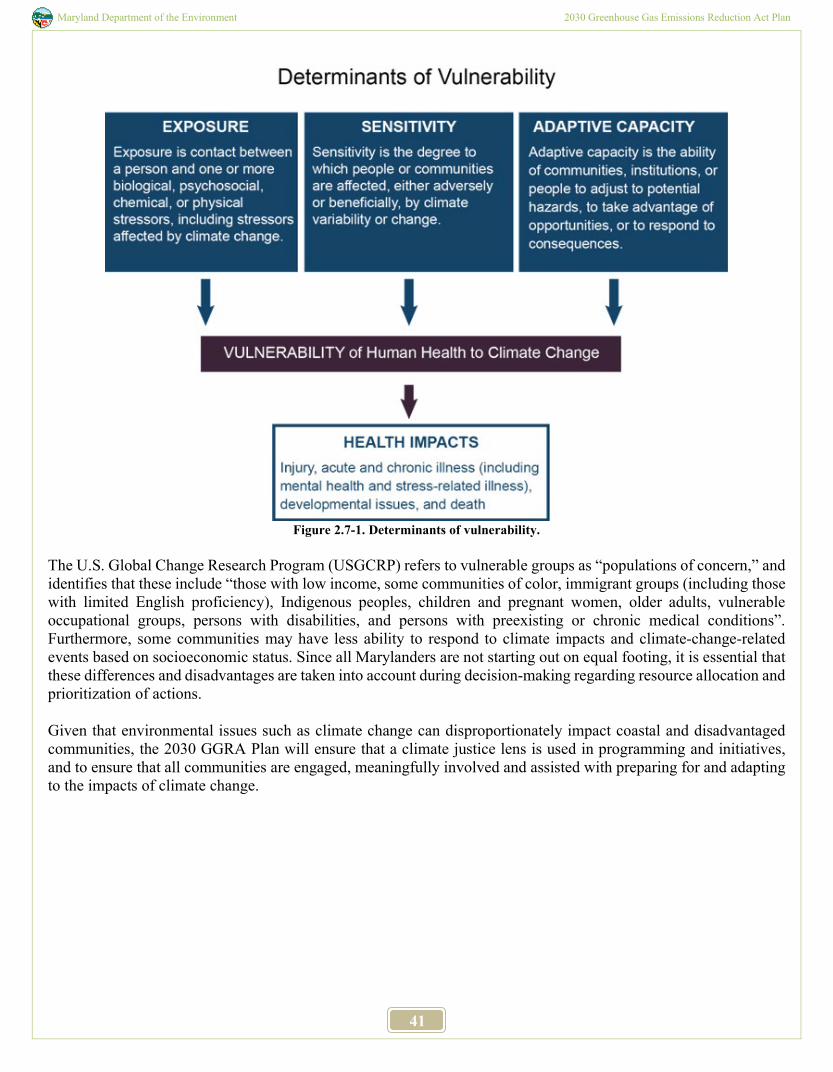
Maryland Department of the Environment 2030 Greenhouse Gas Emissions Reduction Act Plan
41
Figure 2.7-1. Determinants of vulnerability.
The U.S. Global Change Research Program (USGCRP) refers to vulnerable groups as “populations of concern,” and identifies that these include “those with low income, some communities of color, immigrant groups (including those with limited English proficiency), Indigenous peoples, children and pregnant women, older adults, vulnerable occupational groups, persons with disabilities, and persons with preexisting or chronic medical conditions”. Furthermore, some communities may have less ability to respond to climate impacts and climate-change-related events based on socioeconomic status. Since all Marylanders are not starting out on equal footing, it is essential that these differences and disadvantages are taken into account during decision-making regarding resource allocation and prioritization of actions. Given that environmental issues such as climate change can disproportionately impact coastal and disadvantaged communities, the 2030 GGRA Plan will ensure that a climate justice lens is used in programming and initiatives, and to ensure that all communities are engaged, meaningfully involved and assisted with preparing for and adapting to the impacts of climate change.
Maryland Department of the Environment 2030 Greenhouse Gas Emissions Reduction Act Plan
42
Chapter 3
The 2030 GGRA Plan
3.1 Sectors and Programs
The 2030 GGRA Plan utilizes various strategies, programs, and initiatives that the state is developing and implementing to meet the GHG emissions reductions and economic benefit goals. Some of these strategies are already being fully implemented, while others are in an earlier phase of the implementation process. The suite of programs encompasses multiple sectors, including the electricity sector, the transportation sector, the agriculture and forestry sectors, the buildings sector, the waste management sector, and additional non-specific sectors. The plan also includes numerous partnerships with key stakeholders like the private sector, underserved communities, state universities, and the Port of Baltimore. The core programs of the 2030 GGRA Plan extend from the suite of programs developed for previous GGRA plans, specifically the state’s 25% by 2020 Plan and the 2019 GGRA Draft Plan. Based on the recently completed 2017 inventory, the state’s GHG emissions are already below the 2020 Plan goal. These results are encouraging; however, they are at least partly due to mild weather in 2017, so continued progress is necessary to ensure we maintain and sustain reductions beyond 2020. The core programs included in the 25% by 2020, along with recommended new programs, voluntary and non-traditional programs, outreach efforts to build public awareness and promote voluntary action, additional programs being analyzed, and emerging technologies, will all contribute to the state’s goal of reducing GHG emissions by 40% by 2030. 3.1.1 Electricity Generation Now Maryland’s second-largest source of GHG emissions, the electricity generation sector includes emissions from Maryland’s fossil fuel-burning power plants, as well as estimates of the emissions associated with electricity generated outside of Maryland, but used in the state (Imported Power). The electricity generation strategy in the 2030 GGRA Plan is designed to achieve 100% Clean and Renewable Electricity by 2040 by both deploying energy through the existing Renewable Portfolio Standard (RPS) and the proposed Clean and Renewable Energy Standard (CARES), and by capping and reducing emissions through RGGI. Achieving 100% clean electricity is an essential part of the economy-wide decarbonization and electrification strategy, as it will not only reduce emissions from Maryland power plants, but also provide carbon-free energy to
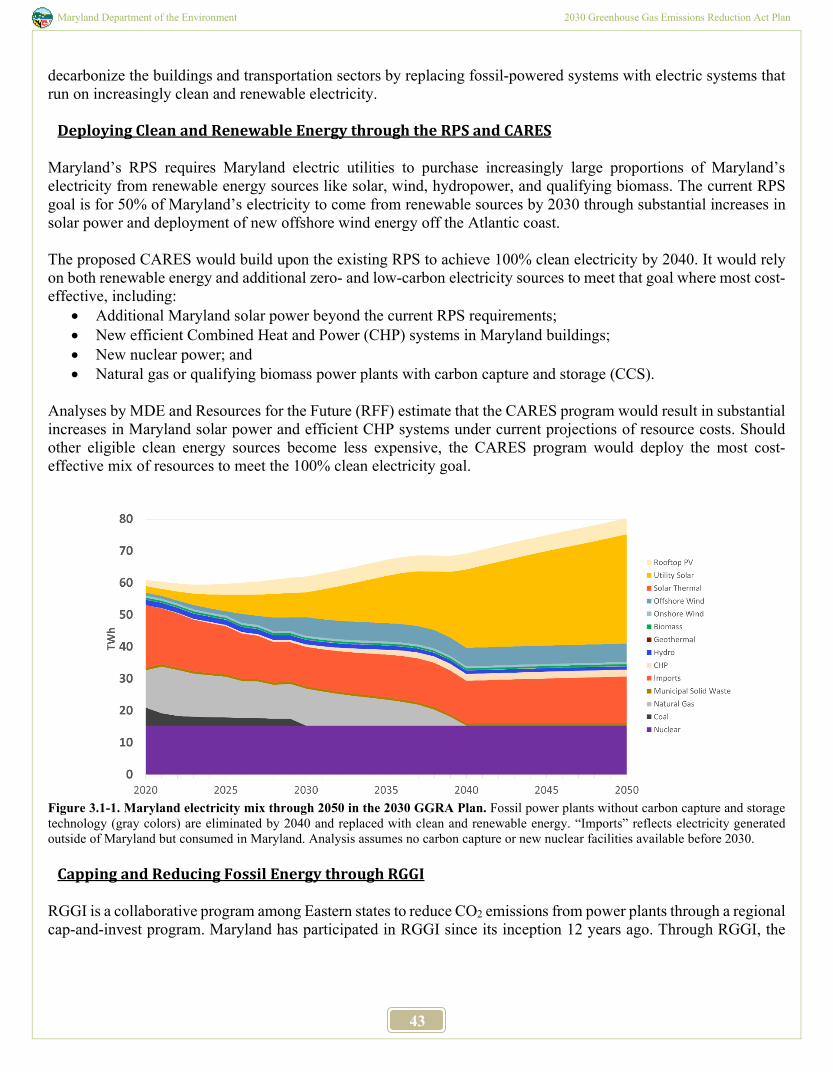
Maryland Department of the Environment 2030 Greenhouse Gas Emissions Reduction Act Plan
43
decarbonize the buildings and transportation sectors by replacing fossil-powered systems with electric systems that run on increasingly clean and renewable electricity.
Deploying Clean and Renewable Energy through the RPS and CARES
Maryland’s RPS requires Maryland electric utilities to purchase increasingly large proportions of Maryland’s electricity from renewable energy sources like solar, wind, hydropower, and qualifying biomass. The current RPS goal is for 50% of Maryland’s electricity to come from renewable sources by 2030 through substantial increases in solar power and deployment of new offshore wind energy off the Atlantic coast. The proposed CARES would build upon the existing RPS to achieve 100% clean electricity by 2040. It would rely on both renewable energy and additional zero- and low-carbon electricity sources to meet that goal where most cost-effective, including:
• Additional Maryland solar power beyond the current RPS requirements; • New efficient Combined Heat and Power (CHP) systems in Maryland buildings; • New nuclear power; and • Natural gas or qualifying biomass power plants with carbon capture and storage (CCS).
Analyses by MDE and Resources for the Future (RFF) estimate that the CARES program would result in substantial increases in Maryland solar power and efficient CHP systems under current projections of resource costs. Should other eligible clean energy sources become less expensive, the CARES program would deploy the most cost-effective mix of resources to meet the 100% clean electricity goal.
Figure 3.1-1. Maryland electricity mix through 2050 in the 2030 GGRA Plan. Fossil power plants without carbon capture and storage technology (gray colors) are eliminated by 2040 and replaced with clean and renewable energy. “Imports” reflects electricity generated outside of Maryland but consumed in Maryland. Analysis assumes no carbon capture or new nuclear facilities available before 2030.
Capping and Reducing Fossil Energy through RGGI RGGI is a collaborative program among Eastern states to reduce CO2 emissions from power plants through a regional cap-and-invest program. Maryland has participated in RGGI since its inception 12 years ago. Through RGGI, the
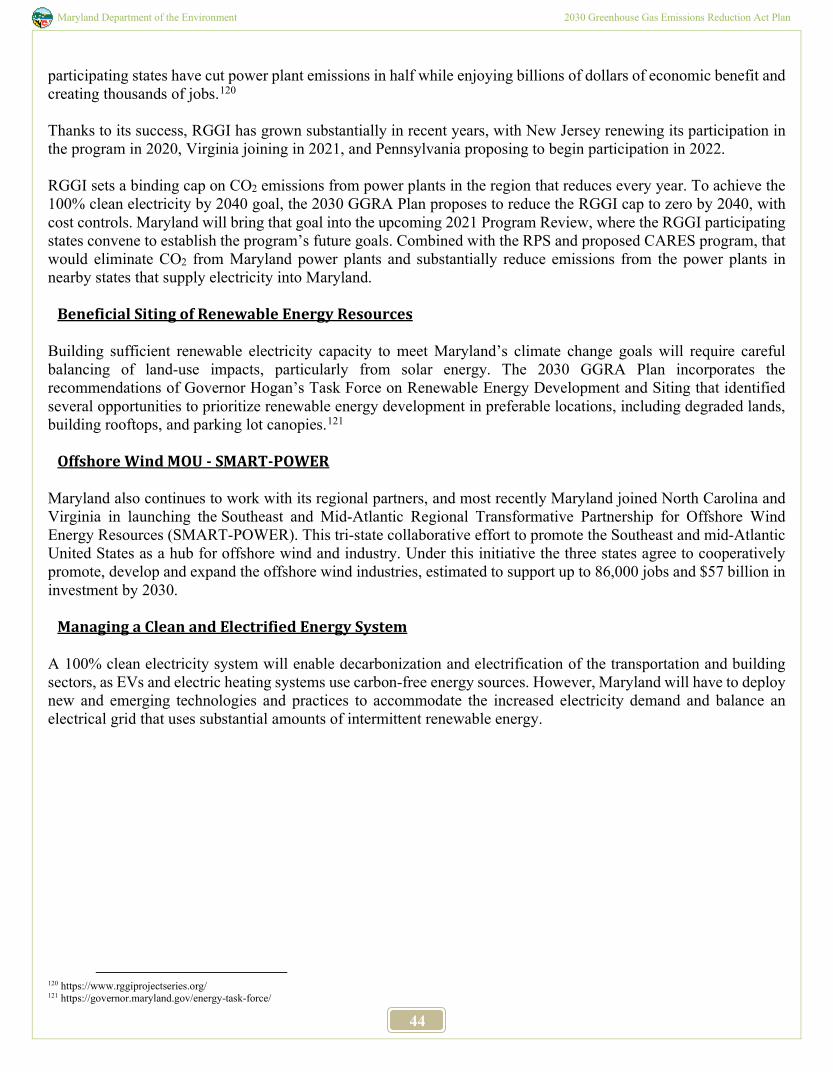
Maryland Department of the Environment 2030 Greenhouse Gas Emissions Reduction Act Plan
44
participating states have cut power plant emissions in half while enjoying billions of dollars of economic benefit and creating thousands of jobs.120 Thanks to its success, RGGI has grown substantially in recent years, with New Jersey renewing its participation in the program in 2020, Virginia joining in 2021, and Pennsylvania proposing to begin participation in 2022. RGGI sets a binding cap on CO2 emissions from power plants in the region that reduces every year. To achieve the 100% clean electricity by 2040 goal, the 2030 GGRA Plan proposes to reduce the RGGI cap to zero by 2040, with cost controls. Maryland will bring that goal into the upcoming 2021 Program Review, where the RGGI participating states convene to establish the program’s future goals. Combined with the RPS and proposed CARES program, that would eliminate CO2 from Maryland power plants and substantially reduce emissions from the power plants in nearby states that supply electricity into Maryland.
Beneficial Siting of Renewable Energy Resources
Building sufficient renewable electricity capacity to meet Maryland’s climate change goals will require careful balancing of land-use impacts, particularly from solar energy. The 2030 GGRA Plan incorporates the recommendations of Governor Hogan’s Task Force on Renewable Energy Development and Siting that identified several opportunities to prioritize renewable energy development in preferable locations, including degraded lands, building rooftops, and parking lot canopies.121
Offshore Wind MOU - SMART-POWER Maryland also continues to work with its regional partners, and most recently Maryland joined North Carolina and Virginia in launching the Southeast and Mid-Atlantic Regional Transformative Partnership for Offshore Wind Energy Resources (SMART-POWER). This tri-state collaborative effort to promote the Southeast and mid-Atlantic United States as a hub for offshore wind and industry. Under this initiative the three states agree to cooperatively promote, develop and expand the offshore wind industries, estimated to support up to 86,000 jobs and $57 billion in investment by 2030.
Managing a Clean and Electrified Energy System A 100% clean electricity system will enable decarbonization and electrification of the transportation and building sectors, as EVs and electric heating systems use carbon-free energy sources. However, Maryland will have to deploy new and emerging technologies and practices to accommodate the increased electricity demand and balance an electrical grid that uses substantial amounts of intermittent renewable energy.
120 https://www.rggiprojectseries.org/ 121 https://governor.maryland.gov/energy-task-force/
Maryland Department of the Environment 2030 Greenhouse Gas Emissions Reduction Act Plan
45
Figure 3.1-2. Electricity use by sector under the 2030 GGRA Plan. Increased demand from building electrification is offset by energy efficiency, but additional load from EVs increases total Maryland electricity consumption beginning in the late 2020s. Building upon the Maryland Public Service Commission’s (PSC) grid modernization process (PC-44), Maryland will deploy battery storage, flexible demand management, and other solutions to integrate higher levels of clean and renewable energy, and satisfy increasing demand for electricity, particularly to charge EVs. Maryland does have time to plan for and deploy those solutions. Increased electricity demand will take decades to accumulate because of the long lifetime of vehicles and building heating systems that will be electrified at the end of their useful life, and most of the additional demand will likely come from EVs whose charging can be timed to help balance generation and load on the electrical grid.
3.1.2 Transportation The transportation sector is the largest source of GHG emissions in Maryland. Most of those emissions come from light-duty passenger cars and trucks, followed by heavy duty trucks. The transportation strategy in the 2030 GGRA Plan is to provide Marylanders with reliable clean transportation alternatives to driving single occupancy vehicles, while accelerating deployments of electric and other zero emissions vehicles (ZEVs) that are powered by increasingly clean Maryland electricity.
Promoting Reliable Clean Transportation Options Reducing miles traveled on Maryland’s roads reduces GHG emissions, saves fuel, and relieves congestion on busy roadways. The 2030 GGRA Plan will reduce vehicle miles traveled (VMT) by continuing and expanding investments in public transit systems, intercity systems like the Maryland Area Regional Commuter (MARC) train, and bike and pedestrian infrastructure, while achieving the Smart Growth program’s compact development goal.
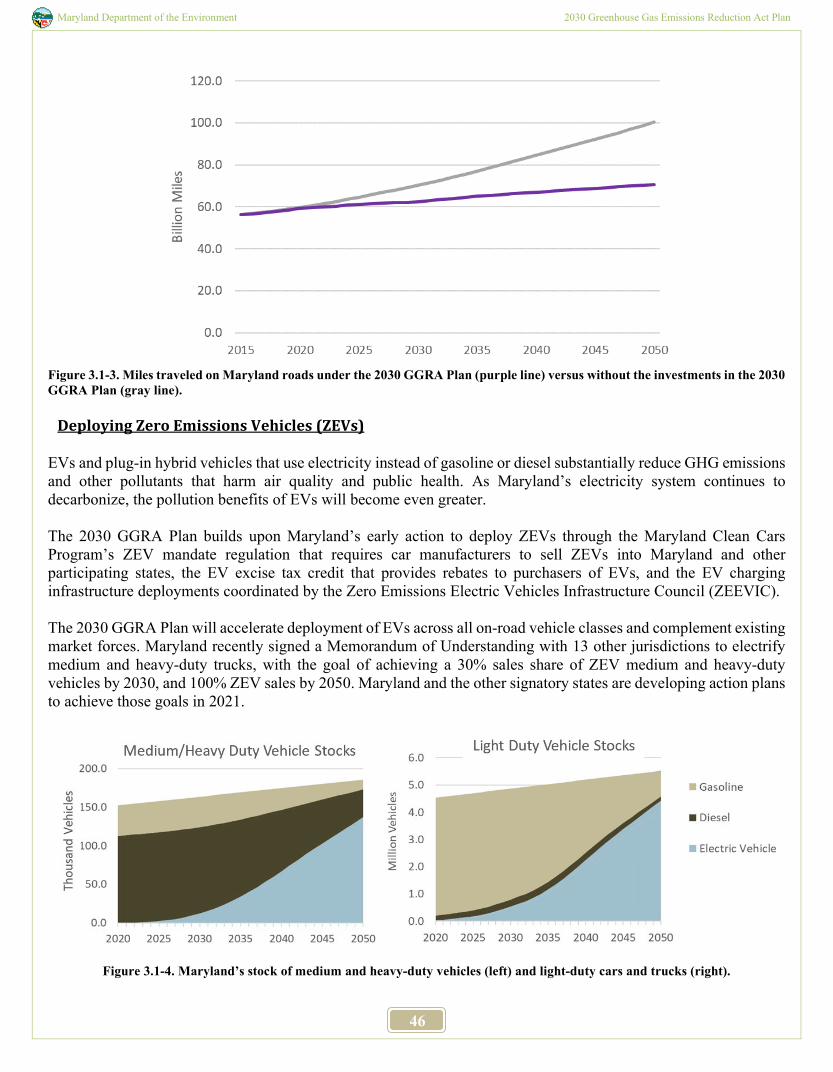
Maryland Department of the Environment 2030 Greenhouse Gas Emissions Reduction Act Plan
46
Figure 3.1-3. Miles traveled on Maryland roads under the 2030 GGRA Plan (purple line) versus without the investments in the 2030 GGRA Plan (gray line).
Deploying Zero Emissions Vehicles (ZEVs) EVs and plug-in hybrid vehicles that use electricity instead of gasoline or diesel substantially reduce GHG emissions and other pollutants that harm air quality and public health. As Maryland’s electricity system continues to decarbonize, the pollution benefits of EVs will become even greater. The 2030 GGRA Plan builds upon Maryland’s early action to deploy ZEVs through the Maryland Clean Cars Program’s ZEV mandate regulation that requires car manufacturers to sell ZEVs into Maryland and other participating states, the EV excise tax credit that provides rebates to purchasers of EVs, and the EV charging infrastructure deployments coordinated by the Zero Emissions Electric Vehicles Infrastructure Council (ZEEVIC). The 2030 GGRA Plan will accelerate deployment of EVs across all on-road vehicle classes and complement existing market forces. Maryland recently signed a Memorandum of Understanding with 13 other jurisdictions to electrify medium and heavy-duty trucks, with the goal of achieving a 30% sales share of ZEV medium and heavy-duty vehicles by 2030, and 100% ZEV sales by 2050. Maryland and the other signatory states are developing action plans to achieve those goals in 2021.
Figure 3.1-4. Maryland’s stock of medium and heavy-duty vehicles (left) and light-duty cars and trucks (right).

Maryland Department of the Environment 2030 Greenhouse Gas Emissions Reduction Act Plan
47
Maryland also works with other states in the Transportation and Climate Initiative (TCI), a regional effort aimed at developing a potential cap-and-invest program to apply the successful RGGI model to transportation emissions. A few of the TCI jurisdictions are moving to implement the program, which would provide additional funding to advance cleaner transportation programs like those in the 2030 GGRA Plan, including investments in clean transportation infrastructure, electric trucks and buses, electric cars, and other projects.
Leading by Example: Maryland State Government Vehicles and Transit Buses Maryland state agencies’ vehicle fleets include nearly 4,000 light-duty vehicles that can be converted to ZEV by 2030, given adequate funding for charging infrastructure at state facilities and for higher vehicle purchase prices. The Maryland Department of General Services (DGS) is coordinating a State Innovation Plan to deploy the necessary infrastructure to electrify those vehicles. In addition, the MDOT Maryland Transit Administration is establishing contracts and building charging infrastructure to convert half of Maryland’s transit buses to ZEV by 2030. 3.1.3 Residential and Commercial Buildings Combustion of fossil fuel in buildings is a substantial source of emissions in Maryland. Most of this energy use is for space and water heating. The 2030 GGRA Plan reduces emissions from energy use in residential and commercial buildings by prioritizing energy efficiency to counteract increases in use that would otherwise occur from growth in Maryland’s economy, and by converting fossil fuel heating systems to efficient electric heat pumps that are powered by increasingly clean and renewable Maryland electricity.
Reducing Energy Use Through Energy Efficiency Originally established in 2008, EmPOWER Maryland is a nation-leading energy efficiency program that has dramatically reduced energy use and emissions in Maryland. EmPOWER has established annual energy savings requirements for Maryland electric utilities through 2023. The 2030 GGRA Plan proposes that the EmPOWER program continue to invest in energy efficiency beyond 2023. Beyond direct investments through EmPOWER Maryland, the 2030 GGRA Plan includes several measures to continue to improve efficiency in Maryland’s buildings. Continuing to achieve the Smart Growth program’s compact development goal saves energy through more efficient homes and businesses. Adoption of new building codes at the state and local level will continuously drive efficiency in new buildings and advance building technologies. And investments in state buildings coordinated under a 2019 Executive Order issued by Governor Hogan will reduce energy use in state facilities by at least 10% by 2030.
Beneficial Electrification of Building Heating Systems Many homes and businesses in Maryland are already heated by heat pumps, which use electricity to move heat from outside air (air source heat pumps) or the ground (ground source heat pumps) into buildings. These heating systems are much more efficient than furnaces or boilers that burn natural gas, heating oil, or propane for heat, and electricity is a lower carbon source for energy than those other fuels. The result is that homes heated by heat pumps are responsible for fewer GHG emissions than those heated by fossil systems. As Maryland’s electricity system continues to decarbonize, the pollution benefits of heat pumps will continue to grow. However, converting fossil fuel systems to electric systems costs more than replacing systems like-for-like when they need to be replaced, and in some cases heat pump systems may cost more to operate than systems that burn natural gas. In its 2020 Annual Report, MCCC identified initial steps Maryland can take to increase the use of efficient electric heat pumps to heat homes and businesses, while launching a Building Energy Transition Plan process for 2021.
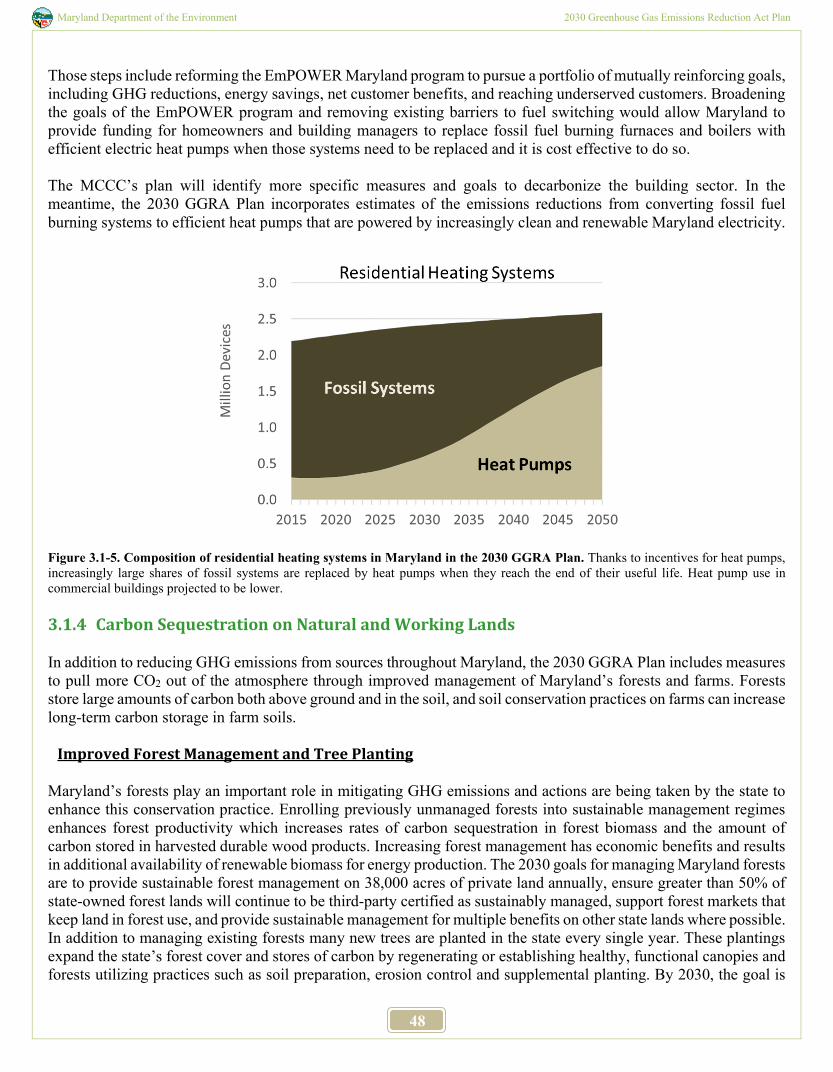
Maryland Department of the Environment 2030 Greenhouse Gas Emissions Reduction Act Plan
48
Those steps include reforming the EmPOWER Maryland program to pursue a portfolio of mutually reinforcing goals, including GHG reductions, energy savings, net customer benefits, and reaching underserved customers. Broadening the goals of the EmPOWER program and removing existing barriers to fuel switching would allow Maryland to provide funding for homeowners and building managers to replace fossil fuel burning furnaces and boilers with efficient electric heat pumps when those systems need to be replaced and it is cost effective to do so. The MCCC’s plan will identify more specific measures and goals to decarbonize the building sector. In the meantime, the 2030 GGRA Plan incorporates estimates of the emissions reductions from converting fossil fuel burning systems to efficient heat pumps that are powered by increasingly clean and renewable Maryland electricity.
Figure 3.1-5. Composition of residential heating systems in Maryland in the 2030 GGRA Plan. Thanks to incentives for heat pumps, increasingly large shares of fossil systems are replaced by heat pumps when they reach the end of their useful life. Heat pump use in commercial buildings projected to be lower. 3.1.4 Carbon Sequestration on Natural and Working Lands In addition to reducing GHG emissions from sources throughout Maryland, the 2030 GGRA Plan includes measures to pull more CO2 out of the atmosphere through improved management of Maryland’s forests and farms. Forests store large amounts of carbon both above ground and in the soil, and soil conservation practices on farms can increase long-term carbon storage in farm soils.
Improved Forest Management and Tree Planting Maryland’s forests play an important role in mitigating GHG emissions and actions are being taken by the state to enhance this conservation practice. Enrolling previously unmanaged forests into sustainable management regimes enhances forest productivity which increases rates of carbon sequestration in forest biomass and the amount of carbon stored in harvested durable wood products. Increasing forest management has economic benefits and results in additional availability of renewable biomass for energy production. The 2030 goals for managing Maryland forests are to provide sustainable forest management on 38,000 acres of private land annually, ensure greater than 50% of state-owned forest lands will continue to be third-party certified as sustainably managed, support forest markets that keep land in forest use, and provide sustainable management for multiple benefits on other state lands where possible. In addition to managing existing forests many new trees are planted in the state every single year. These plantings expand the state’s forest cover and stores of carbon by regenerating or establishing healthy, functional canopies and forests utilizing practices such as soil preparation, erosion control and supplemental planting. By 2030, the goal is
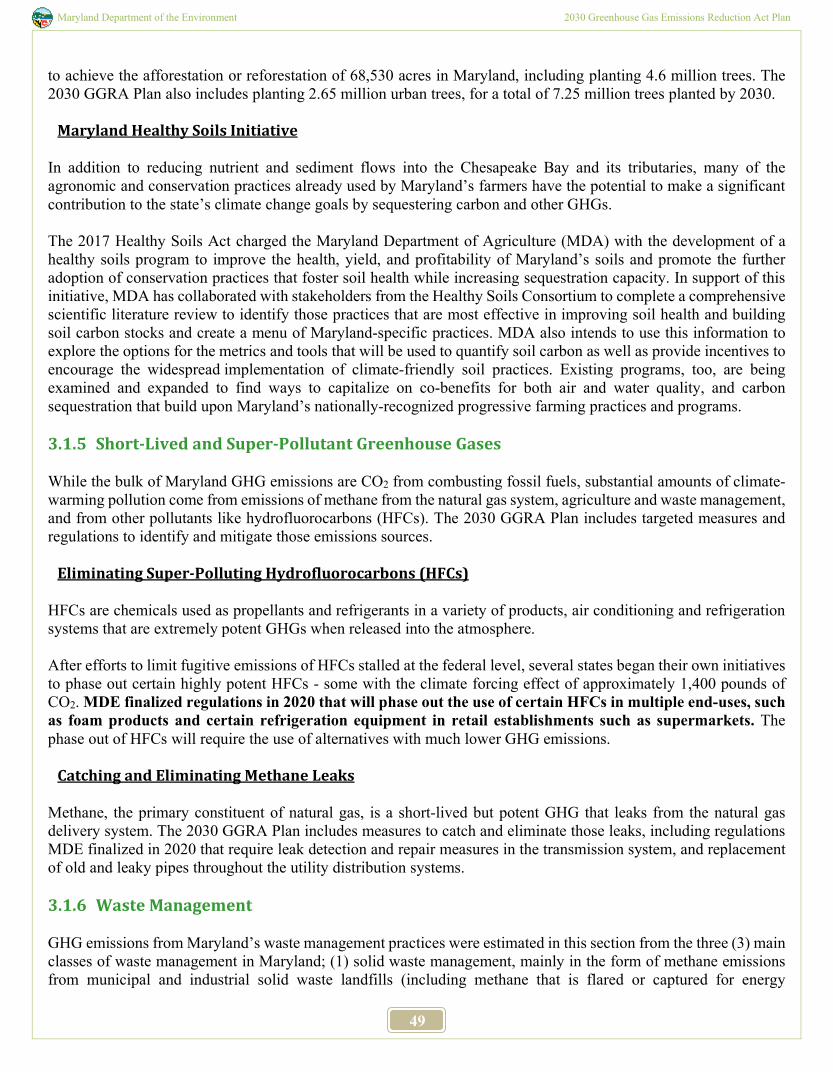
Maryland Department of the Environment 2030 Greenhouse Gas Emissions Reduction Act Plan
49
to achieve the afforestation or reforestation of 68,530 acres in Maryland, including planting 4.6 million trees. The 2030 GGRA Plan also includes planting 2.65 million urban trees, for a total of 7.25 million trees planted by 2030.
Maryland Healthy Soils Initiative In addition to reducing nutrient and sediment flows into the Chesapeake Bay and its tributaries, many of the agronomic and conservation practices already used by Maryland’s farmers have the potential to make a significant contribution to the state’s climate change goals by sequestering carbon and other GHGs. The 2017 Healthy Soils Act charged the Maryland Department of Agriculture (MDA) with the development of a healthy soils program to improve the health, yield, and profitability of Maryland’s soils and promote the further adoption of conservation practices that foster soil health while increasing sequestration capacity. In support of this initiative, MDA has collaborated with stakeholders from the Healthy Soils Consortium to complete a comprehensive scientific literature review to identify those practices that are most effective in improving soil health and building soil carbon stocks and create a menu of Maryland-specific practices. MDA also intends to use this information to explore the options for the metrics and tools that will be used to quantify soil carbon as well as provide incentives to encourage the widespread implementation of climate-friendly soil practices. Existing programs, too, are being examined and expanded to find ways to capitalize on co-benefits for both air and water quality, and carbon sequestration that build upon Maryland’s nationally-recognized progressive farming practices and programs. 3.1.5 Short-Lived and Super-Pollutant Greenhouse Gases While the bulk of Maryland GHG emissions are CO2 from combusting fossil fuels, substantial amounts of climate-warming pollution come from emissions of methane from the natural gas system, agriculture and waste management, and from other pollutants like hydrofluorocarbons (HFCs). The 2030 GGRA Plan includes targeted measures and regulations to identify and mitigate those emissions sources.
Eliminating Super-Polluting Hydrofluorocarbons (HFCs) HFCs are chemicals used as propellants and refrigerants in a variety of products, air conditioning and refrigeration systems that are extremely potent GHGs when released into the atmosphere. After efforts to limit fugitive emissions of HFCs stalled at the federal level, several states began their own initiatives to phase out certain highly potent HFCs - some with the climate forcing effect of approximately 1,400 pounds of CO2. MDE finalized regulations in 2020 that will phase out the use of certain HFCs in multiple end-uses, such as foam products and certain refrigeration equipment in retail establishments such as supermarkets. The phase out of HFCs will require the use of alternatives with much lower GHG emissions.
Catching and Eliminating Methane Leaks Methane, the primary constituent of natural gas, is a short-lived but potent GHG that leaks from the natural gas delivery system. The 2030 GGRA Plan includes measures to catch and eliminate those leaks, including regulations MDE finalized in 2020 that require leak detection and repair measures in the transmission system, and replacement of old and leaky pipes throughout the utility distribution systems. 3.1.6 Waste Management GHG emissions from Maryland’s waste management practices were estimated in this section from the three (3) main classes of waste management in Maryland; (1) solid waste management, mainly in the form of methane emissions from municipal and industrial solid waste landfills (including methane that is flared or captured for energy
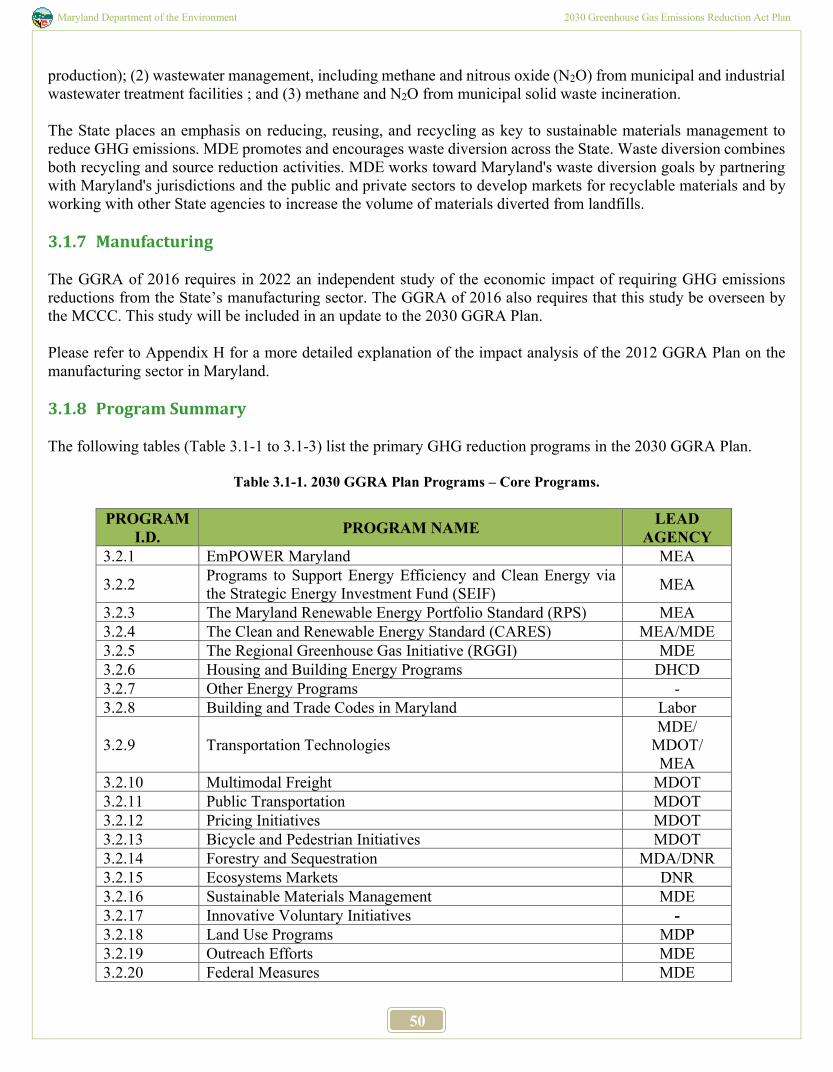
Maryland Department of the Environment 2030 Greenhouse Gas Emissions Reduction Act Plan
50
production); (2) wastewater management, including methane and nitrous oxide (N2O) from municipal and industrial wastewater treatment facilities ; and (3) methane and N2O from municipal solid waste incineration. The State places an emphasis on reducing, reusing, and recycling as key to sustainable materials management to reduce GHG emissions. MDE promotes and encourages waste diversion across the State. Waste diversion combines both recycling and source reduction activities. MDE works toward Maryland's waste diversion goals by partnering with Maryland's jurisdictions and the public and private sectors to develop markets for recyclable materials and by working with other State agencies to increase the volume of materials diverted from landfills. 3.1.7 Manufacturing The GGRA of 2016 requires in 2022 an independent study of the economic impact of requiring GHG emissions reductions from the State’s manufacturing sector. The GGRA of 2016 also requires that this study be overseen by the MCCC. This study will be included in an update to the 2030 GGRA Plan. Please refer to Appendix H for a more detailed explanation of the impact analysis of the 2012 GGRA Plan on the manufacturing sector in Maryland. 3.1.8 Program Summary The following tables (Table 3.1-1 to 3.1-3) list the primary GHG reduction programs in the 2030 GGRA Plan.
Table 3.1-1. 2030 GGRA Plan Programs – Core Programs.
PROGRAM I.D. PROGRAM NAME LEAD
AGENCY 3.2.1 EmPOWER Maryland MEA
3.2.2 Programs to Support Energy Efficiency and Clean Energy via the Strategic Energy Investment Fund (SEIF) MEA
3.2.3 The Maryland Renewable Energy Portfolio Standard (RPS) MEA 3.2.4 The Clean and Renewable Energy Standard (CARES) MEA/MDE 3.2.5 The Regional Greenhouse Gas Initiative (RGGI) MDE 3.2.6 Housing and Building Energy Programs DHCD 3.2.7 Other Energy Programs - 3.2.8 Building and Trade Codes in Maryland Labor
3.2.9 Transportation Technologies MDE/
MDOT/ MEA
3.2.10 Multimodal Freight MDOT 3.2.11 Public Transportation MDOT 3.2.12 Pricing Initiatives MDOT 3.2.13 Bicycle and Pedestrian Initiatives MDOT 3.2.14 Forestry and Sequestration MDA/DNR 3.2.15 Ecosystems Markets DNR 3.2.16 Sustainable Materials Management MDE 3.2.17 Innovative Voluntary Initiatives - 3.2.18 Land Use Programs MDP 3.2.19 Outreach Efforts MDE 3.2.20 Federal Measures MDE
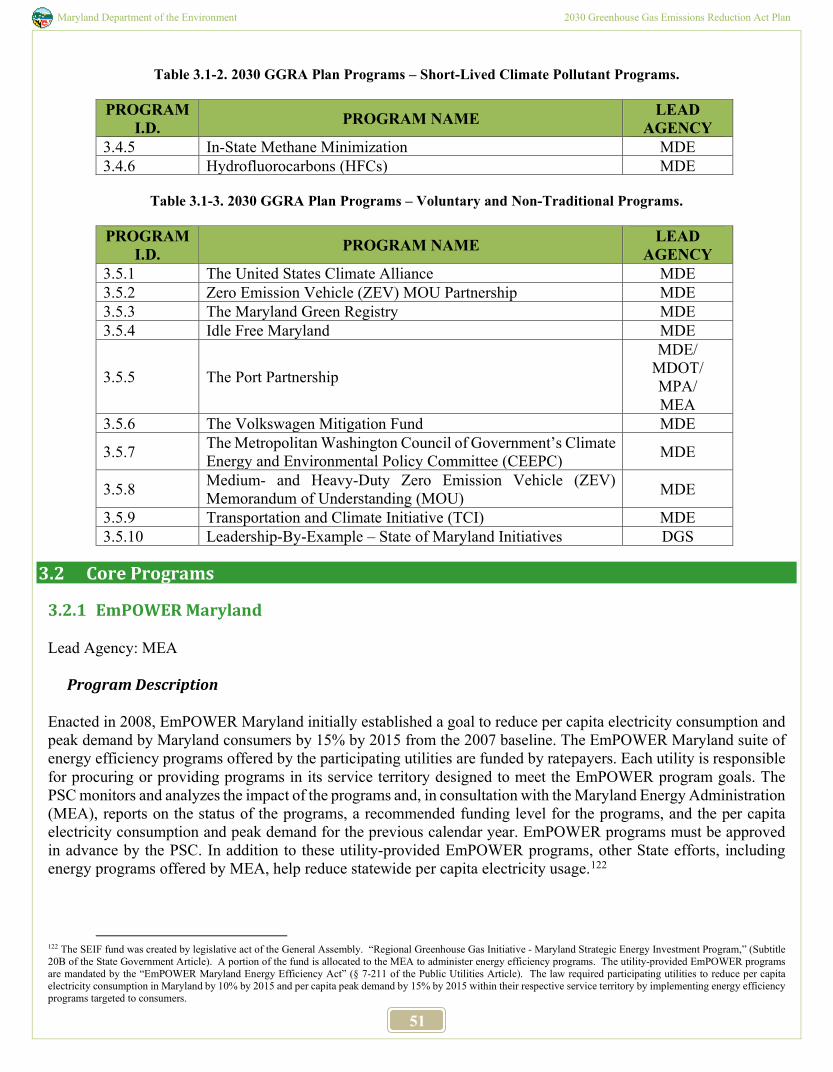
Maryland Department of the Environment 2030 Greenhouse Gas Emissions Reduction Act Plan
51
Table 3.1-2. 2030 GGRA Plan Programs – Short-Lived Climate Pollutant Programs.
PROGRAM I.D. PROGRAM NAME LEAD
AGENCY 3.4.5 In-State Methane Minimization MDE 3.4.6 Hydrofluorocarbons (HFCs) MDE
Table 3.1-3. 2030 GGRA Plan Programs – Voluntary and Non-Traditional Programs.
PROGRAM
I.D. PROGRAM NAME LEAD AGENCY
3.5.1 The United States Climate Alliance MDE 3.5.2 Zero Emission Vehicle (ZEV) MOU Partnership MDE 3.5.3 The Maryland Green Registry MDE 3.5.4 Idle Free Maryland MDE
3.5.5 The Port Partnership
MDE/ MDOT/ MPA/ MEA
3.5.6 The Volkswagen Mitigation Fund MDE
3.5.7 The Metropolitan Washington Council of Government’s Climate Energy and Environmental Policy Committee (CEEPC) MDE
3.5.8 Medium- and Heavy-Duty Zero Emission Vehicle (ZEV) Memorandum of Understanding (MOU) MDE
3.5.9 Transportation and Climate Initiative (TCI) MDE 3.5.10 Leadership-By-Example – State of Maryland Initiatives DGS
3.2 Core Programs
3.2.1 EmPOWER Maryland
Lead Agency: MEA
Program Description Enacted in 2008, EmPOWER Maryland initially established a goal to reduce per capita electricity consumption and peak demand by Maryland consumers by 15% by 2015 from the 2007 baseline. The EmPOWER Maryland suite of energy efficiency programs offered by the participating utilities are funded by ratepayers. Each utility is responsible for procuring or providing programs in its service territory designed to meet the EmPOWER program goals. The PSC monitors and analyzes the impact of the programs and, in consultation with the Maryland Energy Administration (MEA), reports on the status of the programs, a recommended funding level for the programs, and the per capita electricity consumption and peak demand for the previous calendar year. EmPOWER programs must be approved in advance by the PSC. In addition to these utility-provided EmPOWER programs, other State efforts, including energy programs offered by MEA, help reduce statewide per capita electricity usage.122
122 The SEIF fund was created by legislative act of the General Assembly. “Regional Greenhouse Gas Initiative - Maryland Strategic Energy Investment Program,” (Subtitle 20B of the State Government Article). A portion of the fund is allocated to the MEA to administer energy efficiency programs. The utility-provided EmPOWER programs are mandated by the “EmPOWER Maryland Energy Efficiency Act” (§ 7-211 of the Public Utilities Article). The law required participating utilities to reduce per capita electricity consumption in Maryland by 10% by 2015 and per capita peak demand by 15% by 2015 within their respective service territory by implementing energy efficiency programs targeted to consumers.
Maryland Department of the Environment 2030 Greenhouse Gas Emissions Reduction Act Plan
52
In July 2015, the PSC issued order No. 87082 directing the continuation of utility programs supporting EmPOWER Maryland energy reduction policy and setting new savings targets that extend beyond the original 2015 goals in the EmPOWER Maryland statute. In its order, the PSC directed utilities to ramp up electricity savings to 2% of each company’s gross retail sales baseline123 based on three-year cycles. In 2017, the General Assembly codified the energy savings goals and cost-effectiveness measurements in PSC Order No. 87082. Savings can come from a variety of sources, including traditional equipment-based measures, “smart meter” enabled analytics, and more efficient distribution grid hardware. MEA and other agencies continue to work closely with the PSC and Maryland utilities to ensure that programs are effectively designed and implemented. The current EmPOWER statute requires the utilities to continue programs focusing on the efficient use and conservation of energy, subject to the review and approval of the PSC, until 2023. Without prejudice toward the PSC’s process, the 2030 GGRA Plan proposes that the State continue to invest in energy efficiency through EmPOWER beyond 2023, at levels of effort roughly consistent with those required to achieve the current program cycle goals. The 2030 GGRA Plan also proposes to begin incentivizing increased deployment of efficient electric heat pumps to heat homes and businesses in Maryland, including in buildings that currently use a different fuel for heat to transition the energy source for building heating to increasingly clean electricity. In its 2020 Annual Report, the MCCC identified initial steps Maryland can take to increase the use of efficient electric heat pumps to heat homes and businesses, while launching a Building Energy Transition Plan process for 2021. Those steps include reforming the EmPOWER Maryland program to pursue a portfolio of mutually reinforcing goals including GHG reductions, energy savings, net customer benefits, and reaching underserved customers. Broadening the goals of the EmPOWER program and removing existing barriers to fuel switching would allow Maryland to provide funding for homeowners and building managers to replace fossil fuel burning furnaces and boilers with efficient electric heat pumps when those systems need to be replaced and it is cost effective to do so. The MCCC’s 2020 Building Energy Transition Plan will identify more specific measures and goals to decarbonize the buildings sector. In the meantime, the 2030 GGRA Plan incorporates estimates of the emissions reductions from converting fossil fuel burning systems to efficient heat pumps that are powered by increasingly clean Maryland electricity.
Program Objectives Energy efficiency was declared to be “among the least expensive ways to meet the growing electricity demands of the State”124 and a means to “provide affordable, reliable, and clean energy for consumers of Maryland”125 as the State pursues energy efficiency and conservation goals. The EmPOWER Program is funded by a surcharge on ratepayers bills and provides rebates and incentives for energy efficiency upgrades.
Implementation Milestones
Benefits Below are highlights from the EmPOWER Maryland Energy Efficiency Act Standard Report for the 2019 program year126 are as follows:
123 This is not equivalent to requiring that total electricity sales decrease by 2% a year. instead, it requires verified savings to be equivalent to 2% of the most recent baseline year’s weather-normalized gross sales. For example, if a utility’s most recent baseline year’s weather-normalized gross sales were 1,000,000 MWh, their electricity savings target would be 20,000 MWh (2% of 1,000,000). 124 PUA §7-211(b)(1) 125 PUA §7-211(b)(2) 126 2020 EmPOWER Maryland Energy Efficiency Act Standard Report. https://www.psc.state.md.us/wp-content/uploads/2020-EmPOWER-Maryland-Energy-Efficiency-Act-Standard-Report.pdf
Maryland Department of the Environment 2030 Greenhouse Gas Emissions Reduction Act Plan
53
Program-to-date, the Utilities’ EmPOWER Maryland programs have saved a total of 10,197,376 MWh and 2,530 MW. The expected savings associated with EmPOWER Maryland programs is approximately $10.5 billion over the life of the installed measures for the energy efficiency and conservation. (EE&C) programs. Across all Utilities, the lifecycle cost127 per kWh for the EE&C programs, in 2019, is $0.020 per kWh - significantly lower than the current cost of Standard Offer Service (“SOS”), which ranges from $0.053 to $0.075 per kWh. Program-to-date, the Utilities have spent over $2.8 billion on the EmPOWER Maryland programs, including approximately $1.9 billion on EE&C programs and $814 million on DR programs. EmPOWER EE&C programs continue to be cost effective on a statewide basis in 2018, with a statewide Total Resource Cost (“TRC”) score of 1.22 verified for the program year 2018. For every dollar of reported utility or participant cost, the EmPOWER EE&C programs generate approximately $1.22 in benefits. Program-to-date, 39,286 limited-income customers participated in EmPOWER Maryland through the Residential Limited-Income Programs. In 2019, 5,184 limited-income households participated. The average savings per participant in 2019 was 1,480 kWh. Program-to-date spending on limited-income energy efficiency programs is approximately $196.6 million. As the amount of renewable and clean generation capacity increases in the State’s portfolio, GHG emissions will be reduced. EmPOWER does not currently track GHG emissions reduction but could be added to the next implementation of energy efficiency programs.
COVID-19 Impacts and Responses Residents and businesses adapted to the pandemic, resulting in changing energy-usage patterns and behavior, and program administrators modified EmPOWER programs to meet the needs of the communities served. The program administrators modified safety protocols of several programs to continue meeting the needs of the constituents, including providing virtual services, additional training, and online processing. To alleviate some of the uncertainty, governments and regulatory agencies extended relief to those in need to smooth the precipitous impacts.
Beyond 2030 As the EmPOWER Program approaches the final three-year cycle of the current mandate, there are opportunities to increase efficiency across State policy initiatives by re-examining the energy efficiency goals to facilitate other state initiatives and to reduce costs of the initiatives. There is also an opportunity to broaden the scope of efficiency and similar programs to support broader distributed energy, RPS, and vehicle electrification goals. However, this expansion may impact the cost of the programs to ratepayers.
3.2.1.1 EmPOWER Maryland: Combined Heat and Power
Lead Agencies: MEA and MDE, in coordination with other State agencies
Program Description
Combined heat and power, also called co-generation, is a technology designed to generate both power and thermal energy from a single fuel source. A combined heat and power system recovers waste heat from thermal energy used in industrial processes and electricity generation and uses it for heating or cooling, achieving thermal efficiency
127 The lifecycle cost per kWh is calculated by dividing the total EE&C expenditures by the total lifecycle energy savings of the Utilities.
Maryland Department of the Environment 2030 Greenhouse Gas Emissions Reduction Act Plan
54
levels of up to 80%. The increased efficiency means more useful energy is generated from a single fuel source. Therefore, GHG emissions from a combined heat and power system are less per unit of energy produced than from a typical system that produces electric and thermal energy separately. Expanding the use of these systems can greatly enhance a facility’s energy efficiency and decrease overall energy costs. Moreover, combined heat and power is an efficient, clean, and reliable approach to generating power while also reducing aggregate GHG emissions. The five EmPOWER utilities received approval from the PSC to run combined heat and power programs in the spring of 2012. To date, 17 combined heat and power projects have participated.128 3.2.2 Programs to Support Energy Efficiency and Clean Energy via the Strategic Energy Investment Fund (SEIF) Lead Agency: MEA
Program Description MEA administers the Strategic Energy Investment Fund (SEIF), which is funded primarily through proceeds from the auction of GHG allowances under RGGI, to implement energy programs that promote affordable, reliable, and cleaner energy for Maryland residents. Additionally, MEA is focused on enhancing resiliency and reducing GHGs from buildings and the transportation sector. Through its energy programs, MEA also strives to distribute funds across the state to support efforts to improve energy equity, helping all Marylanders have access to clean and affordable energy. To achieve this goal, MEA offers programs that improve energy efficiency, help deploy renewable energy, and incentivize transportation options that leverage clean energy sources.
Program Objectives MEA’s programs support Maryland’s GHG reduction goals by improving overall energy efficiency, incentivizing in-state distributed renewable energy generation, expanding the use of clean fuels for buildings and transportation, and incentivizing options for cleaner vehicle and transportation infrastructure.
Implementation Milestones
Benefits Energy efficiency results in a lower overall use of energy, thus directly reducing GHG impacts as well as other air emissions. Similarly, the deployment of distributed renewable energy technologies helps decrease GHG emissions by offsetting energy production from the centralized power sector, while transportation-related programs focus on technologies that result in lower overall emissions than traditional transportation fossil fuels.
Co-benefits Increased energy efficiency helps decrease demand on the electrical grid, which can help avoid the need for new power plants to be built. MEA’s renewable energy programs support the creation and retention of local Maryland jobs. Investments in energy efficiency and clean energy provide opportunities for residents, businesses and governments to reduce costs or provide more predictable future energy costs. Energy efficiency, renewable energy, and clean fuel transportation programs can all also contribute to improved overall energy resiliency; as an example, combined heat and power projects can help critical infrastructure with enhanced capabilities to enable operation during grid outages. Broader application of in-state renewable energy helps
128 https://www.psc.state.md.us/search-results/?q=9494&x.x=10&x.y=16&search=all&search=case, case file items147, 148, and 151.
Maryland Department of the Environment 2030 Greenhouse Gas Emissions Reduction Act Plan
55
reduce the need for additional utility infrastructure and reduces imports of electricity helping to reduce the risk of brown-outs and regional blackouts. Investment in energy efficiency, clean energy and clean fuels reduce emissions of criteria and other air pollutants which impact resident health. Expanded adoption of energy efficiency, when properly applied, can improve building environmental air quality.
Environmental Justice Considerations Half or more of the funds going into the SEIF for energy efficiency as a result of § 2–1002(g) of the Environment Article must be targeted at low- or moderate-income Maryland residents. MEA continues to include environmental justice considerations in its programs to encourage the equitable distribution of energy reductions and associated energy financial savings; these energy-related benefits are accompanied by emission reductions and job creation benefits. Examples include the Low to Moderate Income Energy Efficiency Program and the Resiliency Hub Program; as well as programs funded out of the Offshore Business Development Fund to support capital investment and workforce training in Maryland including minority owned enterprises.
COVID-19 Impacts and Responses COVID-19 has severely impacted jobs in the clean energy sector nationwide with over 500,000 white- and blue-collar workers displaced since the start of the pandemic, this includes nearly 10,000 Marylanders. Nationwide these impacts have been felt most by people of color, women in the workforce and hourly workers. While some recovery is occurring, the rate of returns to work has been slow. The SEIF, as well as other programs administered by MEA such as the Jane E. Lawton Energy Efficiency Loan Program, is poised to pump needed capital into the energy efficiency and clean energy industries, helping to get people back to work where it is safe and appropriate to do so. COVID-19 has slowed down the progress of some energy projects, in a similar way to how the pandemic has interrupted other parts of Maryland’s economy. MEA continues to monitor the situation and routinely convenes an ad hoc COVID-19 energy workgroup to maintain awareness across agencies that have energy projects. As an agency, MEA has implemented a COVID-19 agency plan to maintain operations and outline adjustments to ease the strain on existing grantees while updating programs to help address COVID-19 related challenges.
Implementation Mechanisms MEA implements programs through a mix of rebates, grants, loans, technical assistance and partnerships as well as funding efforts underway by sister agencies focusing on specific areas of Maryland’s economy. In addition, SEIF also funds some efforts underway by sister agencies. Programs are developed using feedback from representatives of Maryland industry, including, but not limited to, those individuals serving on the board of the SEIF. While there is some variation between specific energy programs, MEA communicates available funding opportunities publicly on MEA’s website and social media. Selected program participants receive reimbursement for incurred costs after MEA’s program team confirms the projects have complied with the requirements of the respective energy program and gathers information to report results.
Programs MEA programs are continuously updated to reflect the diverse needs of Maryland residents, businesses, local governments and others. Examples of energy programs implemented by MEA include, but are not limited to:
Maryland Department of the Environment 2030 Greenhouse Gas Emissions Reduction Act Plan
56
• The Low-to-Moderate Income Energy Efficiency Grant program which enables nonprofits and local governments to enable energy efficiency projects in their communities benefiting low and moderate income residents;
• The Combined Heat and Power program which incentives on-site electricity generation, increasing efficiency by eliminating line losses and deploying waste heat from the combined heat and power process to meet onsite thermal loads;
• The Solar Photovoltaic on Parking Lot with EV Charging program, which encourages the deployment of solar canopy structures above parking areas thus providing a secondary use of the land;
• The Public Facilities Solar Program provides technical assistance to help institutions identify opportunities for solar in the built environment and capital to reduce the costs of implementation, thereby closing the financial barrier between solar on green fields and more expensive but likely more beneficial installations on buildings and parking facilities;
• The Electric Vehicle Supply Equipment (EVSE) program, which incentives the installation of EV charging equipment in support of the state’s EV adoption goal of 300,000 by 2025;
• The Resilient Maryland Program provides grants to assist local governments, energy sensitive industries, low- and moderate-income communities and others assess the feasibility and design microgrids, resilient power systems, resiliency hubs and other efforts; and,
• The Clean Fuels Incentive Program provides grants to assist in the development of clean fuel vehicle infrastructure. The program also provides incentives of conventional vehicles with those fueled by electricity and clean fuels. MEA’s efforts in this area are expanding, recognizing the ongoing interest in electrification and clean fuels, with technical support options to assist local governments develop fleet transition strategies.
Interagency Efforts and MOUs
As the administrator of the SEIF, MEA develops memorandums of understanding with other state agencies receiving SEIF funding to implement energy programs. As an example, SEIF is provided to MDE to pay RGGI dues and to support the Clean Air Fund for projects that mitigate or reduce the effects of climate change, as statutorily required. Another example is that MEA, via the SEIF, funds the DGS’ Office of Energy and Sustainability
Beyond 2030 MEA is continuously responding to trends in energy efficiency, renewable energy and other aspects related to its mission. MEA administers its programs in a flexible framework to ensure that they can be responsive to the needs of Marylanders. While it is impossible to forecast exactly what the State’s specific energy programs will look like in 2030, it is possible to hypothesize on some trends in energy technology and their applications that will present opportunities. Vehicle electrification is rapidly accelerating, making it likely that programs will continue to be needed to help manage the impacts of large numbers of electrical vehicles on the electrical grid. In addition, the expansion of distributed energy resources and active energy management will present opportunities to interact with the utility grid to reduce consumer costs and impact the need for infrastructure improvements. The need for continued investment in low- to moderate-income communities to reduce energy burden will be a priority. Another possible area of focus may be demand response and storage deployment initiatives to match the anticipated higher amounts of intermittent renewables on Maryland’s electrical grid. MEA anticipates that its programs will evolve over the coming years to further incorporate aspects of resiliency, energy equity, market transformation, new technologies and partnerships. 3.2.3 The Maryland Renewable Energy Portfolio Standard (RPS)
Maryland Department of the Environment 2030 Greenhouse Gas Emissions Reduction Act Plan
57
Lead Agency: MEA
Program Description Maryland’s Renewable Portfolio Standard (RPS) statutorily requires Maryland electricity suppliers to obtain renewable energy credits (RECs) from qualified renewable energy generators for 50% of its electricity supply by 2030, where one REC is equal to one megawatt-hour (MWH) of electricity generated by a qualified renewable energy generator.129 To be eligible, generators need to be located within the Pennsylvania Jersey Maryland Interconnection, LLC (PJM) region, or in a control area adjacent to the PJM region.130 In addition, there is a solar carve-out that will ultimately require solar RECs equal to 14.5% of retail electricity sales to be obtained from solar energy generation directly connected to Maryland’s electric distribution grid by 2030, as well as a requirement for a carve out for offshore wind.131 Energy suppliers are required to purchase RECs in order to demonstrate compliance with the RPS. If insufficient RECs are not purchased, suppliers can instead opt to make an Alternative Compliance Payment (ACP) which is then used to incentivize the adoption of new RPS-eligible technologies.
Program Objectives The objectives are outlined in §7–702 of the Public Utilities article that enabled Maryland’s RPS. The defined objectives include recognition of “the economic, environmental, fuel diversity, and security benefits of renewable energy resources”, reducing “greenhouse gas emissions”, eliminating “carbon-fuel generation from the State’s electric grid”, establishing “a market for electricity from these resources in Maryland”, and lowering “the cost to consumers of electricity produced from these resources”.
Implementation Milestones
Benefits GHG reductions accrue when the qualified renewable energy generator producing the RECs required to meet the RPS are located in Maryland and offsetting a portion of Maryland’s electrical grid mix that has a higher relative carbon intensity.
Co-benefits Qualified renewable energy generators that displace electricity currently produced by combustion processes in Maryland, or near Maryland’s borders, can result in improved air quality. In addition, the installation of new qualified renewable energy resources can result in jobs; as an example, there were 4,854 solar jobs in Maryland during 2019.132
Environmental Justice Considerations Chapter 757 of the Acts of Maryland General Assembly directs all future ACP payments to projects that are owned or directly benefit low-income Maryland residents. In addition, this legislation will provide $7 million in access to capital for small, minority, women-owned, and veteran-owned businesses.
COVID-19 Impacts and Responses
129 Qualified renewable energy generators include solar energy, wind, qualifying biomass, methane from the anaerobic decomposition of organic materials in a landfill or wastewater treatment plant, geothermal, ocean, small hydroelectric plants less than 30 MW, poultry litter-to-energy, waste-to-energy, refuse-derived fuel, and thermal energy from a thermal biomass system. Through the end of 2020, hydroelectric power greater than 30 MW is also eligible. See Maryland Public Utility Articles §7–701 and §7–703. 130 PJM Environmental Information Services, Maryland, https://www.pjm-eis.com/program-information/maryland.aspx. (Accessed September 9, 2020). 131 See Maryland Public Utility Article, §7–703. 132 2020, Solar Jobs Census 2019: Maryland. The Solar Foundation. https://www.thesolarfoundation.org/solar-jobs-census/factsheet-2019-MD/
Maryland Department of the Environment 2030 Greenhouse Gas Emissions Reduction Act Plan
58
COVID-19 has changed some electricity usage patterns in Maryland, decreasing commercial usage and increasing residential usage during the shelter-in-place orders during the spring of 2020. While the full impacts of COVID-19 on overall calendar year electricity usage is not yet known, it is likely that there may be a decrease in the number of RECs required to be purchased by electricity suppliers in CY20. It is also known that there were delays experienced in new residential solar installations during the COVID-19 interruptions; this may result in a lesser amount of new in-state solar going online, and thus producing RECs, in 2020.
Implementation Mechanisms While Maryland’s RPS is overseen by the PSC, PJM oversees the tracking and sale of RECs. Details about the status of RECs by state, generation type, year, and REC status (i.e., active, retired, etc.) can be found on PJM’s Generation Attributes Tracking System (GATS).133
Beyond 2030 Maryland’s current RPS currently extends to 2030, when energy suppliers will need to purchase, or otherwise source, RECs totaling 50% of eligible electricity sales, with at least 14.5% of the Tier 1 RECs coming from solar tied to Maryland’s electrical distribution grid. Any future changes to the RPS that increase, or encourage, in-state qualified renewable energy generators that produce less carbon than the current Maryland fuel mix will further help Maryland achieve its GHG reduction goals.
3.2.3.1 Offshore Wind Initiatives to Support Renewable Energy Lead Agencies: MEA and the Department of Commerce
Program Description Maryland waters are part of the Mid-Atlantic Bight region, a coastal area spanning from North Carolina to Massachusetts with substantial wind resources located in close proximity to coastal population centers. In fact, this area has the greatest renewable energy potential relative to other U.S. offshore regions in the Gulf of Mexico, Pacific, and the waters around Alaska. Research indicates that the potential power supply available from offshore wind substantially exceeds the region's current energy use. Maryland and other states thus have the potential to access large energy resources off the coast that could contribute to meeting future energy demands while simultaneously displacing fossil fuel generation with the potential to create new and enduring industries. Maryland has taken a lead among Mid-Atlantic States working to harness offshore wind resources. In 2017, the PSC awarded offshore wind renewable energy credits (ORECs) to two offshore wind projects totaling 368 MW of capacity. The Clean Energy Jobs Act (Chapter 757 of 2019) updated the RPS to provide for incentives, via Offshore Renewable Energy Recs, for at least an additional 1,200 MW of ocean energy.134 The State is moving forward to take advantage of a rapidly evolving regional supply chain for OSW on the eastern seaboard, providing new opportunities for Maryland businesses and workers. To support this burgeoning new industry, the Maryland Offshore Wind Capital Expenditure Program provides grant funding for businesses entering the offshore wind supply chain in Maryland by offsetting the costs of major equipment and substantial facility improvements. The Maryland Offshore Wind Workforce Training program provides grant funding for new or
133 PJM Generation Attributes Tracking System, https://gats.pjm-eis.com/gats2/PublicReports/RPSEligibleReportingYear. 134 Maryland Clean Energy Jobs Act (Ch757 of 2019)
Maryland Department of the Environment 2030 Greenhouse Gas Emissions Reduction Act Plan
59
existing training centers that support the offshore wind energy industry through investment in capital and operating costs. Maryland also continues to work with its regional partners, and most recently Maryland joined North Carolina and Virginia in launching the Southeast and Mid-Atlantic Regional Transformative Partnership for Offshore Wind Energy Resources (SMART-POWER). This tri-state collaborative effort to promote the Southeast and Mid-Atlantic United States as a hub for offshore wind and industry. Under this initiative the three states agree to cooperatively promote, develop and expand the offshore wind industries, estimated to support up to 86,000 jobs and $57 billion in investment by 2030.
Department of Commerce Participation Maryland has the opportunity to be a leader in the development of offshore wind from Maine to North Carolina. Our protected Chesapeake Bay and available land at existing ports make Maryland ideal for the development of an offshore wind industry supply chain estimated at over $7 billion annually. This effort will help Maryland and the entire eastern seaboard move to a carbon free energy future. The Department of Commerce is focused on helping the industry secure 2,000 gigawatts of clean wind energy with a potential employment base of 46,000 workers. The Department of Commerce is actively seeking companies to locate in Maryland and in developing the workforce wind companies will need. The Department of Commerce is actively working with Wor Wic Community College and Frostburg State University as well as private sector job training groups to build a trained workforce specializing in the new clean energy economy. The sophistication of Maryland’s workforce is a key driver in locating companies active in offshore and onshore wind development. 3.2.4 The Clean and Renewable Energy Standard (CARES) Lead Agencies: MEA and MDE Program Description The proposed Clean and Renewable Energy Standard (CARES) would build upon the existing RPS to achieve 100% Clean Electricity by 2040. It would rely on both renewable energy and additional zero- and low-carbon electricity sources to meet that goal where most cost-effective, including:
• Additional Maryland solar power beyond the current RPS requirements; • New efficient Combined Heat and Power (CHP) systems in Maryland buildings; • New nuclear power; and • Natural gas or qualifying biomass power plants with carbon capture and storage (CCS).
Through 2030, CARES would fully incorporate the existing RPS provisions for solar power and offshore wind, eliminate eligibility for black liquor and municipal waste combustion, problematic technologies that currently qualify for RECs, and replace those technologies with additional homegrown clean and renewable energy. Beyond 2030, CARES would steadily increase requirements to meet 100% Clean Electricity by 2040. This additional requirement for clean and renewable energy can be met through any additional Maryland solar power or other renewable energy, or new clean energy installations.
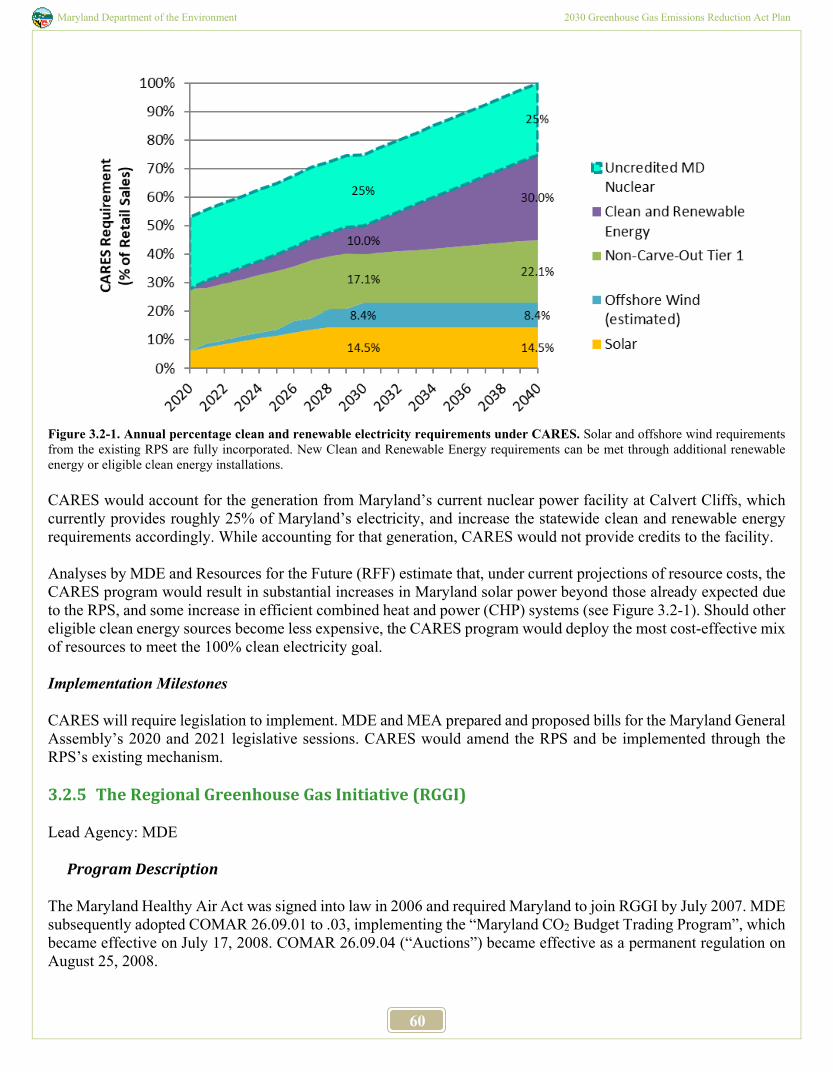
Maryland Department of the Environment 2030 Greenhouse Gas Emissions Reduction Act Plan
60
Figure 3.2-1. Annual percentage clean and renewable electricity requirements under CARES. Solar and offshore wind requirements from the existing RPS are fully incorporated. New Clean and Renewable Energy requirements can be met through additional renewable energy or eligible clean energy installations. CARES would account for the generation from Maryland’s current nuclear power facility at Calvert Cliffs, which currently provides roughly 25% of Maryland’s electricity, and increase the statewide clean and renewable energy requirements accordingly. While accounting for that generation, CARES would not provide credits to the facility. Analyses by MDE and Resources for the Future (RFF) estimate that, under current projections of resource costs, the CARES program would result in substantial increases in Maryland solar power beyond those already expected due to the RPS, and some increase in efficient combined heat and power (CHP) systems (see Figure 3.2-1). Should other eligible clean energy sources become less expensive, the CARES program would deploy the most cost-effective mix of resources to meet the 100% clean electricity goal. Implementation Milestones CARES will require legislation to implement. MDE and MEA prepared and proposed bills for the Maryland General Assembly’s 2020 and 2021 legislative sessions. CARES would amend the RPS and be implemented through the RPS’s existing mechanism. 3.2.5 The Regional Greenhouse Gas Initiative (RGGI)
Lead Agency: MDE
Program Description
The Maryland Healthy Air Act was signed into law in 2006 and required Maryland to join RGGI by July 2007. MDE subsequently adopted COMAR 26.09.01 to .03, implementing the “Maryland CO2 Budget Trading Program”, which became effective on July 17, 2008. COMAR 26.09.04 (“Auctions”) became effective as a permanent regulation on August 25, 2008.
Maryland Department of the Environment 2030 Greenhouse Gas Emissions Reduction Act Plan
61
RGGI is a collaborative program among 11 Eastern states to reduce CO2 emissions from power plants through a regional cap and invest program. These states adopted market-based CO2 cap and invest programs designed to reduce emissions of CO2, from fossil fuel-fired electricity generators with a nameplate capacity of 25 megawatts or greater. Thanks to its success, RGGI has grown substantially in recent years, with New Jersey renewing its participation in the program in 2020, Virginia joining in 2021, and Pennsylvania proposing regulations to begin participation in 2022. RGGI is currently composed of Connecticut, Delaware, Maine, Maryland, Massachusetts, New Hampshire, New Jersey, New York, Rhode Island, Vermont, and Virginia. Participating RGGI states each require electricity generators to have acquired, through regional auction or secondary market transactions, one CO2 allowance for every ton of CO2 emitted over a three-year compliance period. Maryland has participated in RGGI since its inception 12 years ago. Through RGGI, the participating states have cut power plant emissions in half while enjoying billions of dollars of economic benefit and creating thousands of jobs.135 RGGI sets a binding cap on CO2 emissions from power plants in the region that reduces every year. To achieve the 100% clean electricity by 2040 goal, the 2030 GGRA Plan proposes to reduce the RGGI cap to zero by 2040, with cost controls. Maryland will bring that goal into the upcoming 2021 Program Review, where the RGGI participating states convene to establish the program’s future goals. Combined with the RPS and proposed CARES program, that would eliminate CO2 from Maryland power plants and substantially reduce emissions from the power plants in nearby states that supply electricity into Maryland. The RGGI program has several unique features unlike other cap and invest programs in the U.S. The allowances are controlled by the states and can be allocated or sold to sources. Currently states have opted to auction most of the allowances to sources through quarterly auctions. Proceeds from the auctions are used to fund energy efficiency programs to reduce demand for electricity and provide a means to lower CO2 emissions. Further, auction proceeds fund renewable energy projects that reduce the amount of CO2 emissions generated by fossil fuel-fired electricity generators. Under RGGI, more than half of all funds collected by Maryland are invested in energy assistance for low-income households, and energy efficiency in low- and moderate-income communities. The states conducted the first quarterly regional auction in September 2008, and the program officially began in January 2009. RGGI originally set a cap of 188,076,976 tons of CO2 emissions for the region, based on average 2000 to 2002 CO2 emissions from eligible electricity generators subject to the program Maryland received 37,503,983 CO2 allowances each year through 2013. After the 2012 Comprehensive RGGI Program Review, changes to the cap resulted in Maryland receiving 20,360,944 CO2 allowances in 2014. Between 2015 and 2020, Maryland’s allowance budget reduced by 2.5% per year along with the other participating states’. Maryland originally set aside 7,388,491 allowances in four different set aside accounts to account for special needs or programs, but this number and the number of set aside accounts was reduced through the 2016 Comprehensive Program Review. In the 2016 Program Review, the RGGI states established a cap for the 2020s that declines by 30% from 2020 to 2030. Each individual state’s allowance budget, including Maryland’s, will decrease each year accordingly. That cap decline may need to accelerate in the 2020s to work toward the longer term 100% clean electricity by 2040 goal. RGGI is composed of individual CO2 Budget Trading Programs in each RGGI participating state. Each participating state’s CO2 Budget Trading Program is based on the 2008 RGGI Model Rule and subsequent updates, which was developed to provide guidance to states as they implemented the RGGI program. RGGI participating states have completed a 2016 Comprehensive Program Review, which is a comprehensive evaluation of program successes, program impacts, the potential for additional reductions, imports and emissions leakage, and offsets. Amendments to the 2008 Model Rule were developed by the RGGI state staff as part of all Program Reviews. So, the Model Rule is updated prior to the individual states pursuing their regulatory changes. This effort was supported
135 https://www.rggiprojectseries.org/
Maryland Department of the Environment 2030 Greenhouse Gas Emissions Reduction Act Plan
62
by an extensive regional stakeholder process that engaged the regulated community, environmental nonprofits, and other organizations with technical expertise in the design of cap-and-trade programs.
Implementation Milestones
Auctions
Prior to December 2, 2020, Maryland has successfully participated in all 49 regional auctions of CO2 allowances with RGGI. Auction proceeds go to the SEIF, which is administered by MEA. To date, Maryland has generated $752,511,609.34 in cumulative proceeds.
RGGI 2016 Comprehensive Program Review
On August 23, 2017, after completing a comprehensive 1.5-year review, Maryland and the other RGGI participating states announced a consensus agreement on proposed program changes. A regional emissions cap trajectory is proposed that will provide an additional 30% cap reduction by the year 2030 with important new features and innovations. This announcement can be found on the RGGI website.136
History of the RGGI Cap
The RGGI cap was first calculated during the period from 2005-2007, to start in 2009. The participating states decided upon a generation-based program rather than a consumption-based program because the states had authority to control electric generating sources within their jurisdiction. The initial cap was based on the average of 2000-2002 CO2 emissions and the initial cap was set at 188,076,976 short tons of CO2. After a stabilization period, the cap would be reduced starting in 2015 by 2.5% each year until 2018 for a 10% reduction. RGGI states agreed to reduce the existing cap by 45% so that the cap level would match actual emissions. The revised cap took effect in January 2014. Following a second RGGI Program Review, which was completed in 2017, the RGGI states agreed to extend the cap through 2030. As the states tracked emissions to evaluate reductions, the significant downward trend in emissions became evident. The drop in allowance sales at the regional auctions also signaled an oversupply of allowances, and so the participating states elected to revise the cap as part of the 2012 Comprehensive Program Review. During the review, the states considered a number of potential caps in short tons of CO2, and the cap was set at 91 million short tons of CO2 (91M). The 91 million cap put downward pressure on carbon emissions, while receiving support from a wide variety of stakeholders and many generators.
136 http://www.rggi.org/docs/ProgramReview/2017/08-23-17/Announcement_Proposed_Program_Changes.pdf
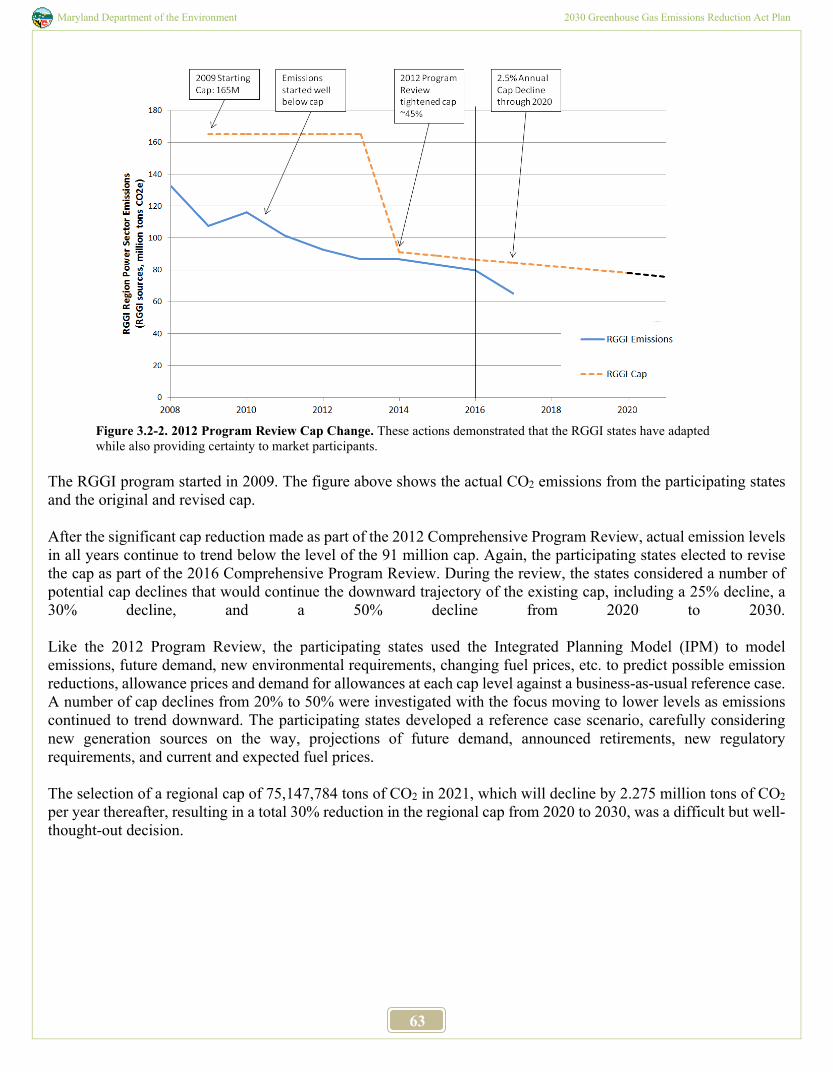
Maryland Department of the Environment 2030 Greenhouse Gas Emissions Reduction Act Plan
63
Figure 3.2-2. 2012 Program Review Cap Change. These actions demonstrated that the RGGI states have adapted while also providing certainty to market participants.
The RGGI program started in 2009. The figure above shows the actual CO2 emissions from the participating states and the original and revised cap. After the significant cap reduction made as part of the 2012 Comprehensive Program Review, actual emission levels in all years continue to trend below the level of the 91 million cap. Again, the participating states elected to revise the cap as part of the 2016 Comprehensive Program Review. During the review, the states considered a number of potential cap declines that would continue the downward trajectory of the existing cap, including a 25% decline, a 30% decline, and a 50% decline from 2020 to 2030. Like the 2012 Program Review, the participating states used the Integrated Planning Model (IPM) to model emissions, future demand, new environmental requirements, changing fuel prices, etc. to predict possible emission reductions, allowance prices and demand for allowances at each cap level against a business-as-usual reference case. A number of cap declines from 20% to 50% were investigated with the focus moving to lower levels as emissions continued to trend downward. The participating states developed a reference case scenario, carefully considering new generation sources on the way, projections of future demand, announced retirements, new regulatory requirements, and current and expected fuel prices. The selection of a regional cap of 75,147,784 tons of CO2 in 2021, which will decline by 2.275 million tons of CO2 per year thereafter, resulting in a total 30% reduction in the regional cap from 2020 to 2030, was a difficult but well-thought-out decision.
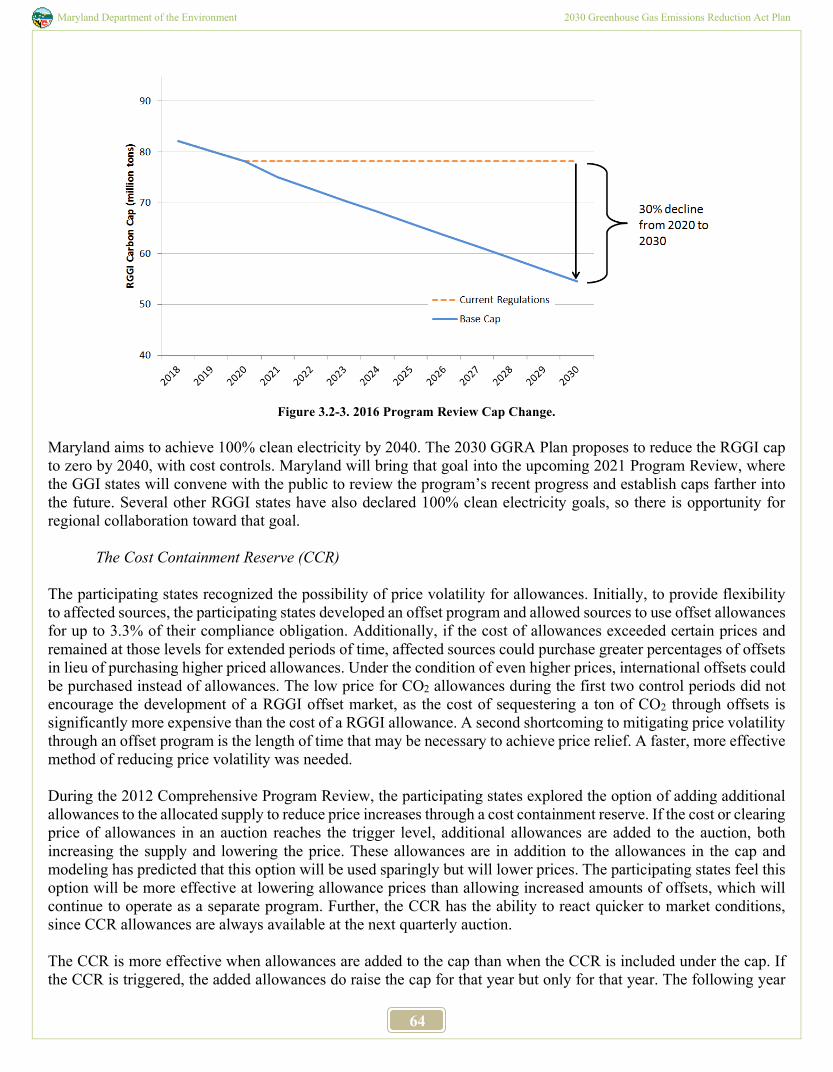
Maryland Department of the Environment 2030 Greenhouse Gas Emissions Reduction Act Plan
64
Figure 3.2-3. 2016 Program Review Cap Change.
Maryland aims to achieve 100% clean electricity by 2040. The 2030 GGRA Plan proposes to reduce the RGGI cap to zero by 2040, with cost controls. Maryland will bring that goal into the upcoming 2021 Program Review, where the GGI states will convene with the public to review the program’s recent progress and establish caps farther into the future. Several other RGGI states have also declared 100% clean electricity goals, so there is opportunity for regional collaboration toward that goal.
The Cost Containment Reserve (CCR) The participating states recognized the possibility of price volatility for allowances. Initially, to provide flexibility to affected sources, the participating states developed an offset program and allowed sources to use offset allowances for up to 3.3% of their compliance obligation. Additionally, if the cost of allowances exceeded certain prices and remained at those levels for extended periods of time, affected sources could purchase greater percentages of offsets in lieu of purchasing higher priced allowances. Under the condition of even higher prices, international offsets could be purchased instead of allowances. The low price for CO2 allowances during the first two control periods did not encourage the development of a RGGI offset market, as the cost of sequestering a ton of CO2 through offsets is significantly more expensive than the cost of a RGGI allowance. A second shortcoming to mitigating price volatility through an offset program is the length of time that may be necessary to achieve price relief. A faster, more effective method of reducing price volatility was needed. During the 2012 Comprehensive Program Review, the participating states explored the option of adding additional allowances to the allocated supply to reduce price increases through a cost containment reserve. If the cost or clearing price of allowances in an auction reaches the trigger level, additional allowances are added to the auction, both increasing the supply and lowering the price. These allowances are in addition to the allowances in the cap and modeling has predicted that this option will be used sparingly but will lower prices. The participating states feel this option will be more effective at lowering allowance prices than allowing increased amounts of offsets, which will continue to operate as a separate program. Further, the CCR has the ability to react quicker to market conditions, since CCR allowances are always available at the next quarterly auction. The CCR is more effective when allowances are added to the cap than when the CCR is included under the cap. If the CCR is triggered, the added allowances do raise the cap for that year but only for that year. The following year
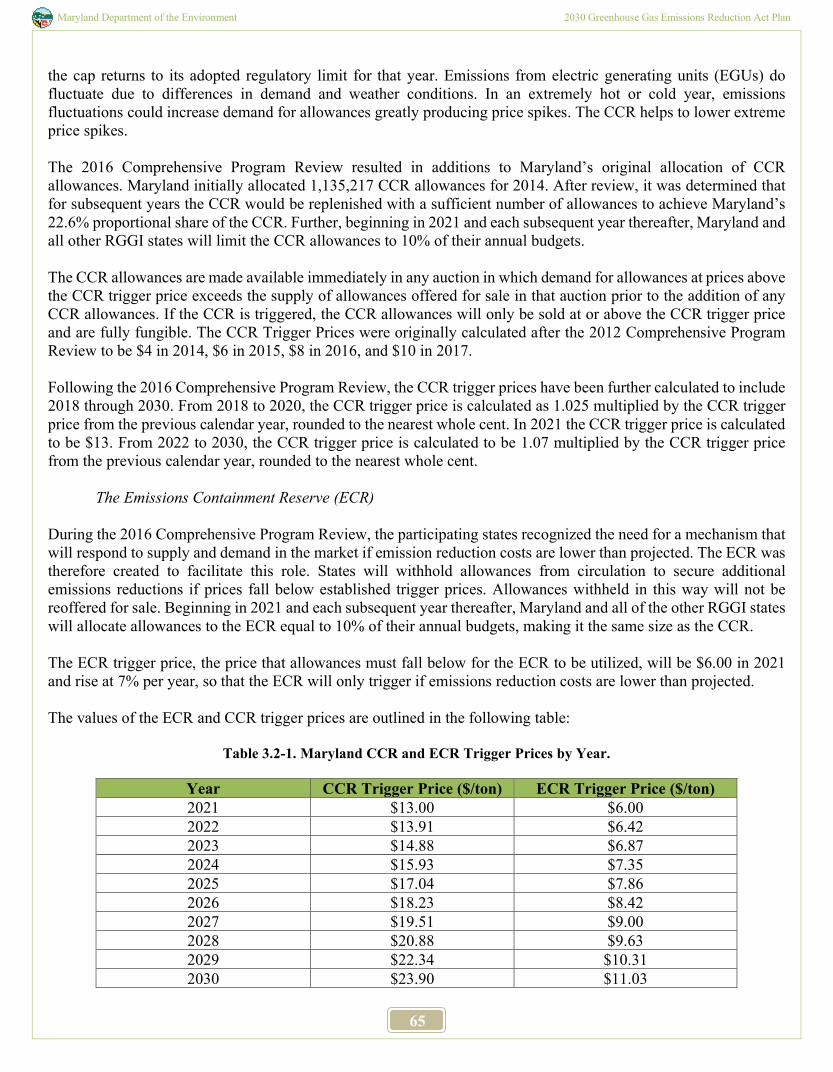
Maryland Department of the Environment 2030 Greenhouse Gas Emissions Reduction Act Plan
65
the cap returns to its adopted regulatory limit for that year. Emissions from electric generating units (EGUs) do fluctuate due to differences in demand and weather conditions. In an extremely hot or cold year, emissions fluctuations could increase demand for allowances greatly producing price spikes. The CCR helps to lower extreme price spikes. The 2016 Comprehensive Program Review resulted in additions to Maryland’s original allocation of CCR allowances. Maryland initially allocated 1,135,217 CCR allowances for 2014. After review, it was determined that for subsequent years the CCR would be replenished with a sufficient number of allowances to achieve Maryland’s 22.6% proportional share of the CCR. Further, beginning in 2021 and each subsequent year thereafter, Maryland and all other RGGI states will limit the CCR allowances to 10% of their annual budgets. The CCR allowances are made available immediately in any auction in which demand for allowances at prices above the CCR trigger price exceeds the supply of allowances offered for sale in that auction prior to the addition of any CCR allowances. If the CCR is triggered, the CCR allowances will only be sold at or above the CCR trigger price and are fully fungible. The CCR Trigger Prices were originally calculated after the 2012 Comprehensive Program Review to be $4 in 2014, $6 in 2015, $8 in 2016, and $10 in 2017. Following the 2016 Comprehensive Program Review, the CCR trigger prices have been further calculated to include 2018 through 2030. From 2018 to 2020, the CCR trigger price is calculated as 1.025 multiplied by the CCR trigger price from the previous calendar year, rounded to the nearest whole cent. In 2021 the CCR trigger price is calculated to be $13. From 2022 to 2030, the CCR trigger price is calculated to be 1.07 multiplied by the CCR trigger price from the previous calendar year, rounded to the nearest whole cent.
The Emissions Containment Reserve (ECR)
During the 2016 Comprehensive Program Review, the participating states recognized the need for a mechanism that will respond to supply and demand in the market if emission reduction costs are lower than projected. The ECR was therefore created to facilitate this role. States will withhold allowances from circulation to secure additional emissions reductions if prices fall below established trigger prices. Allowances withheld in this way will not be reoffered for sale. Beginning in 2021 and each subsequent year thereafter, Maryland and all of the other RGGI states will allocate allowances to the ECR equal to 10% of their annual budgets, making it the same size as the CCR.
The ECR trigger price, the price that allowances must fall below for the ECR to be utilized, will be $6.00 in 2021 and rise at 7% per year, so that the ECR will only trigger if emissions reduction costs are lower than projected. The values of the ECR and CCR trigger prices are outlined in the following table:
Table 3.2-1. Maryland CCR and ECR Trigger Prices by Year.
Year CCR Trigger Price ($/ton) ECR Trigger Price ($/ton) 2021 $13.00 $6.00 2022 $13.91 $6.42 2023 $14.88 $6.87 2024 $15.93 $7.35 2025 $17.04 $7.86 2026 $18.23 $8.42 2027 $19.51 $9.00 2028 $20.88 $9.63 2029 $22.34 $10.31 2030 $23.90 $11.03
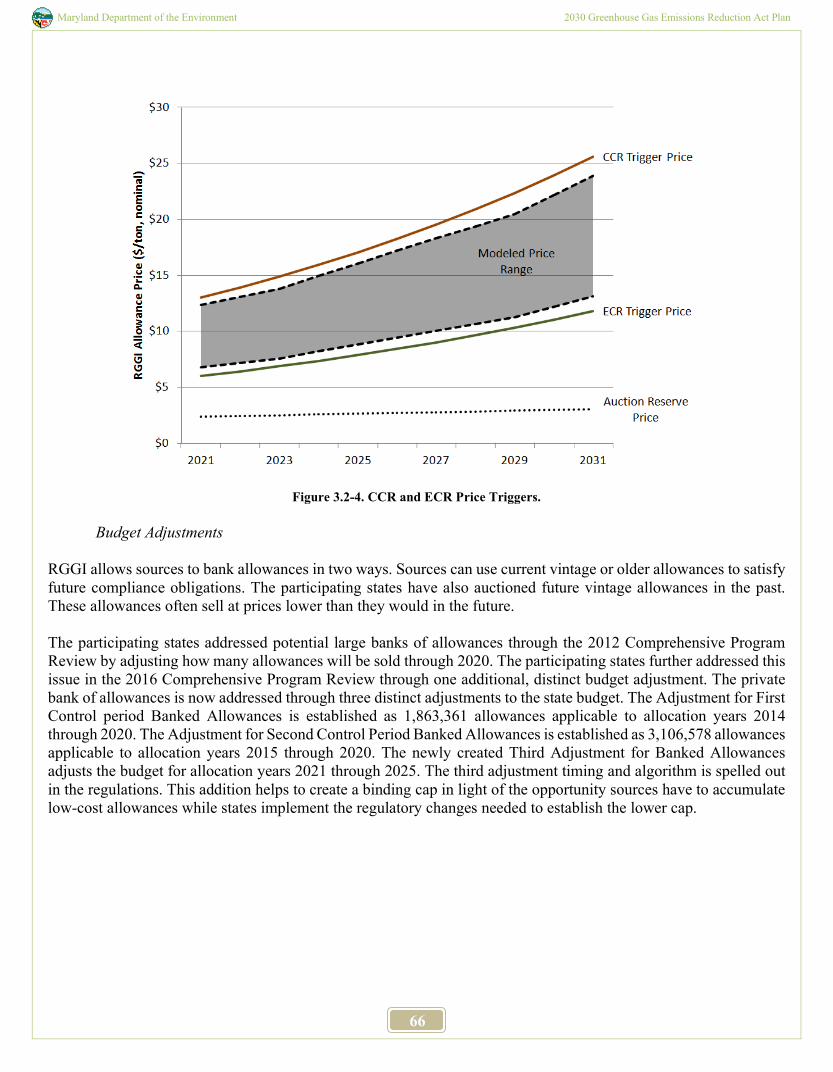
Maryland Department of the Environment 2030 Greenhouse Gas Emissions Reduction Act Plan
66
Figure 3.2-4. CCR and ECR Price Triggers.
Budget Adjustments
RGGI allows sources to bank allowances in two ways. Sources can use current vintage or older allowances to satisfy future compliance obligations. The participating states have also auctioned future vintage allowances in the past. These allowances often sell at prices lower than they would in the future. The participating states addressed potential large banks of allowances through the 2012 Comprehensive Program Review by adjusting how many allowances will be sold through 2020. The participating states further addressed this issue in the 2016 Comprehensive Program Review through one additional, distinct budget adjustment. The private bank of allowances is now addressed through three distinct adjustments to the state budget. The Adjustment for First Control period Banked Allowances is established as 1,863,361 allowances applicable to allocation years 2014 through 2020. The Adjustment for Second Control Period Banked Allowances is established as 3,106,578 allowances applicable to allocation years 2015 through 2020. The newly created Third Adjustment for Banked Allowances adjusts the budget for allocation years 2021 through 2025. The third adjustment timing and algorithm is spelled out in the regulations. This addition helps to create a binding cap in light of the opportunity sources have to accumulate low-cost allowances while states implement the regulatory changes needed to establish the lower cap.
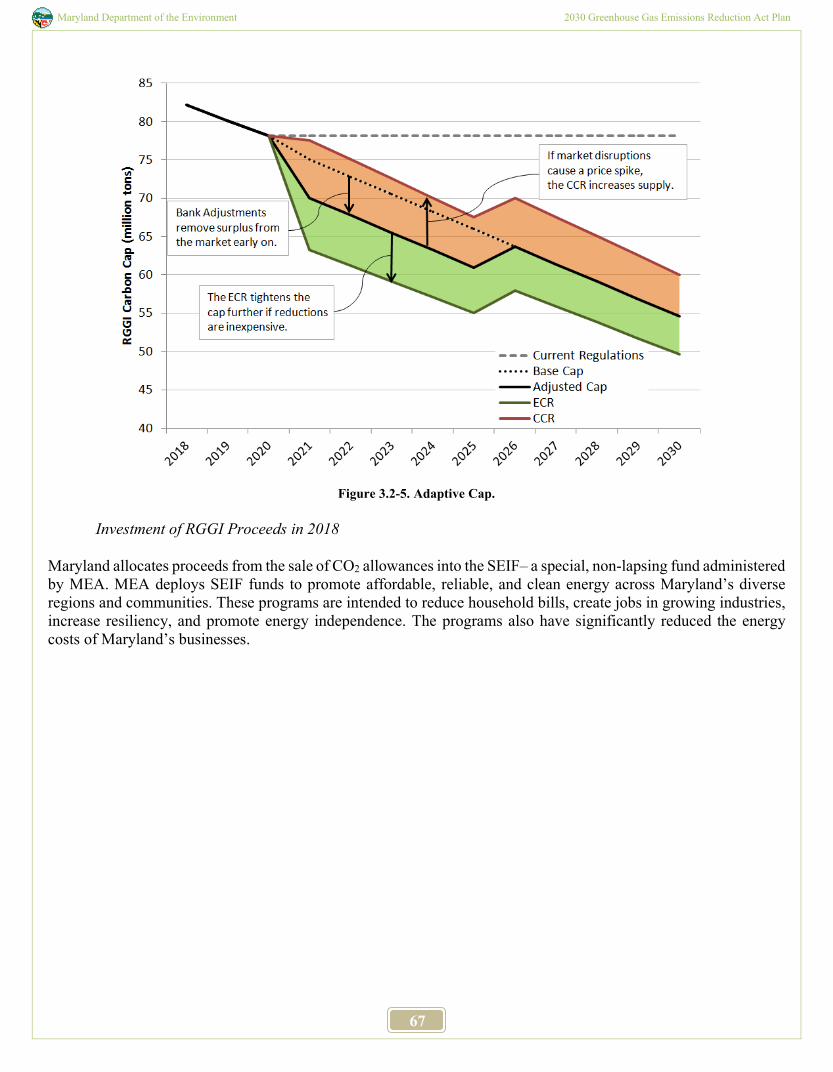
Maryland Department of the Environment 2030 Greenhouse Gas Emissions Reduction Act Plan
67
Figure 3.2-5. Adaptive Cap.
Investment of RGGI Proceeds in 2018
Maryland allocates proceeds from the sale of CO2 allowances into the SEIF– a special, non-lapsing fund administered by MEA. MEA deploys SEIF funds to promote affordable, reliable, and clean energy across Maryland’s diverse regions and communities. These programs are intended to reduce household bills, create jobs in growing industries, increase resiliency, and promote energy independence. The programs also have significantly reduced the energy costs of Maryland’s businesses.
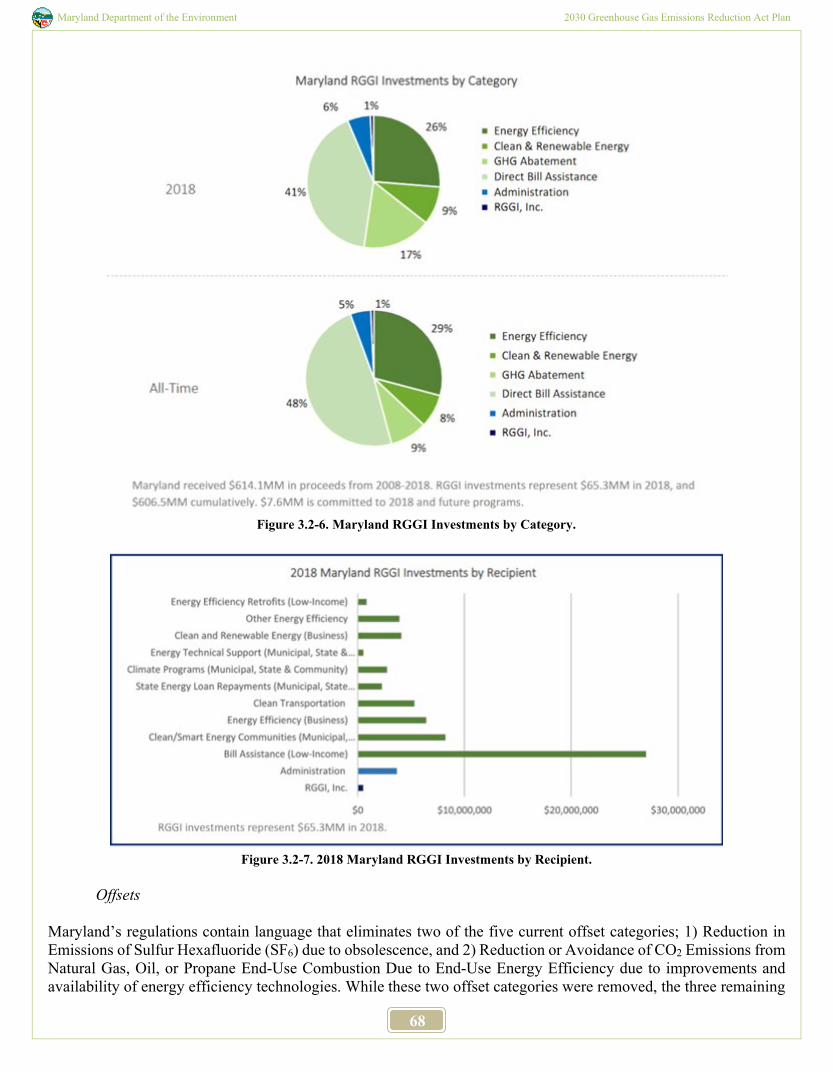
Maryland Department of the Environment 2030 Greenhouse Gas Emissions Reduction Act Plan
68
Figure 3.2-6. Maryland RGGI Investments by Category.
Figure 3.2-7. 2018 Maryland RGGI Investments by Recipient.
Offsets
Maryland’s regulations contain language that eliminates two of the five current offset categories; 1) Reduction in Emissions of Sulfur Hexafluoride (SF6) due to obsolescence, and 2) Reduction or Avoidance of CO2 Emissions from Natural Gas, Oil, or Propane End-Use Combustion Due to End-Use Energy Efficiency due to improvements and availability of energy efficiency technologies. While these two offset categories were removed, the three remaining
Maryland Department of the Environment 2030 Greenhouse Gas Emissions Reduction Act Plan
69
offset categories were maintained and updated. Any awarded offset allowances would remain fully fungible across the participating states.
Continually Stronger RGGI with Geographic Expansion In 2017 RGGI completed a Program Review, and strengthened RGGI with steady, deeper reductions of GHG emissions by 2030, while providing certainty on the future to market participants. With the success of the initiative, and as a national leader in the effort to combat climate change, Maryland and the other participating RGGI states are actively working to engage new participants in the program. The first-in-the-nation carbon cap-and-invest program for power plants has been strengthened by implementing the participating states’ plan to secure an additional 30% reduction in power plant emissions by 2030, and expanding the program to new participating states in the region to reduce pollution from power plants supplying electricity into Maryland. RGGI works to continually reduce CO2 emissions from certain EGUs through a cap-and-invest program. One indirect benefit of this program is the reduction of co-pollutants from fossil fuel combustion, such as particulates and tropospheric ozone. The program’s design allows for trading among EGUs, and therefore does not manage the distribution of co-pollutant emissions. While not inherently inequitable, it does allow for potential creation or exacerbation of pollution ‘hotspots’ in historically disadvantaged communities. As then-chair of the RGGI, Inc. Board of Directors, MDE led deliberations among the RGGI states to broaden participation to include New Jersey and Virginia. In July 2019, New Jersey finalized regulations allowing it to renew its participation in January 2020. Virginia also finalized regulations and began participation in January 2021. Other states, including Pennsylvania have taken important steps that should lead to future participation.
3.2.6 Housing and Building Energy Programs Lead Agency: DHCD The Department of Housing and Community Development’s (DHCD) Housing and Building Energy Program (HBEP) division has developed a highly skilled team of energy efficiency, research and program development, and construction management professionals. The team is dedicated to the refinement, coordination and scaling of the existing suite of programs and to transfer these skills to the development of new and innovative programs and delivery systems that wil l provide growth in the energy efficiency, renewable energy, and weatherization disciplines. The HBEP programs support Maryland’s goals to reduce the energy cost burden on Maryland residents. HBEP is in the process of screening the various program offerings within DHCD’s Division of Development Finance, also known as the Community Development Administration (CDA) and the department at large to determine potential enhancements required to increase the agency's overall impact towards the mitigation of GHG emissions and the negative economic impact of climate change beyond FY20. HBEP administers a number of energy grant and deferred loan programs for limited-income families and affordable multifamily housing.
Program Objectives Under the Housing and Building Energy Programs, the Division provides grants and low-cost loans with flexible terms for the purchase and installation of energy efficiency improvements in single family and affordable multifamily rental housing developments. The program is being undertaken as part of the State’s efforts to:
1. Reduce the energy cost burden on Marylanders.
Maryland Department of the Environment 2030 Greenhouse Gas Emissions Reduction Act Plan
70
2. Increase energy efficiency. 3. Reduce GHG emissions. 4. Promote energy efficiency and renewable energy sources. 5. Provide a healthier environment in which to live. 6. Create and preserve affordable rental housing opportunities. 7. Create jobs. 8. Foster business development and sustainable mortgages by reducing the energy burden on residents and
property owners.
Implementation Milestones The 2015 GGRA Plan Update stated that DHCD’s programs could reduce 0.02 million metric tons of carbon dioxide equivalent (MMtCO2e) by 2020 (LIEEP, MEEHA, WAP). The actual achieved reductions are 0.064 MMtCO2e, or three times the projection. In CY19, DHCD’s energy programs completed energy efficiency upgrades of 9,239 households. These improvements represent a first-year reduction of 0.011 MMtCO2e. The programs delivered 129,230 in MMBtu savings. Below is a table of savings by program.
Table 3.2-2. CY 2019 – Savings in the Installation Year.
Program MMBtu Saved MTCO2e
EmPOWER – Single Family (State) 65,873 5,255 EmPOWER – Multifamily (State) 25,138 1,800 Other Programs (State, federal) 5,368 505 DOE Weatherization Assistance4 Program (federal) 4,925 491 Multifamily Rental Housing (federal, State, Special) 22,348 2,550 NetZero (Special) 5,609 634 First Year Reductions TOTAL 129,230 11,232
The average life of savings for each energy project is eight years. For the 44,508 households that received energy efficiency upgrades since CY12, in CY19 the realized savings over eight years were 73,012 MtCO2e (0.064 MMtCO2e).
Table 3.2-3.
Year Households Served CY12 3,222 CY13 3,788 CY14 6,517 CY15 5,458 CY16 5,517 CY17 4,695 CY19 4,787 CY20 9,239
The projects installed in CY19 will continue to reduce GHG emissions every year until 2027. Some measures will provide savings well into the future, beyond 2030, that this calculation does not capture. In CY19, the savings from
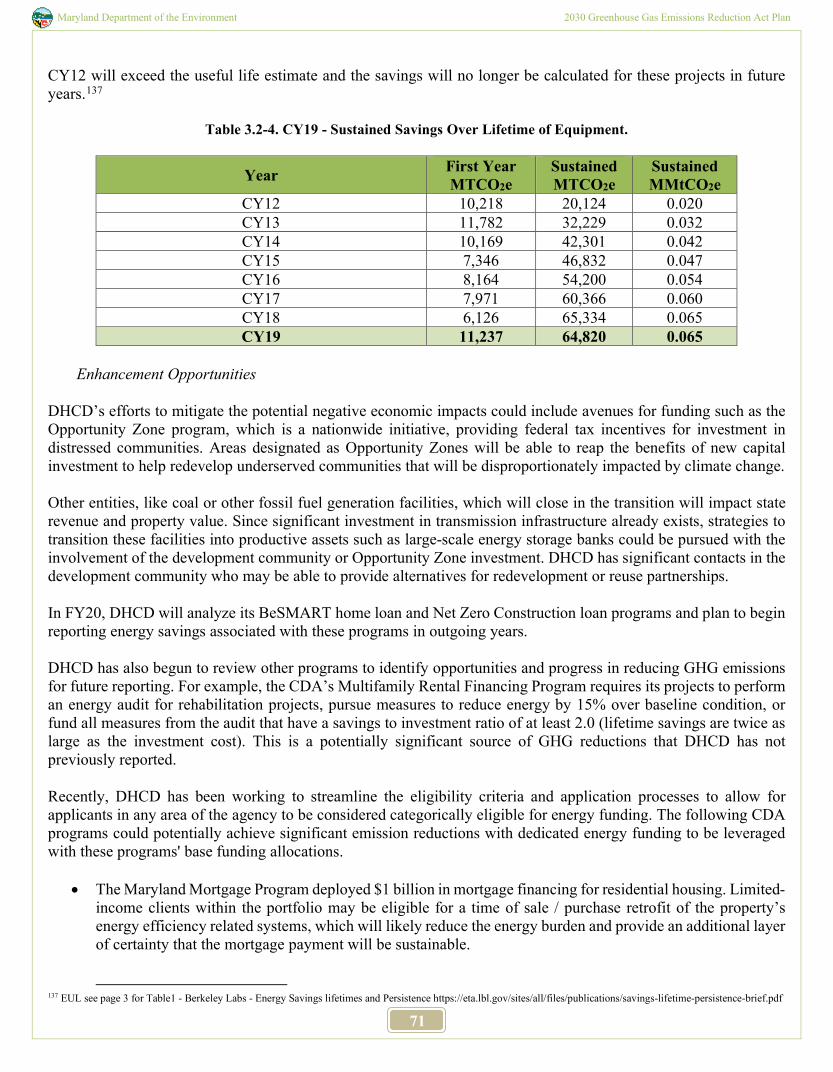
Maryland Department of the Environment 2030 Greenhouse Gas Emissions Reduction Act Plan
71
CY12 will exceed the useful life estimate and the savings will no longer be calculated for these projects in future years.137
Table 3.2-4. CY19 - Sustained Savings Over Lifetime of Equipment.
Year First Year MTCO2e
Sustained MTCO2e
Sustained MMtCO2e
CY12 10,218 20,124 0.020 CY13 11,782 32,229 0.032 CY14 10,169 42,301 0.042 CY15 7,346 46,832 0.047 CY16 8,164 54,200 0.054 CY17 7,971 60,366 0.060 CY18 6,126 65,334 0.065 CY19 11,237 64,820 0.065
Enhancement Opportunities
DHCD’s efforts to mitigate the potential negative economic impacts could include avenues for funding such as the Opportunity Zone program, which is a nationwide initiative, providing federal tax incentives for investment in distressed communities. Areas designated as Opportunity Zones will be able to reap the benefits of new capital investment to help redevelop underserved communities that will be disproportionately impacted by climate change. Other entities, like coal or other fossil fuel generation facilities, which will close in the transition will impact state revenue and property value. Since significant investment in transmission infrastructure already exists, strategies to transition these facilities into productive assets such as large-scale energy storage banks could be pursued with the involvement of the development community or Opportunity Zone investment. DHCD has significant contacts in the development community who may be able to provide alternatives for redevelopment or reuse partnerships. In FY20, DHCD will analyze its BeSMART home loan and Net Zero Construction loan programs and plan to begin reporting energy savings associated with these programs in outgoing years. DHCD has also begun to review other programs to identify opportunities and progress in reducing GHG emissions for future reporting. For example, the CDA’s Multifamily Rental Financing Program requires its projects to perform an energy audit for rehabilitation projects, pursue measures to reduce energy by 15% over baseline condition, or fund all measures from the audit that have a savings to investment ratio of at least 2.0 (lifetime savings are twice as large as the investment cost). This is a potentially significant source of GHG reductions that DHCD has not previously reported. Recently, DHCD has been working to streamline the eligibility criteria and application processes to allow for applicants in any area of the agency to be considered categorically eligible for energy funding. The following CDA programs could potentially achieve significant emission reductions with dedicated energy funding to be leveraged with these programs' base funding allocations.
• The Maryland Mortgage Program deployed $1 billion in mortgage financing for residential housing. Limited-income clients within the portfolio may be eligible for a time of sale / purchase retrofit of the property’s energy efficiency related systems, which will likely reduce the energy burden and provide an additional layer of certainty that the mortgage payment will be sustainable.
137 EUL see page 3 for Table1 - Berkeley Labs - Energy Savings lifetimes and Persistence https://eta.lbl.gov/sites/all/files/publications/savings-lifetime-persistence-brief.pdf
Maryland Department of the Environment 2030 Greenhouse Gas Emissions Reduction Act Plan
72
• Multifamily Rental Housing’s $300 million in development annually and DHCD’s Rental Housing Asset Management portfolio of 48,000 regulated rental housing units has the potential to provide a significant impact in transitioning the existing housing stock to healthy, efficient, affordable housing.
• As mentioned above DHCD looks to expand the number of programs that have quantifiable impact on GHG emissions. These include programs such as the Creating Opportunities for Renewal and Enterprise Program (Project C.O.R.E.), Neighborhood Revitalization and Business Works as detailed below:
o The Project C.O.R.E. program is an example of successful community centric redevelopment. The reclamation of over 4200 blighted properties through Project C.O.R.E., can provide a new canvas for Baltimore, clearing the way for new green space, new affordable and mixed-use housing, and new and greater opportunities for small business owners to innovate and grow.
o The removal of thermal mass within the city to combat heat island effects and provide relief from asthma and other potential health-related problems, while raising the property values and thereby wealth for the residents.
o The Science and Technical work group has identified greater than expected methane emissions centered on Baltimore, Washington DC and other large cities. A C.O.R.E. program enhancement for capping off dormant sewage vents that release methane and other noxious gasses into the atmosphere.
o Neighborhood Revitalization and Business Works could support potential redevelopment and business-related pilot programs, such as a Warehouse Efficiency Upgrade Program or a Commercial Retrofit Demonstration Program.
Financial Division Description DHCD’s CDA is the housing finance agency for the State of Maryland. CDA comprises three branches: Multifamily Housing, Single-Family Housing, and Finance. CDA Multifamily Housing expands quality, affordable rental and transitional housing opportunities for Marylanders by financing the development, rehabilitation, and preservation of these housing types, and by administering rental assistance programs and the federal Low Income Housing Tax Credit program. CDA Single Family Housing provides homebuyer assistance programs by offering mortgage loans, down payment, and closing cost assistance to eligible homebuyers with low-to moderate-income, programs to rehabilitate single family rental housing to improve basic livability, and programs to meet unique housing needs, including lead paint reduction, weatherization assistance and financing for persons with special needs. CDA Finance raises capital in the national municipal bond markets to provide financing at below-market interest rates for individuals to purchase single family homes, for nonprofit and for-profit entities to construct and rehabilitate multifamily properties, and for local governments to improve and construct public infrastructure. The CDA’s primary financing sources are municipal bonds and State-appropriated funds. These programs not only support new construction or the acquisition and rehabilitation of existing housing, but also support businesses, create jobs, leverage multiple funding sources, and provide safe and affordable housing opportunities for families, senior citizens, and individuals with disabilities throughout the state, all of which are directly related to the limited income community. Community Development is critical to minimize anticipated negative economic impacts associated with climate change. Collectively, the CDA provided an economic impact of $2.6 billion in FY19. As RGGI or other funding resources become available, leveraging them with the CDA’s annual $2.6 billion of year over year economic impact is a best bet for achieving substantial reductions in emissions while minimizing the potential negative economic impact of climate change. Transition Towards a Clean Energy Economy
Maryland Department of the Environment 2030 Greenhouse Gas Emissions Reduction Act Plan
73
DHCD and the HBEP team have established a proven track record delivering services and programs to the limited-income community. DHCD is particularly focused on the wellbeing and uplifting of the limited income community and depressed areas through multiple initiatives in almost every driving force of the economy. Offsetting Energy Burden The cost of energy disproportionately impacts the low to moderate income population, potentially causing difficult decisions to be made between paying for energy bills and buying food or paying for medical expenses. The rising cost of energy may further exacerbate these issues, and without assistance people in this situation are unable to pay for the building upgrades necessary to alleviate them. These building upgrades reduce both energy costs and GHG emissions and are widely available for those with the means to purchase them. As such the rebate programs established under EmPOWER are also often beyond the reach of the low-income community. DHCD’s programs help to fill the gap for a more efficient energy future for those without the means to afford them. Currently, DHCD administers programs such as the Department of Energy’s (DOE) Weatherization Assistance Program and the EmPOWER low-income programs that provide direct benefits for people in this community. Other DHCD administered programs provide benefits indirectly such as the upgrades to multifamily buildings through the CDA’s Multifamily programs. These upgrades include improvements to the energy efficiency of the building. DHCD is continually looking for ways to scale up its ability to alleviate the energy burden for those who need it the most through innovative new programs and partnerships.
Challenges It is anticipated that the low-income community will be disproportionately impacted by climate change. To address this, DHCD is working on a coordinated effort for energy related projects, and housing, community and workforce development, pulling in resources across all divisions: In the transition from a fossil fuel economy to a clean energy economy, low-income Marylanders will be prioritized by DHCD including displaced workers who will need assistance in housing, career or workforce development training, and counseling. DHCD’s HBEP has developed comprehensive weatherization training for workforce members who wish to enter the energy efficiency job market. SEIF funds have historically allowed DHCD to maximize savings per project.
Relevant Information DHCD is in the process of screening its various program offerings to determine the potential impact beyond FY20. Some DHCD programs indirectly support energy efficiency by providing funding for projects that are necessary to meet criteria for energy programs. Short term needs include funding for dedicated resources to provide program development and coordination between the various programs, sister agencies, and the HBEP team. Funding for program development, review, and enhancement will enable HBEP to provide meaningful energy savings and emissions reductions in these various program offerings that are not currently being fully quantified. To fully gauge DHCD’s potential impact these resources would need to be provided in the near term for program development, procurement, and staffing to be acquired during the 2021-2023 empower program timeframe.
3.2.6.1 Energy Financing for Housing and Communities Lead Agency: DHCD
Maryland Department of the Environment 2030 Greenhouse Gas Emissions Reduction Act Plan
74
Program Description
The BeSMART Home Energy Loan Program offers financing to homeowners across the state for energy efficiency replacement and/or upgrade of appliances, heating, cooling and ventilation systems and whole house envelope improvements. The product in CY19 was 4.99% APR unsecured loan with a term of 10 years. In CY19 DHCD closed 57 BeSMART loans with homeowners for energy efficiency improvements from revolved EECBG loan payments. DHCD has also developed new finance programs that use Energy Efficiency Community Block Grants (EECBG) revolved funds, SEIF, and/or general fund appropriations. The original EECBG grant was a competitive grant award and was fully expended. Since inception to the end of CY19, the BeSMART program has closed 267 home loans at a total of $4.4 million, $737 thousand in business loans, and $9.6 million in multifamily loans. For the BeSMART (EECBG) Home Loan program, DHCD uses revenue from interest earned on outstanding principal to maintain administrative costs for the program. Returned principal is required to be revolved into new loans.
Funding For the BeSMART (EECBG) Home Loan program, DHCD uses revenue from interest earned on outstanding principal to maintain administrative costs for the program. Returned principal is required to be revolved into new loans. The Net Zero Construction Loan Program received $500,000 in General Fund appropriation in FY17, $1,100,000 in funding from the SEIF FY2018 and $1 million General Fund appropriations in FY18, $1 million General Fund appropriation in FY19. Additional funding is necessary to expand the reach of the Net Zero Program. To date, the program has provided total funding for projects covering multiple areas of the residential built environment. The Net Zero Revolving Loan fund is emerging from this development stage and looks to be a key addition to the suite of program offerings within CDA. Revolving loan funds like Net Zero eventually become self-sustaining programs that require little funding from general funds. Providing initial seed funding now that the program development and pipeline are well underway will go a long way towards providing a sustainable emissions reduction tool.
Challenges Limited administrative resources for BeSMART restrict opportunities for outreach, education for borrowers, and training for contractors. The Net Zero Construction Loan Program funds the construction of new or existing single and multifamily housing in Maryland. The project must achieve a HERS Index Rating of 35 or less, towards Net Zero or Net Zero Ready. DHCD has administered a Net Zero program over the past 4 years. DHCD sees opportunities to leverage EmPOWER funds with this existing program to expand on opportunities, which should result in a deeper reach and aid in achieving Maryland’s emission reduction goals. The Net Zero Revolving Loan fund is emerging from its development stage and looks to be a key addition to the suite of program offerings within CDA. The program has been included in the request for funding - 2021-2023 Empower cycle.
Maryland Department of the Environment 2030 Greenhouse Gas Emissions Reduction Act Plan
75
In CY19 DHCD began construction on a 9-unit Manufactured Net Zero project at the Nicholas landing Multifamily site in Easton, Maryland. The project is developed by the Housing Authority of Talbot County Project, using funding from the SEIF and leveraged with the EECBG loan program for efficiency measures. 3.2.6.2 Energy Efficiency for Affordable Housing and Limited Income Families Lead Agency: DHCD
Program Description DHCD’s division of Housing and Building Energy Programs includes the following energy grant and deferred loan programs for limited income families and affordable multifamily housing: The Weatherization Assistance Program installs energy conservation measures to increase the energy efficiency of dwellings owned or occupied by low-income persons, reduce their total residential energy expenditures, and improve their health and safety, especially low-income persons who are particularly vulnerable, such as the elderly, the disabled, and children. These measures also reduce GHG emissions and the cost of maintenance for these homes. Funding is provided by the U.S. Department of Energy. DHCD works with Local Weatherization Agencies that consists of community action agencies, local governments, and other non-profits. The EmPOWER Low Income Energy Efficiency Program (LIEEP) and the Multifamily Energy Efficiency and Housing Affordability Program (MEEHA) provide grants and deferred loans to limited income households and individually metered affordable housing managers respectfully. These awards fund installation of energy conservation measures in homes and buildings. Funding is provided by ratepayers of the participating EmPOWER Maryland utility companies. These funds are regulated by the PSC. The Special Loan Programs (SPL) - Programs within the SPL funding area will be more closely coordinated and leveraged with the energy programs in a “Whole Home” approach to service delivery.
• Accessible Homes for Seniors is a financing program for accessibility improvements including the installation of grab bars and railings, widening of doorways and installation of ramps. Home improvements such as these represent the key for many people to remain in their home and maintain their independence.
• Lead Hazard Reduction Grant and Loan Program is a grant and loan program to assist homeowners and landlords lessen the risk of lead poisoning and preserve the housing stock by reducing or eliminating lead-based paint hazards.
• Additional programs for rehabilitation are also available (see DHCD website for details). The Customer Investment Fund’s Enhanced Weatherization program and Improved Efficiency for Multifamily Housing Program were pilot programs grants and are fully expended as of the end of CY19. DHCD concluded an evaluation of these programs in FY19 and FY20.
• The Enhanced weatherization component has applied for funding under EmPOWER for inclusion in the 2021-2023 program cycle.
• The Improved Efficiency for Multifamily Housing Program (One Stop Shop) was highly successful deploying 12 turnkey projects in 18 months; significantly reducing the time frame from application through completion. It will likely require an alternate funding source to move forward.
Funding
Funding in each of the last three fiscal years, CDA’s financial commitments (direct benefits to Marylanders and administrative costs) averaged $30 million. This is largely supported by the EmPOWER funding which requires renewal every three years. DHCD has been instructed by the PSC to work with the Limited income Work group to
Maryland Department of the Environment 2030 Greenhouse Gas Emissions Reduction Act Plan
76
establish a percentage-based goal for reducing energy consumption by limited income households. In order to prepare for implementation of any goal additional program support and development funds dedicated to scaling up current operations will be necessary. 3.2.7 Other Energy Programs
This policy contains various other energy programs which, when fully implemented, will provide further potential emissions reductions into the future and will create and retain jobs and increase the State gross domestic product.
3.2.7.1 GHG Power Plant Emission Reductions from Federal Programs
Lead Agency: MDE
Program Description GHG emissions from the energy supply sector in Maryland include emissions from fossil fuel-fired electricity generation and represent a substantial portion of the State’s overall GHG emissions. Electricity demand in Maryland - as with the rest of the world, is expected to increase over time and thus, if unmitigated, GHG emissions will also likely increase. Since approximately 40% of electricity consumption in Maryland is generated out-of-state in the surrounding PJM electricity grid region, State programs alone cannot effectively control GHG emissions from power generated outside of the state but consumed in Maryland. Existing and proposed federal rules summarized in this section (3.3.5.1.1 Boiler Maximum Achievable Control Technology; 3.3.5.1.2 GHG New Source Performance Standard; and 3.3.5.1.3 GHG Prevention of Significant Deterioration Permitting Program) are expected to reduce GHG emissions from Maryland and out-of-state power generators.
3.2.7.1.1 Boiler Maximum Achievable Control Technology (MACT)
Lead Agency: MDE
Program Description The Boiler MACT rule applies to any stationary source with a boiler or group of stationary sources with boilers that emit 10 tons per year of any single Hazardous Air Pollutant (HAP) of 25 tons per year of any combination of HAPs. The Boiler MACT rules require operators to conduct a boiler tune-up to improve efficiency, minimize fuel consumption, and reduce emissions.
Program Objectives
The Boiler MACT program’s purpose is to reduce GHG emissions from both Maryland and out-of-state power generators.
Implementation Milestones
The United States Environmental Protection Agency (EPA) adopted new air emissions requirements for industrial, commercial, and institutional boilers under two separate rulemakings. Specific implementation milestones include:
• January 2013: established national emission standards for HAPs for major sources.
Maryland Department of the Environment 2030 Greenhouse Gas Emissions Reduction Act Plan
77
o The rule affects thousands of boilers and process heaters at facilities nationwide that are considered as major sources.
• February 2013: EPA issued a Boiler MACT rule for smaller “area sources”. • March 2014: All boilers demonstrate compliance with emission limits and perform compliance reports as
mandated. • January 2016: 18 new boilers have obtained permits and are subject to the MACT.
Enhancement Opportunities
This program has the potential to be enhanced every time new control technology is developed through new regulations and standards.
Challenges
While it does not necessarily experience a major “challenge,” the Boiler MACT program is instead limited by the availability, effectiveness, and overall viability of current control technology.
3.2.7.1.2 GHG New Source Performance Standard
Lead Agency: MDE
Program Description
EPA is using the New Source Performance Standard’s authority under the federal Clean Air Act to promulgate new regulations to reduce GHG emissions from fossil fuel-fired power plants. These standards apply to new EGUs and are based on existing technologies. EPA is coordinating this action on GHGs with a number of other required regulatory actions for other pollutants, thereby enabling EGUs to develop multi-pollutant strategies to reduce pollutants in a more efficient and cost-effective way than would be possible by addressing multiple pollutants separately.
Program Objectives
The GHG New Source Performance Standard is designed with the intent to lower GHG pollution from fossil fuel-fired power plants.
Implementation Milestones
The New Source Performance Standard is fully enforceable through the federal Clean Air Act. MDE will continue to implement the federal rules by adopting it into Maryland state regulations. The MDE Air Quality Compliance Program will then ensure that the utilities comply with the requirements. Based on certified emissions reports, the MDE will be able to determine the amount of GHG reductions achieved.
Enhancement Opportunities
The New Source Performance Standard is tied to the Clean Air Act; thus, any enhancements are likewise tied to the authority granted by the Clean Air Act.
Challenges
Maryland Department of the Environment 2030 Greenhouse Gas Emissions Reduction Act Plan
78
The main challenge to this standard will lie in finding these emissions solutions that reduce multiple pollutants at once. Once solutions are found that are applicable to the standard power plant, the program’s success will ultimately just be a matter of proper communication.
3.2.7.1.3 GHG Prevention of Significant Deterioration Permitting Program
Lead Agency: MDE
Program Description
The Prevention of Significant Deterioration (PSD) program is a federal preconstruction review and permitting program. It applies to new major stationary sources and major modifications at existing sources. PSD requires the application of Best Available Control Technology (BACT) to control emissions of certain pollutants, which now include GHGs. Sources subject to the requirements of the PSD program must evaluate and apply currently available measures and future technology as it develops to reduce GHG emissions. The PSD program’s “increment” is the amount of pollution an area is allowed to increase. The PSD program’s increments prevent the air quality in clean areas from deteriorating to the level set by the National Ambient Air Quality Standards. The National Ambient Air Quality Standards is a maximum allowable pollution amount. A PSD program increment, on the other hand, is the maximum allowable increase in concentration that can occur above a baseline concentration for a pollutant. The baseline concentration is defined for each pollutant and, in general, is the ambient concentration at the time that the first complete PSD permit application affecting the area is submitted. Significant deterioration is said to occur when the amount of new pollution would exceed the applicable PSD increment. It is important to note, however, that the air quality cannot deteriorate beyond the concentration allowed by the applicable National Ambient Air Quality Standards, even if not all of the PSD increment is consumed.
Program Objectives
The PSD program aims to limit the emissions of pollutants and GHGs by mandating that stationary sources use BACT. BACT determination is designed to be fair, as it considers the cost-effectiveness and relative energy, and environment impacts of the controls.
Implementation Milestones
MDE has adopted regulations to implement and enforce the federal PSD program and has issued several PSD approvals requiring the regulated sources to implement BACTs for GHGs. Specific implementation milestones include:
• January 2011: Requirements will apply to sources’ GHG emissions only if the sources are already subject to the PSD due to their non-GHG pollutants.
o Therefore, EPA will not require sources or modifications to evaluate whether they are subject to this program’s requirements solely on account of their GHG emissions.
o The PSD program’s BACT will apply to projects that increase net GHG emissions by at least 75,000 tons (CO2e) per year, but only if the project also significantly increases emissions of at least one non-GHG pollutant.
• July 2011: the PSD program’s BACT will apply to either new sources that have the potential to emit 100,000 tons (CO2e) per year or existing sources modified to increase net emission of CO2e by at least 75,000 tons per year.
• July 2013: additional sources will be included under the PSD program requirements and a possible permanent exclusion from permitting will be determined for some source categories.
Maryland Department of the Environment 2030 Greenhouse Gas Emissions Reduction Act Plan
79
• April 2015: EPA will establish an enforceable commitment stating that EPA will complete a streamlining study to evaluate the status of the PSD program for GHG emitting sources.
o No sources with emissions below 50,000 tons (CO2e) per year and no modification resulting in net GHG increases of less than 50,000 tons (CO2e) per year will be subject to this program’s permitting before at least 6 years from now until April 30, 2016.
Enhancement Opportunities
The PSD will be naturally enhanced as new control technologies are developed. As the BACT changes with new advances, the PSD requirements will adjust and improve.
Challenges
As mentioned above, PSD will naturally be enhanced as control technology improves. However, this will require continued funding and research. If money and time is shifted away from finding new techniques and technology to limit GHG emissions, the PSD program will be stalled and may stagnate with a lack of new control technologies. 3.2.8 Building and Trade Codes in Maryland
Lead Agency: Department of Labor
Program Description
Given the long lifetime of buildings, state and local building codes play an integral role in providing long-term GHG emissions reductions. The statewide building code in Maryland is adopted by the Building Codes Administration within the Maryland Department of Labor. The statewide building code is called the Maryland Building Performance Standards (MBPS). MBPS includes International Building Code (IBC), International Residential Code (IRC), International Energy Conservation Code (IECC) and International Green Construction Code (IgCC), all published by the International Codes Council (ICC). MBPS is updated every three years (except for IgCC). Within 18 months of publication of a new edition of these codes by ICC, the Building Codes Administration is required by law to adopt these latest editions of codes into the MBPS (except for IgCC). Subsequently, the local jurisdictions shall adopt and implement the MBPS within 12 months of State adoption. Local jurisdictions may amend the MBPS to meet the specific conditions and needs of their jurisdiction – with a few exceptions. For example, automatic fire sprinkler systems (IRC), the energy code (IECC) and the accessibility code (Maryland Accessibility Code) cannot be weakened. IgCC is a voluntary option for local jurisdictions to adopt. The Building Codes Administration also adopts the Model Performance Code, a collection of separate building codes, which regulates the construction of state buildings (owned, used or leased) and industrialized (modular) buildings. Modular buildings are constructed off-site in manufacturing plants, transported into Maryland and installed at job sites. The Model Performance Code includes not only the same ICC published codes as in the MBPS, but also other codes from the ICC family of codes such as International Mechanical Code & International Plumbing Code, as well as the National Fire Protection Association’s (NFPA) National Electrical Code. The Building Codes Administration also adopts the International Existing Building Code under Maryland Building Rehabilitation Code Regulations. Maryland is at the forefront of building and energy code adoption in the United States because Maryland law requires the latest edition of International Codes (except for IgCC) be adopted within 18 months from their publication. Among the codes adopted, the energy code, IECC, has a direct impact on the GHG emission in Maryland.
Maryland Department of the Environment 2030 Greenhouse Gas Emissions Reduction Act Plan
80
In a report titled “Impact of Model Building Energy Codes”, prepared by the Pacific Northwest National Laboratory for the US Department of Energy, the nation as a whole can achieve 234.52 million metric tons (MMt) in the reduction of CO2 between 2010 and 2030 by the adoption of latest editions of model energy code. For Maryland specifically, 2.91 MMt of CO2 reduction for residential buildings and 2.80 MMt of CO2 reduction for commercial buildings between 2010 and 2030 can be achieved. In the same Report, states are classified into four categories based on their historical rate of adoption: Timely, Medium Slow, Very Slow & Not Applicable. Maryland is one of only seven states which are in the category of “Timely”. During the COVID-19 pandemic, most organizations (public and private) have embraced the ability to work remotely. Technology has advanced in a way that acceptable productivity at work does not require the physical presence of employees in the office. As a result of teleworking during the current pandemic, many organizations may choose to continue the teleworking, which offers benefits to employees and the employers alike, including reduced cost of office space. As demand for new office buildings decreases, energy required for these buildings also decreases, which translates into less GHG emission.
Program Objectives
• Ensure that industrialized (modular) buildings are designed and constructed to meet Maryland’s Model
Performance Code. • Adopt statewide building codes and work with local governments, design professionals, and building code
enforcement officers, including plan reviewers and construction inspectors, to ensure reasonable protection to the public against hazards to life, health and property; to establish the policies and procedures associated with the operation of a database, which contains the MBPS, the local amendments, and other related information.
• Provide training on newly adopted building codes to local code officials and stakeholders. Implementation Milestones
• Review new editions of mandatory building codes, including IBC, IRC and IECC, for adoption. • Review other discretionary building codes during each code adoption cycle and update them as needed. • Review building plans of industrialized (modular) buildings and conduct inspections of manufacturing
facilities to ensure that construction of modular buildings meets requirements of Model Performance Code. • Provide interpretation of Maryland Accessibility Code (MAC) and process Waiver Applications of Maryland
Accessibility Code by following established procedures defined in the MAC. • Conduct meetings of Maryland Building Rehabilitation Code Advisory Council for matters related to
renovation/alteration of existing buildings. Recommendations for Future Actions and Reporting:
• Allow the Building Codes Administration flexibility to consider building code action items due to changes in building technology.
• Provide education to local building code officials on amendments to IECC to allow flexibility in meeting energy efficiency requirements in residential dwelling construction. This was completed during the 2018 code adoption cycle through department regulations.
• Improve and expand training of state adopted building code for employees of local jurisdictions statewide. Enhancement Opportunities
Maryland Department of the Environment 2030 Greenhouse Gas Emissions Reduction Act Plan
81
• Work with counties and other executive branch bodies that have control of different building codes, such as Maryland State Fire Marshal Office and Maryland Department of Labor, Division of Occupational and Professional Licensing, to better align the codes across all jurisdictions in Maryland.
• July 1, 2018, the Building Codes Administration was transferred from DHCD to Department of Labor Division of Labor and Industry (DLI). Within DLI, several related building design/construction related licensed professionals and trades are regulated. Additionally, the International Mechanical Code and International Plumbing Code are also adopted by other units within the Department of Labor. Since the Department of Labor is responsible for the majority of building related codes and licensing of persons engaged in design/construction, new opportunities are being realized for streamlining regulations related to building construction in the State of Maryland. Funding
The Building Codes Administration has two primary funding sources, including general fund and funds received under the Industrialized Building Program. Manufacturers of the industrialized/modular buildings and their Approved Testing Facilities (ATF) are required to renew their Maryland registrations/approvals annually. The manufacturers of industrialized/modular buildings also purchase insignia, which are required to be attached to each modular building unit that is installed in the State. These Manufacturers are required to reimburse the State for travel expenses related to unannounced inspections by employees of the Building Codes Administration. The Building Codes Administration also receives $13,000 in annual revenue from the federal Department of Housing and Urban Development (HUD) for serving as the State Administrative Agency (SAA) of the Manufactured Homes Program.
Challenges
Due to the fact that Maryland is legislatively mandated to adopt the latest codes published before most other states do, cost effective solutions that meet new codes are not always readily available in the marketplace. This can increase the cost of building construction in Maryland until more states adopt the new codes and products are widely produced and become available at competitive prices. Since Maryland statute allows local jurisdictions to amend state adopted building codes with few exceptions, home builders, manufacturers of modular buildings, building designers and general contractors are not always aware of all current requirements of building codes in effect in each jurisdiction. Maryland law requires local jurisdictions to provide information on their amendments and adoption of building codes to Building Codes Administration. This information should be maintained in the database that the Building Codes Administration is responsible for maintaining and updates. However, most local jurisdictions have not fulfilled this obligation.
3.2.8.1 Maryland Apprenticeship and Training Program (MATP) – Division of Workforce Development and Adult Learning
Lead Agency: Department of Labor
Program Description Registered Apprenticeships combine supervised, structured, on-the-job learning, and related technical instruction to teach apprentices the skills necessary to succeed in a specific occupation. The apprentice works full-time and receives training from the sponsoring organization. Typically, apprentices are hired at a percentage of a journeyperson’s
Maryland Department of the Environment 2030 Greenhouse Gas Emissions Reduction Act Plan
82
salary. As the apprentice completes training and demonstrates skills mastery, the percentage of a journeyperson’s wage received increases until the apprentice makes journeyperson’s wages upon completing the program. Registered Apprenticeship programs in the skilled trades, such as electrical, plumbing and other construction trades, can play a key role in building a sustainable pipeline of available workers for green jobs. Currently there are no "standalone" apprenticeship programs for occupations in the green energy industry. For example, there are no apprenticeships for "Solar Installer" or "Solar Technician". These skills are often included within apprenticeship programs for other occupations. Some examples include: The JATC for the Electrical Industry of Baltimore has training for its five-year electrical occupation for Photovoltaics. This training course is a comprehensive guide to design, installation, and evaluation of residential and commercial photovoltaic (PV) systems, also known as solar systems. This course includes the specified electrical requirements in accordance with the 2017 edition of the National Electric Code. Journeypersons and Registered Apprentices from this program, employed with one of the signatory contractors, recently completed the solar panel installation project at all three of the campuses for the Community College of Baltimore County (CCBC). The Independent Electrical Contractors, Chesapeake (IEC) has a four-year electrical occupation which also includes PV training. This training is one component of the four-year apprenticeship program designed to expose apprentices to solar installation practices and to ensure knowledge skill of the industry. Another Registered Apprenticeship Sponsor, the Associated Builders and Contractors, is also seeking to increase training opportunities in the solar energy field. The ABC Chesapeake Shores is currently looking to expand their current training to meet the needs of their member companies. This will include looking at incorporating solar PV systems for the electrical occupation and green topics for the HVAC occupation along with other green topics. In the past, the ABC Metro Washington has offered CORE and Your Role in the Green Environment in its partnership with Goodwill of Greater Washington. ABC Chesapeake Shores is currently in partnership with the Anne Arundel Workforce Development Corporation (AAWDC) and will be offering the CORE and Your Role in the Green Environment course in the near future. In addition to solar power, there are Registered Apprenticeship Programs who currently work with businesses/industries in other green energy sectors. In particular, the Baltimore, Philadelphia, D.C., and the Northeast Regional Council of Carpenters Registered apprenticeship Program perform work within the offshore wind industry. The Journeypersons and Registered Apprentices in this program work to install the offshore wind turbines up and down the Eastern Seaboard. Based in Baltimore, this Registered Apprenticeship Program is beginning pre-apprenticeship training in an attempt to help qualify more applicants for successful entry into their occupation. This pre-apprenticeship program helps to remove barriers to employment from applicants and works with hard to serve and underrepresented populations. Additionally, this sponsor is a sub grantee of the previously mentioned Apprenticeship Innovation Fund and is conducting additional pre-apprenticeship training for women interested in a career within the industry. Currently they have 200 Registered Apprentices in two separate state of the art training centers located in Maryland. In addition to these Maryland based training centers, Journeypersons and Registered apprentices also have access to a world class dive training center located in Philadelphia, Pennsylvania. This is a critical training component for the occupations of piledriver and millwright, as they perform all key aspects of the installation of wind turbines in offshore locations. 3.2.9 Transportation Technologies Lead Agencies: MDE, MDOT, and MEA
Program Description
Maryland Department of the Environment 2030 Greenhouse Gas Emissions Reduction Act Plan
83
The transportation technologies program includes state and federal initiatives that affect vehicle fuel economy through the establishment of emission and fuel standards. The technology advances are designed to improve vehicle fuel economy, which leads to reduced average GHG emissions per mile. The federal emission standards have been adopted through EPA Final Rulemakings and include light-duty vehicles, medium- and heavy-duty trucks, and fuel standards. Benefits from these programs represent the largest contributor to GHG reductions in the transportation sector. The benefits will increase over time as newer vehicles enter the fleet and older vehicles are removed from the fleet. Additionally, Maryland has adopted the California Clean Cars Program, ensuring that Maryland receives the cleanest fossil fuel burning vehicles on the market as well as access to a growing ZEV marketplace. The adoption of California’s Program by 13 other states and the District of Columbia has proven to complement many of the federal GHG and fuel economy programs. Maryland, through the combined efforts of MDE, the Maryland Department of Transportation (MDOT) and MEA, has made significant progress in advancing the deployment of plug-in electric hybrid vehicles and battery EVs.
Light-Duty Vehicle (Passenger Cars and Trucks) Standards
• The Maryland Clean Car Program (Model Year 2011) – The Maryland Clean Cars Act of 2007 required MDE to adopt regulations to apply California’s Low-Emission Vehicle (LEV) standards to vehicles purchased in Maryland. The California program also includes a mandate for the sale of ZEVs (adopted 2007).
• Corporate Average Fuel Economy (CAFE) Standards (Model Years 2008-2011) – Vehicle model years through 2011 are covered under existing CAFE standards that will remain intact under the new national program.
• National Program (Model Years 2012-2016) – The light-duty vehicle fuel economy standards for model years between 2012 and 2016. The fuel economy improvements increase over time until an average 250 gram/mile CO2 standard is met in the year 2016. This equates to an average fuel economy near 35 mpg (published May 2010).
• National Program Phase 2 (Model Years 2017-2050) – The light-duty vehicle fuel economy standards for model years between 2017 and 2050. These standards are phased in and projected to result in an average 163 grams/mile of CO2 equating to an average fuel economy of 54.5 mpg by model year 2025. The SAFE Vehicle Rule replaces model years 2021-2026 with an estimated miles per gallon efficiency of 40.4 mpg (the National Program Phase 2 was originally published October 2012).
Medium/Heavy-Duty Vehicle (Trucks and Buses) Standards
• Phase 1 National Medium and Heavy Vehicle Standards (Model Years 2014-2018) – Fuel efficiency and
GHG standards for model years 2014 to 2018 medium- and heavy-duty vehicles. The new rulemaking adopted standards for three main regulatory categories: combination tractors, heavy-duty pickups and vans, and vocational vehicles. (published September 2011)
• Phase 2 National Medium and Heavy Vehicle Standards (2018 and Beyond) – Fuel efficiency and GHG standards for medium- and heavy-duty vehicles for model year 2018 and beyond. The standards apply to four categories of medium- and heavy-duty vehicles: combination tractors, heavy-duty pickups and vans, vocational vehicles and trailers to reduce GHG emissions and improve fuel efficiency. The standards phase in between model years 2021 and 2027 for engines and vehicles, and between model years 2018 and 2027 for trailers. (published October 2016)
Fuel Standards
Maryland Department of the Environment 2030 Greenhouse Gas Emissions Reduction Act Plan
84
• Tier 3 vehicle and fuel standards – The rule establishes more stringent vehicle emissions standards and will reduce the sulfur content of gasoline from current average level of 30 ppm to 10 ppm beginning in 2017. The gasoline sulfur standard will make emission control systems more effective for both existing and new vehicles and will enable more stringent vehicle emission standards. The vehicle standards will reduce both tailpipe and evaporative emissions from gasoline powered vehicles, yielding minor improvements in vehicle efficiency, resulting in GHG emission reductions. (published April 28, 2014)
• The federal Renewable Fuel Standard Program – Mandates the use of 36 billion gallons of renewable fuel annually by 2022 (published March 2010). Based on an approach utilized by MWCOG, the use of renewable fuels will represent a 2% reduction in total on-road gasoline CO2 emissions in 2030.
• Electric Vehicles (EVs) – Initiatives to encourage the use of electric and other low and zero-emitting vehicles are part of Maryland’s efforts to reduce emissions of GHGs and other air pollutants from mobile sources by providing alternatives to conventional internal combustion engine vehicles. EVs include plug-in all-EVs, battery EVs (BEVs), and plug-in hybrid EVs.
MDOT Solar Initiative
• MDOT issued Master Services Agreements (MSAs) to six qualified contractors to design, construct,
commission, finance, operate and maintain photovoltaic (PV) energy facilities at MDOT locations throughout Maryland. The MSAs provide MDOT with the flexibility of developing PV energy systems quickly and efficiently. The GHG benefit has increased by 10% over the last year and resulted in 15 metric tons of reductions.
Program Objectives
Maryland is a leader in adopting strategies to advance cleaner vehicles and fuels, via the Maryland Clean Car Program, starting in 2011. The Clean Cars Program continues to complement many of the federal motor vehicle emission standards. Further improvements in vehicle technologies and fuels are anticipated to play a key role in significantly improving air quality and GHG emissions. MDE, MDOT, and MEA have different roles in reducing GHG emissions from the transportation sector. The three agencies work together to facilitate programs that promote advanced technology vehicles and alternative fuels. MDE implements the Clean Cars Program, ensuring Maryland stays in compliance with the requirements to maintain California’s emission standards and updating the regulations as necessary to remain consistent with California. MDE enforces the GHG and ZEV requirements of the Program and ensures the vehicle manufacturers remain in compliance. For emerging and innovative technologies, MDOT plays the role of a facilitator and a policy regulator. In this role, MDOT helps provide a safe and conducive environment for Maryland residents and businesses to adopt new technologies that are reshaping mobility choices and providing cleaner alternatives to single occupant vehicle travel. Emerging and innovative strategies are inherently characterized by uncertainty in the technological and policy maturity that is necessary for widespread acceptance and adoption. Examples that need this maturity are connected and autonomous vehicle technologies, zero emission truck corridors, and Superconducting MAGLEV (SCMAGLEV) or Hyperloop. MDOT will continue to nurture the growth of these emerging and innovative technologies through research and partnerships with the private sector. MEA spurs the adoption of new vehicle technologies and alternative fuels by providing rebates and incentives for the purchase of alternative fuel vehicles and the construction of alternative fuel stations. This includes rebates for EV charging infrastructure and incentives for petroleum reducing fuel stations, such as compressed natural gas and Fast Charging EV stations.
Maryland Department of the Environment 2030 Greenhouse Gas Emissions Reduction Act Plan
85
Implementation Milestones
Maryland Clean Cars Program/Federal Vehicle and Fuel Standards Implementation of these state and federal vehicle and fuel standards yields a significant GHG emissions benefit for on-road emissions from cars and trucks through 2030. Ultimately, vehicle turnover rates, vehicle purchase and operating costs, and other economic factors will impact exactly what the on-road fleet looks like in 2030. The federal programs are managed by EPA and the National Highway Transportation Safety Administration (NHTSA) through partnerships with vehicle manufacturers. Electric Vehicles (EVs) Vehicle manufacturers will attain fleet wide GHG emission requirements through a mix of different vehicle models and technologies. The fleet-wide mix will include PHEVs and BEVs, along with traditional gasoline and diesel-powered vehicles. Achieving the goals as part of Maryland’s participation within the ZEV mandate reflects a commitment to a low-emissions fleet that goes beyond what the federal standards require. The path from nearly 26,000 PHEVs and BEVs registered in Maryland in April 2020 to 160,000 vehicles by 2025 and between 535,000 vehicles (without federal action) and 790,000 vehicles (with federal action) by 2030 based on current TCI projections will require a combination of opportunities to come together. Maryland is rising to meet this goal through an aggressive approach to the deployment of EVs and the charging stations necessary to support their adoption. Maryland is also a leader in offering incentives for the purchase and use of plug-in EVs. Plug-in vehicles can use the HOV lanes in Maryland regardless of the number of passengers. Time-of-use (TOU) energy rates are available to some residents of the state depending on their energy provider. TOU rates allow plug-in vehicles to charge during off-peak hours at a reduced energy rate, thereby saving on the cost of energy to recharge their vehicle. Certain utilities throughout the state have begun a program to provide rebates to customers who purchase a qualifying smart EV charger. This program will complement MEA’s Electric Vehicle Supply Equipment (EVSE) rebate program by providing an additional incentive for the purchase of residential and multi-unit dwelling charging stations. Owners and operators of EVSE are not subject to regulations as an electricity supplier and therefore are allowed to sell the electricity they provide to vehicle owners. The Clean Cars Act of 2017 extended the EVSE rebate and vehicle excise tax credit through FY20. The total amount of funding available for the charging equipment rebate increased from $600,000 to $1,200,000. The amount available for the vehicle tax credit increased from $1,800,000 to $3 million and vehicles with an MSRP over $60,000 were no longer eligible for the tax credit. The Clean Cars Act of 2019 increased the amount of funding available for the vehicle tax credit from $3,000,000 to $6 million and included fuel cell vehicles for the first time as an eligible vehicle to receive the tax credit. The law increased the MSRP cap for vehicles to $63,000. The Maryland General Assembly failed to pass the bill during the condensed 2020 session however action is anticipated in 2021. The Zero Emission Vehicle Memorandum of Understanding (ZEV MOU) On June 20, 2018, nine Northeast and West Coast states reaffirmed their strong commitment to a clean, low-carbon transportation sector with the release of a new Multi-State ZEV Action Plan for 2018-2021 to support the successful implementation of the states’ ZEV programs. The Action Plan, which builds on the successes and lessons learned from implementation of an earlier 2014 ZEV Action Plan, presents 80 market-enabling action recommendations for states, automakers, dealers, utilities, charging
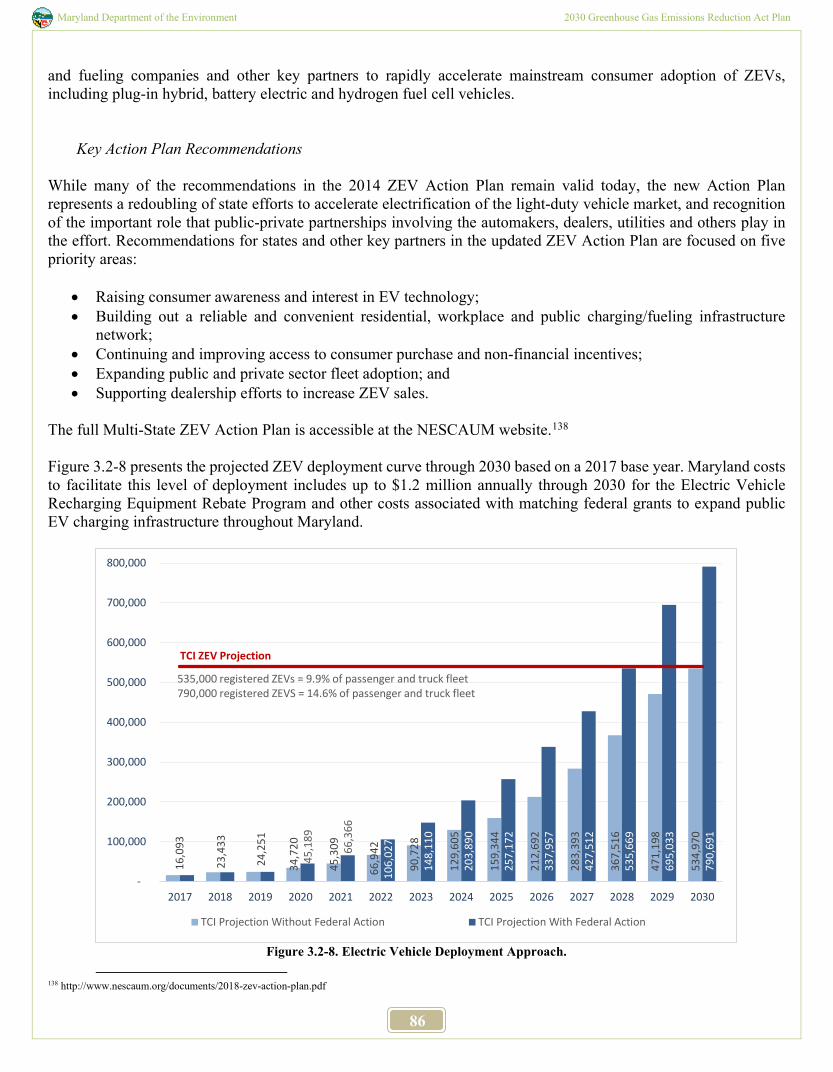
Maryland Department of the Environment 2030 Greenhouse Gas Emissions Reduction Act Plan
86
and fueling companies and other key partners to rapidly accelerate mainstream consumer adoption of ZEVs, including plug-in hybrid, battery electric and hydrogen fuel cell vehicles.
Key Action Plan Recommendations While many of the recommendations in the 2014 ZEV Action Plan remain valid today, the new Action Plan represents a redoubling of state efforts to accelerate electrification of the light-duty vehicle market, and recognition of the important role that public-private partnerships involving the automakers, dealers, utilities and others play in the effort. Recommendations for states and other key partners in the updated ZEV Action Plan are focused on five priority areas:
• Raising consumer awareness and interest in EV technology; • Building out a reliable and convenient residential, workplace and public charging/fueling infrastructure
network; • Continuing and improving access to consumer purchase and non-financial incentives; • Expanding public and private sector fleet adoption; and • Supporting dealership efforts to increase ZEV sales.
The full Multi-State ZEV Action Plan is accessible at the NESCAUM website.138 Figure 3.2-8 presents the projected ZEV deployment curve through 2030 based on a 2017 base year. Maryland costs to facilitate this level of deployment includes up to $1.2 million annually through 2030 for the Electric Vehicle Recharging Equipment Rebate Program and other costs associated with matching federal grants to expand public EV charging infrastructure throughout Maryland.
Figure 3.2-8. Electric Vehicle Deployment Approach.
138 http://www.nescaum.org/documents/2018-zev-action-plan.pdf
16,0
93
23,4
33
24,2
51
34,7
20
45,3
09
66,9
42
90,7
28
129,
605
159,
344
212,
692
283,
393
367,
516
471,
198
534,
970
45,1
89
66,3
66
106,
027
148,
110
203,
890
257,
172
337,
957
427,
512
535,
669
695,
033
790,
691
-
100,000
200,000
300,000
400,000
500,000
600,000
700,000
800,000
2017 2018 2019 2020 2021 2022 2023 2024 2025 2026 2027 2028 2029 2030
TCI Projection Without Federal Action TCI Projection With Federal Action
TCI ZEV Projection
535,000 registered ZEVs = 9.9% of passenger and truck fleet790,000 registered ZEVS = 14.6% of passenger and truck fleet
Maryland Department of the Environment 2030 Greenhouse Gas Emissions Reduction Act Plan
87
The Clean Cars Act of 2019 made changes to the Electric Vehicle Infrastructure Council (EVIC), renaming it the Zero Emission Electric Vehicle Infrastructure Council (ZEEVIC) and broadened the focus of the council to include hydrogen fueling stations and fuel cell vehicles. The law charged the council with developing a plan to facilitate the integration of hydrogen fuel cell vehicles along with plug-in EVs into the State’s transportation network. MDOT chairs the legislatively established body, comprised of a diverse group of stakeholders who are dedicated to attaining Maryland’s ZEV goals. ZEEVIC brings this group together with the goal of creating opportunities, developing financial incentives, promoting ZEVs, and the installation of the infrastructure necessary to support the State’s ZEV goals.
• ZEEVIC has made progress on several vital initiatives and is continuing to work on removing barriers to the adoption of ZEVs. In 2018, the Electrification Coalition recognized Maryland’s work by designating Maryland as a top tier, or Tier 1, EV State when they issued their inaugural, ZEV Scorecard.139 Maryland was second only to California and ranked highly based on the State’s work on incentives, publicly available EVSE, and public outreach.
• ZEEVIC produces annual reports on the progress of developing, evaluating and recommending strategies to facilitate the successful integration of ZEVs and ZEV infrastructure into Maryland’s existing transportation infrastructure.
• ZEEVIC supported the passage of the Clean Cars Act of 2017, which increased and extended funding that support rebates and incentives for EV purchases.
• MDOT is working to complete an EV Signage Plan, focusing first on the acquisition, installation, and maintenance of EV signage on Maryland’s 21 Federal Highway Administration (FHWA) designated alternative fuel corridors (AFCs).
PC44 EV Workgroup With a goal of ensuring that Maryland’s electric grid is customer-centered, affordable, reliable and environmentally sustainable, the PSC initiated a proceeding, titled Public Conference 44 (PC44) to launch a targeted review of electric distribution systems in Maryland. The Commission outlined a series of potential actions that could be pursued by a newly formed EV Work Group in the context of a statewide grid modernization proceeding (i.e., PC44). Specifically, the Commission tasked the PC44 EV Work Group with, at a minimum, pursuing desired outcomes that generally correspond to the following goals: (1) increasing and diversifying EV tariff offerings across multiple service territories and customer classes; (2) planning for a limited utility infrastructure investment in EVSE; (3) developing a strategy to address grid-related costs associated with vehicle fleet electrification; (4) facilitating and encouraging equitable access to benefits derived from vehicle fleet electrification, especially in underserved market segments; and (5) developing a customer education, outreach, and engagement strategy in coordination with other state agencies to promote the outcomes of the PC44 EV Work Group proceeding. The utilities developed programs that would accomplish these goals and presented their proposed plans for review and approval. These proposals were reviewed and finalized. The Utilities began implementation of these programs in 2019. Multi-State Medium- and Heavy-Duty Zero Emission Vehicle Memorandum of Understanding (MHDV MOU) In July 2020, Maryland signed the Multi-State Medium-and Heavy-Duty Zero Emission Vehicle Memorandum of Understanding (MHDV MOU), joining 14 other states and the District of Columbia, to address GHG pollution from
139 https://www.zevscorecard.com/
Maryland Department of the Environment 2030 Greenhouse Gas Emissions Reduction Act Plan
88
medium-and heavy-duty vehicles through the electrification of large pick-up trucks and vans, delivery trucks, box trucks, school and transit buses, and long-haul delivery trucks. The MHDV MOU will identify barriers to the electrification of medium- and heavy-duty vehicles and will develop solutions that will support the deployment of zero emission medium- and heavy-duty vehicles. The MHDV MOU identifies a target of 30% of all medium- and heavy-duty vehicle sales will by ZEVs by 2030. Maryland has outlined a Maryland Clean Truck Planning Framework that will engage stakeholders and communities to collaboratively develop an action plan to reduce air pollution and GHG emissions from the trucking industry, while preserving existing jobs and creating new jobs. The full Multi-State MHDV MOU is accessible online.140 The Volkswagen Mitigation Plan As a result of a 2016 settlement between EPA, the California Air Resources Board (CARB) and Volkswagen for violations of the Clean Air Act that involved software designed to defeat emissions standards, Volkswagen is required to spend $2.7 billion on emission reduction programs nationwide. This software or “defeat device” allowed cars to meet emissions standards in a laboratory or a testing station, but during normal operation those vehicles emitted nitrogen oxide (NOx) at up to 40 times the standard. Approximately 16,000 of the affected vehicles were sold in Maryland, negatively impacting our air quality. Under the Environmental Mitigation Trust established in the 2016 settlement, Maryland is eligible to receive $75.7 million for use on specifically defined mitigation projects to remediate the excess NOx emissions. MDE was the lead agency tasked with developing Maryland’s mitigation plan in accordance with the list of eligible projects and matching fund requirements required under Appendix D-2 of the Settlement. The Maryland VW Mitigation Plan (Feb 2019) allocated 15% of the VW funds to install EV charging infrastructure across the State, and funding for electric school buses and replacement of older, dirty diesel engines with new, cleaner technologies. Electric buses and heavy-duty equipment such as trucks, boats and locomotives are also eligible for funding. In September 2020, MDE opened a Request for Information period for Maryland’s Volkswagen Electric Vehicle Infrastructure Program. The Program is intended to use the full 15% of the Volkswagen Mitigation Funds to help with the installation of EVSE at workplaces, State facilities, and destinations along AFCs. Under this program, MDE, in coordination with MDOT and MEA, developed two frameworks for proposals. The first details requirements for charging infrastructure located at workplaces and State facilities. The second details DC Fast Charging requirements along AFCs and at charging hubs Additional information on Maryland’s Plan can be found on the MDE website.141 MDOT Efforts
• Integrated Corridor Management: MDOT State Highway Administration (MDOT SHA) is a recognized national leader in the testing and deployment of real time technologies to adjust signal operation to maximize throughput and reduce delay. The system uses real-time traffic conditions and artificial intelligence to adjust the timing of traffic signals and synchronize the entire corridor and effectively deploys artificial intelligence to keep traffic moving. The smart traffic signals have been implemented in 16 of the 21 planned corridors across the State ($22.1 million in the FY21-26 CTP).
140 http://d31hzlhk6di2h5.cloudfront.net/20200714/dc/3a/2b/58/794e750e808dd4a82ae402dd/MHDV_ZEV_MOU_7-14-20.pdf 141 https://mde.maryland.gov/programs/Air/MobileSources/Pages/MarylandVolkswagenMitigationPlan.aspx
Maryland Department of the Environment 2030 Greenhouse Gas Emissions Reduction Act Plan
89
• Transportation Systems Management and Operations and MDOT SHA’s Coordinated Highway Action Response Team (CHART): MDOT released the Maryland Transportation Systems Management and Operations (TSMO) Strategic Plan in October 2018 aimed to address capacity limitations due to recurring and non-recurring congestion through business processes, ITS technology and collaboration. The CHART management and operations program continues to yield substantial GHG reductions associated with the efficient management of incidents, provision of traveler information, and deployment of other on-road infrastructure technologies. CHART efforts cleared 31,750 incidents and assisted approximately 39,483 stranded motorists on Maryland roadways in 2019. The effectiveness of CHART in detecting and managing incidents provides measurable benefits in delay, fuel consumption, emissions reductions and cost savings.
• MDOT Solar Initiative: MDOT issued Master Services Agreements (MSAs) to six qualified contractors to design, construct, commission, finance, operate and maintain photovoltaic (PV) energy facilities at MDOT locations throughout Maryland. The MSAs provide MDOT with the flexibility of developing PV energy systems quickly and efficiently. The GHG benefit has increased by 10% over the last year and resulted in 15 metric tons of reductions.
Enhancement Opportunities
Emerging and innovative technology strategies will require additional investments to expand or accelerate deployment of previously planned strategies, deployment of new best-practice strategies, and capitalizing on the opportunities created by new transportation technologies. Potential enhancement opportunities include:
• TSMO/Integrated Corridor Management strategy includes expansion of signal coordination and control, consistent with MDOT SHA’s current Integrated Corridor Management approach on most urban principal and minor arterials by 2030. Only urban arterials are being assumed to be covered as part of this strategy through 2030 as they experience most of the non-highway congestion in Maryland.
• Lead by example – MDOT Fleet Innovation Plan will support the electrification of MDOT’s transit buses and non-revenue light-duty passenger vehicles for all 5 Transportation Business Units (TBUs) and the Maryland Transportation Authority (MDTA). The Plan will identify infrastructure and fleet opportunities, establish timelines for fleet turnover, and create an implementation plan. About 90% of the agency’s light duty fleet (1,925 vehicles) are targeted for transition by 2030.
• Regional Clean Fuel Standard provides a similar approach to the 2015 TCI analysis, with implementation of a regional clean fuels standard to achieve a 15% reduction in the carbon intensity of carbon-based fuels by 2030.
• A total of 790,000 EVs (with federal action) by 2030, which is an additional 250,000 vehicles over the ZEV MOU target of 540,000 EVs, accounting for a 14.6 percent of the passenger and truck fleet in 2030.
• Extended Corporate Average Fuel Economy (CAFE) Standards (Model Years 2026-2030) – assumes federal action of extending the National Fuel Economy Program to continue through 2030 model year vehicles with the phase-in of five percent per year fuel economy efficiency for passenger cars and light duty trucks.
• Variable Speeds/Speed Management is a strategy of speed limit enforcement and enhanced awareness and signage on urban restricted roadways. This assumes applying speed management strategies during both peak and non-peak periods. Enforcement may come about more through automated vehicle technology rather than traditional means.
• Commercial Vehicle Technologies (Idle Reduction, Low-Carbon Fleet, Dynamic Routing) is a strategy that considers extended idling only and not short-term idling (e.g., at a delivery/pick-up point). It assumes that APUs will be used to power trucks during the time spent idling.
• Zero-Emission Truck Corridors strategy to establish infrastructure and vehicle replacements for implementation of zero emission corridors connecting to the Port of Baltimore, comparable to electrification technologies deployed in the I-710 Calstart Corridor at the Ports of Los Angeles and Long Beach. This strategy assumes participation of 700 dray trucks in Maryland that operate in the Port of Baltimore area only.
Maryland Department of the Environment 2030 Greenhouse Gas Emissions Reduction Act Plan
90
• Connected and Automated Vehicles (CAV): MDOT is developing Maryland’s vision for a CAV future and deploying technologies to manage congestion. MDOT has established a CAV Working Group, including MDOT’s TBUs and other planning partners, as the central coordination point for these emerging technologies. The Aberdeen Test Center has been recognized as a federal testing location for AV and US 1 was selected to pilot an innovative technology corridor. Maryland is emerging as a national leader in CAV technology and is building on this progress by developing CAV strategic plans that documents opportunities, challenges, priorities, strategies, and recommendations to help guide the State in planning and implementing CAV technology.
Funding
The transportation technology standards are implemented by the vehicle manufacturers at no cost to the State of Maryland. There may be additional costs to the consumers purchasing new vehicles, but the costs can be offset by reduced fuel costs over the life span of the vehicle. In the near-term, Maryland will continue to invest in EV and EVSE incentives while exploring the potential of hydrogen fuel cell vehicles. Under the federal Volkswagen Settlement, Maryland has submitted proposals and is seeking opportunities to enhance EVSE availability through the National ZEV Investment Plan and the Maryland Volkswagen Mitigation Plan. As part of Volkswagen settlement resulting from their excess NOx emissions, Volkswagen created a subsidiary company, Electrify America that is installing DC Fast Chargers throughout the county for use by EVs. Electrify America has announced three cycles of funding for which it outlined cities and other locations it targeted for fast charging installations. The Washington D.C. area was targeted during the first cycle of funding and the Baltimore Metro Area was targeted during the second cycle of funding. MDOT has committed $20.7 million for FY20 and $102.6 million over the next six years to improve, maintain, and enhance the CHART program with on-road operational technologies and strategic capacity / operational enhancements. The projected scenario for funding is based on the best information we have at this time (over the next six years), which may be subject to change as the State responds to changes in the fiscal environment, mobility choices and travel patterns, and technological advancements that may alter some funding priorities and allocations. These assumptions are based on trends from the last few CTPs and are modeled on the latest version of the adopted CTP. Major technology projects and programs funded include:
• Over $300 million for MDOT MTA bus procurement for fleet replacement and efficiency improvements. • $72.6 million in funding to implement the third-generation electronic tolling system that would represent the
technology platform enabling a conversion to all-electronic tolling (AET), which brings a significant opportunity to eliminate vehicle idling and delay at Maryland’s toll plazas.
Challenges
While technologies offer the most significant GHG emissions reduction potential for the transportation sector, the full potential of GHG benefits will not be fully achieved until the fleet turns over with newer fuel efficient and GHG beneficial vehicles. The federal technology standards will be fully implemented with model years 2026 and 2027 for light-duty and medium- / heavy-duty vehicles, respectively. The pace of adoption of new technologies by individuals, corporations, and government agencies is the primary determinant for emissions reductions from the transportation sector by 2030.
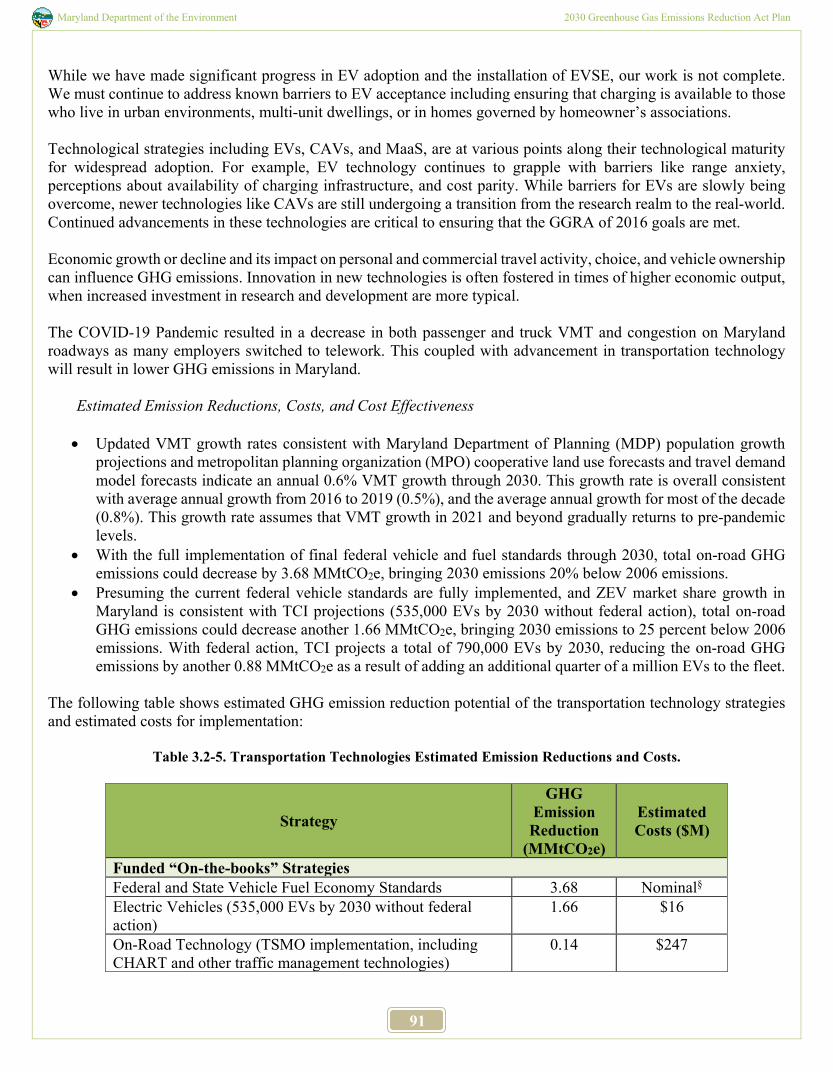
Maryland Department of the Environment 2030 Greenhouse Gas Emissions Reduction Act Plan
91
While we have made significant progress in EV adoption and the installation of EVSE, our work is not complete. We must continue to address known barriers to EV acceptance including ensuring that charging is available to those who live in urban environments, multi-unit dwellings, or in homes governed by homeowner’s associations. Technological strategies including EVs, CAVs, and MaaS, are at various points along their technological maturity for widespread adoption. For example, EV technology continues to grapple with barriers like range anxiety, perceptions about availability of charging infrastructure, and cost parity. While barriers for EVs are slowly being overcome, newer technologies like CAVs are still undergoing a transition from the research realm to the real-world. Continued advancements in these technologies are critical to ensuring that the GGRA of 2016 goals are met. Economic growth or decline and its impact on personal and commercial travel activity, choice, and vehicle ownership can influence GHG emissions. Innovation in new technologies is often fostered in times of higher economic output, when increased investment in research and development are more typical. The COVID-19 Pandemic resulted in a decrease in both passenger and truck VMT and congestion on Maryland roadways as many employers switched to telework. This coupled with advancement in transportation technology will result in lower GHG emissions in Maryland.
Estimated Emission Reductions, Costs, and Cost Effectiveness
• Updated VMT growth rates consistent with Maryland Department of Planning (MDP) population growth projections and metropolitan planning organization (MPO) cooperative land use forecasts and travel demand model forecasts indicate an annual 0.6% VMT growth through 2030. This growth rate is overall consistent with average annual growth from 2016 to 2019 (0.5%), and the average annual growth for most of the decade (0.8%). This growth rate assumes that VMT growth in 2021 and beyond gradually returns to pre-pandemic levels.
• With the full implementation of final federal vehicle and fuel standards through 2030, total on-road GHG emissions could decrease by 3.68 MMtCO2e, bringing 2030 emissions 20% below 2006 emissions.
• Presuming the current federal vehicle standards are fully implemented, and ZEV market share growth in Maryland is consistent with TCI projections (535,000 EVs by 2030 without federal action), total on-road GHG emissions could decrease another 1.66 MMtCO2e, bringing 2030 emissions to 25 percent below 2006 emissions. With federal action, TCI projects a total of 790,000 EVs by 2030, reducing the on-road GHG emissions by another 0.88 MMtCO2e as a result of adding an additional quarter of a million EVs to the fleet.
The following table shows estimated GHG emission reduction potential of the transportation technology strategies and estimated costs for implementation:
Table 3.2-5. Transportation Technologies Estimated Emission Reductions and Costs.
Strategy
GHG Emission Reduction
(MMtCO2e)
Estimated Costs ($M)
Funded “On-the-books” Strategies Federal and State Vehicle Fuel Economy Standards 3.68 Nominal§ Electric Vehicles (535,000 EVs by 2030 without federal action)
1.66 $16
On-Road Technology (TSMO implementation, including CHART and other traffic management technologies)
0.14 $247
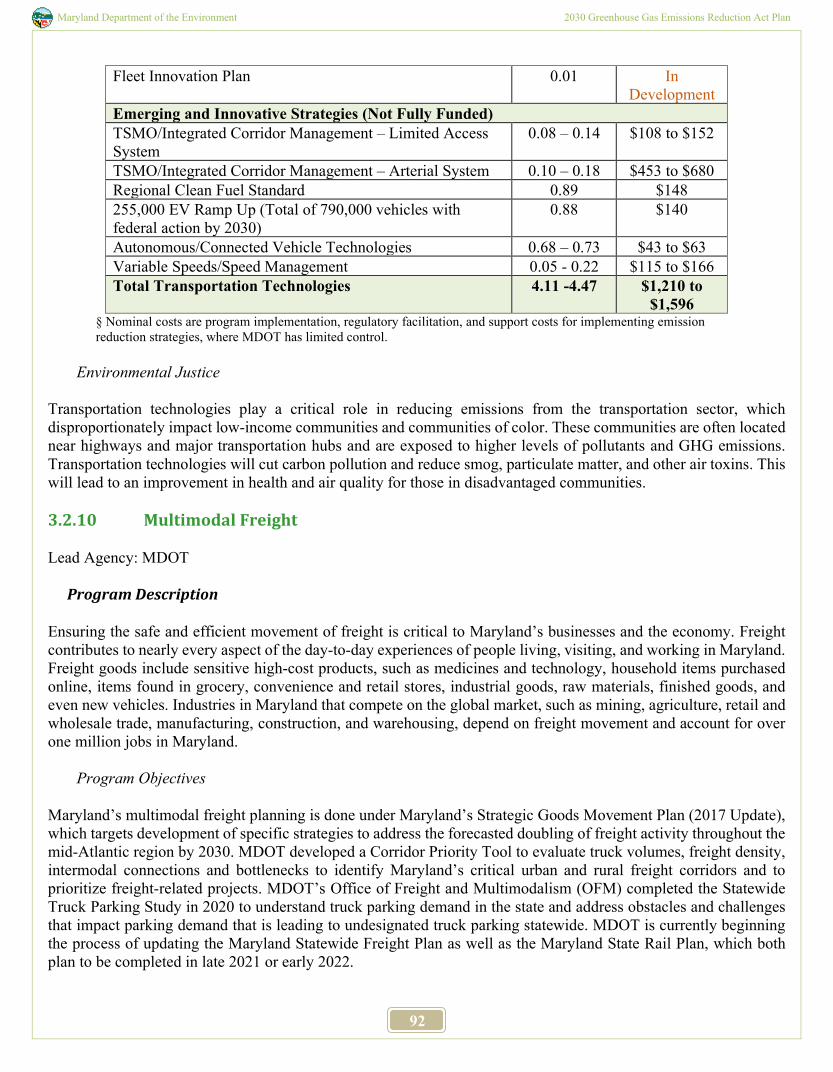
Maryland Department of the Environment 2030 Greenhouse Gas Emissions Reduction Act Plan
92
Fleet Innovation Plan 0.01 In Development
Emerging and Innovative Strategies (Not Fully Funded) TSMO/Integrated Corridor Management – Limited Access System
0.08 – 0.14 $108 to $152
TSMO/Integrated Corridor Management – Arterial System 0.10 – 0.18 $453 to $680 Regional Clean Fuel Standard 0.89 $148 255,000 EV Ramp Up (Total of 790,000 vehicles with federal action by 2030)
0.88 $140
Autonomous/Connected Vehicle Technologies 0.68 – 0.73 $43 to $63 Variable Speeds/Speed Management 0.05 - 0.22 $115 to $166 Total Transportation Technologies 4.11 -4.47 $1,210 to
$1,596 § Nominal costs are program implementation, regulatory facilitation, and support costs for implementing emission reduction strategies, where MDOT has limited control.
Environmental Justice
Transportation technologies play a critical role in reducing emissions from the transportation sector, which disproportionately impact low-income communities and communities of color. These communities are often located near highways and major transportation hubs and are exposed to higher levels of pollutants and GHG emissions. Transportation technologies will cut carbon pollution and reduce smog, particulate matter, and other air toxins. This will lead to an improvement in health and air quality for those in disadvantaged communities. 3.2.10 Multimodal Freight Lead Agency: MDOT
Program Description Ensuring the safe and efficient movement of freight is critical to Maryland’s businesses and the economy. Freight contributes to nearly every aspect of the day-to-day experiences of people living, visiting, and working in Maryland. Freight goods include sensitive high-cost products, such as medicines and technology, household items purchased online, items found in grocery, convenience and retail stores, industrial goods, raw materials, finished goods, and even new vehicles. Industries in Maryland that compete on the global market, such as mining, agriculture, retail and wholesale trade, manufacturing, construction, and warehousing, depend on freight movement and account for over one million jobs in Maryland.
Program Objectives Maryland’s multimodal freight planning is done under Maryland’s Strategic Goods Movement Plan (2017 Update), which targets development of specific strategies to address the forecasted doubling of freight activity throughout the mid-Atlantic region by 2030. MDOT developed a Corridor Priority Tool to evaluate truck volumes, freight density, intermodal connections and bottlenecks to identify Maryland’s critical urban and rural freight corridors and to prioritize freight-related projects. MDOT’s Office of Freight and Multimodalism (OFM) completed the Statewide Truck Parking Study in 2020 to understand truck parking demand in the state and address obstacles and challenges that impact parking demand that is leading to undesignated truck parking statewide. MDOT is currently beginning the process of updating the Maryland Statewide Freight Plan as well as the Maryland State Rail Plan, which both plan to be completed in late 2021 or early 2022.
Maryland Department of the Environment 2030 Greenhouse Gas Emissions Reduction Act Plan
93
The Strategic Goods Movement Plan noted reducing freight bottlenecks, enhancing port operations and throughput, and improving freight infrastructure through technology enhancements and capacity as the path forward to maintain Maryland’s market position. One of the priorities of the Plan is to ensure that the network of highways, railways, waterways, and airports are ready to handle the current level and anticipated growth of goods movement. Among the emerging and innovative strategies that have been analyzed for estimation of their impact in reducing GHG emissions, there are those that increase the efficiency in goods movement through trip/materials consolidation, capacity enhancements, transition to a low-carbon and more efficient fleet.
Implementation Milestones Maryland’s freight industry is a key driver of the economy employing over 1.5 million people and contributing over $123.4 billion to the state’s annual GDP. Truck, rail, water, and air modes moved nearly 631 million tons of freight worth $835 billion, to, from, within, and through Maryland in 2012. By 2040, more than 1 billion tons of freight, worth close to $1.6 trillion, is expected to move within and through Maryland. Over 95% of freight shipments (approximately 76% by tonnage) are moved by trucks on Maryland’s interstate highway and freight system. The Port of Baltimore continues to see investments in its facilities pay dividends as it is ranked as the top port among all U.S. ports for handling autos and light trucks, farm and construction machinery, and imported sugar. The Port of Baltimore handled a record 43.0 million tons of cargo in 2018 and nearly a million cars and light trucks. The FY20-FY25 CTP lists six major Port-related projects for a total of $281.1 million. The port is ranked eleventh among major U.S. ports for cargo tonnage handled.
Funding In the 2020-2025 CTP, there is $1.82 billion committed to MDOT SHA projects that relieve key bottlenecks on Maryland’s roadway network through strategic capacity enhancements, which also impact freight movement across the state. In the short term, these projects are expected to mitigate delay and the additional GHG emissions generated by inefficient and low-speed travel by passenger and commercial vehicles. The National Freight Program (NFP) provided new sources of funding for Maryland with the passage of the FAST Act. Maryland’s NFP allocation for FY20 is $22.6 million. MDOT MPA was recently awarded a $10 million BUILD (Better Utilizing Investments to Leverage Development) grant to provide critical flood mitigation improvements at the Dundalk Marine Terminal. In addition, the new federal Infrastructure for Rebuilding America (INFRA) discretionary grant program will help to fund larger projects supporting freight. The Strategic Goods Movement Plan identified Maryland’s segments within the National Highway Freight Network that are eligible for the NFP. Multimodal freight projects typically have high capital costs and involve private parties including shippers and carriers. Public private partnerships (P3s) are increasingly seen as instruments of funding such projects, though there has been uncertainty and delay in progression. One key success on this front has been the Howard Street Tunnel expansion project where MDOT MPA secured the necessary funding for the $466 million project in late 2019 after winning a $125 million federal grant.142 CSX has also committed $113 million143 to the project.
Challenges
142 https://www.bizjournals.com/baltimore/news/2019/07/22/maryland-getting-125m-from-feds-for-howard-street.html 143 https://www.bizjournals.com/baltimore/news/2019/12/06/jim-white-reflects-on-18-years-at-the-ort-of.html
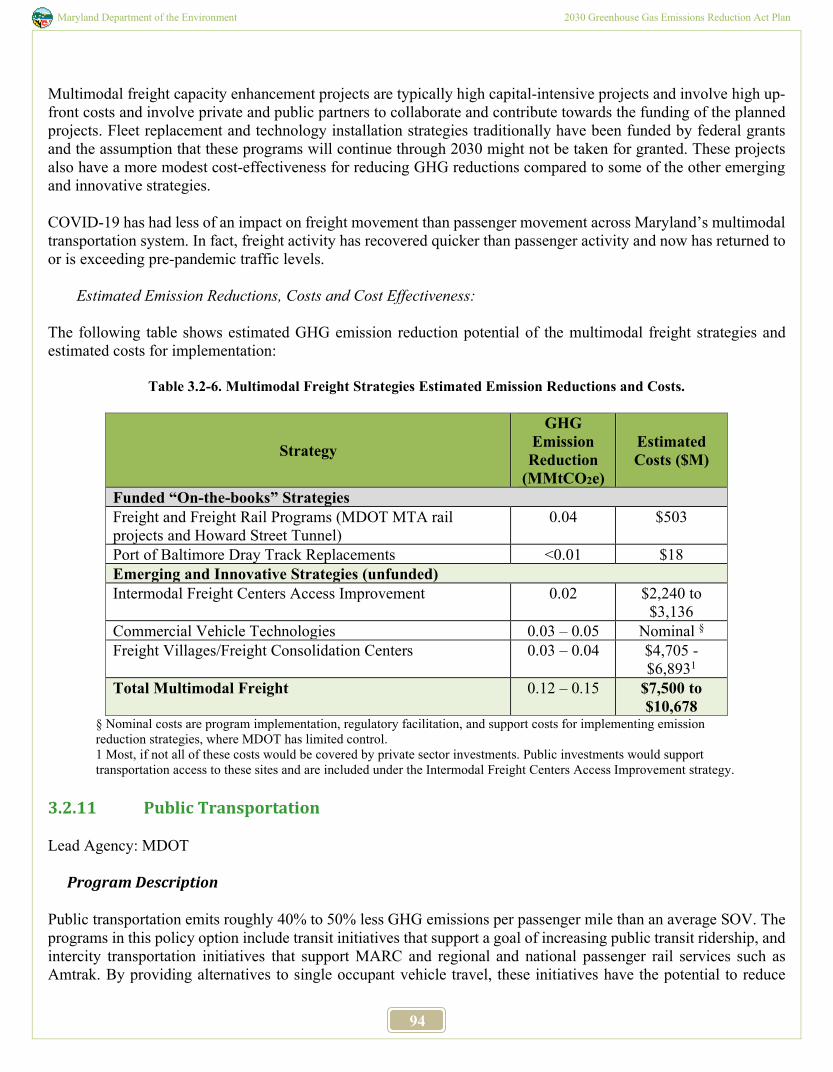
Maryland Department of the Environment 2030 Greenhouse Gas Emissions Reduction Act Plan
94
Multimodal freight capacity enhancement projects are typically high capital-intensive projects and involve high up-front costs and involve private and public partners to collaborate and contribute towards the funding of the planned projects. Fleet replacement and technology installation strategies traditionally have been funded by federal grants and the assumption that these programs will continue through 2030 might not be taken for granted. These projects also have a more modest cost-effectiveness for reducing GHG reductions compared to some of the other emerging and innovative strategies. COVID-19 has had less of an impact on freight movement than passenger movement across Maryland’s multimodal transportation system. In fact, freight activity has recovered quicker than passenger activity and now has returned to or is exceeding pre-pandemic traffic levels.
Estimated Emission Reductions, Costs and Cost Effectiveness: The following table shows estimated GHG emission reduction potential of the multimodal freight strategies and estimated costs for implementation:
Table 3.2-6. Multimodal Freight Strategies Estimated Emission Reductions and Costs.
Strategy
GHG Emission Reduction
(MMtCO2e)
Estimated Costs ($M)
Funded “On-the-books” Strategies Freight and Freight Rail Programs (MDOT MTA rail projects and Howard Street Tunnel)
0.04 $503
Port of Baltimore Dray Track Replacements <0.01 $18 Emerging and Innovative Strategies (unfunded) Intermodal Freight Centers Access Improvement 0.02 $2,240 to
$3,136 Commercial Vehicle Technologies 0.03 – 0.05 Nominal § Freight Villages/Freight Consolidation Centers 0.03 – 0.04 $4,705 -
$6,8931
Total Multimodal Freight 0.12 – 0.15 $7,500 to $10,678
§ Nominal costs are program implementation, regulatory facilitation, and support costs for implementing emission reduction strategies, where MDOT has limited control. 1 Most, if not all of these costs would be covered by private sector investments. Public investments would support transportation access to these sites and are included under the Intermodal Freight Centers Access Improvement strategy.
3.2.11 Public Transportation Lead Agency: MDOT
Program Description Public transportation emits roughly 40% to 50% less GHG emissions per passenger mile than an average SOV. The programs in this policy option include transit initiatives that support a goal of increasing public transit ridership, and intercity transportation initiatives that support MARC and regional and national passenger rail services such as Amtrak. By providing alternatives to single occupant vehicle travel, these initiatives have the potential to reduce
Maryland Department of the Environment 2030 Greenhouse Gas Emissions Reduction Act Plan
95
VMT and GHG emissions. Public transportation strategies analyzed for this plan are broadly classified into two strategy groups:
• Transition to cleaner and efficient public transportation fleet, and • Expansion of public transportation or intercity passenger service (new or increased capacity, improved
operations). MDOT works with MPOs, transit operators, and other local agencies in Maryland to implement projects aimed at advancing a more efficient and accessible multimodal transport system. These include transportation demand management programs (such as Commuter Choice Maryland and MWCOG’s Commuter Connections, which are detailed further in the pricing policy option), transit-supportive enhancements including bicycle and pedestrian access projects, bicycle parking and bike racks on buses, and coordination with expanding bike share programs. There is an emphasis on improving service quality and reliability, better aligning transit service to demand, and improved transit information dissemination to customers. MDOT MTA is also focused on sustainability and in moving towards a more efficient fleet.
Program Objectives To maintain and enhance operations of the current public transportation system while strategically expanding services to provide access for more Marylanders, systematic and coordinated actions are needed. These actions increase the availability, attractiveness and convenience of public transportation, improve operational efficiency and safety of the system, and increase system capacity. Two different types of investments within this program aimed at meeting our GHG reduction goals are the Purple Line and BaltimoreLink. Each of these projects help address high priority operational and capacity needs within the densely populated Washington, DC and Baltimore metro regions through different project investment and delivery approaches. Other ongoing actions include the implementation of innovative transit solutions such as transit signal prioritization, off-board payment, and improved real time arrival information for riders. Actions related to land use planning and development, including Maryland’s commitment to transit oriented development (TOD), enhanced financial incentives for riding transit, and non-motorized access improvements are necessary to continue to enable Maryland’s residents and commuters to have safe, efficient, and affordable transportation options.
• Intercity Transportation Initiatives – Improvements to Maryland's intercity passenger transportation systems helps address multimodal barriers to efficient intercity travel. Improvements to MARC are helping to enhance connectivity, reliability, and access to intercity passenger rail, for both commuting and leisure trips for millions of Maryland residents, employees, and visitors. MDOT MTA is continuing to promote two mobile apps for smartphones that improve the transit user experience. The CharmPass Mobile ticketing app introduced in 2018, allows riders to purchase tickets for Local Bus, Metro Subway, Light Rail, MARC Train, and Commuter Bus Services from a smart phone. Additionally, MDOT MTA has partnered with Transit app to allow for real-time transit information and trip-planning for MARC Train service as of this past August.
o MDOT MTA continues to upgrade its MARC facilities, with repairs and new amenities at BWI, as well is a recently completed renovation at the Camden station. The agency continues to invest in BaltimoreLink, with focus on construction of dedicated busways, transit hubs, Transit Signal Prioritization, and Transit Signal Priority. These efforts help improve regional mobility including connections between Baltimore and Annapolis as well as between Baltimore and Anne Arundel County.
Implementation Milestones
Maryland Department of the Environment 2030 Greenhouse Gas Emissions Reduction Act Plan
96
Support for public transportation and intercity transportation investments are presented in MDOT’s annual capital program, the CTP. Highlighted projects recently implemented or planned through the CTP include:
• After the signing of a $900 million Full Funding Grand Agreement and a $5.6 billion public-private contract, construction has begun in the Purple Line project corridor between Bethesda and New Carrolton. The Purple Line will include direct connections to Metrorail in four locations (serving three Metrorail lines), all three MARC Train lines, Amtrak, and local bus services. The segment between Bethesda and Silver Spring will include a parallel hiker/biker trail as well. This project will improve transit accessibility for anyone working in, living in, or visiting the Washington metro area while supporting economic development and reducing the environmental impact of transportation in the region. The Purple Line will have 21 stations and provide direct connections to the Metrorail. It will also connect to MARC, Amtrak, and local bus services and is projected to have 74,000 daily riders by 2040.
• Since its launch in June 2017, the BaltimoreLink continues to provide fast and reliable access to transit, jobs, and service in the region. Through new programs and innovations, including Transit Signal Priority, the BaltimoreLink has continued to improve its on-top performance. Key features of this enhanced service include essential connections to job centers, and better integration between MDOT MTA transit services, such as CityLink, LocalLink, MetroLink, Light RailLink and MARC. BaltimoreLink network is providing more people with access to transit, jobs, and services in the region with an estimated 130,000 additional people within a ¼ mile access to frequent transit operating every 15 minutes or less during peak and midday periods. Eleven percent more jobs are accessible within 30 minutes and BaltimoreLink is adding several public schools, libraries, pharmacies, hospitals, and supermarkets to the frequent transit network.
• New technologies are supporting MDOT MTA bus system operations and reliability including automatic vehicle locator system deployment, enhancements to MDOT MTA’s Central Control Center, and improvements and expansion to camera systems for safety and security. MDOT’s 2020-2025 CTP includes a total of $6.4 million for replacement of CAD/AVL systems as part of mobility improvements for FY20 and FY21.
• MDOT MTA’s construction program is undertaking an ongoing replacement and mid-life overhaul of Light Rail, Metro, and MARC rail cars to improve passenger comfort, vehicle reliability and overall performance. The program includes a $400 million approved contract to replace 78 rail cars and enhance safety components on the Metro Subway system. The new railcars will be more reliable and more energy efficient, with the first train scheduled to enter service in 2021. MTA is also investing in other fleet modernization measures, including a 53-vehicle light rail vehicle fleet overhaul to be completed in 2022, as well as a $54.2 million overhaul of MARC III passenger coaches, will be complete in 2021.
• Completed in Spring 2019, a Wayside Energy Storage System (WESS) was installed on Metro Subway at West Cold Spring Station. A WESS captures energy from braking trains and re-uses that energy to provide traction power and reduce operating costs.
• Upgrades and repairs to the BWI MARC Station, including new passenger amenities such as additional seating, and a new pedestrian overpass connecting the garage and station, were completed in December 2019.
• A renovation of MARC’s Camden Station was completed in 2019. The building is now LEED certified. • In October 2020, Montgomery County began operation of its first bus rapid transit service, The Flash on a
14-mile bus rapid transit facility on U.S.-29, between Burtonsville and Silver Spring. • Construction began in 2019 on a 7-mile dedicated bus lane on the North Avenue Corridor in Baltimore, with
completion anticipated at the end of 2021. The North Avenue Rising project is a unique suite of proposed transportation investments intended to improve corridor and regional mobility and leverage these transportation improvements with other city, state, and private development initiatives to revitalize the surrounding area. The North Avenue Rising project includes dedicated bus lanes, new bike facilities, enhancing MTA Metro and Light Rail stations, targeted improvements at major bus stops, improved sidewalks, streetscaping, and needed roadway re-pavement along the corridor.
• The Washington Metropolitan Area Transit Authority (WMATA) Capital Improvement Program (CIP) includes $1.2 billion of funding from Maryland to match federal formula funds received directly by WMATA
Maryland Department of the Environment 2030 Greenhouse Gas Emissions Reduction Act Plan
97
as well as Maryland's share of additional funds for WMATA capital projects. The CIP is focused on safety, infrastructure rehabilitation and replacement and maintaining the region's transit system in a state of good repair. The 2020-2025 CTP includes a total of $300 million ($50 million each year in FY20 through 2025) as Maryland’s matching contribution required by the federal PRIIA legislation Starting in FY20, the Governor is to include a State budget appropriation of $167 a year million from revenues available for the State capital program in the transportation trust fund as a grant to be used to pay WMATA capital costs. The Act also calls for an increase of 3% a year of the existing WMATA funding.
• MDOT MTA and locally operated transit services (LOTS) continue to regularly update and renew their bus fleets to maintain the average age of the fleet, yielding reliability benefits and environmental benefits through reduced emissions, fuel consumption, and noise.
Enhancement Opportunities
Implementation of BaltimoreLink provides a good example of how to expand transit service and enhance efficiency with a comparatively low capital commitment. Another example, through support from the MDOT Bikeways Program, is our effort to retrofit our fleet of bi-level MARC cars to accommodate two full size bicycles per car. Investments like this help address first/last-mile access to transit issues. Enhancements to the currently funded program will create opportunities to increase transit service and reliability, which can increase ridership, in terms of capturing choice transit riders, but also create economic opportunity for Maryland residents with limited transportation options. BaltimoreLink and North Avenue Rising are examples of innovative partnerships for service expansion and improvements in developing areas and corridors, where the investment in transit can help to spur further mixed-use and transit-supportive development. These projects are also using existing infrastructure and new technologies to optimize service delivery and reliability. Ongoing planning by MDOT MTA and MDOT SHA, and MDOT MTA and WMATA activities regarding transit signal priority, bus-only lanes, and other on-board bus communication and location technologies will help maintain service quality while meeting public demand for reliable service. The State continues to incorporate responsive and innovative investments, such as the inclusion of a P3 contract for the Purple Line and the establishment of a transit grant for innovative transit projects. MDOT MTA has begun implementation planning for the Regional Transit Plan for Central Maryland including Anne Arundel County, Baltimore County, Baltimore City, Harford County, and Howard County. Other longer-term transit investments include continued implementation of the Cornerstone Plans for MARC, Light Rail, Metro Subway, Bus and Mobility, and replacements for two major bottlenecks on the Amtrak Northeast Corridor, the Baltimore & Potomac Tunnel and Susquehanna River Bridge. There are other areas of implementation that could be targeted for more aggressive implementation through 2030. These strategies could receive additional funding through the Consolidated Transportation Program, as well as funding through other non-transportation sources and possible legislative support. These include:
• Continued bus replacement to cleaner alternatives and hybrid technologies -- 94 clean diesel buses (out of an order of 350 clean diesel buses) were delivered to MDOT MTA in FY20 as part of its fleet modernization efforts. In FY20, Prince George's County Department of Public Works and Transportation purchased four new electric buses, to replace buses from an aging fleet. With the grant, the county also purchased four 120-kilowatt charger stations;
• MDOT and WMATA joint development agreements to help promote and create TOD projects; • Piloting new partnerships and potential service opportunities afforded by transportation network companies;
and • Enhancing multimodal connections, particularly for bicycles and pedestrians.
Maryland Department of the Environment 2030 Greenhouse Gas Emissions Reduction Act Plan
98
There are several strategies that have been identified as emerging and innovative strategies under consideration within this policy option. They are framed as an accelerated service expansion of service expansion and transformation of public transit fleet to cleaner and more efficient alternatives.
• For example, one of the strategies estimates the GHG reduction benefits and costs involved in transforming the Maryland transit bus fleet to 50% EV buses by 2030.
• Another strategy assesses the benefits and costs associated with accelerating transit projects identified in the TPB and BRTB’s most recent long-range transportation plans for implementation after 2030. These projects primarily include build out of bus-rapid-transit systems in Montgomery, Prince Georges, Howard, and Anne Arundel counties. In addition, this strategy considers the advancement of the complete build-out of the MARC Growth and Investment Plan by 2030 and complete development of all identified TOD locations in Maryland.
• One of the strategies also envisions the potential impacts of an expanded high-speed rail system serving Maryland using current or new technology advances. This strategy estimates the potential impacts and costs of a potential build-out of the NEC Vision, or construction of the SCMAGLEV and/or Loop, to facilitate intercity passenger rail travel through 2030.
Funding
Transit investments are strongly supported in the FY20–FY25 CTP, including MARC maintenance and service expansion, BaltimoreLink operations, support of WMATA and MTA capital expansion, and support of LOTS across Maryland.
• The Purple Line presents a new and innovative approach to transit infrastructure funding by using a P3 agreement. The innovative P3 project delivery creates a predictable, transparent, and streamlined approach, incorporating best practices and lessons learned from other states and countries, while addressing the transportation and economic development needs of Marylanders.
• Around $300 million will be dedicated from FY20 through FY25 to restore the safety and reliability of the WMATA system through investments in safety and state of good repair.
• In total, in the 2020-2025 CTP, MDOT estimates that $3.01 billion is programmed to be spent on transit projects that help increase transit reliability, convenience, and accessibility, resulting in a more competitive system that helps to reduce emissions through mode shift from vehicle trips in addition to reducing emissions from transit service.
• No other projects apart from those that are “on-the-books” have appropriated funding or a funding source currently identified for implementation. Notable strategies that may require substantial capital investment includes procurement of an all-electric transit bus fleet, fiscally unconstrained transit capacity expansion consistent with post-2030 projects identified in MPO long-range plans, and the SCMAGLEV/High Speed Rail/Loop.
The COVID-19 pandemic in has led to dramatic reductions in travel, specifically in transit ridership. As a result, transportation revenues have declined dramatically, leading to reductions in operating and capital budgets. Moving forward, MDOT will strategically and efficiently ensure transportation investments maintain and further its priorities, with a focus on its core principles.
Challenges The State works to provide multi-modal connections throughout the State’s transportation system so that users have a variety of options including public transit. Bicycling and pedestrian modes, while they are now being measured more consistently than in previous years, are developed to supplement use of public transit with other non-SOV alternatives. First and last mile connectivity is an area that is constantly changing as Maryland focuses on innovative
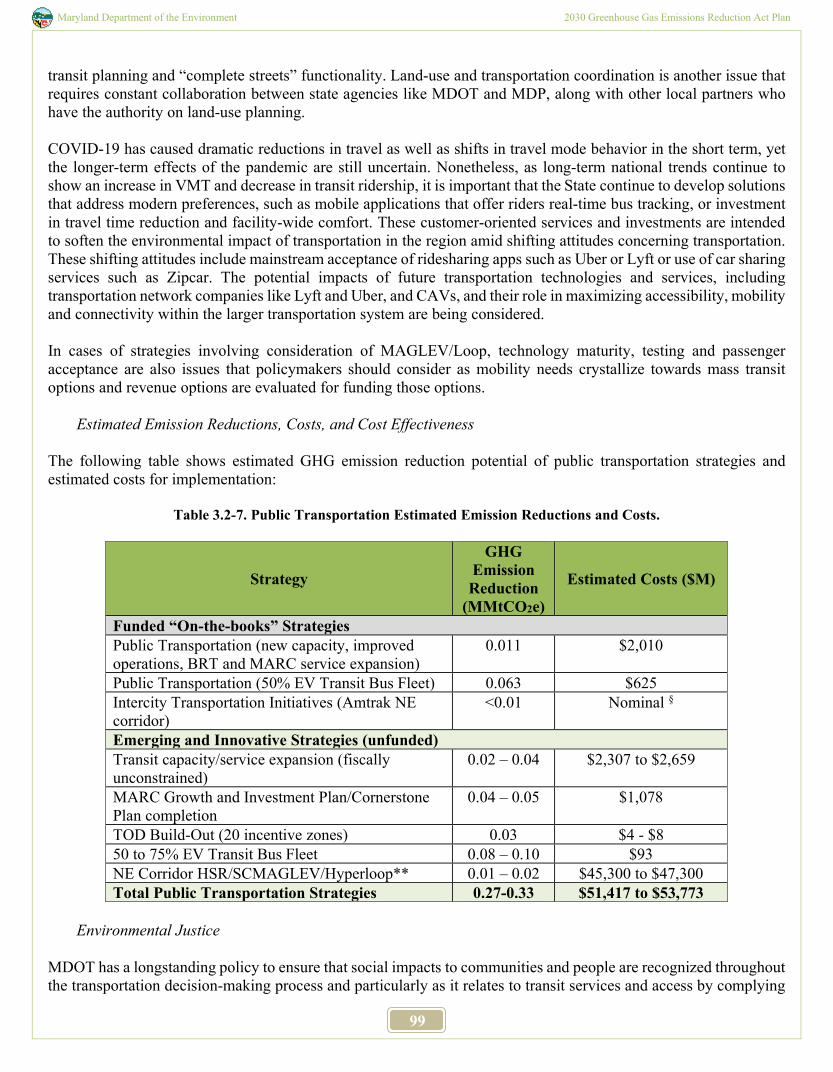
Maryland Department of the Environment 2030 Greenhouse Gas Emissions Reduction Act Plan
99
transit planning and “complete streets” functionality. Land-use and transportation coordination is another issue that requires constant collaboration between state agencies like MDOT and MDP, along with other local partners who have the authority on land-use planning. COVID-19 has caused dramatic reductions in travel as well as shifts in travel mode behavior in the short term, yet the longer-term effects of the pandemic are still uncertain. Nonetheless, as long-term national trends continue to show an increase in VMT and decrease in transit ridership, it is important that the State continue to develop solutions that address modern preferences, such as mobile applications that offer riders real-time bus tracking, or investment in travel time reduction and facility-wide comfort. These customer-oriented services and investments are intended to soften the environmental impact of transportation in the region amid shifting attitudes concerning transportation. These shifting attitudes include mainstream acceptance of ridesharing apps such as Uber or Lyft or use of car sharing services such as Zipcar. The potential impacts of future transportation technologies and services, including transportation network companies like Lyft and Uber, and CAVs, and their role in maximizing accessibility, mobility and connectivity within the larger transportation system are being considered. In cases of strategies involving consideration of MAGLEV/Loop, technology maturity, testing and passenger acceptance are also issues that policymakers should consider as mobility needs crystallize towards mass transit options and revenue options are evaluated for funding those options.
Estimated Emission Reductions, Costs, and Cost Effectiveness The following table shows estimated GHG emission reduction potential of public transportation strategies and estimated costs for implementation:
Table 3.2-7. Public Transportation Estimated Emission Reductions and Costs.
Strategy
GHG Emission Reduction
(MMtCO2e)
Estimated Costs ($M)
Funded “On-the-books” Strategies Public Transportation (new capacity, improved operations, BRT and MARC service expansion)
0.011 $2,010
Public Transportation (50% EV Transit Bus Fleet) 0.063 $625 Intercity Transportation Initiatives (Amtrak NE corridor)
<0.01 Nominal §
Emerging and Innovative Strategies (unfunded) Transit capacity/service expansion (fiscally unconstrained)
0.02 – 0.04 $2,307 to $2,659
MARC Growth and Investment Plan/Cornerstone Plan completion
0.04 – 0.05 $1,078
TOD Build-Out (20 incentive zones) 0.03 $4 - $8 50 to 75% EV Transit Bus Fleet 0.08 – 0.10 $93 NE Corridor HSR/SCMAGLEV/Hyperloop** 0.01 – 0.02 $45,300 to $47,300 Total Public Transportation Strategies 0.27-0.33 $51,417 to $53,773
Environmental Justice
MDOT has a longstanding policy to ensure that social impacts to communities and people are recognized throughout the transportation decision-making process and particularly as it relates to transit services and access by complying
Maryland Department of the Environment 2030 Greenhouse Gas Emissions Reduction Act Plan
100
with Title VI and environmental justice regulations. MDOT MTA has updated its 2020-2023 Title VI plan, which includes a public participation plan, language assistance plan, and requirements for regulatory compliance and oversight towards achieving principles of environmental justice.
3.2.12 Pricing Initiatives
Lead Agency: MDOT
Program Description The State supports multiple alternative commute programs, including ride sharing, guaranteed ride home, travel demand management (TDM) and marketing, outreach and education programs, parking cash-out subsidies, transportation information kiosks, local car sharing programs, telework partnerships, parking fees, and vanpool programs, among others. These programs encourage use of alternative transportation modes through pricing incentives (or disincentives) along with information for employers and employees. The pricing program also includes expanded and enhanced technologies for electronic toll collection on tolled facilities operated by the MDTA. As part of emerging and innovative pricing strategies, the impacts of expanding the current TDM strategies and facilitating Pay-As-You-Drive insurance (PAYD), which is already being offered by the private sector insurance providers, was assessed.
Program Objectives Pricing initiatives are targeted towards reducing SOV travel by providing incentives, alternative travel options that are not as carbon intensive as SOV travel – like carpool, vanpool, and transit options by providing incentives like cash subsidies for travel and parking. Other initiatives also include easy-payment options that reduce wait times for toll payment and collection by using electronic tolling alternatives. PAYD Insurance is a usage-based insurance program where charges are based on usage and driver behavior, which is offered by several auto insurance companies in the U.S.. This strategy involves adoption of PAYD insurance, which has been observed in multiple studies to reduce VMT. There is potential for up to 5% of Maryland drivers being enrolled in PAYD by 2030. The assumed VMT reduction associated with PAYD insurance premiums is 8% based on national studies. The role of MDOT in this area is to provide regulatory or policy enabling framework to make these pricing schemes more competitive.
Implementation Milestones Operational, management, and financial support for a broad range of TDM programs (also known as Transportation Emission Reduction Measures)144 is documented in the CTP. These investments support emission reductions in air quality nonattainment and maintenance areas in Maryland through congestion mitigation, ridesharing and commuter incentive programs. Programs include the Commuter Connections145 program (managed by MWCOG) and the Commuter Choice Maryland146 program (managed by MDOT). Both programs offer commuters and students in the Washington and Baltimore regions access to financial incentives, ride sharing, guaranteed ride home, and traveler information to support carpooling and transit use. Prior to the pandemic, Maryland’s Commuter Choice program saw more than a doubling in employer participation from 2017 to 2019, with a correspondingly similar significant increase in employee participation as well. The Commuter Choice program expanded and enhanced the delivery of
144 The Secretary’s office Capital Program Summary – Line 2 http://www.mdot.maryland.gov/newMDOT/Planning/CTP/CTP_17_22/Documents/TSO.pdf 145 https://www.commuterconnections.org/ 146 https://mdot.maryland.gov/tso/Pages/ErrorPage.aspx?requestUrl=https://mdot.maryland.gov/newMDOT/Commuter/Commuting
Maryland Department of the Environment 2030 Greenhouse Gas Emissions Reduction Act Plan
101
the Maryland Commuter Tax Credit through the Maryland OneStop Online Portal and updated marketing material to help communicate the benefits and how to claim the tax credit. Telework increased dramatically in response to COVID-19 and continues at much higher rates than in prior years. Commuter Choice Maryland provided new educational and outreach material to assist employers and workers with new telework arrangements. Commuter Connections also conducted a survey to examine telework experience and changes in teleworking implemented by employers in the Washington Region (which also includes Maryland employers) during the COVID-19 pandemic in spring 2020. Seven in ten (69%) respondents with more than half of their employees teleworking during the pandemic anticipated teleworking above the pre-pandemic level. Telework continues a steady upward trend observed since 2007, with more than one million regional teleworkers in 2019 in the Washington Region, where potential exists for more than 1.7 million regional teleworkers. The State also supports the Telework Partnership, transit marketing and subsidy programs, and statewide park-and-ride facilities aimed at reducing SOV driving and encouraging ridesharing, transit, and telecommuting. There was a 240% increase in employer participation from 2017 to 2019 with a significant increase in the number of employee participation to 1,260 employees in 2019. MDOT and MDE worked together to develop assumptions for scenario analysis of telework strategy and estimation of potential GHG emission reductions due to an increase in telework activity due to lingering impacts of COVID-19. It was observed, in light of COVID-19, that the share of people who are teleworking has seen a multi-fold increase compared to the levels that existed years ago. Research literature and surveys reviewed for the strategy analysis indicate that the increase in telework trends is going to be a long-term phenomenon. Costs of program management assumed - after considering other states and metro area telework programs, a $10-20 million annual funding was determined to be adequate for a potential Statewide Telework program (not accounting for costs to employers and reimbursed costs for public employees). Electronic toll collection systems expedite the toll collection process, reduce delays at toll plazas, and decrease emissions. GHG emissions are significantly reduced when tolls are collected electronically, due to reduced queuing and idling at toll collection plazas. The MDTA instituted all electronic tolling (AET) across the State, including the John F. Kennedy Memorial Highway (I-95), Fort McHenry Tunnel (I-95), Baltimore Harbor Tunnel (I-895), and Nice/Middleton Bridge (U.S. 301) to allow safe no-contact payment during COVID-19, and these changes were made permanent in August 2020. The percentage of toll transactions conducted electronically increased from 80% in 2019 to 90% in 2020 as a result of this change. Implementation of the MDTA Toll Modernization Plan instituted other program features that improved efficiency of the tolling system and reduced emissions.
Enhancement Opportunities Expansion of Maryland’s TDM program offerings, geographic scope, and incentives would require additional funding and potential legislation regarding tax credits and incentives. Other opportunities, such as expanded coordination with services such as Uber and Lyft, to enhance access to transit and encourage ridesharing, are emerging possibilities to expand the scope of traditional TDM programs. MDOT will continue to add capacity, provide better transit access, and maintain park and ride lots, while providing information to the public to increase awareness about the possibilities of carpooling and taking transit. MDOT SHA’s Parking Lot Demand Model was implemented to ensure future projects to provide new lots will be designed to meet current needs. Within USDOT’s surface transportation reauthorization, the FAST Act, the Surface Transportation System Funding Alternatives grant program147 funds projects to test the design, implementation and acceptance of user-based alternative revenue mechanisms. The program helps to address some of the concerns outlined in the USDOT report Beyond Traffic148, issued in 2016 that examines the challenges facing America's transportation infrastructure over
147 http://www.fhwa.dot.gov/pressroom/fhwa1648.cfm 148 https://www.transportation.gov/sites/dot.gov/files/docs/BeyondTraffic_tagged_508_final.pdf
Maryland Department of the Environment 2030 Greenhouse Gas Emissions Reduction Act Plan
102
the next three decades, such as a rapidly growing population and increasing traffic. USDOT announced funding for eight projects in August 2016 that piloted a variety of options to raise revenue, including on-board vehicle technologies to charge drivers based on miles traveled and multi-state or regional approaches to road user charges. The projects address common challenges involved with implementing user-based fees such as public acceptance, privacy protection, equity and geographic diversity. The Eastern Transportation Coalition (formerly the I-95 Corridor Coalition) completed a 6-month multi-state mileage-based user fee (MBUF) trucking pilot in 2019 and expanded to a nationwide pilot study in 2020. The findings of these pilot studies will inform future initiatives. MDOT has been monitoring the progress of these studies, future grant funding opportunities, and other emerging road pricing technologies to learn innovative methods of funding the transportation system here in Maryland. Each state that received funding has conducted research regarding novel ways to collect road user fees, such as built-in electronic systems and pay-at-pump systems. Minnesota, for instance, investigated MaaS and examined trends (decline in private vehicle ownership, MaaS customers traveling less) and their potential effects on road use pricing. Research is ongoing, and MDOT will continue to examine the outcomes of this research. Ride-hailing/Mobility-as-a-Service (MaaS) services not only encourage cost-saving and emission reducing measures like carpooling (the price savings of services like Uber pool and Lyft Line), but also as a first/last mile connection between users and other modes, reducing the needs for single occupancy vehicle ownership, such as through bike share and electric scooters (or other forms of micro-mobility). Impacts could include reduced vehicle ownership and reduced travel activity, with national literature pointing to a range of anywhere between 10% to 20% adoption of car sharing by 2030.
Funding MDOT sets aside $28.4 million in the CTP over the next six years to support the TERM programs, covering 15 counties in Maryland designated as non-attainment through the Clean Air Act. These funds are leveraged by additional federal and local funds to deliver these programs to Marylanders. The FY20-2025 CTP identifies $72.6 million in funding over the next six years to implement the next generation electronic tolling system that would represent the technology platform enabling a conversion to AET across the entire system. This next generation tolling system continues the implementation of the MDTA Toll Modernization Plan. The CTP also sets aside $20 million for cashless tolling at Key Bridge, $7M for cashless tolling at the Thomas J. Hatem Memorial Bridge, and $924 million for I-95 express toll lanes. Funding has not yet been identified for the emerging and innovative strategies for expanding the TDM program and overseeing the regulatory facilitation of the PAYD strategy.
Challenges TDM offsets vehicle congestion by offering incentives for Marylanders to use public transit, carpool, walk or bicycle instead of driving alone. Other ways that roadway demand can be reduced is the promotion of telecommuting and flexible work hours to reduce or shift trips to times when roadway capacity is less constrained. Expansion of employers offering these incentives and employees using them are associated with several business and personal cost and convenience considerations. Ensuring that information is available to employers and employees regarding program details is key to enhancing participation. A key challenge to broader implementation and participation of TDM programs is the provision of ample and free employee parking. These decisions are traditionally led by the developer and property owners and informed by local zoning and development regulations. The State, through TOD development or other technical assistance programs can take a lead by example role as it relates to parking. Additionally, incentives can be considered to encourage
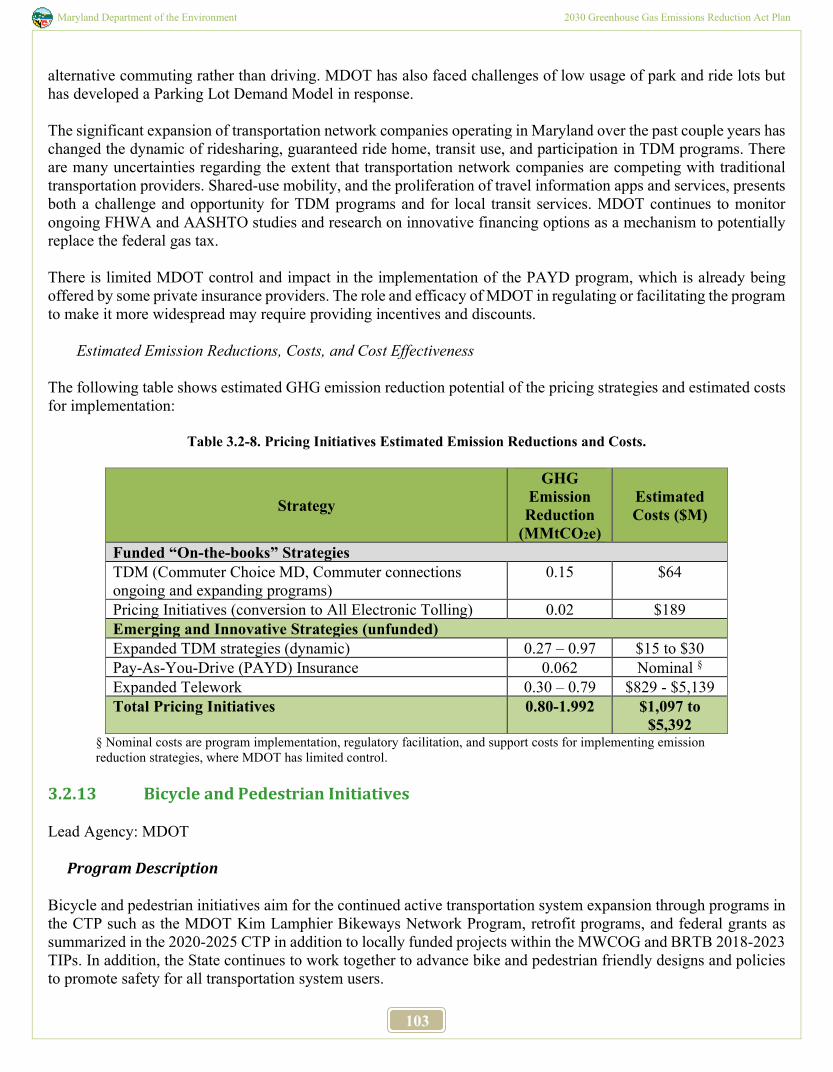
Maryland Department of the Environment 2030 Greenhouse Gas Emissions Reduction Act Plan
103
alternative commuting rather than driving. MDOT has also faced challenges of low usage of park and ride lots but has developed a Parking Lot Demand Model in response. The significant expansion of transportation network companies operating in Maryland over the past couple years has changed the dynamic of ridesharing, guaranteed ride home, transit use, and participation in TDM programs. There are many uncertainties regarding the extent that transportation network companies are competing with traditional transportation providers. Shared-use mobility, and the proliferation of travel information apps and services, presents both a challenge and opportunity for TDM programs and for local transit services. MDOT continues to monitor ongoing FHWA and AASHTO studies and research on innovative financing options as a mechanism to potentially replace the federal gas tax. There is limited MDOT control and impact in the implementation of the PAYD program, which is already being offered by some private insurance providers. The role and efficacy of MDOT in regulating or facilitating the program to make it more widespread may require providing incentives and discounts.
Estimated Emission Reductions, Costs, and Cost Effectiveness The following table shows estimated GHG emission reduction potential of the pricing strategies and estimated costs for implementation:
Table 3.2-8. Pricing Initiatives Estimated Emission Reductions and Costs.
Strategy
GHG Emission Reduction
(MMtCO2e)
Estimated Costs ($M)
Funded “On-the-books” Strategies TDM (Commuter Choice MD, Commuter connections ongoing and expanding programs)
0.15 $64
Pricing Initiatives (conversion to All Electronic Tolling) 0.02 $189 Emerging and Innovative Strategies (unfunded) Expanded TDM strategies (dynamic) 0.27 – 0.97 $15 to $30 Pay-As-You-Drive (PAYD) Insurance 0.062 Nominal § Expanded Telework 0.30 – 0.79 $829 - $5,139 Total Pricing Initiatives 0.80-1.992 $1,097 to
$5,392 § Nominal costs are program implementation, regulatory facilitation, and support costs for implementing emission reduction strategies, where MDOT has limited control.
3.2.13 Bicycle and Pedestrian Initiatives Lead Agency: MDOT
Program Description Bicycle and pedestrian initiatives aim for the continued active transportation system expansion through programs in the CTP such as the MDOT Kim Lamphier Bikeways Network Program, retrofit programs, and federal grants as summarized in the 2020-2025 CTP in addition to locally funded projects within the MWCOG and BRTB 2018-2023 TIPs. In addition, the State continues to work together to advance bike and pedestrian friendly designs and policies to promote safety for all transportation system users.
Maryland Department of the Environment 2030 Greenhouse Gas Emissions Reduction Act Plan
104
Program Objectives
This program is part of a comprehensive effort to reduce GHG and other emissions from passenger vehicles by providing active transportation alternatives to vehicle use. Building connected and safe infrastructure to support bicycle and pedestrian travel in urban areas also increases access to and use of public transit and supports the State’s goal of increasing transit ridership.
Implementation Milestones The 2040 Maryland Bicycle and Pedestrian Master Plan (2019 Update) was completed in January 2019 whose goals include expanding travel choices, improving multimodal connectivity and advanced biking and walking as economic development strategies. The MDOT SHA completed its draft Context Driven: Access and Mobility for all Users Guide in August 2019. The Context Guide is a planning and design resource offering practitioners’ guidelines focused on creating safe, accessible, and effective multi-modal transportation systems. The MDOT SHA developed a set of six contexts based on the distinctive land use characteristics of Maryland communities. This Guide applies the contexts to transportation facilities during the project development process, balances the needs of all users and encourages innovation in design solutions that address the major issues of safety and accessibility. The following implementation elements are consistent with the Bicycle and Pedestrian Master Plan:
• Bike sharing programs continue to expand in many Maryland communities. Successful docked bikeshare programs are operating in Montgomery, Prince George’s and Howard counties as well as in the City of College Park. Privately funded dockless micro mobility services have expanded across Maryland requiring little to no cost to state and local agencies. Dockless micro mobility includes bicycle and scooter access without the need for dock stations and related utility infrastructure.
• There are 42 MARC Stations and 26 state-managed stations with bicycle parking. Bike parking has been expanded and improved, including covered parking, where needed. All MDOT MTA buses contain bike racks.
• In order to increase bicycle and pedestrian access to transit, MDOT MTA will continue working with Baltimore City to implement shared mobility corrals at 11 locations along North Avenue and at or adjacent to nearly every Metro, Light Rail, and MARC station in Baltimore City.
• MDOT MVA Maryland Highway Safety Office is also updating the Maryland Strategic Highway Safety Plan to incorporate principles and strategies consistent with the Vision Zero approach.
• MDOT SHA considers bicycle accommodations for all roadway projects – 73 roadway capacity or bridge upgrade projects in the Consolidated Transportation Program include accommodations for bicycles and pedestrians. In FY20, some 79.5 directional miles of roadways have been improved for bicycle access.
• Nineteen bike network projects were funded in FY21 under the Kim Lamphier Bikeways Network Program. Approximately 116 bikeways projects that received funding through the Bikeways Program have been completed since the programs’ inception in 2012. Additional projects will be solicited through annual grant cycles.
• In 2019 and 2020, to improve roadway safety for all users, MDOT SHA evaluated and completed over 100 context-driven projects including reducing speed limits, installing continental crosswalks, modifying signal timing for pedestrians, restricting right-turns at red lights, and reducing or narrowing lanes, where appropriate in urban and suburban contexts in Maryland
• MDOT SHA completed six sidewalk projects totaling 6.16 miles of both newly constructed and reconstructed sidewalks through the Sidewalk Construction for Pedestrian Access Program. Other funding programs that enhance bicycle and pedestrian safety and access as part of roadway expansion or maintenance projects, or
Maryland Department of the Environment 2030 Greenhouse Gas Emissions Reduction Act Plan
105
as standalone improvements include the Sidewalk Reconstruction for Pedestrian Access Program, Urban Reconstruction Program, and Bicycle Retrofit Program.
• MDOT SHA activated a High-Intensity Activated Crosswalk (HAWK) beacon which flashes yellow and then red lights indicating a pedestrian is in the crosswalk. The beacon is a proven countermeasure that reduces pedestrian/vehicle crashes.
• MDOT SHA has developed and is implementing the “Promote the Be Street Wise – Drive Safe. Walk Safe. Bike Safe.” campaign that targets all road users – drivers, walkers, and riders and reminds them to follow the rules of the road and all traffic laws.
• MDOT continues to improve data collection techniques and access to safety data to support efforts to plan for and implement safer networks for pedestrians and bicyclists.
• MDOT SHA conducted a Ped/Bike Access to Schools Study which focused on the collection and consolidation of data pertaining to the unmet needs for safe pedestrian and bicycle access to Maryland’s 24 public school districts and a representative selection of private schools across the State. Questionnaires were developed and distributed to both public and private schools in order to identify potential concerns and conflicts associated with pedestrian and bicycle safety.
• MDOT continues to convene a multimodal workgroup to help develop and coordinate project, program and policy initiatives. The MDOT Bicycle and Pedestrian Workgroup meets regularly and provides a conduit to improve communication, project delivery, and policy initiatives.
• To focus on Maryland’s pedestrian initiatives and issues, MDOT launched the Walktober campaign during the month of October. The month-long celebration of walking centered around four (4) webinars, or “Walkinars,” with 13 presenters from national, state, and local pedestrian experts – across a broad range of disciplines, including Health, Natural Resources, Transportation, and Advocacy who provided a wide range of perspectives on new trends, safety, education, infrastructure, and opportunities to promote safe walking and walkability. MDOT also partnered with Maryland Department of Health, Maryland Department of Education, MDP, Maryland Department of Aging, encouraging walks with walk leaders, sole mates, and sole-o-walkers on October 7, 2020 to celebrate Walk Maryland Day. An outreach campaign was developed that included social media and a new website, to expand the reach to all Marylanders. MDOT had over fifteen (15) distinct Walktober partners including state, nonprofits and county agencies.
• MDOT staff continues to support the Maryland Bicycle and Pedestrian Advisory Committee (MBPAC), which was created by statute to advise all State agencies on matters pertaining to bicycling and walking. MBPAC has recently focused on walkability initiatives such as MDOT rail transit station walkshed analysis and review of significant MDOT infrastructure projects.
Enhancement Opportunities
Impacts of an expanded bicycle and pedestrian system development initiative were estimated in the form of an accelerated development of bicycle and pedestrian facility infrastructure by 150% of existing bicycle and pedestrian infrastructure provision targets. Future linear miles of pedestrian and bicycle facilities were estimated based on targets provided in the 2020 MDOT Attainment Report (2020 AR). Along with the system-wide development of the bicycle and pedestrian infrastructure, MDOT is leading several major initiatives in the coming years including implementation of the bicycle and pedestrian priority area (BPPA) program, supporting localities in designating areas and developing plans leading toward implementation of network improvements in these areas. To date, BPPA Plans have been developed for Tilghman Island and Prince George’s Plaza Metro, with plans in development for Silver Spring, Bethesda, and the Rockville Town Center area. Additional BPPAs include Large Town Center, Piney Branch/University Boulevard, Prince George’s Plaza, and White Flint. MDOT works closely with area MPOs to support their efforts on bicycle and pedestrian transportation. Several planning efforts are underway in Maryland jurisdictions and in Maryland’s MPOs. MDOT SHA has completed Phase 1 of planning for a Bike Spine Network to connect major activity centers and guide the planning and construction of
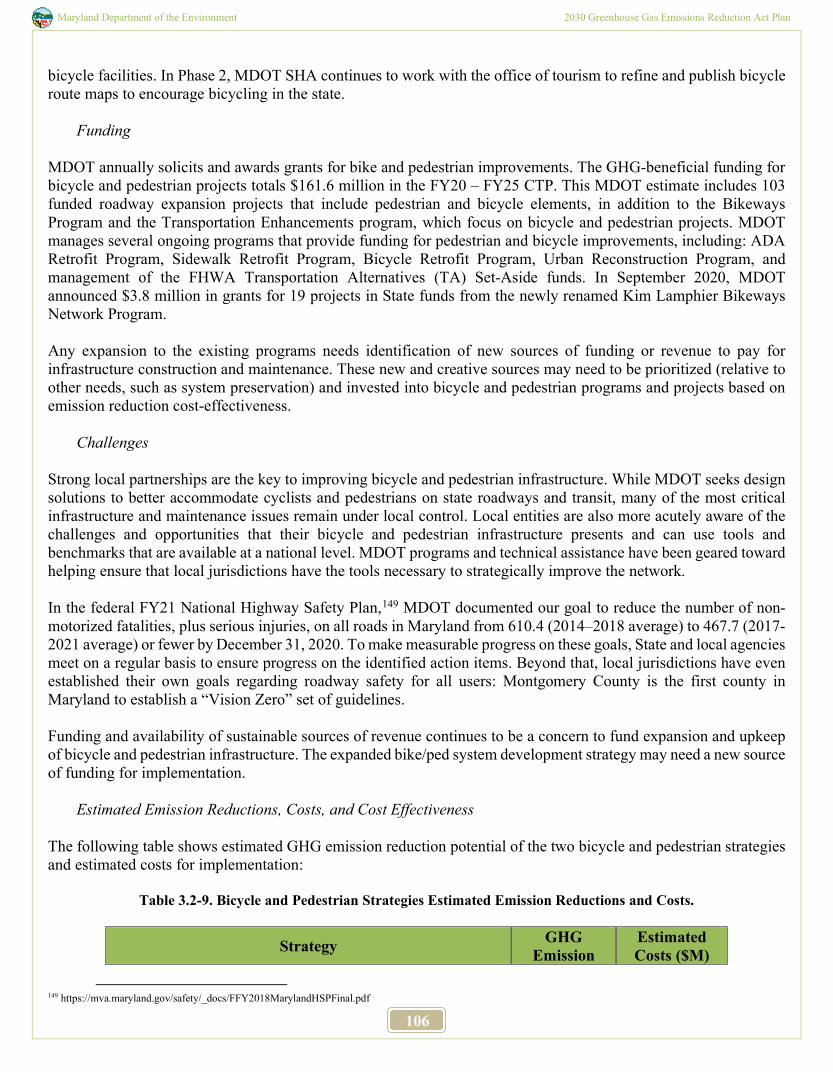
Maryland Department of the Environment 2030 Greenhouse Gas Emissions Reduction Act Plan
106
bicycle facilities. In Phase 2, MDOT SHA continues to work with the office of tourism to refine and publish bicycle route maps to encourage bicycling in the state.
Funding MDOT annually solicits and awards grants for bike and pedestrian improvements. The GHG-beneficial funding for bicycle and pedestrian projects totals $161.6 million in the FY20 – FY25 CTP. This MDOT estimate includes 103 funded roadway expansion projects that include pedestrian and bicycle elements, in addition to the Bikeways Program and the Transportation Enhancements program, which focus on bicycle and pedestrian projects. MDOT manages several ongoing programs that provide funding for pedestrian and bicycle improvements, including: ADA Retrofit Program, Sidewalk Retrofit Program, Bicycle Retrofit Program, Urban Reconstruction Program, and management of the FHWA Transportation Alternatives (TA) Set-Aside funds. In September 2020, MDOT announced $3.8 million in grants for 19 projects in State funds from the newly renamed Kim Lamphier Bikeways Network Program. Any expansion to the existing programs needs identification of new sources of funding or revenue to pay for infrastructure construction and maintenance. These new and creative sources may need to be prioritized (relative to other needs, such as system preservation) and invested into bicycle and pedestrian programs and projects based on emission reduction cost-effectiveness.
Challenges Strong local partnerships are the key to improving bicycle and pedestrian infrastructure. While MDOT seeks design solutions to better accommodate cyclists and pedestrians on state roadways and transit, many of the most critical infrastructure and maintenance issues remain under local control. Local entities are also more acutely aware of the challenges and opportunities that their bicycle and pedestrian infrastructure presents and can use tools and benchmarks that are available at a national level. MDOT programs and technical assistance have been geared toward helping ensure that local jurisdictions have the tools necessary to strategically improve the network. In the federal FY21 National Highway Safety Plan,149 MDOT documented our goal to reduce the number of non-motorized fatalities, plus serious injuries, on all roads in Maryland from 610.4 (2014–2018 average) to 467.7 (2017-2021 average) or fewer by December 31, 2020. To make measurable progress on these goals, State and local agencies meet on a regular basis to ensure progress on the identified action items. Beyond that, local jurisdictions have even established their own goals regarding roadway safety for all users: Montgomery County is the first county in Maryland to establish a “Vision Zero” set of guidelines. Funding and availability of sustainable sources of revenue continues to be a concern to fund expansion and upkeep of bicycle and pedestrian infrastructure. The expanded bike/ped system development strategy may need a new source of funding for implementation.
Estimated Emission Reductions, Costs, and Cost Effectiveness The following table shows estimated GHG emission reduction potential of the two bicycle and pedestrian strategies and estimated costs for implementation:
Table 3.2-9. Bicycle and Pedestrian Strategies Estimated Emission Reductions and Costs.
Strategy GHG Emission
Estimated Costs ($M)
149 https://mva.maryland.gov/safety/_docs/FFY2018MarylandHSPFinal.pdf
Maryland Department of the Environment 2030 Greenhouse Gas Emissions Reduction Act Plan
107
Reduction (MMtCO2e)
Funded “On-the-books” Strategies Bicycle and Pedestrian Strategies (program continuation and expansion through 2030)
0.02 $264
Emerging and Innovative Strategies (unfunded) Expanded bike/pedestrian system development 0.04 – 0.05 $103 Total Bicycle and Pedestrian Strategies 0.06 – 0.07 $367
3.2.14 Forestry and Sequestration
Forest Carbon Cycle and Inventory
Forests represent an important component of the global carbon cycle and have the capacity to be expanded and sustainably managed to remove carbon from the atmosphere. A recent NASA study150 estimated that global forest cover could be increased by 25%, offsetting 20 years of human GHG emissions. Another recent study by U.S. Forest Service scientists estimates that carbon uptake by existing forests in the United States could be increased by 20% just by planting more trees on existing forest lands151. Forests have a natural “boom and bust” cycle (see Figure 3.2-9), where they grow and uptake carbon rapidly and then eventually release the carbon through a disturbance (fire, forest harvest, pest or disease outbreak, etc.). For some forests, this cycle is relatively rapid with disturbances, particularly fire, being a semi-regular occurrence. For most Mid-Atlantic forests, the natural disturbance cycle historically includes low-intensity understory fires every few decades or less, but severe wildfires are rare, occurring every few hundred years (see LandFire fire regime groups).152 .153
150 Bastin et al. The global tree restoration potential. SCIENCE. 05 JUL 2019 : 76-79 151 Domke et al. 2020. Tree planting has the potential to increase carbon sequestration capacity of forests in the United States. Proceedings of the National Academy of Sciences. 202010840; DOI: 10.1073/pnas.2010840117 152 landfire.gov/ 153 https://www.landfire.gov/

Maryland Department of the Environment 2030 Greenhouse Gas Emissions Reduction Act Plan
108
Figure3.2-9. The Natural Cycle of Forest Carbon (USFS 2019).154
Anthropogenic (originating from humans) disturbances occur more frequently; 90% of Maryland was stripped of forest from the mid 1700’s to late 1800’s, with recovery of forest cover occurring post this period as demand for agricultural land in the state declined and our primary energy source shifted to fossil fuels (Figure 3.2-10).
154 USFS Office of Sustainability and Climate. 2019. Carbon Graphics. https://www.fs.usda.gov/sites/default/files/Carbon-Graphics-June-2019.pdf
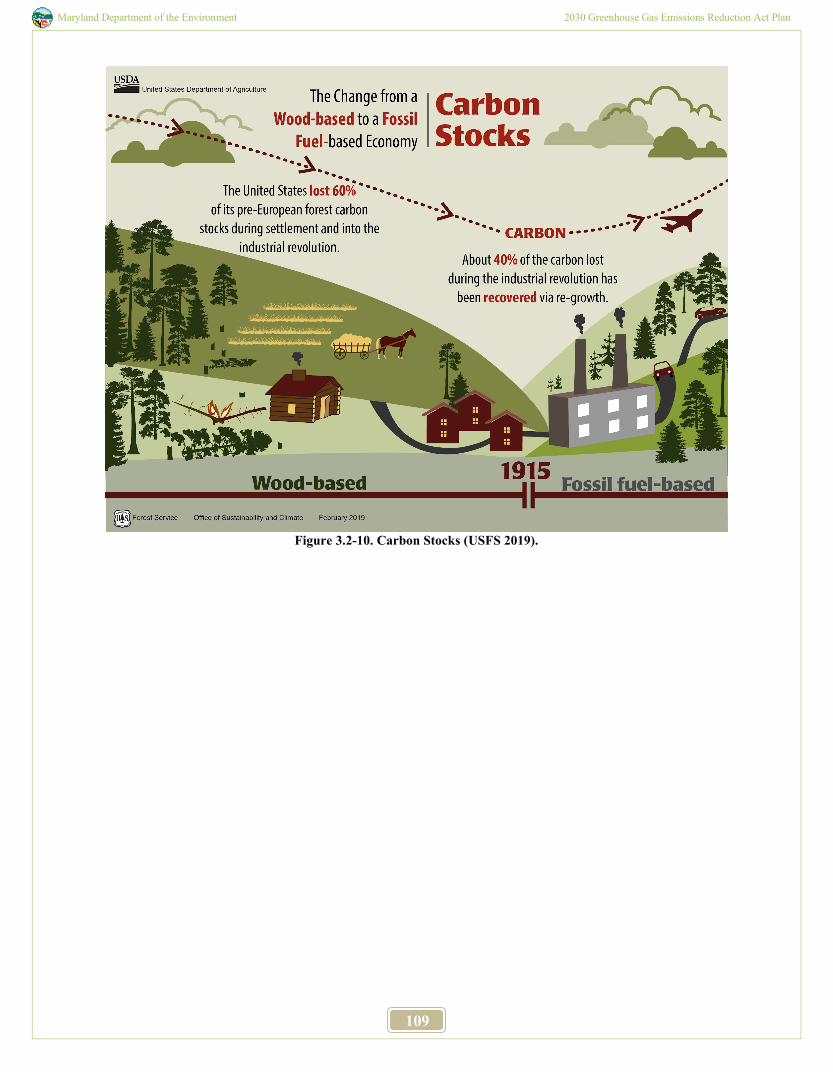
Maryland Department of the Environment 2030 Greenhouse Gas Emissions Reduction Act Plan
109
Figure 3.2-10. Carbon Stocks (USFS 2019).
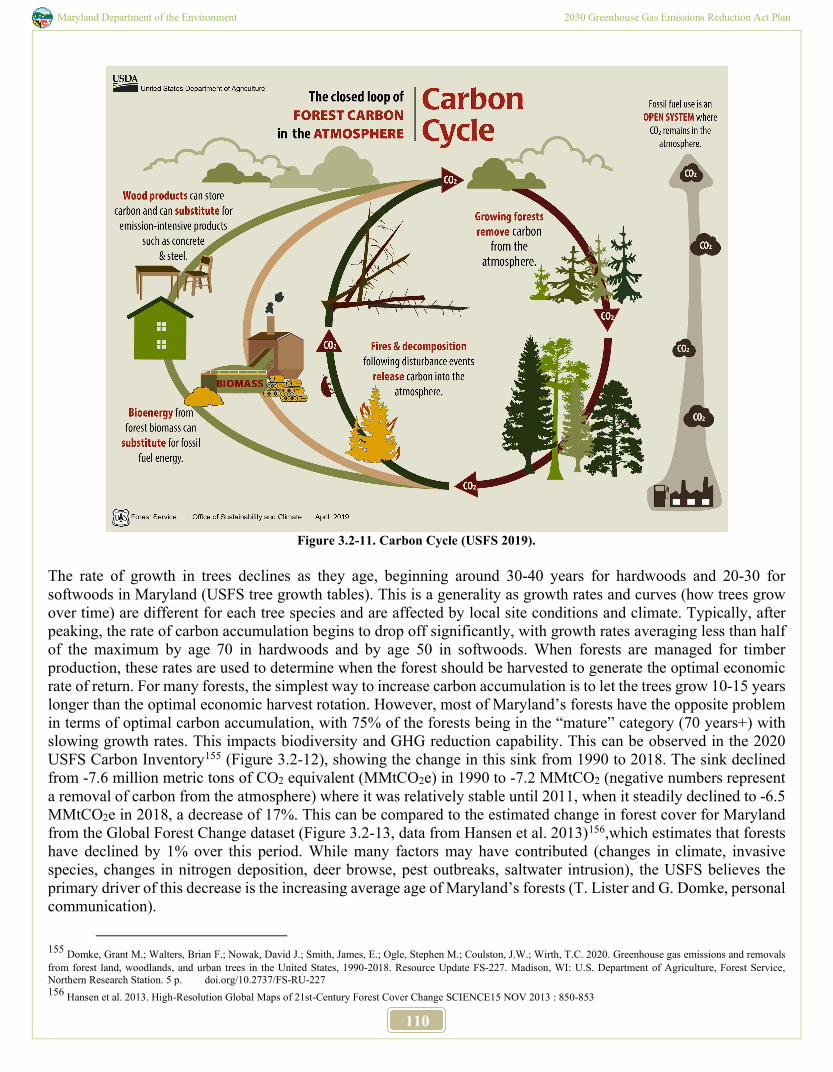
Maryland Department of the Environment 2030 Greenhouse Gas Emissions Reduction Act Plan
110
Figure 3.2-11. Carbon Cycle (USFS 2019).
The rate of growth in trees declines as they age, beginning around 30-40 years for hardwoods and 20-30 for softwoods in Maryland (USFS tree growth tables). This is a generality as growth rates and curves (how trees grow over time) are different for each tree species and are affected by local site conditions and climate. Typically, after peaking, the rate of carbon accumulation begins to drop off significantly, with growth rates averaging less than half of the maximum by age 70 in hardwoods and by age 50 in softwoods. When forests are managed for timber production, these rates are used to determine when the forest should be harvested to generate the optimal economic rate of return. For many forests, the simplest way to increase carbon accumulation is to let the trees grow 10-15 years longer than the optimal economic harvest rotation. However, most of Maryland’s forests have the opposite problem in terms of optimal carbon accumulation, with 75% of the forests being in the “mature” category (70 years+) with slowing growth rates. This impacts biodiversity and GHG reduction capability. This can be observed in the 2020 USFS Carbon Inventory155 (Figure 3.2-12), showing the change in this sink from 1990 to 2018. The sink declined from -7.6 million metric tons of CO2 equivalent (MMtCO2e) in 1990 to -7.2 MMtCO2 (negative numbers represent a removal of carbon from the atmosphere) where it was relatively stable until 2011, when it steadily declined to -6.5 MMtCO2e in 2018, a decrease of 17%. This can be compared to the estimated change in forest cover for Maryland from the Global Forest Change dataset (Figure 3.2-13, data from Hansen et al. 2013)156,which estimates that forests have declined by 1% over this period. While many factors may have contributed (changes in climate, invasive species, changes in nitrogen deposition, deer browse, pest outbreaks, saltwater intrusion), the USFS believes the primary driver of this decrease is the increasing average age of Maryland’s forests (T. Lister and G. Domke, personal communication).
155 Domke, Grant M.; Walters, Brian F.; Nowak, David J.; Smith, James, E.; Ogle, Stephen M.; Coulston, J.W.; Wirth, T.C. 2020. Greenhouse gas emissions and removals from forest land, woodlands, and urban trees in the United States, 1990-2018. Resource Update FS-227. Madison, WI: U.S. Department of Agriculture, Forest Service, Northern Research Station. 5 p. doi.org/10.2737/FS-RU-227 156 Hansen et al. 2013. High-Resolution Global Maps of 21st-Century Forest Cover Change SCIENCE15 NOV 2013 : 850-853
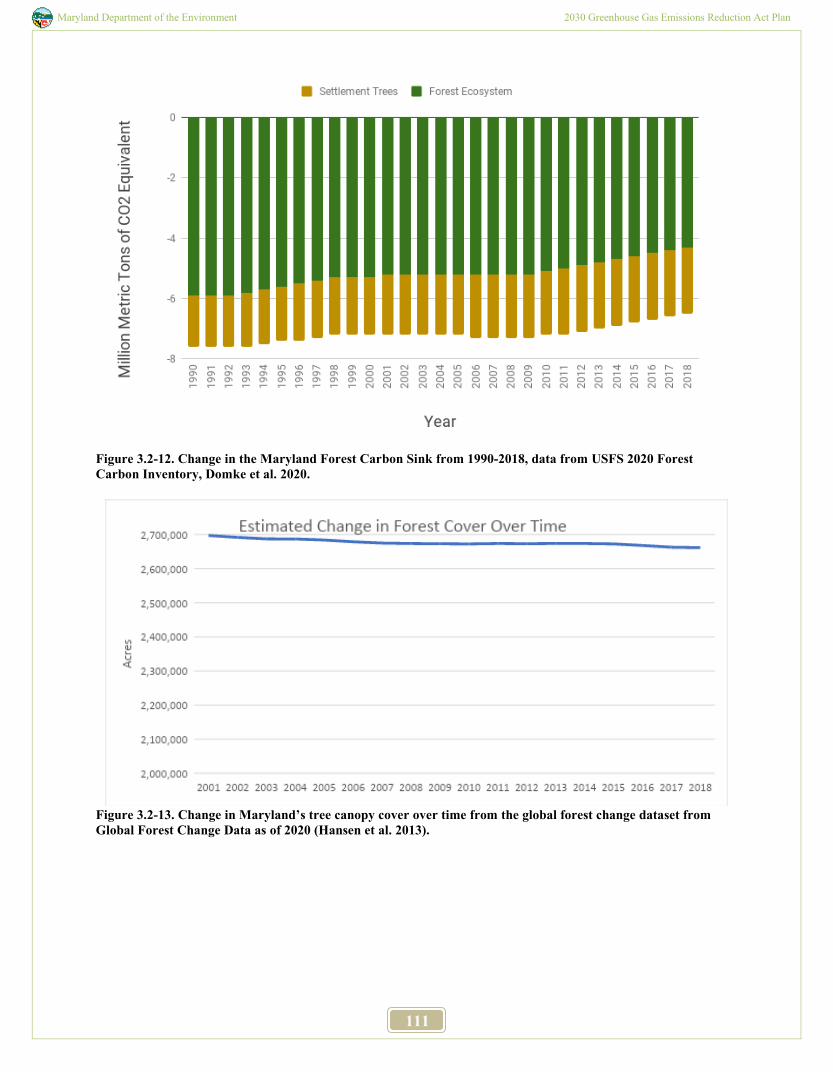
Maryland Department of the Environment 2030 Greenhouse Gas Emissions Reduction Act Plan
111
Figure 3.2-12. Change in the Maryland Forest Carbon Sink from 1990-2018, data from USFS 2020 Forest Carbon Inventory, Domke et al. 2020.
Figure 3.2-13. Change in Maryland’s tree canopy cover over time from the global forest change dataset from Global Forest Change Data as of 2020 (Hansen et al. 2013).
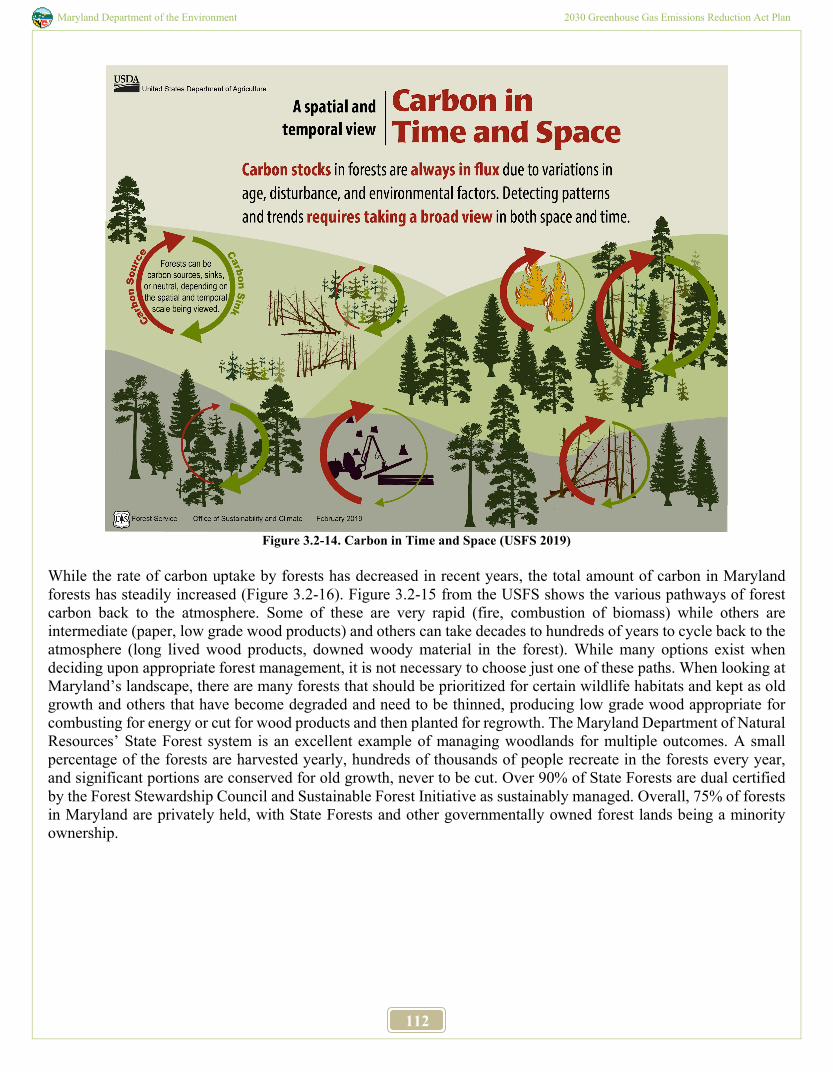
Maryland Department of the Environment 2030 Greenhouse Gas Emissions Reduction Act Plan
112
Figure 3.2-14. Carbon in Time and Space (USFS 2019)
While the rate of carbon uptake by forests has decreased in recent years, the total amount of carbon in Maryland forests has steadily increased (Figure 3.2-16). Figure 3.2-15 from the USFS shows the various pathways of forest carbon back to the atmosphere. Some of these are very rapid (fire, combustion of biomass) while others are intermediate (paper, low grade wood products) and others can take decades to hundreds of years to cycle back to the atmosphere (long lived wood products, downed woody material in the forest). While many options exist when deciding upon appropriate forest management, it is not necessary to choose just one of these paths. When looking at Maryland’s landscape, there are many forests that should be prioritized for certain wildlife habitats and kept as old growth and others that have become degraded and need to be thinned, producing low grade wood appropriate for combusting for energy or cut for wood products and then planted for regrowth. The Maryland Department of Natural Resources’ State Forest system is an excellent example of managing woodlands for multiple outcomes. A small percentage of the forests are harvested yearly, hundreds of thousands of people recreate in the forests every year, and significant portions are conserved for old growth, never to be cut. Over 90% of State Forests are dual certified by the Forest Stewardship Council and Sustainable Forest Initiative as sustainably managed. Overall, 75% of forests in Maryland are privately held, with State Forests and other governmentally owned forest lands being a minority ownership.
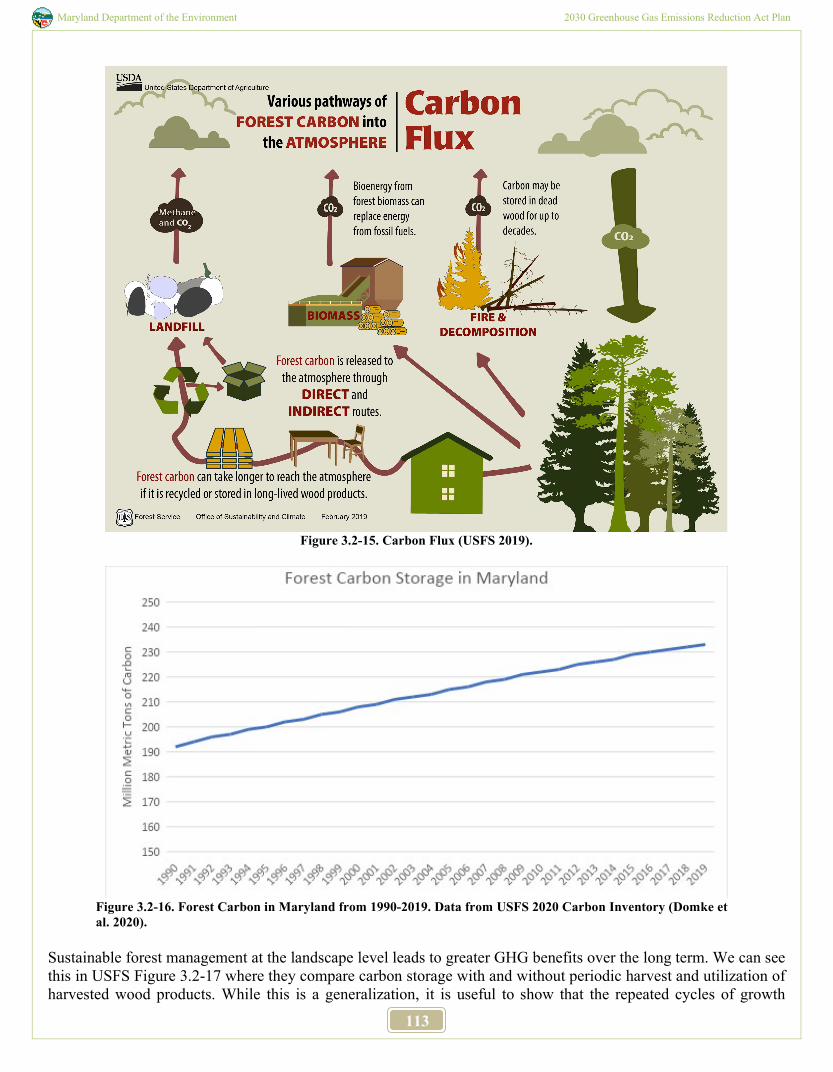
Maryland Department of the Environment 2030 Greenhouse Gas Emissions Reduction Act Plan
113
Figure 3.2-15. Carbon Flux (USFS 2019).
Figure 3.2-16. Forest Carbon in Maryland from 1990-2019. Data from USFS 2020 Carbon Inventory (Domke et al. 2020).
Sustainable forest management at the landscape level leads to greater GHG benefits over the long term. We can see this in USFS Figure 3.2-17 where they compare carbon storage with and without periodic harvest and utilization of harvested wood products. While this is a generalization, it is useful to show that the repeated cycles of growth
Maryland Department of the Environment 2030 Greenhouse Gas Emissions Reduction Act Plan
114
accompanied by long term storage will likely lead to greater carbon removal from the atmosphere. Thinning forests is beneficial for accumulating carbon because it removes slower growing trees that compete for light and nutrients with the healthier trees, increasing overall forest growth and health. Higher utilization of durable wood products and substitution of mass timber for steel or concrete will increase the net benefit over time. Combustion of woody biomass can have a significant GHG benefit as long as it meets certain criteria: it is low grade wood that would otherwise not be used or go to a fast turnover product like paper, the wood is harvested from a sustainably managed forest, and it is displacing a fossil fuel. When displacing a high emissions fuel like coal, biomass to energy can be considered a GHG net benefit. If only the first two conditions are met, it is considered carbon neutral over time, but will be a source of emissions in the short term. There is currently little market for low quality wood in Maryland however in 2019, the U.S. Department of Commerce Economic Development Administration provided grant funding to the State of Maryland and the Western Maryland Resource Conservation and Development Council for development of a Forestry Economic Strategy. This action plan and strategy, which is in draft form, is aimed at countering the economic impact of numerous mill closures across the state. Once completed, the plan will provide a roadmap for capitalizing on new opportunities in the forest industry, which will lead to environmental benefits as well as the creation of jobs and businesses in designated Opportunity Zones. The 2020 Biomass to Energy webinar series,157 and prior studies158 suggest that one of those opportunities is biomass to energy from current sources of waste wood rather than leaving it in landfills, possibly providing 1-2% of yearly electricity demand. Optimally this would take the form of combined heat and power (CHP) systems for mid-sized institutions (schools, prisons, office parks etc.). CHP of this size are highly efficient and have minimal emission of air pollutants. Having a market for harvested wood products is important to incentivize forest management that will result in higher carbon removal from the atmosphere over the long term, but perhaps an even greater benefit is the incentive it gives the landowner to
157 Maryland Clean Energy Center. 2020. Seeing the Forest for the Trees: Future Biomass Potential in Maryland. mdcleanenergy.org/biomass/ 158 Kittler and Beauvais. 2010. The Potential for Sustainable Wood-Based Bioenergy in Maryland. Pinchot Institute for Conservation
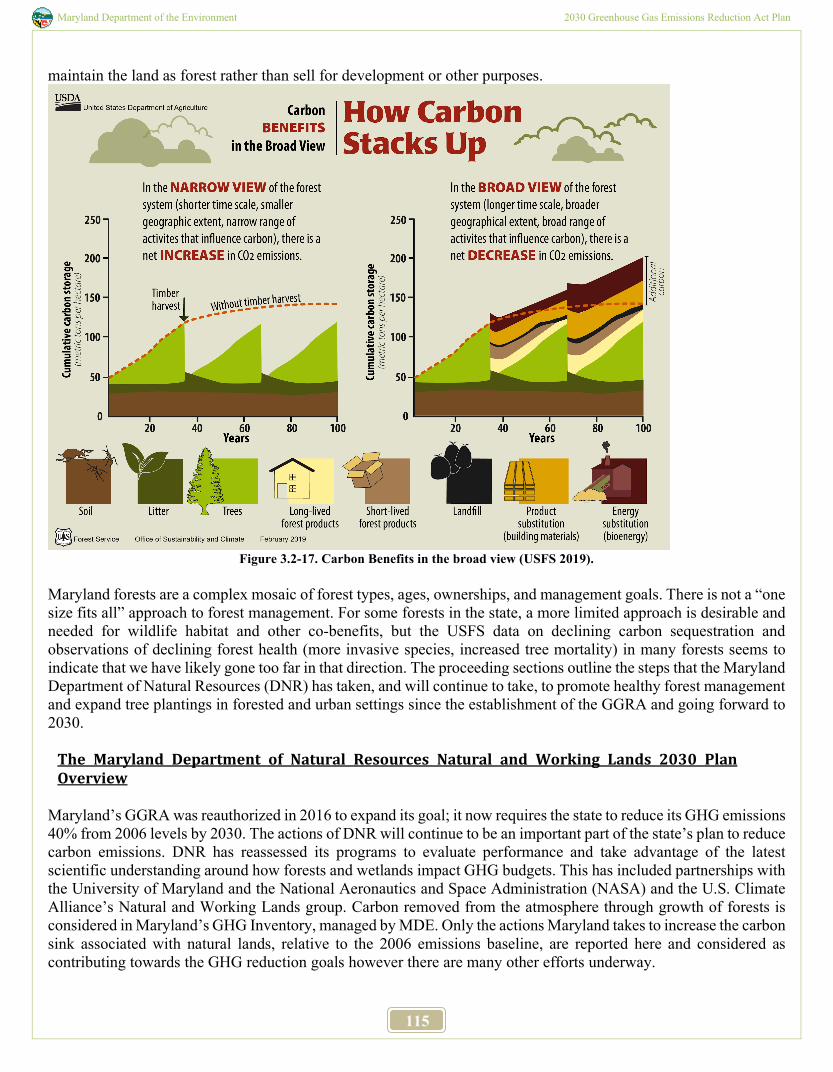
Maryland Department of the Environment 2030 Greenhouse Gas Emissions Reduction Act Plan
115
maintain the land as forest rather than sell for development or other purposes.
Figure 3.2-17. Carbon Benefits in the broad view (USFS 2019).
Maryland forests are a complex mosaic of forest types, ages, ownerships, and management goals. There is not a “one size fits all” approach to forest management. For some forests in the state, a more limited approach is desirable and needed for wildlife habitat and other co-benefits, but the USFS data on declining carbon sequestration and observations of declining forest health (more invasive species, increased tree mortality) in many forests seems to indicate that we have likely gone too far in that direction. The proceeding sections outline the steps that the Maryland Department of Natural Resources (DNR) has taken, and will continue to take, to promote healthy forest management and expand tree plantings in forested and urban settings since the establishment of the GGRA and going forward to 2030.
The Maryland Department of Natural Resources Natural and Working Lands 2030 Plan Overview
Maryland’s GGRA was reauthorized in 2016 to expand its goal; it now requires the state to reduce its GHG emissions 40% from 2006 levels by 2030. The actions of DNR will continue to be an important part of the state’s plan to reduce carbon emissions. DNR has reassessed its programs to evaluate performance and take advantage of the latest scientific understanding around how forests and wetlands impact GHG budgets. This has included partnerships with the University of Maryland and the National Aeronautics and Space Administration (NASA) and the U.S. Climate Alliance’s Natural and Working Lands group. Carbon removed from the atmosphere through growth of forests is considered in Maryland’s GHG Inventory, managed by MDE. Only the actions Maryland takes to increase the carbon sink associated with natural lands, relative to the 2006 emissions baseline, are reported here and considered as contributing towards the GHG reduction goals however there are many other efforts underway.
Maryland Department of the Environment 2030 Greenhouse Gas Emissions Reduction Act Plan
116
Variability in Projections The forest management sequestration impacts in the 2019 GGRA Draft Plan shows what DNR's management programs could achieve in terms of carbon sequestered in our forests by 2030, if fully funded, the forestry industry in Maryland remains healthy, and landowner interest in the programs is high through 2030. Lower funding levels, unfavorable conditions in Maryland's forestry industry, or a lack of willing landowners will result in lower sequestration, commensurate with estimates included in the Reference Case or Policy Scenario 1. This is due to the fact that the interest of landowners can impact implementation levels in a given year. Landowner willingness can vary depending on markets for wood products, land prices, regulatory hurdles, and the availability of incentives. To account for this variability DNR made low, medium, and high projections for 2020-2030 for the following programs- Managing Forests to Capture Carbon; Planting Forests in Maryland; Increasing Urban Trees to Capture Carbon, Avoided Emissions Due to Forest Conservation, Tidal Wetland Restoration, and Woody Biomass to Energy. The projections reflected in the tables under each DNR program represent the expected outcomes of the programs given current programmatic resources, and closely correspond to the mid-level projection modeled in the Pathways GHG scenario model and the Regional Economic Model, Inc. (REMI).
Methodological changes in the 2030 Plan
Programs DNR will continue to track all the programs included in prior GGRA Plans. Additional carbon benefit for Creating and Protecting Wetlands and emission of methane from wetlands makes the net GHG impact of these actions uncertain. Only tidal wetland restoration where methane emissions are typically negligible are included. While DNR did not see a GHG benefit associated with Biomass for Energy Production, Geological Opportunities to Store Carbon, or Creating Ecosystems Markets from 2006-2019, work is underway so that these programs may factor in the 2020-2030 period. Maryland is one of eight partner states in the Midwest Region Carbon Sequestration Partnership whose role is to identify, locate, and characterize potential geologic storage opportunities. Maryland is actively working to promote biomass-to-energy in the state as an important part of our forestry industry and anticipates new installations prior to 2030, if feasible. Maryland is also actively working to advance markets for the forestry industry, and we anticipate there to be GHG benefits if thermal Renewable Energy Credits are allowed in Maryland. DNR will continue to work toward improving the certainty of the calculations of the GHG benefit of these programs. The U.S. Climate Alliance (USCA) has funded a project led by the University of Maryland who is working with partners, including DNR, Delaware Department of Natural Resources and Environmental Control, and the World Resource Institute to combine high resolution LiDAR based estimates of forest carbon with annual estimates of forest cover change from satellite imagery. This will improve Maryland’s GHG inventory by better understanding both how much forest is being lost or gained and how that translates into our carbon budget. This will allow us to more frequently and accurately track progress toward our forestry goals. The estimates of forest change and trees outside of forests will be used to supplement the USFS Carbon Inventory (Domke et al. 2020) based on Forest Inventory and Analysis data. The USFS uses annual field monitoring to update the forest carbon inventory but relies on more approximate methods to estimate the sink from “settlement trees” or trees outside of what is defined as forests and uses land-use change from the updated every 5-year National Land Cover Dataset that will be improved by this project. The resulting inventory estimates will be available for use in Maryland’s 2020 GHG inventory and backcasted to 2006 for use in assessing progress. The carbon benefits of a new program, Avoided Emissions Due to Forest Conservation, are based on an analysis done by the World Resource Institute (WRI) as part of the U.S. Climate Alliance’s Natural and Working Lands working group. The WRI analysis compares historic rates of forest loss from 1986-2000, and the carbon
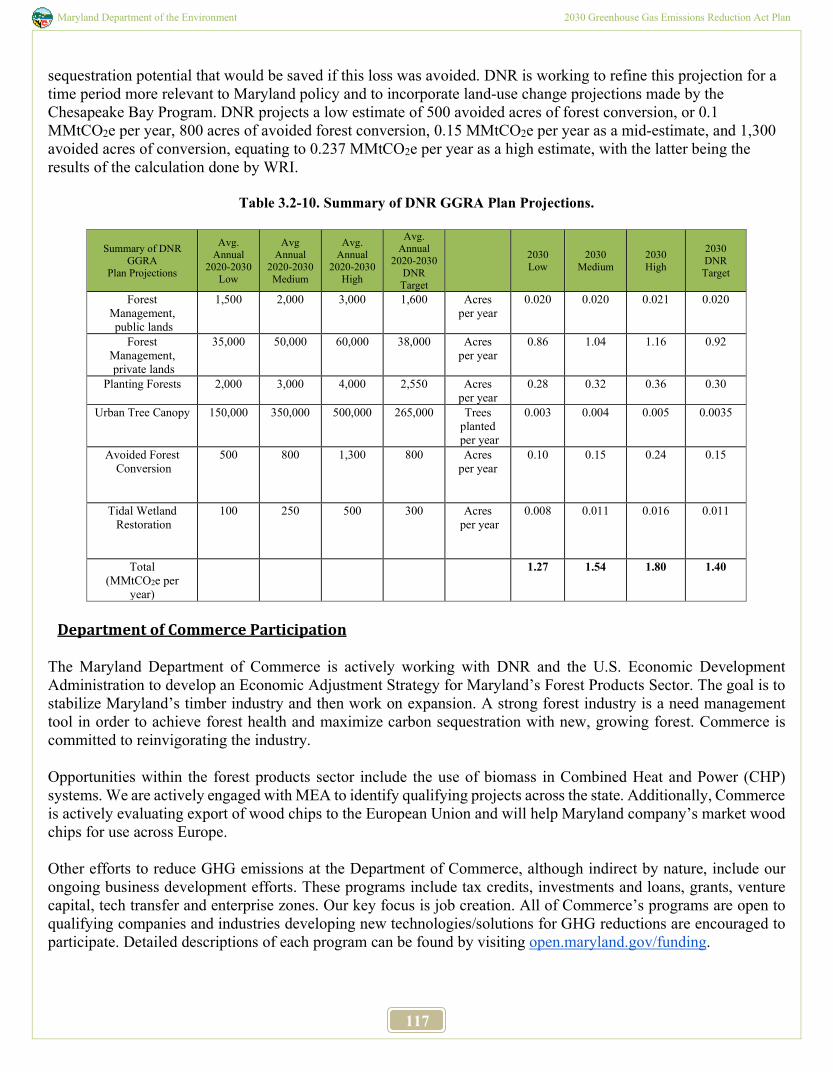
Maryland Department of the Environment 2030 Greenhouse Gas Emissions Reduction Act Plan
117
sequestration potential that would be saved if this loss was avoided. DNR is working to refine this projection for a time period more relevant to Maryland policy and to incorporate land-use change projections made by the Chesapeake Bay Program. DNR projects a low estimate of 500 avoided acres of forest conversion, or 0.1 MMtCO2e per year, 800 acres of avoided forest conversion, 0.15 MMtCO2e per year as a mid-estimate, and 1,300 avoided acres of conversion, equating to 0.237 MMtCO2e per year as a high estimate, with the latter being the results of the calculation done by WRI.
Table 3.2-10. Summary of DNR GGRA Plan Projections.
Summary of DNR GGRA
Plan Projections
Avg. Annual
2020-2030 Low
Avg Annual
2020-2030 Medium
Avg. Annual
2020-2030 High
Avg. Annual
2020-2030 DNR Target
2030 Low
2030 Medium
2030 High
2030 DNR Target
Forest Management, public lands
1,500 2,000 3,000 1,600 Acres per year
0.020 0.020 0.021 0.020
Forest Management, private lands
35,000 50,000 60,000 38,000 Acres per year
0.86 1.04 1.16 0.92
Planting Forests 2,000 3,000 4,000 2,550 Acres per year
0.28 0.32 0.36 0.30
Urban Tree Canopy 150,000 350,000 500,000 265,000 Trees planted
per year
0.003 0.004 0.005 0.0035
Avoided Forest Conversion
500 800 1,300 800 Acres per year
0.10 0.15 0.24 0.15
Tidal Wetland Restoration
100 250 500 300 Acres per year
0.008 0.011 0.016 0.011
Total (MMtCO2e per
year)
1.27 1.54 1.80 1.40
Department of Commerce Participation
The Maryland Department of Commerce is actively working with DNR and the U.S. Economic Development Administration to develop an Economic Adjustment Strategy for Maryland’s Forest Products Sector. The goal is to stabilize Maryland’s timber industry and then work on expansion. A strong forest industry is a need management tool in order to achieve forest health and maximize carbon sequestration with new, growing forest. Commerce is committed to reinvigorating the industry. Opportunities within the forest products sector include the use of biomass in Combined Heat and Power (CHP) systems. We are actively engaged with MEA to identify qualifying projects across the state. Additionally, Commerce is actively evaluating export of wood chips to the European Union and will help Maryland company’s market wood chips for use across Europe. Other efforts to reduce GHG emissions at the Department of Commerce, although indirect by nature, include our ongoing business development efforts. These programs include tax credits, investments and loans, grants, venture capital, tech transfer and enterprise zones. Our key focus is job creation. All of Commerce’s programs are open to qualifying companies and industries developing new technologies/solutions for GHG reductions are encouraged to participate. Detailed descriptions of each program can be found by visiting open.maryland.gov/funding.
Maryland Department of the Environment 2030 Greenhouse Gas Emissions Reduction Act Plan
118
3.2.14.1 Managing Forests to Capture Carbon
Lead Agency: DNR
Program Description Managing more forests to capture carbon will promote sustainable forestry management practices in existing Maryland forests on both public and private lands. Enrolling unmanaged forests into management regimes enhances forest productivity, which increases rates of carbon sequestration in forest biomass and the amount of carbon stored in harvested durable wood products. This translates to economic benefits and increased availability of renewable biomass for energy production. The 2030 goals of this program are to improve sustainable forest management on 38,000 acres of private land annually and ensure greater than 50% of state-owned forest lands will continue to be third-party certified as sustainably managed.
Program Objectives We project that DNR will provide forest management services on between 1,500 and 3,000 acres per year on state lands and between 35,000 and 60,000 acres per year on private forest lands. This equates to the net carbon sink of forests in Maryland being increased by 0.88 MMtCO2e per year by 2030 in the low scenario, and 1.18 MMtCO2e per year by 2030 in the high scenario, with our expected scenario being 0.94 MMtCO2e per year in 2030. There is an ongoing research effort funded by the U.S. Climate Alliance (USCA) to improve our estimates of the carbon benefit of different forest management practices. This is a collaboration with Pennsylvania Department of Conservation and Natural Resources (PA DCNR), U.S. Forest Service (USFS), and led by the nonprofit American Forests to model forest management in Maryland and Pennsylvania over the next 100 years to measure the impact of different types of management on carbon (in forests and forest products) and the economy. Results will be obtained by June 2021 allowing us to refine our estimates of the carbon benefit of forest management for Maryland’s GGRA of 2016 and prioritize policy toward actions that have the greatest economic and carbon benefits. An additional consideration with forest management is that the period for the assumed carbon benefit for the management action is 20 years. Meaning, that once the management action takes place on the forest, we calculate the amount of carbon the forest will sequester relative to an unmanaged forest over a 20-year period. Accordingly, actions taken on forest land 20 years ago begin to “drop out,” (i.e., no longer contribute a carbon benefit) starting in 2026 on land where management actions took place 20 years ago in 2006. This would not preclude crediting subsequent actions taken, such as harvest for biomass-to-energy or additional management. If more acres are managed post-2026 than occurred 20 years prior, the sink will continue to grow. Otherwise, the sink will decrease. While the carbon estimates presented here are reasonable estimates, we reserve the right to update them as improved estimates become available through the USCA project or otherwise.
Co-Benefits Forest management has many benefits for forest health, the economy, and wildlife habitat in addition to increasing the carbon removed from the atmosphere. A well-managed healthy forest has lower risk of pest and disease outbreaks, fire, and invasive species occurrence. It will also be able to produce more merchantable wood, supporting the forestry economy in Maryland, which generated $3.5 billion dollars of economic activity in 2015159. Certain threatened wildlife species in Maryland, such as the Golden Winged Warbler, require the type of habitat that is created through forest management. The Natural Resource Conservation Service (NRCS) runs a successful program
159 Diriker et al. 2018. The Impact of Resource Based Industries on the Maryland Economy. BEACON at Salisbury University
Maryland Department of the Environment 2030 Greenhouse Gas Emissions Reduction Act Plan
119
in Maryland and other states to help forest landowners manage their lands specifically to create ideal habitat for this species. Implementation Mechanisms Public Lands:
● Since 2006, 211,000 acres of State Forests have been certified with dual third-party certification for Forest Sustainability to the Sustainable Forestry Initiative and Forest Sustainability Certification standards.
● DNR is developing similar sustainable forest management practices on state park and wildlife land. ● DNR’s Wildlife and Heritage Service is developing Forest Stewardship Plans on several Wildlife
Management Areas ● The DNR has accelerated pace of silvicultural activity:
o Savage River State Forest will increase the number of timber sales from 14 to 20. o State Forest Annual Work Plans included 2,324 acres of timber harvests for FY19, that will be
naturally regenerated.
Private Lands:
● Since 2006 DNR has implemented: o 299,284 acres of stewardship plans. o 179,858 acres of sediment control. o 111,478 acres of forest stand improvements (e.g., tree planting, timber stand improvements, wildlife
habitat). o Total of 590,621 acres of forest management planning activities on private lands.
● DNR has met the 2020 goal.
Technical Assistance Provided:
● Forest Stewardship Plan preparation. ● Forest Stewardship Plan implementation – expanded special rivers project. ● Financial assistance – state and federal cost sharing.
o Woodland Incentive Program. ▪ Healthy Forests/Healthy Waters.
o Working on the next round of projects. o Backyard Buffer Program. o Environmental Quality Incentive Program (EQIP). o Conservation Reserve Enhancement Program (CREP). o Income Tax Modification (TAXMOD).
▪ Expanded eligibility of forestry practices in 2014. o Forest Conservation and Management Program. o Woodland Assessment Program.
● Completed the development and application of the University of Maryland remote sensing capability for forest carbon assessment.
● Launch of National Aeronautics and Space Administration, U.S. Department of Agriculture and U.S. Department of Energy climate science project for remote sensing, modeling and field-based measurements to quantify the carbon consequences of alternate development and management plans across rapidly changing forests in Maryland.
● Forest Management Study.
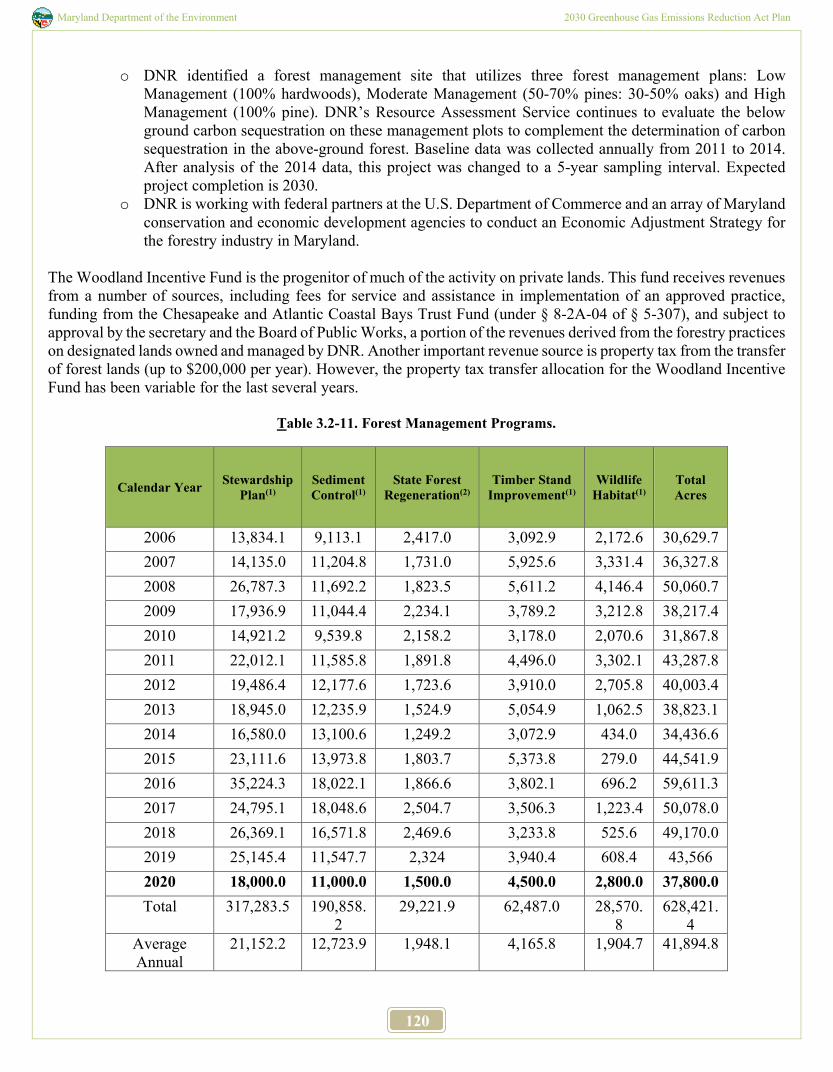
Maryland Department of the Environment 2030 Greenhouse Gas Emissions Reduction Act Plan
120
o DNR identified a forest management site that utilizes three forest management plans: Low Management (100% hardwoods), Moderate Management (50-70% pines: 30-50% oaks) and High Management (100% pine). DNR’s Resource Assessment Service continues to evaluate the below ground carbon sequestration on these management plots to complement the determination of carbon sequestration in the above-ground forest. Baseline data was collected annually from 2011 to 2014. After analysis of the 2014 data, this project was changed to a 5-year sampling interval. Expected project completion is 2030.
o DNR is working with federal partners at the U.S. Department of Commerce and an array of Maryland conservation and economic development agencies to conduct an Economic Adjustment Strategy for the forestry industry in Maryland.
The Woodland Incentive Fund is the progenitor of much of the activity on private lands. This fund receives revenues from a number of sources, including fees for service and assistance in implementation of an approved practice, funding from the Chesapeake and Atlantic Coastal Bays Trust Fund (under § 8-2A-04 of § 5-307), and subject to approval by the secretary and the Board of Public Works, a portion of the revenues derived from the forestry practices on designated lands owned and managed by DNR. Another important revenue source is property tax from the transfer of forest lands (up to $200,000 per year). However, the property tax transfer allocation for the Woodland Incentive Fund has been variable for the last several years.
Table 3.2-11. Forest Management Programs.
Calendar Year Stewardship Plan(1)
Sediment Control(1)
State Forest Regeneration(2)
Timber Stand Improvement(1)
Wildlife Habitat(1)
Total Acres
2006 13,834.1 9,113.1 2,417.0 3,092.9 2,172.6 30,629.7 2007 14,135.0 11,204.8 1,731.0 5,925.6 3,331.4 36,327.8 2008 26,787.3 11,692.2 1,823.5 5,611.2 4,146.4 50,060.7 2009 17,936.9 11,044.4 2,234.1 3,789.2 3,212.8 38,217.4 2010 14,921.2 9,539.8 2,158.2 3,178.0 2,070.6 31,867.8 2011 22,012.1 11,585.8 1,891.8 4,496.0 3,302.1 43,287.8 2012 19,486.4 12,177.6 1,723.6 3,910.0 2,705.8 40,003.4 2013 18,945.0 12,235.9 1,524.9 5,054.9 1,062.5 38,823.1 2014 16,580.0 13,100.6 1,249.2 3,072.9 434.0 34,436.6 2015 23,111.6 13,973.8 1,803.7 5,373.8 279.0 44,541.9 2016 35,224.3 18,022.1 1,866.6 3,802.1 696.2 59,611.3 2017 24,795.1 18,048.6 2,504.7 3,506.3 1,223.4 50,078.0 2018 26,369.1 16,571.8 2,469.6 3,233.8 525.6 49,170.0 2019 25,145.4 11,547.7 2,324 3,940.4 608.4 43,566 2020 18,000.0 11,000.0 1,500.0 4,500.0 2,800.0 37,800.0 Total 317,283.5 190,858.
2 29,221.9 62,487.0 28,570.
8 628,421.
4 Average Annual
21,152.2 12,723.9 1,948.1 4,165.8 1,904.7 41,894.8
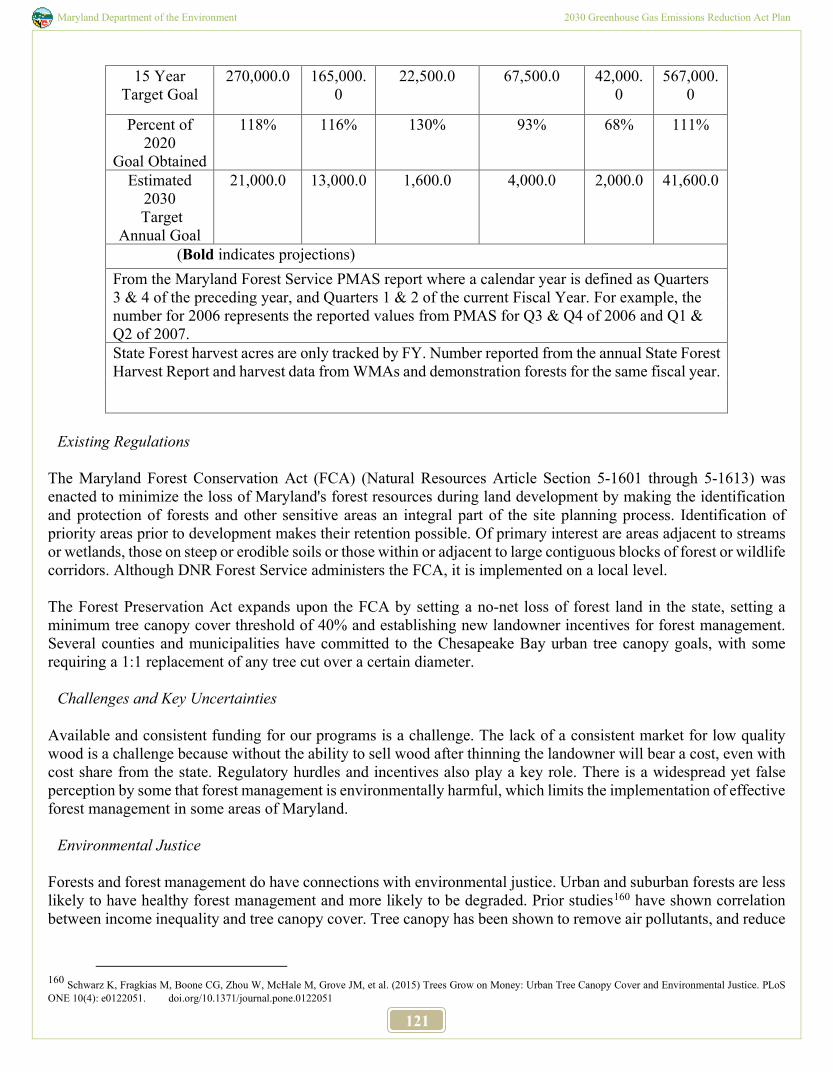
Maryland Department of the Environment 2030 Greenhouse Gas Emissions Reduction Act Plan
121
15 Year Target Goal
270,000.0 165,000.0
22,500.0 67,500.0 42,000.0
567,000.0
Percent of 2020
Goal Obtained
118% 116% 130% 93% 68% 111%
Estimated 2030
Target Annual Goal
21,000.0 13,000.0 1,600.0 4,000.0 2,000.0 41,600.0
(Bold indicates projections) From the Maryland Forest Service PMAS report where a calendar year is defined as Quarters 3 & 4 of the preceding year, and Quarters 1 & 2 of the current Fiscal Year. For example, the number for 2006 represents the reported values from PMAS for Q3 & Q4 of 2006 and Q1 & Q2 of 2007. State Forest harvest acres are only tracked by FY. Number reported from the annual State Forest Harvest Report and harvest data from WMAs and demonstration forests for the same fiscal year.
Existing Regulations
The Maryland Forest Conservation Act (FCA) (Natural Resources Article Section 5-1601 through 5-1613) was enacted to minimize the loss of Maryland's forest resources during land development by making the identification and protection of forests and other sensitive areas an integral part of the site planning process. Identification of priority areas prior to development makes their retention possible. Of primary interest are areas adjacent to streams or wetlands, those on steep or erodible soils or those within or adjacent to large contiguous blocks of forest or wildlife corridors. Although DNR Forest Service administers the FCA, it is implemented on a local level. The Forest Preservation Act expands upon the FCA by setting a no-net loss of forest land in the state, setting a minimum tree canopy cover threshold of 40% and establishing new landowner incentives for forest management. Several counties and municipalities have committed to the Chesapeake Bay urban tree canopy goals, with some requiring a 1:1 replacement of any tree cut over a certain diameter.
Challenges and Key Uncertainties Available and consistent funding for our programs is a challenge. The lack of a consistent market for low quality wood is a challenge because without the ability to sell wood after thinning the landowner will bear a cost, even with cost share from the state. Regulatory hurdles and incentives also play a key role. There is a widespread yet false perception by some that forest management is environmentally harmful, which limits the implementation of effective forest management in some areas of Maryland.
Environmental Justice Forests and forest management do have connections with environmental justice. Urban and suburban forests are less likely to have healthy forest management and more likely to be degraded. Prior studies160 have shown correlation between income inequality and tree canopy cover. Tree canopy has been shown to remove air pollutants, and reduce
160 Schwarz K, Fragkias M, Boone CG, Zhou W, McHale M, Grove JM, et al. (2015) Trees Grow on Money: Urban Tree Canopy Cover and Environmental Justice. PLoS ONE 10(4): e0122051. doi.org/10.1371/journal.pone.0122051
Maryland Department of the Environment 2030 Greenhouse Gas Emissions Reduction Act Plan
122
risk of respiratory and cardiac health problems161. DNR works to address these issues in Maryland through various programs, including tree planting in urban areas. For example, funding organizations that have planted over 12,000 trees in Baltimore City over the past 10 years.
Beyond 2030 Enhancement Opportunities There are many potential actions by federal and nonprofit partners other than the state government that could result in increasing natural and working lands carbon sinks in the state, contributing toward our 40 by 30 goal and beyond. Market-based solutions that incentivize public-private partnerships, enhanced outreach to landowners, and additional incentives are examples. In 2019, the United State signed on to the UN Trillion Tree’s Challenge and launched the U.S. chapter of the effort in August 2020. At its formation the chapter has commitments from 30 corporations, municipal governments, and NGO’s to plant over 850 million trees in the United States by 2030, contributing toward the global 1 trillion trees planted goal. At this point there are no new federal incentives for contributing to the goal, but a bill was introduced at the beginning of 2020 (the Trillion Trees Act) that would have created regional reforestation goals and incentives for reforestation and forest management. Another recently introduced federal bill, The Growing Climate Solutions Act of 2020, would create a USDA carbon credit certification program. The goals would be to break down barriers of entry for forest and agricultural landowners through technical assistance. It is costly for landowners to engage in the carbon credit certification and verification process; projects generating carbon credits are typically only cost-effective for large acreages (>2,000 acres). There are efforts in the Chesapeake Bay region by timber investment management organizations and NGOs to overcome the cost barrier by grouping multiple landowners for single carbon credit projects. However, this is more challenging than dealing with single landowner large holdings. Similarly, the Nature Conservancy and the American Forest Foundation have partnered to create the Family Forest Carbon Program targeted toward smaller forest landowners. They are working with the carbon verifier Verra and are backed by Amazon to conduct carbon friendly forest management practices on smaller forest parcels and create a practice-based protocol with a much lower cost (~75% less) for verification than traditional approaches. This pilot program is currently offered to landowners in Pennsylvania, but will likely expand to western Maryland in the coming years.
COVID Impacts Impacts to regeneration of State Forests were minimal. Impacts to forest planning activities (i.e., Stewardship Plan, Timber Stand Improvement, etc.) were delayed for approximately one month, but little or no backlog was encountered, and these activities are expected to remain near projected levels. Backyard Buffer programs were temporarily cancelled since they require in-person consultations, but seedlings were diverted to other planting locations.
3.2.14.2 Planting Forests in Maryland
Lead Agency: DNR
Program Description Planting trees expands forest cover and associated carbon stocks by regenerating or establishing healthy, functional forests through practices such as soil preparation, erosion control and supplemental planting. These actions help to ensure optimum conditions to support forest growth. By 2030, the implementation goal of this program is to achieve the afforestation and/or reforestation of 68,530 acres in Maryland. In meeting this goal we will plant approximately
161 U.S. EPA. Environmental Benefits Mapping and Analysis Program: Community Edition (BenMAP-CE) User Manual and Appendices. Research Triangle Park, NC, USA. April, 2017. epa.gov/benmap
Maryland Department of the Environment 2030 Greenhouse Gas Emissions Reduction Act Plan
123
4.6 million trees from 2021 through 2030. Achieving the target should reduce GHG emissions in the state by 300,000 metric tons of CO2 equivalent (0.3 MMtCO2e) annually by 2030.
Objectives We expect to plant between 2,000 and 4,000 acres of forest per year from 2020-2030, with the expected average estimate being 2,550 acres per year over that period. This equates to 25,500 acres planted by 2030. The state will also still be benefiting from the annual growth and carbon sequestration of the approximately 45,000 acres planted from 2006-2020. In total, the GHG benefit will range from 0.28 MMtCO2e per year to 0.36 MMtCO2e per year of additional GHG sink, with the expected estimate being 0.3 MMtCO2e per year. Carbon estimates from forest planting were derived from analysis of carbon sequestration in Maryland forests for the 2006-2030 period done by the University of Maryland. Supporting methodology and data can be found in Huang et al. 2019162 and Hurtt et al. 2019,163 respectively.
Co-Benefits
Planting forests is the cheapest and most effective way to remove carbon from the atmosphere. Forests also provide many co-benefits. Increasing forest cover in the state will help meet Chesapeake Bay TMDL (total maximum daily load) for nutrients and sediment, improve the quality of surface drinking water sources, increase resilience to climate change by holding stormwater runoff and reducing temperatures, improve health and air quality by removing otherwise harmful air pollution, and provide habitat for wildlife and recreational and economic opportunities for people. Forests are an incredibly valuable resource for the people of Maryland and a recent study has quantified many of these co-benefits.164 Implementation Mechanisms DNR is implementing this program through a suite of efforts, policies and programs, including: Public Lands:
● State Forest annual work plan implementation Private Lands:
● Technical Assistance o Forest Stewardship Plan implementation o Forest Conservation Act (FCA) implementation
Financial Assistance – Rural Lands: State and federal Cost Sharing:
● Woodland Incentive Program (WIP –MD Forest Service) ● Income Tax Modification (TAXMOD)- expanded eligibility of forestry practices in 2014 ● Environmental Quality Incentive Program (EQIP – federal/NRCS) ● Conservation Reserve Enhancement Program (CREP – federal/NRCS)
162 Wenli Huang et al 2019 High-resolution mapping of aboveground biomass for forest carbon monitoring system in the Tri-State region of Maryland, Pennsylvania and Delaware, USA Environ. Res. Lett. 14 095002, doi.org/10.1088/1748-9326/ab2917 163 Hurtt, G.C., M. Zhao, R. Sahajpal, A. Armstrong, R. Birdsey, E. Campbell, K. Dolan, R.O. Dubayah, J.P. Fisk, S. Flanagan, C. Huang, W. Huang, K. Johnson, R. Lamb, L. Ma, R. Marks, D. O'Leary III, J. O'Neil-Dunne, A. Swatantran, and H. Tang. 2019. Forest Aboveground Biomass and Carbon Sequestration Potential for Maryland, USA. ORNL DAAC, Oak Ridge, Tennessee, USA. doi.org/10.3334/ORNLDAAC/1660 164 Campbell, E., R. Marks, and C. Conn. 2020. Spatial modeling of the biophysical and economic values of ecosystem services in Maryland, USA. Ecosystem Services 43 (2020) 101093
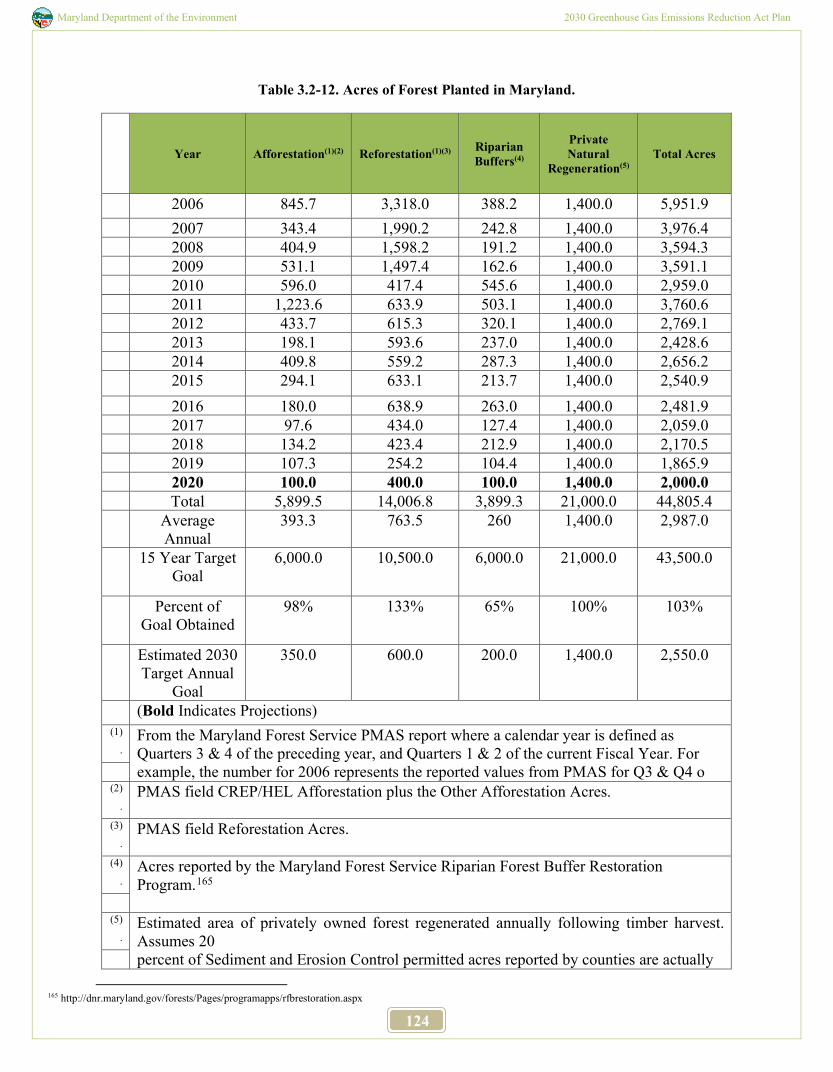
Maryland Department of the Environment 2030 Greenhouse Gas Emissions Reduction Act Plan
124
Table 3.2-12. Acres of Forest Planted in Maryland.
Year Afforestation(1)(2) Reforestation(1)(3) Riparian Buffers(4)
Private Natural
Regeneration(5) Total Acres
2006 845.7 3,318.0 388.2 1,400.0 5,951.9 2007 343.4 1,990.2 242.8 1,400.0 3,976.4 2008 404.9 1,598.2 191.2 1,400.0 3,594.3 2009 531.1 1,497.4 162.6 1,400.0 3,591.1 2010 596.0 417.4 545.6 1,400.0 2,959.0 2011 1,223.6 633.9 503.1 1,400.0 3,760.6 2012 433.7 615.3 320.1 1,400.0 2,769.1 2013 198.1 593.6 237.0 1,400.0 2,428.6 2014 409.8 559.2 287.3 1,400.0 2,656.2 2015 294.1 633.1 213.7 1,400.0 2,540.9 2016 180.0 638.9 263.0 1,400.0 2,481.9 2017 97.6 434.0 127.4 1,400.0 2,059.0 2018 134.2 423.4 212.9 1,400.0 2,170.5 2019 107.3 254.2 104.4 1,400.0 1,865.9 2020 100.0 400.0 100.0 1,400.0 2,000.0 Total 5,899.5 14,006.8 3,899.3 21,000.0 44,805.4 Average
Annual 393.3 763.5 260 1,400.0 2,987.0
15 Year Target Goal
6,000.0 10,500.0 6,000.0 21,000.0 43,500.0
Percent of Goal Obtained
98% 133% 65% 100% 103%
Estimated 2030 Target Annual
Goal
350.0 600.0 200.0 1,400.0 2,550.0
(Bold Indicates Projections) (1)
. From the Maryland Forest Service PMAS report where a calendar year is defined as Quarters 3 & 4 of the preceding year, and Quarters 1 & 2 of the current Fiscal Year. For example, the number for 2006 represents the reported values from PMAS for Q3 & Q4 o
(2)
. PMAS field CREP/HEL Afforestation plus the Other Afforestation Acres.
(3)
. PMAS field Reforestation Acres.
(4)
. Acres reported by the Maryland Forest Service Riparian Forest Buffer Restoration Program.165
(5)
. Estimated area of privately owned forest regenerated annually following timber harvest. Assumes 20 percent of Sediment and Erosion Control permitted acres reported by counties are actually
165 http://dnr.maryland.gov/forests/Pages/programapps/rfbrestoration.aspx
Maryland Department of the Environment 2030 Greenhouse Gas Emissions Reduction Act Plan
125
harvested and regenerated. Historically, the average is 1,400 acre/year
Existing Regulations See prior section 3.2.14.1 for forest regulations.
Challenges Important challenges faced by this program include locating and obtaining funding to continue and build upon the “Lawn to Woodland” and “Marylanders Plant Trees” programs. From a broader perspective, population growth and associated demand for land for housing will present a challenge for the state to maintain or grow its forest cover. The Maryland Department of Planning projects the state’s population to grow by 800 thousand people by 2045. Maryland has measures to constrain growth to more desirable areas, such as priority funding areas, transfer of development rights, and the Forest Conservation Act, which will help to mitigate this challenge.
Environmental Justice Please see content under section 3.2.14.1.
Enhancement Opportunities Beyond 2030 Provide dedicated staff to identify landowners interested in participating in programs like “Lawn to Woodland” and “Marylanders Plant Trees.” See prior section for emerging federal and non-governmental actions that present opportunities for tree planting beyond 2030.
COVID Impacts There were moderate impacts to tree planting activities during the 2020 planting season due to COVID-19 restrictions that were put in place at the height of planting season. Field work protocols were developed, and Forest Service staff were granted temporary emergency/essential employee status to complete tree planting activities in March and April for projects on private lands. Projects completed under the Healthy Forests Healthy Waters programs were still completed, however activities under the popular Backyard Buffer tree planting program were temporarily canceled. 3.2.14.3 Creating and Protecting Wetlands and Waterway Borders to Capture Carbon
Lead Agency: DNR
Program Description In addition to forests, wetlands are known to be very efficient at sequestering carbon. DNR is planting forested stream buffers and pursuing the creation, protection and restoration of wetlands to promote carbon sequestration through several means, including the Natural Filters Program, which restores wetlands and buffers on state and public lands to meet water quality goals and is provided through the Chesapeake and Atlantic Coastal Bays Trust Fund. The objectives of the Coastal Wetlands Initiative include restoring natural tidal marsh hydrology to coastal wetlands through ditch plugging practices and the development of a terrestrial carbon sequestration protocol.
Program Objectives
Maryland Department of the Environment 2030 Greenhouse Gas Emissions Reduction Act Plan
126
The primary objective of this program is to expand on-the-ground wetland and waterway restoration projects and quantify the carbon benefit of these projects, specifically tidal wetland restorations where confidence in a net carbon benefit is high. The Natural Filters Program restored 8.5 acres of wetlands on state and public land and planted 1.2 acres of streamside forest buffers on state and public lands in CY19, working toward the state’s Watershed Implementation Plan (WIP) goals for state and public lands. Funded through The Chesapeake and Atlantic Coastal Bays Trust Fund (Trust Fund), these projects are designed to accelerate bay restoration by focusing limited financial resources on the most efficient, cost-effective, non-point source pollution control projects, which include wetland and buffer restoration projects. The Trust Fund has, as of the end of state FY20, funded the restoration of 2,926 acres of wetlands and 1,400 acres of riparian buffers. These totals include restoration gains from the Natural Filters Program, as documented above, and projects that have occurred on private lands. From this point onward, implementation tracking will be expanded to include both public and private land restoration projects that are funded through the Trust Fund, to more accurately reflect potential carbon sequestration gains. Through a partnership between DNR, The Nature Conservancy (TNC), U.S. Fish and Wildlife Service, Natural Resources Conservation Service and National Oceanic and Atmospheric Administration (NOAA), DNR was able to restore 2,174 acres via a 5-year grant agreement between TNC and the DNR. The Pocomoke project's primary focus was to reconnect the mainstem, channelized Pocomoke River with its historic floodplain. The wetlands restored were mostly forested riparian wetlands, with some emergent wetlands restored in agricultural fields in the watershed. Coastal Wetlands Initiative Program: As of 2019, 505.6 acres of coastal wetlands have been restored by plugging existing drainage ditches to restore these drained wetlands. Living Shorelines through the Shoreline Conservation Service: Between 2006 and 2018, 13.24 acres of Living Shoreline have been created or restored. Wetland restoration and enhancement by federal agencies: The U.S. Fish and Wildlife Service has restored or enhanced 211 acres of tidal wetlands in the Blackwater National Wildlife Refuge over the past 10 years. The U.S. Army Corps of Engineers (USACE) has created, restored, or enhanced 1,875 acres of tidal wetlands in the Maryland portion of the Chesapeake Bay since 2006, with the most significant projects being a wetland enhancement project on Deal Island and wetland creation on Poplar Island. Recent research166 has shown that the Poplar Island created wetlands are sequestering carbon at similar rates to natural wetlands. For the 2020-2030 we expect a similar level of success in enhancing, restoring, protecting, and creating wetlands as has been experienced in the past. Tidal Wetlands Restored from 2006-2020 and Estimated Carbon Benefit For this initial estimate we only consider tidal wetlands restored from 2006 to 2020 and use the default rate of 2.17 Mt of CO2e per acre per year for restored wetlands as determined by the Verified Carbon Standard.167 We assume an additional 3,000 acres of tidal wetlands will be restored by federal partners and the state. Existing USACE documents show 2,000 acres of planned tidal wetland creation and restoration at Poplar Island, Barren Island, and
166 Staver, L.W., Stevenson, J.C., Cornwell, J.C. et al. Tidal Marsh Restoration at Poplar Island: II. Elevation Trends, Vegetation Development, and Carbon Dynamics. Wetlands (2020). doi.org/10.1007/s13157-020-01295-4 167 Restore America’s Estuaries, Silvestrum Climate Associates, and the University of Maryland. 2015. Estimation of Baseline Carbon Stock Changes and Greenhouse Gas Emissions in Tidal Wetland Restoration and Conservation Project Activities. Verified Carbon Standard Module.
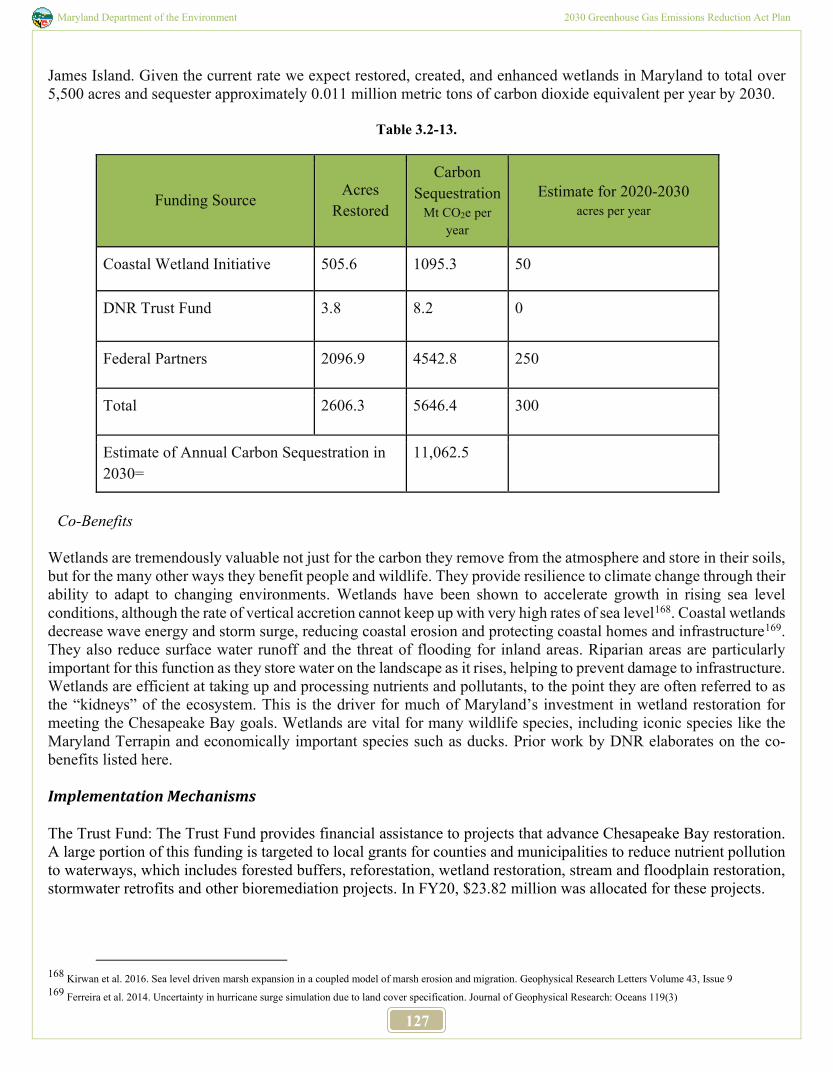
Maryland Department of the Environment 2030 Greenhouse Gas Emissions Reduction Act Plan
127
James Island. Given the current rate we expect restored, created, and enhanced wetlands in Maryland to total over 5,500 acres and sequester approximately 0.011 million metric tons of carbon dioxide equivalent per year by 2030.
Table 3.2-13.
Funding Source Acres Restored
Carbon Sequestration
Mt CO2e per year
Estimate for 2020-2030 acres per year
Coastal Wetland Initiative 505.6 1095.3 50
DNR Trust Fund 3.8 8.2 0
Federal Partners 2096.9 4542.8 250
Total 2606.3 5646.4 300
Estimate of Annual Carbon Sequestration in 2030=
11,062.5
Co-Benefits
Wetlands are tremendously valuable not just for the carbon they remove from the atmosphere and store in their soils, but for the many other ways they benefit people and wildlife. They provide resilience to climate change through their ability to adapt to changing environments. Wetlands have been shown to accelerate growth in rising sea level conditions, although the rate of vertical accretion cannot keep up with very high rates of sea level168. Coastal wetlands decrease wave energy and storm surge, reducing coastal erosion and protecting coastal homes and infrastructure169. They also reduce surface water runoff and the threat of flooding for inland areas. Riparian areas are particularly important for this function as they store water on the landscape as it rises, helping to prevent damage to infrastructure. Wetlands are efficient at taking up and processing nutrients and pollutants, to the point they are often referred to as the “kidneys” of the ecosystem. This is the driver for much of Maryland’s investment in wetland restoration for meeting the Chesapeake Bay goals. Wetlands are vital for many wildlife species, including iconic species like the Maryland Terrapin and economically important species such as ducks. Prior work by DNR elaborates on the co-benefits listed here.
Implementation Mechanisms The Trust Fund: The Trust Fund provides financial assistance to projects that advance Chesapeake Bay restoration. A large portion of this funding is targeted to local grants for counties and municipalities to reduce nutrient pollution to waterways, which includes forested buffers, reforestation, wetland restoration, stream and floodplain restoration, stormwater retrofits and other bioremediation projects. In FY20, $23.82 million was allocated for these projects.
168 Kirwan et al. 2016. Sea level driven marsh expansion in a coupled model of marsh erosion and migration. Geophysical Research Letters Volume 43, Issue 9 169 Ferreira et al. 2014. Uncertainty in hurricane surge simulation due to land cover specification. Journal of Geophysical Research: Oceans 119(3)
Maryland Department of the Environment 2030 Greenhouse Gas Emissions Reduction Act Plan
128
Resiliency through Restoration Initiative: Since 2011, Maryland has experienced six hurricane and flood events warranting presidential disaster declarations, resulting in more than $130 million in federal public assistance. Recognizing that coastal habitats help buffer communities from these climate-related impacts, DNR’s Chesapeake and Coastal Service (CCS) launched a new Resiliency through Restoration Initiative. This Initiative, funded by Governor Hogan through the State Capital Budget, provides technical and financial assistance to restore, enhance and create coastal habitat with the goal of protecting Maryland communities and public resources from extreme weather and climate-related events. The Initiative has led to the design of 16 living shoreline, coastal, and inland restoration projects around Maryland. Shoreline Conservation Services: This program is funded through the Shore Erosion Control Construction Loan Fund through DNR. Maryland Department of Natural Resources/Maryland Department of Transportation Memorandum of Understanding: DNR has partnered with the MDOT State Highway Administration (SHA) to lead by example in restoring the Chesapeake Bay and local waters. State parks will provide opportunities for SHA to implement restoration projects required by their federal Stormwater Permit (MS4) and their nutrient and sediment reduction goals required under the Bay Total Maximum Daily Load (TMDL). A Memorandum of Understanding (MOU) was signed in 2013 to initiate this program, which will increase the rate of restoration projects on state and public lands. In addition, DNR is working with MDOT/SHA to develop a similar MOU that will extend the partnership to the other modes within the MDOT organization.
Existing Regulations There are a number of regulations pertaining to wetlands in Maryland at the federal, state and local levels. At the federal level, Section 404 of the Clean Water Act regulates discharge of dredged or fill material into wetlands. Discharge is prohibited if: (1) a practicable alternative exists that is less damaging to the aquatic environment or (2) the nation’s waters would be significantly degraded. Potential permittees must first show that steps have been taken to avoid impacts to wetlands, streams and other aquatic resources, that potential impacts have been minimized, and that compensation will be provided for all remaining unavoidable impacts. At the state level, we have wetlands that are designated as “Areas of Special State Concern,” the Chesapeake Bay Critical Area, Tidal Wetlands Protection Act, and Non-Tidal Wetlands Protection Act, all of which serve to provide different levels of additional protection. The Maryland Department of the Environment administers some of these programs.
Challenges While wetland restoration, in both inland, freshwater and tidal environments, are practices that significantly contribute to terrestrial carbon sequestration rates throughout the state, the highly variable rate of methane emissions has a marked effect on net GHG benefits. Research at state, regional, national and global scales continue to evolve and narrow in on more precise methods to evaluate the GHG benefits of wetland restoration. The laws that currently govern wetlands do a good job of protecting wetlands against human caused impacts, but do not consider natural impacts, like sea level rise. New wetlands will be created, and many wetlands will migrate inland with SLR, but our laws do not include provisions to mitigate for net wetland loss due to sea level rise, should it occur. Measures of success for the various Coastal Wetland Initiative projects are currently being monitored. In some cases, ditch plugging has been very effective in establishing sheet flow across the marsh and allowing sediment to naturally fill the plugged ditches. In other areas, the ditch plugging has resulted in excessive water pooling, creating a drowned marsh effect. Ongoing monitoring of these projects will improve the design, best practices and success of future efforts.
Maryland Department of the Environment 2030 Greenhouse Gas Emissions Reduction Act Plan
129
Removing barriers to accessing federal funds could also incentivize landowners to participate in restoration projects. DNR is actively working with the Maryland Department of Agriculture and the United States Department of Agriculture on removing those barriers.
Environmental Justice Environmental justice is a concern when considering how climate change is projected to (and in many cases, already) impacting our coastal wetlands and communities. Saltwater intrusion is causing some acreage of farms to become non-arable and forests to die off every year, particularly on Maryland’s low-lying Eastern Shore. These counties have some of Maryland’s highest poverty rates and can least afford to suffer revenue losses or take measures to mitigate the losses. The Maryland Department of Planning has created a saltwater intrusion plan to identify problem areas and suggest viable paths forward, and DNR is examining ways their land conservation and easement programs might allow landowners to receive compensation for lands they are losing by converting them to wetlands. Tools such as the EJ Screening Tool and the Maryland Park Equity Tool are used with the Trust Fund and in public lands planning to help identify underserved and environmental justice communities that would benefit from preservation of open space, shoreline enhancement and other nature-based approaches to risk reduction.
Enhancement Opportunities Beyond 2030 A key enhancement opportunity for the next 10 years and beyond is to utilize market-based solutions to increase wetlands restoration and enhancement projects. The Sea Level Affecting Marsh Model (SLAMM) has been completed for Maryland coastlines and is being actively used for a variety of wetland management practices, including:
● Factoring climate change and resiliency into DNR’s land acquisition scoring process ● Developing new easement opportunities for landowners that own land within these wetland adaptation area
transition zones ● Identifying the value of current and future wetlands for protecting communities and infrastructure from
coastal flooding and shoreline erosion through DNR’s Coastal Resiliency Initiative. Ongoing work funded by the NOAA Ecological Effects of Sea Level Rise project awarded to George Mason University, DNR, and the Maryland chapter of The Nature Conversancy will update the SLAMM model using the latest elevation and wetlands data to more accurately determine the potential loss or gain of tidal wetlands from 2020 to 2100 under six different global carbon emission scenarios. These results will provide input to the Maryland GGRA Draft Plan in understanding the effect of sea level rise on carbon storage pools in current and future wetlands. The USCA has funded a collaboration with Duke University, North Carolina, Virginia, Delaware, New Jersey and New York on modelling coastal blue carbon and coastal resiliency. The coastal blue carbon model simulates change in wetlands over a 100-year period (2020-2120) under different emission scenarios spatially across Maryland and the other participating states. The model results will help build our understanding of the range of outcomes for wetland carbon storage and sequestration, both informing our GGRA plan and helping us prioritize projects for increasing coastal resiliency. The University of Maryland Center for Environmental Science (UMCES), partnering with Restore America’s Estuaries and COMPASS, will be conducting a series of webinars on Blue Carbon starting in summer 2020. These webinars will synthesize the state of knowledge on blue carbon, with one of the stated goals to better understand how blue carbon fits into Maryland’s GHG inventory and reduction goals. Maryland’s Innovative Technology Fund (ITF) expanded its scope of eligible techniques and technologies to include consideration of climate aspects. In addition to the traditional technologies focused on nutrient and sediment
Maryland Department of the Environment 2030 Greenhouse Gas Emissions Reduction Act Plan
130
reductions, the state will also invest in the research, development, and commercialization of solutions addressing climate mitigation to help accelerate the adoption of climate resiliency and GHG mitigation. The ITF has supported six solutions that have the co-benefit of mitigating GHG emissions. Manta Biofuel has a system to grow, harvest and convert algae into biofuel that can be a substitute for fossil fuels. HyTek Bio uses an algae scrubber system to reduce GHG and NOx emissions from the Back River Wastewater treatment plant. DataKwip Holdings LLC, is a startup with a real-time energy and facility analytics platform that helps building operators and managers make their buildings an average of 15% more efficient using existing systems and equipment, without the need for additional hardware. Neighborhood Sun, a company that acquires and manages customers for community solar projects, is providing solar power to anyone who pays an electric bill. SolarCube LLC, provides photovoltaic and battery storage solutions to provide customers with an affordable option to install flexible, lightweight and efficient building integrated photovoltaics. SVE Technology LLC is designing, building, and testing a modernized sleeve valve engine that will contribute to significant reduction in fuel costs and to the development of an environmentally friendly small scale and high-speed engines for various industrial applications. The new protocol for tidal and seagrass restoration and other research efforts quantifying coastal wetland sequestration, opens up opportunities to account for the GHG benefits of carbon sequestration through SAV restoration and re-establishment. There may also be emerging avenues for investing in coastal restoration to reduce the risk of damage to infrastructure from coastal flooding. A number of studies (Naryan et al. 2017, Costanza et al. 2011) have shown a direct causal link between coastal wetlands and damage from storms; if this benefit is better incorporated into the insurance market it could provide another funding source for coastal wetland protection, creation and enhancement.
COVID Impacts DNR anticipates some negative impact on the Trust Fund since it is funded by gasoline and rental car tax revenue. This shortfall will impact the number of projects that can be supported to meet these goals. The state is continually prioritizing these critical investments and are looking for a myriad of technical and financial assistance opportunities to maintain progress.
3.2.14.4 Biomass for Energy Production
Lead Agency: DNR
Program Description Maryland is working to promote the use of locally produced woody biomass for the generation of thermal energy and electricity. Energy from forest by-products can be used to offset fossil fuel-based energy production and associated GHG emissions. There are many end users in the United States that are successfully employing wood heating and cooling. Maryland could benefit from such a program. For example, schools, hospitals, and municipalities could utilize local woody biomass for their energy needs. Creating a woody biomass fuel market would provide an incentive for harvesting low grade wood, a key component of healthy forest management. The goals of this program are to develop policies that recognize wood as a renewable energy source, recognize wood as the largest source of bioenergy production in Maryland, and offer incentives to utilize locally produced wood to meet thermal energy needs. Implementation Mechanisms
● DNR is actively working with partners including the Maryland Energy Administration, and the Maryland Department of Commerce to facilitate installation of wood energy systems and has committed to a pilot program on the Eastern Shore and in western Maryland.
Maryland Department of the Environment 2030 Greenhouse Gas Emissions Reduction Act Plan
131
● Maryland Energy Administration has an existing grant program that could be reinstated if adequate demand is demonstrated.
● A webinar series on the potential of woody biomass to energy in Maryland was presented in 2020. This series was sponsored by the Maryland Forestry Foundation and Maryland Clean Energy Center in partnership with DNR and the Sustainable Forestry Council. More information and recordings can be found at the Maryland Clean Energy website.170
The U.S. Department of Commerce Economic Development Administration awarded a grant to the Western Maryland Resource Conservation and Development Council, who is partnering with DNR and the Maryland Department of Commerce to develop an Economic Adjustment Strategy for Maryland’s forestry industry. Once finalized, the plan will serve as a roadmap for capitalizing on new opportunities in the forest industry, including biomass for energy production and creating jobs, particularly in Opportunity Zones. Recognizing the need for an analysis of “wood sheds” where available wood resources are quantified will help raise confidence in the ability of an area to support industrial scale biomass to energy and in the feasibility of industrial scale biomass to energy. The Eastern Shore Regional GIS Center (ESRGC) at Salisbury University recently partnered with DNR, the Western Maryland Resource Conservation and Development Council, and the Maryland Department of Commerce to assist in answering that question. A Maryland Forest Inventory Resource Viewer (MFIRV) was also developed so potential investors and forestry-related businesses could have information on potential markets and market viability. Actions that still need to be implemented include developing comprehensive policy supporting thermal energy.
Existing Regulations Woody biomass is currently classified as a Tier 1 renewable energy source in Maryland’s Renewable Portfolio standard, eligible to generate renewable energy credits (RECs) providing it meets the following criteria:
● Waste material that is segregated from inorganic waste material and is derived from sources; ● Except for old growth timber, any of the following forest-related resources: A) Mill residue, except sawdust
and wood shavings; B) Precommercial soft wood thinning; C) Slash; D) Brush; or E) Yard waste; ● A pallet, crate, or dunnage; ● Agricultural and silvicultural sources, including tree crops, vineyard materials, grain, legumes, sugar, and
other crop by-products or residues; or ● Gas produced from the anaerobic decomposition of animal waste or poultry waste; or ● A plant that is cultivated exclusively for purposes of being used at a Tier 1 renewable source or a Tier 2
renewable source to produce electricity.
Challenges Awareness of wood energy technology is the primary barrier to this program, in particular adequately informing the managers of commercial and institutional spaces of the opportunities to save money while improving environmental outcomes that are offered by the simple switch to wood fuels. Establishing some demonstration projects in Maryland would greatly assist with DNR's ability to showcase available technology. Maryland Energy Administration has temporarily discontinued its Commercial Wood Boiler grant incentive program due to a lack of success in identifying suitable grant recipients. The program could be reinstated if sufficient industry demand is demonstrated.
170 mdcleanenergy.org/biomass/
Maryland Department of the Environment 2030 Greenhouse Gas Emissions Reduction Act Plan
132
Enhancement Opportunities Beyond 2030 Allowing renewable energy credits (RECs) to be generated from combined heat and power systems using woody biomass, would provide an additional incentive to use this type of system. Additional educational outreach on the feasibility of biomass-to-energy to state agencies, academic institutions and the business community would likely help to establish this program. A statutory change would be needed to accomplish this.
3.2.14.5 Maryland Agricultural Land Preservation Foundation Lead Agency: MDA
Program Description The Maryland Agricultural Land Preservation Foundation (MALPF) is one of the oldest and most successful farmland preservation programs in the country. MALPF was created in 1977 by the Maryland General Assembly. MALPF’s primary purpose is to preserve productive agricultural land and woodland to provide for the continuing production of food and fiber for the citizens of Maryland. MALPF purchases agricultural preservation easements that forever restrict development on prime farmland and woodland and has permanently preserved land in each of Maryland’s 23 counties. In FY19 alone, MALPF settled 45 easements and preserved 5,430 acres of farmland. Since its inception through the end of FY19, MALPF has purchased easements on a cumulative total of 2,347 properties and permanently preserved 318,215 acres of farmland at a public investment of over $752 million. MALPF and its other state agency and local government partners are working to meet a legislative goal (SJ 10, 2002) of preserving 1,030,000 acres of agricultural land by 2022. As reported by MDP, total private land under easement by MALPF, GreenPrint, Rural Legacy, and local preservation programs was 662,923 acres as of the end of FY19, according to best available data as of August 23, 2019. This represents over 64% of the goal.
Implementation Milestones
Enhancement Opportunities Passage of legislation will enable MALPF to participate in the U.S. Department of Defense’s Readiness and Environmental Protection Integration Program (REPI) and enter into agreements with the Navy and other partners to share acquisition costs of easements to preserve agricultural land uses and natural habitat near military installations and ranges.
Funding MALPF’s purchases are funded by dedicated percentages of the Real Estate Transfer Tax and the Agricultural Transfer Tax, along with county and state allocations.
Challenges Although MALPF saw an increase in allocated funds in FY17 and FY18, the applications for participation in MALPF exceed available funding every year. Starting in 2009, the Maryland General Assembly diverted monies from the program and partially replaced them with bond funds. Due to these cuts, the program combined its acquisition years over five cycles in order to have enough funding in each cycle to make at least one offer in each participating county.
Maryland Department of the Environment 2030 Greenhouse Gas Emissions Reduction Act Plan
133
With the full funding of the program in the current fiscal year, MALPF will move back to an annual cycle of easement acquisitions for the first time in a decade.
Relevant Information Since MALPF addresses working agricultural lands, their future sequestration potential will be captured under the Healthy Soils Program as part of the 2030 GGRA Plan to avoid possible double counting of GHG reduction estimates.
3.2.14.6 Increasing Urban Trees to Capture Carbon
Lead Agency: DNR
Program Description Trees in urban areas are extremely important to Maryland’s carbon budget because they help offset some of the GHG emissions from urban pollution sources such as power production and vehicle emissions, reduce heating and cooling costs and energy demand by moderating temperatures around buildings and slow the formation of ground level ozone as well as the evaporation of fuel from motor vehicles. Implementation is supported by several Maryland laws and programs that include outreach and technical assistance for municipalities to assess and evaluate their urban tree canopy goals and plant trees to meet those goals.
Program Objectives The goal of this program is to plant an additional 2.65 million trees in urban areas through the Forest Conservation Act, Marylanders Plant Trees, Tree-Mendous Maryland and 5-103 State Highway Reforestation Act planting programs by 2030 from our 2020 tree planting progress. We estimate that on average, between 150,000 to 500,000 urban trees will be planted in Maryland per year from 2020-2030. This will equate to 1.5 to 5 million total trees planted over that period. DNR estimates that the average of the past three years is reasonable to expect for a projected annual average during the 2020-2030 period that would be 265,000 trees planted per year. The low estimate of GHG benefit is 0.0023 MMtCO2e per year, high is 0.0046 MMtCO2e per year, with the expectation of 0.0035 MMtCO2e per year of additional carbon sink in 2030.
Co-Benefits Urban trees are particularly important for the role they play in improving local air quality, benefiting human health, providing habitat and reducing heating and cooling for adjacent buildings. Tree canopy can also reduce the urban heat island, the effect of human modified surfaces absorbing heat and waste heat from human activities increasing the air temperature in cities relative to less modified landscapes. The urban heat island not only drives additional energy demand for cooling, but increases risk of the heat index being at levels dangerous to human health.
Implementation Mechanisms To date, 5,908,487 trees have been planted from 2006 to 2019 (total for this program and Planting Forests in Maryland).
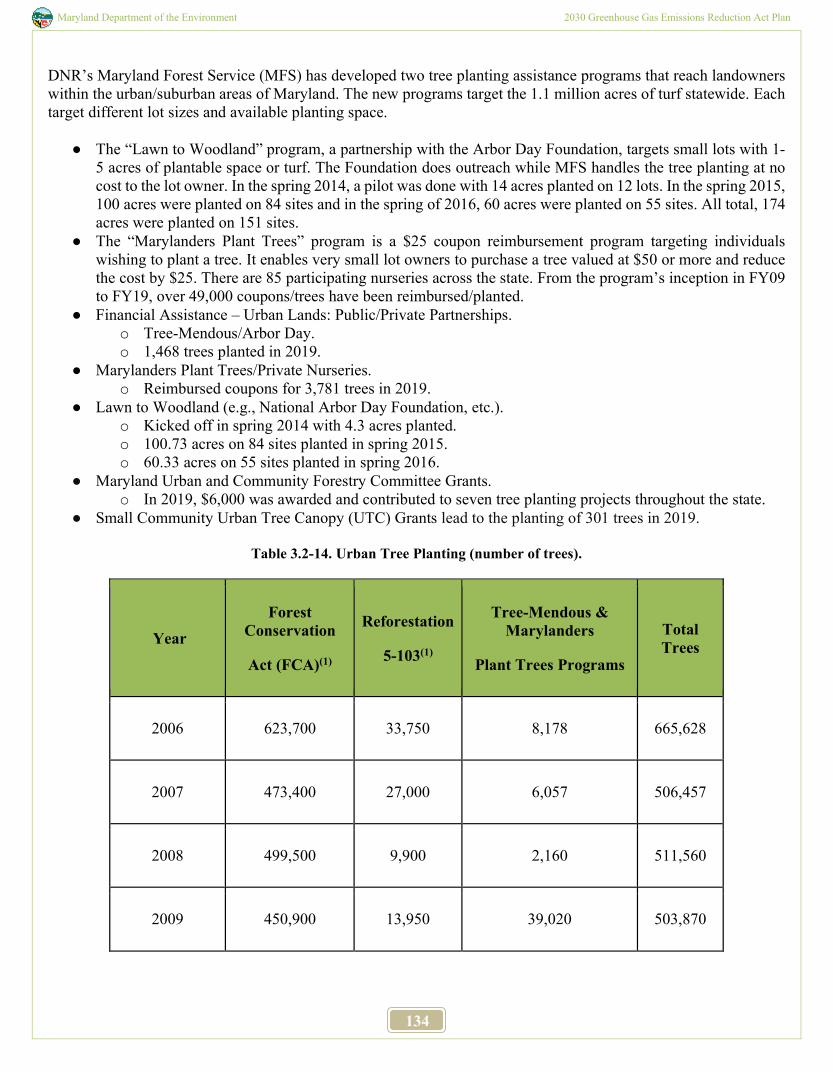
Maryland Department of the Environment 2030 Greenhouse Gas Emissions Reduction Act Plan
134
DNR’s Maryland Forest Service (MFS) has developed two tree planting assistance programs that reach landowners within the urban/suburban areas of Maryland. The new programs target the 1.1 million acres of turf statewide. Each target different lot sizes and available planting space.
● The “Lawn to Woodland” program, a partnership with the Arbor Day Foundation, targets small lots with 1-5 acres of plantable space or turf. The Foundation does outreach while MFS handles the tree planting at no cost to the lot owner. In the spring 2014, a pilot was done with 14 acres planted on 12 lots. In the spring 2015, 100 acres were planted on 84 sites and in the spring of 2016, 60 acres were planted on 55 sites. All total, 174 acres were planted on 151 sites.
● The “Marylanders Plant Trees” program is a $25 coupon reimbursement program targeting individuals wishing to plant a tree. It enables very small lot owners to purchase a tree valued at $50 or more and reduce the cost by $25. There are 85 participating nurseries across the state. From the program’s inception in FY09 to FY19, over 49,000 coupons/trees have been reimbursed/planted.
● Financial Assistance – Urban Lands: Public/Private Partnerships. o Tree-Mendous/Arbor Day. o 1,468 trees planted in 2019.
● Marylanders Plant Trees/Private Nurseries. o Reimbursed coupons for 3,781 trees in 2019.
● Lawn to Woodland (e.g., National Arbor Day Foundation, etc.). o Kicked off in spring 2014 with 4.3 acres planted. o 100.73 acres on 84 sites planted in spring 2015. o 60.33 acres on 55 sites planted in spring 2016.
● Maryland Urban and Community Forestry Committee Grants. o In 2019, $6,000 was awarded and contributed to seven tree planting projects throughout the state.
● Small Community Urban Tree Canopy (UTC) Grants lead to the planting of 301 trees in 2019.
Table 3.2-14. Urban Tree Planting (number of trees).
Year Forest
Conservation
Act (FCA)(1)
Reforestation
5-103(1)
Tree-Mendous & Marylanders
Plant Trees Programs
Total Trees
2006 623,700 33,750 8,178 665,628
2007 473,400 27,000 6,057 506,457
2008 499,500 9,900 2,160 511,560
2009 450,900 13,950 39,020 503,870
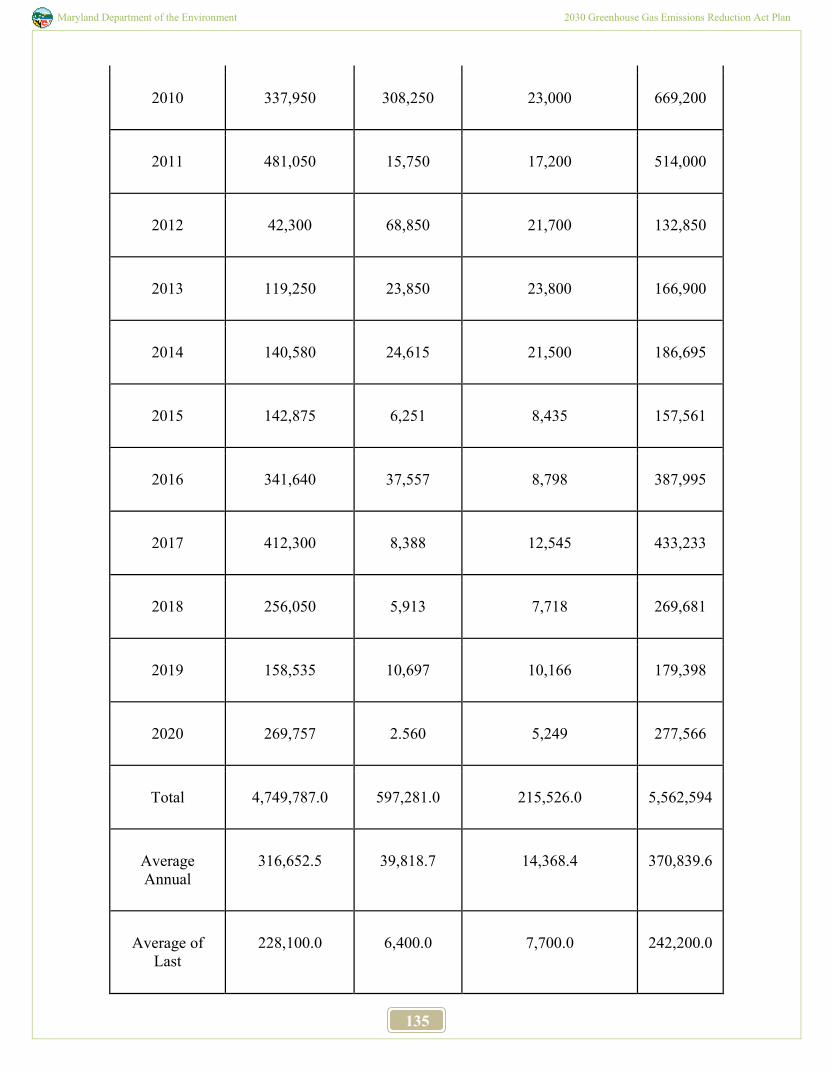
Maryland Department of the Environment 2030 Greenhouse Gas Emissions Reduction Act Plan
135
2010 337,950 308,250 23,000 669,200
2011 481,050 15,750 17,200 514,000
2012 42,300 68,850 21,700 132,850
2013 119,250 23,850 23,800 166,900
2014 140,580 24,615 21,500 186,695
2015 142,875 6,251 8,435 157,561
2016 341,640 37,557 8,798 387,995
2017 412,300 8,388 12,545 433,233
2018 256,050 5,913 7,718 269,681
2019 158,535 10,697 10,166 179,398
2020 269,757 2.560 5,249 277,566
Total 4,749,787.0 597,281.0 215,526.0 5,562,594
Average Annual
316,652.5 39,818.7 14,368.4 370,839.6
Average of Last
228,100.0 6,400.0 7,700.0 242,200.0
Maryland Department of the Environment 2030 Greenhouse Gas Emissions Reduction Act Plan
136
3 Years
(Rounded)
(1). Assumes 450
trees planted/acre.
Totals for 2020 are based on preliminary data and subject to future revisions
Enhancement Opportunities Post 2030
Efforts to expand and diversify buffer and urban tree canopy plantings related to Chesapeake Bay restoration will also benefit GHG reduction efforts. New funding mechanisms are being explored, from revolving loan funds repaid through purchase of MS4 credits or local government climate resilience bonds. The quantification of carbon sequestration for tree planting, soil carbon sequestration, and forest management estimates could form the basis for aggregating private forest management and tree planting for the voluntary carbon credit market.
Challenges Year to year variability in program availability and funding levels creates a challenge in building program awareness in the public. The “Lawn to Woodland” and the “Marylanders Plant Trees” programs are both funded through forest mitigation funds received as a result of highway construction projects complying with Reforestation Law (NRA 5-103). This makes the funding variable from year to year, and for the past several years the “Lawn to Woodland” program was on hold due to limited available funds. Identifying an alternative funding source when mitigation funds are limited or not available would allow for the programs to be consistently offered to the public.
3.2.14.7 Geological Opportunities to Store Carbon
Lead Agency: DNR
Program Description
Geological carbon sequestration differs from other discussed sequestration methods because it captures carbon at the source, transports it to a sequestration site, and then sequesters it. Maryland, through DNR’s Maryland Geological Survey, is one of eight partner states in the Midwest Region Carbon Sequestration Partnership whose role is to identify, locate, and characterize potential geologic storage opportunities. This has evolved into the Mid-West Region Carbon Initiative which is a coordination of over 12 states, the nonprofit Battelle Memorial Institute, and the U.S. Department of Energy. More than 10 gigatonnes of storage capacity has been identified within the terrestrial portion of Maryland (103 years of storage capacity at current CO2 estimated production rate of 97 MMt per year). In the offshore region ranging from Maryland to New York, an estimated 450 gigatonnes of geologic capacity has been calculated.
Maryland Department of the Environment 2030 Greenhouse Gas Emissions Reduction Act Plan
137
The goal of this program is to identify and assess geologic storage opportunities.
Program Objectives The potential emission reductions from the Geological Opportunities to Store Carbon program have been aggregated with the estimated emission reductions from the Terrestrial Sequestration bundle (Forestry and Wetlands).
Co-Benefits Growth in geologic sequestration in Maryland would create additional economic activity and jobs for the state. These jobs would be particularly valuable because the skills and equipment needed for geologic sequestration are similar to those for the fossil fuel industry, helping to mitigate for a projected decline in job opportunities there. New designs of Direct Air Capture devices which remove CO2 from the ambient air have been made and are currently in testing. These devices allow for efficient balancing of the electric grid, using excess electricity, and sequestering CO2 at the site of the sequestration target.
Implementation Mechanisms Previous Geological Carbon Sequestration funding has come from the U.S. Department of Energy through Battelle. Research funds for geologic carbon sequestration ceased in 2020 with a refocusing of DOE funds into implementation of geologic carbon sequestration. Twenty thousand dollars per year is provided through the state’s Environmental Trust Fund. DNR’s Resource Assessment Service (RAS) has completed or is currently working on the following implementation milestones.
• Total organic carbon content in Maryland black shales (e.g., Marcellus) has been evaluated as a precursor for determining the viability of these as storage units for CO2. This data is incorporated into regional and national databases for various integration projects. This project is completed.
• The potential for offshore carbon sequestration has been evaluated in partnership with Harvard University, Battelle, U.S. Department of Energy, Rutgers University, University of Texas and the surrounding mid-Atlantic States. Focus areas of this study included geologic characterization, capacity evaluations, injectability and risk analyses. This project has provided foundation knowledge and an assessment of potential for carbon sequestration offshore in the Baltimore Canyon Trough. Projections from this study state over 450 gigatonnes of carbon sequestration are possible within our region using offshore sequestration targets.
• The potential of saline aquifers located under the Coastal Plain in Maryland as a target for carbon sequestration is being evaluated in cooperation with multiple state Geological Surveys. There is currently no funding for this research and saline aquifers remain a potential option, but unvalidated sink for the GHG CO2.
• Baseline data has been collected to provide the foundation for conducting risk analyses for potential development of stray gas migration into potable aquifers. The final report is in review.
• Research is ongoing to assess the CO2 chemical adsorption capacity of power plant combustion by-products and the organic shales and clays in the closest geologic formations.
• Research has been completed to assess the possibility of CO2 sequestration as both structural and chemical storage within Triassic rift basins. The exposed Gettysburg-Culpepper basin has been characterized and documented as a proxy of the buried rift basins located throughout Maryland. Further research is planned to study the collected cores through the Taylorsville Basin; however, those cores are currently difficult to access and located out of state. Phase I of this project is complete. Phase II is pending the availability of collected
Maryland Department of the Environment 2030 Greenhouse Gas Emissions Reduction Act Plan
138
cores.
Other Resources Assessment Service program notes include: • Site testing (carbon capture, transport and storage) continues in Michigan and Ohio (regional partners to
Maryland in CO2 sequestration projects) and has been completed in Kentucky. A large-scale project is currently being performed in Illinois capturing 6.5 million tons of CO2 annually. These programs are being evaluated at a national level and the results continue to be favorable at this time.
• Depleted gas fields present the most immediate option for permanent storage of CO2 in western Maryland. Maryland Geological Survey is currently working on identifying the site characteristics of individual wells to assist MEA in determining a pilot project injection site.
• A methane emissions study of the Deer Park Anticline by the Western Maryland Regional GIS Center has been ruled out using this Anticline for structural storage of CO2 due to observed methane leaks primarily from the old Mountain Lake Park Gas Field. It could still have potential for chemical adsorption of CO2.
• In collaboration with MEA, a CO2 Sequestration conference was held in November 2019. MEA recorded the talks and are using these talks as educational material for legislators and their staff.
• Maryland Geological Survey is working with NASA to identify any technologies that would assist in identifying methane emitters such as transmissive geologic faults, poorly abandoned wells, fissures, etc. There is presently no funding for this activity, and this project is in its infancy.
Existing Regulations
EPA regulates geologic carbon sequestration. The well-used must be Class VI and is subject to specific rules on permitting, geologic site characterization, Area of review (AOR) and corrective action, financial responsibility, well construction, operation, mechanical integrity testing (MIT, monitoring, well plugging, post-injection site care (PISC), and site closure. The final Rule and supporting documents for this regulation can be found at the EPA website.171
Challenges The cost of capturing CO2 using current technologies involves a parasitic loss of approximately 20% at the generation site. This cost has decreased over the last 10 years by 30%. It is anticipated this will only decline to an 18% parasitic loss unless a vastly improved technology is identified. However, the IRS has created a section 45Q tax credit incentive that allows businesses that geologically sequester carbon to receive a significant offset which will mature to $50 per metric ton by 2026. This tax incentive significantly offsets the cost of carbon capture and geological sequestration allowing for profit making business plans using current technology. A significant, but often overlooked cost for sequestration, is transportation of the CO2 from its source to the sequestration site. Ideally, the sources would be located on top of the sequestration site making this cost minimal. However, it is likely that pipelines will need to be created to efficiently pipe the CO2 from the production location to the sequestration location. Retrofitting equipment onto existing power plants and industrial processing plants is often cost and space prohibitive. CO2 capture must be planned for in new plants.
Enhancement Opportunities Beyond 2030
171 https://www.epa.gov/uic/federal-requirements-under-underground-injection-control-uic-program-carbon-dioxide-co2-geologic#rule-summary
Maryland Department of the Environment 2030 Greenhouse Gas Emissions Reduction Act Plan
139
A federal, regional, or state action to put a cap on carbon emissions would potentially create a demand for geologic sequestration, if it is cost-competitive with other options to offset emissions. If the price of carbon offsets reaches parity with the cost to do geologic sequestration this would also spur action. A pilot project currently being discussed at MEA will allow Maryland to understand the execution of a geologic carbon sequestration program.
3.2.14.8 The Maryland Healthy Soils Program
Lead Agency: MDA
Program Description Established in 2017, the Maryland’s Healthy Soils Program charges MDA to develop a program to improve the health, yield, and profitability of soils; increase biological activity and carbon sequestration in agricultural soils; and promote further education and adoption of healthy soil practices. In FY19, MDA partnered with the USDA Regional Conservation Partnership Program on a $1 million grant to promote soil heath and adaptive management strategies on Maryland’s Eastern Shore. Farmer interest was high, with 71 applicants signing up for this special funding opportunity. Grant funds were targeted to farmers in Caroline, Kent, Queen Anne’s, and Talbot Counties to support the installation of practices that increase soil organic matter, reduce erosion, promote nutrient cycling, improve water retention, and reduce competition from weeds and pests. In addition to reducing nutrient and sediment flows into the Chesapeake Bay and its tributaries, many of the agronomic and conservation practices already used by Maryland’s farmers have the potential to make a significant contribution to the State’s climate change goals by sequestering carbon and other GHGs. Although the agriculture and forestry sectors contribute only a small percentage of Maryland's overall GHG emissions, they more importantly act as sinks and remove carbon dioxide from the atmosphere. As was noted earlier, forests, grasslands, croplands, and wetlands all possess carbon-reducing and energy-related benefits that are extensive and complex. These natural and working lands provide opportunities for carbon sequestration that are not possible in other sectors. Through appropriate management, the potential for land-based sequestration of atmospheric carbon can be significant, offering a pathway to negative emissions that is not only available now, but also highly cost-effective. Agricultural GHG emissions include carbon emitted from soil during decomposition of organic matter by microbes, methane (CH4) from enteric fermentation in cattle, and nitrous oxide (N2O) emissions from manure management, and fertilizer application from both synthetic or organic sources (compost or manure). These emissions, however, can be greatly reduced by the ability of plants to draw carbon out of the air through photosynthesis. Trees and plants store carbon in their trunks, branches, and roots and exude carbon not needed for growth into the soil, where it feeds soil organisms (Figure 3.2-18). Soil organic matter is largely composed of carbon and contributes to soil structure, nutrient and moisture retention and availability, sequestration capacity, fertility, and resilience.
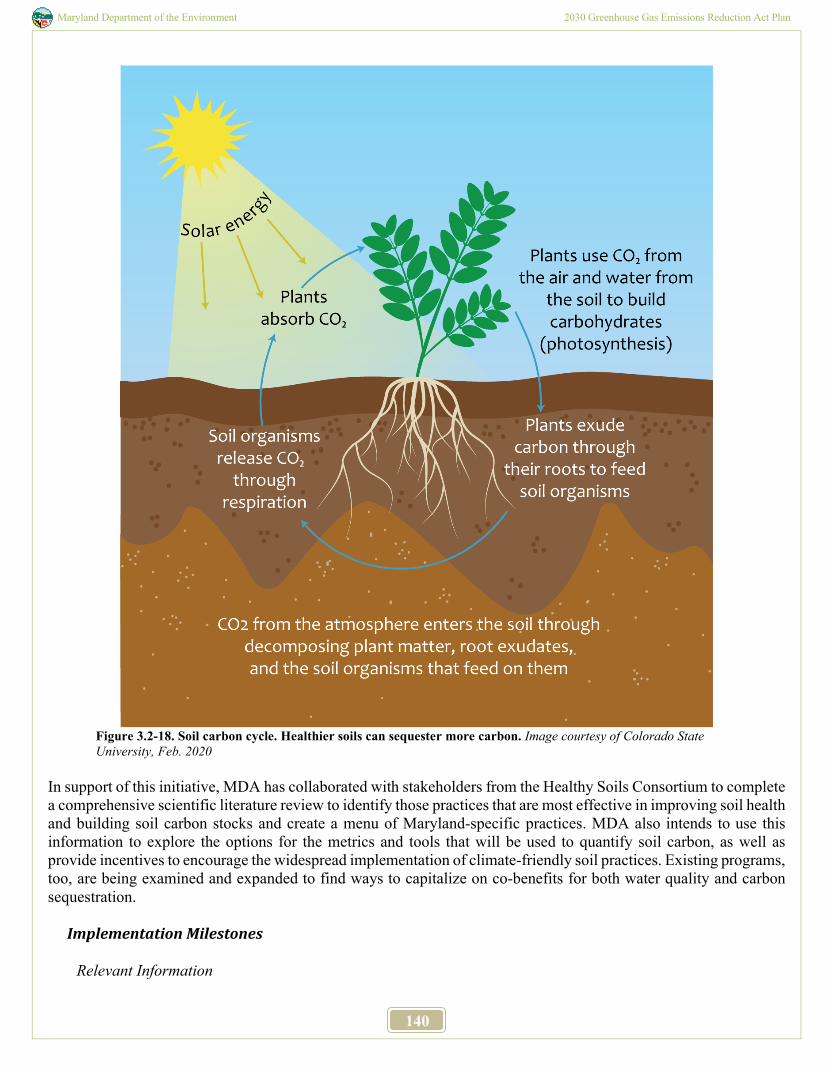
Maryland Department of the Environment 2030 Greenhouse Gas Emissions Reduction Act Plan
140
Figure 3.2-18. Soil carbon cycle. Healthier soils can sequester more carbon. Image courtesy of Colorado State University, Feb. 2020
In support of this initiative, MDA has collaborated with stakeholders from the Healthy Soils Consortium to complete a comprehensive scientific literature review to identify those practices that are most effective in improving soil health and building soil carbon stocks and create a menu of Maryland-specific practices. MDA also intends to use this information to explore the options for the metrics and tools that will be used to quantify soil carbon, as well as provide incentives to encourage the widespread implementation of climate-friendly soil practices. Existing programs, too, are being examined and expanded to find ways to capitalize on co-benefits for both water quality and carbon sequestration.
Implementation Milestones
Relevant Information
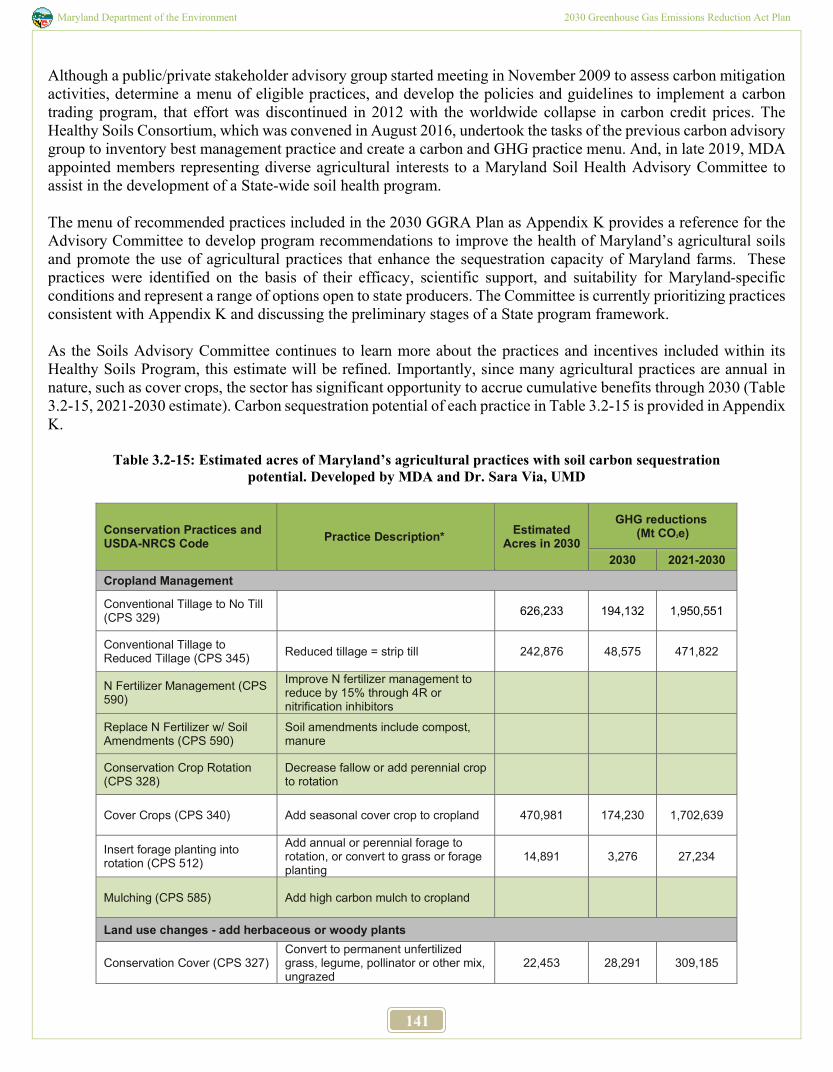
Maryland Department of the Environment 2030 Greenhouse Gas Emissions Reduction Act Plan
141
Although a public/private stakeholder advisory group started meeting in November 2009 to assess carbon mitigation activities, determine a menu of eligible practices, and develop the policies and guidelines to implement a carbon trading program, that effort was discontinued in 2012 with the worldwide collapse in carbon credit prices. The Healthy Soils Consortium, which was convened in August 2016, undertook the tasks of the previous carbon advisory group to inventory best management practice and create a carbon and GHG practice menu. And, in late 2019, MDA appointed members representing diverse agricultural interests to a Maryland Soil Health Advisory Committee to assist in the development of a State-wide soil health program. The menu of recommended practices included in the 2030 GGRA Plan as Appendix K provides a reference for the Advisory Committee to develop program recommendations to improve the health of Maryland’s agricultural soils and promote the use of agricultural practices that enhance the sequestration capacity of Maryland farms. These practices were identified on the basis of their efficacy, scientific support, and suitability for Maryland-specific conditions and represent a range of options open to state producers. The Committee is currently prioritizing practices consistent with Appendix K and discussing the preliminary stages of a State program framework. As the Soils Advisory Committee continues to learn more about the practices and incentives included within its Healthy Soils Program, this estimate will be refined. Importantly, since many agricultural practices are annual in nature, such as cover crops, the sector has significant opportunity to accrue cumulative benefits through 2030 (Table 3.2-15, 2021-2030 estimate). Carbon sequestration potential of each practice in Table 3.2-15 is provided in Appendix K.
Table 3.2-15: Estimated acres of Maryland’s agricultural practices with soil carbon sequestration potential. Developed by MDA and Dr. Sara Via, UMD
Conservation Practices and USDA-NRCS Code Practice Description* Estimated
Acres in 2030 GHG reductions
(Mt CO2e)
2030 2021-2030 Cropland Management Conventional Tillage to No Till (CPS 329) 626,233 194,132 1,950,551
Conventional Tillage to Reduced Tillage (CPS 345) Reduced tillage = strip till 242,876 48,575 471,822
N Fertilizer Management (CPS 590)
Improve N fertilizer management to reduce by 15% through 4R or nitrification inhibitors
Replace N Fertilizer w/ Soil Amendments (CPS 590)
Soil amendments include compost, manure
Conservation Crop Rotation (CPS 328)
Decrease fallow or add perennial crop to rotation
Cover Crops (CPS 340) Add seasonal cover crop to cropland 470,981 174,230 1,702,639
Insert forage planting into rotation (CPS 512)
Add annual or perennial forage to rotation, or convert to grass or forage planting
14,891 3,276 27,234
Mulching (CPS 585) Add high carbon mulch to cropland
Land use changes - add herbaceous or woody plants
Conservation Cover (CPS 327) Convert to permanent unfertilized grass, legume, pollinator or other mix, ungrazed
22,453 28,291 309,185
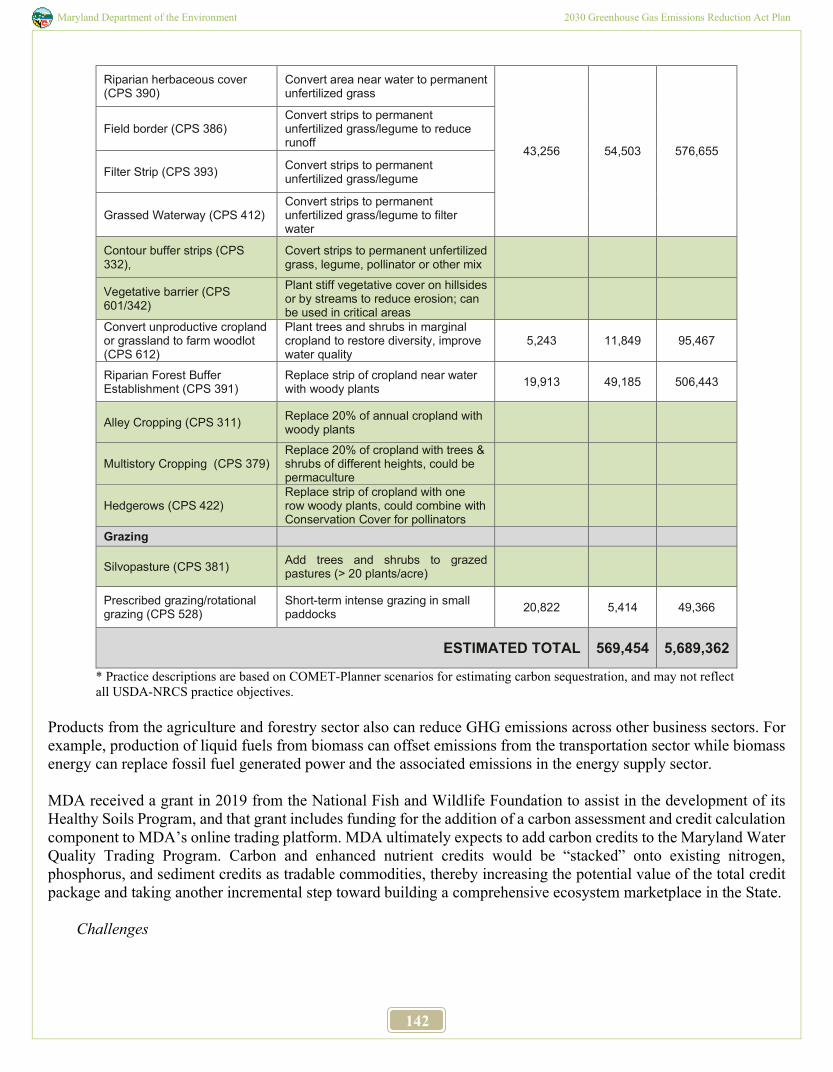
Maryland Department of the Environment 2030 Greenhouse Gas Emissions Reduction Act Plan
142
Riparian herbaceous cover (CPS 390)
Convert area near water to permanent unfertilized grass
43,256 54,503 576,655 Field border (CPS 386)
Convert strips to permanent unfertilized grass/legume to reduce runoff
Filter Strip (CPS 393) Convert strips to permanent unfertilized grass/legume
Grassed Waterway (CPS 412) Convert strips to permanent unfertilized grass/legume to filter water
Contour buffer strips (CPS 332),
Covert strips to permanent unfertilized grass, legume, pollinator or other mix
Vegetative barrier (CPS 601/342)
Plant stiff vegetative cover on hillsides or by streams to reduce erosion; can be used in critical areas
Convert unproductive cropland or grassland to farm woodlot (CPS 612)
Plant trees and shrubs in marginal cropland to restore diversity, improve water quality
5,243 11,849 95,467
Riparian Forest Buffer Establishment (CPS 391)
Replace strip of cropland near water with woody plants 19,913 49,185 506,443
Alley Cropping (CPS 311) Replace 20% of annual cropland with woody plants
Multistory Cropping (CPS 379) Replace 20% of cropland with trees & shrubs of different heights, could be permaculture
Hedgerows (CPS 422) Replace strip of cropland with one row woody plants, could combine with Conservation Cover for pollinators
Grazing
Silvopasture (CPS 381) Add trees and shrubs to grazed pastures (> 20 plants/acre)
Prescribed grazing/rotational grazing (CPS 528)
Short-term intense grazing in small paddocks 20,822 5,414 49,366
ESTIMATED TOTAL 569,454 5,689,362
* Practice descriptions are based on COMET-Planner scenarios for estimating carbon sequestration, and may not reflect all USDA-NRCS practice objectives.
Products from the agriculture and forestry sector also can reduce GHG emissions across other business sectors. For example, production of liquid fuels from biomass can offset emissions from the transportation sector while biomass energy can replace fossil fuel generated power and the associated emissions in the energy supply sector. MDA received a grant in 2019 from the National Fish and Wildlife Foundation to assist in the development of its Healthy Soils Program, and that grant includes funding for the addition of a carbon assessment and credit calculation component to MDA’s online trading platform. MDA ultimately expects to add carbon credits to the Maryland Water Quality Trading Program. Carbon and enhanced nutrient credits would be “stacked” onto existing nitrogen, phosphorus, and sediment credits as tradable commodities, thereby increasing the potential value of the total credit package and taking another incremental step toward building a comprehensive ecosystem marketplace in the State.
Challenges
Maryland Department of the Environment 2030 Greenhouse Gas Emissions Reduction Act Plan
143
As MDA continues to finalize its Healthy Soils Program, a key challenge will be securing permanent funding to accomplish program goals. Over the coming months, the MDA Soil Healthy Advisory Committee will be meeting to consider implementation needs and incentive structures that would further advance adoption of priority practices.
Environmental Justice Despite the size of agriculture’s economic contributions, farm margins are typically razor thin, and 57% of Maryland’s farmers reported net losses according to the latest Census of Agriculture (2017 Census of Agriculture -State Data, USDA, National Agricultural Statistics Service). Rural poverty is an often-hidden issue, and Somerset and Allegany counties have the second and third highest poverty rates in the State after Baltimore City. Along with Somerset, three others in the top six, Dorchester, Wicomico, and Caroline, are contiguous rural counties on the lower Eastern Shore. Identification of permanent, dedicated sources of funding for land-based sequestration offers an opportunity to advance climate solutions while providing supplemental income to the agricultural community and promoting rural economic development. 3.2.15 Ecosystems Markets
3.2.15.1 Creating Ecosystem Markets to Encourage GHG Emission Reductions Lead Agency: DNR Program Description Increased attention to the benefits and cost efficiencies that ecosystem markets could provide has spurred evaluation of the potential its programs and policies may have for fostering carbon market development. Maryland's Forest Conservation Act and Critical Area Act require mitigation for natural resource impacts generated through land development, and mitigation banking is an option to address these requirements.
Program Objectives The goal of this program is to explore the establishment of ecosystem markets, create a tracking mechanism and develop protocols to assess/quantify GHG benefits of individual markets. We also aim to increase participation of Maryland landowners in ecosystem markets, particularly those that have the outcome or co-benefit of increasing carbon sequestration. There is not a defined target outcome or carbon goal for this program.
Co-Benefits If/when a market for land-based carbon sequestration develops, it will provide another revenue stream for landowners that create or enhance forests or agricultural lands. The actions that enhance carbon sequestration are typically also beneficial for reducing nutrient runoff (or reducing the need for nutrient application in agricultural lands), improving the quality of drinking water resources, improving wildlife habitat and enhancing the lands productivity for marketable goods, improving the landowners economic return. Conversely, markets for these other environmental outcomes typically enhance carbon sequestration, so growth in markets for nutrients or wildlife protection will likely increase carbon sequestration as well.
Implementation Milestones
Maryland Department of the Environment 2030 Greenhouse Gas Emissions Reduction Act Plan
144
● Ecosystem co-benefits from forests, wetlands, cropland, and pastureland have been spatially quantified across Maryland. Spatial models for co-benefits have been completed and are available on Maryland GreenPrint.172
● The Nontidal Wetlands Mitigation Banking bill removes barriers to mitigation banking in Maryland, with the goal of reducing the cost for meeting mitigation requirements in an ecologically beneficial way.
● Under FCA banking, several counties in Maryland allow off-site mitigation for forest loss through purchasing credits in a forest bank. Over 2,000 acres of forest loss have been mitigated in this way over the past 15 years.
● The Maryland Department of Agriculture received a National Fish and Wildlife Foundation (NFWF) grant to enhance healthy soils practices in the state. One of the outcomes will be to create a carbon sequestration module of the Nutrient Trading Tool, allowing for the quantification of carbon sequestration by different Best Management Practices alongside the nutrient benefits.
Regulations
Wetland mitigation banks in Maryland are subject to federal law established through the Clean Water Act with regulations contained in the U.S.Army Corps of Engineers 33 CFR Parts 325 and 332 and EPA 40 CFR Part 230 Compensatory Mitigation for Losses of Aquatic Resources Final Rule, and further strengthened through Maryland regulation § 5-910- Wetland mitigation banks. More information on wetland mitigation requirements in Maryland can be found at the Maryland Department of the Environment website.173 Maryland Nat Res Code § 5-1610.1 (2015) establishes regulations around the establishment and use of forest mitigation banks in Maryland. Maryland COMAR 26 08.11- Maryland Water Quality Trading Program establishes the rules for water quality trading in the state. More resources are on the Maryland Department of the Environment website.174
Enhancement Opportunities Beyond 2030 One enhancement opportunity would be the expansion of voluntary, market-based approaches for carbon offsets. Another enhancement opportunity would be to streamline the verification and certification process for existing carbon markets available to Maryland landowners. For example, Maryland landowners can potentially sell offsets on the California Air Resources Board market, the voluntary carbon market or through the Regional Greenhouse Gas Initiative (RGGI). However, given the typical size of forest land held by a landowner, the cost of going through the verification and certification process is not typically worth it. As a result, there have not been carbon credits generated from Maryland sold on these markets. The price of offsets for all three of the aforementioned markets is projected to increase from the current prices ~$5 (VCS), ~7 (RGGI) and $15 (CA) per Mt of carbon reduction. An increase in price, combined with efforts by NGOs and for-profit companies to lower the barrier of entry for smaller forest landowners, could very well allow for participation of many more landowners in these markets. In the mitigation sector, banks for forests and wetlands could prioritize habitat types that have high potential for carbon sequestration, like higher salinity coastal wetlands, forested wetlands, or deciduous forests on productive soils. Generally, increasing investment in conservation and restoration of natural lands, and projects that promote co-benefits, will create a positive trend in ecosystem services provided, including the sequestration of carbon.
Challenges Working within the boundaries of currently functioning ecosystem marketplaces for wetlands, forests and habitat presents limited opportunities for generating net carbon reductions. RGGI does allow for carbon emissions offsets
172 geodata.md.gov/greenprint/ 173 mde.state.md.us/programs/Water/WetlandsandWaterways/AboutWetlands/Pages/mitigationbanks.aspx 174 mde.maryland.gov/programs/Water/WQT/Pages/WQT_Tools_Resources.aspx
Maryland Department of the Environment 2030 Greenhouse Gas Emissions Reduction Act Plan
145
to be generated through forest planting or management activities, but at this time there have not been any offsets generated in this way because they are not currently cost competitive with emission allowances on the RGGI market.
COVID Impacts The voluntary carbon market was projected to double in 2021 due to an alliance of airlines agreeing to purchase offsets for their emissions. This action has been delayed due to the drastic reduction in air travel in 2020. 3.2.16 Sustainable Materials Management
Lead Agencies: MDE and the Department of Commerce
Program Description
On June 27, 2017, Governor Hogan signed Executive Order 01.01.2017.13, Waste Reduction and Resource Recovery Plan for Maryland. The order adopts a first-ever sustainable materials management (SMM) policy for Maryland that aims to minimize the environmental impacts of the materials’ use throughout the entire lifecycle. The policy emphasizes environmentally and economically sustainable methods to capture and reinvest resources into our economy, including everything from metals and plastics to energy, nutrients, and soil. It initiates a stakeholder consultation process to establish ambitious but achievable goals and to ensure tracking of complete materials management data. It also empowers new partnerships across State and local agencies, the agricultural, energy, and transportation sectors, environmental organizations, and recycling innovators. Maryland’s SMM Policy It is the policy of the State that solid waste and recycling planning should, to the extent practicable, seek to:
1. Minimize the environmental impacts of materials management over their entire life cycles, including from product design to production, consumption, and end-of-life management;
2. Conserve and extend existing in-State disposal capacity through source reduction, reuse, and recycling; 3. Capture and make optimal use of recovered resources, including raw materials, water, energy, and nutrients;
and 4. Work toward a system of materials management that is both environmentally and economically sustainable
in the long term. MDE regularly participates in Sustainable Materials Management Maryland (SM3) efforts. SM3’s vision is to improve the environment and create economic development opportunities in the State by identifying and executing creation and innovative sustainable materials management projects and activities, through private and public sector voluntary collaborations. The Resource Management Program along with the Office of Communications within MDE utilizes social media to promote and inform the public on proper recycling and to post positive messages regarding waste diversion and sustainable materials management. These social media campaigns have been developed around recycling to reduce contamination as well as pet waste and anti-litter efforts. MDE’s Recycling web page continues to be updated and also contains a vast number of resources. This was also an outcome of the HB 171 Study Group. In addition, MDE participates in Keep Maryland Beautiful efforts and also worked with Baltimore City to organize recycling collection and outreach events in October of 2020. MDE has organized collaborative Food Summits, conducts composting educational workshops, published a waste sort study; and annually holds a Rethink Recycling art sculpture contact for high school students throughout the State.
Maryland Department of the Environment 2030 Greenhouse Gas Emissions Reduction Act Plan
146
Department of Commerce Participation The Department of Commerce has formed a subcabinet team with DNR, the Port Authority, MDE, MDA, and MEA to manage waste materials as efficiently and sustainably as possible throughout a waste stream's entire life cycle. The Subcabinet team is approaching waste streams on a project-by-project basis. Each identified SM3 project is highlighted to the Subcabinet, Maryland Environmental Services and an external stakeholder group. The goal is to bring state funding programs together with project managers who can then leverage the private sector to manage ongoing waste streams. Examples of projects include:
• Green Cement: A private company in cooperation with Frostburg State University’s Center for Excellence is perfecting a process to convert coal ash from electrical power plants into green cement. This not only provides an innovative reuse of the coal ash waste stream, but also helps reduce the GHG emissions associated with the manufacturing of cement, which contributes close to 12% of our entire GHG emissions.
• Road base and cement recycling, Harford County: A company in Harford County wants to expand and perfect its process for recycling old road base and concrete from demolition projects. If successful Maryland can drastically reduce the amount of road materials being deposited in landfills and reduce the need for aggregate mining for new road projects like the Capital Beltway Project.
Program Objectives
The Maryland Recycling Act (MRA) The Maryland Recycling Act (MRA) mandates that State government achieve a waste reduction goal of at least 30%, or to an amount that is determined "practical and economically feasible", but in no case less than 15%. The All StAR (All State Agencies Recycle) program is the name of the State government agency recycling program. Each All StAR agency designates a Recycling Coordinator to manage their various sites throughout Maryland. The Agency Coordinator provides technical support to encourage recycling within their facility locations and to submit annual online reports detailing each facility's recycling and waste data. For CY18, state agencies achieved a recycling rate of 31.32%. New Program Initiatives Specifically, the order contains the following initiatives:
• A stakeholder consultation process to improve MDE's methodology for tracking waste generation, source reduction, and recycling, including recommendations to better account for business recycling activities and new voluntary statewide goals for continuous improvement in SMM;
• A technical assistance partnership between the Department of Commerce and MDE will help establish new recycling businesses in Maryland;
• A partnership between MDA and MDE will provide research and demonstration of innovative nutrient recovery technologies in order to facilitate adoption of these technologies;
• A partnership between the MEA and MDE will research and promote adoption of energy recovery technologies such as anaerobic digestion;
• A partnership between MDOT and MDE will provide guidance to increase the reuse of dredged materials, including by State agencies; and
• Outreach partnerships will increase awareness of the benefits of and opportunities for waste diversion.
Maryland Department of the Environment 2030 Greenhouse Gas Emissions Reduction Act Plan
147
Implementation Milestones
Business Waste Diversion Data This program will improve the collection of waste diversion data from businesses.
• MDE should promote the new reporting site on its website, through contacts with businesses (such as through
the Maryland Green Registry), and with relevant business groups. • For counties without mandated business reporting, individual counties should refer other businesses within
their jurisdictions to the site to report their waste diversion data. • The counties will be responsible for conducting any verification or quality control on the data prior to
reporting it via the annual Maryland Recycling Act Tonnage Reporting Survey. • Food scraps reduction activities should be prioritized in the checklist. They should be given the same status
as yard trimmings reduction activities in terms of providing credit. • Food Scraps.175
On May 4, 2017, Governor Larry Hogan signed House Bill 171 ("bill") entitled Yard Waste, Food Residuals, and Other Organic Materials Diversion and Infrastructure – Study, Chapter 384, Acts of 2017. The bill became effective July 1, 2017 and required MDE to study, review, explore, identify, and make recommendations regarding specified matters related to the diversion of yard waste, food residuals, and other organic materials from refuse disposal facilities; and to evaluate the status of infrastructure in the State. The bill required MDE to consult with multiple stakeholders to conduct the study. These stakeholders included: several state agencies; the University of Maryland; Johns Hopkins University’s Center for a Livable Future; farm industry and environmental nonprofits; food service trade groups; the Maryland Food Bank; organic materials recycling businesses and trade groups; and other stakeholders in Maryland’s organic materials recovery industry. A total of 10 public meetings were held, with participation and input from other interested parties. Some of the recommendations which have been completed or are ongoing include the development of partnerships between various State agencies to conduct research and provide assistance and opportunities to SMM related businesses. Specifically, after 10 public meetings, one such recommendation was to expand the Farm Food Donation Tax Credit Pilot Program. This was accomplished in the 2019 Legislative Session. This provision was extended to all counties through the 2021 tax year. Another recommendation of HB 171 pertained to outreach to horse farm operators regarding composting. MDE, along with MDA and the UMD provided a day-long seminar in 2019 and another half day webinar in 2020.
Composting Composting is defined as the controlled aerobic biological decomposition of organic waste material. The resulting product of composting, compost, makes an excellent soil conditioner by improving the physical, chemical, and biological characteristics of soil. The benefits of composting include:
• Reduction of GHG emissions; • Extension of landfill/incinerator capacity; • Production of soil conditioner that partially replaces the need for chemical fertilizers; • Reduction of need for irrigation; • Creation of jobs; and • Improvement of water and air quality.
175 https://mde.maryland.gov/programs/LAND/RecyclingandOperationsprogram/Pages/FoodScraps.aspx
Maryland Department of the Environment 2030 Greenhouse Gas Emissions Reduction Act Plan
148
Currently in Maryland, the composting of food scraps (12.4%) lags behind the composting of yard trimmings (71%). To date, 20 composting facilities have applied to be covered under Maryland's composting permits. Only 5 of the proposed operations include the composting of food scraps. More information can be found on MDE's Organics Diversion and Composting webpage.176 For the 2018 reporting year, the SR recommendations above have already been incorporated into the checklist system. Food scraps activities have been elevated to the same level as yard trimmings. New SR activities have been added based upon feedback from the counties. Counties can submit now their source reduction information electronically.
Legislation Expanded Polystyrene (EPS) Ban During the 2019 legislative session the Maryland General Assembly passed Chapter 579 (Sections 9-2201 through 9-2207 of the Environment Article, Annotated Code of Maryland)177 banning the use of food service products composed of expanded polystyrene (EPS), commonly referred to under the trademark name of Styrofoam. EPS food service products (e.g., cups, plates, bowls, trays, etc.) left in any food service inventory should be used by July 1, 2020, when the law goes into effect. On or after July 1, 2020:
• A person may not sell or offer for sale in the state an EPS food service product; and • A food service business or school may not sell or provide food or beverages in an EPS foodservice product
(See June 11, 2020 Public Notice relating to the deadline on the use of EPS foodservice products). MDE is tasked by the legislature to conduct outreach about the ban. The county departments of health or environmental protection will oversee the enforcement of the law and have the authority to assess fines for noncompliance.
Recommendations MDE recommends a goal to reduce the annual GHG emissions from materials management by 1.2 MMtCO2e by 2035, compared to a baseline year of 2016.178 For comparison, this is the equivalent of removing 245,280 passenger vehicles from the road. This goal could be met with a 10% reduction in waste generated per capita (described above),179 as well as an increase in recycling to meet the material-specific goals described below. It is important to note that meeting this goal will require not only reducing GHG emissions from materials management from their 2006 levels, but also avoiding the increase in GHG emissions that would otherwise occur by 2035 in a business-as-usual scenario in which waste generation is expected to increase as population increases. A stakeholder noted that recycling or composting of certain materials actually results in a net increase in GHG emissions under the WARM Model. This was already taken into account in setting the above goal. It is true that if the State based its goals only on GHG emissions reductions, it may discourage activities such as yard waste composting that result in a slight increase in GHG emissions relative to landfilling. This document proposes multiple metrics and goals, which allows tracking of activities that may show a benefit under one metric but not another.
176 https://mde.maryland.gov/programs/LAND/RecyclingandOperationsprogram/Pages/composting.aspx 177 http://mgaleg.maryland.gov/mgawebsite/Laws/StatuteText?article=gen§ion=9-2201&enactments=False&archived=False 178 Reduction goals are based upon the EPA’s v14 WARM. The WARM model is a tool that estimates the GHG emissions, energy savings and economic impacts of baseline and alternative waste management practices, including source reduction, recycling, combustion, composting, anaerobic digestion and landfilling from the entire life-cycle of each material. Some of these impacts occur outside of Maryland. For the purposes of the GGRA and GHG accounting, the emission reductions occurring out of state are not credited in the State’s GGRA Plan. 179 This assumes that the 10% reduction in per capita waste generation occurs evenly across each material.
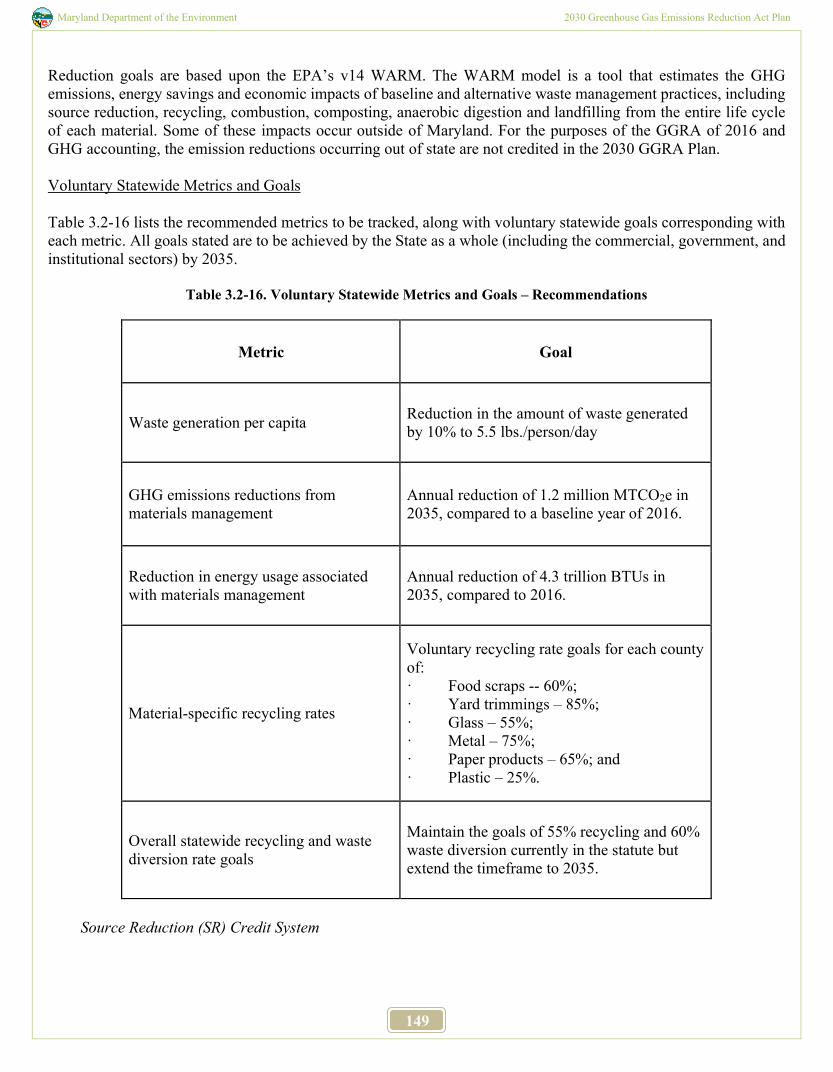
Maryland Department of the Environment 2030 Greenhouse Gas Emissions Reduction Act Plan
149
Reduction goals are based upon the EPA’s v14 WARM. The WARM model is a tool that estimates the GHG emissions, energy savings and economic impacts of baseline and alternative waste management practices, including source reduction, recycling, combustion, composting, anaerobic digestion and landfilling from the entire life cycle of each material. Some of these impacts occur outside of Maryland. For the purposes of the GGRA of 2016 and GHG accounting, the emission reductions occurring out of state are not credited in the 2030 GGRA Plan. Voluntary Statewide Metrics and Goals Table 3.2-16 lists the recommended metrics to be tracked, along with voluntary statewide goals corresponding with each metric. All goals stated are to be achieved by the State as a whole (including the commercial, government, and institutional sectors) by 2035.
Table 3.2-16. Voluntary Statewide Metrics and Goals – Recommendations
Metric Goal
Waste generation per capita Reduction in the amount of waste generated by 10% to 5.5 lbs./person/day
GHG emissions reductions from materials management
Annual reduction of 1.2 million MTCO2e in 2035, compared to a baseline year of 2016.
Reduction in energy usage associated with materials management
Annual reduction of 4.3 trillion BTUs in 2035, compared to 2016.
Material-specific recycling rates
Voluntary recycling rate goals for each county of: · Food scraps -- 60%; · Yard trimmings – 85%; · Glass – 55%; · Metal – 75%; · Paper products – 65%; and · Plastic – 25%.
Overall statewide recycling and waste diversion rate goals
Maintain the goals of 55% recycling and 60% waste diversion currently in the statute but extend the timeframe to 2035.
Source Reduction (SR) Credit System
Maryland Department of the Environment 2030 Greenhouse Gas Emissions Reduction Act Plan
150
To help the State meet its annual Waste Diversion180 goal of 40%, Maryland created a source reduction credit system for use by its 23 counties and Baltimore City. The credit system, which went into effect in 2000, acts as an incentive to counties to boost their waste diversion rate by up to 5%. Each year, counties complete a SR Credit Checklist181 of their source reduction activities. Activities include yard waste reduction (composting), public education programs, and research. Maryland was the third state to offer a source reduction credit, after Minnesota and Oregon. Since the credit system went into effect in the year 2000, the average source reduction credit claimed by Maryland counties has increased from 1.8% in 2000 to 4.3% in 2017 (most recent data). In 2017, 15 counties182 have taken advantage of the credit. MDE will continue to work with counties to get them more involved and to help them increase their source reduction activities. Besides helping to reach the State's 40% waste diversion goal, increasing source reduction activities could save the counties a significant amount of money. Consider this scenario: If Maryland's counties as a whole decreased the total amount of waste generated by just 1%, they could save nearly $4 million in disposal costs (based on the average Maryland tipping fee of $57/ton). The following recommendations are made with respect to the existing SR credit system:
• MDE should maintain the current SR credit system with modifications. • Food scraps reduction activities should be prioritized in the checklist. They should be given the same status
as yard trimmings reduction activities in terms of providing credit. • The checklist should be revised to allow counties to propose new and innovative SR activities for credit on a
case-by-case basis that are not specifically listed on the checklist. For the 2018 reporting year, the SR recommendations above have already been incorporated into the checklist system. Food scraps activities have been elevated to the same level as yard trimmings. New SR activities have been added based upon feedback from the counties. Counties can submit now their source reduction information electronically.
GHG Emissions Reductions from Waste Diversion Background One of the most important environmental outcomes associated with waste diversion is a reduction in GHG emissions. Maryland has a goal to reduce overall GHG emissions by 25% by 2020, and 40% by 2030, relative to 2006 levels. The EPA Waste Reduction Model (WARM) calculates GHG (MTCO2e) emissions and energy (BTU) usage associated with different materials management scenarios. The WARM model is a lifecycle accounting tool, meaning that it factors in emissions from the entire lifecycle: raw materials extraction, manufacturing or processing, transportation, use, and end‐of‐life management. As a SMM metric, tracking GHG emissions reductions has the following advantages:
• Includes the impacts of source reduction, recycling, composting, landfilling, and combustion over the lifecycle of materials;
• Accounts for the differing impacts of different types of materials; and • Is directly linked to an environmental outcome that the State seeks to achieve.
The following WARM table (Table 3.2-17) compares GHG savings of managing materials in different ways. The data has been adjusted to assign landfilling a neutral value (0) to make comparing items to landfilling easier. A
180 https://mde.maryland.gov/programs/LAND/RecyclingandOperationsprogram/Pages/index.aspx 181 https://mde.maryland.gov/programs/LAND/RecyclingandOperationsprogram/Documents/SR%20Credit%20Checklist%20Revision%202018.pdf 182 https://mde.maryland.gov/programs/LAND/RecyclingandOperationsprogram/Documents/SR%20Credit%20Summary%202017.pdf
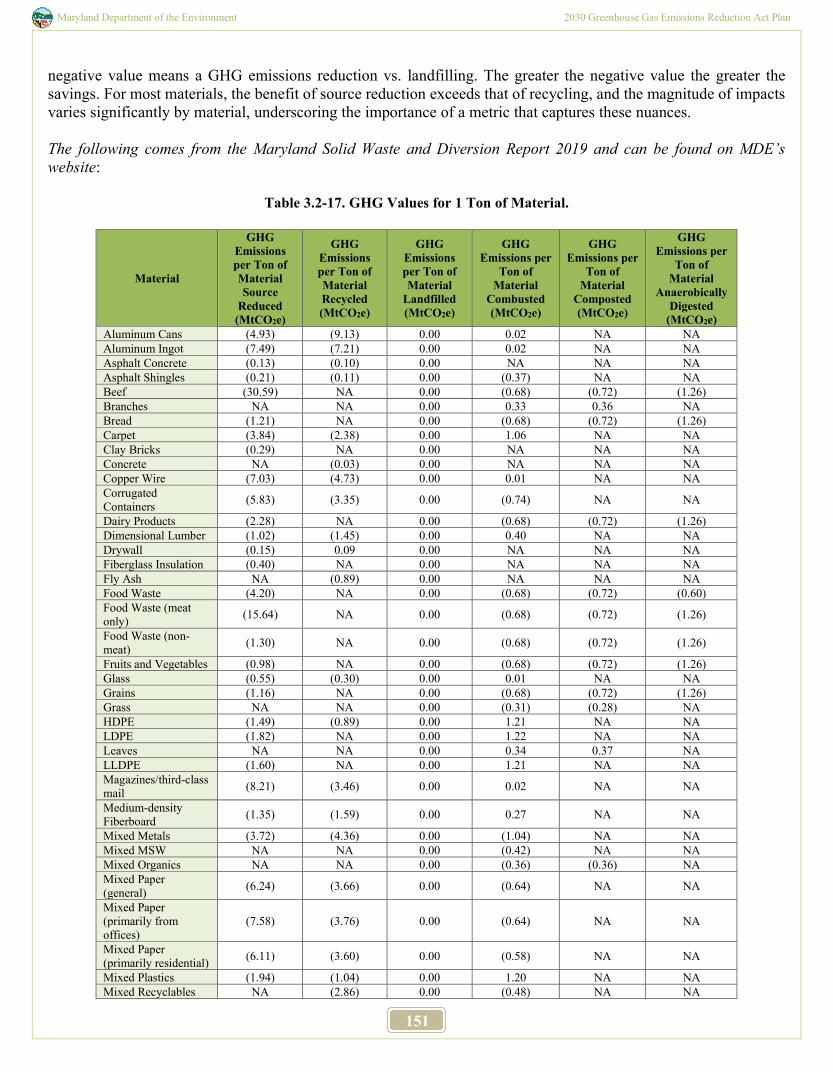
Maryland Department of the Environment 2030 Greenhouse Gas Emissions Reduction Act Plan
151
negative value means a GHG emissions reduction vs. landfilling. The greater the negative value the greater the savings. For most materials, the benefit of source reduction exceeds that of recycling, and the magnitude of impacts varies significantly by material, underscoring the importance of a metric that captures these nuances. The following comes from the Maryland Solid Waste and Diversion Report 2019 and can be found on MDE’s website:
Table 3.2-17. GHG Values for 1 Ton of Material.
Material
GHG Emissions per Ton of Material Source
Reduced (MtCO2e)
GHG Emissions per Ton of Material Recycled (MtCO2e)
GHG Emissions per Ton of Material
Landfilled (MtCO2e)
GHG Emissions per
Ton of Material
Combusted (MtCO2e)
GHG Emissions per
Ton of Material
Composted (MtCO2e)
GHG Emissions per
Ton of Material
Anaerobically Digested
(MtCO2e) Aluminum Cans (4.93) (9.13) 0.00 0.02 NA NA Aluminum Ingot (7.49) (7.21) 0.00 0.02 NA NA Asphalt Concrete (0.13) (0.10) 0.00 NA NA NA Asphalt Shingles (0.21) (0.11) 0.00 (0.37) NA NA Beef (30.59) NA 0.00 (0.68) (0.72) (1.26) Branches NA NA 0.00 0.33 0.36 NA Bread (1.21) NA 0.00 (0.68) (0.72) (1.26) Carpet (3.84) (2.38) 0.00 1.06 NA NA Clay Bricks (0.29) NA 0.00 NA NA NA Concrete NA (0.03) 0.00 NA NA NA Copper Wire (7.03) (4.73) 0.00 0.01 NA NA Corrugated Containers (5.83) (3.35) 0.00 (0.74) NA NA
Dairy Products (2.28) NA 0.00 (0.68) (0.72) (1.26) Dimensional Lumber (1.02) (1.45) 0.00 0.40 NA NA Drywall (0.15) 0.09 0.00 NA NA NA Fiberglass Insulation (0.40) NA 0.00 NA NA NA Fly Ash NA (0.89) 0.00 NA NA NA Food Waste (4.20) NA 0.00 (0.68) (0.72) (0.60) Food Waste (meat only) (15.64) NA 0.00 (0.68) (0.72) (1.26)
Food Waste (non-meat) (1.30) NA 0.00 (0.68) (0.72) (1.26)
Fruits and Vegetables (0.98) NA 0.00 (0.68) (0.72) (1.26) Glass (0.55) (0.30) 0.00 0.01 NA NA Grains (1.16) NA 0.00 (0.68) (0.72) (1.26) Grass NA NA 0.00 (0.31) (0.28) NA HDPE (1.49) (0.89) 0.00 1.21 NA NA LDPE (1.82) NA 0.00 1.22 NA NA Leaves NA NA 0.00 0.34 0.37 NA LLDPE (1.60) NA 0.00 1.21 NA NA Magazines/third-class mail (8.21) (3.46) 0.00 0.02 NA NA
Medium-density Fiberboard (1.35) (1.59) 0.00 0.27 NA NA
Mixed Metals (3.72) (4.36) 0.00 (1.04) NA NA Mixed MSW NA NA 0.00 (0.42) NA NA Mixed Organics NA NA 0.00 (0.36) (0.36) NA Mixed Paper (general) (6.24) (3.66) 0.00 (0.64) NA NA
Mixed Paper (primarily from offices)
(7.58) (3.76) 0.00 (0.64) NA NA
Mixed Paper (primarily residential) (6.11) (3.60) 0.00 (0.58) NA NA
Mixed Plastics (1.94) (1.04) 0.00 1.20 NA NA Mixed Recyclables NA (2.86) 0.00 (0.48) NA NA
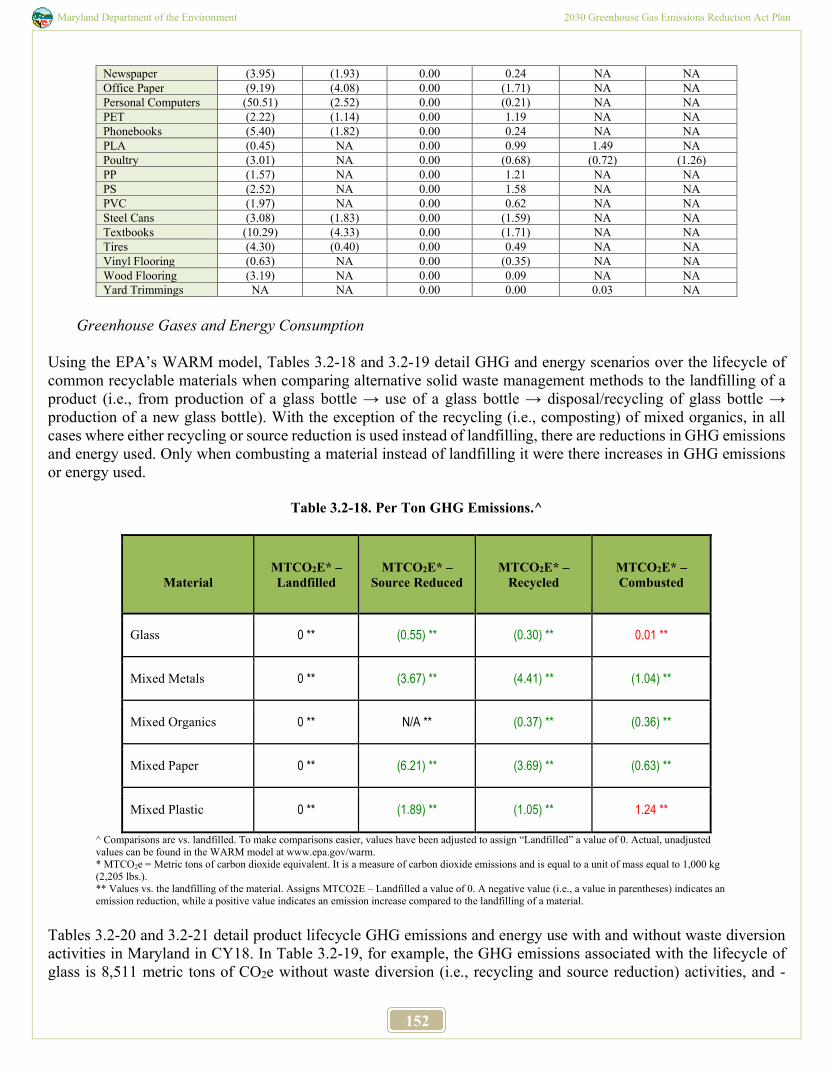
Maryland Department of the Environment 2030 Greenhouse Gas Emissions Reduction Act Plan
152
Newspaper (3.95) (1.93) 0.00 0.24 NA NA Office Paper (9.19) (4.08) 0.00 (1.71) NA NA Personal Computers (50.51) (2.52) 0.00 (0.21) NA NA PET (2.22) (1.14) 0.00 1.19 NA NA Phonebooks (5.40) (1.82) 0.00 0.24 NA NA PLA (0.45) NA 0.00 0.99 1.49 NA Poultry (3.01) NA 0.00 (0.68) (0.72) (1.26) PP (1.57) NA 0.00 1.21 NA NA PS (2.52) NA 0.00 1.58 NA NA PVC (1.97) NA 0.00 0.62 NA NA Steel Cans (3.08) (1.83) 0.00 (1.59) NA NA Textbooks (10.29) (4.33) 0.00 (1.71) NA NA Tires (4.30) (0.40) 0.00 0.49 NA NA Vinyl Flooring (0.63) NA 0.00 (0.35) NA NA Wood Flooring (3.19) NA 0.00 0.09 NA NA Yard Trimmings NA NA 0.00 0.00 0.03 NA
Greenhouse Gases and Energy Consumption
Using the EPA’s WARM model, Tables 3.2-18 and 3.2-19 detail GHG and energy scenarios over the lifecycle of common recyclable materials when comparing alternative solid waste management methods to the landfilling of a product (i.e., from production of a glass bottle → use of a glass bottle → disposal/recycling of glass bottle → production of a new glass bottle). With the exception of the recycling (i.e., composting) of mixed organics, in all cases where either recycling or source reduction is used instead of landfilling, there are reductions in GHG emissions and energy used. Only when combusting a material instead of landfilling it were there increases in GHG emissions or energy used.
Table 3.2-18. Per Ton GHG Emissions.^
Material
MTCO2E* – Landfilled
MTCO2E* – Source Reduced
MTCO2E* – Recycled
MTCO2E* – Combusted
Glass 0 ** (0.55) ** (0.30) ** 0.01 **
Mixed Metals 0 ** (3.67) ** (4.41) ** (1.04) **
Mixed Organics 0 ** N/A ** (0.37) ** (0.36) **
Mixed Paper 0 ** (6.21) ** (3.69) ** (0.63) **
Mixed Plastic 0 ** (1.89) ** (1.05) ** 1.24 **
^ Comparisons are vs. landfilled. To make comparisons easier, values have been adjusted to assign “Landfilled” a value of 0. Actual, unadjusted values can be found in the WARM model at www.epa.gov/warm. * MTCO2e = Metric tons of carbon dioxide equivalent. It is a measure of carbon dioxide emissions and is equal to a unit of mass equal to 1,000 kg (2,205 lbs.). ** Values vs. the landfilling of the material. Assigns MTCO2E – Landfilled a value of 0. A negative value (i.e., a value in parentheses) indicates an emission reduction, while a positive value indicates an emission increase compared to the landfilling of a material.
Tables 3.2-20 and 3.2-21 detail product lifecycle GHG emissions and energy use with and without waste diversion activities in Maryland in CY18. In Table 3.2-19, for example, the GHG emissions associated with the lifecycle of glass is 8,511 metric tons of CO2e without waste diversion (i.e., recycling and source reduction) activities, and -
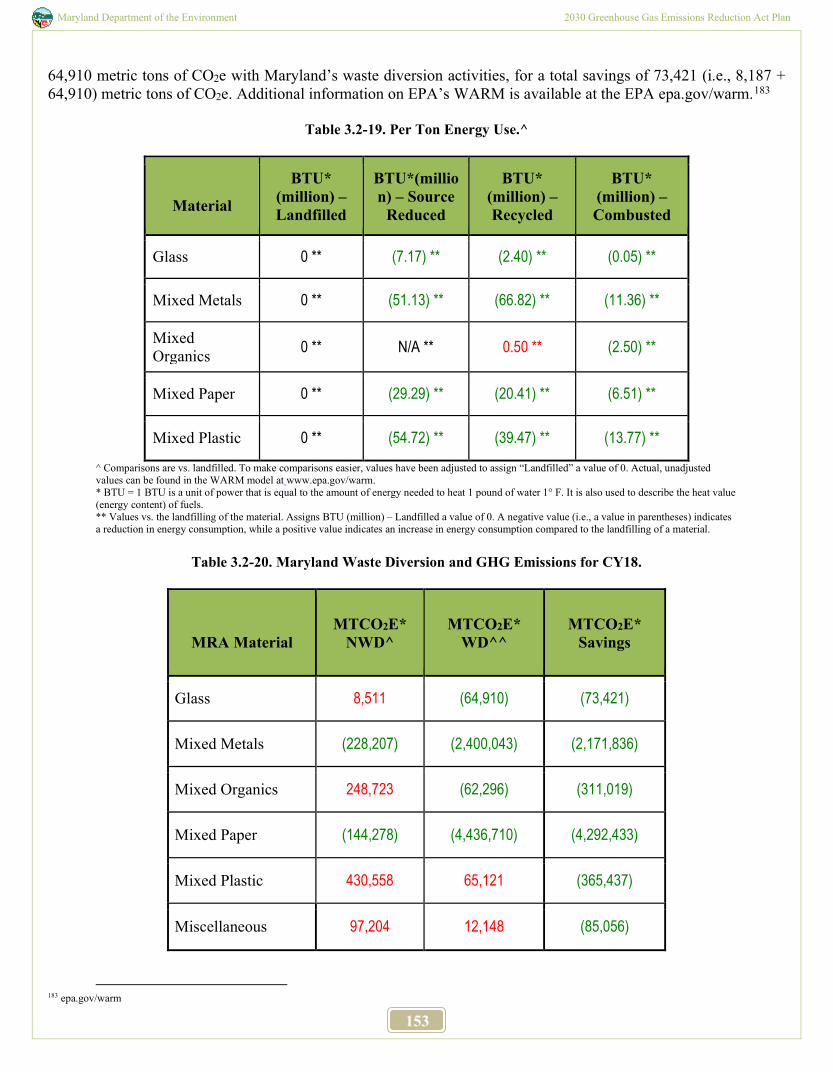
Maryland Department of the Environment 2030 Greenhouse Gas Emissions Reduction Act Plan
153
64,910 metric tons of CO2e with Maryland’s waste diversion activities, for a total savings of 73,421 (i.e., 8,187 + 64,910) metric tons of CO2e. Additional information on EPA’s WARM is available at the EPA epa.gov/warm.183
Table 3.2-19. Per Ton Energy Use.^
Material
BTU* (million) – Landfilled
BTU*(million) – Source
Reduced
BTU* (million) –Recycled
BTU* (million) – Combusted
Glass 0 ** (7.17) ** (2.40) ** (0.05) **
Mixed Metals 0 ** (51.13) ** (66.82) ** (11.36) **
Mixed Organics 0 ** N/A ** 0.50 ** (2.50) **
Mixed Paper 0 ** (29.29) ** (20.41) ** (6.51) **
Mixed Plastic 0 ** (54.72) ** (39.47) ** (13.77) **
^ Comparisons are vs. landfilled. To make comparisons easier, values have been adjusted to assign “Landfilled” a value of 0. Actual, unadjusted values can be found in the WARM model at www.epa.gov/warm. * BTU = 1 BTU is a unit of power that is equal to the amount of energy needed to heat 1 pound of water 1° F. It is also used to describe the heat value (energy content) of fuels. ** Values vs. the landfilling of the material. Assigns BTU (million) – Landfilled a value of 0. A negative value (i.e., a value in parentheses) indicates a reduction in energy consumption, while a positive value indicates an increase in energy consumption compared to the landfilling of a material.
Table 3.2-20. Maryland Waste Diversion and GHG Emissions for CY18.
MRA Material
MTCO2E* NWD^
MTCO2E* WD^^
MTCO2E* Savings
Glass 8,511 (64,910) (73,421)
Mixed Metals (228,207) (2,400,043) (2,171,836)
Mixed Organics 248,723 (62,296) (311,019)
Mixed Paper (144,278) (4,436,710) (4,292,433)
Mixed Plastic 430,558 65,121 (365,437)
Miscellaneous 97,204 12,148 (85,056)
183 epa.gov/warm
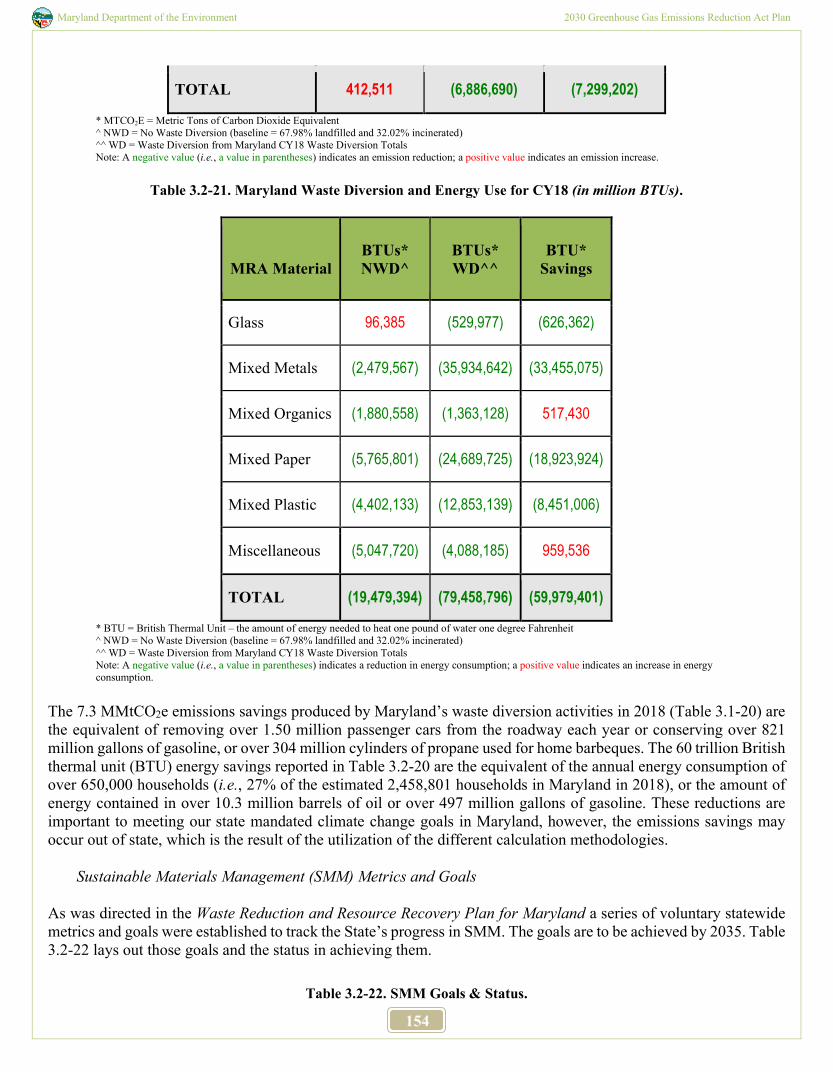
Maryland Department of the Environment 2030 Greenhouse Gas Emissions Reduction Act Plan
154
TOTAL 412,511 (6,886,690) (7,299,202)
* MTCO2E = Metric Tons of Carbon Dioxide Equivalent ^ NWD = No Waste Diversion (baseline = 67.98% landfilled and 32.02% incinerated) ^^ WD = Waste Diversion from Maryland CY18 Waste Diversion Totals Note: A negative value (i.e., a value in parentheses) indicates an emission reduction; a positive value indicates an emission increase.
Table 3.2-21. Maryland Waste Diversion and Energy Use for CY18 (in million BTUs).
MRA Material
BTUs* NWD^
BTUs* WD^^
BTU* Savings
Glass 96,385 (529,977) (626,362)
Mixed Metals (2,479,567) (35,934,642) (33,455,075)
Mixed Organics (1,880,558) (1,363,128) 517,430
Mixed Paper (5,765,801) (24,689,725) (18,923,924)
Mixed Plastic (4,402,133) (12,853,139) (8,451,006)
Miscellaneous (5,047,720) (4,088,185) 959,536
TOTAL (19,479,394) (79,458,796) (59,979,401)
* BTU = British Thermal Unit – the amount of energy needed to heat one pound of water one degree Fahrenheit ^ NWD = No Waste Diversion (baseline = 67.98% landfilled and 32.02% incinerated) ^^ WD = Waste Diversion from Maryland CY18 Waste Diversion Totals Note: A negative value (i.e., a value in parentheses) indicates a reduction in energy consumption; a positive value indicates an increase in energy consumption.
The 7.3 MMtCO2e emissions savings produced by Maryland’s waste diversion activities in 2018 (Table 3.1-20) are the equivalent of removing over 1.50 million passenger cars from the roadway each year or conserving over 821 million gallons of gasoline, or over 304 million cylinders of propane used for home barbeques. The 60 trillion British thermal unit (BTU) energy savings reported in Table 3.2-20 are the equivalent of the annual energy consumption of over 650,000 households (i.e., 27% of the estimated 2,458,801 households in Maryland in 2018), or the amount of energy contained in over 10.3 million barrels of oil or over 497 million gallons of gasoline. These reductions are important to meeting our state mandated climate change goals in Maryland, however, the emissions savings may occur out of state, which is the result of the utilization of the different calculation methodologies.
Sustainable Materials Management (SMM) Metrics and Goals As was directed in the Waste Reduction and Resource Recovery Plan for Maryland a series of voluntary statewide metrics and goals were established to track the State’s progress in SMM. The goals are to be achieved by 2035. Table 3.2-22 lays out those goals and the status in achieving them.
Table 3.2-22. SMM Goals & Status.
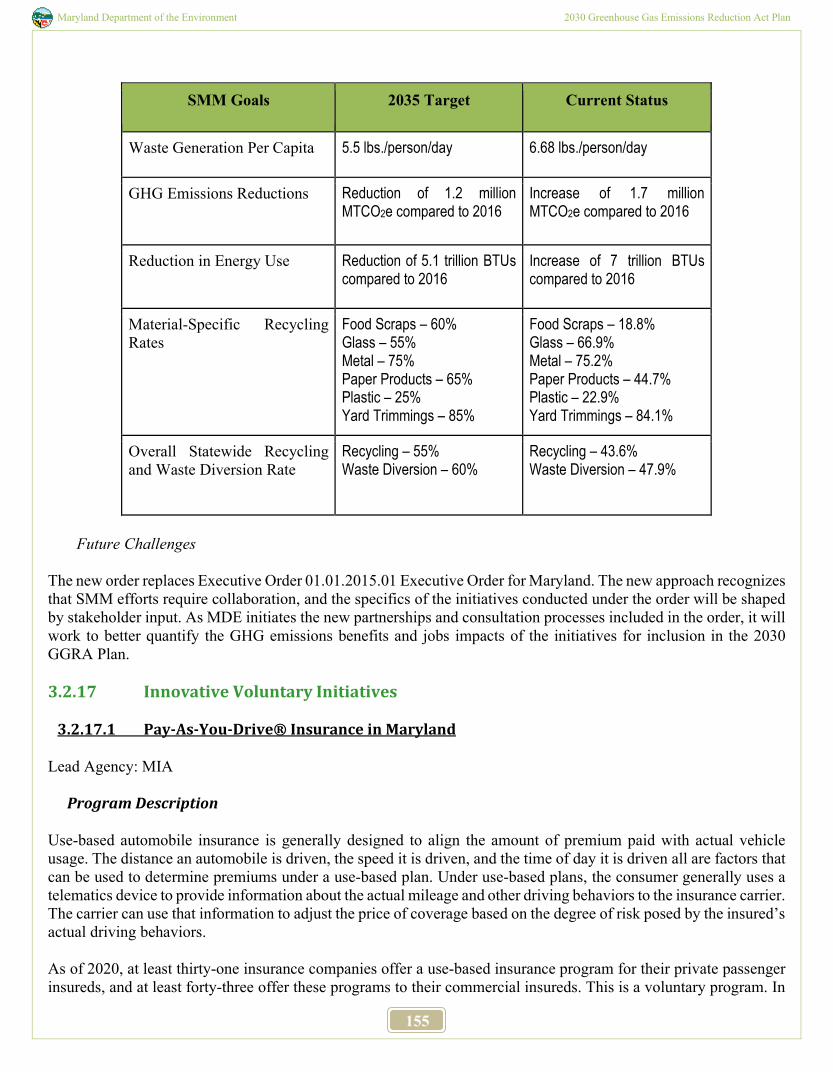
Maryland Department of the Environment 2030 Greenhouse Gas Emissions Reduction Act Plan
155
SMM Goals 2035 Target Current Status
Waste Generation Per Capita 5.5 lbs./person/day 6.68 lbs./person/day
GHG Emissions Reductions Reduction of 1.2 million MTCO2e compared to 2016
Increase of 1.7 million MTCO2e compared to 2016
Reduction in Energy Use Reduction of 5.1 trillion BTUs compared to 2016
Increase of 7 trillion BTUs compared to 2016
Material-Specific Recycling Rates
Food Scraps – 60% Glass – 55% Metal – 75% Paper Products – 65% Plastic – 25% Yard Trimmings – 85%
Food Scraps – 18.8% Glass – 66.9% Metal – 75.2% Paper Products – 44.7% Plastic – 22.9% Yard Trimmings – 84.1%
Overall Statewide Recycling and Waste Diversion Rate
Recycling – 55% Waste Diversion – 60%
Recycling – 43.6% Waste Diversion – 47.9%
Future Challenges
The new order replaces Executive Order 01.01.2015.01 Executive Order for Maryland. The new approach recognizes that SMM efforts require collaboration, and the specifics of the initiatives conducted under the order will be shaped by stakeholder input. As MDE initiates the new partnerships and consultation processes included in the order, it will work to better quantify the GHG emissions benefits and jobs impacts of the initiatives for inclusion in the 2030 GGRA Plan. 3.2.17 Innovative Voluntary Initiatives
3.2.17.1 Pay-As-You-Drive® Insurance in Maryland
Lead Agency: MIA
Program Description
Use-based automobile insurance is generally designed to align the amount of premium paid with actual vehicle usage. The distance an automobile is driven, the speed it is driven, and the time of day it is driven all are factors that can be used to determine premiums under a use-based plan. Under use-based plans, the consumer generally uses a telematics device to provide information about the actual mileage and other driving behaviors to the insurance carrier. The carrier can use that information to adjust the price of coverage based on the degree of risk posed by the insured’s actual driving behaviors. As of 2020, at least thirty-one insurance companies offer a use-based insurance program for their private passenger insureds, and at least forty-three offer these programs to their commercial insureds. This is a voluntary program. In
Maryland Department of the Environment 2030 Greenhouse Gas Emissions Reduction Act Plan
156
addition, four vendors offer a product that insurers may purchase (rather than developing their own program) to make available to their customers. An insurer that uses a vendor-created program must file the program with the Maryland Insurance Administration (MIA) prior to implementation. As a result, the MIA anticipates a continued increase in the availability of use-based automobile insurance. Consumers receive discounts off of their insurance premiums for participating in most use-based programs. However, nationally, the market is moving towards the use of discounts for safe drivers and surcharges for less safe drivers as measured by telematics devices.
Program Objectives
The MIA continues to work with insurers to increase the number of companies offering these programs.
Implementation Milestones
Obstacles/Considerations
While there are no statutory or regulatory prohibitions to use-based automobile insurance, any such program must operate within the confines of Maryland law. That being said, the following is a list of the obstacles/considerations that should be taken into account when reviewing these programs:
1. Use-based automobile insurance only produces financial rewards for individuals who drive short distances. Individuals lacking access to public transportation or alternatives to driving, such as those who live in rural areas or those who commute to work, will not be inclined to sign up for this type of program as it will not result in any cost savings to them.
2. Consumers may be concerned about the privacy issues surrounding programs such as this that utilize devices
that monitor how, when and where they drive in order to justify the discounts provided.
3. Individuals who sign up for use-based automobile insurance are most likely persons who drive a limited number of miles, and as such, the actual reduction in GHG may not add up to the volume projected.
4. The increased costs and expenses for insurers to develop alternative rating plans and the devices used to track
and transmit this data may limit its availability and affordability.
5. The (in)ability to collect additional premiums from insureds who exceed the mileage limits, or to legally disclaim coverage if the insured vehicle is involved in an accident after it is discovered that the amount of mileage insurance purchased has been exceeded.
6. The (in)ability to properly rate policies when more than one vehicle or driver are on the policy. Since different
drivers present different risk factors, it is important for the insurer to know how many miles each insured person is driving each insured vehicle, and this may be almost impossible to determine.
7. Depending on the type of telematics device and whether it sends information to an insurer via wireless phone
networks, the ability to remotely execute malicious code could interfere with the data and data transmission.
3.2.17.2 Job Creation and Economic Development Initiatives Related to Climate Change
Lead Agency: Department of Commerce
Program Description
Maryland Department of the Environment 2030 Greenhouse Gas Emissions Reduction Act Plan
157
This program promotes economic development opportunities associated with reducing GHG emissions in Maryland. There are six areas of focus:
• Strengthen coordination and communication across State agencies, partners and stakeholders to provide strategic vision for advancing a green economy.
• Promote energy and resource efficiency efforts. • Develop and foster clean, local energy production and industrial capacity. • Capitalize upon economic opportunities to restore and protect Maryland’s natural resources. • Promote sustainable development practices that create jobs, generate prosperity and make Maryland more
self-reliant. • Increase access to capital for green businesses and projects.
Implementation Milestones
This is a voluntary initiative.
3.2.18 Land Use Programs
Lead Agency: MDP The two programs designed to minimize GHG emissions from future land development are 3.3.16.1 Reducing Emissions through Smarter Growth and Land Use/Location Efficiency and 3.3.16.2 Priority Funding Area (Growth Boundary) Related Benefits. MDP is the lead agency for these efforts, which involve the private sector and various agencies and commissions at all levels of government within the State. By better managing growth, local communities can minimize sprawl development and contribute to a reduction in Maryland’s GHG emissions. Smart growth is characterized by compact land use, with neighborhood schools, compatible transit options, walkable streets, mixed-use development and a wide range of housing choices. Smart growth concentrates new development and redevelopment in areas with existing or planned infrastructure to avoid sprawl, which is generally characterized as the increased development of land in suburban and rural areas outside of their respective urban centers and planned growth areas. This increased development on the outskirts of towns, villages and metropolitan areas is often accompanied by a lack of development, redevelopment or reuse of land within the urban centers and designated growth areas themselves and results in a marked increase in GHG emissions. It should be noted that many local governments in Maryland are already implementing smarter, more sustainable land use policies and programs that are: promoting green building and compact, transit-oriented development; reducing aggregate VMT; preserving vegetated/forested lands, which sequester carbon; and protecting agriculture.
Implementation Milestones As part of MDP’s technical assistance to local and State government to promote smart growth and land use/location efficiency, MDP provides data analysis and forecasting, making use of a variety of data sets and analytical tools, such as the MDP parcel database and U.S. Census information. MDP assists local planning departments and commissions as they prepare their comprehensive plans for orderly and compact growth of their communities. MDP is also assisting local governments on infill and redevelopment projects in existing communities, utilizing various best planning practices to help revitalize and attract new development to these areas. MDP is involved in various state, regional, and local transportation planning processes to promote integration of land use and transportation and multimodal transportation systems to help reduce GHG emissions. MDP also develops online tools, such as the Transit Station Area Profile Tool (TSAPT), created in partnership with MDOT, to facilitate local and business access to data and information needed to succeed with TOD activities.
Maryland Department of the Environment 2030 Greenhouse Gas Emissions Reduction Act Plan
158
In July 2019, MDP completed a state development plan, entitled A Better Maryland. The plan improves the coordination and effectiveness of State agency programs and enhances the accessibility and utilization of state information for local communities to promote redevelopment and to plan for compact new growth, while also integrating renewable energy opportunities into their communities and planning the compatible siting of renewable energy generation facilities to serve the region. A Better Maryland focuses on how state agencies can improve collaboration with local governments, which is where the ultimate decisions take place in land use planning and development, providing them with the resources and information they need to facilitate decision-making in support of local objectives. Smart Growth Subcabinet:
● Makes recommendations to the Governor regarding changes in State law, regulations, and procedures needed to create, enhance, support, and revitalize Sustainable Communities across Maryland.
● Facilitates interagency coordination to ensure successful statewide community reinvestment and compact development initiatives through implementation of the recommendations from the Maryland Sustainable Growth Commission’s Reinvest Maryland 2.0 report and the strategies associated with the new state development plan, A Better Maryland.
● An interactive Reinvest Maryland 2.0 website, maintained by MDP, illustrates how jurisdictions can promote compact development using smart growth tools offered by Subcabinet agencies and demonstrates how others have used these tools to revitalize their communities.
Maryland Smart Growth Coordinating Committee:
● Identifies regional growth and development issues for the Governor’s Smart Growth Subcabinet and advises on the local impacts of state policies and laws.
● Recommends ways to collaborate on planning between State agencies and local governments and coordinate growth and development among jurisdictions.
● Reviews statewide efforts to implement the State growth plan and the State plans for transportation and housing.
● Facilitates the review of State programs and development of tools and recommendations through the Reinvest Maryland 2.0 effort to assist Maryland’s counties, towns, and communities to accelerate infill, redevelopment and revitalization.
Sustainable Communities Act of 2010:
● Established the “Sustainable Communities” designation to strengthen reinvestment and revitalization. ● Simplified the framework for designated revitalization target areas in the Community Legacy and
Neighborhood BusinessWorks programs. ● Requires MDOT to consider Sustainable Communities as it annually considers the Consolidated
Transportation Program. 2009 legislative suite (HB294/SB273, HB297/SB280 and HB295/SB276):
● Incorporation of the 12 new planning visions in local comprehensive plans ● Development of local land use goals ● Consistency of local land use ordinances with comprehensive plans ● Submittal of local annual reports
Priority Funding Areas:
● Maryland law directs the use of State funding for roads, water and sewer plants, economic development and other growth-related needs toward Priority Funding Areas, recognizing that these investments are the most important tool the State has to influence smarter, more sustainable growth and development.
The 2009 California Climate Scoping Plan notes that GHG prevention should double every 20 years through a combination of land use and enhanced transit policies (Figure 3.2-19).
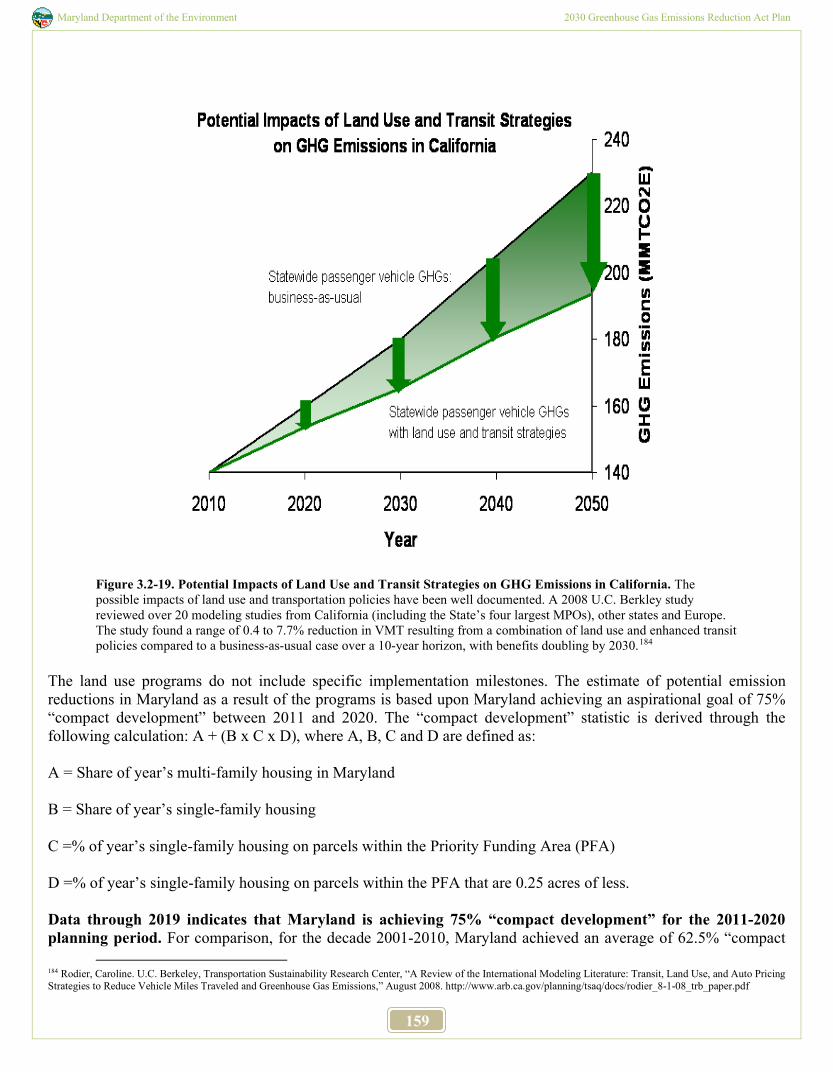
Maryland Department of the Environment 2030 Greenhouse Gas Emissions Reduction Act Plan
159
Figure 3.2-19. Potential Impacts of Land Use and Transit Strategies on GHG Emissions in California. The possible impacts of land use and transportation policies have been well documented. A 2008 U.C. Berkley study reviewed over 20 modeling studies from California (including the State’s four largest MPOs), other states and Europe. The study found a range of 0.4 to 7.7% reduction in VMT resulting from a combination of land use and enhanced transit policies compared to a business-as-usual case over a 10-year horizon, with benefits doubling by 2030.184
The land use programs do not include specific implementation milestones. The estimate of potential emission reductions in Maryland as a result of the programs is based upon Maryland achieving an aspirational goal of 75% “compact development” between 2011 and 2020. The “compact development” statistic is derived through the following calculation: A + (B x C x D), where A, B, C and D are defined as: A = Share of year’s multi-family housing in Maryland B = Share of year’s single-family housing C =% of year’s single-family housing on parcels within the Priority Funding Area (PFA) D =% of year’s single-family housing on parcels within the PFA that are 0.25 acres of less. Data through 2019 indicates that Maryland is achieving 75% “compact development” for the 2011-2020 planning period. For comparison, for the decade 2001-2010, Maryland achieved an average of 62.5% “compact
184 Rodier, Caroline. U.C. Berkeley, Transportation Sustainability Research Center, “A Review of the International Modeling Literature: Transit, Land Use, and Auto Pricing Strategies to Reduce Vehicle Miles Traveled and Greenhouse Gas Emissions,” August 2008. http://www.arb.ca.gov/planning/tsaq/docs/rodier_8-1-08_trb_paper.pdf
Maryland Department of the Environment 2030 Greenhouse Gas Emissions Reduction Act Plan
160
development.” Given that Maryland is achieving 75% “compact development” to date for the 2011-2020 planning period, Planning believes that the appropriate programs and tools are in place for Maryland to continue achieving success in this area for the 2021-2030 planning period. MDP is working to improve the data quality of the sources used to inform the “compact development” statistic, specifically, by ensuring that more local governments update their PFAs to reflect all locally designated growth areas that meet the PFA criteria, and by working to obtain multi-family development data that reflects actual versus proposed construction.
3.2.18.1 Reducing Emissions through Smart Growth and Land Use/Location Efficiency Lead Agency: MDP
Program Description This program reduces Marylanders’ dependence on motor vehicle travel, especially single occupant vehicles, by providing planning assistance to local governments, improving state-local and internal State agency communication and coordination, and developing incentives for development projects. Together, these efforts support regional land use patterns that achieve land use/location efficiency with regard to transportation. The purpose is to reduce VMT and the combustion of fossil fuels. Land use/location efficiency means that residences, jobs, shopping, schools, and recreational opportunities are in close proximity to each other and that alternative transportation modes (e.g., walking, biking and mass transit) are convenient and easily accessed. The Smart Growth development pattern, together with land use/location efficiency, results in shorter trip lengths, less need for automobile and truck travel, and greater use of alternative transportation modes. Existing state laws and initiatives that support this strategy include the Maryland Smart Growth Coordinating Committee, Smart Growth Subcabinet, Sustainable Communities Act of 2010, 2009 planning legislation, and MDP data analysis and forecasting.
3.2.18.2 Priority Funding Area (Growth Boundary) Related Benefits Lead Agency: MDP
Program Description Maryland has established Priority Funding Areas to preserve existing communities, to target State resources to build on past investments, and to reduce development pressure on critical farmland and natural resource areas. By encouraging projects in already developed areas, PFAs reduce the GHG emissions associated with development. PFAs are geographic growth areas defined under Maryland law and designated by local jurisdictions to provide a map for targeting State investment in infrastructure. Local jurisdictions can modify PFAs over time. A map of the PFAs in Maryland is available on MDP’s website.185 Maryland law directs the use of State funding for roads, water and sewer plants, economic development and other growth-related needs toward Priority Funding Areas, recognizing that these investments are the most important tool the State has to influence smarter, more sustainable growth and development.
Implementation Milestones
Environmental Justice (EJ) considerations
185 https://mdpgis.mdp.state.md.us/PFA/publicinfotemplate/index.html
Maryland Department of the Environment 2030 Greenhouse Gas Emissions Reduction Act Plan
161
Per EPA, Smart Growth programs can help address the environmental, health, and economic disparities experienced by historically disadvantaged communities. Such programs invest federal funds in existing neighborhoods. Since 1997, the State has focused on infrastructure and growth-related needs to designated Priority Funding Areas (PFAs). Addressing GHG emissions reductions through “compact development” alone does not guarantee that environmental conditions in a community (and environmental amenities) are equally experienced by its residents. All levels of government (federal, state and local) should take into consideration environmental justice issues when citing and supporting development or infrastructure. MDP will assist in governmental coordination on addressing planning related EJ issues, including by providing data analysis and tools to identify EJ communities and by supporting equitable development and infrastructure planning to increase housing diversity and affordability, promoting zoning inclusiveness, transit and land use planning integration, and affordable transportation alternatives.
Beyond 2030 Despite implementation of the land use programs, market, economic, and other forces invariably have an impact on the location and intensity of new development. This in turn impacts how much GHGs are prevented. Increasing “compact development” over time would support transit-oriented development, closer proximity between homes, jobs and services, and greater accessibility to alternative transportation modes. Through the Smart Growth Coordinating Committee and Smart Growth Subcabinet, MDP will continue to promote policies and programs that support “compact development” beyond 2030.
COVID-19 Impacts The public’s response to COVID-19 has resulted in a substantial increase in worker teleworking, some reductions in VMT, and reduced social interactions and slowing of economic activities. For some workers, the benefits of telework may have lessened the need to live close to work and the concerns with close social interactions could encourage residents to live further away from workplaces, services and each other. On the other hand, even with the presence of COVID-19, living in close proximity to services, such as medical facilities, groceries, pharmacies and restaurants, likely will remain attractive to residents, and the higher number of customers per area will remain attractive to businesses. At this time, MDP believes that forecasting impacts of COVID-19 on “compact development” is premature; however, MDP will continue to track development patterns moving forward.
3.2.19 Outreach Efforts
Lead Agency: A multi-agency effort coordinated by MDE
Program Description
Public Outreach
Outreach and public education are supporting efforts to aid the success of the GGRA programs outlined in the 2030 GGRA Plan. MDE’s Climate Change Program Communications Manager will coordinate with Public Affairs offices of partner agencies to conduct multi-agency outreach in a strategic manner. A team of communications experts who can conduct outreach will better serve all Marylanders than if each agency acts on its own. MDE and the state team will work with community partners to ensure that scientifically-based information is made available through public education and outreach efforts ‘that reach all segments of the public, through convenings and social media.
MDE Initiatives
Maryland Department of the Environment 2030 Greenhouse Gas Emissions Reduction Act Plan
162
Maryland residents want and need to hear about the potential impacts of climate change and the actions that they can take to reduce their GHG emissions. MDE’s ongoing meetings with communities in underserved areas has enabled MDE to listen to their needs and convey important information about climate change to these audiences. In past meetings, MDE has explained what climate change is versus weather events, how GHG is emitted into the atmosphere, the severe weather events, air pollution, and sea level rise that these emissions cause, and in turn, the threats to human health, economic impacts, and quality of life that result. MDE has attended many community meetings and met with advocates from Turner Station, Curtis Bay, West Baltimore, eastern Baltimore County and northern Anne Arundel County communities as well as with air and public health advocacy groups that interact directly with underserved communities. These meetings have presented fruitful opportunities for MDE to learn about residents’ air quality concerns, discuss the impacts of climate change, and establish relationships and processes for sharing information in the future. As an example of the initiative’s success, MDE has partnered with MDOT to provide funds for projects that have reduced air pollution from large trucks at the Port of Baltimore. By actively listening to communities’ concerns, MDE’s understanding of why some programs are not as effective in aiding underserved communities is enhanced so that the state can modify programs to better serve all Marylanders. Perhaps most importantly, underserved communities are made aware of the programs that can help pay for some of the measures they can take, such as to help them make their homes more energy efficient. State-sponsored public education and outreach combined with community actions form the foundation for behavioral and lifestyle changes necessary to reduce GHG emissions. MDE will continue and enhance its work with partner agencies, utility companies, nonpronon-profit organizations, faith communities, the MCCC, the Commission on Equity and Sustainable Communities, the Maryland Climate Leadership Academy and others to identify opportunities to discuss climate change issues and find solutions through the more than 100 state programs and initiatives within the 2030 GGRA Plan to mitigate harmful effects of climate change.
MDE’s Climate Change Program will strive to better address the needs of communities that are environmentally disadvantaged or over-burdened. Chapter 2 specifically addresses environmental equity issues. 3.2.20 Federal Measures
3.2.20.1 Federal Programs Designed to Reduce GHG Emissions
Lead Agency: MDE
Program Description The GGRA of 2016 requires that MDE report on the state of any federal program designed to reduce GHG emissions. The following initiatives are specific to EPA but there are additional federal programs being implemented by other federal agencies such as Housing and Urban Development, Department of Energy, USDA, etc. that are not specifically discussed in this chapter. Many of the rules and initiatives below are being challenged by states and industry in the U.S. Courts.
Affordable Clean Energy Rule and The Clean Power Plan
The Clean Power Plan (CPP)
Maryland Department of the Environment 2030 Greenhouse Gas Emissions Reduction Act Plan
163
This federal proposal was designed to significantly reduce GHG emissions from power plants across the Country. Maryland worked with EPA on the development of the CPP and strongly supported this rule proposed by the previous Administration. Maryland, through MDE, opposed the repeal of the CPP, unless the Plan was going to be replaced with a policy as effective and enforceable as RGGI. The Affordable Clean Energy (ACE) Rule The Affordable Clean Energy Rule (ACE) was proposed to repeal the CPP. The D.C. Circuit issued a decision forcefully upholding that the EPA must regulate greenhouse gases as specified in the Endangerment Finding. The decision sends the rulemaking back to EPA so that the 2020-2024 Administration may issue new protections.
Other EPA Regulatory Initiatives
Stationary Sources
The New Source Review (NSR) program requires industrial facilities to install updated pollution control equipment when they are newly built or when a change is completed that increases the facility’s emissions significantly. There are three types of NSR programs. First, the Prevention of Significant Deterioration program applies to major new sources or major modifications to a source within an attainment area, and requires the source install the best available control technology. Second, the Nonattainment NSR program applies to major new sources or major modifications to a source within a nonattainment area, and requires the source install the lowest achievable emission rate system. Third, the Minor NSR program applies to minor new sources or minor modifications to major or minor sources within both an attainment or nonattainment area, and requires the source meet any emission control measures required by the state. Along with the proposal of the ACE Rule in 2018, the EPA proposed a change to the NSR program. The change to the NSR program would allow sources to exceed annual emissions, as long as their hourly emission rates are not exceeded. The new exemption allows EGUs to extend their life and increase their use of fossil fuels, leading to increased release of CO2 and other pollutants. EPA’s regulatory impact assessment projected substantial increases in sulfur dioxide (SO2) and NOx under the ACE Rule compared to the CPP.
Transportation/Mobile Sources Recent regulatory changes by the federal EPA and National Highway Traffic Safety Administration (NHTSA) sought to both roll back the existing federal fuel economy standards that had been set to improve the fuel economy of light duty vehicles to achieve an average of 54.5 miles per gallon by model year 2025, and to revoke the authority for states to adopt more stringent standards established by California. EPA named these two actions the “Safer Affordable Fuel-Efficient (SAFE) Vehicles Rule” with two parts. Maryland joined lawsuits challenging both efforts, which are still under litigation. The new federal administration is expected to reverse both of those decisions, establishing improved federal vehicle standards and maintaining states’ rights to adopt more stringent standards established by California. The 2030 GGRA Plan assumes that the incoming administration takes those actions, supporting states’ efforts to reduce transportation GHG emissions, improving the fuel efficiency of vehicles that burn gasoline and diesel, and providing new and extended incentives for consumers to purchase EVs. The emissions and economic analysis in the 2030 GGRA Plan incorporate analysis of these steps performed by Maryland and the other states in TCI. The TCI states published documentation of that analysis on the TCI website.186
186 https://www.transportationandclimate.org/modeling-methods-and-results
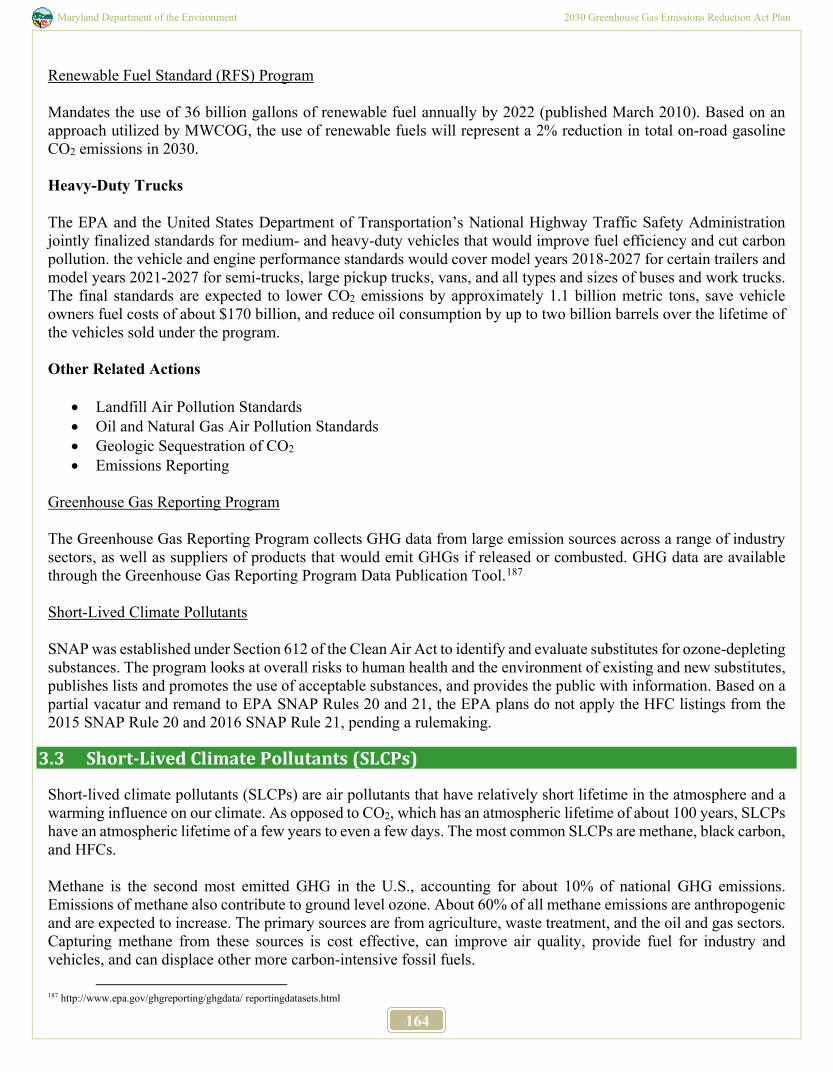
Maryland Department of the Environment 2030 Greenhouse Gas Emissions Reduction Act Plan
164
Renewable Fuel Standard (RFS) Program Mandates the use of 36 billion gallons of renewable fuel annually by 2022 (published March 2010). Based on an approach utilized by MWCOG, the use of renewable fuels will represent a 2% reduction in total on-road gasoline CO2 emissions in 2030.
Heavy-Duty Trucks
The EPA and the United States Department of Transportation’s National Highway Traffic Safety Administration jointly finalized standards for medium- and heavy-duty vehicles that would improve fuel efficiency and cut carbon pollution. the vehicle and engine performance standards would cover model years 2018-2027 for certain trailers and model years 2021-2027 for semi-trucks, large pickup trucks, vans, and all types and sizes of buses and work trucks. The final standards are expected to lower CO2 emissions by approximately 1.1 billion metric tons, save vehicle owners fuel costs of about $170 billion, and reduce oil consumption by up to two billion barrels over the lifetime of the vehicles sold under the program.
Other Related Actions
• Landfill Air Pollution Standards • Oil and Natural Gas Air Pollution Standards • Geologic Sequestration of CO2 • Emissions Reporting
Greenhouse Gas Reporting Program
The Greenhouse Gas Reporting Program collects GHG data from large emission sources across a range of industry sectors, as well as suppliers of products that would emit GHGs if released or combusted. GHG data are available through the Greenhouse Gas Reporting Program Data Publication Tool.187
Short-Lived Climate Pollutants
SNAP was established under Section 612 of the Clean Air Act to identify and evaluate substitutes for ozone-depleting substances. The program looks at overall risks to human health and the environment of existing and new substitutes, publishes lists and promotes the use of acceptable substances, and provides the public with information. Based on a partial vacatur and remand to EPA SNAP Rules 20 and 21, the EPA plans do not apply the HFC listings from the 2015 SNAP Rule 20 and 2016 SNAP Rule 21, pending a rulemaking.
3.3 Short-Lived Climate Pollutants (SLCPs)
Short-lived climate pollutants (SLCPs) are air pollutants that have relatively short lifetime in the atmosphere and a warming influence on our climate. As opposed to CO2, which has an atmospheric lifetime of about 100 years, SLCPs have an atmospheric lifetime of a few years to even a few days. The most common SLCPs are methane, black carbon, and HFCs. Methane is the second most emitted GHG in the U.S., accounting for about 10% of national GHG emissions. Emissions of methane also contribute to ground level ozone. About 60% of all methane emissions are anthropogenic and are expected to increase. The primary sources are from agriculture, waste treatment, and the oil and gas sectors. Capturing methane from these sources is cost effective, can improve air quality, provide fuel for industry and vehicles, and can displace other more carbon-intensive fossil fuels.
187 http://www.epa.gov/ghgreporting/ghgdata/ reportingdatasets.html
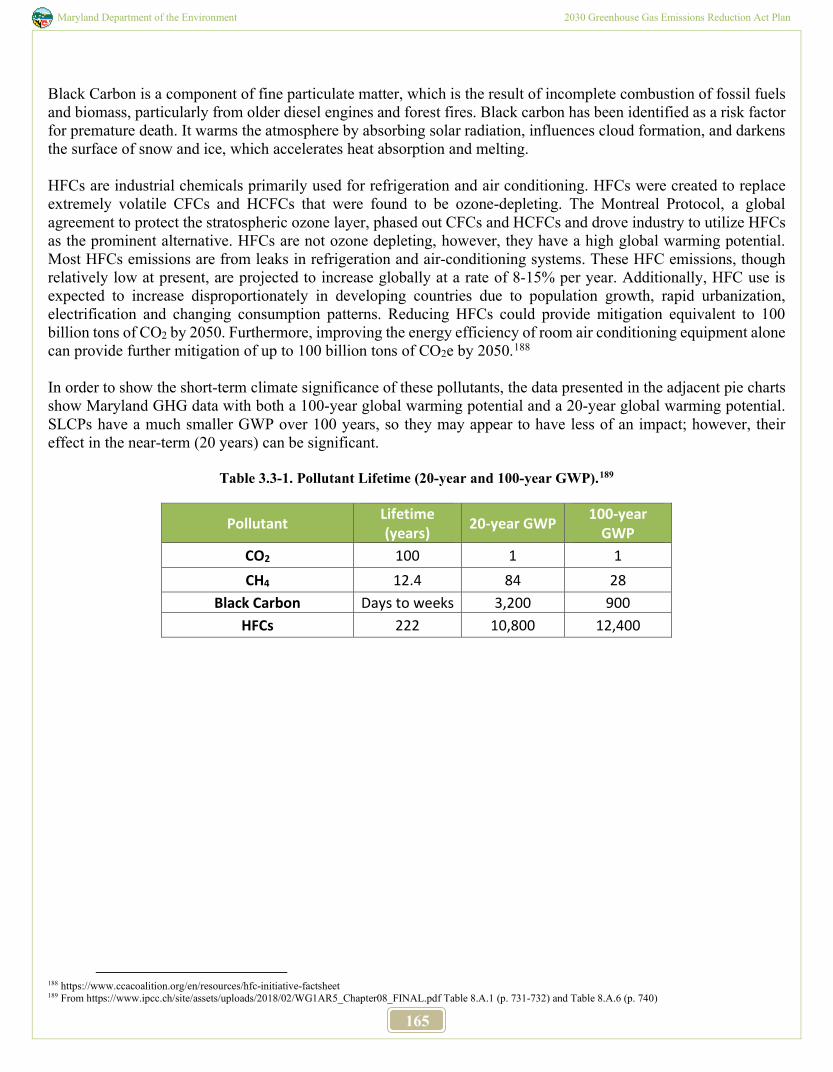
Maryland Department of the Environment 2030 Greenhouse Gas Emissions Reduction Act Plan
165
Black Carbon is a component of fine particulate matter, which is the result of incomplete combustion of fossil fuels and biomass, particularly from older diesel engines and forest fires. Black carbon has been identified as a risk factor for premature death. It warms the atmosphere by absorbing solar radiation, influences cloud formation, and darkens the surface of snow and ice, which accelerates heat absorption and melting. HFCs are industrial chemicals primarily used for refrigeration and air conditioning. HFCs were created to replace extremely volatile CFCs and HCFCs that were found to be ozone-depleting. The Montreal Protocol, a global agreement to protect the stratospheric ozone layer, phased out CFCs and HCFCs and drove industry to utilize HFCs as the prominent alternative. HFCs are not ozone depleting, however, they have a high global warming potential. Most HFCs emissions are from leaks in refrigeration and air-conditioning systems. These HFC emissions, though relatively low at present, are projected to increase globally at a rate of 8-15% per year. Additionally, HFC use is expected to increase disproportionately in developing countries due to population growth, rapid urbanization, electrification and changing consumption patterns. Reducing HFCs could provide mitigation equivalent to 100 billion tons of CO2 by 2050. Furthermore, improving the energy efficiency of room air conditioning equipment alone can provide further mitigation of up to 100 billion tons of CO2e by 2050.188 In order to show the short-term climate significance of these pollutants, the data presented in the adjacent pie charts show Maryland GHG data with both a 100-year global warming potential and a 20-year global warming potential. SLCPs have a much smaller GWP over 100 years, so they may appear to have less of an impact; however, their effect in the near-term (20 years) can be significant.
Table 3.3-1. Pollutant Lifetime (20-year and 100-year GWP).189
Pollutant Lifetime (years) 20-year GWP 100-year
GWP CO2 100 1 1 CH4 12.4 84 28
Black Carbon Days to weeks 3,200 900 HFCs 222 10,800 12,400
188 https://www.ccacoalition.org/en/resources/hfc-initiative-factsheet 189 From https://www.ipcc.ch/site/assets/uploads/2018/02/WG1AR5_Chapter08_FINAL.pdf Table 8.A.1 (p. 731-732) and Table 8.A.6 (p. 740)
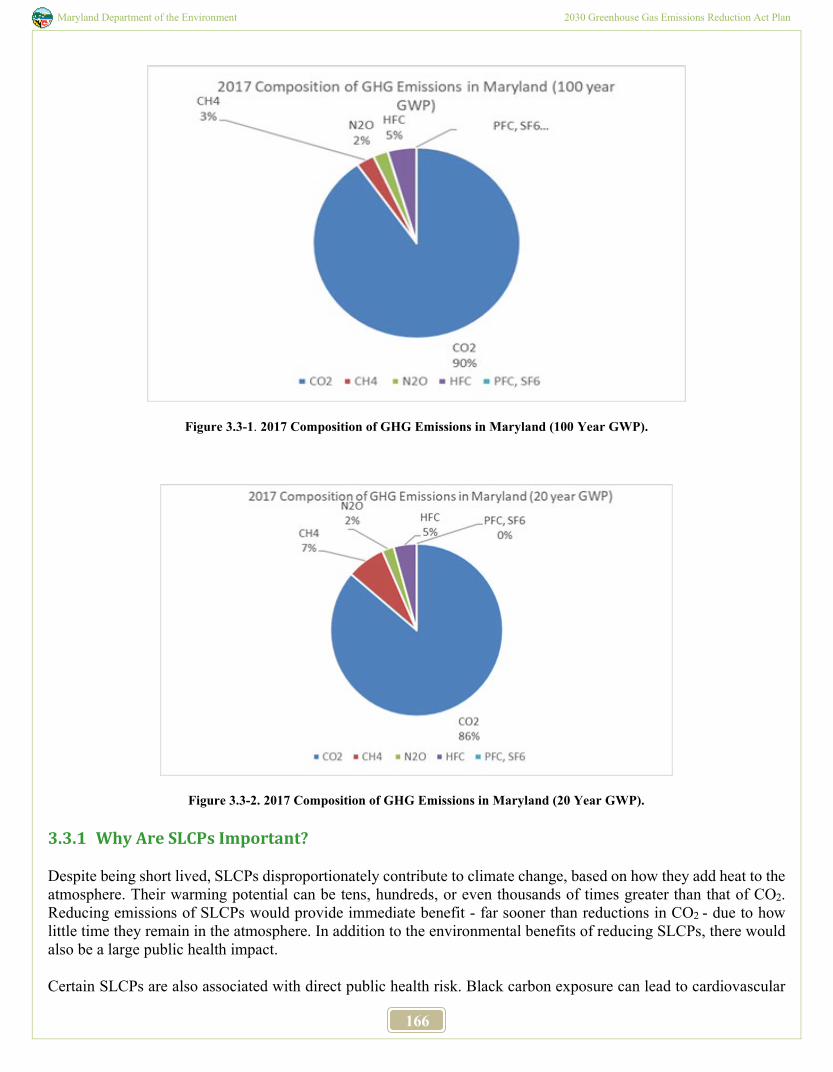
Maryland Department of the Environment 2030 Greenhouse Gas Emissions Reduction Act Plan
166
Figure 3.3-1. 2017 Composition of GHG Emissions in Maryland (100 Year GWP).
Figure 3.3-2. 2017 Composition of GHG Emissions in Maryland (20 Year GWP). 3.3.1 Why Are SLCPs Important? Despite being short lived, SLCPs disproportionately contribute to climate change, based on how they add heat to the atmosphere. Their warming potential can be tens, hundreds, or even thousands of times greater than that of CO2. Reducing emissions of SLCPs would provide immediate benefit - far sooner than reductions in CO2 - due to how little time they remain in the atmosphere. In addition to the environmental benefits of reducing SLCPs, there would also be a large public health impact. Certain SLCPs are also associated with direct public health risk. Black carbon exposure can lead to cardiovascular
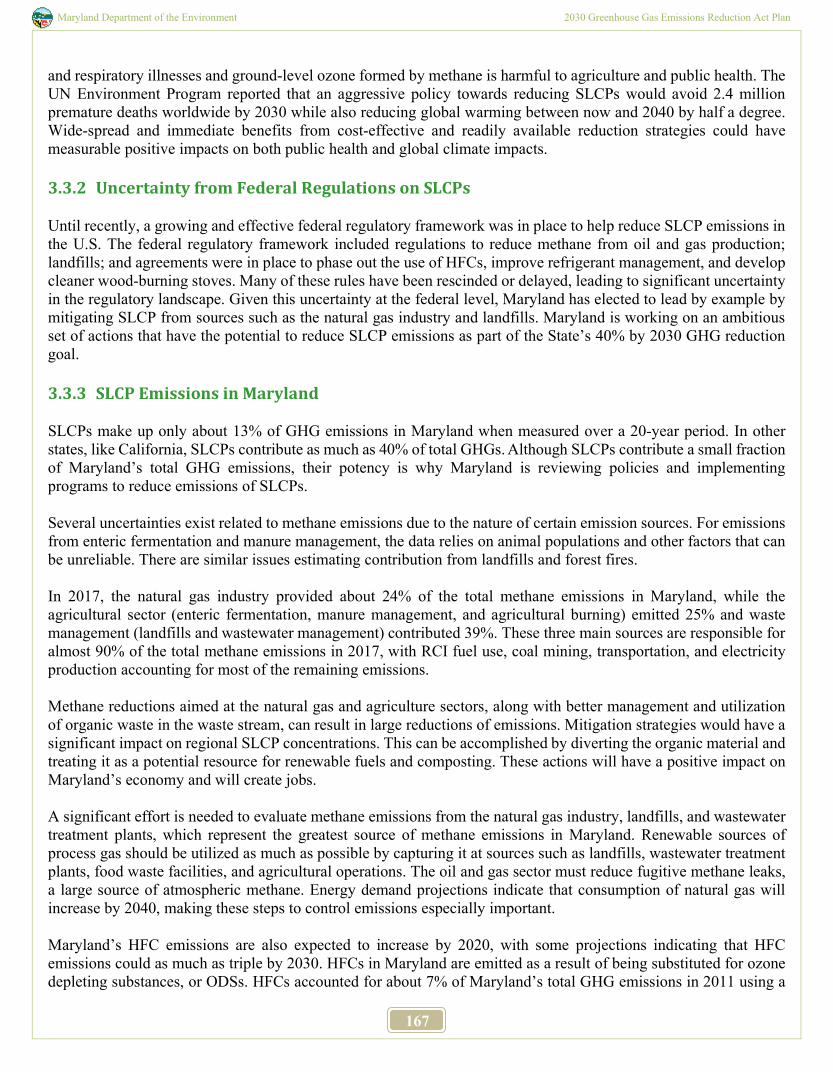
Maryland Department of the Environment 2030 Greenhouse Gas Emissions Reduction Act Plan
167
and respiratory illnesses and ground-level ozone formed by methane is harmful to agriculture and public health. The UN Environment Program reported that an aggressive policy towards reducing SLCPs would avoid 2.4 million premature deaths worldwide by 2030 while also reducing global warming between now and 2040 by half a degree. Wide-spread and immediate benefits from cost-effective and readily available reduction strategies could have measurable positive impacts on both public health and global climate impacts. 3.3.2 Uncertainty from Federal Regulations on SLCPs Until recently, a growing and effective federal regulatory framework was in place to help reduce SLCP emissions in the U.S. The federal regulatory framework included regulations to reduce methane from oil and gas production; landfills; and agreements were in place to phase out the use of HFCs, improve refrigerant management, and develop cleaner wood-burning stoves. Many of these rules have been rescinded or delayed, leading to significant uncertainty in the regulatory landscape. Given this uncertainty at the federal level, Maryland has elected to lead by example by mitigating SLCP from sources such as the natural gas industry and landfills. Maryland is working on an ambitious set of actions that have the potential to reduce SLCP emissions as part of the State’s 40% by 2030 GHG reduction goal. 3.3.3 SLCP Emissions in Maryland SLCPs make up only about 13% of GHG emissions in Maryland when measured over a 20-year period. In other states, like California, SLCPs contribute as much as 40% of total GHGs. Although SLCPs contribute a small fraction of Maryland’s total GHG emissions, their potency is why Maryland is reviewing policies and implementing programs to reduce emissions of SLCPs. Several uncertainties exist related to methane emissions due to the nature of certain emission sources. For emissions from enteric fermentation and manure management, the data relies on animal populations and other factors that can be unreliable. There are similar issues estimating contribution from landfills and forest fires. In 2017, the natural gas industry provided about 24% of the total methane emissions in Maryland, while the agricultural sector (enteric fermentation, manure management, and agricultural burning) emitted 25% and waste management (landfills and wastewater management) contributed 39%. These three main sources are responsible for almost 90% of the total methane emissions in 2017, with RCI fuel use, coal mining, transportation, and electricity production accounting for most of the remaining emissions. Methane reductions aimed at the natural gas and agriculture sectors, along with better management and utilization of organic waste in the waste stream, can result in large reductions of emissions. Mitigation strategies would have a significant impact on regional SLCP concentrations. This can be accomplished by diverting the organic material and treating it as a potential resource for renewable fuels and composting. These actions will have a positive impact on Maryland’s economy and will create jobs. A significant effort is needed to evaluate methane emissions from the natural gas industry, landfills, and wastewater treatment plants, which represent the greatest source of methane emissions in Maryland. Renewable sources of process gas should be utilized as much as possible by capturing it at sources such as landfills, wastewater treatment plants, food waste facilities, and agricultural operations. The oil and gas sector must reduce fugitive methane leaks, a large source of atmospheric methane. Energy demand projections indicate that consumption of natural gas will increase by 2040, making these steps to control emissions especially important. Maryland’s HFC emissions are also expected to increase by 2020, with some projections indicating that HFC emissions could as much as triple by 2030. HFCs in Maryland are emitted as a result of being substituted for ozone depleting substances, or ODSs. HFCs accounted for about 7% of Maryland’s total GHG emissions in 2011 using a
Maryland Department of the Environment 2030 Greenhouse Gas Emissions Reduction Act Plan
168
20-year global warming potential. Emissions are projected to increase to around 8% of total emissions in 2020 and will significantly increase annually according to projections by the USCA and the California Air Resources Board. Alternatives with lower GWPs than currently utilized HFCs are commercially available. HFCs can also be captured and destroyed from the emission sources with relative ease, especially from appliances that have reached the end of their use. HFCs can be phased out in favor of low GWP alternatives that have the same function, such as hydrocarbons for domestic refrigeration and NH3 for industrial refrigeration. There is limited data available for black carbon emissions in Maryland. This is an area that needs a greater focus. 3.3.4 What is Maryland Doing to Reduce SLCP Emissions?
Methane On October 23, 2020, Maryland finalized regulations to reduce vented and fugitive emissions of methane from both new and existing natural gas transmission and storage facilities. Six existing facilities in Maryland will begin conducting surveys for methane leaks and report to MDE, beginning May 1, 2021. Staff are currently in the process of evaluating and drafting regulatory options to address methane emissions from the last segment of the natural gas value chain, the distribution segment. Methane is emitted from a variety of sources related to Maryland’s agriculture industry; the natural gas sector; and waste generation, disposal, and processing. Maryland has already taken steps to curb methane emissions, including requiring controls on landfills and providing incentives to capture and destroy methane emissions from landfills and agricultural manure management operations. In addition, existing source reduction and landfill diversion targets in the State’s waste management plan will further reduce (or eliminate) organic waste disposal in landfills and the resultant methane emissions. In its 2016 annual report, the MCCC issued a recommendation that Maryland should reduce methane emissions from municipal solid waste (MSW) landfills, natural gas infrastructure (e.g., compressor stations, and underground storage) and wastewater treatment plants. At the Dec. 12, 2016 Air Quality Control Advisory Council (AQCAC) meeting, MDE announced that the State will be using EPA’s rules that address methane emissions at MSW landfills and gas compressor stations as a starting point for state regulations. MDE’s Air and Radiation Administration (MDE ARA) has since held several public meetings with various stakeholders concerning in-state methane emissions from the oil and natural gas industry, specifically the transmission and storage sector, and municipal solid waste landfills.
Oil and Natural Gas Industry Priority has been placed on addressing fugitive methane emissions from the oil and natural gas transmission sector. There are at least four natural gas compressor stations and one large liquid natural gas import and export facility currently operating in Maryland. In 2016, EPA required new facilities (built after September 2015) to monitor fugitive methane emissions with a quarterly to annual leak surveys and to repair them within a certain timeframe. However, on August 13, 2020, EPA finalized an amendment to these rules that would remove methane as a regulated pollutant in the oil and natural gas industry. MDE plans to take a two-prong approach in reducing methane emissions from the oil and gas sector in the absence of finalized federal regulations. In December 2020, MDE finalized regulations modeled after leading states’ rules such as California. Maryland’s effort will reduce fugitive emissions from the natural gas transmission and storage sector, including liquid natural gas (LNG) processing facilities. The regulation requires leak detection and swift repair, as well as natural gas compressor engine maintenance and pneumatic devices upgrades.
Maryland Department of the Environment 2030 Greenhouse Gas Emissions Reduction Act Plan
169
MDE has also begun investigation of methane emissions from the natural gas distribution sector and methods to reduce leaking emissions. Local gas distribution companies (LDCs) are the entities that deliver natural gas to retail customers; residential, commercial, and industrial. LDCs typically receive natural gas from one or more interstate or intrastate gas pipelines, which is the transmission sector of the natural gas industry. The natural gas is delivered to customers through a network of main pipelines and service pipelines that connect directly to a facility. The network of natural gas pipeline infrastructure and meters requires maintenance and upgrades. The maintenance, repair and replacement of pipeline/services has been historically driven by safety concerns. Certain older pipeline materials have been identified as leak-prone and thus widespread agreement exists for the removal of these leak-prone piping for safety and environmental reasons. Some natural gas infrastructure in the State has been in place for over 50 years. MDE is looking at regulatory actions that can help mitigate methane emissions from the natural gas distribution sector by working with existing programs to accelerate the replacement of leak-prone pipelines. MDE is also looking to establish leak detection and repair surveys for natural gas storage tanks and metering and regulating stations.
Municipal Solid Waste Landfills On July 14, 2016, EPA finalized rules to reduce landfill gas from MSW landfills (composed of 50% methane) but placed a 90-day stay on the rule on May 5, 2017. In 2018, a coalition of eight states, including Maryland, filed a lawsuit (California v. EPA) against the EPA over its failure to implement and enforce a critical landfill regulation. The regulation, which went into effect on October 28, 2016 requires new, modified and reconstructed MSW landfills (the new source performance standards or NSPS) as well as existing MSW landfills (emission guidelines or EG) to reduce emissions from methane-rich landfill gas. Despite litigation and other extenuating factors, MDE is in the process of updating the current Maryland regulation (COMAR 26.11.19.20 - Control of Landfill Gas Emissions from Municipal Solid Waste Landfills). On September 21, 2020, MDE held a virtual stakeholder meeting to discuss whether a new regulation that will build off the 2016 NSPS requirements for MSW landfills could accelerate GHG reductions.
Wastewater Treatment Plants Capturing and utilizing methane from wastewater treatment plants is a burgeoning area of opportunity that Maryland has already begun exploring. Sixty-seven major wastewater treatment facilities in Maryland have been targeted to be upgraded with enhanced nutrient removal (ENR) technologies to reduce nutrients in wastewater effluent and reduce methane emissions. Over 40 plants have already been upgraded as of late 2015. Emissions reduction benefit from these upgrades is currently unknown.
Black carbon Black carbon emissions are 90% lower than they were in the 1960s and will be cut in half again by 2020. Maryland has several programs and regulations to reduce diesel particulate emissions, a major source of emissions:
• Maryland Diesel Vehicle Emissions Control Program • Engine idling restrictions • Diesel retrofits • SmartWay upgrade kits (voluntary fleet fuel efficiency improvements)
EPA Rules:
• 2007 Heavy Duty Highway Diesel Rule
Maryland Department of the Environment 2030 Greenhouse Gas Emissions Reduction Act Plan
170
• Clean Air Non-Road Diesel Engine & Fuel Rule • Highway and Non-Road Diesel Rules (updated in April 2006) • Clean Diesel Program for Locomotives and Marine Engines
Hydrofluorocarbons (HFCs)
Demonstrating the state’s commitment to meeting GHG reduction goals, Maryland has finalized measures to phase out the use of HFCs in foam products, aerosol propellants, air conditioning and refrigeration. MDE’s regulations are similar to California’s rule and other U.S. Climate Alliance States that prohibits the use of certain HFCs in foam products, aerosol propellants, air conditioning, and in new and retrofitted refrigeration equipment in retail establishments such as supermarkets. The phase out of HFCs will encourage the use of substances with lower GHG emissions that are already available in the state. Under a federal CAA program designed to identify and evaluate alternatives to stratospheric ozone-depleting substances, HFCs have been one of the most common alternatives. However, HFCs are extremely potent GHGs—one pound of certain HFCs is potentially as potent as 1,400 pounds of CO2. After efforts to phase out HFCs stalled at the federal level, states began establishing their own phase-out initiatives. Maryland has finalized HFC regulations that are consistent with rules and laws enacted by U.S. Climate Alliance States, such California, Washington, Vermont, New Jersey, and Colorado. The regulations also model the stalled EPA rules, which phase out the use of certain HFCs in various end-uses—specifically in foam, aerosol propellants, refrigeration, and air-conditioning products and equipment—and will encourage the use of substances with lower GHG emissions that are widely available on the market. Other states in the U.S. Climate Alliance, a bipartisan coalition of 25 U.S. states committed to reducing GHG emissions consistent with the Paris Agreement, are expected to take similar actions. HFCs are thousands of times more potent than CO2 and are the fastest growing source GHG emissions both globally and in the U.S. With the proposed action in place, HFC emissions are expected to be reduced by 12% from the business-as-usual projection in 2020 as calculated by the California Air Resources Board, in consultation with the USCA and in 2030, the estimated impact could be up to 25%. MDE used this emissions tool to evaluate the estimated Maryland HFC reductions.
Tropospheric (ground-level) Ozone Ground-level ozone absorbs radiation and acts as a strong GHG. Ozone affects the climate beyond increased warming, having impacts on evaporation rates, cloud formation, precipitation levels, and atmospheric circulation. These impacts mainly occur within the regions where tropospheric ozone precursors are emitted, so disproportionately affect the United States, especially metropolitan areas like the Washington DC/Baltimore airshed. Maryland continues to make progress to reduce this very pervasive SLCP. In recent years, Maryland has achieved the 2008 ozone standard and is moving closer towards achieving the more stringent 2015 ozone standard. In 2019, Maryland recorded the second fewest number of bad ozone days ever recorded. Two key impediments affect Maryland’s ability to achieve this standard: transported air pollution from other states and NOx emissions, a key component for ozone formation. 3.3.5 In-State Methane Minimization
Lead Agency: MDE
Program Description
Methane Emissions from Sources in the Oil and Gas Industry – Production and Transmission Sector
Maryland Department of the Environment 2030 Greenhouse Gas Emissions Reduction Act Plan
171
On October 23, 2020, Maryland finalized regulations to reduce vented and fugitive emissions of methane from both new and existing natural gas transmission and storage facilities. Six existing facilities in Maryland will begin conducting surveys for methane leaks and report to MDE, beginning May 1, 2021. Staff are currently in the process of evaluating and drafting regulatory options to address methane emissions from the last segment of the natural gas value chain, the distribution segment. In 2018, the EPA proposed amendments to the new source performance standards (NSPS) for pollutant controls in the oil and gas industry that were adopted in 2016. EPA proposed to reduce the monitoring frequency of fugitive emissions at compressor stations and to extend the allotted time for owners and/or operators of compressor stations to repair fugitive emission components. Additionally, EPA sought comment on the removal of the transmission and storage segment as a source category subject to new source performance standards. Lastly, EPA sought comment on extending the time period for owners and/or operators of well sites or compressor stations to conduct an initial monitoring survey and reoccurring leak inspections. MDE submitted written comments opposing EPA’s proposed amendments to the new source performance standards for the oil and natural gas sector. Despite opposition from several states and environmental advocacy organizations, the EPA finalized the proposed amendments on August 13, 2020. Maryland, through MDE, and 13 other states filed a motion to intervene in a lawsuit against EPA’s actions to halt regulation of leaks of GHG emissions and other harmful air pollutants from new sources in the oil and gas industry. Specifically, the suit charges that the EPA has violated the CAA by 'unreasonably delaying' its mandatory obligation under the Act to control methane emissions from these operations. EPA requested that this lawsuit be held by the court due to EPA’s related action on the proposed rulemaking discussed below.
Implementation Milestones The natural gas industry can be divided into four segments: (1) production; (2) gathering and processing; (3) transmission and storage; and (4) distribution. Maryland began taking steps to restrict methane emissions from the natural gas value chain by establishing law to ban hydraulic fracturing in the State—operations which occur in the natural gas industry production segment. With no gathering and processing operations in the State, Maryland then turned to the transmission and storage segment. And on October 23, 2020, Maryland finalized regulations to reduce vented and fugitive emissions of methane from both new and existing natural gas transmission and storage facilities. Six existing facilities in Maryland will begin conducting surveys for methane leaks and report to MDE, beginning May 1, 2021. Staff are currently in the process of evaluating and drafting regulatory options to address methane emissions from the last segment of the natural gas value chain, the distribution segment.
Methane Emissions from Sources in the Oil and Gas Industry – Distribution Sector Local gas distribution companies (LDCs) are the entities that deliver natural gas to retail customers; residential, commercial, and industrial. LDCs typically receive natural gas from one or more interstate or intrastate gas pipelines, which is the transmission sector of the natural gas industry. The natural gas is delivered to customers through a network of main pipelines and service pipelines that connect directly to a facility, business or home and this is referred to as the distribution sector. Metering and regulating stations are the meters that measure natural gas flow on the LDC distribution system. Customer meters are the meters that measure natural gas flow to the customer. The network of natural gas pipeline infrastructure and meters requires maintenance and upgrades. The maintenance, repair and replacement of pipeline/services has been historically driven by safety concerns. Certain older pipeline materials have been identified as leak-prone and thus widespread agreement exists for the removal of these leak-prone piping for safety and environmental reasons. Some natural gas infrastructure in the State have been in place for over 50 years.
Maryland Department of the Environment 2030 Greenhouse Gas Emissions Reduction Act Plan
172
The LDCs in Maryland are regulated through the federal Pipeline and Hazardous Materials Safety Administration (PHMSA) under the United States Department of Transportation, and through the Public Utility Companies (PUC) Article, Annotated Code of Maryland, and the Code of Maryland Regulations under PSC Title 20. PHMSA and PUC regulations require safety upgrades, leak detection and repair surveys, and reporting for total inventory of pipeline and pipe replacements annually. Through legislation in 2013, the Strategic Infrastructure Development and Enhancement Plan (STRIDE) was developed to accelerate replacement of leak-prone piping/services. The three largest LDCs in Maryland are required to participate in the STRIDE program and have actively been replacing leak-prone pipelines/services. Using data from these established pipe replacement programs, Maryland can project GHG emission contributions from the natural gas distribution sector. Overall, the GHG emissions from the natural gas distribution infrastructure piping/services in Maryland have been reduced approximately 3% per year, based on reported PHMSA data. This data includes STRIDE 1 replacements/upgrades and growth, as well as company-driven pipeline replacements. The STRIDE 2 commitments may accelerate that reduction percentage moving from 2019 out to 2037 until certain identified leak prone piping/services are removed from the infrastructure. MDE is looking at regulatory actions that can help mitigate methane emissions from the natural gas distribution sector. MDE has engaged with stakeholders and works with the University of Maryland to review atmospheric data. Future MDE regulatory actions could require accelerated piping/services improvements, leak detection and repair survey for natural gas storage tanks and metering and regulating stations.
Methane Emissions from New and Existing Landfills In 2018, a coalition of eight states, including Maryland, filed a lawsuit (California v. EPA) against the EPA over its failure to implement and enforce a critical landfill regulation. The regulation, which went into effect on October 28, 2016 requires new, modified and reconstructed MSW landfills (the new source performance standards or NSPS) as well as existing MSW landfills (emission guidelines or EG) to reduce emissions from methane-rich landfill gas. Despite litigation and other extenuating factors, MDE is in the process of updating the current Maryland regulation (COMAR 26.11.19.20 - Control of Landfill Gas Emissions from Municipal Solid Waste Landfills). On September 21, 2020, MDE held a virtual stakeholder meeting to discuss a new regulation that will build off the 2016 /NSPS requirements for MSW landfills and will include additional requirements. 3.3.6 Hydrofluorocarbons (HFCs)
Lead Agency: MDE
Program Description
Under a federal CAA program designed to identify and evaluate alternatives to stratospheric ozone-depleting substances, HFCs have been one of the most common alternatives. However, HFCs are extremely potent GHGs—one pound of certain HFCs is potentially as potent as 1,400 pounds of CO2. After efforts to phase out HFCs stalled at the federal level, states began establishing their own phase-out initiatives. Maryland has finalized HFC regulations that are consistent with rules and laws enacted by U.S. Climate Alliance States, such California, Washington, Vermont, New Jersey, and Colorado. The regulations also model the stalled EPA rules, which phase out the use of certain HFCs in various end-uses—specifically in foam, aerosol propellants, refrigeration, and air-conditioning products and equipment—and will encourage the use of substances with lower GHG emissions that are widely available on the market. Other states in the USCA are expected to take similar steps. On December 27, 2020, a bill to phase down the use of HFCs was passed in a larger omnibus bill. The new law, the American Innovation and Manufacturing (AIM) Act has language that would phase down production and consumption of HFCs 85% by 2036, with a narrow clause preempting new state regulations for certain uses of
Maryland Department of the Environment 2030 Greenhouse Gas Emissions Reduction Act Plan
173
HFCs for at least five years should replacements for certain applications not become widely available. This bill will be in alignment with the Kigali Amendment to the Montreal Protocol of 2016.
Implementation Milestones Maryland HFC regulations were adopted on October 6, 2020 and will be in effect on November 2, 2020. Compliance deadlines begin on January 1, 2021 for certain end-uses and will continue through January 1, 2024.
Challenges Several companies approached MDE requesting an extension on compliance deadlines due to COVID-19 impacts on business operations. In response, MDE included a regulatory relief statement in the technical support document which accompanied the regulations. The statement directs companies facing COVID-19-related compliance challenges to submit a plan for compliance for review in accordance with Section 2-611 of the Environment Article. The submitted plan will be made available for public comment for 30 days on MDE’s website, and MDE will, as required by statute, issue its response to the plan within 90 days.
3.4 Voluntary and Non-Traditional Programs
3.4.1 The United States Climate Alliance
Lead Agency: MDE Maryland is a proud and active member of the U.S. Climate Alliance (the “Alliance”), which is a bipartisan coalition of governors committed to transitioning to a clean energy economy and advancing the goals of the Paris Agreement190 — “to strengthen the global response to the threat of climate change by keeping a global temperature rise this century well below 2 degrees Celsius above pre-industrial levels and to pursue efforts to limit the temperature increase even further to 1.5 degrees Celsius.”191 Representing the majority of the U.S. population and gross domestic product (GDP), the 25 Alliance states and territories are working together to adopt and implement ambitious climate policies that decrease emissions, deploy clean power and fuels, enhance our natural carbon sequestration, increase resilience to climate impacts, and improve our communities’ economic and health outcomes. As a member state, Maryland commits to implement policies that advance the goals of the Paris Agreement, aiming to reduce greenhouse gas emissions by at least 26-28% below 2005 levels by 2025 and track and report progress to the global community. Alliance states have continued to make progress on climate commitments, including the following most recent goals:
• Increasing ambition: Setting ambitious near-term GHG emissions reduction targets and advancing climate governance within each of our states.
• Addressing equity and inclusion: Incorporating principles of a just and equitable transition to a clean energy economy into the foundation of our climate actions.
• Expanding energy efficiency: Increasing building energy efficiency through codes, performance standards, and appliance efficiency standards.
• Decarbonizing power generation and distribution: Cleaning and modernizing our power grids. • Advancing clean transportation: Deploying cleaner and more efficient vehicles and fuels.
190 In June 2017, the governors of California, New York, and Washington created the U.S. Climate Alliance when the federal government announced its intention to withdraw the United States from the Paris Agreement. 191 United Nations Climate Change, The Paris Agreement. https://unfccc.int/process-and-meetings/the-paris-agreement/the-paris-agreement
Maryland Department of the Environment 2030 Greenhouse Gas Emissions Reduction Act Plan
174
• Adopting market-based solutions: Joining and developing carbon markets such as the Regional Greenhouse Gas Initiative and the Transportation Climate Initiative.
• Reducing short-lived climate pollutants: Adopting regulations to address potent GHGs like methane and HFCs;
• Strengthening resilience: Increasing communities’ ability to confront the effects of climate change. • Enhancing natural and working lands: Protecting and improving our farmlands, forests, wetlands, grasslands,
and other land types ability to sequester carbon and become more resilient to a changing climate; and • Fostering innovation: Developing cutting edge policies and programs to combat the climate crisis. • Underpinning many of these actions has been the drive to protect community health, promote workforce
development, and expand the opportunities for education, job training, and employment for disenfranchised communities.
Alliance states are committed to rebuilding economies in ways that prioritize addressing climate change, health, equity, and resilience. However, states have had to move forward on without federal leadership. We therefore have provided recommendations to Congressional leadership to help us with these efforts, including the need for immediate, flexible federal aid for states and territories to enable our governors to preserve core government services. As we look toward a strong recovery, states will also need resources to strengthen and modernize our infrastructure in ways that build resiliency and reduce GHG emissions. Nature-based solutions should be utilized where possible and designed to reduce physical risk from extreme events while maximizing carbon removal and storage potential. Public funds and incentives should be used to mobilize private investment and create public-private partnerships, such as green banks, tax credits, and government bond offerings. Recovery from the economic impacts of COVID-19 presents the United States with a unique opportunity to tackle climate change in a way that catalyzes an equitable, clean, and prosperous economy. Pulling from our experience developing and implementing climate policy, the Alliance offers five recommendations that Congress and the federal government should integrate when developing future climate and recovery policy:
1. Ensure climate and energy policy goals are aligned with science; 2. Include equity, environmental justice, and family-sustaining jobs at the core of climate and recovery policy; 3. Utilize states’ experience and knowledge to collaborate in developing national policy frameworks; 4. Support state climate change leadership as they respond to and recover from the COVID-19 crisis; and 5. Protect states’ ambition to go beyond federal standards and formulate and implement policy within their own
borders and in coordination with other states. With or without federal support, Alliance states will continue to demonstrate bold climate action. The COVID-19 pandemic has resulted in job losses across the economy, including clean energy and transportation jobs. A renewed effort is needed to put unemployed people back to work while continuing to meet our energy, environmental, and societal goals. This entails increasing access to quality, family-sustaining jobs, government services, and education and training. The Alliance states are committed to leveraging their experiences, working with communities, and partnering with the federal government to rebound in a stronger, more resilient, and more equitable way – all while tackling the ever-growing climate crisis.
3.4.2 Zero Emission Vehicle (ZEV) MOU Partnership
Lead Agency: MDE
Maryland Department of the Environment 2030 Greenhouse Gas Emissions Reduction Act Plan
175
Program Description On June 20, 2018, nine states, including Maryland, reaffirmed their strong commitment to a clean, low-carbon transportation sector with the release of a new Multi-State ZEV Action Plan for 2018-2021 to support the successful implementation of the states’ ZEV programs. The Action Plan, which builds on the successes and lessons learned from implementation of an earlier 2014 ZEV Action Plan, presents 80 market-enabling recommendations for states, automakers, dealers, utilities, charging and fueling companies and other key partners to rapidly accelerate mainstream consumer adoption of ZEVs, including plug-in hybrid, battery electric and hydrogen fuel cell vehicles. Release of the new Action Plan follows the 2017 expiration of the “travel” provision in the participating states’ ZEV regulations, which allowed automakers to get compliance credit in Oregon and Northeast ZEV states for fully EVs placed in California, and to use that credit to meet their ZEV obligations. Automakers are now required to deliver fully EVs to meet specific sales goals in Oregon and the Northeast ZEV states for the first time.
Background The updated ZEV Action Plan is the work of the Multi-State ZEV Task Force, which was formed in 2013 under a Memorandum of Understanding (MOU) signed by the governors of California and seven other states that have adopted California’s ZEV program – Connecticut, Maryland, Massachusetts, New York, Oregon, Rhode Island and Vermont. New Jersey became the ninth ZEV state to join the coalition when they signed the MOU in May 2018. Together, the nine ZEV MOU states represent nearly 30% of the new car sales market in the United States. The transportation sector is now the largest single source of GHG emissions across the nation. Light duty vehicles alone contribute almost 25% of total emissions. Transportation electrification is essential to deliver the deep reductions in emissions that are needed to meet state climate goals. The state ZEV programs, which require automakers to deliver increasing numbers of ZEVs between now and 2025, are a key strategy in state climate plans. To support successful implementation of the ZEV programs, the MOU states committed to the collaborative development and implementation of the first 2014 Multi-State ZEV Action Plan.
A New Market Phase The ZEV market is entering a new phase of development. In the four years since the release of the first ZEV Action Plan, the cumulative number of ZEV sales in the United States has grown from 200,000 cars to more than 750,000 cars today. During that same time in Maryland, sales of plug-in EVs have almost tripled. Market changes and technology developments have laid a strong foundation for rapid growth of the emerging EV market. Battery costs are continuing to decline and the electric range of lower-cost battery EVs is three times what it was in 2014. Consumers can now choose from more than 40 different plug-in and fuel cell models, and all the major automakers have announced plans to significantly expand EV offerings across multiple market segments in the next several years.
Key Action Plan Recommendations While many of the recommendations in the 2014 Action Plan remain valid today, the new Action Plan represents a redoubling of state efforts to accelerate electrification of the light-duty vehicle market, and recognition of the important role that partnerships involving the automakers, dealers, utilities and others play in the effort. Recommendations for states and other key partners in the updated Action Plan are focused on five priority areas:
• Raising consumer awareness and interest in EV technology;
Maryland Department of the Environment 2030 Greenhouse Gas Emissions Reduction Act Plan
176
• Building out a reliable and convenient residential, workplace and public charging/fueling infrastructure network;
• Continuing and improving access to consumer purchase and non-financial incentives; • Expanding public and private sector fleet adoption; and • Supporting dealership efforts to increase ZEV sales.
The full Multi-State ZEV Action Plan is accessible nescaum.org/documents/2018-zev-action-plan.pdf
Maryland has been a leader in working to implement the ZEV Action Plan recommendations in our State. For years Maryland has had various incentives, financial and other, for purchasing EVs. In 2018, Governor Hogan elected to not only extend the incentive for both EVs and infrastructure, but to significantly increase these incentives. Under the Clean Cars Act of 2017, Maryland offers a tax credit of up to $3,000 for electric and plug-in vehicles with a sale price up to $60,000. Governor Hogan increased the funding for this program from $1.8 million to $3million annually. In addition to vehicles, the Clean Cars Act allows both residential and commercial entities to receive a rebate of 40% of the purchase and installation of electric recharging equipment. Governor Hogan doubled the funding available for this program from $600,000 annually to $1.2 million. In addition to these programs, the State has many other incentives available such as the Alternative Fuel Infrastructure Program and offering HOV access to plug-in vehicles. Through these efforts, Maryland now has over 1,500 public level 2 and 3 chargers throughout the state. In addition to these incentive-based programs, the State has been active in promoting EVs by performing outreach to build consumer awareness. Some of these efforts include hosting workplace charging events and staffing informational booths at events across the state. Additionally, the Clean Cars Act of 2019 increases the transfer amount from SEIF to TTF to $6 million and adds fuel cell vehicles to be eligible for the excise tax credit and adds them to EVIC. Effective July 1, 2019:
• For FY20 the lesser of $6 million or the actual total amount of credits allowed against the excise tax shall be transferred from SEIF to the TTF.
• The bill defines fuel cell vehicles. • Adds fuel cell vehicles to the excise tax credit provision and amends the provision to read “the credit allowed
may not exceed the lesser of the amount of excise tax paid for the purchase of the vehicle; or $3,000”. • Adds fuel cell vehicles to EVIC’s purview and changes the name of EVIC to the ZEEVIC. • Adds a fuel cell EV manufacturer representative and a fuel cell EV equipment representative to the Council. • Adds fuel cell considerations to the Council’s action plan.
Figure 3.4-1 below presents the projected ZEV deployment curve through 2030 based on a 2017 base year. Maryland costs to facilitate this level of deployment includes up to $1.2 million annually through 2030 for the Electric Vehicle Recharging Equipment Rebate Program and other costs associated with matching federal grants to expand public EV charging infrastructure throughout Maryland.
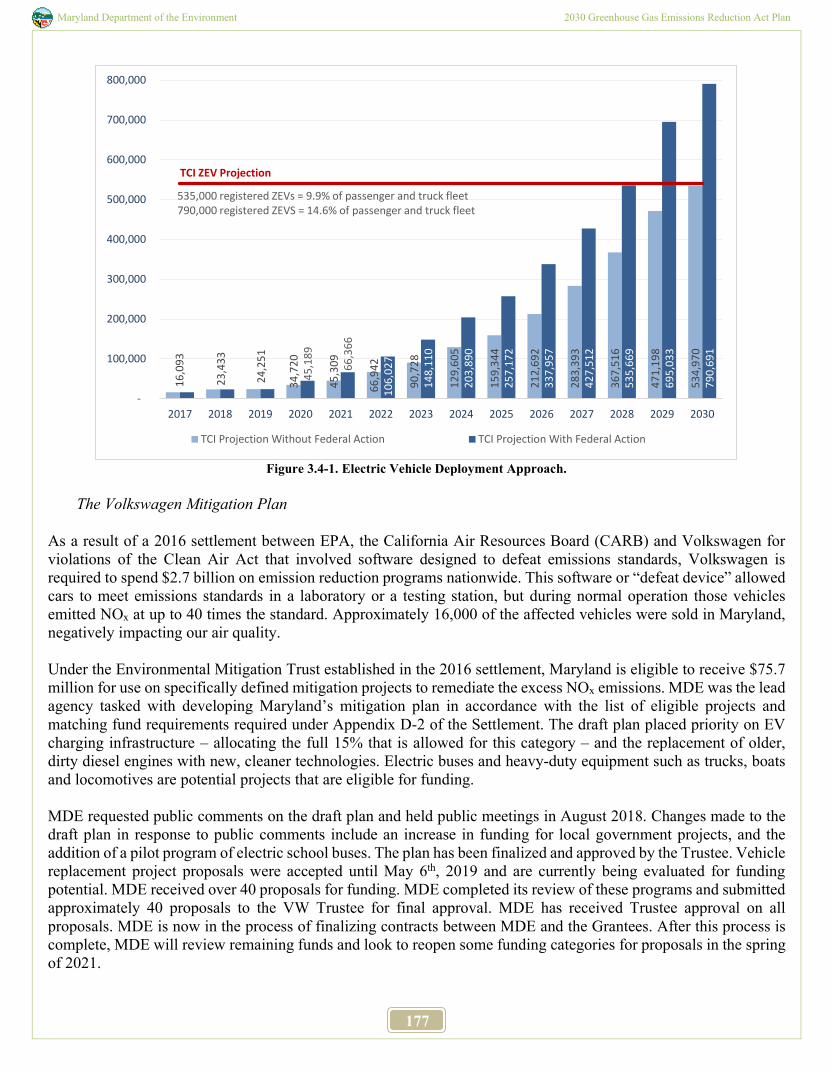
Maryland Department of the Environment 2030 Greenhouse Gas Emissions Reduction Act Plan
177
Figure 3.4-1. Electric Vehicle Deployment Approach.
The Volkswagen Mitigation Plan
As a result of a 2016 settlement between EPA, the California Air Resources Board (CARB) and Volkswagen for violations of the Clean Air Act that involved software designed to defeat emissions standards, Volkswagen is required to spend $2.7 billion on emission reduction programs nationwide. This software or “defeat device” allowed cars to meet emissions standards in a laboratory or a testing station, but during normal operation those vehicles emitted NOx at up to 40 times the standard. Approximately 16,000 of the affected vehicles were sold in Maryland, negatively impacting our air quality. Under the Environmental Mitigation Trust established in the 2016 settlement, Maryland is eligible to receive $75.7 million for use on specifically defined mitigation projects to remediate the excess NOx emissions. MDE was the lead agency tasked with developing Maryland’s mitigation plan in accordance with the list of eligible projects and matching fund requirements required under Appendix D-2 of the Settlement. The draft plan placed priority on EV charging infrastructure – allocating the full 15% that is allowed for this category – and the replacement of older, dirty diesel engines with new, cleaner technologies. Electric buses and heavy-duty equipment such as trucks, boats and locomotives are potential projects that are eligible for funding. MDE requested public comments on the draft plan and held public meetings in August 2018. Changes made to the draft plan in response to public comments include an increase in funding for local government projects, and the addition of a pilot program of electric school buses. The plan has been finalized and approved by the Trustee. Vehicle replacement project proposals were accepted until May 6th, 2019 and are currently being evaluated for funding potential. MDE received over 40 proposals for funding. MDE completed its review of these programs and submitted approximately 40 proposals to the VW Trustee for final approval. MDE has received Trustee approval on all proposals. MDE is now in the process of finalizing contracts between MDE and the Grantees. After this process is complete, MDE will review remaining funds and look to reopen some funding categories for proposals in the spring of 2021.
16,0
93
23,4
33
24,2
51
34,7
20
45,3
09
66,9
42
90,7
28
129,
605
159,
344
212,
692
283,
393
367,
516
471,
198
534,
970
45,1
89
66,3
66
106,
027
148,
110
203,
890
257,
172
337,
957
427,
512
535,
669
695,
033
790,
691
-
100,000
200,000
300,000
400,000
500,000
600,000
700,000
800,000
2017 2018 2019 2020 2021 2022 2023 2024 2025 2026 2027 2028 2029 2030
TCI Projection Without Federal Action TCI Projection With Federal Action
TCI ZEV Projection
535,000 registered ZEVs = 9.9% of passenger and truck fleet790,000 registered ZEVS = 14.6% of passenger and truck fleet
Maryland Department of the Environment 2030 Greenhouse Gas Emissions Reduction Act Plan
178
In September 2020, MDE opened a Request for Information period for Maryland’s Volkswagen Electric Vehicle Infrastructure Program. The Program is intended to use the full 15 percent of the Volkswagen Mitigation Funds to help with the installation of EVSE at workplaces, State facilities, and destinations along AFCs. Under this program, MDE, in coordination with MDOT and MEA, developed two frameworks for proposals. The first details requirements for charging infrastructure located at workplaces and State facilities. The second details DC Fast Charging requirements along AFCs and at charging hubs. Additional information on Maryland’s Plan can be found at: https://mde.maryland.gov/programs/Air/Mobile- Sources/Pages/MarylandVolkswagenMitigationPlan.aspx
3.4.3 The Maryland Green Registry
Lead Agency: MDE
Program Description The Maryland Green Registry is a free program created to promote and recognize sustainable practices at organizations of all types and sizes within the state. Businesses, schools, nonprofits, government agencies and other organizations are all invited to join the program and share the steps they have taken to reduce their environmental footprint. Members complete a profile with information on at least five environmental best practices that their organization has in place and share a measurable result for at least one of those practices. These profiles are maintained on the program’s website for others to learn about practical and proven sustainable practices. The program website has tips and resources for best practices in the areas of environmental management and leadership, waste reduction, energy and water conservation, transportation and green building design. These lists offer examples of activities that may be included in an organization’s profile, as well as inspiration and ideas for future efforts.
Benefit
The program benefits both the members directly as well as the general public by providing transparency on the wide variety of environmental practices at businesses and organizations in their communities. The program also builds a case for undertaking voluntary practices by posting annual results of the total environmental benefits and costs saved. Collectively, members have reported saving on an annual basis more than 176 million kWh, reducing 9.4 million VMT, conserving 198 million gallons of water, and saving more than $76 million through the environmental best practices described in their member profiles. The program also provides an opportunity to recognize significant environmental results and commitment to continual improvement through the annual Leadership Awards. Leadership Circle designation is also available for prior award winners that go on to achieve further significant results. Members benefits include increased visibility of their member profiles through a government website, use of the program logo and window decal, free technical assistance to help businesses identify and implement cost-saving sustainable practices, member spotlights on social media, newsletters, webinars, and annual contests and prize drawings in addition to the Leadership Awards and Leadership Circle recognition. The annual Maryland Green Registry contests encourage members to engage in and share their experiences in implementing a particular set of environmental practices.
Partners
Maryland Department of the Environment 2030 Greenhouse Gas Emissions Reduction Act Plan
179
The Maryland Green Registry maintains active partnerships with local governments, environmental and community groups, universities and colleges, and other state agencies.
Conclusion
Maryland will continue to grow the membership of the Maryland Green Registry program with the help of partner organizations in order to recognize and encourage voluntary environmental practices and to assist in directing information and technical resources that promote the continual improvement of environmental performance at all member organizations.
3.4.4 Idle Free Maryland
Lead Agency: MDE
Program Description Idle Free Maryland is a partnership between the State, the private sector and Maryland schools, which is designed to reduce unnecessary idling through outreach, education and voluntary action. For now, the initiative focuses on three types of idling activities:
• Motorists who idle their cars for a variety of reasons; • Idling by truckers; and • Idling around schools.
Idling emits about 11 million tons of CO2, 55,000 tons of NOx, and 400 tons of particulate matter in the United States each year. These pollutants contribute to climate change and can cause cancer, respiratory issues, reproductive effects, birth defects and other serious illnesses. Idling also impacts the health of Maryland streams, rivers, lakes, bays and coastal waters, increasing the levels of nitrogen in the Chesapeake Bay. Reducing vehicle idling is increasingly seen as a way to improve air quality and to help meet climate change goals. The goal of the Idle Free program is to significantly reduce idling by building awareness of its impact on Maryland communities. The program establishes partnerships with motorists, communities, and the transportation industries with the intention of reducing emissions from unnecessary idling by decreasing the social tolerance of idling through fact-based education. Resources have been created to help spread the word about idling’s impact on health and the environment. The tools developed are aimed at educating motorists, schools, and transportation industries on ways to implement an idle-reduction plan. The campaign includes a toolkit of more than 30 products, including fact sheets, social media materials, pledge sheets, signage, policies and other communications media. This includes resources developed specifically for implementation in schools.192
Benefits If every driver who took the pledge to be idle free could reduce their idling by just five minutes a day, it would prevent 25 pounds of harmful air pollutants and 260 pounds of CO2 from entering the atmosphere each year. Idle Free Maryland reductions will help the State meet its climate change goals by reducing GHG emissions. The initiative will also reduce emissions of other air pollutants and help the State better protect public health by continuing to make progress on ground-level ozone and fine particulate air pollution. If half of Maryland drivers would make that “five minutes a day” commitment, more than 50 million pounds of pollutants per year could be
192 https://mde.maryland.gov/idlefreeMD
Maryland Department of the Environment 2030 Greenhouse Gas Emissions Reduction Act Plan
180
prevented from entering Maryland’s air. Idle Free MD will not only improve the air quality in Maryland communities, but also reduce the negative impact of air pollution on streams, rivers, lakes, bays and the Chesapeake Bay.
Partners MDE and its State partners, MDOT, MEA, and the Maryland State Department of Education, are working with several key partners to implement Idle Free Maryland. These include the Maryland Motor Truck Association. MDE is working with individual schools, many of which are Green Schools, to assist in implementing their own idle reduction strategies. Green Schools is a program administered by the Maryland Association for Environmental & Outdoor Education (MAEOE) so that schools and their communities can evaluate and improve their efforts in environmental sustainability. So far, over fifty-five partner schools and five State Green Centers, which work with schools to achieve their educational and environmental goals, have signed on as partners. MDE has participated in Green School evaluations, made presentations to teacher conferences, and had a booth at MAEOE’s year-end Youth Summit where students could play games and get stickers while teachers could sign up their schools to become Idle Free partners. Opportunities for further engagement with communities, local governments, school systems and additional transportation industry sectors are continually being sought.
Conclusion The tools and resources to launch Idle Free MD have been completed. Additional outreach and stakeholder engagement are planned to increase awareness of the program. MDE will continue to evaluate potential recognition and incentive programs to encourage involvement. There will also be increased emphasis on tracking the results from the Idle Free MD campaign and identifying avoided emissions due to the implementation of the program. Projected emission reductions from the Idle Free MD initiative through 2030 have not been included in the 2030 GGRA Plan. MDE expects the GHG emission reduction from this effort to exceed 100,000 metric tons of CO2e by 2030. As the program matures, MDE may include reductions in future updates to the 2030 GGRA Plan. 3.4.5 The Port Partnership
Lead Agencies: MDE, MDOT, MPA, and MEA
Program Description In December 2015, MDE, MDOT, and the Maryland Port Authority (MPA) entered into a voluntary agreement (the Agreement) that commits the agencies to work cooperatively to identify, develop, and, when appropriate, implement voluntary projects that will reduce emissions and increase energy efficiency at the Port of Baltimore (Port). The port partnership workgroup is primarily focused on reducing emissions at the Port to help the state meet air quality and climate change goals, but also acknowledges the role that the Port plays in driving economic growth and creating jobs. The workgroup made up of representatives from the participating agencies has been meeting monthly to efficiently and effectively leverage resources and pool their knowledge to implement the Agreement’s goals. In December of 2020, the partnership received significant support from MEA. The increased participation from important stakeholders, like MEA, resulted in an update to the 2015 Voluntary Agreement.
NEW Voluntary Agreement: Dec. 9, 2020
Maryland Department of the Environment 2030 Greenhouse Gas Emissions Reduction Act Plan
181
MDOT, the Maryland Port Administration (MDOT MPA), the Air and Radiation Administration of MDE, and MEA (collectively the "Parties") worked together on projects of mutual interest that have improved air quality and enhanced the Port business environment. These innovative projects and programs have demonstrated both environmental and economic benefits to the region and the State. Since 2008, the Port has received $11 million in USEPA grants to upgrade and buy new equipment and vehicles. The Port Diesel Equipment Replacement Program has achieved over 3,300 tons of pollutant reductions since 2008. MDE, MDOT MPA and MEA desire to build on and enhance their prior cooperative efforts. By executing the Agreement, the Parties seek to improve air quality, achieve GHG reductions, and enhance public health, thereby benefiting the region and the State. They also seek to support a vibrant and thriving Port business environment, thereby benefiting the economic health of the region and the State. The Parties seek to engage and solicit input from stakeholders, including those that have been underserved and overburdened, and the private sector, when evaluating projects and programs to implement. The Parties commit to working cooperatively to implement projects and programs that reduce air pollutants such as NOx and particulate matter and that further the policy objectives of Maryland’s GGRA of 2016, given the threat that climate change poses to Maryland, including the Baltimore region. This work should include projects and programs to increase climate resiliency and reduce air pollution and climate change impacts in communities. The purpose of the updated Voluntary Agreement is to document and confirm the Parties' ongoing commitment to pursue mutually agreeable and cooperative efforts that will sustain and advance the economic health of the Port of Baltimore and protect the environment of the State of Maryland. It is recognized that MDOT MPA can only represent its own programs and actions and not those of private interests at the Port of Baltimore. The Voluntary Agreement also documents and confirms the Parties’ commitment to advancing the use of clean energy where practicable.
RECITALS WHEREAS, MDOT MPA, MDE and MEA are committed to the protection and restoration of the environment of the State of
Maryland; and WHEREAS, MDOT MPA, MDE and MEA are committed to advancing the economic health of the State of Maryland through
successful Port related business practices and appropriate development activities; and WHEREAS, MDOT MPA owns several marine terminals and Port facilities in the State, and has a legislatively mandated mission "to
stimulate the flow of waterborne commerce through the State of Maryland in a manner that provides economic benefit to the citizens of the State"; and
WHEREAS, stewardship and sustainability of the environment and protection of human health are essential elements of MDOT MPA's mission and have been incorporated into its daily practices as reflected in its ISO 14001:2015 EMS Certification; and
WHEREAS, MDOT MPA has taken innovative and effective actions, implemented operational efficiencies, purchased equipment, and installed upgrades to reduce air emissions; and
WHEREAS, MDOT MPA is implementing innovative technologies to increase energy efficiency and clean energy and is working with MEA and MDE to identify new projects to achieve the Governor’s Executive Order 01.01.2019.08 of a 10% reduction in energy consumption; and
WHEREAS, MDOT MPA, MEA, and MDE will collaborate on efforts to identify energy efficiency, alternative fuels, clean energy and energy resiliency opportunities that benefit the state’s clean energy, climate and economic development; and workforce goals.
WHEREAS, MDOT MPA has conducted and will continue to conduct extensive stakeholder outreach and citizen engagement activities in pursuing its environmental initiatives; and
WHEREAS, MDE is Maryland's principal regulatory agency with jurisdiction in the areas of environmental protection and pollution prevention, including air quality and climate change; and
WHEREAS, the Parties acknowledge that implementing air quality improvement projects provides an important environmental co-benefit that improves water quality in the Chesapeake Bay; and
WHEREAS, MDE has developed and implemented numerous emissions reduction projects in the State that utilized a variety of technologies; and
WHEREAS, the Parties will coordinate in identifying funding sources for project implementation including but not limited to government and foundation grant programs; and
WHEREAS, the Parties to this Agreement understand that both the operations of MDOT MPA and the air quality challenges facing the State of Maryland are complex, and require increased innovation, funding, and expertise; and
Maryland Department of the Environment 2030 Greenhouse Gas Emissions Reduction Act Plan
182
WHEREAS, the Parties intend by entering into this Agreement to be better able to address these challenges by, among other things: 1) fostering positive interagency coordination, consultation, and cooperation; 2) creating a framework for improving working relationships and for better understanding each other's programs; 3) building trust among the agencies involved in the processes; 4) sharing technical expertise; 5) engaging other stakeholders involved in regional air quality issues; and 6) to the extent possible, promptly sharing data and documents relevant to air quality emissions reduction strategies and implementation plans
NOW THEREFORE, THE PARTIES AGREE THAT:
1. They will continue to work cooperatively to identify, develop and when appropriate, implement new, cost-effective, voluntary
programs to reduce emissions and increase energy efficiency.
2. MDE and MEA will identify and assist MDOT MPA in applying for federal and State grants for these purposes.
3. The Parties will continue to meet in a workgroup and, where appropriate, form new ones on specific areas, including, but not limited to, developing a current emissions inventory, identifying opportunities where MDOT MPA can reduce emissions, and pursuing grant/funding opportunities to implement projects.
4. They will meet periodically to discuss the ongoing efforts and plans for the future.
Benefits
As a result of this unique collaboration, Maryland has made great strides in implementing Port-related projects that have supported a number of emissions reduction grant-supported initiatives, such as projects funded by the Diesel Emission Reduction Act (DERA) Grants. DERA-funded projects have supported the replacement of drayage trucks, cargo handling equipment, and installation of idle reduction equipment on switcher locomotives. To date, over $18 million has been invested into diesel emission reduction activities at the Port. Agreement-supported projects to date will, over the lifetime of the equipment, reduce in excess of 2,500 tons of air pollutants, including NOx, particulates, hydrocarbons and carbon monoxide (CO). The emission reduction activities at the Port will also result in significant reductions in GHG emissions, primarily CO2 and black carbon. The Port-related emission reduction projects continue through 2019 and 2020. The partnership was successful in obtaining a $2.4 million grant, as part of the 2018 DERA process, which will be used to upgrade drayage trucks, cargo handling equipment, and marine engines. In addition to the 2018 DERA initiative, there are several Port projects that will be funded as part of the Volkswagen Mitigation Fund (see Section 3.4.6). Funding from the Volkswagen Mitigation Plan will be used to reduce diesel emissions from the legacy fleet, including drayage trucks and cargo handling equipment. All of the 2019/2020 projects will not only reduce key air pollutants, like NOx and fine particulates but will continue to provide significant reductions of CO2 and black carbon. The Partnership also supports research opportunities. MDOT MPA sponsored Fellows from the Environmental Defense Fund’s (EDF) Climate Corps Program in the summers of 2018 and 2019 on two different research projects. The first project involved studying the potential effectiveness of natural gas fuel cell technology to reduce emissions. This fuel cell study provided guidance for the workgroup as it seeks cost effective reduction projects. MDOT MPA is deploying a natural gas fuel cell to help with peak energy savings in one of its maintenance buildings as a result of this work. The second project looked at carbon sequestration at restored wetlands on dredged material and used Hart Miller Island as the case study (see additional information below). The partnership plans to continue to implement new emission reduction programs every year between now and 2030.
Partners In addition to the primary partners, MDE, MDOT, and MDOT MPA, the workgroup’s projects and initiatives have benefited greatly with the active involvement of others, including the Environmental Defense Fund, MEA, the
Maryland Department of the Environment 2030 Greenhouse Gas Emissions Reduction Act Plan
183
Maryland Clean Energy Center, the U.S. Maritime Administration, and private port businesses. The workgroup also continues to place a high priority on involving key stakeholders, especially those in underserved areas and has received direct input from residents of the Turner Station, Curtis Bay, and Brooklyn communities. As part of this partnership, for the past three years, MDOT MPA has sponsored graduate students from the Environmental Defense Fund’s Climate Corps Program. Through this fellowship program, each student researched opportunities for technology deployment at Port facilities to reduce GHG emissions. This included, but was not limited to, the use of fuel cells and shore power.
Conclusion The workgroup will build on its initial successes by continuing to pursue ways for the Port to grow sustainably. Specifically, the workgroup will focus on developing future innovative emission reduction and energy-saving projects and has already identified potential funding sources for these projects. Over the past 20 years, the State, through MDOT MPA has worked diligently to identify and implement a variety of environmental programs, with a focus on climate initiatives for MDOT MPA and its tenants’ operations, including the following items: Quantifying GHG and criteria air pollutant emissions from Port operations through land-side and water-side air emission inventories, which began in 2008 with the 2006 Comprehensive Baseline Inventory of Landside Air Emissions. Inventories help identify target areas for GHG reductions and track the progress of those programs. Promoting energy efficiency and grid resiliency through Port-wide energy audits and engaging with energy service companies (ESCOs) to design, build, and fund projects that save energy (thereby reducing GHGs), reduce energy costs, and decrease operations and maintenance costs at Port and tenant facilities. Securing over $18 million in federal and state funding to replace or retrofit older, less-efficient diesel engines in drayage trucks, cargo-handling equipment, harbor craft, and switcher locomotives. A highlight of the diesel emission reduction program is the Dray Truck Replacement Program, which provides funds to truck owners to help defray the cost of replacing older trucks with newer, more efficient models. Approximately 200 trucks have been replaced through this program. While primarily focused on reducing criteria pollutant emissions, the newer trucks are more efficient, resulting in reduced GHG emissions as well as fuel consumption. Reusing dredged materials for wetland and coastal habitat restoration projects. Along with providing habitat and water quality benefits, wetlands help store carbon and decrease storm surges, helping to enhance coastal resiliency in adjacent waterways. Instituting new technologies at Port terminals, such as optical character recognition cameras/software to track container movements at the terminal and instituting chassis pooling to reduce the number of truck moves, thereby, reducing trips, idling, and emissions. Partnering with community groups to promote environmental awareness and funding projects, such as the Schoolyard Greening Program, which replaces pavement at local schools with trees and planting to reduce stormwater runoff, provide greenspace, and promote carbon uptake. GHG emission reductions from the Port Partnership are included in the 2030 GGRA Plan. The partnership’s goal is to implement new emission reduction projects through 2030 and beyond. By 2030, this partnership could achieve an additional reduction in GHG emissions approaching the 500,000 metric tons of CO2e level. The Port initiatives will not only help reduce emissions of CO2, but it will also help reduce emission of black carbon, a very potent GHG. As this effort continues to grow, MDE plans to include GHG reductions in future plan updates.
Hart Miller Island Carbon Sequestration
Maryland Department of the Environment 2030 Greenhouse Gas Emissions Reduction Act Plan
184
Hart-Miller Island (HMI) is a State-owned former dredged material placement site located within the Chesapeake Bay near the mouth of Back River. The site was originally two separate islands, Hart Island and Miller Island, which were both eroding at a rapid pace. The Maryland Geological Society predicted that Miller Island would be gone by 2008 and Hart Island by 2045. In 1970, Congress approved deepening of the Port of Baltimore navigation channels, and MDOT MPA began placing dredged material to join and restore Hart and Miller Islands. HMI now includes wetlands, forests, trails, and sand beaches managed by DNR. The restored south area opened to the public in 2016 for wildlife viewing and recreation. Along with restoring nearshore habitat and creating a resource for recreational activities, HMI serves as a potential CO2 sink. MDOT MPA is currently investigating the amount and rate of carbon sequestration in the site to assess if HMI could be a significant carbon capture and storage opportunity. Closure and restoration of former dredged material sites, such as HMI, may provide sustainable and long-term sequestration of carbon through vegetation growth and creation of wetlands and marshes. 3.4.6 The Volkswagen Mitigation Fund
Lead Agency: MDE
Program Description On Sept. 18, 2015, the EPA and the California Air Resources Board (CARB) issued a Notice of Violation of the CAA to Volkswagen AG (VW), Audi AG and Volkswagen Group of America, Inc. alleging that model year 2009-2015 Volkswagen and Audi diesel cars equipped with 2.0-liter and 3.0-liter engines included software that circumvents EPA and CARB emissions standards for NOx. Approximately 550,000 vehicles in the United States had "defeat devices" installed; approximately 16,000 were delivered to Maryland. On October 25, 2016, the U.S. District Court for the Northern District of California approved a Partial Consent Decree between the U.S. Justice Department and VW regarding excess emissions of NOx due to the installation of "defeat devices" on 2.0-liter diesel engines. The use of "defeat devices" has increased vehicle emissions of NOx, resulting in adverse effects on air quality. The Consent Decree established an Environmental Mitigation Trust of $2.7 billion to fully remediate the excess NOx emissions from the affected 2.0-liter and 3.0-liter vehicles. The State of Maryland is eligible to authorize spending $75.7 million from the VW Trust to use for specifically defined eligible mitigation projects. To guide the use of funds over the Trust's 10-year lifetime, Maryland has developed a Mitigation Plan that outlines the eligible projects Maryland will use to reduce excess NOx emissions. MDE received over forty proposals for funding. MDE completed its review of these programs and submitted approximately forty proposals to the VW Trustee for final approval. MDE has received Trustee approval on all proposals. MDE is now in the process of finalizing contracts between MDE and the Grantees. After this process is complete, MDE will review remaining funds and look to reopen some funding categories for proposals in the spring of 2021. More information on the Mitigation Plan can be found on the MDE website.193
Benefits Strategies for reducing NOx emissions will in most cases also result in reductions of GHG emissions. Many of the programs to be implemented under the VW Mitigation Plan will reduce both CO2 emissions and emissions of black carbon. Black carbon is a potent short-lived climate pollutant. Applicants seeking funds from the VW Trust needed to submit a proposal to MDE that specified, among other things, emission reductions from the planned project(s). The evaluation criteria for awarding funds included benefits from reducing other pollutants such as CO2. As projects
193 https://mde.maryland.gov/programs/Air/MobileSources/Pages/MarylandVolkswagenMitigationPlan.aspx
Maryland Department of the Environment 2030 Greenhouse Gas Emissions Reduction Act Plan
185
receiving funds from the VW Trust are implemented, MDE will track avoided/reduced CO2 emissions resulting from these projects. The evaluation criteria for proposed projects also includes identifying benefits to environmental justice and underserved communities. Addressing the needs of underserved communities is a priority for the MCCC.
Implementation Milestones Under the Environmental Mitigation Trust established in the 2016 settlement, Maryland is eligible to receive $75.7 million for use on specifically defined mitigation projects to remediate the excess NOx emissions. MDE was the lead agency tasked with developing Maryland’s mitigation plan in accordance with the list of eligible projects and matching fund requirements required under Appendix D-2 of the Settlement. The draft plan placed priority on EV charging infrastructure – allocating the full 15% that is allowed for this category – and the replacement of older, dirty diesel engines with new, cleaner technologies. Electric buses and heavy-duty equipment such as trucks, boats and locomotives are potential projects that are eligible for funding. MDE requested public comments on the draft plan and held public meetings in August 2018. Changes made to the draft plan in response to public comments include an increase in funding for local government projects, and the addition of a pilot program of electric school buses. The plan has been finalized and approved by the Trustee. Vehicle replacement project proposals were accepted until May 6th, 2019. MDE received over 40 proposals for funding. MDE completed its review of these programs and submitted approximately 40 proposals to the VW Trustee for final approval. MDE has received Trustee approval on all proposals. MDE is now in the process of finalizing contracts between MDE and the Grantees. After this process is complete, MDE will review remaining funds and look to reopen some funding categories for proposals in the spring of 2021.
Partners MDE has conducted extensive outreach with citizens, advocacy groups, local and state government and the private sector with a focus on communities that bear a disproportionate share of the air pollution burden. Citizen and advocacy group engagement is a priority for Maryland. MDE met with citizens at community meetings to discuss the opportunities for funding, as well as, to obtain input on project opportunities. MDE has also worked closely with MEA and MDOT and its business units such as the MD Port and Transit Administrations, in addition to the Baltimore Port Alliance to identify projects to implement at Port facilities and in communities near the Port of Baltimore.
Conclusion The use of funds from the VW Trust to implement projects will provide air quality benefits, including reductions in GHG emissions, which contribute to meeting the policy goals in the GGRA of 2016. Projected emission reductions have not been included in the 2030 GGRA Plan. MDE will be tracking these important emission reductions and including them in updates to the 2030 GGRA Plan.
Challenges The COVID-19 pandemic has impacted the VW Settlement Program. MDE received requests from several applicants to withdraw their proposal from consideration. This happened despite these proposals already receiving approval from both MDE and the Trustee. The reason for these withdrawals was that due to the financial impact of COVID-19 the applicants were no longer in the financial position to explore these new projects. In addition, several projects have had their completion date extended to a later period. One reason for these extensions was to allow the applicant time to recover financially so they would be able to fund the new projects. A second reason was that many companies experience production delays, which has pushed back their delivery times for new products. This would include products such as electric school buses, transit buses and chargers.
Maryland Department of the Environment 2030 Greenhouse Gas Emissions Reduction Act Plan
186
3.4.7 The Metropolitan Washington Council of Governments’ (MWCOG) Climate Energy and Environmental Policy Committee (CEEPC)
Lead Agency: MDE
Program Description
In November 2008, MWCOG’s Board of Directors adopted the National Capital Region Climate Change Report, committing the region to meeting GHG emission reduction goals of 80% by 2050. COG brings area leaders together to address major regional issues in the District of Columbia, suburban Maryland, and Northern Virginia. COG’s membership is composed of 300 elected officials from 24 local governments, the Maryland and Virginia state legislatures, and U.S. Congress. MDE was a member of the Climate Change Steering Committee (CCSC) that developed the regional climate initiative. COG’s Climate, Energy and Environment Policy Committee (CEEPC) was created by the COG Board on April 8, 2009 through Resolution R18-09. The Committee serves as the board’s principal policy adviser on climate change, energy, green building, alternative fuels, solid waste and recycling policy issues, and other environmental issues as the board may assign. CEEPC is responsible for managing the implementation of the National Capital Region Climate Change Report. This responsibility includes development of a regional climate change strategy to meet the regional GHG reduction goals adopted by the board. CEEPC includes representatives from COG’s member governments, state environmental, energy, and transportation agencies, state legislatures, the Air and Climate Public Advisory Committee (ACPAC), federal and regional agencies, electric and gas utilities, environmental organizations, business organizations, and members of the academic community. In addition to the local county and city government members of COG, MDE, MEA, and MDOT are members of CEEPC. Stakeholders from Maryland also regularly participate in CEEPC and regional actions. Climate change activities in the region are guided in part by CEEPC’s Regional Climate and Energy Action Plan, a tool first developed in 2009 to help the region achieve its regional GHG emission reduction goals. The plan puts forth recommended actions for local governments aimed at reducing the carbon impact of the built environment, energy, and transportation sectors, while increasing resiliency and improving education and outreach. Regional efforts are also supported by COG’s Built Environment and Energy Advisory Committee (BEEAC), regional working groups (EVs, tree canopy, agriculture, urban heat island), and the COG Solid Waste and Recycling Committee. Policies and actions are also closely coordinated with COG’s Transportation Planning Board (TPB), Metropolitan Washington Air Quality Committee (MWAQC), and Chesapeake Bay and Water Resources Policy Committee, among other committees. COG and its partners base their climate actions on pillars of economic development, innovation, and finance, while also focusing on issues such as resilience, equity, and competitiveness. COG supports action plan implementation, manages a voluntary data sharing agreement with electric and natural gas utilities, and regularly tracks and shares progress on leading climate and energy indicators through a Regional Climate and Energy Progress Dashboard. COG, state agencies, local members, and other stakeholders routinely collaborate to identify and develop programs and projects to support key activities to reduce emissions and manage efforts to transition to cleaner low-emitting technologies and solutions.
Benefits
Maryland Department of the Environment 2030 Greenhouse Gas Emissions Reduction Act Plan
187
As a result of this strong framework for regional collaboration, COG, member governments, and regional stakeholders have made great strides in implementing programs to address climate change. Some of the more impactful programs have included Sustainable Maryland, Maryland Smart Energy Communities, U.S. Department of Energy programs, including the Better Buildings Residential network, the Rooftop Solar Challenge and Solar Market Pathways initiatives, combined heat and power and microgrid development partnerships, efficient outdoor lighting programs, the Fleets for the Future initiative and the Mid-Atlantic Property Assessed Clean Energy Financing Alliance. COG’s regional dashboard shows that regional climate initiatives through COG and its partners have resulted in significant outcomes across Charles, Frederick, Montgomery, and Prince George’s counties, including:
• GHG emission reductions of 16% between 2005 – 2015. • High performance buildings increased from just over 20 in 2005 to more than 4,198 as of 2019. • Grid-connected renewables have grown from 275 systems with 2,900 kilowatts of capacity in 2009 to more
than 38,700 systems with 4 megawatts of capacity as of 2018. • In 2016 there were more than 123,800 hybrid and EV owners. • As of 2015, 11% of regional energy consumption comes from renewables, with the potential to reach 20%
by 2020. This equates to 6.7 million megawatt hours of renewables in 2015 and more than 12 megawatt hours in 2020.
• On road emissions are expected to drop by 2020 due to the improving fuel economy of vehicles and increasing alternative trip modes.
• EV charging stations in the metropolitan Washington area increased from 124 in 2012 to 852 in 2019.
Updates In October 2020, per CEEPC’s recommendation, the COG Board adopted (and TPB affirmed) the climate mitigation goal of 50% GHG emission reductions below 2005 levels by 2030. Climate Ready Region: To be Climate Ready by 2030, all local governments must assess current and future climate risks, and be actively integrating climate planning across government plans, operations, and communications. Climate Resilient Region: To fully be a Climate Resilient Region, the region must have the ability to adapt and absorb against disturbances caused by current and future, acute and chronic climate impacts and successfully maintain essential functions. The 2030 GHG emission reduction goals adopted by the COG Board of Directors on October 14, 2020 align with the level of effort called for by the Intergovernmental Panel on Climate Change (IPCC). COG Board Resolution R45-2020 established interim climate change goals including:
• The climate mitigation goal of 50% GHG emission reductions below 2005 levels by 2030; • The climate resilience goal of becoming a Climate Ready Region and making significant progress to be a
Climate Resilient Region by 2030; and • The need to incorporate equity principles and expand education on climate change into COG’s CEEPC and
its members’ actions to reach the climate mitigation and resiliency goals.
Next Steps
• Adopt Metropolitan Washington 2030 Climate and Energy Action Plan. • Submit to Global Covenant of Mayors. • Continue support for local plan development. • Continue implementation support. • Support local action cost effectiveness.
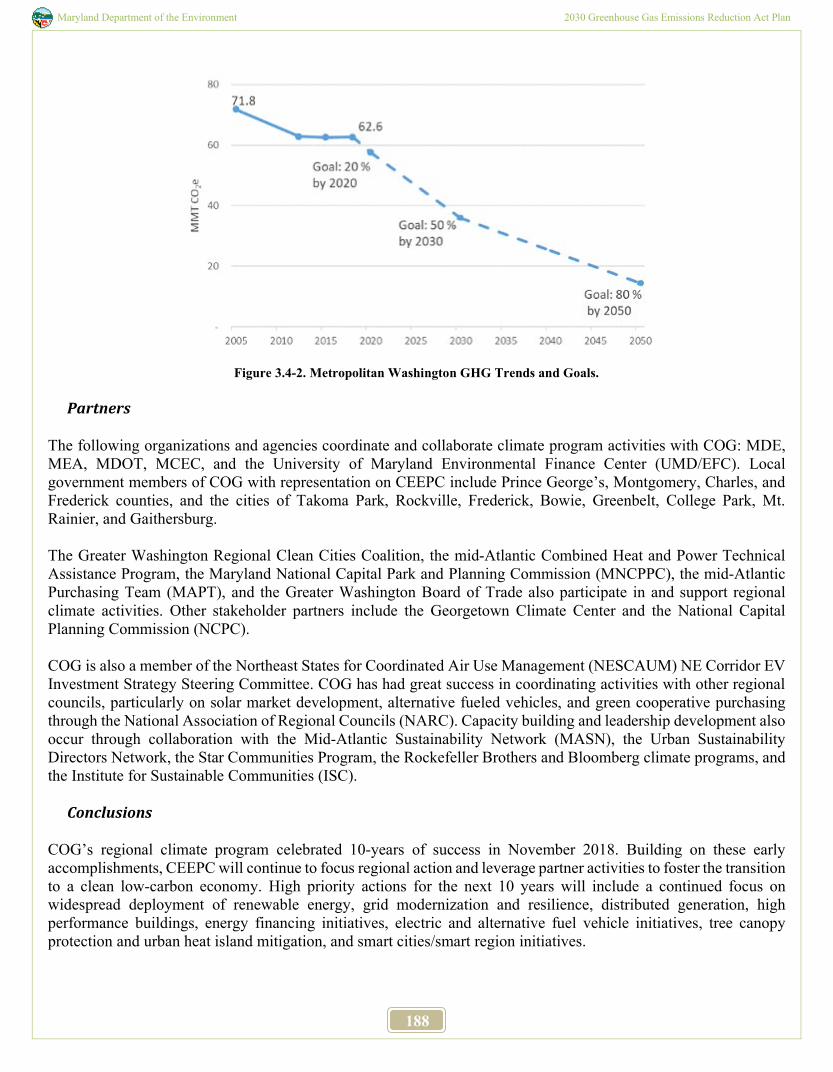
Maryland Department of the Environment 2030 Greenhouse Gas Emissions Reduction Act Plan
188
Figure 3.4-2. Metropolitan Washington GHG Trends and Goals.
Partners
The following organizations and agencies coordinate and collaborate climate program activities with COG: MDE, MEA, MDOT, MCEC, and the University of Maryland Environmental Finance Center (UMD/EFC). Local government members of COG with representation on CEEPC include Prince George’s, Montgomery, Charles, and Frederick counties, and the cities of Takoma Park, Rockville, Frederick, Bowie, Greenbelt, College Park, Mt. Rainier, and Gaithersburg. The Greater Washington Regional Clean Cities Coalition, the mid-Atlantic Combined Heat and Power Technical Assistance Program, the Maryland National Capital Park and Planning Commission (MNCPPC), the mid-Atlantic Purchasing Team (MAPT), and the Greater Washington Board of Trade also participate in and support regional climate activities. Other stakeholder partners include the Georgetown Climate Center and the National Capital Planning Commission (NCPC). COG is also a member of the Northeast States for Coordinated Air Use Management (NESCAUM) NE Corridor EV Investment Strategy Steering Committee. COG has had great success in coordinating activities with other regional councils, particularly on solar market development, alternative fueled vehicles, and green cooperative purchasing through the National Association of Regional Councils (NARC). Capacity building and leadership development also occur through collaboration with the Mid-Atlantic Sustainability Network (MASN), the Urban Sustainability Directors Network, the Star Communities Program, the Rockefeller Brothers and Bloomberg climate programs, and the Institute for Sustainable Communities (ISC).
Conclusions
COG’s regional climate program celebrated 10-years of success in November 2018. Building on these early accomplishments, CEEPC will continue to focus regional action and leverage partner activities to foster the transition to a clean low-carbon economy. High priority actions for the next 10 years will include a continued focus on widespread deployment of renewable energy, grid modernization and resilience, distributed generation, high performance buildings, energy financing initiatives, electric and alternative fuel vehicle initiatives, tree canopy protection and urban heat island mitigation, and smart cities/smart region initiatives.
Maryland Department of the Environment 2030 Greenhouse Gas Emissions Reduction Act Plan
189
Specific additional emission reductions from the COG Climate Action Plan through 2030 and beyond have not been included in the 2030 GGRA Plan. MDE will be working with COG to calculate and may include reductions in future updates to the plan. 3.4.8 Medium- and Heavy-Duty Zero Emission Vehicle (ZEV) Memorandum of Understanding (MOU) Lead Agencies: MDE, MDOT, and MEA
Program Description On July 14, 2020, 15 states and the District of Columbia announced a joint MOU committing to work collaboratively to advance and accelerate the market for electric medium- and heavy-duty vehicles (MHDVs), including large pickup trucks and vans, delivery trucks, box trucks, school and transit buses, and long-haul delivery trucks. The goal is to ensure that 100% of all new medium- and heavy-duty vehicle sales be ZEVs by 2050 with an interim target of 30% ZEV sales by 2030. States signing the MOU include California, Connecticut, Colorado, Hawaii, Maine, Maryland, Massachusetts, New Jersey, New York, North Carolina, Oregon, Pennsylvania, Rhode Island, Vermont, and Washington. To provide a framework and help coordinate state efforts to meet these goals, the signatory jurisdictions will work through the existing multi-state ZEV Task Force facilitated by the Northeast States for Coordinated Air Use Management (NESCAUM) to develop and implement a ZEV action plan for trucks and buses. Maryland has outlined a Maryland Clean Truck Planning Framework. In November of 2020, MDE, MDOT, and MEA hosted two webinars to discuss the MHDV MOU and Clean Truck Planning Framework to engage stakeholders and communities to collaboratively develop an action plan to reduce air pollution and GHG emissions from the trucking industry, while preserving existing jobs and creating new jobs. The MOU will do a long way toward slashing harmful diesel emissions and cutting carbon pollution.
Background The transportation sector is the nation’s largest source of GHG emissions and also contributes to unhealthy levels of smog in many of the signatory states. After passenger cars and light trucks, MHDVs are the next largest source of transportation sector GHG emissions. In fact, emissions from trucks are the fastest growing sources of GHGs, and the number of truck miles traveled on the nation’s roads is forecast to continue to grow significantly in the coming decades. Accelerating the electrification of trucks and buses is an essential step to achieve the deep economy-wide emission reductions needed to avoid the worst consequences of climate change and protect the health of millions of Americans. Maryland has an obligation to provide citizens with air quality that complies with national health-based air quality standards. Fossil fuel related emissions from MHDVs are a major source of smog-forming NOx, particulate matter, and toxic air emissions which contribute to poor air quality. Emissions from MHDVs are a widely acknowledged, but mostly unaddressed, problem that directly and disproportionately impacts disadvantaged communities located near freight corridors, ports and distribution centers. Truck and bus electrification can also deliver wide-spread health benefits, particularly in these communities with heavy truck traffic that are burdened with higher levels of air pollution. The MOU comes at an important transition point for the industry as investment in ZEV technology for the medium- and heavy-duty sector continues to ramp up. Today, at least 70 electric truck and bus models are on the market, and
Maryland Department of the Environment 2030 Greenhouse Gas Emissions Reduction Act Plan
190
manufacturers are expected to make many more new models commercially available over the next decade. Apart from the public health benefits and avoided health care costs zero emission trucks and buses provide, by 2030, the total cost of ownership for many common commercial vehicles is projected to reach parity with conventionally fueled vehicles. By promoting and investing in electric trucks and buses, the signatory jurisdictions will support job creation, and help to build a resilient and clean economy. Investment in electrification of the MHDV sector will help to stimulate economic growth by creating new jobs in the EV charging/fueling equipment manufacturing, supply chain and service sectors. 3.4.9 Transportation and Climate Initiative (TCI) Lead Agencies: MDE and MDOT Program Description The Transportation and Climate Initiative (TCI) is a regional effort of 11 states from the Northeast, Mid-Atlantic, and Southeast, and the District of Columbia. The states have collaborated for more than a decade on projects to advance clean transportation solutions at a regional scale, including coordination on EV charging infrastructure and signage. The TCI states spent 2019 and 2020 developing a potential regional clean transportation program that would apply RGGI’s proven cap-and-invest model to emissions from on-road transportation fuels. A few of the TCI jurisdictions are moving to implement the program, which would provide additional funding to advance cleaner transportation programs like those in the 2030 GGRA Plan, including investments in clean transportation infrastructure, electric trucks and buses, electric cars, and other projects. Details on the potential program and analysis of its expected benefits are available at transportationandclimate.org. Implementation Milestones Massachusetts, Connecticut, Rhode Island, and DC signed a Memorandum of Understanding committing to implement the cap-and-invest program in December 2020. The program will take effect in those jurisdictions in 2022 with a monitoring and reporting period, followed by a declining CO2 cap and clean transportation investments starting in 2023. Maryland and seven other states committed to continue working with those four signatory jurisdictions as they establish a model regulation that would serve as the basis for state regulations implementing the regional program, and as those states finalize the details for initial program implementation. 3.4.10 Leadership-By-Example – State of Maryland Initiatives Lead Agency: DGS
Program Description
The State of Maryland, through DGS and the DGS Office of Energy and Sustainability administers a comprehensive suite of lead-by-example programs that improve energy efficiency, reduce waste, integrate renewable energy, develop sustainable practices, and track the progress of these programs in all State operations and facilities.
Maryland Department of the Environment 2030 Greenhouse Gas Emissions Reduction Act Plan
191
These programs include:
• High Performance Buildings through the Maryland Green Building Council • Maryland Green Purchasing Committee • Generating Clean Horizons Utility-scale Renewable Energy Contracts • Energy Performance Contracting • State Energy Database • Facility submetering • Ongoing energy efficiency projects such as building retro-commissioning, lighting replacements, and
efficient HVAC installations. The objectives of these programs are to reduce energy consumption, lower utility bills, and reduce Maryland’s impact on the environment.
Supporting Laws and Regulations
• EXECUTIVE ORDER 01.01.2019.08 Energy Savings Goals for State Government • State Finance and Procurement 17 Section 4–803, 4–806, 12–301(a), and 12–302 18 Annotated Code of
Maryland • Maryland Green Building Council (Senate Bill 332/ House Bill 94) • EmPOWER Maryland Executive Directive • High Performance Buildings Act of 2008 (Senate Bill 208) • High Performance Buildings Act – Applicable to Community College Capital Projects (Senate Bill
234/House Bill 1044) • Green Purchasing Committee established by the Green Maryland Act of 2010 (Senate Bill 693/House Bill
1164)
Implementation Milestones
High Performance Buildings through the Maryland Green Building Council The Maryland Green Building Council was created to guide Maryland’s High Performance Building Program. By statute, DGS staffs and supports the Council. The Council is composed of private sector and State agency membership and makes recommendations about implementing the High Performance Building Program, assists the Governor and General Assembly on green building legislation and works to promote green building throughout the government and private sector. All new or significantly renovated fully State-funded buildings, K through 12 public schools and new community college buildings over 7,500 gross square feet must be constructed as High Performance Buildings. A High Performance Building is one that achieves a Silver rating or better under the U.S. Green Building Council’s Leadership in Energy and Environmental Design (LEED) rating system, a two Green Globes rating or better under the Green Building Initiative’s Green Globes rating system, or which complies with the Maryland Green Building Council’s supplement to the International Green Construction Code (IgCC) enacted in November 2014. Maryland Green Building Council 2019 Annual Report Summary The 2019 Maryland Green Building Council Annual Report highlights the importance of increasing energy efficiency in State buildings. The Council set four goals in 2019 to help increase the energy efficiency in State buildings. The first goal is to concentrate on existing building education, which includes upgrading existing buildings
Maryland Department of the Environment 2030 Greenhouse Gas Emissions Reduction Act Plan
192
for energy conservation. This first goal also focuses on how to improve the performance of existing buildings. The second goal is to conduct outreach, which entails correlating the Council’s initiatives with the governor’s agenda, as well as performing outreach and engaging with other state agencies. The third goal is energy efficiency education, which incorporates developing recommendations to measure energy and water use in existing buildings so they can guide upgrades in future facilities. This will help in the assistance of establishing state energy reduction goals. The final goal of financial incentives will help promote the use of green building standards for the private sector, along with recommending financial incentives for the renovation of existing facilities. During the 2019 session, the council reviewed several bills and provided informal recommendations while continuing its work to provide guidelines as required by the 21st Century Schools Facilities Act (Senate Bill 1243 and House Bill 1783). The Act requires that the “Maryland Green Building Council develop guidelines for achieving the equivalent of LEED Silver standards without requiring LEED certification of new school buildings, including some independent certification that school systems have achieved the required standards.” As stipulated in the Act, the council developed the required high performance green building guidelines for the Maryland Local Education Agencies. Guidelines were delivered to DGS for approval in October 2019. Maryland Green Schools Buildings: Collectively, the Maryland public schools program implements the greatest number of high performance facilities in the state. In 2019, notable projects initiated or completed in the state will seek or have achieved LEED Silver and Gold certifications. A few will achieve net zero status.
Maryland Green Purchasing Committee Anthropogenic impact on climate is driven in large part by human consumption, from the way things are made and purchased to how they are used and disposed. The Maryland Green Purchasing Committee was created to limit this impact and help lower the State’s environmental footprint while also protecting human health. The interagency Committee was created by the Green Maryland Act of 2010 and is tasked with promoting the procurement of environmentally preferable products and services. As part of this program, the Committee develops and executes statewide green purchasing policies, guidelines, and best practices, while conducting trainings to raise general awareness for these important issues. In 2018, the Maryland Green Purchasing Committee was reinvigorated under new leadership. This new iteration of the Committee identified a gap between sustainability and procurement that would need to be closed for an effective green purchasing program. To accomplish its ambitious goals, the Committee developed subcommittees to tackle topic-specific work and to take advantage of subject-matter expertise within and outside of its membership. It also developed numerous tools and resources to promote green purchasing awareness and compliance. In FY20, environmentally preferable purchasing by Maryland State agencies totaled $47,183,597. Environmentally preferred commodities purchased include office supplies, janitorial supplies, IT equipment, paints and coatings, and food service supplies with a cost savings of $821,179 and GHG reduction of 158,159 metric tons of CO2e accrued from these purchases.
Table 3.4-1. Environmental Benefits of Maryland’s Green Purchasing Program in FY20.
Equivalent To:
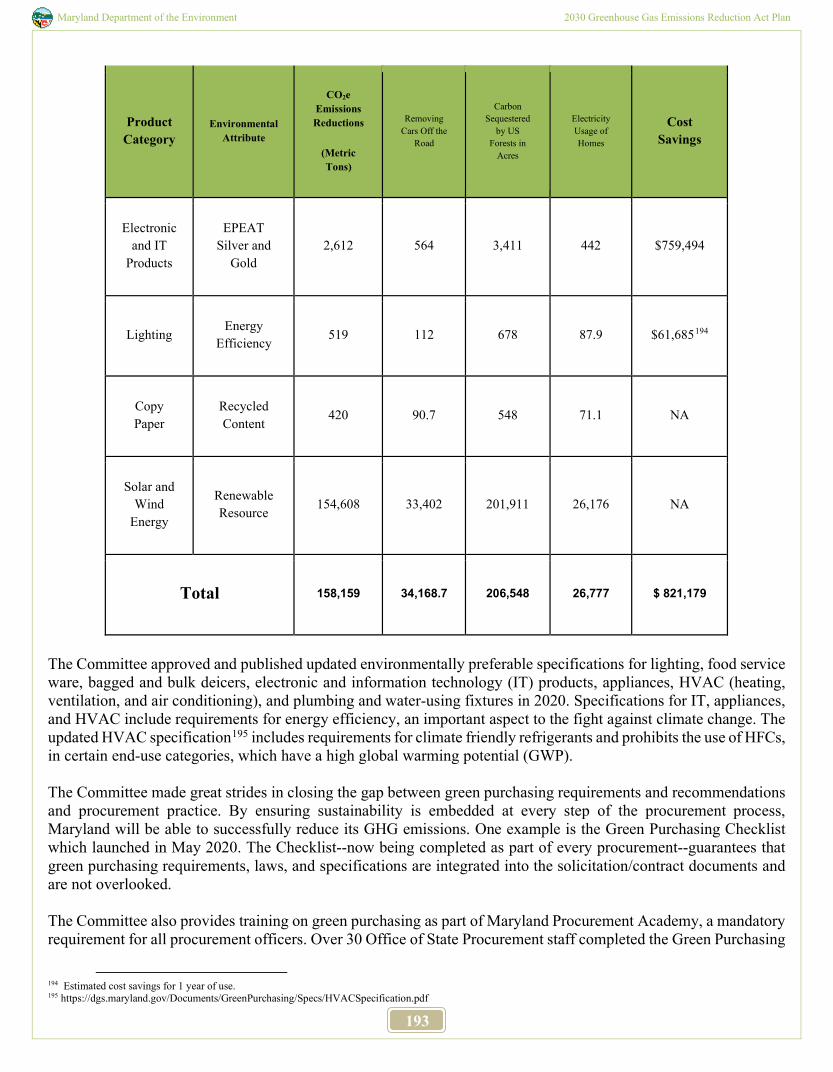
Maryland Department of the Environment 2030 Greenhouse Gas Emissions Reduction Act Plan
193
Product Category
Environmental Attribute
CO2e Emissions Reductions
(Metric Tons)
Removing Cars Off the
Road
Carbon Sequestered
by US Forests in
Acres
Electricity Usage of Homes
Cost Savings
Electronic and IT
Products
EPEAT Silver and
Gold 2,612 564 3,411 442 $759,494
Lighting Energy Efficiency 519 112 678 87.9 $61,685194
Copy Paper
Recycled Content 420 90.7 548 71.1 NA
Solar and Wind
Energy Renewable Resource 154,608 33,402 201,911 26,176 NA
Total 158,159 34,168.7 206,548 26,777 $ 821,179
The Committee approved and published updated environmentally preferable specifications for lighting, food service ware, bagged and bulk deicers, electronic and information technology (IT) products, appliances, HVAC (heating, ventilation, and air conditioning), and plumbing and water-using fixtures in 2020. Specifications for IT, appliances, and HVAC include requirements for energy efficiency, an important aspect to the fight against climate change. The updated HVAC specification195 includes requirements for climate friendly refrigerants and prohibits the use of HFCs, in certain end-use categories, which have a high global warming potential (GWP). The Committee made great strides in closing the gap between green purchasing requirements and recommendations and procurement practice. By ensuring sustainability is embedded at every step of the procurement process, Maryland will be able to successfully reduce its GHG emissions. One example is the Green Purchasing Checklist which launched in May 2020. The Checklist--now being completed as part of every procurement--guarantees that green purchasing requirements, laws, and specifications are integrated into the solicitation/contract documents and are not overlooked. The Committee also provides training on green purchasing as part of Maryland Procurement Academy, a mandatory requirement for all procurement officers. Over 30 Office of State Procurement staff completed the Green Purchasing
194 Estimated cost savings for 1 year of use. 195 https://dgs.maryland.gov/Documents/GreenPurchasing/Specs/HVACSpecification.pdf
Maryland Department of the Environment 2030 Greenhouse Gas Emissions Reduction Act Plan
194
training in 2020 as they work towards earning a State of Maryland procurement credential. In 2021, the Academy will open to other State Agency procurement staff. Green Purchasing will continue to be a required course and will be delivered quarterly to new cohorts. Two awards were earned in 2020 in recognition of Maryland’s leadership in the procurement of sustainable electronics and IT:
• Silver level recognition in the State Electronics Challenge for its procurement of sustainable IT and responsible end-of-life management in 2019. (Northeast Recycling Council, Inc. with funding from the EPA.)
• EPEAT (Electronic Product Environmental Assessment Tool) Purchaser Award from the Green Electronics Council.
o EPEAT-registered products must meet environmental performance criteria that address materials selection, design for product longevity, reuse and recycling, energy conservation, end-of-life management, and corporate performance.
Maryland is continuing to demonstrate leadership in green purchasing. In FY21, DGS signed a pledge to “Increase Public-Sector Demand for Recycled Content Products” as a Government Recycling Demand Champion in a campaign hosted by the Northeast Recycling Council. DGS was the first state agency to sign the pledge. The State of Maryland has recently signed a pledge to “Avoid the Purchase and Use of Refrigerants with High Global Warming Potentials” as part of the Climate Friendly Cooling Campaign. The DGS Office of Business Programs (OBP) helps small, minority, woman and veteran-owned businesses grow by providing companies with access to procurement opportunities with DGS. Small businesses are the foundation of a strong, healthy and vibrant economy. In response to the challenges associated with the COVID-19 global pandemic, the Committee identified three priority focus areas: human health, climate, and saving money. Projects undertaken during FY21 support one or more of these high impact areas. The Green Purchasing website196 continues to grow and serves as a hub of information for State procurement staff, buyers, and vendors. Challenges Budgeting for Environmentally Preferable Purchasing (EPP) may be a challenge for State agencies, since in some cases, an EPP product may cost more up front, while saving money by lasting longer or using fewer resources over its life. In FY21, the Committee will issue guidance to agencies on saving money through green purchasing. The development of strict procurement rules or regulations is necessary in order to seek progressively elevated annual spend totals for environmentally preferable products and services in the state government. If a mandate ensured that State agencies procure a certain amount of “green friendly” items on a yearly basis with increased goals annually, the payback overtime would be astronomical. The challenge is convincing agencies to buy into the idea of purchasing items at a higher market value and removing cheaper items that are less environmentally friendly from their inventory. Another major challenge that continues to be prevalent for the DGS procurement division is capturing each detailed “green or environmentally preferable” product or service that has been provided from a vendor through a purchasing card (pcard) transaction. This challenge is reconcilable through various strategies and approaches that will be pursued
196 https://dgs.maryland.gov/Pages/GreenPurchasing/index.aspx
Maryland Department of the Environment 2030 Greenhouse Gas Emissions Reduction Act Plan
195
through the committee’s proactive and progressive efforts. Over the past two years DGS has done significant work to work with vendors on statewide contracts to receive detailed data on environmentally preferable products procured by the State. While there is increasing awareness in the Office of State Procurement that green purchasing is a mandatory practice based on statute, there is still a gap in that understanding at the agency level. In order to have a consistent and comprehensive green purchasing program, this requirement must be followed by all agencies and particularly, their procurement officers. In addition, a large amount of purchases are made through credit card or p-card holders. These purchases may not be in compliance with Maryland’s environmental/procurement statutes and regulations nor the Committee’s guidelines and standards.
Electric Vehicle (EV) Fleet Infrastructure In 2020, DGS embarked on developing a strategic approach to the deployment of EV infrastructure to support incoming ZEVs and plug-in hybrid electric vehicles (PHEVs) in the state’s fleet. DGS took a leadership role in coordinating with numerous state agencies including DBM, MDOT, MDE, MEA, DNR, and others on this effort. DGS leads monthly EV strategy team meetings and works with stakeholders across the state to ensure that activities are aligned. DGS is taking the lead in identifying and deploying EV infrastructure at state-owned facilities to support an increasingly electrified fleet. In order to plan for infrastructure, an understanding of the State’s fleet and potential to electrify was necessary. In August 2020, DGS launched a data collection campaign to collect detailed state fleet vehicle data from state agencies, excluding MDOT and USM. Agencies were asked to provide data on their non-police pursuit vehicles. As a result of the data collection effort, DGS received detailed data on over 4,000 state fleet vehicles across 40 agencies. That data collection effort and MDOT's analysis of its non-revenue fleet identified 3,852 state-owned light-duty passenger vehicles that could be converted to ZEV and PHEV by 2030, after excluding certain law enforcement, emergency, and other special use vehicles. The 2030 GGRA Plan emissions estimates include conversion of those vehicles to ZEV and PHEV by 2030, while recognizing the final number could change as DGS continues its planning process. In 2021, DGS will continue to analyze the data and work with MDOT to map it so that a data driven EV infrastructure strategy can be defined. A draft strategy and guidance to state agencies is expected in early 2021.
Renewable Energy DGS currently has Solar PV installations at four agency buildings, with a total capacity of 432 kW and generating approximately 520,000 kWh per year:
• Tawes State Office Building - 580 Taylor Avenue. Annapolis - 126 kW • John R. Hargrove, Sr. DC & MS Center -700 E. Patapsco Ave. Baltimore - 106 kW • Elkton DC & MS Center -170 E. Main St. Elkton - 74 kW • Ellicott City DC & MS Center -3451 Courthouse Dr. Ellicott City - 126 kW
Renewable energy accounted for 13.2% of the electricity for State operations in FY20. It enabled the State to prevent approximately 143,526 metric tons of CO2e from entering the atmosphere. This is the equivalent of taking 30,473 passenger vehicles off the road for one year. Calculated using EPA Greenhouse Gas Equivalencies Calculator.197
197 https://www.epa.gov/energy/greenhousegas equivalencies-calculator
Maryland Department of the Environment 2030 Greenhouse Gas Emissions Reduction Act Plan
196
Other Maryland State agencies have Solar PV installations with a total capacity of 1.75 MW and generating approximately 2,943,360 kWh per year:
• Maryland Aviation Administration – Thurgood Marshall/BWI Airport 500 kW • Maryland Transit Administration – 500 kW • Maryland Port Administration (MDOT MPA) – 750 kW
Generating Clean Horizons Through a DGS and USM managed initiative, the State purchases renewable power from two large wind installations and a solar installation, through 20-year Power Purchase Agreements (PPAs) that provide nearly 14% of the electricity that the State uses in government operations:
• Mount St. Mary's Solar – 13 MW installation, 12,968 MWh/year. Delivery began July 2012. • Roth Rock Wind – 10 MW installation, 30,605 MWh/year. Delivery began August in 2011. • Pinnacle - 55.2 MW installation, 173,542 MWh/year. Delivery began December 2011. • DGS also works with State agencies in the development and implementation of additional renewable projects
throughout the State. Renewable Energy Credits (REC) Revenue gained from the sale of RECs incentivizes investment in renewable power generation. Through the Generating Clean Horizons PPAs, the State pays for renewable electricity generation in two parts: the electricity or electrical energy produced by a renewable generator and the renewable “attributes” RECs of that generation. (These attributes account for the tons of GHG that were avoided by generating electricity from renewable resources instead of conventional fuels, such as coal, oil, or gas.) RECs may be sold separately at prevailing market prices. In 2015, DGS elected to retire a portion of its legacy (2012) RECs in order to satisfy its 2014 obligation under the Maryland RPS:
• RECs Retired to Meet DGS 2014 RPS Obligation. o Tier 1: 59,394. o Solar: 2,089. o Tier 2: 14,923.
Expanded Renewable Portfolio Standard (RPS) In 2019, the General Assembly passed a bill that requires the state to generate 50% of its electricity from renewable energy by 2030, and at that time evaluate steps to reaching 100% clean energy by 2040. As the purchaser of virtually all electricity used in State government, DGS recognizes the need to increase our purchases of RECs. Consequently, we are actively pursuing new sources of in-state renewable energy in order to comply with the new RPS targets. Within the next few years, DGS expects to enter into one or more PPA that will take us beyond 2030. Energy Performance Contracting DGS works with State agencies to substantially reduce the energy consumption of Maryland's government operations. As of 2020, DGS manages 27 active energy performance contracts that will save approximately $322.8 million throughout the life of the contracts and $24.9 million annually, with GHG reductions of 104,249 tons of CO2 annually.
Maryland Department of the Environment 2030 Greenhouse Gas Emissions Reduction Act Plan
197
For example, at Spring Grove Hospital Center, energy conservation measures under an EPC completed in January 2010, have provided confirmed avoided utility costs of more than $5.5 million, nearly $1.4 million in excess of the guarantee over that period. State Energy Database The Energy Office maintains the nation’s most comprehensive statewide utility database for tracking energy consumption and cost for all state-owned and leased facilities. The database allows the Energy Office and other agencies to analyze their energy consumption patterns over time in order to identify poor performing facilities, and to track the progress of facilities undergoing energy efficiency projects. The database is used extensively during the development and measurement and verification stages of EPCs. It also is an instrumental tool that enables the State to engage in financially beneficial strategies for energy purchasing. In FY20, building attributes such as square footage, build year, leased owned status, and primary use were added for the majority of the state’s portfolio. Additionally, building/meter relationships were confirmed, allowing the State to verify buildings that are individually metered for further building-level benchmarking and analysis, and to confirm campuses sharing utility meters for future submetering opportunities. The result was a comprehensive report of all State-owned and independently metered buildings, with their energy usage data so their progress may be tracked over time. Maryland has led in data transparency by ensuring that the energy database is available in a public-facing version, hosted on DGS’ website. The database is also available (with detailed cost and consumption data) to over 300 state agency users with log in privileges. DGS operates and maintains the most comprehensive and complete state-wide utility tracking database in the country. DGS tracks the energy consumption, cost and carbon footprint (CO2e) for all utility accounts paid in the State’s name. The State Energy Database is a comprehensive large-scale utility management system that includes over 1 million invoices and over 22,000 State utility accounts. Commodities tracked include electricity, natural gas, water, sewer, steam, chilled water, and fuel oil. The State total utility expenditure was $212 million in FY18. The database provides transparency, access, accountability, and trackability for 58 State entities. It is accessible to the public in a limited version, and with additional detail to over 300 registered users with login privileges. The State Energy Database supports energy efficiency initiatives and Energy Performance Contracts, energy reduction reporting, deregulated energy procurement, energy planning, and utility bill analysis. Facility Submetering In 2020 DGS embarked on an effort to install building level submeters at all State facilities that operate on a central plant. In late FY 19 DGS issued an RFP to pre-qualify submeter installation firms that will compete against each other for individual projects. DGS developed a meter plan for the Annapolis Capital Complex which will become part of the scope of work for the installation contractor. The meter plan provides details for installing meters for natural gas, electricity, steam, chilled water and domestic water at 20 buildings. Building level submeters will empower the State to track the energy use of individual buildings, which is currently not possible at approximately 80% of the State’s buildings. Having energy use data available will allow DGS to identify buildings that are good candidates for efficiency measures. Building level submeters will also allow DGS to track the effectiveness of efficiency projects at individual buildings and will alert maintenance staff to unusual changes in energy patterns. Executive Order 01.01.2019.08
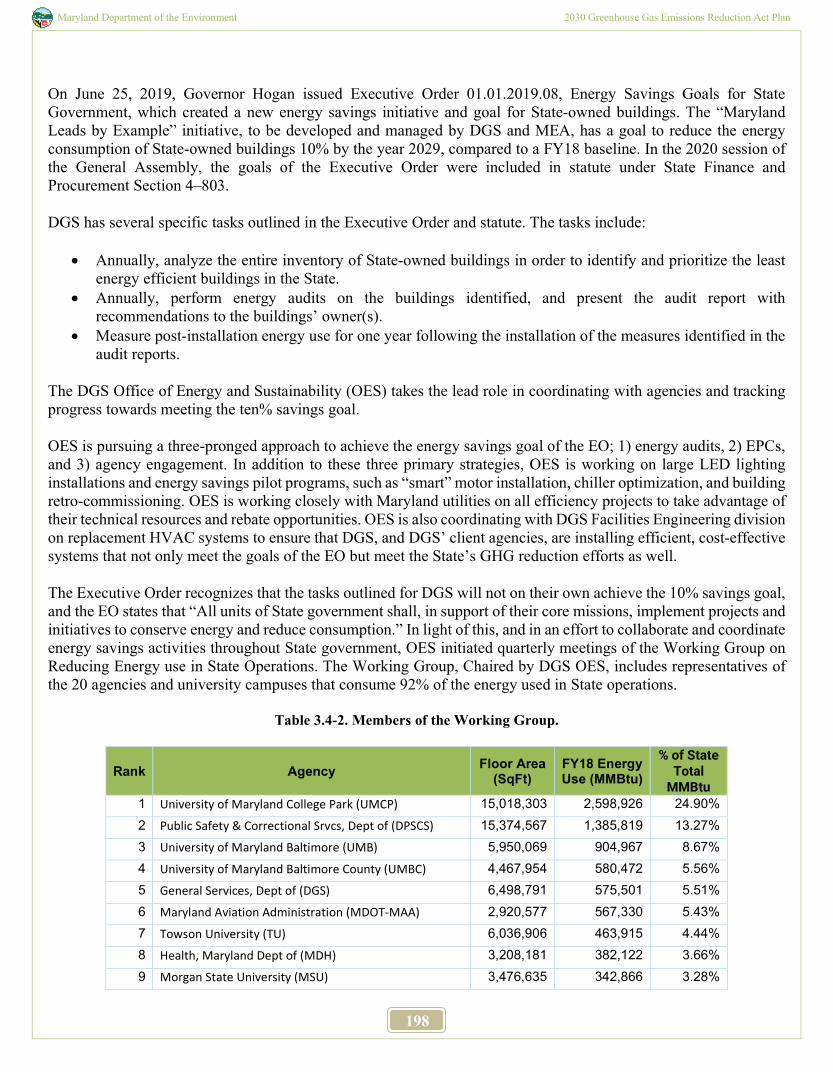
Maryland Department of the Environment 2030 Greenhouse Gas Emissions Reduction Act Plan
198
On June 25, 2019, Governor Hogan issued Executive Order 01.01.2019.08, Energy Savings Goals for State Government, which created a new energy savings initiative and goal for State-owned buildings. The “Maryland Leads by Example” initiative, to be developed and managed by DGS and MEA, has a goal to reduce the energy consumption of State-owned buildings 10% by the year 2029, compared to a FY18 baseline. In the 2020 session of the General Assembly, the goals of the Executive Order were included in statute under State Finance and Procurement Section 4–803. DGS has several specific tasks outlined in the Executive Order and statute. The tasks include:
• Annually, analyze the entire inventory of State-owned buildings in order to identify and prioritize the least energy efficient buildings in the State.
• Annually, perform energy audits on the buildings identified, and present the audit report with recommendations to the buildings’ owner(s).
• Measure post-installation energy use for one year following the installation of the measures identified in the audit reports.
The DGS Office of Energy and Sustainability (OES) takes the lead role in coordinating with agencies and tracking progress towards meeting the ten% savings goal. OES is pursuing a three-pronged approach to achieve the energy savings goal of the EO; 1) energy audits, 2) EPCs, and 3) agency engagement. In addition to these three primary strategies, OES is working on large LED lighting installations and energy savings pilot programs, such as “smart” motor installation, chiller optimization, and building retro-commissioning. OES is working closely with Maryland utilities on all efficiency projects to take advantage of their technical resources and rebate opportunities. OES is also coordinating with DGS Facilities Engineering division on replacement HVAC systems to ensure that DGS, and DGS’ client agencies, are installing efficient, cost-effective systems that not only meet the goals of the EO but meet the State’s GHG reduction efforts as well. The Executive Order recognizes that the tasks outlined for DGS will not on their own achieve the 10% savings goal, and the EO states that “All units of State government shall, in support of their core missions, implement projects and initiatives to conserve energy and reduce consumption.” In light of this, and in an effort to collaborate and coordinate energy savings activities throughout State government, OES initiated quarterly meetings of the Working Group on Reducing Energy use in State Operations. The Working Group, Chaired by DGS OES, includes representatives of the 20 agencies and university campuses that consume 92% of the energy used in State operations.
Table 3.4-2. Members of the Working Group.
Rank Agency Floor Area (SqFt)
FY18 Energy Use (MMBtu)
% of State Total
MMBtu 1 University of Maryland College Park (UMCP) 15,018,303 2,598,926 24.90% 2 Public Safety & Correctional Srvcs, Dept of (DPSCS) 15,374,567 1,385,819 13.27% 3 University of Maryland Baltimore (UMB) 5,950,069 904,967 8.67% 4 University of Maryland Baltimore County (UMBC) 4,467,954 580,472 5.56% 5 General Services, Dept of (DGS) 6,498,791 575,501 5.51% 6 Maryland Aviation Administration (MDOT-MAA) 2,920,577 567,330 5.43% 7 Towson University (TU) 6,036,906 463,915 4.44% 8 Health, Maryland Dept of (MDH) 3,208,181 382,122 3.66% 9 Morgan State University (MSU) 3,476,635 342,866 3.28%
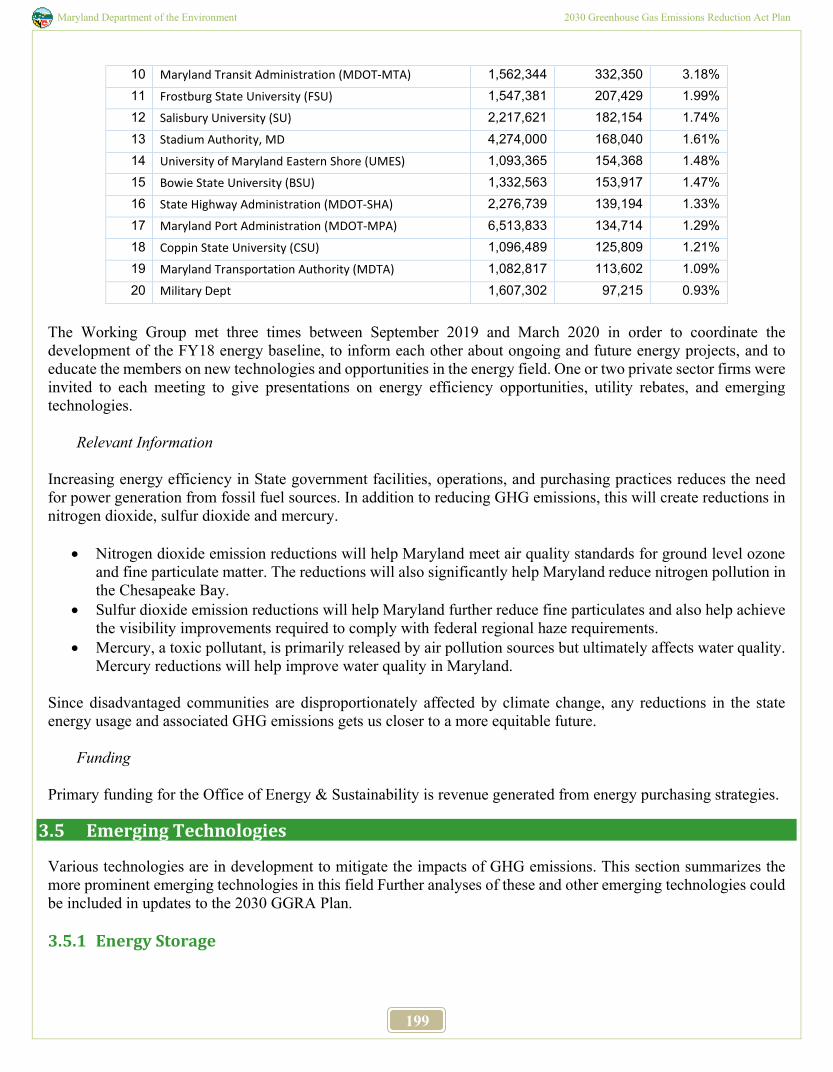
Maryland Department of the Environment 2030 Greenhouse Gas Emissions Reduction Act Plan
199
10 Maryland Transit Administration (MDOT-MTA) 1,562,344 332,350 3.18% 11 Frostburg State University (FSU) 1,547,381 207,429 1.99% 12 Salisbury University (SU) 2,217,621 182,154 1.74% 13 Stadium Authority, MD 4,274,000 168,040 1.61% 14 University of Maryland Eastern Shore (UMES) 1,093,365 154,368 1.48% 15 Bowie State University (BSU) 1,332,563 153,917 1.47% 16 State Highway Administration (MDOT-SHA) 2,276,739 139,194 1.33% 17 Maryland Port Administration (MDOT-MPA) 6,513,833 134,714 1.29% 18 Coppin State University (CSU) 1,096,489 125,809 1.21% 19 Maryland Transportation Authority (MDTA) 1,082,817 113,602 1.09% 20 Military Dept 1,607,302 97,215 0.93%
The Working Group met three times between September 2019 and March 2020 in order to coordinate the development of the FY18 energy baseline, to inform each other about ongoing and future energy projects, and to educate the members on new technologies and opportunities in the energy field. One or two private sector firms were invited to each meeting to give presentations on energy efficiency opportunities, utility rebates, and emerging technologies.
Relevant Information Increasing energy efficiency in State government facilities, operations, and purchasing practices reduces the need for power generation from fossil fuel sources. In addition to reducing GHG emissions, this will create reductions in nitrogen dioxide, sulfur dioxide and mercury.
• Nitrogen dioxide emission reductions will help Maryland meet air quality standards for ground level ozone and fine particulate matter. The reductions will also significantly help Maryland reduce nitrogen pollution in the Chesapeake Bay.
• Sulfur dioxide emission reductions will help Maryland further reduce fine particulates and also help achieve the visibility improvements required to comply with federal regional haze requirements.
• Mercury, a toxic pollutant, is primarily released by air pollution sources but ultimately affects water quality. Mercury reductions will help improve water quality in Maryland.
Since disadvantaged communities are disproportionately affected by climate change, any reductions in the state energy usage and associated GHG emissions gets us closer to a more equitable future.
Funding Primary funding for the Office of Energy & Sustainability is revenue generated from energy purchasing strategies.
3.5 Emerging Technologies
Various technologies are in development to mitigate the impacts of GHG emissions. This section summarizes the more prominent emerging technologies in this field Further analyses of these and other emerging technologies could be included in updates to the 2030 GGRA Plan. 3.5.1 Energy Storage
Maryland Department of the Environment 2030 Greenhouse Gas Emissions Reduction Act Plan
200
Constant improvements to the technology of energy storage have created a lot of important implications for GHG reduction. As the use of clean and renewable energy sources, specifically solar and wind, have increased, so has the need for a reliable way to store the energy produced. Recent improvements to energy storage would allow for renewable energy to be utilized when it is needed instead of immediately when it is generated. This will allow for solar energy to be stored on sunny days and used as the same rate when the sun is down or covered. The same applies for wind energy when the air is still. Energy storage is also important to remove the reliance on “peakers,” which are power plants that operate only during peak energy demand. These power plants use fossil fuels and, therefore, produce GHG emissions. Allowing energy to be stored during off-peak hours could make peakers obsolete. In addition to energy storage connected to the grid, home energy storage is also emerging with the release of the Tesla Powerwall, which will allow consumers the option to store their own renewable or off-peak energy to power their homes. Furthermore, the ability to aggregate household storage is advancing at a rapid pace. This “virtual power plant” model is part of the statewide pilot on energy storage, managed by the PSC, and recent action by the federal Energy Regulatory Commission is allowing smaller units to aggregate and provide wholesale transactions in wholesale energy markets. 3.5.2 Carbon Capture Utilization and Sequestration (Power and Industrial) Carbon capture is emerging as a viable and flexible way to gain serious reductions in GHG emissions. Its viability has increased due to increasing economies of scale and concomitant cost reductions, increasing government support, not only in the United States (primarily 45Q tax credits), but also in Europe (direct government subsidies already in existence and through the European Green Deal), and the ability of these various technologies to capture more carbon per installation. Furthermore, the IPCC, in its 2018 report, relied on carbon capture technologies in three out of four modeling scenarios to reach their goals. The technology is flexible and can augment existing power plant facilities, and just as important, industrial facilities, which may be massive emitters of CO2. Whether captured from a power plant or industrial site, the CO2 can either be utilized in applications like cement mixture, which would serve to solidify these gases preventing their release into the atmosphere, or it can be permanently stored underground deep enough to reach a supercritical state or in disused well locations, among other fitting geological areas. 3.5.3 Small Modular Reactors (SMRs) A new generation of nuclear reactors is advancing development in the United States, Canada, and China. Small modular reactors are smaller, can aggregate with other units, and are far safer than previous iterations of nuclear reactors. The number of personnel required to monitor these reactors is greatly reduced, owing to high levels of automation and passive safety features. Usually, these reactors are as small as 60 MW (for comparison, Calvert Cliffs nuclear facility is roughly 1,800 MW) and are generally grouped by 12 reactors per site, but this is flexible and contingent on local requirements. For instance, the Utah site has this standard configuration for a total of 720 MW on site. These units have ample passive safety features, with water-submerged containment vessels which maintain cool temperatures even without electricity, reduced density limits reducing coolant accidents, and even passive emergency operations such as the release of cold borated water over the control rods. Furthermore, these systems are able to provide quicker ramping of electricity unlike standard nuclear facilities in operation today, which essentially have to operate continuously. Their steam processes can even provide a source of green hydrogen if a user chose to outfit the facility with this technology. 3.5.4 Smart Grid Technology
A smart grid is an electrical grid that has the ability to gather information and then act on it. It integrates both the generator’s and consumer’s information, such as usage or behaviors, and uses it to create the most efficient, economical, and sustainable system possible. Through increasing efficiency and conservation, renewable energy integration, and plug-in EV integration, smart grids can greatly reduce GHG emissions. Smart grids also have numerous benefits in addition to lower GHG emissions. A few other benefits are reduced operating costs for utilities, increased ability to use all available infrastructure, better coordination of plug-in EVs, and easier installation of new
Maryland Department of the Environment 2030 Greenhouse Gas Emissions Reduction Act Plan
201
technologies into the grid. Smart grids reduce the power outages, inefficiencies, and lack of information problems for which the complex U.S. electrical grid is infamous; thus, creating a system that is much more reliable and responsive.
3.5.5 The Water-Energy Nexus The water-energy nexus refers to the connection between how much water is evaporated in energy production and how much energy is used in the human use of water, such as the collecting, cleaning, and moving of water. It is estimated that around two gallons of water is evaporated in order to create one kilowatt hour of energy. This amounts to about 1,000 gallons of water being used to power one 60W light bulb for one year. This results in water shortages as the energy industry must also compete with other major water consumers, especially the ever-growing agriculture industry. It is also true that a lot of energy is required to use water in all processes. Therefore, a way to decrease GHG emissions is to maximize the efficiency of the water-energy nexus. Using less water and less energy continues the cycle in the most efficient way possible. Less water use also means less wastewater produced, which reduces methane generation associated with certain wastewater treatment processes. Some GHG reduction plans have already framed their plans around water mitigation, such as Massachusetts aiming for drinking water and wastewater facilities to reach a 20% GHG reduction goal.
3.5.6 CO2 Reduction Technology Integrated Environmental Services, Inc. has developed CO2 Reduction Technology, a process that breaks down CO2 into graphite and oxygen. The graphite that it produced can then go on to be used in other industries, such as battery, hybrid EV, and solar panel production. This process of breaking down CO2 was initially inefficient due to it emitting more CO2 when producing the energy needed to undergo the process than was removed, but IES has developed a method where they pre-process the CO2, which allows the molecular bond to require less energy to be broken. This results in the process eliminating more CO2 than is produced. This technology can be used in power plants to reduce their CO2 emissions and allow them to produce graphite that can be used in other industrial processes.
3.5.7 Bioenergy with Carbon Capture and Storage (BECCS) Another emerging technology is BECCS, or bioenergy with carbon capture and sequestration. This is the process of generating electricity from biomass and then capturing and storing the resulting CO2 emissions. This process allows the generation of energy to become carbon negative by removing CO2 from the atmosphere and releasing none. The methods of capturing carbon and storing it underground are expensive and there are a number of key technological gaps to be filled in. The compression and transport of CO2 leaves a lot of room for potential leaks and spills that would release large amounts of CO2 back into the atmosphere, and the same can happen when it is stored underground. One method that MIT has determined is geologically viable is injecting and storing the captured CO2 in deep saline aquifers. Another option that is being considered is injecting the CO2 into depleted oil and gas fields. The United States Department of Energy currently has a BECCS project at a corn ethanol facility in Illinois that captures about 1,000 metric tons of CO2 and stores it in a sandstone formation 7,000 feet underground.
3.5.8 Direct Air Capture (DAC)198
198 https://www.engadget.com/2018/09/11/robot-trees-co2-into-concrete-climate-change/?yptr=yahoo http://www.sciencemag.org/news/2017/06/switzerland-giant-new-machine-sucking-carbon-directly-air http://www.sciencemag.org/news/2018/06/cost-plunges-capturing-carbon-dioxide-air https://www.carbonbrief.org/swiss-company-hoping-capture-1-global-co2-emissions-2025
http://carbonengineering.com/about-dac/ https://www.technologyreview.com/s/531346/can-sucking-co2-out-of-the-atmosphere-really-work/ https://www.nytimes.com/2018/02/28/climate/remove-co2-from-air.html http://www.bbc.com/future/story/20121004-fake-trees-to-clean-the-skies
Maryland Department of the Environment 2030 Greenhouse Gas Emissions Reduction Act Plan
202
A technology similar to BECCS or bioenergy with carbon capture and storage is DAC or direct air capture. This method - instead of capturing carbon released from power plants –literally takes CO2 out of the sky. DAC pulls CO2 from the atmosphere, purifies it and then sequesters it for further use. This allows for the capture of CO2 at more diverse and distributed sources over BECC. The only major inputs of DAC are water and energy with the output being pure CO2. This excess CO2 can be sent to a greenhouse, enabling produce to grow. The leftover CO2 can also be used to make synthetic fuels or heated to release a pure gas stream, which could be turned into diesel, gas, or jet fuel. This is accomplished by way of large silver tubes, which imitate trees. These artificial trees are able to pull CO2 out of the atmosphere. These “trees” then mimic the process of photosynthesis that natural leaves accomplish. By using these negative emissions, jurisdictions may be able to restore the atmosphere similar to how forests sequester carbon. If the world had 10 million artificial trees, they could remove 3.6 billion tons of CO2 a year. The limiting problem with this technology is the price; right now, it costs $600 a ton. Firms are attempting to reduce this number to $100 a ton by 2025, making it more economically feasible. DAC technology is currently being utilized on an industrial scale in Europe. The Climateworks AG facility in Switzerland has become the first ever company to capture CO2 at an industrial scale from the air and sell it directly to a buyer.
3.5.9 Biochar A technology similar to BECCS is biochar, a carbon-negative plant byproduct that resembles charcoal. Biochar is made via pyrolysis (heating material slowly without oxygen) of lumber waste, dried corn stalks and other plant residues. The resulting biochar is very carbon rich and can be placed in the soil as fertilizer. This allows carbon to be locked underground instead of being emitted into the atmosphere. However, there are some risks to keep in mind to ensure that it remains carbon negative and doesn’t harm the soil it is meant to be fertilizing. Biochar must be used in soils of similar pH or else it can have a negative effect on soil fertility. Also, biochar made from waste biomass, sustainably harvested crop residues, or crops grown on non-forested abandoned land will be carbon negative. If the biochar is made from forest ecosystems, the result could be a net increase in GHGs.
3.5.10 Green Cement Green cement and concrete is also an emerging carbon negative technology that can be used in place of regular concrete. First of all, it uses fly ash in the mix, which prevents large amounts of it reaching landfills. The mix also requires only half the amount of water that is normally required to form normal concrete, which helps cut down on demand. Finally, it undergoes a unique process that requires the concrete to consume CO2 as it cures. This results in the process being carbon negative since it reduces the amount of CO2 in the atmosphere.
3.5.11 Algae Systems Algae Systems has developed an advanced process that uses algae to produce carbon negative fuels. The system is overall extremely sustainable. It starts by taking untreated wastewater and giving it to algae, which uses CO2 and sunlight to convert nutrients and carbon from the wastewater into biomass. This process also turns wastewater treatment from a huge energy sink into an energy source. The wet biomass is then converted into liquid fuels at high temperature and pressure. This results in “biocrude,” which can either be used directly or refined into a replacement for fossil crude. This results in a carbon-negative fuel because the algae consume more CO2 than the end product biofuels emit.
3.5.12 Fuel Cell Vehicles As an alternative to fossil fuel hybrids or EVs, fuel cell vehicles are an emerging technology that shows a lot of promise. Fuel cells are used to directly produce electricity inside the vehicle using hydrogen or natural gas, as opposed to batteries, which must be charged for a long time from an external source. Hydrogen fuel cells are remarkable due to their only emission being pure liquid or gaseous water. Fuel cell vehicles can also travel much
Maryland Department of the Environment 2030 Greenhouse Gas Emissions Reduction Act Plan
203
farther than battery powered EVs, with a current range of up to 406 miles on a tank of compressed hydrogen gas. Hydrogen fuel cells have gotten some controversy due to the fact that they require energy to electrolyze water to produce the hydrogen fuel. The process, therefore, releases CO2 into the air when creating hydrogen gas, which can make the whole usage of hydrogen cells carbon positive despite the lack of emissions from the vehicle itself. In order to avoid this, wind or solar power could be used to power electrolysis, but these power sources are still relatively inefficient compared to fossil fuels. If fossil fuels are utilized, one of the technologies above can be used to capture and store/sequester the CO2 that is produced to prevent it from entering the atmosphere.
3.5.13 Mass Timber Mass timber refers to the construction method where large structural panels, posts, and beams glued under pressure or nailed together in layers, with the wood’s grain stacked perpendicular for extra strength are used in place of other building materials. This method is relatively common for large building construction in Europe, and is emerging in North America, with several large mass timber buildings completed in Canada and recent completions of mass timber buildings in Portland, Oregon; Minneapolis, Minnesota; and New Haven, Connecticut; with many more in the planning phase. The international building code recommends a maximum of 18 stories if only using mass timber, but buildings incorporating mass timber can be built much higher. Using mass timber has significant carbon benefits and using it reduces the carbon footprint of the construction phase by up to 20%, with lifecycle benefits often much higher. It has also been shown to reduce the time of construction by up to 10%.
Maryland Department of the Environment 2030 Greenhouse Gas Emissions Reduction Act Plan
204
Chapter 4 Meeting Longer-Term
Goals
4.1 Overview
The GGRA of 2016 requires that the 2030 GGRA Plan be developed in recognition of the need for developed nations to reduce greenhouse gas (GHG) emissions between 80 and 95% from 1990 levels by 2050. In its 2020 Annual Report, the MCCC recommended that Maryland adopt a more ambitious long-term goal of achieving net zero GHG emissions as early as 2045. The 2030 GGRA Plan acts as an important step toward achieving this ambitious goal and provides a strong foundation on which to continue the effort to reduce GHG emissions within Maryland far into the future. The analysis in the 2030 GGRA Plan includes several additional “what if” scenarios to estimate the future impact of various climate policies that extend beyond the 2030 goal of the GGRA of 2016, including a scenario that achieves an 80% reduction in GHG emissions by 2050. That analysis identified a number of potential measures and technologies that the state could deploy after 2030 to achieve deeper reductions by 2045 and 2050.
Figure 4.1-1. Maryland GHG emissions (MMtCO2e) by sector in 2006, 2020, 2030, and 2045 in the 2030 GGRA Plan.
With the measures advanced in the 2030 GGRA Plan¸ Maryland will substantially reduce emissions from buildings, transportation, and electricity generation, while improving the rate at which its forests and farms are removing carbon dioxide (CO2) from the atmosphere (Figure 4.1-1). Thanks to the clean electricity programs in the 2030 GGRA Plan,
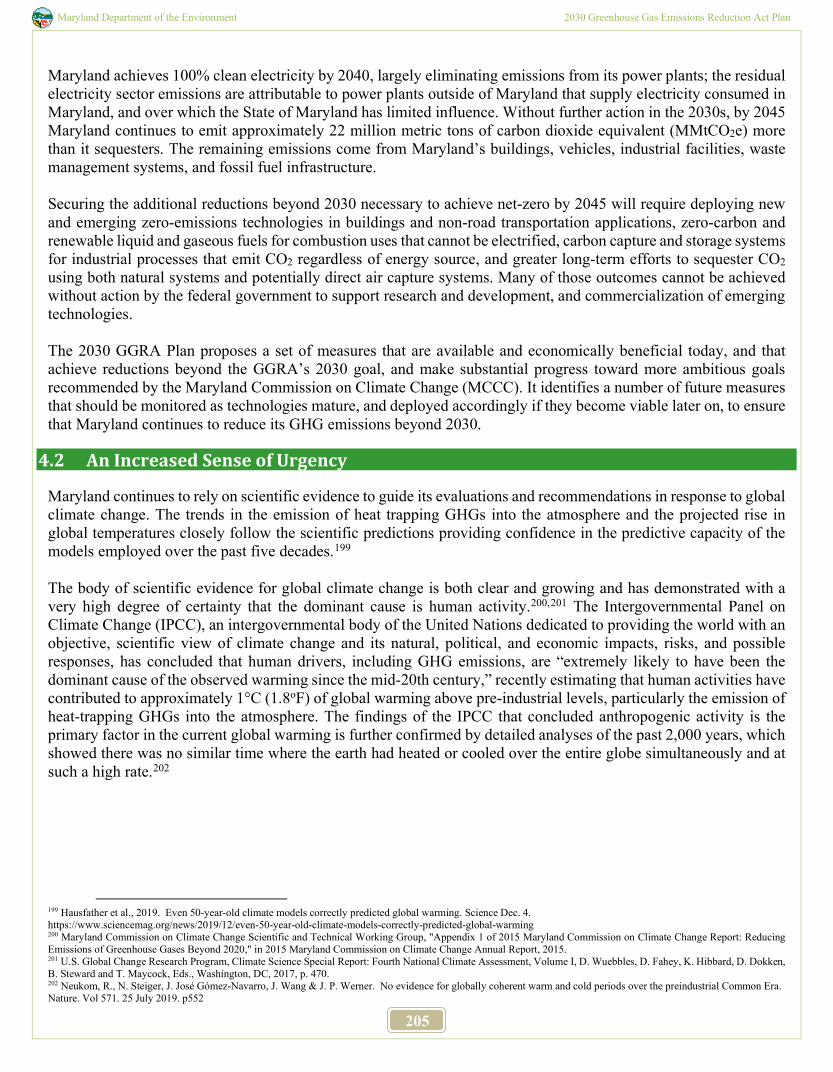
Maryland Department of the Environment 2030 Greenhouse Gas Emissions Reduction Act Plan
205
Maryland achieves 100% clean electricity by 2040, largely eliminating emissions from its power plants; the residual electricity sector emissions are attributable to power plants outside of Maryland that supply electricity consumed in Maryland, and over which the State of Maryland has limited influence. Without further action in the 2030s, by 2045 Maryland continues to emit approximately 22 million metric tons of carbon dioxide equivalent (MMtCO2e) more than it sequesters. The remaining emissions come from Maryland’s buildings, vehicles, industrial facilities, waste management systems, and fossil fuel infrastructure. Securing the additional reductions beyond 2030 necessary to achieve net-zero by 2045 will require deploying new and emerging zero-emissions technologies in buildings and non-road transportation applications, zero-carbon and renewable liquid and gaseous fuels for combustion uses that cannot be electrified, carbon capture and storage systems for industrial processes that emit CO2 regardless of energy source, and greater long-term efforts to sequester CO2 using both natural systems and potentially direct air capture systems. Many of those outcomes cannot be achieved without action by the federal government to support research and development, and commercialization of emerging technologies. The 2030 GGRA Plan proposes a set of measures that are available and economically beneficial today, and that achieve reductions beyond the GGRA’s 2030 goal, and make substantial progress toward more ambitious goals recommended by the Maryland Commission on Climate Change (MCCC). It identifies a number of future measures that should be monitored as technologies mature, and deployed accordingly if they become viable later on, to ensure that Maryland continues to reduce its GHG emissions beyond 2030.
4.2 An Increased Sense of Urgency
Maryland continues to rely on scientific evidence to guide its evaluations and recommendations in response to global climate change. The trends in the emission of heat trapping GHGs into the atmosphere and the projected rise in global temperatures closely follow the scientific predictions providing confidence in the predictive capacity of the models employed over the past five decades.199 The body of scientific evidence for global climate change is both clear and growing and has demonstrated with a very high degree of certainty that the dominant cause is human activity.200,201 The Intergovernmental Panel on Climate Change (IPCC), an intergovernmental body of the United Nations dedicated to providing the world with an objective, scientific view of climate change and its natural, political, and economic impacts, risks, and possible responses, has concluded that human drivers, including GHG emissions, are “extremely likely to have been the dominant cause of the observed warming since the mid-20th century,” recently estimating that human activities have contributed to approximately 1°C (1.8oF) of global warming above pre-industrial levels, particularly the emission of heat-trapping GHGs into the atmosphere. The findings of the IPCC that concluded anthropogenic activity is the primary factor in the current global warming is further confirmed by detailed analyses of the past 2,000 years, which showed there was no similar time where the earth had heated or cooled over the entire globe simultaneously and at such a high rate.202
199 Hausfather et al., 2019. Even 50-year-old climate models correctly predicted global warming. Science Dec. 4. https://www.sciencemag.org/news/2019/12/even-50-year-old-climate-models-correctly-predicted-global-warming 200 Maryland Commission on Climate Change Scientific and Technical Working Group, "Appendix 1 of 2015 Maryland Commission on Climate Change Report: Reducing Emissions of Greenhouse Gases Beyond 2020," in 2015 Maryland Commission on Climate Change Annual Report, 2015. 201 U.S. Global Change Research Program, Climate Science Special Report: Fourth National Climate Assessment, Volume I, D. Wuebbles, D. Fahey, K. Hibbard, D. Dokken, B. Steward and T. Maycock, Eds., Washington, DC, 2017, p. 470. 202 Neukom, R., N. Steiger, J. José Gómez-Navarro, J. Wang & J. P. Werner. No evidence for globally coherent warm and cold periods over the preindustrial Common Era. Nature. Vol 571. 25 July 2019. p552
Maryland Department of the Environment 2030 Greenhouse Gas Emissions Reduction Act Plan
206
The IPCC in 2018 reiterated the importance of keeping global warming below 1.5oC (2.7oF) and this has been reinforced by multiple scientific assessments.203,204,205,206 More recent analyses have evaluated progress toward GHG reductions207 and determined that the current trajectory was insufficient to limit global warming below the 1.5oC (2.7oF) target. Watson et al208 examined the current commitments made by different nations and concluded: “To achieve the Paris Agreement's most ambitious goal of keeping global warming below 1.5oC (2.7oF) above pre-industrial levels requires reducing global greenhouse gas (GHG) emissions by 50% by 2030. An analysis of current commitments to reduce emissions between 2020 and 2030 shows that almost 75% of the climate pledges are… insufficient to reduce GHG emissions by 50% by 2030.” For more information on the science and urgency regarding climate change, please see Chapter 1.
4.3 Key Programs that Will Achieve Deeper Reductions in the 2040 to 2050 Time Frame
Many of the control programs in the 2030 GGRA Plan will not only achieve significant short-term GHG reductions in the 2030 time frame but also continue to generate even deeper reductions in the 2040 to 2050 time frame. The best examples of programs that generate increasingly greater reductions over time are the mobile source control programs. Many of these programs are designed to require new vehicles to meet stringent tailpipe standards whenever a new vehicle is purchased. The reductions are in essence phased in as the fleet turns over. As older vehicles are eliminated from the fleet and new vehicles subject to the stringent limits for new vehicles take their place, emission reductions increase every year. Some vehicles, like light duty vehicles, see the fleet turn over in a relatively short time frame like 10 to 15 years. Other mobile sources, like trucks and construction equipment have fleet turnover times that can be in the 30 to 50 year time frame. Chapter 5 provides more detail on the long-term emission reductions associated with many of the control measures in the 2030 GGRA Plan. Section 4.3.1 below provides a snapshot of some of the more important programs that will continue to generate reductions beyond 2030. 4.3.1 Key Programs That Generate Deeper GHG Reductions After 2030
The Maryland Clean Cars Program Adopted on November 19, 2007, The Maryland Clean Cars Program adopts California’s stricter vehicle emission standards. The Clean Cars Program represented the first program that directly regulates carbon dioxide (CO2) emissions from light duty vehicles. In addition to regulating GHG from passenger vehicles, the Clean Cars Program includes a Zero Emissions Vehicle (ZEV) mandate that car manufacturers must meet. These vehicles produce zero or near zero tailpipe emissions and will further help reduce pollutants from the transportation sector and reduce dependence on foreign oil.
Corporate Average Fuel Economy (CAFE) Standards for Light Duty Vehicles
203 Ripple, W.J, C. Wolf, T.M Newsome, P. Barnard, W.R. Moomaw and 11,258 Scientist signatories from 153 Countries 2019. World Scientists' Warning of a Climate Emergency. Bioscience. November 5, 2019. 204 IPCC, 2018: Global Warming of 1.5°C. An IPCC Special Report on the impacts of global warming of 1.5°C above pre-industrial levels and related global greenhouse gas emission pathways, in the context of strengthening the global response to the threat of climate change, sustainable development, and efforts to eradicate poverty [Masson-Delmotte, V., P. Zhai, H.-O. P.rtner, D. Roberts, J. Skea, P.R. Shukla, A. Pirani, W. Moufouma-Okia, C. P.an, R. Pidcock, S. Connors, J.B.R. Matthews, Y. Chen, X. Zhou, M.I. Gomis, E. Lonnoy, T. Maycock, M. Tignor, and T. Waterfield (eds.)]. 205 World Meteorological Organization, 2019. WMO Statement on the State of Global Climate in 2018. WMO No 1233. 44pp 206 World Meteorological Organization, 2019. The Global Climate in 2015-19. 24pp. 207 UN Environment Program, 2018. Emissions Gap Report. 112pp. ISBN: 978-92-807-3726-4 208 Watson, R., J.J. McCarthy, P. Canziani, N. Nakicenovic and L. Hisas, 2019. The Truth behind the Climate Pledges. November. 30pp. ISBN: 978 0-9831909-3-6. https://feu-us.org/behind-the-climate-pledges/
Maryland Department of the Environment 2030 Greenhouse Gas Emissions Reduction Act Plan
207
First enacted by Congress in 1975, the purpose of CAFE is to reduce energy consumption by increasing the fuel economy of cars and light trucks. The CAFE standards are fleet-wide averages that must be achieved by each automaker for its car and truck fleet, each year, since 1978. When these standards are raised, automakers respond by creating a more fuel-efficient fleet, which improves our nation’s energy security and saves consumers money at the pump, while also reducing GHG emissions. This federal program for light duty vehicles requires that cleaner vehicles (greater fuel efficiency) be phased in over time. Phase 1 covered model years 2012 through 2016. The fuel economy improvements in Phase 1 increased over time until an average 250 gram/mile CO2 standard was met in the year 2016. This equates to an average fuel economy near 35 mpg. Phase 2 covers model years 2017 through 2025. Again, these standards are phased in and projected to result in an average 163 gram/mile of CO2 by model year 2025. This equates to an average fuel economy of 54.5 mpg. National Program Phase 2 covers model years 2017-2050. The light-duty vehicle fuel economy standards for model years between 2017 and 2050. These standards are phased-in and projected to result in an average 163 grams/mile of CO2 equating to an average fuel economy of 54.5 mpg by model year 2025. The SAFE Vehicle Rule replaces model years 2021-2026 with an estimated miles per gallon efficiency of 40.4 mpg. (the National Program Phase 2 was originally published October 2012).
Corporate Average Fuel Economy (CAFE) Standards for Medium and Heavy-Duty Vehicles This federal program for medium- and heavy-duty vehicles requires that cleaner vehicles (greater fuel efficiency) be phased in over time. Phase 1 covered model years 2014 through 2018. This phase included standards for three main regulatory categories: combination tractors, heavy-duty pickups and vans, and vocational vehicles. The Phase 2 fuel efficiency and GHG standards for medium- and heavy-duty vehicles cover model year 2018 and beyond. The standards apply to four categories of medium- and heavy-duty vehicles: combination tractors, heavy-duty pickups and vans, vocational vehicles and trailers to reduce GHG emissions and improve fuel efficiency. The standards phase in between model years 2021 and 2027 for engines and vehicles, and between model years 2018 and 2027 for trailers.)
Tier 3 Vehicle and Fuels Standards The Tier 3 program is part of a comprehensive approach to reducing the impacts of motor vehicles on air quality and public health. The Tier III standard included a new gasoline sulfur standard that will enable more stringent vehicle emissions and will make emission control systems more effective. These federal regulations are being implemented throughout the country and will provide even greater benefits to Maryland. These programs are designed to address criteria pollutants like ozone and fine particulate, but they will also generate co-benefits for GHGs.
Low-Emission Vehicle (LEV III) Program The LEVIII Program when fully implemented by 2025 will reduce GHG emissions from vehicles by 34% from cars from 2016 levels. The LEVIII Program also strengthens the ZEV mandate, increasing the requirements beginning in 2018. By 2025, light-duty vehicles will reduce smog-forming pollutants by 75% and GHG emission by 40% compared to vehicles in 2012. The Advanced Clean Cars Program also required an increase in ZEV production.
The Zero Emission Vehicle (ZEV) MOU

Maryland Department of the Environment 2030 Greenhouse Gas Emissions Reduction Act Plan
208
On June 20, 2018, nine states released a new Multi-State ZEV Action Plan for 2018-2021 to support the successful implementation of the states’ ZEV programs. This effort will drive reductions of GHGs and criteria pollutant emissions like nitrogen oxide (NOx). This plan will generate short-term and long-term benefits. The Action Plan, which builds on the successes and lessons learned from implementation of an earlier 2014 ZEV Action Plan, presents 80 market-enabling action recommendations for states, automakers, dealers, utilities, charging and fueling companies and other key partners to rapidly accelerate mainstream consumer adoption of ZEVs, including plug-in hybrid, battery electric and hydrogen fuel cell vehicles. The updated ZEV Action Plan is the work of the Multi-State ZEV Task Force, which was formed in 2013 under a Memorandum of Understanding (MOU) signed by the Governors of California and seven other states that have adopted California’s ZEV program – Connecticut, Maryland, Massachusetts, New York, Oregon, Rhode Island and Vermont. New Jersey became the ninth ZEV state to join the coalition when they signed the MOU in May. Together, the nine ZEV MOU states represent nearly 30% of the new car sales market in the United States.
Medium- and Heavy-Duty Zero Emissions (ZEV) Memorandum of Understanding (MHDV ZEV MOU)
On July 14, 2020, 15 states and the District of Columbia announced a joint MOU committing to work collaboratively to advance and accelerate the market for electric medium- and heavy-duty vehicles (MHDVs), including large pickup trucks. The goal is to ensure that 100% of all new MHDV sales be ZEVs by 2050 with an interim target of 30% ZEV sales by 2030. To provide a framework and help coordinate state efforts to meet these goals, the signatory jurisdictions will work through the existing multi-state ZEV Task Force to develop and implement a ZEV action plan for trucks and buses. The Maryland Department of the Environment (MDE), MEA, and the Maryland Department of Transportation (MDOT) are hosting a series of workshops and launching working groups to gather input and expertise for the official action plan, which will be completed in 2021.
Capping and Reducing Fossil Energy through the Regional Greenhouse Gas Initiative (RGGI) RGGI is a collaborative program among Eastern states to reduce CO2 emissions from power plants through a regional cap-and-invest program. Maryland has participated in RGGI since its inception 12 years ago. Through RGGI, the participating states have cut power plant emissions in half while enjoying billions of dollars of economic benefit and creating thousands of jobs.209 Thanks to its success, RGGI has grown substantially in recent years, with New Jersey renewing its participation in the program in 2020, Virginia joining in 2021, and Pennsylvania proposing to begin participation in 2022. RGGI sets a binding cap on CO2 emissions from power plants in the region that reduces every year. To achieve the 100% clean electricity by 2040 goal, the 2030 GGRA Plan proposes to reduce the RGGI cap to zero by 2040, with cost controls. Maryland will bring that goal into the upcoming 2021 Program Review, where the RGGI participating states convene to establish the program’s future goals. Combined with the Renewable Portfolio Standard (RPS) and proposed Clean and Renewable Energy Standard (CARES) program, that would eliminate CO2 from Maryland power plants and substantially reduce emissions from the power plants in nearby states that supply electricity into Maryland.
Deploying Clean and Renewable Energy through the RPS and CARES
209 rggiprojectseries.org/
Maryland Department of the Environment 2030 Greenhouse Gas Emissions Reduction Act Plan
209
Now Maryland’s second-largest source of GHG emissions, the electricity generation sector includes emissions from Maryland’s fossil fuel-burning power plants, as well as estimates of the emissions associated with electricity generated outside of Maryland but used in the state (“Imported Power”). The electricity generation strategy in the 2030 GGRA Plan is designed to achieve 100% Clean and Renewable Electricity by 2040 by both deploying energy through the existing RPS and CARES, and by capping and reducing emissions through RGGI. Achieving 100% clean electricity is an essential part of the economy-wide decarbonization and electrification strategy, as it will not only reduce emissions from Maryland power plants, but also provide carbon-free energy to decarbonize the buildings and transportation sectors by replacing fossil-powered systems with electric systems that run on increasingly clean and renewable electricity. Maryland’s RPS requires Maryland electric utilities to purchase increasingly large proportions of Maryland’s electricity from renewable energy sources like solar, wind, hydropower, and qualifying biomass. The current RPS goal is for 50% of Maryland’s electricity to come from renewable sources by 2030 through substantial increases in solar power and deployment of new offshore wind energy off the Atlantic coast. The proposed CARES would build upon the existing RPS to achieve 100% clean electricity by 2040. It would rely on both renewable energy and additional zero- and low-carbon electricity sources to meet that goal where most cost-effective, including:
• Additional Maryland solar power beyond the current RPS requirements; • New efficient Combined Heat and Power (CHP) systems in Maryland buildings; • New nuclear power; and • Natural gas or qualifying biomass power plants with carbon capture and storage (CCS).
Analyses by MDE and Resources for the Future (RFF) estimate that the CARES program would result in substantial increases in Maryland solar power and efficient CHP systems under current projections of resource costs. Should other eligible clean energy sources become less expensive, the CARES program would deploy the most cost-effective mix of resources to meet the 100% clean electricity goal.
The Transportation and Climate Initiative (TCI) Maryland is also a participant in the Transportation and Climate Initiative (TCI), a regional effort of eleven states from the Northeast, Mid-Atlantic, and Southeast, and the District of Columbia. The TCI states have developed a potential cap-and-invest program to apply the successful RGGI model to transportation emissions A few of the TCI states are moving to implement the program, which Maryland continues to consider. If enacted, TCI could help fund and enable the suite of clean transportation measures in the 2030 GGRA Plan, including investments in public transit, bike and pedestrian infrastructure, electric trucks and buses, electric cars, and other projects.
Federal Standards for Marine Engines Marine engines are divided into three categories based on engine displacement. Category 1 and 2 marine diesel engines are used primarily to provide propulsion power on such vessels as tugboats, pushboats, supply vessels, fishing vessels, and other commercial vessels in and around ports. Category 3 marine diesel engines are used as propulsion engines on ocean-going vessels such as container ships, oil tankers, bulk carriers, and cruise ships. Each category is governed by their own emission standards. For Category 1 and 2 the current Tier 4 emission standards emphasize the use of emission aftertreatment technologies and limit the amount of sulfur in fuel to 15 ppm. These emission standards regulate NOx, particulate matter, and hydrocarbon emissions. Currently Category 3 engines
Maryland Department of the Environment 2030 Greenhouse Gas Emissions Reduction Act Plan
210
are governed by Tier 3 standards that were adopted in 2009. These standards provide an 80% reduction of NOx emissions below the Tier 1 levels. Emissions other than NOx are not regulated.
Federal Standards for Locomotives In June 2008, the United States Environmental Protection Agency (EPA) finalized a three-part program aimed at reducing emissions from locomotives of all types – line-haul, switch, and passenger rail. Particulate matter emissions were cut by as much as 90% and NOx e emissions by as much as 80%. The standards apply to new locomotives built in 2015 and later and also apply to locomotives that are remanufactured.
Maryland Idle-Free Idling Reduction Program In 2018, MDE kicked-off its Idle Free MD program. Idle Free MD is a partnership between the State, the private sector and Maryland schools, designed to reduce unnecessary idling through outreach, education and voluntary action. The goal of the Idle Free MD program is to significantly reduce unnecessary idling by building awareness of its impact on Maryland communities. The program establishes partnerships with motorists, communities, and the transportation industries with the intention of reducing emissions from unnecessary idling by decreasing the social tolerance of idling through fact-based education. Idle Free Maryland reductions will help the State meet its climate change goals by reducing GHG emissions.
Renewable Energy and Efficiency Investments
EmPOWER Through EmPOWER, MEA gives grants, loans, rebates, and tax credits to individuals, businesses, nonprofits, and local governments to support various energy saving practices. There are different sub-programs for utilizing wind, solar, CHP, and more. As the EmPOWER Program approaches the final three-year cycle of the current mandate, there are opportunities to increase efficiency across State policy initiatives by re-examining the energy efficiency goals to facilitate other state initiatives and to reduce costs of the initiatives. There is also an opportunity to broaden the scope of efficiency and similar programs to support broader distributed energy, RPS and vehicle electrification goals. However, this expansion may impact the cost of the programs to ratepayers.
CHP As a key player in RGGI, Maryland has committed to promoting Combined Heat and Power (CHP). The CHP Grant Program is designed to further encourage CHP growth in the State. This first-come, first-served program targets eligible commercial, industrial, institutional, and critical infrastructure facilities (including healthcare, wastewater treatment, and essential state and local government facilities). The Combined Heat and Power (CHP) system installation at Peninsula Regional Medical Center is an example of SEIF funds directly supporting the state's energy efficiency goals. The massive medical facility will see an annual CO2 reduction of more than 50%, and the CHP system will offset 81% of its annual energy consumption.
SEIF In 2019, the State used the Strategic Energy Investment Fund (SEIF) for many key efficiency actions. The State helped install over 900 electric vehicle (EV) charging stations, to promote the sale of EVs and prepare for a future with more EVs on the road. MEA's Maryland Smart Energy Communities (MSEC) program welcomed nine new communities and gave out awards to reduce annual energy needs for these communities. It funded over 900 tons of new geothermal energy and more than 37,000 megawatt hours (MWh) of new clean electricity generation.
Maryland Department of the Environment 2030 Greenhouse Gas Emissions Reduction Act Plan
211
Renewable Portfolio Standard (RPS)
The Maryland RPS is the State's way to recognize and reap the benefits of diverse, renewable energy. RPS requires electricity suppliers to acquire a certain amount from predefined (in the RPS Statute) Tier 1 and Tier 2 renewable sources. Tier 1 includes sources such as wind and solar. The program is implemented through the creation, sale, and transfer of renewable energy credits (RECs). If a supplier fails to acquire sufficient RECs to meet the RPS, they must pay a penalty fee that goes directly to the creation of new Tier 1 renewable sources.
Appliance Efficiency Standards Energy efficiency standards save consumers billions of dollars by lowering utility bills and helping utilities avoid the need to build new, expensive energy infrastructure. Today the adoption of new and updated standards for commercial and consumer products provides a significant and highly cost-effective pathway to reduce GHG emissions. Maryland is participating in a USCA led effort to analyze current standards that could reduce GHG emissions significantly prior to 2030. Appliance standards help customers save water, electricity, gas, and delivered fuels by replacing older, inefficient equipment with high-efficiency options and incentivizing the development of new energy saving products. Based on research from the American Council for an Energy-Efficient Economy (ACEEE) and the Appliance Standards Awareness Project (ASAP), minimum efficiency standards on appliances and other energy-using equipment are the top U.S. policy for saving energy in buildings.
4.4 Challenging the Federal Government Over Weakening Key Programs that are Critical to Meeting Maryland’s Long-Term Climate Change Goals
The 2030 GGRA Plan draws upon existing policies at the federal, state, and local level, and puts forward new programs to achieve Maryland’s GHG reduction goals. The state plan does not rely on additional federal action to meet Maryland’s existing goals. However, federal action is absolutely necessary to address the challenge of climate change in the U.S. and globally, and to meet more ambitious Maryland goals posed by the MCCC. Maryland and fellow leadership states in the U.S. Climate Alliance, RGGI, and other collaborations have made great progress by advancing GHG reduction policies in the absence of much federal action, but there are limits to what states can accomplish without the federal government as a partner. Achieving 50% or greater reduction in GHG emissions by 2030 and achieving net-zero GHG emissions by 2045 will require new technologies and substantial investment in energy systems that cross state lines. Federal action on clean electricity can reduce emissions from power plants outside of Maryland that supply electricity into Maryland. Federal action on vehicle efficiency and EV incentives can reduce emissions from Maryland vehicles and from vehicles passing through Maryland. Federal action on building efficiency can deploy new technologies. New technologies to capture and store carbon, and to produce and use green hydrogen and other clean and renewable fuels will require investments in technology development and new interstate infrastructure systems. Maryland will continue its nation-leading work210 to reduce GHG emissions and grow its economy, and to work with other states to deploy solutions at greater scale. Maryland looks forward to partnering with the new federal
210 https://www.wri.org/blog/2020/07/decoupling-emissions-gdp-us
Maryland Department of the Environment 2030 Greenhouse Gas Emissions Reduction Act Plan
212
administration as it renews the federal government’s commitment to reducing GHGs and addressing climate change and environmental injustice. These critical actions are described below. 4.4.1 Critical Actions
The Clean Power Plan (CPP) This federal proposal was designed to significantly reduce GHG emissions from power plants across the Country. Maryland worked with EPA on the development of the CPP and strongly supported this rule proposed by the previous Administration. Maryland, through MDE, opposed the repeal of the CPP, unless the Plan was going to be replaced with a policy as effective and enforceable as RGGI. While the federal administration of 2016-2020 proposed the Affordable Clean Energy Rule (ACE) to repeal the CPP, the D.C. Circuit issued a decision forcefully upholding that the EPA must regulate GHGs as specified in the Endangerment Finding. The decision sends the rulemaking back to EPA so that the 2020-2024 Administration may issue new protections.
Federal Efforts to Revoke GHG Standards for Vehicles that are More Stringent than Federal Standards
Recent regulatory changes by the federal EPA and National Highway Traffic Safety Administration (NHTSA) sought to both roll back the existing federal fuel economy standards that had been set to improve the fuel economy of light duty vehicles to achieve an average of 54.5 miles per gallon by model year 2025, and to revoke the authority for states to adopt more stringent standards established by California. EPA named these two actions the “Safer Affordable Fuel-Efficient (SAFE) Vehicles Rule” with two parts. Maryland joined lawsuits challenging both efforts, which are still under litigation. The new federal administration is expected to reverse both of those decisions, establishing improved federal vehicle standards and maintaining states’ rights to adopt more stringent standards established by California. The 2030 GGRA Plan assumes that the incoming administration takes those actions, supporting states’ efforts to reduce transportation GHG emissions, improving the fuel efficiency of vehicles that burn gasoline and diesel, and providing new and extended incentives for consumers to purchase EVs. The emissions and economic analysis in the 2030 GGRA Plan incorporate analysis of these steps performed by Maryland and the other states in TCI. The TCI states published documentation of that analysis on the TCI website.211
Methane Emissions from New Sources in the Oil and Gas Industry The EPA finalized policy amendments and technical amendments regarding New Source Performance Standards (NSPS) in the oil and gas sector. The policy amendments roll back the NSPS in a variety of respects. Among other things, they rescind the methane (CH4) requirements of the 2016 NSPS for the production and processing segments. The technical amendments roll back other aspects of the NSPS for oil and gas sources. Most significantly, they (1) exempt low production wells, (2) relax the requirements for monitoring those sources for leaks (i.e., “fugitive emissions”), and (3) relax the technical requirements and deadlines for repairing leaks that are detected. MDE submitted comments strongly opposing the NSPS changes. Maryland has joined other states in challenging EPA’s these final rules. The cases are in active litigation.
211 https://www.transportationandclimate.org/modeling-methods-and-results
Maryland Department of the Environment 2030 Greenhouse Gas Emissions Reduction Act Plan
213
In addition to challenging the rollback of these federal rules, Maryland finalized statewide methane regulations for the oil and gas sector. MDE’s final regulation establishes requirements to reduce vented and “fugitive” (or leaked) emissions of methane from both new and existing energy facilities. The regulations require detection, testing, repair, reporting and recordkeeping requirements for these facilities in the state. MDE estimates the finalized methane regulations will potentially prevent up to 5,000 metric tons of emissions per year through leak surveys, replacement of equipment, and components and inspections.
Methane Emissions from New and Existing Landfills Maryland filed a lawsuit against the EPA over its failure to implement and enforce a critical landfill methane regulation. The regulation would have reduced landfill emissions of volatile organic compounds, hazardous air pollutants, CO2, and methane. It went into effect on October 28, 2016, but the EPA did not implement or enforce it. EPA finalized a new rule that delayed the compliance date for states to file a plan. Maryland is a party to multi-state litigation challenging EPA’s final rule. The case is in active litigation.
The U.S. Climate Alliance Maryland is a proud and active member of the U.S. Climate Alliance. The U.S, Climate Alliance now includes 25 states and was initiated when the federal government withdrew from the Paris Climate Accord. When joining the Alliance, Maryland committed to 1) implement policies that advance the goals of the Paris Climate Accord, and reduce GHG emissions by at least 26-28% below 2005 levels by 2025; 2) track and report progress to the global community; and 3) accelerate state and federal policies to reduce carbon pollution and promote clean energy.
Hydrofluorocarbon Regulation/Federal Rules Stalled Maryland, through Governor Hogan and MDE, finalized regulations to reduce hydrofluorocarbons (HFCs), GHGs that are significantly more potent than CO2. The regulations target HFCs in foam products, refrigeration, commercial air conditioning, and aerosol propellants, recognizing the availability of environmentally preferable alternatives. In moving to phase out HFCs, Maryland is acting in concert with commitments of the U. S. Climate Alliance to reduce climate-harming “super pollutants.” HFCs can be hundreds to thousands of times more potent than CO2 in contributing to climate change per unit of mass. The phase out of HFCs will encourage the use of widely available alternatives with lower emissions. Traditionally, the EPA regulates the use of HFCs under a federal Clean Air Act program. However, after two HFC rules issued by the EPA stalled due to legal challenges, states began their own initiatives. In the 2020 Coronavirus Aid, Relief, and Economic Security Act Coronavirus Relief Fund (CRF), Section 103 of Division S of this legislation grants the federal government express authority to phase down the production and consumption of HFCs in a manner consistent with the Kigali Amendment to the Montreal Protocol. It also authorizes the EPA to restrict the use of certain HFCs in certain applications and otherwise manage the transition into HFC substitutes. This new authority is critical to eventual ratification of the Kigali Amendment. Without this legislation, the federal government lacks express authority to phase down HFCs. Such authority is a prerequisite to consideration of the Kigali Amendment by the Senate.
The Mercury and Air Toxics Standard (MATS) Maryland, through MDE, joined with 20 other states and 5 other localities opposing EPA’s final rule “National Emission Standards for Hazardous Air Pollutants: Coal- and Oil-Fired Electric Utility Steam Generating Units—Reconsideration of Supplemental Finding and Residual Risk and Technology Review.” Specifically, this challenge addresses EPA’s action to revise its 2016 supplemental finding, which required EPA to take costs into account when
Maryland Department of the Environment 2030 Greenhouse Gas Emissions Reduction Act Plan
214
evaluating whether it is “appropriate” to regulate coal- and oil-fired power plants under section 112 of the Clean Air Act. EPA changed course in spite of the MATS Rule’s proven public health benefits (such as reductions in fine particulate matter), States and Local Governments’ reliance on the Rule, and over objection of the electric power sector, which has made significant investments to comply with the Rule. This case is in active litigation. The MATS Rule generates significant GHG co-benefits.
Maryland’s Section 126 Petition and Corresponding Litigation Maryland submitted a petition to EPA under Section 126 of the Clean Air Act. The petition asked EPA to require 19 power plants in five upwind states (Indiana, Kentucky, Ohio, Pennsylvania and West Virginia) to run their already installed air pollution controls to reduce emissions. The petition includes data that shows that these power plants have stopped running their pollution controls effectively and the increased emissions significantly affect the quality of the air that Marylanders breathe. Maryland is asking these plants to do what Maryland’s largest coal-fired power plants are already required to do under regulations implemented in 2015 through Governor Hogan and MDE. EPA denied Maryland’s petition. Maryland, through Governor Hogan’s Administration and MDE, sued EPA in the D.C. Circuit Court of Appeals asking the court to review the final action of the EPA on Maryland’s 126 petition. Delaware and Environmental NGOs also filed suit over EPA’s denial of Maryland’s 126 petition and denial of similar petitions filed by Delaware. The court consolidated those cases with Maryland’s case. This lawsuit is in active litigation. The D.C. Circuit remanded part of EPA’s final action and upheld other parts of it. Specifically, the Court is requiring EPA to reconsider its denial of part of Maryland’s petition that requests further reductions from power plants equipped with selective non-catalytic reduction (SNCR) controls.
Maryland’s requested emission reductions are driven primarily by the need to reduce NOx emissions to address ground level ozone, but it will also reduce GHG emissions and have significant climate change co-benefits.
EPA’s Cross State Air Pollution Rule (CSAPR) Close-Out and Revised CSAPR Update Maryland, through MDE, joined five other states and one city in a lawsuit opposing EPA’s final CSAPR Close-Out Rule. MDE strongly disagreed with EPA that the CSAPR Close-Out, fully addressed 20 states’ interstate ozone transport obligations under the 2008 ozone standard. The D.C. Circuit vacated the CSAPR Closeout, and in a separate decision, also remanded part of the CSAPR Update Rule in order for EPA to address ozone transport obligations by the upcoming 2021 attainment date. In response to the above litigation, EPA recently proposed the Revised CSAPR Update. Maryland, through Governor Hogan’s Administration and MDE, supports the Proposed Rule’s new NOx emission budgets as a positive step toward control of upwind ozone transport. However, there are deficiencies in the Proposed Rule that prevent it from fully addressing the CAA’s good neighbor obligations by 2021. MDE submitted comments urging the EPA to immediately implement the Proposed Rule’s NOx budgets to provide those much-needed NOx emissions reductions by the 2021 ozone season, but also to correct the deficiencies of the Proposed Rule in order to fully address ozone transport obligations under the 2008 ozone standard. This issue is driven primarily by the need to reduce NOx and volatile organic compound emissions across the East to address ground-level ozone. It will also generate significant GHG reduction co-benefits.
Maryland Department of the Environment 2030 Greenhouse Gas Emissions Reduction Act Plan
215
Chapter 5 Emissions Modeling and
Economic Impacts
5.1 Emissions and Economic Impact Analysis
The 2030 GGRA Plan advances a comprehensive portfolio of reduction measures that affect greenhouse gas (GHG) emissions across Maryland’s economy. To evaluate the effect of those policies on both GHG emissions and Maryland’s economy, the Maryland Department of the Environment (MDE) engaged the Regional Economic Studies Institute at Towson University (RESI) and Energy and Environmental Economics, Inc (E3) to build a comprehensive, economy-wide analysis framework. MDE worked with those analysts, relevant state agencies, and the Maryland Commission on Climate Change’s (MCCC) Mitigation Working Group to establish a Reference Scenario that estimated what will happen in the future if Maryland takes no further action to reduce GHG emissions beyond its existing policies, and to explore Policy Scenarios where the state takes additional action through portfolios of new programs, policies, and investments. In each scenario, E3 analyzed Maryland’s GHG emissions using PATHWAYS, a model of all energy production and consumption in the state that also includes detailed cost estimates for mitigation measures. The PATHWAYS model yielded estimates of both GHG emissions reductions and the costs and savings from deploying mitigation measures of different types in various sectors of Maryland’s economy. RESI used those results, supplemented with additional cost data from state agencies, to analyze changes in Maryland’s economy using REMI, a standard dynamic economic impact model. That analysis provides rich results on how energy use, emissions, costs, and other factors change in different sectors of Maryland’s economy in response to the GHG emissions reduction measures in the 2030 GGRA Plan. For sector-by-sector results, see Chapter 3. This Chapter provides detail on how the analysis worked, and its overall findings.
5.2 Emissions Modeling
5.2.1 Background E3 performed the GHG emissions analysis for the 2030 GGRA Plan using a model of Maryland’s energy system called PATHWAYS. The analysis project was divided into three phases:
• The first phase (2017) included the development of a reference case of GHG emissions for Maryland consistent with existing energy policies with the LEAP model, a widely used software tool for energy policy analysis and climate change mitigation assessment developed at the Stockholm Environment Institute.
• This work was presented to the Mitigation Working Group of the MCCC in February 2018.
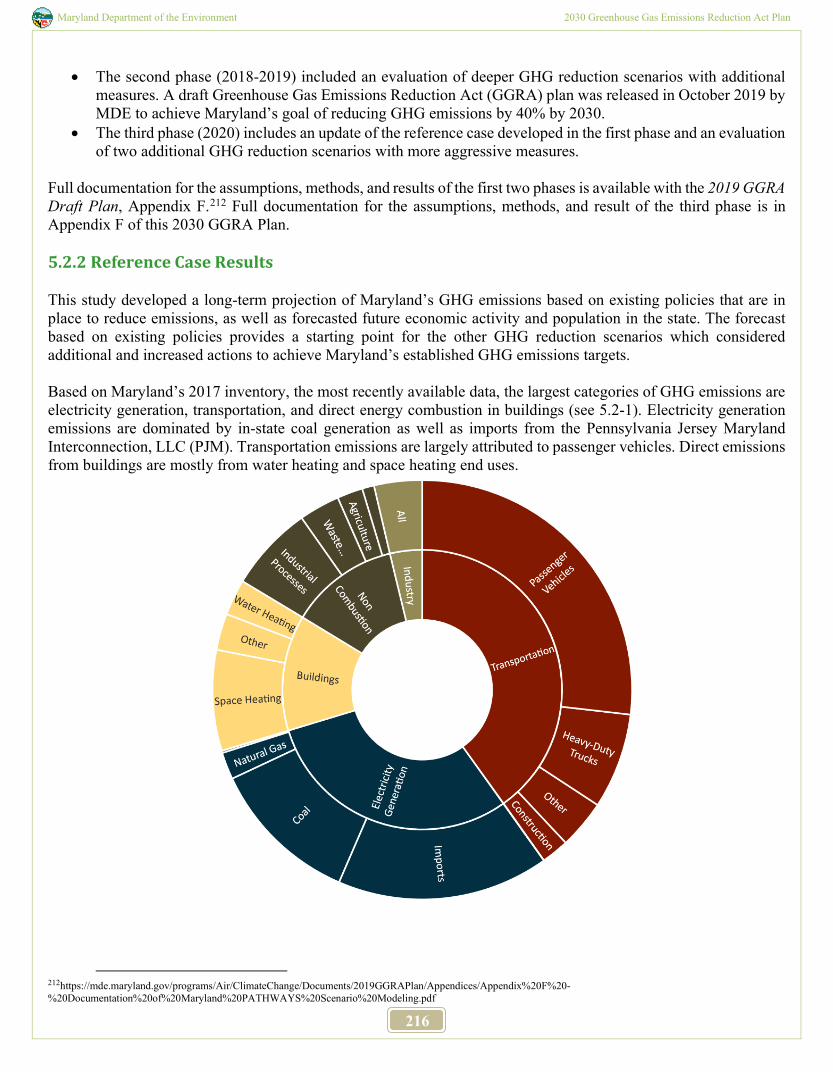
Maryland Department of the Environment 2030 Greenhouse Gas Emissions Reduction Act Plan
216
• The second phase (2018-2019) included an evaluation of deeper GHG reduction scenarios with additional measures. A draft Greenhouse Gas Emissions Reduction Act (GGRA) plan was released in October 2019 by MDE to achieve Maryland’s goal of reducing GHG emissions by 40% by 2030.
• The third phase (2020) includes an update of the reference case developed in the first phase and an evaluation of two additional GHG reduction scenarios with more aggressive measures.
Full documentation for the assumptions, methods, and results of the first two phases is available with the 2019 GGRA Draft Plan, Appendix F.212 Full documentation for the assumptions, methods, and result of the third phase is in Appendix F of this 2030 GGRA Plan. 5.2.2 Reference Case Results This study developed a long-term projection of Maryland’s GHG emissions based on existing policies that are in place to reduce emissions, as well as forecasted future economic activity and population in the state. The forecast based on existing policies provides a starting point for the other GHG reduction scenarios which considered additional and increased actions to achieve Maryland’s established GHG emissions targets. Based on Maryland’s 2017 inventory, the most recently available data, the largest categories of GHG emissions are electricity generation, transportation, and direct energy combustion in buildings (see 5.2-1). Electricity generation emissions are dominated by in-state coal generation as well as imports from the Pennsylvania Jersey Maryland Interconnection, LLC (PJM). Transportation emissions are largely attributed to passenger vehicles. Direct emissions from buildings are mostly from water heating and space heating end uses.
212https://mde.maryland.gov/programs/Air/ClimateChange/Documents/2019GGRAPlan/Appendices/Appendix%20F%20-%20Documentation%20of%20Maryland%20PATHWAYS%20Scenario%20Modeling.pdf
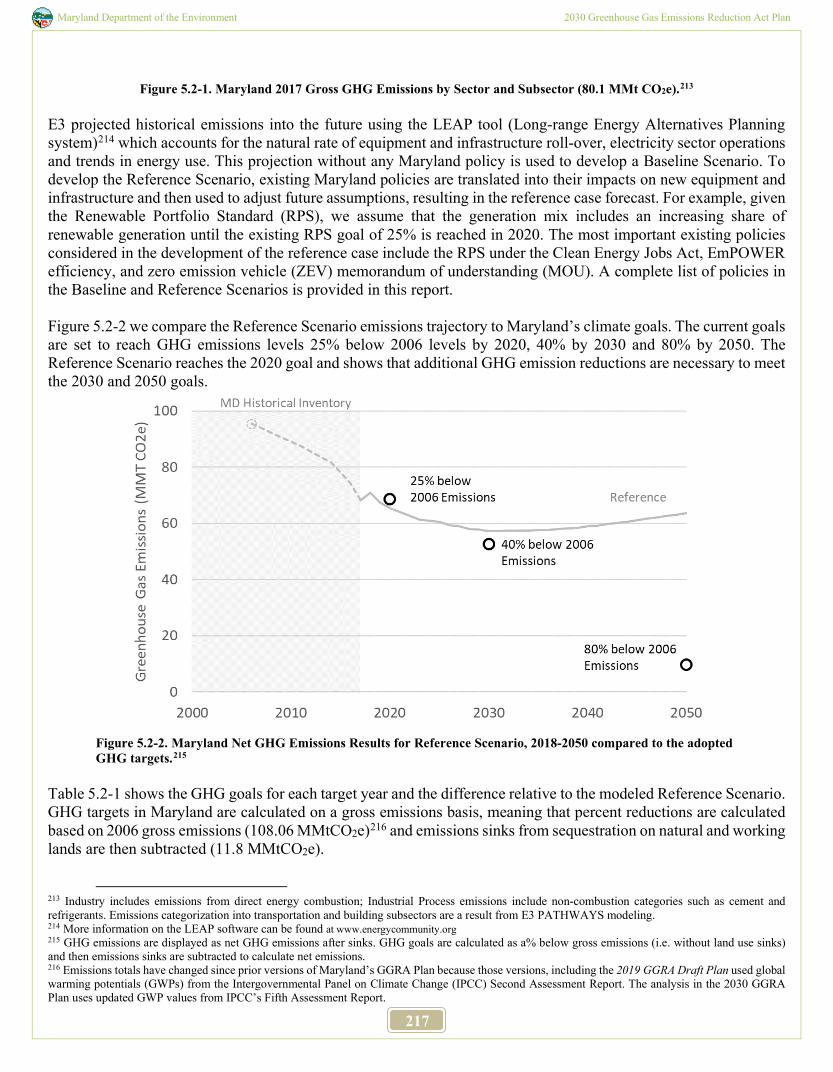
Maryland Department of the Environment 2030 Greenhouse Gas Emissions Reduction Act Plan
217
Figure 5.2-1. Maryland 2017 Gross GHG Emissions by Sector and Subsector (80.1 MMt CO2e).213
E3 projected historical emissions into the future using the LEAP tool (Long-range Energy Alternatives Planning system)214 which accounts for the natural rate of equipment and infrastructure roll-over, electricity sector operations and trends in energy use. This projection without any Maryland policy is used to develop a Baseline Scenario. To develop the Reference Scenario, existing Maryland policies are translated into their impacts on new equipment and infrastructure and then used to adjust future assumptions, resulting in the reference case forecast. For example, given the Renewable Portfolio Standard (RPS), we assume that the generation mix includes an increasing share of renewable generation until the existing RPS goal of 25% is reached in 2020. The most important existing policies considered in the development of the reference case include the RPS under the Clean Energy Jobs Act, EmPOWER efficiency, and zero emission vehicle (ZEV) memorandum of understanding (MOU). A complete list of policies in the Baseline and Reference Scenarios is provided in this report. Figure 5.2-2 we compare the Reference Scenario emissions trajectory to Maryland’s climate goals. The current goals are set to reach GHG emissions levels 25% below 2006 levels by 2020, 40% by 2030 and 80% by 2050. The Reference Scenario reaches the 2020 goal and shows that additional GHG emission reductions are necessary to meet the 2030 and 2050 goals.
Figure 5.2-2. Maryland Net GHG Emissions Results for Reference Scenario, 2018-2050 compared to the adopted GHG targets.215
Table 5.2-1 shows the GHG goals for each target year and the difference relative to the modeled Reference Scenario. GHG targets in Maryland are calculated on a gross emissions basis, meaning that percent reductions are calculated based on 2006 gross emissions (108.06 MMtCO2e)216 and emissions sinks from sequestration on natural and working lands are then subtracted (11.8 MMtCO2e).
213 Industry includes emissions from direct energy combustion; Industrial Process emissions include non-combustion categories such as cement and refrigerants. Emissions categorization into transportation and building subsectors are a result from E3 PATHWAYS modeling. 214 More information on the LEAP software can be found at www.energycommunity.org 215 GHG emissions are displayed as net GHG emissions after sinks. GHG goals are calculated as a% below gross emissions (i.e. without land use sinks) and then emissions sinks are subtracted to calculate net emissions. 216 Emissions totals have changed since prior versions of Maryland’s GGRA Plan because those versions, including the 2019 GGRA Draft Plan used global warming potentials (GWPs) from the Intergovernmental Panel on Climate Change (IPCC) Second Assessment Report. The analysis in the 2030 GGRA Plan uses updated GWP values from IPCC’s Fifth Assessment Report.
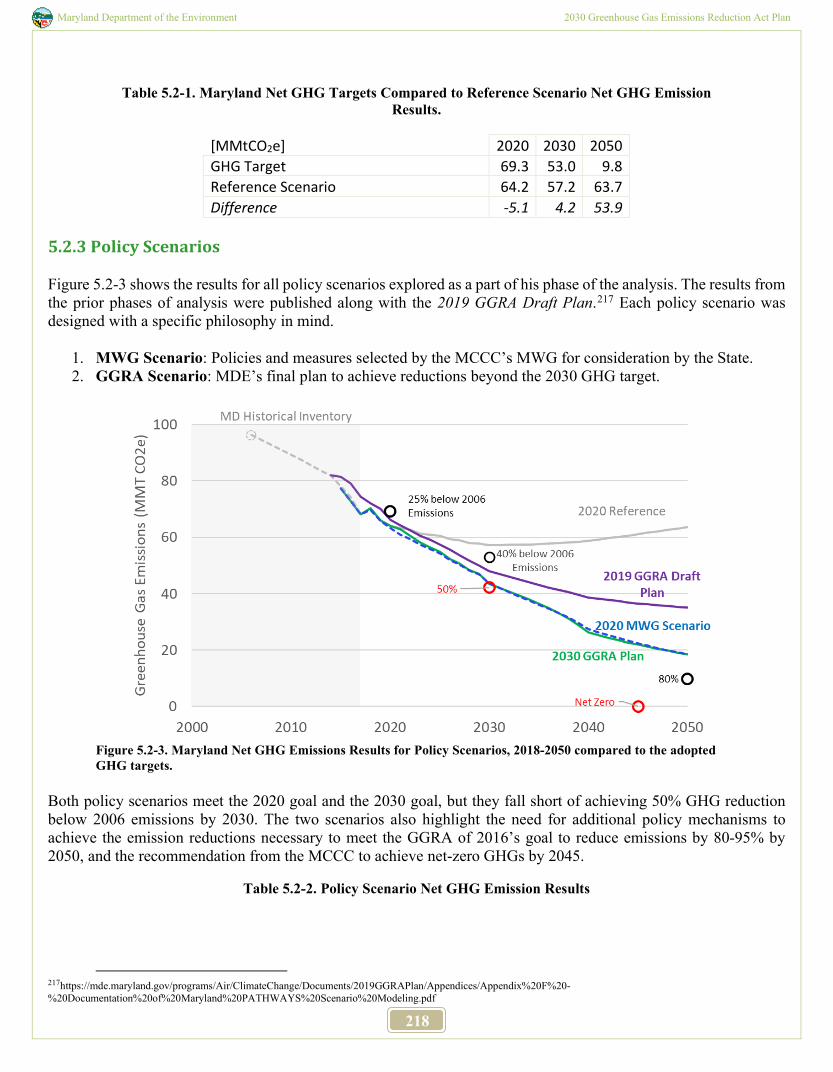
Maryland Department of the Environment 2030 Greenhouse Gas Emissions Reduction Act Plan
218
Table 5.2-1. Maryland Net GHG Targets Compared to Reference Scenario Net GHG Emission
Results.
[MMtCO2e] 2020 2030 2050 GHG Target 69.3 53.0 9.8 Reference Scenario 64.2 57.2 63.7 Difference -5.1 4.2 53.9
5.2.3 Policy Scenarios Figure 5.2-3 shows the results for all policy scenarios explored as a part of his phase of the analysis. The results from the prior phases of analysis were published along with the 2019 GGRA Draft Plan.217 Each policy scenario was designed with a specific philosophy in mind.
1. MWG Scenario: Policies and measures selected by the MCCC’s MWG for consideration by the State. 2. GGRA Scenario: MDE’s final plan to achieve reductions beyond the 2030 GHG target.
Figure 5.2-3. Maryland Net GHG Emissions Results for Policy Scenarios, 2018-2050 compared to the adopted GHG targets.
Both policy scenarios meet the 2020 goal and the 2030 goal, but they fall short of achieving 50% GHG reduction below 2006 emissions by 2030. The two scenarios also highlight the need for additional policy mechanisms to achieve the emission reductions necessary to meet the GGRA of 2016’s goal to reduce emissions by 80-95% by 2050, and the recommendation from the MCCC to achieve net-zero GHGs by 2045.
Table 5.2-2. Policy Scenario Net GHG Emission Results
217https://mde.maryland.gov/programs/Air/ClimateChange/Documents/2019GGRAPlan/Appendices/Appendix%20F%20-%20Documentation%20of%20Maryland%20PATHWAYS%20Scenario%20Modeling.pdf
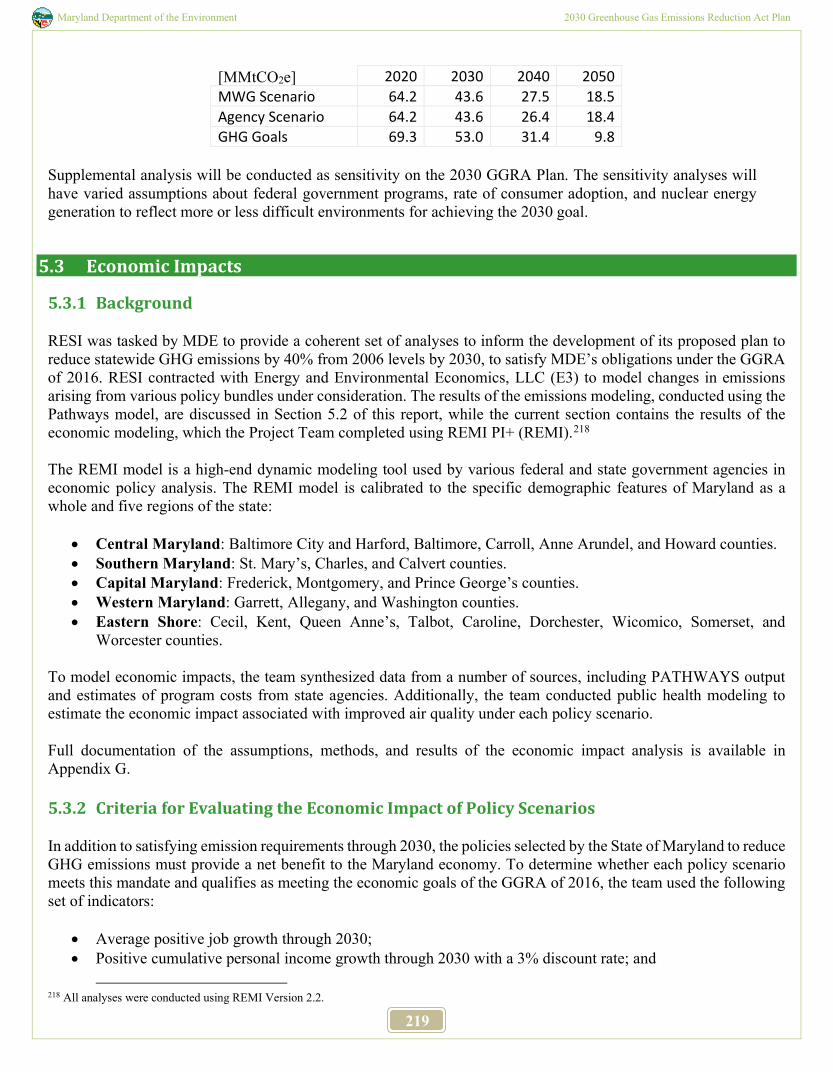
Maryland Department of the Environment 2030 Greenhouse Gas Emissions Reduction Act Plan
219
[MMtCO2e] 2020 2030 2040 2050 MWG Scenario 64.2 43.6 27.5 18.5 Agency Scenario 64.2 43.6 26.4 18.4 GHG Goals 69.3 53.0 31.4 9.8
Supplemental analysis will be conducted as sensitivity on the 2030 GGRA Plan. The sensitivity analyses will have varied assumptions about federal government programs, rate of consumer adoption, and nuclear energy generation to reflect more or less difficult environments for achieving the 2030 goal.
5.3 Economic Impacts
5.3.1 Background RESI was tasked by MDE to provide a coherent set of analyses to inform the development of its proposed plan to reduce statewide GHG emissions by 40% from 2006 levels by 2030, to satisfy MDE’s obligations under the GGRA of 2016. RESI contracted with Energy and Environmental Economics, LLC (E3) to model changes in emissions arising from various policy bundles under consideration. The results of the emissions modeling, conducted using the Pathways model, are discussed in Section 5.2 of this report, while the current section contains the results of the economic modeling, which the Project Team completed using REMI PI+ (REMI).218 The REMI model is a high-end dynamic modeling tool used by various federal and state government agencies in economic policy analysis. The REMI model is calibrated to the specific demographic features of Maryland as a whole and five regions of the state:
• Central Maryland: Baltimore City and Harford, Baltimore, Carroll, Anne Arundel, and Howard counties. • Southern Maryland: St. Mary’s, Charles, and Calvert counties. • Capital Maryland: Frederick, Montgomery, and Prince George’s counties. • Western Maryland: Garrett, Allegany, and Washington counties. • Eastern Shore: Cecil, Kent, Queen Anne’s, Talbot, Caroline, Dorchester, Wicomico, Somerset, and
Worcester counties. To model economic impacts, the team synthesized data from a number of sources, including PATHWAYS output and estimates of program costs from state agencies. Additionally, the team conducted public health modeling to estimate the economic impact associated with improved air quality under each policy scenario. Full documentation of the assumptions, methods, and results of the economic impact analysis is available in Appendix G. 5.3.2 Criteria for Evaluating the Economic Impact of Policy Scenarios In addition to satisfying emission requirements through 2030, the policies selected by the State of Maryland to reduce GHG emissions must provide a net benefit to the Maryland economy. To determine whether each policy scenario meets this mandate and qualifies as meeting the economic goals of the GGRA of 2016, the team used the following set of indicators:
• Average positive job growth through 2030; • Positive cumulative personal income growth through 2030 with a 3% discount rate; and
218 All analyses were conducted using REMI Version 2.2.
Maryland Department of the Environment 2030 Greenhouse Gas Emissions Reduction Act Plan
220
• Positive cumulative gross state product (GSP) growth through 2030 with a 3% discount rate. In addition to these three metrics, the team considered other measures of economic well-being, including:
• The impact across different sectors of Maryland’s economy, including manufacturing; • The impact on consumer prices; • Distributional impacts in terms of income, education and training, and race/ethnicity; and • The regional distribution of jobs.
Reducing GHG emissions and ensuring net benefits to Maryland’s economy are not mutually exclusive goals. The following sections will outline the various policy bundles that the Project Team considered, as well as the results of the analysis. 5.3.3 Policy Scenarios In evaluating policies to reduce GHG emissions in Maryland and achieve the goals set in the 2030 GGRA Plan, the Project Team evaluated a total of four preliminary policy scenarios. Based on these draft analyses, the 2019 Draft GGRA Plan was constructed, a subsequent scenario put forth by the MWG was constructed, and the 2030 GGRA Plan was developed. This section provides an overview of these three newer scenarios.
5.3.3.1 Draft GGRA Plan The 2019 Draft GGRA Plan assumes a continuation or extension of current policies. For example, EmPOWER goals that are currently in place are extended past the expiration year of 2023. In addition to these extensions, the 2019 Draft GGRA Plan layers on additional decarbonization efforts, including:
• A 100% Clean and Renewable Energy Standard (CARES) goal by 2040; • Transit bus electrification and other transportation programs; and • Forest management and healthy soils initiatives.
The 2019 Draft GGRA Plan was constructed both to achieve the emissions requirements laid forth in the GGRA of 2016 and provide a blueprint for future efforts to reduce GHG emissions.
5.3.3.2 MWG Scenario The MWG Scenario established by that working group of the MCCC in 2020 represents an aggressive bundle of decarbonization policies dictated by the working group. In contrast to the Draft GGRA Plan, the MWG Scenario pursues more aggressive:
• Electrification and efficiency in buildings; • Sales of both light duty and heavy duty ZEVs; • Transit bus electrification and other transportation programs; and • Forest management, healthy soils, and related practices.
5.3.3.3 2030 GGRA Plan
The 2030 GGRA Plan represents the plan proposed by MDE to achieve the emissions requirements as specified in the GGRA of 2016 and provide a blueprint for future efforts to reduce GHG emissions. The 2030 GGRA Plan consists of a combination of policies from the MWG Scenario, as well as the 2019 Draft GGRA Plan, to determine an economically efficient bundle that yields significant reductions in emissions.
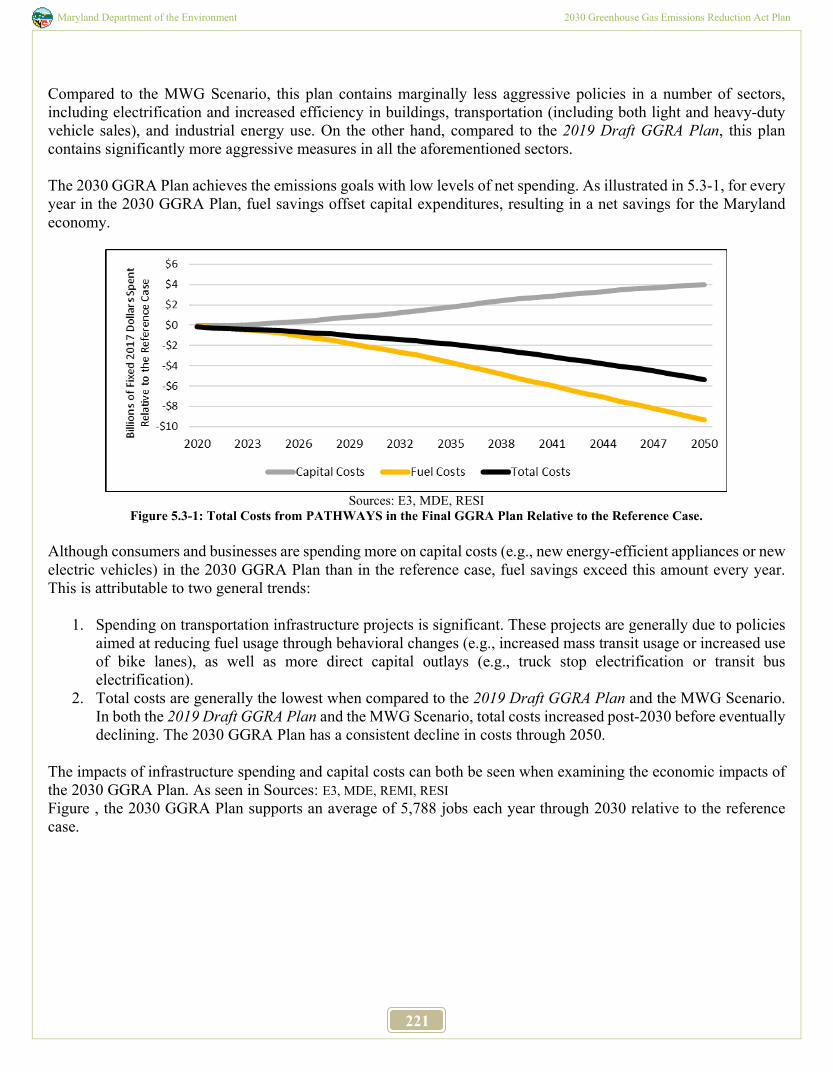
Maryland Department of the Environment 2030 Greenhouse Gas Emissions Reduction Act Plan
221
Compared to the MWG Scenario, this plan contains marginally less aggressive policies in a number of sectors, including electrification and increased efficiency in buildings, transportation (including both light and heavy-duty vehicle sales), and industrial energy use. On the other hand, compared to the 2019 Draft GGRA Plan, this plan contains significantly more aggressive measures in all the aforementioned sectors. The 2030 GGRA Plan achieves the emissions goals with low levels of net spending. As illustrated in 5.3-1, for every year in the 2030 GGRA Plan, fuel savings offset capital expenditures, resulting in a net savings for the Maryland economy.
Sources: E3, MDE, RESI
Figure 5.3-1: Total Costs from PATHWAYS in the Final GGRA Plan Relative to the Reference Case.
Although consumers and businesses are spending more on capital costs (e.g., new energy-efficient appliances or new electric vehicles) in the 2030 GGRA Plan than in the reference case, fuel savings exceed this amount every year. This is attributable to two general trends:
1. Spending on transportation infrastructure projects is significant. These projects are generally due to policies aimed at reducing fuel usage through behavioral changes (e.g., increased mass transit usage or increased use of bike lanes), as well as more direct capital outlays (e.g., truck stop electrification or transit bus electrification).
2. Total costs are generally the lowest when compared to the 2019 Draft GGRA Plan and the MWG Scenario. In both the 2019 Draft GGRA Plan and the MWG Scenario, total costs increased post-2030 before eventually declining. The 2030 GGRA Plan has a consistent decline in costs through 2050.
The impacts of infrastructure spending and capital costs can both be seen when examining the economic impacts of the 2030 GGRA Plan. As seen in Sources: E3, MDE, REMI, RESI Figure , the 2030 GGRA Plan supports an average of 5,788 jobs each year through 2030 relative to the reference case.
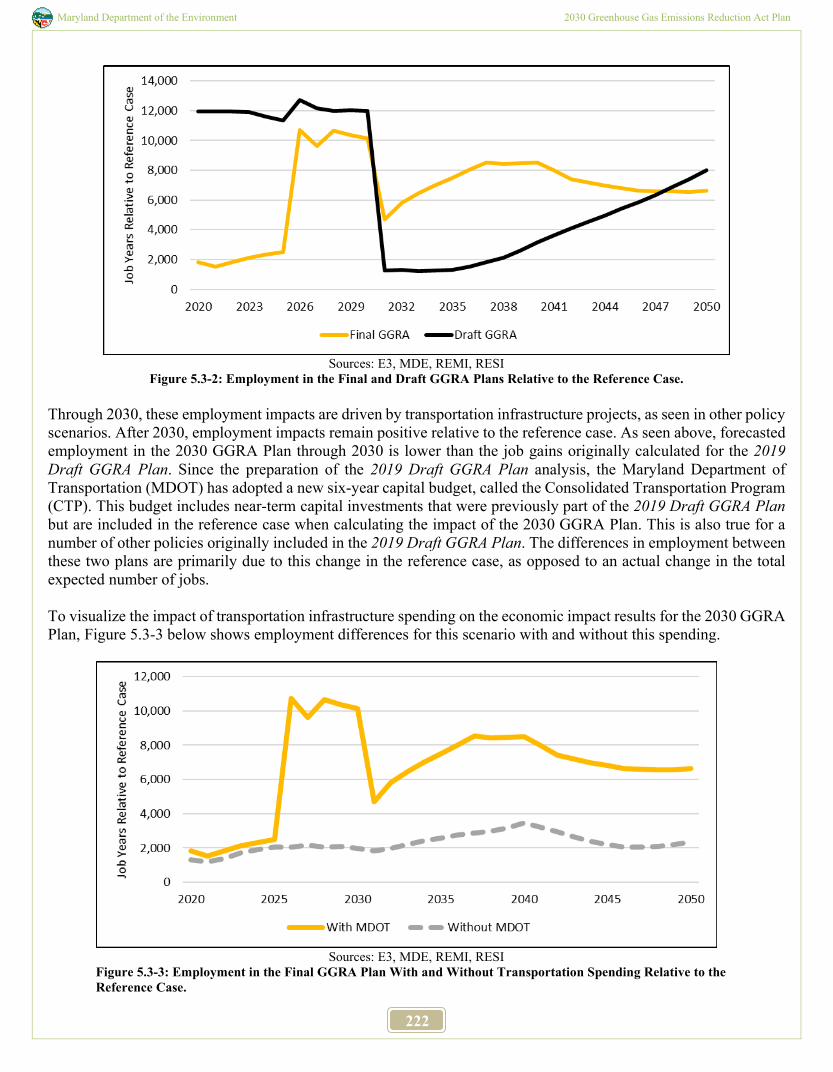
Maryland Department of the Environment 2030 Greenhouse Gas Emissions Reduction Act Plan
222
Sources: E3, MDE, REMI, RESI
Figure 5.3-2: Employment in the Final and Draft GGRA Plans Relative to the Reference Case. Through 2030, these employment impacts are driven by transportation infrastructure projects, as seen in other policy scenarios. After 2030, employment impacts remain positive relative to the reference case. As seen above, forecasted employment in the 2030 GGRA Plan through 2030 is lower than the job gains originally calculated for the 2019 Draft GGRA Plan. Since the preparation of the 2019 Draft GGRA Plan analysis, the Maryland Department of Transportation (MDOT) has adopted a new six-year capital budget, called the Consolidated Transportation Program (CTP). This budget includes near-term capital investments that were previously part of the 2019 Draft GGRA Plan but are included in the reference case when calculating the impact of the 2030 GGRA Plan. This is also true for a number of other policies originally included in the 2019 Draft GGRA Plan. The differences in employment between these two plans are primarily due to this change in the reference case, as opposed to an actual change in the total expected number of jobs. To visualize the impact of transportation infrastructure spending on the economic impact results for the 2030 GGRA Plan, Figure 5.3-3 below shows employment differences for this scenario with and without this spending.
Sources: E3, MDE, REMI, RESI
Figure 5.3-3: Employment in the Final GGRA Plan With and Without Transportation Spending Relative to the Reference Case.
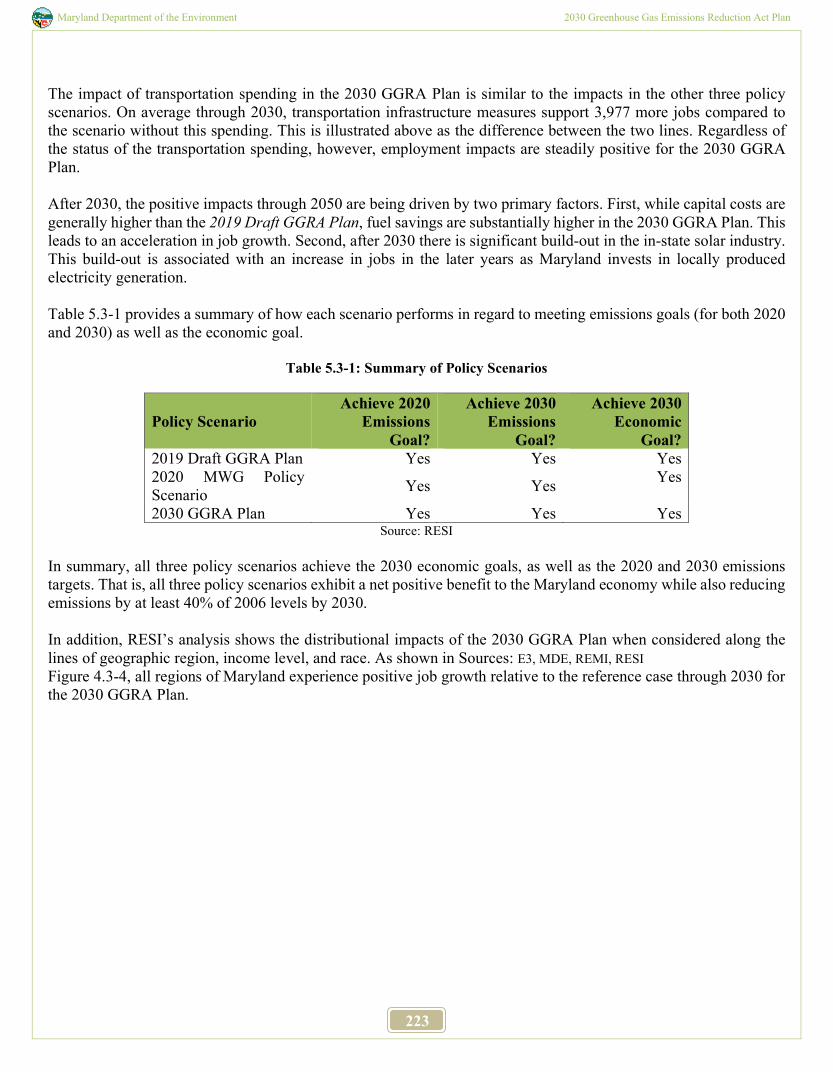
Maryland Department of the Environment 2030 Greenhouse Gas Emissions Reduction Act Plan
223
The impact of transportation spending in the 2030 GGRA Plan is similar to the impacts in the other three policy scenarios. On average through 2030, transportation infrastructure measures support 3,977 more jobs compared to the scenario without this spending. This is illustrated above as the difference between the two lines. Regardless of the status of the transportation spending, however, employment impacts are steadily positive for the 2030 GGRA Plan. After 2030, the positive impacts through 2050 are being driven by two primary factors. First, while capital costs are generally higher than the 2019 Draft GGRA Plan, fuel savings are substantially higher in the 2030 GGRA Plan. This leads to an acceleration in job growth. Second, after 2030 there is significant build-out in the in-state solar industry. This build-out is associated with an increase in jobs in the later years as Maryland invests in locally produced electricity generation. Table 5.3-1 provides a summary of how each scenario performs in regard to meeting emissions goals (for both 2020 and 2030) as well as the economic goal.
Table 5.3-1: Summary of Policy Scenarios
Policy Scenario Achieve 2020
Emissions Goal?
Achieve 2030 Emissions
Goal?
Achieve 2030 Economic
Goal? 2019 Draft GGRA Plan Yes Yes Yes 2020 MWG Policy Scenario Yes Yes Yes
2030 GGRA Plan Yes Yes Yes Source: RESI
In summary, all three policy scenarios achieve the 2030 economic goals, as well as the 2020 and 2030 emissions targets. That is, all three policy scenarios exhibit a net positive benefit to the Maryland economy while also reducing emissions by at least 40% of 2006 levels by 2030. In addition, RESI’s analysis shows the distributional impacts of the 2030 GGRA Plan when considered along the lines of geographic region, income level, and race. As shown in Sources: E3, MDE, REMI, RESI Figure 4.3-4, all regions of Maryland experience positive job growth relative to the reference case through 2030 for the 2030 GGRA Plan.
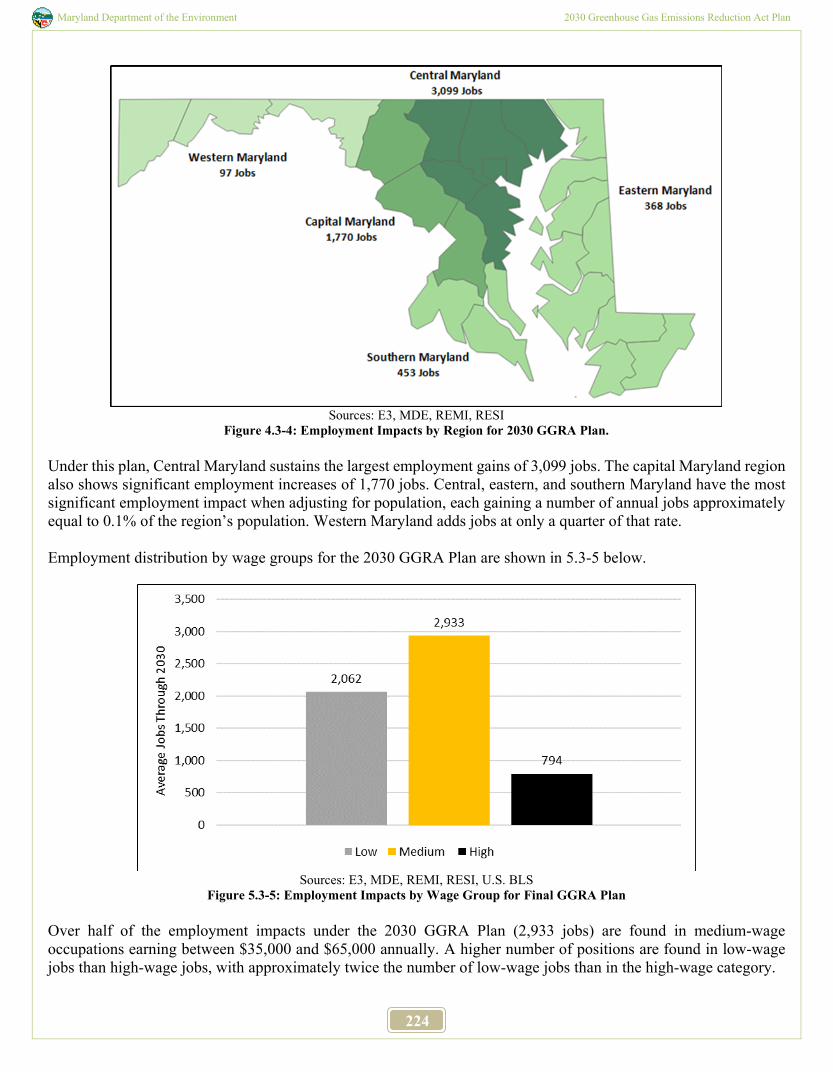
Maryland Department of the Environment 2030 Greenhouse Gas Emissions Reduction Act Plan
224
Sources: E3, MDE, REMI, RESI
Figure 4.3-4: Employment Impacts by Region for 2030 GGRA Plan. Under this plan, Central Maryland sustains the largest employment gains of 3,099 jobs. The capital Maryland region also shows significant employment increases of 1,770 jobs. Central, eastern, and southern Maryland have the most significant employment impact when adjusting for population, each gaining a number of annual jobs approximately equal to 0.1% of the region’s population. Western Maryland adds jobs at only a quarter of that rate. Employment distribution by wage groups for the 2030 GGRA Plan are shown in 5.3-5 below.
Sources: E3, MDE, REMI, RESI, U.S. BLS
Figure 5.3-5: Employment Impacts by Wage Group for Final GGRA Plan Over half of the employment impacts under the 2030 GGRA Plan (2,933 jobs) are found in medium-wage occupations earning between $35,000 and $65,000 annually. A higher number of positions are found in low-wage jobs than high-wage jobs, with approximately twice the number of low-wage jobs than in the high-wage category.
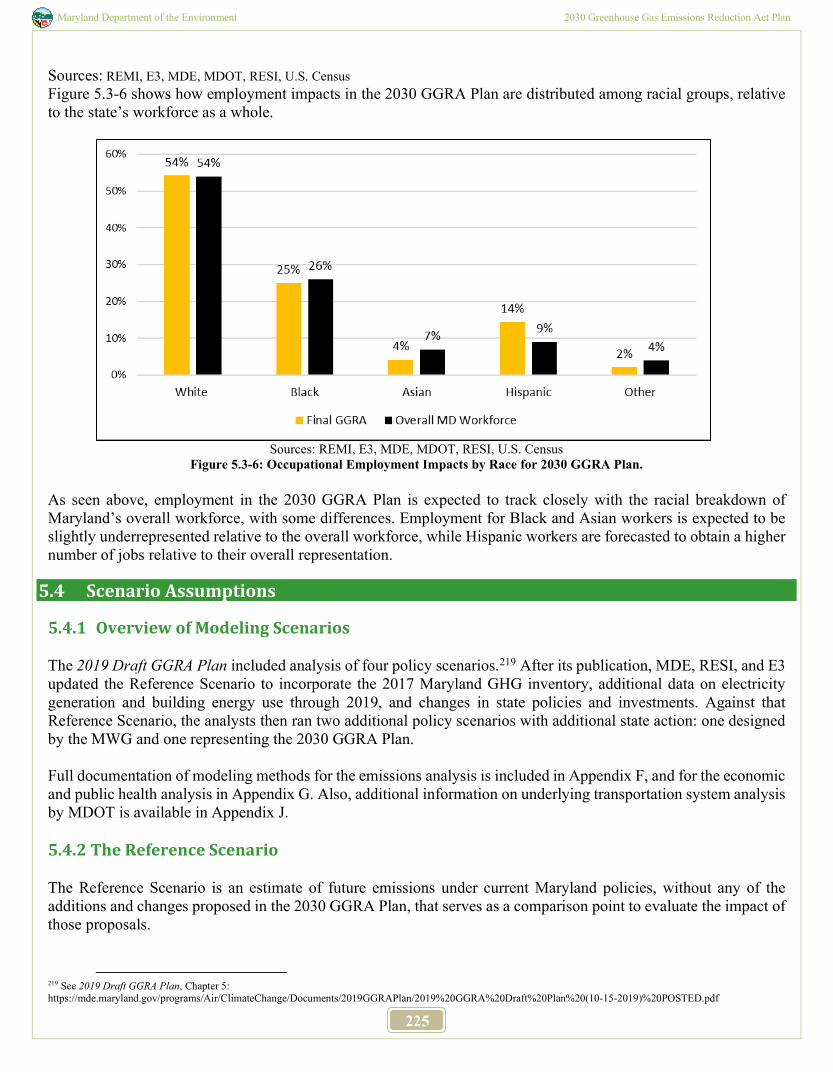
Maryland Department of the Environment 2030 Greenhouse Gas Emissions Reduction Act Plan
225
Sources: REMI, E3, MDE, MDOT, RESI, U.S. Census Figure 5.3-6 shows how employment impacts in the 2030 GGRA Plan are distributed among racial groups, relative to the state’s workforce as a whole.
Sources: REMI, E3, MDE, MDOT, RESI, U.S. Census
Figure 5.3-6: Occupational Employment Impacts by Race for 2030 GGRA Plan. As seen above, employment in the 2030 GGRA Plan is expected to track closely with the racial breakdown of Maryland’s overall workforce, with some differences. Employment for Black and Asian workers is expected to be slightly underrepresented relative to the overall workforce, while Hispanic workers are forecasted to obtain a higher number of jobs relative to their overall representation.
5.4 Scenario Assumptions
5.4.1 Overview of Modeling Scenarios
The 2019 Draft GGRA Plan included analysis of four policy scenarios.219 After its publication, MDE, RESI, and E3 updated the Reference Scenario to incorporate the 2017 Maryland GHG inventory, additional data on electricity generation and building energy use through 2019, and changes in state policies and investments. Against that Reference Scenario, the analysts then ran two additional policy scenarios with additional state action: one designed by the MWG and one representing the 2030 GGRA Plan. Full documentation of modeling methods for the emissions analysis is included in Appendix F, and for the economic and public health analysis in Appendix G. Also, additional information on underlying transportation system analysis by MDOT is available in Appendix J. 5.4.2 The Reference Scenario The Reference Scenario is an estimate of future emissions under current Maryland policies, without any of the additions and changes proposed in the 2030 GGRA Plan, that serves as a comparison point to evaluate the impact of those proposals.
219 See 2019 Draft GGRA Plan, Chapter 5: https://mde.maryland.gov/programs/Air/ClimateChange/Documents/2019GGRAPlan/2019%20GGRA%20Draft%20Plan%20(10-15-2019)%20POSTED.pdf
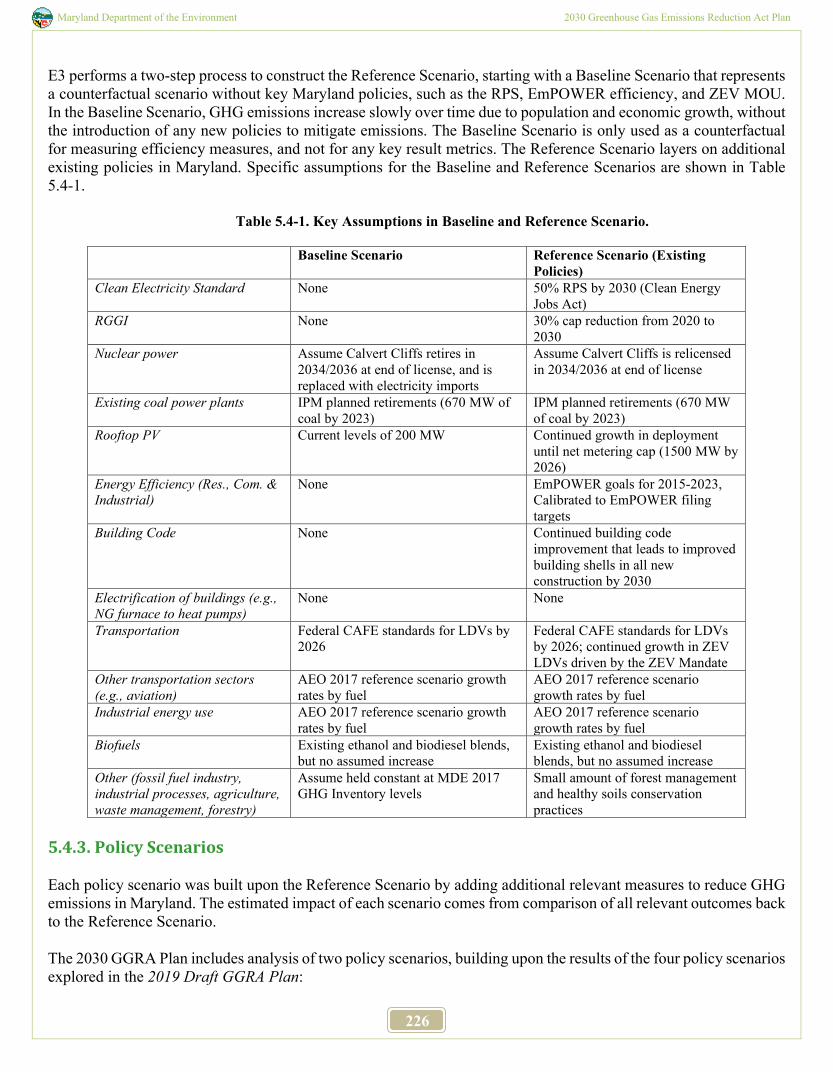
Maryland Department of the Environment 2030 Greenhouse Gas Emissions Reduction Act Plan
226
E3 performs a two-step process to construct the Reference Scenario, starting with a Baseline Scenario that represents a counterfactual scenario without key Maryland policies, such as the RPS, EmPOWER efficiency, and ZEV MOU. In the Baseline Scenario, GHG emissions increase slowly over time due to population and economic growth, without the introduction of any new policies to mitigate emissions. The Baseline Scenario is only used as a counterfactual for measuring efficiency measures, and not for any key result metrics. The Reference Scenario layers on additional existing policies in Maryland. Specific assumptions for the Baseline and Reference Scenarios are shown in Table 5.4-1.
Table 5.4-1. Key Assumptions in Baseline and Reference Scenario.
Baseline Scenario Reference Scenario (Existing Policies)
Clean Electricity Standard None 50% RPS by 2030 (Clean Energy Jobs Act)
RGGI None 30% cap reduction from 2020 to 2030
Nuclear power Assume Calvert Cliffs retires in 2034/2036 at end of license, and is replaced with electricity imports
Assume Calvert Cliffs is relicensed in 2034/2036 at end of license
Existing coal power plants IPM planned retirements (670 MW of coal by 2023)
IPM planned retirements (670 MW of coal by 2023)
Rooftop PV Current levels of 200 MW Continued growth in deployment until net metering cap (1500 MW by 2026)
Energy Efficiency (Res., Com. & Industrial)
None EmPOWER goals for 2015-2023, Calibrated to EmPOWER filing targets
Building Code None Continued building code improvement that leads to improved building shells in all new construction by 2030
Electrification of buildings (e.g., NG furnace to heat pumps)
None None
Transportation Federal CAFE standards for LDVs by 2026
Federal CAFE standards for LDVs by 2026; continued growth in ZEV LDVs driven by the ZEV Mandate
Other transportation sectors (e.g., aviation)
AEO 2017 reference scenario growth rates by fuel
AEO 2017 reference scenario growth rates by fuel
Industrial energy use AEO 2017 reference scenario growth rates by fuel
AEO 2017 reference scenario growth rates by fuel
Biofuels Existing ethanol and biodiesel blends, but no assumed increase
Existing ethanol and biodiesel blends, but no assumed increase
Other (fossil fuel industry, industrial processes, agriculture, waste management, forestry)
Assume held constant at MDE 2017 GHG Inventory levels
Small amount of forest management and healthy soils conservation practices
5.4.3. Policy Scenarios Each policy scenario was built upon the Reference Scenario by adding additional relevant measures to reduce GHG emissions in Maryland. The estimated impact of each scenario comes from comparison of all relevant outcomes back to the Reference Scenario. The 2030 GGRA Plan includes analysis of two policy scenarios, building upon the results of the four policy scenarios explored in the 2019 Draft GGRA Plan:
Maryland Department of the Environment 2030 Greenhouse Gas Emissions Reduction Act Plan
227
1. MWG Scenario: Policies and measures selected by the MCCC’s MWG for consideration by the State.
2. GGRA Scenario: MDE’s final plan to achieve reductions beyond the 2030 GHG target.
The two policy scenarios yielded similar emissions results but included differences in key policies (Table 5.3-1). In addition to the energy system analysis performed by E3, the estimates in the 2030 GGRA Plan include detailed transportation system modeling performed by MDOT, documented in greater detail in Appendix J.
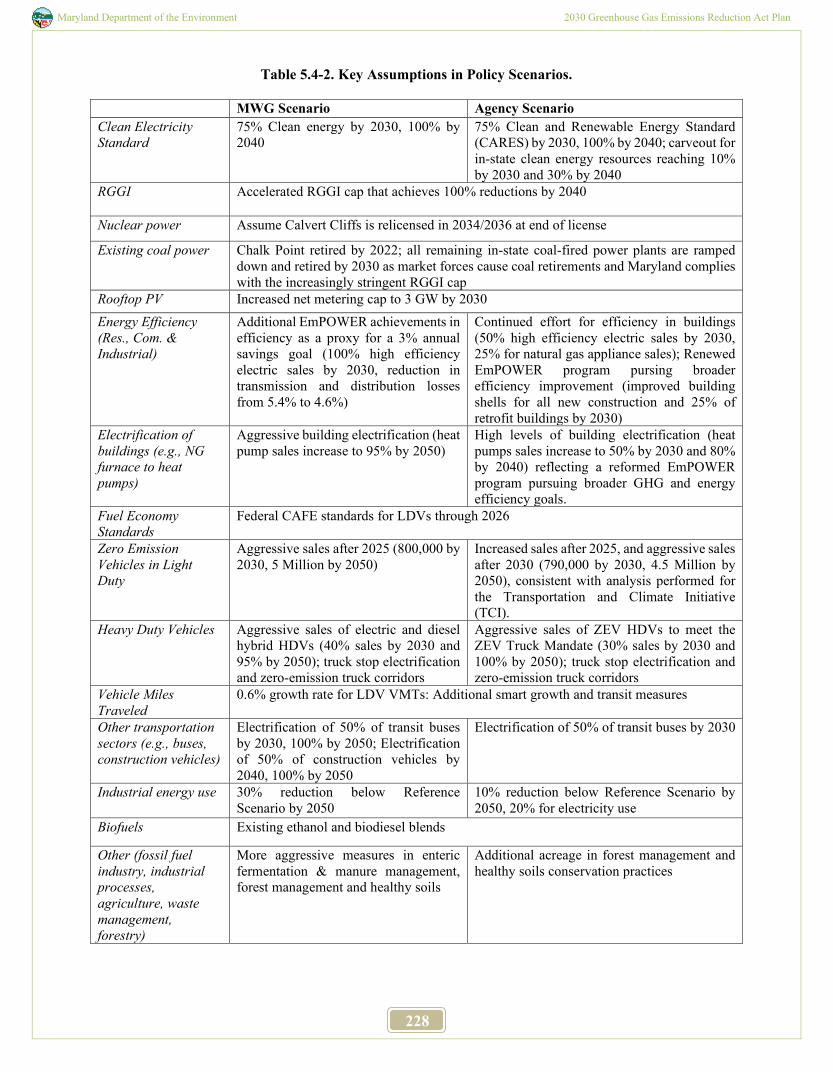
Maryland Department of the Environment 2030 Greenhouse Gas Emissions Reduction Act Plan
228
Table 5.4-2. Key Assumptions in Policy Scenarios.
MWG Scenario Agency Scenario Clean Electricity Standard
75% Clean energy by 2030, 100% by 2040
75% Clean and Renewable Energy Standard (CARES) by 2030, 100% by 2040; carveout for in-state clean energy resources reaching 10% by 2030 and 30% by 2040
RGGI Accelerated RGGI cap that achieves 100% reductions by 2040
Nuclear power Assume Calvert Cliffs is relicensed in 2034/2036 at end of license
Existing coal power Chalk Point retired by 2022; all remaining in-state coal-fired power plants are ramped down and retired by 2030 as market forces cause coal retirements and Maryland complies with the increasingly stringent RGGI cap
Rooftop PV Increased net metering cap to 3 GW by 2030 Energy Efficiency (Res., Com. & Industrial)
Additional EmPOWER achievements in efficiency as a proxy for a 3% annual savings goal (100% high efficiency electric sales by 2030, reduction in transmission and distribution losses from 5.4% to 4.6%)
Continued effort for efficiency in buildings (50% high efficiency electric sales by 2030, 25% for natural gas appliance sales); Renewed EmPOWER program pursing broader efficiency improvement (improved building shells for all new construction and 25% of retrofit buildings by 2030)
Electrification of buildings (e.g., NG furnace to heat pumps)
Aggressive building electrification (heat pump sales increase to 95% by 2050)
High levels of building electrification (heat pumps sales increase to 50% by 2030 and 80% by 2040) reflecting a reformed EmPOWER program pursuing broader GHG and energy efficiency goals.
Fuel Economy Standards
Federal CAFE standards for LDVs through 2026
Zero Emission Vehicles in Light Duty
Aggressive sales after 2025 (800,000 by 2030, 5 Million by 2050)
Increased sales after 2025, and aggressive sales after 2030 (790,000 by 2030, 4.5 Million by 2050), consistent with analysis performed for the Transportation and Climate Initiative (TCI).
Heavy Duty Vehicles Aggressive sales of electric and diesel hybrid HDVs (40% sales by 2030 and 95% by 2050); truck stop electrification and zero-emission truck corridors
Aggressive sales of ZEV HDVs to meet the ZEV Truck Mandate (30% sales by 2030 and 100% by 2050); truck stop electrification and zero-emission truck corridors
Vehicle Miles Traveled
0.6% growth rate for LDV VMTs: Additional smart growth and transit measures
Other transportation sectors (e.g., buses, construction vehicles)
Electrification of 50% of transit buses by 2030, 100% by 2050; Electrification of 50% of construction vehicles by 2040, 100% by 2050
Electrification of 50% of transit buses by 2030
Industrial energy use 30% reduction below Reference Scenario by 2050
10% reduction below Reference Scenario by 2050, 20% for electricity use
Biofuels Existing ethanol and biodiesel blends
Other (fossil fuel industry, industrial processes, agriculture, waste management, forestry)
More aggressive measures in enteric fermentation & manure management, forest management and healthy soils
Additional acreage in forest management and healthy soils conservation practices
Maryland Department of the Environment 2030 Greenhouse Gas Emissions Reduction Act Plan
229
Chapter 6 Greenhouse Gas Emissions
Through 2020
6.1 Overview
6.1.1 Introduction The Maryland Department of the Environment (MDE) tracks the State’s emissions through its Greenhouse Gas (GHG) Emissions Inventory. The 2006 GHG emissions inventory serves as a baseline, which is then compared to other years to determine progress. Since 2006, three additional GHG emissions inventories have been completed for years 2011, 2014, and 2017. The GHG emissions inventory is a core part of the State’s overall strategy to measure emission reduction. It shows purely data and serves as a tool to help planners track progress and make policy decisions. The GHG emissions inventory is mandated by the Greenhouse Gas Emissions Reduction Act – Reauthorization of 2016 (GGRA of 2016) - Senate Bill (SB) 278 and House Bill (HB) 315 in 2009, which is codified in Maryland Annotated Codes, Title 2, Subtitle 1203). 6.1.2 The Goal The GGRA of 2016 requires that the State reduce emissions by 42.89 million metric tons of carbon dioxide equivalent (MMtCO2e) (40% of the state’s gross GHG emissions in 2006) to achieve the 2030 goal. To account for both reductions in emissions and improvements in sequestration from forests and agricultural soils, Maryland’s net GHG emissions must be reduced to 52.55 MMtCO2e (42.89 MMtCO2e below the state’s net GHG emissions in 2006). The combined emissions reductions of all programs in the 2030 GGRA Plan will yield a total of 47.4 MMtCO2e in emissions reductions in 2030, compared to 2006. This will result in a total reduction of 44%, achieving 4.5 MMtCO2e of emission reductions more than the 2030 GGRA goal. See Figure 6.1-1 below.
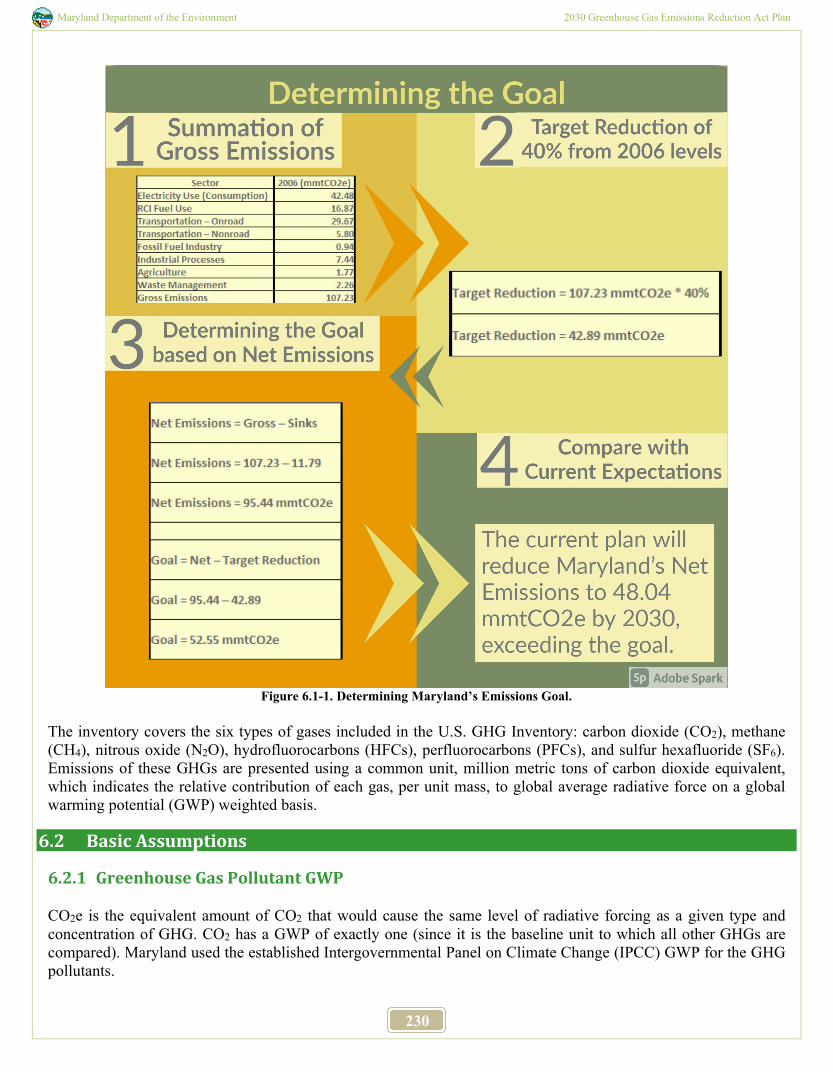
Maryland Department of the Environment 2030 Greenhouse Gas Emissions Reduction Act Plan
230
Figure 6.1-1. Determining Maryland’s Emissions Goal.
The inventory covers the six types of gases included in the U.S. GHG Inventory: carbon dioxide (CO2), methane (CH4), nitrous oxide (N2O), hydrofluorocarbons (HFCs), perfluorocarbons (PFCs), and sulfur hexafluoride (SF6). Emissions of these GHGs are presented using a common unit, million metric tons of carbon dioxide equivalent, which indicates the relative contribution of each gas, per unit mass, to global average radiative force on a global warming potential (GWP) weighted basis.
6.2 Basic Assumptions
6.2.1 Greenhouse Gas Pollutant GWP CO2e is the equivalent amount of CO2 that would cause the same level of radiative forcing as a given type and concentration of GHG. CO2 has a GWP of exactly one (since it is the baseline unit to which all other GHGs are compared). Maryland used the established Intergovernmental Panel on Climate Change (IPCC) GWP for the GHG pollutants.
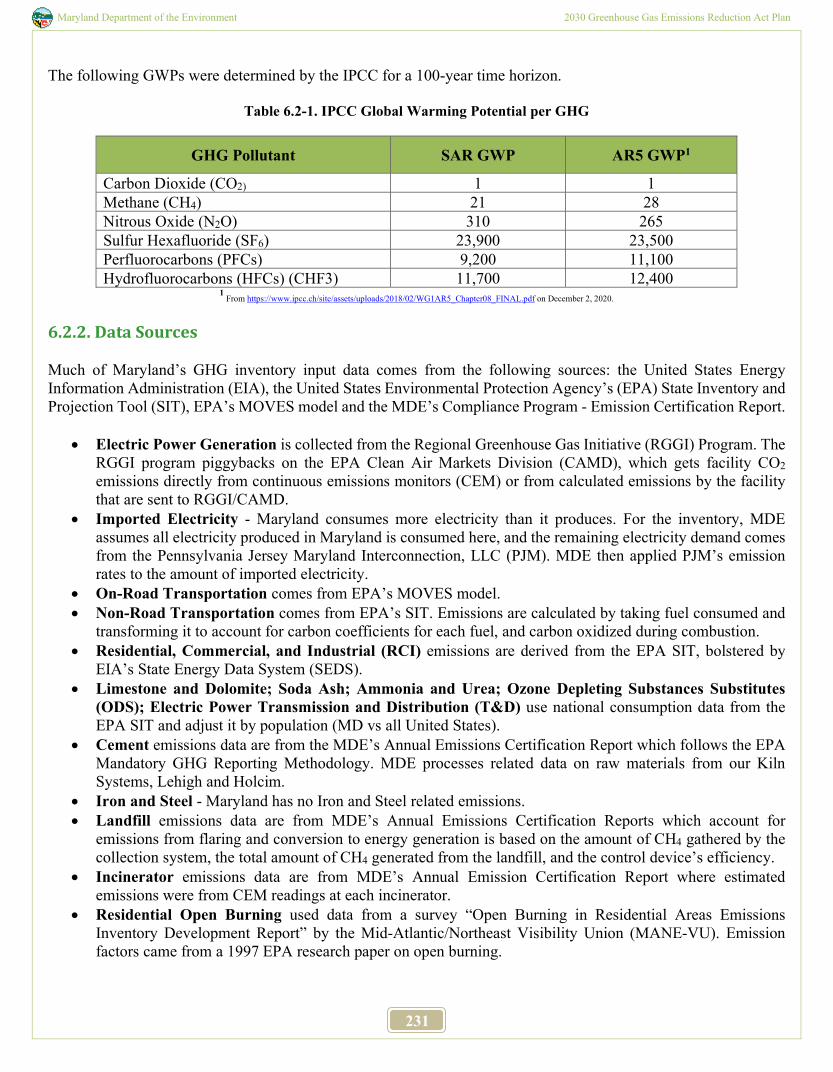
Maryland Department of the Environment 2030 Greenhouse Gas Emissions Reduction Act Plan
231
The following GWPs were determined by the IPCC for a 100-year time horizon.
Table 6.2-1. IPCC Global Warming Potential per GHG
GHG Pollutant SAR GWP AR5 GWP1
Carbon Dioxide (CO2) 1 1 Methane (CH4) 21 28 Nitrous Oxide (N2O) 310 265 Sulfur Hexafluoride (SF6) 23,900 23,500 Perfluorocarbons (PFCs) 9,200 11,100 Hydrofluorocarbons (HFCs) (CHF3) 11,700 12,400
1 From https://www.ipcc.ch/site/assets/uploads/2018/02/WG1AR5_Chapter08_FINAL.pdf on December 2, 2020.
6.2.2. Data Sources Much of Maryland’s GHG inventory input data comes from the following sources: the United States Energy Information Administration (EIA), the United States Environmental Protection Agency’s (EPA) State Inventory and Projection Tool (SIT), EPA’s MOVES model and the MDE’s Compliance Program - Emission Certification Report.
• Electric Power Generation is collected from the Regional Greenhouse Gas Initiative (RGGI) Program. The RGGI program piggybacks on the EPA Clean Air Markets Division (CAMD), which gets facility CO2 emissions directly from continuous emissions monitors (CEM) or from calculated emissions by the facility that are sent to RGGI/CAMD.
• Imported Electricity - Maryland consumes more electricity than it produces. For the inventory, MDE assumes all electricity produced in Maryland is consumed here, and the remaining electricity demand comes from the Pennsylvania Jersey Maryland Interconnection, LLC (PJM). MDE then applied PJM’s emission rates to the amount of imported electricity.
• On-Road Transportation comes from EPA’s MOVES model. • Non-Road Transportation comes from EPA’s SIT. Emissions are calculated by taking fuel consumed and
transforming it to account for carbon coefficients for each fuel, and carbon oxidized during combustion. • Residential, Commercial, and Industrial (RCI) emissions are derived from the EPA SIT, bolstered by
EIA’s State Energy Data System (SEDS). • Limestone and Dolomite; Soda Ash; Ammonia and Urea; Ozone Depleting Substances Substitutes
(ODS); Electric Power Transmission and Distribution (T&D) use national consumption data from the EPA SIT and adjust it by population (MD vs all United States).
• Cement emissions data are from the MDE’s Annual Emissions Certification Report which follows the EPA Mandatory GHG Reporting Methodology. MDE processes related data on raw materials from our Kiln Systems, Lehigh and Holcim.
• Iron and Steel - Maryland has no Iron and Steel related emissions. • Landfill emissions data are from MDE’s Annual Emissions Certification Reports which account for
emissions from flaring and conversion to energy generation is based on the amount of CH4 gathered by the collection system, the total amount of CH4 generated from the landfill, and the control device’s efficiency.
• Incinerator emissions data are from MDE’s Annual Emission Certification Report where estimated emissions were from CEM readings at each incinerator.
• Residential Open Burning used data from a survey “Open Burning in Residential Areas Emissions Inventory Development Report” by the Mid-Atlantic/Northeast Visibility Union (MANE-VU). Emission factors came from a 1997 EPA research paper on open burning.
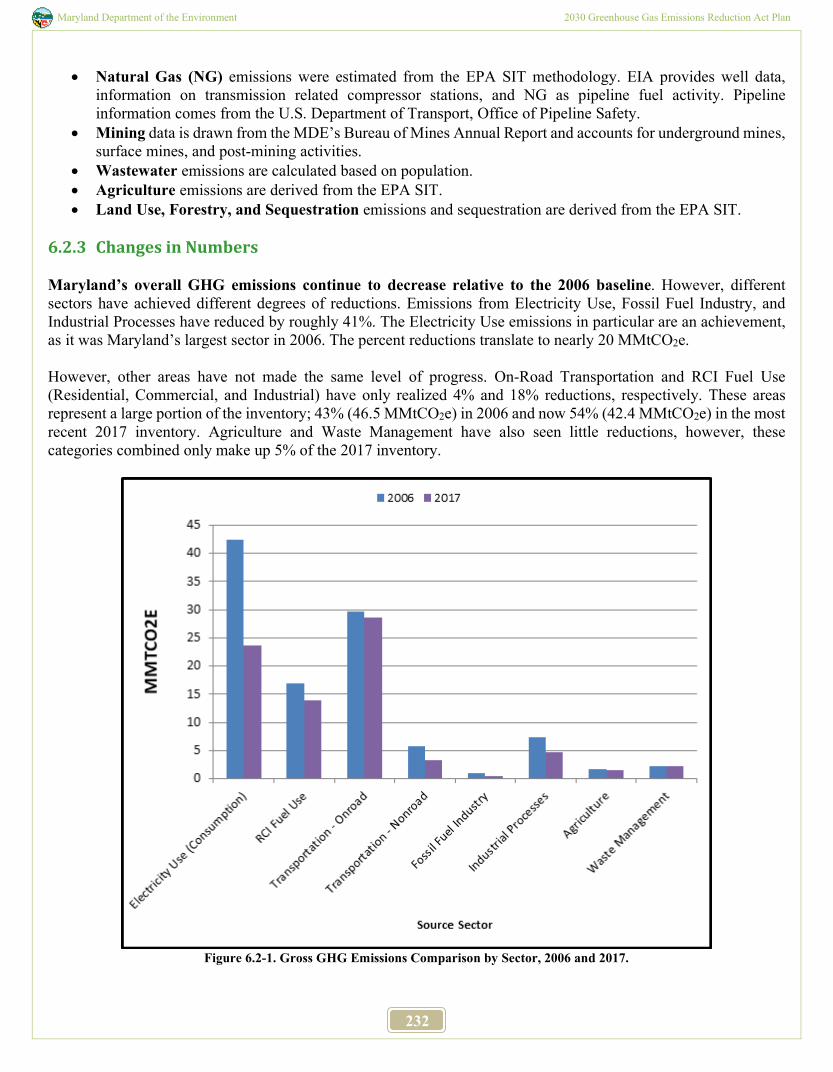
Maryland Department of the Environment 2030 Greenhouse Gas Emissions Reduction Act Plan
232
• Natural Gas (NG) emissions were estimated from the EPA SIT methodology. EIA provides well data, information on transmission related compressor stations, and NG as pipeline fuel activity. Pipeline information comes from the U.S. Department of Transport, Office of Pipeline Safety.
• Mining data is drawn from the MDE’s Bureau of Mines Annual Report and accounts for underground mines, surface mines, and post-mining activities.
• Wastewater emissions are calculated based on population. • Agriculture emissions are derived from the EPA SIT. • Land Use, Forestry, and Sequestration emissions and sequestration are derived from the EPA SIT.
6.2.3 Changes in Numbers Maryland’s overall GHG emissions continue to decrease relative to the 2006 baseline. However, different sectors have achieved different degrees of reductions. Emissions from Electricity Use, Fossil Fuel Industry, and Industrial Processes have reduced by roughly 41%. The Electricity Use emissions in particular are an achievement, as it was Maryland’s largest sector in 2006. The percent reductions translate to nearly 20 MMtCO2e. However, other areas have not made the same level of progress. On-Road Transportation and RCI Fuel Use (Residential, Commercial, and Industrial) have only realized 4% and 18% reductions, respectively. These areas represent a large portion of the inventory; 43% (46.5 MMtCO2e) in 2006 and now 54% (42.4 MMtCO2e) in the most recent 2017 inventory. Agriculture and Waste Management have also seen little reductions, however, these categories combined only make up 5% of the 2017 inventory.
Figure 6.2-1. Gross GHG Emissions Comparison by Sector, 2006 and 2017.
Maryland Department of the Environment 2030 Greenhouse Gas Emissions Reduction Act Plan
233
It is important to note that 2017 was a year of relatively mild weather. This led to less emissions in the electricity sector from reduced energy consumption.
6.3 Source Categories
6.3.1 Electricity Supply Maryland is a net importer of electricity, meaning that the State consumes more electricity than it produces. For the inventory, it is assumed that all power generated in Maryland was consumed here, and the remaining demand was met by importing power. Imported electricity in 2017 amounted to roughly 46% of electricity consumption and was assumed to come from the PJM Interconnection. The fuel mix for the PJM Interconnection was then used to determine imported power emissions. In 2017, the electricity supply sector accounts for about 31% of Maryland’s gross emissions. While this may seem like a lot, the sector has made significant progress since the base year (2006). Maryland’s transition away from coal towards gas and renewables has resulted in a sector-wide emissions reduction of 42% 6.3.2 RCI Fuel Combustion RCI Fuel Use accounts for roughly 17.5% of 2017 gross emissions. It accounts for emissions from direct fossil fuel combustion used in heating the residential, commercial, and industrial sectors. RCI Fuel Use has dropped by 18% since 2006. 6.3.3 Transportation The transportation sector accounts for roughly 40% of 2017 gross emissions, the majority of which is from the On-Road subsector. On-Road emissions mainly compose of commonplace vehicles: cars, vans, light duty trucks, buses, and other diesel vehicles. On-Road emissions have not decreased significantly but have mitigated the effects of a growing population. Non-Road emissions include those from trains, jets and aviation gasoline, marine vessels, and other motorized vehicles that do not operate on public roads (farming equipment, recreational vehicles). Non-road emissions initially rose from 2006-2011, and then dropped by 46% in 2017 for an overall decrease. They also make up a small fraction of Maryland’s gross emissions, at only 4%. 6.3.4 Fossil Fuel Industry The Fossil Fuel Industry makes up a miniscule portion of the inventory at only 0.7%. Most of these are from the natural gas industry, which measures the emissions from production, transmission, distribution, and venting and flaring. This does not include out-of-state methane (see Section 6.4 for more information). This sector also tracks the emissions from underground coal mines, surface coal mines, post-mining activities, and abandoned coal mines. Emissions from the Fossil Fuel Industry sector have decreased by 42% since 2006, largely due to natural gas related reductions. 6.3.5 Industrial Processes Industrial Processes represent 5.9% of Maryland's gross emissions. It includes GHG emissions from the four main industrial processes that occurs in the State:
• CO2 emissions from cement production, soda ash, dolomite and lime/ limestone consumption; • CO2 emissions from iron and steel production; • SF6 emissions from electric power transmission and distribution (T&D) system, transformers use, and
Maryland Department of the Environment 2030 Greenhouse Gas Emissions Reduction Act Plan
234
• HFC and PFC emissions resulting from the consumption of substitutes for ozone-depleting substances (ODS) used in cooling and refrigeration equipment.
Industrial processes sharply cut emissions after 2006 in the 2011 Emissions Inventory but have not made significant reductions since. Currently, the large majority of emissions from this sector are from ODS substitutes. 6.3.6 Agriculture The Agriculture sector represents 2% of the State’s gross emissions. It includes emissions from enteric fermentation, manure management, soils, and animals. Energy emissions (combustion of fossil fuels in agricultural equipment) are not included in this section - they are already accounted for under the RCI Fuel Combustion sector and nonroad transportation subsector. Similarly, reductions in atmospheric CO2 from carbon sequestration in soils is calculated later in the Forestry and Land Use sector with other emissions sinks. Agriculture sector emissions have not changed significantly since 2006. 6.3.7 Waste Management Waste Management accounts for roughly 2.3% of gross emissions. It includes emissions from waste combustion, landfills, wastewater management, and residential open burning. Although this sector has seen increased emissions, the increases are small in context of the inventory, and mostly the result of increased population. 6.3.8 Forestry and Land Use The forestry and land use section is concerned with emission sinks, and effectively subtracts from Maryland’s emissions. For this reason, it is not included in Maryland’s gross emissions, and instead factored in at the end as net emissions. The GHG emissions estimated in this section includes CO2 emissions from urea fertilizer use and methane, N2O emissions from wildfires and prescribed forest burns, and N2O from the application of synthetic fertilizers to settlement soils. Carbon uptake (sequestration) pathways estimated in this section include carbon stored in above ground biomass, below ground biomass, dead wood, and litters (forest carbon flux); carbon stored in landfilled yard trimmings and food scraps; and carbon stored in harvested wood product, wood in landfills, soils, and urban trees. Currently, the Maryland Department of Natural Resources (DNR) is developing a new model to measure the benefits of the various emission sinks in Maryland.
6.4 Out of State Methane Inventory
MDE also released a separate inventory to document methane emissions that occur outside of Maryland from the production and transport of fracked natural gas consumed in Maryland. The analysis includes fugitive leakage emissions and well construction emissions. The report uses the total natural gas consumption in Maryland for year 2017 as a baseline and analyzes four scenarios that represent the amount of natural gas consumed due to fracking activities. The first scenario uses the EIA statistic that 67% of the natural gas consumed is derived from fracking. The other three cases are based on the fact that before 2006, there was no fracking in Maryland and the surrounding areas. All four scenarios estimate the impact of methane emissions on climate change using both the 100-year methane GWP for methane and the 20-year GWP from the latest IPCC assessment report (AR5). For this inventory, MDE took steps to make the least conservative estimates:
• The GWP of methane was initially based on the IPCC Fourth Assessment Report (AR4). Calculations were done with the 100-year GWP (25). The Inventory was later updated with the 20-year GWP of methane (84)
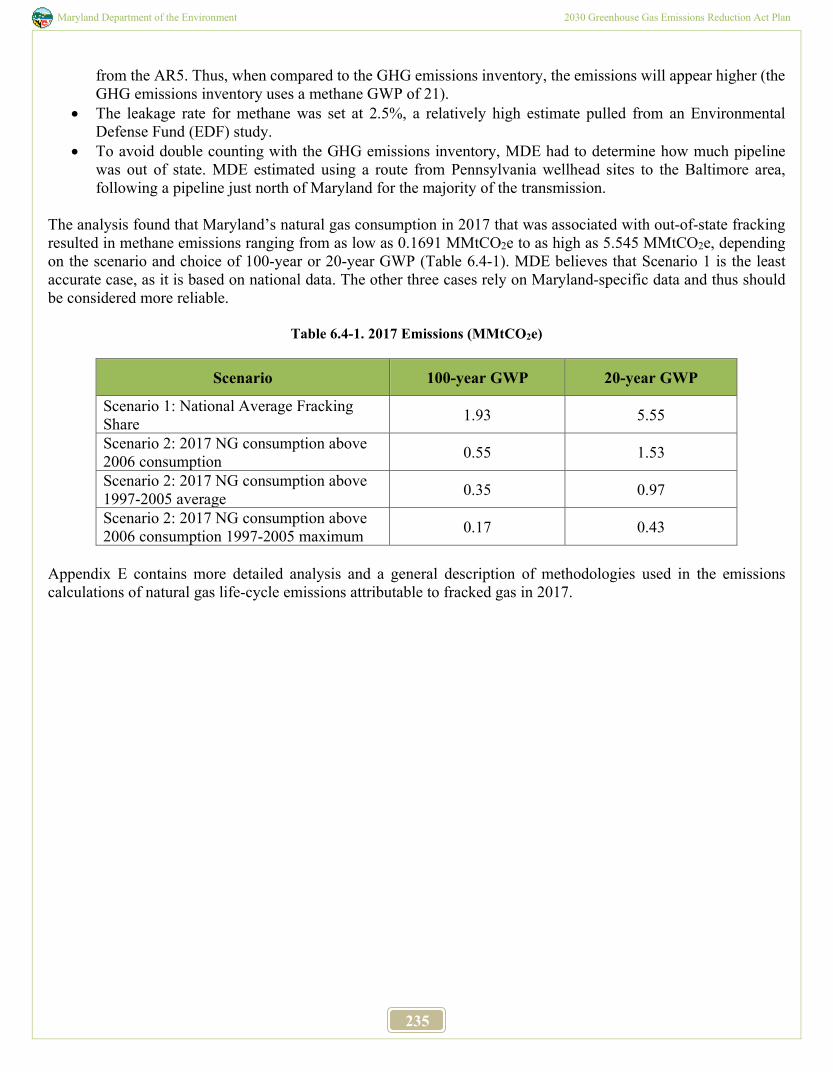
Maryland Department of the Environment 2030 Greenhouse Gas Emissions Reduction Act Plan
235
from the AR5. Thus, when compared to the GHG emissions inventory, the emissions will appear higher (the GHG emissions inventory uses a methane GWP of 21).
• The leakage rate for methane was set at 2.5%, a relatively high estimate pulled from an Environmental Defense Fund (EDF) study.
• To avoid double counting with the GHG emissions inventory, MDE had to determine how much pipeline was out of state. MDE estimated using a route from Pennsylvania wellhead sites to the Baltimore area, following a pipeline just north of Maryland for the majority of the transmission.
The analysis found that Maryland’s natural gas consumption in 2017 that was associated with out-of-state fracking resulted in methane emissions ranging from as low as 0.1691 MMtCO2e to as high as 5.545 MMtCO2e, depending on the scenario and choice of 100-year or 20-year GWP (Table 6.4-1). MDE believes that Scenario 1 is the least accurate case, as it is based on national data. The other three cases rely on Maryland-specific data and thus should be considered more reliable.
Table 6.4-1. 2017 Emissions (MMtCO2e)
Scenario 100-year GWP 20-year GWP
Scenario 1: National Average Fracking Share 1.93 5.55
Scenario 2: 2017 NG consumption above 2006 consumption 0.55 1.53
Scenario 2: 2017 NG consumption above 1997-2005 average 0.35 0.97
Scenario 2: 2017 NG consumption above 2006 consumption 1997-2005 maximum 0.17 0.43
Appendix E contains more detailed analysis and a general description of methodologies used in the emissions calculations of natural gas life-cycle emissions attributable to fracked gas in 2017.
Maryland Department of the Environment 2030 Greenhouse Gas Emissions Reduction Act Plan
236
Chapter 7
Adaptation and Resiliency
7.1 Background
The Chesapeake Bay region’s geography and geology make the state one of the three most vulnerable areas of the country to changes resulting from sea level rise – only Louisiana and Southern Florida are more susceptible. Historic tide records show sea level has increased approximately one foot in the Chesapeake Bay over the last 100 years.220 Over the past 10 years (2010 - 2020), Maryland has experienced ten weather-related events warranting Presidential Disaster declarations, including five coastal flood events.221 In Maryland, climate change risks include increased frequency, duration and intensity of events such as drought, storms, flooding, and forest fires; more heat-related stress; the spread of existing or new vector-borne diseases; changes to public health challenges as a result of climate-driven stressors, and increased erosion and inundation of low-lying areas along the state’s shoreline and coast. These impacts will influence the interactions and management of our resources now and into the future. Maryland has been implementing climate adaptation efforts for more than a decade. In 2008, the Adaptation and Resiliency Working Group (ARWG), a working group of the Maryland Commission on Climate Change (MCCC), published Phase I: Comprehensive Strategy to Reduce Maryland’s Vulnerability to Climate Change,222 which focused on sea level rise and coastal storms. In 2011 the second phase strategy was published, focused on societal, economic and ecological resilience.223 These strategies together laid out the approach to adaptation efforts that address changes in precipitation patterns and increased temperature as well as the likely impacts to human health, agriculture, forest and terrestrial ecosystems, bay and aquatic environments, water resources, and population growth and infrastructure. Climate adaptation is also a key component of Maryland’s Chesapeake Bay restoration efforts. Maryland has participated in the Chesapeake Bay Agreement since its inception in 1983 and has remained an engaged member, working together with neighboring states to address all issues impacting the Bay. Maryland has signed and agreed to all subsequent goals and agreements since the initial program in 1983, including the 2014 Chesapeake Bay Watershed Agreement,224 which includes climate resilience as one of its main goals.
220 Chesapeake Bay Foundation. What is Climate Change? (2020) https://www.cbf.org/issues/climate-change/ 221 FEMA All Disasters Database. (2020) https://www.fema.gov/disasters/disaster-declarations 222 Comprehensive Strategy for Reducing Maryland’s Vulnerability to Climate Change Phase I: Sea-level rise and coastal storms (2008) https://dnr.maryland.gov/ccs/Publication/Comprehensive_Strategy.pdf 223 Comprehensive Strategy for Reducing Maryland’s Vulnerability to Climate Change Phase II: Building societal, economic and ecological resilience (2011) https://climatechange.maryland.gov/wp-content/uploads/sites/16/2014/12/ian_report_2991.pdf 224 Chesapeake Bay Watershed Agreement (2020) https://www.chesapeakebay.net/documents/FINAL_Ches_Bay_Watershed_Agreement.withsignatures-HIres.pdf
Maryland Department of the Environment 2030 Greenhouse Gas Emissions Reduction Act Plan
237
7.2 Adaptation Introduction
Adaptation refers to action to prepare for and adjust to new conditions, thereby reducing harm or taking advantage of new opportunities.225 Climate change adaptation is an extremely complex process with no single means of response. As stressed in a recent report by the National Academies,226 climate change adaptation must be a highly integrated process that occurs on a continuum, across all levels of government, involving many internal and external partners and individual actions, and often evolves at different spatial and temporal scales. Maryland recognizes the need to include robust adaptation and resiliency efforts alongside the aggressive greenhouse gas (GHG) mitigation measures put in place to effectively address and protect the state from climate change impacts. These actions are increasingly dependent on one another, and any program or policy to mitigate the effects of climate change will complement steps to reduce the state’s risk to those impacts. Mitigation without adaptation, or vice versa, would render Maryland, its people, and resources vulnerable to harm from current and future climate impacts.227 Adaptation in Maryland aims to enhance the resilience of natural and human-based systems across multiple sectors including bay and aquatic environments, agriculture, human health, water resources, population growth and infrastructure, forest and terrestrial ecosystems and our coastal zone. Maryland does not work in isolation on these efforts and relies on a diversity of partnerships at the local, state and federal levels. Since the MCCC’s inception, the ARWG has served as the state’s leader on adaptation and resiliency. The ARWG develops comprehensive strategies to reduce Maryland’s climate change vulnerability, serves as a resource to state and local governments for tools and planning resources and provides a platform for collaborative work to occur. In addition to the ARWG, Maryland’s participation in multi-jurisdictional compacts such as the Chesapeake Bay Program (CBP) is essential to the state’s success in the adaptation arena. The CBP’s Climate Resiliency Work Group (CRWG) leads and monitors work being done in accordance with the climate resilience goal of the 2014 Chesapeake Bay Watershed Agreement. The ARWG, CBP and CRWG memberships include representatives across state government agencies, institutes of higher education, and non-governmental organizations. Working across and between compacts like the CBP CRWG and the ARWG of the MCCC ensures Maryland has a large, diverse, and committed group of organizations and individuals implementing climate adaptation efforts across the state, ensuring that Maryland’s societal, economic, and ecological resources are protected for years to come.
7.3 Adaptation in Maryland
7.3.1 Phase III Watershed Implementation Plan (WIP) As a result of climate change, temperature, sea level, and precipitation are expected to increase nutrient and sediment loads to the Chesapeake Bay, and in turn, affect the Bay’s health. The need for added pollution reductions due to this increased load is accounted for in Maryland’s Phase III Watershed Implementation Plan (WIP). The WIP highlights climate change strategies that reduce nutrient and sediment loads, mitigate carbon emissions, build climate resilience, and support local needs, such as flooding prevention and protecting infrastructure. Consequently, these strategies help mitigate the increase in GHGs and help adapt to anticipated climate impacts where possible. The WIP also affirms Maryland’s partnership with the CBP to account for projected climate-induced increases in pollutant loads by 2025 and to continue planning for future reductions beyond 2025. 7.3.2 Adaptation Framework The science to support adaptation work has advanced in the years since Phase I (2008) and Phase II (2011) of the
225 Bierbaum, R., A. Lee, J. Smith, M. Blair, L. M. Carter, F. S. Chapin, III, P. Fleming, S. Ruffo, S. McNeeley, M. Stults, L. Verduzco, and E. Seyller, 2014: Ch. 28: Adaptation. Climate Change Impacts in the United States: The Third National Climate Assessment, J. M. Melillo, Terese (T.C.) Richmond, and G. W. Yohe, Eds., U.S. Global Change Research Program, 670-706. doi:10.7930/J07H1GGT. 226 National Research Council. 2010. Adapting to the Impacts of Climate Change. National Academies Press, Washington, DC 227 Climate Change in Maryland: Adaptation. Maryland Department of the Environment. https://climatechange.maryland.gov/adaptation/
Maryland Department of the Environment 2030 Greenhouse Gas Emissions Reduction Act Plan
238
Comprehensive Strategy to Reduce Maryland’s Vulnerability to Climate Change were published. Beginning in 2018, Maryland began the process of evaluating and updating the state’s adaptation strategy through the Maryland Climate Adaptation 2030 Framework Project (Framework). The intent of the Framework is to guide and prioritize action over the next 10 years, specifically in vulnerable and under-served communities. When developing the concept for the Framework, ARWG members recognized the importance of addressing sector-specific adaptation needs and opportunities as well as considering overarching issues that impact all sectors. As a result, the Framework is being organized into five sectors: Natural Resources, Natural and Working Lands, Human Health, Water Resources - Quality and Quantity, and Protecting Critical Infrastructure. In addition, there are three focus areas that will be integrated into all of the sectors: Diversity and Environmental Justice, Climate Jobs and Training, and Local Government Action and State Service Delivery. The final Framework report will provide goals, strategies and action items for each sector and focus area while also acknowledging and addressing the connections between sectors. Successfully realizing the goals established in the Framework will require robust participation by many different partners. As a result, strategies and action items will be recommended for three separate audiences: state government, local government, and individual stakeholders. The Phase I and II plans were developed with over 100 experts across the governmental, nonprofit, and private sectors who came together to interpret the most recent climate change literature, evaluate adaptation options and recommend strategies to reduce Maryland’s overall climate change vulnerability. Recognizing the invaluable contribution of our partners in the success of the first two phases, Maryland has undertaken a similar approach with the Framework. Each sector and focus area have a work group, with representatives from state, federal and local government agencies, universities, non-profits, and the private sector participating. Each work group is also reaching out to key thought leaders in order to gain their perspectives and incorporate them into the development of adaptation strategies and action items. This process will help to ensure that the final report is as comprehensive and robust as possible. 7.3.3 Adaptation Indicators Between 2015 and 2020, the state implemented many high-priority elements of Maryland’s Phase I and II Adaptation Strategies. In 2018 the ARWG undertook a review of its Phase I and II Comprehensive Strategy for Reducing Maryland’s Vulnerability to Climate Change recommendations to identify progress and highlight gaps and needs. That same year, the MCCC Annual Report called on the ARWG to develop metrics for tracking adaptation progress. Beginning in 2019, ARWG initiated discussions and meetings around identifying how best to work towards establishing metrics to track adaptation progress. In 2020, the Maryland Department of Natural Resources (DNR) Chesapeake and Coastal Services funded the University of Maryland Center for Environmental Sciences - Integration and Application Network (UMCES-IAN) to develop an Adaptation Report Card and indicators to track Maryland adaptation progress. Through their partnership with ARWG, its members, stakeholder workshops and expertise within their organization, UMCES-IAN has begun to research and review existing adaptation metrics, discuss targets and goals of state climate adaptation work, and develop a series of adaptation metrics to track progress towards these goals. These metrics will be used by the MCCC, ARWG, and others to better establish baseline progress and measure future action. The Coastal Adaptation Report Card, with indicators and metrics for measurement, will be finalized in early 2021. Ultimately, the report card will provide a high-level synthesis of findings to decision and policy makers in order to inform management.
7.4 Adaptation Implementation Updates (2015-2020)
7.4.1 Practice and Place Water Quality and Climate Change Resiliency Portfolio: DNR has begun identifying Resiliency Opportunity Zones to define areas with restoration and conservation potential that provide high value resiliency benefits for
Maryland Department of the Environment 2030 Greenhouse Gas Emissions Reduction Act Plan
239
communities, economies, public lands and important ecosystems. In close coordination with public/private/non-profit sectors, a portfolio of projects within these zones is being compiled with an eye toward how they can work together to avoid random acts of restoration. These projects will also optimize resiliency benefits and leverage important habitat, water quality and GHG mitigation gains. Where eligible, land conservation and easement programs could be leveraged to permanently protect properties identified in the portfolio of projects. Innovative Technology Fund: Maryland has expanded the scope of the Innovative Technology Fund to include consideration of project proposals with eligible techniques and technologies that address climate change. In addition to nonpoint source water quality projects, the state will also invest in the research, development, and commercialization of solutions addressing climate mitigation to help accelerate the adoption of climate resiliency and GHG mitigation. Chesapeake and Atlantic Coastal Bays Trust Fund (Trust Fund): The focus of the Trust Fund is to support the most effective and efficient non-point source pollution reduction projects, however many of these projects also yield climate resilience and mitigation co-benefits. Since its inception in 2009, the Trust Fund has provided more than $506 million in support of more than 2,780 projects, including wetland restoration, stream buffer planting, stream restoration, and bioretention facilities. Wetland restoration and forest buffer planting practices are very efficient at sequestering carbon. Establishing broad riparian buffers along stream corridors also allows for channel migration resulting from increased precipitation. The Trust Fund prioritizes stream restoration practices that enhance and restore wetlands by reconnecting the stream to its floodplain, which also helps to spread and slow flood waters. Bioretention projects have been identified in federal and state vulnerability studies as a recommended best management practice for water quality improvement, increasing stormwater retention capacity, and tidal flooding resiliency. Coast Smart Council Construction Program: The Maryland Coast Smart Council was created and tasked with developing Coast Smart Siting and Design Criteria to address impacts associated with sea level rise inundation and coastal flooding on future state and local government capital projects. The Coast Smart Construction Program and the siting and design guidelines were updated in 2020. Additionally, the vulnerable areas within which the program applies were updated to include areas outside of the Special Flood Hazard Area. This new boundary, referred to as the Coast Smart Climate Ready Action Boundary (CS-CRAB), conveys resiliency by adding a vertical extent above the Base Flood Elevation, and is the most technologically feasible and accurate approach to achieve resiliency within the scope of the Coast Smart Program. The Coast Smart Project Screening Form provides assistance in applying the Program requirements. Community Resilience Grants/Resiliency through Restoration: DNR solicited and funded community-based resilience projects in 2019 and 2020 through the Community Resilience Grant Program. The program leverages federal dollars with state “Resiliency through Restoration” funding to promote and support comprehensive, holistic planning and implementation projects that address both water quality and quantity issues. Through these projects, DNR is helping Maryland communities become more resilient to flood risks and enhancing the protection and management of the state’s resources, including the bay and the ocean. Projects funded in 2019 included risk reduction planning in Crisfield, St. Michaels, Mount Rainier, Aberdeen, Talbot County and Charles County, and implementation projects in the City of Hyattsville as well as Queen Anne’s, St. Mary’s, and Worcester counties. Projects funded in 2020 included risk reduction planning in Princess Anne, Calvert County, Talbot County, Dorchester County, Montgomery County and Cecil County, and implementation projects in Anne Arundel and St. Mary’s counties. This work enhances a decade-long effort to provide support to local communities to assess risk, plan risk-reduction efforts and implement projects. Resiliency through Restoration Monitoring: In 2018 and 2019, the Chesapeake Bay National Estuarine Research Reserve - Maryland (CBNERR-MD) developed and tested monitoring protocols to track the effectiveness and adaptive capacity of restoration projects designed to enhance community resilience to the impacts of climate change. DNR has since expanded monitoring protocols to four additional sites in partnership with UMCES. Findings will
Maryland Department of the Environment 2030 Greenhouse Gas Emissions Reduction Act Plan
240
support adaptive management activities at a local scale and inform the design and implementation of future restoration projects. Resiliency and Land Conservation: DNR updated its Program Open Space Stateside scorecard to include coastal community resilience and adaptation benefits in the evaluation of potential land acquisitions. The Program Open Space Stateside scorecard provides justification for acquisitions which must be presented to Maryland’s Board of Public Works (BPW) for approval. These acquisitions (which can be in fee simple or perpetual conservation easements) allow our land conservation and easement programs to permanently protect land that provides coastal resilience to climate change and other climate change benefits. Maryland’s Parcel Evaluation Tool: As a compliment to the Program Open Space Stateside scorecard, DNR also developed a public-facing, web-mapping tool which is designed to identify and prioritize the conservation and protection of ecologically important, sensitive, and valuable land and watershed resources in Maryland. The Parcel Evaluation Tool - accessible through the Maryland Greenprint Map228 - is used by DNR, land conservation organizations, local and state planners, and individual property owners. Among the Ecological Benefits assessed are the Coastal Community Resiliency and Future Wetland Habitat scores. The Coast Community Resiliency score describes the potential of a parcel’s existing natural habitats, such as marshes and coastal forests, to reduce the impact of coastal hazards to adjacent coastal communities. The Future Wetland Habitat score identifies areas important for inland wetland migration resulting from sea level rise that will support the high value coastal habitats of the future. Among the ecological co-benefits assessed are the parcel-level biophysical and economic values of annual Net Carbon Sequestration in forests and wetlands. Carbon sequestration directly offsets carbon emission within the state of Maryland and represents a critical component to the 2030 GGRA Plan. This component of the tool allows for identification and conservation of natural habitats providing high carbon sequestration benefits. Utilizing Continuous Monitoring and Adaptive Control (CMAC) Retrofits for Flood Control in Howard County: CMAC systems have been installed by several Maryland counties in order to provide cost-efficient water quality management in compliance with Municipal Separate Storm Sewer System (MS4) permit requirements. These systems can also be used to provide water quantity management and reduce flood hazards. DNR provided funding to Howard County to evaluate the use of CMAC technology to meet both water quality and flood risk management goals. The County partnered with OptiRTC, Inc. to assess the County’s existing stormwater assets as well as the locations of its flood vulnerabilities in order to develop a prioritization methodology for selecting ponds to be retrofitted with the technology. It also analyzed the water quality and quantity benefits that would be achieved by retrofitting several priority ponds and developed conceptual plans for three priority pond retrofits. Patapsco Valley State Park Resiliency Project: DNR worked with the University of Maryland Center for Disaster Resilience to conduct an assessment of watershed issues driving inland flooding events following intense precipitation at the Glen Artney area of Patapsco Valley State Park. The project team completed watershed and engineering studies, developed management strategies and engaged the surrounding community to support efforts to reduce future impacts. Beneficial Use of Dredged Material: In 2020, DNR finalized a policy and supporting processes to proactively identify environmentally and economically sound beneficial use of dredged material practices to improve coastal resiliency. Through the development of a mapping tool – Beneficial Use: Identifying Locations for Dredge (BUILD)229 - project managers will be able to quickly identify beneficial use opportunities. BUILD has been merged into the Maryland Coastal Atlas where the data is now available.
228 https://dnr.maryland.gov/land/Pages/Green-Infrastructure-Mapping.aspx 229 https://dnr.maryland.gov/ccs/Pages/beneficial-use.aspx
Maryland Department of the Environment 2030 Greenhouse Gas Emissions Reduction Act Plan
241
Clean and Resilient Marinas: The Maryland Clean Marina Initiative continues to provide extensive climate change and severe weather resiliency information to marinas on-line and via workshops and newsletters. Updated resources related to adaptation and resiliency have also been added to the Maryland Clean Marina website.230 Climate Change and Chesapeake Bay Restoration: In 2019, Maryland’s Phase III WIP to reduce nutrients and sediment entering the Chesapeake Bay included actions to reduce the impacts of climate change. The plan identifies nutrient and sediment control strategies that can both help mitigate the increase in GHGs and adapt to anticipated climate impacts. It affirms Maryland’s partnership with the Chesapeake Bay Program to account for any projected climate-induced increase in pollutant loads by 2025 and to continue planning for future reductions beyond 2025. Fairfield Marine Terminal Wet Basin Redevelopment Project: As part of the Maryland Department of Transportation (MDOT) Maryland Port Administration (MPA) Strategy for Resiliency in the Face of Climate Change, the Fairfield Marine Terminal’s enhancement filled in an obsolete wet basin. A storm water management and sand filtration system was constructed in 2019 to capture and filter 14 acres of stormwater runoff. The construction also elevated the terminal area to protect cargo from future sea level rise and extreme weather flooding events. Water Impoundment Infrastructure Emergency Response: Growing incidents of extreme rainfall increases the risk of the failure of dams and similar infrastructure that impound water. In 2020, Maryland adopted legislation to enhance the ability of the Maryland Department of Environment (MDE) to respond to emergency situations thereby reducing this risk (HB0177 - Env. Article, § 5–509). These include the following: Taking control of a water infrastructure asset until it has been rendered safe, obtaining resources for emergency actions, charging the asset owner for costs incurred, and establishing and enforcing a lien on the asset. A remaining need is a revenue source to provide cash flow for emergency repairs or controlled dam removal. Enhancing Sediment Pollution Control: The 2020 draft General Permit For Discharges of Stormwater Associated with Construction Activity includes several refinements that help mitigate the impacts of climate change. For example, there is now a requirement for stream protection zones with vegetated stream buffers, corrective actions triggered by inspections, and procedures for using flocculants or other chemical additives to promote settling treatment. Funding for Flood Mitigation: The Comprehensive Flood Mitigation Program provides grants to local governments for flood mitigation projects which reduce the risk of loss of life and property from flooding. In FY20, following two extreme floods in Ellicott City in the span of less than three years, Governor Larry Hogan reestablished the Comprehensive Flood Management Grant Program (Env. Article 5-809). The governor allocated $5 million for the Flood Program in FY20 and $6.18 million in FY21. The state provides grant funding up to 75% of a project's cost with 25% local share. However, if federal funds from the federal Emergency Management Agency (FEMA) are part of the project, the state will provide 50% of the match requirement. A typical grant from FEMA will provide 75% of the funding for a project, the state will provide 12.5% and local share is 12.5%. MPS Strategic Management Planning: DNR’s Maryland Park Service (MPS) is actively engaged in a methodic park-by-park strategic management planning effort. These plans identify specific threats to park resources (such as storm-related flooding) and identify tasks to address those threats. An example can be found on the DNR website.231 Electric Vehicle (EV) Charging station placement: MPS has worked with private partners to facilitate the installation of EV charging stations at several parks locations. MPS continues to identify additional locations suitable for EV charging to add even more EV infrastructure across Maryland.
230 https://dnr.maryland.gov/boating/Pages/Hurricane-Storm-Preparations.aspx 231 https://dnr.maryland.gov/publiclands/Documents/Smallwood_StrategicMmgtPlan.pdf
Maryland Department of the Environment 2030 Greenhouse Gas Emissions Reduction Act Plan
242
Energy upgrades at existing park buildings: Two parallel efforts are being made to improve energy efficiency at existing park facilities. First, all park sites are being analyzed for the potential installation of solar panels on existing park buildings. A successful installation at Sandy Point State Park is documented on the DNR website.232 In addition, MPS is working with the Maryland Energy Administration (MEA) to conduct energy audits of existing park facilities that will examine everything from HVAC systems to light fixtures. Wherever possible, inefficient fixtures or equipment will be replaced.
7.4.2 Community Engagement and Communication 2020 Mid-Atlantic Climate Change Education Conference: The Mid-Atlantic Climate Change Education Conference (MACCE) was a unique convening of formal and non-formal educators to share and learn about the latest trends in climate change education. Due to COVID-19, the MACCE Conference was hosted virtually on June 29-30. There were four session tracks for the conference: Environmental Justice & Climate Change; Climate Change in the Classroom; Climate Change & Estuaries; Individual & Community Level Climate Change Solutions. The conference was made possible through partnership and collaboration with the following agencies: CBNERR-MD, National Oceanic and Atmospheric Administration (NOAA) Chesapeake Bay Office, DE Sea Grant, DE NERR, CBNERR-VA, Goucher College, PA Sea Grant, NJ Sea Grant, and VA Sea Grant. Funding through SeaGrant made the conference fee affordable to participants ($20). Teachers on the Estuary: The 2019 & 2020 Teachers on the Estuary (TOTE) teacher professional development opportunities offered through a partnership with the CBNERR-MD, the Chesapeake Bay Foundation, and the NOAA Chesapeake Bay Office made the curriculum come alive with real data collected by both students and environmental science professionals from throughout the watershed to address real questions (often including climate change or change over time). Participants from throughout the watershed learned to integrate local and national environmental data into the classroom through cross-disciplinary, hands-on field activities, and online resources. This dynamic online course reinforces confidence in learning outside through conducting investigations of participants’ local environments. Investigations were supported/facilitated by community leaders, scientists, and educators from the NOAA and the CBNERR. This course is designed to model a Meaningful Watershed Educational Experience (MWEE) through participant-driven field experiences and authentic research. In 2020, TOTE was conducted remotely, incorporating outdoor, inquiry-based investigations in participants yards and communities. Nature Cities Forum: On March 26, 2019 DNR co-hosted the NatureCity Forum, a full day exploration of green infrastructure and community health for designers, practitioners, planners and advocates. The day included local, regional and national case studies, as well as tools and research on the planning and implementation of green infrastructure for climate resiliency, community building, human health and ecological benefit. This event was attended by more than 100 participants from across the region and was co-hosted by the Greater Baltimore Wilderness Coalition, Project Green Classrooms, the Maryland Recreation and Parks Association, Montgomery County Parks and Recreation, Brookside Gardens, DNR, the Chesapeake Bay Trust, the U.S. Fish and Wildlife Service, the National Wildlife Federation and Blue Water Baltimore. Shoring Up Resiliency Through Education (SURE): This project aims to support Somerset County Public Schools in addressing regional vulnerability to climate impacts and community resilience through understanding how environment, science and cultural heritage work together to strengthen a community. Students in fifth, seventh and ninth grades experience, study and understand trends in local conditions such as weather and water quality that affect the natural resources upon which much of their local economy depends. Participating teachers receive professional development annually, through which they are supported in writing lesson plans to support this project. In 2020, professional development focused on how to create a virtual field trip, so that students would still be able to
232 https://news.maryland.gov/dnr/2018/01/29/energy-efficient-upgrades-completed-at-sandy-point-state-park/
Maryland Department of the Environment 2030 Greenhouse Gas Emissions Reduction Act Plan
243
participate in their SURE activities to understand what it means to be a resilient coastal community. Partners include the Maryland Department of Health (MDH), Chesapeake Bay Trust, and Somerset County Public Schools. Cultivating Community Flood Resilience - Practitioner Roundtable Discussion: In January 2018 DNR facilitated a round-table discussion for a group of practitioners focused on reducing flood impacts in Maryland communities. Practitioners included representatives from the University of Maryland, the Maryland Sea Grant Extension; The Nature Conservancy; DNR; Maryland Historical Trust; and the National Wildlife Federation. The purpose was to give an overview of the methodologies used for the Integrated Coastal Resilience Assessment on the Deal Island Peninsula to the group. Additionally, there were peer-to-peer discussions about different ways each of the organizations is working with communities on reducing flood risk and discussions on opportunities to work more collaboratively on this issue. This roundtable was an extension of the Deal Island Peninsula Project. Maryland's Climate Leadership Academy: Maryland's Climate Leadership Academy (Academy) is the nation’s first state-sponsored institution providing continuing education and executive training programs specifically designed for state and local government officials, infrastructure executives and business leaders. The Academy supports the work of the MCCC, serving as a tool that establishes a community of climate smart local government and infrastructure leaders. The Academy’s programs and planning efforts are informed by an advisory council that includes senior leadership from numerous Maryland state agencies in order to ensure continuity and coordination with the MCCC. Through extensive partnerships and guidance from a body of Maryland leaders and nationally recognized experts, the Academy's programming is coordinated with universities and community colleges throughout the state, as well as other convening organizations, to deliver training programs statewide. The Academy advances professional competencies in integrating climate change into decision-making across sectors and occupations and helps to ensure that decision-makers across sectors and Maryland communities are appropriately trained and educated to successfully integrate climate change into their operations and activities. Maryland Flood Tabletop Exercise: MDE and FEMA Region III in collaboration with DNR staff hosted a one-day training on April 11, 2018. The purpose of the workshop was to see how state and local partners can work together before, during and after a significant flood event. As part of the workshop a situational manual was developed to accompany the training. There were over 75 participants from state and local jurisdictions who participated. Maryland Marine Debris Emergency Response Plan: NOAA’s Marine Debris Program staff led the planning and preparation of an emergency marine debris response plan with DNR for Maryland. The plan’s goal is to improve preparedness for response and recovery operations following an acute waterway debris incident in coastal Maryland. As severe weather events become more frequent, the plan will allow better communication and clarify responsibilities and capabilities among agencies. Maryland Climate Adaptation Indicators: With funding from NOAA through DNR, UMCES-IAN is developing a suite of climate adaptation indicators and Coastal Adaptation Report Card to assess where Maryland is on adaptation efforts and track progress in the years to come. The approach involves stakeholder workshops and feedback to identify which indicators are of highest priority for Marylanders. The indicators will provide the MCCC, its workgroups, state agencies and others with an assessment tool for adaptation action in the state moving forward. Building Risk Communication Training: In partnership with NOAA and the Eastern Shore Land Conservancy, DNR hosted a 2-day training on June 27 and 28, 2018, with the goal for participants to have a better understanding of how people respond to risk and how to develop new communication skills for discussing hazards in their community. State, local and non-governmental organization partners participated. Aquatic Resources Education: DNR incorporated climate change into a variety of education efforts including Project WET (Water Education for Teachers) Educator workshops, WOW! The Wonder of Wetland Workshops and Invasive Species Workshops that were delivered in 2018 and 2019. Climate issues are currently being worked into all professional development for educators given by Aquatic Resources Education staff.
Maryland Department of the Environment 2030 Greenhouse Gas Emissions Reduction Act Plan
244
Maryland Forest Service: The Maryland Forest Service with other partners - including the U.S. Forest Service, UMCES and Extension - released topic-related fact sheets and technical guidance on woodland and climate change stewardship principles. The Forest Action Plan for 2016-2020 now includes the strategy, ‘Make Landscapes More Resilient to Climate Change’ to help guide forest management on state and public lands.233 MPS Education Programming: MPS incorporated climate change education into its programs, including training and awareness for staff. For example, park rangers attended a day long Climate Change Academy in 2015 hosted by MADE CLEAR (Maryland and Delaware Climate Change Education, Assessment and Research). In addition, DNR’s Chesapeake and Coastal Service unit provided all park managers with a Climate Change awareness training. Climate change themes are incorporated in MWEE programming, Scales and Tales outreach and nature centers in state parks, which reach tens of thousands of students and visitors. Communicating Risk to the Public: DNR staff engaged audiences throughout the year regarding climate communication, including during the Eastern Shore Land Conservancy's Culture and Climate Change Conference where staff gave a presentation titled, “Communicating About Climate Change With Confidence,” to approximately 125 individuals. Staff also participated in conferences for teachers, including the Maryland Association for Environmental and Outdoor Education (MAEOE) where staff presented lessons for understanding climate and Next Generation Science Standards. Partners included NOAA, Audubon Maryland-DC and Partners Advancing Climate Change Education. Biomass Webinars: The Maryland Forestry Foundation and Maryland Clean Energy Center in partnership with the DNR and the Sustainable Forestry Council, hosted several biomass webinars which were funded by the Maryland Agricultural Education and Rural Development Assistance Fund (MAERDAF). The program was offered in association with the Spurring Fossil Free-Biomass initiative and discussed topics such as how woody biomass can complement other renewables in an overall renewable energy strategy and how woody biomass can be utilized as part of carbon mitigation planning.
7.4.3 Advancing the Science Climate Sensitivity Study: DNR, in partnership with NCCOS, UMCES, Chesapeake Environmental Communications and the CBNERR, analyzed climate data from the NERR locations and the National Weather Service. By examining 114 years of meteorological data, the team found clear evidence that physical climate changes are well underway and that species and habitats are responding to those changes. This study provides localized impact data which can inform how we manage our natural areas on a watershed scale. For more information, visit the Climate Sensitivity Study website.234 Thin-layer Sediment Placement: Evaluating an Adaptation Strategy to Enhance Coastal Marsh Resilience: DNR is a participating investigator in a NERR Science Collaborative Grant aimed at gathering data to inform thin-layer placement as a restoration technique to promote marsh resilience in the face of sea level rise. Through this project, replicated restoration experiments are being conducted at several reserve sites across the nation, with the purpose of examining the effectiveness of thin-layer sediment placement as a marsh adaptation strategy. Novel aspects of the project include the broad distribution of sites, the examination of the effectiveness of thin-layer sediment placement at different marsh elevations, a standardized monitoring protocol and the incorporation of biochar (carbon material produced through the conversion of biomass in an oxygen limited environment) to improve soils and plant health. Monitoring guidance developed as part of this study is now being used to inform a marsh enhancement project with the Army Corps of Engineers on the Deal Island Wildlife Management Area.
233 https://extension.umd.edu/sites/extension.umd.edu/files/_docs/programs/woodland-steward/MD_Climate_Adaptation_Guide_for_Forest_Landowners_2013.pdf 234 http://www.chesapeakedata.com/changingchesapeake/
Maryland Department of the Environment 2030 Greenhouse Gas Emissions Reduction Act Plan
245
Margaret A Davidson Fellowship: The Margaret A. Davidson Graduate Fellowship is a new fellowship program that places a graduate student in each of the 29 NERRs to address key coastal management questions through cross-discipline research projects. The fellow will be working to assess wetland condition and management actions for Maryland’s tidal wetlands through a project evaluating the carbon sequestration potential of natural and restored tidal marshes in Chesapeake Bay. The fellow’s research with the reserve is focused on quantifying atmospheric methane (CH4) and carbon effluxes from Chesapeake Bay marshes, which can then be used in combination with plant productivity and carbon burial rates to estimate the net amount of carbon sequestered by these marshes. Information generated on the role of Maryland’s tidal wetlands in capturing carbon will inform future climate mitigation strategies through the conservation and restoration of blue carbon ecosystems. CO2 Sequestration Documentation: The Maryland Geological Survey invested in research and documentation regarding geologic carbon dioxide (CO2) sequestration in multiple geologic avenues including offshore injection, saline aquifer injection and rift basin injection. All of these vary in the manner of sequestration as some are structural sequestration and some of these are mineral re-crystallization sequestration. These projects are being coordinated with 11 different states, several private companies and two federal agencies (United States Geological Survey and the U.S. Department of Energy). This group has partnered with several different energy companies and academic institutions (Core Energy and University of Kentucky) to demonstrate CO2 injection and sequestration. Ecological Effects of Sea Level Rise: DNR partnered with George Mason University and The Nature Conservancy to launch Maryland’s Ecological Effects of Sea Level Rise Project to monitor and model the wave attenuation and flood reduction benefits of marshes, seagrass and other nature-based features. This three-year project will quantify the protective services of Maryland’s natural features and investigate how those services may change as sea levels rise. Wave, water level, and current sensors were deployed in summer 2020 and DNR engaged state, federal and local partners through a Management Transition Advisory Group. This study expands on previous monitoring conducted in Somerset County and will assist managers with identifying restoration needs and priorities in areas where natural features can enhance community resiliency to climate change impacts. Installation of Tide Gauges in Somerset and Talbot County: DNR staff coordinated with Maryland Emergency Management Agency (MEMA), U.S. Geological Survey, Somerset and Talbot Counties on the installation of tide gauges in Crisfield and Claiborne. The gauges will become part of the network of gauges throughout the bay measuring water levels. The two new gauges fill a data gap and will allow for more local and accurate reporting of water levels ongoing and during flood events. The gauges are maintained by the U.S. Geological Survey and became accessible at the end of 2018 on the National Weather Service Advanced Hydrologic Prediction Service website. Toxic Algal Bloom Laboratory Capacity Increase: Increased nutrient runoff and warmer water promote some types of algal growth, which can increase the incidence of harmful algal blooms (HABs). These toxic algae blooms pose a public health risk at water recreation areas and water supplies. State protocols depend on rapid toxicity assessments to make management decisions. To adapt to the risk of more frequent HAB events, in 2020, MDE purchased laboratory equipment that cuts the testing time of multiple HAB toxins by days. Future Projections of Rainstorm Intensity: Climate change is expected to cause more extreme precipitation events in the future. To know whether or how to adapt regulatory permits for stormwater management, sediment and erosion control and waterways construction (culverts and bridges that span streams) it’s necessary to have a better sense of how climate change will affect the intensity, duration and frequency (IDF) of rainstorms. A research project that will help provide useful information to these considerations is a state-funded Restoration Research Grant that was awarded to a consulting firm in 2019 to estimate potential precipitation IDF curves at 79 Atlas 14 sites across Maryland for mid-century (2055) and late-century (2085). This study also analyzed how peak runoff rates may change in the future and applied those results to evaluate the potential impact on certain types of urban stormwater controls, stream stability and roadway flooding associated with culvert sizing. The deliverables of this research
Maryland Department of the Environment 2030 Greenhouse Gas Emissions Reduction Act Plan
246
project are fueling discussion among scientists, engineers and the regulatory community about how the research results can appropriately be applied to state programs and what next steps are needed to continue learning about these trends. Resource Assessment Service Monitoring: Based on climate change projections, Maryland’s streams are likely to become warmer and the flows are likely to become more extreme. Some coastal streams could also become inundated as a result of sea level rise. These changes may alter the ecology, water quality and physical habitat of streams. The Maryland Biological Stream Survey (MBSS) tracks trends in factors such as aquatic species distributions, water temperature and erosion that are indicators of potential climate change influences on Maryland’s streams. Based on temperature and species distribution information, the MBSS has also specifically identified stream animals that prefer cold water and, as a result, may be particularly sensitive to stream temperature increases. Detailed stream temperature information from the MBSS may also help identify streams with particularly cold water and thus are likely to be resilient to temperature increases. In addition to representative sampling of Maryland’s streams, the MBSS has been monitoring 29 “Sentinel" streams since 2000 to specifically examine for potential influences of factors such as climate and weather on Maryland’s stream ecology, temperature, water quality and physical habitat. For more information visit the DNR website.235 Since 2000, along with biological, water quality and habitat data, the MBSS has deployed data loggers in thousands of streams that measure the water temperature throughout the summer. These data are useful for determining habitat for stream biota and for tracking stream temperature conditions. From 2014 – 2018 the MBSS returned to about 200 streams where initial sampling occurred 14 years ago to help represent the condition of Maryland’s streams at that time. The data from this repeated survey will be used to evaluate change over time in the factors measured. For more information visit the DNR website.236 The MBSS also participated in the United States Environmental Protection Agency’s (EPA) Regional Monitoring Network (RMN) and assisted with determining temperature sampling protocols for this network. The goal of the RMN project is to partner with state agencies and select stream sites that can be sampled to establish a long-term record of biological and physical parameters that can be used to assess the vulnerability and response of these streams to climate change.237 Since 1986, Maryland’s ambient water quality monitoring program has measured water quality from more than 120 locations in the Chesapeake Bay, Coastal Bays and non-tidal large rivers on a monthly basis. This sampling is used to determine trends in conditions for nutrients, temperature and other water quality-related factors that could be influenced by climate change. Benthic macroinvertebrate samples have also been collected from select large rivers and used to track biological changes over the more than 30-year period. DNR also partners with the U.S. Geological Survey for tracking stream and river flows throughout the state, and DNR measures stream flow in two streams where the Chesapeake and Atlantic Coastal Bays Trust Fund supports practices to improve pollution runoff.
7.5 Short- and Long-Term Initiatives to Better Address Climate Change
7.5.1 Environmental Justice Addressing Disproportionate Impacts of Climate Change Given that environmental issues such as climate change can disproportionately impact disadvantaged communities, ARWG continues to work alongside the MCCC and their other workgroups to ensure that an environmental justice lens is used in all of our programming and initiatives. ARWG looks to collaborate with the Maryland Commission on Environmental Justice and Sustainable Communities (CEJSC) and other organizations to ensure that all
235 https://dnr.maryland.gov/streams/Publications/2014SentinelSiteReportWEB.pdf 236 https://dnr.maryland.gov/streams/Pages/round4.aspx 237 https://cfpub.epa.gov/ncea/global/recordisplay.cfm?deid=30797
Maryland Department of the Environment 2030 Greenhouse Gas Emissions Reduction Act Plan
247
communities are engaged, meaningfully involved and assisted with preparing for and adapting to the impacts of climate change.
7.5.2 Building Financial Resilience With climate change threatening Maryland communities, infrastructure, and therefore the state’s overall economy, Maryland recognizes the need for a long-term strategy for building financial resilience. Maryland’s 2012 GGRA Plan, addresses the cost of inaction and focuses on five major areas of economic loss if no climate measures are implemented: 1) coastal lands, infrastructures and ecosystems, 2) tourism, 3) agriculture, 4) public health and 5) energy. Using that information as a basis, the ARWG has over the last 5 years, explored multiple avenues to building financial resilience. For example, in fall 2017, DNR contracted with the Environmental Finance Center (EFC) at the University of Maryland College Park to develop a Community Resilience Financing Tool. The tool will help communities determine the actions they can take to become more resilient to climate hazards as well as accelerate and scale the financing efforts needed to implement those projects. It is also recognized that we will need to look beyond traditional funding programs and tools and develop effective, sustainable, market-based financing strategies to fund both bay restoration and climate change reduction activities. This includes continuing to explore and evaluate Public-Private-Partnerships, making grant funds available to local governments for cost-effective reduction strategies, establishing credit-based financing systems, increasing collaboration with Environmental Finance Experts and closely coordinating with the Chesapeake Bay Program and other federal partners on financing opportunities.
7.6 State Enhancement Actions
7.6.1 Local Governments – Resilience Authorities – Authorization In May 2020, Senate Bill 457 entitled “Local Governments - Resilience Authorities - Authorization” was passed. This bill authorizes local governments to create a Resilience Authority by local law, permits an Authority to issue certain bonds for certain purposes and allows the local governing body to dedicate certain revenues of the local government to the repayment of bonds and to support operations or resilience infrastructure projects of an Authority. The legislation will help local governments to leverage revenue, which is an essential step in resiliency planning and programming. 7.6.2 Coast Smart Construction Program Senate Bill 1006/House Bill 1350 was passed during the 2018 legislative session and signed into law by Governor Larry Hogan. Section 3-101(a) and (f) and 8-101(a) and (i) of the Natural Resource Article - titled, "Sea Level Rise Inundation and Coastal Flooding - Construction, Adaptation, and Mitigation," expands the scope of the Coast Smart Council, the applicability of the Coast Smart siting and design criteria and modifies a requirement that must be included in the criteria. Under the bill, the criteria now apply to state and local projects for which at least 50% of the project costs are funded with state funds. The bill also specifies that the criteria do not apply to a public work contract of less than $500,000. The bill clarified the inclusion of a "highway facility" updated the lowest floor elevation requirement and expanded the participation of the Council. HB 1427, titled “Sea Level Rise Inundation and Coastal Flooding - Construction, Adaptation, and Mitigation,” passed during the 2019 legislative session and clarified the applicability of siting and design guidelines, extended deadlines for revising the siting and design criteria and nuisance flood plans, and made technical corrections to clarify implementation during the interim.
Maryland Department of the Environment 2030 Greenhouse Gas Emissions Reduction Act Plan
248
7.6.3 Nuisance Flood Plan Guidance House Bill 1427 (2019) requires local jurisdictions that experience nuisance flooding to develop a plan to address nuisance flooding. In addition, the local jurisdiction shall update the plan every five years; publish the plan on the local jurisdiction’s website and submit a copy to the Maryland Department of Planning (MDP).238 Both MDP and DNR have been working with local jurisdictions on their plans. 7.6.4 Saltwater Intrusion Plan Under Chapter 628 of the 2018 Laws of Maryland, the Maryland General Assembly tasked MDP to “establish a plan to adapt to saltwater intrusion” in consultation with the DNR, MDE, and the Maryland Department of Agriculture (MDA), by Dec. 15, 2019, and to update the plan at least once every five years. Although not specified in the law, MDP submitted the plan to the Governor and the General Assembly. To obtain guidance regarding the plan, MDP established and led a state agency workgroup, which included the DNR (including the Maryland Geological Survey), MDE, and MDA, as well as the University of Maryland, including the Center for Environmental Science, Maryland Sea Grant, and the Harry R. Hughes Center for Agro-Ecology.239
7.7 Conclusions
The information presented in this chapter is a snapshot of where the state currently stands in terms of implementing broad scale, coordinated climate change adaptation efforts. It is also an acknowledgement that we must continue to review and update strategies as new, science-based information becomes available and we gain a better understanding of how to adapt to climate change. State agencies and their partners will remain a key part of advancing climate change adaptation and resiliency in Maryland.
238 https://dnr.maryland.gov/ccs/Documents/NuisanceFloodPlan.pdf 239 https://planning.maryland.gov/Documents/OurWork/envr-planning/2019-1212-Marylands-plan-to-adapt-to-saltwater-intrusion-and-salinization.pdf