202104 kcha board packet a.pdf
TRANSCRIPT
`
MEETING OF THE BOARD OF COMMISSIONERS
VIRTUAL MEETING
Monday, April 19, 2021
Zoom Meeting:
https://zoom.us/j/91909076400?pwd=VVYwakVsTXo1ei9GdzltREpXV28xdz09
PASSCODE: 659945 Meeting ID: 919 0907 6400
Dial by your location
+1 253 215 8782 US (Tacoma)
King County Housing Authority 700 Andover Park West
Tukwila, WA 98188
MEETING OF THE BOARD OF COMMISIONERS
AGENDA
Monday, April 19, 2021 8:30 a.m.
VIRTUAL MEETING King County Housing Authority
700 Andover Park West Tukwila, WA 98188
I. Call to Order
II. Roll Call
III. Public Comment
IV. Approval of Minutes 1 A. Board Meeting Minutes – March 15, 2021 B. Board Meeting Minutes – March 18, 2021 – Executive Session C. Board Meeting Minutes – March 26, 2021 – Executive Session D. Board Meeting Minutes – March 30, 2021 – Executive Session E. Board Meeting Minutes – April 5, 2021 – Executive Session
V. Approval of Agenda
VI. Consent Agenda
A. Voucher Certification Reports for February 2021 2
VII. Resolution for Discussion and Possible Action A. Resolution No. 5683 – Authorizing Changes to the 3
Public Housing Admissions and Continued Occupancy Plan (ACOP)
VIII. Briefings & Reports
A. 2020 MTW Report 4
B. First Quarter 2021 Procurement Report 5
IX. Executive Session
A. To evaluate complaints or charges brought against a public officer or employee (under RCW 42.30.110 (1) (f)) and to review the performance of public employees (under RCW 42.30.110 (1) (g)).
X. Executive Director Report
XI. KCHA in the News 6
XII. Commissioner Comments
XIII. Adjournment
Members of the public who wish to give public comment: We are only accepting written comments for the time being
due to COVID-19. Please send your written comments to [email protected] prior to the meeting date. If you have
questions, please call 206-574-1206.

T A B
N U M B E R
1

MEETING MINUTES OF THE
KING COUNTY HOUSING AUTHORITY BOARD OF COMMISSIONERS
VIRTUAL MEETING
Monday, March 15, 2021
I. CALL TO ORDER
The Special meeting of the King County Housing Authority Board of Commissioners was held virtually on Monday, March 15, 2021. There being a quorum, the virtual meeting was called to order by Chair Doug Barnes at 8:33 a.m.
II. ROLL CALL Present: Commissioner Doug Barnes (Chair) (via Zoom), Commissioner Susan Palmer
(Vice-Chair) (via Zoom), Commissioner Michael Brown (via Zoom), Commissioner John Welch (via Zoom) and Commissioner TerryLynn Stewart (via Zoom).
III. Public Comment
None. IV. APPROVAL OF MINUTES
A. Board Meeting Minutes – February 16, 2021 B. Board Meeting Minutes – February 18, 2021 – Executive Session C. Board Meeting Minutes – February 25, 2021 – Executive Session D. Board Meeting Minutes – March 9, 2021 – Executive Session E. Board Meeting Minutes – March 3, 2021 – Executive Session
On motion by Commissioner John Welch, and seconded by Commissioner Susan Palmer the Board unanimously approved the February 16, 2021, February 18, 2021 Executive Session, February 25, 2021 Executive Session, March 9, 2021 Executive Session and March 3, 2021 Executive Session Board of Commissioners’ Meeting Minutes.
V. APPROVAL OF AGENDA
On motion by Commissioner TerryLynn Stewart, and seconded by Commissioner Michael Brown, the Board unanimously approved the March 15, 2021 virtual Board of Commissioners’ meeting agenda.
VI. CONSENT AGENDA
On motion by Commissioner Susan Palmer, and seconded by Commissioner Michael Brown, the Board unanimously approved the March 15, 2021 virtual Special Board of Commissioners’ meeting consent agenda.
KCHA Board of Commissioners’ March 15, 2021
Meeting Minutes Page 2 of 5
VII. RESOLUTION FOR DISCUSSION AND POSSIBLE ACTION
A. Resolution No. 5678 – A Resolution Authorizing Acquisition of the Trailhead TOD (Transit-Oriented Development) Property in Issaquah and determining related matters.
Dan Landes, Development Director, presented the Resolution with explanations of the TOD site for the Trailhead Apartments.
KCHA plans to build 155-165 units of affordable housing. Development partner Spectrum will build around 200 market-rate units. Financial commitments have been received from the County for $10 million and from ARCH for $12 million. With the infusion of tax credit equity contributions, it is anticipated KCHA should be in a break-even position by the end of the development. Questions of Commissioners were answered. On motion by Commissioner TerryLynn Stewart, and seconded by Commissioner John Welch, the Board unanimously approved Resolution 5678.
B. Resolution No. 5679 – Resolution providing for the issuance of the Authority’s Workforce Housing Preservation Tax-Exempt Revenue Note, 2021, in the Principal Amount of Not to Exceed $161,500,000 and determining related matters. Tim Walter, Senior Director of Development and Asset Management presented Resolutions 5679, 5680, 5681 and 5682 as a package. Mr. Walter covered the intricacies of gap financing and working with entities such as Microsoft and Amazon. The biggest challenge to preserve affordable housing in our region is that the revenue such properties generate is not sufficient to cover 100% of the debt service payments on new incremental debt issued to finance the acquisitions. All of the resolutions pertain to properties that are part of the Amazon package. Questions of Commissioners were answered. On motion by Commissioner TerryLynn Stewart, and seconded by Commissioner Michael Brown, the Board unanimously approved Resolution 5679. C. Resolution No. 5680 – A Resolution Authorizing Acquisition of The Carrington Apartments. Carrington Apartments is located immediately East of Bellevue College, and has a range in size from studios up to two-bedrooms. The property has great access to transit.
KCHA Board of Commissioners’ March 15, 2021
Meeting Minutes Page 3 of 5
On motion by Commissioner Susan Palmer, and seconded by Commissioner Michael Brown, the Board unanimously approved Resolution 5680. D. Resolution No. 5681 – A Resolution Authorizing Acquisition of The Sandpiper East Apartments. The Sandpiper East apartments are located north of Carrington and is a unique property with primarily studios and one bedroom units. It serves a population of single and two person households. It is in an excellent location and is on the bus line. On motion by Commissioner TerryLynn Stewart, and seconded by Commissioner John Welch, the Board unanimously approved Resolution 5681. E. Resolution No. 5682 – A Resolution Authorizing Acquisition of The Argyle Apartments.
The Argyle Apartments are in Federal Way, outside of the original Amazon target area. They eventually agreed as it is the closest large complex of multi-family apartments proximate to the new light rail station on South 320th Street.
On motion by Commissioner Michael Brown, and seconded by Commissioner Susan Palmer, the Board unanimously approved Resolution 5682.
VIII. BRIEFINGS AND REPORTS
A. Fourth Quarter 2020 Executive Dashboard
Andrew Calkins, Manager of Policy and Legislative Affairs, presented the Dashboard.
The financial numbers are compared to the mid-year financial re-forecast. There was slower than average spending on maintenance contracts and in the weatherization program due to the pandemic.
Total units online increased by 144 at the end of the quarter with the addition of Pinewood Village and Illahee Apartments.
Questions of Commissioners’ were answered.
B. Houghton Video https://vimeo.com/520747558/settings

KCHA Board of Commissioners’ March 15, 2021
Meeting Minutes Page 4 of 5
Nikki Parrott, Director of Capital Construction and Weatherization introduced the video and acknowledged the people across the organization that worked on this project.
Deborah Grant and Tracy Friedman from Resident Services were involved in tenant relocation.
Property Manager Caprice Witherspoon and Regional Manager Mayra Jacobs were heavily involved.
The Capital Construction team was led by Patrick Kaapana, Tracy Clairmont, Edmund Lartey, Amy Kurtz, Health MacCoy and Michael Cuadra.
This was a unique project in that some one-bedroom units were combined to create three-bedroom apartments. Special thanks to Heath MacCoy, Patrick Kaapana and Bill Cook for envisioning this.
Video was shown to the Board of Commissioners.
IX. EXECUTIVE SESSION
A. To receive and evaluate complaints or charges brought against a public officer or employee (RCW 42.30.110 (1) (f)) and to review the performance of public employees (RCW 42.30.110 (1) (g)). 9:38 a.m. – Board meeting was suspended for the Executive Session. 10:14 a.m. – Board meeting was re-convened.
X. EXECUTIVE DIRECTOR REPORT Executive Director Norman acknowledged Dan Watson, Tim Walter, Dan Landes and Beth Pearson’s role in the spectacularly complex transactions of buying and preserving almost 500 units of housing and setting the ground work for building another 150. This is a testimony of the staff here moving forward in the midst of the pandemic. On the vaccine front, currently we are up to 1425 vaccinations at over 25 sites across the county. Primarily in our senior complexes, the ability to go out and make sure that our communities are getting what they need. Testimony of the work that Judi Jones, Jenn Ramirez Robson and the rest of the staff are doing. The American Recovery Reinvestment Act of 2021 contains a 5 billion allocation of funding for Housing Choice Vouchers. This is a 20% increase and is supposed to last for 10 years. We are starting to game out scenario’s and looking at implications of this in terms of staff, budget for client assistance funds, space here (once we return to the office) and capacity in
KCHA Board of Commissioners’ March 15, 2021
Meeting Minutes Page 5 of 5
the market to successfully accommodate this spike. Congress gave HUD 60 days. To determine what the allocations were and notify housing authorities. Thanks to Jeb Best, Pam Taylor and Karen House, the leadership team in Section 8 who are leading the charge on this with help from the agency.
XI. KCHA IN THE NEWS
Time Magazine article.
XII. COMMISSIONER COMMENTS
We are making progress on opening schools. K-6 will be reopening by April 5th and by April 19th, 30% of K-12 will be physically back in school.
XIII. ADJOURNMENT
Chair Barnes adjourned the meeting at 10:33 a.m.
THE HOUSING AUTHORITY OF THE
COUNTY OF KING, WASHINGTON
_____________________________ DOUGLAS J. BARNES, Chair
Board of Commissioners
________________________ STEPHEN J. NORMAN Secretary
MEETING MINUTES OF THE
KING COUNTY HOUSING AUTHORITY SPECIAL BOARD OF COMMISSIONERS
VIRTUAL MEETING – EXECUTIVE SESSION ONLY
March 18, 2021
I. CALL TO ORDER
The telephonic special Executive Session meeting of the King County Housing Authority Board of Commissioners was held on Thursday, March 18, 2021 via telephone/zoom. There being a quorum, the meeting was called to order by Chair Susan Palmer at 8:10 a.m.
II. ROLL CALL Present: Commissioner Doug Barnes (Chair) (via Computer/zoom),
Commissioner Susan Palmer (Vice-Chair) (via Computer/zoom), Commissioner John Welch (via Computer/zoom), Commissioner Michael Brown (via Computer/zoom) and Commissioner TerryLynn Stewart (via Computer/zoom)
IX. EXECUTIVE SESSION
This special meeting in executive session is held to receive and evaluate complaints or charges brought against a public officer or employee (RCW 42.30.110 (1) (f)) and to review the performance of a public employees (RCW 42.30.110 (1) (g)).
XIII. ADJOURNMENT
Chair Palmer adjourned the meeting at 9:05 a.m.
THE HOUSING AUTHORITY OF THE COUNTY OF KING, WASHINGTON
_____________________________ DOUGLAS J. BARNES, Chair
Board of Commissioners
________________________ STEPHEN J. NORMAN Secretary

MEETING MINUTES OF THE
KING COUNTY HOUSING AUTHORITY SPECIAL BOARD OF COMMISSIONERS
VIRTUAL MEETING – EXECUTIVE SESSION ONLY
March 26, 2021
I. CALL TO ORDER
The telephonic special Executive Session meeting of the King County Housing Authority Board of Commissioners was held on Friday, March 26, 2021 via telephone/zoom. There being a quorum, the meeting was called to order by Chair Susan Palmer at 10:32 a.m.
II. ROLL CALL Present: Commissioner Doug Barnes (Chair) (via Computer/zoom),
Commissioner Susan Palmer (Vice-Chair) (via Computer/zoom), Commissioner Michael Brown (via Computer/zoom) and Commissioner TerryLynn Stewart (via Computer/zoom)
Excused: Commissioner John Welch IX. EXECUTIVE SESSION
This special meeting in executive session is held to receive and evaluate complaints or charges brought against a public officer or employee (RCW 42.30.110 (1) (f)) and to review the performance of a public employees (RCW 42.30.110 (1) (g)).
XIII. ADJOURNMENT
Chair Palmer adjourned the meeting at 11:20 a.m.
THE HOUSING AUTHORITY OF THE COUNTY OF KING, WASHINGTON
_____________________________ DOUGLAS J. BARNES, Chair
Board of Commissioners
________________________ STEPHEN J. NORMAN Secretary

MEETING MINUTES OF THE
KING COUNTY HOUSING AUTHORITY SPECIAL BOARD OF COMMISSIONERS
VIRTUAL MEETING – EXECUTIVE SESSION ONLY
March 30, 2021
I. CALL TO ORDER
The telephonic special Executive Session meeting of the King County Housing Authority Board of Commissioners was held on Tuesday, March 30, 2021 via telephone/zoom. There being a quorum, the meeting was called to order by Chair Susan Palmer at 10:04 a.m.
II. ROLL CALL Present: Commissioner Doug Barnes (Chair) (via Computer/zoom),
Commissioner Susan Palmer (Vice-Chair) (via Computer/zoom), Commissioner Michael Brown (via Computer/zoom) and Commissioner TerryLynn Stewart (via Computer/zoom)
Excused: Commissioner John Welch IX. EXECUTIVE SESSION
This special meeting in executive session is held to receive and evaluate complaints or charges brought against a public officer or employee (RCW 42.30.110 (1) (f)) and to review the performance of a public employees (RCW 42.30.110 (1) (g)).
XIII. ADJOURNMENT
Chair Palmer adjourned the meeting at 10:50 a.m.
THE HOUSING AUTHORITY OF THE COUNTY OF KING, WASHINGTON
_____________________________ DOUGLAS J. BARNES, Chair
Board of Commissioners
________________________ STEPHEN J. NORMAN Secretary
MEETING MINUTES OF THE
KING COUNTY HOUSING AUTHORITY SPECIAL BOARD OF COMMISSIONERS
VIRTUAL MEETING – EXECUTIVE SESSION ONLY
April 5, 2021
I. CALL TO ORDER
The telephonic special Executive Session meeting of the King County Housing Authority Board of Commissioners was held on Monday, April 5, 2021 via telephone/zoom. There being a quorum, the meeting was called to order by Chair Susan Palmer at 10:00 a.m.
II. ROLL CALL Present: Commissioner Doug Barnes (Chair) (via Computer/zoom),
Commissioner Susan Palmer (Vice-Chair) (via Computer/zoom), Commissioner Michael Brown (via Computer/zoom) and Commissioner TerryLynn Stewart (via Computer/zoom)
Excused: Commissioner John Welch IX. EXECUTIVE SESSION
This special meeting in executive session is held to receive and evaluate complaints or charges brought against a public officer or employee (RCW 42.30.110 (1) (f)) and to review the performance of a public employees (RCW 42.30.110 (1) (g)).
XIII. ADJOURNMENT
Chair Palmer adjourned the meeting at 11:03 a.m.
THE HOUSING AUTHORITY OF THE COUNTY OF KING, WASHINGTON
_____________________________ DOUGLAS J. BARNES, Chair
Board of Commissioners
________________________ STEPHEN J. NORMAN Secretary

T A B
N U M B E R
2
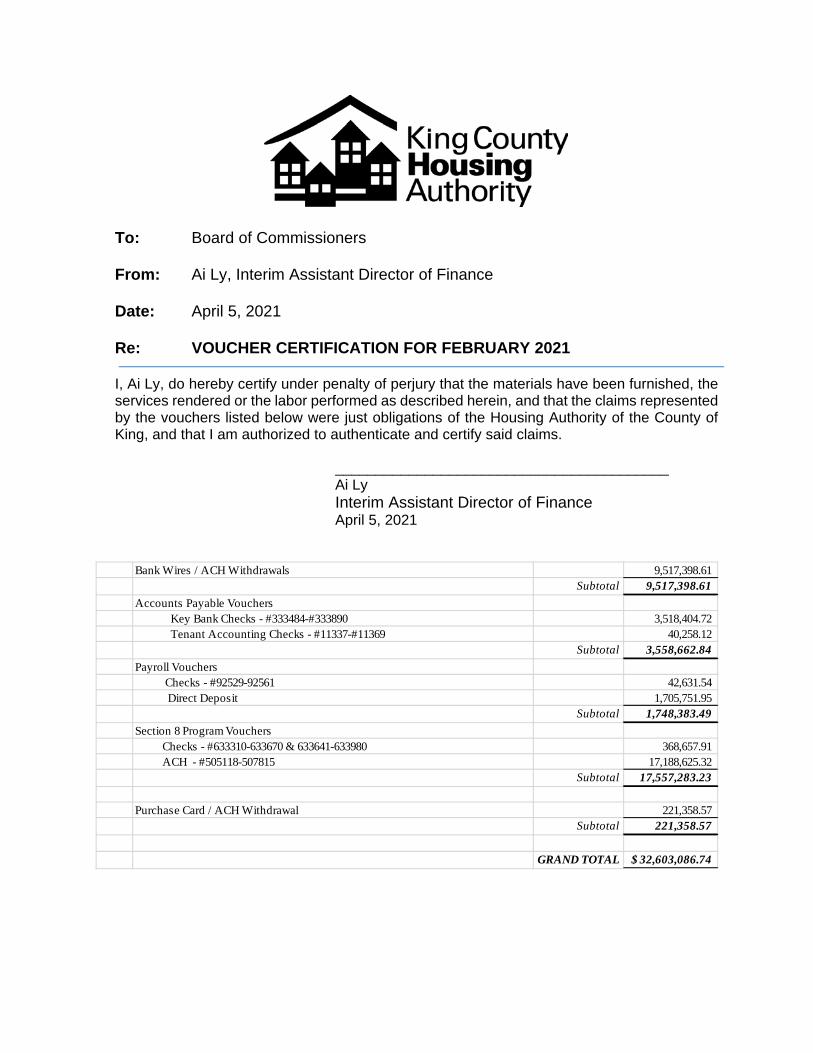
To: Board of Commissioners
From: Ai Ly, Interim Assistant Director of Finance
Date: April 5, 2021 Re: VOUCHER CERTIFICATION FOR FEBRUARY 2021
I, Ai Ly, do hereby certify under penalty of perjury that the materials have been furnished, the services rendered or the labor performed as described herein, and that the claims represented by the vouchers listed below were just obligations of the Housing Authority of the County of King, and that I am authorized to authenticate and certify said claims.
_________________________________________ Ai Ly
Interim Assistant Director of Finance April 5, 2021
Bank Wires / ACH Withdrawals 9,517,398.61 Subtotal 9,517,398.61
Accounts Payable Vouchers Key Bank Checks - #333484-#333890 3,518,404.72 Tenant Accounting Checks - #11337-#11369 40,258.12
Subtotal 3,558,662.84
Payroll Vouchers Checks - #92529-92561 42,631.54 Direct Deposit 1,705,751.95
Subtotal 1,748,383.49
Section 8 Program Vouchers Checks - #633310-633670 & 633641-633980 368,657.91 ACH - #505118-507815 17,188,625.32
Subtotal 17,557,283.23
Purchase Card / ACH Withdrawal 221,358.57 Subtotal 221,358.57
GRAND TOTAL 32,603,086.74$
PropertyWired to Operating Account for Obligations of Property
Notes:Date Wire Transaction Claim
Ballinger Commons 02/03/2021 $ 95,824.47 A/P & Payroll
Emerson 02/03/2021 $ 48,435.22 A/P & Payroll
GILMAN SQUARE 02/03/2021 $ 22,861.37 A/P & Payroll
Hampton Greens 02/03/2021 $ 11,911.33 A/P
Kendall Ridge 02/03/2021 $ 5,210.75 A/P
Landmark 02/03/2021 $ 13,236.27 A/P
Meadowbrook 02/03/2021 $ 18,044.37 A/P & Payroll
Riverstone 02/03/2021 $ 61,669.53 A/P
Villages at South Station 02/03/2021 $ 88,062.62 A/P & Payroll
Woodside East 02/03/2021 $ 1,781.16 A/P
ALPINE RIDGE 02/04/2021 $ 4,242.82 A/P & Payroll
ARBOR HEIGHTS 02/04/2021 $ 8,887.06 A/P & Payroll
Aspen Ridge 02/04/2021 $ 7,252.67 A/P & Payroll
Auburn Square 02/04/2021 $ 28,482.91 A/P & Payroll
Carriage House 02/04/2021 $ 19,604.11 A/P & Payroll
CASCADIAN 02/04/2021 $ 28,023.99 A/P & Payroll
Colonial Gardens 02/04/2021 $ 10,938.24 A/P & Payroll
FAIRWOOD 02/04/2021 $ 12,963.53 A/P & Payroll
HERITAGE PARK 02/04/2021 $ 6,809.23 A/P & Payroll
Pinewood Villages 02/04/2021 $ 10,433.11 A/P & Payroll
LAURELWOOD 02/04/2021 $ 12,174.14 A/P & Payroll
Meadows 02/04/2021 $ 9,941.98 A/P & Payroll
OVERLAKE TOD 02/04/2021 $ 106,149.93 A/P & Payroll & Debt Services
Parkwood 02/04/2021 $ 9,277.20 A/P & Payroll
RAINIER VIEW I 02/04/2021 $ 7,444.88 A/P
RAINIER VIEW II 02/04/2021 $ 6,257.68 A/P
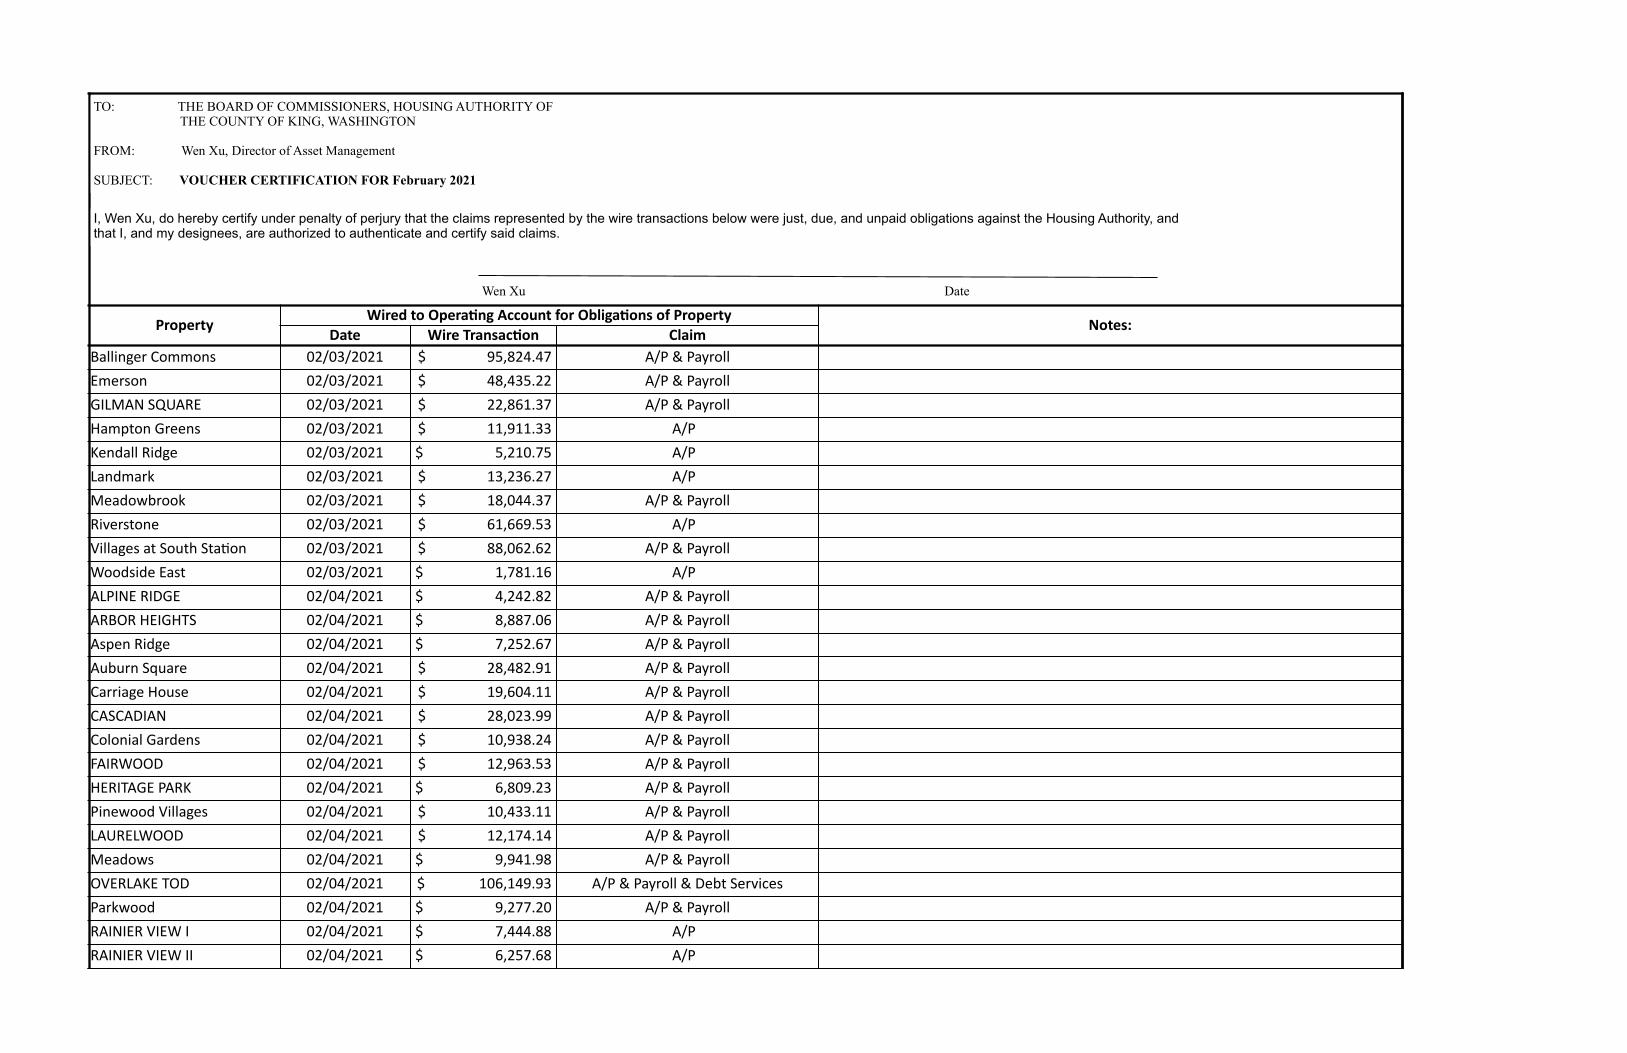
TO: THE BOARD OF COMMISSIONERS, HOUSING AUTHORITY OF THE COUNTY OF KING, WASHINGTON
FROM: Wen Xu, Director of Asset Management
SUBJECT: VOUCHER CERTIFICATION FOR February 2021
I, Wen Xu, do hereby certify under penalty of perjury that the claims represented by the wire transactions below were just, due, and unpaid obligations against the Housing Authority, and that I, and my designees, are authorized to authenticate and certify said claims.
Wen Xu Date

Riverstone 02/04/2021 $ 60,494.59 A/P
SI VIEW 02/04/2021 $ 5,203.79 A/P
SOUTHWOOD SQUARE 02/04/2021 $ 8,931.14 A/P & Payroll
Newporter 02/04/2021 $ 14,406.24 A/P & Payroll
Timberwood 02/04/2021 $ 22,232.76 A/P & Payroll
Vashon Terrace 02/04/2021 $ 1,381.24 A/P
Walnut Park 02/04/2021 $ 11,666.63 A/P & Payroll
WINDSOR HEIGHTS 02/04/2021 $ 20,964.84 A/P & Payroll
Woodridge Park 02/04/2021 $ 30,157.10 A/P & Payroll
Cottonwood 02/08/2021 $ 18,113.04 A/P & Payroll & OCR
Cove East 02/08/2021 $ 40,352.67 A/P & Payroll & OCR
Juanita View 02/08/2021 $ 22,073.10 A/P & Payroll & OCR
Kirkland Heights 02/08/2021 $ 73,837.13 A/P & Payroll & OCR
NIA 02/08/2021 $ 62,597.68 A/P & Payroll & OCR
Bellepark 02/10/2021 $ 14,019.91 A/P & Payroll
Hampton Greens 02/10/2021 $ 33,917.43 A/P & Payroll
Kendall Ridge 02/10/2021 $ 115,059.31 A/P & Payroll
Landmark 02/10/2021 $ 54,150.48 A/P & Payroll
Riverstone 02/10/2021 $ 46,004.05 A/P & Payroll
Woodside East 02/10/2021 $ 27,464.77 A/P & Payroll
ALPINE RIDGE 02/11/2021 $ 3,896.96 A/P
ARBOR HEIGHTS 02/11/2021 $ 14,955.20 A/P
Aspen Ridge 02/11/2021 $ 3,917.37 A/P
Auburn Square 02/11/2021 $ 4,414.96 A/P
Carriage House 02/11/2021 $ 8,358.02 A/P
CASCADIAN 02/11/2021 $ 6,061.64 A/P
Colonial Gardens 02/11/2021 $ 1,938.49 A/P
FAIRWOOD 02/11/2021 $ 10,302.48 A/P
HERITAGE PARK 02/11/2021 $ 16,907.04 A/P
Pinewood Villages 02/11/2021 $ 4,130.36 A/P
LAURELWOOD 02/11/2021 $ 4,072.11 A/P
Meadows 02/11/2021 $ 7,528.65 A/P
OVERLAKE TOD 02/11/2021 $ 20,562.44 A/P & Payroll
Parkwood 02/11/2021 $ 11,452.86 A/P
RAINIER VIEW I 02/11/2021 $ 7,298.09 A/P
RAINIER VIEW II 02/11/2021 $ 4,861.95 A/P
SI VIEW 02/11/2021 $ 2,429.16 A/P
SOUTHWOOD SQUARE 02/11/2021 $ 23,245.85 A/P

Newporter 02/11/2021 $ 4,150.88 A/P
Timberwood 02/11/2021 $ 42,117.90 A/P
Vashon Terrace 02/11/2021 $ 1,633.14 A/P
Walnut Park 02/11/2021 $ 7,691.09 A/P
WINDSOR HEIGHTS 02/11/2021 $ 43,581.84 A/P
Woodridge Park 02/11/2021 $ 10,293.40 A/P
Ballinger Commons 02/17/2021 $ 80,565.50 A/P & Payroll
Bellepark 02/17/2021 $ 17,487.89 A/P
Emerson 02/17/2021 $ 44,047.17 A/P & Payroll
GILMAN SQUARE 02/17/2021 $ 56,126.90 A/P & Payroll
Hampton Greens 02/17/2021 $ 40,607.64 A/P
Kendall Ridge 02/17/2021 $ 19,734.72 A/P
Landmark 02/17/2021 $ 31,749.93 A/P
Meadowbrook 02/17/2021 $ 23,319.13 A/P & Payroll
Riverstone 02/17/2021 $ 42,068.38 A/P
Villages at South Station 02/17/2021 $ 52,999.78 A/P & Payroll
Woodside East 02/17/2021 $ 11,066.47 A/P
ALPINE RIDGE 02/18/2021 $ 12,536.80 A/P & Payroll
ARBOR HEIGHTS 02/18/2021 $ 10,637.62 A/P & Payroll
Aspen Ridge 02/18/2021 $ 7,001.41 A/P & Payroll
Auburn Square 02/18/2021 $ 13,612.17 A/P & Payroll
Carriage House 02/18/2021 $ 13,356.22 A/P & Payroll
CASCADIAN 02/18/2021 $ 24,722.71 A/P & Payroll
Colonial Gardens 02/18/2021 $ 6,507.53 A/P & Payroll
FAIRWOOD 02/18/2021 $ 15,987.20 A/P & Payroll
HERITAGE PARK 02/18/2021 $ 10,520.69 A/P & Payroll
Pinewood Villages 02/18/2021 $ 14,265.18 A/P & Payroll
LAURELWOOD 02/18/2021 $ 15,394.42 A/P & Payroll
Meadows 02/18/2021 $ 9,657.46 A/P & Payroll
OVERLAKE TOD 02/18/2021 $ 15,405.05 A/P & Payroll
Parkwood 02/18/2021 $ 14,390.65 A/P & Payroll
RAINIER VIEW I 02/18/2021 $ 8,341.56 A/P
RAINIER VIEW II 02/18/2021 $ 4,045.88 A/P
SI VIEW 02/18/2021 $ 2,681.53 A/P
SOUTHWOOD SQUARE 02/18/2021 $ 10,301.06 A/P & Payroll
Newporter 02/18/2021 $ 15,750.08 A/P & Payroll
Timberwood 02/18/2021 $ 36,515.71 A/P & Payroll
Vashon Terrace 02/18/2021 $ 4,354.13 A/P
Walnut Park 02/18/2021 $ 19,978.93 A/P & Payroll
WINDSOR HEIGHTS 02/18/2021 $ 37,436.18 A/P & Payroll
Woodridge Park 02/18/2021 $ 28,235.47 A/P & Payroll
Cottonwood 02/23/2021 $ 4,388.18 A/P & Payroll & OCR
Cove East 02/23/2021 $ 35,758.73 A/P & Payroll & OCR
Juanita View 02/23/2021 $ 27,496.44 A/P & Payroll & OCR
Kirkland Heights 02/23/2021 $ 45,289.26 A/P & Payroll & OCR
NIA 02/23/2021 $ 5,064.80 A/P & Payroll & OCR
Bellepark 02/24/2021 $ 13,076.75 A/P & Payroll
Hampton Greens 02/24/2021 $ 23,354.85 A/P & Payroll
Kendall Ridge 02/24/2021 $ 37,274.50 A/P & Payroll
Landmark 02/24/2021 $ 16,186.44 A/P & Payroll
Riverstone 02/24/2021 $ 78,385.19 A/P & Payroll
Woodside East 02/24/2021 $ 29,536.75 A/P & Payroll
ALPINE RIDGE 02/25/2021 $ 6,921.82 A/P & OCR & Management Fee
ARBOR HEIGHTS 02/25/2021 $ 4,308.37 A/P & OCR & Management Fee
Aspen Ridge 02/25/2021 $ 4,021.58 A/P & OCR & Management Fee
Auburn Square 02/25/2021 $ 24,560.73 A/P & OCR & Management Fee
Carriage House 02/25/2021 $ 13,102.63 A/P & OCR & Management Fee
CASCADIAN 02/25/2021 $ 13,119.74 A/P & OCR & Management Fee
Colonial Gardens 02/25/2021 $ 4,438.91 A/P & OCR & Management Fee
FAIRWOOD 02/25/2021 $ 8,400.15 A/P & OCR & Management Fee
HERITAGE PARK 02/25/2021 $ 6,490.43 A/P & OCR & Management Fee
Pinewood Villages 02/25/2021 $ 15,820.42 A/P & OCR & Management Fee
LAURELWOOD 02/25/2021 $ 18,785.97 A/P & OCR & Management Fee
Meadows 02/25/2021 $ 5,252.28 A/P & OCR & Management Fee
OVERLAKE TOD 02/25/2021 $ 33,510.13 A/P & OCR & Management Fee
Parkwood 02/25/2021 $ 7,035.91 A/P & OCR & Management Fee
SI VIEW 02/25/2021 $ 3,863.23 A/P
SOUTHWOOD SQUARE 02/25/2021 $ 8,925.23 A/P & OCR & Management Fee
Tall Cedars 02/25/2021 $ 24,185.46 A/P & Payroll
Newporter 02/25/2021 $ 8,296.96 A/P & OCR & Management Fee
Timberwood 02/25/2021 $ 21,029.99 A/P & OCR & Management Fee
Walnut Park 02/25/2021 $ 12,113.50 A/P & OCR & Management Fee
WINDSOR HEIGHTS 02/25/2021 $ 13,462.41 A/P & OCR & Management Fee
Woodridge Park 02/25/2021 $ 16,629.27 A/P & OCR & Management Fee
TOTAL 138 Wires $ 2,966,246.51

T A B
N U M B E R
3
To: Board of Commissioners
From: Bill Cook, Director of Property Management
Date: April 19th, 2021
Re: Resolution No. 5683: Authorizing Changes to the Public Housing Admissions
and Continued Occupancy Plan (ACOP)
KCHA’s Property Management Department has been reviewing policies in the ACOP that
govern most of Property Management’s internally-managed housing. As a result of this review
process, staff are recommending changes to three of the policies in the ACOP:
Exhibit J: Dwelling Lease
Exhibit I: Grievance Procedure
Exhibit O: Schedule of Maintenance Charges/Charge Policy
Listed below are summaries of the changes proposed to each exhibit:
Dwelling Lease Changes include:
Updates necessary due to changes in federal regulations and state laws.
Updates that streamline program administration.
Increased explanation of the Community Service requirement.
Expanding the listing of tenant responsibilities.
Clarifying requirements relating to vehicles and parking.
Clarifying KCHA’s policy relating to pets and service/companion animals.
Adding language regarding installation of satellite dishes and antennas.
Expanded explanation of Damages and Other Charges.
Modified details relating to the Grievance Procedure.
Proposed Grievance Policy Changes include:
Updated definitions.
Clarifying the Tenant’s ability to seek resolution through the judicial system.
Revising the format of the Grievance Procedure to show each step of the process.
KCHA Board Resolution No. 5683 Page 2 of 2 Proposed Changes to the Schedule of Tenant Charges include:
Modified details relating to charges for labor costs.
Clarifying that charges may include a combination of staff time and materials.
Updating the listing of the anticipated “Life Expectancy” of equipment
Expanded listing of miscellaneous charges.
KCHA staff believe these changes will benefit both residents and staff. Each change will help
ensure a better understanding of our policies and procedures as well as Tenant and KCHA
responsibilities. Together, these changes will help KCHA continue to provide safe, secure, and
peaceful communities in which to live.
Tenants have been involved at several key points in this process. All residents were mailed a
packet that contained each policy in a “marked up” version so they could review the current
policy language and the proposed language changes. These documents were also posted in
each property, available at each Property Management office, and downloadable at kcha.org.
Translated versions were also available at the Property Management offices and kcha.org.
Additionally, the Resident Advisory Council (RAC) members were briefed several times
during the last eighteen months on these changes and given ample opportunity to comment on
the proposed changes.
Lastly, we held four Zoom meetings in February for residents to ask questions and make
comments on these proposed changes. These meetings were publicized in the packet that was
sent to them with the policy changes, and interpreters were made available when requested.
Overall, we had roughly 40 residents attend these meetings.
These policy changes were also reviewed by members of KCHA’s Racial Equity Diversity and
Inclusion (REDI) team to ensure that they did not have an adverse impact on residents from an
equity perspective. The feedback from the REDI team was incorporated into the policy
changes.
For the Grievance Policy changes, KCHA’s contracted grievance Hearing Officers were also
given the opportunity to review the proposed changes and make comments/suggested edits.
Staff recommends approval of Resolution 5683.
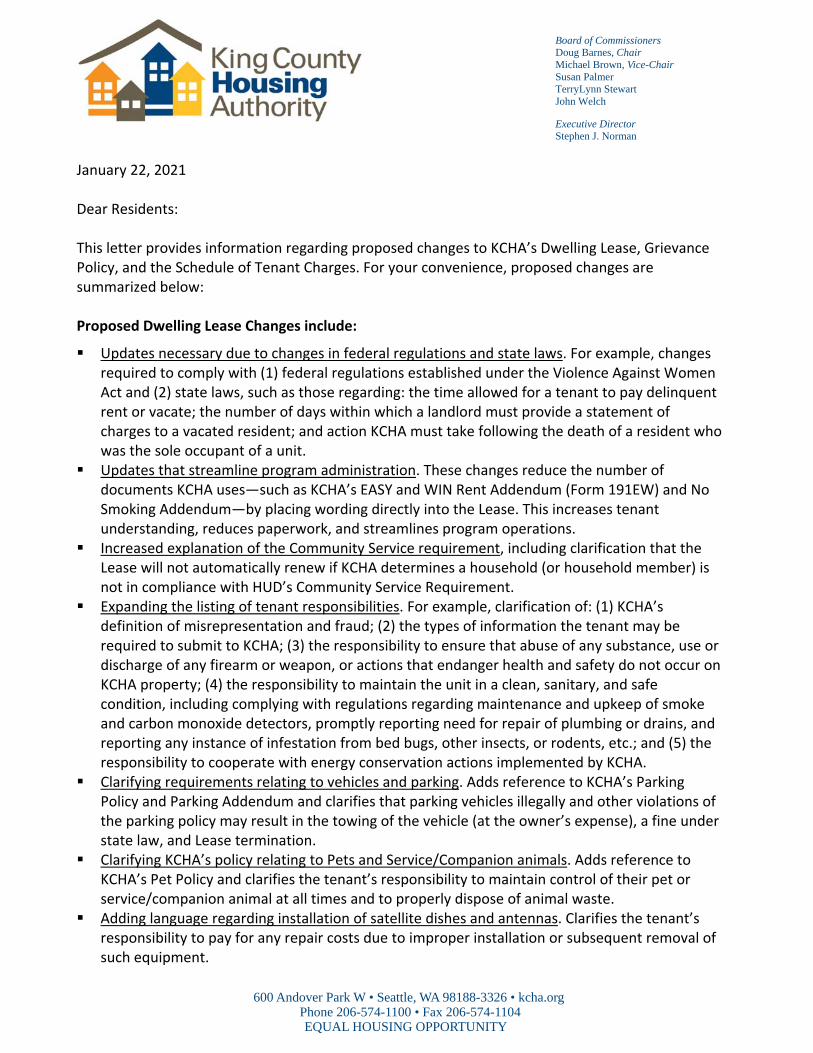
Board of Commissioners Doug Barnes, Chair Michael Brown, Vice-Chair Susan Palmer TerryLynn Stewart John Welch
Executive Director Stephen J. Norman
600 Andover Park W • Seattle, WA 98188-3326 • kcha.org Phone 206-574-1100 • Fax 206-574-1104 EQUAL HOUSING OPPORTUNITY
January 22, 2021 Dear Residents: This letter provides information regarding proposed changes to KCHA’s Dwelling Lease, Grievance Policy, and the Schedule of Tenant Charges. For your convenience, proposed changes are summarized below: Proposed Dwelling Lease Changes include:
Updates necessary due to changes in federal regulations and state laws. For example, changes required to comply with (1) federal regulations established under the Violence Against Women Act and (2) state laws, such as those regarding: the time allowed for a tenant to pay delinquent rent or vacate; the number of days within which a landlord must provide a statement of charges to a vacated resident; and action KCHA must take following the death of a resident who was the sole occupant of a unit.
Updates that streamline program administration. These changes reduce the number of documents KCHA uses—such as KCHA’s EASY and WIN Rent Addendum (Form 191EW) and No Smoking Addendum—by placing wording directly into the Lease. This increases tenant understanding, reduces paperwork, and streamlines program operations.
Increased explanation of the Community Service requirement, including clarification that the Lease will not automatically renew if KCHA determines a household (or household member) is not in compliance with HUD’s Community Service Requirement.
Expanding the listing of tenant responsibilities. For example, clarification of: (1) KCHA’s definition of misrepresentation and fraud; (2) the types of information the tenant may be required to submit to KCHA; (3) the responsibility to ensure that abuse of any substance, use or discharge of any firearm or weapon, or actions that endanger health and safety do not occur on KCHA property; (4) the responsibility to maintain the unit in a clean, sanitary, and safe condition, including complying with regulations regarding maintenance and upkeep of smoke and carbon monoxide detectors, promptly reporting need for repair of plumbing or drains, and reporting any instance of infestation from bed bugs, other insects, or rodents, etc.; and (5) the responsibility to cooperate with energy conservation actions implemented by KCHA.
Clarifying requirements relating to vehicles and parking. Adds reference to KCHA’s Parking Policy and Parking Addendum and clarifies that parking vehicles illegally and other violations of the parking policy may result in the towing of the vehicle (at the owner’s expense), a fine under state law, and Lease termination.
Clarifying KCHA’s policy relating to Pets and Service/Companion animals. Adds reference to KCHA’s Pet Policy and clarifies the tenant’s responsibility to maintain control of their pet or service/companion animal at all times and to properly dispose of animal waste.
Adding language regarding installation of satellite dishes and antennas. Clarifies the tenant’s responsibility to pay for any repair costs due to improper installation or subsequent removal of such equipment.
Expanded explanation of Damages and Other Charges. Clarifies the types of fees for damages or other costs that KCHA may charge to the Tenant, when such charges are due and payable, and that Tenant payments will be applied toward outstanding rent before other charges on the account.
Modified details relating to the Grievance Procedure. Clarifies the circumstances under which a Tenant may access the Grievance Procedures, including examples of an “adverse action”. Also clarifies information regarding the selection and assignment of KCHA Hearing Officers and includes reference to the Grievance Procedure as listed in KCHA’s Admissions and Continued Occupancy Policy.
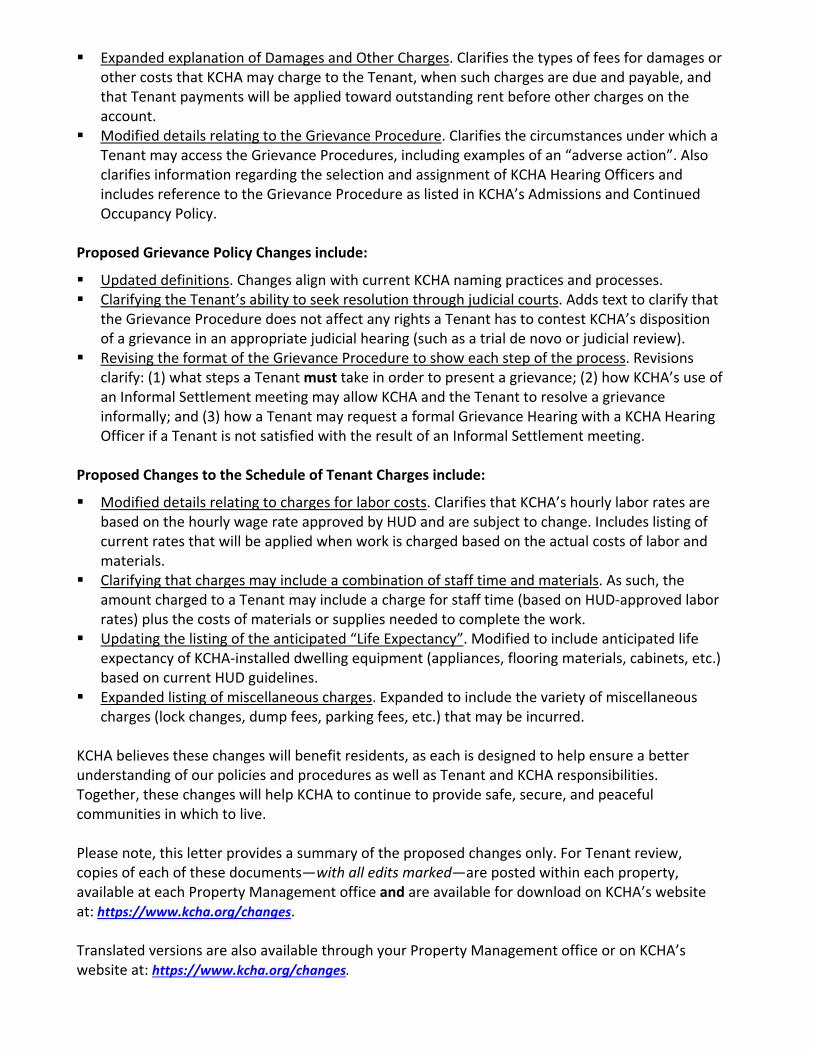
Proposed Grievance Policy Changes include:
Updated definitions. Changes align with current KCHA naming practices and processes. Clarifying the Tenant’s ability to seek resolution through judicial courts. Adds text to clarify that
the Grievance Procedure does not affect any rights a Tenant has to contest KCHA’s disposition of a grievance in an appropriate judicial hearing (such as a trial de novo or judicial review).
Revising the format of the Grievance Procedure to show each step of the process. Revisions clarify: (1) what steps a Tenant must take in order to present a grievance; (2) how KCHA’s use of an Informal Settlement meeting may allow KCHA and the Tenant to resolve a grievance informally; and (3) how a Tenant may request a formal Grievance Hearing with a KCHA Hearing Officer if a Tenant is not satisfied with the result of an Informal Settlement meeting.
Proposed Changes to the Schedule of Tenant Charges include:
Modified details relating to charges for labor costs. Clarifies that KCHA’s hourly labor rates are based on the hourly wage rate approved by HUD and are subject to change. Includes listing of current rates that will be applied when work is charged based on the actual costs of labor and materials.
Clarifying that charges may include a combination of staff time and materials. As such, the amount charged to a Tenant may include a charge for staff time (based on HUD‐approved labor rates) plus the costs of materials or supplies needed to complete the work.
Updating the listing of the anticipated “Life Expectancy”. Modified to include anticipated life expectancy of KCHA‐installed dwelling equipment (appliances, flooring materials, cabinets, etc.) based on current HUD guidelines.
Expanded listing of miscellaneous charges. Expanded to include the variety of miscellaneous charges (lock changes, dump fees, parking fees, etc.) that may be incurred.
KCHA believes these changes will benefit residents, as each is designed to help ensure a better understanding of our policies and procedures as well as Tenant and KCHA responsibilities. Together, these changes will help KCHA to continue to provide safe, secure, and peaceful communities in which to live. Please note, this letter provides a summary of the proposed changes only. For Tenant review, copies of each of these documents—with all edits marked—are posted within each property, available at each Property Management office and are available for download on KCHA’s website at: https://www.kcha.org/changes. Translated versions are also available through your Property Management office or on KCHA’s website at: https://www.kcha.org/changes.

Prior to final approval, we would like to give you the opportunity to provide feedback and submit comments on the proposed changes. We will be holding a series of one‐hour virtual resident meetings, over Zoom for feedback as listed below:
Date Time Zoom Meeting ID Passcode Dial‐in Only February 15, 2021 12:00 PM 960 6034 8051 KCHA 253‐215‐8782
February 16, 2021 5:30 PM 965 6091 0048 KCHA 253‐215‐8782
February 17, 2021 10:30 AM 925 3393 4512 KCHA 253‐215‐8782
February 18, 2021 4:30 PM 969 8072 8271 KCHA 253‐215‐8782
If you plan to attend one of these meetings and need a reasonable accommodation or interpreter, please contact KCHA Resident Services at (206) 693‐6446 before February 1, 2021. If you wish to provide comments regarding the changes, you may do so by attending one of these meetings. Your comments may also be submitted in writing by mail to:
KCHA/Tenant Comments 600 Andover Park West Tukwila, WA 98188
You may also submit comments via e‐mail to [email protected], or you may call 206‐394‐3754 and submit comments via voice message. Your comments must be received no later than February 26, 2021 to ensure review and consideration as we develop final documents for implementation. If you have questions regarding this notice, please contact your Property Management office. Sincerely, Bill Cook Director of Property Management King County Housing Authority
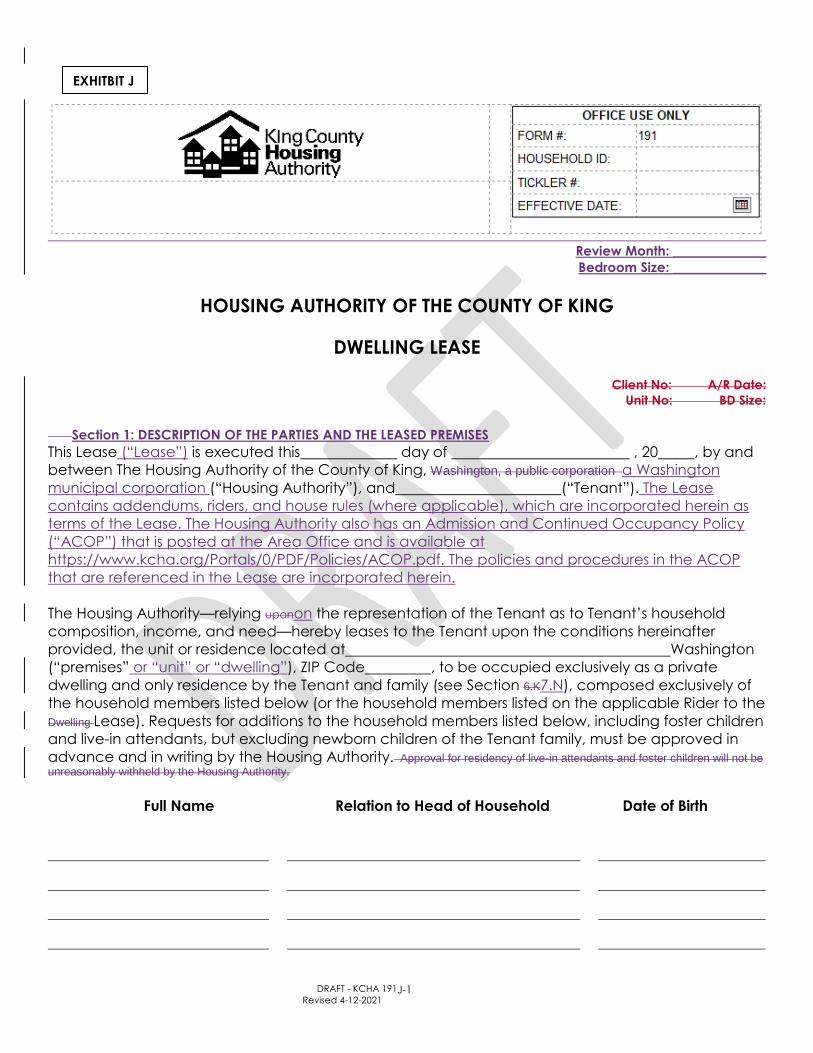
DRAFT - KCHA 191
Revised 4-12-2021 J-1
Review Month: ______________
Bedroom Size: ______________
HOUSING AUTHORITY OF THE COUNTY OF KING
DWELLING LEASE
Client No: A/R Date:
Unit No: BD Size:
Section 1: DESCRIPTION OF THE PARTIES AND THE LEASED PREMISES
This Lease (“Lease”) is executed this day of , 20 , by and
between The Housing Authority of the County of King, Washington, a public corporation a Washington
municipal corporation (“Housing Authority”), and (“Tenant”). The Lease
contains addendums, riders, and house rules (where applicable), which are incorporated herein as
terms of the Lease. The Housing Authority also has an Admission and Continued Occupancy Policy
(“ACOP”) that is posted at the Area Office and is available at
https://www.kcha.org/Portals/0/PDF/Policies/ACOP.pdf. The policies and procedures in the ACOP
that are referenced in the Lease are incorporated herein.
The Housing Authority—relying uponon the representation of the Tenant as to Tenant’s household
composition, income, and need—hereby leases to the Tenant upon the conditions hereinafter
provided, the unit or residence located at Washington
(“premises” or “unit” or “dwelling”), ZIP Code , to be occupied exclusively as a private
dwelling and only residence by the Tenant and family (see Section 6.K7.N), composed exclusively of
the household members listed below (or the household members listed on the applicable Rider to the
Dwelling Lease). Requests for additions to the household members listed below, including foster children
and live-in attendants, but excluding newborn children of the Tenant family, must be approved in
advance and in writing by the Housing Authority. Approval for residency of live-in attendants and foster children will not be
unreasonably withheld by the Housing Authority.
Full Name Relation to Head of Household Date of Birth
EXHITBIT J

DRAFT - KCHA 191
Revised 4-12-2021 J-2
Section 2: LEASE TERM, RENT, DEPOSIT, AND UTILITIES
A. Prorated Term and Rent: The Tenant shall have the right to occupy the premises during the period
from beginning on
, 20 to the commencement of the Lease term on in accordance with the terms and
conditions set forth herein upon payment of $_____ as rental for the partial month until the beginning
of the term. of occupancy. Charges for partial periods of occupancy shall be prorated over the
number of days in athe month in which the unit is occupied by the Tenant.
B. Lease Term: This Lease term shall begin on _________________________________. The term of this
Lease shall be for one (1) year and shall renew automatically for the same period, unless
terminated as provided bywithin this Lease or by law; provided, however, that this Lease shall
not automatically renew if Tenant or Tenant’s family member fails to comply with the Community
Service Requirement set forth in Section 7.E of this Lease. The Housing Authority reserves the right
to modify the terms and conditions of this Lease as provided in Section 1214 of this Lease.
B.C. Rent: The monthly rentalrent is $_____ or such other such sum asestablished by the parties may
agree uponHousing Authority in writing. accordance with the ACOP. This amount is due on or
before the first (1st) day of each month at the place designated in writing by the Housing
Authority and is considered delinquent if not received by the seventh (7th) calendar day of the
month. The amount of the rent shall remain in effect until adjusted in accordance with the
provisions of this Lease. Cash payments are not acceptable. The rental amount is based on one of two –Tenant chosen methods: (1) “Income-based” Rent - Rent is based on the amount of income and other information provided by the Tenant , with a Minimum Rent of $25 per month; or (2) “Flat Rent” - Rent is based on the Housing Authority-determined Flat Rent for this unit. If the Tenant has selected the “Flat Rent” option, they may request a re-examination and change to the “Income-based Rent” at any time the family’s income has decreased, or on-going expenses (such as child care or medical costs) have increased or any other circumstances occur creating a hardship for the family that would be alleviated by a change in rent. A Tenant requesting a rent change under such circumstances would remain under the Income-based calculation method until the time of their next Annual Review. The Tenant may change rent calculation methods at their annual recertification. If a Tenant is paying the Minimum rent and their circumstances change creating an inability to pay the rent, the Tenant may request suspension of the minimum rent because of a recognized hardship as outlined in the Admissions and Occupancy policy.
DRAFT - KCHA 191
Revised 4-12-2021 J-3
TERMS AND CONDITIONS The following terms and conditions of occupancy ("terms") are made part of this Lease:
D. 1. TERMS OF OCCUPANCY. Rent Determination: The rental amount is based on one of
two Housing Authority-designated methods as listed below:
a. “EASY Rent” — Rent is based on the amount of income and other information provided
by the Tenant, and calculated according to the applicable policies and procedures in
the ACOP.
b. “WIN Rent” — Rent is based upon the Housing Authority’s established income bands.
Households are assigned to an income band based on the amount of annual income
and other information provided by the Tenant and calculated according to the
applicable policies and procedures in the ACOP.
E. Rent Payments: Cash payments are not accepted. Rental and/or recurring occupancy charges
are payable in advance without demand or billing at the place designated in writing by the
Housing Authority, on or before the first (1st) day of each calendar month and are delinquent if
received after the seventh (7th) calendar day of the month. If full rent is not received on or
before the seventh (7th) calendar day of the month, a late rent charge of $10 will be charged
for the next three (3) day period. Thereafter, a charge of $2 shallwill be made for each additional
day the rent remains unpaid subject to a maximum of $30.
C.F. Other Charges: The Tenant further agrees to pay in accordance with Section 6.I7.D of this Lease
any charges determined in accordance with the Housing Authority’s current schedules and
arising from the Tenant’s failure to perform obligations under this Lease. If a Tenant check is
returned for insufficient funds, the Housing Authority shall bill the Tenant for the amount the bank
charges for processing the returned check. ThereafterAfter a returned check, the Housing
Authority may require all of the Tenant’s future rental payments to be made by cashier’s check
or money order.
D.G. Deposits: Tenant shall pay a security deposit of $__________ at the time of execution of
this Lease. The deposit will be held at U.S.Key Bank of Washington, Tukwila-, Westfield
Southcenter office, 275 Andover Park office, 151 Andover Park E.,W., Tukwila WA 98188, accruing
no interest, and will be returned to the Tenant at the termination of this Lease less any charges
assessed by the Housing Authority in accordance with the terms of this Lease. The Housing
Authority shall provide the Tenant with a written receipt for the deposit showing the amount of
the deposit. When necessary, and with the written approval of the Housing Authority, the
Security Deposit may be made in two three (23) payments: one-half in advance and one-half
with the second month’s rent payment. Tenant shall be responsible and shall reimburse the
Housing Authority for damages to the premises, or to any equipment supplied by the Housing
Authority, beyond normal wear and tear. If charges are made against Tenant’s deposit, the
Housing Authority will mail to the Tenant at the address last known or provided to the Housing
Authority a written estimate and/or statement of the basis of such charges within fourteen (14)
twenty-one (21) days after the Housing Authority determines that the Tenant has vacated,
together with any refund due. No deposit may be withheld to compensate for wear resulting
from reasonable use. The Housing Authority reserves the right to adjust any written estimate of
charges either up or down, to reflect actual costs of repair or replacement. If the actual costs
are less than the funds retained, the excess shall be promptly paid to the Tenant. If the actual
costs exceed the funds retained, the Tenant shall promptly pay the excess after proper billing
by the Housing Authority.
E.H. Utilities: The rental charge includes minimum water, sewer, garbage collection charges, and
, according to the current Energy Assistance Supplement (EAS) Schedule of Utilities
posted in the Housing Authority Area Office ("Area Office"). The utility allowance EAS amounts established by
the Housing Authority may be modified at its discretion upon thirty (30) days notice to Tenant in
accordance with Section 1214 of this Lease. Tenants using more than the maximum allowance
for any utility service shall pay for such excess in accordance with the current Schedule of Utilities posted in the

DRAFT - KCHA 191
Revised 4-12-2021 J-4
Area Office. without further credit or reimbursement from the Housing Authority. If heat or hot
water is to be supplied by the Housing Authority according to the current EAS Schedule of
Utilities, the Housing Authority agrees to furnish samethem as specified by law. The Housing
Authority shall not, however, be liable for failure to supply any of the above services for any
cause beyond its control. The Housing Authority’s responsibilities are further outlined in Section 7
of the Terms and Conditions8 of this Lease. If heat is to be supplied by the Tenant, the Tenant agrees to
furnish heat to the premises to prevent damage to the premises. If, for any reason, the Tenant
is unable to maintain sufficient heat, Tenant shall immediately notify the Housing Authority.
Tenant shall pay for any damages to the unit resulting from Tenant’s failure to maintain
sufficient heat or to notify the Housing Authority of the lack of sufficient heat due to any cause
beyond the Tenant’s control.
2. Section 3: USE AND OCCUPANCY OF DWELLING.
A. Occupancy: Tenant shall use and occupy the premises exclusively as a private dwelling for
Tenant and family (as listed on this Lease or any attached Rider) and for no other purpose and
only during such time as Tenant may be eligible. Tenant must live in the unit and the unit must
be Tenant’s only place of residence. Tenant shall not occupy, or receive assistance for
occupancy of, any other unit assisted under any Federal Housing assistance program during the
term of this Lease. Tenant shall comply with all laws affecting the use or occupancy of the
premises and with all rules and regulations now or later established or modified by the Housing
Authority.
B. Unauthorized Occupants: Tenant shall not assign this Lease, sublet or transfer possession of the
premises, or give accommodation to boarders or lodgers, whether paying or not, without the
written consent of the Housing Authority.
C. Absences: Tenant shall notify the Housing Authority of any absences from the dwelling unit
(defined to mean that no member of the Tenant family is residing in the unit) and). Tenant shall
not be absent from the unit for periods of time in excess ofmore than 30 (thirty) consecutive
days, unless otherwise permitted within the policy as stated in the Authority’s Admissions and
OccupancyACOP. If Tenant is absent for longer than the maximum period permitted in the
ACOP, it is good cause for Lease termination.
C.D. Guest Policy: Tenant may provide a temporary accommodation to Tenant’s guests or visitors for
a reasonable period, provided that any person staying at the premises, but for no more than
fourteen (14) days in a three (3) month period shall be reported
to the Housing Authority by the Tenant for such review as may be appropriate under Section 5 of this Lease. Tenant shall comply with all laws
affecting the use or occupancy of the premises and with all rules and regulations now or hereafter established or modified by the Housing
Authority. . If Tenant’s guests or visitors exceed maximum allotted period, it is good cause for Lease termination.
D.E. Inability to Meet Requirements of the Lease: In the event that, during the Lease term of the
Lease, the Tenant develops a physical or mental impairment which is permanent or is of long-
continued duration and which impedes the Tenant’s ability to meet the requirements of the
Lease (including Lease violations which endanger or jeopardize the Tenant’s, other residents’,
or Housing Authority’s welfare or property) and the Housing Authority cannot make, or the
Tenant declines, an offer of a reasonable accommodation which enables the Tenant to comply
with the Lease, the Housing Authority may terminate this Lease and the tenancy and require the
Tenant to move.
3. Section 4: TERMINATION OF THE LEASE.
A. A. Good Cause: Unless otherwise described herein (see Section 4.B or 4.C) or allowed
by law, this Lease may be terminated by the Housing Authority giving the Tenant written notice
DRAFT - KCHA 191
Revised 4-12-2021 J-5
of good cause for termination thirty (30) days prior to the expiration of the Lease term. The
Tenant shall, however, pay rent and be responsible for the premises until the termination of the
Lease, until the return of all keys to the Area Office, or until the premises are actually vacated,
whichever occurs last. Good cause includes, but is not limited to a violation of any provision of
this Lease, or any local, state, or federal law. failure to make payments required under the
Lease; chronic rent delinquency as described in Section 6.C of this Lease; serious or repeated
interference with the rights of neighbors or employees, including those listed in Section 6.E of this
Lease; serious or repeated damage to the premises; serious or repeated failure to comply with
material agreements, including without limitation the Tenant Responsibilities listed in Section 6 of
this Lease; creation of serious physical, sanitary, or safety hazards; criminal activity or drug-
related criminal activity as defined in Section 3.D; alcohol abuse that the Housing Authority
determines threatens the health, safety, or right to peaceful enjoyment of the premises by other
residents; misrepresentation of any material fact on the application or at any time during
occupancy; failure of the Tenant to accept, sign, and return any new Lease or Lease
Amendment contemplated under Section 12 of this Lease; failure of the Tenant to comply with
the Community Service Requirement; or other good cause. B. Noncompliance with
Lease. In the case of noncompliance with any provision of this Lease—other than
noncompliance listed in Section 3.C or 3.D 4.B or 4.C below, or the failure of the Tenant to
accept, sign and return a new Lease or Lease Amendment contemplated under Section 12 of
this Lease—the Housing Authority may give the Tenant a warning notice (“Warning Notice”),
requiring the Tenant to comply within ten (10) days. If the Tenant fails or refuses to comply within
ten (10) days after service of the Warning Notice, the Housing Authority may issue, at any time
thereafter during the Lease term, a thirty (30) day notice of termination of tenancy for good
cause. Department of Housing and Urban Development (HUD) regulations in 24 CFR Part 5,
subpart L (Protection for Victims of Domestic Violence, Dating Violence, Sexual Assault, or
Stalking) apply to all Housing Authority termination actions.
B. C. Failure to Pay Rent. : In the case of nonpayment of rent, the Housing Authority may give
the Tenant a Notice to pay rent or vacate within three (3)fourteen (14) days after from the date
of service of the Notice. The Notice shall be in substantially the form required by Chapter 59.18
RCW, and inform the Tenant of the amount of rent due and owing, and that if the Tenant fails
to pay the rent and remains in possession of the unit, an unlawful detainer suit may be
initiatedcommenced on or after the fourth (4th) fourteenth (14th) day after the date of said
Notice asking for a court order terminating the tenancy and evicting the Tenant from the unit
on or after the fourteenth (14th) day from the date of said notice.
C. D. Criminal and/or Drug Related Activity. : If a tenant or any the Tenant, household
member, guest, or any other person under the Tenant’s control engages in any criminal activity
that threatens the health, safety, or right to peaceful enjoyment of the Public Housing premises
of other tenants or of employees of the Housing Authority;, or any drug-related criminal activity
on or off the premises (defined as the illegal manufacture, sale, distribution, use, or possession
with the intent to manufacture, sell, distribute, or use of a controlled substance as defined in
Section 102 of the Controlled Substance Act [21 U.S.C. 502802]) the Housing Authority may give
the Tenant Notice to vacate within three (3) days afterfrom the date of service of the Notice
according to RCW 59.12.030(5), or other applicable statute. Additionally, if any guest or other
person under the Tenant’s control engages in criminal activity that threatens the health, safety,
or right to peaceful enjoyment of the Public Housing premises by other tenants or employees of
the Housing Authority; or any drug-related criminal activity (as defined above) on or near the
premises, the Housing Authority may serve the Tenant with a Notice to vacate within three (3)
days after service of the Notice according to RCW 59.12.030(5), or other applicable statute.
Drug-related or other criminal activity is good cause for eviction, even in the absence of
conviction or arrest.
DRAFT - KCHA 191
Revised 4-12-2021 J-6
The Housing Authority, when evicting a Tenant under this section, shall notify the local post office when such Tenant is no longer residing in the dwelling unit. Drug-related or other criminal activity is cause for eviction even in the absence of conviction or arrest.
D. E. Inability to Meet Program Requirements: Tenant’s inability to meet program requirements
as set forth in this Lease, the ACOP, or HUD regulations shall be good cause for termination or
non-renewal of this Lease.
E. Notices: Any Notice of Lease Termination shall:
1. State the reason for the termination (i.e., criminal activity, drug-related criminal activity, non-payment of rent,
etc.);
2. Inform the Tenant of their right to make such reply as they may wish;
3. State that the Tenant is entitled to a grievance hearing on the termination;(where
applicable);
4. Inform the Tenant of their right, upon request, to examine (and copy at their own
expense) prior to the grievance hearing (if applicable) or court trialnon-privileged
documents, or recordings, or regulations directly related to the termination of tenancy or
eviction.;
5. F. Be combined with, or run concurrently with, any notice which is required by state
law or by federal law shall be combined with, or run concurrently with, a ; and
5.6. Include an attachment of notice of Lease terminationoccupancy rights under Section
3.A.B.C. and D. of this Lease.the Violence Against Women Act and the certification form as
required by HUD (CFR 24 §5.2005).
F. G. Unit Surrender: On or before the date of termination of tenancy, the Tenant must quietly
and peacefully vacate the premises and surrender possession thereof to the Housing Authority.
If the Tenant vacates the premises according to such notice, the Lease shall be terminated (1)
when the Tenant vacates and returns all keys to the premises to the Area Office;, or (2) the day
following the termination effective date of the notice served, whichever occurs later. Upon such
termination, Tenant shall leave any equipment or furnishings provided by the Housing Authority
in good order and repair, reasonable wear and tear excepted.
G. H. Abandonment: If the Tenant abandons the dwelling unit, the Housing Authority shall take
possession of the Tenant’s personal property remaining on the premises and shall store and care
for thenon-perishable property. The Housing Authority will consider the unit to be abandoned
when a Tenant has fallen behind in rent and has clearly indicated by words or actions an
intention to not to continue living in the unit. The Housing Authority has a claim against the
Tenant for reasonable costs and expenses incurred in removing the property, storing, and caring
for the property, and in disposing of the property. If the personal property left by Tenant is stored,
the Housing Authority will mail a written notice to the Tenant at the address last known or
provided to the Housing Authority notifying the Tenant that specified articles are being stored
at a specific location and that said articles are deemed abandoned and will be disposed of
without sale and without further notice forty-five (45) days after the date of the notice, unless
claimed and removed by the Tenant.
H. I. Habitability: This Lease will terminate automatically if the unit is rendered uninhabitable
due to the action or inaction of the Tenant or any member of the Tenant’s household.
I. J. Termination by Tenant Notice. : At any time, the Tenant may give to the Housing Authority
fifteen (15) days’ notice in writing of the termination of the Lease. Tenant shall be liable for rent
up to the end of the 15 days for which notice was required, or, to the date the unit is re-rented,
whichever date comes first.
J. K. Termination of Lease upon Death of Tenant: Upon the death of the Tenant this Lease shall
terminate immediately. The Housing Authority will comply with RCW 59.18.590 when the Tenant
is the sole occupant of the unit.
K. L. Restraining Order: Any court order which restrains, in any way, the Tenant from entering,
occupying, approaching, or being in proximity of the premises for a duration lasting more than
DRAFT - KCHA 191
Revised 4-12-2021 J-7
ninety (90) daysthe absence duration permitted in the ACOP shall be deemed to be good
cause to terminate the Tenant’s tenancy upon thirty (30) days notice..
4. Section 5: NOTICES.
Any notice required by this Lease or by law to be served upon the Housing Authority shall be sufficient
if delivered by Tenant or Tenant’s agent to the Housing Authority Manager at the Area Office or sent
by first class mail, postage prepaid, properly addressed to the Area Office Manager, or to any person
designated in writing by the Housing Authority. Except for notices required under Section 910 and/or
12Section 14 of this Lease, any notice required by this Lease or by law to be served upon the Tenant
shall be served either:
1. By delivering a copy personally to the Tenant; or
2. If the Tenant is absent from the premises, by leaving there a copy, with a person of suitable
age and discretion residing at the premises, and sending a copy through the mail addressed
to the Tenant at Tenant’s residence; or
3. If a person of suitable age and discretion residing at the premises cannot be found, then by
affixing a copy of the notice in a conspicuous place on the premises and also sending a copy
through the mail first class postage prepaid and addressed to the Tenant at the premises.
4. If the Tenant is visually impaired, all notices shall be made in an accessible format. Service of
process shall be made to the Tenant in accordance with the requirements of RCW 59.12.
5. Section 6: REDETERMINATION OF RENT, DWELLING SIZE AND ELIGIBILITY. A. ANNUAL REVIEWS. Tenants whose rent is based on the “Income-based rent” method shall annually submit to the Housing Authority
true, complete and accurate information as to source and amount of Total Family Income and composition in order for the Housing Authority to determine the appropriate rent, the appropriate size of the unit, and the Tenant’s eligibility for continued occupancy. Such annual review will be conducted in accordance with the Admissions and Occupancy Policy Governing Eligibility and Continued Occupancy (“Admissions and Occupancy Policy”) posted at the Area Office. Tenants whose rent is based on the “Flat-rent method” option will only have income reviews conducted once every three years. Tenants who have chosen this option, however, will undergo an Annual review of their compliance with any Community Service requirements attributed to their tenancy (as outlined in the Admissions and Occupancy policy), and will continue to have their unit inspected at least annually. In addition, all Tenants will be notified and be given the opportunity to annually select their rent calculation method and will be advised of any income that will be excluded from consideration (for example, increased earnings due to employment shall be excluded during the twelve-month period following hiring for families whose income has increased because of the employment of a family member who was previously unemployed for one or more years, because of participation in a self-sufficiency program, or after they were assisted by a State TANF program within the last six months). Rent determined at the Annual Review shall remain in effect until the next Annual Review Date unless (1) a Special Review is scheduled by the Housing Authority in accordance with the Admissions and Occupancy Policy; or (2) an Interim Review of Family Income is requested by the Tenant Admissions and Occupancy Policy.
A. Recertification Reviews: Based upon information submitted, Recertification Reviews are
completed in order to determine the appropriate rent, the appropriate size of the unit, and the
Tenant’s eligibility for continued occupancy in accordance with the ACOP. Rental amounts
established through the Recertification Review, or any applicable annual adjustment thereof,
shall remain in effect unless: (1) a Special Review is scheduled by the Housing Authority in
accordance with the ACOP; or (2) an Interim Review of Family Income is requested by the
Tenant and/or warranted under the ACOP. Tenants who are subject to HUD’s Community
Service requirement (as outlined in the ACOP) will undergo a review to determine their
compliance annually. A Tenant may request a waiver of the established rent for reasons of
financial hardship in accordance with the Housing Authority’s Hardship Policy outlined in the
ACOP.
1. EASY Rent Households (as defined in the ACOP) shall submit true, complete and
accurate information as to source and amount of Total Family Income and composition
at least once every three (3) years. However, during intervening years, income and rent
determined during the Recertification Review will be adjusted annually to account for
annual adjustment of Social Security and Supplemental Security Income (SSI) payments
received by the Household.
DRAFT - KCHA 191
Revised 4-12-2021 J-8
2. WIN Rent Households (as defined in the ACOP) shall submit true, complete and
accurate information as to source and amount of Total Family Income and composition
at least once every two (2)years.
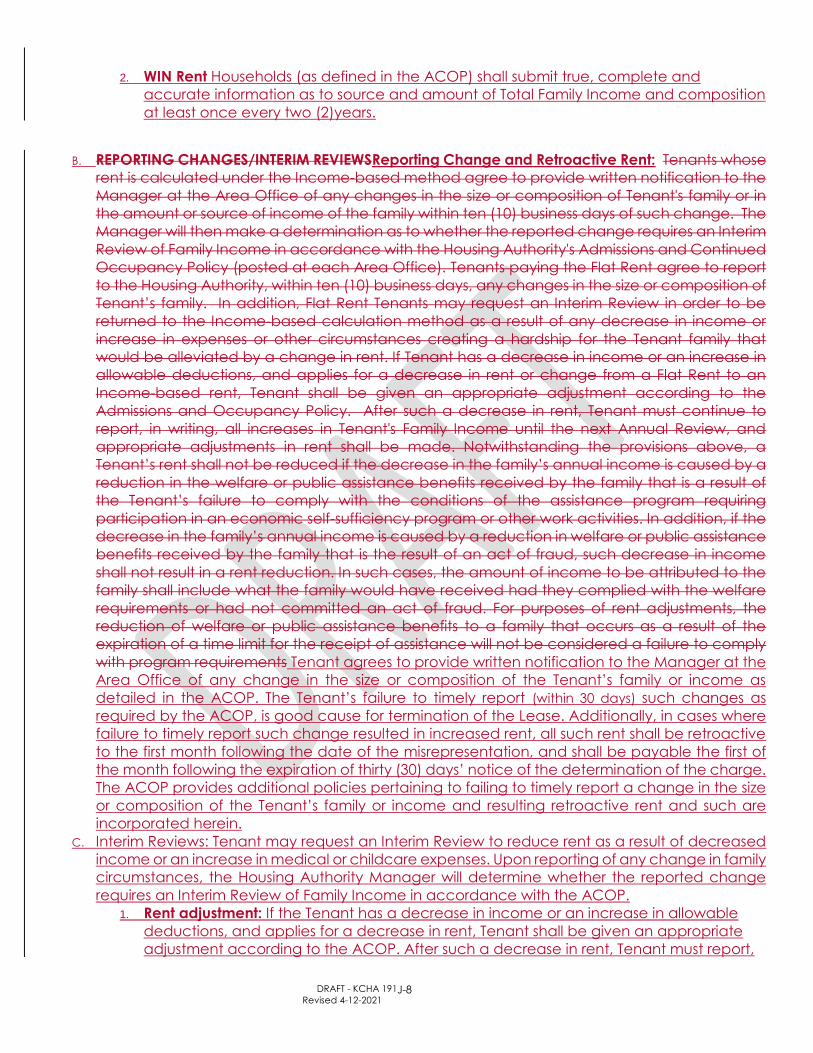
B. REPORTING CHANGES/INTERIM REVIEWSReporting Change and Retroactive Rent: Tenants whose
rent is calculated under the Income-based method agree to provide written notification to the
Manager at the Area Office of any changes in the size or composition of Tenant's family or in
the amount or source of income of the family within ten (10) business days of such change. The
Manager will then make a determination as to whether the reported change requires an Interim
Review of Family Income in accordance with the Housing Authority's Admissions and Continued
Occupancy Policy (posted at each Area Office). Tenants paying the Flat Rent agree to report
to the Housing Authority, within ten (10) business days, any changes in the size or composition of
Tenant’s family. In addition, Flat Rent Tenants may request an Interim Review in order to be
returned to the Income-based calculation method as a result of any decrease in income or
increase in expenses or other circumstances creating a hardship for the Tenant family that
would be alleviated by a change in rent. If Tenant has a decrease in income or an increase in
allowable deductions, and applies for a decrease in rent or change from a Flat Rent to an
Income-based rent, Tenant shall be given an appropriate adjustment according to the
Admissions and Occupancy Policy. After such a decrease in rent, Tenant must continue to
report, in writing, all increases in Tenant's Family Income until the next Annual Review, and
appropriate adjustments in rent shall be made. Notwithstanding the provisions above, a
Tenant’s rent shall not be reduced if the decrease in the family’s annual income is caused by a
reduction in the welfare or public assistance benefits received by the family that is a result of
the Tenant’s failure to comply with the conditions of the assistance program requiring
participation in an economic self-sufficiency program or other work activities. In addition, if the
decrease in the family’s annual income is caused by a reduction in welfare or public assistance
benefits received by the family that is the result of an act of fraud, such decrease in income
shall not result in a rent reduction. In such cases, the amount of income to be attributed to the
family shall include what the family would have received had they complied with the welfare
requirements or had not committed an act of fraud. For purposes of rent adjustments, the
reduction of welfare or public assistance benefits to a family that occurs as a result of the
expiration of a time limit for the receipt of assistance will not be considered a failure to comply
with program requirements Tenant agrees to provide written notification to the Manager at the
Area Office of any change in the size or composition of the Tenant’s family or income as
detailed in the ACOP. The Tenant’s failure to timely report (within 30 days) such changes as
required by the ACOP, is good cause for termination of the Lease. Additionally, in cases where
failure to timely report such change resulted in increased rent, all such rent shall be retroactive
to the first month following the date of the misrepresentation, and shall be payable the first of
the month following the expiration of thirty (30) days’ notice of the determination of the charge.
The ACOP provides additional policies pertaining to failing to timely report a change in the size
or composition of the Tenant’s family or income and resulting retroactive rent and such are
incorporated herein.
C. Interim Reviews: Tenant may request an Interim Review to reduce rent as a result of decreased
income or an increase in medical or childcare expenses. Upon reporting of any change in family
circumstances, the Housing Authority Manager will determine whether the reported change
requires an Interim Review of Family Income in accordance with the ACOP.
1. Rent adjustment: If the Tenant has a decrease in income or an increase in allowable
deductions, and applies for a decrease in rent, Tenant shall be given an appropriate
adjustment according to the ACOP. After such a decrease in rent, Tenant must report,
DRAFT - KCHA 191
Revised 4-12-2021 J-9
in writing, all increases in Tenant’s Family Income to the Housing Authority as established
in the ACOP and appropriate adjustments in rent shall be made.
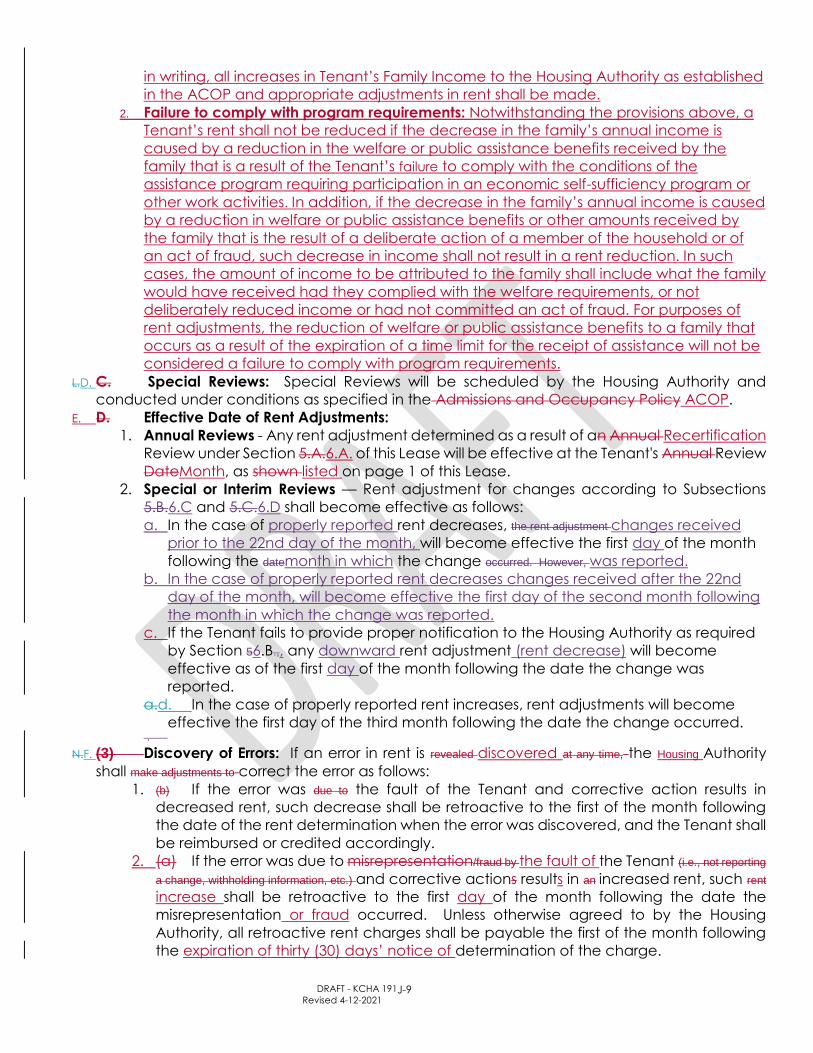
2. Failure to comply with program requirements: Notwithstanding the provisions above, a
Tenant’s rent shall not be reduced if the decrease in the family’s annual income is
caused by a reduction in the welfare or public assistance benefits received by the
family that is a result of the Tenant’s failure to comply with the conditions of the
assistance program requiring participation in an economic self-sufficiency program or
other work activities. In addition, if the decrease in the family’s annual income is caused
by a reduction in welfare or public assistance benefits or other amounts received by
the family that is the result of a deliberate action of a member of the household or of
an act of fraud, such decrease in income shall not result in a rent reduction. In such
cases, the amount of income to be attributed to the family shall include what the family
would have received had they complied with the welfare requirements, or not
deliberately reduced income or had not committed an act of fraud. For purposes of
rent adjustments, the reduction of welfare or public assistance benefits to a family that
occurs as a result of the expiration of a time limit for the receipt of assistance will not be
considered a failure to comply with program requirements.
L.D. C. Special Reviews: Special Reviews will be scheduled by the Housing Authority and
conducted under conditions as specified in the Admissions and Occupancy Policy ACOP.
E. D. Effective Date of Rent Adjustments:
1. Annual Reviews - Any rent adjustment determined as a result of an Annual Recertification
Review under Section 5.A.6.A. of this Lease will be effective at the Tenant's Annual Review
DateMonth, as shown listed on page 1 of this Lease.
2. Special or Interim Reviews — Rent adjustment for changes according to Subsections
5.B.6.C and 5.C.6.D shall become effective as follows:
a. In the case of properly reported rent decreases, the rent adjustment changes received
prior to the 22nd day of the month, will become effective the first day of the month
following the datemonth in which the change occurred. However, was reported.
b. In the case of properly reported rent decreases changes received after the 22nd
day of the month, will become effective the first day of the second month following
the month in which the change was reported.
c. If the Tenant fails to provide proper notification to the Housing Authority as required
by Section 56.B.,, any downward rent adjustment (rent decrease) will become
effective as of the first day of the month following the date the change was
reported.
a.d. In the case of properly reported rent increases, rent adjustments will become
effective the first day of the third month following the date the change occurred. .
N.F. (3) Discovery of Errors: If an error in rent is revealed discovered at any time, the Housing Authority
shall make adjustments to correct the error as follows:
1. (b) If the error was due to the fault of the Tenant and corrective action results in
decreased rent, such decrease shall be retroactive to the first of the month following
the date of the rent determination when the error was discovered, and the Tenant shall
be reimbursed or credited accordingly.
2. (a) If the error was due to misrepresentation/fraud by the fault of the Tenant (i.e., not reporting
a change, withholding information, etc.) and corrective actions results in an increased rent, such rent
increase shall be retroactive to the first day of the month following the date the
misrepresentation or fraud occurred. Unless otherwise agreed to by the Housing
Authority, all retroactive rent charges shall be payable the first of the month following
the expiration of thirty (30) days’ notice of determination of the charge.
DRAFT - KCHA 191
Revised 4-12-2021 J-10
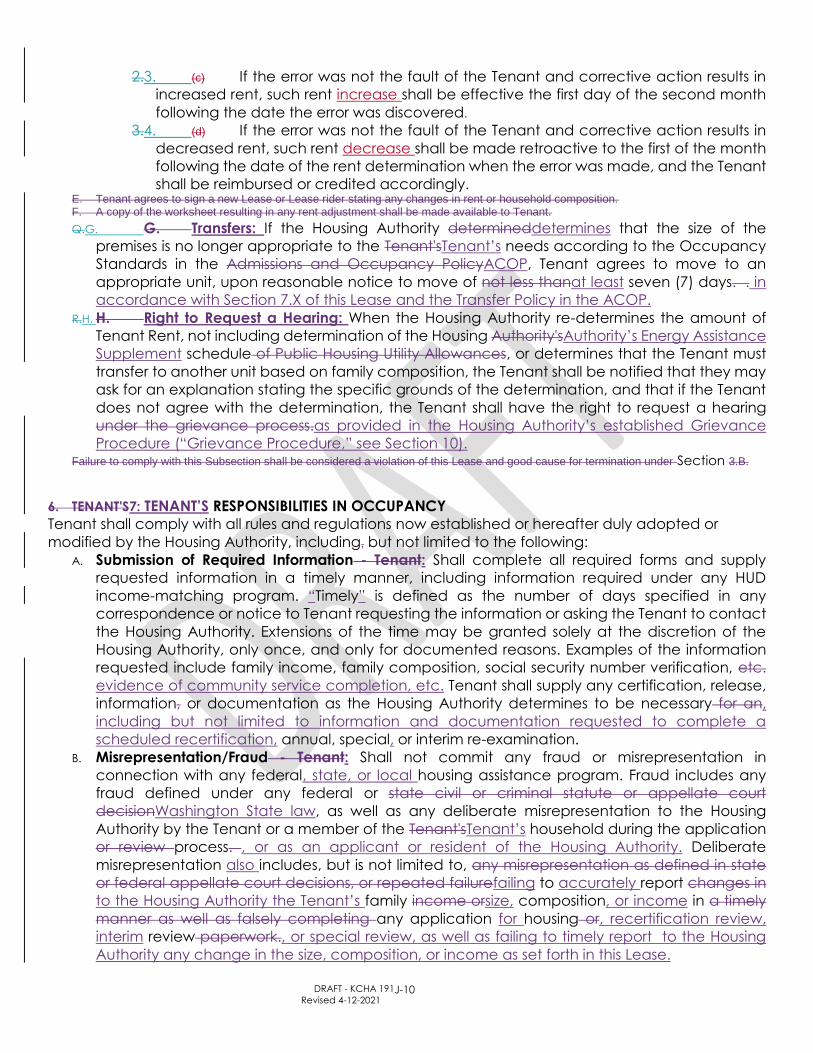
2.3. (c) If the error was not the fault of the Tenant and corrective action results in
increased rent, such rent increase shall be effective the first day of the second month
following the date the error was discovered.
3.4. (d) If the error was not the fault of the Tenant and corrective action results in
decreased rent, such rent decrease shall be made retroactive to the first of the month
following the date of the rent determination when the error was made, and the Tenant
shall be reimbursed or credited accordingly. E. Tenant agrees to sign a new Lease or Lease rider stating any changes in rent or household composition. F. A copy of the worksheet resulting in any rent adjustment shall be made available to Tenant.
Q.G. G. Transfers: If the Housing Authority determineddetermines that the size of the
premises is no longer appropriate to the Tenant'sTenant’s needs according to the Occupancy
Standards in the Admissions and Occupancy PolicyACOP, Tenant agrees to move to an
appropriate unit, upon reasonable notice to move of not less thanat least seven (7) days. . in
accordance with Section 7.X of this Lease and the Transfer Policy in the ACOP.
R.H. H. Right to Request a Hearing: When the Housing Authority re-determines the amount of
Tenant Rent, not including determination of the Housing Authority'sAuthority’s Energy Assistance
Supplement schedule of Public Housing Utility Allowances, or determines that the Tenant must
transfer to another unit based on family composition, the Tenant shall be notified that they may
ask for an explanation stating the specific grounds of the determination, and that if the Tenant
does not agree with the determination, the Tenant shall have the right to request a hearing
under the grievance process.as provided in the Housing Authority’s established Grievance
Procedure (“Grievance Procedure,” see Section 10). Failure to comply with this Subsection shall be considered a violation of this Lease and good cause for termination under Section 3.B.
6. TENANT'S7: TENANT’S RESPONSIBILITIES IN OCCUPANCY
Tenant shall comply with all rules and regulations now established or hereafter duly adopted or
modified by the Housing Authority, including, but not limited to the following:
A. Submission of Required Information - Tenant: Shall complete all required forms and supply
requested information in a timely manner, including information required under any HUD
income-matching program. “Timely” is defined as the number of days specified in any
correspondence or notice to Tenant requesting the information or asking the Tenant to contact
the Housing Authority. Extensions of the time may be granted solely at the discretion of the
Housing Authority, only once, and only for documented reasons. Examples of the information
requested include family income, family composition, social security number verification, etc.
evidence of community service completion, etc. Tenant shall supply any certification, release,
information, or documentation as the Housing Authority determines to be necessary for an,
including but not limited to information and documentation requested to complete a
scheduled recertification, annual, special, or interim re-examination.
B. Misrepresentation/Fraud - Tenant: Shall not commit any fraud or misrepresentation in
connection with any federal, state, or local housing assistance program. Fraud includes any
fraud defined under any federal or state civil or criminal statute or appellate court
decisionWashington State law, as well as any deliberate misrepresentation to the Housing
Authority by the Tenant or a member of the Tenant'sTenant’s household during the application
or review process. , or as an applicant or resident of the Housing Authority. Deliberate
misrepresentation also includes, but is not limited to, any misrepresentation as defined in state
or federal appellate court decisions, or repeated failurefailing to accurately report changes in
to the Housing Authority the Tenant’s family income orsize, composition, or income in a timely
manner as well as falsely completing any application for housing or, recertification review,
interim review paperwork., or special review, as well as failing to timely report to the Housing
Authority any change in the size, composition, or income as set forth in this Lease.

DRAFT - KCHA 191
Revised 4-12-2021 J-11
C. Chronic Rent Delinquency –: Shall consistently pay rent on time (no later than the 7th calendar
day of each month). as defined in Section 2 of this Lease. Chronic repeated late payment of
rent is defined as four (4) times in a twelve (12-) month period.
E.D. I. Damage/Damages and Other Charges – :
1. Damages: Shall pay reasonable charges (other than for normal wear and tear) for the
repair of damages to the dwelling unit, or to the project (including damages to project
buildings, facilities, or common areas) caused by the Tenant, a member of the
household, or a guest. Said charges shall be made according to the current Schedule
of Maintenance Tenant Charges posted in the Area Office. and included in the ACOP.
3.2. TenantOther Fees: Shall also pay other charges and/or fees including, but not
limited to, any excess utility charges, where applicable, and late rent charges as statedand NSF fees,
parking fees, legal and attorney’s fees and costs, or other miscellaneous charges that
may be incurred and are referenced in Section 1 of this Lease. , included on the charge
schedule posted in each Area Office, or as described in the ACOP.
5.3. TenantDue Date: Agrees that payment of all such charges shall become due and
collectable onupon the earlier of (1) the first day of the second month following the date
the charge was incurred. Housing Authority’s issuance of a written notice of the charges, or (2)
lease termination. Such charges shall be considered delinquent if not paid in full on or
before the due date.
F.E. Community Service Requirement –: Shall comply with the federally mandated Community
Service Requirement. Failure of the Tenant or member of the tenant household to perform
required Community Service or be exempted therefrom. Failure to comply with the Community
Service requirementhours, without documented qualification of an exemption shall be good
cause for termination of the Tenant’s tenancy.result in the nonrenewal of this Lease in
accordance with 24 C.F.R. § 966.4(a)(2)(ii).
G.F. E. Conduct -: Shall act, and cause other household members and guests to act, in a manner
which will not disturb other residents'residents’ peaceful enjoyment of their accommodation
and will be conducive to maintaining the project in a decent, safe, and sanitary condition.
Abusive, foul, or threatening language or behavior, directed toward other tenants, guests,
visitors or agents or employees of the Housing Authority including, without limitation, any
harassment or other behavior that violates the Fair Housing Act or any other local, state, or
federal law, directed toward other tenants or employees of the Housing Authority is not
allowedprohibited and shall be good cause for termination of the Tenant’s tenancy. Tenant and
other household members and guests shall not abuse alcohol or any other substance in a
manner that the Housing Authority determines threatens the health, safety, and right to
peaceful enjoyment of the premises by other residents. Any guest who engages in illegal activity
or abusive or, violent/, or threatening behavior on the site will be subject to the loss of visitation
privileges and will be treated as a trespasser. Trespassers may be subject to prosecution. Tenants
remain subject to eviction for the actions of their guests, whether or not guest visitation privileges
are revoked.
G. F. Quiet Hours: Must obey city and state noise ordinances.
H. Weapons: Shall not use or discharge firearms or weapons of any kind or nature, including (but
not limited to) rifles, handguns, bows, slingshots, BB guns, slings, traps, or any other weapon,
within King County Housing Authority properties.
I. Criminal Activity/Drug-related Criminal Activity: - The Tenant Understands that the Housing
Authority has a one-strike, zero-tolerance policy with respect to drug-related and other criminal
activity. Tenant will ensure that Tenant and any household members do not engage in drug-
related criminal activity (as defined in Section 34.D of this Lease) on or off the premises, or, any
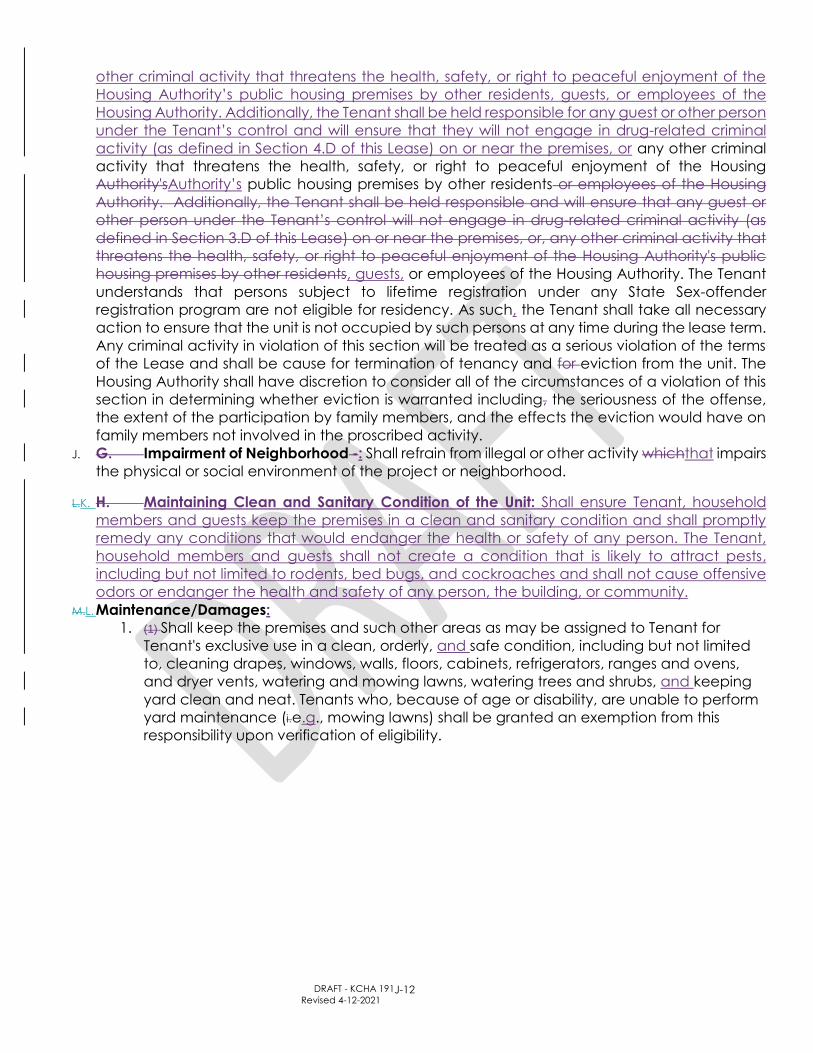
DRAFT - KCHA 191
Revised 4-12-2021 J-12
other criminal activity that threatens the health, safety, or right to peaceful enjoyment of the
Housing Authority’s public housing premises by other residents, guests, or employees of the
Housing Authority. Additionally, the Tenant shall be held responsible for any guest or other person
under the Tenant’s control and will ensure that they will not engage in drug-related criminal
activity (as defined in Section 4.D of this Lease) on or near the premises, or any other criminal
activity that threatens the health, safety, or right to peaceful enjoyment of the Housing
Authority'sAuthority’s public housing premises by other residents or employees of the Housing
Authority. Additionally, the Tenant shall be held responsible and will ensure that any guest or
other person under the Tenant’s control will not engage in drug-related criminal activity (as
defined in Section 3.D of this Lease) on or near the premises, or, any other criminal activity that
threatens the health, safety, or right to peaceful enjoyment of the Housing Authority's public
housing premises by other residents, guests, or employees of the Housing Authority. The Tenant
understands that persons subject to lifetime registration under any State Sex-offender
registration program are not eligible for residency. As such, the Tenant shall take all necessary
action to ensure that the unit is not occupied by such persons at any time during the lease term.
Any criminal activity in violation of this section will be treated as a serious violation of the terms
of the Lease and shall be cause for termination of tenancy and for eviction from the unit. The
Housing Authority shall have discretion to consider all of the circumstances of a violation of this
section in determining whether eviction is warranted including, the seriousness of the offense,
the extent of the participation by family members, and the effects the eviction would have on
family members not involved in the proscribed activity.
J. G. Impairment of Neighborhood -: Shall refrain from illegal or other activity whichthat impairs
the physical or social environment of the project or neighborhood.
L.K. H. Maintaining Clean and Sanitary Condition of the Unit: Shall ensure Tenant, household
members and guests keep the premises in a clean and sanitary condition and shall promptly
remedy any conditions that would endanger the health or safety of any person. The Tenant,
household members and guests shall not create a condition that is likely to attract pests,
including but not limited to rodents, bed bugs, and cockroaches and shall not cause offensive
odors or endanger the health and safety of any person, the building, or community.
M.L. Maintenance/Damages:
1. (1) Shall keep the premises and such other areas as may be assigned to Tenant for
Tenant's exclusive use in a clean, orderly, and safe condition, including but not limited
to, cleaning drapes, windows, walls, floors, cabinets, refrigerators, ranges and ovens,
and dryer vents, watering and mowing lawns, watering trees and shrubs, and keeping
yard clean and neat. Tenants who, because of age or disability, are unable to perform
yard maintenance (i.e.g., mowing lawns) shall be granted an exemption from this
responsibility upon verification of eligibility.
KCHA 191
Revised xx-xx-xx
{426/1055/0201920902019209-1} J-13
2. (2) Shall refrain from, and cause Tenant'sTenant’s household members and guests to
refrain from, destroying, defacing, damaging, or removing any part of the dwelling unit or
project.
3. (3) Shall comply with all obligations imposed upon tenants by applicable provisions
of building and housing codes materially affecting health and safety., including
regulations regarding maintenance and upkeep of smoke detectors and carbon
monoxide detectors installed in the unit and common areas.
4. (4) Shall report to the Housing Authority's Work Order Department Area Office any breakage,
damage, or need for repairs to the dwelling unit or equipment therein, including the need
for repair of dripping/leaking water faucets and shoulddrains and toilets that do not flush
properly. In addition, Tenant shall promptly report any unsafe or unsanitary conditions in
the unit or common areas and grounds whichthat may lead to damage or injury,
including the presence of bed bugs or the infestation of other insects or rodents.
5. Shall allow inspection of the dwelling unit and necessary preventive maintenance and
repairs.
6. (6) Shall use only in a reasonable manner all electrical, plumbing, sanitary, heating,
ventilating, air conditioning, and other facilities and appurtenances, including
elevators, and shall not use any apparatus for heating (including space heaters) except
that provided by the Housing Authority without prior written consent of the Housing
Authority.
7. (7) Shall dispose of all ashes, garbage, rubbish, and other waste into appropriate
containers in such manner as prescribed by the Housing Authority and local laws.
8. (8) Shall make no changes, repairs, or alterations of the premises or
alterations/additions to the equipment, and shall not use tacks, nails, screws or any
fasteners in any part of the premises except in a manner approved by the Housing
Authority. Fencing, screen doors, or communications equipment (including satellite
dishes) may not be installed without the prior written approval of the Housing Authority.
9. (9) Shall not apply wallpaper or paint without the prior written approval of the
Housing Authority.
10. (10) Shall not install additional or different locks or gates on any doors or windows of the
dwelling unit without the written permission of the Housing Authority. If such a request is
approved, Tenant shall provide the Housing Authority with a key for each lock.
11. (11) Shall clean the premises and all equipment supplied to the premises (including
drapes and carpets where supplied) immediately prior to vacating and shall return the
premises to the Housing Authority in as clean and sanitary condition as when the Tenant
took possession.
N.M. J. Boarders/Lease Assignment -: Shall not assign this Lease, sublet or transfer
possession of the premises, or give accommodation to boarders or lodgers, whether paying or
not, without the prior written consent of the Housing Authority.
O.N. K. Private Dwelling -: Shall use the dwelling unit solely as a private dwelling for Tenant
and Tenant'sTenant’s household, as identified on this Lease or attached Lease rider, and shall
not use or permit its use for any other purposes. With the written permission of the Housing
Authority, the Tenant can incidentally use the premises for legally permissible income-producing
purposes, so long as the business does not infringe on the rights of the other tenants. All such
business-related uses of the premises must meet all zoning requirements and the tenant must
have the proper business licenses and insurance.
P.O. L. Storage -: Shall not store household or personal property outside the dwelling unit, other
than in designated storage facilities, without prior written permission of the Housing Authority
and shall store such items at the sole risk of the Tenant. Tenant may only store outdoor furniture,
KCHA 191
Revised xx-xx-xx
{426/1055/0201920902019209-1} J-14
potted plants, and bicycles on decks/balconies, unless otherwise approved in writing by the
Housing Authority.
Q.P. M. Vehicles - Shall park vehicles only in designated areas and Parking: Shall not park trailers,
boats, inoperative, disabled vehicles, or vehicles without valid registrationvehicles of any kind
on the premises or common areas or street without prior written approval of except in a manner
described in the Housing Authority. Tenants, members of the household, or guests
parkingAuthority’s Parking Policy and Parking Addendum. Any vehicle parked in designated
handicapped/disabled parking spaces without a state permit, or vehicles parked in fire lanes,
or otherwise parked illegally will be parked in violation of this section of theirthe Lease and. Such
vehicles will also be subject to being towed and fined under state law. at their owner’s expense
and Tenant’s will be subject to Lease termination. Vehicles without current license tabs will be
considered to be inoperable and not allowed to remain parked on the premises, in common
areas, or on streets. When parking space is limited, parking may be restricted to only one vehicle
per household. All Tenant'sTenant’s family vehicles must be registered with the Housing Authority.
Only minor repairs may be done on Housing Authority property.
R.Q. N. Pets -: Shall not keep, maintain, harbor, or board cats, dogs, or other pets of any nature
on the premises except in a manner described in the Housing Authority’s Pet Policy and Pet
Rider to the Dwelling Lease. . Pets will be allowed only after written approval from the Housing
Authority and after the Tenant has postedpaid the pet deposit, as required, and properly
executed the Pet Rider to the Dwelling Lease. . The pet deposit shall be held by the Housing
Authority and will be refunded to the Tenant at the termination of the Lease on the terms stated
in the Pet Rider to the Dwelling Lease.. A person with a disability may request approval to keep
a companion or service animal that is needed as a reasonable accommodation for his or
hertheir disability. An animal needed as a reasonable accommodation is not subject to the
Authority’s pet policy, although it is subject to reasonable health and safety rules. To ensure
resident safety and health, at all times when traveling in common areas of a building or
community pets must be leashed or kept in an appropriate carrier, and pets, companion
animals and service animals must be kept under the control of the Tenant. The Tenant is
responsible for proper disposal of animal waste.
S.R. O. Fire Safety/Precautions -:
1. (1) Shall permit no combustible material to be kept on the premises except in an
approved container and shall take every precaution, to prevent fire including, but not
limited to, regular cleaning of dryer vents, to prevent fire and ensuring personal property is
kept away from any heat source.
2. (2) Shall make reasonable effort to assist the Housing Authority in keeping the smoke
alarmdetector and carbon monoxide detector operational, including providing immediate notice
toimmediately notifying the Housing Authority of any system malfunction. Any
disconnecting of or tampering with smoke detectors or carbon monoxide detectors is a
serious violation of Washington State Law and this Lease.
3. Q. Fireworks - The use of Shall permit no fireworks, or other such explosive devices, is
prohibited to be kept on the premises and their use shall not be permitted on Housing
Authority property.
4. P. Shall use barbecues or other outdoor cooking devices in designated areas only
and in accordance with local fire code.
T.S. Insurance Coverage: Tenant is encouraged to carry renter’s insurance on their personal
property at all times. Damage to the Tenant'sTenant’s personal belongings due to fire, theft,
water, or any other type of damage shall not be the responsibility of the Housing Authority. The
Tenant is encouraged to carry renter's insurance on their personal property at all times.
U.T. R. Aerials and Antennas: Shall not place radio or television antennas, communications
equipment (including satellite dishes), or other electrical connections on the dwelling
KCHA 191
Revised xx-xx-xx
{426/1055/0201920902019209-1} J-15
unitpremises without the prior written consent of the Housing Authority. Antennas and satellite
dishes may not be installed in a manner that damages the unit or building or poses a risk to
safety and security. Failure to obtain the prior written approval of the Housing Authority prior to
installation of antennas, communication equipment, or satellite dishes and/or failure to ensure
installation complies with the criteria established by the Housing Authority is considered a
violation of this Lease and cause for termination of tenancy. Costs of any repairs due to improper
installation and/or subsequent removal of equipment are the responsibility of the Tenant.
V.U. S. Water Beds -Waterbeds: Shall not have a water bedwaterbed.
W.V. T. Regulations -: Shall abide by other necessary and reasonable regulations
promulgatedand/or requirements put into effect by the Housing Authority for the benefit and
well-being of the housing development and the tenants, which shallare be posted in the Area
Office or listed in the ACOP and are incorporated by reference in this Lease.
W. U. Smoking in Public Areas: Shall not smoke in public areas in accordance with the
Washington State Clean Indoor Air Act. Public areas include the portion of any building open
to other tenants and/or the public, including community rooms, community bathrooms, lobbies,
reception areas, hallways and elevators. Doors from an apartment to a hallway must also be
closed when smoking in an apartment. Shall not smoke within designated “Restricted Areas”.
1. “Smoking” means the igniting, lighting, inhaling, breathing, or exhaling of any prohibited
tobacco product including, without limitation, cigarettes, cigars, pipes and water pipes
(hookahs), tobacco, marijuana, or herbal products or any product intended to be
ignited and inhaled in any manner or form. This definition also includes Electronic
Nicotine Delivery Systems (ENDS), including but not limited to, electronic cigarettes (e-
cigs), personal vaporizers, vape pens, e-cigars, e-hookah, or vaping devices. Carrying
of any prohibited products when ignited or lit within a restricted area is also prohibited.
2. “Restricted Areas” include, but are not limited to:
a. Individual residential homes and apartments, including unit interiors and exterior
balconies/porches/entryways;
b. Common spaces or areas open to other tenants or the public, including entryways,
community patios or balconies, roof terraces, lobbies, hallways, elevators,
management offices, public restrooms, community rooms, community kitchens,
stairwells, parking garages and carports, and any other area of the building that is
accessible to employees, residents, and guests;
c. Community playgrounds, parks, or garden areas of a designated King County
Housing Authority community or facility of any type; and
d. Outdoor areas within 25 feet of any home, apartment, building, office, community
park, playground, or garden area.
3. Smoking is only permitted in common areas outside of a building that are a minimum of
25 feet away from any building, community park, playground, or garden area.
4. Smoking materials must be disposed of in an appropriate collection receptacle.
Receptacles will be provided by the Housing Authority and appropriately placed within
the permitted smoking areas.
5. The Housing Authority is not a guarantor of Tenant’s well-being related to a smoke-free
environment. Tenant understands and accepts that the Housing Authority’s adoption of
a No-Smoking Policy, and efforts to enforce such policy, do not constitute
representation of or a guarantee by the Housing Authority or any of its managing
agents of any direct or consequential benefits to the Tenant’s health or wellbeing.
6. Tenant understands and accepts that the Housing Authority’s adoption of a no-smoking
living environment, and efforts to designate portions of the Property as no-smoking, do
not in any way modify or add to the standard of care that the Housing Authority has
under applicable law to maintain the Property safe relative to air quality. The Housing
KCHA 191
Revised xx-xx-xx
{426/1055/0201920902019209-1} J-16
Authority makes no implied or express warranties that the air quality will be higher than
other comparable rental properties as a result of the No-smoking Policy. The Housing
Authority cannot and does not warranty or promise that the Property will be free from
second-hand smoke. The Housing Authority’s ability to police, monitor or enforce the
No-Smoking Policy is dependent in significant part on voluntary compliance by Tenants,
Tenant’s guests, household members, and other persons under the Tenant’s control.
7. It shall be the Tenant’s responsibility to inform their household members, guests, and any
other persons under the Tenant’s control of this policy. The Tenant shall prohibit any
smoking by their household members, guests, and/or any other persons under the
Tenant’s control while on the premises that would violate this policy.
X. “Transfer –: Shall agree, upon reasonable notice from the Housing Authority (defined as at least
seven (7 days) days’ written notice), to move to another dwelling unit in the following situations:
where the
1. The Housing Authority determines that the size or design of the unit is no longer
appropriate to Tenant’s needs; where the.
2. The Housing Authority determines a move is necessary in order to rehabilitate or
demolish a Tenant’s unit; where .
3. It is necessary to accommodate a Tenant’s disability; and where .
1.4. A Tenant without disabilities who is housed in an accessible or adaptable unit is
asked to move to a unit without such features when a Tenant or Applicant with
disabilities needs such a unit.
2.5. Other circumstances as described within the Housing Authority’s established
Transfer Policy in the ACOP.
Tenant will be notified whenresponsible for transfer costs in transfer circumstances set forth in the
ACOP. Tenant agrees to transfer to an appropriate unit is expected to be ready for occupancy. Thewithin
seven (7) days shall commence onfrom the commencement date of the Lease for the second unit is
executed and the Tenant is given the keys. If the seven-day period has not been extended in
writing by the Housing Authority and the Tenant has not moved from the first unit into the
second unit, the Lease for the second unit is automatically canceled and the Tenant shall
promptly return all the keys for the second unit to the Area Office. The Tenant shall be responsible for all
costs of moving if required to move for the reason given in this Subsection. If the Tenant fails to move, the Housing Authority may terminate the Lease. Refusal or repeated failure to comply with any such rule or regulation shall constitute good cause for termination
of this Lease by the Housing Authority and for eviction of Tenant in accordance with Section 3 of this Lease. A tenant who,
without good cause (as defined in the ACOP), fails to transfer to the designated unit within
seven (7) days after being notified by the Housing Authority that one is available will be
determined to be in violation and subject to termination of this Lease. In addition, the tenant
may be subject to termination of any tenant-initiated transfer request and may incur any
fees/surcharges approved by the Housing Authority and listed in the ACOP.
Y. 7. Energy Conservation: Shall ensure all household members and guests cooperate with
energy conservation, recycling, and/or other environmental initiatives implemented by the
Housing Authority.
Section 8: HOUSING AUTHORITY'SAUTHORITY’S RESPONSIBILITIES.
A. Rent Collection: The Housing Authority agrees to accept rental money without regard to any
other charges owed by the Tenant to the Housing Authority and to seek separate legal remedy
for the collection of any such charges which, from time to time, may become due to the
Housing Authority from the Tenant. The Housing Authority shall first apply any payment made by
a tenant toward rent before applying any payment toward late payments, damages, legal
costs, or other fees, including attorney fees.
KCHA 191
Revised xx-xx-xx
{426/1055/0201920902019209-1} J-17
B. Maintenance:
1. The Housing Authority shall maintain the buildings and common areas and grounds of
the project in a decent, safe, and sanitary condition in conformity with the
requirements of local housing codes and applicable HUD rules and regulations of the
Department of Housing and Urban Development. .
1.2. The Housing Authority shall maintain in good and safe working order and
condition electrical, plumbing, sanitary, heating, ventilating, and other facilities and
appliances, including elevators, supplied or required to be supplied by the Housing
Authority.
2.3. The Housing Authority will provide and maintain appropriate receptacles and
facilities (except containers for the exclusive use of an individual tenant family) for the
deposit of ashes, garbage, rubbish, and other waste removed from the dwelling unit by
the tenant in accordance with Section 67 of this Lease.
3.4. The Housing Authority shall provide running water, and reasonable amounts of hot
water, and reasonable amounts of heat at appropriate times of the year (according to
local custom and usage) except where the building that includes the dwelling unit is not
required by law to be equipped for that purpose, or where heat or hot water is
generated by an installation within the exclusive control of the tenant and supplied by
a direct utility connection.
4.5. The Housing Authority shall make all necessary repairs to the unit with reasonable
promptness at its own cost and expense, except as otherwise provided in this Lease.
5.6. If the dwelling unit is rendered uninhabitable, the tenant shall immediately notify
the Housing Authority. The Housing Authority shall be responsible for repair of the unit
within a reasonable time. If the tenant, household members, or guests caused the
damage, the reasonable costs of the repairs shall be charged to the tenant and/or the
Lease will be terminated.
6.7. The Housing Authority shall offer standard alternative accommodations, if
available, when the necessary repairs cannot be made within a reasonable time. The
Housing Authority shall make a provision for rent abatement in proportion to the
seriousness of the damage and loss in value if repairs are not made within a reasonable
time. No abatement of rent shall occur if the tenant rejects the alternative
accommodations or if the tenant, tenant’s household, or guests caused the damage.
C. 8. Lease Bifurcation: The Housing Authority agrees to consider lease bifurcation, as provided
in 24 CFR 5.2009, in circumstances involving domestic violence, dating violence, sexual assault,
or stalking as identified in 24 CFR part 5, subpart L. If the Housing Authority chooses to bifurcate
this Lease, no assistance will be given for an individual who does not meet public housing
eligibility, and 24 CFR 5.508(h)(2) applies to submission of evidence of citizenship or eligible
immigration status.
Section 9: INSPECTION/REPAIR.
A. Initial Inspection: Tenant agrees that prior to moving into premises, Tenant and/or
Tenant'sTenant’s representative will inspect the premises jointly with a Housing Authority
representative, and that Tenant will sign the inspection report stating the conditions of the
premises and the equipment in it. A copy of suchthe inspection report signed by both parties
shall be given to the Tenant following the inspection, and a signed copy shall be retained in the
Tenant'sTenant’s file. The Tenant has the right to amend the inspection statement within five (5)
business days after taking possession of the premises if defects are discovered which were not
found in the original inspection and which did not arise because of Tenant'sTenant’s failure to
abide by Subsection 6Section 7 of this Lease.
KCHA 191
Revised xx-xx-xx
{426/1055/0201920902019209-1} J-18
C.B. Vacate Inspection: When the Tenant vacates, the Tenant and/or Tenant'sTenant’s
representative may join the representative of the Housing Authority in an inspection of the
premises.
C. Annual and Special Inspections: Tenant agrees that a representativerepresentatives of the
Housing Authority will be permitted to enter the premises whenever reasonably necessary, for
the purpose of examining the conditions thereof or, for making improvements or repairs, or for
extermination, or to show the premises for leasing. In addition, the Tenant agrees that the unit
shallwill be made available for inspection by the Department of Housing and Urban
Development (HUD) or its agent and the Housing Authority as necessary in conjunction with the
HUD’s annual inspection of Housing Authority properties.
D. Notification of Entry: Entry may be made only during reasonable hours after at least two (2)
daysdays’ prior notice in writing to the Tenant of the date, time, and purpose, except that the
Housing Authority shall have the right to enter the premises without prior notice to the Tenant if
the Housing Authority reasonably believes that an emergency exists or that abandonment has
occurred. The Tenant will not unreasonably withhold permission to the Housing Authority, or HUD
(or its agent) to enter the premises for the purposes stated. In the event that the Tenant and all
adult members of the Tenant'sTenant’s household are absent from the premises at the time of
entry, the Housing Authority shall leave on the premises a written statement specifying the date,
time, and purpose of entry prior tobefore leaving the premises. Tenant further agrees that, upon
proper notification, the dwelling unit shall be made available and be properly organized for
required repairs and/or extermination. Repeated failure to meet this requirement may be cause
for Lease termination of the Lease.
9. Section 10: GRIEVANCE PROCEDURE. The Housing Authority shall notify the Tenant of the specific grounds for
any proposed adverse action (such proposed action
Access to the Grievance Procedure shall be available to any Tenant who believes (1) that the
Housing Authority’s action or failure to act adversely affects the Tenant’s rights under this Lease, or (2)
that the Housing Authority’s application of its regulations or policies adversely affects that Tenant’s
rights, duties, welfare, or status. Such “adverse action” includes, but is not limited to, a notice of rent
change, a proposed Lease termination, transfer of the Tenant to another unit, imposition of charges
for maintenance and repair, or for excess consumption of utilities). This notice of adverse action. The Housing
Authority shall informnotify the Tenant, where applicable, of the right to askspecific grounds for a grievance hearing.
Ifany proposed adverse action. The Grievance Procedure provides the Tenant believes (1) that Housing
Authority's action or failure to act adversely affects the Tenant's rights under the Lease; or (2) that the Housing Authority's application of its
regulations or policies adversely affects that Tenant's rights, duties, welfare or status, the Tenant shall have the rightan opportunity to
present a complaint toand settle their grievance informally with the Housing Authority and, if not satisfied
with the Housing Authority’s proposed disposition, to have request a formal grievance hearing with a
reasonable review of that complaint byHearing Officer. The Housing Authority, if the complaint is personally presented to the
appropriate Area Office within ten (10) business days of the Housing Authority's action or failure to act or application of regulations or policies which is the basis of the Tenant's complaint. If the Tenant is dissatisfied with the Housing Authority's proposed disposition of the complaint, the
Tenant shall have the right to a subsequent hearing according to the Housing Authority Grievance Procedure. The Housing Authority
shall establish a list of Hearing Officers through an advertised call for qualified individuals. The
Housing Authority shall assign Hearing Officers to hear individual Tenant grievances and hold all
grievance hearings in accordance with the procedures and policies set forth in the Housing
Authority’s Grievance Procedure included in the ACOP.
At the time of the informal discussion on the Tenant's complaint and additionally thereafter in writing, the Tenant will be informed of (1) the specific reason(s) for the Housing Authority's action or failure to act which is the source of the Tenant's complaint; (2) of the Tenant's right to a subsequent hearing if Tenant is dissatisfied with the Housing Authority's proposed disposition of the complaint; and (3) of the procedures by which such a grievance hearing may be obtained.
KCHA 191
Revised xx-xx-xx
{426/1055/0201920902019209-1} J-19
Any grievance hearing shall be held in accordance with the procedures and requirements of the Grievance Procedure which is in effect at the time such grievance arises, which Grievance Procedure is posted in each Area Office of the Housing Authority and is incorporated herein by reference.
10. Section 11: REASONABLE ACCOMMODATION FOR PERSONS WITH DISABILITIES
For all aspects of thethis Lease and Grievance Procedure, a person with disabilities shall be provided
with reasonable accommodation to the extent necessary to provide such person with an opportunity
to use and occupy the dwelling unit equal to a non-disabled family.
A Tenant may, at any time, request reasonable accommodation of a disability of a household
member, including reasonable accommodation so that the Tenant can meet Lease requirements or
other requirements of tenancy. A Tenant making such a request should obtain from their Area Office
a copy of the Housing Authority’s Request for Reasonable Accommodation Form.
11. Section 12: REPRESENTATIONS AND WAIVERS
The failure of the Housing Authority to insist on strict performance of any term of this Lease shall not be
considered a waiver or relinquishment of the right to subsequently require strict performance of that
or any other term. All terms and conditions shall at all times continue in full force and effect. The rights
and remedies given to the Housing Authority under these terms are distinct, separate, and
cumulative and not one of them whether exercised or not shall be deemed to be to the exclusion of
any other.
Acceptance of rent at any time by the Housing Authority shall not be construed to be a waiver of
any preceding or existing breach of thethis Lease other than the failure of the Tenant to pay the
particular rent so accepted. In cases of non-payment of rent or charges, the deposit of the disputed
rent or charges into escrow shall not be deemed to be an acceptance by the Housing Authority of
the rent so deposited.
12. Section 13: ATTORNEYS’ FEE AND COURT COSTS
In the event any dispute arises in connection with this Lease and a lawsuit is filed in State Superior
Court, the prevailing party shall be entitled to recover its reasonable attorneys’ fees and court costs
incurred in that legal proceeding. Neither party is entitled to recover its attorneys’ fees incurred in
participation in the Grievance Procedure, including the formal grievance hearing with a Hearing
Officer.
Section 14: AMENDMENTS AND CHANGES TO RULES AND REGULATIONS
The Housing Authority may amend its schedules for charges for services and repairs as well as its rules
and regulations, which are otherwise incorporated herein by reference, by giving the Tenant not less
than thirty (30) daysdays’ notice of the same. Resident Organizations will also be given thirty (30) days
days’ notice to comment on proposed changes to the Dwelling Lease or Grievance Procedures. In
addition, the Housing Authority will give thirty (30) days days’ written notice whenever there is a revision
in the system for calculating utility allowances. the Energy Assistance Supplement (EAS). Regular utility
allowanceEAS adjustments due to rate changes will be implemented as soon as administratively feasible
without Tenant comment. Said notice shall be given by either or both of the following: (1) the notice
may be delivered directly or mailed to the Tenant; or (2) posted in at least three [3] conspicuous
places within each structure or building in which the affected dwelling unit is located, as well as in a

KCHA 191
Revised xx-xx-xx
{426/1055/0201920902019209-1} J-20
conspicuous place at eachthe Area Office. The Tenant shall be afforded an opportunity within the
thirty-day period to present written comments which shall be taken into account by the Housing
Authority prior to the proposed modification or amendment becomingbecomes effective.
Change in the Lease document, other than rent, family composition, or special waiver change, shall
be documented by execution of a new Lease or amendment to the existing Lease. At least sixty (60)
days prior to the proposed effective date of the new Lease, the Housing Authority will notify the
Tenant of any changes in the Lease and offer the Tenant the new Lease or Amendment to the
existing agreement. The Tenant may accept the changed terms and conditions by signing the new
Lease or Amendment to the existing agreement and returning it to the Housing Authority within the
time period provided for acceptance by the Tenant. . The new Lease or Lease Amendment will be signed and
dated by both the Housing Authority and the Tenant. Failure of the Tenant to accept, sign, and return
the offered revision of the Lease shall be deemed to be good cause for termination of the Tenant’s
tenancy, and the Housing Authority shall terminate the Lease agreement and the Tenant and
Tenant’s household shall be required to vacate from the unit.
Changes in rent, household composition, and special waivers shall be accomplished by a written Rider
to the Lease, executed by both parties. Changes in rent determined as a result of a Recertification,
Interim, or Special Review under Section 6 of this Lease shall be accomplished by written notice
delivered directly or mailed to the Tenant.
13. Section 15: SEVERABILITY
. If any provision of this Lease or the application thereof to any person or circumstance is held invalid,
the invalidity shall not affect other provisions or application of the Lease, which can be given effect
without the invalid provision or application. To this end, the provisions of this Lease are severable.
________________________________________________ THE HOUSING AUTHORITY OF THE
Tenant Date COUNTY OF KING, WASHINGTON
________________________________________________ By: _____________________________________
Tenant Date Manager Date
HOUSING AUTHORITY OF THE COUNTY OF KING
GRIEVANCE PROCEDURE
I. PURPOSE
The purpose of Tthis document setsis to set forth the requirements, standards, and procedures for the handling and review of Tenant Grievances presented to the Housing Authority of the County of King, Washington (“Housing Authority” or “KCHA”). The Grievance Procedure is established to ensure a assure the Housing Authority Tenant has the opportunity for a reasonable review, and if requested, a hearing with respect to an individualon Tenant disputecomplaints regarding a KCHAthe Housing Authority’s action (or failure to act) involving the in such a way that affects that Tenant’s rights under the lease or with the Housing Authority or Housing Authority application of its regulations whichor policies which the Tenant believes to adversely affect the individual Tenant’s rights, duties, welfare or status. The Grievance Procedure set forth herein has been adopted by the Board of Commissioners of the Housing Authority and is incorporated by reference in all dwelling leases between the Housing Authority and its Tenants.
Copies of the Grievance Procedure shall be providedfurnished to each Tenant and to all resident organizations. In addition, KCHA The Housing Authority shall provide at least thirty (30) days’ notice to Tenants and Resident Organizations ofsetting forth any changes to the Housing Authority’s Grievance Procedure and provideproviding opportunity to submit written comments regarding the proposed changes. Comments submitted shall be considered by the Housing Authority before adoption of any Grievance Procedure changeChanges.
II. DEFINITIONS
For the purpose of handling and reviewing all individual Tenant complaints, the following definitions applyare applicable:
A. “Area Office” means the management office for the property in which the Complainant resides.
B. “Complainant” means any Tenant presenting a complaint or dispute to the Housing Authority, or at one of the Area Offices, to be handled or reviewed in accordance with the procedures set forth below. The Complainant may also be referred to as “Tenant”.
A.C.“Grievance” meansshall mean any complaint or dispute which an individual Tenant (residing in a Housing Authority -owned dwelling unit assisted under the U.S. Housing Act of 1937) may have with respect to a Housing Authority action or failure to act which affects that Tenant’s lease or with respect to Housing Authority regulations which a
EXHIBIT I

Tenant believes adversely affect theirthat tenant’s rights, duties, welfare, or status. Examples include, but are not limited to, a proposed lease termination, transfer of the Tenant to another unit, or imposition of charges for maintenance, and repair, or for excess consumption of utilities.
B. “Complainant” shall mean any Tenant presenting a complaint or dispute to the Housing Authority, or at one of the Area Offices, to be handled or reviewed in accordance with the procedures set forth below.
C.D.“Hearing Officer” means an impartial shall mean a person (or persons) selected by the Housing Authority appointed in accordance with Section V below6 hereunder to hear a Grievance and render a decision.
E. “Regional Manager” means a representative of the Housing Authority assigned to oversee the operations and management of one of KCHA’s property management regions.
D.F.“Resident Organization” includes a resident management corporation, Resident Advisory Committee, and/or KCHA- recognizeda resident council.
E.G.“Tenant” means anshall mean the adult person(s) (other than live-in attendants):
1. Who resides in the unit, and who executed the lease with the Housing Authority, or, if no such person now resides in the unit,
2. Who resides in the unit, and who is the remaining head of household of the tenant family residing in the dwelling unit.
III. APPLICABILITY
This procedure appliesshall be applicable to all individual Tenant Grievances as defined in Section 2, except as stated below:
A. The Grievance Procedure doesshall not applybe applicable to disputes between Tenants or to class grievances against the Housing Authority.
B. The Grievance Procedure is not be to be used as a forum for initiating, negotiating, or reviewing policies established by the Housing Authority Board of Commissioners.
The Grievance Procedure will not affect any rights the Complainant may have to a trial de novo or judicial review in any judicial proceedings.
IV. INFORMAL SETTLEMENT OF GRIEVANCE
Any Grievance shall first be presented, either orally or in writing, to the appropriate Area Office of the Housing Authority so that the Grievance may be discussed informally by the
Complainant and the Manager of the Area Office involved and settled, if possible, without a hearing.
IV. STEPS OF THE GRIEVANCE PROCEDURE
A. STEP 1: Present the Grievance All Grievances mustshall be personally presented, either orally or in writing, to the Areaappropriate office within ten (10) business days of the date of the receipt of the notice of the Housing Authority’s proposed adverse action (or of the date of the Housing Authority’s alleged failure to act), except in the case of a 14-day notice for termination of a tenancy for nonpayment of rent or a 3-day notice for any criminal activity that threatens the health, safety, or right to peaceful enjoyment of the premises of other residents or employees of the Housing Authority, or a 3 day notice for any drug-related criminal activity in which event the Grievance must be presented within three (3) business days of the receipt of the notice to forestall service of a Summons and Complaint.
Failure to request the informal review with the exception of the Housing Authority’s proposed actions that relate to termination of a tenancy. In the cases where the Housing Authority’s proposed actions relate to the termination of a tenancy, the Tenant’s Grievance must be presented, either orally or in writing, to the appropriate Area Office within the time set forth in the termination of tenancy notice the Housing Authority served on Tenant.
Failure to present a GrievanceManager within the above time limits will result in the Complainant forfeiting any further rights to have their grievance heard; if within the Housing Authority’s internal grievance procedure; provided, however, that if the Complainant establishes to the Regional Manager’s satisfaction of the Hearing Officer that the failure to comply with this requirement was for good cause, the Regional Managerhearing Officer may chooseelect to proceed with an informal meeting as set forth in Step 2, below. “Good cause” is defined as an unavoidable conflict that prevented the Complainant from presenting their grievance within the time limit provided. KCHA may request documentation of the good causea formal grievance hearing.
B. STEP 2: Informal Settlement of the Grievance: The Regional Manager will meet with The Complainant so that the Grievance may be discussed informally and settled without a hearing. During theand the Manager shall attempt to resolve the complaint or dispute at this informal meeting,discussion. The Complainant and the Regional Manager may each have a maximum of three (3) other peoplepersons in attendance at the meetinginformal discussion. After the meeting, the Regional Manager willshall write a detailed summary of account of the meeting, shall send the original account to the Tenant with a copy to the meeting which includes:Tenant’s representative, if requested, and place a copy in the Tenant’s file stating: (1) the date of the meeting; (2) the pertinent facts discussed; (3) the names of the participants; (4) the proposed disposition of the Grievance and reasons thereforcomplaint; and (5) an attached
copy of the Grievance Procedure that specifies the procedures by which a hearing may be obtained if , including the date by which a written request for a hearing must be received, if the Complainant is not satisfied with the Regional Manager’sHousing Authority proposed disposition.
This summaryaccount of the proceedings, along with a copy of the Grievance Procedure shall be sent to the TenantComplainant within fivethree (3) business days after the meeting. A copy will also be retained in the Tenant file The procedures for obtaining the formal grievance hearing are set forth in Section 5 below.
C. STEP 3: Grievance Hearing
Once the Complainant receives the Regional Manager’s summary of the meeting, if not satisfied with the proposed disposition the Complainant may request a hearing.
V. PROCEDURE TO OBTAIN A Hearing
1. Request for a Hearing. The Complainant must submit a written request for a hearing to the Area Office within five (5) business days ofafter the receipt of the Regional Manager’s summaryaccount of the informal meetingproceedings prepared pursuant to Subsection BSection 4 above. Receipt is defined as the earlier date of actual delivery to a member of theor tenant household, or, when the documents are sent by mail, five eight (8) days from the date of proper mailing. (properly addressed, postage prepaid) of the Manager’s account of the proceedings. The written request mustshall specify: (1) the Grievance; (2) the reasons for the Grievance; and (3) the action or relief sought.
The Tenant’s request for a grievance hearing will be dated immediately upon receipt at the appropriate Area Office and placed in the Tenant’s file (together with the summary of the informal meeting). filed with a copy of the account of the informal discussion and a copy of the letter to the Tenant in the Tenant’s file. After the hearing is completed, a copy of these documents, along with the written decision of the Hearing Officer, will be placed in a separate grievance hearing file marked with the date of hearing. All names and identifying references shall be deleted from said file.
2. Failure to Request a Hearing. If the Complainant does not request a hearing in the manner describedprovided in Subsection 5.A. above, the Housing Authority’s disposition of the Grievance under Section IV.B above, will 4 shall become final. However, ; provided, however, that the failure to request a hearing doesshall not constitute a waiver by the Complainant of the right thereafter to contest the dispositionHousing Authority’s action in disposing of the Grievancecomplaint in an appropriate judicial proceeding.
C. Amounts Owing. No grievance hearing may be scheduled on any grievance involving rent which the Housing Authority claims is past due until the Complainant pays to the Housing Authority an amount equal to the undisputed part of the rent that is the subject of the dispute. If a grievance does not involve rent, payment of the rent must be made in the normal manner without regard to the pending grievance hearing. In all cases, the undisputed portion of the rent must remain current until the decision of the Hearing Officer is announced and the Tenant shall be obligated to continue paying rent until the rented premises are vacated as set forth in the Tenant’s lease with the Housing Authority.
3. Scheduling of Grievance Hearings. The Hearing Officer will schedule the GrievanceWhen Tenant has satisfied the requirements of Subsections A and C of this Section, a hearing shall be scheduled by the Hearing within a reasonable time,Officer no sooner than seven (7) calendar days but no later than fifteen (15) business days, following after receipt by the Tenant’s properly submittedArea Office of the request as detailedfor hearing specified in Section IV.C(1)5 above. Extension of this, the time limit must be agreed to in writing by both parties. Theand place of the hearing willto be reasonably convenient both to the Complainant and to the Housing Authority. Extension of this time limit shall be agreed to in writing by both parties. The Tenant and the Housing Authority shall be given written notice of the time, the place, and the procedures governing the hearing. , such notices to be delivered to both the Housing Authority and to the Tenant personally, or sent by first-class mail, postage prepaid, properly addressed to the Housing Authority Area Office and to the Tenant at the premises.
VI.V. SELECTION OF HEARING OFFICER
A. For grievances involving a charge under $100, the Hearing Officer will be an impartial employee of the Housing Authority who was not involved in the original decision.
B. For all other grievances, The Hearing Officer willshall be an impartial person who isshall not be an officer, employee, agent, or tenant of the Housing Authority. In these cases, the following applies:
1. The Hearing Officer willshall be selected from a list of qualified individuals established by the Housing Authority in response to an advertiseda request for services. The Housing Authority’s bid proposal. Said list of Hearing Officers will behave previously been presented to the Resident Advisory Boardresidents and resident organizations for their review and comment. Individuals selected for this list of rotating Hearing Officers need not be legal professionals, but must be able to show sufficientwill have successful prior experience and training in the areas of Housing Authority regulationsas a hearing officer, an arbitrator approved by the American Arbitration Association or Federal Mediation and Landlord Tenant lawConciliation Service, a judge or chair of quasi-judicial hearings as well as proven
experience in effectively communicating findings and conclusions both orally and in writing.
2. The Housing Authority reserves the right to pay the Hearing OfficersOfficer a stipend for theirhis/her services and to provide training on such areas as the grievance procedure, dwelling lease requirements, and other related policies.
VII.VI. ACCOMMODATION OF PERSON WITH DISABILITIES
A. At any time during the Grievance process, a Complainant may request reasonable accommodation of a handicap or /disability of a household member, including reasonable accommodation so that the Complainant can meet lease requirements or other requirements of tenancy.
B. The Housing Authority shall provide reasonable accommodations for persons with disabilities to participate in the Grievance process. Reasonable accommodation may include but is not limited to: qualified sign language interpretation, readers, and accessible locations.
C. If the Complainant is visually impaired, any notice to the Complainant thatwhich is required as part of the Grievance procedure willshall be in an accessible format.
VIII.VII. PROCEDURES GOVERNING THE GRIEVANCE HEARING
A. The Complainant willshall be afforded a fair hearing providing the basic safeguards of due process which includesshall include:
1. The opportunity to examine before and during the hearing and, at the expense of the Complainant, to copy all documents, records, and regulations of the Housing Authority directly relevant to the grievance hearing. The Complainant shall be allowed to copy any such document at their own expense. Any document not identified and made available for examination upon request byto the Complainant upon reasonable request may not be used by the Housing Authority at the hearing;
2. The right to be represented by counsel or any other person designated by Complainant as Complainant’s representative, and to have such person make statements on the Complainant’s behalf;
3. The right to a private hearing unless the Complainant requests a public hearing;
4. The right to present evidence and argumentsargue in support of the Tenant’s complaint, to contest evidence or information relied on by the Housing Authority, and to confront or cross -examine all witnesses upon whose testimony or information the Housing Authority relies; and
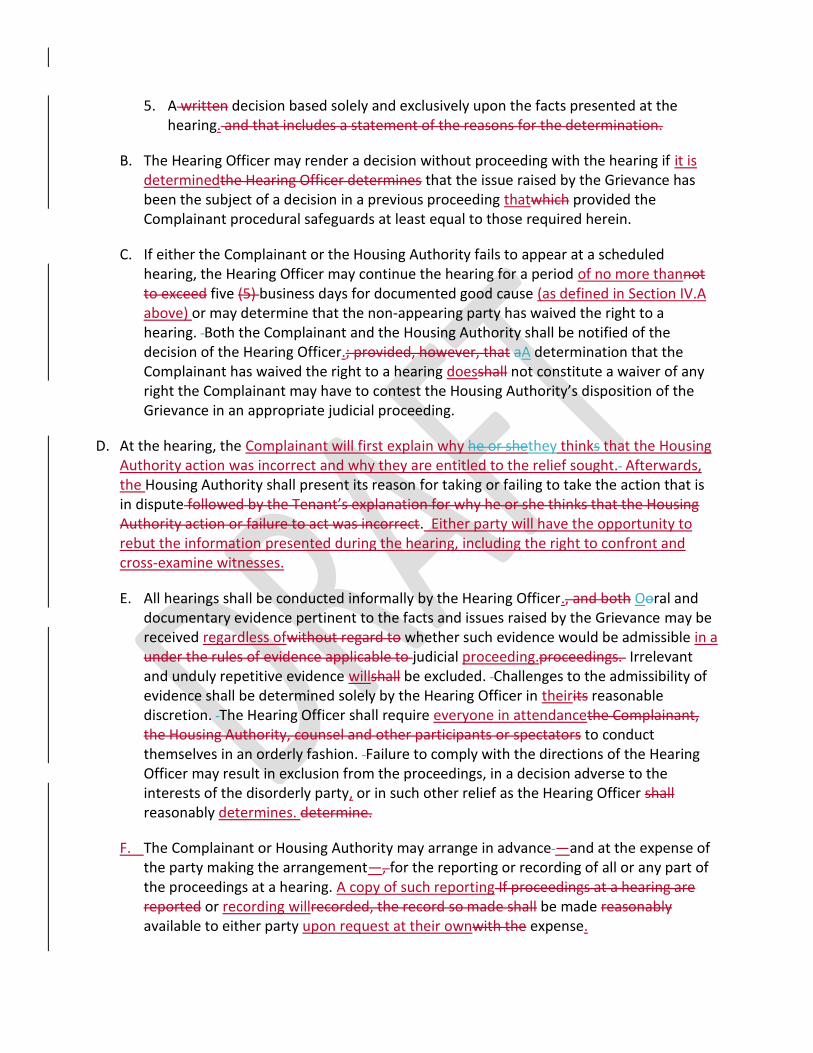
5. A written decision based solely and exclusively upon the facts presented at the hearing. and that includes a statement of the reasons for the determination.
B. The Hearing Officer may render a decision without proceeding with the hearing if it is determinedthe Hearing Officer determines that the issue raised by the Grievance has been the subject of a decision in a previous proceeding thatwhich provided the Complainant procedural safeguards at least equal to those required herein.
C. If either the Complainant or the Housing Authority fails to appear at a scheduled hearing, the Hearing Officer may continue the hearing for a period of no more thannot to exceed five (5) business days for documented good cause (as defined in Section IV.A above) or may determine that the non-appearing party has waived the right to a hearing. Both the Complainant and the Housing Authority shall be notified of the decision of the Hearing Officer.; provided, however, that aA determination that the Complainant has waived the right to a hearing doesshall not constitute a waiver of any right the Complainant may have to contest the Housing Authority’s disposition of the Grievance in an appropriate judicial proceeding.
D. At the hearing, the Complainant will first explain why he or shethey thinks that the Housing Authority action was incorrect and why they are entitled to the relief sought. Afterwards, the Housing Authority shall present its reason for taking or failing to take the action that is in dispute followed by the Tenant’s explanation for why he or she thinks that the Housing Authority action or failure to act was incorrect. Either party will have the opportunity to rebut the information presented during the hearing, including the right to confront and cross-examine witnesses.
E. All hearings shall be conducted informally by the Hearing Officer., and both Ooral and documentary evidence pertinent to the facts and issues raised by the Grievance may be received regardless ofwithout regard to whether such evidence would be admissible in a under the rules of evidence applicable to judicial proceeding.proceedings. Irrelevant and unduly repetitive evidence willshall be excluded. Challenges to the admissibility of evidence shall be determined solely by the Hearing Officer in theirits reasonable discretion. The Hearing Officer shall require everyone in attendancethe Complainant, the Housing Authority, counsel and other participants or spectators to conduct themselves in an orderly fashion. Failure to comply with the directions of the Hearing Officer may result in exclusion from the proceedings, in a decision adverse to the interests of the disorderly party, or in such other relief as the Hearing Officer shall reasonably determines. determine.
F. The Complainant or Housing Authority may arrange in advance —and at the expense of the party making the arrangement—, for the reporting or recording of all or any part of the proceedings at a hearing. A copy of such reporting If proceedings at a hearing are reported or recording willrecorded, the record so made shall be made reasonably available to either party upon request at their ownwith the expense.
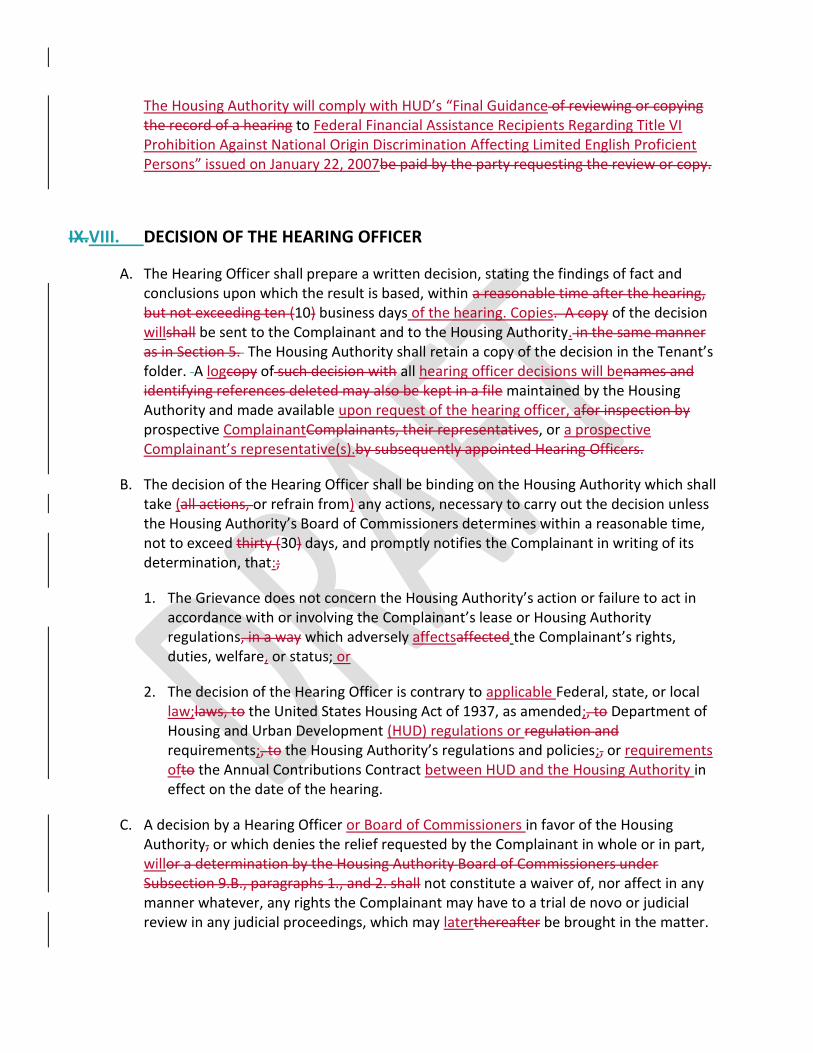
The Housing Authority will comply with HUD’s “Final Guidance of reviewing or copying the record of a hearing to Federal Financial Assistance Recipients Regarding Title VI Prohibition Against National Origin Discrimination Affecting Limited English Proficient Persons” issued on January 22, 2007be paid by the party requesting the review or copy.
IX.VIII. DECISION OF THE HEARING OFFICER
A. The Hearing Officer shall prepare a written decision, stating the findings of fact and conclusions upon which the result is based, within a reasonable time after the hearing, but not exceeding ten (10) business days of the hearing. Copies. A copy of the decision willshall be sent to the Complainant and to the Housing Authority. in the same manner as in Section 5. The Housing Authority shall retain a copy of the decision in the Tenant’s folder. A logcopy of such decision with all hearing officer decisions will benames and identifying references deleted may also be kept in a file maintained by the Housing Authority and made available upon request of the hearing officer, afor inspection by prospective ComplainantComplainants, their representatives, or a prospective Complainant’s representative(s).by subsequently appointed Hearing Officers.
B. The decision of the Hearing Officer shall be binding on the Housing Authority which shall take (all actions, or refrain from) any actions, necessary to carry out the decision unless the Housing Authority’s Board of Commissioners determines within a reasonable time, not to exceed thirty (30) days, and promptly notifies the Complainant in writing of its determination, that:;
1. The Grievance does not concern the Housing Authority’s action or failure to act in accordance with or involving the Complainant’s lease or Housing Authority regulations, in a way which adversely affectsaffected the Complainant’s rights, duties, welfare, or status; or
2. The decision of the Hearing Officer is contrary to applicable Federal, state, or local law;laws, to the United States Housing Act of 1937, as amended;, to Department of Housing and Urban Development (HUD) regulations or regulation and requirements;, to the Housing Authority’s regulations and policies;, or requirements ofto the Annual Contributions Contract between HUD and the Housing Authority in effect on the date of the hearing.
C. A decision by a Hearing Officer or Board of Commissioners in favor of the Housing Authority, or which denies the relief requested by the Complainant in whole or in part, willor a determination by the Housing Authority Board of Commissioners under Subsection 9.B., paragraphs 1., and 2. shall not constitute a waiver of, nor affect in any manner whatever, any rights the Complainant may have to a trial de novo or judicial review in any judicial proceedings, which may laterthereafter be brought in the matter.
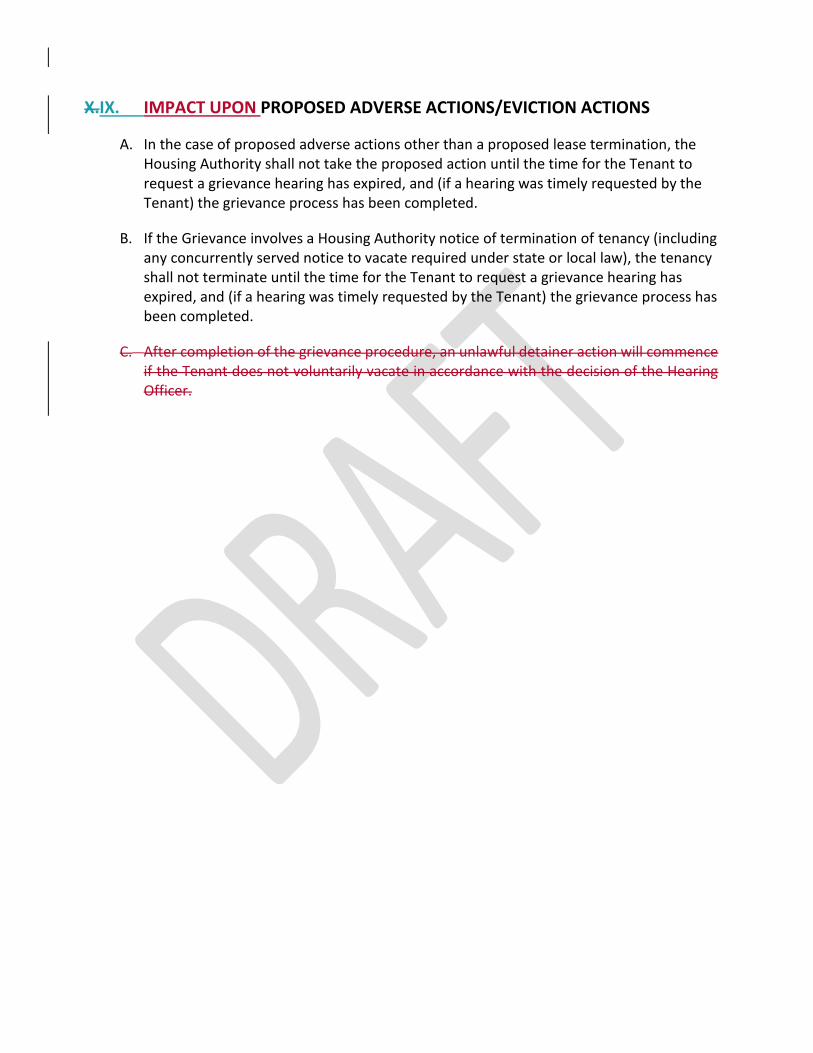
X.IX. IMPACT UPON PROPOSED ADVERSE ACTIONS/EVICTION ACTIONS
A. In the case of proposed adverse actions other than a proposed lease termination, the Housing Authority shall not take the proposed action until the time for the Tenant to request a grievance hearing has expired, and (if a hearing was timely requested by the Tenant) the grievance process has been completed.
B. If the Grievance involves a Housing Authority notice of termination of tenancy (including any concurrently served notice to vacate required under state or local law), the tenancy shall not terminate until the time for the Tenant to request a grievance hearing has expired, and (if a hearing was timely requested by the Tenant) the grievance process has been completed.
C. After completion of the grievance procedure, an unlawful detainer action will commence if the Tenant does not voluntarily vacate in accordance with the decision of the Hearing Officer.
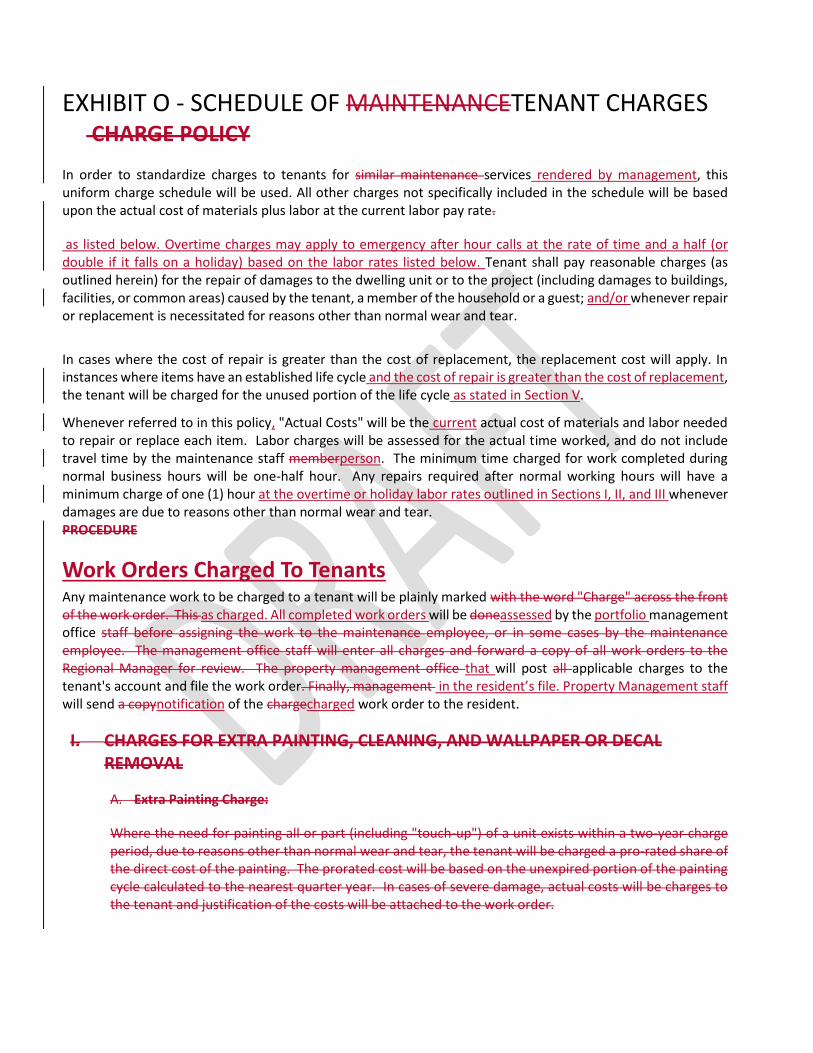
EXHIBIT O - SCHEDULE OF MAINTENANCETENANT CHARGES CHARGE POLICY
In order to standardize charges to tenants for similar maintenance services rendered by management, this uniform charge schedule will be used. All other charges not specifically included in the schedule will be based upon the actual cost of materials plus labor at the current labor pay rate.
as listed below. Overtime charges may apply to emergency after hour calls at the rate of time and a half (or double if it falls on a holiday) based on the labor rates listed below. Tenant shall pay reasonable charges (as outlined herein) for the repair of damages to the dwelling unit or to the project (including damages to buildings, facilities, or common areas) caused by the tenant, a member of the household or a guest; and/or whenever repair or replacement is necessitated for reasons other than normal wear and tear.
In cases where the cost of repair is greater than the cost of replacement, the replacement cost will apply. In instances where items have an established life cycle and the cost of repair is greater than the cost of replacement, the tenant will be charged for the unused portion of the life cycle as stated in Section V.
Whenever referred to in this policy, "Actual Costs" will be the current actual cost of materials and labor needed to repair or replace each item. Labor charges will be assessed for the actual time worked, and do not include travel time by the maintenance staff memberperson. The minimum time charged for work completed during normal business hours will be one-half hour. Any repairs required after normal working hours will have a minimum charge of one (1) hour at the overtime or holiday labor rates outlined in Sections I, II, and III whenever damages are due to reasons other than normal wear and tear. PROCEDURE
Work Orders Charged To Tenants Any maintenance work to be charged to a tenant will be plainly marked with the word "Charge" across the front of the work order. This as charged. All completed work orders will be doneassessed by the portfolio management office staff before assigning the work to the maintenance employee, or in some cases by the maintenance employee. The management office staff will enter all charges and forward a copy of all work orders to the Regional Manager for review. The property management office that will post all applicable charges to the tenant's account and file the work order. Finally, management in the resident’s file. Property Management staff will send a copynotification of the chargecharged work order to the resident.
I. CHARGES FOR EXTRA PAINTING, CLEANING, AND WALLPAPER OR DECAL REMOVAL
A. Extra Painting Charge:
Where the need for painting all or part (including "touch-up") of a unit exists within a two-year charge period, due to reasons other than normal wear and tear, the tenant will be charged a pro-rated share of the direct cost of the painting. The prorated cost will be based on the unexpired portion of the painting cycle calculated to the nearest quarter year. In cases of severe damage, actual costs will be charges to the tenant and justification of the costs will be attached to the work order.
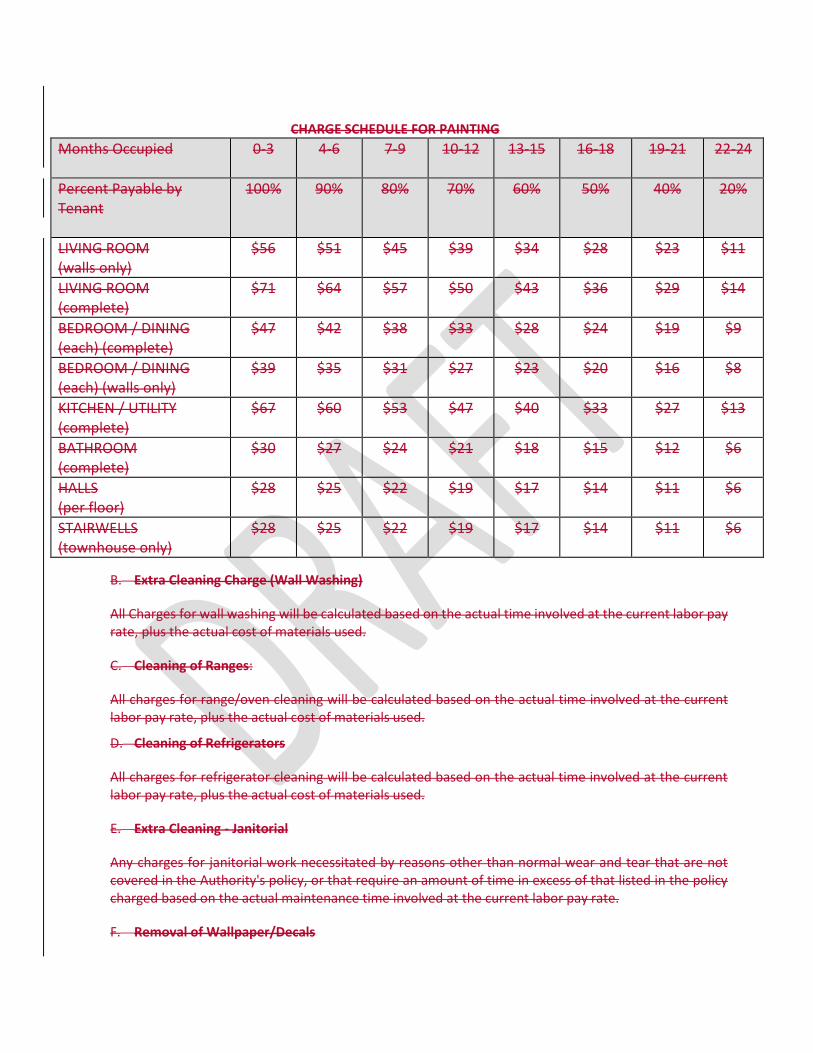
CHARGE SCHEDULE FOR PAINTING
Months Occupied
0-3 4-6 7-9 10-12 13-15 16-18 19-21 22-24
Percent Payable by Tenant
100% 90% 80% 70% 60% 50% 40% 20%
LIVING ROOM (walls only)
$56 $51 $45 $39 $34 $28 $23 $11
LIVING ROOM (complete)
$71 $64 $57 $50 $43 $36 $29 $14
BEDROOM / DINING (each) (complete)
$47 $42 $38 $33 $28 $24 $19 $9
BEDROOM / DINING (each) (walls only)
$39 $35 $31 $27 $23 $20 $16 $8
KITCHEN / UTILITY (complete)
$67 $60 $53 $47 $40 $33 $27 $13
BATHROOM (complete)
$30 $27 $24 $21 $18 $15 $12 $6
HALLS (per floor)
$28 $25 $22 $19 $17 $14 $11 $6
STAIRWELLS (townhouse only)
$28 $25 $22 $19 $17 $14 $11 $6
B. Extra Cleaning Charge (Wall Washing)
All Charges for wall washing will be calculated based on the actual time involved at the current labor pay rate, plus the actual cost of materials used.
C. Cleaning of Ranges:
All charges for range/oven cleaning will be calculated based on the actual time involved at the current labor pay rate, plus the actual cost of materials used.
D. Cleaning of Refrigerators
All charges for refrigerator cleaning will be calculated based on the actual time involved at the current labor pay rate, plus the actual cost of materials used.
E. Extra Cleaning - Janitorial
Any charges for janitorial work necessitated by reasons other than normal wear and tear that are not covered in the Authority's policy, or that require an amount of time in excess of that listed in the policy charged based on the actual maintenance time involved at the current labor pay rate.
F. Removal of Wallpaper/Decals
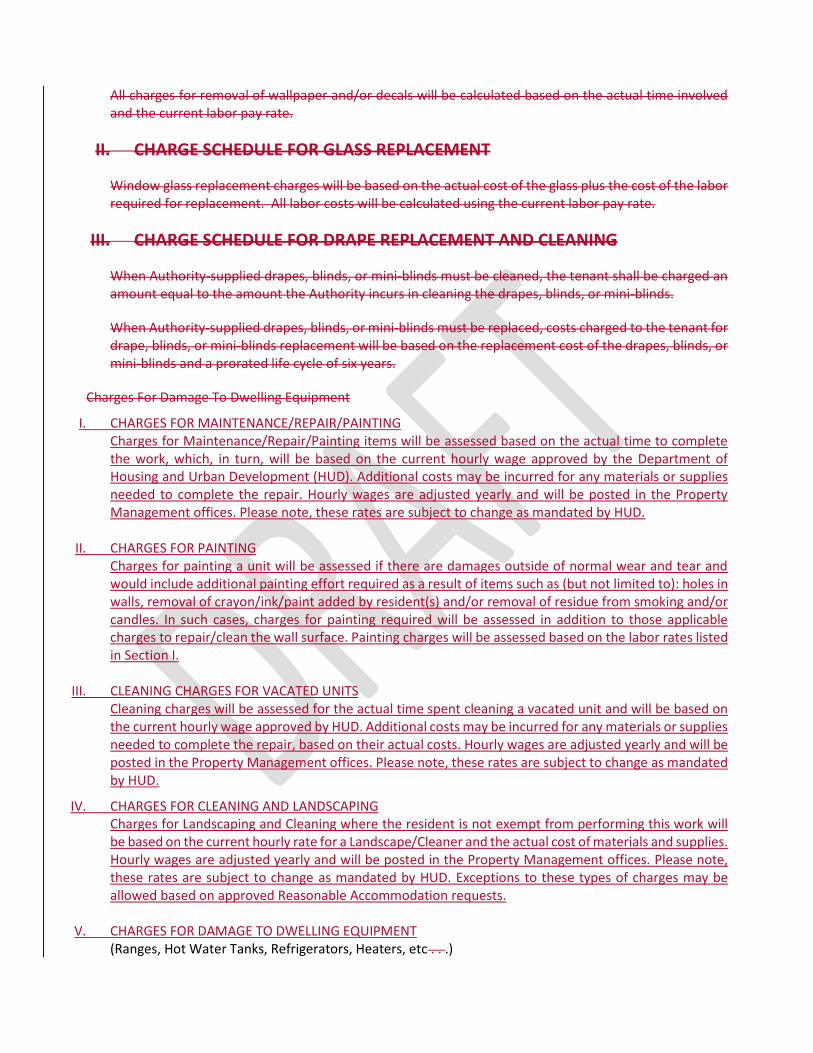
All charges for removal of wallpaper and/or decals will be calculated based on the actual time involved and the current labor pay rate.
II. CHARGE SCHEDULE FOR GLASS REPLACEMENT
Window glass replacement charges will be based on the actual cost of the glass plus the cost of the labor required for replacement. All labor costs will be calculated using the current labor pay rate.
III. CHARGE SCHEDULE FOR DRAPE REPLACEMENT AND CLEANING
When Authority-supplied drapes, blinds, or mini-blinds must be cleaned, the tenant shall be charged an amount equal to the amount the Authority incurs in cleaning the drapes, blinds, or mini-blinds.
When Authority-supplied drapes, blinds, or mini-blinds must be replaced, costs charged to the tenant for drape, blinds, or mini-blinds replacement will be based on the replacement cost of the drapes, blinds, or mini-blinds and a prorated life cycle of six years.
Charges For Damage To Dwelling Equipment
I. CHARGES FOR MAINTENANCE/REPAIR/PAINTING Charges for Maintenance/Repair/Painting items will be assessed based on the actual time to complete the work, which, in turn, will be based on the current hourly wage approved by the Department of Housing and Urban Development (HUD). Additional costs may be incurred for any materials or supplies needed to complete the repair. Hourly wages are adjusted yearly and will be posted in the Property Management offices. Please note, these rates are subject to change as mandated by HUD.
II. CHARGES FOR PAINTING Charges for painting a unit will be assessed if there are damages outside of normal wear and tear and would include additional painting effort required as a result of items such as (but not limited to): holes in walls, removal of crayon/ink/paint added by resident(s) and/or removal of residue from smoking and/or candles. In such cases, charges for painting required will be assessed in addition to those applicable charges to repair/clean the wall surface. Painting charges will be assessed based on the labor rates listed in Section I.
III. CLEANING CHARGES FOR VACATED UNITS
Cleaning charges will be assessed for the actual time spent cleaning a vacated unit and will be based on the current hourly wage approved by HUD. Additional costs may be incurred for any materials or supplies needed to complete the repair, based on their actual costs. Hourly wages are adjusted yearly and will be posted in the Property Management offices. Please note, these rates are subject to change as mandated by HUD.
IV. CHARGES FOR CLEANING AND LANDSCAPING Charges for Landscaping and Cleaning where the resident is not exempt from performing this work will be based on the current hourly rate for a Landscape/Cleaner and the actual cost of materials and supplies. Hourly wages are adjusted yearly and will be posted in the Property Management offices. Please note, these rates are subject to change as mandated by HUD. Exceptions to these types of charges may be allowed based on approved Reasonable Accommodation requests.
V. CHARGES FOR DAMAGE TO DWELLING EQUIPMENT (Ranges, Hot Water Tanks, Refrigerators, Heaters, etc . . .)
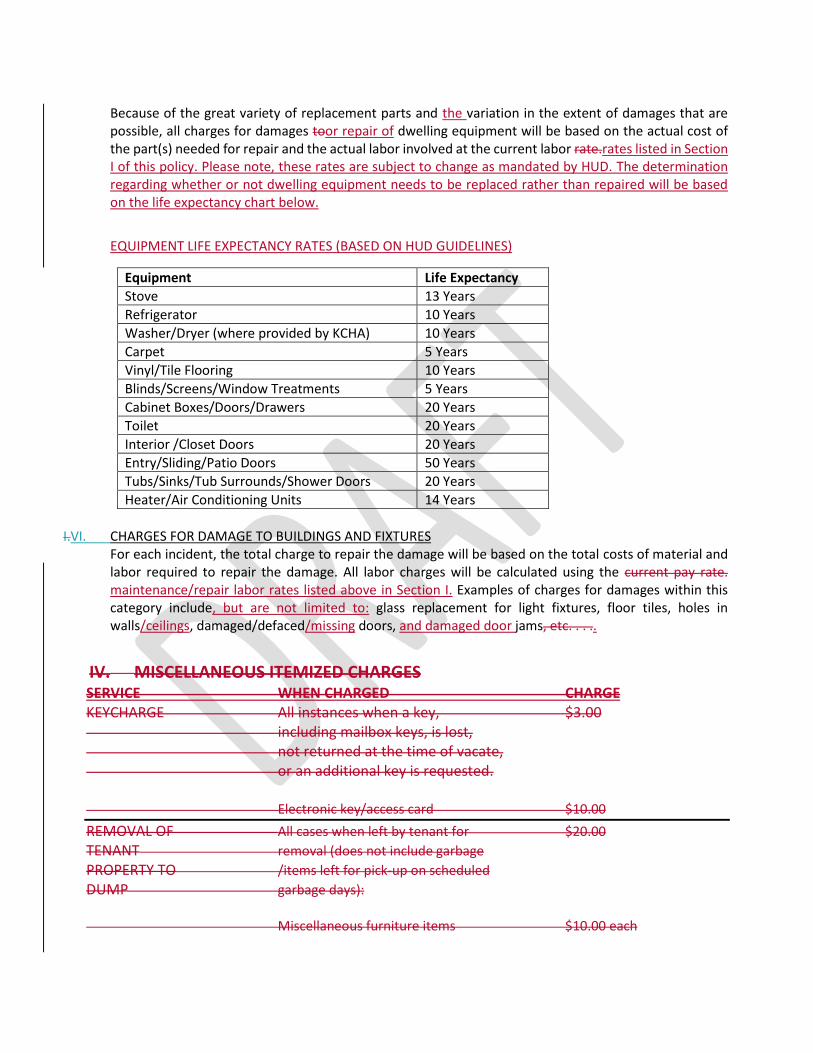
Because of the great variety of replacement parts and the variation in the extent of damages that are possible, all charges for damages toor repair of dwelling equipment will be based on the actual cost of the part(s) needed for repair and the actual labor involved at the current labor rate.rates listed in Section I of this policy. Please note, these rates are subject to change as mandated by HUD. The determination regarding whether or not dwelling equipment needs to be replaced rather than repaired will be based on the life expectancy chart below.
EQUIPMENT LIFE EXPECTANCY RATES (BASED ON HUD GUIDELINES)
Equipment Life Expectancy
Stove 13 Years
Refrigerator 10 Years
Washer/Dryer (where provided by KCHA) 10 Years
Carpet 5 Years
Vinyl/Tile Flooring 10 Years
Blinds/Screens/Window Treatments 5 Years
Cabinet Boxes/Doors/Drawers 20 Years
Toilet 20 Years
Interior /Closet Doors 20 Years
Entry/Sliding/Patio Doors 50 Years
Tubs/Sinks/Tub Surrounds/Shower Doors 20 Years
Heater/Air Conditioning Units 14 Years
I.VI. CHARGES FOR DAMAGE TO BUILDINGS AND FIXTURES
For each incident, the total charge to repair the damage will be based on the total costs of material and labor required to repair the damage. All labor charges will be calculated using the current pay rate. maintenance/repair labor rates listed above in Section I. Examples of charges for damages within this category include, but are not limited to: glass replacement for light fixtures, floor tiles, holes in walls/ceilings, damaged/defaced/missing doors, and damaged door jams, etc. . . ..
IV. MISCELLANEOUS ITEMIZED CHARGES SERVICE WHEN CHARGED CHARGE KEYCHARGE All instances when a key, $3.00 including mailbox keys, is lost, not returned at the time of vacate, or an additional key is requested. Electronic key/access card $10.00
REMOVAL OF All cases when left by tenant for $20.00
TENANT removal (does not include garbage
PROPERTY TO /items left for pick-up on scheduled
DUMP garbage days): Miscellaneous furniture items $10.00 each
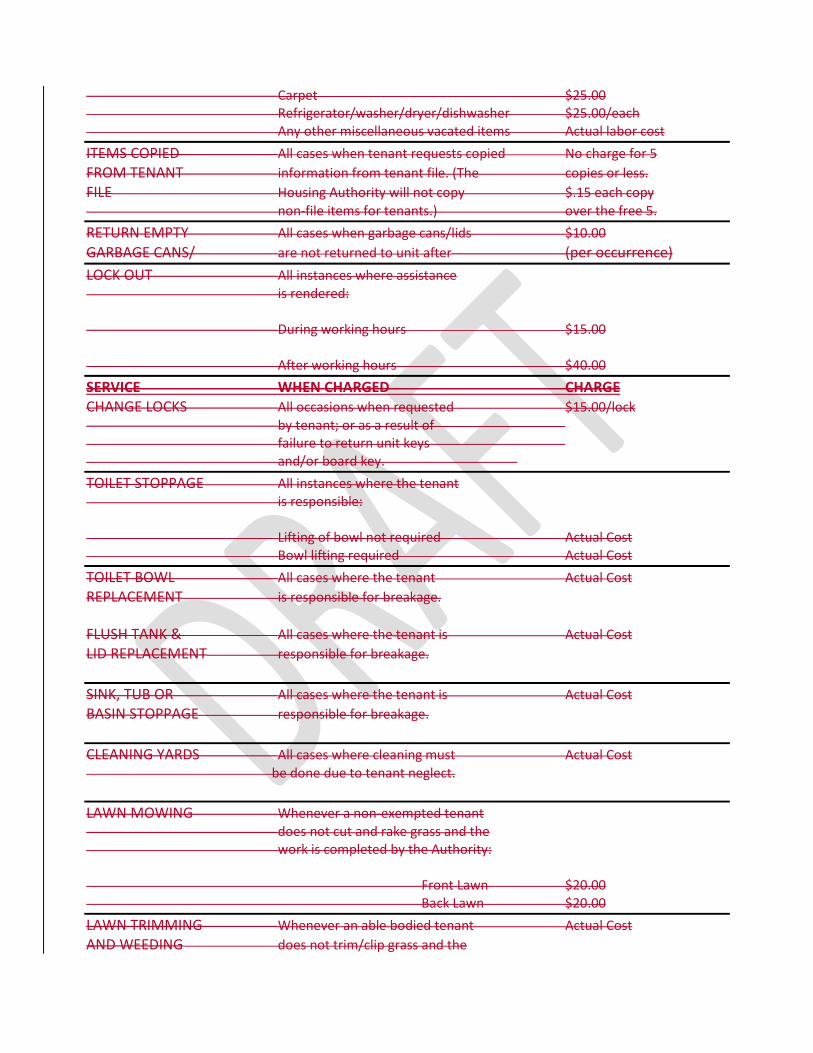
Carpet $25.00 Refrigerator/washer/dryer/dishwasher $25.00/each Any other miscellaneous vacated items Actual labor cost
ITEMS COPIED All cases when tenant requests copied No charge for 5
FROM TENANT information from tenant file. (The copies or less.
FILE Housing Authority will not copy $.15 each copy non-file items for tenants.) over the free 5.
RETURN EMPTY All cases when garbage cans/lids $10.00 GARBAGE CANS/ are not returned to unit after (per occurrence)
LOCK OUT All instances where assistance is rendered: During working hours $15.00 After working hours $40.00
SERVICE WHEN CHARGED CHARGE CHANGE LOCKS All occasions when requested $15.00/lock by tenant; or as a result of failure to return unit keys and/or board key.
TOILET STOPPAGE All instances where the tenant is responsible: Lifting of bowl not required Actual Cost Bowl lifting required Actual Cost
TOILET BOWL All cases where the tenant Actual Cost
REPLACEMENT is responsible for breakage.
FLUSH TANK & All cases where the tenant is Actual Cost
LID REPLACEMENT responsible for breakage.
SINK, TUB OR All cases where the tenant is Actual Cost
BASIN STOPPAGE responsible for breakage.
CLEANING YARDS All cases where cleaning must Actual Cost be done due to tenant neglect.
LAWN MOWING Whenever a non-exempted tenant does not cut and rake grass and the work is completed by the Authority: Front Lawn $20.00 Back Lawn $20.00
LAWN TRIMMING Whenever an able bodied tenant Actual Cost
AND WEEDING does not trim/clip grass and the
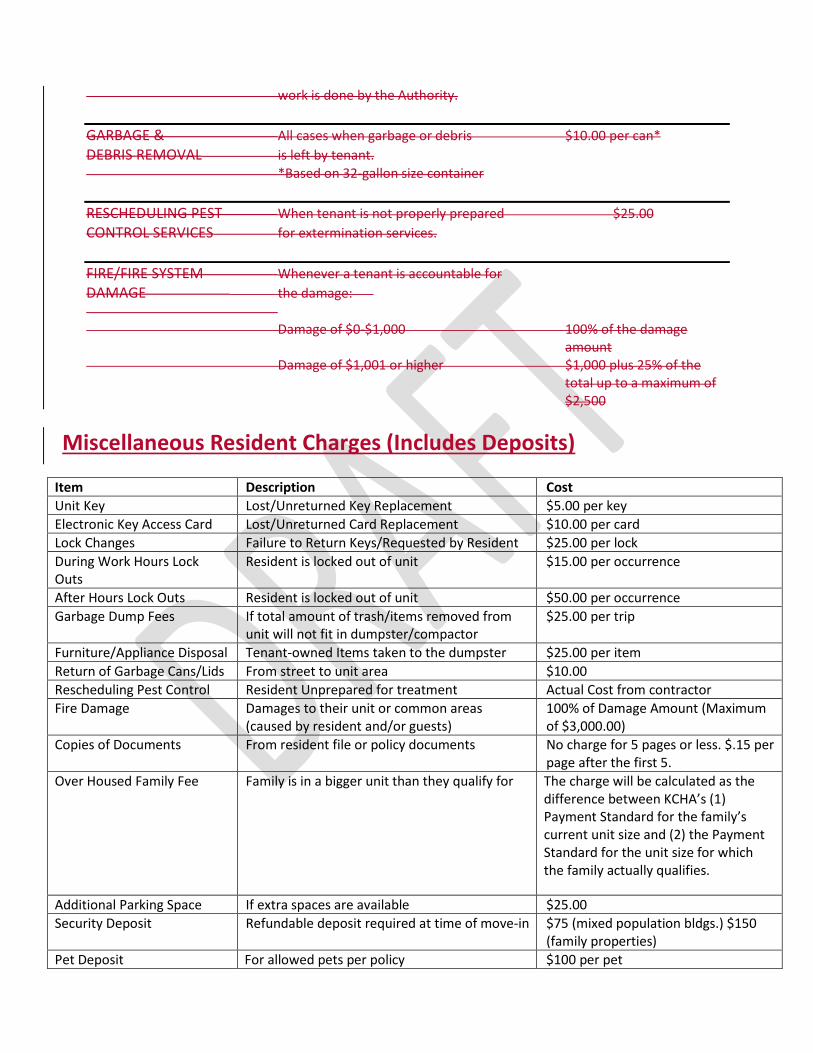
work is done by the Authority.
GARBAGE & All cases when garbage or debris $10.00 per can*
DEBRIS REMOVAL is left by tenant. *Based on 32-gallon size container
RESCHEDULING PEST When tenant is not properly prepared $25.00
CONTROL SERVICES for extermination services.
FIRE/FIRE SYSTEM Whenever a tenant is accountable for DAMAGE the damage: Damage of $0-$1,000 100% of the damage
amount Damage of $1,001 or higher $1,000 plus 25% of the
total up to a maximum of $2,500
Miscellaneous Resident Charges (Includes Deposits)
Item Description Cost
Unit Key Lost/Unreturned Key Replacement $5.00 per key
Electronic Key Access Card Lost/Unreturned Card Replacement $10.00 per card
Lock Changes Failure to Return Keys/Requested by Resident $25.00 per lock
During Work Hours Lock Outs
Resident is locked out of unit $15.00 per occurrence
After Hours Lock Outs Resident is locked out of unit $50.00 per occurrence
Garbage Dump Fees If total amount of trash/items removed from unit will not fit in dumpster/compactor
$25.00 per trip
Furniture/Appliance Disposal Tenant-owned Items taken to the dumpster $25.00 per item
Return of Garbage Cans/Lids From street to unit area $10.00
Rescheduling Pest Control Resident Unprepared for treatment Actual Cost from contractor
Fire Damage Damages to their unit or common areas (caused by resident and/or guests)
100% of Damage Amount (Maximum of $3,000.00)
Copies of Documents From resident file or policy documents No charge for 5 pages or less. $.15 per page after the first 5.
Over Housed Family Fee Family is in a bigger unit than they qualify for The charge will be calculated as the difference between KCHA’s (1) Payment Standard for the family’s current unit size and (2) the Payment Standard for the unit size for which the family actually qualifies.
Additional Parking Space If extra spaces are available $25.00
Security Deposit Refundable deposit required at time of move-in $75 (mixed population bldgs.) $150 (family properties)
Pet Deposit For allowed pets per policy $100 per pet

Note: All charges listed in this policy are subject to exceptions based on approved Reasonable Accommodation requests.

THE HOUSING AUTHORITY OF THE COUNTY OF KING
RESOLUTION NO. 5683
CHANGES TO THE PROPERTY MANAGEMENT LEASE, GRIEVANCE
POLICY AND TENANT CHARGE POLICY
WHEREAS, Public Housing and Project-based Housing Choice Voucher
program participants living in housing managed directly by KCHA’s Property
Management Department are subject to program guidelines as set forth in the Public
Housing Admissions and Continued Occupancy Policy (herein called the “ACOP”)and,
WHEREAS, the Tenant Lease (Exhibit J of the ACOP), the Grievance Policy
(Exhibit I of the ACOP), and the Tenant Charge Policy (Exhibit O of the ACOP) are used
to detail these policies for both residents and staff; and,
WHEREAS, Washington State Landlord/Tenant Laws are periodically updated
and amended based upon legislation passed by the Washington State Legislature; and
WHEREAS, HUD guidance regarding the administration of these programs is
also amended from time to time; and,
WHEREAS, these policies therefor required periodic updating to reflect new
state laws and HUD guidance; and,
WHEREAS, the additional language changes proposed will assist residents and
staff in understanding and accessing these policies; and,
WHEREAS, Board approval of revised operational policies and procedures is
required before KCHA can implement such changes:
NOW THEREFORE, BE IT RESOLVED BY THE BOARD OF
COMMISSIONERS OF THE HOUSING AUTHORITY OF THE COUNTY OF
KING, as follows:
(1) The Board of Commissioners hereby adopts revisions to the Public Housing
Admissions and Continued Occupancy Policy as attached; and
(2) Authorizes the Housing Authority to take the necessary steps to implement these
revisions effective April 19th, 2021.
ADOPTED BY THE BOARD OF COMMISSIONERS OF THE HOUSING
AUTHORITY OF THE COUNTY OF KING AT AN OPEN PUBLIC MEETING
THIS 19th DAY OF APRIL, 2021.
THE HOUSING AUTHORITY OF THE
COUNTY OF KING, WASHINGTON
____________________________________
DOUGLAS J. BARNES, Chair
Board of Commissioners
Attest:
____________________________________
STEPHEN J. NORMAN
Executive Director and Secretary-Treasurer

T A B
N U M B E R
4
To: Board of Commissioners
From: Andrew Calkins, Manager of Policy & Legislative Affairs Date: April 19, 2021 Re: FY 2020 Moving to Work Annual Report
As a participant in the Department of Housing and Urban Development’s Moving to Work (MTW) demonstration program, the King County Housing Authority is required to submit an annual report. Following the format prescribed by HUD, the attached FY 2020 MTW Annual Report outlines the agency’s goals, provides an overview of operational information for the MTW program, and summarizes the status of previously-approved initiatives. The opening letter from the Executive Director, along with Section I: Introduction (Overview of Short-Term MTW Goals and Objectives), provide concise summaries of the agency’s activities during 2020 and its response to the COVID-19 pandemic. At the March Board of Commissioners meeting, staff will provide a brief overview of the 2020 MTW Report. No action is required of the Board.
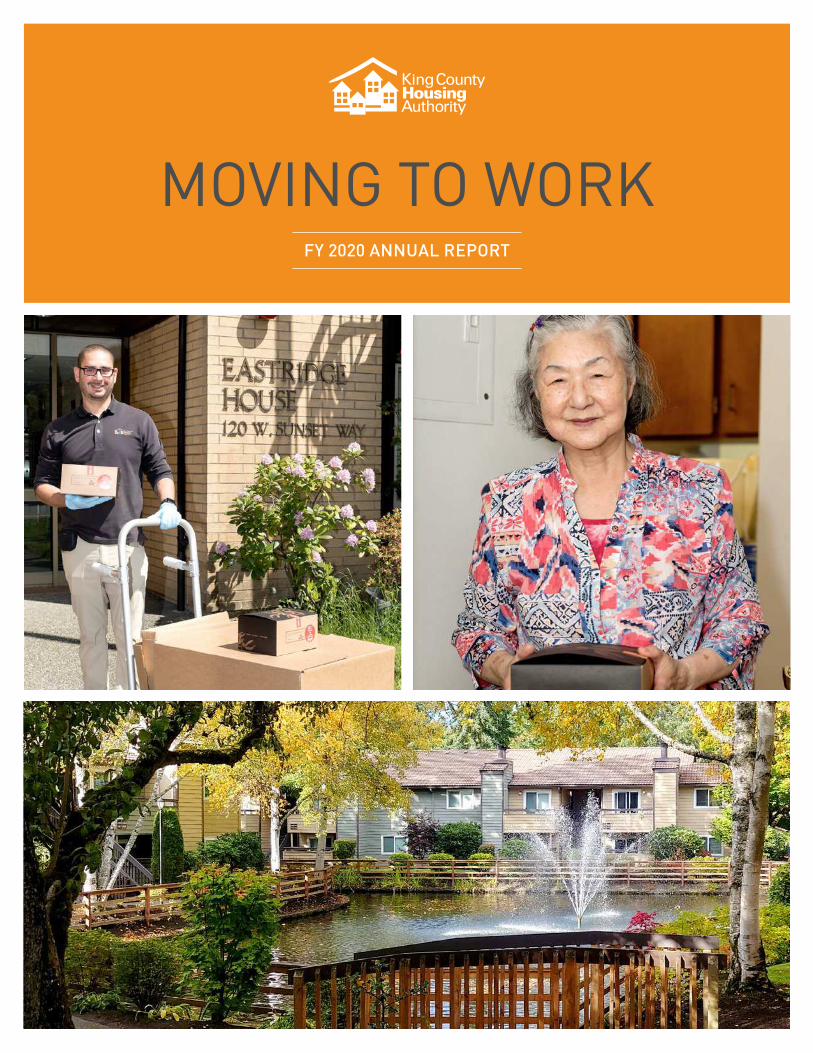
MOVING TO WORKFY 2020 ANNUAL REPORT
Prepared By: Andrew Calkins
Date: March 30, 2021
KING COUNTY
HOUSING AUTHORITY
B O A R D O F CO M M I S S I O N E R S
Doug Barnes, Chair
Michael Brown
Susan Palmer
TerryLynn Stewart
John Welch
E X E C U T I V E D I R E C TO R
Stephen J. Norman
K C H A S E N I O R M A N A G E M E N T
Jeb Best
Bill Cook
John Eliason
Windy Epps
Tonya Harlan
Shawli Hathaway
Karen House
Kristy Johnson
Judi Jones
Amy Kickliter
Gary Leaf
Nikki Parrott
Ginger Peck
Annie Pennucci
Jenn Ramirez Robson
Rhonda Rosenberg
Therese Ross
Pam Taylor
Craig Violante
Tim Walter
Dan Watson
Wen Xu
K I N G C OU N T Y H OU S I N G A U T H OR I T Y
M OV ING TO W ORK A NN UA L R E P OR T FY 20 20
T A B L E O F C ON T E N T S
Letter from the Executive Director
Section I: Introduct ion 1 A . O VER VIEW O F SHO RT -T ERM MTW GOA L S A ND OB JE CT I VE S
B . O VER VI EW O F LO NG -TER M M TW GO AL S A ND O B JEC T IVE S
Section I I : General Housing Authority Operat ing Information 8 A . HOU SING STO CK INFORM AT ION
Actual New Project-based Vouchers
Actual Existing Project-based Vouchers
Actual Other Changes to the Housing Stock in 2020
General Description of Actual Capital Fund Expenditures During 2020 B . LE ASI NG I NFOR MAT IO N
Actual Number of Households Served
Description of Any Issues and Solutions Related to Leasing C . WAI T L I ST I NFORMA TIO N
Waiting List Information at End of 2020
Changes to the Waiting List in 2020 D. INFORM AT ION O N STAT UT ORY O BJE CT I VE S AND RE QU IREM ENTS
75% of Families Assisted Are Very Low-income
Maintain Comparable Mix
Number of Households Transitioned to Self-sufficiency by Fiscal Year-end
Section I I I : Proposed MTW Activi ties 17
Section IV: Approved MTW Act iv i ties 18 A . IM PL EME NTE D A CT I VI TI ES
ACTIVITY 2019-1: Acquire and Develop New Affordable Housing
ACTIVITY 2018-1: Encouraging the Successful Lease-up of the Housing Choice Voucher
Program
ACTIVITY 2016-2: Conversion of Former Opt-out Developments to Public Housing
ACTIVITY 2015-2: Reporting on the Use of Net Proceeds from Disposition Activities
ACTIVITY 2014-1: Stepped-down Assistance for Homeless Youth
ACTIVITY 2014-2: Revised Definition of “Family”
ACTIVITY 2013-1: Passage Point Re-entry Housing Program
ACTIVITY 2013-2: Flexible Rental Assistance
ACTIVITY 2009-1: Project-based Section 8 Local Program Contract Term
ACTIVITY 2008-1: Acquire New Public Housing
ACTIVITY 2008-10 and 2008-11: EASY and WIN Rent Policies
ACTIVITY 2008-21: Public Housing and Housing Choice Voucher Utility Allowances
ACTIVITY 2007-6: Develop a Sponsor-based Housing Program
ACTIVITY 2007-14: Enhanced Transfer Policy
ACTIVITY 2005-4: Payment Standard Changes
ACTIVITY 2004-2: Local Project-based Section 8 Program
ACTIVITY 2004-3: Develop Site-based Waiting Lists
ACTIVITY 2004-5: Modified Housing Quality Standards (HQS) Inspection Protocols
ACTIVITY 2004-7: Streamlining Public Housing and Housing Choice Voucher Forms and
Data Processing
ACTIVITY 2004-9: Rent Reasonableness Modifications
ACTIVITY 2004-12: Energy Performance Contracting
ACTIVITY 2004-16: Housing Choice Voucher Occupancy Requirements B . NO T Y ET IM PL EME NTE D A CT I VI TI ES
ACTIVITY 2015-1: Flat Subsidy for Local, Non-traditional Housing Programs
ACTIVITY 2010-1: Supportive Housing for High-need Homeless Families
ACTIVITY 2010-9: Limit Number of Moves for a HCV Participant
ACTIVITY 2010-11: Incentive Payments to HCV Participants to Leave the Program
ACTIVITY 2008-3: FSS Program Modifications
ACTIVITY 2008-5: Allow Limited Double Subsidy between Programs (Project-based
Section 8/Public Housing/Housing Choice Vouchers) C . AC TI VIT IE S ON HO L D
D. C LO SE D-OU T AC TI VIT IE S
ACTIVITY 2016-1: Budget-based Rent Model
ACTIVITY 2013-3: Short-term Rental Assistance Program
ACTIVITY 2012-2: Community Choice Program
ACTIVITY 2012-4: Supplemental Support for the Highline Community Healthy Homes
Project
ACTIVITY 2011-1: Transfer of Public Housing Units to Project-based Subsidy
ACTIVITY 2011-2: Redesign the Sound Families Program
ACTIVITY 2010-2: Resident Satisfaction Survey
ACTIVITY 2010-10: Implement a Maximum Asset Threshold for Program Eligibility
ACTIVITY 2009-2: Definition of Live-in Attendant
ACTIVITY 2008-4: Combined Program Management
ACTIVITY 2008-6: Performance Standards
ACTIVITY 2008-17: Income Eligibility and Maximum Income Limits
ACTIVITY 2007-4: Housing Choice Voucher Applicant Eligibility
ACTIVITY 2007-8: Remove Cap on Voucher Utilization
ACTIVITY 2007-9: Develop a Local Asset Management Funding Model
ACTIVITY 2007-18: Resident Opportunity Plan (ROP)
ACTIVITY 2006-1: Block Grant Non-mainstream Vouchers
ACTIVITY 2005-18: Modified Rent Cap for Housing Choice Voucher Participants
ACTIVITY 2004-8: Resident Opportunities and Self-Sufficiency (ROSS) Grant
Homeownership
Section V: Sources and Uses of MTW Funds 56 A . SOUR CE S AND U SE S OF M TW FU NDS
Actual Sources and Uses of MTW Funds
Activities that Used Only MTW Single-fund Flexibility B . LOC AL A SSE T M ANAGEME N T PLA N
Section VI: Administrative 60 A . HU D RE VI EW S, AU DIT S , O R PHYSIC AL INSPEC TIO N I SSU E S
B . RE SU LT S OF LAT E ST KC HA - DIR ECT E D E VAL UA TIO NS
C . MTW STA TU TORY RE QU IREM ENT CERT I FI CAT IO N
D. M TW ENE RGY PER FOR M ANCE CONTRA CT (EP C) FLE XIB IL ITY DA TA
Appendi ces A PPE NDIX A . CER TI F ICA TIO N OF ST AT UTORY COM P LIA NC E
A PPE NDIX B . LOC AL A SSE T MANAG EME NT PLA N
A PPE NDIX C . E XI STI NG PRO JEC T- BA SE D VO UC HER CONTRA CT S
A PPE NDIX D. E VAL UA TIO NS
A PPE NDIX E . CO LL ATER AL I ZE D F UN DS RE PORT S
A PPE NDIX F. E NERGY P ERFO RMA NCE CO NT RAC T REPOR T
Board of Commissioners Doug Barnes, Chair Susan Palmer, Vice-Chair Michael Brown TerryLynn Stewart John Welch
Executive Director
Stephen J. Norman
600 Andover Park W • Seattle, WA 98188-3326 • kcha.org
Phone 206-574-1100 • Fax 206-574-1104 EQUAL HOUSING OPPORTUNITY
LETTER FROM THE EXECUTIVE DIRECTOR
The COVID-19 pandemic has starkly demonstrated the importance of housing as a fundamental
underpinning for personal and community health. The focus of King County Housing Authority (KCHA)
in 2020 has been on keeping residents, program participants, and staff safe; assuring the continued
delivery of essential services; and helping to mitigate the impacts of the pandemic and ensuing
economic downturn in our region.
KCHA closed its offices in March 2020 and pivoted to teleworking to the maximum extent possible.
With all but emergency work orders suspended, public housing field staff shifted to keeping the
residents living in our housing safe and healthy — putting particular emphasis on our 30 housing
complexes dedicated to seniors and people with disabilities. Community rooms were closed, air
circulation systems adjusted, and buildings disinfected seven days a week. Partnering with a wide
array of stakeholders — from local school districts to Amazon — KCHA staff from across the agency
delivered meals to thousands of families and individuals to enable them to safely shelter in place.
Resident Services staff undertook an expansive effort to reach residents by phone, providing the
human contact that so many or our residents desperately needed, particularly seniors.
During 2020, KCHA’s programs housed more than 15,000 children from low-income families. Faced
with the challenges of remote learning and physical distancing, KCHA joined with school districts and
local service providers to create all-day learning pods at four of our largest housing complexes. After-
school providers at seven other sites transitioned to offering educational support during the school
day to support remote learning. This initiative exposed existing inequities in internet access for low-
income and BIPOC (Black, Indigenous, and People of Color) communities in our region. This will be an
ongoing challenge as we move forward in addressing the region’s racial and economic disparities.
Housing Choice Voucher staff also shifted operations to connecting with clients over the phone and
internet, prioritizing HQS inspections to get medically at-risk people experiencing homelessness off
the street as quickly as possible, and working with landlords to secure homes for additional
households and assure ongoing housing stability. By the end of 2020, KCHA’s HUD-subsidized
programs were serving 16,023 households, 665 more than at the beginning of the year. Among all
households entering our federally assisted programs in 2020, 45% were experiencing homelessness or
living in temporary or emergency housing immediately prior to entry. Our Housing Choice Voucher
Block Grant utilization rate averaged 107% of HUD’s baseline.
Despite the challenges of the COVID-19 pandemic, KCHA’s construction and maintenance staff continued to focus on the safety and upkeep of our housing. In 2020, $10.7 million in capital projects
that did not require entry into occupied units went forward. These efforts included the substantial
MTW FY 2020 ANNUAL REPORT | KING COUNTY HOUSING AUTHORITY
rehabilitation of 193 units at resident turnover, extending the useful life of these apartments by 20
years. KCHA’s Real Estate Assessment Center score on inspections conducted before the suspension of activities in early 2020 averaged 90.2, and the overall inventory score stands at 94.0. The occupancy
rate for our public housing averaged 99.51% in 2020.
KCHA in 2020 was awarded 461 additional Housing Choice Vouchers targeted to people with special
needs, and is working with the region’s service delivery systems to assure rapid utilization and alignment with the supportive service streams necessary to assure ongoing housing stability. In
support of the region’s development pipeline for permanent supportive housing, KCHA project-based
Housing Choice Vouchers in two projects this year: the YMCA’s New Arcadia development and Catholic Housing Services’ Thea Bowman House. New Arcadia is housing 15 youth transitioning out of homelessness, and Thea Bowman will provide permanent supportive housing to 80 individuals
formerly experiencing homelessness, including 36 veterans. In partnership with King County, KCHA
also purchased the Oaks at Forest Bay, a vacant 45-room nursing home that will open soon as a
COVID-19 homeless shelter with a goal to redevelop the property as permanent supportive housing in
the future.
KCHA continues to take steps to address the displacement of low-income households living in
gentrifying neighborhoods — a trend that is accelerating economic and racial segregation in the
region. In 2020, KCHA purchased two additional properties in Bellevue, a community experiencing a
rapid expansion of high-paying employment in the technology sector. The purchase of these 144 units
will preserve this housing as affordable despite the intense surrounding market pressures. At the end
of 2020, KCHA finalized a partnership with Amazon that will help finance these acquisitions and pave
the way for the preservation, in total, of 1,000 units of existing housing.
As we move into 2021, our efforts must increasingly be shaped by questions of equity and racial
justice. The continuing fallout from the pandemic heightens the urgency of this approach. The Moving
to Work program provides KCHA the flexibility to collaborate with communities to determine how we
can best deploy federal resources to address local challenges. There is much to be done.
Sincerely,
Stephen Norman
Executive Director
MTW FY 2020 ANNUAL REPORT | KING COUNTY HOUSING AUTHORITY PAGE 1
S E C TI ON I
I N T R OD U C T I ON
A. OVERVIEW OF SHORT-TERM MTW GOALS AND OBJECTIVES
In 2020, the King County Housing Authority (KCHA) focused on using Moving to Work (MTW) flexibility
to adapt to the challenging and rapidly changing environment surrounding the COVID-19 pandemic. In
large part due to our MTW status, KCHA was in a strong position to respond to the needs of our lowest-
income community members. MTW flexibility enabled KCHA to maintain existing operations while
building out new partnerships to serve the community in critical new ways. Throughout the year, KCHA
continued to administer federal housing assistance to households facing the greatest barriers to access,
expanded the supply of affordable housing, leveraged staff capacity and leadership skills to quickly
adopt new ways of administering our programs, connected housing to supportive services, and
expanded social impact initiatives that advance positive life outcomes among residents.
In 2020, KCHA:
I NCREA SED THE NU MBER OF E XTREME LY LOW - INCOME HOU SE HO L DS W E SE R VE .
KCHA employed multiple strategies to expand our reach: property acquisitions; the lease-up of new
incremental special purpose vouchers; issuing vouchers beyond HUD’s Housing Choice Voucher
(HCV) baseline; and the continuation of sponsor-based, flexible, and stepped subsidy programs for
special populations. Our federally subsidized programs continued to surpass operational goals,
allowing us to house 14,370 families in 2020.1 The occupancy rate for our on-line owned units
averaged 99.51% and the utilization rate for our HCV block grant averaged 107% of HUD baseline.
I NCREA SED GEO GRAP HIC C HO IC E.
KCHA continued to use a multi-pronged approach to broaden our residents’ geographic choices
across King County. Strategies included: use of a six-tier, ZIP Code-based, payment standard system;
outreach and engagement efforts by dedicated landlord liaisons; expedited inspections; deposit
assistance; targeted new property acquisitions; and project-basing subsidies in high-opportunity
communities. By the close of 2020, over 30% of KCHA’s HUD-subsidized households with children
lived in high- or very high-opportunity neighborhoods, achieving the goal we had set to reach by the
1 This number does not include the 3,414 port-in vouchers that KCHA administered in 2020.
MTW FY 2020 ANNUAL REPORT | KING COUNTY HOUSING AUTHORITY PAGE 2
end of the year. KCHA also continued its partnership with the Seattle Housing Authority (SHA) and a
national interdisciplinary research team headed by Harvard economist Raj Chetty to administer the
Creating Moves to Opportunity (CMTO) initiative. In 2020, KCHA closed out Phase II of the
demonstration, and launched a third phase aimed at identifying the effectiveness of mobility
services for households with a voucher looking to make a subsequent move.
E XPANDE DE D O UR POR TF OL IO OF HOU SING A LO NG EMERG I NG M A SS T RA NSI T COOR I DOR S.
KCHA continued to actively seek out property acquisitions in strategic areas of King County,
including current and emerging high-opportunity neighborhoods and transit-oriented development
sites, to ensure that low-income families can access the benefits these areas afford. In 2020, we
leveraged below-market financing from Amazon to acquire two properties in Bellevue, Pinewood
Village and Illahee Apartments, adding 144 units to our expanding supply of affordable housing. By
year’s end, KCHA’s portfolio had grown to 11,725 units, of which more than half are sited in high-
opportunity neighborhoods.
F O STER O PPOR TU NI TY I N NE IG HBOR HO ODS WI T H HIG H RA TE S O F PO VER TY .
In 2020, KCHA continued our work to bring opportunity to neighborhoods that are historically
underserved and under-resourced, and where the majority of the region’s low-income households
currently live. KCHA continued to provide community facilities that support youth and family
programs across the region. To respond to the heightened demand for resources during the
pandemic, KCHA worked closely with nonprofit partners to bring emergency food supplies onsite in
under-resourced areas and connected residents to other vital resources.
L E VER AGE D PAR TNER SHI P S T HAT A DDR ESSE D T HE MU LT I - FA CET ED NEE DS OF F AM IL IE S
E XPER IE NC ING HOME LE SSNE SS I N O UR REG ION .
In 2020, 45% of all households that entered our federally assisted programs were experiencing
homelessness or living in temporary or emergency housing immediately prior to receiving KCHA
assistance. Our programs serve a diverse population with varying needs: veterans exiting
homelessness; individuals with behavioral health needs; people with prior criminal justice system
involvement; unaccompanied youth; youth experiencing homelessness or transitioning out of foster
care; and families involved with the child welfare system. In 2020, KCHA was awarded new
allocations of special purpose vouchers, including: 200 Veterans Affairs Supportive Housing (VASH)
vouchers for veterans exiting homelessness; 190 Mainstream vouchers that target non-elderly
MTW FY 2020 ANNUAL REPORT | KING COUNTY HOUSING AUTHORITY PAGE 3
people with disabilities, many of whom are experiencing homelessness; and 71 Family Unification
Program (FUP) vouchers serving both families and youth involved in the child welfare system who
are experiencing or at high risk of homelessness. These additional 461 special purpose vouchers
have been a critical resource in expanding our reach during a public health crisis, and in fostering
cross-system efforts to combat housing instability and homelessness among some of the most
marginalized members of our community.
E XPANDE D HO U SI NG A SSI STA NCE TO HOU SEHOL DS E XPE RIE NC I NG HO MEL E SSNE SS T HROU GH
I NNO VA TI VE P ROGRAM S.
Working closely with our service provider partners, KCHA continued to support innovative programs
that utilize federal housing resources to address our region’s homelessness crisis. In 2020, KCHA
worked with Highline College to launch the While in School Housing Program (WISH), a time-limited
rental subsidy pilot that supports post-secondary students experiencing homelessness through the
duration of their academic program and six months following graduation. KCHA also continued a
cross-system collaborative partnership with the Washington State Department of Children, Youth,
and Families (DCYF) and Catholic Community Services to provide a scattered-site supportive housing
model that serves families with children involved in the child welfare system. Finally, with the
addition of 190 new Mainstream vouchers, we were able to expand housing opportunities for non-
elderly people with disabilities through KCHA’s Housing Access and Services Program (HASP), an
almost two-decade partnership with King County’s disability systems. Many of those housed
through the additional Mainstream vouchers were at high risk of contracting COVID-19. At the end
of 2020, the HASP program was housing 2,049 households.
DEE PE NE D PAR T NER SHI P S W IT H LOCA L SC HOOL DISTR IC TS T O IMP RO VE E DUCA TIO NA L
O UTCO ME S.
More than 15,000 children lived in KCHA’s federally subsidized housing during 2020. Our strategies
to support these children’s academic success are the cornerstone of our efforts to prevent multi-
generational cycles of poverty and promote long-term socioeconomic mobility. During the
pandemic, these efforts adapted to the challenges of remote learning and physical distancing. KCHA
coordinated with after-school providers and local schools to create learning pods at four KCHA sites
with high numbers of school-aged children. After-school providers at seven other sites also
transitioned to offering some educational support services during the school day to support remote
learning. KCHA also launched a new pilot, Neighborhood Early Learning Connectors, a co-designed
MTW FY 2020 ANNUAL REPORT | KING COUNTY HOUSING AUTHORITY PAGE 4
program with residents that employs eight resident interns to connect KCHA families to local
programming and resources that support healthy child development, while also supporting families
to register their young children in pre-school and kindergarten. We continued to collaborate with
families, school districts, and local education stakeholders across King County to advance other key
outcomes, including housing and classroom stability, increased parental engagement during the
pandemic, increased access to quality afterschool programs, and improved high school graduation
rates for KCHA youth. To respond to increased food insecurity during the pandemic, KCHA also
worked with 10 school districts and a range of nonprofit and public partners to bring no-cost meals
and food boxes to families living at subsidized housing sites across King County.
SU PPOR TE D F AMI L IE S I N G AI NI NG GRE ATE R E CONOMI C I NDEPE NDE NCE .
During 2020, KCHA assisted 314 Public Housing and HCV households in the Family Self-Sufficiency
(FSS) program, with 35 of the families graduating from the program. The FSS program advances
families toward economic independence through individualized case management, supportive
services, and program incentives including a monthly contribution to an escrow account when a
family experiences an increase in earned income. With the onset of the pandemic, the FSS team
quickly pivoted to remote services and employed multiple strategies to engage residents, including:
conducting regular communication via email, telephone, and video conference; surveying
participants on emerging needs and topics; offering one-on-one virtual budgeting sessions; and
organizing drive-thru events to distribute face coverings, non-perishable food, and other resources.
I NVE STE D I N T HE E LIM I NAT IO N O F AC CRUE D C AP ITA L RE PAI R AND SY STEM REP LA CEME NT NEE DS
I N OU R FE DER AL LY SUB SI DI ZED HO USI NG I NVENTORY .
In 2020, KCHA delayed a number of large capital investments to safeguard resident safety during the
pandemic, and instead focused on external site repairs. Even with this shift, KCHA invested more
than $10.7 million in major repairs to our federally subsidized housing stock, ensuring that quality
housing options remain available to low-income families for years to come. This investment
improved resident safety, reduced maintenance costs and energy consumption, and extended the
life expectancy of these affordable homes. The average Real Estate Assessment Center (REAC) score
for KCHA’s Public Housing inventory inspected in 2020 was 90.2. Our overall inventory score, using
the most current rating for each property, is 94.0.
MTW FY 2020 ANNUAL REPORT | KING COUNTY HOUSING AUTHORITY PAGE 5
ST RENGT HE NE D OUR ME A SUR EME NT, LEAR NING , AND RE SE ARC H CA PAC I TIE S.
In 2020, KCHA continued to leverage our internal capacity for program design and evaluation, and
data management and analysis, while also expanding external partnerships that advance our long-
term research agenda. We continued implementation of the CMTO mobility study in collaboration
with research partners from Harvard, Massachusetts Institute of Technology, Johns Hopkins, and
other universities; began a research project with Johns Hopkins to explore the effects of housing
assistance on children’s health outcomes; initiated a HUD-funded research project with Public
Health Seattle-King County to examine health outcomes associated with positive and negative exits
from housing assistance; completed a collaboration with the University of Washington to
understand the characteristics and experiences of residents moving while using HCV; participated in
a HUD-sponsored evaluation of FUP conducted by the Urban Institute; obtained private funding to
contract with the Urban Institute to measure outcomes of families in place-based assistance located
in high-opportunity areas; and conducted internal assessments of several of our programs. These
efforts support the MTW program’s mission to pilot and assess new approaches that more
effectively and efficiently address local housing needs and interrupt intergenerational cycles of
poverty.
C REA TE D M ORE CO ST -E FF ECT I VE PR OGRAM S BY STA NDAR DI ZI NG L EA DER SHIP P RAC TI CE S,
ST REAM LI NING B U SI NE SS PRO CE SSE S, A ND LE VER AGI NG T EC HNOLOGY IN CORE BU SI NE SS.
KCHA leadership emphasizes a culture of continuous improvement that supports and encourages
employees to improve the quality of their work and KCHA’s overall operations. During the
pandemic, KCHA was able to quickly adjust processes to maintain continuity of operations and
provide effective customer service to our residents, landlords, and community partners. KCHA’s
cross-departmental Virus Response Team (VRT) introduced a number of cost-effective and
streamlined processes to maintain operations during the pandemic, including rapid tenant income
adjustments, new Housing Quality Standards (HQS) inspection protocols, and modified move-in
processes to reduce potential exposure. In 2020, KCHA also leveraged technology to a greater
degree to provide core services remotely, including virtual HCV briefings. Flexibilities provided under
MTW significantly aided our success in responding to the challenges posed by the pandemic.
RE DUCE D T HE ENVIRO NME NTA L IM PAC T OF KC HA’ S P R OGRAM S A ND FAC I LI TIE S.
In 2020, KCHA entered the fourth year of our five-year Resource Management Plan. We continue to
reduce water and energy use, add to the number of alternatively powered vehicles in our fleet, and

MTW FY 2020 ANNUAL REPORT | KING COUNTY HOUSING AUTHORITY PAGE 6
increase solar capacity. KCHA in 2020 added 37.8 kilowatts of solar capacity at Meadows at Lea Hill,
bringing agency-wide solar generating capacity to 234.5 kilowatts. KCHA also collaborated with King
County’s Solid Waste Division to deliver programming to families and youth living in the White
Center neighborhood, including: a sustainable gardening program for nearly 100 gardeners; a youth
program focused on recycling and reducing household chemicals that reached 225 households; and
a family-focused program that taught safe cleaning, recycling, handling of household hazardous
waste, and proper food storage practices.
B. OVERVIEW OF LONG-TERM MTW GOALS AND OBJECTIVES
Through our participation in the MTW demonstration program, KCHA is able to address a wide range of
affordable housing needs in the Puget Sound region. These goals all must be carefully and continuously
viewed through an equity lens, assuring that both internal and external policies and practices recognize
and address the impact of long-standing systemic and institutional racism on underserved and BIPOC
communities. We use the single-fund and regulatory flexibility provided through MTW to support these
overarching strategic goals:
ST RAT EGY 1: Continue to strengthen the physical, operational, financial, and environmental
sustainability of our portfolio of more than 11,700 affordable housing units.
ST RAT EGY 2: Increase the supply of housing in the region that is affordable to extremely low-income
households — those earning below 30% of Area Median Income (AMI) — through the development
of new housing and the preservation of existing housing, as well as through expansion in the size
and reach of our rental subsidy programs.
ST RAT EGY 3: Affirmatively Further Fair Housing and provide greater geographic choice for low-
income households, including residents with disabilities, elderly residents with mobility
impairments, and families with young children, so that more of our residents have the opportunity
to live in neighborhoods with high-performing schools and convenient access to support services,
health care, transit, and employment.
ST RAT EGY 4: Coordinate closely with behavioral health and other social services systems to increase
the supply of supportive housing for people who have experienced chronic homelessness and/or
MTW FY 2020 ANNUAL REPORT | KING COUNTY HOUSING AUTHORITY PAGE 7
have special needs, with the goal of making homelessness rare, brief, and one-time in King County.
ST RAT EGY 5: Engage in the revitalization of King County’s low-income neighborhoods, with a focus
on housing and other services, amenities, institutions, and partnerships that empower strong,
healthy communities.
ST RAT EGY 6: Work with King County government, regional transit agencies, and suburban cities to
support sustainable and equitable regional development by building or preserving affordable
housing in regional growth corridors aligned with current and planned mass transit investments.
ST RAT EGY 7: Expand and deepen partnerships with our residents, local school districts, Head Start
programs, after-school program providers, public health departments, community colleges, and the
philanthropic community with the goal of improving educational and life outcomes for the low-
income children and families we serve.
ST RAT EGY 8: Promote greater economic independence for families and individuals living in
subsidized housing by addressing barriers to employment and facilitating access to training and
education programs, with the goal of enabling moves to market-rate housing at the appropriate
time.
ST RAT EGY 9: Continue to develop institutional capacity and efficiencies at KCHA to make the most
effective use of federal resources.
ST RAT EGY 10: Continue to reduce KCHA’s environmental footprint through energy conservation,
renewable energy generation, waste stream diversion, green procurement policies, water usage
reduction, and fleet management practices.
ST RAT EGY 11: Develop our capacity as a learning organization that uses research and evaluation to
drive decisions that shape policies and programs.
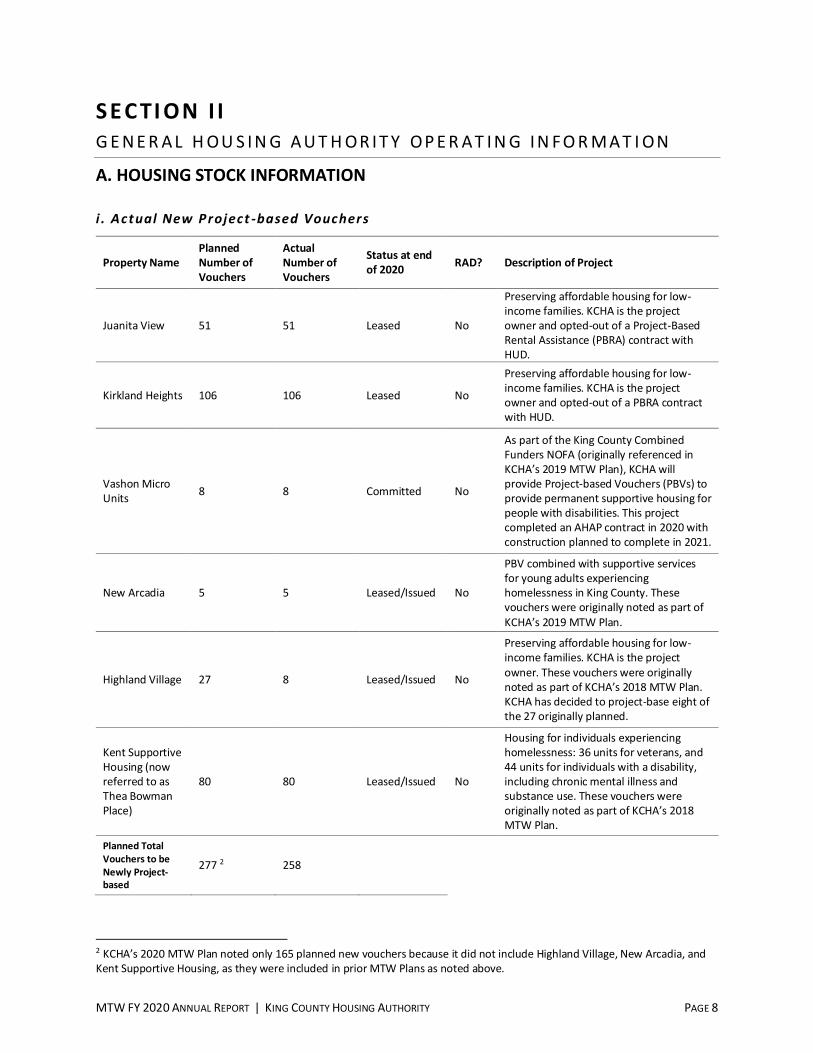
MTW FY 2020 ANNUAL REPORT | KING COUNTY HOUSING AUTHORITY PAGE 8
S E C TI ON I I G E N E R A L H OU S I N G A U T H OR I T Y OP E R A T I N G I N F O R M A T I ON
A. HOUSING STOCK INFORMATION
i . Actual New Project -based Vouchers
Property Name
Planned
Number of
Vouchers
Actual
Number of
Vouchers
Status at end
of 2020 RAD? Description of Project
Juanita View 51 51 Leased No
Preserving affordable housing for low-
income families. KCHA is the project
owner and opted-out of a Project-Based
Rental Assistance (PBRA) contract with
HUD.
Kirkland Heights 106 106 Leased No
Preserving affordable housing for low-
income families. KCHA is the project
owner and opted-out of a PBRA contract
with HUD.
Vashon Micro
Units 8 8 Committed No
As part of the King County Combined
Funders NOFA (originally referenced in
KCHA’s 2019 MTW Plan), KCHA will
provide Project-based Vouchers (PBVs) to
provide permanent supportive housing for
people with disabilities. This project
completed an AHAP contract in 2020 with
construction planned to complete in 2021.
New Arcadia 5 5 Leased/Issued No
PBV combined with supportive services
for young adults experiencing
homelessness in King County. These
vouchers were originally noted as part of
KCHA’s 2019 MTW Plan.
Highland Village 27 8 Leased/Issued No
Preserving affordable housing for low-
income families. KCHA is the project
owner. These vouchers were originally
noted as part of KCHA’s 2018 MTW Plan. KCHA has decided to project-base eight of
the 27 originally planned.
Kent Supportive
Housing (now
referred to as
Thea Bowman
Place)
80 80 Leased/Issued No
Housing for individuals experiencing
homelessness: 36 units for veterans, and
44 units for individuals with a disability,
including chronic mental illness and
substance use. These vouchers were
originally noted as part of KCHA’s 2018 MTW Plan.
Planned Total
Vouchers to be
Newly Project-
based
277 2 258
2 KCHA’s 2020 MTW Plan noted only 165 planned new vouchers because it did not include Highland Village, New Arcadia, and Kent Supportive Housing, as they were included in prior MTW Plans as noted above.
MTW FY 2020 ANNUAL REPORT | KING COUNTY HOUSING AUTHORITY PAGE 9
i i . Actual Exist ing Project -based Vouchers
See Appendix C for a list of KCHA’s existing PBV contracts. In total, KCHA currently project-bases 2,840
vouchers, of which 70% are sited in KCHA-owned properties. All other project-based vouchers are
situated in nonprofit-owned properties. These vouchers support the goals of leveraging services to
provide permanent supportive housing for people formerly experiencing homelessness, increasing
access for extremely low-income households to high-opportunity neighborhoods, and — in partnership
with King County — assisting in the financing of a pipeline of new affordable housing by the region’s
nonprofit housing sector.
i i i . Actual Other Changes to the Housing Stock in 2020
In 2020, KCHA purchased Pinewood Village and Illahee Apartments, adding 144 units to our inventory of
affordable housing. KCHA also completed the conversion of Kirkland Heights and Juanita View, two
properties acquired in 2019, from PBRA contracts with HUD to KCHA-funded PBV assistance. At the end
of 2020, KCHA’s inventory stood at 11,725 units.
i v . General Descript ion of Actual Capi tal Fund Expen ditures During 2020
KCHA continued to improve the quality and long-term viability of our aging affordable housing inventory
by investing more than $10.7 million in capital repairs, unit upgrades, capital construction, and non-
routine maintenance to our HUD-subsidized properties. These investments ensure that our housing
stock is well-maintained and livable for years to come. In 2020, KCHA delayed or altered a number of
projects in order to maintain resident safety during the pandemic.
U N I T U P G R A D E S ( $ 4 . 2 M I L L I O N )
In 2020, KCHA continued ongoing efforts to significantly upgrade the interiors of our affordable
housing inventory as units turn over. KCHA’s in-house, skilled workforce performed the renovations,
which included installation of new flooring, cabinets, and fixtures that extended the useful life of
193 units by 20 years, including 135 units in our HUD-subsidized inventory.
B U I L D I N G E N V E L O P E A N D R E L A T E D C O M P O N E N T S U P G R A D E S ( $ 3 . 0 M I L L I O N )
In 2020, the first phase of substantial renovation work planned for the recently acquired Houghton
property (Kirkland) was completed. This work included the addition of a second story, which
expanded four one-bedroom units into three-bedroom apartments, increasing the site’s capacity to
accommodate children in this high-opportunity neighborhood. KCHA installed new roofs at
Northlake House (Bothell) and Hidden Village (Bellevue). At Pacific Court (Tukwila), KCHA replaced
MTW FY 2020 ANNUAL REPORT | KING COUNTY HOUSING AUTHORITY PAGE 10
all envelope components, including siding, windows, doors, and roofs. New soffits were installed at
Casa Madrona (Olympia). Due to the pandemic, KCHA postponed the envelope work at Kirkland
Place (Kirkland), which would have required entry into each unit, until 2021.
S Y S T E M S ( H E A T I N G , S E W E R , E L E C T R I C A L , D R A I N A G E , S P R I N K L E R ) I M P R O V E M E N T S
( $ 1 . 1 M I L L I O N )
KCHA delayed the planned lining of the sewers at Casa Madrona (Olympia), Westminster
(Shoreline), and Yardley Arms (Burien) until 2021. These projects require both entry into a number
of resident units and temporary water shutoffs, both of which presented unreasonable impacts on
residents during the pandemic. All three of these properties house people with disabilities and
elderly residents. At Munro Manor (Burien), KCHA completed only the lines running outside of the
building in order to avoid unit entry. At Casa Juanita (Shoreline), a break in a main sewer line
resulted in an emergency repair and lining of the sewer system in 2020. At Casa Madrona, the
failure of the domestic hot water heaters, pumps, and boilers required emergency replacement to
components of the heating system. KCHA rescheduled to at least 2021 (post-pandemic) the
replacement of the in-unit radiators in the hydronic heat systems at Casa Madrona and Mardi Gras
(Kent), as well as planned electrical upgrades at Pacific Court (Tukwila) and Wayland Arms (Auburn).
“ 5 0 9 ” I N I T I A T I V E I M P R O V E M E N T S ( $ 1 . 4 M I L L I O N )
Planned improvements to the inventory included in the 2013 conversion of 509 scattered-site Public
Housing properties continued in 2020. At Avondale Manor (Redmond), KCHA improved site
drainage, and the parking lot, curbs, and gutters. Sidewalks were replaced and parking areas
repaved at Cedarwood (Kirkland). The sewer line replacement project at Young’s Lake (Renton),
which also involved complete upgrades of unit interiors, and site improvements at Evergreen Court
(Federal Way) also were completed.
O T H E R C O M P L E T E D P R O J E C T S ( $ 1 M I L L I O N )
Project delays due to the pandemic left funding and staff capacity available to complete additional
capital work not requiring interior unit access. KCHA made structural repairs to six buildings at
Ballinger Homes (Shoreline) and painted all buildings at the 262 unit Birch Creek Apartments (Kent).
KCHA re-roofed three buildings at Spiritwood Manor (Bellevue) and addressed an emerging site
drainage issue at Paramount House (Shoreline). KCHA staff also worked to reconfigure offices and
MTW FY 2020 ANNUAL REPORT | KING COUNTY HOUSING AUTHORITY PAGE 11
installed safety measures at multiple properties to safeguard staff and resident safety during the
pandemic.
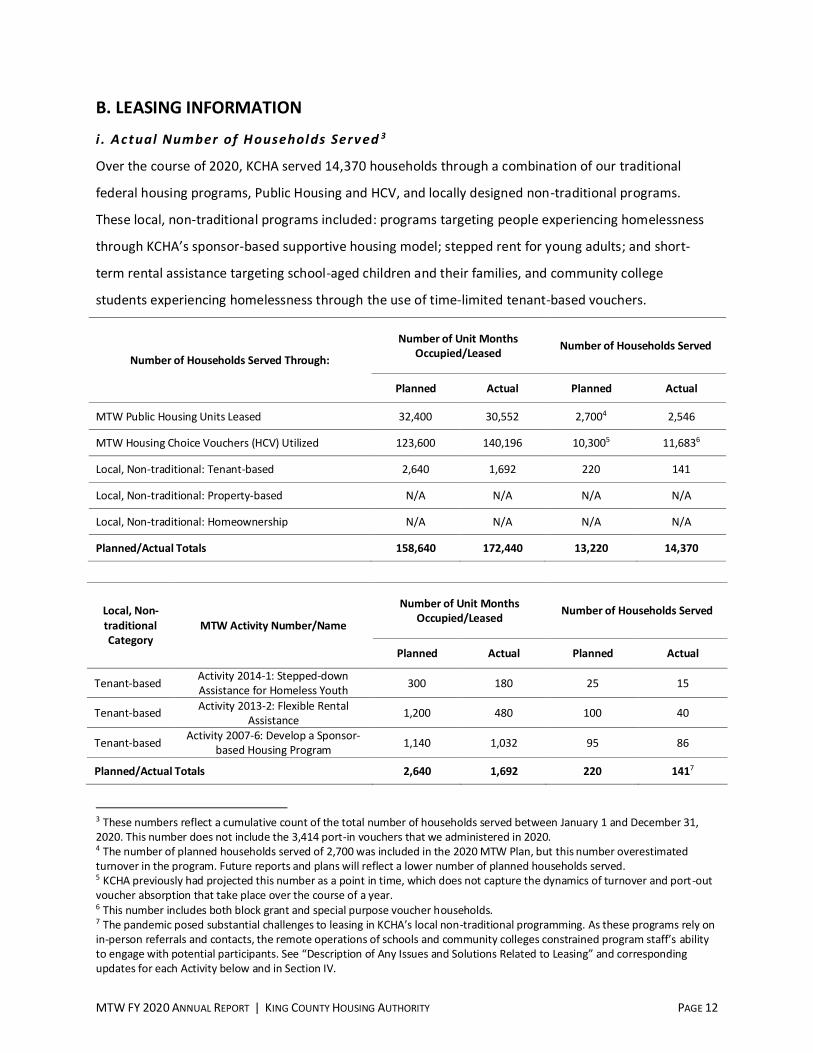
MTW FY 2020 ANNUAL REPORT | KING COUNTY HOUSING AUTHORITY PAGE 12
B. LEASING INFORMATION
i . Actual Number of Households Served 3
Over the course of 2020, KCHA served 14,370 households through a combination of our traditional
federal housing programs, Public Housing and HCV, and locally designed non-traditional programs.
These local, non-traditional programs included: programs targeting people experiencing homelessness
through KCHA’s sponsor-based supportive housing model; stepped rent for young adults; and short-
term rental assistance targeting school-aged children and their families, and community college
students experiencing homelessness through the use of time-limited tenant-based vouchers.
Number of Households Served Through:
Number of Unit Months
Occupied/Leased Number of Households Served
Planned Actual Planned Actual
MTW Public Housing Units Leased 32,400 30,552 2,7004 2,546
MTW Housing Choice Vouchers (HCV) Utilized 123,600 140,196 10,3005 11,6836
Local, Non-traditional: Tenant-based 2,640 1,692 220 141
Local, Non-traditional: Property-based N/A N/A N/A N/A
Local, Non-traditional: Homeownership N/A N/A N/A N/A
Planned/Actual Totals 158,640 172,440 13,220 14,370
Local, Non-
traditional
Category
MTW Activity Number/Name
Number of Unit Months
Occupied/Leased Number of Households Served
Planned Actual Planned Actual
Tenant-based Activity 2014-1: Stepped-down
Assistance for Homeless Youth 300 180 25 15
Tenant-based Activity 2013-2: Flexible Rental
Assistance 1,200 480 100 40
Tenant-based Activity 2007-6: Develop a Sponsor-
based Housing Program 1,140 1,032 95 86
Planned/Actual Totals 2,640 1,692 220 1417
3 These numbers reflect a cumulative count of the total number of households served between January 1 and December 31,
2020. This number does not include the 3,414 port-in vouchers that we administered in 2020. 4 The number of planned households served of 2,700 was included in the 2020 MTW Plan, but this number overestimated
turnover in the program. Future reports and plans will reflect a lower number of planned households served. 5 KCHA previously had projected this number as a point in time, which does not capture the dynamics of turnover and port-out
voucher absorption that take place over the course of a year. 6 This number includes both block grant and special purpose voucher households. 7 The pandemic posed substantial challenges to leasing in KCHA’s local non-traditional programming. As these programs rely on
in-person referrals and contacts, the remote operations of schools and community colleges constrained program staff’s ability
to engage with potential participants. See “Description of Any Issues and Solutions Related to Leasing” and corresponding updates for each Activity below and in Section IV.
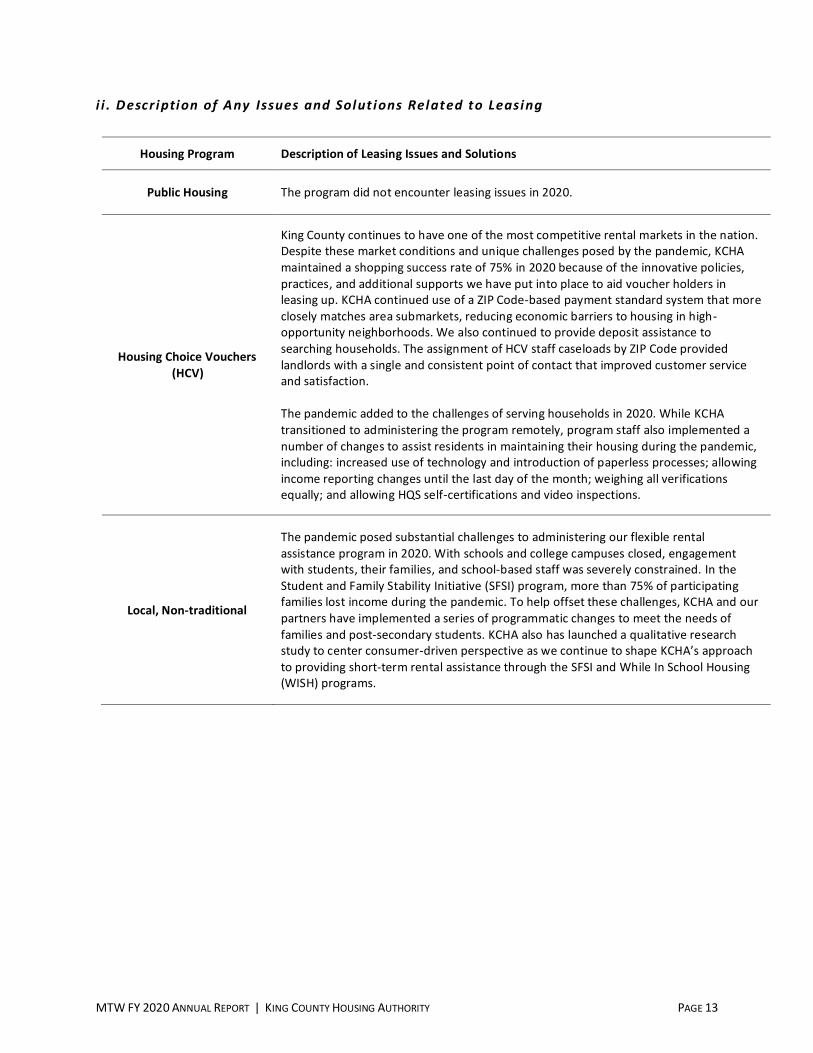
MTW FY 2020 ANNUAL REPORT | KING COUNTY HOUSING AUTHORITY PAGE 13
i i . Descr iption of Any Issues and Solut ions Related to Leasing
Housing Program Description of Leasing Issues and Solutions
Public Housing The program did not encounter leasing issues in 2020.
Housing Choice Vouchers
(HCV)
King County continues to have one of the most competitive rental markets in the nation.
Despite these market conditions and unique challenges posed by the pandemic, KCHA
maintained a shopping success rate of 75% in 2020 because of the innovative policies,
practices, and additional supports we have put into place to aid voucher holders in
leasing up. KCHA continued use of a ZIP Code-based payment standard system that more
closely matches area submarkets, reducing economic barriers to housing in high-
opportunity neighborhoods. We also continued to provide deposit assistance to
searching households. The assignment of HCV staff caseloads by ZIP Code provided
landlords with a single and consistent point of contact that improved customer service
and satisfaction.
The pandemic added to the challenges of serving households in 2020. While KCHA
transitioned to administering the program remotely, program staff also implemented a
number of changes to assist residents in maintaining their housing during the pandemic,
including: increased use of technology and introduction of paperless processes; allowing
income reporting changes until the last day of the month; weighing all verifications
equally; and allowing HQS self-certifications and video inspections.
Local, Non-traditional
The pandemic posed substantial challenges to administering our flexible rental
assistance program in 2020. With schools and college campuses closed, engagement
with students, their families, and school-based staff was severely constrained. In the
Student and Family Stability Initiative (SFSI) program, more than 75% of participating
families lost income during the pandemic. To help offset these challenges, KCHA and our
partners have implemented a series of programmatic changes to meet the needs of
families and post-secondary students. KCHA also has launched a qualitative research
study to center consumer-driven perspective as we continue to shape KCHA’s approach to providing short-term rental assistance through the SFSI and While In School Housing
(WISH) programs.
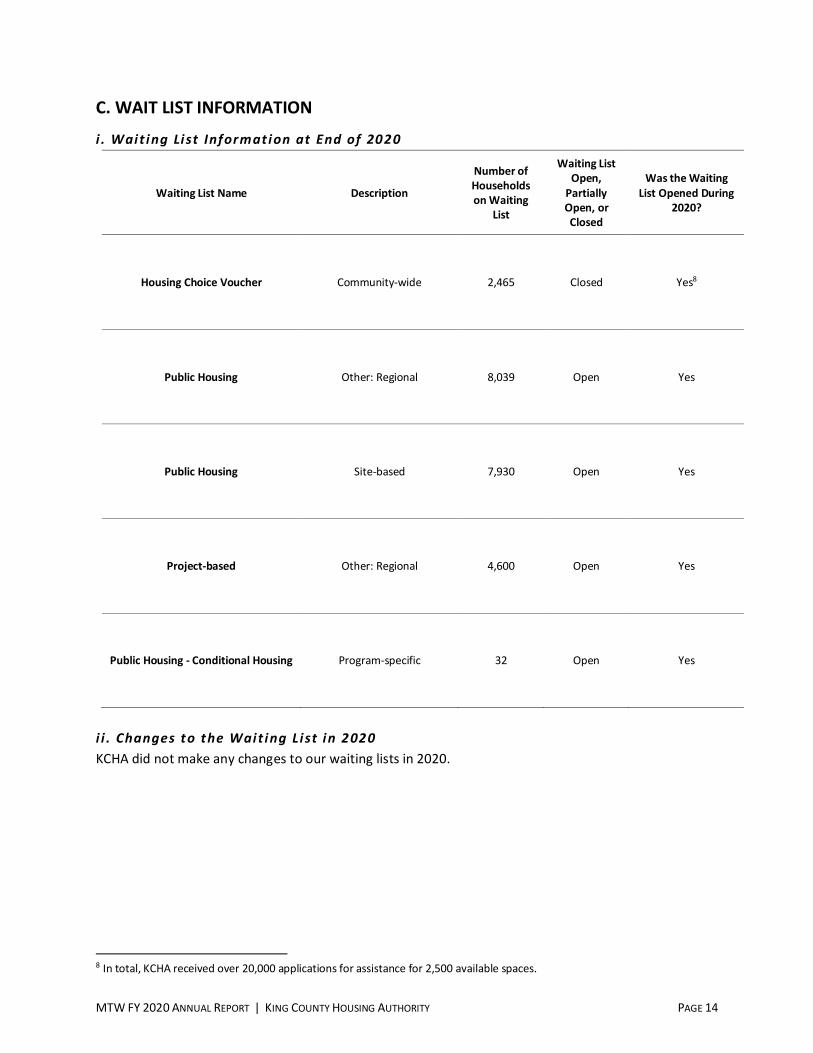
MTW FY 2020 ANNUAL REPORT | KING COUNTY HOUSING AUTHORITY PAGE 14
C. WAIT LIST INFORMATION
i . Wait ing Li st Information at End of 2020
Waiting List Name Description
Number of
Households
on Waiting
List
Waiting List
Open,
Partially
Open, or
Closed
Was the Waiting
List Opened During
2020?
Housing Choice Voucher Community-wide 2,465 Closed Yes8
Public Housing Other: Regional 8,039 Open Yes
Public Housing Site-based 7,930 Open Yes
Project-based Other: Regional 4,600 Open Yes
Public Housing - Conditional Housing Program-specific 32 Open Yes
i i . Changes to the Wait ing Li st in 2020
KCHA did not make any changes to our waiting lists in 2020.
8 In total, KCHA received over 20,000 applications for assistance for 2,500 available spaces.
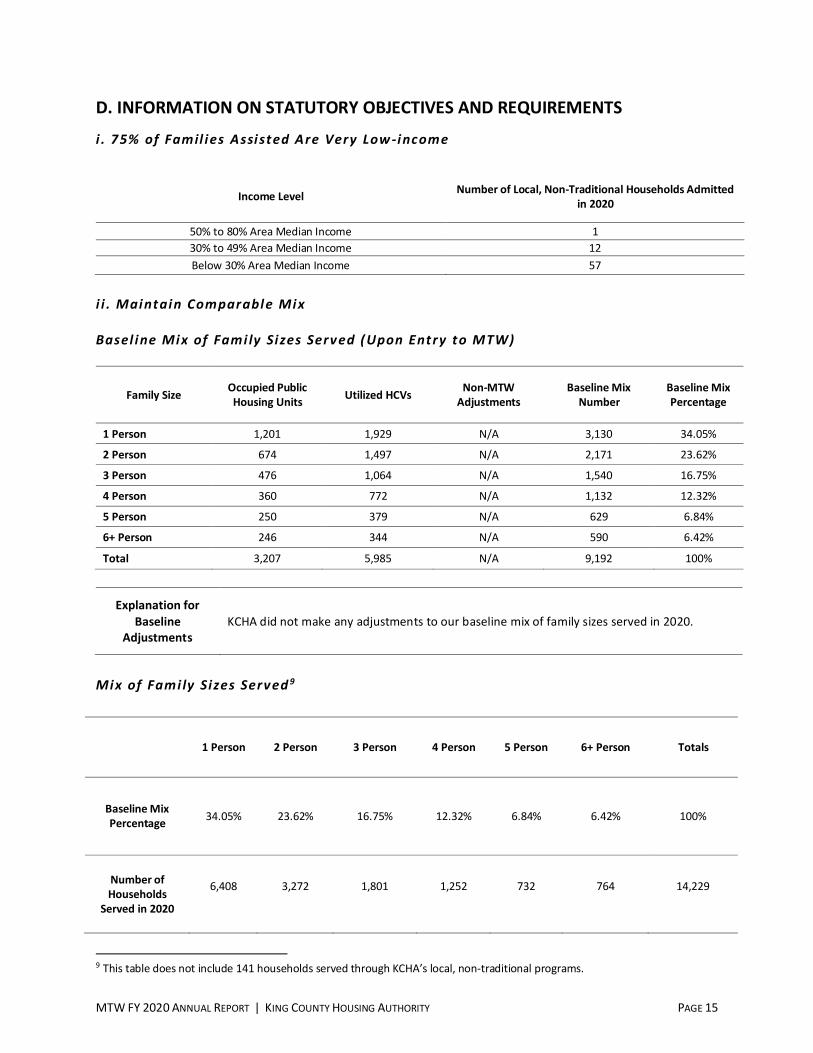
MTW FY 2020 ANNUAL REPORT | KING COUNTY HOUSING AUTHORITY PAGE 15
D. INFORMATION ON STATUTORY OBJECTIVES AND REQUIREMENTS
i . 75% of Famil ies Assisted Are Very Low -income
Income Level Number of Local, Non-Traditional Households Admitted
in 2020
50% to 80% Area Median Income 1
30% to 49% Area Median Income 12
Below 30% Area Median Income 57
i i . Maintain Comparable Mix
Basel ine Mix of Fami ly Si zes Served (Upon Entry to MTW)
Family Size Occupied Public
Housing Units Utilized HCVs
Non-MTW
Adjustments
Baseline Mix
Number
Baseline Mix
Percentage
1 Person 1,201 1,929 N/A 3,130 34.05%
2 Person 674 1,497 N/A 2,171 23.62%
3 Person 476 1,064 N/A 1,540 16.75%
4 Person 360 772 N/A 1,132 12.32%
5 Person 250 379 N/A 629 6.84%
6+ Person 246 344 N/A 590 6.42%
Total 3,207 5,985 N/A 9,192 100%
Explanation for
Baseline
Adjustments
KCHA did not make any adjustments to our baseline mix of family sizes served in 2020.
Mix of Fami ly Si zes Served 9
1 Person 2 Person 3 Person 4 Person 5 Person 6+ Person Totals
Baseline Mix
Percentage 34.05% 23.62% 16.75% 12.32% 6.84% 6.42% 100%
Number of
Households
Served in 2020
6,408 3,272 1,801 1,252 732 764 14,229
9 This table does not include 141 households served through KCHA’s local, non-traditional programs.
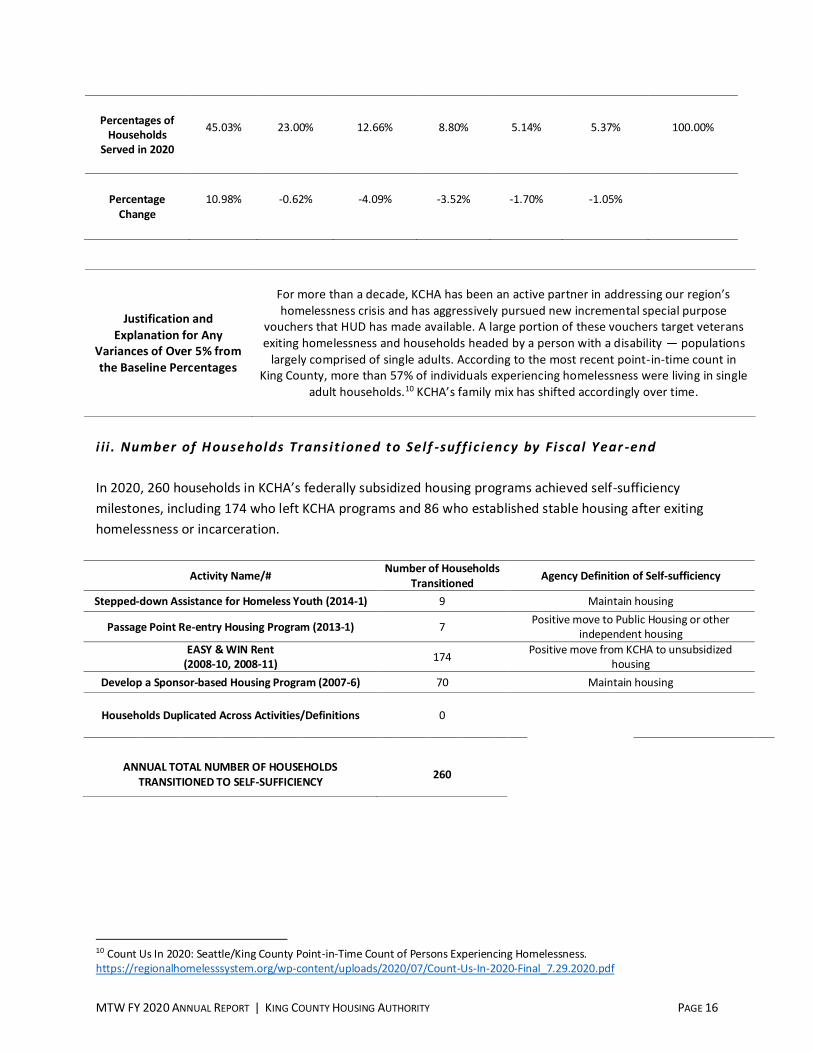
MTW FY 2020 ANNUAL REPORT | KING COUNTY HOUSING AUTHORITY PAGE 16
Percentages of
Households
Served in 2020
45.03% 23.00% 12.66% 8.80% 5.14% 5.37% 100.00%
Percentage
Change
10.98% -0.62% -4.09% -3.52% -1.70% -1.05%
Justification and
Explanation for Any
Variances of Over 5% from
the Baseline Percentages
For more than a decade, KCHA has been an active partner in addressing our region’s homelessness crisis and has aggressively pursued new incremental special purpose
vouchers that HUD has made available. A large portion of these vouchers target veterans
exiting homelessness and households headed by a person with a disability — populations
largely comprised of single adults. According to the most recent point-in-time count in
King County, more than 57% of individuals experiencing homelessness were living in single
adult households.10 KCHA’s family mix has shifted accordingly over time.
i i i . Number of Households Transi t ioned to Sel f -suff i c iency by Fi scal Year -end
In 2020, 260 households in KCHA’s federally subsidized housing programs achieved self-sufficiency
milestones, including 174 who left KCHA programs and 86 who established stable housing after exiting
homelessness or incarceration.
Activity Name/# Number of Households
Transitioned Agency Definition of Self-sufficiency
Stepped-down Assistance for Homeless Youth (2014-1) 9 Maintain housing
Passage Point Re-entry Housing Program (2013-1) 7 Positive move to Public Housing or other
independent housing
EASY & WIN Rent
(2008-10, 2008-11) 174
Positive move from KCHA to unsubsidized
housing
Develop a Sponsor-based Housing Program (2007-6) 70 Maintain housing
Households Duplicated Across Activities/Definitions 0
ANNUAL TOTAL NUMBER OF HOUSEHOLDS
TRANSITIONED TO SELF-SUFFICIENCY 260
10 Count Us In 2020: Seattle/King County Point-in-Time Count of Persons Experiencing Homelessness.
https://regionalhomelesssystem.org/wp-content/uploads/2020/07/Count-Us-In-2020-Final_7.29.2020.pdf

MTW FY 2020 ANNUAL REPORT | KING COUNTY HOUSING AUTHORITY PAGE 17
S E C TI ON I I I P R OP O S E D M T W A C T I V I T I E S
New activities are proposed in the annual MTW Plan.
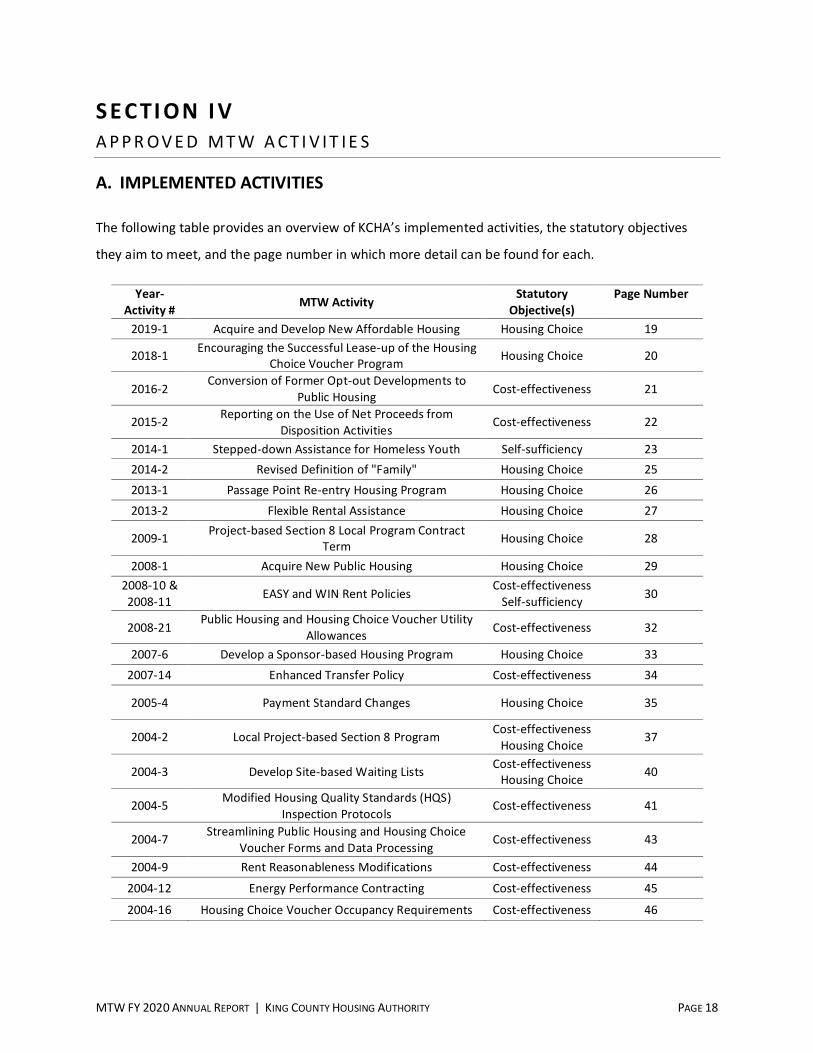
MTW FY 2020 ANNUAL REPORT | KING COUNTY HOUSING AUTHORITY PAGE 18
S E C TI ON I V A P P R OV E D M T W A C T I V I T I E S
A. IMPLEMENTED ACTIVITIES
The following table provides an overview of KCHA’s implemented activities, the statutory objectives
they aim to meet, and the page number in which more detail can be found for each.
Year-
Activity # MTW Activity
Statutory
Objective(s)
Page Number
2019-1 Acquire and Develop New Affordable Housing Housing Choice 19
2018-1 Encouraging the Successful Lease-up of the Housing
Choice Voucher Program Housing Choice 20
2016-2 Conversion of Former Opt-out Developments to
Public Housing Cost-effectiveness 21
2015-2 Reporting on the Use of Net Proceeds from
Disposition Activities Cost-effectiveness 22
2014-1 Stepped-down Assistance for Homeless Youth Self-sufficiency 23
2014-2 Revised Definition of "Family" Housing Choice 25
2013-1 Passage Point Re-entry Housing Program Housing Choice 26
2013-2 Flexible Rental Assistance Housing Choice 27
2009-1 Project-based Section 8 Local Program Contract
Term Housing Choice 28
2008-1 Acquire New Public Housing Housing Choice 29
2008-10 &
2008-11 EASY and WIN Rent Policies
Cost-effectiveness
Self-sufficiency 30
2008-21 Public Housing and Housing Choice Voucher Utility
Allowances Cost-effectiveness 32
2007-6 Develop a Sponsor-based Housing Program Housing Choice 33
2007-14 Enhanced Transfer Policy Cost-effectiveness 34
2005-4 Payment Standard Changes Housing Choice 35
2004-2 Local Project-based Section 8 Program Cost-effectiveness
Housing Choice 37
2004-3 Develop Site-based Waiting Lists Cost-effectiveness
Housing Choice 40
2004-5 Modified Housing Quality Standards (HQS)
Inspection Protocols Cost-effectiveness 41
2004-7 Streamlining Public Housing and Housing Choice
Voucher Forms and Data Processing Cost-effectiveness 43
2004-9 Rent Reasonableness Modifications Cost-effectiveness 44
2004-12 Energy Performance Contracting Cost-effectiveness 45
2004-16 Housing Choice Voucher Occupancy Requirements Cost-effectiveness 46
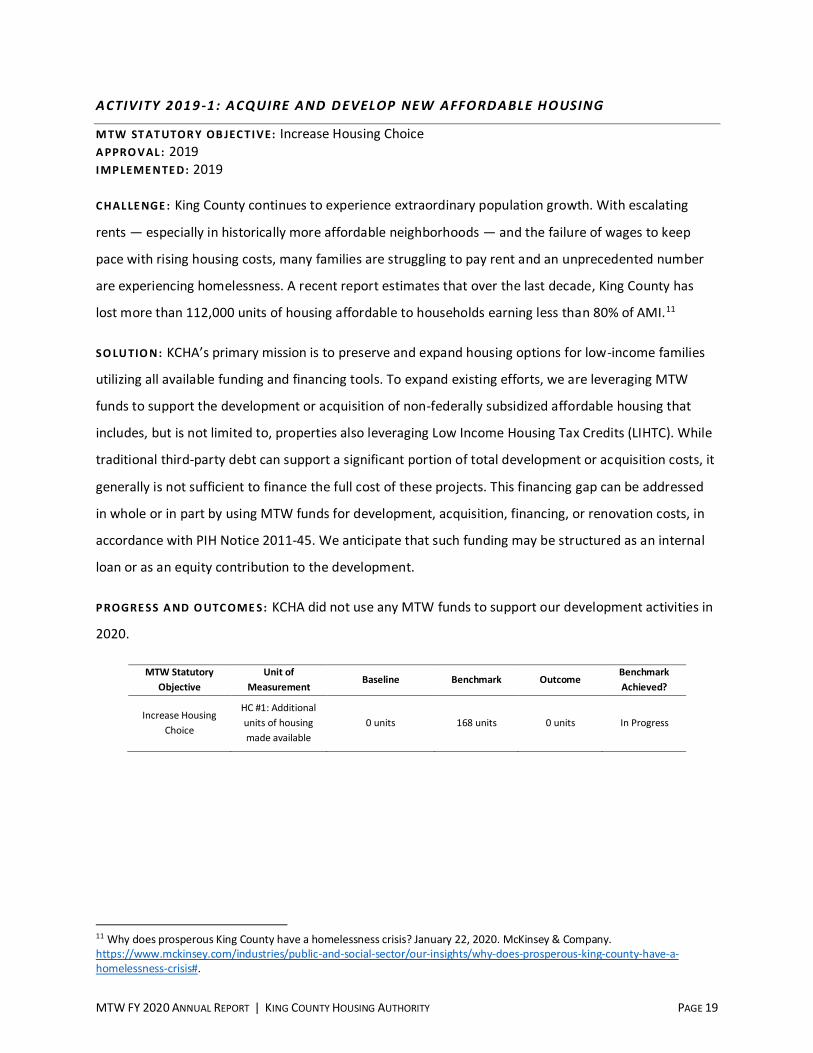
MTW FY 2020 ANNUAL REPORT | KING COUNTY HOUSING AUTHORITY PAGE 19
ACTIVITY 2019 -1: ACQUIRE AND DEVELOP NEW AFFORDABLE HOUSING
M TW ST AT UTOR Y OB JEC TI VE: Increase Housing Choice
A PPRO VAL : 2019
I MP LEME NTE D: 2019
C HAL LE NGE : King County continues to experience extraordinary population growth. With escalating
rents — especially in historically more affordable neighborhoods — and the failure of wages to keep
pace with rising housing costs, many families are struggling to pay rent and an unprecedented number
are experiencing homelessness. A recent report estimates that over the last decade, King County has
lost more than 112,000 units of housing affordable to households earning less than 80% of AMI.11
SO LU TIO N: KCHA’s primary mission is to preserve and expand housing options for low-income families
utilizing all available funding and financing tools. To expand existing efforts, we are leveraging MTW
funds to support the development or acquisition of non-federally subsidized affordable housing that
includes, but is not limited to, properties also leveraging Low Income Housing Tax Credits (LIHTC). While
traditional third-party debt can support a significant portion of total development or acquisition costs, it
generally is not sufficient to finance the full cost of these projects. This financing gap can be addressed
in whole or in part by using MTW funds for development, acquisition, financing, or renovation costs, in
accordance with PIH Notice 2011-45. We anticipate that such funding may be structured as an internal
loan or as an equity contribution to the development.
P ROGRE SS A ND O UTC OME S: KCHA did not use any MTW funds to support our development activities in
2020.
MTW Statutory
Objective
Unit of
Measurement Baseline Benchmark Outcome
Benchmark
Achieved?
Increase Housing
Choice
HC #1: Additional
units of housing
made available
0 units 168 units 0 units In Progress
11 Why does prosperous King County have a homelessness crisis? January 22, 2020. McKinsey & Company.
https://www.mckinsey.com/industries/public-and-social-sector/our-insights/why-does-prosperous-king-county-have-a-
homelessness-crisis#.
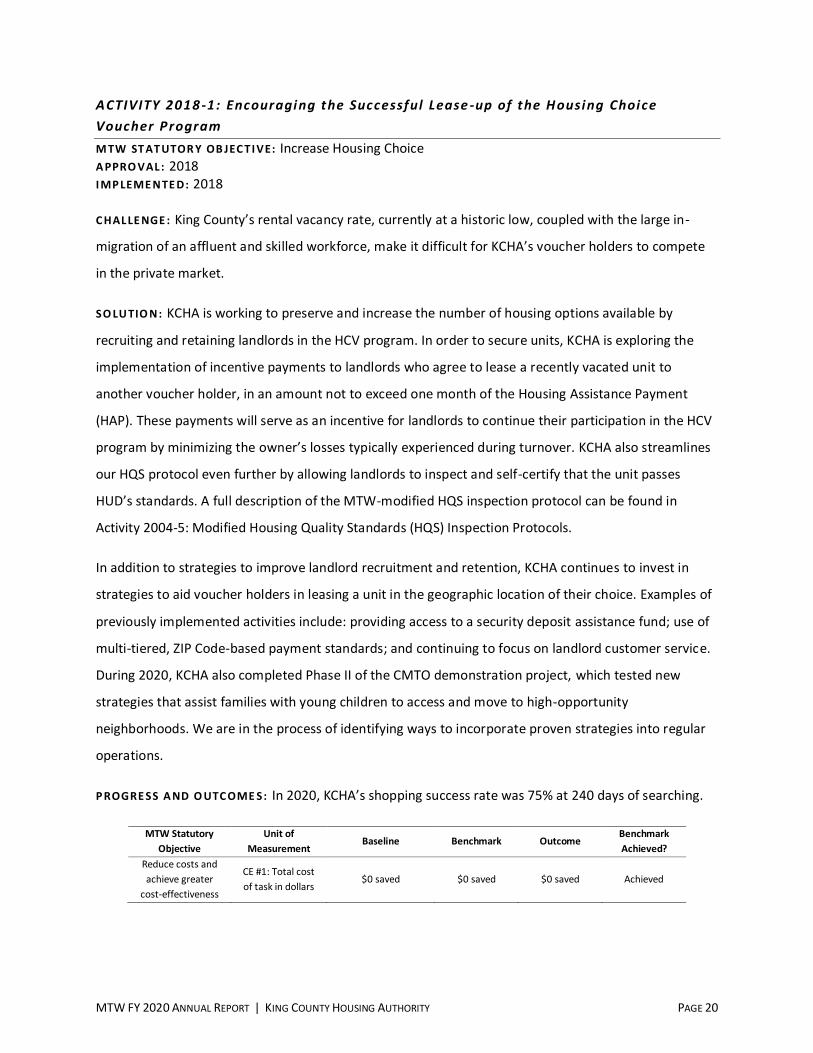
MTW FY 2020 ANNUAL REPORT | KING COUNTY HOUSING AUTHORITY PAGE 20
ACTIVITY 2018 -1: Encouraging the Successful Lease -up of the Housing Choice
Voucher Program
M TW ST AT UTOR Y OB JEC TI VE: Increase Housing Choice
A PPRO VAL : 2018
I MP LEME NTE D: 2018
C HAL LE NGE : King County’s rental vacancy rate, currently at a historic low, coupled with the large in-
migration of an affluent and skilled workforce, make it difficult for KCHA’s voucher holders to compete
in the private market.
SO LU TIO N: KCHA is working to preserve and increase the number of housing options available by
recruiting and retaining landlords in the HCV program. In order to secure units, KCHA is exploring the
implementation of incentive payments to landlords who agree to lease a recently vacated unit to
another voucher holder, in an amount not to exceed one month of the Housing Assistance Payment
(HAP). These payments will serve as an incentive for landlords to continue their participation in the HCV
program by minimizing the owner’s losses typically experienced during turnover. KCHA also streamlines
our HQS protocol even further by allowing landlords to inspect and self-certify that the unit passes
HUD’s standards. A full description of the MTW-modified HQS inspection protocol can be found in
Activity 2004-5: Modified Housing Quality Standards (HQS) Inspection Protocols.
In addition to strategies to improve landlord recruitment and retention, KCHA continues to invest in
strategies to aid voucher holders in leasing a unit in the geographic location of their choice. Examples of
previously implemented activities include: providing access to a security deposit assistance fund; use of
multi-tiered, ZIP Code-based payment standards; and continuing to focus on landlord customer service.
During 2020, KCHA also completed Phase II of the CMTO demonstration project, which tested new
strategies that assist families with young children to access and move to high-opportunity
neighborhoods. We are in the process of identifying ways to incorporate proven strategies into regular
operations.
P ROGRE SS A ND O UTC OME S: In 2020, KCHA’s shopping success rate was 75% at 240 days of searching.
MTW Statutory
Objective
Unit of
Measurement Baseline Benchmark Outcome
Benchmark
Achieved?
Reduce costs and
achieve greater
cost-effectiveness
CE #1: Total cost
of task in dollars $0 saved $0 saved $0 saved Achieved
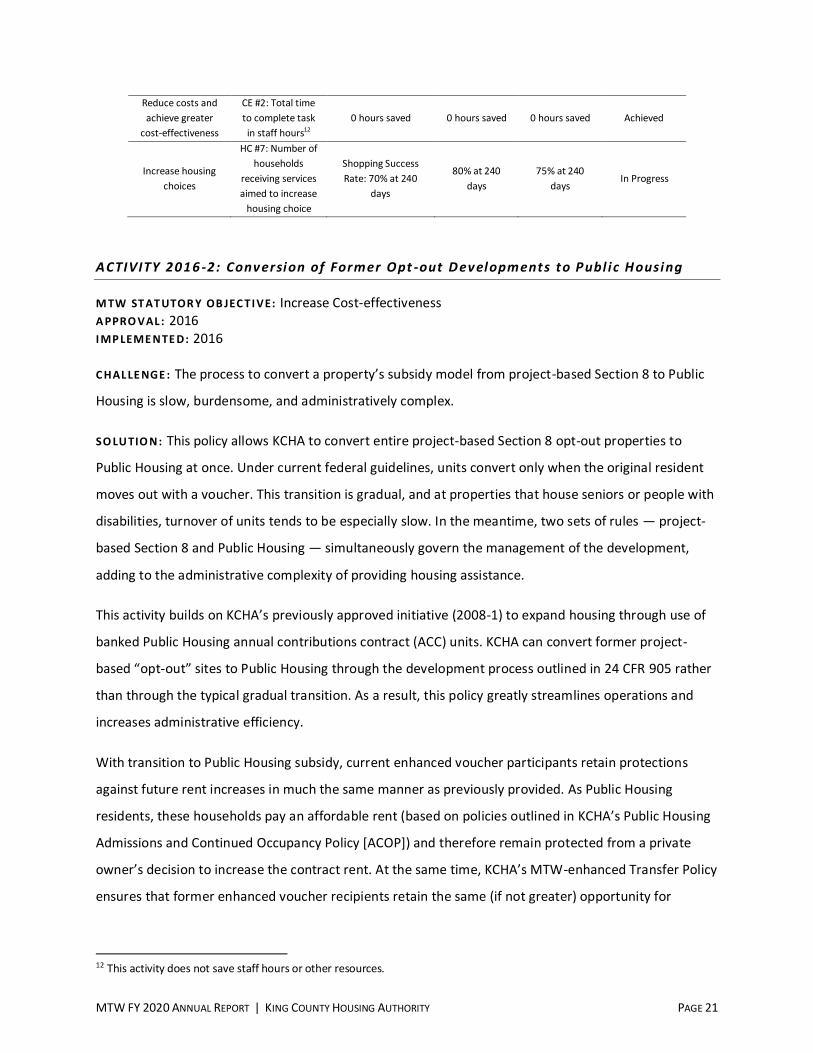
MTW FY 2020 ANNUAL REPORT | KING COUNTY HOUSING AUTHORITY PAGE 21
Reduce costs and
achieve greater
cost-effectiveness
CE #2: Total time
to complete task
in staff hours12
0 hours saved 0 hours saved 0 hours saved Achieved
Increase housing
choices
HC #7: Number of
households
receiving services
aimed to increase
housing choice
Shopping Success
Rate: 70% at 240
days
80% at 240
days
75% at 240
days In Progress
ACTIVITY 2016 -2: Conversion of Former Opt -out Developments to Publ ic Housing
M TW ST AT UTOR Y OB JEC TI VE: Increase Cost-effectiveness
A PPRO VAL : 2016
I MP LEME NTE D: 2016
C HAL LE NGE : The process to convert a property’s subsidy model from project-based Section 8 to Public
Housing is slow, burdensome, and administratively complex.
SO LU TIO N: This policy allows KCHA to convert entire project-based Section 8 opt-out properties to
Public Housing at once. Under current federal guidelines, units convert only when the original resident
moves out with a voucher. This transition is gradual, and at properties that house seniors or people with
disabilities, turnover of units tends to be especially slow. In the meantime, two sets of rules — project-
based Section 8 and Public Housing — simultaneously govern the management of the development,
adding to the administrative complexity of providing housing assistance.
This activity builds on KCHA’s previously approved initiative (2008-1) to expand housing through use of
banked Public Housing annual contributions contract (ACC) units. KCHA can convert former project-
based “opt-out” sites to Public Housing through the development process outlined in 24 CFR 905 rather
than through the typical gradual transition. As a result, this policy greatly streamlines operations and
increases administrative efficiency.
With transition to Public Housing subsidy, current enhanced voucher participants retain protections
against future rent increases in much the same manner as previously provided. As Public Housing
residents, these households pay an affordable rent (based on policies outlined in KCHA’s Public Housing
Admissions and Continued Occupancy Policy [ACOP]) and therefore remain protected from a private
owner’s decision to increase the contract rent. At the same time, KCHA’s MTW-enhanced Transfer Policy
ensures that former enhanced voucher recipients retain the same (if not greater) opportunity for
12 This activity does not save staff hours or other resources.
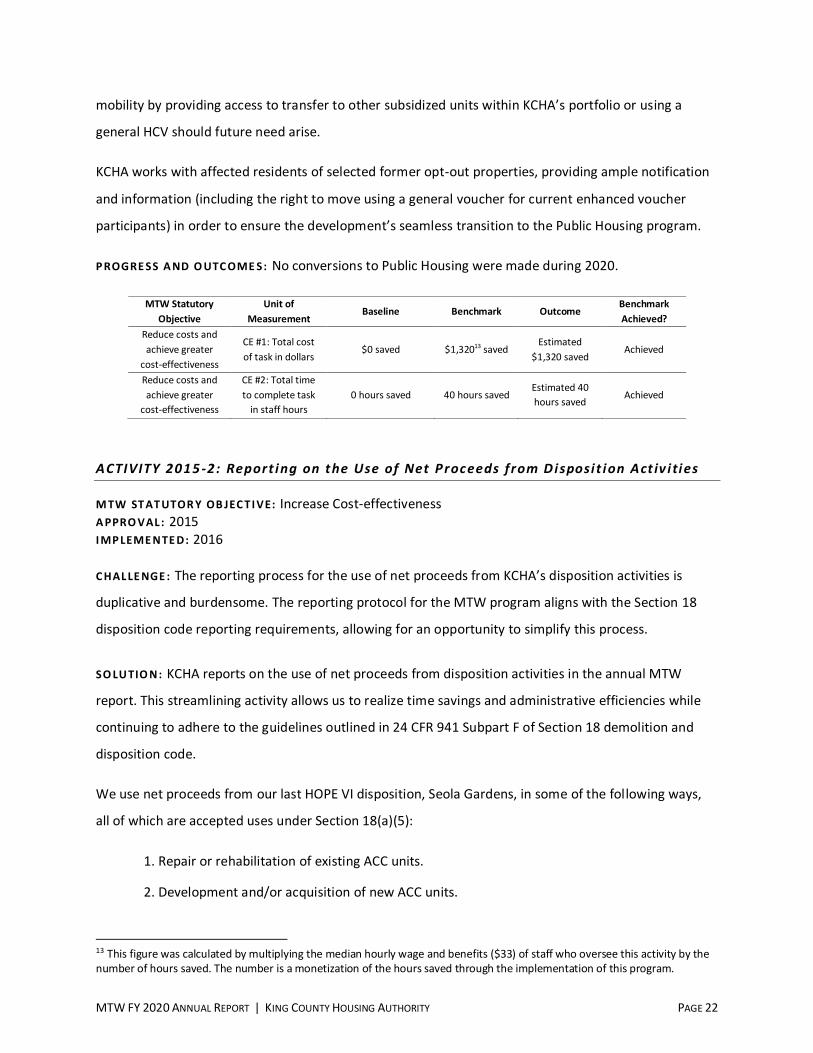
MTW FY 2020 ANNUAL REPORT | KING COUNTY HOUSING AUTHORITY PAGE 22
mobility by providing access to transfer to other subsidized units within KCHA’s portfolio or using a
general HCV should future need arise.
KCHA works with affected residents of selected former opt-out properties, providing ample notification
and information (including the right to move using a general voucher for current enhanced voucher
participants) in order to ensure the development’s seamless transition to the Public Housing program.
P ROGRE SS A ND O UTC OME S: No conversions to Public Housing were made during 2020.
MTW Statutory
Objective
Unit of
Measurement Baseline Benchmark Outcome
Benchmark
Achieved?
Reduce costs and
achieve greater
cost-effectiveness
CE #1: Total cost
of task in dollars $0 saved $1,32013 saved
Estimated
$1,320 saved Achieved
Reduce costs and
achieve greater
cost-effectiveness
CE #2: Total time
to complete task
in staff hours
0 hours saved 40 hours saved Estimated 40
hours saved Achieved
ACTIVITY 2015 -2: Report ing on the Use of Net Proceeds f rom Disposi t ion Act iv i ties
M TW ST AT UTOR Y OB JEC TI VE: Increase Cost-effectiveness
A PPRO VAL : 2015
I MP LEME NTE D: 2016
C HAL LE NGE : The reporting process for the use of net proceeds from KCHA’s disposition activities is
duplicative and burdensome. The reporting protocol for the MTW program aligns with the Section 18
disposition code reporting requirements, allowing for an opportunity to simplify this process.
SO LU TIO N: KCHA reports on the use of net proceeds from disposition activities in the annual MTW
report. This streamlining activity allows us to realize time savings and administrative efficiencies while
continuing to adhere to the guidelines outlined in 24 CFR 941 Subpart F of Section 18 demolition and
disposition code.
We use net proceeds from our last HOPE VI disposition, Seola Gardens, in some of the following ways,
all of which are accepted uses under Section 18(a)(5):
1. Repair or rehabilitation of existing ACC units.
2. Development and/or acquisition of new ACC units.
13 This figure was calculated by multiplying the median hourly wage and benefits ($33) of staff who oversee this activity by the
number of hours saved. The number is a monetization of the hours saved through the implementation of this program.
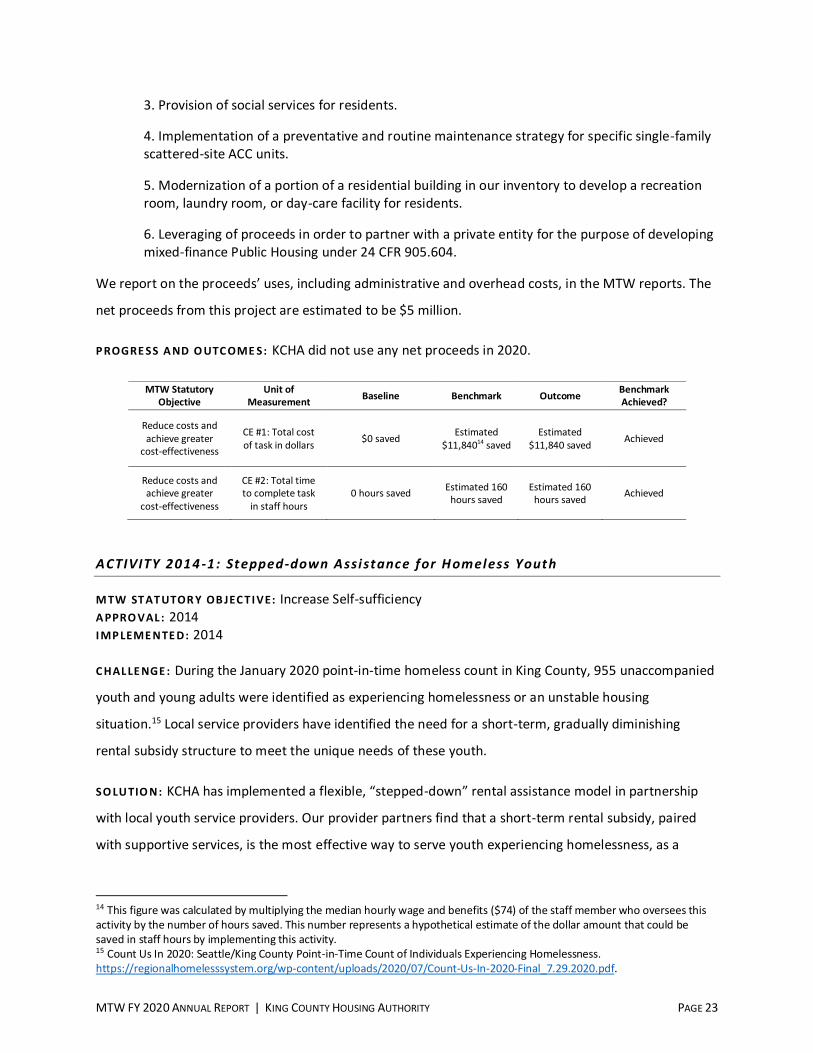
MTW FY 2020 ANNUAL REPORT | KING COUNTY HOUSING AUTHORITY PAGE 23
3. Provision of social services for residents.
4. Implementation of a preventative and routine maintenance strategy for specific single-family
scattered-site ACC units.
5. Modernization of a portion of a residential building in our inventory to develop a recreation
room, laundry room, or day-care facility for residents.
6. Leveraging of proceeds in order to partner with a private entity for the purpose of developing
mixed-finance Public Housing under 24 CFR 905.604.
We report on the proceeds’ uses, including administrative and overhead costs, in the MTW reports. The
net proceeds from this project are estimated to be $5 million.
P ROGRE SS A ND O UTC OME S: KCHA did not use any net proceeds in 2020.
MTW Statutory
Objective
Unit of
Measurement Baseline Benchmark Outcome
Benchmark
Achieved?
Reduce costs and
achieve greater
cost-effectiveness
CE #1: Total cost
of task in dollars $0 saved
Estimated
$11,84014 saved
Estimated
$11,840 saved Achieved
Reduce costs and
achieve greater
cost-effectiveness
CE #2: Total time
to complete task
in staff hours
0 hours saved Estimated 160
hours saved
Estimated 160
hours saved Achieved
ACTIVITY 2014 -1: Stepped-down Assistance for Homeless Youth
M TW ST AT UTOR Y OB JEC TI VE: Increase Self-sufficiency
A PPRO VAL : 2014
I MP LEME NTE D: 2014
C HAL LE NGE : During the January 2020 point-in-time homeless count in King County, 955 unaccompanied
youth and young adults were identified as experiencing homelessness or an unstable housing
situation.15 Local service providers have identified the need for a short-term, gradually diminishing
rental subsidy structure to meet the unique needs of these youth.
SO LU TIO N: KCHA has implemented a flexible, “stepped-down” rental assistance model in partnership
with local youth service providers. Our provider partners find that a short-term rental subsidy, paired
with supportive services, is the most effective way to serve youth experiencing homelessness, as a
14 This figure was calculated by multiplying the median hourly wage and benefits ($74) of the staff member who oversees this
activity by the number of hours saved. This number represents a hypothetical estimate of the dollar amount that could be
saved in staff hours by implementing this activity. 15 Count Us In 2020: Seattle/King County Point-in-Time Count of Individuals Experiencing Homelessness.
https://regionalhomelesssystem.org/wp-content/uploads/2020/07/Count-Us-In-2020-Final_7.29.2020.pdf.
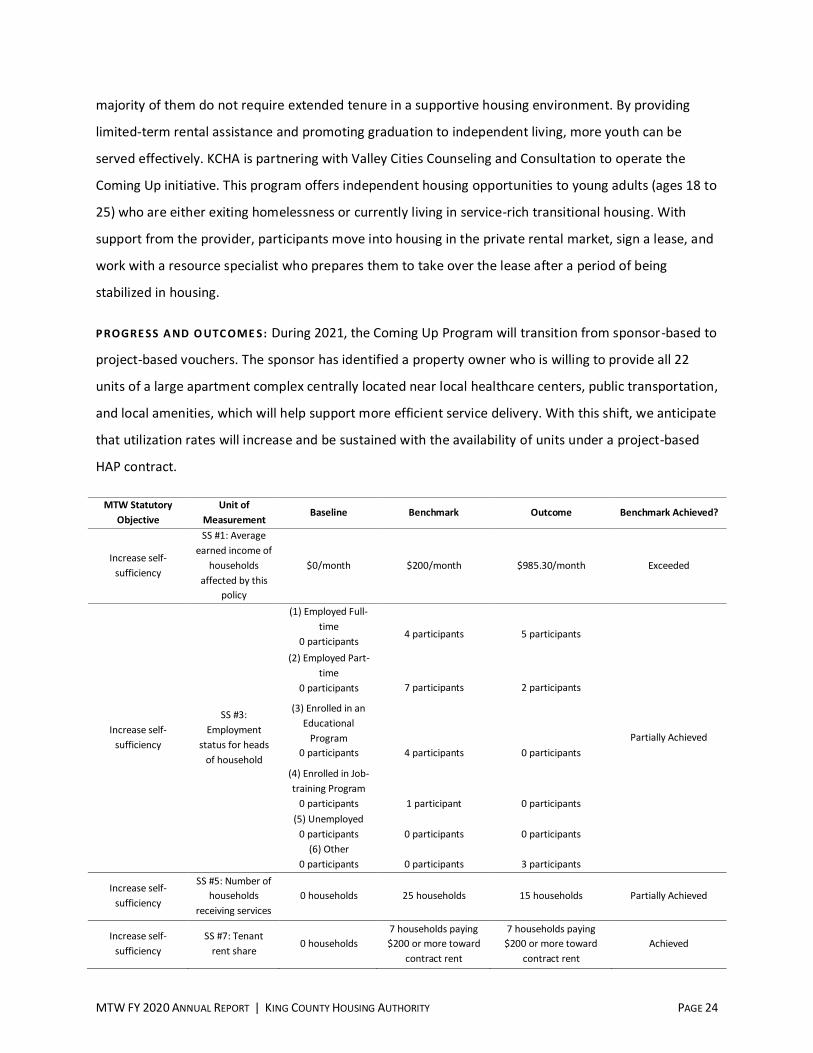
MTW FY 2020 ANNUAL REPORT | KING COUNTY HOUSING AUTHORITY PAGE 24
majority of them do not require extended tenure in a supportive housing environment. By providing
limited-term rental assistance and promoting graduation to independent living, more youth can be
served effectively. KCHA is partnering with Valley Cities Counseling and Consultation to operate the
Coming Up initiative. This program offers independent housing opportunities to young adults (ages 18 to
25) who are either exiting homelessness or currently living in service-rich transitional housing. With
support from the provider, participants move into housing in the private rental market, sign a lease, and
work with a resource specialist who prepares them to take over the lease after a period of being
stabilized in housing.
P ROGRE SS A ND O UTC OME S: During 2021, the Coming Up Program will transition from sponsor-based to
project-based vouchers. The sponsor has identified a property owner who is willing to provide all 22
units of a large apartment complex centrally located near local healthcare centers, public transportation,
and local amenities, which will help support more efficient service delivery. With this shift, we anticipate
that utilization rates will increase and be sustained with the availability of units under a project-based
HAP contract.
MTW Statutory
Objective
Unit of
Measurement Baseline Benchmark Outcome Benchmark Achieved?
Increase self-
sufficiency
SS #1: Average
earned income of
households
affected by this
policy
$0/month $200/month $985.30/month Exceeded
Increase self-
sufficiency
SS #3:
Employment
status for heads
of household
(1) Employed Full-
time
0 participants
4 participants
5 participants
Partially Achieved
(2) Employed Part-
time
0 participants
7 participants
2 participants
(3) Enrolled in an
Educational
Program
0 participants
4 participants
0 participants
(4) Enrolled in Job-
training Program
0 participants
1 participant
0 participants
(5) Unemployed
0 participants
0 participants
0 participants
(6) Other
0 participants
0 participants
3 participants
Increase self-
sufficiency
SS #5: Number of
households
receiving services
0 households 25 households 15 households Partially Achieved
Increase self-
sufficiency
SS #7: Tenant
rent share 0 households
7 households paying
$200 or more toward
contract rent
7 households paying
$200 or more toward
contract rent
Achieved
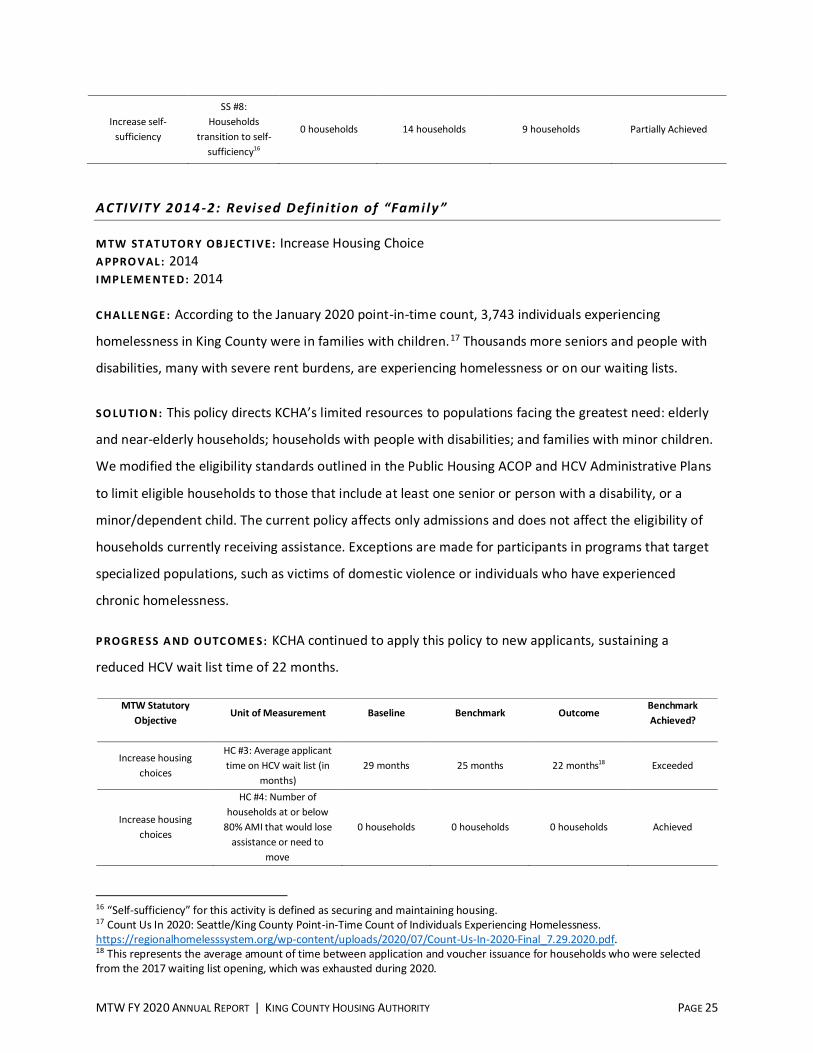
MTW FY 2020 ANNUAL REPORT | KING COUNTY HOUSING AUTHORITY PAGE 25
Increase self-
sufficiency
SS #8:
Households
transition to self-
sufficiency16
0 households 14 households
9 households
Partially Achieved
ACTIVITY 2014 -2: Revised Defini tion of “Fami ly”
M TW ST AT UTOR Y OB JEC TI VE: Increase Housing Choice
A PPRO VAL : 2014
I MP LEME NTE D: 2014
C HAL LE NGE : According to the January 2020 point-in-time count, 3,743 individuals experiencing
homelessness in King County were in families with children.17 Thousands more seniors and people with
disabilities, many with severe rent burdens, are experiencing homelessness or on our waiting lists.
SO LU TIO N: This policy directs KCHA’s limited resources to populations facing the greatest need: elderly
and near-elderly households; households with people with disabilities; and families with minor children.
We modified the eligibility standards outlined in the Public Housing ACOP and HCV Administrative Plans
to limit eligible households to those that include at least one senior or person with a disability, or a
minor/dependent child. The current policy affects only admissions and does not affect the eligibility of
households currently receiving assistance. Exceptions are made for participants in programs that target
specialized populations, such as victims of domestic violence or individuals who have experienced
chronic homelessness.
P ROGRE SS A ND O UTC OME S: KCHA continued to apply this policy to new applicants, sustaining a
reduced HCV wait list time of 22 months.
MTW Statutory
Objective Unit of Measurement Baseline Benchmark Outcome
Benchmark
Achieved?
Increase housing
choices
HC #3: Average applicant
time on HCV wait list (in
months)
29 months 25 months 22 months18 Exceeded
Increase housing
choices
HC #4: Number of
households at or below
80% AMI that would lose
assistance or need to
move
0 households 0 households 0 households Achieved
16 “Self-sufficiency” for this activity is defined as securing and maintaining housing. 17 Count Us In 2020: Seattle/King County Point-in-Time Count of Individuals Experiencing Homelessness.
https://regionalhomelesssystem.org/wp-content/uploads/2020/07/Count-Us-In-2020-Final_7.29.2020.pdf. 18 This represents the average amount of time between application and voucher issuance for households who were selected
from the 2017 waiting list opening, which was exhausted during 2020.
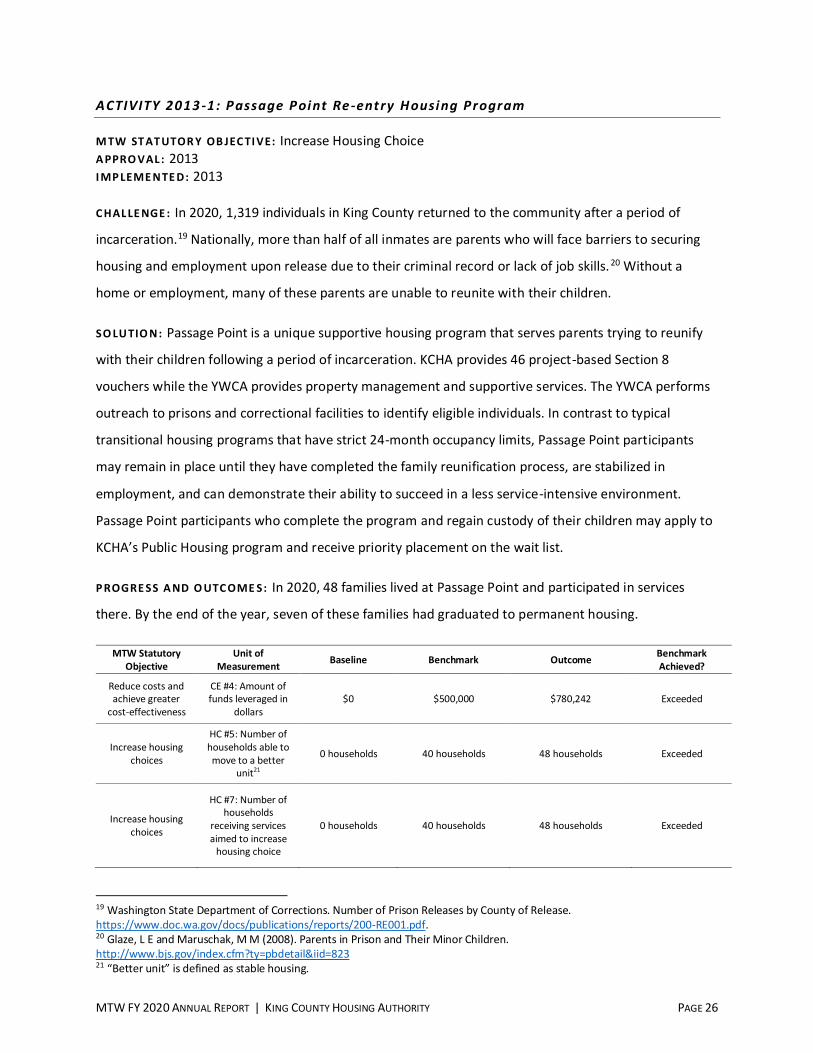
MTW FY 2020 ANNUAL REPORT | KING COUNTY HOUSING AUTHORITY PAGE 26
ACTIVITY 2013 -1: Passage Point Re-entry Housing Program
M TW ST AT UTOR Y OB JEC TI VE: Increase Housing Choice
A PPRO VAL : 2013
I MP LEME NTE D: 2013
C HAL LE NGE : In 2020, 1,319 individuals in King County returned to the community after a period of
incarceration.19 Nationally, more than half of all inmates are parents who will face barriers to securing
housing and employment upon release due to their criminal record or lack of job skills.20 Without a
home or employment, many of these parents are unable to reunite with their children.
SO LU TIO N: Passage Point is a unique supportive housing program that serves parents trying to reunify
with their children following a period of incarceration. KCHA provides 46 project-based Section 8
vouchers while the YWCA provides property management and supportive services. The YWCA performs
outreach to prisons and correctional facilities to identify eligible individuals. In contrast to typical
transitional housing programs that have strict 24-month occupancy limits, Passage Point participants
may remain in place until they have completed the family reunification process, are stabilized in
employment, and can demonstrate their ability to succeed in a less service-intensive environment.
Passage Point participants who complete the program and regain custody of their children may apply to
KCHA’s Public Housing program and receive priority placement on the wait list.
P ROGRE SS A ND O UTC OME S: In 2020, 48 families lived at Passage Point and participated in services
there. By the end of the year, seven of these families had graduated to permanent housing.
MTW Statutory
Objective
Unit of
Measurement Baseline Benchmark Outcome
Benchmark
Achieved?
Reduce costs and
achieve greater
cost-effectiveness
CE #4: Amount of
funds leveraged in
dollars
$0 $500,000 $780,242 Exceeded
Increase housing
choices
HC #5: Number of
households able to
move to a better
unit21
0 households 40 households 48 households Exceeded
Increase housing
choices
HC #7: Number of
households
receiving services
aimed to increase
housing choice
0 households 40 households 48 households Exceeded
19 Washington State Department of Corrections. Number of Prison Releases by County of Release.
https://www.doc.wa.gov/docs/publications/reports/200-RE001.pdf. 20 Glaze, L E and Maruschak, M M (2008). Parents in Prison and Their Minor Children.
http://www.bjs.gov/index.cfm?ty=pbdetail&iid=823 21 “Better unit” is defined as stable housing.
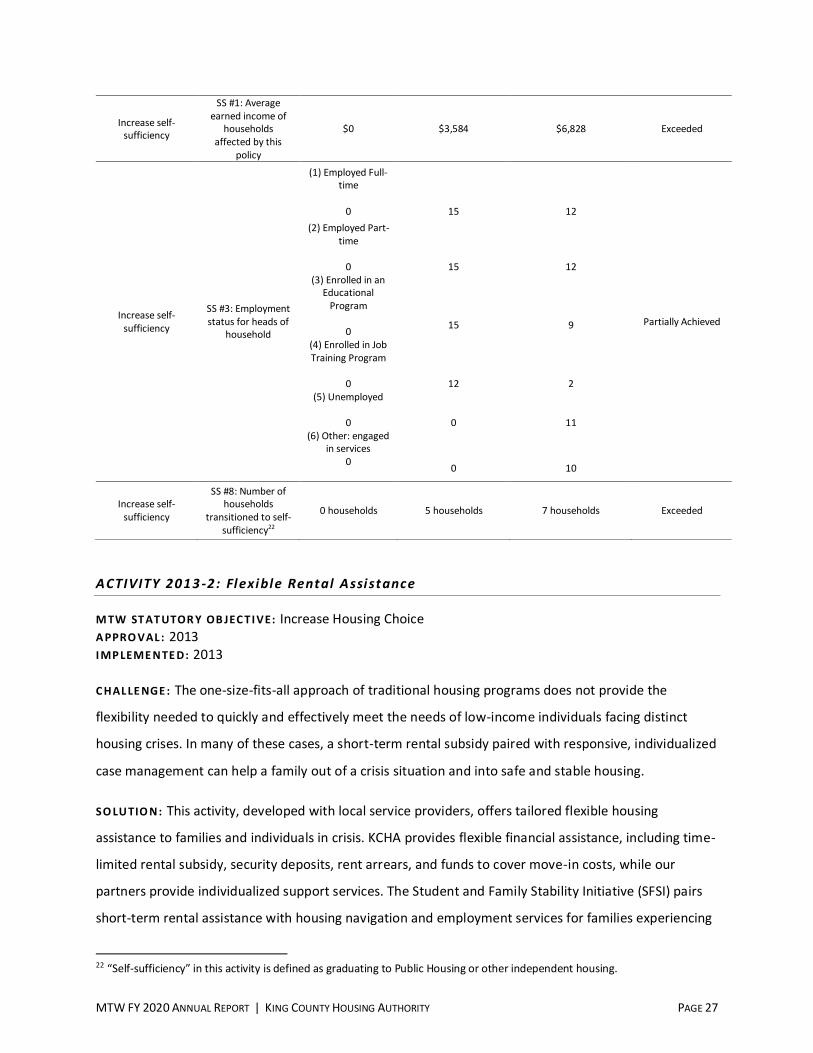
MTW FY 2020 ANNUAL REPORT | KING COUNTY HOUSING AUTHORITY PAGE 27
Increase self-
sufficiency
SS #1: Average
earned income of
households
affected by this
policy
$0 $3,584 $6,828 Exceeded
Increase self-
sufficiency
SS #3: Employment
status for heads of
household
(1) Employed Full-
time
0
15
12
Partially Achieved
(2) Employed Part-
time
0
15
12
(3) Enrolled in an
Educational
Program
0
15
9
(4) Enrolled in Job
Training Program
0
12
2
(5) Unemployed
0
0
11
(6) Other: engaged
in services
0
0
10
Increase self-
sufficiency
SS #8: Number of
households
transitioned to self-
sufficiency22
0 households 5 households 7 households Exceeded
ACTIVITY 2013 -2: Flexible Rental Assistance
M TW ST AT UTOR Y OB JEC TI VE: Increase Housing Choice
A PPRO VAL : 2013
I MP LEME NTE D: 2013
C HAL LE NGE : The one-size-fits-all approach of traditional housing programs does not provide the
flexibility needed to quickly and effectively meet the needs of low-income individuals facing distinct
housing crises. In many of these cases, a short-term rental subsidy paired with responsive, individualized
case management can help a family out of a crisis situation and into safe and stable housing.
SO LU TIO N: This activity, developed with local service providers, offers tailored flexible housing
assistance to families and individuals in crisis. KCHA provides flexible financial assistance, including time-
limited rental subsidy, security deposits, rent arrears, and funds to cover move-in costs, while our
partners provide individualized support services. The Student and Family Stability Initiative (SFSI) pairs
short-term rental assistance with housing navigation and employment services for families experiencing
22 “Self-sufficiency” in this activity is defined as graduating to Public Housing or other independent housing.
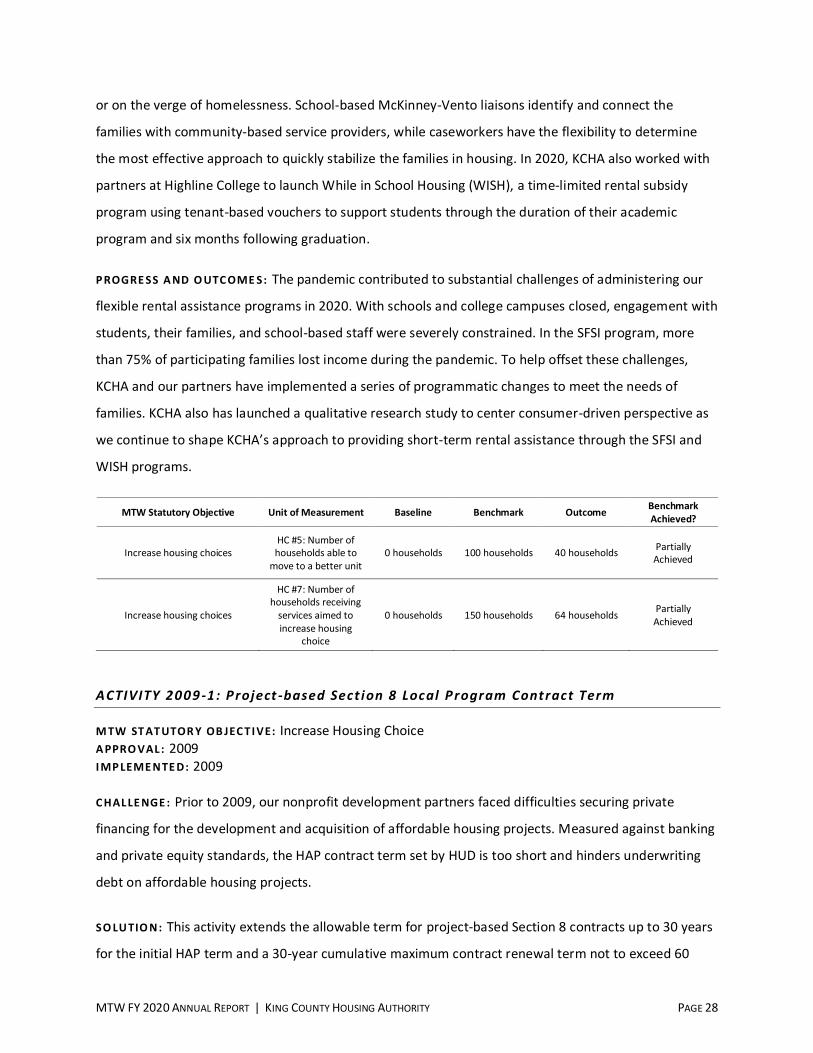
MTW FY 2020 ANNUAL REPORT | KING COUNTY HOUSING AUTHORITY PAGE 28
or on the verge of homelessness. School-based McKinney-Vento liaisons identify and connect the
families with community-based service providers, while caseworkers have the flexibility to determine
the most effective approach to quickly stabilize the families in housing. In 2020, KCHA also worked with
partners at Highline College to launch While in School Housing (WISH), a time-limited rental subsidy
program using tenant-based vouchers to support students through the duration of their academic
program and six months following graduation.
P ROGRE SS A ND O UTC OME S: The pandemic contributed to substantial challenges of administering our
flexible rental assistance programs in 2020. With schools and college campuses closed, engagement with
students, their families, and school-based staff were severely constrained. In the SFSI program, more
than 75% of participating families lost income during the pandemic. To help offset these challenges,
KCHA and our partners have implemented a series of programmatic changes to meet the needs of
families. KCHA also has launched a qualitative research study to center consumer-driven perspective as
we continue to shape KCHA’s approach to providing short-term rental assistance through the SFSI and
WISH programs.
MTW Statutory Objective Unit of Measurement Baseline Benchmark Outcome Benchmark
Achieved?
Increase housing choices
HC #5: Number of
households able to
move to a better unit
0 households 100 households 40 households Partially
Achieved
Increase housing choices
HC #7: Number of
households receiving
services aimed to
increase housing
choice
0 households
150 households 64 households Partially
Achieved
ACTIVITY 2009 -1: Project -based Sect ion 8 Local Program Contract Term
M TW ST AT UTOR Y OB JEC TI VE: Increase Housing Choice
A PPRO VAL : 2009
I MP LEME NTE D: 2009
C HAL LE NGE : Prior to 2009, our nonprofit development partners faced difficulties securing private
financing for the development and acquisition of affordable housing projects. Measured against banking
and private equity standards, the HAP contract term set by HUD is too short and hinders underwriting
debt on affordable housing projects.
SO LU TIO N: This activity extends the allowable term for project-based Section 8 contracts up to 30 years
for the initial HAP term and a 30-year cumulative maximum contract renewal term not to exceed 60
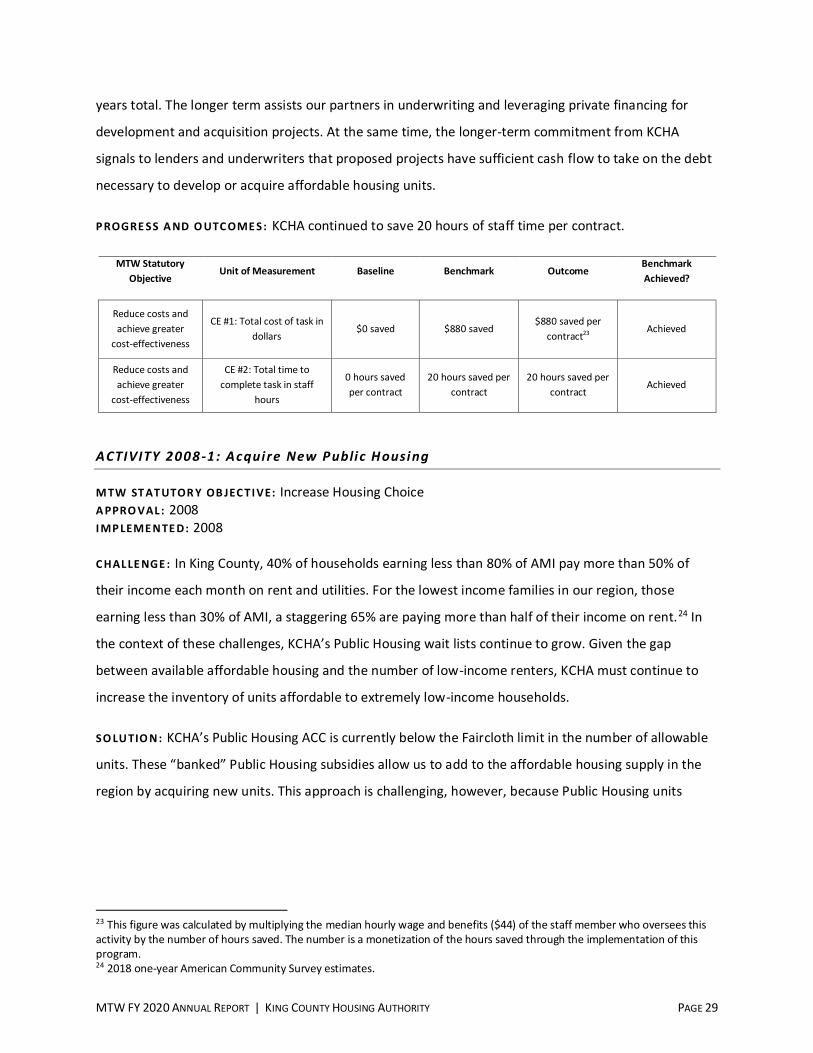
MTW FY 2020 ANNUAL REPORT | KING COUNTY HOUSING AUTHORITY PAGE 29
years total. The longer term assists our partners in underwriting and leveraging private financing for
development and acquisition projects. At the same time, the longer-term commitment from KCHA
signals to lenders and underwriters that proposed projects have sufficient cash flow to take on the debt
necessary to develop or acquire affordable housing units.
P ROGRE SS A ND O UTC OME S: KCHA continued to save 20 hours of staff time per contract.
MTW Statutory
Objective Unit of Measurement Baseline Benchmark Outcome
Benchmark
Achieved?
Reduce costs and
achieve greater
cost-effectiveness
CE #1: Total cost of task in
dollars $0 saved $880 saved
$880 saved per
contract23 Achieved
Reduce costs and
achieve greater
cost-effectiveness
CE #2: Total time to
complete task in staff
hours
0 hours saved
per contract
20 hours saved per
contract
20 hours saved per
contract Achieved
ACTIVITY 2008 -1: Acquire New Public Housing
M TW ST AT UTOR Y OB JEC TI VE: Increase Housing Choice
A PPRO VAL : 2008
I MP LEME NTE D: 2008
C HAL LE NGE : In King County, 40% of households earning less than 80% of AMI pay more than 50% of
their income each month on rent and utilities. For the lowest income families in our region, those
earning less than 30% of AMI, a staggering 65% are paying more than half of their income on rent.24 In
the context of these challenges, KCHA’s Public Housing wait lists continue to grow. Given the gap
between available affordable housing and the number of low-income renters, KCHA must continue to
increase the inventory of units affordable to extremely low-income households.
SO LU TIO N: KCHA’s Public Housing ACC is currently below the Faircloth limit in the number of allowable
units. These “banked” Public Housing subsidies allow us to add to the affordable housing supply in the
region by acquiring new units. This approach is challenging, however, because Public Housing units
23 This figure was calculated by multiplying the median hourly wage and benefits ($44) of the staff member who oversees this
activity by the number of hours saved. The number is a monetization of the hours saved through the implementation of this
program. 24 2018 one-year American Community Survey estimates.
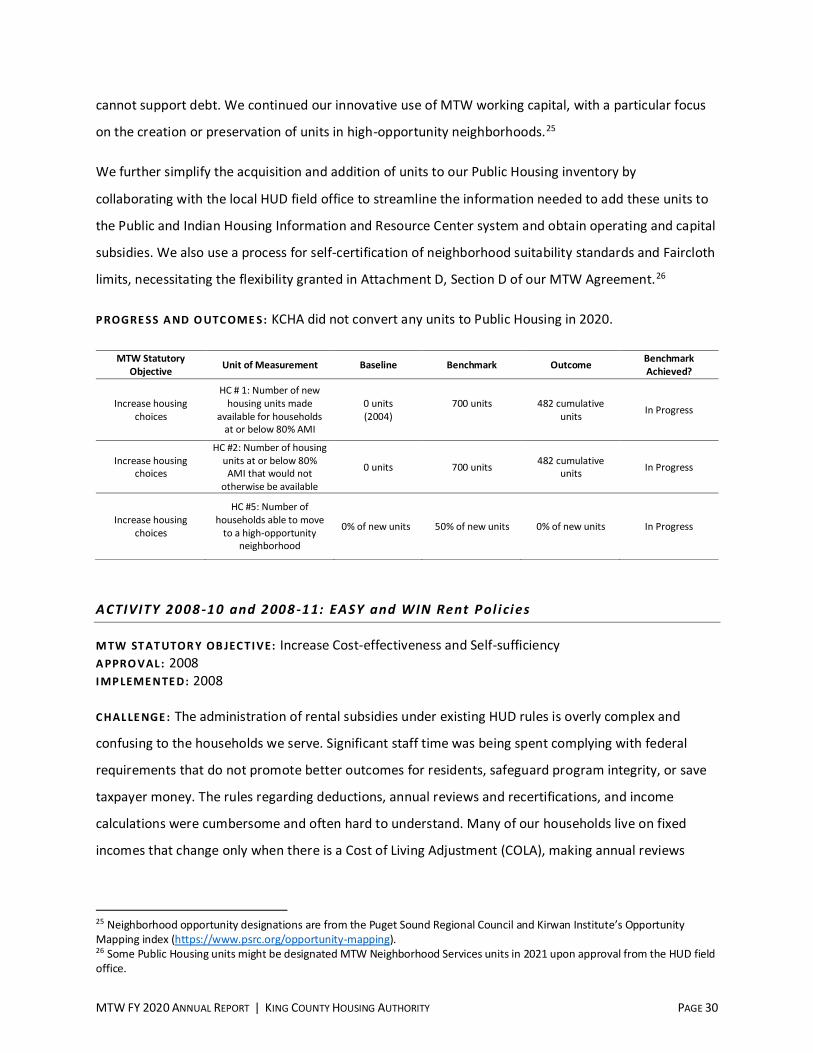
MTW FY 2020 ANNUAL REPORT | KING COUNTY HOUSING AUTHORITY PAGE 30
cannot support debt. We continued our innovative use of MTW working capital, with a particular focus
on the creation or preservation of units in high-opportunity neighborhoods.25
We further simplify the acquisition and addition of units to our Public Housing inventory by
collaborating with the local HUD field office to streamline the information needed to add these units to
the Public and Indian Housing Information and Resource Center system and obtain operating and capital
subsidies. We also use a process for self-certification of neighborhood suitability standards and Faircloth
limits, necessitating the flexibility granted in Attachment D, Section D of our MTW Agreement.26
P ROGRE SS A ND O UTC OME S: KCHA did not convert any units to Public Housing in 2020.
MTW Statutory
Objective Unit of Measurement Baseline Benchmark Outcome
Benchmark
Achieved?
Increase housing
choices
HC # 1: Number of new
housing units made
available for households
at or below 80% AMI
0 units
(2004)
700 units
482 cumulative
units In Progress
Increase housing
choices
HC #2: Number of housing
units at or below 80%
AMI that would not
otherwise be available
0 units 700 units 482 cumulative
units In Progress
Increase housing
choices
HC #5: Number of
households able to move
to a high-opportunity
neighborhood
0% of new units 50% of new units 0% of new units In Progress
ACTIVITY 2008 -10 and 2008 -11: EASY and WIN Rent Pol i cies
M TW ST AT UTOR Y OB JEC TI VE: Increase Cost-effectiveness and Self-sufficiency
A PPRO VAL : 2008
I MP LEME NTE D: 2008
C HAL LE NGE : The administration of rental subsidies under existing HUD rules is overly complex and
confusing to the households we serve. Significant staff time was being spent complying with federal
requirements that do not promote better outcomes for residents, safeguard program integrity, or save
taxpayer money. The rules regarding deductions, annual reviews and recertifications, and income
calculations were cumbersome and often hard to understand. Many of our households live on fixed
incomes that change only when there is a Cost of Living Adjustment (COLA), making annual reviews
25 Neighborhood opportunity designations are from the Puget Sound Regional Council and Kirwan Institute’s Opportunity Mapping index (https://www.psrc.org/opportunity-mapping). 26 Some Public Housing units might be designated MTW Neighborhood Services units in 2021 upon approval from the HUD field
office.
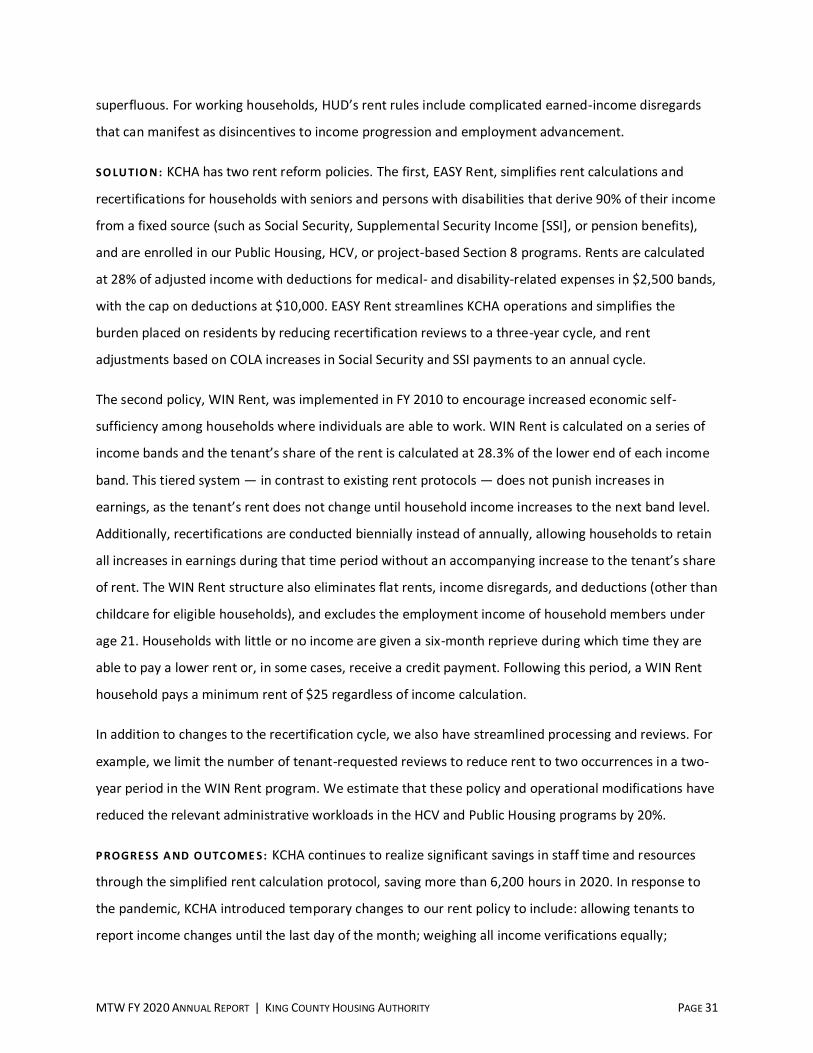
MTW FY 2020 ANNUAL REPORT | KING COUNTY HOUSING AUTHORITY PAGE 31
superfluous. For working households, HUD’s rent rules include complicated earned-income disregards
that can manifest as disincentives to income progression and employment advancement.
SO LU TIO N : KCHA has two rent reform policies. The first, EASY Rent, simplifies rent calculations and
recertifications for households with seniors and persons with disabilities that derive 90% of their income
from a fixed source (such as Social Security, Supplemental Security Income [SSI], or pension benefits),
and are enrolled in our Public Housing, HCV, or project-based Section 8 programs. Rents are calculated
at 28% of adjusted income with deductions for medical- and disability-related expenses in $2,500 bands,
with the cap on deductions at $10,000. EASY Rent streamlines KCHA operations and simplifies the
burden placed on residents by reducing recertification reviews to a three-year cycle, and rent
adjustments based on COLA increases in Social Security and SSI payments to an annual cycle.
The second policy, WIN Rent, was implemented in FY 2010 to encourage increased economic self-
sufficiency among households where individuals are able to work. WIN Rent is calculated on a series of
income bands and the tenant’s share of the rent is calculated at 28.3% of the lower end of each income
band. This tiered system — in contrast to existing rent protocols — does not punish increases in
earnings, as the tenant’s rent does not change until household income increases to the next band level.
Additionally, recertifications are conducted biennially instead of annually, allowing households to retain
all increases in earnings during that time period without an accompanying increase to the tenant’s share
of rent. The WIN Rent structure also eliminates flat rents, income disregards, and deductions (other than
childcare for eligible households), and excludes the employment income of household members under
age 21. Households with little or no income are given a six-month reprieve during which time they are
able to pay a lower rent or, in some cases, receive a credit payment. Following this period, a WIN Rent
household pays a minimum rent of $25 regardless of income calculation.
In addition to changes to the recertification cycle, we also have streamlined processing and reviews. For
example, we limit the number of tenant-requested reviews to reduce rent to two occurrences in a two-
year period in the WIN Rent program. We estimate that these policy and operational modifications have
reduced the relevant administrative workloads in the HCV and Public Housing programs by 20%.
P ROGRE SS A ND O UTC OME S: KCHA continues to realize significant savings in staff time and resources
through the simplified rent calculation protocol, saving more than 6,200 hours in 2020. In response to
the pandemic, KCHA introduced temporary changes to our rent policy to include: allowing tenants to
report income changes until the last day of the month; weighing all income verifications equally;
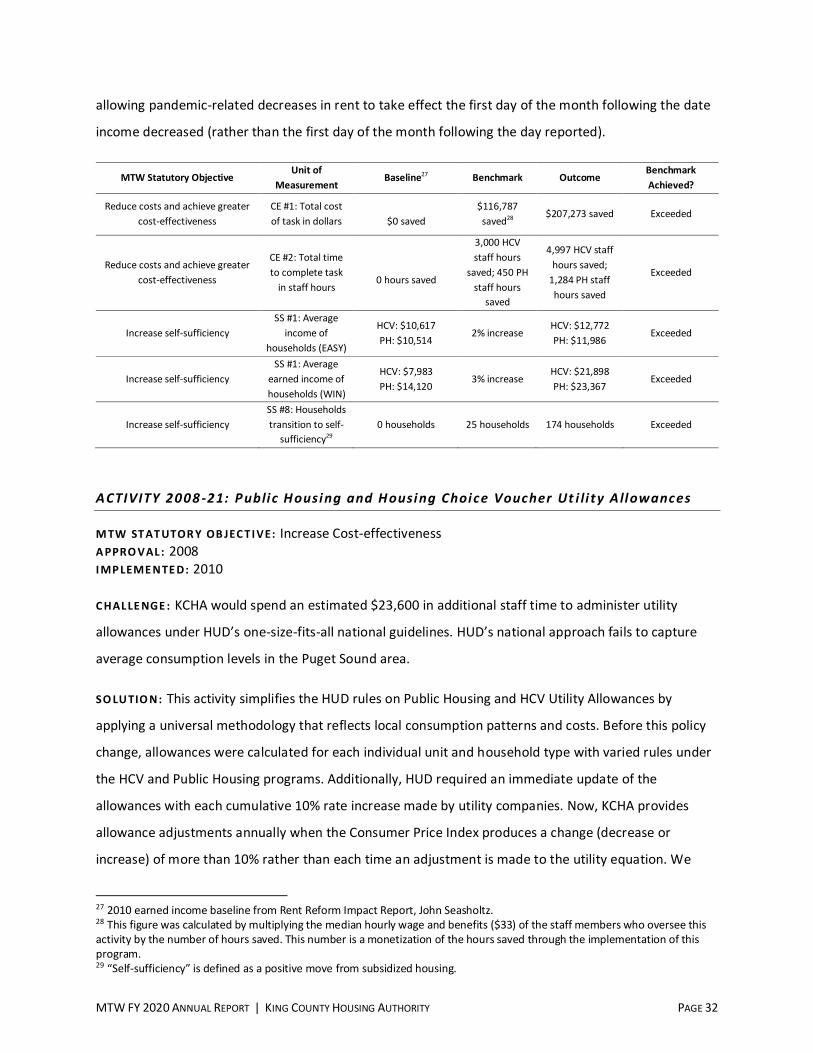
MTW FY 2020 ANNUAL REPORT | KING COUNTY HOUSING AUTHORITY PAGE 32
allowing pandemic-related decreases in rent to take effect the first day of the month following the date
income decreased (rather than the first day of the month following the day reported).
MTW Statutory Objective Unit of
Measurement Baseline27 Benchmark Outcome
Benchmark
Achieved?
Reduce costs and achieve greater
cost-effectiveness
CE #1: Total cost
of task in dollars
$0 saved
$116,787
saved28 $207,273 saved Exceeded
Reduce costs and achieve greater
cost-effectiveness
CE #2: Total time
to complete task
in staff hours
0 hours saved
3,000 HCV
staff hours
saved; 450 PH
staff hours
saved
4,997 HCV staff
hours saved;
1,284 PH staff
hours saved
Exceeded
Increase self-sufficiency
SS #1: Average
income of
households (EASY)
HCV: $10,617
PH: $10,514 2% increase
HCV: $12,772
PH: $11,986 Exceeded
Increase self-sufficiency
SS #1: Average
earned income of
households (WIN)
HCV: $7,983
PH: $14,120 3% increase
HCV: $21,898
PH: $23,367 Exceeded
Increase self-sufficiency
SS #8: Households
transition to self-
sufficiency29
0 households 25 households 174 households Exceeded
ACTIVITY 2008 -21: Public Housing and Housing Choice Voucher Ut i li ty Allowances
M TW ST AT UTOR Y OB JEC TI VE: Increase Cost-effectiveness
A PPRO VAL : 2008
I MP LEME NTE D: 2010
C HAL LE NGE : KCHA would spend an estimated $23,600 in additional staff time to administer utility
allowances under HUD’s one-size-fits-all national guidelines. HUD’s national approach fails to capture
average consumption levels in the Puget Sound area.
SO LU TIO N: This activity simplifies the HUD rules on Public Housing and HCV Utility Allowances by
applying a universal methodology that reflects local consumption patterns and costs. Before this policy
change, allowances were calculated for each individual unit and household type with varied rules under
the HCV and Public Housing programs. Additionally, HUD required an immediate update of the
allowances with each cumulative 10% rate increase made by utility companies. Now, KCHA provides
allowance adjustments annually when the Consumer Price Index produces a change (decrease or
increase) of more than 10% rather than each time an adjustment is made to the utility equation. We
27 2010 earned income baseline from Rent Reform Impact Report, John Seasholtz. 28 This figure was calculated by multiplying the median hourly wage and benefits ($33) of the staff members who oversee this
activity by the number of hours saved. This number is a monetization of the hours saved through the implementation of this
program. 29 “Self-sufficiency” is defined as a positive move from subsidized housing.
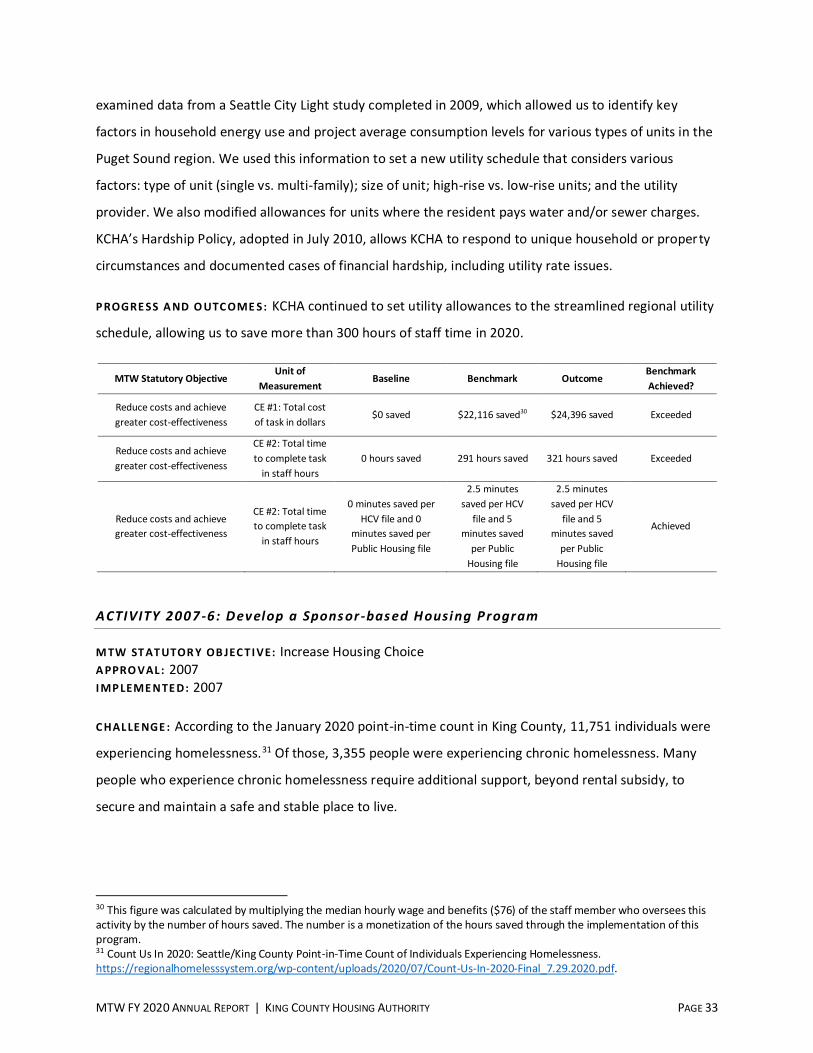
MTW FY 2020 ANNUAL REPORT | KING COUNTY HOUSING AUTHORITY PAGE 33
examined data from a Seattle City Light study completed in 2009, which allowed us to identify key
factors in household energy use and project average consumption levels for various types of units in the
Puget Sound region. We used this information to set a new utility schedule that considers various
factors: type of unit (single vs. multi-family); size of unit; high-rise vs. low-rise units; and the utility
provider. We also modified allowances for units where the resident pays water and/or sewer charges.
KCHA’s Hardship Policy, adopted in July 2010, allows KCHA to respond to unique household or property
circumstances and documented cases of financial hardship, including utility rate issues.
P ROGRE SS A ND O UTC OME S: KCHA continued to set utility allowances to the streamlined regional utility
schedule, allowing us to save more than 300 hours of staff time in 2020.
MTW Statutory Objective Unit of
Measurement Baseline Benchmark Outcome
Benchmark
Achieved?
Reduce costs and achieve
greater cost-effectiveness
CE #1: Total cost
of task in dollars $0 saved $22,116 saved30 $24,396 saved Exceeded
Reduce costs and achieve
greater cost-effectiveness
CE #2: Total time
to complete task
in staff hours
0 hours saved 291 hours saved 321 hours saved Exceeded
Reduce costs and achieve
greater cost-effectiveness
CE #2: Total time
to complete task
in staff hours
0 minutes saved per
HCV file and 0
minutes saved per
Public Housing file
2.5 minutes
saved per HCV
file and 5
minutes saved
per Public
Housing file
2.5 minutes
saved per HCV
file and 5
minutes saved
per Public
Housing file
Achieved
ACTIVITY 2007 -6: Develop a Spons or-bas ed Housing Program
M TW ST AT UTOR Y OB JEC TI VE: Increase Housing Choice
A PPRO VAL : 2007
I MP LEME NTE D: 2007
C HAL LE NGE : According to the January 2020 point-in-time count in King County, 11,751 individuals were
experiencing homelessness.31 Of those, 3,355 people were experiencing chronic homelessness. Many
people who experience chronic homelessness require additional support, beyond rental subsidy, to
secure and maintain a safe and stable place to live.
30 This figure was calculated by multiplying the median hourly wage and benefits ($76) of the staff member who oversees this
activity by the number of hours saved. The number is a monetization of the hours saved through the implementation of this
program. 31 Count Us In 2020: Seattle/King County Point-in-Time Count of Individuals Experiencing Homelessness.
https://regionalhomelesssystem.org/wp-content/uploads/2020/07/Count-Us-In-2020-Final_7.29.2020.pdf.
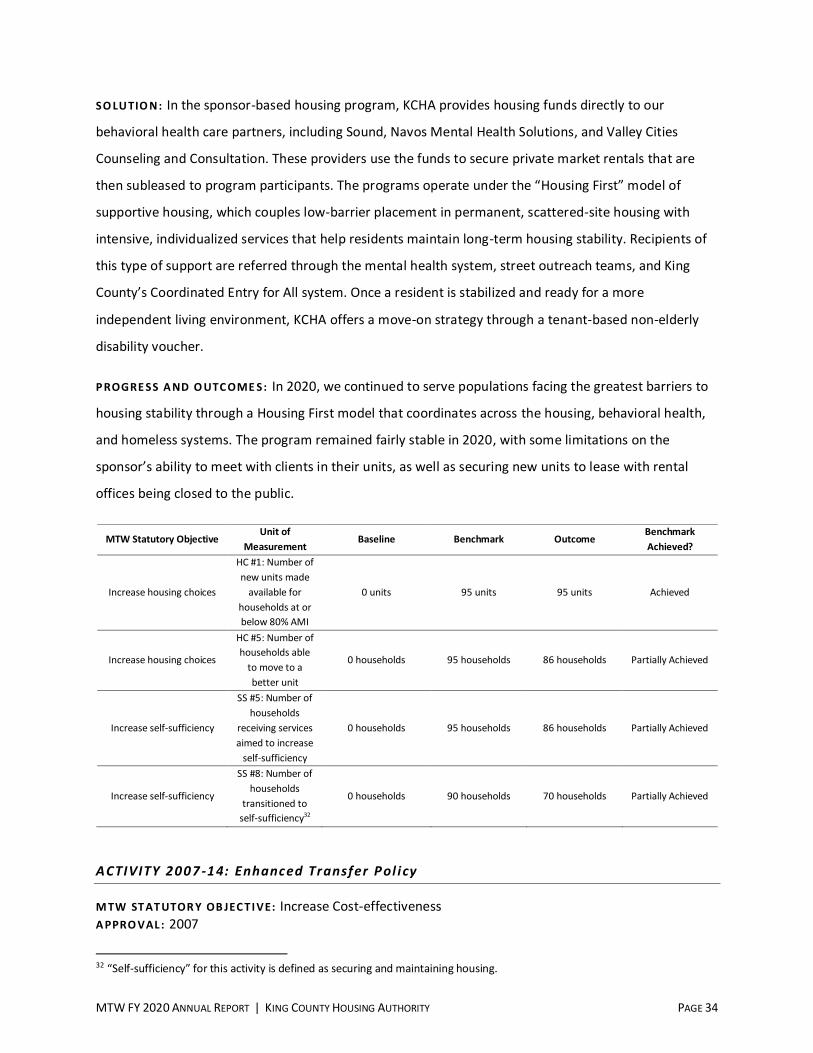
MTW FY 2020 ANNUAL REPORT | KING COUNTY HOUSING AUTHORITY PAGE 34
SO LU TIO N: In the sponsor-based housing program, KCHA provides housing funds directly to our
behavioral health care partners, including Sound, Navos Mental Health Solutions, and Valley Cities
Counseling and Consultation. These providers use the funds to secure private market rentals that are
then subleased to program participants. The programs operate under the “Housing First” model of
supportive housing, which couples low-barrier placement in permanent, scattered-site housing with
intensive, individualized services that help residents maintain long-term housing stability. Recipients of
this type of support are referred through the mental health system, street outreach teams, and King
County’s Coordinated Entry for All system. Once a resident is stabilized and ready for a more
independent living environment, KCHA offers a move-on strategy through a tenant-based non-elderly
disability voucher.
P ROGRE SS A ND O UTC OME S: In 2020, we continued to serve populations facing the greatest barriers to
housing stability through a Housing First model that coordinates across the housing, behavioral health,
and homeless systems. The program remained fairly stable in 2020, with some limitations on the
sponsor’s ability to meet with clients in their units, as well as securing new units to lease with rental
offices being closed to the public.
MTW Statutory Objective Unit of
Measurement Baseline Benchmark Outcome
Benchmark
Achieved?
Increase housing choices
HC #1: Number of
new units made
available for
households at or
below 80% AMI
0 units 95 units 95 units Achieved
Increase housing choices
HC #5: Number of
households able
to move to a
better unit
0 households 95 households 86 households Partially Achieved
Increase self-sufficiency
SS #5: Number of
households
receiving services
aimed to increase
self-sufficiency
0 households 95 households 86 households Partially Achieved
Increase self-sufficiency
SS #8: Number of
households
transitioned to
self-sufficiency32
0 households 90 households 70 households Partially Achieved
ACTIVITY 2007 -14: Enhanced Transfer Pol i cy
M TW ST AT UTOR Y OB JEC TI VE: Increase Cost-effectiveness
A PPRO VAL : 2007
32 “Self-sufficiency” for this activity is defined as securing and maintaining housing.
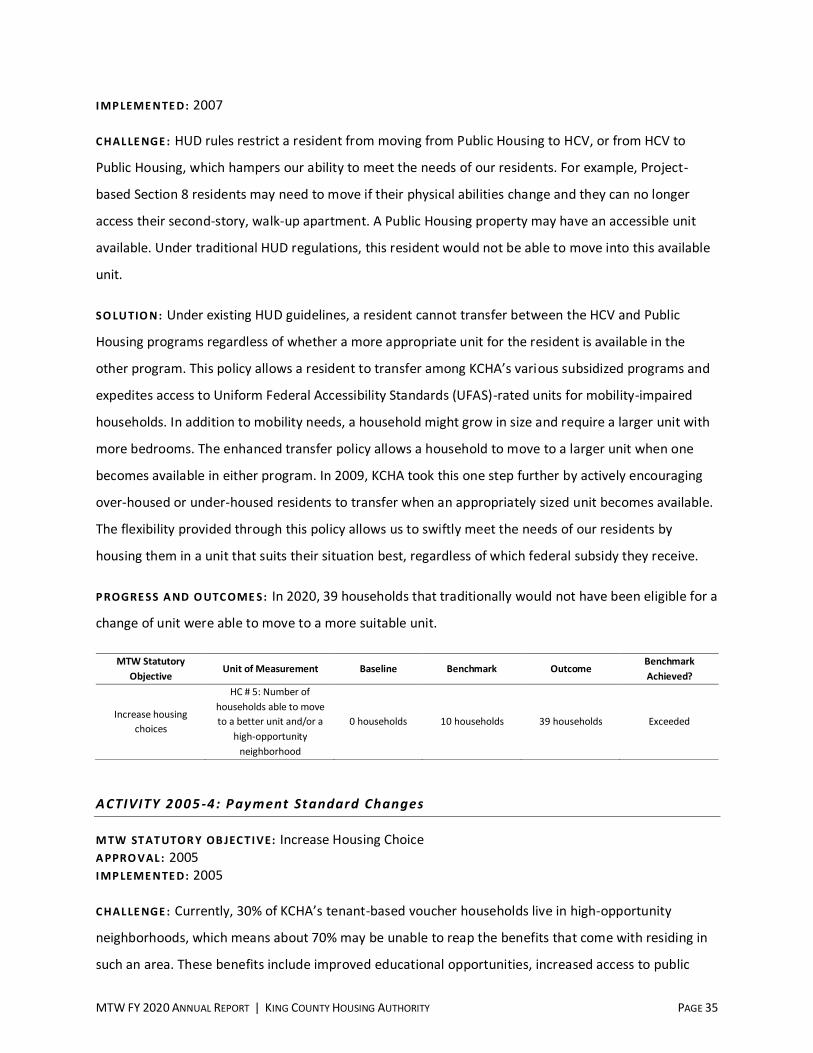
MTW FY 2020 ANNUAL REPORT | KING COUNTY HOUSING AUTHORITY PAGE 35
I MP LEME NTE D: 2007
C HAL LE NGE : HUD rules restrict a resident from moving from Public Housing to HCV, or from HCV to
Public Housing, which hampers our ability to meet the needs of our residents. For example, Project-
based Section 8 residents may need to move if their physical abilities change and they can no longer
access their second-story, walk-up apartment. A Public Housing property may have an accessible unit
available. Under traditional HUD regulations, this resident would not be able to move into this available
unit.
SO LU TIO N: Under existing HUD guidelines, a resident cannot transfer between the HCV and Public
Housing programs regardless of whether a more appropriate unit for the resident is available in the
other program. This policy allows a resident to transfer among KCHA’s various subsidized programs and
expedites access to Uniform Federal Accessibility Standards (UFAS)-rated units for mobility-impaired
households. In addition to mobility needs, a household might grow in size and require a larger unit with
more bedrooms. The enhanced transfer policy allows a household to move to a larger unit when one
becomes available in either program. In 2009, KCHA took this one step further by actively encouraging
over-housed or under-housed residents to transfer when an appropriately sized unit becomes available.
The flexibility provided through this policy allows us to swiftly meet the needs of our residents by
housing them in a unit that suits their situation best, regardless of which federal subsidy they receive.
P ROGRE SS A ND O UTC OME S: In 2020, 39 households that traditionally would not have been eligible for a
change of unit were able to move to a more suitable unit.
MTW Statutory
Objective Unit of Measurement Baseline Benchmark Outcome
Benchmark
Achieved?
Increase housing
choices
HC # 5: Number of
households able to move
to a better unit and/or a
high-opportunity
neighborhood
0 households 10 households 39 households Exceeded
ACTIVITY 2005 -4: Payment Standard Changes
M TW ST AT UTOR Y OB JEC TI VE: Increase Housing Choice
A PPRO VAL : 2005
I MP LEME NTE D: 2005
C HAL LE NGE : Currently, 30% of KCHA’s tenant-based voucher households live in high-opportunity
neighborhoods, which means about 70% may be unable to reap the benefits that come with residing in
such an area. These benefits include improved educational opportunities, increased access to public
MTW FY 2020 ANNUAL REPORT | KING COUNTY HOUSING AUTHORITY PAGE 36
transportation, and greater economic opportunities.33 Not surprisingly, high-opportunity neighborhoods
also have more expensive rents. According to recent market data, a two-bedroom rental unit at the 40th
percentile in east King County — typically a high-opportunity area — costs $554 more than the same
unit in lower opportunity neighborhoods of south King County.34 To move to high-opportunity areas,
voucher holders need sufficient resources, which are not available under traditional payment standards.
Conversely, broadly applied payment standards that encompass multiple housing markets — low and
high — result in HCV rents “leading the market” in lower-priced areas.
SO LU TIO N: This initiative develops local criteria for the determination and assignment of payment
standards to better match local rental markets, with the goals of increasing affordability in high-
opportunity neighborhoods and ensuring the best use of limited financial resources. We develop our
payment standards through an analysis of local submarket conditions, trends, and projections. This
approach means that we can provide subsidy levels sufficient for families to afford the rents in high-
opportunity areas of the county and not have to pay market-leading rents in less expensive
neighborhoods. As a result, our residents are less likely to be squeezed out by tighter rental markets and
therefore have greater geographic choice. In 2005, KCHA began applying new payment standards at the
time of a resident’s next annual review. In 2007, we expanded this initiative and allowed approval of
payment standards of up to 120% of Fair Market Rent (FMR) without HUD approval. In early 2008, we
decoupled the payment standards from HUD’s FMR calculations entirely so that we could be responsive
to the range of rents in Puget Sound’s submarkets. Current payment standards for two-bedroom
apartments range from 79% to 112% of the regional HUD FMR.
In 2016, KCHA implemented a five-tiered payment standard system based on ZIP Codes. We arrived at a
five-tiered approach by analyzing recent tenant lease-up records, consulting local real estate data,
holding forums with residents and staff, reviewing small area FMR payment standard systems
implemented by other housing authorities, and assessing the financial implications of various
approaches. In designing the new system, we sought to have enough tiers to account for submarket
variations but not so many that the new system became burdensome and confusing for staff and
residents. At the end of 2017, we implemented an additional sixth payment standard tier to more
closely account for variations in a local housing market. Since 2018, KCHA has conducted biannual
33 Neighborhood opportunity designations are from the Puget Sound Regional Council and Kirwan Institute’s Opportunity Mapping index (https://www.psrc.org/opportunity-mapping). 34 CoStar Multi-Family Rental Data, 2020.
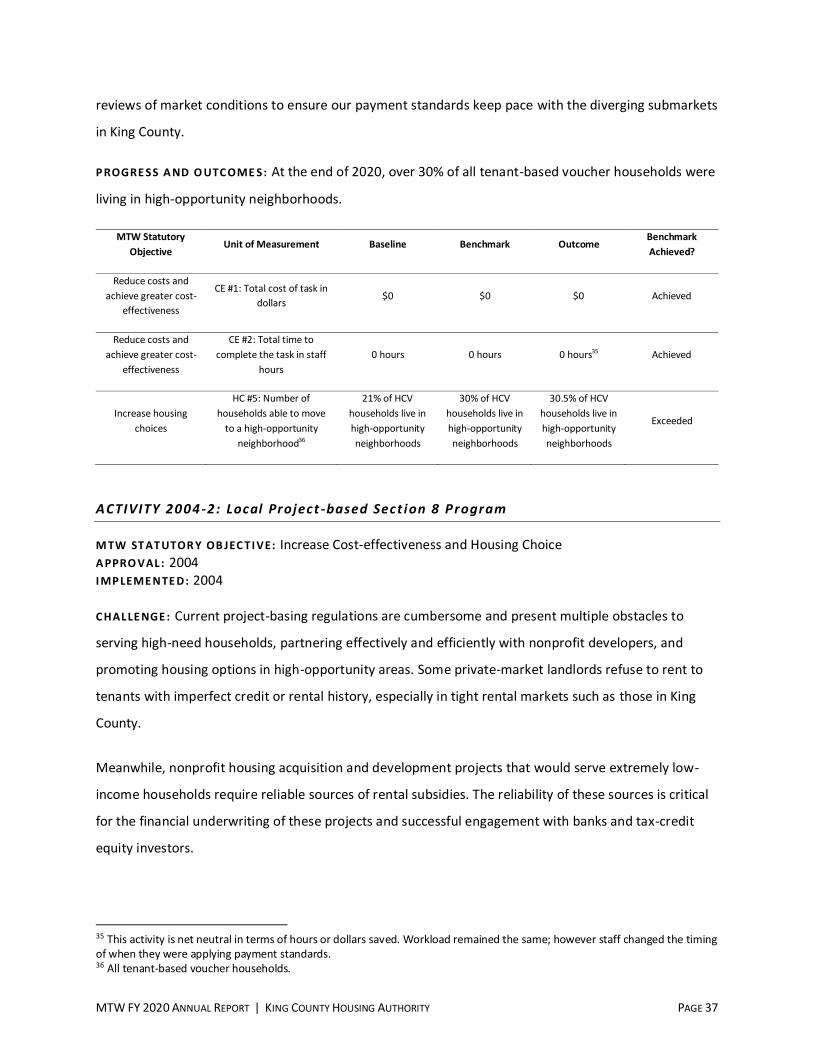
MTW FY 2020 ANNUAL REPORT | KING COUNTY HOUSING AUTHORITY PAGE 37
reviews of market conditions to ensure our payment standards keep pace with the diverging submarkets
in King County.
P ROGRE SS A ND O UTC OME S: At the end of 2020, over 30% of all tenant-based voucher households were
living in high-opportunity neighborhoods.
MTW Statutory
Objective Unit of Measurement Baseline Benchmark Outcome
Benchmark
Achieved?
Reduce costs and
achieve greater cost-
effectiveness
CE #1: Total cost of task in
dollars $0 $0 $0 Achieved
Reduce costs and
achieve greater cost-
effectiveness
CE #2: Total time to
complete the task in staff
hours
0 hours 0 hours 0 hours35 Achieved
Increase housing
choices
HC #5: Number of
households able to move
to a high-opportunity
neighborhood36
21% of HCV
households live in
high-opportunity
neighborhoods
30% of HCV
households live in
high-opportunity
neighborhoods
30.5% of HCV
households live in
high-opportunity
neighborhoods
Exceeded
ACTIVITY 2004 -2: Local Project -based Sect ion 8 Program
M TW ST AT UTOR Y OB JEC TI VE: Increase Cost-effectiveness and Housing Choice
A PPRO VAL : 2004
I MP LEME NTE D: 2004
C HAL LE NGE : Current project-basing regulations are cumbersome and present multiple obstacles to
serving high-need households, partnering effectively and efficiently with nonprofit developers, and
promoting housing options in high-opportunity areas. Some private-market landlords refuse to rent to
tenants with imperfect credit or rental history, especially in tight rental markets such as those in King
County.
Meanwhile, nonprofit housing acquisition and development projects that would serve extremely low-
income households require reliable sources of rental subsidies. The reliability of these sources is critical
for the financial underwriting of these projects and successful engagement with banks and tax-credit
equity investors.
35 This activity is net neutral in terms of hours or dollars saved. Workload remained the same; however staff changed the timing
of when they were applying payment standards. 36 All tenant-based voucher households.
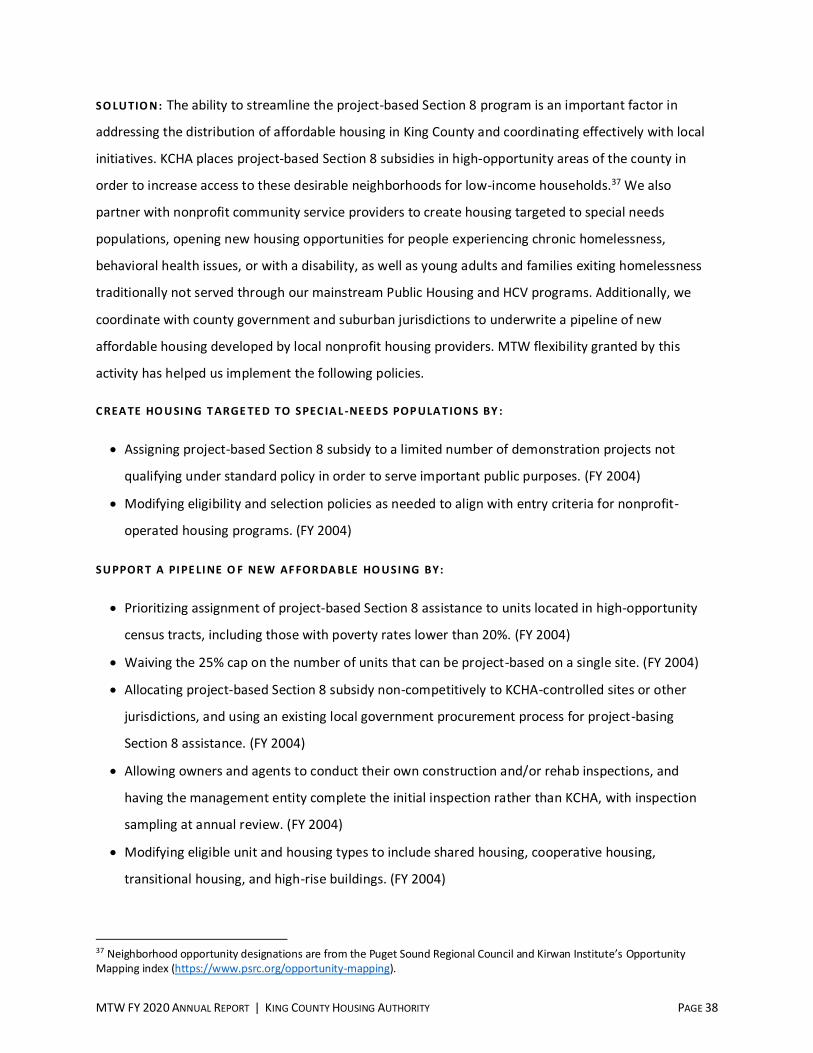
MTW FY 2020 ANNUAL REPORT | KING COUNTY HOUSING AUTHORITY PAGE 38
SO LU TIO N: The ability to streamline the project-based Section 8 program is an important factor in
addressing the distribution of affordable housing in King County and coordinating effectively with local
initiatives. KCHA places project-based Section 8 subsidies in high-opportunity areas of the county in
order to increase access to these desirable neighborhoods for low-income households.37 We also
partner with nonprofit community service providers to create housing targeted to special needs
populations, opening new housing opportunities for people experiencing chronic homelessness,
behavioral health issues, or with a disability, as well as young adults and families exiting homelessness
traditionally not served through our mainstream Public Housing and HCV programs. Additionally, we
coordinate with county government and suburban jurisdictions to underwrite a pipeline of new
affordable housing developed by local nonprofit housing providers. MTW flexibility granted by this
activity has helped us implement the following policies.
C REA TE HO U SI NG T ARGE TE D TO SPEC IA L -NE E DS POP ULA T IONS BY :
Assigning project-based Section 8 subsidy to a limited number of demonstration projects not
qualifying under standard policy in order to serve important public purposes. (FY 2004)
Modifying eligibility and selection policies as needed to align with entry criteria for nonprofit-
operated housing programs. (FY 2004)
SU PPOR T A PI PE LI NE O F NEW AF FOR DA BLE HO USI NG BY:
Prioritizing assignment of project-based Section 8 assistance to units located in high-opportunity
census tracts, including those with poverty rates lower than 20%. (FY 2004)
Waiving the 25% cap on the number of units that can be project-based on a single site. (FY 2004)
Allocating project-based Section 8 subsidy non-competitively to KCHA-controlled sites or other
jurisdictions, and using an existing local government procurement process for project-basing
Section 8 assistance. (FY 2004)
Allowing owners and agents to conduct their own construction and/or rehab inspections, and
having the management entity complete the initial inspection rather than KCHA, with inspection
sampling at annual review. (FY 2004)
Modifying eligible unit and housing types to include shared housing, cooperative housing,
transitional housing, and high-rise buildings. (FY 2004)
37 Neighborhood opportunity designations are from the Puget Sound Regional Council and Kirwan Institute’s Opportunity
Mapping index (https://www.psrc.org/opportunity-mapping).
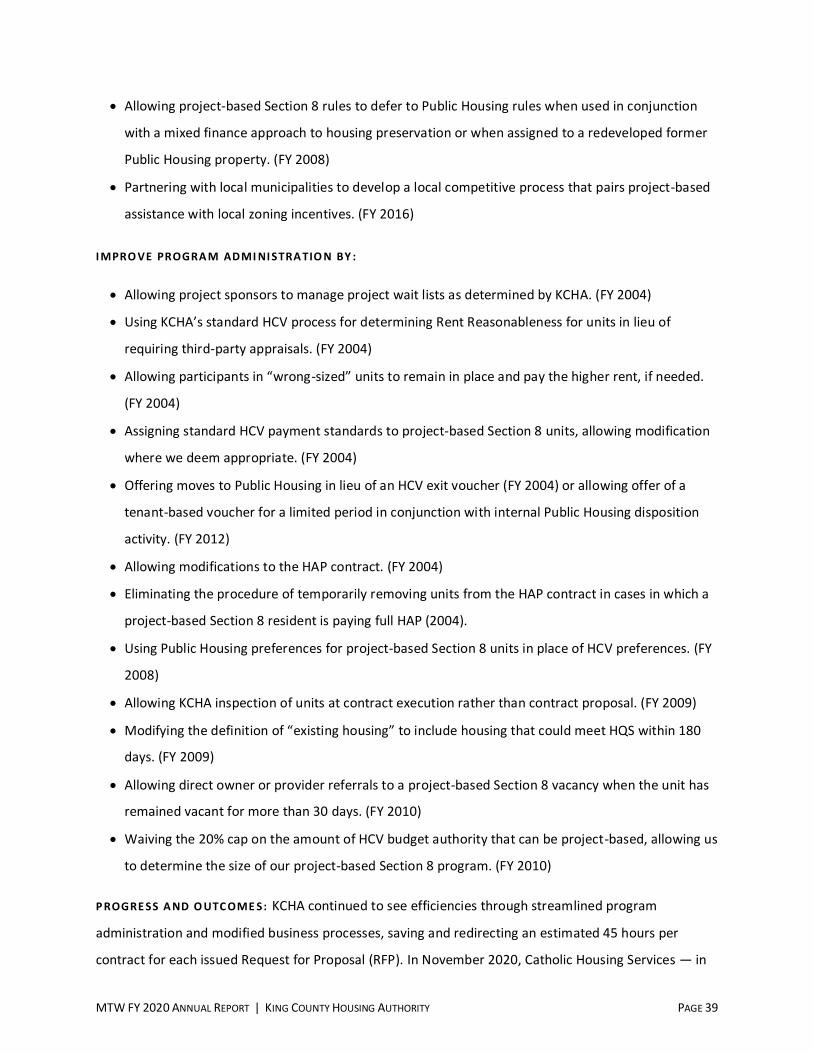
MTW FY 2020 ANNUAL REPORT | KING COUNTY HOUSING AUTHORITY PAGE 39
Allowing project-based Section 8 rules to defer to Public Housing rules when used in conjunction
with a mixed finance approach to housing preservation or when assigned to a redeveloped former
Public Housing property. (FY 2008)
Partnering with local municipalities to develop a local competitive process that pairs project-based
assistance with local zoning incentives. (FY 2016)
I MPRO VE PROGRA M ADMI NI STRA TIO N BY :
Allowing project sponsors to manage project wait lists as determined by KCHA. (FY 2004)
Using KCHA’s standard HCV process for determining Rent Reasonableness for units in lieu of
requiring third-party appraisals. (FY 2004)
Allowing participants in “wrong-sized” units to remain in place and pay the higher rent, if needed.
(FY 2004)
Assigning standard HCV payment standards to project-based Section 8 units, allowing modification
where we deem appropriate. (FY 2004)
Offering moves to Public Housing in lieu of an HCV exit voucher (FY 2004) or allowing offer of a
tenant-based voucher for a limited period in conjunction with internal Public Housing disposition
activity. (FY 2012)
Allowing modifications to the HAP contract. (FY 2004)
Eliminating the procedure of temporarily removing units from the HAP contract in cases in which a
project-based Section 8 resident is paying full HAP (2004).
Using Public Housing preferences for project-based Section 8 units in place of HCV preferences. (FY
2008)
Allowing KCHA inspection of units at contract execution rather than contract proposal. (FY 2009)
Modifying the definition of “existing housing” to include housing that could meet HQS within 180
days. (FY 2009)
Allowing direct owner or provider referrals to a project-based Section 8 vacancy when the unit has
remained vacant for more than 30 days. (FY 2010)
Waiving the 20% cap on the amount of HCV budget authority that can be project-based, allowing us
to determine the size of our project-based Section 8 program. (FY 2010)
P ROGRE SS A ND O UTC OME S: KCHA continued to see efficiencies through streamlined program
administration and modified business processes, saving and redirecting an estimated 45 hours per
contract for each issued Request for Proposal (RFP). In November 2020, Catholic Housing Services — in
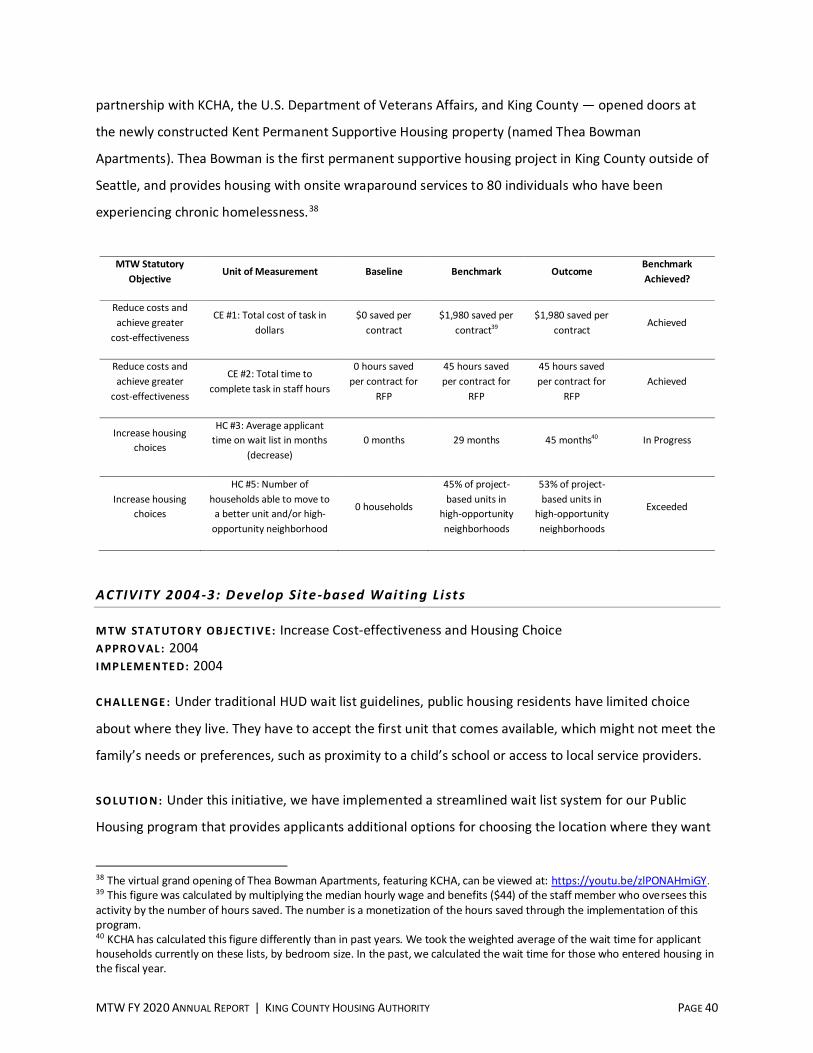
MTW FY 2020 ANNUAL REPORT | KING COUNTY HOUSING AUTHORITY PAGE 40
partnership with KCHA, the U.S. Department of Veterans Affairs, and King County — opened doors at
the newly constructed Kent Permanent Supportive Housing property (named Thea Bowman
Apartments). Thea Bowman is the first permanent supportive housing project in King County outside of
Seattle, and provides housing with onsite wraparound services to 80 individuals who have been
experiencing chronic homelessness.38
MTW Statutory
Objective Unit of Measurement Baseline Benchmark Outcome
Benchmark
Achieved?
Reduce costs and
achieve greater
cost-effectiveness
CE #1: Total cost of task in
dollars
$0 saved per
contract
$1,980 saved per
contract39
$1,980 saved per
contract Achieved
Reduce costs and
achieve greater
cost-effectiveness
CE #2: Total time to
complete task in staff hours
0 hours saved
per contract for
RFP
45 hours saved
per contract for
RFP
45 hours saved
per contract for
RFP
Achieved
Increase housing
choices
HC #3: Average applicant
time on wait list in months
(decrease)
0 months 29 months 45 months40 In Progress
Increase housing
choices
HC #5: Number of
households able to move to
a better unit and/or high-
opportunity neighborhood
0 households
45% of project-
based units in
high-opportunity
neighborhoods
53% of project-
based units in
high-opportunity
neighborhoods
Exceeded
ACTIVITY 2004 -3: Develop Si te-based Wait ing Li sts
M TW ST AT UTOR Y OB JEC TI VE: Increase Cost-effectiveness and Housing Choice
A PPRO VAL : 2004
I MP LEME NTE D: 2004
C HAL LE NGE : Under traditional HUD wait list guidelines, public housing residents have limited choice
about where they live. They have to accept the first unit that comes available, which might not meet the
family’s needs or preferences, such as proximity to a child’s school or access to local service providers.
SO LU TIO N: Under this initiative, we have implemented a streamlined wait list system for our Public
Housing program that provides applicants additional options for choosing the location where they want
38 The virtual grand opening of Thea Bowman Apartments, featuring KCHA, can be viewed at: https://youtu.be/zlPONAHmiGY. 39 This figure was calculated by multiplying the median hourly wage and benefits ($44) of the staff member who oversees this
activity by the number of hours saved. The number is a monetization of the hours saved through the implementation of this
program. 40 KCHA has calculated this figure differently than in past years. We took the weighted average of the wait time for applicant
households currently on these lists, by bedroom size. In the past, we calculated the wait time for those who entered housing in
the fiscal year.
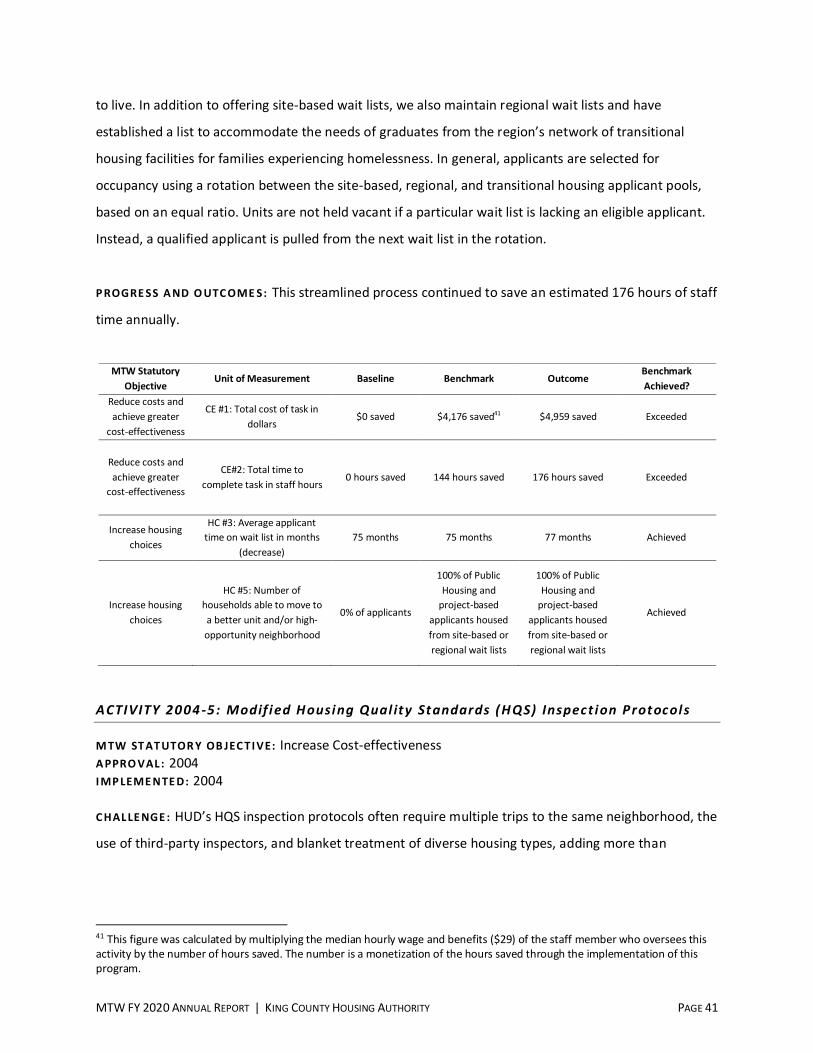
MTW FY 2020 ANNUAL REPORT | KING COUNTY HOUSING AUTHORITY PAGE 41
to live. In addition to offering site-based wait lists, we also maintain regional wait lists and have
established a list to accommodate the needs of graduates from the region’s network of transitional
housing facilities for families experiencing homelessness. In general, applicants are selected for
occupancy using a rotation between the site-based, regional, and transitional housing applicant pools,
based on an equal ratio. Units are not held vacant if a particular wait list is lacking an eligible applicant.
Instead, a qualified applicant is pulled from the next wait list in the rotation.
P ROGRE SS A ND O UTC OME S: This streamlined process continued to save an estimated 176 hours of staff
time annually.
MTW Statutory
Objective Unit of Measurement Baseline Benchmark Outcome
Benchmark
Achieved?
Reduce costs and
achieve greater
cost-effectiveness
CE #1: Total cost of task in
dollars $0 saved $4,176 saved41 $4,959 saved Exceeded
Reduce costs and
achieve greater
cost-effectiveness
CE#2: Total time to
complete task in staff hours 0 hours saved
144 hours saved
176 hours saved Exceeded
Increase housing
choices
HC #3: Average applicant
time on wait list in months
(decrease)
75 months 75 months 77 months Achieved
Increase housing
choices
HC #5: Number of
households able to move to
a better unit and/or high-
opportunity neighborhood
0% of applicants
100% of Public
Housing and
project-based
applicants housed
from site-based or
regional wait lists
100% of Public
Housing and
project-based
applicants housed
from site-based or
regional wait lists
Achieved
ACTIVITY 2004 -5: Modif ied Housing Qual ity Standards (HQS) Inspect ion Protocols
M TW ST AT UTOR Y OB JEC TI VE: Increase Cost-effectiveness
A PPRO VAL : 2004
I MP LEME NTE D: 2004
C HAL LE NGE : HUD’s HQS inspection protocols often require multiple trips to the same neighborhood, the
use of third-party inspectors, and blanket treatment of diverse housing types, adding more than
41 This figure was calculated by multiplying the median hourly wage and benefits ($29) of the staff member who oversees this
activity by the number of hours saved. The number is a monetization of the hours saved through the implementation of this
program.
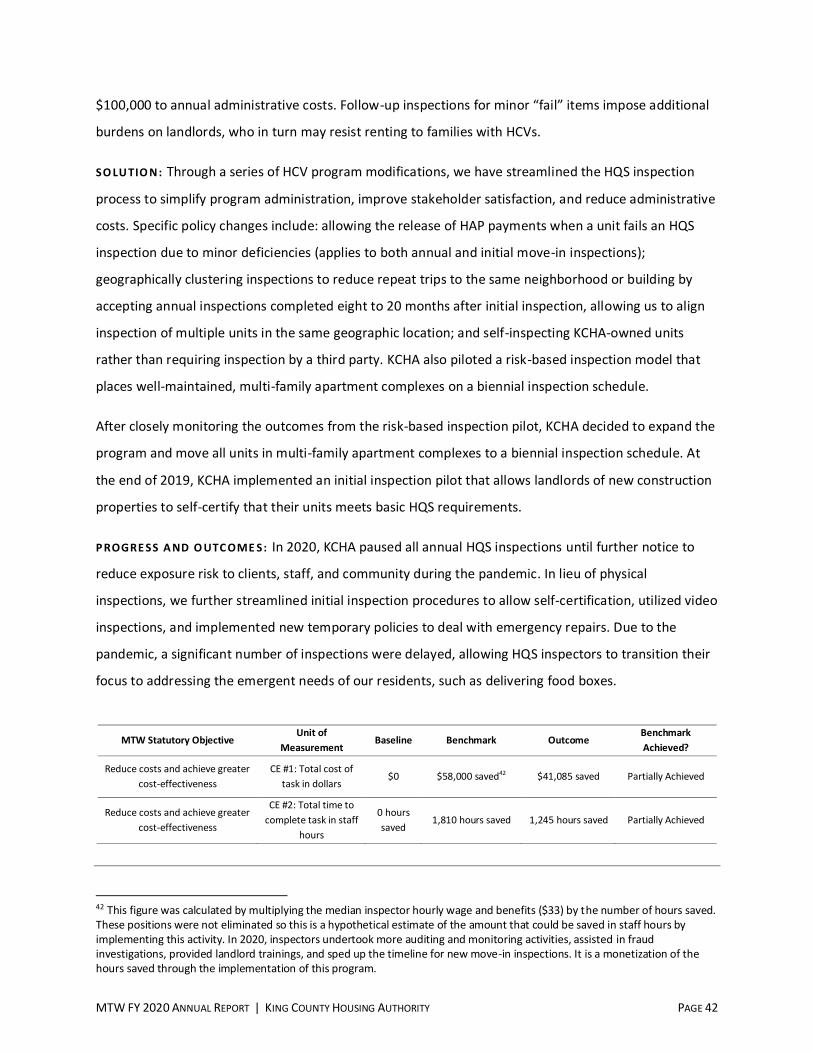
MTW FY 2020 ANNUAL REPORT | KING COUNTY HOUSING AUTHORITY PAGE 42
$100,000 to annual administrative costs. Follow-up inspections for minor “fail” items impose additional
burdens on landlords, who in turn may resist renting to families with HCVs.
SO LU TIO N: Through a series of HCV program modifications, we have streamlined the HQS inspection
process to simplify program administration, improve stakeholder satisfaction, and reduce administrative
costs. Specific policy changes include: allowing the release of HAP payments when a unit fails an HQS
inspection due to minor deficiencies (applies to both annual and initial move-in inspections);
geographically clustering inspections to reduce repeat trips to the same neighborhood or building by
accepting annual inspections completed eight to 20 months after initial inspection, allowing us to align
inspection of multiple units in the same geographic location; and self-inspecting KCHA-owned units
rather than requiring inspection by a third party. KCHA also piloted a risk-based inspection model that
places well-maintained, multi-family apartment complexes on a biennial inspection schedule.
After closely monitoring the outcomes from the risk-based inspection pilot, KCHA decided to expand the
program and move all units in multi-family apartment complexes to a biennial inspection schedule. At
the end of 2019, KCHA implemented an initial inspection pilot that allows landlords of new construction
properties to self-certify that their units meets basic HQS requirements.
P ROGRE SS A ND O UTC OME S: In 2020, KCHA paused all annual HQS inspections until further notice to
reduce exposure risk to clients, staff, and community during the pandemic. In lieu of physical
inspections, we further streamlined initial inspection procedures to allow self-certification, utilized video
inspections, and implemented new temporary policies to deal with emergency repairs. Due to the
pandemic, a significant number of inspections were delayed, allowing HQS inspectors to transition their
focus to addressing the emergent needs of our residents, such as delivering food boxes.
MTW Statutory Objective Unit of
Measurement Baseline Benchmark Outcome
Benchmark
Achieved?
Reduce costs and achieve greater
cost-effectiveness
CE #1: Total cost of
task in dollars $0 $58,000 saved42 $41,085 saved Partially Achieved
Reduce costs and achieve greater
cost-effectiveness
CE #2: Total time to
complete task in staff
hours
0 hours
saved 1,810 hours saved 1,245 hours saved Partially Achieved
42 This figure was calculated by multiplying the median inspector hourly wage and benefits ($33) by the number of hours saved.
These positions were not eliminated so this is a hypothetical estimate of the amount that could be saved in staff hours by
implementing this activity. In 2020, inspectors undertook more auditing and monitoring activities, assisted in fraud
investigations, provided landlord trainings, and sped up the timeline for new move-in inspections. It is a monetization of the
hours saved through the implementation of this program.
MTW FY 2020 ANNUAL REPORT | KING COUNTY HOUSING AUTHORITY PAGE 43
ACTIVITY 2004 -7: Streaml ining Publ ic Housing and Housing Choice Voucher Forms
and Data Processing
M TW ST AT UTOR Y OB JEC TI VE: Increase Cost-effectiveness
A PPRO VAL : 2004
I MP LEME NTE D: 2004
C HAL LE NGE : Duplicative recertifications, complex income calculations, and strict timing rules cause
unnecessary intrusions into the lives of the people we serve and expend limited resources for little
purpose.
SO LU TIO N: After analyzing our business processes, forms, and verification requirements, we have
eliminated or replaced those with little or no value. Through the use of lean engineering techniques,
KCHA continues to review office workflow and identify ways that tasks can be accomplished more
efficiently and intrude less into the lives of program participants, while still assuring program integrity
and quality control. Under this initiative, we have made a number of changes to our business practices
and processes for verifying and calculating tenant income and rent, including:
C HANG ES T O B U SI NE SS PRO CE SSE S:
Modify HCV policy to require notice to move prior to the 20th of the month in order to have
paperwork processed during the month. (FY 2004)
Allow applicant households to self-certify membership in the family at the time of admission. (FY
2004)
Modify HQS inspection requirements for units converted to project-based subsidy from another
KCHA subsidy, and allow the most recent inspection completed within the prior 12 months to
substitute for the initial HQS inspection required before entering the HAP contract. (FY 2012)
Modify standard project-based Section 8 requirements to allow the most recent recertification
(within last 12 months) to substitute for the full recertification when a tenant’s unit is converted to
a project-based Section 8 subsidy. (FY 2012)
Allow Public Housing applicant households to qualify for a preference when household income is
below 30% of AMI. (FY 2004)
Streamline procedures for processing interim rent changes resulting from wholesale reductions in
state entitlement programs. (FY 2011)
Modify the HQS inspection process to allow streamlined processing of inspection data. (FY 2010)
Establish a local release form that replaces the HUD form 9986 and is renewed every 40 months.
(FY 2014)
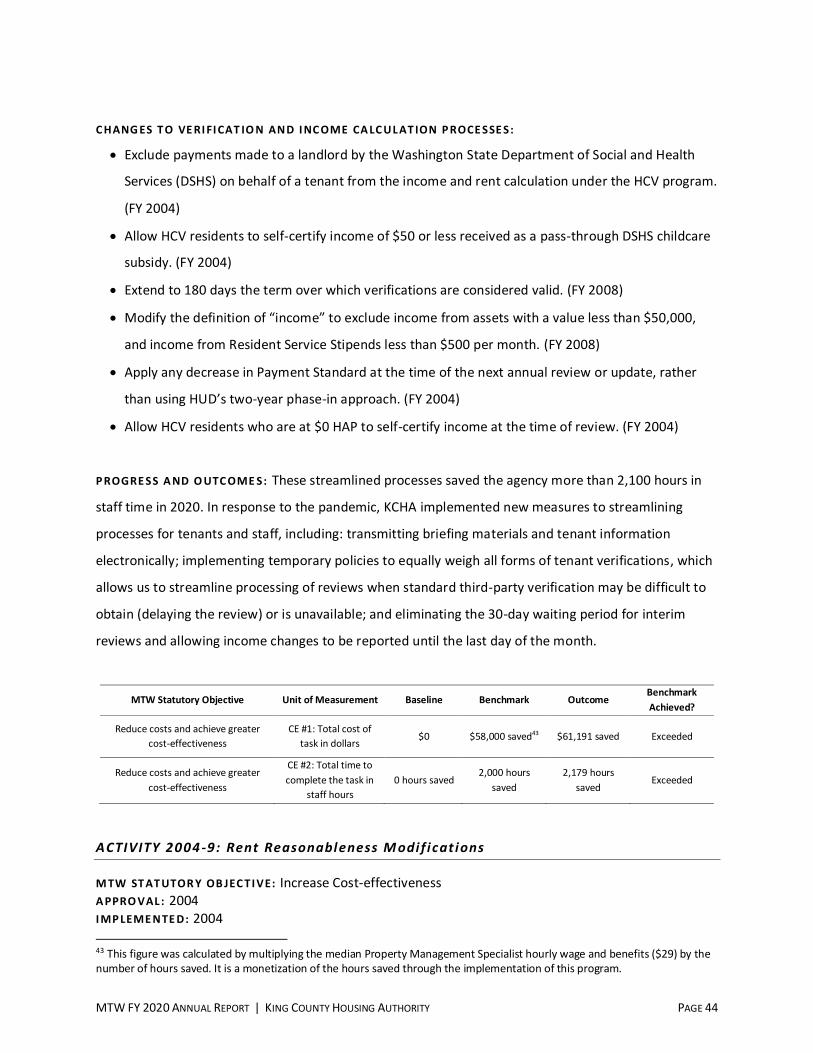
MTW FY 2020 ANNUAL REPORT | KING COUNTY HOUSING AUTHORITY PAGE 44
C HANG ES T O VE RI FI CAT IO N AND I NC OME CA LC UL AT ION P ROCE SSE S:
Exclude payments made to a landlord by the Washington State Department of Social and Health
Services (DSHS) on behalf of a tenant from the income and rent calculation under the HCV program.
(FY 2004)
Allow HCV residents to self-certify income of $50 or less received as a pass-through DSHS childcare
subsidy. (FY 2004)
Extend to 180 days the term over which verifications are considered valid. (FY 2008)
Modify the definition of “income” to exclude income from assets with a value less than $50,000,
and income from Resident Service Stipends less than $500 per month. (FY 2008)
Apply any decrease in Payment Standard at the time of the next annual review or update, rather
than using HUD’s two-year phase-in approach. (FY 2004)
Allow HCV residents who are at $0 HAP to self-certify income at the time of review. (FY 2004)
P ROGRE SS A ND O UTC OME S: These streamlined processes saved the agency more than 2,100 hours in
staff time in 2020. In response to the pandemic, KCHA implemented new measures to streamlining
processes for tenants and staff, including: transmitting briefing materials and tenant information
electronically; implementing temporary policies to equally weigh all forms of tenant verifications, which
allows us to streamline processing of reviews when standard third-party verification may be difficult to
obtain (delaying the review) or is unavailable; and eliminating the 30-day waiting period for interim
reviews and allowing income changes to be reported until the last day of the month.
MTW Statutory Objective Unit of Measurement Baseline Benchmark Outcome Benchmark
Achieved?
Reduce costs and achieve greater
cost-effectiveness
CE #1: Total cost of
task in dollars $0 $58,000 saved43 $61,191 saved Exceeded
Reduce costs and achieve greater
cost-effectiveness
CE #2: Total time to
complete the task in
staff hours
0 hours saved 2,000 hours
saved
2,179 hours
saved Exceeded
ACTIVITY 2004 -9: Rent Reasonableness M odi f i cat ions
M TW ST AT UTOR Y OB JEC TI VE: Increase Cost-effectiveness
A PPRO VAL : 2004
I MP LEME NTE D: 2004
43 This figure was calculated by multiplying the median Property Management Specialist hourly wage and benefits ($29) by the
number of hours saved. It is a monetization of the hours saved through the implementation of this program.
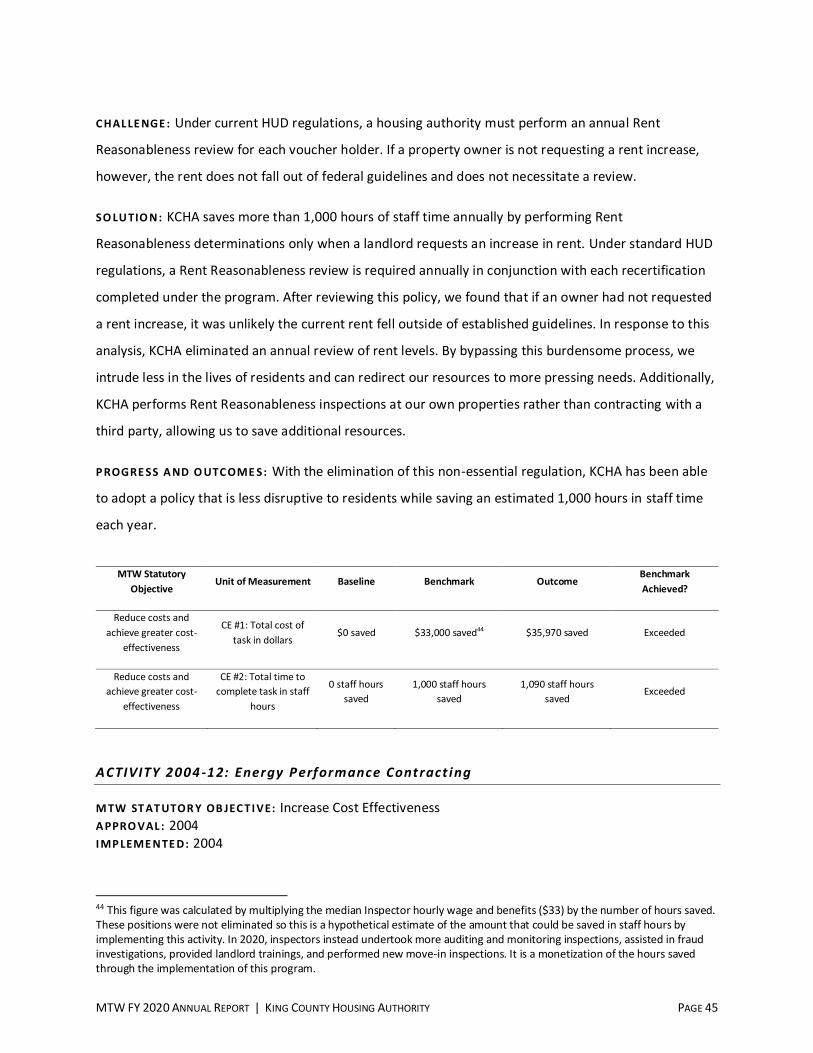
MTW FY 2020 ANNUAL REPORT | KING COUNTY HOUSING AUTHORITY PAGE 45
C HAL LE NGE : Under current HUD regulations, a housing authority must perform an annual Rent
Reasonableness review for each voucher holder. If a property owner is not requesting a rent increase,
however, the rent does not fall out of federal guidelines and does not necessitate a review.
SO LU TIO N: KCHA saves more than 1,000 hours of staff time annually by performing Rent
Reasonableness determinations only when a landlord requests an increase in rent. Under standard HUD
regulations, a Rent Reasonableness review is required annually in conjunction with each recertification
completed under the program. After reviewing this policy, we found that if an owner had not requested
a rent increase, it was unlikely the current rent fell outside of established guidelines. In response to this
analysis, KCHA eliminated an annual review of rent levels. By bypassing this burdensome process, we
intrude less in the lives of residents and can redirect our resources to more pressing needs. Additionally,
KCHA performs Rent Reasonableness inspections at our own properties rather than contracting with a
third party, allowing us to save additional resources.
P ROGRE SS A ND O UTC OME S: With the elimination of this non-essential regulation, KCHA has been able
to adopt a policy that is less disruptive to residents while saving an estimated 1,000 hours in staff time
each year.
MTW Statutory
Objective Unit of Measurement Baseline Benchmark Outcome
Benchmark
Achieved?
Reduce costs and
achieve greater cost-
effectiveness
CE #1: Total cost of
task in dollars $0 saved $33,000 saved44 $35,970 saved Exceeded
Reduce costs and
achieve greater cost-
effectiveness
CE #2: Total time to
complete task in staff
hours
0 staff hours
saved
1,000 staff hours
saved
1,090 staff hours
saved Exceeded
ACTIVITY 2004 -12: Energy Performance Contract ing
M TW ST AT UTOR Y OB JEC TI VE: Increase Cost Effectiveness
A PPRO VAL : 2004
I MP LEME NTE D: 2004
44 This figure was calculated by multiplying the median Inspector hourly wage and benefits ($33) by the number of hours saved.
These positions were not eliminated so this is a hypothetical estimate of the amount that could be saved in staff hours by
implementing this activity. In 2020, inspectors instead undertook more auditing and monitoring inspections, assisted in fraud
investigations, provided landlord trainings, and performed new move-in inspections. It is a monetization of the hours saved
through the implementation of this program.
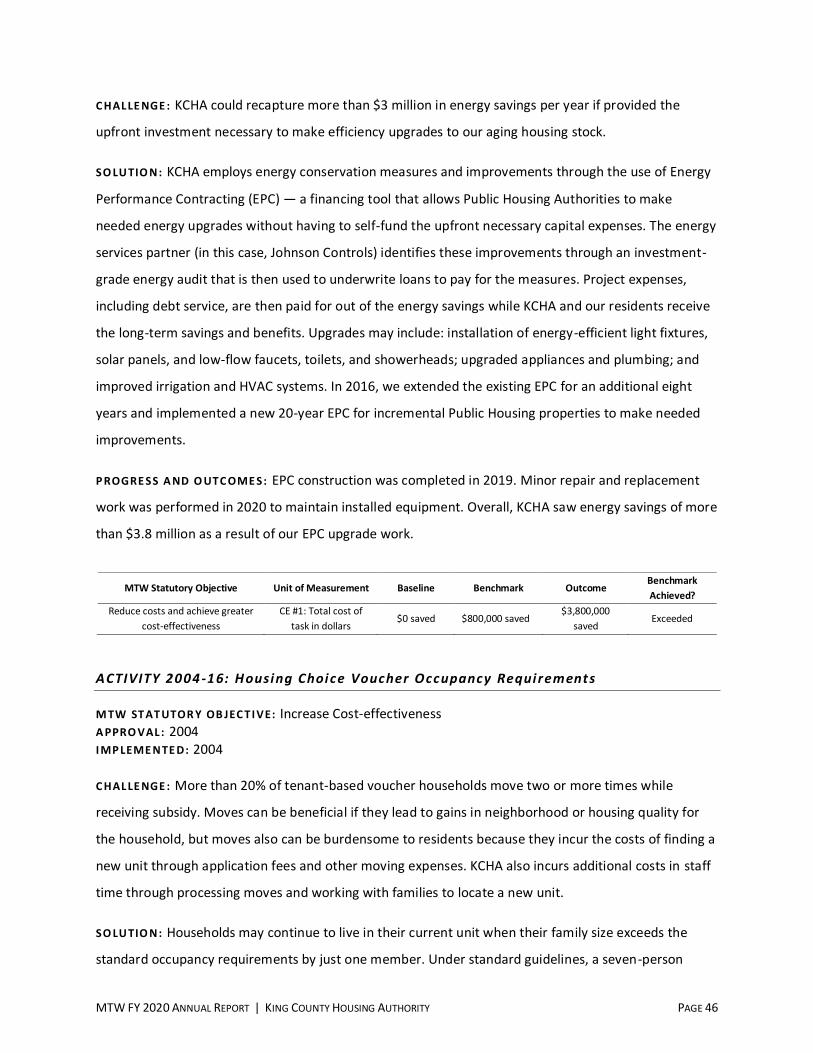
MTW FY 2020 ANNUAL REPORT | KING COUNTY HOUSING AUTHORITY PAGE 46
C HAL LE NGE : KCHA could recapture more than $3 million in energy savings per year if provided the
upfront investment necessary to make efficiency upgrades to our aging housing stock.
SO LU TIO N: KCHA employs energy conservation measures and improvements through the use of Energy
Performance Contracting (EPC) — a financing tool that allows Public Housing Authorities to make
needed energy upgrades without having to self-fund the upfront necessary capital expenses. The energy
services partner (in this case, Johnson Controls) identifies these improvements through an investment-
grade energy audit that is then used to underwrite loans to pay for the measures. Project expenses,
including debt service, are then paid for out of the energy savings while KCHA and our residents receive
the long-term savings and benefits. Upgrades may include: installation of energy-efficient light fixtures,
solar panels, and low-flow faucets, toilets, and showerheads; upgraded appliances and plumbing; and
improved irrigation and HVAC systems. In 2016, we extended the existing EPC for an additional eight
years and implemented a new 20-year EPC for incremental Public Housing properties to make needed
improvements.
P ROGRE SS A ND O UTC OME S: EPC construction was completed in 2019. Minor repair and replacement
work was performed in 2020 to maintain installed equipment. Overall, KCHA saw energy savings of more
than $3.8 million as a result of our EPC upgrade work.
MTW Statutory Objective Unit of Measurement Baseline Benchmark Outcome Benchmark
Achieved?
Reduce costs and achieve greater
cost-effectiveness
CE #1: Total cost of
task in dollars $0 saved $800,000 saved
$3,800,000
saved Exceeded
ACTIVITY 2004 -16: Housing Choice Voucher Occupancy Requirements
M TW ST AT UTOR Y OB JEC TI VE: Increase Cost-effectiveness
A PPRO VAL : 2004
I MP LEME NTE D: 2004
C HAL LE NGE : More than 20% of tenant-based voucher households move two or more times while
receiving subsidy. Moves can be beneficial if they lead to gains in neighborhood or housing quality for
the household, but moves also can be burdensome to residents because they incur the costs of finding a
new unit through application fees and other moving expenses. KCHA also incurs additional costs in staff
time through processing moves and working with families to locate a new unit.
SO LU TIO N: Households may continue to live in their current unit when their family size exceeds the
standard occupancy requirements by just one member. Under standard guidelines, a seven-person
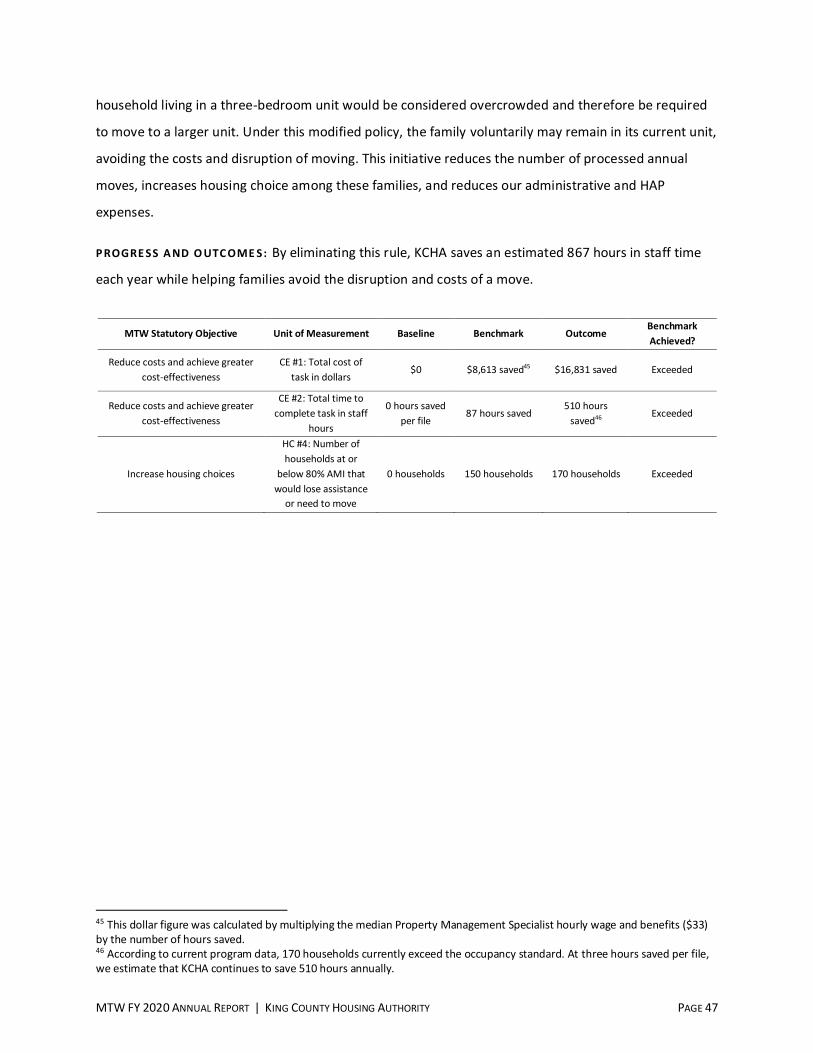
MTW FY 2020 ANNUAL REPORT | KING COUNTY HOUSING AUTHORITY PAGE 47
household living in a three-bedroom unit would be considered overcrowded and therefore be required
to move to a larger unit. Under this modified policy, the family voluntarily may remain in its current unit,
avoiding the costs and disruption of moving. This initiative reduces the number of processed annual
moves, increases housing choice among these families, and reduces our administrative and HAP
expenses.
P ROGRE SS A ND O UTC OME S: By eliminating this rule, KCHA saves an estimated 867 hours in staff time
each year while helping families avoid the disruption and costs of a move.
MTW Statutory Objective Unit of Measurement Baseline Benchmark Outcome Benchmark
Achieved?
Reduce costs and achieve greater
cost-effectiveness
CE #1: Total cost of
task in dollars $0 $8,613 saved45 $16,831 saved Exceeded
Reduce costs and achieve greater
cost-effectiveness
CE #2: Total time to
complete task in staff
hours
0 hours saved
per file 87 hours saved
510 hours
saved46 Exceeded
Increase housing choices
HC #4: Number of
households at or
below 80% AMI that
would lose assistance
or need to move
0 households 150 households 170 households Exceeded
45 This dollar figure was calculated by multiplying the median Property Management Specialist hourly wage and benefits ($33)
by the number of hours saved. 46 According to current program data, 170 households currently exceed the occupancy standard. At three hours saved per file,
we estimate that KCHA continues to save 510 hours annually.
MTW FY 2020 ANNUAL REPORT | KING COUNTY HOUSING AUTHORITY PAGE 48
B. NOT YET IMPLEMENTED ACTIVITIES
Activities listed in this section are approved but have not yet been implemented.
ACTIVITY 2015 -1: Flat Subsidy for Local, Non -tradi t ional Housing Programs
A PPRO VAL : 2015
This activity provides a flat, per-unit subsidy in lieu of a monthly HAP and allows the service provider to
dictate the terms of the tenancy (such as length of stay and the tenant portion of rent). The funding
would be block-granted based on the number of units authorized under contract and occupied in each
program. This flexibility would allow KCHA to better support a “Housing First” approach that places high-
risk populations experiencing homelessness in supportive housing programs tailored to nimbly meet an
individual’s needs. This activity will be reconsidered for implementation when KCHA has more capacity
to develop the program.
ACTIVITY 2010 -1: Support ive Housing for High -need Homeless Fa mi lies
A PPRO VAL : 2010
This activity is a demonstration program for up to 20 households in a project-based Family Unification
Program (FUP)-like environment. The demonstration program currently is deferred, as our program
partners opted for a tenant-based model. It might return in a future program year.
ACTIVITY 2010 -9: Limit Number of Moves for an HCV Part ic ipant A PPRO VAL : 2010
This policy aims to increase family and student classroom stability and reduce program administrative
costs by limiting the number of times an HCV participant can move per year or over a set time. This
activity is currently deferred for consideration to a future year, if the need arises.
ACTIVITY 2010 -11: Incent ive Payments to HCV Part ic ipants to Leave the Program A PPRO VAL : 2010
KCHA may offer incentive payments to families receiving less than $100 per month in HAP to voluntarily
withdraw from the program. This activity is not currently needed in our program model but may be
considered in a future fiscal year.
ACTIVITY 2008 -3: FSS Program Modi fi cations
M TW ST AT UTOR Y OB JEC TI VE: Increase Self-sufficiency
A PPRO VAL : 2008
MTW FY 2020 ANNUAL REPORT | KING COUNTY HOUSING AUTHORITY PAGE 49
KCHA is exploring possible modifications to the Family Self-Sufficiency (FSS) program that could increase
incentives for resident participation and income growth. These outcomes could pave the way for
residents to realize a higher degree of economic independence. The program currently includes
elements that unintentionally act as disincentives for higher income earners, the very residents who
could benefit most from additional support to exit subsidized housing programs. To address these
issues, KCHA is exploring modifying the escrow calculation in order to avoid punishing higher earning
households unintentionally.
This activity is part of a larger strategic planning process with local service providers that seeks to
increase positive economic outcomes for residents.
ACTIVITY 2008 -5: Allow Limited Double Subsidy between Programs (Project -based
Sect ion 8/Publ ic Housing/Housing Choice Vouchers) A PPRO VAL : 2008
This policy change facilitates program transfers in limited circumstances, increases landlord
participation, and reduces the impact on the Public Housing program when tenants transfer. Following
the initial review, this activity was tabled for future consideration.

MTW FY 2020 ANNUAL REPORT | KING COUNTY HOUSING AUTHORITY PAGE 50
C. ACTIVITIES ON HOLD
There are no activities on hold.
MTW FY 2020 ANNUAL REPORT | KING COUNTY HOUSING AUTHORITY PAGE 51
D. CLOSED-OUT ACTIVITIES
Activities listed in this section are closed out, meaning they never have been implemented, that we do
not plan to implement them in the future, or that they are completed or obsolete.
ACTIVITY 2016 -1: Budget -based Re nt Model
A PPRO VAL : 2016
C LO SEO UT YEA R : 2018
This activity allows KCHA to adopt a budget-based approach to calculating the contract rent at our
Project-based Section 8 developments. Traditionally, HUD requires Public Housing Authorities to set rent
in accordance with Rent Reasonableness statutes. These statutes require that a property’s costs reflect
the average costs of a comparable building in the same geographic region at a particular point in time.
However, a property’s needs and purpose can change over time. This set of rules does not take into
consideration variations in costs, which might include added operational expenses, necessary upgrades,
and increased debt service to pay for renovations. This budget-based rent model allows KCHA to create
an appropriate annual budget for each property from which a reasonable, cost-conscious rent level
would derive.
This policy is no longer under consideration.
ACTIVITY 2013 -3: Short -term Rental Assistance Program
A PPRO VAL : 2013
C LO SEO UT YEA R : 2015
In partnership with the Highline School District, KCHA implemented the Student and Family Stability
Initiative, a Rapid Re-housing demonstration program. Using this evidence-based approach, our program
paired short-term rental assistance with housing stability and employment connection services for
families experiencing or on the verge of homelessness. This activity is ongoing but has been combined
with Activity 2013-2: Flexible Rental Assistance, as the program models are similar and enlist the same
MTW flexibilities.
ACTIVITY 2012 -2: Community Choice Program
A PPRO VAL : 2012
C LO SEO UT YEA R : 2016
This initiative was designed to encourage and enable HCV households with young children to relocate to
areas of the county with higher achieving school districts and other community benefits. In addition to
MTW FY 2020 ANNUAL REPORT | KING COUNTY HOUSING AUTHORITY PAGE 52
formidable barriers to accessing these neighborhoods, many households are not aware of the link
between location and educational and employment opportunities. Through collaboration with local
nonprofits and landlords, the Community Choice Program offered one-on-one counseling to households
in deciding where to live, helped households secure housing in their community of choice, and provided
ongoing support once a family moved to a new neighborhood. Lessons learned from this pilot are
informing Creating Moves to Opportunity, KCHA’s new research partnership that seeks to expand
geographic choice.
ACTIVITY 2012 -4: Supplemental Support for the Highl ine Community Healthy Homes
Project
A PPRO VAL : 2012
C LO SEO UT YEA R : 2012
This project provided supplemental financial support to low-income families not otherwise qualified for
the Healthy Homes project but requiring assistance to avoid loss of affordable housing. This activity is
completed. An evaluation of the program by Breysse et al was included in KCHA’s 2013 Annual MTW
Report.
ACTIVITY 2011 -1: Transfer of Publ ic Housing Units to Project -bas ed Subsidy
A PPRO VAL : 2011
C LO SEO UT YEA R : 2012
By transferring Public Housing units to project-based subsidy, KCHA preserved the long-term viability of
509 units of Public Housing. By disposing these units to a KCHA-controlled entity, we were able to
leverage funds to accelerate capital repairs and increase tenant mobility through the provision of
tenant-based voucher options to existing Public Housing residents. This activity is completed.
ACTIVITY 2011 -2: Redesign the Sound Fami l ies Program
A PPRO VAL : 2011
C LO SEO UT YEA R : 2014
KCHA developed an alternative model to the Sound Families program that combines HCV funds with
Washington State Department of Social and Health Services funds. The goal was to continue the support
of at-risk households experiencing homelessness in a FUP-like model after the completion of the Sound
Families demonstration. This activity is completed and the services have been incorporated into our
existing conditional housing program.
MTW FY 2020 ANNUAL REPORT | KING COUNTY HOUSING AUTHORITY PAGE 53
ACTIVITY 2010 -2: Resident Sat i sfact ion Survey
A PPRO VAL : 2010
C LO SEO UT YEA R : 2010
KCHA developed our own resident survey in lieu of the requirement to comply with the Resident
Assessment Subsystem portion of HUD’s Public Housing Assessment System (PHAS). The Resident
Assessment Subsystem is no longer included in PHAS so this activity is obsolete. KCHA nevertheless
continues to survey residents on a regular basis.
ACTIVITY 2010 -10: Implement a Maximum Asset Threshold for Program El igibil i ty
A PPRO VAL : 2010
C LO SEO UT YEA R : 2016
This activity limits the value of assets that can be held by a family in order to obtain (or retain) program
eligibility. This policy is no longer under consideration.
ACTIVITY 2009 -2: Defini tion of L ive -in Attendant
A PPRO VAL : 2009
C LO SEO UT YEA R : 2014
In 2009, KCHA considered a policy change that would redefine who is considered a "Live-in Attendant."
This policy is no longer under consideration.
ACTIVITY 2008 -4: Combined Program Management
A PPRO VAL : 2008
C LO SEO UT YEA R : 2009
This activity streamlined program administration through a series of policy changes that ease operations
of units converted from Public Housing to project-based Section 8 subsidy or those located in sites
supported by mixed funding streams. This policy change is completed.
ACTIVITY 2008 -6: Performance Standards
A PPRO VAL : 2008
C LO SEO UT YEA R : 2014
In 2008, KCHA investigated the idea of developing performance standards and benchmarks to evaluate
the MTW program. We worked with other MTW agencies in the development of the performance
standards now being field-tested across the country. This activity is closed out as KCHA continues to
collaborate with other MTW agencies on industry metrics and standards.
ACTIVITY 2008 -17: Income El igibi li ty and Maximum Income Limits
MTW FY 2020 ANNUAL REPORT | KING COUNTY HOUSING AUTHORITY PAGE 54
A PPRO VAL : 2008
C LO SEO UT YEA R : 2016
This policy would cap the income that residents may have and also still be eligible for KCHA programs.
KCHA is no longer considering this activity.
ACTIVITY 2007 -4: Housing Choice Voucher Appl icant Eligibil ity
A PPRO VAL : 2007
C LO SEO UT YEA R : 2007
This activity increased program efficiency by removing eligibility for those currently on a federal subsidy
program. This activity is completed.
ACTIVITY 2007 -8: Remove Cap on Voucher Ut i l i zation
A PPRO VAL : 2007
C LO SEO UT YEA R : 2014
This initiative allowed us to award HCV assistance to more households than was permissible under the
HUD-established baseline. Our savings from a multi-tiered payment standard system, operational
efficiencies, and other policy changes have been critical in helping us respond to the growing housing
needs of the region’s extremely low-income households. This activity is no longer active as agencies are
now permitted to lease above their ACC limit.
ACTIVITY 2007 -9: Develop a Local Asset Management Funding M o del
A PPRO VAL : 2007
C LO SEO UT YEA R : 2007
This activity streamlined current HUD requirements to track budget expenses and income down to the
Asset Management Project level. This activity is completed.
ACTIVITY 2007 -18: Resident Opportuni ty P lan (ROP)
A PPRO VAL : 2007
C LO SEO UT YEA R : 2015
An expanded and locally designed version of FSS, ROP’s mission was to advance families toward self-
sufficiency through the provision of case management, supportive services, and program incentives,
with the goal of positive transition from Public Housing or HCV into private market rental housing or
home ownership. KCHA implemented this five-year pilot in collaboration with community partners,
including Bellevue College and the YWCA. These partners provided education and employment-focused
case management, such as individualized career planning, a focus on wage progression, and asset-
MTW FY 2020 ANNUAL REPORT | KING COUNTY HOUSING AUTHORITY PAGE 55
building assistance. In lieu of a standard FSS escrow account, each household received a monthly
deposit into a savings account, which continued throughout program participation. Deposits to the
household savings account were made available to residents upon graduation from Public Housing or
HCV subsidy. After reviewing the mixed outcomes from the multi-year evaluation, KCHA decided to
close out the program and re-evaluate the best way to assist families in achieving economic
independence.
ACTIVITY 2006 -1: Block Grant Non-mainstream Vouchers
A PPRO VAL : 2006
C LO SEO UT YEA R : 2006
This policy change expanded KCHA's MTW Block Grant by including all non-Mainstream program
vouchers. This activity is completed.
ACTIVITY 2005 -18: Modi f ied Rent Cap for Housing Choice Voucher Part ic ipants
A PPRO VAL : 2005
C LO SEO UT YEA R : 2005
This modification allowed a tenant’s portion of rent to be capped at up to 40% of gross income upon
initial lease-up rather than 40% of adjusted income. Note: KCHA may implement a rent cap modification
in the future to increase mobility.
ACTIVITY 2004 -8: Resident Opportuni ties and Sel f -Suff i c iency (ROSS) Grant
Homeownership
A PPRO VAL : 2004
C LO SEO UT YEA R : 2006
This grant funded financial assistance through MTW reserves with rules modified to fit local
circumstances, modified eligibility to include Public Housing residents with HCV, required minimum
income and minimum savings prior to entry, and expanded eligibility to include more than first-time
homebuyers. This activity is completed.
MTW FY 2020 ANNUAL REPORT | KING COUNTY HOUSING AUTHORITY PAGE 56
S E C TI ON V S O U R C E S A N D U S E S O F M T W F U N D S
A. SOURCES AND USES OF MTW FUNDS
i . Actual Sources and Uses of MTW Funds
In accordance with the requirements of this report, KCHA has submitted our unaudited information in
the prescribed FDS file format through the Financial Assessment System – PHA. The audited FDS will be
submitted in September 2021.
i i . Act ivi t ies that Used Only MTW Single -fund Flexibi li ty
KCHA is committed to making the most efficient, effective, and creative use of our single-fund flexibility
while adhering to the statutory requirements of the MTW program. Our ability to blend funding sources
gives us the freedom to implement new approaches to program delivery in response to the varied
housing needs of low-income people in the Puget Sound region. With MTW flexibility, we have assisted
more of our county’s households — and among those, more of the most marginalized and lowest
income households — than would have been possible under HUD’s traditional funding and program
constraints. Our single-fund flexibility also allowed us to provide a robust range of services to
households during the pandemic.
KCHA’s MTW single-fund activities, described below, demonstrate the value and effectiveness of single-
fund flexibility in practice:
HOME LE SS HOU SING INIT IA TI VES. These initiatives addressed the varied and diverse needs of
the most vulnerable populations experiencing homelessness — those living with chronic
behavioral health issues, individuals with prior criminal justice involvement, young adults and
foster youth experiencing homelessness, and students and their families living on the streets or
in unstable housing. The traditional housing subsidy programs have failed to reach many of
these households and lack the supportive services necessary to successfully serve these
individuals and families. In 2020, KCHA invested nearly $49 million of housing assistance into
these targeted programs.
HOU SI NG STAB IL IT Y FU ND. This fund provided emergency financial assistance to qualified
residents to cover housing costs, including rental assistance, security deposits, and utility
MTW FY 2020 ANNUAL REPORT | KING COUNTY HOUSING AUTHORITY PAGE 57
support. Under the program design, a designated agency partner disburses funding to qualified
program participants and screens for eligibility according to the program’s guidelines. In 2020,
we awarded emergency assistance to 43 families through this process. As a result of this
assistance, all of these families were able to maintain their housing, avoiding the far greater
human and safety net costs that would occur if they became homeless.
E DUCA TIO N I NIT IAT I VE S. KCHA continued to actively partner with local education stakeholders
to improve outcomes for the 15,286 children who lived in our federally assisted housing in 2020.
Educational outcomes, including improved attendance, grade-level performance, and
graduation, are an integral part of our core mission. By investing in the next generation, we
intend to combat intergenerational cycles of poverty that can persist among the families we
serve. In 2020, after-school providers and numerous sites transitioned to operating day services
to support remote learning for children living in KCHA housing. KCHA also launched the
Neighborhood Early Learning Connectors pilot, a co-designed program that employs resident
interns to connect KCHA families to local services that support healthy child development.
I NCREA SE A CCE SS TO HEA LT HCARE THROUG H P ART NER SHIP S A ND CO L LABOR AT I VE
P LA NNI NG . KCHA partnered with the local healthcare delivery system to support residents in
accessing the services they need to maintain housing stability and a high quality of life. In 2020,
KCHA continued to develop our health and housing strategy by improving service coordination
for residents with complex health needs, increasing resident access to health services, and
identifying opportunities for impacting the social determinants of health. Overall, this effort
enabled KCHA residents to access new health services made available through Medicaid waivers
and expansion, funding opportunities from local sources, and philanthropic supports.
A CQU I SIT ION A ND PRE SE R VAT IO N O F AF FOR DA B LE HOU SI NG. We continued to use MTW
resources to preserve affordable housing that is at risk of for-profit redevelopment, and to
create additional affordable housing opportunities in partnership with the state and local
jurisdictions. When possible, we have been acquiring additional housing adjacent to existing
KCHA properties in emerging and current high-opportunity neighborhoods where banked public
housing subsidies can be utilized. In 2020, KCHA purchased Pinewood Village and Illahee
Apartments, adding 144 units to our inventory of affordable housing.
MTW FY 2020 ANNUAL REPORT | KING COUNTY HOUSING AUTHORITY PAGE 58
L ONG - TERM VI ABI L ITY OF O UR G ROWI NG POR TFO L IO. KCHA used our single-fund flexibility to
reduce outstanding financial liabilities and protect the long-term viability of our inventory.
Single-fund flexibility allows us to make loans in conjunction with Low Income Housing Tax
Credit financing to recapitalize properties in our federally subsidized inventory. MTW resources
that financed a portion of the redevelopment of the Greenbridge HOPE VI site remained
outstanding. This financing will be repaid through proceeds from land sales as the build-out of
this 100-acre, 900-unit site continues. MTW funds also have supported energy conservation
measures as part of our Energy Performance Contracting project, with energy savings over the
life of the contracts repaying the loan. MTW working capital also provided an essential backstop
for outside debt, addressing risk concerns of lenders, enhancing our credit worthiness, and
enabling our continued access to private capital markets.
RE MO VA L O F T HE CA P O N VOUC HER UT I LI ZAT IO N. This initiative enables us to utilize savings
achieved through MTW initiatives to over-lease and provide HCV assistance to more households
than normally permissible under our HUD-established baseline. Our cost containment from a
multi-tiered, ZIP Code-based payment standard system, operational efficiencies, and other
policy changes have been critical in helping us respond to the growing housing needs of the
region’s extremely low-income households. Despite ongoing uncertainties around federal
funding levels, we continue to use MTW program flexibility to support housing voucher issuance
above HUD baseline levels.
MTW FY 2020 ANNUAL REPORT | KING COUNTY HOUSING AUTHORITY PAGE 59
B. LOCAL ASSET MANAGEMENT PLAN
Has the PHA allocated costs within statute during the plan year? No
Has the PHA implemented a local asset management plan (LAMP)? Yes
Has the PHA provided a LAMP in the appendix? Yes
In FY 2008, as detailed in the MTW Annual Plan for that year and adopted by our Board of
Commissioners under Resolution No. 5116, KCHA developed and implemented our own local funding
model for Public Housing and HCV using our MTW block grant authority. Under our current agreement,
KCHA’s Public Housing Operating, Capital, and HCV funds are considered fungible and may be used
interchangeably. In contrast to 990.280 regulations, which require transfers between projects only after
all project expenses are met, KCHA’s model allows budget-based funding at the start of the fiscal year
from a central ledger, not other projects. We maintain a budgeting and accounting system that gives
each property sufficient funds to support annual operations, including allowable fees. Actual revenues
include those provided by HUD and allocated by KCHA based on annual property-based budgets. As
envisioned, all block grants are deposited into a single general ledger fund.
MTW FY 2020 ANNUAL REPORT | KING COUNTY HOUSING AUTHORITY PAGE 60
S E C TI ON VI A D M I N I S T R A T I V E
A. HUD REVIEWS, AUDITS, OR PHYSICAL INSPECTION ISSUES
The results of HUD’s monitoring visits, physical inspections, and other oversight activities have not
identified any deficiencies. The average REAC score for KCHA’s Public Housing inventory inspected in
2020 was 90.2.
B. RESULTS OF LATEST KCHA-DIRECTED EVALUATIONS
In 2020, KCHA continued to expand and enhance our internal program design and evaluation capacity
while leveraging external research partnerships. We continued implementation of the Creating Moves
to Opportunity mobility study in collaboration with research partners from Harvard, Massachusetts
Institute of Technology, Johns Hopkins, and other universities. Results from the first phase of this
project, as well as a new implementation report, can be found in Appendix D. Phase 2 results will be
available in 2021, and KCHA’s internal evaluation team is evaluating Phase 3, which involved remote
delivery of services during the pandemic. We also began research projects with Johns Hopkins University
and Public Health Seattle-King County to explore the effect of receiving housing assistance on health
outcomes; completed a collaboration with the University of Washington to understand the
characteristics and experiences of residents moving with HCV (the August 2020 report can be found in
Appendix D); obtained private funding for a new Urban Institute study of place-based housing assistance
in opportunity areas; and conducted internal assessments of several of our programs, such as While in
School Housing for community college students experiencing homelessness and Housing Outreach
Partners behavioral health referral and support for Public Housing residents. Analysis and reporting for
these efforts are underway and will be made public when available.
C. MTW STATUTORY REQUIREMENT CERTIFICATION
Certification is attached as Appendix A.
D. MTW ENERGY PERFORMANCE CONTRACT (EPC) FLEXIBILITY DATA
EPC data is attached as Appendix F.
A P P EN DI X A
C E R T I F I C A T I O N O F S T A T U T O R Y C O M P L I A N C E
C e r t i f i c a t i o n o f S t a t u t o r y C o m p l i a n c e
On behalf of the King County Housing Authority (KCHA), I certify that the Agency has met the three
statutory requirements of the Restated and Amended Moving to Work Agreement entered into
between the Department of Housing and Urban Development (HUD) and KCHA on March 13, 2009, and
extended on September 19, 2016. Specifically, KCHA has adhered to the following requirements of the
MTW demonstration during FY 2020:
o At least 75 percent of the families assisted by KCHA are very low-income families, as defined in
section 3(b)(2) of the 1937 Act;
o KCHA has continued to assist substantially the same total number of eligible low-income
families as would have been served absent participation in the MTW demonstration; and
o KCHA has continued to serve a comparable mix of families (by family size) as would have been
served without MTW participation.
3/30/21
________________________ ________________________
STEPHEN J. NORMAN DATE
Executive Director
A P P EN DI X B
K C H A ’ S L OC A L A S S E T M A N A G E M E N T P L A N
As detailed in KCHA’s FY 2008 MTW Annual Plan and adopted by the Board of Commissioners under
Resolution No. 5116, KCHA has implemented a Local Asset Management Plan that considers the
following:
o KCHA will develop its own local funding model for Public Housing and Section 8 using its block
grant authority. Under its current agreement, KCHA can treat these funds and CFP dollars as
fungible. In contrast to 990.280 regulations, which require transfers between projects after all
project expenses are met, KCHA’s model allows budget-based funding at the start of the fiscal
year from a central ledger, not other projects. KCHA will maintain a budgeting and accounting
system that gives each property sufficient funds to support annual operations, including
allowable fees. Actual revenues will include those provided by HUD and allocated by KCHA
based on annual property-based budgets. As envisioned, all block grants will be deposited into a
single general ledger fund. This will have multiple benefits.
KCHA gets to decide subsidy amounts for each public housing project. It’s estimated that
HUD’s new funding model has up to a 40% error rate for individual sites. This means some
properties get too much, some too little. Although funds can be transferred between sites,
it’s simpler to determine the proper subsidy amount at the start of the fiscal year rather
than when shortfalls develop. Resident services costs will be accounted for in a centralized
fund that is a sub-fund of the single general ledger, not assigned to individual programs or
properties.
KCHA will establish a restricted public housing operating reserve equivalent to two months’
expenses. KCHA will estimate subsidies and allow sites to use them in their budgets. If the
estimate exceeds the actual subsidy, the difference will come from the operating reserve.
Properties may be asked to replenish this central reserve in the following year by reducing
expenses, or KCHA may choose to make the funding permanent by reducing the
unrestricted block grant reserve.
Using this approach will improve budgeting. Within a reasonable limit, properties will know
what they have to spend each year, allowing them autonomy to spend excess on “wish list”
items and carefully watch their budgets. The private sector doesn’t wait until well into its
fiscal year to know how much revenue is available to support its sites.
o Reporting site-based results is an important component of property management and KCHA will
continue accounting for each site separately; however, KCHA, as owner of the properties will
determine how much revenue will be included as each project’s subsidy. All subsidies will be
properly accounted for under the MTW rubric.
o Allowable fees to the central office cost center (COCC) will be reflected on the property reports,
as required. The MTW ledger won’t pay fees directly to the COCC. As allowable under the asset
management model, however, any subsidy needed to pay legacy costs, such as pension or
terminal leave payments and excess energy savings from the Authority’s ESCO, may be
transferred from the MTW ledger or the projects to the COCC.
o Actual Section 8 amounts needed for housing assistance payments and administrative costs will
be allotted to the Housing Choice Voucher program, including sufficient funds to pay asset
management fees. Block grant reserves and their interest earnings will not be commingled with
Section 8 operations, enhancing budget transparency. Section 8 program managers will become
more responsible for their budgets in the same manner as public housing site managers.
o Block grant ledger expenses, other than transfers out to sites and Section 8, will be those that
support MTW initiatives, such as the South County Pilot or resident self-sufficiency programs.
Isolating these funds and activities will help KCHA’s Board of Commissioners and its
management keeps track of available funding for incremental initiatives and enhances KCHA’s
ability to compare current to pre-MTW historical results with other housing authorities that do
not have this designation.
o In lieu of multiple submissions of Operating Subsidy for individual Asset Management Projects,
KCHA may submit a single subsidy request using a weighted average project expense level
(WAPEL) with aggregated utility and add-on amounts.

A P P EN DI X C
A C T U A L E X I S T I N G P R OJ E C T - B A S E D V OU C H E R S
Project-based Voucher Contracts
Property Name
Number of
Project-based
Vouchers
Status as of End of
2020Population Served RAD?
Parkview Group Home 1 Leased Disabled Individuals No
Inland Empire Group Home 1 Leased Disabled Individuals No
Inland Empire Group Home 1 Leased Disabled Individuals No
Inland Empire Group Home 1 Leased Disabled Individuals No
Inland Empire Group Home 1 Leased Disabled Individuals No
Parkview Group Home 1 Leased Disabled Individuals No
Inland Empire Group Home 1 Leased Disabled Individuals No
Parkview Group Home 1 Leased Disabled Individuals No
Parkview Group Home 1 Leased Disabled Individuals No
Inland Empire Group Home 1 Leased Disabled Individuals No
Inland Empire Group Home 1 Leased Disabled Individuals No
Inland Empire Group Home 1 Leased Disabled Individuals No
Petter Court 4 Leased Homeless Families No
Kensington Square 6 Leased Homeless Families No
Villa Esperanza 23 Leased Homeless Families No
Villa Capri 5 Leased Homeless Families No
Plum Court 10 Leased Low Income Families No
Enumclaw Fourplex 5 Leased Homeless Families No
The Willows 15 Leased Homeless Families No
Chalet 5 Leased Low Income Families No
Francis Village 10 Leased Homeless Young Families No
Independence Bridge 24 Leased Homeless Young Adults No
Chalet 4 Leased Homeless Families No
August Wilson Place 8 Leased Homeless Families No
Lauren Heights 5 Leased Homeless Families No
City Park Townhomes 11 Leased Homeless Families No
Burien Heights 15 Leased Homeless Young Adults No
Evergreen Court Apartments 15 Leased Low Income Seniors No
Village at Overlake Station 8 Leased Disabled Individuals No
Summerfield Apartments 13 Leased Low Income Families No
Phoenix Rising 24 Leased Homeless Young Adults No
Sophia's Home - Timberwood 2 Leased Homeless Individuals No
Sophia's Home - Woodside East 4 Leased Homeless Individuals No
Woodland North 10 Leased Homeless Veterans No
Passage Point 46 Leased Homeless Families/Re-entry No
Family Village 10 Leased Homeless Families No
Discovery Heights 10 Leased Homeless Individuals No
Unity Village of White Center 6 Leased Homeless Families No
Andrew's Glen 10 Leased Low Income Families No
Eernisse 13 Leased Low Income Families No
Avondale Park 43 Leased Homeless Families No
Woodside East 23 Leased Low Income Families No
Landmark Apartments 28 Leased Low Income Families No
Timberwood 20 Leased Low Income Families No
Newporter Apartments 22 Leased Low Income Families No
Village at Overlake Station 12 Leased Low Income Families No
Harrison House 48 Leased Low Income Seniors No
Page 1 of 4
Project-based Voucher Contracts
Property Name
Number of
Project-based
Vouchers
Status as of End of
2020Population Served RAD?
Valley Park East & West 12 Leased Homeless Families No
Valley Park East & West 16 Leased Low Income Families No
Valley Park East & West 2 Leased Disabled Individuals No
Heritage Park 15 Leased Homeless Families No
August Wilson Place 8 Leased Homeless Families No
Appian Way 6 Leased Homeless Families No
Seola Crossing I & II 63 Leased Low Income Families No
Rose Crest 10 Leased Homeless Families No
Rose Crest 8 Leased Homeless Families No
Copper Lantern 4 Leased Homeless Individuals No
Copper Lantern 7 Leased Low Income Families No
Summerwood 25 Leased Low Income Families No
Creston Point 5 Leased Homeless Families No
Joseph House 10 Leased Low Income Seniors No
Johnson Hill 8 Leased Low Income Families No
Velocity Apartments 8 Leased Homeless Families No
Compass Housing Renton 58 Leased Homeless Veterans No
Family Village 26 Leased Low Income Families No
William J. Wood Veterans House 44 Leased Homeless Veterans No
Timberwood Apartments 18 Leased Homeless Veterans No
Francis Village 10 Leased Homeless Veterans No
Bellepark East 12 Leased Low Income Families No
Laurelwood Gardens 8 Leased Low Income Families No
Woodland North 5 Leased Low Income Families No
Carriage House 13 Leased Homeless Veterans No
Villages at South Station 20 Leased Homeless Veterans No
Cove East Apartments 16 Leased Homeless Veterans No
Ronald Commons 8 Leased Homeless Veterans No
Velocity Apartments 8 Leased Homeless Veterans No
Providence John Gabriel House 8 Leased Low Income Seniors No
Kirkland Avenue Townhomes 2 Leased Homeless Veterans No
Athene 9 Leased Low Income Seniors No
Francis Village 3 Leased Low Income Families No
Houser Terrace 25 Leased Homeless Veterans No
NIA Apartments 42 Leased Low Income Seniors No
Spiritwood Manor 128 Leased Low Income Families, Elderly, or
DisabledNo
Birch Creek 262 Leased Low Income Families No
Salmon Creek 9 Leased Low Income Families No
Newport 23 Leased Low Income Families, Elderly, or
DisabledNo
Eastbridge 31 Leased Low Income Families No
Hidden Village 78 Leased Low Income Families, Elderly, or
DisabledNo
Heritage Park 36 Leased Low Income Families No
Alpine Ridge 27 Leased Low Income Families No
Bellevue House # 1 1 Leased Homeless Families No
Page 2 of 4
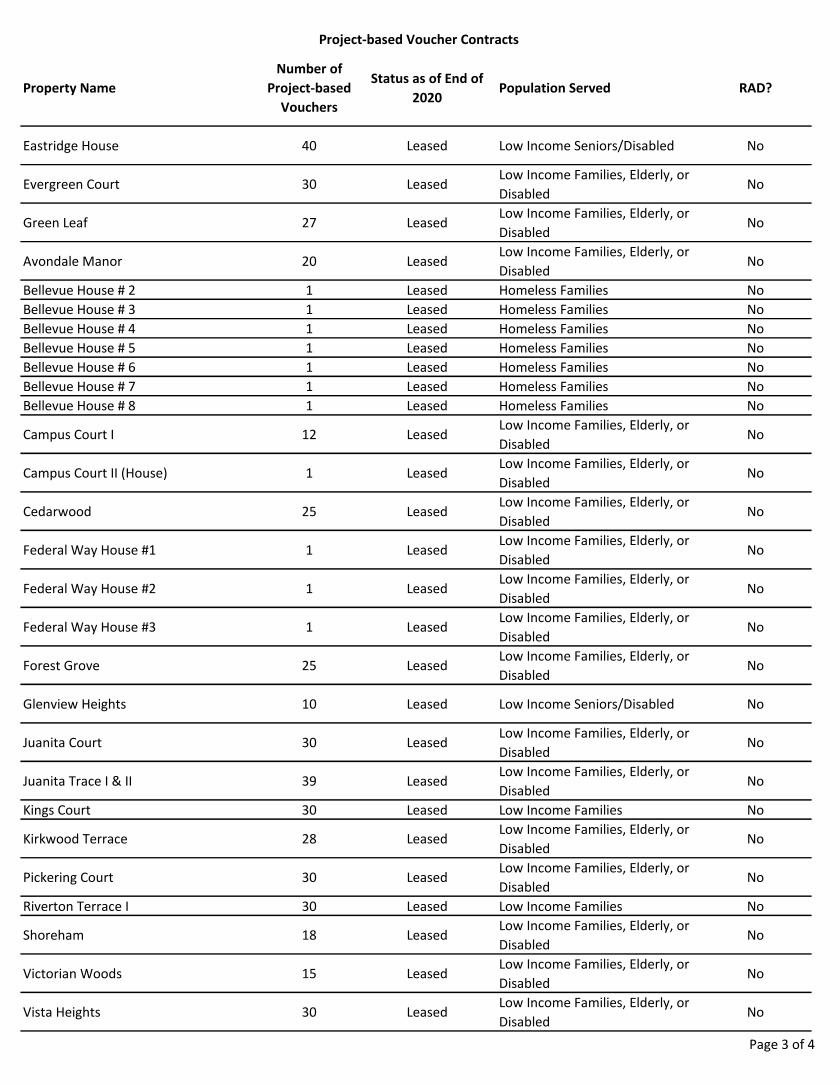
Project-based Voucher Contracts
Property Name
Number of
Project-based
Vouchers
Status as of End of
2020Population Served RAD?
Eastridge House 40 Leased Low Income Seniors/Disabled No
Evergreen Court 30 Leased Low Income Families, Elderly, or
DisabledNo
Green Leaf 27 Leased Low Income Families, Elderly, or
DisabledNo
Avondale Manor 20 Leased Low Income Families, Elderly, or
DisabledNo
Bellevue House # 2 1 Leased Homeless Families No
Bellevue House # 3 1 Leased Homeless Families No
Bellevue House # 4 1 Leased Homeless Families No
Bellevue House # 5 1 Leased Homeless Families No
Bellevue House # 6 1 Leased Homeless Families No
Bellevue House # 7 1 Leased Homeless Families No
Bellevue House # 8 1 Leased Homeless Families No
Campus Court I 12 Leased Low Income Families, Elderly, or
DisabledNo
Campus Court II (House) 1 Leased Low Income Families, Elderly, or
DisabledNo
Cedarwood 25 Leased Low Income Families, Elderly, or
DisabledNo
Federal Way House #1 1 Leased Low Income Families, Elderly, or
DisabledNo
Federal Way House #2 1 Leased Low Income Families, Elderly, or
DisabledNo
Federal Way House #3 1 Leased Low Income Families, Elderly, or
DisabledNo
Forest Grove 25 Leased Low Income Families, Elderly, or
DisabledNo
Glenview Heights 10 Leased Low Income Seniors/Disabled No
Juanita Court 30 Leased Low Income Families, Elderly, or
DisabledNo
Juanita Trace I & II 39 Leased Low Income Families, Elderly, or
DisabledNo
Kings Court 30 Leased Low Income Families No
Kirkwood Terrace 28 Leased Low Income Families, Elderly, or
DisabledNo
Pickering Court 30 Leased Low Income Families, Elderly, or
DisabledNo
Riverton Terrace I 30 Leased Low Income Families No
Shoreham 18 Leased Low Income Families, Elderly, or
DisabledNo
Victorian Woods 15 Leased Low Income Families, Elderly, or
DisabledNo
Vista Heights 30 Leased Low Income Families, Elderly, or
DisabledNo
Page 3 of 4
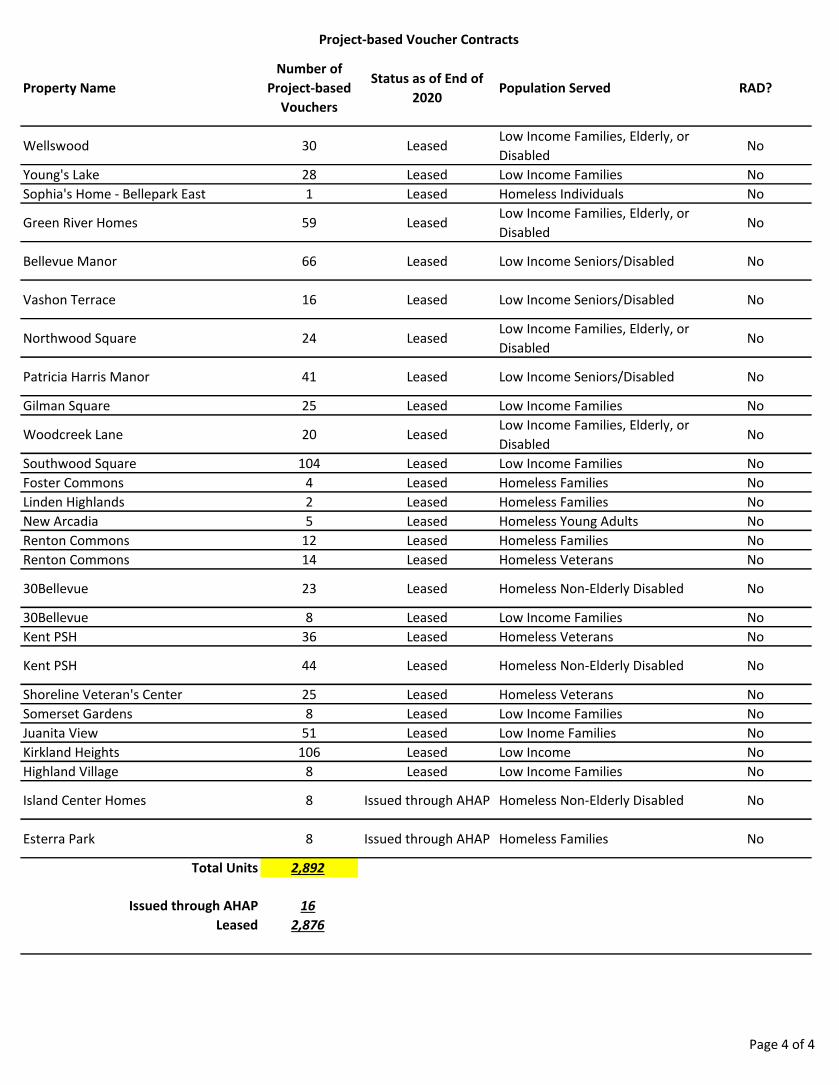
Project-based Voucher Contracts
Property Name
Number of
Project-based
Vouchers
Status as of End of
2020Population Served RAD?
Wellswood 30 Leased Low Income Families, Elderly, or
DisabledNo
Young's Lake 28 Leased Low Income Families No
Sophia's Home - Bellepark East 1 Leased Homeless Individuals No
Green River Homes 59 Leased Low Income Families, Elderly, or
DisabledNo
Bellevue Manor 66 Leased Low Income Seniors/Disabled No
Vashon Terrace 16 Leased Low Income Seniors/Disabled No
Northwood Square 24 Leased Low Income Families, Elderly, or
DisabledNo
Patricia Harris Manor 41 Leased Low Income Seniors/Disabled No
Gilman Square 25 Leased Low Income Families No
Woodcreek Lane 20 Leased Low Income Families, Elderly, or
DisabledNo
Southwood Square 104 Leased Low Income Families No
Foster Commons 4 Leased Homeless Families No
Linden Highlands 2 Leased Homeless Families No
New Arcadia 5 Leased Homeless Young Adults No
Renton Commons 12 Leased Homeless Families No
Renton Commons 14 Leased Homeless Veterans No
30Bellevue 23 Leased Homeless Non-Elderly Disabled No
30Bellevue 8 Leased Low Income Families No
Kent PSH 36 Leased Homeless Veterans No
Kent PSH 44 Leased Homeless Non-Elderly Disabled No
Shoreline Veteran's Center 25 Leased Homeless Veterans No
Somerset Gardens 8 Leased Low Income Families No
Juanita View 51 Leased Low Inome Families No
Kirkland Heights 106 Leased Low Income No
Highland Village 8 Leased Low Income Families No
Island Center Homes 8 Issued through AHAP Homeless Non-Elderly Disabled No
Esterra Park 8 Issued through AHAP Homeless Families No
Total Units 2,892
Issued through AHAP 16
Leased 2,876
Page 4 of 4

A P P EN DI X D
E V A L U A T I ON S
Jonathan Bigelow January 2021
Implementing Creating Moves to Opportunity

JANUARY 2021
Jonathan Bigelow
Implementing Creating Moves to Opportunity

For information about MDRC and copies of our publications,
see our website: www.mdrc.org.
Copyright © 2021 by MDRC®. All rights reserved.
FUNDERS
The funding for this report was provided by grants from the
Surgo Foundation and the Bill & Melinda Gates Foundation.
Dissemination of MDRC publications is supported by the
following organizations and individuals that help finance
MDRC’s public policy outreach and expanding efforts to
communicate the results and implications of our work to
policymakers, practitioners, and others: The Annie E. Casey
Foundation, Arnold Ventures, Charles and Lynn Schusterman
Family Foundation, The Edna McConnell Clark Foundation,
Ford Foundation, The George Gund Foundation, Daniel
and Corinne Goldman, The Harry and Jeanette Weinberg
Foundation, Inc., The JPB Foundation, The Joyce Foundation,
The Kresge Foundation, and Sandler Foundation.
In addition, earnings from the MDRC Endowment help
sustain our dissemination efforts. Contributors to the MDRC
Endowment include Alcoa Foundation, The Ambrose Monell
Foundation, Anheuser-Busch Foundation, Bristol-Myers
Squibb Foundation, Charles Stewart Mott Foundation, Ford
Foundation, The George Gund Foundation, The Grable
Foundation, The Lizabeth and Frank Newman Charitable
Foundation, The New York Times Company Foundation, Jan
Nicholson, Paul H. O’Neill Charitable Foundation, John S.
Reed, Sandler Foundation, and The Stupski Family Fund, as
well as other individual contributors.
The findings and conclusions in this report do not
necessarily represent the official positions or policies of the
funders.
OVERVIEWT
he Creating Moves to Opportunity (CMTO) Demonstration evaluated new services designed to
increase the number of families with young children leasing in areas with historically high upward
income mobility, or “high-opportunity areas,” in the city of Seattle and King County, Washington. In
two phases, King County Housing Authority (KCHA), Seattle Housing Authority (SHA), and a ser-
vice provider called InterIm CDA offered three CMTO programs to families when they applied to the
Housing Choice Voucher program. This report presents staff insights on CMTO.
In Phase 1, families randomly assigned to receive CMTO services were offered a comprehensive package
of high-opportunity-area education, rental application coaching, housing search planning and assistance,
financial assistance to cover rental application and lease-up costs, and landlord engagement to promote
CMTO and expedite the public housing agencies’ (PHAs’) administrative processes. “Navigators” at
InterIm CDA delivered the services, coaching families to obtain their desired housing. Phase 2 tested
this comprehensive program plus two less intensive, lower-cost programs. Select findings include:
■ Navigators believed that many families found CMTO attractive because it improved their chances of
leasing in the voucher program and affording costs like security deposits; they also overwhelmingly
welcomed the focus on high-opportunity neighborhoods.
■ Following high participation in initial CMTO service interactions, some families engaged lightly
with the navigators during their housing search either because they were searching independently
in high-opportunity areas or because they were not actively searching or were searching outside of
high-opportunity areas. Other families engaged intensively with the navigators as partners during
the search process.
■ The navigators initially struggled to serve a minority of families who appeared to expect them to
take the lead in their housing search. Adjustments were made during Phase 1 to reinforce CMTO’s
emphasis on coaching families to lead housing searches with navigator support.
■ Navigators observed that families seemed to have uniform, favorable perceptions of SHA’s relatively
clustered high-opportunity areas. KCHA’s high-opportunity areas were more dispersed and varied,
and many KCHA participants initially searched in more familiar and less aff luent high-opportunity
areas. These families often faced challenges finding affordable rental housing through the voucher
program and so expanded their searches to other areas.
■ Navigators aimed at inf luencing rental application screening outcomes for families in engaging
landlords. Many families had barriers to approval, but although rental application denials were
common, family and staff appeals to landlords could reverse them.
■ The navigators asserted that the full array of Phase 1 services contributed to the program’s effectiveness
and emphasized the importance of coaching families to communicate with landlords. Streamlined
Phase 2 programs led to less vigorous family engagement and fewer opportunities to support families
encountering setbacks, but motivated families who were comfortable dealing directly with landlords
could overcome rental application barriers.
■ Navigators and PHA staff members underscored the importance of empathy, flexibility, and cul-
turally competent approaches to delivering family-centered, landlord-responsive services.
IMPLEMENTING CREATING MOVES TO OPPORTUNITY | i i i

CONTENTS
OVERVIEW iii
LIST OF TABLES, FIGURES, AND BOXES vii
ACKNOWLEDGMENTS ix
EXECUTIVE SUMMARY ES-1
Introduction and Background 1
Conceiving and Forming the CMTO Seattle–King County Partnership 2
Designing the CMTO Service Model 4
Phase 1: Early Implementation to Steady State 12
Phase 2: Varying CMTO Design to Further Learning 30
Looking Forward 44
APPENDIX
A CMTO Coaching and Resources Program Flyer 45
B CMTO Toolkit Program Flyer 49
C CMTO Financial Assistance Program Flyer 53
REFERENCES 57
IMPLEMENTING CREATING MOVES TO OPPORTUNITY | v

LIST OF EXHIBITS
TABLE
1 CMTO Seattle–King County Demonstration Timeline and Key Milestones 3
2Anticipated Family Barriers to Accessing High-Opportunity Areas and
Corresponding Proposed Services5
FIGURE
1 Phase 1 Recruitment Funnel 10
2 CMTO Phase 1 Service Flow Diagram 15
3 CMTO Financial Assistance Flow Diagram 34
4 CMTO Toolkit Service Flow Diagram 36
BOX
1Select Takeaways from Exploratory Fieldwork to Inform the CMTO Program
Design7
2 CMTO Navigator Roles 11
3 Case Study: Serving the Touré Family 21
4 Case Study: Serving the Loyola Family 22
5 Case Study: Serving the Asad Family 23
6 Case Study: Serving the Khalid Family 24
7 Customizing Landlord Engagement to Promote Leasing to CMTO Families 27
IMPLEMENTING CREATING MOVES TO OPPORTUNITY | v i i

ACKNOWLEDGMENTS
Field research into program implementation hinges on the active contributions of many indi-
viduals who are juggling other responsibilities simultaneously. The findings presented in this
report ref lect the time and care invested by staff members of King County Housing Authority,
Seattle Housing Authority, and InterIm CDA not only in interviews and observations but also
in their efforts to support the families they served as part of the Creating Moves to Opportunity
(CMTO) Demonstration in Seattle and King County, Washington. Those families are also owed
immeasurable gratitude for their voluntary participation in CMTO’s efforts to learn from their
experiences exploring and pursuing their housing options. Thank you.
MDRC is grateful for funding from the Surgo Foundation and the Bill & Melinda Gates Foundation
to support its role in the CMTO Seattle-King County Demonstration. It also thanks the dem-
onstration’s principal investigators at Opportunity Insights at Harvard University for their
partnership with MDRC on the CMTO demonstration: Peter Bergman (Columbia University),
Raj Chetty (Harvard University), Stefanie DeLuca (Johns Hopkins University), Nathaniel
Hendren (Harvard University), Lawrence F. Katz (Harvard University), and Christopher Palmer
(Massachusetts Institute of Technology).
MDRC’s overall contributions to the demonstration were supported by numerous committed
individuals across CMTO partner institutions: King County Housing Authority, Seattle Housing
Authority, InterIm CDA, Opportunity Insights, Abdul Latif Jameel Poverty Action Lab, and MEF
Associates. MDRC is grateful to those individuals for their ideas, dedication, and collaboration.
Many partners provided valuable input and support for the implementation research activities
and contributed directly to this report by providing critical input and review at various stages:
David Forte, Jenny Le, and Annie Pennucci at King County Housing Authority; Sarah Birkebak,
Andria Lazaga, and Jodi Speer at Seattle Housing Authority; Stefanie DeLuca at Johns Hopkins
University; and Sebi Devlin-Foltz, Nathaniel Hendren, and Sarah Oppenheimer at Opportunity
Insights.
At MDRC, Andrew Rock provided vital support for a host of research activities, including con-
ducting data analysis, drafting case studies, and coauthoring an early version of findings prepared
for the APPAM 2019 Fall Research Conference. Nandita Verma, project adviser, and James Riccio,
project reviewer, weighed in on report drafts and provided invaluable guidance on all phases
of the implementation research. Former MDRC-ers David Greenberg, Alissa Gardenhire, and
Gloria Tomlinson led and conducted early project activities, notably the formative fieldwork that
is summarized in this report, with partnership from Asaph Glasser, Kimberly Foley, and Angela
Gaffney. Gilda Azurdia supported the implementation research as MDRC’s data manager, and
Stephanie Rubino and Simran Vazirani oversaw the budget and work plan. Alice Tufel led the
publication process, Rebecca Bender edited the report, and Ann Kottner created exhibits, did
the layout, and prepared the report for publication.
The Author
IMPLEMENTING CREATING MOVES TO OPPORTUNITY | i x

Executive Summary
The Creating Moves to Opportunity (CMTO) Seattle–King County Demonstration repre-
sents the work of a practitioner-researcher partnership involving King County Housing
Authority (KCHA), Seattle Housing Authority (SHA), and a coalition of research organizations
led by Opportunity Insights at Harvard University. The goal of the partnership was to design,
field, and rigorously evaluate the effects of housing mobility services provided to families with
children under age 15 who were served by the Housing Choice Voucher (HCV) program.1 The
services were designed to enhance access to the range of geographic choices that were available
to these families by mitigating the barriers to their leasing in private rental markets. Through
these efforts, CMTO sought to increase the number of families leasing in “high-opportunity
areas” within the city of Seattle and King County, Washington, areas with historically high rates
of upward income mobility.2
Across two study phases, two public housing authorities (PHAs) in Seattle and King County and
their service partner, InterIm CDA, offered three service bundles to families who were on HCV
program waitlists. The services were evaluated through randomized controlled trials. Families
who elected to enroll in the CMTO study were assigned randomly to receive either regular
voucher program services only (that is, a control group) or regular voucher program services
plus CMTO services (one or more program groups) designed to support families who pursued
moves to high-opportunity areas. In Phase 1 of the demonstration—and in a five-month pilot
of services that preceded its launch—the PHAs offered families a comprehensive bundle of ser-
vices that they theorized would support families in pursuing “opportunity moves.” In Phase 2,
this “kitchen sink” CMTO approach would continue to be offered alongside two programs that
streamlined and varied the original model. This test of multiple programs in parallel furthered
a learning agenda that sought to yield a deeper understanding of the effectiveness of specific
components of the CMTO model and the ways they were delivered.
Phase 1 study enrollment was conducted between April 2018 and February 2019, and Phase 2
enrollment was conducted between June 2019 and March 2020. In 2019, early findings were
1. The study’s investigators are directors or academic affiliates of Opportunity Insights at Harvard University.Research partners included MDRC, Abdul Latif Jameel Poverty Action Lab (JPAL), and MEF Associates.
The HCV program is the federal government’s major program for providing rental assistance to very low-income families, the elderly, and the disabled in the private market. Housing choice vouchers are administered locally by public housing agencies, which receive federal funds from the U.S. Department of Housing and Urban Development (HUD) to administer the voucher program.
2. For a description of the CMTO intervention and findings from the study, see Peter Bergman, Raj Chetty, Stefanie DeLuca, Nathaniel Hendren, Lawrence F. Katz, and Christopher Palmer, “Creating Moves to Opportunity: Experimental Evidence on Barriers to Neighborhood Choice,” NBER Working Paper No. 26164 (Cambridge, MA: National Bureau of Economic Research, 2020). A nontechnical summary of the paper’s findings and descriptions of the areas and their selection criteria are provided at https://opportunityinsights.org/wp-content/uploads/2019/08/cmto_summary.pdf.
IMPLEMENTING CREATING MOVES TO OPPORTUNITY | ES-1
released from the impact, participation, cost, and qualitative analyses of Phase 1 of the CMTO
Seattle–King County Demonstration. Notably, investigators found that family involvement in
the CMTO program increased the share of families who moved to high-opportunity areas, from
15 percent among peers in the experimental control group to 53 percent in the CMTO group.3
This report draws on interviews with program staff members to describe important perspectives
from both phases of the demonstration and to identify the factors that shaped service delivery
and the ways families and landlords responded to CMTO.4
THE CMTO MODEL
In designing the CMTO approach and services for Phase 1, the PHAs and research partners re-
ferred to existing evidence as well as the experiences and insights of PHA staff members, existing
voucher holders, and landlords to identify the likely barriers to families accessing low-poverty
neighborhoods and the mechanisms that might counter those barriers. The partners also con-
sulted with operators of housing mobility programs to learn more about effective approaches
from existing programs. From these efforts, a core set of CMTO services emerged:5
■ High-opportunity-area education to increase families’ knowledge about these areas and
inform their perceptions of neighborhood desirability. Staff members offered informational
materials, such as neighborhood guides; led neighborhood tours; and held discussions with
families about their neighborhood preferences.
■ Rental application coaching to identify families’ barriers (for example, past evictions or low
credit scores) to leasing in rental markets and to provide guidance to families on mitigating
those barriers or communicating with landlords about them. Staff members offered to pull credit
reports with families, educated families about completing rental applications, and cocreated
tools families could use to communicate with prospective landlords about their circumstances.
■ Housing search planning and assistance to help families plan and execute searches for rental
housing in high-opportunity areas. This support included helping families identify and dif-
ferentiate between their housing “needs” and “wants,” providing training on how to search
and filter listings of available rental units online, and sharing referrals of available units that
staff members thought might match each family’s preferences.
3. Bergman et al. (2020a).
4. The MDRC implementation findings are primarily derived from staff interviews, observations of service delivery, analyses of program documents, and technical assistance experience. These findings do not summarize the direct viewpoints of participating families or address Phase 2 implementation after the COVID-19 pandemic altered service delivery beginning in March 2020.
5. For additional details about the program model and approaches to service delivery, see https://opportunityinsights.org/wp-content/uploads/2019/08/cmto_programoverview.pdf.
ES-2 | IMPLEMENTING CREATING MOVES TO OPPORTUNITY
■ Flexible financial assistance to cover up to $3,500 in costs associated with rental applications
and screening, plus lease-up costs like security deposits.6
■ Landlord engagement to identify units in high-opportunity areas and promote landlords’
participation in CMTO. These interactions entailed brokering on behalf of families to inf lu-
ence (or change) the outcomes of rental applications, promoting the advantages of participa-
tion in the HCV and CMTO programs, and expediting housing authority lease-up processes.
A mitigation fund was set up to pay for any future tenant damages beyond what would be
covered by security deposits.
Four full-time InterIm CDA staff members performed these essential activities. Two family navi-
gators, the primary points of contact for families, provided education about high-opportunity
areas, coaching on completing rental applications, and assistance planning and conducting hous-
ing searches. Two housing navigators conducted outreach to landlords to promote CMTO and
“inf luence rental application decisions” on behalf of CMTO families. They also administered
expedited lease-up processes through the housing authorities once families were approved to lease.
CMTO deployed an individualized approach to coaching families toward achieving their desired
housing outcomes. Navigators held in-person meetings with families at locations that were con-
venient to them, and the frequency of assistance given between and following those meetings
was tailored to each family’s need. The PHAs and navigators drew distinctions between their
approach and other program models in which staff complete many activities, such as housing
searches, without much involvement expected from families. Service delivery spanned the four-
to-eight-week period before a family’s voucher was issued and continued for up to 120 days (or
longer if vouchers were extended). If families leased up in high-opportunity areas, the family
navigator would hold one consultation within the first two weeks of families moving in to offer
guidance on topics such as accessing local resources. This concluded CMTO service delivery, and
families were informed about the PHAs’ typical voucher supports that would still be available.
Phase 2 of the demonstration was set up to test three alternative service delivery strategies: the
comprehensive approach featured in Phase 1, which continued under the name CMTO Coaching
and Resources, and the following two less intensive, lower-cost variations:
■ CMTO Financial Assistance. Families who were assigned to this group were offered finan-
cial assistance identical to what families received in Phase 1, as well as light education about
high-opportunity areas. Families did not receive any rental application coaching, housing
search assistance, or expedited lease-up supports from CMTO.
■ CMTO Toolkit. Families in this group received “lighter-touch, streamlined” services from
CMTO staff: one in-person meeting with a family navigator who was dedicated to this program,
a packet of rental application coaching materials, and access to online housing search tools
that they could use independently. The amount of security-deposit assistance was pared back
6. A “lease-up” generally refers to a successful lease outcome for an HCV program participant wherein the participant receives program rental assistance.
IMPLEMENTING CREATING MOVES TO OPPORTUNITY | ES-3
relative to the Phase 1 model, and customized unit referrals were provided only to families
with vouchers for units with three bedrooms or more.7
LESSONS FROM IMPLEMENTING CMTO IN PHASE 1
■ The PHAs and InterIm built a productive partnership for CMTO, enhanced by
their efforts to codevelop the operational strategies for delivering program
services and entailing significant investments in staff training related to the
model and to HCV program procedures.
The partnership required more time and effort than the PHAs initially forecast, partly to accom-
modate the hiring and training of three of the four navigators during the service delivery pilot.
The pilot period was extended in order to ensure the navigators could be trained on HCV pro-
gram procedures and gain familiarity with the high-opportunity areas in the PHAs’ jurisdictions.
Moreover, taking on the role of the CMTO service provider required InterIm CDA to reorient its
regular service delivery approach from one that emphasized more holistic social service provision
to one that emphasized coaching families within the specific CMTO service framework.
■ Most families seemed to find CMTO attractive because it would improve their
chances of using (as opposed to losing) their voucher, and they welcomed the
focus on “opportunity moves” as a bonus.8
The navigators related that many families were surprised to learn that their vouchers could be
used in more aff luent, higher-cost areas, and they noted that families’ preferences in housing
searches overwhelmingly included access to good schools and safe neighborhoods. According
to the navigators, most families were not focused on whether to participate in CMTO; rather,
they were more concerned with whether they would be able to secure stable, affordable housing
that met their preferences through the voucher program.9 Further, many HCV program families
were experiencing homelessness, unstably housed, or experiencing financial strain and seemed
pleased that CMTO could help them afford lease-up costs, especially security deposits, that
might otherwise be difficult for them to cover.10
7. For a full summary of the program interventions that were offered and tested in Phase 2, see https://opportunityinsights.org/wp-content/uploads/2020/09/CMTO-Phase-II-Intervention-Details.pdf.
8. Although the risk of failing to lease up in the voucher program motivated families to participate in CMTO, overall lease-up rates in the voucher programs at SHA and KCHA were similar. See Bergman et al. (2020a).
9. In addition to perceptions and preferences related to location and neighborhood characteristics, families typically had specific preferences related to unit and building features (for example, dedicated parking or an in-unit washer and dryer) that could inform where they searched for rental housing.
10. KCHA offered security-deposit assistance widely in its regular HCV program; SHA offered it more selectively and to fewer households overall. Neither agency covered rental application-related costs.
ES-4 | IMPLEMENTING CREATING MOVES TO OPPORTUNITY
■ Families’ participation in initial service meetings was consistently high; en-
gagement with navigators during the subsequent housing search phase varied
widely from family to family.
Factors that inf luenced families’ engagement with CMTO during the housing search period
included outside stressors (for example, health issues, housing instability), varying experiences
in housing searches (including setbacks such as rental application denials), different levels of
familiarity with high-opportunity areas, and the availability of family resources or external
housing supports. According to staff members, these same factors also affected families’ inter-
est in moving to high-opportunity areas versus other areas. Common participation patterns
emerged: Some families engaged less with navigators because they were more proactive in
searching independently in high-opportunity areas, while others engaged less (or not at all)
because they were not searching for housing or were searching outside of high-opportunity
areas. Staff members said a subset of seemingly disengaged families eventually reengaged, often
within one month of their initial voucher search period ending. Other families engaged inten-
sively with the navigators as partners during searches, communicating frequently (sometimes
daily) about their search efforts.
■ A nontrivial minority of families expected the navigators to play a more di-
rect role in searching on behalf of families than was intended by the model.
This expectation posed challenges to staff workloads and partly motivated
a realignment of staff roles and practices to reinforce the program’s focus
on coaching families to search independently, with scalable staff supports.
The navigators observed that some families—perhaps up to one-third of participants in the first
several months after the program launch—believed that CMTO would conduct significant housing
search activities on their behalf, including accompanying families on multiple unit tours, tak-
ing the lead in searching for units, and communicating with landlords. Fulfilling these high
expectations increased the workloads of the housing navigators and clashed with the goal of
supporting family-led housing searches. This was one factor that influenced a reconfiguration of
responsibilities for the family navigators and housing navigators, with the former continuing to
assist families throughout the housing search period and the latter focusing on generating unit
referrals and landlord engagement in support of family rental applications. The navigators also
enacted changes to the way services were described and delivered to reflect the fact that although
CMTO supports could be intensive and were scalable to a family’s needs, there were limits to
how much staff members would do in lieu of family engagement in their housing searches.
■ Family attendance on staff-guided, group tours of high-opportunity areas was
low, and the program finally stopped providing the tours and deemphasized
other in-person staff-family interactions during housing searches.
Many families expressed an interest in attending monthly, staff-guided tours of high-opportu-
nity areas that were organized for groups of families, but the no-show rate was high. Although
the families who did attend these tours responded well to their content, it became difficult to
reconcile the time that was invested in executing the tours against the overall workloads of the
IMPLEMENTING CREATING MOVES TO OPPORTUNITY | ES-5
navigators once the program reached scale. Staff members attempted to include some more
informal, individualized neighborhood tours when they joined families on unit tours, but the
program ultimately ended both the group tours and staff accompaniment on unit tours during
Phase 1. Instead, families were offered itineraries for self-guided tours.
■ Families’ preferences for high-opportunity areas varied and often proved to
be flexible in response to the experience of searching for and applying for
housing. Some families initially prioritized searching and leasing up in high-
opportunity areas that were close to their current residences or were other-
wise more familiar, but many of these families had a difficult time finding
affordable units in those areas.
To the surprise of the family navigators, few families expressed concerns about the racial or
economic makeup of high-opportunity neighborhoods, although the navigators noted that many
families expressed affirmative preferences for neighborhoods that staff members suggested
were more racially diverse. SHA families seemed to have more uniform perceptions of SHA’s
high-opportunity areas, and many families appeared to have impressions of certain of these
areas as favorably diverse. In contrast, KCHA families faced a vastly larger and more varied
set of high-opportunity-area options. KCHA families often initially prioritized searching in
the less aff luent south King County areas of Kent, Auburn, and Newcastle, and staff members
believed this was because many families already lived in or near those areas. However, many
families experienced challenges in finding rental units in these high-opportunity areas that
would be affordable under the voucher program. The navigators frequently counseled families
in this position to expand their searches to neighborhoods on the east side of the county, such
as Bellevue, but they said this could be a point at which some families began exploring rental
options outside of high-opportunity areas.
■ The housing navigators focused on engaging landlords who had available,
listed units, rather than on building relationships with a pool of interested
landlords in the hope that future vacancies would become options for CMTO
participants. Denials of families’ rental applications were common, yet they
could lead to engagement with landlords that reversed those outcomes.
Although the housing navigators frequently interacted with landlords who did not have any
current vacancies, they found that the CMTO proposition resonated more with landlords who
had units available to lease because they were motivated to fill the vacancies, even if that meant
relaxing their application screening criteria. Landlord engagement efforts were often customized
to address the concerns landlords expressed about leasing to a CMTO family or to respond to
denials of rental applications. Despite the advance engagement of landlords by CMTO, denials
of families’ rental applications were common. However, a denial often provided a chance for
CMTO families and the housing navigators to communicate about the circumstances that led
to denials and successfully advocate for reconsideration.
ES-6 | IMPLEMENTING CREATING MOVES TO OPPORTUNITY
EARLY INSIGHTS FROM IMPLEMENTING CMTO IN PHASE 2
■ After roughly one year of working with families in the CMTO Financial Assistance
program, the coordinator who served these families observed that those with
income from employment fared comparatively better in the rental application
process. They noted that families who had more rental barriers could also be
approved to lease up in the absence of more robust CMTO supports if they
were comfortable communicating with and attempting to persuade landlords.
Working with families and landlords to process financial assistance payments was straightfor-
ward, with few challenges reported other than the occasional incomplete submission of docu-
mentation. The PHAs and InterIm began sending email reminders about the program during
the course of implementation, which resulted in an increase in family engagement but also some
calls from families who were struggling in their housing searches. The coordinator suggested
that providing referrals of available units in high-opportunity areas might have been a low-cost
way to increase supports for these families.
■ The reduced intensity of service interactions for the CMTO Toolkit group re-
sulted in less vigorous family engagement overall relative to Phase 1, although
family participation in the initial meetings remained high. Opportunities to as-
sess how families’ housing searches were progressing and to coach families
through any challenges were limited relative to both navigator expectations
and the more comprehensive CMTO program.
The family navigator serving families in the CMTO Toolkit program succeeded in condensing
the activities of two initial service meetings from Phase 1 into one session in Phase 2, but this
resulted in a more one-sided conversation between the navigator and families. Families seemed
less deeply engaged in both those meetings and in follow-up check-ins, and they were less likely
to share the challenges they encountered in their housing searches than were families who were
offered more intensive services. Two types of families seemed more likely to be engaged with
the family navigator in relation to the progress of their searches: those who were very motivated
to move to high-opportunity areas and those who experienced at least one rental application
denial and asked the family navigator for help.
TAKING STOCK AND LOOKING FORWARD
In ref lecting on their experiences supporting families and engaging landlords across both
study phases, PHA and InterIm staff members emphasized the importance of placing families’
needs at the center of CMTO’s service delivery efforts while coaching them toward agency in
leading their housing searches in high-opportunity areas. Family navigators reported serving
families who had a variety of lived experiences, a wide range of approaches to searching for
housing and engaging with CMTO, and sometimes high expectations of their service providers.
Housing navigators similarly stressed the individualized approach that was required to engage
landlords on behalf of CMTO and its participating families, with landlords expressing various
IMPLEMENTING CREATING MOVES TO OPPORTUNITY | ES-7
concerns about leasing to voucher holders and different degrees of comfort with relaxing their
application-screening criteria or working through their concerns about partnering with PHAs.
Staff members underscored that providing effective services to families and landlords required
staff to be f lexible in their ways of working (and in their work schedules), deeply knowledgeable
about the HCV program, and both patient and culturally competent.
As Phase 2 enrollment ended—with many families still searching for housing—PHA and InterIm
staff members remarked that their success in implementing lower-cost and lighter-touch service
approaches had supported some families in each of the two new programs in moving to high-
opportunity areas. Staff members suggested that many families in these programs who had
more rental barriers experienced more challenging housing searches than their counterparts
who had access to more robust supports. However, staff members also noted that families who
had more barriers could nevertheless succeed in obtaining landlord approvals to lease up in
high-opportunity areas.
At a time when new efforts are being launched in jurisdictions across the country to establish
and evaluate housing mobility programs serving voucher recipients, implementation lessons
from the CMTO Seattle–King County Demonstration may be especially instructive. With CMTO
Seattle–King County research activities continuing, forthcoming analyses describing the costs
and outcomes of the CMTO program, as well as the experiences of the families and landlords
who participate, will offer further insights to inform both housing mobility research and practice.
ES-8 | IMPLEMENTING CREATING MOVES TO OPPORTUNITY
INTRODUCTION AND BACKGROUND
The Creating Moves to Opportunity (CMTO) Seattle–King County Demonstration was
formed in late 2015 as a partnership between the King County Housing Authority (KCHA),
the Seattle Housing Authority (SHA), and a research coalition led by Opportunity
Insights at Harvard University.1 The demonstration designed, fielded, and tested a set
of housing mobility services intended to enhance residential choices for families who were newly
enrolled in the federally funded Housing Choice Voucher (HCV) program, which helps eligible
low-income households cover their rental costs in the private rental market. More specifically,
CMTO aimed to enable new voucher families to lease and continue living in “high-opportunity
areas” that, according to research, historically offer better chances for economic mobility for
children of low-income families.2 These areas can be difficult for many voucher holders to ac-
cess on their own due to discrimination, lack of knowledge, and limited resources, among other
reasons.3 A nonprofit housing services and community development organization called InterIm
CDA, in partnership with KCHA and SHA, provided various mobility services to families.
The CMTO demonstration is testing three distinct yet related service models across two phases
of research.4 Randomized controlled trials are being used to test the program’s effectiveness in
promoting families’ sustained moves to high-opportunity areas. Phase 1 is testing the effects
of a single bundle of services and financial support to help new voucher families lease in high-
opportunity areas. Phase 2 is testing that same comprehensive approach alongside two alterna-
tive strategies, each of which includes a subset of the features that are part of the comprehensive
package. In 2019, early findings from Phase 1 were released, showing that the CMTO intervention
increased the number of families who were moving to high-opportunity areas by 38 percentage
points: 53 percent of families in the program group, who were offered CMTO services, moved
to these areas, compared with 15 percent of families in the study’s control group, who were not
offered CMTO services.5
This report, undertaken as part of the CMTO evaluation, describes the partners’ experiences
with designing the CMTO model and putting it into practice. Its findings show what was done
1. The study’s investigators are directors or academic affiliates of Opportunity Insights at Harvard University. Abdul Latif Jameel Poverty Action Lab (JPAL) provided demonstration project management and supported cost analyses. In addition to implementation research activities, MDRC (with MEF Associates) conducted rapid qualitative fieldwork in the formative and pilot phases of the demonstration, provided technical assistance and implementation monitoring in support of research and program design, developed study recruitment and random assignment procedures, and provided random assignment and management information system (MIS) software.
2. Chetty, Hendren, and Katz (2016).
3. See Bergman et al. (2020a) for a description of the high-opportunity area selection criteria.
4. Opportunity Insights has compiled an array of online resources for practitioners, including summary descriptions of program practice during the first and second experimental phases of the demonstration, technical and nontechnical summaries of findings from the demonstration, and other materials that describe CMTO service delivery. See, for example, Bergman et al. (2020a) and Opportunity Insights (2020b).
5. Bergman et al. (2020a).
to try to help families achieve “opportunity moves,” and it offers lessons and insights that may
be useful to other public housing agencies (PHAs) and their partners that are designing and
operating mobility programs of their own.6
Demonstration Timeline
With the support of the research partners, and in consultation with existing housing mobility
practitioners, SHA and KCHA jointly developed and refined the CMTO model, beginning in 2015.
The intervention was initially launched and assessed during a pilot period at each PHA before
families were enrolled into the Phase 1 randomized controlled trial. After Phase 1 operations
concluded, the partners took some time to assess the program’s operation and outcomes and to
design the Phase 2 multiarm trial that would test different treatment options against a control
group. (See Table 1 for a timeline of the demonstration’s main phases.) In Phase 2, families were
randomly assigned to a group that would receive one of three services packages (discussed in
more detail later in the report), or to a control group that did not receive any CMTO assistance.7
CONCEIVING AND FORMING THE CMTO SEATTLE–KING COUNTY PARTNERSHIP
Trends in the Geographic Location of Voucher Families
For both PHAs, enhancing geographic choices in the HCV program was a long-standing goal,
dating back years before CMTO was conceived. At SHA, internal research beginning in the
mid-2000s revealed that large numbers of voucher holders used their vouchers in the southeast
portion of Seattle, where poverty rates were relatively high. This finding sparked an increased
focus on identifying ways in which the agency could support families who sought to move to
areas that might better promote upward economic mobility. KCHA had observed patterns of
growing income segregation in recent decades: Poverty was becoming more concentrated in
the south of the county, while communities east of Seattle faced a loss of economic diversity as
the number of higher-income households grew in those areas. Recognizing, in the words of one
PHA leader, that “your zip code is your destiny,” both PHAs began introducing policies that
were intended to counteract the concentration of their clients in high-poverty areas.
6. MDRC’s implementation findings are informed by analyses of qualitative data gathered over the course of the evaluation: semistructured interviews with staff members of the two housing authorities and InterIm CDA in two rounds, occurring primarily in January 2019 and June 2020; operational insights from MDRC and MEF Associates to support demonstration planning and operations—including observations of practice—as well as summaries from formative fieldwork; and case studies based on group interviews with InterIm CDA staff members plus reviews of baseline and MIS data. Case study findings do not directly represent the viewpoints of families, which are identified using pseudonyms.
7. See Opportunity Insights (2020a) for further details about Phase 2.
2 | IMPLEMENTING CREATING MOVES TO OPPORTUNITY
TABLE 1 CMTO Seattle–King County Demonstration Timeline
and Key Milestones
Partnership formation and
CMTO planning
Late 2015
to
late 2017
• PHAs and research team begin partnership in 2015.
• Bill & Melinda Gates Foundation grant awarded October
2016.
• InterIm CDA selected as service provider in August 2017.
CMTO pilot
Late 2017
to
mid-2018
• InterIm CDA service delivery staff identified or newly
hired between August 2017 and February 2018.
• PHAs pilot CMTO service delivery December 2017
through April 2018.
CMTO Phase 1
Mid-2018
to
early 2019
• PHAs enroll families into randomized controlled trial of
CMTO services beginning in April (SHA) and May (KCHA)
2018.
• Enrollment concludes in February 2019 with 499 families
enrolled into study.
CMTO Phase 2
Mid-2019
through
2020
• PHAs and research team convene in February 2019 to
begin assessing early evidence and determine Phase 2
research and program design.
• Phase 2 enrollment begins in late June / early July 2019
and ends in March 2020 with 337 families enrolled into
study.
NOTES: CMTO is Creating Moves to Opportunity. PHA is public housing agency. SHA is Seattle Housing Authority. KCHA is King County Housing Authority.
Partnership Formation and Early Demonstration Planning
The partnership between SHA and KCHA for CMTO began to take shape following a 2015 con-
vening of large PHAs and researchers. This gathering was motivated in part by newly released
long-term findings showing that children whose families used vouchers to move to low-poverty
areas as part of the U.S. Department of Housing and Urban Development (HUD) Moving to
Opportunity (MTO) demonstration had higher earnings and other positive outcomes as adults
when compared with their peers in randomly assigned control-group households who were not
exposed to those neighborhoods.8 The PHA leaders who attended the 2015 meeting recognized
the policy implication of these findings: The voucher program could be used as a platform
for promoting economic mobility by supporting the moves of families with young children to
neighborhoods of higher opportunity.
8. Chetty, Katz, and Hendren (2016).
IMPLEMENTING CREATING MOVES TO OPPORTUNITY | 3
SHA and KCHA have a long legacy of collaboration. According to PHA staff members, the agen-
cies understood the value of cooperation given the combined scale of their voucher programs,
the inclusion of both urban and suburban rental markets in each of their jurisdictions, and
the institutional f lexibility afforded to the agencies as a result of their participation in HUD’s
Moving to Work (MTW) demonstration.9 A major benefit of this administrative designation,
according to PHA staff members, was the budgetary f lexibility to fund policy units whose staff
drove evidence-based practice and new initiatives. These units coordinated the exploration,
planning, and execution of their institutions’ joint CMTO demonstration.
Another factor supporting the focus on innovation was the agencies’ relationship with the Bill &
Melinda Gates Foundation, which had supported pilot programs at each agency through its grant-
making work in the greater Pacific Northwest region.10 The PHAs and research partners secured
program and research funding from the foundation in 2016. The research team subsequently se-
cured a grant from the Surgo Foundation to further support a rigorous evaluation of the program.
DESIGNING THE CMTO SERVICE MODEL
The process of forming a joint research partnership with the CMTO-affiliated research team
continued into 2016. Brainstorming sessions addressed the considerable, essential question of
which program features were likely to drive successful opportunity moves at scale. Tackling this
question took on critical importance for the PHAs and research team in early planning conversa-
tions in 2016 and gained momentum in 2017 after funding was secured for the CMTO program.
Turning to the development of a particular intervention model for CMTO, PHA staff members
and the research team began by considering the kinds of barriers voucher families typically faced
in leasing in high-opportunity areas, and how those barriers might be addressed. They reviewed
existing literature and held conversations with other programs across the nation—including
Abode in San Mateo County, California, and the Baltimore Regional Housing Program—to
understand more about their particular service approaches. One PHA leader observed a critical
limitation of the existing evidence base: It had “less of a focus on what’s been done and more
of a focus on what have been the outcomes of what has been done, but that makes it really hard
for agencies to actually duplicate it.” That missing information made direct consultations with
the operators of other mobility programs even more valuable.
The planners developed a theory of change that identified the major factors that seemingly
constrained voucher holders’ lease-ups in local high-opportunity areas, and suggested service
strategies that could reduce or remove those barriers.11 (See Table 2.) The goal of the pilot
9. See U.S. Department of Housing and Urban Development (2020) for additional information about MTW.
10. The foundation’s prior grants funded education and homelessness initiatives, not housing mobility work.
11. A “lease-up” generally refers to a successful lease outcome for an HCV program participant wherein the participant receives program rental assistance.
4 | IMPLEMENTING CREATING MOVES TO OPPORTUNITY
TABLE 2 Anticipated Family Barriers to Accessing High-Opportunity Areas and
Corresponding Proposed Services
CONSTRAINTS TO FAMILY
LEASE-UPS IN HIGH-
OPPORTUNITY AREAS
PROGRAM SERVICE
COMPONENT MAIN PLANNED PROGRAM ACTIVITIES
Limited knowledge of high-
opportunity areas
High-opportunity-
area education
• Informational materials (e.g., neighborhood
guides)
• Discussions with staff about family priorities
and neighborhood options
• Neighborhood tours
Competitive disadvantages
in the rental application
process
Rental application
coaching
• Identification of rental application screening
barriers (e.g., low credit scores, past evictions)
• Guidance on barrier mitigation
• Coaching and tools for landlord communication
Challenges navigating the
housing search process
Housing search
training, planning,
and assistance
• Completion of housing search plans
• Referrals of available rental units
• Family accompaniment and landlord-family
brokering
• Enhanced housing authority issuance briefings
Difficulty affording
application and lease-up
costs in high-opportunity
areas
Flexible financial
assistance
• Application financial assistance (e.g.,
application fees)
• Lease financial assistance (e.g., security
deposits)
Low landlord participation
in HCV program in high-
opportunity areas
Landlord
engagement
• Marketing and relationship-building among
landlords in high-opportunity areas
• Expedited housing authority lease-up
processes
• Mitigation fund to cover costs beyond security
deposits, in case of unit damage
SOURCE: Housing authority planning documents.
NOTE: HCV is Housing Choice Voucher.
and Phase 1 CMTO program was to take what the PHAs called a comprehensive, “kitchen sink”
approach to serving families and engaging landlords in support of driving high-opportunity-
area lease-ups. That is, the partners would try to address all the identified barriers, ultimately
using preliminary analyses of program impacts, program costs, and families’ and landlords’
responses to the intervention to inform exploration in a second phase. This subsequent phase
would study variations in the program design to generate further evidence about which pro-
IMPLEMENTING CREATING MOVES TO OPPORTUNITY | 5
gram approaches might be, as described in the PHAs’ application to the Gates Foundation for
program funding, the “most essential, most cost-effective, and most scalable” to help families
move to high-opportunity neighborhoods.
As the model began to take shape, the PHAs’ CMTO leads engaged in multiple rounds of discus-
sion with HCV program managers and PHA leadership to ensure that the model would appeal
to families and landlords. In addition, the research team conducted systematic, exploratory
fieldwork with PHA staff members, families, and landlords who were served by each PHA to
identify useful perspectives on the emerging approaches that were being considered for the
demonstration. See Box 1 for a summary of the main takeaways from this work.
Integrating CMTO Within HCV Program Practice
Launching a new mobility program raised questions within the PHAs related to the agencies’
broader missions and HCV program policies, including:
■ To what extent would CMTO override existing HCV program priorities?
■ How could a randomized controlled trial be implemented in HCV program settings?
■ Would promoting access to certain neighborhoods for a subset of HCV program clients—
families with young children—represent an equitable allocation of program resources?
■ Might CMTO services risk meeting problematic standards for “steering” families to certain
neighborhoods?
The CMTO lead staff members within the PHAs believed these overarching concerns about the
mobility program needed to be addressed in order to obtain the support and participation of
their colleagues during the planning phase.
As planning conversations progressed, the CMTO teams also held many meetings with HCV
program stakeholders to consider where modifications, enhancements, or special attention would
be needed in the HCV program process. Particular consideration was given to ensuring voucher
program affordability in high-opportunity areas, expediting voucher lease-up procedures, and
modifying HCV program intake procedures.
Ensuring Voucher Program Affordability in High-Opportunity Areas
Before the CMTO demonstration began, KCHA had implemented tiered payment standards for
subregions of the county that made it more feasible for voucher families to rent housing units in
more expensive areas of King County. This policy increased the likelihood that voucher hold-
ers could afford units up to the 40th percentile on the rent distribution in any given tier, and
thus, in greater King County. KCHA’s staff believed this policy would be sufficient to promote
affordability for families who were receiving CMTO services in high-opportunity areas.
6 | IMPLEMENTING CREATING MOVES TO OPPORTUNITY
BOX 1 Select Takeaways from Exploratory Fieldwork to Inform the
CMTO Program Design
In February 2017, MDRC and its partner MEF Associates conducted 50 interviews with managerial
and line staff members at King County Housing Authority (KCHA) and Seattle Housing Authority
(SHA), with voucher holders with children who were new to the program and who either had
recently leased up in high-opportunity areas or were still searching, and with landlords. The goal
of the discussions was to develop insights that would help to refine and implement the emerging
CMTO service design. These important takeaways were presented to the partners:
• Participating families would likely benefit from engaging in services before the housing
search “clock” starts. Interview respondents believed that the voucher issuance briefings
presented valuable information to new-admissions families, but they expressed concerns that
this information could be overwhelming and suggested that CMTO participants would benefit
from having dedicated time to engage in neighborhood exploration and rental application
coaching. MDRC and MEF recommended that SHA and KCHA attempt to align the Housing
Choice Voucher (HCV) program operations in support of this objective. They predicted that
service staff members may need to do intensive outreach in order to ensure that all families
who were offered CMTO would be able to access the services.
• Families would likely benefit from custom and individualized service delivery. Voucher
holders identified common features of “desirable” neighborhoods, but their weightings of
these characteristics and their awareness of how high-opportunity areas could match their
preferences varied widely. Most voucher families prized good schools, safety, neighborhood
resources and amenities (for example, grocery stores, parks), access to transportation, and
proximity to work. However, respondent families differed in both their familiarity with and their
stances toward moving to high-opportunity areas. Some families were highly familiar with
these areas and were inclined to move. Others were well informed but had very specific and
narrow neighborhood preferences. Still others (especially those who were coming from outside
of King County) had very little knowledge of Seattle and King County. This variation suggests
that education and engagement about high-opportunity areas need to be customized to each
family’s circumstances.
• A wide range of high-opportunity-area options is desirable to meet diverse family
preferences and ensure an adequate supply of rental units that are affordable to the
voucher program. Interview respondents flagged rental unit affordability under the voucher
program as a significant possible constraint to the success of the program, even with increased
voucher payment standards. They specifically expressed concerns about certain areas in
north Seattle and in higher-income areas of King County. Some staff members emphasized the
importance of including some areas of south King County and south Seattle in CMTO.
• Various potential advantages were identified for landlords who participate in CMTO
and the voucher program, as well as some potential pitfalls. Landlords appeared to be
motivated to lease to voucher holders by the prospect of rental income stability, altruism, and
the possibility of lower unit turnover. However, interview respondents perceived a greater risk
of unit damages from leasing to voucher holders and indicated that housing authorities could
often be slow or unresponsive in their interactions with landlords. This suggests that there
are opportunities for enhanced messaging about the features of CMTO and about its benefits
beyond the typical voucher program’s offerings.
IMPLEMENTING CREATING MOVES TO OPPORTUNITY | 7
SHA’s leaders also saw a need to adopt an approach that would enable voucher affordability in
relatively more expensive rental markets in the city of Seattle, while being mindful of the cost
implications of such a policy. The agency developed, and its board adopted, a policy called a
Family Access Supplement that would allow families with children (of any age) to rent higher-
cost units in high-opportunity areas by applying a supplement in excess of the standard voucher
payment—just enough to make the tenant portion affordable within a maximum amount.12 At
the conclusion of Phase 1 enrollment, PHA staff members reported no concerns regarding SHA’s
payment standard supplement and expressed the belief that it had clearly succeeded in promoting
affordability in high-opportunity areas. Consequently, members of the CMTO study’s program
and control groups could all benefit from it.
These approaches to enhancing the affordability of the voucher program ref lected a notable dif-
ference in the HCV program policies that were applicable to CMTO participants, one that would
have some implications for the housing searches of families. KCHA’s payment standards were
determined largely by the costs of rental housing in local markets, but the clusters of zip codes
that composed each tier did not account for CMTO high-opportunity area map boundaries. In
contrast, SHA’s Family Access Supplement was available in CMTO’s targeted high-opportunity
areas only.
Expediting Voucher Lease-Up Procedures
Both PHAs initially explored outsourcing crucial lease-up processes, such as analyses of rent
reasonableness and housing quality inspections, to the CMTO program to ensure that they
would run quickly and smoothly. KCHA ultimately elected not to outsource most tasks to
CMTO-dedicated staff, acknowledging that its existing operations could give priority to expe-
dited lease-up processes for CMTO participants; the housing navigators still conducted some
preinspection work, such as completing necessary forms, in advance of the formal inspection.
In contrast, despite initial objections by its existing inspections team, SHA chose to hand off
many procedures, including inspections, to CMTO staff at InterIm. In addition to the CMTO
staff becoming Nan McKay & Associates-certified housing quality standards (HQS) inspectors,13
SHA and KCHA lead inspectors provided training and support to the housing navigators who
conducted these functions.
Modifying HCV Program Intake Procedures
HCV housing counselors were assigned the responsibility for educating voucher applicants
about CMTO and its evaluation during HCV program intake, securing informed consent and
administering a baseline survey for families who elected to enroll in the study, and conducting
random assignment. Each PHA identified a housing counselor who would execute these tasks,
12. SHA’s Family Access Supplement was available to all eligible voucher program recipients with children of any age in the household. As such, and like KCHA’s HCV program-wide tiered payment standards, members of both the study’s program group and the control group could benefit from it.
13. Nan McKay & Associates is an independent firm that offers training services to HCV program practitioners at PHAs.
8 | IMPLEMENTING CREATING MOVES TO OPPORTUNITY
which entailed significantly altering and customizing each PHA’s typical HCV program service
f lows for CMTO. PHA staff and the research team believed that the efficacy of CMTO family
service delivery would be improved if families could be engaged in education about opportunity
areas and coaching on rental applications before vouchers were issued. This arrangement would
entail procedural changes at both agencies, but KCHA had already adopted policies that reduced
the amount of time between the determination of a family’s eligibility for the voucher program
and the issuance of a voucher to the family. While the two PHAs sought to align their policies
on a common preissuance service period, KCHA’s voucher program leadership was hesitant to
introduce significant new delays in the issuance of vouchers. With the research team’s concur-
rence, the agencies adopted alternative time frames. SHA would schedule the issuance of vouch-
ers roughly two months after families’ initial CMTO intake briefings, while KCHA would issue
vouchers to families about two to four weeks after their CMTO intake sessions (at the soonest
CMTO-dedicated voucher issuance briefing following the determination of family eligibility).14
See Figure 1 for a summary of the timing of various service milestones in Phase 1.
In ref lecting on the time families were given to prepare for their housing search and engage in
CMTO, the navigators strongly preferred the two-month preissuance service period offered to
SHA’s families. They emphasized not only the perceived benefits to families of having more time
to invest in housing search preparation but also the advantages afforded to families of knowing
when their vouchers would be issued when they enrolled.
Selecting a Service Provider and Staffing CMTO
From the outset of their planning efforts, the PHAs expected that CMTO services would be
delivered by an outside agency with which they would contract. They viewed this option as a
way to establish the f lexibility to adapt staff job descriptions and work schedules as needed. At
the same time, choosing the right vendor was complicated by the need for CMTO to address the
requirements of landlords as well as families. During the service provider procurement process,
PHA staff members anticipated that most local social service agencies that had the capacity to
coach and support voucher holders may not also have the in-house capacity to engage landlords
effectively. Similarly, they anticipated that organizations such as for-profit rental brokers or
entities with skill navigating rental housing markets may not have the ability to deliver family-
centered coaching services to voucher families. One PHA leader noted that this reality would
see the PHAs either “teaching a private sector company to do social services…or teaching a
community-based organization to have a private market lens.” Ultimately, the winning bid came
from a community-based agency, InterIm CDA, with a history of delivering services—including
rapid rehousing and affordable housing property management—to low-income and vulnerable
populations. InterIm’s pursuit of the CMTO service contract ref lected a growth opportunity for
the agency, which had not contracted to provide services at such a scale before.
14. KCHA’s “enhanced” voucher issuance briefings for CMTO families were initially held on a biweekly basis. However, as implementation progressed, various operational factors led the agency to hold monthly issuance briefings. This schedule change had the effect of lengthening the period.
IMPLEMENTING CREATING MOVES TO OPPORTUNITY | 9
The process of partnership formation between InterIm and the PHAs took longer than the PHAs
initially expected; staff members at InterIm recalled that becoming familiar with the expecta-
tions for service delivery staffing and approaches required time, effort, and communication.
For example, InterIm staff needed to consider what it would mean to deliver a specific set of
housing mobility services as opposed to the more holistic, wraparound social services that the
agency typically provided to its clients. The PHAs emphasized that the service provider would
focus on coaching and assisting families with their housing searches, and would not take on
the responsibility for addressing other service needs families might present; those issues would
have to be dealt with by referring families to other programs.
The PHAs worked together with InterIm leadership to draft position descriptions, interview
candidates, and decide which candidates would receive offers. It was decided that, in addition to
part-time executive, program manager, and administrative support, CMTO positions at InterIm
would include two family navigators, each dedicated to families who had been issued vouchers
by one of the two PHAs, and two housing navigators, each engaging landlords across the CMTO
high-opportunity areas and supporting families who were served by both PHAs. (See Box 2 for
229
261
286
458
566
1,279
204
238
267
333
527
1,597
0 500 1,000 1,500 2,000 2,500 3,000 3,500
Enrolled families eligible for voucher
Families enrolled into CMTO study
Families offered CMTO enrollment
Families who attended CMTO intake briefing
Prescreened families scheduled for intake
HCVP program waitlist families sent HCV program application
FIGURE 1
Phase 1 Recruitment Funnel
KCHA families SHA families
NOTE: HCV is Housing Choice Voucher. CMTO is Creating Moves to Opportunity. KCHA is King County Housing Authority. SHA is Seattle Housing Authority.
10 | IMPLEMENTING CREATING MOVES TO OPPORTUNITY
further details on these two program roles.) With the exception of a family navigator who was
already an InterIm employee, these navigators were hired between December 2017 and February
2018, and they immediately began working with families as part of a pilot of CMTO services
that started in December 2017 at SHA and in January 2018 at KCHA.
Piloting the CMTO Intervention
In the CMTO pilot, which began in late December 2017 and early January 2018 at SHA and
KCHA, respectively, 46 families were offered CMTO services before the random assignment
study was launched. The pilot provided an opportunity for the PHAs and InterIm to refine and
finalize the operational procedures for recruiting, enrolling, and serving families, and to boost
the training of InterIm staff, most of whom were hired just before or right as the pilot began. For
the navigators, this was a useful chance to translate service protocols that for them felt “really
hazy” into live program activity by serving families and engaging landlords on their behalf.
BOX 2 CMTO Navigator Roles
Two primary groups of staff members provided the CMTO services families received from InterIm
CDA.
Family navigators were the first point of contact for families after they enrolled in the study; they
were charged with building a relationship with families. After families were referred from the public
housing agencies (PHAs), family navigators provided a range of support services:
• information on CMTO and the voucher program
• education about opportunity areas
• rental application coaching to help families make a strong case for tenancy
• housing locator services geared toward training and supporting families in conducting housing
searches and applying for rental housing
• financial planning and financial assistance to cover search-related and lease-up expenses
Family navigators also contacted families within two weeks after they moved to assess their service
needs and provide information about local resources such as schools and how to sign up for
utilities.
Housing navigators conducted outreach to landlords in high-opportunity areas to promote CMTO
and improve the likelihood of families leasing up in those areas. They also provided support to
families as they searched for housing. They offered landlord and unit referrals to families, often
serving as an intermediary between families and landlords. And, they administered the program’s
expedited lease-up processes for landlords, facilitating or executing certain PHA administrative
processes and processing payments such as security deposits.
IMPLEMENTING CREATING MOVES TO OPPORTUNITY | 1 1
After a few months of preliminary service delivery experience, the PHAs decided to pause new
family enrollment into the CMTO pilot and invest in a full month of additional staff training,
including intensive training on both HCV program policies and procedures and the CMTO
service model. This break also granted time for InterIm staff members to improve their famil-
iarity with the KCHA high-opportunity areas.15 The PHAs increased their overall monitoring
of service delivery, making observations of CMTO service and holding regular meetings, called
“learning circles,” during which PHA and InterIm staff members discussed family and landlord
cases and worked through any challenges or unanticipated scenarios that were occurring.16
This period culminated in a “train-back” session, during which the navigators role-played the
program’s intended approaches to service delivery back to PHA staff. A brief resumption in
pilot enrollment and service delivery for new KCHA families occurred in May 2018, before the
PHAs launched Phase 1 enrollment.
During the pilot, the CMTO navigators took what they described as a very “hands-on” approach
to serving families who were actively searching for housing, including accompanying families on
many unit and property tours. Although some navigators recall feeling that this approach served
families well—especially those who had never leased independently in private-market housing
before—a small share of participating families were consuming disproportionate amounts of
staff time during housing searches. In the words of one navigator, this degree of involvement
“was not going to be sustainable once our caseloads grew.”
PHASE 1: EARLY IMPLEMENTATION TO STEADY STATE
With confidence that CMTO service delivery and associated voucher program procedures were
generally working as intended, the PHAs began recruiting eligible families and enrolling them
into the Phase 1 study in April (SHA) and May (KCHA) of 2018.
Recruiting HCV Waitlist Families into CMTO
The PHAs marketed CMTO to potentially eligible families who were on HCV program waitlists
at each agency. They began by mailing an HCV application packet that included information
about CMTO in a cover letter (SHA) or in a half-page f lyer (KCHA). Families who responded
were screened for basic CMTO eligibility and invited to an in-person, individualized HCV intake
briefing, typically lasting between one and two hours.17
During intake, housing counselors assessed applicants’ eligibility for the HCV program and
CMTO based on the information in their application (including their income and the presence of
15. PHA staff members noted that InterIm CDA historically focused its work in the city of Seattle.
16. These learning circles would continue throughout the remainder of the CMTO demonstration.
17. All SHA families who received this HCV mailing were provided a date and time for intake, which could be rescheduled at the family’s request. KCHA families were instructed to make intake briefing appointments through that agency’s call center staff.
12 | IMPLEMENTING CREATING MOVES TO OPPORTUNITY
a child under the age of 15). Unless a family was clearly ineligible, the housing counselors followed
the standard HCV program intake briefing with a five-minute PowerPoint presentation and ac-
companying talking points to introduce the CMTO demonstration. As part of this presentation,
the counselors described the PHAs’ motivations for supporting families who were searching
for housing, the significance of neighborhoods to family members’ lives, and a summary of the
services that CMTO could provide. The counselors also brief ly introduced the study (including
explaining the conditionality of families’ receipt of CMTO services on their study enrollment
and random assignment) and asked families if they were interested in learning more about it. If
families expressed interest, the counselors immediately reviewed the study’s informed consent
forms and, if voucher heads of household consented, collected further information through
an approximately 15-minute baseline survey, then conducted random assignment.18 If families
were assigned to CMTO, they were given a f lyer describing the program (see Appendix A for
an example of a f lyer given to families assigned to CMTO), told that a family navigator would
contact them within two days, and informed about their next steps with the voucher program.
If families were assigned to receive standard PHA services, they were told about the next steps
in the processes for determining voucher eligibility and issuing vouchers.
Before recruitment mailings were sent out to the Phase 1 families, each PHA projected how
many families would need to be “pulled” from their respective waitlists to yield the number of
monthly study enrollees that would meet their overall sample-size targets and service delivery
caseload projections. Within the first few months of beginning enrollment, it was apparent that
these projections would be difficult to meet. Fewer families than needed were responding to the
initial HCV program mailings, and no-shows at appointments further decreased the number of
families who were considering enrollment.
In response, the PHAs expanded their outreach efforts. Housing counselors began phoning and
emailing families after their voucher application packets were sent; this contact also offered
counselors an opportunity to further screen families for ineligibility conditions before asking
them to appear at the PHA in person. The PHAs also increased the number of families who were
mailed application packets each month and added staffing for the recruitment effort, shifting
from one housing counselor to two at each PHA.
The sample enrollment targets were ultimately achieved, but meeting this goal required con-
tending with considerable attrition at each stage of the recruitment and enrollment processes.
Using PHA data, Figure 1 illustrates the challenge, showing the funnel-shaped f low of families
into the study. For example, the PHAs mailed HCV program applications to 2,876 HCV waitlist
families who were potentially eligible for CMTO. Of this group, 38 percent were scheduled for
an intake briefing, but only 72 percent of those who were scheduled attended the briefing. Of
18. Non-head-of-household adults also consented to participation in the study in person, if they attended voucher intake briefings, or by mail, if they were not present. Parents and guardians separately consented to the collection of certain data describing children in the household.
IMPLEMENTING CREATING MOVES TO OPPORTUNITY | 1 3
the attendees, 30 percent were deemed not eligible for either the voucher program or CMTO.19
Of the remaining families who were offered CMTO enrollment, almost 10 percent declined to
enroll in the study. Finally, of the families who enrolled in the CMTO study and were randomly
assigned, 13 percent were found to be ineligible for vouchers. In all, 433 families (15 percent) out
of the 2,876 who had been sent applications both enrolled in the CMTO study and were eligible
to receive a voucher.
Implementing CMTO Services for Families
Families who were randomly assigned to the CMTO program were referred to InterIm by the
housing counselors within two days of their intake briefings. Family navigators then contacted
the families to set up an individualized in-person meeting. Families typically had to wait be-
tween one and two months after random assignment to receive their vouchers.20 During this
period, family navigators began to educate families about high-opportunity areas, coach them
on their rental applications, and prompt them to begin planning for their housing searches.
After vouchers were issued, families searched for housing with the support of both family
and housing navigators. The program covered the rental application fees that some landlords
charged. Once families were approved for a unit, the housing navigators expedited the PHAs’
lease-up processes. Once families leased up and moved into their units, the family navigators
contacted them over a two-week period to offer information and referrals to support families’
needs. Figure 2 illustrates this process.
Structuring Family Search Preparation
Critical to CMTO service delivery were two in-person meetings with families, each of which lasted
between one and two hours, with regular, remote check-ins occurring between and after the two
meetings. The intent of these meetings and check-ins, as the family navigators explained, was
to provide each family with sufficient information to help them “make a really informed choice
about what feels right for their family” and with skills to help them “advocate for themselves
when they start talking to potential landlords” during their housing search.
19. In order to ensure that HCV- and CMTO-eligible families who were randomly assigned to CMTO would be able to engage in some CMTO services before receiving their vouchers, the PHAs and research team elected to enroll families before final HCV program eligibility determinations could be made. Housing counselors used voucher application information to judge if families were likely to be found eligible for vouchers and decided accordingly whether to describe the CMTO program and demonstration and offer study enrollment to families. The partners accepted that some enrolled families would later be determined to be ineligible to receive a voucher, expecting that postenrollment ineligibility would be evenly distributed across the program and control groups.
20. Families who were enrolled into CMTO by SHA were scheduled to receive their voucher roughly two months later, and enrolled families who were eligible to receive a voucher at KCHA could experience periods of two to four weeks between their random assignment and the issuance of their vouchers. KCHA initially held biweekly issuance briefings for CMTO families—with families scheduled for briefings as soon as they were confirmed to be eligible for the HCV program—but eventually joined SHA in conducting monthly issuance briefings during Phase 1. This change lengthened the preissuance service period for KCHA families to approximately one month.
14 | IMPLEMENTING CREATING MOVES TO OPPORTUNITY
The first meeting, which family navigators described as being, in part, a “getting to know you”
session, encompassed a mix of program orientation and assessments, family goal-setting exercises,
education about program high-opportunity areas, and the start of rental application coaching.
These meetings were scheduled within one to three days after the receipt of a referral from the
PHAs and were typically held either at InterIm CDA’s Seattle office or at a location convenient
to where families lived.21 To prepare for the meetings, the family navigators reviewed the study’s
baseline survey data on each family; they noted that information about the family’s composition,
language-access needs, and initial neighborhood preferences and perceptions was especially use-
ful. In the meetings, the family navigators explained why the CMTO program sought to support
high-opportunity moves, and they reviewed the high-opportunity areas using maps and guides
that described neighborhood features and amenities. The navigators also explained what CMTO
services were available to families who were pursuing moves to and leasing in those areas, while
also ensuring that families were aware that they could still use their vouchers in neighborhoods
within their PHAs’ jurisdictions that were not designated as high-opportunity areas, although
without CMTO assistance. Next, the family navigators assessed the families’ familiarity with
the high-opportunity areas, their neighborhood and housing preferences, and what information
and resources would be most important for families to factor into their housing searches. After
forming a preliminary understanding of family preferences, and asking families to begin defining
and making distinctions between their housing “wants” and “needs,” the navigator suggested
21. In Phase 1, families who were randomly assigned to receive CMTO services were referred to InterIm CDA staff using the program’s MIS shortly after completing an application review and study enrollment meeting with SHA staff. In contrast, KCHA staff conditioned a family’s referral upon the determination of each family’s eligibility for the HCV program. This process remained the same in Phase 2, except in the version of the CMTO intervention that did not provide access to family coaching, thus eliminating the need for service referrals from the PHAs.
FIGURE 2
CMTO Phase 1 Service Flow Diagram
Family
contactedFamily navigator
meetings
Navigator
follow-upUnit
selectedLease
signed
PHA Intake
appointmentVoucher issuance
+ enhanced PHA
briefing
Housing search
+ financial
assistance
Expedited
lease-up
Post-lease
support
30-60 days (SHA),
30 days (KCHA)120 days (more if given extension) 14 days
SOURCE: Opportunity Insights.
NOTES: CMTO is Creating Moves to Opportunity. SHA is Seattle Housing Authority. KCHA is King County Housing Authority.
IMPLEMENTING CREATING MOVES TO OPPORTUNITY | 1 5
that families conduct independent reviews of high-opportunity-area guides and recommended
staff‐guided or independent opportunity-area tours if families were unfamiliar with any areas.
After covering the general orientation content, family navigators asked about each family’s rental
history, beginning to assess any past evictions, potential credit-related issues, or other condi-
tions that could represent leasing barriers. Family navigators offered to pull and review families’
credit reports, and they provided information about local housing discrimination laws.22 In
discovering issues that could cause problems in having rental applications approved, the family
navigators conveyed to families that it was critical for them to proactively communicate about
these potential barriers in their upcoming conversations with prospective landlords, before and
during the process of applying for rental housing.
As the final task in this first meeting, the family navigators worked to assess each family’s fi-
nancial resources through a cursory household budgeting exercise. This evaluation provided a
starting point for discussing what financial assistance could be available through CMTO and
highlighting the costs—notably certain move-in expenses, such as moving van rental fees or
new furniture costs—that would be the family’s responsibility.23 In concluding the meeting, the
family navigators would identify steps for families to complete before their next meeting, such
as contesting credit report items, beginning to pay off debts, and gathering documentation in
support of future rental applications.24 Families were encouraged to prepare a testimonial let-
ter explaining the family’s circumstances and contextualizing their possible rental barriers or
a “rental résumé” that summarized a family’s rental history; these documents could be used
to communicate with potential landlords in high-opportunity areas. These letters or lists were
intended to be family-driven activities that the family navigators described as “setting the stage”
for a productive, family-led, staff-supported housing search.
The second meeting between family navigators and families, ideally held soon before vouch-
ers were issued by the PHAs, was described by InterIm staff members as an important “getting
ready” moment for families. The family navigators shared some best practices for communicating
with landlords by phone, by email, and in person (for example, while on property tours) and
checked on families’ independent preparations for addressing barriers they might encounter
during their housing searches. If the rental explanation or history documents were not ready,
the family navigators offered to work on them together with families during the meeting. Family
navigators then modeled or role-played effective landlord communication in an effort to build
22. Washington State enacted source-of-income protections in 2018, and the city of Seattle prohibits landlords from considering criminal justice involvement as a factor in screening rental housing applications.
23. The program allocated up to $3,500 to cover the costs of applying for housing and leasing up in high-opportunity areas.
24. Staff members at InterIm reported that even though most credit-related issues and significant outstanding debts could not be resolved before a family applied for rental housing, they encouraged families to begin taking steps to deal with them in order to demonstrate to landlords that they were being proactive in addressing factors that landlords might view as risks during application screening.
16 | IMPLEMENTING CREATING MOVES TO OPPORTUNITY
families’ confidence in their communication skills.25 Family navigators also walked through
the process of searching for housing, often demonstrating how to search online unit listings.
Reviewing live, online rental listings with staff often led families to reassess their initial housing
preferences, which the family navigators believed help families anticipate trade-offs that might
need to be made when they later decided which units to pursue during their housing searches.
In modeling the use of online rental housing search websites, such as Zillow or HotPads, the
family navigators encouraged families to search broadly across their PHA’s jurisdiction—for
example, searching the entirety of King County outside of Seattle for KCHA families—as a way
of anticipating factors besides a family’s preferences that might eliminate units from consider-
ation. To that end, family navigators discussed the central concept of search filters related to
unit characteristics that would likely be prescribed by the voucher (for example, the contract
rent amount, the unit size) and those that were important to the family (for example, on‐site
parking, the number of bathrooms in the unit, zoned schools). This exercise was geared toward
encouraging families to explore how they might develop and refine a working list of prospective
properties. Family navigators also demonstrated navigating a customized CMTO website, which
offered a tool for families to screen addresses for their location within a high-opportunity area.
In general, families tended to develop expansive lists of available units that matched their basic
criteria, which they then cross‐referenced with the online CMTO high-opportunity area map,
eliminating units that were not in high-opportunity areas and that they could not pursue with
CMTO assistance.
Following the second family meetings, the family navigators continued to maintain contact
with families—mostly by text, email, or phone, on at least a biweekly basis—checking in on the
status of their searches or preparations, and reinforcing the supports that were available. In ad-
dition, the family navigators attended the PHAs’ special “enhanced” voucher issuance briefings
solely for CMTO families, during which they gave a short presentation reiterating the services
that were available from CMTO. These briefings included presentations by PHA staff members
on content that was customary for all voucher waitlist families to receive at the time vouchers
were issued, plus additional content from CMTO staff members at InterIm that recapped CMTO
services, including through a high-quality motivational video.
Supporting Families During Housing Searches
Once families were issued their vouchers and actively began searching for housing—when “the
wheels hit the road” for families, in the words of one navigator—service delivery became less
standardized and more family-driven. Family navigators continued to attempt to contact families
who were still searching roughly every two weeks, but they were as responsive and engaged as
25. Family navigators noted that many families seemed nervous about speaking with landlords; they shared that many foreign-born participants who were proficient English speakers in meetings with staff seemed to doubt their communication skills in the context of a housing search.
IMPLEMENTING CREATING MOVES TO OPPORTUNITY | 1 7
a family requested.26 According to the family navigators, common interactions with families at
this stage consisted of the following:
■ answering basic questions about the search process or the voucher program, such as how to
request an extension of the voucher housing search period
■ facilitating contact between families and housing navigators when families requested (or
staff members at InterIm thought families would benefit from) referrals of available units
identified by CMTO staff
■ coordinating payment of prelease rental application fees on behalf of families
■ reiterating and reinforcing concepts that had been previously covered in meetings, especially
for families who experienced application denials
The navigators emphasized that rental application denials were common, even for families who
were prepared and who would eventually be successful in realizing opportunity moves. They also
stressed that families who engaged erratically or who disengaged and subsequently reengaged
in services could still ultimately make an opportunity move.
Low credit scores or past evictions were cited as the most common barriers to the approval of
families’ rental applications. But, the navigators also expressed the belief that families’ ability
to address these barriers openly in their communications with landlords was the most effective
tactic for overcoming them. Emphasizing the importance of
rental application coaching in successful housing searches,
the navigators noted that the documents families prepared
during the up-front coaching sessions—especially the let-
ters explaining the circumstances of rental barriers that a
landlord might see in a screening report—were particu-
larly helpful in persuading landlords to lease to CMTO
families who had what may be perceived as problematic
backgrounds. More generally, the navigators believed that, when taken together, the full set of
CMTO services could support virtually any type of family in making an opportunity move.
Family Participation Motivations and Patterns
When families began participating in the up-front CMTO meetings, the family navigators ob-
served a high degree of buy-in from families for the prospect of making an opportunity move.
In fact, the family navigators observed that the prevailing concern for most families was not
whether they should participate and consider moving to a high-opportunity area, but, as one
26. Families received this periodic outreach from their family navigator until they leased up or their voucher expired, regardless of a family’s intent to move to a high-opportunity area. Waitlist families at both KCHA and SHA had 120 days to search for and secure housing under the voucher program, but families could extend those search periods to 240 and 180 days, respectively, upon request.
Once families were issued their vouchers and
actively began searching for housing—when “the
wheels hit the road” for families, in the words
of one navigator—service delivery became less
standardized and more family-driven.
18 | IMPLEMENTING CREATING MOVES TO OPPORTUNITY
navigator put it, “Can I make a move happen [in the voucher program]?” In other words, could
families successfully lease with their vouchers, which they had waited a long time to receive?
The family navigators described a sense of near-universal appreciation for the fact that families
would have a partner in their housing search, someone “going through this with me because I
don’t know what to do.”27 They believed that the benefits of successfully attaining subsidized
rents was a powerful motivator for families to participate in CMTO, and they attributed this
feeling to a few major concerns:
■ anxiety over the time limits the voucher program placed on the initial housing search period,
and an awareness that not all families succeeded in leasing up with a voucher
■ financial stress on the part of families, including current difficulty paying rent or a strong
desire to secure a more stable housing arrangement
■ a belief that lease‐up costs, especially security deposits, would be unaffordable to the family
anywhere in Seattle or King County without the support of CMTO
Despite these motivations, family navigators did not discount the idea that many families were
genuinely motivated to pursue opportunity moves, and they observed that families were gener-
ally surprised to learn that voucher holders were able
to use their vouchers in many of the more aff luent
high-opportunity areas. The most common preferences
expressed during housing searches were proximity
to good schools, at least one family-specific desired
unit feature (such as a dedicated parking space or an
in-unit washer and dryer), and neighborhood safety.
Still, not all families fully engaged in CMTO. Although
the navigators acknowledged the difficulty in fore-
casting a given family’s level of engagement, they identified several broad factors to explain
why some families may have participated in the program and pursued opportunity moves with
greater or lesser intensity:
■ a family’s level of interest in pursuing a move to a high-opportunity area
■ the presence or absence of external stressors or barriers, such as homelessness or family
health concerns
■ a family’s confidence in conducting independent search activities, and especially in com-
municating with landlords about rental barriers
27. See Bergman et al. (2020a) for an analysis of families’ perspectives on the benefits of CMTO participation, including the feeling that CMTO staff provided welcome emotional support during the housing search process.
The family navigators observed that the prevailing
concern for most families was not whether they should
participate and consider moving to a high-opportunity
area, but, as one navigator put it, “Can I make a move
happen [in the voucher program]?”
IMPLEMENTING CREATING MOVES TO OPPORTUNITY | 1 9
■ preexisting family familiarity with high-opportunity areas
■ the availability of strong family or social supports or significant external support from other
service agencies that strengthened a family’s preferences for certain neighborhoods, including
neighborhoods that were not CMTO high-opportunity areas, over others
Navigators recalled that families who were experiencing homelessness or who lacked access
to regular means of transportation could be less consistently engaged in CMTO and in inde-
pendently searching for housing. In addition, families with larger household sizes frequently
experienced longer housing searches, given the limited supply of sufficiently large rental units
on the market at any given time.
Among families who engaged with CMTO services, the family
navigators described four common participation patterns in the
housing search phase:
■ Searching mostly independently in high-opportunity areas. Some families were likely to
have successfully leased in the rental market before, to have a strong grasp of the details of
participation in a voucher program, and to complete many search activities independently,
with only light staff supports. In the housing search phase, many such families contacted
the program after they had themselves identified a desirable rental unit and required CMTO
financial assistance to cover prelease application fees. Navigators observed that this group of
searchers was largely composed of families with fewer significant rental barriers or with ac-
cess to more family resources than other types of searchers. See Box 3 for a family case study
that exemplifies this search pattern.
■ Drawing heavily on staff assistance. Many highly engaged families were unfamiliar with the
housing search process or were very uncomfortable independently completing fundamental
steps in that process, such as communicating with landlords. These families checked in fre-
quently with the navigators—a few were in touch with their family navigator virtually every
day until they were approved for a unit—and they depended on CMTO for ongoing coaching
and motivation while they were searching. The program intentionally accommodated this
type of family need and engagement. See Box 4 for a family case study that exemplifies this
search pattern.
■ Relying on navigators to take the lead. Some families were interested in leveraging CMTO
supports but expected CMTO staff to go beyond the role of providing coaching and supports
and to work with landlords to secure a unit that matched the family’s preferences.28 Family
navigators said that these families were likely to have engaged less intensively in presearch
preparatory activities and were more likely to receive remedial review of rental application
coaching concepts during the housing search phase. They worked with these families to em-
28. Family navigators observed that some families had previously received intensive case management from other programs and seemed to assume that CMTO supports would be similarly structured, with staff taking the lead in coordinating housing searches.
“I want to empower families to
be able to do this for themselves,”
underscored one family navigator.
20 | IMPLEMENTING CREATING MOVES TO OPPORTUNITY
phasize their role in coaching families to conduct staff-supported housing searches, rather
than performing family-informed, staff-led searches. “I want to empower families to be able
to do this for themselves,” underscored one family navigator. See Box 5 for a family case study
that exemplifies this search pattern.
■ Engaging inconsistently or disengaging. Some families were not actively or intensively engaged
in the program during the housing search phase, and they could either be actively searching
outside of high-opportunity areas or unresponsive to CMTO outreach. Navigators were keen
to point out that some of these families were experiencing difficult circumstances in their lives
that disrupted their ability to search for housing. One family navigator said, “A lot of [CMTO]
centers around planning for the future, and many families just can’t do that because they’re
trying to survive today.” See Box 6 for a family case study that exemplifies this search pattern.
In describing less consistent searchers and those who more transparently disengaged from the
CMTO program, navigators highlighted that a subset of disengaged families eventually reengaged
in response to continued staff outreach efforts, often about one month before the expiration of
their vouchers. Such families often realized that their vouchers would soon expire and were eager
BOX 3 Case Study: Serving the Touré Family
The Touré family was living in a shelter outside of the Seattle area when they began receiving
CMTO services. According to the navigators, the head of household was not familiar with Seattle
or the opportunity areas but was looking for a fresh start and a neighborhood with good schools
and outdoor space for her children. The navigators said the family had no rental history and had
recently filed for bankruptcy.
According to the navigators, the family engaged in CMTO services fully and had two in-person
meetings, with the family navigator traveling outside of the Seattle area to meet with the family.
The family completed independent housing search preparation work between those meetings
and signed up for a staff-led high-opportunity-area tour. Staff members also described the family
making a reasonable accommodations request to the Seattle Housing Authority (SHA) for an
increased voucher size due to a child’s disability before their voucher was issued and the housing
search began.
Once the family’s housing search was underway, the navigators recalled the head of household
being very proactive in her efforts to find housing in opportunity areas. After identifying one unit
that was willing to accept the family, she ultimately continued looking for a larger home, based
on the advice of the navigators. The Touré family finally found and was approved for a unit in
north Seattle. Upon meeting the landlord, the housing navigators discovered that the landlord
was amenable to accepting voucher holders but was uninformed about the voucher program
and appreciated guidance on its basic details. The landlord has remained in contact with CMTO,
notifying the navigators about units as they become available.
The Touré family received financial assistance to cover the security deposit, parking spot fee,
renter’s insurance, and application fee. The navigators reported receiving holiday season well-
wishes from the head of household, who had found employment, enrolled her children in school
promptly, and was happy in her new neighborhood.
IMPLEMENTING CREATING MOVES TO OPPORTUNITY | 2 1
for CMTO assistance. The navigators observed that these
families were likely to make significant compromises
against their ideal unit and neighborhood preferences,
and they wondered whether such families who leased up
in high-opportunity areas would be inclined to persist
in their new environments or would shortly move again.
Family Geographic Preferences
HCV families could only leverage CMTO services in seeking to move to high-opportunity areas
that were defined by their own PHA.29 Navigators observed that families’ existing knowledge of
29. New-admissions families served by SHA were not allowed to transfer their voucher to another jurisdiction upon initial HCV program lease-up, but KCHA families faced no such limitation. It was not expected that many KCHA families would shift to Seattle and SHA, and such families would not be eligible to receive CMTO services if they did so.
BOX 4 Case Study: Serving the Loyola Family
The Loyola family attended the two initial meetings with their family navigator, and the navigator
recalled the family being especially motivated to find a new unit due to persistent maintenance
issues at their current address; they connected the family with a legal services agency that
assisted them in breaking their existing lease. Staff members also described some disagreement
within the family about where to focus their housing search; the voucher head of household was
attracted to areas in east King County due to the quality of the schools there, while her husband
preferred to lease in south King County opportunity areas.
Staff members described the head of household as being very active in her search, staying in
contact with the navigators and attending property tours. However, she often asked the navigators
to speak with landlords on her behalf because she was unfamiliar with how to discuss the voucher
program. Although the Loyolas had good credit and no history of evictions, staff members said
the family received numerous rental application denials and in some instances had landlords
tell them not to apply for units because the landlord did not accept vouchers. The navigators
supported the family in filing local housing discrimination complaints. During the housing search,
a staff member spoke to the head of household “two to three times a day, almost every day,”
including weekends.
Ultimately, the family found a unit in an opportunity area in south King County owned by an
independent landlord who, according to the navigators, was personally impressed by the head
of household and lowered the contract rent after working with the navigator to understand the
voucher program. The family leveraged CMTO program assistance for their security deposit
but not to cover many of their application fees. The navigators acknowledged that the head of
household was not completely satisfied with the area she leased up in but had resigned herself to
living in south King County after failing to lease up in her preferred areas.
Although some families were inclined to stay close
to their current neighborhoods, CMTO’s messaging
about the potential benefits of moving to the
high-opportunity areas targeted by the program
resonated with most families.
22 | IMPLEMENTING CREATING MOVES TO OPPORTUNITY
high-opportunity areas, or the proximity of these areas to their current neighborhoods, strongly
informed their opinions about the desirability of the areas. Although some families were inclined
to stay close to their current neighborhoods, CMTO’s messaging about the potential benefits of
moving to the high-opportunity areas targeted by the program resonated with most families.
The navigators described SHA families’ perceptions of high-opportunity areas as fairly uniform
because those neighborhoods were all located in north Seattle. They also observed that some
families viewed certain of these neighborhoods as favorably diverse ethnically and culturally.
KCHA families, faced with vastly more varied and geographically dispersed high-opportunity-
area options, seemed more likely to identify certain areas, including the northern and eastern
King County suburbs, as more aff luent and less diverse relative to families’ existing communi-
ties. Notably, navigators reported that many KCHA families initially prioritized searching in
BOX 5 Case Study: Serving the Asad Family
The Asad family was living in south King County when they enrolled in CMTO services. At two in-
person meetings before their voucher was issued, InterIm staff and the Asads met for the typical
suite of preissuance services. According to InterIm staff members, the head of household was
resolute about staying in south King County because he and his family were familiar with the area
and had strong community connections there.
After the Asads’ voucher was issued, InterIm staff members reported that the family asked for
and was given listings of available units. Although initially they did not like many of the suggested
listings in south King County high-opportunity areas, the Asads decided to apply for a unit. The
family asked InterIm staff members to contact the unit’s property manager on the family’s behalf
while they prepared the application. InterIm staff did so and encouraged the family to submit their
application quickly. However, by the time the family had completed the application, the unit had
been leased. In response to this setback, and seemingly overwhelmed by the housing search
process, the family decided to stay in their current unit.
Upon inspection of the Asads’ current housing, the King County Housing Authority (KCHA) found
that the two-bedroom unit was too small for the Asads’ family size of two adults and four children.
According to CMTO staff members, the family then resolved to give up their voucher so that they
could stay in their current home, although the navigators urged them to continue looking for other
units. In the end, the family was approved for a unit in a high-opportunity area, for which the
navigator completed much of the application on behalf of the family.
After moving, the family contacted InterIm with a request that they find the family a new unit
because of the lack of parking in their new area. InterIm staff members told the family that
their engagement with CMTO was complete, but they encouraged the family to conduct an
independent housing search in accordance with KCHA policies.
IMPLEMENTING CREATING MOVES TO OPPORTUNITY | 2 3
high-opportunity areas in the south-county neighborhoods of Kent, Auburn, and Newcastle
because they already lived in or near south King County.
The family navigators had expected many families to be reluctant to move to high-opportunity
areas that were predominantly white and aff luent.30 A few families did question whether their
children would be accepted in new school environments because of their differences or receive
fewer opportunities relative to other children in high-opportunity areas. However, the family
navigators said that to their surprise, families rarely expressed such concerns about the demo-
graphics of the high-opportunity areas. At the same time, families tended to affirm a preference
for more diverse or familiar high-opportunity areas, especially if they had close family or com-
munity ties in or near those areas. In particular, families with East African heritage (for example,
Somali or Ethiopian) often seemed to be “firmly rooted” in those cultural communities in south
King County.31 Finally, in thinking through the role of race and class in informing families’
neighborhood preferences, some of the navigators expressed their belief that communities in the
30. Approximately 75 percent of heads of household in the Phase 1 experimental sample identified as nonwhite. See Bergman et al. (2020a).
31. Approximately 35 percent of heads of household in the Phase 1 experimental sample identified as having been born outside of the United States. See Bergman et al. (2020a).
BOX 6 Case Study: Serving the Khalid Family
At the time of their enrollment into CMTO, the Khalid family of two adults and four children was
living in temporary housing in south Seattle arranged by another housing services organization.
Staff members reported that throughout the early service meetings between the Khalids and
the family navigators, the prospect of making an opportunity move resonated with the family.
However, the household heads were resistant to leaving their community in south Seattle, to
which they were strongly connected; securing permanent housing there was their primary goal.
The Khalids told staff members that they would “do their own research” on opportunity areas
while prioritizing a lease-up in south Seattle.
Scheduling a meeting between the family and the navigators was challenging, but CMTO staff
members recalled meeting with the family in person four times before their voucher was issued.
They covered the standard sequence of services and also discussed various aspects of the
voucher program. At one point, the family considered submitting a request to transfer their
voucher from the Seattle Housing Authority (SHA) to the King County Housing Authority (KCHA)
but ultimately did not follow through. Staff members suggested this was because a transfer
would have made the Khalids ineligible for CMTO financial assistance.
After the family’s voucher was issued, the Khalids were not responsive to outreach by the
navigators, and staff assumed that they were receiving supports from their other service
providers. CMTO staff finally heard from the family that they had been approved for a unit in an
area in south Seattle that was not a high-opportunity area.
24 | IMPLEMENTING CREATING MOVES TO OPPORTUNITY
Seattle and King County region may be inherently more diverse and inclusive than communities
in many other parts of the United States, especially those characterized by historical patterns
of deeply segregated housing markets.
Although KCHA families frequently found the Kent and Auburn high-opportunity areas appealing
and focused their searching there, navigators also observed many families encounter difficulty
leasing up in those areas, in large part because voucher-affordable units were not in large supply
there. When families faced these challenges, navigators often counseled them to consider areas
such as those in King County’s “east side,” including Bellevue, which they observed were more
likely to have more rental units that were affordable to KCHA voucher holders. Staff members
at InterIm described this kind of decision as a critical inf lection point for some families, with
some electing to pursue searching in areas that were not high-opportunity areas.
Engaging Landlords and Expediting Lease-Ups
Once CMTO was under way, the process of engaging landlords in the program departed from
the original expectations. The PHAs originally envisioned that, through marketing and targeted
outreach, the housing navigators would develop a pool of supportive landlords in high-opportunity
areas who would refer available units to the program for families’ consideration. To develop this
pipeline, housing navigators intended to contact, first, existing landlord partners of each PHA,
then local and regional property owner associations
and attendees at real estate industry events. Next, they
would communicate with community institutions, such
as religious and community centers, and finally would
pursue direct, one-on-one engagement with landlords
with available unit listings. In practice, this last type
of outreach—to landlords with active and public unit listings—was the main and most effective
method of engaging landlords on behalf of CMTO and its participants. Contrary to expectations,
a pool of amenable landlords did not materialize during Phase 1.
Engaging Landlords with Available Units
The housing navigators identified their main goal to be “influencing rental application approval
decisions” on behalf of families, with much of their landlord engagement focused on targeting
landlords with available, publicly listed units in high-opportunity areas. They described using
online rental listing services such as Zillow, Craigslist, HotPads, and Doorsteps, in addition
to perusing the listings of available units on corporate property management websites. The
housing navigators attempted to reach the contact person associated with the unit to introduce
the CMTO and HCV programs and assess the landlord’s general interest in accepting CMTO
families. They then sought to understand the landlord’s rental screening criteria and leasing
requirements and to identify factors among those criteria that might be f lexible. In cases where
landlords responded positively and units were deemed to be likely good matches for certain
families, the housing navigators would usually then describe specific participating families who
might be interested in leasing the unit in question. If a family was interested in a rental unit
under management by the landlord, the housing navigator’s engagement would ideally culminate
The housing navigators identified their main
goal to be “influencing rental application
approval decisions” on behalf of families.
IMPLEMENTING CREATING MOVES TO OPPORTUNITY | 2 5
in direct outreach by families to the landlord, followed by their submission of a rental applica-
tion. The housing navigators also spent time broadly engaging the landlord community, which
they felt was a useful investment.
Although the housing navigators typically contacted landlords
with available units before families did, they preferred to interact
with landlords after CMTO families had independently identified
and communicated with the landlords, or even applied for tenancy
without the prior knowledge of staff. The navigators considered this
approach to be the ideal engagement scenario, one in which families
were actively representing their own interests—an emphasis of CMTO’s up-front rental applica-
tion coaching—with staff members at InterIm working with landlords in a family-supporting
role. Although this family-initiated sequence was not the prevailing one, it was increasingly the
model that navigators encouraged in their coaching.
Drivers of Landlord Participation in CMTO
The housing navigators asserted that a significant incentive for landlords to lease to CMTO
families was the prospect of filling vacant units; they were motivated either by occupancy quo-
tas—as was the case with leasing agents at corporate property management companies—or by
the need for rental income, in the case of owners of single units or smaller rental portfolios. The
housing navigators’ work to engage landlords could be highly customized to the circumstances
of both landlords and prospective tenant families, although the navigators observed overall that
every landlord “just wants to occupy a unit.” In taking a tailored approach, the housing naviga-
tors observed some common landlord responses to the prospect of leasing to CMTO families
who would likely not meet one or more of the rental screening criteria. These responses are
summarized in Box 7.
A common worry among landlords in both PHA jurisdictions, according to the housing naviga-
tors, was that their participation in the voucher program would be administratively burdensome.
However, the housing navigators noted that education about the voucher program—including
about CMTO’s expedited lease-up supports and Washington State’s source-of-income discrimi-
nation law—could counter those negative perceptions. In particular, the navigators reported
that landlords responded especially well to the prospect of serving as liaisons and facilitating
or directly conducting basic lease-up functions on behalf of the PHAs.
The housing navigators also led occasional negotiations about rents and lease terms to ensure they
were aligned with families’ voucher amounts and other program requirements. Some families
who obtained rental application approvals without prior intervention by the housing navigators
were surprised to be reminded that their approved family share of rent—a calculation informed
by their income, family composition, utility allowance schedules, and applicable payment stan-
dards—would make the unit in question unaffordable under HCV program rules.32 In certain
32. Housing navigators suggested that a few families mistakenly believed that they could pay any difference between the actual rent and the maximum rent the voucher program would cover “on the side.”
The housing navigators
underscored that “every landlord
just wants to occupy a unit.”
26 | IMPLEMENTING CREATING MOVES TO OPPORTUNITY
BOX 7 Customizing Landlord Engagement to Promote Leasing
to CMTO Families
The CMTO housing navigators described various landlord conditions that could inform their
engagement of landlords after families expressed interest and applied for tenancy.
• Motivation to meet occupancy targets. Leasing agents, property managers, and brokers
representing owners, especially for multifamily apartment buildings, were described as
primarily motivated by leasing quotas or occupancy targets. They could thus be encouraged
to consider relaxing their screening criteria, persuaded in part by the availability of mitigation
funds and the program supports provided to families. These types of actors sometimes need
to secure the approval of regional or managerial staff or unit owners to make an exception
to screening criteria or to ensure that their institution’s fair housing standards were satisfied,
which usually involved additional work from the navigators to communicate with or educate
other stakeholders.
• Aversion to risk. Some landlords were less willing to take a chance on certain CMTO families
who had more rental barriers than other families did. However, staff members suggested that
many of these stakeholders could be persuaded by education about the voucher program and
about the landlord mitigation fund. Moreover, some landlords fitting this description might be
inclined to accept families who had fewer or less serious apparent rental barriers than families
who had significant, prevalent barriers. In at least one case, a landlord who was hesitant to
relax the screening criteria for one CMTO family approved another CMTO family who had fewer
rental barriers; after the successful lease-up, this landlord seemed to be more receptive to
considering additional CMTO families.
• Prioritizing income stability. Independent, “mom-and-pop” landlords were characterized as
being motivated by a common desire to secure stable rental income streams; they were eager
to avoid any risk to their own financial circumstances when they considered leasing to voucher
holders. Housing navigators noted that these types of landlords often responded positively to
education about the voucher program, which emphasized the reliability of housing assistance
payments from the public housing authorities (PHAs). Some of these landlords shared their
concerns about the possibility that families might fall behind on utility payments, as this could
result in liens against the property. Staff members addressed such concerns by providing
information and suggestions: (a) Utility costs such as water and gas might be included in
the contract rent amount, in effect making the housing authority the payee; (b) families with
extremely low or no incomes may receive utility allowances from the Housing Choice Voucher
program; and (c) some utilities offer grants in the form of account credits to low-income families
such that their account balances would be net positive upon lease-up.
• Persuasion following positive family interactions. The navigators also noted that
“landlords are people.” They observed that some families, despite their barriers, persuaded
landlords to “override their requirements” after making positive, personal impressions on
the landlords. These successes suggest that altruism could be a factor in some landlords’
decision-making processes.
IMPLEMENTING CREATING MOVES TO OPPORTUNITY | 2 7
cases, the housing navigators said that they were able to negotiate the contract rent amount with
landlords—such as by suggesting that utility costs be bundled within contract rents—in order
to render the unit affordable.
Housing navigators viewed negative responses to CMTO—including formal denials of family
rental applications—as potentially valuable opportunities to establish long-term relationships
with leasing agents and property managers, which was a main goal of their outreach efforts.
They emphasized that a “no” from a landlord now could turn into a “yes” in the future. They
observed that professional leasing agents and property managers employed by institutional
landlords could frequently change employers or move to different properties, and the housing
navigators saw the potential for cultivating a network of stakeholders who were informed about
CMTO and who might be willing to consider CMTO families as tenants.
One year after their hiring, the housing navigators described efforts to expedite lease-up pro-
cesses as working smoothly at both PHAs, noting that “landlords are
really pleased because we’re keeping our word.” The prompt respon-
siveness of CMTO to the needs of landlords was singled out as a major
contributing factor to this perception. One navigator explained, “If
there’s any issue, something comes up where they haven’t gotten their
payment from the housing authority, I’m like, ‘Okay, let me get back
to you,’ instead of them having to wait three weeks to hear from someone.” Indeed, the housing
navigators described with a sense of pride responding to texts, emails, and phone calls from
landlords on nights and weekends.
The success of expediting PHA lease-up processes for CMTO was measured by the speed at
which CMTO and PHA staff conducted these activities. This speed may have also been partly
enabled by the housing navigators’ ability to foresee and prevent any issues that might slow down
or disrupt leasing approvals, from simple paperwork errors to needed unit repairs. The housing
navigators identified crucial tactics that allowed them to avoid delays, including their ability to
assess unit affordability before official “rent reasonable” analyses were conducted; to ensure that
forms submitted to the housing authorities were free from error; and to “preinspect” units—that
is, to visit units and recommend improvements before official HQS inspections occurred.33
Notable Shifts in Phase 1 Service Delivery
By early 2019, supported by outcome data, PHA and InterIm staff members were confident that
CMTO was on track to support family moves to high-opportunity neighborhoods at scale. The
navigators described a sense that service delivery had reached a steady-state effort, especially
after some important implementation shifts had been made.
33. Despite preinspections, housing navigators reported that about one-fourth of the units leased by CMTO families required a reinspection, following landlord repair or remediation, after initially failing to pass inspection.
The housing navigators emphasized
that a “no” from a landlord now
could turn into a “yes” in the future.
28 | IMPLEMENTING CREATING MOVES TO OPPORTUNITY
Revising and Clarifying the Roles of the Family and Housing Navigators
Although the CMTO program model inherently emphasized family coaching, it became evident
soon after services launched during the pilot that many families—as many as one-third of them
in the first months of implementation, estimated one family navigator—expected a degree of staff
assistance and accompaniment that was more akin to “hand-holding.” After the start-up phase,
CMTO redoubled its efforts to coach families during the housing search, with staff members
at InterIm reaffirming their goal to support family-led searching, even though the intensity of
CMTO staff supports that were provided during the housing search phase could vary and still
be quite high, if this level of involvement was requested by families who were actively engaged
in searching.
Through the end of 2018, families were handed off from the family navigators to the housing
navigators, with the housing navigators serving as the primary point of contact for many, if not
most, families during the housing search period. However, as caseloads matured in the early
implementation period, it became clear that the housing navigators were stretched thin and
working long hours and weekends to be responsive to both families and landlords. Program
operators finally decided that family navigators should continue to be the main point of family
contact through, roughly, the approval of the rental application, with the housing navigators
supporting families primarily by providing referrals of available rental units and engaging with
landlords. The decision to make this shift occurred in the third quarter of 2018, and the change
was implemented throughout the first quarter of 2019.
Eliminating Guided Area Tours
CMTO initially aspired to offer guided tours of high-opportunity areas to individual families,
with families selecting how many and which areas to tour with the family navigators. In Phase
1, this vision proved infeasible given the large number of families who were served. InterIm ulti-
mately adopted monthly, standardized group tours in each PHA jurisdiction, with morning and
afternoon options offered for convenience. Family interest in these tours was described as high,
and sign-up lists for the tours were almost always full. However, in practice, family attendance
at the tours was very low—even though navigators pointed out that attending families “loved”
the tours—and often there would be only “one or two” families in attendance. For a time, the
navigators emphasized conducting in-person tours when they accompanied families on unit tours,
but even this task became time-intensive as the caseloads reached scale. When family navigator
activities became short-staffed, in late 2019, the housing authorities decided to end in-person
staff-led area tours and most staff-accompanied unit or property tours. For the duration of the
demonstration, the family navigators offered printouts of the group-tour itineraries to families
who were interested in visiting high-opportunity areas on their own.
IMPLEMENTING CREATING MOVES TO OPPORTUNITY | 2 9
PHASE 2: VARYING CMTO DESIGN TO FURTHER LEARNING
Taking Stock and Advancing the CMTO Learning Agenda
After Opportunity Insights shared early findings showing CMTO’s impacts on the numbers of
families moving to high-opportunity areas, the PHAs and research partners convened to take
stock of what had been accomplished and learned during the implementation of Phase 1. The
objective of this two-day meeting, held in February 2019, was to consider how a second phase of
the CMTO study—one using a multiarm, randomized controlled trial—could build evidence on
the effectiveness of alternative approaches to delivering housing mobility assistance. A critical
learning objective was to determine whether some selective, lower-cost combinations of CMTO
features could be effective in producing increases in moves to high-opportunity areas.
The partners agreed to use Phase 2 to test two new CMTO interventions against the original
CMTO service bundle as well as a control group that, as in Phase 1, would receive standard HCV
program assistance. Following similar recruitment and enrollment approaches as Phase 1, tar-
geted again to HCV waitlist families with children under age 15, enrollees would be randomly
assigned to one of the following four research groups:
■ Group 1: CMTO Financial Assistance with no direct staff support. Families who were assigned
to this group would have access to financial assistance—up to $3,500, the same amount as
was offered to families in Phase 1—to support moves to high-opportunity areas. They also
received light education about high-opportunity areas from PHA staff members during the
issuance of vouchers and through a customized CMTO website. Families would not receive
any coaching on rental applications, assistance with housing searches, or expedited lease-up
supports from CMTO staff. A staff point of contact at InterIm CDA would coordinate the
financial assistance once families were ready to access it.
■ Group 2: CMTO Toolkit, with reduced staff support and reduced financial assistance. Families
would receive “lighter touch, streamlined” services from CMTO staff through one in-person
meeting with a family navigator dedicated to serving this program. In addition, supportive
tools and resources—generally identical to those used by the existing CMTO program—would
be provided to families in a packet and online through a customized CMTO website. The
CMTO Toolkit would offer reduced security-deposit assistance (specific to the voucher’s
bedroom size) to streamline program costs.
■ Group 3: CMTO Coaching and Resources. The Phase 1 CMTO intervention would be provided
largely as is, with some opportunities for streamlining service delivery. One family navigator would
be tasked with serving a smaller caseload, composed of families from both housing authorities.
■ Group 4: PHA Standard Services (no CMTO support). These families formed the Phase 2
control group and, as in Phase 1, only received voucher program information and supports
that the PHAs normally provided outside of CMTO.34
34. See Opportunity Insights (2020a) for a full summary of the program interventions that were offered and tested in Phase 2.
30 | IMPLEMENTING CREATING MOVES TO OPPORTUNITY
Appendixes A through C present the typical information provided to families who were ran-
domly assigned to receive each of the CMTO programs offered in Phase 2.
Preparing for and Launching CMTO Phase 2 Implementation
The PHAs led the task of translating the broad intervention design objectives that emerged from
the design conference into operationally sound and distinct programs. They met with CMTO
staff members at InterIm CDA to develop lower-effort alternatives, which then allowed the PHAs
to estimate the total time and, thus, cost of each intervention. Although reducing costs was a
primary design imperative in Phase 2, PHA staff members recalled that the priority was designing
effective interventions that would require less staff time, the costs of which were then projected.
Website Redesign and Program Document Digitization
During the program redesign period, revisions were made to the CMTO website as well as the
program materials that would be uploaded to provide families with online access to program
resources. In Phase 2, the PHAs decided to create three password-protected CMTO website
portals, one for each of the distinct interventions. This work entailed producing program docu-
ments that families could access and complete digitally. It also presented an opportunity for the
CMTO staff to revisit and refine the tools they used to coach families.
Enhancing Program Communication
In addition to making coaching and search tools available online to families in the CMTO Toolkit
group, staff members at InterIm CDA developed a process for conducting broad email outreach
to participants in that program. These emails would complement direct outreach by the fam-
ily navigators to families, to occur roughly every few weeks, and would ask families about the
progress of their housing searches. InterIm staff members selected a commercial e-marketing
platform to enable this email outreach, created the email templates, and developed a schedule
for transmitting this content, starting after a family was referred to the program and continuing
every two weeks until the family leased up or had its voucher expire.35
Streamlining Service Delivery
To streamline or eliminate service delivery for the CMTO Toolkit group, the PHAs needed
to explore whether and how to support families with referrals of available units without fully
involving the housing navigators. They decided to send generic (that is, not individualized or
customized) lists of rental units in high-opportunity areas to families with vouchers for units
with three bedrooms or more; these families often had a harder time finding available units.
The family navigators would also be allowed to pass along a list of landlords who had previously
leased to CMTO families to any CMTO Toolkit family who indicated that they were struggling
with the housing search. However, the landlords renting these units would not be engaged by
the housing navigators in advance.
35. The first several emails were transmitted to KCHA’s client families on a weekly basis, given the faster timeline for issuing vouchers to those families.
IMPLEMENTING CREATING MOVES TO OPPORTUNITY | 3 1
Another important pivot from Phase 1 concerned the practice of having the housing navigators
hand-deliver to landlords financial assistance payments, especially security deposits, in check
form. This method of delivery became common practice in Phase 1 out of a desire to meet the
program’s high standards for landlord responsiveness, but it was identified as an investment of
staff time and effort that conflicted with the cost-efficiency objectives of Phase 2. After rejecting
alternatives to using paper checks, the PHAs decided that any checks would be sent by next-
day parcel post.36 The PHAs also decided to no longer pay lease holding fees, if applicable and
required by landlords, until a family’s rental application was approved.
Finally, the PHAs modified the comprehensive set of CMTO services (those offered to Group 1)
by formalizing the elimination of staff-led opportunity-area tours. In the second up-front family
meeting, they also added tools and training on how to complete rental applications, in response
to the observed challenges some families had in completing this task.
Staffing Shifts
Modest changes were made to the staffing plan in support of the new program requirements
and in anticipation of significantly lower caseloads in each program group than in the Phase 1
program:
■ The CMTO Coaching and Resources and CMTO Toolkit programs would each be staffed by
one of the two existing family navigators, meaning that all families participating in a given
program were served by one family navigator, regardless of which PHA offered them a voucher.
■ The CMTO Coaching and Resources group would continue to be served by both housing
navigators, who would also be responsible for providing only expedited lease-up supports for
families leasing in high-opportunity areas in the CMTO Toolkit intervention.
■ The housing authorities would use additional administrative staff support at InterIm CDA—
at 50 percent of one staff member’s time—to coordinate services to families in the CMTO
Financial Assistance program.
Recruiting Families in Phase 2
As in Phase 1, the PHA CMTO teams worked with their HCV program counterparts to assess
the capacity of each agency to offer and issue vouchers to eligible waitlist families in order to
estimate the number of families who could be enrolled in Phase 2. SHA—which would continue
to issue new vouchers in support of CMTO only—had around 850 potentially CMTO-eligible
families remaining on its active HCV program waitlist. For its part, KCHA projected that it could
issue a maximum of 300 vouchers. Using assumptions developed from the Phase 1 recruitment
36. In addition to assuming next-day shipping fees, the housing authorities also encouraged the navigators not to worry excessively over any credit card processing fees that were being charged when payments were made using InterIm CDA corporate credit cards, given the relatively higher cost of hand-delivering checks.
32 | IMPLEMENTING CREATING MOVES TO OPPORTUNITY
experience, the housing authorities estimated that they might together enroll between roughly
560 and 700 families into the Phase 2 study, with between 485 and 600 families issued vouchers.
Upon launching recruitment and study enrollment operations in early July 2019, both PHAs
experienced lower-than-expected sample build-up performance relative to their targets and to
the Phase 1 experience. Trends included the following:
■ lower-than-expected attendance at CMTO intake briefings at SHA
■ fewer families who did respond meeting the voucher program eligibility criteria, such as
income requirements or other local preferences, like homelessness
■ more families who were eligible for the voucher being willing to forgo voucher assistance
because their incomes fell just under voucher eligibility thresholds, and voucher assistance
would have been shallow
In response to these challenges, the PHAs undertook some corrective actions—such as increas-
ing the number of families who were drawn from waitlists and expanding their proactive out-
reach to families—that began to improve the study enrollment rates. However, the onset of the
COVID-19 pandemic prompted the PHAs and research partners to end enrollment in Phase 2
in March 2020. In the end, the PHAs enrolled a combined total of 300 families (nearly evenly
split between SHA and KCHA), who made up just over 24 percent of the 1,229 waitlist families
who were sent a CMTO and HCV application.
Perspectives on Implementing the CMTO Financial Assistance Intervention
The CMTO Financial Assistance program was the most pared-down of the Phase 2 interven-
tion bundles that were offered to families. It offered financial assistance to families who were
pursuing moves to high-opportunity areas and staff engagement only in support of the financial
assistance administration.
Service Delivery
Families who were assigned to receive CMTO Financial Assistance services generally had had
two main service interactions with PHA staff in the past and as their housing searches began.
Families received a basic orientation to the CMTO Financial Assistance option during the voucher
program intake and CMTO enrollment briefing. After their random assignment, families who
were placed in this version of the program received a f lyer summarizing the program (reproduced
in Appendix B) and were told that they would receive more information about CMTO at their
voucher issuance briefing. These group voucher issuance briefings at the PHAs were customized
and conducted exclusively for families who were offered CMTO Financial Assistance. At those
briefings, the CMTO housing counselors explained the CMTO initiative overall, demonstrated
how to navigate the CMTO website—including how to access it and how to use the CMTO address
lookup tool—and explained the steps for getting in touch with the CMTO Financial Assistance
IMPLEMENTING CREATING MOVES TO OPPORTUNITY | 3 3
coordinator.37 After this issuance briefing, the only proactive outreach made to participating
families was through regular email communications that reminded families how to use the
program’s financial supports. See Figure 3 for an overview of the CMTO Financial Assistance
program service f low.
Email outreach was instituted as a midcourse adjustment to practice in order to ensure that fami-
lies were reminded of the services that were available to them. The CMTO Financial Assistance
coordinator described most of the inquiries she received from families as basic in nature, easily
addressable, and often in response to the emails that were sent by the program. Common family
questions centered on practical concerns:
■ How much financial assistance is available?
■ Could the program cover application and holding fees?
■ Is a specific rental unit located within a high-opportunity area?
■ How do I access and use the website?
37. PHA staff held the primary responsibility for orienting families who were offered CMTO financial assistance during the issuance of vouchers—a major difference between this and the other CMTO programs, in which the navigators oriented families to the services and reinforced the service offer at the time the vouchers were issued.
FIGURE 3
CMTO Financial Assistance Flow Diagram
Family
contactedEmail
reminders
Unit
selectedLease
signed
PHA intake
appointmentWindow for financial
assistance
SOURCE: Opportunity Insights.
NOTES: CMTO is Creating Moves to Opportunity. SHA is Seattle Housing Authority. KCHA is King County Housing Authority.
Window for
CMTO website
access
Voucher issuance
+ enhanced PHA
briefing
30-60 days (SHA),
30 days (KCHA) 120 days (more if given extension)
34 | IMPLEMENTING CREATING MOVES TO OPPORTUNITY
The CMTO Financial Assistance coordinator’s observation supported the perspectives of other
staff members at InterIm. They said that the CMTO-specific messages that were being targeted
to families in this program were getting lost among all the other information that the PHAs were
“throwing at them” during up-front voucher service delivery. At the same time, the PHA housing
counselors believed that they had gone as far as they could possibly go in highlighting CMTO
content through standard HCV program interactions. Some PHA staff members wondered if
families would better understand the services that were being offered and be more inclined to
consider pursuing opportunity moves if CMTO staff held just one individualized consultation
with each CMTO family after their voucher was issued.
For families who identified a rental unit located in a high-
opportunity area and who requested assistance, the CMTO
financial coordinator verified the unit’s location and instructed
the family to complete a financial assistance request form and
provide supporting documents. The coordinator then contacted
the landlord, explained that the program would arrange the
financial assistance payments on behalf of the family, and re-
quested from the landlord a breakdown of application and lease-
up costs and other associated documentation. The coordinator also explained to the landlord the
process for scheduling a rental unit inspection from the PHA and, ultimately, made payments
by mailing checks. The coordinator shared that the most common challenge stemmed from
the incomplete submission of required documents by families. Roughly one year into program
implementation, the coordinator believed that the amount of financial assistance offered was
sufficient to support opportunity moves, with no family leveraging the maximum amount of
assistance available, $3,500.
Perceptions of Family Participation and Housing Searches
After about one year of delivering CMTO Financial Assistance program services, the CMTO
team member coordinating those services observed that participation in the program was pretty
“cut and dried” for families in its focus on covering rental application and lease-up costs once
families reached those points in their housing searches. She noted that once program reminder
emails began going out to CMTO Financial Assistance participants, she received an increase in
engagement from families who were still searching for housing, including “some phone calls from
families that were pretty intense, because their backs are up against the wall, they’re stressed out,
they’re crying, they’re frustrated because their voucher is going to end soon.” Overall, the coor-
dinator observed that “[a family’s] credit and income have a lot to do with whether the landlords
want to lease to them.” Although she ref lected that families with income from employment were
probably more likely to see their applications approved, she also noted that any family could be
approved by landlords if they were diligent in their housing search and capable of independently
communicating and negotiating with landlords. Indeed, several families in the program leased
up at properties that other CMTO families had already leased up in, underscoring that families
with significantly fewer supports could achieve the same outcomes as their peers with access to
more supports. Even though more intensive staff housing search supports could not be provided
to such families, the coordinator did believe that compiling and sending customized lists of
“Some phone calls from families ... were
pretty intense, because their backs are up
against the wall, they’re stressed out, they’re
crying, they’re frustrated because their
voucher is going to end soon.”
IMPLEMENTING CREATING MOVES TO OPPORTUNITY | 3 5
available rental units to bolster families’ search efforts would represent a low-touch approach
to supporting families who were searching in high-opportunity areas.
Perspectives on Implementing the CMTO Toolkit Intervention
Families who were offered the CMTO Toolkit program received “lighter touch, streamlined”
services from CMTO relative to the CMTO Coaching and Resources program: one in-person
meeting with a family navigator dedicated to serving this intervention, a packet of rental appli-
cation coaching and housing search tools in hard copy and also available through a customized
CMTO website, and regular phone or email follow-ups from program staff. The CMTO Toolkit
offered a smaller amount of security-deposit assistance to further streamline the program, and
customized unit referrals were available only to families with voucher bedroom sizes of three
or more. Other families could receive only a list of landlords who had previously participated
in CMTO. The housing navigator role in this program was limited to expedited lease-up and
security-deposit administration. See Figure 4 for an overview of the CMTO Toolkit service f low.
Service Delivery and Family Engagement
The content that was conveyed by family navigators in two up-front, in-person family meetings
during CMTO Phase 1 translated into one 60- to 90-minute family meeting for families in the
CMTO Toolkit program. A crucial difference between the two meetings was a big reduction in
modeling or practicing landlord interactions. The family navigator delivering CMTO Toolkit
services described families’ engagement in this single in-person meeting as very high, and she
FIGURE 4
CMTO Toolkit Service Flow Diagram
Family
contacted
Family
navigator
meeting
Family Navigator
phone follow-ups +
email reminders
Unit
selected
Lease
signed
PHA intake
appointmentVoucher issuance +
enhanced PHA
briefing
Window for
financial
assistance
Expedited
lease-up
Post-lease
support
30-60 days (SHA),
30 days (KCHA)120 days (more if given extension) 14 days
SOURCE: Opportunity Insights.
NOTES: CMTO is Creating Moves to Opportunity. SHA is Seattle Housing Authority. KCHA is King County Housing Authority.
36 | IMPLEMENTING CREATING MOVES TO OPPORTUNITY
viewed this result as remarkable given that families were only offered a meeting at the offices
of InterIm CDA or the PHAs, rather than at a location that was convenient to families’ homes
(as was the case during Phase 1). The family navigator further described her surprise that so
much could be “crammed” into one in-person meeting and observed that families “across the
board” expressed appreciation for the services that were described and offered. However, the
navigator also noted that these conversations were significantly more staff-driven than in her
Phase 1 experience, given the amount of information
that had to be conveyed.
The family navigator described fairly high engagement
in follow-up phone calls—she was generally able to get
in touch with a majority of participants—although some
families were easier to communicate with by email or
text messaging after being unresponsive to phone calls.
The navigator expressed that, relative to the family-staff
exchanges in Phase 1, the conversations were less rich and more superficial because they occurred
less frequently, about once per month. She noted that “it felt like we were only getting a snapshot,
whereas in CMTO Coaching and Resources it felt like you were going through the journey with
families.” Notably, fewer families seemed to be raising questions about or challenges relating to
their housing searches. Although the family navigator made efforts to prompt families to discuss
such challenges, she believes that there were simply fewer natural opportunities for families to
ref lect on their search preparations or progress, resulting in less productive interactions. When
families did point out challenges to their searches, the program’s response was to reinforce the
CMTO resources that were available on the website and in the hard-copy program packet, with
customized links sent in a follow-up email. The result was, in the words of the family navigator,
“a much, much shallower level of support in the housing search phase” compared with Phase 1,
but one that was significantly more straightforward and less time-intensive to deliver.
At InterIm’s recommendation, the PHAs and research team implemented an adaptation to the
program, in January 2020, to cover family rental application fees with CMTO Toolkit program
funds. This change came in response to the family navigator’s experience working with families
who were hesitant to expend their resources by applying to units in high-opportunity areas or
who required significant time to save up specifically for these costs and may have missed out
on desirable units as a result. All families who were searching with active vouchers at the time
of this change were informed by email of the program shift, and many families responded posi-
tively. Finally, the housing navigators noted that the existing CMTO processes for conducting
or coordinating HCV unit inspections for CMTO Toolkit families who were leasing in high-
opportunity areas worked seamlessly for the landlords.
Family Search Trajectories
Many of the CMTO Toolkit families’ search experiences were unknown to program staff because
of the lighter-touch approach to the program. However, the family navigator observed two dis-
tinct categories of families who were especially engaged in services overall:
The family navigator for the CMTO Toolkit described “a
much, much shallower level of support in the housing
search phase,” compared with Phase 1, but one that
was significantly more straightforward and less time-
intensive to deliver.
IMPLEMENTING CREATING MOVES TO OPPORTUNITY | 3 7
■ Families who were firmly committed to moving to high-opportunity areas were comfort-
able searching independently—that is, using financial assistance supports only—and seemed
likely to lease quickly.
■ Families who experienced rental application denials generally experienced discouraging (or
discriminatory) landlord interactions, and asked the navigator for assistance.
The family navigator described the first type of participant as likely to have fewer rental ap-
plication barriers and more household resources, such as earned income. She believed that the
CMTO Toolkit program was best suited to supporting these types of searchers.
As was the case with many families who experienced rental application denials in the Phase 1
program, the family navigator noted that her engagement with such families frequently involved
a “remedial” review of materials and approaches that had been covered in her initial meeting
with families, with some specific advice about how to engage with the landlord who had denied
the family. In response to denials, families were encouraged to request a copy of the screening
report. They were also sent links to tools such as a template letter that families could use to
explain the circumstances of any barriers, their recent rental history, and their commitment to
responsible tenancy.
What seemed “more difficult” to the family navigator was when families requested unit referrals.
Unless they had a larger voucher size, the navigator could only provide lists of properties that
CMTO had worked with in the past and suggest that families use the CMTO address lookup tool
in combination with online housing search resources to identify units independently. For families
who did have large bedroom sizes, the family navigator sent listings of available rental units in
high-opportunity areas that she found, but these lists were usually not highly screened against a
family’s preferences, often just matching a family’s PHA jurisdiction and voucher bedroom size.
The navigator observed that she often found out about rental application denials well after the
fact, when opportunities to reverse the denial outcomes usually seemed to have faded. She posited
that even after the program announced that it would cover rental application fees, families were
simply less inclined (and less motivated by staff outreach) to venture to apply to units in higher-
opportunity areas—or to continue applying after experiencing an application denial—with many
opting instead to search in more familiar areas that were not high-opportunity areas. Despite
these trends, the family navigator emphasized that the CMTO Toolkit had demonstrated suc-
cess in supporting some families with significant barriers to leasing in high-opportunity areas.
She noted that some of the families with significant rental application barriers persisted and
had their rental applications approved in high-opportunity areas. From the perspective of the
family navigator, if families are highly motivated and can make the effort and “lean in,” then
they can succeed in being approved by landlords.
Pared-Down Financial Assistance
In the opinion of some staff members at both InterIm CDA and the PHAs, families were motivated,
in part, to engage with CMTO in Phase 1 because it offered more financial assistance, especially
security deposit assistance, than the standard Housing Choice Voucher programs at the PHAs
38 | IMPLEMENTING CREATING MOVES TO OPPORTUNITY
could. However, at both PHAs, the Phase 2 CMTO Toolkit program provided, by design, the
same amount of security-deposit assistance that KCHA provided as part of its standard HCV
program services—that is, less than was offered to CMTO families in Phase 1 and less than the
other Phase 2 CMTO programs offered. SHA did not make security-deposit assistance widely
available to HCV families in its standard program, while KCHA offered security-deposit as-
sistance to all new-admissions voucher holders. Since families who were offered CMTO Toolkit
services at KCHA could receive the same amount of security deposit assistance whether or not
they moved to high-opportunity areas, staff members reasoned that fewer KCHA families in
the CMTO Toolkit program, compared with their SHA peers, were inclined to look for housing
outside of high-opportunity areas, all other things being equal, and early program participation
trends supported this theory. In characterizing the potential for a lack of service contrast on
financial assistance in the CMTO Toolkit, the family navigator serving CMTO Toolkit families
asserted her belief that financial assistance did not primarily motivate families’ engagement
with CMTO. She reiterated that most voucher heads of household were, at minimum, somewhat
“on board” with the rationale for moving to high-opportunity areas as a way to promote op-
portunities for their family members, but she viewed the offer of increased financial assistance
as an added incentive for families to pursue opportunity moves. Nonetheless, some respondents
reasoned that, given KCHA’s generous assistance with security deposits outside of CMTO’s
high-opportunity areas, moves to these areas represented an easy alternative to families whose
overriding concern might be to lease up anywhere they could.
Some respondents remembered having “anxiety” about the reduced amount of financial assis-
tance that was available in the CMTO Toolkit relative to the Phase 1 CMTO program, and they
specifically worried that if security deposits were greater than the amounts that were available,
families would not be able to pay them. However, once service delivery began, they were some-
what relieved to learn that this was not an issue. They theorized that some families were able to
leverage security-deposit assistance from other service agencies, which they generally perceived
as widely available in the Seattle region, or that families were able to save or had access to suf-
ficient resources to fill any gaps in their security-deposit assistance.
Perspectives on Refining and Continuing the CMTO Coaching and Resources Intervention
CMTO Coaching and Resources, as the original CMTO program would be called in Phase 2,
was conceived largely to carry over the existing practices from Phase 1, offering the partners
an opportunity to continue to evaluate that program as it matured. Its continuation would also
enable direct comparisons against the two new CMTO strategies that were being offered to
similar families and in parallel. Thus, in contrast to the significant adaptations to practice that
the CMTO Financial Assistance program and CMTO Toolkit program ref lected, only modest
refinements were needed for the Coaching and Resources program. In sharing their perspec-
tives on implementation and the families’ and landlords’ responses to the continuation of the
program, staff members at InterIm generally remarked that most earlier experiences and trends
were continuing to play out, with some noteworthy exceptions.
IMPLEMENTING CREATING MOVES TO OPPORTUNITY | 3 9
Enhancing Up-Front Rental Application Coaching
After identifying during Phase 1 that many families were unfamiliar with the process of applying
for rental housing, the navigators incorporated up-front training for all families on how to com-
plete and submit rental applications in the second family navigator meeting. This training entailed
family navigators reviewing a stylized example of an application and discussing how to complete
commonly required fields. Of note, they provided the specific guidance that families report their
Housing Assistance Payment amount—referencing their voucher estimate sheet—as family income;
family navigators thought this was important guidance that many families otherwise lacked. Staff
members at InterIm generally remarked that service delivery was proceeding as it had in Phase 1,
but the housing navigators did observe that a larger share of families in Phase 2 were very proac-
tive in conducting independent housing searches. They reasoned that this outreach was a result of
the maturing of CMTO’s approaches to delivering up-front coaching on rental applications and
preparation for housing searches.
Landlord Reengagement
After successfully supporting a critical mass of CMTO lease-ups in high-opportunity neigh-
borhoods, the housing navigators in Phase 2 were now reengaging at scale with landlords who
had already successfully leased to CMTO programs. Roughly two years after launching Phase
1 services, the housing navigators guessed that at least 50 landlords had leased to two families
or more. They also shared that landlords who were open to reengagement were more likely to
be those who were willing to look past family barriers to rental application approval, and they
suggested that by the end of Phase 2, families with fewer barriers were more likely than families
with present barriers to lease with landlords who were new to CMTO participation. Finally, re-
engagement with past landlords was rarely initiated by the landlords, according to the housing
navigators. Most often, the housing navigators said, they noticed available listings from these
landlords and made new outreach efforts, rather than hearing directly from the landlords.
Streamlining Financial Assistance
In the transition to Phase 2, the PHAs identified two issues related to the administration of
financial assistance that would be addressed:
■ Unit holding fees. Some landlords asked that unit holding fees be paid at the time the appli-
cation for the unit was submitted. Such fees would typically be applied to security deposits if
rental applications were approved and refunded if applications were denied. However, although
these funds were often paid by CMTO on behalf of families, they would be refunded directly
to families, and it could be difficult and time-consuming for CMTO staff to coordinate fami-
lies returning these payments to the program. At the request of the PHAs, CMTO staff in
Phase 2 sought to negotiate delays of holding-fee payments with landlords until units passed
inspection and the lease-up was guaranteed; they offered promissory letters instead of pay-
ment at the time the application was submitted. This approach was not successful, however,
and the PHAs finally decided to pay holding fees without restriction, accepting any lost funds
as trivial relative to the overall program budget.
40 | IMPLEMENTING CREATING MOVES TO OPPORTUNITY
■ Hand-delivering landlord payments. In Phase 2, the PHAs requested that InterIm adopt next-
day shipping as a means of delivering financial assistance payments to landlords when paper
checks were required. This transmittal method was partially adopted in the CMTO Coaching
and Resources program and was perceived as successful. However, the housing navigators still
delivered many checks by hand, underscoring the importance to them of making in-person
contact with landlords and of delivering payments rapidly “because many landlords won’t
give families their keys” until they had received security deposits.
Staffing and Caseload Reductions
The housing navigators mentioned that reduced caseloads in the CMTO Coaching and Resources
program and a limited role in expediting lease-ups for CMTO Toolkit families resulted in a
much more manageable and predictable workload, with notably fewer weekend or late-night
hours spent helping families or responding to landlords. A related operational improvement
was the adoption of joint family and housing navigator communication with families during
the housing search phase, copying one another when both the family navigator and one housing
navigator were in touch with a given family. As a consequence, staff members at InterIm could
be more responsive to families, share some tasks, and deliver services as a more unified team.
In ref lecting on staff-family interactions in the housing search phase, staff members observed
that service relationships often developed organically in response to the family’s needs. For
reasons unknown, certain families might be more inclined to communicate with either the
family navigator or the housing navigator, and the staff accommodated this preference. Indeed,
because supporting families through a housing search sometimes meant giving advice to fami-
lies that they may not want to hear or coaching families to do tasks that they might prefer be
completed by staff, it was often ideal for a less-engaged team member to interact with families.
Given these family-specific dynamics, navigators emphasized the importance of f lexibility and
collaboration among themselves.
The Availability and Use of Online Resources
The availability of online high-opportunity-area education, rental application coaching, and
housing search program tools was viewed as a worthwhile investment by PHA and CMTO staff,
although they were uncertain about the extent to which those resources were accessed, used,
and found helpful by families. “I was hoping the website would be more useful than it was,”
the CMTO Coaching and Resources family navigator said. “Even though I walked through the
website with families up front, they generally would ask basic questions later that indicated they
weren’t really using it.” Both she and the CMTO Toolkit navigator described initially sending
families direct email links to tools that were available on the website, but they also stated that
they later adopted the approach of directly attaching files in emails to families to ease family
access to the information.
Overarching Impressions as Phase 2 Entered Maturity
Staff members at InterIm CDA and the housing authorities ref lected broadly on a productive
and successful effort to build on the demonstrated success of CMTO implementation in a second
IMPLEMENTING CREATING MOVES TO OPPORTUNITY | 4 1
phase. The PHAs and InterIm CDA described following through on the design objectives that
emerged from the February 2019 convening of the housing authorities and research partners to
launch, in July 2019, an experimental test of three CMTO programs against a control group. A
challenging sample build-up effort began to see improvement in late 2019 but ended prematurely
in March 2020, following COVID-19 outbreaks in Washington State. Before the service delivery
adaptations that were necessitated by COVID-19—service delivery continued during the pandemic,
with modifications that are not addressed in this report—staff
members described seeing continued success in implementing
the full-f ledged CMTO Coaching and Resources program plus
the two new variations on CMTO that were unique to Phase 2.
As this report was being written in 2020, many participating
families were still being offered services and supported in pur-
suing moves to high-opportunity areas.
Confronting Trade-Offs in Economizing Service Delivery
The CMTO navigators, who generally preferred to use more intensive approaches to supporting
families, found the new, pared-down interventions developed for Phase 2 to be inherently “less
exciting” than their work in Phase 1, although they described adhering faithfully to the new pro-
gram designs. These staff members also described some significant lessons about what motivates
families and what supports might be most critical in creating moves to high-opportunity areas:
■ A narrow focus on helping families afford the costs of applying for and moving into housing
will likely not address the range of challenges that most families face during housing searches
in high-opportunity areas; helping families “continually process their housing search journey”
was seen as critical to the efficacy of the CMTO Coaching and Resources program.
■ Sending proactive program reminders and program content through digital communications
seemingly resulted in marginal improvements in family engagement during Phase 2. However,
family navigators suggested that family participation in the offered services following these
reminders could be uneven.
■ A mobility program that is centered largely around a family’s independent use of program
search materials in lieu of intensive staff coaching and intervention may be less effective with
less motivated or more disadvantaged families.
■ The more intensive coaching and housing search strategy may succeed because it “focuses
families on their own objectives” and “doesn’t leave a lot of down-time for folks to get off track.”
Reflecting on Critical Staff Competencies
With roughly two and a half years of implementation experience, staff members at the housing
authorities and InterIm CDA shared some impressions about what staff attributes and skills
contributed to the success of CMTO’s implementation.
“Even though it’s Saturday, if I don’t
respond to this landlord about this
family’s rental application right now,
then the family might lose this home.”
42 | IMPLEMENTING CREATING MOVES TO OPPORTUNITY
■ Supporting families in the Housing Choice Voucher program requires empathy, patience, and
follow-through. Working knowledge of the HCV program is critical for both family-facing
and landlord-facing staff.
■ Taking a family-centered approach to coaching means asking families to “tell their story” at
the start of the service relationship and then “repeating that story back in everything staff
do” by adapting the program’s services to the family’s own goals. It also means setting clear
boundaries that define what assistance can and cannot be provided. Having knowledge of
external resources can be valuable in helping to meet families’ additional needs.
■ Successfully engaging landlords requires a committed and f lexible mindset that recognizes,
“Even though it’s Saturday, if I don’t respond to this landlord about this family’s rental ap-
plication right now, then the family might lose this home.”
■ “Culturally competent” service delivery was viewed by CMTO staff members as crucial.
They described serving a diverse population possessing a variety of lived experiences, a wide
range of approaches to conducting housing searches, and sometimes very high expectations
of service providers.
■ Finally, staff members emphasized the importance of familiarity with high-opportunity areas
as critical to supporting families in pursuing opportunity moves. Most navigators had some
preexisting familiarity with many of the areas, but they emphasized that superficial awareness
of any given neighborhood’s attributes or amenities was not sufficient. Rather, they described
needing to have an appreciation for “what life would be like for a voucher holder” living in a
particular high-opportunity area.
Perceived Challenges to Accessing Rental Markets in High-Opportunity Areas
As the navigators continued to implement successful housing mobility services promoting fam-
ily choice in high-opportunity areas, they predicted that recent and ongoing rental market and
demographic trends in the Seattle area would continue to require more attention and adapta-
tion. They observed that contract rent amounts in Seattle and King County rose over the course
of the program’s implementation and would probably continue to do so. They also predicted
constant challenges in supporting larger families, given the limited supply of sufficiently large
rental units. Finally, although the navigators had confidence in the benefits to children of resid-
ing in high-opportunity areas, some noted that north Seattle, and in particular the Northgate
high-opportunity area, was undergoing rapid demographic change as a result of new light-rail
development in the area, and they were uncertain about how this transformation might affect
long-term family persistence there.
Despite the overall accomplishments of CMTO in helping families to overcome external bar-
riers to leasing up in high-opportunity areas, the housing navigators remarked that landlords
were increasingly altering rental application screening criteria in ways that might preclude most
voucher households from ever being approved for rental units. They noted that many landlords
were now requiring applicants to have four times a unit’s annual rent amount in earned income,
IMPLEMENTING CREATING MOVES TO OPPORTUNITY | 4 3
a standard that they said most voucher families would not meet, even if PHA payments were
treated as family income. Another application screening criterion the housing navigators had
encountered required applicants to have at least $10,000 in annual income.
LOOKING FORWARD
With an eye toward detailing the partners’ experiences in designing and implementing the CMTO
model, this report documents what was done to help families achieve “opportunity moves.” These
findings shed light on the experiences of staff members, families, and landlords in offering and
engaging with the CMTO program, especially during Phase 1. With many Phase 2 families still
searching for housing at the conclusion of the implementation study, ongoing evaluation efforts
will continue to offer findings and lessons from both study phases.
As shown, the CMTO demonstration in Seattle and King County represents a path-breaking
and successful partnership across two PHAs, a service partner, and several research institutions
to study the effort required to support HCV families with young children in making moves to
high-opportunity areas across a large and varied metropolitan region. Numerous PHAs across
the country are beginning to undertake similar mobility initiatives, and the design choices
about and experiences of implementing CMTO in Seattle and King County that are described
in this report can provide helpful insights to inform those efforts. Looking forward, the CMTO
Seattle–King County Demonstration serves as an important template for endeavors funded by
Congress and private foundations to advance the housing mobility learning agenda.
44 | IMPLEMENTING CREATING MOVES TO OPPORTUNITY
APPENDIX
A
CMTO Coaching and Resources Program Flyer


Coaching and Resources
Contact info:
[redacted] | www.creatingmoves.org
Explore new opportunities for your family!
Now that you are part of Creating Moves to Opportunity (CMTO), don’t miss out on these supports to help you and your family make the most of your next move.
Learn about neighborhood choices and identify places where you think your family will thrive.
Open up the possibilities of new communities and choose the best place for your family with the information and resources.
Find homes in opportunity neighborhoods that match your family’s needs.
Create your housing search plan with guidance from CMTO staff. We can help you look for available rental units and connect you to landlords. We will work with landlords to quickly inspect and approve your new home.
Make your best impression with landlords during your housing search.
CMTO staff can support you with the application process by helping you create a strong rental resume and organize required documents.
Because moving can be costly, we can help you pay for leasing expenses.
Financial assistance is available to support your move to an Opportunity Neighborhood. CMTO can help pay for moving expenses such as application costs, holding fees and security deposits.
Discover Your Choices Search for Homes Market Yourself Financial Support
continued
IMPLEMENTING CREATING MOVES TO OPPORTUNITY | 4 7
NEXT
STEPS
1. A Family Navigator will contact you within the next few days
2. Meet with the Family Navigator to set goals for your housing search
3. Attend the Voucher Briefing
Meet the CMTO Team
Updated 6/12/19
Login to www.creatingmoves.org with your password: [redacted]
[Author’s note: section intentionally left blank
for the purpose of this report.]
48 | IMPLEMENTING CREATING MOVES TO OPPORTUNITY
APPENDIX
B
CMTO Toolkit Program Flyer


Toolkit
Explore new opportunities for your family!
Now that you are part of Creating Moves to Opportunity (CMTO), don’t miss out on these supports to help you and your family make the most of your next move.
Continue working on your housing search plan by using great online tools at www.creatingmoves.org. If you do not have access to a computer or phone with internet data, visit your local library to use the computer for free.
Financial assistance is available to support your move to an Opportunity Neighborhood. Funds can be used to help with lease expenses, such as security deposits.
Access Resources Financial Support
Learn about neighborhood choices and identify places where you think your family will thrive. Open up the possibilities of new communities and choose the best place for your family with the information and resources.
Discover Your Choices
Make your best impression with landlords during your housing search. Meet with CMTO staff to find out how you can build a rental resume and organize your documents to prepare for rental applications.
Market Yourself
Contact info:
[redacted] | www.creatingmoves.org
continued
IMPLEMENTING CREATING MOVES TO OPPORTUNITY | 5 1
NEXT STEPS
1. A Family Navigator will contact you within the next few days
2. Meet with the Family Navigator to
set goals for your housing search
3. Visit the CMTO website 4. Attend the Voucher Briefing
Meet the CMTO Family Navigators
Updated 6/12/19
Over the Next Few Months:
You will meet with a Family Navigator before you get your voucher to prepare you to make the most of your voucher.
You will receive emails about every two weeks with helpful information and reminders during your housing search.
You will be contacted by a Navigator about two weeks before your orientation to answer your questions about these materials.
Login to www.creatingmoves.org with your password: [redacted]
[Author’s note: section intentionally left blank
for the purpose of this report.]
52 | IMPLEMENTING CREATING MOVES TO OPPORTUNITY
APPENDIX
C
CMTO Financial Assistance Program Flyer

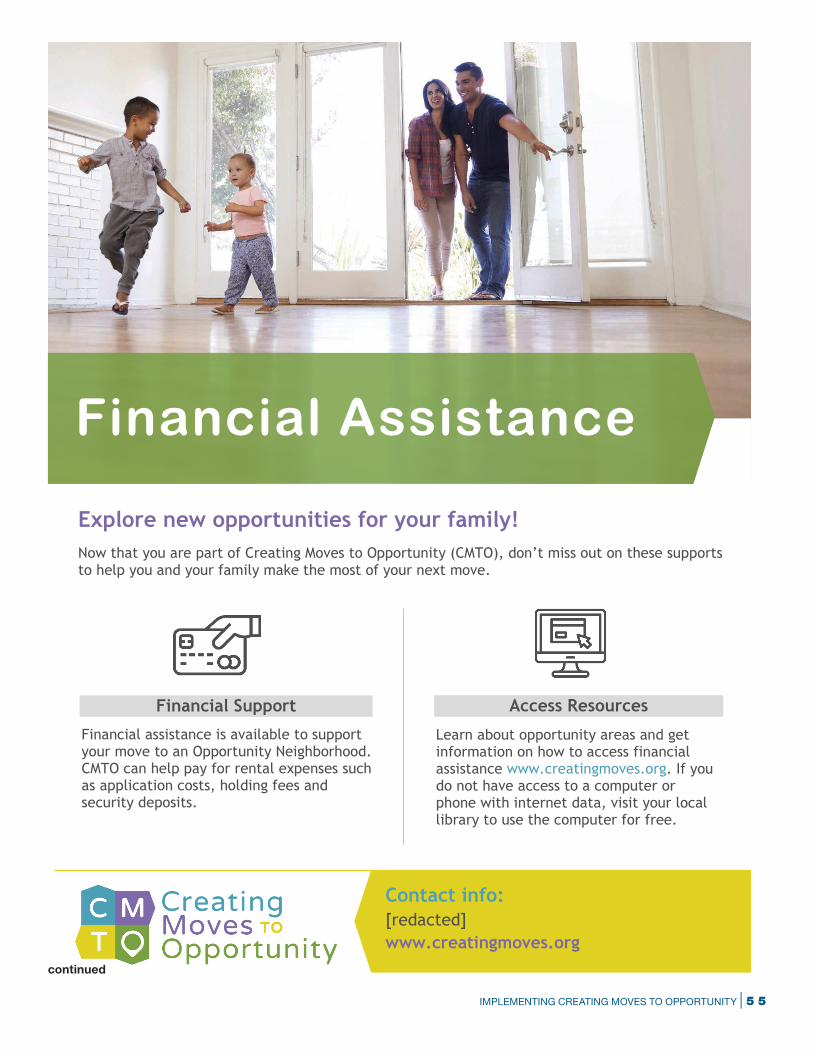
continued
Financial Assistance
Contact info:
[redacted]
www.creatingmoves.org
Explore new opportunities for your family!
Now that you are part of Creating Moves to Opportunity (CMTO), don’t miss out on these supports to help you and your family make the most of your next move.
Financial assistance is available to support your move to an Opportunity Neighborhood. CMTO can help pay for rental expenses such as application costs, holding fees and security deposits.
Learn about opportunity areas and get information on how to access financial assistance www.creatingmoves.org. If you do not have access to a computer or phone with internet data, visit your local library to use the computer for free.
Access Resources Financial Support
IMPLEMENTING CREATING MOVES TO OPPORTUNITY | 5 5
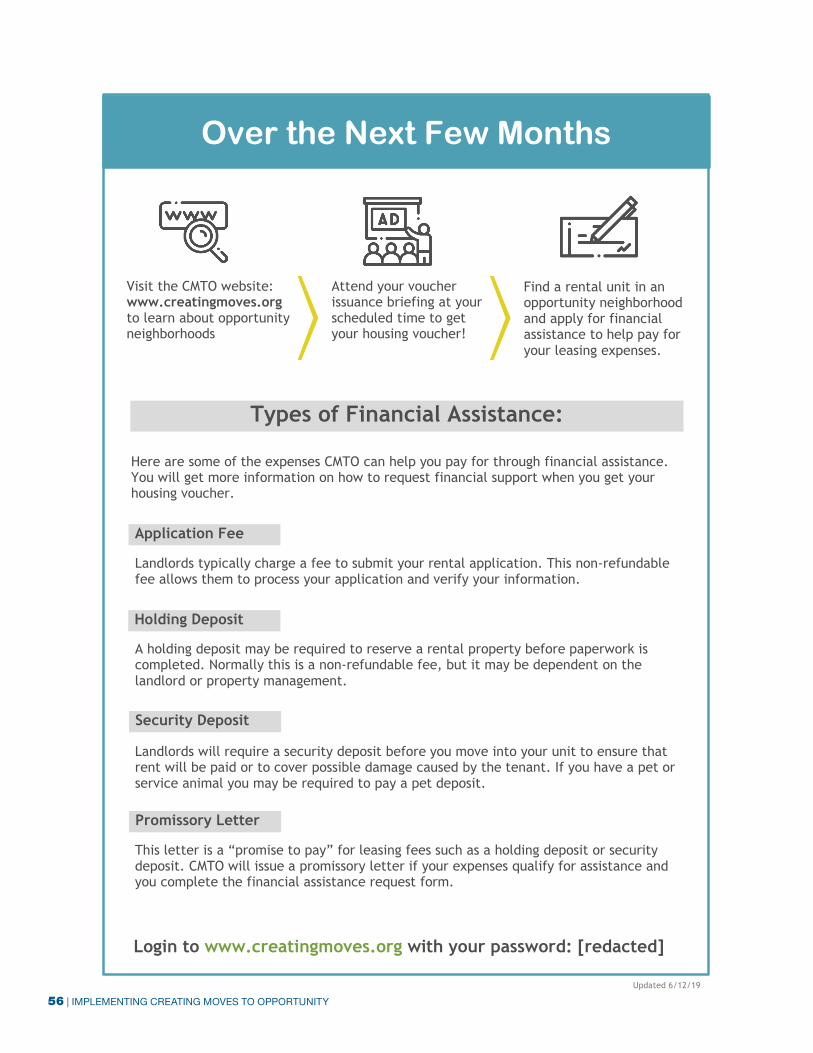
Over the Next Few Months
Updated 6/12/19
Application Fee
Holding Deposit
Security Deposit
Promissory Letter
Here are some of the expenses CMTO can help you pay for through financial assistance. You will get more information on how to request financial support when you get your housing voucher.
Landlords typically charge a fee to submit your rental application. This non-refundable fee allows them to process your application and verify your information.
A holding deposit may be required to reserve a rental property before paperwork is completed. Normally this is a non-refundable fee, but it may be dependent on the landlord or property management.
Landlords will require a security deposit before you move into your unit to ensure that rent will be paid or to cover possible damage caused by the tenant. If you have a pet or service animal you may be required to pay a pet deposit.
This letter is a “promise to pay” for leasing fees such as a holding deposit or security deposit. CMTO will issue a promissory letter if your expenses qualify for assistance and you complete the financial assistance request form.
Login to www.creatingmoves.org with your password: [redacted]
Types of Financial Assistance:
Visit the CMTO website: www.creatingmoves.org to learn about opportunity neighborhoods
Attend your voucher issuance briefing at your scheduled time to get your housing voucher!
Find a rental unit in an opportunity neighborhood and apply for financial assistance to help pay for your leasing expenses.
56 | IMPLEMENTING CREATING MOVES TO OPPORTUNITY
REFERENCES
Bergman, Peter, Raj Chetty, Stefanie DeLuca, Nathaniel Hendren, Lawrence F. Katz, and Christopher Palmer. 2020a. “Creating Moves to Opportunity: Experimental Evidence on Barriers to Neighborhood Choice.” NBER Working Paper No. 26164. Cambridge, MA: National Bureau of Economic Research. Website: https://www.nber.org/system/files/working_papers/w26164/w26164.pdf.
Bergman, Peter, Raj Chetty, Stefanie DeLuca, Nathan Hendren, Lawrence Katz, and Christopher Palmer, with King County Housing Authority, Seattle Housing Authority, J-PAL North America, and MDRC. 2020b. “Creating Moves to Opportunity: Experimental Evidence on Barriers to Neighborhood Choice” [Summary]. Opportunity Insights. Website: https://opportunityinsights.org/wp-content/uploads/2019/08/cmto_summary.pdf.
Chetty, Raj, Nathaniel Hendren, and Lawrence F. Katz. 2016. “The Efects of Exposure to Better Neighborhoods on Children: New Evidence from the Moving to Opportunity Experiment.” American
Economic Review 106, 4: 855–902.
Opportunity Insights. 2020a. “CMTO Seattle/King County Phase II Service Summary.” Website: https://opportunityinsights.org/wp-content/uploads/2020/09/CMTO-Phase-II-Intervention-Details.pdf.
Opportunity Insights. 2020b. “Overview of the Creating Moves to Opportunity Program in Seattle and King County.” Website: https://opportunityinsights.org/wp-content/uploads/2019/08/cmto_programoverview.pdf.
U.S. Department of Housing and Urban Development. 2020. “Moving to Work (MTW) Demonstration Program.” Website: www.hud.gov/program_offices/public_indian_housing/programs/ph/mtw.
IMPLEMENTING CREATING MOVES TO OPPORTUNITY | 5 7
ABOUT MDRCMDRC, A NONPROFIT, NONPARTISAN SOCIAL AND
EDUCATION POLICY RESEARCH ORGANIZATION, IS
COMMITTED TO finding solutions to some of the most difficult
problems facing the nation. We aim to reduce poverty and bolster
economic mobility; improve early child development, public
education, and pathways from high school to college completion
and careers; and reduce inequities in the criminal justice system.
Our partners include public agencies and school systems, nonprofit
and community-based organizations, private philanthropies, and
others who are creating opportunity for individuals, families, and
communities.
Founded in 1974, MDRC builds and applies evidence about
changes in policy and practice that can improve the well-being
of people who are economically disadvantaged. In service of
this goal, we work alongside our programmatic partners and
the people they serve to identify and design more effective and
equitable approaches. We work with them to strengthen the
impact of those approaches. And we work with them to evaluate
policies or practices using the highest research standards. Our
staff members have an unusual combination of research and
organizational experience, with expertise in the latest qualitative
and quantitative research methods, data science, behavioral
science, culturally responsive practices, and collaborative design
and program improvement processes. To disseminate what
we learn, we actively engage with policymakers, practitioners,
public and private funders, and others to apply the best evidence
available to the decisions they are making.
MDRC works in almost every state and all the nation’s largest cities,
with offices in New York City; Oakland, California; Washington,
DC; and Los Angeles.
2020 REPORT: HOUSEHOLDS, NEIGHBORHOODS, AND MOBILITY PATTERNS OF
SEATTLE AND KING COUNTY VOUCHER HOUSEHOLDS A report to the King County and Seattle Housing Authorities
Report presented by Hannah Lee and Kyle Crowder Department of Sociology and
Center for Studies in Demography and Ecology University of Washington
August 2020
1
Executive Summary
This report provides an update and extension of analyses presented to the Seattle Housing Authority (SHA) and King County Housing Authority (KCHA) in 2016. The report is based on the analysis of administrative records for tenant-based voucher holders between 2008 and 2019 in these jurisdictions and seeks to: 1) describe the frequency, patterns, and trends in residential mobility among households receiving vouchers through SHA and KCHA; 2) develop and describe several strategies for measuring various types of moves that are potentially destabilizing for affected families; and 3) assess the individual, household, and geographic conditions associated with destabilizing moves among voucher holders within the jurisdictions of these public housing authorities (PHAs). Given the well-documented effects of residential mobility and neighborhood location on health and wellbeing, analysis of these patterns and associations are key for understanding the needs of voucher recipients. We focus on the combined populations served by the two PHAs to provide a broader, county-level perspective on mobility patterns, and to assess the mobility patterns of households who move between jurisdictions and receive, at different times, services from both SHA and KCHA. The analysis supports several key findings:
▪ The 31,453 unique households receiving a tenant-based voucher at any time between 2008 and 2019 made a total of 23,382 moves between months of observation. Almost 65% of these moves occurred within the KCHA jurisdiction, just over 20% were between locations within the SHA jurisdiction, and 15% were from one agency to another.
▪ Mirroring declines in mobility nationwide, monthly rates of mobility among housing choice voucher (HCV) householders declined in all areas between 2008 and 2019. By 2019, about 11% of households within the KCHA jurisdiction, and just over 5% of those in the SHA jurisdiction, moved one or more times in the year.
▪ In most years, monthly residential mobility rates were highest among households with children, but these households also saw the most dramatic declines in rates of mobility across the years of the data.
▪ Rates of mobility, as well as trends in these rates, also varied substantially by unit size, voucher type, income, race/ethnicity, and language. However, these patterns differed substantially across SHA and KCHA.
▪ The frequency of several types of potentially destabilizing mobility has also changed significantly over time. Most notably, the percentage of households experiencing two or more moves in any twelve-month period declined sharply between 2008 and 2019, especially in the KCHA jurisdiction.
▪ Among households without children, the likelihood of originating in a low-opportunity neighborhood, as measured by the Regional Opportunity Index, was greater in KCHA than in SHA. However, the likelihood of downward mobility (moving to a neighborhood with a lower opportunity score) among childless households was greater within SHA than within KCHA. Given the high concentration of high-opportunity neighborhoods in Seattle, downward mobility was especially common for childless households moving from SHA to KCHA, while upward mobility was particularly common for those moving from KCHA to SHA. These patterns of opportunity mobility have remained largely consistent over time.
▪ More than half of HCV households with children who moved within KCHA, and more than three-quarters of those moving within SHA, originated in a neighborhood with a low or very low level of opportunity as measured using the Opportunity Atlas index from Opportunity Insights. However, mobility patterns within both jurisdictions tended to redistribute households towards destinations with moderate or high levels of opportunity. These patterns of upward mobility have remained largely unchanged over time, as have smaller flows of households moving to lower-opportunity destinations.
▪ More than half of all moves carried out by SHA households with children of high-school or middle-school ages resulted in a change of school catchment area. A substantial share of moves by KCHA households with adolescents also involved a change in school attendance zones but the share was smaller than in SHA, likely due to a difference in the relative geographic size of school catchment areas in the two jurisdictions.
▪ The majority of moves carried out by KCHA and SHA households were not characterized by any type of focal disruptions; they did not involve a move to a lower-opportunity neighborhood, necessitate a
2
change in schools for children in the household, or represent one of several moves over a short span of time. Only 11% of moves were associated with multiple types of potential destabilization.
▪ Disruptive moves tended to occur relatively close to entry into the HCV program but typically did not prompt an exit from the program within the subsequent two-year period.
▪ The likelihood of disruptive or destabilizing moves also varied across a number of household characteristics. Most pronounced were variations by race. In comparison to white households, Black households were substantially less likely to move to a high-opportunity neighborhood, more likely to move to a low-opportunity area, and more likely to move with adolescent children to a different school catchment area. Highlighting the persistence of broader processes of residential stratification, these racial differences were pronounced even after controlling for household composition, income, and a range of other mobility-related factors.
In addition to these research findings, key products of this research are a clean, unified dataset for the analysis of residential mobility among HCV participants, and a robust approach to incorporating new waves of administrative data as they become available.
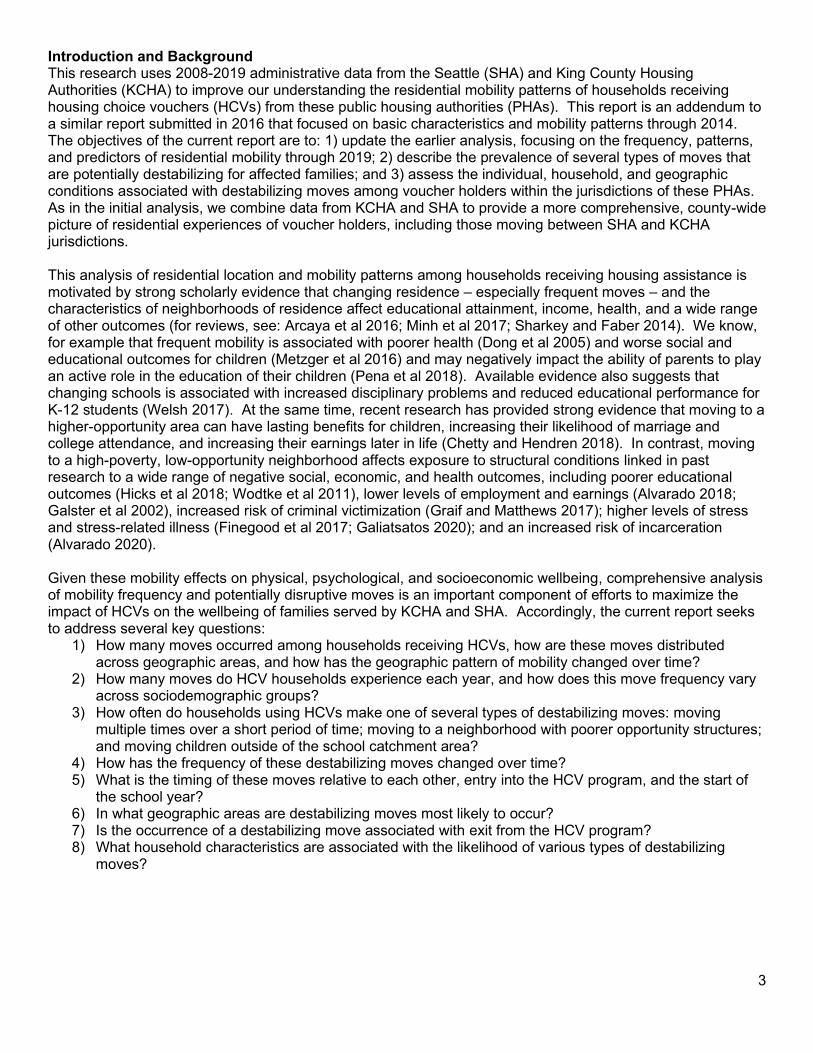
3
Introduction and Background This research uses 2008-2019 administrative data from the Seattle (SHA) and King County Housing Authorities (KCHA) to improve our understanding the residential mobility patterns of households receiving housing choice vouchers (HCVs) from these public housing authorities (PHAs). This report is an addendum to a similar report submitted in 2016 that focused on basic characteristics and mobility patterns through 2014. The objectives of the current report are to: 1) update the earlier analysis, focusing on the frequency, patterns, and predictors of residential mobility through 2019; 2) describe the prevalence of several types of moves that are potentially destabilizing for affected families; and 3) assess the individual, household, and geographic conditions associated with destabilizing moves among voucher holders within the jurisdictions of these PHAs. As in the initial analysis, we combine data from KCHA and SHA to provide a more comprehensive, county-wide picture of residential experiences of voucher holders, including those moving between SHA and KCHA jurisdictions. This analysis of residential location and mobility patterns among households receiving housing assistance is motivated by strong scholarly evidence that changing residence – especially frequent moves – and the characteristics of neighborhoods of residence affect educational attainment, income, health, and a wide range of other outcomes (for reviews, see: Arcaya et al 2016; Minh et al 2017; Sharkey and Faber 2014). We know, for example that frequent mobility is associated with poorer health (Dong et al 2005) and worse social and educational outcomes for children (Metzger et al 2016) and may negatively impact the ability of parents to play an active role in the education of their children (Pena et al 2018). Available evidence also suggests that changing schools is associated with increased disciplinary problems and reduced educational performance for K-12 students (Welsh 2017). At the same time, recent research has provided strong evidence that moving to a higher-opportunity area can have lasting benefits for children, increasing their likelihood of marriage and college attendance, and increasing their earnings later in life (Chetty and Hendren 2018). In contrast, moving to a high-poverty, low-opportunity neighborhood affects exposure to structural conditions linked in past research to a wide range of negative social, economic, and health outcomes, including poorer educational outcomes (Hicks et al 2018; Wodtke et al 2011), lower levels of employment and earnings (Alvarado 2018; Galster et al 2002), increased risk of criminal victimization (Graif and Matthews 2017); higher levels of stress and stress-related illness (Finegood et al 2017; Galiatsatos 2020); and an increased risk of incarceration (Alvarado 2020). Given these mobility effects on physical, psychological, and socioeconomic wellbeing, comprehensive analysis of mobility frequency and potentially disruptive moves is an important component of efforts to maximize the impact of HCVs on the wellbeing of families served by KCHA and SHA. Accordingly, the current report seeks to address several key questions:
1) How many moves occurred among households receiving HCVs, how are these moves distributed across geographic areas, and how has the geographic pattern of mobility changed over time?
2) How many moves do HCV households experience each year, and how does this move frequency vary across sociodemographic groups?
3) How often do households using HCVs make one of several types of destabilizing moves: moving multiple times over a short period of time; moving to a neighborhood with poorer opportunity structures; and moving children outside of the school catchment area?
4) How has the frequency of these destabilizing moves changed over time? 5) What is the timing of these moves relative to each other, entry into the HCV program, and the start of
the school year? 6) In what geographic areas are destabilizing moves most likely to occur? 7) Is the occurrence of a destabilizing move associated with exit from the HCV program? 8) What household characteristics are associated with the likelihood of various types of destabilizing
moves?
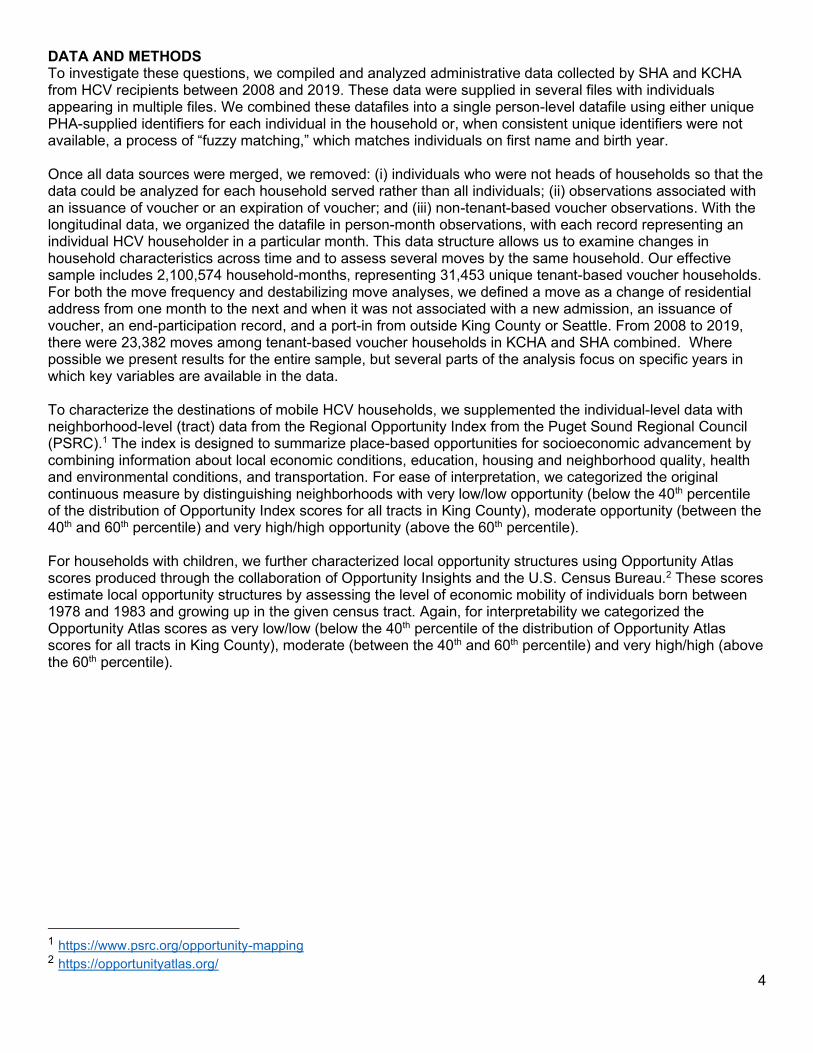
4
DATA AND METHODS To investigate these questions, we compiled and analyzed administrative data collected by SHA and KCHA from HCV recipients between 2008 and 2019. These data were supplied in several files with individuals appearing in multiple files. We combined these datafiles into a single person-level datafile using either unique PHA-supplied identifiers for each individual in the household or, when consistent unique identifiers were not available, a process of “fuzzy matching,” which matches individuals on first name and birth year. Once all data sources were merged, we removed: (i) individuals who were not heads of households so that the data could be analyzed for each household served rather than all individuals; (ii) observations associated with an issuance of voucher or an expiration of voucher; and (iii) non-tenant-based voucher observations. With the longitudinal data, we organized the datafile in person-month observations, with each record representing an individual HCV householder in a particular month. This data structure allows us to examine changes in household characteristics across time and to assess several moves by the same household. Our effective sample includes 2,100,574 household-months, representing 31,453 unique tenant-based voucher households. For both the move frequency and destabilizing move analyses, we defined a move as a change of residential address from one month to the next and when it was not associated with a new admission, an issuance of voucher, an end-participation record, and a port-in from outside King County or Seattle. From 2008 to 2019, there were 23,382 moves among tenant-based voucher households in KCHA and SHA combined. Where possible we present results for the entire sample, but several parts of the analysis focus on specific years in which key variables are available in the data. To characterize the destinations of mobile HCV households, we supplemented the individual-level data with neighborhood-level (tract) data from the Regional Opportunity Index from the Puget Sound Regional Council (PSRC).1 The index is designed to summarize place-based opportunities for socioeconomic advancement by combining information about local economic conditions, education, housing and neighborhood quality, health and environmental conditions, and transportation. For ease of interpretation, we categorized the original continuous measure by distinguishing neighborhoods with very low/low opportunity (below the 40th percentile of the distribution of Opportunity Index scores for all tracts in King County), moderate opportunity (between the 40th and 60th percentile) and very high/high opportunity (above the 60th percentile). For households with children, we further characterized local opportunity structures using Opportunity Atlas scores produced through the collaboration of Opportunity Insights and the U.S. Census Bureau.2 These scores estimate local opportunity structures by assessing the level of economic mobility of individuals born between 1978 and 1983 and growing up in the given census tract. Again, for interpretability we categorized the Opportunity Atlas scores as very low/low (below the 40th percentile of the distribution of Opportunity Atlas scores for all tracts in King County), moderate (between the 40th and 60th percentile) and very high/high (above the 60th percentile).
1 https://www.psrc.org/opportunity-mapping 2 https://opportunityatlas.org/
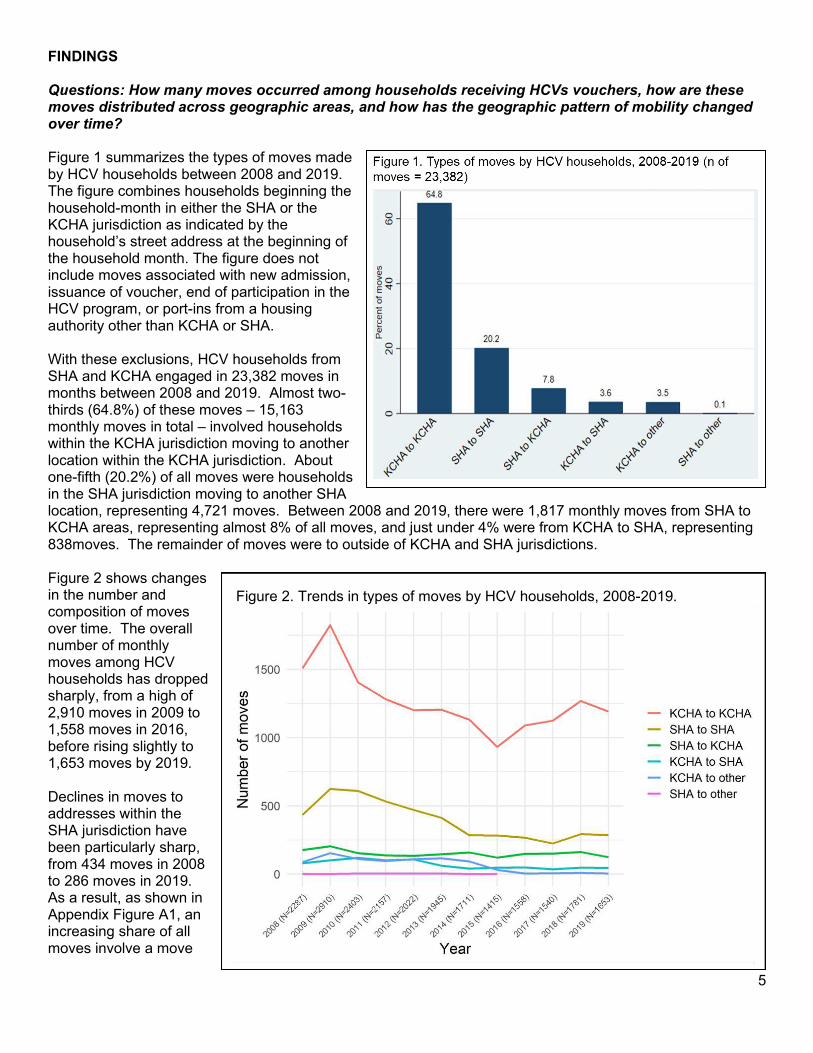
5
FINDINGS Questions: How many moves occurred among households receiving HCVs vouchers, how are these moves distributed across geographic areas, and how has the geographic pattern of mobility changed over time? Figure 1 summarizes the types of moves made by HCV households between 2008 and 2019. The figure combines households beginning the household-month in either the SHA or the KCHA jurisdiction as indicated by the household’s street address at the beginning of the household month. The figure does not include moves associated with new admission, issuance of voucher, end of participation in the HCV program, or port-ins from a housing authority other than KCHA or SHA. With these exclusions, HCV households from SHA and KCHA engaged in 23,382 moves in months between 2008 and 2019. Almost two-thirds (64.8%) of these moves – 15,163 monthly moves in total – involved households within the KCHA jurisdiction moving to another location within the KCHA jurisdiction. About one-fifth (20.2%) of all moves were households in the SHA jurisdiction moving to another SHA location, representing 4,721 moves. Between 2008 and 2019, there were 1,817 monthly moves from SHA to KCHA areas, representing almost 8% of all moves, and just under 4% were from KCHA to SHA, representing 838moves. The remainder of moves were to outside of KCHA and SHA jurisdictions. Figure 2 shows changes in the number and composition of moves over time. The overall number of monthly moves among HCV households has dropped sharply, from a high of 2,910 moves in 2009 to 1,558 moves in 2016, before rising slightly to 1,653 moves by 2019. Declines in moves to addresses within the SHA jurisdiction have been particularly sharp, from 434 moves in 2008 to 286 moves in 2019. As a result, as shown in Appendix Figure A1, an increasing share of all moves involve a move
Figure 2. Trends in types of moves by HCV households, 2008-2019.
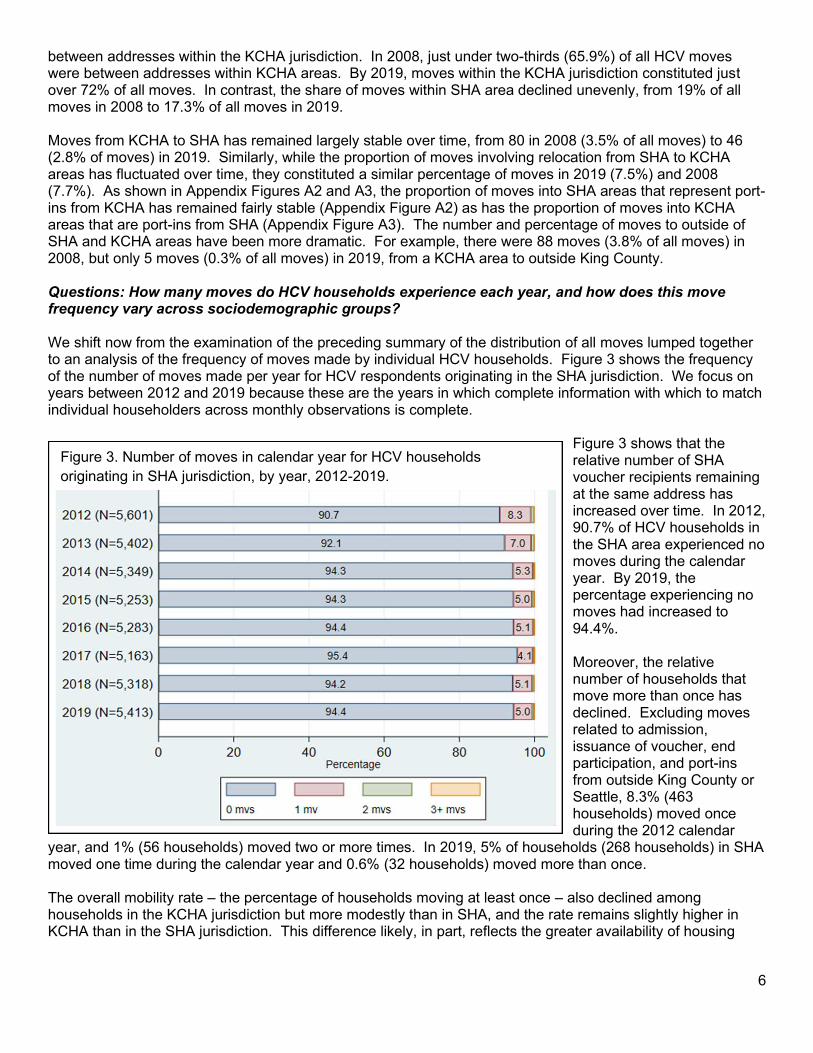
6
between addresses within the KCHA jurisdiction. In 2008, just under two-thirds (65.9%) of all HCV moves were between addresses within KCHA areas. By 2019, moves within the KCHA jurisdiction constituted just over 72% of all moves. In contrast, the share of moves within SHA area declined unevenly, from 19% of all moves in 2008 to 17.3% of all moves in 2019. Moves from KCHA to SHA has remained largely stable over time, from 80 in 2008 (3.5% of all moves) to 46 (2.8% of moves) in 2019. Similarly, while the proportion of moves involving relocation from SHA to KCHA areas has fluctuated over time, they constituted a similar percentage of moves in 2019 (7.5%) and 2008 (7.7%). As shown in Appendix Figures A2 and A3, the proportion of moves into SHA areas that represent port-ins from KCHA has remained fairly stable (Appendix Figure A2) as has the proportion of moves into KCHA areas that are port-ins from SHA (Appendix Figure A3). The number and percentage of moves to outside of SHA and KCHA areas have been more dramatic. For example, there were 88 moves (3.8% of all moves) in 2008, but only 5 moves (0.3% of all moves) in 2019, from a KCHA area to outside King County. Questions: How many moves do HCV households experience each year, and how does this move frequency vary across sociodemographic groups? We shift now from the examination of the preceding summary of the distribution of all moves lumped together to an analysis of the frequency of moves made by individual HCV households. Figure 3 shows the frequency of the number of moves made per year for HCV respondents originating in the SHA jurisdiction. We focus on years between 2012 and 2019 because these are the years in which complete information with which to match individual householders across monthly observations is complete.
Figure 3 shows that the relative number of SHA voucher recipients remaining at the same address has increased over time. In 2012, 90.7% of HCV households in the SHA area experienced no moves during the calendar year. By 2019, the percentage experiencing no moves had increased to 94.4%. Moreover, the relative number of households that move more than once has declined. Excluding moves related to admission, issuance of voucher, end participation, and port-ins from outside King County or Seattle, 8.3% (463 households) moved once during the 2012 calendar
year, and 1% (56 households) moved two or more times. In 2019, 5% of households (268 households) in SHA moved one time during the calendar year and 0.6% (32 households) moved more than once. The overall mobility rate – the percentage of households moving at least once – also declined among households in the KCHA jurisdiction but more modestly than in SHA, and the rate remains slightly higher in KCHA than in the SHA jurisdiction. This difference likely, in part, reflects the greater availability of housing
Figure 3. Number of moves in calendar year for HCV households
originating in SHA jurisdiction, by year, 2012-2019.
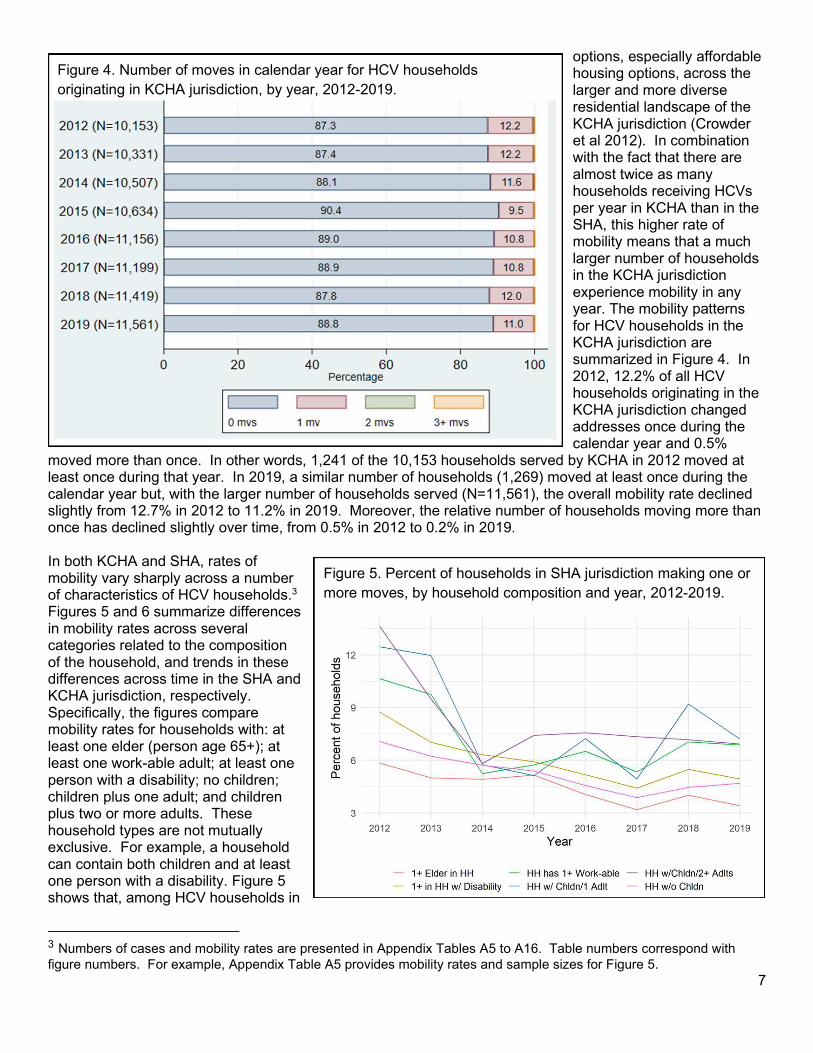
7
options, especially affordable housing options, across the larger and more diverse residential landscape of the KCHA jurisdiction (Crowder et al 2012). In combination with the fact that there are almost twice as many households receiving HCVs per year in KCHA than in the SHA, this higher rate of mobility means that a much larger number of households in the KCHA jurisdiction experience mobility in any year. The mobility patterns for HCV households in the KCHA jurisdiction are summarized in Figure 4. In 2012, 12.2% of all HCV households originating in the KCHA jurisdiction changed addresses once during the calendar year and 0.5%
moved more than once. In other words, 1,241 of the 10,153 households served by KCHA in 2012 moved at least once during that year. In 2019, a similar number of households (1,269) moved at least once during the calendar year but, with the larger number of households served (N=11,561), the overall mobility rate declined slightly from 12.7% in 2012 to 11.2% in 2019. Moreover, the relative number of households moving more than once has declined slightly over time, from 0.5% in 2012 to 0.2% in 2019. In both KCHA and SHA, rates of mobility vary sharply across a number of characteristics of HCV households.3 Figures 5 and 6 summarize differences in mobility rates across several categories related to the composition of the household, and trends in these differences across time in the SHA and KCHA jurisdiction, respectively. Specifically, the figures compare mobility rates for households with: at least one elder (person age 65+); at least one work-able adult; at least one person with a disability; no children; children plus one adult; and children plus two or more adults. These household types are not mutually exclusive. For example, a household can contain both children and at least one person with a disability. Figure 5 shows that, among HCV households in
3 Numbers of cases and mobility rates are presented in Appendix Tables A5 to A16. Table numbers correspond with
figure numbers. For example, Appendix Table A5 provides mobility rates and sample sizes for Figure 5.
Figure 4. Number of moves in calendar year for HCV households
originating in KCHA jurisdiction, by year, 2012-2019.
Figure 5. Percent of households in SHA jurisdiction making one or
more moves, by household composition and year, 2012-2019.
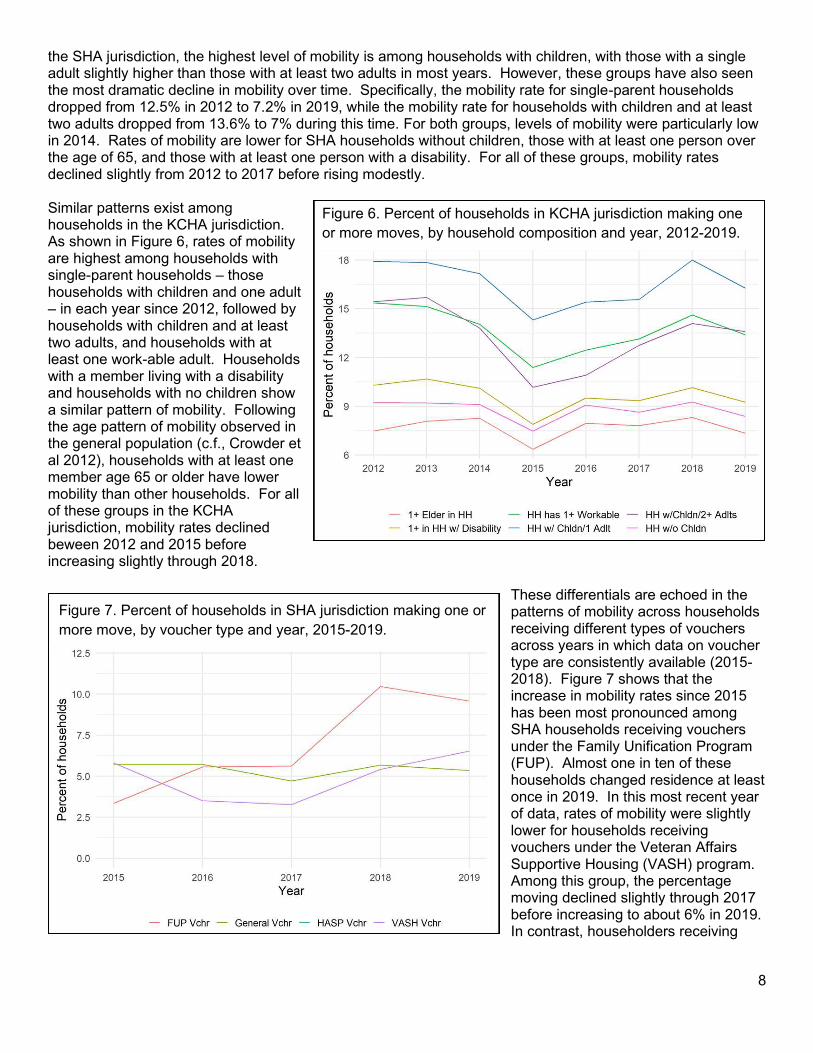
8
the SHA jurisdiction, the highest level of mobility is among households with children, with those with a single adult slightly higher than those with at least two adults in most years. However, these groups have also seen the most dramatic decline in mobility over time. Specifically, the mobility rate for single-parent households dropped from 12.5% in 2012 to 7.2% in 2019, while the mobility rate for households with children and at least two adults dropped from 13.6% to 7% during this time. For both groups, levels of mobility were particularly low in 2014. Rates of mobility are lower for SHA households without children, those with at least one person over the age of 65, and those with at least one person with a disability. For all of these groups, mobility rates declined slightly from 2012 to 2017 before rising modestly. Similar patterns exist among households in the KCHA jurisdiction. As shown in Figure 6, rates of mobility are highest among households with single-parent households – those households with children and one adult – in each year since 2012, followed by households with children and at least two adults, and households with at least one work-able adult. Households with a member living with a disability and households with no children show a similar pattern of mobility. Following the age pattern of mobility observed in the general population (c.f., Crowder et al 2012), households with at least one member age 65 or older have lower mobility than other households. For all of these groups in the KCHA jurisdiction, mobility rates declined beween 2012 and 2015 before increasing slightly through 2018.
These differentials are echoed in the patterns of mobility across households receiving different types of vouchers across years in which data on voucher type are consistently available (2015-2018). Figure 7 shows that the increase in mobility rates since 2015 has been most pronounced among SHA households receiving vouchers under the Family Unification Program (FUP). Almost one in ten of these households changed residence at least once in 2019. In this most recent year of data, rates of mobility were slightly lower for households receiving vouchers under the Veteran Affairs Supportive Housing (VASH) program. Among this group, the percentage moving declined slightly through 2017 before increasing to about 6% in 2019. In contrast, householders receiving
Figure 6. Percent of households in KCHA jurisdiction making one
or more moves, by household composition and year, 2012-2019.
Figure 7. Percent of households in SHA jurisdiction making one or
more move, by voucher type and year, 2015-2019.
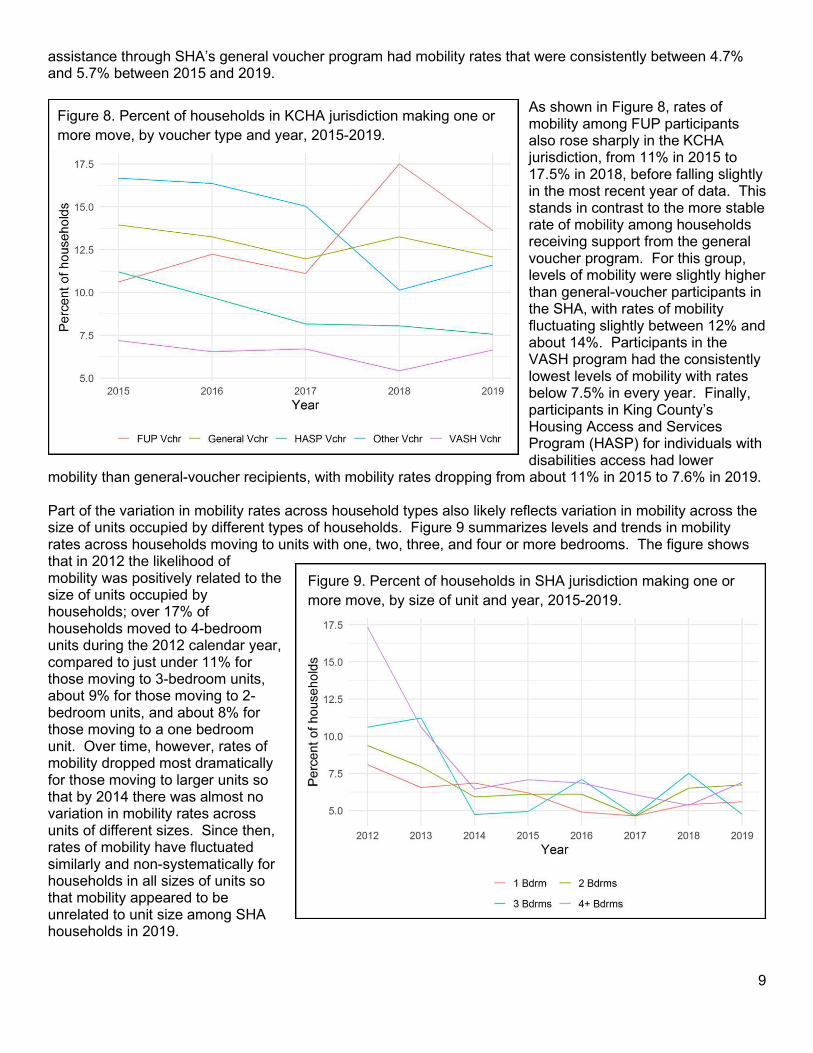
9
assistance through SHA’s general voucher program had mobility rates that were consistently between 4.7% and 5.7% between 2015 and 2019.
As shown in Figure 8, rates of mobility among FUP participants also rose sharply in the KCHA jurisdiction, from 11% in 2015 to 17.5% in 2018, before falling slightly in the most recent year of data. This stands in contrast to the more stable rate of mobility among households receiving support from the general voucher program. For this group, levels of mobility were slightly higher than general-voucher participants in the SHA, with rates of mobility fluctuating slightly between 12% and about 14%. Participants in the VASH program had the consistently lowest levels of mobility with rates below 7.5% in every year. Finally, participants in King County’s Housing Access and Services Program (HASP) for individuals with disabilities access had lower
mobility than general-voucher recipients, with mobility rates dropping from about 11% in 2015 to 7.6% in 2019. Part of the variation in mobility rates across household types also likely reflects variation in mobility across the size of units occupied by different types of households. Figure 9 summarizes levels and trends in mobility rates across households moving to units with one, two, three, and four or more bedrooms. The figure shows that in 2012 the likelihood of mobility was positively related to the size of units occupied by households; over 17% of households moved to 4-bedroom units during the 2012 calendar year, compared to just under 11% for those moving to 3-bedroom units, about 9% for those moving to 2-bedroom units, and about 8% for those moving to a one bedroom unit. Over time, however, rates of mobility dropped most dramatically for those moving to larger units so that by 2014 there was almost no variation in mobility rates across units of different sizes. Since then, rates of mobility have fluctuated similarly and non-systematically for households in all sizes of units so that mobility appeared to be unrelated to unit size among SHA households in 2019.
Figure 8. Percent of households in KCHA jurisdiction making one or
more move, by voucher type and year, 2015-2019.
Figure 9. Percent of households in SHA jurisdiction making one or
more move, by size of unit and year, 2015-2019.
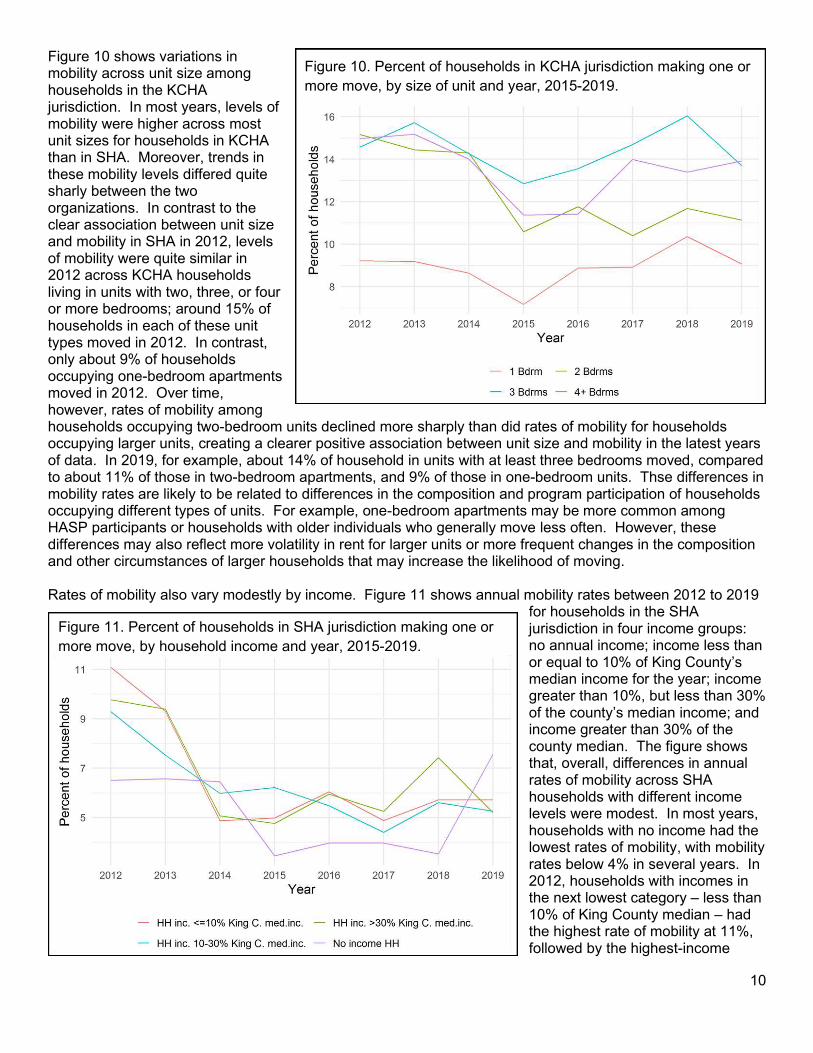
10
Figure 10 shows variations in mobility across unit size among households in the KCHA jurisdiction. In most years, levels of mobility were higher across most unit sizes for households in KCHA than in SHA. Moreover, trends in these mobility levels differed quite sharly between the two organizations. In contrast to the clear association between unit size and mobility in SHA in 2012, levels of mobility were quite similar in 2012 across KCHA households living in units with two, three, or four or more bedrooms; around 15% of households in each of these unit types moved in 2012. In contrast, only about 9% of households occupying one-bedroom apartments moved in 2012. Over time, however, rates of mobility among households occupying two-bedroom units declined more sharply than did rates of mobility for households occupying larger units, creating a clearer positive association between unit size and mobility in the latest years of data. In 2019, for example, about 14% of household in units with at least three bedrooms moved, compared to about 11% of those in two-bedroom apartments, and 9% of those in one-bedroom units. Thse differences in mobility rates are likely to be related to differences in the composition and program participation of households occupying different types of units. For example, one-bedroom apartments may be more common among HASP participants or households with older individuals who generally move less often. However, these differences may also reflect more volatility in rent for larger units or more frequent changes in the composition and other circumstances of larger households that may increase the likelihood of moving. Rates of mobility also vary modestly by income. Figure 11 shows annual mobility rates between 2012 to 2019
for households in the SHA jurisdiction in four income groups: no annual income; income less than or equal to 10% of King County’s median income for the year; income greater than 10%, but less than 30% of the county’s median income; and income greater than 30% of the county median. The figure shows that, overall, differences in annual rates of mobility across SHA households with different income levels were modest. In most years, households with no income had the lowest rates of mobility, with mobility rates below 4% in several years. In 2012, households with incomes in the next lowest category – less than 10% of King County median – had the highest rate of mobility at 11%, followed by the highest-income
Figure 10. Percent of households in KCHA jurisdiction making one or
more move, by size of unit and year, 2015-2019.
Figure 11. Percent of households in SHA jurisdiction making one or
more move, by household income and year, 2015-2019.
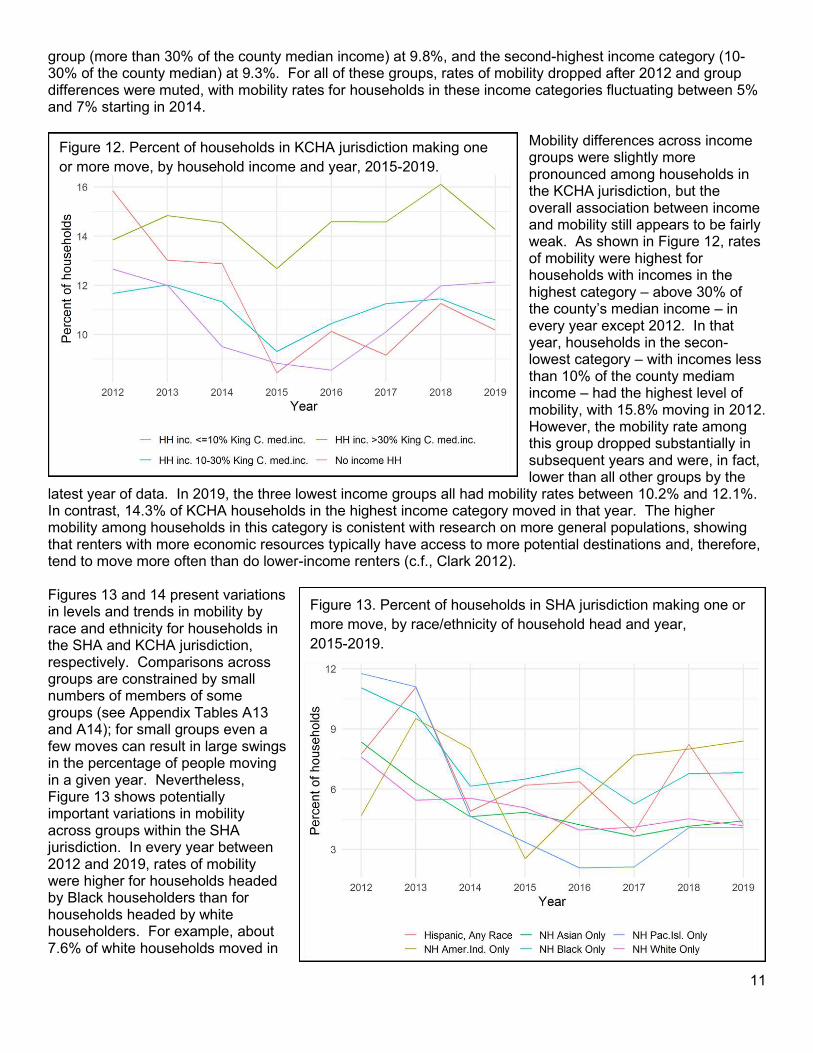
11
group (more than 30% of the county median income) at 9.8%, and the second-highest income category (10-30% of the county median) at 9.3%. For all of these groups, rates of mobility dropped after 2012 and group differences were muted, with mobility rates for households in these income categories fluctuating between 5% and 7% starting in 2014.
Mobility differences across income groups were slightly more pronounced among households in the KCHA jurisdiction, but the overall association between income and mobility still appears to be fairly weak. As shown in Figure 12, rates of mobility were highest for households with incomes in the highest category – above 30% of the county’s median income – in every year except 2012. In that year, households in the secon-lowest category – with incomes less than 10% of the county mediam income – had the highest level of mobility, with 15.8% moving in 2012. However, the mobility rate among this group dropped substantially in subsequent years and were, in fact, lower than all other groups by the
latest year of data. In 2019, the three lowest income groups all had mobility rates between 10.2% and 12.1%. In contrast, 14.3% of KCHA households in the highest income category moved in that year. The higher mobility among households in this category is conistent with research on more general populations, showing that renters with more economic resources typically have access to more potential destinations and, therefore, tend to move more often than do lower-income renters (c.f., Clark 2012). Figures 13 and 14 present variations in levels and trends in mobility by race and ethnicity for households in the SHA and KCHA jurisdiction, respectively. Comparisons across groups are constrained by small numbers of members of some groups (see Appendix Tables A13 and A14); for small groups even a few moves can result in large swings in the percentage of people moving in a given year. Nevertheless, Figure 13 shows potentially important variations in mobility across groups within the SHA jurisdiction. In every year between 2012 and 2019, rates of mobility were higher for households headed by Black householders than for households headed by white householders. For example, about 7.6% of white households moved in
Figure 12. Percent of households in KCHA jurisdiction making one
or more move, by household income and year, 2015-2019.
Figure 13. Percent of households in SHA jurisdiction making one or
more move, by race/ethnicity of household head and year,
2015-2019.
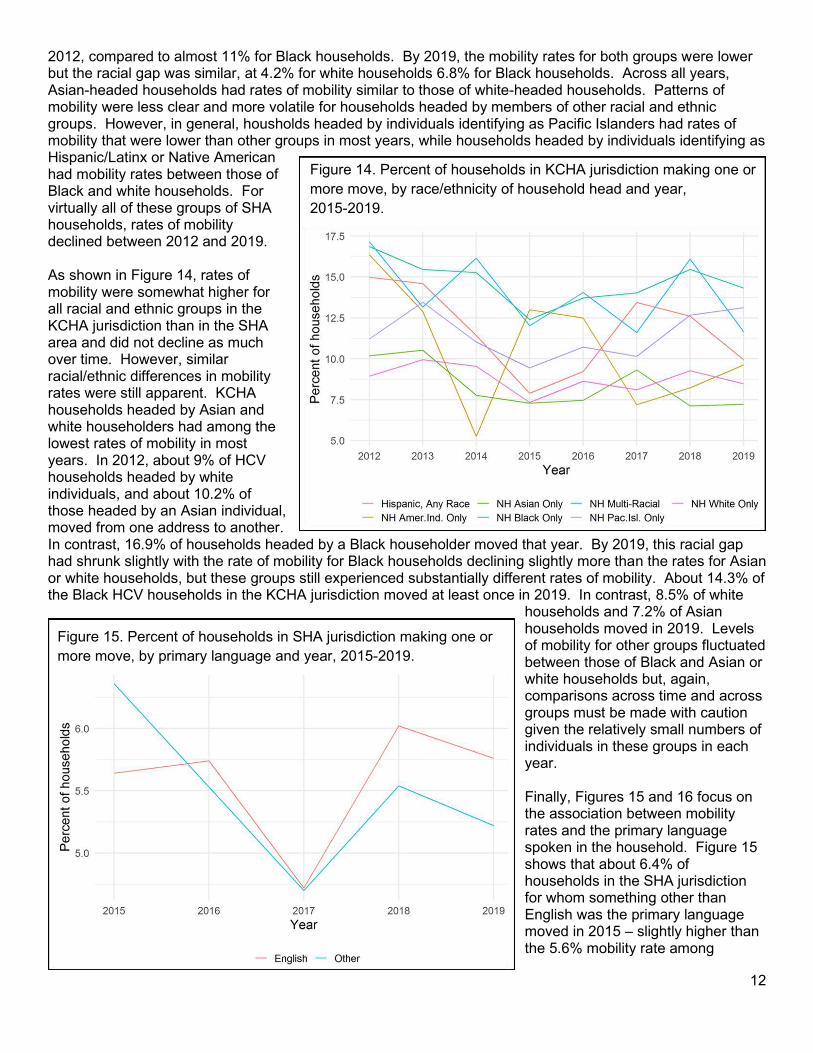
12
2012, compared to almost 11% for Black households. By 2019, the mobility rates for both groups were lower but the racial gap was similar, at 4.2% for white households 6.8% for Black households. Across all years, Asian-headed households had rates of mobility similar to those of white-headed households. Patterns of mobility were less clear and more volatile for households headed by members of other racial and ethnic groups. However, in general, housholds headed by individuals identifying as Pacific Islanders had rates of mobility that were lower than other groups in most years, while households headed by individuals identifying as Hispanic/Latinx or Native American had mobility rates between those of Black and white households. For virtually all of these groups of SHA households, rates of mobility declined between 2012 and 2019. As shown in Figure 14, rates of mobility were somewhat higher for all racial and ethnic groups in the KCHA jurisdiction than in the SHA area and did not decline as much over time. However, similar racial/ethnic differences in mobility rates were still apparent. KCHA households headed by Asian and white householders had among the lowest rates of mobility in most years. In 2012, about 9% of HCV households headed by white individuals, and about 10.2% of those headed by an Asian individual, moved from one address to another. In contrast, 16.9% of households headed by a Black householder moved that year. By 2019, this racial gap had shrunk slightly with the rate of mobility for Black households declining slightly more than the rates for Asian or white households, but these groups still experienced substantially different rates of mobility. About 14.3% of the Black HCV households in the KCHA jurisdiction moved at least once in 2019. In contrast, 8.5% of white
households and 7.2% of Asian households moved in 2019. Levels of mobility for other groups fluctuated between those of Black and Asian or white households but, again, comparisons across time and across groups must be made with caution given the relatively small numbers of individuals in these groups in each year. Finally, Figures 15 and 16 focus on the association between mobility rates and the primary language spoken in the household. Figure 15 shows that about 6.4% of households in the SHA jurisdiction for whom something other than English was the primary language moved in 2015 – slightly higher than the 5.6% mobility rate among
Figure 14. Percent of households in KCHA jurisdiction making one or
more move, by race/ethnicity of household head and year,
2015-2019.
Figure 15. Percent of households in SHA jurisdiction making one or
more move, by primary language and year, 2015-2019.
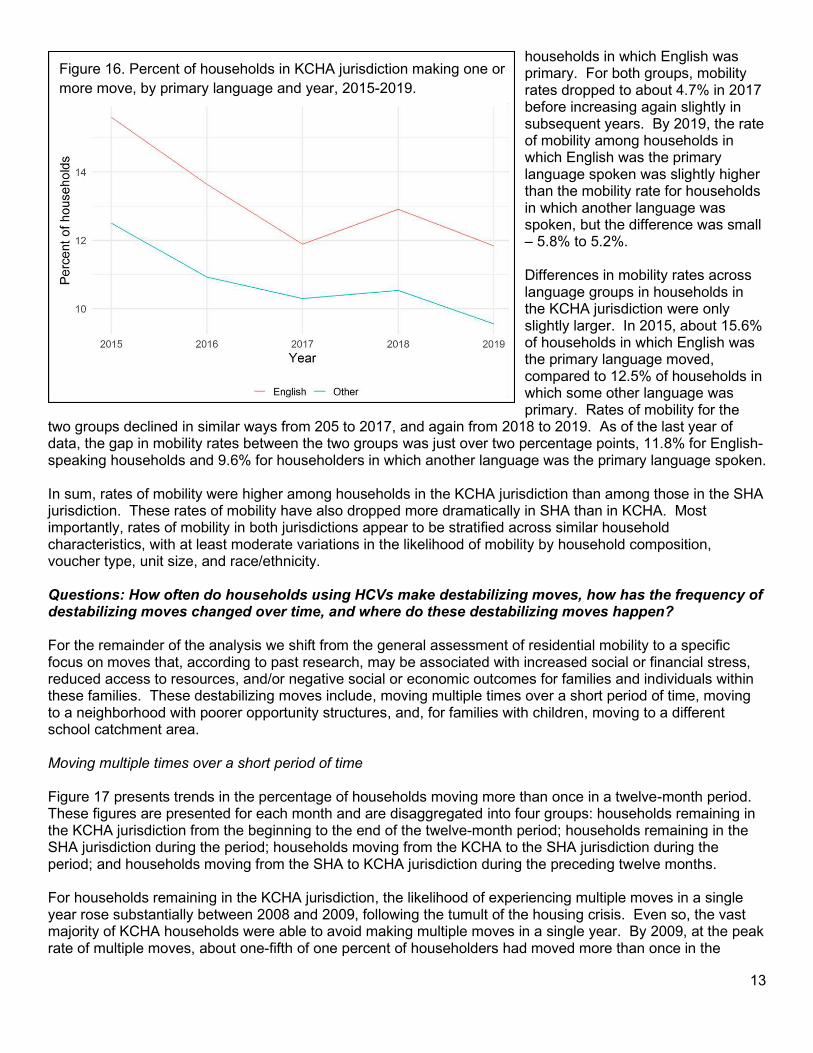
13
households in which English was primary. For both groups, mobility rates dropped to about 4.7% in 2017 before increasing again slightly in subsequent years. By 2019, the rate of mobility among households in which English was the primary language spoken was slightly higher than the mobility rate for households in which another language was spoken, but the difference was small – 5.8% to 5.2%. Differences in mobility rates across language groups in households in the KCHA jurisdiction were only slightly larger. In 2015, about 15.6% of households in which English was the primary language moved, compared to 12.5% of households in which some other language was primary. Rates of mobility for the
two groups declined in similar ways from 205 to 2017, and again from 2018 to 2019. As of the last year of data, the gap in mobility rates between the two groups was just over two percentage points, 11.8% for English-speaking households and 9.6% for householders in which another language was the primary language spoken. In sum, rates of mobility were higher among households in the KCHA jurisdiction than among those in the SHA jurisdiction. These rates of mobility have also dropped more dramatically in SHA than in KCHA. Most importantly, rates of mobility in both jurisdictions appear to be stratified across similar household characteristics, with at least moderate variations in the likelihood of mobility by household composition, voucher type, unit size, and race/ethnicity. Questions: How often do households using HCVs make destabilizing moves, how has the frequency of destabilizing moves changed over time, and where do these destabilizing moves happen? For the remainder of the analysis we shift from the general assessment of residential mobility to a specific focus on moves that, according to past research, may be associated with increased social or financial stress, reduced access to resources, and/or negative social or economic outcomes for families and individuals within these families. These destabilizing moves include, moving multiple times over a short period of time, moving to a neighborhood with poorer opportunity structures, and, for families with children, moving to a different school catchment area. Moving multiple times over a short period of time Figure 17 presents trends in the percentage of households moving more than once in a twelve-month period. These figures are presented for each month and are disaggregated into four groups: households remaining in the KCHA jurisdiction from the beginning to the end of the twelve-month period; households remaining in the SHA jurisdiction during the period; households moving from the KCHA to the SHA jurisdiction during the period; and households moving from the SHA to KCHA jurisdiction during the preceding twelve months. For households remaining in the KCHA jurisdiction, the likelihood of experiencing multiple moves in a single year rose substantially between 2008 and 2009, following the tumult of the housing crisis. Even so, the vast majority of KCHA households were able to avoid making multiple moves in a single year. By 2009, at the peak rate of multiple moves, about one-fifth of one percent of householders had moved more than once in the
Figure 16. Percent of households in KCHA jurisdiction making one or
more move, by primary language and year, 2015-2019.
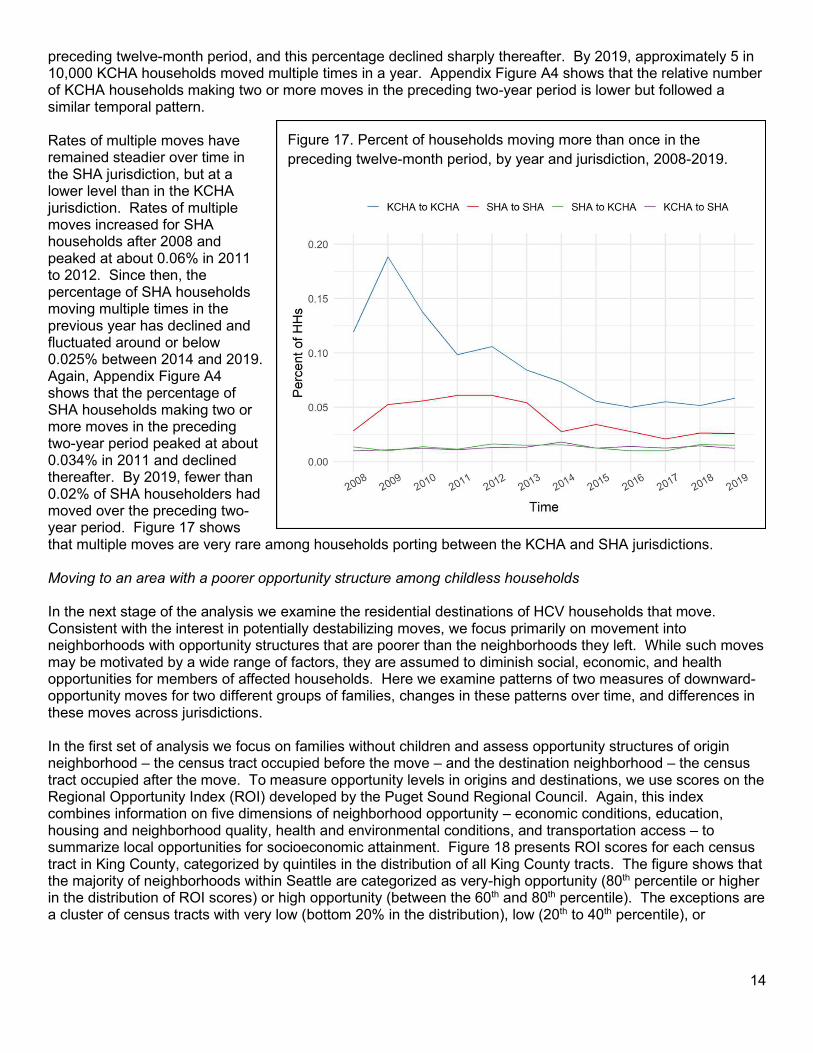
14
preceding twelve-month period, and this percentage declined sharply thereafter. By 2019, approximately 5 in 10,000 KCHA households moved multiple times in a year. Appendix Figure A4 shows that the relative number of KCHA households making two or more moves in the preceding two-year period is lower but followed a similar temporal pattern. Rates of multiple moves have remained steadier over time in the SHA jurisdiction, but at a lower level than in the KCHA jurisdiction. Rates of multiple moves increased for SHA households after 2008 and peaked at about 0.06% in 2011 to 2012. Since then, the percentage of SHA households moving multiple times in the previous year has declined and fluctuated around or below 0.025% between 2014 and 2019. Again, Appendix Figure A4 shows that the percentage of SHA households making two or more moves in the preceding two-year period peaked at about 0.034% in 2011 and declined thereafter. By 2019, fewer than 0.02% of SHA householders had moved over the preceding two-year period. Figure 17 shows that multiple moves are very rare among households porting between the KCHA and SHA jurisdictions. Moving to an area with a poorer opportunity structure among childless households In the next stage of the analysis we examine the residential destinations of HCV households that move. Consistent with the interest in potentially destabilizing moves, we focus primarily on movement into neighborhoods with opportunity structures that are poorer than the neighborhoods they left. While such moves may be motivated by a wide range of factors, they are assumed to diminish social, economic, and health opportunities for members of affected households. Here we examine patterns of two measures of downward-opportunity moves for two different groups of families, changes in these patterns over time, and differences in these moves across jurisdictions. In the first set of analysis we focus on families without children and assess opportunity structures of origin neighborhood – the census tract occupied before the move – and the destination neighborhood – the census tract occupied after the move. To measure opportunity levels in origins and destinations, we use scores on the Regional Opportunity Index (ROI) developed by the Puget Sound Regional Council. Again, this index combines information on five dimensions of neighborhood opportunity – economic conditions, education, housing and neighborhood quality, health and environmental conditions, and transportation access – to summarize local opportunities for socioeconomic attainment. Figure 18 presents ROI scores for each census tract in King County, categorized by quintiles in the distribution of all King County tracts. The figure shows that the majority of neighborhoods within Seattle are categorized as very-high opportunity (80th percentile or higher in the distribution of ROI scores) or high opportunity (between the 60th and 80th percentile). The exceptions are a cluster of census tracts with very low (bottom 20% in the distribution), low (20th to 40th percentile), or
Figure 17. Percent of households moving more than once in the
preceding twelve-month period, by year and jurisdiction, 2008-2019.
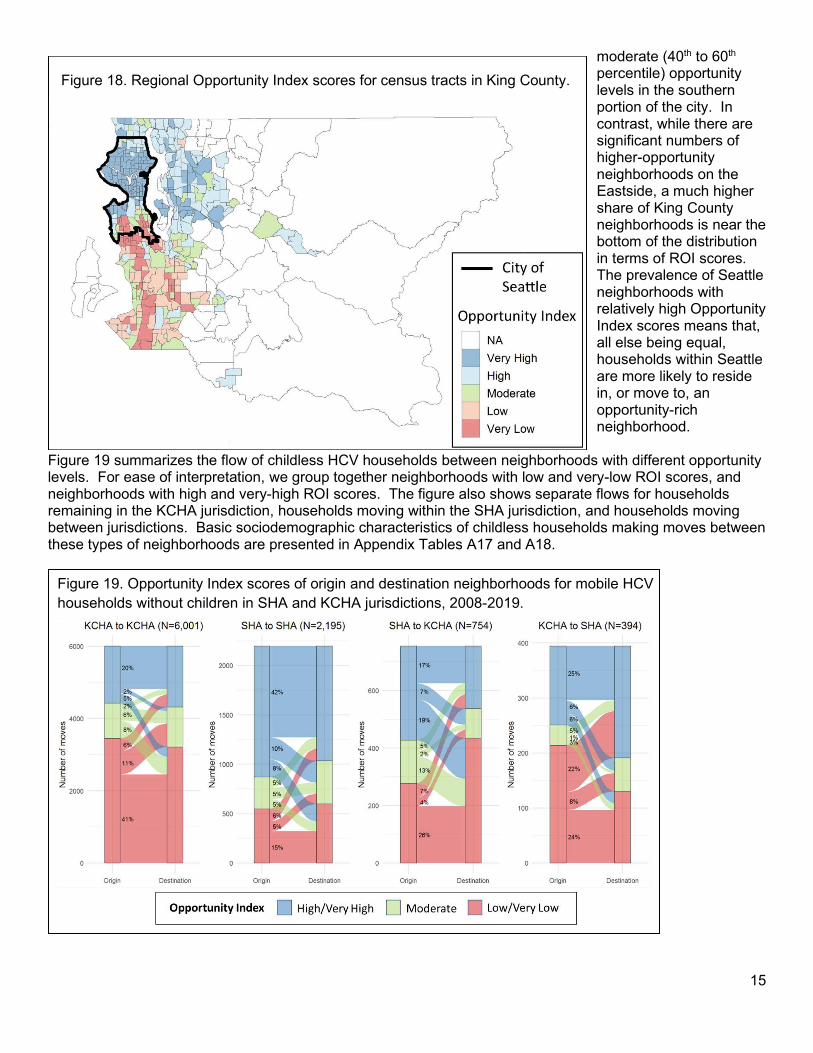
15
moderate (40th to 60th percentile) opportunity levels in the southern portion of the city. In contrast, while there are significant numbers of higher-opportunity neighborhoods on the Eastside, a much higher share of King County neighborhoods is near the bottom of the distribution in terms of ROI scores. The prevalence of Seattle neighborhoods with relatively high Opportunity Index scores means that, all else being equal, households within Seattle are more likely to reside in, or move to, an opportunity-rich neighborhood.
Figure 19 summarizes the flow of childless HCV households between neighborhoods with different opportunity levels. For ease of interpretation, we group together neighborhoods with low and very-low ROI scores, and neighborhoods with high and very-high ROI scores. The figure also shows separate flows for households remaining in the KCHA jurisdiction, households moving within the SHA jurisdiction, and households moving between jurisdictions. Basic sociodemographic characteristics of childless households making moves between these types of neighborhoods are presented in Appendix Tables A17 and A18.
Figure 18. Regional Opportunity Index scores for census tracts in King County.
Figure 19. Opportunity Index scores of origin and destination neighborhoods for mobile HCV
households without children in SHA and KCHA jurisdictions, 2008-2019.
16
Among the 6,001 moves occurring within the KCHA jurisdiction, 27% originated in a high- or very-high-opportunity neighborhood and, among these, most childless households moved to another high-opportunity area. Only 7% of all moves were from a higher-opportunity to a moderate- or low-/very-low-opportunity area. In contrast, those within-KCHA moves originating in a moderate-opportunity area were just as likely to end in a lower-opportunity neighborhood than in a moderate- or higher-opportunity area. Finally, 58% of all moves within KCHA originated in a low or very-low-opportunity neighborhood, and in the vast majority of these moves the household moved to another low-/very-low-opportunity neighborhood. This tendency for childless households to move laterally between neighborhoods with similar ROI scores likely reflects, in part, the geographic clustering of neighborhoods with similar opportunity structures and the fact that most moves occur over relatively short geographic distances (Crowder and South 2008). Among the smaller number (N=2,195) of moves occurring within the SHA jurisdiction, a much higher share – 60% of all moves – originated in tracts with high or very-high ROI scores. Again, this reflects the higher concentration of higher-opportunity neighborhoods within the city of Seattle. Moreover, 42% of moves within the SHA jurisdiction were moves between higher-opportunity neighborhoods, 5% were from moderate- to higher-opportunity neighborhoods, and 6% were from lower- to higher-opportunity neighborhoods. At the same time, despite a relative paucity of moderate- and lower-opportunity neighborhoods in the Seattle area, there was still considerable downward mobility of SHA households without children; 10% of all moves within the SHA jurisdiction were from higher-opportunity to moderate-opportunity neighborhoods and 8% were from higher-opportunity to neighborhoods with low or very-low ROI scores. Another 5% of moves were from moderate- to lower-opportunity neighborhoods. Patterns of mobility for childless households moving between SHA and KCHA also reflect the relative distribution of lower-, moderate-, and higher-opportunity neighborhoods in the two jurisdictions. Among the 754 household moves from SHA to KCHA, more than half moved into a low- or very-low-opportunity neighborhood. About 7% of the moves were from a high- or very-high-opportunity neighborhood in the SHA jurisdiction into a moderate-opportunity neighborhood in SHA, and 19% were from a high- or very-high-opportunity neighborhood to a low- or very-low opportunity neighborhood in the KCHA jurisdiction. Approximately two-thirds of the childless households moving out of a moderate-opportunity neighborhood in SHA to KCHA ended up in a neighborhood with a low or very low ROI score. In contrast, more than half of the 394 households moving from the KCHA jurisdiction to the SHA jurisdiction ended up in a Seattle neighborhood with a high or very high level of opportunity. About 25% of moves were from a high-opportunity neighborhood in KCHA to a high-opportunity neighborhood in SHA, but 5% were moves from a moderate-opportunity neighborhood to a higher-opportunity neighborhood, and 22% were moves from a KCHA with a low or very-low level of opportunity to a Seattle neighborhood with high or very-high opportunity. Downward mobility was much less common among those moving from KCHA to SHA; only 15% of these moves involved households moving into a neighborhood with an ROI score lower than in their origin tract, including 6% who moved from high- or very-high-opportunity areas in KCHA to a moderate-opportunity neighborhood in SHA. Given the relative paucity of low- or very-low-opportunity neighborhoods in SHA, it is perhaps not surprising that only 9% of all moves from KCHA to SHA involved a household moving from a neighborhood with a moderate, high, or very high ROI score to a neighborhood with a low or very low opportunity score. Perhaps the most prominent pattern emerging from Figure 19 is the high level of lateral mobility from neighborhood origins to destinations. With few exceptions the most likely residential outcome is for mobile households to move into a neighborhood with an opportunity structure similar to the neighborhood they left. For example, among households moving within KCHA, the percentage moving from a low-opportunity neighborhood to another low-opportunity area (41% of all moves) is over twice as large as the percentage moving from a low-opportunity neighborhood to any other type of destination (17% of all moves). Similarly, SHA and KCHA households moving from high-opportunity neighborhoods are more than twice as likely to move to another high-opportunity neighborhood than to any other type of destination. This tendency toward lateral mobility likely reflects two complimentary dynamics, both highlighted in emerging theories of residential stratification (Crowder and Krysan 2016; Krysan and Crowder 2017). First, origins and destinations tend to be
17
similar because most residential moves cover fairly short distances, often into an adjacent neighborhoods which, given the geographic clustering of similar neighborhoods, tend to have characteristics similar to the origin neighborhood. Second, the tendency for households to move to nearby neighborhoods and other areas with similar compositional characteristics likely reflects the development of social networks and daily activities that generate the greatest familiarity with neighborhoods similar to the origin. Regardless of the source, the strong tendency for households to move between similar neighborhoods has important programmatic implications, especially in relation to efforts to improve access to high-opportunity neighborhoods. Figures 20 and 21 provide summaries of trends in mobility between neighborhoods with different opportunity structures for residential moves occurring among childless households remaining in the KCHA jurisdiction (Figure 20) and those moves occurring within the SHA jurisdiction (Figure 21). To assess these trends, we focus on flows between neighborhood origins and destinations for moves occurring within three equal time periods: 2008 to 2011, 2012 to 2015, and 2016 to 2019. While the number of moves within the KCHA jurisdiction differed across these time periods – declining from 2,149 in 2008-2011 to 1,803 in 2012-2015 before rising again to 2,049 in 2016-2019 – the relative size of flows between different types of neighborhoods remained remarkably stable. For example, in 2008-2011, about 12% of all moves by childless HCV households in the KCHA jurisdiction involved mobility from neighborhoods with a low or very-low opportunity score to a neighborhood in the moderate-opportunity range. This type of move became slightly less common in the 2012-2015 period – dropping to 9% of all moves – but this percentage increased again to 12% by 2016-2019. Moreover, the percentage of moves that involved relocation from a very-low- or low-opportunity neighborhood to a high- or very-high-opportunity neighborhood dropped from 5% to 4% between the first two time periods but rebounded to 8% by the 2016-2019 period. More important, given our focus on destabilizing moves, is the fact that downward mobility, in which the destination has a poorer opportunity structure than the origin area, did not change appreciably over time for moves within the KCHA jurisdiction. For example, 7% of all moves by childless households between 2012 and 2015 were from moderate- to lower-opportunity areas, and 4% were from high- or very-high-opportunity places to low- or very-low-opportunity areas. These figures were, respectively, 9% and 5% in the 2012-2015 period, and 8% and 4% in the 2016-2019 period.
Figure 20. Regional Opportunity Index scores of origin and destination tracts for moves
occurring within the KCHA jurisdiction, by period. Childless HCV households, 2008-2019.
18
Patterns of downward mobility among childless households remaining in the SHA jurisdiction were also fairly stable over time, but also showed some potentially important reduction in the latest period. For example, about 5% of all moves within the SHA jurisdiction in both the 2008-2011 and the 2012-2015 periods were from moderate-opportunity neighborhoods to low- or very-low-opportunity neighborhoods, and this percentage dropped just slightly, to 4%, by the 2016-2019 period. More pronounced was the change in downward mobility out of higher-opportunity neighborhoods. In 2008-2011, about 10% of all moves were from higher-opportunity to moderate-opportunity neighborhoods and this rate increased slightly, to 12%, in the 2012-2015 period. In the 2016-2019 period, this type of downward mobility had declined to 9% of all moves by childless SHA households. In contrast, in 2016-2019, 46% of all moves for childless SHA households were from one high-opportunity neighborhood to another, up from 40% in 2012-2105 and 41% in 2008-2011. Thus, the overall decline in mobility among childless SHA households – from 885 moves in 2008-2011 to 547 moves in 2016-2019 – was accompanied by an increasing prevalence of lateral moves. Moving to an area with a poorer opportunity structure among households with children We now turn to a parallel analysis of neighborhood flows for families with children remaining in the same PHA jurisdiction. Given the focus on households with children, we shift to the use of a measure of neighborhood opportunity related to child outcomes. Specifically, in this segment we measure neighborhood opportunity structures using Opportunity Atlas (OA) scores produced through the collaboration of Opportunity Insights and the U.S. Census Bureau. Rather than measuring specific characteristics of neighborhoods, OA scores are reflective of the adult economic attainment of people who lived in the neighborhood as children.
Figure 21. Regional Opportunity Index scores of origin and destination tracts for moves
occurring within the SHA jurisdiction, by period. Childless HCV households, 2008-2019.
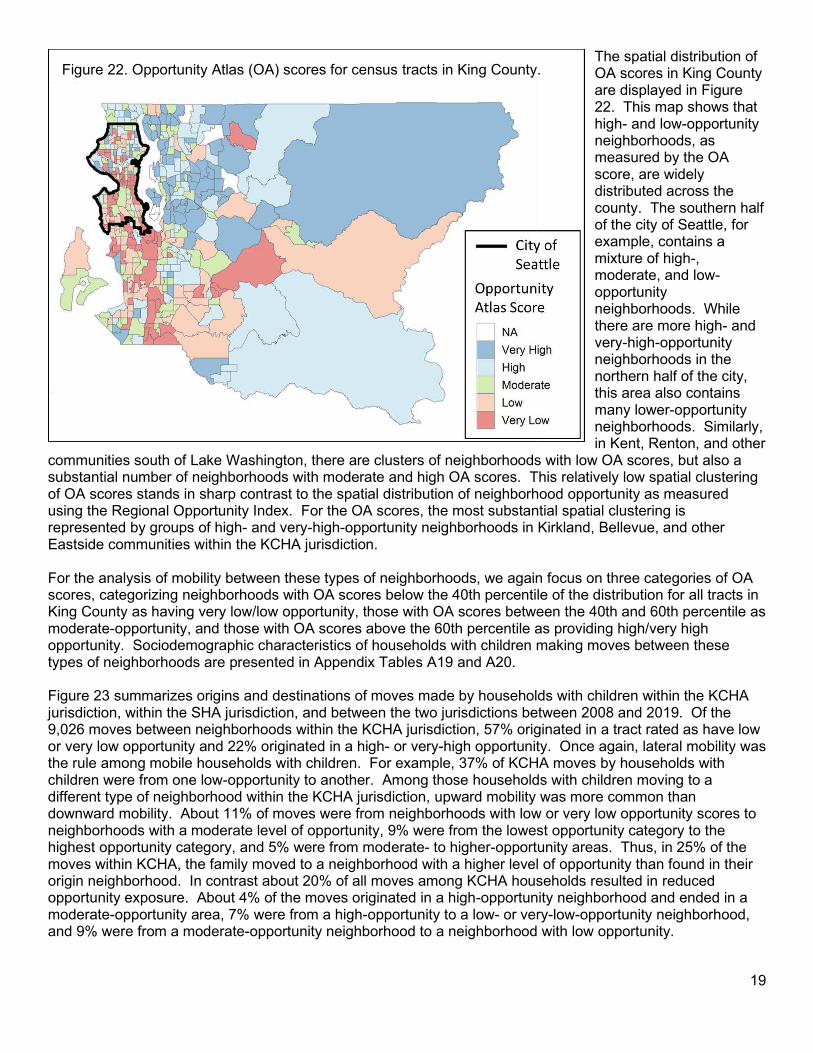
19
The spatial distribution of OA scores in King County are displayed in Figure 22. This map shows that high- and low-opportunity neighborhoods, as measured by the OA score, are widely distributed across the county. The southern half of the city of Seattle, for example, contains a mixture of high-, moderate, and low-opportunity neighborhoods. While there are more high- and very-high-opportunity neighborhoods in the northern half of the city, this area also contains many lower-opportunity neighborhoods. Similarly, in Kent, Renton, and other
communities south of Lake Washington, there are clusters of neighborhoods with low OA scores, but also a substantial number of neighborhoods with moderate and high OA scores. This relatively low spatial clustering of OA scores stands in sharp contrast to the spatial distribution of neighborhood opportunity as measured using the Regional Opportunity Index. For the OA scores, the most substantial spatial clustering is represented by groups of high- and very-high-opportunity neighborhoods in Kirkland, Bellevue, and other Eastside communities within the KCHA jurisdiction. For the analysis of mobility between these types of neighborhoods, we again focus on three categories of OA scores, categorizing neighborhoods with OA scores below the 40th percentile of the distribution for all tracts in King County as having very low/low opportunity, those with OA scores between the 40th and 60th percentile as moderate-opportunity, and those with OA scores above the 60th percentile as providing high/very high opportunity. Sociodemographic characteristics of households with children making moves between these types of neighborhoods are presented in Appendix Tables A19 and A20. Figure 23 summarizes origins and destinations of moves made by households with children within the KCHA jurisdiction, within the SHA jurisdiction, and between the two jurisdictions between 2008 and 2019. Of the 9,026 moves between neighborhoods within the KCHA jurisdiction, 57% originated in a tract rated as have low or very low opportunity and 22% originated in a high- or very-high opportunity. Once again, lateral mobility was the rule among mobile households with children. For example, 37% of KCHA moves by households with children were from one low-opportunity to another. Among those households with children moving to a different type of neighborhood within the KCHA jurisdiction, upward mobility was more common than downward mobility. About 11% of moves were from neighborhoods with low or very low opportunity scores to neighborhoods with a moderate level of opportunity, 9% were from the lowest opportunity category to the highest opportunity category, and 5% were from moderate- to higher-opportunity areas. Thus, in 25% of the moves within KCHA, the family moved to a neighborhood with a higher level of opportunity than found in their origin neighborhood. In contrast about 20% of all moves among KCHA households resulted in reduced opportunity exposure. About 4% of the moves originated in a high-opportunity neighborhood and ended in a moderate-opportunity area, 7% were from a high-opportunity to a low- or very-low-opportunity neighborhood, and 9% were from a moderate-opportunity neighborhood to a neighborhood with low opportunity.
Figure 22. Opportunity Atlas (OA) scores for census tracts in King County.
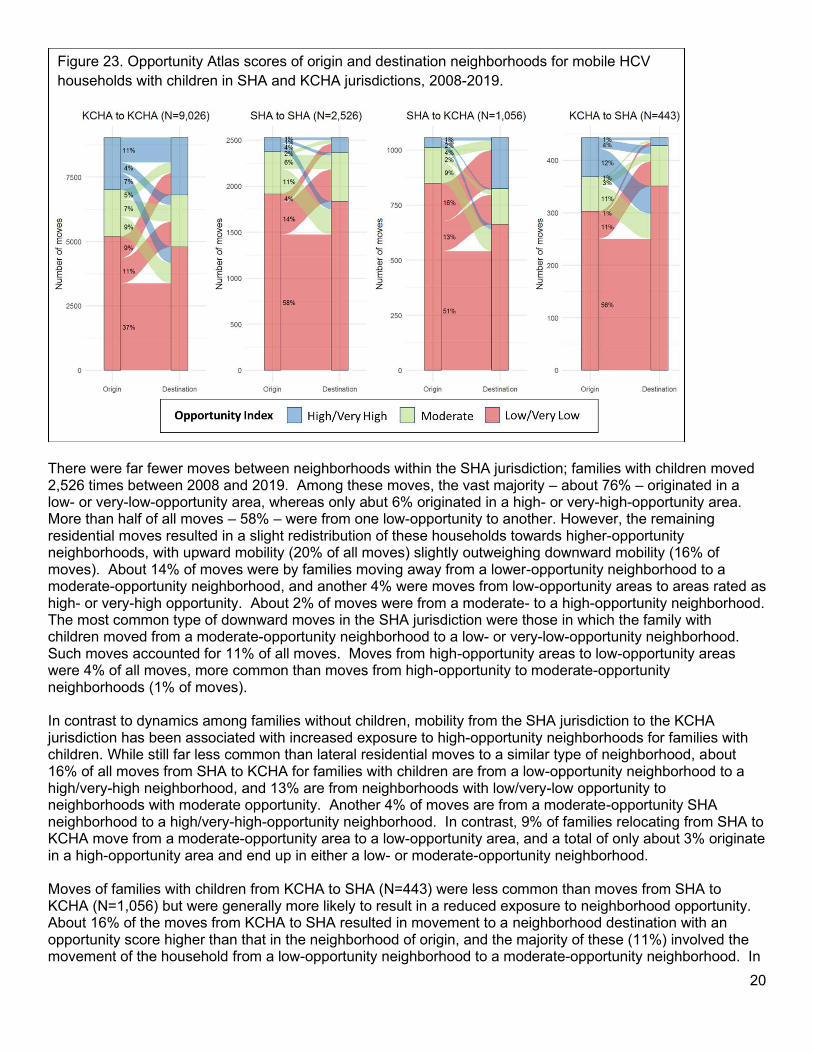
20
There were far fewer moves between neighborhoods within the SHA jurisdiction; families with children moved 2,526 times between 2008 and 2019. Among these moves, the vast majority – about 76% – originated in a low- or very-low-opportunity area, whereas only abut 6% originated in a high- or very-high-opportunity area. More than half of all moves – 58% – were from one low-opportunity to another. However, the remaining residential moves resulted in a slight redistribution of these households towards higher-opportunity neighborhoods, with upward mobility (20% of all moves) slightly outweighing downward mobility (16% of moves). About 14% of moves were by families moving away from a lower-opportunity neighborhood to a moderate-opportunity neighborhood, and another 4% were moves from low-opportunity areas to areas rated as high- or very-high opportunity. About 2% of moves were from a moderate- to a high-opportunity neighborhood. The most common type of downward moves in the SHA jurisdiction were those in which the family with children moved from a moderate-opportunity neighborhood to a low- or very-low-opportunity neighborhood. Such moves accounted for 11% of all moves. Moves from high-opportunity areas to low-opportunity areas were 4% of all moves, more common than moves from high-opportunity to moderate-opportunity neighborhoods (1% of moves). In contrast to dynamics among families without children, mobility from the SHA jurisdiction to the KCHA jurisdiction has been associated with increased exposure to high-opportunity neighborhoods for families with children. While still far less common than lateral residential moves to a similar type of neighborhood, about 16% of all moves from SHA to KCHA for families with children are from a low-opportunity neighborhood to a high/very-high neighborhood, and 13% are from neighborhoods with low/very-low opportunity to neighborhoods with moderate opportunity. Another 4% of moves are from a moderate-opportunity SHA neighborhood to a high/very-high-opportunity neighborhood. In contrast, 9% of families relocating from SHA to KCHA move from a moderate-opportunity area to a low-opportunity area, and a total of only about 3% originate in a high-opportunity area and end up in either a low- or moderate-opportunity neighborhood. Moves of families with children from KCHA to SHA (N=443) were less common than moves from SHA to KCHA (N=1,056) but were generally more likely to result in a reduced exposure to neighborhood opportunity. About 16% of the moves from KCHA to SHA resulted in movement to a neighborhood destination with an opportunity score higher than that in the neighborhood of origin, and the majority of these (11%) involved the movement of the household from a low-opportunity neighborhood to a moderate-opportunity neighborhood. In
Figure 23. Opportunity Atlas scores of origin and destination neighborhoods for mobile HCV
households with children in SHA and KCHA jurisdictions, 2008-2019.
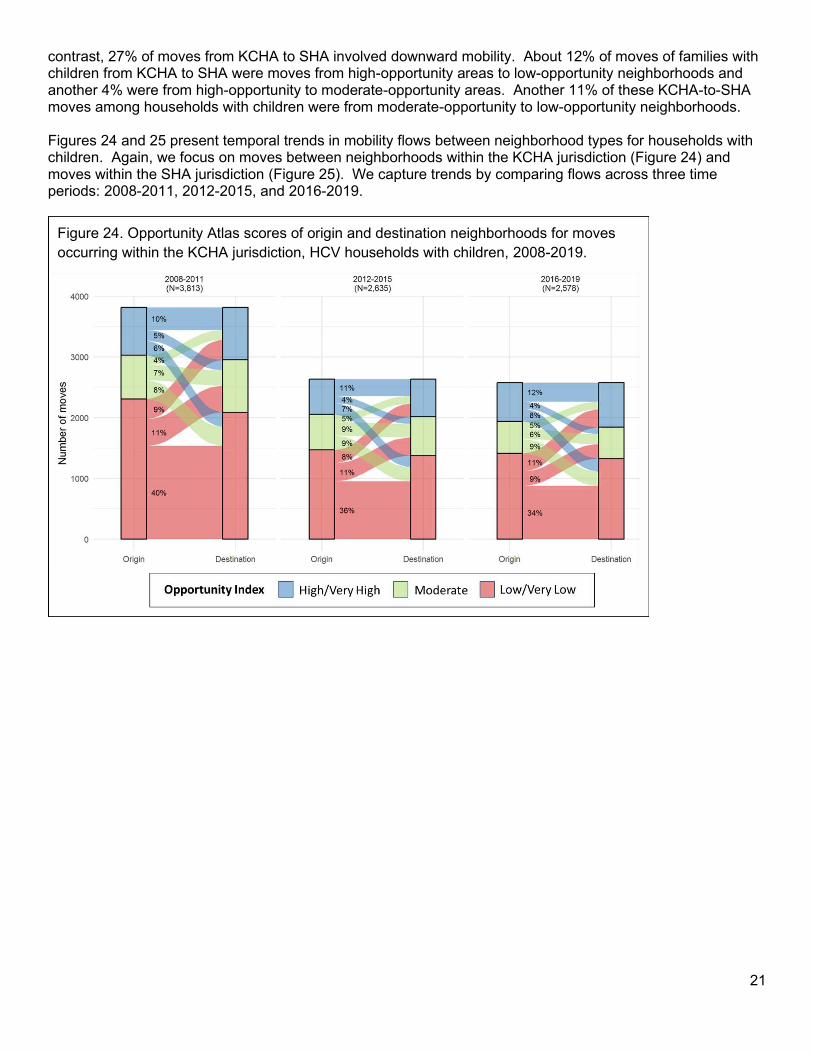
21
contrast, 27% of moves from KCHA to SHA involved downward mobility. About 12% of moves of families with children from KCHA to SHA were moves from high-opportunity areas to low-opportunity neighborhoods and another 4% were from high-opportunity to moderate-opportunity areas. Another 11% of these KCHA-to-SHA moves among households with children were from moderate-opportunity to low-opportunity neighborhoods. Figures 24 and 25 present temporal trends in mobility flows between neighborhood types for households with children. Again, we focus on moves between neighborhoods within the KCHA jurisdiction (Figure 24) and moves within the SHA jurisdiction (Figure 25). We capture trends by comparing flows across three time periods: 2008-2011, 2012-2015, and 2016-2019.
Figure 24. Opportunity Atlas scores of origin and destination neighborhoods for moves
occurring within the KCHA jurisdiction, HCV households with children, 2008-2019.
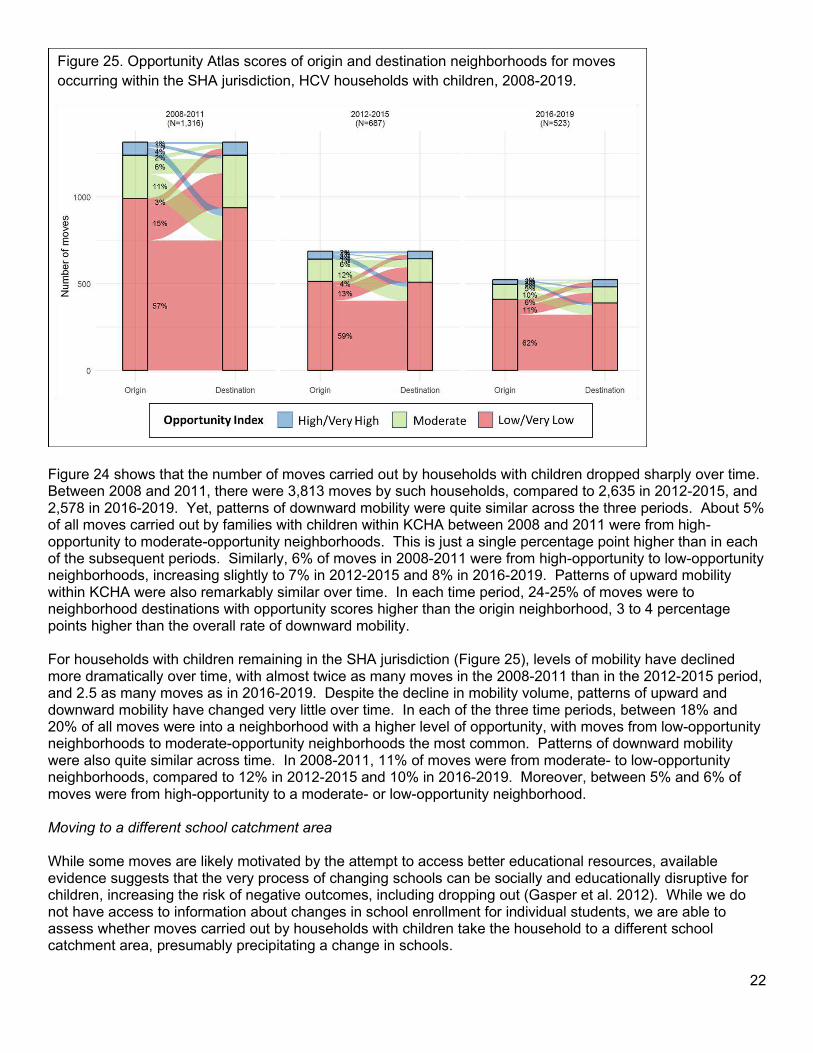
22
Figure 24 shows that the number of moves carried out by households with children dropped sharply over time. Between 2008 and 2011, there were 3,813 moves by such households, compared to 2,635 in 2012-2015, and 2,578 in 2016-2019. Yet, patterns of downward mobility were quite similar across the three periods. About 5% of all moves carried out by families with children within KCHA between 2008 and 2011 were from high-opportunity to moderate-opportunity neighborhoods. This is just a single percentage point higher than in each of the subsequent periods. Similarly, 6% of moves in 2008-2011 were from high-opportunity to low-opportunity neighborhoods, increasing slightly to 7% in 2012-2015 and 8% in 2016-2019. Patterns of upward mobility within KCHA were also remarkably similar over time. In each time period, 24-25% of moves were to neighborhood destinations with opportunity scores higher than the origin neighborhood, 3 to 4 percentage points higher than the overall rate of downward mobility. For households with children remaining in the SHA jurisdiction (Figure 25), levels of mobility have declined more dramatically over time, with almost twice as many moves in the 2008-2011 than in the 2012-2015 period, and 2.5 as many moves as in 2016-2019. Despite the decline in mobility volume, patterns of upward and downward mobility have changed very little over time. In each of the three time periods, between 18% and 20% of all moves were into a neighborhood with a higher level of opportunity, with moves from low-opportunity neighborhoods to moderate-opportunity neighborhoods the most common. Patterns of downward mobility were also quite similar across time. In 2008-2011, 11% of moves were from moderate- to low-opportunity neighborhoods, compared to 12% in 2012-2015 and 10% in 2016-2019. Moreover, between 5% and 6% of moves were from high-opportunity to a moderate- or low-opportunity neighborhood. Moving to a different school catchment area While some moves are likely motivated by the attempt to access better educational resources, available evidence suggests that the very process of changing schools can be socially and educationally disruptive for children, increasing the risk of negative outcomes, including dropping out (Gasper et al. 2012). While we do not have access to information about changes in school enrollment for individual students, we are able to assess whether moves carried out by households with children take the household to a different school catchment area, presumably precipitating a change in schools.
Figure 25. Opportunity Atlas scores of origin and destination neighborhoods for moves
occurring within the SHA jurisdiction, HCV households with children, 2008-2019.
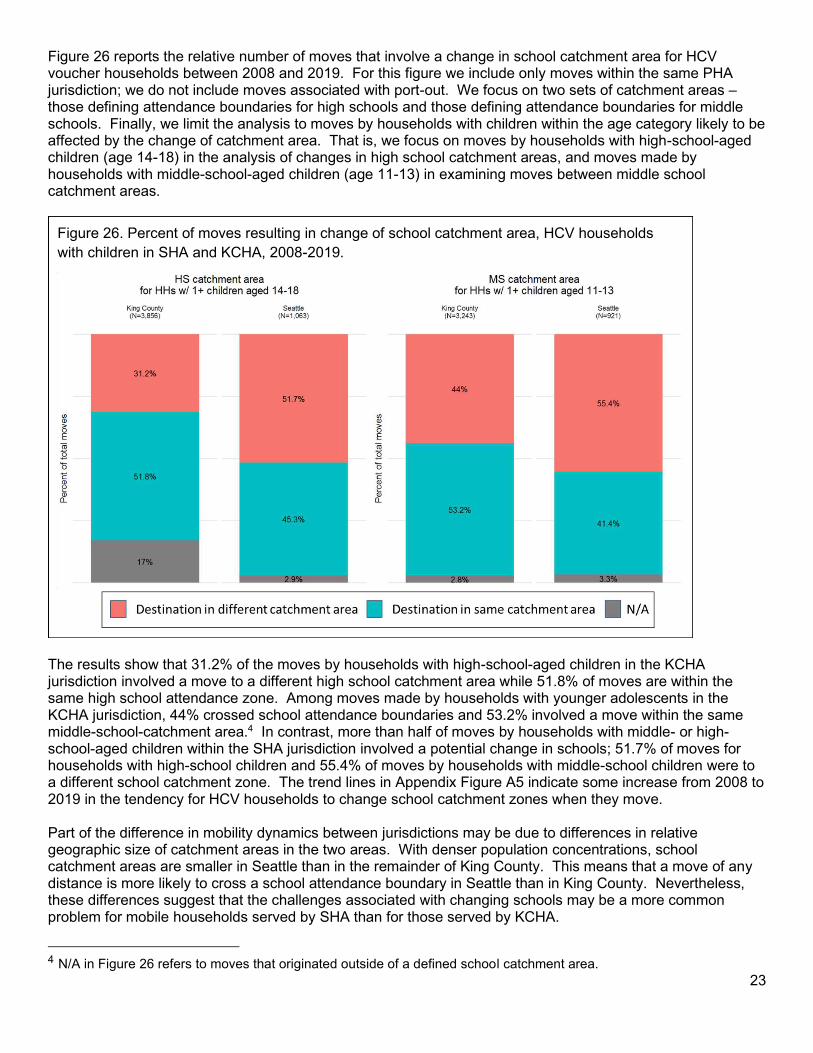
23
Figure 26 reports the relative number of moves that involve a change in school catchment area for HCV voucher households between 2008 and 2019. For this figure we include only moves within the same PHA jurisdiction; we do not include moves associated with port-out. We focus on two sets of catchment areas – those defining attendance boundaries for high schools and those defining attendance boundaries for middle schools. Finally, we limit the analysis to moves by households with children within the age category likely to be affected by the change of catchment area. That is, we focus on moves by households with high-school-aged children (age 14-18) in the analysis of changes in high school catchment areas, and moves made by households with middle-school-aged children (age 11-13) in examining moves between middle school catchment areas.
The results show that 31.2% of the moves by households with high-school-aged children in the KCHA jurisdiction involved a move to a different high school catchment area while 51.8% of moves are within the same high school attendance zone. Among moves made by households with younger adolescents in the KCHA jurisdiction, 44% crossed school attendance boundaries and 53.2% involved a move within the same middle-school-catchment area.4 In contrast, more than half of moves by households with middle- or high-school-aged children within the SHA jurisdiction involved a potential change in schools; 51.7% of moves for households with high-school children and 55.4% of moves by households with middle-school children were to a different school catchment zone. The trend lines in Appendix Figure A5 indicate some increase from 2008 to 2019 in the tendency for HCV households to change school catchment zones when they move. Part of the difference in mobility dynamics between jurisdictions may be due to differences in relative geographic size of catchment areas in the two areas. With denser population concentrations, school catchment areas are smaller in Seattle than in the remainder of King County. This means that a move of any distance is more likely to cross a school attendance boundary in Seattle than in King County. Nevertheless, these differences suggest that the challenges associated with changing schools may be a more common problem for mobile households served by SHA than for those served by KCHA.
4 N/A in Figure 26 refers to moves that originated outside of a defined school catchment area.
Figure 26. Percent of moves resulting in change of school catchment area, HCV households
with children in SHA and KCHA, 2008-2019.
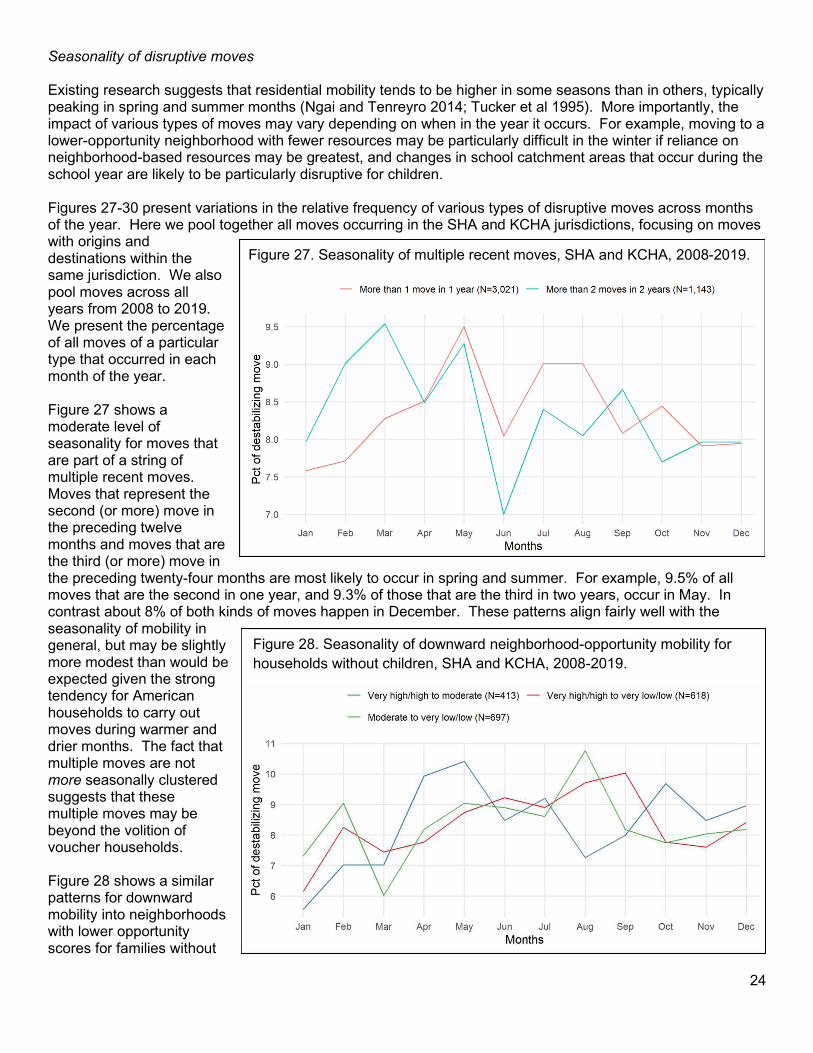
24
Seasonality of disruptive moves Existing research suggests that residential mobility tends to be higher in some seasons than in others, typically peaking in spring and summer months (Ngai and Tenreyro 2014; Tucker et al 1995). More importantly, the impact of various types of moves may vary depending on when in the year it occurs. For example, moving to a lower-opportunity neighborhood with fewer resources may be particularly difficult in the winter if reliance on neighborhood-based resources may be greatest, and changes in school catchment areas that occur during the school year are likely to be particularly disruptive for children. Figures 27-30 present variations in the relative frequency of various types of disruptive moves across months of the year. Here we pool together all moves occurring in the SHA and KCHA jurisdictions, focusing on moves with origins and destinations within the same jurisdiction. We also pool moves across all years from 2008 to 2019. We present the percentage of all moves of a particular type that occurred in each month of the year. Figure 27 shows a moderate level of seasonality for moves that are part of a string of multiple recent moves. Moves that represent the second (or more) move in the preceding twelve months and moves that are the third (or more) move in the preceding twenty-four months are most likely to occur in spring and summer. For example, 9.5% of all moves that are the second in one year, and 9.3% of those that are the third in two years, occur in May. In contrast about 8% of both kinds of moves happen in December. These patterns align fairly well with the seasonality of mobility in general, but may be slightly more modest than would be expected given the strong tendency for American households to carry out moves during warmer and drier months. The fact that multiple moves are not more seasonally clustered suggests that these multiple moves may be beyond the volition of voucher households. Figure 28 shows a similar patterns for downward mobility into neighborhoods with lower opportunity scores for families without
Figure 27. Seasonality of multiple recent moves, SHA and KCHA, 2008-2019.
Figure 28. Seasonality of downward neighborhood-opportunity mobility for
households without children, SHA and KCHA, 2008-2019.
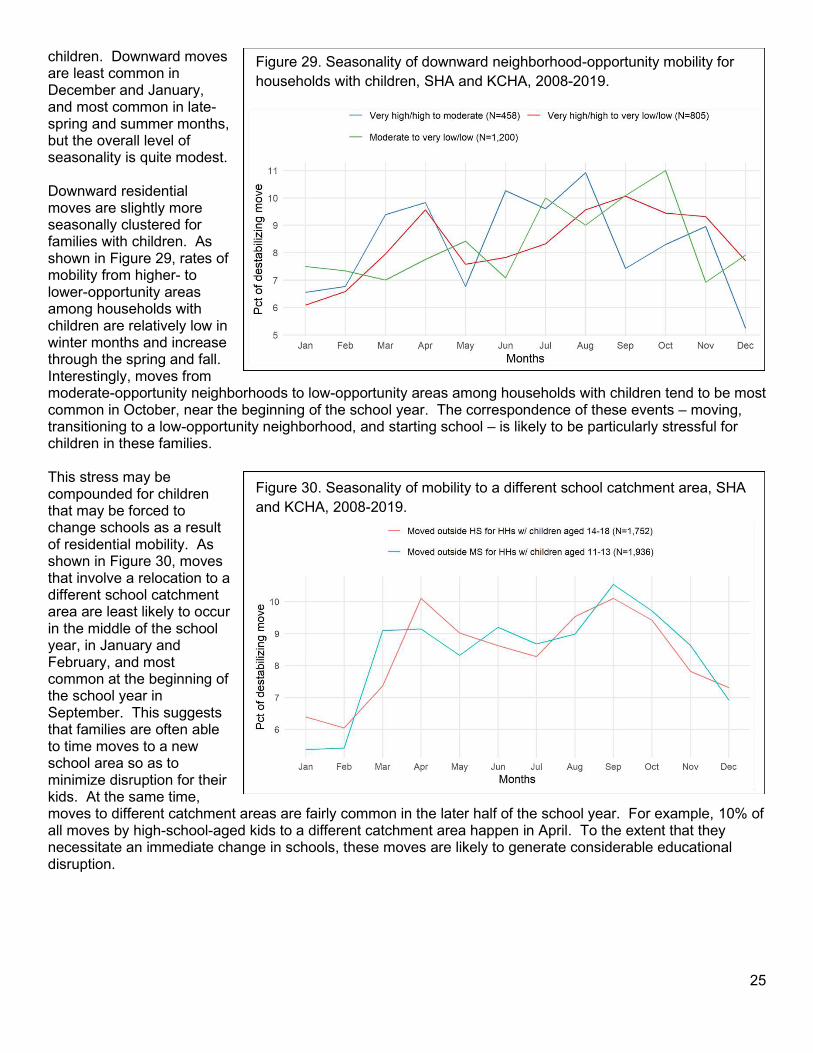
25
children. Downward moves are least common in December and January, and most common in late-spring and summer months, but the overall level of seasonality is quite modest. Downward residential moves are slightly more seasonally clustered for families with children. As shown in Figure 29, rates of mobility from higher- to lower-opportunity areas among households with children are relatively low in winter months and increase through the spring and fall. Interestingly, moves from moderate-opportunity neighborhoods to low-opportunity areas among households with children tend to be most common in October, near the beginning of the school year. The correspondence of these events – moving, transitioning to a low-opportunity neighborhood, and starting school – is likely to be particularly stressful for children in these families. This stress may be compounded for children that may be forced to change schools as a result of residential mobility. As shown in Figure 30, moves that involve a relocation to a different school catchment area are least likely to occur in the middle of the school year, in January and February, and most common at the beginning of the school year in September. This suggests that families are often able to time moves to a new school area so as to minimize disruption for their kids. At the same time, moves to different catchment areas are fairly common in the later half of the school year. For example, 10% of all moves by high-school-aged kids to a different catchment area happen in April. To the extent that they necessitate an immediate change in schools, these moves are likely to generate considerable educational disruption.
Figure 30. Seasonality of mobility to a different school catchment area, SHA
and KCHA, 2008-2019.
Figure 29. Seasonality of downward neighborhood-opportunity mobility for
households with children, SHA and KCHA, 2008-2019.
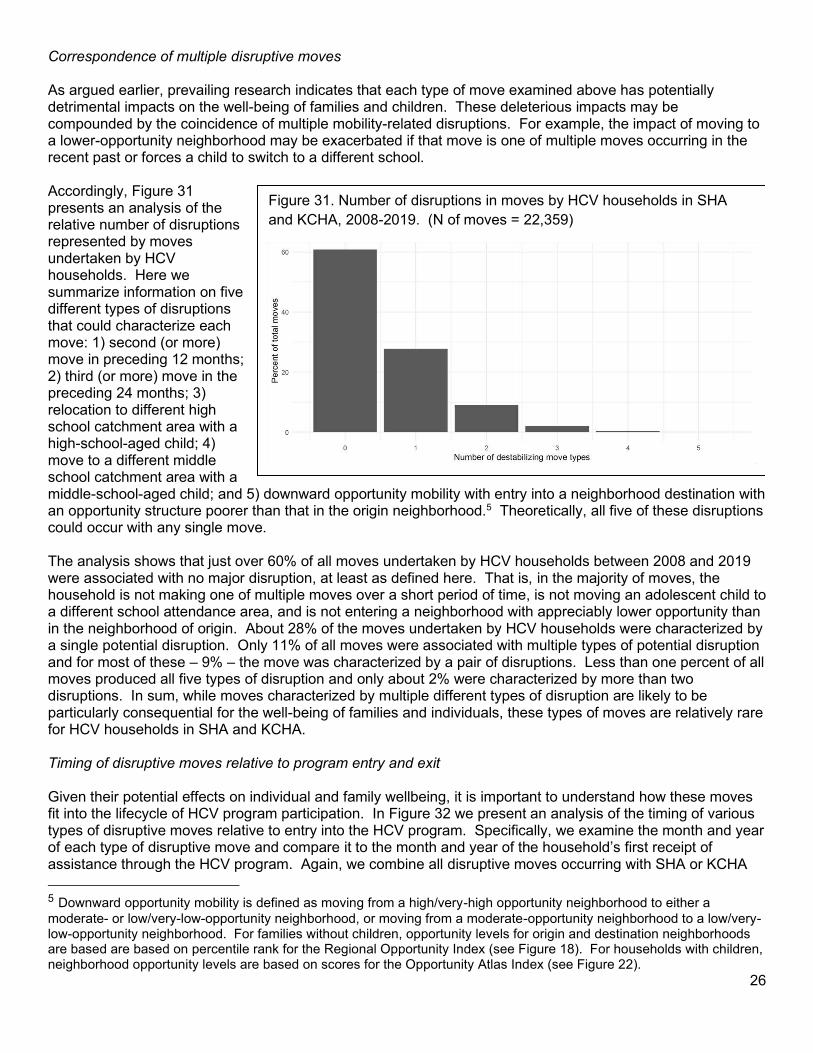
26
Correspondence of multiple disruptive moves As argued earlier, prevailing research indicates that each type of move examined above has potentially detrimental impacts on the well-being of families and children. These deleterious impacts may be compounded by the coincidence of multiple mobility-related disruptions. For example, the impact of moving to a lower-opportunity neighborhood may be exacerbated if that move is one of multiple moves occurring in the recent past or forces a child to switch to a different school. Accordingly, Figure 31 presents an analysis of the relative number of disruptions represented by moves undertaken by HCV households. Here we summarize information on five different types of disruptions that could characterize each move: 1) second (or more) move in preceding 12 months; 2) third (or more) move in the preceding 24 months; 3) relocation to different high school catchment area with a high-school-aged child; 4) move to a different middle school catchment area with a middle-school-aged child; and 5) downward opportunity mobility with entry into a neighborhood destination with an opportunity structure poorer than that in the origin neighborhood.5 Theoretically, all five of these disruptions could occur with any single move. The analysis shows that just over 60% of all moves undertaken by HCV households between 2008 and 2019 were associated with no major disruption, at least as defined here. That is, in the majority of moves, the household is not making one of multiple moves over a short period of time, is not moving an adolescent child to a different school attendance area, and is not entering a neighborhood with appreciably lower opportunity than in the neighborhood of origin. About 28% of the moves undertaken by HCV households were characterized by a single potential disruption. Only 11% of all moves were associated with multiple types of potential disruption and for most of these – 9% – the move was characterized by a pair of disruptions. Less than one percent of all moves produced all five types of disruption and only about 2% were characterized by more than two disruptions. In sum, while moves characterized by multiple different types of disruption are likely to be particularly consequential for the well-being of families and individuals, these types of moves are relatively rare for HCV households in SHA and KCHA. Timing of disruptive moves relative to program entry and exit Given their potential effects on individual and family wellbeing, it is important to understand how these moves fit into the lifecycle of HCV program participation. In Figure 32 we present an analysis of the timing of various types of disruptive moves relative to entry into the HCV program. Specifically, we examine the month and year of each type of disruptive move and compare it to the month and year of the household’s first receipt of assistance through the HCV program. Again, we combine all disruptive moves occurring with SHA or KCHA
5 Downward opportunity mobility is defined as moving from a high/very-high opportunity neighborhood to either a
moderate- or low/very-low-opportunity neighborhood, or moving from a moderate-opportunity neighborhood to a low/very-low-opportunity neighborhood. For families without children, opportunity levels for origin and destination neighborhoods are based are based on percentile rank for the Regional Opportunity Index (see Figure 18). For households with children, neighborhood opportunity levels are based on scores for the Opportunity Atlas Index (see Figure 22).
Figure 31. Number of disruptions in moves by HCV households in SHA
and KCHA, 2008-2019. (N of moves = 22,359)
(N = 22,539)
27
between 2008 and 2019, and we exclude moves associated with entry into the HCV program or porting to a different jurisdiction.
The figure shows that the disruptive moves that tend to happen in closest temporal proximity to program enter are downward opportunity moves for households with children. On average, when these households move to a neighborhood with a low or very low opportunity score, from either a moderate-opportunity neighborhood or a higher-opportunity neighborhood, they do so an average of just under six years (69 months) after program entry. Similarly, moves by households with children move from high-opportunity neighborhoods to moderate-opportunity areas do so an average of 72 months after first receiving HCV assistance. At the other end of the spectrum are moves from higher-opportunity to moderate-opportunity neighborhoods among households without children which occur, on average, about 7 years and 2 months after program entry. Moving a high-school-aged child to a different high school catchment area has a similar average timing, while moving a middle-school-aged child to a different middle school attendance zone tends to happen slightly sooner – an average of about 75 months after program entry. When it occurs, making a second move within a twelve-month period happens, on average, 74 months after entry into the HCV program, while making a third move over a 24-month period tends to occur slightly later. Timing of disruptive moves relative to program exit Figure 33 presents an analysis designed to assess the link between various types of disruptive moves and exit from the voucher program. Specifically, we examine the percentage of different types of moves that are followed by a program exit within 24 months after the move. For example, the figure shows that about 10.5% of all non-disruptive moves – that is, moves that are not one in a recent series of moves, involve movement to a lower-opportunity area, or take a family with children to a different catchment area – are followed by exit from the program over the subsequent two years. In other words, in almost 90% of all non-disruptive, the household remains in the voucher program for at least two years following the move. Somewhat surprisingly, in comparison to non-disruptive moves, most types of disruptive moves were associated with slightly lower rates of subsequent exit from the program. Among households with children, for example, just over 9% that move from a high- to a moderate-opportunity area, 7.6% of those that move from a high- to a low-opportunity neighborhood, and 6.8% of those that move from a moderate- to a low-opportunity neighborhood leave the voucher program in the following two years. Similarly, among families without children, short-term program exit
Figure 32. Average number of months between entry into HCV program and disruptive moves,
SHA and KCHA households, 2008-2019.
28
follows about 9% of moves from a moderate- to a low-opportunity neighborhood, and 8.5% of moves from high- to moderate-opportunity neighborhoods. Moves by households with children to a different school catchment area are especially unlikely to be followed by program exit; only 7.3% of families moving to a different high-school catchment area, and 6.4% of families changing middle-school catchment areas leave the voucher program within two years after the move. Only two extreme types of disruptive moves – those that are one of multiple moves within a one-year period and moves by childless families from high- to low-opportunity areas – are associated with a higher frequency of program exit than are non-disruptive moves.
Again, these differences are slight and reflect only the raw association between mobility and subsequent program exit. It very well could be the case that part of the relative longevity of households in the voucher program following some types of moves reflect the effects of household- and individual-level factors associated with those types of moves. Characteristics associated with the likelihood of various types of destabilizing moves For the final part of the analysis of disruptive or destabilizing moves, we present a set of regression models that predict each type of destabilizing move as a function of sociodemographic characteristics of HCV households. These regression results are presented in Appendix Tables A21 through A26. In all of these analyses we build the regression models sequentially, starting with models with predictors related to household composition and then adding, in groups, variables related race-ethnicity, unit characteristics, household resources, and other demographic and neighborhood-level characteristics. All results are presented in odds ratios, so coefficients below 1 indicate that the variable tends to reduce the likelihood of the outcome of interest and coefficients greater than 1 indicate an increased likelihood associated with the variable. In our discussion of results, we focus our description on the general pattern of the effects of these variable groups across the various types of disruptive moves. Household composition appears to have modest effects on most types of disruptive moves. Households with two or more children are slightly less likely than households without children to move more than once in a
Figure 33. Percent of moves followed by exit from voucher program within 24 months, SHA and KCHA
households, 2008-2019.
29
twelve-month period, but this effect emerges only after controlling for all other variables (Appendix Table A21). After accounting for differences related to race/ethnicity and unit size, households with two or more children area substantially – and statistically significantly – less likely than are households with one child to move to a different middle-school or high-school catchment area (Appendix Tables A25 and A26). However, household composition has no appreciable effect on the likelihood of moving to a lower-opportunity neighborhood once the effects of other variables are controlled (Appendix Tables A23 and A24). Net of the effects of household composition and other factors, patterns of mobility between neighborhoods with different opportunity structures is significantly associated with the type of unit a household occupies. Among households with children, those residing in 2-, 3- and 4-bedroom units are all more likely than are those occupying 1-bedroom units to move to a moderate-opportunity than a low-opportunity area, as defined by the Opportunity Atlas scores (Appendix Table A24), and this effect persists even after controlling for the composition of the household and other destination drivers. This effect stands in contrast to the effects of unit size for households without children, for whom neighborhood opportunity is measured using the Regional Opportunity Index. Among these childless households, the likelihood of moving to a high-opportunity neighborhood versus a low-opportunity neighborhood is lower for households living in 2- and 3-bedroom units than for those in 1-bedroom units (Appendix Table A23). This effect, which persists with all other controls, likely reflects the relative distribution of affordable larger units in high- and low-opportunity neighborhoods across the region. Household income appears to have no effect, net of other household characteristics, on mobility between neighborhoods with different levels of opportunity (Appendix Table A23 and A24), or exit from the school catchment area (Appendix Tables A25 and A26), but does appear to influence the occurrence of multiple moves over short periods. Households with any level of income are about 1.3 to 1.6 times as likely as those with no income to make two or more moves in a twelve-month period (Appendix Table A21), and 1.5 times more likely to make three or more moves over a two-year period (Appendix Table A22). These differences across income groups persist even after controlling for other household characteristics and opportunity level in the origin neighborhood. Racial/ethnic difference in mobility outcomes are more pronounced and apparent across a large number of outcomes. Even after controlling for household composition, income, neighborhood conditions, and all other available characteristics, the odds of moving with a middle-school child out of the middle-school catchment area are about 29.7% (1 - .703 = .297) lower for white households than for Black households (Appendix Table A26). Other group differences on this outcome are not statistically significant. Racial differences in the likelihood of moving with a high-school-aged child to a different attendance zone are even more pronounced. All else being equal, the odds of moving to a different high school catchment area are only about 60% as high for white-headed households as for Black-headed households (Appendix Table A25). Moving to a different catchment area also appears to be somewhat less common among Asian households than among Black-headed households, but this contrast is smaller than the Black-white difference and is only marginally statistically significant under some model specifications. The odds of entering a high-opportunity neighborhood rather than a low-opportunity neighborhood are about 2.5 times greater for mobile white families without children than for mobile Black families without children (Appendix Table A23). These odds of entering a high-opportunity area are also about twice as high for Latinx households without children than for Black households without children. Among mobile families with children, the odds of moving to a high-opportunity neighborhood instead of a low-opportunity neighborhood are about 74% higher for white-led households than for households with a Black householder, all else equal. These racial differences persist and, in fact, becomes stronger, with controls for other household characteristics and the opportunity level of the neighborhood of origin (Appendix Table A24). These racial variations in the likelihood of disruptive moves point to the continuation of substantial stratification in residential opportunity structures and housing processes (Krysan and Crowder 2017). Perhaps the most important predictor of potentially disruptive or advantageous moves are the residential origins of households. For example, as shown in Appendix Table A24, the odds of moving to a moderate-
30
opportunity neighborhood are 2.25 times higher for a household with children starting out in a moderate-opportunity neighborhood than a for a comparable household originating in a low-opportunity neighborhood. Similarly, in comparison to households with children starting out in low-opportunity neighborhoods, the odds of moving to a high-opportunity neighborhood are almost twice as high for households with children originating in moderate-opportunity neighborhoods, and over five times higher for households with children originating in high-opportunity areas. The impacts of origin neighborhood are even more dramatic for households without children. According to the results in Appendix Table A23, the odds of moving to a high-opportunity neighborhood are 2.6 times higher for childless households originating in a moderate-opportunity neighborhood than for those starting out in a low-opportunity area, and the odds are 13.9 times higher for those originating in a high-opportunity neighborhood. Thus, there is considerable persistence in residential exposures, with a strong association between origin and destination conditions among households who move, and these origin effects remain strong even after controlling for a wide range of individual-level and household characteristics that shape mobility outcomes. In other words, the tendency for households to move laterally, from one disadvantaged neighborhood to another, or from one high-opportunity neighborhood to another, cannot be attributed to observable characteristics of households starting out in different types of places. Conclusions This report provides a broad picture of the residential mobility experiences of households receiving voucher-based assistance from public housing authorities in Seattle and King County. The data developed for this project are extensive, drawing on administrative records for more than two million monthly observations of more than thirty thousand unique households. Data from multiple sources have been cleaned and deduplicated to provide a reliable source of rich, longitudinal data on the characteristics and mobility experiences of voucher recipients and their households between 2008 and 2019. It is important to note that these data exclude residential moves associated with entry into the program and between periods of voucher use. The data may miss significant residential instability as households attempt to identify units that will allow them to use their housing vouchers. As a result, the results presented here likely provide conservative estimates of the residential disruptions experienced by households served by SHA and KCHA voucher programs. Nevertheless, these data point to some clear patterns and trends in patterns of mobility among voucher holders. The overall number of moves for households within both SHA and KCHA has declined markedly since 2008, corresponding with a continued decline in mobility for the U.S. population in general. The decline in mobility has been especially strong among households in SHA, but in both jurisdictions, the likelihood of moving remains stratified across a host of individual- and household-level factors. In both SHA and KCHA, rates of mobility tend to be highest for households with children and for households with at least one work-able adult, but at least in SHA these households have also shown the most dramatic declines in rates of mobility since 2008. Among households using vouchers through KCHA, mobility is highest for households headed by a Black or mixed-race individual and tend to be lowest for households renting one-bedroom units. Perhaps more importantly, the results of the analysis highlight clear lines of stratification in types of moves that are potentially disruptive to voucher users and their families – moving to a lower-opportunity area, switching children to a different school area, or making multiple moves over a short period of time. These kinds of moves are relatively rare for families in both KCHA and SHA but, according to existing evidence, may stifle education, reduce economic mobility, and undermine health. The results of this analysis indicate that, in comparison to households with multiple children, households with no children are more likely to move multiple times over a short period of time, and families with a single child are more likely to move to a different school catchment area. These differences, which hold even after controlling for the effects of unit size and other mobility predictors, likely reflect the fact that smaller families tend to develop fewer social and logistical ties that bind them to places and schools. However, these effects of household composition pale in comparison to racial stratification in mobility outcomes. In comparison to households headed by white and Asian voucher holders, Black householders are substantially more likely to move multiple times over a short period of time, and more likely to make moves that
31
take their children to a different school catchment zone. Moreover, Black householders are substantially more likely than white and Asian households to experience downward residential mobility – moving into neighborhoods with relatively few opportunities for socioeconomic advancement and well-being. These racial differences in mobility outcomes remain large and statistically significant even after controlling for economic resources, household composition, unit size, and a wide range of other mobility determinants, and highlight the dire need to address discriminatory treatment by landlords and other factors that limit residential opportunities for many families of color. The effects of race and other household characteristics may justify the development of services and interventions to increase residential stability for voucher users who are particularly susceptible to a variety of disruptive moves. But the results of the analysis also point to the potential importance of general strategies to establish initial residential placements that positively shape subsequent mobility experiences. The results of the analysis show remarkable persistence of residential location across time; the vast majority of householders move infrequently, and when they do move, they tend to relocate to neighborhoods that are quite similar to those they left. Largely regardless of their individual and family characteristics, households that start out in low-opportunity neighborhoods are very likely to move to another low-opportunity area, and those that originate in a higher-opportunity area are more likely to end up in another higher-opportunity area when they move. These patterns likely reflect the social dynamics of mobility (Crowder and Krysan 2016; Krysan and Crowder 2017). Residential location has important impacts on social networks and daily activities that shape information about, and perceptions of, residential opportunities. As a result, households starting out in lower-opportunity neighborhoods are likely to develop knowledge of residential options that is heavily slanted towards opportunities in similar neighborhood environments. Thus, as the results of our analysis suggest, once a family resides in a relatively disadvantaged neighborhood, it is exceedingly unlikely that they will move to a higher-opportunity area. In this sense, a focus on efforts to enhance opportunities to gain access to higher-opportunity areas at lease-up is likely to be impactful in establishing mobility trajectories that help to ensure well-being and upward educational and economic mobility for families using vouchers.
32
References Alvarado, Steven Elías. "The Complexities of Race and Place: Childhood Neighborhood Disadvantage and
Adult Incarceration for Whites, Blacks, and Latinos." Socius 6 (2020): 2378023120927154. Alvarado, Steven Elías. "The impact of childhood neighborhood disadvantage on adult joblessness and
income." Social Science Research 70 (2018): 1-17. Arcaya, Mariana C., Reginald D. Tucker-Seeley, Rockli Kim, Alina Schnake-Mahl, Marvin So, and S. V.
Subramanian. "Research on neighborhood effects on health in the United States: a systematic review of study characteristics." Social Science & Medicine 168 (2016): 16-29.
Chetty, Raj, and Nathaniel Hendren. "The impacts of neighborhoods on intergenerational mobility I: Childhood exposure effects." The Quarterly Journal of Economics 133, no. 3 (2018): 1107-1162.
Clark, William AV. 2012. "Residential mobility and the housing market." The Sage handbook of housing studies 66-83.
Crowder, Kyle, and Maria Krysan. 2016. "Moving beyond the big three: A call for new approaches to studying racial residential segregation." City & Community 15.1: 18-22.
Crowder, Kyle, and Scott J. South. 2008. "Spatial dynamics of white flight: The effects of local and extralocal racial conditions on neighborhood out-migration." American Sociological Review 73.5: 792-812.
Crowder, Kyle, Jeremy Pais, and Scott J. South. 2012. "Neighborhood diversity, metropolitan constraints, and household migration." American Sociological Review 77(3): 325-353.
Dong, Maxia, Robert F. Anda, Vincent J. Felitti, David F. Williamson, Shanta R. Dube, David W. Brown, and Wayne H. Giles. 2005. "Childhood Residential Mobility and Multiple Health Risks During Adolescence and Adulthood: The Hidden Role of Adverse Childhood Experiences.” Archives of Pediatrics & Adolescent Medicine 159(12), 1104-1110.
Finegood, Eric D., Jason RD Rarick, Clancy Blair, and Family Life Project Investigators. "Exploring longitudinal associations between neighborhood disadvantage and cortisol levels in early childhood." Development and psychopathology 29, no. 5 (2017): 1649-1662.
Galiatsatos, Panagis, Han Woo, Laura M. Paulin, Amy Kind, Nirupama Putcha, Amanda J. Gassett, Christopher B. Cooper et al. "The Association Between Neighborhood Socioeconomic Disadvantage and Chronic Obstructive Pulmonary Disease." International Journal of Chronic Obstructive Pulmonary Disease 15 (2020): 981.
Galster, George, Dave E. Marcotte, Marv Mandell, Hal Wolman, and Nancy Augustine. 2007. "The Influence of Neighborhood Poverty During Childhood on Fertility, Education, and Earnings Outcomes.” Housing Studies 22(2), 723-751.
Gasper, Joseph, Stefanie DeLuca, and Angela Estacion. 2012. "Switching schools: Revisiting the relationship between school mobility and high school dropout." American Educational Research Journal 49(3): 487-519.
Graif, Corina, and Stephen A. Matthews. "The long arm of poverty: extended and relational geographies of child victimization and neighborhood violence exposures." Justice Quarterly 34, no. 6 (2017): 1096-1125.
Hicks, Andrew L., Mark S. Handcock, Narayan Sastry, and Anne R. Pebley. "Sequential neighborhood effects: The effect of long-term exposure to concentrated disadvantage on children’s reading and math test scores." Demography 55, no. 1 (2018): 1-31.
Krysan, Maria, and Kyle Crowder. 2017. Cycle of segregation: Social processes and residential stratification. New York: Russell Sage Foundation.
Metzger, Molly W., Patrick J. Fowler, Courtney Lauren Anderson, and Constance A. Lindsay. "Residential mobility during adolescence: Do even “upward” moves predict dropout risk?." Social science research 53 (2015): 218-230.
Minh, Anita, Nazeem Muhajarine, Magdalena Janus, Marni Brownell, and Martin Guhn. "A review of neighborhood effects and early child development: How, where, and for whom, do neighborhoods matter?." Health & place 46 (2017): 155-174.
Ngai, L. Rachel, and Silvana Tenreyro. 2014. "Hot and Cold Seasons in the Housing Market." American Economic Review, 104 (12): 3991-4026.
Pena, Stephanie, David Becerra, Felicia Mitchell, Kristina Lopez, and Cindy C. Sangalang. "Subsidized Housing and Low-Income Mother’s School-Based Parent Involvement: Findings from the Fragile
33
Families and Child Wellbeing Study Wave Five." In Child and Youth Care Forum. Human Sciences Press, 2018.
Sharkey, Patrick, and Jacob W. Faber. "Where, when, why, and for whom do residential contexts matter? Moving away from the dichotomous understanding of neighborhood effects." Annual review of sociology 40 (2014): 559-579.
Tucker, C. Jack, Larry Long, and Jonathan Marx. "Seasonality of children's residential mobility: A research note." Population Research and Policy Review 14.2 (1995): 205-213.
Welsh, Richard O. "School hopscotch: A comprehensive review of K–12 student mobility in the United States." Review of Educational Research 87, no. 3 (2017): 475-511.
Wodtke, Geoffrey T., David J. Harding, and Felix Elwert. "Neighborhood effects in temporal perspective: The impact of long-term exposure to concentrated disadvantage on high school graduation." American sociological review 76, no. 5 (2011): 713-736.
34
APPENDIX
Appendix Figure A1. Types of moves by HCV households, by year, 2008-2019.
Appendix Figure A2. Types of moves by HCV households moving to areas in
SHA jurisdiction, by year, 2008-2019.
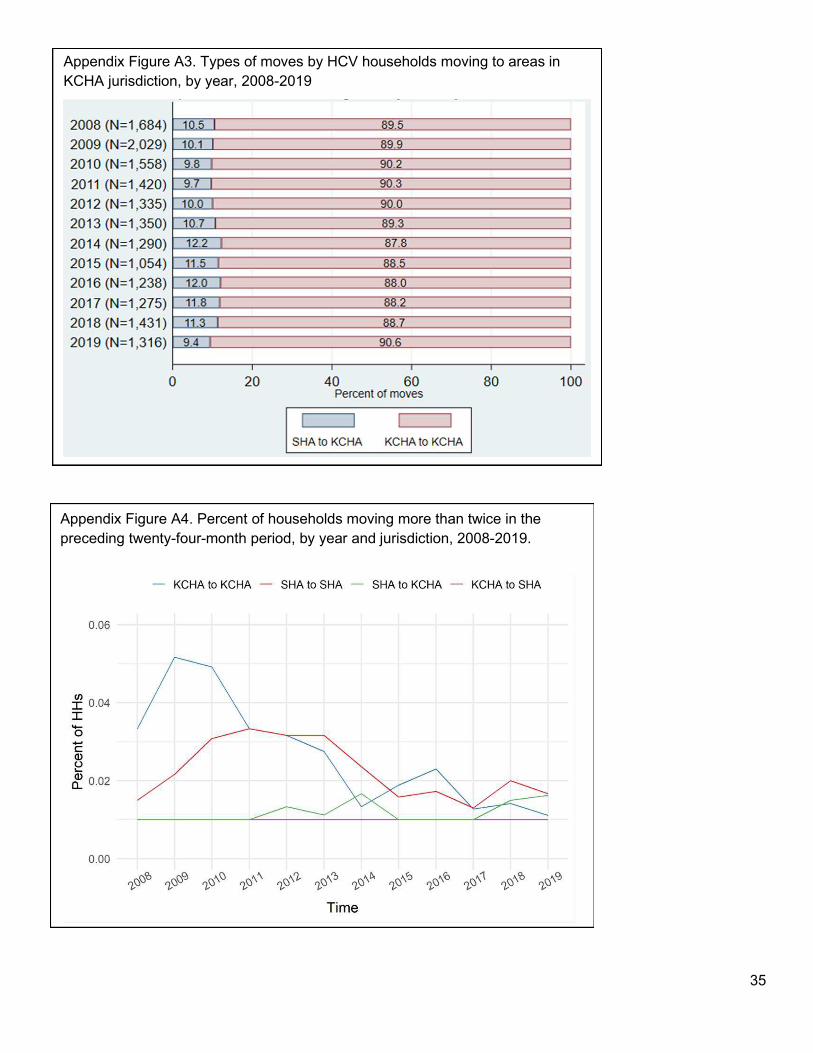
35
Appendix Figure A3. Types of moves by HCV households moving to areas in
KCHA jurisdiction, by year, 2008-2019
Appendix Figure A4. Percent of households moving more than twice in the
preceding twenty-four-month period, by year and jurisdiction, 2008-2019.
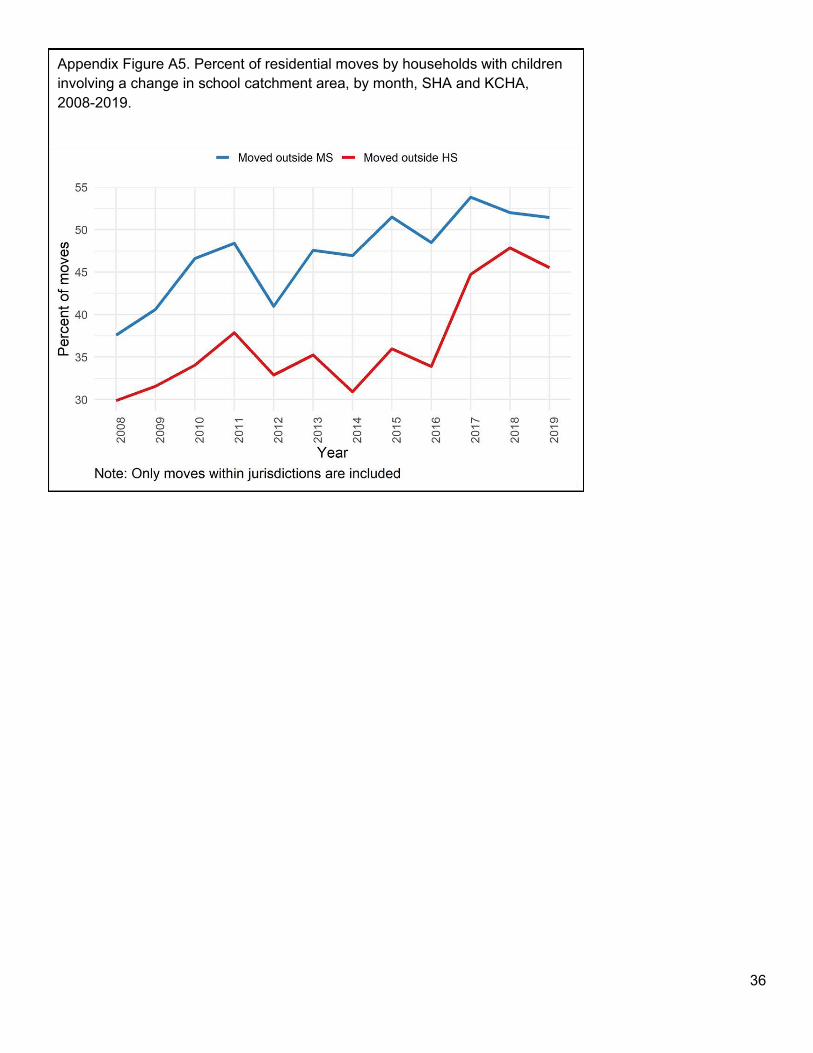
36
Appendix Figure A5. Percent of residential moves by households with children
involving a change in school catchment area, by month, SHA and KCHA,
2008-2019.
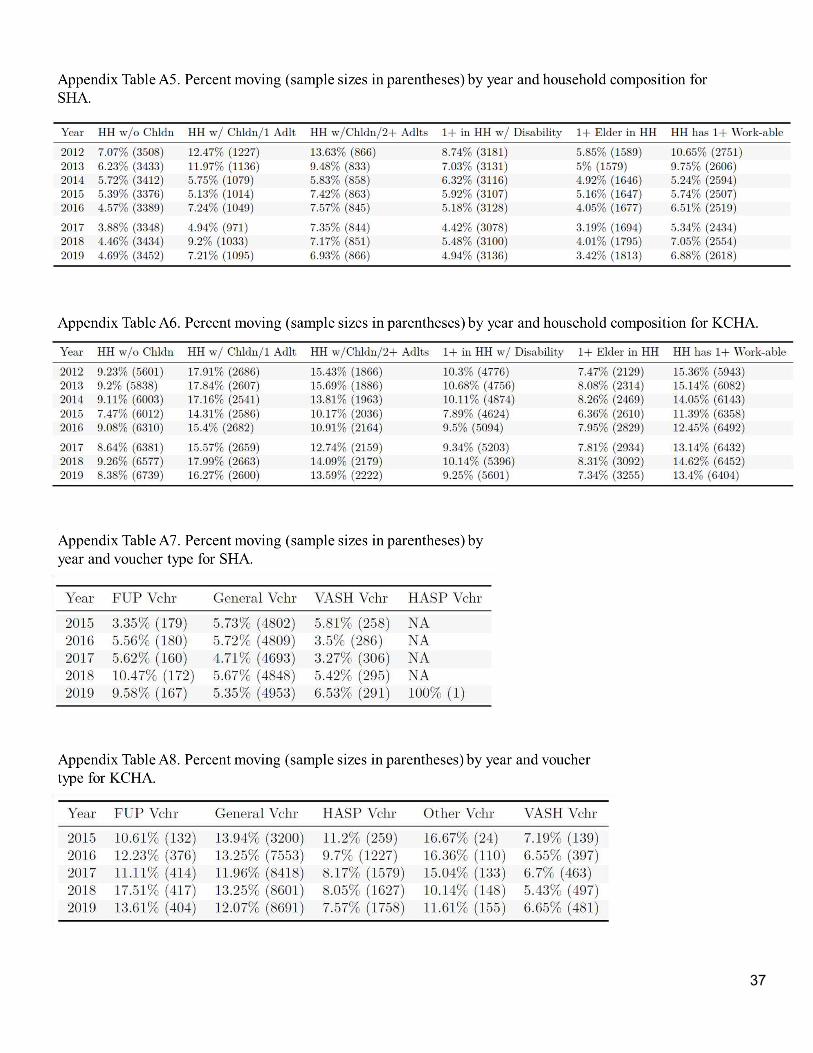
37
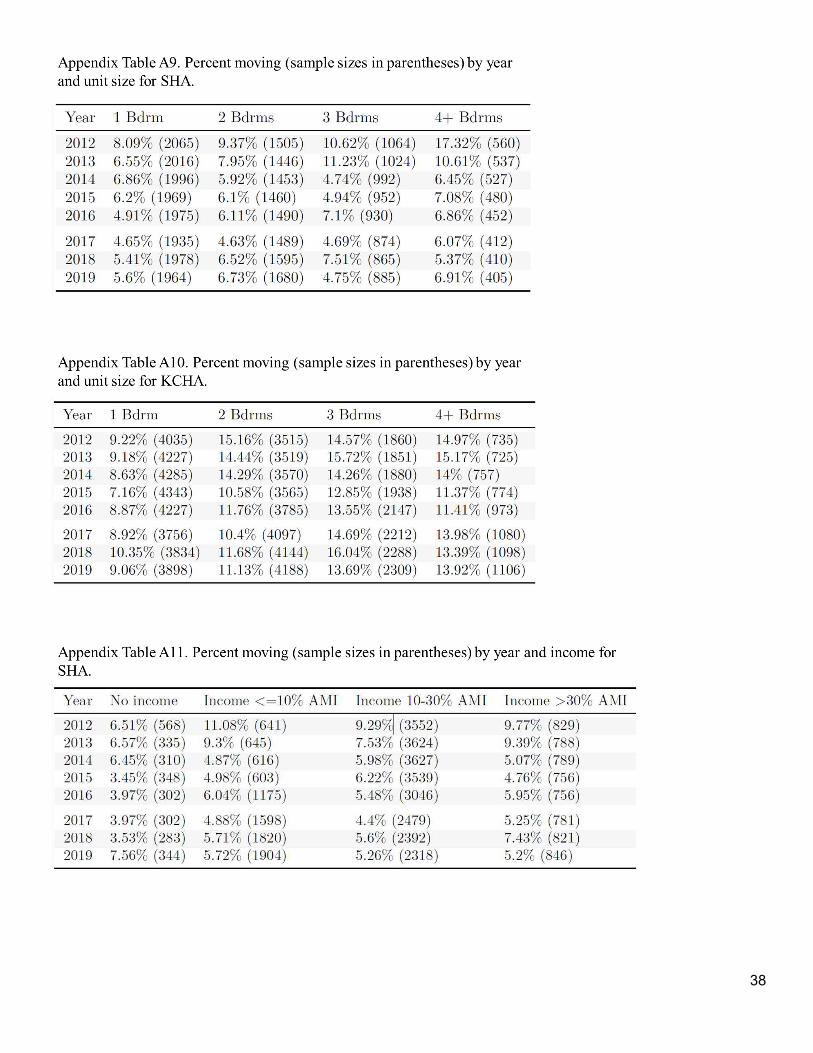
38
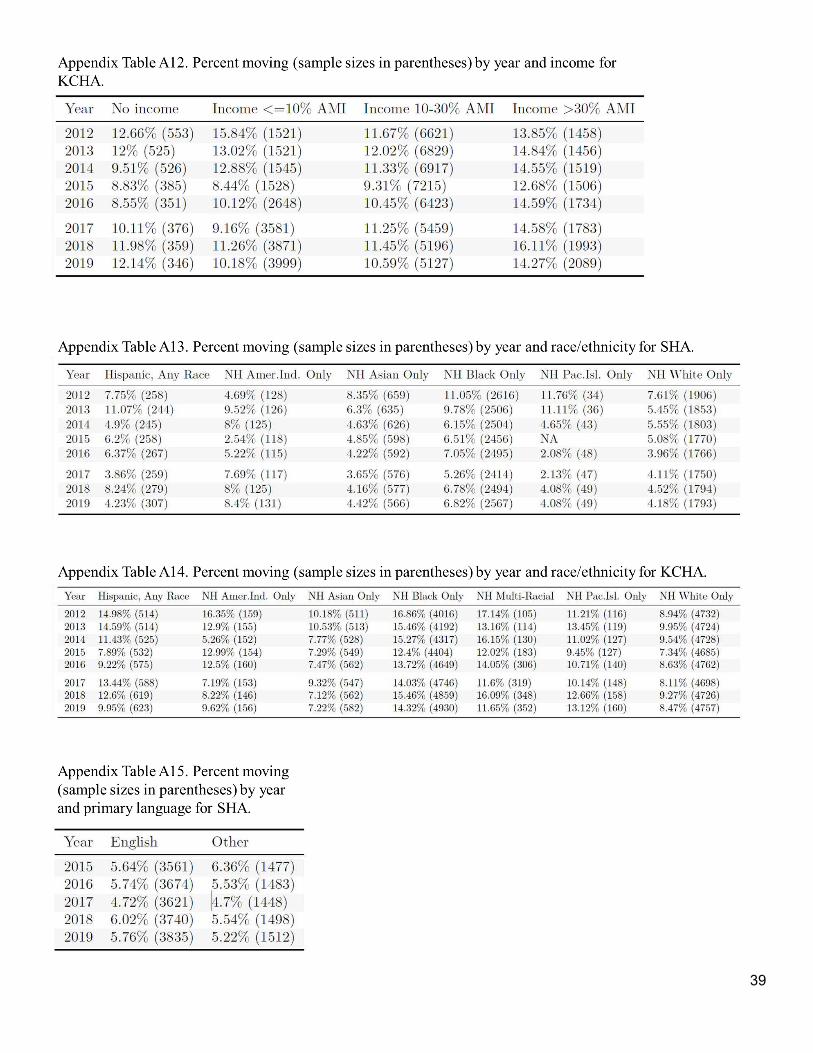
39
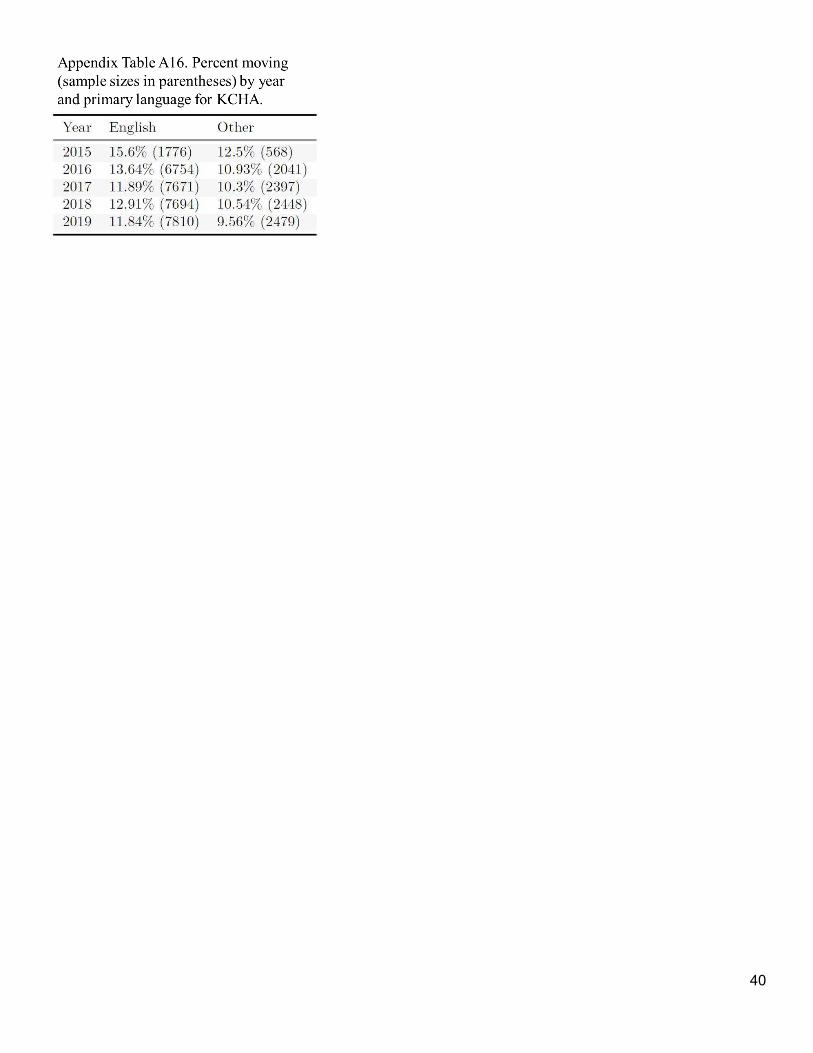
40
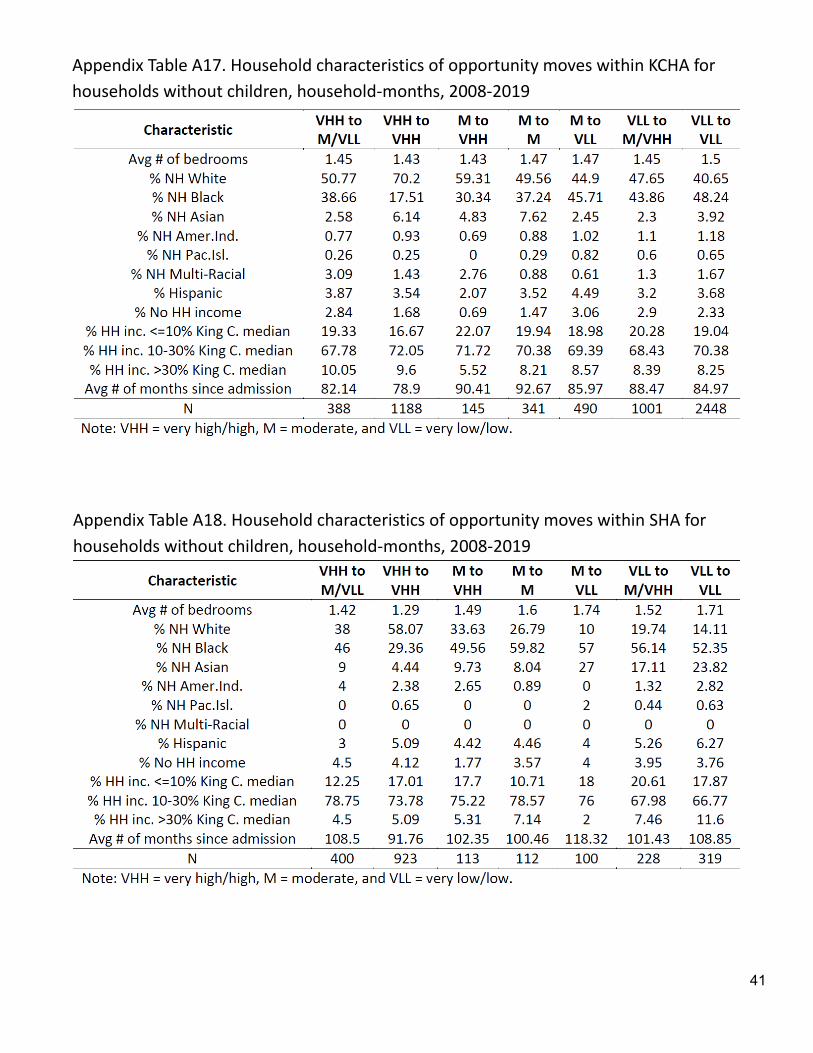
41
Appendix Table A17. Household characteristics of opportunity moves within KCHA for households without children, household-months, 2008-2019
Appendix Table A18. Household characteristics of opportunity moves within SHA for households without children, household-months, 2008-2019
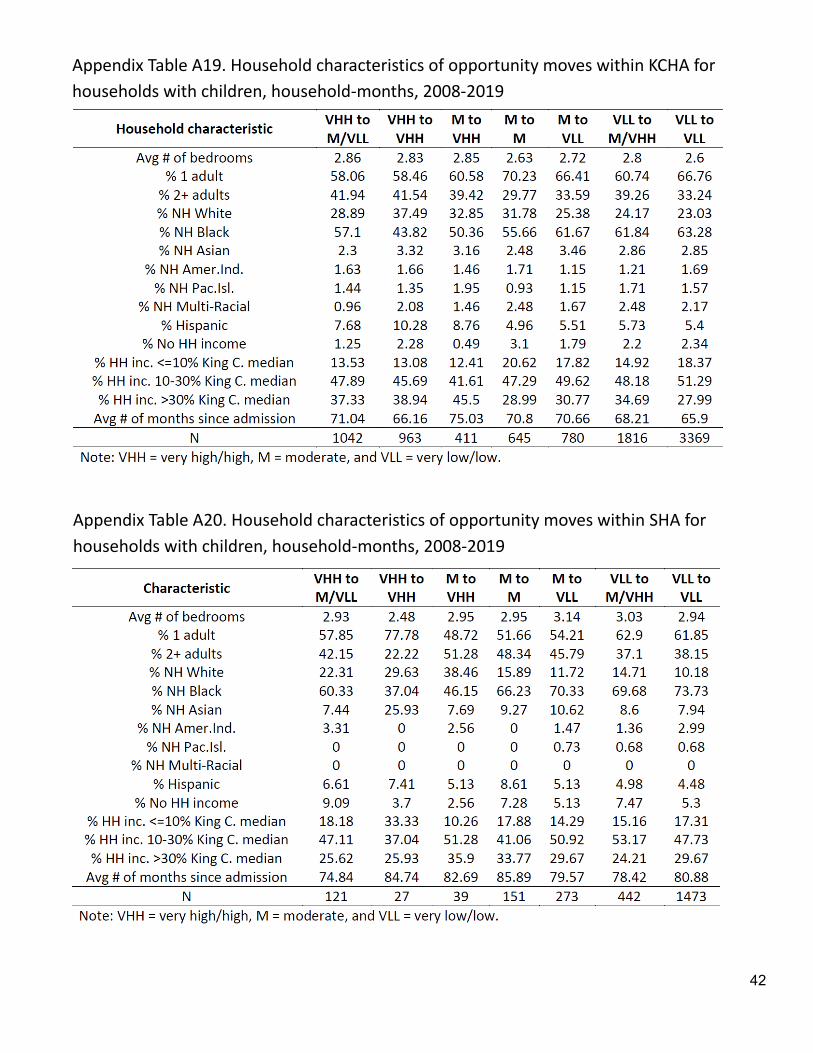
42
Appendix Table A19. Household characteristics of opportunity moves within KCHA for households with children, household-months, 2008-2019
Appendix Table A20. Household characteristics of opportunity moves within SHA for households with children, household-months, 2008-2019
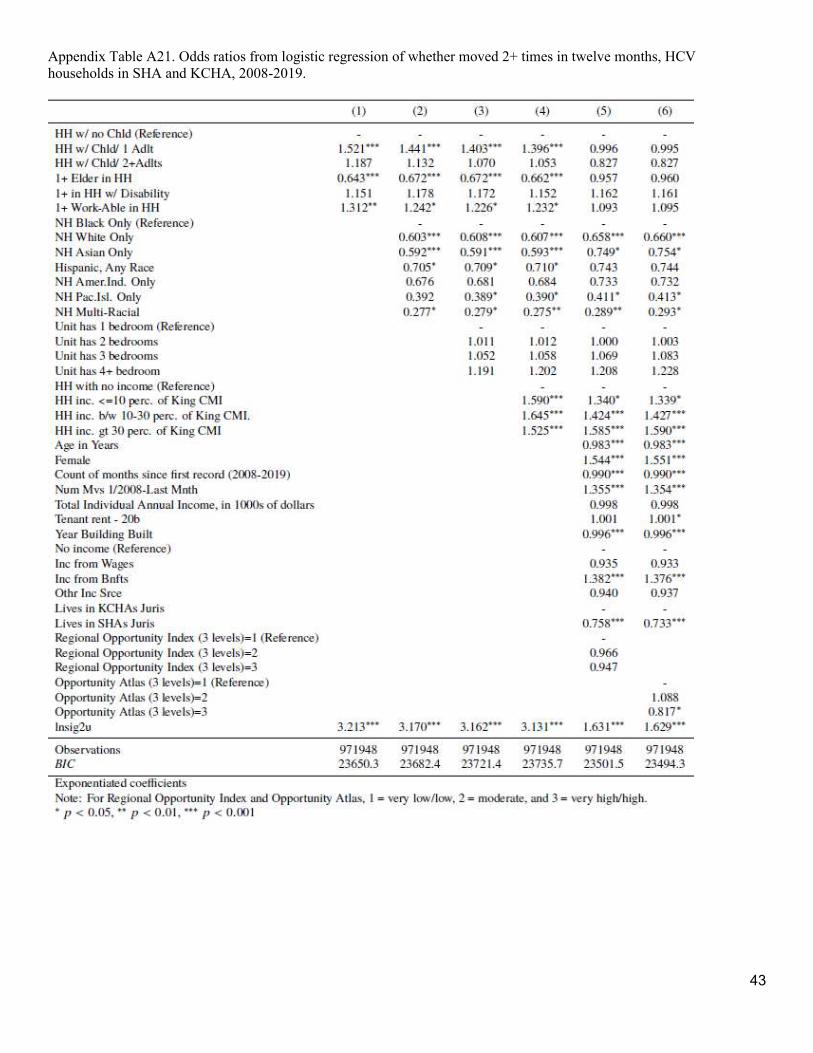
43
Appendix Table A21. Odds ratios from logistic regression of whether moved 2+ times in twelve months, HCV
households in SHA and KCHA, 2008-2019.
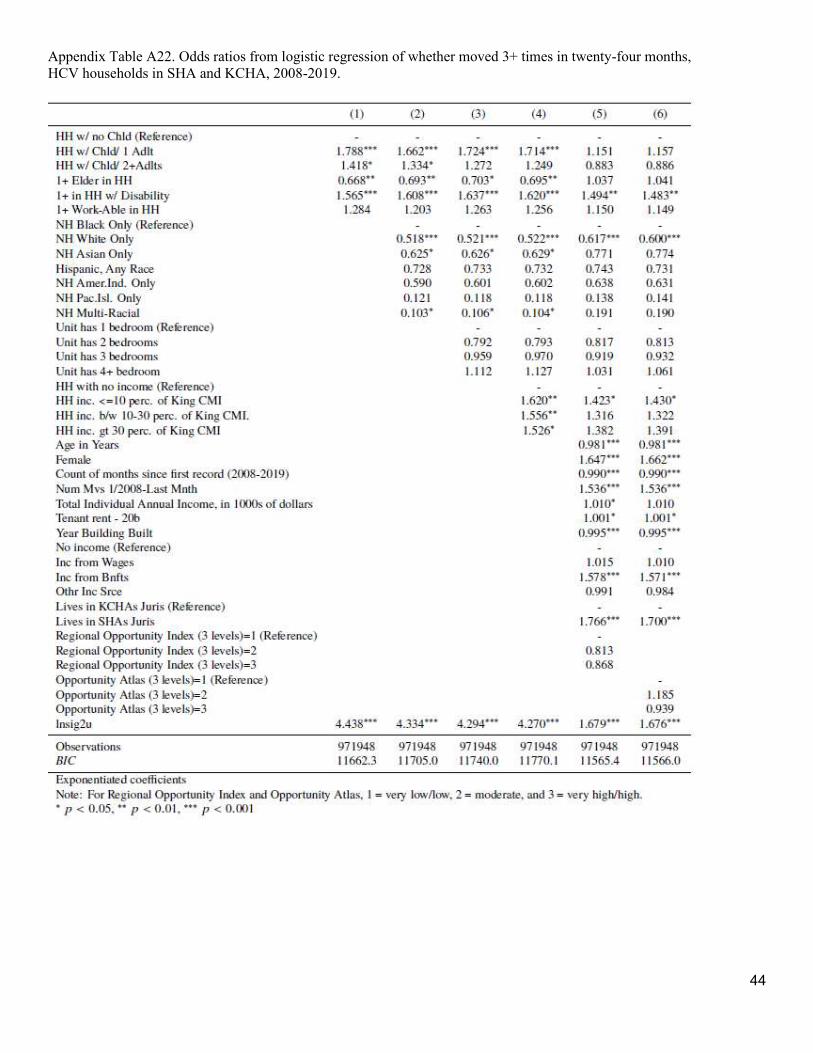
44
Appendix Table A22. Odds ratios from logistic regression of whether moved 3+ times in twenty-four months,
HCV households in SHA and KCHA, 2008-2019.
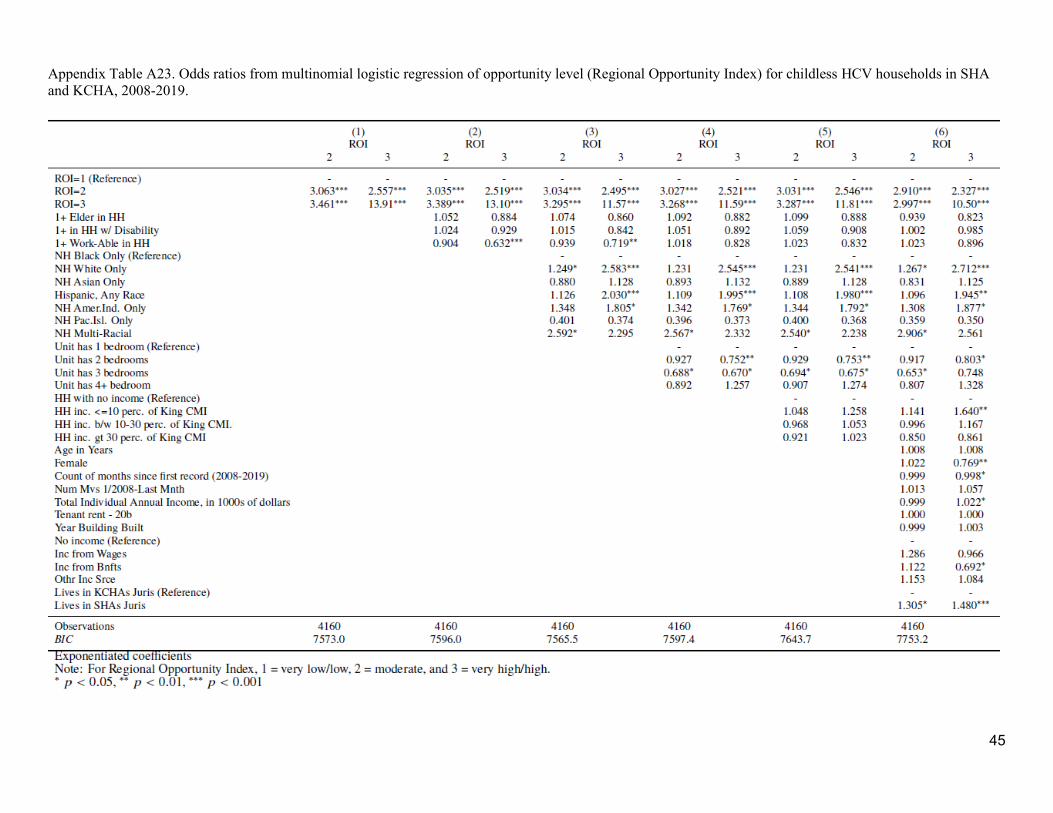
45
Appendix Table A23. Odds ratios from multinomial logistic regression of opportunity level (Regional Opportunity Index) for childless HCV households in SHA
and KCHA, 2008-2019.
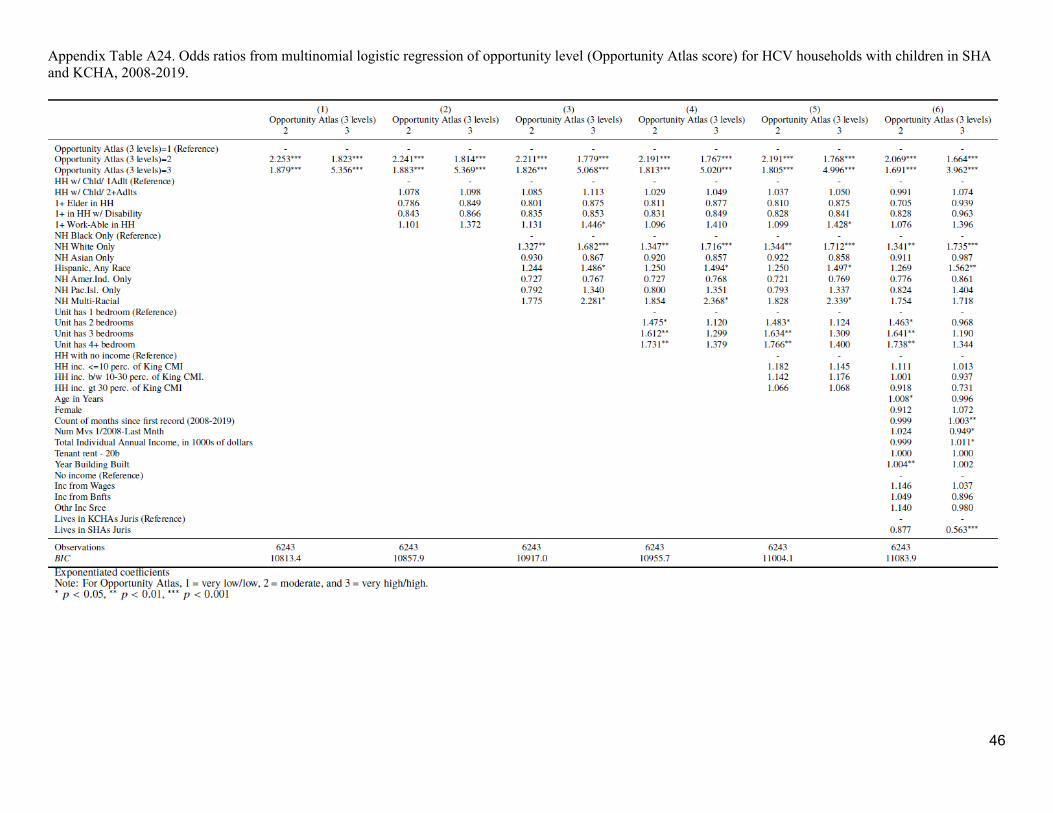
46
Appendix Table A24. Odds ratios from multinomial logistic regression of opportunity level (Opportunity Atlas score) for HCV households with children in SHA
and KCHA, 2008-2019.
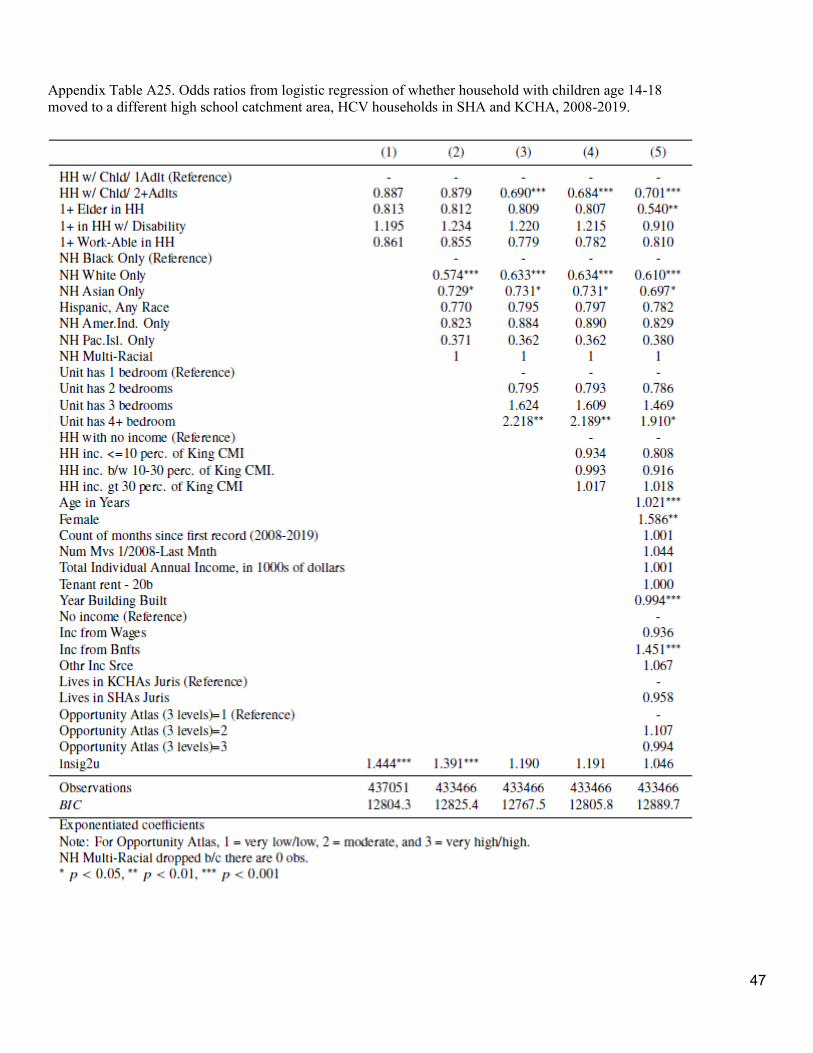
47
Appendix Table A25. Odds ratios from logistic regression of whether household with children age 14-18
moved to a different high school catchment area, HCV households in SHA and KCHA, 2008-2019.
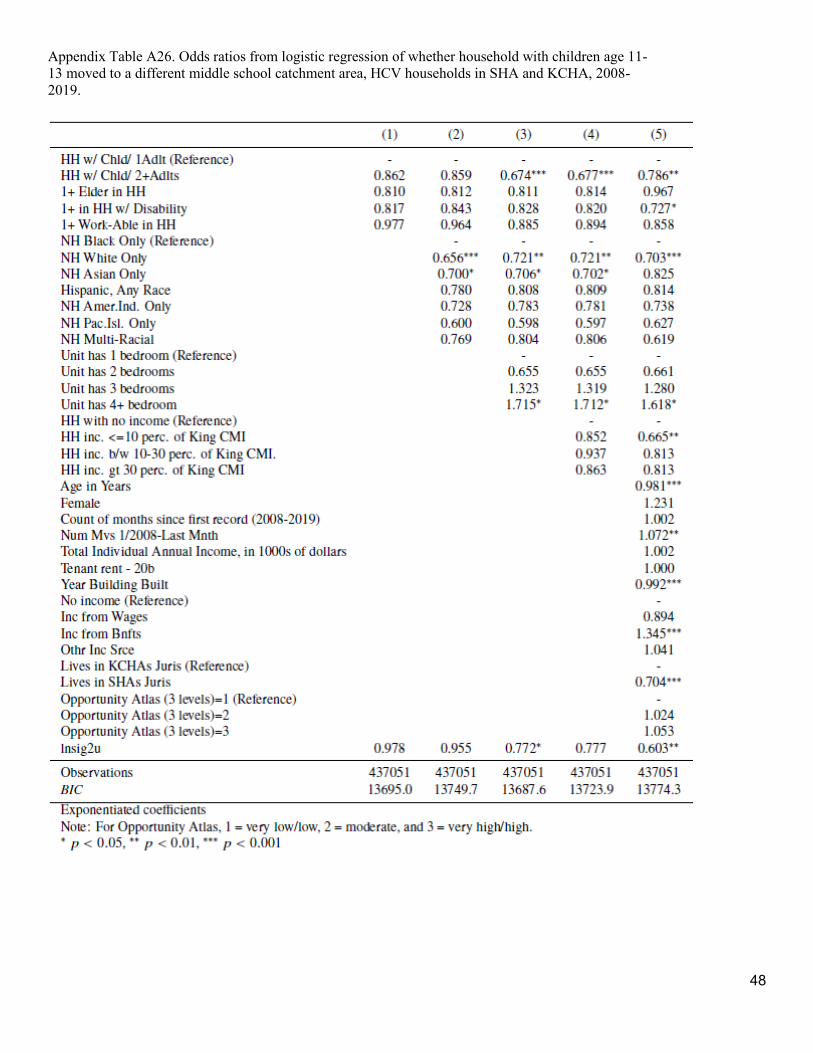
48
Appendix Table A26. Odds ratios from logistic regression of whether household with children age 11-
13 moved to a different middle school catchment area, HCV households in SHA and KCHA, 2008-
2019.

A P P EN DI X E
C O L L A T E R A L I Z E D F U N D S R E P OR T S
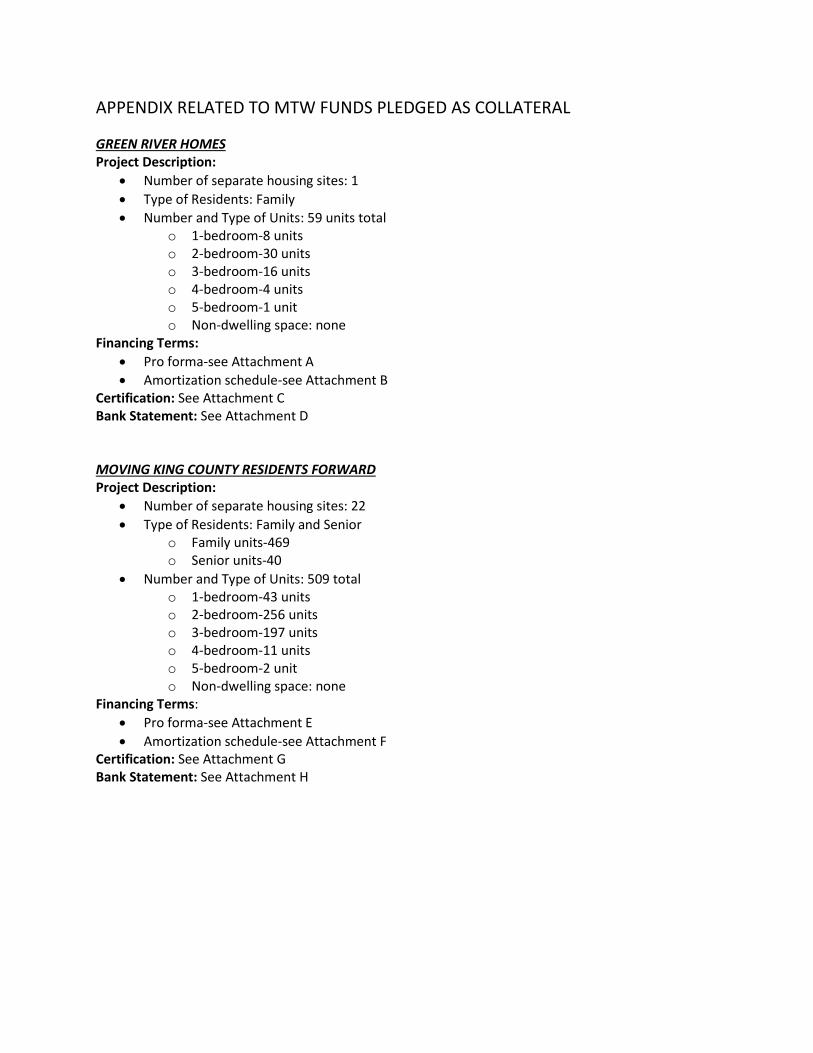
APPENDIX RELATED TO MTW FUNDS PLEDGED AS COLLATERAL
GREEN RIVER HOMES
Project Description:
Number of separate housing sites: 1
Type of Residents: Family
Number and Type of Units: 59 units total
o 1-bedroom-8 units
o 2-bedroom-30 units
o 3-bedroom-16 units
o 4-bedroom-4 units
o 5-bedroom-1 unit
o Non-dwelling space: none
Financing Terms:
Pro forma-see Attachment A
Amortization schedule-see Attachment B
Certification: See Attachment C
Bank Statement: See Attachment D
MOVING KING COUNTY RESIDENTS FORWARD
Project Description:
Number of separate housing sites: 22
Type of Residents: Family and Senior
o Family units-469
o Senior units-40
Number and Type of Units: 509 total
o 1-bedroom-43 units
o 2-bedroom-256 units
o 3-bedroom-197 units
o 4-bedroom-11 units
o 5-bedroom-2 unit
o Non-dwelling space: none
Financing Terms:
Pro forma-see Attachment E
Amortization schedule-see Attachment F
Certification: See Attachment G
Bank Statement: See Attachment H

ATTACHMENT A
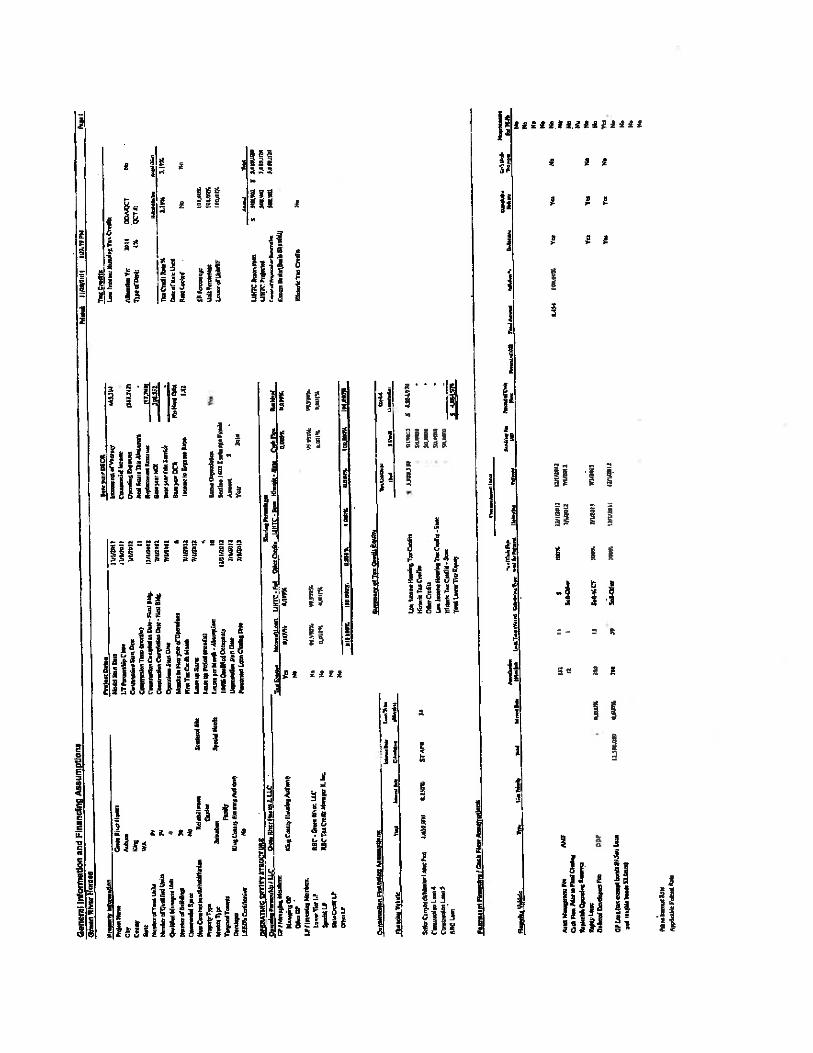
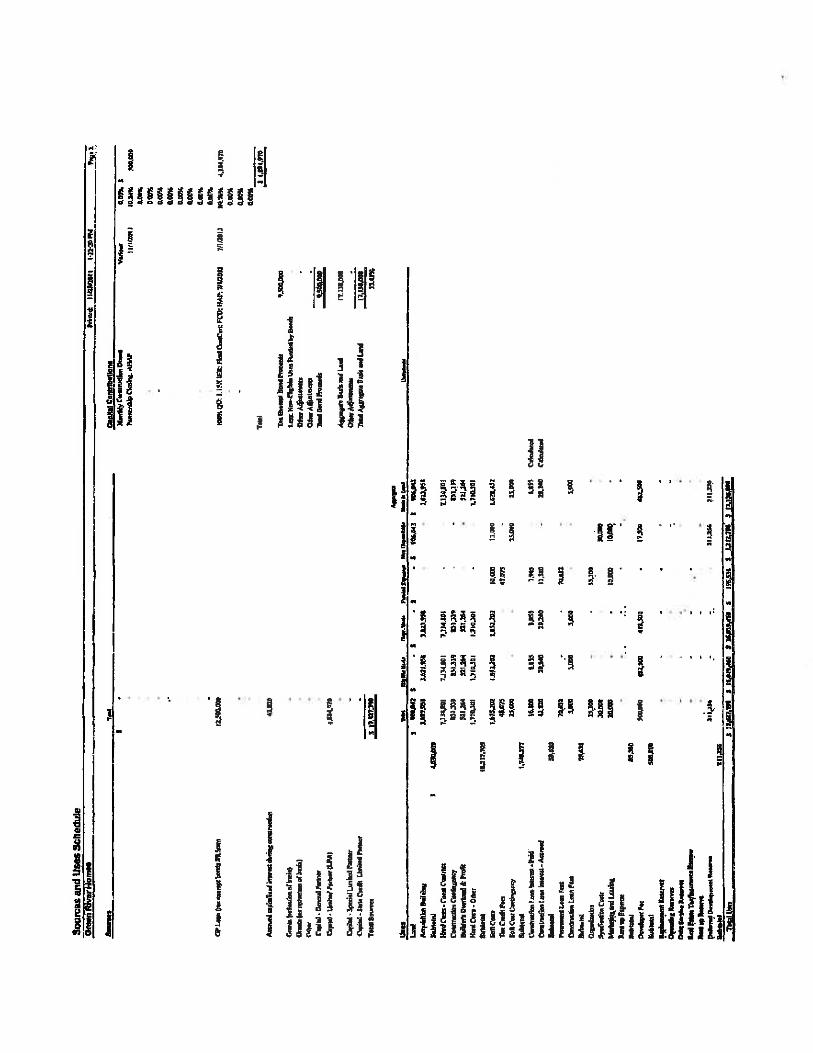
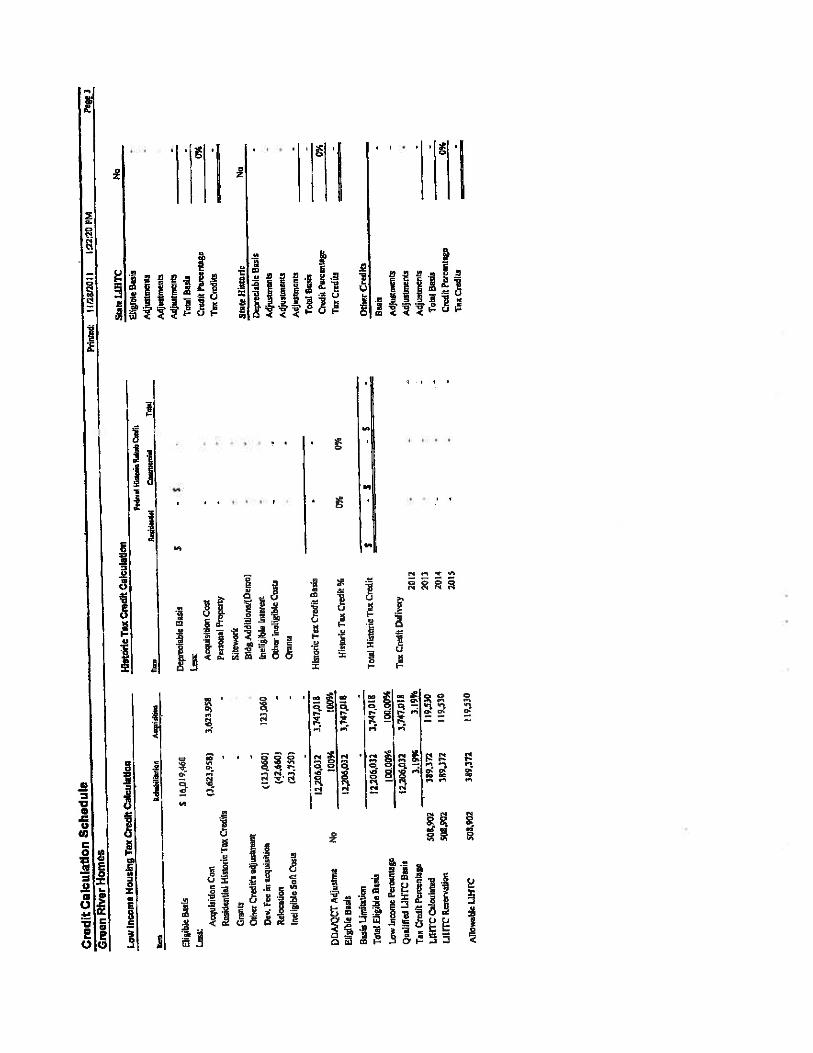
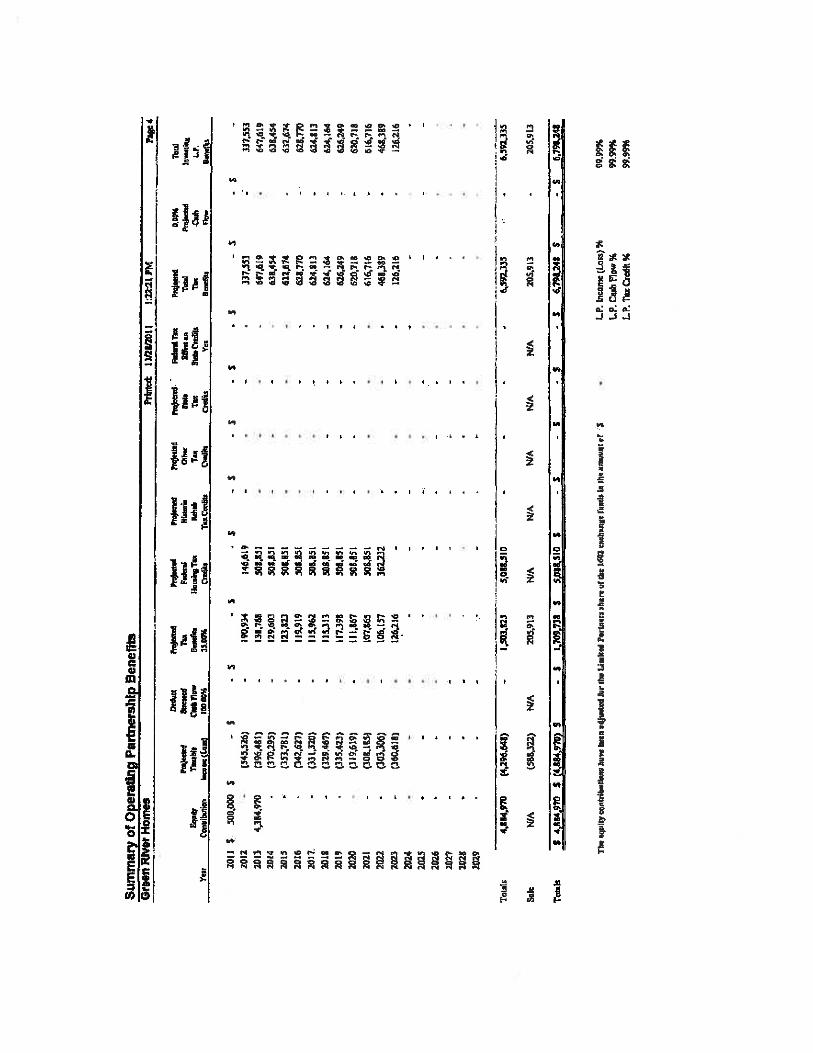
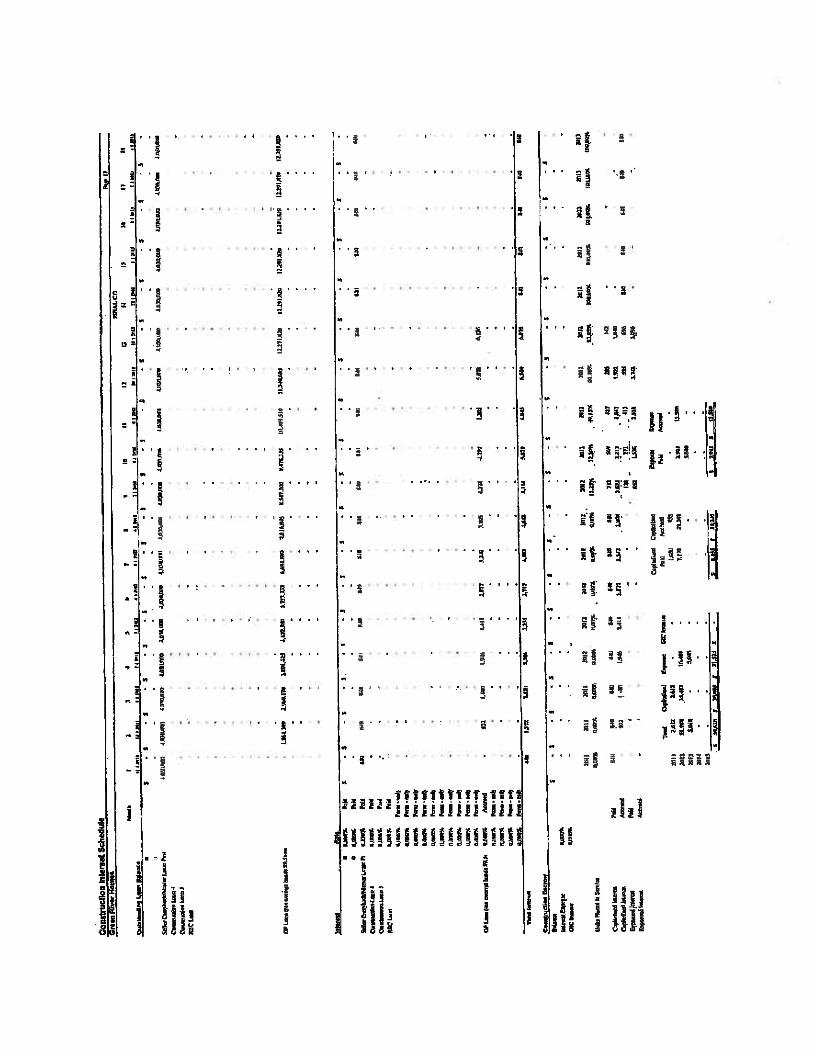
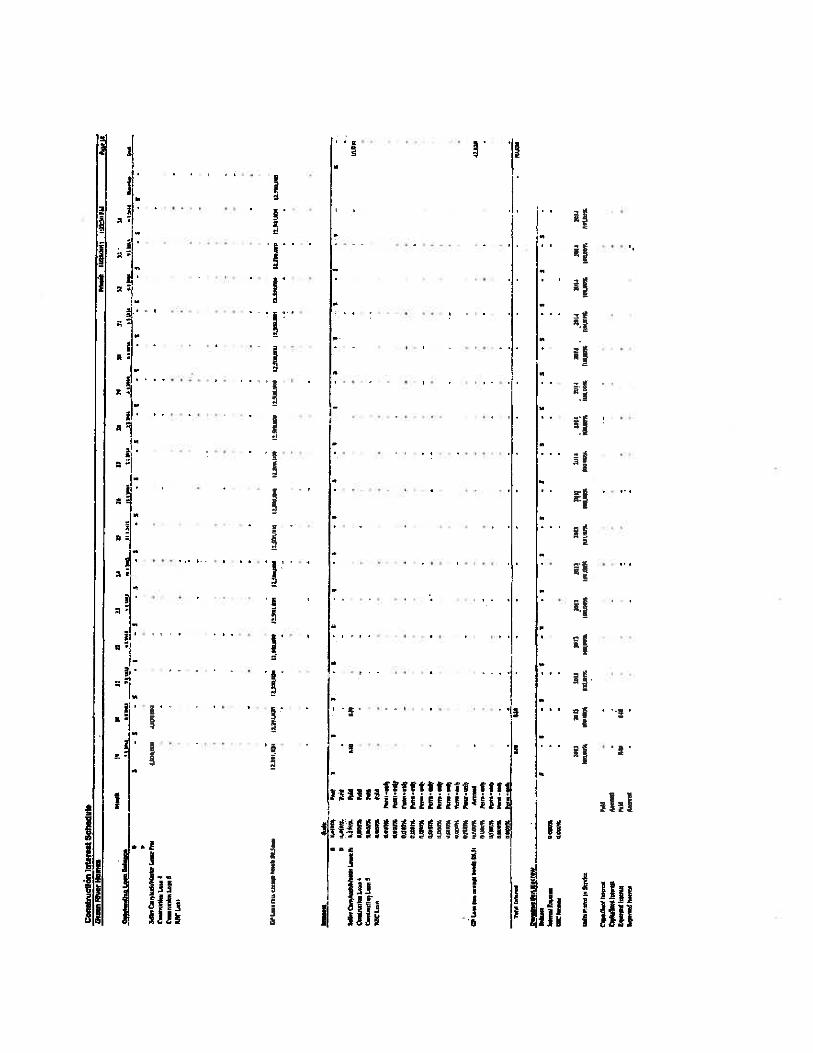

ATTACHMENT B
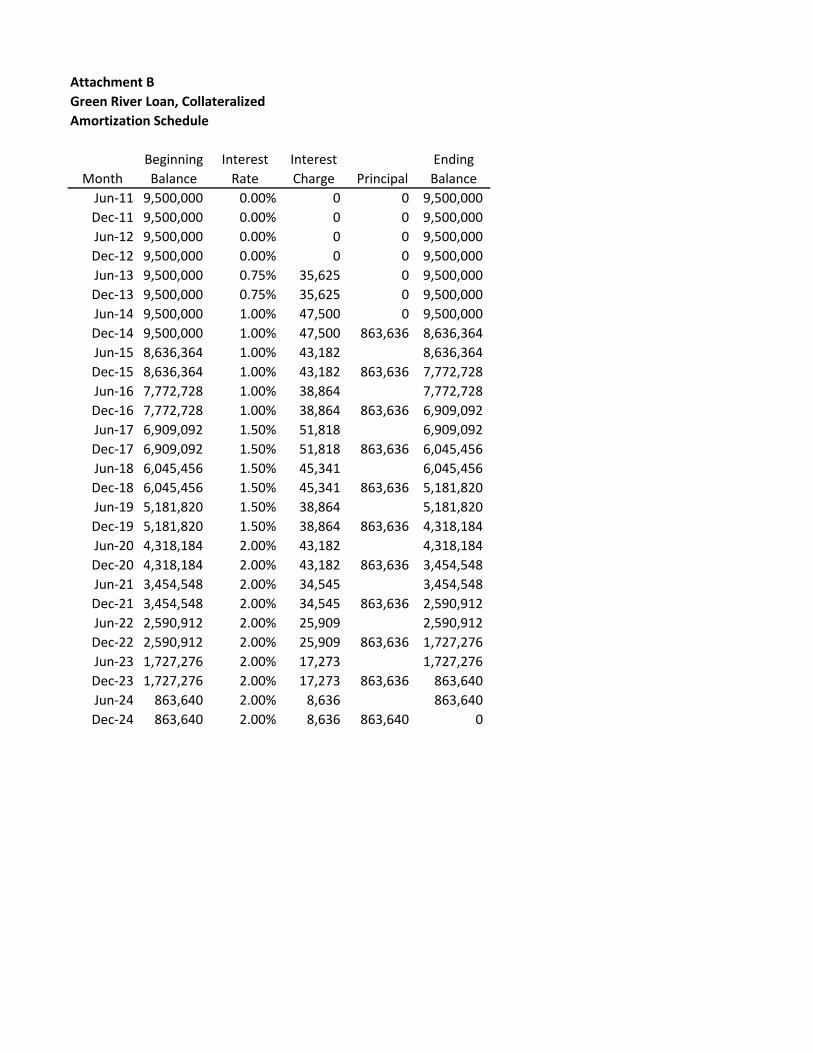
Attachment B
Green River Loan, Collateralized
Amortization Schedule
Beginning Interest Interest Ending
Month Balance Rate Charge Principal Balance
Jun-11 9,500,000 0.00% 0 0 9,500,000
Dec-11 9,500,000 0.00% 0 0 9,500,000
Jun-12 9,500,000 0.00% 0 0 9,500,000
Dec-12 9,500,000 0.00% 0 0 9,500,000
Jun-13 9,500,000 0.75% 35,625 0 9,500,000
Dec-13 9,500,000 0.75% 35,625 0 9,500,000
Jun-14 9,500,000 1.00% 47,500 0 9,500,000
Dec-14 9,500,000 1.00% 47,500 863,636 8,636,364
Jun-15 8,636,364 1.00% 43,182 8,636,364
Dec-15 8,636,364 1.00% 43,182 863,636 7,772,728
Jun-16 7,772,728 1.00% 38,864 7,772,728
Dec-16 7,772,728 1.00% 38,864 863,636 6,909,092
Jun-17 6,909,092 1.50% 51,818 6,909,092
Dec-17 6,909,092 1.50% 51,818 863,636 6,045,456
Jun-18 6,045,456 1.50% 45,341 6,045,456
Dec-18 6,045,456 1.50% 45,341 863,636 5,181,820
Jun-19 5,181,820 1.50% 38,864 5,181,820
Dec-19 5,181,820 1.50% 38,864 863,636 4,318,184
Jun-20 4,318,184 2.00% 43,182 4,318,184
Dec-20 4,318,184 2.00% 43,182 863,636 3,454,548
Jun-21 3,454,548 2.00% 34,545 3,454,548
Dec-21 3,454,548 2.00% 34,545 863,636 2,590,912
Jun-22 2,590,912 2.00% 25,909 2,590,912
Dec-22 2,590,912 2.00% 25,909 863,636 1,727,276
Jun-23 1,727,276 2.00% 17,273 1,727,276
Dec-23 1,727,276 2.00% 17,273 863,636 863,640
Jun-24 863,640 2.00% 8,636 863,640
Dec-24 863,640 2.00% 8,636 863,640 0

ATTACHMENT C
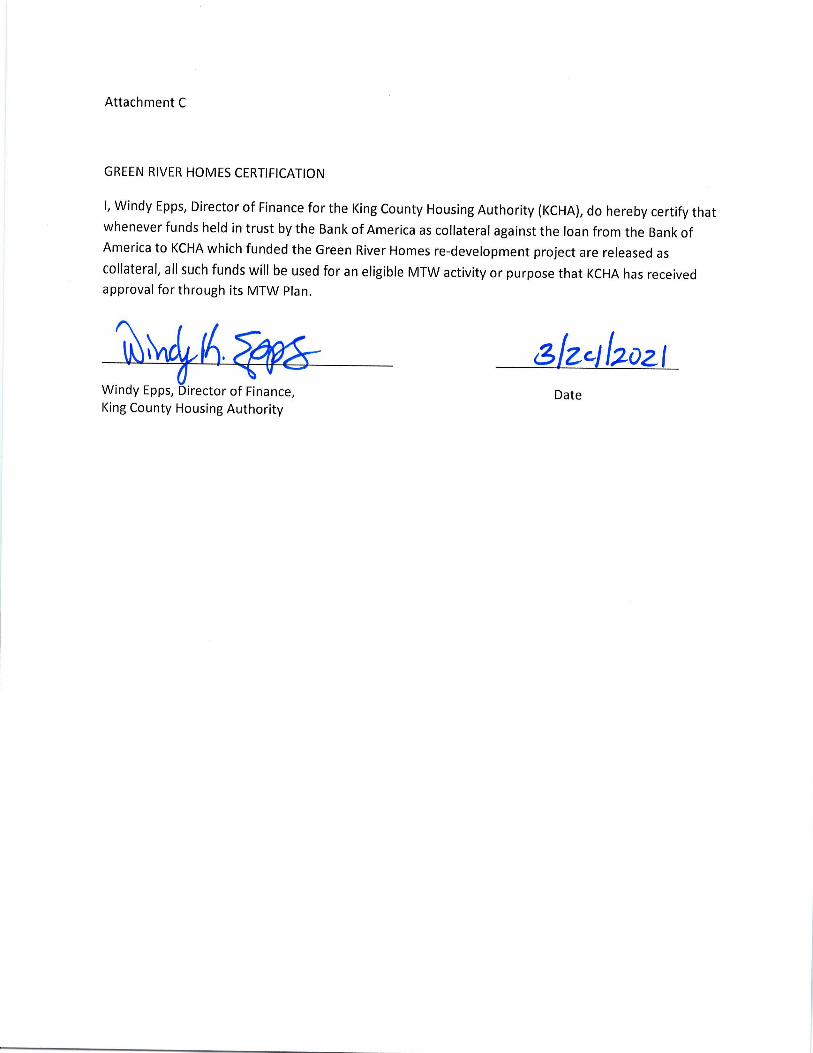

ATTACHMENT D
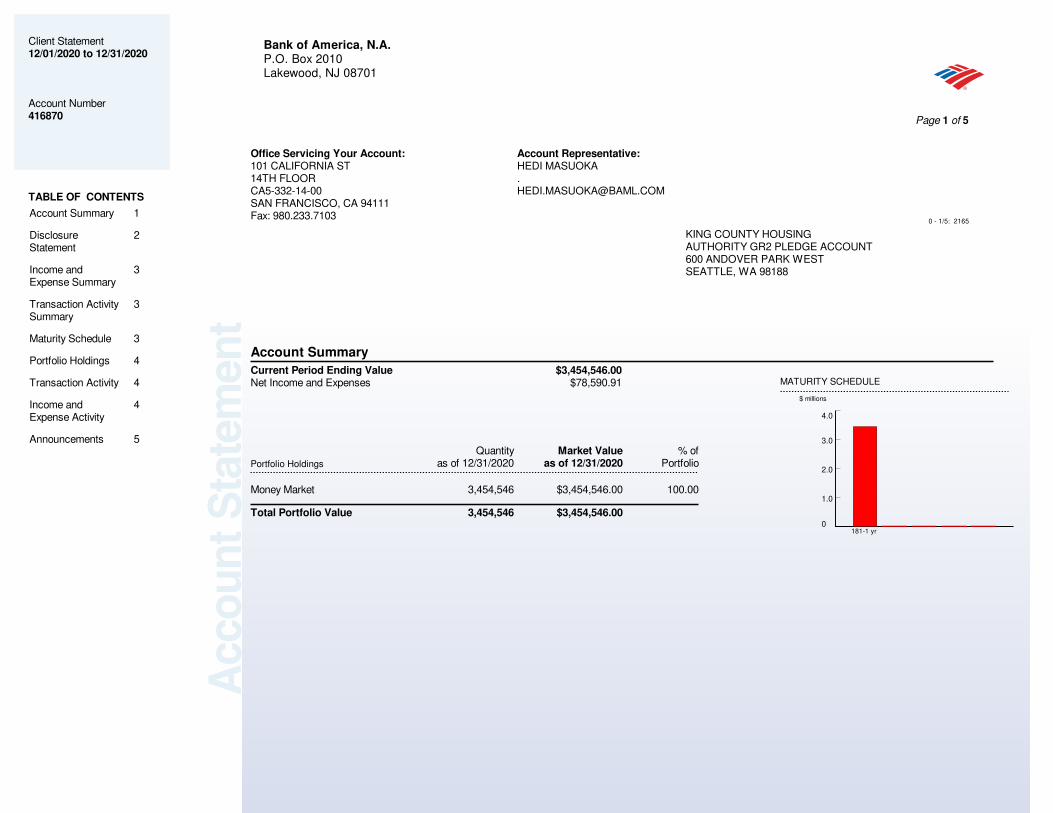
Acco
un
t S
tate
men
t
Bank of America, N.A.P.O. Box 2010Lakewood, NJ 08701
Account Summary
0
1
2
3
4
Client Statement12/01/2020 to 12/31/2020
Account Number416870
Office Servicing Your Account:101 CALIFORNIA ST14TH FLOORCA5-332-14-00SAN FRANCISCO, CA 94111Fax: 980.233.7103
Account Representative:HEDI [email protected]
KING COUNTY HOUSINGAUTHORITY GR2 PLEDGE ACCOUNT600 ANDOVER PARK WESTSEATTLE, WA 98188
TABLE OF CONTENTS
Page 1 of 5
Current Period Ending Value $3,454,546.00Net Income and Expenses $78,590.91
Portfolio Holdings
Quantityas of 12/31/2020
Market Valueas of 12/31/2020
% ofPortfolio
Money Market 3,454,546 $3,454,546.00 100.00
Total Portfolio Value 3,454,546 $3,454,546.00
181-1 yr
MATURITY SCHEDULE
$ millions
0 - 1/5: 2165
.0
.0
.0
.0
Account Summary 1
Disclosure Statement
2
Income and Expense Summary
3
Transaction Activity Summary
3
Maturity Schedule 3
Portfolio Holdings 4
Transaction Activity 4
Income and Expense Activity
4
Announcements 5
Acco
un
t S
tate
men
tGENERAL - Securities transactions are recorded in your account on the settlement dateshown on the confirmation or statement for such transactions (except in the case ofcancellations or corrections where processing dates are used). Securities transactionshaving trade dates on or before, but settlement dates after, the date of the statement willappear on your next statement. Cash received or paid and securities received ordelivered are shown as of the date of the activity. All cash received has been distributedin accordance with your instructions. Unless otherwise agreed, proceeds from pledgedsecurities which mature or are sold are held until the pledge is released. Please adviseyour account representative promptly in writing of any material change in yourinvestment objectives or financial situation. If you have a complaint, please call1-888-221-9276 or notify us in writing at Bank of America, Bank of America Tower, OneBryant Park, Attn: Compliance Complaint Department Mail Code: NY1-100-17-01, NewYork, NY 10036.
DISCLOSURES - Bank of America, N.A. (BANA), is a subsidiary of Bank of AmericaCorporation, the parent company of several banking institutions. BANA is a nationalbank and has registered a separately identifiable department as a municipal securitiesdealer with the Securities and Exchange Commission. BANA also has filed notice of itsstatus as a government securities broker-dealer with the Office Comptroller of theCurrency. From time to time, BANA or one or more affiliates may lend to one or moreissuers whose securities are underwritten, dealt or placed by BANA or one or more ofits affiliates. Please refer to the relevant prospectus offering statement or otherdisclosure document for material information relating to any such lending relationshipand whether the proceeds of an issue will be used to repay any such loans. BANA mayalso from time to time participate in a primary or secondary distribution of the securitiesoffered or sold to you by it. Further, BANA may act as investment advisor to an issuerwhose securities may be sold to you by it.
SECURITY INTEREST - BANA shall have a continuing security interest in all securities,funds and other assets now and hereafter held or carried by BANA in your account(s),including any property in transit or held by others on behalf of BANA, and all proceedsthereof, as collateral security for the payment and performance by you of all yourobligations to BANA now existing or hereafter arising and whether arising under yoursecurities accounts or any other agreement between you and BANA, together with allcosts and expenses of BANA in connection therewith (the "Obligations"). If you fail toperform any Obligation or if you are in default on any agreement between us, BANA maycancel any transaction or may, in a private or a public sale, sell out or buy in thesecurities shown in this statement, holding you liable for any loss incurred. BANA shallhave, in addition to the rights provided herein or by other applicable law, all the rightsand remedies provided to a secured party under the Uniform Commercial Code in theState of New York.
CALCULATION METHODOLOGY - The percentage of Portfolio column, the Asset Mixpie chart and the Maturity Schedule bar graph are calculated using the market value ofthe relevant securities when a market price is available to BANA. When a market priceis not available, BANA uses the current par value.
NON-DEPOSIT INVESTMENT PRODUCTS - Non-deposit investment productspurchased through BANA are NOT FDIC insured and, subject to the following sentence,are NOT deposits or other obligations of, or guaranteed by, Bank of AmericaCorporation or any of its affiliates. Certain investment products are deposits of BANA orare obligations of Bank of America Corporation or an affiliate, as described at the timeof purchase. An investment in securities involves investment risks, including possibleloss of the principal amount invested.
Disclosure Statement RECORD OF OWNERSHIP - Securities held for your account by BANA or held inBANA’s account at a securities depository are commingled with the same securitiesbeing held for other clients. Your ownership of these securities is reflected on BANArecords.
CALLABLE SECURITIES - In the event any securities held by BANA for you in nomineename or in book entry (non-certificated) at a securities depository are called for partialredemption and BANA receives proceeds that belong to more than one person, BANA isauthorized in its sole discretion to determine your proportionate share of such proceeds.Call features shown indicate the next regularly scheduled call date and price. Yourholdings may be subject to other redemption features including sinking funds orextraordinary calls.
INTEREST, DIVIDENDS, SALE PROCEEDS - Although all figures shown are intendedto be accurate, statement data should not be used for tax purposes, BANA is requiredby law to report to the Internal Revenue Service certain interest, dividend income andsales proceeds. Dividends and interest payments may be subject to country specificwithholding taxes.
MARKET VALUATION/PRICE/ESTIMATED FIGURES - Securities positions are valuedat or about the close of the statement period if prices are available from referencesources deemed reliable. For money market positions, if price is shown as N/A, aderived valuation (unadjusted for the credit quality) is provided based on the originalcost basis reported to BANA and adjusted by the amount of any accrued discount fromthe purchase date to the end of the statement period. The month-end valuations of yourportfolio are for guidance only and do not necessarily reflect prices at which eachposition could be sold for, if short, covered on the valuation date, particularly in the caseof inactively or infrequently traded securities. BANA cannot guarantee the accuracy ofsuch information. Information regarding average cost, unrealized gain or loss, accruedinterest, current yield and estimated income figures that appear on your statement arederived from information provided by sources considered reliable by BANA. Contactyour Account Representative to obtain current quotations or if you have questionsregarding statement account valuations/estimated figures. N/A= Information notapplicable or available at the time of statement creation.
ERRORS AND OMISSIONS - Please notify us within ten (10) days if you believe there isany inaccuracy in any entry reflected on this statement. Please include your accountnumber when you notify us in writing. Failure to notify BANA of any error or omissionwill constitute your waiver of any claim arising as a result of such error or omission.
PROXY DISCLOSURES - Any attempt to vote securities will be void to the extent thatsuch securities are not in the possession or control of BANA including (i) securities notyet delivered to BANA, (ii) securities purchased and not paid for by settlement date, and(iii) securities that BANA has hypothecated, re-hypothecated, pledged, re-pledged, sold,lent or otherwise transferred. Please be advised that for the purposes of proxy voting,customers will not be notified that the securities are not in BANA’S possession orcontrol. Furthermore, BANA will not notify customers that a vote was void.
Bank of America, N.A.P.O. Box 2010Lakewood, NJ 08701
Client Statement12/01/2020 to 12/31/2020
Account Number416870 Page 2 of 5
0 - 2/5: 2166
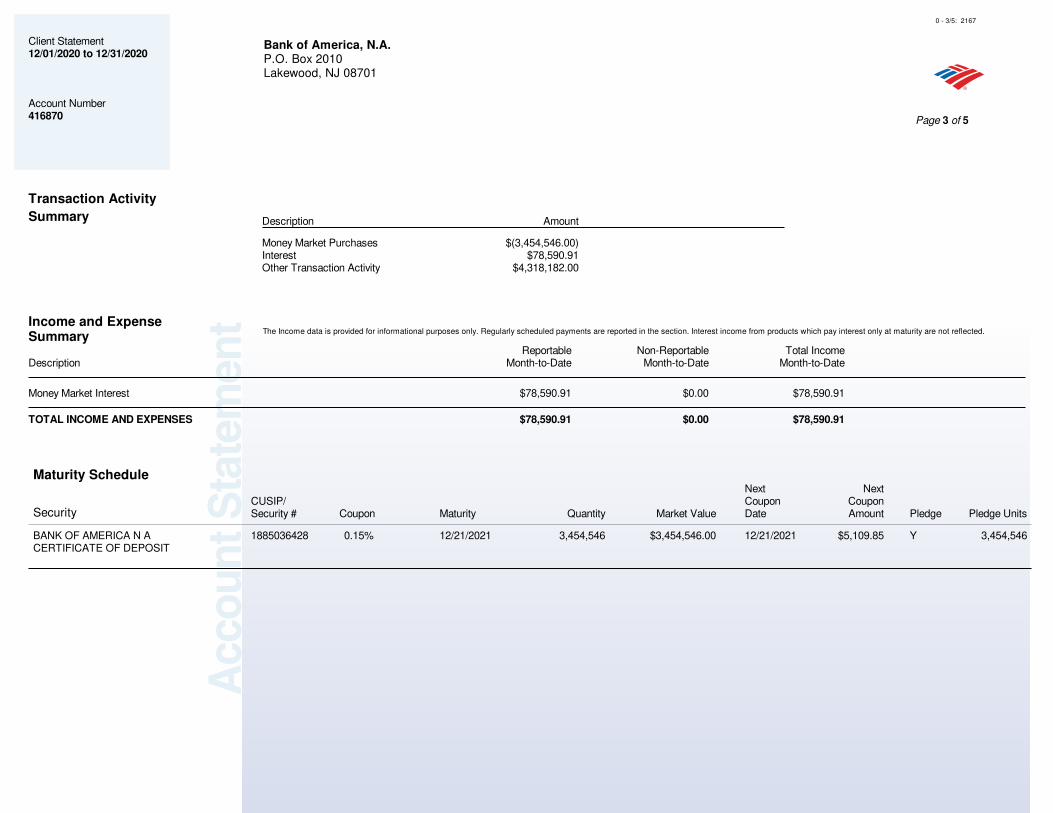
Acco
un
t S
tate
men
t
Bank of America, N.A.P.O. Box 2010Lakewood, NJ 08701
Income and ExpenseSummary
The Income data is provided for informational purposes only. Regularly scheduled payments are reported in the section. Interest income from products which pay interest only at maturity are not reflected.
DescriptionReportable
Month-to-DateNon-Reportable
Month-to-DateTotal Income
Month-to-Date
Money Market Interest $78,590.91 $0.00 $78,590.91
TOTAL INCOME AND EXPENSES $78,590.91 $0.00 $78,590.91
Transaction Activity
Summary Description Amount
Money Market Purchases $(3,454,546.00)Interest $78,590.91Other Transaction Activity $4,318,182.00
Client Statement12/01/2020 to 12/31/2020
Account Number416870 Page 3 of 5
0 - 3/5: 2167
Maturity Schedule
SecurityCUSIP/Security # Coupon Maturity Quantity Market Value
NextCouponDate
NextCouponAmount Pledge Pledge Units
BANK OF AMERICA N ACERTIFICATE OF DEPOSIT
1885036428 0.15% 12/21/2021 3,454,546 $3,454,546.00 12/21/2021 $5,109.85 Y 3,454,546
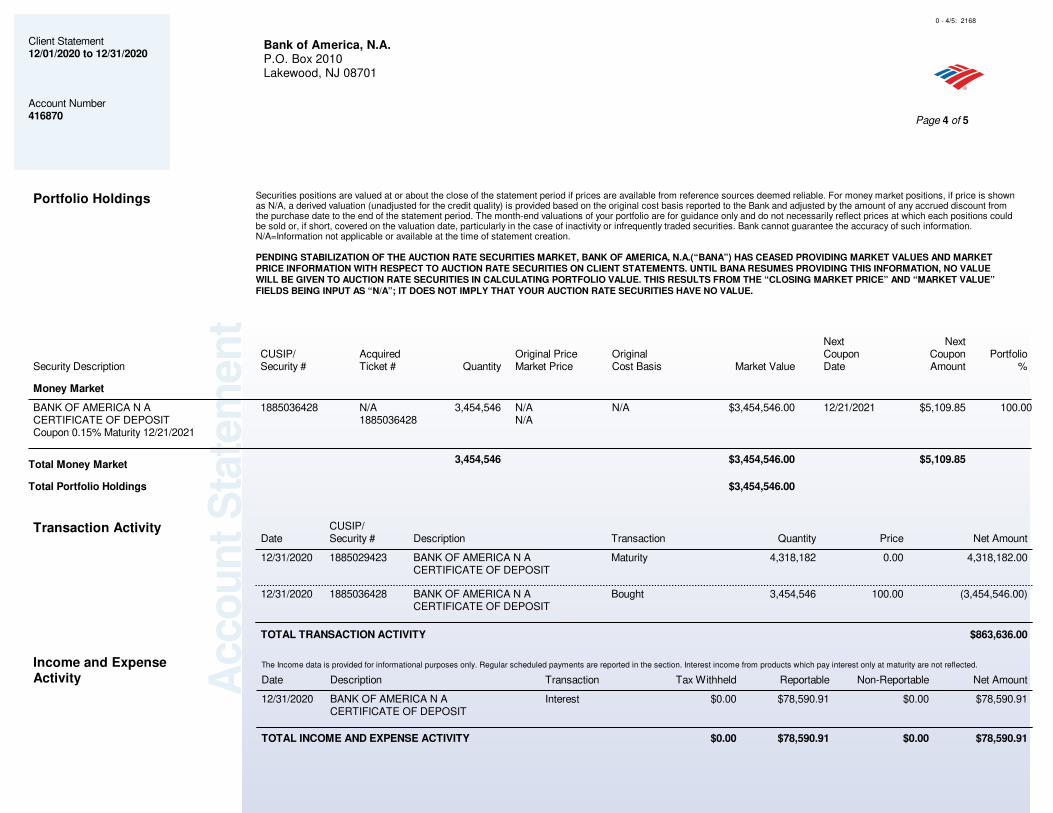
Acco
un
t S
tate
men
t
Bank of America, N.A.P.O. Box 2010Lakewood, NJ 08701
Client Statement12/01/2020 to 12/31/2020
Account Number416870 Page 4 of 5
0 - 4/5: 2168
Portfolio Holdings Securities positions are valued at or about the close of the statement period if prices are available from reference sources deemed reliable. For money market positions, if price is shownas N/A, a derived valuation (unadjusted for the credit quality) is provided based on the original cost basis reported to the Bank and adjusted by the amount of any accrued discount fromthe purchase date to the end of the statement period. The month-end valuations of your portfolio are for guidance only and do not necessarily reflect prices at which each positions couldbe sold or, if short, covered on the valuation date, particularly in the case of inactivity or infrequently traded securities. Bank cannot guarantee the accuracy of such information.N/A=Information not applicable or available at the time of statement creation.
PENDING STABILIZATION OF THE AUCTION RATE SECURITIES MARKET, BANK OF AMERICA, N.A.(“BANA”) HAS CEASED PROVIDING MARKET VALUES AND MARKETPRICE INFORMATION WITH RESPECT TO AUCTION RATE SECURITIES ON CLIENT STATEMENTS. UNTIL BANA RESUMES PROVIDING THIS INFORMATION, NO VALUEWILL BE GIVEN TO AUCTION RATE SECURITIES IN CALCULATING PORTFOLIO VALUE. THIS RESULTS FROM THE “CLOSING MARKET PRICE” AND “MARKET VALUE”FIELDS BEING INPUT AS “N/A”; IT DOES NOT IMPLY THAT YOUR AUCTION RATE SECURITIES HAVE NO VALUE.
Security DescriptionCUSIP/Security #
AcquiredTicket # Quantity
Original PriceMarket Price
OriginalCost Basis Market Value
NextCouponDate
NextCouponAmount
Portfolio%
Money Market
BANK OF AMERICA N ACERTIFICATE OF DEPOSITCoupon 0.15% Maturity 12/21/2021
1885036428 N/A1885036428
3,454,546 N/AN/A
N/A $3,454,546.00 12/21/2021 $5,109.85 100.00
Total Money Market 3,454,546 $3,454,546.00 $5,109.85
Total Portfolio Holdings $3,454,546.00
Transaction ActivityDate
CUSIP/Security # Description Transaction Quantity Price Net Amount
12/31/2020 1885029423 BANK OF AMERICA N ACERTIFICATE OF DEPOSIT
Maturity 4,318,182 0.00 4,318,182.00
12/31/2020 1885036428 BANK OF AMERICA N ACERTIFICATE OF DEPOSIT
Bought 3,454,546 100.00 (3,454,546.00)
TOTAL TRANSACTION ACTIVITY $863,636.00
Income and Expense The Income data is provided for informational purposes only. Regular scheduled payments are reported in the section. Interest income from products which pay interest only at maturity are not reflected.
Activity Date Description Transaction Tax Withheld Reportable Non-Reportable Net Amount
12/31/2020 BANK OF AMERICA N ACERTIFICATE OF DEPOSIT
Interest $0.00 $78,590.91 $0.00 $78,590.91
TOTAL INCOME AND EXPENSE ACTIVITY $0.00 $78,590.91 $0.00 $78,590.91
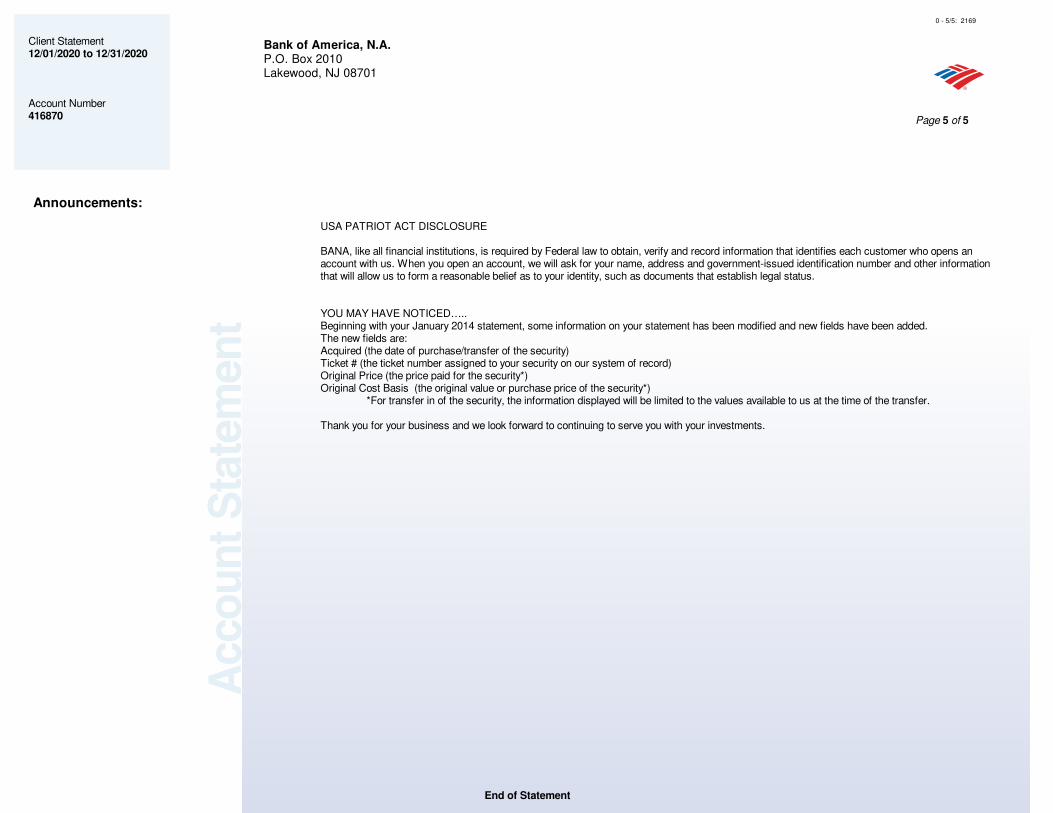
Acco
un
t S
tate
men
t
Bank of America, N.A.P.O. Box 2010Lakewood, NJ 08701
Client Statement12/01/2020 to 12/31/2020
Account Number416870 Page 5 of 5
0 - 5/5: 2169
End of Statement
Announcements:
USA PATRIOT ACT DISCLOSURE
BANA, like all financial institutions, is required by Federal law to obtain, verify and record information that identifies each customer who opens anaccount with us. When you open an account, we will ask for your name, address and government-issued identification number and other informationthat will allow us to form a reasonable belief as to your identity, such as documents that establish legal status.
YOU MAY HAVE NOTICED…..Beginning with your January 2014 statement, some information on your statement has been modified and new fields have been added.The new fields are:Acquired (the date of purchase/transfer of the security)Ticket # (the ticket number assigned to your security on our system of record)Original Price (the price paid for the security*)Original Cost Basis (the original value or purchase price of the security*)
*For transfer in of the security, the information displayed will be limited to the values available to us at the time of the transfer.
Thank you for your business and we look forward to continuing to serve you with your investments.

ATTACHMENT E
Attachment E
Moving King County Residents Forward Pro Forma
Initial Loan Balance $18,000,000 $17,215,339
Interest Rate on LOC 6.00%
Amort Term (Yrs) 20 Net Transaction Costs
DSCR (stabilized) 1.96 Legal $50,000
Net Trans. Costs not available for Rehab $1,175,661 Misc $125,000
Minimum Rehab needed ($51K/Unit) $25,959,000 $8,743,661.01 Underwriting $216,000
Total Rehab needed ($65,000/Unit) $33,085,000 Debt Reserve (6 m $784,661
Add'l Capital in 2021 adjusted for infl $9,576,748
1 2 3 4 5 6 7 8 9 10 11 12 13 14 15
Rental Income Ave Rent per Unit $1,200 2012 2013 2014 2015 2016 2017 2018 2019 2020 2021 2022 2023 2024 2025 2026
Lease Revenue 1.00% $7,329,600 $7,402,896 $7,476,925 $7,551,694 $7,627,211 $7,703,483 $7,780,518 $7,858,323 $7,936,907 $8,016,276 $8,096,438 $8,177,403 $8,259,177 $8,341,769 $8,425,186
Vacancy due to rehab -$3,371,616 -$2,442,956
Vacancy -2.5% -$98,950 -$123,999 -$186,923 -$188,792 -$190,680 -$192,587 -$194,513 -$196,458 -$198,423 -$200,407 -$202,411 -$204,435 -$206,479 -$208,544 -$210,630
Total Net Rental Income $3,859,034 $4,835,942 $7,290,002 $7,362,902 $7,436,531 $7,510,896 $7,586,005 $7,661,865 $7,738,484 $7,815,869 $7,894,027 $7,972,968 $8,052,697 $8,133,224 $8,214,557
Expenses Expense Trend % 3.5%
Existing Operating Expense $6,500 $3,308,500 $3,424,298 $3,544,148 $3,668,193 $3,796,580 $3,929,460 $4,066,991 $4,209,336 $4,356,663 $4,509,146 $4,666,966 $4,830,310 $4,999,371 $5,174,349 $5,355,451
Add'l Base Cost $100 $50,900 $52,682 $54,525 $56,434 $58,409 $60,453 $62,569 $64,759 $67,026 $69,371 $71,799 $74,312 $76,913 $79,605 $82,392
Add'l costs due to structure $250 $127,250 $131,704 $136,313 $141,084 $146,022 $151,133 $156,423 $161,898 $167,564 $173,429 $179,499 $185,781 $192,283 $199,013 $205,979
Replacement Reserves $400 $203,600 $210,726 $218,101 $225,735 $233,636 $241,813 $250,276 $259,036 $268,102 $277,486 $287,198 $297,250 $307,654 $318,421 $329,566
Total Expenses 3,690,250$ 3,819,409$ 3,953,088$ 4,091,446$ 4,234,647$ 4,382,859$ 4,536,259$ 4,695,029$ 4,859,355$ 5,029,432$ 5,205,462$ 5,387,653$ 5,576,221$ 5,771,389$ 5,973,387$
Net Operating Income 168,784 1,016,533 3,336,914 3,271,456 3,201,884 3,128,037 3,049,746 2,966,837 2,879,129 2,786,437 2,688,565 2,585,314 2,476,476 2,361,835 2,241,169
0.11 0.65 2.13 2.08 2.04 1.99 1.94 1.89 1.83 1.78 1.71 1.65 1.58 1.51 1.43
Debt Payments ($1,569,322) ($1,569,322) ($1,569,322) ($1,569,322) ($1,569,322) ($1,569,322) ($1,569,322) ($1,569,322) ($1,569,322) ($1,569,322) ($1,569,322) ($1,569,322) ($1,569,322) ($1,569,322) ($1,569,322)
Cash flow available for def'd capital needs/(Shortfall) (1,400,538) (552,789) 1,767,592 1,702,134 1,632,562 1,558,715 1,480,424 1,397,515 1,309,807 1,217,115 1,119,243 1,015,992 907,154 792,513 671,847
$9,576,748
Add'l Capital needs not funded from Debt $8,743,661 18
Balance to cover from Cash Flow 3.00% $10,144,199 $11,001,314 $9,563,761 $8,148,540 $6,760,434 $5,404,533 $4,086,245 $2,811,318 $1,585,850 $416,311 $8,873,816 $7,857,823 $6,950,669 $6,158,156 $5,486,309
bal. outstanding

ATTACHMENT F
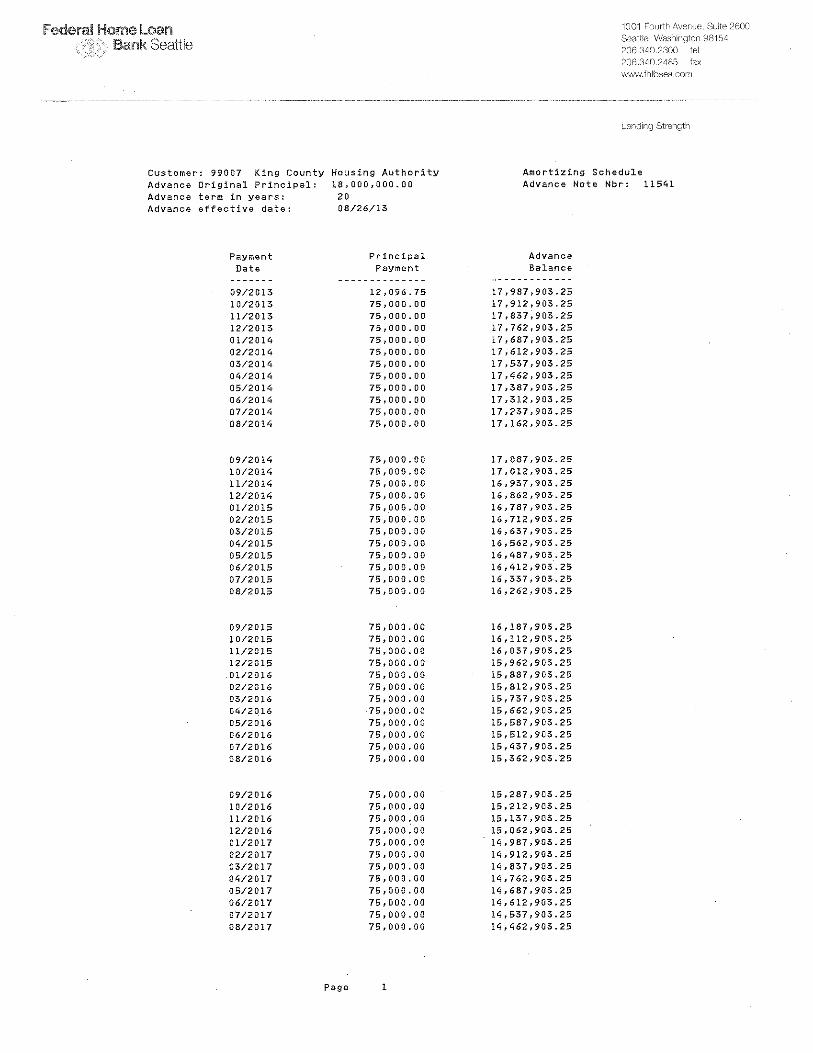
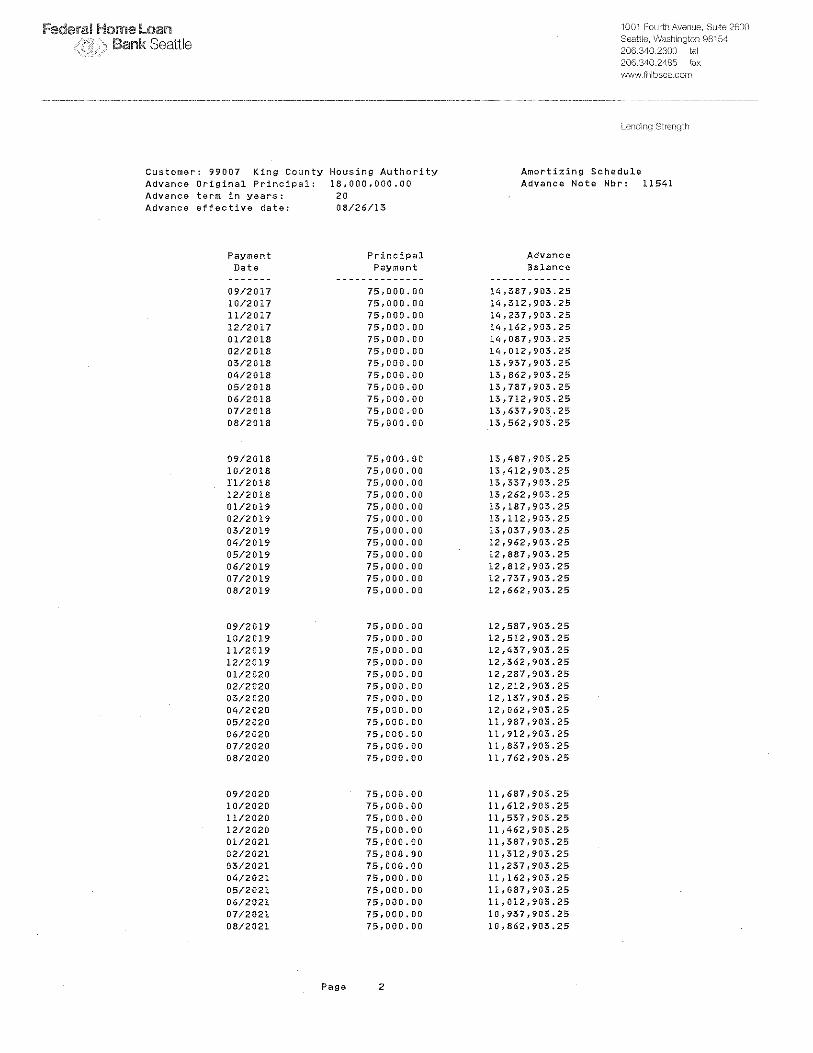
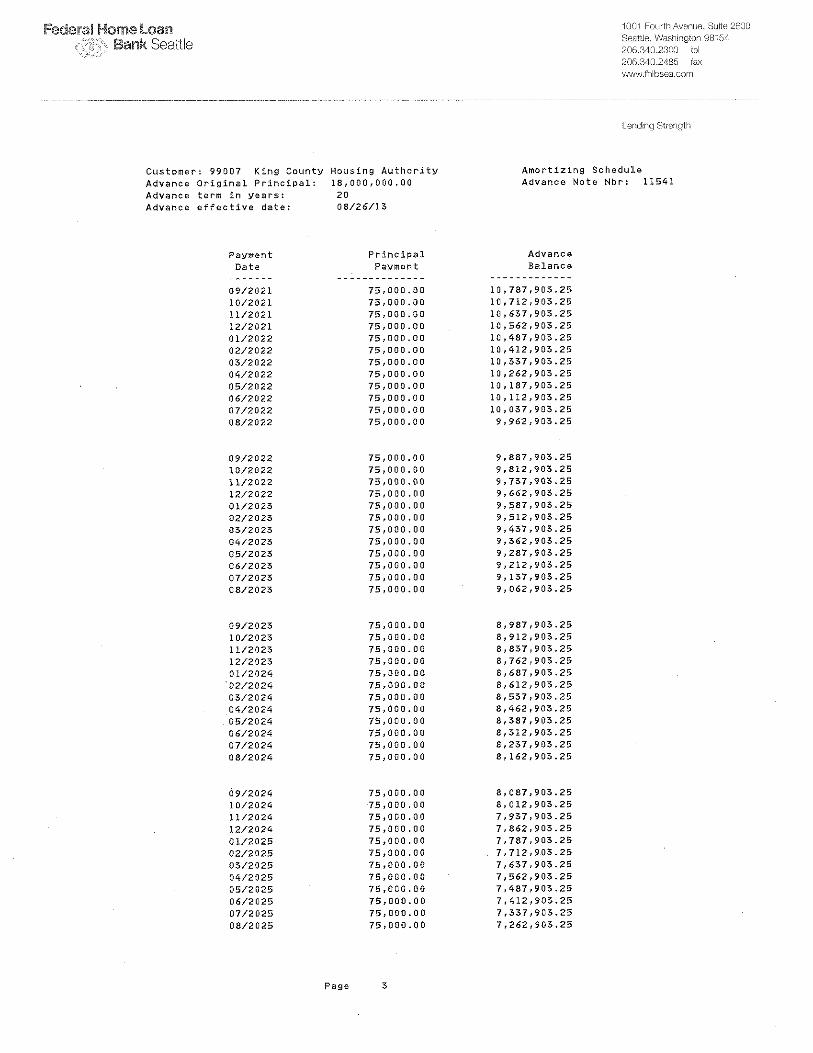
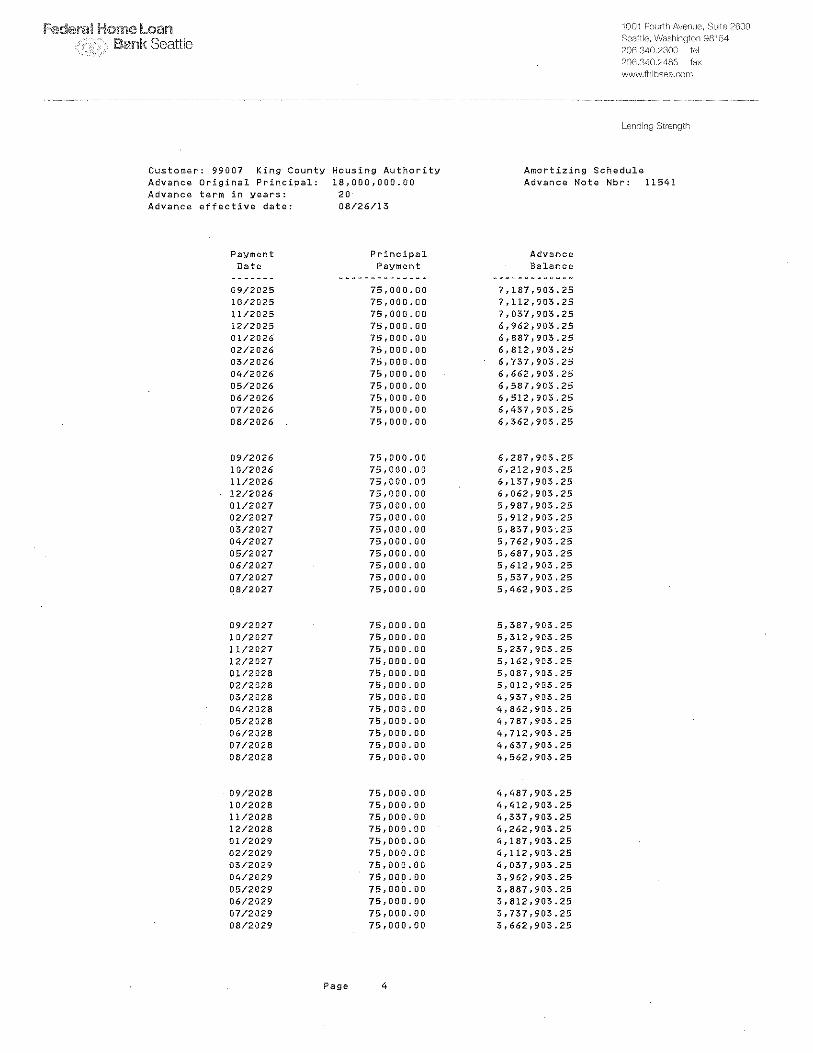
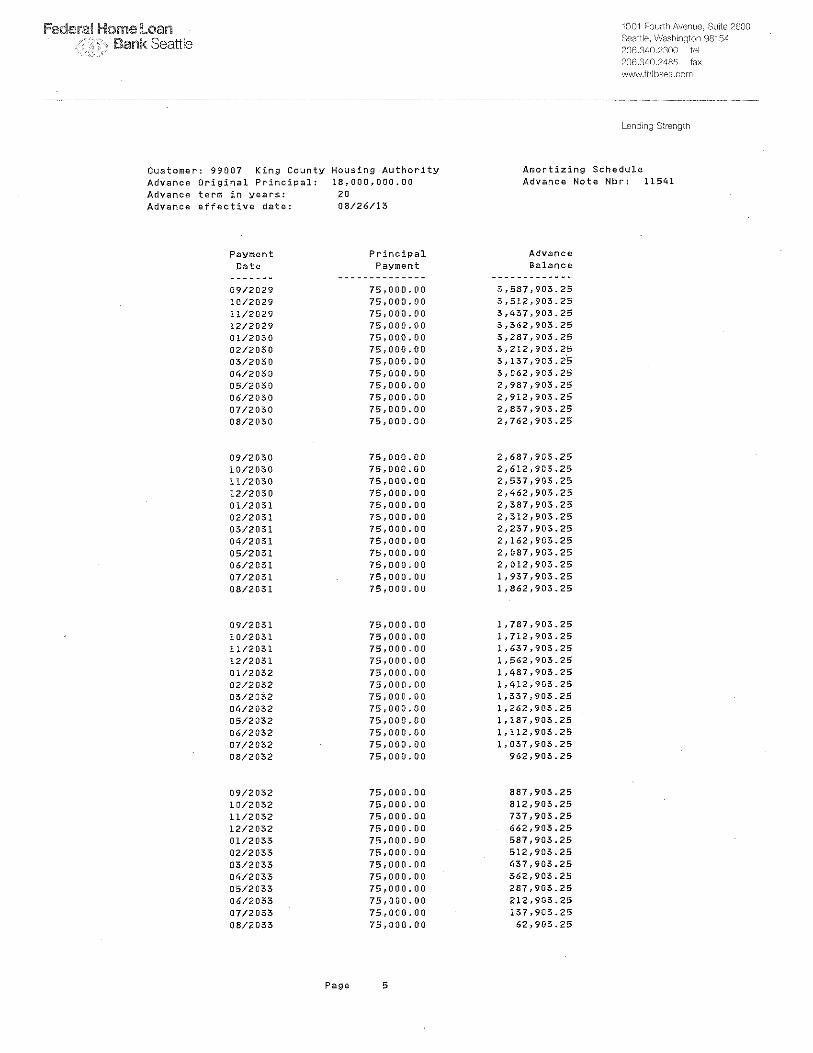
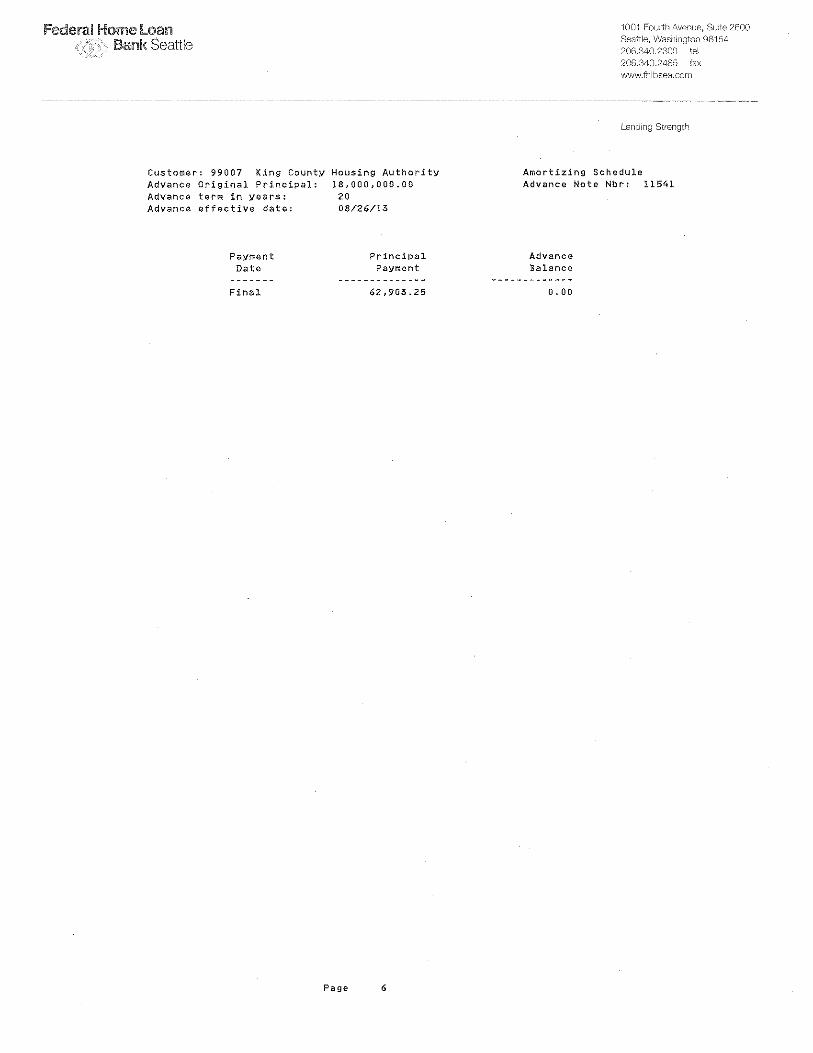

ATTACHMENT G
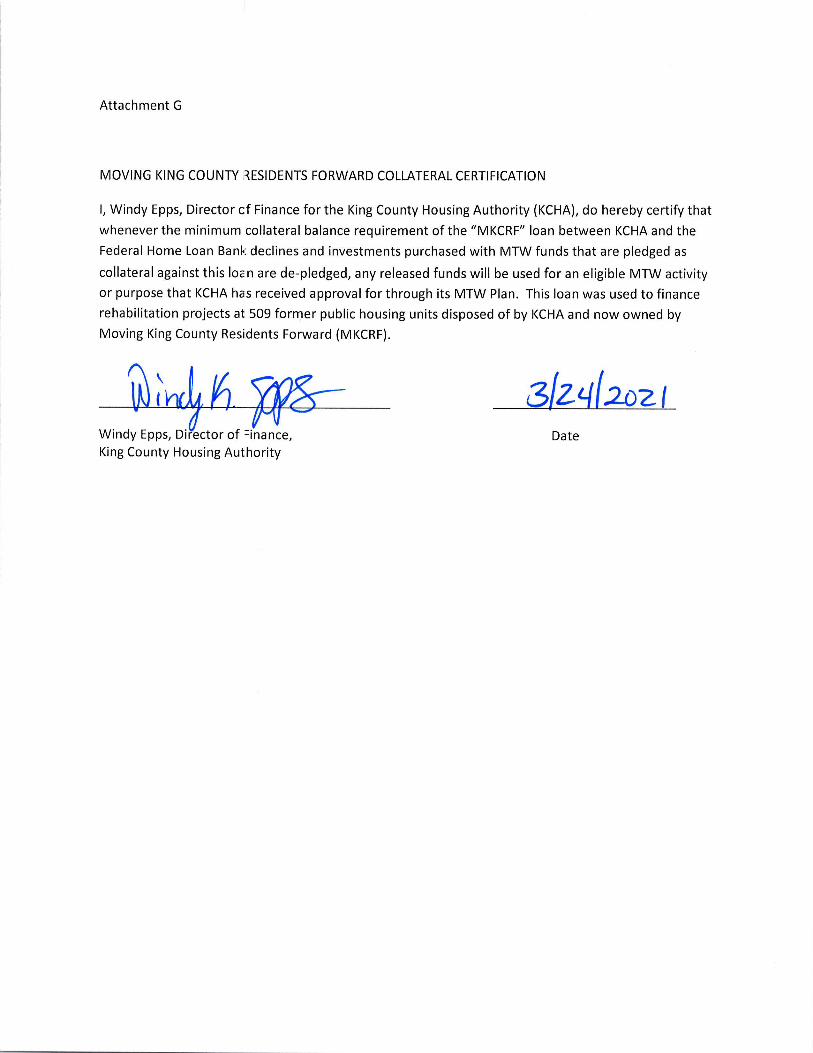

ATTACHMENT H
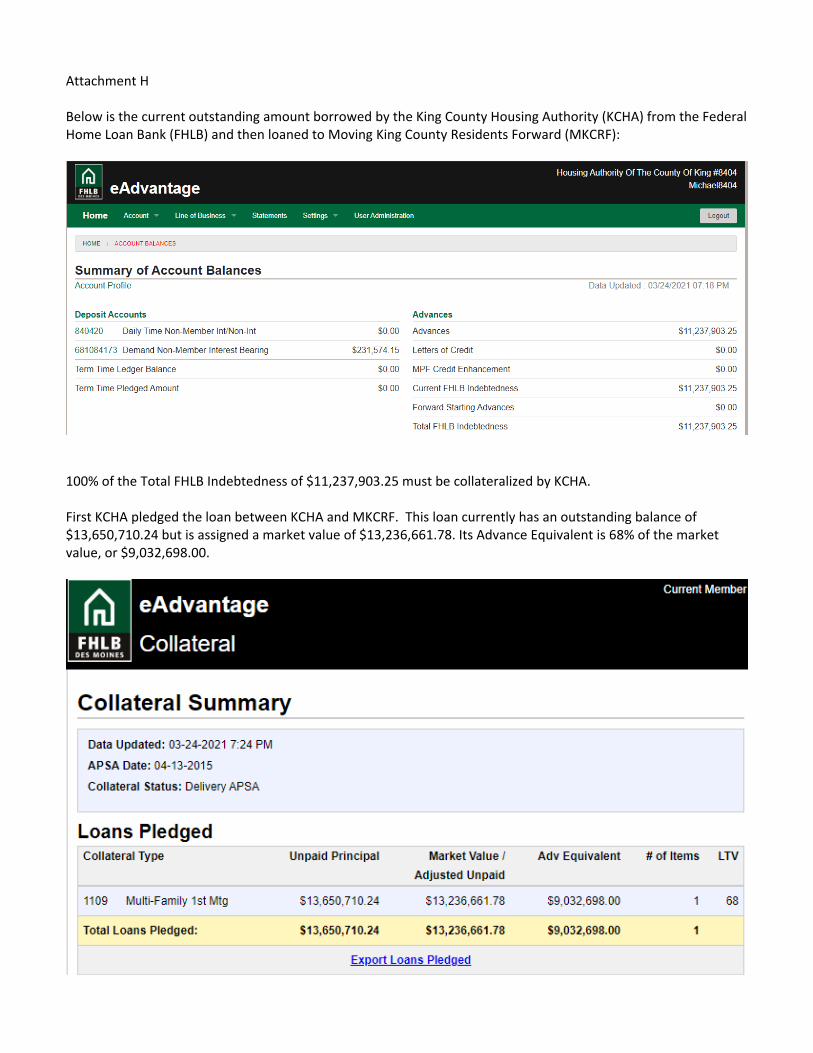
Attachment H Below is the current outstanding amount borrowed by the King County Housing Authority (KCHA) from the Federal Home Loan Bank (FHLB) and then loaned to Moving King County Residents Forward (MKCRF):
100% of the Total FHLB Indebtedness of $11,237,903.25 must be collateralized by KCHA. First KCHA pledged the loan between KCHA and MKCRF. This loan currently has an outstanding balance of $13,650,710.24 but is assigned a market value of $13,236,661.78. Its Advance Equivalent is 68% of the market value, or $9,032,698.00.
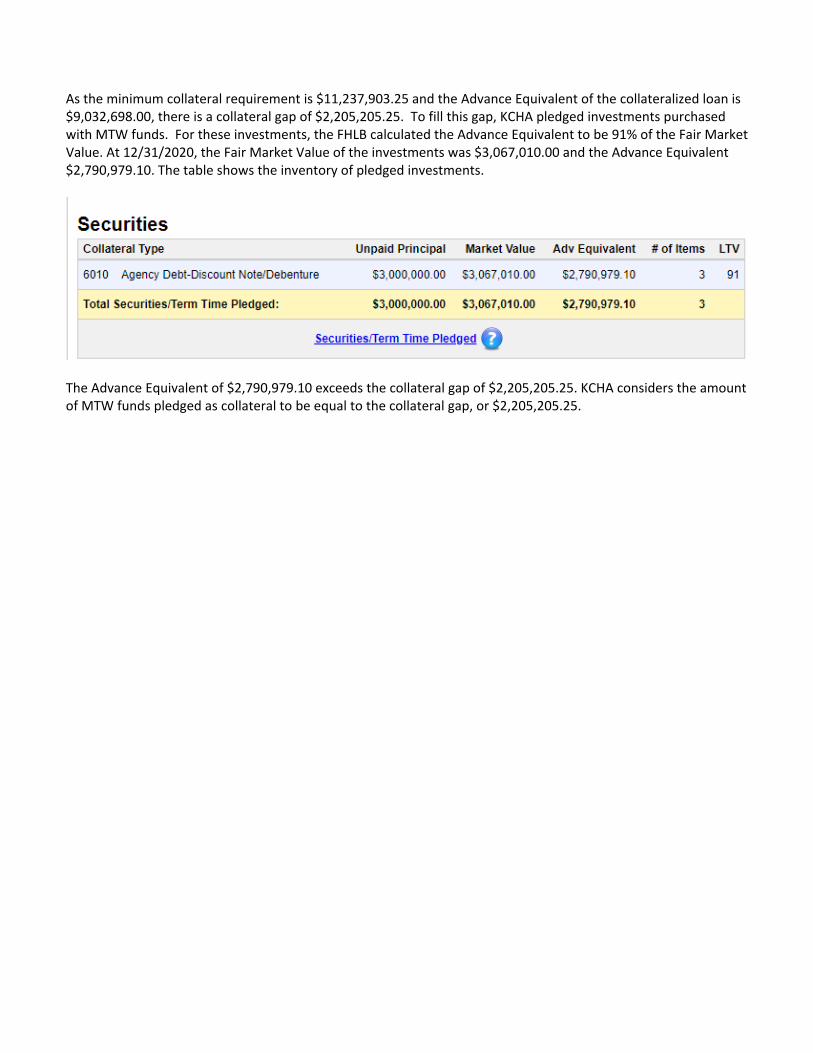
As the minimum collateral requirement is $11,237,903.25 and the Advance Equivalent of the collateralized loan is $9,032,698.00, there is a collateral gap of $2,205,205.25. To fill this gap, KCHA pledged investments purchased with MTW funds. For these investments, the FHLB calculated the Advance Equivalent to be 91% of the Fair Market Value. At 12/31/2020, the Fair Market Value of the investments was $3,067,010.00 and the Advance Equivalent $2,790,979.10. The table shows the inventory of pledged investments.
The Advance Equivalent of $2,790,979.10 exceeds the collateral gap of $2,205,205.25. KCHA considers the amount of MTW funds pledged as collateral to be equal to the collateral gap, or $2,205,205.25.

A P P EN DI X F
E N E R G Y P E R F OR M A N C E C ON T R A C T R E P OR T
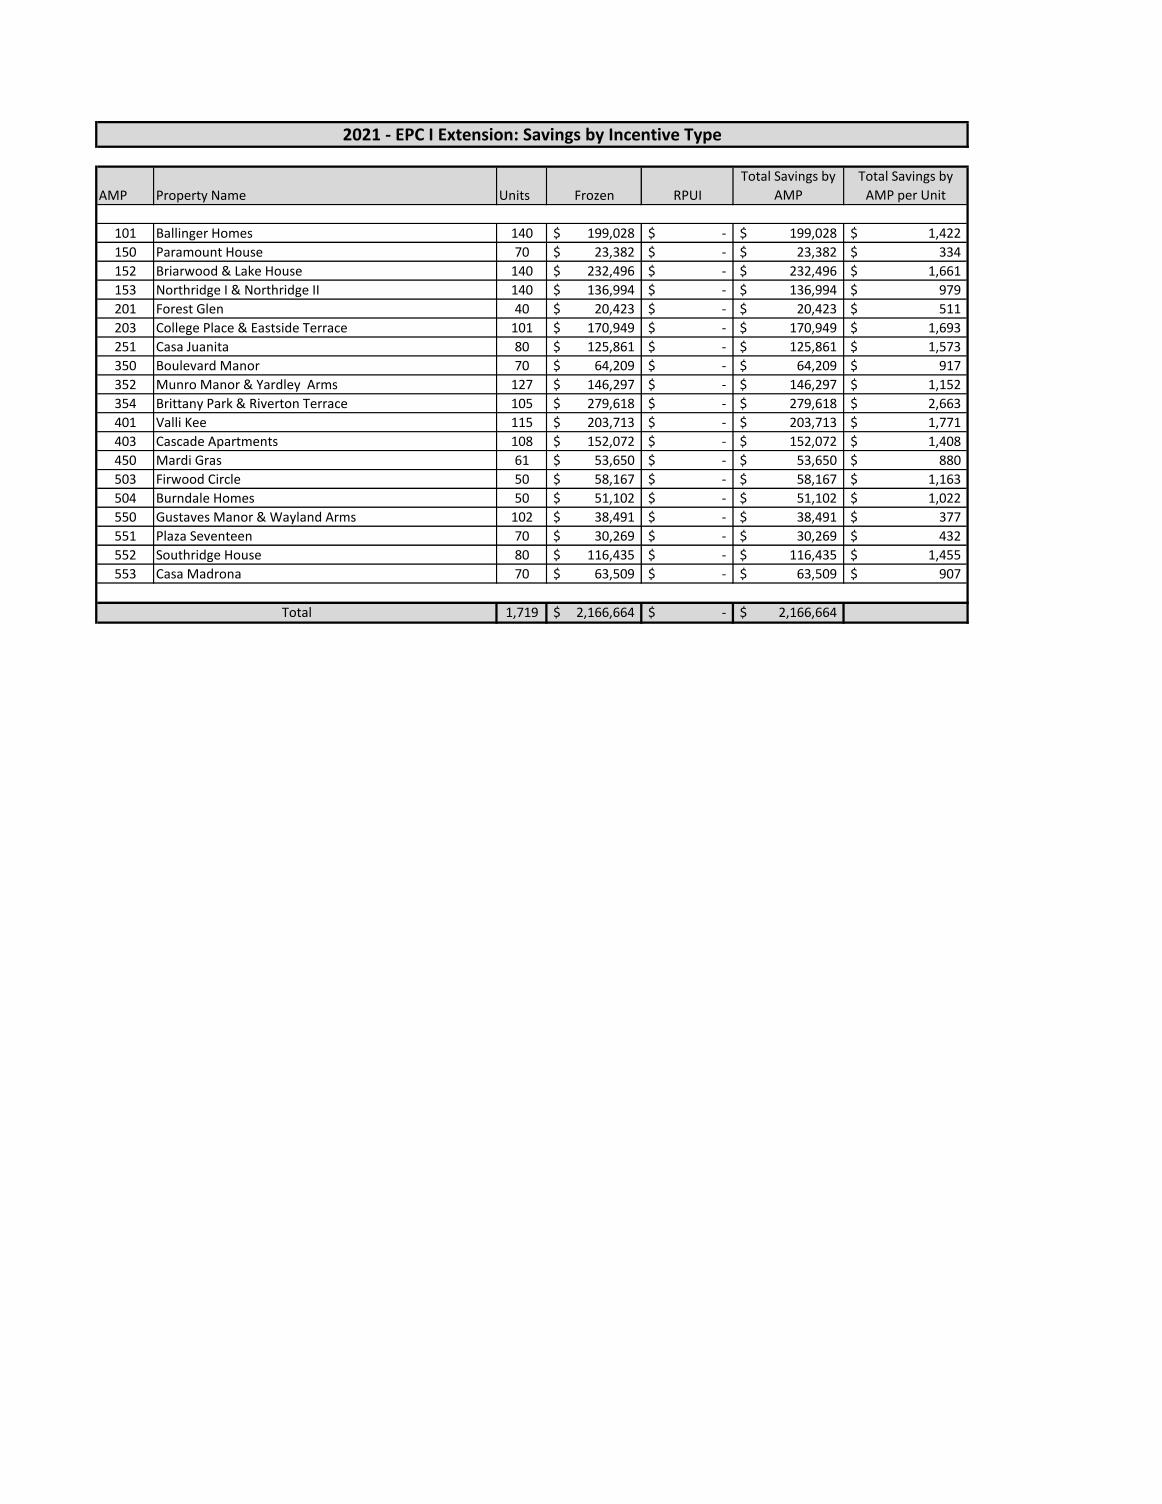
AMP Property Name Units Frozen RPUI
Total Savings by
AMP
Total Savings by
AMP per Unit
101 Ballinger Homes 140 199,028$ -$ 199,028$ 1,422$
150 Paramount House 70 23,382$ -$ 23,382$ 334$
152 Briarwood & Lake House 140 232,496$ -$ 232,496$ 1,661$
153 Northridge I & Northridge II 140 136,994$ -$ 136,994$ 979$
201 Forest Glen 40 20,423$ -$ 20,423$ 511$
203 College Place & Eastside Terrace 101 170,949$ -$ 170,949$ 1,693$
251 Casa Juanita 80 125,861$ -$ 125,861$ 1,573$
350 Boulevard Manor 70 64,209$ -$ 64,209$ 917$
352 Munro Manor & Yardley Arms 127 146,297$ -$ 146,297$ 1,152$
354 Brittany Park & Riverton Terrace 105 279,618$ -$ 279,618$ 2,663$
401 Valli Kee 115 203,713$ -$ 203,713$ 1,771$
403 Cascade Apartments 108 152,072$ -$ 152,072$ 1,408$
450 Mardi Gras 61 53,650$ -$ 53,650$ 880$
503 Firwood Circle 50 58,167$ -$ 58,167$ 1,163$
504 Burndale Homes 50 51,102$ -$ 51,102$ 1,022$
550 Gustaves Manor & Wayland Arms 102 38,491$ -$ 38,491$ 377$
551 Plaza Seventeen 70 30,269$ -$ 30,269$ 432$
552 Southridge House 80 116,435$ -$ 116,435$ 1,455$
553 Casa Madrona 70 63,509$ -$ 63,509$ 907$
1,719 2,166,664$ -$ 2,166,664$
2021 - EPC I Extension: Savings by Incentive Type
Total
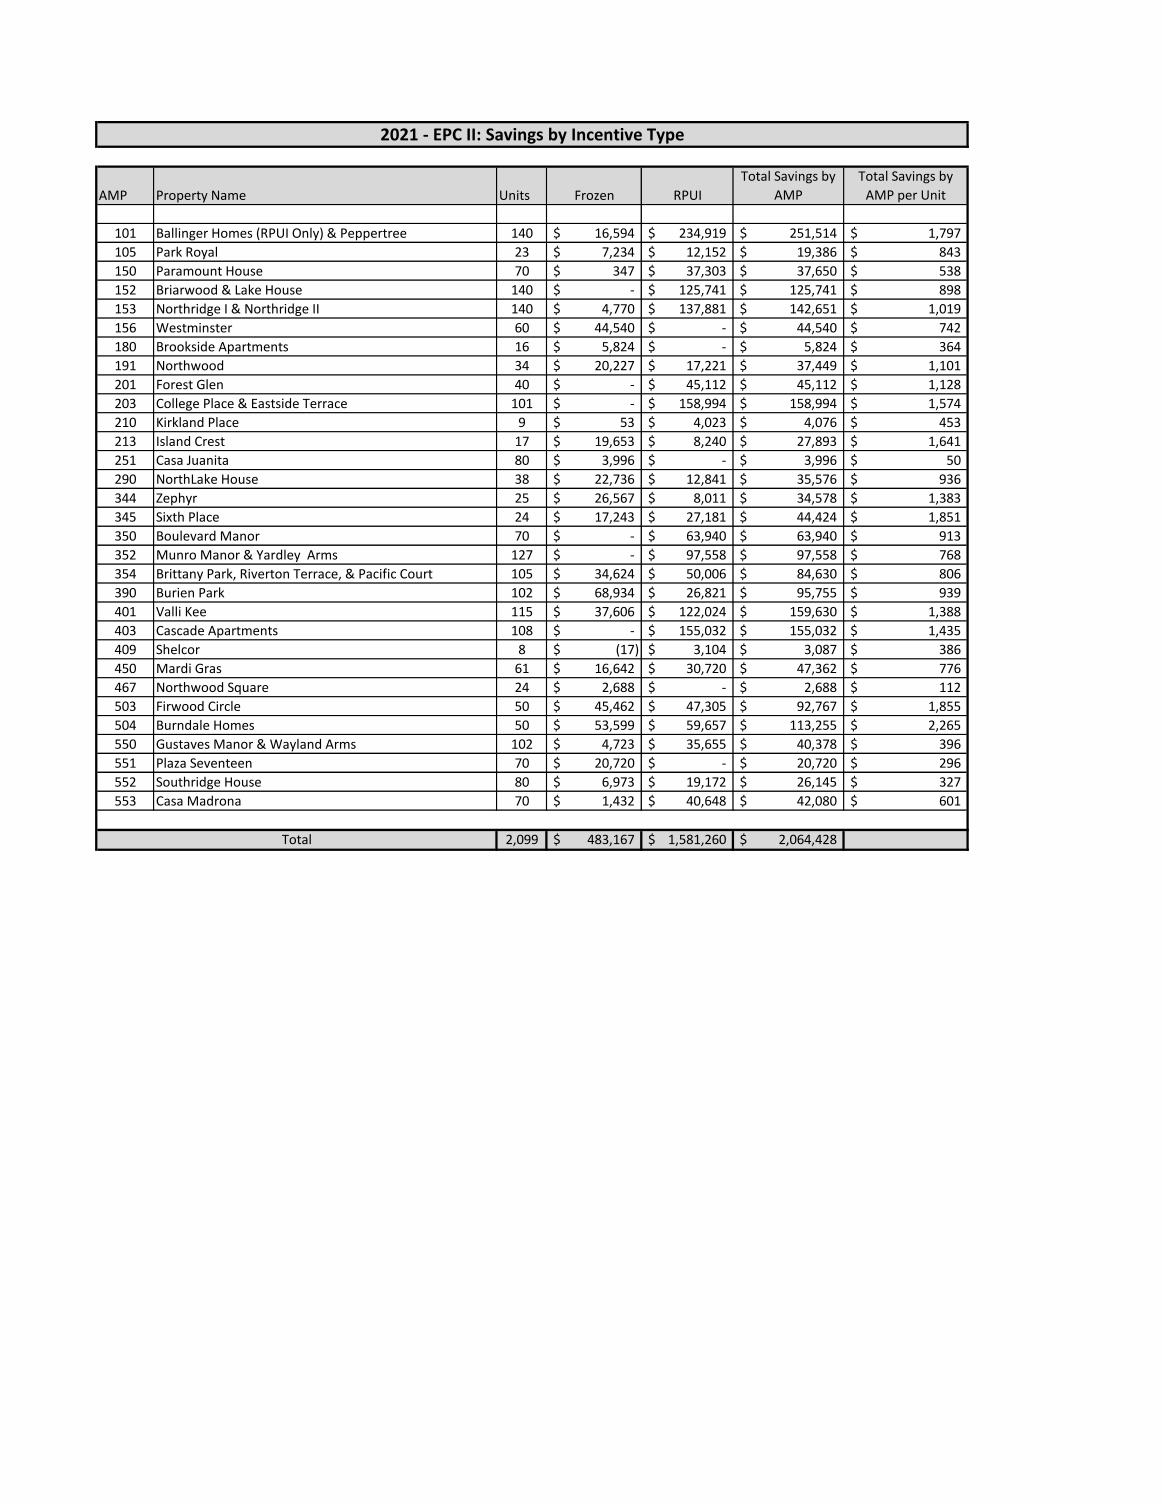
AMP Property Name Units Frozen RPUI
Total Savings by
AMP
Total Savings by
AMP per Unit
101 Ballinger Homes (RPUI Only) & Peppertree 140 16,594$ 234,919$ 251,514$ 1,797$
105 Park Royal 23 7,234$ 12,152$ 19,386$ 843$
150 Paramount House 70 347$ 37,303$ 37,650$ 538$
152 Briarwood & Lake House 140 -$ 125,741$ 125,741$ 898$
153 Northridge I & Northridge II 140 4,770$ 137,881$ 142,651$ 1,019$
156 Westminster 60 44,540$ -$ 44,540$ 742$
180 Brookside Apartments 16 5,824$ -$ 5,824$ 364$
191 Northwood 34 20,227$ 17,221$ 37,449$ 1,101$
201 Forest Glen 40 -$ 45,112$ 45,112$ 1,128$
203 College Place & Eastside Terrace 101 -$ 158,994$ 158,994$ 1,574$
210 Kirkland Place 9 53$ 4,023$ 4,076$ 453$
213 Island Crest 17 19,653$ 8,240$ 27,893$ 1,641$
251 Casa Juanita 80 3,996$ -$ 3,996$ 50$
290 NorthLake House 38 22,736$ 12,841$ 35,576$ 936$
344 Zephyr 25 26,567$ 8,011$ 34,578$ 1,383$
345 Sixth Place 24 17,243$ 27,181$ 44,424$ 1,851$
350 Boulevard Manor 70 -$ 63,940$ 63,940$ 913$
352 Munro Manor & Yardley Arms 127 -$ 97,558$ 97,558$ 768$
354 Brittany Park, Riverton Terrace, & Pacific Court 105 34,624$ 50,006$ 84,630$ 806$
390 Burien Park 102 68,934$ 26,821$ 95,755$ 939$
401 Valli Kee 115 37,606$ 122,024$ 159,630$ 1,388$
403 Cascade Apartments 108 -$ 155,032$ 155,032$ 1,435$
409 Shelcor 8 (17)$ 3,104$ 3,087$ 386$
450 Mardi Gras 61 16,642$ 30,720$ 47,362$ 776$
467 Northwood Square 24 2,688$ -$ 2,688$ 112$
503 Firwood Circle 50 45,462$ 47,305$ 92,767$ 1,855$
504 Burndale Homes 50 53,599$ 59,657$ 113,255$ 2,265$
550 Gustaves Manor & Wayland Arms 102 4,723$ 35,655$ 40,378$ 396$
551 Plaza Seventeen 70 20,720$ -$ 20,720$ 296$
552 Southridge House 80 6,973$ 19,172$ 26,145$ 327$
553 Casa Madrona 70 1,432$ 40,648$ 42,080$ 601$
2,099 483,167$ 1,581,260$ 2,064,428$
2021 - EPC II: Savings by Incentive Type
Total

T A B
N U M B E R
5
TO: Board of Commissioners
FROM: Tim Baker, Senior Management Analyst
DATE: April 9, 2021
RE: First Quarter CY 2021 Procurement Report
In order to update the Board concerning KCHA’s procurement activities, staff is presenting the attached Quarterly Procurement Report. This report covers all procurement activities from January through March 2021 that involved the award of contracts valued over the amount of $100,000 and change orders that have cumulatively exceeded 10% of the original or not to exceed contract amount. Awarded Contracts Over $100,000: The awarded contracts section of the report lists the issuing department, contract type, the company awarded the contract, the award and estimate/budgeted amounts, the procurement process involved, the number of bids received and notes about the procurement. In the first quarter, there were 14 contracts awarded and valued at more than $100,000, representing 99% of the contracts executed in the quarter. The largest contract executed for construction work was for $4,493,000 awarded to Cadence for the Ballinger Homes envelope and roof replacement project managed by the Capital Construction Department. There were also four task order contracts executed, contract amounts ranging from $500k to $1 million. The largest non-construction contract was awarded for the amount of $3,241,968 for behavioral health services issued to NAVOS by the Social Impact Department.
Contract Change Orders Exceeding 10%: KCHA’s internal procedures require heightened oversight and review once a contract has incurred change orders valued at more than 10% of the original contract amount. The change order (CO) section of the report includes the issuing department, contract type, company awarded the contract, the original amount awarded, as well as the number of change orders, the amounts of the total change orders to date expressed both in dollars and percentages above the original contract value, and notes about the procurement. Per the Board’s request, this section was divided between change orders issued in response to unforeseen field conditions or expanded project scopes, and
change orders which were foreseen at the time the initial contract was executed (primarily through contract extensions on multi-year contracts). The not-to-exceed total for the “foreseen” change order section is the projected total amount of the contract once all the foreseen change orders are completed. There were 14 condition change orders issued, including six by Asset Management, five by Capital Construction and two by HOPE VI. The Bellevue Manor, Abbey Ridge and Woodland North renovations, and the Greenbridge infrastructure project experienced the largest changes in the quarter. At Bellevue Manor, the year long delay due to COVID resulted in increased in labor and material costs. At Abbey Ridge extensive, unforeseen moisture damage and rot in the walls and framing were encountered when siding and drywall were removed. At Woodland North the investor required seismic upgrades were far more extensive than anticipated adding approximately $275,000 in costs. The street and utility infrastructure work at Greenbridge was significantly delayed when existing water district utility lines were found in undocumented locations that conflicted with the new lines being installed. Re-engineering and additional water lines were required which delayed work into the rainy seasons of November, December, and January which imposed additional costs for further delay, erosion control, and dewatering. There were 11 change orders issued due to foreseen conditions in this quarter. Five were from the Social Impact for after school & summer learning programs going through their first renewal as planned by the contracts.
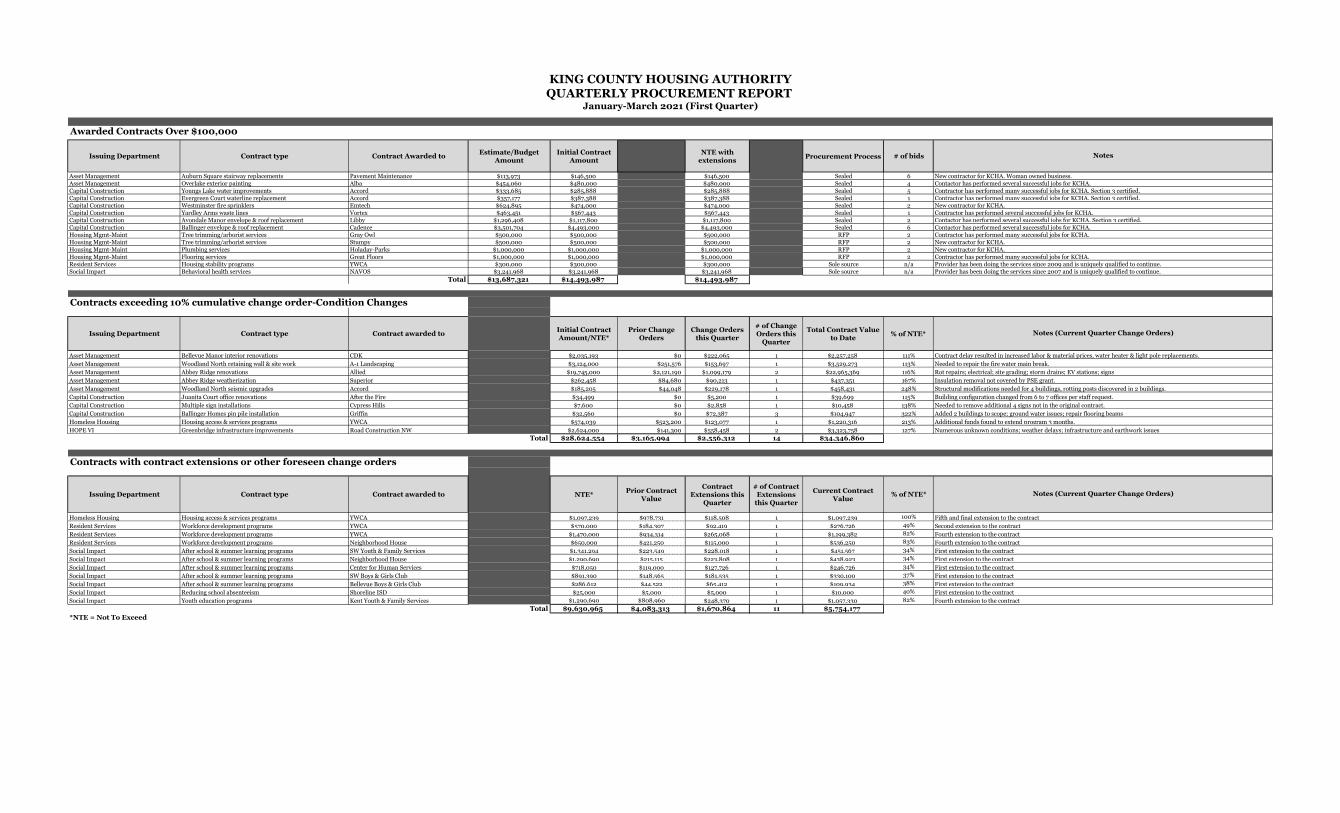
Issuing Department Contract type Contract Awarded toEstimate/Budget
AmountInitial Contract
AmountNTE with
extensionsProcurement Process # of bids
Asset Management Auburn Square stairway replacements Pavement Maintenance $113,973 $146,500 $146,500 Sealed 6 New contractor for KCHA. Woman owned business.Asset Management Overlake exterior painting Alba $454,060 $480,000 $480,000 Sealed 4 Contactor has performed several successful jobs for KCHA.Capital Construction Youngs Lake water improvements Accord $333,685 $285,888 $285,888 Sealed 5 Contractor has performed many successful jobs for KCHA. Section 3 certified. Capital Construction Evergreen Court waterline replacement Accord $357,177 $387,388 $387,388 Sealed 1 Contractor has performed many successful jobs for KCHA. Section 3 certified. Capital Construction Westminster fire sprinklers Emtech $624,895 $474,000 $474,000 Sealed 2 New contractor for KCHA. Capital Construction Yardley Arms waste lines Vortex $463,451 $567,443 $567,443 Sealed 1 Contractor has performed several successful jobs for KCHA. Capital Construction Avondale Manor envelope & roof replacement Libby $1,296,408 $1,117,800 $1,117,800 Sealed 2 Contactor has performed several successful jobs for KCHA. Section 3 certified.Capital Construction Ballinger envelope & roof replacement Cadence $3,501,704 $4,493,000 $4,493,000 Sealed 6 Contactor has performed several successful jobs for KCHA.Housing Mgmt-Maint Tree trimming/arborist services Gray Owl $500,000 $500,000 $500,000 RFP 2 Contractor has performed many successful jobs for KCHA. Housing Mgmt-Maint Tree trimming/arborist services Stumpy $500,000 $500,000 $500,000 RFP 2 New contractor for KCHA.Housing Mgmt-Maint Plumbing services Holaday-Parks $1,000,000 $1,000,000 $1,000,000 RFP 2 New contractor for KCHA.Housing Mgmt-Maint Flooring services Great Floors $1,000,000 $1,000,000 $1,000,000 RFP 2 Contractor has performed many successful jobs for KCHA. Resident Services Housing stability programs YWCA $300,000 $300,000 $300,000 Sole source n/a Provider has been doing the services since 2009 and is uniquely qualified to continue.Social Impact Behavioral health services NAVOS $3,241,968 $3,241,968 $3,241,968 Sole source n/a Provider has been doing the services since 2007 and is uniquely qualified to continue.
Total $13,687,321 $14,493,987 $14,493,987
Contracts exceeding 10% cumulative change order-Condition Changes
Issuing Department Contract type Contract awarded toInitial Contract Amount/NTE*
Prior Change Orders
Change Orders this Quarter
# of Change Orders this
Quarter
Total Contract Value to Date
% of NTE*
Asset Management Bellevue Manor interior renovations CDK $2,035,193 $0 $222,065 1 $2,257,258 111% Contract delay resulted in increased labor & material prices, water heater & light pole replacements.
Asset Management Woodland North retaining wall & site work A-1 Landscaping $3,124,000 $251,576 $153,697 1 $3,529,273 113% Needed to repair the fire water main break.
Asset Management Abbey Ridge renovations Allied $19,745,000 $2,121,190 $1,099,179 2 $22,965,369 116% Rot repairs; electrical; site grading; storm drains; EV stations; signs
Asset Management Abbey Ridge weatherization Superior $262,458 $84,680 $90,213 1 $437,351 167% Insulation removal not covered by PSE grant.
Asset Management Woodland North seismic upgrades Accord $185,205 $44,048 $229,178 1 $458,431 248% Structural modifications needed for 4 buildings, rotting posts discovered in 2 buildings.
Capital Construction Juanita Court office renovations After the Fire $34,499 $0 $5,200 1 $39,699 115% Building configuration changed from 6 to 7 offices per staff request.
Capital Construction Multiple sign installations Cypress Hills $7,600 $0 $2,858 1 $10,458 138% Needed to remove additional 4 signs not in the original contract.
Capital Construction Ballinger Homes pin pile installation Griffin $32,560 $0 $72,387 3 $104,947 322% Added 2 buildings to scope; ground water issues; repair flooring beams
Homeless Housing Housing access & services programs YWCA $574,039 $523,200 $123,077 1 $1,220,316 213% Additional funds found to extend program 3 months.
HOPE VI Greenbridge infrastructure improvements Road Construction NW $2,624,000 $141,300 $558,458 2 $3,323,758 127% Numerous unknown conditions; weather delays; infrastructure and earthwork issues
Total $28,624,554 $3,165,994 $2,556,312 14 $34,346,860
Contracts with contract extensions or other foreseen change orders
Issuing Department Contract type Contract awarded to NTE*Prior Contract
Value
Contract Extensions this
Quarter
# of Contract Extensions
this Quarter
Current Contract Value
% of NTE*
Homeless Housing Housing access & services programs YWCA $1,097,239 $978,731 $118,508 1 $1,097,239 100% Fifth and final extension to the contract
Resident Services Workforce development programs YWCA $570,000 $184,307 $92,419 1 $276,726 49% Second extension to the contract
Resident Services Workforce development programs YWCA $1,470,000 $934,314 $265,068 1 $1,199,382 82% Fourth extension to the contract
Resident Services Workforce development programs Neighborhood House $650,000 $421,250 $115,000 1 $536,250 83% Fourth extension to the contract
Social Impact After school & summer learning programs SW Youth & Family Services $1,341,294 $223,549 $228,018 1 $451,567 34% First extension to the contract
Social Impact After school & summer learning programs Neighborhood House $1,290,690 $215,115 $223,808 1 $438,923 34% First extension to the contract
Social Impact After school & summer learning programs Center for Human Services $718,050 $119,000 $127,726 1 $246,726 34% First extension to the contract
Social Impact After school & summer learning programs SW Boys & Girls Club $891,390 $148,565 $181,535 1 $330,100 37% First extension to the contract
Social Impact After school & summer learning programs Bellevue Boys & Girls Club $286,612 $44,522 $65,412 1 $109,934 38% First extension to the contract
Social Impact Reducing school absenteeism Shoreline ISD $25,000 $5,000 $5,000 1 $10,000 40% First extension to the contract
Social Impact Youth education programs Kent Youth & Family Services $1,290,690 $808,960 $248,370 1 $1,057,330 82% Fourth extension to the contract
Total $9,630,965 $4,083,313 $1,670,864 11 $5,754,177
*NTE = Not To Exceed
Notes (Current Quarter Change Orders)
Notes (Current Quarter Change Orders)
KING COUNTY HOUSING AUTHORITYQUARTERLY PROCUREMENT REPORT
January-March 2021 (First Quarter)
Awarded Contracts Over $100,000
Notes

T A B
N U M B E R
6
KCHA IN THE NEWS
April 19, 2021
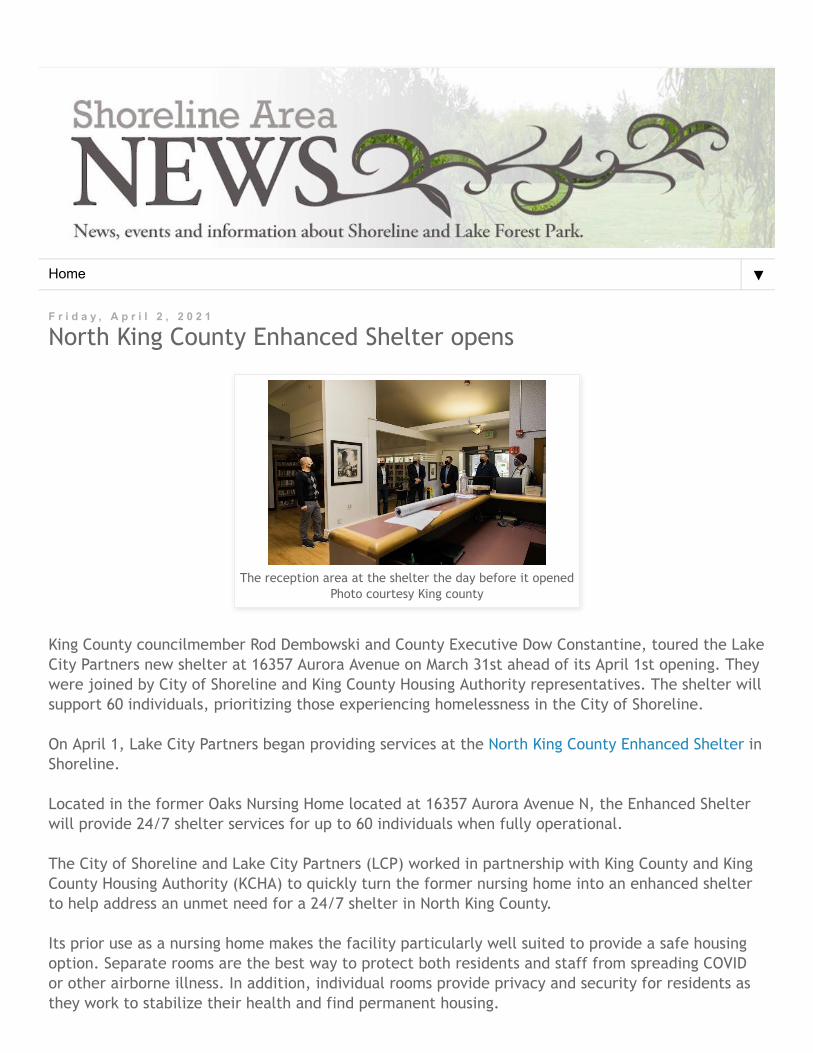
������������ � � ����������������������� !��"����#��$����������������"%�%&��'� (�%&�)$*��� �������+�����,�(�)���$�������-����� ���.�*�����/������$��)$��"�����012345�����5,������6����20$����� �7��$5#��"0$��#�����89���)���:���� &������7!����"����� ����������;��$���5����������#��$������,�$89��$��"���)�""$�##���1<�� �,� ��"$-#�������=������$��+#�����������%�"�$$��$$����������7!����"���8>�5#��"0-.�*�����/������$&����#��,� ���$��,���$��������������������������� !��"�����!����"���8.����� �����7��%��>�*$���$���;�%�"����� ��012345�����5,�����-���������� !��"���)�""#��,� �?@A4$��"���$��,���$7���#��1<�� �,� ��"$)���7�""��#��������"89�������7!����"����� .�*�����/������$B.�/C)��*� ��#������$��#)��������������� ����������;��$���5��������B��;5C��D���*"��������7��%�����$�����%�������������� $��"�������"#� ��$$����%����� 7���?@A4$��"��������������������8E�$#�����$��$����$�����%�%�*�$���7���"���#������"��"�)�""$���� ��#��,� ��$�7����$����#����8!�#��������%$������&�$�)����#������&�����$� ���$�� $��777��%$#��� ����>FE(����������&�����""��$$8E�� �����-�� �,� ��"���%$#��,� �#��,����� $�������7����$� ���$�$����)��*��$��&�"�=���������"���� 7�� #��%��������$���8
9������#�������������$��"������ ��&�7������#��� /����������$�����������
GHIJ
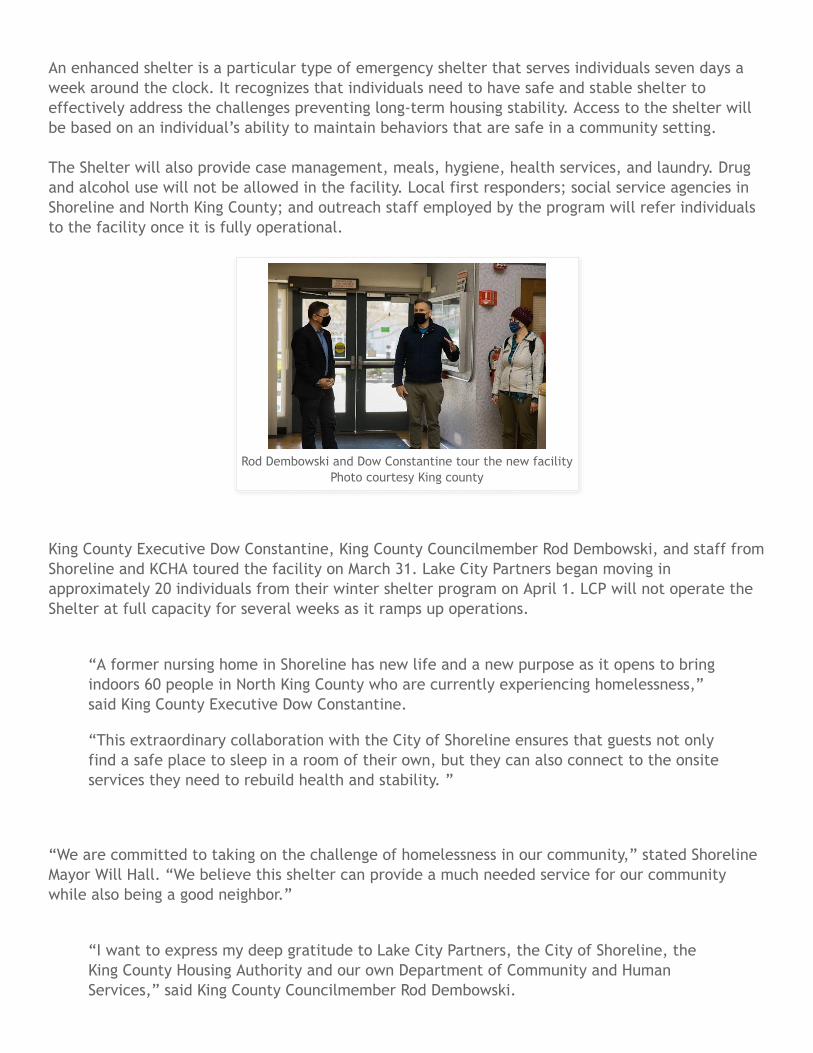
������������������ ������� ��������������������������������������� �� � ��������������������������������������������� �������� �� � �������������������������������������������� ����������������������������� ��������������� ������ ����������������������� �������������� �� � ������� �������� ��� ������� ���������������� ���������� ������ ���������������� �������� ����������������� ���� ���� ��� ���������� �� �������������!����������������� �������������� ��������� ����"����� �����������#��� ����� �������� �� ������ �������$�����% ���&�����#������������������������������������������� ������� �� � ������������� �������� �� ����������� ������% ���&������'(���� ���!���&������ �� �% ���&������&���� �������)���!������ ������������������� �������%&*���������������� ������+�����,-��"����& ���.���������������� ��� ������( ������/0� �� � ������������ ��� ������������������������� �-��"&.�� ���������������������������������� �������������������� ���������������� ����1������������ �������� ������� ���������� ���������������������� ������������ �� ������20������� ��$�����% ���&������������������������(��� ��� ���������� 3� ��% ���&������'(���� ���!���&������ ����1�� ��(������ ������������� ���� �������& ����������� ��������������������������� ��������������������� ��������������� ����� ���������������������������������� ����� �������������������� ��������������� ����314���������� ����������� ����������������������������� ������������ �� 3������������ ��+�����4 �*���14���� ������ ��������������� �������������������� ����������������� ���� ������� ������������ ������3��1�����������(���������������� ��������"����& ���.������ �����& ����������� �� ����% ���&������*�� ��������� ���������������!�������������&����� �������*�������� �� 3�� ��% ���&������&���� �������)���!������ ��
)���!������ �����!���&������ ������������������� ���.�������������% ���������

���������������� ����������������������� ����������������������������������� ��������� ������ ����� ��� ��������� ���������������������������� ������� ������ �������������������� ��������������������� � ����� ���������������� ���� �������!������ �����"���� �������#����� ���$������������ ��� � ������%���!���� ��"�������&����!�'(���� ���) ������� ����������� �� ���� ������� �� ����������������������������������� � ��� �� �������������������*�� ������������ �������������������������������������������+������������������������������������� �������� ������ ��������� �����,$��-�� �!���������� ���������������!�� ���� ��!��� ��-������������������� ������������������������������������������������ ������� ������������������ ��!�������!������������(��� ����!���������.���� ��&������!�) ��������#����� ���$������������ ����������������������(��������� �� ������ ��������������� ������� ���(��� ������ ���� ��-������ ���������������������������/�����������������������������������01�� ���������������������� �����������������������������2������������������������������������ ��� ��!������������� ������� ����!�������������������������� �3����������� ����� ��,���� ���� �������� ���� ������ �������������������������������� ����������-����������4536������������������� ��������� ������ ���������-�������+� � � ��� ���� ��������������-��������������������������������������������������� ������ ��7����� �������� ��������������������������� ������������������� �������������������������������� ����"�����)�������������������������� ���� ������ ������ � ��������� ������� ����#����� ���$��������� ����������������������� ����� 8�� �!���������������� ����������������� �� �� ��4116!�������� ��������� �������������������������� ����������
7�������������������������������������$������������ �������
� ���������� ��������������������������� !��"#�"� �$�����%���"��"�&��#����$�� �%�"�'(����)����"��� ������%�"� �)$$���%��"��$��������*��"�� ����"���"(�������"��(����"�$������������+�,�-�&��#�.���������-����"�������-��*�'����"���/��� �()��������()%��0�''�����*��"�*���"��'')���#!������(��� �����0���1������!�"�'(����% �����!�0� ��'���(��0����!���%���0"�������$�� �%��"(�����%�"�)���0��� �0�������� �������"($�����0������(��#������%� �%)�(��*����0"�'(�����+��2$%��%�*�������(���*��'������34/4����5678�9����)��0��"��"�)0"�*)(��"����0��*��*��'��������%��%��+�9�:$�����''���������� �(���%���$��*)(!���"����$�����(������-�����**��� �(��0)�0+�9���� ��"���0"����%(����#���''��+;����''����.������&�''��
.��%��#�<(�00�+
Rep. Smith Introduces Bill to Provide Rental Assistance to Struggling Families Throughout the Pandemic March 16, 2021
WASHINGTON, D.C. – Congressman Adam Smith (D-Wash.) released the following statement after introducing the Ensuring a Long-Term Housing Recovery Act, which would utilize local Public Housing Authorities (PHAs) to provide rental assistance for the duration of the COVID-19 pandemic and economic recession.
“The COVID-19 pandemic has exacerbated the existing affordable housing crisis facing far too many families in the Puget Sound region and across the country,” said Congressman Adam Smith. “As many renters struggle to pay for the essentials and keep up with monthly rent and utilities, we must invest heavily in our most efficient and effective programs available for providing rental assistance.”
“The Ensuring a Long-Term Housing Recovery Act will invest in new housing vouchers that eligible households can stay on until their income returns to normal. Housing vouchers are proven as one of the most effective policies for reducing homelessness and housing insecurity among low-income people and underserved communities,” continued Congressman Smith. “Investing in single-issue vouchers for all income-eligible families through the Public Housing Authorities maximizes our ability to reach households in need of support and ensures that emergency rental assistance will be efficiently distributed and last as long as people need it.”
“KCHA applauds Congressman Smith for introducing this critical legislation to bring new housing resources to low-income people in Washington State,” said Stephen Norman, Executive Director of the King County Housing Authority (KCHA). “The COVID-19 pandemic has illustrated how central a stable and affordable home is to a family’s wellbeing. With so many families facing mounting rental debt, Congress must address the immediate needs of people on the brink of eviction, but also recognize that low-income people across the country will not see their incomes recover overnight. A new infusion of emergency Housing Choice Vouchers would provide immediate assistance and long-term stability for low-income families who have disproportionally seen their livelihoods impacted by the pandemic.”
“In all these ways, the bill is a smart response to an unprecedented housing emergency,” said Michael Mirra, Executive Director of the Tacoma Housing Authority. “The nation has invested billions in one-time housing assistance
payments during the pandemic. Doing that has been a vital effort to forestall disaster for millions of households. Yet, if the only benefit the nation gets from that enormous investment is a modest reduction in rent arrearages and perhaps a short-term delay in eviction, then we must count that as a policy and financial defeat, as well as an unrelieved disaster for the most vulnerable victims of the pandemic. In contrast, your bill recognizes the value of a Housing Choice Voucher. A voucher helps a family, and a landlord, not only to avoid disaster, but also to recover a measure of stability. That stability will, in turn, allow them to regain a measure of prosperity. That is what builds families, builds neighborhoods, and promotes a housing market that works better for all.”
Click here to read the Tacoma Housing Authority’s full letter to Rep. Smith.
"The Seattle Housing Authority thanks Representative Adam Smith (D-WA) for introducing vital legislation to provide single-use housing vouchers,” said the Seattle Housing Authority. “Millions of people in our country are experiencing an inability to maintain or get housing as they struggle with job loss, reduced hours, loss of their businesses, caring full-time for children as day care centers and schools have closed, and the myriad other destabilizing impacts of the pandemic on their lives. Now more than ever there is a need for immediate and innovative help for them. Representative Smith’s bill to provide single-use housing vouchers will provide those most in need with housing. Without these vouchers it will be an incredible challenge for local communities and housing authorities to help keep these individuals and families from spiraling into extended homelessness. Housing authorities are positioned to take on administration of these vouchers and get them into the hands of people who have no means to pay full rent as they attempt to recover and rebuild from the crisis. Housing authorities and our community partners have the experience and infrastructure in place to support this desperately needed increase in housing vouchers for those hardest-hit by the economic fallout of COVID-19.”
"The Council of Large Public Housing Authorities applauds Representative Adam Smith (D-WA) for introducing this most important legislation to provide single-use housing vouchers to communities in need,” said Sunia Zaterman, Executive Director of the Council of Large Public Housing Authorities. “The pandemic has created an urgency for a deeper investment in this form of housing assistance for long-term recovery. Single-use housing vouchers can provide immediate assistance to individuals and families and can do so more efficiently while placing the least amount of strain on local stakeholders and government services. These vouchers will assist housing authorities and communities across the country meet their most urgent housing needs arising from the coronavirus and resulting economic contraction. Housing authorities have the capacity for a rapid expansion and administration of these vouchers because the infrastructure is already in place within these agencies to support a substantial increase in voucher availability."
“As the pandemic-induced economic crisis continues, we must provide adequate federal rental assistance to help families stay in or find homes,” said Adrianne Todman, Chief Executive Officer of the National Association of Housing and Redevelopment Officials (NAHRO). “This bill would authorize $25 billion for new Housing Choice Vouchers as well as cover fees for utilities, security deposits, and
application fees. The bill would also ensure that housing authorities had the flexibility and funding to make sure that the vouchers were used as quickly as possible. NAHRO supports Congressman Smith's effort to expand vouchers to more families who need assistance.”
“PHADA is pleased to endorse the Ensuring a Long-Term Housing Recovery Act, which will provide critically needed funding to address the serious affordable rental needs of low-income households across the country,” said Timothy Kaiser, Executive Director – Public Housing Authorities Directors Association (PHADA). “As you know, these needs have been exacerbated by the Coronavirus pandemic… PHADA recognizes that this expansion of the voucher program will directly address homelessness, housing instability, and overcrowding of low-income households. It will also help tens of thousands of households to gain quickly some measure of security and stability during the pandemic, which will help them get back on their feet and recover financially. Thank you for your commitment to helping low-income households in need and responding to the economic and health crisis facing our communities. An investment of this size and at this time is a direct investment in America’s families.”
Click here to read PHADA’s full letter to Rep. Smith.
“The MTW Collaborative supports the legislation introduced by Representative Adam Smith (D-WA) to provide single-use housing vouchers to communities in need,” said Andrew Lofton, President of MTW Collaborative. “The COVID-10 pandemic has only exacerbated our nation’s ongoing housing crisis and created an even more pressing need for investment in long-term recovery through housing assistance. Public housing authorities are well positioned to support a substantial increase in voucher assistance and already have the infrastructure and capacity in place for a rapid expansion and administration of single-use vouchers."
“Tenant based assistance has long been the cornerstone of the federal housing programs and represents a proven tool to be utilized in providing much needed assistance to those impacted by the COVID-19 pandemic and its associated economic impact,” said Denise Muha, Executive Director of the National Leased Housing Association. “The current network of local and state housing agencies/authorities under the current Section 8 voucher program represent an efficient delivery system to assist urban, suburban and rural renters. Importantly, your proposed bill will provide housing authorities essential flexibility in meeting the challenges of both renters and landlords perpetuated by the pandemic. The authority to address rental arrears as well as current rental needs along with waivers and the ability to offer incentives for landlord participation will be key to that effort.
Click here to read the National Leased Housing Association’s full letter to Rep. Smith.
“Universal housing vouchers are key to ending the nationwide crisis in affordable housing as well as homelessness,” said the National Alliance to End Homelessness. “Rep. Smith’s bill commands the Alliance’s support because it is a significant step in the right direction. The Alliance thanks Rep. Smith for his leadership on low income housing and homelessness issues.”
The Ensuring a Long-Term Housing Recovery Act would provide $25 billion for single-issue vouchers through Public Housing Authorities (PHAs) to all income-eligible families.
This would fund approximately 200,000 vouchers over five years. The single-issue housing vouchers sunset whenever the initial households
that use them exit the program. PHAs are prohibited from reissuing these vouchers to other households.
A portion of the $25 billion would be given to HUD to award to PHAs competitively to ensure a subset of vouchers are targeted in a manner consistent with highest need or awarded to PHAs with demonstrated capacity to issue vouchers quickly and effectively.

Amazon leases another Bellevue office tower as it makes room for planned 25k employees in city BY KURT SCHLOSSER on March 9, 2021 at 8:49 am
A rendering of The Artise office tower from N.E. 8th Street and 106th Avenue N.E. in Bellevue, Wash. (Motiv Studio Image)
Amazon is making room for some of the 25,000 employees it plans to add in Bellevue, Wash., announcing Tuesday that it has signed a lease to occupy a 600,000-square-foot office building called The Artise which is under development in the city east of Seattle.
Scheduled to open in 2024, the 25-story glass tower by Schnitzer West and architects NBBJ is at the corner of N.E. 8th Street and 106th Avenue N.E.
Amazon shared the lease news in an update to a previous blog post from September where it announced its growing intentions in Bellevue. The tech giant said at the time that its plans to add 10,000 employees would expand by another 15,000.
Amazon also said Tuesday that it will invest $185.5 million in below-market loans and grants to the King County Housing Authority to preserve up to 1,000 affordable homes on the Eastside, including units in Pinewood Village, Hampton Greens, and the Illahee Apartments. It’s part of Amazon’s $2 billion Housing Equity Fund, announced in January and aimed at offsetting the deepening economic divide in communities where the company is growing.

A ground view rendering of The Artise.
With its lease agreements, Amazon is poised to become downtown Bellevue’s largest tenant at roughly 5.5 million square feet, doubling the footprint of Microsoft.
In addition to The Artise, Amazon had landed another two million square feet of downtown Bellevue office space at new properties being developed by Vulcan: 555 Tower and West Main — both slated to open in 2023. Vulcan, the real estate company started by the late Microsoft co-founder Paul Allen, is a longtime partner of Amazon that built out its South Lake Union headquarters in Seattle.
Amazon is also developing another 27-story office tower at its Bellevue 600 project, where a 43-story tower is already planned for construction. Bellevue 600 will be built by 2025.
Even as the COVID-19 pandemic has caused companies to reconsider where and how employees will work in the future, Amazon has been charging ahead with plans for physical office space in multiple cities, including Boston and Arlington, Va. — its so-called HQ2.
Amazon’s expanding footprint in Bellevue, Wash.
With more than 75,000 employees now in the region it calls home, Amazon has exhibited a strong desire to stretch further beyond the limits of Seattle, driven in part by disputes with the Seattle City Council over its impact on the community, and efforts by the city to impose new taxes on big businesses. In 2019, after a prior tax battle, the company announced plans to move its worldwide operations to Bellevue.
Amazon launched its highly-publicized HQ sweepstakes in 2019 as it planned to open a second North American headquarters. But the company decided to split the second headquarters between Northern Virginia and New York, and then dropped New York entirely.
In February, the company unveiled design plans for the headquarters campus in Arlington, Va., with renderings showing three tall office buildings ringing a unique glass-enclosed structure called “The Helix.”