fprs board special meeting agenda and packet
TRANSCRIPT

Page 1 of 2
PURSUANT TO ASSEMBLY BILL 361 AND ONGOING SOCIAL DISTANCING RECOMMENDATIONS,
THE SPECIAL PASADENA FIRE & POLICE RETIREMENT SYSTEM BOARD MEETING FOR
NOVEMBER 17, 2021 AT 10:00 A.M. WILL TAKE PLACE SOLELY BY TELECONFERENCE/VIDEOCONFERENCE.
TO ACCESS THE MEETING:
Livestream of the Retirement Board meeting with captioning is available at http://www.pasadenamedia.org and at
http://pasadena.granicus.com/MediaPlayer.php?publish_id=9
OR
Join Zoom Meeting: https://us02web.zoom.us/j/81311806009
Meeting ID: 813 1180 6009 One tap mobile +16699006833,,81311806009# US (San Jose)
Dial by your location +1 669 900 6833 US (San Jose)Meeting ID: 813 1180 6009
Find your local number: https://us02web.zoom.us/u/kdppcdw9ZO
In order to facilitate public participation at meetings held solely by electronic means, the Retirement Board will accept public comment in the following manner:
1. Advance Correspondence, to become part of the record:
Members of the public may submit comments of any length up to two hours prior to the start of the meeting, at the following e-mail address:
Please be aware that, while these comments will be provided to the members of the body and will become part of the meeting record, they will not be read aloud. Any comment submitted in this fashion will be forwarded to the legislative body prior to the start of the meeting.
2. Live Public Comments during the meeting
During the meeting, members of the public may provide live public comment on an agenda item, at the time the Chair solicits public comment, by either (a) if using the Zoom program, selecting the “raise hand” function; or (b) if participating by telephone, pressing *9 to raise your hand.

Page 2 of 2
Public comments are limited to 3 minutes each, and the Chair or the Retirement Board may limit this time if reasonable under the circumstances. Your phone call to the Retirement Board meeting will be recorded as part of the Retirement Board meeting. By staying on the line and making public comment during the Retirement Board meeting, you are agreeing to have your phone call recorded. If assistance is needed by phone, please call the FPRS Office at (626) 744-4320.
Public Comment will be limited to items on this Special Meeting Agenda.
IF YOU NEED A REASONABLE MODIFICATION OR ACCOMMODATION PURSUANT TO THE AMERICANS WITH DISABILITIES ACT
BECAUSE YOU ARE UNABLE TO PARTICIPATE ELECTRONICALLY AS SET FORTH ABOVE, CONTACT THE FPRS OFFICE AS SOON AS POSSIBLE AT
(626) 744-4320 OR [email protected].

P A S A D E N A
F I R E &
P O L I C E R E T I R E M E N T S Y S T E M
PASADENA FIRE & POLICE RETIREMENT SYSTEM
RETIREMENT BOARD - SPECIAL MEETING
Wednesday, November 17, 2021
Teleconference/Videoconference
10:00 a.m.
AGENDA
1. Call to Order 2. Public Comment - Limited to items on this Special Meeting Agenda. 3. Minutes: October 20, 2021 (Special Meeting) CONSENT CALENDAR 4. Approve the revised monthly retirement allowance roll of $1,009,100.18 for
September 2021 and monthly retirement allowance roll of $1,012,396.89 for October 2021.
5. Approve additions/removals of the following members/beneficiaries to/from the monthly allowance roll:
NameEffective
Date
Add/
Remove
Pension
Continuance
Pension
Amount
a. R. Zufall 9/26/2021 Remove No $4,168.23
6. Receive and file the 3rd Quarter 2021 Asset Manager Performance Reports from the following asset managers: a. Atlanta Capital Investment Managers b. Capital Group, American Funds EuroPacific Growth Fund c. Dodge & Cox International Stock Fund d. Dodge & Cox Stock Fund e. Invesco Core Real Estate, USA – LP f. PanAgora Risk Parity Multi-Asset GT g. TCW MetWest Fixed Income Review
h. T. Rowe Price Institutional Large Cap Growth Fund i. Vanguard Inflation-Protected Securities Fund j. Vanguard Institutional Index Fund k. Vanguard Short-Term Investment-Grade Fund l. Voya Senior Loan Trust Fund Review 7. Schedule the CalPERS Industrial Disability Retirement hearing application for
Eric Butler, Police Officer for the January 19, 2022 regular meeting of the FPRS Board.

CalPERS HEARINGS 8. CalPERS scheduled hearing on the Service Pending Industrial Disability
Retirement application for Emilio Heraldez, Firefighter/Paramedic.
ACTION ITEMS - The Board may discuss and take action on the following items: 9. Review, discuss and consider approval of resolution authorizing the continuation
of virtual meetings pursuant to AB 361. 10. Discuss and possibly take action on the following investment reports submitted
by Verus Investments: a. Receive and file, 3rd Quarter 2021 Investment Performance Review b. Receive and file, October 2021 Performance Update c. Receive and file, October 2021 Withdrawal and Rebalance
Transaction Summary d. Review and approve, November 2021-January 2022 Withdrawal and
Rebalance e. Receive and file, Liquidity Analysis
INFORMATION ITEMS 11 . Staff Report
a. October 2021 BudgeUExpense Report 12. Counsel Report 13. Articles/Newsletters/Conferences
COMMENTS FROM BOARD MEMBERS
ADJOURN
POSTING STATEMENT: I HEREBY CERTIFY that this Agenda was posted in its entirety at the City Kiosk and on the City Council Chamber bulletin board, Room S249, on November 10, 2021 at 5:00 p.m.
, Bernadette Kastner
Administrator/Secretary to the Board
Agendas and related documents are available for public review on the City website at:
hu ://\1 w11 .c it I ofpa ·adcna.nc lirc-and-policc-rcLircmcnt-buard/
Any documents distributed to a majority of the Pasadena Fire & Police Retirement Board regarding any item on this agenda will be made available at the office of the Fire & Police Retirement System, located at 100 N Garfield Avenue, #N204, Pasadena, CA 91101 . To make arrangements to view items, during normal business hours, please contact the Retirement Office at (626)744-4320
DISTRIBUTION Board Members A. Taylor, Verus I. Safie, System Atty City Attorney
Police Dept (Admin Srv) Fire Chief Director of Finance City Treasurer City Controller Principal Accountant
J. Curtis M. Howard L. Demirdjian B. Yates D. Thomas, City counsel A, Snitzer M Treger
Page 2 of 2
L. Derderian, PIO Library, NIS T. Phillips, CPA
J Head, AIMS E Rodriguez, AIMS M. Baluyot, AIMS s Haddock, AIMS

Page 1 of 7
PASADENA FIRE & POLICE RETIREMENT SYSTEM RETIREMENT BOARD - SPECIAL MEETING
Wednesday, October 20, 2021 Teleconference/Videoconference
9:30 a.m.
MINUTES
1. Call to Order
The regular meeting of the Pasadena Fire & Police Retirement Board was called toorder by Chair, Mr. Keith Jones, on Wednesday, October 20, 2021 at 9:39 a.m.virtually via a Zoom meeting.
Members – PresentK. Jones, ChairP. Boyle, Vice ChairJ. BrinsleyG. MasudaJ. Milligan
Staff – Present B. Kastner, Administrator/SecretaryM. Price, Senior Office AssistantI. Safie, Board Counsel
Others A. Taylor (Verus Investments)J. Godsey (MGO)L. Hurley (MGO)C. Harner (MGO)R. Ridley (City of Pasadena)S. Pangan (City of Pasadena)M. Howard (City of Pasadena)L. Demirdjian (City of Pasadena)B. Yates (City of Pasadena)K. EvansA. SnitzerA. Peinado
2. Public Comment
None noted.
3. Minutes: Approve the minutes for the special meeting of September 15, 2021.
Item: 3Date: 11/17/2021
Page 2 of 7
MOTION by Mr. Milligan, seconded by Mr. Brinsley, to approve the minutes for the meeting of September 15, 2021. (Motion unanimously carried, 5-0).
CONSENT CALENDAR
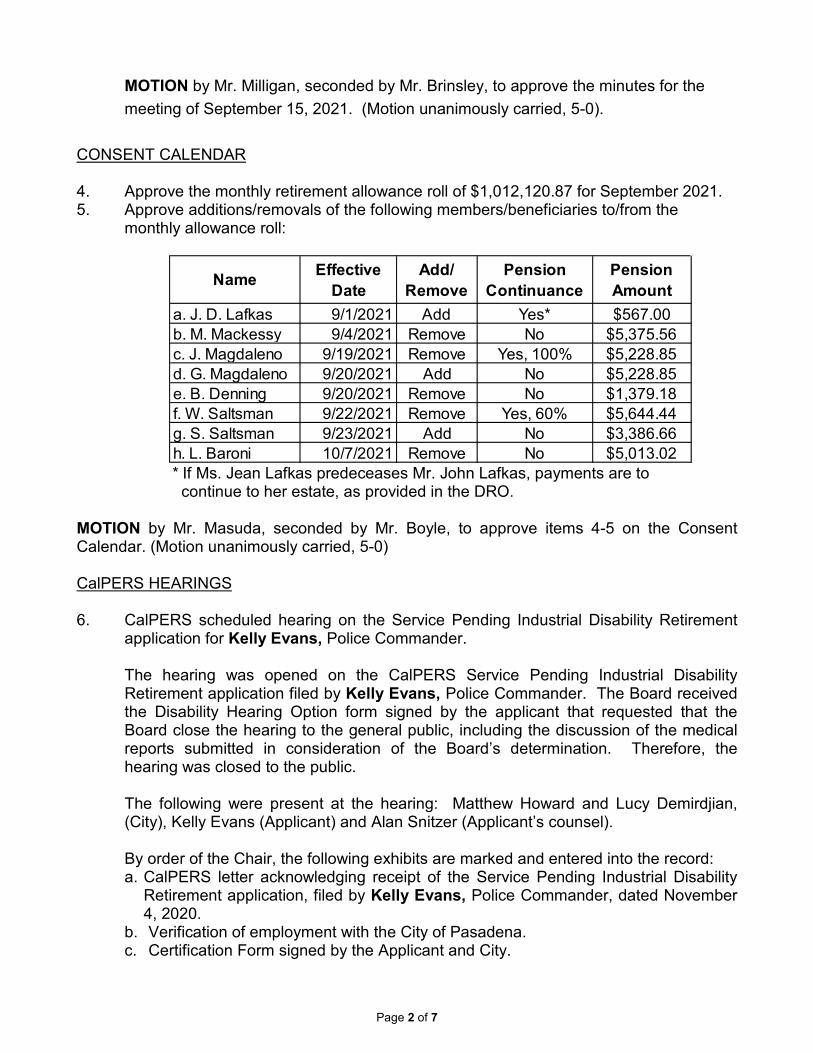
4. Approve the monthly retirement allowance roll of $1,012,120.87 for September 2021.5. Approve additions/removals of the following members/beneficiaries to/from the
monthly allowance roll:
Name Effective Date
Add/ Remove
PensionContinuance
Pension Amount
a. J. D. Lafkas 9/1/2021 Add Yes* $567.00 b. M. Mackessy 9/4/2021 Remove No $5,375.56 c. J. Magdaleno 9/19/2021 Remove Yes, 100% $5,228.85 d. G. Magdaleno 9/20/2021 Add No $5,228.85 e. B. Denning 9/20/2021 Remove No $1,379.18 f. W. Saltsman 9/22/2021 Remove Yes, 60% $5,644.44 g. S. Saltsman 9/23/2021 Add No $3,386.66 h. L. Baroni 10/7/2021 Remove No $5,013.02 * If Ms. Jean Lafkas predeceases Mr. John Lafkas, payments are to
continue to her estate, as provided in the DRO.
MOTION by Mr. Masuda, seconded by Mr. Boyle, to approve items 4-5 on the Consent Calendar. (Motion unanimously carried, 5-0)
CalPERS HEARINGS
6. CalPERS scheduled hearing on the Service Pending Industrial Disability Retirementapplication for Kelly Evans, Police Commander.
The hearing was opened on the CalPERS Service Pending Industrial DisabilityRetirement application filed by Kelly Evans, Police Commander. The Board receivedthe Disability Hearing Option form signed by the applicant that requested that theBoard close the hearing to the general public, including the discussion of the medicalreports submitted in consideration of the Board’s determination. Therefore, thehearing was closed to the public.
The following were present at the hearing: Matthew Howard and Lucy Demirdjian,(City), Kelly Evans (Applicant) and Alan Snitzer (Applicant’s counsel).
By order of the Chair, the following exhibits are marked and entered into the record:a. CalPERS letter acknowledging receipt of the Service Pending Industrial Disability
Retirement application, filed by Kelly Evans, Police Commander, dated November4, 2020.
b. Verification of employment with the City of Pasadena.c. Certification Form signed by the Applicant and City.

Page 3 of 7
d. Information report and recommendation from the Human ResourcesDepartment dated October 11, 2021 and the accompanying medical file, including:1) DWC-1 Claim Form2) Notice of Application3) Essential Functions Job Analysis - Police Commander4) Medical Reports:
a) AME Complex ML Ortho Evaluation - Clive Segil, MD - 8/25/2020b) AME Supplemental Report - Clive Segil, MD - 11/18/2020c) AME Supplemental Report - Clive Segil, MD - 10/8/2021
e. Letter from Applicant’s Attorney, Alan Snitzer, dated September 7, 2021,October 6, 2021, October 11, 2021 and theaccompanying medical file, including:
1. Bryan Ales, DC - 12/7/20202. Bryan Ales, DC - 6/10/20213. Amended Application for Adjudication of Claim - 9/3/20194. Amended Application for Adjudication of Claim - 2/6/20195. Application for Adjudication of Claim - 1/16/20196. AME, Clive Segil, MD, Orthopaedic Surgeon - 7/30/20197. AME, Clive Segil, MD, Orthopaedic Surgeon - 10/15/20198. AME, Clive Segil, MD, Orthopaedic Surgeon - 12/19/20199. AME, Clive Segil, MD, Orthopaedic Surgeon - 8/25/202010. AME, Clive Segil, MD, Orthopaedic Surgeon - 11/18/202011. AME, Clive Segil, MD, Orthopaedic Surgeon - 10/8/202112. PQME, Andrew Berman, MD, ENT - 8/15/201913. AME, Jeffrey Caren, MD - 7/22/201914. AME, Jeffrey Caren, MD - 10/25/201915. AME, Jeffrey Caren, MD - 11/21/201916. AME, Jeffrey Caren, MD - 3/19/2020
Mr. Snitzer briefly reviewed the Applicant’s memorandum and the most relevant medical reports on the disabling injuries. Mr. Howard noted the City’s concurrence with the medical evidence and acknowledged Mr. Evans for his years of service with the City of Pasadena.
There being no testimony or discussion, a MOTION to close the hearing was made by Mr. Brinsley, seconded by Mr. Milligan. (Motion unanimously carried, 5-0)
MOTION by Mr. Brinsley, seconded by Mr. Boyle, to approve the CalPERS Service Pending Industrial Disability Retirement Application, filed by Kelly Evans, Police Commander, who has filed a CalPERS Service Pending Industrial Disability Retirement Application, is substantially incapacitated, within the meaning of the Public Employees’ Retirement Law, from the performance of his usual duties in the position of Police Commander effective December 31, 2020, and that such disability is a result of injury or disease arising in the course of his employment as a local safety member, and to instruct the System’s Attorney and the Secretary to prepare the necessary documentation of this Board’s determination and forward same to the CalPERS. (Motion unanimously carried, 5-0)

Page 4 of 7
7. CalPERS scheduled hearing on the Service Pending Industrial Disability Retirementapplication for Alejandro Peinado, Police Sergeant.
The hearing was opened on the CalPERS Service Pending Industrial DisabilityRetirement application filed by Alejandro Peinado, Police Sergeant. The Boardreceived the Disability Hearing Option form signed by the applicant that requested thatthe Board close the hearing to the general public, including the discussion of themedical reports submitted in consideration of the Board’s determination. Therefore,the hearing was closed to the public.
The following were present at the hearing: Matthew Howard and Bonnie Yates, (City)and Alejandro Peinado (Applicant).
By order of the Chair, the following exhibits are marked and entered into the record:a. CalPERS letter acknowledging receipt of the Service Pending Industrial Disability
Retirement application, filed by Alejandro Peinado, Police Sergeant, datedNovember 6, 2020.
b. Verification of employment with the City of Pasadena.c. Certification Form signed by the Applicant and City.d. Information report and recommendation from the Human Resources Department
dated October 7, 2021 and the accompanying medical file, including:1) DWC-1 Claim Form2) Notice of Application3) Essential Functions Job Analysis - Police Sergeant4) Medical Reports:
a) AME in Oncology - Noam Drazin, MD - 8/13/2020b) PQME Supplemental Report - Frederic Nicola, MD, QME - 10/2/2020c) Agreed Neuropsychological Exam - Nicholas Thaler, PhD - 12/29/2020d) PQME Supplemental Report - Frederic Nicola, MD, QME - 3/29/2021
e. Applicant’s medical reports:1. Frederic Nicola, MD, QME - 5/15/20202. AME in Oncology - Noam Drazin, MD - 8/13/20203. Frederic Nicola, MD, QME - 10/2/20204. Frederic Nicola, MD, QME - 10/7/20205. AdminSure Cancer Claim, Antoinette Salazar 10/7/20206. Alexander Shar, MD - 8/30/2021
Mr. Howard noted the City’s concurrence with the medical evidence and acknowledged Mr. Peinado for his years of service with the City of Pasadena.
There being no testimony or discussion, a MOTION to close the hearing was made by Mr. Brinsley, seconded by Mr. Milligan. (Motion unanimously carried, 5-0)
MOTION by Mr. Milligan, seconded by Mr. Masuda, to approve the CalPERS Service Pending Industrial Disability Retirement Application, filed by Alejandro Peinado, Police Sergeant, who has filed a CalPERS Service Pending Industrial Disability Retirement Application, is substantially incapacitated, within the meaning of the Public Employees’ Retirement Law, from the performance of his usual duties in the position
Page 5 of 7
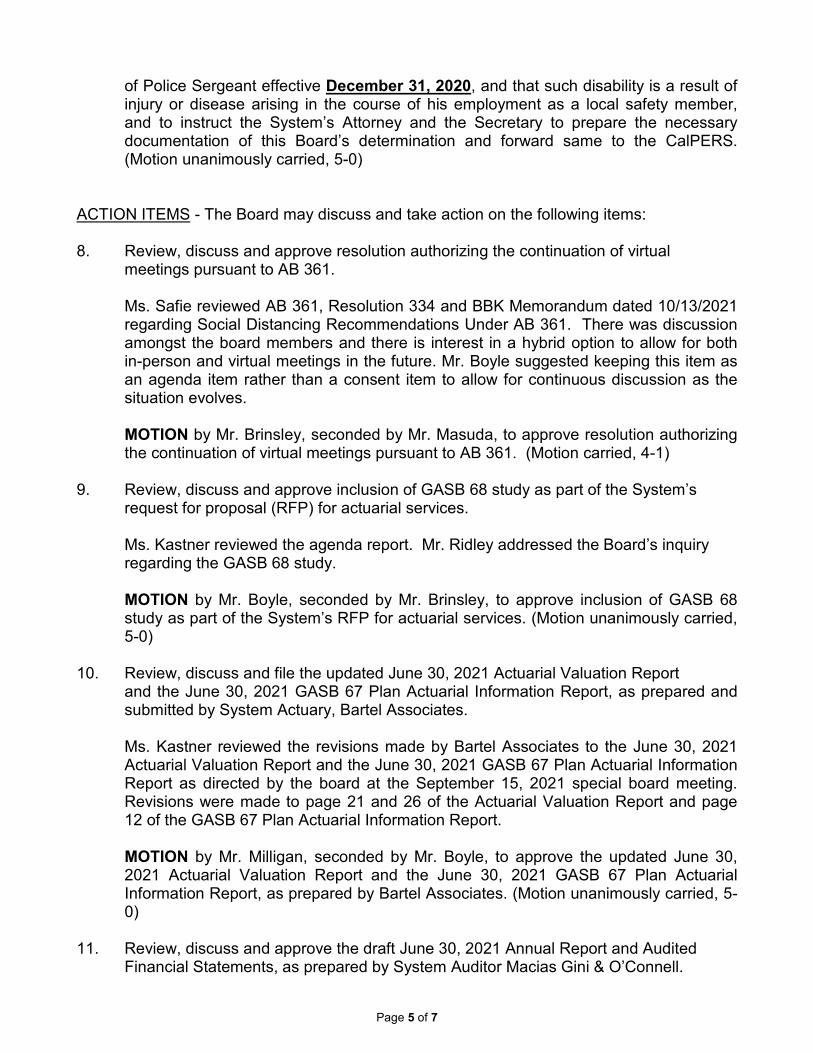
of Police Sergeant effective December 31, 2020, and that such disability is a result of injury or disease arising in the course of his employment as a local safety member, and to instruct the System’s Attorney and the Secretary to prepare the necessary documentation of this Board’s determination and forward same to the CalPERS. (Motion unanimously carried, 5-0)
ACTION ITEMS - The Board may discuss and take action on the following items:
8. Review, discuss and approve resolution authorizing the continuation of virtualmeetings pursuant to AB 361.
Ms. Safie reviewed AB 361, Resolution 334 and BBK Memorandum dated 10/13/2021regarding Social Distancing Recommendations Under AB 361. There was discussionamongst the board members and there is interest in a hybrid option to allow for bothin-person and virtual meetings in the future. Mr. Boyle suggested keeping this item asan agenda item rather than a consent item to allow for continuous discussion as thesituation evolves.
MOTION by Mr. Brinsley, seconded by Mr. Masuda, to approve resolution authorizingthe continuation of virtual meetings pursuant to AB 361. (Motion carried, 4-1)
9. Review, discuss and approve inclusion of GASB 68 study as part of the System’srequest for proposal (RFP) for actuarial services.
Ms. Kastner reviewed the agenda report. Mr. Ridley addressed the Board’s inquiryregarding the GASB 68 study.
MOTION by Mr. Boyle, seconded by Mr. Brinsley, to approve inclusion of GASB 68study as part of the System’s RFP for actuarial services. (Motion unanimously carried,5-0)
10. Review, discuss and file the updated June 30, 2021 Actuarial Valuation Reportand the June 30, 2021 GASB 67 Plan Actuarial Information Report, as prepared andsubmitted by System Actuary, Bartel Associates.
Ms. Kastner reviewed the revisions made by Bartel Associates to the June 30, 2021Actuarial Valuation Report and the June 30, 2021 GASB 67 Plan Actuarial InformationReport as directed by the board at the September 15, 2021 special board meeting.Revisions were made to page 21 and 26 of the Actuarial Valuation Report and page12 of the GASB 67 Plan Actuarial Information Report.
MOTION by Mr. Milligan, seconded by Mr. Boyle, to approve the updated June 30,2021 Actuarial Valuation Report and the June 30, 2021 GASB 67 Plan ActuarialInformation Report, as prepared by Bartel Associates. (Motion unanimously carried, 5-0)
11. Review, discuss and approve the draft June 30, 2021 Annual Report and AuditedFinancial Statements, as prepared by System Auditor Macias Gini & O’Connell.

Page 6 of 7
Engagement Partner James Godsey of Macias Gini & O’Connell (“MGO”) introduced the MGO audit team. Engagement Director Craig Harner of MGO reviewed the audit results, reports and significant information in the financial statements and notes. He reported that there were no findings, and that MGO had issued an unmodified opinion on the financial statements. Although MGO was not engaged to provide an opinion on internal controls, if they had discovered any, they would have disclosed them to the Board. No such deficiencies in internal control were found, and MGO believes that adequate checks and balances are in place to maintain control.
Mr. Boyle pointed out that there was no reference to the Concord in the financial statements. MGO indicated that there were no Concord proceeds received for FY2021 which would affect the audited financial statements. However, there are anticipated proceeds expected in the next fiscal year which the board agreed should be disclosed as a note to the audited financial statements.
MOTION by Mr. Masuda, seconded by Mr. Milligan, to approve the June 30, 2021 draft Annual Report and Audited Financial Statements subject to addition of discussed note regarding the Concord. (Motion carried, 4-1)
12. Discuss and possibly take action on the following investment reports submittedby Verus Investments:
a. Receive and file, September 2021 Performance Update.
The performance update was reviewed reflecting performance without pooled cash. The total fund return for September was -1.1% net of fees (vs. the index of -1.8%), bringing the fiscal year-to-date return for three months to 0.4% net of fees (vs. the index of -0.4%). Total market value at the end of September was $132 million, including pooled cash with the City.
MOTION by Mr. Boyle, seconded by Mr. Brinsley, to receive and file the September 2021 Performance Update, as recommended by Verus Investments. (Motion unanimously carried, 5-0)
b. Receive and file, September 2021 Transaction Summary.
Ms. Taylor reviewed the transaction summary. On September 29, 2021, a total of $1,050,000 was wired to the City for September 2021 benefits and administration expenses.
MOTION by Mr. Boyle, seconded by Mr. Milligan, to receive and file the Transaction Summary. (Motion unanimously carried, 5-0)
INFORMATION ITEMS
13. Staff Report – Ms. Kastner reviewed the CALAPRS Disability Retirement Training sheattended earlier that month. Ms. Kastner informed the board that the FPRS office has

Page 7 of 7
relocated to Room S201 at Pasadena City Hall. The costs of the move are being paid for by the City Attorney’s office. Ms. Kastner also informed the board that FPRS staff will resume telecommuting on October 25, 2021 as part of the approved Hybrid Work Program. Ms. Kastner provided a brief update on the budget actuals and provided an update on pending disability retirement hearings.
a. September 2021 Budget/Expense Report - noted.
14. Counsel Report – Ms. Safie presented the Local Safety Member DisabilityDetermination training and reviewed the various types of applications andrequirements which would need to be met. Ms. Safie went over a few scenarios withthe board and answered their questions.
a. Disability Determination refresher training session.
P. Boyle left meeting at 11:30 a.m. and returned to the meeting at 11:32 a.m.
15. Articles/Newsletters/Conferences – none noted.
COMMENTS FROM BOARD MEMBERS
None noted.
ADJOURN
MOTION by Mr. Boyle, seconded by Mr. Brinsley, to adjourn the meeting at 11:48 a.m.
Respectfully submitted,
_______________________ ___ ________________________ Bernadette Kastner Keith Jones Secretary to the Board/Administrator Chair, Retirement Board
Details of this meeting are contained on a digital recording of the meeting and will be kept in the archives for two years, per Board policy.
DISTRIBUTION: Board Members Fire & Police Retirees Assn. J. CurtisCity Attorney Police Chief M. HowardI. Safie, System Atty Fire Chief L. DemirdjianA. Taylor, Verus Director of Finance B.YatesBartel Associates City Controller A. PeinadoMGO Principal Accountant A. Snitzer
J. Head
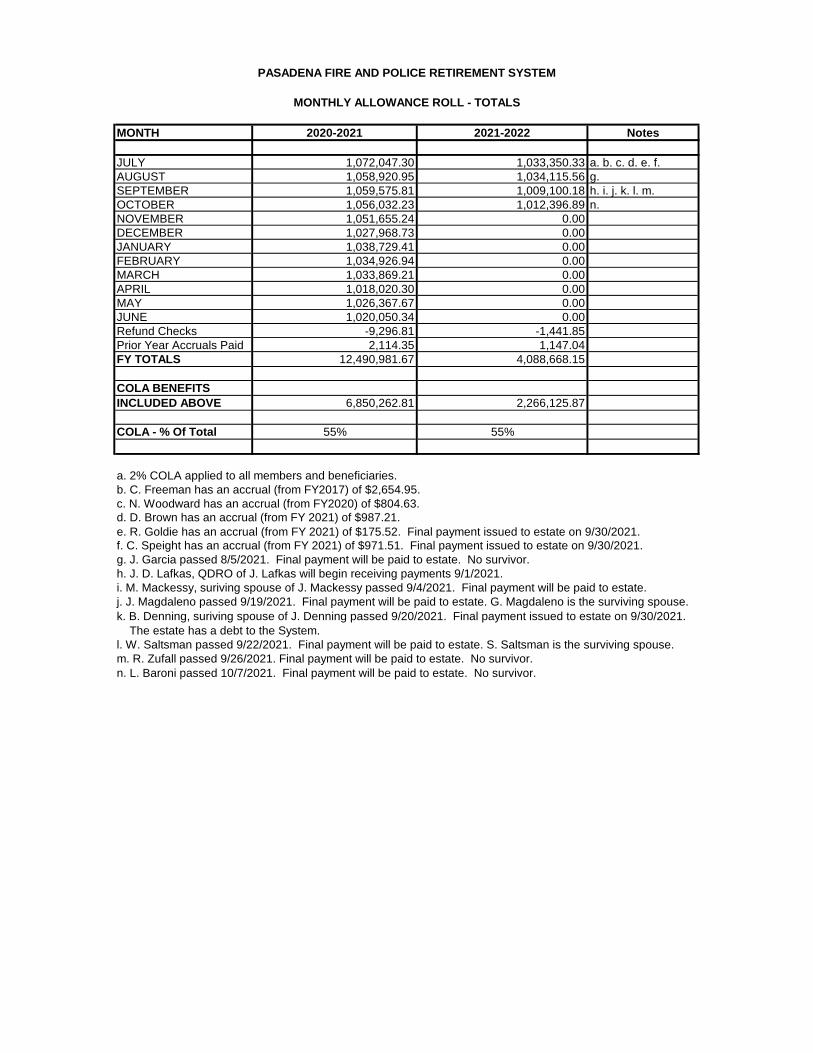
PASADENA FIRE AND POLICE RETIREMENT SYSTEM
MONTHLY ALLOWANCE ROLL - TOTALS
MONTH 2020-2021 2021-2022 Notes
JULY 1,072,047.30 1,033,350.33 a. b. c. d. e. f.
AUGUST 1,058,920.95 1,034,115.56 g.
SEPTEMBER 1,059,575.81 1,009,100.18 h. i. j. k. l. m.
OCTOBER 1,056,032.23 1,012,396.89 n.
NOVEMBER 1,051,655.24 0.00
DECEMBER 1,027,968.73 0.00
JANUARY 1,038,729.41 0.00
FEBRUARY 1,034,926.94 0.00
MARCH 1,033,869.21 0.00
APRIL 1,018,020.30 0.00
MAY 1,026,367.67 0.00
JUNE 1,020,050.34 0.00
Refund Checks -9,296.81 -1,441.85
Prior Year Accruals Paid 2,114.35 1,147.04
FY TOTALS 12,490,981.67 4,088,668.15
COLA BENEFITS
INCLUDED ABOVE 6,850,262.81 2,266,125.87
COLA - % Of Total 55% 55%
a. 2% COLA applied to all members and beneficiaries.
b. C. Freeman has an accrual (from FY2017) of $2,654.95.
c. N. Woodward has an accrual (from FY2020) of $804.63.
e. R. Goldie has an accrual (from FY 2021) of $175.52. Final payment issued to estate on 9/30/2021.
n. L. Baroni passed 10/7/2021. Final payment will be paid to estate. No survivor.
m. R. Zufall passed 9/26/2021. Final payment will be paid to estate. No survivor.
h. J. D. Lafkas, QDRO of J. Lafkas will begin receiving payments 9/1/2021.
l. W. Saltsman passed 9/22/2021. Final payment will be paid to estate. S. Saltsman is the surviving spouse.
f. C. Speight has an accrual (from FY 2021) of $971.51. Final payment issued to estate on 9/30/2021.
d. D. Brown has an accrual (from FY 2021) of $987.21.
g. J. Garcia passed 8/5/2021. Final payment will be paid to estate. No survivor.
i. M. Mackessy, suriving spouse of J. Mackessy passed 9/4/2021. Final payment will be paid to estate.
j. J. Magdaleno passed 9/19/2021. Final payment will be paid to estate. G. Magdaleno is the surviving spouse.
k. B. Denning, suriving spouse of J. Denning passed 9/20/2021. Final payment issued to estate on 9/30/2021.
The estate has a debt to the System.
1075 Peachtree Street NE | Suite 2100 | Atlanta | GA | 30309
City of Pasadena Fire and Police Retirement System
Michael Jaje, CFA Investment Specialist
(404) [email protected]
Cheryl Innerarity Investment Operations Supervisor
(404) [email protected]
High Quality Small CapThird Quarter 2021 Portfolio Review
Prepared for City of Pasadena Fire and Police Retirement System use only. Not for further distribution.

• Founded in 1969 in Atlanta, Georgia
• Singular focus on High Quality stocks and bonds
• Employs 38 professionals
• Part of Morgan Stanley Investment Management, the asset management division of Morgan Stanley
Atlanta Capital Management Co., LLC As of September 30, 2021
Investment Franchises($28.3 Billion)
28%
67%
5%
Growth Equity
Fixed Income
Core Equity
14%
78%
8%
Small Cap$2.6 bn │ 1992
SMID Cap$14.8 bn │ 2004
Core Equity Management($18.8 Billion)
Select Equity$1.4 bn │ 2006
Assets under management │ inception date of strategy
Assets under management are approximate. Source: Atlanta Capital as of September 30, 2021.
1

Consistent Growth & Stability in EarningsKey Tenet of Our Investment Philosophy
Earnings Stability Avg. 5-Year CAGR Earnings Variability # Positive Periods # Negative PeriodsHigh Quality Portfolio 7.1% 1.8% 120 or 100% 0 or 0%Low Quality Portfolio 4.2% 3.3% 106 or 88% 14 or 12%
-3%
0%
3%
6%
9%
12%
15%
91 92 93 94 95 96 97 98 99 00 01 02 03 04 05 06 07 08 09 10 11 12 13 14 15 16 17 18 19 20
Five-Year Rolling CAGR of As Reported EarningsRussell 2000® Index by Earnings Stability
Recession
Time period: January 1, 1991 – December 31, 2020. This information is provided for general illustrative purposes only. The High Quality and Low Quality Research portfolios are provided to compare the aggregate earnings stability of all companies in the index with High Quality SPGMI Quality Rankings (B+ or Better) to those with Low Quality SPGMI Quality Rankings (B or Below). The High Quality Research and Low Quality Research portfolios are model portfolios formed and rebalanced monthly by Atlanta Capital. The universe includes all Russell 2000® Index constituents with SPGMI Quality Rankings and prices greater than $1. Five-year historical earnings growth rates are calculated using a market capitalization-weighted methodology. The Russell 2000® Index is an unmanaged index of 2,000 US small-cap stocks. Historical performance of the index and Research portfolios illustrates market trends and does not represent past or future performance of the strategy. The material is based upon information that Atlanta Capital considers to be reliable, however no assurances are provided. The material should not be considered investment advice or a recommendation to invest in a particular strategy. Reproduction or redistribution of this page in any form without express permission from Atlanta Capital is prohibited. Past performance is not a reliable indicator of future results. Sources: FTSE Russell, S&P Global, Wilshire Atlas, Atlanta Capital as of December 31, 2020.
2

High Quality Small Cap Investment Objective April 1, 1992 – September 30, 2021
Our objective is to participate in rising markets, protect capital during declining markets, and outperform over the long-term without the volatility typically associated with small cap investing.
Rising Markets(80 Positive Quarters)Net of Fees
30.1%
36.9%
10%
20%
30%
40%
82%
Since Inception*(118 Total Quarters)Net of Fees
12.0%
9.9%
6%
8%
10%
12%
14%
+2.1%
Upside Reward + Downside Protection = Long-Term Results
BetaHQ Small Cap | R2000®
0.71 | 1.00
Standard DeviationHQ Small Cap | R2000®
15.9% | 21.0%
Declining Markets(38 Negative Quarters)Net of Fees
-18.2%
-30.8%
-35%
-30%
-25%
-20%
-15%
-10%59%
*The inception date of the High Quality Small Capitalization Composite is April 1, 1992. For illustrative purposes only. The charts above illustrate the average (annualized) return of the High Quality Small Capitalization Composite during both rising and declining markets since inception. Results for other time periods may differ from the long-term trend shown above. Rising markets are defined as quarters where the return of the Russell 2000® index was positive. Declining markets are defined as quarters where the return of the Russell 2000® index was negative. These positive and negative quarters are separated out from the intervening quarters, cumulated across the period, and annualized. Long-term investment returns include both rising and declining periods. Composite performance is calculated in US dollars and reflects reinvestment of all income and capital gains. Composite performance is shown net of investment advisory fees using a maximum annual investment management fee of 0.80% applied monthly; client results will be reduced by custody fees and other client expenses. Performance during certain periods reflects strong stock market performance that is not typical and may not be repeated. Individual client returns will vary due to fees, client-imposed investment constraints and client inception date. Beta measures the historical sensitivity of portfolio excess returns to movements in the excess return of the market index. Standard Deviation is a measure of absolute volatility of returns. The Russell 2000® index is unmanaged and does not incur management fees or other expenses associated with managed accounts. It is not possible to directly invest in an index. Please see the Composite’s GIPS® compliant presentation at the end of this presentation for important additional information and disclosure. Past performance does not predict future results. Source: eVestment and Atlanta Capital as of September 30, 2021.
3
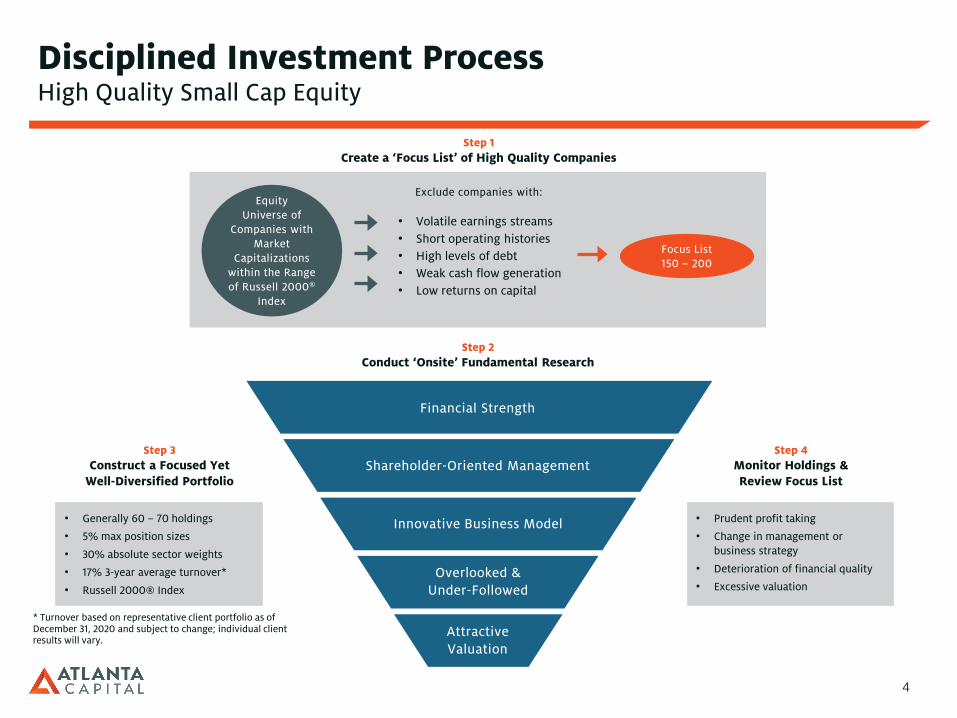
Disciplined Investment ProcessHigh Quality Small Cap Equity
• Generally 60 – 70 holdings
• 5% max position sizes
• 30% absolute sector weights
• 17% 3-year average turnover*
• Russell 2000® Index
Financial Strength
Overlooked &Under-Followed
Innovative Business Model
Exclude companies with:
Focus List150 – 200
• Volatile earnings streams• Short operating histories• High levels of debt• Weak cash flow generation• Low returns on capital
Shareholder-Oriented Management
• Prudent profit taking
• Change in management or business strategy
• Deterioration of financial quality
• Excessive valuation
Step 1Create a ‘Focus List’ of High Quality Companies
Step 2Conduct ‘Onsite’ Fundamental Research
Step 3Construct a Focused Yet
Well-Diversified Portfolio
Step 4Monitor Holdings &Review Focus List
AttractiveValuation
Equity Universe of
Companies with Market
Capitalizations within the Range of Russell 2000®
Index
* Turnover based on representative client portfolio as of December 31, 2020 and subject to change; individual client results will vary.
4

Total Returns (%) QTD YTD 1 Yr 3 Yrs* 5 Yrs* 7 Yrs* 10 Yrs*Since
Inception*
High Quality Small Cap -1.76 8.91 30.25 10.05 14.15 13.78 16.43 16.28
Russell 2500™ ~ 2000® (03/01/15)
-4.36 12.41 47.68 10.54 13.45 11.66 14.89 14.85
Annualized PerformanceCity of Pasadena Fire and Police Retirement System
*Performance returns over one year are annualized. The unmanaged benchmark index returns are shown for comparative purposes only and do not reflect the subtraction of any fees or transaction costs. It is not possible to directly invest in an index. Portfolio returns are gross of management fees unless otherwise noted. The deduction of an advisory fee would reduce an investor’s return. Past performance is not indicative of future results. All investments subject to loss. Please refer to the disclosures at the end of this presentation.
Source: ICE Data Services and Atlanta Capital as of September 30, 2021.
Account Summary
Performance Inception Date: June 30, 2009
Net Investment Contributions: -$7,770,100
Investment Dollars Earned: $12,944,582
Market Value (09/30/21): $5,174,482
5

Performance Drivers & DetractorsCity of Pasadena Fire and Police Retirement System
Source: Factset and Atlanta Capital as of September 30, 2021.The above attribution results are based on each day's ending holdings, and linked to generate attribution over longer periods. Cash in the portfolio is included in the analysis. Portfolio returns do not reflect applicable expenses and trading costs, or variations in transaction prices from end of day values. Past performance does not predict future results.
Total Portfolio
vs.
Russell 2000® Index
Top Contributorsto Relative Results
+ Positive selection in Health Care, Technology, Communication Services, Materials, Discretionary, and Staples
+ Underweight Health Care and Communication Services
+ Overweight Industrials
+ Positive selection in Communication Services
+ Underweight Health Care, Utilities, and Real Estate
+ Overweight Industrials and Technology
Top Detractorsfrom Relative Results
– Negative stock selection most pronounced in Industrials and Financials.
– Underweight Energy and Real Estate
– Negative stock selection most pronounced in Industrials, Technology, Consumer Discretionary, Financials, Materials, and Health Care
– Underweight Energy and Communication Services
– Overweight Staples
Last 12-Mos. Attribution (%)Last 3-Mos. Attribution (%)
Stock Selection + Sector Allocation = Excess Return
2.6
1.6
1.0
Excess Return
Stock Selection
Sector Allocation
-17.4
-17.1
-0.4
Excess Return
Stock Selection
Sector Allocation
6
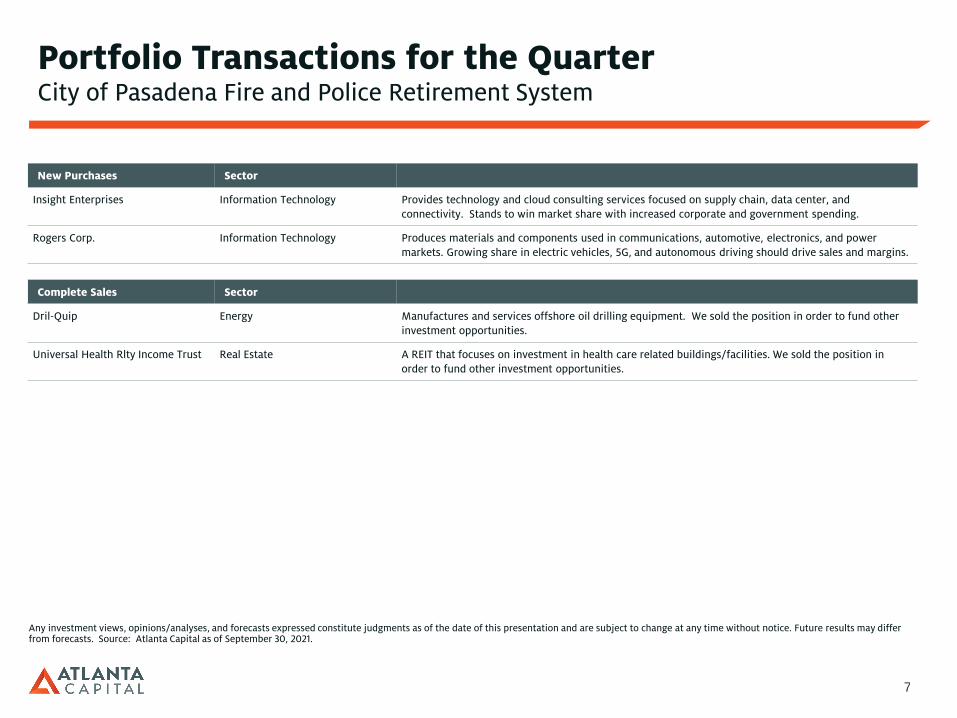
Portfolio Transactions for the QuarterCity of Pasadena Fire and Police Retirement System
New Purchases Sector
Insight Enterprises Information Technology Provides technology and cloud consulting services focused on supply chain, data center, and connectivity. Stands to win market share with increased corporate and government spending.
Rogers Corp. Information Technology Produces materials and components used in communications, automotive, electronics, and power markets. Growing share in electric vehicles, 5G, and autonomous driving should drive sales and margins.
Complete Sales Sector
Dril-Quip Energy Manufactures and services offshore oil drilling equipment. We sold the position in order to fund other investment opportunities.
Universal Health Rlty Income Trust Real Estate A REIT that focuses on investment in health care related buildings/facilities. We sold the position in order to fund other investment opportunities.
Any investment views, opinions/analyses, and forecasts expressed constitute judgments as of the date of this presentation and are subject to change at any time without notice. Future results may differ from forecasts. Source: Atlanta Capital as of September 30, 2021.
7

9.2 7.74.6
25.9
18.2 16.813.2
1.0 0.0 0.0 0.03.6
20.2
3.2 3.8
14.4 14.1 15.511.5
3.5 4.56.9
2.40.0
05
1015202530354045
Health Care ConsumerStaples
Materials Industrials InformationTechnology
Financials ConsumerDiscretionary
CommunicationServices
Energy Real Estate Utilities Cash
Total PortfolioRussell 2000® Index
Portfolio CharacteristicsCity of Pasadena Fire and Police Retirement System
Sector Exposure
Source: FactSet and Atlanta Capital as of September 30, 2021.
Top Ten Holdings (%)
Choice Hotels International 3.1 ICU Medical 2.7 Inter Parfums 2.6 Houlihan Lokey CL A 2.5 Dorman Products 2.5 Qualys 2.5 Integra LifeSciences Hldgs. Corp. 2.4 Selective Insurance Group 2.4 Kinsale Capital Group 2.3 Envestnet 2.3
Portfolio Metrics Russell 2000® Index Total Portfolio
# of Holdings 2,026 63
Wtd. Avg. Mkt. Cap (billions) $3.3 $3.8
Historical Earnings Growth 9% 8%
Forecasted Earnings Growth 17% 15%
Return on Equity -2% 10%
P/E (NTM, Excl. Neg. Earn.) 15.9x 19.8x
Dividend Yield 1.0% 0.8%
8
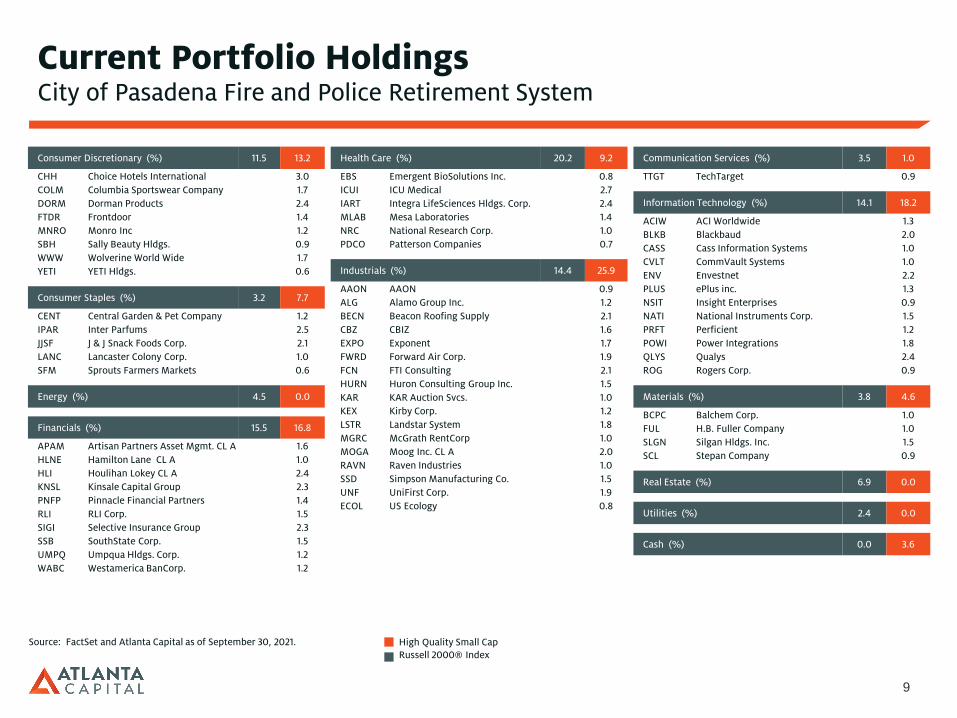
Current Portfolio HoldingsCity of Pasadena Fire and Police Retirement System
Source: FactSet and Atlanta Capital as of September 30, 2021. High Quality Small Cap Russell 2000® Index
Consumer Discretionary (%) 11.5 13.2
CHH Choice Hotels International 3.0 COLM Columbia Sportswear Company 1.7 DORM Dorman Products 2.4 FTDR Frontdoor 1.4 MNRO Monro Inc 1.2 SBH Sally Beauty Hldgs. 0.9 WWW Wolverine World Wide 1.7 YETI YETI Hldgs. 0.6
Consumer Staples (%) 3.2 7.7
CENT Central Garden & Pet Company 1.2 IPAR Inter Parfums 2.5 JJSF J & J Snack Foods Corp. 2.1 LANC Lancaster Colony Corp. 1.0 SFM Sprouts Farmers Markets 0.6
Energy (%) 4.5 0.0
Financials (%) 15.5 16.8
APAM Artisan Partners Asset Mgmt. CL A 1.6 HLNE Hamilton Lane CL A 1.0 HLI Houlihan Lokey CL A 2.4 KNSL Kinsale Capital Group 2.3 PNFP Pinnacle Financial Partners 1.4 RLI RLI Corp. 1.5 SIGI Selective Insurance Group 2.3 SSB SouthState Corp. 1.5 UMPQ Umpqua Hldgs. Corp. 1.2 WABC Westamerica BanCorp. 1.2
Health Care (%) 20.2 9.2
EBS Emergent BioSolutions Inc. 0.8 ICUI ICU Medical 2.7 IART Integra LifeSciences Hldgs. Corp. 2.4 MLAB Mesa Laboratories 1.4 NRC National Research Corp. 1.0 PDCO Patterson Companies 0.7
Industrials (%) 14.4 25.9
AAON AAON 0.9 ALG Alamo Group Inc. 1.2 BECN Beacon Roofing Supply 2.1 CBZ CBIZ 1.6 EXPO Exponent 1.7 FWRD Forward Air Corp. 1.9 FCN FTI Consulting 2.1 HURN Huron Consulting Group Inc. 1.5 KAR KAR Auction Svcs. 1.0 KEX Kirby Corp. 1.2 LSTR Landstar System 1.8 MGRC McGrath RentCorp 1.0 MOGA Moog Inc. CL A 2.0 RAVN Raven Industries 1.0 SSD Simpson Manufacturing Co. 1.5 UNF UniFirst Corp. 1.9 ECOL US Ecology 0.8
Communication Services (%) 3.5 1.0
TTGT TechTarget 0.9
Information Technology (%) 14.1 18.2
ACIW ACI Worldwide 1.3 BLKB Blackbaud 2.0 CASS Cass Information Systems 1.0 CVLT CommVault Systems 1.0 ENV Envestnet 2.2 PLUS ePlus inc. 1.3 NSIT Insight Enterprises 0.9 NATI National Instruments Corp. 1.5 PRFT Perficient 1.2 POWI Power Integrations 1.8 QLYS Qualys 2.4 ROG Rogers Corp. 0.9
Materials (%) 3.8 4.6
BCPC Balchem Corp. 1.0 FUL H.B. Fuller Company 1.0 SLGN Silgan Hldgs. Inc. 1.5 SCL Stepan Company 0.9
Real Estate (%) 6.9 0.0
Utilities (%) 2.4 0.0
Cash (%) 0.0 3.6
9

Investment Outlook & StrategyHigh Quality Small Cap
• After five consecutive quarters of robust returns, U.S. equity markets were decidedly muted in the 3rd quarter. The Russell 2000® lost -4.4% in the third quarter, and is now up +12.4% year-to-date.
• Events that weighed on market expectations included difficult negotiations around infrastructure and government spending, growing signs of inflation, labor/supply-chain bottlenecks, and liquidity problems with a large Chinese property developer.
• Low Quality stocks, (those with negative/ inconsistent earnings) have experienced meaningful outperformance since the pandemic lows of March 2020. We have lived through past periods of low quality speculation and it usually proves to be an opportune time to invest in companies with positive earnings, strong balance sheets, and strong levels of profitability.
• During the quarter, we purchased two new holdings and sold two entirely.
• At quarter end, the representative portfolio held 63 stocks representing eight of the eleven economic sectors in the Russell 2000®.
• Relative to the benchmark, the portfolio was overweight Industrials, Staples, Technology, Discretionary, Financials, and Materials.
• The portfolio was underweight Health Care and Communication Services. There are no positions in Utilities, Real Estate, and Energy.
Investment Outlook
Portfolio Positioning
Any investment views, opinions/analyses, and forecasts expressed constitute judgments as of the date of this presentation and are subject to change at any time without notice. Future results may differ from forecasts. Source: Atlanta Capital as of September 30, 2021.
10

Core Equity Team BiographiesAs of September 30, 2021
William O. Bell, IV, CFA
Mr. Bell is a Vice President of the firm. He serves as a portfolio manager for Atlanta Capital's Small Cap, SMID Cap and Select Equity portfolios. He is also a member of the Management Committee. Prior to joining the firm in 1999, Mr. Bell was a portfolio manager with the Florida State Board of Administration where he was responsible for managing their internal special situation equity fund. Mr. Bell holds the Chartered Financial Analyst designation and is a graduate of Florida State University where he earned a Bachelor of Science degree in Business.
Charles B. Reed, CFAMr. Reed is Managing Director for the Core Equity Team. He serves as a portfolio manager for Atlanta Capital's Small Cap, SMID Cap and Select Equity portfolios. He is also a member of the Management Committee. Prior to joining the firm in 1998, Mr. Reed was a portfolio manager with the Florida State Board of Administration where he was responsible for managing their internal special situation equity fund. Mr. Reed holds the Chartered Financial Analyst designation and is a graduate of Florida State University where he earned a Bachelor of Science degree in Finance.
W. Matt Hereford, CFAMr. Hereford is a Vice President of the firm. He serves as a portfolio manager for Atlanta Capital's Small Cap, SMID Cap and Select Equity portfolios. He is also a member of the Management Committee. Prior to joining Atlanta Capital in 2002, Mr. Hereford worked for five years at Invesco where he was responsible for managing their Concentrated Equity Portfolio. Mr. Hereford is a graduate from the University of Mississippi, where he earned a Bachelor of Business Administration degree in International Business. Mr. Hereford holds the Chartered Financial Analyst designation and is a member of the Atlanta Society of Financial and Investment Professionals.
J. Michael Jaje, Jr., CFAMr. Jaje is a Vice President of the firm. He serves as a Core Equity Investment Specialist. Prior to joining the firm in 2014, Mr. Jaje was a Partner and Marketing and Client Service representative with Buckhead Capital Management. Prior to Buckhead Capital, he was responsible for product management at Earnest Partners, served as an Institutional Equity Salesperson for Donaldson, Lufkin & Jenrette and Credit Suisse First Boston, and was a Regional Marketing Coordinator for the Managed Accounts Group of Invesco. Mr. Jaje is a graduate of Vanderbilt University where he earned a Bachelor of Science degree in English. Mr. Jaje holds the Chartered Financial Analyst designation.
11
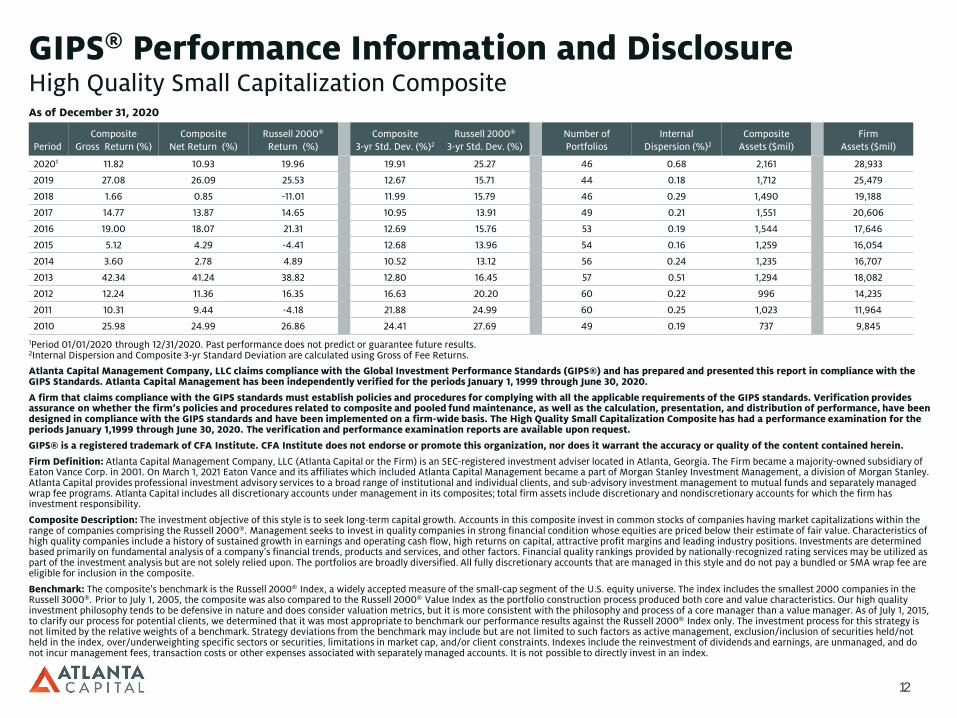
GIPS® Performance Information and DisclosureHigh Quality Small Capitalization CompositeAs of December 31, 2020
1Period 01/01/2020 through 12/31/2020. Past performance does not predict or guarantee future results.2Internal Dispersion and Composite 3-yr Standard Deviation are calculated using Gross of Fee Returns.
PeriodComposite
Gross Return (%)Composite
Net Return (%)Russell 2000®
Return (%)Composite
3-yr Std. Dev. (%)2Russell 2000®
3-yr Std. Dev. (%)Number of Portfolios
InternalDispersion (%)2
CompositeAssets ($mil)
FirmAssets ($mil)
20201 11.82 10.93 19.96 19.91 25.27 46 0.68 2,161 28,933
2019 27.08 26.09 25.53 12.67 15.71 44 0.18 1,712 25,479
2018 1.66 0.85 -11.01 11.99 15.79 46 0.29 1,490 19,188
2017 14.77 13.87 14.65 10.95 13.91 49 0.21 1,551 20,606
2016 19.00 18.07 21.31 12.69 15.76 53 0.19 1,544 17,646
2015 5.12 4.29 -4.41 12.68 13.96 54 0.16 1,259 16,054
2014 3.60 2.78 4.89 10.52 13.12 56 0.24 1,235 16,707
2013 42.34 41.24 38.82 12.80 16.45 57 0.51 1,294 18,082
2012 12.24 11.36 16.35 16.63 20.20 60 0.22 996 14,235
2011 10.31 9.44 -4.18 21.88 24.99 60 0.25 1,023 11,964
2010 25.98 24.99 26.86 24.41 27.69 49 0.19 737 9,845
Atlanta Capital Management Company, LLC claims compliance with the Global Investment Performance Standards (GIPS®) and has prepared and presented this report in compliance with the GIPS Standards. Atlanta Capital Management has been independently verified for the periods January 1, 1999 through June 30, 2020.
A firm that claims compliance with the GIPS standards must establish policies and procedures for complying with all the applicable requirements of the GIPS standards. Verification provides assurance on whether the firm’s policies and procedures related to composite and pooled fund maintenance, as well as the calculation, presentation, and distribution of performance, have been designed in compliance with the GIPS standards and have been implemented on a firm-wide basis. The High Quality Small Capitalization Composite has had a performance examination for the periods January 1,1999 through June 30, 2020. The verification and performance examination reports are available upon request.
GIPS® is a registered trademark of CFA Institute. CFA Institute does not endorse or promote this organization, nor does it warrant the accuracy or quality of the content contained herein.
Firm Definition: Atlanta Capital Management Company, LLC (Atlanta Capital or the Firm) is an SEC-registered investment adviser located in Atlanta, Georgia. The Firm became a majority-owned subsidiary of Eaton Vance Corp. in 2001. On March 1, 2021 Eaton Vance and its affiliates which included Atlanta Capital Management became a part of Morgan Stanley Investment Management, a division of Morgan Stanley. Atlanta Capital provides professional investment advisory services to a broad range of institutional and individual clients, and sub-advisory investment management to mutual funds and separately managed wrap fee programs. Atlanta Capital includes all discretionary accounts under management in its composites; total firm assets include discretionary and nondiscretionary accounts for which the firm has investment responsibility.
Composite Description: The investment objective of this style is to seek long-term capital growth. Accounts in this composite invest in common stocks of companies having market capitalizations within the range of companies comprising the Russell 2000®. Management seeks to invest in quality companies in strong financial condition whose equities are priced below their estimate of fair value. Characteristics of high quality companies include a history of sustained growth in earnings and operating cash flow, high returns on capital, attractive profit margins and leading industry positions. Investments are determined based primarily on fundamental analysis of a company’s financial trends, products and services, and other factors. Financial quality rankings provided by nationally-recognized rating services may be utilized as part of the investment analysis but are not solely relied upon. The portfolios are broadly diversified. All fully discretionary accounts that are managed in this style and do not pay a bundled or SMA wrap fee are eligible for inclusion in the composite.
Benchmark: The composite’s benchmark is the Russell 2000® Index, a widely accepted measure of the small-cap segment of the U.S. equity universe. The index includes the smallest 2000 companies in the Russell 3000®. Prior to July 1, 2005, the composite was also compared to the Russell 2000® Value Index as the portfolio construction process produced both core and value characteristics. Our high quality investment philosophy tends to be defensive in nature and does consider valuation metrics, but it is more consistent with the philosophy and process of a core manager than a value manager. As of July 1, 2015, to clarify our process for potential clients, we determined that it was most appropriate to benchmark our performance results against the Russell 2000® Index only. The investment process for this strategy is not limited by the relative weights of a benchmark. Strategy deviations from the benchmark may include but are not limited to such factors as active management, exclusion/inclusion of securities held/not held in the index, over/underweighting specific sectors or securities, limitations in market cap, and/or client constraints. Indexes include the reinvestment of dividends and earnings, are unmanaged, and do not incur management fees, transaction costs or other expenses associated with separately managed accounts. It is not possible to directly invest in an index.
12

*Inception date is April 1, 1992.E7 01.13.21, 06.10.21
Annualized Returns (%) for Periods Ending December 31, 2020 Cumulative (%)
Atlanta Capital High Quality Small Capitalization Composite 1 Year 3 Years 5 Years 7 Years 10 Years Since Inception* Since Inception*
Composite Gross of Fees 11.82 13.04 14.56 11.55 14.24 12.97 3229.12
Composite Net of Fees 10.93 12.15 13.66 10.67 13.34 12.07 2548.37
Russell 2000® Index 19.96 10.25 13.26 9.34 11.20 9.73 1341.81
Gross and Net Returns: Performance reflects reinvestment of all income and capital gains. Composite returns and market values are reported in U.S. dollars. Gross-of-fees performance returns are presented before management and custodial fees but after all trading expenses. Certain accounts in the composite do not pay commissions. Returns are presented net of withholding taxes. Net-of-fees performance returns are calculated by deducting the highest management fee of 0.80% from the monthly gross-of-fees returns. Other expenses will reduce a client’s returns. The annual fee schedule for this composite is as follows: 0.80% on the first $50 million in assets; 0.70% on the next $50 million in assets; 0.60% on the next $150 million. Actual management fees incurred by clients may vary.
Composite Dispersion: The annual internal composite dispersion is calculated using the asset-weighted standard deviation of annual gross of fee returns of those portfolios that were included in the composite for the entire year. Internal dispersion is shown only for composites that held at least six accounts for the entire year. The three-year annualized standard deviation measures the variability of the composite and the benchmark returns over the preceding 36-month period.
Notes to Composite: The creation date of this composite is July 1992. Effective July 1, 2010, the composite was redefined to include both taxable and tax-exempt institutional accounts. The composite up to that time included only tax-exempt institutional accounts. The change provides increased transparency to prospective clients by reducing the number of separate composites maintained for this strategy. There has been no change in investment objective or management style. Clients or prospective clients should not assume that they will have an investment experience similar to that indicated by past performance results, as shown on the Schedule. Returns may vary based upon differences in account size, timing of transactions and market conditions at the time of investment. Performance during certain time periods reflects the strong stock market performance and/or the strong performance of stocks held during those periods. This performance is not typical and may not be repeated. Investing entails risks and there is always the possibility of loss.
Other Matters: The Firm’s list of composite descriptions and policies for valuing investments, calculating performance and preparing GIPS Reports are available upon request. To request any additional information, please contact the Atlanta Capital Management Performance Department at 404-876-9411 or write to Atlanta Capital Management Company, LLC, 1075 Peachtree Street NE, Suite 2100, Atlanta, Georgia 30309, Attention Performance Department. Past performance does not predict future results.
13

Portfolio Administrative Review
Investment Summary, Holdings and Transactions
14

Portfolio Appraisal – Investment SummaryCity of Pasadena Fire and Police Retirement System
Total Cost ($) Total Market ($) Port Weight (%) Current Yield (%)
INVESTMENT SUMMARY as of 09/30/21
Equities
Communication Services 33,782 49,617 1.0 0.0Consumer Discretionary 496,386 680,107 13.2 0.7Consumer Staples 277,167 395,606 7.6 1.2Financials 596,244 867,343 16.8 2.3Health Care 402,382 477,125 9.2 0.3Industrials 983,062 1,339,407 25.9 0.5Information Technology 734,239 941,099 18.2 0.4Materials 173,583 235,198 4.5 1.0
Total Equities 3,696,845 4,985,501 96.3 0.8
Cash 187,575 187,575 3.7 0.0
Total Investments 3,884,420 5,173,076 100.0 0.8
Accrued Dividends 1,406
Total Portfolio 5,174,482
Source: Blackrock Aladdin and Atlanta Capital
15
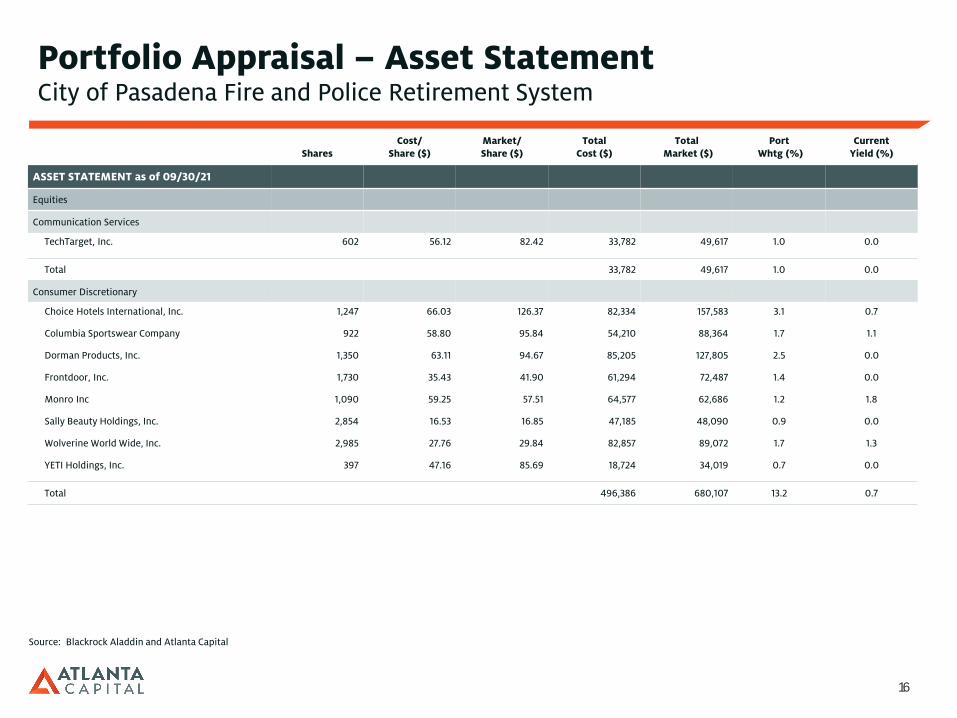
Portfolio Appraisal – Asset StatementCity of Pasadena Fire and Police Retirement System
SharesCost/
Share ($)Market/Share ($)
Total Cost ($)
TotalMarket ($)
PortWhtg (%)
Current Yield (%)
ASSET STATEMENT as of 09/30/21
Equities
Communication Services
TechTarget, Inc. 602 56.12 82.42 33,782 49,617 1.0 0.0
Total 33,782 49,617 1.0 0.0
Consumer Discretionary
Choice Hotels International, Inc. 1,247 66.03 126.37 82,334 157,583 3.1 0.7
Columbia Sportswear Company 922 58.80 95.84 54,210 88,364 1.7 1.1
Dorman Products, Inc. 1,350 63.11 94.67 85,205 127,805 2.5 0.0
Frontdoor, Inc. 1,730 35.43 41.90 61,294 72,487 1.4 0.0
Monro Inc 1,090 59.25 57.51 64,577 62,686 1.2 1.8
Sally Beauty Holdings, Inc. 2,854 16.53 16.85 47,185 48,090 0.9 0.0
Wolverine World Wide, Inc. 2,985 27.76 29.84 82,857 89,072 1.7 1.3
YETI Holdings, Inc. 397 47.16 85.69 18,724 34,019 0.7 0.0
Total 496,386 680,107 13.2 0.7
Source: Blackrock Aladdin and Atlanta Capital
16

Portfolio Appraisal – Asset StatementCity of Pasadena Fire and Police Retirement System
SharesCost/
Share ($)Market/Share ($)
Total Cost ($)
TotalMarket ($)
PortWhtg (%)
Current Yield (%)
ASSET STATEMENT as of 09/30/21
Equities
Consumer Staples
Central Garden & Pet Company 1,361 33.53 48.00 45,631 65,328 1.3 0.0
Inter Parfums, Inc. 1,788 38.96 74.77 69,654 133,689 2.6 1.4
J & J Snack Foods Corp. 718 121.36 152.82 87,140 109,725 2.1 1.7
Lancaster Colony Corporation 308 113.24 168.81 34,879 51,993 1.0 1.8
Sprouts Farmers Markets, Inc. 1,505 26.49 23.17 39,863 34,871 0.7 0.0
Total 277,167 395,606 7.6 1.2
Financials
Artisan Partners Asset Management, Inc. Class A 1,703 37.08 48.92 63,151 83,311 1.6 8.2
Hamilton Lane Incorporated Class A 636 70.61 84.82 44,908 53,946 1.0 1.7
Houlihan Lokey, Inc. Class A 1,397 52.67 92.10 73,582 128,664 2.5 1.9
Kinsale Capital Group, Inc. 740 69.72 161.70 51,595 119,658 2.3 0.3
Pinnacle Financial Partners, Inc. 798 41.82 94.08 33,375 75,076 1.5 0.8
Source: Blackrock Aladdin and Atlanta Capital
17

Portfolio Appraisal – Asset StatementCity of Pasadena Fire and Police Retirement System
SharesCost/
Share ($)Market/Share ($)
Total Cost ($)
TotalMarket ($)
PortWhtg (%)
Current Yield (%)
ASSET STATEMENT as of 09/30/21
Equities
Financials
RLI Corp. 784 61.44 100.27 48,171 78,612 1.5 1.0
Selective Insurance Group, Inc. 1,606 69.41 75.53 111,466 121,301 2.3 1.3
SouthState Corporation 1,042 75.41 74.67 78,575 77,806 1.5 2.6
Umpqua Holdings Corporation 3,210 11.77 20.25 37,793 65,003 1.3 4.2
Westamerica Bancorporation 1,137 47.17 56.26 53,628 63,968 1.2 2.9
Total 596,244 867,343 16.8 2.3
Health Care
Emergent BioSolutions Inc. 834 62.37 50.07 52,013 41,758 0.8 0.0
ICU Medical, Inc. 607 181.26 233.38 110,027 141,662 2.7 0.0
Integra LifeSciences Holdings Corporation 1,822 45.37 68.48 82,665 124,771 2.4 0.0
Mesa Laboratories, Inc. 253 203.92 302.36 51,593 76,497 1.5 0.2
National Research Corporation 1,245 49.32 42.17 61,407 52,502 1.0 0.0
Patterson Companies Incorporated 1,325 33.72 30.14 44,676 39,936 0.8 3.5
Source: Blackrock Aladdin and Atlanta Capital
18
Portfolio Appraisal – Asset StatementCity of Pasadena Fire and Police Retirement System
SharesCost/
Share ($)Market/Share ($)
Total Cost ($)
TotalMarket ($)
PortWhtg (%)
Current Yield (%)
ASSET STATEMENT as of 09/30/21
Equities
Health Care
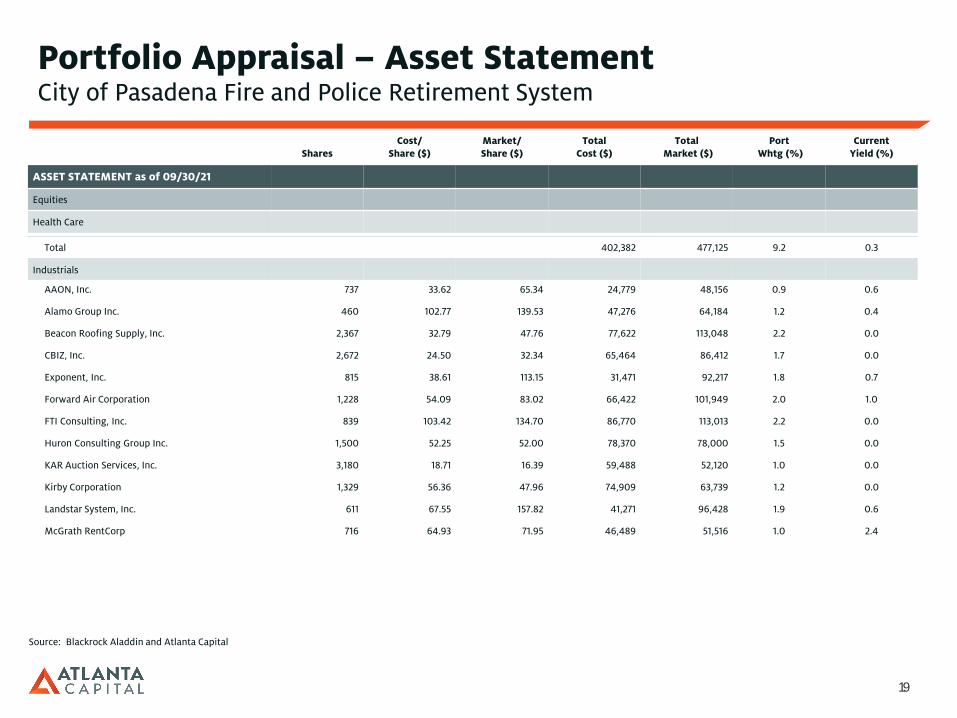
Total 402,382 477,125 9.2 0.3
Industrials
AAON, Inc. 737 33.62 65.34 24,779 48,156 0.9 0.6
Alamo Group Inc. 460 102.77 139.53 47,276 64,184 1.2 0.4
Beacon Roofing Supply, Inc. 2,367 32.79 47.76 77,622 113,048 2.2 0.0
CBIZ, Inc. 2,672 24.50 32.34 65,464 86,412 1.7 0.0
Exponent, Inc. 815 38.61 113.15 31,471 92,217 1.8 0.7
Forward Air Corporation 1,228 54.09 83.02 66,422 101,949 2.0 1.0
FTI Consulting, Inc. 839 103.42 134.70 86,770 113,013 2.2 0.0
Huron Consulting Group Inc. 1,500 52.25 52.00 78,370 78,000 1.5 0.0
KAR Auction Services, Inc. 3,180 18.71 16.39 59,488 52,120 1.0 0.0
Kirby Corporation 1,329 56.36 47.96 74,909 63,739 1.2 0.0
Landstar System, Inc. 611 67.55 157.82 41,271 96,428 1.9 0.6
McGrath RentCorp 716 64.93 71.95 46,489 51,516 1.0 2.4
Source: Blackrock Aladdin and Atlanta Capital
19

Portfolio Appraisal – Asset StatementCity of Pasadena Fire and Police Retirement System
SharesCost/
Share ($)Market/Share ($)
Total Cost ($)
TotalMarket ($)
PortWhtg (%)
Current Yield (%)
ASSET STATEMENT as of 09/30/21
Equities
Industrials
Moog Inc. Class A 1,405 63.96 76.23 89,871 107,103 2.1 1.3
Raven Industries, Inc. 930 22.19 57.61 20,633 53,577 1.0 0.0
Simpson Manufacturing Co., Inc. 724 72.70 106.97 52,637 77,446 1.5 0.9
UniFirst Corporation 463 145.47 212.62 67,354 98,443 1.9 0.5
US Ecology, Inc. 1,300 40.18 32.35 52,236 42,055 0.8 0.0
Total 983,062 1,339,407 25.9 0.5
Information Technology
ACI Worldwide, Inc. 2,286 31.43 30.73 71,855 70,249 1.4 0.0
Blackbaud, Inc. 1,527 36.77 70.35 56,143 107,424 2.1 0.0
Cass Information Systems, Inc. 1,234 37.89 41.85 46,762 51,643 1.0 2.6
CommVault Systems, Inc. 737 76.03 75.31 56,037 55,503 1.1 0.0
Envestnet, Inc. 1,448 57.99 80.24 83,965 116,188 2.3 0.0
ePlus inc. 701 82.94 102.61 58,140 71,930 1.4 0.0
Insight Enterprises, Inc. 569 98.77 90.08 56,202 51,256 1.0 0.0
Source: Blackrock Aladdin and Atlanta Capital
20

Portfolio Appraisal – Asset StatementCity of Pasadena Fire and Police Retirement System
SharesCost/
Share ($)Market/Share ($)
Total Cost ($)
TotalMarket ($)
PortWhtg (%)
Current Yield (%)
ASSET STATEMENT as of 09/30/21
Equities
Information Technology
National Instruments Corporation 1,982 32.99 39.23 65,394 77,754 1.5 2.8
Perficient, Inc. 550 69.26 115.70 38,093 63,635 1.2 0.0
Power Integrations, Inc. 978 40.04 98.99 39,159 96,812 1.9 0.5
Qualys, Inc. 1,150 93.41 111.29 107,417 127,984 2.5 0.0
Rogers Corporation 272 202.47 186.48 55,071 50,723 1.0 0.0
Total 734,239 941,099 18.2 0.4
Materials
Balchem Corporation 363 75.72 145.07 27,488 52,660 1.0 0.4
H.B. Fuller Company 818 68.00 64.56 55,626 52,810 1.0 1.0
Silgan Holdings Inc. 2,054 31.09 38.36 63,858 78,791 1.5 1.5
Stepan Company 451 59.00 112.94 26,611 50,936 1.0 1.1
Total 173,583 235,198 4.5 1.0
Total Equities 3,696,845 4,985,501 96.3 0.8
Cash 187,575 187,575 3.7 0.0
Total Investments 3,884,420 5,173,076 100.0 0.8
Accrued Dividends 1,406
Total Portfolio 5,174,482
Source: Blackrock Aladdin and Atlanta Capital
21

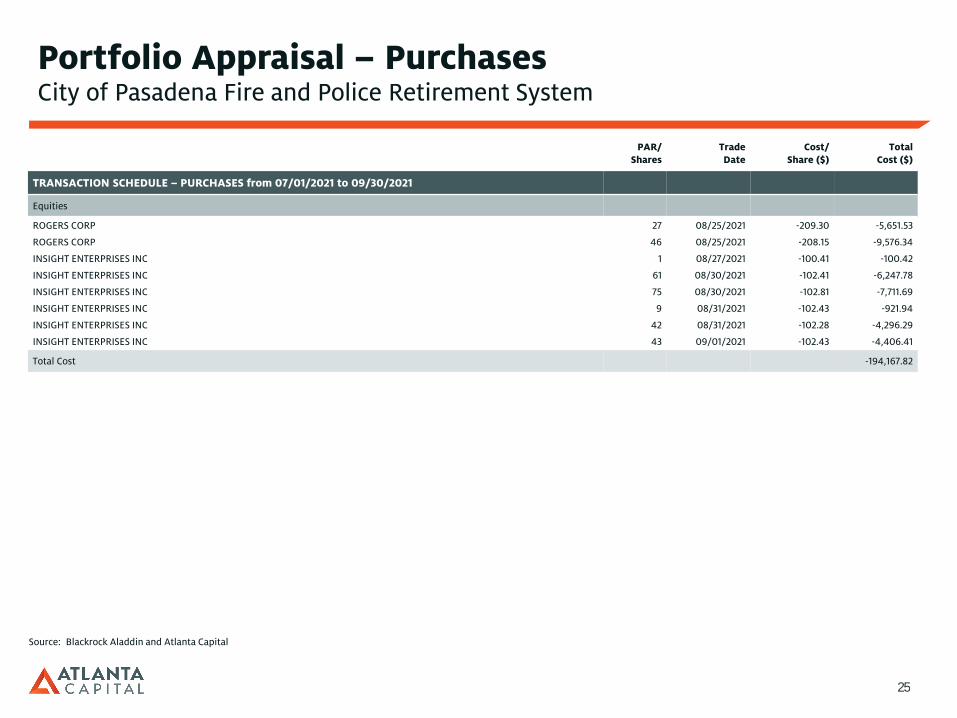
Portfolio Appraisal – PurchasesCity of Pasadena Fire and Police Retirement System
PAR/Shares
Trade Date
Cost/Share ($)
Total Cost ($)
TRANSACTION SCHEDULE – PURCHASES from 07/01/2021 to 09/30/2021
Equities
NATIONAL RESEARCH CORP 1 07/01/2021 -46.46 -46.47
NATIONAL RESEARCH CORP 5 07/02/2021 -47.33 -236.72
NATIONAL RESEARCH CORP 5 07/06/2021 -47.11 -235.61
NATIONAL RESEARCH CORP 16 07/07/2021 -47.28 -756.61
NATIONAL RESEARCH CORP 7 07/08/2021 -46.95 -328.72
NATIONAL RESEARCH CORP 14 07/09/2021 -47.84 -669.94
NATIONAL RESEARCH CORP 1 07/12/2021 -48.05 -48.06
NATIONAL RESEARCH CORP 8 07/13/2021 -48.77 -390.20
NATIONAL RESEARCH CORP 18 07/14/2021 -49.25 -886.97
NATIONAL RESEARCH CORP 8 07/15/2021 -49.82 -398.77
NATIONAL RESEARCH CORP 17 07/16/2021 -50.70 -862.41
NATIONAL RESEARCH CORP 14 07/19/2021 -50.12 -702.03
NATIONAL RESEARCH CORP 21 07/20/2021 -51.22 -1,076.16
NATIONAL RESEARCH CORP 9 07/21/2021 -51.51 -463.85
NATIONAL RESEARCH CORP 10 07/22/2021 -51.08 -510.94
NATIONAL RESEARCH CORP 20 07/22/2021 -51.50 -1,030.25
NATIONAL RESEARCH CORP 9 07/23/2021 -51.99 -468.14
NATIONAL RESEARCH CORP 12 07/26/2021 -52.31 -628.07
NATIONAL RESEARCH CORP 18 07/27/2021 -52.25 -941.09
Source: Blackrock Aladdin and Atlanta Capital
22

Portfolio Appraisal – PurchasesCity of Pasadena Fire and Police Retirement System
PAR/Shares
Trade Date
Cost/Share ($)
Total Cost ($)
TRANSACTION SCHEDULE – PURCHASES from 07/01/2021 to 09/30/2021
Equities
NATIONAL RESEARCH CORP 7 07/29/2021 -52.22 -365.76
NATIONAL RESEARCH CORP 14 08/02/2021 -53.06 -743.22
NATIONAL RESEARCH CORP 12 08/04/2021 -52.85 -634.59
NATIONAL RESEARCH CORP 13 08/05/2021 -52.92 -688.41
NATIONAL RESEARCH CORP 8 08/06/2021 -53.20 -425.82
NATIONAL RESEARCH CORP 16 08/10/2021 -53.48 -856.23
BEACON ROOFING SUPPLY INC 171 08/11/2021 -52.74 -9,021.02
FORWARD AIR CORP 85 08/11/2021 -90.29 -7,675.50
NATIONAL RESEARCH CORP 9 08/11/2021 -53.31 -480.06
WOLVERINE WORLD WIDE INC 116 08/11/2021 -37.06 -4,299.93
ICU MEDICAL INC 39 08/12/2021 -191.54 -7,470.75
ICU MEDICAL INC 58 08/12/2021 -191.18 -11,089.47
INSIGHT ENTERPRISES INC 10 08/12/2021 -96.50 -965.20
INSIGHT ENTERPRISES INC 11 08/12/2021 -97.06 -1,067.76
POWER INTEGRATIONS INC 58 08/12/2021 -97.72 -5,668.05
QUALYS INC 13 08/12/2021 -110.28 -1,434.13
QUALYS INC 65 08/12/2021 -107.66 -6,998.71
ROGERS CORP 23 08/12/2021 -200.40 -4,609.53
WOLVERINE WORLD WIDE INC 387 08/12/2021 -37.10 -14,361.65
Source: Blackrock Aladdin and Atlanta Capital
23

Portfolio Appraisal – PurchasesCity of Pasadena Fire and Police Retirement System
PAR/Shares
Trade Date
Cost/Share ($)
Total Cost ($)
TRANSACTION SCHEDULE – PURCHASES from 07/01/2021 to 09/30/2021
Equities
INSIGHT ENTERPRISES INC 44 08/13/2021 -97.14 -4,274.54
ROGERS CORP 35 08/13/2021 -200.23 -7,008.52
INSIGHT ENTERPRISES INC 40 08/16/2021 -97.67 -3,907.07
ROGERS CORP 44 08/16/2021 -198.23 -8,722.77
INSIGHT ENTERPRISES INC 12 08/17/2021 -95.98 -1,151.94
INSIGHT ENTERPRISES INC 75 08/18/2021 -96.10 -7,208.34
ROGERS CORP 5 08/18/2021 -198.42 -992.14
INSIGHT ENTERPRISES INC 23 08/19/2021 -94.52 -2,174.30
INSIGHT ENTERPRISES INC 36 08/19/2021 -94.14 -3,389.67
ROGERS CORP 4 08/19/2021 -195.78 -783.16
ROGERS CORP 18 08/19/2021 -195.53 -3,519.81
INSIGHT ENTERPRISES INC 26 08/20/2021 -96.13 -2,499.60
ROGERS CORP 8 08/20/2021 -196.55 -1,572.45
ROGERS CORP 12 08/20/2021 -197.91 -2,375.10
INSIGHT ENTERPRISES INC 31 08/23/2021 -96.07 -2,978.42
ROGERS CORP 7 08/23/2021 -202.16 -1,415.34
INSIGHT ENTERPRISES INC 21 08/24/2021 -96.25 -2,021.42
ROGERS CORP 43 08/24/2021 -205.66 -8,844.53
INSIGHT ENTERPRISES INC 9 08/25/2021 -97.71 -879.50
Source: Blackrock Aladdin and Atlanta Capital
24
Portfolio Appraisal – PurchasesCity of Pasadena Fire and Police Retirement System
PAR/Shares
Trade Date
Cost/Share ($)
Total Cost ($)
TRANSACTION SCHEDULE – PURCHASES from 07/01/2021 to 09/30/2021
Equities
ROGERS CORP 27 08/25/2021 -209.30 -5,651.53
ROGERS CORP 46 08/25/2021 -208.15 -9,576.34
INSIGHT ENTERPRISES INC 1 08/27/2021 -100.41 -100.42
INSIGHT ENTERPRISES INC 61 08/30/2021 -102.41 -6,247.78
INSIGHT ENTERPRISES INC 75 08/30/2021 -102.81 -7,711.69
INSIGHT ENTERPRISES INC 9 08/31/2021 -102.43 -921.94
INSIGHT ENTERPRISES INC 42 08/31/2021 -102.28 -4,296.29
INSIGHT ENTERPRISES INC 43 09/01/2021 -102.43 -4,406.41
Total Cost -194,167.82
Source: Blackrock Aladdin and Atlanta Capital
25

Portfolio Appraisal – SalesCity of Pasadena Fire and Police Retirement System
PAR/Shares
Trade Date
Cost/Share ($)
Total Cost ($)
Price/Share ($)
Total Proceeds ($)
Gain Loss ($)
TRANSACTION SCHEDULE – SALES from 07/01/2021 to 09/30/2021
Equities
DRIL QUIP INC 26 08/12/2021 46.24 1,202.24 26.90 698.93 -503.27
DRIL QUIP INC 79 08/12/2021 46.24 3,652.96 26.87 2,122.03 -1,530.82
DRIL QUIP INC 149 08/12/2021 46.24 6,889.76 26.92 4,007.74 -2,881.81
HOULIHAN LOKEY INC CLASS A 187 08/12/2021 52.67 9,849.29 88.07 16,467.34 6,617.84
PERFICIENT INC 142 08/12/2021 69.26 9,834.92 102.02 14,484.70 4,649.79
UNIVERSAL HEALTH REALTY INCOME TRU 18 08/12/2021 67.32 1,211.76 58.03 1,044.38 -167.45
DRIL QUIP INC 37 08/13/2021 46.24 1,710.88 26.73 988.26 -722.57
DRIL QUIP INC 51 08/13/2021 46.24 2,358.24 26.68 1,359.93 -998.24
DRIL QUIP INC 103 08/13/2021 46.24 4,762.72 26.57 2,735.68 -2,026.90
HOULIHAN LOKEY INC CLASS A 118 08/13/2021 52.67 6,215.06 88.46 10,433.55 4,218.35
UNIVERSAL HEALTH REALTY INCOME TRU 13 08/13/2021 67.32 875.16 57.27 744.38 -130.83
DRIL QUIP INC 30 08/16/2021 46.24 1,387.20 25.28 758.18 -628.98
UNIVERSAL HEALTH REALTY INCOME TRU 10 08/16/2021 67.32 673.20 57.35 573.40 -99.84
DRIL QUIP INC 18 08/17/2021 46.24 832.32 24.30 437.19 -395.11
UNIVERSAL HEALTH REALTY INCOME TRU 111 08/17/2021 67.32 7,472.52 57.31 6,360.79 -1,112.13
DRIL QUIP INC 31 08/18/2021 46.24 1,433.44 24.30 752.96 -680.44
UNIVERSAL HEALTH REALTY INCOME TRU 81 08/18/2021 67.32 5,452.92 57.95 4,693.20 -760.02
DRIL QUIP INC 18 08/19/2021 46.24 832.32 22.91 412.23 -420.07
DRIL QUIP INC 118 08/19/2021 46.24 5,456.32 22.91 2,701.00 -2,755.16
Source: Blackrock Aladdin and Atlanta Capital
26

Portfolio Appraisal – SalesCity of Pasadena Fire and Police Retirement System
PAR/Shares
Trade Date
Cost/Share ($)
Total Cost ($)
Price/Share ($)
Total Proceeds ($)
Gain Loss ($)
TRANSACTION SCHEDULE – SALES from 07/01/2021 to 09/30/2021
Equities
DRIL QUIP INC 247 08/19/2021 46.24 11,421.28 22.94 5,663.83 -5,757.11
UNIVERSAL HEALTH REALTY INCOME TRU 100 08/19/2021 67.32 6,732.00 58.52 5,850.71 -881.65
DRIL QUIP INC 95 08/20/2021 46.24 4,392.80 23.02 2,185.57 -2,207.10
UNIVERSAL HEALTH REALTY INCOME TRU 25 08/20/2021 67.32 1,683.00 59.00 1,474.76 -208.33
DRIL QUIP INC 23 08/23/2021 46.24 1,063.52 23.74 545.72 -517.77
DRIL QUIP INC 68 08/23/2021 46.24 3,144.32 23.70 1,610.67 -1,533.56
UNIVERSAL HEALTH REALTY INCOME TRU 37 08/23/2021 67.32 2,490.84 58.60 2,167.86 -323.11
DRIL QUIP INC 184 08/24/2021 46.24 8,508.16 24.18 4,446.33 -4,061.57
DRIL QUIP INC 197 08/24/2021 46.24 9,109.28 24.11 4,748.62 -4,360.39
UNIVERSAL HEALTH REALTY INCOME TRU 24 08/24/2021 67.32 1,615.68 58.88 1,412.93 -202.84
DRIL QUIP INC 103 08/25/2021 46.24 4,762.72 24.00 2,469.26 -2,293.32
UNIVERSAL HEALTH REALTY INCOME TRU 38 08/25/2021 67.32 2,558.16 59.22 2,249.96 -308.34
UNIVERSAL HEALTH REALTY INCOME TRU 23 08/27/2021 67.32 1,548.36 59.13 1,359.73 -188.71
UNIVERSAL HEALTH REALTY INCOME TRU 10 08/30/2021 67.32 673.20 59.01 589.99 -83.25
UNIVERSAL HEALTH REALTY INCOME TRU 9 08/31/2021 67.32 605.88 59.41 534.58 -71.33
UNIVERSAL HEALTH REALTY INCOME TRU 51 09/03/2021 67.32 3,433.32 57.90 2,950.66 -482.85
UNIVERSAL HEALTH REALTY INCOME TRU 32 09/07/2021 67.32 2,154.24 56.84 1,817.57 -336.79
UNIVERSAL HEALTH REALTY INCOME TRU 61 09/08/2021 67.32 4,106.52 55.78 3,400.17 -706.57
UNIVERSAL HEALTH REALTY INCOME TRU 143 09/08/2021 67.32 9,626.76 55.57 7,944.54 -1,682.74
Source: Blackrock Aladdin and Atlanta Capital
27

Portfolio Appraisal – SalesCity of Pasadena Fire and Police Retirement System
PAR/Shares
Trade Date
Cost/Share ($)
Total Cost ($)
Price/Share ($)
Total Proceeds ($)
Gain Loss ($)
TRANSACTION SCHEDULE – SALES from 07/01/2021 to 09/30/2021
Equities
UNIVERSAL HEALTH REALTY INCOME TRU 120 09/09/2021 67.32 8,078.40 56.74 6,804.36 -1,274.47
UNIVERSAL HEALTH REALTY INCOME TRU 149 09/10/2021 67.32 10,030.68 56.63 8,431.43 -1,599.79
EXPONENT INC 36 09/16/2021 38.61 1,389.96 115.98 4,174.92 2,784.79
EXPONENT INC 59 09/16/2021 38.61 2,277.99 116.51 6,872.79 4,594.52
YETI HOLDINGS INC 174 09/16/2021 47.16 8,205.84 101.00 17,566.29 9,359.81
EXPONENT INC 10 09/17/2021 38.62 386.20 115.62 1,155.96 769.81
EXPONENT INC 93 09/17/2021 38.61 3,590.73 114.70 10,663.36 7,072.19
BALCHEM CORP 87 09/27/2021 75.72 6,587.64 147.41 12,820.69 6,232.67
CHOICE HOTELS INTERNATIONAL INC 314 09/27/2021 66.03 20,733.42 128.69 40,395.89 19,663.73
HOULIHAN LOKEY INC CLASS A 161 09/27/2021 52.67 8,479.87 95.66 15,394.74 6,914.69
ICU MEDICAL INC 196 09/27/2021 181.26 35,526.96 242.71 47,563.60 12,035.87
MESA LABORATORIES INC 46 09/27/2021 203.92 9,380.32 316.41 14,552.94 5,172.40
PERFICIENT INC 145 09/27/2021 69.26 10,042.70 121.69 17,639.89 7,597.20
QUALYS INC 115 09/27/2021 93.41 10,742.15 116.18 13,356.36 2,614.62
RAVEN INDUSTRIES INC 481 09/27/2021 22.19 10,673.39 57.63 27,701.12 17,029.89
SIMPSON MANUFACTURING INC 109 09/27/2021 72.70 7,924.30 111.88 12,190.49 4,265.80
TECHTARGET INC 185 09/27/2021 56.12 10,382.20 88.51 16,366.47 5,984.85
Total 316,166.02 398,850.63 82,683.59
Source: Blackrock Aladdin and Atlanta Capital
28

Proxy Report
29

City of Pasadena Fire and Police Retirement SystemReporting Period: 07/01/2021 to 09/30/2021
Monro, Inc.Meeting Date: 08/17/2021 Record Date: 06/28/2021 Shares Voted: 1,090
Issue VoteProposal Number
Elect Director Frederick M. Danziger1.1 For
Elect Director Stephen C. McCluski1.2 For
Elect Director Robert E. Mellor1.3 For
Elect Director Peter J. Solomon1.4 For
Elect Director Michael T. Broderick2 For
Advisory Vote to Ratify Named Executive Officers' Compensation
3 For
Ratify PricewaterhouseCoopers LLP as Auditors4 For
5 Approve Recapitalization Plan for all Stock to Have One-vote per Share
For
Commvault Systems, Inc.Meeting Date: 08/19/2021 Record Date: 06/24/2021 Shares Voted: 737
Issue VoteProposal Number
1.1 Elect Director Sanjay Mirchandani For
Elect Director Vivie "YY" Lee1.2 For
Elect Director Keith Geeslin1.3 For
Ratify Ernst & Young LLP as Auditors2 For
Amend Omnibus Stock Plan3 For
4 Advisory Vote to Ratify Named Executive Officers' Compensation
For
Mesa Laboratories, Inc.Meeting Date: 08/27/2021 Record Date: 07/06/2021 Shares Voted: 299
Issue VoteProposal Number
1.1 Elect Director Jennifer S. Alltoft For
Elect Director Evan C. Guillemin1.2 For
Elect Director Shannon M. Hall1.3 For
Elect Director David M. Kelly1.4 For
Elect Director Gary M. Owens1.5 For
Elect Director John B. Schmieder1.6 For
Elect Director John J. Sullivan1.7 For
Advisory Vote to Ratify Named Executive Officers' Compensation
2 For
Ratify Plante & Moran, PLLC as Auditors3 For
4 Approve Omnibus Stock Plan For
Hamilton Lane IncorporatedMeeting Date: 09/02/2021 Record Date: 07/07/2021 Shares Voted: 636
Issue VoteProposal Number
1.1 Elect Director R. Vann Graves For
Elect Director Erik R. Hirsch1.2 Withhold
Elect Director Leslie F. Varon1.3 Withhold
Advisory Vote to Ratify Named Executive Officers' Compensation
2 For
3 Ratify Ernst & Young LLP as Auditors For
Patterson Companies, Inc.Meeting Date: 09/13/2021 Record Date: 07/16/2021 Shares Voted: 1,325
Issue VoteProposal Number
1a Elect Director John D. Buck For
Elect Director Alex N. Blanco1b For
Elect Director Jody H. Feragen1c For
Elect Director Robert C. Frenzel1d For
Elect Director Francis J. Malecha1e For
Elect Director Ellen A. Rudnick1f For
Elect Director Neil A. Schrimsher1g For
Elect Director Mark S. Walchirk1h For
Amend Omnibus Stock Plan2 For
Advisory Vote to Ratify Named Executive Officers' Compensation
3 For
4 Ratify Ernst & Young LLP as Auditors For
Raven Industries, Inc.Meeting Date: 09/15/2021 Record Date: 08/04/2021 Shares Voted: 1,411
Issue VoteProposal Number
1 Approve Merger Agreement For
Advisory Vote on Golden Parachutes2 Against
3 Adjourn Meeting For
30
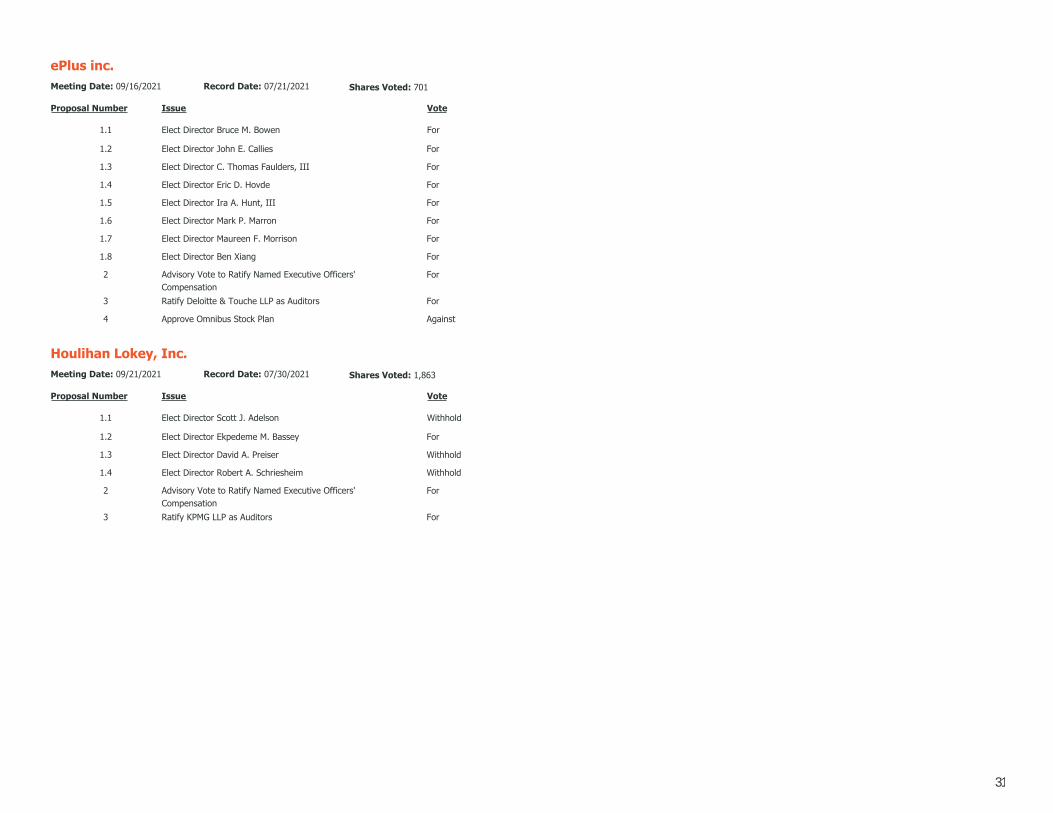
ePlus inc.Meeting Date: 09/16/2021 Record Date: 07/21/2021 Shares Voted: 701
Issue VoteProposal Number
1.1 Elect Director Bruce M. Bowen For
Elect Director John E. Callies1.2 For
Elect Director C. Thomas Faulders, III1.3 For
Elect Director Eric D. Hovde1.4 For
Elect Director Ira A. Hunt, III1.5 For
Elect Director Mark P. Marron1.6 For
Elect Director Maureen F. Morrison1.7 For
Elect Director Ben Xiang1.8 For
Advisory Vote to Ratify Named Executive Officers' Compensation
2 For
Ratify Deloitte & Touche LLP as Auditors3 For
4 Approve Omnibus Stock Plan Against
Houlihan Lokey, Inc.Meeting Date: 09/21/2021 Record Date: 07/30/2021 Shares Voted: 1,863
Issue VoteProposal Number
1.1 Elect Director Scott J. Adelson Withhold
Elect Director Ekpedeme M. Bassey1.2 For
Elect Director David A. Preiser1.3 Withhold
Elect Director Robert A. Schriesheim1.4 Withhold
Advisory Vote to Ratify Named Executive Officers' Compensation
2 For
Ratify KPMG LLP as Auditors3 For
31

For Financial Professionals/Institutional Clients only.
Founded in 1969, Atlanta Capital Management Company, LLC is an SEC-registered investment advisory firm that specializes in managing high quality stock and bond portfolios on behalf of institutional and individual investors. The Firm became a majority-owned subsidiary of Eaton Vance Corp. in 2001. On March 1, 2021, Eaton Vance and its affiliates which included Atlanta Capital Management became a part of Morgan Stanley Investment Management, a division of Morgan Stanley.
The firm continues to operate as Atlanta Capital Management Company, LLC and is located in Atlanta, Georgia. Atlanta Capital claims compliance with the Global Investment Performance Standards (GIPS®). Please contact the Performance Department at 404-876-9411 to request a complete list and descriptions of Atlanta Capital’s composites and/or a GIPS Report that adheres to the GIPS® standards.
This material is presented for informational and illustrative purposes only and should not be construed as investment advice, a recommendation to purchase or sell specific instruments, or to adopt any particular investment strategy. Opinions and estimates offered constitute our judgment and are subject to change without notice, as are statements of financial market trends, which are based on current market conditions. This material has been prepared on the basis of publicly available information, internally developed data and other third party sources believed to be reliable, however, no assurances are provided and Atlanta Capital has not sought to independently verify information taken from public and third party sources. Information contained in this material is current as of the date indicated and is subject to change at any time without notice. Please contact Atlanta Capital if you require further clarification on the source or calculation methodology of any data or information presented within this material. Future results may differ significantly from those stated, depending on factors such as changes in instruments or financial markets or general economic conditions. Investing entails risks and there can be no assurance that Atlanta Capital will achieve profits or avoid incurring losses. Atlanta Capital does not provide legal, tax and/or accounting advice or services. Clients should consult with their own tax or legal advisor prior to entering into any transaction or strategy described herein.
Specific securities, sectors and portfolio characteristics mentioned are included only to provide a snap-shot illustrative sample based upon the portfolio management team’s current investment strategy as of the date indicated. There is no assurance that any securities or portfolio characteristics mentioned in this document are currently held or will remain in the portfolio at the time you receive this report or that securities have not been sold or repurchased. The specific securities mentioned are not representative of all the securities purchased, sold or recommended for advisory clients. It should not be assumed that any of the securities/sectors were or will be profitable, or that any recommendations in the future will be profitable or will equal the performance of the listed securities. Actual portfolio holdings and performance will vary for each client. This is no guarantee that a particular client’s account will hold any, or all, of the securities/sectors mentioned.
Additional Important Information and Disclosures
NOT FDIC INSURED | OFFER NO BANK GUARANTEE | MAY LOSE VALUE | NOT INSURED BY ANY FEDERAL GOVERNMENT AGENCY | NOT A DEPOSIT
32

1OPINION AND ANALYSIS OF KEY ECONOMIC AND INVESTMENT ISSUES
Bill Hackney, CFA
October 12, 2021
I got my fi rst job in the investment business by sheer luck.
In the summer of 1974, during the severe recession and bear
market of 1973-1975, I took leave from the Marine Corps to
test the civilian job market. After pursuing a couple of dead
ends, I got a job interview with a bank in my home town
of Charlotte, North Carolina. As luck would have it, the
bank had two openings for investment analysts in its Trust
Division.
My resume for this position was a bit “thin.” While I had
a business degree from a major southern university, my
last four years had been spent as an infantry platoon
commander in southeast Asia and more recently as a guard
offi cer at the Charleston Naval Base—not exactly skills
that prepared one for analyzing company balance sheets
or picking stocks. In any event, perhaps because of pity or
patriotism, I got a job off er and resigned from active duty.
Upon arrival at my new job, I quickly recognized that I was
behind my peers both in terms of experience and credibility.
To overcome the credibility gap I decided to volunteer to
write my department’s monthly Economic and Investment
Review—an annoying, time consuming and tight deadline
task heretofore done by my boss, the Director of Research.
He was only too happy to give it up.
The rest, as they say, is history. For most of the next 45
years I have written an investment newsletter on a monthly
or quarterly basis. As I gradually grew into the task, I
developed several goals. First, I would write primarily for
the individual investor or layman, not the professional
investor. I wanted to reach a wide audience.
Second, I would strive to keep it interesting and
provocative. Analysis of economic and investment data with
charts and tables can be boring! Use of humor, anecdotes,
historical comparisons and psychology can provide more
compelling ways to illustrate points of view.
Third, I would strive to identify and discuss nonconsensus
ideas and the unintended consequences of government
and private sector actions. The national media does a more
than adequate job of covering consensus thinking, but
spends little time playing the devil’s advocate or digging
into unusual ways of interpreting the economic landscape. I
thought I could add value by bridging that gap.

2OPINION AND ANALYSIS OF KEY ECONOMIC AND INVESTMENT ISSUES
That said, what follows are a few “guiding principles”
I developed, by trial and error, over my 45 years in the
investment business. This is my last newsletter. I thought
now was an appropriate time to share them with you.
1. The US economy and stock market are related, but
not tightly correlated. Because of its large foreign sales
exposure, the global competitiveness of US multinational
companies and the large weighting in the technology,
health care and internet shares, the US stock market should
continue to outgrow the US economy over the long term.
Using the S&P 500 index as its proxy, the stock market is
more oriented toward manufacturing, foreign sales, large
and higher growth companies than the general economy.
About 40% of S&P 500 company sales are international
vs. 11% for the US economy. Slightly over 50% of the
stock market is represented by manufacturing companies
vs. about 12% for the economy. About 33% of the stock
market is represented by consumer spending sectors vs.
70% for the economy. And remember, the stock market is a
“generally reliable” leading indicator of economic activity.
Investors must be forward thinking because the S&P 500
usually turns down three to six months ahead of a peak in
economic activity and turns up several months in advance
of the worst of a recession.
2. The credit markets are the best leading indicator
of the stock market and the economy. While many
variables effect the stock market, if I had to pick one
variable to watch it would be the credit markets. The old
adage, “Don’t fight the Fed” means easy money is good
for stocks and tight money is bad. Free-market economies
have a natural tendency to grow as long as credit is
available to help finance that growth. But how do you tell
when conditions are getting too tight? One indicator that’s
worked exceptionally well over the years is the shape of
the Treasury yield curve, the relationship between short
and long-term interest rates. To measure this, take the
yield on three month Treasury bills compared to 10-year
Treasury notes. When the Federal Reserve drives T-bill
yields up to and above 10-year yields (thus creating a flat
or inverted yield curve), this is a signal to investors that
credit conditions are tight enough to eventually cause a
recession. Indeed, every recession in my lifetime has been
preceded by an inverted yield curve.
3. Don’t let your political beliefs interfere with your
investment decisions. On the few occasions I have
violated this rule, I have always regretted it. This year
provides a good example of why it is sometimes wise to
ignore politics and stick with the stock market: The S&P 500
index is up 16% for the past nine months, despite tough talk
by the Biden administration about sharply raising taxes on
capital gains and corporate profits. As an investor, it can be
better to ignore political rhetoric about policy issues until
those policies get closer to implementation.
4. Good investors need to be cyclical not linear
thinkers. While economic activity often plods along in
pretty much a linear fashion, stock prices gyrate up and
down based on investor pessimism or optimism about
the future (some call it fear and greed.) Sustained periods
of prosperity can create bubble-like conditions in the
equity markets as the linear thinkers extrapolate favorable
trends too far into the future. In the red hot real estate
market of 2006, I was surprised to learn that my former
employer, a major regional bank, had purchased a large
mortgage company and then followed that up in 2007 with
the purchase of a major regional brokerage firm. Didn’t
management realize that the Fed had been steadily raising
interest rates since 2004 and the yield curve had flattened
in 2005 as signs of speculation arose in the housing market?
Apparently not. The bank, a victim of linear thinking in the
executive suite, needed a bailout in 2008.
5. Don’t just do something, stand there! For an equity
investor, doing nothing can be a good strategy—particularly
during periods of financial crisis when stock prices have
already declined 20% or more. Take September 2008
around the fall of Lehman Brothers or March 2020 when the
credit markets seized up during the pandemic. Uncertain
times like these put tremendous psychological pressure
on investors to “do something” in reaction to the horrible
news of the day. As a result, investors usually sell at the
wrong time. But remember, in its 95-year history, the S&P
500 index has produced positive rates of return—price
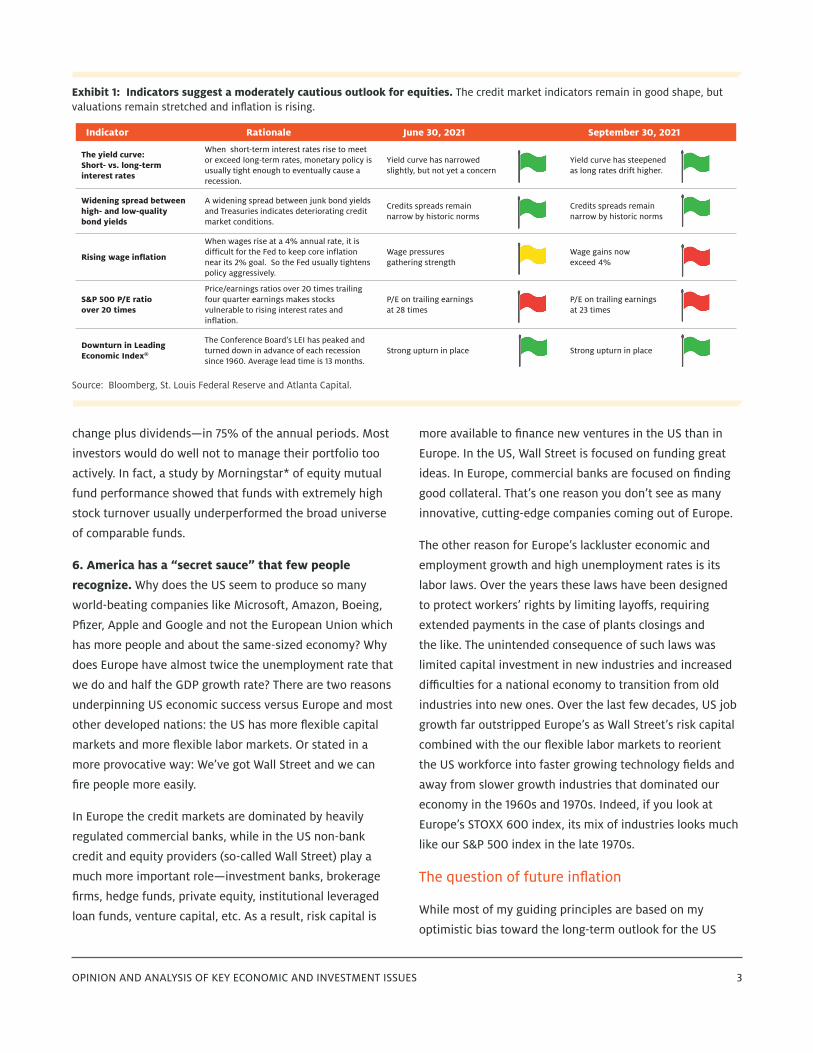
3OPINION AND ANALYSIS OF KEY ECONOMIC AND INVESTMENT ISSUES
change plus dividends—in 75% of the annual periods. Most
investors would do well not to manage their portfolio too
actively. In fact, a study by Morningstar* of equity mutual
fund performance showed that funds with extremely high
stock turnover usually underperformed the broad universe
of comparable funds.
6. America has a “secret sauce” that few people
recognize. Why does the US seem to produce so many
world-beating companies like Microsoft, Amazon, Boeing,
Pfizer, Apple and Google and not the European Union which
has more people and about the same-sized economy? Why
does Europe have almost twice the unemployment rate that
we do and half the GDP growth rate? There are two reasons
underpinning US economic success versus Europe and most
other developed nations: the US has more flexible capital
markets and more flexible labor markets. Or stated in a
more provocative way: We’ve got Wall Street and we can
fire people more easily.
In Europe the credit markets are dominated by heavily
regulated commercial banks, while in the US non-bank
credit and equity providers (so-called Wall Street) play a
much more important role—investment banks, brokerage
firms, hedge funds, private equity, institutional leveraged
loan funds, venture capital, etc. As a result, risk capital is
more available to finance new ventures in the US than in
Europe. In the US, Wall Street is focused on funding great
ideas. In Europe, commercial banks are focused on finding
good collateral. That’s one reason you don’t see as many
innovative, cutting-edge companies coming out of Europe.
The other reason for Europe’s lackluster economic and
employment growth and high unemployment rates is its
labor laws. Over the years these laws have been designed
to protect workers’ rights by limiting layoffs, requiring
extended payments in the case of plants closings and
the like. The unintended consequence of such laws was
limited capital investment in new industries and increased
difficulties for a national economy to transition from old
industries into new ones. Over the last few decades, US job
growth far outstripped Europe’s as Wall Street’s risk capital
combined with the our flexible labor markets to reorient
the US workforce into faster growing technology fields and
away from slower growth industries that dominated our
economy in the 1960s and 1970s. Indeed, if you look at
Europe’s STOXX 600 index, its mix of industries looks much
like our S&P 500 index in the late 1970s.
The question of future inflation
While most of my guiding principles are based on my
optimistic bias toward the long-term outlook for the US
Indicator Rationale June 30, 2021 September 30, 2021
The yield curve:Short- vs. long-term interest rates
When short-term interest rates rise to meet or exceed long-term rates, monetary policy is usually tight enough to eventually cause a recession.
Yield curve has narrowed slightly, but not yet a concern
Yield curve has steepened as long rates drift higher.
Widening spread between high- and low-qualitybond yields
A widening spread between junk bond yields and Treasuries indicates deteriorating credit market conditions.
Credits spreads remain narrow by historic norms
Credits spreads remain narrow by historic norms
Rising wage inflation
When wages rise at a 4% annual rate, it is difficult for the Fed to keep core inflation near its 2% goal. So the Fed usually tightens policy aggressively.
Wage pressuresgathering strength
Wage gains nowexceed 4%
S&P 500 P/E ratioover 20 times
Price/earnings ratios over 20 times trailing four quarter earnings makes stocks vulnerable to rising interest rates and inflation.
P/E on trailing earningsat 28 times
P/E on trailing earningsat 23 times
Downturn in Leading Economic Index®
The Conference Board’s LEI has peaked and turned down in advance of each recession since 1960. Average lead time is 13 months.
Strong upturn in place Strong upturn in place
Source: Bloomberg, St. Louis Federal Reserve and Atlanta Capital.
Exhibit 1: Indicators suggest a moderately cautious outlook for equities. The credit market indicators remain in good shape, but valuations remain stretched and inflation is rising.

4OPINION AND ANALYSIS OF KEY ECONOMIC AND INVESTMENT ISSUES
economy and its stock market, the near-term outlook for
both is becoming more uncertain.
The biggest question facing most investors at the moment
is whether the recent spike in inflation is transitory or more
permanent. The answer is crucial to determining how much
life is left in this bull market and economic expansion. Both
typically end when the Federal Reserve begins to fight rising
inflation with tighter monetary policy.
Currently inflation is running well above the Fed’s 2%
target. The headline consumer price index is 5.4%, while
the Fed’s preferred inflation measure—based on Personal
Consumption Expenditures, less food and energy—is
running at 3.6%. Our five market indicators at the top of
page 3 indicate that there’s still adequate liquidity in the
financial system, but wage inflation has just broken above
4%, an important and worrisome threshold.
Longer term, I believe that the four decade secular
decline in inflation is over because a number of powerful
countertrends are in place to pressure prices higher. The
trend toward globalization, which helped drive inflation
lower, is being reversed as the US and other countries
begin to re-shore the manufacture of essential goods like
semiconductors, antibiotics and medical supplies. Labor
supplies are already tight and will tighten further as birth
rates continue to fall across the globe. Even China, once
a source of cheap labor, now has a fertility rate below its
population replacement level. Many of the up-front costs
associated with fighting climate change and cybercrime
represent deadweight costs to the economy and are
inherently inflationary. In recent years both our fiscal and
monetary institutions have grown more comfortable with
providing ever-increasing amounts of stimulus to the
economy with ever-increasing amounts of government
borrowing.
Soon there will be an inflation piper to be paid.
Undoubtedly, some inflation indicators, like airline fares
and used car prices, can drop back from their transitory
spike caused by the economy reopening. But longer term,
inflation is likely to settle closer to 3% than 2%. Bond yields
should drift higher to reflect a more historically normal
premium to inflation.
In the meantime, thanks to a Fed who wants to keep short-
term rates near zero well into next year, this bull market
seems to be taking a long time to say goodbye. As for
me, I’ll be brief. Good luck. Godspeed. And goodbye. I’ve
enjoyed my years at Atlanta Capital and serving you as part
of a great investment team.
*Morningstar’s Fund Spy report titled, How Important is Turnover? By Russel Kinnel, August 6, 2012.
This material is presented for informational and illustrative purposes only and should not be construed as investment advice, a recommendation to purchase or sell specific securities, or to adopt any particular investment strategy. The opinions expressed herein are those of the author and do not necessarily reflect the views of other employees at Atlanta Capital Management. Any current investment views and opinions/analyses expressed constitute judgments as of the date of this material and are subject to change at any time without notice. Index and commodity changes are based on price-only percentage change. This material has been prepared on the basis of publicly available information, internally developed data, and other third party sources believed to be reliable. However, no assurances are provided regarding the reliability of such information and Atlanta Capital has not sought to independently verify information taken from public and third party sources. This material may contain statements that are not historical facts, referred to as forward-looking statements. Future results may differ significantly from those stated in forward-looking statements, depending on factors such as changes in securities or financial markets or general economic conditions.
Investing entails risks and there can be no assurance that any forecasts or opinions expressed in this material will be realized. It is not possible to directly invest in an index. Past performance does not predict future results.
Atlanta Capital Management Co., LLC | 1075 Peachtree Street NE, Suite 2100, Atlanta, Georgia 30309 | Tel: 404.876.9411 | atlcap.com
Editor’s Note: Mr. Hackney has retired from Atlanta Capital and is involved in real estate development and investments in the North Carolina mountains where he has a second home. He resides in Atlanta and Lake Toxaway, NC.

• International stocks lost ground, weighed down by rising inflation fears and signs of a slowdown in China’s economy. European stocksdeclined, notably exporters that rely on demand from China for industrial machinery, chemicals and luxury goods. Japanese stocks rallied,bolstered by a change in the country’s leadership and solid progress in the battle against COVID-19. Chinese equities tumbled ontightening regulatory policies. Overall, the MSCI ACWI ex-USA Index fell 3%.
• Eight of 11 sectors declined in the MSCI ACWI ex-USA Index. The consumer discretionary sector dropped 11%, with double-digit declinesfrom China’s internet-related platform companies and European luxury goods makers. The communications services sector lost 10%, andthe real estate sector fell 6%. By contrast, energy stocks gained 7%. Oil giants BP, Royal Dutch Shell and Total enjoyed strong gains as oilprices climbed higher. Financials rose 1%, led by gains from banks in Europe, Australia and Japan. Overall, small-cap stocks outpaced thebroader index.
• European stocks ended the quarter essentially flat amid investor worries about sharply higher inflation in the 19-member eurozone.Concerns about China’s slowing economy also weighed on European exporters, which depend heavily on Chinese demand for industrialmachinery, chemicals and luxury goods. Overall, European stocks rose 0.5% in local currency terms while declining 1.6% in U.S. dollarterms (MSCI Europe Index).
• Japanese stocks rallied late in the quarter amid a change in the country’s leadership and solid progress in the battle against COVID-19.Financial and technology stocks powered the market higher, while the communication services and utilities sectors lost ground. The MSCIJapan Index rose 5% and the MSCI Pacific ex Japan Index fell 4%. The Japanese yen dipped 0.5% against the U.S. dollar.
• In foreign exchange markets, the U.S. dollar rose against major currencies and almost all emerging market currencies. The dollar gained2.3% against the euro and 2.5% against the British pound sterling. It rose modestly against the Japanese yen. The dollar finished flatagainst the Chinese renminbi.
3Q 2021 EuroPacific Growth Fund® quarterly attribution report
As of September 30, 2021
Investments are not FDIC-insured, nor are they deposits of or guaranteed by a bank or any other entity, so they may lose value.For institutional investors and financial professionals only. Not for use with the public.© 2021 Capital Group. All rights reserved.
Market index returns (net of dividends) Cumulative Average annualFor periods ended September 30, 2021 (%) 3 month YTD 1 year 3 years 5 years 10 years
MSCI All Country World Index (ACWI) –1.05 11.12 27.44 12.58 13.20 11.90
MSCI All Country World Index (ACWI) ex USA –2.99 5.90 23.92 8.03 8.94 7.48
MSCI World Index –0.01 13.04 28.82 13.14 13.74 12.68
MSCI EAFE (Europe, Australasia, Far East) Index –0.45 8.35 25.73 7.62 8.81 8.10
MSCI Emerging Markets Index –8.09 –1.25 18.20 8.58 9.23 6.09
Standard & Poor's 500 Composite Index 0.58 15.92 30.00 15.99 16.90 16.63
Market overview

EuroPacific Growth Fund
Results
2
Returns (%) Cumulative Average annual
Expense ratioFor periods ended September 30, 2021 3 months YTD 1 year 3 years 5 years 10 years Lifetime
EuroPacific Growth Fund R-6 –2.35 4.01 24.76 13.21 12.17 10.63 11.18 0.46
EuroPacific Growth Fund F-3 –2.33 4.02 24.79 13.21 12.17 10.63 11.23 0.46
EuroPacific Growth Fund F-2 –2.37 3.94 24.64 13.09 12.05 10.52 11.07 0.57
Historical Benchmarks Index* –2.99 5.90 23.92 8.03 8.94 7.48 8.35 —
MSCI All Country World Index (ACWI) ex USA** –2.99 5.90 23.92 8.03 8.94 7.48 n/a —
Morningstar Foreign Large Growth Category Average –1.52 5.36 20.30 13.07 12.18 10.50 8.19 —
Lipper International Funds Average –1.82 7.12 24.21 8.66 9.06 8.32 8.77 —
Fund Inception: April 16, 1984
Figures shown are past results for Classes F-2, F-3 and R-6 shares and are not predictive of results in future periods. Current and future results may be lower or higher than those shown. Prices and returns will vary, so investors may lose money. Returns shown at net asset value (NAV) have all distributions reinvested. Investing for short periods makes losses more likely. For current information and month-end results, visit capitalgroup.com.
*Returns reflect results of the fund‘s current and former benchmark indexes: MSCI All Country World ex USA Index, April 2007–present; MSCI EAFE Index, fund inception–March 2007. Results reflect net dividends.**Results reflect gross dividends through December 31, 2000 and net dividends thereafter.We offer a range of share classes designed to meet the needs of retirement plan sponsors and participants. The different share classes incorporate varying levels of advisor compensation and service provider payments. Because Class R-6 shares do not include any recordkeeping payments, expenses are lower and results are higher. Other share classes that include recordkeeping costs have higher expenses and lower results than Class R-6.Investment results assume all distributions are reinvested and reflect applicable fees and expenses. When applicable, investment results reflect fee waivers and/or expense reimbursements, without which results would have been lower. Please see capitalgroup.com for more information. Certain share classes were offered after the inception dates of some funds. Results for these share classes prior to the dates of first sale are hypothetical based on the results of the original share class of the fund without a sales charge, adjusted for typical estimated expenses. (Inception date: Class F-2, August 1, 2008; Class F-3, January 27, 2017; Class R-6, May 1, 2009.) Results for certain funds with an inception date after the share class inception also include hypothetical returns because those funds' shares sold after the funds' date of first offering. Please see capitalgroup.com for more information on specific expense adjustments and the actual dates of first sale. The expense ratios are as of each fund's prospectus available at the time of publication.Market indexes are unmanaged and, therefore, have no expenses. Investors cannot invest directly in an index. There have been periods when the fund has lagged the index.Although our portfolios are compared to their benchmarks, portfolio managers manage them to be consistent with their investment objectives.Investing outside the United States involves risks, such as currency fluctuations, periods of illiquidity and price volatility, as more fully described in the prospectus. These risks may be heightened in connection with investments in developing countries.
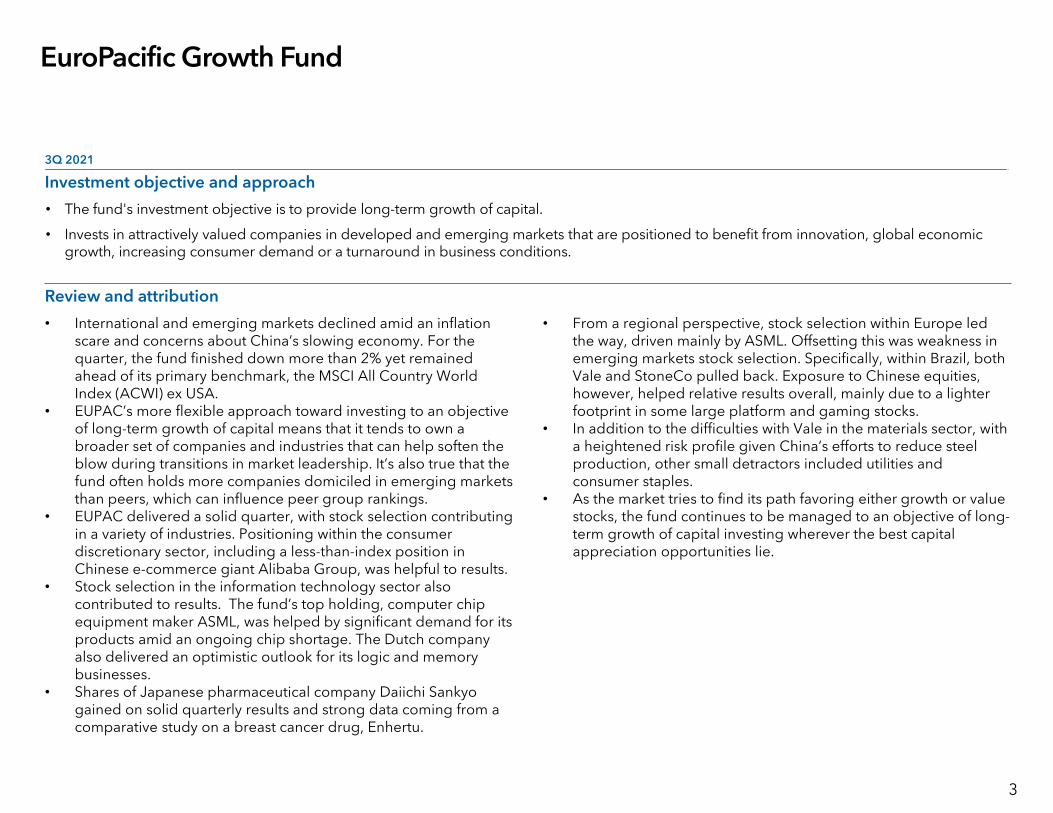
EuroPacific Growth Fund
3Q 2021
Investment objective and approach
• The fund's investment objective is to provide long-term growth of capital.
• Invests in attractively valued companies in developed and emerging markets that are positioned to benefit from innovation, global economic growth, increasing consumer demand or a turnaround in business conditions.
Review and attribution
• International and emerging markets declined amid an inflation scare and concerns about China’s slowing economy. For the quarter, the fund finished down more than 2% yet remained ahead of its primary benchmark, the MSCI All Country World Index (ACWI) ex USA.
• EUPAC’s more flexible approach toward investing to an objective of long-term growth of capital means that it tends to own a broader set of companies and industries that can help soften the blow during transitions in market leadership. It’s also true that the fund often holds more companies domiciled in emerging markets than peers, which can influence peer group rankings.
• EUPAC delivered a solid quarter, with stock selection contributing in a variety of industries. Positioning within the consumer discretionary sector, including a less-than-index position in Chinese e-commerce giant Alibaba Group, was helpful to results.
• Stock selection in the information technology sector also contributed to results. The fund’s top holding, computer chip equipment maker ASML, was helped by significant demand for its products amid an ongoing chip shortage. The Dutch company also delivered an optimistic outlook for its logic and memory businesses.
• Shares of Japanese pharmaceutical company Daiichi Sankyo gained on solid quarterly results and strong data coming from a comparative study on a breast cancer drug, Enhertu.
• From a regional perspective, stock selection within Europe led the way, driven mainly by ASML. Offsetting this was weakness in emerging markets stock selection. Specifically, within Brazil, both Vale and StoneCo pulled back. Exposure to Chinese equities, however, helped relative results overall, mainly due to a lighter footprint in some large platform and gaming stocks.
• In addition to the difficulties with Vale in the materials sector, with a heightened risk profile given China’s efforts to reduce steel production, other small detractors included utilities and consumer staples.
• As the market tries to find its path favoring either growth or value stocks, the fund continues to be managed to an objective of long-term growth of capital investing wherever the best capital appreciation opportunities lie.
3

EuroPacific Growth Fund
Review and attribution — Year to date
• International and emerging markets delivered positive returns on a year-to-date basis despite investor concerns about rising inflation, higher interest rates and the path of a COVID-19 recovery. EuroPacific Growth, within that context, finished up 4% overall, about 2% behind its primary benchmark, the ACWI ex USA. The fund narrowed the gap somewhat in the latest quarter.
• The largest detractor was stock selection in the financials sector. The fund held fewer positions than the universe while also experiencing weakness in Indian banks and stock exchanges, which pulled back after a big run amid lower volatility in markets.
• Health care stocks, in particular the fund’s Japanese pharmaceutical holdings, detracted from results as they were held back by weak markets in Japan and selling pressure. Japan was the top detractor year to date from a regional perspective.
• Strength in ASML helped stock selection in the information technology sector. In addition, Sea Ltd., in the communication services sector, continued to show gains in both gaming and e-commerce.
• Among the top contributors for the year-to-date period were two companies in the energy sector, Reliance Industries and Canadian Natural Resources, with each benefiting from the sector’s leading returns.
• From a regional perspective, while Japan was a detractor, the top contributors were domiciled in the Netherlands and Singapore
respectively, driven by ASML and Sea Ltd.• Within emerging markets, China has led the way, mainly with the
fund having lighter exposure to areas experiencing the pressure of recent regulatory changes. Offsetting that, though, has been weakness in Brazil, where digital payment stocks and stock exchanges have come under pressure.
4

EuroPacific Growth Fund vs. MSCI All Country World Index (ACWI) ex USA — Quarter to date
5
Data as of September 30, 2021, and is preliminary.*Average position for time period; portfolio holdings change.EuroPacific Growth Fund vs. MSCI All Country World Index (ACWI) ex USA with net dividends reinvested.Source: MSCI. MSCI has not approved, reviewed or produced this report, makes no express or implied warranties or representations and is not liable whatsoever for any data in the report. You may not redistribute the MSCI data or use it as a basis for other indices or investment products. Cash includes short-term securities, accrued income and other assets less liabilities as well as currencies. It may also include investments in money market or similar funds managed by the investment adviser or its affiliates that are not offered to the public.See attribution methodology disclosure for additional information.
Attribution summary (relative)
Largest contributors (%) Portfolioweight*
Active weight
Stockreturn
Relative contribution
Alibaba Group Holding Ltd. 0.14 –1.15 –35.52 0.46
ISR: Reliance Industries Limited 2.39 2.07 20.06 0.45
Sea Ltd. (Singapore) Sponsored ADR Class A 2.13 2.09 16.07 0.36
ASML Holding NV 3.83 2.63 8.94 0.28
Daiichi Sankyo Company, Limited 1.15 1.01 24.35 0.26
MercadoLibre, Inc. 2.31 2.31 7.81 0.22
Keyence Corporation 1.40 0.98 19.03 0.19
ISR: HDFC Bank Limited 1.75 1.75 0.26 0.14
Sartorius AG Pref 0.71 0.65 22.39 0.14
KOTAK MAHINDRA BANK LTD - - KTKM1 0.88 0.88 17.73 0.13
Country (%) Portfolioweight*
Active weight
Countryselection
Security selection
Relative contribution
India 7.05 3.74 0.47 0.12 0.66
Netherlands 7.19 4.23 0.27 0.15 0.40
South Korea 0.62 –3.28 0.25 0.01 0.37
Singapore 2.27 1.58 0.04 0.27 0.35
United States 3.63 3.63 0.00 0.24 0.30
Brazil 5.96 4.46 –0.56 –0.63 –1.20
Hong Kong 3.44 1.44 –0.11 –0.11 –0.20
Canada 4.73 –2.31 –0.03 –0.15 –0.11
Saudi Arabia 0.00 –0.92 –0.08 0.00 –0.10
Taiwan 2.96 –1.39 0.01 –0.03 –0.04
Sector (%) Portfolioweight*
Active weight
Sectorselection
Security selection
Relative contribution
Consumer discretionary 13.77 0.67 –0.05 0.72 0.67
Information technology 19.42 6.14 0.11 0.48 0.59
Health care 11.84 2.34 0.03 0.39 0.42
Communication services 5.99 –0.37 0.02 0.24 0.27
Energy 5.29 0.82 0.08 0.07 0.16
Industrials 10.08 –2.04 –0.07 0.23 0.15
Real estate 0.40 –2.12 0.06 –0.06 0.00
Financials 14.91 –3.87 –0.16 0.13 –0.03
Consumer staples 4.43 –4.09 0.02 –0.13 –0.11
Utilities 2.31 –0.70 0.02 –0.18 –0.16
Materials 7.59 –0.77 0.04 –0.83 –0.79
Cash 3.98 3.98 0.12 0.00 0.12
Largest detractors (%) Portfolioweight*
Active weight
Stockreturn
Relative contribution
ISR: Vale S.A. 2.65 2.37 –31.99 –0.78
ISR: Bilibili, Inc. Class Z 0.46 0.41 –46.64 –0.26
StoneCo Ltd. Class A 0.38 0.38 –48.23 –0.23 KUAISHOU TECHNOLOGY B 144A (CORNERSTONE) (180 DAYS LOCKUP)
0.09 0.09 –56.70 –0.14
Futu Holdings Ltd. Sponsored ADR Class A 0.21 0.19 –49.18 –0.12
Wuxi Biologics (Cayman) Inc. 1.42 1.22 –11.32 –0.11
Kweichow Moutai Co., Ltd. Class A 0.87 0.80 –11.03 –0.09
First Quantum Minerals Ltd. 0.51 0.47 –19.76 –0.09
ISR: Royal Dutch Shell Plc Class A 0.06 –0.51 14.62 –0.09
ASOS plc 0.17 0.17 –40.93 –0.08
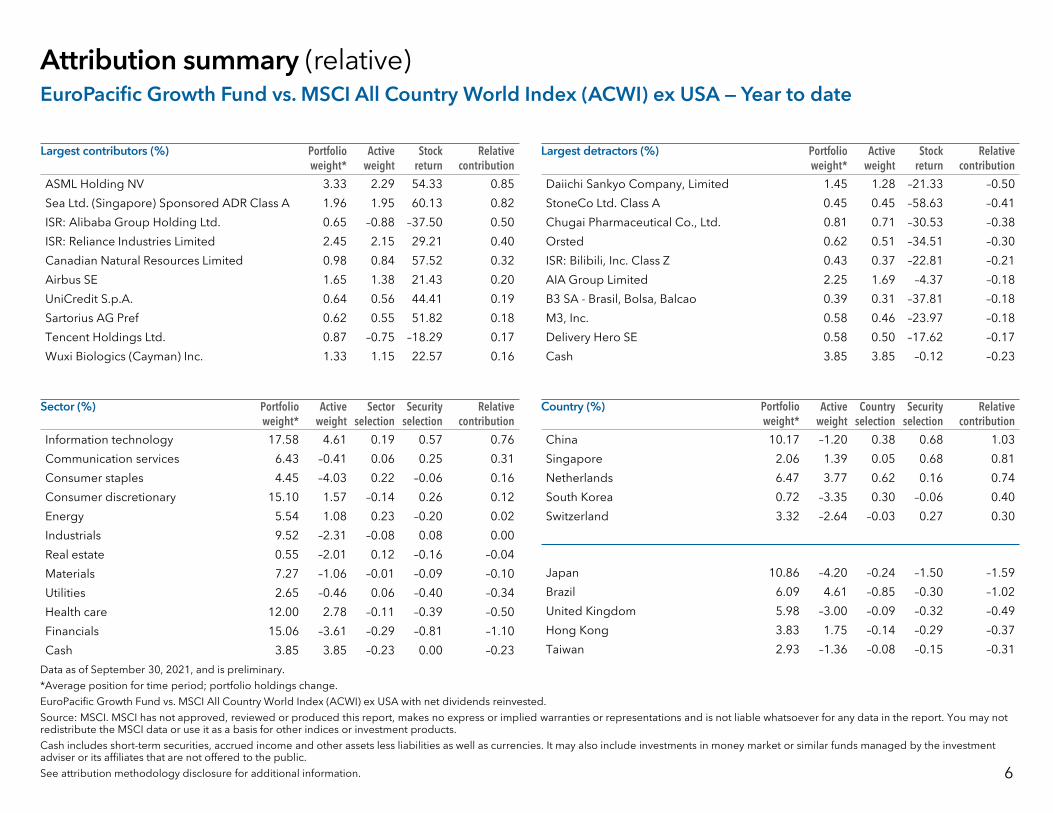
6
EuroPacific Growth Fund vs. MSCI All Country World Index (ACWI) ex USA — Year to date
Data as of September 30, 2021, and is preliminary.
*Average position for time period; portfolio holdings change.
EuroPacific Growth Fund vs. MSCI All Country World Index (ACWI) ex USA with net dividends reinvested.
Source: MSCI. MSCI has not approved, reviewed or produced this report, makes no express or implied warranties or representations and is not liable whatsoever for any data in the report. You may not redistribute the MSCI data or use it as a basis for other indices or investment products.
Cash includes short-term securities, accrued income and other assets less liabilities as well as currencies. It may also include investments in money market or similar funds managed by the investment adviser or its affiliates that are not offered to the public.
See attribution methodology disclosure for additional information.
Attribution summary (relative)
Largest contributors (%) Portfolioweight*
Active weight
Stockreturn
Relative contribution
ASML Holding NV 3.33 2.29 54.33 0.85
Sea Ltd. (Singapore) Sponsored ADR Class A 1.96 1.95 60.13 0.82
ISR: Alibaba Group Holding Ltd. 0.65 –0.88 –37.50 0.50
ISR: Reliance Industries Limited 2.45 2.15 29.21 0.40
Canadian Natural Resources Limited 0.98 0.84 57.52 0.32
Airbus SE 1.65 1.38 21.43 0.20
UniCredit S.p.A. 0.64 0.56 44.41 0.19
Sartorius AG Pref 0.62 0.55 51.82 0.18
Tencent Holdings Ltd. 0.87 –0.75 –18.29 0.17
Wuxi Biologics (Cayman) Inc. 1.33 1.15 22.57 0.16
Country (%) Portfolioweight*
Active weight
Countryselection
Security selection
Relative contribution
China 10.17 –1.20 0.38 0.68 1.03
Singapore 2.06 1.39 0.05 0.68 0.81
Netherlands 6.47 3.77 0.62 0.16 0.74
South Korea 0.72 –3.35 0.30 –0.06 0.40
Switzerland 3.32 –2.64 –0.03 0.27 0.30
Japan 10.86 –4.20 –0.24 –1.50 –1.59
Brazil 6.09 4.61 –0.85 –0.30 –1.02
United Kingdom 5.98 –3.00 –0.09 –0.32 –0.49
Hong Kong 3.83 1.75 –0.14 –0.29 –0.37
Taiwan 2.93 –1.36 –0.08 –0.15 –0.31
Sector (%) Portfolioweight*
Active weight
Sectorselection
Security selection
Relative contribution
Information technology 17.58 4.61 0.19 0.57 0.76
Communication services 6.43 –0.41 0.06 0.25 0.31
Consumer staples 4.45 –4.03 0.22 –0.06 0.16
Consumer discretionary 15.10 1.57 –0.14 0.26 0.12
Energy 5.54 1.08 0.23 –0.20 0.02
Industrials 9.52 –2.31 –0.08 0.08 0.00
Real estate 0.55 –2.01 0.12 –0.16 –0.04
Materials 7.27 –1.06 –0.01 –0.09 –0.10
Utilities 2.65 –0.46 0.06 –0.40 –0.34
Health care 12.00 2.78 –0.11 –0.39 –0.50
Financials 15.06 –3.61 –0.29 –0.81 –1.10
Cash 3.85 3.85 –0.23 0.00 –0.23
Largest detractors (%) Portfolioweight*
Active weight
Stockreturn
Relative contribution
Daiichi Sankyo Company, Limited 1.45 1.28 –21.33 –0.50
StoneCo Ltd. Class A 0.45 0.45 –58.63 –0.41
Chugai Pharmaceutical Co., Ltd. 0.81 0.71 –30.53 –0.38
Orsted 0.62 0.51 –34.51 –0.30
ISR: Bilibili, Inc. Class Z 0.43 0.37 –22.81 –0.21
AIA Group Limited 2.25 1.69 –4.37 –0.18
B3 SA - Brasil, Bolsa, Balcao 0.39 0.31 –37.81 –0.18
M3, Inc. 0.58 0.46 –23.97 –0.18
Delivery Hero SE 0.58 0.50 –17.62 –0.17
Cash 3.85 3.85 –0.12 –0.23

EuroPacific Growth Fund
Portfolio positioning and outlook
7
• The fund’s largest exposures relative to the index are found in the consumer discretionary, information technology and health care sectors. E-commerce and luxury goods are a focus in consumer discretionary, while semiconductors and IT services are prominent in the technology sector. Entertainment stocks are well represented in communication services, while aerospace and defense remain large positions in the industrials sector. The fund’s limited exposures to autos, banks and large pharmaceutical companies also stand out relative to the index.
• The fund’s exposure to the consumer discretionary sector, off its 10-year high reached just a year ago, was the largest sector trim, as many companies had reached elevated valuations or received increased attention from China’s recent regulatory moves.
• The fund’s weight in Indian companies was down a bit over the period. Managers trimmed exposure to private sector bank stocks on concerns of a slowing economy and repositioned a portion to higher convictions.
• Portfolio managers have added to technology companies, including those with the ability to disrupt the financial sector and those with unique software or platform support.
• Investors also added to companies in industrials that will benefit from strong trends in semiconductor equipment and battery technology for electronic vehicles.
• Exposure to emerging markets companies ended the period at 26.4%, down from 30.3% last quarter, and remained lower than
the index weighting of 29.6%. Positions within the region are concentrated in just a handful of countries, with the top five capturing nearly all of the fund’s exposure: namely China, India, Brazil, Taiwan and Russia. The composition of the fund’s convictions have changed in these countries over the years. For example, health care stocks in China recently emerged as a focus while consumer discretionary and communication services have decreased. These exposures change and evolve according to the fund managers’ bottom-up convictions in companies. Over the longer term, security selection in emerging markets has been a regional contributor for the one-year, three-year and five-year periods.

8
Data shown reflect the top holdings in each sector. The information shown may include affiliates of the same issuer when applicable.
Cash and equivalents includes short-term securities, accrued income and other assets less liabilities. It may also include investments in money market or similar funds managed by the investment adviser or its affiliates that are not offered to the public.
Index reflects MSCI All Country World Index (ACWI) ex USA. Source: MSCI. MSCI has not approved, reviewed or produced this report, makes no express or implied warranties or representations and is not liable whatsoever for any data in the report. You may not redistribute the MSCI data or use it as a basis for other indices or investment products.
Totals may not reconcile due to rounding.
Sector diversification
Portfolio (%) Index (%)
12/31/20 9/30/21 9/30/21
Energy 6.0 5.9 4.9
Reliance Industries 2.8
Canadian Natural Resources 1.0
Petrobras 0.8
Materials 6.6 6.7 8.0
Vale 1.9
Sika 1.1
Shin-Etsu 0.6
Industrials 8.6 10.2 12.2
Airbus 1.8
Recruit Holdings 0.7
Safran 0.6
Consumer discretionary 17.1 13.0 12.7
MercadoLibre 2.3
LVMH Moet Hennessy Louis Vuitton 1.9
Flutter Entertainment 0.9
Consumer staples 4.6 4.4 8.5
Kweichow Moutai 0.9
Nestlé 0.7
Danone 0.3
Health care 13.4 12.3 9.5
WuXi Biologics (Cayman) 1.5
Daiichi Sankyo 1.4
Sartorius 0.7
Portfolio (%) Index (%)
12/31/20 9/30/21 9/30/21
Financials 14.4 15.4 19.3
AIA Group 2.0
HDFC Bank 1.8
UniCredit 0.8
Information technology 16.1 19.7 13.2
ASML 3.7
TSMC 2.7
Keyence 1.5
Communication services 6.6 5.9 6.3
SEA 2.5
Bharti Airtel 0.5
Tencent 0.5
Utilities 3.0 1.8 3.0
ENN Energy Holdings 0.7
China Gas 0.3
Real estate 0.8 0.5 2.5
Country Garden 0.2
Goodman Group 0.1
Total equity 97.3 95.7 100.0
Total fixed income 0.1 0.1 —
Total cash & equivalents 2.6 4.2 —
Total assets 100.0 100.0 100.0
EuroPacific Growth Fund
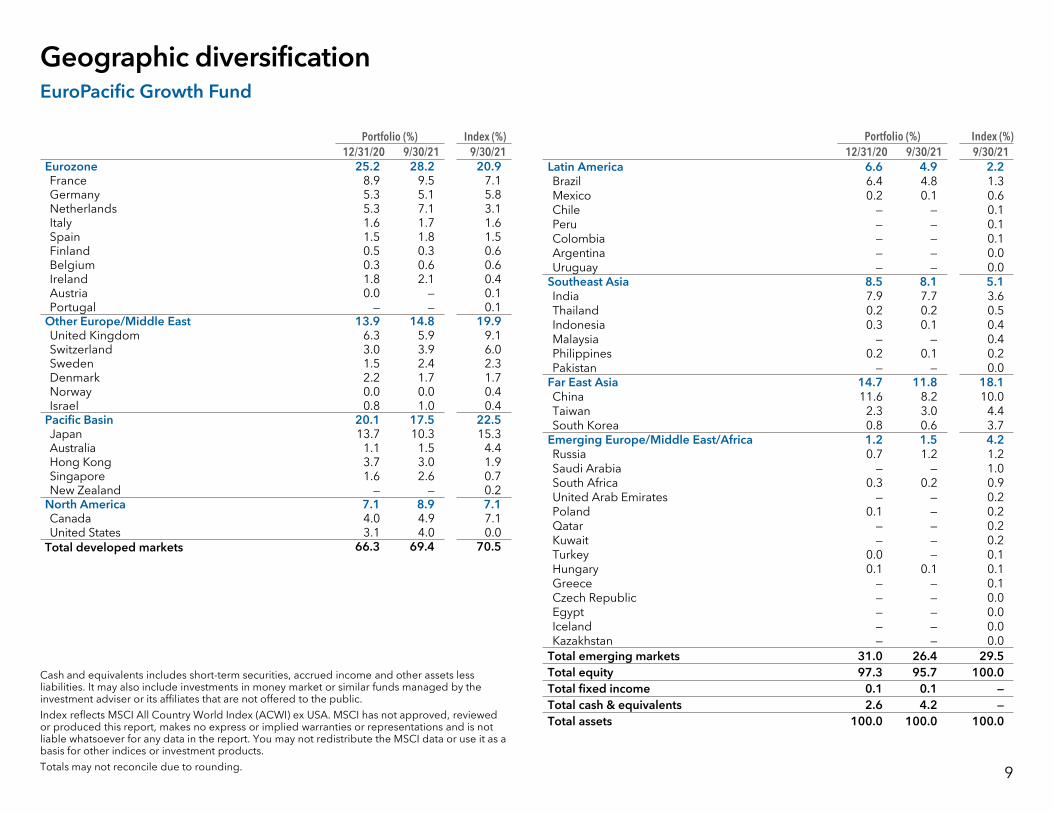
9
Portfolio (%) Index (%) 12/31/20 9/30/21 9/30/21
Latin America 6.6 4.9 2.2Brazil 6.4 4.8 1.3Mexico 0.2 0.1 0.6Chile — — 0.1Peru — — 0.1Colombia — — 0.1Argentina — — 0.0Uruguay — — 0.0
Southeast Asia 8.5 8.1 5.1India 7.9 7.7 3.6Thailand 0.2 0.2 0.5Indonesia 0.3 0.1 0.4Malaysia — — 0.4Philippines 0.2 0.1 0.2Pakistan — — 0.0
Far East Asia 14.7 11.8 18.1China 11.6 8.2 10.0Taiwan 2.3 3.0 4.4South Korea 0.8 0.6 3.7
Emerging Europe/Middle East/Africa 1.2 1.5 4.2Russia 0.7 1.2 1.2 Saudi Arabia — — 1.0 South Africa 0.3 0.2 0.9 United Arab Emirates — — 0.2 Poland 0.1 — 0.2 Qatar — — 0.2 Kuwait — — 0.2 Turkey 0.0 — 0.1 Hungary 0.1 0.1 0.1 Greece — — 0.1 Czech Republic — — 0.0 Egypt — — 0.0 Iceland — — 0.0 Kazakhstan — — 0.0
Total emerging markets 31.0 26.4 29.5Total equity 97.3 95.7 100.0 Total fixed income 0.1 0.1 —Total cash & equivalents 2.6 4.2 —Total assets 100.0 100.0 100.0
Geographic diversificationEuroPacific Growth Fund
Cash and equivalents includes short-term securities, accrued income and other assets less liabilities. It may also include investments in money market or similar funds managed by the investment adviser or its affiliates that are not offered to the public.
Index reflects MSCI All Country World Index (ACWI) ex USA. MSCI has not approved, reviewed or produced this report, makes no express or implied warranties or representations and is not liable whatsoever for any data in the report. You may not redistribute the MSCI data or use it as a basis for other indices or investment products.
Totals may not reconcile due to rounding.
Portfolio (%) Index (%) 12/31/20 9/30/21 9/30/21
Eurozone 25.2 28.2 20.9France 8.9 9.5 7.1Germany 5.3 5.1 5.8Netherlands 5.3 7.1 3.1Italy 1.6 1.7 1.6Spain 1.5 1.8 1.5Finland 0.5 0.3 0.6Belgium 0.3 0.6 0.6Ireland 1.8 2.1 0.4Austria 0.0 — 0.1Portugal — — 0.1
Other Europe/Middle East 13.9 14.8 19.9United Kingdom 6.3 5.9 9.1Switzerland 3.0 3.9 6.0Sweden 1.5 2.4 2.3Denmark 2.2 1.7 1.7Norway 0.0 0.0 0.4Israel 0.8 1.0 0.4
Pacific Basin 20.1 17.5 22.5 Japan 13.7 10.3 15.3 Australia 1.1 1.5 4.4 Hong Kong 3.7 3.0 1.9 Singapore 1.6 2.6 0.7 New Zealand — — 0.2
North America 7.1 8.9 7.1 Canada 4.0 4.9 7.1 United States 3.1 4.0 0.0
Total developed markets 66.3 69.4 70.5
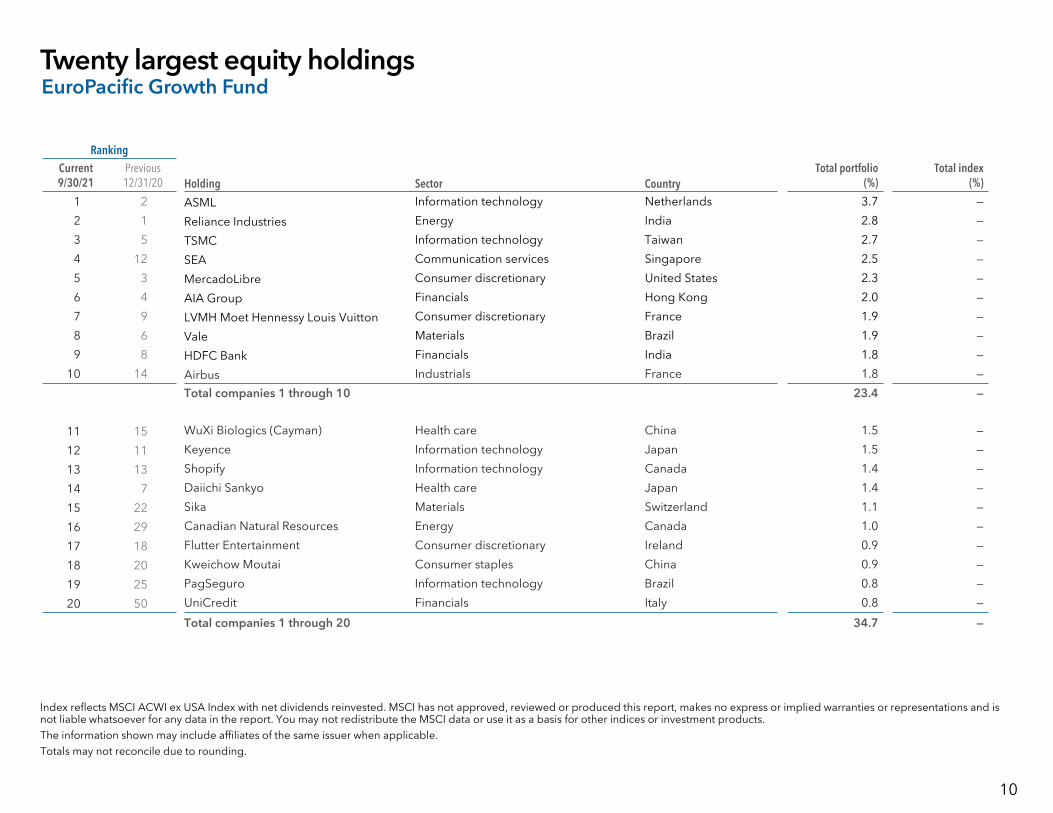
EuroPacific Growth Fund
RankingCurrent 9/30/21
Previous12/31/20 Holding Sector Country
Total portfolio (%)
Total index (%)
1 2 ASML Information technology Netherlands 3.7 —
2 1 Reliance Industries Energy India 2.8 —
3 5 TSMC Information technology Taiwan 2.7 —
4 12 SEA Communication services Singapore 2.5 —
5 3 MercadoLibre Consumer discretionary United States 2.3 —
6 4 AIA Group Financials Hong Kong 2.0 —
7 9 LVMH Moet Hennessy Louis Vuitton Consumer discretionary France 1.9 —
8 6 Vale Materials Brazil 1.9 —
9 8 HDFC Bank Financials India 1.8 —
10 14 Airbus Industrials France 1.8 —
Total companies 1 through 10 23.4 —
11 15 WuXi Biologics (Cayman) Health care China 1.5 —
12 11 Keyence Information technology Japan 1.5 —
13 13 Shopify Information technology Canada 1.4 —
14 7 Daiichi Sankyo Health care Japan 1.4 —
15 22 Sika Materials Switzerland 1.1 —
16 29 Canadian Natural Resources Energy Canada 1.0 —
17 18 Flutter Entertainment Consumer discretionary Ireland 0.9 —
18 20 Kweichow Moutai Consumer staples China 0.9 —
19 25 PagSeguro Information technology Brazil 0.8 —
20 50 UniCredit Financials Italy 0.8 —
Total companies 1 through 20 34.7 —
Index reflects MSCI ACWI ex USA Index with net dividends reinvested. MSCI has not approved, reviewed or produced this report, makes no express or implied warranties or representations and is not liable whatsoever for any data in the report. You may not redistribute the MSCI data or use it as a basis for other indices or investment products. The information shown may include affiliates of the same issuer when applicable.Totals may not reconcile due to rounding.
Twenty largest equity holdings
10

11
Portfolio changes (Buy and sell activity)EuroPacific Growth Fund
Top five largest equity purchases
Security nameChange (%) from buying
Current weight %
Kingspan Group 0.43 0.59 Bilibili 0.35 0.31 Banco Santander 0.34 0.38 TSMC 0.32 2.72 Sonova Holding 0.31 0.56
Top five largest equity reductions
Security nameChange (%) from selling
Current weight %
Alibaba Group –1.54 0.11 adidas –0.58 0.26 Kotak Mahindra Bank –0.56 0.74 Orsted –0.49 0.22 SoftBank Group –0.47 0.26
Top five largest equity purchases
Security nameChange (%)
buyingCurrent
weight % Bharti Airtel 0.28 0.53 Domino's Pizza Enterprises 0.23 0.24 SEA 0.22 2.47 EQT 0.20 0.20 Wise 0.18 0.22
Top five largest equity reductions
Security nameChange (%) From selling
CurrentWeight %
Chugai –0.39 0.38 Kotak Mahindra Bank –0.37 0.74 Tencent –0.30 0.50 Orsted –0.26 0.22 Square Enix Holdings –0.22 0.00
YTD 2021 3Q 2021
Data as of September 30, 2021.Data reflects purchases and sales of common stock, which also includes depository receipts. Data excludes fixed income and other non-equity securities.Change (%) from buying/selling is calculated by first calculating the cumulative net transactions by the fund in the specified security during the reported timeframe. The cumulative net transactions are then divided by the fund’s weighted average total net assets during that same timeframe.
Equity attribution data was produced using FactSet, a third-party software system, based on prior calendar quarter-end publicly disclosed portfolio(s). Securities in their initial period of acquisition may not be included in this analysis. The analysis includes equity investments only and excludes forward contracts and fixed income investments, if applicable. It does not account for buy and sell transactions that might have occurred during the quarter. As a result, average portfolio weight percentages are approximate and the actual average portfolio weight percentages might be higher or lower. Data elements such as pricing, income, market cap, etc. were provided by FactSet. The index provided for attribution is based on FactSet’s methodology. The index is a broad-based market benchmark and may not be used by Capital Group as the sole comparative index for this portfolio. Capital Group believes the software and information from FactSet to be reliable. However, Capital Group cannot be responsible for inaccuracies, incomplete information or updating of information by FactSet.
Relative contribution measures the impact a security has on the portfolio's excess return (the portfolio return minus the benchmark return). Past results are not indicative of results in future periods.
All of the attribution data contained in the report that display the portfolio weights, benchmark weights and weight differences are average weights over the period. The mnemonic ‘ISR:’ indicates that two or more issues of the same issuer have been rolled up and thus what is presented in the report is the Issuer Level data.
EuroPacific Growth FundAs of September 30, 2021
Attribution methodology notes
ITGEQSX-016-1021O CGD/10219-S84483
Important information
Investors should carefully consider investment objectives, risks, charges and expenses. This and other important information is contained in the fund prospectuses and summary prospectuses, which can be obtained from a financial professional and should be read carefully before investing. Statements attributed to an individual represent the opinions of that individual as of the date published and do not necessarily reflect the opinions of Capital Group or its affiliates. This information is intended to highlight issues and should not be considered advice, an endorsement or a recommendation.
Portfolios are managed, so holdings will change. Certain fixed income and/or cash and equivalents holdings may be held through mutual funds managed by the investment adviser or its affiliates that are not offered to the public.
Results for the Lipper indexes do not reflect sales charges. Lipper indexes track the largest mutual funds (no more than 30), represented by one share class per fund, in the corresponding Lipper category. Lipper categories are dynamic and averages may have few funds, especially over longer periods. To see the number of funds included in the Lipper category for each fund's lifetime, please see the Quarterly Statistical Update, available on our website.
© 2021 Morningstar, Inc. All rights reserved. The information contained herein: (1) is proprietary to Morningstar and/or its content providers; (2) may not be copied or distributed; and (3) is not warranted to be accurate, complete or timely. Neither Morningstar nor its content providers are responsible for any damages or losses arising from this information. Past performance is no guarantee of future results.
MSCI has not approved, reviewed or produced this report, makes no express or implied warranties or representations and is not liable whatsoever for any data in the report. You may not redistribute the MSCI data or use it as a basis for other indices or investment products.
The Standard & Poor’s 500 Composite Index ("Index") is a product of S&P Dow Jones Indices LLC and/or its affiliates and has been licensed for use by Capital Group. Copyright © 2021 S&P Dow Jones Indices LLC, a division of S&P Global, and/or its affiliates. All rights reserved. Redistribution or reproduction in whole or in part is prohibited without written permission of S&P Dow Jones Indices LLC.
All Capital Group trademarks mentioned are owned by The Capital Group Companies, Inc., an affiliated company or fund. All other company and product names mentioned are the property of their respective companies.
American Funds Distributors, Inc., member FINRA.
12
Institutional client notice and addendum for retirement plans
Capital Group, its affiliates and representatives (collectively “Capital Group”) engage in sales, marketing and servicing activities as part of our efforts to distribute our services and products (“distribution activities”). Our distribution activities reflect our understanding of the following:
1. The Plan is represented by a “fiduciary” within the meaning of section 3(21)(A) of ERISA with full authority and responsibility for the decision to enter into transactions or service relationships (the “Plan fiduciary”);
2. The Plan fiduciary is responsible for exercising independent judgment in evaluating any transactions or services and is capable of evaluating investment risks independently, both in general and with regard to particular transactions and investment strategies that Capital Group may market to the Plan; and
3. Capital Group is not undertaking to provide impartial investment advice, act as an impartial adviser or provide advice in a fiduciary capacity in connection with its distribution activities, and the parties agree that such activities will not be used as a primary basis for the Plan’s investment decisions.
This Notice does not apply beyond distribution activities. Thus, for example, Capital Group will act as a fiduciary and as an investment manager under ERISA to the extent provided in the terms of a participation or investment management agreement.
13

International Stock FundObjectives The Fund seeks long-term growth of principal and income.
Strategy The Fund invests primarily in a diversified portfolio of equity securities issued by non-U.S. companies from at least three different countries, including emerging market
countries. The Fund is not required to allocate its investments in set percentages in particular countries. The Fund typically invests in medium-to-large well establishedcompanies based on standards of the applicable market.
RisksThe Fund is subject to market risk, meaning holdings in the Fund may decline in value for extended periods due to the financial prospects of individual companies or
due to general market and economic conditions. Investing in non-U.S. securities may entail risk due to foreign economic and political developments; this risk may be higher when investing in emerging markets. Please read the prospectus for specific details regarding the Fund’s risk profile.
General InformationNet Asset Value Per Share $47.38Total Net Assets (billions) $43.7Expense Ratio 0.63%Portfolio Turnover Rate (1/1/21 to 6/30/21, unannualized) 10%30-Day SEC Yield(a) 1.55%Active Share(b) 91%Number of Companies 70Fund Inception 2001No sales charges or distribution fees
Investment Manager: Dodge & Cox, San Francisco. Managed by the International Equity Investment Committee, whose seven members’ average tenure at Dodge & Cox is 22 years.
Ten Largest Equity Holdings (% Market Value)(d)(e) Fund
GlaxoSmithKline PLC (United Kingdom) 3.7Sanofi (France) 3.7ICICI Bank, Ltd. (India) 3.3Roche Holding AG (Switzerland) 3.1UBS Group AG (Switzerland) 3.0BNP Paribas SA (France) 3.0Novartis AG (Switzerland) 3.0Samsung Electronics Co., Ltd. (South Korea) 2.8Banco Santander SA (Spain) 2.8Honda Motor Co., Ltd. (Japan) 2.5
Region Diversification (% Market Value)(d)(g) Fund MSCI EAFE
Europe (excluding United Kingdom) 37.3 49.5United Kingdom 17.3 14.4Asia Pacific (excluding Japan) 14.1 11.3Japan 12.0 24.2Canada 5.5 0.0United States 5.5 0.0Latin America 4.5 0.0Africa 0.6 0.0Middle East 0.0 0.6
Sector Diversification (% Market Value)(d) Fund MSCI EAFE
Financials 27.6 17.2Health Care 15.9 12.6Consumer Discretionary 9.9 12.7Materials 9.1 7.3Energy 7.6 3.5Industrials 7.0 15.8Information Technology 7.0 9.6Communication Services 6.3 4.8Consumer Staples 4.1 10.2Real Estate 2.0 2.9Utilities 0.5 3.3
Portfolio Characteristics Fund MSCI EAFE
Median Market Capitalization (billions) $42 $14Weighted Average Market Capitalization (billions) $81 $77Price-to-Earnings Ratio(c) 11.0x 15.3xCountries Represented 21 21Emerging Markets (Brazil, China, India,
Mexico, Peru, Russia, South Africa, South Korea)(d)(g) 18.6% 0.0%
Asset Allocation
(a) SEC Yield is an annualization of the Fund’s net investment income for the trailing 30-day period. Dividends paid by the Fund may be higher or lower than implied by the SEC Yield.(b) Active share is a measure of how much an investment portfolio differs from its benchmark index, based on a scale of 0% (complete overlap with the index) to 100% (no overlap). Overlap for each security in the Fund is the lower
of either its percentage weight in the Fund or its percentage weight in the relevant index. Active share is calculated as 100% minus the sum of the overlapping security weights.(c) Price-to-earnings (P/E) ratios are calculated using 12-month forward earnings estimates from third-party sources as of the reporting period. Estimates reflect a consensus of sell-side analyst estimates, which may lag as
market conditions change.(d) Excludes derivatives.(e) The Fund’s portfolio holdings are subject to change without notice. The mention of specific securities is not a recommendation to buy, sell, or hold any particular security and is not indicative of Dodge & Cox’s current or future
trading activity.(f) Net Cash & Other includes cash, short-term investments, unrealized gain (loss) on derivatives, receivables, and payables.(g) The Fund may classify a company in a different category than the MSCI EAFE. The Fund generally classifies a company based on its country of incorporation, but may designate a different country in certain circumstances.
Equity Securities: 96.8%
Net Cash& Other:(f) 3.2%
September 30, 2021
TICKER SYMBOL
D ODFX
*Total sector exposure, including the notional exposure of equity total return swaps, is Consumer Discretionary at 11.2% and Communication Services at 5.2% . Portfolio totals may not sum to 100%.
*Total issuer exposure, including notional value of total return swaps, is 2.8% for Prosus NV (Netherlands).Portfolio totals may not sum to 100%.

dodgeandcox.com
The Dodge & Cox International Stock Fund had a total return of –3.3% for the third quarter of 2021, compared to –0.5% for the MSCI EAFE (Europe, Australasia, Far East) Index. For the nine months ended September 30, 2021, the Fund had a total return of 8.4%, compared to 8.3% for the MSCI EAFE.
Investment CommentaryAfter appreciating for five consecutive quarters, international equity markets declined modestly in the third quarter of 2021. Despite this pullback, developed markets still posted a total return of 8% during the first nine months of 2021. Currently, three wide valuation disparities in the international equity market are creating compelling opportunities for active, value-oriented investment managers like Dodge & Cox. First, the valuation gap between value and growth stocks2 remains remarkably wide and is almost as large as its peak last January. The MSCI EAFE Value Index trades at 11.1 times forward earnings compared to 23.7 times for the MSCI EAFE Growth Index.3 The Financials, Energy, and Materials sectors are demonstrably cheaper than the rest of the market and remain large overweight areas of the MSCI EAFE Value. Second, the valuation spread between stocks that would benefit or suffer from higher interest rates is at a 20-year high, with those—notably Financials—that stand to benefit from rising interest rates trading at particularly low relative valuations. Companies that should benefit from rising rates are trading at an average of 12.0 times forward earnings, while those that would suffer from rising rates are trading at 21.8 times forward earnings. This exceptionally wide valuation spread reflects more certainty about the likelihood of rates remaining low for the foreseeable future than we believe is merited. Third, international stocks are priced more attractively than U.S. stocks. The S&P 500 Index trades at 20.8 times forward earnings compared to 15.3 times for the MSCI EAFE and 12.6 times for the MSCI Emerging Markets Index. In emerging markets, China tumbled 17% year to date amid concerns about the Chinese government’s increased regulations across multiple industries. So far, the government’s attempts to pursue social equality goals have disproportionately affected education and internet companies. China internet stocks, as defined by the CSI Overseas China Internet Index, dropped 54% from their peak in February 2021 through September 30, significantly lagging both the MSCI ACWI ex USA Index (down 1%) and the NASDAQ 100 Index (up 8%).4 At Dodge & Cox, we eschew labels and look past headlines to assess whether the valuations appropriately reflect risk and opportunity or are too pessimistic or optimistic. We conduct thorough, in-depth due diligence and update our model assumptions to incorporate short-term and long-term financial impacts as the facts change. In addition, we incorporate the experience and judgment of a seasoned investment team to develop the insights and perspectives that enable us to build conviction. We have found what we believe are highly attractive opportunities across the market, notably in areas that receive the most debate. On a bottom-up basis, the Fund remains overweight Financials and Energy based on low valuations that reflect overly pessimistic expectations for future earnings and return of capital to shareholders. The Fund is also overweight companies with research and development-driven earnings growth, such as in Health Care (15.9% of the Fund) and China Internet5 (7.5% of the Fund). In Health Care, during the first nine months of 2021, we added to the Fund’s pharmaceutical holdings given their compelling valuations and strong innovation pipelines that should drive attractive earnings growth over the coming years. In addition, we started new positions in Olympus6 (a global medical devices company that specializes in endoscopes) and Fresenius Medical Care (the world’s largest vertically integrated provider of dialysis products and services) at attractive valuations relative to their respective franchise strength and market leading positions. After incorporating the changing regulatory environment and risk-reward outlook for the Fund’s China Internet holdings, we reaffirmed our view that these are attractive long-term investments and recently added to Alibaba, Baidu, and JD.com. We recognize that we do not have a crystal ball when it comes to predicting the impact that the changing regulatory environment will ultimately have on the Fund’s China Internet holdings. However, the following three factors gave us the confidence to increase the Fund’s exposure to these holdings. First, some of the government’s actions are similar to other data privacy and anti-monopoly policies around the world. Second, important government officials and publications have sought to clarify the government’s agenda and stress the importance of private enterprise. Third, valuations remain attractive and embed more conservative assumptions of growth and profitability. As always, we remain focused on the long term, and we encourage our shareholders to do so as well. Thank you for your continued confidence in Dodge & Cox.
Before investing in any Dodge & Cox Fund, you should carefully consider the Fund’s investment objectives, risks, and charges and expenses. To obtain a Fund’s prospectus and summary prospectus, which contain this and other important information, visit dodgeandcox.com or call 800-621-3979. Please read the prospectus and summary prospectus carefully before investing.
Third Quarter Performance ReviewThe Fund underperformed the MSCI EAFE by 2.9 percentage points during the quarter.
Key Detractors from Relative Results The Fund’s China Internet5 holdings in the Consumer Discretionary and
Communication Services sectors detracted significantly from results. The Fund’s pharmaceutical holdings in the Health Care sector (down 6% versus down
1% for the MSCI EAFE sector) also led to relative underperformance, especially Sanofi and Novartis.
The Fund’s average underweight in Information Technology (7% versus 10% for the MSCI EAFE sector) and its holdings within the sector (down 2% versus up 5%), especially Samsung Electronics, led to relative underperformance.
Additional key detractors included Holcim, Grupo Televisa, Suncor Energy, and Itau Unibanco.
Key Contributors to Relative Results The Fund’s average overweight in Financials (28% versus 17% for the MSCI EAFE
sector) contributed to performance. ICICI Bank, Barclays, and Aegon were particularly strong performers.
In the Materials sector, the Fund’s relative outperformance (down 1% versus down 6% for the MSCI EAFE sector) contributed to results, especially Glencore.
Additional key contributors included Equinor and Liberty Global.
Year-to-Date Performance ReviewThe Fund outperformed the MSCI EAFE by 0.1 percentage points year to date.
Key Contributors to Relative Results The Fund’s average overweight in Energy (8% versus 3% for the MSCI EAFE sector)
and its holdings within the sector (up 39% versus up 24% for the EAFE sector), especially Ovintiv, Suncor Energy, Schlumberger, and Equinor, led to relative outperformance.
In the Materials sector, the Fund’s relative outperformance (up 21% versus up 4% for the MSCI EAFE sector) contributed to results, especially Glencore and Nutrien.
The Fund’s average overweight in Financials (28% versus 17% for the MSCI EAFE sector) contributed to results. In particular, ICICI Bank, BNP Paribas, Barclays, Banco Santander, Mitsubishi UFJ, and Aviva performed well.
Additional key contributors included Johnson Controls International.
Key Detractors from Relative Results The Fund’s China Internet5 holdings in the Consumer Discretionary and
Communication Services sectors detracted significantly from results. The Fund’s holdings within the Information Technology sector (down 2% versus up
16%), especially Samsung Electronics, led to relative underperformance. The Fund’s average overweight in the Health Care sector (16% versus 12% for the
MSCI EAFE sector) combined with its holdings (up 2% versus up 5% for the MSCI EAFE sector), especially Novartis and Sanofi, led to relative underperformance.
Additional key detractors included Credit Suisse, Itau Unibanco, Mitsubishi Electric, Credicorp, and Holcim.
09/21 ISF FS
1 The Fund’s total returns include the reinvestment of dividend and capital gain distributions, but have not been adjusted for any income taxes payable by shareholders on these distributions or on Fund share redemptions. Index returns include dividends but, unlike Fund returns, do not reflect fees or expenses. The MSCI EAFE (Europe, Australasia, Far East) Index is a broad based, unmanaged equity market index aggregated from 21 Developed Market country indices, excluding the United States and Canada. Results reflect dividends net of withholding taxes. MSCI makes no express or implied warranties or representations and shall have no liability whatsoever with respect to any MSCI data contained herein. The MSCI data may not be further redistributed or used as a basis for other indices or any securities or financial products. This report is not approved, reviewed, or produced by MSCI. All returns are stated in U.S. dollars, unless otherwise noted.
2 Generally, stocks that have lower valuations are considered “value” stocks, while those with higher valuations are considered “growth” stocks.
3 Unless otherwise specified, all weightings and characteristics are as of September 30, 2021.4 The NASDAQ 100 Index is a stock market index made up of equity securities issued by 100 of the largest
non-financial companies listed on the Nasdaq stock market. This Index includes many of the China Internet companies’ counterparts in the United States.
5 China Internet comprises Alibaba, Baidu, JD.com, Naspers, Prosus, and Tencent.6 The use of specific examples does not imply that they are more or less attractive investments than the
portfolio’s other holdings.MSCI EAFE is a service mark of MSCI Barra. S&P 500® is a trademark of S&P Global Inc. For more information about these indices, visit dodgeandcox.com
Average Annual Total Return1
For periods ended September 30, 2021 1 Yeart 3 Years 5 Years 10 Years
Dodge & Cox International Stock Fund 35.19% 5.99% 7.39% 7.77%
MSCI EAFE Index 25.73 7.62 8.81 8.10
Returns represent past performance and do not guarantee future results. Investment return and share price will fluctuate with market conditions, and investors may have a gain or loss when shares are sold. Fund performance changes over time and currently may be significantly lower than stated above. Performance is updated and published monthly. Visit the Fund’s website at dodgeandcox.com or call 800-621-3979 for current month-end performance figures. tInvestors should note that the Fund’s short-term performance is highly unusual and unlikely to be sustained.
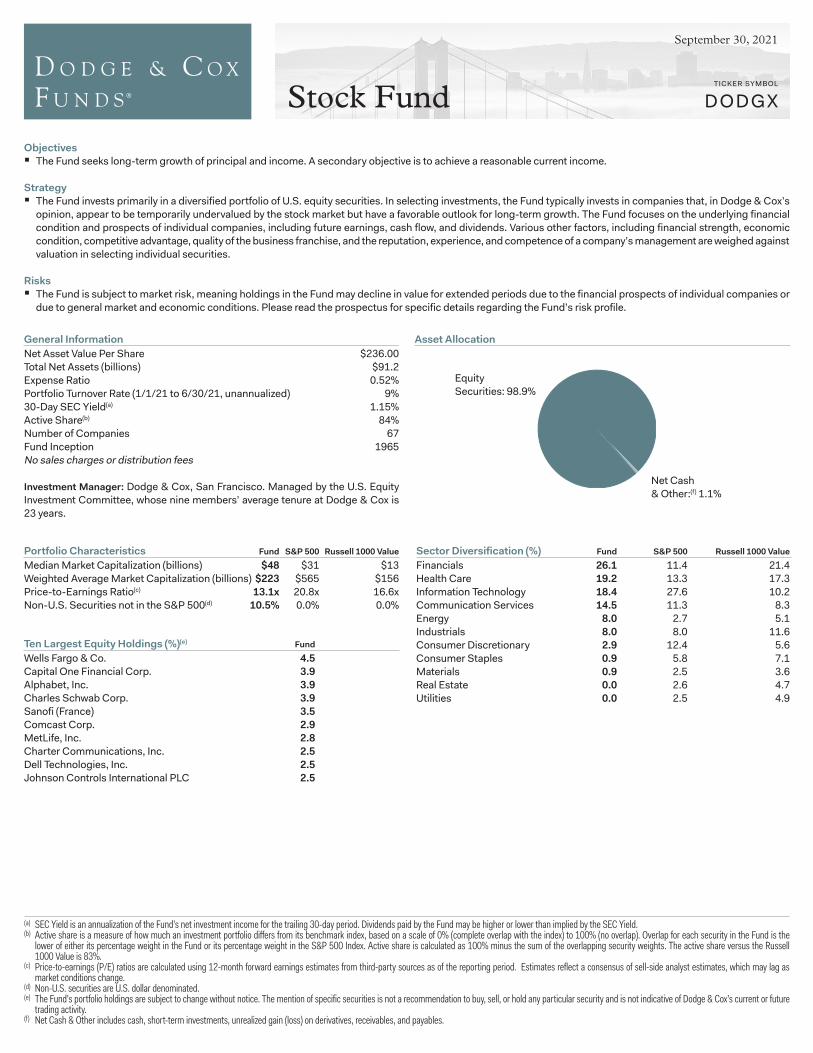
Stock FundObjectives The Fund seeks long-term growth of principal and income. A secondary objective is to achieve a reasonable current income.
Strategy The Fund invests primarily in a diversified portfolio of U.S. equity securities. In selecting investments, the Fund typically invests in companies that, in Dodge & Cox’s
opinion, appear to be temporarily undervalued by the stock market but have a favorable outlook for long-term growth. The Fund focuses on the underlying financial condition and prospects of individual companies, including future earnings, cash flow, and dividends. Various other factors, including financial strength, economiccondition, competitive advantage, quality of the business franchise, and the reputation, experience, and competence of a company’s management are weighed against valuation in selecting individual securities.
RisksThe Fund is subject to market risk, meaning holdings in the Fund may decline in value for extended periods due to the financial prospects of individual companies or
due to general market and economic conditions. Please read the prospectus for specific details regarding the Fund’s risk profile.
General InformationNet Asset Value Per Share $236.00Total Net Assets (billions) $91.2Expense Ratio 0.52%Portfolio Turnover Rate (1/1/21 to 6/30/21, unannualized) 9%30-Day SEC Yield(a) 1.15%Active Share(b) 84%Number of Companies 67Fund Inception 1965No sales charges or distribution fees
Investment Manager: Dodge & Cox, San Francisco. Managed by the U.S. Equity Investment Committee, whose nine members’ average tenure at Dodge & Cox is 23 years.
Ten Largest Equity Holdings (%)(e) Fund
Wells Fargo & Co. 4.5Capital One Financial Corp. 3.9Alphabet, Inc. 3.9Charles Schwab Corp. 3.9Sanofi (France) 3.5Comcast Corp. 2.9MetLife, Inc. 2.8Charter Communications, Inc. 2.5Dell Technologies, Inc. 2.5Johnson Controls International PLC 2.5
Asset Allocation
(a) SEC Yield is an annualization of the Fund’s net investment income for the trailing 30-day period. Dividends paid by the Fund may be higher or lower than implied by the SEC Yield.(b) Active share is a measure of how much an investment portfolio differs from its benchmark index, based on a scale of 0% (complete overlap with the index) to 100% (no overlap). Overlap for each security in the Fund is the
lower of either its percentage weight in the Fund or its percentage weight in the S&P 500 Index. Active share is calculated as 100% minus the sum of the overlapping security weights. The active share versus the Russell 1000 Value is 83%.
(c) Price-to-earnings (P/E) ratios are calculated using 12-month forward earnings estimates from third-party sources as of the reporting period. Estimates reflect a consensus of sell-side analyst estimates, which may lag as market conditions change.
(d) Non-U.S. securities are U.S. dollar denominated.(e) The Fund’s portfolio holdings are subject to change without notice. The mention of specific securities is not a recommendation to buy, sell, or hold any particular security and is not indicative of Dodge & Cox’s current or future
trading activity.(f) Net Cash & Other includes cash, short-term investments, unrealized gain (loss) on derivatives, receivables, and payables.
Equity Securities: 98.9%
Net Cash& Other:(f) 1.1%
September 30, 2021
TICKER SYMBOL
D OD GX
Portfolio Characteristics Fund S&P 500 Russell 1000 Value
Median Market Capitalization (billions) $48 $31 $13Weighted Average Market Capitalization (billions) $223 $565 $156Price-to-Earnings Ratio(c) 13.1x 20.8x 16.6xNon-U.S. Securities not in the S&P 500(d) 10.5% 0.0% 0.0%
Sector Diversification (%) Fund S&P 500 Russell 1000 Value
Financials 26.1 11.4 21.4Health Care 19.2 13.3 17.3Information Technology 18.4 27.6 10.2Communication Services 14.5 11.3 8.3Energy 8.0 2.7 5.1Industrials 8.0 8.0 11.6Consumer Discretionary 2.9 12.4 5.6Consumer Staples 0.9 5.8 7.1Materials 0.9 2.5 3.6Real Estate 0.0 2.6 4.7Utilities 0.0 2.5 4.9
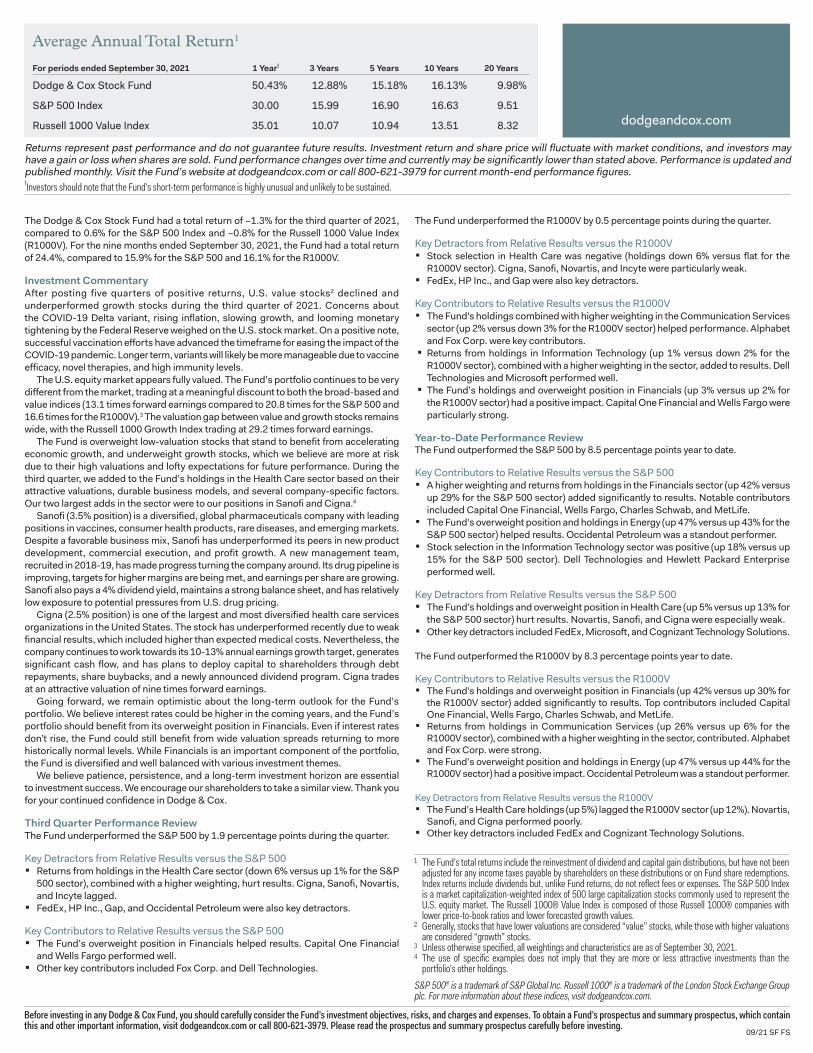
dodgeandcox.com
The Dodge & Cox Stock Fund had a total return of –1.3% for the third quarter of 2021, compared to 0.6% for the S&P 500 Index and –0.8% for the Russell 1000 Value Index (R1000V). For the nine months ended September 30, 2021, the Fund had a total return of 24.4%, compared to 15.9% for the S&P 500 and 16.1% for the R1000V.
Investment CommentaryAfter posting five quarters of positive returns, U.S. value stocks2 declined and underperformed growth stocks during the third quarter of 2021. Concerns about the COVID-19 Delta variant, rising inflation, slowing growth, and looming monetary tightening by the Federal Reserve weighed on the U.S. stock market. On a positive note, successful vaccination efforts have advanced the timeframe for easing the impact of the COVID-19 pandemic. Longer term, variants will likely be more manageable due to vaccine efficacy, novel therapies, and high immunity levels. The U.S. equity market appears fully valued. The Fund’s portfolio continues to be very different from the market, trading at a meaningful discount to both the broad-based and value indices (13.1 times forward earnings compared to 20.8 times for the S&P 500 and 16.6 times for the R1000V).3 The valuation gap between value and growth stocks remains wide, with the Russell 1000 Growth Index trading at 29.2 times forward earnings. The Fund is overweight low-valuation stocks that stand to benefit from accelerating economic growth, and underweight growth stocks, which we believe are more at risk due to their high valuations and lofty expectations for future performance. During the third quarter, we added to the Fund’s holdings in the Health Care sector based on their attractive valuations, durable business models, and several company-specific factors. Our two largest adds in the sector were to our positions in Sanofi and Cigna.4 Sanofi (3.5% position) is a diversified, global pharmaceuticals company with leading positions in vaccines, consumer health products, rare diseases, and emerging markets. Despite a favorable business mix, Sanofi has underperformed its peers in new product development, commercial execution, and profit growth. A new management team, recruited in 2018-19, has made progress turning the company around. Its drug pipeline is improving, targets for higher margins are being met, and earnings per share are growing. Sanofi also pays a 4% dividend yield, maintains a strong balance sheet, and has relatively low exposure to potential pressures from U.S. drug pricing. Cigna (2.5% position) is one of the largest and most diversified health care services organizations in the United States. The stock has underperformed recently due to weak financial results, which included higher than expected medical costs. Nevertheless, the company continues to work towards its 10-13% annual earnings growth target, generates significant cash flow, and has plans to deploy capital to shareholders through debt repayments, share buybacks, and a newly announced dividend program. Cigna trades at an attractive valuation of nine times forward earnings. Going forward, we remain optimistic about the long-term outlook for the Fund’s portfolio. We believe interest rates could be higher in the coming years, and the Fund’s portfolio should benefit from its overweight position in Financials. Even if interest rates don’t rise, the Fund could still benefit from wide valuation spreads returning to more historically normal levels. While Financials is an important component of the portfolio, the Fund is diversified and well balanced with various investment themes. We believe patience, persistence, and a long-term investment horizon are essential to investment success. We encourage our shareholders to take a similar view. Thank you for your continued confidence in Dodge & Cox.
Third Quarter Performance ReviewThe Fund underperformed the S&P 500 by 1.9 percentage points during the quarter.
Key Detractors from Relative Results versus the S&P 500 Returns from holdings in the Health Care sector (down 6% versus up 1% for the S&P
500 sector), combined with a higher weighting, hurt results. Cigna, Sanofi, Novartis, and Incyte lagged.
FedEx, HP Inc., Gap, and Occidental Petroleum were also key detractors.
Key Contributors to Relative Results versus the S&P 500 The Fund’s overweight position in Financials helped results. Capital One Financial
and Wells Fargo performed well. Other key contributors included Fox Corp. and Dell Technologies.
Before investing in any Dodge & Cox Fund, you should carefully consider the Fund’s investment objectives, risks, and charges and expenses. To obtain a Fund’s prospectus and summary prospectus, which contain this and other important information, visit dodgeandcox.com or call 800-621-3979. Please read the prospectus and summary prospectus carefully before investing.
The Fund underperformed the R1000V by 0.5 percentage points during the quarter.
Key Detractors from Relative Results versus the R1000V Stock selection in Health Care was negative (holdings down 6% versus flat for the
R1000V sector). Cigna, Sanofi, Novartis, and Incyte were particularly weak. FedEx, HP Inc., and Gap were also key detractors.
Key Contributors to Relative Results versus the R1000V The Fund's holdings combined with higher weighting in the Communication Services
sector (up 2% versus down 3% for the R1000V sector) helped performance. Alphabet and Fox Corp. were key contributors.
Returns from holdings in Information Technology (up 1% versus down 2% for the R1000V sector), combined with a higher weighting in the sector, added to results. Dell Technologies and Microsoft performed well.
The Fund’s holdings and overweight position in Financials (up 3% versus up 2% for the R1000V sector) had a positive impact. Capital One Financial and Wells Fargo were particularly strong.
Year-to-Date Performance ReviewThe Fund outperformed the S&P 500 by 8.5 percentage points year to date.
Key Contributors to Relative Results versus the S&P 500 A higher weighting and returns from holdings in the Financials sector (up 42% versus
up 29% for the S&P 500 sector) added significantly to results. Notable contributors included Capital One Financial, Wells Fargo, Charles Schwab, and MetLife.
The Fund's overweight position and holdings in Energy (up 47% versus up 43% for the S&P 500 sector) helped results. Occidental Petroleum was a standout performer.
Stock selection in the Information Technology sector was positive (up 18% versus up 15% for the S&P 500 sector). Dell Technologies and Hewlett Packard Enterprise performed well.
Key Detractors from Relative Results versus the S&P 500 The Fund's holdings and overweight position in Health Care (up 5% versus up 13% for
the S&P 500 sector) hurt results. Novartis, Sanofi, and Cigna were especially weak. Other key detractors included FedEx, Microsoft, and Cognizant Technology Solutions.
The Fund outperformed the R1000V by 8.3 percentage points year to date.
Key Contributors to Relative Results versus the R1000V The Fund's holdings and overweight position in Financials (up 42% versus up 30% for
the R1000V sector) added significantly to results. Top contributors included Capital One Financial, Wells Fargo, Charles Schwab, and MetLife.
Returns from holdings in Communication Services (up 26% versus up 6% for the R1000V sector), combined with a higher weighting in the sector, contributed. Alphabet and Fox Corp. were strong.
The Fund’s overweight position and holdings in Energy (up 47% versus up 44% for the R1000V sector) had a positive impact. Occidental Petroleum was a standout performer.
Key Detractors from Relative Results versus the R1000V The Fund’s Health Care holdings (up 5%) lagged the R1000V sector (up 12%). Novartis,
Sanofi, and Cigna performed poorly. Other key detractors included FedEx and Cognizant Technology Solutions.
09/21 SF FS
Average Annual Total Return1
For periods ended September 30, 2021 1 Yeart 3 Years 5 Years 10 Years 20 Years
Dodge & Cox Stock Fund 50.43% 12.88% 15.18% 16.13% 9.98%
S&P 500 Index 30.00 15.99 16.90 16.63 9.51
Russell 1000 Value Index 35.01 10.07 10.94 13.51 8.32
Returns represent past performance and do not guarantee future results. Investment return and share price will fluctuate with market conditions, and investors may have a gain or loss when shares are sold. Fund performance changes over time and currently may be significantly lower than stated above. Performance is updated and published monthly. Visit the Fund’s website at dodgeandcox.com or call 800-621-3979 for current month-end performance figures. tInvestors should note that the Fund’s short-term performance is highly unusual and unlikely to be sustained.
1 The Fund’s total returns include the reinvestment of dividend and capital gain distributions, but have not been adjusted for any income taxes payable by shareholders on these distributions or on Fund share redemptions. Index returns include dividends but, unlike Fund returns, do not reflect fees or expenses. The S&P 500 Index is a market capitalization-weighted index of 500 large capitalization stocks commonly used to represent the U.S. equity market. The Russell 1000® Value Index is composed of those Russell 1000® companies with lower price-to-book ratios and lower forecasted growth values.
2 Generally, stocks that have lower valuations are considered “value” stocks, while those with higher valuations are considered “growth” stocks.
3 Unless otherwise specified, all weightings and characteristics are as of September 30, 2021.4 The use of specific examples does not imply that they are more or less attractive investments than the
portfolio’s other holdings.S&P 500® is a trademark of S&P Global Inc. Russell 1000® is a trademark of the London Stock Exchange Group plc. For more information about these indices, visit dodgeandcox.com.

The Fund provides the foundation to an investor’s long-term real estate portfolio, investing in aportfolio driven by secular trends that provides durable and growing income through resilientassets.
Performance For the third quarter 2021, Invesco Core Real Estate – U.S.A. (“ICRE” or “the Fund”) generated
a total gross return of 7.56%, comprised of 0.95% income and 6.61% appreciation. Thiscompares to a preliminary NFI – ODCE total gross return of 6.59%.
The Fund experienced total gross unlevered property appreciation of 493 bps during thequarter. Strong appreciation in the Core Industrial, Core Residential and Manage-to-Coreportfolios was incremented by more moderate appreciation in the Office and Retail portfolios.
Operations Core Portfolio occupancy remains strong at 93.5%, a YTD increase of approximately 100 bps. NOI growth YTD in 2021 is ahead of budget, with particular strength in the Multifamily, Self-
Storage and Life Science sectors. Same Store 3Q21 NOI was up 17% compared to 3Q20.Transactions During the third quarter the Fund acquired six industrial development opportunities: one in the
Phoenix, AZ area for a total of $36.2 million, one in Los Angeles for a total of $63.4 million,three in Las Vegas for a total of $169.1 million and one in the SF Bay Area for a total of $22.3million. A self-storage asset in Solana Beach, CA was also acquired for $48.5 million.
The Fund’s Single-Family Rental program continued adding homes to the portfolio, which nowtotals over 500 homes across 14 markets.
The Fund closed on the sale of an office investment in Westlake Village, CA for $80.8M. At quarter end the Fund had $142.5 million in signed and verbal capital commitments, with
$1,011.9 million in redemption requests. Capital called subsequent to quarter end was $99.5million, and $300.0 million was made available for redemption requests, which resulted in$711.9 million in redemption requests remaining. Going forward, future redemptions willcontinue to be milestone-driven based on factors within the Fund, limited partners, and thebroader commercial real estate market. Based on current information, we anticipateextinguishing the remaining redemption queue by 1Q22 - 2Q22.
28%
24%28%
13%
7%
Investment Performance
Gross Returns Quarter YTD 1 Year 3 Year 5 Year 7 Year 10 Year SI 4Q’04
Income 0.95 2.80 3.68 3.63 3.67 3.80 4.11 4.86
Appreciation 6.61 11.41 12.26 3.31 3.99 5.20 5.60 3.16
Total 7.56 14.41 16.27 7.03 7.76 9.14 9.87 8.14
Key Statistics 1
Gross Asset Value $16.42B
Net Asset Value $12.14B
Investments 119
LTV (incl./excl. short-term borrowings) 2 24.3%/24.3%
Manage-to-Core Portfolio 3 9.1%
Total/Core Leased 90.9%/93.5%
Investors 4 139
Contributions 5 $447.7M
Withdrawals $125.0M
Dividend Declared $92.0M
Trailing 4Q Gross Dist Yield/CQ Annualized Gross Dist Yield
3.2%/3.2%
Cash % of NAV 3.1%
1 See Notes to Performance2 Short-term line of credit balance was $0 as of
9/30/213 Represents the Manage-to-Core Portfolio on a fully
funded basis plus appreciation to date – At current carry values, the Manage-to-Core portfolio is 6.6%
4 Invested as of 9/30/215 Includes reinvested dividends
1 Based on Proforma Gross Market Values, which includes the Manage-to-Core Portfolio on a fully funded basis plus appreciation to date2 Certain MSAs within close proximity to each other are grouped into Areas
Invesco Core Real Estate – U.S.A. Flash Report
Third Quarter 2021
Diversification by Property Type 1
18% 18%
11%8% 7% 6% 5%
5% 4% 3%
0.0
0.5
1.0
1.5
2.0
2.5
3.0
3.5Top Ten MSAs ($ billions) 1, 2
Legend: Residential Industrial Office Retail Other
Fund Highlights
PRIVILEGED AND CONFIDENTIAL. FOR EXISTING FUND INVESTOR USE ONLY.
Solana Beach Self Storage Solana Beach, CA
confidential
confidential

Investment Policy & Performance Product Management
William C. Grubbs Jr.Managing Director,Co-Lead Portfolio ManagerInvesco Real Estate2001 Ross Ave, 3400Dallas, TX [email protected]
Michelle L. FossManaging Director,Co-Lead Portfolio ManagerInvesco Real Estate101 California St, 1800San Francisco, CA [email protected]
Chad ProvostSenior Director,Portfolio ManagerInvesco Real Estate225 Liberty St, 1200New York, NY [email protected]
Preston Covington Associate Director,Portfolio ManagementInvesco Real Estate2001 Ross Ave, 3400Dallas, TX [email protected]
Isabel HanSenior Associate,Product ManagementInvesco Real Estate225 Liberty St, 1200New York, NY [email protected]
Fund Operations Investor Relations
Thomas ThreadgillDirector,Fund Operations Invesco Real Estate2001 Ross Ave, 3400Dallas, TX 75201972-715-7440 [email protected]
Trent HeinerSenior Associate,Fund OperationsInvesco Real Estate2001 Ross Ave, 3400Dallas, TX [email protected]
Meredith WeatherbyAssociate,Fund OperationsInvesco Real Estate2001 Ross Ave, 3400Dallas, TX [email protected]
Melissa NeckarAssociate Director,Investor Relations SpecialistInvesco Real Estate2001 Ross Ave, 3400Dallas, TX [email protected]
Notes to Performance
Invesco Core Real Estate – U.S.A.Third Quarter 2021
1. Invesco Core Real Estate - U.S.A., L.P. is a core style, open-end real estate fund with a September 30, 2004 inception date. The Fund can alsoinvest up to 15% of gross assets in value added strategies.
2. Information is presented on a preliminary basis and is subject to change.3. Performance is calculated in U.S. dollars. Performance returns are leveraged and calculated on an investment level following the Modified Dietz
methodology.4. Returns include Fund Level operating expenses. The impact of cash balances and any interest earnings are also reflected in the Fund’s returns.5. Returns are shown gross of fees. An investor’s return would be reduced by the amount of the fees which could differ based on the size of their
investment. The highest fee would be 1.0% of NAV assuming a minimum investment of $10 million.6. Operating results of the Fund are presented on a fair value basis of accounting in conformity with U.S. GAAP and are audited annually.7. Real estate investments and debt obligations are valued on a quarterly basis by independent third party valuers.8. In an effort to most accurately reflect the Fund’s geographic and property type exposure and provide information on leverage and other investment
parameters, all Joint Venture investments are reported at the Fund’s ownership percentage.9. Investors in the Fund have the option of reinvesting all or a portion of the quarterly cash distributions made by the Fund.10. UBIT/Transactions: To date, no investments have been made outside of ICRE REIT Holdings. If ICRE REIT Holdings is determined to be a "pension-
held REIT", the Manager does not anticipate that tax-exempt Members will be subject to unrelated business income tax except to the extent theyown more than 10% of the Fund's Units or they have borrowed to make their investment in the Fund. As of the date of this report ICRE REITHoldings is not a “pension-held REIT”.
11. As with all investments there are associated inherent risks. Please obtain and review all financial materials carefully before investing.12. Certain information contained in this report constitutes forward-looking statements, which can be identified by the use of forward-looking
terminology such as “may,” “seek,” “should,” “expect,” “anticipate,” “project,” “estimate,” “intend,” “continue,” or “believe” or the negativesthereof or other variations thereon or comparable terminology. While we believe that such statements and information are based upon reasonableestimates and assumptions, due to various risks and uncertainties, actual events or results or the actual performance may differ materially fromthose reflected or contemplated in such forward-looking statements.
This report may contain confidential and proprietary information for the Fund and Invesco Ltd. Circulation, disclosure or dissemination of all or any part ofthis material to any unauthorized persons is prohibited.
PRIVILEGED AND CONFIDENTIAL. FOR EXISTING FUND INVESTOR USE ONLY.
303 Logistics Glendale, AZ
confidential
confidential

Invesco Core Real Estate - U.S.A., L.P.
Pasadena Fire & Police Retirement System
Statement of Net Asset Value
Rollforward of quarterly investment activity:
FQE 09/30/21 FQE 12/31/20FQE 03/31/21FQE 06/30/21
Beginning Net Asset Value 11,931,126 11,413,309 11,270,711 11,116,901$ $ $ $
Dividend Reinvestments 62,753 62,72762,63963,880
Net Income/(Loss) 114,097 108,883 98,634 96,179
Realized Gain/(Loss) on Investments (46,496) (39,954) 12,9359,461
Unrealized Gain/(Loss) on Investments 794,398 491,277 102,609 69,644
Unrealized Gain/(Loss) on Debt (11,079) (4,543) 9,957 3,482
Dividend Payable (93,943) (91,401) (91,157)(97,040)
Ending Net Asset Value 12,804,843 11,931,126 11,413,309 11,270,711$ $ $ $
Ending Number of Units 62.63 62.30 61.96 61.61
Ownership Percentage 0.11% 0.11% 0.11% 0.11%
Management Fees Due 32,254.71 30,062.67 28,761.77 28,404.67$ $ $ $
Net Asset Value per Unit 204,448.47 191,518.22 184,211.71 182,923.00$ $ $ $
Total Fund Units Outstanding 57,452.5957,618.6857,693.3359,378.22
Notes*:
Units outstanding at beginning of quarter 62.30 61.96 61.61 61.27
Change in units due to contributions/(redemptions) - - - -
Change in units due to dividend reinvestments 0.33 0.34 0.34 0.35
Units outstanding at end of quarter 62.63 62.30 61.96 61.61
Dividend paid from previous quarter 93,943.11$ $ $ $91,400.80 91,157.48 90,746.55
Payment of management fees due from previous quarter (30,062.67) (28,761.77) (28,404.67) (28,019.12)
63,880.44 62,752.81 62,727.4362,639.03$ $ $ $Dividend reinvestments in current quarter
Pasadena Fire & Police Ret
*Due to the calculations/rounding of the disclosure information above, amounts may/may not total to the exact unit.
Invesco Core Real Estate - U.S.A., L.P.
127
confidential
confidential

Risk Parity Multi-Asset
Pasadena Fire & PoliceRetirement System
Month Ending:
September 30, 2021
Copyright © 2021 PanAgora AssetManagement. All Rights Reserved
1
Cover1
Contact Info3
Market Review4
Portfolio Returns (Abs Ret Accts)7
Statement of Net Assets8
Statement of Change in Net Assets9
Holdings10
Transactions11
Disclaimers12
Table of Contents
Table of Contents
2

Vanessa DeMeoPanAgora Asset ManagementOne International Place, 24th FloorBoston, MA 02210
Should you have any questions regarding the information in this report, please contact your ClientService Manager.
email:phone:fax:
617-204-1227
617-235-6200
Pasadena Fire & Police Retirement System Contact Information
3

Major Market Indices
Market Review
Q3 2021
Global equities did not perform well in Q3 with a return of -1.1% as measured by the MSCI All CountryWorld Index (ACWI) as concerns grew in regard to supply disruptions and rising inflation. Investorscontinued to scrutinize the economic growth rate, regardless of the pace, with sentiments regarding therisk of recession remaining low.
From a sector perspective, as measured by the MSCI ACWI, top performers consisted of Energy (+2.8%),Financials (+1.9%), and Information Technology (+0.5%). Sectors that underperformed consisted ofConsumer Discretionary (-5.1%), Materials (-5.0%), and Communication Services (-2.6%). From a factorperspective, investors favored high growth and momentum stocks as companies with strong value-basedmetrics were shunned.
Worries over persistent inflation coupled with the U.S. Federal Reserve (Fed) moving toward winding downaccommodative monetary policy caused yields to rise during Q3. The yield on the benchmark U.S. 10-yearTreasury note climbed 7 basis points as prices declined ending September at 1.52%. Performance across thebond market was mixed during the quarter with July being a particularly strong month of positiveperformance followed by down months in both August and September. In aggregate for Q3, the FTSE U.S.Treasury Index edged modestly lower by -0.04% while the FTSE World Government Bond ex-U.S. (Hedged)Index fared slightly worse losing -0.13%. Investment grade credit also only slightly declined during thequarter as the Bloomberg Barclays Credit Index fell by -0.03%. High inflation readings helped drive theBloomberg Barclays World Government Inflation-Linked Bond (Hedged) Index up +2.14% by quarter-end.
Commodity prices maintained their upward momentum in Q3 as the global economy began to fully reopenand demand increased following the worst of the coronavirus pandemic. The more heavily energy-weightedS&P Goldman Sachs Commodity Index (GSCI) gained +5.2% trailing the more balanced BloombergCommodity Index, which climbed by +6.6%.
Three Months Year to Date One YearIndexThreeYearsOne Month
FiveYears
S&P 500 Index 0.58 15.92 30.00 15.99 16.90-4.65
Russell 2000 Index -4.36 12.41 47.68 10.54 13.45-2.95
Russell 3000 Index -0.10 14.99 31.88 16.00 16.85-4.49
MSCI World Index -0.01 13.04 28.82 13.14 13.74-4.15
MSCI EAFE Index -0.45 8.35 25.73 7.62 8.81-2.90
MSCI Emerging Markets Index -8.09 -1.25 18.20 8.58 9.23-3.97
Bloomberg Barclays U.S. Aggregate Bond Index 0.05 -1.55 -0.90 5.36 2.94-0.87
ICE BofAML US 3-Month Treasury Bill Index 0.01 0.04 0.07 1.18 1.160.01
FTSE World Government Bond Index -1.24 -5.93 -3.33 3.73 1.35-2.26
60% MSCI World / 40% FTSE WGBI -0.49 5.14 15.13 9.72 8.92-3.39
Pasadena Fire & Police Retirement System MARKET REVIEW
4

Pasadena Fire & Police Retirement System MARKET REVIEW
July 2021
Global equities gained marginally in July. A strong earnings season among U.S. corporations helped equitiesgain during the month. Fears over the growing number of Covid-19 cases from the Delta variant sparkedworries among market participants. The U.S. Fed kept its interest rate target range between zero and 0.25%after its July meeting, as the economy continued to strengthen following the pandemic. From amacroeconomic standpoint, headline inflation surged in June. Eurozone business activity, as measured bythe Purchasing Managers’ Index (PMI), climbed to 60.2 in July, its highest level since June 2006, as moreindustries reopened throughout the region. The European Union outlined a new legislation package in Julyto combat climate change. Within emerging market equities, Chinese stocks sold off sharply during themonth as Beijing tightened regulations within the education sector.
Bonds were broadly positive to start Q3 as concerns over the spike in coronavirus cases caused by the Deltavariant boosted demand for safer assets. While advance estimate USD GDP came in at an annualized rate of6.5% in Q2, it was well below expectations and the decline in yields during the month signaled uneasinessin the marketplace regarding the global economic recovery. In the U.S., the yield on the 10-year Treasurynote fell 21 basis points as prices rose ending July at 1.24%. This notably was the largest one-month declinefor the yield on the 10-year since the pandemic struck in March 2020. Across the Atlantic, the decline inyields was even more pronounced for developed market government debt with the yield on the benchmark10-year German bund falling 31 basis points and ending the month at -0.47%.
Commodity prices rose in July for the fourth consecutive month as the broad economic reopeningcontinued to boost demand. Across the main commodity sectors, industrial metals and energy were the topperformers, while agriculture lagged. Both livestock and precious metals were close to flat for the month.
August 2021
A strong Q2 earnings season continued to help global equities rally during the month of August. Dovishcomments from the U.S. Fed also boosted equities despite ongoing concerns regarding the spread of theinfectious Delta variant of COVID-19. U.S. macroeconomic data released earlier in the month showed theproducer price index (PPI) jumping to a record high and its largest annual increase in more than a decade.Inflation in the Eurozone also hit its highest level in a decade as rising costs sparked by shortages ofsemiconductors are increasing the prices paid by consumers. Emerging market equities performed well forthe month. As the Fed debated the need to raise interest rates, emerging market economies such as Braziland Chile both raised interest rates during the month as consumer prices continued to rise.
After a strong showing in July, bonds took a step back in August as performance was modestly negativeacross segments of the market. The full FDA approval of the Pfizer vaccine combined with the release ofstrong economic data throughout the month put a damper on the demand for safer assets. Investors werealso able to take their cues from the Kansas City Fed’s Jackson Hole conference in which the central bankindicated no change from easy monetary policy. The yield on the benchmark U.S. 10-year Treasury noteclimbed 6 basis points to close August at 1.30%. Yields for European and Asia-Pacific developed marketgovernment debt also climbed during the month as economies expand amidst improved distribution of theCOVID-19 vaccines.
The commodities rally took a pause in August as the main indices were negative for the first time since
5
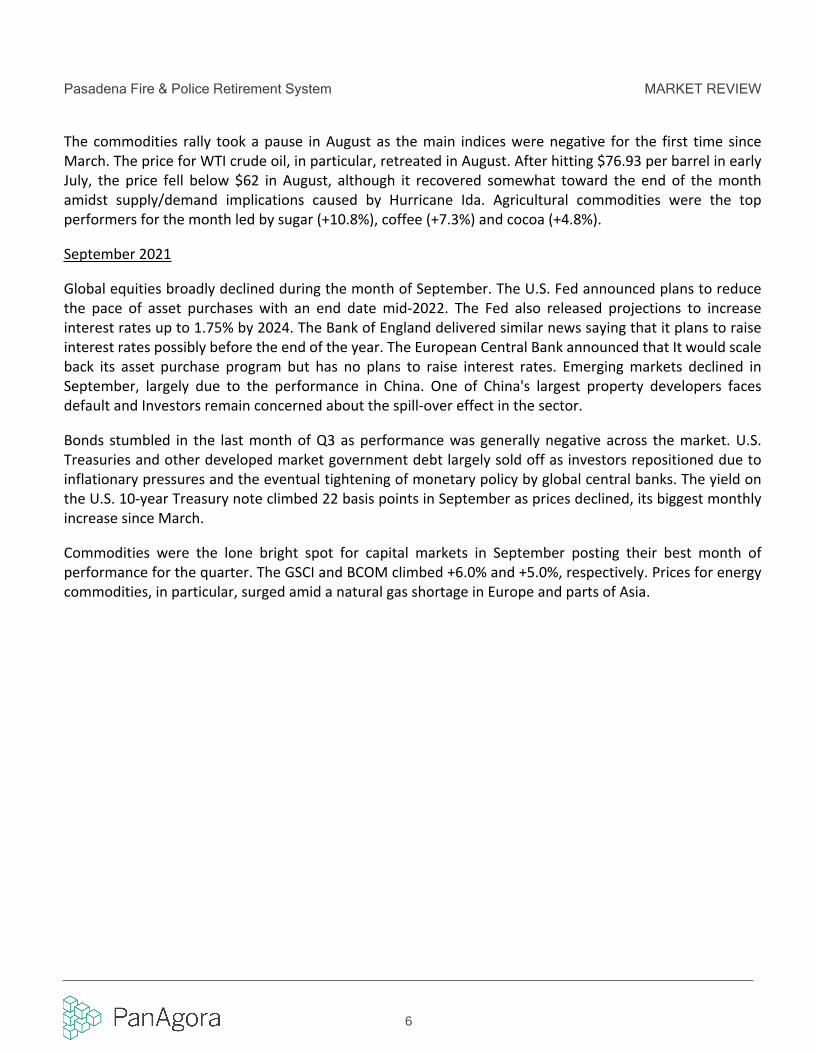
Pasadena Fire & Police Retirement System MARKET REVIEW
The commodities rally took a pause in August as the main indices were negative for the first time sinceMarch. The price for WTI crude oil, in particular, retreated in August. After hitting $76.93 per barrel in earlyJuly, the price fell below $62 in August, although it recovered somewhat toward the end of the monthamidst supply/demand implications caused by Hurricane Ida. Agricultural commodities were the topperformers for the month led by sugar (+10.8%), coffee (+7.3%) and cocoa (+4.8%).
September 2021
Global equities broadly declined during the month of September. The U.S. Fed announced plans to reducethe pace of asset purchases with an end date mid-2022. The Fed also released projections to increaseinterest rates up to 1.75% by 2024. The Bank of England delivered similar news saying that it plans to raiseinterest rates possibly before the end of the year. The European Central Bank announced that It would scaleback its asset purchase program but has no plans to raise interest rates. Emerging markets declined inSeptember, largely due to the performance in China. One of China's largest property developers facesdefault and Investors remain concerned about the spill-over effect in the sector.
Bonds stumbled in the last month of Q3 as performance was generally negative across the market. U.S.Treasuries and other developed market government debt largely sold off as investors repositioned due toinflationary pressures and the eventual tightening of monetary policy by global central banks. The yield onthe U.S. 10-year Treasury note climbed 22 basis points in September as prices declined, its biggest monthlyincrease since March.
Commodities were the lone bright spot for capital markets in September posting their best month ofperformance for the quarter. The GSCI and BCOM climbed +6.0% and +5.0%, respectively. Prices for energycommodities, in particular, surged amid a natural gas shortage in Europe and parts of Asia.
6
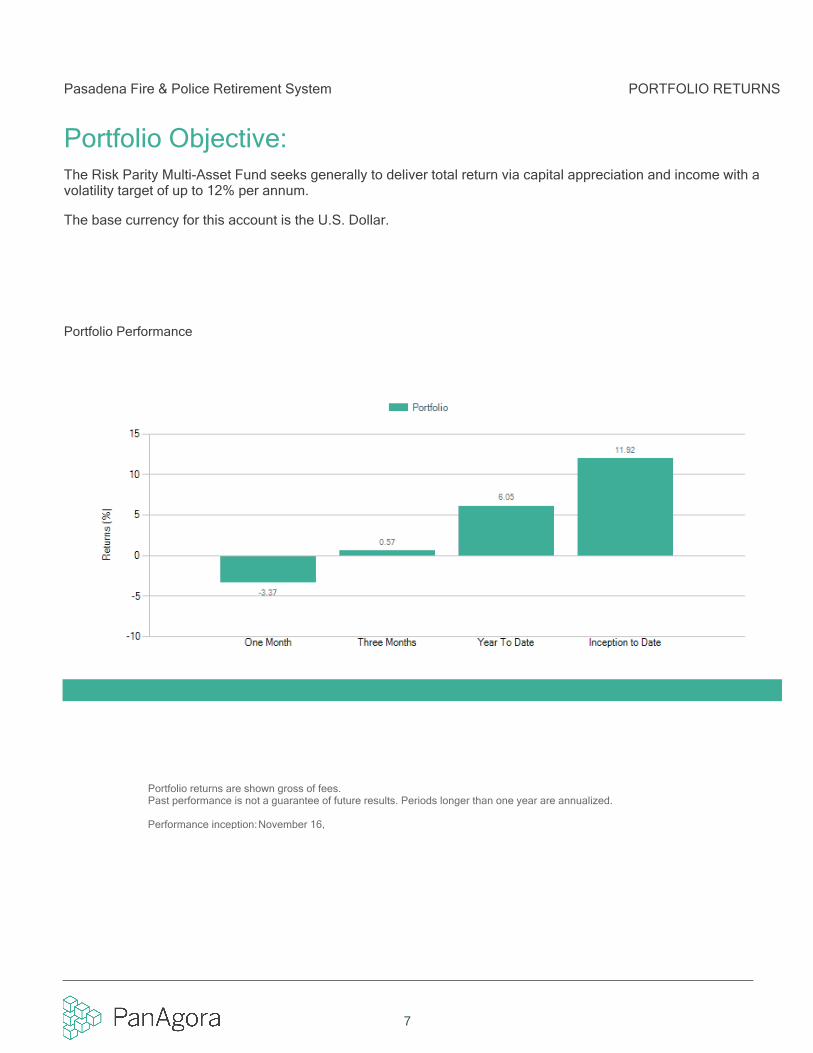
The base currency for this account is the U.S. Dollar.
The Risk Parity Multi-Asset Fund seeks generally to deliver total return via capital appreciation and income with avolatility target of up to 12% per annum.
Portfolio Objective:
Portfolio Performance
Portfolio returns are shown gross of fees.Past performance is not a guarantee of future results. Periods longer than one year are annualized.
Performance inception:November 16,
Pasadena Fire & Police Retirement System PORTFOLIO RETURNS
7

ASSETS
INVESTMENTS
5,987,173.66Cost
713,621.87Unrealized Appreciation-Invest
6,700,795.53INVESTMENTS SUBTOTAL
6,700,795.53TOTAL ASSETS
Net Assets 6,700,795.53
Pasadena Fire & Police Retirement System
Risk Parity Multi-Asset
STATEMENT OF NET ASSETSSeptember 30, 2021
8

Information shown in .USD
6,934,539.72Net Assets -- Beginning of Period
RECEIPTS:
INVESTMENT INCOME:
-233,744.19UNREALIZED GAIN/LOSS-INVESTMENT
-233,744.19TOTAL RECEIPTS:
6,700,795.53Net Assets -- End of Period
Pasadena Fire & Police Retirement System STATEMENT OF CHANGE IN NET ASSETS
9

Description Sedol Base PriceUnrealized
Gain/Loss BaseShares/ Par
Value % of TotalBase
Market Value Base Cost
U.S. Dollar 1.000000
6,700,795.5323.68282,971 713,621.88Risk Parity Multi Asset GT 100.00%5,987,173.65
Total U.S. Dollar : 100.00% 6,700,795.53 713,621.88 100.00%5,987,173.65
TOTAL:713,621.886,700,795.53 5,987,173.65
Detailed holdings information available on request.
Pasadena Fire & Police Retirement System HOLDINGS
10

There were no transactions during this period.
Pasadena Fire & Police Retirement System TRANSACTIONS
11

The opinions expressed in this article represent the current, good faith views of the author(s) at the time ofpublication, are provided for limited purposes, are not definitive investment advice, and should not be relied on assuch. The information presented in this article has been developed internally and/or obtained from sourcesbelieved to be reliable; however, PanAgora does not guarantee the accuracy, adequacy or completeness of suchinformation. Predictions, opinions, and other information contained in this article are subject to changecontinually and without notice of any kind and may no longer be true after the date indicated. Past performanceis not a guarantee of future results. As with any investment there is a potential for profit as well as the possibilityof loss.
Any forward-looking statements speak only as of the date they are made, and PanAgora assumes no duty to anddoes not undertake to update forward-looking statements. Forward-looking statements are subject to numerousassumptions, risks and uncertainties, which change over time. Actual results could differ materially from thoseanticipated in forward-looking statements.
This material is directed exclusively at investment professionals. Any investments to which this material relatesare available only to or will be engaged in only with investment professionals.
Pasadena Fire & Police Retirement System DISCLAIMERS
12
Risk Parity Multi-Asset
Risk Parity Multi-Asset GT
Month Ending:
September 30, 2021
Copyright © 2021 PanAgora AssetManagement. All Rights Reserved

RPMA Master Fund Return Summary 1
RPMA Contribution to Return 2
RPMA Notional Exposure 3
RPMA Risk Allocation 4
RPMA Porfolio Composition 5
RPMA Lag Holdings 6
RPMA Trade Secret Disclosure 83
Table of Contents Page Number

MASTER FUNDPERFORMANCERISK PARITY MULTI-ASSET GT
AUM: 1,930,569,898
Account Return
USDCurrency:
CUMULATIVE PERIODS
One Month -3.37 %Quarter to Date 0.58 %Three Months 0.58 %Four Months 1.95 %Six Months 7.93 %Year To Date 6.07 %
ANNUALIZED PERIODS
One Year 15.20 %
Two Years 9.26 %
Three Years 11.45 %
Four Years 8.83 %
Five Years 7.72 %
Six Years 9.59 %
Seven Years 8.08 %
Eight Years 8.57 %
Nine Years 7.94 %
Ten Years 9.07 %
Inception to Date 8.16 %
CALENDAR YEARS
2008 -14.38 %
2009 7.23 %
2010 19.15 %
2011 11.72 %
2012 14.11 %
2013 3.62 %
2014 13.93 %
2015 -3.65 %
2016 13.77 %
2017 13.07 %
2018 -6.99 %
2019 21.43 %
2020 12.24 %
Portfolio Performance is Gross of FeesPast Performance is not a guarantee of future results
January 31, 2007
September 30, 2021
Inception Date:
1
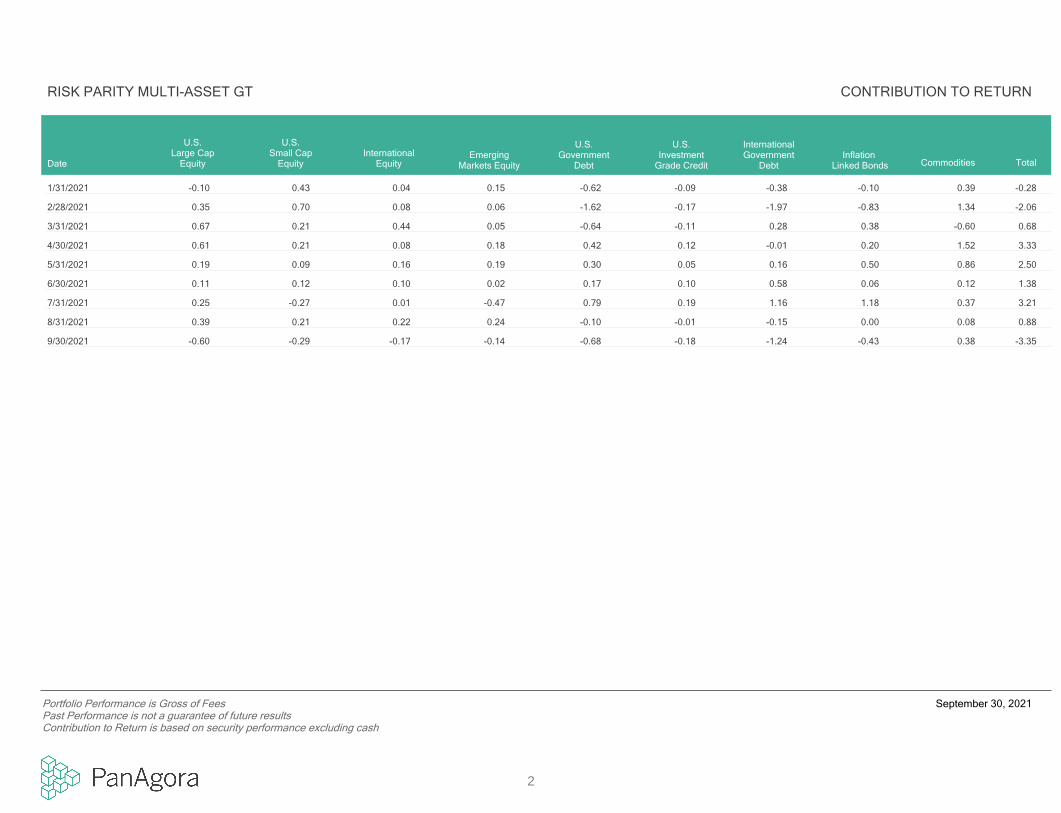
1/31/2021 -0.10 0.43 0.04 0.15 -0.62 -0.09 -0.38 -0.10 0.39 -0.28
2/28/2021 0.35 0.70 0.08 0.06 -1.62 -0.17 -1.97 -0.83 1.34 -2.06
3/31/2021 0.67 0.21 0.44 0.05 -0.64 -0.11 0.28 0.38 -0.60 0.68
4/30/2021 0.61 0.21 0.08 0.18 0.42 0.12 -0.01 0.20 1.52 3.33
5/31/2021 0.19 0.09 0.16 0.19 0.30 0.05 0.16 0.50 0.86 2.50
6/30/2021 0.11 0.12 0.10 0.02 0.17 0.10 0.58 0.06 0.12 1.38
7/31/2021 0.25 -0.27 0.01 -0.47 0.79 0.19 1.16 1.18 0.37 3.21
8/31/2021 0.39 0.21 0.22 0.24 -0.10 -0.01 -0.15 0.00 0.08 0.88
9/30/2021 -0.60 -0.29 -0.17 -0.14 -0.68 -0.18 -1.24 -0.43 0.38 -3.35
Date
U.S.Large Cap
Equity
U.S.Small Cap
EquityInternational
EquityEmerging
Markets Equity
U.S.Government
Debt
U.S.Investment
Grade Credit
InternationalGovernment
DebtInflation
Linked Bonds Commodities Total
CONTRIBUTION TO RETURNRISK PARITY MULTI-ASSET GT
September 30, 2021Portfolio Performance is Gross of FeesPast Performance is not a guarantee of future resultsContribution to Return is based on security performance excluding cash
2

1/31/2021 13.55 11.66 10.08 9.37 61.36 6.92 61.95 20.89 27.73 223.52
2/28/2021 11.67 12.33 9.02 9.66 57.48 6.84 59.51 19.66 28.67 214.84
3/31/2021 12.97 12.30 8.99 8.65 44.02 8.08 55.70 16.74 23.15 190.61
4/30/2021 13.68 11.64 9.51 8.17 37.43 7.05 58.01 21.33 24.50 191.31
5/31/2021 13.76 10.61 10.51 7.93 49.36 7.74 69.98 17.99 27.13 215.01
6/30/2021 12.84 9.88 10.13 8.98 35.42 9.29 61.37 18.70 21.80 188.40
7/31/2021 14.02 10.07 9.92 8.29 41.38 9.03 61.25 18.14 18.18 190.27
8/31/2021 14.07 10.14 12.49 7.09 38.89 8.78 63.83 18.09 19.96 193.34
9/30/2021 12.81 10.33 13.16 7.62 40.80 8.66 67.48 18.28 19.82 198.95
PanAgora accounts may have exposure to some or all of the markets and asset classes discussed herein. Source: PanAgoraFixed Income positions are expressed in 10-year zero coupon duration equivalents
September 30, 2021
Date
U.S.Large Cap
Equity
U.S.Small Cap
EquityInternational
EquityEmerging
Markets Equity
U.S.Government
Debt
U.S.Investment
Grade Credit
InternationalGovernment
Debt
InflationLinkedBonds Commodities Total
NOTIONAL EXPOSURERISK PARITY MULTI-ASSET GT
3
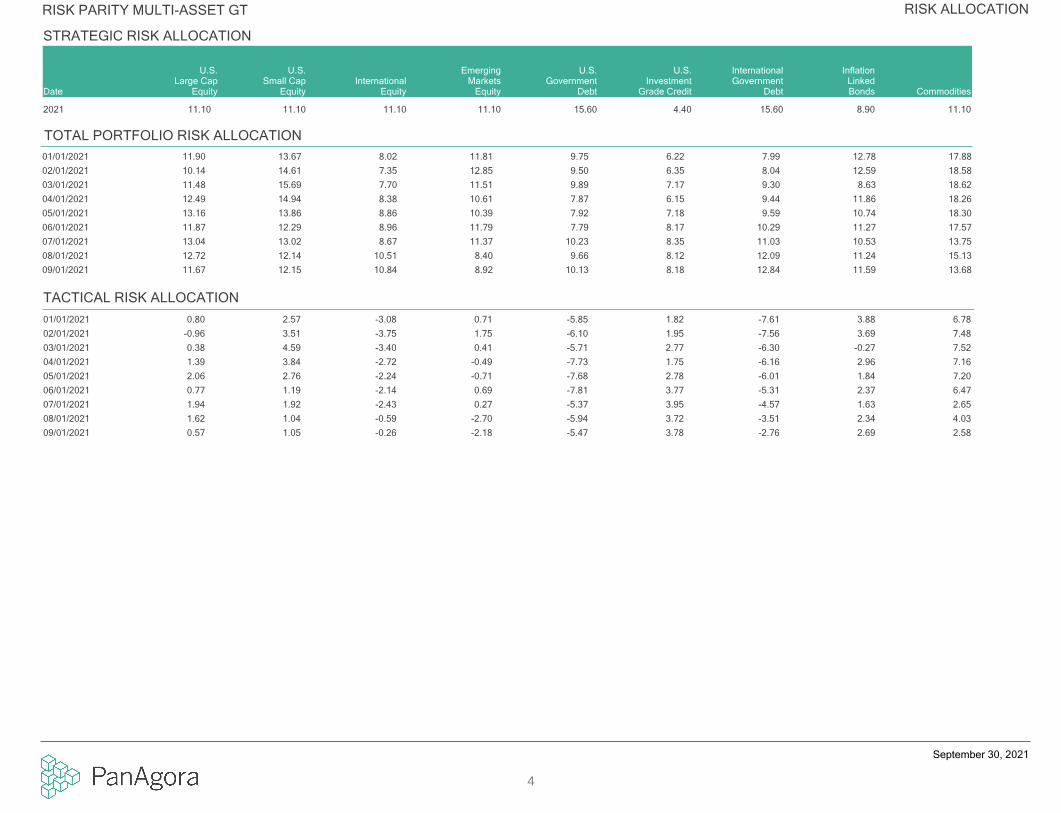
U.S.Large Cap
Equity
U.S.Investment
Grade CreditDate
U.S.Government
Debt Commodities
EmergingMarkets
Equity
U.S.Small Cap
EquityInternational
Equity
InternationalGovernment
Debt
InflationLinkedBonds
STRATEGIC RISK ALLOCATION
11.10 8.9015.60 11.104.4011.10 11.10 15.6011.102021
TOTAL PORTFOLIO RISK ALLOCATION
01/01/2021 11.90 13.67 8.02 11.81 9.75 6.22 7.99 12.78 17.88
02/01/2021 10.14 14.61 7.35 12.85 9.50 6.35 8.04 12.59 18.58
03/01/2021 11.48 15.69 7.70 11.51 9.89 7.17 9.30 8.63 18.62
04/01/2021 12.49 14.94 8.38 10.61 7.87 6.15 9.44 11.86 18.26
05/01/2021 13.16 13.86 8.86 10.39 7.92 7.18 9.59 10.74 18.30
06/01/2021 11.87 12.29 8.96 11.79 7.79 8.17 10.29 11.27 17.57
07/01/2021 13.04 13.02 8.67 11.37 10.23 8.35 11.03 10.53 13.75
08/01/2021 12.72 12.14 10.51 8.40 9.66 8.12 12.09 11.24 15.13
09/01/2021 11.67 12.15 10.84 8.92 10.13 8.18 12.84 11.59 13.68
TACTICAL RISK ALLOCATION
01/01/2021 0.80 2.57 -3.08 0.71 -5.85 1.82 -7.61 3.88 6.78
02/01/2021 -0.96 3.51 -3.75 1.75 -6.10 1.95 -7.56 3.69 7.48
03/01/2021 0.38 4.59 -3.40 0.41 -5.71 2.77 -6.30 -0.27 7.52
04/01/2021 1.39 3.84 -2.72 -0.49 -7.73 1.75 -6.16 2.96 7.16
05/01/2021 2.06 2.76 -2.24 -0.71 -7.68 2.78 -6.01 1.84 7.20
06/01/2021 0.77 1.19 -2.14 0.69 -7.81 3.77 -5.31 2.37 6.47
07/01/2021 1.94 1.92 -2.43 0.27 -5.37 3.95 -4.57 1.63 2.65
08/01/2021 1.62 1.04 -0.59 -2.70 -5.94 3.72 -3.51 2.34 4.03
09/01/2021 0.57 1.05 -0.26 -2.18 -5.47 3.78 -2.76 2.69 2.58
RISK ALLOCATIONRISK PARITY MULTI-ASSET GT
September 30, 2021
4

Top 10 Holdings % of Portfolio
JPN 10Y BOND(OSE) Dec 2021 23.28 %
TREASURY NOTES FUTURES, 10-YEAR - CBT Dec 2021 12.33 %
US LONG BOND(CBT) Dec 2021 11.92 %
AUSTRALIAN BOND FUTURE, 10-YEAR Dec 2021 9.57 %
CANADA BOND FUTURE, 10-YEAR Dec 2021 9.14 %
TREASURY NOTES FUTURES, 5-YEAR - CBT Dec 2021 9.11 %
UK LONG GILT FUTURES Dec 2021 8.46 %
TREASURY NOTES FUTURES, 2-YEAR - CBT Dec 2021 7.44 %
E-MINI RUSSELL 2000 Dec 2021 7.39 %
E-MINI S&P 500 INDEX FUTURE Dec 2021 6.56 %
Total 105.19 %
Fixed Income positions are expressed in 10-year zero coupon duration equivalents September 30, 2021
PORTFOLIO COMPOSITIONRISK PARITY MULTI-ASSET GT
5

21VIANET GROUP INC-ADR 0.0090138A103 AMERICAN DEPOSITORY RECEIPT 2,011 39,79219.79INFORMATION TECHNOLOGY CN
360 SECURITY TECHNOLOGY IN-A 0.00BDF57C1 COMMON STOCK 10,456 19,2511.84INFORMATION TECHNOLOGY CN
3SBIO INC 0.00BY9D3L9 COMMON STOCK 14,298 15,9391.11HEALTH CARE CN
A2 MILK CO LTD 0.006287250 COMMON STOCK 15,932 67,6174.24CONSUMER STAPLES NZ
AAC TECHNOLOGIES HOLDINGS IN 0.00B85LKS1 COMMON STOCK 2,234 12,4535.57INFORMATION TECHNOLOGY CN
AAON INC 0.01000360206 COMMON STOCK 2,888 196,72768.11INDUSTRIALS US
ABBOTT LABORATORIES 0.02002824100 COMMON STOCK 2,558 323,308126.37HEALTH CARE US
ABBVIE INC 0.0100287Y109 COMMON STOCK 1,925 232,498120.78HEALTH CARE US
ABC-MART INC 0.016292102 COMMON STOCK 2,736 146,67853.61CONSUMER DISCRETIONARY JP
ABDULLAH AL OTHAIM MARKETS 0.03B3BQB93 COMMON STOCK 18,009 553,12330.71CONSUMER STAPLES SA
ABIOMED INC 0.01003654100 COMMON STOCK 493 179,466363.96HEALTH CARE US
ABM INDUSTRIES INC 0.00000957100 COMMON STOCK 1,931 95,60349.52INDUSTRIALS US
ABOITIZ EQUITY VENTURES INC 0.016068411 COMMON STOCK 138,095 119,4970.87INDUSTRIALS PH
ABU DHABI COMMERCIAL BANK 0.006545464 COMMON STOCK 24,507 50,1072.04FINANCIALS AE
ABU DHABI ISLAMIC BANK 0.006001728 COMMON STOCK 3,037 4,6631.54FINANCIALS AE
ABU DHABI NATIONAL OIL CO FO 0.00BYVGM64 COMMON STOCK 67,743 83,3621.23CONSUMER DISCRETIONARY AE
ACCTON TECHNOLOGY CORP 0.006005214 COMMON STOCK 7,519 76,10410.12INFORMATION TECHNOLOGY TW
ACER INC 0.016005850 COMMON STOCK 151,025 137,3280.91INFORMATION TECHNOLOGY TW
ACI WORLDWIDE INC 0.01004498101 COMMON STOCK 4,963 159,96032.23INFORMATION TECHNOLOGY US
ACOM CO LTD 0.006049784 COMMON STOCK 12,863 49,7603.87FINANCIALS JP
ACTIVISION BLIZZARD INC 0.0200507V109 COMMON STOCK 4,885 402,40682.37COMMUNICATION SERVICES US
ACUSHNET HOLDINGS CORP 0.03005098108 COMMON STOCK 9,920 495,61049.96CONSUMER DISCRETIONARY US
ADANI PORTS AND SPECIAL ECON 0.01B28XXH2 COMMON STOCK 10,273 105,29810.25INDUSTRIALS IN
ADANI TOTAL GAS LTD 0.00BGJW2K2 COMMON STOCK 232 4,62319.90UTILITIES IN
ADECCO GROUP AG-REG 0.017110720 COMMON STOCK 2,677 148,95555.65INDUSTRIALS CH
ADIDAS AG 0.014031976 COMMON STOCK 333 118,094354.67CONSUMER DISCRETIONARY DE
ADMIRAL GROUP PLC 0.01B02J639 COMMON STOCK 3,499 173,90749.70FINANCIALS GB
ADOBE INC 0.0200724F101 COMMON STOCK 547 362,956663.70INFORMATION TECHNOLOGY US
ADVANCE AUTO PARTS INC 0.0100751Y106 COMMON STOCK 625 126,832202.85CONSUMER DISCRETIONARY US
ADVANCED INFO SERVICE-FOR RG 0.016412591 COMMON STOCK 18,588 108,4155.83COMMUNICATION SERVICES TH
ADVANCED INFO SERVICE-FOR RG 0.006412591 COMMON STOCK 1,698 9,9035.83COMMUNICATION SERVICES TH
ADVANCED MICRO DEVICES 0.01007903107 COMMON STOCK 1,490 164,996110.72INFORMATION TECHNOLOGY US
ADVANCED PETROCHEMICALS CO 0.01B1P6WF8 COMMON STOCK 8,927 170,42419.09MATERIALS SA
ADVANCED PETROCHEMICALS CO 0.00B1P6WF8 COMMON STOCK 45 85319.09MATERIALS SA
Security NameSecurityWeight
HOLDINGS 30 DAY LAG
SecurityIdentifier Security Type Units Held
Base MarketValueBase PriceSector Country
Risk Parity Multi-Asset GT
USDBase Currency:
Market Value: 1,961,759,259
August 31, 2021
6

ADVANTECH CO LTD 0.006202673 COMMON STOCK 4,914 68,44513.93INFORMATION TECHNOLOGY TW
ADVANTECH CO LTD 0.006202673 COMMON STOCK 624 8,68813.93INFORMATION TECHNOLOGY TW
ADVANTEST CORP 0.006870490 COMMON STOCK 730 63,24186.66INFORMATION TECHNOLOGY JP
ADYEN NV 0.02BZ1HM42 COMMON STOCK 97 312,1383,227.96INFORMATION TECHNOLOGY NL
AEGON NV 0.015927375 COMMON STOCK 25,898 128,2164.95FINANCIALS NL
AENA SME SA 0.00BVRZ8L1 COMMON STOCK 605 96,528159.60INDUSTRIALS ES
AEON CO LTD 0.026480048 COMMON STOCK 17,633 468,58826.57CONSUMER STAPLES JP
AES CORP 0.0200130H105 COMMON STOCK 13,803 329,47623.87UTILITIES US
AFLAC INC 0.01001055102 COMMON STOCK 2,347 133,02656.68FINANCIALS US
AFRICAN DEVELOPMENT BANK 0.0800828EBD0
CORPORATE BOND 1,500,000 1,517,541100.13US
AFRICAN RAINBOW MINERALS LTD 0.016041122 COMMON STOCK 5,565 99,70717.92MATERIALS ZA
AFRICAN RAINBOW MINERALS LTD 0.006041122 COMMON STOCK 165 2,96217.92MATERIALS ZA
AFTERPAY LTD 0.01BF5L8B9 COMMON STOCK 1,861 183,05698.37INFORMATION TECHNOLOGY AU
AGC INC 0.006055208 COMMON STOCK 1,003 48,59348.43INDUSTRIALS JP
AGEAS 0.01B86S2N0 COMMON STOCK 2,424 121,17449.99FINANCIALS BE
AGILE GROUP HOLDINGS LTD 0.00B0PR2F4 COMMON STOCK 893 1,0241.15REAL ESTATE CN
AGILENT TECHNOLOGIES INC 0.0100846U101 COMMON STOCK 1,358 238,298175.47HEALTH CARE US
AGILITY 0.016890302 COMMON STOCK 67,906 225,5263.32INDUSTRIALS KW
AGL ENERGY LTD 0.01BSS7GP5 COMMON STOCK 21,991 103,6644.71UTILITIES AU
AGNICO EAGLE MINES LTD 0.00008474108 COMMON STOCK 1,596 91,66757.45MATERIALS CA
AGREE REALTY CORP 0.00008492100 REAL ESTATE INVESTMENT TRUST 632 47,08074.55REAL ESTATE US
AGRICULTURAL BANK OF CHINA-A 0.00BP3R228 COMMON STOCK 2,681 1,2280.46FINANCIALS CN
AGRICULTURAL BANK OF CHINA-H 0.00B60LZR6 COMMON STOCK 4,468 1,4990.34FINANCIALS CN
AIR CANADA 0.00008911877 COMMON STOCK 3,212 62,30119.40INDUSTRIALS CA
AIR LIQUIDE SA 0.01B1YXBJ7 COMMON STOCK 1,195 214,172179.22MATERIALS FR
AIR PRODUCTS & CHEMICALS INC 0.01009158106 COMMON STOCK 1,041 280,525269.51MATERIALS US
AIRBUS SE 0.004012250 COMMON STOCK 699 95,439136.58INDUSTRIALS FR
AJINOMOTO CO INC 0.036010906 COMMON STOCK 21,507 635,07429.53CONSUMER STAPLES JP
AKAMAI TECHNOLOGIES INC 0.0100971T101 COMMON STOCK 1,189 134,704113.25INFORMATION TECHNOLOGY US
AKZO NOBEL N.V. 0.01BJ2KSG2 COMMON STOCK 1,441 177,632123.24MATERIALS NL
AL RAJHI BANK 0.01B12LZH9 COMMON STOCK 3,855 124,37032.26FINANCIALS SA
ALBEMARLE CORP 0.02012653101 COMMON STOCK 1,350 319,564236.74MATERIALS US
ALCON INC 0.02BJT1GR5 COMMON STOCK 3,571 294,04782.35HEALTH CARE CH
ALDAR PROPERTIES PJSC 0.01B0LX3Y2 COMMON STOCK 129,148 145,9141.13REAL ESTATE AE
Security NameSecurityWeight
HOLDINGS 30 DAY LAG
SecurityIdentifier Security Type Units Held
Base MarketValueBase PriceSector Country
Risk Parity Multi-Asset GT
USDBase Currency:
Market Value: 1,961,759,259
August 31, 2021
7

ALERUS FINANCIAL CORP 0.0101446U103 COMMON STOCK 4,741 141,56329.86FINANCIALS US
ALEXANDER'S INC 0.00014752109 REAL ESTATE INVESTMENT TRUST 134 35,713266.30REAL ESTATE US
ALEXANDRIA REAL ESTATE EQUIT 0.01015271109 REAL ESTATE INVESTMENT TRUST 1,360 280,638206.37REAL ESTATE US
ALFA LAVAL AB 0.017332687 COMMON STOCK 6,263 253,76940.52INDUSTRIALS SE
ALGONQUIN POWER & UTILITIES 0.00015857105 COMMON STOCK 3,591 55,66415.50UTILITIES CA
ALIBABA GROUP HOLDING-SP ADR 0.0001609W102
AMERICAN DEPOSITORY RECEIPT 139 23,280166.99CONSUMER DISCRETIONARY CN
ALIBABA HEALTH INFORMATION T 0.00BRXVS60 COMMON STOCK 19,660 32,2561.64HEALTH CARE HK
ALIGN TECHNOLOGY INC 0.03016255101 COMMON STOCK 811 575,131709.00HEALTH CARE US
ALIMENTATION COUCHE-TARD -B 0.0101626P403 COMMON STOCK 4,704 189,79440.34CONSUMER STAPLES CA
ALINMA BANK 0.00B39NWT3 COMMON STOCK 5,067 30,9366.11FINANCIALS SA
ALINMA BANK 0.00B39NWT3 COMMON STOCK 368 2,2486.11FINANCIALS SA
ALLEGIANCE BANCSHARES INC 0.0001748H107 COMMON STOCK 1,732 64,39437.17FINANCIALS US
ALLEGION PLC 0.01G0176J109 COMMON STOCK 1,382 198,958143.99INDUSTRIALS IE
ALLETE INC 0.03018522300 COMMON STOCK 8,672 584,67467.42UTILITIES US
ALLIANT ENERGY CORP 0.03018802108 COMMON STOCK 10,994 668,31660.79UTILITIES US
ALLIANZ SE-REG 0.005231485 COMMON STOCK 360 84,639234.89FINANCIALS DE
ALLSTATE CORP 0.01020002101 COMMON STOCK 1,294 175,086135.28FINANCIALS US
ALMARAI CO 0.00B137VV2 COMMON STOCK 3,042 47,04015.46CONSUMER STAPLES SA
ALPARGATAS SA - PREF 0.00B07C796 PREFERENCE 3,932 46,05911.71CONSUMER DISCRETIONARY BR
ALPHABET INC 0.0502079KAC1
CORPORATE BOND 1,000,000 1,052,482105.16US
ALPHABET INC-CL A 0.0302079K305 COMMON STOCK 197 569,7382,893.95COMMUNICATION SERVICES US
ALROSA PJSC 0.00B6QPBP2 COMMON STOCK 28,908 57,5431.99MATERIALS RU
ALSTOM 0.00B0DJ8Q5 COMMON STOCK 1,753 75,33942.97INDUSTRIALS FR
ALTAGAS LTD 0.00021361100 COMMON STOCK 3,492 69,83320.00UTILITIES CA
ALTAIR ENGINEERING INC - A 0.01021369103 COMMON STOCK 1,686 124,77673.99INFORMATION TECHNOLOGY US
ALTEOGEN INC 0.00BSTJWN0 COMMON STOCK 386 28,30273.31HEALTH CARE KR
ALTRIA GROUP INC 0.0802209S103 COMMON STOCK 32,513 1,633,13250.23CONSUMER STAPLES US
AMAZON.COM INC 0.01023135106 COMMON STOCK 45 155,0083,470.79CONSUMER DISCRETIONARY US
AMBU A/S-B 0.01BD9G333 COMMON STOCK 7,339 231,94231.60HEALTH CARE DK
AMBUJA CEMENTS LTD 0.00B09QQ11 COMMON STOCK 16,373 94,4285.77MATERIALS IN
AMCOR PLC 0.05G0250X107 COMMON STOCK 81,736 1,050,30312.85MATERIALS GB
AMEREN CORPORATION 0.03023608102 COMMON STOCK 7,531 660,64387.72UTILITIES US
AMERICA MOVIL-SPN ADR CL L 0.0102364W105
AMERICAN DEPOSITORY RECEIPT 6,591 128,91219.56COMMUNICATION SERVICES MX
AMERICAN AIRLINES GROUP INC 0.0102376R102 COMMON STOCK 5,333 106,33719.94INDUSTRIALS US
Security NameSecurityWeight
HOLDINGS 30 DAY LAG
SecurityIdentifier Security Type Units Held
Base MarketValueBase PriceSector Country
Risk Parity Multi-Asset GT
USDBase Currency:
Market Value: 1,961,759,259
August 31, 2021
8

AMERICAN ELECTRIC POWER 0.03025537101 COMMON STOCK 7,599 680,61789.57UTILITIES US
AMERICAN EXPRESS CO 0.00025816109 COMMON STOCK 374 62,018165.96FINANCIALS US
AMERICAN SOFTWARE INC-CL A 0.01029683109 COMMON STOCK 7,711 195,63625.37INFORMATION TECHNOLOGY US
AMERICAN STATES WATER CO 0.05029899101 COMMON STOCK 11,679 1,076,88292.21UTILITIES US
AMERICAN TOWER CORP 0.0103027X100 REAL ESTATE INVESTMENT TRUST 376 109,714292.17REAL ESTATE US
AMERICAN VANGUARD CORP 0.01030371108 COMMON STOCK 14,093 216,03915.33MATERIALS US
AMERICAN WATER WORKS CO INC 0.02030420103 COMMON STOCK 1,983 361,457182.25UTILITIES US
AMERICANAS SA 0.00BN925F7 COMMON STOCK 3,606 29,1318.08CONSUMER DISCRETIONARY BR
AMERIPRISE FINANCIAL INC 0.0103076C106 COMMON STOCK 868 236,803272.91FINANCIALS US
AMERISAFE INC 0.0003071H100 COMMON STOCK 940 54,08457.55FINANCIALS US
AMETEK INC 0.00031100100 COMMON STOCK 561 76,340135.97INDUSTRIALS US
AMGEN INC 0.01031162100 COMMON STOCK 1,256 283,259225.53HEALTH CARE US
AMMB HOLDINGS BHD 0.016047023 COMMON STOCK 155,047 113,0120.73FINANCIALS MY
AMMB HOLDINGS BHD 0.006047023 COMMON STOCK 6,702 4,8850.73FINANCIALS MY
AMOREPACIFIC CORP 0.00B15SK50 COMMON STOCK 161 31,562196.21CONSUMER STAPLES KR
AMOREPACIFIC CORP 0.00B15SK50 COMMON STOCK 22 4,384196.21CONSUMER STAPLES KR
AMOREPACIFIC GROUP 0.006665931 COMMON STOCK 427 21,29449.85CONSUMER STAPLES KR
AMPHENOL CORP-CL A 0.01032095101 COMMON STOCK 3,500 268,20176.63INFORMATION TECHNOLOGY US
AMPLIFON SPA 0.01B14NJ71 COMMON STOCK 3,261 170,46952.27HEALTH CARE IT
AMSTERDAM INDEX FUTURE SEP 2021 0.59AEXSEP2021
AMSTERDAM INDEX FUTURE 62 11,525,693929.49NL
ANA HOLDINGS INC 0.006014908 COMMON STOCK 3,740 88,70523.72INDUSTRIALS JP
ANALOG DEVICES INC 0.01032654105 COMMON STOCK 1,539 250,850162.95INFORMATION TECHNOLOGY US
ANGLO AMERICAN PLATINUM LTD 0.006761000 COMMON STOCK 193 21,997113.96MATERIALS ZA
ANGLO AMERICAN PLC 0.01B1XZS82 COMMON STOCK 3,319 140,17542.24MATERIALS GB
ANHEUSER-BUSCH INBEV SA/NV 0.01BYYHL23 COMMON STOCK 1,866 114,49261.37CONSUMER STAPLES BE
ANHUI CONCH CEMENT CO LTD-A 0.00BP3R2Z1 COMMON STOCK 11,605 71,7496.18MATERIALS CN
ANHUI CONCH CEMENT CO LTD-A 0.00BP3R2Z1 COMMON STOCK 518 3,2056.18MATERIALS CN
ANHUI CONCH CEMENT CO LTD-H 0.006080396 COMMON STOCK 14,998 81,1865.41MATERIALS CN
ANHUI GUJING DISTILLERY CO-A 0.00BD5M1G4 COMMON STOCK 89 2,93132.80CONSUMER STAPLES CN
ANHUI GUJING DISTILLERY CO-B 0.006026691 COMMON STOCK 5,898 72,03712.21CONSUMER STAPLES CN
ANHUI KOUZI DISTILLERY CO -A 0.00BYQDNL2 COMMON STOCK 1,519 11,6357.66CONSUMER STAPLES CN
ANHUI KOUZI DISTILLERY CO -A 0.00BYQDNL2 COMMON STOCK 89 6847.66CONSUMER STAPLES CN
ANTA SPORTS PRODUCTS LTD 0.00B1YVKN8 COMMON STOCK 2,754 56,66120.57CONSUMER DISCRETIONARY CN
ANTA SPORTS PRODUCTS LTD 0.00B1YVKN8 COMMON STOCK 1,054 21,67520.57CONSUMER DISCRETIONARY CN
Security NameSecurityWeight
HOLDINGS 30 DAY LAG
SecurityIdentifier Security Type Units Held
Base MarketValueBase PriceSector Country
Risk Parity Multi-Asset GT
USDBase Currency:
Market Value: 1,961,759,259
August 31, 2021
9

ANTHEM INC 0.01036752103 COMMON STOCK 585 219,507375.13HEALTH CARE US
ANTOFAGASTA PLC 0.010045614 COMMON STOCK 5,947 119,16620.04MATERIALS CL
AON PLC-CLASS A 0.01G0403H108
COMMON STOCK 555 159,227286.86FINANCIALS US
APA CORP 0.0103743Q108 COMMON STOCK 8,488 165,35219.48ENERGY US
APA GROUP 0.016247306 STAPLED SECURITY 35,864 240,6206.71UTILITIES AU
APELOA PHARMACEUTICAL CO-A 0.01BD5LY17 COMMON STOCK 36,103 176,5164.89HEALTH CARE CN
APOLLO COMMERCIAL REAL ESTAT 0.0003762U105 REAL ESTATE INVESTMENT TRUST 1,780 27,68615.55FINANCIALS US
APOLLO HOSPITALS ENTERPRISE 0.006273583 COMMON STOCK 907 61,74268.07HEALTH CARE IN
APPLE 2.400 20230503 0.04037833AK6 CORPORATE BOND 750,000 782,627103.56US
APPLE INC 0.04037833CM0
CORPORATE BOND 750,000 757,432100.84US
APPLE INC 0.01037833100 COMMON STOCK 1,885 286,180151.83INFORMATION TECHNOLOGY US
APPLE INC 0.03037833BZ2 CORPORATE BOND 500,000 534,055106.63US
APPLE INC 0.04037833CG3
CORPORATE BOND 750,000 793,097105.75US
APPLE INC 0.02037833CU2 CORPORATE BOND 375,000 400,637105.97US
APPLIED INDUSTRIAL TECH INC 0.0003820C105 COMMON STOCK 590 52,44188.81INDUSTRIALS US
APPLIED MATERIALS INC 0.03038222105 COMMON STOCK 3,853 520,613135.13INFORMATION TECHNOLOGY US
ARCA CONTINENTAL SAB DE CV 0.002823885 COMMON STOCK 10,366 66,9226.46CONSUMER STAPLES MX
ARCA CONTINENTAL SAB DE CV 0.002823885 COMMON STOCK 1,877 12,1156.46CONSUMER STAPLES MX
ARCELORMITTAL 0.01BYPBS67 COMMON STOCK 4,039 135,39833.52MATERIALS LU
ARCH RESOURCES INC 0.0303940R107 COMMON STOCK 7,850 594,20075.69ENERGY US
ARCHER-DANIELS-MIDLAND CO 0.02039483102 COMMON STOCK 5,810 348,57360.00CONSUMER STAPLES US
ARCHROCK INC 0.0103957W106
COMMON STOCK 17,432 133,8807.68ENERGY US
ARGAN INC 0.0104010E109 COMMON STOCK 2,419 111,99946.30INDUSTRIALS US
ARGENX SE 0.02BNHKYX4 COMMON STOCK 995 335,776337.37HEALTH CARE NL
ARISTA NETWORKS INC 0.01040413106 COMMON STOCK 360 133,039369.53INFORMATION TECHNOLOGY US
ARISTOCRAT LEISURE LTD 0.016253983 COMMON STOCK 5,368 179,16233.38CONSUMER DISCRETIONARY AU
ARROW FINANCIAL CORP 0.00042744102 COMMON STOCK 2,157 79,47736.85FINANCIALS US
ARTESIAN RESOURCES CORP-CL A 0.03043113208 COMMON STOCK 17,271 680,65739.41UTILITIES US
ARTHUR J GALLAGHER & CO 0.01363576109 COMMON STOCK 1,897 272,407143.62FINANCIALS US
ASAHI GROUP HOLDINGS LTD 0.016054409 COMMON STOCK 3,402 158,35346.55CONSUMER STAPLES JP
ASAHI INTECC CO LTD 0.01B019MQ5 COMMON STOCK 4,014 121,66630.31HEALTH CARE JP
ASAHI KASEI CORP 0.016054603 COMMON STOCK 12,954 133,94910.34MATERIALS JP
ASE TECHNOLOGY HOLDING CO LT 0.00BFXZDY1 COMMON STOCK 7,716 35,7764.64INFORMATION TECHNOLOGY TW
ASE TECHNOLOGY HOLDING CO LT 0.00BFXZDY1 COMMON STOCK 2,013 9,3354.64INFORMATION TECHNOLOGY TW
Security NameSecurityWeight
HOLDINGS 30 DAY LAG
SecurityIdentifier Security Type Units Held
Base MarketValueBase PriceSector Country
Risk Parity Multi-Asset GT
USDBase Currency:
Market Value: 1,961,759,259
August 31, 2021
10

ASELSAN ELEKTRONIK SANAYI 0.00B03MP41 COMMON STOCK 46,550 88,9621.91INDUSTRIALS TR
ASHTEAD GROUP PLC 0.000053673 COMMON STOCK 1,251 97,94078.31INDUSTRIALS GB
ASIA CEMENT CORP 0.016056331 COMMON STOCK 100,088 162,1571.62MATERIALS TW
ASIA CEMENT CORP 0.006056331 COMMON STOCK 425 6891.62MATERIALS TW
ASIAN DEVELOPMENT BANK 0.04045167DN0 CORPORATE BOND 750,000 797,393105.61US
ASIAN DEVELOPMENT BANK 0.04045167DU4 CORPORATE BOND 750,000 817,671109.02US
ASIAN PAINTS LTD 0.00BCRWL65 COMMON STOCK 1,777 77,90143.85MATERIALS IN
ASM INTERNATIONAL NV 0.015165294 COMMON STOCK 608 235,670387.90INFORMATION TECHNOLOGY NL
ASMEDIA TECHNOLOGY INC 0.00B6ZZQ69 COMMON STOCK 605 45,29874.87INFORMATION TECHNOLOGY TW
ASML HOLDING NV 0.01B929F46 COMMON STOCK 309 257,184831.63INFORMATION TECHNOLOGY NL
ASPEN PHARMACARE HOLDINGS LT 0.00B09C0Z1 COMMON STOCK 1,617 21,91713.56HEALTH CARE ZA
ASSET WORLD CORP PCL-FOREIGN 0.00BJCVZG4 COMMON STOCK 142,000 19,1200.13CONSUMER DISCRETIONARY TH
ASSICURAZIONI GENERALI 0.014056719 COMMON STOCK 4,845 98,77120.39FINANCIALS IT
ASSOCIATED BRITISH FOODS PLC 0.010673123 COMMON STOCK 4,020 109,55227.25CONSUMER STAPLES GB
ASSURANT INC 0.0104621X10⁸ COMMON STOCK 1,641 279,083170.11FINANCIALS US
ASTELLAS PHARMA INC 0.016985383 COMMON STOCK 13,410 226,67516.90HEALTH CARE JP
ASTRA INTERNATIONAL TBK PT 0.00B800MQ5 COMMON STOCK 189,629 69,4700.37CONSUMER DISCRETIONARY ID
ASTRAZENECA 6.45 20370915 0.02046353AD0 CORPORATE BOND 250,000 376,134150.45US
ASTRAZENECA PLC 0.010989529 COMMON STOCK 2,411 282,516117.17HEALTH CARE GB
ASUSTEK COMPUTER INC 0.006051046 COMMON STOCK 3,575 41,79011.69INFORMATION TECHNOLOGY TW
ASUSTEK COMPUTER INC 0.006051046 COMMON STOCK 619 7,24011.69INFORMATION TECHNOLOGY TW
ASX LTD 0.016129222 COMMON STOCK 3,023 193,92864.15FINANCIALS AU
AT&T INC 0.0200206R102 COMMON STOCK 13,876 380,47627.42COMMUNICATION SERVICES US
ATACADAO SA 0.00BF7LBH4 COMMON STOCK 7,149 25,3453.55CONSUMER STAPLES BR
ATCO LTD -CLASS I 0.00046789400 COMMON STOCK 917 30,79933.59UTILITIES CA
ATMOS ENERGY CORP 0.02049560105 COMMON STOCK 3,243 316,21797.51UTILITIES US
ATN INTERNATIONAL INC 0.0000215F107 COMMON STOCK 449 20,48745.59COMMUNICATION SERVICES US
ATRION CORPORATION 0.05049904105 COMMON STOCK 1,483 1,029,441694.06HEALTH CARE US
AU OPTRONICS CORP 0.006288190 COMMON STOCK 101,072 64,1880.64INFORMATION TECHNOLOGY TW
AU OPTRONICS CORP 0.006288190 COMMON STOCK 6,255 3,9730.64INFORMATION TECHNOLOGY TW
AUCKLAND INTL AIRPORT LTD 0.01BKX3XG2 COMMON STOCK 22,435 113,8525.07INDUSTRIALS NZ
AURIZON HOLDINGS LTD 0.01B87CVM3 COMMON STOCK 49,205 135,9342.76INDUSTRIALS AU
AUROBINDO PHARMA LTD 0.006702634 COMMON STOCK 3,869 38,5489.96HEALTH CARE IN
AUSNET SERVICES 0.01BPXR7J0 COMMON STOCK 150,721 213,1481.41UTILITIES AU
Security NameSecurityWeight
HOLDINGS 30 DAY LAG
SecurityIdentifier Security Type Units Held
Base MarketValueBase PriceSector Country
Risk Parity Multi-Asset GT
USDBase Currency:
Market Value: 1,961,759,259
August 31, 2021
11

AUSTRALIA & NEW ZEALAND BANKING GROUP 0.0605253JAL5 CORPORATE BOND 1,000,000 1,129,889111.91US
AUSTRALIAN BOND FUTURE, 10-YEAR SEP 2021 11.36YTCSEP2021
AUSTRALIAN BOND FUTURE, 10-YEAR 2,090 222,719,77510,656.45AU
AUTO TRADER GROUP PLC 0.01BVYVFW2 COMMON STOCK 24,315 210,4878.66COMMUNICATION SERVICES GB
AUTODESK INC 0.01052769106 COMMON STOCK 409 126,901310.09INFORMATION TECHNOLOGY US
AUTOHOME INC-ADR 0.0005278C107 AMERICAN DEPOSITORY RECEIPT 1,258 55,69044.26COMMUNICATION SERVICES CN
AUTOMATIC DATA PROCESSING 0.02053015103 COMMON STOCK 1,411 294,938209.04INFORMATION TECHNOLOGY US
AUTOZONE INC 0.02053332102 COMMON STOCK 250 386,8791,549.15CONSUMER DISCRETIONARY US
AVENUE SUPERMARTS LTD 0.00BYW1G33 COMMON STOCK 1,537 83,26254.17CONSUMER STAPLES IN
AVERY DENNISON CORP 0.02053611109 COMMON STOCK 1,370 308,762225.39MATERIALS US
AVEVA GROUP PLC 0.01BBG9VN7 COMMON STOCK 2,625 149,44656.92INFORMATION TECHNOLOGY GB
AVISTA CORP 0.0305379B107 COMMON STOCK 13,529 566,19341.85UTILITIES US
AXIATA GROUP BERHAD 0.00B2QZGV5 COMMON STOCK 36,103 35,9551.00COMMUNICATION SERVICES MY
AYALA CORPORATION 0.00B09JBT3 COMMON STOCK 2,645 42,13715.93INDUSTRIALS PH
AYALA LAND INC 0.006055112 COMMON STOCK 20,375 13,8220.68REAL ESTATE PH
AZBIL CORP 0.006985543 COMMON STOCK 2,098 91,19643.46INFORMATION TECHNOLOGY JP
AZZ INC 0.00002474104 COMMON STOCK 1,479 79,21253.55INDUSTRIALS US
B GRIMM POWER PCL-FOREIGN 0.00BYQN3W3 COMMON STOCK 31,324 44,9461.43UTILITIES TH
B2GOLD CORP 0.0111777Q209 COMMON STOCK 26,448 102,1373.86MATERIALS CA
BADGER METER INC 0.01056525108 COMMON STOCK 2,151 230,325107.09INFORMATION TECHNOLOGY US
BAIDU INC - SPON ADR 0.00056752108 AMERICAN DEPOSITORY RECEIPT 397 62,302157.02COMMUNICATION SERVICES CN
BAJAJ AUTO LTD 0.00B2QKXW0 COMMON STOCK 1,041 53,15951.06CONSUMER DISCRETIONARY IN
BAJAJ FINANCE LTD 0.00BD2N0P2 COMMON STOCK 327 33,710103.06FINANCIALS IN
BAJAJ FINANCE LTD 0.00BD2N0P2 COMMON STOCK 222 22,842103.06FINANCIALS IN
BAKER HUGHES CO 0.0105722G100 COMMON STOCK 10,434 237,69222.78ENERGY US
BALCHEM CORP 0.02057665200 COMMON STOCK 3,090 433,832140.42MATERIALS US
BALL CORP 0.01058498106 COMMON STOCK 2,818 270,43395.96MATERIALS US
BALLARD POWER SYSTEMS INC 0.00058586108 COMMON STOCK 3,941 66,30316.82INDUSTRIALS CA
BALOISE HOLDING AG - REG 0.017124594 COMMON STOCK 754 120,323159.49FINANCIALS CH
BANCO BRADESCO S.A. 0.00B00FM86 COMMON STOCK 6,098 23,7523.89FINANCIALS BR
BANCO DE CHILE-ADR 0.00059520106 AMERICAN DEPOSITORY RECEIPT 3,221 62,93219.54FINANCIALS CL
BANCO DE CREDITO E INVERSION 0.002069355 COMMON STOCK 577 24,97143.26FINANCIALS CL
BANCO SANTANDER-CHILE-ADR 0.0005965X10⁹ AMERICAN DEPOSITORY RECEIPT 2,881 60,64721.05FINANCIALS CL
BANCOLOMBIA SA 0.00BJ62K57 COMMON STOCK 2,170 17,9158.26FINANCIALS CO
BANDAI NAMCO HOLDINGS INC 0.01B0JDQD4 COMMON STOCK 2,436 169,40869.55CONSUMER DISCRETIONARY JP
Security NameSecurityWeight
HOLDINGS 30 DAY LAG
SecurityIdentifier Security Type Units Held
Base MarketValueBase PriceSector Country
Risk Parity Multi-Asset GT
USDBase Currency:
Market Value: 1,961,759,259
August 31, 2021
12

BANDWIDTH INC-CLASS A 0.0005988J103 COMMON STOCK 376 38,722102.90COMMUNICATION SERVICES US
BANGKOK COMMERCIAL-FOREIGN 0.00BJYD4B6 COMMON STOCK 43,878 25,3200.58FINANCIALS TH
BANGKOK DUSIT MED SERVICE-F 0.00BLZGSM7 COMMON STOCK 122,876 89,2050.73HEALTH CARE TH
BANGKOK DUSIT MED SERVICE-F 0.00BLZGSM7 COMMON STOCK 4,111 2,9840.73HEALTH CARE TH
BANGKOK EXPRESSWAY AND METRO 0.00BYV76H6 COMMON STOCK 58,980 15,8280.27INDUSTRIALS TH
BANK AL-JAZIRA 0.00B12LZQ8 COMMON STOCK 14,036 69,3044.94FINANCIALS SA
BANK AL-JAZIRA 0.00B12LZQ8 COMMON STOCK 403 1,9904.94FINANCIALS SA
BANK ALBILAD 0.00B085SR9 COMMON STOCK 4,536 51,70211.40FINANCIALS SA
BANK ALBILAD 0.00B085SR9 COMMON STOCK 199 2,27111.40FINANCIALS SA
BANK CENTRAL ASIA TBK PT 0.00B01C1P6 COMMON STOCK 28,239 64,8432.30FINANCIALS ID
BANK LEUMI LE-ISRAEL 0.026076425 COMMON STOCK 35,949 297,3548.27FINANCIALS IL
BANK MANDIRI PERSERO TBK PT 0.006651048 COMMON STOCK 143,698 61,4590.43FINANCIALS ID
BANK MONTREAL MEDIUM TERM SR NTS BOOK EN 0.0306366RJJ5 CORPORATE BOND 500,000 516,573102.50US
BANK NEGARA INDONESIA PERSER 0.006727121 COMMON STOCK 36,243 13,7220.38FINANCIALS ID
BANK OF BEIJING CO LTD -A 0.00BP3R2W8 COMMON STOCK 2,323 1,5600.67FINANCIALS CN
BANK OF CHINA LTD-A 0.00BP3R239 COMMON STOCK 3,753 1,7600.47FINANCIALS CN
BANK OF COMMUNICATIONS CO-H 0.00B0B8Z29 COMMON STOCK 116,173 66,7700.57FINANCIALS CN
BANK OF JIANGSU CO LTD-A 0.00BYW5MY8 COMMON STOCK 33,923 33,7480.99FINANCIALS CN
BANK OF JIANGSU CO LTD-A 0.00BYW5MY8 COMMON STOCK 2,413 2,4000.99FINANCIALS CN
BANK OF MONTREAL 0.00063671101 COMMON STOCK 949 94,26999.36FINANCIALS CA
BANK OF NEW YORK MELLON CORP 0.00064058100 COMMON STOCK 1,721 95,02355.22FINANCIALS US
BANK OF NOVA SCOTIA 0.01064149107 COMMON STOCK 2,358 145,84061.84FINANCIALS CA
BANK OF NOVA SCOTIA/THE 0.04064159JG2 CORPORATE BOND 750,000 759,613101.28US
BANK OF THE PHILIPPINE ISLAN 0.016074968 COMMON STOCK 111,553 186,5581.67FINANCIALS PH
BANK RAKYAT INDONESIA PERSER 0.006709099 COMMON STOCK 109,471 30,1650.28FINANCIALS ID
BANK RAKYAT INDONESIA PERSER 0.006709099 COMMON STOCK 46,112 12,7060.28FINANCIALS ID
BAOSHAN IRON & STEEL CO-A 0.00BP3R2Y0 COMMON STOCK 1,251 1,9731.58MATERIALS CN
BAOZUN INC-SPN ADR 0.0006684L103 AMERICAN DEPOSITORY RECEIPT 458 11,01824.08CONSUMER DISCRETIONARY CN
BAOZUN INC-SPN ADR 0.0006684L103 AMERICAN DEPOSITORY RECEIPT 46 1,11924.08CONSUMER DISCRETIONARY CN
BARITO PACIFIC TBK PT 0.006070706 COMMON STOCK 358,041 26,7350.07MATERIALS ID
BARNES GROUP INC 0.00067806109 COMMON STOCK 826 39,36047.67INDUSTRIALS US
BARRICK GOLD CORP 0.01067901108 COMMON STOCK 7,348 147,46920.07MATERIALS CA
BARRY CALLEBAUT AG-REG 0.025476929 COMMON STOCK 159 404,4312,547.90CONSUMER STAPLES CH
BARWA REAL ESTATE CO 0.00B0YTG26 COMMON STOCK 84,467 71,2200.84REAL ESTATE QA
Security NameSecurityWeight
HOLDINGS 30 DAY LAG
SecurityIdentifier Security Type Units Held
Base MarketValueBase PriceSector Country
Risk Parity Multi-Asset GT
USDBase Currency:
Market Value: 1,961,759,259
August 31, 2021
13
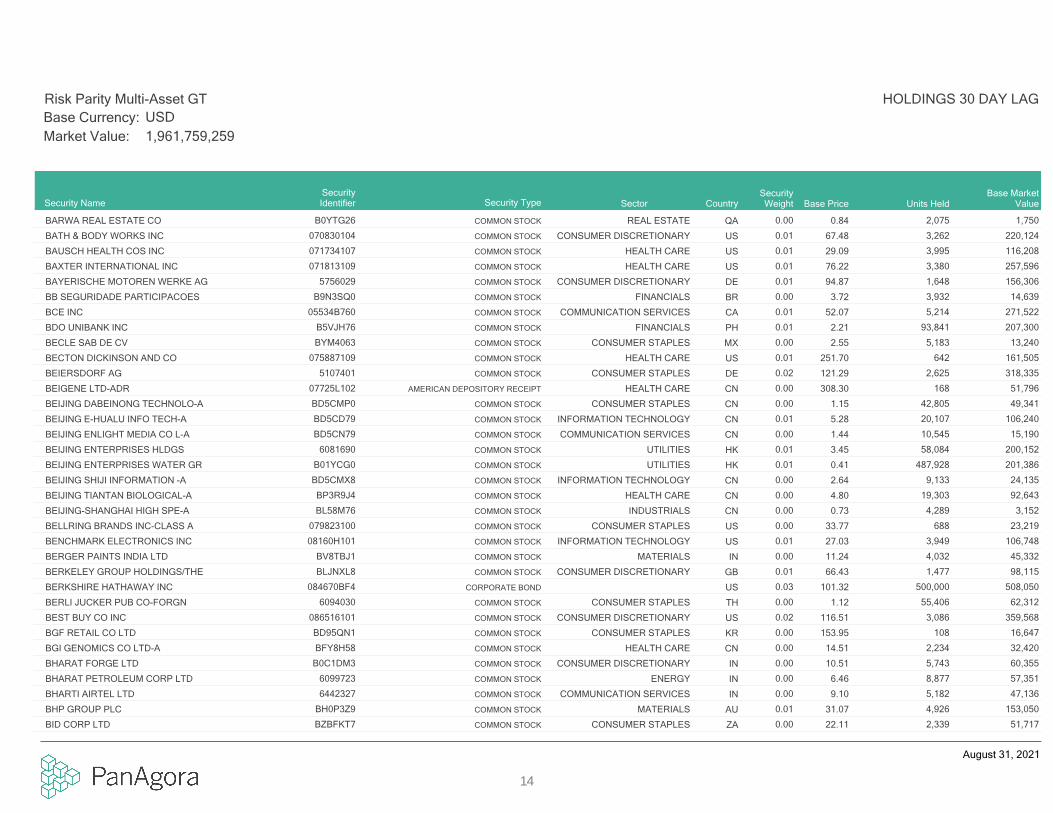
BARWA REAL ESTATE CO 0.00B0YTG26 COMMON STOCK 2,075 1,7500.84REAL ESTATE QA
BATH & BODY WORKS INC 0.01070830104 COMMON STOCK 3,262 220,12467.48CONSUMER DISCRETIONARY US
BAUSCH HEALTH COS INC 0.01071734107 COMMON STOCK 3,995 116,20829.09HEALTH CARE US
BAXTER INTERNATIONAL INC 0.01071813109 COMMON STOCK 3,380 257,59676.22HEALTH CARE US
BAYERISCHE MOTOREN WERKE AG 0.015756029 COMMON STOCK 1,648 156,30694.87CONSUMER DISCRETIONARY DE
BB SEGURIDADE PARTICIPACOES 0.00B9N3SQ0 COMMON STOCK 3,932 14,6393.72FINANCIALS BR
BCE INC 0.0105534B760 COMMON STOCK 5,214 271,52252.07COMMUNICATION SERVICES CA
BDO UNIBANK INC 0.01B5VJH76 COMMON STOCK 93,841 207,3002.21FINANCIALS PH
BECLE SAB DE CV 0.00BYM4063 COMMON STOCK 5,183 13,2402.55CONSUMER STAPLES MX
BECTON DICKINSON AND CO 0.01075887109 COMMON STOCK 642 161,505251.70HEALTH CARE US
BEIERSDORF AG 0.025107401 COMMON STOCK 2,625 318,335121.29CONSUMER STAPLES DE
BEIGENE LTD-ADR 0.0007725L102 AMERICAN DEPOSITORY RECEIPT 168 51,796308.30HEALTH CARE CN
BEIJING DABEINONG TECHNOLO-A 0.00BD5CMP0 COMMON STOCK 42,805 49,3411.15CONSUMER STAPLES CN
BEIJING E-HUALU INFO TECH-A 0.01BD5CD79 COMMON STOCK 20,107 106,2405.28INFORMATION TECHNOLOGY CN
BEIJING ENLIGHT MEDIA CO L-A 0.00BD5CN79 COMMON STOCK 10,545 15,1901.44COMMUNICATION SERVICES CN
BEIJING ENTERPRISES HLDGS 0.016081690 COMMON STOCK 58,084 200,1523.45UTILITIES HK
BEIJING ENTERPRISES WATER GR 0.01B01YCG0 COMMON STOCK 487,928 201,3860.41UTILITIES HK
BEIJING SHIJI INFORMATION -A 0.00BD5CMX8 COMMON STOCK 9,133 24,1352.64INFORMATION TECHNOLOGY CN
BEIJING TIANTAN BIOLOGICAL-A 0.00BP3R9J4 COMMON STOCK 19,303 92,6434.80HEALTH CARE CN
BEIJING-SHANGHAI HIGH SPE-A 0.00BL58M76 COMMON STOCK 4,289 3,1520.73INDUSTRIALS CN
BELLRING BRANDS INC-CLASS A 0.00079823100 COMMON STOCK 688 23,21933.77CONSUMER STAPLES US
BENCHMARK ELECTRONICS INC 0.0108160H101 COMMON STOCK 3,949 106,74827.03INFORMATION TECHNOLOGY US
BERGER PAINTS INDIA LTD 0.00BV8TBJ1 COMMON STOCK 4,032 45,33211.24MATERIALS IN
BERKELEY GROUP HOLDINGS/THE 0.01BLJNXL8 COMMON STOCK 1,477 98,11566.43CONSUMER DISCRETIONARY GB
BERKSHIRE HATHAWAY INC 0.03084670BF4 CORPORATE BOND 500,000 508,050101.32US
BERLI JUCKER PUB CO-FORGN 0.006094030 COMMON STOCK 55,406 62,3121.12CONSUMER STAPLES TH
BEST BUY CO INC 0.02086516101 COMMON STOCK 3,086 359,568116.51CONSUMER DISCRETIONARY US
BGF RETAIL CO LTD 0.00BD95QN1 COMMON STOCK 108 16,647153.95CONSUMER STAPLES KR
BGI GENOMICS CO LTD-A 0.00BFY8H58 COMMON STOCK 2,234 32,42014.51HEALTH CARE CN
BHARAT FORGE LTD 0.00B0C1DM3 COMMON STOCK 5,743 60,35510.51CONSUMER DISCRETIONARY IN
BHARAT PETROLEUM CORP LTD 0.006099723 COMMON STOCK 8,877 57,3516.46ENERGY IN
BHARTI AIRTEL LTD 0.006442327 COMMON STOCK 5,182 47,1369.10COMMUNICATION SERVICES IN
BHP GROUP PLC 0.01BH0P3Z9 COMMON STOCK 4,926 153,05031.07MATERIALS AU
BID CORP LTD 0.00BZBFKT7 COMMON STOCK 2,339 51,71722.11CONSUMER STAPLES ZA
Security NameSecurityWeight
HOLDINGS 30 DAY LAG
SecurityIdentifier Security Type Units Held
Base MarketValueBase PriceSector Country
Risk Parity Multi-Asset GT
USDBase Currency:
Market Value: 1,961,759,259
August 31, 2021
14

BID CORP LTD 0.00BZBFKT7 COMMON STOCK 231 5,09922.11CONSUMER STAPLES ZA
BIDVEST GROUP LTD 0.016100089 COMMON STOCK 11,534 163,46514.17INDUSTRIALS ZA
BILIBILI INC-SPONSORED ADR 0.00090040106 AMERICAN DEPOSITORY RECEIPT 345 27,67580.23COMMUNICATION SERVICES CN
BIM BIRLESIK MAGAZALAR AS 0.01B0D0006 COMMON STOCK 15,215 131,4828.64CONSUMER STAPLES TR
BIOCON LTD 0.006741251 COMMON STOCK 3,720 18,2864.92HEALTH CARE IN
BIOGEN INC 0.0209062X10³ COMMON STOCK 884 299,631338.91HEALTH CARE US
BIOMERIEUX 0.02BF0LBX7 COMMON STOCK 3,361 411,992122.59HEALTH CARE FR
BLACK HILLS CORP 0.03092113109 COMMON STOCK 8,828 620,89070.33UTILITIES US
BLACKBAUD INC 0.0109227Q100 COMMON STOCK 1,782 124,22069.69INFORMATION TECHNOLOGY US
BLACKBERRY LTD 0.0109228F103 COMMON STOCK 14,146 160,98011.38INFORMATION TECHNOLOGY CA
BLACKROCK INC 0.0109247X101 COMMON STOCK 198 186,567943.29FINANCIALS US
BLACKROCK INC 0.0409247XAJ0 CORPORATE BOND 750,000 773,634102.31US
BOC AVIATION LTD 0.00BYZJV17 COMMON STOCK 3,217 24,1167.50INDUSTRIALS SG
BOE TECHNOLOGY GROUP CO LT-A 0.00BD5CPL7 COMMON STOCK 13,762 12,3930.90INFORMATION TECHNOLOGY CN
BOLIDEN AB 0.01BMWPW33 COMMON STOCK 4,850 168,94934.83MATERIALS SE
BOLLORE 0.014572709 COMMON STOCK 25,554 151,1285.91COMMUNICATION SERVICES FR
BOOKING HOLDINGS INC 0.0109857L108 COMMON STOCK 102 234,7552,299.67CONSUMER DISCRETIONARY US
BORGWARNER INC 0.01099724106 COMMON STOCK 3,579 152,76242.68CONSUMER DISCRETIONARY US
BOSIDENG INTL HLDGS LTD 0.01B24FZ32 COMMON STOCK 203,750 166,6190.82CONSUMER DISCRETIONARY HK
BOSTON SCIENTIFIC CORP 0.01101137107 COMMON STOCK 5,254 237,19945.15HEALTH CARE US
BOTTOMLINE TECHNOLOGIES (DE) 0.01101388106 COMMON STOCK 4,024 170,10742.27INFORMATION TECHNOLOGY US
BOUBYAN BANK K.S.C 0.00B15DYL9 COMMON STOCK 35,915 93,4882.60FINANCIALS KW
BOUYGUES SA 0.004002121 COMMON STOCK 1,788 74,78141.82INDUSTRIALS FR
BP PLC 0.050798059 COMMON STOCK 219,255 896,0494.09ENERGY GB
BRADY CORPORATION - CL A 0.01104674106 COMMON STOCK 2,471 131,78053.33INDUSTRIALS US
BRAMBLES LTD 0.01B1FJ0C0 COMMON STOCK 12,139 107,4408.85INDUSTRIALS AU
BRENT CRUDE FUTURE DEC 2021 0.54CODEC2021
BRENT CRUDE FUTURE 149 10,579,00071.00US
BRF SA-ADR 0.0010552T107 AMERICAN DEPOSITORY RECEIPT 8,140 36,8754.53CONSUMER STAPLES BR
BRIDGESTONE CORP 0.016132101 COMMON STOCK 3,479 160,37946.10CONSUMER DISCRETIONARY JP
BRIDGEWATER BANCSHARES INC 0.00108621103 COMMON STOCK 3,767 61,59216.35FINANCIALS US
BRISTOL-MYERS SQUIBB CO 0.01110122108 COMMON STOCK 1,773 118,52766.86HEALTH CARE US
BRISTOW GROUP INC 0.0311040G103 COMMON STOCK 19,972 630,32831.56ENERGY US
BRITANNIA INDUSTRIES LTD 0.00BGSQG47 COMMON STOCK 1,004 54,95054.75CONSUMER STAPLES IN
BRITANNIA INDUSTRIES LTD 0.00BN0ZCV0 CORPORATE BOND 29,496 40.01IN
Security NameSecurityWeight
HOLDINGS 30 DAY LAG
SecurityIdentifier Security Type Units Held
Base MarketValueBase PriceSector Country
Risk Parity Multi-Asset GT
USDBase Currency:
Market Value: 1,961,759,259
August 31, 2021
15

BRITANNIA INDUSTRIES LTD 0.00INE216A07052
CORPORATE BOND 88,787 130.01IN
BRITISH AMERICAN TOBACCO PLC 0.010287580 COMMON STOCK 3,819 143,42237.56CONSUMER STAPLES GB
BRITISH COLUMBIA 2.650 20210922 0.03110709BN1 CORPORATE BOND 500,000 506,567100.14US
BRITISH COLUMBIA 6.500 20260115 0.06110709DL3 CORPORATE BOND 1,000,000 1,235,922122.76US
BROADCOM INC 0.0011135F101 COMMON STOCK 178 88,370497.21INFORMATION TECHNOLOGY US
BROOKFIELD INFRASTRUCTURE-A 0.00BLB7675 COMMON STOCK 600 38,12063.51UTILITIES CA
BROOKFIELD RENEWABLE COR-A 0.00BMXWR83 COMMON STOCK 2,194 95,99543.75UTILITIES US
BROOKLINE BANCORP INC 0.0011373M107 COMMON STOCK 3,426 51,28414.97FINANCIALS US
BROWN-FORMAN CORP-CLASS B 0.01115637209 COMMON STOCK 3,016 211,78270.22CONSUMER STAPLES US
BRYN MAWR BANK CORP 0.00117665109 COMMON STOCK 1,596 65,12940.80FINANCIALS US
BT GROUP PLC 0.013091357 COMMON STOCK 83,669 195,5242.34COMMUNICATION SERVICES GB
BTPEI 2.100 09/15/2021 0.07B3PVDZ4 TREASURY INFLATIONARY PROTECTED 1,159,730 1,382,867118.10IT
BTPEI 2.350 09/15/2024 0.21BKRVT31 TREASURY INFLATIONARY PROTECTED 3,012,100 4,035,061132.68IT
BTPEI 2.550 09/15/2041 0.33B58RK85 TREASURY INFLATIONARY PROTECTED 3,489,060 6,381,100181.50IT
BTPEI 3.100 09/15/2026 0.18B4NSG22 TREASURY INFLATIONARY PROTECTED 2,383,920 3,506,950145.42IT
BTS GROUP HOLDINGS PCL-FORGN 0.00BDGHT08 COMMON STOCK 75,513 22,0220.29INDUSTRIALS TH
BUCKLE INC/THE 0.00118440106 COMMON STOCK 253 9,80738.73CONSUMER DISCRETIONARY US
BUDWEISER BREWING CO APAC LT 0.00BKDXJH5 COMMON STOCK 30,469 76,2382.50CONSUMER STAPLES HK
BUMRUNGRAD HOSPITAL-FOREIGN 0.00B0166H5 COMMON STOCK 16,205 66,8674.13HEALTH CARE TH
BUNZL PLC 0.01B0744B3 COMMON STOCK 4,480 162,52836.28INDUSTRIALS GB
BUPA ARABIA FOR COOPERATIVE 0.00B2RLCR0 COMMON STOCK 59 2,62644.53FINANCIALS SA
BY-HEALTH CO LTD-A 0.00BD5CKV2 COMMON STOCK 179 6953.89CONSUMER STAPLES CN
BYD CO LTD -A 0.01BD5CQ69 COMMON STOCK 4,558 195,32942.86CONSUMER DISCRETIONARY CN
BYD CO LTD-H 0.006536651 COMMON STOCK 1,340 45,39833.87CONSUMER DISCRETIONARY CN
BYD ELECTRONIC INTL CO LTD 0.00B29SHS5 COMMON STOCK 2,317 10,5774.56INFORMATION TECHNOLOGY CN
BYD ELECTRONIC INTL CO LTD 0.00B29SHS5 COMMON STOCK 447 2,0404.56INFORMATION TECHNOLOGY CN
C.H. ROBINSON WORLDWIDE INC 0.0312541W209
COMMON STOCK 5,962 536,91690.06INDUSTRIALS US
CACTUS INC - A 0.01127203107 COMMON STOCK 4,319 161,98937.51ENERGY US
CADENCE DESIGN SYS INC 0.02127387108 COMMON STOCK 2,094 342,260163.48INFORMATION TECHNOLOGY US
CAE INC 0.00124765108 COMMON STOCK 3,246 93,57328.83INDUSTRIALS CA
CAIXABANK SA 0.00B283W97 COMMON STOCK 23,369 72,6073.11FINANCIALS ES
CAL-MAINE FOODS INC 0.03128030202 COMMON STOCK 16,098 582,11136.16CONSUMER STAPLES US
CALAVO GROWERS INC 0.01128246105 COMMON STOCK 5,681 266,53746.92CONSUMER STAPLES US
CAMDEN NATIONAL CORP 0.00133034108 COMMON STOCK 1,399 65,29846.67FINANCIALS US
Security NameSecurityWeight
HOLDINGS 30 DAY LAG
SecurityIdentifier Security Type Units Held
Base MarketValueBase PriceSector Country
Risk Parity Multi-Asset GT
USDBase Currency:
Market Value: 1,961,759,259
August 31, 2021
16
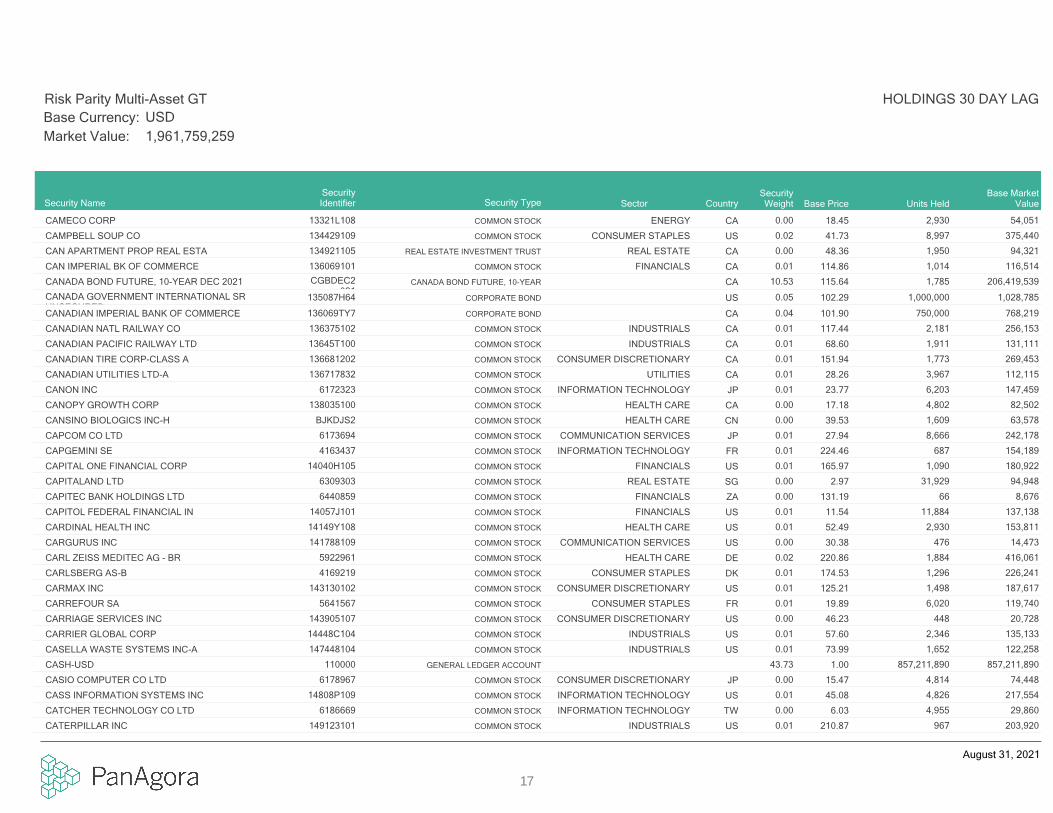
CAMECO CORP 0.0013321L108 COMMON STOCK 2,930 54,05118.45ENERGY CA
CAMPBELL SOUP CO 0.02134429109 COMMON STOCK 8,997 375,44041.73CONSUMER STAPLES US
CAN APARTMENT PROP REAL ESTA 0.00134921105 REAL ESTATE INVESTMENT TRUST 1,950 94,32148.36REAL ESTATE CA
CAN IMPERIAL BK OF COMMERCE 0.01136069101 COMMON STOCK 1,014 116,514114.86FINANCIALS CA
CANADA BOND FUTURE, 10-YEAR DEC 2021 10.53CGBDEC2021
CANADA BOND FUTURE, 10-YEAR 1,785 206,419,539115.64CA
CANADA GOVERNMENT INTERNATIONAL SRUNSECURED
0.05135087H64 CORPORATE BOND 1,000,000 1,028,785102.29US
CANADIAN IMPERIAL BANK OF COMMERCE 0.04136069TY7 CORPORATE BOND 750,000 768,219101.90CA
CANADIAN NATL RAILWAY CO 0.01136375102 COMMON STOCK 2,181 256,153117.44INDUSTRIALS CA
CANADIAN PACIFIC RAILWAY LTD 0.0113645T100 COMMON STOCK 1,911 131,11168.60INDUSTRIALS CA
CANADIAN TIRE CORP-CLASS A 0.01136681202 COMMON STOCK 1,773 269,453151.94CONSUMER DISCRETIONARY CA
CANADIAN UTILITIES LTD-A 0.01136717832 COMMON STOCK 3,967 112,11528.26UTILITIES CA
CANON INC 0.016172323 COMMON STOCK 6,203 147,45923.77INFORMATION TECHNOLOGY JP
CANOPY GROWTH CORP 0.00138035100 COMMON STOCK 4,802 82,50217.18HEALTH CARE CA
CANSINO BIOLOGICS INC-H 0.00BJKDJS2 COMMON STOCK 1,609 63,57839.53HEALTH CARE CN
CAPCOM CO LTD 0.016173694 COMMON STOCK 8,666 242,17827.94COMMUNICATION SERVICES JP
CAPGEMINI SE 0.014163437 COMMON STOCK 687 154,189224.46INFORMATION TECHNOLOGY FR
CAPITAL ONE FINANCIAL CORP 0.0114040H105 COMMON STOCK 1,090 180,922165.97FINANCIALS US
CAPITALAND LTD 0.006309303 COMMON STOCK 31,929 94,9482.97REAL ESTATE SG
CAPITEC BANK HOLDINGS LTD 0.006440859 COMMON STOCK 66 8,676131.19FINANCIALS ZA
CAPITOL FEDERAL FINANCIAL IN 0.0114057J101 COMMON STOCK 11,884 137,13811.54FINANCIALS US
CARDINAL HEALTH INC 0.0114149Y108 COMMON STOCK 2,930 153,81152.49HEALTH CARE US
CARGURUS INC 0.00141788109 COMMON STOCK 476 14,47330.38COMMUNICATION SERVICES US
CARL ZEISS MEDITEC AG - BR 0.025922961 COMMON STOCK 1,884 416,061220.86HEALTH CARE DE
CARLSBERG AS-B 0.014169219 COMMON STOCK 1,296 226,241174.53CONSUMER STAPLES DK
CARMAX INC 0.01143130102 COMMON STOCK 1,498 187,617125.21CONSUMER DISCRETIONARY US
CARREFOUR SA 0.015641567 COMMON STOCK 6,020 119,74019.89CONSUMER STAPLES FR
CARRIAGE SERVICES INC 0.00143905107 COMMON STOCK 448 20,72846.23CONSUMER DISCRETIONARY US
CARRIER GLOBAL CORP 0.0114448C104 COMMON STOCK 2,346 135,13357.60INDUSTRIALS US
CASELLA WASTE SYSTEMS INC-A 0.01147448104 COMMON STOCK 1,652 122,25873.99INDUSTRIALS US
CASH-USD 43.73110000 GENERAL LEDGER ACCOUNT 857,211,890 857,211,8901.00
CASIO COMPUTER CO LTD 0.006178967 COMMON STOCK 4,814 74,44815.47CONSUMER DISCRETIONARY JP
CASS INFORMATION SYSTEMS INC 0.0114808P109 COMMON STOCK 4,826 217,55445.08INFORMATION TECHNOLOGY US
CATCHER TECHNOLOGY CO LTD 0.006186669 COMMON STOCK 4,955 29,8606.03INFORMATION TECHNOLOGY TW
CATERPILLAR INC 0.01149123101 COMMON STOCK 967 203,920210.87INDUSTRIALS US
Security NameSecurityWeight
HOLDINGS 30 DAY LAG
SecurityIdentifier Security Type Units Held
Base MarketValueBase PriceSector Country
Risk Parity Multi-Asset GT
USDBase Currency:
Market Value: 1,961,759,259
August 31, 2021
17

CATHAY FINANCIAL HOLDING CO 0.006425663 COMMON STOCK 14,790 31,8072.15FINANCIALS TW
CATHAY FINANCIAL HOLDING CO 0.006425663 COMMON STOCK 894 1,9222.15FINANCIALS TW
CATTLE FEEDER FUTURE OCT 2021 0.55FCOCT2021
CATTLE FEEDER FUTURE 128 10,736,000167.75US
CATTLE FEEDER FUTURE SEP 2021 0.22FCSEP2021
CATTLE FEEDER FUTURE 54 4,401,000163.00US
CBIZ INC 0.01124805102 COMMON STOCK 5,769 196,77134.11INDUSTRIALS US
CBOE GLOBAL MARKETS INC 0.0112503M108 COMMON STOCK 1,006 126,937126.15FINANCIALS US
CBRE GROUP INC - A 0.0112504L109 COMMON STOCK 2,535 244,09496.30REAL ESTATE US
CCL INDUSTRIES INC - CL B 0.01124900309 COMMON STOCK 2,304 131,33356.99MATERIALS CA
CCR SA 0.002840970 COMMON STOCK 7,239 17,3202.39INDUSTRIALS BR
CD PROJEKT SA 0.007302215 COMMON STOCK 548 24,22544.22COMMUNICATION SERVICES PL
CELANESE CORP 0.03150870103 COMMON STOCK 4,217 668,857158.60MATERIALS US
CELLNEX TELECOM SA 0.01BX90C05 COMMON STOCK 1,804 123,54368.47COMMUNICATION SERVICES ES
CELLTRION HEALTHCARE CO LTD 0.00BYZ6DH8 COMMON STOCK 333 35,562106.69HEALTH CARE KR
CELLTRION INC 0.00B0C5YV1 COMMON STOCK 63 15,808252.71HEALTH CARE KR
CELLTRION PHARM INC 0.00B0V3YP0 COMMON STOCK 239 35,714149.12HEALTH CARE KR
CEMEX SAB-SPONS ADR PART CER 0.00151290889 AMERICAN DEPOSITORY RECEIPT 4,222 34,6178.20MATERIALS MX
CENCOSUD SA 0.00B00R3L2 COMMON STOCK 12,570 23,6821.88CONSUMER STAPLES CL
CENTENE CORP 0.0115135B101 COMMON STOCK 3,270 205,96162.98HEALTH CARE US
CENTERPOINT ENERGY INC 0.0215189T107 COMMON STOCK 17,415 436,94225.09UTILITIES US
CENTRAL JAPAN RAILWAY CO 0.016183552 COMMON STOCK 1,733 254,406146.78INDUSTRIALS JP
CENTRAL RETAIL CORP-FOREIGN 0.00BKV1PT5 COMMON STOCK 66,465 70,6251.06CONSUMER DISCRETIONARY TH
CENTURY BANCORP INC -CL A 0.00156432106 COMMON STOCK 464 53,093114.33FINANCIALS US
CERNER CORP 0.01156782104 COMMON STOCK 1,456 111,20376.35HEALTH CARE US
CEZ AS 0.015624030 COMMON STOCK 5,391 169,91131.52UTILITIES CZ
CEZ AS 0.005624030 COMMON STOCK 359 11,32231.52UTILITIES CZ
CF INDUSTRIES HOLDINGS INC 0.01125269100 COMMON STOCK 4,925 223,71445.42MATERIALS US
CGI INC 0.0212532H104 COMMON STOCK 3,723 332,20689.23INFORMATION TECHNOLOGY CA
CGN POWER CO LTD-H 0.00BSBMM04 COMMON STOCK 16,979 3,7550.22UTILITIES CN
CHAILEASE HOLDING CO LTD 0.00B58J1S8 COMMON STOCK 7,989 76,8269.62FINANCIALS TW
CHAMPIONX CORP 0.0115872M104 COMMON STOCK 9,723 226,83723.33ENERGY US
CHAROEN POKPHAND FOOD-FORGN 0.00B5L2DG6 COMMON STOCK 80,964 67,8210.84CONSUMER STAPLES TH
CHAROEN POKPHAND INDONESI PT 0.006315344 COMMON STOCK 48,525 21,7740.45CONSUMER STAPLES ID
CHARTER COMMUNICATIONS INC-A 0.0216119P108 COMMON STOCK 569 464,469816.66COMMUNICATION SERVICES US
CHASE CORP 0.0116150R104 COMMON STOCK 2,398 274,567114.50MATERIALS US
Security NameSecurityWeight
HOLDINGS 30 DAY LAG
SecurityIdentifier Security Type Units Held
Base MarketValueBase PriceSector Country
Risk Parity Multi-Asset GT
USDBase Currency:
Market Value: 1,961,759,259
August 31, 2021
18
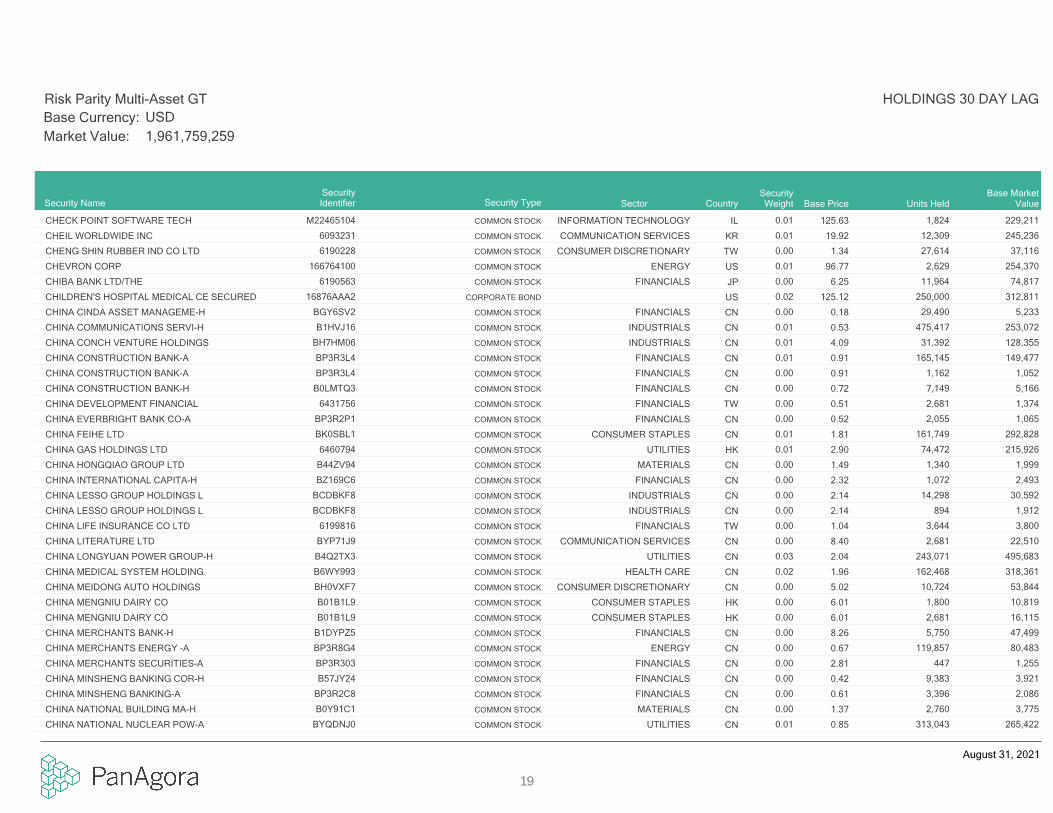
CHECK POINT SOFTWARE TECH 0.01M22465104 COMMON STOCK 1,824 229,211125.63INFORMATION TECHNOLOGY IL
CHEIL WORLDWIDE INC 0.016093231 COMMON STOCK 12,309 245,23619.92COMMUNICATION SERVICES KR
CHENG SHIN RUBBER IND CO LTD 0.006190228 COMMON STOCK 27,614 37,1161.34CONSUMER DISCRETIONARY TW
CHEVRON CORP 0.01166764100 COMMON STOCK 2,629 254,37096.77ENERGY US
CHIBA BANK LTD/THE 0.006190563 COMMON STOCK 11,964 74,8176.25FINANCIALS JP
CHILDREN'S HOSPITAL MEDICAL CE SECURED 0.0216876AAA2 CORPORATE BOND 250,000 312,811125.12US
CHINA CINDA ASSET MANAGEME-H 0.00BGY6SV2 COMMON STOCK 29,490 5,2330.18FINANCIALS CN
CHINA COMMUNICATIONS SERVI-H 0.01B1HVJ16 COMMON STOCK 475,417 253,0720.53INDUSTRIALS CN
CHINA CONCH VENTURE HOLDINGS 0.01BH7HM06 COMMON STOCK 31,392 128,3554.09INDUSTRIALS CN
CHINA CONSTRUCTION BANK-A 0.01BP3R3L4 COMMON STOCK 165,145 149,4770.91FINANCIALS CN
CHINA CONSTRUCTION BANK-A 0.00BP3R3L4 COMMON STOCK 1,162 1,0520.91FINANCIALS CN
CHINA CONSTRUCTION BANK-H 0.00B0LMTQ3 COMMON STOCK 7,149 5,1660.72FINANCIALS CN
CHINA DEVELOPMENT FINANCIAL 0.006431756 COMMON STOCK 2,681 1,3740.51FINANCIALS TW
CHINA EVERBRIGHT BANK CO-A 0.00BP3R2P1 COMMON STOCK 2,055 1,0650.52FINANCIALS CN
CHINA FEIHE LTD 0.01BK0SBL1 COMMON STOCK 161,749 292,8281.81CONSUMER STAPLES CN
CHINA GAS HOLDINGS LTD 0.016460794 COMMON STOCK 74,472 215,9262.90UTILITIES HK
CHINA HONGQIAO GROUP LTD 0.00B44ZV94 COMMON STOCK 1,340 1,9991.49MATERIALS CN
CHINA INTERNATIONAL CAPITA-H 0.00BZ169C6 COMMON STOCK 1,072 2,4932.32FINANCIALS CN
CHINA LESSO GROUP HOLDINGS L 0.00BCDBKF8 COMMON STOCK 14,298 30,5922.14INDUSTRIALS CN
CHINA LESSO GROUP HOLDINGS L 0.00BCDBKF8 COMMON STOCK 894 1,9122.14INDUSTRIALS CN
CHINA LIFE INSURANCE CO LTD 0.006199816 COMMON STOCK 3,644 3,8001.04FINANCIALS TW
CHINA LITERATURE LTD 0.00BYP71J9 COMMON STOCK 2,681 22,5108.40COMMUNICATION SERVICES CN
CHINA LONGYUAN POWER GROUP-H 0.03B4Q2TX3 COMMON STOCK 243,071 495,6832.04UTILITIES CN
CHINA MEDICAL SYSTEM HOLDING 0.02B6WY993 COMMON STOCK 162,468 318,3611.96HEALTH CARE CN
CHINA MEIDONG AUTO HOLDINGS 0.00BH0VXF7 COMMON STOCK 10,724 53,8445.02CONSUMER DISCRETIONARY CN
CHINA MENGNIU DAIRY CO 0.00B01B1L9 COMMON STOCK 1,800 10,8196.01CONSUMER STAPLES HK
CHINA MENGNIU DAIRY CO 0.00B01B1L9 COMMON STOCK 2,681 16,1156.01CONSUMER STAPLES HK
CHINA MERCHANTS BANK-H 0.00B1DYPZ5 COMMON STOCK 5,750 47,4998.26FINANCIALS CN
CHINA MERCHANTS ENERGY -A 0.00BP3R8G4 COMMON STOCK 119,857 80,4830.67ENERGY CN
CHINA MERCHANTS SECURITIES-A 0.00BP3R303 COMMON STOCK 447 1,2552.81FINANCIALS CN
CHINA MINSHENG BANKING COR-H 0.00B57JY24 COMMON STOCK 9,383 3,9210.42FINANCIALS CN
CHINA MINSHENG BANKING-A 0.00BP3R2C8 COMMON STOCK 3,396 2,0860.61FINANCIALS CN
CHINA NATIONAL BUILDING MA-H 0.00B0Y91C1 COMMON STOCK 2,760 3,7751.37MATERIALS CN
CHINA NATIONAL NUCLEAR POW-A 0.01BYQDNJ0 COMMON STOCK 313,043 265,4220.85UTILITIES CN
Security NameSecurityWeight
HOLDINGS 30 DAY LAG
SecurityIdentifier Security Type Units Held
Base MarketValueBase PriceSector Country
Risk Parity Multi-Asset GT
USDBase Currency:
Market Value: 1,961,759,259
August 31, 2021
19

CHINA NATIONAL NUCLEAR POW-A 0.00BYQDNJ0 COMMON STOCK 18,320 15,5330.85UTILITIES CN
CHINA NATIONAL SOFTWARE -A 0.00BP3R949 COMMON STOCK 1,966 14,8087.53INFORMATION TECHNOLOGY CN
CHINA PACIFIC INSURANCE GR-A 0.00BP3R2K6 COMMON STOCK 1,877 7,6364.07FINANCIALS CN
CHINA PETROLEUM & CHEMICAL-A 0.00BP3R240 COMMON STOCK 46,421 30,5970.66ENERGY CN
CHINA PETROLEUM & CHEMICAL-A 0.00BP3R240 COMMON STOCK 16,622 10,9560.66ENERGY CN
CHINA PETROLEUM & CHEMICAL-H 0.036291819 COMMON STOCK 1,037,312 502,8280.48ENERGY CN
CHINA POWER INTERNATIONAL 0.03B02ZKQ8 COMMON STOCK 1,404,877 567,2000.40UTILITIES HK
CHINA RAILWAY GROUP LTD-A 0.01BP3R3D6 COMMON STOCK 202,499 176,3940.87INDUSTRIALS CN
CHINA RAILWAY GROUP LTD-A 0.00BP3R3D6 COMMON STOCK 10,366 9,0300.87INDUSTRIALS CN
CHINA RAILWAY GROUP LTD-H 0.00B297KM7 COMMON STOCK 58,087 27,8580.48INDUSTRIALS CN
CHINA RESOURCES BEER HOLDING 0.006972459 COMMON STOCK 7,149 58,8308.23CONSUMER STAPLES HK
CHINA RESOURCES GAS GROUP LT 0.016535517 COMMON STOCK 41,363 251,0296.07UTILITIES HK
CHINA RESOURCES LAND LTD 0.006193766 COMMON STOCK 2,619 9,7503.72REAL ESTATE HK
CHINA RESOURCES PHARMACEUTIC 0.00BYNGG26 COMMON STOCK 76,389 39,7790.52HEALTH CARE CN
CHINA RESOURCES POWER HOLDIN 0.036711566 COMMON STOCK 213,594 525,1032.46UTILITIES HK
CHINA RESOURCES SANJIU MED-A 0.00BD5CL42 COMMON STOCK 17,161 74,2114.32HEALTH CARE CN
CHINA RESOURCES SANJIU MED-A 0.00BD5CL42 COMMON STOCK 1,134 4,9044.32HEALTH CARE CN
CHINA SHENHUA ENERGY CO-A 0.03BP3R262 COMMON STOCK 196,244 607,2653.09ENERGY CN
CHINA SHENHUA ENERGY CO-A 0.00BP3R262 COMMON STOCK 3,664 11,3383.09ENERGY CN
CHINA SHENHUA ENERGY CO-H 0.04B09N7M0 COMMON STOCK 312,715 692,3892.21ENERGY CN
CHINA SHENHUA ENERGY CO-H 0.00B09N7M0 COMMON STOCK 6,255 13,8502.21ENERGY CN
CHINA SOUTH PUBLISHING -A 0.03BP3R507 COMMON STOCK 391,951 527,5991.35COMMUNICATION SERVICES CN
CHINA SOUTH PUBLISHING -A 0.00BP3R507 COMMON STOCK 22,430 30,1931.35COMMUNICATION SERVICES CN
CHINA SOUTHERN AIRLINES CO-H 0.006013693 COMMON STOCK 46,469 27,0670.58INDUSTRIALS CN
CHINA STATE CONSTRUCTION -A 0.00BP3R2Q2 COMMON STOCK 9,383 6,9690.74INDUSTRIALS CN
CHINA STEEL CORP 0.006190950 COMMON STOCK 11,617 15,9921.38MATERIALS TW
CHINA TOURISM GROUP DUTY F-A 0.00BP3R466 COMMON STOCK 1,877 66,28635.32CONSUMER DISCRETIONARY CN
CHINA TOURISM GROUP DUTY F-A 0.00BP3R466 COMMON STOCK 89 3,15635.32CONSUMER DISCRETIONARY CN
CHINA TOWER CORP LTD-H 0.00BFZ2PK0 COMMON STOCK 616,613 80,8690.13COMMUNICATION SERVICES CN
CHINA TRADITIONAL CHINESE ME 0.026971779 COMMON STOCK 675,593 321,4070.48HEALTH CARE HK
CHINA YANGTZE POWER CO LTD-A 0.00BP3R2M8 COMMON STOCK 1,086 3,2492.99UTILITIES CN
CHINA ZHESHANG BANK CO LTD-A 0.00CNE100003PS9
COMMON STOCK 5,004 2,7490.55FINANCIALS CN
CHIPOTLE MEXICAN GRILL INC 0.01169656105 COMMON STOCK 126 239,4001,903.33CONSUMER DISCRETIONARY US
CHOCOLADEFABRIKEN LINDT-REG 0.025962309 COMMON STOCK 4 445,742122,154.90CONSUMER STAPLES CH
Security NameSecurityWeight
HOLDINGS 30 DAY LAG
SecurityIdentifier Security Type Units Held
Base MarketValueBase PriceSector Country
Risk Parity Multi-Asset GT
USDBase Currency:
Market Value: 1,961,759,259
August 31, 2021
20
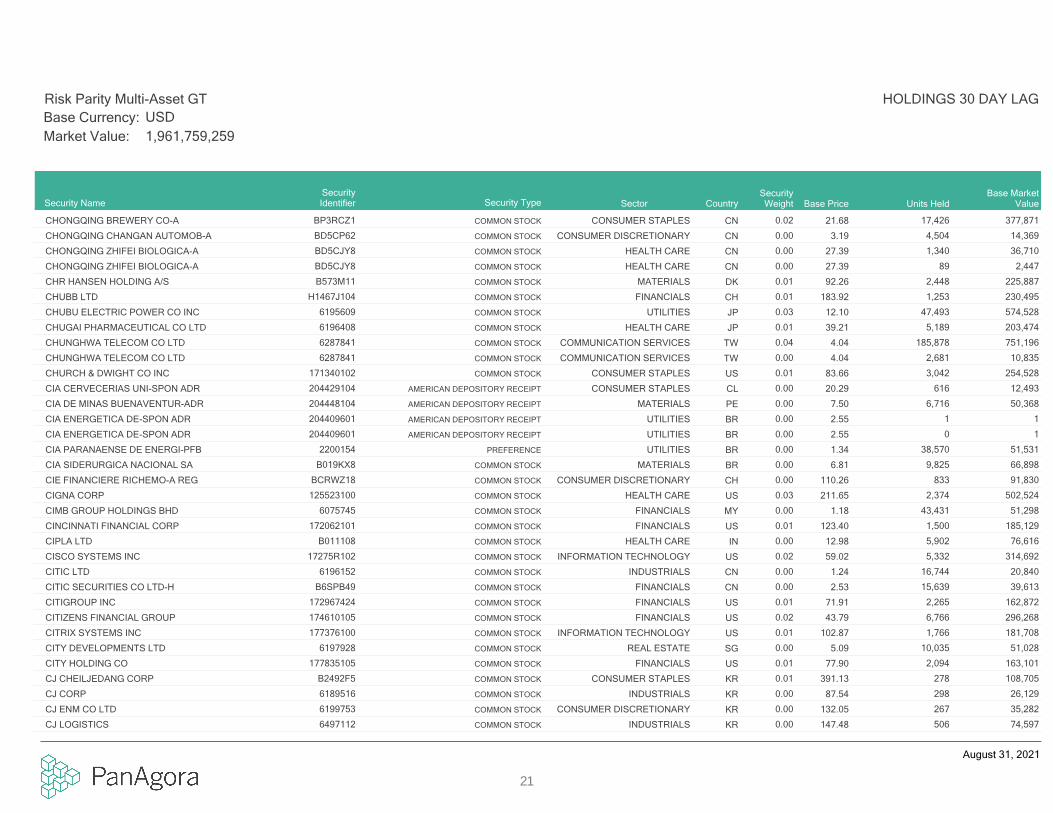
CHONGQING BREWERY CO-A 0.02BP3RCZ1 COMMON STOCK 17,426 377,87121.68CONSUMER STAPLES CN
CHONGQING CHANGAN AUTOMOB-A 0.00BD5CP62 COMMON STOCK 4,504 14,3693.19CONSUMER DISCRETIONARY CN
CHONGQING ZHIFEI BIOLOGICA-A 0.00BD5CJY8 COMMON STOCK 1,340 36,71027.39HEALTH CARE CN
CHONGQING ZHIFEI BIOLOGICA-A 0.00BD5CJY8 COMMON STOCK 89 2,44727.39HEALTH CARE CN
CHR HANSEN HOLDING A/S 0.01B573M11 COMMON STOCK 2,448 225,88792.26MATERIALS DK
CHUBB LTD 0.01H1467J104 COMMON STOCK 1,253 230,495183.92FINANCIALS CH
CHUBU ELECTRIC POWER CO INC 0.036195609 COMMON STOCK 47,493 574,52812.10UTILITIES JP
CHUGAI PHARMACEUTICAL CO LTD 0.016196408 COMMON STOCK 5,189 203,47439.21HEALTH CARE JP
CHUNGHWA TELECOM CO LTD 0.046287841 COMMON STOCK 185,878 751,1964.04COMMUNICATION SERVICES TW
CHUNGHWA TELECOM CO LTD 0.006287841 COMMON STOCK 2,681 10,8354.04COMMUNICATION SERVICES TW
CHURCH & DWIGHT CO INC 0.01171340102 COMMON STOCK 3,042 254,52883.66CONSUMER STAPLES US
CIA CERVECERIAS UNI-SPON ADR 0.00204429104 AMERICAN DEPOSITORY RECEIPT 616 12,49320.29CONSUMER STAPLES CL
CIA DE MINAS BUENAVENTUR-ADR 0.00204448104 AMERICAN DEPOSITORY RECEIPT 6,716 50,3687.50MATERIALS PE
CIA ENERGETICA DE-SPON ADR 0.00204409601 AMERICAN DEPOSITORY RECEIPT 1 12.55UTILITIES BR
CIA ENERGETICA DE-SPON ADR 0.00204409601 AMERICAN DEPOSITORY RECEIPT 0 12.55UTILITIES BR
CIA PARANAENSE DE ENERGI-PFB 0.002200154 PREFERENCE 38,570 51,5311.34UTILITIES BR
CIA SIDERURGICA NACIONAL SA 0.00B019KX8 COMMON STOCK 9,825 66,8986.81MATERIALS BR
CIE FINANCIERE RICHEMO-A REG 0.00BCRWZ18 COMMON STOCK 833 91,830110.26CONSUMER DISCRETIONARY CH
CIGNA CORP 0.03125523100 COMMON STOCK 2,374 502,524211.65HEALTH CARE US
CIMB GROUP HOLDINGS BHD 0.006075745 COMMON STOCK 43,431 51,2981.18FINANCIALS MY
CINCINNATI FINANCIAL CORP 0.01172062101 COMMON STOCK 1,500 185,129123.40FINANCIALS US
CIPLA LTD 0.00B011108 COMMON STOCK 5,902 76,61612.98HEALTH CARE IN
CISCO SYSTEMS INC 0.0217275R102 COMMON STOCK 5,332 314,69259.02INFORMATION TECHNOLOGY US
CITIC LTD 0.006196152 COMMON STOCK 16,744 20,8401.24INDUSTRIALS CN
CITIC SECURITIES CO LTD-H 0.00B6SPB49 COMMON STOCK 15,639 39,6132.53FINANCIALS CN
CITIGROUP INC 0.01172967424 COMMON STOCK 2,265 162,87271.91FINANCIALS US
CITIZENS FINANCIAL GROUP 0.02174610105 COMMON STOCK 6,766 296,26843.79FINANCIALS US
CITRIX SYSTEMS INC 0.01177376100 COMMON STOCK 1,766 181,708102.87INFORMATION TECHNOLOGY US
CITY DEVELOPMENTS LTD 0.006197928 COMMON STOCK 10,035 51,0285.09REAL ESTATE SG
CITY HOLDING CO 0.01177835105 COMMON STOCK 2,094 163,10177.90FINANCIALS US
CJ CHEILJEDANG CORP 0.01B2492F5 COMMON STOCK 278 108,705391.13CONSUMER STAPLES KR
CJ CORP 0.006189516 COMMON STOCK 298 26,12987.54INDUSTRIALS KR
CJ ENM CO LTD 0.006199753 COMMON STOCK 267 35,282132.05CONSUMER DISCRETIONARY KR
CJ LOGISTICS 0.006497112 COMMON STOCK 506 74,597147.48INDUSTRIALS KR
Security NameSecurityWeight
HOLDINGS 30 DAY LAG
SecurityIdentifier Security Type Units Held
Base MarketValueBase PriceSector Country
Risk Parity Multi-Asset GT
USDBase Currency:
Market Value: 1,961,759,259
August 31, 2021
21

CK INFRASTRUCTURE HOLDINGS L 0.04BYVS6J1 COMMON STOCK 123,154 748,1996.08UTILITIES HK
CLARIANT AG-REG 0.017113990 COMMON STOCK 6,939 146,05421.05MATERIALS CH
CLEARWAY ENERGY INC-A 0.0218539C105 COMMON STOCK 16,068 477,86829.74UTILITIES US
CLICKS GROUP LTD 0.006105578 COMMON STOCK 2,337 48,88020.92CONSUMER STAPLES ZA
CLOROX COMPANY 0.02189054109 COMMON STOCK 2,126 357,342168.05CONSUMER STAPLES US
CLP HOLDINGS LTD 0.106097017 COMMON STOCK 201,840 2,017,79410.00UTILITIES HK
CMC MATERIALS INC 0.0012571T100 COMMON STOCK 738 97,821132.62INFORMATION TECHNOLOGY US
CME 3 20220915 0.0312572QAE5
CORPORATE BOND 500,000 521,180102.85US
CME GROUP INC 0.0112572Q105 COMMON STOCK 666 134,399201.72FINANCIALS US
CMS ENERGY CORP 0.03125896100 COMMON STOCK 10,321 661,89964.13UTILITIES US
CNH INDUSTRIAL NV 0.01BDSV2V0 COMMON STOCK 8,870 146,58616.53INDUSTRIALS GB
CNP ASSURANCES 0.005543986 COMMON STOCK 5,354 91,61117.11FINANCIALS FR
CO FOR COOPERATIVE INSURANCE 0.00B05M583 COMMON STOCK 598 14,58524.40FINANCIALS SA
COAL INDIA LTD 0.00B4Z9XF5 COMMON STOCK 16,119 32,2012.00ENERGY IN
COCA-COLA CO/THE 0.01191216100 COMMON STOCK 4,053 228,23656.31CONSUMER STAPLES US
COCA-COLA EUROPACIFIC PARTNE 0.01G25839104 COMMON STOCK 2,522 145,64157.74CONSUMER STAPLES GB
COCA-COLA FEMSA SAB-SP ADR 0.00191241108 AMERICAN DEPOSITORY RECEIPT 143 8,27957.90CONSUMER STAPLES MX
COCA-COLA HBC AG-DI 0.01B9895B7 COMMON STOCK 3,484 126,05336.18CONSUMER STAPLES CH
COCHLEAR LTD 0.016211798 COMMON STOCK 1,314 223,889170.43HEALTH CARE AU
COCOA FUTURE DEC 2021 0.96CCDEC2021
COCOA FUTURE 744 18,897,6002,540.00US
COFFEE 'C' FUTURE DEC 2021 0.51KCDEC2021
COFFEE 'C' FUTURE 137 10,064,363195.90US
COGENT COMMUNICATIONS HOLDIN 0.0019239V302 COMMON STOCK 192 13,94772.58COMMUNICATION SERVICES US
COGNIZANT TECH SOLUTIONS-A 0.01192446102 COMMON STOCK 3,287 250,80676.31INFORMATION TECHNOLOGY US
COLBUN SA 0.002309255 COMMON STOCK 303,162 50,1090.17UTILITIES CL
COLES GROUP LTD 0.01BYWR0T5 COMMON STOCK 16,536 218,50713.21CONSUMER STAPLES AU
COLGATE-PALMOLIVE CO 0.02194162103 COMMON STOCK 4,750 370,22777.95CONSUMER STAPLES US
COLOPLAST-B 0.03B8FMRX8 COMMON STOCK 2,880 498,749173.18HEALTH CARE DK
COLRUYT SA 0.045806225 COMMON STOCK 15,092 844,28755.94CONSUMER STAPLES BE
COMCAST CORP-CLASS A 0.0220030N101 COMMON STOCK 6,896 418,44960.68COMMUNICATION SERVICES US
COMMERCIAL BANK PSQC 0.006150448 COMMON STOCK 19,931 33,0521.66FINANCIALS QA
COMMERCIAL BANK PSQC 0.006150448 COMMON STOCK 2,294 3,8041.66FINANCIALS QA
COMMERCIAL INTL BANK-GDR REG 0.015668287 GLOBAL DEPOSITORY RECEIPTS 41,388 120,2332.90FINANCIALS EG
COMMONWEALTH BANK OF AUSTRAL 0.016215035 COMMON STOCK 1,505 110,14073.17FINANCIALS AU
COMMUNITY BANK SYSTEM INC 0.01203607106 COMMON STOCK 1,900 140,56774.00FINANCIALS US
Security NameSecurityWeight
HOLDINGS 30 DAY LAG
SecurityIdentifier Security Type Units Held
Base MarketValueBase PriceSector Country
Risk Parity Multi-Asset GT
USDBase Currency:
Market Value: 1,961,759,259
August 31, 2021
22

COMMUNITY TRUST BANCORP INC 0.00204149108 COMMON STOCK 1,704 71,00541.66FINANCIALS US
COMMVAULT SYSTEMS INC 0.01204166102 COMMON STOCK 1,683 136,30380.97INFORMATION TECHNOLOGY US
COMPAGNIE DE SAINT GOBAIN 0.017380482 COMMON STOCK 2,372 171,88372.47INDUSTRIALS FR
COMPAL ELECTRONICS 0.006225744 COMMON STOCK 56,299 46,5210.83INFORMATION TECHNOLOGY TW
COMPAL ELECTRONICS 0.006225744 COMMON STOCK 16,086 13,2920.83INFORMATION TECHNOLOGY TW
COMPASS GROUP PLC 0.01BD6K457 COMMON STOCK 4,796 99,03420.65CONSUMER DISCRETIONARY GB
COMPASS MINERALS INTERNATION 0.0220451N101 COMMON STOCK 4,906 328,36066.93MATERIALS US
COMPUTER PROGRAMS & SYSTEMS 0.03205306103 COMMON STOCK 18,644 663,17835.57HEALTH CARE US
COMPUTERSHARE LTD 0.016180412 COMMON STOCK 13,641 164,49512.06INFORMATION TECHNOLOGY AU
CONAGRA BRANDS INC 0.02205887102 COMMON STOCK 11,313 374,68233.12CONSUMER STAPLES US
CONCORDIA FINANCIAL GROUP LT 0.00BD97JW7 COMMON STOCK 10,560 41,0453.89FINANCIALS JP
CONOCOPHILLIPS 0.0120825C104 COMMON STOCK 5,038 279,73655.53ENERGY US
CONSOLIDATED EDISON INC 0.03209115104 COMMON STOCK 8,630 651,16975.45UTILITIES US
CONSTELLATION BRANDS INC-A 0.0221036P108 COMMON STOCK 1,517 320,224211.14CONSUMER STAPLES US
CONSTELLATION SOFTWARE INC 0.0121037X100 COMMON STOCK 161 271,6721,692.07INFORMATION TECHNOLOGY CA
CONTAINER CORP OF INDIA LTD 0.00BG0ZVG9 COMMON STOCK 8,231 76,6179.31INDUSTRIALS IN
CONTINENTAL AG 0.004598589 COMMON STOCK 484 65,084134.36CONSUMER DISCRETIONARY DE
COOPER COS INC/THE 0.01216648402 COMMON STOCK 400 180,340450.71HEALTH CARE US
COPPER FUTURE (CMX) DEC 2021 0.89HGDEC2021
COPPER FUTURE (CMX) 160 17,500,000437.50US
CORN FUTURE (CBT) DEC 2021 0.62C DEC2021 CORN FUTURE (CBT) 454 12,127,475534.25US
CORPORACION ANDI 4.375 20220615 0.06B7VZ4D3 CORPORATE BOND 1,125,000 1,169,303103.01US
CORTEVA INC 0.0122052L104 COMMON STOCK 5,892 259,09343.97MATERIALS US
CORVEL CORP 0.00221006109 COMMON STOCK 96 15,835164.81HEALTH CARE US
COSCO SHIPPING ENERGY TRAN-A 0.01BP3R9Y9 COMMON STOCK 134,225 110,0680.82ENERGY CN
COSCO SHIPPING HOLDINGS CO-A 0.00BP3R552 COMMON STOCK 2,091 6,7103.21INDUSTRIALS CN
COSCO SHIPPING HOLDINGS CO-H 0.00B0B8Z18 COMMON STOCK 3,485 6,5871.89INDUSTRIALS CN
COSMOS PHARMACEUTICAL CORP 0.01B036QP1 COMMON STOCK 821 145,581177.32CONSUMER STAPLES JP
COSTCO WHOLESALE CORP 0.0222160K105 COMMON STOCK 741 337,520455.49CONSUMER STAPLES US
COTERRA ENERGY INC 0.01127097103 COMMON STOCK 15,251 242,34215.89ENERGY US
COTTON NO.2 FUTURE DEC 2021 0.45CTDEC2021
COTTON NO.2 FUTURE 189 8,744,08592.53US
COUNCIL OF EUROPE DEVELOPMENT BANK 0.05222213AR1 CORPORATE BOND 875,000 906,695103.49FR
COUNCIL OF EUROPE DEVELOPMENT BANK 0.07222213AS9 CORPORATE BOND 1,375,000 1,446,341105.19FR
COUNCIL OF EUROPE DEVELOPMENT BANK 0.02222213AT7 CORPORATE BOND 375,000 384,208101.70FR
COUNTRY GARDEN HOLDINGS CO 0.00B1VKYN6 COMMON STOCK 1,541 1,7041.11REAL ESTATE CN
Security NameSecurityWeight
HOLDINGS 30 DAY LAG
SecurityIdentifier Security Type Units Held
Base MarketValueBase PriceSector Country
Risk Parity Multi-Asset GT
USDBase Currency:
Market Value: 1,961,759,259
August 31, 2021
23

COUNTRY GARDEN SERVICES HOLD 0.00BDQZP48 COMMON STOCK 9,830 74,8887.62INDUSTRIALS CN
COVANTA HOLDING CORP 0.0122282E102 COMMON STOCK 6,793 136,19120.05INDUSTRIALS US
COWAY CO LTD 0.006173401 COMMON STOCK 853 57,50067.45CONSUMER DISCRETIONARY KR
CP ALL PCL-FOREIGN 0.00B08YDF9 COMMON STOCK 38,695 78,0322.02CONSUMER STAPLES TH
CPFL ENERGIA SA 0.00B031NN3 COMMON STOCK 6,613 37,5115.67UTILITIES BR
CREDICORP LTD 0.00G2519Y108 COMMON STOCK 216 23,060106.63FINANCIALS PE
CRH PLC 0.014182249 COMMON STOCK 3,343 177,76153.17MATERIALS IE
CRODA INTERNATIONAL PLC 0.02BJFFLV0 COMMON STOCK 2,764 348,001125.90MATERIALS GB
CSG SYSTEMS INTL INC 0.01126349109 COMMON STOCK 3,377 162,79448.21INFORMATION TECHNOLOGY US
CSL LTD 0.016185495 COMMON STOCK 1,223 278,895227.98HEALTH CARE AU
CSPC PHARMACEUTICAL GROUP LT 0.006191997 COMMON STOCK 50,197 63,7031.27HEALTH CARE CN
CSW INDUSTRIALS INC 0.01126402106 COMMON STOCK 1,531 203,336132.79INDUSTRIALS US
CSX CORP 0.01126408103 COMMON STOCK 5,928 192,83932.53INDUSTRIALS US
CTBC FINANCIAL HOLDING CO LT 0.006527666 COMMON STOCK 47,995 39,8320.83FINANCIALS TW
CTBC FINANCIAL HOLDING CO LT 0.006527666 COMMON STOCK 894 7420.83FINANCIALS TW
CTS CORP 0.01126501105 COMMON STOCK 3,929 137,83735.08INFORMATION TECHNOLOGY US
CUMMINS INC 0.02231021106 COMMON STOCK 1,377 324,990235.98INDUSTRIALS US
CVB FINANCIAL CORP 0.01126600105 COMMON STOCK 7,551 153,74220.36FINANCIALS US
CVS HEALTH CORP 0.04126650100 COMMON STOCK 8,737 754,79986.39HEALTH CARE US
CYBERAGENT INC 0.016220501 COMMON STOCK 13,775 253,40618.40COMMUNICATION SERVICES JP
CYBERARK SOFTWARE LTD/ISRAEL 0.02M2682V108
COMMON STOCK 1,872 314,372167.94INFORMATION TECHNOLOGY IL
CYFROWY POLSAT SA 0.00B2QRCM4 COMMON STOCK 8,721 83,2759.55COMMUNICATION SERVICES PL
DAAN GENE CO LTD-A 0.02BD5CKW3 COMMON STOCK 102,322 296,5232.90HEALTH CARE CN
DABUR INDIA LTD 0.016297356 COMMON STOCK 11,533 98,1818.51CONSUMER STAPLES IN
DABUR INDIA LTD 0.006297356 COMMON STOCK 820 6,9848.51CONSUMER STAPLES IN
DAEWOO SHIPBUILDING & MARINE 0.006211732 COMMON STOCK 584 14,11724.19INDUSTRIALS KR
DAI-ICHI LIFE HOLDINGS INC 0.00B601QS4 COMMON STOCK 4,014 79,26619.75FINANCIALS JP
DAIICHI SANKYO CO LTD 0.01B0J7D91 COMMON STOCK 4,288 102,03823.80HEALTH CARE JP
DAILY JOURNAL CORP 0.04233912104 COMMON STOCK 2,140 727,517340.00COMMUNICATION SERVICES US
DAIMLER AG-REGISTERED SHARES 0.015529027 COMMON STOCK 1,466 123,59484.31CONSUMER DISCRETIONARY DE
DAITO TRUST CONSTRUCT CO LTD 0.016250508 COMMON STOCK 912 100,309109.96REAL ESTATE JP
DAIWA HOUSE INDUSTRY CO LTD 0.006251363 COMMON STOCK 1,521 46,45530.55REAL ESTATE JP
DAIWA HOUSE REIT INVESTMENT 0.01B0Z6WY0 REAL ESTATE INVESTMENT TRUST 58 172,9832,962.86REAL ESTATE JP
DALI FOODS GROUP CO LTD 0.00BYQ9796 COMMON STOCK 86,892 48,7120.56CONSUMER STAPLES CN
Security NameSecurityWeight
HOLDINGS 30 DAY LAG
SecurityIdentifier Security Type Units Held
Base MarketValueBase PriceSector Country
Risk Parity Multi-Asset GT
USDBase Currency:
Market Value: 1,961,759,259
August 31, 2021
24
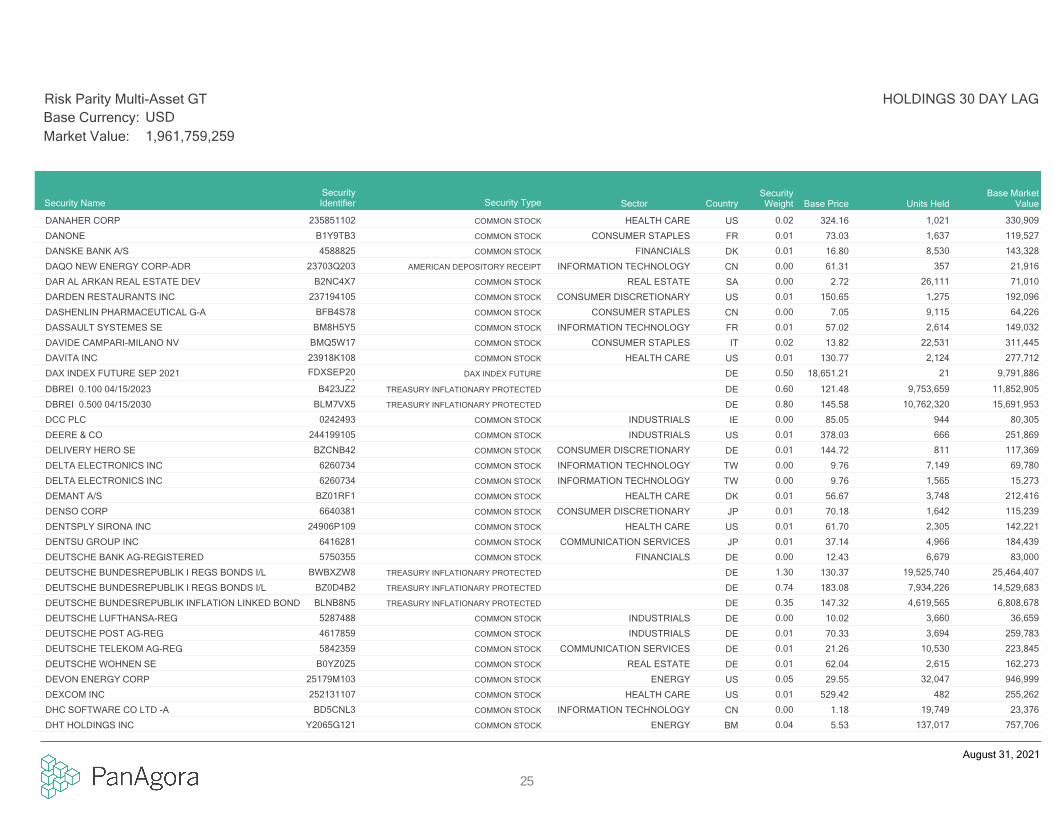
DANAHER CORP 0.02235851102 COMMON STOCK 1,021 330,909324.16HEALTH CARE US
DANONE 0.01B1Y9TB3 COMMON STOCK 1,637 119,52773.03CONSUMER STAPLES FR
DANSKE BANK A/S 0.014588825 COMMON STOCK 8,530 143,32816.80FINANCIALS DK
DAQO NEW ENERGY CORP-ADR 0.0023703Q203 AMERICAN DEPOSITORY RECEIPT 357 21,91661.31INFORMATION TECHNOLOGY CN
DAR AL ARKAN REAL ESTATE DEV 0.00B2NC4X7 COMMON STOCK 26,111 71,0102.72REAL ESTATE SA
DARDEN RESTAURANTS INC 0.01237194105 COMMON STOCK 1,275 192,096150.65CONSUMER DISCRETIONARY US
DASHENLIN PHARMACEUTICAL G-A 0.00BFB4S78 COMMON STOCK 9,115 64,2267.05CONSUMER STAPLES CN
DASSAULT SYSTEMES SE 0.01BM8H5Y5 COMMON STOCK 2,614 149,03257.02INFORMATION TECHNOLOGY FR
DAVIDE CAMPARI-MILANO NV 0.02BMQ5W17 COMMON STOCK 22,531 311,44513.82CONSUMER STAPLES IT
DAVITA INC 0.0123918K108 COMMON STOCK 2,124 277,712130.77HEALTH CARE US
DAX INDEX FUTURE SEP 2021 0.50FDXSEP2021
DAX INDEX FUTURE 21 9,791,88618,651.21DE
DBREI 0.100 04/15/2023 0.60B423JZ2 TREASURY INFLATIONARY PROTECTED 9,753,659 11,852,905121.48DE
DBREI 0.500 04/15/2030 0.80BLM7VX5 TREASURY INFLATIONARY PROTECTED 10,762,320 15,691,953145.58DE
DCC PLC 0.000242493 COMMON STOCK 944 80,30585.05INDUSTRIALS IE
DEERE & CO 0.01244199105 COMMON STOCK 666 251,869378.03INDUSTRIALS US
DELIVERY HERO SE 0.01BZCNB42 COMMON STOCK 811 117,369144.72CONSUMER DISCRETIONARY DE
DELTA ELECTRONICS INC 0.006260734 COMMON STOCK 7,149 69,7809.76INFORMATION TECHNOLOGY TW
DELTA ELECTRONICS INC 0.006260734 COMMON STOCK 1,565 15,2739.76INFORMATION TECHNOLOGY TW
DEMANT A/S 0.01BZ01RF1 COMMON STOCK 3,748 212,41656.67HEALTH CARE DK
DENSO CORP 0.016640381 COMMON STOCK 1,642 115,23970.18CONSUMER DISCRETIONARY JP
DENTSPLY SIRONA INC 0.0124906P109 COMMON STOCK 2,305 142,22161.70HEALTH CARE US
DENTSU GROUP INC 0.016416281 COMMON STOCK 4,966 184,43937.14COMMUNICATION SERVICES JP
DEUTSCHE BANK AG-REGISTERED 0.005750355 COMMON STOCK 6,679 83,00012.43FINANCIALS DE
DEUTSCHE BUNDESREPUBLIK I REGS BONDS I/L 1.30BWBXZW8 TREASURY INFLATIONARY PROTECTED 19,525,740 25,464,407130.37DE
DEUTSCHE BUNDESREPUBLIK I REGS BONDS I/L 0.74BZ0D4B2 TREASURY INFLATIONARY PROTECTED 7,934,226 14,529,683183.08DE
DEUTSCHE BUNDESREPUBLIK INFLATION LINKED BOND 0.35BLNB8N5 TREASURY INFLATIONARY PROTECTED 4,619,565 6,808,678147.32DE
DEUTSCHE LUFTHANSA-REG 0.005287488 COMMON STOCK 3,660 36,65910.02INDUSTRIALS DE
DEUTSCHE POST AG-REG 0.014617859 COMMON STOCK 3,694 259,78370.33INDUSTRIALS DE
DEUTSCHE TELEKOM AG-REG 0.015842359 COMMON STOCK 10,530 223,84521.26COMMUNICATION SERVICES DE
DEUTSCHE WOHNEN SE 0.01B0YZ0Z5 COMMON STOCK 2,615 162,27362.04REAL ESTATE DE
DEVON ENERGY CORP 0.0525179M103 COMMON STOCK 32,047 946,99929.55ENERGY US
DEXCOM INC 0.01252131107 COMMON STOCK 482 255,262529.42HEALTH CARE US
DHC SOFTWARE CO LTD -A 0.00BD5CNL3 COMMON STOCK 19,749 23,3761.18INFORMATION TECHNOLOGY CN
DHT HOLDINGS INC 0.04Y2065G121 COMMON STOCK 137,017 757,7065.53ENERGY BM
Security NameSecurityWeight
HOLDINGS 30 DAY LAG
SecurityIdentifier Security Type Units Held
Base MarketValueBase PriceSector Country
Risk Parity Multi-Asset GT
USDBase Currency:
Market Value: 1,961,759,259
August 31, 2021
25

DIAGEO PLC 0.010237400 COMMON STOCK 3,301 158,75348.09CONSUMER STAPLES GB
DIALOG GROUP BHD 0.00B00MRS2 COMMON STOCK 65,670 42,0210.64ENERGY MY
DIALOG GROUP BHD 0.00B00MRS2 COMMON STOCK 10,456 6,6900.64ENERGY MY
DIAMONDBACK ENERGY INC 0.0325278X10⁹ COMMON STOCK 7,395 570,41677.14ENERGY US
DIASORIN SPA 0.03B234WN9 COMMON STOCK 2,444 557,513228.12HEALTH CARE IT
DIGI.COM BHD 0.016086242 COMMON STOCK 196,959 208,4721.06COMMUNICATION SERVICES MY
DIGITAL REALTY TRUST INC 0.01253868103 REAL ESTATE INVESTMENT TRUST 614 100,692163.91REAL ESTATE US
DINO POLSKA SA 0.00BD0YVN2 COMMON STOCK 180 15,22884.78CONSUMER STAPLES PL
DIODES INC 0.00254543101 COMMON STOCK 631 61,05396.83INFORMATION TECHNOLOGY US
DIRECT LINE INSURANCE GROUP 0.00BY9D0Y1 COMMON STOCK 10,843 46,1114.25FINANCIALS GB
DISCO CORP 0.016270948 COMMON STOCK 365 106,454291.73INFORMATION TECHNOLOGY JP
DISCOVER FINANCIAL SERVICES 0.01254709108 COMMON STOCK 1,468 188,270128.22FINANCIALS US
DISCOVERY INC - A 0.0425470F104 COMMON STOCK 26,494 764,08428.84COMMUNICATION SERVICES US
DISCOVERY LTD 0.006177878 COMMON STOCK 2,074 18,4648.90FINANCIALS ZA
DISH NETWORK CORP-A 0.0225470M109 COMMON STOCK 7,189 313,35043.59COMMUNICATION SERVICES US
DIVI'S LABORATORIES LTD 0.006602518 COMMON STOCK 1,041 73,77670.86HEALTH CARE IN
DLF LTD 0.00B1YLCV0 COMMON STOCK 4,826 21,1884.39REAL ESTATE IN
DMC GLOBAL INC 0.0223291C103 COMMON STOCK 10,360 416,18140.17ENERGY US
DNB BANK ASA 0.00BNG7113 COMMON STOCK 1,728 36,44021.09FINANCIALS NO
DOLLAR GENERAL CORP 0.02256677105 COMMON STOCK 1,413 314,914222.91CONSUMER DISCRETIONARY US
DOLLAR TREE INC 0.01256746108 COMMON STOCK 2,925 264,81490.54CONSUMER DISCRETIONARY US
DOLLARAMA INC 0.0125675T107 COMMON STOCK 5,871 267,29945.53CONSUMER DISCRETIONARY CA
DOMINION ENERGY INC 0.0425746U109 COMMON STOCK 8,912 693,71977.84UTILITIES US
DOMINO'S PIZZA ENTERPRISES L 0.01B07SFG7 COMMON STOCK 2,190 250,907114.55CONSUMER DISCRETIONARY AU
DOMINO'S PIZZA INC 0.0125754A201 COMMON STOCK 407 210,118516.89CONSUMER DISCRETIONARY US
DONEGAL GROUP INC-CL A 0.00257701201 COMMON STOCK 4,478 67,43415.06FINANCIALS US
DONGFANG ELECTRIC CORP LTD-A 0.01BP3R604 COMMON STOCK 72,653 177,9462.45INDUSTRIALS CN
DONGFENG MOTOR GRP CO LTD-H 0.01B0PH5N3 COMMON STOCK 95,956 105,1181.10CONSUMER DISCRETIONARY CN
DOOSAN BOBCAT INC 0.00BYX9GP8 COMMON STOCK 357 13,36537.39INDUSTRIALS KR
DORMAN PRODUCTS INC 0.04258278100 COMMON STOCK 7,547 708,37993.86CONSUMER DISCRETIONARY US
DOUYU INTERNATIONAL HOLD-ADR 0.0025985W105
AMERICAN DEPOSITORY RECEIPT 9,534 40,8074.28COMMUNICATION SERVICES CN
DOUZONE BIZON CO LTD 0.006510989 COMMON STOCK 669 49,24373.57INFORMATION TECHNOLOGY KR
DOVER CORP 0.01260003108 COMMON STOCK 792 138,101174.36INDUSTRIALS US
DOW INC 0.04260557103 COMMON STOCK 12,016 755,78062.90MATERIALS US
Security NameSecurityWeight
HOLDINGS 30 DAY LAG
SecurityIdentifier Security Type Units Held
Base MarketValueBase PriceSector Country
Risk Parity Multi-Asset GT
USDBase Currency:
Market Value: 1,961,759,259
August 31, 2021
26
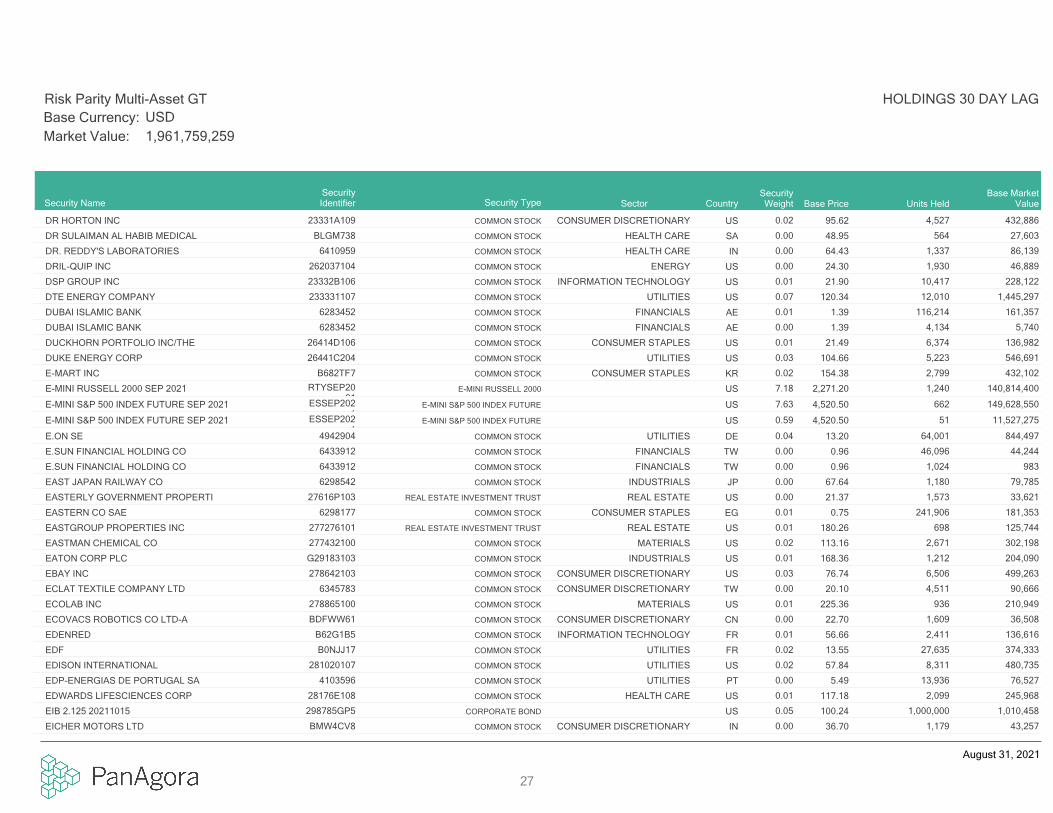
DR HORTON INC 0.0223331A109 COMMON STOCK 4,527 432,88695.62CONSUMER DISCRETIONARY US
DR SULAIMAN AL HABIB MEDICAL 0.00BLGM738 COMMON STOCK 564 27,60348.95HEALTH CARE SA
DR. REDDY'S LABORATORIES 0.006410959 COMMON STOCK 1,337 86,13964.43HEALTH CARE IN
DRIL-QUIP INC 0.00262037104 COMMON STOCK 1,930 46,88924.30ENERGY US
DSP GROUP INC 0.0123332B106 COMMON STOCK 10,417 228,12221.90INFORMATION TECHNOLOGY US
DTE ENERGY COMPANY 0.07233331107 COMMON STOCK 12,010 1,445,297120.34UTILITIES US
DUBAI ISLAMIC BANK 0.016283452 COMMON STOCK 116,214 161,3571.39FINANCIALS AE
DUBAI ISLAMIC BANK 0.006283452 COMMON STOCK 4,134 5,7401.39FINANCIALS AE
DUCKHORN PORTFOLIO INC/THE 0.0126414D106 COMMON STOCK 6,374 136,98221.49CONSUMER STAPLES US
DUKE ENERGY CORP 0.0326441C204 COMMON STOCK 5,223 546,691104.66UTILITIES US
E-MART INC 0.02B682TF7 COMMON STOCK 2,799 432,102154.38CONSUMER STAPLES KR
E-MINI RUSSELL 2000 SEP 2021 7.18RTYSEP2021
E-MINI RUSSELL 2000 1,240 140,814,4002,271.20US
E-MINI S&P 500 INDEX FUTURE SEP 2021 7.63ESSEP2021
E-MINI S&P 500 INDEX FUTURE 662 149,628,5504,520.50US
E-MINI S&P 500 INDEX FUTURE SEP 2021 0.59ESSEP2021
E-MINI S&P 500 INDEX FUTURE 51 11,527,2754,520.50US
E.ON SE 0.044942904 COMMON STOCK 64,001 844,49713.20UTILITIES DE
E.SUN FINANCIAL HOLDING CO 0.006433912 COMMON STOCK 46,096 44,2440.96FINANCIALS TW
E.SUN FINANCIAL HOLDING CO 0.006433912 COMMON STOCK 1,024 9830.96FINANCIALS TW
EAST JAPAN RAILWAY CO 0.006298542 COMMON STOCK 1,180 79,78567.64INDUSTRIALS JP
EASTERLY GOVERNMENT PROPERTI 0.0027616P103 REAL ESTATE INVESTMENT TRUST 1,573 33,62121.37REAL ESTATE US
EASTERN CO SAE 0.016298177 COMMON STOCK 241,906 181,3530.75CONSUMER STAPLES EG
EASTGROUP PROPERTIES INC 0.01277276101 REAL ESTATE INVESTMENT TRUST 698 125,744180.26REAL ESTATE US
EASTMAN CHEMICAL CO 0.02277432100 COMMON STOCK 2,671 302,198113.16MATERIALS US
EATON CORP PLC 0.01G29183103 COMMON STOCK 1,212 204,090168.36INDUSTRIALS US
EBAY INC 0.03278642103 COMMON STOCK 6,506 499,26376.74CONSUMER DISCRETIONARY US
ECLAT TEXTILE COMPANY LTD 0.006345783 COMMON STOCK 4,511 90,66620.10CONSUMER DISCRETIONARY TW
ECOLAB INC 0.01278865100 COMMON STOCK 936 210,949225.36MATERIALS US
ECOVACS ROBOTICS CO LTD-A 0.00BDFWW61 COMMON STOCK 1,609 36,50822.70CONSUMER DISCRETIONARY CN
EDENRED 0.01B62G1B5 COMMON STOCK 2,411 136,61656.66INFORMATION TECHNOLOGY FR
EDF 0.02B0NJJ17 COMMON STOCK 27,635 374,33313.55UTILITIES FR
EDISON INTERNATIONAL 0.02281020107 COMMON STOCK 8,311 480,73557.84UTILITIES US
EDP-ENERGIAS DE PORTUGAL SA 0.004103596 COMMON STOCK 13,936 76,5275.49UTILITIES PT
EDWARDS LIFESCIENCES CORP 0.0128176E108 COMMON STOCK 2,099 245,968117.18HEALTH CARE US
EIB 2.125 20211015 0.05298785GP5 CORPORATE BOND 1,000,000 1,010,458100.24US
EICHER MOTORS LTD 0.00BMW4CV8 COMMON STOCK 1,179 43,25736.70CONSUMER DISCRETIONARY IN
Security NameSecurityWeight
HOLDINGS 30 DAY LAG
SecurityIdentifier Security Type Units Held
Base MarketValueBase PriceSector Country
Risk Parity Multi-Asset GT
USDBase Currency:
Market Value: 1,961,759,259
August 31, 2021
27

EIFFAGE 0.00B13X013 COMMON STOCK 928 96,397103.90INDUSTRIALS FR
EISAI CO LTD 0.016307200 COMMON STOCK 2,140 177,00082.71HEALTH CARE JP
ELBIT SYSTEMS LTD 0.016308913 COMMON STOCK 1,173 170,823145.61INDUSTRIALS IL
ELECTRONIC ARTS INC 0.03285512109 COMMON STOCK 3,517 510,742145.21COMMUNICATION SERVICES US
ELI LILLY & CO 0.01532457108 COMMON STOCK 614 158,671258.29HEALTH CARE US
ELIA GROUP SA/NV 0.01B09M9F4 COMMON STOCK 1,760 221,023125.60UTILITIES BE
ELISA OYJ 0.015701513 COMMON STOCK 2,760 176,74764.03COMMUNICATION SERVICES FI
EMAAR ECONOMIC CITY 0.00B19NK95 COMMON STOCK 17,359 59,1483.41REAL ESTATE SA
EMAAR PROPERTIES PJSC 0.00B01RM25 COMMON STOCK 61,903 70,7811.14REAL ESTATE AE
EMERA INC 0.01290876101 COMMON STOCK 2,670 125,85347.13UTILITIES CA
EMERSON ELECTRIC CO 0.01291011104 COMMON STOCK 1,472 155,294105.50INDUSTRIALS US
EMIRATES NBD PJSC 0.00B28PFX8 COMMON STOCK 1,321 4,9803.77FINANCIALS AE
EMIRATES TELECOM GROUP CO 0.066322173 COMMON STOCK 195,003 1,252,8976.43COMMUNICATION SERVICES AE
EMIRATES TELECOM GROUP CO 0.006322173 COMMON STOCK 323 2,0736.43COMMUNICATION SERVICES AE
EMPIRE CO LTD 'A' 0.02291843407 COMMON STOCK 10,319 333,18532.29CONSUMER STAPLES CA
EMPLOYERS HOLDINGS INC 0.00292218104 COMMON STOCK 513 21,13841.17FINANCIALS US
EMPRESAS CMPC SA 0.002196015 COMMON STOCK 7,143 15,8442.22MATERIALS CL
EMPRESAS COPEC SA 0.002196026 COMMON STOCK 2,655 24,6649.29ENERGY CL
ENAGAS SA 0.007383072 COMMON STOCK 3,055 69,47822.74UTILITIES ES
ENCORE WIRE CORP 0.01292562105 COMMON STOCK 2,693 228,95085.01INDUSTRIALS US
ENDEAVOUR GROUP LTD/AUSTRALI 0.00BNVS144 COMMON STOCK 7,210 38,4695.34CONSUMER STAPLES AU
ENDESA SA 0.005271782 COMMON STOCK 2,486 59,74624.03UTILITIES ES
ENEL CHILE SA-ADR 0.0029278D105 AMERICAN DEPOSITORY RECEIPT 5,720 14,9872.62UTILITIES CL
ENEL SPA 0.007144569 COMMON STOCK 7,553 68,8089.11UTILITIES IT
ENEOS HOLDINGS INC 0.10B627LW9 COMMON STOCK 521,462 2,022,5293.88ENERGY JP
ENERGISA SA-UNITS 0.00B56XQT8 UNIT 4,289 37,1768.67UTILITIES BR
ENERGIZER HOLDINGS INC 0.0229272W109
COMMON STOCK 8,185 321,98739.34CONSUMER STAPLES US
ENERPAC TOOL GROUP CORP 0.00292765104 COMMON STOCK 3,706 93,24425.16INDUSTRIALS US
ENERSYS 0.0029275Y102 COMMON STOCK 1,052 88,97784.59INDUSTRIALS US
ENGIE 0.01B0C2CQ3 COMMON STOCK 15,557 222,80314.32UTILITIES FR
ENGIE BRASIL ENERGIA SA 0.00BD1WX84 COMMON STOCK 5,628 41,2777.33UTILITIES BR
ENGIE BRASIL ENERGIA SA 0.00BD1WX84 COMMON STOCK 0 37.33UTILITIES BR
ENN ENERGY HOLDINGS LTD 0.026333937 COMMON STOCK 19,761 391,03719.79UTILITIES CN
ENNIS INC 0.00293389102 COMMON STOCK 3,005 58,33619.41INDUSTRIALS US
Security NameSecurityWeight
HOLDINGS 30 DAY LAG
SecurityIdentifier Security Type Units Held
Base MarketValueBase PriceSector Country
Risk Parity Multi-Asset GT
USDBase Currency:
Market Value: 1,961,759,259
August 31, 2021
28
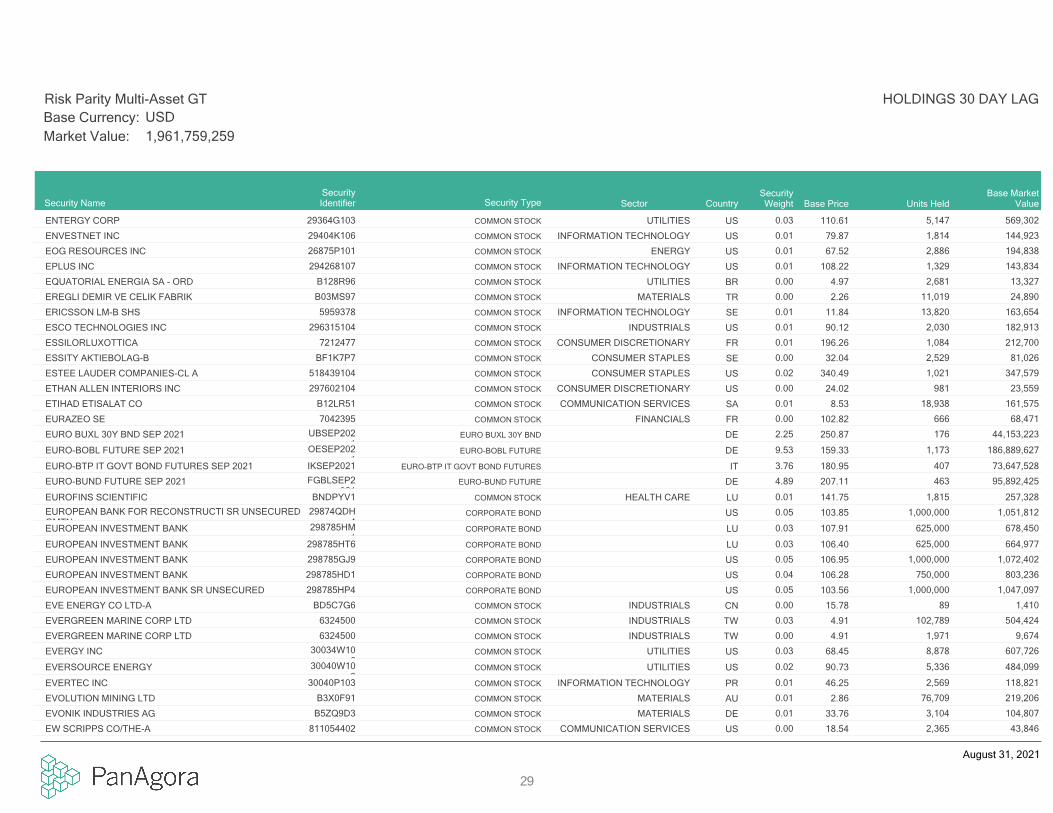
ENTERGY CORP 0.0329364G103 COMMON STOCK 5,147 569,302110.61UTILITIES US
ENVESTNET INC 0.0129404K106 COMMON STOCK 1,814 144,92379.87INFORMATION TECHNOLOGY US
EOG RESOURCES INC 0.0126875P101 COMMON STOCK 2,886 194,83867.52ENERGY US
EPLUS INC 0.01294268107 COMMON STOCK 1,329 143,834108.22INFORMATION TECHNOLOGY US
EQUATORIAL ENERGIA SA - ORD 0.00B128R96 COMMON STOCK 2,681 13,3274.97UTILITIES BR
EREGLI DEMIR VE CELIK FABRIK 0.00B03MS97 COMMON STOCK 11,019 24,8902.26MATERIALS TR
ERICSSON LM-B SHS 0.015959378 COMMON STOCK 13,820 163,65411.84INFORMATION TECHNOLOGY SE
ESCO TECHNOLOGIES INC 0.01296315104 COMMON STOCK 2,030 182,91390.12INDUSTRIALS US
ESSILORLUXOTTICA 0.017212477 COMMON STOCK 1,084 212,700196.26CONSUMER DISCRETIONARY FR
ESSITY AKTIEBOLAG-B 0.00BF1K7P7 COMMON STOCK 2,529 81,02632.04CONSUMER STAPLES SE
ESTEE LAUDER COMPANIES-CL A 0.02518439104 COMMON STOCK 1,021 347,579340.49CONSUMER STAPLES US
ETHAN ALLEN INTERIORS INC 0.00297602104 COMMON STOCK 981 23,55924.02CONSUMER DISCRETIONARY US
ETIHAD ETISALAT CO 0.01B12LR51 COMMON STOCK 18,938 161,5758.53COMMUNICATION SERVICES SA
EURAZEO SE 0.007042395 COMMON STOCK 666 68,471102.82FINANCIALS FR
EURO BUXL 30Y BND SEP 2021 2.25UBSEP2021
EURO BUXL 30Y BND 176 44,153,223250.87DE
EURO-BOBL FUTURE SEP 2021 9.53OESEP2021
EURO-BOBL FUTURE 1,173 186,889,627159.33DE
EURO-BTP IT GOVT BOND FUTURES SEP 2021 3.76IKSEP2021 EURO-BTP IT GOVT BOND FUTURES 407 73,647,528180.95IT
EURO-BUND FUTURE SEP 2021 4.89FGBLSEP2021
EURO-BUND FUTURE 463 95,892,425207.11DE
EUROFINS SCIENTIFIC 0.01BNDPYV1 COMMON STOCK 1,815 257,328141.75HEALTH CARE LU
EUROPEAN BANK FOR RECONSTRUCTI SR UNSECUREDGMTN
0.0529874QDH4
CORPORATE BOND 1,000,000 1,051,812103.85US
EUROPEAN INVESTMENT BANK 0.03298785HM1
CORPORATE BOND 625,000 678,450107.91LU
EUROPEAN INVESTMENT BANK 0.03298785HT6 CORPORATE BOND 625,000 664,977106.40LU
EUROPEAN INVESTMENT BANK 0.05298785GJ9 CORPORATE BOND 1,000,000 1,072,402106.95US
EUROPEAN INVESTMENT BANK 0.04298785HD1 CORPORATE BOND 750,000 803,236106.28US
EUROPEAN INVESTMENT BANK SR UNSECURED 0.05298785HP4 CORPORATE BOND 1,000,000 1,047,097103.56US
EVE ENERGY CO LTD-A 0.00BD5C7G6 COMMON STOCK 89 1,41015.78INDUSTRIALS CN
EVERGREEN MARINE CORP LTD 0.036324500 COMMON STOCK 102,789 504,4244.91INDUSTRIALS TW
EVERGREEN MARINE CORP LTD 0.006324500 COMMON STOCK 1,971 9,6744.91INDUSTRIALS TW
EVERGY INC 0.0330034W106
COMMON STOCK 8,878 607,72668.45UTILITIES US
EVERSOURCE ENERGY 0.0230040W108
COMMON STOCK 5,336 484,09990.73UTILITIES US
EVERTEC INC 0.0130040P103 COMMON STOCK 2,569 118,82146.25INFORMATION TECHNOLOGY PR
EVOLUTION MINING LTD 0.01B3X0F91 COMMON STOCK 76,709 219,2062.86MATERIALS AU
EVONIK INDUSTRIES AG 0.01B5ZQ9D3 COMMON STOCK 3,104 104,80733.76MATERIALS DE
EW SCRIPPS CO/THE-A 0.00811054402 COMMON STOCK 2,365 43,84618.54COMMUNICATION SERVICES US
Security NameSecurityWeight
HOLDINGS 30 DAY LAG
SecurityIdentifier Security Type Units Held
Base MarketValueBase PriceSector Country
Risk Parity Multi-Asset GT
USDBase Currency:
Market Value: 1,961,759,259
August 31, 2021
29
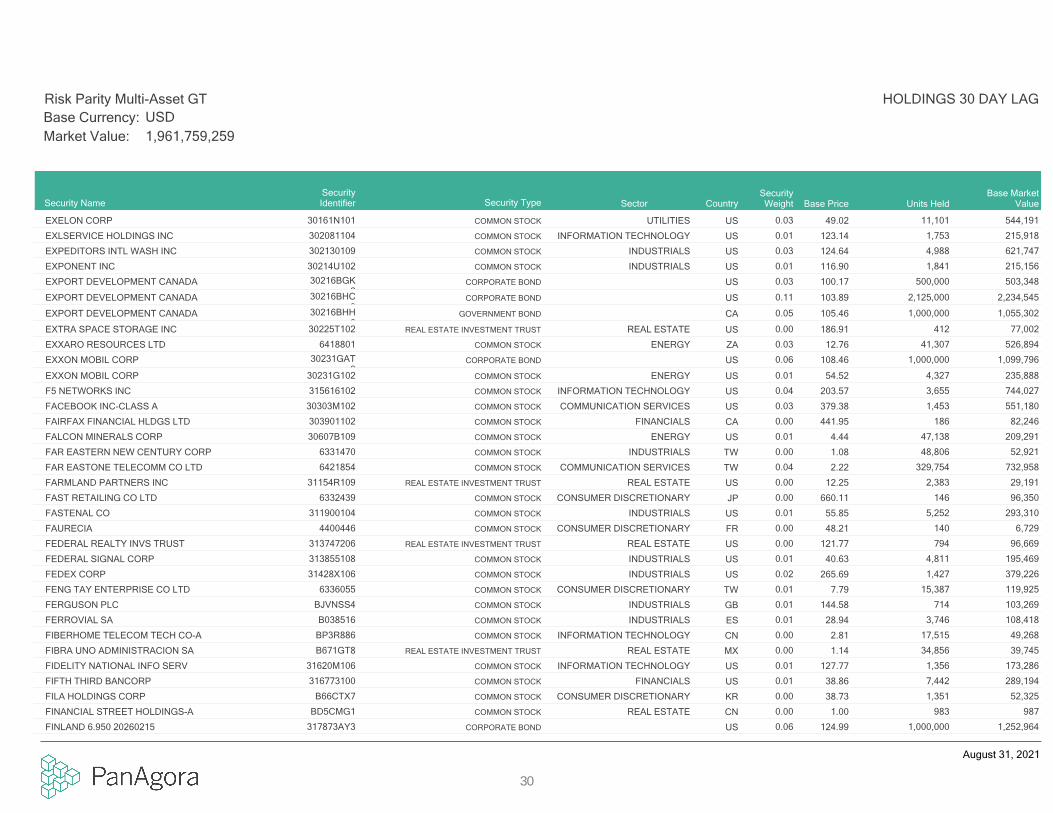
EXELON CORP 0.0330161N101 COMMON STOCK 11,101 544,19149.02UTILITIES US
EXLSERVICE HOLDINGS INC 0.01302081104 COMMON STOCK 1,753 215,918123.14INFORMATION TECHNOLOGY US
EXPEDITORS INTL WASH INC 0.03302130109 COMMON STOCK 4,988 621,747124.64INDUSTRIALS US
EXPONENT INC 0.0130214U102 COMMON STOCK 1,841 215,156116.90INDUSTRIALS US
EXPORT DEVELOPMENT CANADA 0.0330216BGK2
CORPORATE BOND 500,000 503,348100.17US
EXPORT DEVELOPMENT CANADA 0.1130216BHC9
CORPORATE BOND 2,125,000 2,234,545103.89US
EXPORT DEVELOPMENT CANADA 0.0530216BHH8
GOVERNMENT BOND 1,000,000 1,055,302105.46CA
EXTRA SPACE STORAGE INC 0.0030225T102 REAL ESTATE INVESTMENT TRUST 412 77,002186.91REAL ESTATE US
EXXARO RESOURCES LTD 0.036418801 COMMON STOCK 41,307 526,89412.76ENERGY ZA
EXXON MOBIL CORP 0.0630231GAT9
CORPORATE BOND 1,000,000 1,099,796108.46US
EXXON MOBIL CORP 0.0130231G102 COMMON STOCK 4,327 235,88854.52ENERGY US
F5 NETWORKS INC 0.04315616102 COMMON STOCK 3,655 744,027203.57INFORMATION TECHNOLOGY US
FACEBOOK INC-CLASS A 0.0330303M102 COMMON STOCK 1,453 551,180379.38COMMUNICATION SERVICES US
FAIRFAX FINANCIAL HLDGS LTD 0.00303901102 COMMON STOCK 186 82,246441.95FINANCIALS CA
FALCON MINERALS CORP 0.0130607B109 COMMON STOCK 47,138 209,2914.44ENERGY US
FAR EASTERN NEW CENTURY CORP 0.006331470 COMMON STOCK 48,806 52,9211.08INDUSTRIALS TW
FAR EASTONE TELECOMM CO LTD 0.046421854 COMMON STOCK 329,754 732,9582.22COMMUNICATION SERVICES TW
FARMLAND PARTNERS INC 0.0031154R109 REAL ESTATE INVESTMENT TRUST 2,383 29,19112.25REAL ESTATE US
FAST RETAILING CO LTD 0.006332439 COMMON STOCK 146 96,350660.11CONSUMER DISCRETIONARY JP
FASTENAL CO 0.01311900104 COMMON STOCK 5,252 293,31055.85INDUSTRIALS US
FAURECIA 0.004400446 COMMON STOCK 140 6,72948.21CONSUMER DISCRETIONARY FR
FEDERAL REALTY INVS TRUST 0.00313747206 REAL ESTATE INVESTMENT TRUST 794 96,669121.77REAL ESTATE US
FEDERAL SIGNAL CORP 0.01313855108 COMMON STOCK 4,811 195,46940.63INDUSTRIALS US
FEDEX CORP 0.0231428X10⁶ COMMON STOCK 1,427 379,226265.69INDUSTRIALS US
FENG TAY ENTERPRISE CO LTD 0.016336055 COMMON STOCK 15,387 119,9257.79CONSUMER DISCRETIONARY TW
FERGUSON PLC 0.01BJVNSS4 COMMON STOCK 714 103,269144.58INDUSTRIALS GB
FERROVIAL SA 0.01B038516 COMMON STOCK 3,746 108,41828.94INDUSTRIALS ES
FIBERHOME TELECOM TECH CO-A 0.00BP3R886 COMMON STOCK 17,515 49,2682.81INFORMATION TECHNOLOGY CN
FIBRA UNO ADMINISTRACION SA 0.00B671GT8 REAL ESTATE INVESTMENT TRUST 34,856 39,7451.14REAL ESTATE MX
FIDELITY NATIONAL INFO SERV 0.0131620M106 COMMON STOCK 1,356 173,286127.77INFORMATION TECHNOLOGY US
FIFTH THIRD BANCORP 0.01316773100 COMMON STOCK 7,442 289,19438.86FINANCIALS US
FILA HOLDINGS CORP 0.00B66CTX7 COMMON STOCK 1,351 52,32538.73CONSUMER DISCRETIONARY KR
FINANCIAL STREET HOLDINGS-A 0.00BD5CMG1 COMMON STOCK 983 9871.00REAL ESTATE CN
FINLAND 6.950 20260215 0.06317873AY3 CORPORATE BOND 1,000,000 1,252,964124.99US
Security NameSecurityWeight
HOLDINGS 30 DAY LAG
SecurityIdentifier Security Type Units Held
Base MarketValueBase PriceSector Country
Risk Parity Multi-Asset GT
USDBase Currency:
Market Value: 1,961,759,259
August 31, 2021
30

FIRST ABU DHABI BANK PJSC 0.016624471 COMMON STOCK 23,328 107,9644.63FINANCIALS AE
FIRST FINANCIAL HOLDING CO 0.006580119 COMMON STOCK 39,248 32,4310.83FINANCIALS TW
FIRST FINANCIAL HOLDING CO 0.006580119 COMMON STOCK 903 7460.83FINANCIALS TW
FIRST FINL BANKSHARES INC 0.0132020R109 COMMON STOCK 2,071 98,60747.62FINANCIALS US
FIRST QUANTUM MINERALS LTD 0.00335934105 COMMON STOCK 2,835 58,96520.80MATERIALS CA
FIRSTENERGY CORP 0.03337932107 COMMON STOCK 12,848 499,39138.87UTILITIES US
FIRSTRAND LTD 0.006606996 COMMON STOCK 3,091 13,2264.28FINANCIALS ZA
FISERV INC 0.01337738108 COMMON STOCK 1,178 138,708117.79INFORMATION TECHNOLOGY US
FISHER & PAYKEL HEALTHCARE C 0.016340250 COMMON STOCK 5,452 127,00923.30HEALTH CARE NZ
FLORIDA POWER & LIGHT CO 0.06341081FM4 CORPORATE BOND 1,000,000 1,092,978108.52US
FLUTTER ENTERTAINMENT PLC-DI 0.01BWT6H89 COMMON STOCK 649 126,141194.48CONSUMER DISCRETIONARY IE
FMC CORP 0.02302491303 COMMON STOCK 3,206 300,22193.63MATERIALS US
FMS WERTMANAGEMENT 0.0530254WAP4
CORPORATE BOND 1,000,000 1,059,176105.68DE
FMS WERTMANAGEMENT AOER GOVT GUARANTEED 0.0830254WAN9
CORPORATE BOND 1,500,000 1,577,592103.84US
FOCUS MEDIA INFORMATION TE-A 0.00BD5CND5 COMMON STOCK 14,745 16,4031.11COMMUNICATION SERVICES CN
FOCUS MEDIA INFORMATION TE-A 0.00BD5CND5 COMMON STOCK 804 8951.11COMMUNICATION SERVICES CN
FOMENTO ECONOMICO MEX-SP ADR 0.00344419106 AMERICAN DEPOSITORY RECEIPT 1,013 87,87186.71CONSUMER STAPLES MX
FORD OTOMOTIV SANAYI AS 0.01B03MSR5 COMMON STOCK 9,734 201,14020.66CONSUMER DISCRETIONARY TR
FORMOSA CHEMICALS & FIBRE 0.006348715 COMMON STOCK 26,639 80,8413.03MATERIALS TW
FORMOSA PETROCHEMICAL CORP 0.036718716 COMMON STOCK 171,342 604,6623.53ENERGY TW
FORMOSA PLASTICS CORP 0.006348544 COMMON STOCK 22,707 83,9813.70MATERIALS TW
FORMOSA PLASTICS CORP 0.006348544 COMMON STOCK 197 7273.70MATERIALS TW
FORRESTER RESEARCH INC 0.01346563109 COMMON STOCK 2,395 113,88147.55INDUSTRIALS US
FORTIS INC 0.00349553107 COMMON STOCK 1,355 61,96445.74UTILITIES CA
FORTUM OYJ 0.005579550 COMMON STOCK 1,484 45,06330.36UTILITIES FI
FORTUNE BRANDS HOME & SECURI 0.0134964C106 COMMON STOCK 3,020 294,02097.37INDUSTRIALS US
FOSHAN HAITIAN FLAVOURING -A 0.00BTFRHX0 COMMON STOCK 3,253 47,80214.70CONSUMER STAPLES CN
FOX CORP - CLASS B 0.0235137L204 COMMON STOCK 9,085 314,62334.63COMMUNICATION SERVICES US
FOXCONN TECHNOLOGY CO LTD 0.006801779 COMMON STOCK 13,549 32,4132.39INFORMATION TECHNOLOGY TW
FOXCONN TECHNOLOGY CO LTD 0.006801779 COMMON STOCK 8,043 19,2412.39INFORMATION TECHNOLOGY TW
FRANCE (GOVT OF) 0.507453317 TREASURY INFLATIONARY PROTECTED 5,293,799 9,802,083184.77FR
FRANCE GOVERNMENT BOND OA REGS BONDS OATI 0.50BW4Q278 TREASURY INFLATIONARY PROTECTED 7,709,456 9,719,487126.01FR
FRANCE GOVERNMENT OATEI 0.700 07/25/2030 0.12BNB7RZ4 TREASURY INFLATIONARY PROTECTED 1,610,130 2,340,317145.35FR
FRANCO-NEVADA CORP 0.01351858105 COMMON STOCK 1,080 157,316145.65MATERIALS CA
Security NameSecurityWeight
HOLDINGS 30 DAY LAG
SecurityIdentifier Security Type Units Held
Base MarketValueBase PriceSector Country
Risk Parity Multi-Asset GT
USDBase Currency:
Market Value: 1,961,759,259
August 31, 2021
31

FRANKLIN ELECTRIC CO INC 0.01353514102 COMMON STOCK 2,501 212,53984.98INDUSTRIALS US
FRANKLIN RESOURCES INC 0.02354613101 COMMON STOCK 11,313 366,98932.44FINANCIALS US
FRASER & NEAVE HOLDINGS BHD 0.006555946 COMMON STOCK 5,719 38,3586.71CONSUMER STAPLES MY
FRASER & NEAVE HOLDINGS BHD 0.006555946 COMMON STOCK 715 4,7956.71CONSUMER STAPLES MY
FREEPORT-MCMORAN INC 0.0135671D857 COMMON STOCK 5,221 189,98336.39MATERIALS US
FRENCH REPUBLIC GOVERNMENT BOND OAT 0.26BFMNWH2 TREASURY INFLATIONARY PROTECTED 3,474,405 5,081,221146.23FR
FRENCH REPUBLIC GOVERNMENT BOND OAT 0.18BDVNQS8 TREASURY INFLATIONARY PROTECTED 2,136,699 3,440,067160.99FR
FRENCH REPUBLIC GOVERNMENT BOND OAT 0.14BDCKJW3 TREASURY INFLATIONARY PROTECTED 2,108,661 2,793,584132.48FR
FRENCH REPUBLIC GOVERNMENT BOND OAT 0.25BJ9J293 TREASURY INFLATIONARY PROTECTED 3,605,948 4,889,332135.59FR
FRENCH REPUBLIC GOVERNMENT BOND OAT 0.37BMY72S2 TREASURY INFLATIONARY PROTECTED 5,610,936 7,267,280129.46FR
FRENCH REPUBLIC GOVERNMENT BOND OAT 0.17BMW13H2 TREASURY INFLATIONARY PROTECTED 2,323,920 3,352,855144.28FR
FRENCH REPUBLIC GOVERNMENT BOND OAT 0.20BN4Q1D4 TREASURY INFLATIONARY PROTECTED 2,860,902 3,996,962139.70FR
FRENCH REPUBLIC GOVERNMENT BOND OAT 0.07BNNTS55 TREASURY INFLATIONARY PROTECTED 1,013,310 1,403,113138.47FR
FRESENIUS MEDICAL CARE AG & 0.015129074 COMMON STOCK 1,836 140,99076.78HEALTH CARE DE
FRESH DEL MONTE PRODUCE INC 0.00G36738105 COMMON STOCK 947 31,13032.88CONSUMER STAPLES US
FRONTLINE LTD 0.02G3682E192 COMMON STOCK 43,913 317,0527.22ENERGY NO
FTSE 100 INDEX FUTURES SEP 2021 0.89FFISEP2021
FTSE 100 INDEX FUTURES 178 17,384,5259,766.59GB
FUBON FINANCIAL HOLDING CO 0.006411673 COMMON STOCK 542 1,6643.07FINANCIALS TW
FUCHS PETROLUB SE-PREF 0.01BNHRG84 PREFERENCE 3,238 163,84950.59MATERIALS DE
FUJIAN SUNNER DEVELOPMENT-A 0.00BD5CHS8 COMMON STOCK 21,269 58,2132.74CONSUMER STAPLES CN
FUJIFILM HOLDINGS CORP 0.026356525 COMMON STOCK 4,046 333,94882.54INFORMATION TECHNOLOGY JP
FUJITSU LTD 0.016356945 COMMON STOCK 639 117,996184.78INFORMATION TECHNOLOGY JP
FUYAO GLASS INDUSTRY GROUP-A 0.01BP3R6K4 COMMON STOCK 19,303 143,0567.41CONSUMER DISCRETIONARY CN
FUYAO GLASS INDUSTRY GROUP-H 0.00BWGCFG4 COMMON STOCK 7,149 44,0316.16CONSUMER DISCRETIONARY CN
G-BITS NETWORK TECHNOLOGY-A 0.00BYZQW37 COMMON STOCK 1,072 60,82856.72COMMUNICATION SERVICES CN
GAIL INDIA LTD 0.006133405 COMMON STOCK 47,745 95,5772.00UTILITIES IN
GALAXY ENTERTAINMENT GROUP L 0.006465874 COMMON STOCK 5,473 35,0836.41CONSUMER DISCRETIONARY HK
GANFENG LITHIUM CO LTD-A 0.00BD5CB19 COMMON STOCK 89 3,04234.04MATERIALS CN
GAOTU TECHEDU INC 0.0036257Y109 AMERICAN DEPOSITORY RECEIPT 1,071 3,0862.88CONSUMER DISCRETIONARY CN
GAP INC/THE 0.01364760108 COMMON STOCK 6,041 161,47826.73CONSUMER DISCRETIONARY US
GARMIN LTD 0.04H2906T109 COMMON STOCK 4,011 699,686174.43CONSUMER DISCRETIONARY CH
GARTNER INC 0.01366651107 COMMON STOCK 933 288,153308.74INFORMATION TECHNOLOGY US
GAS OIL FUTURE (ICE) DEC 2021 0.63QSDEC2021
GAS OIL FUTURE (ICE) 207 12,321,675595.25US
GASOLINE RBOB FUT (NYM) NOV 2021 0.59XBNOV2021
GASOLINE RBOB FUT (NYM) 133 11,542,910206.64US
Security NameSecurityWeight
HOLDINGS 30 DAY LAG
SecurityIdentifier Security Type Units Held
Base MarketValueBase PriceSector Country
Risk Parity Multi-Asset GT
USDBase Currency:
Market Value: 1,961,759,259
August 31, 2021
32

GATX CORP 0.00361448103 COMMON STOCK 589 54,04491.68INDUSTRIALS US
GCL SYSTEM INTEGRATION TEC-A 0.00BD6QVT8 COMMON STOCK 43,967 37,0750.84INFORMATION TECHNOLOGY CN
GCP APPLIED TECHNOLOGIES 0.0136164Y101 COMMON STOCK 10,530 251,02723.84MATERIALS US
GDS HOLDINGS LTD - ADR 0.0036165L108 AMERICAN DEPOSITORY RECEIPT 382 22,31558.48INFORMATION TECHNOLOGY CN
GE CAPITAL INTERNATIONAL 0.0636164QNA2
CORPORATE BOND 1,000,000 1,225,974121.30US
GEBERIT AG-REG 0.01B1WGG93 COMMON STOCK 151 125,734835.33INDUSTRIALS CH
GECINA SA 0.007742468 REAL ESTATE INVESTMENT TRUST 269 41,790155.29REAL ESTATE FR
GEELY AUTOMOBILE HOLDINGS LT 0.006531827 COMMON STOCK 2,681 9,6863.61CONSUMER DISCRETIONARY HK
GEELY AUTOMOBILE HOLDINGS LT 0.006531827 COMMON STOCK 4,864 17,5743.61CONSUMER DISCRETIONARY HK
GENERAL MILLS INC 0.02370334104 COMMON STOCK 7,388 427,11057.81CONSUMER STAPLES US
GENMAB A/S 0.024595739 COMMON STOCK 649 307,015473.34HEALTH CARE DK
GENSCRIPT BIOTECH CORP 0.00BD9Q2J2 COMMON STOCK 13,054 62,0214.75HEALTH CARE CN
GENTHERM INC 0.0337253A103 COMMON STOCK 7,633 655,08785.82CONSUMER DISCRETIONARY US
GENTING MALAYSIA BHD 0.00B1VXKN7 COMMON STOCK 86,683 61,9320.71CONSUMER DISCRETIONARY MY
GERMAN AMERICAN BANCORP 0.00373865104 COMMON STOCK 1,893 70,70637.36FINANCIALS US
GF SECURITIES CO LTD-A 0.00BD5CQ36 COMMON STOCK 804 2,3632.94FINANCIALS CN
GFL ENVIRONMENTAL INC-SUB VT 0.00BKDT649 COMMON STOCK 2,188 76,98235.18INDUSTRIALS CA
GIANT MANUFACTURING 0.006372167 COMMON STOCK 894 10,80212.09CONSUMER DISCRETIONARY TW
GIANT NETWORK GROUP CO LTD-A 0.00BD6QVW1 COMMON STOCK 18,766 29,3551.56COMMUNICATION SERVICES CN
GIGADEVICE SEMICONDUCTOR B-A 0.00BHWLWF8 COMMON STOCK 525 12,44323.68INFORMATION TECHNOLOGY CN
GILDAN ACTIVEWEAR INC 0.01375916103 COMMON STOCK 6,764 259,62138.38CONSUMER DISCRETIONARY CA
GILEAD SCIENCES INC 0.02375558103 COMMON STOCK 4,097 298,17672.78HEALTH CARE US
GIVAUDAN-REG 0.015980613 COMMON STOCK 41 205,9175,016.10MATERIALS CH
GJENSIDIGE FORSIKRING ASA 0.00B4PH0C5 COMMON STOCK 3,208 74,92723.35FINANCIALS NO
GLACIER BANCORP INC 0.0037637Q105 COMMON STOCK 1,199 63,85853.26FINANCIALS US
GLAXOSMITHKLINE PLC 0.010925288 COMMON STOCK 9,370 188,52620.12HEALTH CARE GB
GLOBAL PAYMENTS INC 0.0137940X10² COMMON STOCK 1,189 193,450162.64INFORMATION TECHNOLOGY US
GLOBAL POWER SYNERGY PCL-F 0.00BWX43T2 COMMON STOCK 6,944 17,9362.58UTILITIES TH
GLOBAL WATER RESOURCES INC 0.00379463102 COMMON STOCK 3,117 62,33120.00UTILITIES US
GLOBALWAFERS CO LTD 0.00BS7JP33 COMMON STOCK 174 5,47031.39INFORMATION TECHNOLOGY TW
GLOBANT SA 0.00BP40HF4 COMMON STOCK 122 39,168322.28INFORMATION TECHNOLOGY UY
GLOBE TELECOM INC 0.026284864 COMMON STOCK 8,954 489,56154.67COMMUNICATION SERVICES PH
GLOBE TELECOM INC 0.006284864 COMMON STOCK 127 6,93854.67COMMUNICATION SERVICES PH
GLP J-REIT 0.01B8RBZV7 REAL ESTATE INVESTMENT TRUST 61 111,1031,817.77REAL ESTATE JP
Security NameSecurityWeight
HOLDINGS 30 DAY LAG
SecurityIdentifier Security Type Units Held
Base MarketValueBase PriceSector Country
Risk Parity Multi-Asset GT
USDBase Currency:
Market Value: 1,961,759,259
August 31, 2021
33

GMO PAYMENT GATEWAY INC 0.00B06CMQ9 COMMON STOCK 639 84,109131.71INFORMATION TECHNOLOGY JP
GN STORE NORD A/S 0.014501093 COMMON STOCK 2,854 214,65375.22HEALTH CARE DK
GODREJ CONSUMER PRODUCTS LTD 0.00B1BDGY0 COMMON STOCK 6,018 90,61215.06CONSUMER STAPLES IN
GOLD 100 OZ FUTURES (CMX) DEC 2021 3.26GCDEC2021
GOLD 100 OZ FUTURES (CMX) 351 63,815,3101,818.10US
GOLD FIELDS LTD-SPONS ADR 0.0038059T106 AMERICAN DEPOSITORY RECEIPT 2,428 23,0189.48MATERIALS ZA
GOLDMAN SACHS GROUP INC 0.0138141G104 COMMON STOCK 271 111,937413.51FINANCIALS US
GOME RETAIL HOLDINGS LTD 0.00B01Z8S7 COMMON STOCK 600,528 64,8610.11CONSUMER DISCRETIONARY CN
GOOGLE 3.375 20240225 0.0202079KAB3 CORPORATE BOND 400,000 429,664107.42US
GORMAN-RUPP CO 0.00383082104 COMMON STOCK 2,686 94,20535.07INDUSTRIALS US
GOTION HIGH-TECH CO LTD-A 0.00BD5CJ71 COMMON STOCK 6,881 57,2258.32INDUSTRIALS CN
GPT GROUP 0.006365866 REAL ESTATE INVESTMENT TRUST 19,366 68,6463.54REAL ESTATE AU
GRAHAM HOLDINGS CO-CLASS B 0.01384637104 COMMON STOCK 172 106,178616.81CONSUMER DISCRETIONARY US
GRASIM INDUSTRIES LTD 0.00BYQKH33 COMMON STOCK 3,637 74,74820.55MATERIALS IN
GREAT SOUTHERN BANCORP INC 0.00390905107 COMMON STOCK 1,229 66,94454.47FINANCIALS US
GREAT WALL MOTOR COMPANY-H 0.016718255 COMMON STOCK 32,171 148,0874.60CONSUMER DISCRETIONARY CN
GREAT WALL MOTOR COMPANY-H 0.006718255 COMMON STOCK 2,681 12,3414.60CONSUMER DISCRETIONARY CN
GREAT-WEST LIFECO INC 0.0039138C106 COMMON STOCK 365 11,27130.89FINANCIALS CA
GREEN PLAINS INC 0.00393222104 COMMON STOCK 378 13,27935.10ENERGY US
GREENTOWN SERVICE GROUP CO L 0.00BD20C13 COMMON STOCK 62,555 66,9201.07INDUSTRIALS CN
GREIF INC-CL B 0.01397624206 COMMON STOCK 3,815 234,63061.50MATERIALS US
GRIFOLS SA 0.01BYY3DX6 COMMON STOCK 8,879 216,85524.42HEALTH CARE ES
GROWTHPOINT PROPERTIES LTD 0.00BBGB5W0 REAL ESTATE INVESTMENT TRUST 45,119 48,2851.07REAL ESTATE ZA
GRUMA S.A.B.-B 0.002392545 COMMON STOCK 6,634 75,93711.45CONSUMER STAPLES MX
GRUPO AEROPORTUARIO PAC-ADR 0.00400506101 AMERICAN DEPOSITORY RECEIPT 178 20,702116.41INDUSTRIALS MX
GRUPO AEROPORTUARIO SUR-ADR 0.0040051E202 AMERICAN DEPOSITORY RECEIPT 427 76,368178.78INDUSTRIALS MX
GRUPO BIMBO SAB- SERIES A 0.012392471 COMMON STOCK 59,606 151,1602.54CONSUMER STAPLES MX
GRUPO CARSO SAB DE CV-SER A1 0.002393452 COMMON STOCK 7,685 26,1823.41INDUSTRIALS MX
GRUPO DE INV SURAMERICANA 0.00BMSK715 COMMON STOCK 2,009 10,2505.10FINANCIALS CO
GRUPO FINANCIERO BANORTE-O 0.002421041 COMMON STOCK 5,055 33,4466.62FINANCIALS MX
GRUPO FINANCIERO BANORTE-O 0.002421041 COMMON STOCK 1,877 12,4166.62FINANCIALS MX
GRUPO FINANCIERO INBURSA-O 0.002822398 COMMON STOCK 18,894 18,1310.96FINANCIALS MX
GRUPO MEXICO SAB DE CV-SER B 0.002643674 COMMON STOCK 3,753 17,5214.67MATERIALS MX
GRUPO MEXICO SAB DE CV-SER B 0.002643674 COMMON STOCK 2,323 10,8474.67MATERIALS MX
GRUPO TELEVISA SA-SPON ADR 0.0040049J206 AMERICAN DEPOSITORY RECEIPT 1,938 25,45013.13COMMUNICATION SERVICES MX
Security NameSecurityWeight
HOLDINGS 30 DAY LAG
SecurityIdentifier Security Type Units Held
Base MarketValueBase PriceSector Country
Risk Parity Multi-Asset GT
USDBase Currency:
Market Value: 1,961,759,259
August 31, 2021
34

GS ENGINEERING & CONSTRUCT 0.006537096 COMMON STOCK 528 20,38438.60INDUSTRIALS KR
GS HOLDINGS 0.00B01RJV3 COMMON STOCK 978 35,83636.66ENERGY KR
GS HOLDINGS 0.00B01RJV3 COMMON STOCK 611 22,40636.66ENERGY KR
GT CAPITAL HOLDINGS INC 0.00B77H110 COMMON STOCK 4,010 43,52310.85INDUSTRIALS PH
GUANGDONG INVESTMENT LTD 0.026913168 COMMON STOCK 235,921 327,6121.39UTILITIES HK
GUANGHUI ENERGY CO LTD-A 0.02BP3R3N6 COMMON STOCK 397,939 384,8120.97ENERGY CN
GUANGZHOU AUTOMOBILE GROUP-H 0.00B433995 COMMON STOCK 41,108 41,3861.01CONSUMER DISCRETIONARY CN
GUANGZHOU BAIYUNSHAN PHAR-A 0.00BP3R4Q6 COMMON STOCK 5,809 26,4774.56HEALTH CARE CN
GUANGZHOU HAIGE COMMUNICAT-A 0.00BD5CM72 COMMON STOCK 28,418 49,2011.73INFORMATION TECHNOLOGY CN
GUDANG GARAM TBK PT 0.006366999 COMMON STOCK 8,586 19,9112.32CONSUMER STAPLES ID
GULF ENERGY DEVELOPM-FOREIGN 0.00BLR5MQ4 COMMON STOCK 46,277 59,9421.30UTILITIES TH
GUOTAI JUNAN SECURITIES CO-A 0.00BYQDMZ9 COMMON STOCK 357 9822.75FINANCIALS CN
H.B. FULLER CO. 0.02359694106 COMMON STOCK 4,508 304,58567.57MATERIALS US
HABIB BANK LTD 0.01B282PJ5 COMMON STOCK 267,024 200,9700.75FINANCIALS PK
HACKETT GROUP INC/THE 0.01404609109 COMMON STOCK 5,779 113,26319.60INFORMATION TECHNOLOGY US
HAIER SMART HOME CO LTD-A 0.00BP3R3G9 COMMON STOCK 268 1,1224.19CONSUMER DISCRETIONARY CN
HAIER SMART HOME CO LTD-H 0.00BLD4QD0 COMMON STOCK 5,542 20,8803.77CONSUMER DISCRETIONARY CN
HAITIAN INTERNATIONAL HLDGS 0.00B1L2RC2 COMMON STOCK 535 2,0513.83INDUSTRIALS CN
HAITONG SECURITIES CO LTD-H 0.00B71SXC4 COMMON STOCK 25,379 23,4630.92FINANCIALS CN
HAKUHODO DY HOLDINGS INC 0.01B05LZ02 COMMON STOCK 11,221 176,79715.76COMMUNICATION SERVICES JP
HALMA PLC 0.010405207 COMMON STOCK 7,081 292,64541.33INFORMATION TECHNOLOGY GB
HALOZYME THERAPEUTICS INC 0.0040637H109 COMMON STOCK 241 10,12841.99HEALTH CARE US
HAMAMATSU PHOTONICS KK 0.016405870 COMMON STOCK 2,007 117,28258.44INFORMATION TECHNOLOGY JP
HANA FINANCIAL GROUP 0.00B0RNRF5 COMMON STOCK 636 24,72238.85FINANCIALS KR
HANA FINANCIAL GROUP 0.00B0RNRF5 COMMON STOCK 259 10,06938.85FINANCIALS KR
HANESBRANDS INC 0.01410345102 COMMON STOCK 15,678 292,86118.68CONSUMER DISCRETIONARY US
HANG SENG INDEX FUTURE SEP 2021 0.81HSISEP2021
HANG SENG INDEX FUTURE 96 15,894,7713,311.41HK
HANGZHOU SILAN MICROELECTR-A 0.00BP3RCV7 COMMON STOCK 6,524 55,3128.48INFORMATION TECHNOLOGY CN
HANGZHOU TIGERMED CONSULTI-A 0.00BD5CCK5 COMMON STOCK 3,932 81,57020.75HEALTH CARE CN
HANKOOK TIRE & TECHNOLOGY CO 0.00B7T5KQ0 COMMON STOCK 1,240 49,85240.19CONSUMER DISCRETIONARY KR
HANMI PHARM CO LTD 0.00B613DJ9 COMMON STOCK 97 25,960266.51HEALTH CARE KR
HANSOH PHARMACEUTICAL GROUP 0.00BJYKB72 COMMON STOCK 11,097 30,3212.73HEALTH CARE CN
HAP SENG CONSOLIDATED 0.006297743 COMMON STOCK 16,532 33,8042.04INDUSTRIALS MY
HAP SENG CONSOLIDATED 0.006297743 COMMON STOCK 2,860 5,8472.04INDUSTRIALS MY
Security NameSecurityWeight
HOLDINGS 30 DAY LAG
SecurityIdentifier Security Type Units Held
Base MarketValueBase PriceSector Country
Risk Parity Multi-Asset GT
USDBase Currency:
Market Value: 1,961,759,259
August 31, 2021
35

HAPVIDA PARTICIPACOES E INVE 0.00BF4J7N9 COMMON STOCK 18,217 52,3782.88HEALTH CARE BR
HARGREAVES LANSDOWN PLC 0.00B1VZ0M2 COMMON STOCK 2,073 43,02920.76FINANCIALS GB
HARTALEGA HOLDINGS BHD 0.00B2QPJK5 COMMON STOCK 44,057 78,2141.78HEALTH CARE MY
HARTFORD FINANCIAL SVCS GRP 0.01416515104 COMMON STOCK 3,013 202,55067.22FINANCIALS US
HASBRO INC 0.01418056107 COMMON STOCK 2,169 213,25898.31CONSUMER DISCRETIONARY US
HAVELLS INDIA LTD 0.00BQGZWP9 COMMON STOCK 3,526 61,26717.37INDUSTRIALS IN
HCA HEALTHCARE INC 0.0440412C101 COMMON STOCK 2,727 689,888252.98HEALTH CARE US
HCL TECHNOLOGIES LTD 0.016294896 COMMON STOCK 8,904 144,19716.19INFORMATION TECHNOLOGY IN
HEALTHCARE REALTY TRUST INC 0.00421946104 REAL ESTATE INVESTMENT TRUST 2,546 76,45930.03REAL ESTATE US
HEALTHPEAK PROPERTIES INC 0.0042250P103 REAL ESTATE INVESTMENT TRUST 2,376 85,54136.00REAL ESTATE US
HEALTHSTREAM INC 0.0042222N103 COMMON STOCK 688 20,89530.39HEALTH CARE US
HEARTLAND EXPRESS INC 0.01422347104 COMMON STOCK 7,318 122,79616.78INDUSTRIALS US
HEATING OIL FUTURE (NYM) DEC 2021 0.54HODEC2021
HEATING OIL FUTURE (NYM) 118 10,502,260211.91US
HEATING OIL FUTURE (NYM) NOV 2021 0.07HONOV2021
HEATING OIL FUTURE (NYM) 16 1,427,462212.42US
HEILONGJIANG AGRICULTURE-A 0.00BFF5BX4 COMMON STOCK 29,669 66,6072.25CONSUMER STAPLES CN
HEINEKEN NV 0.017792559 COMMON STOCK 1,248 136,562109.43CONSUMER STAPLES NL
HELEN OF TROY LTD 0.05G4388N106
COMMON STOCK 3,981 952,279239.19CONSUMER DISCRETIONARY US
HELLENIC TELECOMMUN ORGANIZA 0.005051605 COMMON STOCK 1,079 21,21919.67COMMUNICATION SERVICES GR
HELLO GROUP INC -SPN ADR 0.00423403104 AMERICAN DEPOSITORY RECEIPT 2,204 28,95713.14COMMUNICATION SERVICES CN
HELLOFRESH SE 0.01BYWH8S0 COMMON STOCK 1,634 176,049107.75CONSUMER DISCRETIONARY DE
HEMISPHERE MEDIA GROUP INC 0.0042365Q103 COMMON STOCK 5,484 67,56912.32COMMUNICATION SERVICES US
HENAN SHUANGHUI INVESTMENT-A 0.00BD5CP84 COMMON STOCK 1,441 5,3753.73CONSUMER STAPLES CN
HENDERSON LAND DEVELOPMENT 0.006420538 COMMON STOCK 18,568 84,0384.53REAL ESTATE HK
HENGAN INTL GROUP CO LTD 0.006136233 COMMON STOCK 894 5,1825.80CONSUMER STAPLES CN
HENGLI PETROCHEMICAL CO L-A 0.00BFB4HL5 COMMON STOCK 268 1,0874.05MATERIALS CN
HENGYI PETROCHEMICAL CO -A 0.00BD5M1L9 COMMON STOCK 46,380 84,1031.81MATERIALS CN
HENKEL AG & CO KGAA 0.015002465 COMMON STOCK 2,194 197,34889.95CONSUMER STAPLES DE
HENNES & MAURITZ AB-B SHS 0.005687431 COMMON STOCK 3,832 76,73020.02CONSUMER DISCRETIONARY SE
HENRY SCHEIN INC 0.02806407102 COMMON STOCK 4,053 306,38175.59HEALTH CARE US
HERMES INTERNATIONAL 0.015253973 COMMON STOCK 197 289,4751,469.08CONSUMER DISCRETIONARY FR
HERSHEY CO/THE 0.02427866108 COMMON STOCK 2,333 414,627177.70CONSUMER STAPLES US
HESS CORP 0.0142809H107 COMMON STOCK 3,371 231,72468.75ENERGY US
HESTEEL CO LTD-A 0.00BD5CNS0 COMMON STOCK 78,462 37,8760.48MATERIALS CN
HIKMA PHARMACEUTICALS PLC 0.01B0LCW08 COMMON STOCK 8,063 281,64834.93HEALTH CARE JO
Security NameSecurityWeight
HOLDINGS 30 DAY LAG
SecurityIdentifier Security Type Units Held
Base MarketValueBase PriceSector Country
Risk Parity Multi-Asset GT
USDBase Currency:
Market Value: 1,961,759,259
August 31, 2021
36

HILLENBRAND INC 0.00431571108 COMMON STOCK 1,859 86,27346.42INDUSTRIALS US
HINDALCO INDUSTRIES LTD 0.00B0GWF48 COMMON STOCK 7,869 50,4786.41MATERIALS IN
HINDUSTAN PETROLEUM CORP 0.006100476 COMMON STOCK 4,282 15,6383.65ENERGY IN
HINDUSTAN UNILEVER LTD 0.016261674 COMMON STOCK 2,942 109,76937.31CONSUMER STAPLES IN
HINDUSTAN UNILEVER LTD 0.006261674 COMMON STOCK 1,150 42,91437.31CONSUMER STAPLES IN
HINGHAM INSTITUTION FOR SVGS 0.00433323102 COMMON STOCK 251 81,516324.50FINANCIALS US
HINO MOTORS LTD 0.006428305 COMMON STOCK 6,025 52,2688.67INDUSTRIALS JP
HIROSE ELECTRIC CO LTD 0.016428725 COMMON STOCK 1,016 169,559166.85INFORMATION TECHNOLOGY JP
HISAMITSU PHARMACEUTICAL CO 0.016428907 COMMON STOCK 2,819 113,15440.14HEALTH CARE JP
HITACHI METALS LTD 0.006429201 COMMON STOCK 2,919 56,46519.34MATERIALS JP
HIWIN TECHNOLOGIES CORP 0.00B1YMYT5 COMMON STOCK 1,737 20,43611.76INDUSTRIALS TW
HK ELECTRIC INVESTMENTS -SS 0.06BJ3WDZ1 STAPLED SECURITY 1,251,030 1,245,0221.00UTILITIES HK
HKT TRUST AND HKT LTD-SS 0.02B4TXDZ3 STAPLED SECURITY 284,621 387,9201.36COMMUNICATION SERVICES HK
HLB INC 0.006517407 COMMON STOCK 799 38,24247.87CONSUMER DISCRETIONARY KR
HOLOGIC INC 0.04436440101 COMMON STOCK 10,423 825,00379.15HEALTH CARE US
HOME DEPOT INC 0.01437076102 COMMON STOCK 854 278,566326.18CONSUMER DISCRETIONARY US
HOME PRODUCT CENTER PCL-FOR 0.006418533 COMMON STOCK 118,318 52,4920.44CONSUMER DISCRETIONARY TH
HON HAI PRECISION INDUSTRY 0.016438564 COMMON STOCK 25,631 102,6614.01INFORMATION TECHNOLOGY TW
HON HAI PRECISION INDUSTRY 0.006438564 COMMON STOCK 2,681 10,7384.01INFORMATION TECHNOLOGY TW
HONEYWELL INTERNATIONAL INC 0.01438516106 COMMON STOCK 828 191,927231.91INDUSTRIALS US
HONG KONG & CHINA GAS 0.096436557 COMMON STOCK 1,069,074 1,720,9981.61UTILITIES HK
HONG KONG EXCHANGES & CLEAR 0.016267359 COMMON STOCK 2,646 166,94963.11FINANCIALS HK
HONG LEONG BANK BERHAD 0.006436892 COMMON STOCK 715 3,2994.61FINANCIALS MY
HONG LEONG FINANCIAL GROUP 0.016436450 COMMON STOCK 25,648 112,5364.39FINANCIALS MY
HONG LEONG FINANCIAL GROUP 0.006436450 COMMON STOCK 626 2,7454.39FINANCIALS MY
HOPSON DEVELOPMENT HOLDINGS 0.00BMXJW56 COMMON STOCK 10,545 41,0823.90REAL ESTATE HK
HOPSON DEVELOPMENT HOLDINGS 0.00BMXJW56 COMMON STOCK 506 1,9713.90REAL ESTATE HK
HORACE MANN EDUCATORS 0.01440327104 COMMON STOCK 4,070 166,88441.00FINANCIALS US
HORMEL FOODS CORP 0.02440452100 COMMON STOCK 10,016 456,12345.54CONSUMER STAPLES US
HOSHIZAKI CORP 0.01B3FF8W8 COMMON STOCK 1,095 102,93394.03INDUSTRIALS JP
HOST HOTELS & RESORTS INC 0.0144107P104 REAL ESTATE INVESTMENT TRUST 6,281 104,01016.56REAL ESTATE US
HOSTESS BRANDS INC 0.0244109J106 COMMON STOCK 30,488 486,58915.96CONSUMER STAPLES US
HOTAI MOTOR COMPANY LTD 0.006417165 COMMON STOCK 3,617 76,08121.04CONSUMER DISCRETIONARY TW
HOTEL SHILLA CO LTD 0.006440332 COMMON STOCK 408 31,63077.45CONSUMER DISCRETIONARY KR
Security NameSecurityWeight
HOLDINGS 30 DAY LAG
SecurityIdentifier Security Type Units Held
Base MarketValueBase PriceSector Country
Risk Parity Multi-Asset GT
USDBase Currency:
Market Value: 1,961,759,259
August 31, 2021
37

HOULIHAN LOKEY INC 0.01441593100 COMMON STOCK 1,328 119,79490.20FINANCIALS US
HOUSING DEVELOPMENT FINANCE 0.006171900 COMMON STOCK 903 34,59738.33FINANCIALS IN
HOWMET AEROSPACE INC 0.01443201108 COMMON STOCK 3,729 118,38731.75INDUSTRIALS US
HOYA CORP 0.016441506 COMMON STOCK 1,124 181,893161.84HEALTH CARE JP
HP INC 0.0340434L105 COMMON STOCK 17,399 517,43429.74INFORMATION TECHNOLOGY US
HUA HONG SEMICONDUCTOR LTD 0.00BRB3857 COMMON STOCK 384 2,2635.89INFORMATION TECHNOLOGY CN
HUA NAN FINANCIAL HOLDINGS C 0.006411877 COMMON STOCK 50,221 37,8740.75FINANCIALS TW
HUA NAN FINANCIAL HOLDINGS C 0.006411877 COMMON STOCK 1,787 1,3480.75FINANCIALS TW
HUADIAN POWER INTL CORP-A 0.01BP3R637 COMMON STOCK 447,179 267,7590.60UTILITIES CN
HUADIAN POWER INTL CORP-A 0.00BP3R637 COMMON STOCK 6,077 3,6390.60UTILITIES CN
HUADONG MEDICINE CO LTD-A 0.00BD5CM94 COMMON STOCK 5,147 24,4904.76HEALTH CARE CN
HUANENG POWER INTL INC-A 0.01BP3R314 COMMON STOCK 252,114 216,4930.86UTILITIES CN
HUANENG POWER INTL INC-H 0.026099671 COMMON STOCK 648,783 312,8240.48UTILITIES CN
HUAYU AUTOMOTIVE SYSTEMS -A 0.00BP3R4T9 COMMON STOCK 9,473 34,0023.59CONSUMER DISCRETIONARY CN
HULIC CO LTD 0.006805317 COMMON STOCK 5,017 58,91511.74REAL ESTATE JP
HUMANA INC 0.01444859102 COMMON STOCK 464 188,085405.42HEALTH CARE US
HUNAN VALIN STEEL CO LTD -A 0.01BD5M0H8 COMMON STOCK 105,450 127,2601.21MATERIALS CN
HUNDSUN TECHNOLOGIES INC-A 0.00BP3R6B5 COMMON STOCK 959 7,3537.67INFORMATION TECHNOLOGY CN
HUNTINGTON BANCSHARES INC 0.01446150104 COMMON STOCK 16,171 251,13315.53FINANCIALS US
HUTCHMED CHINA-ADR 0.0044842L103 AMERICAN DEPOSITORY RECEIPT 1,358 54,82240.36HEALTH CARE HK
HUYA INC-ADR 0.0044852D108 AMERICAN DEPOSITORY RECEIPT 4,600 49,17910.69COMMUNICATION SERVICES CN
HYDRO ONE LTD 0.01448811208 COMMON STOCK 6,568 163,21124.85UTILITIES CA
HYPERA SA 0.00B2QY968 COMMON STOCK 8,668 60,2266.95HEALTH CARE BR
HYUNDAI ENGINEERING & CONST 0.006450988 COMMON STOCK 1,220 58,39047.87INDUSTRIALS KR
HYUNDAI GLOVIS CO LTD 0.00B0V3XR5 COMMON STOCK 374 62,651167.32INDUSTRIALS KR
HYUNDAI MOBIS CO LTD 0.006449544 COMMON STOCK 219 52,401239.34CONSUMER DISCRETIONARY KR
HYUNDAI MOTOR CO 0.006451055 COMMON STOCK 290 53,066183.28CONSUMER DISCRETIONARY KR
IBERDROLA SA 0.00B288C92 COMMON STOCK 6,553 81,18012.39UTILITIES ES
IBEX 35 FUTURE SEP 2021 0.44MFXISEP2021
IBEX 35 FUTURE 83 8,648,50710,419.89ES
IBIDEN CO LTD 0.016456102 COMMON STOCK 1,916 103,58154.07INFORMATION TECHNOLOGY JP
ICA GRUPPEN AB 0.01B0S1651 COMMON STOCK 4,712 234,15249.70CONSUMER STAPLES SE
ICICI BANK LTD-SPON ADR 0.0045104G104 AMERICAN DEPOSITORY RECEIPT 1,905 37,38119.62FINANCIALS IN
ICL GROUP LTD 0.016455530 COMMON STOCK 24,600 174,2237.08MATERIALS IL
IDB 3.875 20411028 0.034581X0BT4 CORPORATE BOND 500,000 655,495131.10US
Security NameSecurityWeight
HOLDINGS 30 DAY LAG
SecurityIdentifier Security Type Units Held
Base MarketValueBase PriceSector Country
Risk Parity Multi-Asset GT
USDBase Currency:
Market Value: 1,961,759,259
August 31, 2021
38

IDEMITSU KOSAN CO LTD 0.11B1FF8P7 COMMON STOCK 91,395 2,194,62124.01ENERGY JP
IDEXX LABORATORIES INC 0.0145168D104 COMMON STOCK 221 148,611673.76HEALTH CARE US
IFLYTEK CO LTD - A 0.00BD5CNN5 COMMON STOCK 8,311 67,3548.10INFORMATION TECHNOLOGY CN
IHH HEALTHCARE BHD 0.00B83X6P8 COMMON STOCK 48,525 74,7071.54HEALTH CARE MY
IHH HEALTHCARE BHD 0.00B83X6P8 COMMON STOCK 10,009 15,4091.54HEALTH CARE MY
ILIAD SA 0.017759435 COMMON STOCK 1,359 292,025214.84COMMUNICATION SERVICES FR
ILLUMINA INC 0.01452327109 COMMON STOCK 428 195,838457.16HEALTH CARE US
IMPALA PLATINUM HOLDINGS LTD 0.00B1FFT76 COMMON STOCK 3,077 47,41215.41MATERIALS ZA
IMPALA PLATINUM HOLDINGS LTD 0.00B1FFT76 COMMON STOCK 661 10,19015.41MATERIALS ZA
INCYTE CORP 0.0145337C102 COMMON STOCK 2,048 156,65376.49HEALTH CARE US
IND & COMM BK OF CHINA-A 0.00BP3R217 COMMON STOCK 1,787 1,2780.71FINANCIALS CN
INDAH KIAT PULP & PAPER TBK 0.006462422 COMMON STOCK 32,618 18,0670.55MATERIALS ID
INDEPENDENT BANK CORP/MA 0.00453836108 COMMON STOCK 141 10,82476.70FINANCIALS US
INDIAN OIL CORP LTD 0.006253767 COMMON STOCK 47,771 72,5331.52ENERGY IN
INDOFOOD CBP SUKSES MAKMUR T 0.01B4LD3M8 COMMON STOCK 199,381 117,7770.59CONSUMER STAPLES ID
INDOFOOD CBP SUKSES MAKMUR T 0.00B4LD3M8 COMMON STOCK 11,885 7,0210.59CONSUMER STAPLES ID
INDOFOOD SUKSES MAKMUR TBK P 0.006283979 COMMON STOCK 222,517 96,3400.43CONSUMER STAPLES ID
INDORAMA VENTURES-FOREIGN 0.00B5V4S12 COMMON STOCK 12,332 16,7391.36MATERIALS TH
INDRAPRASTHA GAS LTD 0.00BD9PXD0 COMMON STOCK 3,166 23,6727.48UTILITIES IN
INDUS TOWERS LTD 0.01B92P9G4 COMMON STOCK 96,327 284,1342.95COMMUNICATION SERVICES IN
INDUSTRIA DE DISENO TEXTIL 0.01BP9DL90 COMMON STOCK 5,617 191,68234.13CONSUMER DISCRETIONARY ES
INDUSTRIAL BANK OF KOREA 0.006462972 COMMON STOCK 1,303 11,5758.88FINANCIALS KR
INDUSTRIAL LOGISTICS PROPERT 0.01456237106 REAL ESTATE INVESTMENT TRUST 6,172 169,30027.43REAL ESTATE US
INDUSTRIAS PENOLES SAB DE CV 0.002448200 COMMON STOCK 1,921 27,28614.20MATERIALS MX
INDUSTRIES QATAR 0.006673570 COMMON STOCK 9,005 31,7823.53INDUSTRIALS QA
INDUSTRIES QATAR 0.006673570 COMMON STOCK 1,800 6,3523.53INDUSTRIALS QA
INFO EDGE INDIA LTD 0.00B1685L0 COMMON STOCK 555 46,99484.68COMMUNICATION SERVICES IN
INFORMA PLC 0.01BMJ6DW5 COMMON STOCK 16,099 117,6537.31COMMUNICATION SERVICES GB
INFOSYS LTD-SP ADR 0.00456788108 AMERICAN DEPOSITORY RECEIPT 2,933 69,86223.82INFORMATION TECHNOLOGY IN
INFRASTRUTTURE WIRELESS ITAL 0.01BZ0P4R4 COMMON STOCK 12,023 142,91411.89COMMUNICATION SERVICES IT
INGERSOLL-RAND INC 0.0145687V106 COMMON STOCK 2,107 111,72753.02INDUSTRIALS US
INGLES MARKETS INC-CLASS A 0.00457030104 COMMON STOCK 249 16,91867.89CONSUMER STAPLES US
INNER MONGOLIA BAOTOU STE-A 0.00BP3R488 COMMON STOCK 20,911 12,1650.58MATERIALS CN
INNER MONGOLIA JUNZHENG EN-A 0.00BP3R7B2 COMMON STOCK 52,904 47,5570.90MATERIALS CN
Security NameSecurityWeight
HOLDINGS 30 DAY LAG
SecurityIdentifier Security Type Units Held
Base MarketValueBase PriceSector Country
Risk Parity Multi-Asset GT
USDBase Currency:
Market Value: 1,961,759,259
August 31, 2021
39

INNER MONGOLIA JUNZHENG EN-A 0.00BP3R7B2 COMMON STOCK 894 8030.90MATERIALS CN
INNOLUX CORP 0.00B0CC0M5 COMMON STOCK 95,620 59,5180.62INFORMATION TECHNOLOGY TW
INNOSPEC INC 0.0245768S105 COMMON STOCK 3,255 304,63793.60MATERIALS US
INNOVENT BIOLOGICS INC 0.00BGR6KX5 COMMON STOCK 6,394 51,5488.06HEALTH CARE CN
INPEX CORP 0.06B10RB15 COMMON STOCK 169,861 1,171,9866.90ENERGY JP
INSPUR ELECTRONIC INFORMAT-A 0.00BD5CLB9 COMMON STOCK 20,286 94,1284.64INFORMATION TECHNOLOGY CN
INTCO MEDICAL TECHNOLOGY C-A 0.01CNE100003456
COMMON STOCK 17,158 271,23215.81HEALTH CARE CN
INTEGER HOLDINGS CORP 0.0045826H109 COMMON STOCK 644 63,57498.79HEALTH CARE US
INTEL CORP 0.01458140100 COMMON STOCK 2,184 118,05754.06INFORMATION TECHNOLOGY US
INTER PARFUMS INC 0.02458334109 COMMON STOCK 5,775 418,89972.54CONSUMER STAPLES US
INTER-AMERICAN DEVELOPMENT BAN 0.014581X0CC0
CORPORATE BOND 250,000 264,115105.65US
INTER-AMERICAN DEVELOPMENT BAN 0.034581X0CF3 CORPORATE BOND 500,000 532,320106.46US
INTER-AMERICAN DEVELOPMENT BAN 0.034581X0CU0
CORPORATE BOND 500,000 530,556105.62US
INTER-AMERICAN DEVELOPMENT BANK 0.054581X0CW6
CORPORATE BOND 1,000,000 1,010,078100.75US
INTER-AMERICAN DEVELOPMENT BANK 0.064581X0DA3
CORPORATE BOND 1,125,000 1,164,835103.24US
INTERCONTINENTAL EXCHANGE IN 0.0145866F104 COMMON STOCK 1,307 156,227119.53FINANCIALS US
INTERDIGITAL INC 0.0145867G101 COMMON STOCK 3,240 233,61272.11INFORMATION TECHNOLOGY US
INTERGLOBE AVIATION LTD 0.00BYYZ7D0 COMMON STOCK 1,853 48,31726.08INDUSTRIALS IN
INTERNATIONAL BANK FOR RECONST 0.05459058DY6 CORPORATE BOND 1,000,000 1,007,576100.66US
INTERNATIONAL BANK FOR RECONST 0.05459058FT5 CORPORATE BOND 1,000,000 1,057,478105.10US
INTERNATIONAL BANK FOR RECONST 0.03459058FY4 CORPORATE BOND 500,000 504,772100.76US
INTERNATIONAL BANK FOR RECONST 0.04459058DX8 CORPORATE BOND 750,000 802,844106.38US
INTERNATIONAL BANK FOR RECONST 0.05459058EP4 CORPORATE BOND 1,000,000 1,073,666107.14US
INTERNATIONAL BANK FOR RECONSTRUCTION &DEVELOPMENT
0.12459058GE7 CORPORATE BOND 2,125,000 2,329,308108.93US
INTERNATIONAL BANK FOR RECONSTRUCTION &DEVELOPMENT
0.12459058GL1 CORPORATE BOND 2,125,000 2,271,254105.60US
INTERNATIONAL FINANCE CORP 0.1445950VHX7
CORPORATE BOND 2,625,000 2,807,879106.12US
INTERNATIONAL PAPER CO 0.02460146103 COMMON STOCK 5,383 323,46460.09MATERIALS US
INTERPUBLIC GROUP OF COS INC 0.02460690100 COMMON STOCK 11,315 421,24637.23COMMUNICATION SERVICES US
INTERTEK GROUP PLC 0.013163836 COMMON STOCK 1,672 121,27972.53INDUSTRIALS GB
INTL BUSINESS MACHINES CORP 0.01459200101 COMMON STOCK 1,571 220,521140.34INFORMATION TECHNOLOGY US
INTL CONTAINER TERM SVCS INC 0.006455819 COMMON STOCK 12,180 45,5633.74INDUSTRIALS PH
INTL FLAVORS & FRAGRANCES 0.02459506101 COMMON STOCK 2,125 321,874151.50MATERIALS US
INTUIT INC 0.01461202103 COMMON STOCK 236 133,638566.11INFORMATION TECHNOLOGY US
INVENTEC CORP 0.006459930 COMMON STOCK 35,184 30,8510.88INFORMATION TECHNOLOGY TW
Security NameSecurityWeight
HOLDINGS 30 DAY LAG
SecurityIdentifier Security Type Units Held
Base MarketValueBase PriceSector Country
Risk Parity Multi-Asset GT
USDBase Currency:
Market Value: 1,961,759,259
August 31, 2021
40

INVENTEC CORP 0.006459930 COMMON STOCK 13,405 11,7540.88INFORMATION TECHNOLOGY TW
INVESCO LTD 0.01G491BT108
COMMON STOCK 6,108 154,64425.32FINANCIALS US
INVESTOR AB-B SHS 0.01BMV7PQ4 COMMON STOCK 9,695 231,64823.89FINANCIALS SE
IOI CORP BHD 0.00B1Y3WG1 COMMON STOCK 33,690 33,3900.99CONSUMER STAPLES MY
IPCA LABORATORIES LTD 0.016433473 COMMON STOCK 3,123 110,17235.27HEALTH CARE IN
IPG PHOTONICS CORP 0.0144980X10⁹ COMMON STOCK 588 100,340170.68INFORMATION TECHNOLOGY US
IQIYI INC-ADR 0.0046267X10⁸ AMERICAN DEPOSITORY RECEIPT 1,366 12,3799.06COMMUNICATION SERVICES CN
IRIDIUM COMMUNICATIONS INC 0.0446269C102 COMMON STOCK 18,165 808,52044.51COMMUNICATION SERVICES US
IRON MOUNTAIN INC 0.0046284V101 REAL ESTATE INVESTMENT TRUST 1,883 89,91547.75REAL ESTATE US
ISHARES IBOXX INVESTMENT GRA 1.89464287242 ISHARES GS$ INVESTOP CORP BD 273,360 36,985,608135.30US
ITALY (REP OF) 0.27B03KSM4 TREASURY INFLATIONARY PROTECTED 3,199,127 5,249,011164.08IT
ITALY (REPUBLIC OF) I/L 0.23B1Z5FX4 TREASURY INFLATIONARY PROTECTED 3,421,883 4,411,702128.93IT
ITALY BUONI POLIENNALI DE 144A UNSECURED CPI 0.53BYVYTQ7 TREASURY INFLATIONARY PROTECTED 7,271,106 10,411,986142.52IT
ITALY BUONI POLIENNALI DEL TESORO 0.36BYXYY37 TREASURY INFLATIONARY PROTECTED 5,131,252 7,030,666136.56IT
ITALY BUONI POLIENNALI DEL TESORO 0.16BD0QRT6 TREASURY INFLATIONARY PROTECTED 2,697,725 3,227,462119.64IT
ITALY BUONI POLIENNALI DEL TESORO 0.38BK5MSX9 TREASURY INFLATIONARY PROTECTED 5,697,946 7,410,126129.91IT
ITAUSA SA 0.002458771 PREFERENCE 12,061 27,2352.26FINANCIALS BR
ITC LTD 0.00B0JGGP5 COMMON STOCK 28,073 81,2492.89CONSUMER STAPLES IN
ITO EN LTD 0.016455789 COMMON STOCK 2,189 138,70663.35CONSUMER STAPLES JP
ITOCHU CORP 0.016467803 COMMON STOCK 3,284 98,97730.14INDUSTRIALS JP
ITOCHU TECHNO-SOLUTIONS CORP 0.016200194 COMMON STOCK 3,375 104,61530.99INFORMATION TECHNOLOGY JP
J & J SNACK FOODS CORP 0.03466032109 COMMON STOCK 3,803 622,799163.76CONSUMER STAPLES US
JACOBS ENGINEERING GROUP INC 0.01469814107 COMMON STOCK 805 108,617134.96INDUSTRIALS US
JAFRON BIOMEDICAL CO LTD-A 0.00BFY8H03 COMMON STOCK 10,634 80,5907.58HEALTH CARE CN
JAMES HARDIE INDUSTRIES-CDI 0.01B60QWJ2 GLOBAL DEPOSITORY RECEIPTS 2,685 104,07238.76MATERIALS IE
JAMES RIVER GROUP HOLDINGS L 0.00G5005R107
COMMON STOCK 1,962 72,16836.79FINANCIALS BM
JAPAN METROPOLITAN FUND INVE 0.006513342 REAL ESTATE INVESTMENT TRUST 57 55,923973.06REAL ESTATE JP
JAPAN REAL ESTATE INVESTMENT 0.016397580 REAL ESTATE INVESTMENT TRUST 22 135,7166,198.80REAL ESTATE JP
JAPAN TOBACCO INC 0.016474535 COMMON STOCK 10,308 200,09719.41CONSUMER STAPLES JP
JARDINE MATHESON HLDGS LTD 0.006472119 COMMON STOCK 1,117 60,65354.32INDUSTRIALS HK
JARIR MARKETING CO 0.01B128FM5 COMMON STOCK 2,318 133,86957.75CONSUMER DISCRETIONARY SA
JARIR MARKETING CO 0.00B128FM5 COMMON STOCK 155 8,98057.75CONSUMER DISCRETIONARY SA
JBS SA 0.00B1V74X7 COMMON STOCK 4,736 28,8376.09CONSUMER STAPLES BR
JDE PEET'S NV 0.00BMC4ZZ3 COMMON STOCK 2,846 97,77134.35CONSUMER STAPLES NL
Security NameSecurityWeight
HOLDINGS 30 DAY LAG
SecurityIdentifier Security Type Units Held
Base MarketValueBase PriceSector Country
Risk Parity Multi-Asset GT
USDBase Currency:
Market Value: 1,961,759,259
August 31, 2021
41

JERONIMO MARTINS 0.01B1Y1SQ7 COMMON STOCK 6,773 143,50421.19CONSUMER STAPLES PT
JG SUMMIT HOLDINGS INC 0.006466457 COMMON STOCK 7,024 9,1631.30INDUSTRIALS PH
JIANGSU EXPRESS CO LTD-H 0.006005504 COMMON STOCK 33,958 35,2361.04INDUSTRIALS CN
JIANGSU EXPRESS CO LTD-H 0.006005504 COMMON STOCK 7,149 7,4181.04INDUSTRIALS CN
JIANGSU HENGRUI MEDICINE C-A 0.00BP3R369 COMMON STOCK 4,786 33,4736.99HEALTH CARE CN
JIANGSU YANGHE BREWERY -A 0.00BD5CPF1 COMMON STOCK 2,949 76,44525.92CONSUMER STAPLES CN
JIANGSU YANGHE BREWERY -A 0.00BD5CPF1 COMMON STOCK 89 2,31725.92CONSUMER STAPLES CN
JIANGSU YUYUE MEDICAL EQU-A 0.00BD5CJM6 COMMON STOCK 13,315 67,4505.07HEALTH CARE CN
JIANGSU ZHONGTIAN TECHNOLO-A 0.00BP3R9T4 COMMON STOCK 41,733 52,4961.26INDUSTRIALS CN
JIANGXI ZHENGBANG TECH -A 0.00BD5LZ81 COMMON STOCK 9,294 12,2951.32CONSUMER STAPLES CN
JILIN AODONG PHARMACEUTICA-A 0.00BD5CLG4 COMMON STOCK 2,238 5,5052.46HEALTH CARE CN
JIUGUI LIQUOR CO LTD-A 0.00BD73KS0 COMMON STOCK 1,072 34,75732.41CONSUMER STAPLES CN
JM SMUCKER CO/THE 0.02832696405 COMMON STOCK 3,235 400,038123.67CONSUMER STAPLES US
JOHN B. SANFILIPPO & SON INC 0.03800422107 COMMON STOCK 6,191 526,18084.99CONSUMER STAPLES US
JOHNSON & JOHNSON 0.06478160BY9 CORPORATE BOND 1,000,000 1,079,028106.68US
JOHNSON CONTROLS INTERNATION 0.02G51502105 COMMON STOCK 5,599 418,80674.80INDUSTRIALS US
JOHNSON JOHNSON 4.500 20400901 0.02478160AV6 CORPORATE BOND 350,000 456,440130.41US
JOHNSON JOHNSON 5.950 20370815 0.02478160AN4 CORPORATE BOND 250,000 369,449147.78US
JOINTOWN PHARMACEUTICAL-A 0.00BP3R541 COMMON STOCK 12,511 29,2882.34HEALTH CARE CN
JOINTOWN PHARMACEUTICAL-A 0.00BP3R541 COMMON STOCK 7,328 17,1542.34HEALTH CARE CN
JOYY INC-ADR 0.0046591M109 AMERICAN DEPOSITORY RECEIPT 848 53,68363.30COMMUNICATION SERVICES SG
JPMORGAN CHASE & CO 0.0146625H100 COMMON STOCK 633 101,175159.95FINANCIALS US
JPN 10Y BOND(OSE) SEP 2021 30.38JGBSEP2021
JPN 10Y BOND(OSE) 430 595,565,2651.39JP
JSR CORP 0.006470986 COMMON STOCK 2,737 95,03634.73MATERIALS JP
JSW STEEL LTD 0.00BZBYJJ7 COMMON STOCK 2,375 22,3719.42MATERIALS IN
JSW STEEL LTD 0.00BZBYJJ7 COMMON STOCK 625 5,8839.42MATERIALS IN
JUBILANT FOODWORKS LTD 0.00B3PRM66 COMMON STOCK 406 22,20154.72CONSUMER DISCRETIONARY IN
JUMBO SA 0.007243530 COMMON STOCK 3,572 56,07915.70CONSUMER DISCRETIONARY GR
JUNIPER NETWORKS INC 0.0148203R104 COMMON STOCK 6,153 178,31928.98INFORMATION TECHNOLOGY US
JUST EAT TAKEAWAY 0.01BYQ7HZ6 COMMON STOCK 1,398 126,57090.56CONSUMER DISCRETIONARY NL
KADANT INC 0.0048282T104 COMMON STOCK 377 78,903209.12INDUSTRIALS US
KAISA GROUP HOLDINGS LTD 0.00B58RBK4 COMMON STOCK 2,681 8930.33REAL ESTATE CN
KAKAKU.COM INC 0.016689533 COMMON STOCK 6,477 202,22131.22COMMUNICATION SERVICES JP
KAKAO CORP 0.006194037 COMMON STOCK 464 62,003133.68COMMUNICATION SERVICES KR
Security NameSecurityWeight
HOLDINGS 30 DAY LAG
SecurityIdentifier Security Type Units Held
Base MarketValueBase PriceSector Country
Risk Parity Multi-Asset GT
USDBase Currency:
Market Value: 1,961,759,259
August 31, 2021
42

KALBE FARMA TBK PT 0.00B7311V6 COMMON STOCK 692,928 65,3450.09HEALTH CARE ID
KAMAN CORP 0.00483548103 COMMON STOCK 1,383 54,05339.08INDUSTRIALS US
KANGWON LAND INC 0.006683449 COMMON STOCK 1,935 46,22223.89CONSUMER DISCRETIONARY KR
KANSAI ELECTRIC POWER CO INC 0.046483489 COMMON STOCK 82,611 830,92610.06UTILITIES JP
KANSAI PAINT CO LTD 0.006483746 COMMON STOCK 3,010 78,12425.95MATERIALS JP
KANSAS CITY SOUTHERN 0.01485170302 COMMON STOCK 792 222,304280.67INDUSTRIALS US
KAO CORP 0.016483809 COMMON STOCK 3,488 210,97860.50CONSUMER STAPLES JP
KB FINANCIAL GROUP INC 0.00B3DF0Y6 COMMON STOCK 735 33,55645.63FINANCIALS KR
KDDI CORP 0.026248990 COMMON STOCK 13,488 413,73730.68COMMUNICATION SERVICES JP
KEIO CORP 0.006487362 COMMON STOCK 1,095 58,99053.89INDUSTRIALS JP
KELLOGG CO 0.02487836108 COMMON STOCK 6,583 415,67463.14CONSUMER STAPLES US
KEPPEL CORP LTD 0.01B1VQ5C0 COMMON STOCK 48,988 189,3813.87INDUSTRIALS SG
KERRY GROUP PLC-A 0.044519579 COMMON STOCK 5,727 839,665146.61CONSUMER STAPLES IE
KESKO OYJ-B SHS 0.014490005 COMMON STOCK 5,827 240,49141.27CONSUMER STAPLES FI
KEYCORP 0.01493267108 COMMON STOCK 7,285 148,03520.32FINANCIALS US
KEYENCE CORP 0.016490995 COMMON STOCK 274 164,738601.95INFORMATION TECHNOLOGY JP
KEYSIGHT TECHNOLOGIES IN 0.0149338L103 COMMON STOCK 1,139 204,369179.38INFORMATION TECHNOLOGY US
KGHM POLSKA MIEDZ SA 0.005263251 COMMON STOCK 210 9,78046.57MATERIALS PL
KIA CORP 0.006490928 COMMON STOCK 943 69,19873.40CONSUMER DISCRETIONARY KR
KIA CORP 0.006490928 COMMON STOCK 181 13,31573.40CONSUMER DISCRETIONARY KR
KIKKOMAN CORP 0.016490809 COMMON STOCK 2,378 178,81175.19CONSUMER STAPLES JP
KIMBALL ELECTRONICS INC 0.0149428J109 COMMON STOCK 6,460 156,14524.17INFORMATION TECHNOLOGY US
KIMBERLY-CLARK CORP 0.02494368103 COMMON STOCK 3,337 459,845137.81CONSUMER STAPLES US
KIMBERLY-CLARK DE MEXICO-A 0.002491914 COMMON STOCK 45,584 80,6831.77CONSUMER STAPLES MX
KIMCO REALTY CORP 0.0149446R109 REAL ESTATE INVESTMENT TRUST 9,588 208,93121.79REAL ESTATE US
KINDER MORGAN INC 0.0149456B101 COMMON STOCK 15,481 251,87416.27ENERGY US
KINGBOARD HOLDINGS LTD 0.006491318 COMMON STOCK 1,787 8,7904.92INFORMATION TECHNOLOGY HK
KINGBOARD HOLDINGS LTD 0.006491318 COMMON STOCK 321 1,5784.92INFORMATION TECHNOLOGY HK
KINGBOARD LAMINATES HLDG LTD 0.00B1HHFV6 COMMON STOCK 5,556 10,9301.97INFORMATION TECHNOLOGY HK
KINGBOARD LAMINATES HLDG LTD 0.00B1HHFV6 COMMON STOCK 700 1,3771.97INFORMATION TECHNOLOGY HK
KINGDEE INTERNATIONAL SFTWR 0.006327587 COMMON STOCK 7,149 26,0143.64INFORMATION TECHNOLOGY CN
KINGDEE INTERNATIONAL SFTWR 0.006327587 COMMON STOCK 1,993 7,2513.64INFORMATION TECHNOLOGY CN
KINGFA SCI.& TECH CO LTD-A 0.00BP3R8H5 COMMON STOCK 14,656 36,7572.51MATERIALS CN
KINGFISHER PLC 0.013319521 COMMON STOCK 20,577 99,2004.82CONSUMER DISCRETIONARY GB
Security NameSecurityWeight
HOLDINGS 30 DAY LAG
SecurityIdentifier Security Type Units Held
Base MarketValueBase PriceSector Country
Risk Parity Multi-Asset GT
USDBase Currency:
Market Value: 1,961,759,259
August 31, 2021
43

KINGSOFT CORP LTD 0.00B27WRM3 COMMON STOCK 2,681 10,7384.01INFORMATION TECHNOLOGY CN
KINGSPAN GROUP PLC 0.014491235 COMMON STOCK 1,258 143,719114.24INDUSTRIALS IE
KINROSS GOLD CORP 0.00496902404 COMMON STOCK 14,760 88,6566.01MATERIALS CA
KINSALE CAPITAL GROUP INC 0.0049714P108 COMMON STOCK 263 47,866181.85FINANCIALS US
KINTETSU GROUP HOLDINGS CO L 0.016492968 COMMON STOCK 3,010 103,03334.23INDUSTRIALS JP
KIRKLAND LAKE GOLD LTD 0.0149741E100 COMMON STOCK 3,288 130,89639.81MATERIALS CA
KKR REAL ESTATE FINANCE TRUS 0.0048251K100 REAL ESTATE INVESTMENT TRUST 3,593 76,63821.33FINANCIALS US
KLA CORP 0.01482480100 COMMON STOCK 753 255,940339.96INFORMATION TECHNOLOGY US
KLABIN SA - UNIT 0.00BJ0K6Z9 UNIT 6,792 34,9035.14MATERIALS BR
KMW CO LTD 0.006219888 COMMON STOCK 898 32,99836.74INFORMATION TECHNOLOGY KR
KNOWLES CORP 0.0149926D109 COMMON STOCK 6,001 120,01820.00INFORMATION TECHNOLOGY US
KOBAYASHI PHARMACEUTICAL CO 0.006149457 COMMON STOCK 1,186 92,94478.37CONSUMER STAPLES JP
KOBE BUSSAN CO LTD 0.01B14RJB7 COMMON STOCK 3,375 131,49838.96CONSUMER STAPLES JP
KOC HOLDING AS 0.00B03MVJ8 COMMON STOCK 24,937 69,1022.77INDUSTRIALS TR
KOEI TECMO HOLDINGS CO LTD 0.01B60DR09 COMMON STOCK 3,622 155,10442.83COMMUNICATION SERVICES JP
KOFC 4.625 20211116 0.0150065TAC7 CORPORATE BOND 250,000 255,565100.88US
KOMATSU LTD 0.016496584 COMMON STOCK 8,393 203,40024.24INDUSTRIALS JP
KOMERCNI BANKA AS 0.004519449 COMMON STOCK 1,898 72,95638.44FINANCIALS CZ
KONAMI HOLDINGS CORP 0.016496681 COMMON STOCK 2,463 156,49263.54COMMUNICATION SERVICES JP
KONE OYJ-B 0.00B09M9D2 COMMON STOCK 766 63,53782.92INDUSTRIALS FI
KONINKLIJKE AHOLD DELHAIZE N 0.02BD0Q398 COMMON STOCK 9,519 321,04533.73CONSUMER STAPLES NL
KONINKLIJKE DSM NV 0.01B0HZL93 COMMON STOCK 1,090 231,956212.78MATERIALS NL
KONINKLIJKE KPN NV 0.015956078 COMMON STOCK 59,829 191,6773.20COMMUNICATION SERVICES NL
KONINKLIJKE PHILIPS NV 0.025986622 COMMON STOCK 6,833 314,88746.09HEALTH CARE NL
KOREA AEROSPACE INDUSTRIES 0.00B3N3363 COMMON STOCK 1,101 31,19328.33INDUSTRIALS KR
KOREA ELECTRIC POWER CORP 0.006495730 COMMON STOCK 776 16,05620.70UTILITIES KR
KOREA EXIMBANK 4.375 20210915 0.01302154BA6 CORPORATE BOND 250,000 255,411100.15US
KOREA INTERNATIONAL BOND 0.0650064FAK0 CORPORATE BOND 1,000,000 1,087,699106.94US
KOREA INVESTMENT HOLDINGS CO 0.006654586 COMMON STOCK 337 27,69182.19FINANCIALS KR
KOREA SHIPBUILDING & OFFSHOR 0.006446620 COMMON STOCK 200 20,459102.20INDUSTRIALS KR
KOREA ZINC CO LTD 0.006495428 COMMON STOCK 119 54,535458.84MATERIALS KR
KOREAN AIR LINES CO LTD 0.006496766 COMMON STOCK 1,716 46,31927.00INDUSTRIALS KR
KOSE CORP 0.006194468 COMMON STOCK 655 79,296121.06CONSUMER STAPLES JP
KOSSAN RUBBER INDUSTRIES 0.00B0DD1H9 COMMON STOCK 43,699 32,5880.75HEALTH CARE MY
Security NameSecurityWeight
HOLDINGS 30 DAY LAG
SecurityIdentifier Security Type Units Held
Base MarketValueBase PriceSector Country
Risk Parity Multi-Asset GT
USDBase Currency:
Market Value: 1,961,759,259
August 31, 2021
44

KRAFT HEINZ CO/THE 0.01500754106 COMMON STOCK 7,797 280,59635.99CONSUMER STAPLES US
KREDITANSTALT FUER WIEDERAUFBA 0.05500769HF4 CORPORATE BOND 1,000,000 1,020,731101.05US
KREDITANSTALT FUER WIEDERAUFBA 0.03500769HJ6 CORPORATE BOND 500,000 508,018101.60US
KROGER CO 0.10501044101 COMMON STOCK 43,425 1,998,84846.03CONSUMER STAPLES US
KRUNG THAI BANK PUB CO-FOREI 0.006492838 COMMON STOCK 132,308 45,9740.35FINANCIALS TH
KRUNGTHAI CARD PCL-FOREIGN 0.00BF2LWT8 COMMON STOCK 13,226 27,1842.06FINANCIALS TH
KT&G CORP 0.016175076 COMMON STOCK 3,935 276,91770.38CONSUMER STAPLES KR
KT&G CORP 0.006175076 COMMON STOCK 32 2,26470.38CONSUMER STAPLES KR
KUAISHOU TECHNOLOGY 0.00BLC90T0 COMMON STOCK 2,145 23,30210.86COMMUNICATION SERVICES CN
KUALA LUMPUR KEPONG BHD 0.006497446 COMMON STOCK 9,294 47,7555.14CONSUMER STAPLES MY
KUMBA IRON ORE LTD 0.00B1G4262 COMMON STOCK 1,296 58,49645.14MATERIALS ZA
KUMBA IRON ORE LTD 0.00B1G4262 COMMON STOCK 53 2,38045.14MATERIALS ZA
KUMHO PETROCHEMICAL CO LTD 0.006499323 COMMON STOCK 330 55,317167.75MATERIALS KR
KUNLUN ENERGY CO LTD 0.016340078 COMMON STOCK 121,238 128,4501.06UTILITIES HK
KUNLUN TECH CO LTD-A 0.00BD5CN13 COMMON STOCK 27,256 70,9742.60COMMUNICATION SERVICES CN
KURITA WATER INDUSTRIES LTD 0.006497963 COMMON STOCK 1,003 47,13246.97INDUSTRIALS JP
KWEICHOW MOUTAI CO LTD-A 0.00BP3R2F1 COMMON STOCK 89 21,542241.06CONSUMER STAPLES CN
KWG GROUP HOLDINGS LTD 0.00B1YBF00 COMMON STOCK 8,490 8,9511.05REAL ESTATE CN
KWG GROUP HOLDINGS LTD 0.00B1YBF00 COMMON STOCK 894 9421.05REAL ESTATE CN
KYOCERA CORP 0.016499260 COMMON STOCK 2,281 142,11862.32INFORMATION TECHNOLOGY JP
KYOWA KIRIN CO LTD 0.016499550 COMMON STOCK 7,300 238,87532.72HEALTH CARE JP
L'OREAL 0.024057808 COMMON STOCK 849 397,317467.81CONSUMER STAPLES FR
LA FRANCAISE DES JEUX SAEM 0.01BG0SC10 COMMON STOCK 2,878 148,84551.72CONSUMER DISCRETIONARY FR
LA-Z-BOY INC 0.03505336107 COMMON STOCK 14,795 517,97835.01CONSUMER DISCRETIONARY US
LABORATORY CRP OF AMER HLDGS 0.0450540R409 COMMON STOCK 2,418 733,592303.38HEALTH CARE US
LAM RESEARCH CORP 0.03512807108 COMMON STOCK 821 496,686604.82INFORMATION TECHNOLOGY US
LAMB WESTON HOLDINGS INC 0.01513272104 COMMON STOCK 3,138 204,44865.15CONSUMER STAPLES US
LANCASTER COLONY CORP 0.04513847103 COMMON STOCK 4,190 742,713177.24CONSUMER STAPLES US
LAND & HOUSES PUB CO-FOR REG 0.006581930 COMMON STOCK 78,551 19,8620.25REAL ESTATE TH
LANDEC CORP 0.00514766104 COMMON STOCK 2,114 22,89210.83CONSUMER STAPLES US
LANDSEA HOMES CORP 0.0151509P103 COMMON STOCK 12,709 111,7168.79CONSUMER DISCRETIONARY US
LANDWIRTSCHAFTLICHE RENTENBANK 0.02515110BT0 CORPORATE BOND 375,000 410,804108.81DE
LANDWIRTSCHAFTLICHE RENTENBANK 0.05515110BL7 CORPORATE BOND 1,000,000 1,011,125100.17US
LANDWIRTSCHAFTLICHE RENTENBANK 0.03515110BN3 CORPORATE BOND 500,000 525,198104.77US
Security NameSecurityWeight
HOLDINGS 30 DAY LAG
SecurityIdentifier Security Type Units Held
Base MarketValueBase PriceSector Country
Risk Parity Multi-Asset GT
USDBase Currency:
Market Value: 1,961,759,259
August 31, 2021
45
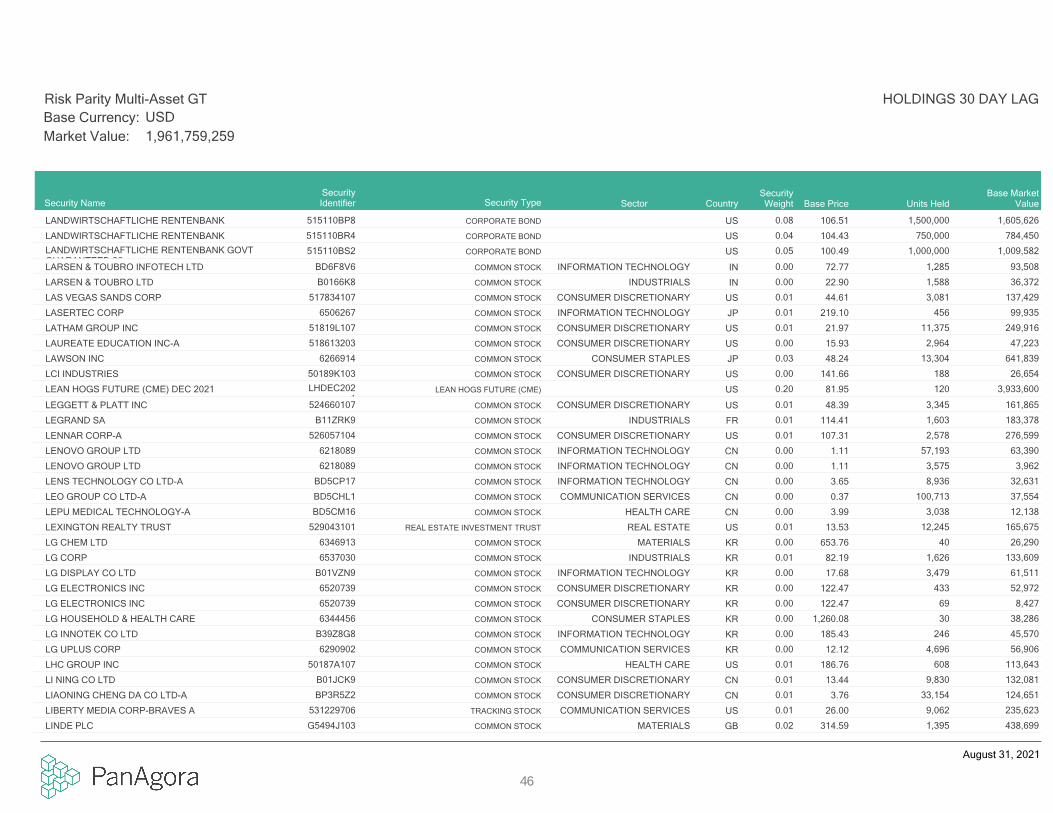
LANDWIRTSCHAFTLICHE RENTENBANK 0.08515110BP8 CORPORATE BOND 1,500,000 1,605,626106.51US
LANDWIRTSCHAFTLICHE RENTENBANK 0.04515110BR4 CORPORATE BOND 750,000 784,450104.43US
LANDWIRTSCHAFTLICHE RENTENBANK GOVTGUARANTEED 36
0.05515110BS2 CORPORATE BOND 1,000,000 1,009,582100.49US
LARSEN & TOUBRO INFOTECH LTD 0.00BD6F8V6 COMMON STOCK 1,285 93,50872.77INFORMATION TECHNOLOGY IN
LARSEN & TOUBRO LTD 0.00B0166K8 COMMON STOCK 1,588 36,37222.90INDUSTRIALS IN
LAS VEGAS SANDS CORP 0.01517834107 COMMON STOCK 3,081 137,42944.61CONSUMER DISCRETIONARY US
LASERTEC CORP 0.016506267 COMMON STOCK 456 99,935219.10INFORMATION TECHNOLOGY JP
LATHAM GROUP INC 0.0151819L107 COMMON STOCK 11,375 249,91621.97CONSUMER DISCRETIONARY US
LAUREATE EDUCATION INC-A 0.00518613203 COMMON STOCK 2,964 47,22315.93CONSUMER DISCRETIONARY US
LAWSON INC 0.036266914 COMMON STOCK 13,304 641,83948.24CONSUMER STAPLES JP
LCI INDUSTRIES 0.0050189K103 COMMON STOCK 188 26,654141.66CONSUMER DISCRETIONARY US
LEAN HOGS FUTURE (CME) DEC 2021 0.20LHDEC2021
LEAN HOGS FUTURE (CME) 120 3,933,60081.95US
LEGGETT & PLATT INC 0.01524660107 COMMON STOCK 3,345 161,86548.39CONSUMER DISCRETIONARY US
LEGRAND SA 0.01B11ZRK9 COMMON STOCK 1,603 183,378114.41INDUSTRIALS FR
LENNAR CORP-A 0.01526057104 COMMON STOCK 2,578 276,599107.31CONSUMER DISCRETIONARY US
LENOVO GROUP LTD 0.006218089 COMMON STOCK 57,193 63,3901.11INFORMATION TECHNOLOGY CN
LENOVO GROUP LTD 0.006218089 COMMON STOCK 3,575 3,9621.11INFORMATION TECHNOLOGY CN
LENS TECHNOLOGY CO LTD-A 0.00BD5CP17 COMMON STOCK 8,936 32,6313.65INFORMATION TECHNOLOGY CN
LEO GROUP CO LTD-A 0.00BD5CHL1 COMMON STOCK 100,713 37,5540.37COMMUNICATION SERVICES CN
LEPU MEDICAL TECHNOLOGY-A 0.00BD5CM16 COMMON STOCK 3,038 12,1383.99HEALTH CARE CN
LEXINGTON REALTY TRUST 0.01529043101 REAL ESTATE INVESTMENT TRUST 12,245 165,67513.53REAL ESTATE US
LG CHEM LTD 0.006346913 COMMON STOCK 40 26,290653.76MATERIALS KR
LG CORP 0.016537030 COMMON STOCK 1,626 133,60982.19INDUSTRIALS KR
LG DISPLAY CO LTD 0.00B01VZN9 COMMON STOCK 3,479 61,51117.68INFORMATION TECHNOLOGY KR
LG ELECTRONICS INC 0.006520739 COMMON STOCK 433 52,972122.47CONSUMER DISCRETIONARY KR
LG ELECTRONICS INC 0.006520739 COMMON STOCK 69 8,427122.47CONSUMER DISCRETIONARY KR
LG HOUSEHOLD & HEALTH CARE 0.006344456 COMMON STOCK 30 38,2861,260.08CONSUMER STAPLES KR
LG INNOTEK CO LTD 0.00B39Z8G8 COMMON STOCK 246 45,570185.43INFORMATION TECHNOLOGY KR
LG UPLUS CORP 0.006290902 COMMON STOCK 4,696 56,90612.12COMMUNICATION SERVICES KR
LHC GROUP INC 0.0150187A107 COMMON STOCK 608 113,643186.76HEALTH CARE US
LI NING CO LTD 0.01B01JCK9 COMMON STOCK 9,830 132,08113.44CONSUMER DISCRETIONARY CN
LIAONING CHENG DA CO LTD-A 0.01BP3R5Z2 COMMON STOCK 33,154 124,6513.76CONSUMER DISCRETIONARY CN
LIBERTY MEDIA CORP-BRAVES A 0.01531229706 TRACKING STOCK 9,062 235,62326.00COMMUNICATION SERVICES US
LINDE PLC 0.02G5494J103 COMMON STOCK 1,395 438,699314.59MATERIALS GB
Security NameSecurityWeight
HOLDINGS 30 DAY LAG
SecurityIdentifier Security Type Units Held
Base MarketValueBase PriceSector Country
Risk Parity Multi-Asset GT
USDBase Currency:
Market Value: 1,961,759,259
August 31, 2021
46

LINDSAY CORP 0.01535555106 COMMON STOCK 679 111,792164.75INDUSTRIALS US
LION CORP 0.026518808 COMMON STOCK 20,434 348,38517.05CONSUMER STAPLES JP
LITE-ON TECHNOLOGY CORP 0.006519481 COMMON STOCK 41,332 91,2732.21INFORMATION TECHNOLOGY TW
LITE-ON TECHNOLOGY CORP 0.006519481 COMMON STOCK 5,613 12,3952.21INFORMATION TECHNOLOGY TW
LIVE CATTLE FUTURE DEC 2021 0.48LCDEC2021
LIVE CATTLE FUTURE 178 9,503,420133.47US
LIVE CATTLE FUTURE OCT 2021 0.61LCOCT2021
LIVE CATTLE FUTURE 236 11,979,360126.90US
LIVE NATION ENTERTAINMENT IN 0.01538034109 COMMON STOCK 3,162 274,12886.70COMMUNICATION SERVICES US
LKQ CORP 0.02501889208 COMMON STOCK 5,872 309,37152.69CONSUMER DISCRETIONARY US
LME NICKEL FUTURE DEC 2021 0.67LNDEC2021
LME NICKEL FUTURE 112 13,134,91219,546.00US
LME PRIMARY ALUMINUM FUTURE DEC 2021 1.18LADEC2021
LME PRIMARY ALUMINUM FUTURE 341 23,160,2942,716.75US
LME ZINC FUTURE DEC 2021 0.92LXDEC2021
LME ZINC FUTURE 240 18,034,5003,005.75US
LOBLAW COMPANIES LTD 0.04539481101 COMMON STOCK 10,312 725,39070.34CONSUMER STAPLES CA
LOCALIZA RENT A CAR 0.00B08K3S0 COMMON STOCK 2,185 23,67010.83INDUSTRIALS BR
LOCKHEED MARTIN CORP 0.00539830109 COMMON STOCK 189 67,883359.80INDUSTRIALS US
LOEWS CORP 0.01540424108 COMMON STOCK 2,239 125,06655.87FINANCIALS US
LOGAN GROUP CO LTD 0.00BH6X937 COMMON STOCK 1,419 1,6931.19REAL ESTATE CN
LOGITECH INTERNATIONAL-REG 0.01B18ZRK2 COMMON STOCK 2,166 221,379102.22INFORMATION TECHNOLOGY CH
LOJAS RENNER S.A. 0.00B0CGYD6 COMMON STOCK 1,483 11,0287.43CONSUMER DISCRETIONARY BR
LONGFOR GROUP HOLDINGS LTD 0.00B56KLY9 COMMON STOCK 12,511 54,2114.33REAL ESTATE CN
LONGI GREEN ENERGY TECHNOL-A 0.00BRTL411 COMMON STOCK 5,505 76,19513.84INFORMATION TECHNOLOGY CN
LONGI GREEN ENERGY TECHNOL-A 0.00BRTL411 COMMON STOCK 250 3,46313.84INFORMATION TECHNOLOGY CN
LONZA GROUP AG-REG 0.027333378 COMMON STOCK 445 376,630846.02HEALTH CARE CH
LOTTE CHEMICAL CORP 0.006440020 COMMON STOCK 173 37,381215.62MATERIALS KR
LOTTE SHOPPING CO 0.00B0WGPZ5 COMMON STOCK 199 18,47792.72CONSUMER DISCRETIONARY KR
LOWE'S COS INC 0.02548661107 COMMON STOCK 1,629 332,086203.89CONSUMER DISCRETIONARY US
LTC PROPERTIES INC 0.00502175102 REAL ESTATE INVESTMENT TRUST 1,642 56,67734.51REAL ESTATE US
LUCKY CEMENT 0.006537557 COMMON STOCK 6,358 31,7444.99MATERIALS PK
LUKOIL PJSC-SPON ADR 0.00BYZDW27 AMERICAN DEPOSITORY RECEIPT 632 53,55284.76ENERGY RU
LUMEN TECHNOLOGIES INC 0.01550241103 COMMON STOCK 22,731 279,59712.30COMMUNICATION SERVICES US
LUNDIN ENERGY AB 0.047187627 COMMON STOCK 26,030 794,28330.51ENERGY SE
LUPIN LTD 0.006143761 COMMON STOCK 4,768 62,55013.12HEALTH CARE IN
LUXSHARE PRECISION INDUSTR-A 0.00BD5CN80 COMMON STOCK 2,340 12,2615.24INFORMATION TECHNOLOGY CN
LUXSHARE PRECISION INDUSTR-A 0.00BD5CN80 COMMON STOCK 357 1,8735.24INFORMATION TECHNOLOGY CN
LUZHOU LAOJIAO CO LTD-A 0.00BD5CMM7 COMMON STOCK 89 2,35126.30CONSUMER STAPLES CN
Security NameSecurityWeight
HOLDINGS 30 DAY LAG
SecurityIdentifier Security Type Units Held
Base MarketValueBase PriceSector Country
Risk Parity Multi-Asset GT
USDBase Currency:
Market Value: 1,961,759,259
August 31, 2021
47
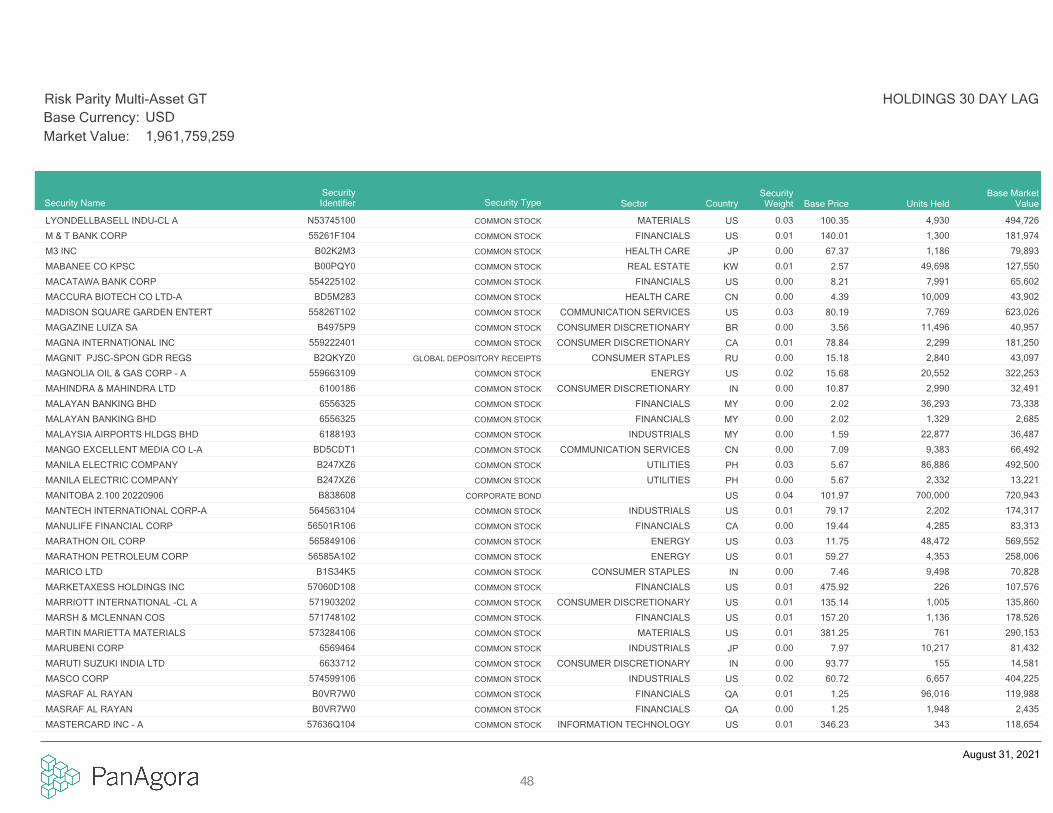
LYONDELLBASELL INDU-CL A 0.03N53745100 COMMON STOCK 4,930 494,726100.35MATERIALS US
M & T BANK CORP 0.0155261F104 COMMON STOCK 1,300 181,974140.01FINANCIALS US
M3 INC 0.00B02K2M3 COMMON STOCK 1,186 79,89367.37HEALTH CARE JP
MABANEE CO KPSC 0.01B00PQY0 COMMON STOCK 49,698 127,5502.57REAL ESTATE KW
MACATAWA BANK CORP 0.00554225102 COMMON STOCK 7,991 65,6028.21FINANCIALS US
MACCURA BIOTECH CO LTD-A 0.00BD5M283 COMMON STOCK 10,009 43,9024.39HEALTH CARE CN
MADISON SQUARE GARDEN ENTERT 0.0355826T102 COMMON STOCK 7,769 623,02680.19COMMUNICATION SERVICES US
MAGAZINE LUIZA SA 0.00B4975P9 COMMON STOCK 11,496 40,9573.56CONSUMER DISCRETIONARY BR
MAGNA INTERNATIONAL INC 0.01559222401 COMMON STOCK 2,299 181,25078.84CONSUMER DISCRETIONARY CA
MAGNIT PJSC-SPON GDR REGS 0.00B2QKYZ0 GLOBAL DEPOSITORY RECEIPTS 2,840 43,09715.18CONSUMER STAPLES RU
MAGNOLIA OIL & GAS CORP - A 0.02559663109 COMMON STOCK 20,552 322,25315.68ENERGY US
MAHINDRA & MAHINDRA LTD 0.006100186 COMMON STOCK 2,990 32,49110.87CONSUMER DISCRETIONARY IN
MALAYAN BANKING BHD 0.006556325 COMMON STOCK 36,293 73,3382.02FINANCIALS MY
MALAYAN BANKING BHD 0.006556325 COMMON STOCK 1,329 2,6852.02FINANCIALS MY
MALAYSIA AIRPORTS HLDGS BHD 0.006188193 COMMON STOCK 22,877 36,4871.59INDUSTRIALS MY
MANGO EXCELLENT MEDIA CO L-A 0.00BD5CDT1 COMMON STOCK 9,383 66,4927.09COMMUNICATION SERVICES CN
MANILA ELECTRIC COMPANY 0.03B247XZ6 COMMON STOCK 86,886 492,5005.67UTILITIES PH
MANILA ELECTRIC COMPANY 0.00B247XZ6 COMMON STOCK 2,332 13,2215.67UTILITIES PH
MANITOBA 2.100 20220906 0.04B838608 CORPORATE BOND 700,000 720,943101.97US
MANTECH INTERNATIONAL CORP-A 0.01564563104 COMMON STOCK 2,202 174,31779.17INDUSTRIALS US
MANULIFE FINANCIAL CORP 0.0056501R106 COMMON STOCK 4,285 83,31319.44FINANCIALS CA
MARATHON OIL CORP 0.03565849106 COMMON STOCK 48,472 569,55211.75ENERGY US
MARATHON PETROLEUM CORP 0.0156585A102 COMMON STOCK 4,353 258,00659.27ENERGY US
MARICO LTD 0.00B1S34K5 COMMON STOCK 9,498 70,8287.46CONSUMER STAPLES IN
MARKETAXESS HOLDINGS INC 0.0157060D108 COMMON STOCK 226 107,576475.92FINANCIALS US
MARRIOTT INTERNATIONAL -CL A 0.01571903202 COMMON STOCK 1,005 135,860135.14CONSUMER DISCRETIONARY US
MARSH & MCLENNAN COS 0.01571748102 COMMON STOCK 1,136 178,526157.20FINANCIALS US
MARTIN MARIETTA MATERIALS 0.01573284106 COMMON STOCK 761 290,153381.25MATERIALS US
MARUBENI CORP 0.006569464 COMMON STOCK 10,217 81,4327.97INDUSTRIALS JP
MARUTI SUZUKI INDIA LTD 0.006633712 COMMON STOCK 155 14,58193.77CONSUMER DISCRETIONARY IN
MASCO CORP 0.02574599106 COMMON STOCK 6,657 404,22560.72INDUSTRIALS US
MASRAF AL RAYAN 0.01B0VR7W0 COMMON STOCK 96,016 119,9881.25FINANCIALS QA
MASRAF AL RAYAN 0.00B0VR7W0 COMMON STOCK 1,948 2,4351.25FINANCIALS QA
MASTERCARD INC - A 0.0157636Q104 COMMON STOCK 343 118,654346.23INFORMATION TECHNOLOGY US
Security NameSecurityWeight
HOLDINGS 30 DAY LAG
SecurityIdentifier Security Type Units Held
Base MarketValueBase PriceSector Country
Risk Parity Multi-Asset GT
USDBase Currency:
Market Value: 1,961,759,259
August 31, 2021
48
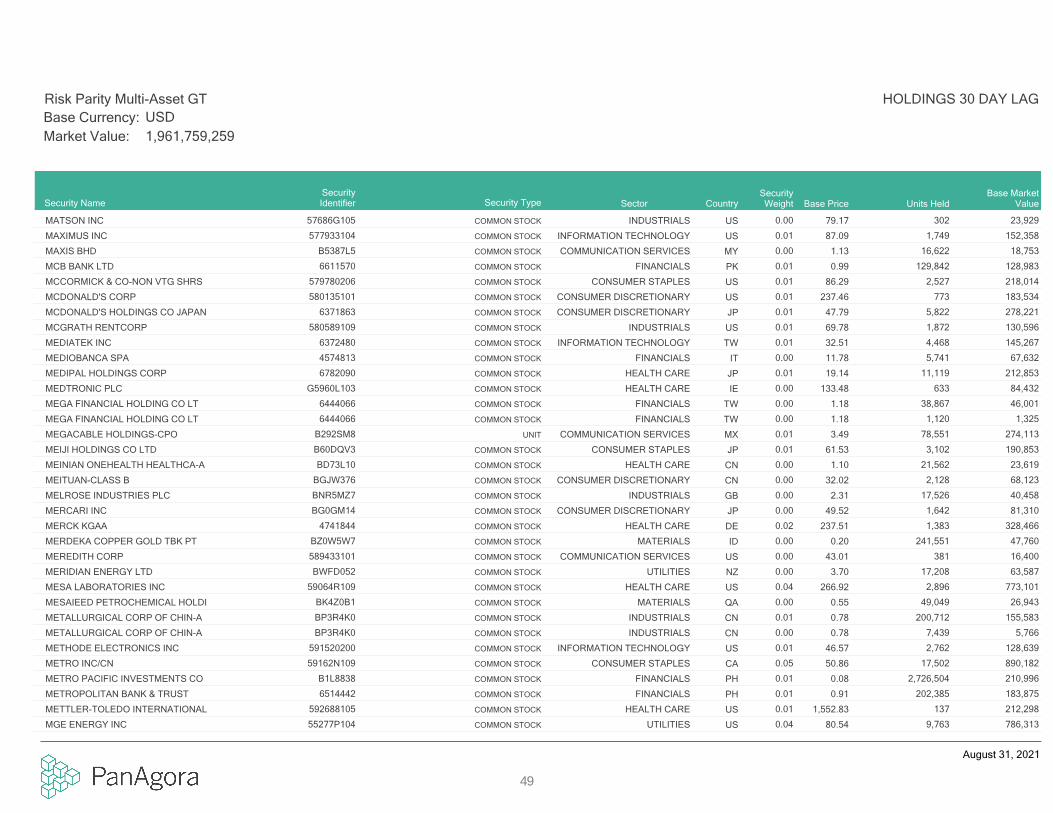
MATSON INC 0.0057686G105 COMMON STOCK 302 23,92979.17INDUSTRIALS US
MAXIMUS INC 0.01577933104 COMMON STOCK 1,749 152,35887.09INFORMATION TECHNOLOGY US
MAXIS BHD 0.00B5387L5 COMMON STOCK 16,622 18,7531.13COMMUNICATION SERVICES MY
MCB BANK LTD 0.016611570 COMMON STOCK 129,842 128,9830.99FINANCIALS PK
MCCORMICK & CO-NON VTG SHRS 0.01579780206 COMMON STOCK 2,527 218,01486.29CONSUMER STAPLES US
MCDONALD'S CORP 0.01580135101 COMMON STOCK 773 183,534237.46CONSUMER DISCRETIONARY US
MCDONALD'S HOLDINGS CO JAPAN 0.016371863 COMMON STOCK 5,822 278,22147.79CONSUMER DISCRETIONARY JP
MCGRATH RENTCORP 0.01580589109 COMMON STOCK 1,872 130,59669.78INDUSTRIALS US
MEDIATEK INC 0.016372480 COMMON STOCK 4,468 145,26732.51INFORMATION TECHNOLOGY TW
MEDIOBANCA SPA 0.004574813 COMMON STOCK 5,741 67,63211.78FINANCIALS IT
MEDIPAL HOLDINGS CORP 0.016782090 COMMON STOCK 11,119 212,85319.14HEALTH CARE JP
MEDTRONIC PLC 0.00G5960L103 COMMON STOCK 633 84,432133.48HEALTH CARE IE
MEGA FINANCIAL HOLDING CO LT 0.006444066 COMMON STOCK 38,867 46,0011.18FINANCIALS TW
MEGA FINANCIAL HOLDING CO LT 0.006444066 COMMON STOCK 1,120 1,3251.18FINANCIALS TW
MEGACABLE HOLDINGS-CPO 0.01B292SM8 UNIT 78,551 274,1133.49COMMUNICATION SERVICES MX
MEIJI HOLDINGS CO LTD 0.01B60DQV3 COMMON STOCK 3,102 190,85361.53CONSUMER STAPLES JP
MEINIAN ONEHEALTH HEALTHCA-A 0.00BD73L10 COMMON STOCK 21,562 23,6191.10HEALTH CARE CN
MEITUAN-CLASS B 0.00BGJW376 COMMON STOCK 2,128 68,12332.02CONSUMER DISCRETIONARY CN
MELROSE INDUSTRIES PLC 0.00BNR5MZ7 COMMON STOCK 17,526 40,4582.31INDUSTRIALS GB
MERCARI INC 0.00BG0GM14 COMMON STOCK 1,642 81,31049.52CONSUMER DISCRETIONARY JP
MERCK KGAA 0.024741844 COMMON STOCK 1,383 328,466237.51HEALTH CARE DE
MERDEKA COPPER GOLD TBK PT 0.00BZ0W5W7 COMMON STOCK 241,551 47,7600.20MATERIALS ID
MEREDITH CORP 0.00589433101 COMMON STOCK 381 16,40043.01COMMUNICATION SERVICES US
MERIDIAN ENERGY LTD 0.00BWFD052 COMMON STOCK 17,208 63,5873.70UTILITIES NZ
MESA LABORATORIES INC 0.0459064R109 COMMON STOCK 2,896 773,101266.92HEALTH CARE US
MESAIEED PETROCHEMICAL HOLDI 0.00BK4Z0B1 COMMON STOCK 49,049 26,9430.55MATERIALS QA
METALLURGICAL CORP OF CHIN-A 0.01BP3R4K0 COMMON STOCK 200,712 155,5830.78INDUSTRIALS CN
METALLURGICAL CORP OF CHIN-A 0.00BP3R4K0 COMMON STOCK 7,439 5,7660.78INDUSTRIALS CN
METHODE ELECTRONICS INC 0.01591520200 COMMON STOCK 2,762 128,63946.57INFORMATION TECHNOLOGY US
METRO INC/CN 0.0559162N109 COMMON STOCK 17,502 890,18250.86CONSUMER STAPLES CA
METRO PACIFIC INVESTMENTS CO 0.01B1L8838 COMMON STOCK 2,726,504 210,9960.08FINANCIALS PH
METROPOLITAN BANK & TRUST 0.016514442 COMMON STOCK 202,385 183,8750.91FINANCIALS PH
METTLER-TOLEDO INTERNATIONAL 0.01592688105 COMMON STOCK 137 212,2981,552.83HEALTH CARE US
MGE ENERGY INC 0.0455277P104 COMMON STOCK 9,763 786,31380.54UTILITIES US
Security NameSecurityWeight
HOLDINGS 30 DAY LAG
SecurityIdentifier Security Type Units Held
Base MarketValueBase PriceSector Country
Risk Parity Multi-Asset GT
USDBase Currency:
Market Value: 1,961,759,259
August 31, 2021
49

MICHELIN (CGDE) 0.014588364 COMMON STOCK 1,046 169,280161.78CONSUMER DISCRETIONARY FR
MICRO-STAR INTERNATIONAL CO 0.006133450 COMMON STOCK 13,205 62,1834.71INFORMATION TECHNOLOGY TW
MICROCHIP TECHNOLOGY INC 0.01595017104 COMMON STOCK 624 98,246157.36INFORMATION TECHNOLOGY US
MICRON TECHNOLOGY INC 0.02595112103 COMMON STOCK 6,361 468,80473.70INFORMATION TECHNOLOGY US
MICROSOFT 5.3 20410208 0.02594918AM6
CORPORATE BOND 250,000 361,402144.56US
MICROSOFT CORP 0.06594918BJ2 CORPORATE BOND 1,000,000 1,100,345109.01US
MICROSOFT CORP 0.00594918104 COMMON STOCK 299 90,248301.88INFORMATION TECHNOLOGY US
MICROSOFT CORP 0.05594918BR4 CORPORATE BOND 1,000,000 1,070,766106.92US
MID-AMERICA APARTMENT COMM 0.0159522J103 REAL ESTATE INVESTMENT TRUST 621 119,403192.37REAL ESTATE US
MIDEA GROUP CO LTD-A 0.00BD5CPP1 COMMON STOCK 6,881 70,26710.21CONSUMER DISCRETIONARY CN
MILLER INDUSTRIES INC/TENN 0.00600551204 COMMON STOCK 2,027 75,43237.22INDUSTRIALS US
MINERALS TECHNOLOGIES INC 0.01603158106 COMMON STOCK 3,652 287,19378.64MATERIALS US
MINI MSCI EMERGING MARKET INDEX SEP 2021 3.55MESSEP2021
MINI MSCI EMERGING MARKET INDEX 1,070 69,507,2001,299.20US
MIRAE ASSET SECURITIES CO LT 0.006249658 COMMON STOCK 3,270 24,8747.61FINANCIALS KR
MISC BHD 0.006557997 COMMON STOCK 37,980 65,7821.73INDUSTRIALS MY
MITSUBISHI CHEMICAL HOLDINGS 0.01B0JQTJ0 COMMON STOCK 11,222 98,6518.79MATERIALS JP
MITSUBISHI ELECTRIC CORP 0.016597045 COMMON STOCK 14,505 198,77013.70INDUSTRIALS JP
MITSUBISHI GAS CHEMICAL CO 0.006596923 COMMON STOCK 2,828 53,41418.89MATERIALS JP
MITSUI CHEMICALS INC 0.006597368 COMMON STOCK 1,863 64,43434.59MATERIALS JP
MIURA CO LTD 0.006597777 COMMON STOCK 1,642 73,83744.97INDUSTRIALS JP
MIZRAHI TEFAHOT BANK LTD 0.016916703 COMMON STOCK 5,390 179,52833.30FINANCIALS IL
MIZUHO FINANCIAL GROUP INC 0.016591014 COMMON STOCK 8,044 112,98214.05FINANCIALS JP
MMC NORILSK NICKEL PJSC-ADR 0.00BYSW6D0 AMERICAN DEPOSITORY RECEIPT 1,598 52,48932.85MATERIALS RU
MOBILE TELECOMMUNICATIONS CO 0.046600084 COMMON STOCK 372,801 757,2532.03COMMUNICATION SERVICES KW
MOBILE TELECOMMUNICATIONS CO 0.01B2QG180 COMMON STOCK 29,989 115,7753.86COMMUNICATION SERVICES SA
MOBILE TELESYSTEMS-SP ADR 0.00607409109 AMERICAN DEPOSITORY RECEIPT 9,877 92,6429.38COMMUNICATION SERVICES RU
MODIVCARE INC 0.0060783X10⁴ COMMON STOCK 82 16,189197.26HEALTH CARE US
MOHAWK INDUSTRIES INC 0.01608190104 COMMON STOCK 1,359 268,749197.76CONSUMER DISCRETIONARY US
MOL HUNGARIAN OIL AND GAS PL 0.00BD5ZXH8 COMMON STOCK 8,117 66,5198.20ENERGY HU
MOLSON COORS BEVERAGE CO - B 0.0160871R209 COMMON STOCK 5,757 273,61547.53CONSUMER STAPLES US
MONCLER SPA 0.00BGLP232 COMMON STOCK 733 46,92763.98CONSUMER DISCRETIONARY IT
MONDELEZ INTERNATIONAL INC-A 0.01609207105 COMMON STOCK 4,646 288,35562.07CONSUMER STAPLES US
MONETA MONEY BANK AS 0.01BD3CQ16 COMMON STOCK 40,126 162,7114.05FINANCIALS CZ
MONMOUTH REAL ESTATE INV COR 0.00609720107 REAL ESTATE INVESTMENT TRUST 4,669 88,61418.98REAL ESTATE US
Security NameSecurityWeight
HOLDINGS 30 DAY LAG
SecurityIdentifier Security Type Units Held
Base MarketValueBase PriceSector Country
Risk Parity Multi-Asset GT
USDBase Currency:
Market Value: 1,961,759,259
August 31, 2021
50

MONOTARO CO LTD 0.00B1GHR88 COMMON STOCK 3,010 66,67022.15INDUSTRIALS JP
MONSTER BEVERAGE CORP 0.0261174X10⁹ COMMON STOCK 4,286 418,14897.57CONSUMER STAPLES US
MOODY'S CORP 0.01615369105 COMMON STOCK 540 205,801380.77FINANCIALS US
MOSAIC CO/THE 0.0161945C103 COMMON STOCK 6,753 217,30832.18MATERIALS US
MOSCOW EXCHANGE MICEX-RTS PJ 0.01B9GFHQ6 COMMON STOCK 51,331 128,4512.50FINANCIALS RU
MOTHERSON SUMI SYSTEMS LTD 0.006743990 COMMON STOCK 8,331 24,9432.99CONSUMER DISCRETIONARY IN
MOTOROLA SOLUTIONS INC 0.01620076307 COMMON STOCK 952 232,387244.22INFORMATION TECHNOLOGY US
MOUWASAT MEDICAL SERVICES CO 0.00B403QG4 COMMON STOCK 219 11,44152.26HEALTH CARE SA
MOWI ASA 0.01B02L486 COMMON STOCK 4,160 111,29126.75CONSUMER STAPLES NO
MR PRICE GROUP LTD 0.00BYXW419 COMMON STOCK 5,715 86,09615.07CONSUMER DISCRETIONARY ZA
MR PRICE GROUP LTD 0.00BYXW419 COMMON STOCK 356 5,35815.07CONSUMER DISCRETIONARY ZA
MRF LTD 0.006214128 COMMON STOCK 4 4,8801,092.25CONSUMER DISCRETIONARY IN
MS&AD INSURANCE GROUP HOLDIN 0.00B2Q4CS1 COMMON STOCK 2,666 86,25732.36FINANCIALS JP
MTN GROUP LTD 0.006563206 COMMON STOCK 9,322 86,0009.23COMMUNICATION SERVICES ZA
MTN GROUP LTD 0.006563206 COMMON STOCK 1,421 13,1089.23COMMUNICATION SERVICES ZA
MTR CORP 0.016290054 COMMON STOCK 23,149 130,3705.63INDUSTRIALS HK
MUANGTHAI CAPITAL PCL-FOREIG 0.00BFXP664 COMMON STOCK 16,834 33,8162.01FINANCIALS TH
MUELLER INDUSTRIES INC 0.01624756102 COMMON STOCK 2,343 104,51844.61INDUSTRIALS US
MUENCHENER RUECKVER AG-REG 0.015294121 COMMON STOCK 490 143,095292.10FINANCIALS DE
MULTICHOICE GROUP LTD 0.00BHZSKR4 COMMON STOCK 8,918 70,8367.94COMMUNICATION SERVICES ZA
MUYUAN FOODSTUFF CO LTD-A 0.00BD5CJX7 COMMON STOCK 6,130 40,1316.55CONSUMER STAPLES CN
N B T BANCORP INC 0.01628778102 COMMON STOCK 4,003 143,55835.86FINANCIALS US
NAN YA PLASTICS CORP 0.016621580 COMMON STOCK 34,302 110,9033.23MATERIALS TW
NANJI E-COMMERCE CO LTD-A 0.01BD5LSJ3 COMMON STOCK 93,564 114,2191.22COMMUNICATION SERVICES CN
NANYA TECHNOLOGY CORP 0.006283601 COMMON STOCK 18,492 44,3062.40INFORMATION TECHNOLOGY TW
NASDAQ INC 0.01631103108 COMMON STOCK 1,189 232,868195.78FINANCIALS US
NASPERS LTD-N SHS 0.006622691 COMMON STOCK 113 19,458171.45CONSUMER DISCRETIONARY ZA
NATIONAL AUSTRALIA BANK LTD 0.006624608 COMMON STOCK 4,361 88,37320.27FINANCIALS AU
NATIONAL AUSTRALIA BANK LTD/NE 0.0563254AAS7 CORPORATE BOND 1,000,000 1,069,808106.64US
NATIONAL BANK OF KUWAIT 0.006889526 COMMON STOCK 2,967 9,2323.11FINANCIALS KW
NATIONAL GRID PLC 0.03BDR05C0 COMMON STOCK 38,136 494,03512.95UTILITIES GB
NATIONAL HEALTHCARE CORP 0.03635906100 COMMON STOCK 8,452 624,17573.85HEALTH CARE US
NATIONAL PRESTO INDS INC 0.01637215104 COMMON STOCK 2,623 219,13883.54INDUSTRIALS US
NATL HEALTH INVESTORS INC 0.0063633D104 REAL ESTATE INVESTMENT TRUST 474 28,37859.82REAL ESTATE US
Security NameSecurityWeight
HOLDINGS 30 DAY LAG
SecurityIdentifier Security Type Units Held
Base MarketValueBase PriceSector Country
Risk Parity Multi-Asset GT
USDBase Currency:
Market Value: 1,961,759,259
August 31, 2021
51

NATURA &CO HOLDING SA 0.00BJRFY31 COMMON STOCK 2,949 29,73510.08CONSUMER STAPLES BR
NATURAL GAS FUTURE (NYM) DEC 2021 0.06NGDEC2021
NATURAL GAS FUTURE (NYM) 27 1,219,0504.51US
NATURAL GAS FUTURE (NYM) JAN 2022 0.06NGJAN2022
NATURAL GAS FUTURE (NYM) 26 1,186,3804.56US
NATURAL GAS FUTURE (NYM) NOV 2021 1.35NGNOV2021
NATURAL GAS FUTURE (NYM) 600 26,550,0004.42US
NATUS MEDICAL INC 0.00639050103 COMMON STOCK 2,800 74,26426.52HEALTH CARE US
NAVER CORP 0.016560393 COMMON STOCK 319 120,794378.63COMMUNICATION SERVICES KR
NCSOFT CORP 0.016264189 COMMON STOCK 401 228,403569.24COMMUNICATION SERVICES KR
NEC CORP 0.006640400 COMMON STOCK 1,668 87,73652.61INFORMATION TECHNOLOGY JP
NEENAH INC 0.01640079109 COMMON STOCK 5,777 291,09050.39MATERIALS US
NEMETSCHEK SE 0.005633962 COMMON STOCK 986 96,64398.00INFORMATION TECHNOLOGY DE
NEOGEN CORP 0.04640491106 COMMON STOCK 15,925 697,19943.78HEALTH CARE US
NEPI ROCKCASTLE PLC 0.00BDD7WV3 COMMON STOCK 2,697 19,5577.25REAL ESTATE RO
NESTLE (MALAYSIA) BERHAD 0.006629335 COMMON STOCK 715 23,16532.40CONSUMER STAPLES MY
NESTLE (MALAYSIA) BERHAD 0.006629335 COMMON STOCK 84 2,72232.40CONSUMER STAPLES MY
NESTLE INDIA LTD 0.016128605 COMMON STOCK 768 204,694266.65CONSUMER STAPLES IN
NESTLE INDIA LTD 0.006128605 COMMON STOCK 141 37,650266.65CONSUMER STAPLES IN
NESTLE SA-REG 0.017123870 COMMON STOCK 1,062 134,162126.35CONSUMER STAPLES CH
NETEASE INC-ADR 0.0064110W102
AMERICAN DEPOSITORY RECEIPT 567 55,28297.42COMMUNICATION SERVICES CN
NETFLIX INC 0.0264110L106 COMMON STOCK 754 429,036569.19COMMUNICATION SERVICES US
NETMARBLE CORP 0.00BF2S426 COMMON STOCK 254 28,237111.26COMMUNICATION SERVICES KR
NETMARBLE CORP 0.00BF2S426 COMMON STOCK 17 1,889111.26COMMUNICATION SERVICES KR
NETSTREIT CORP 0.0164119V303 REAL ESTATE INVESTMENT TRUST 4,747 122,75525.86REAL ESTATE US
NEW CHINA LIFE INSURANCE C-A 0.00BP3R3F8 COMMON STOCK 357 2,2476.28FINANCIALS CN
NEW CHINA LIFE INSURANCE C-H 0.00B5730Z1 COMMON STOCK 894 2,6312.94FINANCIALS CN
NEW HOPE LIUHE CO LTD-A 0.00BD5CNF7 COMMON STOCK 1,758 2,9751.69CONSUMER STAPLES CN
NEW JERSEY RESOURCES CORP 0.00646025106 COMMON STOCK 1,713 63,97937.34UTILITIES US
NEW ORIENTAL EDUCATIO-SP ADR 0.00647581107 AMERICAN DEPOSITORY RECEIPT 500 1,1312.26CONSUMER DISCRETIONARY CN
NEWELL BRANDS INC 0.01651229106 COMMON STOCK 11,166 283,73125.41CONSUMER DISCRETIONARY US
NEWMONT CORP 0.02651639106 COMMON STOCK 6,304 365,54357.99MATERIALS US
NEWS CORP - CLASS A 0.0165249B109 COMMON STOCK 5,053 113,54222.47COMMUNICATION SERVICES US
NEWS CORP - CLASS B 0.0465249B208 COMMON STOCK 33,458 737,08522.03COMMUNICATION SERVICES US
NEXI SPA 0.01BJ1F880 COMMON STOCK 11,538 240,32920.83INFORMATION TECHNOLOGY IT
NEXON CO LTD 0.01B63QM77 COMMON STOCK 11,129 203,62418.30COMMUNICATION SERVICES JP
NEXT PLC 0.003208986 COMMON STOCK 837 91,166108.86CONSUMER DISCRETIONARY GB
Security NameSecurityWeight
HOLDINGS 30 DAY LAG
SecurityIdentifier Security Type Units Held
Base MarketValueBase PriceSector Country
Risk Parity Multi-Asset GT
USDBase Currency:
Market Value: 1,961,759,259
August 31, 2021
52

NEXTERA ENERGY INC 0.0365339F101 COMMON STOCK 6,063 509,22683.99UTILITIES US
NH FOODS LTD 0.006640767 COMMON STOCK 2,197 85,28038.82CONSUMER STAPLES JP
NH INVESTMENT & SECURITIES C 0.006537085 COMMON STOCK 1,895 21,66011.43FINANCIALS KR
NI HOLDINGS INC 0.0065342T106 COMMON STOCK 2,913 56,86919.52FINANCIALS US
NICE LTD 0.036647133 COMMON STOCK 1,758 513,475292.10INFORMATION TECHNOLOGY IL
NICOLET BANKSHARES INC 0.0065406E102 COMMON STOCK 844 64,46776.41FINANCIALS US
NIEN MADE ENTERPRISE CO LTD 0.01BSZLN15 COMMON STOCK 13,465 201,15414.94CONSUMER DISCRETIONARY TW
NINE DRAGONS PAPER HOLDINGS 0.00B0WC2B8 COMMON STOCK 64,342 88,0251.37MATERIALS HK
NINESTAR CORP-A 0.00BD5M2G1 COMMON STOCK 6,434 35,0725.45INFORMATION TECHNOLOGY CN
NINGBO TUOPU GROUP CO LTD-A 0.00BYQDMF9 COMMON STOCK 11,081 61,4655.55CONSUMER DISCRETIONARY CN
NINTENDO CO LTD 0.016639550 COMMON STOCK 274 131,780481.52COMMUNICATION SERVICES JP
NIO INC - ADR 0.0062914V106 AMERICAN DEPOSITORY RECEIPT 393 15,45739.31CONSUMER DISCRETIONARY CN
NIPPON BUILDING FUND INC 0.016396800 REAL ESTATE INVESTMENT TRUST 19 124,6816,508.28REAL ESTATE JP
NIPPON EXPRESS CO LTD 0.006642127 COMMON STOCK 1,186 80,85368.18INDUSTRIALS JP
NIPPON PAINT HOLDINGS CO LTD 0.016640507 COMMON STOCK 9,305 115,95212.46MATERIALS JP
NIPPON PROLOGIS REIT INC 0.01B98BC67 REAL ESTATE INVESTMENT TRUST 72 260,1023,609.14REAL ESTATE JP
NIPPON SANSO HOLDINGS CORP 0.016640541 COMMON STOCK 4,744 115,28924.30MATERIALS JP
NIPPON SHINYAKU CO LTD 0.016640563 COMMON STOCK 2,646 215,04281.29HEALTH CARE JP
NIPPON STEEL CORP 0.006642569 COMMON STOCK 4,040 82,67520.46MATERIALS JP
NIPPON TELEGRAPH & TELEPHONE 0.016641373 COMMON STOCK 10,777 288,02326.72COMMUNICATION SERVICES JP
NISOURCE INC 0.0365473P105 COMMON STOCK 22,613 557,40924.65UTILITIES US
NISSAN CHEMICAL CORP 0.016641588 COMMON STOCK 2,463 138,33256.16MATERIALS JP
NISSHIN SEIFUN GROUP INC 0.016640961 COMMON STOCK 6,887 113,08416.42CONSUMER STAPLES JP
NISSIN FOODS HOLDINGS CO LTD 0.016641760 COMMON STOCK 2,407 187,50977.92CONSUMER STAPLES JP
NITORI HOLDINGS CO LTD 0.006644800 COMMON STOCK 456 85,445187.33CONSUMER DISCRETIONARY JP
NN GROUP NV 0.01BNG8PQ9 COMMON STOCK 3,204 166,29351.90FINANCIALS NL
NOAH HOLDINGS LTD-SPON ADS 0.0065487X10² AMERICAN DEPOSITORY RECEIPT 27 1,04538.98FINANCIALS CN
NOKIA OYJ 0.015902941 COMMON STOCK 30,426 182,4576.00INFORMATION TECHNOLOGY FI
NOMURA REAL ESTATE HOLDINGS 0.00B1CWJM5 COMMON STOCK 2,189 56,10025.62REAL ESTATE JP
NOMURA REAL ESTATE MASTER FU 0.00BYSJJF4 REAL ESTATE INVESTMENT TRUST 55 84,5491,544.69REAL ESTATE JP
NOMURA RESEARCH INSTITUTE LT 0.016390921 COMMON STOCK 5,473 206,01637.64INFORMATION TECHNOLOGY JP
NONGFU SPRING CO LTD-H 0.02BMGWW30 COMMON STOCK 79,713 421,7615.29CONSUMER STAPLES CN
NORDEA BANK ABP 0.00BYZF9J9 COMMON STOCK 7,874 92,43811.74FINANCIALS FI
NORDIC INVESTMENT BANK 0.0565562QAW5
CORPORATE BOND 1,000,000 1,011,128100.17US
Security NameSecurityWeight
HOLDINGS 30 DAY LAG
SecurityIdentifier Security Type Units Held
Base MarketValueBase PriceSector Country
Risk Parity Multi-Asset GT
USDBase Currency:
Market Value: 1,961,759,259
August 31, 2021
53
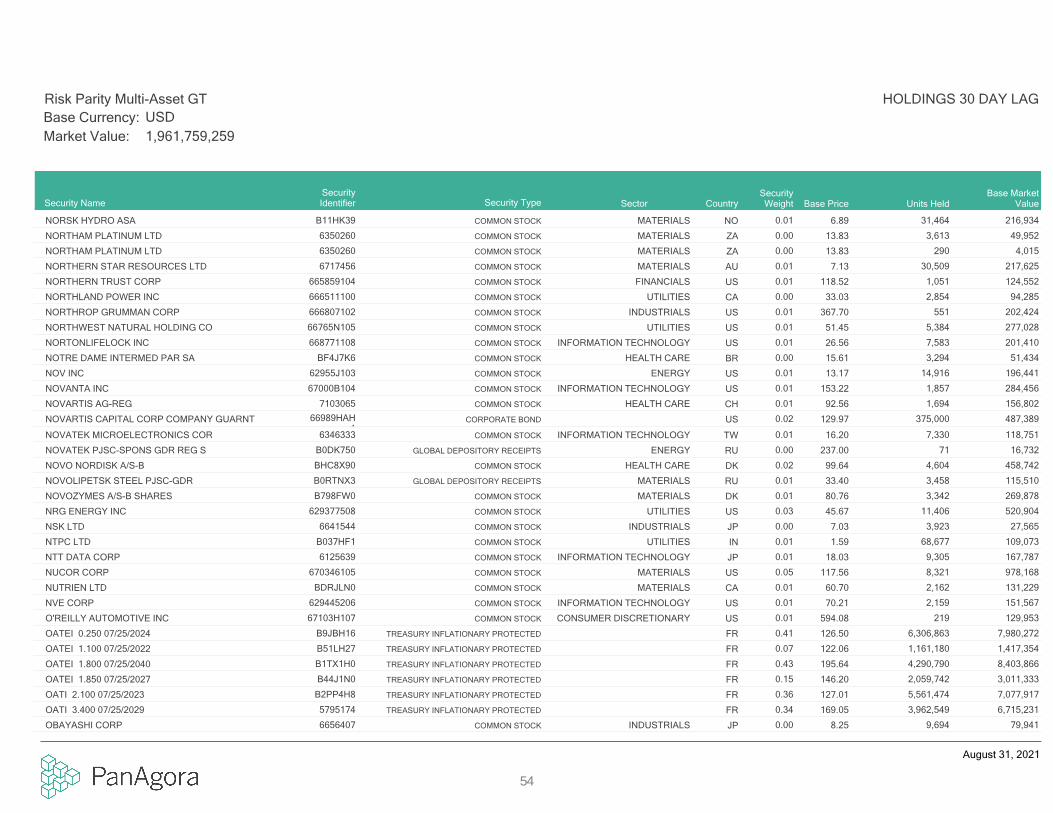
NORSK HYDRO ASA 0.01B11HK39 COMMON STOCK 31,464 216,9346.89MATERIALS NO
NORTHAM PLATINUM LTD 0.006350260 COMMON STOCK 3,613 49,95213.83MATERIALS ZA
NORTHAM PLATINUM LTD 0.006350260 COMMON STOCK 290 4,01513.83MATERIALS ZA
NORTHERN STAR RESOURCES LTD 0.016717456 COMMON STOCK 30,509 217,6257.13MATERIALS AU
NORTHERN TRUST CORP 0.01665859104 COMMON STOCK 1,051 124,552118.52FINANCIALS US
NORTHLAND POWER INC 0.00666511100 COMMON STOCK 2,854 94,28533.03UTILITIES CA
NORTHROP GRUMMAN CORP 0.01666807102 COMMON STOCK 551 202,424367.70INDUSTRIALS US
NORTHWEST NATURAL HOLDING CO 0.0166765N105 COMMON STOCK 5,384 277,02851.45UTILITIES US
NORTONLIFELOCK INC 0.01668771108 COMMON STOCK 7,583 201,41026.56INFORMATION TECHNOLOGY US
NOTRE DAME INTERMED PAR SA 0.00BF4J7K6 COMMON STOCK 3,294 51,43415.61HEALTH CARE BR
NOV INC 0.0162955J103 COMMON STOCK 14,916 196,44113.17ENERGY US
NOVANTA INC 0.0167000B104 COMMON STOCK 1,857 284,456153.22INFORMATION TECHNOLOGY US
NOVARTIS AG-REG 0.017103065 COMMON STOCK 1,694 156,80292.56HEALTH CARE CH
NOVARTIS CAPITAL CORP COMPANY GUARNT 0.0266989HAH1
CORPORATE BOND 375,000 487,389129.97US
NOVATEK MICROELECTRONICS COR 0.016346333 COMMON STOCK 7,330 118,75116.20INFORMATION TECHNOLOGY TW
NOVATEK PJSC-SPONS GDR REG S 0.00B0DK750 GLOBAL DEPOSITORY RECEIPTS 71 16,732237.00ENERGY RU
NOVO NORDISK A/S-B 0.02BHC8X90 COMMON STOCK 4,604 458,74299.64HEALTH CARE DK
NOVOLIPETSK STEEL PJSC-GDR 0.01B0RTNX3 GLOBAL DEPOSITORY RECEIPTS 3,458 115,51033.40MATERIALS RU
NOVOZYMES A/S-B SHARES 0.01B798FW0 COMMON STOCK 3,342 269,87880.76MATERIALS DK
NRG ENERGY INC 0.03629377508 COMMON STOCK 11,406 520,90445.67UTILITIES US
NSK LTD 0.006641544 COMMON STOCK 3,923 27,5657.03INDUSTRIALS JP
NTPC LTD 0.01B037HF1 COMMON STOCK 68,677 109,0731.59UTILITIES IN
NTT DATA CORP 0.016125639 COMMON STOCK 9,305 167,78718.03INFORMATION TECHNOLOGY JP
NUCOR CORP 0.05670346105 COMMON STOCK 8,321 978,168117.56MATERIALS US
NUTRIEN LTD 0.01BDRJLN0 COMMON STOCK 2,162 131,22960.70MATERIALS CA
NVE CORP 0.01629445206 COMMON STOCK 2,159 151,56770.21INFORMATION TECHNOLOGY US
O'REILLY AUTOMOTIVE INC 0.0167103H107 COMMON STOCK 219 129,953594.08CONSUMER DISCRETIONARY US
OATEI 0.250 07/25/2024 0.41B9JBH16 TREASURY INFLATIONARY PROTECTED 6,306,863 7,980,272126.50FR
OATEI 1.100 07/25/2022 0.07B51LH27 TREASURY INFLATIONARY PROTECTED 1,161,180 1,417,354122.06FR
OATEI 1.800 07/25/2040 0.43B1TX1H0 TREASURY INFLATIONARY PROTECTED 4,290,790 8,403,866195.64FR
OATEI 1.850 07/25/2027 0.15B44J1N0 TREASURY INFLATIONARY PROTECTED 2,059,742 3,011,333146.20FR
OATI 2.100 07/25/2023 0.36B2PP4H8 TREASURY INFLATIONARY PROTECTED 5,561,474 7,077,917127.01FR
OATI 3.400 07/25/2029 0.345795174 TREASURY INFLATIONARY PROTECTED 3,962,549 6,715,231169.05FR
OBAYASHI CORP 0.006656407 COMMON STOCK 9,694 79,9418.25INDUSTRIALS JP
Security NameSecurityWeight
HOLDINGS 30 DAY LAG
SecurityIdentifier Security Type Units Held
Base MarketValueBase PriceSector Country
Risk Parity Multi-Asset GT
USDBase Currency:
Market Value: 1,961,759,259
August 31, 2021
54

OBIC CO LTD 0.016136749 COMMON STOCK 639 121,774190.70INFORMATION TECHNOLOGY JP
OCADO GROUP PLC 0.00B3MBS74 COMMON STOCK 3,245 89,89627.70CONSUMER DISCRETIONARY GB
OCCIDENTAL PETROLEUM CORP 0.01674599105 COMMON STOCK 8,596 220,82725.69ENERGY US
ODAKYU ELECTRIC RAILWAY CO 0.006656106 COMMON STOCK 1,460 34,06523.34INDUSTRIALS JP
OESTERREICHISCHE KONTROLLBANK 0.04676167BL2 CORPORATE BOND 750,000 751,380100.18US
OESTERREICHISCHE KONTROLLBANK AG 0.05676167BV0 CORPORATE BOND 875,000 922,544104.09AT
OESTERREICHISCHE KONTROLLBANK AG 0.02676167BZ1 CORPORATE BOND 375,000 383,476101.52AT
OESTERREICHISCHE KONTROLLBANK AG 0.02676167BX6 CORPORATE BOND 375,000 397,944106.12AT
OESTERREICHISCHE KONTROLLBANK AG 0.02676167BY4 CORPORATE BOND 375,000 379,729101.03AT
OFILM GROUP CO LTD-A 0.00BD5CLK8 COMMON STOCK 11,081 12,7901.15INFORMATION TECHNOLOGY CN
OIL & NATURAL GAS CORP LTD 0.006139362 COMMON STOCK 34,342 56,7051.65ENERGY IN
OIL SEARCH LTD 0.006657604 COMMON STOCK 26,019 71,1202.73ENERGY AU
OIL-DRI CORP OF AMERICA 0.01677864100 COMMON STOCK 6,242 222,71935.68CONSUMER STAPLES US
OJI HOLDINGS CORP 0.016657701 COMMON STOCK 29,093 152,5335.24MATERIALS JP
OLD DOMINION FREIGHT LINE 0.01679580100 COMMON STOCK 885 255,521288.72INDUSTRIALS US
OLYMPUS CORP 0.016658801 COMMON STOCK 5,382 113,24521.04HEALTH CARE JP
OMNICELL INC 0.0068213N109 COMMON STOCK 82 12,743155.27HEALTH CARE US
OMNICOM GROUP 0.02681919106 COMMON STOCK 5,066 370,91973.22COMMUNICATION SERVICES US
OMRON CORP 0.016659428 COMMON STOCK 1,087 102,74294.48INFORMATION TECHNOLOGY JP
OMV AG 0.004651459 COMMON STOCK 844 46,74755.40ENERGY AT
OMXS30 INDEX FUTURE SEP 2021 0.43QCSEP2021
OMXS30 INDEX FUTURE 312 8,500,981272.47SE
ONE LIBERTY PROPERTIES INC 0.00682406103 REAL ESTATE INVESTMENT TRUST 2,682 85,40131.84REAL ESTATE US
ONEOK INC 0.06682680103 COMMON STOCK 20,656 1,084,85852.52ENERGY US
ONO PHARMACEUTICAL CO LTD 0.016660107 COMMON STOCK 6,415 154,38824.07HEALTH CARE JP
ONTARIO PROVINCE 0.05BQR8S93 CORPORATE BOND 1,000,000 1,012,395100.05US
ONTARIO PROVINCE 2.450 20220629 0.0168323ABK9 CORPORATE BOND 200,000 203,762101.88CA
OOMA INC 0.01683416101 COMMON STOCK 6,835 129,85819.00COMMUNICATION SERVICES US
OOREDOO QPSC 0.006158174 COMMON STOCK 33,975 64,5071.90COMMUNICATION SERVICES QA
OOREDOO QPSC 0.006158174 COMMON STOCK 617 1,1711.90COMMUNICATION SERVICES QA
OPAP SA 0.007107250 COMMON STOCK 2,570 40,29015.68CONSUMER DISCRETIONARY GR
OPEN TEXT CORP 0.01683715106 COMMON STOCK 3,908 214,04554.77INFORMATION TECHNOLOGY CA
ORACLE CORP 0.0168389X10⁵ COMMON STOCK 2,401 213,97989.13INFORMATION TECHNOLOGY US
ORACLE CORP JAPAN 0.006141680 COMMON STOCK 1,001 82,34782.29INFORMATION TECHNOLOGY JP
ORANGE 0.025176177 COMMON STOCK 32,344 367,29511.36COMMUNICATION SERVICES FR
Security NameSecurityWeight
HOLDINGS 30 DAY LAG
SecurityIdentifier Security Type Units Held
Base MarketValueBase PriceSector Country
Risk Parity Multi-Asset GT
USDBase Currency:
Market Value: 1,961,759,259
August 31, 2021
55

ORIENTAL LAND CO LTD 0.016648891 COMMON STOCK 1,330 201,700151.65CONSUMER DISCRETIONARY JP
ORIGIN ENERGY LTD 0.006214861 COMMON STOCK 18,824 61,2223.25UTILITIES AU
ORION CORP/REPUBLIC OF KOREA 0.00BDVLJ72 COMMON STOCK 403 43,972109.10CONSUMER STAPLES KR
ORION OYJ-CLASS B 0.01B17NY40 COMMON STOCK 3,132 127,65440.76HEALTH CARE FI
ORIX CORP 0.016661144 COMMON STOCK 5,930 110,72818.67FINANCIALS JP
ORIX JREIT INC 0.006527774 REAL ESTATE INVESTMENT TRUST 34 60,2491,785.00REAL ESTATE JP
ORKLA ASA 0.01B1VQF42 COMMON STOCK 16,347 145,8738.92CONSUMER STAPLES NO
ORPEA 0.017339451 COMMON STOCK 1,040 130,865125.84HEALTH CARE FR
ORRSTOWN FINL SERVICES INC 0.01687380105 COMMON STOCK 6,128 146,21523.86FINANCIALS US
ORSTED A/S 0.01BYT16L4 COMMON STOCK 1,398 222,208158.89UTILITIES DK
ORTHO CLINICAL DIAGNOSTICS H 0.03G6829J107 COMMON STOCK 33,249 679,61520.44HEALTH CARE US
ORTHOFIX MEDICAL INC 0.0368752M108 COMMON STOCK 13,901 589,42042.40HEALTH CARE US
OSAKA GAS CO LTD 0.046661768 COMMON STOCK 37,121 697,07818.78UTILITIES JP
OSI SYSTEMS INC 0.01671044105 COMMON STOCK 1,613 159,62298.94INFORMATION TECHNOLOGY US
OSOTSPA PCL-FOREIGN 0.00BGR9QQ9 COMMON STOCK 60,300 68,2841.13CONSUMER STAPLES TH
OTP BANK PLC 0.017320154 COMMON STOCK 1,675 101,06460.35FINANCIALS HU
OTP BANK PLC 0.007320154 COMMON STOCK 130 7,87460.35FINANCIALS HU
OTSUKA CORP 0.016267058 COMMON STOCK 2,281 118,32851.88INFORMATION TECHNOLOGY JP
OTSUKA HOLDINGS CO LTD 0.01B5LTM93 COMMON STOCK 4,288 182,68842.61HEALTH CARE JP
OTTER TAIL CORP 0.04689648103 COMMON STOCK 14,916 818,45454.87UTILITIES US
PACCAR INC 0.00693718108 COMMON STOCK 832 68,12881.87INDUSTRIALS US
PACKAGING CORP OF AMERICA 0.02695156109 COMMON STOCK 2,792 423,510151.70MATERIALS US
PAGE INDUSTRIES LTD 0.00B1VJS64 COMMON STOCK 123 53,208431.45CONSUMER DISCRETIONARY IN
PAN OCEAN CO LTD 0.00B24FX49 COMMON STOCK 3,500 25,0827.17INDUSTRIALS KR
PAN PACIFIC INTERNATIONAL HO 0.026269861 COMMON STOCK 20,526 391,79119.09CONSUMER DISCRETIONARY JP
PANASONIC CORP 0.006572707 COMMON STOCK 8,046 96,08911.94CONSUMER DISCRETIONARY JP
PANDORA A/S 0.00B44XTX8 COMMON STOCK 692 82,870119.69CONSUMER DISCRETIONARY DK
PAR PACIFIC HOLDINGS INC 0.0169888T207 COMMON STOCK 10,117 166,83416.49ENERGY US
PARK NATIONAL CORP 0.01700658107 COMMON STOCK 855 100,205117.24FINANCIALS US
PARKER HANNIFIN CORP 0.01701094104 COMMON STOCK 631 187,116296.67INDUSTRIALS US
PAYCOM SOFTWARE INC 0.0170432V102 COMMON STOCK 381 186,263488.90INFORMATION TECHNOLOGY US
PEARL ABYSS CORP 0.01BYX56S9 COMMON STOCK 1,939 157,71981.33COMMUNICATION SERVICES KR
PEARSON PLC 0.010677608 COMMON STOCK 23,612 249,43710.56COMMUNICATION SERVICES GB
PEGATRON CORP 0.00B4PLX17 COMMON STOCK 36,639 85,6702.34INFORMATION TECHNOLOGY TW
Security NameSecurityWeight
HOLDINGS 30 DAY LAG
SecurityIdentifier Security Type Units Held
Base MarketValueBase PriceSector Country
Risk Parity Multi-Asset GT
USDBase Currency:
Market Value: 1,961,759,259
August 31, 2021
56
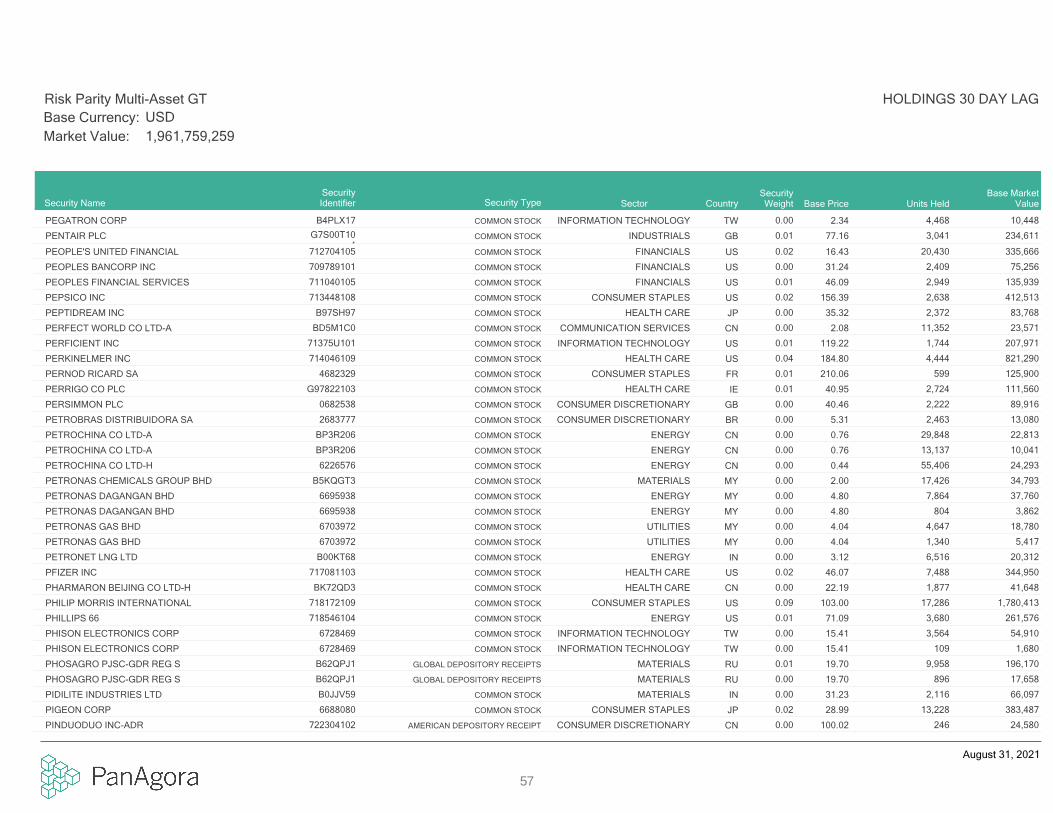
PEGATRON CORP 0.00B4PLX17 COMMON STOCK 4,468 10,4482.34INFORMATION TECHNOLOGY TW
PENTAIR PLC 0.01G7S00T104
COMMON STOCK 3,041 234,61177.16INDUSTRIALS GB
PEOPLE'S UNITED FINANCIAL 0.02712704105 COMMON STOCK 20,430 335,66616.43FINANCIALS US
PEOPLES BANCORP INC 0.00709789101 COMMON STOCK 2,409 75,25631.24FINANCIALS US
PEOPLES FINANCIAL SERVICES 0.01711040105 COMMON STOCK 2,949 135,93946.09FINANCIALS US
PEPSICO INC 0.02713448108 COMMON STOCK 2,638 412,513156.39CONSUMER STAPLES US
PEPTIDREAM INC 0.00B97SH97 COMMON STOCK 2,372 83,76835.32HEALTH CARE JP
PERFECT WORLD CO LTD-A 0.00BD5M1C0 COMMON STOCK 11,352 23,5712.08COMMUNICATION SERVICES CN
PERFICIENT INC 0.0171375U101 COMMON STOCK 1,744 207,971119.22INFORMATION TECHNOLOGY US
PERKINELMER INC 0.04714046109 COMMON STOCK 4,444 821,290184.80HEALTH CARE US
PERNOD RICARD SA 0.014682329 COMMON STOCK 599 125,900210.06CONSUMER STAPLES FR
PERRIGO CO PLC 0.01G97822103 COMMON STOCK 2,724 111,56040.95HEALTH CARE IE
PERSIMMON PLC 0.000682538 COMMON STOCK 2,222 89,91640.46CONSUMER DISCRETIONARY GB
PETROBRAS DISTRIBUIDORA SA 0.002683777 COMMON STOCK 2,463 13,0805.31CONSUMER DISCRETIONARY BR
PETROCHINA CO LTD-A 0.00BP3R206 COMMON STOCK 29,848 22,8130.76ENERGY CN
PETROCHINA CO LTD-A 0.00BP3R206 COMMON STOCK 13,137 10,0410.76ENERGY CN
PETROCHINA CO LTD-H 0.006226576 COMMON STOCK 55,406 24,2930.44ENERGY CN
PETRONAS CHEMICALS GROUP BHD 0.00B5KQGT3 COMMON STOCK 17,426 34,7932.00MATERIALS MY
PETRONAS DAGANGAN BHD 0.006695938 COMMON STOCK 7,864 37,7604.80ENERGY MY
PETRONAS DAGANGAN BHD 0.006695938 COMMON STOCK 804 3,8624.80ENERGY MY
PETRONAS GAS BHD 0.006703972 COMMON STOCK 4,647 18,7804.04UTILITIES MY
PETRONAS GAS BHD 0.006703972 COMMON STOCK 1,340 5,4174.04UTILITIES MY
PETRONET LNG LTD 0.00B00KT68 COMMON STOCK 6,516 20,3123.12ENERGY IN
PFIZER INC 0.02717081103 COMMON STOCK 7,488 344,95046.07HEALTH CARE US
PHARMARON BEIJING CO LTD-H 0.00BK72QD3 COMMON STOCK 1,877 41,64822.19HEALTH CARE CN
PHILIP MORRIS INTERNATIONAL 0.09718172109 COMMON STOCK 17,286 1,780,413103.00CONSUMER STAPLES US
PHILLIPS 66 0.01718546104 COMMON STOCK 3,680 261,57671.09ENERGY US
PHISON ELECTRONICS CORP 0.006728469 COMMON STOCK 3,564 54,91015.41INFORMATION TECHNOLOGY TW
PHISON ELECTRONICS CORP 0.006728469 COMMON STOCK 109 1,68015.41INFORMATION TECHNOLOGY TW
PHOSAGRO PJSC-GDR REG S 0.01B62QPJ1 GLOBAL DEPOSITORY RECEIPTS 9,958 196,17019.70MATERIALS RU
PHOSAGRO PJSC-GDR REG S 0.00B62QPJ1 GLOBAL DEPOSITORY RECEIPTS 896 17,65819.70MATERIALS RU
PIDILITE INDUSTRIES LTD 0.00B0JJV59 COMMON STOCK 2,116 66,09731.23MATERIALS IN
PIGEON CORP 0.026688080 COMMON STOCK 13,228 383,48728.99CONSUMER STAPLES JP
PINDUODUO INC-ADR 0.00722304102 AMERICAN DEPOSITORY RECEIPT 246 24,580100.02CONSUMER DISCRETIONARY CN
Security NameSecurityWeight
HOLDINGS 30 DAY LAG
SecurityIdentifier Security Type Units Held
Base MarketValueBase PriceSector Country
Risk Parity Multi-Asset GT
USDBase Currency:
Market Value: 1,961,759,259
August 31, 2021
57

PING AN BANK CO LTD-A 0.00BD5CPS4 COMMON STOCK 18,230 50,2072.75FINANCIALS CN
PING AN HEALTHCARE AND TECHN 0.00BDRYVB3 COMMON STOCK 864 6,3787.38HEALTH CARE CN
PINNACLE WEST CAPITAL 0.03723484101 COMMON STOCK 7,386 568,01176.90UTILITIES US
PIRAMAL ENTERPRISES LTD 0.00B058J56 COMMON STOCK 1,418 50,63635.70FINANCIALS IN
PLDT INC 0.01BDGN274 COMMON STOCK 9,566 281,70529.45COMMUNICATION SERVICES PH
PLDT INC-SPON ADR 0.0269344D408 AMERICAN DEPOSITORY RECEIPT 16,374 475,67029.05COMMUNICATION SERVICES PH
PLEXUS CORP 0.01729132100 COMMON STOCK 1,866 171,31291.83INFORMATION TECHNOLOGY US
PNC FINANCIAL SERVICES GROUP 0.02693475105 COMMON STOCK 2,083 397,995191.10FINANCIALS US
PNM RESOURCES INC 0.0469349H107 COMMON STOCK 14,366 711,10649.50UTILITIES US
POLA ORBIS HOLDINGS INC 0.00B5N4QN8 COMMON STOCK 4,105 89,83021.88CONSUMER STAPLES JP
POLYMETAL INTERNATIONAL PLC 0.00B6T5S47 COMMON STOCK 79 1,56719.93MATERIALS RU
POLYMETAL INTERNATIONAL PLC 0.00BBMT4K9 COMMON STOCK 99 1,98119.97MATERIALS RU
POLYUS PJSC-REG S-GDR 0.00BYXL3S6 GLOBAL DEPOSITORY RECEIPTS 245 21,70788.65MATERIALS RU
PORTLAND GENERAL ELECTRIC CO 0.03736508847 COMMON STOCK 11,530 592,08951.35UTILITIES US
POSCO CHEMICAL CO LTD 0.006419451 COMMON STOCK 201 26,966134.12MATERIALS KR
POSTAL SAVINGS BANK OF CHI-A 0.00BL61XF9 COMMON STOCK 2,323 1,8480.80FINANCIALS CN
POSTE ITALIANE SPA 0.01BYYN701 COMMON STOCK 7,791 105,62113.56FINANCIALS IT
POU CHEN 0.016696157 COMMON STOCK 100,088 119,0001.19CONSUMER DISCRETIONARY TW
POWER ASSETS HOLDINGS LTD 0.066435327 COMMON STOCK 200,621 1,260,1116.28UTILITIES HK
POWER GRID CORP OF INDIA LTD 0.01B233HS6 COMMON STOCK 63,332 152,1102.40UTILITIES IN
POWER INTEGRATIONS INC 0.01739276103 COMMON STOCK 1,866 202,671108.64INFORMATION TECHNOLOGY US
POWERTECH TECHNOLOGY INC 0.006599676 COMMON STOCK 13,405 54,4154.06INFORMATION TECHNOLOGY TW
PPB GROUP BERHAD 0.006681669 COMMON STOCK 10,188 45,3874.46CONSUMER STAPLES MY
PPB GROUP BERHAD 0.006681669 COMMON STOCK 3,753 16,7214.46CONSUMER STAPLES MY
PPG INDUSTRIES INC 0.01693506107 COMMON STOCK 1,369 218,422159.55MATERIALS US
PPL CORP 0.0969351T106 COMMON STOCK 60,346 1,771,15229.35UTILITIES US
PRESIDENT & FELLOWS HARVARD COLLEGE 3.61 0.03740816AL7 CORPORATE BOND 500,000 595,490117.59US
PRESIDENT CHAIN STORE CORP 0.016704986 COMMON STOCK 25,022 257,77210.30CONSUMER STAPLES TW
PRESS METAL ALUMINIUM HOLDIN 0.00BF0J5S4 COMMON STOCK 22,341 29,0211.30MATERIALS MY
PRESTIGE CONSUMER HEALTHCARE 0.0474112D101 COMMON STOCK 13,745 788,84157.39HEALTH CARE US
PRICESMART INC 0.00741511109 COMMON STOCK 396 33,53384.61CONSUMER STAPLES US
PRIMIS FINANCIAL CORP 0.0174167B109 COMMON STOCK 9,751 146,16714.99FINANCIALS US
PRIMO WATER CORP 0.0074167P108 COMMON STOCK 898 15,94417.76CONSUMER STAPLES US
PRINCETON UNIVRS 5.700 20390301 0.0289837LAB1 CORPORATE BOND 250,000 372,092148.84US
Security NameSecurityWeight
HOLDINGS 30 DAY LAG
SecurityIdentifier Security Type Units Held
Base MarketValueBase PriceSector Country
Risk Parity Multi-Asset GT
USDBase Currency:
Market Value: 1,961,759,259
August 31, 2021
58

PRINCIPAL FINANCIAL GROUP 0.0274251V102 COMMON STOCK 5,885 393,19066.81FINANCIALS US
PROCTER & GAMBLE CO/THE 0.02742718109 COMMON STOCK 2,523 359,233142.39CONSUMER STAPLES US
PROCTER & GAMBLE CO/THE 0.03742718EU9 CORPORATE BOND 500,000 509,366101.87US
PROCTER GAMBLE 2.300 20220206 0.02742718DY2 CORPORATE BOND 400,000 404,254100.90US
PROGRESS SOFTWARE CORP 0.01743312100 COMMON STOCK 3,242 150,93246.56INFORMATION TECHNOLOGY US
PROGRESSIVE CORP 0.02743315103 COMMON STOCK 3,902 375,90996.34FINANCIALS US
PROLOGIS INC 0.0174340W103
REAL ESTATE INVESTMENT TRUST 1,485 199,936134.66REAL ESTATE US
PROMOTORA Y OPERADORA DE INF 0.002393388 COMMON STOCK 5,250 39,2987.49INDUSTRIALS MX
PROSUS NV 0.01BJDS7L3 COMMON STOCK 1,252 110,66288.42CONSUMER DISCRETIONARY NL
PROVINCE OF ALBERTA CANADA 0.05013051EA1 GOVERNMENT BOND 875,000 986,079112.69CA
PROVINCE OF ALBERTA CANADA 0.03013051EE3 GOVERNMENT BOND 500,000 537,513106.39CA
PROVINCE OF ALBERTA CANADA 0.03013051EF0 GOVERNMENT BOND 500,000 529,972105.99CA
PROVINCE OF MANITOBA CANADA 0.04563469UU7 GOVERNMENT BOND 750,000 799,214105.59CA
PROVINCE OF MANITOBA CANADA 0.01563469UQ6
CORPORATE BOND 250,000 255,087101.34US
PROVINCE OF ONTARIO CANADA 0.0468323AED2
CORPORATE BOND 750,000 758,425100.97US
PROVINCE OF ONTARIO CANADA 0.046832342L1 CORPORATE BOND 750,000 765,928101.48US
PROVINCE OF ONTARIO CANADA 0.0468323AEQ3
CORPORATE BOND 750,000 773,545102.23US
PROVINCE OF ONTARIO CANADA 0.0368323ACT9 GOVERNMENT BOND 500,000 536,408107.28CA
PROVINCE OF ONTARIO CANADA 0.0768323ADP6
GOVERNMENT BOND 1,250,000 1,352,664107.35CA
PROVINCE OF ONTARIO CANADA 0.0568323AFG4
GOVERNMENT BOND 875,000 924,227104.80CA
PROVINCE OF QUEBEC CANADA 0.07748149AQ4 GOVERNMENT BOND 1,250,000 1,329,412105.37CA
PROVINCE OF QUEBEC CANADA 0.06748149AH4 CORPORATE BOND 1,000,000 1,082,275107.15US
PROVINCE OF QUEBEC CANADA 0.04748149AJ0 CORPORATE BOND 750,000 807,087107.61US
PROXIMUS 0.02B00D9P6 COMMON STOCK 19,967 391,38819.60COMMUNICATION SERVICES BE
PRUDENTIAL FINANCIAL INC 0.01744320102 COMMON STOCK 1,693 179,208105.88FINANCIALS US
PS BUSINESS PARKS INC/MD 0.0069360J107 REAL ESTATE INVESTMENT TRUST 242 38,081157.23REAL ESTATE US
PTT EXPLORATION & PROD-FOR 0.00B1359J0 COMMON STOCK 15,728 54,4073.46ENERGY TH
PTT PCL/FOREIGN 0.00BD0BDJ3 COMMON STOCK 53,131 63,0501.19ENERGY TH
PUBLIC BANK BERHAD 0.00B012W42 COMMON STOCK 21,666 21,7861.01FINANCIALS MY
PUBLIC SERVICE ENTERPRISE GP 0.03744573106 COMMON STOCK 10,457 668,62163.94UTILITIES US
PUBLIC STORAGE 0.0174460D109 REAL ESTATE INVESTMENT TRUST 406 131,254323.61REAL ESTATE US
PUBLICIS GROUPE 0.014380429 COMMON STOCK 2,561 167,82465.54COMMUNICATION SERVICES FR
PULTEGROUP INC 0.02745867101 COMMON STOCK 5,718 307,99353.86CONSUMER DISCRETIONARY US
PUMA SE 0.015064722 COMMON STOCK 1,233 149,669121.35CONSUMER DISCRETIONARY DE
Security NameSecurityWeight
HOLDINGS 30 DAY LAG
SecurityIdentifier Security Type Units Held
Base MarketValueBase PriceSector Country
Risk Parity Multi-Asset GT
USDBase Currency:
Market Value: 1,961,759,259
August 31, 2021
59

QAD INC-A 0.0174727D306 COMMON STOCK 1,886 164,06187.01INFORMATION TECHNOLOGY US
QATAR ELECTRICITY & WATER CO 0.016566614 COMMON STOCK 30,332 138,2894.56UTILITIES QA
QATAR ELECTRICITY & WATER CO 0.006566614 COMMON STOCK 2,558 11,6654.56UTILITIES QA
QATAR GAS TRANSPORT(NAKILAT) 0.00B0MLBC9 COMMON STOCK 8,662 7,3630.85ENERGY QA
QATAR INTERNATIONAL ISLAMIC 0.006571544 COMMON STOCK 13,855 36,5312.64FINANCIALS QA
QATAR INTERNATIONAL ISLAMIC 0.006571544 COMMON STOCK 576 1,5172.64FINANCIALS QA
QATAR ISLAMIC BANK 0.016713982 COMMON STOCK 29,930 150,4305.03FINANCIALS QA
QATAR ISLAMIC BANK 0.006713982 COMMON STOCK 375 1,8865.03FINANCIALS QA
QATAR NATIONAL BANK 0.016148197 COMMON STOCK 22,022 115,9475.27FINANCIALS QA
QATAR NATIONAL BANK 0.006148197 COMMON STOCK 459 2,4185.27FINANCIALS QA
QIAGEN N.V. 0.02BYXS699 COMMON STOCK 6,367 352,25055.33HEALTH CARE NL
QL RESOURCES BHD 0.00B00G234 COMMON STOCK 22,967 30,7181.34CONSUMER STAPLES MY
QORVO INC 0.0174736K101 COMMON STOCK 946 177,891188.03INFORMATION TECHNOLOGY US
QTS REALTY TRUST INC-CL A 0.0074736A103 REAL ESTATE INVESTMENT TRUST 249 19,43377.98REAL ESTATE US
QUAKER CHEMICAL CORP 0.02747316107 COMMON STOCK 1,390 360,213259.12MATERIALS US
QUALCOMM INC 0.04747525103 COMMON STOCK 5,018 736,152146.69INFORMATION TECHNOLOGY US
QUANTA COMPUTER INC 0.016141011 COMMON STOCK 37,949 107,3572.83INFORMATION TECHNOLOGY TW
QUANTA COMPUTER INC 0.006141011 COMMON STOCK 3,950 11,1742.83INFORMATION TECHNOLOGY TW
QUANTA SERVICES INC 0.0174762E102 COMMON STOCK 2,434 248,466102.10INDUSTRIALS US
QUEBEC PROV CANADA-GLOBAL 0.035778517 CORPORATE BOND 375,000 557,333145.16CA
QUEBEC PROVINCE 2.625 20230213 0.07748149AG6 CORPORATE BOND 1,250,000 1,295,217103.49US
QUEBECOR INC -CL B 0.01748193208 COMMON STOCK 5,496 136,92424.91COMMUNICATION SERVICES CA
QUEST DIAGNOSTICS INC 0.0574834L100 COMMON STOCK 6,034 922,141152.83HEALTH CARE US
QUIMICA Y MINERA CHIL-SP ADR 0.00833635105 AMERICAN DEPOSITORY RECEIPT 370 19,29452.15MATERIALS CL
QUIMICA Y MINERA CHIL-SP ADR 0.00833635105 AMERICAN DEPOSITORY RECEIPT 89 4,66052.15MATERIALS CL
RABIGH REFINING AND PETROCHE 0.01B2PF1B1 COMMON STOCK 15,674 102,8836.56ENERGY SA
RABOBANK 3.875 20220208 0.0321685WDD6
CORPORATE BOND 500,000 509,203101.59US
RAIA DROGASIL SA 0.00B7FQV64 COMMON STOCK 10,277 51,3094.99CONSUMER STAPLES BR
RAKUTEN GROUP INC 0.006229597 COMMON STOCK 7,298 76,52710.49CONSUMER DISCRETIONARY JP
RALPH LAUREN CORP 0.02751212101 COMMON STOCK 2,584 300,074116.13CONSUMER DISCRETIONARY US
RAMBUS INC 0.00750917106 COMMON STOCK 3,117 74,17423.80INFORMATION TECHNOLOGY US
RATCH GROUP PCL-FOREIGN 0.00BK1W1W3 COMMON STOCK 35,600 52,1861.47UTILITIES TH
RAYMOND JAMES FINANCIAL INC 0.02754730109 COMMON STOCK 2,374 332,167139.90FINANCIALS US
RAYTHEON TECHNOLOGIES CORP 0.0175513E101 COMMON STOCK 3,212 272,24384.76INDUSTRIALS US
Security NameSecurityWeight
HOLDINGS 30 DAY LAG
SecurityIdentifier Security Type Units Held
Base MarketValueBase PriceSector Country
Risk Parity Multi-Asset GT
USDBase Currency:
Market Value: 1,961,759,259
August 31, 2021
60

REA GROUP LTD 0.016198578 COMMON STOCK 914 102,546112.19COMMUNICATION SERVICES AU
REALTEK SEMICONDUCTOR CORP 0.016051422 COMMON STOCK 6,507 130,06919.99INFORMATION TECHNOLOGY TW
REALTY INCOME CORP 0.00756109104 REAL ESTATE INVESTMENT TRUST 950 68,58972.22REAL ESTATE US
REC LTD 0.00B2Q7WL3 COMMON STOCK 6,584 13,6812.08FINANCIALS IN
RECORDATI INDUSTRIA CHIMICA 0.02B07DRZ5 COMMON STOCK 4,785 313,81365.59HEALTH CARE IT
RED ELECTRICA CORPORACION SA 0.01BD6FXN3 COMMON STOCK 5,511 109,87619.94UTILITIES ES
REGENCY CENTERS CORP 0.00758849103 REAL ESTATE INVESTMENT TRUST 1,330 91,25168.62REAL ESTATE US
REGENERON PHARMACEUTICALS 0.0675886F107 COMMON STOCK 1,674 1,127,490673.40HEALTH CARE US
REGIONS FINANCIAL CORP 0.017591EP100 COMMON STOCK 12,445 254,24920.43FINANCIALS US
REINET INVESTMENTS SCA 0.00BF52QF2 COMMON STOCK 678 13,18019.43FINANCIALS LU
RELIANCE INDUSTRIES LTD 0.006099626 COMMON STOCK 2,283 70,62230.93ENERGY IN
RELX PLC 0.01B2B0DG9 COMMON STOCK 3,437 103,22330.03INDUSTRIALS GB
REMGRO LTD 0.006290689 COMMON STOCK 1,946 16,2568.35FINANCIALS ZA
REMY COINTREAU 0.014741714 COMMON STOCK 1,225 241,232196.90CONSUMER STAPLES FR
RENESAS ELECTRONICS CORP 0.006635677 COMMON STOCK 7,389 79,97210.82INFORMATION TECHNOLOGY JP
RENTOKIL INITIAL PLC 0.01B082RF1 COMMON STOCK 16,137 128,8977.99INDUSTRIALS GB
REPSOL SA 0.005669354 COMMON STOCK 1,786 20,46311.46ENERGY ES
REPUBLIC SERVICES INC 0.01760759100 COMMON STOCK 2,026 251,505124.13INDUSTRIALS US
RESMED INC 0.01761152107 COMMON STOCK 694 201,514290.53HEALTH CARE US
RESONA HOLDINGS INC 0.006421553 COMMON STOCK 24,813 96,1493.87FINANCIALS JP
RESOURCES CONNECTION INC 0.0176122Q105 COMMON STOCK 10,197 161,11815.80INDUSTRIALS US
RESTAURANT BRANDS INTERN 0.0176131D103 COMMON STOCK 4,476 287,15064.15CONSUMER DISCRETIONARY CA
RHB BANK BHD 0.006244675 COMMON STOCK 37,622 50,5911.34FINANCIALS MY
RICHTER GEDEON NYRT 0.00BC9ZH86 COMMON STOCK 1,225 36,69929.95HEALTH CARE HU
RICHTER GEDEON NYRT 0.00BC9ZH86 COMMON STOCK 225 6,74629.95HEALTH CARE HU
RICOH CO LTD 0.016738220 COMMON STOCK 10,673 108,81210.19INFORMATION TECHNOLOGY JP
RIO TINTO PLC 0.010718875 COMMON STOCK 2,596 192,30574.07MATERIALS GB
RLI CORP 0.00749607107 COMMON STOCK 620 67,669109.23FINANCIALS US
ROBERT HALF INTL INC 0.03770323103 COMMON STOCK 5,185 536,151103.40INDUSTRIALS US
ROCHE HOLDING AG-BR 0.027108918 COMMON STOCK 748 334,805447.57HEALTH CARE CH
ROCKWELL AUTOMATION INC 0.02773903109 COMMON STOCK 923 300,486325.45INDUSTRIALS US
ROCKWOOL INTL A/S-B SHS 0.014713490 COMMON STOCK 269 142,377529.06INDUSTRIALS DK
ROGERS COMMUNICATIONS INC-B 0.01775109200 COMMON STOCK 2,209 112,39250.87COMMUNICATION SERVICES CA
ROHM CO LTD 0.016747204 COMMON STOCK 1,186 114,64196.67INFORMATION TECHNOLOGY JP
Security NameSecurityWeight
HOLDINGS 30 DAY LAG
SecurityIdentifier Security Type Units Held
Base MarketValueBase PriceSector Country
Risk Parity Multi-Asset GT
USDBase Currency:
Market Value: 1,961,759,259
August 31, 2021
61

ROLLINS INC 0.01775711104 COMMON STOCK 4,502 175,20338.92INDUSTRIALS US
ROSS STORES INC 0.01778296103 COMMON STOCK 1,932 228,780118.40CONSUMER DISCRETIONARY US
ROYAL BANK OF CANADA 0.00780087102 COMMON STOCK 601 61,656102.56FINANCIALS CA
ROYAL DUTCH SHELL PLC-B SHS 0.04B03MM40 COMMON STOCK 43,254 851,85819.69ENERGY NL
RUENTEX DEVELOPMENT CO LTD 0.006748423 COMMON STOCK 586 1,4662.50REAL ESTATE TW
RUMO SA 0.00BYXZ2W5 COMMON STOCK 4,647 16,9923.66INDUSTRIALS BR
RWE AG 0.034768962 COMMON STOCK 13,566 529,90739.06UTILITIES DE
RYMAN HEALTHCARE LTD 0.006161525 COMMON STOCK 6,868 74,83510.90HEALTH CARE NZ
RYOHIN KEIKAKU CO LTD 0.016758455 COMMON STOCK 5,565 119,43921.46CONSUMER DISCRETIONARY JP
S F HOLDING CO LTD-A 0.00BD73M39 COMMON STOCK 4,558 40,6318.92INDUSTRIALS CN
S F HOLDING CO LTD-A 0.00BD73M39 COMMON STOCK 179 1,5938.92INDUSTRIALS CN
S&P GLOBAL INC 0.0178409V104 COMMON STOCK 517 229,362443.82FINANCIALS US
S&P/TSE 60 INDEX FUTURE SEP 2021 1.01TXFSEP2021
S&P/TSE 60 INDEX FUTURE 102 19,855,150973.29CA
S-1 CORPORATION 0.006180230 COMMON STOCK 1,346 95,29770.81INDUSTRIALS KR
S-1 CORPORATION 0.006180230 COMMON STOCK 298 21,13570.81INDUSTRIALS KR
S-OIL CORP 0.006406055 COMMON STOCK 828 67,94782.02ENERGY KR
SABIC AGRI-NUTRIENTS CO 0.01B1323K0 COMMON STOCK 4,751 158,83033.43MATERIALS SA
SABIC AGRI-NUTRIENTS CO 0.00B1323K0 COMMON STOCK 30 1,01633.43MATERIALS SA
SAFETY INSURANCE GROUP INC 0.0178648T100 COMMON STOCK 2,072 168,45081.31FINANCIALS US
SAFRAN SA 0.00B058TZ6 COMMON STOCK 470 58,930125.44INDUSTRIALS FR
SAGE GROUP PLC/THE 0.01B8C3BL0 COMMON STOCK 23,941 244,54710.21INFORMATION TECHNOLOGY GB
SAIC MOTOR CORP LTD-A 0.00BP3R2D9 COMMON STOCK 15,817 47,2822.99CONSUMER DISCRETIONARY CN
SAINSBURY (J) PLC 0.01B019KW7 COMMON STOCK 39,762 166,3574.18CONSUMER STAPLES GB
SALESFORCE.COM INC 0.0179466L302 COMMON STOCK 646 171,421265.27INFORMATION TECHNOLOGY US
SAMPO OYJ-A SHS 0.015226038 COMMON STOCK 1,993 102,91851.63FINANCIALS FI
SAMSUNG BIOLOGICS CO LTD 0.00BYNJCV6 COMMON STOCK 29 23,801832.29HEALTH CARE KR
SAMSUNG C&T CORP 0.00BSXN8K7 COMMON STOCK 238 27,267114.71INDUSTRIALS KR
SAMSUNG ELECTRO-MECHANICS CO 0.006771689 COMMON STOCK 436 69,395159.13INFORMATION TECHNOLOGY KR
SAMSUNG ELECTRONICS CO LTD 0.006771720 COMMON STOCK 790 52,25966.15INFORMATION TECHNOLOGY KR
SAMSUNG ELECTRONICS CO LTD 0.016771720 COMMON STOCK 1,733 114,62666.15INFORMATION TECHNOLOGY KR
SAMSUNG ELECTRONICS-PREF 0.006773812 PREFERENCE 55 3,32961.06INFORMATION TECHNOLOGY KR
SAMSUNG ENGINEERING CO LTD 0.006765239 COMMON STOCK 2,283 44,01319.28INDUSTRIALS KR
SAMSUNG FIRE & MARINE INS 0.006155250 COMMON STOCK 105 20,380194.92FINANCIALS KR
SAMSUNG HEAVY INDUSTRIES 0.006772217 COMMON STOCK 3,409 18,5255.43INDUSTRIALS KR
Security NameSecurityWeight
HOLDINGS 30 DAY LAG
SecurityIdentifier Security Type Units Held
Base MarketValueBase PriceSector Country
Risk Parity Multi-Asset GT
USDBase Currency:
Market Value: 1,961,759,259
August 31, 2021
62

SAMSUNG LIFE INSURANCE CO LT 0.00B12C0T9 COMMON STOCK 282 18,14564.25FINANCIALS KR
SAMSUNG SDI CO LTD 0.006771645 COMMON STOCK 139 95,347683.94INFORMATION TECHNOLOGY KR
SAMSUNG SDS CO LTD 0.00BRS2KY0 COMMON STOCK 300 44,672148.78INFORMATION TECHNOLOGY KR
SAMSUNG SECURITIES CO LTD 0.006408448 COMMON STOCK 1,007 42,95442.65FINANCIALS KR
SAN DIEGO GAS & ELECTRIC CO 0.05797440BU7 CORPORATE BOND 1,000,000 1,066,915105.96US
SANAN OPTOELECTRONICS CO L-A 0.00BP3R3R0 COMMON STOCK 9,205 51,7115.62INFORMATION TECHNOLOGY CN
SANDERSON FARMS INC 0.03800013104 COMMON STOCK 3,128 614,567196.50CONSUMER STAPLES US
SANDVIK AB 0.01B1VQ252 COMMON STOCK 5,616 143,01725.47INDUSTRIALS SE
SANOFI 0.015671735 COMMON STOCK 1,843 190,598103.43HEALTH CARE FR
SANTEN PHARMACEUTICAL CO LTD 0.016776606 COMMON STOCK 11,303 168,72914.93HEALTH CARE JP
SANTOS LTD 0.006776703 COMMON STOCK 14,367 63,5264.42ENERGY AU
SANY HEAVY INDUSTRY CO LTD-A 0.00BP3R3H0 COMMON STOCK 20,018 81,2394.06INDUSTRIALS CN
SANY HEAVY INDUSTRY CO LTD-A 0.00BP3R3H0 COMMON STOCK 447 1,8134.06INDUSTRIALS CN
SAP SE 0.014846288 COMMON STOCK 1,232 185,435150.46INFORMATION TECHNOLOGY DE
SAPIENS INTERNATIONAL CORP 0.01G7T16G103
COMMON STOCK 4,989 142,38928.54INFORMATION TECHNOLOGY IL
SAPUTO INC 0.01802912105 COMMON STOCK 8,385 235,50628.09CONSUMER STAPLES CA
SARTORIUS AG-VORZUG 0.015843329 PREFERENCE 208 137,004658.69HEALTH CARE DE
SARTORIUS STEDIM BIOTECH 0.02BYZ2QP5 COMMON STOCK 715 433,615606.28HEALTH CARE FR
SASOL LTD 0.006777450 COMMON STOCK 1,275 19,74815.49MATERIALS ZA
SASOL LTD 0.006777450 COMMON STOCK 431 6,67015.49MATERIALS ZA
SAUDI ARABIAN OIL CO 0.02BJTM270 COMMON STOCK 44,332 415,4599.37ENERGY SA
SAUDI BASIC INDUSTRIES CORP 0.00B1324D0 COMMON STOCK 25 82132.79MATERIALS SA
SAUDI CEMENT 0.00B132HD1 COMMON STOCK 1,099 18,37516.72MATERIALS SA
SAUDI ELECTRICITY CO 0.01B132NM2 COMMON STOCK 14,858 108,1447.28UTILITIES SA
SAUDI ELECTRICITY CO 0.00B132NM2 COMMON STOCK 793 5,7697.28UTILITIES SA
SAUDI KAYAN PETROCHEMICAL CO 0.00B1Z8F66 COMMON STOCK 13,900 69,0044.96MATERIALS SA
SAUDI TELECOM CO 0.01B12M7Q5 COMMON STOCK 7,170 258,06135.99COMMUNICATION SERVICES SA
SAUDI TELECOM CO 0.00B12M7Q5 COMMON STOCK 42 1,51235.99COMMUNICATION SERVICES SA
SAUL CENTERS INC 0.01804395101 REAL ESTATE INVESTMENT TRUST 3,008 138,63046.08REAL ESTATE US
SAVOLA 0.00B133RS9 COMMON STOCK 8,441 90,36210.70CONSUMER STAPLES SA
SBA COMMUNICATIONS CORP 0.0178410G104 REAL ESTATE INVESTMENT TRUST 293 105,352358.97REAL ESTATE US
SBERBANK OF RUSSIA PJSC 0.004767981 COMMON STOCK 7,909 35,5134.49FINANCIALS RU
SBERBANK PJSC -SPONSORED ADR 0.01B5SC091 AMERICAN DEPOSITORY RECEIPT 10,990 196,11717.84FINANCIALS RU
SBI HOLDINGS INC 0.006309466 COMMON STOCK 3,010 73,16424.30FINANCIALS JP
Security NameSecurityWeight
HOLDINGS 30 DAY LAG
SecurityIdentifier Security Type Units Held
Base MarketValueBase PriceSector Country
Risk Parity Multi-Asset GT
USDBase Currency:
Market Value: 1,961,759,259
August 31, 2021
63

SCENTRE GROUP 0.01BLZH0Z7 REAL ESTATE INVESTMENT TRUST 62,726 130,6542.08REAL ESTATE AU
SCHINDLER HOLDING AG-REG 0.01B11WWH2 COMMON STOCK 582 181,457311.77INDUSTRIALS CH
SCHOLASTIC CORP 0.02807066105 COMMON STOCK 14,246 473,52733.24COMMUNICATION SERVICES US
SCHWAB (CHARLES) CORP 0.01808513105 COMMON STOCK 1,738 126,62272.85FINANCIALS US
SCHWEITZER-MAUDUIT INTL INC 0.01808541106 COMMON STOCK 6,350 243,02338.27MATERIALS US
SCOR SE 0.00B1LB9P6 COMMON STOCK 2,074 63,61630.68FINANCIALS FR
SCOUT24 AG 0.01BYT9340 COMMON STOCK 2,365 198,73784.05COMMUNICATION SERVICES DE
SDIC POWER HOLDINGS CO LTD-A 0.01BP3R433 COMMON STOCK 189,720 265,9461.40UTILITIES CN
SDIC POWER HOLDINGS CO LTD-A 0.00BP3R433 COMMON STOCK 6,524 9,1451.40UTILITIES CN
SEA LTD-ADR 0.0481141R100 AMERICAN DEPOSITORY RECEIPT 2,194 742,260338.32COMMUNICATION SERVICES SG
SEAGATE TECHNOLOGY HOLDINGS 0.01G7997R103
COMMON STOCK 1,840 161,18487.59INFORMATION TECHNOLOGY US
SEALED AIR CORP 0.0581211K100 COMMON STOCK 17,296 1,055,55061.03MATERIALS US
SEAZEN GROUP LTD 0.00BMWYQP0 COMMON STOCK 12,511 11,1000.89REAL ESTATE CN
SECOM CO LTD 0.006791591 COMMON STOCK 1,095 83,15475.96INDUSTRIALS JP
SEEGENE INC 0.00B679Q36 COMMON STOCK 546 30,98756.75HEALTH CARE KR
SEEK LTD 0.01B0767Y3 COMMON STOCK 4,597 109,32123.78COMMUNICATION SERVICES AU
SEIKO EPSON CORP 0.006616508 COMMON STOCK 3,284 61,28218.66INFORMATION TECHNOLOGY JP
SELECT MEDICAL HOLDINGS CORP 0.0081619Q105 COMMON STOCK 296 10,24134.57HEALTH CARE US
SELECTIVE INSURANCE GROUP 0.00816300107 COMMON STOCK 768 64,15183.57FINANCIALS US
SEMEN INDONESIA PERSERO TBK 0.006795236 COMMON STOCK 27,345 17,7350.65MATERIALS ID
SEMPRA ENERGY 0.02816851109 COMMON STOCK 3,501 463,374132.36UTILITIES US
SENSIENT TECHNOLOGIES CORP 0.0281725T100 COMMON STOCK 4,092 355,42186.85MATERIALS US
SEVEN & I HOLDINGS CO LTD 0.01B0FS5D6 COMMON STOCK 4,656 204,07143.83CONSUMER STAPLES JP
SEVERN TRENT PLC 0.02B1FH8J7 COMMON STOCK 8,975 341,14738.01UTILITIES GB
SEVERSTAL - GDR REG S 0.00B1G4YH7 GLOBAL DEPOSITORY RECEIPTS 1,407 32,65423.20MATERIALS RU
SEVERSTAL PJSC 0.00B5B9C59 COMMON STOCK 190 4,46623.46MATERIALS RU
SFL CORP LTD 0.00G7738W106
COMMON STOCK 3,372 27,0758.03ENERGY NO
SG HOLDINGS CO LTD 0.00BFFY885 COMMON STOCK 3,102 84,47227.23INDUSTRIALS JP
SHAANXI COAL INDUSTRY CO L-A 0.03BS7K5P8 COMMON STOCK 277,386 588,4032.12ENERGY CN
SHANDONG BUCHANG PHARMACEU-A 0.00BYW5NC3 COMMON STOCK 5,252 15,3172.92HEALTH CARE CN
SHANDONG LINGLONG TYRE CO -A 0.00BYW5N12 COMMON STOCK 7,149 33,0954.63CONSUMER DISCRETIONARY CN
SHANDONG PHARMACEUTICAL - A 0.00CNE000001BG9
COMMON STOCK 9,115 47,9375.26HEALTH CARE CN
SHANDONG WEIGAO GP MEDICAL-H 0.006742340 COMMON STOCK 21,447 35,2981.65HEALTH CARE CN
SHANGHAI CONSTRUCTION GROU-A 0.00BP3R6J3 COMMON STOCK 19,571 8,3880.43INDUSTRIALS CN
Security NameSecurityWeight
HOLDINGS 30 DAY LAG
SecurityIdentifier Security Type Units Held
Base MarketValueBase PriceSector Country
Risk Parity Multi-Asset GT
USDBase Currency:
Market Value: 1,961,759,259
August 31, 2021
64

SHANGHAI ELECTRIC GRP CO L-A 0.00BP3R3T2 COMMON STOCK 14,924 11,2910.76INDUSTRIALS CN
SHANGHAI FOSUN PHARMACEUTI-H 0.00B8XBQ96 COMMON STOCK 606 3,8876.42HEALTH CARE CN
SHANGHAI JAHWA UNITED CO -A 0.00BP3R5H4 COMMON STOCK 13,226 97,4477.37CONSUMER STAPLES CN
SHANGHAI LUJIAZUI FIN&TRAD-B 0.006798666 COMMON STOCK 6,195 5,5690.90REAL ESTATE CN
SHANGHAI PHARMACEUTICALS-A 0.00BP3R4Z5 COMMON STOCK 25,469 75,6592.97HEALTH CARE CN
SHANGHAI PHARMACEUTICALS-A 0.00BP3R4Z5 COMMON STOCK 5,630 16,7252.97HEALTH CARE CN
SHANGHAI PHARMACEUTICALS-H 0.02B4Q4CJ6 COMMON STOCK 199,729 396,5121.99HEALTH CARE CN
SHANGHAI PHARMACEUTICALS-H 0.00B4Q4CJ6 COMMON STOCK 8,222 16,3221.99HEALTH CARE CN
SHANGHAI PUDONG DEVEL BANK-A 0.00BP3R2B7 COMMON STOCK 17,694 24,7761.40FINANCIALS CN
SHANGHAI PUTAILAI NEW ENER-A 0.00BF2DZJ5 COMMON STOCK 3,038 71,92623.67MATERIALS CN
SHANGHAI RAAS BLOOD PRODUC-A 0.00BD5CPJ5 COMMON STOCK 17,873 19,1911.07HEALTH CARE CN
SHANXI COKING COAL ENERGY-A 0.00BD5CKB2 COMMON STOCK 49,838 88,9091.78ENERGY CN
SHANXI LU'AN ENVIRONMENTAL-A 0.00BP3R682 COMMON STOCK 33,804 83,1602.46ENERGY CN
SHANXI MEIJIN ENERGY CO LT-A 0.01BFCCPV4 COMMON STOCK 101,875 219,2542.15ENERGY CN
SHANXI TAIGANG STAINLESS-A 0.01BD5CLM0 COMMON STOCK 72,921 114,0661.56MATERIALS CN
SHANXI XINGHUACUN FEN WINE-A 0.00BP3R820 COMMON STOCK 500 21,48842.94CONSUMER STAPLES CN
SHANXI XINGHUACUN FEN WINE-A 0.00BP3R820 COMMON STOCK 125 5,37242.94CONSUMER STAPLES CN
SHARP CORP 0.006800602 COMMON STOCK 4,744 62,74013.23CONSUMER DISCRETIONARY JP
SHELL INTERNATIONAL FINANCE BV 0.01822582BD3 CORPORATE BOND 250,000 271,157108.46US
SHENANDOAH TELECOMMUNICATION 0.0482312B106 COMMON STOCK 24,233 722,86729.83COMMUNICATION SERVICES US
SHENERGY COMPANY LIMITED-A 0.02BP3R5V8 COMMON STOCK 333,659 336,0751.01UTILITIES CN
SHENERGY COMPANY LIMITED-A 0.00BP3R5V8 COMMON STOCK 17,158 17,2821.01UTILITIES CN
SHENZHEN ENERGY GROUP CO L-A 0.01BD5CN68 COMMON STOCK 185,561 224,8031.21UTILITIES CN
SHENZHEN GOODIX TECHNOLOGY-A 0.00BYW5QT1 COMMON STOCK 1,251 20,16416.12INFORMATION TECHNOLOGY CN
SHENZHEN INOVANCE TECHNOLO-A 0.00BD5CMN8 COMMON STOCK 134 1,47310.99INDUSTRIALS CN
SHENZHEN INTL HOLDINGS 0.00BJVBTY1 COMMON STOCK 71,045 92,6271.30INDUSTRIALS HK
SHENZHEN KAIFA TECHNOLOGY-A 0.00BD5CDW4 COMMON STOCK 24,754 61,0882.47INFORMATION TECHNOLOGY CN
SHENZHEN KANGTAI BIOLOGICA-A 0.00BFY8HT2 COMMON STOCK 983 18,41418.73HEALTH CARE CN
SHENZHEN MINDRAY BIO-MEDIC-A 0.00BHQK864 COMMON STOCK 250 12,69850.75HEALTH CARE CN
SHENZHEN MTC CO LTD -A 0.00BD5CFV7 COMMON STOCK 68,185 57,9180.85CONSUMER DISCRETIONARY CN
SHENZHEN SALUBRIS PHARM-A 0.00BD5CM05 COMMON STOCK 19,660 77,0813.92HEALTH CARE CN
SHENZHOU INTERNATIONAL GROUP 0.00B0MP1B0 COMMON STOCK 561 12,23821.81CONSUMER DISCRETIONARY CN
SHENZHOU INTERNATIONAL GROUP 0.00B0MP1B0 COMMON STOCK 478 10,42621.81CONSUMER DISCRETIONARY CN
SHERWIN-WILLIAMS CO/THE 0.02824348106 COMMON STOCK 1,304 396,070303.67MATERIALS US
Security NameSecurityWeight
HOLDINGS 30 DAY LAG
SecurityIdentifier Security Type Units Held
Base MarketValueBase PriceSector Country
Risk Parity Multi-Asset GT
USDBase Currency:
Market Value: 1,961,759,259
August 31, 2021
65

SHIJIAZHUANG YILING PHARMA-A 0.00BD5CHJ9 COMMON STOCK 19,892 52,6302.65HEALTH CARE CN
SHIMADZU CORP 0.006804369 COMMON STOCK 1,368 61,46844.92INFORMATION TECHNOLOGY JP
SHIMANO INC 0.016804820 COMMON STOCK 730 214,568294.01CONSUMER DISCRETIONARY JP
SHIN KONG FINANCIAL HOLDING 0.006452586 COMMON STOCK 67,547 23,1550.34FINANCIALS TW
SHIN POONG PHARMACEUTICAL CO 0.006806116 COMMON STOCK 254 15,45460.89HEALTH CARE KR
SHINHAN FINANCIAL GROUP LTD 0.006397502 COMMON STOCK 1,354 45,36433.51FINANCIALS KR
SHINSEGAE INC 0.006805049 COMMON STOCK 92 21,355232.01CONSUMER DISCRETIONARY KR
SHIONOGI & CO LTD 0.016804682 COMMON STOCK 2,554 161,63763.28HEALTH CARE JP
SHISEIDO CO LTD 0.016805265 COMMON STOCK 1,867 123,96566.38CONSUMER STAPLES JP
SHIZUOKA BANK LTD/THE 0.006805328 COMMON STOCK 10,515 82,5087.85FINANCIALS JP
SHOPIFY INC - CLASS A 0.0182509L107 COMMON STOCK 88 133,5201,524.62INFORMATION TECHNOLOGY CA
SHOPRITE HOLDINGS LTD 0.006801575 COMMON STOCK 3,940 50,07812.71CONSUMER STAPLES ZA
SHREE CEMENT LTD 0.006100357 COMMON STOCK 141 54,708387.47MATERIALS IN
SIAM CEMENT PUB CO-FOR REG 0.006609906 COMMON STOCK 5,987 79,87513.34MATERIALS TH
SIAM CEMENT PUB CO-FOR REG 0.006609906 COMMON STOCK 894 11,92213.34MATERIALS TH
SIBANYE-STILLWATER LTD-ADR 0.0082575P107 AMERICAN DEPOSITORY RECEIPT 2,374 38,96416.41MATERIALS ZA
SIBANYE-STILLWATER LTD-ADR 0.0082575P107 AMERICAN DEPOSITORY RECEIPT 479 7,86016.41MATERIALS ZA
SICHUAN CHUANTOU ENERGY CO-A 0.03BP3R4Y4 COMMON STOCK 334,102 588,2671.76UTILITIES CN
SICHUAN CHUANTOU ENERGY CO-A 0.00BP3R4Y4 COMMON STOCK 5,434 9,5681.76UTILITIES CN
SICHUAN KELUN PHARMACEUTIC-A 0.00BD5CL08 COMMON STOCK 12,868 36,2372.82HEALTH CARE CN
SICHUAN SWELLFUN CO LTD-A 0.00BFB4JK8 COMMON STOCK 4,915 88,45718.00CONSUMER STAPLES CN
SIEMENS AG-REG 0.015727973 COMMON STOCK 726 120,726166.26INDUSTRIALS DE
SIEMENS GAMESA RENEWABLE ENE 0.00B01CP21 COMMON STOCK 2,547 75,49629.64INDUSTRIALS ES
SIEMENS HEALTHINEERS AG 0.01BD594Y4 COMMON STOCK 3,620 251,68169.53HEALTH CARE DE
SIEMENS LTD 0.00B15T569 COMMON STOCK 1,308 40,72131.13INDUSTRIALS IN
SIKA AG-REG 0.01BF2DSG3 COMMON STOCK 406 146,285360.35MATERIALS CH
SILERGY CORP 0.00BH4DMW9 COMMON STOCK 475 68,276143.61INFORMATION TECHNOLOGY CN
SILERGY CORP 0.00BH4DMW9 COMMON STOCK 60 8,599143.61INFORMATION TECHNOLOGY CN
SILICON LABORATORIES INC 0.00826919102 COMMON STOCK 395 62,311157.62INFORMATION TECHNOLOGY US
SILVER FUTURE (CMX) DEC 2021 1.27SIDEC2021 SILVER FUTURE (CMX) 207 24,846,21024.01US
SIME DARBY BERHAD 0.00B29TTR1 COMMON STOCK 105,271 59,7640.57INDUSTRIALS MY
SIME DARBY BERHAD 0.00B29TTR1 COMMON STOCK 7,953 4,5150.57INDUSTRIALS MY
SIME DARBY PLANTATION BHD 0.00BF6RHY2 COMMON STOCK 33,154 32,1410.97CONSUMER STAPLES MY
SIME DARBY PLANTATION BHD 0.00BF6RHY2 COMMON STOCK 894 8660.97CONSUMER STAPLES MY
Security NameSecurityWeight
HOLDINGS 30 DAY LAG
SecurityIdentifier Security Type Units Held
Base MarketValueBase PriceSector Country
Risk Parity Multi-Asset GT
USDBase Currency:
Market Value: 1,961,759,259
August 31, 2021
66

SIMPLY GOOD FOODS CO/THE 0.0082900L102 COMMON STOCK 368 13,11935.62CONSUMER STAPLES US
SINGAPORE EXCHANGE LTD 0.006303866 COMMON STOCK 4,561 33,5717.36FINANCIALS SG
SINGAPORE TELECOMMUNICATIONS 0.07B02PY11 COMMON STOCK 843,738 1,455,2621.72COMMUNICATION SERVICES SG
SINO BIOPHARMACEUTICAL 0.00B00XSF9 COMMON STOCK 63,584 53,2220.84HEALTH CARE HK
SINOPAC FINANCIAL HOLDINGS 0.006525875 COMMON STOCK 45,206 23,2440.51FINANCIALS TW
SINOPAC FINANCIAL HOLDINGS 0.006525875 COMMON STOCK 4,886 2,5120.51FINANCIALS TW
SINOPEC SHANGHAI PETROCHE-A 0.00BP3R596 COMMON STOCK 34,138 17,9060.52MATERIALS CN
SINOPHARM GROUP CO-H 0.00B3ZVDV0 COMMON STOCK 22,407 57,5642.57HEALTH CARE CN
SINOTRANS LIMITED-A 0.01BHHLN72 COMMON STOCK 147,666 113,5510.77INDUSTRIALS CN
SINOTRUK HONG KONG LTD 0.00B296ZH4 COMMON STOCK 37,980 74,8131.97INDUSTRIALS CN
SINOTRUK HONG KONG LTD 0.00B296ZH4 COMMON STOCK 447 8801.97INDUSTRIALS CN
SJM HOLDINGS LTD 0.00B2NR3Y6 COMMON STOCK 108,557 94,4970.87CONSUMER DISCRETIONARY HK
SK HYNIX INC 0.016450267 COMMON STOCK 1,265 116,15091.85INFORMATION TECHNOLOGY KR
SK HYNIX INC 0.006450267 COMMON STOCK 385 35,37891.85INFORMATION TECHNOLOGY KR
SK INC 0.00B39Z8L3 COMMON STOCK 71 16,247227.26INDUSTRIALS KR
SK INNOVATION CO LTD 0.00B232R05 COMMON STOCK 77 16,538215.19ENERGY KR
SK TELECOM 0.016224871 COMMON STOCK 559 143,552257.02COMMUNICATION SERVICES KR
SK TELECOM 0.006224871 COMMON STOCK 69 17,686257.02COMMUNICATION SERVICES KR
SKANDINAVISKA ENSKILDA BAN-A 0.014813345 COMMON STOCK 8,513 114,21613.42FINANCIALS SE
SKYWORKS SOLUTIONS INC 0.0383088M102 COMMON STOCK 3,393 622,537183.46INFORMATION TECHNOLOGY US
SM INVESTMENTS CORP 0.01B068DB9 COMMON STOCK 5,709 115,79620.28INDUSTRIALS PH
SMITH & NEPHEW PLC 0.010922320 COMMON STOCK 11,353 217,96219.20HEALTH CARE GB
SMITH (A.O.) CORP 0.02831865209 COMMON STOCK 5,396 392,37972.72INDUSTRIALS US
SMITHS GROUP PLC 0.00B1WY233 COMMON STOCK 2,949 58,55119.85INDUSTRIALS GB
SMOORE INTERNATIONAL HOLDING 0.00BKWGSQ7 COMMON STOCK 5,362 28,7145.36CONSUMER STAPLES CN
SMOORE INTERNATIONAL HOLDING 0.00BKWGSQ7 COMMON STOCK 849 4,5465.36CONSUMER STAPLES CN
SMURFIT KAPPA GROUP PLC 0.01B1RR828 COMMON STOCK 4,254 243,94257.35MATERIALS IE
SNAM SPA 0.007251470 COMMON STOCK 12,570 74,2505.91UTILITIES IT
SNAP-ON INC 0.02833034101 COMMON STOCK 1,575 354,291224.95INDUSTRIALS US
SODEXO SA 0.017062713 COMMON STOCK 1,537 127,05382.66CONSUMER DISCRETIONARY FR
SOFINA 0.014820301 COMMON STOCK 327 144,338441.96FINANCIALS BE
SOFTBANK CORP 0.01BF5M0K5 COMMON STOCK 20,890 280,19413.41COMMUNICATION SERVICES JP
SOFTBANK GROUP CORP 0.006770620 COMMON STOCK 1,257 70,72656.26COMMUNICATION SERVICES JP
SOHGO SECURITY SERVICES CO 0.016546359 COMMON STOCK 2,372 107,62545.38INDUSTRIALS JP
Security NameSecurityWeight
HOLDINGS 30 DAY LAG
SecurityIdentifier Security Type Units Held
Base MarketValueBase PriceSector Country
Risk Parity Multi-Asset GT
USDBase Currency:
Market Value: 1,961,759,259
August 31, 2021
67

SOLVAY SA 0.014821100 COMMON STOCK 1,757 230,116130.97MATERIALS BE
SOMPO HOLDINGS INC 0.00B62G7K6 COMMON STOCK 1,916 84,19043.95FINANCIALS JP
SONIC HEALTHCARE LTD 0.016821120 COMMON STOCK 7,345 232,96031.72HEALTH CARE AU
SONOVA HOLDING AG-REG 0.027156036 COMMON STOCK 776 299,156385.35HEALTH CARE CH
SONY GROUP CORP 0.016821506 COMMON STOCK 1,003 103,763103.40CONSUMER DISCRETIONARY JP
SOUTHERN CALIFORNIA GAS CO 0.02842434CK6 CORPORATE BOND 375,000 419,842111.96US
SOUTHERN CO/THE 0.03842587107 COMMON STOCK 8,466 556,49765.73UTILITIES US
SOUTHERN COPPER CORP 0.0184265V105 COMMON STOCK 1,863 116,62062.59MATERIALS PE
SOUTHERN COPPER CORP 0.0084265V105 COMMON STOCK 66 4,13962.59MATERIALS PE
SOUTHSIDE BANCSHARES INC 0.0084470P109 COMMON STOCK 1,630 61,44737.69FINANCIALS US
SOUTHWEST AIRLINES CO 0.01844741108 COMMON STOCK 3,801 189,20049.78INDUSTRIALS US
SOYBEAN FUTURE JAN 2022 0.08S-JAN2022 SOYBEAN FUTURE 25 1,625,3131,300.25US
SOYBEAN FUTURE NOV 2021 0.41S-NOV2021
SOYBEAN FUTURE 124 8,013,5001,292.50US
SOYBEAN MEAL (CBT) DEC 2021 0.51SMDEC2021
SOYBEAN MEAL (CBT) 289 9,987,840345.60US
SOYBEAN OIL FUTURE DEC 2021 0.40BODEC2021
SOYBEAN OIL FUTURE 225 7,931,25058.75US
SPAR GROUP LIMITED/THE 0.00B038WK4 COMMON STOCK 3,239 46,48614.35CONSUMER STAPLES ZA
SPARK NEW ZEALAND LTD 0.016881436 COMMON STOCK 35,748 122,6633.43COMMUNICATION SERVICES NZ
SPI 200 INDEX FUTURE SEP 2021 0.89YAPSEP2021
SPI 200 INDEX FUTURE 127 17,349,9935,464.56AU
SPS COMMERCE INC 0.0178463M107 COMMON STOCK 1,167 158,158135.53INFORMATION TECHNOLOGY US
SQUARE ENIX HOLDINGS CO LTD 0.016309262 COMMON STOCK 3,102 180,97258.35COMMUNICATION SERVICES JP
SRI TRANG GLOVES THA-FOREIGN 0.01BMGJNP0 COMMON STOCK 187,039 214,7041.15HEALTH CARE TH
SRISAWADCORP PCL - FOREIGN 0.00BF0F5S2 COMMON STOCK 12,511 27,8502.23FINANCIALS TH
SSE PLC 0.010790873 COMMON STOCK 11,524 258,92322.47UTILITIES GB
SSY GROUP LTD 0.00BYP9J68 COMMON STOCK 48,257 30,0310.62HEALTH CARE HK
STANDARD CHARTERED PLC 0.000408284 COMMON STOCK 5,207 32,5926.26FINANCIALS GB
STANDARD MOTOR PRODS 0.03853666105 COMMON STOCK 13,100 561,84842.89CONSUMER DISCRETIONARY US
STANLEY BLACK & DECKER INC 0.02854502101 COMMON STOCK 2,036 393,530193.27INDUSTRIALS US
STANLEY ELECTRIC CO LTD 0.006841106 COMMON STOCK 2,189 54,76525.01CONSUMER DISCRETIONARY JP
STARBUCKS CORP 0.01855244109 COMMON STOCK 2,099 246,618117.49CONSUMER DISCRETIONARY US
STATE STREET CORP 0.00857477103 COMMON STOCK 856 79,51792.91FINANCIALS US
STATOIL ASA COMPANY GUARNT 0.0585771PAG7
CORPORATE BOND 1,000,000 1,032,534102.95US
STELLANTIS NV 0.01BMD8KX7 COMMON STOCK 5,133 102,60019.99CONSUMER DISCRETIONARY NL
STEPAN CO 0.01858586100 COMMON STOCK 2,429 285,552117.56MATERIALS US
STMICROELECTRONICS NV 0.015962332 COMMON STOCK 2,849 126,83844.52INFORMATION TECHNOLOGY CH
Security NameSecurityWeight
HOLDINGS 30 DAY LAG
SecurityIdentifier Security Type Units Held
Base MarketValueBase PriceSector Country
Risk Parity Multi-Asset GT
USDBase Currency:
Market Value: 1,961,759,259
August 31, 2021
68

STRAUMANN HOLDING AG-REG 0.017156832 COMMON STOCK 132 255,5851,932.21HEALTH CARE CH
STRYKER CORP 0.02863667101 COMMON STOCK 1,131 313,429277.10HEALTH CARE US
SUBARU CORP 0.016356406 COMMON STOCK 5,473 101,46318.54CONSUMER DISCRETIONARY JP
SUEZ 0.01B3B8D04 COMMON STOCK 11,417 264,82323.20UTILITIES FR
SUGAR #11 WORLD FUTURE (NYB) MAR 2022 0.67SBMAR2022
SUGAR #11 WORLD FUTURE (NYB) 573 13,188,16820.55US
SUMITOMO DAINIPPON PHARMA CO 0.016250865 COMMON STOCK 6,043 108,46817.95HEALTH CARE JP
SUMITOMO METAL MINING CO LTD 0.016858849 COMMON STOCK 3,010 115,74738.45MATERIALS JP
SUMITOMO REALTY & DEVELOPMEN 0.006858902 COMMON STOCK 2,646 85,53532.33REAL ESTATE JP
SUN HUNG KAI PROPERTIES 0.006859927 COMMON STOCK 6,386 89,98914.09REAL ESTATE HK
SUN LIFE FINANCIAL INC 0.00866796105 COMMON STOCK 1,188 61,05851.41FINANCIALS CA
SUN PHARMACEUTICAL INDUS 0.006582483 COMMON STOCK 3,464 37,67310.88HEALTH CARE IN
SUNNY OPTICAL TECH 0.00B1YBT08 COMMON STOCK 1,968 59,51030.24INFORMATION TECHNOLOGY CN
SUNNY OPTICAL TECH 0.00B1YBT08 COMMON STOCK 574 17,35030.24INFORMATION TECHNOLOGY CN
SUNTORY BEVERAGE & FOOD LTD 0.01BBD7Q84 COMMON STOCK 4,744 190,20540.10CONSUMER STAPLES JP
SUOFEIYA HOME COLLECTION C-A 0.00BD5CFM8 COMMON STOCK 32,707 93,7722.87CONSUMER DISCRETIONARY CN
SUPERMAX CORP BHD 0.00B1V7L36 COMMON STOCK 32,274 25,6200.79HEALTH CARE MY
SUZANO SA 0.00B02GKC7 COMMON STOCK 1,966 23,42511.92MATERIALS BR
SUZUKI MOTOR CORP 0.006865504 COMMON STOCK 1,277 55,29043.29CONSUMER DISCRETIONARY JP
SVB FINANCIAL GROUP 0.0178486Q101 COMMON STOCK 512 286,594559.50FINANCIALS US
SVENSK EXPORTKREDIT AB 0.02870297BV9 CORPORATE BOND 375,000 375,169100.05SE
SVENSK EXPORTKREDIT AB 0.0300254EMT6
CORPORATE BOND 500,000 507,687100.56SE
SVENSK EXPORTKREDIT AB 0.0200254EMP4
CORPORATE BOND 375,000 381,939101.85SE
SVENSK EXPORTKREDIT AB 0.0700254EMQ2
CORPORATE BOND 1,250,000 1,316,934104.02SE
SVENSKA CELLULOSA AB SCA-B 0.01B1VVGZ5 COMMON STOCK 6,148 108,34817.62MATERIALS SE
SVENSKA HANDELSBANKEN-A SHS 0.01BXDZ9Q1 COMMON STOCK 8,842 99,33911.24FINANCIALS SE
SWATCH GROUP AG/THE-BR 0.017184725 COMMON STOCK 546 154,020281.86CONSUMER DISCRETIONARY CH
SWEDBANK AB - A SHARES 0.014846523 COMMON STOCK 5,209 100,46919.29FINANCIALS SE
SWEDISH MATCH AB 0.01BP09MR2 COMMON STOCK 19,394 178,8879.22CONSUMER STAPLES SE
SWISS LIFE HOLDING AG-REG 0.017437805 COMMON STOCK 318 165,991521.37FINANCIALS CH
SWISS PRIME SITE-REG 0.01B083BH4 COMMON STOCK 1,323 141,438106.93REAL ESTATE CH
SWISS RE AG 0.00B545MG5 COMMON STOCK 869 79,96791.98FINANCIALS CH
SWISSCOM AG-REG 0.125533976 COMMON STOCK 3,852 2,260,022586.65COMMUNICATION SERVICES CH
SYDNEY AIRPORT 0.01B70DWB2 STAPLED SECURITY 28,824 167,8985.82INDUSTRIALS AU
SYMRISE AG 0.01B1JB4K8 COMMON STOCK 1,849 263,247142.36MATERIALS DE
Security NameSecurityWeight
HOLDINGS 30 DAY LAG
SecurityIdentifier Security Type Units Held
Base MarketValueBase PriceSector Country
Risk Parity Multi-Asset GT
USDBase Currency:
Market Value: 1,961,759,259
August 31, 2021
69

SYNCHRONY FINANCIAL 0.0187165B103 COMMON STOCK 4,594 228,53649.75FINANCIALS US
SYNNEX TECHNOLOGY INTL CORP 0.006868439 COMMON STOCK 45,129 87,6081.94INFORMATION TECHNOLOGY TW
SYNNEX TECHNOLOGY INTL CORP 0.006868439 COMMON STOCK 5,825 11,3081.94INFORMATION TECHNOLOGY TW
SYNOPSYS INC 0.01871607107 COMMON STOCK 509 169,276332.24INFORMATION TECHNOLOGY US
SYSMEX CORP 0.016883807 COMMON STOCK 1,890 215,411113.96HEALTH CARE JP
T ROWE PRICE GROUP INC 0.0274144T108 COMMON STOCK 2,113 472,977223.87FINANCIALS US
T&D HOLDINGS INC 0.006744294 COMMON STOCK 5,291 64,29612.15FINANCIALS JP
T-MOBILE US INC 0.03872590104 COMMON STOCK 3,941 540,008137.02COMMUNICATION SERVICES US
TAISHIN FINANCIAL HOLDING 0.006451680 COMMON STOCK 58,980 41,1810.70FINANCIALS TW
TAISHO PHARMACEUTICAL HOLDIN 0.01B3QX5G4 COMMON STOCK 3,102 181,25458.44HEALTH CARE JP
TAIWAN BUSINESS BANK 0.006098816 COMMON STOCK 58,980 20,6220.35FINANCIALS TW
TAIWAN BUSINESS BANK 0.006098816 COMMON STOCK 2,681 9370.35FINANCIALS TW
TAIWAN CEMENT 0.016869937 COMMON STOCK 100,959 176,5011.75MATERIALS TW
TAIWAN CEMENT 0.006869937 COMMON STOCK 808 1,4121.75MATERIALS TW
TAIWAN COOPERATIVE FINANCIAL 0.00B73XCZ3 COMMON STOCK 33,943 27,3740.81FINANCIALS TW
TAIWAN COOPERATIVE FINANCIAL 0.00B73XCZ3 COMMON STOCK 3,117 2,5140.81FINANCIALS TW
TAIWAN HIGH SPEED RAIL CORP 0.00B04BGQ6 COMMON STOCK 68,810 74,9841.09INDUSTRIALS TW
TAIWAN MOBILE CO LTD 0.046290496 COMMON STOCK 211,793 771,8663.64COMMUNICATION SERVICES TW
TAIWAN MOBILE CO LTD 0.006290496 COMMON STOCK 371 1,3523.64COMMUNICATION SERVICES TW
TAIWAN SEMICONDUCTOR-SP ADR 0.00874039100 AMERICAN DEPOSITORY RECEIPT 571 67,959119.01INFORMATION TECHNOLOGY TW
TAIWAN SEMICONDUCTOR-SP ADR 0.01874039100 AMERICAN DEPOSITORY RECEIPT 1,536 182,820119.01INFORMATION TECHNOLOGY TW
TAKE-TWO INTERACTIVE SOFTWRE 0.02874054109 COMMON STOCK 2,510 404,682161.22COMMUNICATION SERVICES US
TAKEDA PHARMACEUTICAL CO LTD 0.016870445 COMMON STOCK 3,895 130,44633.49HEALTH CARE JP
TAL EDUCATION GROUP- ADR 0.00874080104 AMERICAN DEPOSITORY RECEIPT 124 6615.32CONSUMER DISCRETIONARY CN
TAPESTRY INC 0.01876030107 COMMON STOCK 6,063 244,45840.32CONSUMER DISCRETIONARY US
TARGET CORP 0.0287612E106 COMMON STOCK 1,958 483,534246.98CONSUMER DISCRETIONARY US
TATA CONSULTANCY SVCS LTD 0.00B01NPJ1 COMMON STOCK 1,824 94,59651.86INFORMATION TECHNOLOGY IN
TATA MOTORS LTD-SPON ADR 0.00876568502 AMERICAN DEPOSITORY RECEIPT 1,003 19,73219.68CONSUMER DISCRETIONARY IN
TATA STEEL LTD 0.006101156 COMMON STOCK 843 16,74019.86MATERIALS IN
TCS GROUP HOLDING-GDR REG S 0.00BK1K310 GLOBAL DEPOSITORY RECEIPTS 94 8,32788.74FINANCIALS CY
TDK CORP 0.006869302 COMMON STOCK 553 58,221105.32INFORMATION TECHNOLOGY JP
TE CONNECTIVITY LTD 0.01H84989104 COMMON STOCK 1,508 226,461150.22INFORMATION TECHNOLOGY CH
TEAMVIEWER AG 0.01BJ7WGS1 COMMON STOCK 3,064 102,04133.30INFORMATION TECHNOLOGY DE
TECH MAHINDRA LTD 0.01BWFGD63 COMMON STOCK 10,986 217,83019.83INFORMATION TECHNOLOGY IN
Security NameSecurityWeight
HOLDINGS 30 DAY LAG
SecurityIdentifier Security Type Units Held
Base MarketValueBase PriceSector Country
Risk Parity Multi-Asset GT
USDBase Currency:
Market Value: 1,961,759,259
August 31, 2021
70
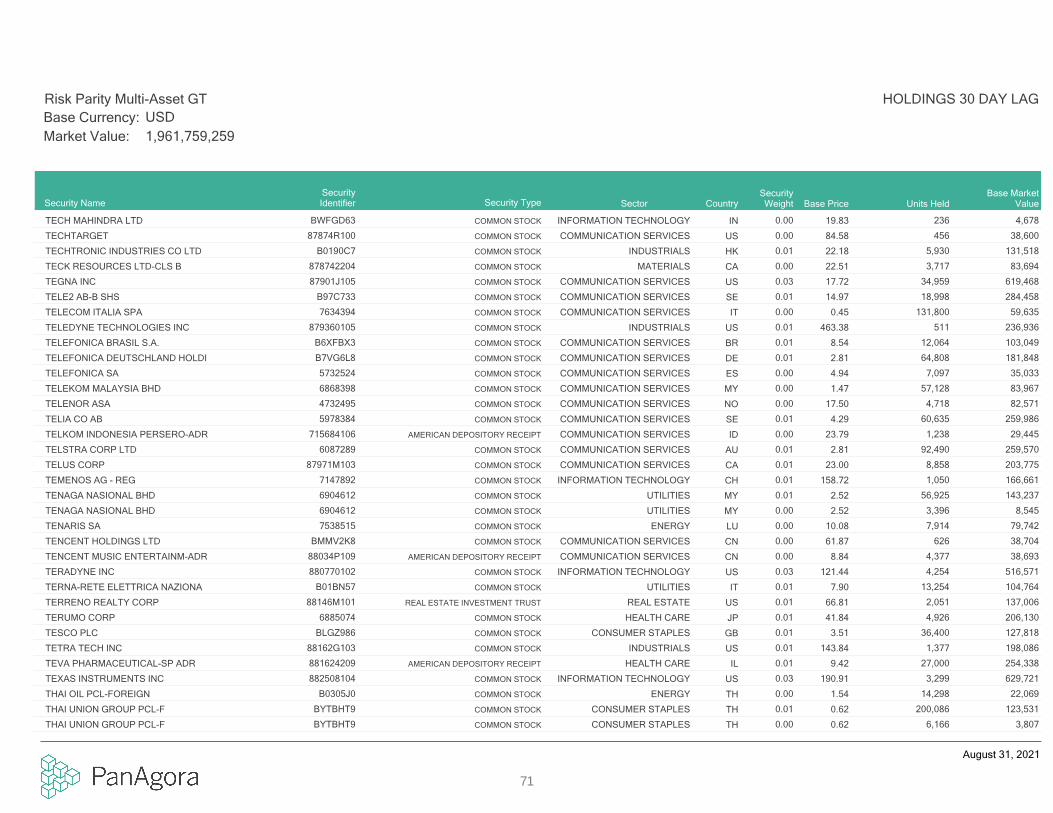
TECH MAHINDRA LTD 0.00BWFGD63 COMMON STOCK 236 4,67819.83INFORMATION TECHNOLOGY IN
TECHTARGET 0.0087874R100 COMMON STOCK 456 38,60084.58COMMUNICATION SERVICES US
TECHTRONIC INDUSTRIES CO LTD 0.01B0190C7 COMMON STOCK 5,930 131,51822.18INDUSTRIALS HK
TECK RESOURCES LTD-CLS B 0.00878742204 COMMON STOCK 3,717 83,69422.51MATERIALS CA
TEGNA INC 0.0387901J105 COMMON STOCK 34,959 619,46817.72COMMUNICATION SERVICES US
TELE2 AB-B SHS 0.01B97C733 COMMON STOCK 18,998 284,45814.97COMMUNICATION SERVICES SE
TELECOM ITALIA SPA 0.007634394 COMMON STOCK 131,800 59,6350.45COMMUNICATION SERVICES IT
TELEDYNE TECHNOLOGIES INC 0.01879360105 COMMON STOCK 511 236,936463.38INDUSTRIALS US
TELEFONICA BRASIL S.A. 0.01B6XFBX3 COMMON STOCK 12,064 103,0498.54COMMUNICATION SERVICES BR
TELEFONICA DEUTSCHLAND HOLDI 0.01B7VG6L8 COMMON STOCK 64,808 181,8482.81COMMUNICATION SERVICES DE
TELEFONICA SA 0.005732524 COMMON STOCK 7,097 35,0334.94COMMUNICATION SERVICES ES
TELEKOM MALAYSIA BHD 0.006868398 COMMON STOCK 57,128 83,9671.47COMMUNICATION SERVICES MY
TELENOR ASA 0.004732495 COMMON STOCK 4,718 82,57117.50COMMUNICATION SERVICES NO
TELIA CO AB 0.015978384 COMMON STOCK 60,635 259,9864.29COMMUNICATION SERVICES SE
TELKOM INDONESIA PERSERO-ADR 0.00715684106 AMERICAN DEPOSITORY RECEIPT 1,238 29,44523.79COMMUNICATION SERVICES ID
TELSTRA CORP LTD 0.016087289 COMMON STOCK 92,490 259,5702.81COMMUNICATION SERVICES AU
TELUS CORP 0.0187971M103 COMMON STOCK 8,858 203,77523.00COMMUNICATION SERVICES CA
TEMENOS AG - REG 0.017147892 COMMON STOCK 1,050 166,661158.72INFORMATION TECHNOLOGY CH
TENAGA NASIONAL BHD 0.016904612 COMMON STOCK 56,925 143,2372.52UTILITIES MY
TENAGA NASIONAL BHD 0.006904612 COMMON STOCK 3,396 8,5452.52UTILITIES MY
TENARIS SA 0.007538515 COMMON STOCK 7,914 79,74210.08ENERGY LU
TENCENT HOLDINGS LTD 0.00BMMV2K8 COMMON STOCK 626 38,70461.87COMMUNICATION SERVICES CN
TENCENT MUSIC ENTERTAINM-ADR 0.0088034P109 AMERICAN DEPOSITORY RECEIPT 4,377 38,6938.84COMMUNICATION SERVICES CN
TERADYNE INC 0.03880770102 COMMON STOCK 4,254 516,571121.44INFORMATION TECHNOLOGY US
TERNA-RETE ELETTRICA NAZIONA 0.01B01BN57 COMMON STOCK 13,254 104,7647.90UTILITIES IT
TERRENO REALTY CORP 0.0188146M101 REAL ESTATE INVESTMENT TRUST 2,051 137,00666.81REAL ESTATE US
TERUMO CORP 0.016885074 COMMON STOCK 4,926 206,13041.84HEALTH CARE JP
TESCO PLC 0.01BLGZ986 COMMON STOCK 36,400 127,8183.51CONSUMER STAPLES GB
TETRA TECH INC 0.0188162G103 COMMON STOCK 1,377 198,086143.84INDUSTRIALS US
TEVA PHARMACEUTICAL-SP ADR 0.01881624209 AMERICAN DEPOSITORY RECEIPT 27,000 254,3389.42HEALTH CARE IL
TEXAS INSTRUMENTS INC 0.03882508104 COMMON STOCK 3,299 629,721190.91INFORMATION TECHNOLOGY US
THAI OIL PCL-FOREIGN 0.00B0305J0 COMMON STOCK 14,298 22,0691.54ENERGY TH
THAI UNION GROUP PCL-F 0.01BYTBHT9 COMMON STOCK 200,086 123,5310.62CONSUMER STAPLES TH
THAI UNION GROUP PCL-F 0.00BYTBHT9 COMMON STOCK 6,166 3,8070.62CONSUMER STAPLES TH
Security NameSecurityWeight
HOLDINGS 30 DAY LAG
SecurityIdentifier Security Type Units Held
Base MarketValueBase PriceSector Country
Risk Parity Multi-Asset GT
USDBase Currency:
Market Value: 1,961,759,259
August 31, 2021
71

THE SAUDI NATIONAL BANK 0.00BSHYYN1 COMMON STOCK 1,118 18,12216.21FINANCIALS SA
THERMO FISHER SCIENTIFIC INC 0.01883556102 COMMON STOCK 276 153,259554.95HEALTH CARE US
TIGER BRANDS LTD 0.00B0J4PP2 COMMON STOCK 2,495 32,07312.85CONSUMER STAPLES ZA
TIM SA-ADR 0.0088706T108 AMERICAN DEPOSITORY RECEIPT 3,962 47,15311.90COMMUNICATION SERVICES BR
TINGYI (CAYMAN ISLN) HLDG CO 0.006903556 COMMON STOCK 3,575 6,3611.78CONSUMER STAPLES CN
TIP 1/8 01/15/2022 0.06912828SA9 TREASURY INFLATIONARY PROTECTED 1,200,060 1,214,569101.19US
TIP 1/8 07/15/2022 10 0.13912828TE0 TREASURY INFLATIONARY PROTECTED 2,567,777 2,636,401102.66US
TIP 1 3/4 01/15/2028 0.24912810PV4 TREASURY INFLATIONARY PROTECTED 3,889,560 4,753,535121.98US
TIP 2 1/8 02/15/2040 0.39912810QF8 TREASURY INFLATIONARY PROTECTED 5,026,680 7,644,246151.98US
TIP 2 1/8 02/15/2041 0.29912810QP6 TREASURY INFLATIONARY PROTECTED 3,720,900 5,725,749153.78US
TIS INC 0.01B2Q4CR0 COMMON STOCK 4,561 129,12328.31INFORMATION TECHNOLOGY JP
TITAN CO LTD 0.016139340 COMMON STOCK 4,222 111,11426.32CONSUMER DISCRETIONARY IN
TITAN CO LTD 0.006139340 COMMON STOCK 224 5,90426.32CONSUMER DISCRETIONARY IN
TOBU RAILWAY CO LTD 0.016895169 COMMON STOCK 4,105 107,28026.13INDUSTRIALS JP
TOHO CO LTD 0.026895200 COMMON STOCK 6,789 294,15143.33COMMUNICATION SERVICES JP
TOHO GAS CO LTD 0.036895222 COMMON STOCK 10,942 510,92246.70UTILITIES JP
TOHOKU ELECTRIC POWER CO INC 0.046895266 COMMON STOCK 103,415 792,6057.66UTILITIES JP
TOKIO MARINE HOLDINGS INC 0.006513126 COMMON STOCK 1,830 89,56648.94FINANCIALS JP
TOKYO ELECTRIC POWER COMPANY 0.026895404 COMMON STOCK 121,003 318,3142.63UTILITIES JP
TOKYO ELECTRON LTD 0.006895675 COMMON STOCK 91 39,227430.00INFORMATION TECHNOLOGY JP
TOKYO GAS CO LTD 0.066895448 COMMON STOCK 59,220 1,140,62019.26UTILITIES JP
TOMPKINS FINANCIAL CORP 0.00890110109 COMMON STOCK 947 75,35479.59FINANCIALS US
TONGHUA DONGBAO PHARMACEUT-A 0.00BP3R808 COMMON STOCK 9,115 14,7801.62HEALTH CARE CN
TONGWEI CO LTD-A 0.00BP3RCK6 COMMON STOCK 179 1,6879.44CONSUMER STAPLES CN
TOP GLOVE CORP BHD 0.01B05L892 COMMON STOCK 186,503 179,4590.96HEALTH CARE MY
TOPIX INDEX FUTURE SEP 2021 0.77JTISEP2021
TOPIX INDEX FUTURE 84 15,020,75417.88JP
TORAY INDUSTRIES INC 0.006897143 COMMON STOCK 14,140 95,4766.75MATERIALS JP
TORONTO-DOMINION BANK 0.01891160509 COMMON STOCK 2,100 136,15564.84FINANCIALS CA
TORONTO-DOMINION BANK/THE 0.0189114QCB2
CORPORATE BOND 125,000 133,464106.77CA
TORONTO-DOMINION BANK/THE 0.0289114QC48
CORPORATE BOND 375,000 397,845106.09CA
TORRENT PHARMACEUTICALS LTD 0.01B0XPSB8 COMMON STOCK 2,483 105,61342.54HEALTH CARE IN
TOSHIBA CORP 0.006897217 COMMON STOCK 1,551 67,40643.46INDUSTRIALS JP
TOSOH CORP 0.006900289 COMMON STOCK 4,561 82,95418.19MATERIALS JP
TOTALENERGIES SE 0.01B15C557 COMMON STOCK 5,510 242,90344.08ENERGY FR
Security NameSecurityWeight
HOLDINGS 30 DAY LAG
SecurityIdentifier Security Type Units Held
Base MarketValueBase PriceSector Country
Risk Parity Multi-Asset GT
USDBase Currency:
Market Value: 1,961,759,259
August 31, 2021
72
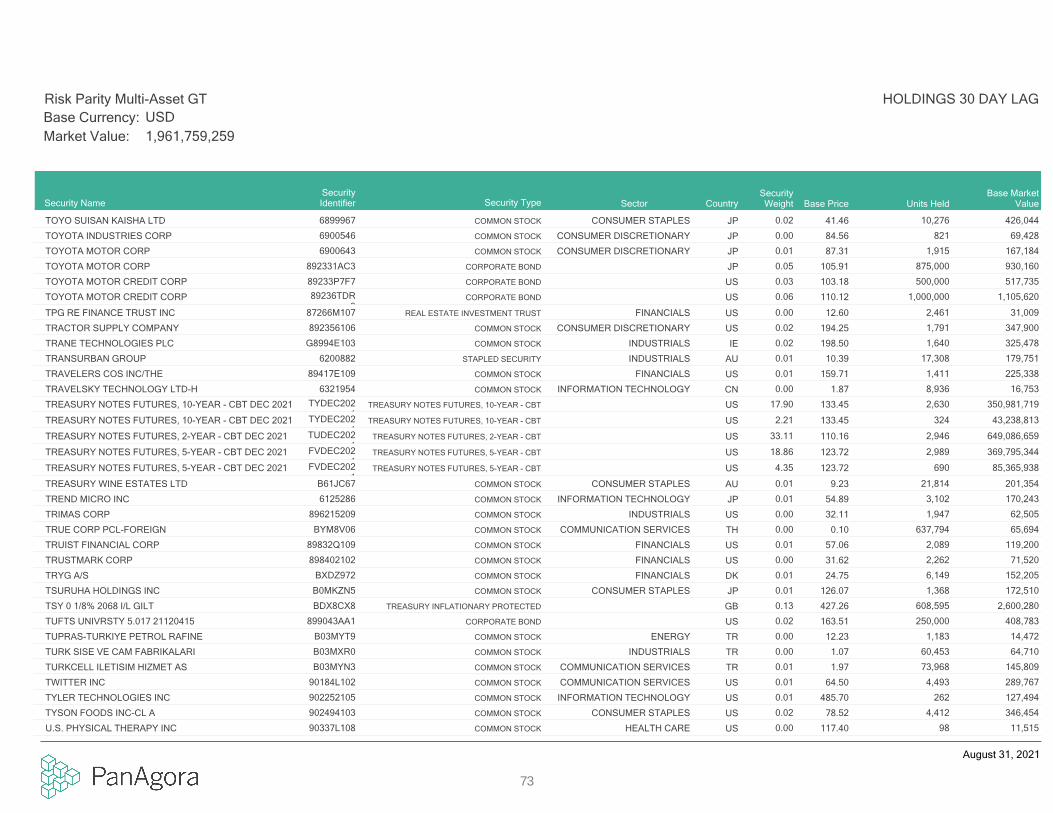
TOYO SUISAN KAISHA LTD 0.026899967 COMMON STOCK 10,276 426,04441.46CONSUMER STAPLES JP
TOYOTA INDUSTRIES CORP 0.006900546 COMMON STOCK 821 69,42884.56CONSUMER DISCRETIONARY JP
TOYOTA MOTOR CORP 0.016900643 COMMON STOCK 1,915 167,18487.31CONSUMER DISCRETIONARY JP
TOYOTA MOTOR CORP 0.05892331AC3 CORPORATE BOND 875,000 930,160105.91JP
TOYOTA MOTOR CREDIT CORP 0.0389233P7F7 CORPORATE BOND 500,000 517,735103.18US
TOYOTA MOTOR CREDIT CORP 0.0689236TDR3
CORPORATE BOND 1,000,000 1,105,620110.12US
TPG RE FINANCE TRUST INC 0.0087266M107 REAL ESTATE INVESTMENT TRUST 2,461 31,00912.60FINANCIALS US
TRACTOR SUPPLY COMPANY 0.02892356106 COMMON STOCK 1,791 347,900194.25CONSUMER DISCRETIONARY US
TRANE TECHNOLOGIES PLC 0.02G8994E103 COMMON STOCK 1,640 325,478198.50INDUSTRIALS IE
TRANSURBAN GROUP 0.016200882 STAPLED SECURITY 17,308 179,75110.39INDUSTRIALS AU
TRAVELERS COS INC/THE 0.0189417E109 COMMON STOCK 1,411 225,338159.71FINANCIALS US
TRAVELSKY TECHNOLOGY LTD-H 0.006321954 COMMON STOCK 8,936 16,7531.87INFORMATION TECHNOLOGY CN
TREASURY NOTES FUTURES, 10-YEAR - CBT DEC 2021 17.90TYDEC2021
TREASURY NOTES FUTURES, 10-YEAR - CBT 2,630 350,981,719133.45US
TREASURY NOTES FUTURES, 10-YEAR - CBT DEC 2021 2.21TYDEC2021
TREASURY NOTES FUTURES, 10-YEAR - CBT 324 43,238,813133.45US
TREASURY NOTES FUTURES, 2-YEAR - CBT DEC 2021 33.11TUDEC2021
TREASURY NOTES FUTURES, 2-YEAR - CBT 2,946 649,086,659110.16US
TREASURY NOTES FUTURES, 5-YEAR - CBT DEC 2021 18.86FVDEC2021
TREASURY NOTES FUTURES, 5-YEAR - CBT 2,989 369,795,344123.72US
TREASURY NOTES FUTURES, 5-YEAR - CBT DEC 2021 4.35FVDEC2021
TREASURY NOTES FUTURES, 5-YEAR - CBT 690 85,365,938123.72US
TREASURY WINE ESTATES LTD 0.01B61JC67 COMMON STOCK 21,814 201,3549.23CONSUMER STAPLES AU
TREND MICRO INC 0.016125286 COMMON STOCK 3,102 170,24354.89INFORMATION TECHNOLOGY JP
TRIMAS CORP 0.00896215209 COMMON STOCK 1,947 62,50532.11INDUSTRIALS US
TRUE CORP PCL-FOREIGN 0.00BYM8V06 COMMON STOCK 637,794 65,6940.10COMMUNICATION SERVICES TH
TRUIST FINANCIAL CORP 0.0189832Q109 COMMON STOCK 2,089 119,20057.06FINANCIALS US
TRUSTMARK CORP 0.00898402102 COMMON STOCK 2,262 71,52031.62FINANCIALS US
TRYG A/S 0.01BXDZ972 COMMON STOCK 6,149 152,20524.75FINANCIALS DK
TSURUHA HOLDINGS INC 0.01B0MKZN5 COMMON STOCK 1,368 172,510126.07CONSUMER STAPLES JP
TSY 0 1/8% 2068 I/L GILT 0.13BDX8CX8 TREASURY INFLATIONARY PROTECTED 608,595 2,600,280427.26GB
TUFTS UNIVRSTY 5.017 21120415 0.02899043AA1 CORPORATE BOND 250,000 408,783163.51US
TUPRAS-TURKIYE PETROL RAFINE 0.00B03MYT9 COMMON STOCK 1,183 14,47212.23ENERGY TR
TURK SISE VE CAM FABRIKALARI 0.00B03MXR0 COMMON STOCK 60,453 64,7101.07INDUSTRIALS TR
TURKCELL ILETISIM HIZMET AS 0.01B03MYN3 COMMON STOCK 73,968 145,8091.97COMMUNICATION SERVICES TR
TWITTER INC 0.0190184L102 COMMON STOCK 4,493 289,76764.50COMMUNICATION SERVICES US
TYLER TECHNOLOGIES INC 0.01902252105 COMMON STOCK 262 127,494485.70INFORMATION TECHNOLOGY US
TYSON FOODS INC-CL A 0.02902494103 COMMON STOCK 4,412 346,45478.52CONSUMER STAPLES US
U.S. PHYSICAL THERAPY INC 0.0090337L108 COMMON STOCK 98 11,515117.40HEALTH CARE US
Security NameSecurityWeight
HOLDINGS 30 DAY LAG
SecurityIdentifier Security Type Units Held
Base MarketValueBase PriceSector Country
Risk Parity Multi-Asset GT
USDBase Currency:
Market Value: 1,961,759,259
August 31, 2021
73
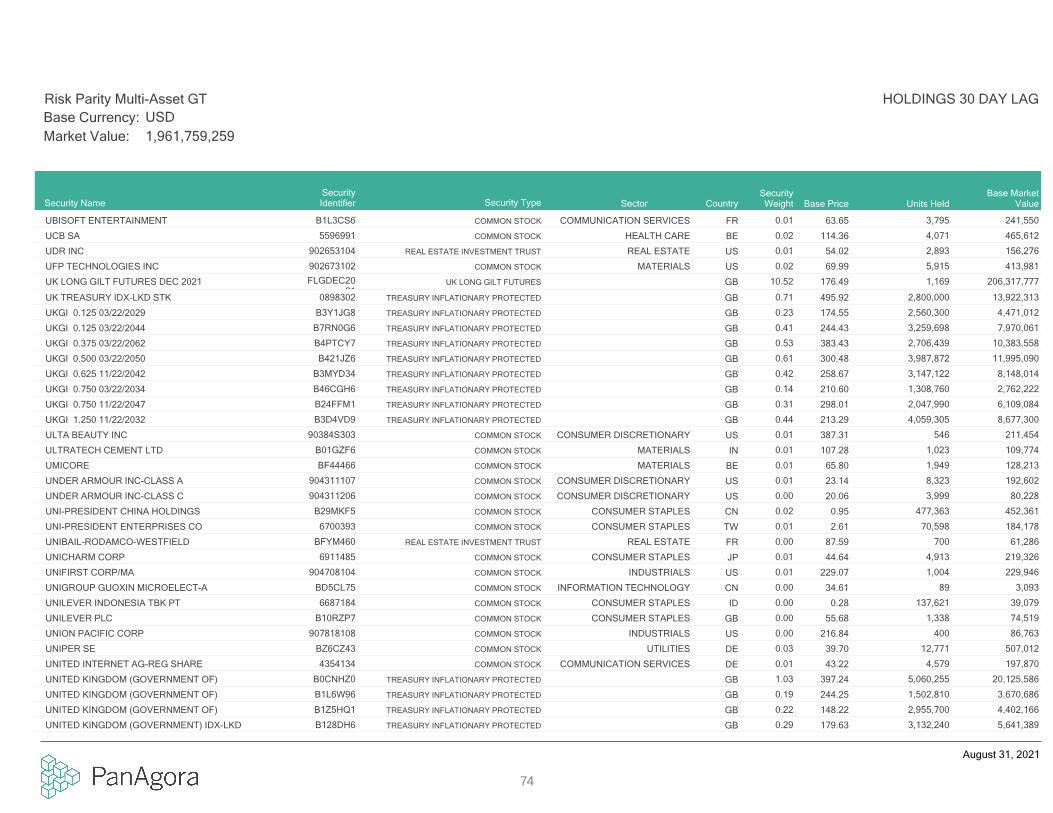
UBISOFT ENTERTAINMENT 0.01B1L3CS6 COMMON STOCK 3,795 241,55063.65COMMUNICATION SERVICES FR
UCB SA 0.025596991 COMMON STOCK 4,071 465,612114.36HEALTH CARE BE
UDR INC 0.01902653104 REAL ESTATE INVESTMENT TRUST 2,893 156,27654.02REAL ESTATE US
UFP TECHNOLOGIES INC 0.02902673102 COMMON STOCK 5,915 413,98169.99MATERIALS US
UK LONG GILT FUTURES DEC 2021 10.52FLGDEC2021
UK LONG GILT FUTURES 1,169 206,317,777176.49GB
UK TREASURY IDX-LKD STK 0.710898302 TREASURY INFLATIONARY PROTECTED 2,800,000 13,922,313495.92GB
UKGI 0.125 03/22/2029 0.23B3Y1JG8 TREASURY INFLATIONARY PROTECTED 2,560,300 4,471,012174.55GB
UKGI 0.125 03/22/2044 0.41B7RN0G6 TREASURY INFLATIONARY PROTECTED 3,259,698 7,970,061244.43GB
UKGI 0.375 03/22/2062 0.53B4PTCY7 TREASURY INFLATIONARY PROTECTED 2,706,439 10,383,558383.43GB
UKGI 0.500 03/22/2050 0.61B421JZ6 TREASURY INFLATIONARY PROTECTED 3,987,872 11,995,090300.48GB
UKGI 0.625 11/22/2042 0.42B3MYD34 TREASURY INFLATIONARY PROTECTED 3,147,122 8,148,014258.67GB
UKGI 0.750 03/22/2034 0.14B46CGH6 TREASURY INFLATIONARY PROTECTED 1,308,760 2,762,222210.60GB
UKGI 0.750 11/22/2047 0.31B24FFM1 TREASURY INFLATIONARY PROTECTED 2,047,990 6,109,084298.01GB
UKGI 1.250 11/22/2032 0.44B3D4VD9 TREASURY INFLATIONARY PROTECTED 4,059,305 8,677,300213.29GB
ULTA BEAUTY INC 0.0190384S303 COMMON STOCK 546 211,454387.31CONSUMER DISCRETIONARY US
ULTRATECH CEMENT LTD 0.01B01GZF6 COMMON STOCK 1,023 109,774107.28MATERIALS IN
UMICORE 0.01BF44466 COMMON STOCK 1,949 128,21365.80MATERIALS BE
UNDER ARMOUR INC-CLASS A 0.01904311107 COMMON STOCK 8,323 192,60223.14CONSUMER DISCRETIONARY US
UNDER ARMOUR INC-CLASS C 0.00904311206 COMMON STOCK 3,999 80,22820.06CONSUMER DISCRETIONARY US
UNI-PRESIDENT CHINA HOLDINGS 0.02B29MKF5 COMMON STOCK 477,363 452,3610.95CONSUMER STAPLES CN
UNI-PRESIDENT ENTERPRISES CO 0.016700393 COMMON STOCK 70,598 184,1782.61CONSUMER STAPLES TW
UNIBAIL-RODAMCO-WESTFIELD 0.00BFYM460 REAL ESTATE INVESTMENT TRUST 700 61,28687.59REAL ESTATE FR
UNICHARM CORP 0.016911485 COMMON STOCK 4,913 219,32644.64CONSUMER STAPLES JP
UNIFIRST CORP/MA 0.01904708104 COMMON STOCK 1,004 229,946229.07INDUSTRIALS US
UNIGROUP GUOXIN MICROELECT-A 0.00BD5CL75 COMMON STOCK 89 3,09334.61INFORMATION TECHNOLOGY CN
UNILEVER INDONESIA TBK PT 0.006687184 COMMON STOCK 137,621 39,0790.28CONSUMER STAPLES ID
UNILEVER PLC 0.00B10RZP7 COMMON STOCK 1,338 74,51955.68CONSUMER STAPLES GB
UNION PACIFIC CORP 0.00907818108 COMMON STOCK 400 86,763216.84INDUSTRIALS US
UNIPER SE 0.03BZ6CZ43 COMMON STOCK 12,771 507,01239.70UTILITIES DE
UNITED INTERNET AG-REG SHARE 0.014354134 COMMON STOCK 4,579 197,87043.22COMMUNICATION SERVICES DE
UNITED KINGDOM (GOVERNMENT OF) 1.03B0CNHZ0 TREASURY INFLATIONARY PROTECTED 5,060,255 20,125,586397.24GB
UNITED KINGDOM (GOVERNMENT OF) 0.19B1L6W96 TREASURY INFLATIONARY PROTECTED 1,502,810 3,670,686244.25GB
UNITED KINGDOM (GOVERNMENT OF) 0.22B1Z5HQ1 TREASURY INFLATIONARY PROTECTED 2,955,700 4,402,166148.22GB
UNITED KINGDOM (GOVERNMENT) IDX-LKD 0.29B128DH6 TREASURY INFLATIONARY PROTECTED 3,132,240 5,641,389179.63GB
Security NameSecurityWeight
HOLDINGS 30 DAY LAG
SecurityIdentifier Security Type Units Held
Base MarketValueBase PriceSector Country
Risk Parity Multi-Asset GT
USDBase Currency:
Market Value: 1,961,759,259
August 31, 2021
74

UNITED KINGDOM (GOVT OF) INX-LKD 0.433179082 TREASURY INFLATIONARY PROTECTED 2,000,000 8,353,975417.70GB
UNITED KINGDOM GILT INFLA REGS 0.57BD9MZZ7 TREASURY INFLATIONARY PROTECTED 2,800,848 11,092,022395.98GB
UNITED KINGDOM GILT INFLA REGS BONDS 3MO 0.24BP9DLZ6 TREASURY INFLATIONARY PROTECTED 1,425,311 4,716,887330.94GB
UNITED KINGDOM GILT INFLATION 0.14B85SFQ5 TREASURY INFLATIONARY PROTECTED 1,880,624 2,827,316150.34GB
UNITED KINGDOM GILT INFLATION 0.15B73ZYW0 TREASURY INFLATIONARY PROTECTED 1,004,528 3,001,871298.68GB
UNITED KINGDOM GILT INFLATION LINKED 0.19BYY5F14 TREASURY INFLATIONARY PROTECTED 2,353,860 3,772,000160.17GB
UNITED KINGDOM GILT INFLATION LINKED 0.23BZ1NTB6 TREASURY INFLATIONARY PROTECTED 2,612,278 4,497,409172.15GB
UNITED KINGDOM GILT INFLATION LINKED 0.49BZ13DV4 TREASURY INFLATIONARY PROTECTED 3,539,328 9,577,071270.58GB
UNITED KINGDOM TSY I/L GILT 0.26B3LZBF6 TREASURY INFLATIONARY PROTECTED 2,105,550 5,106,449242.14GB
UNITED MICROELECTRONICS CORP 0.016916628 COMMON STOCK 85,873 195,5212.28INFORMATION TECHNOLOGY TW
UNITED MICROELECTRONICS CORP 0.006916628 COMMON STOCK 9,402 21,4072.28INFORMATION TECHNOLOGY TW
UNITED PARCEL SERVICE-CL B 0.01911312106 COMMON STOCK 1,062 207,727195.63INDUSTRIALS US
UNITED RENTALS INC 0.02911363109 COMMON STOCK 1,249 440,347352.65INDUSTRIALS US
UNITED SPIRITS LTD 0.01BYWFSB7 COMMON STOCK 10,960 107,3569.80CONSUMER STAPLES IN
UNITED STATES LIME & MINERAL 0.01911922102 COMMON STOCK 1,714 250,458146.09MATERIALS US
UNITED STATES TREASURY INFLATION INDEXED BONDS 0.41912828S50 TREASURY INFLATIONARY PROTECTED 7,365,411 8,114,179110.15US
UNITED STATES TREASURY INFLATION INDEXED BONDS 0.11912810SG4 TREASURY INFLATIONARY PROTECTED 1,619,100 2,233,715137.91US
UNITED STATES TREASURY INFLATION INDEXED BONDS 0.389128283R9 TREASURY INFLATIONARY PROTECTED 6,606,900 7,498,925113.44US
UNITED STATES TREASURY INFLATION INDEXED BONDS 0.48912828Z37 TREASURY INFLATIONARY PROTECTED 8,445,600 9,422,182111.55US
UNITED STATES TREASURY INFLATION INDEXED BONDS 0.499128287D6 TREASURY INFLATIONARY PROTECTED 8,494,800 9,596,916112.94US
UNITED STATES TREASURY INFLATION INDEXED BONDS 0.23912828YL8 TREASURY INFLATIONARY PROTECTED 4,234,640 4,553,202107.48US
UNITED STATES TREASURY INFLATION INDEXED BONDS 0.29912828V49 TREASURY INFLATIONARY PROTECTED 5,059,935 5,652,009111.65US
UNITED STATES TREASURY INFLATION INDEXED BONDS 0.2991282CAQ4
TREASURY INFLATIONARY PROTECTED 5,234,050 5,711,483109.07US
UNITED STATES TREASURY INFLATION INDEXED BONDS 0.3991282CBF7 TREASURY INFLATIONARY PROTECTED 6,782,165 7,581,233111.77US
UNITED STATES TREASURY INFLATION INDEXED BONDS 0.1291282CCA7
TREASURY INFLATIONARY PROTECTED 2,071,420 2,264,010109.25US
UNITED URBAN INVESTMENT CORP 0.006723839 REAL ESTATE INVESTMENT TRUST 39 55,5591,416.35REAL ESTATE JP
UNITED UTILITIES GROUP PLC 0.02B39J2M4 COMMON STOCK 22,626 329,30314.55UTILITIES GB
UNITEDHEALTH GROUP INC 0.0191324P102 COMMON STOCK 562 234,094416.27HEALTH CARE US
UNITIL CORP 0.02913259107 COMMON STOCK 9,069 449,84449.60UTILITIES US
UNIVERSAL CORP/VA 0.02913456109 COMMON STOCK 7,133 360,92250.60CONSUMER STAPLES US
UNIVERSAL HEALTH SERVICES-B 0.03913903100 COMMON STOCK 4,135 644,103155.76HEALTH CARE US
UNIVERSAL ROBINA CORP 0.006919519 COMMON STOCK 9,383 28,4423.03CONSUMER STAPLES PH
UNUM GROUP 0.0191529Y106 COMMON STOCK 4,297 114,39926.62FINANCIALS US
UOL GROUP LTD 0.016916844 COMMON STOCK 21,073 109,6655.20REAL ESTATE SG
Security NameSecurityWeight
HOLDINGS 30 DAY LAG
SecurityIdentifier Security Type Units Held
Base MarketValueBase PriceSector Country
Risk Parity Multi-Asset GT
USDBase Currency:
Market Value: 1,961,759,259
August 31, 2021
75
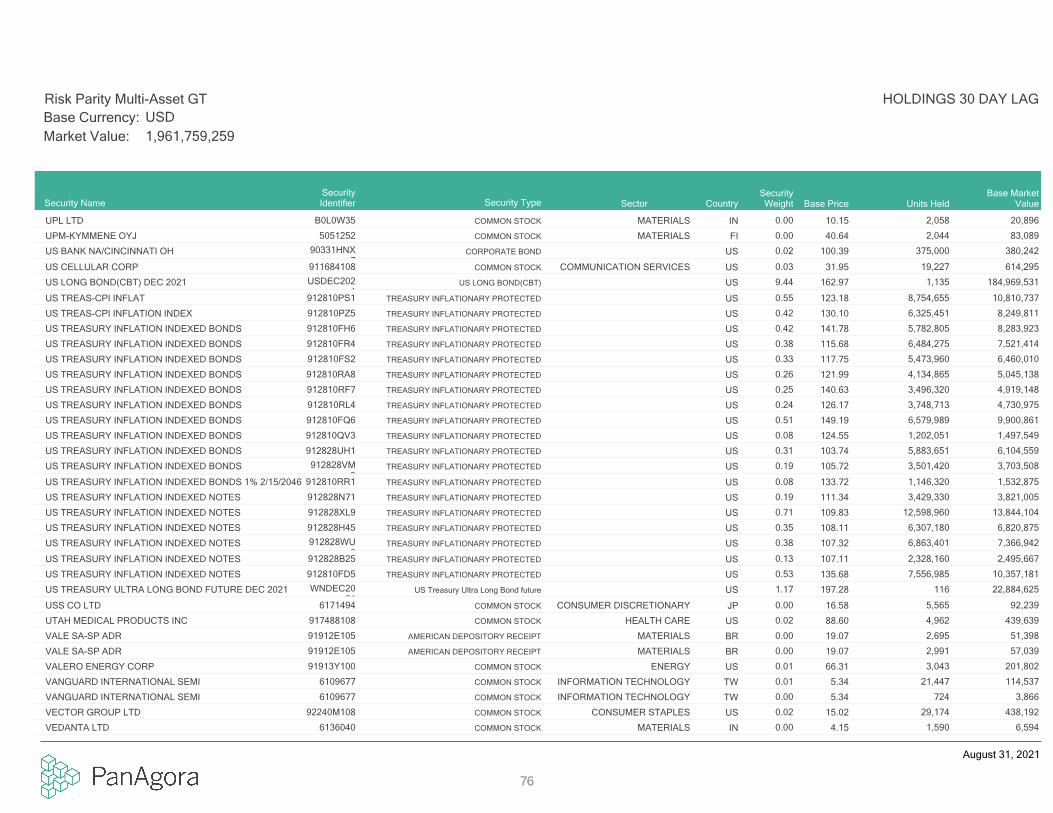
UPL LTD 0.00B0L0W35 COMMON STOCK 2,058 20,89610.15MATERIALS IN
UPM-KYMMENE OYJ 0.005051252 COMMON STOCK 2,044 83,08940.64MATERIALS FI
US BANK NA/CINCINNATI OH 0.0290331HNX7
CORPORATE BOND 375,000 380,242100.39US
US CELLULAR CORP 0.03911684108 COMMON STOCK 19,227 614,29531.95COMMUNICATION SERVICES US
US LONG BOND(CBT) DEC 2021 9.44USDEC2021
US LONG BOND(CBT) 1,135 184,969,531162.97US
US TREAS-CPI INFLAT 0.55912810PS1 TREASURY INFLATIONARY PROTECTED 8,754,655 10,810,737123.18US
US TREAS-CPI INFLATION INDEX 0.42912810PZ5 TREASURY INFLATIONARY PROTECTED 6,325,451 8,249,811130.10US
US TREASURY INFLATION INDEXED BONDS 0.42912810FH6 TREASURY INFLATIONARY PROTECTED 5,782,805 8,283,923141.78US
US TREASURY INFLATION INDEXED BONDS 0.38912810FR4 TREASURY INFLATIONARY PROTECTED 6,484,275 7,521,414115.68US
US TREASURY INFLATION INDEXED BONDS 0.33912810FS2 TREASURY INFLATIONARY PROTECTED 5,473,960 6,460,010117.75US
US TREASURY INFLATION INDEXED BONDS 0.26912810RA8 TREASURY INFLATIONARY PROTECTED 4,134,865 5,045,138121.99US
US TREASURY INFLATION INDEXED BONDS 0.25912810RF7 TREASURY INFLATIONARY PROTECTED 3,496,320 4,919,148140.63US
US TREASURY INFLATION INDEXED BONDS 0.24912810RL4 TREASURY INFLATIONARY PROTECTED 3,748,713 4,730,975126.17US
US TREASURY INFLATION INDEXED BONDS 0.51912810FQ6 TREASURY INFLATIONARY PROTECTED 6,579,989 9,900,861149.19US
US TREASURY INFLATION INDEXED BONDS 0.08912810QV3 TREASURY INFLATIONARY PROTECTED 1,202,051 1,497,549124.55US
US TREASURY INFLATION INDEXED BONDS 0.31912828UH1 TREASURY INFLATIONARY PROTECTED 5,883,651 6,104,559103.74US
US TREASURY INFLATION INDEXED BONDS 0.19912828VM9
TREASURY INFLATIONARY PROTECTED 3,501,420 3,703,508105.72US
US TREASURY INFLATION INDEXED BONDS 1% 2/15/2046 0.08912810RR1 TREASURY INFLATIONARY PROTECTED 1,146,320 1,532,875133.72US
US TREASURY INFLATION INDEXED NOTES 0.19912828N71 TREASURY INFLATIONARY PROTECTED 3,429,330 3,821,005111.34US
US TREASURY INFLATION INDEXED NOTES 0.71912828XL9 TREASURY INFLATIONARY PROTECTED 12,598,960 13,844,104109.83US
US TREASURY INFLATION INDEXED NOTES 0.35912828H45 TREASURY INFLATIONARY PROTECTED 6,307,180 6,820,875108.11US
US TREASURY INFLATION INDEXED NOTES 0.38912828WU0
TREASURY INFLATIONARY PROTECTED 6,863,401 7,366,942107.32US
US TREASURY INFLATION INDEXED NOTES 0.13912828B25 TREASURY INFLATIONARY PROTECTED 2,328,160 2,495,667107.11US
US TREASURY INFLATION INDEXED NOTES 0.53912810FD5 TREASURY INFLATIONARY PROTECTED 7,556,985 10,357,181135.68US
US TREASURY ULTRA LONG BOND FUTURE DEC 2021 1.17WNDEC2021
US Treasury Ultra Long Bond future 116 22,884,625197.28US
USS CO LTD 0.006171494 COMMON STOCK 5,565 92,23916.58CONSUMER DISCRETIONARY JP
UTAH MEDICAL PRODUCTS INC 0.02917488108 COMMON STOCK 4,962 439,63988.60HEALTH CARE US
VALE SA-SP ADR 0.0091912E105 AMERICAN DEPOSITORY RECEIPT 2,695 51,39819.07MATERIALS BR
VALE SA-SP ADR 0.0091912E105 AMERICAN DEPOSITORY RECEIPT 2,991 57,03919.07MATERIALS BR
VALERO ENERGY CORP 0.0191913Y100 COMMON STOCK 3,043 201,80266.31ENERGY US
VANGUARD INTERNATIONAL SEMI 0.016109677 COMMON STOCK 21,447 114,5375.34INFORMATION TECHNOLOGY TW
VANGUARD INTERNATIONAL SEMI 0.006109677 COMMON STOCK 724 3,8665.34INFORMATION TECHNOLOGY TW
VECTOR GROUP LTD 0.0292240M108 COMMON STOCK 29,174 438,19215.02CONSUMER STAPLES US
VEDANTA LTD 0.006136040 COMMON STOCK 1,590 6,5944.15MATERIALS IN
Security NameSecurityWeight
HOLDINGS 30 DAY LAG
SecurityIdentifier Security Type Units Held
Base MarketValueBase PriceSector Country
Risk Parity Multi-Asset GT
USDBase Currency:
Market Value: 1,961,759,259
August 31, 2021
76

VENTAS INC 0.0092276F100 REAL ESTATE INVESTMENT TRUST 1,254 70,15755.94REAL ESTATE US
VENTURE CORP LTD 0.016927374 COMMON STOCK 11,549 164,50814.24INFORMATION TECHNOLOGY SG
VEOLIA ENVIRONNEMENT 0.014031879 COMMON STOCK 8,342 286,05234.29UTILITIES FR
VERBUND AG 0.004661607 COMMON STOCK 880 96,384109.49UTILITIES AT
VERISIGN INC 0.0192343E102 COMMON STOCK 1,305 282,260216.26INFORMATION TECHNOLOGY US
VERISK ANALYTICS INC 0.0192345Y106 COMMON STOCK 571 115,301201.76INDUSTRIALS US
VERIZON COMMUNICATIONS INC 0.0392343V104 COMMON STOCK 9,392 516,58455.00COMMUNICATION SERVICES US
VERRA MOBILITY CORP 0.0092511U102 COMMON STOCK 6,178 95,82215.51INFORMATION TECHNOLOGY US
VERTEX PHARMACEUTICALS INC 0.0192532F100 COMMON STOCK 1,057 211,762200.29HEALTH CARE US
VIA S/A 0.00BKSF0G2 COMMON STOCK 7,328 14,8722.03CONSUMER DISCRETIONARY BR
VIACOMCBS INC - CLASS B 0.0592556H206 COMMON STOCK 21,442 888,76141.45COMMUNICATION SERVICES US
VIATRIS INC 0.0192556V106 COMMON STOCK 9,536 139,50514.63HEALTH CARE US
VIAVI SOLUTIONS INC 0.01925550105 COMMON STOCK 12,122 197,46616.29INFORMATION TECHNOLOGY US
VICINITY CENTRES 0.01BY7QXS7 REAL ESTATE INVESTMENT TRUST 82,870 104,7781.26REAL ESTATE AU
VICTORIA'S SECRET & CO 0.00926400102 COMMON STOCK 1,087 72,09266.30CONSUMER DISCRETIONARY US
VIFOR PHARMA AG 0.01BZ12TW4 COMMON STOCK 962 136,871142.35HEALTH CARE CH
VINDA INTERNATIONAL HOLDINGS 0.00B1Z7648 COMMON STOCK 303 8922.94CONSUMER STAPLES HK
VIPSHOP HOLDINGS LTD - ADR 0.0092763W103
AMERICAN DEPOSITORY RECEIPT 3,694 54,63914.79CONSUMER DISCRETIONARY CN
VISA INC 0.0592826CAD4
CORPORATE BOND 875,000 961,167109.17US
VISA INC 0.0192826CAE2
CORPORATE BOND 125,000 154,082123.27US
VISA INC 0.0192826CAG7
CORPORATE BOND 125,000 127,265101.81US
VISHAY INTERTECHNOLOGY INC 0.00928298108 COMMON STOCK 3,705 81,40021.97INFORMATION TECHNOLOGY US
VISHAY PRECISION GROUP 0.0192835K103 COMMON STOCK 2,743 102,51537.37INFORMATION TECHNOLOGY US
VIVENDI SE 0.014834777 COMMON STOCK 5,800 221,28638.15COMMUNICATION SERVICES FR
VODACOM GROUP LTD 0.00B65B4D0 COMMON STOCK 7,329 72,7819.93COMMUNICATION SERVICES ZA
VODAFONE GROUP PLC 0.00BH4HKS3 COMMON STOCK 51,806 86,9551.68COMMUNICATION SERVICES GB
VOLKSWAGEN AG 0.005497102 COMMON STOCK 258 86,306334.31CONSUMER DISCRETIONARY DE
VONAGE HOLDINGS CORP 0.0292886T201 COMMON STOCK 21,643 305,16314.10INFORMATION TECHNOLOGY US
VONOVIA SE 0.01BBJPFY1 COMMON STOCK 1,909 128,83267.47REAL ESTATE DE
VOPAK 0.005809428 COMMON STOCK 1,423 61,60343.29ENERGY NL
VTB BANK PJSC 0.00B5B1TP4 COMMON STOCK 66,190,124 47,8770.00FINANCIALS RU
VULCAN MATERIALS CO 0.01929160109 COMMON STOCK 1,344 249,961185.93MATERIALS US
WAL-MART STORES INC 0.02931142BF9 CORPORATE BOND 250,000 366,630146.32US
WALGREENS BOOTS ALLIANCE INC 0.01931427108 COMMON STOCK 5,417 274,89950.75CONSUMER STAPLES US
Security NameSecurityWeight
HOLDINGS 30 DAY LAG
SecurityIdentifier Security Type Units Held
Base MarketValueBase PriceSector Country
Risk Parity Multi-Asset GT
USDBase Currency:
Market Value: 1,961,759,259
August 31, 2021
77

WALMART DE MEXICO SAB DE CV 0.01BW1YVH8 COMMON STOCK 46,559 166,0263.57CONSUMER STAPLES MX
WALMART DE MEXICO SAB DE CV 0.00BW1YVH8 COMMON STOCK 3,128 11,1533.57CONSUMER STAPLES MX
WALMART INC 0.02931142103 COMMON STOCK 2,496 369,724148.10CONSUMER STAPLES US
WALSIN TECHNOLOGY CORP 0.006089694 COMMON STOCK 2,436 15,8666.51INFORMATION TECHNOLOGY TW
WALT DISNEY CO/THE 0.02254687106 COMMON STOCK 2,013 365,026181.30COMMUNICATION SERVICES US
WARTSILA OYJ ABP 0.014525189 COMMON STOCK 8,176 115,85914.17INDUSTRIALS FI
WASHINGTON H. SOUL PATTINSON 0.016821807 COMMON STOCK 3,875 101,45026.18ENERGY AU
WASHINGTON REIT 0.00939653101 REAL ESTATE INVESTMENT TRUST 1,264 31,77825.14REAL ESTATE US
WATERS CORP 0.01941848103 COMMON STOCK 414 171,320414.02HEALTH CARE US
WATERSTONE FINANCIAL INC 0.0194188P101 COMMON STOCK 7,630 154,74220.28FINANCIALS US
WATTS WATER TECHNOLOGIES-A 0.01942749102 COMMON STOCK 1,529 262,374171.57INDUSTRIALS US
WD-40 CO 0.00929236107 COMMON STOCK 48 11,512239.63CONSUMER STAPLES US
WEC ENERGY GROUP INC 0.0392939U106 COMMON STOCK 5,701 538,63994.48UTILITIES US
WEG SA 0.002945422 COMMON STOCK 4,468 31,0366.95INDUSTRIALS BR
WEG SA 0.002945422 COMMON STOCK 1,364 9,4726.95INDUSTRIALS BR
WEIBO CORP-SPON ADR 0.00948596101 AMERICAN DEPOSITORY RECEIPT 923 46,63750.52COMMUNICATION SERVICES CN
WEICHAI POWER CO LTD-A 0.00BD5CQ03 COMMON STOCK 24,575 76,3133.11INDUSTRIALS CN
WEICHAI POWER CO LTD-H 0.006743956 COMMON STOCK 28,063 70,7952.52INDUSTRIALS CN
WEIFU HIGH-TECHNOLOGY GRP-A 0.01BD5CJP9 COMMON STOCK 42,979 154,0093.58CONSUMER DISCRETIONARY CN
WEIFU HIGH-TECHNOLOGY GRP-A 0.00BD5CJP9 COMMON STOCK 12,868 46,1123.58CONSUMER DISCRETIONARY CN
WEIMOB INC 0.00BGHWHF4 COMMON STOCK 19,660 28,7171.46INFORMATION TECHNOLOGY CN
WEIS MARKETS INC 0.01948849104 COMMON STOCK 2,601 148,13556.95CONSUMER STAPLES US
WELCIA HOLDINGS CO LTD 0.01B3CF1G6 COMMON STOCK 5,382 190,33435.36CONSUMER STAPLES JP
WELLS FARGO BANK NA 0.0794988J5R4 CORPORATE BOND 1,375,000 1,460,124106.02US
WELLS FARGO BANK NA 0.0294988J5T0 CORPORATE BOND 375,000 376,810100.48US
WERNER ENTERPRISES INC 0.01950755108 COMMON STOCK 3,523 166,13947.16INDUSTRIALS US
WEST JAPAN RAILWAY CO 0.006957995 COMMON STOCK 1,095 59,94654.76INDUSTRIALS JP
WEST PHARMACEUTICAL SERVICES 0.02955306105 COMMON STOCK 719 324,774451.62HEALTH CARE US
WESTAMERICA BANCORPORATION 0.01957090103 COMMON STOCK 2,430 137,87856.74FINANCIALS US
WESTERN DIGITAL CORP 0.01958102105 COMMON STOCK 2,162 136,63563.20INFORMATION TECHNOLOGY US
WESTERN UNION CO 0.01959802109 COMMON STOCK 10,333 223,60721.64INFORMATION TECHNOLOGY US
WESTON (GEORGE) LTD 0.01961148509 COMMON STOCK 1,627 175,154107.62CONSUMER STAPLES CA
WESTPAC BANKING CORP 0.016076146 COMMON STOCK 6,999 132,07118.87FINANCIALS AU
WESTPORTS HOLDINGS BHD 0.00BDFM1K8 COMMON STOCK 39,142 41,4301.06INDUSTRIALS MY
Security NameSecurityWeight
HOLDINGS 30 DAY LAG
SecurityIdentifier Security Type Units Held
Base MarketValueBase PriceSector Country
Risk Parity Multi-Asset GT
USDBase Currency:
Market Value: 1,961,759,259
August 31, 2021
78

WESTPORTS HOLDINGS BHD 0.00BDFM1K8 COMMON STOCK 3,485 3,6891.06INDUSTRIALS MY
WESTROCK CO 0.0196145D105 COMMON STOCK 4,846 252,19452.04MATERIALS US
WH GROUP LTD 0.01BLLHKZ1 COMMON STOCK 189,748 164,6830.87CONSUMER STAPLES HK
WHARF REAL ESTATE INVESTMENT 0.00BF0GWS4 COMMON STOCK 19,157 94,9574.96REAL ESTATE HK
WHEAT FUTURES(CBT) DEC 2021 0.68WDEC2021 WHEAT FUTURES(CBT) 369 13,325,513722.25US
WHEATON PRECIOUS METALS CORP 0.01962879102 COMMON STOCK 3,320 149,37445.00MATERIALS CA
WHIRLPOOL CORP 0.02963320106 COMMON STOCK 1,376 304,888221.53CONSUMER DISCRETIONARY US
WHITBREAD PLC 0.00B1KJJ40 COMMON STOCK 1,852 81,76044.15CONSUMER DISCRETIONARY GB
WILLIAMS COS INC 0.01969457100 COMMON STOCK 11,189 276,25424.69ENERGY US
WILLIS TOWERS WATSON PLC 0.01G96629103 COMMON STOCK 598 131,970220.72FINANCIALS GB
WILMAR INTERNATIONAL LTD 0.01B17KC69 COMMON STOCK 60,874 187,3613.08CONSUMER STAPLES SG
WIN SEMICONDUCTORS CORP 0.00B56LHP5 COMMON STOCK 3,575 42,62911.93INFORMATION TECHNOLOGY TW
WINBOND ELECTRONICS CORP 0.006966515 COMMON STOCK 22,341 23,7811.06INFORMATION TECHNOLOGY TW
WINMARK CORP 0.04974250102 COMMON STOCK 3,867 810,675209.63CONSUMER DISCRETIONARY US
WINNING HEALTH TECHNOLOGY-A 0.00BD5CKZ6 COMMON STOCK 12,323 27,0752.20HEALTH CARE CN
WIPRO LTD-ADR 0.0097651M109 AMERICAN DEPOSITORY RECEIPT 10,172 95,0109.34INFORMATION TECHNOLOGY IN
WISETECH GLOBAL LTD 0.02BZ8GX83 COMMON STOCK 8,483 299,69835.33INFORMATION TECHNOLOGY AU
WISTRON CORP 0.006672481 COMMON STOCK 49,674 49,1120.99INFORMATION TECHNOLOGY TW
WIWYNN CORP 0.00BF4QXG5 COMMON STOCK 730 25,55435.00INFORMATION TECHNOLOGY TW
WIX.COM LTD 0.01M98068105 COMMON STOCK 1,025 227,714222.08INFORMATION TECHNOLOGY IL
WOLTERS KLUWER 0.025671519 COMMON STOCK 2,757 317,034115.00INDUSTRIALS NL
WOODSIDE PETROLEUM LTD 0.006979728 COMMON STOCK 3,457 49,23514.24ENERGY AU
WOOLWORTHS GROUP LTD 0.016981239 COMMON STOCK 7,210 220,01130.51CONSUMER STAPLES AU
WOOLWORTHS HOLDINGS LTD 0.00B06KZ97 COMMON STOCK 7,970 35,0724.40CONSUMER DISCRETIONARY ZA
WORLD BANK 7.625 20230119 0.06459056LD7 CORPORATE BOND 1,125,000 1,250,509110.27US
WORLDLINE SA 0.01BNFWR44 COMMON STOCK 1,222 108,61588.85INFORMATION TECHNOLOGY FR
WORTHINGTON INDUSTRIES 0.00981811102 COMMON STOCK 191 11,07857.95MATERIALS US
WPG HOLDINGS LTD 0.00B0P6L87 COMMON STOCK 34,530 60,3051.75INFORMATION TECHNOLOGY TW
WPG HOLDINGS LTD 0.00B0P6L87 COMMON STOCK 7,149 12,4861.75INFORMATION TECHNOLOGY TW
WPP PLC 0.01B8KF9B4 COMMON STOCK 14,309 193,69313.54COMMUNICATION SERVICES GB
WTI CRUDE FUTURE DEC 2021 0.56CLDEC2021
WTI CRUDE FUTURE 163 11,074,22067.94US
WUHU SANQI INTERACTIVE ENT-A 0.00BD5CMH2 COMMON STOCK 13,580 35,8242.64COMMUNICATION SERVICES CN
WULIANGYE YIBIN CO LTD-A 0.00BD5CPG2 COMMON STOCK 1,340 41,83031.21CONSUMER STAPLES CN
WULIANGYE YIBIN CO LTD-A 0.00BD5CPG2 COMMON STOCK 268 8,36631.21CONSUMER STAPLES CN
Security NameSecurityWeight
HOLDINGS 30 DAY LAG
SecurityIdentifier Security Type Units Held
Base MarketValueBase PriceSector Country
Risk Parity Multi-Asset GT
USDBase Currency:
Market Value: 1,961,759,259
August 31, 2021
79

WUS PRINTED CIRCUIT KUNSHA-A 0.00BD5C7Z5 COMMON STOCK 2,949 5,1061.73INFORMATION TECHNOLOGY CN
WUXI APPTEC CO LTD-H 0.01BGHH0L6 COMMON STOCK 6,627 132,07919.93HEALTH CARE CN
WUXI BIOLOGICS CAYMAN INC 0.00BL6B9P1 COMMON STOCK 2,460 38,08615.48HEALTH CARE CN
WUXI LEAD INTELLIGENT EQUI-A 0.00BD6QWJ5 COMMON STOCK 8,436 97,37011.54INFORMATION TECHNOLOGY CN
WW GRAINGER INC 0.03384802104 COMMON STOCK 1,183 513,091433.70INDUSTRIALS US
X 5 RETAIL GROUP NV-REGS GDR 0.00B07T3T9 GLOBAL DEPOSITORY RECEIPTS 631 20,90233.13CONSUMER STAPLES RU
XCEL ENERGY INC 0.0398389B100 COMMON STOCK 8,819 606,31668.75UTILITIES US
XERO LTD 0.01B8P4LP4 COMMON STOCK 1,617 179,363110.96INFORMATION TECHNOLOGY NZ
XIAMEN C & D INC-A 0.00BP3R6L5 COMMON STOCK 4,379 5,2711.20INDUSTRIALS CN
XIAMEN INTRETECH INC-A 0.00BDC41P2 COMMON STOCK 14,432 71,3674.94CONSUMER DISCRETIONARY CN
XILINX INC 0.01983919101 COMMON STOCK 1,629 253,418155.59INFORMATION TECHNOLOGY US
XINJIANG GOLDWIND SCI&TEC-H 0.00B59GZJ7 COMMON STOCK 47,542 90,8371.91INDUSTRIALS CN
XINYI GLASS HOLDINGS LTD 0.01B05NXN7 COMMON STOCK 40,139 168,7654.20INDUSTRIALS HK
XINYI SOLAR HOLDINGS LTD 0.01BGQYNN1 COMMON STOCK 57,643 139,3382.42INFORMATION TECHNOLOGY CN
XINYI SOLAR HOLDINGS LTD 0.00BGQYNN1 COMMON STOCK 3,202 7,7402.42INFORMATION TECHNOLOGY CN
XPENG INC - ADR 0.0098422D105 AMERICAN DEPOSITORY RECEIPT 959 40,75242.50CONSUMER DISCRETIONARY CN
XYLEM INC 0.0298419M100 COMMON STOCK 2,221 302,771136.31INDUSTRIALS US
YADEA GROUP HOLDINGS LTD 0.00BZ04KX9 COMMON STOCK 23,235 41,2871.78CONSUMER DISCRETIONARY CN
YADEA GROUP HOLDINGS LTD 0.00BZ04KX9 COMMON STOCK 848 1,5071.78CONSUMER DISCRETIONARY CN
YAGEO CORPORATION 0.006984380 COMMON STOCK 736 12,74117.30INFORMATION TECHNOLOGY TW
YAKULT HONSHA CO LTD 0.026985112 COMMON STOCK 8,170 471,49557.71CONSUMER STAPLES JP
YAMADA HOLDINGS CO LTD 0.006985026 COMMON STOCK 21,438 92,3004.31CONSUMER DISCRETIONARY JP
YAMAHA CORP 0.006642387 COMMON STOCK 1,515 89,51359.08CONSUMER DISCRETIONARY JP
YAMANA GOLD INC 0.0198462Y100 COMMON STOCK 23,957 105,6014.41MATERIALS CA
YAMATO HOLDINGS CO LTD 0.006985565 COMMON STOCK 2,828 72,07625.49INDUSTRIALS JP
YANBU NATIONAL PETROCHEMICAL 0.00B128CF7 COMMON STOCK 41 74318.08MATERIALS SA
YANG MING MARINE TRANSPORT 0.006987583 COMMON STOCK 1,196 5,7604.82INDUSTRIALS TW
YANTAI JEREH OILFIELD-A 0.00BD5CMC7 COMMON STOCK 16,264 92,7565.70ENERGY CN
YANZHOU COAL MINING CO-A 0.04BP3R5S5 COMMON STOCK 182,278 720,0083.95ENERGY CN
YANZHOU COAL MINING CO-A 0.00BP3R5S5 COMMON STOCK 536 2,1183.95ENERGY CN
YANZHOU COAL MINING CO-H 0.036109893 COMMON STOCK 355,669 621,0331.75ENERGY CN
YARA INTERNATIONAL ASA 0.007751259 COMMON STOCK 1,817 91,13850.15MATERIALS NO
YEALINK NETWORK TECHNOLOGY-A 0.00BFCCR07 COMMON STOCK 4,427 58,90713.31INFORMATION TECHNOLOGY CN
YIHAI INTERNATIONAL HOLDING 0.00BD9GZX7 COMMON STOCK 1,787 9,6525.40CONSUMER STAPLES CN
Security NameSecurityWeight
HOLDINGS 30 DAY LAG
SecurityIdentifier Security Type Units Held
Base MarketValueBase PriceSector Country
Risk Parity Multi-Asset GT
USDBase Currency:
Market Value: 1,961,759,259
August 31, 2021
80

YINTAI GOLD CO LTD-A 0.00BD5CF40 COMMON STOCK 39,308 53,8851.37MATERIALS CN
YOKOGAWA ELECTRIC CORP 0.006986427 COMMON STOCK 3,558 55,79915.68INFORMATION TECHNOLOGY JP
YONGHUI SUPERSTORES CO LTD-A 0.00BP3R5Q3 COMMON STOCK 122,697 72,3290.59CONSUMER STAPLES CN
YORK WATER CO 0.04987184108 COMMON STOCK 15,896 819,75951.57UTILITIES US
YOUNGOR GROUP CO-A 0.00BP3R6R1 COMMON STOCK 4,826 4,8231.00REAL ESTATE CN
YUANTA FINANCIAL HOLDING CO 0.006424110 COMMON STOCK 64,675 58,3420.90FINANCIALS TW
YUANTA FINANCIAL HOLDING CO 0.006424110 COMMON STOCK 894 8060.90FINANCIALS TW
YUEXIU PROPERTY CO LTD 0.00BNR5PB4 COMMON STOCK 1,072 1,0050.94REAL ESTATE HK
YUHAN CORP 0.006988337 COMMON STOCK 1,060 57,13253.90HEALTH CARE KR
YUM CHINA HOLDINGS INC 0.0098850P109 COMMON STOCK 233 14,35861.56CONSUMER DISCRETIONARY CN
YUM! BRANDS INC 0.01988498101 COMMON STOCK 1,351 176,990131.03CONSUMER DISCRETIONARY US
YUNNAN BAIYAO GROUP CO LTD-A 0.00BD5CP95 COMMON STOCK 2,055 28,20413.72HEALTH CARE CN
Z HOLDINGS CORP 0.016084848 COMMON STOCK 27,185 177,4236.53COMMUNICATION SERVICES JP
ZAI LAB LTD-ADR 0.0198887Q104 AMERICAN DEPOSITORY RECEIPT 747 107,954144.50HEALTH CARE CN
ZHANGZHOU PIENTZEHUANG PHA-A 0.00BP3R7Z6 COMMON STOCK 89 4,79953.70HEALTH CARE CN
ZHAOJIN MINING INDUSTRY - H 0.00B1H5082 COMMON STOCK 90,705 74,1750.82MATERIALS CN
ZHEJIANG CENTURY HUATONG -A 0.01BD5CG58 COMMON STOCK 109,024 105,4280.97COMMUNICATION SERVICES CN
ZHEJIANG DAHUA TECHNOLOGY-A 0.01BD5CNJ1 COMMON STOCK 33,154 118,0853.56INFORMATION TECHNOLOGY CN
ZHEJIANG EXPRESSWAY CO-H 0.016990763 COMMON STOCK 116,173 101,8730.88INDUSTRIALS CN
ZHEJIANG SANHUA INTELLIGEN-A 0.00BD5CDC4 COMMON STOCK 179 6983.91INDUSTRIALS CN
ZHEJIANG SEMIR GARMENT CO-A 0.00BD5CM83 COMMON STOCK 53,082 77,6951.46CONSUMER DISCRETIONARY CN
ZHEJIANG WEIXING NEW BUILD-A 0.01BD5LYB7 COMMON STOCK 34,673 106,0073.06INDUSTRIALS CN
ZHEN DING TECHNOLOGY HOLDING 0.00B734XQ4 COMMON STOCK 12,046 43,1633.58INFORMATION TECHNOLOGY TW
ZHENRO PROPERTIES GROUP LTD 0.00BDRHD05 COMMON STOCK 112,599 65,7290.58REAL ESTATE CN
ZHONGJIN GOLD CORP-A 0.01BP3R585 COMMON STOCK 97,139 131,3581.35MATERIALS CN
ZHONGSHENG GROUP HOLDINGS 0.00B633D97 COMMON STOCK 8,490 70,9538.36CONSUMER DISCRETIONARY CN
ZHONGSHENG GROUP HOLDINGS 0.00B633D97 COMMON STOCK 447 3,7348.36CONSUMER DISCRETIONARY CN
ZIFF DAVIS INC 0.0148123V102 COMMON STOCK 1,496 206,031137.70INFORMATION TECHNOLOGY US
ZIJIN MINING GROUP CO LTD-A 0.00BP3R400 COMMON STOCK 4,289 7,3731.72MATERIALS CN
ZIJIN MINING GROUP CO LTD-H 0.006725299 COMMON STOCK 5,362 7,6391.42MATERIALS CN
ZIMMER BIOMET HOLDINGS INC 0.0198956P102 COMMON STOCK 944 142,064150.45HEALTH CARE US
ZIONS BANCORP NA 0.01989701107 COMMON STOCK 2,534 146,70857.90FINANCIALS US
ZOETIS INC 0.0198978V103 COMMON STOCK 571 116,901204.56HEALTH CARE US
ZOOMLION HEAVY INDUSTRY - H 0.00B544N70 COMMON STOCK 84,002 80,0350.95INDUSTRIALS CN
Security NameSecurityWeight
HOLDINGS 30 DAY LAG
SecurityIdentifier Security Type Units Held
Base MarketValueBase PriceSector Country
Risk Parity Multi-Asset GT
USDBase Currency:
Market Value: 1,961,759,259
August 31, 2021
81
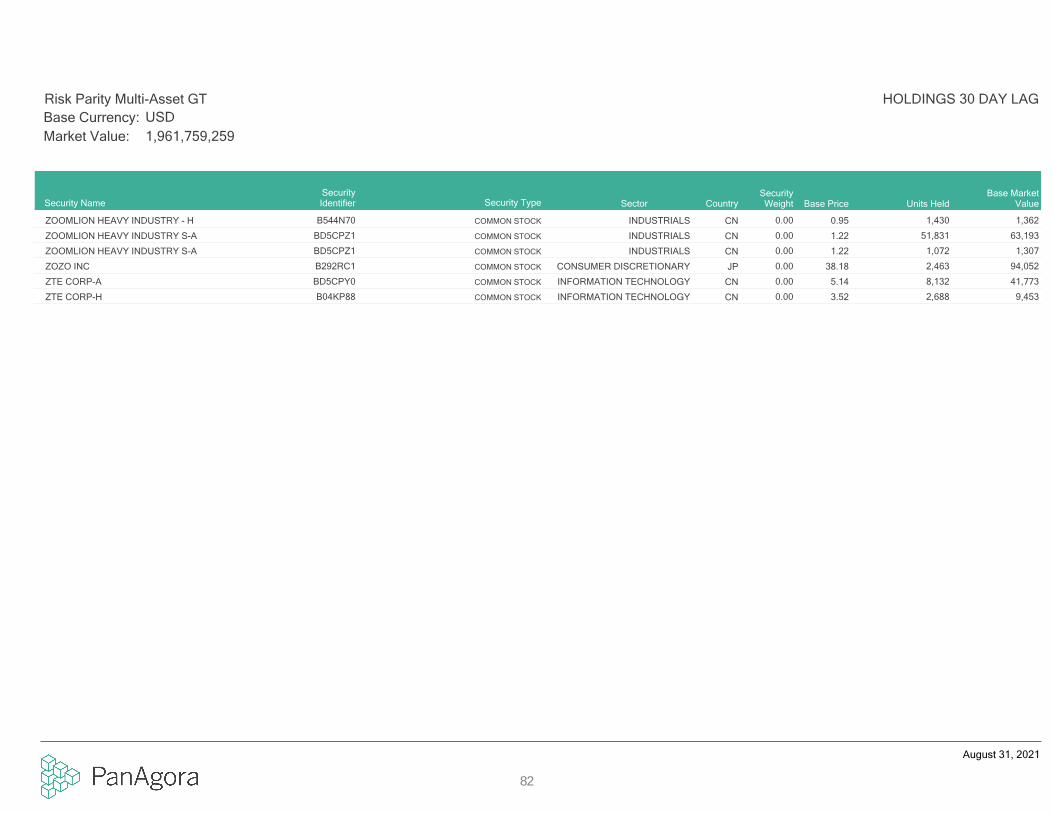
ZOOMLION HEAVY INDUSTRY - H 0.00B544N70 COMMON STOCK 1,430 1,3620.95INDUSTRIALS CN
ZOOMLION HEAVY INDUSTRY S-A 0.00BD5CPZ1 COMMON STOCK 51,831 63,1931.22INDUSTRIALS CN
ZOOMLION HEAVY INDUSTRY S-A 0.00BD5CPZ1 COMMON STOCK 1,072 1,3071.22INDUSTRIALS CN
ZOZO INC 0.00B292RC1 COMMON STOCK 2,463 94,05238.18CONSUMER DISCRETIONARY JP
ZTE CORP-A 0.00BD5CPY0 COMMON STOCK 8,132 41,7735.14INFORMATION TECHNOLOGY CN
ZTE CORP-H 0.00B04KP88 COMMON STOCK 2,688 9,4533.52INFORMATION TECHNOLOGY CN
Security NameSecurityWeight
HOLDINGS 30 DAY LAG
SecurityIdentifier Security Type Units Held
Base MarketValueBase PriceSector Country
Risk Parity Multi-Asset GT
USDBase Currency:
Market Value: 1,961,759,259
August 31, 2021
82

Trade Secrets are considered by PanAgora to be confidential, and are not subject to disclosure under any federal or state freedom of information law or regulation. A “Trade Secret” is generally regarded as:1. information used in a company's business that is not known or available to the public,2. information the provides the company with an economic advantage over its competitors in the marketplace3. information that the company actively protects from disclosure through reasonable efforts to maintain its status as a "secret".
The information provided is only available to those who PanAgora has deemed appropriate to receive this material, and is not available to the public. PanAgora believes that information pertaining its proprietary investmentstrategies, processes, and holdings are commercially valuable and a result of PanAgora’s exhaustive research. As the recipient of this material, you agree not to disclose information provided to any third parties, or to anyemployees, representatives, consultants, or agents, except those who have a need to know with respect to an investment, or prospective investment, with PanAgora.
DISCLOSURES
83
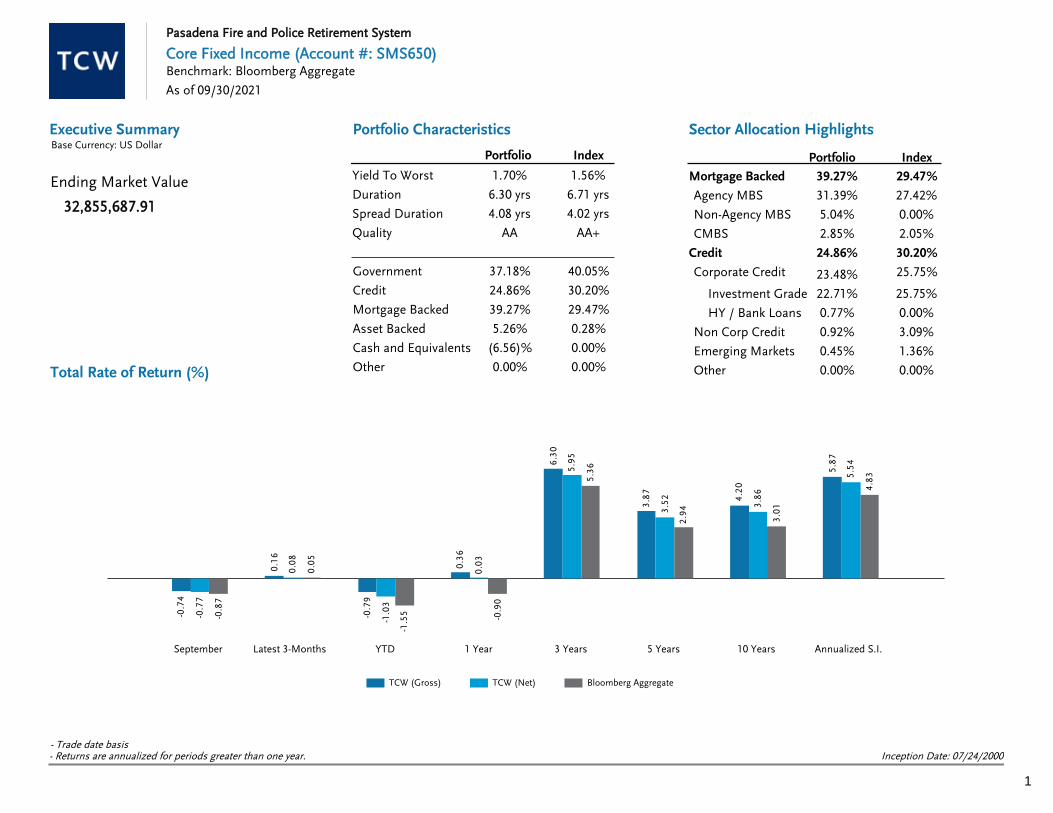
Executive SummaryBase Currency: US Dollar
Portfolio Characteristics
Total Rate of Return (%)
Sector Allocation Highlights
-0.7
4
0.1
6
-0.7
9
0.3
6
6.3
0
3.8
7
4.2
0
5.8
7
-0.7
7
0.0
8
-1.0
3
0.0
3
5.9
5
3.5
2
3.8
6
5.5
4
-0.8
7
0.0
5
-1.5
5 -0.9
0
5.3
6
2.9
4
3.0
1
4.8
3
September Latest 3-Months YTD 1 Year 3 Years 5 Years 10 Years Annualized S.I.
TCW (Gross) TCW (Net) Bloomberg Aggregate
IndexPortfolio
Yield To Worst 1.70% 1.56%
Duration 6.30 yrs 6.71 yrs
Spread Duration 4.08 yrs 4.02 yrs
Quality AA AA+
Portfolio Index
Mortgage Backed 39.27% 29.47%
Agency MBS 31.39% 27.42%
Non-Agency MBS 5.04% 0.00%
CMBS 2.85% 2.05%
Credit 24.86% 30.20%
23.48% 25.75%Corporate Credit
Investment Grade 22.71% 25.75%
HY / Bank Loans 0.77% 0.00%
Non Corp Credit 0.92% 3.09%
Emerging Markets 0.45% 1.36%
Other 0.00% 0.00%
32,855,687.91
Ending Market Value
37.18%Government 40.05%
24.86%Credit 30.20%
39.27%Mortgage Backed 29.47%
5.26%Asset Backed 0.28%
(6.56)%Cash and Equivalents 0.00%
0.00%Other 0.00%
Pasadena Fire and Police Retirement System
As of 09/30/2021
Core Fixed Income (Account #: SMS650)Benchmark: Bloomberg Aggregate
Inception Date: 07/24/2000- Trade date basis- Returns are annualized for periods greater than one year.
1

Duration BreakdownQuality Breakdown
Maturity BreakdownBase Currency: US Dollar
Characteristics Summary
IndexPortfolio
Yield to Worst 1.70% 1.56%
Spread Duration 4.08 yrs 4.02 yrs
Effective Duration 6.30 yrs 6.71 yrs
Duration Difference -0.41 yrs
Average Maturity 8.39 yrs 8.55 yrs
Average Credit Quality AA AA+
Average Coupon 2.17% 2.48%
Current Yield 2.11% 2.35%
Average Convexity 0.12 yrs 0.33 yrs
Index
Market Value %
PortfolioMarket Value Portfolio Index
Duration %
-980,5350 - 1 Years -2.98% 0.26% 0.62% 0.04%
7,812,0981 -3 Years 23.78% 19.57% 6.02% 5.70%
9,078,2573 -5 Years 27.63% 22.01% 17.38% 12.17%
4,242,8685 -7 Years 12.91% 22.15% 7.91% 16.49%
7,347,6807 - 10 Years 22.36% 16.67% 21.86% 17.78%
1,839,15710 - 20 Years 5.60% 6.24% 10.70% 11.99%
3,516,16320+ Years 10.70% 13.09% 35.50% 35.84%
TOTAL 32,855,688 100%100% 100% 100%
Index
Market Value %
PortfolioMarket Value Portfolio Index
Duration %
70,966< 0 Yrs 0.22% 0.00% 0.00% 0.00%
1,687,1000 - 1 Yrs 5.13% 0.30% 0.83% 0.03%
6,178,7381 - 2 Yrs 18.81% 10.61% 5.04% 2.42%
1,428,1232 - 3 Yrs 4.35% 11.73% 1.79% 4.43%
10,254,5353 - 5 Yrs 31.21% 29.13% 21.55% 17.14%
6,463,9975 - 7 Yrs 19.67% 21.08% 18.78% 18.71%
2,023,7437 - 10 Yrs 6.16% 8.60% 8.53% 10.49%
4,748,48610+ Yrs 14.45% 18.53% 43.49% 46.77%
TOTAL 32,855,688 100%100% 100% 100%
Index
Market Value %
PortfolioMarket Value Portfolio Index
Duration %
22,759,045AAA 69.27% 71.25% 70.52% 63.33%
932,316AA 2.84% 3.32% 3.97% 4.19%
3,142,242A 9.56% 11.30% 6.19% 14.18%
5,143,211BBB 15.65% 14.13% 17.81% 18.30%
350,802BB 1.07% 0.00% 1.47% 0.00%
430,683B 1.31% 0.00% 0.04% 0.00%
97,388CCC & Below 0.30% 0.00% 0.01% 0.00%
0Not Rated 0.00% 0.00% 0.00% 0.00%
TOTAL 32,855,688 100%100% 100% 100%
Pasadena Fire and Police Retirement System
Core Fixed Income (Account #: SMS650)
As of 09/30/2021
Benchmark: Bloomberg Aggregate
All market values include accrued interestAll securities unrated by NRSROs will defer to the manager determined rating where applicable and permitted 2

Base Currency: US Dollar
Sector Allocations
Market Value Portfolio Index
% Market Value
Portfolio Index Portfolio Index
Duration % Duration
Mortgage Backed 39.27%12,902,923 27.51% 20.43%29.47% 4.41 4.65
Agency MBS 10,312,999 31.39% 27.42% 4.96 18.87%4.62 24.72%
0.00ARM 0.00% 0.00%0 0.00%0.00% 0.00
4.62Pass Through 30.66% 24.16%10,074,438 18.87%27.42% 4.96
0.00CMO 0.73% 0.56%238,561 0.00%0.00% 4.85
0.00Other 0.00% 0.00%0 0.00%0.00% 0.00
Non Agency MBS 1,654,412 5.04% 0.00% 0.40 0.00%0.00 0.32%
0.00Prime 0.32% 0.01%104,169 0.00%0.00% 0.20
0.00Alt-A 1.21% 0.14%398,086 0.00%0.00% 0.71
0.00Subprime 1.97% 0.06%648,251 0.00%0.00% 0.20
0.00Option ARM 1.39% 0.04%456,654 0.00%0.00% 0.20
0.00Other 0.14% 0.07%47,252 0.00%0.00% 2.95
CMBS 935,512 2.85% 2.05% 5.46 1.56%5.11 2.47%
5.78Agency CMBS 0.70% 1.08%231,290 0.78%0.90% 9.64
4.59Non Agency CMBS 2.14% 1.39%704,221 0.78%1.15% 4.09
Other 0 0.00% 0.00% 0.00 0.00%0.00 0.00%
Asset Backed 5.26%1,728,711 0.50% 0.09%0.28% 0.59 2.26
0.00Student Loan 2.30% 0.04%755,428 0.00%0.00% 0.12
0.00CLO 2.26% 0.05%741,840 0.00%0.00% 0.14
1.93Automobile 0.00% 0.00%0 0.05%0.18% 0.00
3.29Credit Card 0.00% 0.00%0 0.03%0.06% 0.00
2.24Other 0.70% 0.40%231,443 0.01%0.03% 3.59
Other 0.00%0 1.34% 0.00%0.00% 7.15 0.00
0.00Futures 0.00% 1.34%0 0.00%0.00% 7.15
0.00Swaps and Options 0.00% 0.00%0 0.00%0.00% 0.00
0.00Other 0.00% 0.00%0 0.00%0.00% 0.00
TOTAL ACCOUNT 6.3032,855,688 6.71100% 100% 100% 100%
Market Value Portfolio Index
% Market Value
Portfolio Index Portfolio Index
Duration % Duration
Cash and Equivalents (6.56)%(2,156,563) 0.51% 0.00%0.00% 0.25 0.00
0.00Cash (20.12)% (0.03)%(6,612,144) 0.00%0.00% 0.00
0.00T-Bill 13.44% 0.54%4,414,581 0.00%0.00% 0.25
0.00Agency Discount Note 0.00% 0.00%0 0.00%0.00% 0.00
0.00UST Cash Equivalent 0.00% 0.00%0 0.00%0.00% 0.00
0.00TIPS Cash Equivalent 0.00% 0.00%0 0.00%0.00% 0.00
0.00Agency Cash Equiv 0.00% 0.00%0 0.00%0.00% 0.00
0.00Other Cash Equiv 0.12% 0.00%41,000 0.00%0.00% 0.01
Government 37.18%12,214,150 40.70% 41.51%40.05% 6.90 6.95
7.06U.S. Treasury 36.93% 39.57%12,133,523 40.50%38.52% 6.75
0.00U.S. TIPs 0.25% 1.13%80,626 0.00%0.00% 28.90
3.89U.S. Agency 0.00% 0.00%0 0.79%1.36% 0.00
8.37Dev Mkts Sovereigns 0.00% 0.00%0 0.22%0.18% 0.00
Credit 24.86%8,166,468 29.44% 37.97%30.20% 7.46 8.44
23.48% 25.75%7,715,930Corporate Credit 33.42%26.99%7.24 8.71
9.54Industrial 11.37% 16.42%3,734,281 22.04%15.50% 9.10
10.84Utility 1.92% 1.99%630,566 3.44%2.13% 6.52
6.56Financial 10.20% 8.59%3,351,083 7.94%8.12% 5.30
0.92% 3.09%303,862Non Corporate Credit 2.60%1.77%12.06 5.65
4.00Foreign Agency 0.00% 0.00%0 0.41%0.69% 0.00
3.90Supranational 0.00% 0.00%0 0.82%1.42% 0.00
9.34Municipal 0.92% 1.77%303,862 1.37%0.98% 12.06
0.00% 0.00%0Bank Loan 0.00%0.00%0.00 0.00
0.45% 1.36%146,675Emerging Markets 1.95%0.68%9.64 9.63
0.00% 0.00%0Other 0.00%0.00%0.00 0.00
Pasadena Fire and Police Retirement System
Core Fixed Income (Account #: SMS650)
As of 09/30/2021
Benchmark: Bloomberg Aggregate
All market values include accrued interest3

Cusip Security Name Coupon Maturity PriceParOriginal
CostCostPrice Principal Accrued
% ofPortfolio Dur S&PMoodys Fitch
CreditQuality
CASH AND EQUIVALENTS
CASH
USD US DOLLAR (6,612,143.80)1.000 (6,612,143.80) 0.00 (20.12)% 0.01 AAA
TOTAL CASH (6,612,143.80) (6,612,143.80) 0.00 (20.12)% 0.00
T-BILL
912796M22 US CASH MGMT BILL10/5/2021
0.000 10/05/21 100.000225,000.00 224,981.4199.992 224,999.56 0.00 0.68% 0.01 AAA Aaa AA+ AAA
912796P60 US CASH MGMT BILL12/14/2021
0.000 12/14/21 99.995710,000.00 709,925.7999.990 709,966.42 0.00 2.16% 0.21 AAA Aaa AA+ AAA
912796P78 US CASH MGMT BILL12/21/2021
0.000 12/21/21 99.996165,000.00 164,977.0999.986 164,992.58 0.00 0.50% 0.23 AAA Aaa AA+ AAA
912796K65 US TREASURY BILL1/6/2022
0.000 01/06/22 99.992155,000.00 154,973.1099.983 154,987.49 0.00 0.47% 0.27 AAA Aaa AA+ AAA
9127965G0 US TREASURY BILL12/2/2021
0.000 12/02/21 99.9921,420,000.00 1,419,835.9199.988 1,419,889.95 0.00 4.32% 0.18 AAA Aaa AA+ AAA
912796L72 US TREASURY BILL2/10/2022
0.000 02/10/22 99.9851,630,000.00 1,629,631.5999.977 1,629,760.93 0.00 4.96% 0.37 AAA Aaa AA+ AAA
912796K99 US TREASURY BILL2/3/2022
0.000 02/03/22 99.985110,000.00 109,976.5099.979 109,983.77 0.00 0.33% 0.35 AAA Aaa AA+ AAA
TOTAL T-BILL 4,414,301.39 4,414,580.68 0.00 13.44% 0.25
OTHER CASH EQUIV
FUTURECOL FUTURES USD CASHCOLLATERAL
0.000 01/01/50 100.00041,000.00 41,000.00100.000 41,000.00 0.00 0.12% 0.01 AA
TOTAL OTHER CASH EQUIV 41,000.00 41,000.00 0.00 0.12% 0.01
(2,156,842.41) (2,156,563.12) 0.00 (6.56)%TOTAL CASH AND EQUIVALENTS 0.25
GOVERNMENT
U.S. TREASURY
912810SX7 US TREASURY N/B 2.375 05/15/51 106.657256,000.00 288,458.14112.679 273,042.62 2,296.52 0.84% 21.89 AAA Aaa AA+ AAA
912810SY5 US TREASURY N/B 2.250 05/15/41 103.952373,000.00 400,131.58107.274 387,739.84 3,169.99 1.19% 16.32 AAA Aaa AA+ AAA
Pasadena Fire and Police Retirement System
Core Fixed Income (Account #: SMS650)
As of 09/30/2021
Base Currency: US Dollar
Account Holdings Detail
Benchmark: Bloomberg Aggregate
4

Pasadena Fire and Police Retirement System
Core Fixed Income (Account #: SMS650)
As of 09/30/2021
Base Currency: US Dollar
Account Holdings Detail (continued)
Benchmark: Bloomberg Aggregate
Cusip Security Name Coupon Maturity PriceParOriginal
CostCostPrice Principal Accrued
% ofPortfolio Dur S&PMoodys Fitch
CreditQuality
U.S. TREASURY
912810SZ2 US TREASURY N/B 2.000 08/15/51 98.1731,515,000.00 1,517,941.22100.194 1,487,315.04 3,869.84 4.54% 22.87 AAA Aaa AA+ AAA
91282CCN9 US TREASURY N/B 0.125 07/31/23 99.7952,360,000.00 2,355,849.8699.824 2,355,152.56 497.01 7.17% 1.83 AAA Aaa AA+ AAA
91282CCP4 US TREASURY N/B 0.625 07/31/26 98.409770,000.00 764,850.7899.331 757,745.80 810.80 2.31% 4.78 AAA Aaa AA+ AAA
91282CCS8 US TREASURY N/B 1.250 08/15/31 97.586600,000.00 592,078.8098.680 585,515.63 957.88 1.79% 9.37 AAA Aaa AA+ AAA
91282CCU3 US TREASURY N/B 0.125 08/31/23 99.7421,840,000.00 1,835,636.7299.763 1,835,256.26 196.96 5.59% 1.91 AAA Aaa AA+ AAA
91282CCW9 US TREASURY N/B 0.750 08/31/26 98.9411,235,000.00 1,230,482.7799.634 1,221,926.36 793.20 3.72% 4.85 AAA Aaa AA+ AAA
91282CCZ2 US TREASURY N/B 0.875 09/30/26 99.4742,094,000.00 2,082,869.7499.469 2,082,977.08 50.34 6.34% 4.92 AAA Aaa AA+ AAA
91282CDA6 US TREASURY N/B 0.250 09/30/23 99.9301,135,000.00 1,133,816.2999.896 1,134,201.96 7.80 3.45% 1.99 AAA Aaa AA+ AAA
TOTAL U.S. TREASURY 12,202,115.90 12,120,873.15 12,650.34 36.93% 6.75
U.S. TIPS
912810SV1 TSY INFL IX N/B 0.125 02/15/51 109.84473,390.10 82,264.46113.045 80,614.32 11.72 0.25% 28.90 AAA Aaa AA+ AAA
TOTAL U.S. TIPS 82,264.46 80,614.32 11.72 0.25% 28.90
12,284,380.36 12,201,487.47 12,662.06 37.18%TOTAL GOVERNMENT 6.90
CREDIT
CORPORATE CREDIT
INDUSTRIAL
00287YAR0 ABBVIE INC 4.500 05/14/35 119.66555,000.00 67,468.65122.670 65,815.68 941.88 0.20% 10.33 BBB+ Baa2 BBB+
00287YAW9 ABBVIE INC 4.450 05/14/46 120.39010,000.00 8,761.8087.618 12,039.00 169.35 0.04% 15.85 BBB+ Baa2 BBB+
00287YCA5 ABBVIE INC 4.050 11/21/39 115.00110,000.00 11,016.10110.161 11,500.10 146.25 0.04% 13.25 BBB+ Baa2 BBB+
00287YDA4 ABBVIE INC 4.850 06/15/44 125.95625,000.00 30,019.50120.078 31,488.98 357.01 0.10% 14.83 BBB+ Baa2 BBB+
023135CA2 AMAZON.COM INC 2.875 05/12/41 103.27935,000.00 34,405.3598.301 36,147.79 388.52 0.11% 15.20 AA- A1 AA AA-
03522AAH3 ANHEUSER-BUSCHCO/INBEV
4.700 02/01/36 121.01513,000.00 14,849.64114.228 15,731.95 101.83 0.05% 10.74 BBB+ Baa1 BBB+ BBB
03522AAJ9 ANHEUSER-BUSCHCO/INBEV
4.900 02/01/46 123.10970,000.00 89,035.10127.193 86,176.53 571.67 0.26% 15.33 BBB+ Baa1 BBB+ BBB
037833AL4 APPLE INC 3.850 05/04/43 116.0085,000.00 5,867.80117.356 5,800.41 78.60 0.02% 15.40 AA+ Aa1 AA+
5
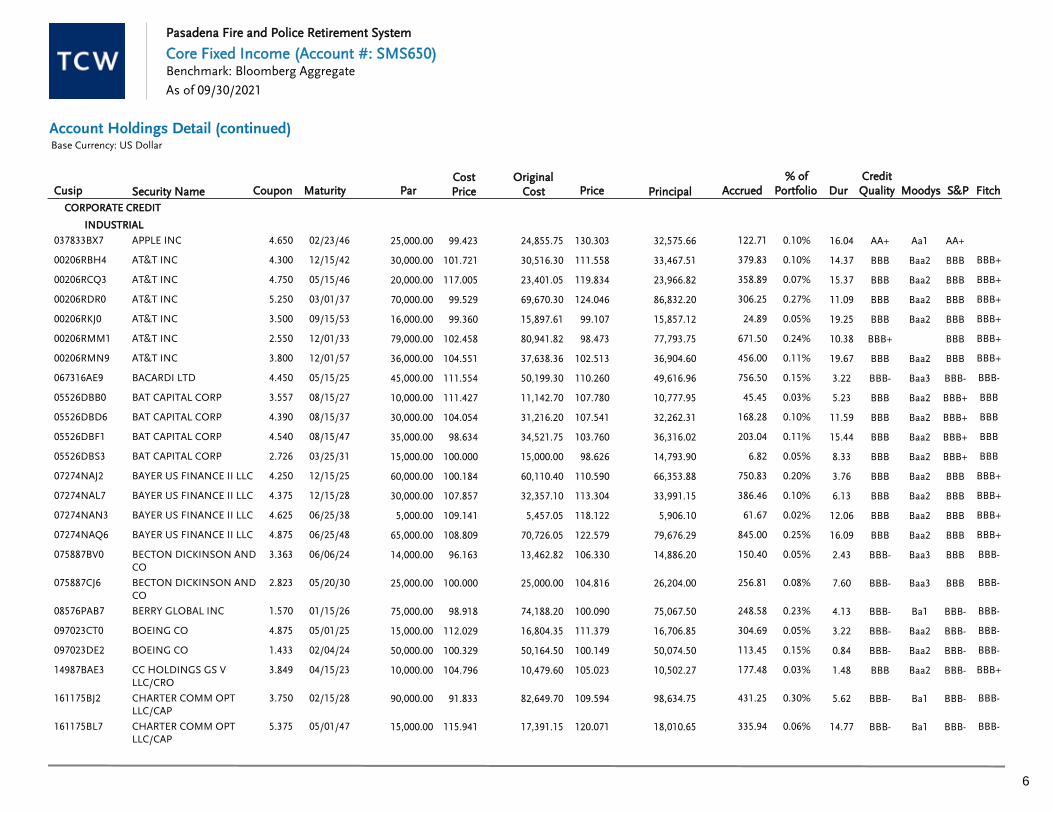
Pasadena Fire and Police Retirement System
Core Fixed Income (Account #: SMS650)
As of 09/30/2021
Base Currency: US Dollar
Account Holdings Detail (continued)
Benchmark: Bloomberg Aggregate
Cusip Security Name Coupon Maturity PriceParOriginal
CostCostPrice Principal Accrued
% ofPortfolio Dur S&PMoodys Fitch
CreditQuality
CORPORATE CREDIT
INDUSTRIAL
037833BX7 APPLE INC 4.650 02/23/46 130.30325,000.00 24,855.7599.423 32,575.66 122.71 0.10% 16.04 AA+ Aa1 AA+
00206RBH4 AT&T INC 4.300 12/15/42 111.55830,000.00 30,516.30101.721 33,467.51 379.83 0.10% 14.37 BBB Baa2 BBB BBB+
00206RCQ3 AT&T INC 4.750 05/15/46 119.83420,000.00 23,401.05117.005 23,966.82 358.89 0.07% 15.37 BBB Baa2 BBB BBB+
00206RDR0 AT&T INC 5.250 03/01/37 124.04670,000.00 69,670.3099.529 86,832.20 306.25 0.27% 11.09 BBB Baa2 BBB BBB+
00206RKJ0 AT&T INC 3.500 09/15/53 99.10716,000.00 15,897.6199.360 15,857.12 24.89 0.05% 19.25 BBB Baa2 BBB BBB+
00206RMM1 AT&T INC 2.550 12/01/33 98.47379,000.00 80,941.82102.458 77,793.75 671.50 0.24% 10.38 BBB+ BBB BBB+
00206RMN9 AT&T INC 3.800 12/01/57 102.51336,000.00 37,638.36104.551 36,904.60 456.00 0.11% 19.67 BBB Baa2 BBB BBB+
067316AE9 BACARDI LTD 4.450 05/15/25 110.26045,000.00 50,199.30111.554 49,616.96 756.50 0.15% 3.22 BBB- Baa3 BBB- BBB-
05526DBB0 BAT CAPITAL CORP 3.557 08/15/27 107.78010,000.00 11,142.70111.427 10,777.95 45.45 0.03% 5.23 BBB Baa2 BBB+ BBB
05526DBD6 BAT CAPITAL CORP 4.390 08/15/37 107.54130,000.00 31,216.20104.054 32,262.31 168.28 0.10% 11.59 BBB Baa2 BBB+ BBB
05526DBF1 BAT CAPITAL CORP 4.540 08/15/47 103.76035,000.00 34,521.7598.634 36,316.02 203.04 0.11% 15.44 BBB Baa2 BBB+ BBB
05526DBS3 BAT CAPITAL CORP 2.726 03/25/31 98.62615,000.00 15,000.00100.000 14,793.90 6.82 0.05% 8.33 BBB Baa2 BBB+ BBB
07274NAJ2 BAYER US FINANCE II LLC 4.250 12/15/25 110.59060,000.00 60,110.40100.184 66,353.88 750.83 0.20% 3.76 BBB Baa2 BBB BBB+
07274NAL7 BAYER US FINANCE II LLC 4.375 12/15/28 113.30430,000.00 32,357.10107.857 33,991.15 386.46 0.10% 6.13 BBB Baa2 BBB BBB+
07274NAN3 BAYER US FINANCE II LLC 4.625 06/25/38 118.1225,000.00 5,457.05109.141 5,906.10 61.67 0.02% 12.06 BBB Baa2 BBB BBB+
07274NAQ6 BAYER US FINANCE II LLC 4.875 06/25/48 122.57965,000.00 70,726.05108.809 79,676.29 845.00 0.25% 16.09 BBB Baa2 BBB BBB+
075887BV0 BECTON DICKINSON ANDCO
3.363 06/06/24 106.33014,000.00 13,462.8296.163 14,886.20 150.40 0.05% 2.43 BBB- Baa3 BBB BBB-
075887CJ6 BECTON DICKINSON ANDCO
2.823 05/20/30 104.81625,000.00 25,000.00100.000 26,204.00 256.81 0.08% 7.60 BBB- Baa3 BBB BBB-
08576PAB7 BERRY GLOBAL INC 1.570 01/15/26 100.09075,000.00 74,188.2098.918 75,067.50 248.58 0.23% 4.13 BBB- Ba1 BBB- BBB-
097023CT0 BOEING CO 4.875 05/01/25 111.37915,000.00 16,804.35112.029 16,706.85 304.69 0.05% 3.22 BBB- Baa2 BBB- BBB-
097023DE2 BOEING CO 1.433 02/04/24 100.14950,000.00 50,164.50100.329 50,074.50 113.45 0.15% 0.84 BBB- Baa2 BBB- BBB-
14987BAE3 CC HOLDINGS GS VLLC/CRO
3.849 04/15/23 105.02310,000.00 10,479.60104.796 10,502.27 177.48 0.03% 1.48 BBB Baa2 BBB- BBB+
161175BJ2 CHARTER COMM OPTLLC/CAP
3.750 02/15/28 109.59490,000.00 82,649.7091.833 98,634.75 431.25 0.30% 5.62 BBB- Ba1 BBB- BBB-
161175BL7 CHARTER COMM OPTLLC/CAP
5.375 05/01/47 120.07115,000.00 17,391.15115.941 18,010.65 335.94 0.06% 14.77 BBB- Ba1 BBB- BBB-
6

Pasadena Fire and Police Retirement System
Core Fixed Income (Account #: SMS650)
As of 09/30/2021
Base Currency: US Dollar
Account Holdings Detail (continued)
Benchmark: Bloomberg Aggregate
Cusip Security Name Coupon Maturity PriceParOriginal
CostCostPrice Principal Accrued
% ofPortfolio Dur S&PMoodys Fitch
CreditQuality
CORPORATE CREDIT
INDUSTRIAL
161175BT0 CHARTER COMM OPTLLC/CAP
4.800 03/01/50 113.45325,000.00 27,626.00110.504 28,363.25 100.00 0.09% 16.34 BBB- Ba1 BBB- BBB-
125523AG5 CIGNA CORP 4.125 11/15/25 111.16590,000.00 89,925.3099.917 100,048.22 1,402.50 0.31% 3.69 BBB+ Baa1 A- BBB
125523CL2 CIGNA CORP 2.400 03/15/30 101.72715,000.00 14,974.8099.832 15,258.98 16.00 0.05% 7.64 BBB+ Baa1 A- BBB
125523CQ1 CIGNA CORP 3.400 03/15/51 103.4385,000.00 5,004.60100.092 5,171.90 7.56 0.02% 18.95 BBB+ Baa1 A- BBB
20268JAB9 COMMONSPIRIT HEALTH 3.347 10/01/29 107.54215,000.00 15,795.27105.302 16,131.31 251.03 0.05% 6.92 BBB+ Baa1 BBB+ BBB+
20268JAF0 COMMONSPIRIT HEALTH 2.782 10/01/30 103.01735,000.00 35,847.65102.422 36,055.95 486.85 0.11% 7.87 BBB+ Baa1 BBB+ BBB+
126650CN8 CVS HEALTH CORP 5.125 07/20/45 129.03725,000.00 28,919.50115.678 32,259.25 252.69 0.10% 15.07 BBB Baa2 BBB
126650CZ1 CVS HEALTH CORP 5.050 03/25/48 129.01270,000.00 74,497.85106.426 90,308.40 58.92 0.28% 16.21 BBB Baa2 BBB
29273RBF5 ENERGY TRANSFER LP 5.150 03/15/45 114.55095,000.00 94,783.4099.772 108,822.07 217.44 0.33% 14.38 BBB- Baa3 BBB- BBB-
29278NAR4 ENERGY TRANSFER LP 5.000 05/15/50 115.58225,000.00 23,761.7595.047 28,895.50 472.22 0.09% 15.98 BBB- Baa3 BBB- BBB-
30231GAZ5 EXXON MOBILCORPORATION
3.095 08/16/49 101.27325,000.00 25,263.95101.056 25,318.25 96.72 0.08% 18.90 AA Aa2 AA-
30231GBF8 EXXON MOBILCORPORATION
4.227 03/19/40 118.8235,000.00 5,000.00100.000 5,941.14 7.05 0.02% 13.50 AA Aa2 AA-
30231GBG6 EXXON MOBILCORPORATION
4.327 03/19/50 122.63830,000.00 30,000.00100.000 36,791.47 43.27 0.11% 17.75 AA Aa2 AA-
345397XA6 FORD MOTOR CREDIT COLLC
3.219 01/09/22 100.37530,000.00 30,248.10100.827 30,112.50 219.97 0.09% 0.27 BB+ Ba2 BB+ BB+
345397YJ6 FORD MOTOR CREDIT COLLC
1.402 03/28/22 100.0785,000.00 4,952.0099.040 5,003.89 0.58 0.02% 0.24 BB+ Ba2 BB+ BB+
345397YP2 FORD MOTOR CREDIT COLLC
1.198 08/03/22 99.95035,000.00 34,686.4099.104 34,982.50 68.70 0.11% 0.08 BB+ Ba2 BB+ BB+
345397ZG1 FORD MOTOR CREDIT COLLC
0.999 10/12/21 100.00130,000.00 29,741.1099.137 30,000.21 67.43 0.09% 0.03 BB+ Ba2 BB+ BB+
345397ZH9 FORD MOTOR CREDIT COLLC
3.813 10/12/21 100.1755,000.00 5,091.90101.838 5,008.75 89.50 0.02% 0.03 BB+ Ba2 BB+ BB+
35805BAC2 FRESENIUS MED CARE III 1.875 12/01/26 100.50135,000.00 35,148.75100.425 35,175.35 242.45 0.11% 4.90 BBB- Baa3 BBB BBB-
37045XAW6 GENERAL MOTORS FINLCO
3.450 04/10/22 101.0785,000.00 5,122.85102.457 5,053.90 81.94 0.02% 0.36 BBB- Baa3 BBB BBB-
37045XBY1 GENERAL MOTORS FINLCO
3.150 06/30/22 101.73930,000.00 30,593.60101.979 30,521.62 238.88 0.09% 0.66 BBB- Baa3 BBB BBB-
37045XCP9 GENERAL MOTORS FINLCO
4.200 11/06/21 100.34050,000.00 51,696.30103.393 50,170.00 845.83 0.16% 0.10 BBB- Baa3 BBB BBB-
7

Pasadena Fire and Police Retirement System
Core Fixed Income (Account #: SMS650)
As of 09/30/2021
Base Currency: US Dollar
Account Holdings Detail (continued)
Benchmark: Bloomberg Aggregate
Cusip Security Name Coupon Maturity PriceParOriginal
CostCostPrice Principal Accrued
% ofPortfolio Dur S&PMoodys Fitch
CreditQuality
CORPORATE CREDIT
INDUSTRIAL37045XCP9 GENERAL MOTORS FINLCO
4.200 11/06/21 100.34050,000.00 51,696.30103.393 50,170.00 845.83 0.16% 0.10 BBB- Baa3 BBB BBB-
37045XCU8 GENERAL MOTORS FINLCO
3.550 07/08/22 102.39415,000.00 15,449.85102.999 15,359.07 122.77 0.05% 0.76 BBB- Baa3 BBB BBB-
375558BV4 GILEAD SCIENCES INC 0.652 09/29/23 100.06095,000.00 95,000.00100.000 95,057.32 3.44 0.29% 0.08 A- A3 BBB+
361841AF6 GLP CAPITAL LP / FIN II 5.375 11/01/23 107.99615,000.00 16,401.15109.341 16,199.40 335.94 0.05% 1.74 BBB- Ba1 BBB- BBB-
361841AH2 GLP CAPITAL LP / FIN II 5.375 04/15/26 113.82050,000.00 51,687.55103.375 56,910.00 1,239.24 0.18% 3.86 BBB- Ba1 BBB- BBB-
361841AL3 GLP CAPITAL LP / FIN II 5.300 01/15/29 116.45550,000.00 52,172.00104.344 58,227.50 559.44 0.18% 6.04 BBB- Ba1 BBB- BBB-
404119BN8 HCA INC 5.000 03/15/24 109.75330,000.00 33,206.75110.689 32,925.90 66.67 0.10% 2.33 BBB- Baa3 BBB- BBB-
404119BQ1 HCA INC 5.250 04/15/25 113.40620,000.00 20,650.00103.250 22,681.25 484.17 0.07% 3.22 BBB- Baa3 BBB- BBB-
404119BT5 HCA INC 5.250 06/15/26 114.83910,000.00 11,445.80114.458 11,483.92 154.58 0.04% 3.88 BBB- Baa3 BBB- BBB-
404119BX6 HCA INC 4.125 06/15/29 111.77249,000.00 54,235.65110.685 54,768.28 595.15 0.17% 6.56 BBB- Baa3 BBB- BBB-
404119BY4 HCA INC 5.125 06/15/39 123.76715,000.00 14,862.9099.086 18,565.05 226.35 0.06% 12.27 BBB- Baa3 BBB- BBB-
404119BZ1 HCA INC 5.250 06/15/49 127.85620,000.00 20,210.40101.052 25,571.18 309.17 0.08% 16.05 BBB- Baa3 BBB- BBB-
404119CC1 HCA INC 2.375 07/15/31 98.37515,000.00 14,835.1598.901 14,756.25 90.05 0.05% 8.67 BBB- Baa3 BBB- BBB-
42809HAD9 HESS CORP 5.600 02/15/41 124.58920,000.00 24,336.80121.684 24,917.80 143.11 0.08% 12.84 BBB- Ba1 BBB- BBB-
44962LAC1 IHS MARKIT LTD 4.000 03/01/26 110.14620,000.00 22,613.00113.065 22,029.20 66.67 0.07% 3.94 BBB Ba1 BBB
44962LAF4 IHS MARKIT LTD 4.750 08/01/28 117.21045,000.00 44,832.6099.628 52,744.50 356.25 0.16% 5.83 BBB Ba1 BBB
44962LAH0 IHS MARKIT LTD 3.625 05/01/24 106.54520,000.00 21,541.40107.707 21,309.00 302.08 0.07% 2.39 BBB Ba1 BBB
45262BAA1 IMPERIAL BRANDS FINPLC
3.125 07/26/24 105.13980,000.00 85,327.20106.659 84,111.20 451.39 0.26% 2.64 BBB Baa3 BBB BBB
458140BW9 INTEL CORP 3.050 08/12/51 100.15646,000.00 45,856.4899.688 46,071.76 190.96 0.14% 19.73 A+ A1 A+ A+
459506AL5 INTL FLAVOR &FRAGRANCES
5.000 09/26/48 129.54440,000.00 42,208.00105.520 51,817.74 27.78 0.16% 16.47 BBB Baa3 BBB BBB
459506AQ4 INTL FLAVOR &FRAGRANCES
2.300 11/01/30 99.21310,000.00 10,040.20100.402 9,921.34 95.83 0.03% 8.11 BBB Baa3 BBB BBB
50076QAE6 KRAFT HEINZ FOODS CO 5.000 06/04/42 122.84710,000.00 10,364.60103.646 12,284.72 162.50 0.04% 13.83 BB+ Baa3 BB+ BB+
50077LAM8 KRAFT HEINZ FOODS CO 5.200 07/15/45 125.46435,000.00 37,700.45107.716 43,912.25 384.22 0.13% 14.81 BB+ Baa3 BB+ BB+
50077LAZ9 KRAFT HEINZ FOODS CO 4.875 10/01/49 121.88635,000.00 34,915.8599.760 42,660.10 853.13 0.13% 16.62 BB+ Baa3 BB+ BB+
527298BP7 LEVEL 3 FINANCING INC 3.400 03/01/27 105.35710,000.00 10,655.40106.554 10,535.70 28.33 0.03% 4.91 BBB- Ba1 BBB- BBB-
8

Pasadena Fire and Police Retirement System
Core Fixed Income (Account #: SMS650)
As of 09/30/2021
Base Currency: US Dollar
Account Holdings Detail (continued)
Benchmark: Bloomberg Aggregate
Cusip Security Name Coupon Maturity PriceParOriginal
CostCostPrice Principal Accrued
% ofPortfolio Dur S&PMoodys Fitch
CreditQuality
CORPORATE CREDIT
INDUSTRIAL
527298BQ5 LEVEL 3 FINANCING INC 3.875 11/15/29 107.05545,000.00 47,731.05106.069 48,174.75 658.75 0.15% 6.89 BBB- Ba1 BBB- BBB-
68389XBX2 ORACLE CORP 3.600 04/01/50 100.32350,000.00 49,827.0099.654 50,161.54 900.00 0.16% 17.99 BBB+ Baa2 BBB+ BBB+
68389XCA1 ORACLE CORP 3.950 03/25/51 106.05750,000.00 49,912.5099.825 53,028.50 32.92 0.16% 17.90 BBB+ Baa2 BBB+ BBB+
761713BA3 REYNOLDS AMERICANINC
5.700 08/15/35 119.91635,000.00 42,020.65120.059 41,970.60 254.92 0.13% 9.89 BBB Baa2 BBB+ BBB
761713BB1 REYNOLDS AMERICANINC
5.850 08/15/45 122.0005,000.00 5,531.60110.632 6,100.00 37.38 0.02% 13.94 BBB Baa2 BBB+ BBB
77340RAM9 ROCKIES EXPRESSPIPELINE
6.875 04/15/40 110.50015,000.00 16,134.90107.566 16,575.00 475.52 0.05% 10.68 BB+ Ba2 BB+ BB+
77340RAR8 ROCKIES EXPRESSPIPELINE
4.950 07/15/29 104.15630,000.00 30,017.10100.057 31,246.80 313.50 0.10% 6.38 BB+ Ba2 BB+ BB+
85208NAD2 SPRINT SPECTRUM / SPECI
4.738 03/20/25 106.92552,500.00 56,628.91107.865 56,135.63 76.01 0.17% 1.63 A A2 BBB+
85208NAE0 SPRINT SPECTRUM / SPECI
5.152 03/20/28 114.405100,000.00 102,000.00102.000 114,405.00 157.42 0.35% 3.74 A A2 BBB+
87264AAX3 T-MOBILE USA INC 4.375 04/15/40 115.33540,000.00 39,210.0098.025 46,133.83 806.94 0.14% 13.07 BBB- Baa3 BBB- BBB-
87264ABD6 T-MOBILE USA INC 3.750 04/15/27 110.22130,000.00 32,856.30109.521 33,066.30 518.75 0.10% 4.92 BBB- Baa3 BBB- BBB-
87264ABF1 T-MOBILE USA INC 3.875 04/15/30 110.46965,000.00 68,787.50105.827 71,805.13 1,161.42 0.22% 7.20 BBB- Baa3 BBB- BBB-
87264ACB9 T-MOBILE USA INC 2.550 02/15/31 100.42212,000.00 12,371.40103.095 12,050.61 39.10 0.04% 8.31 BBB- Baa3 BBB- BBB-
90345WAA2 US AIRWAYS 2012-1A PTT 5.900 10/01/24 105.85697,310.30 92,916.0695.484 103,009.16 2,870.65 0.32% 2.35 BBB+ Ba1 BBB+ A
92343VGJ7 VERIZONCOMMUNICATIONS
2.550 03/21/31 101.46415,000.00 14,980.3599.869 15,219.60 10.63 0.05% 8.41 BBB+ Baa1 BBB+ A-
92343VGM0 VERIZONCOMMUNICATIONS
2.355 03/15/32 99.03360,000.00 60,166.00100.277 59,419.80 43.18 0.18% 9.26 BBB+ Baa1 BBB+ A-
92857WBS8 VODAFONE GROUP PLC 4.875 06/19/49 124.92072,000.00 77,483.28107.616 89,942.02 994.50 0.28% 16.62 BBB Baa2 BBB BBB
254687FZ4 WALT DISNEYCOMPANY/THE
3.600 01/13/51 111.53537,000.00 37,144.16100.390 41,267.85 288.60 0.13% 18.80 A- A2 BBB+ A-
TOTAL INDUSTRIAL 3,470,165.01 3,701,806.29 32,474.75 11.37% 9.10
UTILITY
00115AAH2 AEP TRANSMISSION COLLC
3.750 12/01/47 112.42935,000.00 38,351.95109.577 39,349.96 437.50 0.12% 17.28 A A2 A- A
9

Pasadena Fire and Police Retirement System
Core Fixed Income (Account #: SMS650)
As of 09/30/2021
Base Currency: US Dollar
Account Holdings Detail (continued)
Benchmark: Bloomberg Aggregate
Cusip Security Name Coupon Maturity PriceParOriginal
CostCostPrice Principal Accrued
% ofPortfolio Dur S&PMoodys Fitch
CreditQuality
CORPORATE CREDIT
UTILITY
030288AB0 AMERICANTRANSMISSION SY
5.000 09/01/44 128.88875,000.00 74,255.2599.007 96,665.89 312.50 0.30% 14.94 BBB A3 BB+ BBB
25746UDE6 DOMINION ENERGY INC 3.300 03/15/25 107.07935,000.00 34,944.3599.841 37,477.70 51.33 0.11% 3.24 BBB Baa2 BBB BBB+
26442CAM6 DUKE ENERGY CAROLINAS 4.250 12/15/41 118.97950,000.00 49,936.5099.873 59,489.49 625.69 0.18% 14.24 AA- Aa3 A
26441CBL8 DUKE ENERGY CORP 2.550 06/15/31 101.58760,000.00 59,920.8099.868 60,952.20 471.75 0.19% 8.54 BBB Baa2 BBB
476556DD4 JERSEY CENTRAL PWR & LT 2.750 03/01/32 102.54320,000.00 19,945.2099.726 20,508.60 45.83 0.06% 9.06 BBB A3 BB+ BBB
65339KBT6 NEXTERA ENERGYCAPITAL
0.401 02/22/23 100.01480,000.00 80,000.00100.000 80,011.20 35.62 0.24% 0.08 BBB+ Baa1 BBB+ A-
898813AL4 TUCSON ELECTRIC POWERCO
3.850 03/15/23 103.887225,000.00 224,268.7599.675 233,745.70 385.00 0.71% 1.19 A- A3 A-
TOTAL UTILITY 581,622.80 628,200.75 2,365.23 1.92% 6.52
FINANCIAL
00772BAR2 AERCAP IRELANDCAP/GLOBA
3.950 02/01/22 100.84240,000.00 41,251.60103.129 40,336.89 263.33 0.12% 0.25 BBB- Baa3 BBB BBB-
00774MAD7 AERCAP IRELANDCAP/GLOBA
3.300 01/23/23 103.10420,000.00 20,640.80103.204 20,620.78 124.67 0.06% 1.20 BBB- Baa3 BBB BBB-
00774MAE5 AERCAP IRELANDCAP/GLOBA
3.875 01/23/28 106.82410,000.00 9,393.1093.931 10,682.36 73.19 0.03% 5.53 BBB- Baa3 BBB BBB-
00774MAF2 AERCAP IRELANDCAP/GLOBA
4.125 07/03/23 105.38025,000.00 26,575.00106.300 26,345.00 252.08 0.08% 1.62 BBB- Baa3 BBB BBB-
00912XBE3 AIR LEASE CORP 3.500 01/15/22 100.86845,000.00 44,680.5099.290 45,390.48 332.50 0.14% 0.29 BBB BBB BBB
024836AD0 AMERICAN CAMPUSCMNTYS
3.625 11/15/27 109.51335,000.00 34,969.2099.912 38,329.55 479.31 0.12% 5.39 BBB Baa2 BBB
04685A2X8 ATHENE GLOBALFUNDING
0.750 05/24/24 100.49545,000.00 45,000.00100.000 45,222.75 35.62 0.14% (0.02) A+ A+ A
04685A3C3 ATHENE GLOBALFUNDING
1.985 08/19/28 98.89735,000.00 34,786.8599.391 34,613.95 81.05 0.11% 6.47 A+ A+ A
05401AAF8 AVOLON HOLDINGSFNDG LTD
3.950 07/01/24 106.18910,000.00 10,459.90104.599 10,618.90 98.75 0.03% 2.54 BBB- Baa3 BBB- BBB-
05401AAH4 AVOLON HOLDINGSFNDG LTD
2.875 02/15/25 102.88920,000.00 19,976.2099.881 20,577.80 73.47 0.06% 3.18 BBB- Baa3 BBB- BBB-
05401AAR2 AVOLON HOLDINGSFNDG LTD
2.528 11/18/27 98.43346,000.00 46,386.40100.840 45,279.31 138.90 0.14% 5.66 BBB- Baa3 BBB- BBB-
10

Pasadena Fire and Police Retirement System
Core Fixed Income (Account #: SMS650)
As of 09/30/2021
Base Currency: US Dollar
Account Holdings Detail (continued)
Benchmark: Bloomberg Aggregate
Cusip Security Name Coupon Maturity PriceParOriginal
CostCostPrice Principal Accrued
% ofPortfolio Dur S&PMoodys Fitch
CreditQuality
CORPORATE CREDIT
FINANCIAL
06051GHG7 BANK OF AMERICA CORP 3.970 03/05/29 111.12715,000.00 16,937.25112.915 16,669.03 43.01 0.05% 5.77 A A2 A- AA-
06051GHT9 BANK OF AMERICA CORP 3.559 04/23/27 108.86450,000.00 54,673.00109.346 54,432.18 781.00 0.17% 4.20 A A2 A- AA-
06051GHX0 BANK OF AMERICA CORP 2.884 10/22/30 104.45320,000.00 21,288.40106.442 20,890.55 254.75 0.06% 7.20 A A2 A- AA-
06051GJQ3 BANK OF AMERICA CORP 1.658 03/11/27 100.673125,000.00 125,551.65100.441 125,840.95 115.14 0.38% 4.30 A A2 A- AA-
06051GJS9 BANK OF AMERICA CORP 1.734 07/22/27 100.54875,000.00 75,611.75100.816 75,411.00 249.26 0.23% 4.62 A A2 A- AA-
10112RBD5 BOSTON PROPERTIES LP 3.250 01/30/31 106.05120,000.00 19,970.0099.850 21,210.20 110.14 0.06% 8.03 BBB+ Baa1 BBB+
172967MP3 CITIGROUP INC 4.412 03/31/31 115.51930,000.00 34,138.50113.795 34,655.68 3.68 0.11% 7.30 A- A3 BBB+ A
172967NA5 CITIGROUP INC 1.462 06/09/27 99.50475,000.00 74,936.2599.915 74,628.00 341.13 0.23% 4.53 A- A3 BBB+ A
225401AC2 CREDIT SUISSE GROUP AG 4.282 01/09/28 111.13210,000.00 11,056.45110.565 11,113.20 97.53 0.03% 5.02 BBB+ Baa1 BBB+ A-
225401AQ1 CREDIT SUISSE GROUP AG 2.193 06/05/26 102.01295,000.00 97,179.55102.294 96,911.02 671.30 0.30% 3.52 BBB+ Baa1 BBB+ A-
225401AT5 CREDIT SUISSE GROUP AG 1.305 02/02/27 97.89660,000.00 58,616.8597.695 58,737.60 128.33 0.18% 4.21 BBB+ Baa1 BBB+ A-
23283PAT1 CYRUSONE LP/CYRUSONEFIN
2.150 11/01/30 94.09330,000.00 29,638.5098.795 28,227.90 268.75 0.09% 8.14 BBB- Ba1 BBB- BBB-
23329PAF7 DNB BANK ASA 1.127 09/16/26 98.97950,000.00 49,432.5098.865 49,489.50 23.48 0.15% 3.88 A A2 A
30958PAA1 FARMERS EXCHANGE CAPII
6.151 11/01/53 128.74480,000.00 80,000.00100.000 102,995.48 2,050.33 0.32% 8.94 BBB+ Baa2 BBB+
36164QNA2 GE CAPITAL INTLFUNDING
4.418 11/15/35 120.122175,000.00 179,683.45102.676 210,213.69 2,920.79 0.65% 10.88 BBB+ Baa1 BBB+ BBB
38141GWQ3 GOLDMAN SACHS GROUPINC
3.272 09/29/25 106.96060,000.00 63,943.50106.573 64,176.01 10.91 0.20% 2.88 A A2 BBB+ A
38141GXM1 GOLDMAN SACHS GROUPINC
1.093 12/09/26 98.58415,000.00 14,769.9098.466 14,787.60 51.01 0.05% 4.09 A A2 BBB+ A
38141GYA6 GOLDMAN SACHS GROUPINC
1.431 03/09/27 99.74085,000.00 85,000.00100.000 84,779.00 74.33 0.26% 4.31 A A2 BBB+ A
421946AM6 HEALTHCARE REALTYTRUST
2.050 03/15/31 97.39615,000.00 14,878.3599.189 14,609.39 13.67 0.04% 8.57 BBB Baa2 BBB BBB+
42225UAH7 HEALTHCARE TRUST OFAMER
2.000 03/15/31 95.95450,000.00 49,598.0099.196 47,976.88 44.44 0.15% 8.58 BBB Baa2 BBB
404280BX6 HSBC HOLDINGS PLC 4.292 09/12/26 110.25215,000.00 16,694.55111.297 16,537.77 33.98 0.05% 3.67 A- A3 A- A+
404280CL1 HSBC HOLDINGS PLC 2.013 09/22/28 100.05680,000.00 79,908.4099.886 80,044.80 40.26 0.24% 5.66 A- A3 A- A+
404280CM9 HSBC HOLDINGS PLC 1.589 05/24/27 99.37250,000.00 49,779.4099.559 49,686.15 280.28 0.15% 4.47 A- A3 A- A+
11
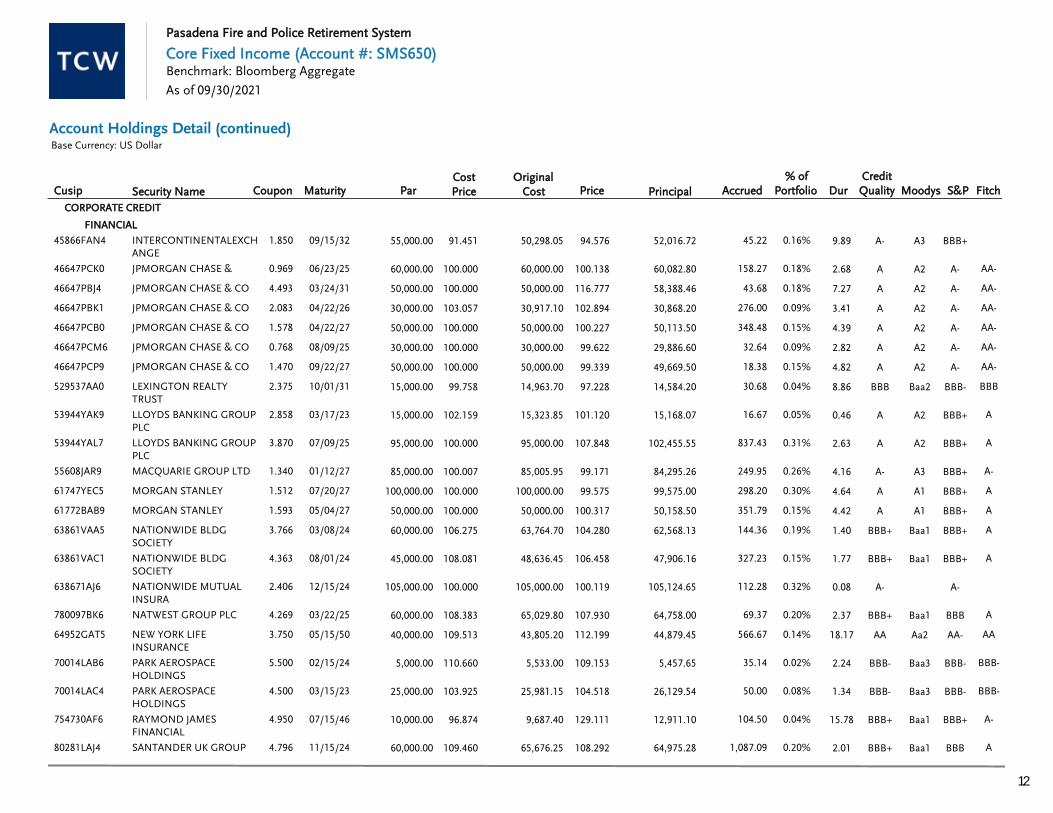
Pasadena Fire and Police Retirement System
Core Fixed Income (Account #: SMS650)
As of 09/30/2021
Base Currency: US Dollar
Account Holdings Detail (continued)
Benchmark: Bloomberg Aggregate
Cusip Security Name Coupon Maturity PriceParOriginal
CostCostPrice Principal Accrued
% ofPortfolio Dur S&PMoodys Fitch
CreditQuality
CORPORATE CREDIT
FINANCIAL
45866FAN4 INTERCONTINENTALEXCHANGE
1.850 09/15/32 94.57655,000.00 50,298.0591.451 52,016.72 45.22 0.16% 9.89 A- A3 BBB+
46647PCK0 JPMORGAN CHASE & 0.969 06/23/25 100.13860,000.00 60,000.00100.000 60,082.80 158.27 0.18% 2.68 A A2 A- AA-
46647PBJ4 JPMORGAN CHASE & CO 4.493 03/24/31 116.77750,000.00 50,000.00100.000 58,388.46 43.68 0.18% 7.27 A A2 A- AA-
46647PBK1 JPMORGAN CHASE & CO 2.083 04/22/26 102.89430,000.00 30,917.10103.057 30,868.20 276.00 0.09% 3.41 A A2 A- AA-
46647PCB0 JPMORGAN CHASE & CO 1.578 04/22/27 100.22750,000.00 50,000.00100.000 50,113.50 348.48 0.15% 4.39 A A2 A- AA-
46647PCM6 JPMORGAN CHASE & CO 0.768 08/09/25 99.62230,000.00 30,000.00100.000 29,886.60 32.64 0.09% 2.82 A A2 A- AA-
46647PCP9 JPMORGAN CHASE & CO 1.470 09/22/27 99.33950,000.00 50,000.00100.000 49,669.50 18.38 0.15% 4.82 A A2 A- AA-
529537AA0 LEXINGTON REALTYTRUST
2.375 10/01/31 97.22815,000.00 14,963.7099.758 14,584.20 30.68 0.04% 8.86 BBB Baa2 BBB- BBB
53944YAK9 LLOYDS BANKING GROUPPLC
2.858 03/17/23 101.12015,000.00 15,323.85102.159 15,168.07 16.67 0.05% 0.46 A A2 BBB+ A
53944YAL7 LLOYDS BANKING GROUPPLC
3.870 07/09/25 107.84895,000.00 95,000.00100.000 102,455.55 837.43 0.31% 2.63 A A2 BBB+ A
55608JAR9 MACQUARIE GROUP LTD 1.340 01/12/27 99.17185,000.00 85,005.95100.007 84,295.26 249.95 0.26% 4.16 A- A3 BBB+ A-
61747YEC5 MORGAN STANLEY 1.512 07/20/27 99.575100,000.00 100,000.00100.000 99,575.00 298.20 0.30% 4.64 A A1 BBB+ A
61772BAB9 MORGAN STANLEY 1.593 05/04/27 100.31750,000.00 50,000.00100.000 50,158.50 351.79 0.15% 4.42 A A1 BBB+ A
63861VAA5 NATIONWIDE BLDGSOCIETY
3.766 03/08/24 104.28060,000.00 63,764.70106.275 62,568.13 144.36 0.19% 1.40 BBB+ Baa1 BBB+ A
63861VAC1 NATIONWIDE BLDGSOCIETY
4.363 08/01/24 106.45845,000.00 48,636.45108.081 47,906.16 327.23 0.15% 1.77 BBB+ Baa1 BBB+ A
638671AJ6 NATIONWIDE MUTUALINSURA
2.406 12/15/24 100.119105,000.00 105,000.00100.000 105,124.65 112.28 0.32% 0.08 A- A-
780097BK6 NATWEST GROUP PLC 4.269 03/22/25 107.93060,000.00 65,029.80108.383 64,758.00 69.37 0.20% 2.37 BBB+ Baa1 BBB A
64952GAT5 NEW YORK LIFEINSURANCE
3.750 05/15/50 112.19940,000.00 43,805.20109.513 44,879.45 566.67 0.14% 18.17 AA Aa2 AA- AA
70014LAB6 PARK AEROSPACEHOLDINGS
5.500 02/15/24 109.1535,000.00 5,533.00110.660 5,457.65 35.14 0.02% 2.24 BBB- Baa3 BBB- BBB-
70014LAC4 PARK AEROSPACEHOLDINGS
4.500 03/15/23 104.51825,000.00 25,981.15103.925 26,129.54 50.00 0.08% 1.34 BBB- Baa3 BBB- BBB-
754730AF6 RAYMOND JAMESFINANCIAL
4.950 07/15/46 129.11110,000.00 9,687.4096.874 12,911.10 104.50 0.04% 15.78 BBB+ Baa1 BBB+ A-
80281LAJ4 SANTANDER UK GROUPHLDGS
4.796 11/15/24 108.29260,000.00 65,676.25109.460 64,975.28 1,087.09 0.20% 2.01 BBB+ Baa1 BBB A
12

Pasadena Fire and Police Retirement System
Core Fixed Income (Account #: SMS650)
As of 09/30/2021
Base Currency: US Dollar
Account Holdings Detail (continued)
Benchmark: Bloomberg Aggregate
Cusip Security Name Coupon Maturity PriceParOriginal
CostCostPrice Principal Accrued
% ofPortfolio Dur S&PMoodys Fitch
CreditQuality
CORPORATE CREDIT
FINANCIAL80281LAJ4 SANTANDER UK GROUPHLDGS
4.796 11/15/24 108.29260,000.00 65,676.25109.460 64,975.28 1,087.09 0.20% 2.01 BBB+ Baa1 BBB A
80281LAM7 SANTANDER UK GROUPHLDGS
1.532 08/21/26 99.84040,000.00 40,126.60100.317 39,935.99 68.09 0.12% 3.78 BBB+ Baa1 BBB A
80281LAQ8 SANTANDER UK GROUPHLDGS
1.673 06/14/27 99.65650,000.00 50,013.50100.027 49,827.92 248.63 0.15% 4.52 BBB+ Baa1 BBB A
80283LAA1 SANTANDER UK PLC 5.000 11/07/23 108.18710,000.00 10,820.20108.202 10,818.70 200.00 0.03% 1.98 BBB+ Baa1 BBB- BBB+
878091BF3 TEACHERS INSUR &ANNUITY
4.270 05/15/47 120.8735,000.00 5,926.50118.530 6,043.63 80.66 0.02% 16.53 AA- Aa3 AA- AA
878091BG1 TEACHERS INSUR &ANNUITY
3.300 05/15/50 105.29555,000.00 54,833.0099.696 57,912.38 685.67 0.18% 18.79 AA- Aa3 AA- AA
91324PEE8 UNITEDHEALTH GROUPINC
3.050 05/15/41 103.62535,000.00 34,849.5099.570 36,268.57 391.42 0.11% 14.97 A A3 A+ A
92277GAT4 VENTAS REALTY LP 2.650 01/15/25 104.39375,000.00 74,590.5099.454 78,294.75 419.58 0.24% 3.11 BBB+ Baa1 BBB+ BBB+
95000U2A0 WELLS FARGO &COMPANY
3.584 05/22/28 109.55615,000.00 16,243.20108.288 16,433.41 192.64 0.05% 5.13 A+ A1 BBB+ A+
95000U2N2 WELLS FARGO &COMPANY
2.188 04/30/26 103.252130,000.00 134,921.80103.786 134,227.18 1,193.07 0.41% 3.43 A+ A1 BBB+ A+
95000U2Q5 WELLS FARGO &COMPANY
3.068 04/30/41 102.85640,000.00 40,000.00100.000 41,142.44 514.74 0.13% 14.40 A+ A1 BBB+ A+
95000U2S1 WELLS FARGO &COMPANY
2.393 06/02/28 103.22535,000.00 35,000.00100.000 36,128.76 276.86 0.11% 5.31 A+ A1 BBB+ A+
TOTAL FINANCIAL 3,249,353.15 3,331,047.38 20,035.74 10.20% 5.30
TOTAL CORPORATE CREDIT 7,301,140.96 7,661,054.41 54,875.72 23.48% 7.24
NON CORPORATE CREDIT
MUNICIPAL
544525NZ7 LA DWP 6.008 07/01/39 133.156100,000.00 124,307.00124.307 133,155.59 1,502.00 0.41% 8.66 AA Aa2 AA+ AA
59261AG76 MET TRANSPRTN AUTHNY
5.175 11/15/49 135.7645,000.00 5,109.10102.182 6,788.18 97.75 0.02% 16.44 A- A3 BBB+ A-
64966QRP7 NYC -TXBL -REF -D 1.823 08/01/30 98.23830,000.00 30,000.00100.000 29,471.27 91.15 0.09% 8.21 AA Aa2 AA AA-
64971M4P4 NYC FIN AUTH 5.508 08/01/37 133.72350,000.00 63,200.50126.401 66,861.40 459.00 0.20% 9.95 AAA Aa1 AAA AAA
913366KC3 UNIV OF CALIFORNIA CA 3.256 05/15/60 107.83060,000.00 60,000.00100.000 64,698.00 738.03 0.20% 22.49 AA- Aa3 AA- AA-
13
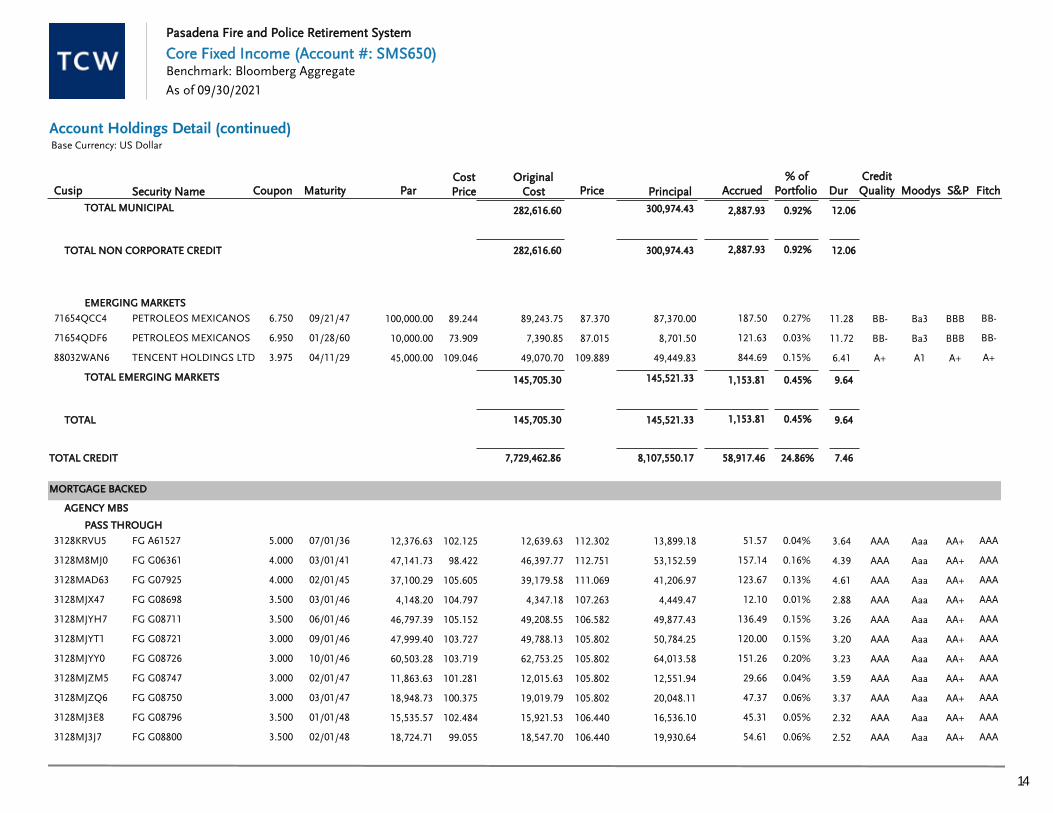
Pasadena Fire and Police Retirement System
Core Fixed Income (Account #: SMS650)
As of 09/30/2021
Base Currency: US Dollar
Account Holdings Detail (continued)
Benchmark: Bloomberg Aggregate
Cusip Security Name Coupon Maturity PriceParOriginal
CostCostPrice Principal Accrued
% ofPortfolio Dur S&PMoodys Fitch
CreditQuality
TOTAL MUNICIPAL 282,616.60 300,974.43 2,887.93 0.92% 12.06
TOTAL NON CORPORATE CREDIT 282,616.60 300,974.43 2,887.93 0.92% 12.06
EMERGING MARKETS
71654QCC4 PETROLEOS MEXICANOS 6.750 09/21/47 87.370100,000.00 89,243.7589.244 87,370.00 187.50 0.27% 11.28 BB- Ba3 BBB BB-
71654QDF6 PETROLEOS MEXICANOS 6.950 01/28/60 87.01510,000.00 7,390.8573.909 8,701.50 121.63 0.03% 11.72 BB- Ba3 BBB BB-
88032WAN6 TENCENT HOLDINGS LTD 3.975 04/11/29 109.88945,000.00 49,070.70109.046 49,449.83 844.69 0.15% 6.41 A+ A1 A+ A+
TOTAL EMERGING MARKETS 145,705.30 145,521.33 1,153.81 0.45% 9.64
TOTAL 145,705.30 145,521.33 1,153.81 0.45% 9.64
7,729,462.86 8,107,550.17 58,917.46 24.86%TOTAL CREDIT 7.46
MORTGAGE BACKED
AGENCY MBS
PASS THROUGH
3128KRVU5 FG A61527 5.000 07/01/36 112.30212,376.63 12,639.63102.125 13,899.18 51.57 0.04% 3.64 AAA Aaa AA+ AAA
3128M8MJ0 FG G06361 4.000 03/01/41 112.75147,141.73 46,397.7798.422 53,152.59 157.14 0.16% 4.39 AAA Aaa AA+ AAA
3128MAD63 FG G07925 4.000 02/01/45 111.06937,100.29 39,179.58105.605 41,206.97 123.67 0.13% 4.61 AAA Aaa AA+ AAA
3128MJX47 FG G08698 3.500 03/01/46 107.2634,148.20 4,347.18104.797 4,449.47 12.10 0.01% 2.88 AAA Aaa AA+ AAA
3128MJYH7 FG G08711 3.500 06/01/46 106.58246,797.39 49,208.55105.152 49,877.43 136.49 0.15% 3.26 AAA Aaa AA+ AAA
3128MJYT1 FG G08721 3.000 09/01/46 105.80247,999.40 49,788.13103.727 50,784.25 120.00 0.15% 3.20 AAA Aaa AA+ AAA
3128MJYY0 FG G08726 3.000 10/01/46 105.80260,503.28 62,753.25103.719 64,013.58 151.26 0.20% 3.23 AAA Aaa AA+ AAA
3128MJZM5 FG G08747 3.000 02/01/47 105.80211,863.63 12,015.63101.281 12,551.94 29.66 0.04% 3.59 AAA Aaa AA+ AAA
3128MJZQ6 FG G08750 3.000 03/01/47 105.80218,948.73 19,019.79100.375 20,048.11 47.37 0.06% 3.37 AAA Aaa AA+ AAA
3128MJ3E8 FG G08796 3.500 01/01/48 106.44015,535.57 15,921.53102.484 16,536.10 45.31 0.05% 2.32 AAA Aaa AA+ AAA
3128MJ3J7 FG G08800 3.500 02/01/48 106.44018,724.71 18,547.7099.055 19,930.64 54.61 0.06% 2.52 AAA Aaa AA+ AAA
14

Pasadena Fire and Police Retirement System
Core Fixed Income (Account #: SMS650)
As of 09/30/2021
Base Currency: US Dollar
Account Holdings Detail (continued)
Benchmark: Bloomberg Aggregate
Cusip Security Name Coupon Maturity PriceParOriginal
CostCostPrice Principal Accrued
% ofPortfolio Dur S&PMoodys Fitch
CreditQuality
AGENCY MBS
PASS THROUGH
3128MJ4A5 FG G08816 3.500 06/01/48 106.08925,879.07 25,439.3398.301 27,454.71 75.48 0.08% 2.38 AAA Aaa AA+ AAA
3128MJ4T4 FG G08833 5.000 07/01/48 109.7178,883.78 9,384.19105.633 9,747.00 37.02 0.03% 3.10 AAA Aaa AA+ AAA
3128MJ5D8 FG G08843 4.500 10/01/48 108.14010,680.42 11,041.51103.381 11,549.83 40.05 0.04% 2.90 AAA Aaa AA+ AAA
3128MFVV7 FG G16728 2.500 11/01/31 104.53136,219.04 36,202.0799.953 37,860.03 75.46 0.12% 2.77 AAA Aaa AA+ AAA
3128MFWR5 FG G16756 3.500 01/01/34 107.38528,490.95 29,007.35101.813 30,595.04 83.10 0.09% 2.23 AAA Aaa AA+ AAA
3128MMYK3 FG G18713 3.500 11/01/33 106.85824,352.93 24,743.91101.606 26,022.97 71.03 0.08% 1.42 AAA Aaa AA+ AAA
31335AJX7 FG G60278 4.000 10/01/45 111.08640,373.78 43,414.43107.531 44,849.53 134.58 0.14% 4.65 AAA Aaa AA+ AAA
31335APZ5 FG G60440 3.500 03/01/46 108.767110,987.75 115,097.77103.703 120,717.59 323.71 0.37% 4.36 AAA Aaa AA+ AAA
31335AWU8 FG G60659 3.500 08/01/46 108.20428,385.79 29,374.86103.484 30,714.59 82.79 0.09% 4.01 AAA Aaa AA+ AAA
31335B6A9 FG G61765 4.000 02/01/48 107.78413,685.37 14,211.40103.844 14,750.70 45.62 0.05% 2.94 AAA Aaa AA+ AAA
3132XCRY3 FG G67703 3.500 04/01/47 108.64250,458.11 52,350.29103.750 54,818.49 147.17 0.17% 4.50 AAA Aaa AA+ AAA
3132XCR31 FG G67706 3.500 12/01/47 108.61071,541.97 72,549.56101.408 77,701.97 208.66 0.24% 4.24 AAA Aaa AA+ AAA
3132XCR49 FG G67707 3.500 01/01/48 109.49848,078.16 48,108.21100.063 52,644.69 140.23 0.16% 4.74 AAA Aaa AA+ AAA
3132XCR56 FG G67708 3.500 03/01/48 108.024109,737.17 110,140.54100.368 118,542.13 320.07 0.36% 3.81 AAA Aaa AA+ AAA
3132XCR64 FG G67709 3.500 03/01/48 108.46962,899.48 63,209.06100.492 68,226.28 183.46 0.21% 4.27 AAA Aaa AA+ AAA
3132XCR72 FG G67710 3.500 03/01/48 107.570107,693.59 107,921.87100.212 115,845.95 314.11 0.35% 3.58 AAA Aaa AA+ AAA
3132XCSA4 FG G67713 4.000 06/01/48 109.74720,792.37 21,229.41102.102 22,819.08 69.31 0.07% 3.68 AAA Aaa AA+ AAA
3132XCSF3 FG G67718 4.000 01/01/49 108.93130,915.67 31,680.11102.473 33,676.75 103.05 0.10% 3.29 AAA Aaa AA+ AAA
3132GLQN7 FG Q05261 3.500 12/01/41 109.96645,278.87 46,506.35102.711 49,791.53 132.06 0.15% 4.44 AAA Aaa AA+ AAA
3132JMFT1 FG Q20178 3.500 07/01/43 110.74389,436.91 89,758.33100.359 99,044.74 260.86 0.30% 4.82 AAA Aaa AA+ AAA
31390TVV8 FN 655928 7.000 08/01/32 119.46319,579.92 20,877.09106.625 23,390.67 114.22 0.07% 3.16 AAA Aaa AA+ AAA
31416WYK2 FN AB1613 4.000 10/01/40 111.72952,099.02 53,075.87101.875 58,209.84 173.66 0.18% 4.23 AAA Aaa AA+ AAA
31418RHG9 FN AD3830 4.500 04/01/25 105.45215,831.57 16,484.62104.125 16,694.73 59.37 0.05% 1.22 AAA Aaa AA+ AAA
3140J86J7 FN BM4472 3.500 07/01/48 108.45826,198.70 27,418.58104.656 28,414.47 76.41 0.09% 4.37 AAA Aaa AA+ AAA
3140Q8J48 FN CA1182 3.500 02/01/48 108.08339,950.99 41,764.40104.539 43,180.04 116.52 0.13% 3.75 AAA Aaa AA+ AAA
3140Q8J97 FN CA1187 3.500 02/01/48 106.4226,469.87 6,499.44100.457 6,885.37 18.87 0.02% 2.93 AAA Aaa AA+ AAA
3140Q83U7 FN CA1710 4.500 05/01/48 108.44340,565.53 42,181.81103.984 43,990.56 152.12 0.13% 3.06 AAA Aaa AA+ AAA
15

Pasadena Fire and Police Retirement System
Core Fixed Income (Account #: SMS650)
As of 09/30/2021
Base Currency: US Dollar
Account Holdings Detail (continued)
Benchmark: Bloomberg Aggregate
Cusip Security Name Coupon Maturity PriceParOriginal
CostCostPrice Principal Accrued
% ofPortfolio Dur S&PMoodys Fitch
CreditQuality
AGENCY MBS
PASS THROUGH
3140Q83V5 FN CA1711 4.500 05/01/48 108.48919,452.63 20,087.88103.266 21,103.86 72.95 0.06% 3.08 AAA Aaa AA+ AAA
3140Q9N25 FN CA2208 4.500 08/01/48 108.49919,748.31 20,485.01103.731 21,426.62 74.06 0.07% 3.02 AAA Aaa AA+ AAA
3140QBBB3 FN CA3633 3.500 06/01/49 108.17987,740.64 93,471.19106.531 94,916.64 255.91 0.29% 4.19 AAA Aaa AA+ AAA
31418AXN3 FN MA1584 3.500 09/01/33 107.70621,728.93 22,469.07103.406 23,403.41 63.38 0.07% 2.64 AAA Aaa AA+ AAA
31418CDL5 FN MA2806 3.000 11/01/46 105.76831,273.85 31,391.13100.375 33,077.72 78.18 0.10% 3.36 AAA Aaa AA+ AAA
31418CKH6 FN MA2995 4.000 05/01/47 108.05015,709.64 16,526.42105.199 16,974.19 52.37 0.05% 2.80 AAA Aaa AA+ AAA
31418CLK8 FN MA3029 3.000 06/01/32 105.60518,368.54 18,832.06102.524 19,398.02 45.92 0.06% 2.12 AAA Aaa AA+ AAA
31418CNE0 FN MA3088 4.000 08/01/47 107.77844,601.17 47,073.40105.543 48,070.35 148.67 0.15% 2.64 AAA Aaa AA+ AAA
31418CR89 FN MA3210 3.500 12/01/47 106.52258,125.37 57,805.2299.449 61,916.04 169.53 0.19% 2.61 AAA Aaa AA+ AAA
31418CUV4 FN MA3295 3.500 02/01/28 106.68749,692.01 51,213.82103.063 53,014.71 144.94 0.16% 1.84 AAA Aaa AA+ AAA
31418DHY1 FN MA3846 3.000 11/01/49 102.46826,578.17 26,727.67100.563 27,234.22 66.45 0.08% 4.32 AAA Aaa AA+ AAA
31418DTJ1 FN MA4152 2.000 10/01/40 102.140136,529.76 140,977.65103.258 139,450.99 227.55 0.43% 4.24 AAA Aaa AA+ AAA
31418DUA8 FN MA4176 2.000 11/01/40 102.108122,971.13 126,780.35103.098 125,563.26 204.95 0.38% 4.26 AAA Aaa AA+ AAA
31418DY71 FN MA4333 2.000 05/01/41 102.19648,688.98 49,483.98101.633 49,758.15 81.15 0.15% 4.74 AAA Aaa AA+ AAA
3132DMHG3 FR SD0231 3.000 01/01/50 106.260107,142.65 113,470.76105.906 113,850.12 267.86 0.35% 4.55 AAA Aaa AA+ AAA
31329NU48 FR ZA5103 3.500 12/01/47 106.4276,055.55 6,404.69105.766 6,444.74 17.66 0.02% 2.65 AAA Aaa AA+ AAA
3131XU6Q5 FR ZM1779 3.000 09/01/46 105.766124,509.23 131,629.60105.719 131,688.53 311.27 0.40% 3.59 AAA Aaa AA+ AAA
3132ADRY6 FR ZT1403 3.500 11/01/33 106.8737,606.97 7,820.92102.813 8,129.82 22.19 0.02% 1.81 AAA Aaa AA+ AAA
36179R4E6 G2 MA3521 3.500 03/20/46 106.57114,383.69 15,237.72105.938 15,328.84 41.95 0.05% 3.40 AAA Aaa AA+ AAA
36179SB71 G2 MA3662 3.000 05/20/46 105.31529,630.42 31,357.31105.828 31,205.35 74.08 0.10% 3.41 AAA Aaa AA+ AAA
36179SLS4 G2 MA3937 3.500 09/20/46 106.38470,455.26 72,712.03103.203 74,952.76 205.49 0.23% 3.17 AAA Aaa AA+ AAA
36179SQW0 G2 MA4069 3.500 11/20/46 106.16564,835.83 67,409.00103.969 68,832.79 189.10 0.21% 3.16 AAA Aaa AA+ AAA
36179SUU9 G2 MA4195 3.000 01/20/47 105.31587,221.95 88,192.19101.112 91,858.03 218.05 0.28% 3.26 AAA Aaa AA+ AAA
36179S2P1 G2 MA4382 3.500 04/20/47 106.07122,323.99 23,264.04104.211 23,679.28 65.11 0.07% 2.83 AAA Aaa AA+ AAA
36179TAK1 G2 MA4510 3.500 06/20/47 106.0706,424.30 6,686.80104.086 6,814.24 18.74 0.02% 2.83 AAA Aaa AA+ AAA
36179TCX1 G2 MA4586 3.500 07/20/47 106.0716,642.77 6,528.3498.277 7,046.05 19.37 0.02% 2.71 AAA Aaa AA+ AAA
36179TCZ6 G2 MA4588 4.500 07/20/47 108.32745,847.99 47,810.86104.281 49,665.90 171.93 0.15% 2.81 AAA Aaa AA+ AAA
16

Pasadena Fire and Police Retirement System
Core Fixed Income (Account #: SMS650)
As of 09/30/2021
Base Currency: US Dollar
Account Holdings Detail (continued)
Benchmark: Bloomberg Aggregate
Cusip Security Name Coupon Maturity PriceParOriginal
CostCostPrice Principal Accrued
% ofPortfolio Dur S&PMoodys Fitch
CreditQuality
AGENCY MBS
PASS THROUGH
36179TC29 G2 MA4589 5.000 07/20/47 109.95713,348.04 14,340.80107.438 14,677.12 55.62 0.04% 3.57 AAA Aaa AA+ AAA
36179TG41 G2 MA4719 3.500 09/20/47 106.0406,586.44 6,807.19103.352 6,984.25 19.21 0.02% 2.59 AAA Aaa AA+ AAA
36179TLR4 G2 MA4836 3.000 11/20/47 105.2188,780.46 8,554.0997.422 9,238.59 21.95 0.03% 2.96 AAA Aaa AA+ AAA
36179TLS2 G2 MA4837 3.500 11/20/47 106.07066,731.73 67,526.23101.191 70,782.19 194.63 0.22% 2.54 AAA Aaa AA+ AAA
36179TLT0 G2 MA4838 4.000 11/20/47 107.18516,033.08 16,836.61105.012 17,185.10 53.44 0.05% 2.73 AAA Aaa AA+ AAA
36179TSH9 G2 MA5020 4.000 02/20/48 107.17929,254.45 30,333.93103.690 31,354.69 97.51 0.10% 2.60 AAA Aaa AA+ AAA
36179UCB6 G2 MA5466 4.000 09/20/48 106.58320,106.05 20,644.00102.676 21,429.68 67.02 0.07% 3.00 AAA Aaa AA+ AAA
36179UD90 G2 MA5528 4.000 10/20/48 106.55233,450.68 34,366.65102.738 35,642.37 111.50 0.11% 2.94 AAA Aaa AA+ AAA
36179UGE6 G2 MA5597 5.000 11/20/48 108.07412,672.59 13,232.96104.422 13,695.81 52.80 0.04% 2.44 AAA Aaa AA+ AAA
36179U3S9 G2 MA6209 3.000 10/20/49 102.80723,224.46 23,362.35100.594 23,876.38 58.06 0.07% 3.17 AAA Aaa AA+ AAA
T201121BA G2SF 30 YR 2.0 TBA NOV21
2.000 11/20/50 101.22875,000.00 75,843.75101.125 75,920.91 0.00 0.23% 5.32 AAA Aaa AA+ AAA
T201121CG G2SF 30 YR 2.0 TBA NOV21
2.000 11/20/50 101.22850,000.00 50,591.80101.184 50,613.94 0.00 0.15% 5.32 AAA Aaa AA+ AAA
T201121FB G2SF 30 YR 2.0 TBA NOV21
2.000 11/20/50 101.22850,000.00 50,562.50101.125 50,613.94 0.00 0.15% 5.32 AAA Aaa AA+ AAA
T201121GS G2SF 30 YR 2.0 TBA NOV21
2.000 11/20/50 101.228125,000.00 126,420.90101.137 126,534.84 0.00 0.39% 5.32 AAA Aaa AA+ AAA
T251121BA G2SF 30 YR 2.5 TBA NOV21
2.500 12/20/50 103.058150,000.00 154,968.75103.313 154,586.31 0.00 0.47% 4.65 AAA Aaa AA+ AAA
T251121CG G2SF 30 YR 2.5 TBA NOV21
2.500 12/20/50 103.05825,000.00 25,704.10102.816 25,764.39 0.00 0.08% 4.65 AAA Aaa AA+ AAA
T251121FB G2SF 30 YR 2.5 TBA NOV21
2.500 12/20/50 103.058150,000.00 154,757.81103.172 154,586.31 0.00 0.47% 4.65 AAA Aaa AA+ AAA
T251121GS G2SF 30 YR 2.5 TBA NOV21
2.500 12/20/50 103.058100,000.00 103,175.78103.176 103,057.54 0.00 0.31% 4.65 AAA Aaa AA+ AAA
36204QFC9 GN 376463 6.500 04/15/24 111.769467.25 446.2295.499 522.24 2.53 0.00% 1.01 AAA Aaa AA+ AAA
36225ABC3 GN 780035 6.500 07/15/24 111.768303.28 289.6495.502 338.97 1.64 0.00% 0.87 AAA Aaa AA+ AAA
36241LDX1 GN 782818 4.500 11/15/39 115.35771,192.47 72,977.84102.508 82,125.47 266.97 0.25% 4.91 AAA Aaa AA+ AAA
D151121BA UMBS 15 YR 1.5 TBA NOV21
1.500 03/25/36 100.81075,000.00 75,972.66101.297 75,607.58 0.00 0.23% 4.25 AAA Aaa AA+ AAA
D151121BC UMBS 15 YR 1.5 TBA NOV21
1.500 03/25/36 100.81050,000.00 50,653.32101.307 50,405.05 0.00 0.15% 4.25 AAA Aaa AA+ AAA
17

Pasadena Fire and Police Retirement System
Core Fixed Income (Account #: SMS650)
As of 09/30/2021
Base Currency: US Dollar
Account Holdings Detail (continued)
Benchmark: Bloomberg Aggregate
Cusip Security Name Coupon Maturity PriceParOriginal
CostCostPrice Principal Accrued
% ofPortfolio Dur S&PMoodys Fitch
CreditQuality
AGENCY MBS
PASS THROUGHD151121BC UMBS 15 YR 1.5 TBA NOV21
1.500 03/25/36 100.81050,000.00 50,653.32101.307 50,405.05 0.00 0.15% 4.25 AAA Aaa AA+ AAA
D151121FB UMBS 15 YR 1.5 TBA NOV21
1.500 03/25/36 100.810150,000.00 152,200.20101.467 151,215.16 0.00 0.46% 4.25 AAA Aaa AA+ AAA
D151121GS UMBS 15 YR 1.5 TBA NOV21
1.500 03/25/36 100.810100,000.00 101,578.13101.578 100,810.10 0.00 0.31% 4.25 AAA Aaa AA+ AAA
D201121BA UMBS 15 YR 2.0 TBA NOV21
2.000 03/25/36 102.859175,000.00 180,484.38103.134 180,003.90 0.00 0.55% 3.55 AAA Aaa AA+ AAA
D201121BC UMBS 15 YR 2.0 TBA NOV21
2.000 03/25/36 102.85975,000.00 77,576.66103.436 77,144.53 0.00 0.23% 3.55 AAA Aaa AA+ AAA
D201121CG UMBS 15 YR 2.0 TBA NOV21
2.000 03/25/36 102.859100,000.00 103,429.69103.430 102,859.37 0.00 0.31% 3.55 AAA Aaa AA+ AAA
D201121FB UMBS 15 YR 2.0 TBA NOV21
2.000 03/25/36 102.859125,000.00 129,275.39103.420 128,574.22 0.00 0.39% 3.55 AAA Aaa AA+ AAA
D201121GS UMBS 15 YR 2.0 TBA NOV21
2.000 03/25/36 102.85950,000.00 51,449.22102.898 51,429.69 0.00 0.16% 3.55 AAA Aaa AA+ AAA
F201121BA UMBS 30 YR 2.0 TBA NOV21
2.000 02/25/51 100.072300,000.00 302,011.72100.671 300,215.77 0.00 0.91% 6.57 AAA Aaa AA+ AAA
F201121BC UMBS 30 YR 2.0 TBA NOV21
2.000 02/25/51 100.07250,000.00 50,025.39100.051 50,035.96 0.00 0.15% 6.57 AAA Aaa AA+ AAA
F201121CG UMBS 30 YR 2.0 TBA NOV21
2.000 02/25/51 100.072375,000.00 378,745.12100.999 375,269.71 0.00 1.14% 6.57 AAA Aaa AA+ AAA
F201121FB UMBS 30 YR 2.0 TBA NOV21
2.000 02/25/51 100.0721,350,000.00 1,363,097.67100.970 1,350,970.96 0.00 4.11% 6.57 AAA Aaa AA+ AAA
F201121GS UMBS 30 YR 2.0 TBA NOV21
2.000 02/25/51 100.072250,000.00 252,744.14101.098 250,179.81 0.00 0.76% 6.57 AAA Aaa AA+ AAA
F201121JP UMBS 30 YR 2.0 TBA NOV21
2.000 02/25/51 100.072225,000.00 227,144.54100.953 225,161.83 0.00 0.69% 6.57 AAA Aaa AA+ AAA
F251121BA UMBS 30 YR 2.5 TBA NOV21
2.500 02/25/51 102.902350,000.00 362,140.62103.469 360,157.71 0.00 1.10% 5.49 AAA Aaa AA+ AAA
F251121BC UMBS 30 YR 2.5 TBA NOV21
2.500 02/25/51 102.902175,000.00 181,207.03103.547 180,078.86 0.00 0.55% 5.49 AAA Aaa AA+ AAA
F251121CG UMBS 30 YR 2.5 TBA NOV21
2.500 02/25/51 102.902200,000.00 206,894.53103.447 205,804.41 0.00 0.63% 5.49 AAA Aaa AA+ AAA
F251121FB UMBS 30 YR 2.5 TBA NOV21
2.500 02/25/51 102.902850,000.00 878,496.10103.353 874,668.73 0.00 2.66% 5.49 AAA Aaa AA+ AAA
F251121GS UMBS 30 YR 2.5 TBA NOV21
2.500 02/25/51 102.902800,000.00 827,989.27103.499 823,217.63 0.00 2.51% 5.49 AAA Aaa AA+ AAA
18
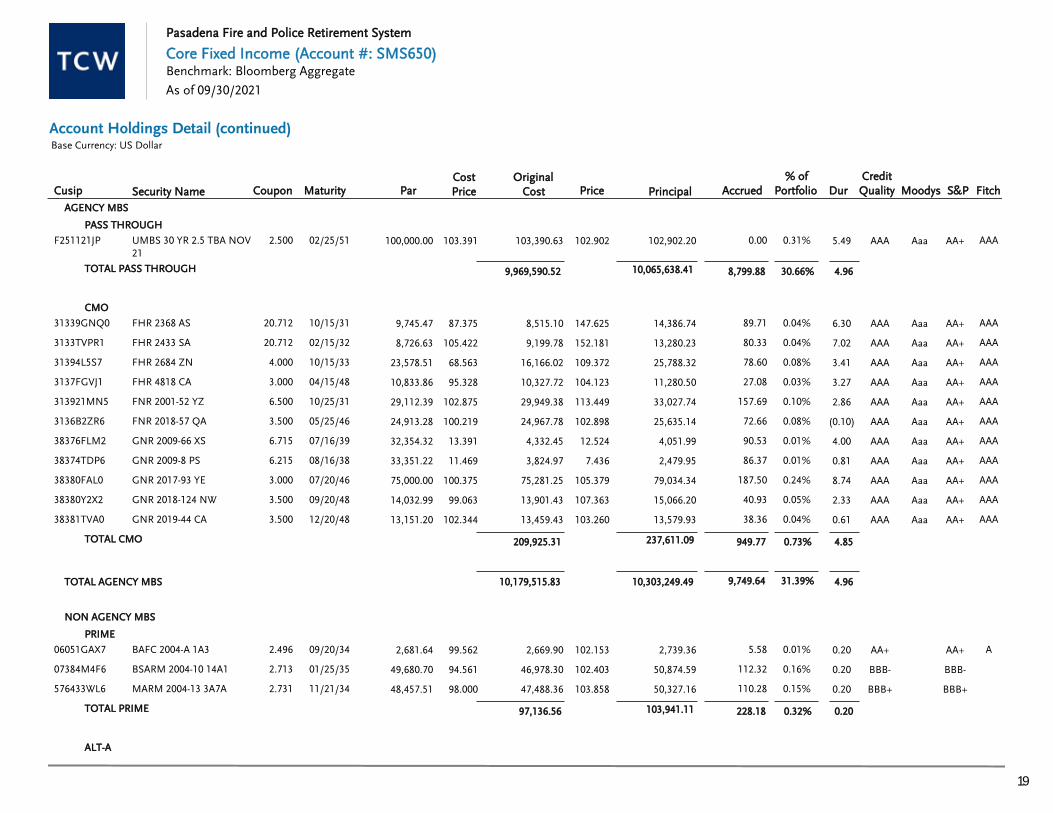
Pasadena Fire and Police Retirement System
Core Fixed Income (Account #: SMS650)
As of 09/30/2021
Base Currency: US Dollar
Account Holdings Detail (continued)
Benchmark: Bloomberg Aggregate
Cusip Security Name Coupon Maturity PriceParOriginal
CostCostPrice Principal Accrued
% ofPortfolio Dur S&PMoodys Fitch
CreditQuality
AGENCY MBS
PASS THROUGH
F251121JP UMBS 30 YR 2.5 TBA NOV21
2.500 02/25/51 102.902100,000.00 103,390.63103.391 102,902.20 0.00 0.31% 5.49 AAA Aaa AA+ AAA
TOTAL PASS THROUGH 9,969,590.52 10,065,638.41 8,799.88 30.66% 4.96
CMO
31339GNQ0 FHR 2368 AS 20.712 10/15/31 147.6259,745.47 8,515.1087.375 14,386.74 89.71 0.04% 6.30 AAA Aaa AA+ AAA
3133TVPR1 FHR 2433 SA 20.712 02/15/32 152.1818,726.63 9,199.78105.422 13,280.23 80.33 0.04% 7.02 AAA Aaa AA+ AAA
31394L5S7 FHR 2684 ZN 4.000 10/15/33 109.37223,578.51 16,166.0268.563 25,788.32 78.60 0.08% 3.41 AAA Aaa AA+ AAA
3137FGVJ1 FHR 4818 CA 3.000 04/15/48 104.12310,833.86 10,327.7295.328 11,280.50 27.08 0.03% 3.27 AAA Aaa AA+ AAA
313921MN5 FNR 2001-52 YZ 6.500 10/25/31 113.44929,112.39 29,949.38102.875 33,027.74 157.69 0.10% 2.86 AAA Aaa AA+ AAA
3136B2ZR6 FNR 2018-57 QA 3.500 05/25/46 102.89824,913.28 24,967.78100.219 25,635.14 72.66 0.08% (0.10) AAA Aaa AA+ AAA
38376FLM2 GNR 2009-66 XS 6.715 07/16/39 12.52432,354.32 4,332.4513.391 4,051.99 90.53 0.01% 4.00 AAA Aaa AA+ AAA
38374TDP6 GNR 2009-8 PS 6.215 08/16/38 7.43633,351.22 3,824.9711.469 2,479.95 86.37 0.01% 0.81 AAA Aaa AA+ AAA
38380FAL0 GNR 2017-93 YE 3.000 07/20/46 105.37975,000.00 75,281.25100.375 79,034.34 187.50 0.24% 8.74 AAA Aaa AA+ AAA
38380Y2X2 GNR 2018-124 NW 3.500 09/20/48 107.36314,032.99 13,901.4399.063 15,066.20 40.93 0.05% 2.33 AAA Aaa AA+ AAA
38381TVA0 GNR 2019-44 CA 3.500 12/20/48 103.26013,151.20 13,459.43102.344 13,579.93 38.36 0.04% 0.61 AAA Aaa AA+ AAA
TOTAL CMO 209,925.31 237,611.09 949.77 0.73% 4.85
TOTAL AGENCY MBS 10,179,515.83 10,303,249.49 9,749.64 31.39% 4.96
NON AGENCY MBS
PRIME
06051GAX7 BAFC 2004-A 1A3 2.496 09/20/34 102.1532,681.64 2,669.9099.562 2,739.36 5.58 0.01% 0.20 AA+ AA+ A
07384M4F6 BSARM 2004-10 14A1 2.713 01/25/35 102.40349,680.70 46,978.3094.561 50,874.59 112.32 0.16% 0.20 BBB- BBB-
576433WL6 MARM 2004-13 3A7A 2.731 11/21/34 103.85848,457.51 47,488.3698.000 50,327.16 110.28 0.15% 0.20 BBB+ BBB+
TOTAL PRIME 97,136.56 103,941.11 228.18 0.32% 0.20
ALT-A
19

Pasadena Fire and Police Retirement System
Core Fixed Income (Account #: SMS650)
As of 09/30/2021
Base Currency: US Dollar
Account Holdings Detail (continued)
Benchmark: Bloomberg Aggregate
Cusip Security Name Coupon Maturity PriceParOriginal
CostCostPrice Principal Accrued
% ofPortfolio Dur S&PMoodys Fitch
CreditQuality
NON AGENCY MBS
ALT-A
173109AE9 CRMSI 2007-1 A5 5.172 03/25/37 102.355179,665.78 122,621.9068.250 183,897.02 774.32 0.56% 1.29 A Aa3 CCC A
45254NJV0 IMM 2004-6 1A1 0.886 10/25/34 102.03543,238.18 42,724.7298.813 44,118.07 4.26 0.13% 0.20 BBB+ Baa1 BB-
589929V21 MLCC 2003-D A 0.706 08/25/28 100.46378,238.22 77,602.5499.188 78,600.53 9.21 0.24% 0.20 BBB BB+ BBB
55265WBD4 MSSTR 2004-1 4A1 2.470 10/25/32 104.9424,230.63 4,313.92101.969 4,439.69 8.71 0.01% 0.20 BBB
45660LAP4 RAST 2004-IP2 2A1 2.846 12/25/34 99.2079,266.03 9,392.86101.369 9,192.58 21.97 0.03% 0.20 A- A-
86359LAP4 SAMI 2004-AR1 1A1 0.787 03/19/34 100.47176,638.98 75,759.6398.853 76,999.80 20.11 0.23% 0.20 AA- AA-
TOTAL ALT-A 332,415.57 397,247.68 838.58 1.21% 0.71
SUBPRIME
004375CU3 ACCR 2005-1 M2 1.121 04/25/35 101.158164,334.02 157,349.8395.750 166,236.60 20.47 0.51% 0.20 A Ba2 A
17309LAF2 CMLTI 2006-HE2 M1 0.376 08/25/36 100.536123,189.07 122,419.1499.375 123,848.97 5.15 0.38% 0.20 A B1 A
126670DC9 CWL 2005-11 MV3 0.881 02/25/36 100.032140,408.34 140,276.7099.906 140,453.61 13.74 0.43% 0.20 BBB+ B1 BBB+
126698AC3 CWL 2007-13 2A1 0.986 10/25/47 100.28687,118.46 59,458.3568.250 87,367.51 9.54 0.27% 0.20 AA A2 AA
437084NZ5 HEAT 2005-7 M1 0.761 01/25/36 100.32514,513.44 14,491.8999.852 14,560.54 1.23 0.04% 0.20 AAA Aaa A+ AAA
80557BAA2 SAST 2007-3 1A 0.396 09/25/37 98.843117,083.03 115,034.0898.250 115,728.08 5.15 0.35% 0.20 BBB+ Baa1 CCC A
TOTAL SUBPRIME 609,029.99 648,195.31 55.28 1.97% 0.20
OPTION ARM
45660LWD7 INDX 2005-AR18 2A1A 0.706 10/25/36 59.157164,605.01 78,598.8947.750 97,375.55 12.91 0.30% 0.20 CCC+ Caa1 CCC
45668RAC2 INDX 2007-FLX2 A1C 0.276 04/25/37 96.232273,736.77 126,261.0946.125 263,421.85 8.39 0.80% 0.20 B- B3 CCC
92922FR75 WAMU 2005-AR8 2A1A 0.666 07/25/45 99.11896,677.02 89,758.5792.844 95,824.63 10.73 0.29% 0.20 AA- A3 AA-
TOTAL OPTION ARM 294,618.55 456,622.03 32.04 1.39% 0.20
OTHER
59560UAD3 MDST 2004-1 B 8.900 08/15/37 111.64842,043.36 44,677.64106.266 46,940.36 311.82 0.14% 2.95 A+ A1 BBB
TOTAL OTHER 44,677.64 46,940.36 311.82 0.14% 2.95
1,465.91 5.04%
20
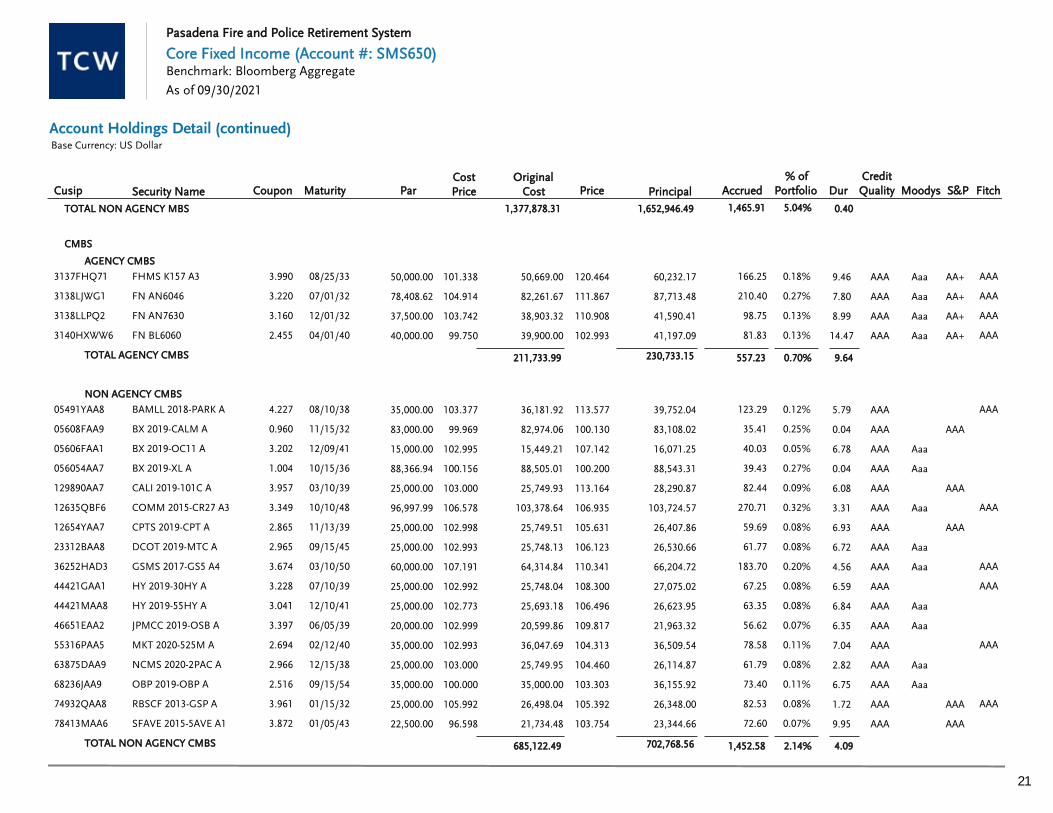
Pasadena Fire and Police Retirement System
Core Fixed Income (Account #: SMS650)
As of 09/30/2021
Base Currency: US Dollar
Account Holdings Detail (continued)
Benchmark: Bloomberg Aggregate
Cusip Security Name Coupon Maturity PriceParOriginal
CostCostPrice Principal Accrued
% ofPortfolio Dur S&PMoodys Fitch
CreditQuality
TOTAL NON AGENCY MBS 1,377,878.31 1,652,946.49 1,465.91 5.04% 0.40
CMBS
AGENCY CMBS
3137FHQ71 FHMS K157 A3 3.990 08/25/33 120.46450,000.00 50,669.00101.338 60,232.17 166.25 0.18% 9.46 AAA Aaa AA+ AAA
3138LJWG1 FN AN6046 3.220 07/01/32 111.86778,408.62 82,261.67104.914 87,713.48 210.40 0.27% 7.80 AAA Aaa AA+ AAA
3138LLPQ2 FN AN7630 3.160 12/01/32 110.90837,500.00 38,903.32103.742 41,590.41 98.75 0.13% 8.99 AAA Aaa AA+ AAA
3140HXWW6 FN BL6060 2.455 04/01/40 102.99340,000.00 39,900.0099.750 41,197.09 81.83 0.13% 14.47 AAA Aaa AA+ AAA
TOTAL AGENCY CMBS 211,733.99 230,733.15 557.23 0.70% 9.64
NON AGENCY CMBS
05491YAA8 BAMLL 2018-PARK A 4.227 08/10/38 113.57735,000.00 36,181.92103.377 39,752.04 123.29 0.12% 5.79 AAA AAA
05608FAA9 BX 2019-CALM A 0.960 11/15/32 100.13083,000.00 82,974.0699.969 83,108.02 35.41 0.25% 0.04 AAA AAA
05606FAA1 BX 2019-OC11 A 3.202 12/09/41 107.14215,000.00 15,449.21102.995 16,071.25 40.03 0.05% 6.78 AAA Aaa
056054AA7 BX 2019-XL A 1.004 10/15/36 100.20088,366.94 88,505.01100.156 88,543.31 39.43 0.27% 0.04 AAA Aaa
129890AA7 CALI 2019-101C A 3.957 03/10/39 113.16425,000.00 25,749.93103.000 28,290.87 82.44 0.09% 6.08 AAA AAA
12635QBF6 COMM 2015-CR27 A3 3.349 10/10/48 106.93596,997.99 103,378.64106.578 103,724.57 270.71 0.32% 3.31 AAA Aaa AAA
12654YAA7 CPTS 2019-CPT A 2.865 11/13/39 105.63125,000.00 25,749.51102.998 26,407.86 59.69 0.08% 6.93 AAA AAA
23312BAA8 DCOT 2019-MTC A 2.965 09/15/45 106.12325,000.00 25,748.13102.993 26,530.66 61.77 0.08% 6.72 AAA Aaa
36252HAD3 GSMS 2017-GS5 A4 3.674 03/10/50 110.34160,000.00 64,314.84107.191 66,204.72 183.70 0.20% 4.56 AAA Aaa AAA
44421GAA1 HY 2019-30HY A 3.228 07/10/39 108.30025,000.00 25,748.04102.992 27,075.02 67.25 0.08% 6.59 AAA AAA
44421MAA8 HY 2019-55HY A 3.041 12/10/41 106.49625,000.00 25,693.18102.773 26,623.95 63.35 0.08% 6.84 AAA Aaa
46651EAA2 JPMCC 2019-OSB A 3.397 06/05/39 109.81720,000.00 20,599.86102.999 21,963.32 56.62 0.07% 6.35 AAA Aaa
55316PAA5 MKT 2020-525M A 2.694 02/12/40 104.31335,000.00 36,047.69102.993 36,509.54 78.58 0.11% 7.04 AAA AAA
63875DAA9 NCMS 2020-2PAC A 2.966 12/15/38 104.46025,000.00 25,749.95103.000 26,114.87 61.79 0.08% 2.82 AAA Aaa
68236JAA9 OBP 2019-OBP A 2.516 09/15/54 103.30335,000.00 35,000.00100.000 36,155.92 73.40 0.11% 6.75 AAA Aaa
74932QAA8 RBSCF 2013-GSP A 3.961 01/15/32 105.39225,000.00 26,498.04105.992 26,348.00 82.53 0.08% 1.72 AAA AAA AAA
78413MAA6 SFAVE 2015-5AVE A1 3.872 01/05/43 103.75422,500.00 21,734.4896.598 23,344.66 72.60 0.07% 9.95 AAA AAA
TOTAL NON AGENCY CMBS 685,122.49 702,768.56 1,452.58 2.14% 4.09
21

Pasadena Fire and Police Retirement System
Core Fixed Income (Account #: SMS650)
As of 09/30/2021
Base Currency: US Dollar
Account Holdings Detail (continued)
Benchmark: Bloomberg Aggregate
Cusip Security Name Coupon Maturity PriceParOriginal
CostCostPrice Principal Accrued
% ofPortfolio Dur S&PMoodys Fitch
CreditQuality
TOTAL CMBS 896,856.48 933,501.71 2,009.81 2.85% 5.46
12,454,250.62 12,889,697.70 13,225.36 39.27%TOTAL MORTGAGE BACKED 4.41
ASSET BACKED
STUDENT LOAN
10620NCE6 BRHEA 2010-1 A2 1.329 02/25/35 101.787100,000.00 95,585.9495.586 101,787.38 136.62 0.31% 0.15 AAA AAA AAA
10620NCL0 BRHEA 2011-2 A3 1.125 10/27/36 101.23580,000.00 77,884.3897.356 80,987.70 167.54 0.25% 0.15 AAA AAA AAA
17284LAA2 CITEL 2007-1 A 0.237 03/25/42 97.28334,954.41 33,096.3094.684 34,004.62 0.92 0.10% 0.15 AAA Aaa AA+
63938QAA5 NAVSL 2014-4 A 0.706 03/25/83 99.85490,923.11 90,923.11100.000 90,790.26 7.13 0.28% 0.05 AAA Aaa AAA
64033MAB4 NSLT 2014-4A A2 1.036 11/25/48 101.956115,000.00 115,000.00100.000 117,249.65 13.24 0.36% 0.05 AAA Aa1 AAA
78442GHH2 SLMA 2003-7A A5A 1.316 12/15/33 100.38239,535.76 40,036.14101.266 39,686.62 23.12 0.12% 0.15 BBB- Baa3 AA B
78443HAF0 SLMA 2006-8 A6 0.285 01/25/41 98.799124,752.22 109,470.0787.750 123,254.29 66.23 0.38% 0.15 AAA Aaa AA+ AAA
784442AD7 SLMA 2008-2 B 1.325 01/25/83 96.05435,000.00 30,311.9186.606 33,618.74 86.33 0.10% 0.15 B A1 B B
78444GAD6 SLMA 2008-3 B 1.325 04/26/83 94.46735,000.00 30,995.5188.559 33,063.43 86.33 0.10% 0.15 B Aa2 B CCC
78445CAD4 SLMA 2008-6 A4 1.225 07/25/23 100.56179,955.83 80,866.87101.139 80,404.28 182.33 0.25% 0.15 B Baa3 B B
78445JAA5 SLMA 2008-9 A 1.625 04/25/23 100.70619,613.83 20,030.62102.125 19,752.21 59.33 0.06% 0.15 B Baa3 B B
TOTAL STUDENT LOAN 724,200.85 754,599.19 829.10 2.30% 0.12
CLO
00140NAA8 AIMCO 2020-11A A1 1.506 10/15/31 100.01560,000.00 60,000.00100.000 60,009.00 195.80 0.18% 0.15 AAA AAA
06761CAA7 BABSN 2016-2A AR 1.214 07/20/28 100.10538,481.49 38,481.49100.000 38,521.74 94.75 0.12% 0.15 AAA Aaa AAA
06760PAC5 BABSN 2018-3A A1 1.084 07/20/29 100.03570,000.00 69,715.6399.594 70,024.43 153.90 0.21% 0.15 AAA Aaa AAA
05586AAA6 BSPRT 2018-FL4 A 1.134 09/15/35 100.02628,051.32 28,064.47100.047 28,058.63 14.13 0.09% 0.05 AAA Aaa
26249BAQ4 DRSLF 2013-30A AR 0.945 11/15/28 100.04419,028.89 18,990.8499.800 19,037.27 22.97 0.06% 0.15 AAA Aaa AAA
30312UAA1 FSRIA 2019-FL1 A 1.285 12/16/36 99.89565,000.00 65,000.00100.000 64,931.56 34.79 0.20% 0.05 AAA Aaa
38123HAN4 GOLD9 2014-9A AR2 1.240 10/29/29 100.05260,000.00 60,000.00100.000 60,031.02 132.23 0.18% 0.15 AAA AAA AAA
55951PBA4 MAGNE 2012-7A A1R2 0.926 01/15/28 99.83559,273.30 58,888.0399.350 59,175.50 118.94 0.18% 0.15 AAA AAA AAA
22

Pasadena Fire and Police Retirement System
Core Fixed Income (Account #: SMS650)
As of 09/30/2021
Base Currency: US Dollar
Account Holdings Detail (continued)
Benchmark: Bloomberg Aggregate
Cusip Security Name Coupon Maturity PriceParOriginal
CostCostPrice Principal Accrued
% ofPortfolio Dur S&PMoodys Fitch
CreditQuality
CLO
64130TBA2 NEUB 2015-20A ARR 1.298 07/15/34 100.15785,000.00 85,000.00100.000 85,133.79 346.38 0.26% 0.15 AAA Aaa AAA
67590ABP6 OCT14 2012-1A AARR 1.076 07/15/29 100.00585,000.00 85,000.00100.000 85,004.25 198.19 0.26% 0.15 AAA Aaa
77341KAA9 ROCKT 2021-1A A1 1.253 07/20/34 100.21585,000.00 85,000.00100.000 85,182.33 331.36 0.26% 0.15 AAA Aaa
89532WAC3 TREST 2021-4A B1 0.000 07/21/34 100.10285,000.00 85,000.00100.000 85,087.04 0.00 0.26% 0.15 AA AA
TOTAL CLO 739,140.46 740,196.56 1,643.44 2.26% 0.14
OTHER
46617LAA9 HENDR 2013-3A A 4.080 01/17/73 112.26143,016.23 42,981.4199.919 48,290.37 78.00 0.15% 6.59 AAA Aaa
46618AAA2 HENDR 2014-2A A 3.610 01/17/73 110.10656,964.64 56,927.7299.935 62,721.33 91.40 0.19% 7.10 AAA Aaa
37952UAE3 SEACO 2014-1A A2 3.090 07/17/29 102.00624,083.33 24,076.8699.973 24,566.51 28.94 0.07% 1.72 A- A-
89613DAA1 TAH 2017-SFR1 A 2.716 09/17/34 99.96495,484.23 96,200.35100.750 95,449.87 216.11 0.29% 0.26 AAA Aaa
TOTAL OTHER 220,186.34 231,028.08 414.45 0.70% 3.59
1,683,527.65 1,725,823.83 2,886.99 5.26%TOTAL ASSET BACKED 0.59
OTHER
FUTURES
TUZ1 US 2YR NOTE (CBT) DEC21 6.000 12/31/21 110.027(2.00) 0.00 0.00 0.00% 1.97 AAA Aaa AA+ AAA
WNZ1 US ULTRA BOND CBTDEC21
6.000 12/21/21 191.0631.00 0.00 0.00 0.00% 19.08 AAA Aaa AA+ AAA
TOTAL FUTURES 0.00 0.00 0.00 0.00% 7.15
0.00 0.00 0.00 0.00%TOTAL OTHER 7.15
23

Pasadena Fire and Police Retirement System
Core Fixed Income (Account #: SMS650)
As of 09/30/2021
Base Currency: US Dollar
Account Holdings Detail (continued)
Benchmark: Bloomberg Aggregate
Cusip Security Name Coupon Maturity PriceParOriginal
CostCostPrice Principal Accrued
% ofPortfolio Dur S&PMoodys Fitch
CreditQuality
32,767,996.05
87,691.87
32,855,687.91
Principal Market Value
Accrued Income
Total Portfolio Market Value
Account Holdings Summary MarketValue
24
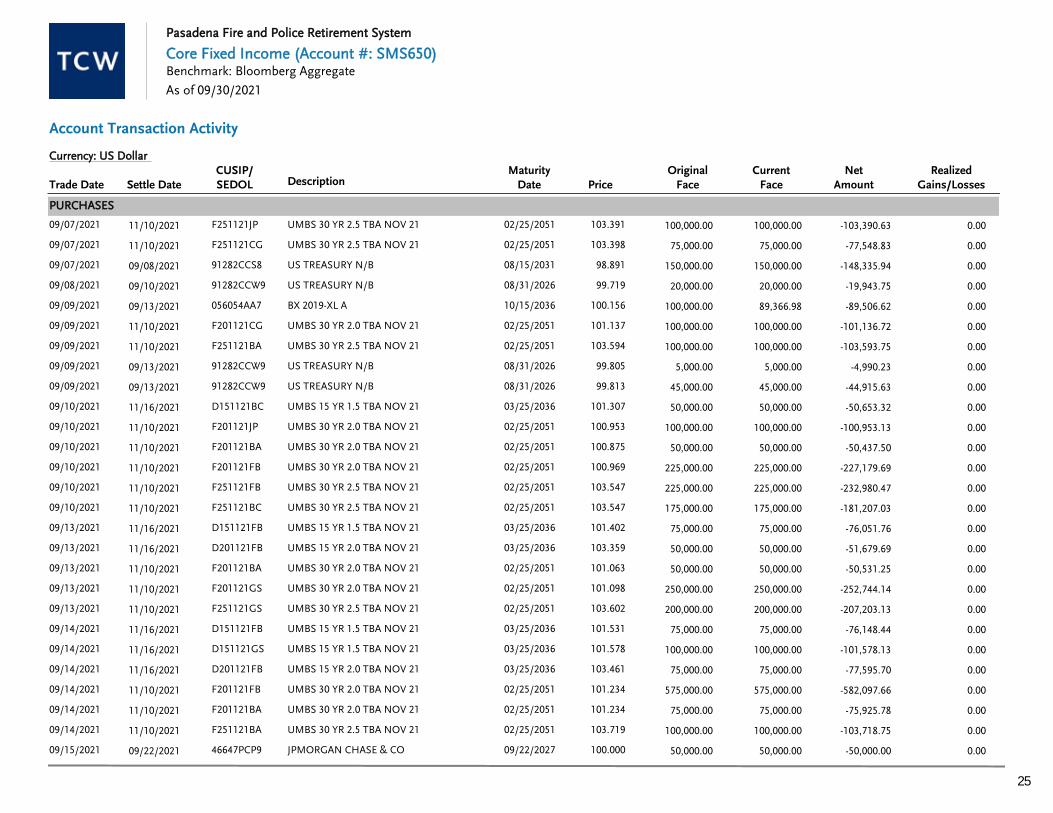
DescriptionTrade DateCurrent
FaceRealized
Gains/LossesCUSIP/SEDOL
NetAmount
OriginalFacePrice
Currency: US Dollar
Settle DateMaturity
Date
PURCHASES
09/07/2021 UMBS 30 YR 2.5 TBA NOV 21 103.391F251121JP -103,390.63100,000.00 0.0011/10/2021 02/25/2051 100,000.00
09/07/2021 UMBS 30 YR 2.5 TBA NOV 21 103.398F251121CG -77,548.8375,000.00 0.0011/10/2021 02/25/2051 75,000.00
09/07/2021 US TREASURY N/B 98.89191282CCS8 -148,335.94150,000.00 0.0009/08/2021 08/15/2031 150,000.00
09/08/2021 US TREASURY N/B 99.71991282CCW9 -19,943.7520,000.00 0.0009/10/2021 08/31/2026 20,000.00
09/09/2021 BX 2019-XL A 100.156056054AA7 -89,506.6289,366.98 0.0009/13/2021 10/15/2036 100,000.00
09/09/2021 UMBS 30 YR 2.0 TBA NOV 21 101.137F201121CG -101,136.72100,000.00 0.0011/10/2021 02/25/2051 100,000.00
09/09/2021 UMBS 30 YR 2.5 TBA NOV 21 103.594F251121BA -103,593.75100,000.00 0.0011/10/2021 02/25/2051 100,000.00
09/09/2021 US TREASURY N/B 99.80591282CCW9 -4,990.235,000.00 0.0009/13/2021 08/31/2026 5,000.00
09/09/2021 US TREASURY N/B 99.81391282CCW9 -44,915.6345,000.00 0.0009/13/2021 08/31/2026 45,000.00
09/10/2021 UMBS 15 YR 1.5 TBA NOV 21 101.307D151121BC -50,653.3250,000.00 0.0011/16/2021 03/25/2036 50,000.00
09/10/2021 UMBS 30 YR 2.0 TBA NOV 21 100.953F201121JP -100,953.13100,000.00 0.0011/10/2021 02/25/2051 100,000.00
09/10/2021 UMBS 30 YR 2.0 TBA NOV 21 100.875F201121BA -50,437.5050,000.00 0.0011/10/2021 02/25/2051 50,000.00
09/10/2021 UMBS 30 YR 2.0 TBA NOV 21 100.969F201121FB -227,179.69225,000.00 0.0011/10/2021 02/25/2051 225,000.00
09/10/2021 UMBS 30 YR 2.5 TBA NOV 21 103.547F251121FB -232,980.47225,000.00 0.0011/10/2021 02/25/2051 225,000.00
09/10/2021 UMBS 30 YR 2.5 TBA NOV 21 103.547F251121BC -181,207.03175,000.00 0.0011/10/2021 02/25/2051 175,000.00
09/13/2021 UMBS 15 YR 1.5 TBA NOV 21 101.402D151121FB -76,051.7675,000.00 0.0011/16/2021 03/25/2036 75,000.00
09/13/2021 UMBS 15 YR 2.0 TBA NOV 21 103.359D201121FB -51,679.6950,000.00 0.0011/16/2021 03/25/2036 50,000.00
09/13/2021 UMBS 30 YR 2.0 TBA NOV 21 101.063F201121BA -50,531.2550,000.00 0.0011/10/2021 02/25/2051 50,000.00
09/13/2021 UMBS 30 YR 2.0 TBA NOV 21 101.098F201121GS -252,744.14250,000.00 0.0011/10/2021 02/25/2051 250,000.00
09/13/2021 UMBS 30 YR 2.5 TBA NOV 21 103.602F251121GS -207,203.13200,000.00 0.0011/10/2021 02/25/2051 200,000.00
09/14/2021 UMBS 15 YR 1.5 TBA NOV 21 101.531D151121FB -76,148.4475,000.00 0.0011/16/2021 03/25/2036 75,000.00
09/14/2021 UMBS 15 YR 1.5 TBA NOV 21 101.578D151121GS -101,578.13100,000.00 0.0011/16/2021 03/25/2036 100,000.00
09/14/2021 UMBS 15 YR 2.0 TBA NOV 21 103.461D201121FB -77,595.7075,000.00 0.0011/16/2021 03/25/2036 75,000.00
09/14/2021 UMBS 30 YR 2.0 TBA NOV 21 101.234F201121FB -582,097.66575,000.00 0.0011/10/2021 02/25/2051 575,000.00
09/14/2021 UMBS 30 YR 2.0 TBA NOV 21 101.234F201121BA -75,925.7875,000.00 0.0011/10/2021 02/25/2051 75,000.00
09/14/2021 UMBS 30 YR 2.5 TBA NOV 21 103.719F251121BA -103,718.75100,000.00 0.0011/10/2021 02/25/2051 100,000.00
09/15/2021 JPMORGAN CHASE & CO 100.00046647PCP9 -50,000.0050,000.00 0.0009/22/2021 09/22/2027 50,000.00
Pasadena Fire and Police Retirement System
Core Fixed Income (Account #: SMS650)
Account Transaction Activity
As of 09/30/2021
Benchmark: Bloomberg Aggregate
25

Pasadena Fire and Police Retirement System
Core Fixed Income (Account #: SMS650)
Account Transaction Activity (continued)
As of 09/30/2021
Benchmark: Bloomberg Aggregate
DescriptionTrade DateCurrent
FaceRealized
Gains/LossesCUSIP/SEDOL
NetAmount
OriginalFacePrice
Currency: US Dollar
Settle DateMaturity
Date
PURCHASES
09/15/2021 UMBS 15 YR 2.0 TBA NOV 21 103.430D201121CG -103,429.69100,000.00 0.0011/16/2021 03/25/2036 100,000.00
09/15/2021 UMBS 15 YR 2.0 TBA NOV 21 103.436D201121BC -77,576.6675,000.00 0.0011/16/2021 03/25/2036 75,000.00
09/15/2021 UMBS 30 YR 2.5 TBA NOV 21 103.633F251121GS -207,265.63200,000.00 0.0011/10/2021 02/25/2051 200,000.00
09/16/2021 ATHENE GLOBAL FUNDING 99.39104685A3C3 -34,786.8535,000.00 0.0009/21/2021 08/19/2028 35,000.00
09/16/2021 CREDIT SUISSE GROUP AG 102.446225401AQ1 -25,611.5025,000.00 0.0009/20/2021 06/05/2026 25,000.00
09/16/2021 UMBS 15 YR 1.5 TBA NOV 21 101.297D151121BA -75,972.6675,000.00 0.0011/16/2021 03/25/2036 75,000.00
09/16/2021 US TREASURY N/B 99.81691282CCU3 -39,926.5640,000.00 0.0009/20/2021 08/31/2023 40,000.00
09/17/2021 UMBS 15 YR 2.0 TBA NOV 21 103.125D201121BA -77,343.7575,000.00 0.0011/16/2021 03/25/2036 75,000.00
09/17/2021 UMBS 30 YR 2.5 TBA NOV 21 103.320F251121GS -284,130.86275,000.00 0.0011/10/2021 02/25/2051 275,000.00
09/20/2021 UMBS 30 YR 2.0 TBA NOV 21 100.906F201121FB -227,039.06225,000.00 0.0011/10/2021 02/25/2051 225,000.00
09/20/2021 UMBS 30 YR 2.0 TBA NOV 21 100.953F201121JP -126,191.41125,000.00 0.0011/10/2021 02/25/2051 125,000.00
09/20/2021 UMBS 30 YR 2.0 TBA NOV 21 100.941F201121CG -151,412.11150,000.00 0.0011/10/2021 02/25/2051 150,000.00
09/20/2021 UMBS 30 YR 2.0 TBA NOV 21 100.957F201121CG -126,196.29125,000.00 0.0011/10/2021 02/25/2051 125,000.00
09/20/2021 UMBS 30 YR 2.5 TBA NOV 21 103.484F251121BA -77,613.2875,000.00 0.0011/10/2021 02/25/2051 75,000.00
09/20/2021 UMBS 30 YR 2.5 TBA NOV 21 103.477F251121CG -129,345.70125,000.00 0.0011/10/2021 02/25/2051 125,000.00
09/20/2021 UMBS 30 YR 2.5 TBA NOV 21 103.453F251121FB -258,632.81250,000.00 0.0011/10/2021 02/25/2051 250,000.00
09/21/2021 G2SF 30 YR 2.5 TBA NOV 21 103.313T251121BA -154,968.75150,000.00 0.0011/18/2021 12/20/2050 150,000.00
09/21/2021 UMBS 30 YR 2.5 TBA NOV 21 103.512F251121GS -129,389.65125,000.00 0.0011/10/2021 02/25/2051 125,000.00
09/21/2021 VERIZON COMMUNICATIONS 100.57392343VGM0 -25,143.2525,000.00 0.0009/23/2021 03/15/2032 25,000.00
09/22/2021 G2SF 30 YR 2.5 TBA NOV 21 103.391T251121FB -77,542.9775,000.00 0.0011/18/2021 12/20/2050 75,000.00
09/22/2021 UMBS 30 YR 2.0 TBA NOV 21 100.938F201121FB -176,640.63175,000.00 0.0011/10/2021 02/25/2051 175,000.00
09/22/2021 UMBS 30 YR 2.5 TBA NOV 21 103.516F251121FB -155,273.44150,000.00 0.0011/10/2021 02/25/2051 150,000.00
09/23/2021 G2SF 30 YR 2.5 TBA NOV 21 103.176T251121GS -103,175.78100,000.00 0.0011/18/2021 12/20/2050 100,000.00
09/23/2021 UMBS 15 YR 2.0 TBA NOV 21 103.141D201121BA -103,140.63100,000.00 0.0011/16/2021 03/25/2036 100,000.00
09/23/2021 US TREASURY N/B 99.66191282CCZ2 -159,458.24160,000.00 0.0009/30/2021 09/30/2026 160,000.00
09/23/2021 US TREASURY N/B 99.69591282CCZ2 -64,802.0265,000.00 0.0009/30/2021 09/30/2026 65,000.00
09/23/2021 US TREASURY N/B 99.72091282CCZ2 -64,817.8365,000.00 0.0009/30/2021 09/30/2026 65,000.00
26
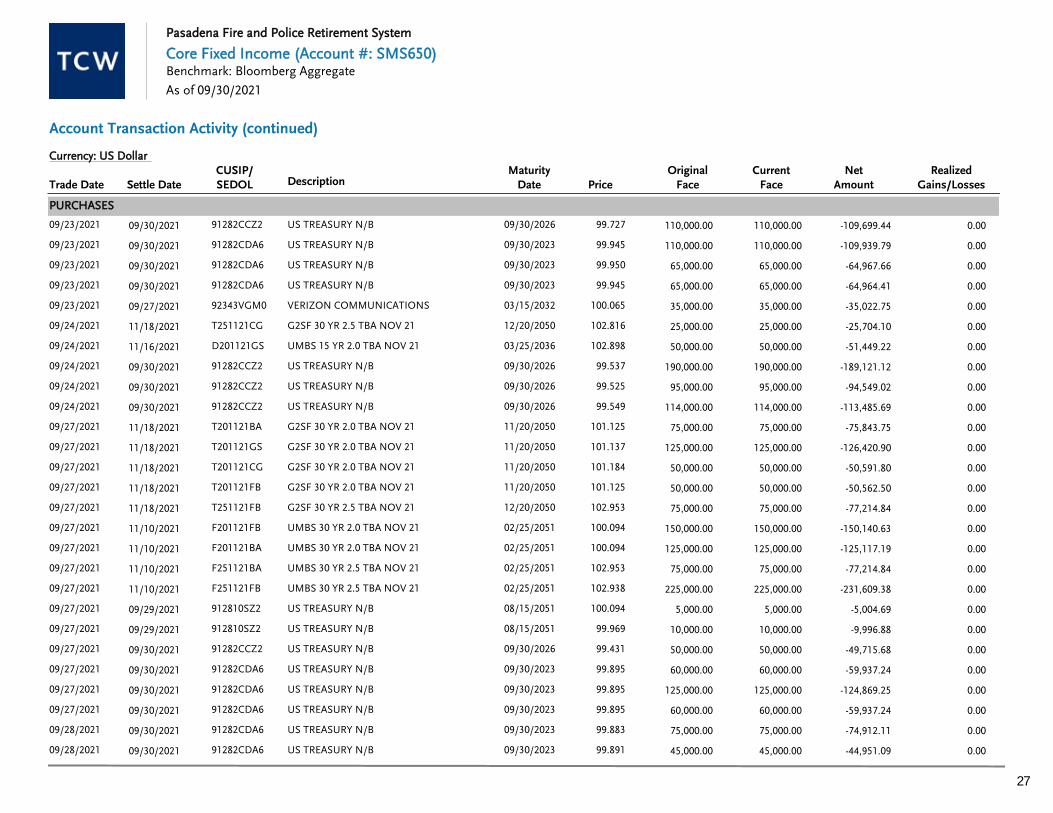
Pasadena Fire and Police Retirement System
Core Fixed Income (Account #: SMS650)
Account Transaction Activity (continued)
As of 09/30/2021
Benchmark: Bloomberg Aggregate
DescriptionTrade DateCurrent
FaceRealized
Gains/LossesCUSIP/SEDOL
NetAmount
OriginalFacePrice
Currency: US Dollar
Settle DateMaturity
Date
PURCHASES
09/23/2021 US TREASURY N/B 99.72791282CCZ2 -109,699.44110,000.00 0.0009/30/2021 09/30/2026 110,000.00
09/23/2021 US TREASURY N/B 99.94591282CDA6 -109,939.79110,000.00 0.0009/30/2021 09/30/2023 110,000.00
09/23/2021 US TREASURY N/B 99.95091282CDA6 -64,967.6665,000.00 0.0009/30/2021 09/30/2023 65,000.00
09/23/2021 US TREASURY N/B 99.94591282CDA6 -64,964.4165,000.00 0.0009/30/2021 09/30/2023 65,000.00
09/23/2021 VERIZON COMMUNICATIONS 100.06592343VGM0 -35,022.7535,000.00 0.0009/27/2021 03/15/2032 35,000.00
09/24/2021 G2SF 30 YR 2.5 TBA NOV 21 102.816T251121CG -25,704.1025,000.00 0.0011/18/2021 12/20/2050 25,000.00
09/24/2021 UMBS 15 YR 2.0 TBA NOV 21 102.898D201121GS -51,449.2250,000.00 0.0011/16/2021 03/25/2036 50,000.00
09/24/2021 US TREASURY N/B 99.53791282CCZ2 -189,121.12190,000.00 0.0009/30/2021 09/30/2026 190,000.00
09/24/2021 US TREASURY N/B 99.52591282CCZ2 -94,549.0295,000.00 0.0009/30/2021 09/30/2026 95,000.00
09/24/2021 US TREASURY N/B 99.54991282CCZ2 -113,485.69114,000.00 0.0009/30/2021 09/30/2026 114,000.00
09/27/2021 G2SF 30 YR 2.0 TBA NOV 21 101.125T201121BA -75,843.7575,000.00 0.0011/18/2021 11/20/2050 75,000.00
09/27/2021 G2SF 30 YR 2.0 TBA NOV 21 101.137T201121GS -126,420.90125,000.00 0.0011/18/2021 11/20/2050 125,000.00
09/27/2021 G2SF 30 YR 2.0 TBA NOV 21 101.184T201121CG -50,591.8050,000.00 0.0011/18/2021 11/20/2050 50,000.00
09/27/2021 G2SF 30 YR 2.0 TBA NOV 21 101.125T201121FB -50,562.5050,000.00 0.0011/18/2021 11/20/2050 50,000.00
09/27/2021 G2SF 30 YR 2.5 TBA NOV 21 102.953T251121FB -77,214.8475,000.00 0.0011/18/2021 12/20/2050 75,000.00
09/27/2021 UMBS 30 YR 2.0 TBA NOV 21 100.094F201121FB -150,140.63150,000.00 0.0011/10/2021 02/25/2051 150,000.00
09/27/2021 UMBS 30 YR 2.0 TBA NOV 21 100.094F201121BA -125,117.19125,000.00 0.0011/10/2021 02/25/2051 125,000.00
09/27/2021 UMBS 30 YR 2.5 TBA NOV 21 102.953F251121BA -77,214.8475,000.00 0.0011/10/2021 02/25/2051 75,000.00
09/27/2021 UMBS 30 YR 2.5 TBA NOV 21 102.938F251121FB -231,609.38225,000.00 0.0011/10/2021 02/25/2051 225,000.00
09/27/2021 US TREASURY N/B 100.094912810SZ2 -5,004.695,000.00 0.0009/29/2021 08/15/2051 5,000.00
09/27/2021 US TREASURY N/B 99.969912810SZ2 -9,996.8810,000.00 0.0009/29/2021 08/15/2051 10,000.00
09/27/2021 US TREASURY N/B 99.43191282CCZ2 -49,715.6850,000.00 0.0009/30/2021 09/30/2026 50,000.00
09/27/2021 US TREASURY N/B 99.89591282CDA6 -59,937.2460,000.00 0.0009/30/2021 09/30/2023 60,000.00
09/27/2021 US TREASURY N/B 99.89591282CDA6 -124,869.25125,000.00 0.0009/30/2021 09/30/2023 125,000.00
09/27/2021 US TREASURY N/B 99.89591282CDA6 -59,937.2460,000.00 0.0009/30/2021 09/30/2023 60,000.00
09/28/2021 US TREASURY N/B 99.88391282CDA6 -74,912.1175,000.00 0.0009/30/2021 09/30/2023 75,000.00
09/28/2021 US TREASURY N/B 99.89191282CDA6 -44,951.0945,000.00 0.0009/30/2021 09/30/2023 45,000.00
27

Pasadena Fire and Police Retirement System
Core Fixed Income (Account #: SMS650)
Account Transaction Activity (continued)
As of 09/30/2021
Benchmark: Bloomberg Aggregate
DescriptionTrade DateCurrent
FaceRealized
Gains/LossesCUSIP/SEDOL
NetAmount
OriginalFacePrice
Currency: US Dollar
Settle DateMaturity
Date
PURCHASES
09/28/2021 US TREASURY N/B 97.41891282CCS8 -9,741.8010,000.00 0.0009/30/2021 08/15/2031 10,000.00
09/28/2021 US TREASURY N/B 99.33291282CCZ2 -74,499.0275,000.00 0.0009/30/2021 09/30/2026 75,000.00
09/28/2021 US TREASURY N/B 99.50091282CCZ2 -49,750.0050,000.00 0.0009/30/2021 09/30/2026 50,000.00
09/28/2021 US TREASURY N/B 99.36391282CCZ2 -129,172.27130,000.00 0.0009/30/2021 09/30/2026 130,000.00
09/28/2021 US TREASURY N/B 99.50091282CCZ2 -49,750.0050,000.00 0.0009/30/2021 09/30/2026 50,000.00
09/28/2021 US TREASURY N/B 99.28991282CCZ2 -238,293.75240,000.00 0.0009/30/2021 09/30/2026 240,000.00
09/28/2021 US TREASURY N/B 99.32491282CCZ2 -228,445.70230,000.00 0.0009/30/2021 09/30/2026 230,000.00
09/29/2021 DNB BANK ASA 98.86523329PAF7 -49,432.5050,000.00 0.0010/01/2021 09/16/2026 50,000.00
09/29/2021 US TREASURY N/B 99.35991282CCZ2 -198,718.75200,000.00 0.0009/30/2021 09/30/2026 200,000.00
09/29/2021 US TREASURY N/B 99.50091282CCZ2 -54,725.0055,000.00 0.0009/30/2021 09/30/2026 55,000.00
09/29/2021 US TREASURY N/B 99.87591282CDA6 -529,337.50530,000.00 0.0009/30/2021 09/30/2023 530,000.00
09/30/2021 NATWEST GROUP PLC 107.926780097BK6 -16,188.9015,000.00 0.0010/04/2021 03/22/2025 15,000.00
09/30/2021 UMBS 30 YR 2.0 TBA NOV 21 100.051F201121BC -50,025.3950,000.00 0.0011/10/2021 02/25/2051 50,000.00
09/30/2021 US TREASURY N/B 97.43891282CCS8 -141,284.38145,000.00 0.0010/01/2021 08/15/2031 145,000.00
09/30/2021 US TREASURY N/B 99.47391282CCZ2 -213,866.21215,000.00 0.0010/01/2021 09/30/2026 215,000.00
09/30/2021 US TREASURY N/B 98.500912810SZ2 -83,725.0085,000.00 0.0010/01/2021 08/15/2051 85,000.00
09/30/2021 US TREASURY N/B 98.500912810SZ2 -29,550.0030,000.00 0.0010/01/2021 08/15/2051 30,000.00
09/30/2021 US TREASURY N/B 98.297912810SZ2 -29,489.0630,000.00 0.0010/01/2021 08/15/2051 30,000.00
09/30/2021 US TREASURY N/B 97.984912810SZ2 -29,395.3130,000.00 0.0010/01/2021 08/15/2051 30,000.00
0.00-10,937,209.43TOTAL PURCHASES
SALES
09/07/2021 UMBS 30 YR 2.5 TBA OCT 21 103.578F251021CG 77,683.5975,000.00 -32.2310/14/2021 07/25/2050 75,000.00
09/07/2021 UMBS 30 YR 2.5 TBA OCT 21 103.570F251021JP 103,570.31100,000.00 335.9410/14/2021 07/25/2050 100,000.00
09/08/2021 VERIZON COMMUNICATIONS 102.39292343VGH1 15,358.8015,000.00 365.5509/10/2021 03/22/2028 15,000.00
09/09/2021 BANK OF AMERICA CORP 101.38806051GJS9 45,624.6045,000.00 624.6009/13/2021 07/22/2027 45,000.00
09/09/2021 GOLDMAN SACHS GROUP INC 99.31138141GXM1 4,965.555,000.00 42.2509/13/2021 12/09/2026 5,000.00
09/09/2021 UMBS 30 YR 2.0 TBA OCT 21 101.307F201021CG 101,306.64100,000.00 33.2010/14/2021 01/25/2051 100,000.00
28
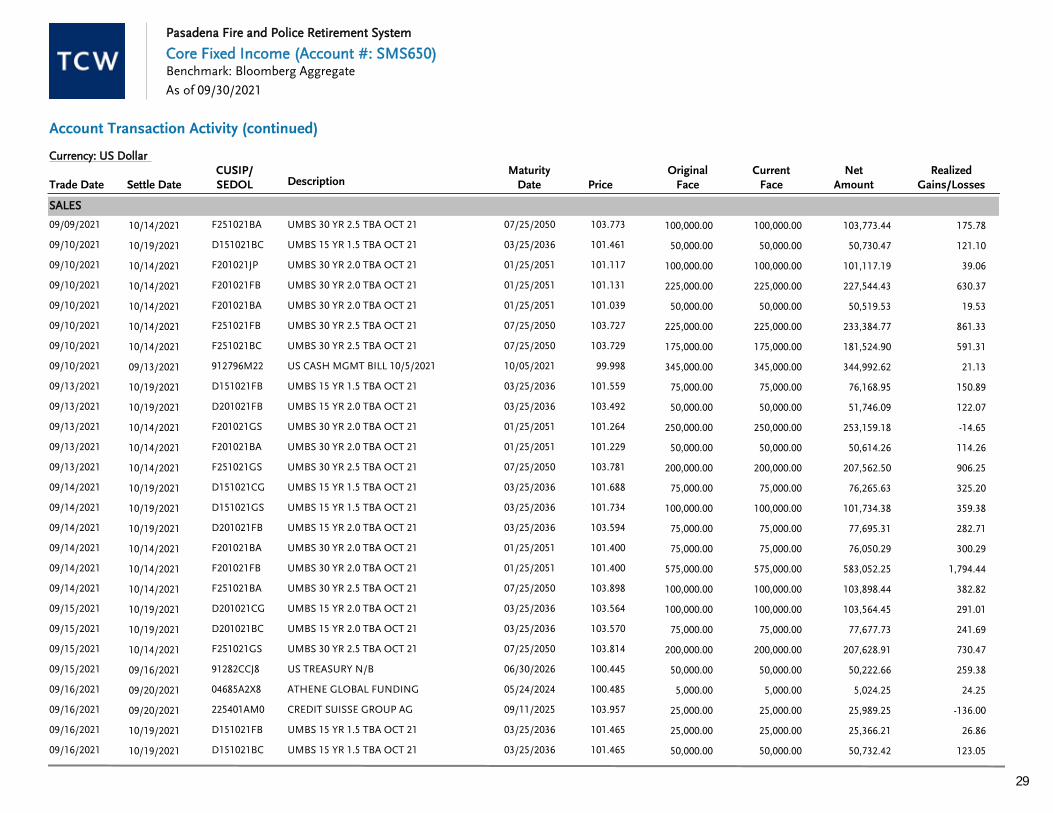
Pasadena Fire and Police Retirement System
Core Fixed Income (Account #: SMS650)
Account Transaction Activity (continued)
As of 09/30/2021
Benchmark: Bloomberg Aggregate
DescriptionTrade DateCurrent
FaceRealized
Gains/LossesCUSIP/SEDOL
NetAmount
OriginalFacePrice
Currency: US Dollar
Settle DateMaturity
Date
SALES
09/09/2021 UMBS 30 YR 2.5 TBA OCT 21 103.773F251021BA 103,773.44100,000.00 175.7810/14/2021 07/25/2050 100,000.00
09/10/2021 UMBS 15 YR 1.5 TBA OCT 21 101.461D151021BC 50,730.4750,000.00 121.1010/19/2021 03/25/2036 50,000.00
09/10/2021 UMBS 30 YR 2.0 TBA OCT 21 101.117F201021JP 101,117.19100,000.00 39.0610/14/2021 01/25/2051 100,000.00
09/10/2021 UMBS 30 YR 2.0 TBA OCT 21 101.131F201021FB 227,544.43225,000.00 630.3710/14/2021 01/25/2051 225,000.00
09/10/2021 UMBS 30 YR 2.0 TBA OCT 21 101.039F201021BA 50,519.5350,000.00 19.5310/14/2021 01/25/2051 50,000.00
09/10/2021 UMBS 30 YR 2.5 TBA OCT 21 103.727F251021FB 233,384.77225,000.00 861.3310/14/2021 07/25/2050 225,000.00
09/10/2021 UMBS 30 YR 2.5 TBA OCT 21 103.729F251021BC 181,524.90175,000.00 591.3110/14/2021 07/25/2050 175,000.00
09/10/2021 US CASH MGMT BILL 10/5/2021 99.998912796M22 344,992.62345,000.00 21.1309/13/2021 10/05/2021 345,000.00
09/13/2021 UMBS 15 YR 1.5 TBA OCT 21 101.559D151021FB 76,168.9575,000.00 150.8910/19/2021 03/25/2036 75,000.00
09/13/2021 UMBS 15 YR 2.0 TBA OCT 21 103.492D201021FB 51,746.0950,000.00 122.0710/19/2021 03/25/2036 50,000.00
09/13/2021 UMBS 30 YR 2.0 TBA OCT 21 101.264F201021GS 253,159.18250,000.00 -14.6510/14/2021 01/25/2051 250,000.00
09/13/2021 UMBS 30 YR 2.0 TBA OCT 21 101.229F201021BA 50,614.2650,000.00 114.2610/14/2021 01/25/2051 50,000.00
09/13/2021 UMBS 30 YR 2.5 TBA OCT 21 103.781F251021GS 207,562.50200,000.00 906.2510/14/2021 07/25/2050 200,000.00
09/14/2021 UMBS 15 YR 1.5 TBA OCT 21 101.688D151021CG 76,265.6375,000.00 325.2010/19/2021 03/25/2036 75,000.00
09/14/2021 UMBS 15 YR 1.5 TBA OCT 21 101.734D151021GS 101,734.38100,000.00 359.3810/19/2021 03/25/2036 100,000.00
09/14/2021 UMBS 15 YR 2.0 TBA OCT 21 103.594D201021FB 77,695.3175,000.00 282.7110/19/2021 03/25/2036 75,000.00
09/14/2021 UMBS 30 YR 2.0 TBA OCT 21 101.400F201021BA 76,050.2975,000.00 300.2910/14/2021 01/25/2051 75,000.00
09/14/2021 UMBS 30 YR 2.0 TBA OCT 21 101.400F201021FB 583,052.25575,000.00 1,794.4410/14/2021 01/25/2051 575,000.00
09/14/2021 UMBS 30 YR 2.5 TBA OCT 21 103.898F251021BA 103,898.44100,000.00 382.8210/14/2021 07/25/2050 100,000.00
09/15/2021 UMBS 15 YR 2.0 TBA OCT 21 103.564D201021CG 103,564.45100,000.00 291.0110/19/2021 03/25/2036 100,000.00
09/15/2021 UMBS 15 YR 2.0 TBA OCT 21 103.570D201021BC 77,677.7375,000.00 241.6910/19/2021 03/25/2036 75,000.00
09/15/2021 UMBS 30 YR 2.5 TBA OCT 21 103.814F251021GS 207,628.91200,000.00 730.4710/14/2021 07/25/2050 200,000.00
09/15/2021 US TREASURY N/B 100.44591282CCJ8 50,222.6650,000.00 259.3809/16/2021 06/30/2026 50,000.00
09/16/2021 ATHENE GLOBAL FUNDING 100.48504685A2X8 5,024.255,000.00 24.2509/20/2021 05/24/2024 5,000.00
09/16/2021 CREDIT SUISSE GROUP AG 103.957225401AM0 25,989.2525,000.00 -136.0009/20/2021 09/11/2025 25,000.00
09/16/2021 UMBS 15 YR 1.5 TBA OCT 21 101.465D151021FB 25,366.2125,000.00 26.8610/19/2021 03/25/2036 25,000.00
09/16/2021 UMBS 15 YR 1.5 TBA OCT 21 101.465D151021BC 50,732.4250,000.00 123.0510/19/2021 03/25/2036 50,000.00
29

Pasadena Fire and Police Retirement System
Core Fixed Income (Account #: SMS650)
Account Transaction Activity (continued)
As of 09/30/2021
Benchmark: Bloomberg Aggregate
DescriptionTrade DateCurrent
FaceRealized
Gains/LossesCUSIP/SEDOL
NetAmount
OriginalFacePrice
Currency: US Dollar
Settle DateMaturity
Date
SALES
09/16/2021 US TREASURY N/B 99.27391282CCS8 24,818.3625,000.00 86.5509/17/2021 08/15/2031 25,000.00
09/16/2021 US TREASURY N/B 100.29391282CCJ8 20,058.5920,000.00 70.7909/17/2021 06/30/2026 20,000.00
09/17/2021 UMBS 15 YR 2.0 TBA OCT 21 103.260D201021BA 77,444.8275,000.00 65.9110/19/2021 03/25/2036 75,000.00
09/17/2021 UMBS 30 YR 2.5 TBA OCT 21 103.504F251021GS 284,635.74275,000.00 -93.7510/14/2021 07/25/2050 275,000.00
09/20/2021 UMBS 30 YR 2.0 TBA OCT 21 101.076F201021FB 227,421.39225,000.00 -180.1710/14/2021 01/25/2051 225,000.00
09/20/2021 UMBS 30 YR 2.0 TBA OCT 21 101.123F201021GS 126,403.81125,000.00 -183.1110/14/2021 01/25/2051 125,000.00
09/20/2021 UMBS 30 YR 2.0 TBA OCT 21 101.127F201021BC 126,408.69125,000.00 -212.4010/14/2021 01/25/2051 125,000.00
09/20/2021 UMBS 30 YR 2.0 TBA OCT 21 101.111F201021CG 151,666.99150,000.00 -243.1610/14/2021 01/25/2051 150,000.00
09/20/2021 UMBS 30 YR 2.5 TBA OCT 21 103.660F251021CG 129,575.20125,000.00 115.2410/14/2021 07/25/2050 125,000.00
09/20/2021 UMBS 30 YR 2.5 TBA OCT 21 103.668F251021BA 77,750.9875,000.00 114.2610/14/2021 07/25/2050 75,000.00
09/20/2021 UMBS 30 YR 2.5 TBA OCT 21 103.637F251021FB 259,091.80250,000.00 435.5510/14/2021 07/25/2050 250,000.00
09/21/2021 G2SF 30 YR 2.5 TBA OCT 21 103.477T251021BA 155,214.84150,000.00 175.7810/21/2021 05/20/2050 150,000.00
09/21/2021 UMBS 30 YR 2.5 TBA OCT 21 103.697F251021BC 77,772.9575,000.00 124.5110/14/2021 07/25/2050 75,000.00
09/21/2021 UMBS 30 YR 2.5 TBA OCT 21 103.697F251021JP 51,848.6350,000.00 231.4410/14/2021 07/25/2050 50,000.00
09/21/2021 US TREASURY N/B 99.33691282CCS8 24,833.9825,000.00 102.1709/22/2021 08/15/2031 25,000.00
09/22/2021 G2SF 30 YR 2.5 TBA OCT 21 103.555T251021FB 77,666.0275,000.00 158.2110/21/2021 05/20/2050 75,000.00
09/22/2021 UMBS 30 YR 2.0 TBA OCT 21 101.109F201021FB 176,941.41175,000.00 -82.0310/14/2021 01/25/2051 175,000.00
09/22/2021 UMBS 30 YR 2.5 TBA OCT 21 103.703F251021FB 155,554.69150,000.00 117.1910/14/2021 07/25/2050 150,000.00
09/23/2021 G2SF 30 YR 2.5 TBA OCT 21 103.342T251021BA 103,341.80100,000.00 -17.5810/21/2021 05/20/2050 100,000.00
09/23/2021 T-MOBILE USA INC 101.48787264ACB9 35,520.4535,000.00 478.0309/27/2021 02/15/2031 35,000.00
09/23/2021 UMBS 15 YR 2.0 TBA OCT 21 103.271D201021GS 103,271.48100,000.00 52.7310/19/2021 03/25/2036 100,000.00
09/23/2021 US TREASURY N/B 99.84491282CCK5 74,882.8175,000.00 67.7709/24/2021 06/30/2023 75,000.00
09/23/2021 US TREASURY N/B 99.84491282CCK5 124,804.69125,000.00 113.2809/24/2021 06/30/2023 125,000.00
09/23/2021 US TREASURY N/B 99.84491282CCK5 74,882.8175,000.00 11.7209/24/2021 06/30/2023 75,000.00
09/23/2021 US TREASURY N/B 99.90691282CCJ8 114,892.19115,000.00 35.9409/24/2021 06/30/2026 115,000.00
09/23/2021 US TREASURY N/B 99.84491282CCJ8 169,734.38170,000.00 -53.1209/24/2021 06/30/2026 170,000.00
09/23/2021 US TREASURY N/B 99.89391282CCJ8 69,924.8870,000.00 -32.4209/24/2021 06/30/2026 70,000.00
30

Pasadena Fire and Police Retirement System
Core Fixed Income (Account #: SMS650)
Account Transaction Activity (continued)
As of 09/30/2021
Benchmark: Bloomberg Aggregate
DescriptionTrade DateCurrent
FaceRealized
Gains/LossesCUSIP/SEDOL
NetAmount
OriginalFacePrice
Currency: US Dollar
Settle DateMaturity
Date
SALES
09/23/2021 US TREASURY N/B 99.86991282CCJ8 69,908.5970,000.00 -48.7109/24/2021 06/30/2026 70,000.00
09/24/2021 G2SF 30 YR 2.5 TBA OCT 21 102.984T251021CG 25,746.0925,000.00 -91.8010/21/2021 05/20/2050 25,000.00
09/24/2021 UMBS 15 YR 2.0 TBA OCT 21 103.033D201021FB 51,516.6050,000.00 -60.5510/19/2021 03/25/2036 50,000.00
09/24/2021 US TREASURY N/B 99.71291282CCJ8 99,711.88100,000.00 -163.1209/27/2021 06/30/2026 100,000.00
09/24/2021 US TREASURY N/B 99.73491282CCJ8 119,681.25120,000.00 -174.6109/27/2021 06/30/2026 120,000.00
09/24/2021 US TREASURY N/B 98.48191282CCP4 192,037.41195,000.00 -2,101.3809/27/2021 07/31/2026 195,000.00
09/27/2021 ENERGY TRANSFER LP 118.53029278NAR4 11,853.0010,000.00 2,348.3009/29/2021 05/15/2050 10,000.00
09/27/2021 G2SF 30 YR 2.0 TBA OCT 21 101.307T201021CG 50,653.3250,000.00 -200.2010/21/2021 10/20/2050 50,000.00
09/27/2021 G2SF 30 YR 2.0 TBA OCT 21 101.365T201021CG 50,682.6250,000.00 -170.9010/21/2021 10/20/2050 50,000.00
09/27/2021 G2SF 30 YR 2.0 TBA OCT 21 101.318T201021GS 126,647.95125,000.00 -529.7810/21/2021 10/20/2050 125,000.00
09/27/2021 G2SF 30 YR 2.0 TBA OCT 21 101.307T201021BA 75,979.9875,000.00 -227.0510/21/2021 10/20/2050 75,000.00
09/27/2021 G2SF 30 YR 2.5 TBA OCT 21 103.123T251021FB 77,342.2975,000.00 -177.2510/21/2021 05/20/2050 75,000.00
09/27/2021 HESS CORP 125.98342809HAD9 6,299.155,000.00 214.9509/29/2021 02/15/2041 5,000.00
09/27/2021 UMBS 30 YR 2.0 TBA OCT 21 100.268F201021FB 150,401.37150,000.00 -1,333.0010/14/2021 01/25/2051 150,000.00
09/27/2021 UMBS 30 YR 2.0 TBA OCT 21 100.268F201021FB 125,334.47125,000.00 -1,110.8410/14/2021 01/25/2051 125,000.00
09/27/2021 UMBS 30 YR 2.5 TBA OCT 21 103.135F251021FB 232,053.22225,000.00 -946.7810/14/2021 07/25/2050 225,000.00
09/27/2021 UMBS 30 YR 2.5 TBA OCT 21 103.150F251021FB 77,362.7975,000.00 -297.3710/14/2021 07/25/2050 75,000.00
09/27/2021 US TREASURY N/B 98.36791282CCP4 49,183.5950,000.00 -644.5409/28/2021 07/31/2026 50,000.00
09/27/2021 US TREASURY N/B 99.76291282CCN9 64,845.0065,000.00 -39.7509/28/2021 07/31/2023 65,000.00
09/27/2021 US TREASURY N/B 99.76291282CCN9 64,845.0065,000.00 -39.7509/28/2021 07/31/2023 65,000.00
09/27/2021 US TREASURY N/B 99.76291282CCN9 134,678.09135,000.00 -82.5409/28/2021 07/31/2023 135,000.00
09/28/2021 PETROLEOS MEXICANOS 94.050706451BG5 9,405.0010,000.00 -432.5009/30/2021 06/15/2035 10,000.00
09/28/2021 US TREASURY N/B 99.74991282CCN9 79,799.5480,000.00 -58.2509/29/2021 07/31/2023 80,000.00
09/28/2021 US TREASURY N/B 98.43891282CCP4 49,218.7550,000.00 -609.3809/29/2021 07/31/2026 50,000.00
09/28/2021 US TREASURY N/B 98.43891282CCP4 49,218.7550,000.00 -609.3809/29/2021 07/31/2026 50,000.00
09/28/2021 US TREASURY N/B 99.70791282CCU3 44,868.1645,000.00 -40.4209/29/2021 08/31/2023 45,000.00
09/28/2021 US TREASURY N/B 99.55191282CCJ8 134,393.54135,000.00 -591.8809/29/2021 06/30/2026 135,000.00
31

Pasadena Fire and Police Retirement System
Core Fixed Income (Account #: SMS650)
Account Transaction Activity (continued)
As of 09/30/2021
Benchmark: Bloomberg Aggregate
DescriptionTrade DateCurrent
FaceRealized
Gains/LossesCUSIP/SEDOL
NetAmount
OriginalFacePrice
Currency: US Dollar
Settle DateMaturity
Date
SALES
09/28/2021 US TREASURY N/B 99.52191282CCJ8 79,616.7880,000.00 -396.1609/29/2021 06/30/2026 80,000.00
09/28/2021 US TREASURY N/B 99.51491282CCJ8 238,832.45240,000.00 -1,708.7109/29/2021 06/30/2026 240,000.00
09/29/2021 US TREASURY N/B 98.27391282CCP4 49,136.7250,000.00 -691.4109/30/2021 07/31/2026 50,000.00
09/29/2021 US TREASURY N/B 99.69191282CCU3 553,287.30555,000.00 -586.6209/30/2021 08/31/2023 555,000.00
09/29/2021 US TREASURY N/B 98.97791282CCW9 54,437.1155,000.00 -416.3509/30/2021 08/31/2026 55,000.00
09/30/2021 US TREASURY N/B 97.58291282CCS8 14,637.3015,000.00 -201.7810/01/2021 08/15/2031 15,000.00
09/30/2021 US TREASURY N/B 106.824912810SX7 5,341.215,000.00 -90.8210/01/2021 05/15/2051 5,000.00
09/30/2021 US TREASURY N/B 106.984912810SX7 85,587.5080,000.00 -2,347.9510/01/2021 05/15/2051 80,000.00
09/30/2021 US TREASURY N/B 106.992912810SX7 32,097.6630,000.00 -447.5810/01/2021 05/15/2051 30,000.00
09/30/2021 US TREASURY N/B 99.77791282CCN9 19,955.4720,000.00 -8.9610/01/2021 07/31/2023 20,000.00
09/30/2021 US TREASURY N/B 99.73891282CCU3 14,960.7415,000.00 -8.7910/01/2021 08/31/2023 15,000.00
09/30/2021 US TREASURY N/B 98.94691282CCW9 217,680.36220,000.00 -1,717.1510/01/2021 08/31/2026 220,000.00
09/30/2021 US TREASURY N/B 98.93091282CCW9 14,839.4515,000.00 -120.5810/01/2021 08/31/2026 15,000.00
-5,388.7210,546,691.83TOTAL SALES
MATURED BOND PRINCIPAL
09/25/2021 GENERAL MOTORS FINL CO37045XAQ9 35,000.0035,000.00 -1,238.1009/27/2021 09/25/2021 35,000.00
-1,238.1035,000.00TOTAL MATURED BOND PRINCIPAL
PAYDOWNS
09/10/2021 COMM 2015-CR27 A312635QBF6 0.03-0.03 0.0009/10/2021 10/10/2048 97,000.00
09/15/2021 BSPRT 2018-FL4 A05586AAA6 3,961.66-3,961.66 -1.8609/15/2021 09/15/2035 63,000.00
09/15/2021 BX 2019-XL A056054AA7 1,000.05-1,000.05 -1.5609/15/2021 10/15/2036 100,000.00
09/15/2021 FG A615273128KRVU5 66.44-66.44 -1.4109/15/2021 07/01/2036 520,000.00
09/15/2021 FG G063613128M8MJ0 874.89-874.89 13.8109/15/2021 03/01/2041 210,000.00
09/15/2021 FG G079253128MAD63 892.87-892.87 -50.0409/15/2021 02/01/2045 116,000.00
09/15/2021 FG G086983128MJX47 185.43-185.43 -8.8909/15/2021 03/01/2046 20,000.00
09/15/2021 FG G087113128MJYH7 2,151.83-2,151.83 -110.8709/15/2021 06/01/2046 205,000.00
09/15/2021 FG G087213128MJYT1 2,055.43-2,055.43 -76.6009/15/2021 09/01/2046 160,000.00
32
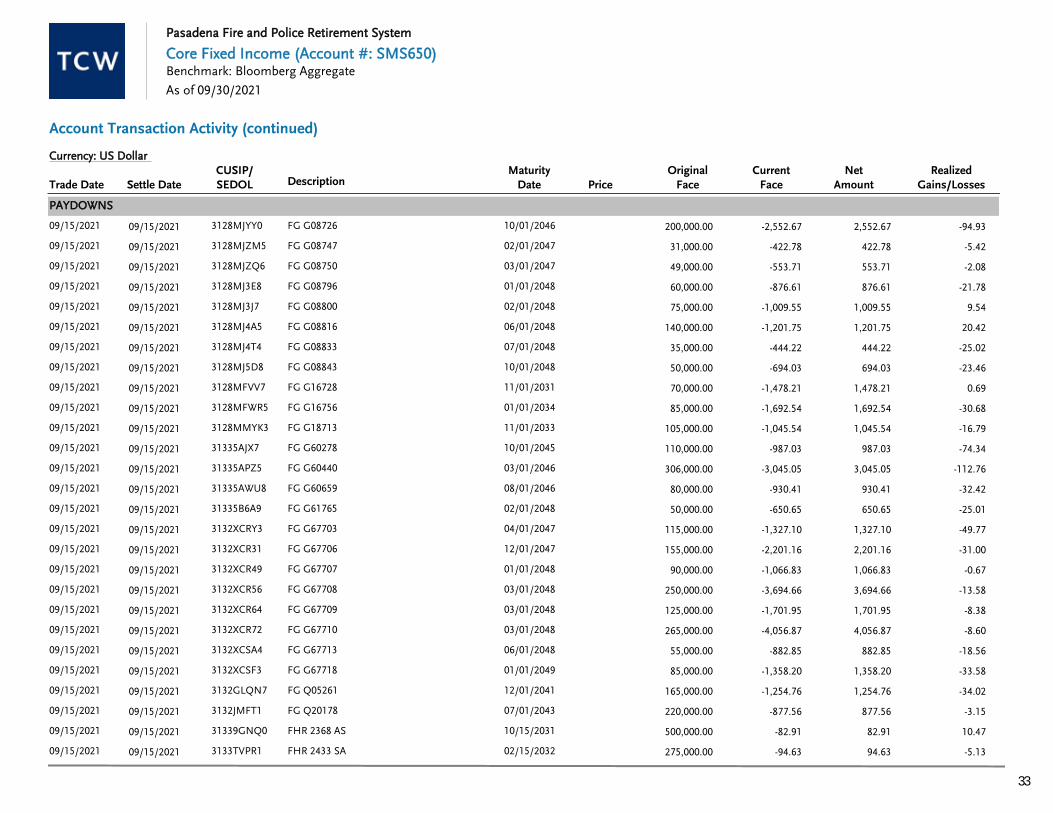
Pasadena Fire and Police Retirement System
Core Fixed Income (Account #: SMS650)
Account Transaction Activity (continued)
As of 09/30/2021
Benchmark: Bloomberg Aggregate
DescriptionTrade DateCurrent
FaceRealized
Gains/LossesCUSIP/SEDOL
NetAmount
OriginalFacePrice
Currency: US Dollar
Settle DateMaturity
Date
PAYDOWNS
09/15/2021 FG G087263128MJYY0 2,552.67-2,552.67 -94.9309/15/2021 10/01/2046 200,000.00
09/15/2021 FG G087473128MJZM5 422.78-422.78 -5.4209/15/2021 02/01/2047 31,000.00
09/15/2021 FG G087503128MJZQ6 553.71-553.71 -2.0809/15/2021 03/01/2047 49,000.00
09/15/2021 FG G087963128MJ3E8 876.61-876.61 -21.7809/15/2021 01/01/2048 60,000.00
09/15/2021 FG G088003128MJ3J7 1,009.55-1,009.55 9.5409/15/2021 02/01/2048 75,000.00
09/15/2021 FG G088163128MJ4A5 1,201.75-1,201.75 20.4209/15/2021 06/01/2048 140,000.00
09/15/2021 FG G088333128MJ4T4 444.22-444.22 -25.0209/15/2021 07/01/2048 35,000.00
09/15/2021 FG G088433128MJ5D8 694.03-694.03 -23.4609/15/2021 10/01/2048 50,000.00
09/15/2021 FG G167283128MFVV7 1,478.21-1,478.21 0.6909/15/2021 11/01/2031 70,000.00
09/15/2021 FG G167563128MFWR5 1,692.54-1,692.54 -30.6809/15/2021 01/01/2034 85,000.00
09/15/2021 FG G187133128MMYK3 1,045.54-1,045.54 -16.7909/15/2021 11/01/2033 105,000.00
09/15/2021 FG G6027831335AJX7 987.03-987.03 -74.3409/15/2021 10/01/2045 110,000.00
09/15/2021 FG G6044031335APZ5 3,045.05-3,045.05 -112.7609/15/2021 03/01/2046 306,000.00
09/15/2021 FG G6065931335AWU8 930.41-930.41 -32.4209/15/2021 08/01/2046 80,000.00
09/15/2021 FG G6176531335B6A9 650.65-650.65 -25.0109/15/2021 02/01/2048 50,000.00
09/15/2021 FG G677033132XCRY3 1,327.10-1,327.10 -49.7709/15/2021 04/01/2047 115,000.00
09/15/2021 FG G677063132XCR31 2,201.16-2,201.16 -31.0009/15/2021 12/01/2047 155,000.00
09/15/2021 FG G677073132XCR49 1,066.83-1,066.83 -0.6709/15/2021 01/01/2048 90,000.00
09/15/2021 FG G677083132XCR56 3,694.66-3,694.66 -13.5809/15/2021 03/01/2048 250,000.00
09/15/2021 FG G677093132XCR64 1,701.95-1,701.95 -8.3809/15/2021 03/01/2048 125,000.00
09/15/2021 FG G677103132XCR72 4,056.87-4,056.87 -8.6009/15/2021 03/01/2048 265,000.00
09/15/2021 FG G677133132XCSA4 882.85-882.85 -18.5609/15/2021 06/01/2048 55,000.00
09/15/2021 FG G677183132XCSF3 1,358.20-1,358.20 -33.5809/15/2021 01/01/2049 85,000.00
09/15/2021 FG Q052613132GLQN7 1,254.76-1,254.76 -34.0209/15/2021 12/01/2041 165,000.00
09/15/2021 FG Q201783132JMFT1 877.56-877.56 -3.1509/15/2021 07/01/2043 220,000.00
09/15/2021 FHR 2368 AS31339GNQ0 82.91-82.91 10.4709/15/2021 10/15/2031 500,000.00
09/15/2021 FHR 2433 SA3133TVPR1 94.63-94.63 -5.1309/15/2021 02/15/2032 275,000.00
33

Pasadena Fire and Police Retirement System
Core Fixed Income (Account #: SMS650)
Account Transaction Activity (continued)
As of 09/30/2021
Benchmark: Bloomberg Aggregate
DescriptionTrade DateCurrent
FaceRealized
Gains/LossesCUSIP/SEDOL
NetAmount
OriginalFacePrice
Currency: US Dollar
Settle DateMaturity
Date
PAYDOWNS
09/15/2021 FHR 2684 ZN31394L5S7 694.34-694.34 218.2809/15/2021 10/15/2033 190,000.00
09/15/2021 FHR 4818 CA3137FGVJ1 660.05-660.05 30.8409/15/2021 04/15/2048 50,000.00
09/15/2021 GN 37646336204QFC9 26.18-26.18 1.1809/15/2021 04/15/2024 341,247.00
09/15/2021 GN 78003536225ABC3 19.92-19.92 0.9009/15/2021 07/15/2024 199,051.00
09/15/2021 GN 78281836241LDX1 1,544.71-1,544.71 -38.7409/15/2021 11/15/2039 430,000.00
09/15/2021 HENDR 2013-3A A46617LAA9 277.39-277.39 0.2209/15/2021 01/17/2073 75,000.00
09/15/2021 HENDR 2014-2A A46618AAA2 485.07-485.07 0.3109/15/2021 01/17/2073 90,000.00
09/15/2021 SLMA 2003-7A A5A78442GHH2 1,283.54-1,283.54 -16.2409/15/2021 12/15/2033 110,000.00
09/16/2021 MDST 2004-1 B59560UAD3 1,659.08-1,659.08 -103.9509/15/2021 08/15/2037 400,000.00
09/17/2021 SEACO 2014-1A A237952UAE3 708.33-708.33 0.1909/17/2021 07/17/2029 85,000.00
09/17/2021 TAH 2017-SFR1 A89613DAA1 752.81-752.81 -5.6509/17/2021 09/17/2034 99,000.00
09/19/2021 SAMI 2004-AR1 1A186359LAP4 4,181.83-4,181.83 47.9809/20/2021 03/19/2034 6,700,000.00
09/20/2021 G2 MA352136179R4E6 683.20-683.20 -40.5609/20/2021 03/20/2046 70,000.00
09/20/2021 G2 MA366236179SB71 1,369.13-1,369.13 -79.7909/20/2021 05/20/2046 125,000.00
09/20/2021 G2 MA393736179SLS4 3,548.72-3,548.72 -113.6709/20/2021 09/20/2046 275,000.00
09/20/2021 G2 MA406936179SQW0 3,136.62-3,136.62 -124.4809/20/2021 11/20/2046 245,000.00
09/20/2021 G2 MA419536179SUU9 3,893.66-3,893.66 -43.3109/20/2021 01/20/2047 295,000.00
09/20/2021 G2 MA438236179S2P1 1,155.67-1,155.67 -48.6609/20/2021 04/20/2047 90,000.00
09/20/2021 G2 MA451036179TAK1 371.11-371.11 -15.1609/20/2021 06/20/2047 25,000.00
09/20/2021 G2 MA458636179TCX1 388.62-388.62 6.6909/20/2021 07/20/2047 25,000.00
09/20/2021 G2 MA458836179TCZ6 2,061.66-2,061.66 -88.2609/20/2021 07/20/2047 230,000.00
09/20/2021 G2 MA458936179TC29 676.14-676.14 -50.2909/20/2021 07/20/2047 65,000.00
09/20/2021 G2 MA471936179TG41 370.04-370.04 -12.4009/20/2021 09/20/2047 25,000.00
09/20/2021 G2 MA483636179TLR4 469.06-469.06 12.0909/20/2021 11/20/2047 30,000.00
09/20/2021 G2 MA483736179TLS2 3,859.14-3,859.14 -45.9509/20/2021 11/20/2047 240,000.00
09/20/2021 G2 MA483836179TLT0 869.58-869.58 -43.5809/20/2021 11/20/2047 65,000.00
09/20/2021 G2 MA502036179TSH9 1,667.47-1,667.47 -61.5309/20/2021 02/20/2048 125,000.00
34

Pasadena Fire and Police Retirement System
Core Fixed Income (Account #: SMS650)
Account Transaction Activity (continued)
As of 09/30/2021
Benchmark: Bloomberg Aggregate
DescriptionTrade DateCurrent
FaceRealized
Gains/LossesCUSIP/SEDOL
NetAmount
OriginalFacePrice
Currency: US Dollar
Settle DateMaturity
Date
PAYDOWNS
09/20/2021 G2 MA546636179UCB6 1,273.95-1,273.95 -34.0909/20/2021 09/20/2048 95,000.00
09/20/2021 G2 MA552836179UD90 2,059.03-2,059.03 -56.3809/20/2021 10/20/2048 160,000.00
09/20/2021 G2 MA559736179UGE6 1,053.43-1,053.43 -46.5809/20/2021 11/20/2048 80,000.00
09/20/2021 G2 MA620936179U3S9 1,627.46-1,627.46 -9.6609/20/2021 10/20/2049 135,000.00
09/20/2021 GNR 2018-124 NW38380Y2X2 424.48-424.48 3.9809/20/2021 09/20/2048 30,000.00
09/20/2021 GNR 2019-44 CA38381TVA0 2,567.85-2,567.85 -60.1809/20/2021 12/20/2048 135,000.00
09/20/2021 SPRINT SPECTRUM / SPEC I85208NAD2 3,750.00-3,750.00 -294.9209/20/2021 03/20/2025 60,000.00
09/21/2021 MARM 2004-13 3A7A576433WL6 1,621.32-1,621.32 32.4309/21/2021 11/21/2034 555,000.00
09/22/2021 BAFC 2004-A 1A306051GAX7 15.50-15.50 0.0709/20/2021 09/20/2034 660,000.00
09/25/2021 BSARM 2004-10 14A107384M4F6 173.84-173.84 9.4509/27/2021 01/25/2035 1,530,000.00
09/25/2021 CRMSI 2007-1 A5173109AE9 10,019.78-10,019.78 3,181.2809/27/2021 03/25/2037 300,000.00
09/25/2021 FN 65592831390TVV8 519.57-519.57 -34.4209/27/2021 08/01/2032 765,000.00
09/25/2021 FN AB161331416WYK2 1,129.14-1,129.14 -21.1709/27/2021 10/01/2040 305,000.00
09/25/2021 FN AD383031418RHG9 795.95-795.95 -32.8309/27/2021 04/01/2025 390,000.00
09/25/2021 FN AL09053138EHAF9 16,860.94-16,860.94 -1,435.8109/27/2021 09/01/2021 210,000.00
09/25/2021 FN AN60463138LJWG1 138.08-138.08 -6.7909/27/2021 07/01/2032 85,000.00
09/25/2021 FN BM44723140J86J7 873.24-873.24 -40.6609/27/2021 07/01/2048 50,000.00
09/25/2021 FN CA11823140Q8J48 1,089.19-1,089.19 -49.4409/27/2021 02/01/2048 90,000.00
09/25/2021 FN CA11873140Q8J97 283.53-283.53 -1.3009/27/2021 02/01/2048 25,000.00
09/25/2021 FN CA17103140Q83U7 1,576.35-1,576.35 -62.8109/27/2021 05/01/2048 150,000.00
09/25/2021 FN CA17113140Q83V5 1,230.18-1,230.18 -40.1709/27/2021 05/01/2048 75,000.00
09/25/2021 FN CA22083140Q9N25 1,085.08-1,085.08 -40.4809/27/2021 08/01/2048 75,000.00
09/25/2021 FN CA36333140QBBB3 2,840.36-2,840.36 -185.5109/27/2021 06/01/2049 160,000.00
09/25/2021 FN MA158431418AXN3 618.31-618.31 -21.0609/27/2021 09/01/2033 100,000.00
09/25/2021 FN MA280631418CDL5 1,303.17-1,303.17 -4.8909/27/2021 11/01/2046 95,000.00
09/25/2021 FN MA299531418CKH6 829.09-829.09 -43.1109/27/2021 05/01/2047 75,000.00
09/25/2021 FN MA302931418CLK8 711.55-711.55 -17.9609/27/2021 06/01/2032 60,000.00
35

Pasadena Fire and Police Retirement System
Core Fixed Income (Account #: SMS650)
Account Transaction Activity (continued)
As of 09/30/2021
Benchmark: Bloomberg Aggregate
DescriptionTrade DateCurrent
FaceRealized
Gains/LossesCUSIP/SEDOL
NetAmount
OriginalFacePrice
Currency: US Dollar
Settle DateMaturity
Date
PAYDOWNS
09/25/2021 FN MA308831418CNE0 2,355.48-2,355.48 -130.5609/27/2021 08/01/2047 200,000.00
09/25/2021 FN MA321031418CR89 2,926.55-2,926.55 16.1209/27/2021 12/01/2047 225,000.00
09/25/2021 FN MA329531418CUV4 808.21-808.21 -24.7509/27/2021 02/01/2028 132,000.00
09/25/2021 FN MA384631418DHY1 2,125.36-2,125.36 -11.9609/27/2021 11/01/2049 135,000.00
09/25/2021 FN MA415231418DTJ1 3,666.16-3,666.16 -119.4409/27/2021 10/01/2040 160,000.00
09/25/2021 FN MA417631418DUA8 3,640.70-3,640.70 -112.7809/27/2021 11/01/2040 140,000.00
09/25/2021 FN MA433331418DY71 377.02-377.02 -6.1609/27/2021 05/01/2041 50,000.00
09/25/2021 FNR 2001-52 YZ313921MN5 532.26-532.26 -15.3009/27/2021 10/25/2031 575,000.00
09/25/2021 FNR 2018-57 QA3136B2ZR6 2,197.73-2,197.73 -4.8109/27/2021 05/25/2046 115,000.00
09/25/2021 FR SD02313132DMHG3 3,725.15-3,725.15 -220.0209/27/2021 01/01/2050 150,000.00
09/25/2021 FR ZA510331329NU48 454.59-454.59 -26.2109/27/2021 12/01/2047 25,000.00
09/25/2021 FR ZM17793131XU6Q5 5,727.43-5,727.43 -327.5409/27/2021 09/01/2046 380,000.00
09/25/2021 FR ZT14033132ADRY6 334.92-334.92 -9.4209/27/2021 11/01/2033 30,000.00
09/25/2021 MSSTR 2004-1 4A155265WBD4 30.47-30.47 -0.6009/27/2021 10/25/2032 550,000.00
09/25/2021 RAST 2004-IP2 2A145660LAP4 27.47-27.47 -0.3809/27/2021 12/25/2034 535,000.00
09/25/2021 WAMU 2005-AR8 2A1A92922FR75 1,546.81-1,546.81 110.7009/27/2021 07/25/2045 2,500,000.00
09/27/2021 ACCR 2005-1 M2004375CU3 22,523.54-22,523.54 957.2509/27/2021 04/25/2035 730,000.00
09/27/2021 CITEL 2007-1 A17284LAA2 1,515.34-1,515.34 140.1709/27/2021 03/25/2042 150,000.00
09/27/2021 CMLTI 2006-HE2 M117309LAF2 10,582.03-10,582.03 66.1409/27/2021 08/25/2036 203,024.00
09/27/2021 CWL 2005-11 MV3126670DC9 9,386.06-9,386.06 8.8009/27/2021 02/25/2036 314,000.00
09/27/2021 CWL 2007-13 2A1126698AC3 2,254.08-2,254.08 715.6709/27/2021 10/25/2047 400,000.00
09/27/2021 HEAT 2005-7 M1437084NZ5 3,022.12-3,022.12 4.4909/27/2021 01/25/2036 128,000.00
09/27/2021 IMM 2004-6 1A145254NJV0 433.69-433.69 5.1509/27/2021 10/25/2034 4,500,000.00
09/27/2021 INDX 2005-AR18 2A1A45660LWD7 252.63-252.63 132.0009/27/2021 10/25/2036 1,300,000.00
09/27/2021 INDX 2007-FLX2 A1C45668RAC2 5,053.09-5,053.09 2,722.3509/27/2021 04/25/2037 320,000.00
09/27/2021 NAVSL 2014-4 A63938QAA5 272.39-272.39 0.0009/27/2021 03/25/2083 185,000.00
09/27/2021 SAST 2007-3 1A80557BAA2 2,286.16-2,286.16 40.0109/27/2021 09/25/2037 700,000.00
36
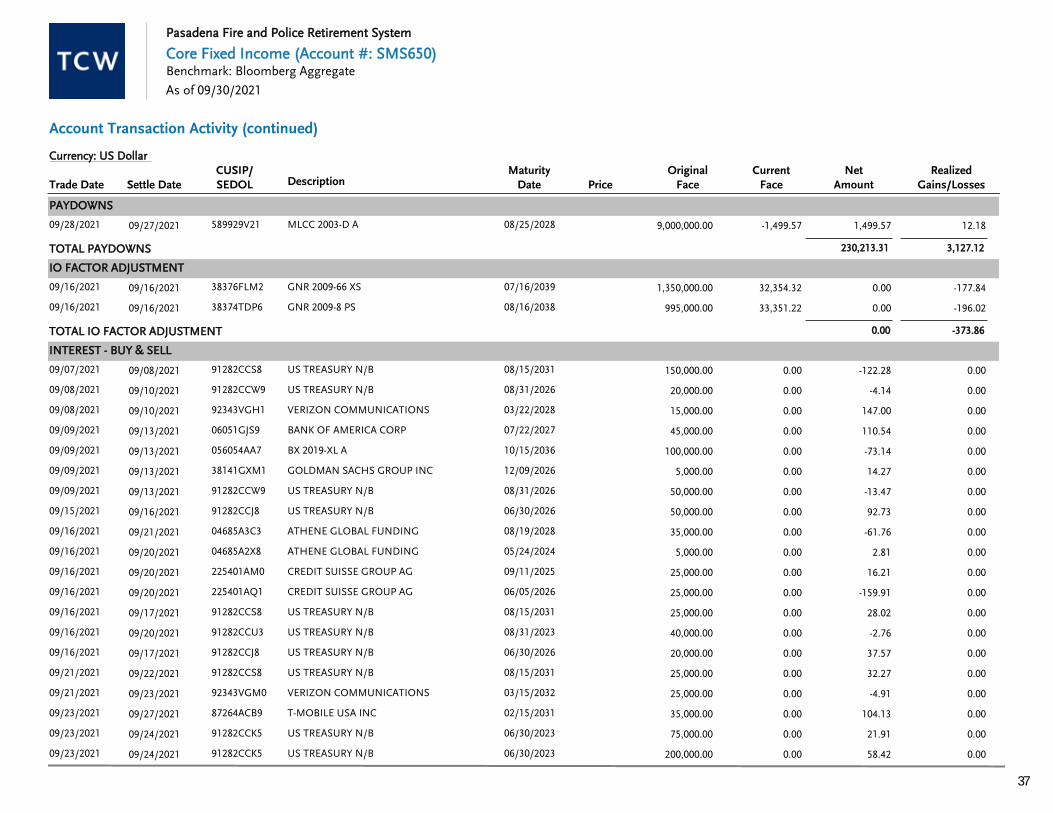
Pasadena Fire and Police Retirement System
Core Fixed Income (Account #: SMS650)
Account Transaction Activity (continued)
As of 09/30/2021
Benchmark: Bloomberg Aggregate
DescriptionTrade DateCurrent
FaceRealized
Gains/LossesCUSIP/SEDOL
NetAmount
OriginalFacePrice
Currency: US Dollar
Settle DateMaturity
Date
PAYDOWNS
09/28/2021 MLCC 2003-D A589929V21 1,499.57-1,499.57 12.1809/27/2021 08/25/2028 9,000,000.00
3,127.12230,213.31TOTAL PAYDOWNS
IO FACTOR ADJUSTMENT
09/16/2021 GNR 2009-66 XS38376FLM2 0.0032,354.32 -177.8409/16/2021 07/16/2039 1,350,000.00
09/16/2021 GNR 2009-8 PS38374TDP6 0.0033,351.22 -196.0209/16/2021 08/16/2038 995,000.00
-373.860.00TOTAL IO FACTOR ADJUSTMENT
INTEREST - BUY & SELL
09/07/2021 US TREASURY N/B91282CCS8 -122.280.00 0.0009/08/2021 08/15/2031 150,000.00
09/08/2021 US TREASURY N/B91282CCW9 -4.140.00 0.0009/10/2021 08/31/2026 20,000.00
09/08/2021 VERIZON COMMUNICATIONS92343VGH1 147.000.00 0.0009/10/2021 03/22/2028 15,000.00
09/09/2021 BANK OF AMERICA CORP06051GJS9 110.540.00 0.0009/13/2021 07/22/2027 45,000.00
09/09/2021 BX 2019-XL A056054AA7 -73.140.00 0.0009/13/2021 10/15/2036 100,000.00
09/09/2021 GOLDMAN SACHS GROUP INC38141GXM1 14.270.00 0.0009/13/2021 12/09/2026 5,000.00
09/09/2021 US TREASURY N/B91282CCW9 -13.470.00 0.0009/13/2021 08/31/2026 50,000.00
09/15/2021 US TREASURY N/B91282CCJ8 92.730.00 0.0009/16/2021 06/30/2026 50,000.00
09/16/2021 ATHENE GLOBAL FUNDING04685A3C3 -61.760.00 0.0009/21/2021 08/19/2028 35,000.00
09/16/2021 ATHENE GLOBAL FUNDING04685A2X8 2.810.00 0.0009/20/2021 05/24/2024 5,000.00
09/16/2021 CREDIT SUISSE GROUP AG225401AM0 16.210.00 0.0009/20/2021 09/11/2025 25,000.00
09/16/2021 CREDIT SUISSE GROUP AG225401AQ1 -159.910.00 0.0009/20/2021 06/05/2026 25,000.00
09/16/2021 US TREASURY N/B91282CCS8 28.020.00 0.0009/17/2021 08/15/2031 25,000.00
09/16/2021 US TREASURY N/B91282CCU3 -2.760.00 0.0009/20/2021 08/31/2023 40,000.00
09/16/2021 US TREASURY N/B91282CCJ8 37.570.00 0.0009/17/2021 06/30/2026 20,000.00
09/21/2021 US TREASURY N/B91282CCS8 32.270.00 0.0009/22/2021 08/15/2031 25,000.00
09/21/2021 VERIZON COMMUNICATIONS92343VGM0 -4.910.00 0.0009/23/2021 03/15/2032 25,000.00
09/23/2021 T-MOBILE USA INC87264ACB9 104.130.00 0.0009/27/2021 02/15/2031 35,000.00
09/23/2021 US TREASURY N/B91282CCK5 21.910.00 0.0009/24/2021 06/30/2023 75,000.00
09/23/2021 US TREASURY N/B91282CCK5 58.420.00 0.0009/24/2021 06/30/2023 200,000.00
37
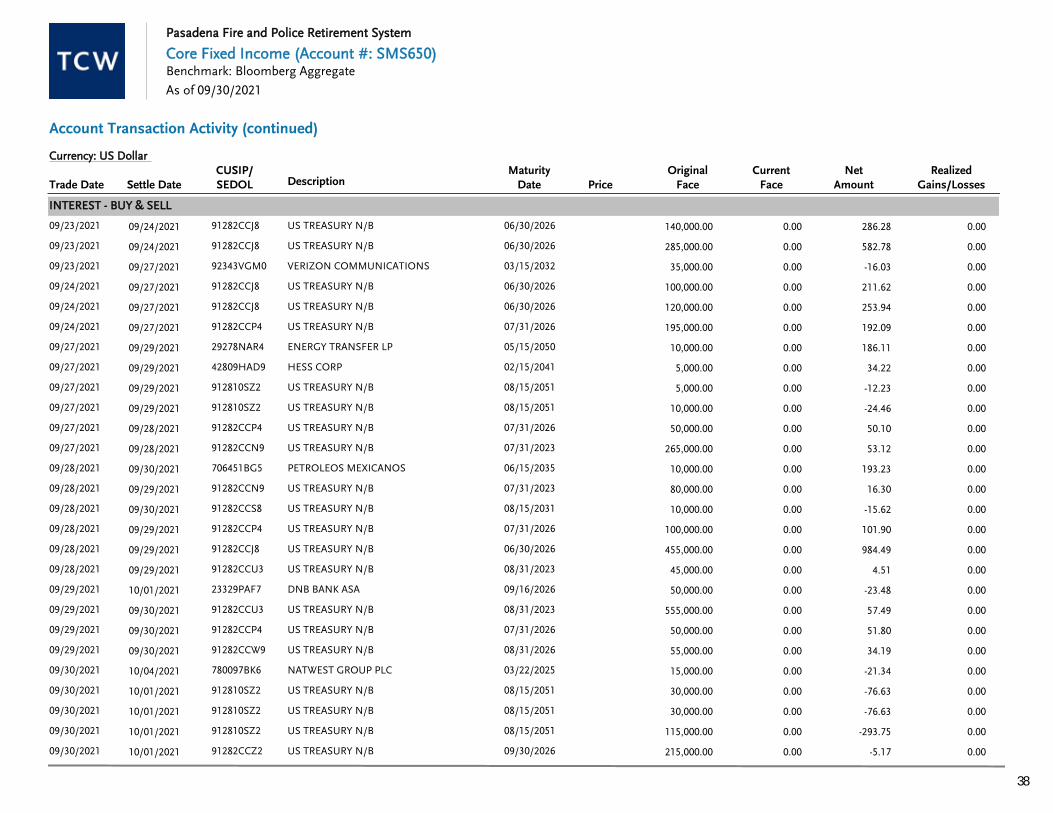
Pasadena Fire and Police Retirement System
Core Fixed Income (Account #: SMS650)
Account Transaction Activity (continued)
As of 09/30/2021
Benchmark: Bloomberg Aggregate
DescriptionTrade DateCurrent
FaceRealized
Gains/LossesCUSIP/SEDOL
NetAmount
OriginalFacePrice
Currency: US Dollar
Settle DateMaturity
Date
INTEREST - BUY & SELL
09/23/2021 US TREASURY N/B91282CCJ8 286.280.00 0.0009/24/2021 06/30/2026 140,000.00
09/23/2021 US TREASURY N/B91282CCJ8 582.780.00 0.0009/24/2021 06/30/2026 285,000.00
09/23/2021 VERIZON COMMUNICATIONS92343VGM0 -16.030.00 0.0009/27/2021 03/15/2032 35,000.00
09/24/2021 US TREASURY N/B91282CCJ8 211.620.00 0.0009/27/2021 06/30/2026 100,000.00
09/24/2021 US TREASURY N/B91282CCJ8 253.940.00 0.0009/27/2021 06/30/2026 120,000.00
09/24/2021 US TREASURY N/B91282CCP4 192.090.00 0.0009/27/2021 07/31/2026 195,000.00
09/27/2021 ENERGY TRANSFER LP29278NAR4 186.110.00 0.0009/29/2021 05/15/2050 10,000.00
09/27/2021 HESS CORP42809HAD9 34.220.00 0.0009/29/2021 02/15/2041 5,000.00
09/27/2021 US TREASURY N/B912810SZ2 -12.230.00 0.0009/29/2021 08/15/2051 5,000.00
09/27/2021 US TREASURY N/B912810SZ2 -24.460.00 0.0009/29/2021 08/15/2051 10,000.00
09/27/2021 US TREASURY N/B91282CCP4 50.100.00 0.0009/28/2021 07/31/2026 50,000.00
09/27/2021 US TREASURY N/B91282CCN9 53.120.00 0.0009/28/2021 07/31/2023 265,000.00
09/28/2021 PETROLEOS MEXICANOS706451BG5 193.230.00 0.0009/30/2021 06/15/2035 10,000.00
09/28/2021 US TREASURY N/B91282CCN9 16.300.00 0.0009/29/2021 07/31/2023 80,000.00
09/28/2021 US TREASURY N/B91282CCS8 -15.620.00 0.0009/30/2021 08/15/2031 10,000.00
09/28/2021 US TREASURY N/B91282CCP4 101.900.00 0.0009/29/2021 07/31/2026 100,000.00
09/28/2021 US TREASURY N/B91282CCJ8 984.490.00 0.0009/29/2021 06/30/2026 455,000.00
09/28/2021 US TREASURY N/B91282CCU3 4.510.00 0.0009/29/2021 08/31/2023 45,000.00
09/29/2021 DNB BANK ASA23329PAF7 -23.480.00 0.0010/01/2021 09/16/2026 50,000.00
09/29/2021 US TREASURY N/B91282CCU3 57.490.00 0.0009/30/2021 08/31/2023 555,000.00
09/29/2021 US TREASURY N/B91282CCP4 51.800.00 0.0009/30/2021 07/31/2026 50,000.00
09/29/2021 US TREASURY N/B91282CCW9 34.190.00 0.0009/30/2021 08/31/2026 55,000.00
09/30/2021 NATWEST GROUP PLC780097BK6 -21.340.00 0.0010/04/2021 03/22/2025 15,000.00
09/30/2021 US TREASURY N/B912810SZ2 -76.630.00 0.0010/01/2021 08/15/2051 30,000.00
09/30/2021 US TREASURY N/B912810SZ2 -76.630.00 0.0010/01/2021 08/15/2051 30,000.00
09/30/2021 US TREASURY N/B912810SZ2 -293.750.00 0.0010/01/2021 08/15/2051 115,000.00
09/30/2021 US TREASURY N/B91282CCZ2 -5.170.00 0.0010/01/2021 09/30/2026 215,000.00
38
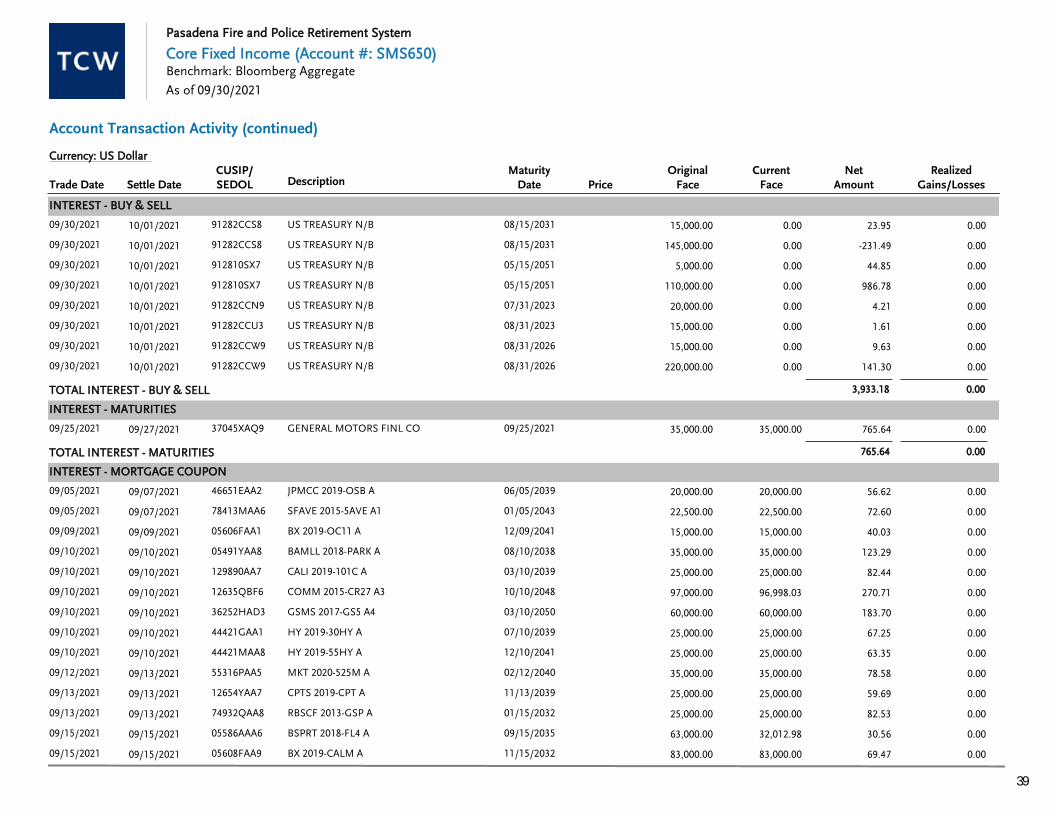
Pasadena Fire and Police Retirement System
Core Fixed Income (Account #: SMS650)
Account Transaction Activity (continued)
As of 09/30/2021
Benchmark: Bloomberg Aggregate
DescriptionTrade DateCurrent
FaceRealized
Gains/LossesCUSIP/SEDOL
NetAmount
OriginalFacePrice
Currency: US Dollar
Settle DateMaturity
Date
INTEREST - BUY & SELL
09/30/2021 US TREASURY N/B91282CCS8 23.950.00 0.0010/01/2021 08/15/2031 15,000.00
09/30/2021 US TREASURY N/B91282CCS8 -231.490.00 0.0010/01/2021 08/15/2031 145,000.00
09/30/2021 US TREASURY N/B912810SX7 44.850.00 0.0010/01/2021 05/15/2051 5,000.00
09/30/2021 US TREASURY N/B912810SX7 986.780.00 0.0010/01/2021 05/15/2051 110,000.00
09/30/2021 US TREASURY N/B91282CCN9 4.210.00 0.0010/01/2021 07/31/2023 20,000.00
09/30/2021 US TREASURY N/B91282CCU3 1.610.00 0.0010/01/2021 08/31/2023 15,000.00
09/30/2021 US TREASURY N/B91282CCW9 9.630.00 0.0010/01/2021 08/31/2026 15,000.00
09/30/2021 US TREASURY N/B91282CCW9 141.300.00 0.0010/01/2021 08/31/2026 220,000.00
0.003,933.18TOTAL INTEREST - BUY & SELL
INTEREST - MATURITIES
09/25/2021 GENERAL MOTORS FINL CO37045XAQ9 765.6435,000.00 0.0009/27/2021 09/25/2021 35,000.00
0.00765.64TOTAL INTEREST - MATURITIES
INTEREST - MORTGAGE COUPON
09/05/2021 JPMCC 2019-OSB A46651EAA2 56.6220,000.00 0.0009/07/2021 06/05/2039 20,000.00
09/05/2021 SFAVE 2015-5AVE A178413MAA6 72.6022,500.00 0.0009/07/2021 01/05/2043 22,500.00
09/09/2021 BX 2019-OC11 A05606FAA1 40.0315,000.00 0.0009/09/2021 12/09/2041 15,000.00
09/10/2021 BAMLL 2018-PARK A05491YAA8 123.2935,000.00 0.0009/10/2021 08/10/2038 35,000.00
09/10/2021 CALI 2019-101C A129890AA7 82.4425,000.00 0.0009/10/2021 03/10/2039 25,000.00
09/10/2021 COMM 2015-CR27 A312635QBF6 270.7196,998.03 0.0009/10/2021 10/10/2048 97,000.00
09/10/2021 GSMS 2017-GS5 A436252HAD3 183.7060,000.00 0.0009/10/2021 03/10/2050 60,000.00
09/10/2021 HY 2019-30HY A44421GAA1 67.2525,000.00 0.0009/10/2021 07/10/2039 25,000.00
09/10/2021 HY 2019-55HY A44421MAA8 63.3525,000.00 0.0009/10/2021 12/10/2041 25,000.00
09/12/2021 MKT 2020-525M A55316PAA5 78.5835,000.00 0.0009/13/2021 02/12/2040 35,000.00
09/13/2021 CPTS 2019-CPT A12654YAA7 59.6925,000.00 0.0009/13/2021 11/13/2039 25,000.00
09/13/2021 RBSCF 2013-GSP A74932QAA8 82.5325,000.00 0.0009/13/2021 01/15/2032 25,000.00
09/15/2021 BSPRT 2018-FL4 A05586AAA6 30.5632,012.98 0.0009/15/2021 09/15/2035 63,000.00
09/15/2021 BX 2019-CALM A05608FAA9 69.4783,000.00 0.0009/15/2021 11/15/2032 83,000.00
39
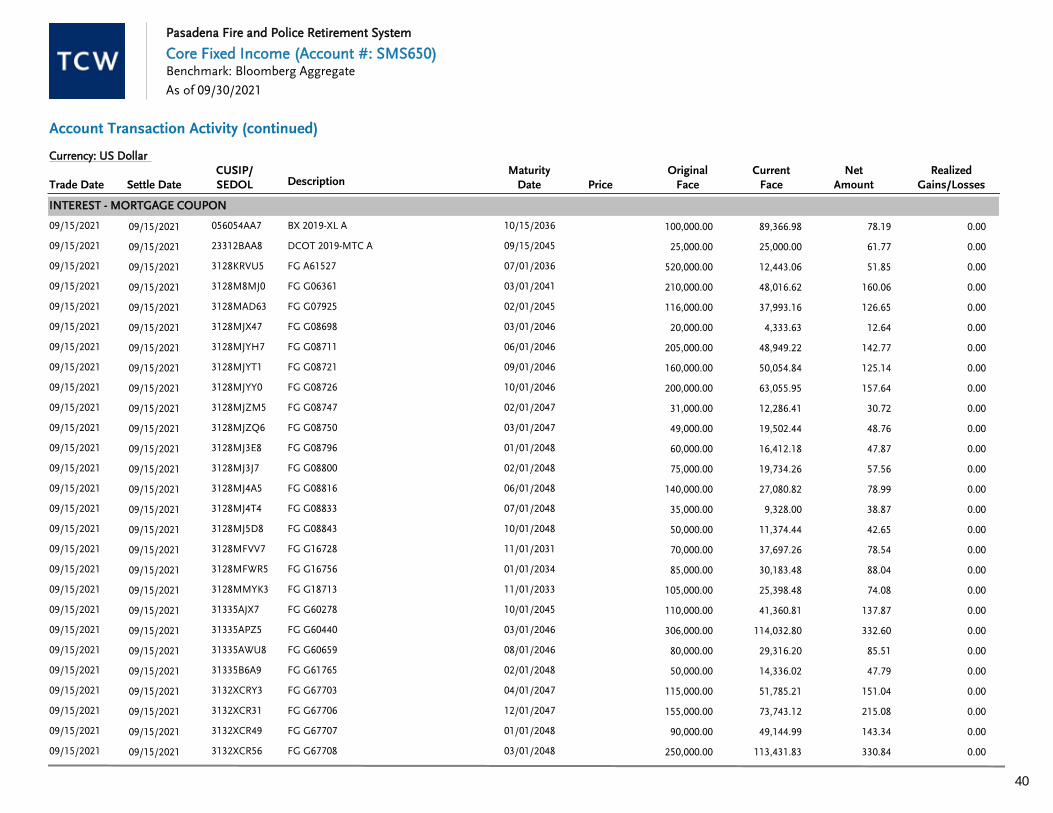
Pasadena Fire and Police Retirement System
Core Fixed Income (Account #: SMS650)
Account Transaction Activity (continued)
As of 09/30/2021
Benchmark: Bloomberg Aggregate
DescriptionTrade DateCurrent
FaceRealized
Gains/LossesCUSIP/SEDOL
NetAmount
OriginalFacePrice
Currency: US Dollar
Settle DateMaturity
Date
INTEREST - MORTGAGE COUPON
09/15/2021 BX 2019-XL A056054AA7 78.1989,366.98 0.0009/15/2021 10/15/2036 100,000.00
09/15/2021 DCOT 2019-MTC A23312BAA8 61.7725,000.00 0.0009/15/2021 09/15/2045 25,000.00
09/15/2021 FG A615273128KRVU5 51.8512,443.06 0.0009/15/2021 07/01/2036 520,000.00
09/15/2021 FG G063613128M8MJ0 160.0648,016.62 0.0009/15/2021 03/01/2041 210,000.00
09/15/2021 FG G079253128MAD63 126.6537,993.16 0.0009/15/2021 02/01/2045 116,000.00
09/15/2021 FG G086983128MJX47 12.644,333.63 0.0009/15/2021 03/01/2046 20,000.00
09/15/2021 FG G087113128MJYH7 142.7748,949.22 0.0009/15/2021 06/01/2046 205,000.00
09/15/2021 FG G087213128MJYT1 125.1450,054.84 0.0009/15/2021 09/01/2046 160,000.00
09/15/2021 FG G087263128MJYY0 157.6463,055.95 0.0009/15/2021 10/01/2046 200,000.00
09/15/2021 FG G087473128MJZM5 30.7212,286.41 0.0009/15/2021 02/01/2047 31,000.00
09/15/2021 FG G087503128MJZQ6 48.7619,502.44 0.0009/15/2021 03/01/2047 49,000.00
09/15/2021 FG G087963128MJ3E8 47.8716,412.18 0.0009/15/2021 01/01/2048 60,000.00
09/15/2021 FG G088003128MJ3J7 57.5619,734.26 0.0009/15/2021 02/01/2048 75,000.00
09/15/2021 FG G088163128MJ4A5 78.9927,080.82 0.0009/15/2021 06/01/2048 140,000.00
09/15/2021 FG G088333128MJ4T4 38.879,328.00 0.0009/15/2021 07/01/2048 35,000.00
09/15/2021 FG G088433128MJ5D8 42.6511,374.44 0.0009/15/2021 10/01/2048 50,000.00
09/15/2021 FG G167283128MFVV7 78.5437,697.26 0.0009/15/2021 11/01/2031 70,000.00
09/15/2021 FG G167563128MFWR5 88.0430,183.48 0.0009/15/2021 01/01/2034 85,000.00
09/15/2021 FG G187133128MMYK3 74.0825,398.48 0.0009/15/2021 11/01/2033 105,000.00
09/15/2021 FG G6027831335AJX7 137.8741,360.81 0.0009/15/2021 10/01/2045 110,000.00
09/15/2021 FG G6044031335APZ5 332.60114,032.80 0.0009/15/2021 03/01/2046 306,000.00
09/15/2021 FG G6065931335AWU8 85.5129,316.20 0.0009/15/2021 08/01/2046 80,000.00
09/15/2021 FG G6176531335B6A9 47.7914,336.02 0.0009/15/2021 02/01/2048 50,000.00
09/15/2021 FG G677033132XCRY3 151.0451,785.21 0.0009/15/2021 04/01/2047 115,000.00
09/15/2021 FG G677063132XCR31 215.0873,743.12 0.0009/15/2021 12/01/2047 155,000.00
09/15/2021 FG G677073132XCR49 143.3449,144.99 0.0009/15/2021 01/01/2048 90,000.00
09/15/2021 FG G677083132XCR56 330.84113,431.83 0.0009/15/2021 03/01/2048 250,000.00
40

Pasadena Fire and Police Retirement System
Core Fixed Income (Account #: SMS650)
Account Transaction Activity (continued)
As of 09/30/2021
Benchmark: Bloomberg Aggregate
DescriptionTrade DateCurrent
FaceRealized
Gains/LossesCUSIP/SEDOL
NetAmount
OriginalFacePrice
Currency: US Dollar
Settle DateMaturity
Date
INTEREST - MORTGAGE COUPON
09/15/2021 FG G677093132XCR64 188.4264,601.43 0.0009/15/2021 03/01/2048 125,000.00
09/15/2021 FG G677103132XCR72 325.94111,750.47 0.0009/15/2021 03/01/2048 265,000.00
09/15/2021 FG G677133132XCSA4 72.2521,675.22 0.0009/15/2021 06/01/2048 55,000.00
09/15/2021 FG G677183132XCSF3 107.5832,273.87 0.0009/15/2021 01/01/2049 85,000.00
09/15/2021 FG Q052613132GLQN7 135.7246,533.63 0.0009/15/2021 12/01/2041 165,000.00
09/15/2021 FG Q201783132JMFT1 263.4290,314.47 0.0009/15/2021 07/01/2043 220,000.00
09/15/2021 FHR 2368 AS31339GNQ0 169.399,828.38 0.0009/15/2021 10/15/2031 500,000.00
09/15/2021 FHR 2433 SA3133TVPR1 152.038,821.26 0.0009/15/2021 02/15/2032 275,000.00
09/15/2021 FHR 2684 ZN31394L5S7 80.9124,272.85 0.0009/15/2021 10/15/2033 190,000.00
09/15/2021 FHR 4818 CA3137FGVJ1 28.7311,493.91 0.0009/15/2021 04/15/2048 50,000.00
09/15/2021 GN 37646336204QFC9 2.67493.43 0.0009/15/2021 04/15/2024 341,247.00
09/15/2021 GN 78003536225ABC3 1.75323.20 0.0009/15/2021 07/15/2024 199,051.00
09/15/2021 GN 78281836241LDX1 272.7672,737.18 0.0009/15/2021 11/15/2039 430,000.00
09/15/2021 HENDR 2013-3A A46617LAA9 142.2943,293.61 0.0009/15/2021 01/17/2073 75,000.00
09/15/2021 HENDR 2014-2A A46618AAA2 172.8357,449.71 0.0009/15/2021 01/17/2073 90,000.00
09/15/2021 MDST 2004-1 B59560UAD3 324.1343,702.43 0.0009/15/2021 08/15/2037 400,000.00
09/15/2021 NCMS 2020-2PAC A63875DAA9 61.7925,000.00 0.0009/15/2021 12/15/2038 25,000.00
09/15/2021 OBP 2019-OBP A68236JAA9 73.4035,000.00 0.0009/15/2021 09/15/2054 35,000.00
09/15/2021 SLMA 2003-7A A5A78442GHH2 137.5840,819.30 0.0009/15/2021 12/15/2033 110,000.00
09/16/2021 FSRIA 2019-FL1 A30312UAA1 72.5465,000.00 0.0009/16/2021 12/16/2036 65,000.00
09/16/2021 GNR 2009-66 XS38376FLM2 188.1933,682.43 0.0009/16/2021 07/16/2039 1,350,000.00
09/16/2021 GNR 2009-8 PS38374TDP6 181.2835,060.39 0.0009/16/2021 08/16/2038 995,000.00
09/17/2021 SEACO 2014-1A A237952UAE3 63.8424,791.67 0.0009/17/2021 07/17/2029 85,000.00
09/17/2021 TAH 2017-SFR1 A89613DAA1 217.8296,237.04 0.0009/17/2021 09/17/2034 99,000.00
09/19/2021 SAMI 2004-AR1 1A186359LAP4 52.3180,820.81 0.0009/20/2021 03/19/2034 6,700,000.00
09/20/2021 BAFC 2004-A 1A306051GAX7 5.612,697.13 0.0009/20/2021 09/20/2034 660,000.00
09/20/2021 G2 MA352136179R4E6 43.9515,066.88 0.0009/20/2021 03/20/2046 70,000.00
41
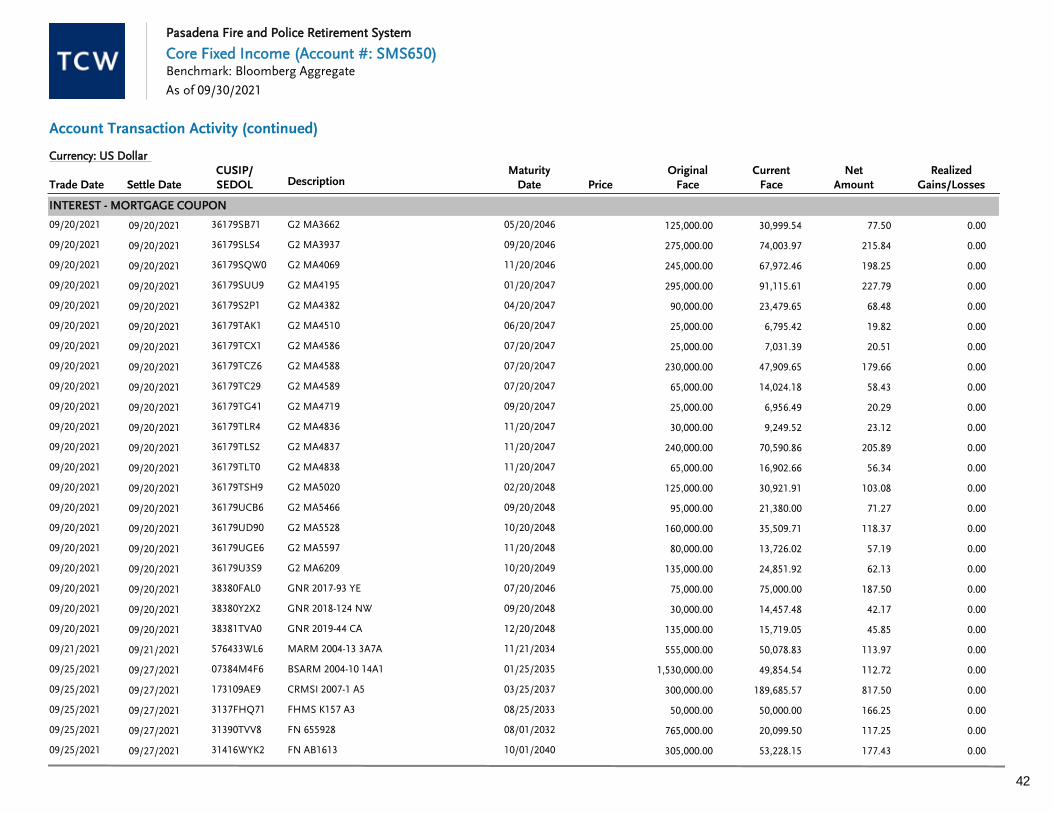
Pasadena Fire and Police Retirement System
Core Fixed Income (Account #: SMS650)
Account Transaction Activity (continued)
As of 09/30/2021
Benchmark: Bloomberg Aggregate
DescriptionTrade DateCurrent
FaceRealized
Gains/LossesCUSIP/SEDOL
NetAmount
OriginalFacePrice
Currency: US Dollar
Settle DateMaturity
Date
INTEREST - MORTGAGE COUPON
09/20/2021 G2 MA366236179SB71 77.5030,999.54 0.0009/20/2021 05/20/2046 125,000.00
09/20/2021 G2 MA393736179SLS4 215.8474,003.97 0.0009/20/2021 09/20/2046 275,000.00
09/20/2021 G2 MA406936179SQW0 198.2567,972.46 0.0009/20/2021 11/20/2046 245,000.00
09/20/2021 G2 MA419536179SUU9 227.7991,115.61 0.0009/20/2021 01/20/2047 295,000.00
09/20/2021 G2 MA438236179S2P1 68.4823,479.65 0.0009/20/2021 04/20/2047 90,000.00
09/20/2021 G2 MA451036179TAK1 19.826,795.42 0.0009/20/2021 06/20/2047 25,000.00
09/20/2021 G2 MA458636179TCX1 20.517,031.39 0.0009/20/2021 07/20/2047 25,000.00
09/20/2021 G2 MA458836179TCZ6 179.6647,909.65 0.0009/20/2021 07/20/2047 230,000.00
09/20/2021 G2 MA458936179TC29 58.4314,024.18 0.0009/20/2021 07/20/2047 65,000.00
09/20/2021 G2 MA471936179TG41 20.296,956.49 0.0009/20/2021 09/20/2047 25,000.00
09/20/2021 G2 MA483636179TLR4 23.129,249.52 0.0009/20/2021 11/20/2047 30,000.00
09/20/2021 G2 MA483736179TLS2 205.8970,590.86 0.0009/20/2021 11/20/2047 240,000.00
09/20/2021 G2 MA483836179TLT0 56.3416,902.66 0.0009/20/2021 11/20/2047 65,000.00
09/20/2021 G2 MA502036179TSH9 103.0830,921.91 0.0009/20/2021 02/20/2048 125,000.00
09/20/2021 G2 MA546636179UCB6 71.2721,380.00 0.0009/20/2021 09/20/2048 95,000.00
09/20/2021 G2 MA552836179UD90 118.3735,509.71 0.0009/20/2021 10/20/2048 160,000.00
09/20/2021 G2 MA559736179UGE6 57.1913,726.02 0.0009/20/2021 11/20/2048 80,000.00
09/20/2021 G2 MA620936179U3S9 62.1324,851.92 0.0009/20/2021 10/20/2049 135,000.00
09/20/2021 GNR 2017-93 YE38380FAL0 187.5075,000.00 0.0009/20/2021 07/20/2046 75,000.00
09/20/2021 GNR 2018-124 NW38380Y2X2 42.1714,457.48 0.0009/20/2021 09/20/2048 30,000.00
09/20/2021 GNR 2019-44 CA38381TVA0 45.8515,719.05 0.0009/20/2021 12/20/2048 135,000.00
09/21/2021 MARM 2004-13 3A7A576433WL6 113.9750,078.83 0.0009/21/2021 11/21/2034 555,000.00
09/25/2021 BSARM 2004-10 14A107384M4F6 112.7249,854.54 0.0009/27/2021 01/25/2035 1,530,000.00
09/25/2021 CRMSI 2007-1 A5173109AE9 817.50189,685.57 0.0009/27/2021 03/25/2037 300,000.00
09/25/2021 FHMS K157 A33137FHQ71 166.2550,000.00 0.0009/27/2021 08/25/2033 50,000.00
09/25/2021 FN 65592831390TVV8 117.2520,099.50 0.0009/27/2021 08/01/2032 765,000.00
09/25/2021 FN AB161331416WYK2 177.4353,228.15 0.0009/27/2021 10/01/2040 305,000.00
42

Pasadena Fire and Police Retirement System
Core Fixed Income (Account #: SMS650)
Account Transaction Activity (continued)
As of 09/30/2021
Benchmark: Bloomberg Aggregate
DescriptionTrade DateCurrent
FaceRealized
Gains/LossesCUSIP/SEDOL
NetAmount
OriginalFacePrice
Currency: US Dollar
Settle DateMaturity
Date
INTEREST - MORTGAGE COUPON
09/25/2021 FN AD383031418RHG9 62.3516,627.52 0.0009/27/2021 04/01/2025 390,000.00
09/25/2021 FN AL09053138EHAF9 62.6116,860.94 0.0009/27/2021 09/01/2021 210,000.00
09/25/2021 FN AN60463138LJWG1 217.7978,546.70 0.0009/27/2021 07/01/2032 85,000.00
09/25/2021 FN AN76303138LLPQ2 102.0437,500.00 0.0009/27/2021 12/01/2032 37,500.00
09/25/2021 FN BL60603140HXWW6 84.5640,000.00 0.0009/27/2021 04/01/2040 40,000.00
09/25/2021 FN BM44723140J86J7 78.9627,071.95 0.0009/27/2021 07/01/2048 50,000.00
09/25/2021 FN CA11823140Q8J48 119.7041,040.18 0.0009/27/2021 02/01/2048 90,000.00
09/25/2021 FN CA11873140Q8J97 19.706,753.41 0.0009/27/2021 02/01/2048 25,000.00
09/25/2021 FN CA17103140Q83U7 158.0342,141.87 0.0009/27/2021 05/01/2048 150,000.00
09/25/2021 FN CA17113140Q83V5 77.5620,682.80 0.0009/27/2021 05/01/2048 75,000.00
09/25/2021 FN CA22083140Q9N25 78.1320,833.39 0.0009/27/2021 08/01/2048 75,000.00
09/25/2021 FN CA36333140QBBB3 264.1990,580.99 0.0009/27/2021 06/01/2049 160,000.00
09/25/2021 FN MA158431418AXN3 65.1822,347.24 0.0009/27/2021 09/01/2033 100,000.00
09/25/2021 FN MA280631418CDL5 81.4432,577.02 0.0009/27/2021 11/01/2046 95,000.00
09/25/2021 FN MA299531418CKH6 55.1316,538.74 0.0009/27/2021 05/01/2047 75,000.00
09/25/2021 FN MA302931418CLK8 47.7019,080.09 0.0009/27/2021 06/01/2032 60,000.00
09/25/2021 FN MA308831418CNE0 156.5246,956.65 0.0009/27/2021 08/01/2047 200,000.00
09/25/2021 FN MA321031418CR89 178.0761,051.92 0.0009/27/2021 12/01/2047 225,000.00
09/25/2021 FN MA329531418CUV4 147.2950,500.21 0.0009/27/2021 02/01/2028 132,000.00
09/25/2021 FN MA384631418DHY1 71.7628,703.53 0.0009/27/2021 11/01/2049 135,000.00
09/25/2021 FN MA415231418DTJ1 233.66140,195.92 0.0009/27/2021 10/01/2040 160,000.00
09/25/2021 FN MA417631418DUA8 211.02126,611.83 0.0009/27/2021 11/01/2040 140,000.00
09/25/2021 FN MA433331418DY71 81.7849,065.99 0.0009/27/2021 05/01/2041 50,000.00
09/25/2021 FNR 2001-52 YZ313921MN5 160.5829,644.65 0.0009/27/2021 10/25/2031 575,000.00
09/25/2021 FNR 2018-57 QA3136B2ZR6 79.0727,111.01 0.0009/27/2021 05/25/2046 115,000.00
09/25/2021 FR SD02313132DMHG3 277.17110,867.80 0.0009/27/2021 01/01/2050 150,000.00
09/25/2021 FR ZA510331329NU48 18.996,510.15 0.0009/27/2021 12/01/2047 25,000.00
43
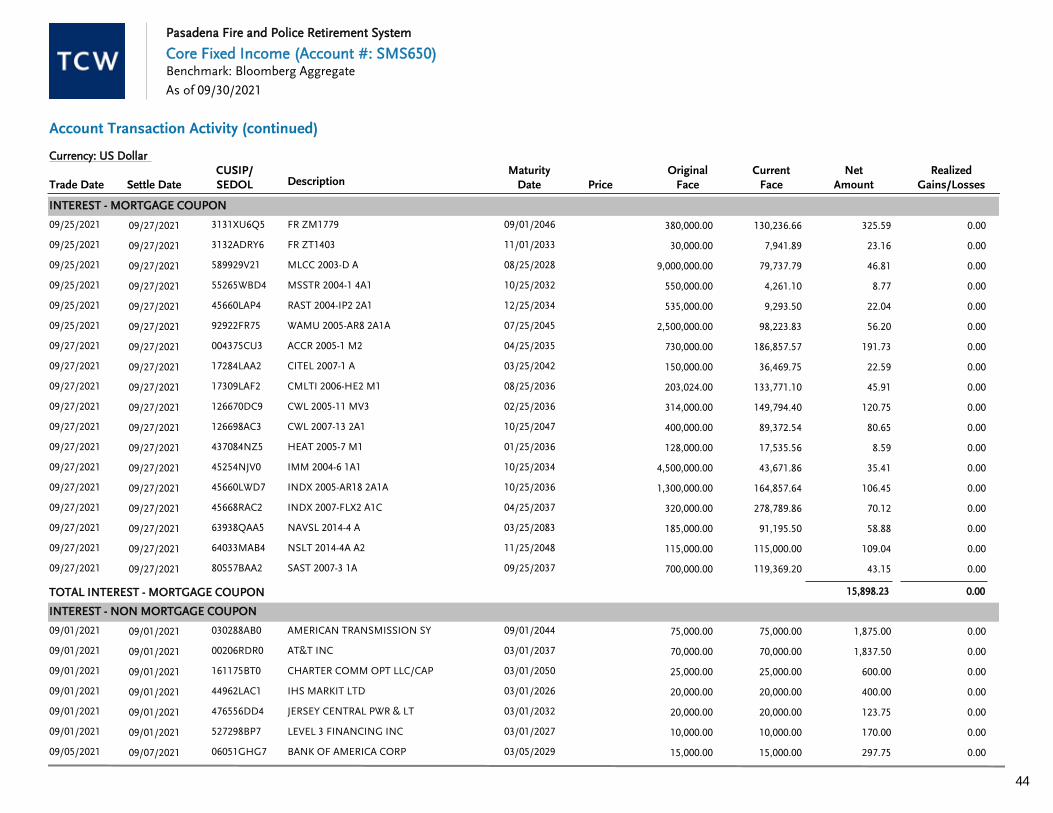
Pasadena Fire and Police Retirement System
Core Fixed Income (Account #: SMS650)
Account Transaction Activity (continued)
As of 09/30/2021
Benchmark: Bloomberg Aggregate
DescriptionTrade DateCurrent
FaceRealized
Gains/LossesCUSIP/SEDOL
NetAmount
OriginalFacePrice
Currency: US Dollar
Settle DateMaturity
Date
INTEREST - MORTGAGE COUPON
09/25/2021 FR ZM17793131XU6Q5 325.59130,236.66 0.0009/27/2021 09/01/2046 380,000.00
09/25/2021 FR ZT14033132ADRY6 23.167,941.89 0.0009/27/2021 11/01/2033 30,000.00
09/25/2021 MLCC 2003-D A589929V21 46.8179,737.79 0.0009/27/2021 08/25/2028 9,000,000.00
09/25/2021 MSSTR 2004-1 4A155265WBD4 8.774,261.10 0.0009/27/2021 10/25/2032 550,000.00
09/25/2021 RAST 2004-IP2 2A145660LAP4 22.049,293.50 0.0009/27/2021 12/25/2034 535,000.00
09/25/2021 WAMU 2005-AR8 2A1A92922FR75 56.2098,223.83 0.0009/27/2021 07/25/2045 2,500,000.00
09/27/2021 ACCR 2005-1 M2004375CU3 191.73186,857.57 0.0009/27/2021 04/25/2035 730,000.00
09/27/2021 CITEL 2007-1 A17284LAA2 22.5936,469.75 0.0009/27/2021 03/25/2042 150,000.00
09/27/2021 CMLTI 2006-HE2 M117309LAF2 45.91133,771.10 0.0009/27/2021 08/25/2036 203,024.00
09/27/2021 CWL 2005-11 MV3126670DC9 120.75149,794.40 0.0009/27/2021 02/25/2036 314,000.00
09/27/2021 CWL 2007-13 2A1126698AC3 80.6589,372.54 0.0009/27/2021 10/25/2047 400,000.00
09/27/2021 HEAT 2005-7 M1437084NZ5 8.5917,535.56 0.0009/27/2021 01/25/2036 128,000.00
09/27/2021 IMM 2004-6 1A145254NJV0 35.4143,671.86 0.0009/27/2021 10/25/2034 4,500,000.00
09/27/2021 INDX 2005-AR18 2A1A45660LWD7 106.45164,857.64 0.0009/27/2021 10/25/2036 1,300,000.00
09/27/2021 INDX 2007-FLX2 A1C45668RAC2 70.12278,789.86 0.0009/27/2021 04/25/2037 320,000.00
09/27/2021 NAVSL 2014-4 A63938QAA5 58.8891,195.50 0.0009/27/2021 03/25/2083 185,000.00
09/27/2021 NSLT 2014-4A A264033MAB4 109.04115,000.00 0.0009/27/2021 11/25/2048 115,000.00
09/27/2021 SAST 2007-3 1A80557BAA2 43.15119,369.20 0.0009/27/2021 09/25/2037 700,000.00
0.0015,898.23TOTAL INTEREST - MORTGAGE COUPON
INTEREST - NON MORTGAGE COUPON
09/01/2021 AMERICAN TRANSMISSION SY030288AB0 1,875.0075,000.00 0.0009/01/2021 09/01/2044 75,000.00
09/01/2021 AT&T INC00206RDR0 1,837.5070,000.00 0.0009/01/2021 03/01/2037 70,000.00
09/01/2021 CHARTER COMM OPT LLC/CAP161175BT0 600.0025,000.00 0.0009/01/2021 03/01/2050 25,000.00
09/01/2021 IHS MARKIT LTD44962LAC1 400.0020,000.00 0.0009/01/2021 03/01/2026 20,000.00
09/01/2021 JERSEY CENTRAL PWR & LT476556DD4 123.7520,000.00 0.0009/01/2021 03/01/2032 20,000.00
09/01/2021 LEVEL 3 FINANCING INC527298BP7 170.0010,000.00 0.0009/01/2021 03/01/2027 10,000.00
09/05/2021 BANK OF AMERICA CORP06051GHG7 297.7515,000.00 0.0009/07/2021 03/05/2029 15,000.00
44

Pasadena Fire and Police Retirement System
Core Fixed Income (Account #: SMS650)
Account Transaction Activity (continued)
As of 09/30/2021
Benchmark: Bloomberg Aggregate
DescriptionTrade DateCurrent
FaceRealized
Gains/LossesCUSIP/SEDOL
NetAmount
OriginalFacePrice
Currency: US Dollar
Settle DateMaturity
Date
INTEREST - NON MORTGAGE COUPON
09/08/2021 NATIONWIDE BLDG SOCIETY63861VAA5 1,129.8060,000.00 0.0009/08/2021 03/08/2024 60,000.00
09/09/2021 GOLDMAN SACHS GROUP INC38141GYA6 611.5585,000.00 0.0009/09/2021 03/09/2027 85,000.00
09/11/2021 BANK OF AMERICA CORP06051GJQ3 1,036.25125,000.00 0.0009/13/2021 03/11/2027 125,000.00
09/11/2021 CREDIT SUISSE GROUP AG225401AM0 324.1325,000.00 0.0009/13/2021 09/11/2025 25,000.00
09/12/2021 HSBC HOLDINGS PLC404280BX6 321.9015,000.00 0.0009/13/2021 09/12/2026 15,000.00
09/15/2021 AT&T INC00206RKJ0 280.0016,000.00 0.0009/15/2021 09/15/2053 16,000.00
09/15/2021 CIGNA CORP125523CL2 180.0015,000.00 0.0009/15/2021 03/15/2030 15,000.00
09/15/2021 CIGNA CORP125523CQ1 90.675,000.00 0.0009/15/2021 03/15/2051 5,000.00
09/15/2021 DOMINION ENERGY INC25746UDE6 577.5035,000.00 0.0009/15/2021 03/15/2025 35,000.00
09/15/2021 ENERGY TRANSFER LP29273RBF5 2,446.2595,000.00 0.0009/15/2021 03/15/2045 95,000.00
09/15/2021 HCA INC404119BN8 750.0030,000.00 0.0009/15/2021 03/15/2024 30,000.00
09/15/2021 HEALTHCARE REALTY TRUST421946AM6 153.7515,000.00 0.0009/15/2021 03/15/2031 15,000.00
09/15/2021 HEALTHCARE TRUST OF AMER42225UAH7 500.0050,000.00 0.0009/15/2021 03/15/2031 50,000.00
09/15/2021 INTERCONTINENTALEXCHANGE45866FAN4 508.7555,000.00 0.0009/15/2021 09/15/2032 55,000.00
09/15/2021 NATIONWIDE MUTUAL INSURA638671AJ6 646.38105,000.00 0.0009/15/2021 12/15/2024 105,000.00
09/15/2021 PARK AEROSPACE HOLDINGS70014LAC4 562.5025,000.00 0.0009/15/2021 03/15/2023 25,000.00
09/15/2021 TUCSON ELECTRIC POWER CO898813AL4 4,331.25225,000.00 0.0009/15/2021 03/15/2023 225,000.00
09/17/2021 LLOYDS BANKING GROUP PLC53944YAK9 214.3515,000.00 0.0009/17/2021 03/17/2023 15,000.00
09/19/2021 EXXON MOBIL CORPORATION30231GBF8 105.685,000.00 0.0009/20/2021 03/19/2040 5,000.00
09/19/2021 EXXON MOBIL CORPORATION30231GBG6 649.0530,000.00 0.0009/20/2021 03/19/2050 30,000.00
09/20/2021 SPRINT SPECTRUM / SPEC I85208NAE0 1,288.00100,000.00 0.0009/20/2021 03/20/2028 100,000.00
09/20/2021 SPRINT SPECTRUM / SPEC I85208NAD2 666.2852,500.00 0.0009/20/2021 03/20/2025 60,000.00
09/21/2021 PETROLEOS MEXICANOS71654QCC4 3,375.00100,000.00 0.0009/21/2021 09/21/2047 100,000.00
09/21/2021 VERIZON COMMUNICATIONS92343VGJ7 190.1915,000.00 0.0009/21/2021 03/21/2031 15,000.00
09/22/2021 HSBC HOLDINGS PLC404280CL1 805.2180,000.00 0.0009/22/2021 09/22/2028 80,000.00
09/22/2021 NATWEST GROUP PLC780097BK6 960.5345,000.00 0.0009/22/2021 03/22/2025 45,000.00
09/24/2021 JPMORGAN CHASE & CO46647PBJ4 1,123.2550,000.00 0.0009/24/2021 03/24/2031 50,000.00
45
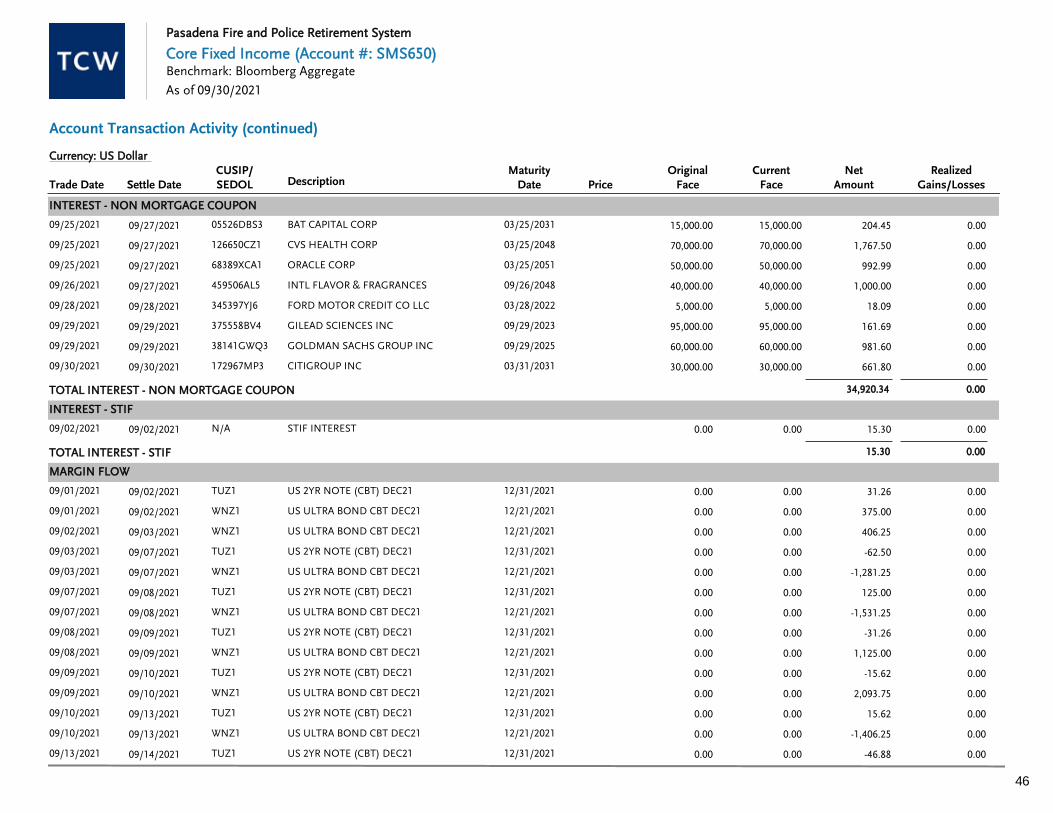
Pasadena Fire and Police Retirement System
Core Fixed Income (Account #: SMS650)
Account Transaction Activity (continued)
As of 09/30/2021
Benchmark: Bloomberg Aggregate
DescriptionTrade DateCurrent
FaceRealized
Gains/LossesCUSIP/SEDOL
NetAmount
OriginalFacePrice
Currency: US Dollar
Settle DateMaturity
Date
INTEREST - NON MORTGAGE COUPON
09/25/2021 BAT CAPITAL CORP05526DBS3 204.4515,000.00 0.0009/27/2021 03/25/2031 15,000.00
09/25/2021 CVS HEALTH CORP126650CZ1 1,767.5070,000.00 0.0009/27/2021 03/25/2048 70,000.00
09/25/2021 ORACLE CORP68389XCA1 992.9950,000.00 0.0009/27/2021 03/25/2051 50,000.00
09/26/2021 INTL FLAVOR & FRAGRANCES459506AL5 1,000.0040,000.00 0.0009/27/2021 09/26/2048 40,000.00
09/28/2021 FORD MOTOR CREDIT CO LLC345397YJ6 18.095,000.00 0.0009/28/2021 03/28/2022 5,000.00
09/29/2021 GILEAD SCIENCES INC375558BV4 161.6995,000.00 0.0009/29/2021 09/29/2023 95,000.00
09/29/2021 GOLDMAN SACHS GROUP INC38141GWQ3 981.6060,000.00 0.0009/29/2021 09/29/2025 60,000.00
09/30/2021 CITIGROUP INC172967MP3 661.8030,000.00 0.0009/30/2021 03/31/2031 30,000.00
0.0034,920.34TOTAL INTEREST - NON MORTGAGE COUPON
INTEREST - STIF
09/02/2021 STIF INTERESTN/A 15.300.00 0.0009/02/2021 0.00
0.0015.30TOTAL INTEREST - STIF
MARGIN FLOW
09/01/2021 US 2YR NOTE (CBT) DEC21TUZ1 31.260.00 0.0009/02/2021 12/31/2021 0.00
09/01/2021 US ULTRA BOND CBT DEC21WNZ1 375.000.00 0.0009/02/2021 12/21/2021 0.00
09/02/2021 US ULTRA BOND CBT DEC21WNZ1 406.250.00 0.0009/03/2021 12/21/2021 0.00
09/03/2021 US 2YR NOTE (CBT) DEC21TUZ1 -62.500.00 0.0009/07/2021 12/31/2021 0.00
09/03/2021 US ULTRA BOND CBT DEC21WNZ1 -1,281.250.00 0.0009/07/2021 12/21/2021 0.00
09/07/2021 US 2YR NOTE (CBT) DEC21TUZ1 125.000.00 0.0009/08/2021 12/31/2021 0.00
09/07/2021 US ULTRA BOND CBT DEC21WNZ1 -1,531.250.00 0.0009/08/2021 12/21/2021 0.00
09/08/2021 US 2YR NOTE (CBT) DEC21TUZ1 -31.260.00 0.0009/09/2021 12/31/2021 0.00
09/08/2021 US ULTRA BOND CBT DEC21WNZ1 1,125.000.00 0.0009/09/2021 12/21/2021 0.00
09/09/2021 US 2YR NOTE (CBT) DEC21TUZ1 -15.620.00 0.0009/10/2021 12/31/2021 0.00
09/09/2021 US ULTRA BOND CBT DEC21WNZ1 2,093.750.00 0.0009/10/2021 12/21/2021 0.00
09/10/2021 US 2YR NOTE (CBT) DEC21TUZ1 15.620.00 0.0009/13/2021 12/31/2021 0.00
09/10/2021 US ULTRA BOND CBT DEC21WNZ1 -1,406.250.00 0.0009/13/2021 12/21/2021 0.00
09/13/2021 US 2YR NOTE (CBT) DEC21TUZ1 -46.880.00 0.0009/14/2021 12/31/2021 0.00
46

Pasadena Fire and Police Retirement System
Core Fixed Income (Account #: SMS650)
Account Transaction Activity (continued)
As of 09/30/2021
Benchmark: Bloomberg Aggregate
DescriptionTrade DateCurrent
FaceRealized
Gains/LossesCUSIP/SEDOL
NetAmount
OriginalFacePrice
Currency: US Dollar
Settle DateMaturity
Date
MARGIN FLOW
09/13/2021 US ULTRA BOND CBT DEC21WNZ1 1,125.000.00 0.0009/14/2021 12/21/2021 0.00
09/14/2021 US 2YR NOTE (CBT) DEC21TUZ1 -46.880.00 0.0009/15/2021 12/31/2021 0.00
09/14/2021 US ULTRA BOND CBT DEC21WNZ1 2,093.750.00 0.0009/15/2021 12/21/2021 0.00
09/15/2021 US 2YR NOTE (CBT) DEC21TUZ1 46.880.00 0.0009/16/2021 12/31/2021 0.00
09/15/2021 US ULTRA BOND CBT DEC21WNZ1 -750.000.00 0.0009/16/2021 12/21/2021 0.00
09/16/2021 US 2YR NOTE (CBT) DEC21TUZ1 62.500.00 0.0009/17/2021 12/31/2021 0.00
09/16/2021 US ULTRA BOND CBT DEC21WNZ1 -500.000.00 0.0009/17/2021 12/21/2021 0.00
09/17/2021 US 2YR NOTE (CBT) DEC21TUZ1 78.120.00 0.0009/20/2021 12/31/2021 0.00
09/17/2021 US ULTRA BOND CBT DEC21WNZ1 -1,187.500.00 0.0009/20/2021 12/21/2021 0.00
09/20/2021 US 2YR NOTE (CBT) DEC21TUZ1 -109.380.00 0.0009/21/2021 12/31/2021 0.00
09/20/2021 US ULTRA BOND CBT DEC21WNZ1 2,375.000.00 0.0009/21/2021 12/21/2021 0.00
09/21/2021 US 2YR NOTE (CBT) DEC21TUZ1 -31.240.00 0.0009/22/2021 12/31/2021 0.00
09/21/2021 US ULTRA BOND CBT DEC21WNZ1 -343.750.00 0.0009/22/2021 12/21/2021 0.00
09/22/2021 US 2YR NOTE (CBT) DEC21TUZ1 234.380.00 0.0009/23/2021 12/31/2021 0.00
09/22/2021 US ULTRA BOND CBT DEC21WNZ1 218.750.00 0.0009/23/2021 12/21/2021 0.00
09/23/2021 US 2YR NOTE (CBT) DEC21TUZ1 187.500.00 0.0009/24/2021 12/31/2021 0.00
09/23/2021 US ULTRA BOND CBT DEC21WNZ1 -2,968.750.00 0.0009/24/2021 12/21/2021 0.00
09/24/2021 US 2YR NOTE (CBT) DEC21TUZ1 140.620.00 0.0009/27/2021 12/31/2021 0.00
09/24/2021 US ULTRA BOND CBT DEC21WNZ1 -2,281.250.00 0.0009/27/2021 12/21/2021 0.00
09/27/2021 US 2YR NOTE (CBT) DEC21TUZ1 93.740.00 0.0009/28/2021 12/31/2021 0.00
09/27/2021 US ULTRA BOND CBT DEC21WNZ1 -281.250.00 0.0009/28/2021 12/21/2021 0.00
09/28/2021 US 2YR NOTE (CBT) DEC21TUZ1 15.620.00 0.0009/29/2021 12/31/2021 0.00
09/28/2021 US ULTRA BOND CBT DEC21WNZ1 -2,812.500.00 0.0009/29/2021 12/21/2021 0.00
09/29/2021 US 2YR NOTE (CBT) DEC21TUZ1 -62.500.00 0.0009/30/2021 12/31/2021 0.00
09/29/2021 US ULTRA BOND CBT DEC21WNZ1 -531.250.00 0.0009/30/2021 12/21/2021 0.00
09/30/2021 US 2YR NOTE (CBT) DEC21TUZ1 -78.120.00 0.0010/01/2021 12/31/2021 0.00
09/30/2021 US ULTRA BOND CBT DEC21WNZ1 -156.250.00 0.0010/01/2021 12/21/2021 0.00
47
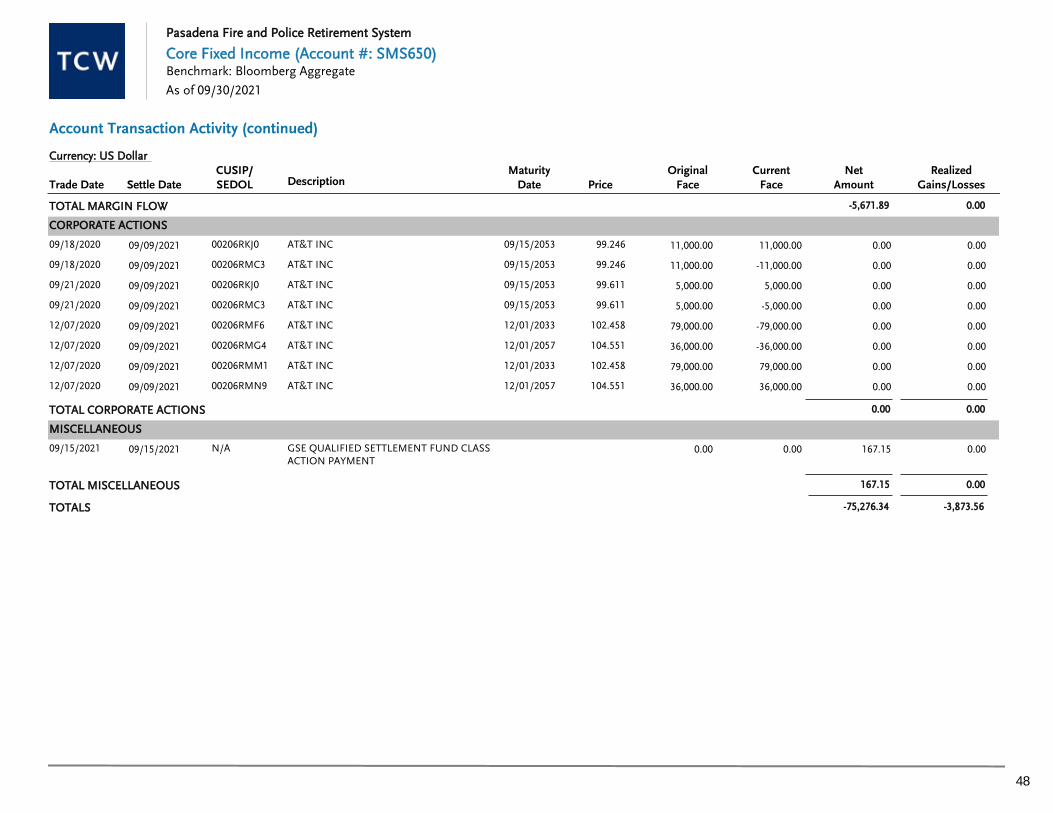
Pasadena Fire and Police Retirement System
Core Fixed Income (Account #: SMS650)
Account Transaction Activity (continued)
As of 09/30/2021
Benchmark: Bloomberg Aggregate
DescriptionTrade DateCurrent
FaceRealized
Gains/LossesCUSIP/SEDOL
NetAmount
OriginalFacePrice
Currency: US Dollar
Settle DateMaturity
Date
0.00-5,671.89TOTAL MARGIN FLOW
CORPORATE ACTIONS
09/18/2020 AT&T INC 99.24600206RKJ0 0.0011,000.00 0.0009/09/2021 09/15/2053 11,000.00
09/18/2020 AT&T INC 99.24600206RMC3 0.00-11,000.00 0.0009/09/2021 09/15/2053 11,000.00
09/21/2020 AT&T INC 99.61100206RKJ0 0.005,000.00 0.0009/09/2021 09/15/2053 5,000.00
09/21/2020 AT&T INC 99.61100206RMC3 0.00-5,000.00 0.0009/09/2021 09/15/2053 5,000.00
12/07/2020 AT&T INC 102.45800206RMF6 0.00-79,000.00 0.0009/09/2021 12/01/2033 79,000.00
12/07/2020 AT&T INC 104.55100206RMG4 0.00-36,000.00 0.0009/09/2021 12/01/2057 36,000.00
12/07/2020 AT&T INC 102.45800206RMM1 0.0079,000.00 0.0009/09/2021 12/01/2033 79,000.00
12/07/2020 AT&T INC 104.55100206RMN9 0.0036,000.00 0.0009/09/2021 12/01/2057 36,000.00
0.000.00TOTAL CORPORATE ACTIONS
MISCELLANEOUS
09/15/2021 GSE QUALIFIED SETTLEMENT FUND CLASSACTION PAYMENT
N/A 167.150.00 0.0009/15/2021 0.00
0.00167.15TOTAL MISCELLANEOUS
-3,873.56TOTALS -75,276.34
48
Metropolitan West Asset Management, LLC, TCW Asset Management Company LLC, and TCW Investment Management Company LLC are wholly owned subsidiaries of TheTCW Group Inc. (“TCW”).
This statement was prepared as a private communication to clients regarding an account with TCW, and is not intended for public circulation. Clients may authorize TCW inwriting to distribute this statement to their consultants or other agents. TCW manages a number of separate strategies, and the holdings in each separate strategy may differdepending on the portfolio manager’s views or analysis with respect to a particular company, security or the economy.
As part of the respective investment process, some TCW equity strategies have a defined range or maximum number of securities for the portfolio. The number of securitiesreflected in this statement may be over or under the range or maximum number due to open orders.
Nothing in this statement constitutes investment, legal, accounting, or tax advice, or a representation that any investment strategy is suitable or appropriate to therecipient’s individual circumstances. This statement is not to be relied upon for investment decisions by the client, or as a substitute for the exercise of independentjudgment by its recipient.
This statement is provided to its recipient as an indication of the holdings of the client’s account as of the date the statement was generated. This statement should not berelied upon to make investment decisions with respect to holdings of the portfolio. TCW may in fact be currently recommending the purchase of a security or the sale of asecurity regardless of any statement made in this document about that security and whether it is held in the client portfolio.
Important Information Regarding Risk FactorsInvestment strategies may not achieve the desired results due to implementation lag, other timing factors, portfolio management decision-making, economic or marketconditions or other unanticipated factors. The price and value of any of the securities or financial instruments mentioned in this statement are subject to variability and canfall as well as rise. Past performance is no guarantee of future results.
Important Information Regarding Client ResponsibilitiesClients are requested to carefully review all portfolio holdings and strategies and to promptly inform TCW of any potential or perceived policy or guideline inconsistencies. Inparticular, TCW understands that guideline enabling language is subject to a measure of interpretation and TCW strongly encourages clients to express any contrastinginterpretation as soon as practical. Due to changing industry standards and the wide variety of interpretations to which a client guideline may be subjected, there can be noassurance that TCW’s interpretation will conform to that of clients or their consultants. TCW Client Services can be reached by calling (213) 244-0810, or [email protected].
Clients are also requested to notify TCW of any updates to Client’s organization, such as (but not limited to) adding affiliates (including broker dealer affiliates), issuingadditional securities, name changes, mergers or other alterations to Client’s legal structure.
Important Information Regarding This Report
The manager has the discretion to assign a security to a country other than its Bloomberg Country of Risk in the event that (i) the relevant index has assigned the security tothat country and/or (ii) the largest share of its income and/or assets is generated or located in that country.
Benchmark: Bloomberg Aggregate
Pasadena Fire and Police Retirement System
Core Fixed Income (Account #: SMS650)
As of 09/30/2021
© 2016 The TCW Group Inc. 49

Nimbus 9
QUARTERLY REVIEW
Large-Cap Growth Fund - I Class 1As of September 30, 2021
Not for use with Individual Investors. 1
PERFORMANCE(NAV, total return) Annualized
ThreeMonths
Year-to-Date
OneYear
ThreeYears
FiveYears
TenYears
FifteenYears
Large-Cap Growth Fund - I Class -0.50% 16.06% 31.21% 21.95% 24.94% 21.22% 14.42%
Russell 1000 Growth Index 1.16 14.30 27.32 22.00 22.84 19.68 13.33
PORTFOLIO HIGHLIGHTS
The portfolio underperformed the Russell 1000 Growth Index during thethree-month period ended September 30, 2021. Relative performance drivers:p Stock selection in the consumer discretionary and health care sectors
detracted the most from relative returns.p Conversely, industrials and business services helped relative performance
the most due to an underweight allocation and security choices.
Additional highlights:p In our view, the trajectory of equity markets heading into 2022 depends on
several competing crosscurrents, which creates uncertainty and a widerange of potential outcomes.
p We continue to lean heavily on our analyst platform for unique insights aswe look to identify the companies that we think are best positioned tomanage through the current environment.
FUND INFORMATION
Symbol TRLGX 1
CUSIP 45775L408 2
Inception Date of Fund October 31, 2001 3
Benchmark Russell 1000 GrowthIndex 4
Expense Information (as of themost recent Prospectus) 0.56% 5
Fiscal Year End December 31 6
12B-1 Fee – 7
Total Assets (all shareclasses) $23,914,505,782 8
Percent of Portfolio in Cash 0.7% 9
CALENDAR YEAR PERFORMANCE(NAV, total return)
Inception Date 2011 2012 2013 2014 2015 2016 2017 2018 2019 2020
Large-Cap Growth Fund - I Class Oct 31 2001 -1.40% 17.55% 44.44% 8.72% 10.08% 2.85% 37.82% 4.32% 28.49% 39.56%
Russell 1000 Growth Index 2.64 15.26 33.48 13.05 5.67 7.08 30.21 -1.51 36.39 38.49
Performance data quoted represents past performance and is not a reliable indicator of future performance. Investment return and principal value willfluctuate so that an investor’s shares, when redeemed, may be worth more or less than their original cost. Current performance may be lower or higherthan the performance data quoted. To obtain the most recent month-end performance, visit troweprice.com. Consider the investment objectives, risks,and charges and expenses carefully before investing. For a prospectus or, if available, a summary prospectus containing this and other information, call1-800-638-7780 or visit troweprice.com. Read it carefully. The Fund’s total return figures reflect the reinvestment of dividends and capital gains, if any.¹ The Institutional Large-Cap Growth Fund changed its name to Large-Cap Growth Fund and designated all outstanding shares as I Class as of May 1, 2020.Performance shown prior to May 1, 2020, reflects the performance of the fund while it was structured as the T. Rowe Price Institutional Large-Cap Growth Fund.The Fund is subject to the volatility inherent in common stock investing, and its share price may fluctuate more than a Fund investing in income-oriented stocks.The fund(s) may have other share classes available that offer different investment minimums and fees. See the prospectus for details. For Sourcing Information,please see Additional Disclosures.

Large-Cap Growth Fund - I Class As of September 30, 2021
Not for use with Individual Investors. 2
PERFORMANCE REVIEWLate Slump Leaves Benchmarks Mixed for QuarterA sharp pullback from record highs late in the quarter left themajor benchmarks mixed for the period. Growth sharesoutperformed their value counterparts, except among small-caps,while large-caps outperformed smaller-caps. Stock and bondprices fell late in the quarter after Federal Reserve officialsannounced on September 22 that they would soon considertapering the central bank's purchases of Treasuries andmortgage-backed securities, a move that would reduce somedownward pressure on longer-term interest rates. Inflation alsospiked to multiyear highs in the quarter as persistent supply chainproblems, including soaring shipping costs, raised prices for bothinputs and finished goods. The release of pent-up demand fortravel, recreation, and other services also pushed prices higher,although the new wave in coronavirus cases that began early inJune appeared to cool both growth and inflation pressures. Casesbegan to decline again in mid-September, however.
Stock Selection in Consumer Discretionary Hurt RelativeReturns the MostConsumer discretionary underperformed the broader market.Retail sales fell in July before posting a surprise gain, excludingautomobile sales, in August. However, while many automakerswere constrained by the global semiconductor chip shortage andthe rising costs of raw materials, automobiles was thebest-performing industry over the quarter, driven by certainautomakers' dominance in the electric vehicle business.p Shares of Chinese technology company Alibaba Group
Holding took a hit following a wave of new regulations in thecountry, including rules focused on banning anticompetitivepractices. We curtailed our position on reduced risk/reward,but we still maintain a modest overweight due to what we viewas a robust, long-term growth opportunity.
p Shares of off-price retailer Ross Stores traded lower in thewake of the company's quarterly earnings release in August.Despite solid headline results, investors appeared concernedwith conservative forward guidance, which managementattributed to escalating freight and supply chain costs.
Health Care Hampered Relative Results Due to SecuritySelectionWhile health care posted a negative return in the portfolio, thesector was among the market's best performers during thequarter. Amid the uptick of COVID-19 delta variant cases,pharmaceuticals buoyed the sector as vaccine mandates andbooster shot approvals were issued. Select names within thehealth care equipment and supplies industry also benefited fromstrong earnings reported during the period.p Shares of Cigna traded lower in response to
higher-than-expected costs, which were driven by historicallevels of utilization as well as costs directly associated withCOVID-19 testing and treatment.
Financials Lowered Relative Returns Due to Stock Choicesand an UnderweightThe financials sector delivered a slight negative return in theportfolio but posted solid gains in the broader market. Risinginflation early in the quarter tempered gains within the sector.Financials rallied late in the period on the expectation of higherinterest rates as bond yields rose and after the Federal Reservesignaled its intention to taper bond buying by year-end.
p Shares of XP, the leading nonbank investment platform inBrazil, finished lower against a difficult political and economicbackdrop in the country. While we are cautious about thestock's setup for 2022, we maintain a modest position as wethink XP has significant potential to grow market share overthe long term.
Industrials and Business Services Contributed Due to anUnderweight and Stock PicksIndustrials and business services delivered negative returns for thequarter and trailed the rest of the market. Higher oil and gas costsalong with continued supply chain disruptions were a headwind toseveral companies within the sector, notably those within airfreight and transportation. Additionally, the spread of the deltavariant seemed to contribute to soft airline ticket sales, and manyU.S. airlines narrowed revenue forecasts as a result. However,construction and engineering names performed well based on theongoing expectation of the passing of the USD 1 trillion bipartisaninfrastructure bill, although the vote was delayed late in the period.p Ingersoll-Rand is a provider of a broad range of mission-critical
air, fluid, energy, specialty vehicle, and medical technologies.With its industrial end markets in the midst of a cyclicalrecovery, the company outperformed market expectations forthe recently ended quarter. We are encouraged by thecompany's continued efforts to achieve cost synergies andmaintain its robust M&A pipeline. In our view, the stock'srisk/reward potential remains favorable at current valuations.
PORTFOLIO POSITIONING AND ACTIVITYIn our view, the trajectory of equity markets heading into 2022depends on several competing crosscurrents, which createsuncertainty and a wide range of potential outcomes. With elevatedmultiples across much of the market, we are staying mindful ofvaluations given the risk for rate hikes and subsequent multiplecontraction. Additionally, the pandemic is continuing to serve asan accelerant to many secular growth trends and is causingmaterial changes to consumer behavior; therefore, we continue tofocus on how to best position ourselves for those changes inbehavior that we believe will remain permanent and avoid thosethat are likely to be transitory.
Information TechnologyDisruptive business models and technologies within the sectorcontinue to present compelling investment opportunities. Seculardemand for public cloud computing services continues to be agrowth driver. We also continue to favor companies driven by theconvergence of communications and computing, includinginternet software companies, and those that will benefit frombroad global tailwinds in digital payments.p We purchased shares of Amphenol, an industrial supplier of
sensors, cables, and connectors to a broad diversity ofattractive and growing end markets, including military,telecommunications, and automotive applications. We believethe shares offer a favorable risk/reward trade-off. Thecompany generates significant cash flow, is financially flexible,and is led by a capable management team with a proven trackrecord of solid capital allocation.
p Global Payments is a U.S.-centric merchant acquirer andleading provider of cloud and enterprise applications to helpbusinesses simplify operations and offer customer-friendlypayment solutions. We added shares on weakness after along-awaited recovery in merchant payment volumes outsideof the U.S. failed to materialize during the recently ended

Large-Cap Growth Fund - I Class As of September 30, 2021
Not for use with Individual Investors. 3
quarter. Investors are also contending with new competitivethreats within the payments space that could disrupt legacymerchant acquirers. Despite the market's harsh reaction, wecontinue to see potential in Global Payments forintermediate-term earnings growth, driven by strongerrevenues from technology products and synergies fromacquisitions.
Consumer DiscretionaryWe are optimistic about stock-specific opportunities within theconsumer discretionary sector. We favor businesses benefitingfrom the secular shift of consumer spending to online productsand services. We believe that industries such as physical retail andtraditional media are secularly challenged, and we will continue toemphasize companies within the sector that we think are on theright side of change and disruption.p We partially trimmed our position in Aptiv, a manufacturer of
vehicle components like electrical architecture for electricvehicles and sensors for active safety systems, in favor of othercompelling opportunities, but we remain constructive on thename.
p We bought shares of Coupang, a leading South Koreane-commerce firm, on weakness as shares slid amid concernsover diminished near-term earnings visibility and constrainedfulfillment capacity. We feel the company can leverage its widemoat in logistics technology to offer consumers bettermerchandise selection, faster delivery, and lower prices thanmany of its competitors and, in doing so, continue to grow itsmarket share. We also value Coupang's differentiated businessstrategy that enables it to manage its operating costs betterthan its competitors. At current prices, we believe the companyoffers an attractive risk/reward trade-off.
Communication ServicesWithin the sector, we are focused on companies that arebenefiting from the shift of advertising spending to digital andsocial media channels. We also favor wireless communicationservices firms with strong company-specific growth prospects andcompetitive advantages or differentiated business models.p We added shares of Spotify Technology on weakness. Shares
of the largest global audio streaming service slumpedfollowing the release of underwhelming monthly average usernumbers in their second-quarter earnings report. We believethe company's scale, higher-margin advertising, and artistpromotion adjacencies provide it with a viable path todouble-digit profit margins.
p We modestly reduced our overweight position in Chineseinternet giant Tencent Holdings following a wave of newregulations in the country, including increased scrutiny overvideo game approval. Despite a fluid regulatory landscape thatis still taking shape, we believe Tencent is the best positionedcompany in Chinese mobile internet, with ample opportunity tofurther monetize its large, rapidly growing user base. Inaddition to mobile internet, Tencent possesses broadcapabilities, including online payments, online finance, andcloud computing services.
MANAGER'S OUTLOOKDespite the strength and speed of the global economic recovery,potential risks to economic growth persist. Vaccine progress remainsslow in parts of the world, and the rapid spread of the delta variant ofthe coronavirus has emerged as a threat. While the Bidenadministration is seeking to raise the U.S. corporate tax rate, any
increase is likely already baked into U.S. equity markets. However,proposed increases in capital gains and dividend taxes could benegative for after-tax returns on most asset classes. Meanwhile,price-to-earnings multiples in some sectors and stocks implydemanding earnings expectations. The U.S. debt ceiling impasse inCongress has injected uncertainty into financial markets. Marketsmust also contend with the regulatory crackdown in China, the driverof much of the global economy's growth in recent years.
Nevertheless, growth appears likely to continue in most of the world'smajor economies over the coming months. We remain focused onthe area where we believe we have an edge and can potentially addthe most value over a full economic cycle: identifying opportunitieswhere we think that the market does not fully appreciate the possiblestrength and length of a company's growth story. As such, wecontinue to lean heavily on our analyst platform for unique insights aswe look to identify the companies that we think are best positioned tomanage through the current environment. Overall, we will continue tofavor companies that have more control of their destiny, arepositioned to benefit from powerful secular trends, and are usinginnovation to disrupt less efficient business models and create newones.

Large-Cap Growth Fund - I Class As of September 30, 2021
Not for use with Individual Investors. 4
QUARTERLY ATTRIBUTIONSECTOR ATTRIBUTION DATA VS. RUSSELL 1000 GROWTH INDEX(3 months ended September 30, 2021)
-3%
-2%
-1%
0%
1%Total Value Added
Value Added from Group Weight
Value Added from Stock Selection
Over/Underweight
Total
Indust &BusSvcs
Real Es-tate
Materi-als
Con-sumerStaples Utilities Energy
InfoTech
CommSvcs
Finan-cials
HealthCare
Con-sumerDisc
Over/Underweight 0.00% -4.48% -1.67% -0.97% -3.82% -0.03% -0.30% -8.30% 13.42% -1.13% 2.98% -1.18%
Fund Performance -0.36 1.68 0.00 0.00 0.00 9.89 0.71 1.83 0.86 -0.65 -1.57 -5.74
Index Performance 1.16 -5.85 -2.24 -2.96 0.40 0.03 1.10 1.79 2.12 7.32 3.66 0.12
Value Add - Group Weight 0.52 0.34 0.06 0.04 0.03 0.00 0.00 -0.07 0.13 -0.06 0.11 -0.04
Value Add - Stock Selection -2.03 0.12 0.00 0.00 0.00 0.00 0.00 0.02 -0.30 -0.11 -0.68 -1.09
Total Contribution -1.52 0.47 0.06 0.04 0.03 0.01 0.00 -0.04 -0.17 -0.17 -0.57 -1.13
-42%
-28%
-14%
0%
14%
TOP 5 RELATIVE CONTRIBUTORS VS. RUSSELL 1000GROWTH INDEX(3 months ended September 30, 2021)
TOP 5 RELATIVE DETRACTORS VS. RUSSELL 1000GROWTH INDEX(3 months ended September 30, 2021)
Security % of Equities
NetContribution(Basis Points) Security % of Equities
NetContribution(Basis Points)
Alphabet Inc. 10.2% 34 Global Payments Inc. 2.7% -47
Intuit Inc. 3.1 22 Tencent Holdings Ltd. 1.2 -36
Snap, Inc. 2.8 22 Alibaba Group Holding Ltd. 0.5 -36
Fortinet, Inc. 1.3 20 Tesla, Inc. 0.0 -35
Salesforce.Com, Inc. 2.2 20 Cigna Corporation 1.7 -30
Net contribution is calculated versus a specific benchmark. It is the difference between the security’s absolute contribution to the portfolio and the security’sabsolute contribution to the benchmark. This reflects the amount the security has impacted relative return.Past performance is not a reliable indicator of future performance. All numbers are percentages. Analysis represents the total performance of the portfolio ascalculated by the FactSet attribution model and is inclusive of other assets. Non-equity positions are excluded from structure shown. Returns will not matchofficial T. Rowe Price performance because FactSet uses different exchange rate sources and does not capture intra-day trading. Performance for each security isobtained in the local currency and, if necessary, is converted using an exchange rate determined by an independent third party. Figures are shown with grossdividends reinvested. Sources: Financial data and analytics provider FactSet. Copyright 2021 FactSet. All Rights Reserved. MSCI/S&P GICS Sectors; Analysis byT. Rowe Price Associates, Inc. T. Rowe Price uses the current MSCI/S&P Global Industry Classification Standard (GICS) for sector and industry reporting. T. RowePrice will adhere to all updates to GICS for prospective reporting. Figures are shown gross of fees. Returns would be lower as a result of the deduction of suchfees. Performance returns are in USD. For Sourcing Information, please see Additional Disclosures.

Large-Cap Growth Fund - I Class As of September 30, 2021
Not for use with Individual Investors. 5
12-MONTH ATTRIBUTIONSECTOR ATTRIBUTION DATA VS. RUSSELL 1000 GROWTH INDEX(12 months ended September 30, 2021)
-12%-9%-6%-3%0%3%6%9%
12%15%Total Value
Added
Value Added from Group Weight
Value Added from Stock Selection
Over/Underweight
TotalCommSvcs
Con-sumerStaples
Indust &BusSvcs
Finan-cials
Materi-als
Real Es-tate Energy Utilities
HealthCare
InfoTech
Con-sumerDisc
Over/Underweight 0.00% 13.42% -3.82% -4.48% -1.13% -0.97% -1.67% -0.30% -0.03% 2.98% -8.30% -1.18%
Fund Performance 31.92 51.20 0.00 20.74 49.67 0.00 0.00 1.60 18.52 22.79 27.47 9.17
Index Performance 27.32 46.47 11.43 15.64 30.32 9.62 19.42 86.06 34.43 26.55 29.65 20.32
Value Add - Group Weight 7.34 2.15 0.77 0.62 -0.03 0.21 0.18 0.02 0.14 0.19 -0.23 -0.14
Value Add - Stock Selection -2.74 0.58 0.00 0.11 0.32 0.00 0.00 0.03 -0.12 -0.66 -0.69 -2.32
Total Contribution 4.60 2.73 0.77 0.73 0.29 0.21 0.18 0.05 0.02 -0.47 -0.92 -2.46
-12%-9%-6%-3%0%3%6%9%12%15%
Past performance is not a reliable indicator of future performance. All numbers are percentages. Analysis represents the total performance of the portfolio ascalculated by the FactSet attribution model and is inclusive of other assets. Non-equity positions are excluded from structure shown. Returns will not matchofficial T. Rowe Price performance because FactSet uses different exchange rate sources and does not capture intra-day trading. Performance for each security isobtained in the local currency and, if necessary, is converted using an exchange rate determined by an independent third party. Figures are shown with grossdividends reinvested. Sources: Financial data and analytics provider FactSet. Copyright 2021 FactSet. All Rights Reserved. MSCI/S&P GICS Sectors; Analysis byT. Rowe Price Associates, Inc. T. Rowe Price uses the current MSCI/S&P Global Industry Classification Standard (GICS) for sector and industry reporting. T. RowePrice will adhere to all updates to GICS for prospective reporting. Figures are shown gross of fees. Returns would be lower as a result of the deduction of suchfees. Performance returns are in USD. For Sourcing Information, please see Additional Disclosures.
TOP 5 RELATIVE CONTRIBUTORS VS. RUSSELL 1000GROWTH INDEX(12 months ended September 30, 2021)
TOP 5 RELATIVE DETRACTORS VS. RUSSELL 1000GROWTH INDEX(12 months ended September 30, 2021)
Security % of Equities
NetContribution(Basis Points) Security % of Equities
NetContribution(Basis Points)
Snap, Inc. 2.8% 269 Tesla, Inc. 0.0% -157
Alphabet Inc. 10.2 266 Apple Inc. 4.1 -152
Asml Holding Nv 1.6 130 Alibaba Group Holding Ltd. 0.5 -104
Intuit Inc. 3.1 128 Nvidia Corporation 0.0 -103
Facebook, Inc. 5.9 70 Moderna, Inc. 0.0 -59
Net contribution is calculated versus a specific benchmark. It is the difference between the security’s absolute contribution to the portfolio and the security’sabsolute contribution to the benchmark. This reflects the amount the security has impacted relative return.
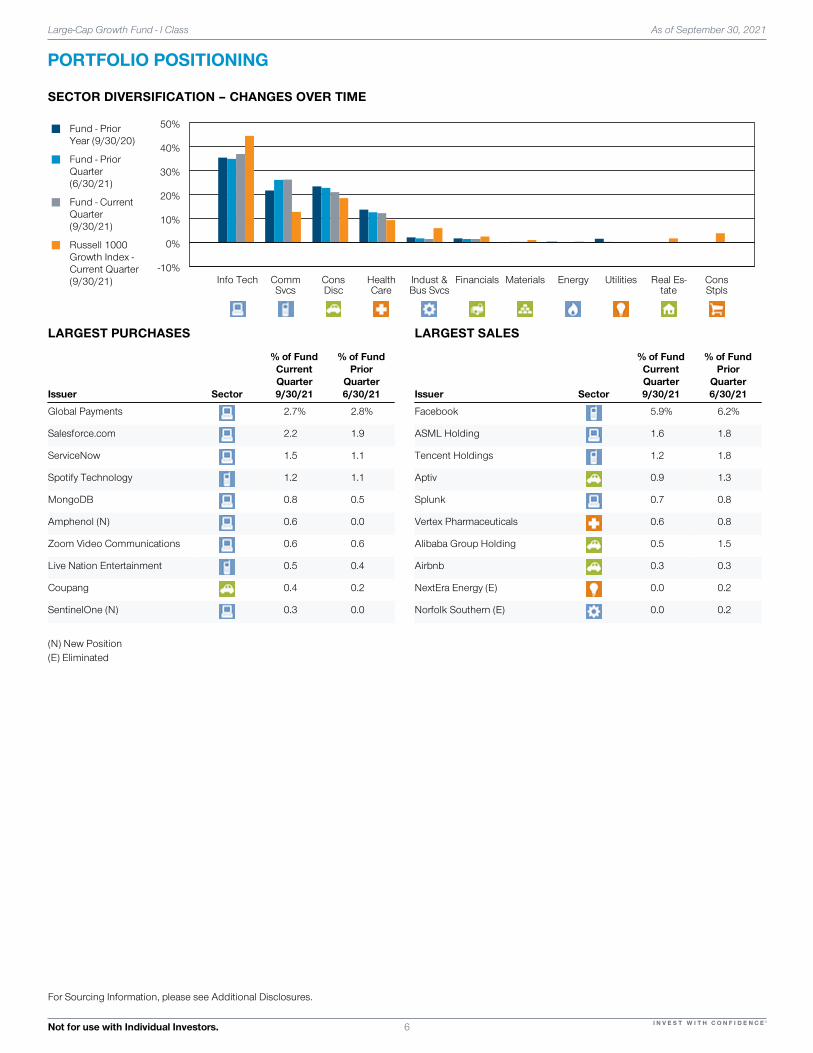
Large-Cap Growth Fund - I Class As of September 30, 2021
Not for use with Individual Investors. 6
For Sourcing Information, please see Additional Disclosures.
PORTFOLIO POSITIONING
SECTOR DIVERSIFICATION – CHANGES OVER TIME
-10%
0%
10%
20%
30%
40%
50%Fund - Prior Year (9/30/20)
Fund - Prior Quarter (6/30/21)
Fund - Current Quarter (9/30/21)
Russell 1000 Growth Index - Current Quarter (9/30/21) Info Tech Comm
SvcsConsDisc
HealthCare
Indust &Bus Svcs
Financials Materials Energy Utilities Real Es-tate
ConsStpls
LARGEST PURCHASES LARGEST SALES
Issuer Sector
% of FundCurrentQuarter9/30/21
% of FundPrior
Quarter6/30/21 Issuer Sector
% of FundCurrentQuarter9/30/21
% of FundPrior
Quarter6/30/21
Global Payments 2.7% 2.8% Facebook 5.9% 6.2%
Salesforce.com 2.2 1.9 ASML Holding 1.6 1.8
ServiceNow 1.5 1.1 Tencent Holdings 1.2 1.8
Spotify Technology 1.2 1.1 Aptiv 0.9 1.3
MongoDB 0.8 0.5 Splunk 0.7 0.8
Amphenol (N) 0.6 0.0 Vertex Pharmaceuticals 0.6 0.8
Zoom Video Communications 0.6 0.6 Alibaba Group Holding 0.5 1.5
Live Nation Entertainment 0.5 0.4 Airbnb 0.3 0.3
Coupang 0.4 0.2 NextEra Energy (E) 0.0 0.2
SentinelOne (N) 0.3 0.0 Norfolk Southern (E) 0.0 0.2
(N) New Position(E) Eliminated

Large-Cap Growth Fund - I Class As of September 30, 2021
Not for use with Individual Investors. 7
For Sourcing Information, please see Additional Disclosures.
HOLDINGSTOP 10 ISSUERS
Issuer Industry % of Fund% of Russell 1000
Growth Index
Alphabet Interactive Media & Services 10.2% 6.3%
Microsoft Software 8.6 10.0
Amazon.com Internet & Direct Marketing Retail 8.1 6.7
Facebook Interactive Media & Services 5.9 3.8
Apple Technology Hardware, Storage & Peripherals 4.1 10.4
Visa IT Services 3.4 1.8
Intuit Software 3.1 0.6
Snap Inc. Interactive Media & Services 2.8 0.0
Global Payments IT Services 2.7 0.0
Salesforce.com Software 2.2 0.2
TOP 5 OVER/UNDERWEIGHT POSITIONS VS. RUSSELL 1000 GROWTH INDEX
Issuer Industry % of Fund
% of Rus-sell 1000
Growth In-dex Over/Underweight
Alphabet Interactive Media & Services 10.2% 6.3% 4.0%
Snap Inc. Interactive Media & Services 2.8 0.0 2.8
Global Payments IT Services 2.7 0.0 2.7
Intuit Software 3.1 0.6 2.5
Facebook Interactive Media & Services 5.9 3.8 2.0
Apple Technology Hardware, Storage & Peripherals 4.1 10.4 -6.3
Tesla Automobiles 0.0 2.9 -2.9
NVIDIA Semicons & Semicon Equip 0.0 2.3 -2.3
Home Depot Specialty Retail 0.0 1.6 -1.6
MasterCard IT Services 0.0 1.4 -1.4
Portfolio Manager:Taymour Tamaddon
Managed Fund Since:2017
Joined Firm:2004
PORTFOLIO MANAGEMENT

Large-Cap Growth Fund - I Class As of September 30, 2021
Not for use with Individual Investors. 8
Additional Disclosures
London Stock Exchange Group plc and its group undertakings (collectively, the “LSE Group”). © LSE Group 2021. FTSE Russell is a trading name of certain of theLSE Group companies. All rights in the FTSE Russell indexes or data vest in the relevant LSE Group company which owns the index or the data. Neither LSEGroup nor its licensors accept any liability for any errors or omissions in the indexes or data and no party may rely on any indexes or data contained in thiscommunication. No further distribution of data from the LSE Group is permitted without the relevant LSE Group company’s express written consent. The LSEGroup does not promote, sponsor or endorse the content of this communication.Unless otherwise noted, index returns are shown with gross dividends reinvested.The manager’s views and portfolio holdings are historical and subject to change. This material should not be deemed a recommendation to buy or sell any of thesecurities mentioned. The specific securities identified and described do not represent all of the securities purchased, sold, or recommended for the Fund and noassumptions should be made that the securities identified and discussed were or will be profitable.The information shown does not reflect any Exchange Traded Funds (ETFs) that may be held in the portfolio.T. Rowe Price uses the current MSCI/S&P Global Industry Classification Standard (GICS) for sector and industry reporting. T. Rowe Price will adhere to all futureupdates to GICS for prospective reporting.The Global Industry Classification Standard ("GICS") was developed by and is the exclusive property and a service mark of Morgan Stanley Capital International Inc,("MSCI") and Standard & Poor's, a division of The McGraw-Hill Companies, Inc. ("S&P") and is licensed for use by T. Rowe Price. Neither MSCI, S&P nor any thirdparty involved in making or compiling the GICS or any GICS classifications makes any express or implied warranties or representations with respect to suchstandard or classification (or the results to be obtained by the use thereof), and all such parties hereby expressly disclaim all warranties of originality, accuracy,completeness, merchantability and fitness for a particular purpose with respect to any or such standard or classification, Without limiting any or the foregoing, in noevent shall MSCI, S&P, any of their affiliates or any third party involved in making or compiling the GICS or any GICS classifications have any liability for any direct,indirect, special, punitive, consequential or any other damages (including lost profits) even if notified of the possibility of such damages.Diversification exhibits may not add to 100% due to exclusion or inclusion of cash.Certain numbers in this report may not equal stated totals due to rounding. Unless otherwise stated, data is as of the report date.Unless indicated otherwise the source of all data is T. Rowe Price.This material has been prepared for informational purposes only. The views and opinions stated in this commentary are those of the portfolio managers listed as ofthe date indicated. These views and opinions are subject to change based on market or other conditions and may differ from those of other T. Rowe Priceassociates. Actual market and investment results may differ materially from expectations.© 2021 T. Rowe Price. All Rights Reserved. T. ROWE PRICE, INVEST WITH CONFIDENCE, and the Bighorn Sheep design are, collectively and/or apart,trademarks of T. Rowe Price Group, Inc.T. Rowe Price Investment Services, Inc., Distributor.202110-1840234

Fact sheet | September 30, 2021
Vanguard®
Vanguard Inflation-Protected Securities FundBond fund | Institutional Shares
Fund facts
Risk level Low High
Total net assets
Expense ratio as of 04/29/21
Ticker symbol
Turnover rate
Inception date
Fund number
1 2 3 4 5 $13,979 MM 0.07 % VIPIX 48.0 % 12/12/03 1190
Investment objective
Vanguard Inflation-Protected Securities Fund seeks to provide investors inflation protection and income consistent with investment in inflation-indexed securities.
Benchmark
Bloomberg US Trsy Inflat Prtcd Idx
Growth of a $10,000 investment : January 31, 2011— December 31, 2020
$14,428 Fund as of 12/31/20
$14,504 Benchmark as of 12/31/20
Annual returns
Bloomberg US Trsy Inflat Prtcd Idx: Includes the inflation-indexed securities within the Bloomberg U.S. Treasury Bond Index, which represents U.S. Treasury obligations with maturities of more than 1 year. The fund held a subscription period from June 5, 2000 (the effective date of the fund) to June 29, 2000, during which time all assets were held directly or indirectly in money market instruments. Performance measurement began June 29, 2000.
F1190 092021
Investment strategy
The fund invests at least 80% of its assets in inflation-indexed bonds issued by the U.S. government, its agencies and instrumentalities, and corporations. The fund may invest in bonds of any maturity; however, its dollar-weighted average maturity is expected to be in a range of 7 to 20 years. At a minimum, all bonds purchased by the fund will be rated “investment grade” or, if unrated, will be considered by the advisor to be investment grade.
For the most up-to-date fund data, please scan the QR code below.
2011 2012 2013 2014 2015 2016 2017 2018 2019 2020
Annual returns 2011 2012 2013 2014 2015 2016 2017 2018 2019 2020
Fund 13.39 6.87 -8.83 4.07 -1.67 4.63 2.97 -1.40 8.18 11.05
Benchmark 13.56 6.98 -8.61 3.64 -1.44 4.68 3.01 -1.26 8.43 10.99
Total returnsPeriods ended September 30, 2021
Total returns Quarter Year to date One year Three years Five years Ten years
Fund 1.70% 3.42% 5.18% 7.34% 4.19% 3.05%
Benchmark 1.75% 3.51% 5.19% 7.45% 4.34% 3.12%
The performance data shown represent past performance, which is not a guarantee of future results. Investment returns and principal value will fluctuate, so investors’ shares, when sold, may be worth more or less than their original cost. Current performance may be lower or higher than the performance data cited. For performance data current to the most recent month-end, visit our website at vanguard.com/performance . The performance of an index is not an exact representation of any particular investment, as you cannot invest directly in an index. Figures for periods of less than one year are cumulative returns. All other figures represent average annual returns. Performance figures include the reinvestment of all dividends and any capital gains distributions. All returns are net of expenses.
Distribution by issuer–bonds
Treasury/Agency 97.8% Other 2.2
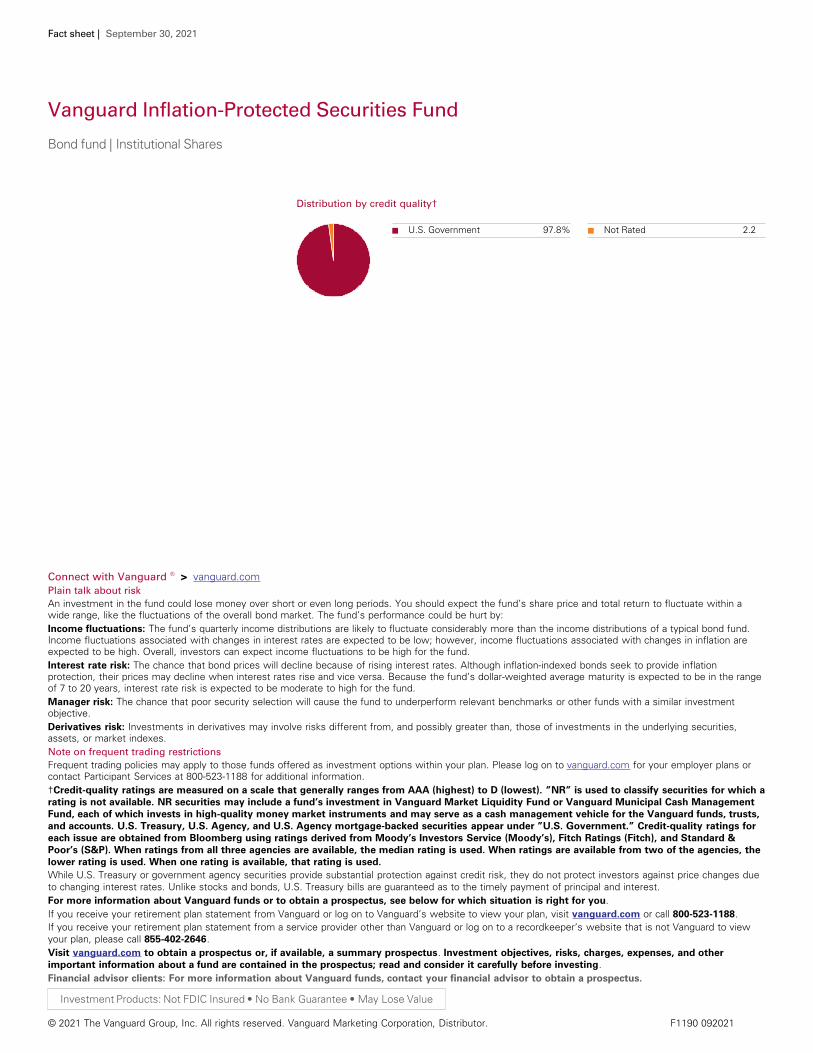
Fact sheet | September 30, 2021
Vanguard Inflation-Protected Securities Fund
Bond fund | Institutional Shares
Connect with Vanguard ® > vanguard.com Plain talk about risk An investment in the fund could lose money over short or even long periods. You should expect the fund’s share price and total return to fluctuate within a wide range, like the fluctuations of the overall bond market. The fund’s performance could be hurt by: Income fluctuations: The fund’s quarterly income distributions are likely to fluctuate considerably more than the income distributions of a typical bond fund. Income fluctuations associated with changes in interest rates are expected to be low; however, income fluctuations associated with changes in inflation are expected to be high. Overall, investors can expect income fluctuations to be high for the fund. Interest rate risk: The chance that bond prices will decline because of rising interest rates. Although inflation-indexed bonds seek to provide inflation protection, their prices may decline when interest rates rise and vice versa. Because the fund’s dollar-weighted average maturity is expected to be in the range of 7 to 20 years, interest rate risk is expected to be moderate to high for the fund. Manager risk: The chance that poor security selection will cause the fund to underperform relevant benchmarks or other funds with a similar investment objective. Derivatives risk: Investments in derivatives may involve risks different from, and possibly greater than, those of investments in the underlying securities, assets, or market indexes. Note on frequent trading restrictions Frequent trading policies may apply to those funds offered as investment options within your plan. Please log on to vanguard.com for your employer plans or contact Participant Services at 800-523-1188 for additional information. †Credit-quality ratings are measured on a scale that generally ranges from AAA (highest) to D (lowest). ”NR” is used to classify securities for which a rating is not available. NR securities may include a fund’s investment in Vanguard Market Liquidity Fund or Vanguard Municipal Cash Management Fund, each of which invests in high-quality money market instruments and may serve as a cash management vehicle for the Vanguard funds, trusts, and accounts. U.S. Treasury, U.S. Agency, and U.S. Agency mortgage-backed securities appear under ”U.S. Government.” Credit-quality ratings for each issue are obtained from Bloomberg using ratings derived from Moody’s Investors Service (Moody’s), Fitch Ratings (Fitch), and Standard & Poor’s (S&P). When ratings from all three agencies are available, the median rating is used. When ratings are available from two of the agencies, the lower rating is used. When one rating is available, that rating is used. While U.S. Treasury or government agency securities provide substantial protection against credit risk, they do not protect investors against price changes due to changing interest rates. Unlike stocks and bonds, U.S. Treasury bills are guaranteed as to the timely payment of principal and interest. For more information about Vanguard funds or to obtain a prospectus, see below for which situation is right for you .If you receive your retirement plan statement from Vanguard or log on to Vanguard’s website to view your plan, visit vanguard.com or call 800-523-1188 .If you receive your retirement plan statement from a service provider other than Vanguard or log on to a recordkeeper’s website that is not Vanguard to view your plan, please call 855-402-2646 .Visit vanguard.com to obtain a prospectus or, if available, a summary prospectus . Investment objectives, risks, charges, expenses, and other important information about a fund are contained in the prospectus; read and consider it carefully before investing . Financial advisor clients: For more information about Vanguard funds, contact your financial advisor to obtain a prospectus.
Investment Products: Not FDIC Insured • No Bank Guarantee • May Lose Value
© 2021 The Vanguard Group, Inc. All rights reserved. Vanguard Marketing Corporation, Distributor. F1190 092021
Distribution by credit quality†
U.S. Government 97.8% Not Rated 2.2

Fact sheet | September 30, 2021
Vanguard®
Vanguard Institutional Index FundDomestic stock fund | Institutional Shares
Fund facts
Risk level Low High
Total net assets
Expense ratio as of 04/29/21
Ticker symbol
Turnover rate
Inception date
Fund number
1 2 3 4 5 $120,889 MM 0.035 % VINIX 4.0 % 07/31/90 0094
Investment objective
Vanguard Institutional Index Fund seeks to track the performance of a benchmark index that measures the investment return of large-capitalization stocks.
Benchmark
S&P 500 Index
Growth of a $10,000 investment : January 31, 2011— December 31, 2020
$35,766 Fund as of 12/31/20
$35,850 Benchmark as of 12/31/20
Annual returns
S&P 500 Index: A widely used barometer of U.S. stock market performance; as a market-weighted index of leading companies in leading industries, it is dominated by large-capitalization companies.
F0094 092021
Investment strategy
The fund employs an indexing investment approach designed to track the performance of the Standard & Poor’s 500 Index, which is dominated by the stocks of large U.S. companies. The fund attempts to replicate the target index by investing all, or substantially all, of its assets in the stocks that make up the index.
For the most up-to-date fund data, please scan the QR code below.
2011 2012 2013 2014 2015 2016 2017 2018 2019 2020
Annual returns 2011 2012 2013 2014 2015 2016 2017 2018 2019 2020
Fund 2.09 15.98 32.35 13.65 1.37 11.93 21.79 -4.42 31.46 18.39
Benchmark 2.11 16.00 32.39 13.69 1.38 11.96 21.83 -4.38 31.49 18.40
Total returnsPeriods ended September 30, 2021
Total returns Quarter Year to date One year Three years Five years Ten years
Fund 0.57% 15.90% 29.98% 15.97% 16.87% 16.61%
Benchmark 0.58% 15.92% 30.00% 15.99% 16.90% 16.63%
The performance data shown represent past performance, which is not a guarantee of future results. Investment returns and principal value will fluctuate, so investors’ shares, when sold, may be worth more or less than their original cost. Current performance may be lower or higher than the performance data cited. For performance data current to the most recent month-end, visit our website at vanguard.com/performance . The performance of an index is not an exact representation of any particular investment, as you cannot invest directly in an index. Figures for periods of less than one year are cumulative returns. All other figures represent average annual returns. Performance figures include the reinvestment of all dividends and any capital gains distributions. All returns are net of expenses.

Fact sheet | September 30, 2021
Vanguard Institutional Index Fund
Domestic stock fund | Institutional Shares
Connect with Vanguard ® > vanguard.com Plain talk about risk An investment in the fund could lose money over short or even long periods. You should expect the fund’s share price and total return to fluctuate within a wide range, like the fluctuations of the overall stock market. The fund’s performance could be hurt by: Stock market risk: The chance that stock prices overall will decline. Stock markets tend to move in cycles, with periods of rising stock prices and periods of falling stock prices. The fund’s target index may, at times, become focused in stocks of a particular sector, category, or group of companies. Because the fund seeks to track its target index, the fund may underperform the overall stock market. Investment style risk: The chance that returns from large-capitalization stocks will trail returns from the overall stock market. Large-cap stocks tend to go through cycles of doing better—or worse—than other segments of the stock market or the stock market in general. These periods have, in the past, lasted for as long as several years. Note on frequent trading restrictions Frequent trading policies may apply to those funds offered as investment options within your plan. Please log on to vanguard.com for your employer plans or contact Participant Services at 800-523-1188 for additional information. The index is a product of S&P Dow Jones Indices LLC (“SPDJI”), and has been licensed for use by Vanguard. Standard & Poor’s® and S&P® are registered trademarks of Standard & Poor’s Financial Services LLC (“S&P”); Dow Jones® is a registered trademark of Dow Jones Trademark Holdings LLC (“Dow Jones”); S&P® and S&P 500® are trademarks of S&P; and these trademarks have been licensed for use by SPDJI and sublicensed for certain purposes by Vanguard. Vanguard product(s) are not sponsored, endorsed, sold or promoted by SPDJI, Dow Jones, S&P, or their respective affiliates and none of such parties make any representation regarding the advisability of investing in such product(s) nor do they have any liability for any errors, omissions, or interruptions of the index. For more information about Vanguard funds or to obtain a prospectus, see below for which situation is right for you .If you receive your retirement plan statement from Vanguard or log on to Vanguard’s website to view your plan, visit vanguard.com or call 800-523-1188 .If you receive your retirement plan statement from a service provider other than Vanguard or log on to a recordkeeper’s website that is not Vanguard to view your plan, please call 855-402-2646 .Visit vanguard.com to obtain a prospectus or, if available, a summary prospectus . Investment objectives, risks, charges, expenses, and other important information about a fund are contained in the prospectus; read and consider it carefully before investing . Financial advisor clients: For more information about Vanguard funds, contact your financial advisor to obtain a prospectus.
Investment Products: Not FDIC Insured • No Bank Guarantee • May Lose Value
© 2021 The Vanguard Group, Inc. All rights reserved. Vanguard Marketing Corporation, Distributor. F0094 092021
Sector Diversification
Information Tech 27.6% Health Care 13.2 Consumer Discretionary 12.4 Financials 11.4 Communication Services 11.3 Industrials 8.0
Consumer Staples 5.8 Energy 2.7 Real Estate 2.6 Materials 2.5 Utilities 2.5 Other 0.0
Sector categories are based on the Global Industry Classification Standard (“GICS”), except for the “Other” category (if applicable), which includes securities that have not been provided a GICS classification as of the effective reporting period.
Ten largest holdings *
1 Apple Inc.
2 Microsoft Corp.
3 Alphabet Inc.
4 Amazon.com Inc.
5 Facebook Inc.
6 Tesla Inc.
7 NVIDIA Corp.
8 Berkshire Hathaway Inc.
9 JPMorgan Chase & Co.
10 Johnson & Johnson
Top 10 as % of total net assets 29.2%
* The holdings listed exclude any temporary cash investments and equity index products.

Fact sheet | September 30, 2021
Vanguard®
Vanguard Short-Term Investment-Grade FundBond fund | Institutional Shares
Fund facts
Risk level Low High
Total net assets
Expense ratio as of 05/28/21
Ticker symbol
Turnover rate
Inception date
Fund number
1 2 3 4 5 $14,529 MM 0.07 % VFSIX 86.3 % 09/30/97 0858
Investment objective
Vanguard Short-Term Investment-Grade Fund seeks to provide current income while maintaining limited price volatility.
Benchmark
Bloomberg US 1-5 Year Credit Index
Growth of a $10,000 investment : January 31, 2011— December 31, 2020
$13,095 Fund as of 12/31/20
$13,407 Benchmark as of 12/31/20
Annual returns
Bloomberg US 1-5 Year Credit Index: Includes investment-grade (rated Baa3 or above by Moody’s) corporate and international dollar-denominated bonds with maturities of 1 to 5 years.
F0858 092021
Investment strategy
The fund invests in a variety of high-quality and medium-quality fixed income securities, at least 80% of which will be short- and intermediate-term investment-grade securities. High-quality fixed income securities are those rated the equivalent of A3 or better by Moody’s Investors Service, Inc., or another independent rating agency; medium-quality fixed income securities are those rated the equivalent of Baa1, Baa2, or Baa3 by Moody’s or another independent rating agency. (Investment-grade fixed income securities are those rated the equivalent of Baa3 and above by Moody’s.) The fund is expected to maintain a dollar-weighted average maturity of 1 to 4 years.
For the most up-to-date fund data, please scan the QR code below.
2011 2012 2013 2014 2015 2016 2017 2018 2019 2020
Annual returns 2011 2012 2013 2014 2015 2016 2017 2018 2019 2020
Fund 2.06 4.66 1.10 1.90 1.16 2.85 2.16 1.00 5.87 5.28
Benchmark 3.04 5.51 1.24 1.95 1.06 2.58 2.32 1.11 6.58 5.19
Total returnsPeriods ended September 30, 2021
Total returns Quarter Year to date One year Three years Five years Ten years
Fund 0.15% 0.38% 1.37% 4.05% 2.74% 2.67%
Benchmark 0.09% 0.13% 1.08% 4.25% 2.85% 2.79%
The performance data shown represent past performance, which is not a guarantee of future results. Investment returns and principal value will fluctuate, so investors’ shares, when sold, may be worth more or less than their original cost. Current performance may be lower or higher than the performance data cited. For performance data current to the most recent month-end, visit our website at vanguard.com/performance . The performance of an index is not an exact representation of any particular investment, as you cannot invest directly in an index. Figures for periods of less than one year are cumulative returns. All other figures represent average annual returns. Performance figures include the reinvestment of all dividends and any capital gains distributions. All returns are net of expenses.
Distribution by issuer–bonds
Industrial 40.1% Finance 31.2 Treasury/Agency 10.8 Asset-Backed 4.0 Commercial Mortgage-Backed 3.9
Foreign 3.9 Utilities 3.9 Other 2.1 Government Mortgage-Backed 0.1
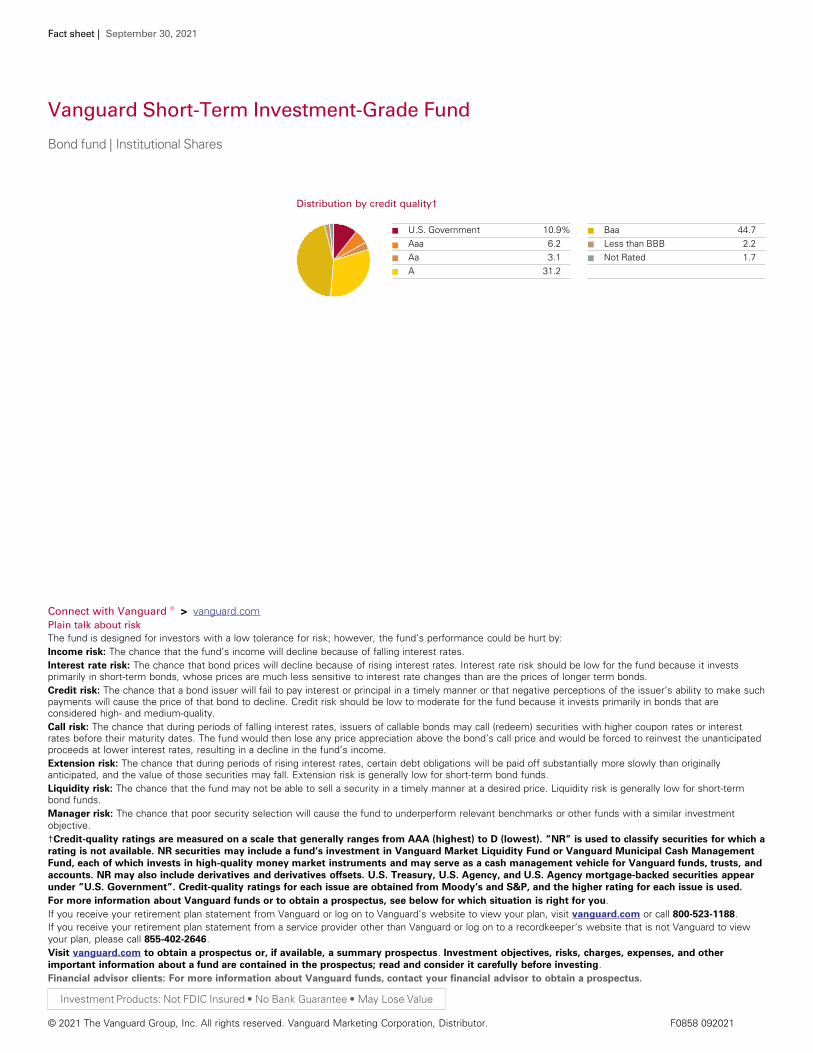
Fact sheet | September 30, 2021
Vanguard Short-Term Investment-Grade Fund
Bond fund | Institutional Shares
Connect with Vanguard ® > vanguard.com Plain talk about risk The fund is designed for investors with a low tolerance for risk; however, the fund’s performance could be hurt by: Income risk: The chance that the fund’s income will decline because of falling interest rates. Interest rate risk: The chance that bond prices will decline because of rising interest rates. Interest rate risk should be low for the fund because it invests primarily in short-term bonds, whose prices are much less sensitive to interest rate changes than are the prices of longer term bonds. Credit risk: The chance that a bond issuer will fail to pay interest or principal in a timely manner or that negative perceptions of the issuer’s ability to make such payments will cause the price of that bond to decline. Credit risk should be low to moderate for the fund because it invests primarily in bonds that are considered high- and medium-quality. Call risk: The chance that during periods of falling interest rates, issuers of callable bonds may call (redeem) securities with higher coupon rates or interest rates before their maturity dates. The fund would then lose any price appreciation above the bond’s call price and would be forced to reinvest the unanticipated proceeds at lower interest rates, resulting in a decline in the fund’s income. Extension risk: The chance that during periods of rising interest rates, certain debt obligations will be paid off substantially more slowly than originally anticipated, and the value of those securities may fall. Extension risk is generally low for short-term bond funds. Liquidity risk: The chance that the fund may not be able to sell a security in a timely manner at a desired price. Liquidity risk is generally low for short-term bond funds. Manager risk: The chance that poor security selection will cause the fund to underperform relevant benchmarks or other funds with a similar investment objective. †Credit-quality ratings are measured on a scale that generally ranges from AAA (highest) to D (lowest). ”NR” is used to classify securities for which a rating is not available. NR securities may include a fund’s investment in Vanguard Market Liquidity Fund or Vanguard Municipal Cash Management Fund, each of which invests in high-quality money market instruments and may serve as a cash management vehicle for Vanguard funds, trusts, and accounts. NR may also include derivatives and derivatives offsets. U.S. Treasury, U.S. Agency, and U.S. Agency mortgage-backed securities appear under ”U.S. Government”. Credit-quality ratings for each issue are obtained from Moody’s and S&P, and the higher rating for each issue is used. For more information about Vanguard funds or to obtain a prospectus, see below for which situation is right for you .If you receive your retirement plan statement from Vanguard or log on to Vanguard’s website to view your plan, visit vanguard.com or call 800-523-1188 .If you receive your retirement plan statement from a service provider other than Vanguard or log on to a recordkeeper’s website that is not Vanguard to view your plan, please call 855-402-2646 .Visit vanguard.com to obtain a prospectus or, if available, a summary prospectus . Investment objectives, risks, charges, expenses, and other important information about a fund are contained in the prospectus; read and consider it carefully before investing . Financial advisor clients: For more information about Vanguard funds, contact your financial advisor to obtain a prospectus.
Investment Products: Not FDIC Insured • No Bank Guarantee • May Lose Value
© 2021 The Vanguard Group, Inc. All rights reserved. Vanguard Marketing Corporation, Distributor. F0858 092021
Distribution by credit quality†
U.S. Government 10.9% Aaa 6.2 Aa 3.1 A 31.2
Baa 44.7 Less than BBB 2.2 Not Rated 1.7

1
Pasadena Fire and Police Ret. System
Quarter Ending September 30, 2021
Prepared for:
Portfolio Review
For financial professional or qualified institutional investor use only. Not for inspection by, distribution or quotation to, the general public.

2
Table of Contents Voya Team
Pasadena Fire and Police Ret. System
For financial professional or qualified institutional investor use only. Not for inspection by, distribution or quotation to, the general public.
Jeffrey Bakalar
Group Head and Chief Investment Officer, Leveraged Credit
Group
Ryan Jusko
Vice President, Institutional Client Advisor
Rosa Martone
Institutional Client Service
Assistant Vice President, Client Service Manager
Phone: 860-275-4607
Email: [email protected]
Web Access:
https://www.investments.voya.com/ClientAccess
.................................................................................. 3 Market Review 4 .................................................................................. Investment Policy 5 .................................................................................. Performance Analysis 8 .................................................................................. Performance Summary 9 .................................................................................. Portfolio Characteristics
11 .................................................................................. Asset Allocation .................................................................................. 12 Business Highlights
13 .................................................................................. Appendix

3
Market Review - Quarter Ending September 30, 2021
Pasadena Fire and Police Ret. System
For financial professional or qualified institutional investor use only. Not for inspection by, distribution or quotation to, the general public.
Quarterly Market Review
Global stock markets ended the third quarter mostly in the red. Investor sentiment, which had overcome ambivalent economic signals in July and
August, faltered in September as uncertainty intensified around the U.S. debt ceiling and bond-market volatility increased, worsened by
resurgent inflation concerns, persistent supply-chain disruptions and rising Covid-19 deaths. Of the major U.S. indexes, only the S&P 500 posted
a slight gain of 0.58%; the Dow Jones Industrial Average returned -1.46% and the NASDAQ Composite returned -0.38%. Non-U.S. stocks, as
measured by the MSCI All Country World ex-U.S. index, returned -2.99%.
Bond yields rose, and bond prices fell, in response to a significant increase in the personal consumption expenditures price index, an important
inflation gauge for the Federal Reserve. What’s more, the Fed announced it would soon begin “tapering,” i.e., trimming its monthly purchases of
mortgage-backed securities, which have helped support the economy by keeping long-term interest rates low. The ten-year U.S. Treasury yield
was volatile, particularly in September, but changed only slightly over the quarter, climbing from 1.47% to 1.49%. For the quarter, the Bloomberg
U.S. Aggregate Bond index eked out a 0.05% gain. Inflation expectations pushed up prices of commodities such as oil; however, gold prices
declined as rising yields prompted investors to shift toward bonds.
Though the Fed may soon begin tapering, monetary policy remains highly supportive of economic growth. We do not think growth will decline to
the point of concern, nor do we expect inflation to get out of hand ― most inflation pressures are coming from Covid-sensitive sectors, and are
likely to dissipate over the coming months as supply chains return to normal. Given this macro environment, we still expect risk assets such as
stocks to outperform, but not to the extent we have seen in the past few months.

4
Investment Policy
Pasadena Fire and Police Ret. System Senior Loan
For financial professional or qualified institutional investor use only. Not for inspection by, distribution or quotation to, the general public.
Mandate Senior Loan
The investment management agreement between Voya Investment Management and Pasadena Fire and Police
Ret. System was effective June 27, 2014.
Inception
Actively managed, ultra-short duration floating-rate income strategy that invests primarily in privately syndicated,
below investment grade senior secured corporate loans
Strategy Summary
Supported by an over 50-person dedicated investment team, our investment process focuses on fundamental credit analysis, relative value assessment and high levels of diversification. We conduct top-down analysis to target
industries with strong operating momentum or improving credit conditions, while avoiding those sectors prone to the clustering of defaults. The other major component of our process, specific borrower selection, is based on
fundamental bottom-up credit analysis that includes independent credit research, in-depth collateral review and relative value analysis.
Process
$6,874,175.48 as of September 30, 2021 Account Balance

5
Performance Analysis - Quarter Ending September 30, 2021
Pasadena Fire and Police Ret. System Senior Loan
For financial professional or qualified institutional investor use only. Not for inspection by, distribution or quotation to, the general public.
Portfolio Review
The Voya Senior Loan Collective Trust (the “Trust”) returned 1.22% in 3Q21 on a gross-of-fees basis, outperforming the S&P/LSTA Leveraged
Loan index (the “index”) by 12 basis points (bp). The Trust benefitted from selection and underweight among BB-rated loans and an underweight
in BBB-rated loans, both of which underperformed lower-rated credits during the period. At the sector level, relative contributors were largely
dispersed, with the exception of selection in telecommunication, while no material performance boosts could be identified at the individual issuer
level. In contrast, partially offsetting relative detractors largely stemmed from selection in CCC-rated loans. Other detractors included selection in
forest products, mainly due to an overweight to Yak Mat. The company reported a downside quarterly earnings surprise during the period.
The Trust experienced one default during the quarter, Glass Mountain Pipeline, as did the index. The index’s trailing-12-month default rate by
principal amount fell to just 0.35% in 3Q21, which is only 14 bp above the post-global financial crisis (GFC) low. Comparatively, the Trust’s
default rate closed out the period at 0.28%. Diversification measures in the portfolio remain robust with 37 industries and 373 individual issuers
represented.
Current Strategy and Outlook
In 3Q21, the U.S. loan market experienced many of the same themes underpinning the previous quarter and virtually all of 2021. Strong investor
demand for floating rate products, robust new-issue supply and muted default activity created a constructive environment for loans. The index
posted a quarterly gain of 1.11% despite periodic pockets of volatility in broad risk markets. Market value appreciation was a small contributor
(+10 bp) during the quarter with coupon income being the main driver of performance. By ratings, the prevailing risk-on sentiment continued in
3Q21, as lower-rated, riskier credits outperformed higher-quality. CCC-rated loans led all cohorts with a 2.09% return, as compared to single-B-

6
Performance Analysis - Quarter Ending September 30, 2021
Pasadena Fire and Police Ret. System Senior Loan
For financial professional or qualified institutional investor use only. Not for inspection by, distribution or quotation to, the general public.
and BB-rated loans, which returned 1.14% and 0.83%, respectively. The outperformance of riskier credits was even more pronounced on a year-
to-date (YTD) basis: CCC-rated loans +12.01%, single-B-rated loans +4.35% and BB-rated loans +2.45%.
The technical environment was healthy in 3Q21, as loan arrangers syndicated roughly $155 billion of new institutional paper. Merger and
acquisition (M&A) activity, which was largely on the sidelines last year, has been the primary catalyst for the surging supply levels, and
represented nearly 60% of the entire quarterly volume. While re-financing activities tapered off relative to last quarter, other opportunistic
transactions such as dividend recapitalizations remained in high gear. Altogether, YTD issuance is tracking $487 billion through three quarters, a
record for the comparable period and on pace to eclipse the previous annual record of $503 billion from 2017. The strong primary market activity
has created a strong backdrop for collateralized loan obligation (CLO) issuance, which amounted to a record $46.7 billion in 3Q21. This now
surpasses the previous quarterly high-water mark of $43.4 billion set last quarter. CLO issuance has already exceeded the previous annual
record from 2018 of $129 billion and is expected to reach well above $150 billion for the full-year period according to current market estimates.
Appetite for CLOs has been incredibly robust in 2021, despite lack of demand from historically dominant buyers in large Japanese banks, as
U.S. banks and insurance companies have increasingly tapped into the CLO market given attractive yields relative to other securitized products.
Elsewhere, retail loan funds experienced solid flows during the timeframe, with roughly $7.9 billion allocated into loan funds as per LCD,
although the pace of inflows decelerated compared to 2Q21.
Default activity was minimal with just one index default during the period, marking only the third default of the year. As a result, the trailing-12-
month default rate by principal amount fell by 90 bp to 0.35%, which was only 14 bp above the post GFC-low. The notable drop is a function of
improving corporate credit health and more COVID-19-induced defaults rolling off the trailing calendar. While the default rate is unlikely to move

7
Performance Analysis - Quarter Ending September 30, 2021
Pasadena Fire and Police Ret. System Senior Loan
For financial professional or qualified institutional investor use only. Not for inspection by, distribution or quotation to, the general public.
much lower from current levels, the general market consensus points to a continued default rate well below historical averages, in the near
future.
As we look ahead, barring any unexpected disruption, we think the macro backdrop should remain supportive through the balance of 2021.
However, inflation continues to be in the spotlight with sustained global supply shortages persisting and a recent supply crunch in energy
markets creating additional concerns. We believe the sustainability of the strong projected global growth amid the current supply shocks will
continue to weigh heavily on investors’ minds. These concerns are likely to have heightened focus during the upcoming corporate earnings
cycle. While this environment is producing an increased level of caution, we still view the current conditions in the loan market as constructive,
both from a technical and fundamental perspective. The asset class continues to offer an attractive risk and return profile relative to other
income-generating products and has been, at times, de-coupled from equity and fixed income market choppiness given less sensitivity to rate
volatility and inherent rising-rate protection.

8
Performance Summary
Pasadena Fire and Police Ret. System Senior Loan
For financial professional or qualified institutional investor use only. Not for inspection by, distribution or quotation to, the general public.
Quarter YTD 1 Year 3 Year Since Inception* 5 Year
Portfolio Gross (%) 1.23 4.18 7.63 3.54 3.93 4.11
Portfolio Net (%) 1.10 3.80 7.11 3.04 3.42 3.60
Benchmark (%) 1.11 4.42 8.40 4.14 3.96 4.58
Relative to Gross (%) 0.12 -0.25 -0.77 -0.60 -0.03 -0.48
Calendar Year Returns 2020 2019 2018 2017 2016 2015
Portfolio Gross (%) 1.45 8.50 0.81 3.67 8.52 1.39
Portfolio Net (%) 0.95 7.98 0.31 3.16 7.98 0.88
Benchmark (%) 3.12 8.64 0.44 4.12 10.16 -0.69
Quarter Ending September 30, 2021
*Performance inception date is 7/01/2014. Benchmark: S&P/LSTA Leveraged Loan Index
Performance returns for time periods greater than 1 year are annualized. Past performance does not guarantee future results.
Investors cannot invest directly in an index. See Explanatory Notes Section for footnotes and disclosures.

9
Portfolio Characteristics Quarter Ending September 30, 2021
Characteristics Portfolio
Number of Industries 37
Average per Industry $55,315,467
Average per Industry as a % of AUM 2.70%
Number of Issuers 373
Average per Issuer $5,487,057
Average per Issuer as a % of AUM 0.27%
Weighted Average Spread 3.84%
Weighted Average Maturity Years 5.20
Weighted Average Market Price 99.22%
Leverage for Investment Purposes Percent 0.00%
Weighted Average Days To Reset 0
Weighted Average Coupon 4.38%
Weighted Average Quality B
Discount Yield To 3 yr Call 4.72%
Total AUM ($ Millions) 2046.67
% of Loans Denominated in USD 100.00%
Weighted Average Rating Factor 2677.00
See Explanatory Notes Section for footnotes and disclosures.
Pasadena Fire and Police Ret. System Senior Loan
For financial professional or qualified institutional investor use only. Not for inspection by, distribution or quotation to, the general public.
Returns-Based Statistics (10 years) Portfolio Benchmark
Standard Deviation (%) 4.84 5.18
Tracking Error (%) 0.73 N/A
Information Ratio 0.29 N/A
Alpha (annualized %) 0.53 N/A
Beta 0.93 1.00
R-Squared 0.98 1.00
Sharpe Ratio 0.93 0.83
Portfolio holdings characteristics are subject to change and may not be representative of current holdings and characteristics.
Spread Distribution (LIBOR + bps)
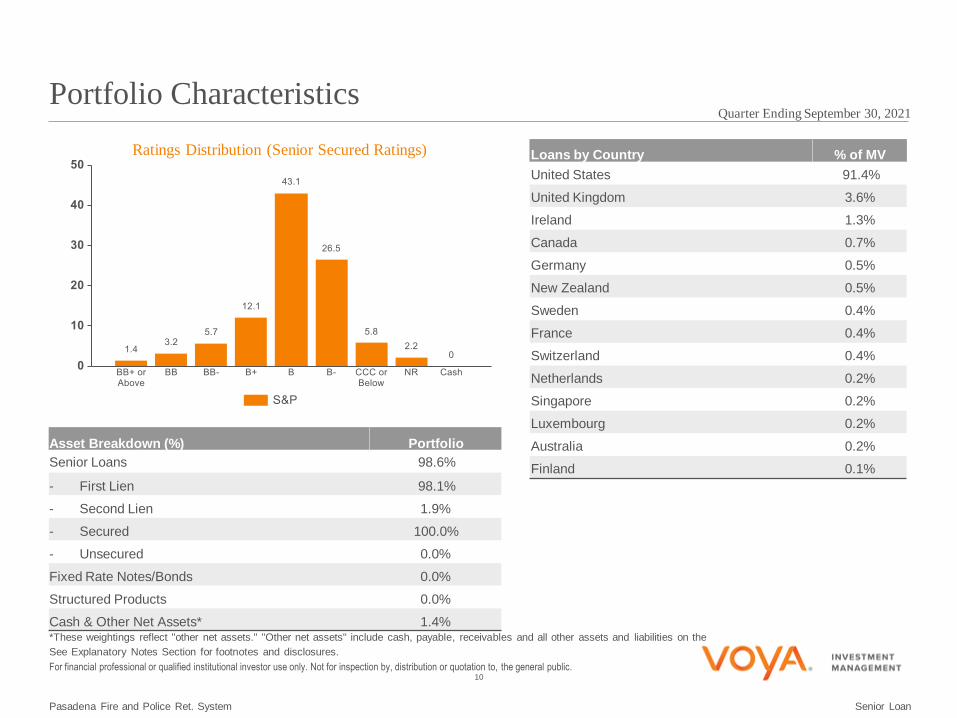
10
Portfolio Characteristics Quarter Ending September 30, 2021
Pasadena Fire and Police Ret. System Senior Loan
For financial professional or qualified institutional investor use only. Not for inspection by, distribution or quotation to, the general public.
See Explanatory Notes Section for footnotes and disclosures.
Loans by Country % of MV
United States 91.4%
United Kingdom 3.6%
Ireland 1.3%
Canada 0.7%
Germany 0.5%
New Zealand 0.5%
Sweden 0.4%
France 0.4%
Switzerland 0.4%
Netherlands 0.2%
Singapore 0.2%
Luxembourg 0.2%
Australia 0.2%
Finland 0.1%
Asset Breakdown (%) Portfolio
Senior Loans 98.6%
- First Lien 98.1%
- Second Lien 1.9%
- Secured 100.0%
- Unsecured 0.0%
Fixed Rate Notes/Bonds 0.0%
Structured Products 0.0%
Cash & Other Net Assets* 1.4% *These weightings reflect "other net assets." "Other net assets" include cash, payable, receivables and all other assets and liabilities on the
Ratings Distribution (Senior Secured Ratings)

11
Asset Allocation Quarter Ending September 30, 2021
Pasadena Fire and Police Ret. System Senior Loan
For financial professional or qualified institutional investor use only. Not for inspection by, distribution or quotation to, the general public.
Top Ten Industries*
Top Issuers ($ millions) Market Value % of MV
Asurion, LLC $17.3 0.86%
Acrisure, LLC $16.7 0.83%
Sedgwick Holdings, Inc. $16.4 0.81%
Edelman Financial Services $16.0 0.80%
Peraton $15.6 0.77%
Internet Brands, Inc. $15.5 0.77%
Quest Software US Holdings Inc. $15.5 0.77%
Misys (Finastra) $15.1 0.75%
Ultimate Kronos Group, Inc. $14.8 0.73%
Proofpoint, Inc. $14.7 0.73%
Industry Allocations* Market Value % of MV
Electronics/Electrical $390.4 19.35%
Business Equipment & Services $231.7 11.48%
Health Care $219.7 10.89%
Diversified Insurance $109.1 5.41%
All Telecom $100.1 4.96%
Building & Development $91.7 4.55%
Automotive $78.0 3.87%
Containers & Glass Products $74.8 3.71%
Leisure Goods/Activities/Movies $58.4 2.90%
Retailers (Except Food & Drug) $50.9 2.52%
Industrial Equipment $48.8 2.42%
Financial Intermediaries $47.6 2.36%
Chemicals & Plastics $43.1 2.14%
Radio & Television $42.9 2.13%
Aerospace & Defense $42.4 2.10%
Other $388.0 19.23%
See Explanatory Notes Section for footnotes and disclosures.
Allocations may not add to 100% due to rounding.
*Industry allocation is tracked using S&P Industries.
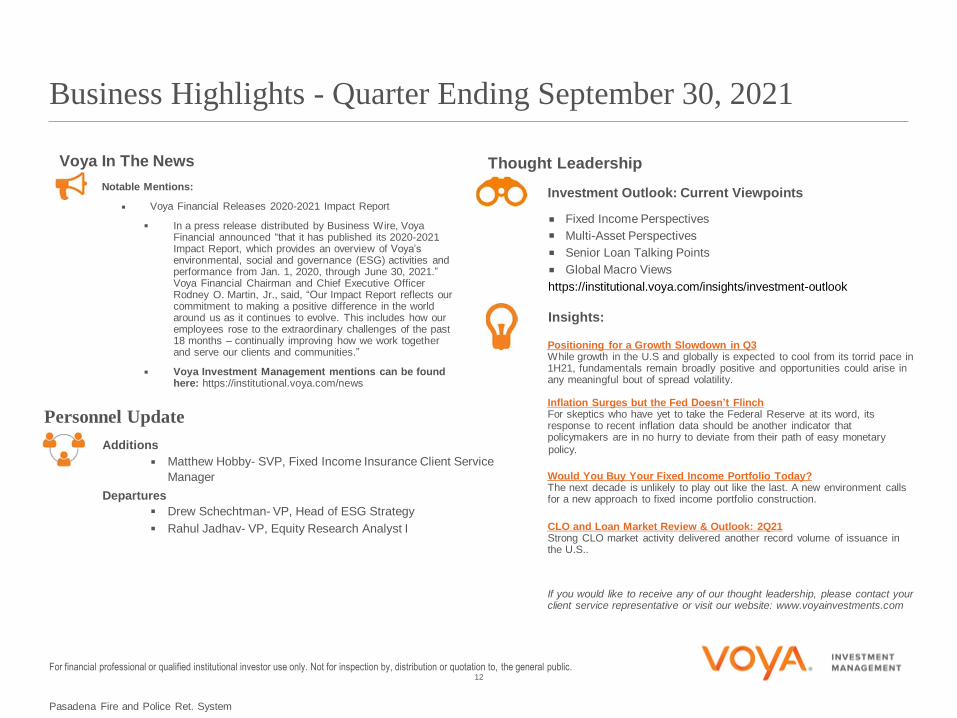
12
Pasadena Fire and Police Ret. System
For financial professional or qualified institutional investor use only. Not for inspection by, distribution or quotation to, the general public.
Business Highlights - Quarter Ending September 30, 2021
Voya In The News Thought Leadership
Notable Mentions:
Voya Financial Releases 2020-2021 Impact Report
In a press release distributed by Business Wire, Voya Financial announced “that it has published its 2020-2021 Impact Report, which provides an overview of Voya’s environmental, social and governance (ESG) activities and performance from Jan. 1, 2020, through June 30, 2021.” Voya Financial Chairman and Chief Executive Officer Rodney O. Martin, Jr., said, “Our Impact Report reflects our commitment to making a positive difference in the world around us as it continues to evolve. This includes how our employees rose to the extraordinary challenges of the past 18 months – continually improving how we work together and serve our clients and communities.”
Voya Investment Management mentions can be found here: https://institutional.voya.com/news
Investment Outlook: Current Viewpoints
Fixed Income Perspectives
Multi-Asset Perspectives
Senior Loan Talking Points
Global Macro Views
https://institutional.voya.com/insights/investment-outlook
Insights:
Positioning for a Growth Slowdown in Q3 While growth in the U.S and globally is expected to cool from its torrid pace in 1H21, fundamentals remain broadly positive and opportunities could arise in any meaningful bout of spread volatility.
Inflation Surges but the Fed Doesn’t Flinch For skeptics who have yet to take the Federal Reserve at its word, its response to recent inflation data should be another indicator that policymakers are in no hurry to deviate from their path of easy monetary
policy.
Would You Buy Your Fixed Income Portfolio Today? The next decade is unlikely to play out like the last. A new environment calls for a new approach to fixed income portfolio construction.
CLO and Loan Market Review & Outlook: 2Q21 Strong CLO market activity delivered another record volume of issuance in the U.S..
If you would like to receive any of our thought leadership, please contact your client service representative or visit our website: www.voyainvestments.com
Personnel Update
Additions
Matthew Hobby- SVP, Fixed Income Insurance Client Service
Manager
Departures
Drew Schechtman- VP, Head of ESG Strategy
Rahul Jadhav- VP, Equity Research Analyst I
13
Appendix
Pasadena Fire and Police Ret. System
For financial professional or qualified institutional investor use only. Not for inspection by, distribution or quotation to, the general public.
.............................................................................................. 14 Portfolio: Voya Senior Loan Trust
........................................................................................ Holdings 14
.............................................................................................. 40 Explanatory Notes

14
Holdings Report Quarter Ending September 30, 2021
Pasadena Fire and Police Ret. System Senior Loan
For financial professional or qualified institutional investor use only. Not for inspection by, distribution or quotation to, the general public.
Voya Senior Loan Trust
Issuer LoanX ID Industry (S&P) Tranche Market Value % Portfolio Maturity Spread %
S&P
Rating Price
Aerospace & Defense
Peraton LX192468 Upsized First Lien Term Loan $15,609,342 0.77% 2/01/2028 3.75 B+ 100.21 Aerospace & Defense
Delta Airlines, Inc. LX189934 SkyMiles Term Loan $10,166,567 0.50% 10/20/2027 3.75 NR 106.46 Aerospace & Defense
American Airlines, Inc. LX193380 AAdvantage Term Loan $7,895,417 0.39% 4/20/2028 4.75 NR 103.48 Aerospace & Defense
Amentum (Maverick) LX185105 First Lien Term Loan $5,312,527 0.26% 1/22/2027 3.50 B 100.08 Aerospace & Defense
ADS Tactical, Inc. LX192695 First Lien Term Loan $3,403,326 0.17% 3/19/2026 5.75 B+ 100.63 Aerospace & Defense
$42,387,180 2.10%
Air Transport
United Airlines, Inc. LX194289 First Lien Term Loan $7,033,653 0.35% 4/15/2028 3.75 BB- 100.91 Air Transport
$7,033,653 0.35%
All Telecom
CommScope, Inc. LX178454 Term Loan B $11,996,031 0.59% 4/06/2026 3.25 B 99.64 All Telecom
Avaya Inc. LX190026 Term Loan B-1 $11,951,695 0.59% 12/15/2027 4.25 B+ 100.35 All Telecom
Asurion, LLC LX196395 Second Lien Term Loan B-4 $7,916,813 0.39% 1/14/2029 5.25 B 99.77 All Telecom
Iridium Communications LX196612 Term Loan B $7,704,791 0.38% 11/04/2026 2.50 BB- 100.19 All Telecom
Inmarsat plc LX192181 Term Loan B $6,892,466 0.34% 12/12/2026 3.50 B+ 100.18 All Telecom
Altice France S.A. (fka SFR Group S.A., aka Numericable) LX169002 USD TL B12 $6,788,529 0.34% 1/30/2026 3.68 B 99.38 All Telecom
Global Tel*Link Corporation LX176983 First Lien Term Loan $5,970,916 0.30% 11/29/2025 4.25 B 94.96 All Telecom
Cablevision Lightpath LX189872 Term Loan B $5,005,197 0.25% 11/30/2027 3.25 B+ 100.20 All Telecom
Consumer Cellular LX190922 First Lien Term Loan $4,983,669 0.25% 12/15/2027 3.75 B- 100.38 All Telecom
Asurion, LLC LX192293 Upsized B-9 Term Loan $4,768,492 0.24% 7/31/2027 3.25 B+ 98.65 All Telecom

15
Holdings Report Quarter Ending September 30, 2021
Pasadena Fire and Police Ret. System Senior Loan
For financial professional or qualified institutional investor use only. Not for inspection by, distribution or quotation to, the general public.
Voya Senior Loan Trust
Issuer LoanX ID Industry (S&P) Tranche Market Value % Portfolio Maturity Spread %
S&P
Rating Price
All Telecom
ORBCOMM LX194322 First Lien Term Loan $3,382,113 0.17% 6/17/2028 4.25 B 100.06 All Telecom
GTT Communications, Inc LX171875 USD TL B $3,214,182 0.16% 5/31/2025 2.75 CCC- 85.20 All Telecom
Gogo LX194240 Term Loan B $3,066,163 0.15% 4/30/2028 3.75 B 99.88 All Telecom
Cologix Holdings, Inc. LX193903 Term Loan B $2,999,981 0.15% 4/01/2028 3.75 B 100.25 All Telecom
Asurion, LLC LX191415 B-8 Term Loan $2,637,751 0.13% 12/23/2026 3.25 B+ 98.64 All Telecom
Mega Broadband (d/b/a Vyve Broadband) LX190259 Term Loan B $2,619,869 0.13% 11/12/2027 3.00 B+ 100.18 All Telecom
Aventiv Technologies (f/k/a Securus) LX164887 Fully Upsized First Lien Term Loan $2,586,566 0.13% 11/01/2024 4.50 B- 95.45 All Telecom
Flexential Corp (f/k/a Peak 10, Inc.) LX167188 2nd lien $2,529,357 0.13% 8/01/2025 7.25 CCC- 91.98 All Telecom
Asurion, LLC LX192294 Second Lien Term Loan B-3 $1,996,666 0.10% 1/28/2028 5.25 B 99.83 All Telecom
Global Tel*Link Corporation LX177113 Second Lien Term Loan $966,842 0.05% 11/26/2026 8.25 CCC+ 93.50 All Telecom
Avaya Inc. LX192780 Term Loan B-2 $125,312 0.01% 12/15/2027 4.00 B+ 100.25 All Telecom
$100,103,399 4.96%
Automotive
Gates Global LLC LX192751 USD TL $12,983,344 0.64% 4/01/2027 2.50 B+ 99.98 Automotive
JCI Power Solutions LX192923 USD Term Loan $9,189,516 0.46% 4/30/2026 3.25 NR 99.66 Automotive
Les Schwab Tire Centers LX190472 Term Loan B $8,064,267 0.40% 10/31/2027 3.25 B 100.19 Automotive
Truck Hero, Inc. LX192014 First Lien Term Loan $7,778,572 0.39% 1/31/2028 3.25 B- 99.91 Automotive
TI Group Automotive Systems, L.L.C. LX194145 USD Term Loan B $5,998,294 0.30% 12/31/2026 3.25 BB+ 100.31 Automotive
Wheel Pros LX194316 Term Loan B $5,150,263 0.26% 4/30/2028 4.50 B- 100.10 Automotive
Verra Mobility LX193557 Term Loan B $4,409,654 0.22% 3/25/2028 3.25 BB- 100.03 Automotive
Dealer Tire, LLC LX185508 Incremental 1L TL $4,044,504 0.20% 12/31/2025 4.25 B- 100.28 Automotive

16
Holdings Report Quarter Ending September 30, 2021
Pasadena Fire and Police Ret. System Senior Loan
For financial professional or qualified institutional investor use only. Not for inspection by, distribution or quotation to, the general public.
Voya Senior Loan Trust
Issuer LoanX ID Industry (S&P) Tranche Market Value % Portfolio Maturity Spread %
S&P
Rating Price
Automotive
Rough Country LLC LX196465 First Lien Term Loan $3,995,000 0.20% 7/31/2028 3.50 B- 100.00 Automotive
IXS LLC LX185722 First Lien Term Loan $3,913,316 0.19% 3/01/2027 4.25 B 99.95 Automotive
L&W Group, Inc. LX193607 Upsized Term Loan $3,196,706 0.16% 4/30/2028 4.50 B 100.20 Automotive
Hertz Corporation (The) LX195525 Term Loan B $2,850,409 0.14% 6/15/2028 3.50 B+ 100.18 Automotive
Mister Car Wash Holdings, Inc. LX180151 Term Loan B $2,232,979 0.11% 5/14/2026 3.00 B 99.80 Automotive
Holley/Driven LX176336 First Lien Term Loan $1,986,450 0.10% 10/24/2025 5.00 B 100.34 Automotive
Rough Country LLC LX196467 Second Lien Term Loan $1,685,000 0.08% 7/31/2029 6.75 CCC 100.00 Automotive
Hertz Corporation (The) LX195526 Term Loan C $538,539 0.03% 6/15/2028 3.50 BB- 100.18 Automotive
$78,016,812 3.87%
Beverage & Tobacco
Nestle Waters North America LX193319 First Lien Term Loan $7,155,946 0.35% 3/25/2028 3.50 B 99.98 Beverage & Tobacco
City Brewing Company, LLC LX193773 First Lien Term Loan $6,977,841 0.35% 4/05/2028 3.50 B+ 99.19 Beverage & Tobacco
$14,133,787 0.70%
Building & Development
Ply Gem Industries, Inc. LX193695 Upsized TL B $11,933,784 0.59% 4/01/2028 3.25 B+ 99.99 Building & Development
HD Supply Waterworks, Ltd. LX195426 Term Loan B $10,936,383 0.54% 7/27/2028 2.50 B+ 99.77 Building & Development
White Cap LX190112 1st Lien Term Loan B $7,788,297 0.39% 10/07/2027 4.00 B 100.35 Building & Development
Foundation Building Materials LX192263 First Lien TL $7,401,822 0.37% 1/29/2028 3.25 B 99.47 Building & Development
Wilsonart LLC LX193657 Term Loan B - Tranche E $6,161,806 0.31% 12/31/2026 3.50 B+ 100.16 Building & Development
SRS Distribution Inc. LX195086 New Term Loan B $6,140,368 0.30% 5/20/2028 3.75 B- 100.09 Building & Development

17
Holdings Report Quarter Ending September 30, 2021
Pasadena Fire and Police Ret. System Senior Loan
For financial professional or qualified institutional investor use only. Not for inspection by, distribution or quotation to, the general public.
Voya Senior Loan Trust
Issuer LoanX ID Industry (S&P) Tranche Market Value % Portfolio Maturity Spread %
S&P
Rating Price
Building & Development
PrimeSource Building Products LX192016 First Lien Term Loan $4,796,896 0.24% 12/28/2027 3.25 B- 99.67 Building & Development
Barrette Outdoor Living LX190003 Upsized First Lien Term Loan $4,732,257 0.23% 11/02/2027 3.75 B 100.39 Building & Development
Forterra Finance, LLC LX162521 First Lien Term Loan $4,403,496 0.22% 10/25/2023 3.00 B 100.08 Building & Development
WernerCo LX165605 Incremental Term Loan B $4,199,400 0.21% 7/24/2024 4.00 B- 100.25 Building & Development
American Bath Group LX192222 First Lien Term Loan $4,159,195 0.21% 11/23/2027 3.75 B- 99.88 Building & Development
Empire Today LX193285 Fungible Incremental 1st Lien Term Loan $3,512,022 0.17% 3/24/2028 5.00 B 99.46 Building & Development
Aegion LX193563 First Lien Term Loan $3,032,814 0.15% 5/17/2028 4.75 B 101.09 Building & Development
US LBM LX191233 Term Loan B $2,961,786 0.15% 12/17/2027 3.75 B- 99.25 Building & Development
Kodiak Building Partners LX192870 Term Loan B $2,302,112 0.11% 3/01/2028 3.25 B- 100.13 Building & Development
IPS Corp LX198140 Term Loan B $2,094,281 0.10% 9/20/2028 3.75 B- 100.13 Building & Development
Northstar Group Services, Inc. LX190299 Term Loan $1,920,367 0.10% 11/09/2026 5.50 B 100.50 Building & Development
US LBM LX196040 Term Loan B-2 $1,899,177 0.09% 12/18/2027 3.75 B- 99.09 Building & Development
US LBM LX196041 Delayed Draw TLB-2 $949,589 0.05% 12/18/2027 3.75 B- 99.09 Building & Development
IPS Corp LX198141 Delayed Draw Term Loan B $418,856 0.02% 9/20/2028 3.75 B- 100.13 Building & Development
$91,744,706 4.55%
Business Equipment & Services
Misys (Finastra) LX163228 TL B USD $13,400,097 0.66% 6/13/2024 3.50 CCC+ 99.31 Business Equipment & Services
Cotiviti (Verscend Technologies, Inc.) LX192759 Incremental 1st Lien Term Loan $11,920,894 0.59% 8/27/2025 4.00 B+ 100.28 Business Equipment & Services
Endure Digital (FKA Endurance International) LX191271 First Lien Term Loan $10,006,031 0.50% 1/29/2028 3.50 B 99.56 Business Equipment & Services
Anticimex LX196323 USD TLB $8,495,629 0.42% 7/21/2028 3.50 B 99.97 Business Equipment & Services
Solera Management LX195131 USD First Lien Term Loan $8,097,236 0.40% 6/04/2028 4.00 B- 100.34 Business Equipment & Services

18
Holdings Report Quarter Ending September 30, 2021
Pasadena Fire and Police Ret. System Senior Loan
For financial professional or qualified institutional investor use only. Not for inspection by, distribution or quotation to, the general public.
Voya Senior Loan Trust
Issuer LoanX ID Industry (S&P) Tranche Market Value % Portfolio Maturity Spread %
S&P
Rating Price
Business Equipment & Services
NielsenIQ LX192273 Term Loan B (USD) $8,021,935 0.40% 3/05/2028 4.00 B 100.40 Business Equipment & Services
Gainwell Technologies (fka Milano Acquisition Corp.) LX189433 Incremental First Lien Term Loan $7,916,119 0.39% 10/01/2027 4.00 B+ 100.38 Business Equipment & Services
Legal Shield LX172721 1L Term Loan Add-On $7,645,867 0.38% 5/01/2025 3.25 B 99.81 Business Equipment & Services
Verifone, Inc. LX175222 Upsized 1L Term Loan $7,579,435 0.38% 8/20/2025 4.00 B- 98.24 Business Equipment & Services
Intrado (fka West Corp) LX168759 Term Loan $7,129,712 0.35% 10/10/2024 4.00 B- 98.68 Business Equipment & Services
Consilio, Inc. LX194581 First Lien Term Loan $6,510,494 0.32% 5/01/2028 4.00 B- 99.63 Business Equipment & Services
Renaissance Learning Inc. LX173615 1st Lien Incremental $5,964,543 0.30% 5/30/2025 3.25 B- 99.30 Business Equipment & Services
Ascend Learning LLC LX190386 Incremental Term Loan B $5,737,221 0.28% 7/12/2024 3.75 B- 100.26 Business Equipment & Services
Yak Mat LX173885 1st Lien TL $5,594,051 0.28% 7/11/2025 5.00 CCC+ 80.25 Business Equipment & Services
Vivint LX196067 Term Loan B $5,536,915 0.27% 7/01/2028 3.75 B 99.85 Business Equipment & Services
Mileage Plus Holdings, LLC LX188905 First Lien Term Loan $5,484,652 0.27% 6/26/2027 5.25 BB 106.29 Business Equipment & Services
EVO Payments LX173992 Upsized 1L Term Loan $5,426,306 0.27% 12/22/2023 3.25 B 100.00 Business Equipment & Services
ION Trading Technologies Limited LX193674 USD TLB $5,412,340 0.27% 3/17/2028 4.75 B 100.32 Business Equipment & Services
Convergint Technologies LX193314 1st Lien Term Loan $4,950,016 0.25% 3/31/2028 3.75 B 100.45 Business Equipment & Services
GreenSky LX172188 Term Loan B $4,892,952 0.24% 3/31/2025 3.25 B 99.75 Business Equipment & Services
Ensono LX194687 First Lien Term Loan $4,683,979 0.23% 5/28/2028 4.00 B 100.35 Business Equipment & Services
SurveyMonkey.com, LLC LX176247 Term Loan $4,674,685 0.23% 10/10/2025 3.75 B+ 99.75 Business Equipment & Services
BELFOR USA Group, Inc. LX178613 Upsized First Lien Term Loan $4,541,907 0.23% 4/06/2026 4.00 B 100.38 Business Equipment & Services
Cision LX185089 US Term Loan B $4,403,046 0.22% 1/31/2027 3.75 B- 99.30 Business Equipment & Services
KinderCare Education, LLC (fka Knowledge Universe Education, LLC) LX176016 Upsized 2025 First Lien Term Loan $4,092,757 0.20% 2/21/2025 3.75 CCC+ 99.20 Business Equipment & Services
Veeam Software LX185660 1st Lien Term Loan $3,914,307 0.19% 2/28/2027 3.00 B 99.85 Business Equipment & Services

19
Holdings Report Quarter Ending September 30, 2021
Pasadena Fire and Police Ret. System Senior Loan
For financial professional or qualified institutional investor use only. Not for inspection by, distribution or quotation to, the general public.
Voya Senior Loan Trust
Issuer LoanX ID Industry (S&P) Tranche Market Value % Portfolio Maturity Spread %
S&P
Rating Price
Business Equipment & Services
ThoughtWorks LX193472 First Lien Term Loan $3,838,900 0.19% 3/15/2028 3.00 B+ 100.09 Business Equipment & Services
Staples, Inc. LX179530 1LTL $3,796,372 0.19% 4/16/2026 5.00 B 95.64 Business Equipment & Services
Cimpress LX194399 TLB $3,628,467 0.18% 4/29/2028 3.50 BB 100.21 Business Equipment & Services
Cubic Corporation LX194446 Term Loan B $3,493,494 0.17% 5/25/2028 4.25 B 100.58 Business Equipment & Services
Service Logic LX190318 1st Lien Term Loan $3,350,945 0.17% 11/15/2027 4.00 B 100.25 Business Equipment & Services
Clarivate (f/k/a Thomson Reuters Intellectual Property & Science) LX190007 Incremental TLB $3,193,553 0.16% 10/31/2026 3.00 B 100.40 Business Equipment & Services
TruGreen LX190495 1st Lien Term Loan B $3,142,965 0.16% 11/02/2027 4.00 B 100.21 Business Equipment & Services
Research Now LX169473 First Lien Term Loan $3,041,832 0.15% 12/20/2024 5.50 B 98.96 Business Equipment & Services
EagleView Technology Corporation LX175037 1st Lien Term Loan $2,949,768 0.15% 8/14/2025 3.50 B 99.03 Business Equipment & Services
Protective Industrial Products LX191949 Upsized First Lien Term Loan $2,912,700 0.14% 12/29/2027 4.00 B- 100.00 Business Equipment & Services
Spring Education LX174889 Incermental First Lien Term Loan $2,886,862 0.14% 7/30/2025 4.25 CCC+ 97.47 Business Equipment & Services
Ankura Consulting Group, LLC LX192953 First Lien Term Loan $2,388,925 0.12% 3/15/2028 4.50 B- 100.38 Business Equipment & Services
AlliedUniversal fka Universal Services of America LX194227 USD First Lien Term Loan due 2028 $2,314,474 0.11% 5/12/2028 3.75 B 100.19 Business Equipment & Services
Learning Care Group LX171794 First Lien Term Loan $1,953,330 0.10% 3/13/2025 3.25 CCC+ 98.68 Business Equipment & Services
Virtusa Corporation LX190303 Term Loan B $1,896,644 0.09% 2/11/2028 4.25 B+ 100.33 Business Equipment & Services
Misys (Finastra) LX163231 TL 2nd lien USD $1,662,834 0.08% 6/13/2025 7.25 CCC- 100.78 Business Equipment & Services
Acuren LX185280 Term Loan B $1,606,754 0.08% 2/01/2027 4.00 B 100.40 Business Equipment & Services
Intrado (fka West Corp) LX172702 Term Loan B-1 $1,374,050 0.07% 10/10/2024 3.50 B- 98.08 Business Equipment & Services
Learning Care Group LX171796 Second Lien Term Loan $1,092,947 0.05% 3/13/2026 7.50 CCC- 99.81 Business Equipment & Services
Insight Global LX173551 Incremental Term Loan $1,057,635 0.05% 5/23/2025 3.75 B- 100.42 Business Equipment & Services
Convergint Technologies LX193315 Delayed Draw Term Loan $1,036,653 0.05% 3/31/2028 3.75 B 100.45 Business Equipment & Services
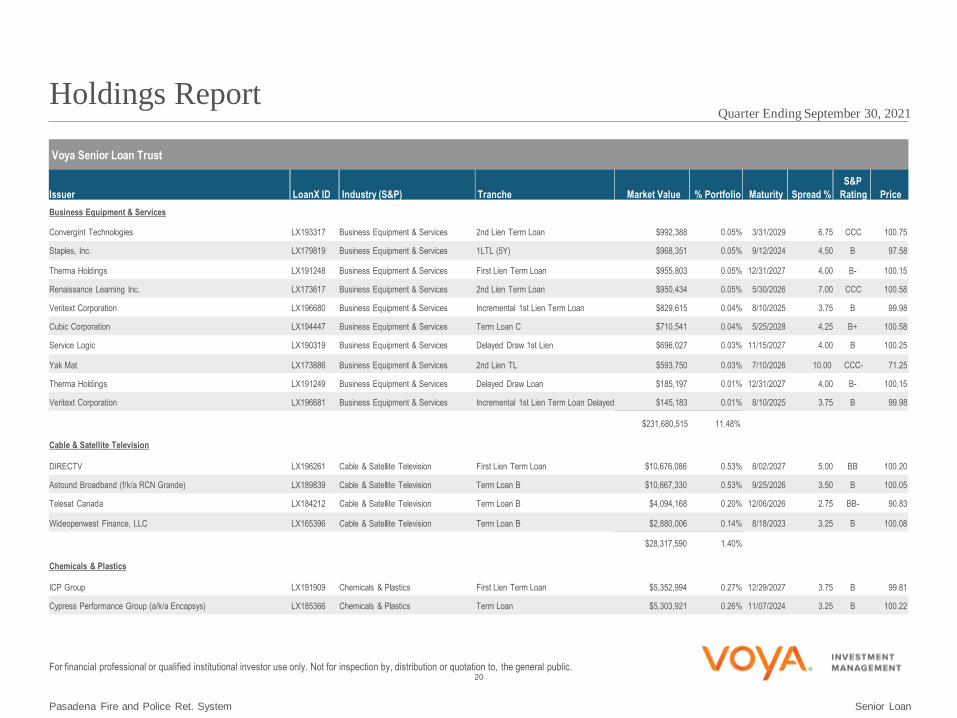
20
Holdings Report Quarter Ending September 30, 2021
Pasadena Fire and Police Ret. System Senior Loan
For financial professional or qualified institutional investor use only. Not for inspection by, distribution or quotation to, the general public.
Voya Senior Loan Trust
Issuer LoanX ID Industry (S&P) Tranche Market Value % Portfolio Maturity Spread %
S&P
Rating Price
Business Equipment & Services
Convergint Technologies LX193317 2nd Lien Term Loan $992,388 0.05% 3/31/2029 6.75 CCC 100.75 Business Equipment & Services
Staples, Inc. LX179819 1LTL (5Y) $968,351 0.05% 9/12/2024 4.50 B 97.58 Business Equipment & Services
Therma Holdings LX191248 First Lien Term Loan $955,803 0.05% 12/31/2027 4.00 B- 100.15 Business Equipment & Services
Renaissance Learning Inc. LX173617 2nd Lien Term Loan $950,434 0.05% 5/30/2026 7.00 CCC 100.58 Business Equipment & Services
Veritext Corporation LX196680 Incremental 1st Lien Term Loan $829,615 0.04% 8/10/2025 3.75 B 99.98 Business Equipment & Services
Cubic Corporation LX194447 Term Loan C $710,541 0.04% 5/25/2028 4.25 B+ 100.58 Business Equipment & Services
Service Logic LX190319 Delayed Draw 1st Lien $696,027 0.03% 11/15/2027 4.00 B 100.25 Business Equipment & Services
Yak Mat LX173886 2nd Lien TL $593,750 0.03% 7/10/2026 10.00 CCC- 71.25 Business Equipment & Services
Therma Holdings LX191249 Delayed Draw Loan $185,197 0.01% 12/31/2027 4.00 B- 100.15 Business Equipment & Services
Veritext Corporation LX196681 Incremental 1st Lien Term Loan Delayed $145,183 0.01% 8/10/2025 3.75 B 99.98 Business Equipment & Services
$231,680,515 11.48%
Cable & Satellite Television
DIRECTV LX196261 First Lien Term Loan $10,676,086 0.53% 8/02/2027 5.00 BB 100.20 Cable & Satellite Television
Astound Broadband (f/k/a RCN Grande) LX189839 Term Loan B $10,667,330 0.53% 9/25/2026 3.50 B 100.05 Cable & Satellite Television
Telesat Canada LX184212 Term Loan B $4,094,168 0.20% 12/06/2026 2.75 BB- 90.83 Cable & Satellite Television
Wideopenwest Finance, LLC LX165396 Term Loan B $2,880,006 0.14% 8/18/2023 3.25 B 100.08 Cable & Satellite Television
$28,317,590 1.40%
Chemicals & Plastics
ICP Group LX191909 First Lien Term Loan $5,352,994 0.27% 12/29/2027 3.75 B 99.81 Chemicals & Plastics
Cypress Performance Group (a/k/a Encapsys) LX185366 Term Loan $5,303,921 0.26% 11/07/2024 3.25 B 100.22 Chemicals & Plastics

21
Holdings Report Quarter Ending September 30, 2021
Pasadena Fire and Police Ret. System Senior Loan
For financial professional or qualified institutional investor use only. Not for inspection by, distribution or quotation to, the general public.
Voya Senior Loan Trust
Issuer LoanX ID Industry (S&P) Tranche Market Value % Portfolio Maturity Spread %
S&P
Rating Price
Chemicals & Plastics
PQ Performance Chemicals LX194554 First Lien Term Loan $5,076,485 0.25% 8/02/2028 3.50 B+ 100.31 Chemicals & Plastics
Olympus Water US Holding Corp (a.k.a Solenis) LX198098 USD Term Loan $4,027,157 0.20% 10/01/2028 3.75 B- 100.05 Chemicals & Plastics
LSI (fka Lonza Specialty Ingredients) LX194448 USD TLB $3,759,074 0.19% 7/02/2028 4.00 B 100.36 Chemicals & Plastics
Diversey (a.k.a Diamond (BC) B.V) LX198206 Term Loan B $3,662,310 0.18% 9/17/2028 3.00 B 100.20 Chemicals & Plastics
Potters Industries LLC LX190823 Term Loan $3,040,440 0.15% 11/30/2027 4.00 B 100.19 Chemicals & Plastics
Innophos Holdings, Inc LX185180 Term Loan B $2,929,107 0.15% 2/10/2027 3.75 B+ 100.13 Chemicals & Plastics
GEON Performance Solutions LX196700 Term Loan $2,829,544 0.14% 8/11/2028 4.75 B+ 100.88 Chemicals & Plastics
W.R. Grace Holdings LLC LX196992 Term Loan $2,381,111 0.12% 8/11/2028 3.75 B 100.47 Chemicals & Plastics
AOC (a.k.a LSF11 A5 Holdco LLC) LX174417 Term Loan $2,200,699 0.11% 8/01/2025 4.25 B+ 100.14 Chemicals & Plastics
SI Group (aka Polar US Borrower LLC) LX175356 Term Loan $1,808,006 0.09% 10/15/2025 4.75 B- 100.00 Chemicals & Plastics
ICP Group LX191924 Second Lien Term Loan $718,575 0.04% 12/29/2028 7.75 CCC 100.50 Chemicals & Plastics
$43,089,423 2.14%
Clothing/Textiles
Birkenstock LX194375 USD TLB $5,074,223 0.25% 4/26/2028 3.75 B 100.08 Clothing/Textiles
Varsity Brands (fka Herff Jones, Inc.) LX169970 Senior Secured First Lien $2,144,709 0.11% 12/16/2024 3.50 CCC+ 98.26 Clothing/Textiles
$7,218,932 0.36%
Containers & Glass Products
Charter Nex US, Inc. LX195935 First Lien Term Loan $9,961,930 0.49% 12/01/2027 3.75 B 100.35 Containers & Glass Products
ProAmpac PG Borrower LLC LX190689 First Lien Term Loan $8,468,386 0.42% 11/03/2025 3.75 B- 100.35 Containers & Glass Products
Novolex (aka Flex Acquisition Company, Inc) LX192862 Term Loan due 2028 $8,177,563 0.41% 2/25/2028 3.50 B 99.91 Containers & Glass Products

22
Holdings Report Quarter Ending September 30, 2021
Pasadena Fire and Police Ret. System Senior Loan
For financial professional or qualified institutional investor use only. Not for inspection by, distribution or quotation to, the general public.
Voya Senior Loan Trust
Issuer LoanX ID Industry (S&P) Tranche Market Value % Portfolio Maturity Spread %
S&P
Rating Price
Containers & Glass Products
Bway Holding Company (aka Mauser Packaging Solutions Holding LX161694 Upsized Term Loan $7,052,534 0.35% 4/03/2024 3.25 B- 98.12 Containers & Glass Products
Pactiv Evergreen Group Holdings Inc (f.k.a Reynolds Group) LX198297 New '28 Term Loan $6,645,325 0.33% 9/27/2028 3.50 B+ 99.93 Containers & Glass Products
Novolex (aka Flex Acquisition Company, Inc) LX174279 Term Loan due 2025 $6,162,131 0.31% 6/29/2025 3.00 B 99.56 Containers & Glass Products
Trident TPI Holdings, Inc (a.k.a Tekni Plex) LX168808 Re-Upsized Term Loan $5,799,307 0.29% 10/17/2024 3.00 B- 100.03 Containers & Glass Products
PLZ Aeroscience Corporation LX189542 Upsized Incremental NF Term Loan B $3,972,133 0.20% 8/03/2026 3.75 B 100.04 Containers & Glass Products
Pro Mach, Inc LX196943 First Lien Term Loan $3,566,627 0.18% 8/21/2028 4.00 B- 100.50 Containers & Glass Products
Graham Packaging LX192845 Term Loan B $2,730,616 0.14% 7/31/2027 3.00 B 100.05 Containers & Glass Products
TricorBraun LX192253 First Lien Term Loan $2,635,166 0.13% 2/15/2028 3.25 B- 99.57 Containers & Glass Products
Pactiv Evergreen Group Holdings Inc (f.k.a Reynolds Group) LX189891 New USD Term Loan B $2,565,985 0.13% 2/05/2026 3.25 B+ 99.44 Containers & Glass Products
Pretium Packaging LX197568 1L Term Loan $2,341,323 0.12% 10/01/2028 4.00 B- 100.27 Containers & Glass Products
Albea S.A LX172001 USD TLB $1,315,911 0.07% 4/22/2024 3.00 B- 97.00 Containers & Glass Products
Pretium Packaging LX197570 2L Term Loan $1,100,475 0.05% 10/01/2029 6.75 CCC 100.50 Containers & Glass Products
Tosca Services, LLC LX192643 First Lien Term Loan $1,093,455 0.05% 7/31/2027 3.50 B 100.16 Containers & Glass Products
TricorBraun LX192255 Delayed Draw Term Loan $594,213 0.03% 2/15/2028 3.25 B- 99.57 Containers & Glass Products
Pro Mach, Inc LX196944 Delayed Draw Term Loan $578,998 0.03% 8/21/2028 4.00 B- 100.50 Containers & Glass Products
$74,762,078 3.71%
Cosmetics/Toiletries
PDC Brands LX165998 Upsized First Lien Term Loan $5,751,129 0.29% 6/30/2024 4.00 B 99.94 Cosmetics/Toiletries
Anastasia Beverly Hills LX175016 Term Loan $2,538,750 0.13% 8/11/2025 3.75 CCC 84.63 Cosmetics/Toiletries
$8,289,879 0.41%
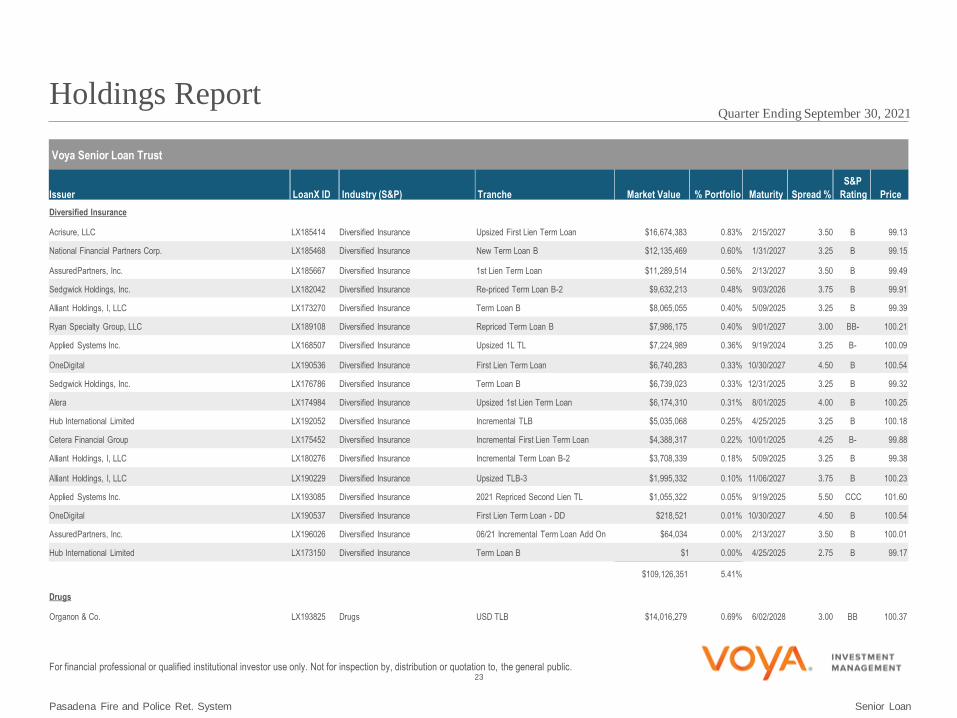
23
Holdings Report Quarter Ending September 30, 2021
Pasadena Fire and Police Ret. System Senior Loan
For financial professional or qualified institutional investor use only. Not for inspection by, distribution or quotation to, the general public.
Voya Senior Loan Trust
Issuer LoanX ID Industry (S&P) Tranche Market Value % Portfolio Maturity Spread %
S&P
Rating Price
Diversified Insurance
Acrisure, LLC LX185414 Upsized First Lien Term Loan $16,674,383 0.83% 2/15/2027 3.50 B 99.13 Diversified Insurance
National Financial Partners Corp. LX185468 New Term Loan B $12,135,469 0.60% 1/31/2027 3.25 B 99.15 Diversified Insurance
AssuredPartners, Inc. LX185667 1st Lien Term Loan $11,289,514 0.56% 2/13/2027 3.50 B 99.49 Diversified Insurance
Sedgwick Holdings, Inc. LX182042 Re-priced Term Loan B-2 $9,632,213 0.48% 9/03/2026 3.75 B 99.91 Diversified Insurance
Alliant Holdings, I, LLC LX173270 Term Loan B $8,065,055 0.40% 5/09/2025 3.25 B 99.39 Diversified Insurance
Ryan Specialty Group, LLC LX189108 Repriced Term Loan B $7,986,175 0.40% 9/01/2027 3.00 BB- 100.21 Diversified Insurance
Applied Systems Inc. LX168507 Upsized 1L TL $7,224,989 0.36% 9/19/2024 3.25 B- 100.09 Diversified Insurance
OneDigital LX190536 First Lien Term Loan $6,740,283 0.33% 10/30/2027 4.50 B 100.54 Diversified Insurance
Sedgwick Holdings, Inc. LX176786 Term Loan B $6,739,023 0.33% 12/31/2025 3.25 B 99.32 Diversified Insurance
Alera LX174984 Upsized 1st Lien Term Loan $6,174,310 0.31% 8/01/2025 4.00 B 100.25 Diversified Insurance
Hub International Limited LX192052 Incremental TLB $5,035,068 0.25% 4/25/2025 3.25 B 100.18 Diversified Insurance
Cetera Financial Group LX175452 Incremental First Lien Term Loan $4,388,317 0.22% 10/01/2025 4.25 B- 99.88 Diversified Insurance
Alliant Holdings, I, LLC LX180276 Incremental Term Loan B-2 $3,708,339 0.18% 5/09/2025 3.25 B 99.38 Diversified Insurance
Alliant Holdings, I, LLC LX190229 Upsized TLB-3 $1,995,332 0.10% 11/06/2027 3.75 B 100.23 Diversified Insurance
Applied Systems Inc. LX193085 2021 Repriced Second Lien TL $1,055,322 0.05% 9/19/2025 5.50 CCC 101.60 Diversified Insurance
OneDigital LX190537 First Lien Term Loan - DD $218,521 0.01% 10/30/2027 4.50 B 100.54 Diversified Insurance
AssuredPartners, Inc. LX196026 06/21 Incremental Term Loan Add On $64,034 0.00% 2/13/2027 3.50 B 100.01 Diversified Insurance
Hub International Limited LX173150 Term Loan B $1 0.00% 4/25/2025 2.75 B 99.17 Diversified Insurance
$109,126,351 5.41%
Drugs
Organon & Co. LX193825 USD TLB $14,016,279 0.69% 6/02/2028 3.00 BB 100.37 Drugs

24
Holdings Report Quarter Ending September 30, 2021
Pasadena Fire and Police Ret. System Senior Loan
For financial professional or qualified institutional investor use only. Not for inspection by, distribution or quotation to, the general public.
Voya Senior Loan Trust
Issuer LoanX ID Industry (S&P) Tranche Market Value % Portfolio Maturity Spread %
S&P
Rating Price
Drugs
Jazz Financing Lux S.à r.l. LX194307 Term B $7,444,953 0.37% 5/05/2028 3.50 BB- 100.25 Drugs
Amneal Pharmaceuticals LLC LX172008 Term B $5,700,600 0.28% 5/04/2025 3.50 B 98.85 Drugs
Alvogen Pharma U.S. LX186377 Extended Term Loan B $3,768,982 0.19% 12/31/2023 5.25 B- 96.75 Drugs
ANI Pharmaceuticals, Inc. LX194640 Term B $2,374,750 0.12% 5/24/2027 6.00 B+ 100.63 Drugs
$33,305,565 1.65%
Ecological Services & Equipment
GFL Environmental Inc. LX191503 First Lien Term Loan $5,493,842 0.27% 5/30/2025 3.00 BB- 100.33 Ecological Services & Equipment
Denali Water Solutions LLC LX192749 Term Loan B $3,000,000 0.15% 3/31/2028 4.25 B- 100.00 Ecological Services & Equipment
$8,493,842 0.42%
Electronics/Electrical
Proofpoint, Inc. LX195373 1st Lien Term Loan $14,741,351 0.73% 8/31/2028 3.25 B- 99.56 Electronics/Electrical
RealPage LX192752 Term Loan B $14,718,155 0.73% 4/28/2028 3.25 B 99.78 Electronics/Electrical
McAfee, LLC LX176623 USD Upsized 1st Lien Term Loan $13,661,609 0.68% 9/30/2024 3.75 BB 100.18 Electronics/Electrical
Internet Brands, Inc. LX168014 1st Lien TLB $13,025,483 0.65% 9/15/2024 3.50 B 99.86 Electronics/Electrical
Ultimate Kronos Group, Inc. LX179563 1st Lien Term Loan $12,332,599 0.61% 5/04/2026 3.75 B- 100.35 Electronics/Electrical
Quest Software US Holdings Inc. LX173579 Incremental 1L Term Loan $12,272,207 0.61% 5/18/2025 4.25 B 100.02 Electronics/Electrical
Rackspace Technology Global, Inc. LX192323 Term Loan B $11,896,656 0.59% 2/02/2028 2.75 B+ 99.35 Electronics/Electrical
Hyland Software, Inc. LX176492 Incremental Term Loan $10,912,888 0.54% 7/01/2024 3.50 B- 100.26 Electronics/Electrical
BMC Software, Inc. LX192761 USD Term Loan $10,639,473 0.53% 10/02/2025 3.75 B- 99.56 Electronics/Electrical
Informatica Corporation LX185673 USD 1st Lien Term Loan $10,240,926 0.51% 2/26/2027 3.25 B- 99.79 Electronics/Electrical

25
Holdings Report Quarter Ending September 30, 2021
Pasadena Fire and Police Ret. System Senior Loan
For financial professional or qualified institutional investor use only. Not for inspection by, distribution or quotation to, the general public.
Voya Senior Loan Trust
Issuer LoanX ID Industry (S&P) Tranche Market Value % Portfolio Maturity Spread %
S&P
Rating Price
Electronics/Electrical
Epicor Software Corporation LX189137 1st Lien Term Loan $8,845,040 0.44% 7/31/2027 3.25 B- 100.08 Electronics/Electrical
McAfee Enterprise LX194237 Incremental 1L Term Loan $8,587,863 0.43% 7/27/2028 5.00 B 100.15 Electronics/Electrical
Greeneden U.S. Holdings II, L.L.C. LX190170 New USD Term Loan B $8,471,036 0.42% 12/01/2027 4.00 B- 100.46 Electronics/Electrical
Ingram Micro LX193891 Term Loan B $8,331,808 0.41% 6/30/2028 3.50 BB- 100.39 Electronics/Electrical
CoreLogic LX193776 First Lien Term Loan $7,946,051 0.39% 6/04/2028 3.50 B 99.89 Electronics/Electrical
Rocket Software, Inc. LX176847 1st Lien Term Loan $7,923,612 0.39% 11/28/2025 4.25 B- 99.35 Electronics/Electrical
Sophos LX184762 USD TLB add-on $7,812,553 0.39% 3/05/2027 3.50 B- 99.63 Electronics/Electrical
Barracuda Networks, Inc. LX170759 10/20 Incremental 1st Lien Term Loan $7,724,698 0.38% 2/12/2025 3.75 B- 100.44 Electronics/Electrical
Imperva, Inc. LX176959 10/20 Incremental 1L Term Loan $7,359,883 0.36% 1/10/2026 4.00 B- 100.32 Electronics/Electrical
RSA Security LX194108 1L Term Loan $7,225,448 0.36% 4/30/2028 4.75 B 98.71 Electronics/Electrical
LogMeIn, Inc. LX185343 Incremental 1L Term Loan $7,193,929 0.36% 8/31/2027 4.75 B- 100.07 Electronics/Electrical
Cornerstone OnDemand, Inc. LX198193 First Lien Term Loan $7,058,532 0.35% 9/22/2028 3.75 B- 99.98 Electronics/Electrical
Yahoo (Verizon Media Group) LX196282 Term B-1 Loan $7,044,135 0.35% 9/01/2027 5.50 B 100.34 Electronics/Electrical
Cloudera Inc LX196367 1st Lien Term Loan $6,945,191 0.34% 8/10/2028 3.75 B- 100.03 Electronics/Electrical
Autodata, Inc. LX180448 Incremental Term Loan (Jan '20) $6,913,248 0.34% 5/30/2026 3.50 B- 99.64 Electronics/Electrical
Veritas Technologies Corporation LX193430 USD Term Loan B $6,783,261 0.34% 9/01/2025 5.00 B- 100.63 Electronics/Electrical
Xperi Corporation LX188248 Term Loan B $5,911,832 0.29% 6/07/2028 3.50 BB- 99.84 Electronics/Electrical
Kofax, Inc LX178173 Incremental Term Loan $5,756,797 0.29% 7/07/2024 4.75 B 100.51 Electronics/Electrical
Yahoo (Verizon Media Group) LX196283 Term B-2 Loan $5,637,808 0.28% 9/01/2027 5.50 B 100.41 Electronics/Electrical
Ultra Clean Holdings, Inc LX193302 Term Loan B $5,432,904 0.27% 8/27/2025 3.75 B+ 100.31 Electronics/Electrical
Constant Contact LX192459 Term Loan B $5,005,210 0.25% 2/10/2028 4.00 B 100.10 Electronics/Electrical

26
Holdings Report Quarter Ending September 30, 2021
Pasadena Fire and Police Ret. System Senior Loan
For financial professional or qualified institutional investor use only. Not for inspection by, distribution or quotation to, the general public.
Voya Senior Loan Trust
Issuer LoanX ID Industry (S&P) Tranche Market Value % Portfolio Maturity Spread %
S&P
Rating Price
Electronics/Electrical
Forcepoint LX192008 Incremental Term Loan $4,929,525 0.24% 1/08/2028 4.50 B- 100.50 Electronics/Electrical
Bomgar Corporation LX172811 Term Loan $4,865,411 0.24% 4/18/2025 4.00 B- 100.11 Electronics/Electrical
SonicWall US Holdings Inc. LX173537 1st Lien Term Loan $4,419,568 0.22% 5/16/2025 3.50 B- 99.48 Electronics/Electrical
Navex Global LX175329 Incremental Term Loan $4,303,625 0.21% 9/05/2025 3.25 B- 99.38 Electronics/Electrical
Planview LX191189 Term Loan B $4,295,723 0.21% 12/31/2027 4.00 B- 100.42 Electronics/Electrical
Trader Interactive LX196394 Term Loan B $4,215,263 0.21% 7/21/2028 4.00 B 100.13 Electronics/Electrical
CommerceHub LX191363 Term Loan B $4,121,790 0.20% 12/31/2027 4.00 B 100.31 Electronics/Electrical
Optiv Security, Inc. (f.k.a. Accuvant Inc.) LX158907 1st Lien Term Loan $4,120,052 0.20% 2/01/2024 3.25 B- 99.03 Electronics/Electrical
Ivanti Software, Inc. (f.k.a. LANDesk Software) LX190509 1L Term Loan $3,918,539 0.19% 12/15/2027 4.75 B- 100.41 Electronics/Electrical
ECi Software Solutions LX189876 1st Lien Term Loan $3,906,376 0.19% 11/09/2027 3.75 B- 100.15 Electronics/Electrical
Infoblox, Inc LX190133 1st Lien Term Loan $3,905,381 0.19% 12/01/2027 3.75 B- 100.26 Electronics/Electrical
ABC Financial Inc. LX170018 Incremental 1st Lien Term Loan $3,882,979 0.19% 1/02/2025 4.25 B- 98.25 Electronics/Electrical
PowerSchool LX174029 1st Lien Term Loan $3,676,669 0.18% 8/01/2025 3.25 B- 99.69 Electronics/Electrical
Travelport, Inc. LX190025 Super Priority Term Loan (06/21) $3,676,232 0.18% 2/28/2025 7.00 B- 103.77 Electronics/Electrical
Watlow LX193018 Term Loan B $3,656,875 0.18% 3/02/2028 4.00 B 100.42 Electronics/Electrical
Grab Holdings Inc LX191886 Term Loan B $3,576,536 0.18% 1/14/2026 4.50 B- 101.00 Electronics/Electrical
Ivanti Software, Inc. (f.k.a. LANDesk Software) LX192710 02/21 Incremental Term Loan $3,350,191 0.17% 12/01/2027 4.00 B- 100.41 Electronics/Electrical
ION Corporates LX193157 TLB $3,282,167 0.16% 3/04/2028 3.75 B 100.03 Electronics/Electrical
Quest Software US Holdings Inc. LX173580 2nd Lien Term Loan $3,243,378 0.16% 5/18/2026 8.25 B- 99.95 Electronics/Electrical
Sabre Inc. LX196145 Repriced 2020 Incremental Term B $3,144,794 0.16% 12/17/2027 3.50 B 99.39 Electronics/Electrical
Weld North Education LX198239 Repriced Term Loan B $2,882,290 0.14% 12/31/2027 3.75 B- 100.23 Electronics/Electrical

27
Holdings Report Quarter Ending September 30, 2021
Pasadena Fire and Police Ret. System Senior Loan
For financial professional or qualified institutional investor use only. Not for inspection by, distribution or quotation to, the general public.
Voya Senior Loan Trust
Issuer LoanX ID Industry (S&P) Tranche Market Value % Portfolio Maturity Spread %
S&P
Rating Price
Electronics/Electrical
Travelport, Inc. LX196301 Consented First Lien Term Loan (06/21) $2,700,952 0.13% 5/30/2026 6.25 CCC- 86.38 Electronics/Electrical
Creation Technologies LX198342 Term Loan B $2,545,419 0.13% 10/01/2028 5.50 B 99.63 Electronics/Electrical
Internet Brands, Inc. LX192714 2nd Lien Term Loan $2,502,538 0.12% 2/12/2029 6.25 CCC+ 101.73 Electronics/Electrical
Riverbed Technology, Inc. LX191776 1st Lien Term Loan $2,489,091 0.12% 12/31/2025 6.00 CCC+ 89.67 Electronics/Electrical
Ultimate Kronos Group, Inc. LX192066 Incremental 1st Lien Term Loan $2,483,091 0.12% 5/03/2026 3.25 B- 100.33 Electronics/Electrical
McAfee Enterprise LX194239 Incremental 2L Term Loan $2,257,175 0.11% 5/03/2029 8.25 CCC+ 99.88 Electronics/Electrical
Superion LX175394 Incremental 1st Lien Term Loan $2,063,974 0.10% 8/29/2025 3.75 B- 93.06 Electronics/Electrical
BMC Software, Inc. LX198309 2nd Lien Term Loan $1,988,949 0.10% 3/02/2026 5.50 CCC+ 101.22 Electronics/Electrical
Aspect Software, Inc. LX194465 1st Lien TL $1,984,838 0.10% 5/06/2028 5.25 B- 98.75 Electronics/Electrical
Sabre Inc. LX196146 2021 Revolver Replacement Term B $1,971,201 0.10% 12/17/2027 3.50 B 99.39 Electronics/Electrical
Autodata, Inc. LX195765 2021 Incremental Term Loan B $1,715,000 0.09% 5/30/2026 3.50 B- 100.00 Electronics/Electrical
ConnectWise, LLC LX198249 Term Loan B $1,573,425 0.08% 9/30/2028 3.50 NR 99.90 Electronics/Electrical
Sovos Compliance LX196507 Term Loan B $1,524,729 0.08% 8/01/2028 4.50 B- 100.73 Electronics/Electrical
Rocket Software, Inc. LX195174 Incremental 1L Term Loan $1,119,557 0.06% 11/28/2025 4.25 B- 99.77 Electronics/Electrical
CoreLogic LX193778 Second Lien Term Loan $1,101,875 0.05% 6/04/2029 6.50 CCC+ 102.50 Electronics/Electrical
Mediaocean LLC LX183973 First Lien Term Loan $1,085,847 0.05% 8/15/2025 4.00 B 100.08 Electronics/Electrical
Sirius Computer Solutions, Inc. LX185340 1st Lien Term Loan $1,032,177 0.05% 7/03/2026 3.50 B 100.00 Electronics/Electrical
Barracuda Networks, Inc. LX190420 10/20 2nd Lien Term Loan $841,759 0.04% 10/30/2028 6.75 CCC+ 101.42 Electronics/Electrical
SonicWall US Holdings Inc. LX173538 2nd Lien Term Loan $782,348 0.04% 5/18/2026 7.50 CCC+ 99.50 Electronics/Electrical
Hyland Software, Inc. LX193771 Incremental 2nd Lien Term Loan $339,188 0.02% 7/07/2025 6.25 CCC 101.25 Electronics/Electrical
Travelport, Inc. LX190025 Super Priority Term Loan (06/21) $295,343 0.01% 2/28/2025 7.00 B- 103.77 Electronics/Electrical

28
Holdings Report Quarter Ending September 30, 2021
Pasadena Fire and Police Ret. System Senior Loan
For financial professional or qualified institutional investor use only. Not for inspection by, distribution or quotation to, the general public.
Voya Senior Loan Trust
Issuer LoanX ID Industry (S&P) Tranche Market Value % Portfolio Maturity Spread %
S&P
Rating Price
Electronics/Electrical
Sovos Compliance LX196508 Delayed Draw TL $263,307 0.01% 8/02/2023 4.50 B- 100.73 Electronics/Electrical
Allegro Microsystems Inc. LX189882 First Lien Term Loan $61,538 0.00% 9/30/2027 3.75 BB 100.00 Electronics/Electrical
$390,448,867 19.35%
Equipment Leasing
Rent-A-Center, Inc. LX198205 1L TL B $4,039,655 0.20% 2/17/2028 3.25 BB- 100.50 Equipment Leasing
$4,039,655 0.20%
Equity REITs and REOCs
Brookfield Property Partners LX173182 Term Loan B $5,794,456 0.29% 8/27/2025 2.50 BB+ 98.98 Equity REITs and REOCs
Forest City Enterprises, L.P. LX183933 Term B $4,145,863 0.21% 12/08/2025 3.50 B+ 98.94 Equity REITs and REOCs
$9,940,319 0.49%
Financial Intermediaries
Edelman Financial Services LX193555 1L Term Loan $16,049,056 0.80% 3/19/2028 3.50 B 99.93 Financial Intermediaries
Duff & Phelps LX186124 Incremental Term Loan B $8,194,835 0.41% 4/09/2027 3.75 B- 100.42 Financial Intermediaries
Wells Fargo Asset Management LX194247 First Lien Term Loan $6,219,160 0.31% 4/21/2028 3.25 BB- 100.45 Financial Intermediaries
Blucora (fka TaxAct / HD Vest) LX169647 New Upsized First Lien Term Loan $6,216,269 0.31% 5/24/2024 4.00 BB 100.38 Financial Intermediaries
Ascensus, Inc. LX194867 First Lien Term Loan $4,031,974 0.20% 8/02/2028 3.50 B- 99.93 Financial Intermediaries
Advisor Group LX192367 Incremental First Lien Term Loan $3,458,213 0.17% 8/01/2026 4.50 B- 100.28 Financial Intermediaries
Hightower Holding, LLC LX194178 Incremental First Lien Term Loan $1,900,029 0.09% 4/21/2028 4.00 B- 100.21 Financial Intermediaries
Ascensus, Inc. LX194868 Second Lien Term Loan $1,004,246 0.05% 8/02/2029 6.50 CCC 99.93 Financial Intermediaries
Hightower Holding, LLC LX194179 Delayed Draw Term Loan $475,007 0.02% 4/15/2028 4.00 B- 100.21 Financial Intermediaries
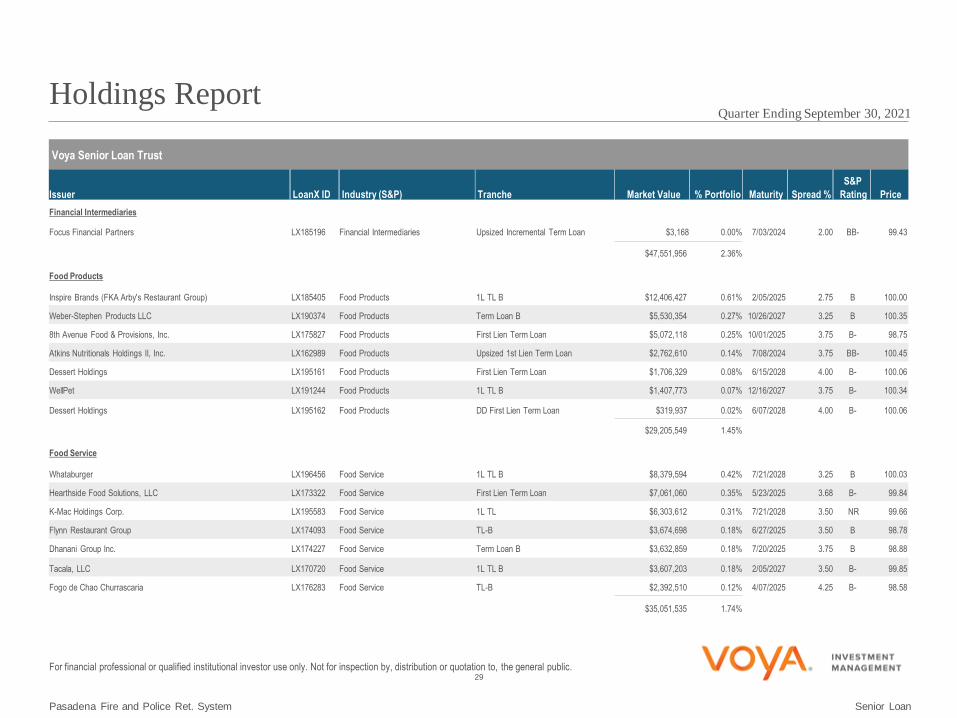
29
Holdings Report Quarter Ending September 30, 2021
Pasadena Fire and Police Ret. System Senior Loan
For financial professional or qualified institutional investor use only. Not for inspection by, distribution or quotation to, the general public.
Voya Senior Loan Trust
Issuer LoanX ID Industry (S&P) Tranche Market Value % Portfolio Maturity Spread %
S&P
Rating Price
Financial Intermediaries
Focus Financial Partners LX185196 Upsized Incremental Term Loan $3,168 0.00% 7/03/2024 2.00 BB- 99.43 Financial Intermediaries
$47,551,956 2.36%
Food Products
Inspire Brands (FKA Arby's Restaurant Group) LX185405 1L TL B $12,406,427 0.61% 2/05/2025 2.75 B 100.00 Food Products
Weber-Stephen Products LLC LX190374 Term Loan B $5,530,354 0.27% 10/26/2027 3.25 B 100.35 Food Products
8th Avenue Food & Provisions, Inc. LX175827 First Lien Term Loan $5,072,118 0.25% 10/01/2025 3.75 B- 98.75 Food Products
Atkins Nutritionals Holdings II, Inc. LX162989 Upsized 1st Lien Term Loan $2,762,610 0.14% 7/08/2024 3.75 BB- 100.45 Food Products
Dessert Holdings LX195161 First Lien Term Loan $1,706,329 0.08% 6/15/2028 4.00 B- 100.06 Food Products
WellPet LX191244 1L TL B $1,407,773 0.07% 12/16/2027 3.75 B- 100.34 Food Products
Dessert Holdings LX195162 DD First Lien Term Loan $319,937 0.02% 6/07/2028 4.00 B- 100.06 Food Products
$29,205,549 1.45%
Food Service
Whataburger LX196456 1L TL B $8,379,594 0.42% 7/21/2028 3.25 B 100.03 Food Service
Hearthside Food Solutions, LLC LX173322 First Lien Term Loan $7,061,060 0.35% 5/23/2025 3.68 B- 99.84 Food Service
K-Mac Holdings Corp. LX195583 1L TL $6,303,612 0.31% 7/21/2028 3.50 NR 99.66 Food Service
Flynn Restaurant Group LX174093 TL-B $3,674,698 0.18% 6/27/2025 3.50 B 98.78 Food Service
Dhanani Group Inc. LX174227 Term Loan B $3,632,859 0.18% 7/20/2025 3.75 B 98.88 Food Service
Tacala, LLC LX170720 1L TL B $3,607,203 0.18% 2/05/2027 3.50 B- 99.85 Food Service
Fogo de Chao Churrascaria LX176283 TL-B $2,392,510 0.12% 4/07/2025 4.25 B- 98.58 Food Service
$35,051,535 1.74%
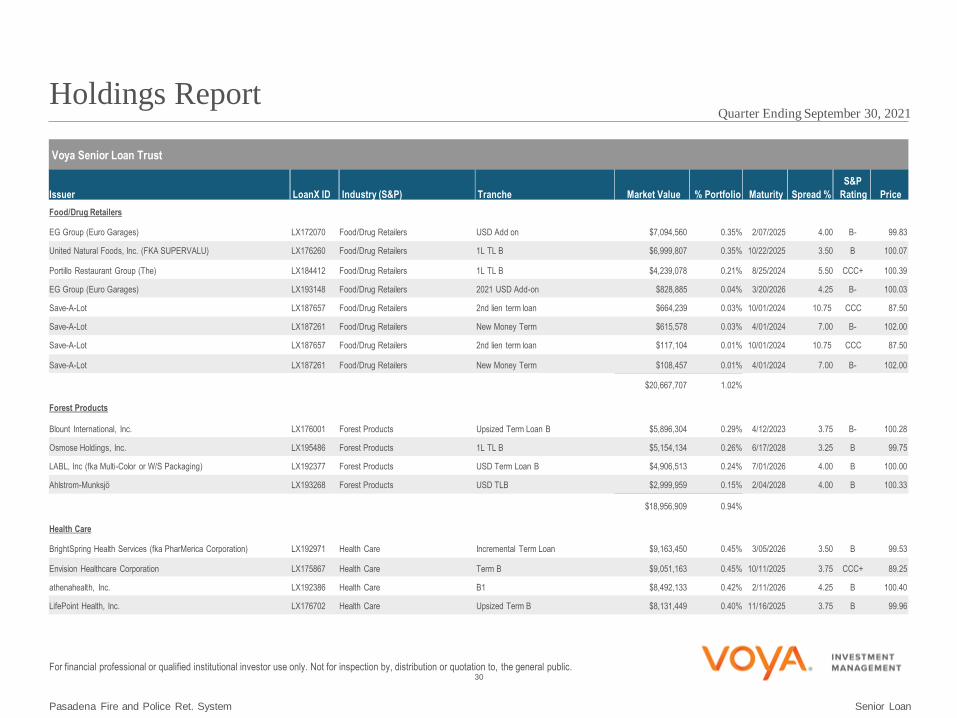
30
Holdings Report Quarter Ending September 30, 2021
Pasadena Fire and Police Ret. System Senior Loan
For financial professional or qualified institutional investor use only. Not for inspection by, distribution or quotation to, the general public.
Voya Senior Loan Trust
Issuer LoanX ID Industry (S&P) Tranche Market Value % Portfolio Maturity Spread %
S&P
Rating Price
Food/Drug Retailers
EG Group (Euro Garages) LX172070 USD Add on $7,094,560 0.35% 2/07/2025 4.00 B- 99.83 Food/Drug Retailers
United Natural Foods, Inc. (FKA SUPERVALU) LX176260 1L TL B $6,999,807 0.35% 10/22/2025 3.50 B 100.07 Food/Drug Retailers
Portillo Restaurant Group (The) LX184412 1L TL B $4,239,078 0.21% 8/25/2024 5.50 CCC+ 100.39 Food/Drug Retailers
EG Group (Euro Garages) LX193148 2021 USD Add-on $828,885 0.04% 3/20/2026 4.25 B- 100.03 Food/Drug Retailers
Save-A-Lot LX187657 2nd lien term loan $664,239 0.03% 10/01/2024 10.75 CCC 87.50 Food/Drug Retailers
Save-A-Lot LX187261 New Money Term $615,578 0.03% 4/01/2024 7.00 B- 102.00 Food/Drug Retailers
Save-A-Lot LX187657 2nd lien term loan $117,104 0.01% 10/01/2024 10.75 CCC 87.50 Food/Drug Retailers
Save-A-Lot LX187261 New Money Term $108,457 0.01% 4/01/2024 7.00 B- 102.00 Food/Drug Retailers
$20,667,707 1.02%
Forest Products
Blount International, Inc. LX176001 Upsized Term Loan B $5,896,304 0.29% 4/12/2023 3.75 B- 100.28 Forest Products
Osmose Holdings, Inc. LX195486 1L TL B $5,154,134 0.26% 6/17/2028 3.25 B 99.75 Forest Products
LABL, Inc (fka Multi-Color or W/S Packaging) LX192377 USD Term Loan B $4,906,513 0.24% 7/01/2026 4.00 B 100.00 Forest Products
Ahlstrom-Munksjö LX193268 USD TLB $2,999,959 0.15% 2/04/2028 4.00 B 100.33 Forest Products
$18,956,909 0.94%
Health Care
BrightSpring Health Services (fka PharMerica Corporation) LX192971 Incremental Term Loan $9,163,450 0.45% 3/05/2026 3.50 B 99.53 Health Care
Envision Healthcare Corporation LX175867 Term B $9,051,163 0.45% 10/11/2025 3.75 CCC+ 89.25 Health Care
athenahealth, Inc. LX192386 B1 $8,492,133 0.42% 2/11/2026 4.25 B 100.40 Health Care
LifePoint Health, Inc. LX176702 Upsized Term B $8,131,449 0.40% 11/16/2025 3.75 B 99.96 Health Care

31
Holdings Report Quarter Ending September 30, 2021
Pasadena Fire and Police Ret. System Senior Loan
For financial professional or qualified institutional investor use only. Not for inspection by, distribution or quotation to, the general public.
Voya Senior Loan Trust
Issuer LoanX ID Industry (S&P) Tranche Market Value % Portfolio Maturity Spread %
S&P
Rating Price
Health Care
ExamWorks Group, Inc. LX159615 Incremental Term Loan $7,976,847 0.40% 7/27/2023 3.25 B 100.14 Health Care
Change Healthcare, Inc. LX159695 Term B $6,647,915 0.33% 3/01/2024 2.50 B+ 99.99 Health Care
PCI Pharma Services LX189979 TLB $6,603,367 0.33% 11/30/2027 3.50 B- 100.25 Health Care
Huntsworth/UDG LX196752 USD TL $6,531,534 0.32% 8/06/2028 4.25 B 100.56 Health Care
Global Medical Response, Inc. (fka Air Medical Group Holdings, Inc.) LX189951 Incremental Extended Term Loan B (Oct $5,940,653 0.29% 10/02/2025 4.75 B 100.43 Health Care
Curia Global, Inc. LX196585 2021 Upsized B $5,901,371 0.29% 8/30/2026 3.75 B 100.23 Health Care
Wellsky LX193028 First Lien Term Loan $5,688,287 0.28% 3/02/2028 3.25 B 99.95 Health Care
WCG LX184508 Upsized Term B $5,624,374 0.28% 1/08/2027 4.00 B 100.50 Health Care
Multiplan, Inc LX197152 1L Term Loan B $5,556,626 0.28% 8/17/2028 4.25 B+ 99.05 Health Care
National Mentor (fka Civitas Solutions) LX192639 First Lien Term Loan $5,525,481 0.27% 2/17/2028 3.75 B 100.14 Health Care
MedRisk, LLC LX193138 1L Term Loan $5,082,118 0.25% 5/10/2028 3.75 B 100.04 Health Care
Tecomet LX169359 2020 Upsized B $5,022,408 0.25% 5/01/2024 3.50 B 98.88 Health Care
PAREXEL LX196814 Term B $4,921,827 0.24% 8/30/2028 3.50 B 100.14 Health Care
ICON Clinical Investments LLC LX195616 TERM B LUX $4,710,265 0.23% 7/01/2028 2.50 BB+ 100.46 Health Care
U.S. Anesthesia Partners LX198300 Term B $4,577,047 0.23% 10/01/2028 4.25 B 100.26 Health Care
Pathway Vet Alliance LX192324 Incremental First Lien Term Loan $4,357,556 0.22% 3/31/2027 3.75 B 99.91 Health Care
Careismatic Brands LX191933 1L Term Loan $4,315,577 0.21% 1/20/2028 3.25 B 99.92 Health Care
AccentCare, Inc. LX195540 New First Lien Term Loan $4,268,668 0.21% 6/20/2026 4.00 B- 99.97 Health Care
LifeScan Global Corp LX173565 1L Term Loan $4,075,055 0.20% 10/01/2024 6.00 B 99.30 Health Care
RadNet, Inc. LX194154 Term B $4,047,951 0.20% 4/15/2028 3.00 B 99.95 Health Care
Perrigo Rx LX195723 Term B $4,046,262 0.20% 6/30/2028 4.75 B 100.03 Health Care
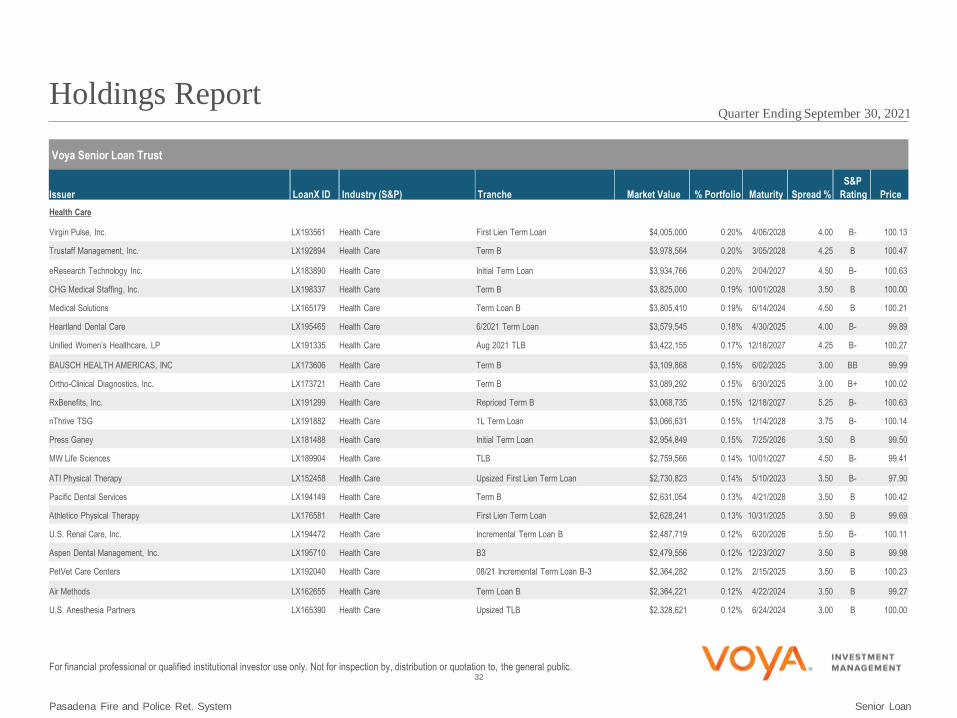
32
Holdings Report Quarter Ending September 30, 2021
Pasadena Fire and Police Ret. System Senior Loan
For financial professional or qualified institutional investor use only. Not for inspection by, distribution or quotation to, the general public.
Voya Senior Loan Trust
Issuer LoanX ID Industry (S&P) Tranche Market Value % Portfolio Maturity Spread %
S&P
Rating Price
Health Care
Virgin Pulse, Inc. LX193561 First Lien Term Loan $4,005,000 0.20% 4/06/2028 4.00 B- 100.13 Health Care
Trustaff Management, Inc. LX192894 Term B $3,978,564 0.20% 3/05/2028 4.25 B 100.47 Health Care
eResearch Technology Inc. LX183890 Initial Term Loan $3,934,766 0.20% 2/04/2027 4.50 B- 100.63 Health Care
CHG Medical Staffing, Inc. LX198337 Term B $3,825,000 0.19% 10/01/2028 3.50 B 100.00 Health Care
Medical Solutions LX165179 Term Loan B $3,805,410 0.19% 6/14/2024 4.50 B 100.21 Health Care
Heartland Dental Care LX195465 6/2021 Term Loan $3,579,545 0.18% 4/30/2025 4.00 B- 99.89 Health Care
Unified Women’s Healthcare, LP LX191335 Aug 2021 TLB $3,422,155 0.17% 12/18/2027 4.25 B- 100.27 Health Care
BAUSCH HEALTH AMERICAS, INC LX173606 Term B $3,109,868 0.15% 6/02/2025 3.00 BB 99.99 Health Care
Ortho-Clinical Diagnostics, Inc. LX173721 Term B $3,089,292 0.15% 6/30/2025 3.00 B+ 100.02 Health Care
RxBenefits, Inc. LX191299 Repriced Term B $3,068,735 0.15% 12/18/2027 5.25 B- 100.63 Health Care
nThrive TSG LX191882 1L Term Loan $3,066,631 0.15% 1/14/2028 3.75 B- 100.14 Health Care
Press Ganey LX181488 Initial Term Loan $2,954,849 0.15% 7/25/2026 3.50 B 99.50 Health Care
MW Life Sciences LX189904 TLB $2,759,566 0.14% 10/01/2027 4.50 B- 99.41 Health Care
ATI Physical Therapy LX152458 Upsized First Lien Term Loan $2,730,823 0.14% 5/10/2023 3.50 B- 97.90 Health Care
Pacific Dental Services LX194149 Term B $2,631,054 0.13% 4/21/2028 3.50 B 100.42 Health Care
Athletico Physical Therapy LX176581 First Lien Term Loan $2,628,241 0.13% 10/31/2025 3.50 B 99.69 Health Care
U.S. Renal Care, Inc. LX194472 Incremental Term Loan B $2,487,719 0.12% 6/20/2026 5.50 B- 100.11 Health Care
Aspen Dental Management, Inc. LX195710 B3 $2,479,556 0.12% 12/23/2027 3.50 B 99.98 Health Care
PetVet Care Centers LX192040 08/21 Incremental Term Loan B-3 $2,364,282 0.12% 2/15/2025 3.50 B 100.23 Health Care
Air Methods LX162655 Term Loan B $2,364,221 0.12% 4/22/2024 3.50 B 99.27 Health Care
U.S. Anesthesia Partners LX165390 Upsized TLB $2,328,621 0.12% 6/24/2024 3.00 B 100.00 Health Care

33
Holdings Report Quarter Ending September 30, 2021
Pasadena Fire and Police Ret. System Senior Loan
For financial professional or qualified institutional investor use only. Not for inspection by, distribution or quotation to, the general public.
Voya Senior Loan Trust
Issuer LoanX ID Industry (S&P) Tranche Market Value % Portfolio Maturity Spread %
S&P
Rating Price
Health Care
Upstream Physical Therapy LX196625 Term B $2,002,812 0.10% 11/20/2026 4.25 B 100.14 Health Care
Cano Health LX191011 TERM B $1,833,062 0.09% 11/19/2027 4.50 B 100.22 Health Care
MDVIP, Inc. LX198634 Term B $1,243,750 0.06% 10/01/2028 3.75 B 99.50 Health Care
ICON Clinical Investments LLC LX195815 US TERM B $1,173,565 0.06% 7/01/2028 2.50 BB+ 100.46 Health Care
PointClickCare LX191337 1L Term Loan $896,619 0.04% 12/15/2027 3.00 B+ 100.13 Health Care
MDVIP, Inc. LX198635 2L $646,750 0.03% 10/01/2029 6.50 CCC+ 99.50 Health Care
National Mentor (fka Civitas Solutions) LX192642 Second Lien Term Loan $595,969 0.03% 2/17/2029 7.25 CCC+ 101.88 Health Care
National Mentor (fka Civitas Solutions) LX192641 First Lien Term Loan - DD $257,121 0.01% 2/17/2028 3.75 B 100.14 Health Care
National Mentor (fka Civitas Solutions) LX192640 Term Loan C $174,437 0.01% 2/17/2028 3.75 B 100.14 Health Care
$219,697,367 10.89%
Home Furnishings
ADT fka Protection One, Inc. LX192168 1st Lien Term Loan B $5,638,779 0.28% 9/23/2026 2.75 BB- 100.00 Home Furnishings
Conair LX194841 First Lien Term Loan $3,693,963 0.18% 5/17/2028 3.75 B 100.20 Home Furnishings
Hunter Fan Company LX193934 First Lien Term Loan $2,956,300 0.15% 4/02/2028 5.00 B 99.88 Home Furnishings
Visual Comfort & Co LX195836 First Lien Term Loan $1,526,748 0.08% 7/21/2028 3.50 B 100.11 Home Furnishings
$13,815,790 0.68%
Industrial Equipment
Madison IAQ LX195492 Upsized First Lien Term Loan $12,362,107 0.61% 6/15/2028 3.25 B 99.98 Industrial Equipment
Alliance Laundry Systems LLC LX190032 Term Loan B $7,433,620 0.37% 10/01/2027 3.50 B 100.22 Industrial Equipment
Kenan Advantage Group, Inc. LX193260 Upsized First Lien Term Loan $5,832,884 0.29% 3/15/2026 3.75 B- 100.09 Industrial Equipment

34
Holdings Report Quarter Ending September 30, 2021
Pasadena Fire and Police Ret. System Senior Loan
For financial professional or qualified institutional investor use only. Not for inspection by, distribution or quotation to, the general public.
Voya Senior Loan Trust
Issuer LoanX ID Industry (S&P) Tranche Market Value % Portfolio Maturity Spread %
S&P
Rating Price
Industrial Equipment
TK Elevator (fka Thyssenkrupp Elevator) LX196018 USD TLB $4,848,671 0.24% 7/31/2027 3.50 B+ 100.31 Industrial Equipment
Howden LX192167 Term Loan B $4,247,118 0.21% 9/30/2026 4.00 B 100.05 Industrial Equipment
SUBCOM LX194107 First Lien Term Loan $3,731,081 0.18% 4/22/2027 5.00 B 101.00 Industrial Equipment
CPM Holdings, Inc. LX176453 First Lien Term Loan $3,389,997 0.17% 11/17/2025 3.50 B- 99.63 Industrial Equipment
Ion Analytics LX192466 USD TLB $3,350,962 0.17% 2/03/2028 4.00 B 100.49 Industrial Equipment
CentroMotion LX195839 Term Loan B $2,739,617 0.14% 6/08/2028 6.00 B 100.13 Industrial Equipment
CentroMotion LX195840 Delayed Draw $815,362 0.04% 6/08/2028 6.00 B 100.13 Industrial Equipment
$48,751,418 2.42%
Leisure Goods/Activities/Movies
City Football Group LX195726 First Lien Term Loan $7,840,188 0.39% 7/21/2028 3.50 NR 99.88 Leisure Goods/Activities/Movies
Samsonite LX188061 Repriced Incremental Term Loan B-2 $5,141,576 0.25% 4/25/2025 3.00 B+ 99.50 Leisure Goods/Activities/Movies
Club Car LX194777 Senior Secured Term Loan $5,061,553 0.25% 5/31/2028 4.00 B 100.33 Leisure Goods/Activities/Movies
WeddingWire LX176821 1st Lien $4,931,955 0.24% 12/19/2025 4.50 B+ 100.25 Leisure Goods/Activities/Movies
Cineworld LX171023 Term Loan B $4,926,450 0.24% 2/28/2025 2.50 CCC 82.67 Leisure Goods/Activities/Movies
Fitness International, LLC. LX172914 Term Loan B $4,567,494 0.23% 4/18/2025 3.25 CCC+ 93.23 Leisure Goods/Activities/Movies
Cineworld LX191039 Super Priority $4,085,138 0.20% 5/23/2024 7.00 CCC 124.08 Leisure Goods/Activities/Movies
RV Retailer LX192101 Term Loan B $3,073,852 0.15% 1/31/2028 4.00 B+ 100.00 Leisure Goods/Activities/Movies
AMC Entertainment Inc. LX179152 Term Loan B due 2026 $2,923,431 0.14% 4/22/2026 3.00 B- 93.10 Leisure Goods/Activities/Movies
National CineMedia, LLC LX193188 New Term Loan $2,879,353 0.14% 12/20/2024 8.00 CCC+ 100.50 Leisure Goods/Activities/Movies
Viagogo (fka STUBHUB) LX185246 USD Senior Term Loan $2,877,057 0.14% 2/12/2027 3.50 B- 97.94 Leisure Goods/Activities/Movies
Ancestry.com LX192925 1st Lien Term Loan $2,506,029 0.12% 12/06/2027 3.25 B 99.60 Leisure Goods/Activities/Movies

35
Holdings Report Quarter Ending September 30, 2021
Pasadena Fire and Police Ret. System Senior Loan
For financial professional or qualified institutional investor use only. Not for inspection by, distribution or quotation to, the general public.
Voya Senior Loan Trust
Issuer LoanX ID Industry (S&P) Tranche Market Value % Portfolio Maturity Spread %
S&P
Rating Price
Leisure Goods/Activities/Movies
ClubCorp Club Operations, Inc LX167985 Senior Secured Term Loan B $2,322,320 0.12% 9/18/2024 2.75 B- 94.25 Leisure Goods/Activities/Movies
Alterra Mountain Company (fka Intrawest) LX196645 Term Loan B due 2028 $2,204,304 0.11% 7/30/2028 3.50 B 99.88 Leisure Goods/Activities/Movies
Cineworld LX196880 7/21 Incremental Priority $1,380,903 0.07% 5/23/2024 8.25 B- 107.75 Leisure Goods/Activities/Movies
24 Hour Fitness Worldwide, Inc LX193337 Super Priority $1,040,573 0.05% 8/25/2022 14.00 NR 100.00 Leisure Goods/Activities/Movies
24 Hour Fitness Worldwide, Inc LX191778 Exit Term Lon $668,564 0.03% 12/29/2025 5.00 CCC 87.25 Leisure Goods/Activities/Movies
$58,430,737 2.90%
Lodging & Casinos
Golden Entertainment LX165659 1st Lien $7,190,188 0.36% 10/21/2024 3.00 B+ 99.92 Lodging & Casinos
Enterprise Development Authority LX192685 TLB $6,006,541 0.30% 2/18/2028 4.25 B 100.37 Lodging & Casinos
Caesars Resort Collection LX188823 Non-Fungible TLB-1 $5,370,344 0.27% 7/21/2025 3.50 B+ 100.18 Lodging & Casinos
Bally's (f.k.a Twin River Management) LX196763 TLB $4,945,019 0.25% 8/06/2028 3.25 BB- 100.10 Lodging & Casinos
Hilton Grand Vacations LLC LX193532 TLB $4,783,621 0.24% 7/31/2028 3.00 BB 100.35 Lodging & Casinos
Flutter Entertainment plc LX174018 USD TLB $3,741,547 0.19% 7/15/2026 2.25 BBB- 99.79 Lodging & Casinos
Aristocrat Leisure Limited LX188215 Non-Fungible Incremental TLB $3,249,979 0.16% 10/19/2024 3.75 BB+ 100.65 Lodging & Casinos
J&J Ventures LX193818 TLB $3,064,031 0.15% 4/07/2028 4.00 B 100.63 Lodging & Casinos
Aimbridge Hospitality LX189972 Non Fungible Incremental $3,011,313 0.15% 2/01/2026 4.75 CCC+ 99.63 Lodging & Casinos
ECL Entertainment LX193677 TLB $853,215 0.04% 4/02/2028 7.50 B- 102.44 Lodging & Casinos
$42,215,797 2.09%

36
Holdings Report Quarter Ending September 30, 2021
Pasadena Fire and Police Ret. System Senior Loan
For financial professional or qualified institutional investor use only. Not for inspection by, distribution or quotation to, the general public.
Voya Senior Loan Trust
Issuer LoanX ID Industry (S&P) Tranche Market Value % Portfolio Maturity Spread %
S&P
Rating Price
Mortgage REITs
BGIS LX180094 Incremental Term Loan $3,772,729 0.19% 5/31/2026 3.75 B 99.63 Mortgage REITs
$3,772,729 0.19%
Nonferrous Metals/Minerals
U.S. Silica Company LX172957 Term Loan $10,779,898 0.53% 5/01/2025 4.00 B- 98.06 Nonferrous Metals/Minerals
Covia Holdings Corporation (fka Unimin Corporation) LX191801 New Term Loan $5,260,076 0.26% 7/31/2026 4.00 B- 99.61 Nonferrous Metals/Minerals
$16,039,974 0.79%
Oil & Gas
BCP Renaissance Parent LLC (i.e. Rover) LX168609 Term Loan $5,600,888 0.28% 10/31/2024 3.50 B 99.31 Oil & Gas
Traverse Midstream Partners LLC LX168620 Term Loan $4,622,556 0.23% 9/27/2024 5.50 B 100.23 Oil & Gas
Oryx Midstream LX179718 Term Loan $3,348,357 0.17% 5/22/2026 4.00 B- 100.05 Oil & Gas
Navitas Midstream Midland Basin, LLC LX170023 Term Loan $2,364,846 0.12% 12/13/2024 4.00 B 100.04 Oil & Gas
Bison Midstream Holdings, LLC LX173489 Term Loan $2,202,094 0.11% 5/21/2025 4.00 B- 98.66 Oil & Gas
Lucid Energy Group II Borrower, LLC LX171113 Term Loan $2,001,612 0.10% 2/17/2025 3.00 B 99.05 Oil & Gas
Harvey Gulf International Marine, LLC LX172240 Exit Term Loan $1,251,820 0.06% 7/02/2023 6.00 D 74.50 Oil & Gas
Prairie ECI Acquiror LP (Tallgrass) LX178951 Upsized Term Loan $1,101,170 0.05% 3/11/2026 4.75 B 96.83 Oil & Gas
Glass Mountain Pipeline, LLC LX170112 Term Loan $898,013 0.04% 12/23/2024 4.50 D 35.88 Oil & Gas
$23,391,354 1.16%
Property & Casualty Insurance
BroadStreet Partners, Inc. LX185267 1st Lien Term Loan B $7,102,992 0.35% 1/20/2027 3.00 B 98.92 Property & Casualty Insurance
$7,102,992 0.35%

37
Holdings Report Quarter Ending September 30, 2021
Pasadena Fire and Police Ret. System Senior Loan
For financial professional or qualified institutional investor use only. Not for inspection by, distribution or quotation to, the general public.
Voya Senior Loan Trust
Issuer LoanX ID Industry (S&P) Tranche Market Value % Portfolio Maturity Spread %
S&P
Rating Price
Publishing
Meredith Corporation LX188884 Term Loan B-3 $9,193,122 0.46% 1/31/2025 4.25 BB- 102.30 Publishing
McGraw-Hill LX196470 Term Loan B $4,012,123 0.20% 7/30/2028 4.75 B- 100.43 Publishing
Cengage Learning Acquisition, Inc. LX195798 New Term Loan B $3,801,449 0.19% 6/28/2026 4.75 B 100.77 Publishing
Alchemy Copyrights, LLC (d/b/a Concord) LX189327 Repriced Term Loan B $2,064,612 0.10% 3/05/2028 3.00 B+ 100.25 Publishing
$19,071,306 0.95%
Radio & Television
Cox Media Group LX192290 Repriced Term Loan B $10,257,762 0.51% 12/17/2026 3.50 B+ 99.91 Radio & Television
Univision Communications, Inc. LX161197 TL-C5 $10,227,887 0.51% 3/15/2024 2.75 B 100.02 Radio & Television
Diamond Sports Group, LLC LX180415 Term Loan B $9,882,660 0.49% 8/24/2026 3.25 CCC 62.79 Radio & Television
Clear Channel Outdoor LX182154 Term Loan B $8,371,894 0.41% 8/21/2026 3.50 B 98.08 Radio & Television
Cumulus Media Inc. LX182786 Extended Exit TL $4,161,017 0.21% 3/31/2026 3.75 B 100.05 Radio & Television
$42,901,221 2.13%
Retailers (Except Food & Drug)
Great Outdoors Group, LLC LX193047 1LTL $10,035,929 0.50% 2/26/2028 4.25 BB- 100.61 Retailers (Except Food & Drug)
Petco Animal Supplies, Inc. LX192745 TLB $7,389,510 0.37% 2/25/2028 3.25 B 100.07 Retailers (Except Food & Drug)
Harbor Freight Tools USA, Inc. LX195957 TL-B $5,016,533 0.25% 10/19/2027 2.75 BB- 100.07 Retailers (Except Food & Drug)
1-800 Contacts LX190219 1L TL B $4,904,579 0.24% 11/08/2027 3.75 B 100.19 Retailers (Except Food & Drug)
Michaels Stores, Inc. LX193790 1L TL B $4,139,652 0.21% 4/08/2028 4.25 B 100.24 Retailers (Except Food & Drug)
Victoria’s Secret & Co. LX195986 1L TL B $4,074,900 0.20% 6/30/2028 3.25 BB+ 99.88 Retailers (Except Food & Drug)
Tory Burch LX193950 1L TL B $3,021,998 0.15% 4/14/2028 3.50 BB- 100.23 Retailers (Except Food & Drug)

38
Holdings Report Quarter Ending September 30, 2021
Pasadena Fire and Police Ret. System Senior Loan
For financial professional or qualified institutional investor use only. Not for inspection by, distribution or quotation to, the general public.
Voya Senior Loan Trust
Issuer LoanX ID Industry (S&P) Tranche Market Value % Portfolio Maturity Spread %
S&P
Rating Price
Retailers (Except Food & Drug)
Tailored Brands (fka Men’s Wearhouse) LX191266 Take Back Debt Term Loan $2,899,636 0.14% 12/01/2025 8.00 CCC+ 85.75 Retailers (Except Food & Drug)
Jo-Ann Stores, Inc. LX195936 1L TL B $2,878,094 0.14% 6/30/2028 4.75 B 97.56 Retailers (Except Food & Drug)
Franchise Group, Inc. LX192345 1L TL B $2,764,552 0.14% 2/24/2026 4.75 BB- 100.75 Retailers (Except Food & Drug)
Culligan Holding Inc. LX195536 First Lien Term Loan $1,392,213 0.07% 7/30/2028 4.00 B 100.40 Retailers (Except Food & Drug)
Tailored Brands (fka Men’s Wearhouse) LX191262 Liquidity Term Loan $1,130,928 0.06% 6/21/2025 11.00 B 99.00 Retailers (Except Food & Drug)
Lakeshore Learning Materials LX198578 1L TL B $965,150 0.05% 9/29/2028 3.50 B 99.50 Retailers (Except Food & Drug)
Culligan Holding Inc. LX195537 Delayed Draw Term Loan $174,027 0.01% 7/31/2028 4.00 B 100.40 Retailers (Except Food & Drug)
Belk LX193026 FLSO Term Loan $80,272 0.00% 7/31/2025 10.00 CCC- 78.00 Retailers (Except Food & Drug)
Tailored Brands (fka Men’s Wearhouse) LX191266 Take Back Debt Term Loan $71,830 0.00% 12/01/2025 8.00 CCC+ 85.75 Retailers (Except Food & Drug)
$50,939,803 2.52%
Surface Transport
PODS LX193458 First Lien Term Loan $6,078,714 0.30% 3/30/2028 3.00 B 100.15 Surface Transport
American Trailer World Corp. LX192672 Upsized First Lien Term Loan $4,969,834 0.25% 3/15/2028 3.75 B 99.65 Surface Transport
LaserShip LX194516 First Lien Term Loan $3,993,683 0.20% 4/30/2028 4.50 B- 100.34 Surface Transport
Worldwide Express Operations, LLC LX196468 First Lien Term Loan $3,579,606 0.18% 8/15/2028 4.25 B- 100.41 Surface Transport
Savage Enterprises, LLC LX196907 1st Lien Term Loan $3,382,216 0.17% 8/15/2028 3.25 BB- 100.36 Surface Transport
Evans Network of Companies LX196636 First Lien Term Loan $1,828,134 0.09% 8/31/2028 4.25 B- 99.78 Surface Transport
Worldwide Express Operations, LLC LX196469 Second Lien Term Loan $1,080,000 0.05% 8/15/2029 7.00 CCC 100.00 Surface Transport
Evans Network of Companies LX196637 Delayed Draw Term Loan $162,501 0.01% 8/15/2028 4.25 B- 99.78 Surface Transport
$25,074,688 1.24%

39
Holdings Report Quarter Ending September 30, 2021
Pasadena Fire and Police Ret. System Senior Loan
For financial professional or qualified institutional investor use only. Not for inspection by, distribution or quotation to, the general public.
Voya Senior Loan Trust
Issuer LoanX ID Industry (S&P) Tranche Market Value % Portfolio Maturity Spread %
S&P
Rating Price
Utilities
Sabre Industries LX194855 First Lien Term Loan $5,058,669 0.25% 5/31/2028 3.25 B 99.88 Utilities
Nautilus Power, LLC LX163284 Term Loan $3,054,406 0.15% 5/16/2024 4.25 B+ 92.46 Utilities
Generation Bridge LX196727 1L TL B $2,249,559 0.11% 8/06/2028 5.00 BB 100.50 Utilities
Heritage Power, LLC LX181091 Term Loan B $1,912,537 0.09% 7/30/2026 6.00 B 89.25 Utilities
Longview Power, LLC LX187961 Exit term loan $527,674 0.03% 7/30/2025 10.00 D 101.75 Utilities
Generation Bridge LX196728 1L TL C $46,866 0.00% 8/06/2028 5.00 BB 100.50 Utilities
$12,849,711 0.64%
$2,017,621,095 100.00% Total Loans
Total Market Value $2,017,621,095
Coupon reflects a calculation of the loan spread plus 3-month LIBOR, and does not necessarily reflect the actual changing underlying LIBOR contracts for the
loan.
The holdings displayed represent the holdings of the entire commingled fund and do not represent individual client ownership.

40
Pasadena Fire and Police Ret. System
For financial professional or qualified institutional investor use only. Not for inspection by, distribution or quotation to, the general public.
Explanatory Notes
The information contained in this document has been prepared solely for informational purposes and is not an offer or invitation to buy or sell any
security or to participate in any trading activity. This document is intended only for professional investors and describes a strategy only. Some
material shown is compiled from third party sources thought to be reliable, but accuracy and completeness cannot be guaranteed. Any opinions
expressed herein reflect our judgment at this date and are subject to change without notice. Neither Voya Investment Management nor any other
company or unit belonging to Voya Financial, nor any of its officers, directors, or employees accept any liability or responsibility in respect to the
information or any recommendations expressed herein. No liability is accepted for any losses sustained by readers as a result of using this
publication or basing decisions on it. The value of your investments may rise or fall. Past performance is not indicative of future results.
Investments involve risk. The primary risks of investing in market based securities include, but are not limited to, credit risk (the risk that a borrower
may default in the payment of interest and/or principal on its loans), interest rate risk (the risk that the yield on an investment will rise and fall in
response to changes in market rates of interest), and market risk (the risk that the value of an investment will rise or fall in response to general
economic conditions and events). Exposure to financial, market, prepayment, credit and interest rate risks. The value of an investment is not
guaranteed and will fluctuate. Higher yielding bonds are subject to greater volatility and credit risk. A strategy may invest in securities guaranteed
by the U.S. Government as to timely payments of interest and principal, butt the strategy itself is not insured or guaranteed. Bonds have fixed
principal and return if held to maturity, but may fluctuate in the interim. Generally, when interest rates rise, bond prices fall. Bonds with longer
maturities tend to be more sensitive to changes in interest rates. In addition to the general risks of investing in fixed income securities, investing in
foreign securities poses special risks, including currency fluctuation, economic and political risks not found in investments that are solely
domestic. Risks of foreign investing are generally intensified for investments in emerging markets
The account information presented in this report is based on the records and information provided by Voya Investment Management. The results
may be preliminary and unreconciled and are subject to change. Voya Investment Management does not guarantee the accuracy of the
information contained in this portfolio accounting report. The report is for informational purposes only and should not be relied upon or construed to
be final. Clients are advised to refer to their custodial statements and confirmations for trade and holdings information.
Footnotes
Market Value
The ending balance shown on the Investment Policy page may differ from the total market value on the Portfolio Holdings Report due to cash flow
posted at close of business on the last day of the quarter.

41
Pasadena Fire and Police Ret. System
For financial professional or qualified institutional investor use only. Not for inspection by, distribution or quotation to, the general public.
Explanatory Notes
Portfolio Characteristics
The portfolio specific characteristics (such as Average Duration, Average Yield, etc.) are based on the total portfolio market value including cash
and derivatives, as provided by our valuation provider (BNY Mellon) and security characteristics provided by BlackRock Solutions which utilizes a
different pricing hierarchy (Barclays).BNY Mellon prices combined with Barclays analytics will result in different portfolio averages than are
reported. Portfolio and Benchmark averages (Duration, Yield to Maturity, Convexity and Average Life) are reported directly from BlackRock
Solutions using Blackrock models and assumptions. As such, the Benchmark Analytics provided above may be different from Barclays. Top ten
credit exposures include cash.
Ratings
The portfolio’s average quality rating is calculated as a market value-weighted average of the rating assigned to all positions, including derivative
securities, but excluding non-rated securities held within the portfolio measured and reported as of the date of this report. The "Effective Rating" is
determined as follows: Voya IM seeks individual security ratings from three credit rating agencies that are registered with the SEC as nationally
recognized statistical rating organizations – typically Moody's, S&P and Fitch. If ratings are available from all three agencies, the security will be
assigned the median rating. If ratings are available from only two of the agencies, the lower of the ratings will be used.If a rating is available from
only one agency, then that rating will be used. If ratings are not available from any of the three agencies, then we may either assign the security an
internal rating or mark it as "N/R" (not rated). AAA is the highest (best) Effective Rating, and D is the lowest (worst) Effective Rating. When an
Effective Rating is reported for a group of securities (such as for an asset class or the overall portfolio), it is calculated as a market value-weighted
average of the Effective Rating assigned to each component security (excluding securities without an Effective Rating). Please note that Voya
does not endorse or affirm the Effective Ratings or any agency ratings.

42
Pasadena Fire and Police Ret. System
For financial professional or qualified institutional investor use only. Not for inspection by, distribution or quotation to, the general public.
Explanatory Notes
Ratings Cont.
Furthermore, credit rating agencies disclaim all warranties and liability for their ratings, which (a) should be viewed as their opinions and not as
statements of fact or recommendations as to suitability or to purchase, hold, or sell a security and (b) are not guaranteed as being accurate, timely
or available. For derivative securities, swap contracts are rated on the basis of the underlying security, however, futures contracts are treated as a
combination of Treasury securities and cash positions, they have no net impact to the average quality rating in the portfolio. Measures pertaining to
average credit quality may change over time and illustrations presented in the client report are for informational purposes only. Individual client
investment guidelines may have different rules and the foregoing presentation is not meant to represent a compliance certification of the portfolio’s
overall credit quality.
This report may contain information obtained from third parties, including ratings from credit ratings agencies. Reproduction and distribution of
third party content in any form is prohibited except with the prior written permission of the related third party. Third party content providers do not
guarantee the accuracy, completeness, timeliness or availability of any information, including ratings, and are not responsible for any errors or
omissions (negligent or otherwise), regardless of the cause, or for the result obtained from the use of such content. THIRD PARTY CONTENT
PROVIDERS GIVE NO EXPRESS OR IMPLIED WARRANTIES, INCLUDING, BUT NOT LIMITED TO, ANY WARRANTIES OF
MERCHANTABILITY OR FITNESS FOR A PARTICULAR PURPOSE OR USE. THIRD PARTY CONTENT PROVIDERS SHALL NOT BE LIABLE
FOR ANY DIRECT, INDIRECT, INCIDENTAL, EXEMPLARY, COMPENSATORY, PUNITIVE, SPECIAL OR CONSEQUENTIAL DAMAGES,
COSTS, EXPENSES, LEGAL FREES, OR LOSSES (INCLUDING LOST INCOME OR PROFITS AND OPPORTUNITY COSTS OR LOSSES
CAUSED BY NEGLIGENCE) IN CONNECTION WITH ANY USE OF THEIR CONTENT, INCLUDING RATINGS. Credit agency ratings are
statement of opinions and are not statements of fact or recommendations to purchase, hold or sell securities. They do not address the suitability of
securities or the suitability of securities for investment purposes, and should not be relied on as investment advice.

43
Pasadena Fire and Police Ret. System
For financial professional or qualified institutional investor use only. Not for inspection by, distribution or quotation to, the general public.
Explanatory Notes
Bond Sector Comparisons
Sector weights are based on total portfolio market value, which includes security market values (including accrued income), plus cash, cash
equivalents and derivatives (variation margin for Futures, and Market Value of Swaps).
With the exception of the Treasury, ABS, and CMBS Sectors, the following sector groupings apply:
Treasury and Cash includes Cash/Cash equivalents which includes trade receivables/payables (which may be net positive or
negative), TBA liabilities, accrued income on securities that have been sold pending settlement (accrued income is otherwise
reflected in the other sectors), and in Sector Weights, also includes variation margin for futures (which may be positive or negative).
Government Related sector is comprised of Agency, Local Government, Sovereign and Supranational securities.
Corporate sector is comprised of Financial Institutions, Industrial and Utility securities.
Agency Mortgages sector contains Fannie Mae (FNMA), Freddie Mac (FHLMC), and Government National Mortgage Association
(GNMA).
Securitized sector is comprised of ABS, CMBS, and Agency and Non-Agency Mortgage Backed Securities.
Other sector is comprised of Convertibles, Common and Preferred Stocks and Municipal Bonds.
"Derivatives“ (if applicable) includes forwards, options and swaps (see Appendix – Portfolio Holdings Derivatives for details) and
futures.
Performance Disclosures
Performance is calculated on a time-weighted total return basis. Performance quoted is past performance, is no guarantee of future results and
assumes that dividends and distributions are reinvested. Current performance may be lower or higher. Investment value will fluctuate, and shares,
when redeemed, may be worth more or less than original cost.
Net returns are reflective of trading costs, management fees, and other administrative fees. Gross returns are net of trading costs, but do not reflect
the deduction of management, operating and admin fees. The returns for the Benchmark Indexes are time-weighted total return performance
results.

44
Pasadena Fire and Police Ret. System
For financial professional or qualified institutional investor use only. Not for inspection by, distribution or quotation to, the general public.
Explanatory Notes
Performance Disclosures Cont.
For Bloomberg Barclay Indices the source is: Bloomberg Index Services Limited. BLOOMBERG® is a trademark and service mark of Bloomberg
Finance L.P. and its affiliates (collectively “Bloomberg”). BARCLAYS® is a trademark and service mark of Barclays Bank Plc (collectively with its
affiliates, “Barclays”), used under license. Bloomberg or Bloomberg’s licensors, including Barclays, own all proprietary rights in the Bloomberg
Barclays Indices. Neither Bloomberg nor Barclays approves or endorses this material, or guarantees the accuracy or completeness of any
information herein, or makes any warranty, express or implied, as to the results to be obtained therefrom and, to the maximum extent allowed by
law, neither shall have any liability or responsibility for injury or damages arising in connection therewith. Notwithstanding the foregoing, solely to
the extent Licensee publishes Insubstantial Portions of Derivative Indices in accordance with the paragraph above, in addition to the disclaimer
required above, each such publication of Insubstantial Portions of the Derivative Indices shall include a statement that the Derivative Index is not
sponsored or endorsed by BISL, but is calculated and published with the consent of BISL.
Performance Attribution
Attribution results for sub-portfolio components, as provided by Blackrock Solutions Systems, are calculated on a daily basis. These daily results
are then geometrically compounded using a smoothing algorithm (Frongello Linking Algorithm) to produce results for “Month to Date” , “Quarter To
Date” and “Year To Date” time periods. However, the use of this smoothing process, as well as rounding effects, may create immaterial differences
to total portfolio returns reported to the client for “Month To Date” , “Quarter To Date” and “Year To Date” time periods. Additional details of these
calculations are available upon request. Total attribution may not add or match portfolio returns due to rounding. Total attribution may not add or
match portfolio returns due to rounding.
Holdings
Cash and Cash Equivalents include trade receivables/payables (which may be net positive or negative), accrued income, cash collateral, variation
margin (which may be positive or negative), and TBA liabilities. The current market value of foreign currency as well as derivative holdings is (a)
included in the net cash/cash equivalent line at the end of the Portfolio Holdings Report and (b) reflected in the “other” sector in the Bond Sector
Comparisons page.
All derivative holdings (including notional amounts) are listed, as applicable. The market value of all derivatives other than futures (and only the
variation margin for futures) is (a) included in the net cash/cash equivalent line at the end of the Portfolio Holdings Report and (b) reflected in the
“other” sector in the Bond Sector Comparisons page.

45
Pasadena Fire and Police Ret. System
For financial professional or qualified institutional investor use only. Not for inspection by, distribution or quotation to, the general public.
Explanatory Notes
Holdings Cont.
The individual holdings and their respective valuations, (pricing and accruals) illustrated in this report are provided by IM’s operations servicer,
Bank of New York Mellon. Individual Security and Portfolio Level attributes illustrations are provided by BlackRock Solutions which utilizes a
different pricing hierarchy (Barclays) in the deriving of analytics such as; Duration, Yield to Maturity, Convexity, and Average Life. Please refer to
the Explanatory Notes Section of your quarterly performance report for the valuation hierarchy as provided by Bank of New York Mellon, as well as
other important disclosures.
Notes
A To-Be-Announced (“TBA”) security represents a “forward purchase” of a potential mortgage pool of similar characteristics such as coupon, yield
and par value to be announced by a broker bundling “like” mortgages. The cash segregated as collateral for these forward purchases, in an
amount equal to the purchase price to be paid, may be invested in “liquid assets, such as cash, U.S. Government securities or other appropriate
high grade debt obligations” in a “segregated account” as described in Release 10666 of the SEC. Voya reports these within “Portfolio Holdings”.
The valuation of this collateral is independent of the valuation of the TBA liability and may rise or fall, based on interest rates and market
conditions.
FAS 157 Tier levels
FASB 157 establishes a framework for measuring fair value in Generally Accepted Accounting Principles. Under FAS, “fair value” is the price that
would be received to sell an asset or paid to transfer a liability in an orderly transaction between market participants at the measurement date.
FASB 157 identifies a fair value hierarchy to rank the reliability of inputs used in a valuation approach. The first – and highest – level (Level 1)
refers to quoted prices for identical assets or liabilities in an active market. When those prices are not available, the second – or middle – level
(Level 2) will base fair value estimates on observable inputs that a market participant would use. If observable inputs are not available, the third –
and lowest – level (Level 3) will require the use of unobservable inputs. Source: Valuation Research Corporation
Voya Investment Management employs the following criteria for the tier selection under the FAS 157 Rule:
Level 2 is identified as any security for which we have received a price through one of our pricing vendors (currently IDC, Pricing Direct, and Markit
Partners). We identify as Level 3 any security (including mortgage-related securities) for which only a broker quote is available for valuation, as
opposed to prices sourced from pricing vendors. Under our current policy, Level 1 is reserved for U.S. Treasury securities.
Effective January 1, 2013 , all Subprime assets that are priced by an external vendors are now classified as Tier 2. Prior to this time, Voya
Investment Management was categorizing subprime external vendor priced securities as Tier 3 since December 2008.
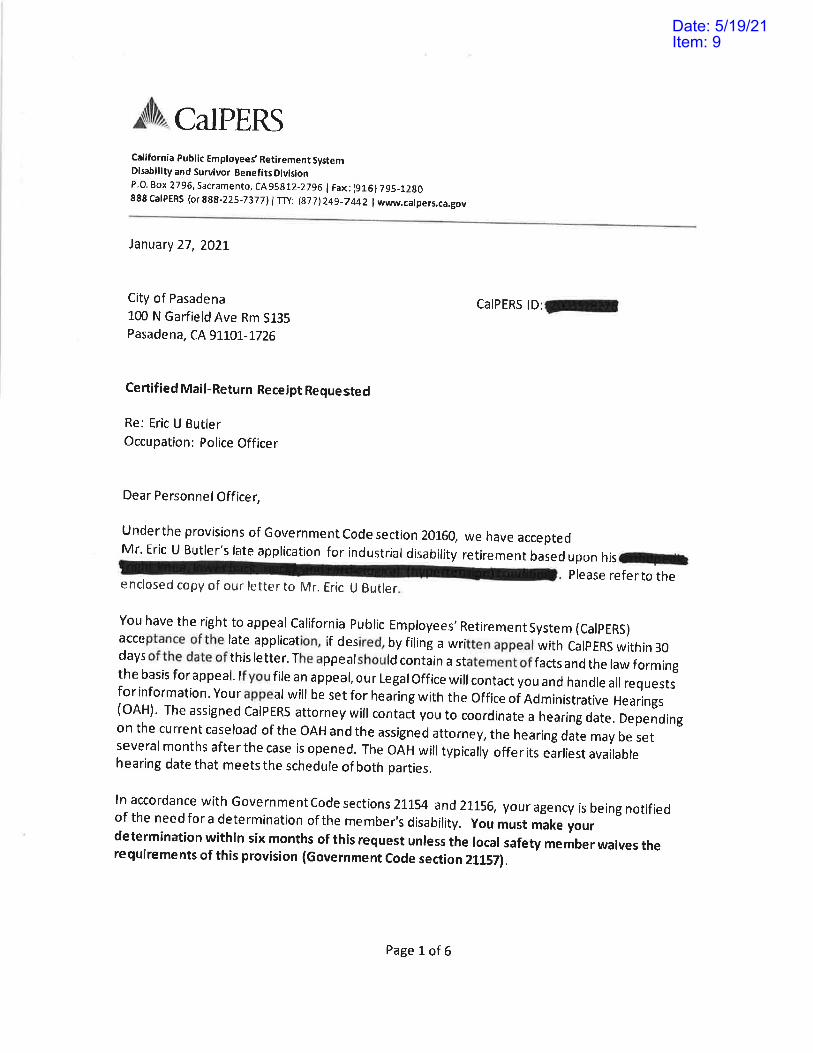
Date: 5/19/21Item: 9


November 17, 2021 AB 361 Virtual Meetings
Page 1 of 2
Pasadena Fire & Police Retirement System
AGENDA REPORT
TO: Chair Jones and Board Members of the Fire & Police Retirement System
FROM: Bernadette Kastner, Secretary to the Board
DATE: November 17, 2021
ITEM: Review, discuss and consider approval of resolution authorizing the continuation of virtual meetings pursuant to AB 361.
SUBJECT
Resolution No. 335 Renewing Authorization and Making Findings and Determinations Under AB 361 for Continued Virtual Meetings.
RECOMMENDATION
That the Board Adopt Resolution No. 335 Renewing Authorization and Making Findings and Determinations Under AB 361 for Continued Virtual Meetings; and
That the Board provide direction to staff to explore the implementation of a hybrid format for future meeting.
BACKGROUND
AB 361 allows the Board to meet virtually or telephonically without meeting certain Brown Act posting requirements, identifying each teleconference location, requiring each teleconference location to be publicly accessible, or requiring a quorum of the legislative body to be physically present within the jurisdiction of FPRS. Virtual public meetings still require standard meeting agendas and notices and the ability for the public to provide public comment.
At its October 20, 2021 meeting, the Board adopted Resolution No. 334 making findings and determinations under AB 361 for continued virtual meetings. To continue virtual meetings, the Board must make findings every 30 days, or at the next meeting if later, that 1) it has reconsidered the circumstances of the ongoing COVID-19 pandemic state of emergency and 2) either the state of emergency continues to directly impact the ability of the public to meet safely in person, or state or local officials continue to impose or recommend measures to promote social distancing.
Item 9Date: 11/17/2021

November 17, 2021 AB 361 Virtual Meetings
Page 2 of 2
DISCUSSION
AB 361 allows virtual public meetings to continue through January 1, 2024, provided that:
1. The Board holds a meeting during a proclaimed state of emergency, and state or local officials have imposed or recommended measures to promote social distancing; or
2. The Council holds a meeting during a proclaimed state of emergency and determines, or has determined by majority vote that as a result of the emergency, meeting in person would present imminent risks to the health or safety of attendees.
At its October 20, 2021 meeting, the Board adopted Resolution No. 334 making the initial findings and determinations under AB 361 for continued virtual meetings under AB 361. The Board has reconsidered the circumstances of the state emergency and finds that state or local officials continue to impose or recommend measures to promote social distancing.
This item will be placed on the agenda as a recurring action item for every future Board meeting as long as a state emergency exists and the Board desires to hold a virtual meeting (including hybrid meetings). This is because AB 361 requires the Board to renew its every 30 days, or the next meeting if later, after meeting virtually for the first time under AB 361.
AB 361 does not require in-person meetings if the Board decides to continue with remote or Zoom meetings during the state emergency. AB 361 also does not require the Board to hold remote or Zoom meetings during the state emergency. However, any in-person attendance would still need to comply with health orders related to masking or social distancing, as applicable.
Members of the Board indicated interest at the October 20, 2021 meeting for possibly using a hybrid format for future meetings that allows for both in-person and remote access to public meetings for either board members, staff or the public. Two people are required to manage a hybrid system: one to manage the Zoom format and the other to manage the in-person format. If the Board wishes to move in this direction, staff will coordinate with the City to determine the adjustments necessary to implement a hybrid system. Once implemented, a hybrid meeting would also be an option for the Board.
FISCAL IMPACT None. ATTACHMENT Resolution 335

RESOLUTION NO. 335
Moved by ___________ that the following resolution be adopted:
RESOLUTION OF THE BOARD OF THE PASADENA FIRE & POLICE RETIREMENT SYSTEM MAKING
FINDINGS AND DETERMINATIONS UNDER AB 361 FOR CONTINUED VIRTUAL MEETINGS
WHEREAS, the Ralph M. Brown Act (Gov. Code § 54950 et seq.) generally requires local agencies meeting via teleconference, including through other virtual or electronic means, to provide public access at each location in which members of the legislative body are teleconferencing; and
WHEREAS, the Legislature recently enacted Assembly Bill 361 (AB 361), which amended Government Code section 54953 to allow local agencies to meet fully virtually during a proclaimed state of emergency if state or local officials have imposed or recommended measures to promote social distancing; and
WHEREAS, , the Retirement Board finds that the Governor issued a proclamation declaring a state of emergency on March 4, 2020 due to the COVID-19 pandemic, pursuant to section 8625 of the California Emergency Services Act; and
WHEREAS, the Retirement Board has reconsidered the circumstances of the state of emergency and finds that state or local officials continue to recommend measures to promote social distancing; and
WHEREAS, the Retirement Board desires that the Pasadena Fire & Police Retirement System Retirement Board shall continue to hold virtual meetings pursuant to AB 361 and Government Code section 54953(e).
NOW, THEREFORE, BE IT RESOLVED, as follows: 1. The above recitals are true and correct and shall be the findings of the
Retirement Board.
2. The Retirement Board shall continue to meet virtually in accordance with Government Code section 54953(e) and without compliance with section 54953(b)(3).
Resolution 335 Page 2 of 2
PASSED AND ADOPTED at a special meeting of the Pasadena Fire & Police
Retirement System Retirement Board held on November 17, 2021, by the following vote:
AYES: NOES: ABSENT: ABSTAIN:
__________________________________ Keith Jones, Board Chair ATTEST: _________________________________ Bernadette Kastner, Board Secretary APPROVED AS TO FORM: __________________________________ Isabel Safie, Board Counsel
PERIOD ENDING: SEPTEMBER 30, 2021
Investment Performance Review for
Pasadena Fire & Police Retirement System
VERUSINVESTMENTS.COM
SEATTLE 206‐622‐3700LOS ANGELES 300‐297‐1777
SAN FRANCISCO 415‐362‐3484PITTSBURGH 412‐784‐6678
Table of Contents
Investment Landscape TAB I
Investment Performance Review
TAB II

4TH QUARTER 2021Investment Landscape

Recent Verus research
4th Quarter 2021Investment Landscape 2
Visit: https://www.verusinvestments.com/insights/
Consulting | Outsourced CIO (OCIO) | Risk Advisory | Private Markets
An evolving market environment has arguably diminished the role of traditional fixed income as a diversifier in portfolios and led to a higher opportunity cost of holding bonds due to lower yields. This may suggest improved relative attractiveness of other equity risk mitigation approaches. In this research piece we discuss other approaches to risk mitigation and outline their merits, while tying these ideas to the Functionally‐Focused Portfolios (FFP) approach to portfolio construction.
ESTABLISHMENT OF RISK MITIGATION BUCKETS
Today’s market environment appears to be an exceedingly challenging one to navigate, and investors are grappling with the question of how best to structure portfolios that not only meet their return targets but provide impactful diversification and risk management. In this Topic of Interest paper, we will assess a wide variety of less‐conventional investment strategies in both mature and nascent marketplaces, and which may only appeal to a specific set of investors.
THINKING DIFFERENTLY
Topics of interest
Inflation has been subdued in the United States for the last three decades. In this piece, we analyze historic inflationary environments to understand the protection offered by different types of assets. Using a variety of risk tools, we consider the impact inflation has on an investor’s overall portfolio and their obligations. No single asset class can reliably protect against inflationary environments but through constructing diversified portfolios and understanding risk exposures, we believe an investor can best position themselves for an uncertain future.
THINKING ABOUT INFLATION IN RISK TERMS
Annual research
In the Verus 2021 Private Equity Outlook, we focus attention on investor appetite for ESG and the growing response from private equity. The outlook also addresses the resilience of private equity in the face of COVID; SPACs rise as a streamlined path to the public markets, however not without risk; Private credit markets continue to gain investor interest; Buyout purchase multiples expand as public market valuations continue to climb; and Venture capital valuations soar alongside increased economic confidence
2021 PRIVATE EQUITY OUTLOOK
Table of contentsVERUSINVESTMENTS.COM
SEATTLE 206.622.3700PITTSBURGH 412.784.6678LOS ANGELES 310.297.1777
SAN FRANCISCO 415.362.3484
3
Economic environment 6
Fixed income rates & credit 21
Equity 26
Other assets 36
Appendix 38

3rd quarter summaryTHE ECONOMIC CLIMATE
— Real GDP grew at a 12.2% rate year‐over‐year in Q2 (+6.7% quarterly annualized rate) as the U.S. fully recovered from the pandemic‐induced recession of 2020. p. 10
— In the U.S. labor market, unemployment has fallen as many workers who desired jobs have been successful in gaining employment. The overall U.S. labor participation rate has not improved, as millions of workers remain neither employed nor seeking employment. p. 15
— Consumer sentiment deteriorated during the third quarter, on reports of pessimism around the COVID Delta variant, higher inflation, and unfavorable economic prospects. Small business optimism also fell, as businesses face difficulty in hiring and are concerned about tax increases and more burdensome government regulations. p. 17
PORTFOLIO IMPACTS
— Credit markets traded in a relatively tight range throughout the quarter, delivering mild returns. Bank loans outperformed in Q3, returning 1.1% and outpacing high yield bonds (0.9%) and corporate investment grade (0.0%). p. 24
—U.S. core CPI, which excludes food & energy prices, rose 4.0% YoY in September. U.S. headline inflation came in at 5.4%. Price changes moderated during Q3, relative to the larger price moves that occurred in March through June. p. 12
4th Quarter 2021Investment Landscape
THE INVESTMENT CLIMATE
— The Biden Administration’s $3.5 trillion social spending package remains in the negotiation stage among Democrats, as the size of the package, the contents, and national concerns over inflation have given some members of the party reason to pause. The package is reportedly being scaled back, which creates the risk of rejection from progressives within the party who are pushing for more spending. p. 10
— It seems that investors have put the 2020 pandemic‐induced recession and its associated risks behind them. However, it is not clear that market risks have completely subsided, as the Delta‐variant continues to spread, high inflation could indeed persist, and most governments are set to pull back generous stimulus programs. p. 34
ASSET ALLOCATION ISSUES
— Equity markets took a breather in Q3. U.S. equities delivered 0.6%, while international equities experienced slight losses of ‐0.4% and emerging market equities saw a larger selloff of ‐8.1%, on an unhedged currency basis. p. 27
— Factor performance was negative during the quarter, as large capitalization stocks outperformed small cap by a wide margin (Russell 1000 +0.2%, Russell 2000 ‐4.4%) and growth stocks beat value (Russell 1000 Growth +1.2%, Russell 1000 Value ‐0.8%). p. 30
4
The economic recovery may be slowing, though the environment remains positive for risk assets
We believe a neutral risk stance is warranted in the current environment

What drove the market in Q3?
4th Quarter 2021Investment Landscape
NASDAQ GOLDEN DRAGON CHINA INDEX
SUPPLIER DELIVERY INDICES
5
Source: NASDAQ, Bloomberg, as of 9/30/21
Source: Bloomberg, as of 9/30/21
Source: Institute for Supply Management, as of 9/30/21
AVERAGE DAILY CASE GROWTH PER 100,000 (TRAILING TWO WEEKS)
“The World Economy’s Supply Chain Problem Keeps Getting Worse”
SHIPS AT ANCHOR OUTSIDE THE PORT OF LOS ANGELES (MONTHLY AVERAGE)
Apr May Jun Jul Aug Sep11 10 7 12 22 27
Article Source: Bloomberg, August 25th, 2021
“Beijing’s Crackdown Ruins July for Investors Everywhere”
NASDAQ GOLDEN DRAGON CHINA INDEX TOTAL RETURN
Apr May Jun Jul Aug Sep‐0.1% ‐5.6% +1.8% ‐22.0% ‐1.6% ‐9.8%
Article Source: Bloomberg, July 27th, 2021
“Commodities surge again; spot price index hits decade high”
BLOOMBERG COMMODITY SPOT INDEX
Apr May Jun Jul Aug Sep464.0 476.9 480.2 487.4 486.3 510.3
Article Source: BNN Bloomberg, September 13th, 2021
“Covid cases are rising again in all 50 states across U.S. as delta variant tightens its grip”DELTA VARIANT SHARE OF COVID CASE GROWTH IN THE UNITED STATES
Apr May Jun Jul Aug Sep0.6% 3.1% 31.9% 96.0% 97.9% 99.9%
Article Source: CNBC, as of July 23rd, 2021 0
20
40
60
80
Mar‐20 Sep‐20 Mar‐21 Sep‐21
U.S EU27 + U.K. Asia ex India India South America ex Brazil Brazil
40
50
60
70
80
Sep‐01 Sep‐06 Sep‐11 Sep‐16 Sep‐21
Manufacturing Services
A reading over 50 indicates suppliers are taking longer to deliver their input goods, relative to the prior month.
4,000
7,000
10,000
13,000
16,000
19,000
22,000
Sep‐19 Mar‐20 Sep‐20 Mar‐21 Sep‐21
The NASDAQ Golden Dragon China Index is comprised of companies whose stock is publicly traded in the United States and the majority of whose business is conducted within the People’s Republic of China.

Economic environment
4th Quarter 2021Investment Landscape 6

U.S. economics summary— Real GDP grew at a 12.2% rate
year‐over‐year in Q2 (+6.7% quarterly annualized rate) as the U.S. fully recovered from the pandemic‐induced recession of 2020. However, it appears that recent strong economic activity may be slowing down.
— U.S. core CPI, which excludes food & energy prices, rose 4.0% YoY in September. U.S. headline inflation came in at 5.4%. Price changes moderated during Q3, relative to the larger price moves that occurred in March through June, but remain elevated.
— Unemployment fell from 5.9% to 4.8% during the quarter, while the laborforce participation was unmoved at 61.6%. The unemployment rate has fallen as many workers who desired jobs have been successful in gaining employment, but the overall U.S. laborforce participation rate has not improved
— The Biden Administration’s $3.5 trillion social spending package remains in the negotiation stage among Democrats, as the size of the package, the contents, and national concerns over inflation have given some members of the party reason to pause. The package is reportedly being scaled back, which creates the risk of rejection from progressives within the party who are pushing for more spending.
— U.S. home prices have rocketed higher, up 19.7% over the past year, according to the S&P/Case‐Shiller U.S. National Home Price Index.
— Consumer sentiment was mixed over the quarter. The University of Michigan reported that the Delta variant and persistent inflation, as well as unfavorable prospects for the national economy, are weighing on sentiment. High prices of homes, vehicles, and durables are a concern.
4th Quarter 2021Investment Landscape 7
Most Recent 12 Months Prior
GDP (YoY) 12.2%6/30/21
(9.1%)6/30/20
Inflation(CPI YoY, Core)
4.0%9/30/21
1.7%9/30/20
Expected Inflation (5yr‐5yr forward)
2.2%9/30/21
1.7%9/30/20
Fed Funds Target Range
0% – 0.25%9/30/21
0% – 0.25%9/30/20
10‐Year Rate 1.49%9/30/21
0.68%9/30/20
U‐3 Unemployment 4.8%9/30/21
7.8%9/30/20
U‐6 Unemployment 8.5%9/30/21
12.8%9/30/20
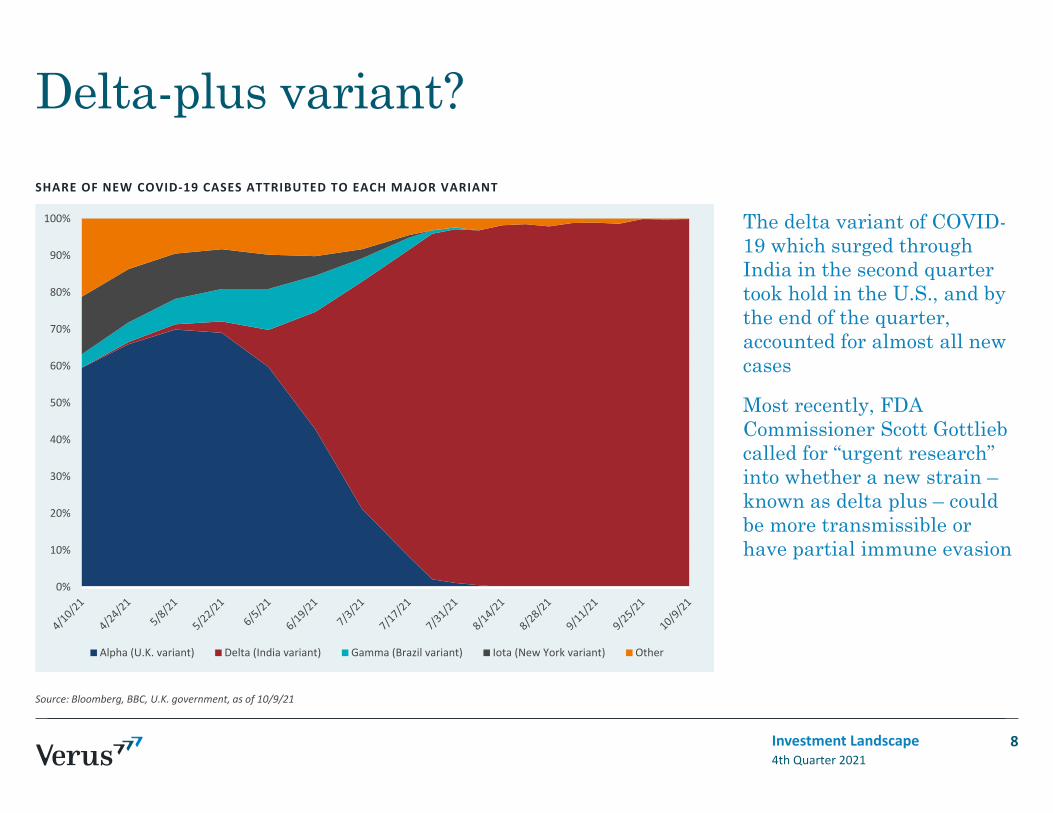
SHARE OF NEW COVID‐19 CASES ATTRIBUTED TO EACH MAJOR VARIANT
Delta-plus variant?
4th Quarter 2021Investment Landscape
The delta variant of COVID-19 which surged through India in the second quarter took hold in the U.S., and by the end of the quarter, accounted for almost all new cases
Most recently, FDA Commissioner Scott Gottlieb called for “urgent research” into whether a new strain –known as delta plus – could be more transmissible or have partial immune evasion
Source: Bloomberg, BBC, U.K. government, as of 10/9/21
8
0%
10%
20%
30%
40%
50%
60%
70%
80%
90%
100%
Alpha (U.K. variant) Delta (India variant) Gamma (Brazil variant) Iota (New York variant) Other
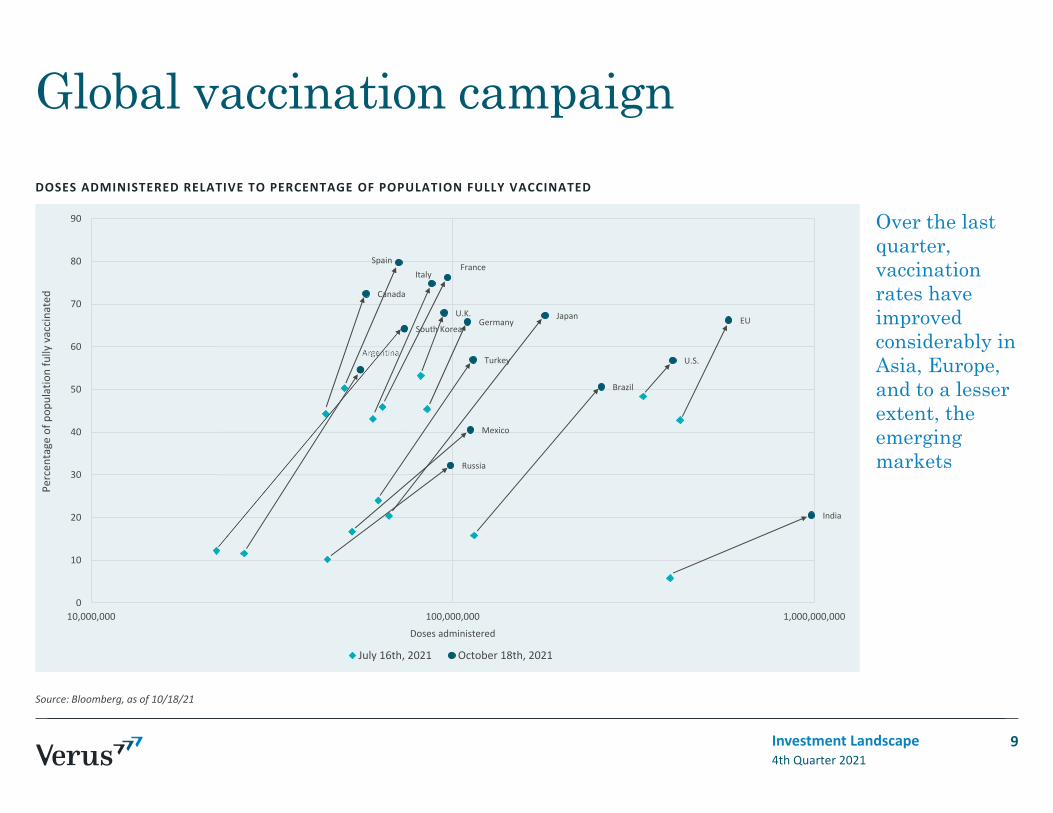
DOSES ADMINISTERED RELATIVE TO PERCENTAGE OF POPULATION FULLY VACCINATED
Global vaccination campaign
4th Quarter 2021Investment Landscape
Over the last quarter, vaccination rates have improved considerably in Asia, Europe, and to a lesser extent, the emerging markets
Source: Bloomberg, as of 10/18/21
9
EU
India
U.S.
Brazil
GermanyU.K. Japan
France
Turkey
Italy
Mexico
Spain
Russia
Canada
Argentina
South Korea
0
10
20
30
40
50
60
70
80
90
10,000,000 100,000,000 1,000,000,000
Percen
tage of p
opulation fully vaccina
ted
Doses administered
July 16th, 2021 October 18th, 2021

GDP growthReal GDP grew at a 12.2% rate year‐over‐year in Q2 (+6.7% quarterly annualized rate) as the U.S. fully recovered from the pandemic‐induced recession of 2020. However, it appears that recent strong economic activity may be slowing down. The Atlanta Fed GDPNow estimate, as of October 15th, suggests that GDP growth will slow to 1.2% in the fourth quarter (seasonally‐adjusted quarterly annualized rate).
In contrast to the wild swings of 2020, quarterly GDP growth has steadied. Consumption has contributed to the lion’s share of GDP, while supply chain issues have detracted from growth as some businesses have been unable to purchase inventory.
The Biden Administration’s $3.5 trillion social spending package remains in the negotiation stage among Democrats, as the size of the package, the contents, and national concerns over inflation have given some members of the party reason to pause. The package is reportedly being scaled back, which creates the risk of rejection from progressives within the party who are pushing for more spending. House Speaker Nancy Pelosi reportedly expressed the party’s intent to include each of the original social programs (expanded government healthcare, child tax credit, tuition‐free community college, etc.) but to scale back the planned length of guaranteed funding in order to reduce overall costs.
4th Quarter 2021Investment Landscape
During Q2 2021 the U.S. economy fully recovered from the COVID-19 recession
Source: FRED, as of 6/30/21 Source: FRED, as of 6/30/21
10
U.S. REAL GROSS DOMESTIC PRODUCT U.S. REAL GDP COMPONENTS (QOQ)
17,000
17,500
18,000
18,500
19,000
19,500
Jan‐18 Jan‐19 Jan‐20 Jan‐21
Real GDP
($ Billions)
1.5 2.6 2.4 ‐5.0
‐31.4
33.4
4.3 6.3 6.7
‐50‐40‐30‐20‐100
1020304050
Q2 19 Q3 19 Q4 19 Q1 20 Q2 20 Q3 20 Q4 20 Q1 21 Q2 21
U.S. R
eal G
DP Growth (Q
oQ)
Consumption Investment Government Exports Imports Inventories

IMPACT OF SEMICONDUCTOR SHORTAGE ON EUROPEAN TRUCK PRODUCTION (THOUSANDS) VESSELS AT ANCHOR – PORT OF LOS ANGELES
MAGNITUDE OF THE IMPACT OF SUPPLY CHAIN DISRUPTIONS ON SMALL BUSINESSES IN THE US
Supply chain disruptionsThroughout the course of the pandemic, idiosyncratic supply chain snags have caused largely temporary price distortions affecting all sorts of markets, from labor, to lumber, to meat‐packing and semiconductors, and many others. In some cases, these distortions have had a large impact on overall inflation levels. For example, limited semiconductor chip supplies led major suppliers to ration chips for higher‐margin tech clients at the expense of lower‐margin automaker clients. This prioritization resulted in a lower level of new vehicle production, and a massive surge in prices for used cars.
In September, key ports in Southern California hit several new cargo ship backlog records, forcing these ships to remain at anchor outside the ports
for several weeks in some cases. Part of the problem has been the massive size of these ships, which require many workers to unload, a lot of trucks to ship their cargo, and many warehouses to store that cargo. If there are not enough truckers to move the new cargo coming in, or there is not enough warehouse capacity to offload new cargo, new ships have longer unload times and the problem compounds. It is important to remember that global supply chains are very complex, and issues in certain segments tend to cascade through the others. According to the NFIB’s Small Business Optimism Survey, only 10% of small business owners have been insulated from the impacts of these disruptions. We will be watching corporate guidance to gauge the impact of these disruptions on profit margins.
4th Quarter 2021Investment Landscape
Source: The Port of Los Angeles, as of 10/15/21
11
0
5
10
15
20
25
30
35
40
Source: NFIB, as of 9/30/21Source: IHS Markit, as of 9/28/21
Significant impact, 35%
Moderate impact, 32%
Mild impact, 21%
No impact, 10%
400
450
500
550
600
650
2018 2019 2020 2021 2022 2023 2024 2025 2026
Q3 2021 European annual truck production forecast
Production with chip shortage in H2/2021‐2022

‐4%
0%
4%
8%
12%
16%
Dec‐70 Sep‐84 May‐98 Jan‐12
US CPI Ex Food & Energy US CPI
U.S. core CPI, which excludes food & energy prices, rose 4.0% YoY in September. U.S. headline inflation came in at 5.4%. Price changes moderated somewhat during Q3, relative to the larger price moves that occurred from March through June.
Energy and used automobile prices have had outsized impacts on inflation over the past year, increasing 24.8% and 24.4%, respectively. These two components have driven most of the rise in inflation experienced since 2019. If energy and used auto prices moderate, this will push inflation back down towards “normal” level, all else equal. However, continued supply chain issues appear to be contributing to a material rise in certain goods prices such as food, up +0.9% in September. Rent prices
(+0.5% over the month) are also a concern as costs begin to catch up with real estate values. As food comprises 13.9% of the overall inflation basket, and shelter comprises 32.6%, price moves across these categories could impact the direction of future inflation.
While we retain our long‐term view that inflation is likely to return to lower levels, as most of the recent increases can be attributed to base effects or short‐term one‐time issues, the significant disruptions in the global supply chain are clearly an important component of the developing story. If this disruption continues there will likely be ongoing effects on the economy as a whole, and on inflation outcomes. We continue to research this issue and it’s likely effects.
U.S. CPI (YOY) U.S. CPI (YOY) MONTHLY PRICE MOVEMENT
Inflation
4th Quarter 2021Investment Landscape
Recent moves suggest a moderation of prices, though we are watching closely for potential structural inflation
Source: BLS, as of 9/30/21 Source: BLS, as of 9/30/21 Source: BLS, as of 9/30/21
12
0.9%
1.7%
0%
2%
4%
6%
Sep‐19 Sep‐20 Sep‐21
0.2%0.1%
0.2%0.2%0.3%
0.4%
0.6%
0.8%
0.6%
0.9%
0.5%
0.3%0.4%
0.0%
0.2%
0.4%
0.6%
0.8%
1.0%
Sep‐20
Oct‐20
Nov
‐20
Dec‐20
Jan‐21
Feb‐21
Mar‐21
Apr‐21
May‐21
Jun‐21
Jul‐2
1
Aug‐21
Sep‐21
5.4% 4.6%
24.8%
4.0%
0%
10%
20%
30%
All items Food Energy All items lessfood & energy
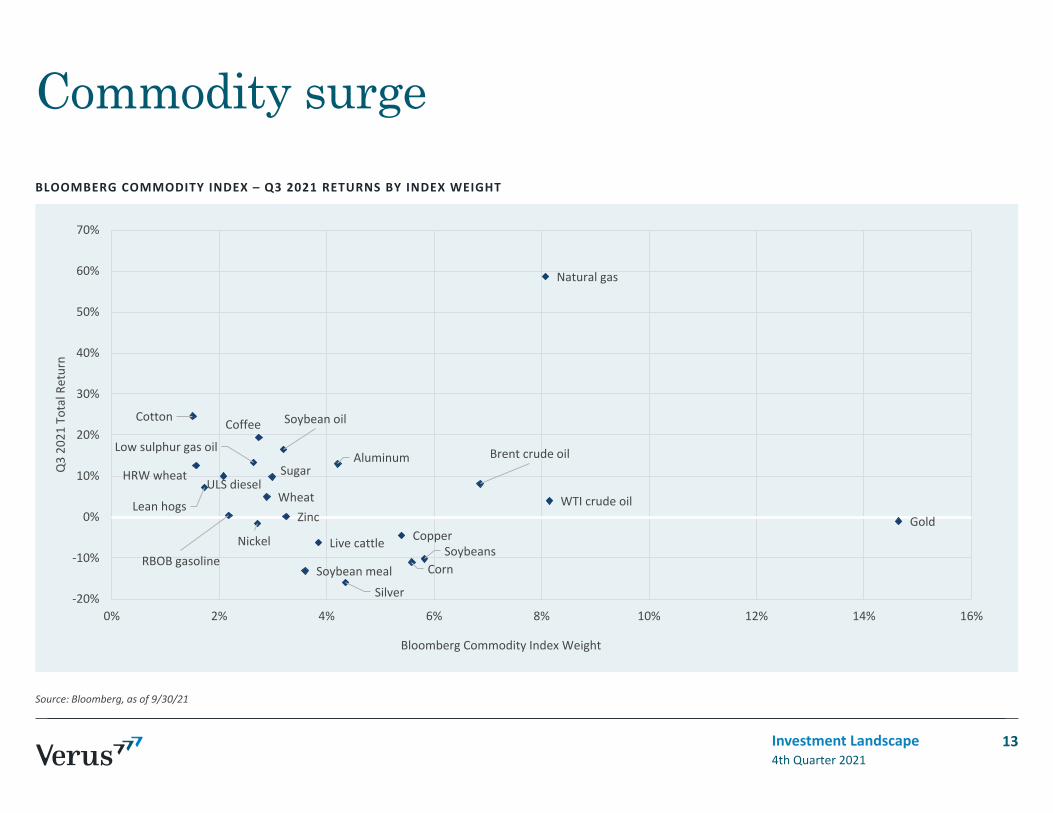
BLOOMBERG COMMODITY INDEX – Q3 2021 RETURNS BY INDEX WEIGHT
Commodity surge
4th Quarter 2021Investment Landscape
Source: Bloomberg, as of 9/30/21
13
WTI crude oil
Natural gas
Brent crude oilLow sulphur gas oil
RBOB gasoline
ULS diesel
CornSoybeans
Soybean meal
Wheat
Soybean oil
HRW wheat
Copper
Aluminum
Zinc
NickelGold
Silver
Sugar
CoffeeCotton
Live cattle
Lean hogs
‐20%
‐10%
0%
10%
20%
30%
40%
50%
60%
70%
0% 2% 4% 6% 8% 10% 12% 14% 16%
Q3 20
21 Total Return
Bloomberg Commodity Index Weight

UNEMPLOYMENT VS. JOB OPENINGS LABOR PARTICIPATION RATE % OF AMERICANS RETIRED
Labor marketU.S. unemployment fell from 5.9% to 4.8% during the quarter, while the labor participation rate was unmoved at 61.6%.
Two major themes can be observed in the U.S. labor market: 1) the unemployment rate has fallen as many workers who desired jobs have been successful in gaining employment, but 2) the overall U.S. laborforce participation rate has not improved, as millions of workers remain out of the laborforceand are not seeking employment. We continue to believe that the second effect has been fueled by approximately two million abnormally early retirements since 2020, which implies that the available U.S. workforce is now permanently smaller. As
demonstrated below and on the next slide, the proportion of retired Americans per age group has increased markedly since 2019. It is difficult to know the main drivers behind the trend towards early retirement, but greater wealth (strong returns from markets and real estate), the need to take care of family, and an unwillingness to return to full‐time work after extended periods of time off, may all be playing a part.
The number of U.S. job openings has far surpassed the supply of workers. As of August, 10.4 million job openings were posted across the country, while only 8.3 million Americans were seeking employment.
4th Quarter 2021Investment Landscape
A portion of the U.S. labor force remains neither employed nor seeking work
Much of this loss appears to be due to early retirements
Source: FRED, as of 9/30/21 Source: FRED, as of 9/30/21 Source: St. Louis Federal Reserve
14
57
59
61
63
65
67
69
Mar‐48 Mar‐68 Feb‐88 Feb‐08
Participation Ra
te (%
)
60
62
64
Sep‐19 Sep‐20 Sep‐21
2.5%
31.6
Women Men
Age cohort 2019 2021 2019 2021
55+ 52% 54% 44% 45%
55‐59 11% 11% 7% 7%
60‐64 28% 29% 21% 21%
65‐69 59% 62% 52% 53%
70‐74 78% 80% 71% 73%
75+ 87% 88% 83% 85%
0
5
10
15
20
25
2003 2007 2011 2015 2019
Millions
# Unemployed # Job Openings

Labor participation rate
4th Quarter 2021Investment Landscape
The U.S. labor participation rate remains considerably depressed, due to millions of workers being out of work and also not seeking work
Economic data suggests that this effect may be largely due to millions of unusually early retirements since 2019
Source: Federal Reserve Bank of St. Louis, Verus, as of Q2 2021
15
0.0%
‐1.3%‐1.6%
‐3%
‐2%
‐1%
0%
1%
2%
3%
2019 2020 2021
Cumulative % cha
nge in Lab
or
Participation Ra
te since Q2 20
19
Disability/Illness In school Family Responsibilities Shadow Labor Force Other Retirement Total Change in Participation
Early retirement appears to be the primary reason for the lower participation rate of older workers
88
92
96
100
104
Jun‐19 Dec‐19 Jun‐20 Dec‐20 Jun‐21
% Cha
nge in Partic
ipation Ra
te by Ag
e Group
Ages 20‐24 Ages 25‐54 Ages 55+
The labor participation rate among older workers remains depressed

U.S. retail sales remain strong but have now slowed for two consecutive quarters, lower by ‐1.1% in Q3. The reopening spending surge appears to be slowing down, as retail sales, auto sales, and home sales have all declined in recent months. Fears around the COVID‐19 Delta variant are also likely weighing on consumer spending activity. We examine quarterly rate of change here, because year‐over‐year rate of change (the traditional measure) is skewed due to the events of 2020.
Retail sales were expected to fall in September, but exceeded those expectations despite global supply chain issues and the rolling off of some enhanced government benefits. U.S. auto sales continued to fall sharply,
likely fueled by the dual effects of low supply and also the fact that many potential buyers, flush with stimulus cash, had already made a recent purchase.
According to anonymized cellular phone data collected by Google for COVID‐19 public health research, most economic activity seems to be back to normal for the most part. Public transportation and workplace travel remains the exception, though a recent uptick in workplace mobility might imply that some businesses are bringing staff back to the office.
REAL RETAIL SALES AUTO SALES GOOGLE U.S. ACTIVITY TRACKER
The consumer
4th Quarter 2021Investment Landscape
Source: FRED, as of 9/30/21 Source: Federal Reserve, as of 9/30/21 Source: Google anonymized U.S. citizen mobility, as of 9/30/21
16
14%
6
10
14
18
22
26
Feb‐82 Oct‐95 Jul‐09
Millions (a
nnua
l)
US Light Truck & Car Sales
$140
$150
$160
$170
$180
$190
$200
$210
$220
$230
$240
Jan‐15 Jan‐16 Jan‐17 Jan‐18 Jan‐19 Jan‐20 Jan‐21
Real Retail Sales ($
billion
s) 61014182226
Dec‐19 May‐21
‐100
‐50
0
50
100
Feb‐20 Aug‐20 Feb‐21 Aug‐21Retail & Recreation Grocery & PharmacyParks Transit StationsWorkplace Residential

405060708090
100110120
Sep‐85 May‐97 Jan‐09 Sep‐20
U of Michigan Consumer Sentiment Survey
Consumer sentiment deteriorated during the third quarter, on reports of pessimism around COVID‐19, inflation, and the economy. Small business optimism also fell as businesses face difficulty in hiring and are concerned about tax increases and more burdensome government regulations.
The University of Michigan Consumer Sentiment Survey attempts to gauge attitudes about the business climate, personal finances, and spending conditions. The survey reading fell from 85.5 to 72.8 on reports that the Delta variant and persistent inflation, as well as unfavorable prospects for the national economy, are weighing on sentiment. High prices of homes, vehicles, and durables are a concern, and only 18% of households anticipate that wage gains will be greater than inflation. The
Bloomberg Consumer Comfort Index attempts to gauge Americans’ views on the economy, their personal financial situation, and buying conditions. The index fell from 55.1 to 53.4.
The NFIB Small Business Optimism index fell from 102.5 to 99.1 during the quarter. As reported, “Small business owners are doing their best to meet the needs of customers, but are unable to hire workers or receive the needed supplies and inventories,” said NFIB Chief Economist Bill Dunkelberg. “The outlook for economic policy is not encouraging to owners, as lawmakers shift to talks about tax increases and additional regulations.”
CONSUMER COMFORT CONSUMER SENTIMENT SMALL BUSINESS OPTIMISM
Sentiment
4th Quarter 2021Investment Landscape
Source: Bloomberg, as of 9/30/21 Source: University of Michigan, as of 9/30/21 Source: NFIB, as of 9/30/21
17
72.842
80
85
90
95
100
105
110
Apr‐00 Apr‐05 Apr‐10 Apr‐15 Apr‐20
20
30
40
50
60
70
Oct‐91 Oct‐96 Oct‐01 Oct‐06 Oct‐11 Oct‐16 Oct‐21
Langer US Weekly Consumer Comfort Index
53.4

30YR FIXED MORTGAGE RATE (AVERAGE) U.S. HOME PRICES ZILLOW OBSERVED RENT INDEXES – ZORI* (YOY)
Housing U.S. home prices have rocketed higher, up 19.7% over the past year, according to the S&P/Case‐Shiller U.S. National Home Price Index. This surprising boom appears to have been the product of a perfect storm for home demand, impacted by ultra‐low interest rates, Americans’ need for more space in the work‐from‐home environment, and likely pent‐up demand from younger families who have been slower to purchase homes than past generations.
Mortgage interest rates have remained steady at around 3.0%, as attractive borrowing conditions support potential buyers who face elevated home prices.
The cost of renting has seen a considerable rise throughout the pandemic, with rents up 9.2% year‐over‐year in September, according to Zillow. The rise in rent prices has differed quite a bit across the country, and it may be reasonable to assume that states with more outgoing net migration (ex: New York, California) may be experiencing less upward rent pressure than states with more incoming net migration (ex: Arizona, Florida), as demonstrated by recent rental price trends. Dramatic increases in rent prices, without a commensurate improvement in wages, creates obvious issues for many Americans.
4th Quarter 2021Investment Landscape
*Measures changes in asking rents across 100 markets over time.Source: U.S. Census Bureau, as of 9/30/21 Source: S&P/Case‐Shiller U.S. National Home Price Index, as of 7/31/21 Source: Zillow ZORI, as of 9/30/21
18
3.0
4.0
Jul‐19 Dec‐19 May‐20
More affordable
Less affordable5.1
400
900
Jan‐19 Jan‐20 Jan‐21
0%
5%
10%
15%
20%
1980 1990 2000 2010 2020
30yr Fixed
Mortgage Ra
te
2%
3%
Jun‐20 Jun‐21
100
120
140
160
180
200
220
240
260
280
300
2003 2007 2011 2015 2019
U.S. H
ome Price Inde
x
‐10%
‐5%
0%
5%
10%
15%
20%
25%
Jan‐15 Jul‐16 Jan‐18 Jul‐19 Jan‐21United States New York, NYTampa, FL Atlanta, GASeattle, WA Phoenix, AZLA‐Long Beach‐Anaheim, CA San Francisco, CA
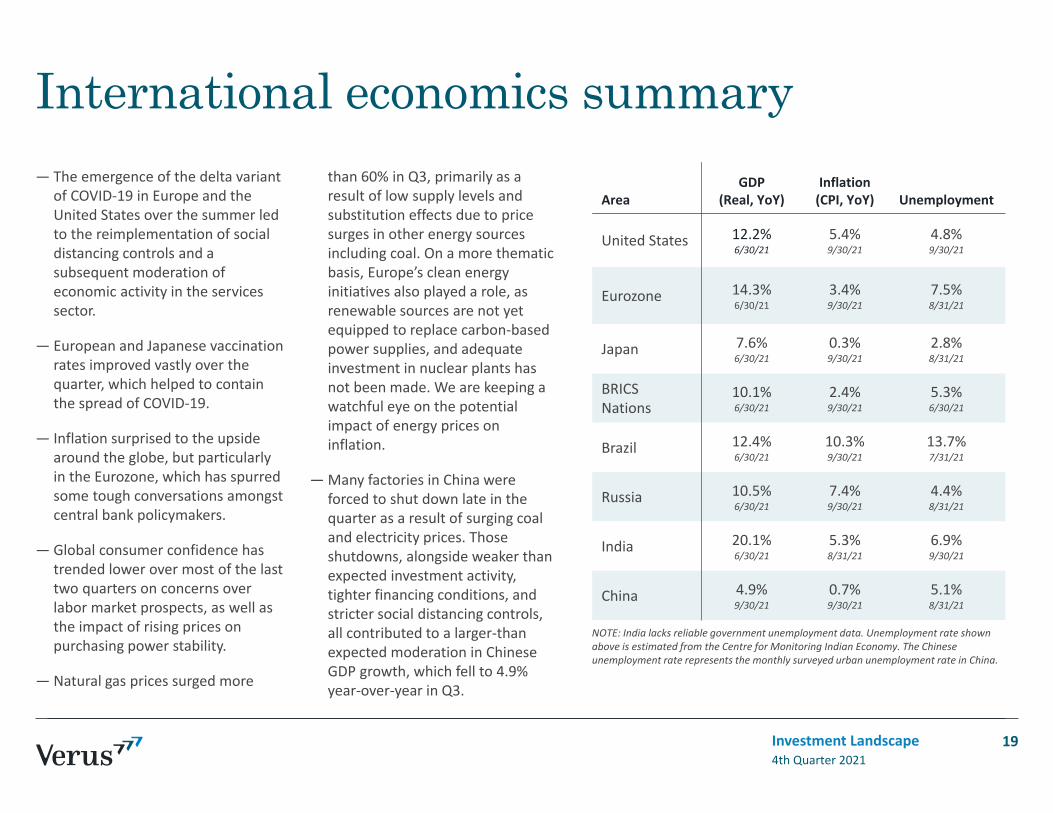
International economics summary— The emergence of the delta variant
of COVID‐19 in Europe and the United States over the summer led to the reimplementation of social distancing controls and a subsequent moderation of economic activity in the services sector.
— European and Japanese vaccination rates improved vastly over the quarter, which helped to contain the spread of COVID‐19.
— Inflation surprised to the upside around the globe, but particularly in the Eurozone, which has spurred some tough conversations amongst central bank policymakers.
— Global consumer confidence has trended lower over most of the last two quarters on concerns over labor market prospects, as well as the impact of rising prices on purchasing power stability.
— Natural gas prices surged more
than 60% in Q3, primarily as a result of low supply levels and substitution effects due to price surges in other energy sources including coal. On a more thematic basis, Europe’s clean energy initiatives also played a role, as renewable sources are not yet equipped to replace carbon‐based power supplies, and adequate investment in nuclear plants has not been made. We are keeping a watchful eye on the potential impact of energy prices on inflation.
—Many factories in China were forced to shut down late in the quarter as a result of surging coal and electricity prices. Those shutdowns, alongside weaker than expected investment activity, tighter financing conditions, and stricter social distancing controls, all contributed to a larger‐than expected moderation in Chinese GDP growth, which fell to 4.9% year‐over‐year in Q3.
4th Quarter 2021Investment Landscape 19
AreaGDP
(Real, YoY)Inflation (CPI, YoY) Unemployment
United States 12.2%6/30/21
5.4%9/30/21
4.8%9/30/21
Eurozone 14.3%6/30/21
3.4%9/30/21
7.5%8/31/21
Japan 7.6%6/30/21
0.3%9/30/21
2.8%8/31/21
BRICS Nations
10.1%6/30/21
2.4%9/30/21
5.3%6/30/21
Brazil 12.4%6/30/21
10.3%9/30/21
13.7%7/31/21
Russia 10.5%6/30/21
7.4%9/30/21
4.4%8/31/21
India 20.1%6/30/21
5.3%8/31/21
6.9%9/30/21
China 4.9%9/30/21
0.7%9/30/21
5.1%8/31/21
NOTE: India lacks reliable government unemployment data. Unemployment rate shown above is estimated from the Centre for Monitoring Indian Economy. The Chinese unemployment rate represents the monthly surveyed urban unemployment rate in China.
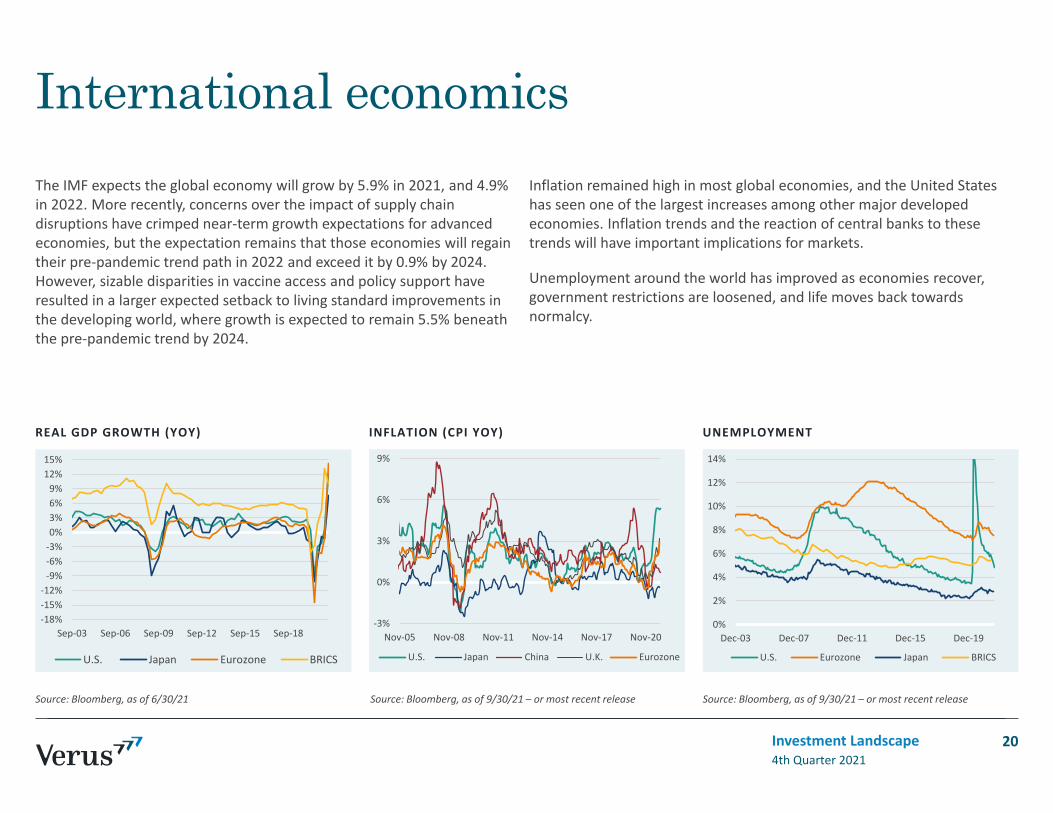
The IMF expects the global economy will grow by 5.9% in 2021, and 4.9% in 2022. More recently, concerns over the impact of supply chain disruptions have crimped near‐term growth expectations for advanced economies, but the expectation remains that those economies will regain their pre‐pandemic trend path in 2022 and exceed it by 0.9% by 2024. However, sizable disparities in vaccine access and policy support have resulted in a larger expected setback to living standard improvements in the developing world, where growth is expected to remain 5.5% beneath the pre‐pandemic trend by 2024.
Inflation remained high in most global economies, and the United States has seen one of the largest increases among other major developed economies. Inflation trends and the reaction of central banks to these trends will have important implications for markets.
Unemployment around the world has improved as economies recover, government restrictions are loosened, and life moves back towards normalcy.
‐18%‐15%‐12%‐9%‐6%‐3%0%3%6%9%
12%15%
Sep‐03 Sep‐06 Sep‐09 Sep‐12 Sep‐15 Sep‐18
U.S. Japan Eurozone BRICS
‐3%
0%
3%
6%
9%
Nov‐05 Nov‐08 Nov‐11 Nov‐14 Nov‐17 Nov‐20
U.S. Japan China U.K. Eurozone
REAL GDP GROWTH (YOY) INFLATION (CPI YOY) UNEMPLOYMENT
International economics
4th Quarter 2021Investment Landscape
Source: Bloomberg, as of 6/30/21 Source: Bloomberg, as of 9/30/21 – or most recent release Source: Bloomberg, as of 9/30/21 – or most recent release
20
0%
2%
4%
6%
8%
10%
12%
14%
Dec‐03 Dec‐07 Dec‐11 Dec‐15 Dec‐19
U.S. Eurozone Japan BRICS

Fixed income rates & credit
4th Quarter 2021Investment Landscape 21

Fixed income environment— The 10‐year U.S. Treasury yield
increased slightly during the quarter, from 1.45% to 1.52%. Longer‐term Treasury bond yields drifted lower in July and August before picking up considerably in September, as speculation mounted that the Federal Reserve would begin tapering the current asset purchase program ($80 billion in monthly Treasury purchases and $40 billion in monthly agency mortgage‐backed‐securities) in November or December of this year.
— Credit spreads traded in a relatively tight range during the quarter and remained at a very low level relative to the historical average. Historically low credit default rates have supported tight spread levels. Above‐average credit quality has also been supportive, specifically in the high‐yield universe. Although credit spreads are tight, spreads arguably remain healthy relative to current bond default levels.
— Reports that Evergrande, one of the
largest property developers in China, was on track to miss debt service payments led to a sell‐off in Chinese high‐yield debt as investors braced for potential contagion. Dollar‐denominated high‐yield Chinese bonds in aggregate fell by around 20% in value.
— Realized and expected inflation metrics reached high levels relative to history, sparking a number of different policy responses from central bankers. The base case at the Fed and at the ECB remains that inflation will be transitory, and that rates can remain at current levels at least until late next year. In contrast, officials at the Bank of England are now expected to begin hiking rates in November, and many central banks in the emerging markets have already begun tightening policy.
— The four‐year discount margin, our preferred spread metric for bank loans, compressed slightly over the quarter from 4.32% to 4.28%.
4th Quarter 2021Investment Landscape
Source: Bloomberg, as of 9/30/21
22
QTD Total Return
1 Year Total Return
Core Fixed Income(BBgBarc U.S. Aggregate) 0.1% (0.9%)
Core Plus Fixed Income (BBgBarc U.S. Universal) 0.1% 0.2%
U.S. Treasuries (BBgBarc U.S. Treasury) 0.1% (3.3%)
U.S. High Yield (BBgBarc U.S. Corporate HY)
0.9% 11.3%
Bank Loans(S&P/LSTA Leveraged Loan) 1.1% 8.4%
Emerging Market Debt Local (JPM GBI‐EM Global Diversified)
(3.1%) 2.6%
Emerging Market Debt Hard (JPM EMBI Global Diversified) (0.7%) 4.4%
Mortgage‐Backed Securities (BBgBarc MBS) 0.1% (0.4%)

Yield environment
4th Quarter 2021Investment Landscape
Source: Bloomberg, as of 9/30/21
23
YIELD CURVE CHANGES OVER LAST FIVE YEARS IMPLIED CHANGES OVER NEXT YEAR
U.S. YIELD CURVE GLOBAL GOVERNMENT YIELD CURVES
‐1%
0%
1%
2%
3%
1M3M6M 1Y 2Y 3Y 4Y 5Y 7Y 9Y 10Y 12Y 15Y 20Y 30Y
United States Curve 9/30/21 Japan Curve 9/30/21 Canada Curve 9/30/21Germany Curve 9/30/21 UK Curve 9/30/21 France Curve 9/30/21Italy Curve 9/30/21 Australia Curve 9/30/21
‐2%
‐1%
0%
1%
1M3M6M 1Y 2Y 3Y 4Y 5Y 7Y 9Y 10Y 12Y 15Y 20Y 30YUS Treasury Japan Treasury Canada TreasuryGermany Treasury UK Treasury France TreasuryItaly Treasury Australia Treasury
‐0.2%
0.0%
0.2%
0.4%
0.6%
0.8%
1M 3M 6M 1Y 2Y 3Y 4Y 5Y 7Y 9Y 10Y 12Y 15Y 20Y 30Y
Yield Ch
ange
US Treasury UK Treasury Japan TreasuryGermany Treasury Canada Treasury France TreasuryItaly Treasury Australia Treasury
‐1%
0%
1%
2%
3%
4%
5%
1M 3M 6M 1Y 2Y 3Y 5Y 7Y 10Y 20y 30Y
US Treasury Curve 9/30/21 US Treasury Curve 12/31/20US Treasury Curve 12/31/19 US Treasury Curve 12/31/18US Treasury Curve 12/31/17 US Treasury Curve 12/31/10

0%
5%
10%
15%
20%
25%
Dec‐01 Dec‐05 Dec‐09 Dec‐13 Dec‐17
Barclays Long US Corp. Barclays US Agg.Barclays US HY Bloomberg US HY EnergyIG Energy
200
500
800
1100
1400
1700
2000
2300
Dec‐15 May‐17 Sep‐18 Feb‐20 Jun‐21Bloomberg US HY Energy USD HY ConsDisc. OASUSD HY Financials Snr OAS USD HY Comm. OASUSD HY Comm. OAS USD HY Materials OASUSD HY Technology OAS USD HY Industrial OASUSD HY HealthCare OAS USD HY ConsStaple OAS
Market
Credit Spread (OAS)
9/30/21 9/30/20
Long U.S. Corp 1.2% 1.9%
U.S. Inv Grade Corp 0.8% 1.4%
U.S. High Yield 2.9% 5.2%
U.S. Bank Loans* 4.3% 5.3%
SPREADS HIGH YIELD SECTOR SPREADS (BPS)
Credit environmentCredit markets traded in a relatively tight range throughout the quarter, delivering mild returns. Bank loans outperformed, returning 1.1% and outpacing high yield bonds (0.9%) and corporate investment grade (0.0%). Credit spreads widened as strong demand did not fully offset lingering concerns around inflation, persistent supply chain delays, default the by Chinese property developer Evergrande, and risk of a government shutdown. High yield spreads widened 21 basis points to 289 basis points while investment grade spreads widened 4 basis points to end the quarter at 84 basis points.
Demand for high quality credit has been strong this year with an estimated $80 billion flowing into corporate investment grade funds. At the same
time, the sector has seen improvement in credit fundamentals as businesses repay some of last year’s precautionary borrowing, reducing total debt levels. Strong demand and declining leverage, in conjunction with a potentially higher rate environment, are all supportive factors for credit (for example: global investors have stepped in to buy high yield bonds as rates rise, despite tight credit spreads, because the U.S. is a higher interest rate market). Investment grade spreads have only been this tight roughly 5% of the time since 2000. Tight valuations, which product low spread carry and longer relative duration, likely present challenges to credit performance going forward.
4th Quarter 2021Investment Landscape
Source: Barclays, Credit Suisse, Bloomberg, as of 9/30/21Source: Barclays, Bloomberg, as of 9/30/21 Source: Bloomberg, as of 9/30/21 *Discount margin (4‐year life)
24
U.S. HY 2.9%
U.S. HY Energy 3.8%
U.S. Agg 0.8%

HY DEFAULT RATE (ROLLING 1‐YEAR) U.S. HY SECTOR DEFAULTS (LAST 12 MONTHS) U.S. ISSUANCE ($ BILLIONS)
Default & issuance
4th Quarter 2021Investment Landscape
Source: BofA Merrill Lynch, as of 9/30/21 Source: BofA Merrill Lynch, as of 9/30/21 – par weighted Source: BofA Merrill Lynch, as of 9/30/21
25
Default activity continued at a moderate pace in the third quarter with three defaults totaling $1.3 billion across high yield bonds and bank loans. Over the first three quarters of the year, a total of nine companies defaulted on $6.1 billion. As default activity continues to be light, the par‐weighted U.S. high yield default rate declined in half to end the quarter at 1.3% year‐over‐year. Similarly, the loan par‐weighted default rate ended the quarter at 0.9%, falling 3.4% year‐to‐date.
High yield bond issuance remains strong with Q3 gross issuance of $129.4 billion, bringing the year‐to date total to $469.8 billion. Leveraged loan issuance continued at a historic pace with $133.7 billion of new loan issued over the quarter. The $418.3 billion of loans issued year‐to‐date has already
surpassed all previous annual periods with the exception of 2017 ($419.2 billion).
Investment grade issuance for the quarter totaled $321 billion, below first ($423 billion) and second quarter ($350 billion) issuance but in‐line with the 4‐year average of $323 billion. Of note, year‐to‐date Financial sector issuance has seen an uptick, accounting for 42% of issuance versus its four‐year average share of roughly one‐third of total investment grade issuance.
0%
5%
10%
15%
20%
25%
Jan‐06 Jan‐09 Jan‐12 Jan‐15 Jan‐18 Jan‐21
Default (%)
U.S. High Yield U.S. High Yield ex‐Energy 0% 5% 10% 15% 20% 25%
CableGaming
Packaging/PaperUtilities
ChemicalsFood ProducersCapital Goods
AutosMetalsMedia
Real EstateTravel
ServicesFinancials
TechnologyTelecoms
HealthcareRetailEnergy
Transportation
0
100
200
300
400
500
600
2002
2003
2004
2005
2006
2007
2008
2009
2010
2011
2012
2013
2014
2015
2016
2017
2018
2019
2020 YTD
$ Billion
U.S. Bank Loan Issuance U.S. HY Issuance
Equity
4th Quarter 2021Investment Landscape 26
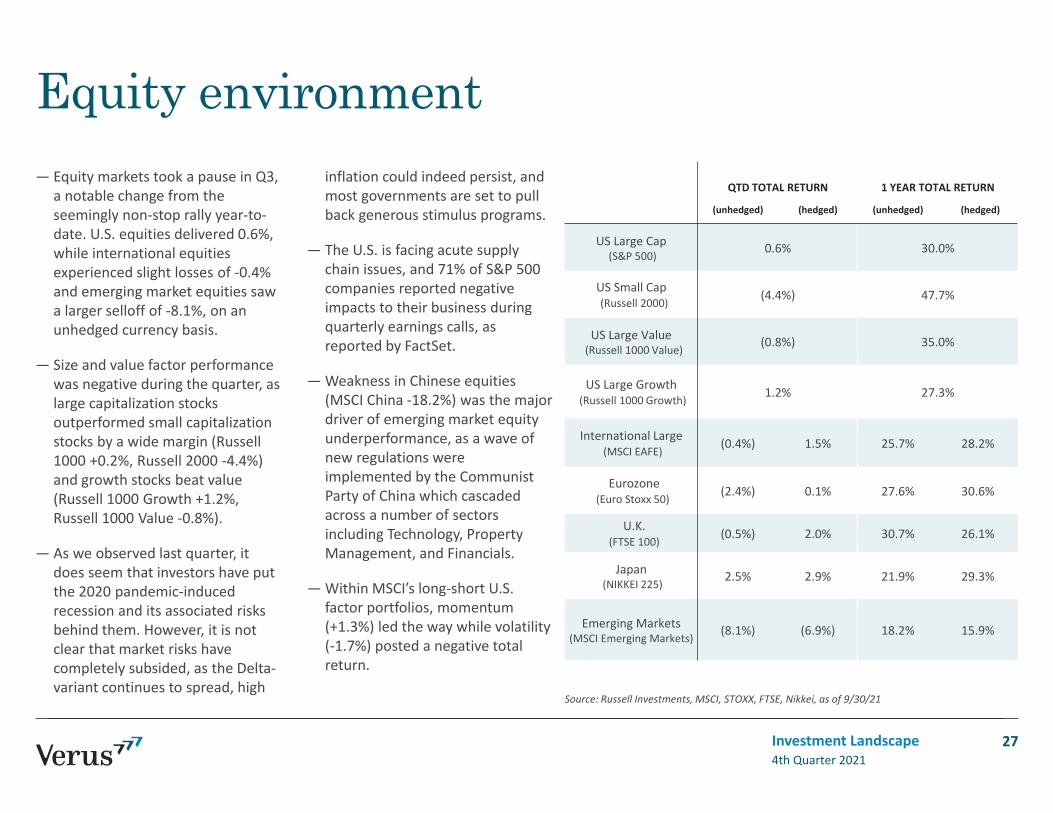
Equity environmentQTD TOTAL RETURN 1 YEAR TOTAL RETURN
(unhedged) (hedged) (unhedged) (hedged)
US Large Cap (S&P 500)
0.6% 30.0%
US Small Cap (Russell 2000)
(4.4%) 47.7%
US Large Value(Russell 1000 Value)
(0.8%) 35.0%
US Large Growth(Russell 1000 Growth)
1.2% 27.3%
International Large(MSCI EAFE)
(0.4%) 1.5% 25.7% 28.2%
Eurozone (Euro Stoxx 50)
(2.4%) 0.1% 27.6% 30.6%
U.K. (FTSE 100)
(0.5%) 2.0% 30.7% 26.1%
Japan (NIKKEI 225)
2.5% 2.9% 21.9% 29.3%
Emerging Markets(MSCI Emerging Markets)
(8.1%) (6.9%) 18.2% 15.9%
4th Quarter 2021Investment Landscape
Source: Russell Investments, MSCI, STOXX, FTSE, Nikkei, as of 9/30/21
— Equity markets took a pause in Q3, a notable change from the seemingly non‐stop rally year‐to‐date. U.S. equities delivered 0.6%, while international equities experienced slight losses of ‐0.4% and emerging market equities saw a larger selloff of ‐8.1%, on an unhedged currency basis.
— Size and value factor performance was negative during the quarter, as large capitalization stocks outperformed small capitalization stocks by a wide margin (Russell 1000 +0.2%, Russell 2000 ‐4.4%) and growth stocks beat value (Russell 1000 Growth +1.2%, Russell 1000 Value ‐0.8%).
— As we observed last quarter, it does seem that investors have put the 2020 pandemic‐induced recession and its associated risks behind them. However, it is not clear that market risks have completely subsided, as the Delta‐variant continues to spread, high
inflation could indeed persist, and most governments are set to pull back generous stimulus programs.
— The U.S. is facing acute supply chain issues, and 71% of S&P 500 companies reported negative impacts to their business during quarterly earnings calls, as reported by FactSet.
—Weakness in Chinese equities (MSCI China ‐18.2%) was the major driver of emerging market equity underperformance, as a wave of new regulations were implemented by the Communist Party of China which cascaded across a number of sectors including Technology, Property Management, and Financials.
—Within MSCI’s long‐short U.S. factor portfolios, momentum (+1.3%) led the way while volatility (‐1.7%) posted a negative total return.
27

U.S. equities performed relatively well in Q2, delivering a slightly positive return of 0.6% (S&P 500). The index is expected to report Q3 earnings growth of 27.6% year‐over‐year, as indicated by FactSet. The U.S. is facing acute supply chain issues, and 71% of S&P 500 companies reported negative impacts to their business during quarterly earnings calls.
Mildly higher interest rates during the quarter likely supported Financials (+2.7%) while acting as a headwind to growth‐oriented sectors such as Information Technology (+1.3%).
Performance over the near‐term may be constrained by a degree of economic slowdown induced by the COVID‐19 Delta variant, as well as moderating earnings growth expectations, although the analyst consensus price target for the S&P 500 over the next year is 5051, as of October 6th.
Recent price increases have raised questions around the defensibility of net profit margins, which are expected to moderate in Q3 but remain elevated well above recent averages. Some investors have begun to discuss positioning within sectors that have exhibited more pricing power.
S&P 500 INDEX S&P 500 NET PROFIT MARGINS Q3 SECTOR PERFORMANCE
Domestic equity
4th Quarter 2021Investment Landscape
Source: Standard & Poor’s, as of 9/30/21 Source: FactSet, as of 10/18/21 Source: Standard & Poor’s, as of 9/30/21
28
0
2
4
2017 2018 2019
2200
2700
3200
3700
4200
4700
Sep‐19 Mar‐20 Sep‐20 Mar‐21 Sep‐21‐4.2%
‐3.5%
‐1.7%
‐0.3%
0.0%
0.6%
0.9%
1.3%
1.4%
1.6%
1.8%2.7%
‐6% ‐3% 0% 3% 6%
Industrials
Materials
Energy
Consumer Staples
Consumer Discretionary
S&P 500
Real Estate
Information Technology
Health Care
Telecom
Utilities
Financials
7%
8%
9%
10%
11%
12%
13%
14%
Net profit margin Five‐year average
Q3 2021 forecast

U.S. equity Price/Earnings
4th Quarter 2021Investment Landscape
Corporate earnings growth has been the main driver of U.S. equity returns in 2021
Strong earnings growth expectations have led to slightly cheaper equities, as demonstrated by the P/E multiple
A very expensive “P” but record-growth of “E”
Source: Standard & Poor’s, Bloomberg, Factset ‐ Forward P/E , as of 9/30/21
29
‐10%
‐5%
0%
5%
10%
15%
20%
25%
30%
Jan‐21 Feb‐21 Mar‐21 Apr‐21 May‐21 Jun‐21 Jul‐21 Aug‐21 Sep‐21 Oct‐21
Earnings Growth Valuation Change Price Return

‐20
‐15
‐10
‐5
0
5
10
15
20
Jan‐10 Jan‐12 Jan‐14 Jan‐16 Jan‐18
Return Differen
ce (%
)
R3000 Value minus R3000 Growth
SMALL CAP VS LARGE CAP (YOY) VALUE VS GROWTH (YOY) VALUE VS. GROWTH RELATIVE VALUATIONS
Domestic equity size & styleLarge capitalization stocks outperformed small cap during the quarter by a wide margin (Russell 1000 +0.2%, Russell 2000 ‐4.4%) and growth stocks beat value (Russell 1000 Growth +1.2%, Russell 1000 Value ‐0.8%).
Following the notable turnaround in value stock performance during Q1, growth stocks took the lead in Q2, dampening excitement for a value comeback. Growth further outperformed in Q3. As we expressed earlier in the year, style performance is often impacted heavily by sector
randomness, which suggests that investors should be cautious in assuming that performance is signal rather than noise. Value stocks continue to be cheap relative to growth stocks, historically speaking. However, there does not appear to be a clear catalyst on the horizon that would imply a value timing opportunity. Factor performance tends to be noisy and difficult to predict, which suggests that style investing should in most cases involve a longer‐term focus.
4th Quarter 2021Investment Landscape
Large cap and growth stocks outperformed during Q3
Source: FTSE, as of 9/30/21 Source: FTSE, as of 9/30/21 Source: Standard & Poor’s, as of 9/30/21
30
‐20
‐15
‐10
‐5
0
5
10
15
20
Jan‐01 Jan‐04 Jan‐07 Jan‐10 Jan‐13 Jan‐16
Return Differen
ce (%
)
‐24%
‐16%
‐8%
0%
8%
16%
24%
32%
40%
Jun‐03 Jun‐08 Jun‐13 Jun‐18
Russell 2000 minus Russell 1000
‐46%
‐38%
‐30%
‐22%
‐14%
‐6%
2%
10%
Jun‐03 Jun‐08 Jun‐13 Jun‐18
R1000 Value minus R1000 Growth
‐15%
‐5%
5%
15%
0.0
0.5
1.0
1.5
2.0
2.5
Relative P/E (Value/Growth) (Left)Relative Average Valuation (Left)Subsequent 5 Year Rolling Excess Returns (Value/Growth) (Right)

International equities experienced slight losses of ‐0.4% (MSCI EAFE Index) during the quarter on an unhedged currency basis, lagging U.S. equities but outperforming emerging markets. Currency movement during the quarter resulted in a loss of ‐1.9% relative to those investors with a currency hedging program.
Japanese equities (MSCI Japan +4.6%) rallied on strong earnings, and on the news that Prime Minister Suga’s successor, Fumio Kishida, would be less likely to pursue tax hikes on investment income. Japan’s vaccination rate also improved considerably, and ended the quarter in line with major European countries, laying the groundwork for a broader reopening of the economy.
The strong performance of Japanese equities helped to offset for international developed equity investors the negative returns delivered by European equities (MSCI Europe ‐1.6%), which faced headwinds from a significant weakening in the pound sterling (‐2.4%) and euro (‐2.3%) relative to the U.S. dollar. According to futures market positioning data from the CFTC, more people are betting that the euro will depreciate in value than those betting that it will appreciate in value, for the first time since March 2020.
EFFECT OF CURRENCY (1‐YEAR ROLLING)INTERNATIONAL DEVELOPED EQUITIES EURO NET FUTURES POSITIONING
International developed equity
4th Quarter 2021Investment Landscape
Source: MSCI, as of 9/30/21 Source: MSCI, as of 9/30/21 Source: CFTC, non‐commercial positioning, as of 9/28/21
31
Tighter U.S. dollar liquidity
Dollar funding pressures easing
625
1250
2500
Jul‐92 Jul‐99 Jul‐06 Jul‐13 Jul‐20
Log scale
MSCI EAFE
U.S. yields relatively more attractive compared to Japanese yields
‐20%‐15%‐10%‐5%0%5%
10%15%20%25%30%
Jun‐09 Jun‐11 Jun‐13 May‐15 May‐17 May‐19 Apr‐21
MSCI EAFE MSCI ACWI ex USA MSCI EM‐200,000
‐150,000
‐100,000
‐50,000
0
50,000
100,000
150,000
200,000
250,000
Sep‐16 Sep‐17 Sep‐18 Sep‐19 Sep‐20 Sep‐21
Num
ber o
f con
tracts
More bullish bets on the euro
More bearish bets on the euro

Emerging market equities saw large losses (MSCI EM ‐8.1%) on an unhedged currency basis, underperforming other markets during the third quarter. China has dragged down emerging markets performance considerably, producing losses of ‐18.2% in Q3 relative to ex‐China emerging market performance of ‐2.0%, and producing losses of ‐7.2% over the past year relative to ex‐China emerging market performance of 36.9% (MSCI China vs. MSCI Emerging Markets ex‐China). China comprises 34% of the MSCI Emerging Markets Index.
Latin American emerging markets have taken the lead over Asian emerging markets over the past year, a notable change from strong Asian
leadership in recent years (MSCI EM Latin America +27.3%, MSCI EM Asia +13.9%)
Inflation in Brazil has risen to 10.3%, and in Russia to 7.4%, which has generated responses from central banks. Brazil has hiked their central bank rate from 2.00% to 6.25% to battle rising prices, while Russia has hiked its rate from 4.25% to 6.75% year‐to‐date. While inflation rate in the U.S. is one of the highest in the developed world, emerging markets are also facing tough decisions regarding the balance between economic recovery and the risks of uncomfortably high inflation.
EMERGING MARKET EQUITY INFLATION (YOY) Q3 PERFORMANCE – TOP 10 EM CONSTITUENTS
Emerging market equity
4th Quarter 2021Investment Landscape
Source: MSCI, as of 9/30/21 Source: Bloomberg, as of 9/30/21 or most recent data Source: Bloomberg, MSCI, as of 9/30/21, performance in USD terms
32
EM expected to accelerate while DM expected to slow
IMF Forecasts
‐30%
‐10%
10%
Sep‐18 Sep‐19
200
400
800
1600
Sep‐96 Sep‐01 Sep‐06 Sep‐11 Sep‐16 Sep‐21
Log Scale
MSCI Emerging Markets
‐2
2
6
10
14
18
2009 2010 2012 2013 2014 2016 2017 2019 2020
Infla
tion (%
)
Brazil CPI YoY China CPI Russia CPI YoY
Indexed 3/31/20 = 100
‐20.2%‐18.2%
‐13.2%‐8.1%‐5.8%‐3.6%‐2.1%
1.4%7.3%8.2%
12.6%
‐30% ‐20% ‐10% 0% 10% 20%
BrazilChinaKorea
Emerging MarketsSouth Africa
ThailandTaiwanMexicoRussia
Saudi ArabiaIndia

Forward price/earnings equity multiples have been falling around the world, as earnings expectations rise faster than equity prices, though valuations remain very high. U.S. stock valuations are, and have been, incredibly elevated. A larger share of technology stocks in U.S. indices partly explains these historically high prices, as technology stocks tend to demand a higher P/E than most other industry sectors. Investors appear to agree that high prices of domestic stocks will likely translate to below‐average future performance over the long‐term, as reflected in industry capital market assumptions.
Global equity earnings yields improved considerably, as trailing 12‐month earnings have rebounded from low levels. Price growth has moderated in the U.S. and has moved into negative territory across international developed and emerging market equities. The question moving ahead will be whether valuations (which remain rich) are sustainable absent further above‐average earnings growth. Rising prices of major input costs, including labor and energy, have dampened the outlook for margins, which may lead companies to raise prices where possible. This pricing power varies by sector and by region.
FORWARD P/E RATIOS CURRENT EARNINGS YIELD (3‐MONTH AVERAGE)
Equity valuations
4th Quarter 2021Investment Landscape
Source: MSCI, 12m forward P/E, as of 9/30/21 Source: Bloomberg, MSCI, as of 9/30/21 Source: Bloomberg, MSCI as of 9/30/21 ‐ trailing P/E
33
VALUATION METRICS (3‐MONTH AVERAGE)
*projected
4.7
26.9
31.8
1.33.7
1.8
19.3
10.4
2.55.2
1.9
15.8 15.9
2.2
6.3
0
5
10
15
20
25
30
35
P/B P/E P/FCF DividendYield (%)
EarningsYield (%)
United States EAFE Emerging Markets
5
10
15
20
25
Sep‐05 Sep‐09 Sep‐13 Sep‐17 Sep‐21
U.S. EAFE EM
0%
3%
6%
9%
12%
15%
Sep‐01 Sep‐06 Sep‐11 Sep‐16 Sep‐21
U.S. EAFE EM

The Cboe VIX Index remained below the longer‐term average of 19 through July and August, then increased throughout September, ending the quarter at an elevated 23.1. This compares to only 13.9% realized volatility over the past year. As is typical, international developed equity realized volatility has been slightly greater than that of the U.S. market. The realized volatility of emerging market equities, on the other hand, has been on par with the U.S. for a few years—a rare occurrence, historically speaking.
As we observed last quarter, it does seem that investors have put the 2020 pandemic‐induced recession and its associated risks behind them. However, it is not clear that market risks have completely subsided, as the Delta‐variant continues to spread, high inflation could indeed persist, and most governments are set to pull back generous stimulus programs. While U.S. equities have marched higher with very few road bumps over the year‐to‐date, the S&P 500 Index closed the quarter 5.1% below its previous record high level, snapping a streak of 231 consecutive trading days where it had not fallen more than 5% beneath the record high.
U.S. IMPLIED VOLATILITY (VIX) REALIZED VOLATILITY DAYS SINCE LAST 5% DRAWDOWN – S&P 500
Equity volatility
4th Quarter 2021Investment Landscape
Source: Cboe, as of 9/30/21 Source: Standard & Poor’s, MSCI, as of 9/30/21 Source: Standard & Poor’s, Verus, as of 9/30/21
34
10203040
Sep‐18 Dec‐18
0
10
20
30
40
50
60
70
80
90
Jun‐90 Dec‐95 Jun‐01 Nov‐06 May‐12 Nov‐17
VIX
0%
10%
20%
30%
40%
50%
60%
Mar‐03 Mar‐08 Mar‐13 Mar‐18
Volatility
(1yr Rollin
g)
S&P 500 MSCI EAFE MSCI EM
‐10
40
90
Dec‐19 Jul‐20 Feb‐21 Aug‐21
0
50
100
150
200
250
Sep‐18 Sep‐19 Sep‐20 Sep‐21

500
1000
1500
2000
2500
3000
3500
4000
4500
5000
5500
Sep‐11 Sep‐13 Sep‐15 Sep‐17 Sep‐19 Sep‐21
Growth of $
1,00
0
S&P 500 Russell 2000 MSCI EAFE MSCI EAFE Small MSCI Emerging Markets MSCI ACWI
Long-term equity performance
4th Quarter 2021Investment Landscape
Source: Morningstar, as of 9/30/21
35

Other assets
4th Quarter 2021Investment Landscape 36
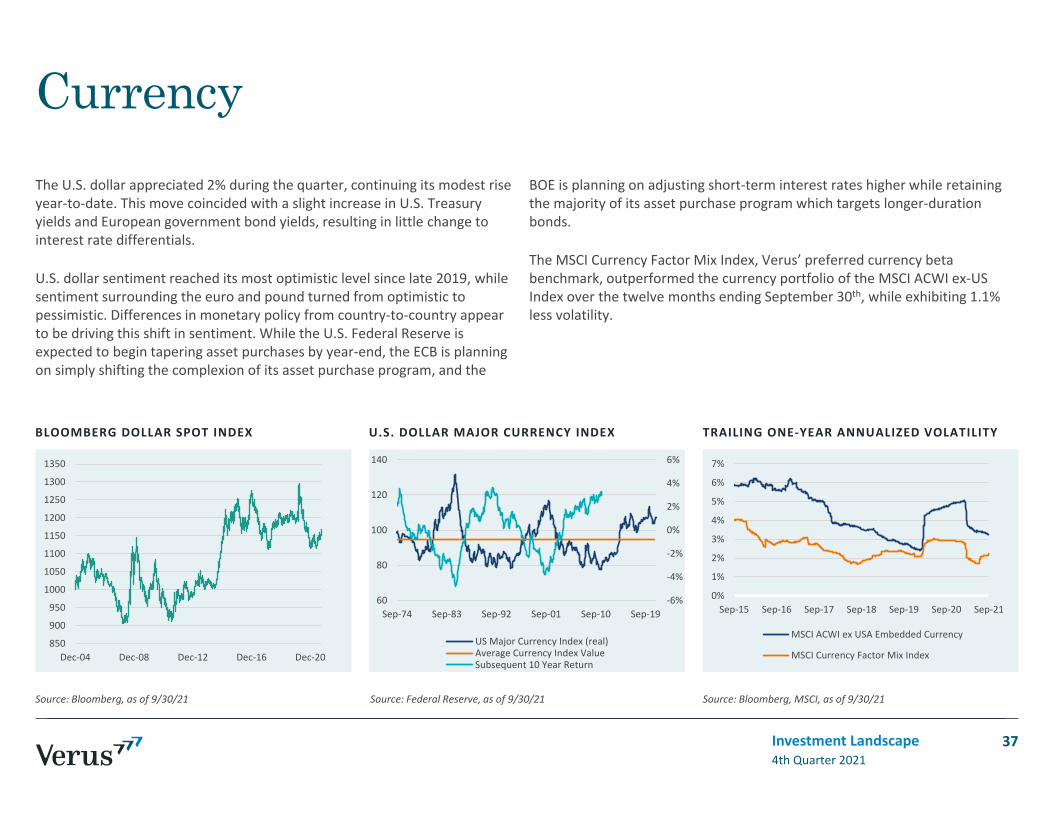
The U.S. dollar appreciated 2% during the quarter, continuing its modest rise year‐to‐date. This move coincided with a slight increase in U.S. Treasury yields and European government bond yields, resulting in little change to interest rate differentials.
U.S. dollar sentiment reached its most optimistic level since late 2019, while sentiment surrounding the euro and pound turned from optimistic to pessimistic. Differences in monetary policy from country‐to‐country appear to be driving this shift in sentiment. While the U.S. Federal Reserve is expected to begin tapering asset purchases by year‐end, the ECB is planning on simply shifting the complexion of its asset purchase program, and the
BOE is planning on adjusting short‐term interest rates higher while retaining the majority of its asset purchase program which targets longer‐duration bonds.
The MSCI Currency Factor Mix Index, Verus’ preferred currency beta benchmark, outperformed the currency portfolio of the MSCI ACWI ex‐US Index over the twelve months ending September 30th, while exhibiting 1.1% less volatility.
BLOOMBERG DOLLAR SPOT INDEX U.S. DOLLAR MAJOR CURRENCY INDEX TRAILING ONE‐YEAR ANNUALIZED VOLATILITY
Currency
4th Quarter 2021Investment Landscape
Source: Bloomberg, as of 9/30/21 Source: Federal Reserve, as of 9/30/21 Source: Bloomberg, MSCI, as of 9/30/21
37
‐6%
‐4%
‐2%
0%
2%
4%
6%
60
80
100
120
140
Sep‐74 Sep‐83 Sep‐92 Sep‐01 Sep‐10 Sep‐19
US Major Currency Index (real)Average Currency Index ValueSubsequent 10 Year Return
850
900
950
1000
1050
1100
1150
1200
1250
1300
1350
Dec‐04 Dec‐08 Dec‐12 Dec‐16 Dec‐20
0%
1%
2%
3%
4%
5%
6%
7%
Sep‐15 Sep‐16 Sep‐17 Sep‐18 Sep‐19 Sep‐20 Sep‐21
MSCI ACWI ex USA Embedded Currency
MSCI Currency Factor Mix Index

Appendix
4th Quarter 2021Investment Landscape 38

Periodic table of returns
Source Data: Morningstar, Inc., Hedge Fund Research, Inc. (HFR), National Council of Real Estate Investment Fiduciaries (NCREIF). Indices used: Russell 1000, Russell 1000 Value, Russell 1000 Growth, Russell 2000, Russell 2000 Value, Russell 2000 Growth, MSCI EAFE, MSCI EM, Bloomberg US Aggregate, T‐Bill 90 Day, Bloomberg Commodity, NCREIF Property, HFRI FOF, MSCI ACWI, Bloomberg Global Bond. NCREIF Property Index performance data as of 6/30/21.
Large Cap Equity Small Cap Growth Commodities
Large Cap Value International Equity Real Estate
Large Cap Growth Emerging Markets Equity Hedge Funds of Funds
Small Cap Equity US Bonds 60% MSCI ACWI/40% BBgBarc Global Bond
Small Cap Value Cash
BEST
WORS
T
4th Quarter 2021Investment Landscape 39
1999 2000 2001 2002 2003 2004 2005 2006 2007 2008 2009 2010 2011 2012 2013 2014 2015 2016 2017 2018 2019 2020 YTD 5‐Year 10‐Year
Commodities 66.4 31.8 14.0 25.9 56.3 26.0 34.5 32.6 39.8 5.2 79.0 29.1 14.3 18.6 43.3 13.5 13.3 31.7 37.3 6.7 36.4 38.5 29.1 22.8 19.7
Small Cap Value 43.1 22.8 8.4 10.3 48.5 22.2 21.4 26.9 16.2 1.4 37.2 26.9 7.8 18.1 38.8 13.2 5.7 21.3 30.2 1.9 31.4 34.6 22.9 17.1 16.8
Large Cap Value 33.2 12.2 7.3 6.7 47.3 20.7 20.1 23.5 15.8 ‐6.5 34.5 24.5 2.6 17.9 34.5 13.0 0.9 17.3 25.0 0.0 28.5 21.0 16.1 15.3 15.7
Large Cap Equity 27.3 11.6 3.3 1.6 46.0 18.3 14.0 22.2 11.8 ‐21.4 32.5 19.2 1.5 17.5 33.5 11.8 0.6 12.1 22.2 ‐1.5 26.5 20.0 15.2 13.5 14.6
Large Cap Growth 26.5 7.0 2.8 1.0 39.2 16.5 7.5 18.4 11.6 ‐25.9 28.4 16.8 0.4 16.4 33.1 6.0 0.0 11.8 21.7 ‐3.5 25.5 18.3 14.3 11.0 13.5
Small Cap Equity 21.3 4.1 ‐2.4 ‐6.0 29.9 14.3 6.3 15.5 10.3 ‐33.8 23.3 16.1 ‐2.1 15.3 23.3 4.9 ‐0.8 11.2 14.6 ‐6.0 22.4 14.0 12.4 10.9 13.2
International Equity 24.3 6.0 2.5 ‐5.9 30.0 14.5 7.1 16.6 10.9 ‐28.9 27.2 16.7 0.1 16.3 32.5 5.6 ‐0.4 11.3 17.1 ‐4.8 22.0 10.3 8.3 9.2 8.8
Hedge Funds of Funds 20.9 ‐3.0 ‐5.6 ‐11.4 29.7 12.9 5.3 15.1 7.0 ‐35.6 20.6 15.5 ‐2.9 14.6 12.1 4.2 ‐1.4 8.0 13.7 ‐8.3 18.6 7.8 6.4 8.9 8.1
Real Estate 13.2 ‐7.3 ‐9.1 ‐15.5 25.2 11.4 4.7 13.3 7.0 ‐36.8 19.7 13.1 ‐4.2 11.5 11.0 3.4 ‐2.5 7.1 7.8 ‐9.3 18.4 7.5 5.4 8.8 8.0
60/40 Global Portfolio 11.4 ‐7.8 ‐9.2 ‐15.7 23.9 9.1 4.6 10.4 5.8 ‐37.6 18.9 10.2 ‐5.5 10.5 9.0 2.8 ‐3.8 5.7 7.7 ‐11.0 8.7 4.6 5.0 6.1 6.1
Small Cap Growth 7.3 ‐14.0 ‐12.4 ‐20.5 11.6 6.9 4.6 9.1 4.4 ‐38.4 11.5 8.2 ‐5.7 4.8 0.1 0.0 ‐4.4 2.6 7.0 ‐11.2 7.8 2.8 2.8 5.9 4.5
Cash 4.8 ‐22.4 ‐19.5 ‐21.7 9.0 6.3 4.2 4.8 ‐0.2 ‐38.5 5.9 6.5 ‐11.7 4.2 ‐2.0 ‐1.8 ‐7.5 1.0 3.5 ‐12.9 7.7 0.5 0.0 4.5 3.0
Emerging Markets Equity ‐0.8 ‐22.4 ‐20.4 ‐27.9 4.1 4.3 3.2 4.3 ‐1.6 ‐43.1 0.2 5.7 ‐13.3 0.1 ‐2.3 ‐4.5 ‐14.9 0.5 1.7 ‐13.8 6.4 0.5 ‐1.2 2.9 0.6
US Bonds ‐1.5 ‐30.6 ‐21.2 ‐30.3 1.0 1.4 2.4 2.1 ‐9.8 ‐53.2 ‐16.9 0.1 ‐18.2 ‐1.1 ‐9.5 ‐17.0 ‐24.7 0.3 0.9 ‐14.6 2.1 ‐3.1 ‐1.6 1.1 ‐2.7
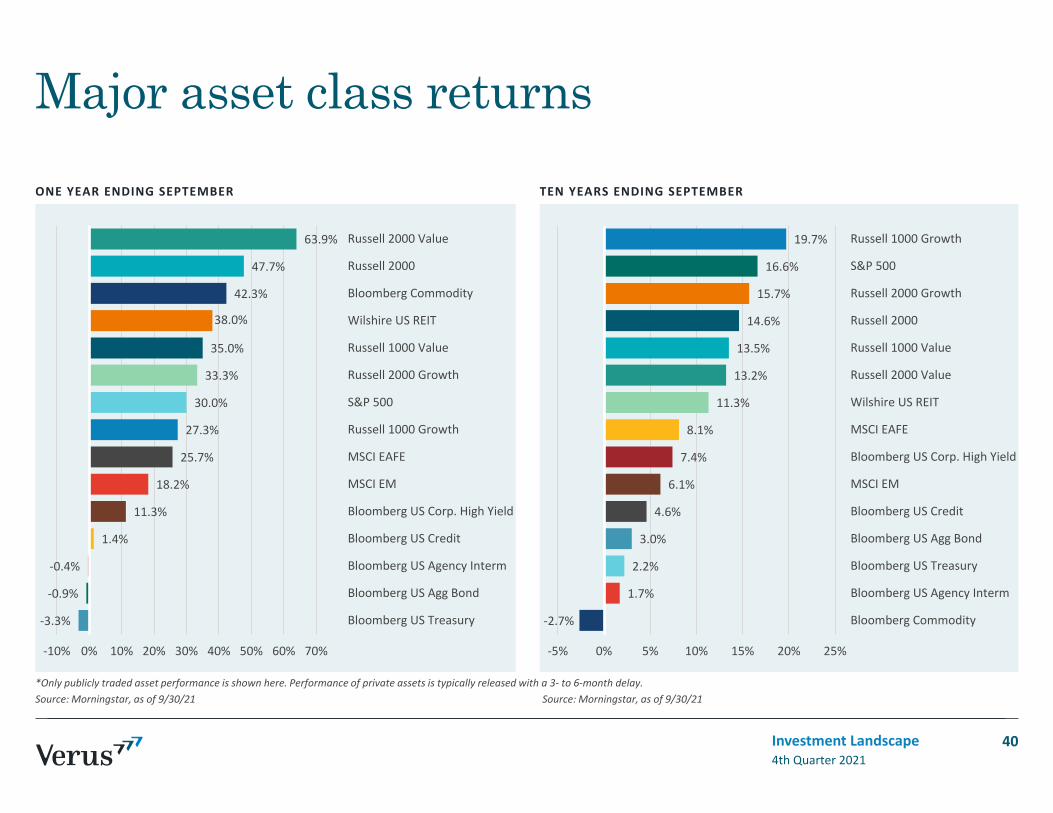
ONE YEAR ENDING SEPTEMBER
Major asset class returns
*Only publicly traded asset performance is shown here. Performance of private assets is typically released with a 3‐ to 6‐month delay.Source: Morningstar, as of 9/30/21 Source: Morningstar, as of 9/30/21
TEN YEARS ENDING SEPTEMBER
4th Quarter 2021Investment Landscape 40
‐3.3%
‐0.9%
‐0.4%
1.4%
11.3%
18.2%
25.7%
27.3%
30.0%
33.3%
35.0%
38.0%
42.3%
47.7%
63.9%
‐10% 0% 10% 20% 30% 40% 50% 60% 70%
Bloomberg US Treasury
Bloomberg US Agg Bond
Bloomberg US Agency Interm
Bloomberg US Credit
Bloomberg US Corp. High Yield
MSCI EM
MSCI EAFE
Russell 1000 Growth
S&P 500
Russell 2000 Growth
Russell 1000 Value
Wilshire US REIT
Bloomberg Commodity
Russell 2000
Russell 2000 Value
‐2.7%
1.7%
2.2%
3.0%
4.6%
6.1%
7.4%
8.1%
11.3%
13.2%
13.5%
14.6%
15.7%
16.6%
19.7%
‐5% 0% 5% 10% 15% 20% 25%
Bloomberg Commodity
Bloomberg US Agency Interm
Bloomberg US Treasury
Bloomberg US Agg Bond
Bloomberg US Credit
MSCI EM
Bloomberg US Corp. High Yield
MSCI EAFE
Wilshire US REIT
Russell 2000 Value
Russell 1000 Value
Russell 2000
Russell 2000 Growth
S&P 500
Russell 1000 Growth

Q3 2021
S&P 500 sector returns
Source: Morningstar, as of 9/30/21 Source: Morningstar, as of 9/30/21
ONE YEAR ENDING SEPTEMBER
4th Quarter 2021Investment Landscape 41
‐4.2%
‐3.5%
‐1.7%
‐0.3%
0.0%
0.6%
0.9%
1.3%
1.4%
1.6%
1.8%
2.7%
‐6% ‐3% 0% 3% 6%
Industrials
Materials
Energy
Consumer Staples
Consumer Discretionary
S&P 500
Real Estate
Information Technology
Health Care
Telecom
Utilities
Financials
11.0%
11.3%
19.1%
22.6%
26.5%
28.9%
29.0%
30.0%
30.5%
38.4%
59.1%
83.0%
0% 20% 40% 60% 80%
Utilities
Consumer Staples
Consumer Discretionary
Health Care
Materials
Information Technology
Industrials
S&P 500
Real Estate
Telecom
Financials
Energy

Private equity vs. traditional assets performance
42
‐5.6%
5.7% 2.9%2.2% 1.8%
0%
20%
40%
60%
80%
1 Year 3 Year 5 Year 10 Year 20 YearVC/Gr Buyouts Debt/SS Total Direct Russell 3000 Barclays Agg.
‐13.6%
3.4% ‐0.5% ‐0.4% 0.0%
0%
20%
40%
60%
80%
1 Year 3 Year 5 Year 10 Year 20 YearFoF Secondaries Total "Passive" Russell 3000 Barclays Agg.
Direct P.E Fund Investments outperformed comparable public equites across all time periods, aside from the 1-year basis.
“Passive” strategies underperformed comparable public equities across all time periods, aside from the 3-year basis.
Investment Landscape2nd Quarter 2021
Sources: Refinitiv Cambridge Universe’s PME Module: U.S. Private Equity Funds sub asset classes as of March 31, 2021. Public Market Equivalent returns resulted from “Total Passive” and Total Direct’s identical cash flows invested into and distributed from respective traditional asset comparable.
DIRECT PRIVATE EQUITY FUND INVESTMENTS
“PASSIVE” STRATEGIES
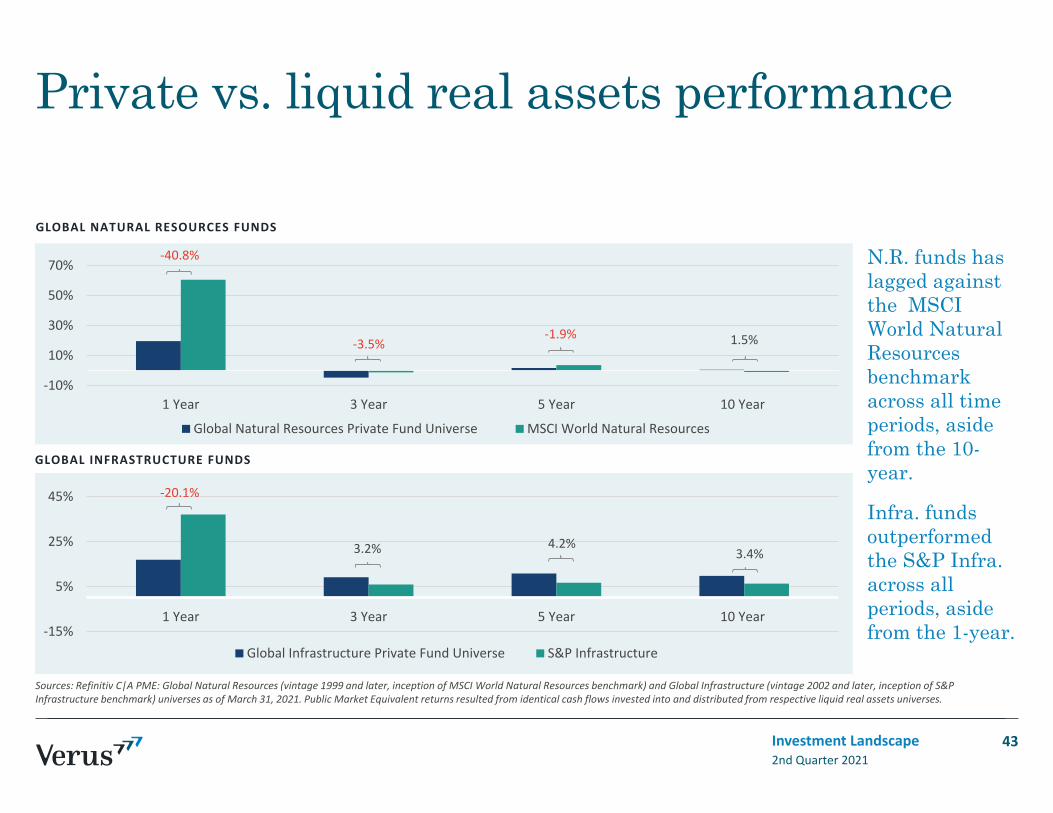
Private vs. liquid real assets performance
43
‐40.8%
‐3.5%‐1.9% 1.5%
‐10%
10%
30%
50%
70%
1 Year 3 Year 5 Year 10 Year
Global Natural Resources Private Fund Universe MSCI World Natural Resources
N.R. funds has lagged against the MSCI World Natural Resources benchmark across all time periods, aside from the 10-year.
Infra. funds outperformed the S&P Infra. across all periods, aside from the 1-year.
‐20.1%
3.2% 4.2%3.4%
‐15%
5%
25%
45%
1 Year 3 Year 5 Year 10 Year
Global Infrastructure Private Fund Universe S&P Infrastructure
Investment Landscape2nd Quarter 2021
Sources: Refinitiv C|A PME: Global Natural Resources (vintage 1999 and later, inception of MSCI World Natural Resources benchmark) and Global Infrastructure (vintage 2002 and later, inception of S&P Infrastructure benchmark) universes as of March 31, 2021. Public Market Equivalent returns resulted from identical cash flows invested into and distributed from respective liquid real assets universes.
GLOBAL NATURAL RESOURCES FUNDS
GLOBAL INFRASTRUCTURE FUNDS

10.5%
2.1%2.6%
2.1%
0.7%
0%
5%
10%
15%
1 Year 3 Year 5 Year 10 Year 20 YearU.S. Real Estate Private Fund Universe NCREIF Property Index
Private vs. liquid and core real estate performance
44
‐21.4%
‐2.3%3.5%
2.4%
‐1.7%
0%
5%
10%
15%
1 Year 3 Year 5 Year 10 Year 20 YearU.S. Real Estate Private Fund Universe Wilshire US REIT
U.S. Private R.E. funds lagged against the Wilshire U.S. REIT Index across all time periods, aside on the 5 and 10 year-basis.
U.S. Private R.E. Funds outperformed the NCREIF Property Index across all time periods.
Investment Landscape2nd Quarter 2021
U.S. PRIVATE REAL ESTATE FUNDS VS. LIQUID UNIVERSE
U.S. PRIVATE REAL ESTATE FUNDS VS. CORE FUNDS
Sources: Refinitiv C|A PME: Global and U.S. Real Estate universes as of March 31, 2021. Public Market Equivalent returns resulted from identical cash flows invested into and distributed from respective liquid real estate universes.
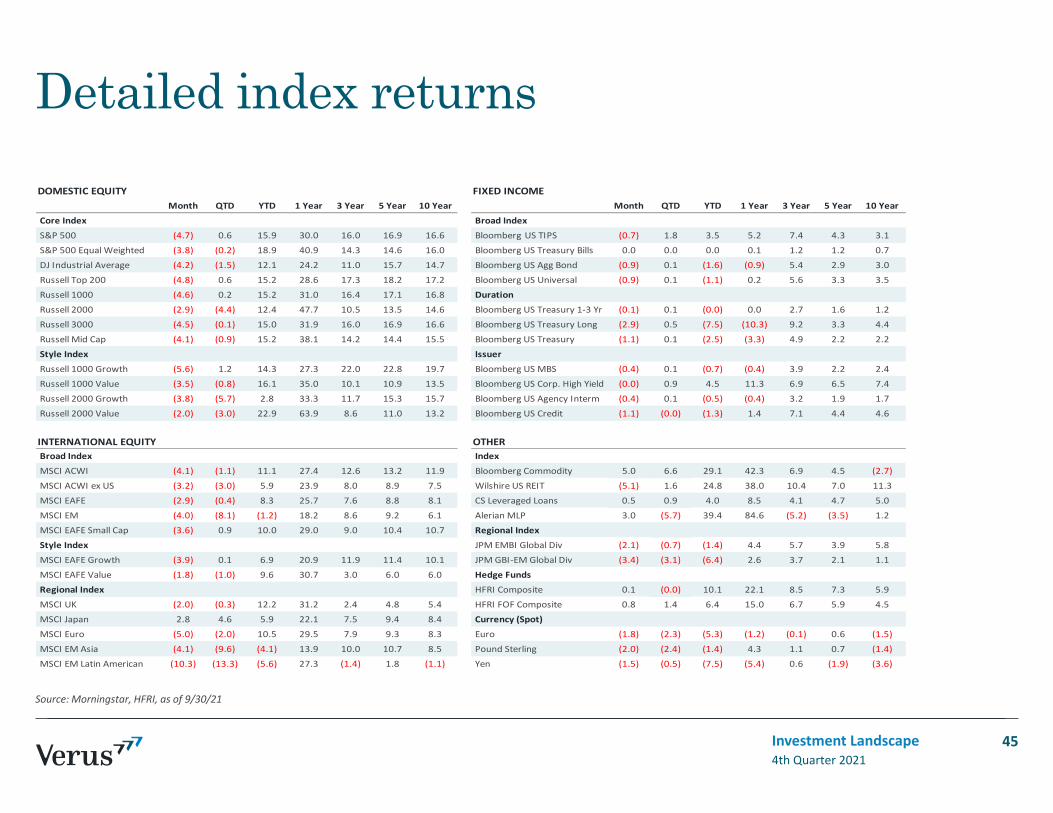
Detailed index returns
Source: Morningstar, HFRI, as of 9/30/21
4th Quarter 2021Investment Landscape 45
DOMESTIC EQUITY FIXED INCOMEMonth QTD YTD 1 Year 3 Year 5 Year 10 Year Month QTD YTD 1 Year 3 Year 5 Year 10 Year
Core Index Broad Index
S&P 500 (4.7) 0.6 15.9 30.0 16.0 16.9 16.6 Bloomberg US TIPS (0.7) 1.8 3.5 5.2 7.4 4.3 3.1
S&P 500 Equal Weighted (3.8) (0.2) 18.9 40.9 14.3 14.6 16.0 Bloomberg US Treasury Bills 0.0 0.0 0.0 0.1 1.2 1.2 0.7
DJ Industrial Average (4.2) (1.5) 12.1 24.2 11.0 15.7 14.7 Bloomberg US Agg Bond (0.9) 0.1 (1.6) (0.9) 5.4 2.9 3.0
Russell Top 200 (4.8) 0.6 15.2 28.6 17.3 18.2 17.2 Bloomberg US Universal (0.9) 0.1 (1.1) 0.2 5.6 3.3 3.5
Russell 1000 (4.6) 0.2 15.2 31.0 16.4 17.1 16.8 Duration
Russell 2000 (2.9) (4.4) 12.4 47.7 10.5 13.5 14.6 Bloomberg US Treasury 1‐3 Yr (0.1) 0.1 (0.0) 0.0 2.7 1.6 1.2
Russell 3000 (4.5) (0.1) 15.0 31.9 16.0 16.9 16.6 Bloomberg US Treasury Long (2.9) 0.5 (7.5) (10.3) 9.2 3.3 4.4
Russell Mid Cap (4.1) (0.9) 15.2 38.1 14.2 14.4 15.5 Bloomberg US Treasury (1.1) 0.1 (2.5) (3.3) 4.9 2.2 2.2
Style Index Issuer
Russell 1000 Growth (5.6) 1.2 14.3 27.3 22.0 22.8 19.7 Bloomberg US MBS (0.4) 0.1 (0.7) (0.4) 3.9 2.2 2.4
Russell 1000 Value (3.5) (0.8) 16.1 35.0 10.1 10.9 13.5 Bloomberg US Corp. High Yield (0.0) 0.9 4.5 11.3 6.9 6.5 7.4
Russell 2000 Growth (3.8) (5.7) 2.8 33.3 11.7 15.3 15.7 Bloomberg US Agency Interm (0.4) 0.1 (0.5) (0.4) 3.2 1.9 1.7
Russell 2000 Value (2.0) (3.0) 22.9 63.9 8.6 11.0 13.2 Bloomberg US Credit (1.1) (0.0) (1.3) 1.4 7.1 4.4 4.6
INTERNATIONAL EQUITY OTHER Broad Index Index
MSCI ACWI (4.1) (1.1) 11.1 27.4 12.6 13.2 11.9 Bloomberg Commodity 5.0 6.6 29.1 42.3 6.9 4.5 (2.7)
MSCI ACWI ex US (3.2) (3.0) 5.9 23.9 8.0 8.9 7.5 Wilshire US REIT (5.1) 1.6 24.8 38.0 10.4 7.0 11.3
MSCI EAFE (2.9) (0.4) 8.3 25.7 7.6 8.8 8.1 CS Leveraged Loans 0.5 0.9 4.0 8.5 4.1 4.7 5.0
MSCI EM (4.0) (8.1) (1.2) 18.2 8.6 9.2 6.1 Alerian MLP 3.0 (5.7) 39.4 84.6 (5.2) (3.5) 1.2
MSCI EAFE Small Cap (3.6) 0.9 10.0 29.0 9.0 10.4 10.7 Regional Index
Style Index JPM EMBI Global Div (2.1) (0.7) (1.4) 4.4 5.7 3.9 5.8
MSCI EAFE Growth (3.9) 0.1 6.9 20.9 11.9 11.4 10.1 JPM GBI‐EM Global Div (3.4) (3.1) (6.4) 2.6 3.7 2.1 1.1
MSCI EAFE Value (1.8) (1.0) 9.6 30.7 3.0 6.0 6.0 Hedge Funds
Regional Index HFRI Composite 0.1 (0.0) 10.1 22.1 8.5 7.3 5.9
MSCI UK (2.0) (0.3) 12.2 31.2 2.4 4.8 5.4 HFRI FOF Composite 0.8 1.4 6.4 15.0 6.7 5.9 4.5
MSCI Japan 2.8 4.6 5.9 22.1 7.5 9.4 8.4 Currency (Spot)
MSCI Euro (5.0) (2.0) 10.5 29.5 7.9 9.3 8.3 Euro (1.8) (2.3) (5.3) (1.2) (0.1) 0.6 (1.5)
MSCI EM Asia (4.1) (9.6) (4.1) 13.9 10.0 10.7 8.5 Pound Sterling (2.0) (2.4) (1.4) 4.3 1.1 0.7 (1.4)
MSCI EM Latin American (10.3) (13.3) (5.6) 27.3 (1.4) 1.8 (1.1) Yen (1.5) (0.5) (7.5) (5.4) 0.6 (1.9) (3.6)
Definitions
4th Quarter 2021Investment Landscape 46
Bloomberg US Weekly Consumer Comfort Index ‐ tracks the public’s economic attitudes each week, providing a high‐frequency read on consumer sentiment. The index, based on cell and landline telephone interviews with a random, representative national sample of U.S. adults, tracks Americans' ratings of the national economy, their personal finances and the buying climate on a weekly basis, with views of the economy’s direction measured separately each month. (www.langerresearch.com)
University of Michigan Consumer Sentiment Index ‐ A survey of consumer attitudes concerning both the present situation as well as expectations regarding economic conditions conducted by the University of Michigan. For the preliminary release approximately three hundred consumers are surveyed while five hundred are interviewed for the final figure. The level of consumer sentiment is related to the strength of consumer spending. (www.Bloomberg.com)
NFIB Small Business Outlook ‐ Small Business Economic Trends (SBET) is a monthly assessment of the U.S. small‐business economy and its near‐term prospects. Its data are collected through mail surveys to random samples of the National Federal of Independent Business (NFIB) membership. The survey contains three broad question types: recent performance, near‐term forecasts, and demographics. The topics addressed include: outlook, sales, earnings, employment, employee compensation, investment, inventories, credit conditions, and single most important problem. (http://www.nfib‐sbet.org/about/)
NAHB Housing Market Index – the housing market index is a weighted average of separate diffusion induces for three key single‐family indices: market conditions for the sale of new homes at the present time, market conditions for the sale of new homes in the next six months, and the traffic of prospective buyers of new homes. The first two series are rated on a scale of Good, Fair, and Poor and the last is rated on a scale of High/Very High, Average, and Low/Very Low. A diffusion index is calculated for each series by applying the formula “(Good‐Poor + 100)/2” to the present and future sales series and “(High/Very High‐Low/Very Low + 100)/2” to the traffic series. Each resulting index is then seasonally adjusted and weighted to produce the HMI. Based on this calculation, the HMI can range between 0 and 100.
Notices & disclosuresPast performance is no guarantee of future results. This report or presentation is provided for informational purposes only and is directed to institutional clients and eligible institutional counterparties only and should not be relied upon by retail investors. Nothing herein constitutes investment, legal, accounting or tax advice, or a recommendation to buy, sell or hold a security or pursue a particular investment vehicle or any trading strategy. The opinions and information expressed are current as of the date provided or cited only and are subject to change without notice. This information is obtained from sources deemed reliable, but there is no representation or warranty as to its accuracy, completeness or reliability. Verus Advisory Inc. expressly disclaim any and all implied warranties or originality, accuracy, completeness, non‐infringement, merchantability and fitness for a particular purpose. This report or presentation cannot be used by the recipient for advertising or sales promotion purposes.
The material may include estimates, outlooks, projections and other “forward‐looking statements.” Such statements can be identified by the use of terminology such as “believes,” “expects,” “may,” “will,” “should,” “anticipates,” or the negative of any of the foregoing or comparable terminology, or by discussion of strategy, or assumptions such as economic conditions underlying other statements. No assurance can be given that future results described or implied by any forward looking information will be achieved. Actual events may differ significantly from those presented. Investing entails risks, including possible loss of principal. Risk controls and models do not promise any level of performance or guarantee against loss of principal.
“VERUS ADVISORY™ and any associated designs are the respective trademarks of Verus Advisory, Inc. Additional information is available upon request.
is a registered trademark of Verus Advisory, Inc.

Pasadena Fire & Police Retirement SystemInvestment Performance Review
Period Ending: September 30, 2021
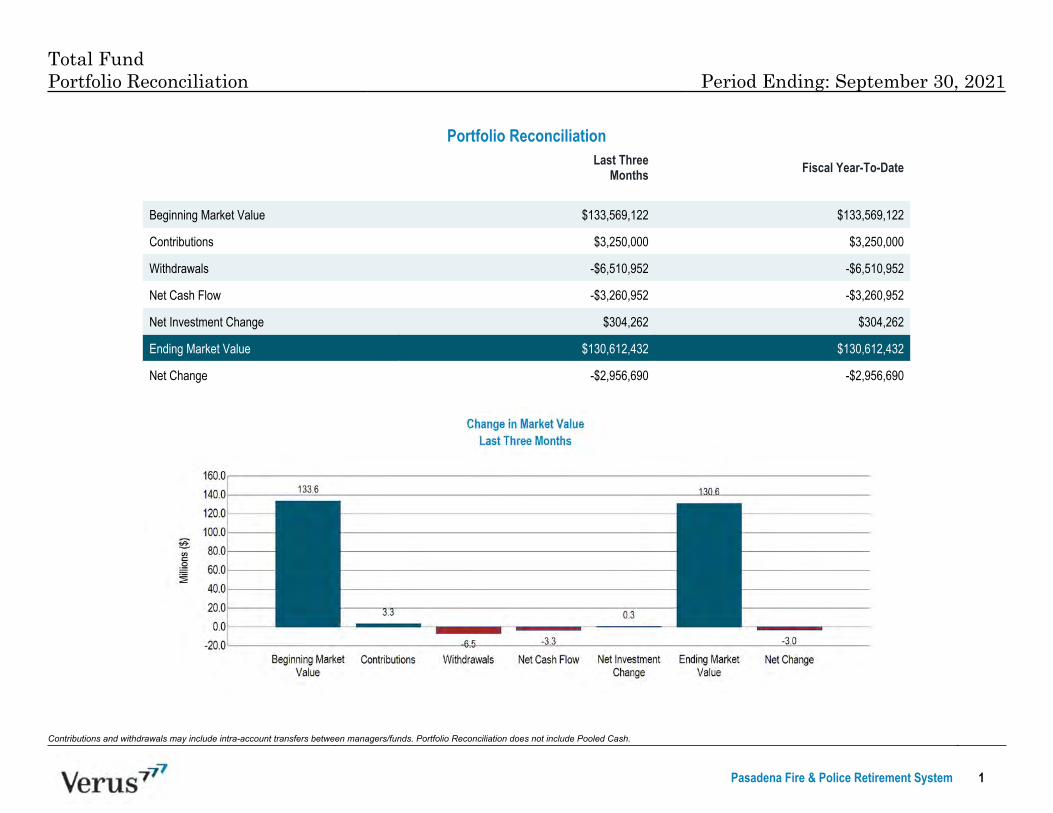
Portfolio Reconciliation
Last ThreeMonths Fiscal Year-To-Date
_
Beginning Market Value $133,569,122 $133,569,122
Contributions $3,250,000 $3,250,000
Withdrawals -$6,510,952 -$6,510,952
Net Cash Flow -$3,260,952 -$3,260,952
Net Investment Change $304,262 $304,262
Ending Market Value $130,612,432 $130,612,432
Net Change -$2,956,690 -$2,956,690_
Contributions and withdrawals may include intra-account transfers between managers/funds. Portfolio Reconciliation does not include Pooled Cash.
Total FundPortfolio Reconciliation Period Ending: September 30, 2021
Pasadena Fire & Police Retirement System 1
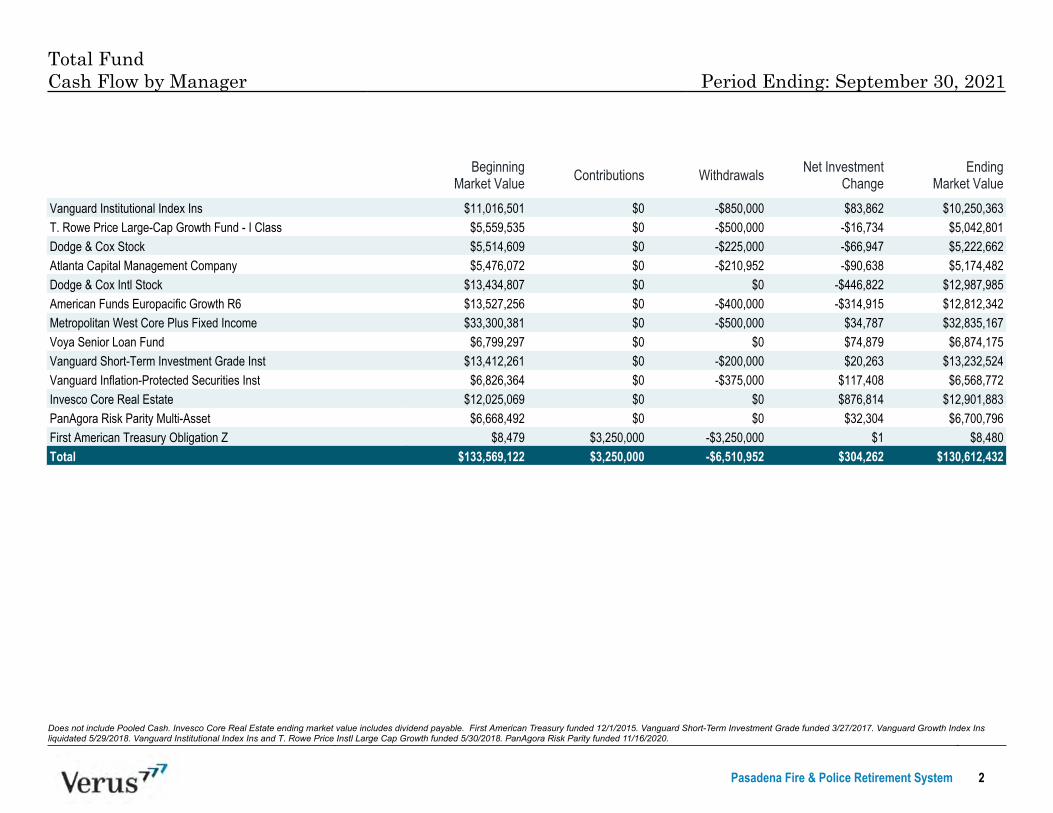
Does not include Pooled Cash. Invesco Core Real Estate ending market value includes dividend payable. First American Treasury funded 12/1/2015. Vanguard Short-Term Investment Grade funded 3/27/2017. Vanguard Growth Index Insliquidated 5/29/2018. Vanguard Institutional Index Ins and T. Rowe Price Instl Large Cap Growth funded 5/30/2018. PanAgora Risk Parity funded 11/16/2020.
BeginningMarket Value Contributions Withdrawals Net Investment
ChangeEnding
Market Value_
Vanguard Institutional Index Ins $11,016,501 $0 -$850,000 $83,862 $10,250,363T. Rowe Price Large-Cap Growth Fund - I Class $5,559,535 $0 -$500,000 -$16,734 $5,042,801Dodge & Cox Stock $5,514,609 $0 -$225,000 -$66,947 $5,222,662Atlanta Capital Management Company $5,476,072 $0 -$210,952 -$90,638 $5,174,482Dodge & Cox Intl Stock $13,434,807 $0 $0 -$446,822 $12,987,985American Funds Europacific Growth R6 $13,527,256 $0 -$400,000 -$314,915 $12,812,342Metropolitan West Core Plus Fixed Income $33,300,381 $0 -$500,000 $34,787 $32,835,167Voya Senior Loan Fund $6,799,297 $0 $0 $74,879 $6,874,175Vanguard Short-Term Investment Grade Inst $13,412,261 $0 -$200,000 $20,263 $13,232,524Vanguard Inflation-Protected Securities Inst $6,826,364 $0 -$375,000 $117,408 $6,568,772Invesco Core Real Estate $12,025,069 $0 $0 $876,814 $12,901,883PanAgora Risk Parity Multi-Asset $6,668,492 $0 $0 $32,304 $6,700,796First American Treasury Obligation Z $8,479 $3,250,000 -$3,250,000 $1 $8,480Total $133,569,122 $3,250,000 -$6,510,952 $304,262 $130,612,432
XXXXX
Total FundCash Flow by Manager Period Ending: September 30, 2021
Pasadena Fire & Police Retirement System 2

Pasadena Fire & Police Retirement System 3
Total FundAsset Allocation vs. Policy Period Ending: September 30, 2021
CurrentBalance
CurrentAllocation Policy Difference Policy Range Within IPS
Range?_
Domestic Equity Large CapCore $10,250,363 7.8% 8.0% -$198,631 3.0% - 20.0% Yes
Domestic Equity Large CapGrowth $5,042,801 3.9% 4.0% -$181,697 0.0% - 10.0% Yes
Domestic Equity Large CapValue $5,222,662 4.0% 4.0% -$1,835 0.0% - 10.0% Yes
Domestic Equity Small CapCore $5,174,482 4.0% 4.0% -$50,015 0.0% - 10.0% Yes
International Equity $25,800,327 19.8% 20.0% -$322,160 10.0% - 25.0% YesDomestic Fixed Income Core $32,835,167 25.1% 25.0% $182,059 15.0% - 40.0% YesDomestic Fixed Income BankLoans $6,874,175 5.3% 5.0% $343,554 0.0% - 10.0% Yes
Domestic Fixed Income ShortTerm $13,232,524 10.1% 10.0% $171,281 0.0% - 15.0% Yes
Domestic Fixed Income RealReturn $6,568,772 5.0% 5.0% $38,150 0.0% - 10.0% Yes
Real Estate $12,901,883 9.9% 10.0% -$159,360 0.0% - 15.0% YesAlternative Investment $6,700,796 5.1% 5.0% $170,174 0.0% - 10.0% YesCash and Equivalents $8,480 0.0% 0.0% $8,480 0.0% - 10.0% YesTotal $130,612,432 100.0% 100.0%
XXXXX
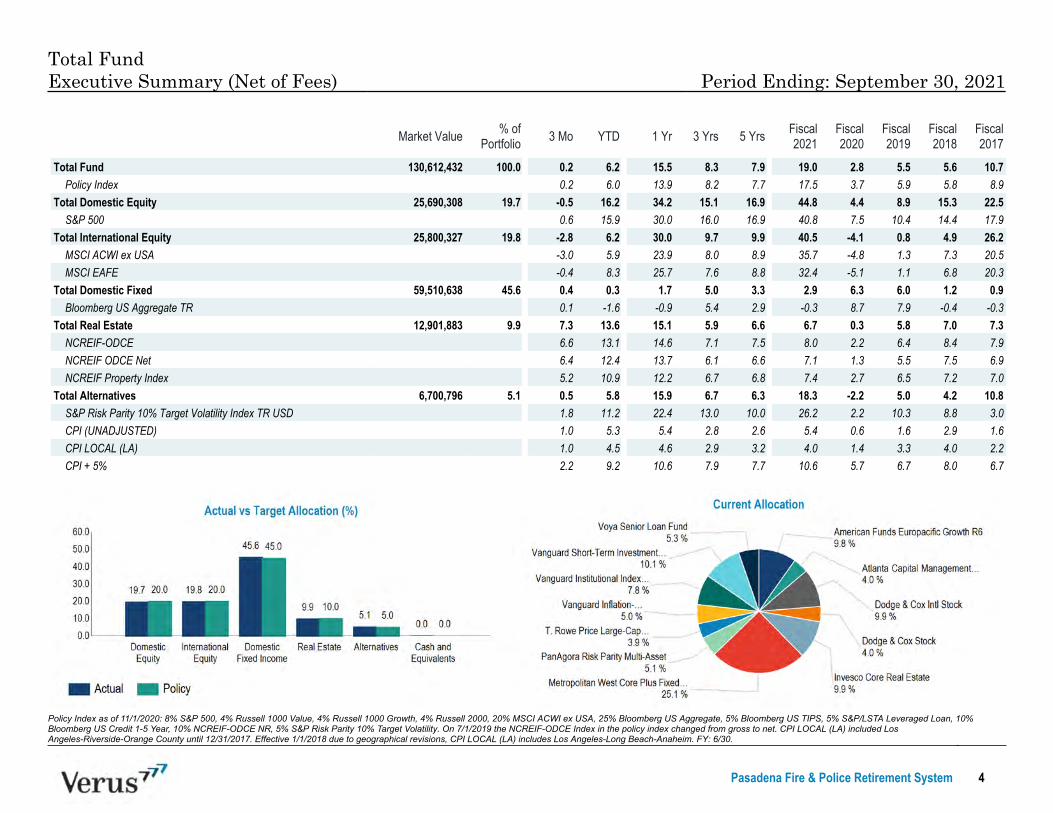
Policy Index as of 11/1/2020: 8% S&P 500, 4% Russell 1000 Value, 4% Russell 1000 Growth, 4% Russell 2000, 20% MSCI ACWI ex USA, 25% Bloomberg US Aggregate, 5% Bloomberg US TIPS, 5% S&P/LSTA Leveraged Loan, 10%Bloomberg US Credit 1-5 Year, 10% NCREIF-ODCE NR, 5% S&P Risk Parity 10% Target Volatility. On 7/1/2019 the NCREIF-ODCE Index in the policy index changed from gross to net. CPI LOCAL (LA) included LosAngeles-Riverside-Orange County until 12/31/2017. Effective 1/1/2018 due to geographical revisions, CPI LOCAL (LA) includes Los Angeles-Long Beach-Anaheim. FY: 6/30.
Market Value % ofPortfolio 3 Mo YTD 1 Yr 3 Yrs 5 Yrs Fiscal
2021Fiscal2020
Fiscal2019
Fiscal2018
Fiscal2017
_
Total Fund 130,612,432 100.0 0.2 6.2 15.5 8.3 7.9 19.0 2.8 5.5 5.6 10.7Policy Index 0.2 6.0 13.9 8.2 7.7 17.5 3.7 5.9 5.8 8.9
Total Domestic Equity 25,690,308 19.7 -0.5 16.2 34.2 15.1 16.9 44.8 4.4 8.9 15.3 22.5S&P 500 0.6 15.9 30.0 16.0 16.9 40.8 7.5 10.4 14.4 17.9
Total International Equity 25,800,327 19.8 -2.8 6.2 30.0 9.7 9.9 40.5 -4.1 0.8 4.9 26.2MSCI ACWI ex USA -3.0 5.9 23.9 8.0 8.9 35.7 -4.8 1.3 7.3 20.5MSCI EAFE -0.4 8.3 25.7 7.6 8.8 32.4 -5.1 1.1 6.8 20.3
Total Domestic Fixed 59,510,638 45.6 0.4 0.3 1.7 5.0 3.3 2.9 6.3 6.0 1.2 0.9Bloomberg US Aggregate TR 0.1 -1.6 -0.9 5.4 2.9 -0.3 8.7 7.9 -0.4 -0.3
Total Real Estate 12,901,883 9.9 7.3 13.6 15.1 5.9 6.6 6.7 0.3 5.8 7.0 7.3NCREIF-ODCE 6.6 13.1 14.6 7.1 7.5 8.0 2.2 6.4 8.4 7.9NCREIF ODCE Net 6.4 12.4 13.7 6.1 6.6 7.1 1.3 5.5 7.5 6.9NCREIF Property Index 5.2 10.9 12.2 6.7 6.8 7.4 2.7 6.5 7.2 7.0
Total Alternatives 6,700,796 5.1 0.5 5.8 15.9 6.7 6.3 18.3 -2.2 5.0 4.2 10.8S&P Risk Parity 10% Target Volatility Index TR USD 1.8 11.2 22.4 13.0 10.0 26.2 2.2 10.3 8.8 3.0CPI (UNADJUSTED) 1.0 5.3 5.4 2.8 2.6 5.4 0.6 1.6 2.9 1.6CPI LOCAL (LA) 1.0 4.5 4.6 2.9 3.2 4.0 1.4 3.3 4.0 2.2CPI + 5% 2.2 9.2 10.6 7.9 7.7 10.6 5.7 6.7 8.0 6.7
Pasadena Fire & Police Retirement System 4
Total FundExecutive Summary (Net of Fees) Period Ending: September 30, 2021

Total MarketValue
% ofPortfolio
DomesticEquity Large
Cap Core
DomesticEquity LargeCap Growth
DomesticEquity Large
Cap Value
DomesticEquity Small
Cap Core
InternationalEquity
DomesticFixed
IncomeCore
DomesticFixed
IncomeBank Loans
DomesticFixed
IncomeShort Term
DomesticFixed
Income RealReturn
Real Estate AlternativeInvestment
Cash andEquivalents
_
Total Domestic Equity Vanguard Institutional Index Ins $10,250,363 7.8% $10,250,363T. Rowe Price Large-Cap Growth Fund - I Class $5,042,801 3.9% $5,042,801Dodge & Cox Stock $5,222,662 4.0% $5,222,662Atlanta Capital Management Company $5,174,482 4.0% $5,174,482
Total International Equity Dodge & Cox Intl Stock $12,987,985 9.9% $12,987,985American Funds Europacific Growth R6 $12,812,342 9.8% $12,812,342
Total Domestic Fixed Metropolitan West Core Plus Fixed Income $32,835,167 25.1% $32,835,167Voya Senior Loan Fund $6,874,175 5.3% $6,874,175Vanguard Short-Term Investment Grade Inst $13,232,524 10.1% $13,232,524Vanguard Inflation-Protected Securities Inst $6,568,772 5.0% $6,568,772
Total Real Estate Invesco Core Real Estate $12,901,883 9.9% $12,901,883
Total Alternatives PanAgora Risk Parity Multi-Asset $6,700,796 5.1% $6,700,796
Cash First American Treasury Obligation Z $8,480 0.0% $8,480
Total $130,612,432 100.0% $10,250,363 $5,042,801 $5,222,662 $5,174,482 $25,800,327 $32,835,167 $6,874,175 $13,232,524 $6,568,772 $12,901,883 $6,700,796 $8,480XXXXX
Invesco Core Real Estate market value includes dividend payable. Total Fund does not include Pooled Cash.
Pasadena Fire & Police Retirement System 5
Total FundAsset Allocation by Account Period Ending: September 30, 2021

TotalMarketValue
% ofPortfolio
DomesticEquity
Large CapCore
DomesticEquity
Large CapGrowth
DomesticEquity
Large CapValue
DomesticEquity
Small CapCore
International Equity
DomesticFixed
IncomeCore
DomesticFixed
IncomeBank Loans
DomesticFixed
IncomeShort Term
DomesticFixed
IncomeReal Return
Real Estate AlternativeInvestment
Cash andEquivalents
_
Total Fund Total Domestic Equity
Vanguard Institutional Index Ins $10,250,363 7.8% $10,250,363T. Rowe Price Large-Cap Growth Fund - I Class $5,042,801 3.8% $5,042,801Dodge & Cox Stock $5,222,662 4.0% $5,222,662Atlanta Capital Management Company $5,174,482 3.9% $5,174,482
Total International Equity Dodge & Cox Intl Stock $12,987,985 9.8% $12,987,985American Funds Europacific Growth R6 $12,812,342 9.7% $12,812,342
Total Domestic Fixed Metropolitan West Core Plus Fixed Income $32,835,167 24.9% $32,835,167Voya Senior Loan Fund $6,874,175 5.2% $6,874,175Vanguard Short-Term Investment Grade Inst $13,232,524 10.0% $13,232,524Vanguard Inflation-Protected Securities Inst $6,568,772 5.0% $6,568,772
Total Real Estate Invesco Core Real Estate $12,901,883 9.8% $12,901,883
Total Alternatives PanAgora Risk Parity Multi-Asset $6,700,796 5.1% $6,700,796
Cash First American Treasury Obligation Z $8,480 0.0% $8,480
Pooled Cash $1,330,000 1.0% $1,330,000Total $131,942,432 100.0% $10,250,363 $5,042,801 $5,222,662 $5,174,482 $25,800,327 $32,835,167 $6,874,175 $13,232,524 $6,568,772 $12,901,883 $6,700,796 $1,338,480
Total Fund with Pooled CashAsset Allocation by Account with Pooled Cash Period Ending: September 30, 2021
Invesco Core Real Estate market value includes dividend payable.
Pasadena Fire & Police Retirement System 6
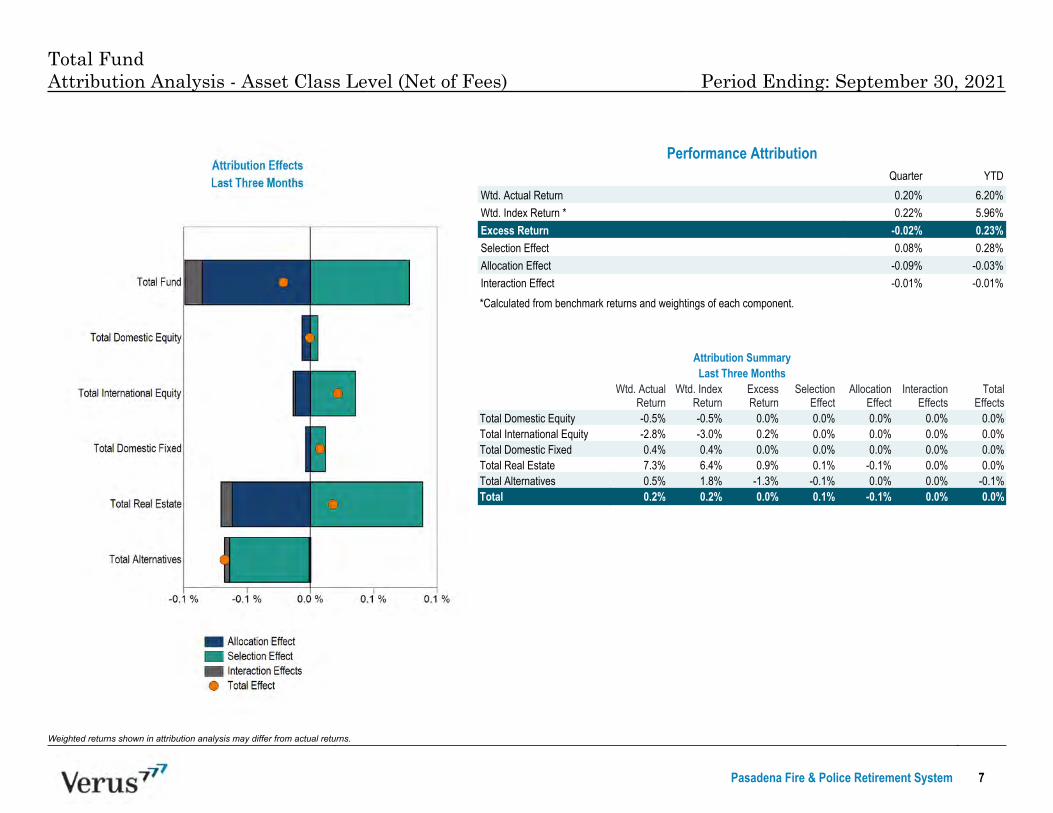
Attribution SummaryLast Three Months
Wtd. ActualReturn
Wtd. IndexReturn
ExcessReturn
SelectionEffect
AllocationEffect
InteractionEffects
TotalEffects
Total Domestic Equity -0.5% -0.5% 0.0% 0.0% 0.0% 0.0% 0.0%Total International Equity -2.8% -3.0% 0.2% 0.0% 0.0% 0.0% 0.0%Total Domestic Fixed 0.4% 0.4% 0.0% 0.0% 0.0% 0.0% 0.0%Total Real Estate 7.3% 6.4% 0.9% 0.1% -0.1% 0.0% 0.0%Total Alternatives 0.5% 1.8% -1.3% -0.1% 0.0% 0.0% -0.1%Total 0.2% 0.2% 0.0% 0.1% -0.1% 0.0% 0.0%
Weighted returns shown in attribution analysis may differ from actual returns.
Performance AttributionQuarter YTD
Wtd. Actual Return 0.20% 6.20%Wtd. Index Return * 0.22% 5.96%Excess Return -0.02% 0.23%Selection Effect 0.08% 0.28%Allocation Effect -0.09% -0.03%Interaction Effect -0.01% -0.01%
*Calculated from benchmark returns and weightings of each component.
Total FundAttribution Analysis - Asset Class Level (Net of Fees) Period Ending: September 30, 2021
Pasadena Fire & Police Retirement System 7
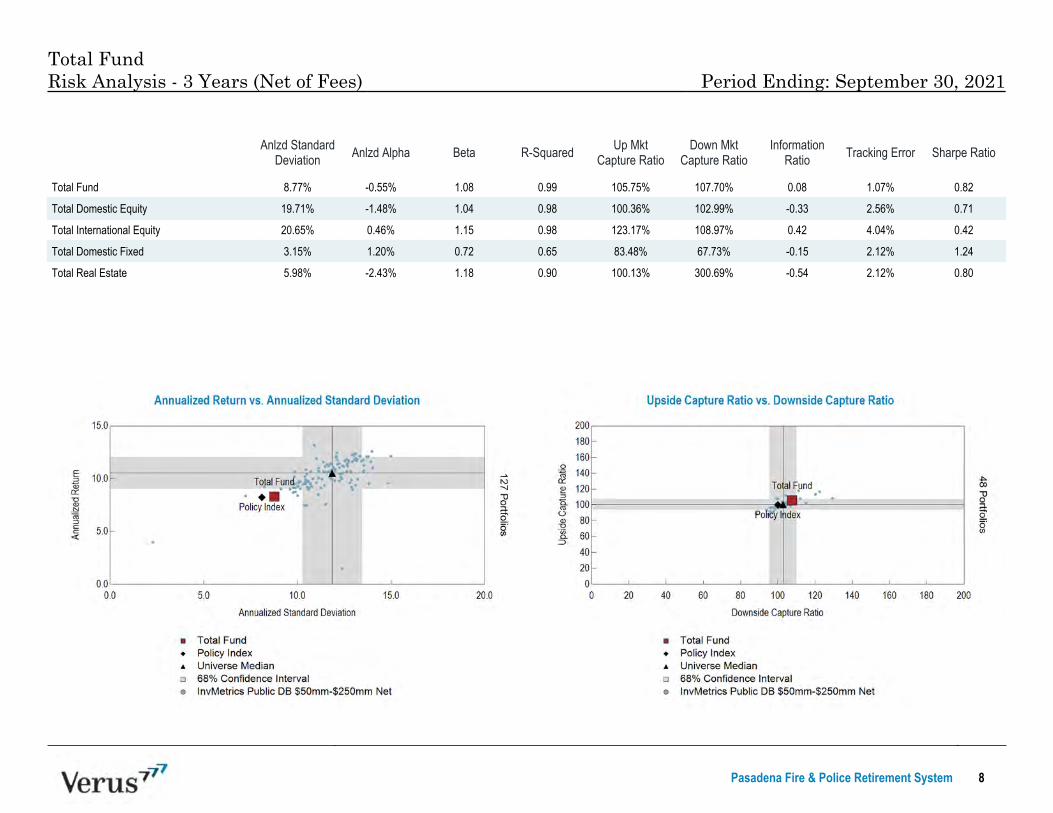
Anlzd StandardDeviation Anlzd Alpha Beta R-Squared Up Mkt
Capture RatioDown Mkt
Capture RatioInformation
Ratio Tracking Error Sharpe Ratio_
Total Fund 8.77% -0.55% 1.08 0.99 105.75% 107.70% 0.08 1.07% 0.82
Total Domestic Equity 19.71% -1.48% 1.04 0.98 100.36% 102.99% -0.33 2.56% 0.71
Total International Equity 20.65% 0.46% 1.15 0.98 123.17% 108.97% 0.42 4.04% 0.42
Total Domestic Fixed 3.15% 1.20% 0.72 0.65 83.48% 67.73% -0.15 2.12% 1.24
Total Real Estate 5.98% -2.43% 1.18 0.90 100.13% 300.69% -0.54 2.12% 0.80
Total FundRisk Analysis - 3 Years (Net of Fees) Period Ending: September 30, 2021
Pasadena Fire & Police Retirement System 8

Total FundRolling Risk Statistics (Net of Fees) Period Ending: September 30, 2021
Pasadena Fire & Police Retirement System 9

Pasadena Fire & Police Retirement System 10
Total FundRolling Performance Relative to Policy (Net of Fees) Period Ending: September 30, 2021

Page excludes managers with less than 5 years of history.
Anlzd StandardDeviation Anlzd Alpha Beta R-Squared Up Mkt
Capture RatioDown Mkt
Capture RatioInformation
Ratio Tracking Error Sharpe Ratio_
Vanguard Institutional Index Ins 15.20% -0.03% 1.00 1.00 99.88% 100.03% -2.66 0.01% 1.04
T. Rowe Price Large-Cap Growth Fund - IClass 16.32% 2.83% 0.97 0.95 97.91% 88.79% 0.55 3.81% 1.46
Dodge & Cox Stock 19.22% 2.57% 1.15 0.95 134.85% 103.20% 0.88 4.79% 0.73
Atlanta Capital Management Company 16.53% 3.29% 0.74 0.90 70.04% 82.26% -0.02 7.46% 0.74
Dodge & Cox Intl Stock 19.01% -3.73% 1.24 0.92 119.23% 115.59% -0.24 6.51% 0.33
American Funds Europacific Growth R6 15.60% 2.89% 1.04 0.95 116.03% 96.43% 0.92 3.51% 0.71
Metropolitan West Core Plus Fixed Income 3.21% 0.67% 0.96 0.98 102.78% 88.11% 1.14 0.48% 0.74
Voya Senior Loan Fund 6.46% -0.73% 0.94 0.99 86.50% 100.15% -1.49 0.66% 0.39
Vanguard Short-Term Investment Grade Inst 2.26% -0.06% 0.99 0.98 94.49% 91.47% -0.30 0.31% 0.73
Vanguard Inflation-Protected Securities Inst 3.58% 0.02% 0.96 0.98 96.17% 97.21% -0.31 0.48% 0.85
Invesco Core Real Estate 5.02% -1.83% 1.12 0.90 96.90% 300.69% -0.53 1.70% 1.09XXXXX
Total FundRisk Analysis by Manager - 5 Years (Net of Fees) Period Ending: September 30, 2021
Pasadena Fire & Police Retirement System 11

Market Value % ofPortfolio 3 Mo YTD 1 Yr 3 Yrs 5 Yrs Fiscal
2021Fiscal2020
Fiscal2019
Fiscal2018
Fiscal2017 Inception Inception
Date_
Total Domestic Equity -0.5 16.2 34.2 15.1 16.9 44.8 4.4 8.9 15.3 22.5Vanguard Institutional Index Ins 10,250,363 39.9 0.6 15.9 30.0 16.0 16.9 40.8 7.5 10.4 14.3 17.9 16.8 May-18
S&P 500 0.6 15.9 30.0 16.0 16.9 40.8 7.5 10.4 14.4 17.9 16.8 May-18T. Rowe Price Large-Cap Growth Fund - I Class 5,042,801 19.6 -0.5 16.1 31.2 22.0 24.9 47.0 20.5 10.0 29.1 31.5 22.2 May-18
Russell 1000 Growth 1.2 14.3 27.3 22.0 22.8 42.5 23.3 11.6 22.5 20.4 22.9 May-18Dodge & Cox Stock 5,222,662 20.3 -1.3 24.4 50.4 12.9 15.2 58.9 -6.2 4.1 11.9 28.6 9.8 Aug-00
Russell 1000 Value -0.8 16.1 35.0 10.1 10.9 43.7 -8.8 8.5 6.8 15.5 7.4 Aug-00Atlanta Capital Management Company 5,174,482 20.1 -2.0 8.3 29.3 9.3 13.3 36.2 -3.9 9.7 18.3 14.8 15.4 Jun-09
Russell 2000 -4.4 12.4 47.7 10.5 13.4 62.0 -6.6 -3.3 17.6 24.6 14.2 Jun-09Russell 2500 -2.7 13.8 45.0 12.5 14.3 57.8 -4.7 1.8 16.2 19.8
XXXXX
Dodge & Cox Stock Inception: 8/31/2000. Vanguard Growth Index Ins and Atlanta Capital Management Company Inception: 6/30/2009. Dodge & Cox separate account performance shown prior to 6/19/2009. Effective 3/1/2015 Atlanta SMIDCap strategy changed to Atlanta Small Cap Core strategy. Vanguard Growth Index Ins liquidated 5/29/2018. Vanguard Institutional Index Ins and T. Rowe Price Instl Large Cap Growth funded 5/30/2018.
Total Domestic EquityPerformance Summary (Net of Fees) Period Ending: September 30, 2021
Pasadena Fire & Police Retirement System 12

Market Value % ofPortfolio 3 Mo YTD 1 Yr 3 Yrs 5 Yrs Fiscal
2021Fiscal2020
Fiscal2019
Fiscal2018
Fiscal2017 Inception Inception
Date_
Total International Equity -2.8 6.2 30.0 9.7 9.9 40.5 -4.1 0.8 4.9 26.2Dodge & Cox Intl Stock 12,987,985 50.3 -3.3 8.4 35.2 6.0 7.4 40.4 -11.3 -0.3 0.5 30.4 6.6 Sep-04
MSCI ACWI ex USA -3.0 5.9 23.9 8.0 8.9 35.7 -4.8 1.3 7.3 20.5 6.5 Sep-04American Funds Europacific Growth R6 12,812,342 49.7 -2.3 4.0 24.8 13.2 12.2 40.1 3.2 1.9 9.3 22.2 9.2 Feb-12
MSCI ACWI ex USA -3.0 5.9 23.9 8.0 8.9 35.7 -4.8 1.3 7.3 20.5 6.2 Feb-12XXXXX
Dodge & Cox Intl Stock Inception: 9/30/2004. American Funds Europacific Growth R6 Inception: 2/24/2012. Dodge & Cox separate account performance shown prior to 6/19/2009.
Total International EquityPerformance Summary (Net of Fees) Period Ending: September 30, 2021
Pasadena Fire & Police Retirement System 13
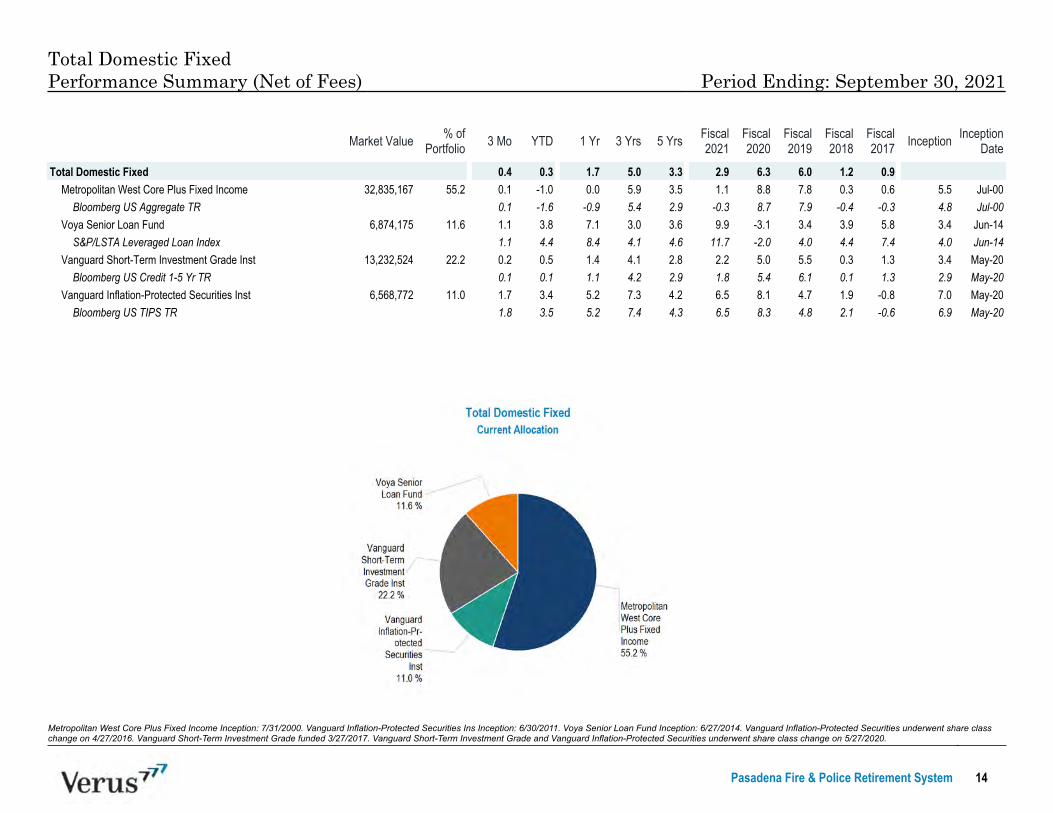
Metropolitan West Core Plus Fixed Income Inception: 7/31/2000. Vanguard Inflation-Protected Securities Ins Inception: 6/30/2011. Voya Senior Loan Fund Inception: 6/27/2014. Vanguard Inflation-Protected Securities underwent share classchange on 4/27/2016. Vanguard Short-Term Investment Grade funded 3/27/2017. Vanguard Short-Term Investment Grade and Vanguard Inflation-Protected Securities underwent share class change on 5/27/2020.
Market Value % ofPortfolio 3 Mo YTD 1 Yr 3 Yrs 5 Yrs Fiscal
2021Fiscal2020
Fiscal2019
Fiscal2018
Fiscal2017 Inception Inception
Date_
Total Domestic Fixed 0.4 0.3 1.7 5.0 3.3 2.9 6.3 6.0 1.2 0.9Metropolitan West Core Plus Fixed Income 32,835,167 55.2 0.1 -1.0 0.0 5.9 3.5 1.1 8.8 7.8 0.3 0.6 5.5 Jul-00
Bloomberg US Aggregate TR 0.1 -1.6 -0.9 5.4 2.9 -0.3 8.7 7.9 -0.4 -0.3 4.8 Jul-00Voya Senior Loan Fund 6,874,175 11.6 1.1 3.8 7.1 3.0 3.6 9.9 -3.1 3.4 3.9 5.8 3.4 Jun-14
S&P/LSTA Leveraged Loan Index 1.1 4.4 8.4 4.1 4.6 11.7 -2.0 4.0 4.4 7.4 4.0 Jun-14Vanguard Short-Term Investment Grade Inst 13,232,524 22.2 0.2 0.5 1.4 4.1 2.8 2.2 5.0 5.5 0.3 1.3 3.4 May-20
Bloomberg US Credit 1-5 Yr TR 0.1 0.1 1.1 4.2 2.9 1.8 5.4 6.1 0.1 1.3 2.9 May-20Vanguard Inflation-Protected Securities Inst 6,568,772 11.0 1.7 3.4 5.2 7.3 4.2 6.5 8.1 4.7 1.9 -0.8 7.0 May-20
Bloomberg US TIPS TR 1.8 3.5 5.2 7.4 4.3 6.5 8.3 4.8 2.1 -0.6 6.9 May-20XXXXX
Total Domestic FixedPerformance Summary (Net of Fees) Period Ending: September 30, 2021
Pasadena Fire & Police Retirement System 14

Market Value % ofPortfolio 3 Mo YTD 1 Yr 3 Yrs 5 Yrs Fiscal
2021Fiscal2020
Fiscal2019
Fiscal2018
Fiscal2017 Inception Inception
Date_
Total Real Estate 7.3 13.6 15.1 5.9 6.6 6.7 0.3 5.8 7.0 7.3Invesco Core Real Estate 12,901,883 100.0 7.3 13.6 15.1 5.9 6.6 6.7 0.3 5.8 7.0 7.3 8.8 Oct-12
NCREIF-ODCE 6.6 13.1 14.6 7.1 7.5 8.0 2.2 6.4 8.4 7.9 9.7 Oct-12NCREIF ODCE Net 6.4 12.4 13.7 6.1 6.6 7.1 1.3 5.5 7.5 6.9
XXXXX
Invesco Core Real Estate Inception: 10/1/2012. Invesco Core Real Estate market value includes dividend payable.
Total Real EstatePerformance Summary (Net of Fees) Period Ending: September 30, 2021
Pasadena Fire & Police Retirement System 15

PIMCO All Asset Ins Inception: 5/28/2013. PIMCO liquidated 11/9/2020. PanAgora funded 11/16/2020.
Market Value % ofPortfolio 3 Mo YTD 1 Yr 3 Yrs 5 Yrs Fiscal
2021Fiscal2020
Fiscal2019
Fiscal2018
Fiscal2017 Inception Inception
Date_
Total Alternatives 0.5 5.8 15.9 6.7 6.3 18.3 -2.2 5.0 4.2 10.8PanAgora Risk Parity Multi-Asset 6,700,796 100.0 0.5 5.8 -- -- -- -- -- -- -- -- 11.6 Nov-20
S&P Risk Parity 10% Target Volatility Index TR USD 1.8 11.2 -- -- -- -- -- -- -- -- 18.4 Nov-2060% MSCI ACWI Net/40% Bloomberg Global Aggregate -1.0 4.9 -- -- -- -- -- -- -- --
XXXXX
Pasadena Fire & Police Retirement System 16
Total AlternativesPerformance Summary (Net of Fees) Period Ending: September 30, 2021

Name Asset Class Identifier Fee Schedule Market Value Estimated FeeValue Estimated Fee
Vanguard Institutional Index Ins Domestic Equity VINIX 0.04% of Assets $10,250,363 $3,588 0.04%T. Rowe Price Large-Cap Growth Fund - I Class Domestic Equity TRLGX 0.56% of Assets $5,042,801 $28,240 0.56%Dodge & Cox Stock Domestic Equity DODGX 0.52% of Assets $5,222,662 $27,158 0.52%
Atlanta Capital Management Company Domestic Equity0.80% of First 50.0 Mil,0.70% of Next 105.0 Mil,0.60% of Next 255.0 Mil
$5,174,482 $41,396 0.80%
Dodge & Cox Intl Stock International Equity DODFX 0.63% of Assets $12,987,985 $81,824 0.63%American Funds Europacific Growth R6 International Equity RERGX 0.46% of Assets $12,812,342 $58,937 0.46%
Metropolitan West Core Plus Fixed Income Domestic Fixed Income0.35% of First 25.0 Mil,0.25% of Next 75.0 Mil,0.20% of Next 100.0 Mil
$32,835,167 $107,088 0.33%
Voya Senior Loan Fund Domestic Fixed Income 0.45% of Assets $6,874,175 $30,934 0.45%Vanguard Short-Term Investment Grade Inst Domestic Fixed Income VFSIX 0.07% of Assets $13,232,524 $9,263 0.07%Vanguard Inflation-Protected Securities Inst Domestic Fixed Income VIPIX 0.07% of Assets $6,568,772 $4,598 0.07%Invesco Core Real Estate Real Estate 1.10% of Assets $12,901,883 $141,921 1.10%PanAgora Risk Parity Multi-Asset Alternatives 0.35% of Assets $6,700,796 $23,453 0.35%First American Treasury Obligation Z Cash and Equivalents FUZXX 0.18% of Assets $8,480 $15 0.18%Total $130,612,432 $558,413 0.43%
XXXXX
Does not include Pooled Cash. Invesco Core Real Estate market value includes dividend payable. First American Treasury Obligation expense ratio is discounted to fund's actual yield when below 20 bps. Mutual fund fees shown are sourcedfrom Morningstar and are as of the most current prospectus.
Total FundInvestment Fund Fee Analysis Period Ending: September 30, 2021
Pasadena Fire & Police Retirement System 17

Pasadena Fire & Police Retirement System 18
Total FundAsset Allocation History Period Ending: September 30, 2021
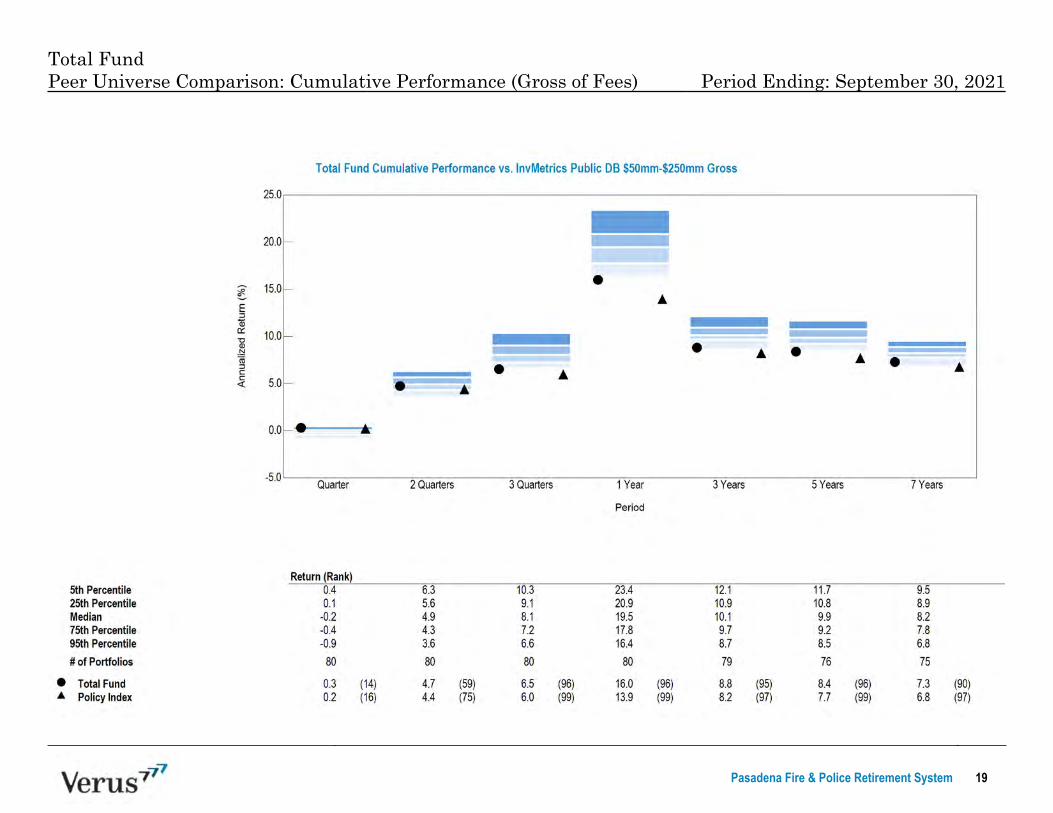
Pasadena Fire & Police Retirement System 19
Total FundPeer Universe Comparison: Cumulative Performance (Gross of Fees) Period Ending: September 30, 2021
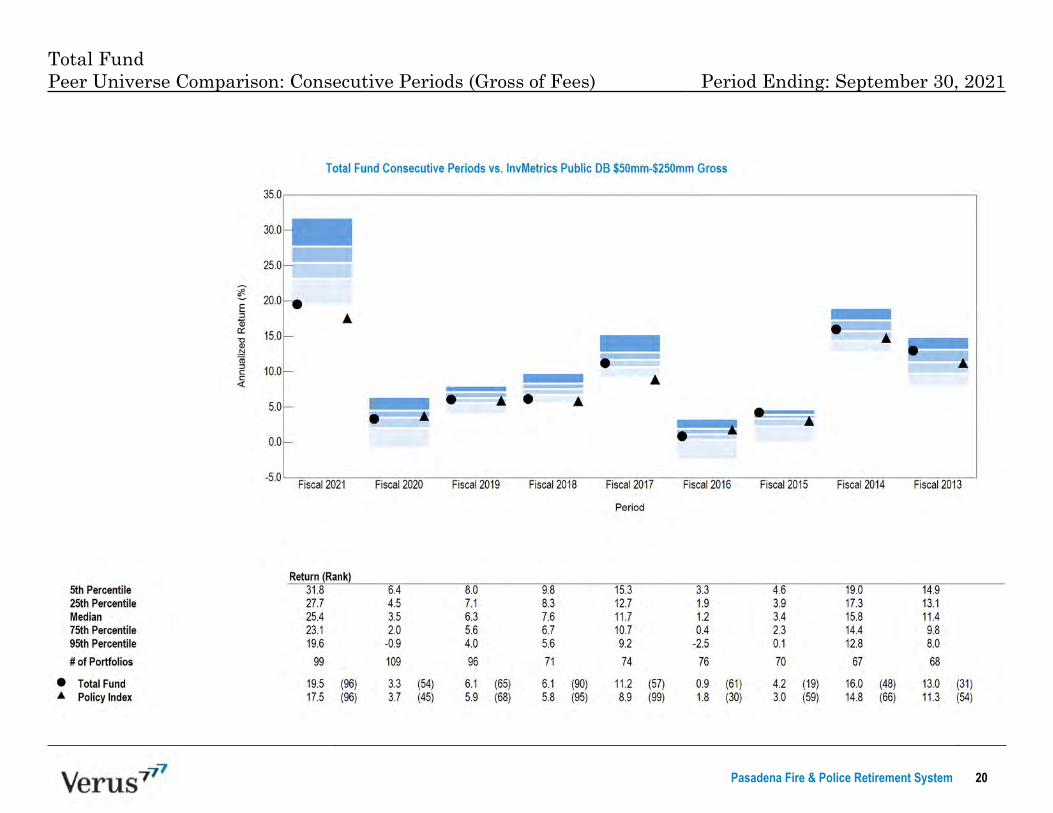
Total FundPeer Universe Comparison: Consecutive Periods (Gross of Fees) Period Ending: September 30, 2021
Pasadena Fire & Police Retirement System 20

Pasadena Fire & Police Retirement System 21
Total FundPeer Universe Comparison: Asset Allocation Period Ending: September 30, 2021

Data Sources & Methodology Period Ending: September 30, 2021
Pasadena Fire & Police Retirement System 22

Glossary
Allocation Effect: An attribution effect that describes the amount attributable to the managers' asset allocation decisions, relative to the benchmark.
Alpha: The excess return of a portfolio after adjusting for market risk. This excess return is attributable to the selection skill of the portfolio manager. Alpha is calculated as: Portfolio Return ‐ [Risk‐free Rate + Portfolio Beta x (Market Return ‐ Risk‐free Rate)].
Benchmark R‐squared: Measures how well the Benchmark return series fits the manager's return series. The higher the Benchmark R‐squared, the more appropriate the benchmark is for the manager. Beta: A measure of systematic, or market risk; the part of risk in a portfolio or security that is attributable to general market movements. Beta is calculated by dividing the covariance of a security by the variance of the market.
Book‐to‐Market: The ratio of book value per share to market price per share. Growth managers typically have low book‐to‐market ratios while value managers typically have high book‐to‐market ratios.
Capture Ratio: A statistical measure of an investment manager's overall performance in up or down markets. The capture ratio is used to evaluate how well an investment manager performed relative to an
index during periods when that index has risen (up market) or fallen (down market). The capture ratio is calculated by dividing the manager's returns by the returns of the index during the up/down market,
and multiplying that factor by 100.
Correlation: A measure of the relative movement of returns of one security or asset class relative to another over time. A correlation of 1 means the returns of two securities move in lock step, a correlation of ‐1 means the returns of two securities move in the exact opposite direction over time. Correlation is used as a measure to help maximize the benefits of diversification when constructing an investment
portfolio.
Excess Return: A measure of the difference in appreciation or depreciation in the price of an investment compared to its benchmark, over a given time period. This is usually expressed as a percentage and may be annualized over a number of years or represent a single period.
Information Ratio: A measure of a manager's ability to earn excess return without incurring additional risk. Information ratio is calculated as: excess return divided by tracking error.
Interaction Effect: An attribution effect that describes the portion of active management that is contributable to the cross interaction between the allocation and selection effect. This can also be explained as an effect that cannot be easily traced to a source.
Portfolio Turnover: The percentage of a portfolio that is sold and replaced (turned over) during a given time period. Low portfolio turnover is indicative of a buy and hold strategy while high portfolio turnover implies a more active form of management.
Price‐to‐Earnings Ratio (P/E): Also called the earnings multiplier, it is calculated by dividing the price of a company's stock into earnings per share. Growth managers typically hold stocks with high price‐to‐earnings ratios whereas value managers hold stocks with low price‐to‐earnings ratios.
R‐Squared: Also called the coefficient of determination, it measures the amount of variation in one variable explained by variations in another, i.e., the goodness of fit to a benchmark. In the case of investments, the term is used to explain the amount of variation in a security or portfolio explained by movements in the market or the portfolio's benchmark.
Selection Effect: An attribution effect that describes the amount attributable to the managers' stock selection decisions, relative to the benchmark.
Sharpe Ratio: A measure of portfolio efficiency. The Sharpe Ratio indicates excess portfolio return for each unit of risk associated with achieving the excess return. The higher the Sharpe Ratio, the more efficient the portfolio. Sharpe ratio is calculated as: Portfolio Excess Return / Portfolio Standard Deviation.
Sortino Ratio: Measures the risk‐adjusted return of an investment, portfolio, or strategy. It is a modification of the Sharpe Ratio, but penalizes only those returns falling below a specified benchmark. The Sortino Ratio uses downside deviation in the denominator rather than standard deviation, like the Sharpe Ratio.
Standard Deviation: A measure of volatility, or risk, inherent in a security or portfolio. The standard deviation of a series is a measure of the extent to which observations in the series differ from the arithmetic mean of the series. For example, if a security has an average annual rate of return of 10% and a standard deviation of 5%, then two‐thirds of the time, one would expect to receive an annual rate of return between 5% and 15%.
Style Analysis: A return based analysis designed to identify combinations of passive investments to closely replicate the performance of funds
Style Map: A specialized form or scatter plot chart typically used to show where a Manager lies in relation to a set of style indices on a two‐dimensional plane. This is simply a way of viewing the asset loadings in a different context. The coordinates are calculated by rescaling the asset loadings to range from ‐1 to 1 on each axis and are dependent on the Style Indices comprising the Map.

Disclaimer
This report contains confidential and proprietary information and is subject to the terms and conditions of the Consulting Agreement. It is being provided for use solely by the customer. The report may not be sold or otherwise provided, in whole or in part, to any other person or entity without written permission from Verus Advisory, Inc., (hereinafter Verus) or as required by law or any regulatory authority. The information presented does not constitute a recommendation by Verus and cannot be used for advertising or sales promotion purposes. This does not constitute an offer or a solicitation of an offer to buy or sell securities, commodities or any other financial instruments or products.
The information presented has been prepared using data from third party sources that Verus believes to be reliable. While Verus exercised reasonable professional care in preparing the report, it cannot guarantee the accuracy of the information provided by third party sources. Therefore, Verus makes no representations or warranties as to the accuracy of the information presented. Verus takes no responsibility or liability (including damages) for any error, omission, or inaccuracy in the data supplied by any third party. Nothing contained herein is, or should be relied on as a promise, representation, or guarantee as to future performance or a particular outcome. Even with portfolio diversification, asset allocation, and a long‐term approach, investing involves risk of loss that the investor should be prepared to bear.
The information presented may be deemed to contain forward‐looking information. Examples of forward looking information include, but are not limited to, (a) projections of or statements regarding return on investment, future earnings, interest income, other income, growth prospects, capital structure and other financial terms, (b) statements of plans or objectives of management, (c) statements of future economic performance, and (d) statements of assumptions, such as economic conditions underlying other statements. Such forward‐looking information can be identified by the use of forward looking terminology such as believes, expects, may, will, should, anticipates, or the negative of any of the foregoing or other variations thereon comparable terminology, or by discussion of strategy. No assurance can be given that the future results described by the forward‐looking information will be achieved. Such statements are subject to risks, uncertainties, and other factors which could cause the actual results to differ materially from future results expressed or implied by such forward looking information. The findings, rankings, and opinions expressed herein are the intellectual property of Verus and are subject to change without notice. The information presented does not claim to be all‐inclusive, nor does it contain all information that clients may desire for their purposes. The information presented should be read in conjunction with any other material provided by Verus, investment managers, and custodians.
Verus will make every reasonable effort to obtain and include accurate market values. However, if managers or custodians are unable to provide the reporting period's market values prior to the report issuance, Verus may use the last reported market value or make estimates based on the manager's stated or estimated returns and other information available at the time. These estimates may differ materially from the actual value. Hedge fund market values presented in this report are provided by the fund manager or custodian. Market values presented for private equity investments reflect the last reported NAV by the custodian or manager net of capital calls and distributions as of the end of the reporting period. These values are estimates and may differ materially from the investments actual value. Private equity managers report performance using an internal rate of return (IRR), which differs from the time‐weighted rate of return (TWRR) calculation done by Verus. It is inappropriate to compare IRR and TWRR to each other. IRR figures reported in the illiquid alternative pages are provided by the respective managers, and Verus has not made any attempts to verify these returns. Until a partnership is liquidated (typically over 10‐12 years), the IRR is only an interim estimated return. The actual IRR performance of any LP is not known until the final liquidation.
Verus receives universe data from InvMetrics, eVestment Alliance, and Morningstar. We believe this data to be robust and appropriate for peer comparison. Nevertheless, these universes may not be comprehensive of all peer investors/managers but rather of the investors/managers that comprise that database. The resulting universe composition is not static and will change over time. Returns are annualized when they cover more than one year. Investment managers may revise their data after report distribution. Verus will make the appropriate correction to the client account but may or may not disclose the change to the client based on the materiality of the change.

Policy Index as of 11/1/2020: 8% S&P 500, 4% Russell 1000 Value, 4% Russell 1000 Growth, 4% Russell 2000, 20% MSCI ACWI ex USA, 25% Bloomberg US Aggregate, 5% Bloomberg US TIPS, 10% Bloomberg US 1-5 Yr Credit, 5%S&P/LSTA Leveraged Loan, 10% NCREIF-ODCE, 5% S&P Risk Parity 10% Target Volatility Index. On 7/1/2019 NCREIF-ODCE Index in the policy index changed from gross to net. FY: 6/30. Pooled Cash not included in Total Fund calculation.CPI LOCAL (LA) included Los Angeles-Riverside-Orange County until 12/31/2017. Effective 1/1/2018 due to geographical revisions, CPI LOCAL (LA) includes Los Angeles-Long Beach-Anaheim. Effective 3/1/2015 Atlanta SMID Cap strategychanged to Atlanta Small Cap Core strategy. Vanguard Growth Index Ins liquidated 5/29/2018. T. Rowe Price Instl Large Cap Growth Ins and Vanguard Institutional Index Ins funded 5/30/2018. Vanguard Short-Term Investment Grade Admchanged share classes to Vanguard Short-Term Investment Grade Inst on 5/27/2020. Vanguard Inflation-Protected Securities Adm changed share classes to Vanguard Inflation-Protected Securities Inst on 5/27/2020. PIMCO All Asset Insliquidated 11/9/2020. PanAgora Risk Parity Multi-Asset funded 11/10/2020. All data is preliminary.
Current % Policy %_
Domestic Equity LargeCap Core $10,716,415 8.1% $10,547,993 8.0%
Domestic Equity LargeCap Growth $5,326,742 4.0% $5,273,996 4.0%
Domestic Equity LargeCap Value $5,209,482 4.0% $5,273,996 4.0%
Domestic Equity SmallCap Core $5,290,012 4.0% $5,273,996 4.0%
International Equity $26,194,643 19.9% $26,369,982 20.0%Domestic FixedIncome Core $32,808,806 24.9% $32,962,477 25.0%
Domestic FixedIncome Bank Loans $6,889,239 5.2% $6,592,495 5.0%
Domestic FixedIncome Short Term $13,166,511 10.0% $13,184,991 10.0%
Domestic FixedIncome Real Return $6,636,901 5.0% $6,592,495 5.0%
Real Estate $12,901,883 9.8% $13,184,991 10.0%Alternative Investment $6,700,796 5.1% $6,592,495 5.0%Cash and Equivalents $8,480 0.0% $0 0.0%Total $131,849,908 100.0% $131,849,908 100.0%
XXXXX
Market Value % ofPortfolio 1 Mo QTD YTD Fiscal
YTD 1 Yr 3 Yrs 5 Yrs_
Total Fund 131,849,908 100.0 1.7 1.7 8.0 1.9 18.6 10.1 8.4Policy Index 1.9 1.9 7.9 2.1 17.5 10.1 8.4Total Domestic Equity 26,542,650 20.1 5.8 5.8 22.9 5.3 44.7 20.3 18.7
S&P 500 7.0 7.0 24.0 7.6 42.9 21.5 18.9Vanguard Institutional Index Ins 10,716,415 8.1 7.0 7.0 24.0 7.6 42.9 21.5 18.9
S&P 500 7.0 7.0 24.0 7.6 42.9 21.5 18.9T. Rowe Price Large-Cap Growth Fund- I Class 5,326,742 4.0 5.6 5.6 22.6 5.1 41.1 27.6 26.5
Russell 1000 Growth 8.7 8.7 24.2 9.9 43.2 29.4 25.5Dodge & Cox Stock 5,209,482 4.0 4.5 4.5 30.0 3.1 60.2 16.9 16.2
Russell 1000 Value 5.1 5.1 22.0 4.3 43.8 13.9 12.4Atlanta Capital Management Company 5,290,012 4.0 5.1 5.1 13.8 3.0 36.2 14.6 15.1
Russell 2000 4.3 4.3 17.2 -0.3 50.8 16.5 15.5Russell 2500 4.9 4.9 19.4 2.1 49.4 18.4 16.3
Total International Equity 26,194,643 19.9 3.1 3.1 9.5 0.1 36.1 13.8 10.6MSCI ACWI ex USA 2.4 2.4 8.4 -0.7 29.7 12.0 9.8MSCI EAFE 2.5 2.5 11.0 2.0 34.2 11.5 9.8Dodge & Cox Intl Stock 13,133,806 10.0 4.2 4.2 13.0 0.7 44.0 9.7 7.9
MSCI ACWI ex USA 2.4 2.4 8.4 -0.7 29.7 12.0 9.8American Funds Europacific GrowthR6 13,060,837 9.9 1.9 1.9 6.0 -0.5 28.4 17.6 13.1
MSCI ACWI ex USA 2.4 2.4 8.4 -0.7 29.7 12.0 9.8Total Domestic Fixed 59,501,457 45.1 0.0 0.0 0.3 0.4 1.9 5.2 3.4
Bloomberg US Aggregate TR 0.0 0.0 -1.6 0.0 -0.5 5.6 3.1Metropolitan West Core Plus FixedIncome 32,808,806 24.9 -0.1 -0.1 -1.1 0.0 0.3 6.1 3.6
Bloomberg US Aggregate TR 0.0 0.0 -1.6 0.0 -0.5 5.6 3.1Voya Senior Loan Fund 6,889,239 5.2 0.2 0.2 4.0 1.3 7.5 3.1 3.5
S&P/LSTA Leveraged Loan Index 0.3 0.3 4.7 1.4 8.5 4.2 4.5
Pasadena Fire & Police Retirement SystemExecutive Summary - Preliminary (Net of Fees) Period Ending: October 31, 2021
Pasadena Fire & Police Retirement System 1

Policy Index as of 11/1/2020: 8% S&P 500, 4% Russell 1000 Value, 4% Russell 1000 Growth, 4% Russell 2000, 20% MSCI ACWI ex USA, 25% Bloomberg US Aggregate, 5% Bloomberg US TIPS, 10% Bloomberg US 1-5 Yr Credit, 5%S&P/LSTA Leveraged Loan, 10% NCREIF-ODCE, 5% S&P Risk Parity 10% Target Volatility Index. On 7/1/2019 NCREIF-ODCE Index in the policy index changed from gross to net. FY: 6/30. Pooled Cash not included in Total Fund calculation.CPI LOCAL (LA) included Los Angeles-Riverside-Orange County until 12/31/2017. Effective 1/1/2018 due to geographical revisions, CPI LOCAL (LA) includes Los Angeles-Long Beach-Anaheim. Effective 3/1/2015 Atlanta SMID Cap strategychanged to Atlanta Small Cap Core strategy. Vanguard Growth Index Ins liquidated 5/29/2018. T. Rowe Price Instl Large Cap Growth Ins and Vanguard Institutional Index Ins funded 5/30/2018. Vanguard Short-Term Investment Grade Admchanged share classes to Vanguard Short-Term Investment Grade Inst on 5/27/2020. Vanguard Inflation-Protected Securities Adm changed share classes to Vanguard Inflation-Protected Securities Inst on 5/27/2020. PIMCO All Asset Insliquidated 11/9/2020. PanAgora Risk Parity Multi-Asset funded 11/10/2020. All data is preliminary.
Pasadena Fire & Police Retirement SystemExecutive Summary - Preliminary (Net of Fees) Period Ending: October 31, 2021
Pasadena Fire & Police Retirement System 2
Market Value % ofPortfolio 1 Mo QTD YTD Fiscal
YTD 1 Yr 3 Yrs 5 Yrs_
Vanguard Short-Term InvestmentGrade Inst 13,166,511 10.0 -0.5 -0.5 0.0 -0.3 0.9 3.9 2.7
Bloomberg US Credit 1-5 Yr TR -0.5 -0.5 -0.4 -0.4 0.4 4.1 2.8Vanguard Inflation-Protected SecuritiesInst 6,636,901 5.0 1.0 1.0 4.5 2.8 6.9 8.2 4.5
Bloomberg US TIPS TR 1.1 1.1 4.7 2.9 7.1 8.4 4.7Total Real Estate 12,901,883 9.8 NA NA 13.6 7.3 15.1 5.9 6.6
NCREIF-ODCE NA NA 13.1 6.6 14.6 7.1 7.5NCREIF ODCE Net NA NA 12.4 6.4 13.7 6.1 6.6NCREIF Property Index NA NA 10.9 5.2 12.2 6.7 6.8Invesco Core Real Estate 12,901,883 9.8 NA NA 13.6 7.3 15.1 5.9 6.6
NCREIF-ODCE NA NA 13.1 6.6 14.6 7.1 7.5NCREIF ODCE Net NA NA 12.4 6.4 13.7 6.1 6.6
Total Alternatives 6,700,796 5.1 NA NA 5.8 0.5 17.4 7.9 6.2S&P Risk Parity 10% Target VolatilityIndex TR USD 2.1 2.1 13.5 3.9 27.7 14.8 10.8
CPI LOCAL (LA) NA NA 4.5 1.0 4.4 2.8 3.1CPI + 5% NA NA 9.2 2.2 10.1 7.7 7.6PanAgora Risk Parity Multi-Asset 6,700,796 5.1 NA NA 5.8 0.5 11.7 -- --
S&P Risk Parity 10% TargetVolatility Index TR USD 2.1 2.1 13.5 3.9 27.7 -- --
60% MSCI ACWI Net/40%Bloomberg Global Aggregate 3.0 3.0 8.0 2.0 20.6 -- --
Cash 8,480 0.0 0.0 0.0 0.0 0.0 0.0 1.0 1.0FTSE T-Bill 3 Months TR 0.0 0.0 0.0 0.0 0.1 1.1 1.1First American Treasury Obligation Z 8,480 0.0 0.0 0.0 0.0 0.0 0.0 1.0 1.0
FTSE T-Bill 3 Months TR 0.0 0.0 0.0 0.0 0.1 1.1 1.1XXXXX
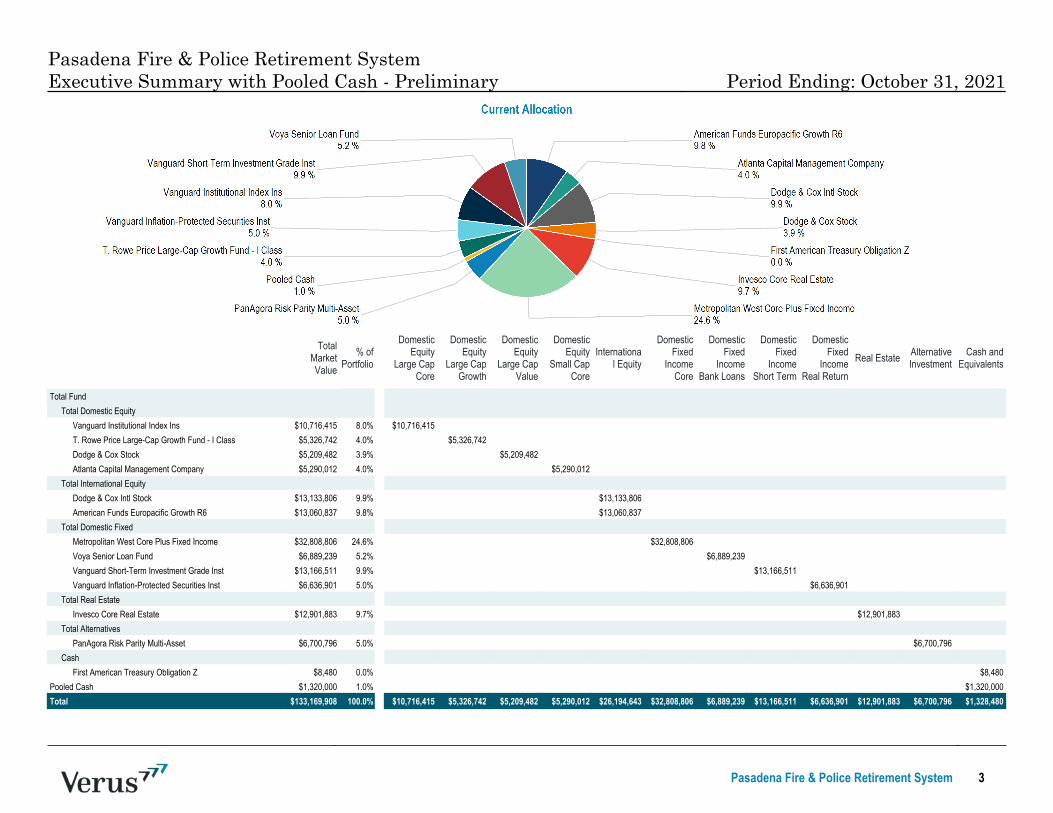
Pasadena Fire & Police Retirement SystemExecutive Summary with Pooled Cash - Preliminary Period Ending: October 31, 2021
Pasadena Fire & Police Retirement System 3
TotalMarketValue
% ofPortfolio
DomesticEquity
Large CapCore
DomesticEquity
Large CapGrowth
DomesticEquity
Large CapValue
DomesticEquity
Small CapCore
International Equity
DomesticFixed
IncomeCore
DomesticFixed
IncomeBank Loans
DomesticFixed
IncomeShort Term
DomesticFixed
IncomeReal Return
Real Estate AlternativeInvestment
Cash andEquivalents
_
Total Fund Total Domestic Equity
Vanguard Institutional Index Ins $10,716,415 8.0% $10,716,415T. Rowe Price Large-Cap Growth Fund - I Class $5,326,742 4.0% $5,326,742Dodge & Cox Stock $5,209,482 3.9% $5,209,482Atlanta Capital Management Company $5,290,012 4.0% $5,290,012
Total International Equity Dodge & Cox Intl Stock $13,133,806 9.9% $13,133,806American Funds Europacific Growth R6 $13,060,837 9.8% $13,060,837
Total Domestic Fixed Metropolitan West Core Plus Fixed Income $32,808,806 24.6% $32,808,806Voya Senior Loan Fund $6,889,239 5.2% $6,889,239Vanguard Short-Term Investment Grade Inst $13,166,511 9.9% $13,166,511Vanguard Inflation-Protected Securities Inst $6,636,901 5.0% $6,636,901
Total Real Estate Invesco Core Real Estate $12,901,883 9.7% $12,901,883
Total Alternatives PanAgora Risk Parity Multi-Asset $6,700,796 5.0% $6,700,796
Cash First American Treasury Obligation Z $8,480 0.0% $8,480
Pooled Cash $1,320,000 1.0% $1,320,000Total $133,169,908 100.0% $10,716,415 $5,326,742 $5,209,482 $5,290,012 $26,194,643 $32,808,806 $6,889,239 $13,166,511 $6,636,901 $12,901,883 $6,700,796 $1,328,480

Transaction summary
November 17, 2021Pasadena Fire & Police Retirement System 1
Date Transaction Type Fund(s) Sold Fund(s) Purchased Amount ($)
October 27, 2021 Pooled cash funding
1. Vanguard Institutional Index fund$250,000
2. Dodge & Cox Stock fund$250,000
3. Atlanta Capital Management$150,000
4. Dodge & Cox Int'l Stock fund$400,000
Pooled Cash 1,050,000$

Asset Class Manager Name Ticker Symbol CUSIP Actual $ Actual % Targets %Above / Under
Target % Target $Re‐Balance Estimate Re‐Balance Actual New $ New %
Variance to Targets (%)
Domestic EquityLarge Cap Core Vanguard Institutional Index VINIX 922040100 10,943,172$ 8.2% 8.0% 0.2% 10,389,645$ (553,527)$ (550,000) 10,393,172$ 8.0% 0.0%Large Cap Value Dodge & Cox Stock DODGX 256219106 5,322,938$ 4.0% 4.0% 0.0% 5,194,823$ (128,115)$ (125,000) 5,197,938$ 4.0% 0.0%Large Cap Growth T. Rowe Price Institutional Large Cap Growth TRLGX 45775L408 5,415,474$ 4.1% 4.0% 0.1% 5,194,823$ (220,651)$ (220,000) 5,195,474$ 4.0% 0.0%Small Cap Core Atlanta Capital Management n/a n/a 5,616,474$ 4.2% 4.0% 0.2% 5,194,823$ (421,651)$ (420,000) 5,196,474$ 4.0% 0.0%Total Domestic 27,298,058$ 20.5% 20.0% 0.5% 25,974,113$ (1,323,945)$ (1,315,000) 25,983,058$ 20.0% 0.0%
International EquityInternational Value Dodge & Cox Int'l Stock DODFX 256206103 13,224,274$ 9.9% 10.0% ‐0.1% 12,987,056$ (237,218)$ (240,000) 12,984,274$ 10.0% 0.00%International Growth American Funds EuroPacific Growth RERGX 298706821 13,216,610$ 9.9% 10.0% ‐0.1% 12,987,056$ (229,554)$ (230,000) 12,986,610$ 10.0% 0.00%Total International 26,440,884$ 19.9% 20.0% ‐0.1% 25,974,113$ (466,771)$ (470,000) 25,970,884$ 20.0% 0.00%
Total Equity 53,738,942$ 40.4% 40.0% 0.4% 51,948,226$ (1,790,716) (1,785,000) 51,953,942$ 40.0% 0.00%
Fixed Income
Core Fixed MetWest Core Plus 1 n/a n/a 32,877,414$ 24.7% 25.0% ‐0.3% 32,467,641$ (409,773)$ (450,000) 32,427,414$ 25.0% 0.0%Short‐Term Fixed Vanguard Short‐Term Investment‐Grade VFSIX 922031877 13,178,635$ 9.9% 10.0% ‐0.1% 12,987,056$ (191,578)$ (215,000) 12,963,635$ 10.0% 0.0%Senior Bank Loans Voya Senior Bank Loan CIT n/a n/a 6,898,030$ 5.2% 5.0% 0.2% 6,493,528$ (404,502)$ (450,000) 6,448,030$ 5.0% 0.0%Real Return Vanguard Inflation‐Protected Securities VIPIX 922031745 6,716,385$ 5.0% 5.0% 0.0% 6,493,528$ (222,856)$ (250,000) 6,466,385$ 5.0% 0.0%Total Fixed 59,670,464$ 44.9% 45.0% ‐0.1% 58,441,754$ (1,228,709)$ (1,365,000) 58,305,464$ 44.9% ‐0.1%
Real Estate
Real Estate Invesco Core Real Estate 2 n/a n/a 12,901,883$ 9.7% 10.0% ‐0.3% 12,987,056$ 85,173$ 12,901,883$ 9.9% ‐0.1%Total Real Estate 12,901,883$ 9.7% 10.0% ‐0.3% 12,987,056$ 85,173$ 0 12,901,883$ 9.9% ‐0.1%
Alternatives
Risk Parity Panagora Multi Asset Risk Parity (10% Vol) 2 n/a n/a 6,700,796$ 5.0% 5.0% 0.0% 6,493,528$ (207,268)$ 6,700,796$ 5.2% 0.2%Total Alternatives 6,700,796$ 5.0% 5.0% 0.0% 6,493,528$ (207,268)$ 0 6,700,796$ 5.2% 0.2%
Cash First American Treasury Obligations FUZXX 195998BA6 8,480$ 0.0% 0.0% 0.0% ‐$ (8,480)$ 8,480$ 0.0% 0.0%
Total Assets 133,020,565$ 100.0% 100% 0% 129,870,565$ (3,150,000)$ (3,150,000)$ 129,870,565$ 100% 0.0%
1 Including negative cash from mortgage TBD forward contracts2 As of 9/30/2021
Pasadena Fire and Police Retirement PlanNovember 8, 2021

Asset Class Manager Name Ticker Symbol CUSIP Actual $ Actual % Targets %Above / Under
Target % Target $Re‐Balance Estimate Re‐Balance Actual New $ New %
Variance to Targets (%)
Domestic EquityLarge Cap Core Vanguard Institutional Index VINIX 922040100 10,943,172$ 8.2% 8.0% 0.2% 10,557,645$ (385,527)$ (400,000) 10,543,172$ 8.0% 0.0%Large Cap Value Dodge & Cox Stock DODGX 256219106 5,322,938$ 4.0% 4.0% 0.0% 5,278,823$ (44,115)$ (50,000) 5,272,938$ 4.0% 0.0%Large Cap Growth T. Rowe Price Institutional Large Cap Growth TRLGX 45775L408 5,415,474$ 4.1% 4.0% 0.1% 5,278,823$ (136,651)$ (150,000) 5,265,474$ 4.0% 0.0%Small Cap Core Atlanta Capital Management n/a n/a 5,616,474$ 4.2% 4.0% 0.2% 5,278,823$ (337,651)$ (350,000) 5,266,474$ 4.0% 0.0%Total Domestic 27,298,058$ 20.5% 20.0% 0.5% 26,394,113$ (903,945)$ (950,000) 26,348,058$ 20.0% 0.0%
International EquityInternational Value Dodge & Cox Int'l Stock DODFX 256206103 13,224,274$ 9.9% 10.0% ‐0.1% 13,197,056$ (27,218)$ 13,224,274$ 10.0% 0.0%International Growth American Funds EuroPacific Growth RERGX 298706821 13,216,610$ 9.9% 10.0% ‐0.1% 13,197,056$ (19,554)$ 13,216,610$ 10.0% 0.0%Total International 26,440,884$ 19.9% 20.0% ‐0.1% 26,394,113$ (46,771)$ 0 26,440,884$ 20.0% 0.0%
Total Equity 53,738,942$ 40.4% 40.0% 0.4% 52,788,226$ (950,716) (950,000) 52,788,942$ 40.0% 0.0%
Fixed Income
Core Fixed MetWest Core Plus 1 n/a n/a 32,877,414$ 24.7% 25.0% ‐0.3% 32,992,641$ 115,227$ 32,877,414$ 24.9% ‐0.1%Short‐Term Fixed Vanguard Short‐Term Investment‐Grade VFSIX 922031877 13,178,635$ 9.9% 10.0% ‐0.1% 13,197,056$ 18,422$ 13,178,635$ 10.0% 0.0%Senior Bank Loans Voya Senior Bank Loan CIT n/a n/a 6,898,030$ 5.2% 5.0% 0.2% 6,598,528$ (299,502)$ 6,898,030$ 5.2% 0.2%Real Return Vanguard Inflation‐Protected Securities VIPIX 922031745 6,716,385$ 5.0% 5.0% 0.0% 6,598,528$ (117,856)$ (100,000) 6,616,385$ 5.0% 0.0%Total Fixed 59,670,464$ 44.9% 45.0% ‐0.1% 59,386,754$ (283,709)$ (100,000) 59,570,464$ 45.1% 0.1%
Real Estate
Real Estate Invesco Core Real Estate 2 n/a n/a 12,901,883$ 9.7% 10.0% ‐0.3% 13,197,056$ 295,173$ 12,901,883$ 9.8% ‐0.2%Total Real Estate 12,901,883$ 9.7% 10.0% ‐0.3% 13,197,056$ 295,173$ 0 12,901,883$ 9.8% ‐0.2%
Alternatives
Risk Parity Panagora Multi Asset Risk Parity (10% Vol) 2 n/a n/a 6,700,796$ 5.0% 5.0% 0.0% 6,598,528$ (102,268)$ 6,700,796$ 5.1% 0.1%Total Alternatives 6,700,796$ 5.0% 5.0% 0.0% 6,598,528$ (102,268)$ 0 6,700,796$ 5.1% 0.1%
Cash First American Treasury Obligations FUZXX 195998BA6 8,480$ 0.0% 0.0% 0.0% ‐$ (8,480)$ 8,480$ 0.0% 0.0%
Total Assets 133,020,565$ 100.0% 100% 0% 131,970,565$ (1,050,000)$ (1,050,000)$ 131,970,565$ 100% 0.0%
1 Including negative cash from mortgage TBD forward contracts2 As of 9/30/2021
Pasadena Fire and Police Retirement PlanNovember 8, 2021

NOVEMBER 17, 2021
Liquidity Analysis
Pasadena Fire & Police Retirement System
VERUSINVESTMENTS.COM
SEATTLE 206‐622‐3700PITTSBURGH 412‐784‐6678LOS ANGELES 310‐297‐1777
SAN FRANCISCO 415‐362‐3484
Past performance is no guarantee of future results. This document is provided for informational purposes only and is directed to institutional clients and eligible institutionalcounterparties only and is not intended for retail investors. Nothing herein constitutes investment, legal, accounting or tax advice, or a recommendation to buy, sell or hold a security or pursue a particular investment vehicle or any trading strategy. This document may include or imply estimates, outlooks, projections and other “forward‐looking statements.” No assurance can be given that future results described or implied by any forward looking information will be achieved. Investing entails risks, including possible loss of principal. Additional information about Verus Advisory, Inc. is available on the SEC’s website at www.adviserinfo.sec.gov. Verus – also known as Verus Advisory™.
Table of contents
2
Plan review 3
Observations 9
Appendix 11
Plan review
November 17, 2021PFPRS 3

Liquidity overview
PFPRS 4
As of September 30, 2021
Liquidity AssetsDaily (Trade Date + 1) Mutual Funds
Vanguard Institutional Index fund T. Rowe Price Institutional Large Cap Growth fund Dodge & Cox Stock fund Dodge & Cox International Stock fund American Funds EuroPacific Growth fund Vanguard Inflation Protected Securities fund Vanguard Short‐Term Investment‐Grade Bond fund First American Treasury Obligations fund
(US Bank cash sweep vehicle)
51.2% of Total Assets Capacity to address immediate cash need
Weekly (Trade Date + 2) Separate Accounts
Atlanta Small Cap strategy MetWest Core Plus Bond strategy
28.8% of Total Assets Capacity to address immediate cash need
Monthly Collective Investment Trust
Voya Senior Loan fund PanAgora Risk Parity Multi‐Asset fund
10.3% of Total Assets Capacity to address monthly cash needs Voya requires 30 days advance notice, redemption distributed on the
15th of each month PanAgora redemptions are beginning & mid‐month w/ 2‐day notice
Quarterly Collective Investment Trust
Invesco Core Real Estate fund
9.7% of Total Assets Capacity to address long‐term re‐balancing Requirement of 45 days advance notice, redemption distributed 1 day
following the end of each quarter
November 17, 2021
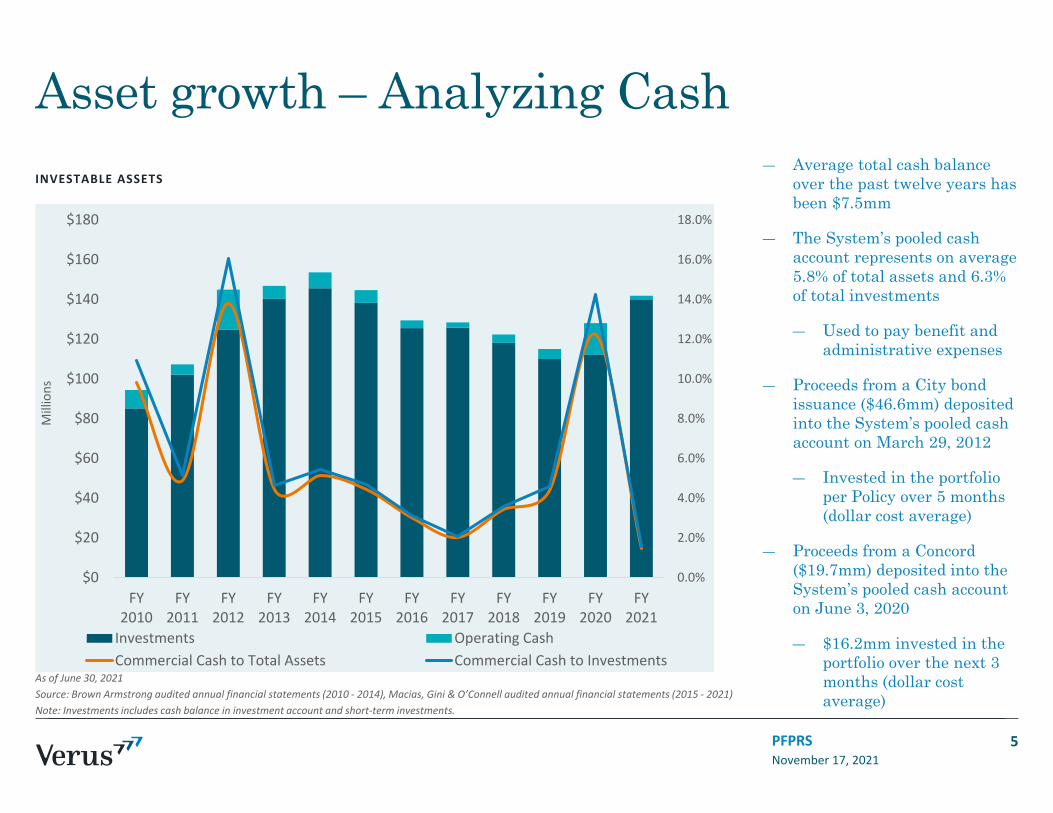
INVESTABLE ASSETS
Asset growth – Analyzing Cash
November 17, 2021PFPRS
― Average total cash balance over the past twelve years has been $7.5mm
― The System’s pooled cash account represents on average 5.8% of total assets and 6.3% of total investments
― Used to pay benefit and administrative expenses
― Proceeds from a City bond issuance ($46.6mm) deposited into the System’s pooled cash account on March 29, 2012
― Invested in the portfolio per Policy over 5 months (dollar cost average)
― Proceeds from a Concord ($19.7mm) deposited into the System’s pooled cash account on June 3, 2020
― $16.2mm invested in the portfolio over the next 3 months (dollar cost average)
As of June 30, 2021Source: Brown Armstrong audited annual financial statements (2010 ‐ 2014), Macias, Gini & O’Connell audited annual financial statements (2015 ‐ 2021)Note: Investments includes cash balance in investment account and short‐term investments.
5
0.0%
2.0%
4.0%
6.0%
8.0%
10.0%
12.0%
14.0%
16.0%
18.0%
$0
$20
$40
$60
$80
$100
$120
$140
$160
$180
FY2010
FY2011
FY2012
FY2013
FY2014
FY2015
FY2016
FY2017
FY2018
FY2019
FY2020
FY2021
Millions
Investments Operating CashCommercial Cash to Total Assets Commercial Cash to Investments
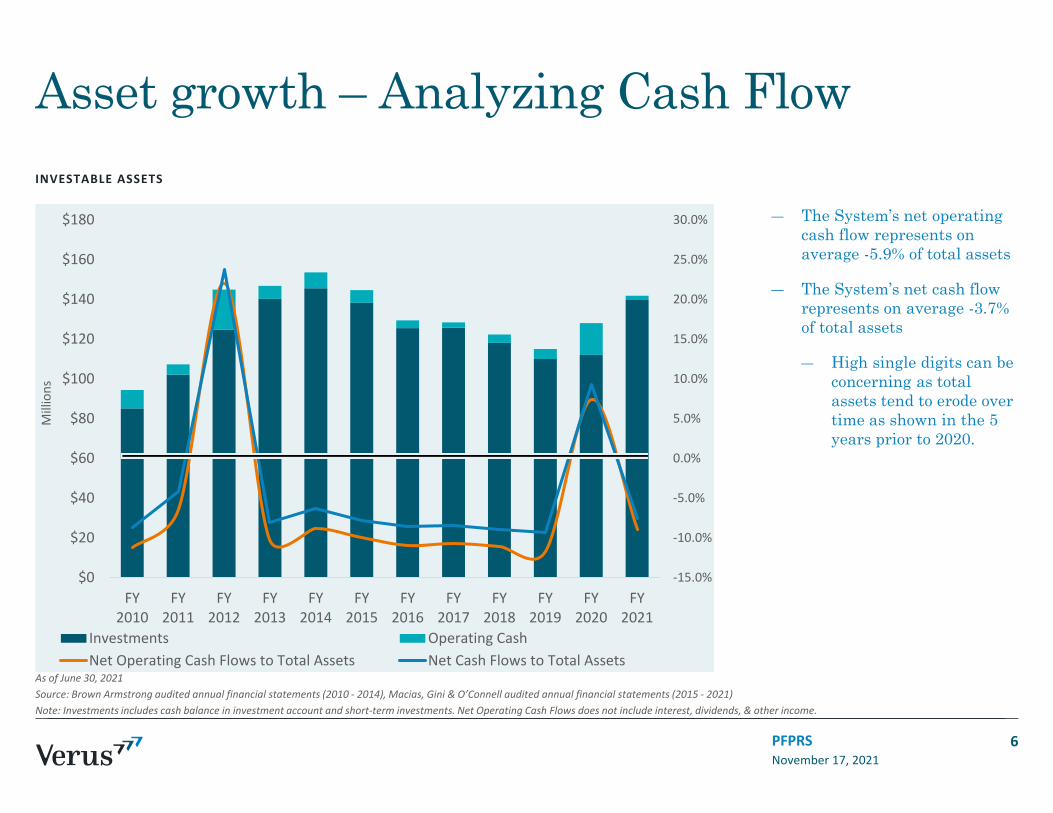
INVESTABLE ASSETS
Asset growth – Analyzing Cash Flow
November 17, 2021PFPRS
― The System’s net operating cash flow represents on average -5.9% of total assets
― The System’s net cash flow represents on average -3.7% of total assets
― High single digits can be concerning as total assets tend to erode over time as shown in the 5 years prior to 2020.
As of June 30, 2021Source: Brown Armstrong audited annual financial statements (2010 ‐ 2014), Macias, Gini & O’Connell audited annual financial statements (2015 ‐ 2021)Note: Investments includes cash balance in investment account and short‐term investments. Net Operating Cash Flows does not include interest, dividends, & other income.
6
‐15.0%
‐10.0%
‐5.0%
0.0%
5.0%
10.0%
15.0%
20.0%
25.0%
30.0%
$0
$20
$40
$60
$80
$100
$120
$140
$160
$180
FY2010
FY2011
FY2012
FY2013
FY2014
FY2015
FY2016
FY2017
FY2018
FY2019
FY2020
FY2021
Millions
Investments Operating CashNet Operating Cash Flows to Total Assets Net Cash Flows to Total Assets
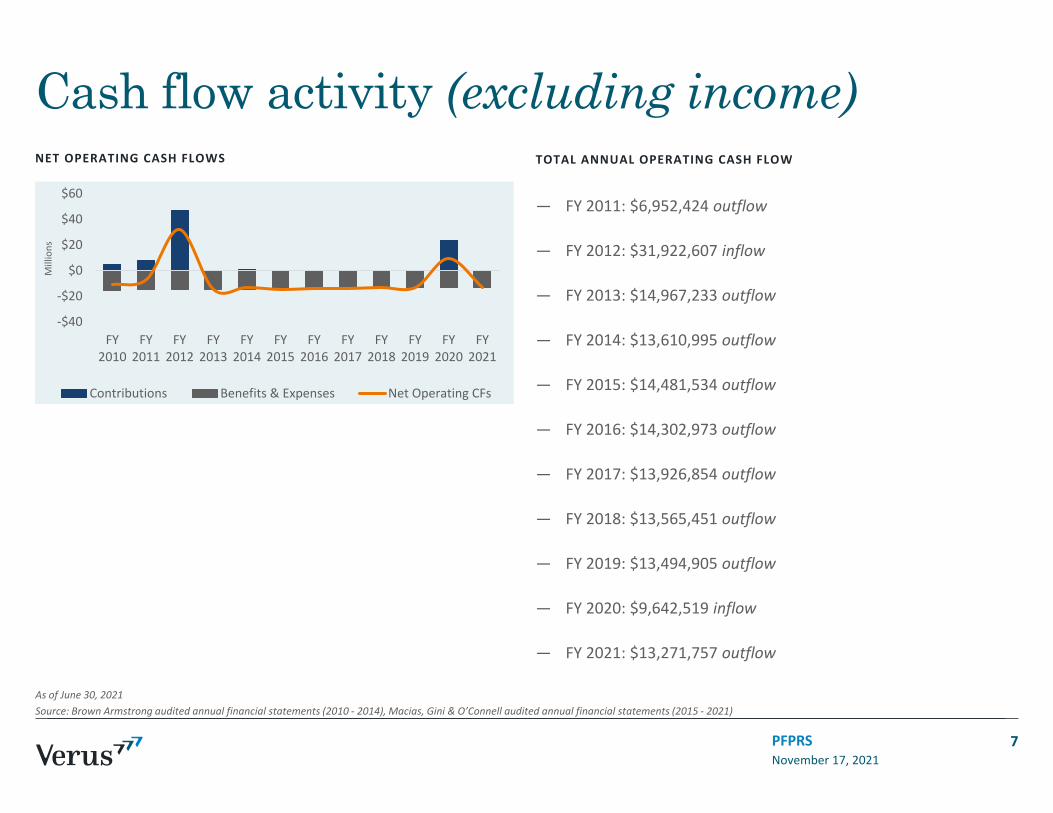
Cash flow activity (excluding income)TOTAL ANNUAL OPERATING CASH FLOW
— FY 2011: $6,952,424 outflow
— FY 2012: $31,922,607 inflow
— FY 2013: $14,967,233 outflow
— FY 2014: $13,610,995 outflow
— FY 2015: $14,481,534 outflow
— FY 2016: $14,302,973 outflow
— FY 2017: $13,926,854 outflow
— FY 2018: $13,565,451 outflow
— FY 2019: $13,494,905 outflow
— FY 2020: $9,642,519 inflow
— FY 2021: $13,271,757 outflow
November 17, 2021PFPRS
As of June 30, 2021Source: Brown Armstrong audited annual financial statements (2010 ‐ 2014), Macias, Gini & O’Connell audited annual financial statements (2015 ‐ 2021)
7
NET OPERATING CASH FLOWS
‐$40
‐$20
$0
$20
$40
$60
FY2010
FY2011
FY2012
FY2013
FY2014
FY2015
FY2016
FY2017
FY2018
FY2019
FY2020
FY2021
Millions
Contributions Benefits & Expenses Net Operating CFs

Cash flow activity (including income)TOTAL ANNUAL OPERATING CASH FLOW
— FY 2011: $4,549,019 outflow
— FY 2012: $34,545,605 inflow
— FY 2013: $11,849,431 outflow
— FY 2014: $9,750,419 outflow
— FY 2015: $11,320,492 outflow
— FY 2016: $11,216,392 outflow
— FY 2017: $11,063,086 outflow
— FY 2018: $10,909,993 outflow
— FY 2019: $10,778,825 outflow
— FY 2020: $12,208,581 inflow
— FY 2021: $11,305,054 outflow
November 17, 2021PFPRS
As of June 30, 2021Source: Brown Armstrong audited annual financial statements (2010 ‐ 2014), Macias, Gini & O’Connell audited annual financial statements (2015 ‐ 2021)
8
NET CASH FLOWS
‐$20
$0
$20
$40
$60
FY2010
FY2011
FY2012
FY2013
FY2014
FY2015
FY2016
FY2017
FY2018
FY2019
FY2020
FY2021
Millions
Contributions Benefits & Expenses Int & Div Net CFs

Observations
November 17, 2021PFPRS 9

Observations— The System’s investment portfolio consists predominantly of highly liquid assets
80.0% of investment portfolio assets are highly liquid (redeemable T+1 or T+2)
— On average, the System has received annual city contributions of $7.0mm and distributes annual benefit payments and administrative expense of $14.3mm
The variable annual city contributions to the System are dependent upon funded status
— On average, the System experiences annual cash outflows of $7.3mm (excluding investment income)
The current total operating cash balance of $2,178,627* (as of 6/30/2021) represents:
• 0.6 quarter(s) of total expenses (benefit payments and operating fees)
— The System’s negative net cash flow necessitates periodic redemptions from the investment portfolio to pooled cash
November 17, 2021PFPRS
*Pooled cash portion represents $1,355,955
10
Appendix
November 17, 2021PFPRS 11

November 17, 2021PFPRS
As of June 30, 2021Source: Brown Armstrong audited annual financial statements (2010 ‐ 2014), Macias, Gini & O’Connell audited annual financial statements (2015 ‐ 2021)
12
FY 2010 FY 2011 FY 2012 FY 2013 FY 2014 FY 2015 FY 2016 FY 2017 FY 2018Cash FlowsContributions:Employer 4,981,704 8,036,000 46,600,000 ‐ 1,164,000 ‐ ‐ ‐ ‐
Total Contributions 4,981,704 8,036,000 46,600,000 ‐ 1,164,000 ‐ ‐ ‐ ‐
Benefit Payments & Operating Expenses:Administrative Expenses 246,316 241,635 286,778 271,035 295,882 272,961 301,633 299,630 273,989
Investment Expenses 331,763 365,264 242,728 373,953 338,651 563,740 553,674 509,501 476,303
Benefits Paid 14,974,640 14,381,525 14,147,887 14,322,245 14,140,462 13,644,833 13,447,666 13,117,723 12,815,159
Total Benefit Payments & Operating Expenses (15,552,719) (14,988,424) (14,677,393) (14,967,233) (14,774,995) (14,481,534) (14,302,973) (13,926,854) (13,565,451)
Net Operating Cash Flows (10,571,015) (6,952,424) 31,922,607 (14,967,233) (13,610,995) (14,481,534) (14,302,973) (13,926,854) (13,565,451)
Interest and Dividends:Interest 1,517,524 1,504,834 1,556,037 1,812,766 2,211,690 2,059,075 1,385,469 1,104,673 816,278
Dividends 774,255 898,571 1,066,961 1,305,036 1,128,886 1,101,967 1,701,112 1,759,095 1,839,180
Other Income ‐ ‐ ‐ ‐ 520,000 ‐ ‐ ‐ ‐
Total Interest and Dividends 2,291,779 2,403,405 2,622,998 3,117,802 3,860,576 3,161,042 3,086,581 2,863,768 2,655,458
Net Cash Flows (8,279,236) (4,549,019) 34,545,605 (11,849,431) (9,750,419) (11,320,492) (11,216,392) (11,063,086) (10,909,993)
AssetsAssets:Cash and cash equivalents 9,281,352 5,234,332 20,038,869 6,531,090 7,918,592 6,469,469 3,943,631 2,616,941 4,218,042
Short‐term investments ‐ ‐ ‐ ‐ ‐ ‐ ‐ ‐ ‐
Investments 85,112,541 102,078,425 124,843,499 140,238,405 145,618,881 138,205,928 125,535,556 125,811,805 118,115,549
Total Investments 85,112,541 102,078,425 124,843,499 140,238,405 145,618,881 138,205,928 125,535,556 125,811,805 118,115,549
Interest Receivable 183,072 200,421 256,442 269,374 267,661 193,141 178,985 122,475 132,169
Pending Trade Sales ‐ ‐ ‐ ‐ 790,981 426,624 1,218,352 1,585,224 ‐
Total Assets 94,576,965 107,513,178 145,138,810 147,038,869 154,596,115 145,295,162 130,876,524 130,136,445 122,465,760
Total Liabilities 2,660,631 2,578,781 6,002,731 6,866,100 6,391,725 5,326,122 4,607,964 4,771,687 3,533,683
Net Assets 91,916,334 104,934,397 139,136,079 140,172,769 148,204,390 139,969,040 126,268,560 125,364,758 118,932,077

November 17, 2021PFPRS
As of June 30, 2021Source: Brown Armstrong audited annual financial statements (2010 ‐ 2014), Macias, Gini & O’Connell audited annual financial statements (2015 ‐ 2021)
13
FY 2019 FY 2020 FY 2021Cash FlowsContributions:Employer ‐ 23,137,382 ‐
Total Contributions ‐ 23,137,382 ‐
Benefit Payments & Operating Expenses:Administrative Expenses 256,986 321,126 326,542
Investment Expenses 414,238 400,280 439,243
Benefits Paid 12,823,681 12,773,457 12,505,972
Total Benefit Payments & Operating Expenses (13,494,905) (13,494,863) (13,271,757)
Net Operating Cash Flows (13,494,905) 9,642,519 (13,271,757)
Interest and Dividends:Interest 838,911 858,343 603,309
Dividends 1,877,169 1,707,719 1,363,394
Other Income ‐ ‐
Total Interest and Dividends 2,716,080 2,566,062 1,966,703
Net Cash Flows (10,778,825) 12,208,581 (11,305,054)
AssetsAssets:Cash and cash equivalents 5,039,242 15,959,198 2,178,627
Short‐term investments ‐ 6,122,888 4,124,710
Investments 109,975,566 105,982,905 135,540,289
Total Investments 109,975,566 112,105,793 139,664,999
Interest Receivable 123,972 115,550 169,918
Pending Trade Sales 91,328 2,419,005 6,786,349
Total Assets 115,230,108 130,599,546 148,799,893
Total Liabilities 3,446,029 5,388,293 14,067,307
Net Assets 111,784,079 125,211,253 134,732,586
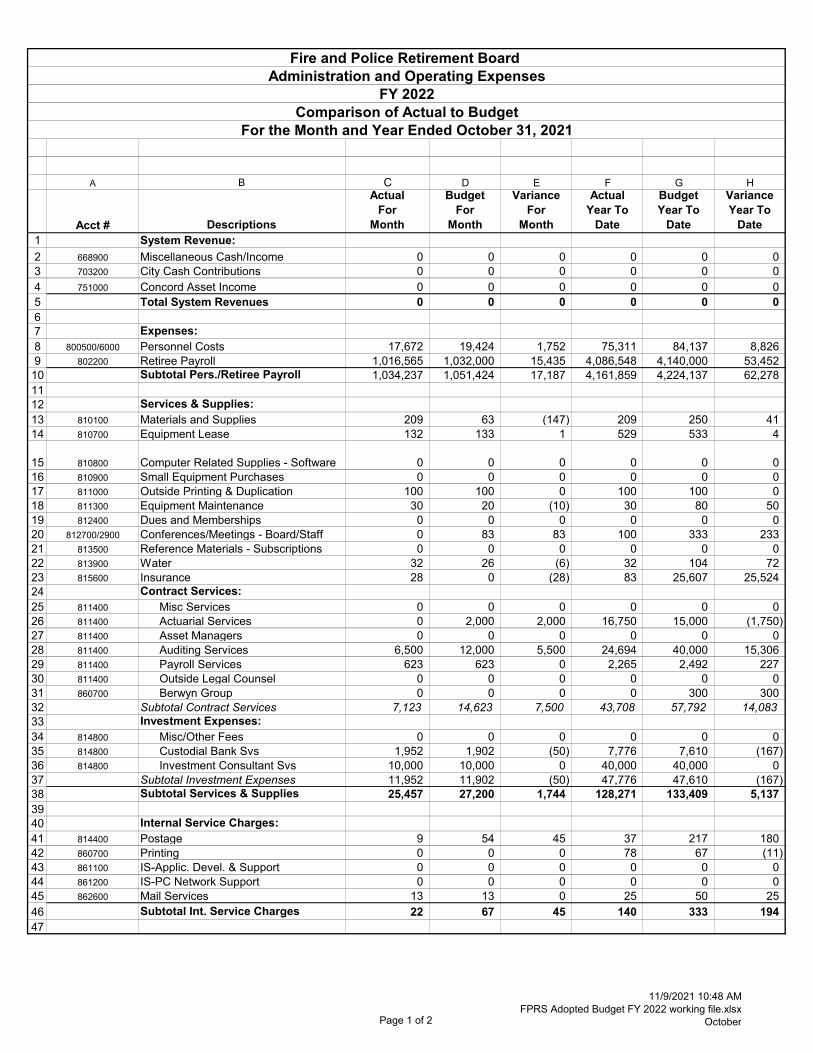
Page 1 of 2
11/9/2021 10:48 AMFPRS Adopted Budget FY 2022 working file.xlsx
October
A B C D E F G H
Acct # Descriptions
ActualFor
Month
BudgetFor
Month
VarianceFor
Month
ActualYear To
Date
BudgetYear To
Date
VarianceYear To
Date1 System Revenue:2 668900 Miscellaneous Cash/Income 0 0 0 0 0 03 703200 City Cash Contributions 0 0 0 0 0 04 751000 Concord Asset Income 0 0 0 0 0 05 Total System Revenues 0 0 0 0 0 067 Expenses:8 800500/6000 Personnel Costs 17,672 19,424 1,752 75,311 84,137 8,8269 802200 Retiree Payroll 1,016,565 1,032,000 15,435 4,086,548 4,140,000 53,45210 Subtotal Pers./Retiree Payroll 1,034,237 1,051,424 17,187 4,161,859 4,224,137 62,2781112 Services & Supplies:13 810100 Materials and Supplies 209 63 (147) 209 250 4114 810700 Equipment Lease 132 133 1 529 533 4
15 810800 Computer Related Supplies - Software 0 0 0 0 0 016 810900 Small Equipment Purchases 0 0 0 0 0 017 811000 Outside Printing & Duplication 100 100 0 100 100 018 811300 Equipment Maintenance 30 20 (10) 30 80 5019 812400 Dues and Memberships 0 0 0 0 0 020 812700/2900 Conferences/Meetings - Board/Staff 0 83 83 100 333 23321 813500 Reference Materials - Subscriptions 0 0 0 0 0 022 813900 Water 32 26 (6) 32 104 7223 815600 Insurance 28 0 (28) 83 25,607 25,52424 Contract Services:25 811400 Misc Services 0 0 0 0 0 026 811400 Actuarial Services 0 2,000 2,000 16,750 15,000 (1,750)27 811400 Asset Managers 0 0 0 0 0 028 811400 Auditing Services 6,500 12,000 5,500 24,694 40,000 15,30629 811400 Payroll Services 623 623 0 2,265 2,492 22730 811400 Outside Legal Counsel 0 0 0 0 0 031 860700 Berwyn Group 0 0 0 0 300 30032 Subtotal Contract Services 7,123 14,623 7,500 43,708 57,792 14,08333 Investment Expenses:34 814800 Misc/Other Fees 0 0 0 0 0 035 814800 Custodial Bank Svs 1,952 1,902 (50) 7,776 7,610 (167)36 814800 Investment Consultant Svs 10,000 10,000 0 40,000 40,000 037 Subtotal Investment Expenses 11,952 11,902 (50) 47,776 47,610 (167)38 Subtotal Services & Supplies 25,457 27,200 1,744 128,271 133,409 5,1373940 Internal Service Charges:41 814400 Postage 9 54 45 37 217 18042 860700 Printing 0 0 0 78 67 (11)43 861100 IS-Applic. Devel. & Support 0 0 0 0 0 044 861200 IS-PC Network Support 0 0 0 0 0 045 862600 Mail Services 13 13 0 25 50 2546 Subtotal Int. Service Charges 22 67 45 140 333 19447
Fire and Police Retirement Board
FY 2022Comparison of Actual to Budget
For the Month and Year Ended October 31, 2021
Administration and Operating Expenses
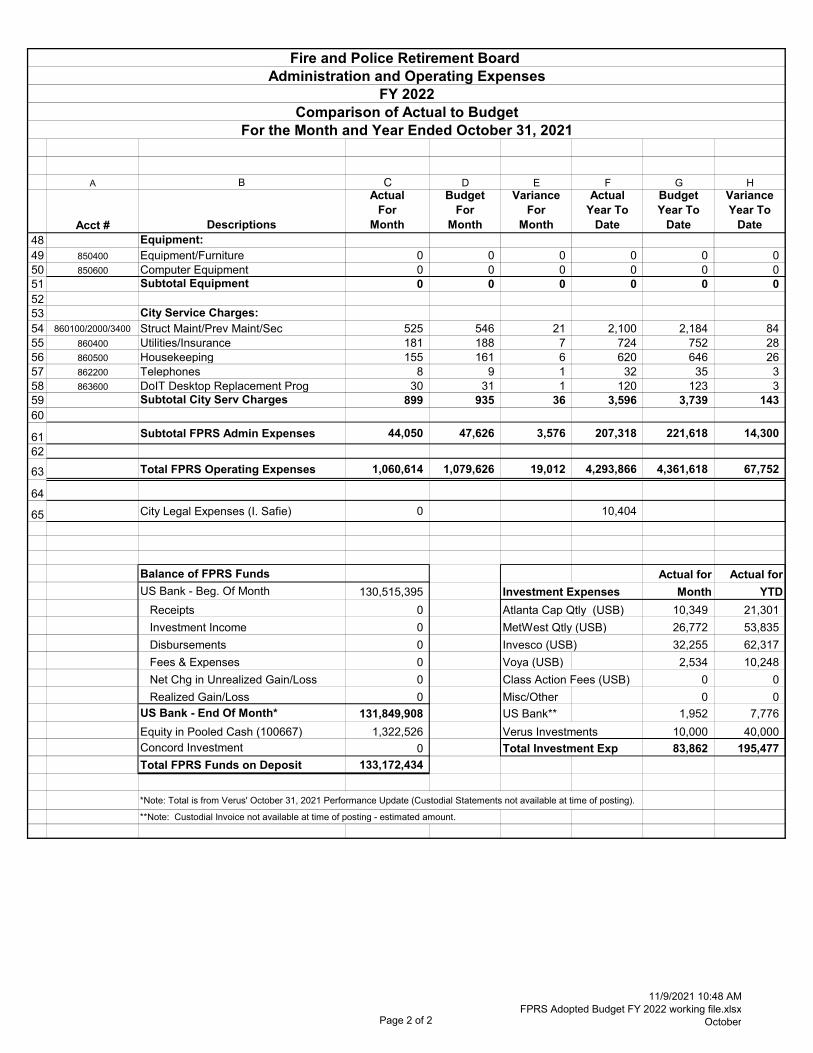
Page 2 of 2
11/9/2021 10:48 AMFPRS Adopted Budget FY 2022 working file.xlsx
October
A B C D E F G H
Acct # Descriptions
ActualFor
Month
BudgetFor
Month
VarianceFor
Month
ActualYear To
Date
BudgetYear To
Date
VarianceYear To
Date
Fire and Police Retirement Board
FY 2022Comparison of Actual to Budget
For the Month and Year Ended October 31, 2021
Administration and Operating Expenses
48 Equipment:49 850400 Equipment/Furniture 0 0 0 0 0 050 850600 Computer Equipment 0 0 0 0 0 051 Subtotal Equipment 0 0 0 0 0 05253 City Service Charges:54 860100/2000/3400 Struct Maint/Prev Maint/Sec 525 546 21 2,100 2,184 8455 860400 Utilities/Insurance 181 188 7 724 752 2856 860500 Housekeeping 155 161 6 620 646 2657 862200 Telephones 8 9 1 32 35 358 863600 DoIT Desktop Replacement Prog 30 31 1 120 123 359 Subtotal City Serv Charges 899 935 36 3,596 3,739 14360
61 Subtotal FPRS Admin Expenses 44,050 47,626 3,576 207,318 221,618 14,30062
63 Total FPRS Operating Expenses 1,060,614 1,079,626 19,012 4,293,866 4,361,618 67,752
64
65 City Legal Expenses (I. Safie) 0 10,404
Balance of FPRS Funds Actual for Actual forUS Bank - Beg. Of Month 130,515,395 Investment Expenses Month YTD Receipts 0 Atlanta Cap Qtly (USB) 10,349 21,301 Investment Income 0 MetWest Qtly (USB) 26,772 53,835 Disbursements 0 Invesco (USB) 32,255 62,317 Fees & Expenses 0 Voya (USB) 2,534 10,248 Net Chg in Unrealized Gain/Loss 0 Class Action Fees (USB) 0 0 Realized Gain/Loss 0 Misc/Other 0 0US Bank - End Of Month* 131,849,908 US Bank** 1,952 7,776Equity in Pooled Cash (100667) 1,322,526 Verus Investments 10,000 40,000Concord Investment 0 Total Investment Exp 83,862 195,477Total FPRS Funds on Deposit 133,172,434
*Note: Total is from Verus' October 31, 2021 Performance Update (Custodial Statements not available at time of posting).
**Note: Custodial Invoice not available at time of posting - estimated amount.